Embed Size (px)
Citation preview

Media Monitoring Configuration Guide, Cisco IOS XE Gibraltar 16.12.xAmericas HeadquartersCisco Systems, Inc.170 West Tasman DriveSan Jose, CA 95134-1706USAhttp://www.cisco.comTel: 408 526-4000
800 553-NETS (6387)Fax: 408 527-0883

THE SPECIFICATIONS AND INFORMATION REGARDING THE PRODUCTS IN THIS MANUAL ARE SUBJECT TO CHANGE WITHOUT NOTICE. ALL STATEMENTS,INFORMATION, AND RECOMMENDATIONS IN THIS MANUAL ARE BELIEVED TO BE ACCURATE BUT ARE PRESENTED WITHOUT WARRANTY OF ANY KIND,EXPRESS OR IMPLIED. USERS MUST TAKE FULL RESPONSIBILITY FOR THEIR APPLICATION OF ANY PRODUCTS.
THE SOFTWARE LICENSE AND LIMITED WARRANTY FOR THE ACCOMPANYING PRODUCT ARE SET FORTH IN THE INFORMATION PACKET THAT SHIPPED WITHTHE PRODUCT AND ARE INCORPORATED HEREIN BY THIS REFERENCE. IF YOU ARE UNABLE TO LOCATE THE SOFTWARE LICENSE OR LIMITED WARRANTY,CONTACT YOUR CISCO REPRESENTATIVE FOR A COPY.
The Cisco implementation of TCP header compression is an adaptation of a program developed by the University of California, Berkeley (UCB) as part of UCB's public domain version ofthe UNIX operating system. All rights reserved. Copyright © 1981, Regents of the University of California.
NOTWITHSTANDING ANY OTHERWARRANTY HEREIN, ALL DOCUMENT FILES AND SOFTWARE OF THESE SUPPLIERS ARE PROVIDED “AS IS" WITH ALL FAULTS.CISCO AND THE ABOVE-NAMED SUPPLIERS DISCLAIM ALL WARRANTIES, EXPRESSED OR IMPLIED, INCLUDING, WITHOUT LIMITATION, THOSE OFMERCHANTABILITY, FITNESS FOR A PARTICULAR PURPOSE AND NONINFRINGEMENT OR ARISING FROM A COURSE OF DEALING, USAGE, OR TRADE PRACTICE.
IN NO EVENT SHALL CISCO OR ITS SUPPLIERS BE LIABLE FOR ANY INDIRECT, SPECIAL, CONSEQUENTIAL, OR INCIDENTAL DAMAGES, INCLUDING, WITHOUTLIMITATION, LOST PROFITS OR LOSS OR DAMAGE TO DATA ARISING OUT OF THE USE OR INABILITY TO USE THIS MANUAL, EVEN IF CISCO OR ITS SUPPLIERSHAVE BEEN ADVISED OF THE POSSIBILITY OF SUCH DAMAGES.
Any Internet Protocol (IP) addresses and phone numbers used in this document are not intended to be actual addresses and phone numbers. Any examples, command display output, networktopology diagrams, and other figures included in the document are shown for illustrative purposes only. Any use of actual IP addresses or phone numbers in illustrative content is unintentionaland coincidental.
All printed copies and duplicate soft copies of this document are considered uncontrolled. See the current online version for the latest version.
Cisco has more than 200 offices worldwide. Addresses and phone numbers are listed on the Cisco website at www.cisco.com/go/offices.
Cisco and the Cisco logo are trademarks or registered trademarks of Cisco and/or its affiliates in the U.S. and other countries. To view a list of Cisco trademarks, go to this URL: www.cisco.comgo trademarks. Third-party trademarks mentioned are the property of their respective owners. The use of the word partner does not imply a partnership relationship between Cisco and anyother company. (1721R)
© 2019 Cisco Systems, Inc. All rights reserved.

C O N T E N T S
Read Me First 1C H A P T E R 1
Configuring Cisco Mediatrace 3C H A P T E R 2
Finding Feature Information 3
Information About Configuring Cisco Mediatrace 3
Overview of Cisco Mediatrace 3
Metrics That You Can Collect Using Cisco Mediatrace 4
Overview of Configuring Cisco Mediatrace 7
Limitations 8
How to Configure Cisco Mediatrace 9
Enabling Cisco Mediatrace 9
Troubleshooting Tips 10
Configuring a Cisco Mediatrace Video Profile on the Mediatrace Initiator 10
Troubleshooting Tips 12
Configuring a Cisco Mediatrace System Profile 12
Troubleshooting Tips 13
Configuring a Cisco Mediatrace Path-Specifier Profile 13
Troubleshooting Tips 14
Configuring a Cisco Mediatrace Flow-Specifier Profile 15
Troubleshooting Tips 16
Configuring a Cisco Mediatrace Session Parameters Profile 16
Troubleshooting Tips 17
Configuring a Cisco Mediatrace Session 18
Troubleshooting Tips 19
Scheduling a Cisco Mediatrace Session 20
Troubleshooting Tips 21
Media Monitoring Configuration Guide, Cisco IOS XE Gibraltar 16.12.xiii

Clearing a Cisco Mediatrace Session 21
Troubleshooting Tips 21
Executing a Cisco Mediatrace Poll 22
Troubleshooting Tips 23
Examples 23
How to Troubleshoot and Monitor a Cisco Mediatrace Session 25
Configuration Examples for Cisco Mediatrace 32
Example Basic Mediatrace Configuration 32
Where to Go Next 33
Additional References 34
Feature Information for Cisco Mediatrace 35
Configuring Cisco Performance Monitor 37C H A P T E R 3
Finding Feature Information 37
Information About Cisco Performance Monitor 37
Overview of Cisco Performance Monitor 37
Prerequisites for Configuring Cisco Performance Monitor 38
Configuration Components of Cisco Performance Monitor 38
Data That You Can Monitor Using Cisco Performance Monitor 39
SNMP MIB Support for Cisco Performance Monitor 41
Limitations for the Catalyst 6500 Platform 41
Restrictions for Performance Monitor 43
How to Configure Troubleshoot and Maintain Cisco Performance Monitor 43
Configuring a Flow Exporter for Cisco Performance Monitor 43
Troubleshooting Tips 46
Configuring a Flow Record for Cisco Performance Monitor 46
Troubleshooting Tips 49
Configuring a Flow Monitor for Cisco Performance Monitor 49
Troubleshooting Tips 50
Configuring a Flow Class for Cisco Performance Monitor 51
Troubleshooting Tips 52
Configuring a Flow Policy for Cisco Performance Monitor Using an Existing Flow Monitor 52
Troubleshooting Tips 57
Media Monitoring Configuration Guide, Cisco IOS XE Gibraltar 16.12.xiv
Contents

Configuring a Flow Policy for Cisco PerformanceMonitorWithout Using an Existing FlowMonitor57
Troubleshooting Tips 62
Applying a Cisco Performance Monitor Policy to an Interface Using an Existing Flow Policy 62
Troubleshooting Tips 63
Applying a Cisco Performance Monitor Policy to an Interface Without Using an Existing FlowPolicy 63
Verifying That Cisco Performance Monitor Is Collecting Data 69
Displaying the Performance Monitor Cache and Clients 76
Displaying the Clock Rate for Cisco Performance Monitor Classes 78
Displaying the Current Status of a Flow Monitor 80
Verifying the Flow Monitor Configuration 80
Verifying That Cisco IOS Flexible NetFlow and Cisco Performance Monitor Is Enabled on anInterface 81
Displaying the Flow Monitor Cache 82
Displaying the Current Status of a Flow Exporter 84
Verifying the Flow Exporter Configuration 85
Enabling Debugging 86
Configuration Example for Cisco Performance Monitor 87
Example Monitor for Lost RTP Packets and RTP Jitter 87
Where to Go Next 88
Additional References 89
Feature Information for Cisco Performance Monitor 90
Metrics for Assurance Monitoring 95C H A P T E R 4
Feature Information for Metrics for Assurance Monitoring 95
Information About Metrics for Assurance Monitoring 96
Overview 96
Metrics Collected for Assurance 96
How to Configure Metrics for Assurance Monitoring 99
Configuring Assurance Monitors Outside of DNA Center 99
Configuring Assurance Monitors Using ezPM 99
Configuring Assurance Monitors Using Pre-defined FNF Records 100
How to configure on a routing platform 100
Media Monitoring Configuration Guide, Cisco IOS XE Gibraltar 16.12.xv
Contents

How to configure on a wireless platform 101
About Attaching the Assurance Monitors to Interfaces 102
Viewing Details of Assurance Records and Contexts 104
Overview 104
Displaying Structure of the Assurance Record 104
Displaying Configuration of a Context 104
Notes and Limitations 106
Assurance-related Metrics and Elephant Flows 106
Media Monitoring Configuration Guide, Cisco IOS XE Gibraltar 16.12.xvi
Contents

C H A P T E R 1Read Me First
Important Information about Cisco IOS XE 16
Effective Cisco IOS XE Release 3.7.0E for Catalyst Switching and Cisco IOS XE Release 3.17S (for Accessand Edge Routing) the two releases evolve (merge) into a single version of converged release—the Cisco IOSXE 16—providing one release covering the extensive range of access and edge products in the Switching andRouting portfolio.
Feature Information
Use Cisco Feature Navigator to find information about feature support, platform support, and Cisco softwareimage support. An account on Cisco.com is not required.
Related References
• Cisco IOS Command References, All Releases
Obtaining Documentation and Submitting a Service Request
• To receive timely, relevant information from Cisco, sign up at Cisco Profile Manager.
• To get the business impact you’re looking for with the technologies that matter, visit Cisco Services.
• To submit a service request, visit Cisco Support.
• To discover and browse secure, validated enterprise-class apps, products, solutions and services, visitCisco Marketplace.
• To obtain general networking, training, and certification titles, visit Cisco Press.
• To find warranty information for a specific product or product family, access Cisco Warranty Finder.
Media Monitoring Configuration Guide, Cisco IOS XE Gibraltar 16.12.x1

Media Monitoring Configuration Guide, Cisco IOS XE Gibraltar 16.12.x2
Read Me First
C H A P T E R 2Configuring Cisco Mediatrace
This chapter contains information about and instructions for configuring Cisco Mediatrace.
Cisco Mediatrace enables you to isolate and troubleshoot network degradation problems for data streams.Although it can be used to monitor any type of flow, it is primary used with video flows. It can also be usedfor non-flow related monitoring along a media flow path.
• Finding Feature Information, on page 3• Information About Configuring Cisco Mediatrace, on page 3• How to Configure Cisco Mediatrace, on page 9• Configuration Examples for Cisco Mediatrace, on page 32• Where to Go Next, on page 33• Additional References, on page 34• Feature Information for Cisco Mediatrace, on page 35
Finding Feature InformationYour software release may not support all the features documented in this module. For the latest caveats andfeature information, see Bug Search Tool and the release notes for your platform and software release. Tofind information about the features documented in this module, and to see a list of the releases in which eachfeature is supported, see the feature information table.
Use Cisco Feature Navigator to find information about platform support and Cisco software image support.To access Cisco Feature Navigator, go to www.cisco.com/go/cfn. An account on Cisco.com is not required.
Information About Configuring Cisco Mediatrace
Overview of Cisco Mediatrace
Mediatrace is no longer supported on M&T train. For performance monitoring, see Configuring CiscoPerformance Monitor, on page 37 chapter.
Note
Media Monitoring Configuration Guide, Cisco IOS XE Gibraltar 16.12.x3

Cisco Mediatrace helps to isolate and troubleshoot network degradation problems by enabling a networkadministrator to discover an IP flow’s path, dynamically enable monitoring capabilities on the nodes alongthe path, and collect information on a hop-by-hop basis. This information includes, among other things, flowstatistics, and utilization information for incoming and outgoing interfaces, CPUs, and memory, as well asany changes to IP routes or the Cisco Mediatrace monitoring state.
This information can be retrieved in either of two ways:
• By issuing an exec command to perform an on-demand collection of statistics from the hops along amedia flow. During this one-shot operation, the hops along the media flow are discovered and shown toyou, along with a set of other specified information.
• By configuring CiscoMediatrace to start a recurring monitoring session at a specific time and on specificdays. The session can be configured to specify which metrics to collect, and how frequently they arecollected. The hops along the path are automatically discovered as part of the operation.
After collecting the metrics you specified, you can view a report on the metrics.
Cisco Mediatrace is part of the Cisco Medianet family of products. For more information about the design,configuration, and troubleshooting ofMediatrace when used in conjunctionwith other Cisco products, includinga Quick Start Guide and Deployment Guide, see the Cisco Medianet Knowledge Base Portal, located athttp://www.cisco.com/web/solutions/medianet/knowledgebase/index.html.
Metrics That You Can Collect Using Cisco MediatraceYou can collect the following categories of metrics using Mediatrace:
• Common Metrics for Each Responder
• System Metrics: TCP Profile
• System Metrics: RTP Profile
• System Metrics: INTF Profile
• System Metrics: CPU Profile
• System Metrics: MEMORY Profile
• App-Health Metrics: MEDIATRACE-HEALTH Profile
• Metrics for the Mediatrace Request Summary from Initiator
The individual metrics under each of these categories are listed the appropriate section below.
Metics for Mediatrace Request Summary from Initiator
• Request Timestamp
• Request Status
• Number of Hops Responded
• Number of Hops with Valid Data
• Number of Hops with Error
• Number of hops with no data record
Media Monitoring Configuration Guide, Cisco IOS XE Gibraltar 16.12.x4
Configuring Cisco MediatraceMetrics That You Can Collect Using Cisco Mediatrace
• Last Route Change Timestamp
• Route Index
Common Metrics for Each Responder
• Metrics Collection Status
• Reachability address
• Ingress Interface
• Egress Interface
• Mediatrace IP TTL
• Hostname
• Mediatrace Hop Count
Perf-Monitor Metrics: TCP Profile
• Flow Sampling Start Timestamp
• Loss of measurement confidence
• Media Stop Event Occurred
• IP Packet Drop Count
• IP Byte Count
• IP Packet Count
• IP Byte Rate
• IP DSCP
• IP TTL
• IP Protocol
• Media Byte Count
• TCP Connect Round Trip Delay
• TCP Lost Event Count
Perf-Monitor Metrics: RTP Profile
• Flow Sampling Start Timestamp
• Loss of measurement confidence
• Media Stop Event Occurred
• IP Packet Drop Count
• IP Byte Count
Media Monitoring Configuration Guide, Cisco IOS XE Gibraltar 16.12.x5
Configuring Cisco MediatraceMetrics That You Can Collect Using Cisco Mediatrace
• IP Packet Count
• IP Byte Rate
• Packet Drop Reason
• IP DSCP
• IP TTL
• IP Protocol
• Media Byte Rate Average
• Media Byte Count
• Media Packet Count
• RTP Interarrival Jitter Average
• RTP Packets Lost
• RTP Packets Expected (pkts):
• RTP Packet Lost Event Count:
• RTP Loss Percent
System Metrics: INTF Profile
• Collection timestamp
• Octet input at Ingress
• Octet output at Egress
• Packets received with errors at Ingress
• Packets with errors at Egress
• Packets discarded at Ingress
• Packets discarded at Egress
• Ingress interface speed
• Egress interface speed
System Metrics: CPU Profile
• CPU Utilization (1min)
• CPU Utilization (5min)
• Collection timestamp
System Metrics: MEMORY Profile
• Processor memory utilization %
Media Monitoring Configuration Guide, Cisco IOS XE Gibraltar 16.12.x6
Configuring Cisco MediatraceMetrics That You Can Collect Using Cisco Mediatrace
• Collection timestamp
App-Health Metrics: MEDIATRACE-HEALTH Profile
• Requests Received
• Time Last Request Received
• Initiator of Last Request
• Requests Dropped
• Max Concurrent Sessions supported
• Sessions currently active
• Sessions Teared down
• Sessions Timed out
• Hop Info Requests Received
• Performance Monitor Requests Received
• Performance Monitor Requests failed
• Static Policy Requests Received
• Static Policy Requests Failed
• System Data Requests Received
• System Data Requests Failed
• Application Health Requests Received
• Local route change events
• Time of last route change event
• Number of unknown requests received
Overview of Configuring Cisco MediatraceInformation can be retrieved from Mediatrace by using in either:
• A pre-scheduled, recurring monitoring session.
• An one-shot, on-demand collection of statistics, known as a Mediatrace poll.
Before you can implement a Mediatrace session or poll, you enable Mediatrace on each network node thatyou want to collect flow information from. You must enable the Mediatrace Initiator on the network nodethat you will use to configure, initiate, and control the Mediatrace sessions or polls. On each of the networknodes that you want top collect information from, you must enable the Mediatrace Responder.
To configure a Cisco Mediatrace session, you can set session parameters by associating either of two typesof pre-packaged profiles with the session:
• video-monitoring profiles
Media Monitoring Configuration Guide, Cisco IOS XE Gibraltar 16.12.x7
Configuring Cisco MediatraceOverview of Configuring Cisco Mediatrace
• system-data profiles
You can also configure your own parameters for a Cisco Mediatrace session by configuring the followingtypes of profiles and associating them with the session:
• Path-specifier profile
• Flow-specifier profile
• Sessions-parameters profile
Therefore, the next section describes how to perform the following tasks in order to configure a CiscoMediatrace session:
1. Enable mediatrace
2. Setup a video-monitoring profile
3. Setup a system-data profile
4. Setup a path-specifier profile
5. Setup a flow-specifier profile
6. Setup a sessions-params profile
7. Associate profiles with a mediatrace session
8. Schedule a mediatrace session
The next section also describes how to execute a mediatrace poll, which is an on-demand fetch of data fromthe hops on a specific path.
In addition, the next section describes how to manage mediatrace sessions by performing the following tasks:
• Clear incomplete Cisco Mediatrace sessions
• Troubleshoot a Cisco Mediatrace session
Limitations• Mediatrace does not support IPv6.• Resource Reservation Protocol (RSVP) does not forward an incoming Path message on the same interface(i.e., through the interface from where it receives the path message). It displays an error some messageon the console, “ingress interface = egress interface”. But the Path is sent out on the incoming interfacein case of an Performance Routing (PfR) border router.
Media Monitoring Configuration Guide, Cisco IOS XE Gibraltar 16.12.x8
Configuring Cisco MediatraceLimitations
How to Configure Cisco Mediatrace
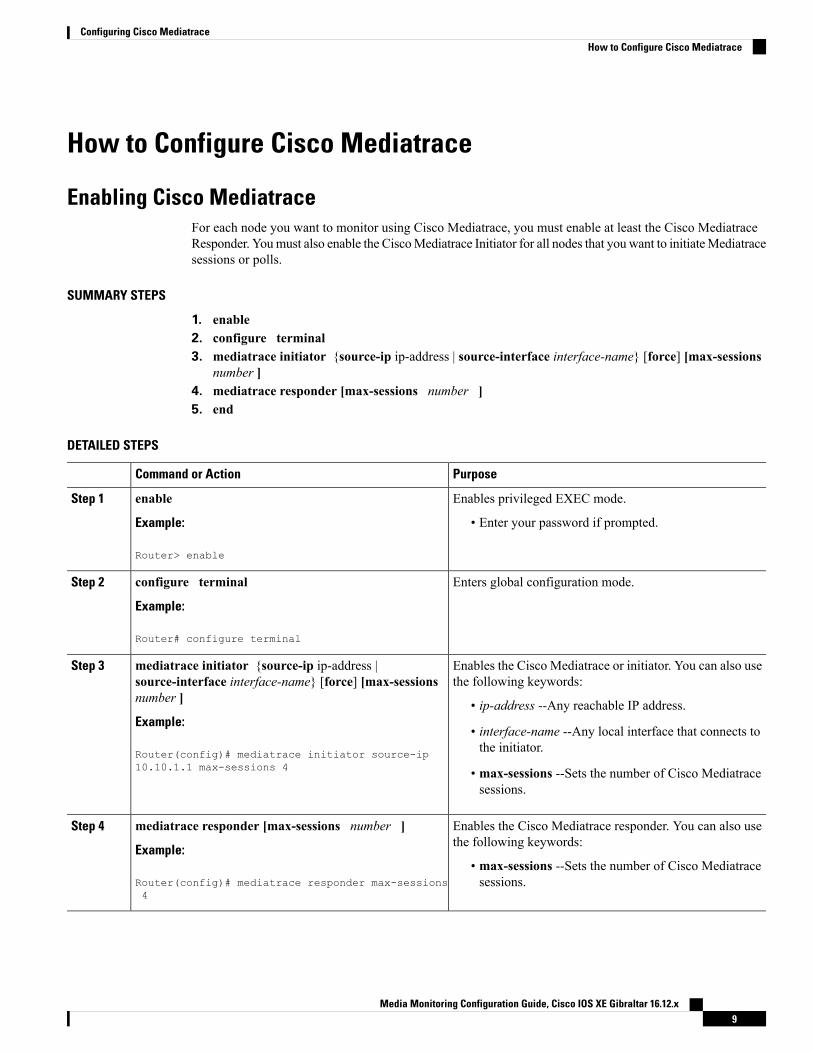
Enabling Cisco MediatraceFor each node you want to monitor using Cisco Mediatrace, you must enable at least the Cisco MediatraceResponder. Youmust also enable the CiscoMediatrace Initiator for all nodes that you want to initiateMediatracesessions or polls.
SUMMARY STEPS
1. enable2. configure terminal3. mediatrace initiator {source-ip ip-address | source-interface interface-name} [force] [max-sessions
number ]4. mediatrace responder [max-sessions number ]5. end
DETAILED STEPS
PurposeCommand or Action
Enables privileged EXEC mode.enableStep 1
Example: • Enter your password if prompted.
Router> enable
Enters global configuration mode.configure terminal
Example:
Step 2
Router# configure terminal
Enables the Cisco Mediatrace or initiator. You can also usethe following keywords:
mediatrace initiator {source-ip ip-address |source-interface interface-name} [force] [max-sessionsnumber ]
Step 3
• ip-address --Any reachable IP address.Example:
• interface-name --Any local interface that connects tothe initiator.Router(config)# mediatrace initiator source-ip
10.10.1.1 max-sessions 4 • max-sessions --Sets the number of Cisco Mediatracesessions.
Enables the Cisco Mediatrace responder. You can also usethe following keywords:
mediatrace responder [max-sessions number ]
Example:
Step 4
• max-sessions --Sets the number of Cisco Mediatracesessions.Router(config)# mediatrace responder max-sessions
4
Media Monitoring Configuration Guide, Cisco IOS XE Gibraltar 16.12.x9
Configuring Cisco MediatraceHow to Configure Cisco Mediatrace
PurposeCommand or Action
Exits the current configuration mode and returns toprivileged EXEC mode.
end
Example:
Step 5
Router(config)# end
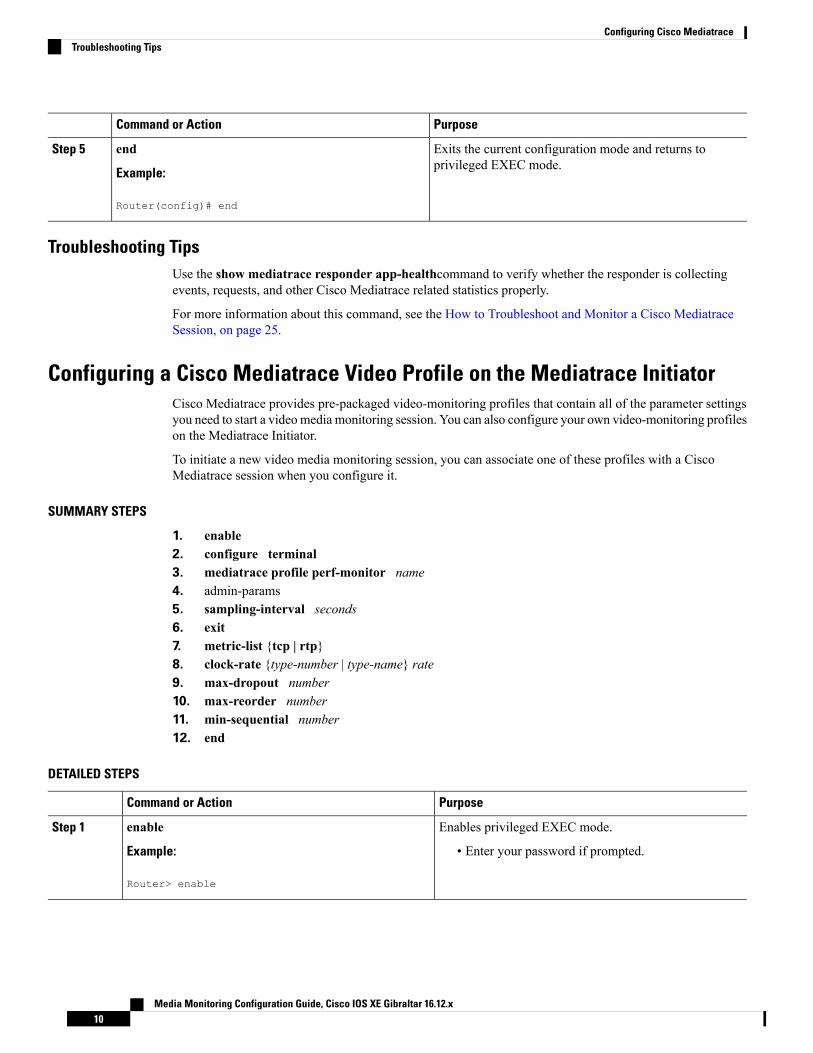
Troubleshooting TipsUse the show mediatrace responder app-healthcommand to verify whether the responder is collectingevents, requests, and other Cisco Mediatrace related statistics properly.
For more information about this command, see the How to Troubleshoot and Monitor a Cisco MediatraceSession, on page 25.
Configuring a Cisco Mediatrace Video Profile on the Mediatrace InitiatorCisco Mediatrace provides pre-packaged video-monitoring profiles that contain all of the parameter settingsyou need to start a video media monitoring session. You can also configure your own video-monitoring profileson the Mediatrace Initiator.
To initiate a new video media monitoring session, you can associate one of these profiles with a CiscoMediatrace session when you configure it.
SUMMARY STEPS
1. enable2. configure terminal3. mediatrace profile perf-monitor name4. admin-params5. sampling-interval seconds6. exit7. metric-list {tcp | rtp}8. clock-rate {type-number | type-name} rate9. max-dropout number10. max-reorder number11. min-sequential number12. end
DETAILED STEPS
PurposeCommand or Action
Enables privileged EXEC mode.enableStep 1
Example: • Enter your password if prompted.
Router> enable
Media Monitoring Configuration Guide, Cisco IOS XE Gibraltar 16.12.x10
Configuring Cisco MediatraceTroubleshooting Tips
PurposeCommand or Action
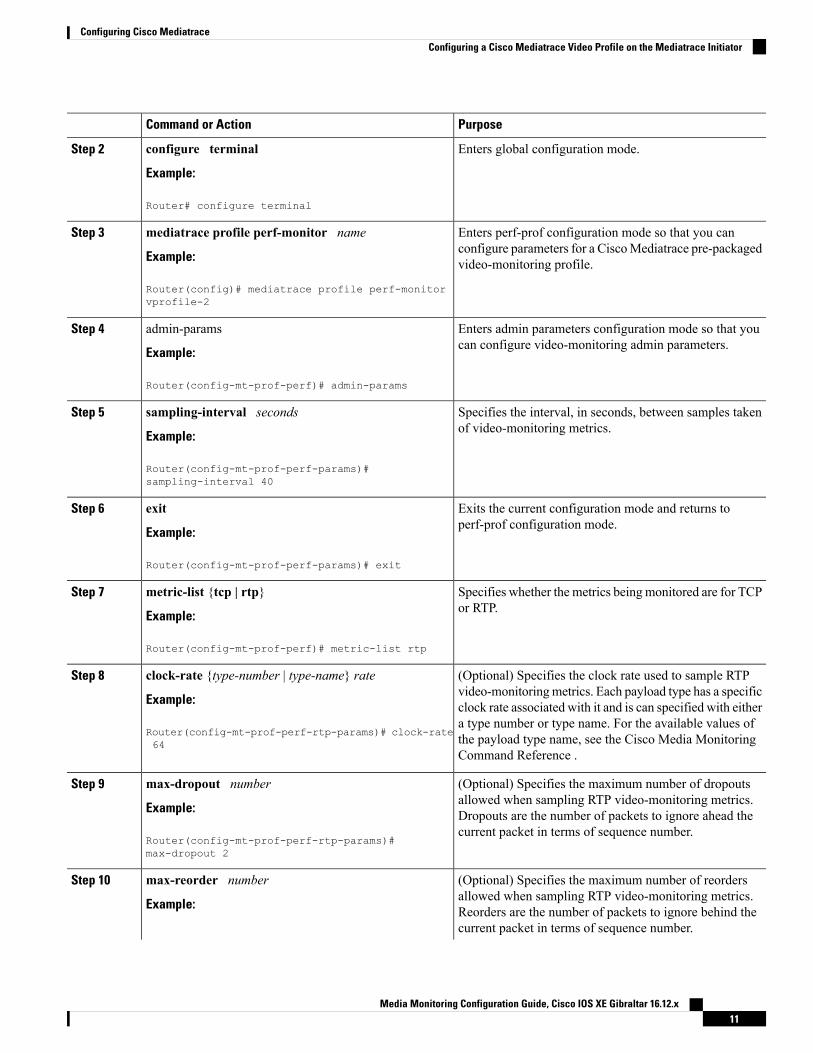
Enters global configuration mode.configure terminal
Example:
Step 2
Router# configure terminal
Enters perf-prof configuration mode so that you canconfigure parameters for a CiscoMediatrace pre-packagedvideo-monitoring profile.
mediatrace profile perf-monitor name
Example:
Router(config)# mediatrace profile perf-monitorvprofile-2
Step 3
Enters admin parameters configuration mode so that youcan configure video-monitoring admin parameters.
admin-params
Example:
Step 4
Router(config-mt-prof-perf)# admin-params
Specifies the interval, in seconds, between samples takenof video-monitoring metrics.
sampling-interval seconds
Example:
Step 5
Router(config-mt-prof-perf-params)#sampling-interval 40
Exits the current configuration mode and returns toperf-prof configuration mode.
exit
Example:
Step 6
Router(config-mt-prof-perf-params)# exit
Specifies whether the metrics beingmonitored are for TCPor RTP.
metric-list {tcp | rtp}
Example:
Step 7
Router(config-mt-prof-perf)# metric-list rtp
(Optional) Specifies the clock rate used to sample RTPvideo-monitoringmetrics. Each payload type has a specific
clock-rate {type-number | type-name} rate
Example:
Step 8
clock rate associated with it and is can specified with either
Router(config-mt-prof-perf-rtp-params)# clock-rate64
a type number or type name. For the available values ofthe payload type name, see the Cisco Media MonitoringCommand Reference .
(Optional) Specifies the maximum number of dropoutsallowed when sampling RTP video-monitoring metrics.
max-dropout number
Example:
Step 9
Dropouts are the number of packets to ignore ahead thecurrent packet in terms of sequence number.
Router(config-mt-prof-perf-rtp-params)#max-dropout 2
(Optional) Specifies the maximum number of reordersallowed when sampling RTP video-monitoring metrics.
max-reorder number
Example:
Step 10
Reorders are the number of packets to ignore behind thecurrent packet in terms of sequence number.
Media Monitoring Configuration Guide, Cisco IOS XE Gibraltar 16.12.x11
Configuring Cisco MediatraceConfiguring a Cisco Mediatrace Video Profile on the Mediatrace Initiator
PurposeCommand or Action
Router(config-mt-prof-perf-rtp-params)#max-reorder 4
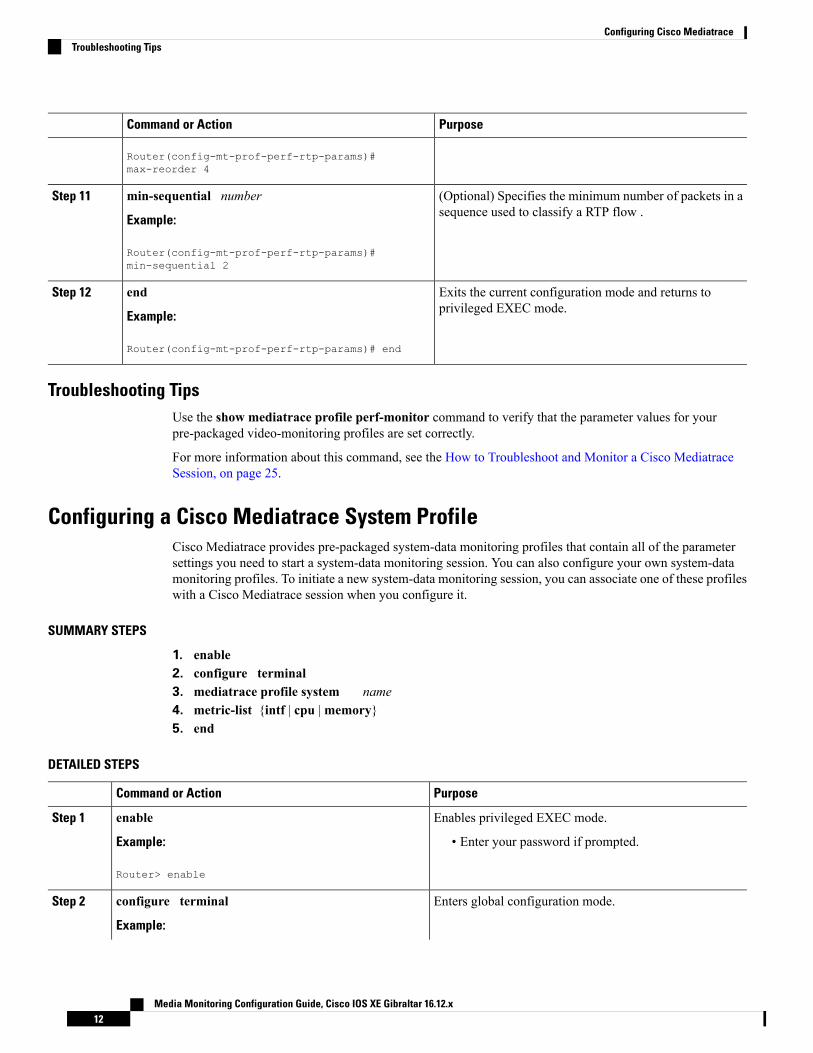
(Optional) Specifies the minimum number of packets in asequence used to classify a RTP flow .
min-sequential number
Example:
Step 11
Router(config-mt-prof-perf-rtp-params)#min-sequential 2
Exits the current configuration mode and returns toprivileged EXEC mode.
end
Example:
Step 12
Router(config-mt-prof-perf-rtp-params)# end
Troubleshooting TipsUse the show mediatrace profile perf-monitor command to verify that the parameter values for yourpre-packaged video-monitoring profiles are set correctly.
For more information about this command, see the How to Troubleshoot and Monitor a Cisco MediatraceSession, on page 25.
Configuring a Cisco Mediatrace System ProfileCisco Mediatrace provides pre-packaged system-data monitoring profiles that contain all of the parametersettings you need to start a system-data monitoring session. You can also configure your own system-datamonitoring profiles. To initiate a new system-data monitoring session, you can associate one of these profileswith a Cisco Mediatrace session when you configure it.
SUMMARY STEPS
1. enable2. configure terminal3. mediatrace profile system name4. metric-list {intf | cpu |memory}5. end
DETAILED STEPS
PurposeCommand or Action
Enables privileged EXEC mode.enableStep 1
Example: • Enter your password if prompted.
Router> enable
Enters global configuration mode.configure terminal
Example:
Step 2
Media Monitoring Configuration Guide, Cisco IOS XE Gibraltar 16.12.x12
Configuring Cisco MediatraceTroubleshooting Tips
PurposeCommand or Action
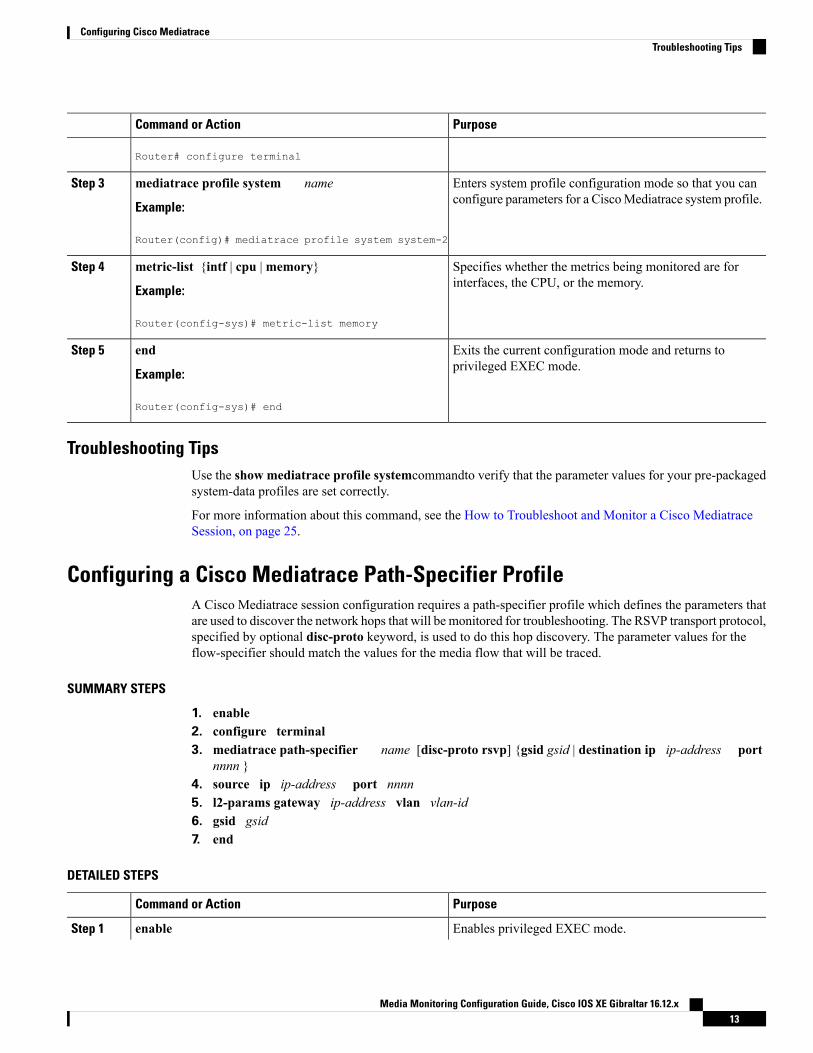
Router# configure terminal
Enters system profile configuration mode so that you canconfigure parameters for a CiscoMediatrace system profile.
mediatrace profile system name
Example:
Step 3
Router(config)# mediatrace profile system system-2
Specifies whether the metrics being monitored are forinterfaces, the CPU, or the memory.
metric-list {intf | cpu |memory}
Example:
Step 4
Router(config-sys)# metric-list memory
Exits the current configuration mode and returns toprivileged EXEC mode.
end
Example:
Step 5
Router(config-sys)# end
Troubleshooting TipsUse the show mediatrace profile systemcommandto verify that the parameter values for your pre-packagedsystem-data profiles are set correctly.
For more information about this command, see the How to Troubleshoot and Monitor a Cisco MediatraceSession, on page 25.
Configuring a Cisco Mediatrace Path-Specifier ProfileA Cisco Mediatrace session configuration requires a path-specifier profile which defines the parameters thatare used to discover the network hops that will be monitored for troubleshooting. The RSVP transport protocol,specified by optional disc-proto keyword, is used to do this hop discovery. The parameter values for theflow-specifier should match the values for the media flow that will be traced.
SUMMARY STEPS
1. enable2. configure terminal3. mediatrace path-specifier name [disc-proto rsvp] {gsid gsid | destination ip ip-address port
nnnn }4. source ip ip-address port nnnn5. l2-params gateway ip-address vlan vlan-id6. gsid gsid7. end
DETAILED STEPS
PurposeCommand or Action
Enables privileged EXEC mode.enableStep 1
Media Monitoring Configuration Guide, Cisco IOS XE Gibraltar 16.12.x13
Configuring Cisco MediatraceTroubleshooting Tips
PurposeCommand or Action
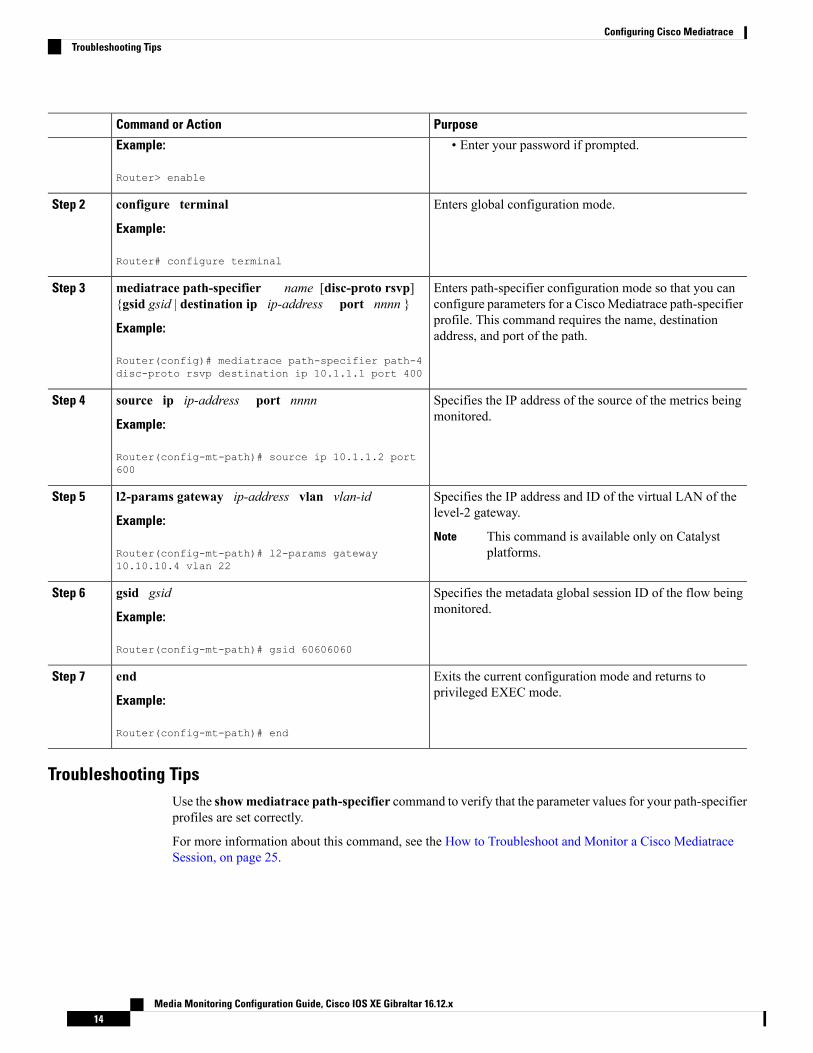
Example: • Enter your password if prompted.
Router> enable
Enters global configuration mode.configure terminal
Example:
Step 2
Router# configure terminal
Enters path-specifier configuration mode so that you canconfigure parameters for a CiscoMediatrace path-specifier
mediatrace path-specifier name [disc-proto rsvp]{gsid gsid | destination ip ip-address port nnnn }
Step 3
profile. This command requires the name, destinationaddress, and port of the path.Example:
Router(config)# mediatrace path-specifier path-4disc-proto rsvp destination ip 10.1.1.1 port 400
Specifies the IP address of the source of the metrics beingmonitored.
source ip ip-address port nnnn
Example:
Step 4
Router(config-mt-path)# source ip 10.1.1.2 port600
Specifies the IP address and ID of the virtual LAN of thelevel-2 gateway.
l2-params gateway ip-address vlan vlan-id
Example:
Step 5
This command is available only on Catalystplatforms.
NoteRouter(config-mt-path)# l2-params gateway10.10.10.4 vlan 22
Specifies the metadata global session ID of the flow beingmonitored.
gsid gsid
Example:
Step 6
Router(config-mt-path)# gsid 60606060
Exits the current configuration mode and returns toprivileged EXEC mode.
end
Example:
Step 7
Router(config-mt-path)# end
Troubleshooting TipsUse the showmediatrace path-specifier command to verify that the parameter values for your path-specifierprofiles are set correctly.
For more information about this command, see the How to Troubleshoot and Monitor a Cisco MediatraceSession, on page 25.
Media Monitoring Configuration Guide, Cisco IOS XE Gibraltar 16.12.x14
Configuring Cisco MediatraceTroubleshooting Tips
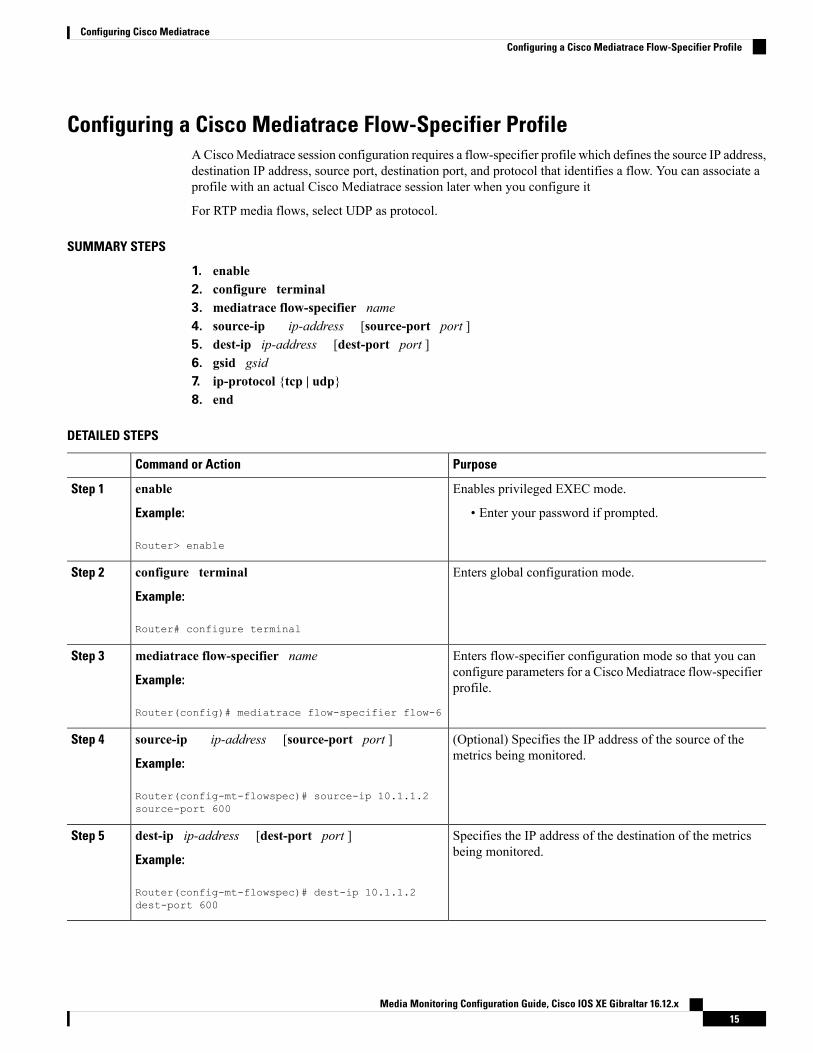
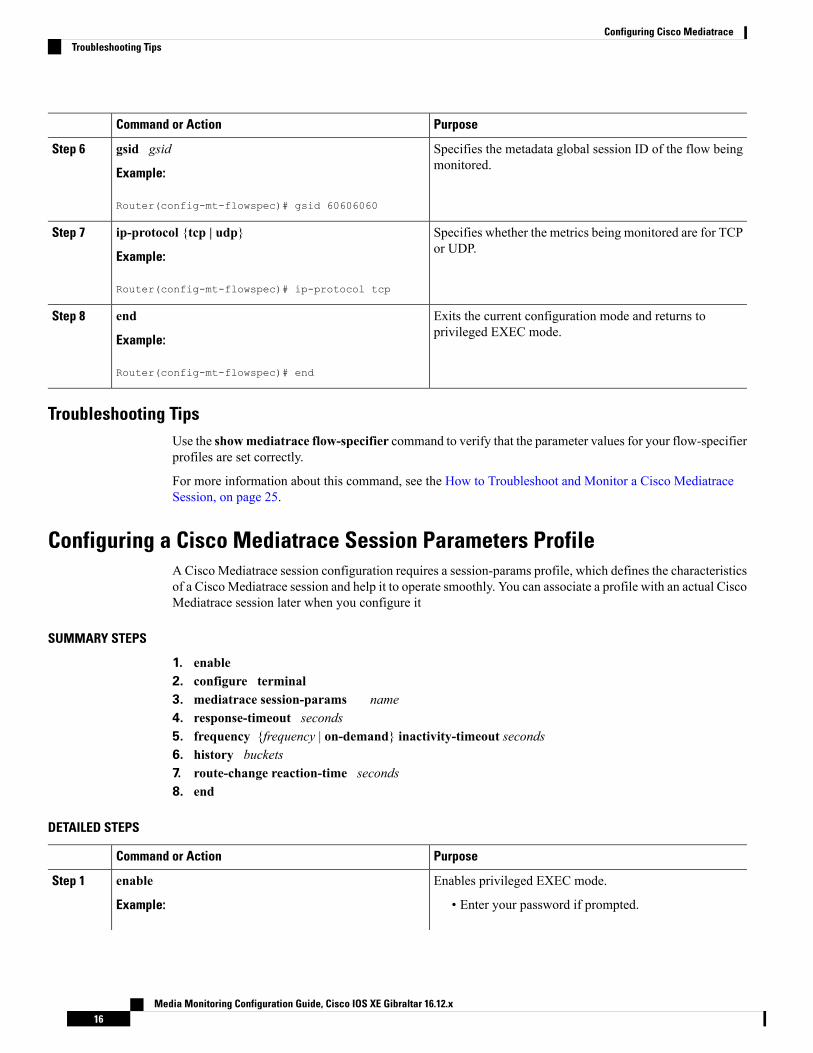
Configuring a Cisco Mediatrace Flow-Specifier ProfileACiscoMediatrace session configuration requires a flow-specifier profile which defines the source IP address,destination IP address, source port, destination port, and protocol that identifies a flow. You can associate aprofile with an actual Cisco Mediatrace session later when you configure it
For RTP media flows, select UDP as protocol.
SUMMARY STEPS
1. enable2. configure terminal3. mediatrace flow-specifier name4. source-ip ip-address [source-port port ]5. dest-ip ip-address [dest-port port ]6. gsid gsid7. ip-protocol {tcp | udp}8. end
DETAILED STEPS
PurposeCommand or Action
Enables privileged EXEC mode.enableStep 1
Example: • Enter your password if prompted.
Router> enable
Enters global configuration mode.configure terminal
Example:
Step 2
Router# configure terminal
Enters flow-specifier configuration mode so that you canconfigure parameters for a CiscoMediatrace flow-specifierprofile.
mediatrace flow-specifier name
Example:
Router(config)# mediatrace flow-specifier flow-6
Step 3
(Optional) Specifies the IP address of the source of themetrics being monitored.
source-ip ip-address [source-port port ]
Example:
Step 4
Router(config-mt-flowspec)# source-ip 10.1.1.2source-port 600
Specifies the IP address of the destination of the metricsbeing monitored.
dest-ip ip-address [dest-port port ]
Example:
Step 5
Router(config-mt-flowspec)# dest-ip 10.1.1.2dest-port 600
Media Monitoring Configuration Guide, Cisco IOS XE Gibraltar 16.12.x15
Configuring Cisco MediatraceConfiguring a Cisco Mediatrace Flow-Specifier Profile
PurposeCommand or Action
Specifies the metadata global session ID of the flow beingmonitored.
gsid gsid
Example:
Step 6
Router(config-mt-flowspec)# gsid 60606060
Specifies whether the metrics being monitored are for TCPor UDP.
ip-protocol {tcp | udp}
Example:
Step 7
Router(config-mt-flowspec)# ip-protocol tcp
Exits the current configuration mode and returns toprivileged EXEC mode.
end
Example:
Step 8
Router(config-mt-flowspec)# end
Troubleshooting TipsUse the showmediatrace flow-specifier command to verify that the parameter values for your flow-specifierprofiles are set correctly.
For more information about this command, see the How to Troubleshoot and Monitor a Cisco MediatraceSession, on page 25.
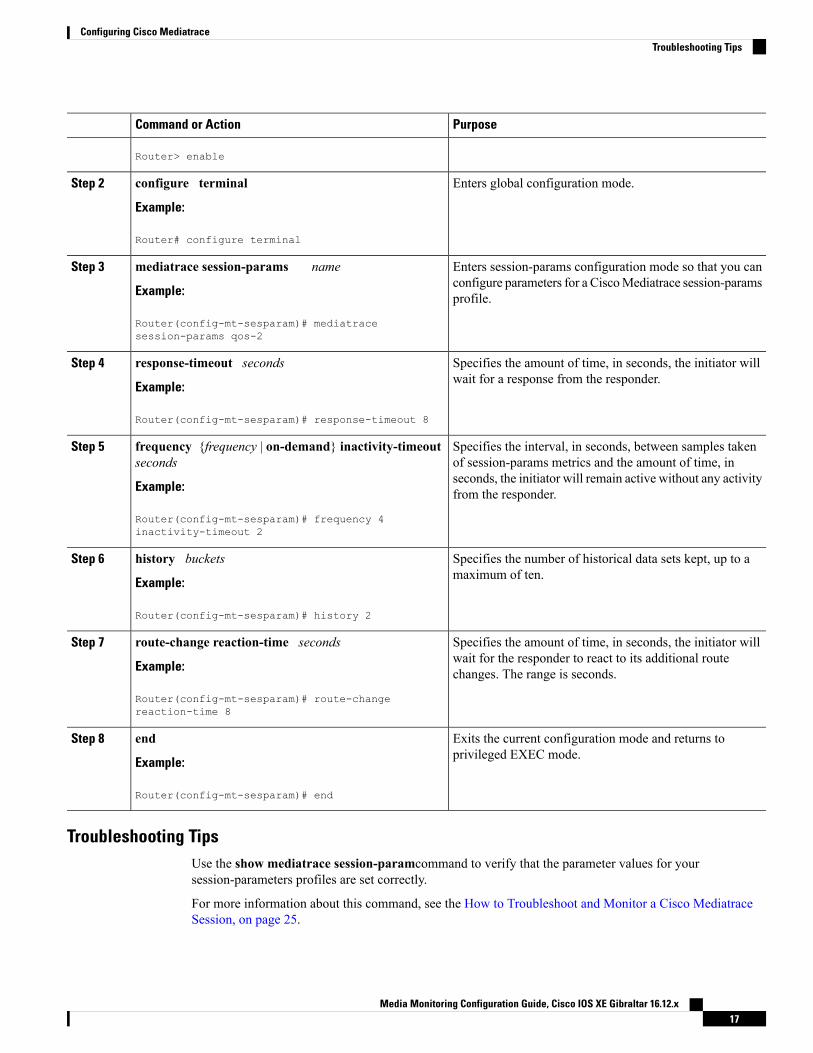
Configuring a Cisco Mediatrace Session Parameters ProfileA Cisco Mediatrace session configuration requires a session-params profile, which defines the characteristicsof a CiscoMediatrace session and help it to operate smoothly. You can associate a profile with an actual CiscoMediatrace session later when you configure it
SUMMARY STEPS
1. enable2. configure terminal3. mediatrace session-params name4. response-timeout seconds5. frequency {frequency | on-demand} inactivity-timeout seconds6. history buckets7. route-change reaction-time seconds8. end
DETAILED STEPS
PurposeCommand or Action
Enables privileged EXEC mode.enableStep 1
Example: • Enter your password if prompted.
Media Monitoring Configuration Guide, Cisco IOS XE Gibraltar 16.12.x16
Configuring Cisco MediatraceTroubleshooting Tips
PurposeCommand or Action
Router> enable
Enters global configuration mode.configure terminal
Example:
Step 2
Router# configure terminal
Enters session-params configuration mode so that you canconfigure parameters for a CiscoMediatrace session-paramsprofile.
mediatrace session-params name
Example:
Router(config-mt-sesparam)# mediatracesession-params qos-2
Step 3
Specifies the amount of time, in seconds, the initiator willwait for a response from the responder.
response-timeout seconds
Example:
Step 4
Router(config-mt-sesparam)# response-timeout 8
Specifies the interval, in seconds, between samples takenof session-params metrics and the amount of time, in
frequency {frequency | on-demand} inactivity-timeoutseconds
Step 5
seconds, the initiator will remain active without any activityfrom the responder.Example:
Router(config-mt-sesparam)# frequency 4inactivity-timeout 2
Specifies the number of historical data sets kept, up to amaximum of ten.
history buckets
Example:
Step 6
Router(config-mt-sesparam)# history 2
Specifies the amount of time, in seconds, the initiator willwait for the responder to react to its additional routechanges. The range is seconds.
route-change reaction-time seconds
Example:
Router(config-mt-sesparam)# route-changereaction-time 8
Step 7
Exits the current configuration mode and returns toprivileged EXEC mode.
end
Example:
Step 8
Router(config-mt-sesparam)# end
Troubleshooting TipsUse the show mediatrace session-paramcommand to verify that the parameter values for yoursession-parameters profiles are set correctly.
For more information about this command, see the How to Troubleshoot and Monitor a Cisco MediatraceSession, on page 25.
Media Monitoring Configuration Guide, Cisco IOS XE Gibraltar 16.12.x17
Configuring Cisco MediatraceTroubleshooting Tips
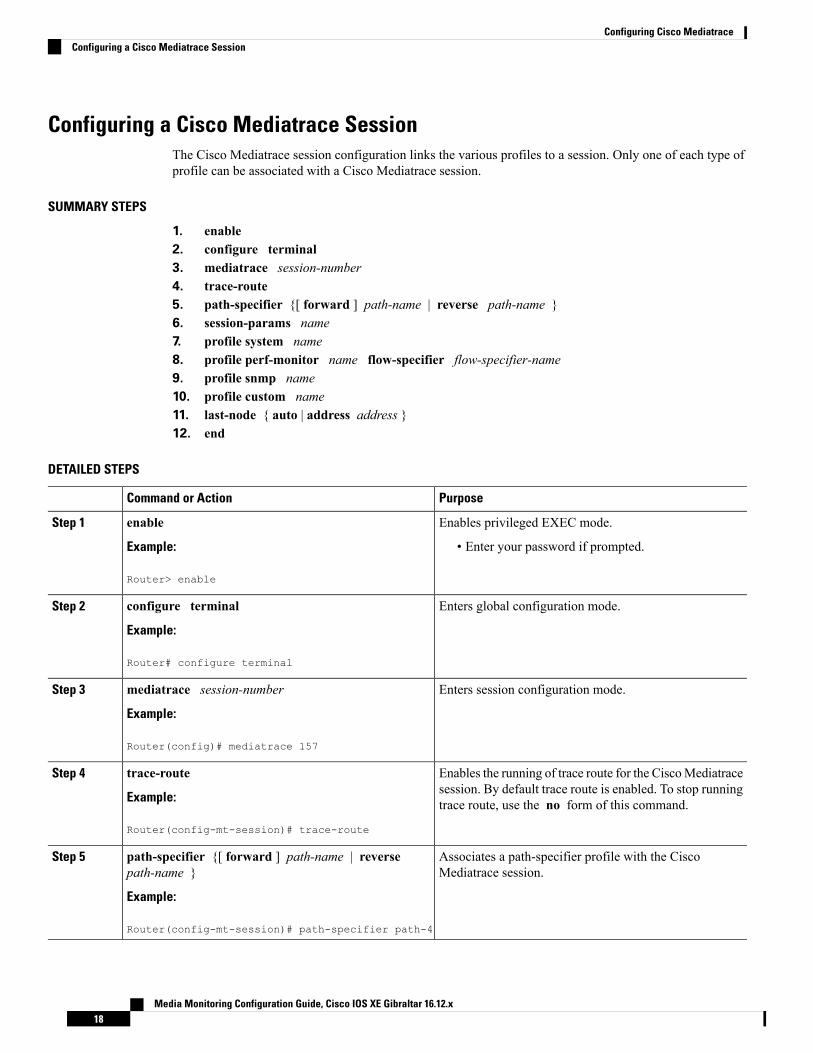
Configuring a Cisco Mediatrace SessionThe Cisco Mediatrace session configuration links the various profiles to a session. Only one of each type ofprofile can be associated with a Cisco Mediatrace session.
SUMMARY STEPS
1. enable2. configure terminal3. mediatrace session-number4. trace-route5. path-specifier {[ forward ] path-name | reverse path-name }6. session-params name7. profile system name8. profile perf-monitor name flow-specifier flow-specifier-name9. profile snmp name10. profile custom name11. last-node { auto | address address }12. end
DETAILED STEPS
PurposeCommand or Action
Enables privileged EXEC mode.enableStep 1
Example: • Enter your password if prompted.
Router> enable
Enters global configuration mode.configure terminal
Example:
Step 2
Router# configure terminal
Enters session configuration mode.mediatrace session-number
Example:
Step 3
Router(config)# mediatrace 157
Enables the running of trace route for the CiscoMediatracesession. By default trace route is enabled. To stop runningtrace route, use the no form of this command.
trace-route
Example:
Router(config-mt-session)# trace-route
Step 4
Associates a path-specifier profile with the CiscoMediatrace session.
path-specifier {[ forward ] path-name | reversepath-name }
Example:
Step 5
Router(config-mt-session)# path-specifier path-4
Media Monitoring Configuration Guide, Cisco IOS XE Gibraltar 16.12.x18
Configuring Cisco MediatraceConfiguring a Cisco Mediatrace Session
PurposeCommand or Action
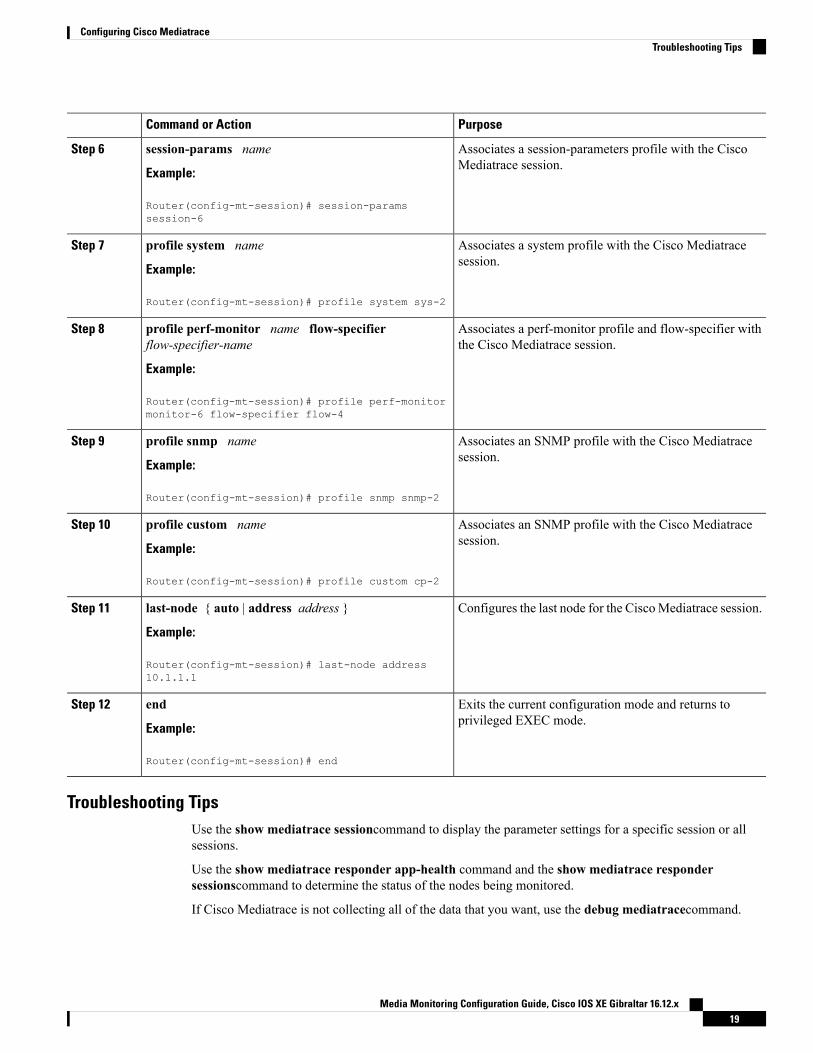
Associates a session-parameters profile with the CiscoMediatrace session.
session-params name
Example:
Step 6
Router(config-mt-session)# session-paramssession-6
Associates a system profile with the Cisco Mediatracesession.
profile system name
Example:
Step 7
Router(config-mt-session)# profile system sys-2
Associates a perf-monitor profile and flow-specifier withthe Cisco Mediatrace session.
profile perf-monitor name flow-specifierflow-specifier-name
Example:
Step 8
Router(config-mt-session)# profile perf-monitormonitor-6 flow-specifier flow-4
Associates an SNMP profile with the Cisco Mediatracesession.
profile snmp name
Example:
Step 9
Router(config-mt-session)# profile snmp snmp-2
Associates an SNMP profile with the Cisco Mediatracesession.
profile custom name
Example:
Step 10
Router(config-mt-session)# profile custom cp-2
Configures the last node for the CiscoMediatrace session.last-node { auto | address address }
Example:
Step 11
Router(config-mt-session)# last-node address10.1.1.1
Exits the current configuration mode and returns toprivileged EXEC mode.
end
Example:
Step 12
Router(config-mt-session)# end
Troubleshooting TipsUse the show mediatrace sessioncommand to display the parameter settings for a specific session or allsessions.
Use the show mediatrace responder app-health command and the show mediatrace respondersessionscommand to determine the status of the nodes being monitored.
If Cisco Mediatrace is not collecting all of the data that you want, use the debug mediatracecommand.
Media Monitoring Configuration Guide, Cisco IOS XE Gibraltar 16.12.x19
Configuring Cisco MediatraceTroubleshooting Tips
For more information about these commands, see the How to Troubleshoot and Monitor a Cisco MediatraceSession, on page 25.
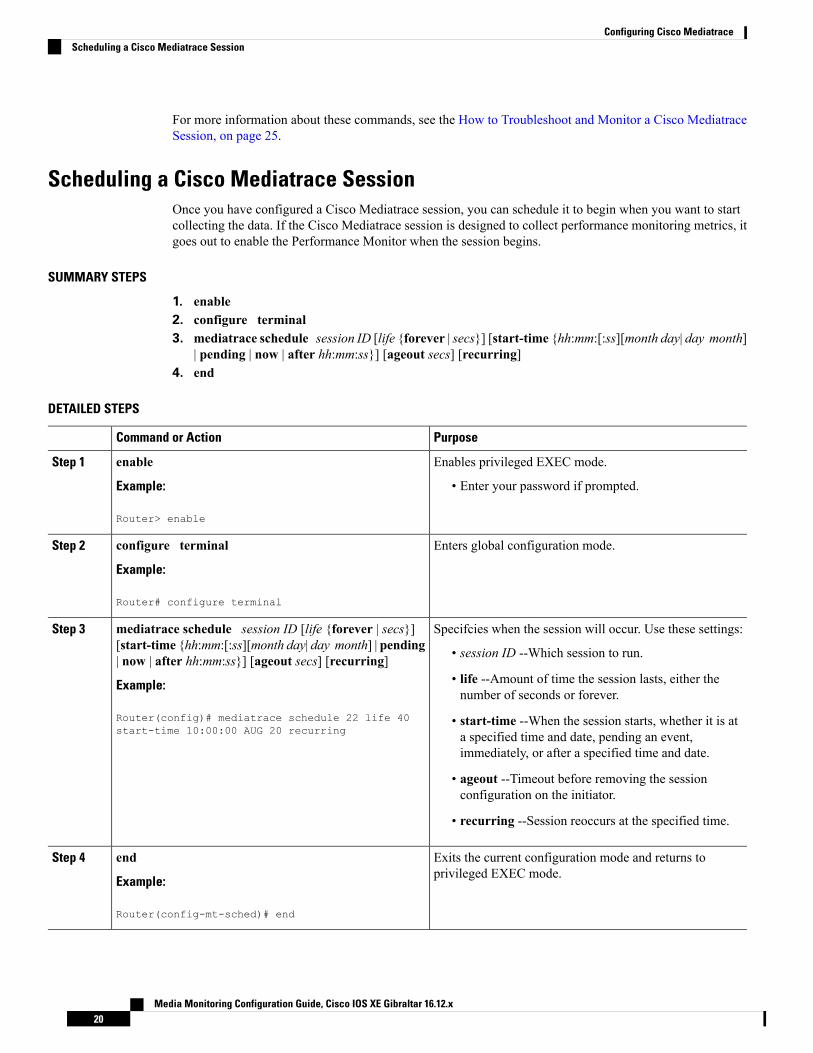
Scheduling a Cisco Mediatrace SessionOnce you have configured a Cisco Mediatrace session, you can schedule it to begin when you want to startcollecting the data. If the Cisco Mediatrace session is designed to collect performance monitoring metrics, itgoes out to enable the Performance Monitor when the session begins.
SUMMARY STEPS
1. enable2. configure terminal3. mediatrace schedule session ID [life {forever | secs}] [start-time {hh:mm:[:ss][month day| day month]
| pending | now | after hh:mm:ss}] [ageout secs] [recurring]4. end
DETAILED STEPS
PurposeCommand or Action
Enables privileged EXEC mode.enableStep 1
Example: • Enter your password if prompted.
Router> enable
Enters global configuration mode.configure terminal
Example:
Step 2
Router# configure terminal
Specifcies when the session will occur. Use these settings:mediatrace schedule session ID [life {forever | secs}][start-time {hh:mm:[:ss][month day| day month] | pending| now | after hh:mm:ss}] [ageout secs] [recurring]
Step 3
• session ID --Which session to run.
Example: • life --Amount of time the session lasts, either thenumber of seconds or forever.
Router(config)# mediatrace schedule 22 life 40start-time 10:00:00 AUG 20 recurring
• start-time --When the session starts, whether it is ata specified time and date, pending an event,immediately, or after a specified time and date.
• ageout --Timeout before removing the sessionconfiguration on the initiator.
• recurring --Session reoccurs at the specified time.
Exits the current configuration mode and returns toprivileged EXEC mode.
end
Example:
Step 4
Router(config-mt-sched)# end
Media Monitoring Configuration Guide, Cisco IOS XE Gibraltar 16.12.x20
Configuring Cisco MediatraceScheduling a Cisco Mediatrace Session
Troubleshooting TipsUse the show mediatrace sessioncommand to verify that the intended values are set for the parameters for aspecific session or all sessions.
Use the show mediatrace responder app-health command and the show mediatrace respondersessionscommand to determine the status of the nodes being monitored.
If Cisco Mediatrace is not collecting all of the data that you want, use the debug mediatracecommand.
For more information about these commands, see the How to Troubleshoot and Monitor a Cisco MediatraceSession, on page 25.
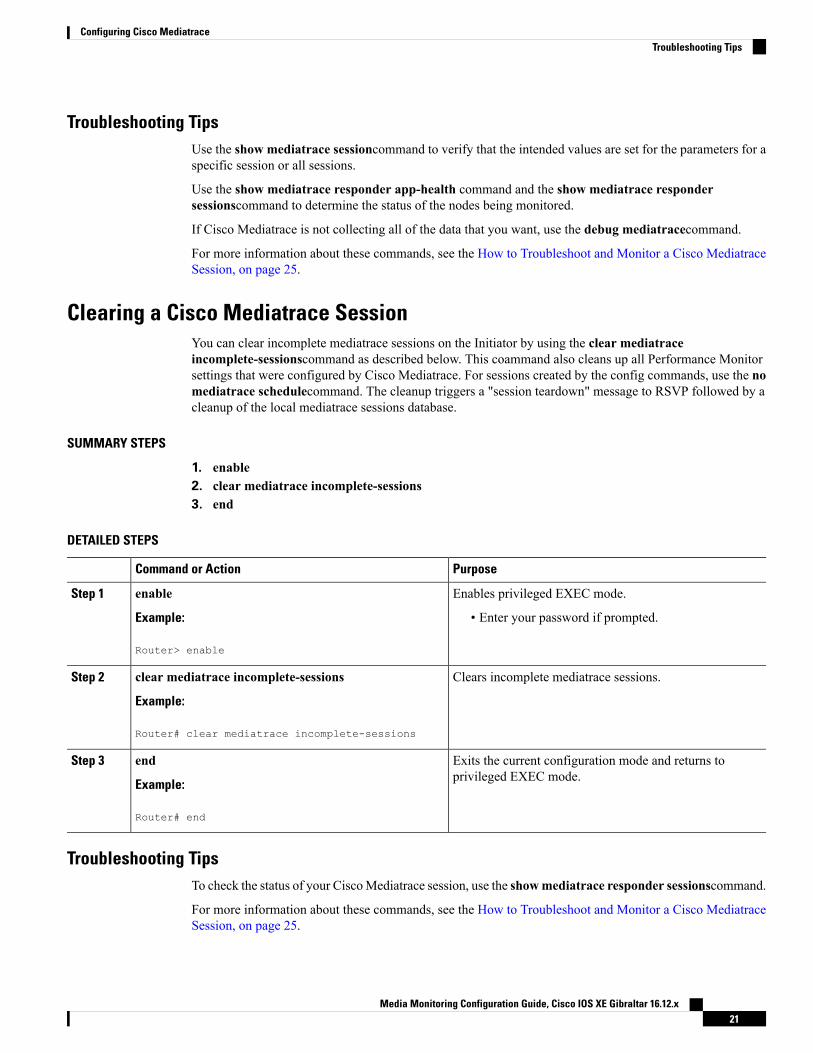
Clearing a Cisco Mediatrace SessionYou can clear incomplete mediatrace sessions on the Initiator by using the clear mediatraceincomplete-sessionscommand as described below. This coammand also cleans up all Performance Monitorsettings that were configured by Cisco Mediatrace. For sessions created by the config commands, use the nomediatrace schedulecommand. The cleanup triggers a "session teardown" message to RSVP followed by acleanup of the local mediatrace sessions database.
SUMMARY STEPS
1. enable2. clear mediatrace incomplete-sessions3. end
DETAILED STEPS
PurposeCommand or Action
Enables privileged EXEC mode.enableStep 1
Example: • Enter your password if prompted.
Router> enable
Clears incomplete mediatrace sessions.clear mediatrace incomplete-sessions
Example:
Step 2
Router# clear mediatrace incomplete-sessions
Exits the current configuration mode and returns toprivileged EXEC mode.
end
Example:
Step 3
Router# end
Troubleshooting TipsTo check the status of your CiscoMediatrace session, use the showmediatrace responder sessionscommand.
For more information about these commands, see the How to Troubleshoot and Monitor a Cisco MediatraceSession, on page 25.
Media Monitoring Configuration Guide, Cisco IOS XE Gibraltar 16.12.x21
Configuring Cisco MediatraceTroubleshooting Tips
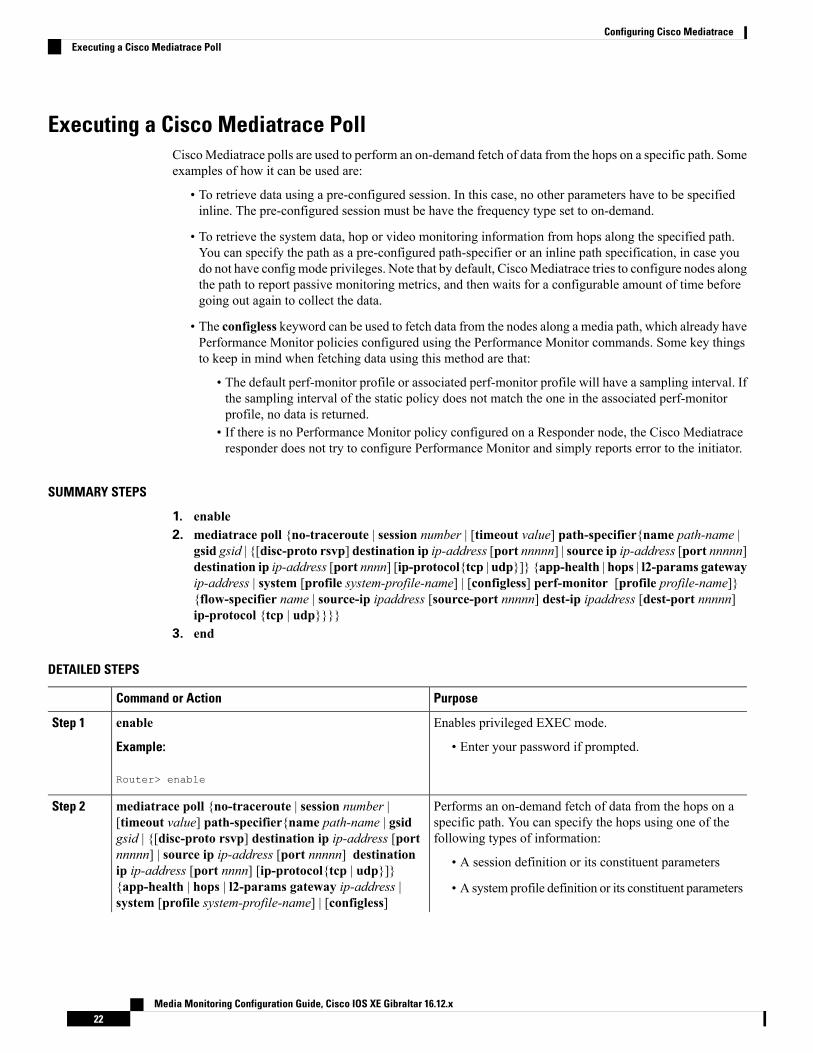
Executing a Cisco Mediatrace PollCiscoMediatrace polls are used to perform an on-demand fetch of data from the hops on a specific path. Someexamples of how it can be used are:
• To retrieve data using a pre-configured session. In this case, no other parameters have to be specifiedinline. The pre-configured session must be have the frequency type set to on-demand.
• To retrieve the system data, hop or video monitoring information from hops along the specified path.You can specify the path as a pre-configured path-specifier or an inline path specification, in case youdo not have config mode privileges. Note that by default, CiscoMediatrace tries to configure nodes alongthe path to report passive monitoring metrics, and then waits for a configurable amount of time beforegoing out again to collect the data.
• The configless keyword can be used to fetch data from the nodes along a media path, which already havePerformance Monitor policies configured using the Performance Monitor commands. Some key thingsto keep in mind when fetching data using this method are that:
• The default perf-monitor profile or associated perf-monitor profile will have a sampling interval. Ifthe sampling interval of the static policy does not match the one in the associated perf-monitorprofile, no data is returned.
• If there is no Performance Monitor policy configured on a Responder node, the Cisco Mediatraceresponder does not try to configure Performance Monitor and simply reports error to the initiator.
SUMMARY STEPS
1. enable2. mediatrace poll {no-traceroute | session number | [timeout value] path-specifier{name path-name |
gsid gsid | {[disc-proto rsvp] destination ip ip-address [port nnnnn] | source ip ip-address [port nnnnn]destination ip ip-address [port nnnn] [ip-protocol{tcp | udp}]} {app-health | hops | l2-params gatewayip-address | system [profile system-profile-name] | [configless] perf-monitor [profile profile-name]}{flow-specifier name | source-ip ipaddress [source-port nnnnn] dest-ip ipaddress [dest-port nnnnn]ip-protocol {tcp | udp}}}}
3. end
DETAILED STEPS
PurposeCommand or Action
Enables privileged EXEC mode.enableStep 1
Example: • Enter your password if prompted.
Router> enable
Performs an on-demand fetch of data from the hops on aspecific path. You can specify the hops using one of thefollowing types of information:
mediatrace poll {no-traceroute | session number |[timeout value] path-specifier{name path-name | gsidgsid | {[disc-proto rsvp] destination ip ip-address [port
Step 2
nnnnn] | source ip ip-address [port nnnnn] destination • A session definition or its constituent parametersip ip-address [port nnnn] [ip-protocol{tcp | udp}]}{app-health | hops | l2-params gateway ip-address | • A system profile definition or its constituent parameterssystem [profile system-profile-name] | [configless]
Media Monitoring Configuration Guide, Cisco IOS XE Gibraltar 16.12.x22
Configuring Cisco MediatraceExecuting a Cisco Mediatrace Poll
PurposeCommand or Action
perf-monitor [profile profile-name]} {flow-specifiername | source-ip ipaddress [source-port nnnnn] dest-ipipaddress [dest-port nnnnn] ip-protocol {tcp | udp}}}}
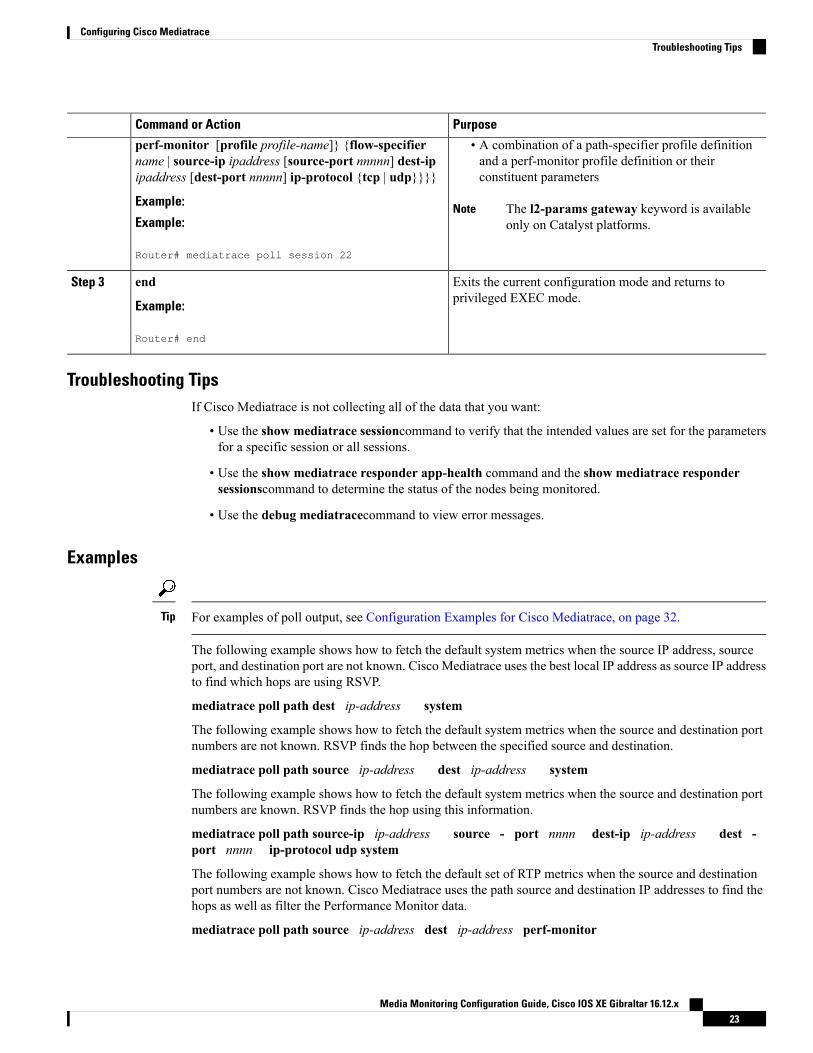
• A combination of a path-specifier profile definitionand a perf-monitor profile definition or theirconstituent parameters
Example: The l2-params gateway keyword is availableonly on Catalyst platforms.
NoteExample:
Router# mediatrace poll session 22
Exits the current configuration mode and returns toprivileged EXEC mode.
end
Example:
Step 3
Router# end
Troubleshooting TipsIf Cisco Mediatrace is not collecting all of the data that you want:
• Use the show mediatrace sessioncommand to verify that the intended values are set for the parametersfor a specific session or all sessions.
• Use the show mediatrace responder app-health command and the show mediatrace respondersessionscommand to determine the status of the nodes being monitored.
• Use the debug mediatracecommand to view error messages.
Examples
For examples of poll output, see Configuration Examples for Cisco Mediatrace, on page 32.Tip
The following example shows how to fetch the default system metrics when the source IP address, sourceport, and destination port are not known. Cisco Mediatrace uses the best local IP address as source IP addressto find which hops are using RSVP.
mediatrace poll path dest ip-address system
The following example shows how to fetch the default system metrics when the source and destination portnumbers are not known. RSVP finds the hop between the specified source and destination.
mediatrace poll path source ip-address dest ip-address system
The following example shows how to fetch the default system metrics when the source and destination portnumbers are known. RSVP finds the hop using this information.
mediatrace poll path source-ip ip-address source - port nnnn dest-ip ip-address dest -port nnnn ip-protocol udp system
The following example shows how to fetch the default set of RTP metrics when the source and destinationport numbers are not known. Cisco Mediatrace uses the path source and destination IP addresses to find thehops as well as filter the Performance Monitor data.
mediatrace poll path source ip-address dest ip-address perf-monitor
Media Monitoring Configuration Guide, Cisco IOS XE Gibraltar 16.12.x23
Configuring Cisco MediatraceTroubleshooting Tips
The following example shows how to fetch the default set of RTP metrics. Cisco Mediatrace uses the pathparameters to discover hops and uses the inline flow specifier profile as a filter for PerformanceMonitor data.
mediatrace poll path source ip-address dest ip-address perf-monitor source-ip ip-address source- port nnnn dest-ip ip-address dest - port nnnn ip-protocol udp
The following example shows how to fetch the default set of TCP metrics. Cisco Mediatrace uses the pathparameters to discover hops and uses the inline flow-specifier profile as a filter for PerformanceMonitor data.
mediatrace poll path source ip-address dest ip-address perf-monitor source-ip ip-address source- port nnnn dest-ip ip-address dest - port nnnn ip-protocol tcp
The following example shows how to fetch the default set of RTP metrics. Cisco Mediatrace uses the bestlocal IP address as source IP address for finding hops on the path and uses the inline flow specifier profile asa filter for Performance Monitor data.
mediatrace poll path dest ip-address perf-monitor source-ip ip-address source - port nnnndest-ip ip-address dest - port nnnn ip-protocol udp
The following example shows how to fetch the default set of TCP metrics. Cisco Mediatrace uses the bestlocal IP address as source IP address for finding hops on the path and uses the inline flow-specifier profile asa filter for Performance Monitor data.
mediatrace poll path dest ip-address perf-monitor source-ip ip-address source - port nnnndest-ip ip-address dest - port nnnn ip-protocol tcp
The following example shows how to fetch the default set of RTP metrics from the static policy that is alreadyconfigured on the hops. The command does not configure the Performance Monitor. Cisco Mediatrace usesthe path parameters to discover hops and use the inline flow specifier profile as a filter for PerformanceMonitordata.
mediatrace poll path source ip-address dest ip-address configless perf-monitor flow-specifier sourceip-address port nnnn dest ip-address port nnnn ip-protocol udp
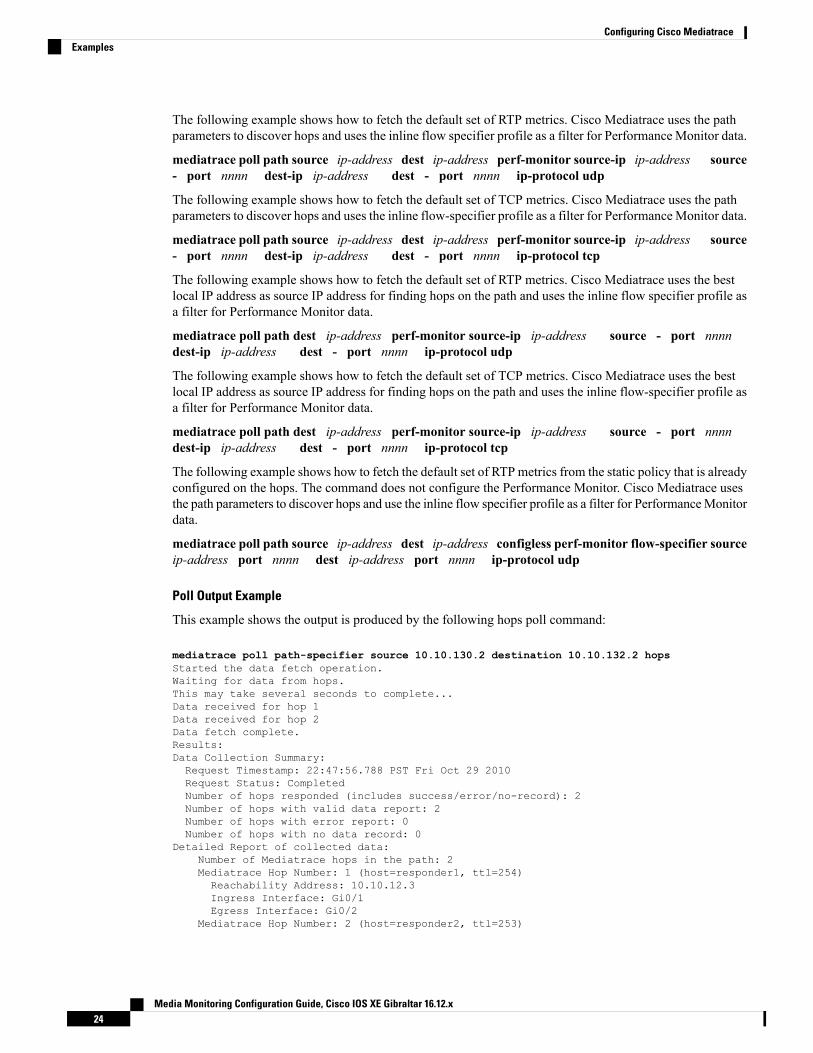
Poll Output Example
This example shows the output is produced by the following hops poll command:
mediatrace poll path-specifier source 10.10.130.2 destination 10.10.132.2 hopsStarted the data fetch operation.Waiting for data from hops.This may take several seconds to complete...Data received for hop 1Data received for hop 2Data fetch complete.Results:Data Collection Summary:Request Timestamp: 22:47:56.788 PST Fri Oct 29 2010Request Status: CompletedNumber of hops responded (includes success/error/no-record): 2Number of hops with valid data report: 2Number of hops with error report: 0Number of hops with no data record: 0
Detailed Report of collected data:Number of Mediatrace hops in the path: 2Mediatrace Hop Number: 1 (host=responder1, ttl=254)Reachability Address: 10.10.12.3Ingress Interface: Gi0/1Egress Interface: Gi0/2
Mediatrace Hop Number: 2 (host=responder2, ttl=253)
Media Monitoring Configuration Guide, Cisco IOS XE Gibraltar 16.12.x24
Configuring Cisco MediatraceExamples
Reachability Address: 10.10.34.3Ingress Interface: Gi0/1Egress Interface: Gi0/2
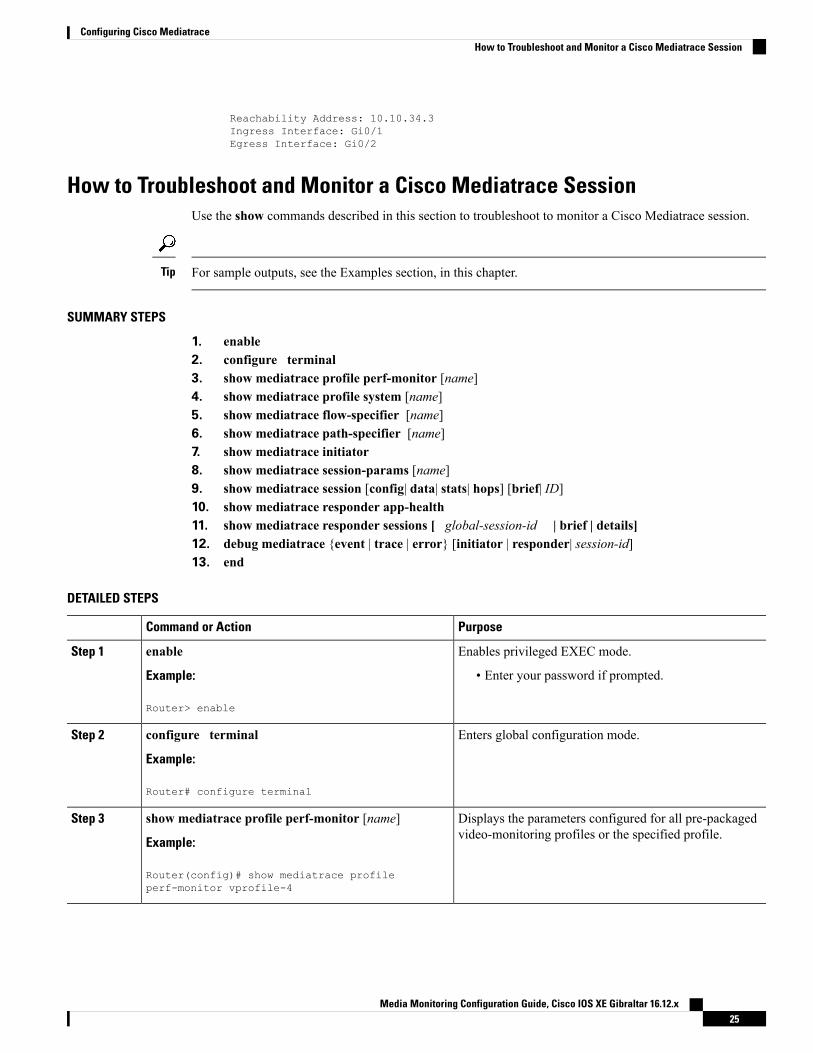
How to Troubleshoot and Monitor a Cisco Mediatrace SessionUse the show commands described in this section to troubleshoot to monitor a Cisco Mediatrace session.
For sample outputs, see the Examples section, in this chapter.Tip
SUMMARY STEPS
1. enable2. configure terminal3. show mediatrace profile perf-monitor [name]4. show mediatrace profile system [name]5. show mediatrace flow-specifier [name]6. show mediatrace path-specifier [name]7. show mediatrace initiator8. show mediatrace session-params [name]9. show mediatrace session [config| data| stats| hops] [brief| ID]10. show mediatrace responder app-health11. show mediatrace responder sessions [ global-session-id | brief | details]12. debug mediatrace {event | trace | error} [initiator | responder| session-id]13. end
DETAILED STEPS
PurposeCommand or Action
Enables privileged EXEC mode.enableStep 1
Example: • Enter your password if prompted.
Router> enable
Enters global configuration mode.configure terminal
Example:
Step 2
Router# configure terminal
Displays the parameters configured for all pre-packagedvideo-monitoring profiles or the specified profile.
show mediatrace profile perf-monitor [name]
Example:
Step 3
Router(config)# show mediatrace profileperf-monitor vprofile-4
Media Monitoring Configuration Guide, Cisco IOS XE Gibraltar 16.12.x25
Configuring Cisco MediatraceHow to Troubleshoot and Monitor a Cisco Mediatrace Session
PurposeCommand or Action
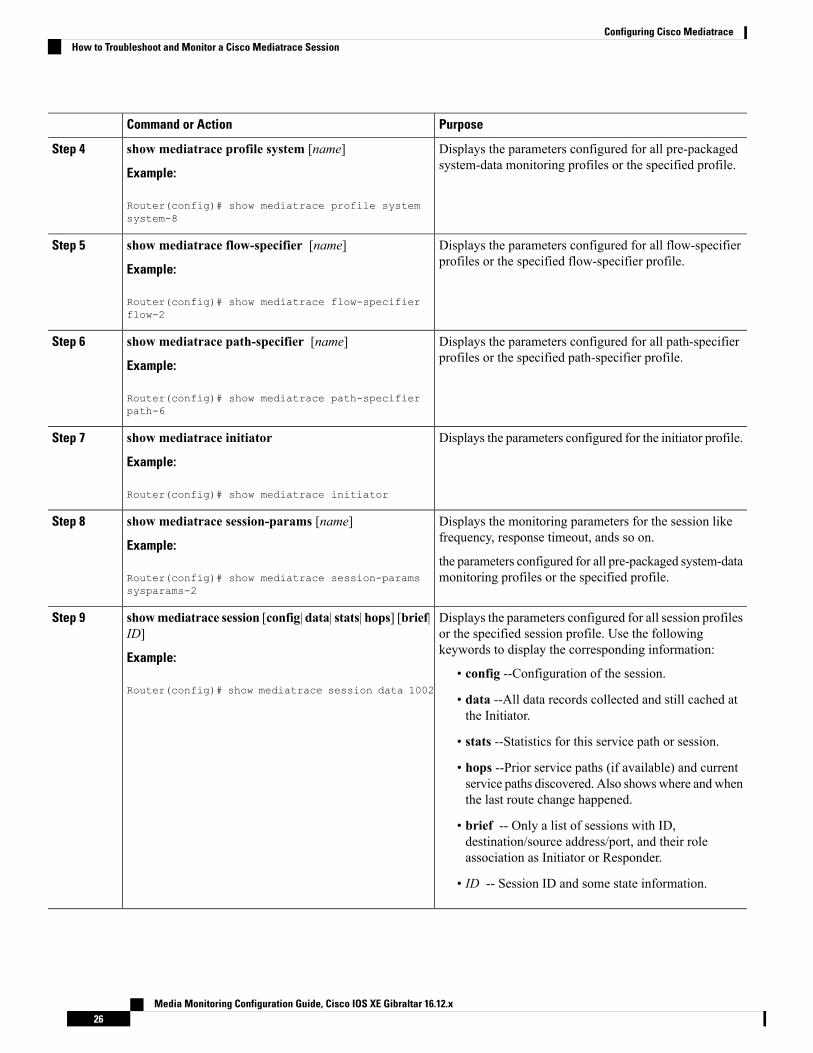
Displays the parameters configured for all pre-packagedsystem-data monitoring profiles or the specified profile.
show mediatrace profile system [name]
Example:
Step 4
Router(config)# show mediatrace profile systemsystem-8
Displays the parameters configured for all flow-specifierprofiles or the specified flow-specifier profile.
show mediatrace flow-specifier [name]
Example:
Step 5
Router(config)# show mediatrace flow-specifierflow-2
Displays the parameters configured for all path-specifierprofiles or the specified path-specifier profile.
show mediatrace path-specifier [name]
Example:
Step 6
Router(config)# show mediatrace path-specifierpath-6
Displays the parameters configured for the initiator profile.show mediatrace initiator
Example:
Step 7
Router(config)# show mediatrace initiator
Displays the monitoring parameters for the session likefrequency, response timeout, ands so on.
show mediatrace session-params [name]
Example:
Step 8
the parameters configured for all pre-packaged system-datamonitoring profiles or the specified profile.Router(config)# show mediatrace session-params
sysparams-2
Displays the parameters configured for all session profilesor the specified session profile. Use the followingkeywords to display the corresponding information:
showmediatrace session [config| data| stats| hops] [brief|ID]
Example:
Step 9
• config --Configuration of the session.Router(config)# show mediatrace session data 1002
• data --All data records collected and still cached atthe Initiator.
• stats --Statistics for this service path or session.
• hops --Prior service paths (if available) and currentservice paths discovered. Also showswhere andwhenthe last route change happened.
• brief -- Only a list of sessions with ID,destination/source address/port, and their roleassociation as Initiator or Responder.
• ID -- Session ID and some state information.
Media Monitoring Configuration Guide, Cisco IOS XE Gibraltar 16.12.x26
Configuring Cisco MediatraceHow to Troubleshoot and Monitor a Cisco Mediatrace Session
PurposeCommand or Action
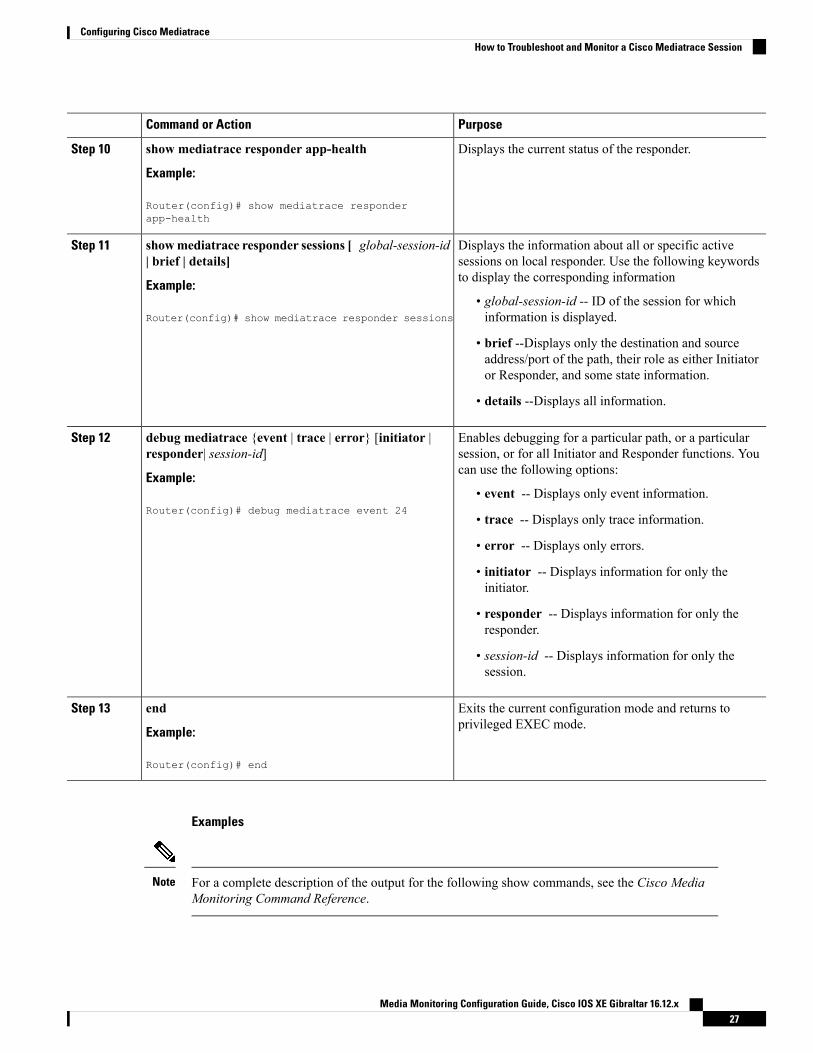
Displays the current status of the responder.show mediatrace responder app-health
Example:
Step 10
Router(config)# show mediatrace responderapp-health
Displays the information about all or specific activesessions on local responder. Use the following keywordsto display the corresponding information
showmediatrace responder sessions [ global-session-id| brief | details]
Example:
Step 11
• global-session-id -- ID of the session for whichinformation is displayed.Router(config)# show mediatrace responder sessions
• brief --Displays only the destination and sourceaddress/port of the path, their role as either Initiatoror Responder, and some state information.
• details --Displays all information.
Enables debugging for a particular path, or a particularsession, or for all Initiator and Responder functions. Youcan use the following options:
debug mediatrace {event | trace | error} [initiator |responder| session-id]
Example:
Step 12
• event -- Displays only event information.Router(config)# debug mediatrace event 24
• trace -- Displays only trace information.
• error -- Displays only errors.
• initiator -- Displays information for only theinitiator.
• responder -- Displays information for only theresponder.
• session-id -- Displays information for only thesession.
Exits the current configuration mode and returns toprivileged EXEC mode.
end
Example:
Step 13
Router(config)# end
Examples
For a complete description of the output for the following show commands, see the Cisco MediaMonitoring Command Reference.
Note
Media Monitoring Configuration Guide, Cisco IOS XE Gibraltar 16.12.x27
Configuring Cisco MediatraceHow to Troubleshoot and Monitor a Cisco Mediatrace Session

The following example displays video-monitoring profiles:
Router# show mediatrace profile perf-monitorPerf-monitor Profile: vprof-4Metric List: rtpRTP Admin Parameter:Max Dropout: 5Max Reorder: 5Min Sequential: 5
Admin Parameter:Sampling Interval (sec): 30
The following example displays system-data profiles:
Router# show mediatrace profilesystem
System Profile: sys-1Metric List: intf
The following example displays flow-specifier profiles:
Router# show mediatraceflow-specifier flow-1Flow Specifier: flow-1
Source address/port:Destination address/port:Protocol: udp
The following example displays path-specifier profiles:
Router# show mediatracepath-specifier flow-1Path Configuration: ps1
Destination address/port: 10.10.10.1Source address/port: 10.10.10.4Gateway address/vlan:Discovery protocol: rsvp
The following example displays the initiator profile:
Router# show mediatraceinitiatorVersion: Mediatrace 1.0Mediatrace Initiator status: enabledSource IP: 1.1.1.1Number of Maximum Allowed Active Session: 127Number of Configured Session: 1Number of Active Session : 0Number of Pending Session : 0Number of Inactive Session : 1Note: the number of active session may be higher than max active session
because the max active session count was changed recently.
The following example displays session profiles:
Router# show mediatrace session-paramsSession Parameters: s-1
Response timeout (sec): 60Frequency: On Demand
Media Monitoring Configuration Guide, Cisco IOS XE Gibraltar 16.12.x28
Configuring Cisco MediatraceHow to Troubleshoot and Monitor a Cisco Mediatrace Session
Inactivity timeout (sec): 300History statistics:
Number of history buckets kept: 3Route change:
Reaction time (sec): 5
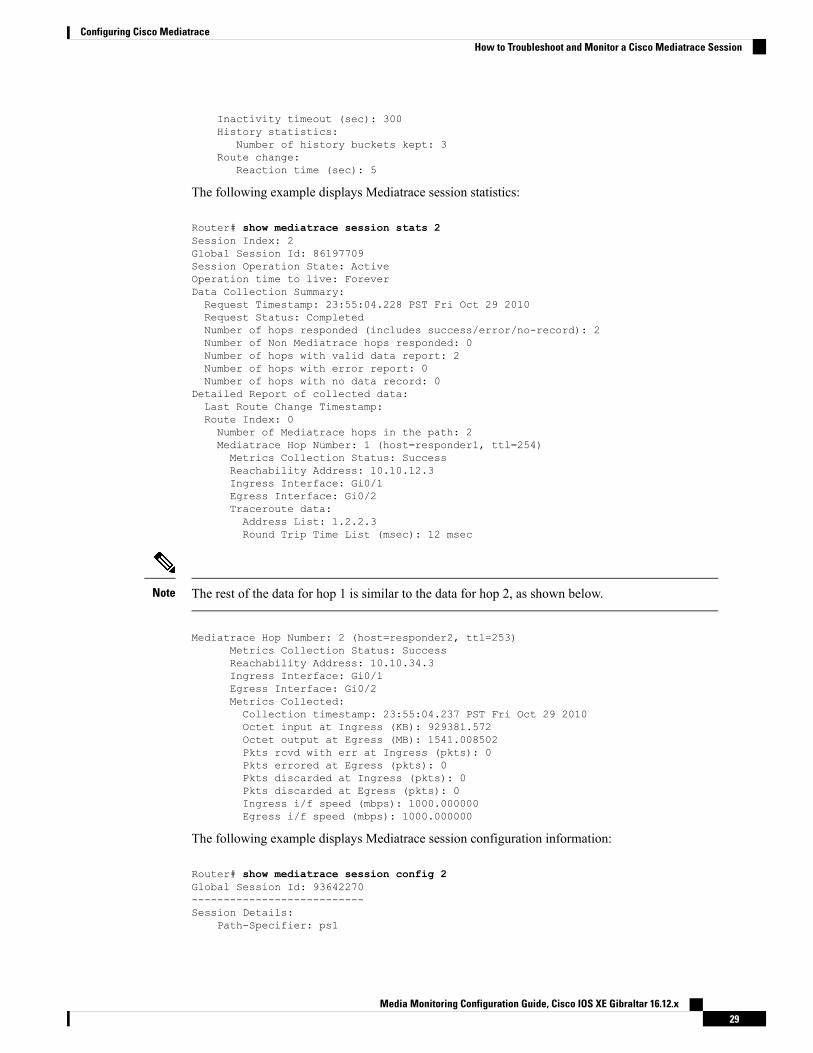
The following example displays Mediatrace session statistics:
Router# show mediatrace session stats 2Session Index: 2Global Session Id: 86197709Session Operation State: ActiveOperation time to live: ForeverData Collection Summary:Request Timestamp: 23:55:04.228 PST Fri Oct 29 2010Request Status: CompletedNumber of hops responded (includes success/error/no-record): 2Number of Non Mediatrace hops responded: 0Number of hops with valid data report: 2Number of hops with error report: 0Number of hops with no data record: 0
Detailed Report of collected data:Last Route Change Timestamp:Route Index: 0Number of Mediatrace hops in the path: 2Mediatrace Hop Number: 1 (host=responder1, ttl=254)Metrics Collection Status: SuccessReachability Address: 10.10.12.3Ingress Interface: Gi0/1Egress Interface: Gi0/2Traceroute data:Address List: 1.2.2.3Round Trip Time List (msec): 12 msec
The rest of the data for hop 1 is similar to the data for hop 2, as shown below.Note
Mediatrace Hop Number: 2 (host=responder2, ttl=253)Metrics Collection Status: SuccessReachability Address: 10.10.34.3Ingress Interface: Gi0/1Egress Interface: Gi0/2Metrics Collected:Collection timestamp: 23:55:04.237 PST Fri Oct 29 2010Octet input at Ingress (KB): 929381.572Octet output at Egress (MB): 1541.008502Pkts rcvd with err at Ingress (pkts): 0Pkts errored at Egress (pkts): 0Pkts discarded at Ingress (pkts): 0Pkts discarded at Egress (pkts): 0Ingress i/f speed (mbps): 1000.000000Egress i/f speed (mbps): 1000.000000
The following example displays Mediatrace session configuration information:
Router# show mediatrace session config 2Global Session Id: 93642270---------------------------Session Details:
Path-Specifier: ps1
Media Monitoring Configuration Guide, Cisco IOS XE Gibraltar 16.12.x29
Configuring Cisco MediatraceHow to Troubleshoot and Monitor a Cisco Mediatrace Session

Session Params: sp1Collectable Metrics Profile: intf1Flow Specifier:
Schedule:Operation frequency (seconds): 30 (not considered if randomly scheduled)Next Scheduled Start Time: Start Time already passedGroup Scheduled : FALSERandomly Scheduled : FALSELife (seconds): ForeverEntry Ageout (seconds): neverRecurring (Starting Everyday): FALSEStatus of entry (SNMP RowStatus): Active
History Statistics:Number of history Buckets kept: 10
The following example displays Mediatrace session hops:
show mediatrace session hops 2Session Index: 2Global Session Id: 93642270Session Operation State: ActiveData Collection Summary:Request Timestamp: 13:40:32.515 PST Fri Jun 18 2010Request Status: CompletedNumber of hops responded (includes success/error/no-record): 3Number of hops with valid data report: 3Number of hops with error report: 0Number of hops with no data record: 0
Detailed Report of collected data:Last Route Change Timestamp:Route Index: 0Number of Mediatrace hops in the path: 3Mediatrace Hop Number: 1 (host=responder1, ttl=254)Ingress Interface: Gi0/1Egress Interface: Gi1/0
Mediatrace Hop Number: 2 (host=responder2, ttl=253)Ingress Interface: Gi0/1Egress Interface: Gi1/0
Mediatrace Hop Number: 3 (host=responder3, ttl=252)Ingress Interface: Gi0/1Egress Interface: Gi0/2
The following example displays Mediatrace session data:
Router# show mediatrace session data 2Session Index: 2Global Session Id: 35325453Session Operation State: ActiveBucket index: 1Data Collection Summary:Request Timestamp: 13:02:47.969 PST Fri Jun 18 2010Request Status: CompletedNumber of hops responded (includes success/error/no-record): 3Number of hops with valid data report: 3Number of hops with error report: 0Number of hops with no data record: 0
Detailed Report of collected data:Last Route Change Timestamp:Route Index: 0Number of Mediatrace hops in the path: 3Mediatrace Hop Number: 1 (host=responder1, ttl=254)Metrics Collection Status: SuccessIngress Interface: Gi0/1
Media Monitoring Configuration Guide, Cisco IOS XE Gibraltar 16.12.x30
Configuring Cisco MediatraceHow to Troubleshoot and Monitor a Cisco Mediatrace Session

Egress Interface: Gi1/0Metrics Collected:Collection timestamp: 13:04:57.781 PST Fri Jun 18 2010Octet input at Ingress (KB): 10982.720Octet output at Egress (KB): 11189.176
Pkts rcvd with err at Ingress (pkts): 0Pkts errored at Egress (pkts): 0Pkts discarded at Ingress (pkts): 0Pkts discarded at Egress (pkts): 0Ingress i/f speed (mbps): 1000.000000Egress i/f speed (mbps): 1000.000000
Mediatrace Hop Number: 2 (host=responder2, ttl=253)Metrics Collection Status: SuccessIngress Interface: Gi0/1Egress Interface: Gi1/0Metrics Collected:Collection timestamp: 13:04:57.792 PST Fri Jun 18 2010Octet input at Ingress (MB): 1805.552836Octet output at Egress (MB): 1788.468650Pkts rcvd with err at Ingress (pkts): 0Pkts errored at Egress (pkts): 0Pkts discarded at Ingress (pkts): 0Pkts discarded at Egress (pkts): 0Ingress i/f speed (mbps): 1000.000000Egress i/f speed (mbps): 1000.000000
The following example displays application health information for the Mediatrace responder:
Router# show mediatrace responder app-healthMediatrace App-Health Stats:
Number of all requests received: 0Time of the last request received:Initiator ID of the last request received: 0Requests dropped due to queue full: 0Responder current max sessions: 45Responder current active sessions: 0Session down or tear down requests received: 0Session timed out and removed: 0HOPS requests received: 0VM dynamic polling requests received: 0VM dynamic polling failed: 0VM configless polling requests received: 0VM configless polling failed: 0SYSTEM data polling requests received: 0SYSTEM data polling requests failed: 0APP-HEALTH polling requests received: 0Route Change or Interface Change notices received: 0Last time Route Change or Interface Change:Unknown requests received: 0
The following example displays brief session information for the Mediatrace responder:
Router# show mediatrace responder sessions briefLocal Responder configured session list:Current configured max sessions: 45Current number of active sessions: 0session-id initiator-name src-ip src-port dst-ip dst-port det-l2 host-18 10.10.10.2 200 10.10.10.8 200
Media Monitoring Configuration Guide, Cisco IOS XE Gibraltar 16.12.x31
Configuring Cisco MediatraceHow to Troubleshoot and Monitor a Cisco Mediatrace Session
Configuration Examples for Cisco Mediatrace
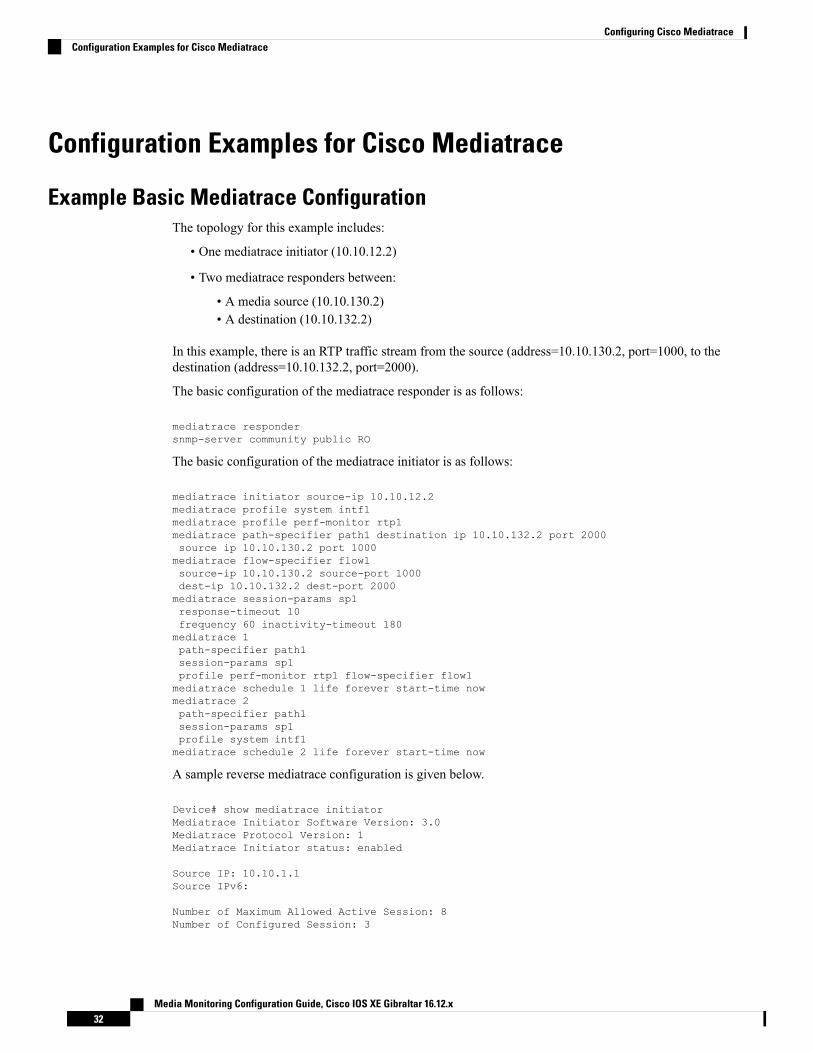
Example Basic Mediatrace ConfigurationThe topology for this example includes:
• One mediatrace initiator (10.10.12.2)
• Two mediatrace responders between:
• A media source (10.10.130.2)• A destination (10.10.132.2)
In this example, there is an RTP traffic stream from the source (address=10.10.130.2, port=1000, to thedestination (address=10.10.132.2, port=2000).
The basic configuration of the mediatrace responder is as follows:
mediatrace respondersnmp-server community public RO
The basic configuration of the mediatrace initiator is as follows:
mediatrace initiator source-ip 10.10.12.2mediatrace profile system intf1mediatrace profile perf-monitor rtp1mediatrace path-specifier path1 destination ip 10.10.132.2 port 2000source ip 10.10.130.2 port 1000mediatrace flow-specifier flow1source-ip 10.10.130.2 source-port 1000dest-ip 10.10.132.2 dest-port 2000mediatrace session-params sp1response-timeout 10frequency 60 inactivity-timeout 180mediatrace 1path-specifier path1session-params sp1profile perf-monitor rtp1 flow-specifier flow1mediatrace schedule 1 life forever start-time nowmediatrace 2path-specifier path1session-params sp1profile system intf1mediatrace schedule 2 life forever start-time now
A sample reverse mediatrace configuration is given below.
Device# show mediatrace initiatorMediatrace Initiator Software Version: 3.0Mediatrace Protocol Version: 1Mediatrace Initiator status: enabled
Source IP: 10.10.1.1Source IPv6:
Number of Maximum Allowed Active Session: 8Number of Configured Session: 3
Media Monitoring Configuration Guide, Cisco IOS XE Gibraltar 16.12.x32
Configuring Cisco MediatraceConfiguration Examples for Cisco Mediatrace

Number of Active Session : 2Number of Pending Session : 0Number of Inactive Session : 1Number of Total Proxy Session : 1Number of Active Proxy Session : 1Number of Pending Proxy Session : 0Number of Inactive Proxy Session : 0
Note: the number of active session may be higher than max active sessionbecause the max active session count was changed recently.
Device# show runDevice# show running-config | show mediatracemediatrace respondermediatrace initiator source-ip 10.10.1.1mediatrace profile perf-monitor MT_PERF_RTPmediatrace path-specifier MT_PATH destination ip 10.11.1.10 port 21064source ip 10.10.1.11 port 28938mediatrace path-specifier MT_PATH2 destination ip 10.10.10.10 port 16514source ip 10.10.1.10 port 16558mediatrace flow-specifier MT_FLOWsource-ip 10.10.1.11 source-port 28938dest-ip 10.10.1.50 dest-port 21064mediatrace flow-specifier MT_FLOW2source-ip 10.1.1.50 source-port 21064dest-ip 10.1.1.11 dest-port 28938mediatrace session-params MT_PARAMSresponse-timeout 50frequency 60 inactivity-timeout 180history data-sets-kept 10mediatrace reverse 155path-specifier forward/reverse MT_PATH/MT_PATH2session-params MT_PARAMSprofile perf-monitor MT_PERF_RTP flow-specifier MT_FLOW2mediatrace schedule 155 life forever start-time nowmediatrace 157path-specifier MT_PATHsession-params MT_PARAMSprofile perf-monitor MT_PERF_RTP flow-specifier MT_FLOWmediatrace schedule 157 life forever start-time now
Where to Go NextFor more information about configuring the products in the Medianet product family, see the other chapterin this guide or see the Cisco Media Monitoring Configuration Guide.
Media Monitoring Configuration Guide, Cisco IOS XE Gibraltar 16.12.x33
Configuring Cisco MediatraceWhere to Go Next
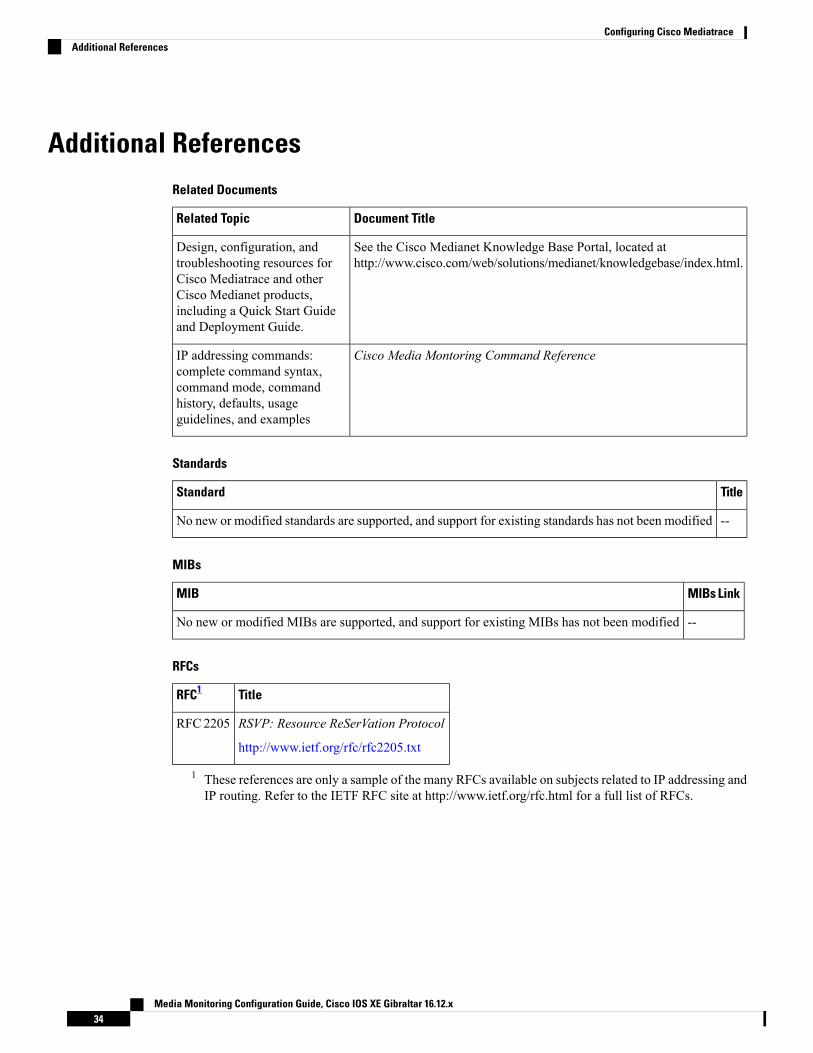
Additional ReferencesRelated Documents
Document TitleRelated Topic
See the Cisco Medianet Knowledge Base Portal, located athttp://www.cisco.com/web/solutions/medianet/knowledgebase/index.html.
Design, configuration, andtroubleshooting resources forCisco Mediatrace and otherCisco Medianet products,including a Quick Start Guideand Deployment Guide.
Cisco Media Montoring Command ReferenceIP addressing commands:complete command syntax,command mode, commandhistory, defaults, usageguidelines, and examples
Standards
TitleStandard
--No new or modified standards are supported, and support for existing standards has not been modified
MIBs
MIBs LinkMIB
--No new or modified MIBs are supported, and support for existing MIBs has not been modified
RFCs
TitleRFC1
RSVP: Resource ReSerVation Protocol
http://www.ietf.org/rfc/rfc2205.txt
RFC 2205
1 These references are only a sample of the many RFCs available on subjects related to IP addressing andIP routing. Refer to the IETF RFC site at http://www.ietf.org/rfc.html for a full list of RFCs.
Media Monitoring Configuration Guide, Cisco IOS XE Gibraltar 16.12.x34
Configuring Cisco MediatraceAdditional References
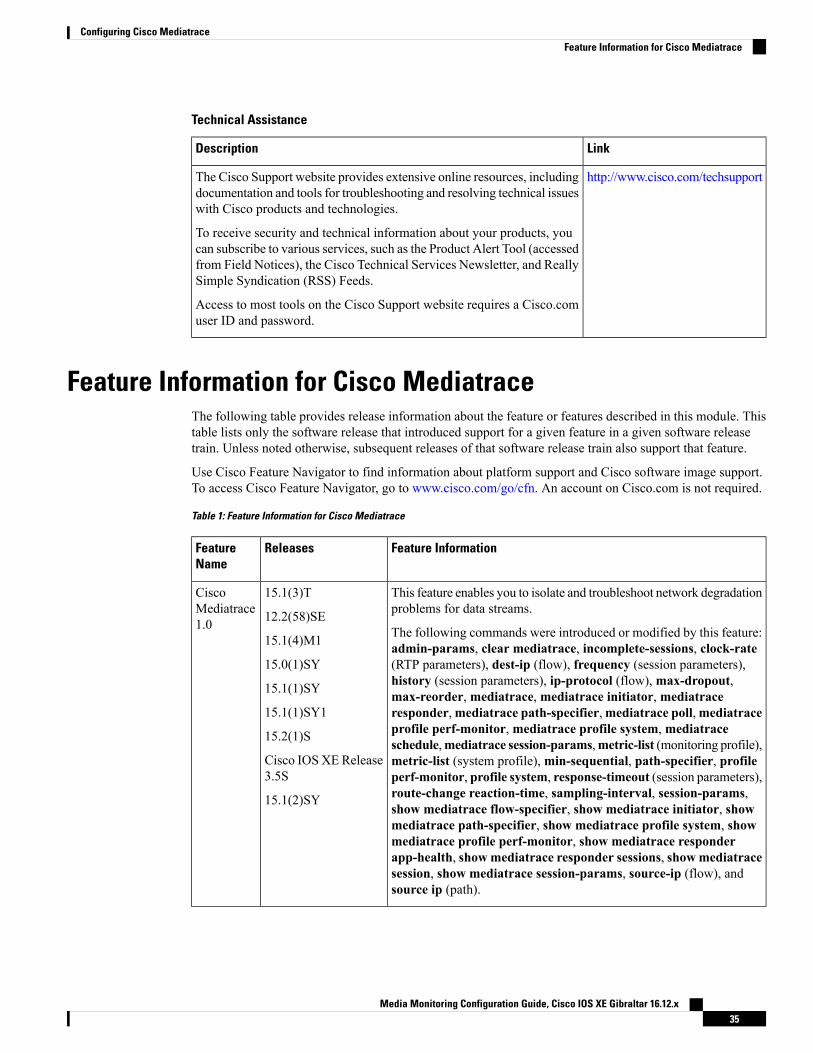
Technical Assistance
LinkDescription
http://www.cisco.com/techsupportThe Cisco Support website provides extensive online resources, includingdocumentation and tools for troubleshooting and resolving technical issueswith Cisco products and technologies.
To receive security and technical information about your products, youcan subscribe to various services, such as the Product Alert Tool (accessedfrom Field Notices), the Cisco Technical Services Newsletter, and ReallySimple Syndication (RSS) Feeds.
Access to most tools on the Cisco Support website requires a Cisco.comuser ID and password.
Feature Information for Cisco MediatraceThe following table provides release information about the feature or features described in this module. Thistable lists only the software release that introduced support for a given feature in a given software releasetrain. Unless noted otherwise, subsequent releases of that software release train also support that feature.
Use Cisco Feature Navigator to find information about platform support and Cisco software image support.To access Cisco Feature Navigator, go to www.cisco.com/go/cfn. An account on Cisco.com is not required.
Table 1: Feature Information for Cisco Mediatrace
Feature InformationReleasesFeatureName
This feature enables you to isolate and troubleshoot network degradationproblems for data streams.
The following commands were introduced or modified by this feature:admin-params, clear mediatrace, incomplete-sessions, clock-rate(RTP parameters), dest-ip (flow), frequency (session parameters),history (session parameters), ip-protocol (flow),max-dropout,max-reorder, mediatrace, mediatrace initiator, mediatraceresponder,mediatrace path-specifier,mediatrace poll,mediatraceprofile perf-monitor, mediatrace profile system, mediatraceschedule,mediatrace session-params,metric-list (monitoring profile),metric-list (system profile),min-sequential, path-specifier, profileperf-monitor, profile system, response-timeout (session parameters),route-change reaction-time, sampling-interval, session-params,show mediatrace flow-specifier, show mediatrace initiator, showmediatrace path-specifier, show mediatrace profile system, showmediatrace profile perf-monitor, show mediatrace responderapp-health, showmediatrace responder sessions, showmediatracesession, show mediatrace session-params, source-ip (flow), andsource ip (path).
15.1(3)T
12.2(58)SE
15.1(4)M1
15.0(1)SY
15.1(1)SY
15.1(1)SY1
15.2(1)S
Cisco IOS XERelease3.5S
15.1(2)SY
CiscoMediatrace1.0
Media Monitoring Configuration Guide, Cisco IOS XE Gibraltar 16.12.x35
Configuring Cisco MediatraceFeature Information for Cisco Mediatrace

Media Monitoring Configuration Guide, Cisco IOS XE Gibraltar 16.12.x36
Configuring Cisco MediatraceFeature Information for Cisco Mediatrace
C H A P T E R 3Configuring Cisco Performance Monitor
This document contains information about and instructions for configuring Cisco Performance Monitor.
• Finding Feature Information, on page 37• Information About Cisco Performance Monitor, on page 37• Restrictions for Performance Monitor, on page 43• How to Configure Troubleshoot and Maintain Cisco Performance Monitor, on page 43• Configuration Example for Cisco Performance Monitor, on page 87• Where to Go Next, on page 88• Additional References, on page 89• Feature Information for Cisco Performance Monitor, on page 90
Finding Feature InformationYour software release may not support all the features documented in this module. For the latest caveats andfeature information, see Bug Search Tool and the release notes for your platform and software release. Tofind information about the features documented in this module, and to see a list of the releases in which eachfeature is supported, see the feature information table.
Use Cisco Feature Navigator to find information about platform support and Cisco software image support.To access Cisco Feature Navigator, go to www.cisco.com/go/cfn. An account on Cisco.com is not required.
Information About Cisco Performance Monitor
Overview of Cisco Performance MonitorCisco Performance Monitor enables you to monitor the flow of packets in your network and become awareof any issues that might impact the flow before it starts to significantly impact the performance of the applicationin question. Performance monitoring is especially important for video traffic because high quality interactivevideo traffic is highly sensitive to network issues. Even minor issues that may not affect other applicationscan have dramatic effects on video quality.
Because Cisco PerformanceMonitor uses similar software components and commands as Cisco NetFlow andCisco Flexible NetFlow, familiarity with these products will help you to understand how to configure CiscoPerformance Monitor. These products provide statistics on packets flowing through a router and are the
Media Monitoring Configuration Guide, Cisco IOS XE Gibraltar 16.12.x37
standard for acquiring IP operational data from IP networks. They provide data to support network and securitymonitoring, network planning, traffic analysis, and IP accounting. For more information about Cisco NetFlowand Cisco Flexible NetFlow, see the documents listed in the Additional References section.
For more information about the design, configuration, and troubleshooting of PerformanceMonitor and otherCisco Medianet products, including a Quick Start Guide and Deployment Guide, see the Cisco MedianetKnowledge Base Portal, located at http://www.cisco.com/web/solutions/medianet/knowledgebase/index.html.
Prerequisites for Configuring Cisco Performance MonitorThe following prerequisites must be met before you can configure Cisco Performance Monitor:
IPv4 Traffic
• The networking device must be configured for IPv4 routing.
• One of the following must be enabled on your router and on any interfaces on which you want to enableCisco Performance Monitor: Cisco Express Forwarding or distributed Cisco Express Forwarding.
IPv6 Traffic
• Cisco Express Forwarding must be enabled on your router and on any interfaces on which you want toenable Cisco Performance Monitor. You can use the ipv6 cef command to enable Cisco ExpressForwarding.
Configuration Components of Cisco Performance MonitorTo configure Cisco Performance Monitor, configure many of the same basic elements that you normallyconfigure for Flexible NetFlow:
• Interface
• Policy
• Class
• Flow monitor
• Flow record
• Flow exporter
The figure below shows how these elements are related to each other. The elements at the bottom of the figureare configured first.
Media Monitoring Configuration Guide, Cisco IOS XE Gibraltar 16.12.x38
Configuring Cisco Performance MonitorPrerequisites for Configuring Cisco Performance Monitor
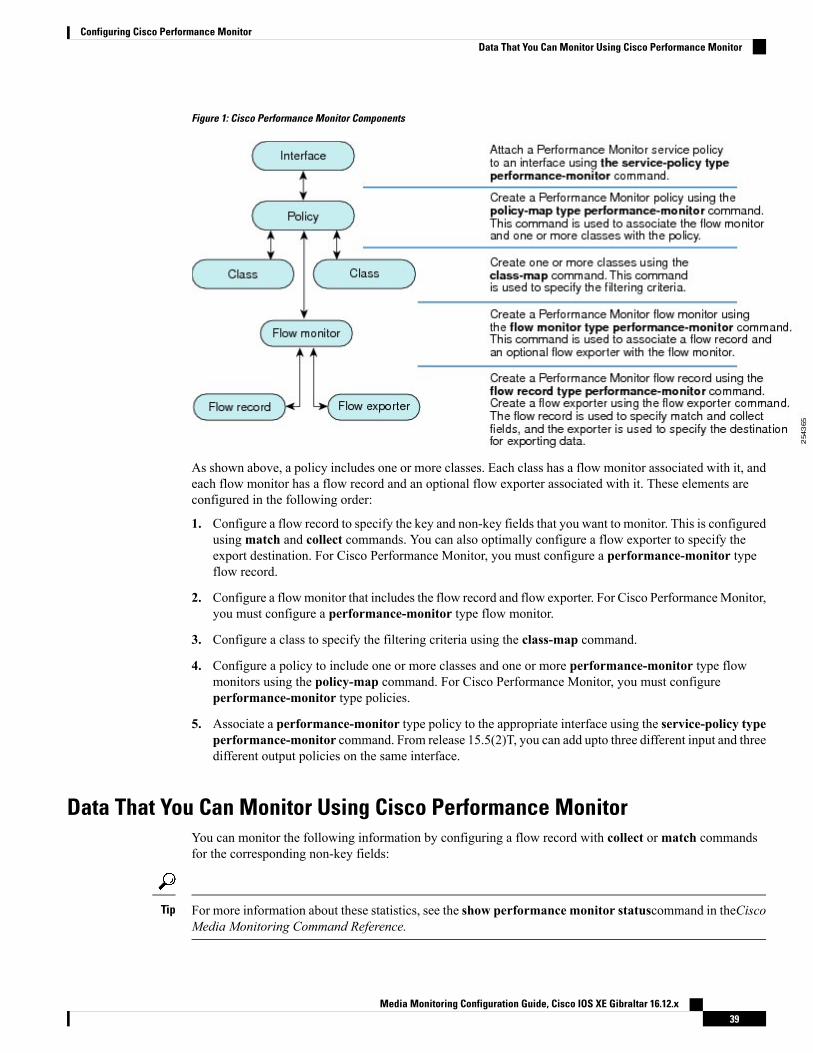
Figure 1: Cisco Performance Monitor Components
As shown above, a policy includes one or more classes. Each class has a flow monitor associated with it, andeach flow monitor has a flow record and an optional flow exporter associated with it. These elements areconfigured in the following order:
1. Configure a flow record to specify the key and non-key fields that you want to monitor. This is configuredusingmatch and collect commands. You can also optimally configure a flow exporter to specify theexport destination. For Cisco Performance Monitor, you must configure a performance-monitor typeflow record.
2. Configure a flowmonitor that includes the flow record and flow exporter. For Cisco PerformanceMonitor,you must configure a performance-monitor type flow monitor.
3. Configure a class to specify the filtering criteria using the class-map command.
4. Configure a policy to include one or more classes and one or more performance-monitor type flowmonitors using the policy-map command. For Cisco Performance Monitor, you must configureperformance-monitor type policies.
5. Associate a performance-monitor type policy to the appropriate interface using the service-policy typeperformance-monitor command. From release 15.5(2)T, you can add upto three different input and threedifferent output policies on the same interface.
Data That You Can Monitor Using Cisco Performance MonitorYou can monitor the following information by configuring a flow record with collect or match commandsfor the corresponding non-key fields:
For more information about these statistics, see the show performance monitor statuscommand in theCiscoMedia Monitoring Command Reference.
Tip
Media Monitoring Configuration Guide, Cisco IOS XE Gibraltar 16.12.x39
Configuring Cisco Performance MonitorData That You Can Monitor Using Cisco Performance Monitor

• IP Packet Count
• IP TTL
• IP TTL minimum
• IP TTL maximum
• Flow to Interface Mapping
• IP Flow destination address and port, source address and port, and protocol
• RTP Synchronization Source (SSRC)
• IP Octets Count
• Media Stream Packet Count
• Media Stream Octect Count
• Media Byte Rate
• Media Byte Count
• Media Packet Rate
• Media Packet Loss Count
• Media Packet Loss Rate
• Packets Expected Count
• Measured Rate
• Media Loss Event Count
• Round Trip Time (RTT)
• Interarrival Jitter (RFC3550) max
• Interarrival Jitter (RFC3550) min 2
• Interarrival Jitter (RFC3550) mean
• Media Rate Variation
• Monitor Event
• Media Error
• Media Stop
• IP Byte Count
• IP Byte Rate
• IP Source Mask
• IP Destination Mask
• Epoch of A Monitoring Interval
• Packet Forwarding Status
Media Monitoring Configuration Guide, Cisco IOS XE Gibraltar 16.12.x40
Configuring Cisco Performance MonitorData That You Can Monitor Using Cisco Performance Monitor
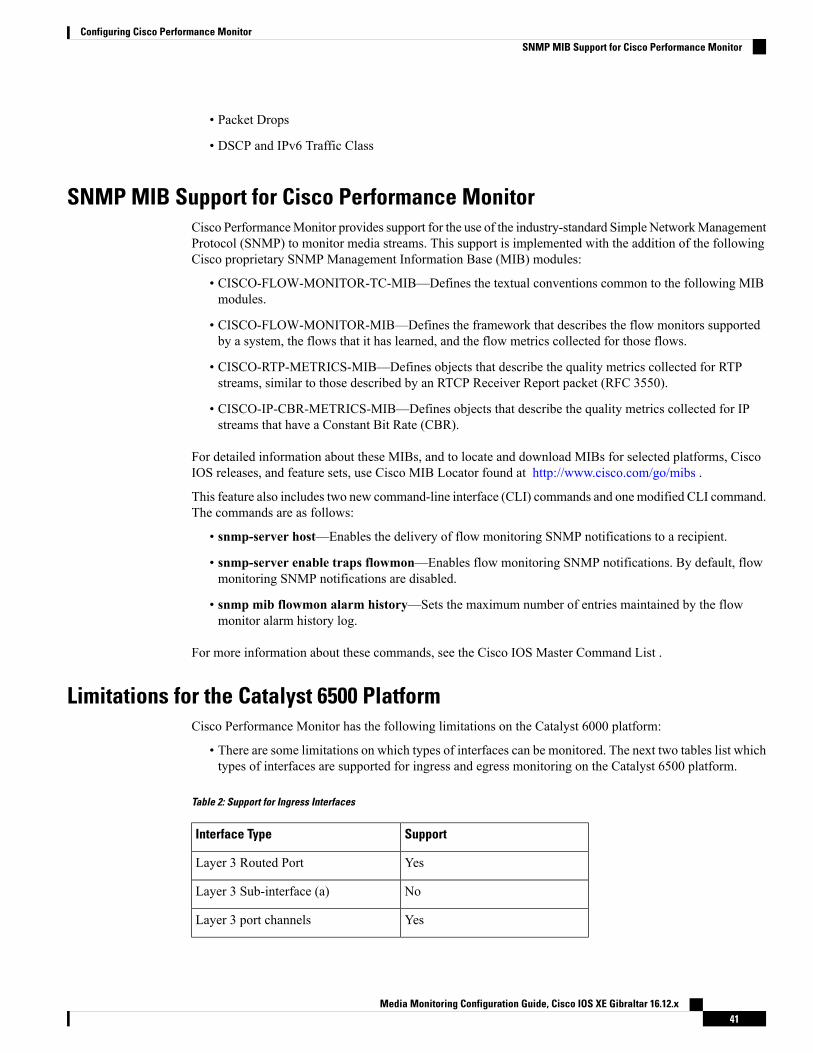
• Packet Drops
• DSCP and IPv6 Traffic Class
SNMP MIB Support for Cisco Performance MonitorCisco PerformanceMonitor provides support for the use of the industry-standard Simple NetworkManagementProtocol (SNMP) to monitor media streams. This support is implemented with the addition of the followingCisco proprietary SNMP Management Information Base (MIB) modules:
• CISCO-FLOW-MONITOR-TC-MIB—Defines the textual conventions common to the following MIBmodules.
• CISCO-FLOW-MONITOR-MIB—Defines the framework that describes the flow monitors supportedby a system, the flows that it has learned, and the flow metrics collected for those flows.
• CISCO-RTP-METRICS-MIB—Defines objects that describe the quality metrics collected for RTPstreams, similar to those described by an RTCP Receiver Report packet (RFC 3550).
• CISCO-IP-CBR-METRICS-MIB—Defines objects that describe the quality metrics collected for IPstreams that have a Constant Bit Rate (CBR).
For detailed information about these MIBs, and to locate and download MIBs for selected platforms, CiscoIOS releases, and feature sets, use Cisco MIB Locator found at http://www.cisco.com/go/mibs .
This feature also includes two new command-line interface (CLI) commands and one modified CLI command.The commands are as follows:
• snmp-server host—Enables the delivery of flow monitoring SNMP notifications to a recipient.
• snmp-server enable traps flowmon—Enables flow monitoring SNMP notifications. By default, flowmonitoring SNMP notifications are disabled.
• snmp mib flowmon alarm history—Sets the maximum number of entries maintained by the flowmonitor alarm history log.
For more information about these commands, see the Cisco IOS Master Command List .
Limitations for the Catalyst 6500 PlatformCisco Performance Monitor has the following limitations on the Catalyst 6000 platform:
• There are some limitations on which types of interfaces can be monitored. The next two tables list whichtypes of interfaces are supported for ingress and egress monitoring on the Catalyst 6500 platform.
Table 2: Support for Ingress Interfaces
SupportInterface Type
YesLayer 3 Routed Port
NoLayer 3 Sub-interface (a)
YesLayer 3 port channels
Media Monitoring Configuration Guide, Cisco IOS XE Gibraltar 16.12.x41
Configuring Cisco Performance MonitorSNMP MIB Support for Cisco Performance Monitor
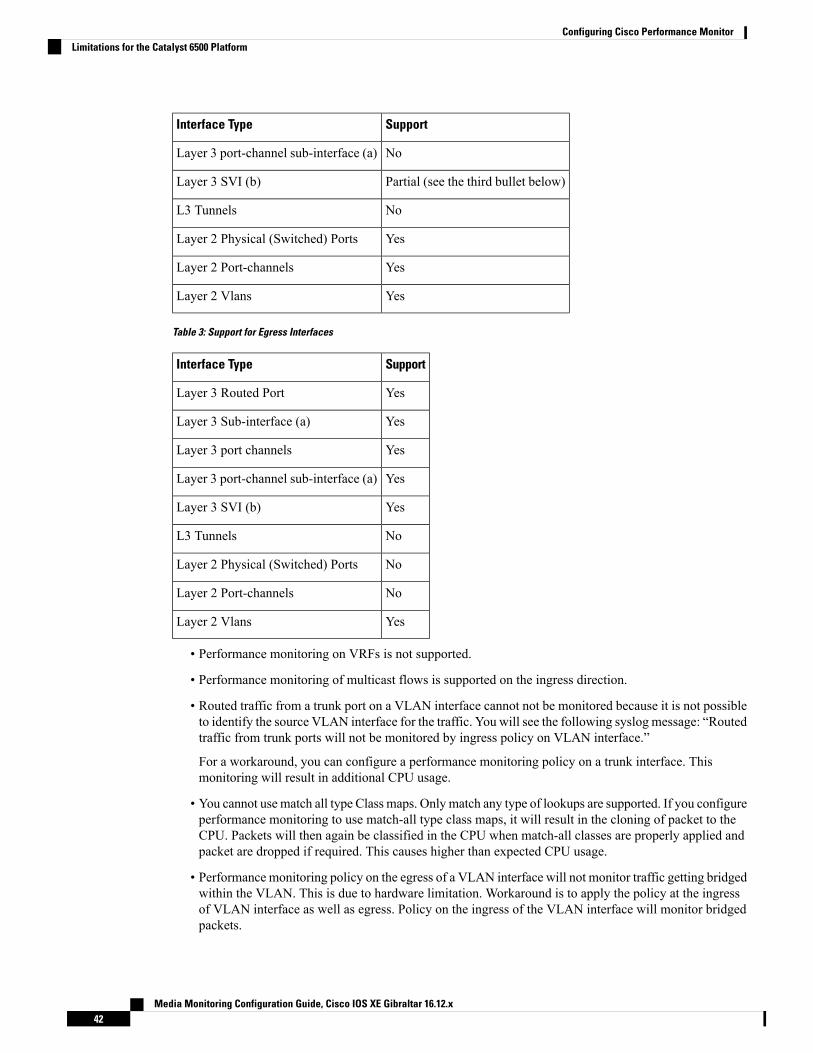
SupportInterface Type
NoLayer 3 port-channel sub-interface (a)
Partial (see the third bullet below)Layer 3 SVI (b)
NoL3 Tunnels
YesLayer 2 Physical (Switched) Ports
YesLayer 2 Port-channels
YesLayer 2 Vlans
Table 3: Support for Egress Interfaces
SupportInterface Type
YesLayer 3 Routed Port
YesLayer 3 Sub-interface (a)
YesLayer 3 port channels
YesLayer 3 port-channel sub-interface (a)
YesLayer 3 SVI (b)
NoL3 Tunnels
NoLayer 2 Physical (Switched) Ports
NoLayer 2 Port-channels
YesLayer 2 Vlans
• Performance monitoring on VRFs is not supported.
• Performance monitoring of multicast flows is supported on the ingress direction.
• Routed traffic from a trunk port on a VLAN interface cannot not be monitored because it is not possibleto identify the source VLAN interface for the traffic. You will see the following syslog message: “Routedtraffic from trunk ports will not be monitored by ingress policy on VLAN interface.”
For a workaround, you can configure a performance monitoring policy on a trunk interface. Thismonitoring will result in additional CPU usage.
• You cannot use match all type Class maps. Only match any type of lookups are supported. If you configureperformance monitoring to use match-all type class maps, it will result in the cloning of packet to theCPU. Packets will then again be classified in the CPU when match-all classes are properly applied andpacket are dropped if required. This causes higher than expected CPU usage.
• Performance monitoring policy on the egress of a VLAN interface will not monitor traffic getting bridgedwithin the VLAN. This is due to hardware limitation. Workaround is to apply the policy at the ingressof VLAN interface as well as egress. Policy on the ingress of the VLAN interface will monitor bridgedpackets.
Media Monitoring Configuration Guide, Cisco IOS XE Gibraltar 16.12.x42
Configuring Cisco Performance MonitorLimitations for the Catalyst 6500 Platform
• Cloned packets from Egress policies can only be software rate-limited. No hardware-based protectionis available for these packets. Therefore, you might see high interrupt CPU usage during scenarios whenmany flows are being monitored.
• Egress performance monitoring makes use of a recirculation mechanism on the Catalyst 6500 platform.This introduces several microseconds of additional latency to the frame switching.
• Performance monitoring is not supported for the packets switched using the Fast (CEF) Path.
• Lawful intercept and performance monitoring makes use of the samemechanism for cloning the packets.The Lawful Intercept feature takes precedence over performance monitoring. Therefore, performancemonitoring does not function when the Lawful Intercept feature is enabled. When this occurs, a syslogmessage is created.
• Performancemonitoringmakes use of samemechanism as other features, such as OptimizedACL logging,VACL Capture, IPv6 Copy, and so on. The feature that is enabled first takes precedence. The otherfeatures are blocked from being configured and a syslog message is created.
When reacts (including media-stop) are configured under a performance monitoring policy and whenthe traffic is unstable, syslog messages are logged into the buffer and are not printed on the consolescreen.
Restrictions for Performance Monitor• On Cisco ASR 1000 Series Aggregation Services Routers, you can configure only 30 fields in a flowrecord.
HowtoConfigureTroubleshootandMaintainCiscoPerformanceMonitor
Many of the Flexible NetFlow commands, keywords, and arguments used in used in these tasks are availablein previous releases. For more information about these existing Flexible NetFlow commands, keywords, andarguments, refer to the Cisco IOS Flexible NetFlow Command Reference.
Note
Configuring a Flow Exporter for Cisco Performance MonitorFlow exporters are used to send the data that you collect with Cisco Performance Monitor to a remote systemsuch as a NetFlow Collection Engine. Flow exporters use user datagram protocol (UDP) as the transportprotocol and use the Version 9 export format.
To configure a flow exporter for the flow monitor, in order to export the data that is collected by CiscoPerformanceMonitor to a remote system for further analysis and storage, perform the following optional task.For Cisco Performance Monitor, flow exporters are configured the same way as they are configured for CiscoIOS Flexible NetFlow. For more information. see Configuring Data Export for Cisco IOS Flexible NetFlowwith Flow Exporters.
Media Monitoring Configuration Guide, Cisco IOS XE Gibraltar 16.12.x43
Configuring Cisco Performance MonitorRestrictions for Performance Monitor
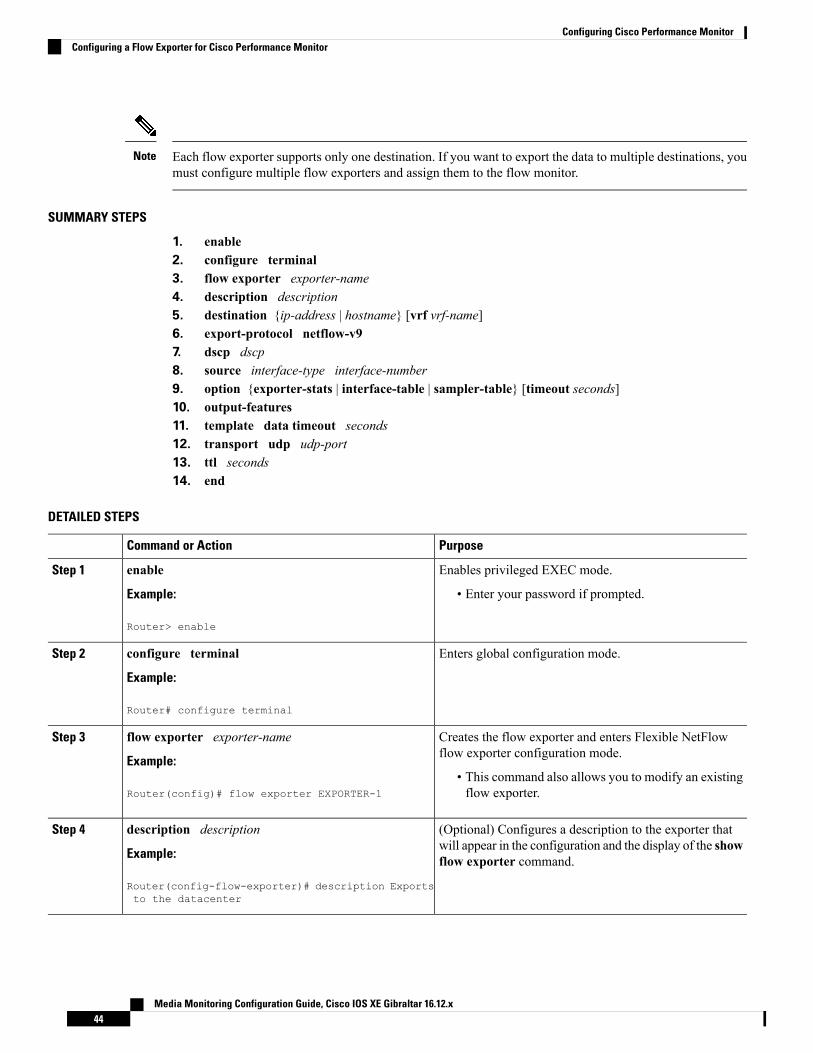
Each flow exporter supports only one destination. If you want to export the data to multiple destinations, youmust configure multiple flow exporters and assign them to the flow monitor.
Note
SUMMARY STEPS
1. enable2. configure terminal3. flow exporter exporter-name4. description description5. destination {ip-address | hostname} [vrf vrf-name]6. export-protocol netflow-v97. dscp dscp8. source interface-type interface-number9. option {exporter-stats | interface-table | sampler-table} [timeout seconds]10. output-features11. template data timeout seconds12. transport udp udp-port13. ttl seconds14. end
DETAILED STEPS
PurposeCommand or Action
Enables privileged EXEC mode.enableStep 1
Example: • Enter your password if prompted.
Router> enable
Enters global configuration mode.configure terminal
Example:
Step 2
Router# configure terminal
Creates the flow exporter and enters Flexible NetFlowflow exporter configuration mode.
flow exporter exporter-name
Example:
Step 3
• This command also allows you to modify an existingflow exporter.Router(config)# flow exporter EXPORTER-1
(Optional) Configures a description to the exporter thatwill appear in the configuration and the display of the showflow exporter command.
description description
Example:
Router(config-flow-exporter)# description Exportsto the datacenter
Step 4
Media Monitoring Configuration Guide, Cisco IOS XE Gibraltar 16.12.x44
Configuring Cisco Performance MonitorConfiguring a Flow Exporter for Cisco Performance Monitor
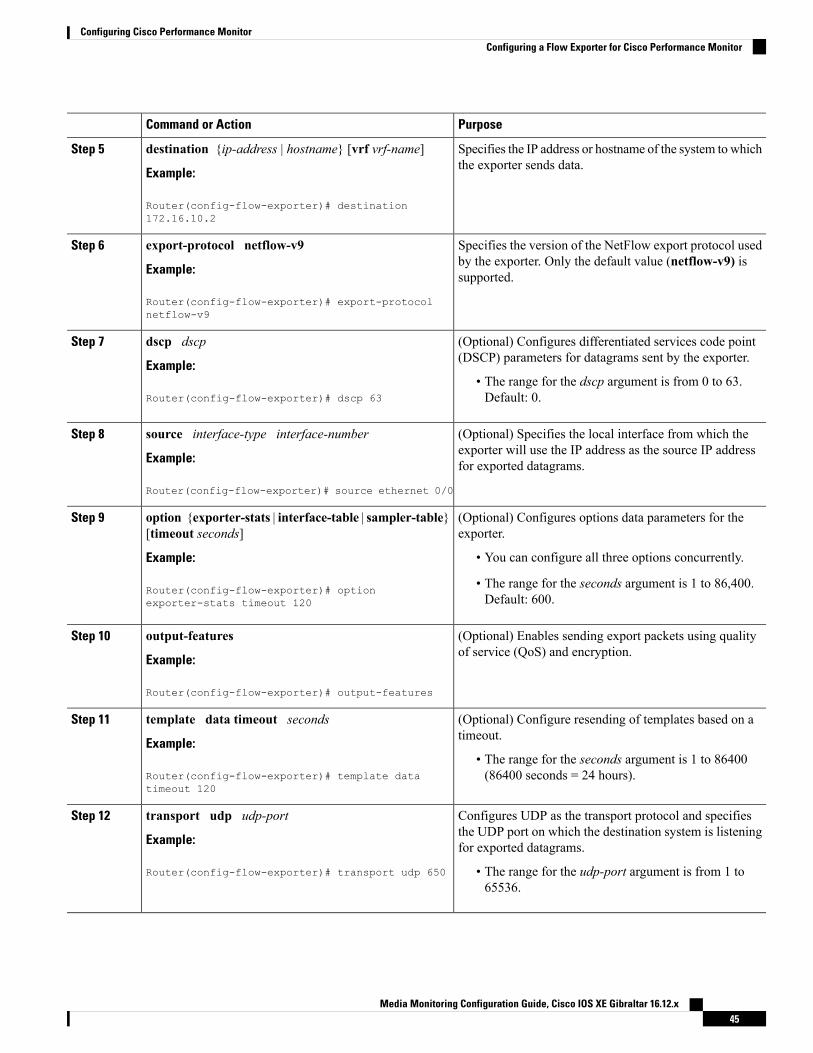
PurposeCommand or Action
Specifies the IP address or hostname of the system to whichthe exporter sends data.
destination {ip-address | hostname} [vrf vrf-name]
Example:
Step 5
Router(config-flow-exporter)# destination172.16.10.2
Specifies the version of the NetFlow export protocol usedby the exporter. Only the default value (netflow-v9) issupported.
export-protocol netflow-v9
Example:
Router(config-flow-exporter)# export-protocolnetflow-v9
Step 6
(Optional) Configures differentiated services code point(DSCP) parameters for datagrams sent by the exporter.
dscp dscp
Example:
Step 7
• The range for the dscp argument is from 0 to 63.Default: 0.Router(config-flow-exporter)# dscp 63
(Optional) Specifies the local interface from which theexporter will use the IP address as the source IP addressfor exported datagrams.
source interface-type interface-number
Example:
Router(config-flow-exporter)# source ethernet 0/0
Step 8
(Optional) Configures options data parameters for theexporter.
option {exporter-stats | interface-table | sampler-table}[timeout seconds]
Step 9
Example: • You can configure all three options concurrently.
Router(config-flow-exporter)# optionexporter-stats timeout 120
• The range for the seconds argument is 1 to 86,400.Default: 600.
(Optional) Enables sending export packets using qualityof service (QoS) and encryption.
output-features
Example:
Step 10
Router(config-flow-exporter)# output-features
(Optional) Configure resending of templates based on atimeout.
template data timeout seconds
Example:
Step 11
• The range for the seconds argument is 1 to 86400(86400 seconds = 24 hours).Router(config-flow-exporter)# template data
timeout 120
Configures UDP as the transport protocol and specifiesthe UDP port on which the destination system is listeningfor exported datagrams.
transport udp udp-port
Example:
Router(config-flow-exporter)# transport udp 650
Step 12
• The range for the udp-port argument is from 1 to65536.
Media Monitoring Configuration Guide, Cisco IOS XE Gibraltar 16.12.x45
Configuring Cisco Performance MonitorConfiguring a Flow Exporter for Cisco Performance Monitor
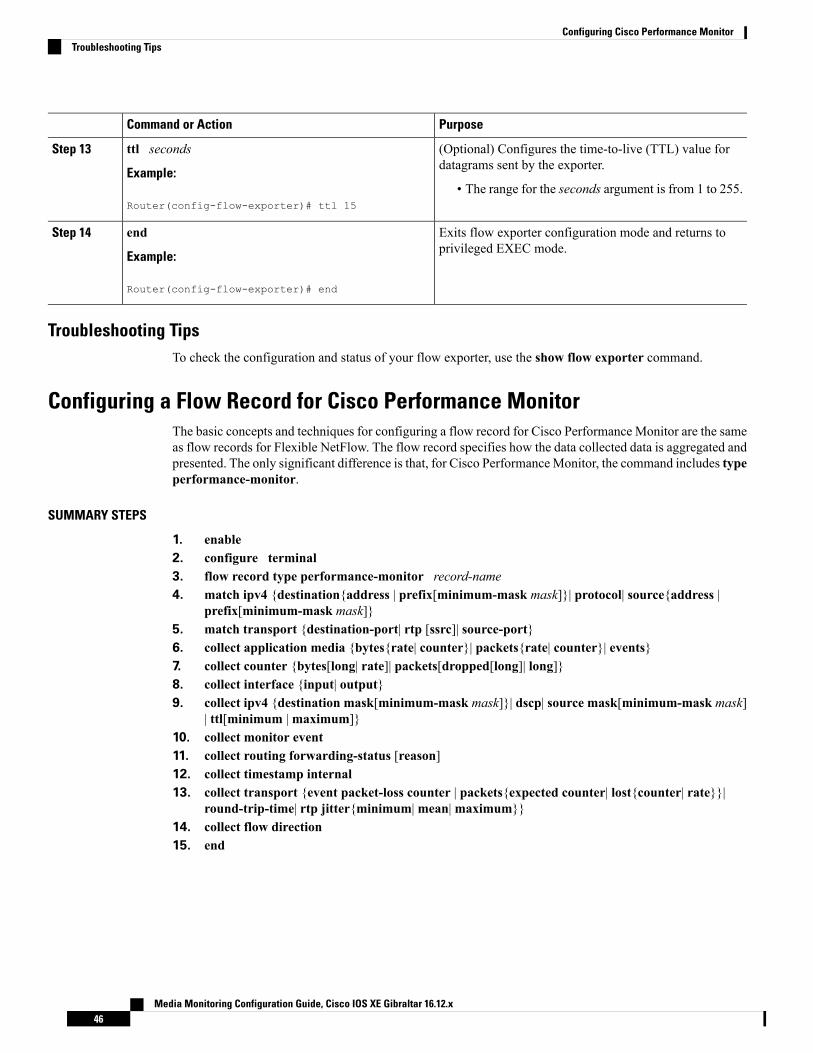
PurposeCommand or Action
(Optional) Configures the time-to-live (TTL) value fordatagrams sent by the exporter.
ttl seconds
Example:
Step 13
• The range for the seconds argument is from 1 to 255.Router(config-flow-exporter)# ttl 15
Exits flow exporter configuration mode and returns toprivileged EXEC mode.
end
Example:
Step 14
Router(config-flow-exporter)# end
Troubleshooting TipsTo check the configuration and status of your flow exporter, use the show flow exporter command.
Configuring a Flow Record for Cisco Performance MonitorThe basic concepts and techniques for configuring a flow record for Cisco Performance Monitor are the sameas flow records for Flexible NetFlow. The flow record specifies how the data collected data is aggregated andpresented. The only significant difference is that, for Cisco PerformanceMonitor, the command includes typeperformance-monitor.
SUMMARY STEPS
1. enable2. configure terminal3. flow record type performance-monitor record-name4. match ipv4 {destination{address | prefix[minimum-mask mask]}| protocol| source{address |
prefix[minimum-mask mask]}5. match transport {destination-port| rtp [ssrc]| source-port}6. collect application media {bytes{rate| counter}| packets{rate| counter}| events}7. collect counter {bytes[long| rate]| packets[dropped[long]| long]}8. collect interface {input| output}9. collect ipv4 {destination mask[minimum-mask mask]}| dscp| source mask[minimum-mask mask]
| ttl[minimum |maximum]}10. collect monitor event11. collect routing forwarding-status [reason]12. collect timestamp internal13. collect transport {event packet-loss counter | packets{expected counter| lost{counter| rate}}|
round-trip-time| rtp jitter{minimum|mean|maximum}}14. collect flow direction15. end
Media Monitoring Configuration Guide, Cisco IOS XE Gibraltar 16.12.x46
Configuring Cisco Performance MonitorTroubleshooting Tips
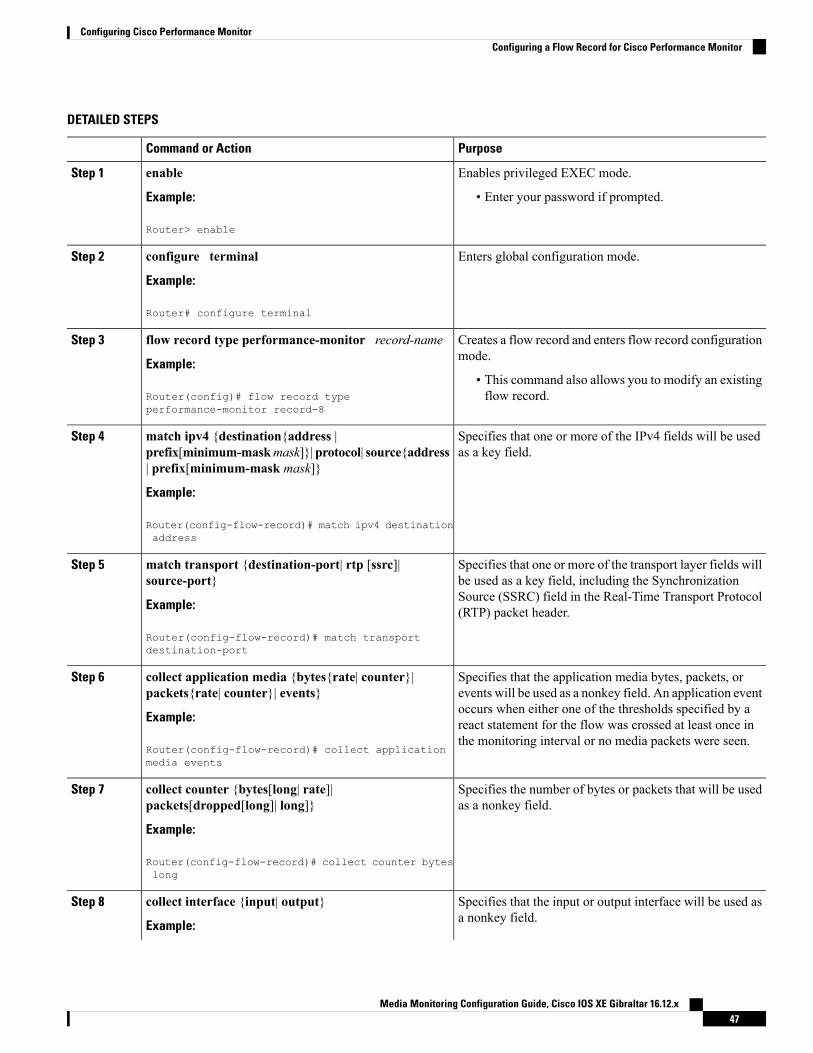
DETAILED STEPS
PurposeCommand or Action
Enables privileged EXEC mode.enableStep 1
Example: • Enter your password if prompted.
Router> enable
Enters global configuration mode.configure terminal
Example:
Step 2
Router# configure terminal
Creates a flow record and enters flow record configurationmode.
flow record type performance-monitor record-name
Example:
Step 3
• This command also allows you to modify an existingflow record.Router(config)# flow record type
performance-monitor record-8
Specifies that one or more of the IPv4 fields will be usedas a key field.
match ipv4 {destination{address |prefix[minimum-maskmask]}| protocol| source{address| prefix[minimum-mask mask]}
Step 4
Example:
Router(config-flow-record)# match ipv4 destinationaddress
Specifies that one or more of the transport layer fields willbe used as a key field, including the Synchronization
match transport {destination-port| rtp [ssrc]|source-port}
Step 5
Source (SSRC) field in the Real-Time Transport Protocol(RTP) packet header.Example:
Router(config-flow-record)# match transportdestination-port
Specifies that the application media bytes, packets, orevents will be used as a nonkey field. An application event
collect application media {bytes{rate| counter}|packets{rate| counter}| events}
Step 6
occurs when either one of the thresholds specified by aExample: react statement for the flow was crossed at least once in
the monitoring interval or no media packets were seen.Router(config-flow-record)# collect applicationmedia events
Specifies the number of bytes or packets that will be usedas a nonkey field.
collect counter {bytes[long| rate]|packets[dropped[long]| long]}
Example:
Step 7
Router(config-flow-record)# collect counter byteslong
Specifies that the input or output interface will be used asa nonkey field.
collect interface {input| output}
Example:
Step 8
Media Monitoring Configuration Guide, Cisco IOS XE Gibraltar 16.12.x47
Configuring Cisco Performance MonitorConfiguring a Flow Record for Cisco Performance Monitor
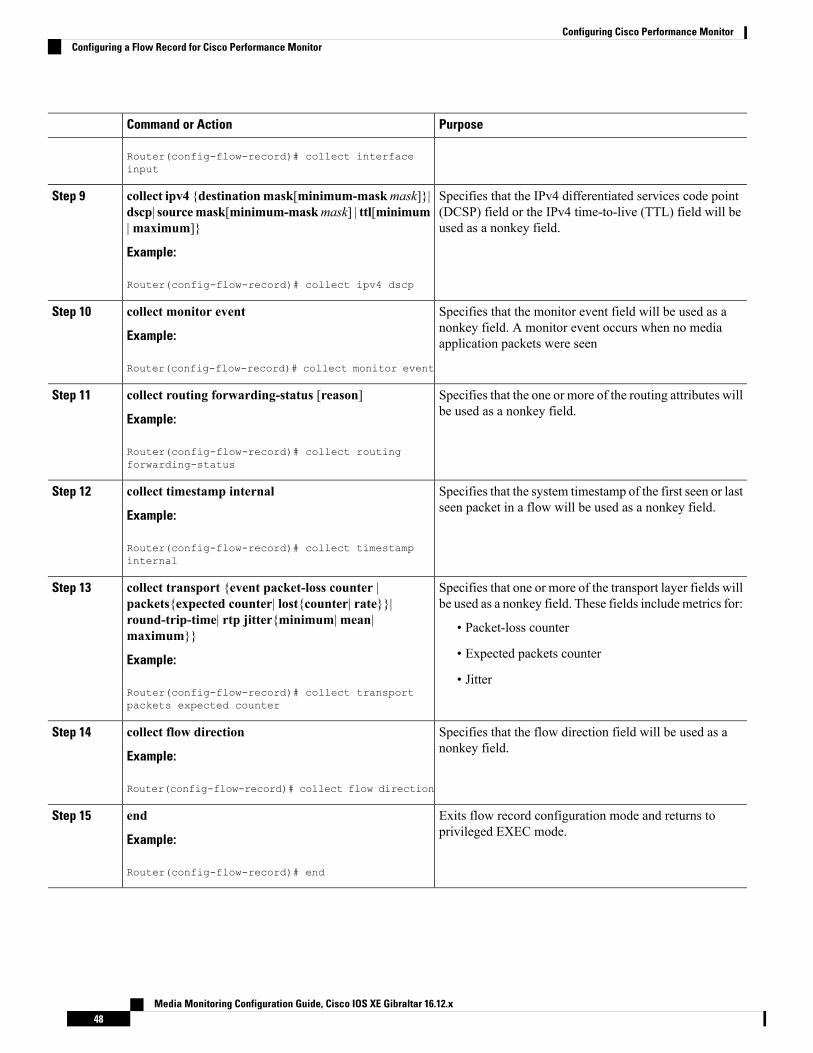
PurposeCommand or Action
Router(config-flow-record)# collect interfaceinput
Specifies that the IPv4 differentiated services code point(DCSP) field or the IPv4 time-to-live (TTL) field will beused as a nonkey field.
collect ipv4 {destinationmask[minimum-maskmask]}|dscp| sourcemask[minimum-maskmask] | ttl[minimum|maximum]}
Example:
Step 9
Router(config-flow-record)# collect ipv4 dscp
Specifies that the monitor event field will be used as anonkey field. A monitor event occurs when no mediaapplication packets were seen
collect monitor event
Example:
Router(config-flow-record)# collect monitor event
Step 10
Specifies that the one or more of the routing attributes willbe used as a nonkey field.
collect routing forwarding-status [reason]
Example:
Step 11
Router(config-flow-record)# collect routingforwarding-status
Specifies that the system timestamp of the first seen or lastseen packet in a flow will be used as a nonkey field.
collect timestamp internal
Example:
Step 12
Router(config-flow-record)# collect timestampinternal
Specifies that one or more of the transport layer fields willbe used as a nonkey field. These fields includemetrics for:
collect transport {event packet-loss counter |packets{expected counter| lost{counter| rate}}|
Step 13
round-trip-time| rtp jitter{minimum|mean|maximum}} • Packet-loss counter
Example: • Expected packets counter
• JitterRouter(config-flow-record)# collect transportpackets expected counter
Specifies that the flow direction field will be used as anonkey field.
collect flow direction
Example:
Step 14
Router(config-flow-record)# collect flow direction
Exits flow record configuration mode and returns toprivileged EXEC mode.
end
Example:
Step 15
Router(config-flow-record)# end
Media Monitoring Configuration Guide, Cisco IOS XE Gibraltar 16.12.x48
Configuring Cisco Performance MonitorConfiguring a Flow Record for Cisco Performance Monitor
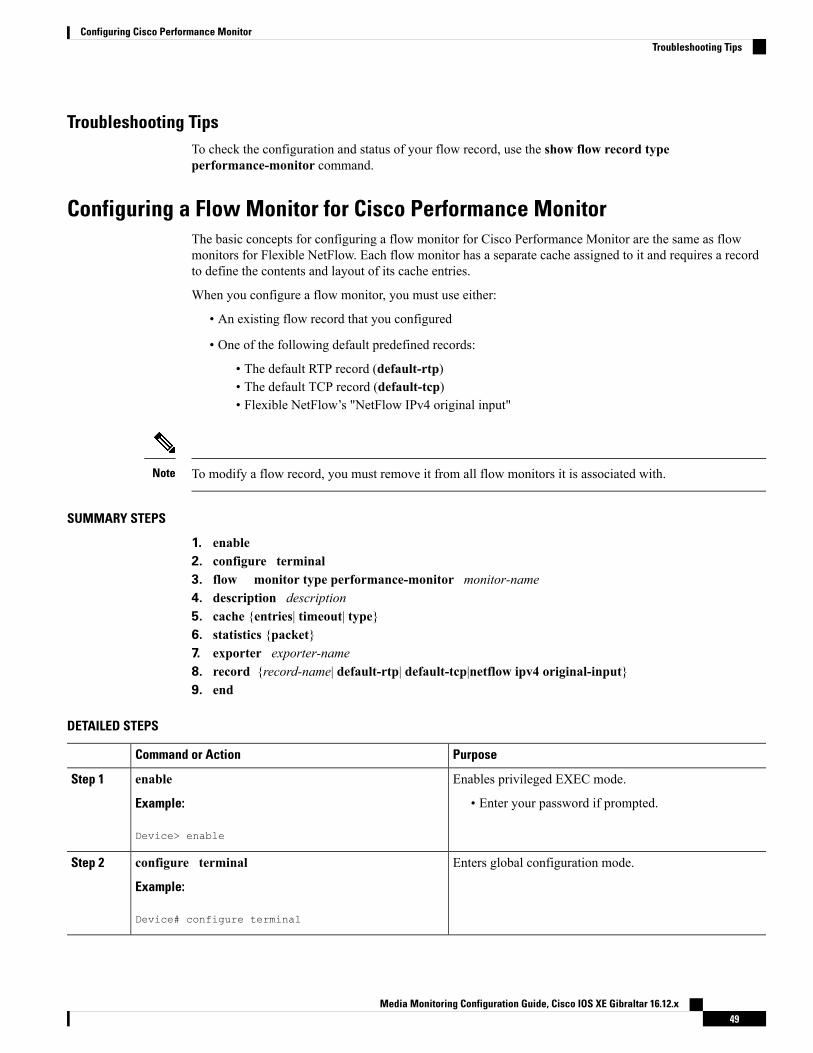
Troubleshooting TipsTo check the configuration and status of your flow record, use the show flow record typeperformance-monitor command.
Configuring a Flow Monitor for Cisco Performance MonitorThe basic concepts for configuring a flow monitor for Cisco Performance Monitor are the same as flowmonitors for Flexible NetFlow. Each flow monitor has a separate cache assigned to it and requires a recordto define the contents and layout of its cache entries.
When you configure a flow monitor, you must use either:
• An existing flow record that you configured
• One of the following default predefined records:
• The default RTP record (default-rtp)• The default TCP record (default-tcp)• Flexible NetFlow’s "NetFlow IPv4 original input"
To modify a flow record, you must remove it from all flow monitors it is associated with.Note
SUMMARY STEPS
1. enable2. configure terminal3. flow monitor type performance-monitor monitor-name4. description description5. cache {entries| timeout| type}6. statistics {packet}7. exporter exporter-name8. record {record-name| default-rtp| default-tcp|netflow ipv4 original-input}9. end
DETAILED STEPS
PurposeCommand or Action
Enables privileged EXEC mode.enableStep 1
Example: • Enter your password if prompted.
Device> enable
Enters global configuration mode.configure terminal
Example:
Step 2
Device# configure terminal
Media Monitoring Configuration Guide, Cisco IOS XE Gibraltar 16.12.x49
Configuring Cisco Performance MonitorTroubleshooting Tips
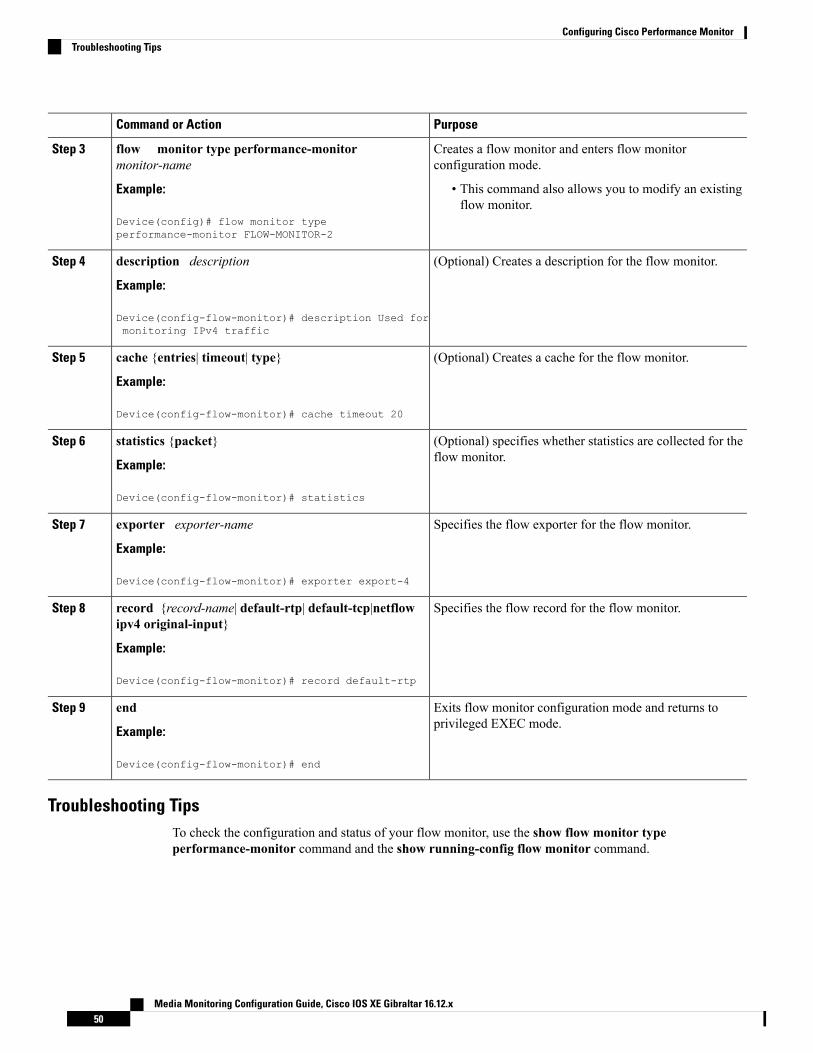
PurposeCommand or Action
Creates a flow monitor and enters flow monitorconfiguration mode.
flow monitor type performance-monitormonitor-name
Step 3
Example: • This command also allows you to modify an existingflow monitor.
Device(config)# flow monitor typeperformance-monitor FLOW-MONITOR-2
(Optional) Creates a description for the flow monitor.description description
Example:
Step 4
Device(config-flow-monitor)# description Used formonitoring IPv4 traffic
(Optional) Creates a cache for the flow monitor.cache {entries| timeout| type}
Example:
Step 5
Device(config-flow-monitor)# cache timeout 20
(Optional) specifies whether statistics are collected for theflow monitor.
statistics {packet}
Example:
Step 6
Device(config-flow-monitor)# statistics
Specifies the flow exporter for the flow monitor.exporter exporter-name
Example:
Step 7
Device(config-flow-monitor)# exporter export-4
Specifies the flow record for the flow monitor.record {record-name| default-rtp| default-tcp|netflowipv4 original-input}
Step 8
Example:
Device(config-flow-monitor)# record default-rtp
Exits flow monitor configuration mode and returns toprivileged EXEC mode.
end
Example:
Step 9
Device(config-flow-monitor)# end
Troubleshooting TipsTo check the configuration and status of your flow monitor, use the show flow monitor typeperformance-monitor command and the show running-config flow monitor command.
Media Monitoring Configuration Guide, Cisco IOS XE Gibraltar 16.12.x50
Configuring Cisco Performance MonitorTroubleshooting Tips
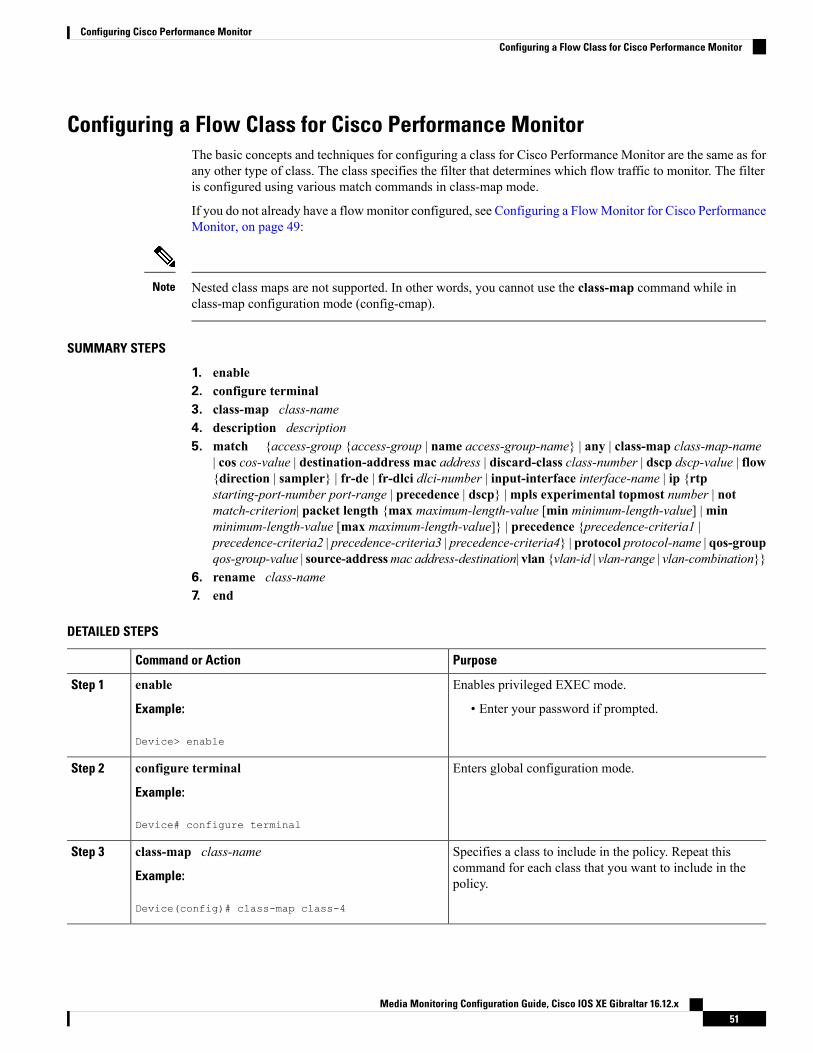
Configuring a Flow Class for Cisco Performance MonitorThe basic concepts and techniques for configuring a class for Cisco Performance Monitor are the same as forany other type of class. The class specifies the filter that determines which flow traffic to monitor. The filteris configured using various match commands in class-map mode.
If you do not already have a flowmonitor configured, see Configuring a FlowMonitor for Cisco PerformanceMonitor, on page 49:
Nested class maps are not supported. In other words, you cannot use the class-map command while inclass-map configuration mode (config-cmap).
Note
SUMMARY STEPS
1. enable2. configure terminal3. class-map class-name4. description description5. match {access-group {access-group | name access-group-name} | any | class-map class-map-name
| cos cos-value | destination-address mac address | discard-class class-number | dscp dscp-value | flow{direction | sampler} | fr-de | fr-dlci dlci-number | input-interface interface-name | ip {rtpstarting-port-number port-range | precedence | dscp} |mpls experimental topmost number | notmatch-criterion| packet length {max maximum-length-value [min minimum-length-value] |minminimum-length-value [max maximum-length-value]} | precedence {precedence-criteria1 |precedence-criteria2 | precedence-criteria3 | precedence-criteria4} | protocol protocol-name | qos-groupqos-group-value | source-addressmac address-destination| vlan {vlan-id | vlan-range | vlan-combination}}
6. rename class-name7. end
DETAILED STEPS
PurposeCommand or Action
Enables privileged EXEC mode.enableStep 1
Example: • Enter your password if prompted.
Device> enable
Enters global configuration mode.configure terminal
Example:
Step 2
Device# configure terminal
Specifies a class to include in the policy. Repeat thiscommand for each class that you want to include in thepolicy.
class-map class-name
Example:
Device(config)# class-map class-4
Step 3
Media Monitoring Configuration Guide, Cisco IOS XE Gibraltar 16.12.x51
Configuring Cisco Performance MonitorConfiguring a Flow Class for Cisco Performance Monitor
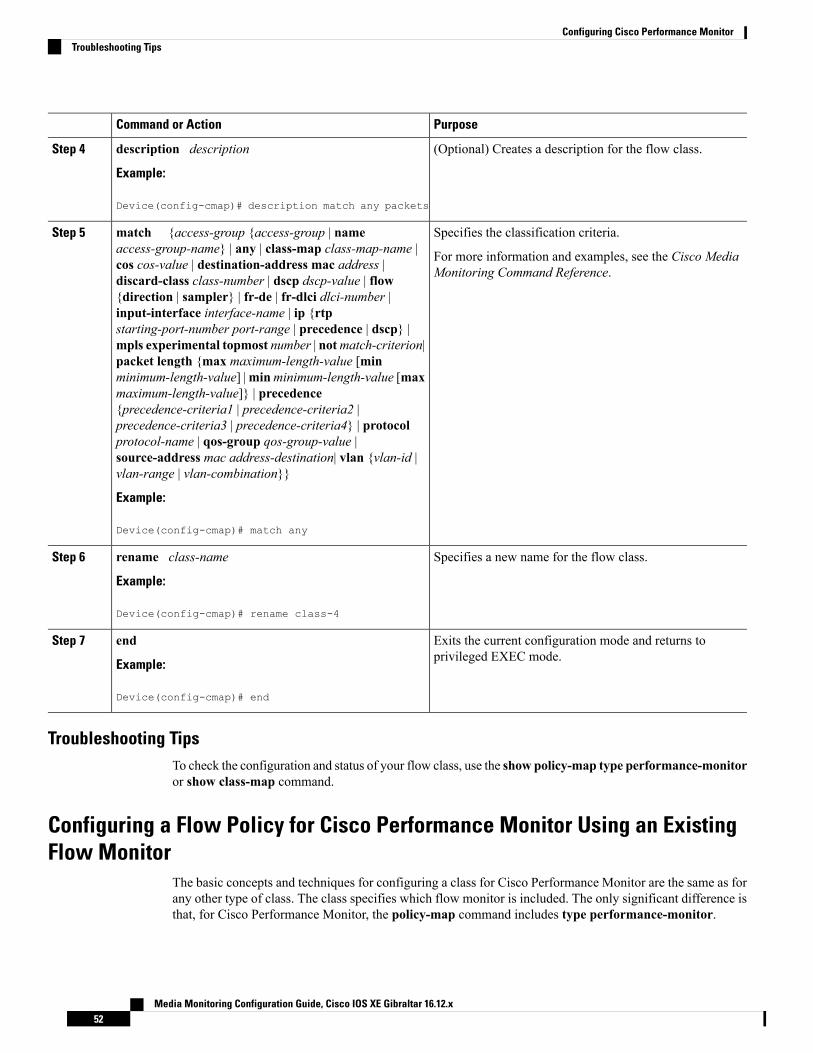
PurposeCommand or Action
(Optional) Creates a description for the flow class.description description
Example:
Step 4
Device(config-cmap)# description match any packets
Specifies the classification criteria.match {access-group {access-group | nameaccess-group-name} | any | class-map class-map-name |
Step 5
For more information and examples, see the Cisco MediaMonitoring Command Reference.cos cos-value | destination-address mac address |
discard-class class-number | dscp dscp-value | flow{direction | sampler} | fr-de | fr-dlci dlci-number |input-interface interface-name | ip {rtpstarting-port-number port-range | precedence | dscp} |mpls experimental topmost number | notmatch-criterion|packet length {max maximum-length-value [minminimum-length-value] |minminimum-length-value [maxmaximum-length-value]} | precedence{precedence-criteria1 | precedence-criteria2 |precedence-criteria3 | precedence-criteria4} | protocolprotocol-name | qos-group qos-group-value |source-address mac address-destination| vlan {vlan-id |vlan-range | vlan-combination}}
Example:
Device(config-cmap)# match any
Specifies a new name for the flow class.rename class-name
Example:
Step 6
Device(config-cmap)# rename class-4
Exits the current configuration mode and returns toprivileged EXEC mode.
end
Example:
Step 7
Device(config-cmap)# end
Troubleshooting TipsTo check the configuration and status of your flow class, use the show policy-map type performance-monitoror show class-map command.
Configuring a Flow Policy for Cisco Performance Monitor Using an ExistingFlow Monitor
The basic concepts and techniques for configuring a class for Cisco Performance Monitor are the same as forany other type of class. The class specifies which flow monitor is included. The only significant difference isthat, for Cisco Performance Monitor, the policy-map command includes type performance-monitor.
Media Monitoring Configuration Guide, Cisco IOS XE Gibraltar 16.12.x52
Configuring Cisco Performance MonitorTroubleshooting Tips
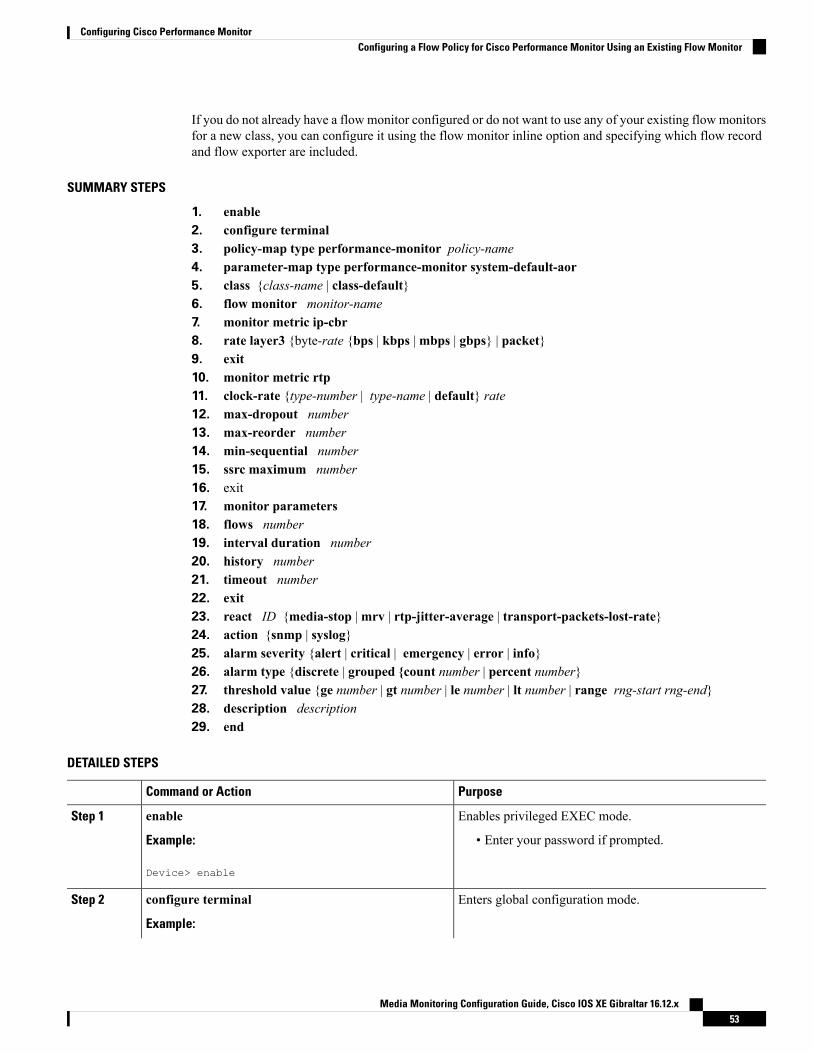
If you do not already have a flow monitor configured or do not want to use any of your existing flow monitorsfor a new class, you can configure it using the flow monitor inline option and specifying which flow recordand flow exporter are included.
SUMMARY STEPS
1. enable2. configure terminal3. policy-map type performance-monitor policy-name4. parameter-map type performance-monitor system-default-aor5. class {class-name | class-default}6. flow monitor monitor-name7. monitor metric ip-cbr8. rate layer3 {byte-rate {bps | kbps |mbps | gbps} | packet}9. exit10. monitor metric rtp11. clock-rate {type-number | type-name | default} rate12. max-dropout number13. max-reorder number14. min-sequential number15. ssrc maximum number16. exit17. monitor parameters18. flows number19. interval duration number20. history number21. timeout number22. exit23. react ID {media-stop |mrv | rtp-jitter-average | transport-packets-lost-rate}24. action {snmp | syslog}25. alarm severity {alert | critical | emergency | error | info}26. alarm type {discrete | grouped {count number | percent number}27. threshold value {ge number | gt number | le number | lt number | range rng-start rng-end}28. description description29. end
DETAILED STEPS
PurposeCommand or Action
Enables privileged EXEC mode.enableStep 1
Example: • Enter your password if prompted.
Device> enable
Enters global configuration mode.configure terminal
Example:
Step 2
Media Monitoring Configuration Guide, Cisco IOS XE Gibraltar 16.12.x53
Configuring Cisco Performance MonitorConfiguring a Flow Policy for Cisco Performance Monitor Using an Existing Flow Monitor
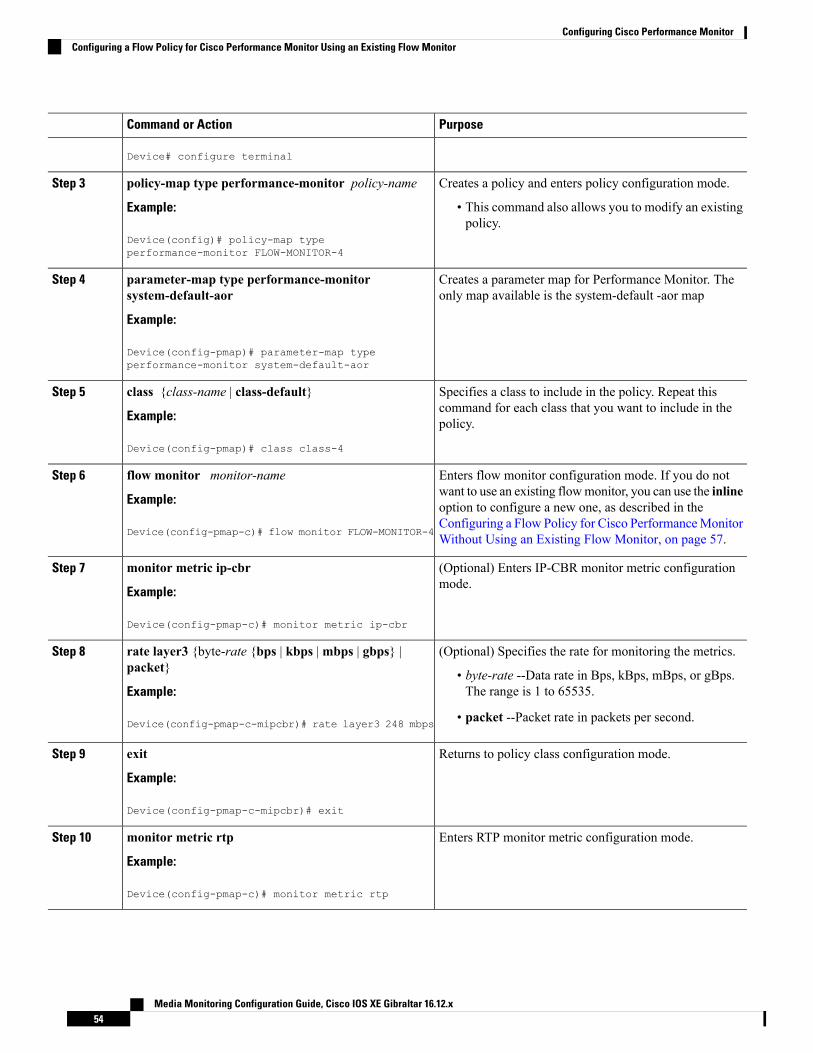
PurposeCommand or Action
Device# configure terminal
Creates a policy and enters policy configuration mode.policy-map type performance-monitor policy-nameStep 3
Example: • This command also allows you to modify an existingpolicy.
Device(config)# policy-map typeperformance-monitor FLOW-MONITOR-4
Creates a parameter map for Performance Monitor. Theonly map available is the system-default -aor map
parameter-map type performance-monitorsystem-default-aor
Example:
Step 4
Device(config-pmap)# parameter-map typeperformance-monitor system-default-aor
Specifies a class to include in the policy. Repeat thiscommand for each class that you want to include in thepolicy.
class {class-name | class-default}
Example:
Device(config-pmap)# class class-4
Step 5
Enters flow monitor configuration mode. If you do notwant to use an existing flowmonitor, you can use the inline
flow monitor monitor-name
Example:
Step 6
option to configure a new one, as described in the
Device(config-pmap-c)# flow monitor FLOW-MONITOR-4Configuring a Flow Policy for Cisco PerformanceMonitorWithout Using an Existing Flow Monitor, on page 57.
(Optional) Enters IP-CBR monitor metric configurationmode.
monitor metric ip-cbr
Example:
Step 7
Device(config-pmap-c)# monitor metric ip-cbr
(Optional) Specifies the rate for monitoring the metrics.rate layer3 {byte-rate {bps | kbps |mbps | gbps} |packet}
Step 8
• byte-rate --Data rate in Bps, kBps, mBps, or gBps.The range is 1 to 65535.Example:
Device(config-pmap-c-mipcbr)# rate layer3 248 mbps • packet --Packet rate in packets per second.
Returns to policy class configuration mode.exit
Example:
Step 9
Device(config-pmap-c-mipcbr)# exit
Enters RTP monitor metric configuration mode.monitor metric rtp
Example:
Step 10
Device(config-pmap-c)# monitor metric rtp
Media Monitoring Configuration Guide, Cisco IOS XE Gibraltar 16.12.x54
Configuring Cisco Performance MonitorConfiguring a Flow Policy for Cisco Performance Monitor Using an Existing Flow Monitor
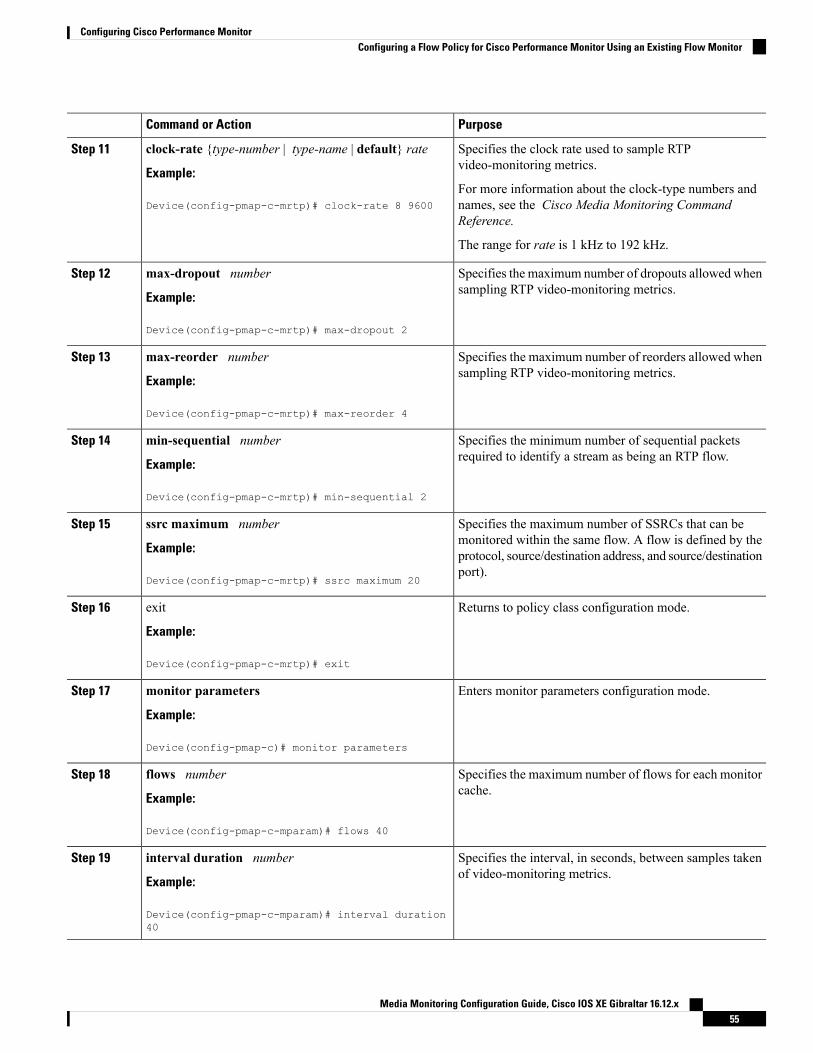
PurposeCommand or Action
Specifies the clock rate used to sample RTPvideo-monitoring metrics.
clock-rate {type-number | type-name | default} rate
Example:
Step 11
For more information about the clock-type numbers andnames, see the Cisco Media Monitoring CommandReference.
Device(config-pmap-c-mrtp)# clock-rate 8 9600
The range for rate is 1 kHz to 192 kHz.
Specifies the maximum number of dropouts allowed whensampling RTP video-monitoring metrics.
max-dropout number
Example:
Step 12
Device(config-pmap-c-mrtp)# max-dropout 2
Specifies the maximum number of reorders allowed whensampling RTP video-monitoring metrics.
max-reorder number
Example:
Step 13
Device(config-pmap-c-mrtp)# max-reorder 4
Specifies the minimum number of sequential packetsrequired to identify a stream as being an RTP flow.
min-sequential number
Example:
Step 14
Device(config-pmap-c-mrtp)# min-sequential 2
Specifies the maximum number of SSRCs that can bemonitored within the same flow. A flow is defined by the
ssrc maximum number
Example:
Step 15
protocol, source/destination address, and source/destinationport).
Device(config-pmap-c-mrtp)# ssrc maximum 20
Returns to policy class configuration mode.exit
Example:
Step 16
Device(config-pmap-c-mrtp)# exit
Enters monitor parameters configuration mode.monitor parameters
Example:
Step 17
Device(config-pmap-c)# monitor parameters
Specifies the maximum number of flows for each monitorcache.
flows number
Example:
Step 18
Device(config-pmap-c-mparam)# flows 40
Specifies the interval, in seconds, between samples takenof video-monitoring metrics.
interval duration number
Example:
Step 19
Device(config-pmap-c-mparam)# interval duration40
Media Monitoring Configuration Guide, Cisco IOS XE Gibraltar 16.12.x55
Configuring Cisco Performance MonitorConfiguring a Flow Policy for Cisco Performance Monitor Using an Existing Flow Monitor
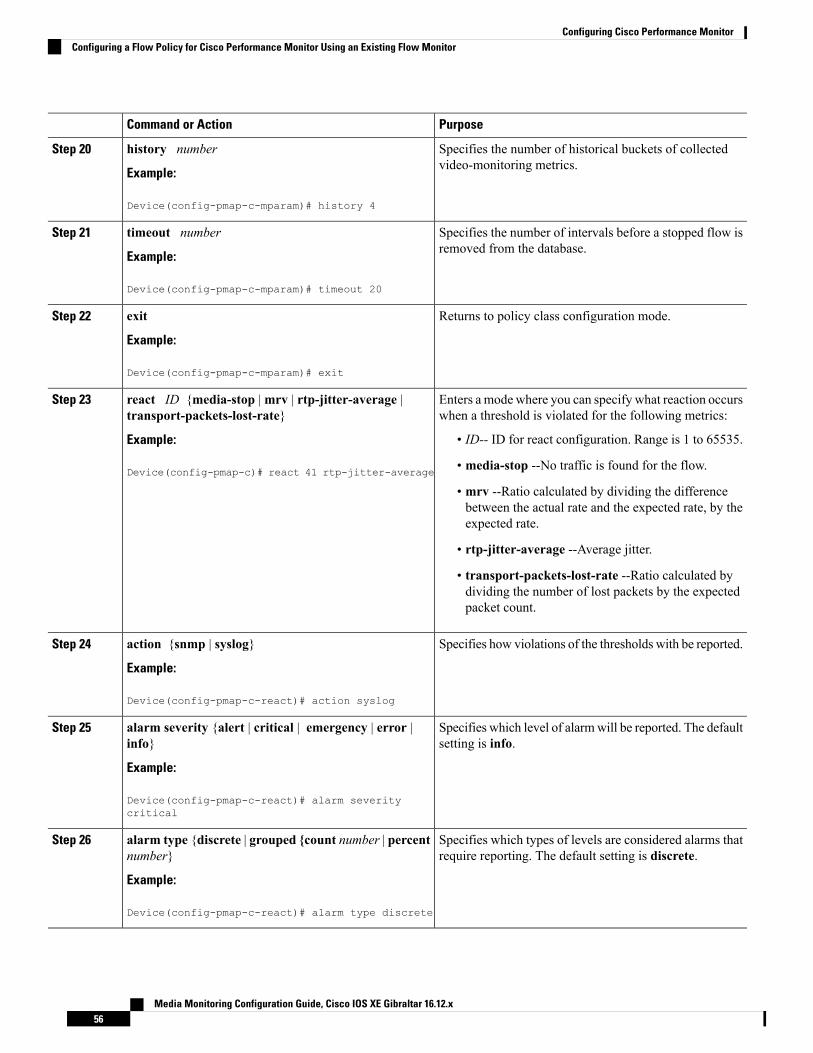
PurposeCommand or Action
Specifies the number of historical buckets of collectedvideo-monitoring metrics.
history number
Example:
Step 20
Device(config-pmap-c-mparam)# history 4
Specifies the number of intervals before a stopped flow isremoved from the database.
timeout number
Example:
Step 21
Device(config-pmap-c-mparam)# timeout 20
Returns to policy class configuration mode.exit
Example:
Step 22
Device(config-pmap-c-mparam)# exit
Enters a mode where you can specify what reaction occurswhen a threshold is violated for the following metrics:
react ID {media-stop |mrv | rtp-jitter-average |transport-packets-lost-rate}
Step 23
Example: • ID-- ID for react configuration. Range is 1 to 65535.
Device(config-pmap-c)# react 41 rtp-jitter-average • media-stop --No traffic is found for the flow.
• mrv --Ratio calculated by dividing the differencebetween the actual rate and the expected rate, by theexpected rate.
• rtp-jitter-average --Average jitter.
• transport-packets-lost-rate --Ratio calculated bydividing the number of lost packets by the expectedpacket count.
Specifies how violations of the thresholds with be reported.action {snmp | syslog}
Example:
Step 24
Device(config-pmap-c-react)# action syslog
Specifies which level of alarmwill be reported. The defaultsetting is info.
alarm severity {alert | critical | emergency | error |info}
Example:
Step 25
Device(config-pmap-c-react)# alarm severitycritical
Specifies which types of levels are considered alarms thatrequire reporting. The default setting is discrete.
alarm type {discrete | grouped {count number | percentnumber}
Example:
Step 26
Device(config-pmap-c-react)# alarm type discrete
Media Monitoring Configuration Guide, Cisco IOS XE Gibraltar 16.12.x56
Configuring Cisco Performance MonitorConfiguring a Flow Policy for Cisco Performance Monitor Using an Existing Flow Monitor
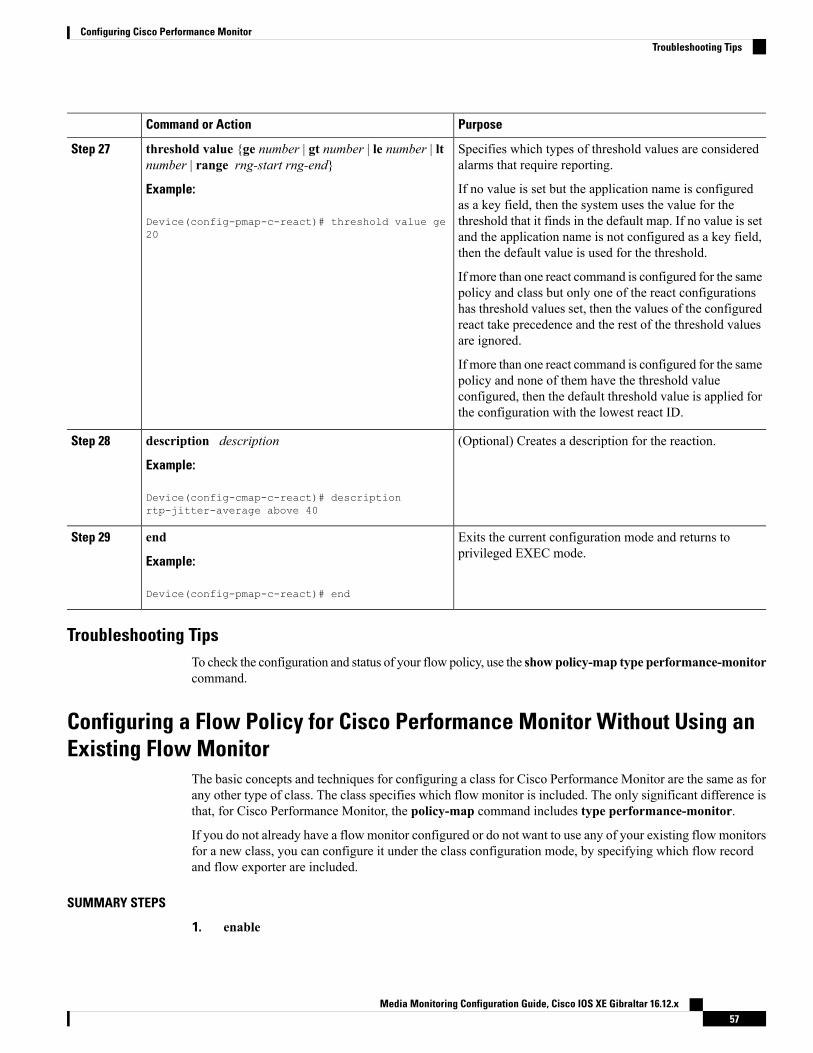
PurposeCommand or Action
Specifies which types of threshold values are consideredalarms that require reporting.
threshold value {ge number | gt number | le number | ltnumber | range rng-start rng-end}
Step 27
Example: If no value is set but the application name is configuredas a key field, then the system uses the value for the
Device(config-pmap-c-react)# threshold value ge20
threshold that it finds in the default map. If no value is setand the application name is not configured as a key field,then the default value is used for the threshold.
If more than one react command is configured for the samepolicy and class but only one of the react configurationshas threshold values set, then the values of the configuredreact take precedence and the rest of the threshold valuesare ignored.
If more than one react command is configured for the samepolicy and none of them have the threshold valueconfigured, then the default threshold value is applied forthe configuration with the lowest react ID.
(Optional) Creates a description for the reaction.description description
Example:
Step 28
Device(config-cmap-c-react)# descriptionrtp-jitter-average above 40
Exits the current configuration mode and returns toprivileged EXEC mode.
end
Example:
Step 29
Device(config-pmap-c-react)# end
Troubleshooting TipsTo check the configuration and status of your flow policy, use the show policy-map type performance-monitorcommand.
Configuring a Flow Policy for Cisco Performance Monitor Without Using anExisting Flow Monitor
The basic concepts and techniques for configuring a class for Cisco Performance Monitor are the same as forany other type of class. The class specifies which flow monitor is included. The only significant difference isthat, for Cisco Performance Monitor, the policy-map command includes type performance-monitor.
If you do not already have a flow monitor configured or do not want to use any of your existing flow monitorsfor a new class, you can configure it under the class configuration mode, by specifying which flow recordand flow exporter are included.
SUMMARY STEPS
1. enable
Media Monitoring Configuration Guide, Cisco IOS XE Gibraltar 16.12.x57
Configuring Cisco Performance MonitorTroubleshooting Tips
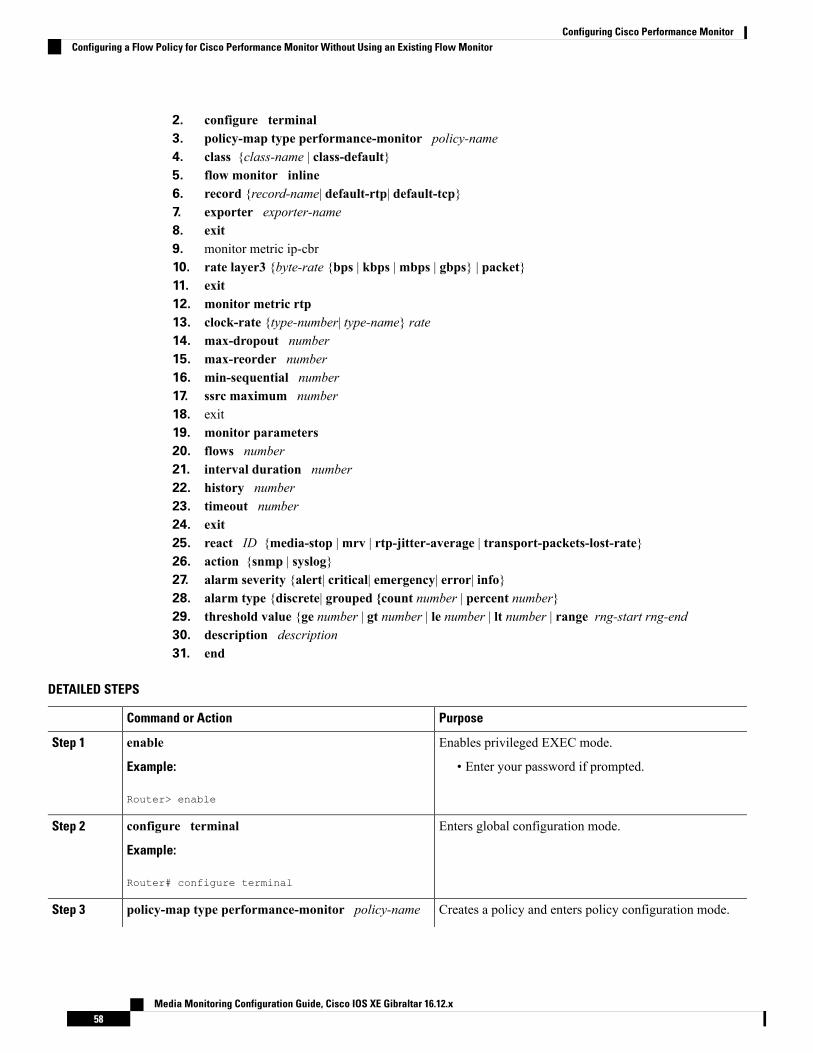
2. configure terminal3. policy-map type performance-monitor policy-name4. class {class-name | class-default}5. flow monitor inline6. record {record-name| default-rtp| default-tcp}7. exporter exporter-name8. exit9. monitor metric ip-cbr10. rate layer3 {byte-rate {bps | kbps |mbps | gbps} | packet}11. exit12. monitor metric rtp13. clock-rate {type-number| type-name} rate14. max-dropout number15. max-reorder number16. min-sequential number17. ssrc maximum number18. exit19. monitor parameters20. flows number21. interval duration number22. history number23. timeout number24. exit25. react ID {media-stop |mrv | rtp-jitter-average | transport-packets-lost-rate}26. action {snmp | syslog}27. alarm severity {alert| critical| emergency| error| info}28. alarm type {discrete| grouped {count number | percent number}29. threshold value {ge number | gt number | le number | lt number | range rng-start rng-end30. description description31. end
DETAILED STEPS
PurposeCommand or Action
Enables privileged EXEC mode.enableStep 1
Example: • Enter your password if prompted.
Router> enable
Enters global configuration mode.configure terminal
Example:
Step 2
Router# configure terminal
Creates a policy and enters policy configuration mode.policy-map type performance-monitor policy-nameStep 3
Media Monitoring Configuration Guide, Cisco IOS XE Gibraltar 16.12.x58
Configuring Cisco Performance MonitorConfiguring a Flow Policy for Cisco Performance Monitor Without Using an Existing Flow Monitor
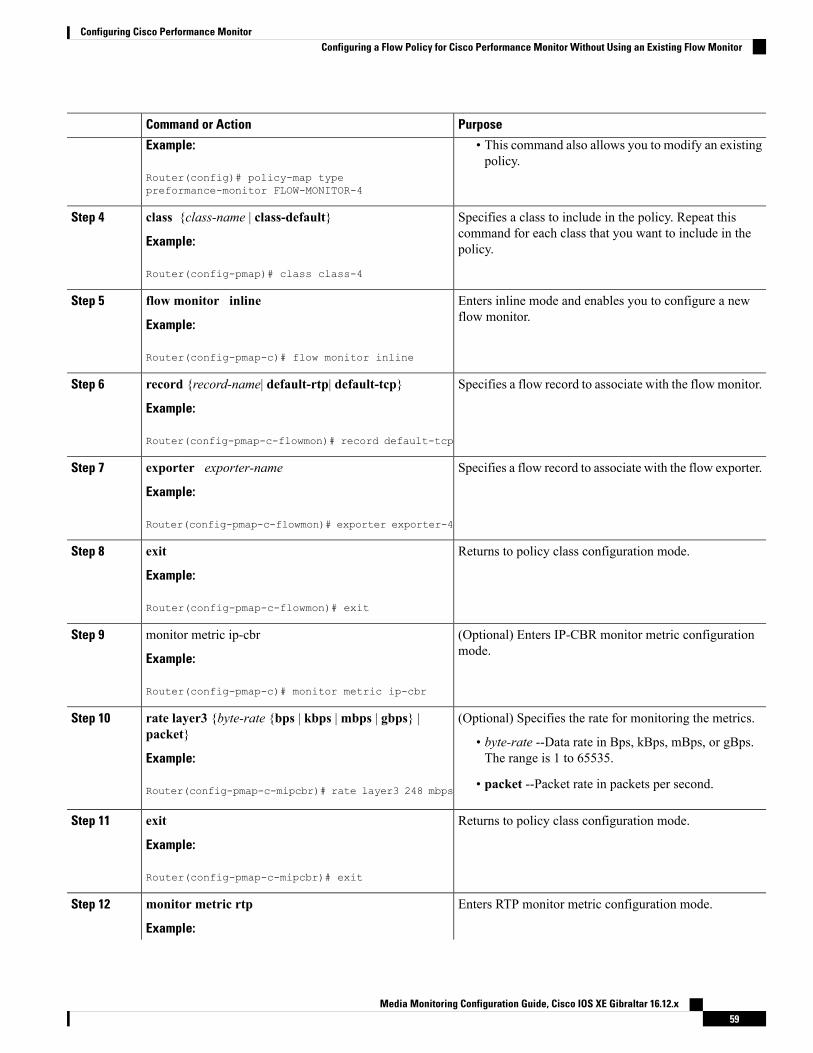
PurposeCommand or Action
Example: • This command also allows you to modify an existingpolicy.
Router(config)# policy-map typepreformance-monitor FLOW-MONITOR-4
Specifies a class to include in the policy. Repeat thiscommand for each class that you want to include in thepolicy.
class {class-name | class-default}
Example:
Router(config-pmap)# class class-4
Step 4
Enters inline mode and enables you to configure a newflow monitor.
flow monitor inline
Example:
Step 5
Router(config-pmap-c)# flow monitor inline
Specifies a flow record to associate with the flowmonitor.record {record-name| default-rtp| default-tcp}
Example:
Step 6
Router(config-pmap-c-flowmon)# record default-tcp
Specifies a flow record to associate with the flow exporter.exporter exporter-name
Example:
Step 7
Router(config-pmap-c-flowmon)# exporter exporter-4
Returns to policy class configuration mode.exit
Example:
Step 8
Router(config-pmap-c-flowmon)# exit
(Optional) Enters IP-CBR monitor metric configurationmode.
monitor metric ip-cbr
Example:
Step 9
Router(config-pmap-c)# monitor metric ip-cbr
(Optional) Specifies the rate for monitoring the metrics.rate layer3 {byte-rate {bps | kbps |mbps | gbps} |packet}
Step 10
• byte-rate --Data rate in Bps, kBps, mBps, or gBps.The range is 1 to 65535.Example:
Router(config-pmap-c-mipcbr)# rate layer3 248 mbps • packet --Packet rate in packets per second.
Returns to policy class configuration mode.exit
Example:
Step 11
Router(config-pmap-c-mipcbr)# exit
Enters RTP monitor metric configuration mode.monitor metric rtp
Example:
Step 12
Media Monitoring Configuration Guide, Cisco IOS XE Gibraltar 16.12.x59
Configuring Cisco Performance MonitorConfiguring a Flow Policy for Cisco Performance Monitor Without Using an Existing Flow Monitor
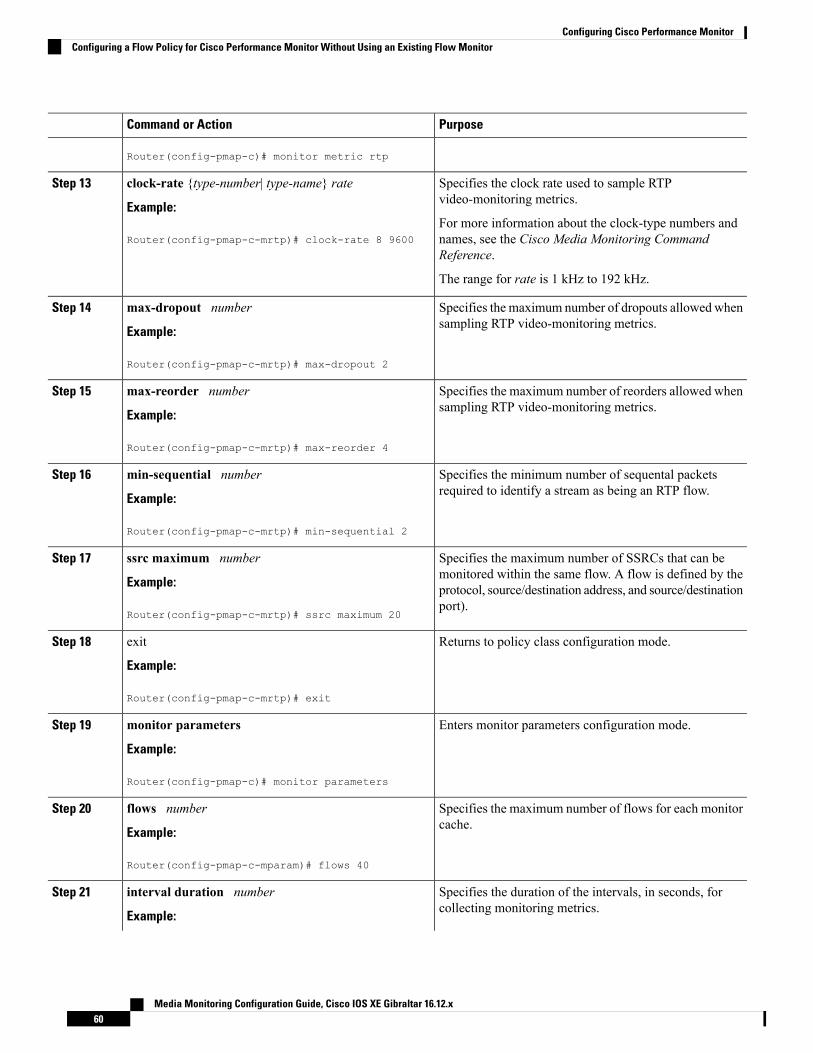
PurposeCommand or Action
Router(config-pmap-c)# monitor metric rtp
Specifies the clock rate used to sample RTPvideo-monitoring metrics.
clock-rate {type-number| type-name} rate
Example:
Step 13
For more information about the clock-type numbers andnames, see the Cisco Media Monitoring CommandReference.
Router(config-pmap-c-mrtp)# clock-rate 8 9600
The range for rate is 1 kHz to 192 kHz.
Specifies the maximum number of dropouts allowed whensampling RTP video-monitoring metrics.
max-dropout number
Example:
Step 14
Router(config-pmap-c-mrtp)# max-dropout 2
Specifies the maximum number of reorders allowed whensampling RTP video-monitoring metrics.
max-reorder number
Example:
Step 15
Router(config-pmap-c-mrtp)# max-reorder 4
Specifies the minimum number of sequental packetsrequired to identify a stream as being an RTP flow.
min-sequential number
Example:
Step 16
Router(config-pmap-c-mrtp)# min-sequential 2
Specifies the maximum number of SSRCs that can bemonitored within the same flow. A flow is defined by the
ssrc maximum number
Example:
Step 17
protocol, source/destination address, and source/destinationport).
Router(config-pmap-c-mrtp)# ssrc maximum 20
Returns to policy class configuration mode.exit
Example:
Step 18
Router(config-pmap-c-mrtp)# exit
Enters monitor parameters configuration mode.monitor parameters
Example:
Step 19
Router(config-pmap-c)# monitor parameters
Specifies the maximum number of flows for each monitorcache.
flows number
Example:
Step 20
Router(config-pmap-c-mparam)# flows 40
Specifies the duration of the intervals, in seconds, forcollecting monitoring metrics.
interval duration number
Example:
Step 21
Media Monitoring Configuration Guide, Cisco IOS XE Gibraltar 16.12.x60
Configuring Cisco Performance MonitorConfiguring a Flow Policy for Cisco Performance Monitor Without Using an Existing Flow Monitor
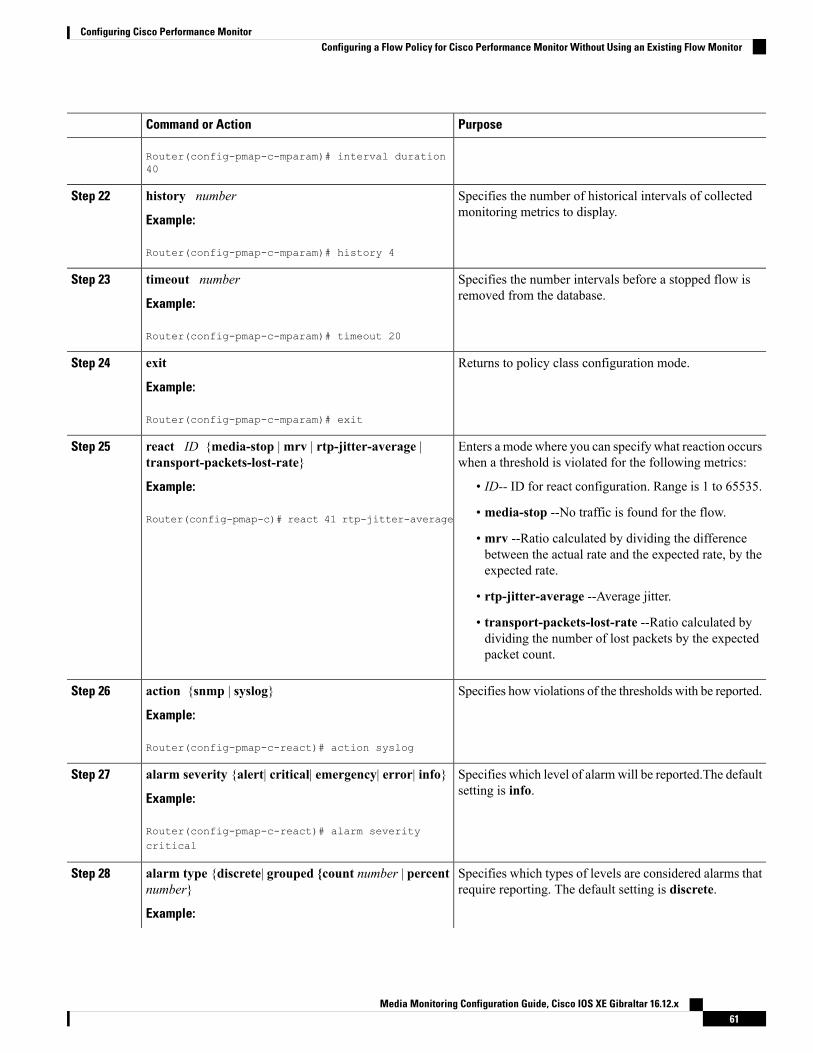
PurposeCommand or Action
Router(config-pmap-c-mparam)# interval duration40
Specifies the number of historical intervals of collectedmonitoring metrics to display.
history number
Example:
Step 22
Router(config-pmap-c-mparam)# history 4
Specifies the number intervals before a stopped flow isremoved from the database.
timeout number
Example:
Step 23
Router(config-pmap-c-mparam)# timeout 20
Returns to policy class configuration mode.exit
Example:
Step 24
Router(config-pmap-c-mparam)# exit
Enters a mode where you can specify what reaction occurswhen a threshold is violated for the following metrics:
react ID {media-stop |mrv | rtp-jitter-average |transport-packets-lost-rate}
Step 25
Example: • ID-- ID for react configuration. Range is 1 to 65535.
Router(config-pmap-c)# react 41 rtp-jitter-average • media-stop --No traffic is found for the flow.
• mrv --Ratio calculated by dividing the differencebetween the actual rate and the expected rate, by theexpected rate.
• rtp-jitter-average --Average jitter.
• transport-packets-lost-rate --Ratio calculated bydividing the number of lost packets by the expectedpacket count.
Specifies how violations of the thresholds with be reported.action {snmp | syslog}
Example:
Step 26
Router(config-pmap-c-react)# action syslog
Specifies which level of alarmwill be reported.The defaultsetting is info.
alarm severity {alert| critical| emergency| error| info}
Example:
Step 27
Router(config-pmap-c-react)# alarm severitycritical
Specifies which types of levels are considered alarms thatrequire reporting. The default setting is discrete.
alarm type {discrete| grouped {count number | percentnumber}
Example:
Step 28
Media Monitoring Configuration Guide, Cisco IOS XE Gibraltar 16.12.x61
Configuring Cisco Performance MonitorConfiguring a Flow Policy for Cisco Performance Monitor Without Using an Existing Flow Monitor
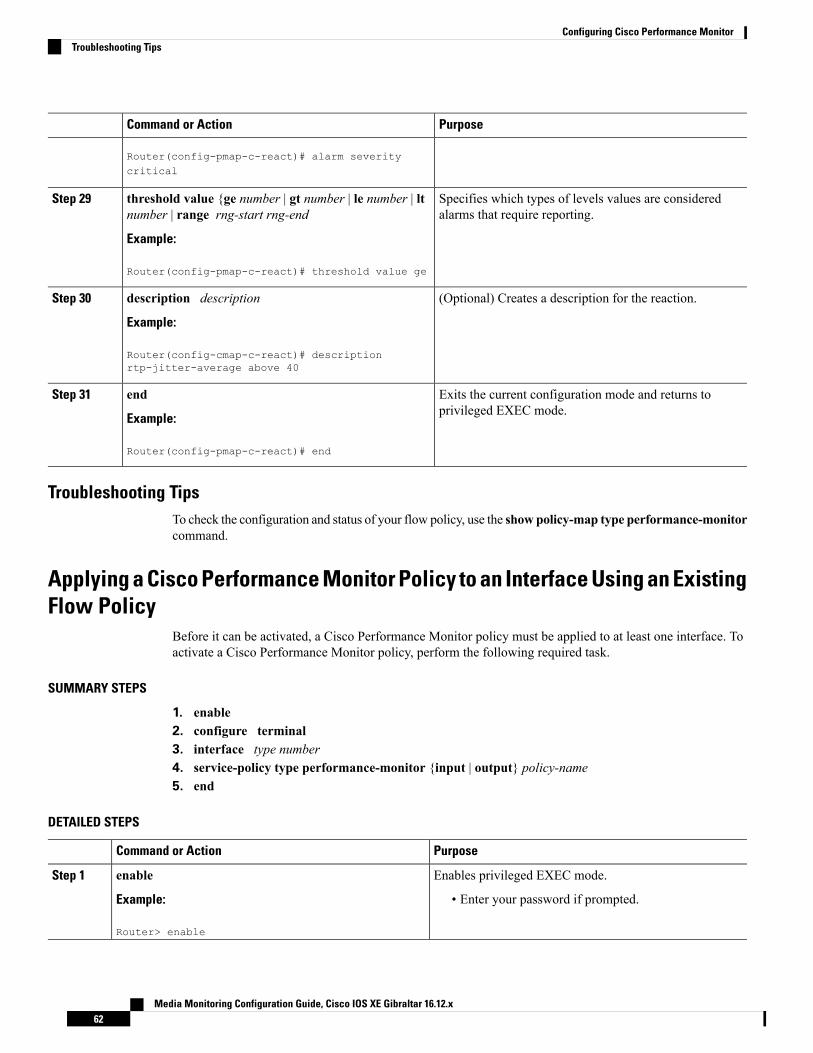
PurposeCommand or Action
Router(config-pmap-c-react)# alarm severitycritical
Specifies which types of levels values are consideredalarms that require reporting.
threshold value {ge number | gt number | le number | ltnumber | range rng-start rng-end
Example:
Step 29
Router(config-pmap-c-react)# threshold value ge
(Optional) Creates a description for the reaction.description description
Example:
Step 30
Router(config-cmap-c-react)# descriptionrtp-jitter-average above 40
Exits the current configuration mode and returns toprivileged EXEC mode.
end
Example:
Step 31
Router(config-pmap-c-react)# end
Troubleshooting TipsTo check the configuration and status of your flow policy, use the show policy-map type performance-monitorcommand.
Applying a Cisco Performance Monitor Policy to an Interface Using an ExistingFlow Policy
Before it can be activated, a Cisco Performance Monitor policy must be applied to at least one interface. Toactivate a Cisco Performance Monitor policy, perform the following required task.
SUMMARY STEPS
1. enable2. configure terminal3. interface type number4. service-policy type performance-monitor {input | output} policy-name5. end
DETAILED STEPS
PurposeCommand or Action
Enables privileged EXEC mode.enableStep 1
Example: • Enter your password if prompted.
Router> enable
Media Monitoring Configuration Guide, Cisco IOS XE Gibraltar 16.12.x62
Configuring Cisco Performance MonitorTroubleshooting Tips
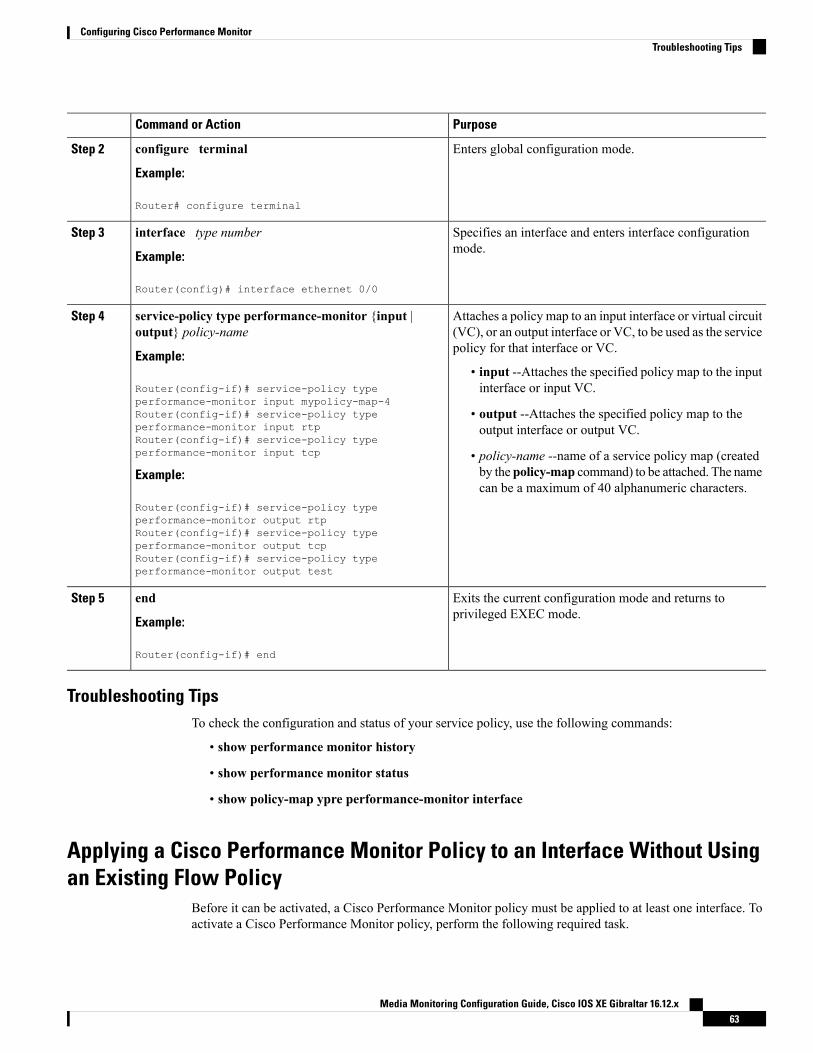
PurposeCommand or Action
Enters global configuration mode.configure terminal
Example:
Step 2
Router# configure terminal
Specifies an interface and enters interface configurationmode.
interface type number
Example:
Step 3
Router(config)# interface ethernet 0/0
Attaches a policy map to an input interface or virtual circuit(VC), or an output interface or VC, to be used as the servicepolicy for that interface or VC.
service-policy type performance-monitor {input |output} policy-name
Example:
Step 4
• input --Attaches the specified policy map to the inputinterface or input VC.Router(config-if)# service-policy type
performance-monitor input mypolicy-map-4• output --Attaches the specified policy map to theoutput interface or output VC.
Router(config-if)# service-policy typeperformance-monitor input rtpRouter(config-if)# service-policy typeperformance-monitor input tcp • policy-name --name of a service policy map (created
by the policy-map command) to be attached. The namecan be a maximum of 40 alphanumeric characters.
Example:
Router(config-if)# service-policy typeperformance-monitor output rtpRouter(config-if)# service-policy typeperformance-monitor output tcpRouter(config-if)# service-policy typeperformance-monitor output test
Exits the current configuration mode and returns toprivileged EXEC mode.
end
Example:
Step 5
Router(config-if)# end
Troubleshooting TipsTo check the configuration and status of your service policy, use the following commands:
• show performance monitor history
• show performance monitor status
• show policy-map ypre performance-monitor interface
Applying a Cisco Performance Monitor Policy to an Interface Without Usingan Existing Flow Policy
Before it can be activated, a Cisco Performance Monitor policy must be applied to at least one interface. Toactivate a Cisco Performance Monitor policy, perform the following required task.
Media Monitoring Configuration Guide, Cisco IOS XE Gibraltar 16.12.x63
Configuring Cisco Performance MonitorTroubleshooting Tips
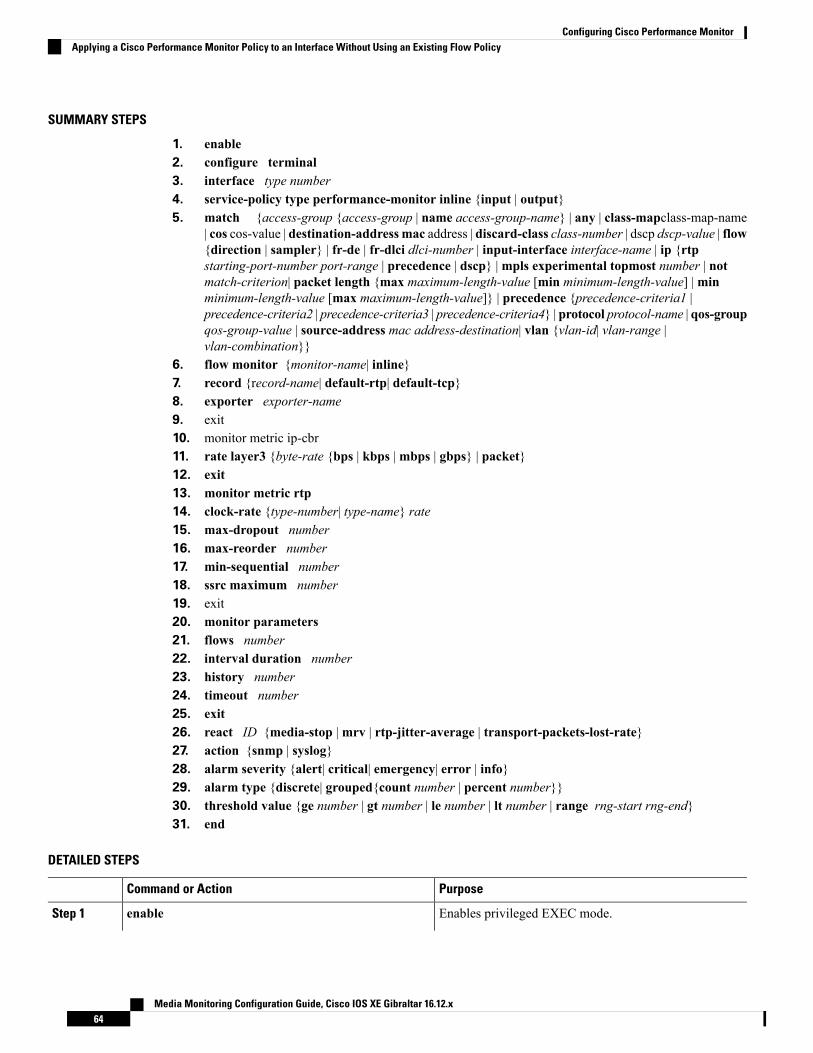
SUMMARY STEPS
1. enable2. configure terminal3. interface type number4. service-policy type performance-monitor inline {input | output}5. match {access-group {access-group | name access-group-name} | any | class-mapclass-map-name
| cos cos-value | destination-address mac address | discard-class class-number | dscp dscp-value | flow{direction | sampler} | fr-de | fr-dlci dlci-number | input-interface interface-name | ip {rtpstarting-port-number port-range | precedence | dscp} |mpls experimental topmost number | notmatch-criterion| packet length {max maximum-length-value [min minimum-length-value] |minminimum-length-value [max maximum-length-value]} | precedence {precedence-criteria1 |precedence-criteria2 | precedence-criteria3 | precedence-criteria4} | protocol protocol-name | qos-groupqos-group-value | source-address mac address-destination| vlan {vlan-id| vlan-range |vlan-combination}}
6. flow monitor {monitor-name| inline}7. record {record-name| default-rtp| default-tcp}8. exporter exporter-name9. exit10. monitor metric ip-cbr11. rate layer3 {byte-rate {bps | kbps |mbps | gbps} | packet}12. exit13. monitor metric rtp14. clock-rate {type-number| type-name} rate15. max-dropout number16. max-reorder number17. min-sequential number18. ssrc maximum number19. exit20. monitor parameters21. flows number22. interval duration number23. history number24. timeout number25. exit26. react ID {media-stop |mrv | rtp-jitter-average | transport-packets-lost-rate}27. action {snmp | syslog}28. alarm severity {alert| critical| emergency| error | info}29. alarm type {discrete| grouped{count number | percent number}}30. threshold value {ge number | gt number | le number | lt number | range rng-start rng-end}31. end
DETAILED STEPS
PurposeCommand or Action
Enables privileged EXEC mode.enableStep 1
Media Monitoring Configuration Guide, Cisco IOS XE Gibraltar 16.12.x64
Configuring Cisco Performance MonitorApplying a Cisco Performance Monitor Policy to an Interface Without Using an Existing Flow Policy
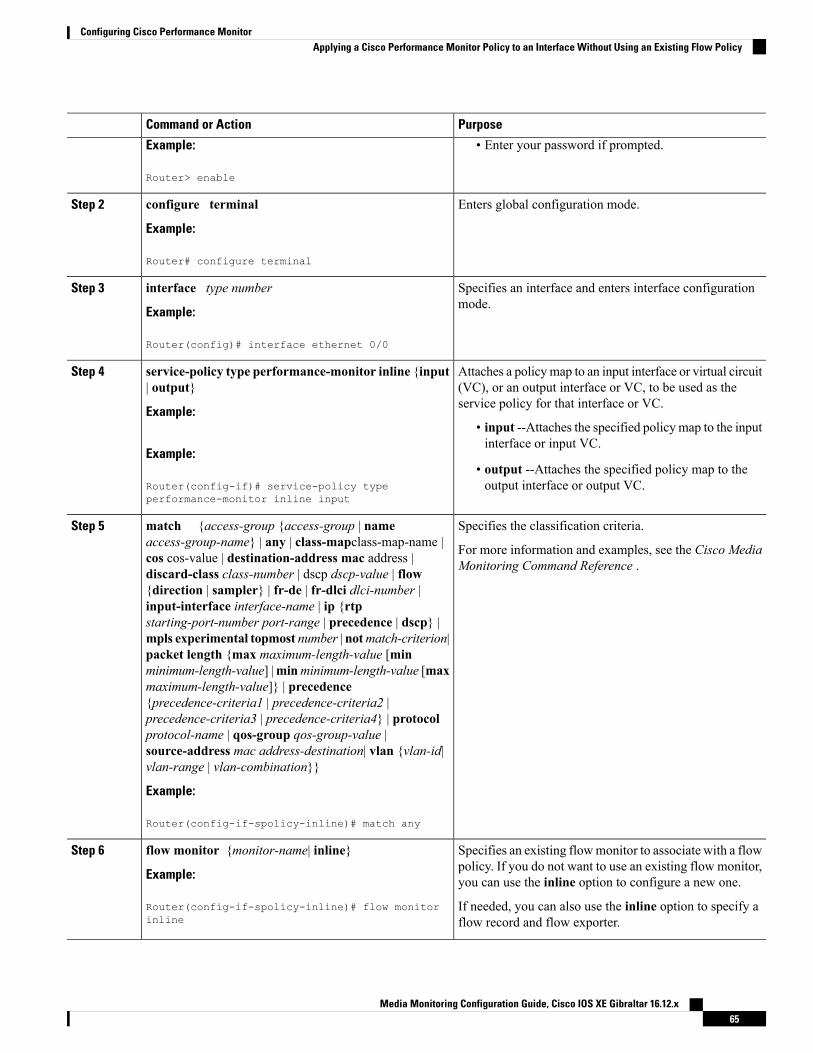
PurposeCommand or Action
Example: • Enter your password if prompted.
Router> enable
Enters global configuration mode.configure terminal
Example:
Step 2
Router# configure terminal
Specifies an interface and enters interface configurationmode.
interface type number
Example:
Step 3
Router(config)# interface ethernet 0/0
Attaches a policymap to an input interface or virtual circuit(VC), or an output interface or VC, to be used as theservice policy for that interface or VC.
service-policy type performance-monitor inline {input| output}
Example:
Step 4
• input --Attaches the specified policy map to the inputinterface or input VC.
Example:• output --Attaches the specified policy map to theoutput interface or output VC.Router(config-if)# service-policy type
performance-monitor inline input
Specifies the classification criteria.match {access-group {access-group | nameaccess-group-name} | any | class-mapclass-map-name |
Step 5
For more information and examples, see the Cisco MediaMonitoring Command Reference .cos cos-value | destination-address mac address |
discard-class class-number | dscp dscp-value | flow{direction | sampler} | fr-de | fr-dlci dlci-number |input-interface interface-name | ip {rtpstarting-port-number port-range | precedence | dscp} |mpls experimental topmost number | notmatch-criterion|packet length {max maximum-length-value [minminimum-length-value] |minminimum-length-value [maxmaximum-length-value]} | precedence{precedence-criteria1 | precedence-criteria2 |precedence-criteria3 | precedence-criteria4} | protocolprotocol-name | qos-group qos-group-value |source-address mac address-destination| vlan {vlan-id|vlan-range | vlan-combination}}
Example:
Router(config-if-spolicy-inline)# match any
Specifies an existing flowmonitor to associate with a flowpolicy. If you do not want to use an existing flow monitor,you can use the inline option to configure a new one.
flow monitor {monitor-name| inline}
Example:
Router(config-if-spolicy-inline)# flow monitorinline
Step 6
If needed, you can also use the inline option to specify aflow record and flow exporter.
Media Monitoring Configuration Guide, Cisco IOS XE Gibraltar 16.12.x65
Configuring Cisco Performance MonitorApplying a Cisco Performance Monitor Policy to an Interface Without Using an Existing Flow Policy
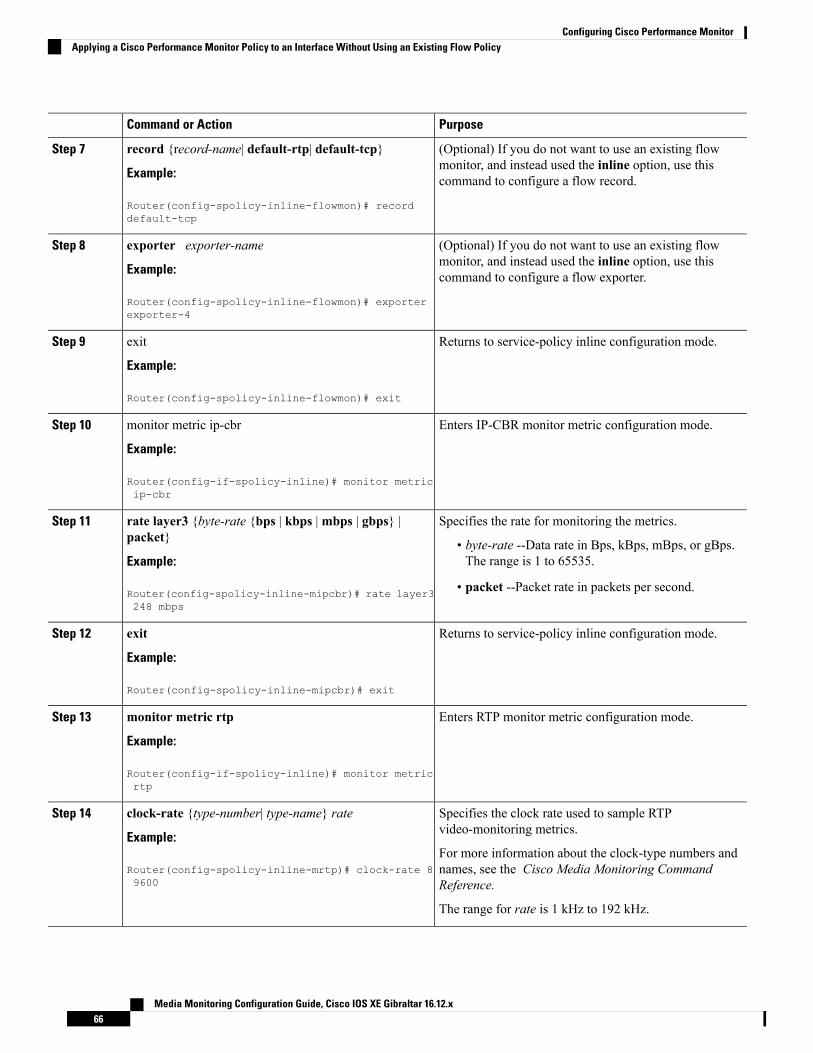
PurposeCommand or Action
(Optional) If you do not want to use an existing flowmonitor, and instead used the inline option, use thiscommand to configure a flow record.
record {record-name| default-rtp| default-tcp}
Example:
Router(config-spolicy-inline-flowmon)# recorddefault-tcp
Step 7
(Optional) If you do not want to use an existing flowmonitor, and instead used the inline option, use thiscommand to configure a flow exporter.
exporter exporter-name
Example:
Router(config-spolicy-inline-flowmon)# exporterexporter-4
Step 8
Returns to service-policy inline configuration mode.exit
Example:
Step 9
Router(config-spolicy-inline-flowmon)# exit
Enters IP-CBR monitor metric configuration mode.monitor metric ip-cbr
Example:
Step 10
Router(config-if-spolicy-inline)# monitor metricip-cbr
Specifies the rate for monitoring the metrics.rate layer3 {byte-rate {bps | kbps |mbps | gbps} |packet}
Step 11
• byte-rate --Data rate in Bps, kBps, mBps, or gBps.The range is 1 to 65535.Example:
Router(config-spolicy-inline-mipcbr)# rate layer3248 mbps
• packet --Packet rate in packets per second.
Returns to service-policy inline configuration mode.exit
Example:
Step 12
Router(config-spolicy-inline-mipcbr)# exit
Enters RTP monitor metric configuration mode.monitor metric rtp
Example:
Step 13
Router(config-if-spolicy-inline)# monitor metricrtp
Specifies the clock rate used to sample RTPvideo-monitoring metrics.
clock-rate {type-number| type-name} rate
Example:
Step 14
For more information about the clock-type numbers andnames, see the Cisco Media Monitoring CommandReference.
Router(config-spolicy-inline-mrtp)# clock-rate 89600
The range for rate is 1 kHz to 192 kHz.
Media Monitoring Configuration Guide, Cisco IOS XE Gibraltar 16.12.x66
Configuring Cisco Performance MonitorApplying a Cisco Performance Monitor Policy to an Interface Without Using an Existing Flow Policy
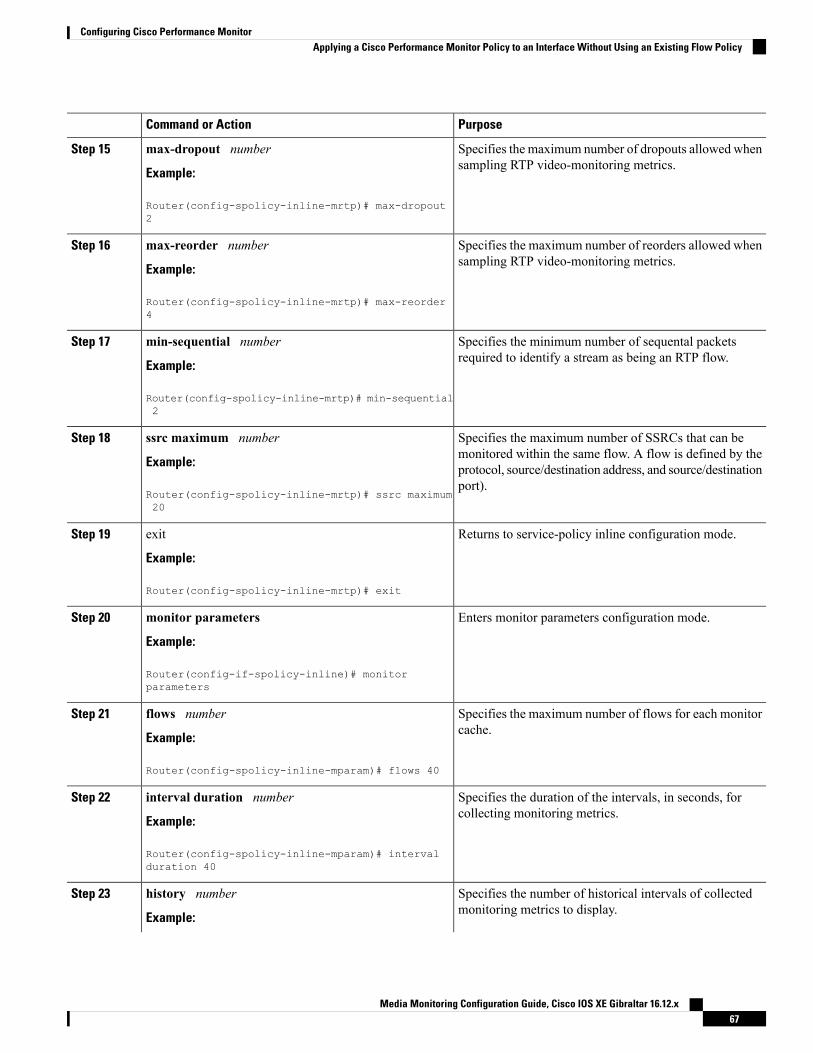
PurposeCommand or Action
Specifies the maximum number of dropouts allowed whensampling RTP video-monitoring metrics.
max-dropout number
Example:
Step 15
Router(config-spolicy-inline-mrtp)# max-dropout2
Specifies the maximum number of reorders allowed whensampling RTP video-monitoring metrics.
max-reorder number
Example:
Step 16
Router(config-spolicy-inline-mrtp)# max-reorder4
Specifies the minimum number of sequental packetsrequired to identify a stream as being an RTP flow.
min-sequential number
Example:
Step 17
Router(config-spolicy-inline-mrtp)# min-sequential2
Specifies the maximum number of SSRCs that can bemonitored within the same flow. A flow is defined by the
ssrc maximum number
Example:
Step 18
protocol, source/destination address, and source/destinationport).
Router(config-spolicy-inline-mrtp)# ssrc maximum20
Returns to service-policy inline configuration mode.exit
Example:
Step 19
Router(config-spolicy-inline-mrtp)# exit
Enters monitor parameters configuration mode.monitor parameters
Example:
Step 20
Router(config-if-spolicy-inline)# monitorparameters
Specifies the maximum number of flows for each monitorcache.
flows number
Example:
Step 21
Router(config-spolicy-inline-mparam)# flows 40
Specifies the duration of the intervals, in seconds, forcollecting monitoring metrics.
interval duration number
Example:
Step 22
Router(config-spolicy-inline-mparam)# intervalduration 40
Specifies the number of historical intervals of collectedmonitoring metrics to display.
history number
Example:
Step 23
Media Monitoring Configuration Guide, Cisco IOS XE Gibraltar 16.12.x67
Configuring Cisco Performance MonitorApplying a Cisco Performance Monitor Policy to an Interface Without Using an Existing Flow Policy
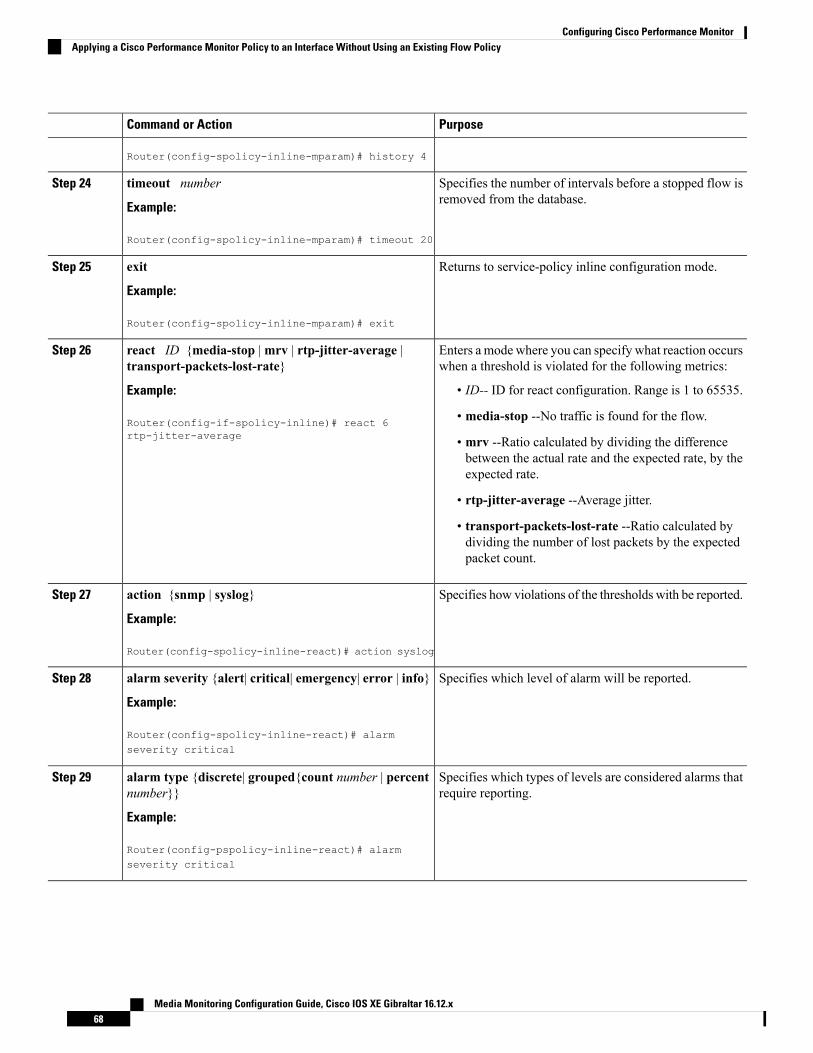
PurposeCommand or Action
Router(config-spolicy-inline-mparam)# history 4
Specifies the number of intervals before a stopped flow isremoved from the database.
timeout number
Example:
Step 24
Router(config-spolicy-inline-mparam)# timeout 20
Returns to service-policy inline configuration mode.exit
Example:
Step 25
Router(config-spolicy-inline-mparam)# exit
Enters a mode where you can specify what reaction occurswhen a threshold is violated for the following metrics:
react ID {media-stop |mrv | rtp-jitter-average |transport-packets-lost-rate}
Step 26
Example: • ID-- ID for react configuration. Range is 1 to 65535.
Router(config-if-spolicy-inline)# react 6rtp-jitter-average
• media-stop --No traffic is found for the flow.
• mrv --Ratio calculated by dividing the differencebetween the actual rate and the expected rate, by theexpected rate.
• rtp-jitter-average --Average jitter.
• transport-packets-lost-rate --Ratio calculated bydividing the number of lost packets by the expectedpacket count.
Specifies how violations of the thresholds with be reported.action {snmp | syslog}
Example:
Step 27
Router(config-spolicy-inline-react)# action syslog
Specifies which level of alarm will be reported.alarm severity {alert| critical| emergency| error | info}
Example:
Step 28
Router(config-spolicy-inline-react)# alarmseverity critical
Specifies which types of levels are considered alarms thatrequire reporting.
alarm type {discrete| grouped{count number | percentnumber}}
Example:
Step 29
Router(config-pspolicy-inline-react)# alarmseverity critical
Media Monitoring Configuration Guide, Cisco IOS XE Gibraltar 16.12.x68
Configuring Cisco Performance MonitorApplying a Cisco Performance Monitor Policy to an Interface Without Using an Existing Flow Policy
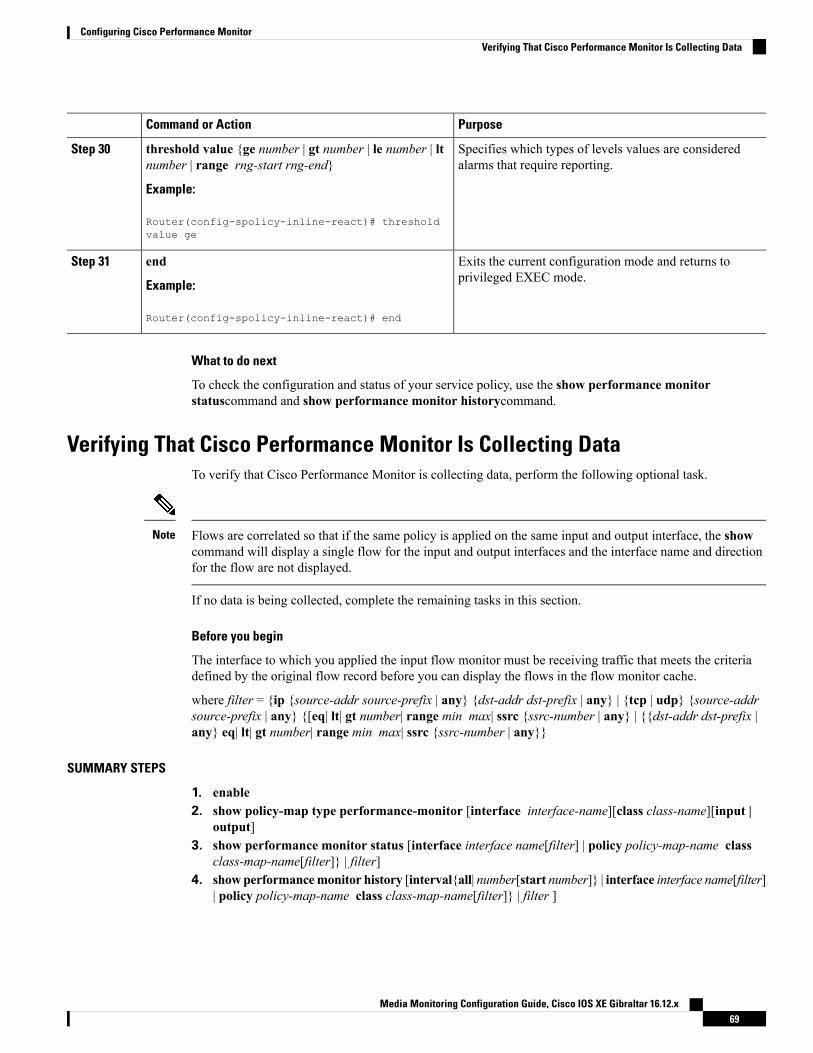
PurposeCommand or Action
Specifies which types of levels values are consideredalarms that require reporting.
threshold value {ge number | gt number | le number | ltnumber | range rng-start rng-end}
Example:
Step 30
Router(config-spolicy-inline-react)# thresholdvalue ge
Exits the current configuration mode and returns toprivileged EXEC mode.
end
Example:
Step 31
Router(config-spolicy-inline-react)# end
What to do next
To check the configuration and status of your service policy, use the show performance monitorstatuscommand and show performance monitor historycommand.
Verifying That Cisco Performance Monitor Is Collecting DataTo verify that Cisco Performance Monitor is collecting data, perform the following optional task.
Flows are correlated so that if the same policy is applied on the same input and output interface, the showcommand will display a single flow for the input and output interfaces and the interface name and directionfor the flow are not displayed.
Note
If no data is being collected, complete the remaining tasks in this section.
Before you begin
The interface to which you applied the input flow monitor must be receiving traffic that meets the criteriadefined by the original flow record before you can display the flows in the flow monitor cache.
where filter = {ip {source-addr source-prefix | any} {dst-addr dst-prefix | any} | {tcp | udp} {source-addrsource-prefix | any} {[eq| lt| gt number| range min max| ssrc {ssrc-number | any} | {{dst-addr dst-prefix |any} eq| lt| gt number| range min max| ssrc {ssrc-number | any}}
SUMMARY STEPS
1. enable2. show policy-map type performance-monitor [interface interface-name][class class-name][input |
output]3. show performance monitor status [interface interface name[filter] | policy policy-map-name class
class-map-name[filter]} | filter]4. showperformancemonitor history [interval{all| number[start number]} | interface interface name[filter]
| policy policy-map-name class class-map-name[filter]} | filter ]
Media Monitoring Configuration Guide, Cisco IOS XE Gibraltar 16.12.x69
Configuring Cisco Performance MonitorVerifying That Cisco Performance Monitor Is Collecting Data
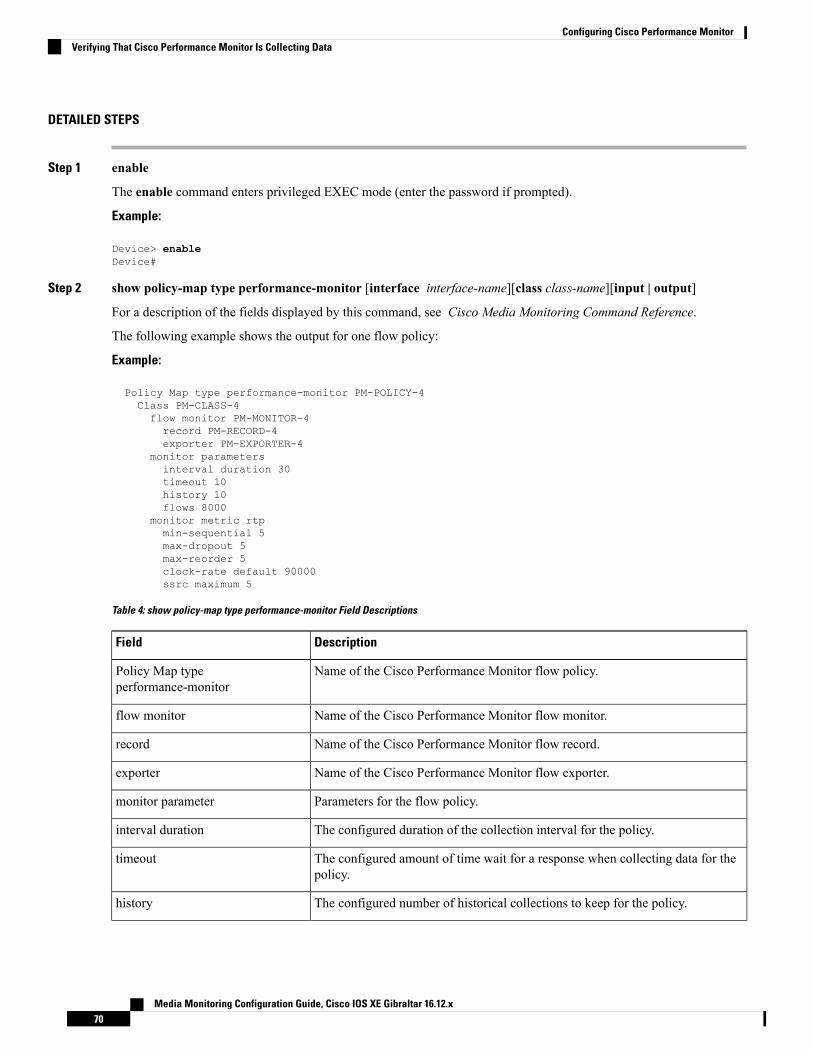
DETAILED STEPS
Step 1 enable
The enable command enters privileged EXEC mode (enter the password if prompted).
Example:
Device> enableDevice#
Step 2 show policy-map type performance-monitor [interface interface-name][class class-name][input | output]
For a description of the fields displayed by this command, see Cisco Media Monitoring Command Reference.
The following example shows the output for one flow policy:
Example:
Policy Map type performance-monitor PM-POLICY-4Class PM-CLASS-4flow monitor PM-MONITOR-4record PM-RECORD-4exporter PM-EXPORTER-4
monitor parametersinterval duration 30timeout 10history 10flows 8000
monitor metric rtpmin-sequential 5max-dropout 5max-reorder 5clock-rate default 90000ssrc maximum 5
Table 4: show policy-map type performance-monitor Field Descriptions
DescriptionField
Name of the Cisco Performance Monitor flow policy.Policy Map typeperformance-monitor
Name of the Cisco Performance Monitor flow monitor.flow monitor
Name of the Cisco Performance Monitor flow record.record
Name of the Cisco Performance Monitor flow exporter.exporter
Parameters for the flow policy.monitor parameter
The configured duration of the collection interval for the policy.interval duration
The configured amount of time wait for a response when collecting data for thepolicy.
timeout
The configured number of historical collections to keep for the policy.history
Media Monitoring Configuration Guide, Cisco IOS XE Gibraltar 16.12.x70
Configuring Cisco Performance MonitorVerifying That Cisco Performance Monitor Is Collecting Data
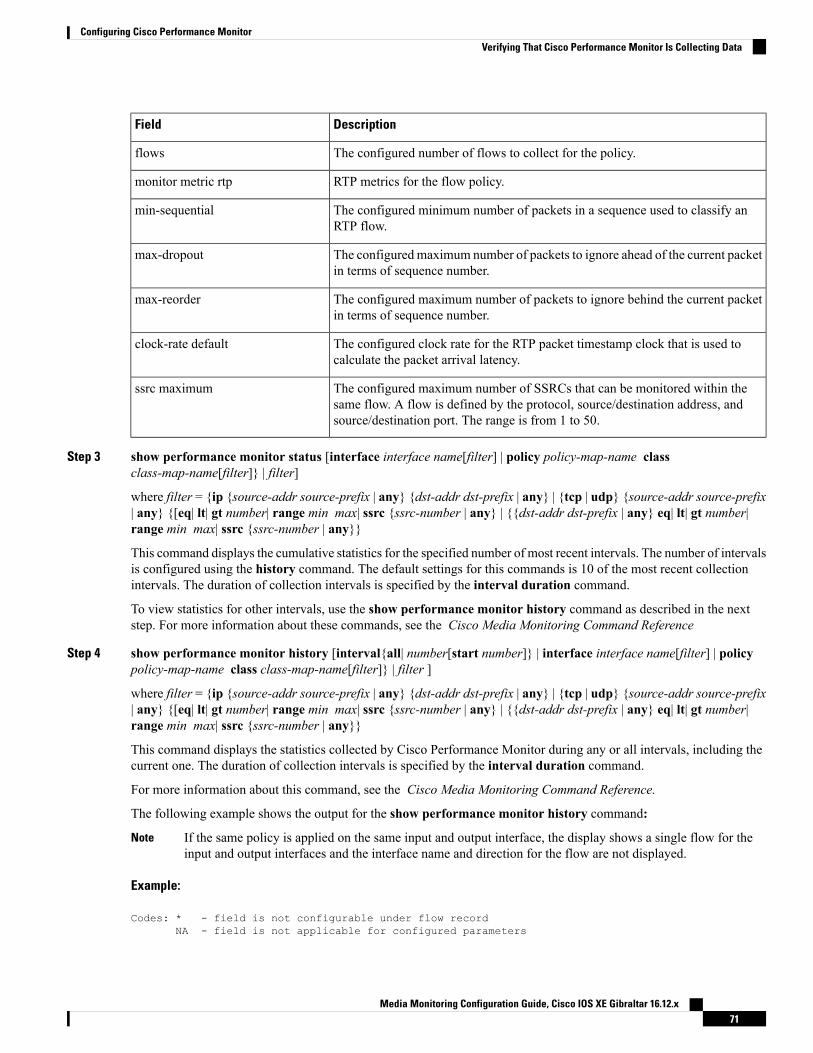
DescriptionField
The configured number of flows to collect for the policy.flows
RTP metrics for the flow policy.monitor metric rtp
The configured minimum number of packets in a sequence used to classify anRTP flow.
min-sequential
The configured maximum number of packets to ignore ahead of the current packetin terms of sequence number.
max-dropout
The configured maximum number of packets to ignore behind the current packetin terms of sequence number.
max-reorder
The configured clock rate for the RTP packet timestamp clock that is used tocalculate the packet arrival latency.
clock-rate default
The configured maximum number of SSRCs that can be monitored within thesame flow. A flow is defined by the protocol, source/destination address, andsource/destination port. The range is from 1 to 50.
ssrc maximum
Step 3 show performance monitor status [interface interface name[filter] | policy policy-map-name classclass-map-name[filter]} | filter]
where filter = {ip {source-addr source-prefix | any} {dst-addr dst-prefix | any} | {tcp | udp} {source-addr source-prefix| any} {[eq| lt| gt number| range min max| ssrc {ssrc-number | any} | {{dst-addr dst-prefix | any} eq| lt| gt number|range min max| ssrc {ssrc-number | any}}
This command displays the cumulative statistics for the specified number of most recent intervals. The number of intervalsis configured using the history command. The default settings for this commands is 10 of the most recent collectionintervals. The duration of collection intervals is specified by the interval duration command.
To view statistics for other intervals, use the show performance monitor history command as described in the nextstep. For more information about these commands, see the Cisco Media Monitoring Command Reference
Step 4 show performance monitor history [interval{all| number[start number]} | interface interface name[filter] | policypolicy-map-name class class-map-name[filter]} | filter ]
where filter = {ip {source-addr source-prefix | any} {dst-addr dst-prefix | any} | {tcp | udp} {source-addr source-prefix| any} {[eq| lt| gt number| range min max| ssrc {ssrc-number | any} | {{dst-addr dst-prefix | any} eq| lt| gt number|range min max| ssrc {ssrc-number | any}}
This command displays the statistics collected by Cisco Performance Monitor during any or all intervals, including thecurrent one. The duration of collection intervals is specified by the interval duration command.
For more information about this command, see the Cisco Media Monitoring Command Reference.
The following example shows the output for the show performance monitor history command:
If the same policy is applied on the same input and output interface, the display shows a single flow for theinput and output interfaces and the interface name and direction for the flow are not displayed.
Note
Example:
Codes: * - field is not configurable under flow recordNA - field is not applicable for configured parameters
Media Monitoring Configuration Guide, Cisco IOS XE Gibraltar 16.12.x71
Configuring Cisco Performance MonitorVerifying That Cisco Performance Monitor Is Collecting Data
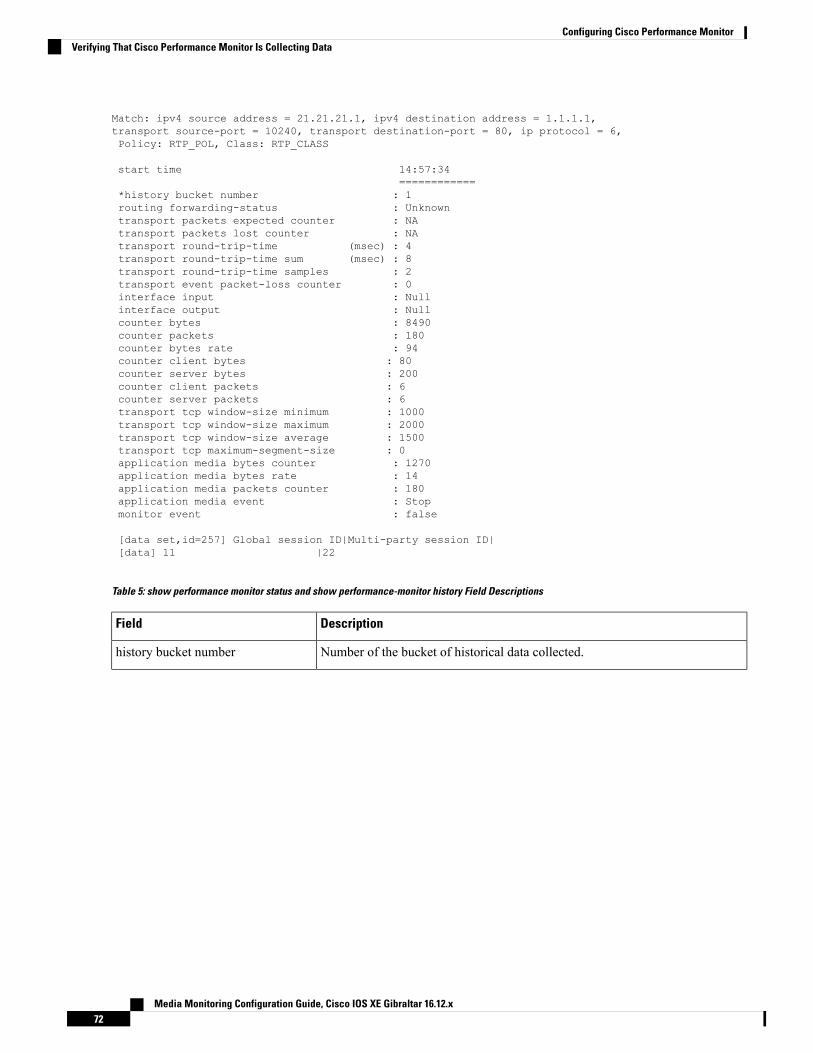
Match: ipv4 source address = 21.21.21.1, ipv4 destination address = 1.1.1.1,transport source-port = 10240, transport destination-port = 80, ip protocol = 6,Policy: RTP_POL, Class: RTP_CLASS
start time 14:57:34============
*history bucket number : 1routing forwarding-status : Unknowntransport packets expected counter : NAtransport packets lost counter : NAtransport round-trip-time (msec) : 4transport round-trip-time sum (msec) : 8transport round-trip-time samples : 2transport event packet-loss counter : 0interface input : Nullinterface output : Nullcounter bytes : 8490counter packets : 180counter bytes rate : 94counter client bytes : 80counter server bytes : 200counter client packets : 6counter server packets : 6transport tcp window-size minimum : 1000transport tcp window-size maximum : 2000transport tcp window-size average : 1500transport tcp maximum-segment-size : 0application media bytes counter : 1270application media bytes rate : 14application media packets counter : 180application media event : Stopmonitor event : false
[data set,id=257] Global session ID|Multi-party session ID|[data] 11 |22
Table 5: show performance monitor status and show performance-monitor history Field Descriptions
DescriptionField
Number of the bucket of historical data collected.history bucket number
Media Monitoring Configuration Guide, Cisco IOS XE Gibraltar 16.12.x72
Configuring Cisco Performance MonitorVerifying That Cisco Performance Monitor Is Collecting Data

DescriptionField
routing forwarding-status reason
Media Monitoring Configuration Guide, Cisco IOS XE Gibraltar 16.12.x73
Configuring Cisco Performance MonitorVerifying That Cisco Performance Monitor Is Collecting Data
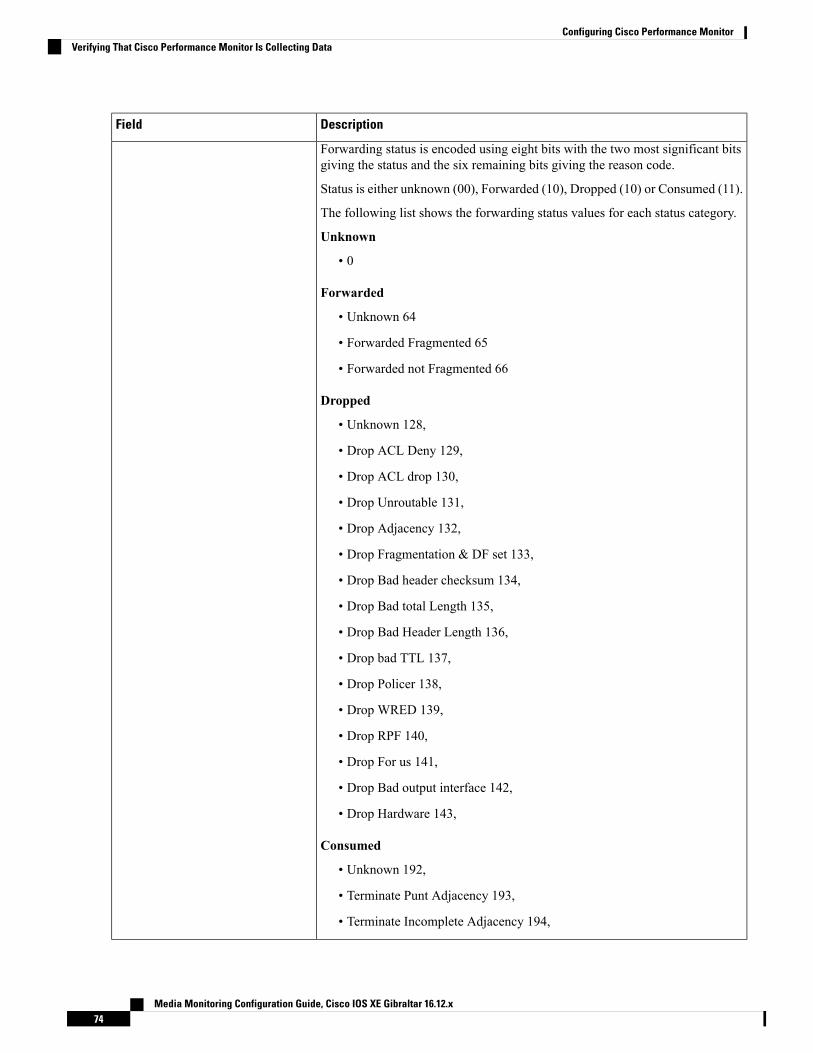
DescriptionField
Forwarding status is encoded using eight bits with the two most significant bitsgiving the status and the six remaining bits giving the reason code.
Status is either unknown (00), Forwarded (10), Dropped (10) or Consumed (11).
The following list shows the forwarding status values for each status category.
Unknown
• 0
Forwarded
• Unknown 64
• Forwarded Fragmented 65
• Forwarded not Fragmented 66
Dropped
• Unknown 128,
• Drop ACL Deny 129,
• Drop ACL drop 130,
• Drop Unroutable 131,
• Drop Adjacency 132,
• Drop Fragmentation & DF set 133,
• Drop Bad header checksum 134,
• Drop Bad total Length 135,
• Drop Bad Header Length 136,
• Drop bad TTL 137,
• Drop Policer 138,
• Drop WRED 139,
• Drop RPF 140,
• Drop For us 141,
• Drop Bad output interface 142,
• Drop Hardware 143,
Consumed
• Unknown 192,
• Terminate Punt Adjacency 193,
• Terminate Incomplete Adjacency 194,
Media Monitoring Configuration Guide, Cisco IOS XE Gibraltar 16.12.x74
Configuring Cisco Performance MonitorVerifying That Cisco Performance Monitor Is Collecting Data
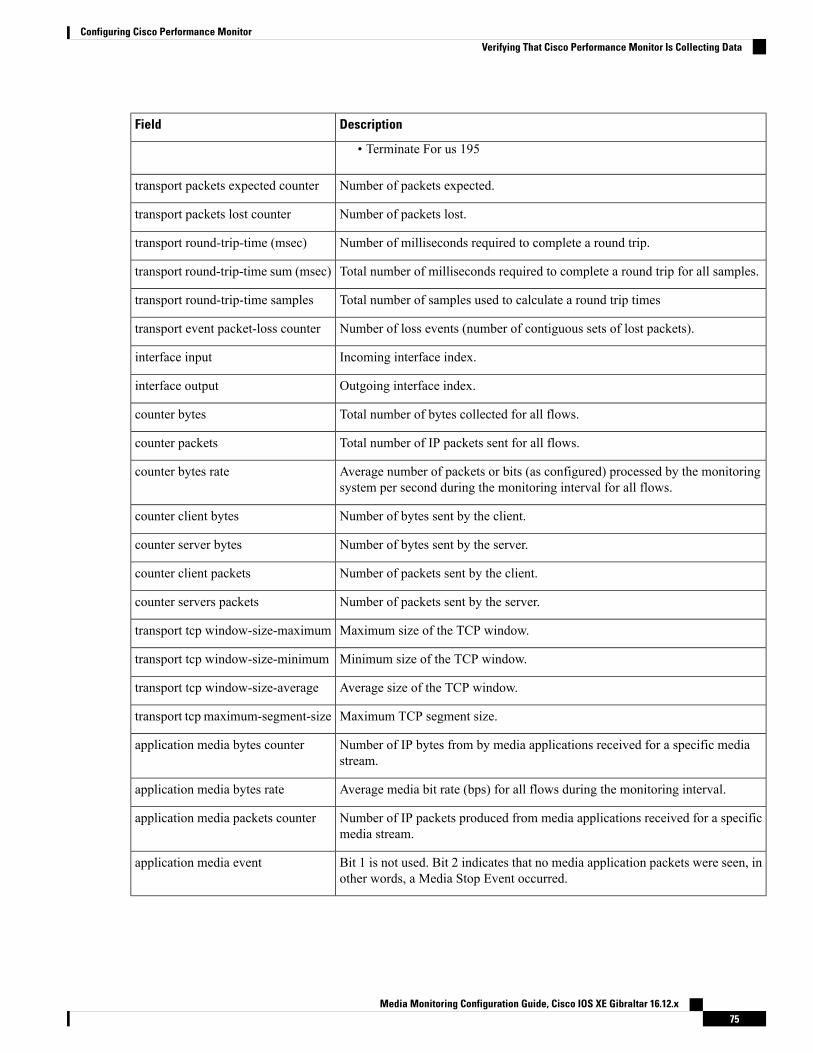
DescriptionField
Terminate For us 195•
Number of packets expected.transport packets expected counter
Number of packets lost.transport packets lost counter
Number of milliseconds required to complete a round trip.transport round-trip-time (msec)
Total number of milliseconds required to complete a round trip for all samples.transport round-trip-time sum (msec)
Total number of samples used to calculate a round trip timestransport round-trip-time samples
Number of loss events (number of contiguous sets of lost packets).transport event packet-loss counter
Incoming interface index.interface input
Outgoing interface index.interface output
Total number of bytes collected for all flows.counter bytes
Total number of IP packets sent for all flows.counter packets
Average number of packets or bits (as configured) processed by the monitoringsystem per second during the monitoring interval for all flows.
counter bytes rate
Number of bytes sent by the client.counter client bytes
Number of bytes sent by the server.counter server bytes
Number of packets sent by the client.counter client packets
Number of packets sent by the server.counter servers packets
Maximum size of the TCP window.transport tcp window-size-maximum
Minimum size of the TCP window.transport tcp window-size-minimum
Average size of the TCP window.transport tcp window-size-average
Maximum TCP segment size.transport tcp maximum-segment-size
Number of IP bytes from by media applications received for a specific mediastream.
application media bytes counter
Average media bit rate (bps) for all flows during the monitoring interval.application media bytes rate
Number of IP packets produced from media applications received for a specificmedia stream.
application media packets counter
Bit 1 is not used. Bit 2 indicates that no media application packets were seen, inother words, a Media Stop Event occurred.
application media event
Media Monitoring Configuration Guide, Cisco IOS XE Gibraltar 16.12.x75
Configuring Cisco Performance MonitorVerifying That Cisco Performance Monitor Is Collecting Data
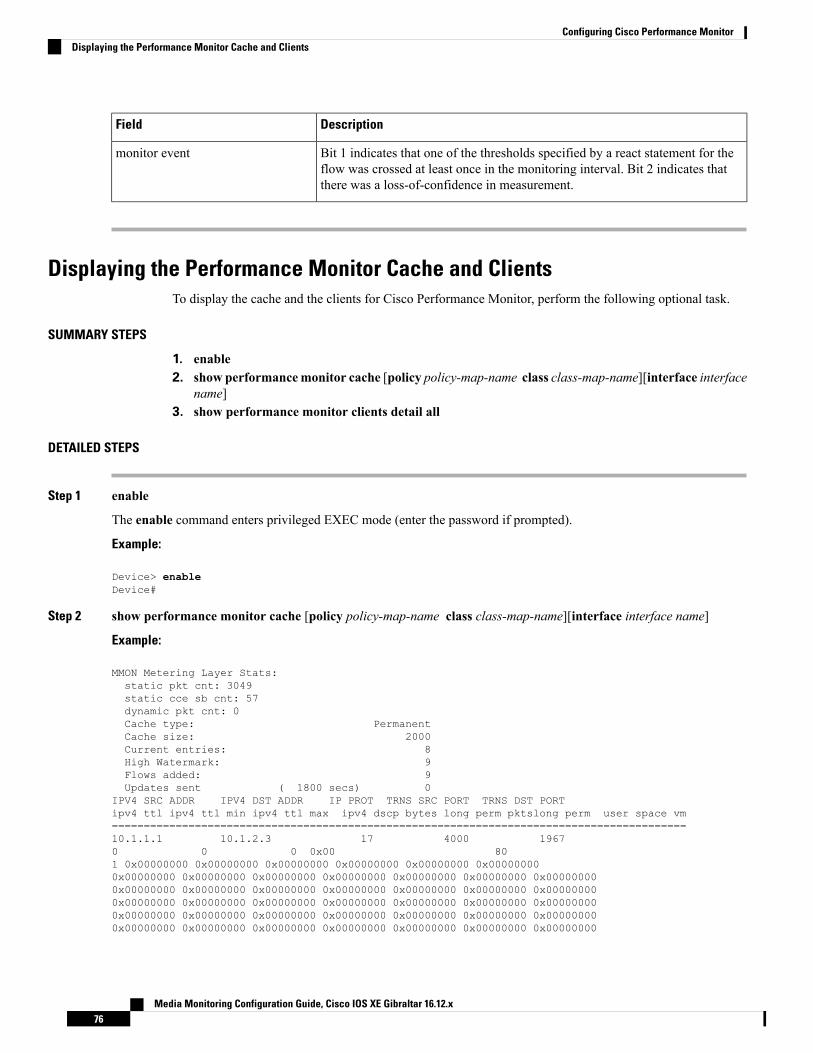
DescriptionField
Bit 1 indicates that one of the thresholds specified by a react statement for theflow was crossed at least once in the monitoring interval. Bit 2 indicates thatthere was a loss-of-confidence in measurement.
monitor event
Displaying the Performance Monitor Cache and ClientsTo display the cache and the clients for Cisco Performance Monitor, perform the following optional task.
SUMMARY STEPS
1. enable2. show performancemonitor cache [policy policy-map-name class class-map-name][interface interface
name]3. show performance monitor clients detail all
DETAILED STEPS
Step 1 enable
The enable command enters privileged EXEC mode (enter the password if prompted).
Example:
Device> enableDevice#
Step 2 show performance monitor cache [policy policy-map-name class class-map-name][interface interface name]
Example:
MMON Metering Layer Stats:static pkt cnt: 3049static cce sb cnt: 57dynamic pkt cnt: 0Cache type: PermanentCache size: 2000Current entries: 8High Watermark: 9Flows added: 9Updates sent ( 1800 secs) 0
IPV4 SRC ADDR IPV4 DST ADDR IP PROT TRNS SRC PORT TRNS DST PORTipv4 ttl ipv4 ttl min ipv4 ttl max ipv4 dscp bytes long perm pktslong perm user space vm==========================================================================================10.1.1.1 10.1.2.3 17 4000 19670 0 0 0x00 801 0x00000000 0x00000000 0x00000000 0x00000000 0x00000000 0x000000000x00000000 0x00000000 0x00000000 0x00000000 0x00000000 0x00000000 0x000000000x00000000 0x00000000 0x00000000 0x00000000 0x00000000 0x00000000 0x000000000x00000000 0x00000000 0x00000000 0x00000000 0x00000000 0x00000000 0x000000000x00000000 0x00000000 0x00000000 0x00000000 0x00000000 0x00000000 0x000000000x00000000 0x00000000 0x00000000 0x00000000 0x00000000 0x00000000 0x00000000
Media Monitoring Configuration Guide, Cisco IOS XE Gibraltar 16.12.x76
Configuring Cisco Performance MonitorDisplaying the Performance Monitor Cache and Clients

0x0000000010.1.1.1 10.1.2.3 17 6000 19670 0 0 0x00 801 0x00000000 0x00000000 0x00000000 0x00000000 0x00000000 0x000000000x00000000 0x00000000 0x00000000 0x00000000 0x00000000 0x00000000 0x000000000x00000000 0x00000000 0x00000000 0x00000000 0x00000000 0x00000000 0x000000000x00000000 0x00000000 0x00000000 0x00000000 0x00000000 0x00000000 0x000000000x00000000 0x00000000 0x00000000 0x00000000 0x00000000 0x00000000 0x000000000x00000000 0x00000000 0x00000000 0x00000000 0x00000000 0x00000000 0x000000000x0000000010.1.1.1 10.1.2.3 17 4000 20000 0 0 0x00 441 0x00000000 0x00000000 0x00000000 0x00000000 0x00000000 0x000000000x00000000 0x00000000 0x00000000 0x00000000 0x00000000 0x00000000 0x000000000x00000000 0x00000000 0x00000000 0x00000000 0x00000000 0x00000000 0x000000000x00000000 0x00000000 0x00000000 0x00000000 0x00000000 0x00000000 0x000000000x00000000 0x00000000 0x00000000 0x00000000 0x00000000 0x00000000 0x000000000x00000000 0x00000000 0x00000000 0x00000000 0x00000000 0x00000000 0x000000000x0000000010.1.1.1 10.1.2.3 6 6000 30000 0 0 0x00 842 0x00000000 0x00000000 0x00000000 0x00000000 0x00000000 0x000000000x00000000 0x00000000 0x00000000 0x00000000 0x00000000 0x00000000 0x000000000x00000000 0x00000000 0x00000000 0x00000000 0x00000000 0x00000000 0x000000000x00000000 0x00000000 0x00000000 0x00000000 0x00000000 0x00000000 0x000000000x00000000 0x00000000 0x00000000 0x00000000 0x00000000 0x00000000 0x000000000x00000000 0x00000000 0x00000000 0x00000000 0x00000000 0x00000000 0x000000000x0000000010.1.1.1 10.1.2.3 17 1967 60010 0 0 0x00 361 0x00000000 0x00000000 0x00000000 0x00000000 0x00000000 0x000000000x00000000 0x00000000 0x00000000 0x00000000 0x00000000 0x00000000 0x000000000x00000000 0x00000000 0x00000000 0x00000000 0x00000000 0x00000000 0x000000000x00000000 0x00000000 0x00000000 0x00000000 0x00000000 0x00000000 0x000000000x00000000 0x00000000 0x00000000 0x00000000 0x00000000 0x00000000 0x000000000x00000000 0x00000000 0x00000000 0x00000000 0x00000000 0x00000000 0x000000000x0000000010.1.1.1 10.1.2.3 17 1967 40010 0 0 0x00 361 0x00000000 0x00000000 0x00000000 0x00000000 0x00000000 0x000000000x00000000 0x00000000 0x00000000 0x00000000 0x00000000 0x00000000 0x000000000x00000000 0x00000000 0x00000000 0x00000000 0x00000000 0x00000000 0x000000000x00000000 0x00000000 0x00000000 0x00000000 0x00000000 0x00000000 0x000000000x00000000 0x00000000 0x00000000 0x00000000 0x00000000 0x00000000 0x000000000x00000000 0x00000000 0x00000000 0x00000000 0x00000000 0x00000000 0x000000000x0000000010.1.1.1 10.1.2.3 6 3001 60010 0 0 0x00 1243 0x00000000 0x00000000 0x00000000 0x00000000 0x00000000 0x000000000x00000000 0x00000000 0x00000000 0x00000000 0x00000000 0x00000000 0x000000000x00000000 0x00000000 0x00000000 0x00000000 0x00000000 0x00000000 0x000000000x00000000 0x00000000 0x00000000 0x00000000 0x00000000 0x00000000 0x000000000x00000000 0x00000000 0x00000000 0x00000000 0x00000000 0x00000000 0x000000000x00000000 0x00000000 0x00000000 0x00000000 0x00000000 0x00000000 0x000000000x0000000010.1.1.1 10.1.2.3 17 2001 40010 0 0 0x00 441 0x00000000 0x00000000 0x00000000 0x00000000 0x00000000 0x000000000x00000000 0x00000000 0x00000000 0x00000000 0x00000000 0x00000000 0x000000000x00000000 0x00000000 0x00000000 0x00000000 0x00000000 0x00000000 0x000000000x00000000 0x00000000 0x00000000 0x00000000 0x00000000 0x00000000 0x000000000x00000000 0x00000000 0x00000000 0x00000000 0x00000000 0x00000000 0x000000000x00000000 0x00000000 0x00000000 0x00000000 0x00000000 0x00000000 0x000000000x00000000
Media Monitoring Configuration Guide, Cisco IOS XE Gibraltar 16.12.x77
Configuring Cisco Performance MonitorDisplaying the Performance Monitor Cache and Clients
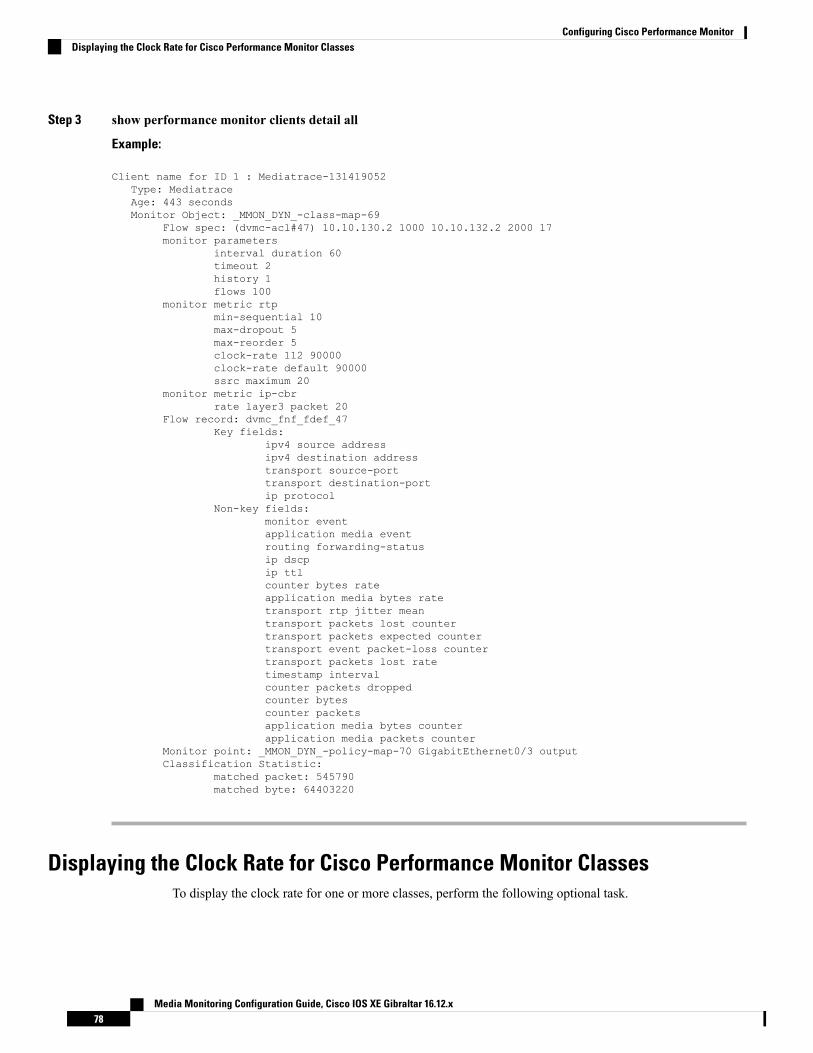
Step 3 show performance monitor clients detail all
Example:
Client name for ID 1 : Mediatrace-131419052Type: MediatraceAge: 443 secondsMonitor Object: _MMON_DYN_-class-map-69
Flow spec: (dvmc-acl#47) 10.10.130.2 1000 10.10.132.2 2000 17monitor parameters
interval duration 60timeout 2history 1flows 100
monitor metric rtpmin-sequential 10max-dropout 5max-reorder 5clock-rate 112 90000clock-rate default 90000ssrc maximum 20
monitor metric ip-cbrrate layer3 packet 20
Flow record: dvmc_fnf_fdef_47Key fields:
ipv4 source addressipv4 destination addresstransport source-porttransport destination-portip protocol
Non-key fields:monitor eventapplication media eventrouting forwarding-statusip dscpip ttlcounter bytes rateapplication media bytes ratetransport rtp jitter meantransport packets lost countertransport packets expected countertransport event packet-loss countertransport packets lost ratetimestamp intervalcounter packets droppedcounter bytescounter packetsapplication media bytes counterapplication media packets counter
Monitor point: _MMON_DYN_-policy-map-70 GigabitEthernet0/3 outputClassification Statistic:
matched packet: 545790matched byte: 64403220
Displaying the Clock Rate for Cisco Performance Monitor ClassesTo display the clock rate for one or more classes, perform the following optional task.
Media Monitoring Configuration Guide, Cisco IOS XE Gibraltar 16.12.x78
Configuring Cisco Performance MonitorDisplaying the Clock Rate for Cisco Performance Monitor Classes
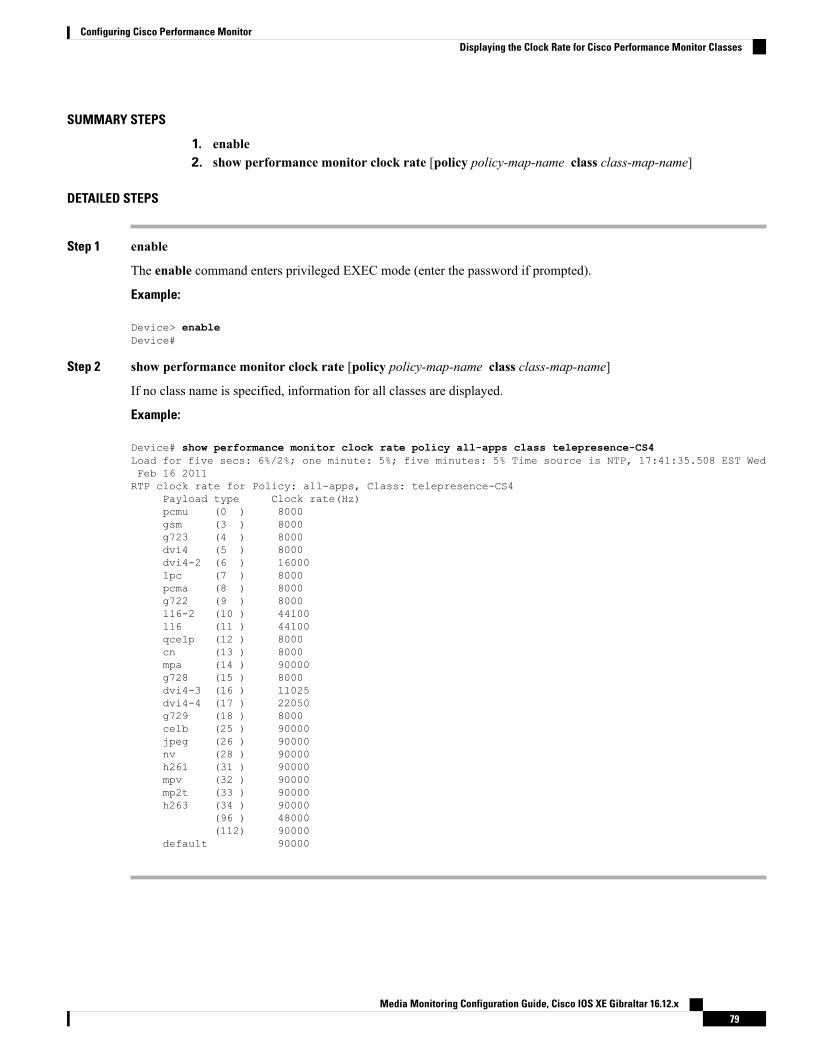
SUMMARY STEPS
1. enable2. show performance monitor clock rate [policy policy-map-name class class-map-name]
DETAILED STEPS
Step 1 enable
The enable command enters privileged EXEC mode (enter the password if prompted).
Example:
Device> enableDevice#
Step 2 show performance monitor clock rate [policy policy-map-name class class-map-name]
If no class name is specified, information for all classes are displayed.
Example:
Device# show performance monitor clock rate policy all-apps class telepresence-CS4Load for five secs: 6%/2%; one minute: 5%; five minutes: 5% Time source is NTP, 17:41:35.508 EST WedFeb 16 2011RTP clock rate for Policy: all-apps, Class: telepresence-CS4
Payload type Clock rate(Hz)pcmu (0 ) 8000gsm (3 ) 8000g723 (4 ) 8000dvi4 (5 ) 8000dvi4-2 (6 ) 16000lpc (7 ) 8000pcma (8 ) 8000g722 (9 ) 8000l16-2 (10 ) 44100l16 (11 ) 44100qcelp (12 ) 8000cn (13 ) 8000mpa (14 ) 90000g728 (15 ) 8000dvi4-3 (16 ) 11025dvi4-4 (17 ) 22050g729 (18 ) 8000celb (25 ) 90000jpeg (26 ) 90000nv (28 ) 90000h261 (31 ) 90000mpv (32 ) 90000mp2t (33 ) 90000h263 (34 ) 90000
(96 ) 48000(112) 90000
default 90000
Media Monitoring Configuration Guide, Cisco IOS XE Gibraltar 16.12.x79
Configuring Cisco Performance MonitorDisplaying the Clock Rate for Cisco Performance Monitor Classes
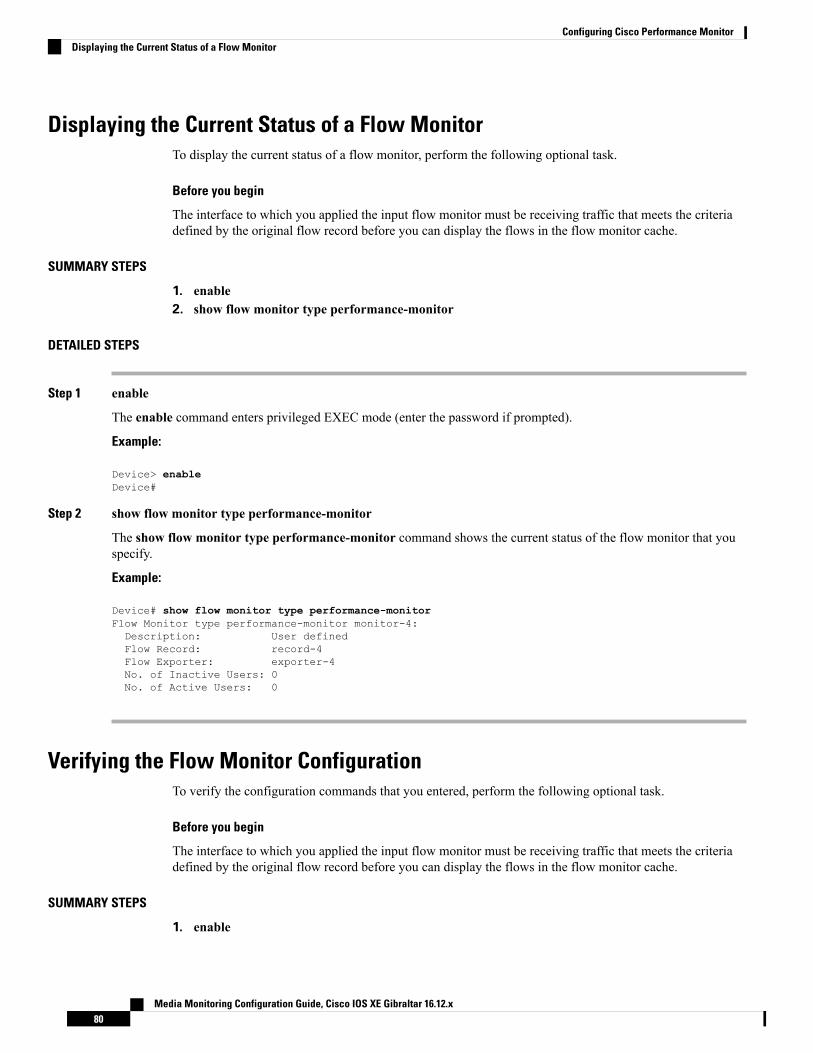
Displaying the Current Status of a Flow MonitorTo display the current status of a flow monitor, perform the following optional task.
Before you begin
The interface to which you applied the input flow monitor must be receiving traffic that meets the criteriadefined by the original flow record before you can display the flows in the flow monitor cache.
SUMMARY STEPS
1. enable2. show flow monitor type performance-monitor
DETAILED STEPS
Step 1 enable
The enable command enters privileged EXEC mode (enter the password if prompted).
Example:
Device> enableDevice#
Step 2 show flow monitor type performance-monitor
The show flow monitor type performance-monitor command shows the current status of the flow monitor that youspecify.
Example:
Device# show flow monitor type performance-monitorFlow Monitor type performance-monitor monitor-4:Description: User definedFlow Record: record-4Flow Exporter: exporter-4No. of Inactive Users: 0No. of Active Users: 0
Verifying the Flow Monitor ConfigurationTo verify the configuration commands that you entered, perform the following optional task.
Before you begin
The interface to which you applied the input flow monitor must be receiving traffic that meets the criteriadefined by the original flow record before you can display the flows in the flow monitor cache.
SUMMARY STEPS
1. enable
Media Monitoring Configuration Guide, Cisco IOS XE Gibraltar 16.12.x80
Configuring Cisco Performance MonitorDisplaying the Current Status of a Flow Monitor
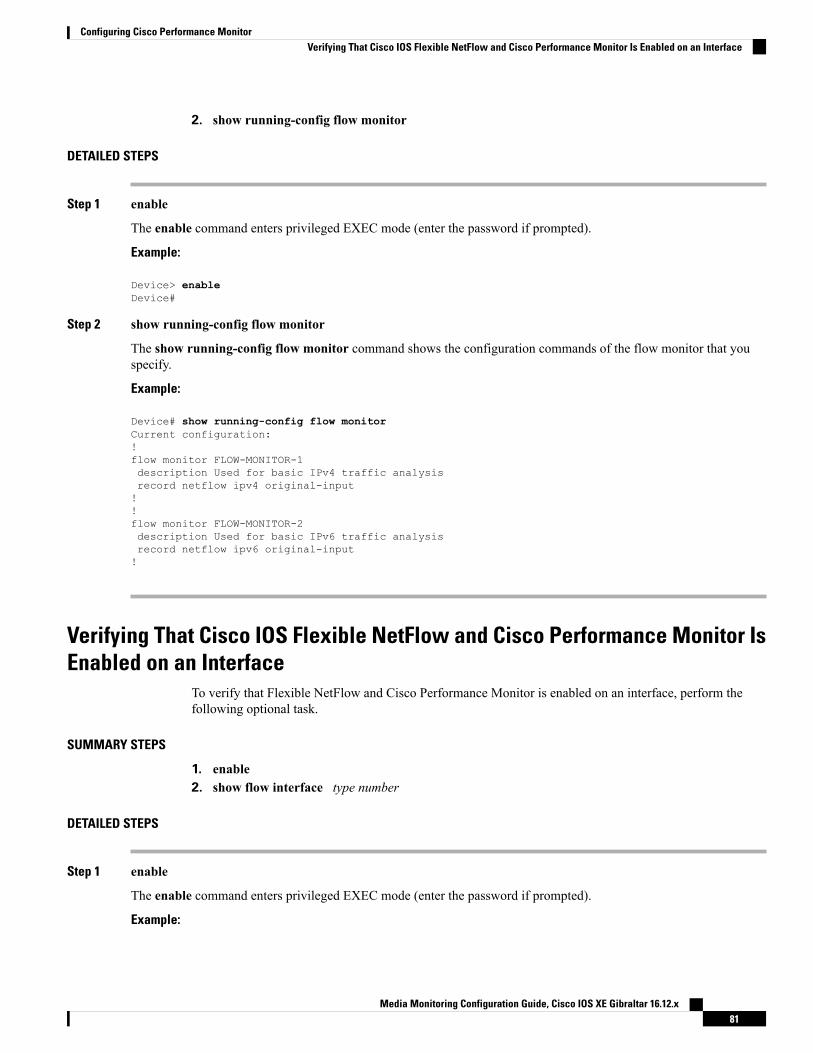
2. show running-config flow monitor
DETAILED STEPS
Step 1 enable
The enable command enters privileged EXEC mode (enter the password if prompted).
Example:
Device> enableDevice#
Step 2 show running-config flow monitor
The show running-config flow monitor command shows the configuration commands of the flow monitor that youspecify.
Example:
Device# show running-config flow monitorCurrent configuration:!flow monitor FLOW-MONITOR-1description Used for basic IPv4 traffic analysisrecord netflow ipv4 original-input!!flow monitor FLOW-MONITOR-2description Used for basic IPv6 traffic analysisrecord netflow ipv6 original-input!
Verifying That Cisco IOS Flexible NetFlow and Cisco Performance Monitor IsEnabled on an Interface
To verify that Flexible NetFlow and Cisco Performance Monitor is enabled on an interface, perform thefollowing optional task.
SUMMARY STEPS
1. enable2. show flow interface type number
DETAILED STEPS
Step 1 enable
The enable command enters privileged EXEC mode (enter the password if prompted).
Example:
Media Monitoring Configuration Guide, Cisco IOS XE Gibraltar 16.12.x81
Configuring Cisco Performance MonitorVerifying That Cisco IOS Flexible NetFlow and Cisco Performance Monitor Is Enabled on an Interface
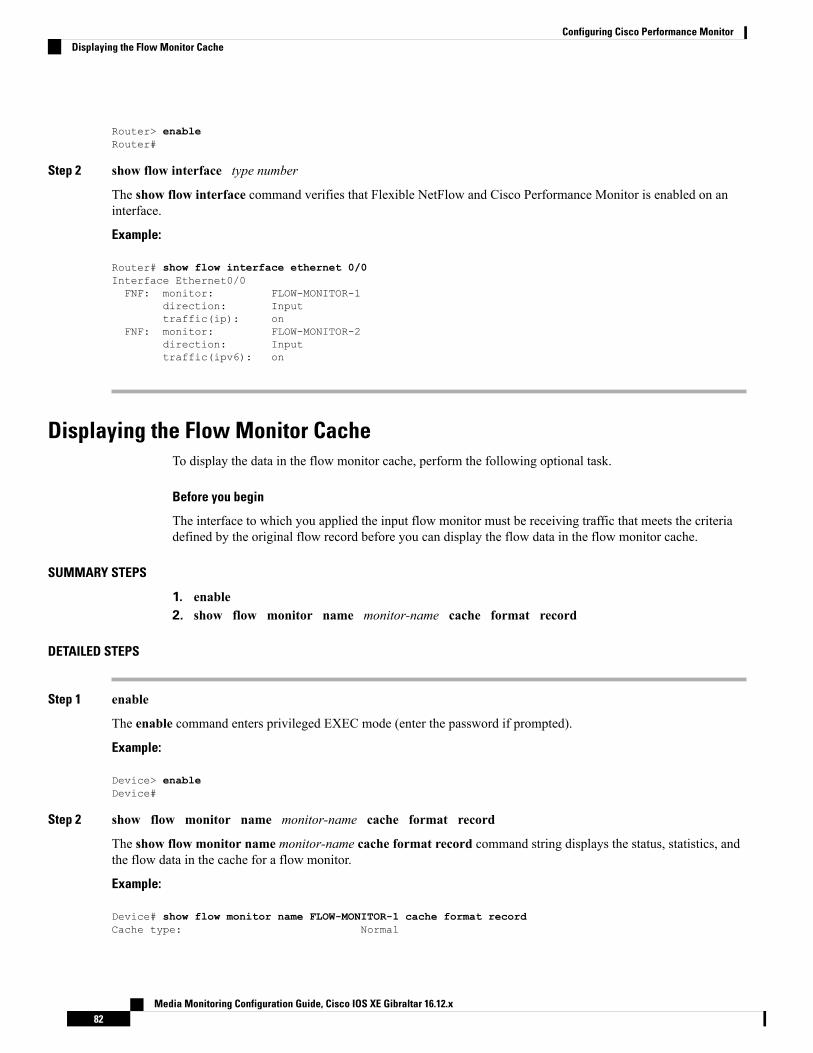
Router> enableRouter#
Step 2 show flow interface type number
The show flow interface command verifies that Flexible NetFlow and Cisco Performance Monitor is enabled on aninterface.
Example:
Router# show flow interface ethernet 0/0Interface Ethernet0/0FNF: monitor: FLOW-MONITOR-1
direction: Inputtraffic(ip): on
FNF: monitor: FLOW-MONITOR-2direction: Inputtraffic(ipv6): on
Displaying the Flow Monitor CacheTo display the data in the flow monitor cache, perform the following optional task.
Before you begin
The interface to which you applied the input flow monitor must be receiving traffic that meets the criteriadefined by the original flow record before you can display the flow data in the flow monitor cache.
SUMMARY STEPS
1. enable2. show flow monitor name monitor-name cache format record
DETAILED STEPS
Step 1 enable
The enable command enters privileged EXEC mode (enter the password if prompted).
Example:
Device> enableDevice#
Step 2 show flow monitor name monitor-name cache format record
The show flow monitor name monitor-name cache format record command string displays the status, statistics, andthe flow data in the cache for a flow monitor.
Example:
Device# show flow monitor name FLOW-MONITOR-1 cache format recordCache type: Normal
Media Monitoring Configuration Guide, Cisco IOS XE Gibraltar 16.12.x82
Configuring Cisco Performance MonitorDisplaying the Flow Monitor Cache
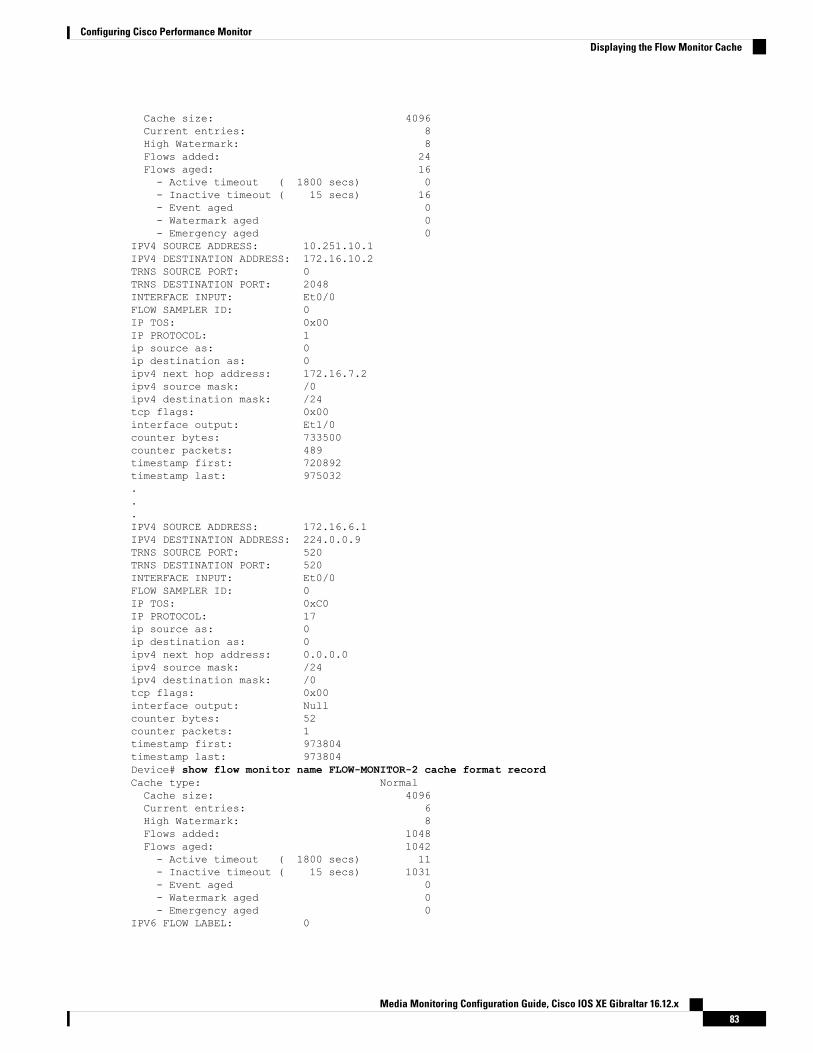
Cache size: 4096Current entries: 8High Watermark: 8Flows added: 24Flows aged: 16- Active timeout ( 1800 secs) 0- Inactive timeout ( 15 secs) 16- Event aged 0- Watermark aged 0- Emergency aged 0
IPV4 SOURCE ADDRESS: 10.251.10.1IPV4 DESTINATION ADDRESS: 172.16.10.2TRNS SOURCE PORT: 0TRNS DESTINATION PORT: 2048INTERFACE INPUT: Et0/0FLOW SAMPLER ID: 0IP TOS: 0x00IP PROTOCOL: 1ip source as: 0ip destination as: 0ipv4 next hop address: 172.16.7.2ipv4 source mask: /0ipv4 destination mask: /24tcp flags: 0x00interface output: Et1/0counter bytes: 733500counter packets: 489timestamp first: 720892timestamp last: 975032...IPV4 SOURCE ADDRESS: 172.16.6.1IPV4 DESTINATION ADDRESS: 224.0.0.9TRNS SOURCE PORT: 520TRNS DESTINATION PORT: 520INTERFACE INPUT: Et0/0FLOW SAMPLER ID: 0IP TOS: 0xC0IP PROTOCOL: 17ip source as: 0ip destination as: 0ipv4 next hop address: 0.0.0.0ipv4 source mask: /24ipv4 destination mask: /0tcp flags: 0x00interface output: Nullcounter bytes: 52counter packets: 1timestamp first: 973804timestamp last: 973804Device# show flow monitor name FLOW-MONITOR-2 cache format recordCache type: NormalCache size: 4096Current entries: 6High Watermark: 8Flows added: 1048Flows aged: 1042- Active timeout ( 1800 secs) 11- Inactive timeout ( 15 secs) 1031- Event aged 0- Watermark aged 0- Emergency aged 0
IPV6 FLOW LABEL: 0
Media Monitoring Configuration Guide, Cisco IOS XE Gibraltar 16.12.x83
Configuring Cisco Performance MonitorDisplaying the Flow Monitor Cache
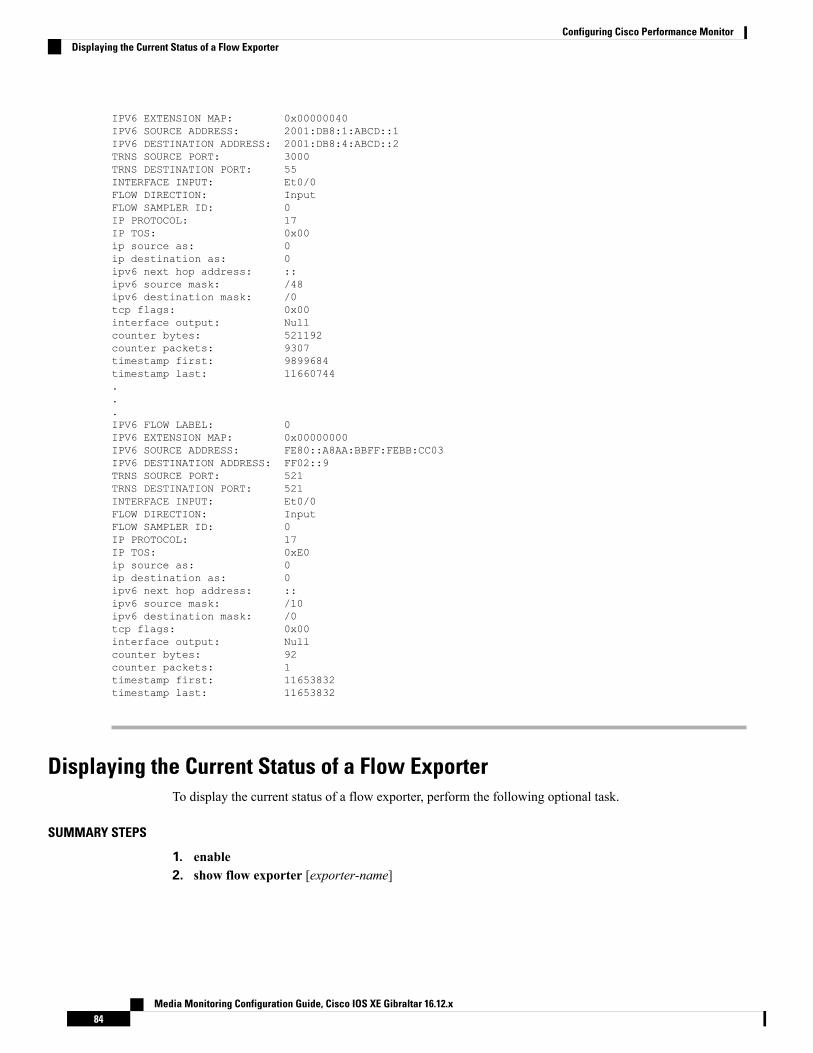
IPV6 EXTENSION MAP: 0x00000040IPV6 SOURCE ADDRESS: 2001:DB8:1:ABCD::1IPV6 DESTINATION ADDRESS: 2001:DB8:4:ABCD::2TRNS SOURCE PORT: 3000TRNS DESTINATION PORT: 55INTERFACE INPUT: Et0/0FLOW DIRECTION: InputFLOW SAMPLER ID: 0IP PROTOCOL: 17IP TOS: 0x00ip source as: 0ip destination as: 0ipv6 next hop address: ::ipv6 source mask: /48ipv6 destination mask: /0tcp flags: 0x00interface output: Nullcounter bytes: 521192counter packets: 9307timestamp first: 9899684timestamp last: 11660744...IPV6 FLOW LABEL: 0IPV6 EXTENSION MAP: 0x00000000IPV6 SOURCE ADDRESS: FE80::A8AA:BBFF:FEBB:CC03IPV6 DESTINATION ADDRESS: FF02::9TRNS SOURCE PORT: 521TRNS DESTINATION PORT: 521INTERFACE INPUT: Et0/0FLOW DIRECTION: InputFLOW SAMPLER ID: 0IP PROTOCOL: 17IP TOS: 0xE0ip source as: 0ip destination as: 0ipv6 next hop address: ::ipv6 source mask: /10ipv6 destination mask: /0tcp flags: 0x00interface output: Nullcounter bytes: 92counter packets: 1timestamp first: 11653832timestamp last: 11653832
Displaying the Current Status of a Flow ExporterTo display the current status of a flow exporter, perform the following optional task.
SUMMARY STEPS
1. enable2. show flow exporter [exporter-name]
Media Monitoring Configuration Guide, Cisco IOS XE Gibraltar 16.12.x84
Configuring Cisco Performance MonitorDisplaying the Current Status of a Flow Exporter
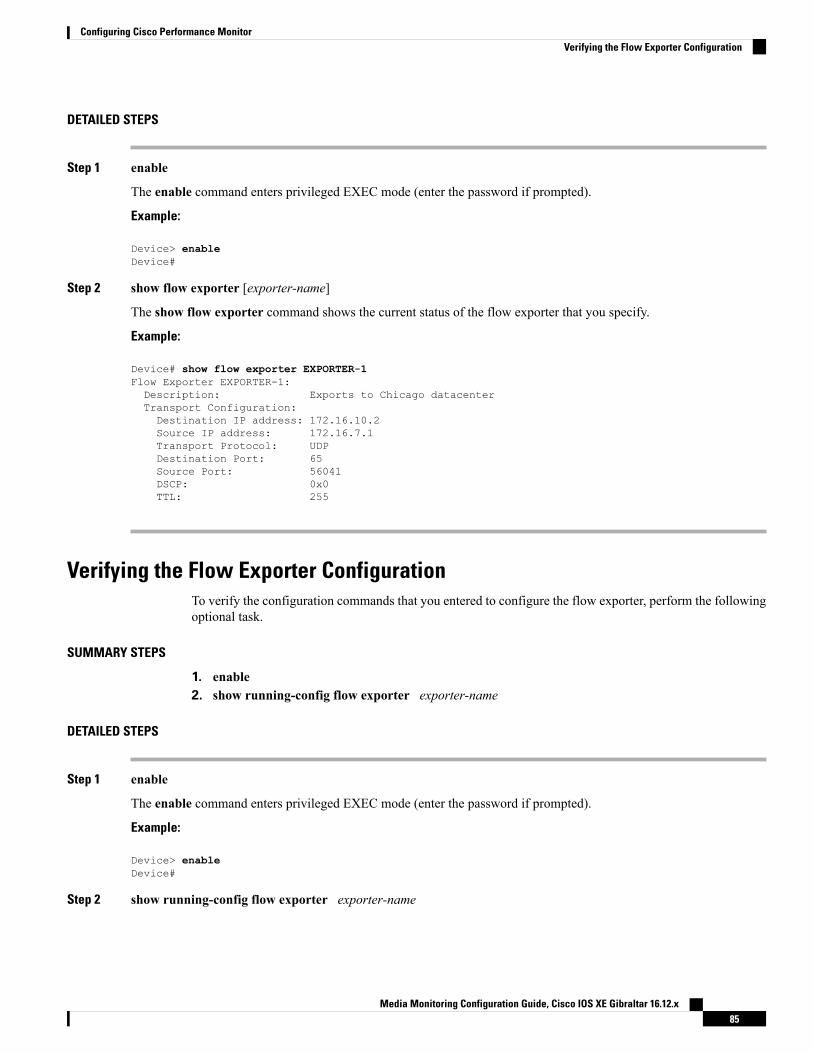
DETAILED STEPS
Step 1 enable
The enable command enters privileged EXEC mode (enter the password if prompted).
Example:
Device> enableDevice#
Step 2 show flow exporter [exporter-name]
The show flow exporter command shows the current status of the flow exporter that you specify.
Example:
Device# show flow exporter EXPORTER-1Flow Exporter EXPORTER-1:Description: Exports to Chicago datacenterTransport Configuration:Destination IP address: 172.16.10.2Source IP address: 172.16.7.1Transport Protocol: UDPDestination Port: 65Source Port: 56041DSCP: 0x0TTL: 255
Verifying the Flow Exporter ConfigurationTo verify the configuration commands that you entered to configure the flow exporter, perform the followingoptional task.
SUMMARY STEPS
1. enable2. show running-config flow exporter exporter-name
DETAILED STEPS
Step 1 enable
The enable command enters privileged EXEC mode (enter the password if prompted).
Example:
Device> enableDevice#
Step 2 show running-config flow exporter exporter-name
Media Monitoring Configuration Guide, Cisco IOS XE Gibraltar 16.12.x85
Configuring Cisco Performance MonitorVerifying the Flow Exporter Configuration
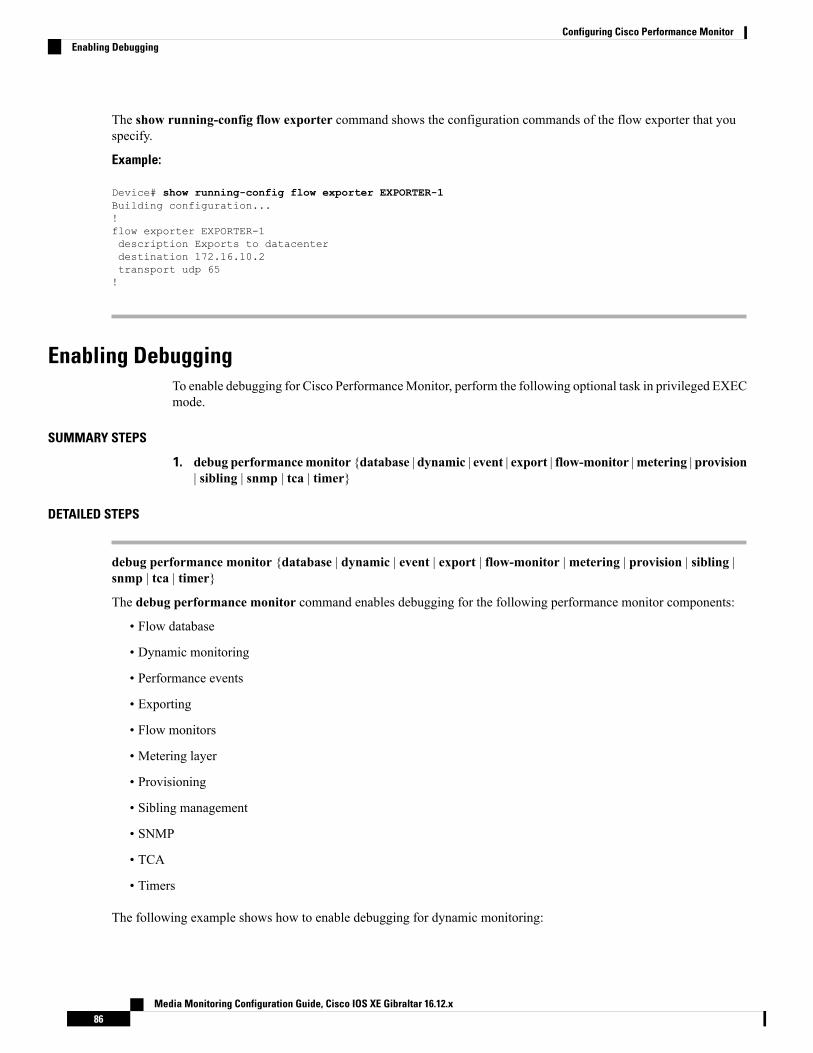
The show running-config flow exporter command shows the configuration commands of the flow exporter that youspecify.
Example:
Device# show running-config flow exporter EXPORTER-1Building configuration...!flow exporter EXPORTER-1description Exports to datacenterdestination 172.16.10.2transport udp 65!
Enabling DebuggingTo enable debugging for Cisco PerformanceMonitor, perform the following optional task in privileged EXECmode.
SUMMARY STEPS
1. debug performancemonitor {database | dynamic | event | export | flow-monitor |metering | provision| sibling | snmp | tca | timer}
DETAILED STEPS
debug performance monitor {database | dynamic | event | export | flow-monitor |metering | provision | sibling |snmp | tca | timer}
The debug performance monitor command enables debugging for the following performance monitor components:
• Flow database
• Dynamic monitoring
• Performance events
• Exporting
• Flow monitors
• Metering layer
• Provisioning
• Sibling management
• SNMP
• TCA
• Timers
The following example shows how to enable debugging for dynamic monitoring:
Media Monitoring Configuration Guide, Cisco IOS XE Gibraltar 16.12.x86
Configuring Cisco Performance MonitorEnabling Debugging
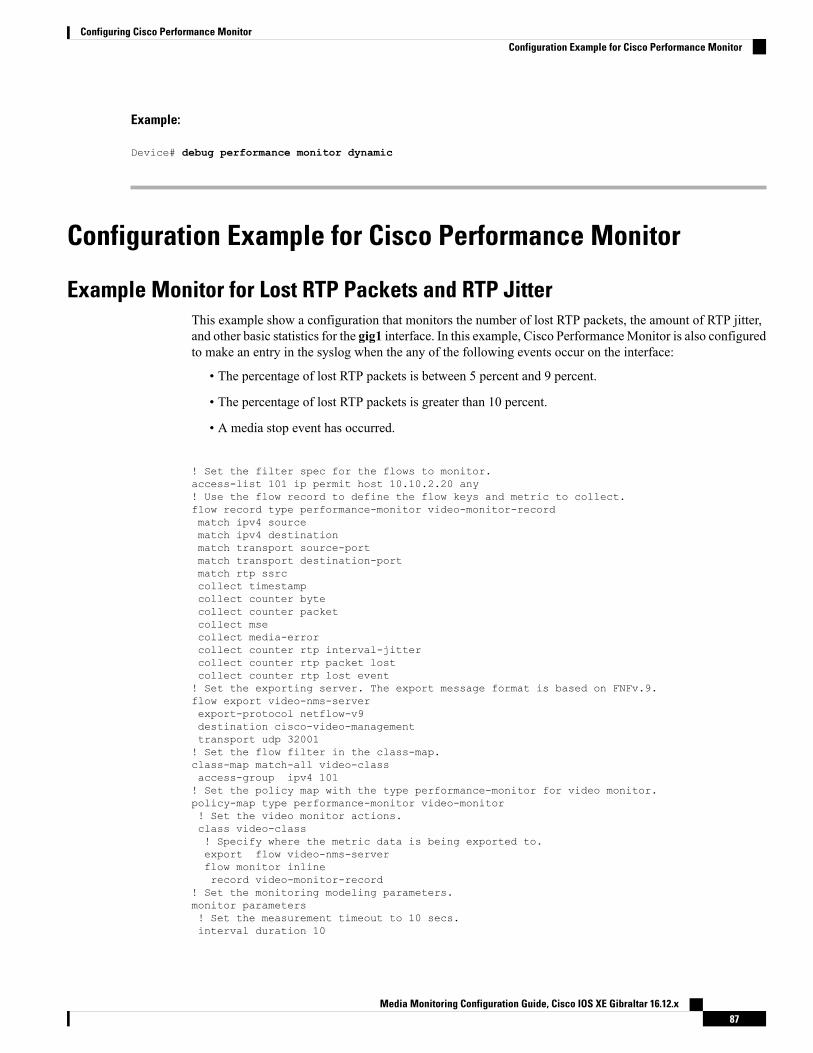
Example:
Device# debug performance monitor dynamic
Configuration Example for Cisco Performance Monitor
Example Monitor for Lost RTP Packets and RTP JitterThis example show a configuration that monitors the number of lost RTP packets, the amount of RTP jitter,and other basic statistics for the gig1 interface. In this example, Cisco PerformanceMonitor is also configuredto make an entry in the syslog when the any of the following events occur on the interface:
• The percentage of lost RTP packets is between 5 percent and 9 percent.
• The percentage of lost RTP packets is greater than 10 percent.
• A media stop event has occurred.
! Set the filter spec for the flows to monitor.access-list 101 ip permit host 10.10.2.20 any! Use the flow record to define the flow keys and metric to collect.flow record type performance-monitor video-monitor-recordmatch ipv4 sourcematch ipv4 destinationmatch transport source-portmatch transport destination-portmatch rtp ssrccollect timestampcollect counter bytecollect counter packetcollect msecollect media-errorcollect counter rtp interval-jittercollect counter rtp packet lostcollect counter rtp lost event! Set the exporting server. The export message format is based on FNFv.9.flow export video-nms-serverexport-protocol netflow-v9destination cisco-video-managementtransport udp 32001! Set the flow filter in the class-map.class-map match-all video-classaccess-group ipv4 101! Set the policy map with the type performance-monitor for video monitor.policy-map type performance-monitor video-monitor! Set the video monitor actions.class video-class! Specify where the metric data is being exported to.export flow video-nms-serverflow monitor inlinerecord video-monitor-record
! Set the monitoring modeling parameters.monitor parameters! Set the measurement timeout to 10 secs.interval duration 10
Media Monitoring Configuration Guide, Cisco IOS XE Gibraltar 16.12.x87
Configuring Cisco Performance MonitorConfiguration Example for Cisco Performance Monitor
! Set the timeout to 10 minutes.timeout 10! Specify that 30 flow intervals can be kept in performance database.history 30priority 7! Set rtp flow verification criteria.monitor metric rtp! Configure a RTP flow criteria: at least 10 packets in sequence.min-sequential 10! Ignore packets that are more than 5 packet ahead in terms of seq number. max-dropout5! Ignore packets that are more than 5 packets behind in terms of seq number.max-reorder 5! Set the clock rate frequency for rtp packet timestamp clock.clock-rate 89000! Set the maximum number of ssrc allowed within this class.ssrc maximum 100! Set TCA for alarm.react 100 transport-packets-lost-ratedescription critical TCA! Set the threshold to greater than 10%.threshold gt 10! Set the threshold to the average number based on the last five intervals.threshold type average 5action syslogalarm severity criticalreact 110 transport-packets-lost-ratedescription medium TCA! Set the threshold to between 5% and 9% of packet lost.threshold range gt 5 le 9threshold type average 10action syslogalarm type grouped percent 30react 3000 media-stopaction syslogalarm severity criticalalarm type grouped percent 30
interface gig1service-policy type performance-monitor video-mon in
Where to Go NextFor more information about configuring the products in the Medianet product family, see the other chapterin this guide or see the Cisco Media Monitoring Configuration Guide.
Media Monitoring Configuration Guide, Cisco IOS XE Gibraltar 16.12.x88
Configuring Cisco Performance MonitorWhere to Go Next
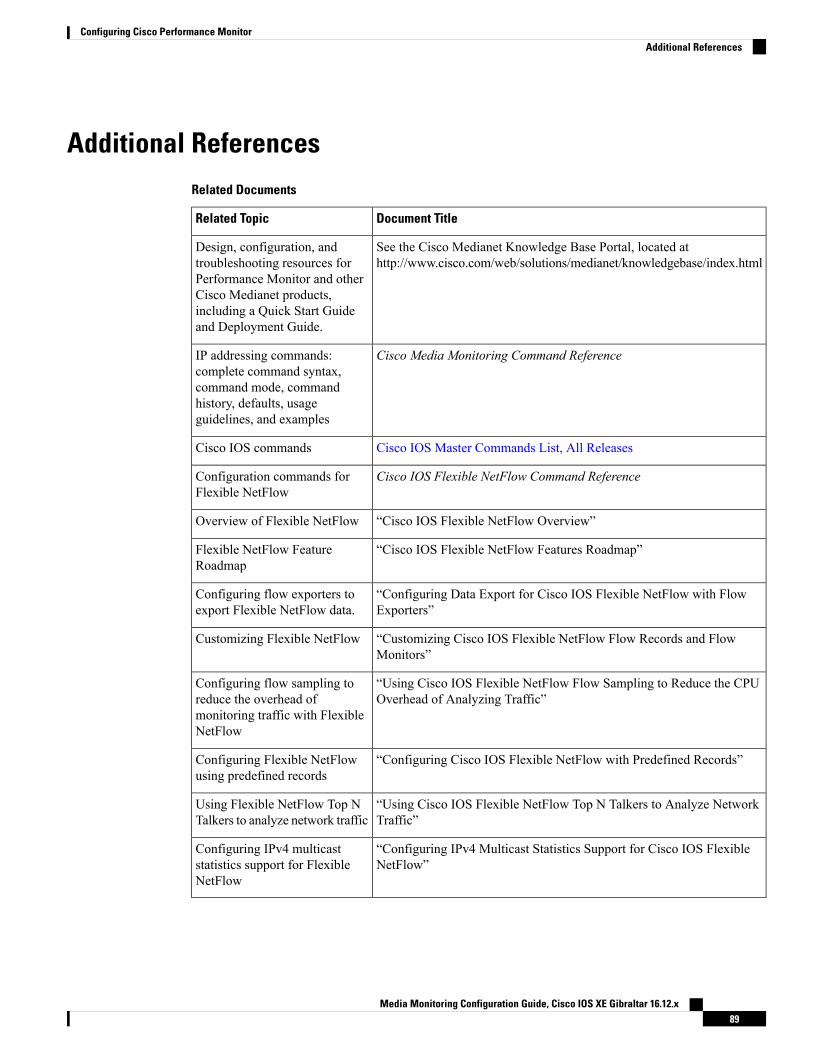
Additional ReferencesRelated Documents
Document TitleRelated Topic
See the Cisco Medianet Knowledge Base Portal, located athttp://www.cisco.com/web/solutions/medianet/knowledgebase/index.html
Design, configuration, andtroubleshooting resources forPerformance Monitor and otherCisco Medianet products,including a Quick Start Guideand Deployment Guide.
Cisco Media Monitoring Command ReferenceIP addressing commands:complete command syntax,command mode, commandhistory, defaults, usageguidelines, and examples
Cisco IOS Master Commands List, All ReleasesCisco IOS commands
Cisco IOS Flexible NetFlow Command ReferenceConfiguration commands forFlexible NetFlow
“Cisco IOS Flexible NetFlow Overview”Overview of Flexible NetFlow
“Cisco IOS Flexible NetFlow Features Roadmap”Flexible NetFlow FeatureRoadmap
“Configuring Data Export for Cisco IOS Flexible NetFlow with FlowExporters”
Configuring flow exporters toexport Flexible NetFlow data.
“Customizing Cisco IOS Flexible NetFlow Flow Records and FlowMonitors”
Customizing Flexible NetFlow
“Using Cisco IOS Flexible NetFlow Flow Sampling to Reduce the CPUOverhead of Analyzing Traffic”
Configuring flow sampling toreduce the overhead ofmonitoring traffic with FlexibleNetFlow
“Configuring Cisco IOS Flexible NetFlow with Predefined Records”Configuring Flexible NetFlowusing predefined records
“Using Cisco IOS Flexible NetFlow Top N Talkers to Analyze NetworkTraffic”
Using Flexible NetFlow Top NTalkers to analyze network traffic
“Configuring IPv4 Multicast Statistics Support for Cisco IOS FlexibleNetFlow”
Configuring IPv4 multicaststatistics support for FlexibleNetFlow
Media Monitoring Configuration Guide, Cisco IOS XE Gibraltar 16.12.x89
Configuring Cisco Performance MonitorAdditional References
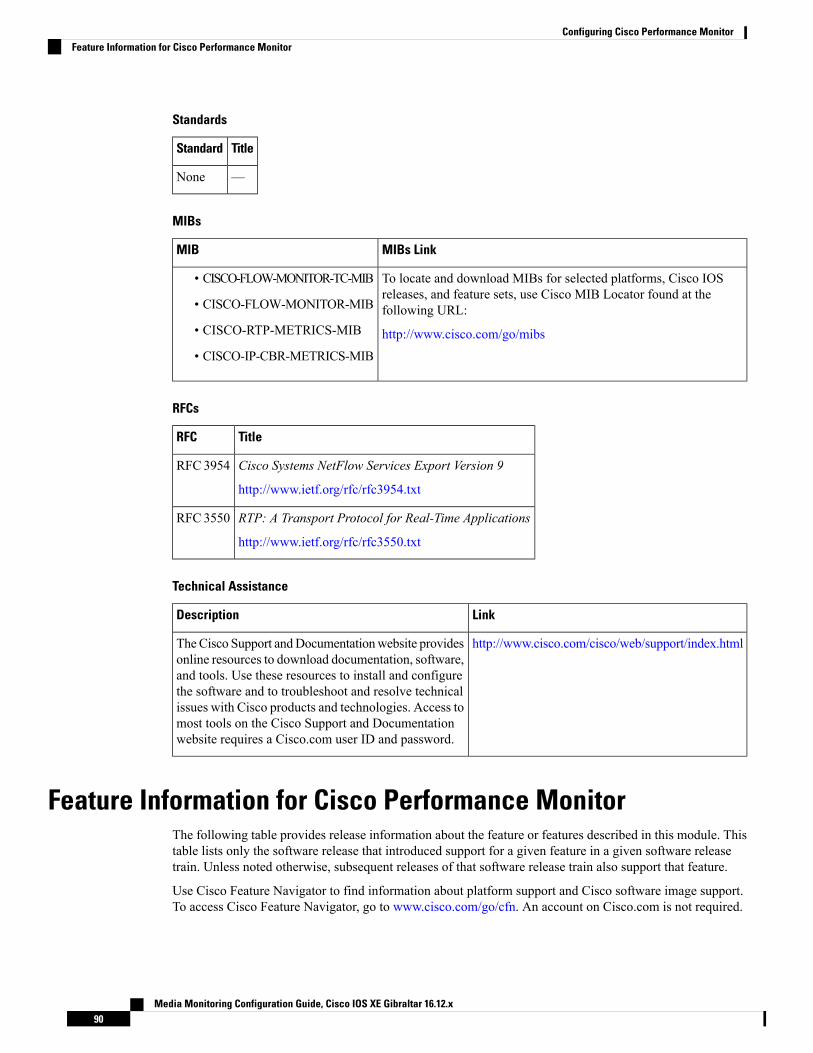
Standards
TitleStandard
—None
MIBs
MIBs LinkMIB
To locate and download MIBs for selected platforms, Cisco IOSreleases, and feature sets, use Cisco MIB Locator found at thefollowing URL:
http://www.cisco.com/go/mibs
• CISCO-FLOW-MONITOR-TC-MIB
• CISCO-FLOW-MONITOR-MIB
• CISCO-RTP-METRICS-MIB
• CISCO-IP-CBR-METRICS-MIB
RFCs
TitleRFC
Cisco Systems NetFlow Services Export Version 9
http://www.ietf.org/rfc/rfc3954.txt
RFC 3954
RTP: A Transport Protocol for Real-Time Applications
http://www.ietf.org/rfc/rfc3550.txt
RFC 3550
Technical Assistance
LinkDescription
http://www.cisco.com/cisco/web/support/index.htmlTheCisco Support andDocumentationwebsite providesonline resources to download documentation, software,and tools. Use these resources to install and configurethe software and to troubleshoot and resolve technicalissues with Cisco products and technologies. Access tomost tools on the Cisco Support and Documentationwebsite requires a Cisco.com user ID and password.
Feature Information for Cisco Performance MonitorThe following table provides release information about the feature or features described in this module. Thistable lists only the software release that introduced support for a given feature in a given software releasetrain. Unless noted otherwise, subsequent releases of that software release train also support that feature.
Use Cisco Feature Navigator to find information about platform support and Cisco software image support.To access Cisco Feature Navigator, go to www.cisco.com/go/cfn. An account on Cisco.com is not required.
Media Monitoring Configuration Guide, Cisco IOS XE Gibraltar 16.12.x90
Configuring Cisco Performance MonitorFeature Information for Cisco Performance Monitor
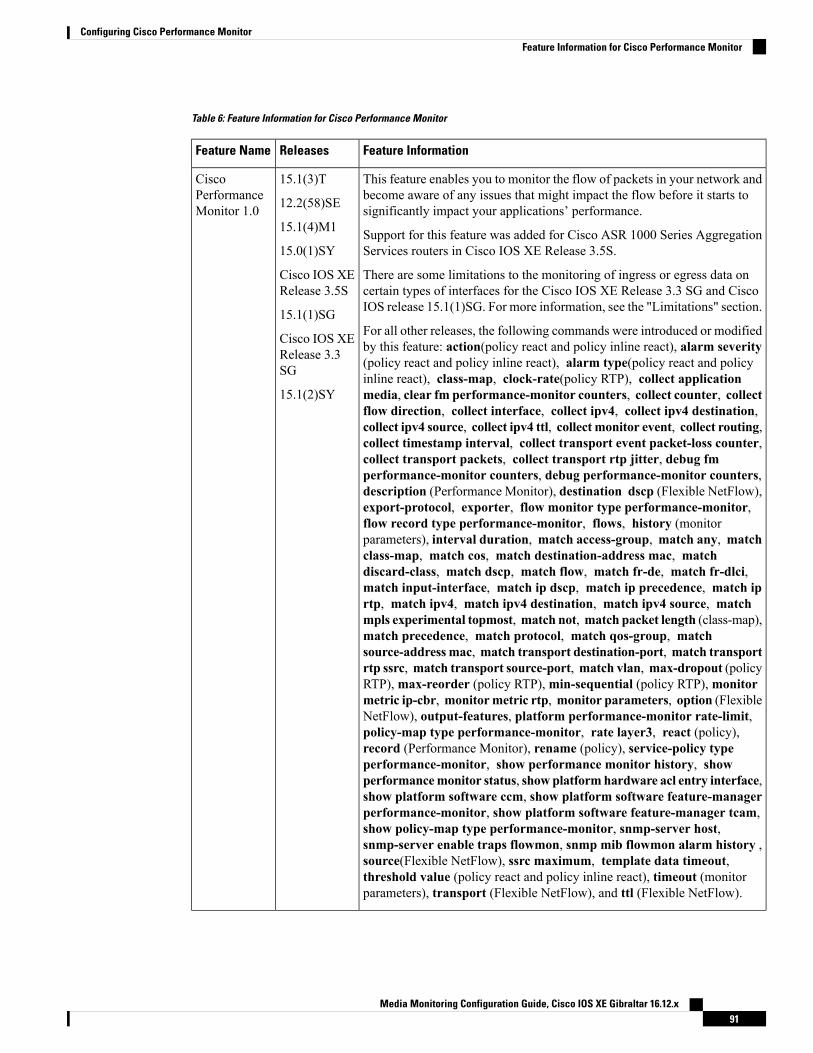
Table 6: Feature Information for Cisco Performance Monitor
Feature InformationReleasesFeature Name
This feature enables you to monitor the flow of packets in your network andbecome aware of any issues that might impact the flow before it starts tosignificantly impact your applications’ performance.
Support for this feature was added for Cisco ASR 1000 Series AggregationServices routers in Cisco IOS XE Release 3.5S.
There are some limitations to the monitoring of ingress or egress data oncertain types of interfaces for the Cisco IOS XE Release 3.3 SG and CiscoIOS release 15.1(1)SG. For more information, see the "Limitations" section.
For all other releases, the following commands were introduced or modifiedby this feature: action(policy react and policy inline react), alarm severity(policy react and policy inline react), alarm type(policy react and policyinline react), class-map, clock-rate(policy RTP), collect applicationmedia, clear fm performance-monitor counters, collect counter, collectflow direction, collect interface, collect ipv4, collect ipv4 destination,collect ipv4 source, collect ipv4 ttl, collect monitor event, collect routing,collect timestamp interval, collect transport event packet-loss counter,collect transport packets, collect transport rtp jitter, debug fmperformance-monitor counters, debug performance-monitor counters,description (Performance Monitor), destination dscp (Flexible NetFlow),export-protocol, exporter, flow monitor type performance-monitor,flow record type performance-monitor, flows, history (monitorparameters), interval duration, match access-group, match any, matchclass-map, match cos, match destination-address mac, matchdiscard-class, match dscp, match flow, match fr-de, match fr-dlci,match input-interface, match ip dscp, match ip precedence, match iprtp, match ipv4, match ipv4 destination, match ipv4 source, matchmpls experimental topmost, match not, match packet length (class-map),match precedence, match protocol, match qos-group, matchsource-addressmac, match transport destination-port, match transportrtp ssrc, match transport source-port, match vlan, max-dropout (policyRTP),max-reorder (policy RTP),min-sequential (policy RTP),monitormetric ip-cbr, monitormetric rtp, monitor parameters, option (FlexibleNetFlow), output-features, platform performance-monitor rate-limit,policy-map type performance-monitor, rate layer3, react (policy),record (Performance Monitor), rename (policy), service-policy typeperformance-monitor, show performance monitor history, showperformancemonitor status, showplatformhardware acl entry interface,show platform software ccm, show platform software feature-managerperformance-monitor, show platform software feature-manager tcam,show policy-map type performance-monitor, snmp-server host,snmp-server enable traps flowmon, snmp mib flowmon alarm history ,source(Flexible NetFlow), ssrc maximum, template data timeout,threshold value (policy react and policy inline react), timeout (monitorparameters), transport (Flexible NetFlow), and ttl (Flexible NetFlow).
15.1(3)T
12.2(58)SE
15.1(4)M1
15.0(1)SY
Cisco IOS XERelease 3.5S
15.1(1)SG
Cisco IOS XERelease 3.3SG
15.1(2)SY
CiscoPerformanceMonitor 1.0
Media Monitoring Configuration Guide, Cisco IOS XE Gibraltar 16.12.x91
Configuring Cisco Performance MonitorFeature Information for Cisco Performance Monitor
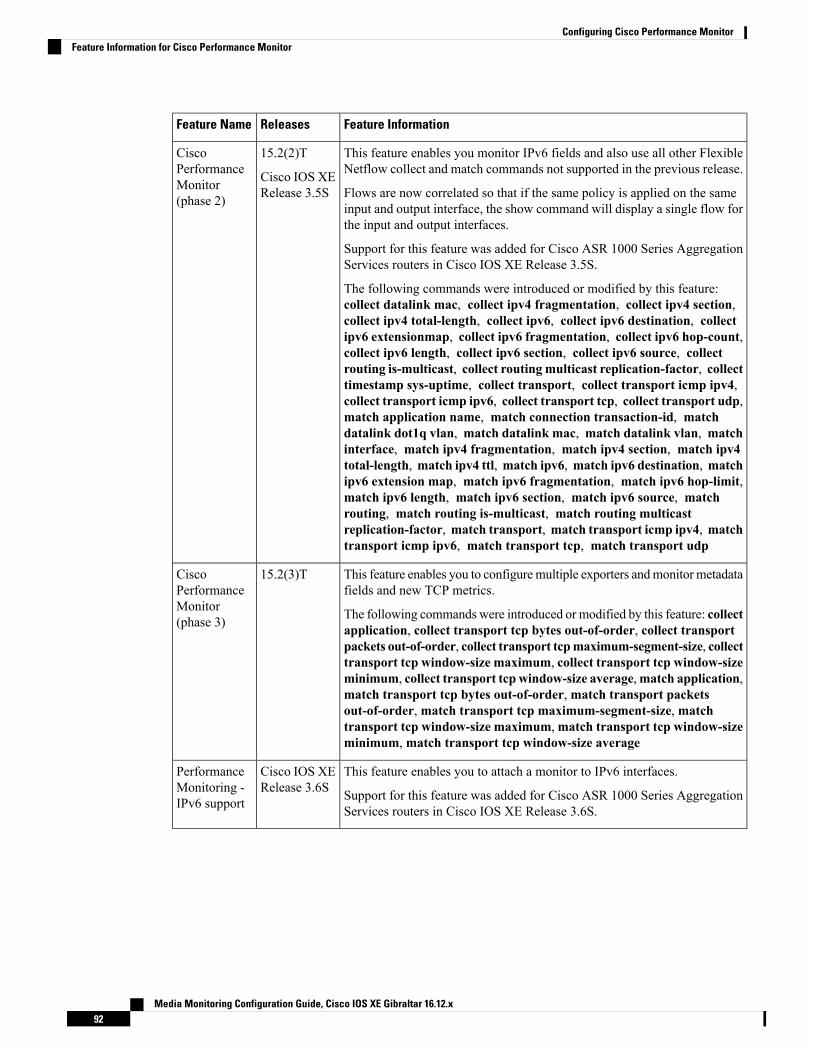
Feature InformationReleasesFeature Name
This feature enables you monitor IPv6 fields and also use all other FlexibleNetflow collect and match commands not supported in the previous release.
Flows are now correlated so that if the same policy is applied on the sameinput and output interface, the show command will display a single flow forthe input and output interfaces.
Support for this feature was added for Cisco ASR 1000 Series AggregationServices routers in Cisco IOS XE Release 3.5S.
The following commands were introduced or modified by this feature:collect datalink mac, collect ipv4 fragmentation, collect ipv4 section,collect ipv4 total-length, collect ipv6, collect ipv6 destination, collectipv6 extensionmap, collect ipv6 fragmentation, collect ipv6 hop-count,collect ipv6 length, collect ipv6 section, collect ipv6 source, collectrouting is-multicast, collect routingmulticast replication-factor, collecttimestamp sys-uptime, collect transport, collect transport icmp ipv4,collect transport icmp ipv6, collect transport tcp, collect transport udp,match application name, match connection transaction-id, matchdatalink dot1q vlan, match datalink mac, match datalink vlan, matchinterface, match ipv4 fragmentation, match ipv4 section, match ipv4total-length, match ipv4 ttl, match ipv6, match ipv6 destination, matchipv6 extension map, match ipv6 fragmentation, match ipv6 hop-limit,match ipv6 length, match ipv6 section, match ipv6 source, matchrouting, match routing is-multicast, match routing multicastreplication-factor, match transport, match transport icmp ipv4, matchtransport icmp ipv6, match transport tcp, match transport udp
15.2(2)T
Cisco IOS XERelease 3.5S
CiscoPerformanceMonitor(phase 2)
This feature enables you to configuremultiple exporters andmonitor metadatafields and new TCP metrics.
The following commands were introduced or modified by this feature: collectapplication, collect transport tcp bytes out-of-order, collect transportpackets out-of-order, collect transport tcpmaximum-segment-size, collecttransport tcp window-size maximum, collect transport tcp window-sizeminimum, collect transport tcp window-size average,match application,match transport tcp bytes out-of-order, match transport packetsout-of-order, match transport tcp maximum-segment-size, matchtransport tcp window-size maximum,match transport tcp window-sizeminimum, match transport tcp window-size average
15.2(3)TCiscoPerformanceMonitor(phase 3)
This feature enables you to attach a monitor to IPv6 interfaces.
Support for this feature was added for Cisco ASR 1000 Series AggregationServices routers in Cisco IOS XE Release 3.6S.
Cisco IOS XERelease 3.6S
PerformanceMonitoring -IPv6 support
Media Monitoring Configuration Guide, Cisco IOS XE Gibraltar 16.12.x92
Configuring Cisco Performance MonitorFeature Information for Cisco Performance Monitor

Feature InformationReleasesFeature Name
This feature enables you to monitor the total number of out-of-order TCPpackets.
Support for this feature was added for Cisco ASR 1000 Series AggregationServices routers in Cisco IOS XE Release 3.6S.
The following commands were introduced or modified by this feature: collecttransport tcp bytes out-of-order and collect transport packetsout-of-order.
Cisco IOS XERelease 3.6S
PerformanceMonitoring -transportpacket out oforder
Enables sending export packets using the IPFIX export protocol. The exportof extracted fields from NBAR is only supported over IPFIX.
The following command was introduced: export-protocol.
15.2(4)MFlexibleNetFlow:IPFIX ExportFormat
Media Monitoring Configuration Guide, Cisco IOS XE Gibraltar 16.12.x93
Configuring Cisco Performance MonitorFeature Information for Cisco Performance Monitor

Media Monitoring Configuration Guide, Cisco IOS XE Gibraltar 16.12.x94
Configuring Cisco Performance MonitorFeature Information for Cisco Performance Monitor
C H A P T E R 4Metrics for Assurance Monitoring
Metrics for Assurance monitoring refers to Assurance-related metrics collected per network application, forflows forwarded through specific interfaces, to support Assurance monitoring by Cisco DNA Center. FNFprovides a pair of record types (for IPv4 and IPv6) to collect this data. Monitoring for Assurance is optimizedto provide better than typical performance for FNF monitors.
• Feature Information for Metrics for Assurance Monitoring, on page 95• Information About Metrics for Assurance Monitoring, on page 96• How to Configure Metrics for Assurance Monitoring, on page 99• Viewing Details of Assurance Records and Contexts, on page 104• Notes and Limitations, on page 106
Feature Information for Metrics for Assurance MonitoringThe following table provides release information about the feature or features described in this module. Thistable lists only the software release that introduced support for a given feature in a given software releasetrain. Unless noted otherwise, subsequent releases of that software release train also support that feature.
Use Cisco Feature Navigator to find information about platform support and Cisco software image support.To access Cisco Feature Navigator, go to www.cisco.com/go/cfn. An account on Cisco.com is not required.
Table 7: Feature Information for Metrics for Assurance Monitoring
Feature InformationReleasesFeature Name
FNF provides a pair of record typesto collect data for Assurance,optimized to provide better thantypical performance for FNFmonitors.
Cisco IOS XE Gibraltar 16.10.1Metrics for Assurance Monitoring
Media Monitoring Configuration Guide, Cisco IOS XE Gibraltar 16.12.x95
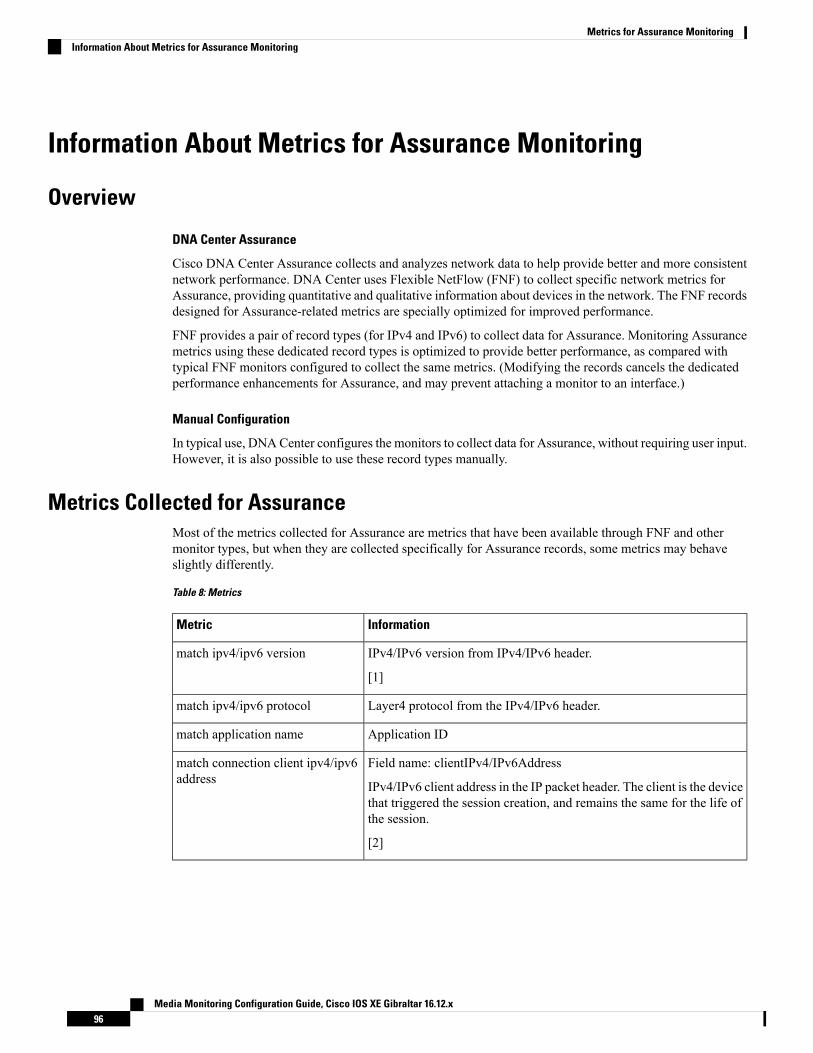
Information About Metrics for Assurance Monitoring
Overview
DNA Center Assurance
Cisco DNA Center Assurance collects and analyzes network data to help provide better and more consistentnetwork performance. DNA Center uses Flexible NetFlow (FNF) to collect specific network metrics forAssurance, providing quantitative and qualitative information about devices in the network. The FNF recordsdesigned for Assurance-related metrics are specially optimized for improved performance.
FNF provides a pair of record types (for IPv4 and IPv6) to collect data for Assurance. Monitoring Assurancemetrics using these dedicated record types is optimized to provide better performance, as compared withtypical FNF monitors configured to collect the same metrics. (Modifying the records cancels the dedicatedperformance enhancements for Assurance, and may prevent attaching a monitor to an interface.)
Manual Configuration
In typical use, DNACenter configures the monitors to collect data for Assurance, without requiring user input.However, it is also possible to use these record types manually.
Metrics Collected for AssuranceMost of the metrics collected for Assurance are metrics that have been available through FNF and othermonitor types, but when they are collected specifically for Assurance records, some metrics may behaveslightly differently.
Table 8: Metrics
InformationMetric
IPv4/IPv6 version from IPv4/IPv6 header.
[1]
match ipv4/ipv6 version
Layer4 protocol from the IPv4/IPv6 header.match ipv4/ipv6 protocol
Application IDmatch application name
Field name: clientIPv4/IPv6Address
IPv4/IPv6 client address in the IP packet header. The client is the devicethat triggered the session creation, and remains the same for the life ofthe session.
[2]
match connection client ipv4/ipv6address
Media Monitoring Configuration Guide, Cisco IOS XE Gibraltar 16.12.x96
Metrics for Assurance MonitoringInformation About Metrics for Assurance Monitoring
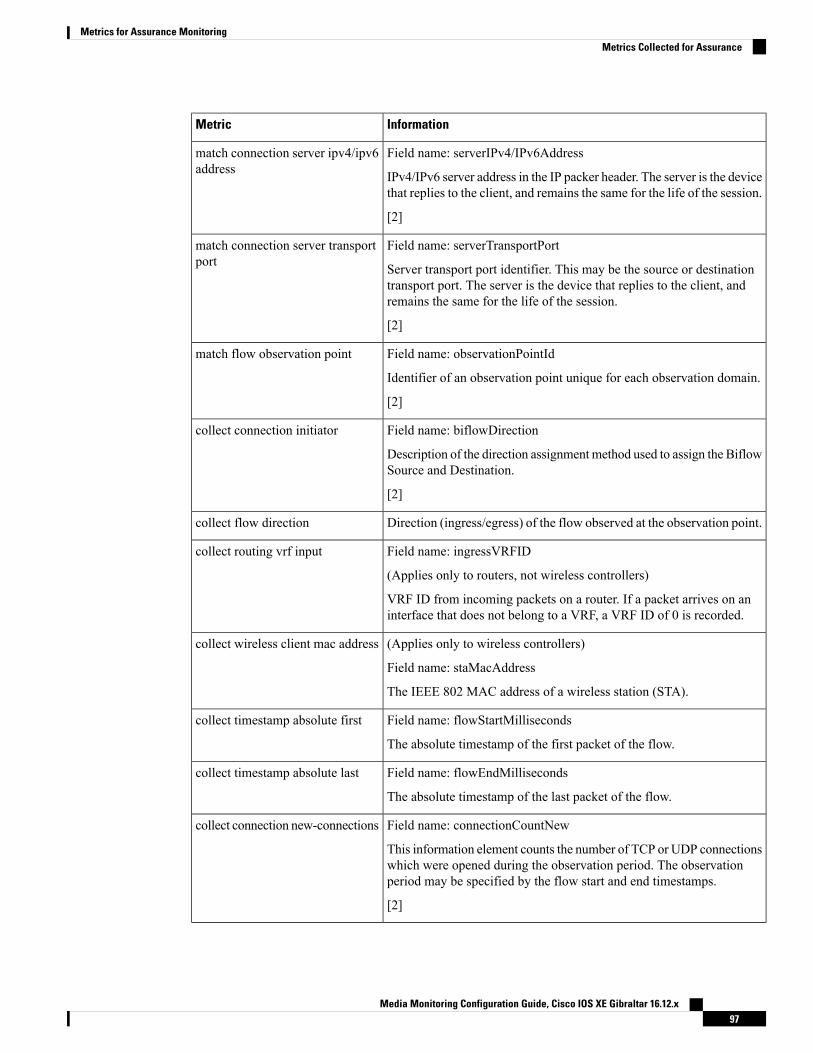
InformationMetric
Field name: serverIPv4/IPv6Address
IPv4/IPv6 server address in the IP packer header. The server is the devicethat replies to the client, and remains the same for the life of the session.
[2]
match connection server ipv4/ipv6address
Field name: serverTransportPort
Server transport port identifier. This may be the source or destinationtransport port. The server is the device that replies to the client, andremains the same for the life of the session.
[2]
match connection server transportport
Field name: observationPointId
Identifier of an observation point unique for each observation domain.
[2]
match flow observation point
Field name: biflowDirection
Description of the direction assignment method used to assign the BiflowSource and Destination.
[2]
collect connection initiator
Direction (ingress/egress) of the flow observed at the observation point.collect flow direction
Field name: ingressVRFID
(Applies only to routers, not wireless controllers)
VRF ID from incoming packets on a router. If a packet arrives on aninterface that does not belong to a VRF, a VRF ID of 0 is recorded.
collect routing vrf input
(Applies only to wireless controllers)
Field name: staMacAddress
The IEEE 802 MAC address of a wireless station (STA).
collect wireless client mac address
Field name: flowStartMilliseconds
The absolute timestamp of the first packet of the flow.
collect timestamp absolute first
Field name: flowEndMilliseconds
The absolute timestamp of the last packet of the flow.
collect timestamp absolute last
Field name: connectionCountNew
This information element counts the number of TCP or UDP connectionswhich were opened during the observation period. The observationperiod may be specified by the flow start and end timestamps.
[2]
collect connection new-connections
Media Monitoring Configuration Guide, Cisco IOS XE Gibraltar 16.12.x97
Metrics for Assurance MonitoringMetrics Collected for Assurance
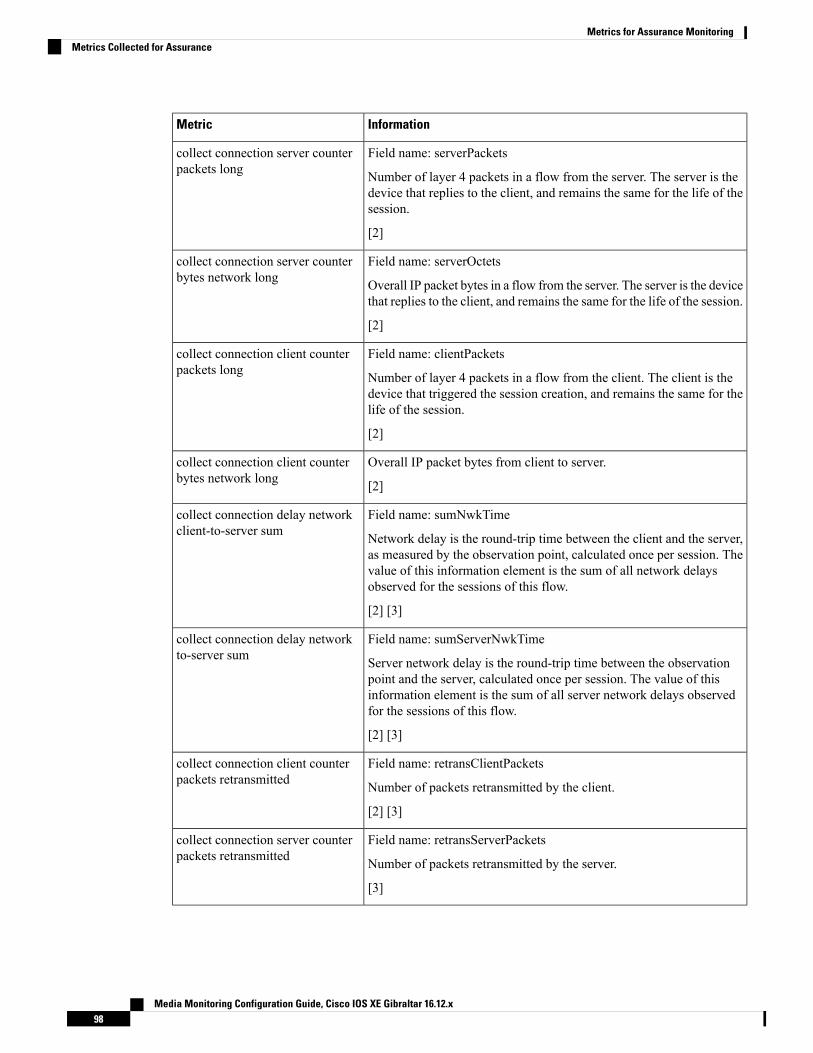
InformationMetric
Field name: serverPackets
Number of layer 4 packets in a flow from the server. The server is thedevice that replies to the client, and remains the same for the life of thesession.
[2]
collect connection server counterpackets long
Field name: serverOctets
Overall IP packet bytes in a flow from the server. The server is the devicethat replies to the client, and remains the same for the life of the session.
[2]
collect connection server counterbytes network long
Field name: clientPackets
Number of layer 4 packets in a flow from the client. The client is thedevice that triggered the session creation, and remains the same for thelife of the session.
[2]
collect connection client counterpackets long
Overall IP packet bytes from client to server.
[2]
collect connection client counterbytes network long
Field name: sumNwkTime
Network delay is the round-trip time between the client and the server,as measured by the observation point, calculated once per session. Thevalue of this information element is the sum of all network delaysobserved for the sessions of this flow.
[2] [3]
collect connection delay networkclient-to-server sum
Field name: sumServerNwkTime
Server network delay is the round-trip time between the observationpoint and the server, calculated once per session. The value of thisinformation element is the sum of all server network delays observedfor the sessions of this flow.
[2] [3]
collect connection delay networkto-server sum
Field name: retransClientPackets
Number of packets retransmitted by the client.
[2] [3]
collect connection client counterpackets retransmitted
Field name: retransServerPackets
Number of packets retransmitted by the server.
[3]
collect connection server counterpackets retransmitted
Media Monitoring Configuration Guide, Cisco IOS XE Gibraltar 16.12.x98
Metrics for Assurance MonitoringMetrics Collected for Assurance

InformationMetric
Field name: sumServerRespTime
The sum of all application delays observed for all responses of the flow.
[2] [3]
collect connection delay applicationsum
Field name: numRespsCountDelta
Total number of responses sent by the server.
[2] [3]
collect connection server counterresponses
Notes
[1] See Cisco IOS Flexible NetFlow Command Reference.[2] See Cisco AVC Field Definition Guide.[3] This metric can be used in Cisco Performance Monitor record types. It can be used with FNF only aspart of the specially optimized Assurance-related records. Attempting to use this metric in a different FNFrecord type will cause the record to be rejected when attaching it to an interface.
How to Configure Metrics for Assurance Monitoring
Configuring Assurance Monitors Outside of DNA CenterIn typical use, DNA Center configures the monitors without requiring additional user input, but it is possibleto configure monitors for Assurance-related metrics manually.
Manual methods for monitoring Assurance-related metrics:
See section...Applicable to...Method
Configuring Assurance MonitorsUsing ezPM, on page 99
Platforms that support ezPM
Not wireless controllers
ezPM profile
Configuring Assurance MonitorsUsing Pre-defined FNF Records,on page 100
Routers
Wireless controllers
Pre-defined FNF records forAssurance
Configuring Assurance Monitors Using ezPMApplicable to: routers, not wireless controllers
The application-assurance ezPM profile makes use of the application performance monitoring (APM) FNFrecords designed for Assurance-related metrics. Configuring APM with ezPM greatly simplifies theconfiguration, as compared with working with the FNF records directly.
1. Configure the ezPM context.
performance monitor context context-name profile application-assurance
traffic-monitor assurance-monitor ipv4
Media Monitoring Configuration Guide, Cisco IOS XE Gibraltar 16.12.x99
Metrics for Assurance MonitoringHow to Configure Metrics for Assurance Monitoring
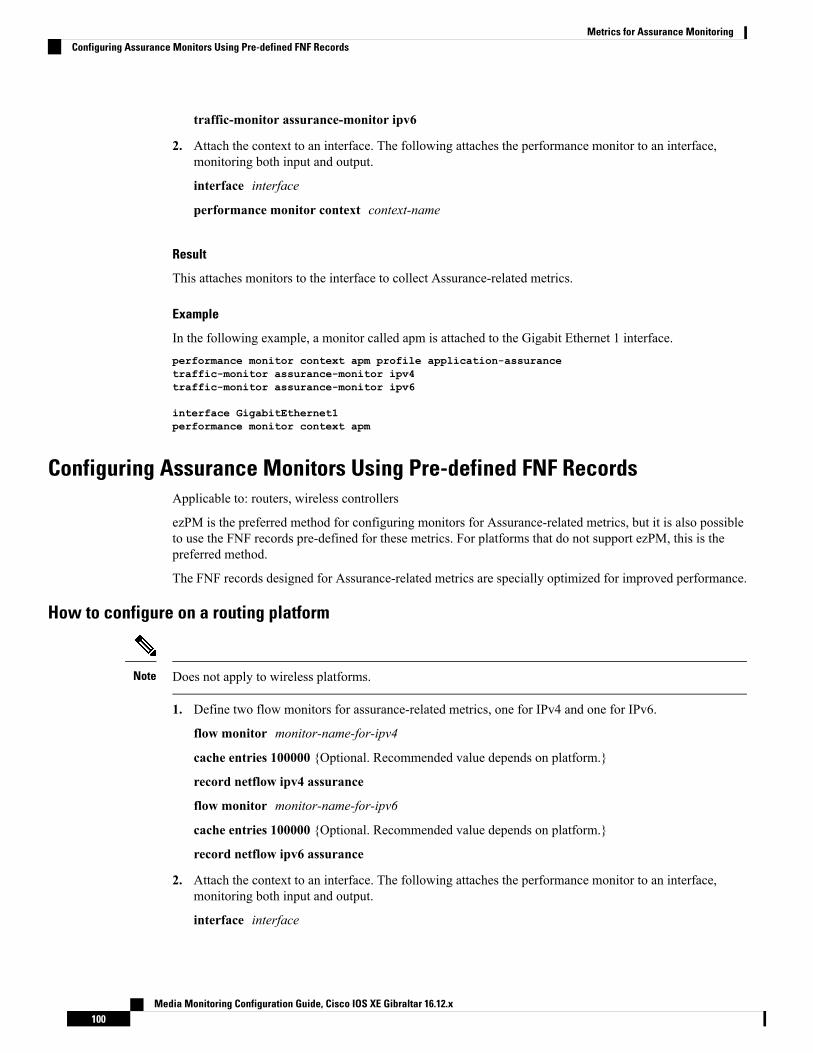
traffic-monitor assurance-monitor ipv6
2. Attach the context to an interface. The following attaches the performance monitor to an interface,monitoring both input and output.
interface interface
performance monitor context context-name
Result
This attaches monitors to the interface to collect Assurance-related metrics.
Example
In the following example, a monitor called apm is attached to the Gigabit Ethernet 1 interface.performance monitor context apm profile application-assurancetraffic-monitor assurance-monitor ipv4traffic-monitor assurance-monitor ipv6
interface GigabitEthernet1performance monitor context apm
Configuring Assurance Monitors Using Pre-defined FNF RecordsApplicable to: routers, wireless controllers
ezPM is the preferred method for configuring monitors for Assurance-related metrics, but it is also possibleto use the FNF records pre-defined for these metrics. For platforms that do not support ezPM, this is thepreferred method.
The FNF records designed for Assurance-related metrics are specially optimized for improved performance.
How to configure on a routing platform
Does not apply to wireless platforms.Note
1. Define two flow monitors for assurance-related metrics, one for IPv4 and one for IPv6.
flow monitor monitor-name-for-ipv4
cache entries 100000 {Optional. Recommended value depends on platform.}
record netflow ipv4 assurance
flow monitor monitor-name-for-ipv6
cache entries 100000 {Optional. Recommended value depends on platform.}
record netflow ipv6 assurance
2. Attach the context to an interface. The following attaches the performance monitor to an interface,monitoring both input and output.
interface interface
Media Monitoring Configuration Guide, Cisco IOS XE Gibraltar 16.12.x100
Metrics for Assurance MonitoringConfiguring Assurance Monitors Using Pre-defined FNF Records
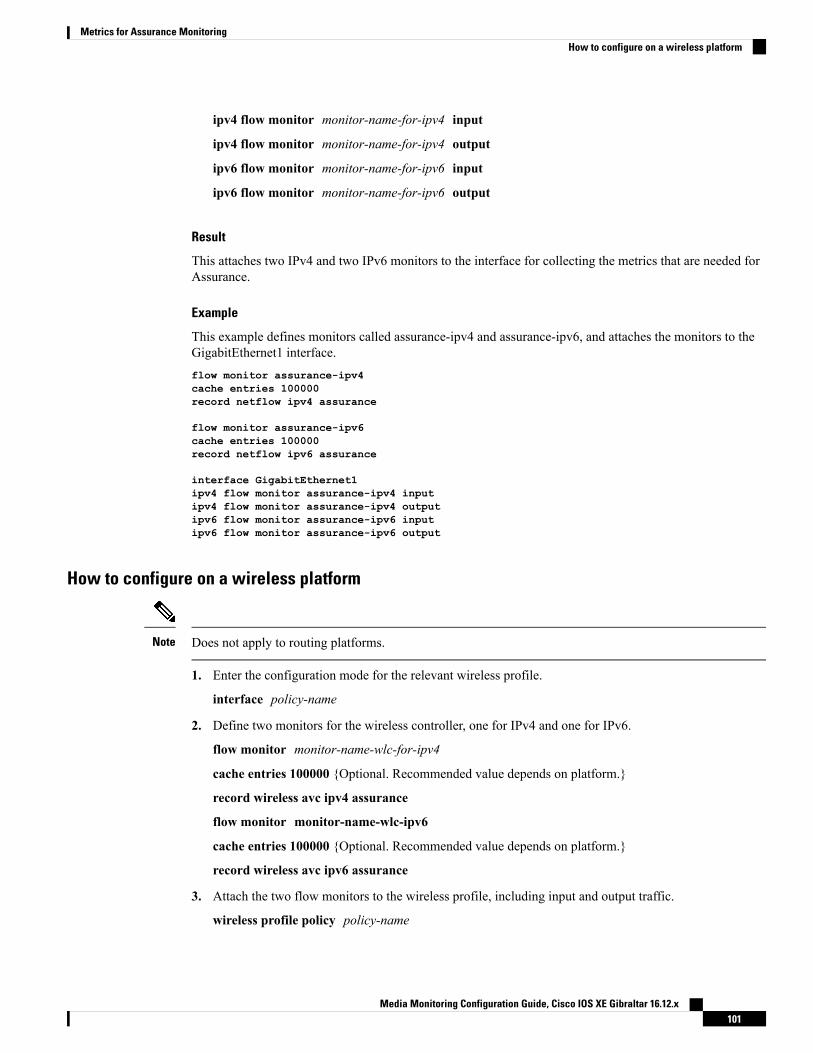
ipv4 flow monitor monitor-name-for-ipv4 input
ipv4 flow monitor monitor-name-for-ipv4 output
ipv6 flow monitor monitor-name-for-ipv6 input
ipv6 flow monitor monitor-name-for-ipv6 output
Result
This attaches two IPv4 and two IPv6 monitors to the interface for collecting the metrics that are needed forAssurance.
Example
This example defines monitors called assurance-ipv4 and assurance-ipv6, and attaches the monitors to theGigabitEthernet1 interface.flow monitor assurance-ipv4cache entries 100000record netflow ipv4 assurance
flow monitor assurance-ipv6cache entries 100000record netflow ipv6 assurance
interface GigabitEthernet1ipv4 flow monitor assurance-ipv4 inputipv4 flow monitor assurance-ipv4 outputipv6 flow monitor assurance-ipv6 inputipv6 flow monitor assurance-ipv6 output
How to configure on a wireless platform
Does not apply to routing platforms.Note
1. Enter the configuration mode for the relevant wireless profile.
interface policy-name
2. Define two monitors for the wireless controller, one for IPv4 and one for IPv6.
flow monitor monitor-name-wlc-for-ipv4
cache entries 100000 {Optional. Recommended value depends on platform.}
record wireless avc ipv4 assurance
flow monitor monitor-name-wlc-ipv6
cache entries 100000 {Optional. Recommended value depends on platform.}
record wireless avc ipv6 assurance
3. Attach the two flow monitors to the wireless profile, including input and output traffic.
wireless profile policy policy-name
Media Monitoring Configuration Guide, Cisco IOS XE Gibraltar 16.12.x101
Metrics for Assurance MonitoringHow to configure on a wireless platform
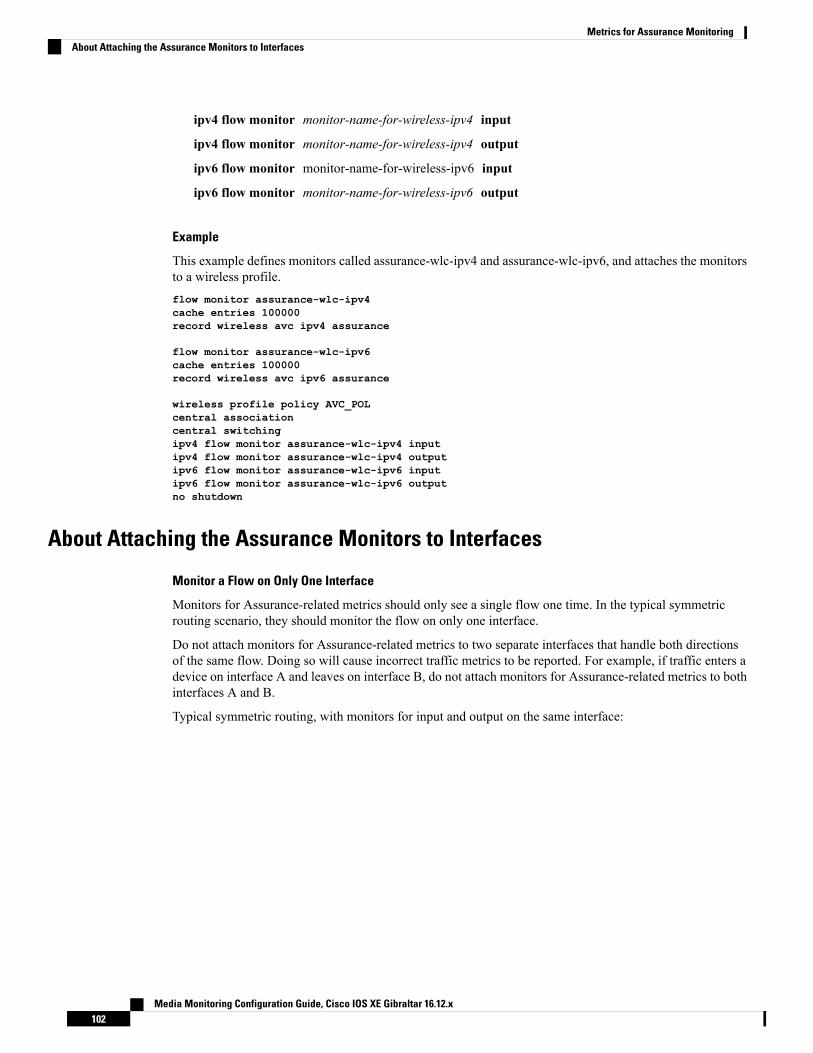
ipv4 flow monitor monitor-name-for-wireless-ipv4 input
ipv4 flow monitor monitor-name-for-wireless-ipv4 output
ipv6 flow monitor monitor-name-for-wireless-ipv6 input
ipv6 flow monitor monitor-name-for-wireless-ipv6 output
Example
This example defines monitors called assurance-wlc-ipv4 and assurance-wlc-ipv6, and attaches the monitorsto a wireless profile.flow monitor assurance-wlc-ipv4cache entries 100000record wireless avc ipv4 assurance
flow monitor assurance-wlc-ipv6cache entries 100000record wireless avc ipv6 assurance
wireless profile policy AVC_POLcentral associationcentral switchingipv4 flow monitor assurance-wlc-ipv4 inputipv4 flow monitor assurance-wlc-ipv4 outputipv6 flow monitor assurance-wlc-ipv6 inputipv6 flow monitor assurance-wlc-ipv6 outputno shutdown
About Attaching the Assurance Monitors to Interfaces
Monitor a Flow on Only One Interface
Monitors for Assurance-related metrics should only see a single flow one time. In the typical symmetricrouting scenario, they should monitor the flow on only one interface.
Do not attach monitors for Assurance-related metrics to two separate interfaces that handle both directionsof the same flow. Doing so will cause incorrect traffic metrics to be reported. For example, if traffic enters adevice on interface A and leaves on interface B, do not attach monitors for Assurance-related metrics to bothinterfaces A and B.
Typical symmetric routing, with monitors for input and output on the same interface:
Media Monitoring Configuration Guide, Cisco IOS XE Gibraltar 16.12.x102
Metrics for Assurance MonitoringAbout Attaching the Assurance Monitors to Interfaces
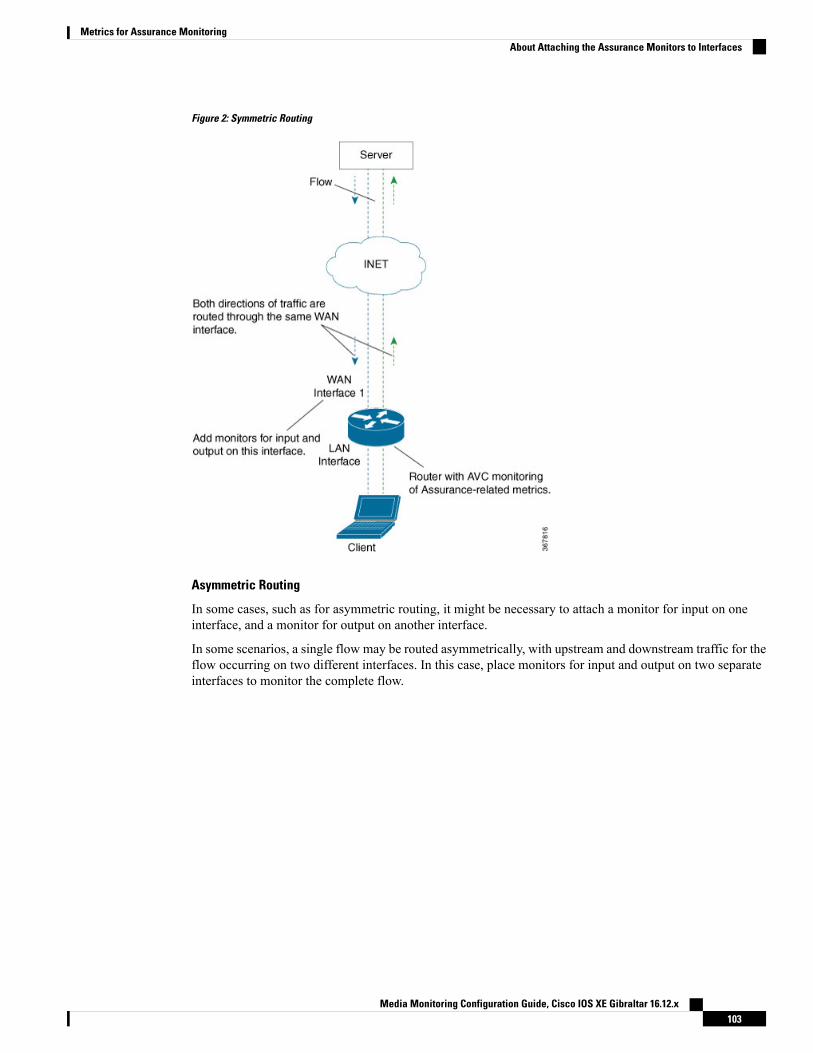
Figure 2: Symmetric Routing
Asymmetric Routing
In some cases, such as for asymmetric routing, it might be necessary to attach a monitor for input on oneinterface, and a monitor for output on another interface.
In some scenarios, a single flow may be routed asymmetrically, with upstream and downstream traffic for theflow occurring on two different interfaces. In this case, place monitors for input and output on two separateinterfaces to monitor the complete flow.
Media Monitoring Configuration Guide, Cisco IOS XE Gibraltar 16.12.x103
Metrics for Assurance MonitoringAbout Attaching the Assurance Monitors to Interfaces
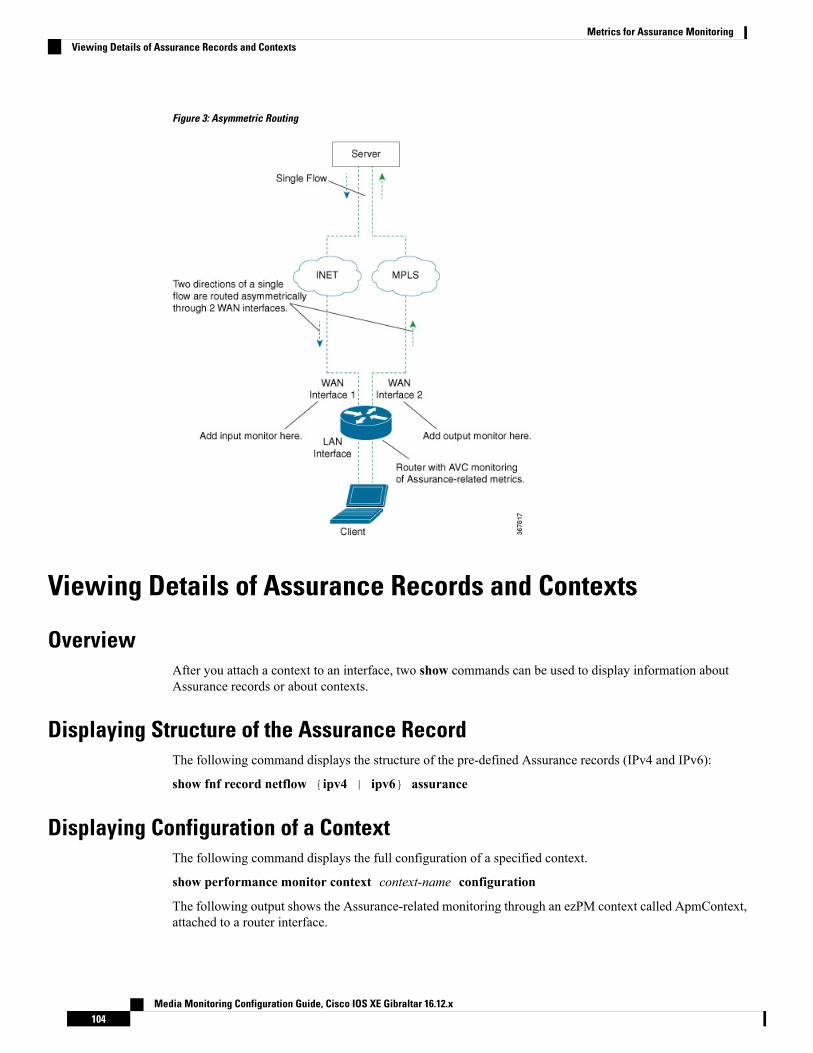
Figure 3: Asymmetric Routing
Viewing Details of Assurance Records and Contexts
OverviewAfter you attach a context to an interface, two show commands can be used to display information aboutAssurance records or about contexts.
Displaying Structure of the Assurance RecordThe following command displays the structure of the pre-defined Assurance records (IPv4 and IPv6):
show fnf record netflow {ipv4 | ipv6} assurance
Displaying Configuration of a ContextThe following command displays the full configuration of a specified context.
show performance monitor context context-name configuration
The following output shows the Assurance-related monitoring through an ezPM context called ApmContext,attached to a router interface.
Media Monitoring Configuration Guide, Cisco IOS XE Gibraltar 16.12.x104
Metrics for Assurance MonitoringViewing Details of Assurance Records and Contexts
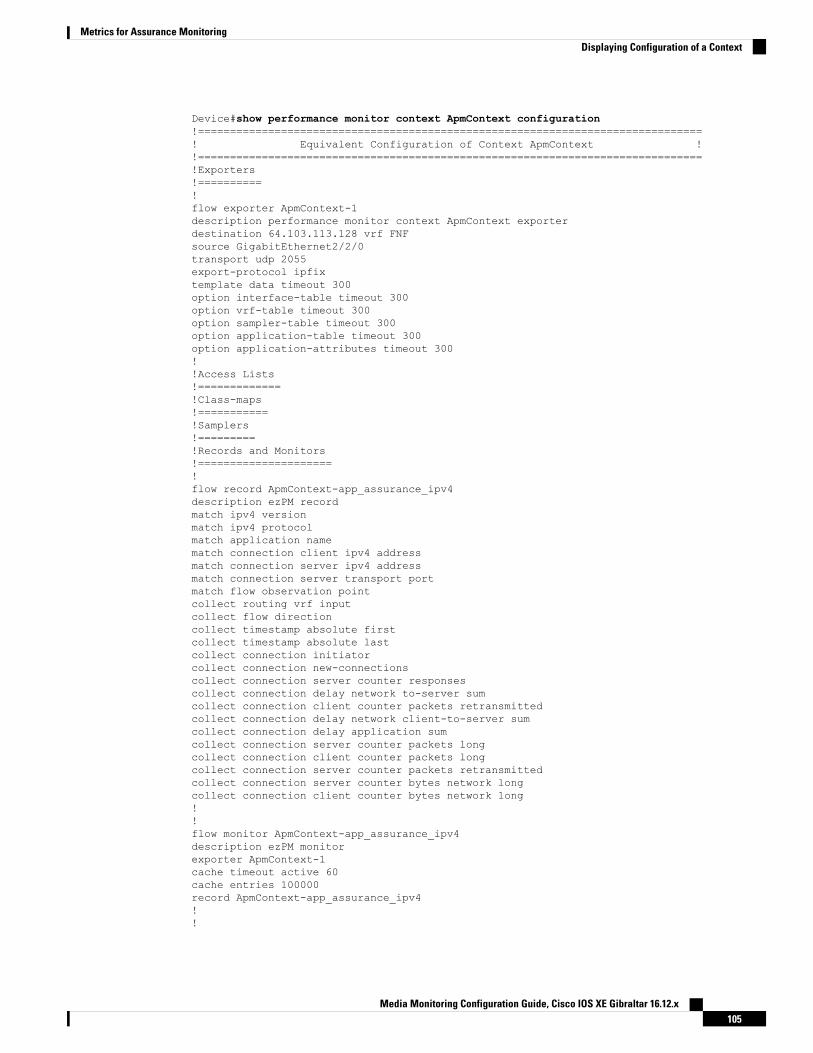
Device#show performance monitor context ApmContext configuration!===============================================================================! Equivalent Configuration of Context ApmContext !!===============================================================================!Exporters!==========!flow exporter ApmContext-1description performance monitor context ApmContext exporterdestination 64.103.113.128 vrf FNFsource GigabitEthernet2/2/0transport udp 2055export-protocol ipfixtemplate data timeout 300option interface-table timeout 300option vrf-table timeout 300option sampler-table timeout 300option application-table timeout 300option application-attributes timeout 300!!Access Lists!=============!Class-maps!===========!Samplers!=========!Records and Monitors!=====================!flow record ApmContext-app_assurance_ipv4description ezPM recordmatch ipv4 versionmatch ipv4 protocolmatch application namematch connection client ipv4 addressmatch connection server ipv4 addressmatch connection server transport portmatch flow observation pointcollect routing vrf inputcollect flow directioncollect timestamp absolute firstcollect timestamp absolute lastcollect connection initiatorcollect connection new-connectionscollect connection server counter responsescollect connection delay network to-server sumcollect connection client counter packets retransmittedcollect connection delay network client-to-server sumcollect connection delay application sumcollect connection server counter packets longcollect connection client counter packets longcollect connection server counter packets retransmittedcollect connection server counter bytes network longcollect connection client counter bytes network long!!flow monitor ApmContext-app_assurance_ipv4description ezPM monitorexporter ApmContext-1cache timeout active 60cache entries 100000record ApmContext-app_assurance_ipv4!!
Media Monitoring Configuration Guide, Cisco IOS XE Gibraltar 16.12.x105
Metrics for Assurance MonitoringDisplaying Configuration of a Context
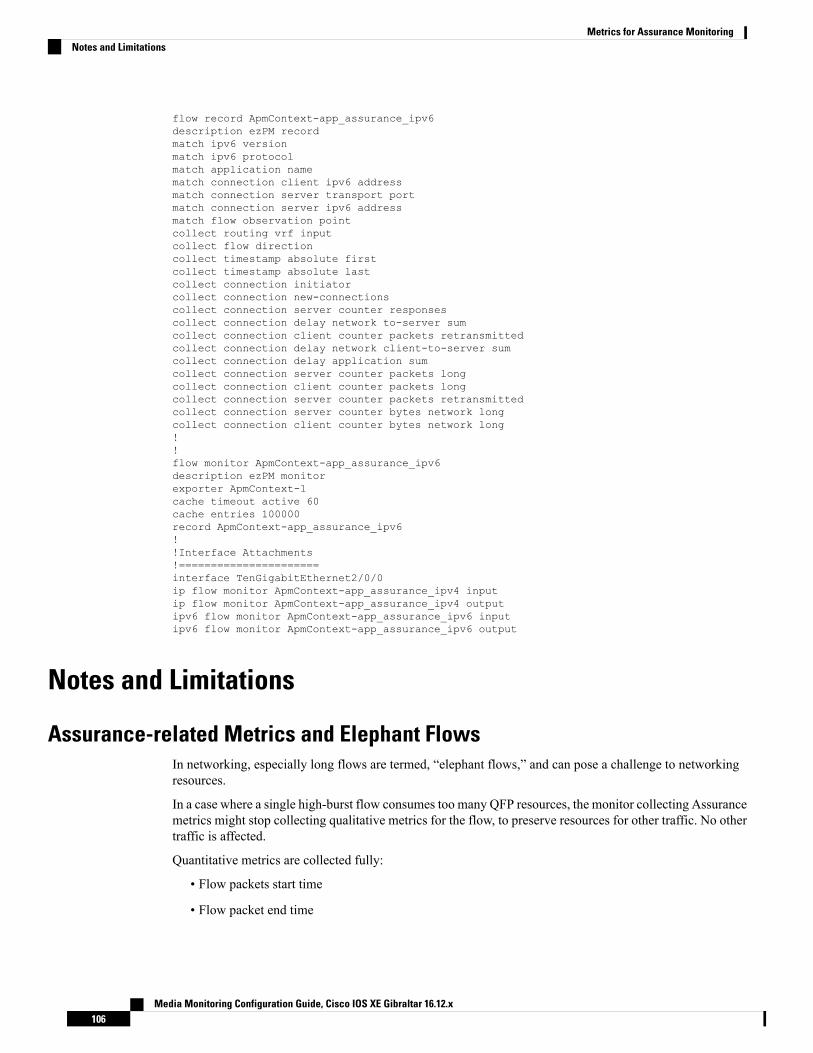
flow record ApmContext-app_assurance_ipv6description ezPM recordmatch ipv6 versionmatch ipv6 protocolmatch application namematch connection client ipv6 addressmatch connection server transport portmatch connection server ipv6 addressmatch flow observation pointcollect routing vrf inputcollect flow directioncollect timestamp absolute firstcollect timestamp absolute lastcollect connection initiatorcollect connection new-connectionscollect connection server counter responsescollect connection delay network to-server sumcollect connection client counter packets retransmittedcollect connection delay network client-to-server sumcollect connection delay application sumcollect connection server counter packets longcollect connection client counter packets longcollect connection server counter packets retransmittedcollect connection server counter bytes network longcollect connection client counter bytes network long!!flow monitor ApmContext-app_assurance_ipv6description ezPM monitorexporter ApmContext-1cache timeout active 60cache entries 100000record ApmContext-app_assurance_ipv6!!Interface Attachments!======================interface TenGigabitEthernet2/0/0ip flow monitor ApmContext-app_assurance_ipv4 inputip flow monitor ApmContext-app_assurance_ipv4 outputipv6 flow monitor ApmContext-app_assurance_ipv6 inputipv6 flow monitor ApmContext-app_assurance_ipv6 output
Notes and Limitations
Assurance-related Metrics and Elephant FlowsIn networking, especially long flows are termed, “elephant flows,” and can pose a challenge to networkingresources.
In a case where a single high-burst flow consumes too many QFP resources, the monitor collecting Assurancemetrics might stop collecting qualitative metrics for the flow, to preserve resources for other traffic. No othertraffic is affected.
Quantitative metrics are collected fully:
• Flow packets start time
• Flow packet end time
Media Monitoring Configuration Guide, Cisco IOS XE Gibraltar 16.12.x106
Metrics for Assurance MonitoringNotes and Limitations

• Packets
• Bytes
Qualitative metrics are not collected fully:
• Total network delay sum (in the TCP handshake)
• Network to-server delay sum (in the TCP handshake)
• Client packets retransmitted
• Server packets retransmitted
• Application delay sum
• Number of server application responses
Media Monitoring Configuration Guide, Cisco IOS XE Gibraltar 16.12.x107
Metrics for Assurance MonitoringAssurance-related Metrics and Elephant Flows

Media Monitoring Configuration Guide, Cisco IOS XE Gibraltar 16.12.x108
Metrics for Assurance MonitoringAssurance-related Metrics and Elephant Flows


