Embed Size (px)
Citation preview

This article appeared in a journal published by Elsevier. The attachedcopy is furnished to the author for internal non-commercial researchand education use, including for instruction at the authors institution
and sharing with colleagues.
Other uses, including reproduction and distribution, or selling orlicensing copies, or posting to personal, institutional or third party
websites are prohibited.
In most cases authors are permitted to post their version of thearticle (e.g. in Word or Tex form) to their personal website orinstitutional repository. Authors requiring further information
regarding Elsevier’s archiving and manuscript policies areencouraged to visit:
http://www.elsevier.com/copyright

Author's personal copy
Mechanical properties evolution during post-welding-heat treatmentsof double-lap Friction Stir Welded joints
E. Cerri ⇑, P. LeoDept. Innovation Engineering, University of Salento, via Arnesano, 73100 Lecce, Italy
a r t i c l e i n f o
Article history:Received 3 November 2010Accepted 28 January 2011Available online 4 February 2011
Keywords:Mechanical propertiesNon-ferrous metals and alloysHeat treatments
a b s t r a c t
The present study focuses on double-lap Friction Stir Welded (FSW) joints in 2024T3 and 7075T6aluminium alloys subjected to several post-welding-heat treatments at warm (typical aging) and hightemperature (solution range) followed by room temperature deformation (tensile tests). The effect ofpost-welding-heat treatments on the microstructure and mechanical properties of double lap FSW jointswere investigated. Polarized Optical Microscopy (POM) and Scanning Electron Microscopy (SEM) analysisreveal a progressive change in grain size and morphology in high temperature post-welding-heat treatedjoints, leading to Abnormal Grain Growth in the stir zone. Stress–strain curves are rather flat for 200� and300 �C post-welded heat treated joints while, for the other set of samples, stress increases with strain toreach maximum stress of 140–160 MPa. Micro-hardness profiles measured on transversal sections ofpost-welded heat treated joints reveal conditions (temperature and time) of hardness homogeneity attop, bottom and central nugget zone and/or along the whole measured profile. When homogeneity isreached, fracture occurs in the nugget. A relationship between hardness and tensile properties has beenapplied in the nugget.
� 2011 Elsevier Ltd. All rights reserved.
1. Introduction
Friction Stir Welding (FSW) is a solid state joining methodparticularly suited for aluminium alloys, which are often difficultto be fusion welded without hot cracking, porosity or distortion.During welding, the material is frictionally heated to a temperatureat which it becomes more plastic. The heat of friction and plasticflow arising from the rotating tool produce significant microstruc-tural changes, which lead to local variations in the mechanicalproperties of the weld [1–5]. FSW is being targeted by the industryfor structurally demanding applications to provide high-performance benefits [6]. The FSW zone consists of a weld nugget,thermomechanically affected zone (TMAZ) and a heat affectedzone (HAZ). From a microstructural point of view the grain struc-ture in the weld nugget is very fine and equiaxed causing a highermechanical strength and ductility [7–12].
In FSW the work piece does not reach the melting point and themechanical properties such as ductility and strength of the weldedzone are much higher compared to the traditional techniques [1].The very attractive mechanical properties are principally due tothe strong grain refining effect of the process. The data available
in literature demonstrated that the mean grain sizes resulting fromthe FSW process result at least 10 times smaller than thosemeasured in the undeformed parent material [13,14]. In short, theresults of these studies suggest that FSW can cause grain refine-ment through severe plastic deformation. In particular, a single passof FSW produces an estimated effective strain e > 40 [15] resultingin a mean 0.5–10 lm grain size structure.
Recently, some studies have been conducted on Friction StirWelded joints after a heat treatment to evaluate the stability ofthe fine grain structure at high temperature. One interesting de-tails after heat treatment is the presence of Abnormal GrainGrowth (AGG) in the welding area and particularly in the nugget.The occurrence of this phenomenon may be a problem if it leadsto a decay of mechanical properties of the weld. Several theorieshave been developed to try to clarify the origin of this behaviourand understand the link with the parameters and characteristicsof the weld [16].
The aim of this work is to investigate the effect of post-welding-heat treatments on mechanical properties of double lap FSW jointsin 2024T3 and 7075T6 aluminium alloys. To achieve these results,a number of post-welding-heat treatments on double lap FSWjoints have been performed at different temperatures and time,followed by tensile tests and micro-hardness measurements.Microstructure evolution was characterized by light microscopyand Scanning Electron Microscopy SEM. Abnormal Grain Growth(ABB) develops during post-welding-heat treatments.
0261-3069/$ - see front matter � 2011 Elsevier Ltd. All rights reserved.doi:10.1016/j.matdes.2011.01.052
⇑ Corresponding author. Tel.: +39 0832 297324.E-mail addresses: [email protected] (E. Cerri), paola.leo@unisalento.
it (P. Leo).
Materials and Design 32 (2011) 3465–3475
Contents lists available at ScienceDirect
Materials and Design
journal homepage: www.elsevier .com/locate /matdes

Author's personal copy
2. Experimental
Sheets of 2024T3 and 7075T6 aluminium alloys of differentthickness were friction stir lap welded using a feeding rate of80 mm/min and a rotating speed of 1000 rpm. The chemicalcomposition of the materials is given in Table 1. The configurationof the double lap joint is reported in Fig. 1. The 2024T3 has athickness of 1.3 mm and the 7075T6 of 2 mm. The external sheets(2024T3) were welded parallel to the rolling direction while thecentral sheet (7075T6) was put in the long transverse directionfor FSW process in order to limit potential effect of rolling texture.
The weld parameters were optimised taking into account themechanical properties of the softer alloy (7075).
Table 1Chemical composition (% in weight) of the Base Materials.
Cu Mg Zn Fe Si Mn Cr Ti Al
7075T6 1.2–2 2.1–2.9 5.1–6.1 60.5 60.4 60.3 0.18–0.28 <0.2 rem2024T3 3.8–4.9 1.2–1.8 60.25 60.5 60.5 0.3–0.9 60.1 60.15 rem
Fig. 1. Schematic illustration of the Friction Stir Welded double lap joints andprocess parameters.
2024T3top
2024T3bottom
7075T6
7075T6
2024T3 nugget
TMAZ
nugget
0 1 2 3 4 5 6 7 8 9 100
2
4
6
8
10
12
14
16
18
Counts Gauss fitC
ount
s
Equivalent diameter [µm]
(b)(a)
(c)
(d)(e)
200 µm
100µm
10 µm
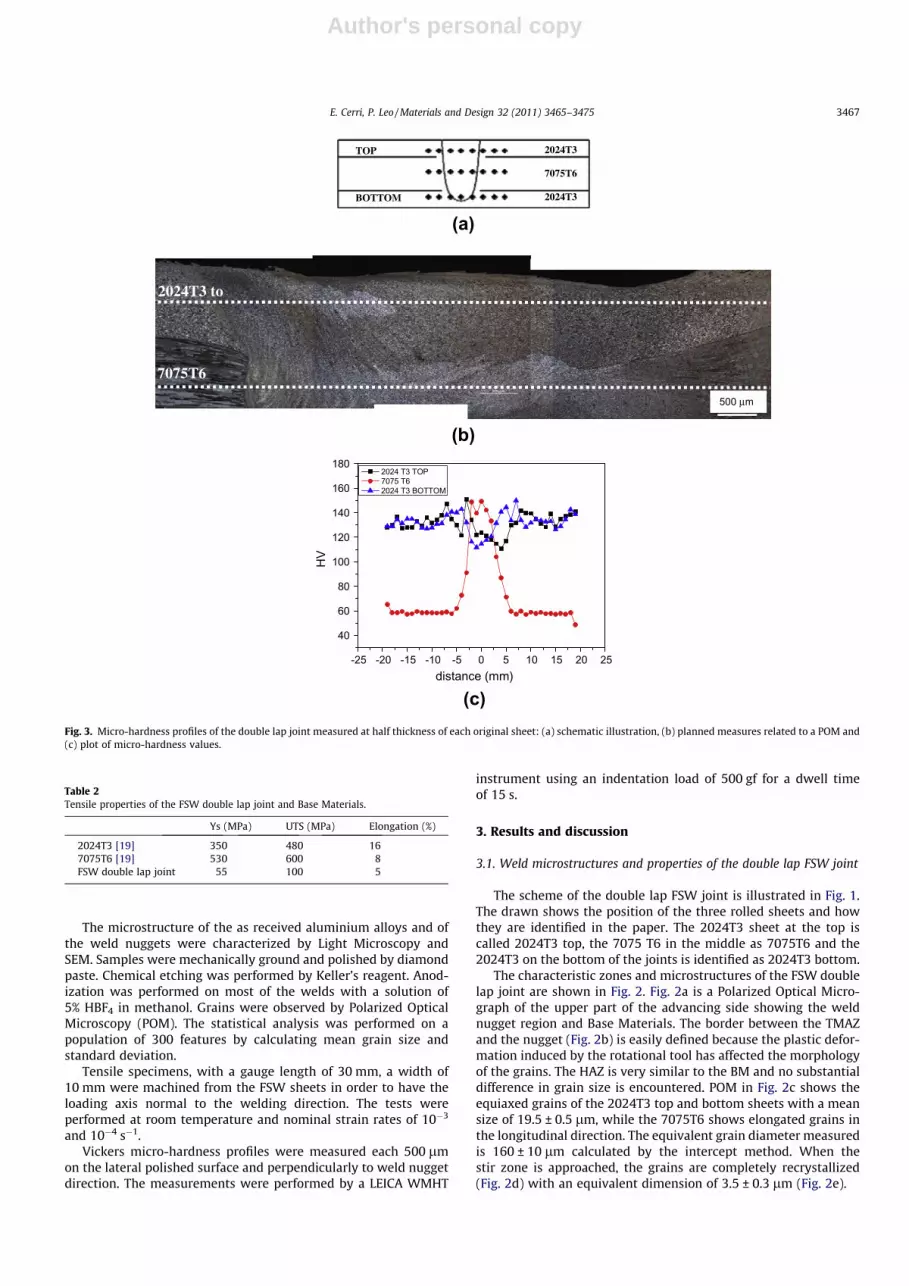
Fig. 2. Optical micrographs showing grain morphology in the advancing side: (a) stir zone and Base Materials, (b) thermo mechanical affected zone and the nugget, (c) lowmagnification of half FSW joint, (d) recrystallized grains of the nugget and (e) statistical evaluation of equivalent grain size.
3466 E. Cerri, P. Leo / Materials and Design 32 (2011) 3465–3475
Author's personal copy
The microstructure of the as received aluminium alloys and ofthe weld nuggets were characterized by Light Microscopy andSEM. Samples were mechanically ground and polished by diamondpaste. Chemical etching was performed by Keller’s reagent. Anod-ization was performed on most of the welds with a solution of5% HBF4 in methanol. Grains were observed by Polarized OpticalMicroscopy (POM). The statistical analysis was performed on apopulation of 300 features by calculating mean grain size andstandard deviation.
Tensile specimens, with a gauge length of 30 mm, a width of10 mm were machined from the FSW sheets in order to have theloading axis normal to the welding direction. The tests wereperformed at room temperature and nominal strain rates of 10�3
and 10�4 s�1.Vickers micro-hardness profiles were measured each 500 lm
on the lateral polished surface and perpendicularly to weld nuggetdirection. The measurements were performed by a LEICA WMHT
instrument using an indentation load of 500 gf for a dwell timeof 15 s.
3. Results and discussion
3.1. Weld microstructures and properties of the double lap FSW joint
The scheme of the double lap FSW joint is illustrated in Fig. 1.The drawn shows the position of the three rolled sheets and howthey are identified in the paper. The 2024T3 sheet at the top iscalled 2024T3 top, the 7075 T6 in the middle as 7075T6 and the2024T3 on the bottom of the joints is identified as 2024T3 bottom.
The characteristic zones and microstructures of the FSW doublelap joint are shown in Fig. 2. Fig. 2a is a Polarized Optical Micro-graph of the upper part of the advancing side showing the weldnugget region and Base Materials. The border between the TMAZand the nugget (Fig. 2b) is easily defined because the plastic defor-mation induced by the rotational tool has affected the morphologyof the grains. The HAZ is very similar to the BM and no substantialdifference in grain size is encountered. POM in Fig. 2c shows theequiaxed grains of the 2024T3 top and bottom sheets with a meansize of 19.5 ± 0.5 lm, while the 7075T6 shows elongated grains inthe longitudinal direction. The equivalent grain diameter measuredis 160 ± 10 lm calculated by the intercept method. When thestir zone is approached, the grains are completely recrystallized(Fig. 2d) with an equivalent dimension of 3.5 ± 0.3 lm (Fig. 2e).
2024T3
7075T6
2024T3
TOP
BOTTOM
-25 -20 -15 -10 -5 0 5 10 15 20 25
40
60
80
100
120
140
160
180
HV
distance (mm)
2024 T3 TOP 7075 T6 2024 T3 BOTTOM
2024T3 to
7075T6
500 µm
(a)
(b)
(c)Fig. 3. Micro-hardness profiles of the double lap joint measured at half thickness of each original sheet: (a) schematic illustration, (b) planned measures related to a POM and(c) plot of micro-hardness values.
Table 2Tensile properties of the FSW double lap joint and Base Materials.
Ys (MPa) UTS (MPa) Elongation (%)
2024T3 [19] 350 480 167075T6 [19] 530 600 8FSW double lap joint 55 100 5
E. Cerri, P. Leo / Materials and Design 32 (2011) 3465–3475 3467

Author's personal copy
The variation in hardness profiles with distance from weld cen-tre has been measured along ideal lines of the three sheets asdescribed in Fig. 3a and b. The results are plotted in Fig. 3c startingfrom the BM to the centre of the weld, in the advancing andretreating directions. The three profiles substantially differ in thestir zone and in the BMs, according to their thermal historyand microstructure modifications occurred during FSW. For the
2024T3 top and bottom Base Material, the hardness is in the rangeof 130–140 HV, then it increases in the TMAZ and reaches a mini-mum in the nugget (110–120 HV). This trend is reversed in the7075T6: the hardness profile has a maximum in the nugget zone(140–150 HV) and lower values in the BM (60 HV). In order to ex-plain this trend we should consider an important feature, i.e. thestrong difference in grain shape and size of the two Base Materials.
-25 -20 -15 -10 -5 0 5 10 15 20 2540
60
80
100
120
140
160
Har
dnes
s H
V
distance from the nugget center [mm]
300°C-1h
-25 -20 -15 -10 -5 0 5 10 15 20 2540
60
80
100
120
140
160
distance from the nugget center [mm]
300°C-2h
-25 -20 -15 -10 -5 0 5 10 15 20 2540
60
80
100
120
140
160
distance from the nugget center [mm]
2024 T3 TOP 7075 T6 2024 T3 BOTTOM
300°C-6h
-25 -20 -15 -10 -5 0 5 10 15 20 2540
60
80
100
120
140
160
Har
dnes
s H
V
distance from the nugget center [mm]
2024 T3 TOP 7075 T6 2024 T3 BOTTOM
200°C-1h
-25 -20 -15 -10 -5 0 5 10 15 20 2540
60
80
100
120
140
160
distance from the nugget center [mm]
200°C-2h
-25 -20 -15 -10 -5 0 5 10 15 20 2540
60
80
100
120
140
160
distance from the nugget center [mm]
200°C-6h
(a)
(b)Fig. 4. Hardness profiles after post-welding-heat treatments performed: (a) at 200� and (b) at 300 �C for 1, 2 and 6 h.
200°C 300°C
1h
6h
Fig. 5. Anodized microstructure of the stir zone after heat treatments at 200 �C and 300 �C for 1 and 6 h.
3468 E. Cerri, P. Leo / Materials and Design 32 (2011) 3465–3475

Author's personal copy
In fact, the 7075T6 BM presents the longitudinal plane perpendic-ular to the weld direction while the 2024T3 BM the transverseplane with an equivalent grain dimension that is 7–8 times largerin 7075T6 BM. This substantially contributes to the high differencein hardness of the BMs (7075T6 BM softer than 2014T3). Moreover,the central sheet is originally in T6 state while top and bottom arein T3 state.
In the stir zone or weld nugget, the hardness of the 2024T3 islower compared to its BM because of the recrystallization processoccurred during Friction Stir Welding and the temperature incre-
ment that contribute to precipitate coarsening. At the same time,the hardness of the 7075T6 substantially increases in the nuggetzone to values comparable with 2024T3 BM due to the strong grainrefinement obtained by FSW (from 160 ± 10 lm in 7075T6 BM to3.5 ± 0.3 lm in the nugget zone). This microstructural modificationis common to both the alloys in the stir zone. Precipitate dissolu-tion and solubilisation in the matrix induce solute strengtheningthat is more efficient than precipitation when particles createdby a T6 heat treatment are exposed to high temperatures (400–450 �C) [17] during severe plastic deformation process.
300°C-2h 300°C-6h
(a) (b)Fig. 6. Scanning Electron Micrographs of nugget zones after 300 �C: (a) 2 h and (b) 6 h showing particle distribution on grain boundaries.
-25 -20 -15 -10 -5 0 5 10 15 20 2540
60
80
100
120
140
160
Har
dnes
s H
V
distance from nugget centre [mm]
2024 T3 TOP 7075 T6 2024 T3 BOTTOM
400°C-1h
-25 -20 -15 -10 -5 0 5 10 15 20 2540
60
80
100
120
140
160
distance from the nugget center [mm]
400°C-2h
-25 -20 -15 -10 -5 0 5 10 15 20 2540
60
80
100
120
140
160
distance from nugget centre [mm]
400°C-6h
400°C-2h 400°C-1h
(a)
(b) (c)Fig. 7. Post-welding-heat treatments at 400 �C: (a) micro-hardness measurements after 1, 2 and 6 h, (b) anodized microstructure of half joint (advancing side) after exposureat 400 �C for 2 h, and (c) SEM micrograph showing particle distribution in the nugget.
E. Cerri, P. Leo / Materials and Design 32 (2011) 3465–3475 3469

Author's personal copy
The tensile properties at room temperature of the double lapFSW joint and of Base Materials are summarized in Table 2. Failureof FSW double lap joint occurs in 7075T6 Base Material.
3.2. Post-welding-heat treatments
In order to study the thermal stability, double lap FSW jointshave been heat treated at 200�, 300�, 400� and 450 �C. Mechanicalproperties were then evaluated by micro-hardness and tensiletests at room temperature and microstructure by polarizedlight microscopy. Fig. 4 illustrates the hardness profiles for thejoints after heat treatment at 200� and 300 �C for 1, 2 and 6 h. At
200 �C (Fig. 4a), HV profiles are comparable with those of theFSW joint. A small increment of hardness in 2024T3 top (stir zone)delineates with time (after 6 h). The exposure at 300 �C (Fig. 4b) in-duces changes in hardness of the BMs and in the stir zones. In fact,the 2024T3 BM has a decrease in hardness from 140–150 HV to120 HV after 6 h, while the 7075T6 BM remains constant. In thenugget, there is a progressive reduction in hardness values forthe 2024T3 and 7075T6 to comparable values (80–90 HV) after6 h. The decrease of HV in 7075T6 nugget in 6 h is very large(60 HV points). Moreover, 6 h HV profiles are less scattered com-pared with shorter time values. Fig. 5 reports the anodized micro-structure of the nugget for samples heat treated at 200� and 300 �C
40
60
80
100
120
140
160H
V
distance from the nugget center (µm)
2024 T3 TOP 7075 T6 2024 T3 BOTTOM 450°C-0,5h
40
60
80
100
120
140
160
HV
distance from the nugget center (µm)
2024 T3 TOP 7075 T6 2424 T3 BOTTOM
450°C-1h
-25 -20 -15 -10 -5 0 5 10 15 20 25
-25 -20 -15 -10 -5 0 5 10 15 20 25
-25 -20 -15 -10 -5 0 5 10 15 20 2540
60
80
100
120
140
160
HV
distance from the nugget center (µm)
2024 T3 TOP 7075 T6 2024 T3 BOTTOM 450°C-2h
(a)
(b)
(c)Fig. 8. Post-welding-heat treatments at 450 �C showing micro-hardness profiles (left) and anodized microstructure (right) of half joint (advancing side) after: (a) 0.5 h, (b)1 h, (c) 2 h, (d) 4 h and (e) 6 h. (f) Average micro-hardness.
3470 E. Cerri, P. Leo / Materials and Design 32 (2011) 3465–3475

Author's personal copy
showing a small coarsening in grain size at the higher temperatureand time. Grain coarsening contributes to decrease hardness withtime in the nugget (Fig. 4b). Statistical evaluation of grain size willbe presented at the end of this paragraph. Fig. 6 reports Back-Scattered Electron images of post-welded heat treated joints at300 �C for a) 2 h and b) 6 h showing particle distribution in thenugget zone. Particle size increases with time and their coarseningcontributed to lower HV profile in the nugget zone (Fig. 4b).
The results of post-welding-heat treatments at high tempera-tures (400–450 �C) are illustrated in Figs. 7 and 8 showinghardness measurements and microstructures. After exposure at400 �C for 1 h (Fig. 7a), hardness profiles of the 2024T3 top andbottom are constant in the BMs (80 HV) and show a small mini-
mum in the stir zone. The 7075T6 presents micro-hardness valuesaround 100 HV in the BM and a large peak, 10 HV higher, in the stirzone. The difference between external and central section of thedouble lap joint is removed after one hour more of exposure at400 �C, even if the minimum still remains in the 2024T3 top. Any-way, the double lap joint has reached homogeneity in hardness. InFig. 7b, the microstructure of the sample exposed at 400 �C for 2 his shown. The grain size and shape are quite different in the 2024T3and 7075T6 but the micro-hardness values are comparable in theBMs. A strong contribution to levelling hardness comes from pre-cipitation and/or dissolution processes occurring at 400 �C in thesealloys. The nugget still presents small equiaxed recrystallizedgrains. Fig. 7c is a BSE image of particles in the nugget after post-
40
60
80
100
120
140
160
HV
distance from the nugget center (µm)
2024 T3 TOP 7075 T6 2024 T3 BOTTOM
450°C-4h
40
60
80
100
120
140
160
HV
distance from the nugget (µm)
2024 T3 TOP 7075 T6 2024 T3 BOTTOM
450°C-6h
-25 -20 -15 -10 -5 0 5 10 15 20 25
-25 -20 -15 -10 -5 0 5 10 15 20 25
0 5000 10000 15000 20000 2500030
60
90
120
150
180
aver
age
mic
roha
rdne
ss in
the
nugg
et, H
V 0,5
time, s
2024T3 top nugget 7075T6 nugget
(d)
(e)
(f)Fig. 8 (continued)
E. Cerri, P. Leo / Materials and Design 32 (2011) 3465–3475 3471

Author's personal copy
welding-heat treatment at 400 �C–1 h. Coarsening and partiallysolubilisation of particles are clearly visible in the micrograph.
During post-welding-heat treatment at 450 �C, the micro-structure of the whole joint modifies, especially in the nugget zone(Fig. 8). In fact, after half an hour of exposure at 450 �C, abnormalgrains are visible at the bottom of the nugget zone. The extensionof abnormal grains increases in volume with passing time and afterfour hours abnormal grains totally cover the nugget zone. Accord-ingly to microstructure evolution, micro-hardness profiles havebeen measured after 0.5, 1, 2, 4 and 6 h and the results shown inFig. 8 on the left column. The HV profiles of 7075T6 remain similarin values (110–130 HV) and shape at 450 �C. The HV profiles of2024T3 top and bottom tend to overlap and remain lower in valuescompared with those of the 7075T6. The joint and the wholenugget result homogeneous in hardness after 4 h of post-welding
treatment at 450 �C. After this time, the HV profiles of the central7075T6 and 2024T3 top and bottom are again separated. It isimportant to remark that HV profiles at 450 �C–6 h are almostconstant, (i.e. few scattered points are present) although micro-structure is different in the nugget and in the BMs (AGG andelongated grains in 7075T6; AGG and transversal rolled grains in2024T3 top and bottom). The variation of average of micro-hard-ness at 450 �C in the nugget zone has been plotted as a functionof time in Fig. 8f to show its evolution. The alloy 2024 in the T3temper show a complex softening behaviour with two competingmechanisms at 450 �C: dissolution and overaging. For the first hourthe substantial softening is due to overaging (solution temperatureis close to 490 �C) of a large quantity of S0/S particles; the increaseto a peak can be due to solution strengthening. Then after 4 h, thereis again a light softening due to overaging of equilibrium particles
failure
ε
0
20
40
60
80
100
120
140
160
180
σ, M
Pa
tensile tests after exposure at 300°C
1h
2h6h
0.00 0.02 0.04 0.060.00 0.02 0.04 0.060
20
40
60
80
100
120
140
160
180
tensile tests after exposure at 200°C
2h
as FSW
6h
ε
σ, M
Pa
(a) (b) (c)Fig. 9. Stress–strain curves of as-FSW and post-welding-heat treated samples at (a) 200� and (b) 300 �C. (c) Localization of the fracture zone.
failure
ε0,00 0,02 0,04 0,06
0
20
40
60
80
100
120
140
160
180
as FSW
2h 6 h
σ, M
Pa
tensile tests after exposure at 400°C
1 h
(a) (b)Fig. 10. (a) Stress–strain curves after post-welding-heat treatment at 400 �C. (b) Localization of the fracture zone.
3472 E. Cerri, P. Leo / Materials and Design 32 (2011) 3465–3475

Author's personal copy
(S phase) [18,19]. For the 7075T6 nugget, the exposure at 450 �Cdetermines, at first, the complete dissolution of small particlesand the coalescence of bigger ones giving rise to a light depressionin micro-hardness values after 4 h; afterwards, the solid solutionstrengthening mechanism increases again HV.
It is important to evaluate the effect of post-welding-heattreatments on tensile properties of the double lap joints. Fig. 9
illustrates the stress–strain curves after post-welding-heat treat-ments at lower temperatures (200� and 300 �C) while Fig. 10 showsthe results for the joints heat treated at 400� and 450 �C. The ten-sile curves in Fig. 9a and b exhibit the same trend in strengths andductilities. The UTS are in the range of 90–100 MPa and the elonga-tions of 4–5%, quite far from the original sheet properties (seeTable 2). In this figure, the stress–strain curve of FSW joint isreported too. It perfectly overlaps with ‘‘200 �C’’ curves. Thefracture mode is also common for these joints because ruptureoccurs in the 7075T6 Base Material, as shown in the scheme ofFig. 9c. Failure in the 7075T6 BM was expected because, accordingto HV profiles (Fig. 4), the post-welding-heat treatments at 200�and 300 �C do not substantially modify the initial HV profiles ofthe joints that were extremely inhomogeneous and let the7075T6 BM be the softer part of the double lap joints.
The tensile behaviour of FSW joints after exposure at 400 �C(Fig. 10) is completely different. In fact, the stress increaseswith strain for all the investigated conditions reaching an UTS of160 MPa for the sample post-welding-heat treated at 400 �C for1 h (Fig. 10c). The ductility is 2–3%. In these samples, failure occursinside the weld nugget and no more in the 7075T6, as indicated inFig. 10b. From the HV profiles (Fig. 7a) it is visible that the nuggetzone is lightly softer than other regions of the joint, even for fewhardness points. In Fig. 10a the comparison of stress–strain curvesof post-welded heat treated samples with the as-FSW joint is re-ported to show the difference in strength and elongation.
The region where fracture has occurred in the FSW joint isshown in Fig. 11a–c illustrates SEM pictures of the fracture surfaceshowing dimple distribution and, at higher magnification, particlesinside dimples respectively.
A statistical evaluation of equivalent grain size is reported inFig. 12a at different temperatures and time. The grain size has beenevaluated in the nugget zone along the hardness lines and for theexperimental conditions where micro-hardness does not interceptAbnormal Grain Growth. The measurements show constant meangrain size after post-welding-heat treatment at 200 �C. At highertemperatures, grain growth kinetic increases and at 500 �C grainshave duplicated their size in two hours. A linear correlation of mi-cro-hardness with mean grain size is shown in Fig. 12b. Two differ-ent behaviour are identified, i.e. at low temperatures (200� and300 �C) and at 450 �C. In the former case, the best correlation ofHV with mean grain size d is represented by the formulaHV = 140, 24–20, 85d with R2 = 0.89.
As hardness can be compared to 1/3 of yield strength andHall –Petch equation relates the yield strength to grain diameter,we have tried to apply the same kind of relationship to Hardness(HV � 1/d). The results are not suitable from a statistical point ofview due to a very poor R2 (0.14).
At 450 �C, the plot of HV vs. d is a flat line.In the past, efforts to correlate hardness and strength of materi-
als have been made as reported in [20,21]. Tabor has proposed acomplex relationship between the ultimate tensile strength UTSand the micro-hardness HV by taking the strain hardening coeffi-cient into consideration [22]. Following his approach, simplifiedexpressions relating UTS and the yield strength Ys with H werepresented as follows [20]:
UTS ¼ H2:9
n0:217
� �nð1Þ
Ys ¼ H3ð0:1Þn ð2Þ
where H is the hardness and n is the strain hardening coefficient.The strain hardening coefficient is microstructure dependent,
and is distributed homogeneously in the nugget because of therecrystallized microstructure. The direct way to obtain the strain
Fig. 11. Fracture mode of the FSW sample showing: (a) rupture region, (b) dimpledistribution and (c) particles inside dimples in the fracture zone occurred in the7075T6 sheet.
E. Cerri, P. Leo / Materials and Design 32 (2011) 3465–3475 3473

Author's personal copy
hardening coefficient is based on a uniaxial tensile test. Besides,the classic Meyer hardness measurement is also an importantmethod [23]. Moteff [24] also proposed an empirical expression(Eq. (3)) for the determination of the strain hardening coefficientby taking account of the subgrain or dislocation cell size:
nk ¼ k ð3Þ
where k is the subgrain size in lm and k is a constant equal to0.2 lm.
In the present work, n in the nugget is calculated according toEq. (3) by using the characteristic microstructure size instead ofthe subgrain size that is the recrystallized grain size of the frictionstir welded structure. Then n is employed in Eqs. (1) and (2) to esti-mate the strength in the nugget.
Fig. 13 shows the distribution of UTS, YS and strain hardeningcoefficient in the nugget centre of samples heat treated at 200�and 300 �C. As indicated in Fig. 13, UTS and YS slightly decreasewhen n decreases as a function of temperature and time. Thesecan be rationalized by the fact that in the nugget, the hardness val-ues are mainly controlled by particle dimension and distributionand less by recrystrallized grain size variation. Therefore, UTSand YS slightly decrease while n decreases with a small increasein grain size and particle evolution at 200� and 300 �C.
4. Conclusions
Double-lap Friction Stir Welded joints in 2024T3 and 7075T6aluminium alloys were subjected to a number of post-welding-
heat treatments at warm (typical aging) and high temperature(solution range) followed by room temperature deformation (ten-sile tests). The following conclusions were drawn from the results.
– The double lap FSW joints after post-welding-heat treatment atlow temperatures (200 �C) have mechanical properties (tensileproperties and micro-hardness) comparable with the as-FSWjoint. At 300 �C, microstructure modification in the nugget(mainly particle coarsening) reduces hardness in the nuggetand let hardness at the top, centre and bottom region to be com-parable (75–85 HV). The 2024T3 top and bottom Base Materialsdecrease in hardness too while 7075T6 BM remains constant toinitial values. The tensile properties are similar after post-weld-ing-heat treatments at 200� and 300 �C and also the fractureoccurs in the same zone. Stress–strain curves reaches a plateauat a strain of 0.02.
– Post-welding-heat treatments at higher temperature (400� and450 �C) induces faster kinetics for particles (coarsening and/orsolubilisation) and also for grain growth. At 400 �C, hardnessprofiles overlap after 2 h (a sort of homogenisation) and theybecomes almost flat after 6 h. Apparently, the microstructurelooks very different from BMs to nugget region. Stress–straincurves show an increase of stress with strain typical of workhardening. The fracture strain is almost 50% of joints deformedafter heat treatment at lower temperature. Fracture occursinside the stir zone. At 450 �C, hardness profiles of the top, bot-tom and central line overlap after 4 h exposure. At this time, thenugget zone has been completely occupied by Abnormal Grainsthat started to develop from the bottom part of the nugget.
– After different attempts made to locally correlate Vickers Hard-ness to grain size, a correlation between HV and tensile strengththat included the microstructural feature (recrystallized grainsize) in the nugget has been performed. During exposureat 200� and 300 �C the tensile strengths in the nugget centreslightly decreases with time and temperature. The strain hard-ening coefficient correspondingly decreases.
Acknowledgement
The authors wish to thank MIUR for funding this research.
References
[1] Rodes CG, Mahoney MW, Bingel WH, Spurling RA, Bampton CC. Effects offriction stir welding on microstructure of 7075 aluminum. Scripta Mater1997;36:69–75.
1,5 2,0 2,5 3,0 3,5 4,0 4,5 5,00
20
40
60
80
100
120
140
160
HV
mean grain size diameter at nugget center, μm
200°C 300°C 450°C
-110-1 100 3103 104 105
1
2
3
4
5
6m
ean
grai
n si
ze a
t the
nug
get
ce
nter
(μm
)
time (s)
200°C 300°C 450°C 500°C
(a) (b)Fig. 12. (a) Mean grain size diameter at the nugget centre vs. time at different temperature and (b) hardness vs. mean grain size diameter.
0 5000 10000 15000 20000 2500010
20
30
40
50
60 UTS 200°C Ys 200°C UTS 300°C Ys 300°C n at 200°C n at 300°C
time, s
−−−−
− U
TS o
r Ys,
MPa
0,04
0,05
0,06
0,07
0,08
0,09
0,10
- - - - - strain hardening coefficient, n
Fig. 13. UTS, Ys and strain hardening coefficient n calculated at the nugget centrefor the joint exposed at 200� and 300 �C.
3474 E. Cerri, P. Leo / Materials and Design 32 (2011) 3465–3475

Author's personal copy
[2] Mahoney MW, Rodes CG, Flintoff JG, Spurling RA, Bingel WH. Properties offriction-stir-welded 7075 T651 aluminum. Metall Mater Trans A1998;29:1955–64.
[3] Sato Y, Kokawa H, Enomoto M, Jogan S. Microstructural evolution of 6063aluminum during friction-stir welding. Metall Mater Trans A1999;30:2429–37.
[4] Jata KV. Friction stir welding of high strength aluminium alloys. Mater SciForum 2000;331–337:1701–12.
[5] Braun R, Dalle Donne C, Staniek G. Laser beam welding and friction stir weldingof 6013-T6 aluminium alloy sheet. Materialwiss Werkst 2000;31:1017–26.
[6] Thomas WM, Nicholas ED, Needam JC, Murch MG, Templesmith P, Dawes CJ.GB Patent application 9125978.8, 9125978.8, December 1991 and US PatentNo. 5460317; October 1995.
[7] Charit I, Mishra RS, Mahoney MW. Multi-sheet structures in 7475 aluminumby friction stir welding in concert with post-weld superplastic forming. ScriptaMater 2002;47:631–6.
[8] Salem HG, Reynolds AP, Lyons JS. Microstructure and retention ofsuperplasticity of friction stir welded superplastic 2095 sheet. Scripta Mater2002;46:337–42.
[9] Rhodes CG, Mahoney MW, Bingel WH, Calabrese M. Fine-grain evolution infriction-stir processed 7050 aluminum. Scripta Mater 2003;48:1451–5.
[10] Jata KV, Semiatin SL. Continuous dynamic recrystallization during friction stirwelding of high strength aluminum alloys. Scripta Mater 2000;43(8):743–9.
[11] Lockwood WD, Tomaz B, Reynolds AP. Mechanical response of friction stirwelded AA2024: experiment and modelling. Mater Sci Eng 2002;A323:348–53.
[12] Guerra M, Schmidt C, McClure JC, Murr LE, Nes AC. Flow patterns duringfriction stir welding. Mater Charact 2003;49:95–101.
[13] Liu G, Murr LE, Niou CS, McClure JC, Vega FR. Microstructural aspects of thefriction-stir welding of 6061-T6 aluminum. Scripta Mater 1997;37:355.
[14] Murr LE, Liu G, McClur JC. Microtextures in the recrystallized zone of a friction-stir. J Mater Sci Lett 1997;16:1801.
[15] Heurtier P, Desrayaud C, Montheillet F. A thermomechanical analysis of thefriction stir welding process. Mater Sci Forum 2002;396–402:1537.
[16] Charit I, Mishra RS. Abnormal grain growth in friction stir processed alloys.Scripta Mater 2008;58:367–71.
[17] Mishra RS, Ma ZY. Friction stir welding and processing. Mater Sci Eng R2005;50:1–78.
[18] Shercliff HR, Russell MJ, Taylor A, Dickerson TL. Microstructural modelling infriction stir welding of 2000 series aluminium alloys. Mec Ind 2005;6:25–35.
[19] Conserva M, Donzelli G, Trippodo R. Aluminium and itsapplications. Italy: Edimet-Brescia; 1992.
[20] Xuan ML, Zhu FZ. Correlation between microstructure, hardness and strengthin HAZ of dissimilar welds of rotor steels. Mater Sci Eng A 2010;527:4035–42.
[21] Zhu ML, Xuan FZ. Effects of temperature on tensile and impact behavior ofdissimilar welds of rotor steels. Mater Design 2010;31:3346–52.
[22] Tabor D. The hardness and strength of metals. J Inst Metal 1951;79:1–18.[23] Dieter GE. Mechanical metallurgy. 3rd ed. Mc Graw Hill Company; 1986.[24] Moteff J, Bhargava RK, McCullough WL. Correlation of the hot-hardness with
the tensile strength of 304 stainless steel to temperatures of 1200�C. MetallTrans A 1975;6:1101–4.
E. Cerri, P. Leo / Materials and Design 32 (2011) 3465–3475 3475