Embed Size (px)
Citation preview

1 The International Journal of Educational and Psychological Assessment January 2013, Vol. 12(2)
© 2013 Time Taylor Academic Journals ISSN 2094-0734
Measuring “Orthorexia”: Development of the Eating Habits Questionnaire
David H. Gleaves
University of South Australia, Australia
Erin C. Graham
Texas A&M University, USA
Suman Ambwani
Dickinson College, USA
Abstract
As a preliminary step in researching “orthorexia nervosa,” an alleged syndrome
characterized by a pathological fixation on healthy eating, we designed the 21-item Eating
Habits Questionnaire (EHQ) to assess the cognitions, behaviors, and feelings related to an
extreme focus on healthy eating. Study 1 (n = 174) examined the factor structure of the
EHQ and refined the instrument with exploratory factor analysis. Results suggested a 3-
factor solution with the following subscales: knowledge of healthy eating, problems
associated with healthy eating, and feeling positively about healthy eating. The subscales
displayed good internal consistency (α = .87 to .91) and test-retest reliability (r =.74 to .87).
Study 2 examined the fit of the 3-factor model in a new sample (n = 213) with confirmatory
factor analysis. After eliminating poorly fitting items, model fit was adequate with good
internal consistency (α = .82 to .90) and test-retest reliability (r = .72 to .81) of the subscales.
Examination of correlations between the EHQ subscales and a variety of other measures,
and comparisons of nutrition students with non-nutrition students on EHQ subscales
provided preliminary evidence for convergent,discriminant, and criterion-related validity.
Keywords: orthorexia nervosa, anorexia, health foods
Introduction
When an otherwise healthy behavior is taken to extremes, the potential arises for
myriad problems to occur, sometimes meeting criteria for a psychological disorder. For
some individuals, eating healthfully may become an overwhelming preoccupation that is
the central focus of their lives, a condition that has been termed “orthorexia nervosa”
(ON)with the prefix ortho- meaning correct, straight, or true (Bratman & Knight,
2000).Although ON has received relatively scant research attention, it is frequently
mentioned in the popular media and according to one survey of Dutch-speaking eating
disorder treatment professionals, 66.7% reported observing orthorexia symptoms in their
own practices (Vandereycken, 2011). Even more recently Saddichha, Babu, and Chandra
(2012) described ON as a disorder “which has not yet reached no so logical significance,
has worried nutritionists and clinicians due to itssimilarities with both anorexia and bulimia
nervosa” (p. 110). These facts suggest that this condition clearly warrants further
investigation.

2 The International Journal of Educational and Psychological Assessment January 2013, Vol. 12(2)
© 2013 Time Taylor Academic Journals ISSN 2094-0734
“ON” is ostensibly characterized by: 1) spending large amounts of time (more than
3 hours per day) thinking about, shopping for, and preparing healthy food, 2) feeling
superior to those with differing eating habits, 3) following a particular health-food diet
rigidly and engaging in compensatory restriction to make up for any dietary indiscretions, 4)
tying self-esteem to adherence to the diet (feeling guilt and self-loathing when straying and
self-satisfaction when complying), and 5) turning eating “properly” into the central focus of
life, at the expense of other personal values, relationships, previously enjoyed activities, and
sometimes, ironically, physical health (Bratman & Knight, 2000). However, these alleged
criteria appear to be largely derived from the experiences of those authors; they have not
been identified empirically and it has not been established that they represent a co-
occurring pattern of behaviors (i. e. a syndrome).
ONallegedly has a number of shared characteristics with Anorexia Nervosa (AN),
and according to one report, symptoms of ON are highly correlated with the maladaptive
eating attitudes and behaviors associated with AN (Varga & Máté, 2010). First, individuals
with both conditions tend to be overly preoccupied with food, may practice food-
relatedrituals, feel a sense of superiority over others based on their eating practices, have
rigid or restrictive eating habits, increase restriction following consumption of forbidden
foods, link their self-esteem to food-related behaviors, and make their eating-related issues
the primary focus of their lives (Bratman & Knight, 2000; Haas & Clopton, 2001). Second,
both groups of individuals experience their symptoms as ego-syntonic, making it unlikely
that they would seek help for their eating-related problems. Instead, family members or
physicians may express their concern and attempt to refer them to treatment (Bratman &
Knight, 2000). Third, individuals with AN and ON may follow similar types of diets. For
instance,one study found that 54% of patients with ANavoided red meat (O’Connor,
Touyz, Dunn, & Beumont, 1987). Although “orthorexics” are thought to be on diets more
atypical in the Western world than vegetarianism (i. e. raw foods, macrobiotics; Bratman &
Knight, 2000), vegetarianism is sometimes defined as avoiding red meat, which would also
include more restrictive or complex diets than vegetarianism (Bakan, Birmingham,
Aeberhardt, & Goldner, 1993). In one study among individuals with AN, following a
vegetarian diet did not appear to be a way to avoid eating, as there were no significant
differences in caloric intake between vegetarians and non-vegetarians (Bakan, et al., 1993).
These similarities between AN and ON suggest that some extant literature may, in fact, be
capturing some ON/AN overlap.
Despite the apparent similarities between ON and AN, important differences
suggest that these are distinct syndromes. For instance, in contrast to those with AN,
individuals with ONare unlikely (although it is possible) to have body weight less than 85%
of expected or to experience amenorrhea. Perhaps more important is an alleged
motivational difference between ON and AN: whereas individuals with ANare motivated
by fear of fatness (Habermas, 1996), those with ON likely control their eating to become
what they view as healthier or more pure, though at times weight loss will occur as a side-
effect (Bratman & Knight, 2000). Moreover, although both groups of individuals
experience cognitive/perceptual distortions, the foci of these disturbances appear to be
different: whereas individuals with AN experience body image distortions (Schneider et al.,
2009), those with ON may have distorted ideas about the properties of foods, what some
have called magical beliefs about food (Bratman & Knight, 2000; Lindeman, Keskivaara, &
Roschier, 2000).However, in a study with fitness center attendees, internalization of the

3 The International Journal of Educational and Psychological Assessment January 2013, Vol. 12(2)
© 2013 Time Taylor Academic Journals ISSN 2094-0734
thin-ideal accounted for most or all of the variance in self-reported orthorexia symptoms
(Eriksson, Baigi, Marklund, & Lindgren, 2008), thus suggesting that orthorexia may be
more closely linked with pursuit of the thin-ideal than previously assumed. It is notable,
however, that these alleged similarities and differences between those with AN and ON
have not been empirically established and thus require further investigation.
In addition to similarities with AN, ON also allegedly exhibits overlap with
obsessive-compulsive disorder (OCD), which is not surprising given the co-
morbidity(Thornton & Russell, 1997) and possible neurochemical correspondence (Davis,
Kaptein, Kaplan, Olmsted, & Woodside, 1998) between AN and OCD. One possibility is
that ON is a subtype or variant of OCD, as those with ON appear to exhibit time-
consuming obsessions (thinking about eating in “correct” ways, planning detailed menus)
and compulsions (spending excessive time selecting, preparing, and eating healthful foods
in the “proper” manner). However, it is not clear that their obsessive thoughts cause them
distress, or that their compulsive behaviors are aimed at reducing distress or preventing a
catastrophic event, which are required at some point to meet criteria for “obsessions” or
“compulsions” in OCD (APA, 2000). Moreover, those with “ON” are also thought to feel
smug and self-satisfied because of their focus on eating the “proper” foods, and are so
proud of their extreme behavior that they often try to convince others to think and act the
same way (Bratman & Knight, 2000). Thus, more research on “ON” is necessary to clarify
the nature of its overlap with OCD.
Given the functional impairment associated with ON, as well as its apparent overlap
with clinical symptoms of AN and OCD, this disorder potentiallyrepresents a significant
health issue. However, due to the extreme paucity of research on orthorexia, there are
numerous unanswered empirical questions regarding ON. Does it even exist as it is
described? Can it be reliably measured and discriminated from other related constructs?
If so, how is it related to psychological adjustment and other eating-related problems?
Estimates for orthorexia nervosa prevalence vary greatly, from 6.9% (Donini et al., 2004) to
45.5% among medical professionals (BağciBosi et al., 2007), and one study reported
“moderate” elevations on an orthorexia scale among 57.5% of medical students (Fidan,
Ertekin, Işikay, & Kırpınar, 2010). This wide range is likely influenced by substantial
variability in assessment methods and criteria for establishing an orthorexia “diagnosis”.
The first step towards addressing these questions would be to develop an adequate
tool to assess symptoms of this alleged disorder. In a unique study, Donini and colleagues
(2005) developed a diagnostic instrument for orthorexia, the ORTO-15, and reported that
their tool exhibited good predictive value for differentiating individuals with possible ON
and nonclinical controls. The test has subsequently been used to measure the prevalence of
ON in medical residents in Turkey (BağciBosi, Camur, & Güler,2007; Fidan, Ertekin,
Işikay, & Kırpınar, 2010). However, given that there are no established criteria for ON,
their studies are limited by how they constructed their ON groups (i. e., based on the
presence of healthy eating habits and pathological MMPI profiles). Furthermore, it is
useful to have more than one assessment for any construct, particularly those that are
constructed independently. Furthermore, it’s notable that the ORTO-15 was developed
and validated in Italian, and only translated into English “for editorial purposes” (p. e32) by
Donini et al. (2005). Thus, as of yet, there doesn’t appear to be a psychometric evaluation
of an English-language Orthorexia test. The present study sought to design and evaluate the

4 The International Journal of Educational and Psychological Assessment January 2013, Vol. 12(2)
© 2013 Time Taylor Academic Journals ISSN 2094-0734
psychometric properties of anew research tool, developed independently of the ORTO-15,
for the measurement of orthorexia nervosa.
Study 1
Method
Participants. Participants were undergraduates (N = 174) from introductory
psychology classes (43%), introductory nutrition classes (29%), and upper-level nutrition
classes (29%) at a large Southeastern U.S. University. The latter two groups were recruited
to extend the range of reported attitudes and behaviors related to healthy eating.
Participants either received course credit for their participation, or were entered into a
lottery for one of 3 cash prizes ($50, $25, $25) and permitted to request knowledge of their
body fat percentage measurement. Participants were 68% female, and aged 18-38 years (M
= 20; SD = 2.43). Reported race/ethnicity of the sample was: 76.4% Euro-
American/Caucasian, 14.9% Hispanic/Latino, 4.6% Asian-American, 3.4% African-
American, and 0.6% other.
Materials. Participants completed an informed consent form, a demographic
information sheet, the Eating Habits Questionnaire developed for the purpose of this study
(see below for description), and the Balanced Inventory of Desirable Responding (BIDR;
Paulhus, 1991). The 40-item BIDR measures impression management (IM) and self-
deceptive enhancement (SDE) and is scored on a 7-point Likert-type format ranging from
“not true” to “very true”. In this sample, internal consistency was .70 for IM and .67 for
SDE; 2- to 4-week test-retest reliability was .84 for IM and .76 for SDE. In the Study 2
sample (see below), internal consistency was .75 for IM and .64 for SDE.
Procedure
Test development. The authors developed the Eating Habits Questionnaire (EHQ)
to assess symptoms of “ON” The initial 160-item pool covered the depth and breadth of
content theorized to be essential to the construct of “ON” based on Bratman and Knight’s
(2000) case studies. No previous research suggested a particular factor structure of “ON”,
therefore none was delineated at this stage. The first 150 items were scored on a 4-point
Likert-type scale ranging from “False, Not At All True” to “Very True”. An additional 10
items required participants to rank-order the importance of 5 qualities, one of which was
“healthy eating” (not defined for them). These items captured whether healthy eating was
of primary importance to test-takers. Participants in Study 1 completed this 160 item
version of the EHQ. Subsequently four advanced graduate students in clinical psychology,
trained on the alleged symptoms of “ON”, assessed the degree to which the content
surveyed by the EHQ accurately captured the construct of “ON”. Only items that all 4
raters agreed upon were retained for analysis. This process resulted in the retention of 59
items.
Data collection. Participants completed survey materials (demographics form, the
EHQ, and the BIDR in random order) in small groups, and were then privately
measuredfor height and weight with a tape measure and digital scale, and body fat

5 The International Journal of Educational and Psychological Assessment January 2013, Vol. 12(2)
© 2013 Time Taylor Academic Journals ISSN 2094-0734
percentage with the OMRON BodyLogic body fat analyzer (Wolkodoff, 1999).
Participants were then scheduled for a follow-up data collection period 2-4 weeks later
(86% complied). At the end of the follow-up session (identical in procedure to the initial
session) participants from nutrition classes learned their body fat percentage and entered a
lottery to earn $25-$50 for their participation.
Results
Kaiser’s measure of sampling adequacy (MSA; Kaiser, 1974) for the EHQ
indicated the data were appropriate for exploratory factor analysis (EFA). The overall
MSA for the EHQ was .89, which Kaiser described as “meritorious”. MSAs for the
individual items ranged from .61 to .93. Items with MSAs below .70 were deleted (2
items), yielding new individual MSAs ranging from .76 to .94, considered “middling” to
“marvelous” (Kaiser).A series of exploratory factor analyses using the maximum likelihood
estimation with oblimin rotation guided decision-making regarding the number of factors
that appeared to best describe the data. Decision-making rules included the size and
pattern (i.e. a scree plot) of the eigenvalues, the percentages of total and common variance
explained, the number of sizable structure coefficients per factor, and the explanatory
ability of the model.
A 3-factor solution appeared to meet the above criteria somewhat better than a 4-
factor solution, explaining a similar amount of total variance (40% vs. 43%) and common
variance (62% vs. 67%) appeared more easily interpretable. All factors of the 3-factor
solution contained at least 4 variables with structure coefficients greater than .60, whereas
the last factor of the 4-factor solution did not meet this criterion. Additionally, the 3-factor
solution appeared more easily interpretable. The revised version of the EHQ, based on
the 3-factor model, contained 26 items that had factor loadings of at least .60 on any factor.
According to Guadagnoli and Velicer (1988), regardless of sample size, components may
be considered stable if they each contain at least 4 variables with loadings over .60. The
remaining 29 items were deleted based on the following: similar loadings on multiple
factors, theoretical inconsistency of item content, and lack of ease of interpretation. Due to
the lack of a truly “orthorexic” sample, we treated items on a factor assessing problems with
healthy eating with greater leniency than items on other factors. Consideration of these
criteria resulted in the retention of an additional 9 items, for a total of 35 items retained, all
scored on a Likert-type scale (no rank-order items remained). Evaluation of item content
suggested that the factors from the 3-factor solution could be labeled: 1) knowledge of
healthy eating (9 items; α = .91), 2) problems associated with healthy eating (20 items;α =
.92), and 3) feeling positively about healthy eating (6 items; α = .87) (see Table 1). Test-
retest correlations were r = .87, r = .82 and r = .74 for the respective factors. Correlations
between the EHQ subscales and the BIDR IM and SDE subscales were nonsignificant,
with the exception of a small (r = .21) correlation between the EHQ Knowledge subscale
and IM. These small and nonsignificant correlations suggested that the EHQ data were
notoverly affected by participants’ intentional or unintentional attempts to respond in a
socially desirable manner.

6 The International Journal of Educational and Psychological Assessment January 2013, Vol. 12(2)
© 2013 Time Taylor Academic Journals ISSN 2094-0734
Study 1 Discussion
At the completion of Study 1, the EHQ consisted of 35 items scored on a Likert-
type scale: a 9-itemKnowledge factor, 20-item Problems factor, and 6-item Feelings factor.
Results suggested good internal consistency and test-retest reliability in this sample, thus,
the next step was to confirm the fit of the 3-factor solution, and to examine the validity of
the EHQ.
Study 2
The purpose of Study 2 was twofold: first, to confirm the 3-factor structure for the
EHQ in an independent sample, and second, to examine the convergent, discriminant, and
criterion-related validity of the EHQ. We predicted that: (1) the EHQ Problems subscale
would correlate highly with measures of eating pathology and moderately with
obsessionality; (2) there would be smaller but significant correlations between the Problems
subscale and measures of depression, general psychopathology, neuroticism, and
conscientiousness. Bratman and Knight’s (2000) theoretical descriptions of “ON” did not
give an indication of how the Knowledge and Feelings subscales would be related to other
measures. Given previous research suggesting that dietetic students exhibit higher levels of
orthorexia symptoms than non-dietetic students (Varga & Máté, 2010), we also expected
that nutrition major undergraduates would exhibit higher scores on the EHQ subscales
than their psychology major counterparts.
Method
Participants. Participants were undergraduates (N = 213) from introductory
psychology classes (46%), introductory nutrition classes (34%), and upper-level nutrition
classes (20%) at a large Southeastern U.S. University, who either received course credit or
were entered in a lottery for one of 3 cash prizes ($50, $50, $99) and received knowledge
of their body fat percentage measurement. Participants were 65% female, aged 18-48 years
(M = 20, SD = 2.64). Reported race/ethnicity of the sample was: 85.9% Euro-
American/Caucasian, 8.0% Hispanic/Latino, 3.3% Asian-American, 1.9% African-
American, and 0.9% other.
7 The International Journal of Educational and Psychological Assessment January 2013, Vol. 12(2)
© 2013 Time Taylor Academic Journals ISSN 2094-0734
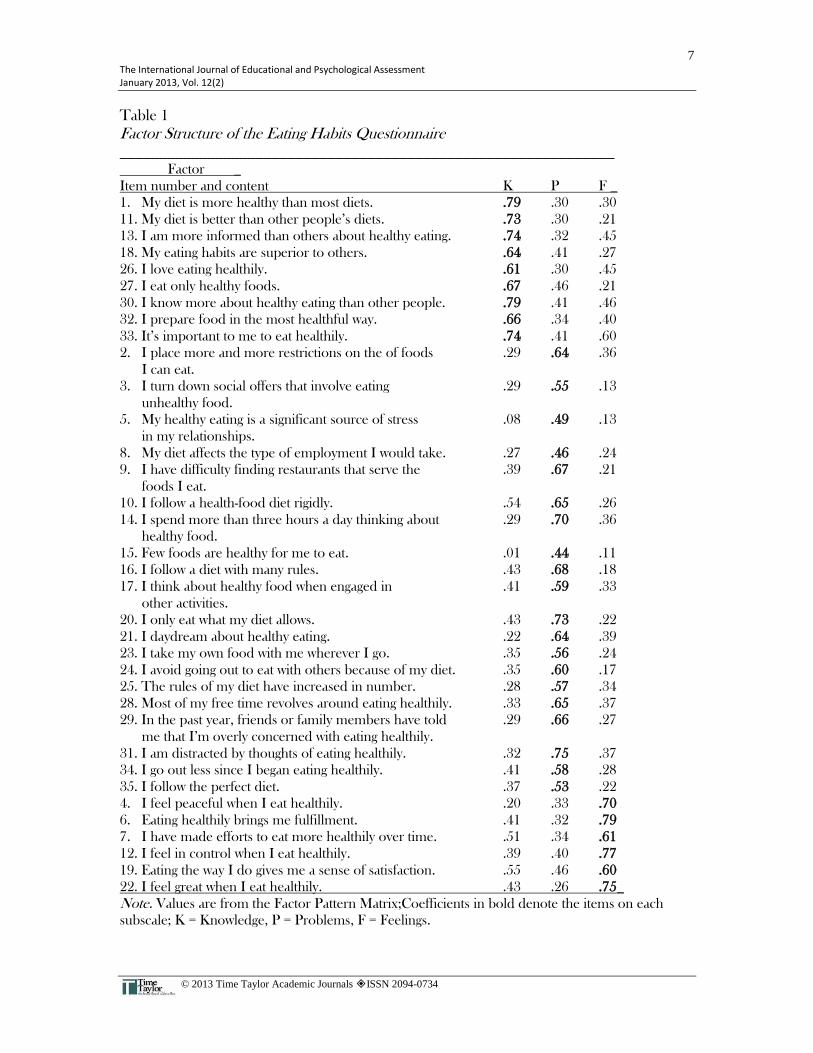
Table 1
Factor Structure of the Eating Habits Questionnaire ______________________________________________________________ Factor _
Item number and content K P F _
1. My diet is more healthy than most diets. .79 .30 .30
11. My diet is better than other people’s diets. .73 .30 .21
13. I am more informed than others about healthy eating. .74 .32 .45
18. My eating habits are superior to others. .64 .41 .27
26. I love eating healthily. .61 .30 .45
27. I eat only healthy foods. .67 .46 .21
30. I know more about healthy eating than other people. .79 .41 .46
32. I prepare food in the most healthful way. .66 .34 .40
33. It’s important to me to eat healthily. .74 .41 .60
2. I place more and more restrictions on the of foods .29 .64 .36
I can eat.
3. I turn down social offers that involve eating .29 .55 .13
unhealthy food.
5. My healthy eating is a significant source of stress .08 .49 .13
in my relationships.
8. My diet affects the type of employment I would take. .27 .46 .24
9. I have difficulty finding restaurants that serve the .39 .67 .21
foods I eat.
10. I follow a health-food diet rigidly. .54 .65 .26
14. I spend more than three hours a day thinking about .29 .70 .36
healthy food.
15. Few foods are healthy for me to eat. .01 .44 .11
16. I follow a diet with many rules. .43 .68 .18
17. I think about healthy food when engaged in .41 .59 .33
other activities.
20. I only eat what my diet allows. .43 .73 .22
21. I daydream about healthy eating. .22 .64 .39
23. I take my own food with me wherever I go. .35 .56 .24
24. I avoid going out to eat with others because of my diet. .35 .60 .17
25. The rules of my diet have increased in number. .28 .57 .34
28. Most of my free time revolves around eating healthily. .33 .65 .37
29. In the past year, friends or family members have told .29 .66 .27
me that I’m overly concerned with eating healthily.
31. I am distracted by thoughts of eating healthily. .32 .75 .37
34. I go out less since I began eating healthily. .41 .58 .28
35. I follow the perfect diet. .37 .53 .22
4. I feel peaceful when I eat healthily. .20 .33 .70
6. Eating healthily brings me fulfillment. .41 .32 .79
7. I have made efforts to eat more healthily over time. .51 .34 .61
12. I feel in control when I eat healthily. .39 .40 .77
19. Eating the way I do gives me a sense of satisfaction. .55 .46 .60
22. I feel great when I eat healthily. .43 .26 .75_
Note. Values are from the Factor Pattern Matrix;Coefficients in bold denote the items on each
subscale; K = Knowledge, P = Problems, F = Feelings.

8 The International Journal of Educational and Psychological Assessment January 2013, Vol. 12(2)
© 2013 Time Taylor Academic Journals ISSN 2094-0734
Materials. Participants completed study materials (a demographic information
sheet, the 35-item EHQ, and variousself-report measures to examine the validity of the
EHQ described below) in small groups. Researchers then followed the same procedure as
for Study 1 to assess height, weight, and body fat percentage.
Eating Attitudes Test-26 (EAT-26; Garner, Olmsted, Bohr, &Garfinkel, 1982). The
26-item version of the EAT assesses maladaptive attitudes and behaviors related to AN.
Items are scored on a 6-point Likert-type format, with higher scores indicating greater
endorsement of problems. Previous studies suggest adequate internal consistency (Garner
et al.,1982)and 2- to 3-week test-retest reliability (Carter & Moss, 1984).In this sample
internal consistency was .90.
Bulimia Test-Revised (BULIT-R; Thelen, Farmer, Wonderlich, & Smith, 1991).
The 28-item BULIT-R is a self-report measure of bulimia nervosa symptoms. Items are
scored on a 5-point rating scale, with higher scores indicating greater endorsement of
problems. Thelen et al. (1991) reported good internal consistency and 2-month test-retest
reliability in clinical and nonclinical samples. In this sample internal consistency was .93.
Center for Epidemiologic Studies—Depressed Mood Scale (CES-D; Radloff, 1977).
The 20-item CES-D measures current levels of depressive symptomatology in the general
population with an emphasis on depressed mood. Items are scored on a 4-point Likert-
type format with higher scores indicating greater symptomatology. Radloff (1977) reported
good internal consistency, fair 2- to 8-week test-retest reliability and evidence of convergent
validity. In this sample internal consistency was .90.
Personality Assessment Screener (PAS; Morey, 1997). The 22-item PAS is derived
from its parent instrument, the Personality Assessment Inventory (PAI; Morey, 1991) and
rapidly screens for a broad range of clinical problems. Items are scored on a 4-point Likert-
type format and are organized hierarchically into a total score and 10 distinct element
scores: Negative Affect, Acting Out, Health Problems, Psychotic Features, Social
Withdrawal, Hostile Control, Suicidal Thinking, Alienation, Alcohol Problem, and Anger
Control. As the items capturing the separate elements were not chosen to be highly
related, internal consistency was neither expected nor intended to be high.
The Maudsley Obsessional Compulsive Inventory (MOCI; Hodgson &Rachman,
1977). The 30-item MOCI measures the existence and extent of obsessional-compulsive
complaints using a true/false response format. Hodgson and Rachman (1977) provided
evidence of convergent validity and reported that 6-month post-treatment change scores on
the MOCI correlated positively with both therapist and patient ratings of improvement.
Internal consistency in this sample was .76.
The International Personality Item Pool Five Factor Personality Inventory (IPIP-
41; Buchanan, Goldberg, & Johnson, 1999). The 41-item version of the IPIP, based on the
original 50 item IPIP (Goldberg, 1999), assesses the domains of the Five Factor Model
(Openness, Conscientiousness, Extraversion, Agreeableness, Neuroticism) using a 5-point
Likert-type format. Buchanan et al. (1999) reported acceptable subscale internal

9 The International Journal of Educational and Psychological Assessment January 2013, Vol. 12(2)
© 2013 Time Taylor Academic Journals ISSN 2094-0734
consistency in an online sample (.74 to .88). Internal consistency estimates for the factors in
this sample ranged from .67 to .87.
Procedure.The data collection procedure was the same as for Study 1, with two
exceptions: the addition of the above inventories administered in random order, and
exclusion of a 2-4 week follow up assessment.
Results
Confirmatory Factor Analysis. Kaiser’s (1974) MSA for the 35-item EHQ was .93,
which Kaiser (1974) described as “marvelous”. MSAs for the individual items ranged from
.88 to .95, considered “meritorious to marvelous”, and indicating the data were appropriate
for factor analysis.
Measures of goodness-of-fit for the 3-factor model were: the χ2
statistic, the
Goodness-of-Fit Index (GFI; Joreskog & Sorbom, 1993), the Normed-Fit Index (NFI;
Bentler & Bonett, 1980), the Tucker-Lewis Index (TLI; Marsh, Balia, & McDonald, 1988),
the Comparative Fit Index (CFI; Bentler, 1990), and the root mean square error of
approximation (RMSEA; Browne & Cudeck, 1993). Values of the GFI, NFI, TLI, and
CFI range from 0 to 1.00, with values closer to 1.00 indicating a better fit (e. g., Byrne,
1989; Mulaik et al., 1989). For the RMSEA, values of less than .05 are considered a close
fit and less than .08 an adequate fit (Finch & West, 1997). The TLI and CFI arelargely
unaffected by sample size (Bentler, 1990; Fan, Thompson, & Wang, 1999; Marsh et al.,
1988).
Initial fit indices were poor, with GFI and NFI values below .70, and RMSEA at
.10. Large correlations between error terms indicated redundancy of some items. Items
with non-zero loadings on multiple factors also contributed to the poor fit. Ferrando and
Lorenzo-Seva (2000) reported that a CFA follow-up to an EFA will commonly result in a
poor fit due to inclusion of factorially impure items. These items cause specification errors
in which significant loadings are incorrectly omitted or fixed to zero. Most EHQ items had
non-zero loadings on multiple factors in the exploratory analyses from Study 1. However,
the fit of the CFA could be improved by using modification indices and standardized
residual scores to eliminate items. By sequentially eliminating 14 items from the 35-item
EHQ, many with content that highly overlapped that of other items, the model fit
improved substantially (GFI = .85; TLI = .90; CFI = .91; RMSEA = .07).
Inter-factor correlations of the 21-item EHQ ranged from r = .40 to r = .76,
suggesting the presence of a general, underlying factor. However, the fact that none of the
confidence intervals around factor correlations included 1.0 supported the discriminant
validity of the model (see Anderson & Gerbing, 1988) as did the fact that fixing the largest
correlation to 1.0 (see Bagozzi & Yi, 1988) led to a significant degradation in fit.
Reliability. Internal consistency of the final 21-item version of the EHQ in the
Study 2 sample was good, with subscale alphas .90, .82 and .86 for the Problems,
Knowledge, and Feelings factors, respectively. Test-retest reliability of the subscale scores
for the 21-item EHQ using the Study 1 sample data (as Study 2 participants did not retake
the instruments) was acceptable, with test-retest correlations of r = .81, r = .81, and r = .72
respectively.

10 The International Journal of Educational and Psychological Assessment January 2013, Vol. 12(2)
© 2013 Time Taylor Academic Journals ISSN 2094-0734
Validity. Table 2 shows the correlations between the EHQ subscale scores and the
measures administered to assess their convergent and discriminant validity. Partial
correlations, controlling for the other two scales are also presented. As expected, the EHQ
Problems subscale correlated highly with measures of eating pathology (r = .79 with EAT-
26 and r = .62 with BULIT-R), and moderately with the MOCI (r = .32), a measure of
obsessional-compulsive complaints. Also as expected, there were small correlations
between the Problems subscale and measures of depression (r = .22 with the CES-D) and
general psychopathology (r = .21 with the PAS). Correlations with neuroticism (r = .31),
and conscientiousness (r = .07) were somewhat higher and lower than expected,
respectively. The small but statistically significant correlation between the Problems
subscale and the BIDR SDE subscale (r = -.18) was not anticipated.
The pattern of correlations between measures of eating pathology and
obsessionality and the Knowledge and Feelings subscales were similar to those with the
Problems subscale, but smaller in magnitude. For example, correlations between the EAT-
26 and the EHQ subscales were as follows: Problems r = .79; Knowledge r = .54; Feelings;
r = .41.In contrast to the results for the Problems subscale, correlations between the
Knowledge and Feelings subscales the measures of general psychopathology (r = .11 to r =
.12), depression (r = .09 to r = .13), and unintentional socially desirable responding (r = -.02
to r = -.01) were not statistically significant. However, the Knowledge and Feelings
subscales did exhibit small positive correlations with conscientiousness (r = .17 and r = .20,
respectively).
Consideration of partial correlations showed that after removing the influence of
the other 2 EHQ subscales, most of the relationships between the validity measures and
the EHQ subscales were accounted for by the Problems subscale alone. The Feelings
subscale showed a positive partial correlation with the EAT-26 total score (r =.20), the
EAT-26 Dieting subscale (r =.32), and the BULIT-R (r =.22), in addition to a small
correlation with conscientiousness (r =.14). In contrast, the Knowledge subscale was
unrelated to some measures of eating pathology and negatively related with other measures
of eating pathology (r = -.14 with EAT-26 Dieting subscale, r = -.21 with BULIT-R) when
the effect of all other EHQ subscales was removed. The Knowledge subscale showed a
statistically significant but small positive partial correlation with the BIDR SDE subscale (r =.17).
To assess whether the Problems subscale provided any predictive power above the
EAT-26, we performed a series of hierarchical multiple regression analyses using EAT-26
scores to predict scores on the MOCI, CES-D, PAS, and IPIP-41, and entering the
Problems subscale as a secondary predictor. Statistically significant change in R2
values
would have indicated that the Problems subscale provided predictive power above that of
EAT-26 scores. However, none of the change scores were statistically significant, indicating
that, in this sample, the Problems subscale did not exhibit incremental utility above and
beyond the EAT-26. Separate analyses with the Knowledge and Feelings subscales had
similar results, with the exception that both subscales predicted conscientiousness above
and beyond EAT-26 scores (R2
change values = .03 and .04, respectively, p< .01 level).

11 The International Journal of Educational and Psychological Assessment January 2013, Vol. 12(2)
© 2013 Time Taylor Academic Journals ISSN 2094-0734
Table 2
Correlations and Partial Correlations between Eating Habits Questionnaire Subscales and Validity Measures _________________________________________________________________
EHQ Subscales _ _____
Problems Knowledge Feelings___
EAT-26 .79**/.69** .54**/-.08 .41**/.20**
EAT-26-DIET .75**/.66** .51**/-.14* .46**/.32**
EAT-26-BUL .72**/.60** .49**/.01 .28**/.01
EAT-26-ORAL .42**/.31** .30**/.08 .07/-.13
BULIT-R .62**/.57** .34**/-.21** .34**/.22**
MOCI .32**/.28** .17*/-.09 .17*/.10
CES-D .22**/.22** .09/-.11 .13/.09
PAS .21**/.18** .11/-.06 .12/.07
PAS-NA .25**/.21** .17*/-.05 .18*/.09
PAS-AO .06/.19** -.11/- .23 .02/.11
PAS-HP .18*/.18** .09/-.02 -.01/-.09
PAS-PF .11/.10 .11-.01 .12/.04
PAS-SW -.05/-.03 -.05/.02 -.09/-.09
PAS-HC .05/-.02 .12/.10 .10/.04
PAS-ST .14*/.13 .07/-.04 .06/.03
PAS-AN .12/.07 .11/.03 .05/-.03
PAS-AP .20**/.15* .14*/-.06 .14/.09
PAS-AC .05/.04 .02/-.02 .03/.02
IPIP-41-O .01/.03 .01/-.05 .08/.11
IPIP-41-C .07/-.07 .17*/.12 .20**/.14*
IPIP-41-E .10/.07 .10/.10 .15*/.15*
IPIP-41-A -.10/-.07 -.06/-.05 .06/.10
IPIP-41-N .31**/.29** .14/-.13 .19**/.13
BIDR-IM -.11/-.14* -.01/.03 .05/.06
BIDR-SDE -.18**/-.26** -.01/.17* -.02/-.03 _
Note. * p< .05 ** p< .01. Number on left is zero-order correlation/number on right is
partial correlation after controlling for other two scales. Abbreviated items are: EHQ =
Eating Habits Questionnaire; EAT-26 = Eating Attitudes Test-26, DIET = dieting, BUL =
bulimia, ORAL = oral control; BULIT-R = Bulimia Test Revised; MOCI = Maudsley
Obsessional Compulsive Inventory; CES-D = Center for Epidemiologic Studies—
Depressed Mood Scale; PAS = Personality Assessment Screener, NA = Negative Affect,
AO = Acting Out, HP = Health Problems, PF = Psychotic Features, SW = Social
Withdrawal, HC = Hostile Control, ST = Suicidal Thinking, AN = Alienation, AP =
Alcohol Problem, AC = Anger Control; IPIP-41 = International Personality Item Pool Five
Factor Personality Inventory-41, O = Openness, C = Conscientiousness, E = Extraversion,
A = Agreeableness, N = Neuroticism; BIDR = Balanced Inventory of Desirable
Responding, IM = Impression Management, SDE = Self-Deceptive Enhancement.

12 The International Journal of Educational and Psychological Assessment January 2013, Vol. 12(2)
© 2013 Time Taylor Academic Journals ISSN 2094-0734
Comparison of student group means on EHQ subscales indicated the expected
direction of results (see Table 3). On all subscales, nutrition majors scored higher (more
“orthorexic”) than students from introductory nutrition classes, who scored higher than
students from introductory psychology classes. An ANOVA indicated statistically
significant between group differences on each subscale (all p-values < .001). The majority
of Tukey’s post-hoc t-tests on simple contrasts were statistically significant, and all had at
least a small effect size as measured by Cohen’s d (Cohen, 1988). Because the proportion
of males to females varied across majors, it is possible that the differences between majors
were due to the effects of gender. To account for this, separate Two-Way ANOVAs were
run on the EHQ subscales using both gender and major as the independent variables, but
neither the gender main effectsnor the gender-by-major interaction effectswere statistically
significant.
Table 3
Comparison of Eating Habits Questionnaire Subscale Means by Student Group _______________________________________________________________ Student Group _
EHQ Intro. Intro. Nutrition
Subscale Psych. Nutrition Major F η2
Knowledge
Mean 7.38a
8.81b
11.05c
27.35* .21
Std. Dev. 2.45 3.11 2.69
Problems
Mean 14.18a
16.03a
18.47b
9.64* .09
Std. Dev. 3.42 5.89 7.26
Feelings
Mean 13.92a
15.13a
16.98b
10.63* .09
Std. Dev. 3.94 15.13 16.98 ___
Note. EHQ = Eating Habits Questionnaire.
*p<.001 .
Means with same superscript are not statistically different at p<.05 level.
Study 2 Discussion
Study 2 examined the proposed 3-factor structure and psychometric properties for
the EHQ.After eliminating items with redundant content or other indications of poor
model fit, the fit of a final 21-item version of the EHQ was adequate, and results supported
the internal consistency, and 2- to 4- week test-retest reliability of the factors. The EHQ
Problems subscale correlated more highly with measures of eating pathology than with
measures of general pathology, personality, or social desirability, thus providing evidence of
both convergent and discriminant validity. Assuming that orthorexia symptoms would be
elevated among nutrition majors, our results provide some evidence of criterion-related
validity. Results alsoindicate that the Feelings subscale was related to pathological eating
constructs, though it may not be obvious from its content (i. e. “I feel great when I eat
healthily”). In contrast, when the effects of the other EHQ subscales were removed, the

13 The International Journal of Educational and Psychological Assessment January 2013, Vol. 12(2)
© 2013 Time Taylor Academic Journals ISSN 2094-0734
Knowledge subscale was unrelated to some measures of eating pathology and to
obsessionality, and was negatively correlated with other measures of eating pathology. This
differed from Bratman’s (2000) view that obsessive knowledge-seeking about healthy eating
can be problematic. Future research among patients seeking advice about healthy eating
from an alternative medicine physician, or in an eating disordered population may shed
more light on this issue. The Knowledge subscale showed a statistically significant positive
correlation with the BIDR SDE subscale (r = .17), however this relationship was not large
enough to cause concern that the Knowledge subscale primarily measured unintentional
socially desirable responding.
Unlike the Problems subscale, the Knowledge and Feelings subscales were
generally unrelated to general psychopathology, depression, and self-deceptive
enhancement, and were unexpectedly related to conscientiousness. We had expected the
Problems subscale to be related to conscientiousness, due to a possible link to
perfectionism; however, it is unclear why this was not so. Future research using specific
measures of perfectionism may provide clearer evidence of these links.
In spite of the need for more research on the predictive validity of the EHQ, it is
interesting to note the high statistical overlap with a measure of eating pathology, given that
the item content of the EHQ did not explicitly assess eating “pathology”. Because of the
correlational design of this study, all that can be concluded is that people who had elevated
scores on the EHQ also generally had elevated scores on the EAT-26 (and to some degree
the BULIT-R). This may mean that the EHQ is measuring the same construct as the
EAT-26, but more poorly in regard to its predictive power, or alternatively may mean that
“ON” is simply a sub-facet of AN. If “ON” and AN are indeed distinct from one another,
yet still related, then a sample of individuals with orthorexia would be expected to score
more highly on the EHQ but lower on the EAT-26 than those with AN, whereas both
groups would score more highly on both measures than those in the general population.
General Discussion
The EHQ is a 21-item self-report inventory designed to measure a pathological
fixation on healthy eating that has been labeled “orthorexia nervosa”. The subscales of the
EHQ appear to capture: 1) problems associated with healthy eating, 2) knowledge of
healthy eating, and 3) feeling positively about healthy eating. In these studies, we examined
several different types of reliability and validity. The EHQ displayed good internal
consistency and test-retest reliability in a college student sample. The exploratory and
confirmatory factor analyses support and shed further light on the construct validity of the
tests. Examination of correlations between the EHQ subscales and a variety of other
measures provided preliminary evidence for both convergent and discriminant validity in
this sample, as evidenced by larger correlations with measures of maladaptive eating
attitudes and behaviors (associated with Anorexia Nervosa) than with measures of
personality functioning, social desirability, and general psychopathology. We also evaluated
EHQ responses among college student samples that varied in nutrition knowledge and
academic pursuits, and observed differences in expected directions such that those with
greater interests/knowledge in nutrition exhibited higher scores on EHQ subscales.
However more research is needed, in particular on the validity of EHQ scores in other
populations, and on the predictive value of the EHQ. One obvious direction for future

14 The International Journal of Educational and Psychological Assessment January 2013, Vol. 12(2)
© 2013 Time Taylor Academic Journals ISSN 2094-0734
research would be to compare the EHQ and the ORTO-15, given that they were
developed independently to measure the same alleged construct.
Despite the reportedly high incidence of orthorexia symptoms (Vandereycken,
2011) and concerns about similarities between ON and diagnosable eating disorders
(Saddichha et al., 2012), there is a striking paucity of research on this condition. One
possibility for this is that the absence of appropriate measurement tools prevents
researchers from engaging in such study; thus, the development of the Eating Habits
Questionnaire provides avenues for further assessment of this construct and its
psychosocial correlates. The present study also provides clarification about the nature of
the ON construct, such as by suggesting that problems with healthy eating are linked with
measures of eating pathology, rather than with measures of personality functioning, social
desirability, or general psychopathology.The three-factor structure of the EHQ may shed
some light on the construct of ON, although more research is clearly needed. The fact that
the test, which was designed to measure the construct, turned out to be multidimensional,
suggests that ON itself may be a multidimensional construct. This suggestion would not be
unlike what has been found with both AN (Gleaves & Eberenz, 1993) and BN (Gleaves,
Williamson, & Barker, 1993) which have been found to be multimensional disorders.
However it is noteworthy that it was primarily the “problems” subscale that was primarily
associated with additional psychopathology, suggesting that some of the dimensions of ON
may not be harmful or even problematic. This suggestion would be not unlike what has
been found with perfectionism, where there appear to be multiple dimensions with only
one of them being associated with additional pathology (Pearson & Gleaves, 2006)
Although this study is unique in its examination of orthorexia, interpretation of
present findings is limited by two significant concernsthat also suggest several directions for
future research. First, participants were predominantly Caucasian American college
students, limiting our ability to generalize findings to different age, racial/ethnic, or
socioeconomic status groups. Second, as defining and identifying a population of
individuals with ON would not be possible (due to the absence of established, empirically
evaluated criteria), data were not collected with an identified clinical population.
Recruitment of nutrition majors increased the range of EHQ scores over those provided by
psychology majors alone (as shown by larger interquartile ranges); however it is not clear
that any of the participants in these studies would meet Bratman’s (2000) definition of
“ON”. Review of responses to a question asking about health-food related diets did not
indicate that any participants followed extreme diets (macrobiotics, raw foods, etc.). This
may be a reflection of the community in which participants were recruited, or could mean
that “ON”, if it exists, is a rarely occurring phenomenon.
In terms of recommendations on the use of the questionnaire, the EHQ may be
used to identify cases in which individuals exhibit problematic preoccupations with healthy
eating as a way to better describe and understand this construct. The EHQ was developed
and normed in English-speaking U.S. samples, and may thus be particularly appropriate
for use in similar populations. A number of empirical questions regarding this construct
remain, such as, does ON even exist as described, and can it be measured in a reliable
manner that distinguishes it from other related constructs? Use of this instrument may
facilitate research about ON, and perhaps most usefully, the EHQ may be used in
longitudinal research to evaluate the course of such preoccupation with healthful eating and
the antecedents and consequences of such behaviors. Indeed, given the debate about

15 The International Journal of Educational and Psychological Assessment January 2013, Vol. 12(2)
© 2013 Time Taylor Academic Journals ISSN 2094-0734
whether ON and AN are distinct conditions, additional use of the EHQ could facilitate our
ability to discriminate between these disorders and identify the unique components of ON.
Collectively, these data emphasize the need for future research on both “ON” and
the EHQ to further clarify the nature of the construct. Further research would also help to
clarify individuals who may be at elevated risk for developing ON symptoms. In a study
employing a German translation of 10items originally proposed by Bratman and Knight
(2000), Korinth, Schiess, and Westenhoefer (2010) found that nutrition students exhibited
higher scores than non-nutrition students although the difference was not statistically
significant. There was an interesting statistically significant interaction however in that
nutrition students’ ON symptoms appeared to go down over time, whereas controls did
not. Thus, as stated previously, research in an identified population of individuals with ON
(rather than a comparative group of nutrition students) could provide further evidence of
the convergent and discriminant validity of EHQ scores among the target group, as could
comparison research with an eating disordered population. Additionally, comparison of
individuals with ON and AN on related constructs, such as body image, magical
beliefsabout food, and perfectionism, could serve to clarify the nature of orthorexia as an
ostensibly distinct syndrome.
References
American Psychiatric Association. (2000). Diagnostic and statistical manual of mentaldisorders (4
th
ed., text revision). Washington, DC: Author.
Anderson, J. C., & Gerbing, D. W. (1988). Structural equation modeling in practice: A
review and recommended two-step approach. Psychological Bulletin, 103, 411-423.
Bagozzi, R. P., & Yi, Y. (1988). On the evaluation of structural equation models. Journal of the Academy of Marketing Science, 16, 74-94.
BağciBosi, A. T., Camur, D., & Güler, C. (2007). Prevalence of orthorexia nervosa in
resident medical doctors in the faculty of medicine (Ankara,Turkey). Appetite, 49, 661-666.
Bakan, R., Birmingham, C. L., Aeberhardt, L., & Goldner, E. M. (1993). Dietary zinc
intake of vegetarian and nonvegetarian patients with anorexia nervosa. International Journal of Eating Disorders, 13, 229-233.
Bentler, P. M. (1990). Comparative indexes in structural models. Psychological Bulletin, 107, 238-246.
Bentler, P. M., & Bonett, D. G. (1980).Significance tests and goodness of fit in the analysis
of covariance structures.Psychological Bulletin, 88, 591-606.
Bratman, S., & Knight, D. (2000). Health food junkies: Overcoming the obsession with
healthful eating. New York: Broadway Books.
Brehm, B. J., & Steffen, J. J. (1998). Relation between obligatory exercise and eating
disorders. American Journal of Health Behavior, 22, 108-119.
Browne, M. W., &Cudeck, R. (1993). Alternative ways of assessing model fit. In K. A.
Bollen & J. S. Long (Eds.), Testing structural equation models (pp.136-162).
Newbury Park, CA: Sage.
Buchanan, T., Goldberg, L. R., & Johnson, J. A. (1999, November).WWW personality assessment: Evaluation of an online Five Factor Inventory. Paper presented at the
1999 Society for Computers in Psychology Conference. Los Angeles, CA.

16 The International Journal of Educational and Psychological Assessment January 2013, Vol. 12(2)
© 2013 Time Taylor Academic Journals ISSN 2094-0734
Byrne, B. M. (1989). A primer of LISREL: Basic applications and programming for confirmatory factor analytic models. New York: Springer-Verlag.
Carter, P. I., & Moss, R. A. (1984). Screening for anorexia and bulimia nervosa in a college
population: Problems and limitations. Addictive Behaviors, 9, 417-419.
Cohen, J. (1988). Statistical power analysis for the behavioral sciences (2nd
Ed.). Hillsdale,
NJ: Lawrence Erlbaum Associates.
Davis, C., Kaptein, S., Kaplan, A., Olmsted, M. P., & Woodside, D. B.
(1998).Obsessionality in anorexia nervosa: The moderating influence of exercise.
Psychosomatic Medicine, 60, 192-197.
Donini, L. M., Marsili, D., Graziani, M. P., Imbriale, M., & Cannella, C. (2004).
Orthorexia nervosa: a preliminary study with a proposal for diagnosis and an attempt
to measure the dimension of the phenomenon. Eating and Weight Disorders, 9, 151-157.
Donini, L. M., Marsili, D., Graziani, M. P., Imbriale, M., & Cannella, C. (2005).
Orthorexia nervosa: Validation of a diagnosis questionnaire. Eating and Weight Disorders, 10, 28-32.
Eriksson, L., Baigi, A., Marklund, B., & Lindgren, E. C. (2008). Social physique anxiety
and socioculturalattitudes toward appearance impact on orthorexia test in fitness
participants. Scandinavian Journal of Medicine & Science in Sports, 18, 389-394.
Fan, X., Thompson, B., & Wang, L. (1999). Effects of sample size, estimation methods,
and model specification on structural equation modeling fit indexes. Structural Equation Modeling, 6, 56-83.
Ferrando, P. J., & Lorenzo-Seva, U. (2000).Unrestricted versus restricted factor analysis of
multidimensional test items: some aspects of the problem and some suggestions.
Psicologica, 21, 301-323.
Fidan, T., Ertekin, V., Işikay, S. & Kırpınar, I. (2010).Prevalence of orthorexia among
medical students in Erzurum, Turkey.Comprehensive Psychiatry, 51, 49-54.
Finch, J. F., & West, S. G. (1997). The investigation of personality structure: Statistical
models. Journal of Research in Personality, 31, 439-485.
Garner, D. M., Olmsted, M. P., Bohr, Y., & Garfinkel, P. E. (1982). The Eating Attitudes
Test: Psychometric features and clinical correlates. Psychological Medicine, 12, 871-
878.
Gleaves, D. H., & Eberenz, K. P. (1993). The psychopathology of anorexia nervosa: A
factor analytic investigation. Journal of Psychopathology and Behavioral Assessment, 15, 141-152.
Gleaves, D. H., Williamson, D. A., & Barker, S. E. (1993). Confirmatory factor analysis of
a multidimensional model of bulimia nervosa. Journal of Abnormal Psychology,
102, 173-176.
Goldberg, L. R. (1999). International Personality Item Pool: A scientific collaboratory for the development of advanced measures of personality and other individual differences [Online]. Available: http://ipip.ori.org/ipip/.
Guadagnoli, E., & Velicer, W. F. (1988). Relation of sample size to the stability of
component patterns. Psychological Bulletin, 103, 265-275.
Haas, H. L., & Clopton, J. R. (2001).Psychology of an eating disorder. In J. J. Robert-
McComb (Ed.), Eating disorders in women and children: Prevention, stressmanagement, and treatment (pp. 39-48). Boca Raton, FL: CRC Press.

17 The International Journal of Educational and Psychological Assessment January 2013, Vol. 12(2)
© 2013 Time Taylor Academic Journals ISSN 2094-0734
Hodgson, R. J., & Rachman, S. (1977) Obsessional-compulsive complaints.
BehavioralResearch & Therapy, 15, 389-395.
Joreskog, K. G., & Sorbom, D. (1993). LISREL 8 User’s reference guide. Chicago:
Scientific Software, International.
Kaiser, H. F. (1974). An index of factorial simplicity. Psychometrika, 39, 31-36.
Korinth, A., Schiess, S., & Westenhoefer, J. (2010). Eating behaviour and eating disorders
in students of nutrition sciences. Public Health Nutrition, 13, 32-37.
Lindeman, M., Keskivaara, P., & Roschier, M. (2000).Assessment of magical beliefsabout
food and health.Journal of Health Psychology, 5, 195-209.
Marsh, H. W., Balla, R., & McDonald, R. P. (1988). Goodness-of-fit indices in
confirmatory factor analysis: The effect of sample size. Psychological Bulletin, 103, 391-410.
Morey, L. C. (1991).Personality Assessment Inventory professional manual. Odessa, FL:
Psychological Assessment Resources.
Morey, L. C. (1997). Personality Assessment Screener professional manual. Odessa, FL:
Psychological Assessment Resources.
Mulaik, S. A., James, L. R., Alstine, J. V., Bennett, N., Lind, S., & Stilwell, C. D. (1989).
Evaluation of goodness-of-fit indices for structural equation models. Psychological Bulletin, 10, 430-445.
O’Connor, M. A., Touyz, S. W., Dunn, S. M., & Beumont, P. J. V. (1987). Vegetarianism
in anorexia nervosa?A review of 116 consecutive cases.The Medical Journal of Australia,147, 540-542.
Paulhus, D. L. (1991).Measurement and control of response bias. In J. P. Robinson, P. R.
Shaver, & L. S. Wrightsman (Eds.), Measures of personality and social psychological attitudes (pp.17-59). New York: Academic Press.
Pearson, C. A., & Gleaves, D. H. (2006). The Multiple dimensions of perfectionism and
their relation with eating disorder features. Personality & Individual Differences, 41,
225-235.
Radloff, L. S. (1977). The CES-D scale: A self-report depression scale for research in the
general population. Applied Psychological Measurement, 1, 385-401.
Saddichha, S. Babu, G. N., & Chandra, P. (2012). Orthorexia nervosa presenting as
prodrome of schizophrenia. Schizophrenia Research, 134, 110.
Schneider, N., Frieler, K., Pfeiffer, E., Lehmkuhl, U., &Salbach-Andrae, H. (2009).
Comparison of body size estimation in adolescents with different types of eating
disorders. European Eating Disorders Review, 17, 468-475.
Thelen, M. H., Farmer, J., Wonderlich, S., & Smith, S. (1991). A revision of the
BulimiaTest: The BULIT-R. Psychological Assessment, 3, 119-124.
Thornton, C., & Russell, J. (1997). Obsessive compulsive comorbidity in the dieting
disorders. International Journal of Eating Disorders, 21, 83-87.
Vandereycken, W. (2011). Media hype, diagnostic fad or genuine disorder? Professionals’
opinions about night eating syndrome, orthorexia, muscle dysmorphia, and
emetophobia. Eating Disorders, 19, 145-155.
Varga, M., & Máté, G. (2010). Eating disturbances in orthorexia nervosa. XIII annual
meeting of the European Association for Consultation-Liason Psychiatry and
Psychosomatics (EACLPP) XVIII European Conference on Psychosomatic

18 The International Journal of Educational and Psychological Assessment January 2013, Vol. 12(2)
© 2013 Time Taylor Academic Journals ISSN 2094-0734
Research (ECPR): A selection of the best abstracts submitted. Journal of Psychosomatic Research, 68, 672-673.
Wolkodoff, N. (1999). BodyLogic guide to wellness, fitness, & nutrition. Vernon Hills, IL:
Omron Healthcare, Inc.
Author Note
This research was based in part on the Master’s thesis of the second author while at Texas
A&M University. Correspondence concerning this article should be addressed to David H.
Gleaves, PhD, School of Psychology, Social Work and Social Policy, University of South
Australia, Magill Campus, GPO Box 2471, Adelaide, SA 5001, Australia.
Email:[email protected].
About the Authors
David H. Gleaves, Ph.D earned his doctorate degree in clinical psychology from Louisiana
State University. Currently, he is Professor of Psychology (Clinical) in the School of
Psychology, Social Work and Social Policy at the University of South Australia. He is a
clinical psychologistspecializing in eating disorders, dissociative disorders, and related
psychopathology.School of Psychology, Social Work and Social Policy, University of South
Australia, Magill Campus, GPO Box 2471, Adelaide, SA 5001, Australia.
Email:[email protected].
Erin C. Graham, M.S., earned her Master’s degree in Clinical Psychology from Texas
A&M University, College Station, TX, USA. She is currently residing in Bellingham, WA,
USA.Email: [email protected]
Suman Ambwani, Ph.D received her doctorate degree in Psychology (Clinical) from Texas
A&M University, and completed her clinical internship at the Medical University of South
Carolina. She is currently Assistant Professor of Psychology at Dickinson College. Her
scholarship has concentrated in the area of eating disorders and obesity, borderline
personality disorder, and cross-cultural considerations in psychological assessment. Her
current research focuses on personality factors and affective changes associated with
maladaptive eating behaviors. Email:[email protected]