Embed Size (px)
Citation preview

1 Copyright © 2007 by ASME
Journal of Offshore Mechanics and Arctic Engineering
OMAE-06-1034
MEASUREMENTS OF WAVE INDUCED HULL GIRDER VIBRATIONS OF AN ORE CARRIER IN DIFFERENT TRADES
Gaute Storhaug
Hydrodynamics, Structures & Stability DNV
Veritasveien 1, 1322 Hoevik, Norway
CeSOS, NTNU Marine Technology Centre, 7491 Trondheim
Norway
Erlend Moe Bulk Carriers & Container Ships
DNV Veritasveien 1, 1322 Hoevik,
Norway [email protected]
Gabriel Holtsmark Class Services & Newbuilding
DNV Veritasveien 1, 1322 Hoevik,
Norway [email protected]
ABSTRACT
Currently, the conventional wave loading is the only effect considered in fatigue assessment of ships. DNV has recently confirmed that fatigue damage from wave induced vibrations may be of similar magnitude as from the conventional wave loading (Moe et al. 2005). A 40% contribution to the total fatigue damage in deck amidships is documented through extensive measurements onboard an ore carrier (the reference ship) trading in the North Atlantic. The effect of strengthening the vessel, increasing the natural frequency by 10%, is ineffective to reduce the relative magnitude of the vibration damage.
The wave induced vibration, often referred to as whipping and/or springing, does contribute to fatigue damage also for other ship types and trades (Moe et al. 2005). This paper considers the effect of trade. It indicates when the wave induced vibrations should be accounted for in the design phase with respect to fatigue damage.
A second ore carrier (the target ship) is monitored with respect to the wave induced hull vibrations and their fatigue effect. Stress records from strain sensors located in the midship deck region are supplemented by wave radar and wind records. Based on the measurements, the vibration stress response and associated vibration induced fatigue damage are determined for varying wind- and wave forces and relative headings.
While the reference ship operates in the Canada to Europe ore trade, the target ship trades between Canada and Europe, Brazil and Europe, and South Africa and Europe.
A procedure is suggested by Moe et al. (2005) to estimate the long term fatigue damage for different trades by utilizing the measured data from the reference ship. The vibration and wave damage are considered separately. By comparing the measured wave environment and the DNV North Atlantic
scatter diagram, the effect of routing indicated a reduction of the fatigue damage by one third. A slightly revised procedure is applied to estimate the effect of trade for the second ore carrier, comparing the long term predicted fatigue damage with the measured fatigue damage.
The importance of trade is confirmed. However, the relative contribution of the vibration damage is shown to increase in less harsh environments. The target ship vibrates more than the reference ship for the same trade and Beaufort strength. The vibration damage of the target ship constitutes 56% of the total measured damage, and the high natural frequency is observed to have no significant effect.
1 INTRODUCTION
Current design rules applicable for conventional ships are developed to ensure that the hull girder of ships can withstand the critical loads during the life span of the vessel.
One of the critical loads is head sea waves with length comparable to the ship length and with height exceeding 20m, which can potentially cause hull girder collapse. These events are rare, typically with a return period in the order of 20 years.
Another loading considered is related to high cycle fatigue damage of critical structural details. All wave loads encountered by the ship in e.g. NA/WW trade are considered, normally based on linear hydrodynamic theory, assuming the hull girder to be rigid. The waves that dominate the contribution to fatigue damage are still substantial, but have higher probability of occurrence. During a 20 year life span in the order of 60 million load cycles are encountered.
The hull girder is however flexible. The lowest hull girder frequency is normally the vertical 2-node vibration mode with a natural period of roughly 2s. This vibration is excited continuously as springing or whipping, and can potentially
2 Copyright © 2007 by ASME
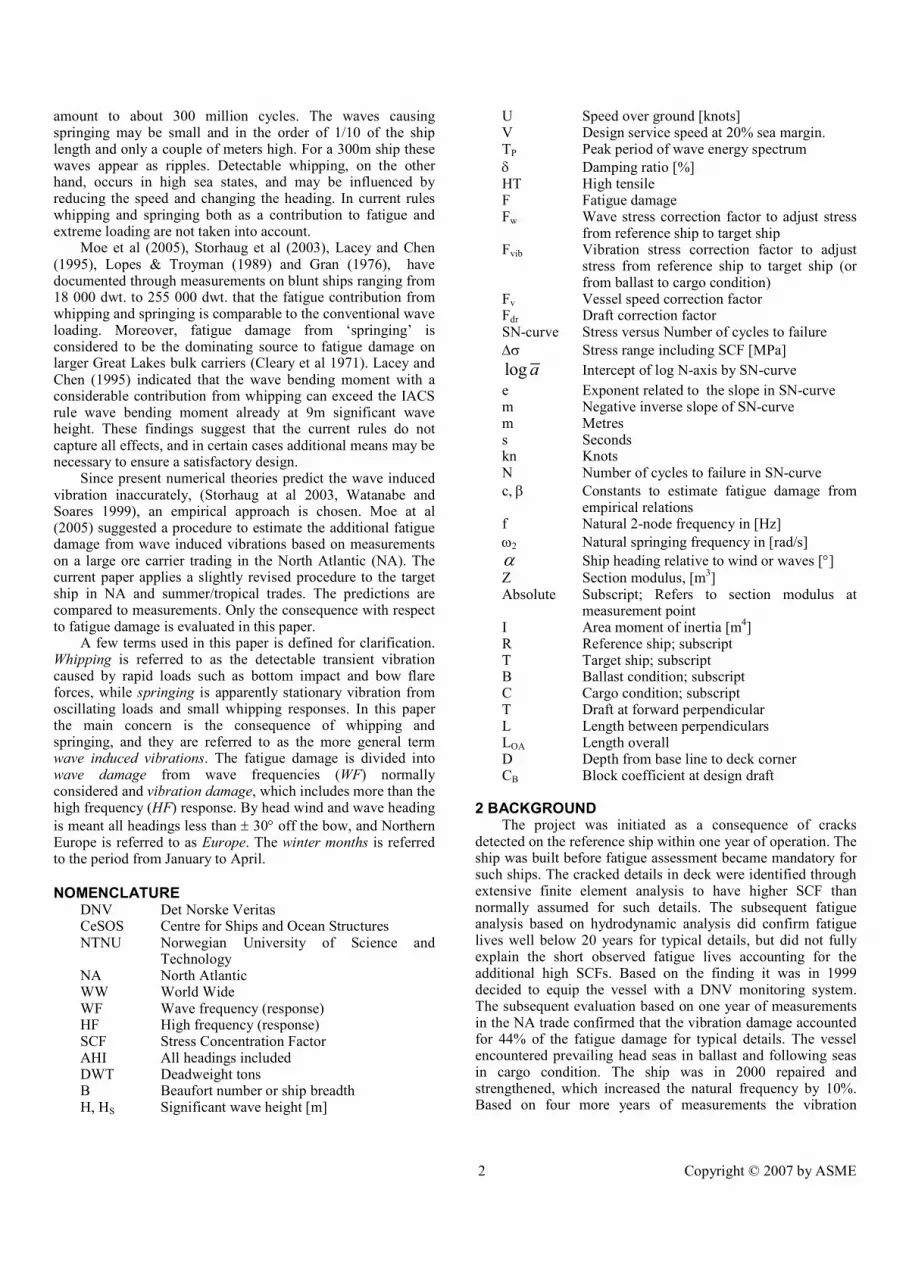
amount to about 300 million cycles. The waves causing springing may be small and in the order of 1/10 of the ship length and only a couple of meters high. For a 300m ship these waves appear as ripples. Detectable whipping, on the other hand, occurs in high sea states, and may be influenced by reducing the speed and changing the heading. In current rules whipping and springing both as a contribution to fatigue and extreme loading are not taken into account.
Moe et al (2005), Storhaug et al (2003), Lacey and Chen (1995), Lopes & Troyman (1989) and Gran (1976), have documented through measurements on blunt ships ranging from 18 000 dwt. to 255 000 dwt. that the fatigue contribution from whipping and springing is comparable to the conventional wave loading. Moreover, fatigue damage from ‘springing’ is considered to be the dominating source to fatigue damage on larger Great Lakes bulk carriers (Cleary et al 1971). Lacey and Chen (1995) indicated that the wave bending moment with a considerable contribution from whipping can exceed the IACS rule wave bending moment already at 9m significant wave height. These findings suggest that the current rules do not capture all effects, and in certain cases additional means may be necessary to ensure a satisfactory design.
Since present numerical theories predict the wave induced vibration inaccurately, (Storhaug at al 2003, Watanabe and Soares 1999), an empirical approach is chosen. Moe at al (2005) suggested a procedure to estimate the additional fatigue damage from wave induced vibrations based on measurements on a large ore carrier trading in the North Atlantic (NA). The current paper applies a slightly revised procedure to the target ship in NA and summer/tropical trades. The predictions are compared to measurements. Only the consequence with respect to fatigue damage is evaluated in this paper.
A few terms used in this paper is defined for clarification. Whipping is referred to as the detectable transient vibration caused by rapid loads such as bottom impact and bow flare forces, while springing is apparently stationary vibration from oscillating loads and small whipping responses. In this paper the main concern is the consequence of whipping and springing, and they are referred to as the more general term wave induced vibrations. The fatigue damage is divided into wave damage from wave frequencies (WF) normally considered and vibration damage, which includes more than the high frequency (HF) response. By head wind and wave heading
is meant all headings less than ± 30° off the bow, and Northern Europe is referred to as Europe. The winter months is referred to the period from January to April.
NOMENCLATURE DNV Det Norske Veritas CeSOS Centre for Ships and Ocean Structures NTNU Norwegian University of Science and
Technology NA North Atlantic WW World Wide WF Wave frequency (response) HF High frequency (response) SCF Stress Concentration Factor AHI All headings included DWT Deadweight tons B Beaufort number or ship breadth H, HS Significant wave height [m]
U Speed over ground [knots] V Design service speed at 20% sea margin. TP Peak period of wave energy spectrum
δ Damping ratio [%] HT High tensile F Fatigue damage Fw Wave stress correction factor to adjust stress
from reference ship to target ship Fvib Vibration stress correction factor to adjust
stress from reference ship to target ship (or from ballast to cargo condition)
Fv Vessel speed correction factor Fdr Draft correction factor SN-curve Stress versus Number of cycles to failure
∆σ Stress range including SCF [MPa]
log a Intercept of log N-axis by SN-curve
e Exponent related to the slope in SN-curve m Negative inverse slope of SN-curve m Metres s Seconds kn Knots N Number of cycles to failure in SN-curve
c, β Constants to estimate fatigue damage from empirical relations
f Natural 2-node frequency in [Hz]
ω2 Natural springing frequency in [rad/s]
α Ship heading relative to wind or waves [°] Z Section modulus, [m
3]
Absolute Subscript; Refers to section modulus at measurement point
I Area moment of inertia [m4]
R Reference ship; subscript T Target ship; subscript B Ballast condition; subscript C Cargo condition; subscript T Draft at forward perpendicular L Length between perpendiculars LOA Length overall D Depth from base line to deck corner CB Block coefficient at design draft
2 BACKGROUND
The project was initiated as a consequence of cracks detected on the reference ship within one year of operation. The ship was built before fatigue assessment became mandatory for such ships. The cracked details in deck were identified through extensive finite element analysis to have higher SCF than normally assumed for such details. The subsequent fatigue analysis based on hydrodynamic analysis did confirm fatigue lives well below 20 years for typical details, but did not fully explain the short observed fatigue lives accounting for the additional high SCFs. Based on the finding it was in 1999 decided to equip the vessel with a DNV monitoring system. The subsequent evaluation based on one year of measurements in the NA trade confirmed that the vibration damage accounted for 44% of the fatigue damage for typical details. The vessel encountered prevailing head seas in ballast and following seas in cargo condition. The ship was in 2000 repaired and strengthened, which increased the natural frequency by 10%. Based on four more years of measurements the vibration

3 Copyright © 2007 by ASME
damage contributed 38% to the total fatigue damage. The difference in the natural frequency did not affect the relative magnitude of the vibration damage. Further description is given in (Moe et al 2005).
3 CASE
The procedure suggested by Moe et al (2005) is based on the measurements onboard the large ore carrier referred to as the reference ship. The second ship, referred to as the target ship, is representative for a large number of Capesize ships. The principal dimensions and characteristic data of the two ships are listed in Table 1.
Table 1 Principal dimensions and characteristic data.
Parameter Reference ship
Target ship
Length overall, LOA [m] 305 292
Length btw. perpendicul., L [m] 294 281
Breadth, B [m] 53 48
Depth, D [m] 24.6 23.7
Draft, T [m] 18.8 17.4
Typical draft ballast, TB [m] 12 11
Typical draft cargo, TC [m] 18.5 17.0
Deadweight tons, DWT [tons] 218 000 175 000
Block coefficient, CB [-] 0.824 0.839
Service speed, V [kn] 14.9 15.3
Power M.C.R. [kW] 19940 19940
f, ballast [Hz] 0.58 0.61
f, cargo [Hz] 0.51 0.53
The reference ship is strengthened due to the observed
cracks, while the target ship is built to a higher standard based on experience from the reference ship. The sectional properties amidships are provided in Table 2. The IACS minimum standard relates to HT32 steel, and the strength of both ships are far above the normal standard for Capesize ships.
Table 2 Sectional properties versus rule minima.
Reference ship Actual IACS min. (HT32)
Excess %
Z deck [m3] 77.8 58.9 32
Z bottom [m3] 77.1 58.9 31
ZR,Actual strain gauge [m3] 73.2
I [m4] 952 665 43
Target ship
Z deck [m3] 74.4 47.6 56
Z bottom [m3] 67.7 47.6 42
ZT,Actual strain gauge [m3] 70.6
I [m4] 837 507 65
The trades are illustrated in Figure 1. The target ship trades
between Canada and Europe (same as reference ship), Brazil and Europe, and South Africa and Europe. In all cases the ship trades in ballast from Europe and in cargo condition to Europe. A summer/tropical area of the vessel’s trading is defined
between latitudes 34° north and 36° south, as indicated in Figure 1.
Figure 1 Illustration of the different trades of the target ship.
The total number of half hour stress recordings is 13308, corresponding to 277 effective days at sea during the period of November 2003 to May 2005. The number of recordings in the different trades is listed in Table 3. The Canada-Europe records represent six ballast and cargo voyages from two winter seasons. The summer/tropical trade recordings are taken from Brazil-Europe and South Africa-Europe trade. The respective duration in the summer/tropical area are 75 and 83%.
Table 3 Number of half hour records in different trades.
Trade target ship Ballast Cargo
All 6580 6728
Canada - Northern Europe 1864 1741
Brazil - Northern Europe 2028 2370
South Africa - Northern Europe 2214 1980
Summer/Tropical 3117 2588
4 PREDICTION OF LONG TERM FATIGUE DAMAGE
The stresses are measured continuously and saved every half hour. The stress records are adjusted to include a SCF of 2.0, representing many typical details in deck.
The stress history is determined by a rainflow counting procedure. This procedure is verified against internal and external alternative procedures including analytical solution for well separated two peak narrow band spectra.
Based on the stress history, the fatigue damage is determined utilizing Miner-Palmgren’s rule, assuming a two slope SN-curve valid for welded joints protected against corrosive environment, (DNV, 2003). The whole dynamic cycle is assumed to occur in tension. The SCF is not included in the SN-curve (one curve for all details), and the method is referred to as the hot spot stress approach.
The total fatigue damage is evaluated based on the total stress signal (only filtered to remove noise above 2Hz). The wave damage is determined from the stress signal, which is filtered to remove the high frequency vibration above 0.35Hz. The difference constitutes the vibration damage.
The wave and vibration damage from each half hour is collected into intervals defined by heading relative to the ship and Beaufort wind strength, or significant wave height. In either case the interval is one unit wide, while the heading is
divided into sectors of 30°. For each sector in ballast condition,

4 Copyright © 2007 by ASME
the distribution of the annual wave and vibration damage is approximated by empirical relations
1 as a function of
significant wave height, H
αβαα ,
,
31075.1),( HHcHF HH ⋅⋅⋅= − (1)
or Beaufort number, B (not to be taken larger than 9)
αβαα ,
,
31075.1),( BBcBF BB ⋅⋅⋅= − (2)
The constants given in Table 4 and Table 5 are fitted to the
data as shown by Moe et al (2005), and the tables constitute the response matrix
2 of the fatigue damage.
Table 4 Response matrix parameters for wave height related fatigue damage.
α (Relative heading range)
0- 30
30-60
60-90
90-120
120-150
150-180
Hβ 4 4 4 4 4 4 Wave damage
Hc 0.11 0.08 0.05 0.05 0.08 0.11
Hβ 2.7 2.7 2.7 2.7 2.5 2 Ballast
Vibration damage
Hc 0.90 0.70 0.40 0.25 0.25 0.40
Table 5 Response matrix parameters for Beaufort related fatigue damage. Note that this is representative for wind speed 10m above sea surface, while in Moe et al (2005) the response matrix is representative for wind speed at the sensor height.
α (Relative heading range)
0- 30
30-60
60-90
90-120
120-150
150-180
Bβ 3.9 3.9 3.9 3.9 3.9 3.9 Wave damage
Bc 0.05 0.04 0.03 0.03 0.04 0.05
Bβ 3 3 3 3 1.7 1 Ballast
Vibration damage
Bc 0.26 0.23 0.18 0.08 0.35 1.00
The parameters are based on several assumptions, (Moe et
al 2005). The fatigue damage is predicted by combining the response matrices with directional trade specific scatter diagrams and correction factors (relative to ballast condition for the reference ship).
5 RESULTS 5.1 Damping
Independent on the vibration being caused by whipping or springing, the damping is a crucial parameter affecting the vibration damage, while for extreme loading the damping is of minor importance.
The damping ratio is estimated by fitting an analytical SDOF spectrum to the measured vibration spectrum, described by Storhaug et al (2003). The damping estimates are presented as a function of the HF standard deviation stress in Figure 2 for ballast condition. The mean damping ratio of 0.78% is derived from about 200 recordings of the target ship, and the 95% confidence interval of the sample and mean value are also
1 Note that 10-7 is forgotten in the half hour damage in (Moe et al 2005). 2 Note that the response matrix for cargo condition is now disregarded.
displayed. The difference between the damping in ballast and cargo condition is small, and the damping appears to be linear and independent of the response level.
The damping ratio is similar for the target and reference ship, and any difference in vibration response cannot be explained by different damping.
Figure 2 Damping ratio estimates from target ship in ballast condition. The pair of dots represents port and starboard sensors.
The damping is also estimated from the reference ship based on whipping events. A typical time series with wave frequency (WF) and vibration (HF) filtered response is presented in the upper plot of Figure 3. A fit to the peak values in sagging of the high pass filtered 2-node vibration is displayed in lower plot of Figure 3. The damping ratio is 0.5%, this representing the mean value from several whipping events. The value is significantly below the 0.78% predicted by the spectral method. The spectral method overestimates the damping. This concurs with Gran (1974), who indicates a 25% higher damping from his spectral method compared to whipping decay curves.
Figure 3 Upper: High pass and wave pass filtered stress in a sea
state with 30° head sea, HS=6m, TP=11.5s, U=5.4kn. Lower: Fit of decay curve to high pass filtered response for a single whipping event in ballast condition of the reference ship.
5 Copyright © 2007 by ASME
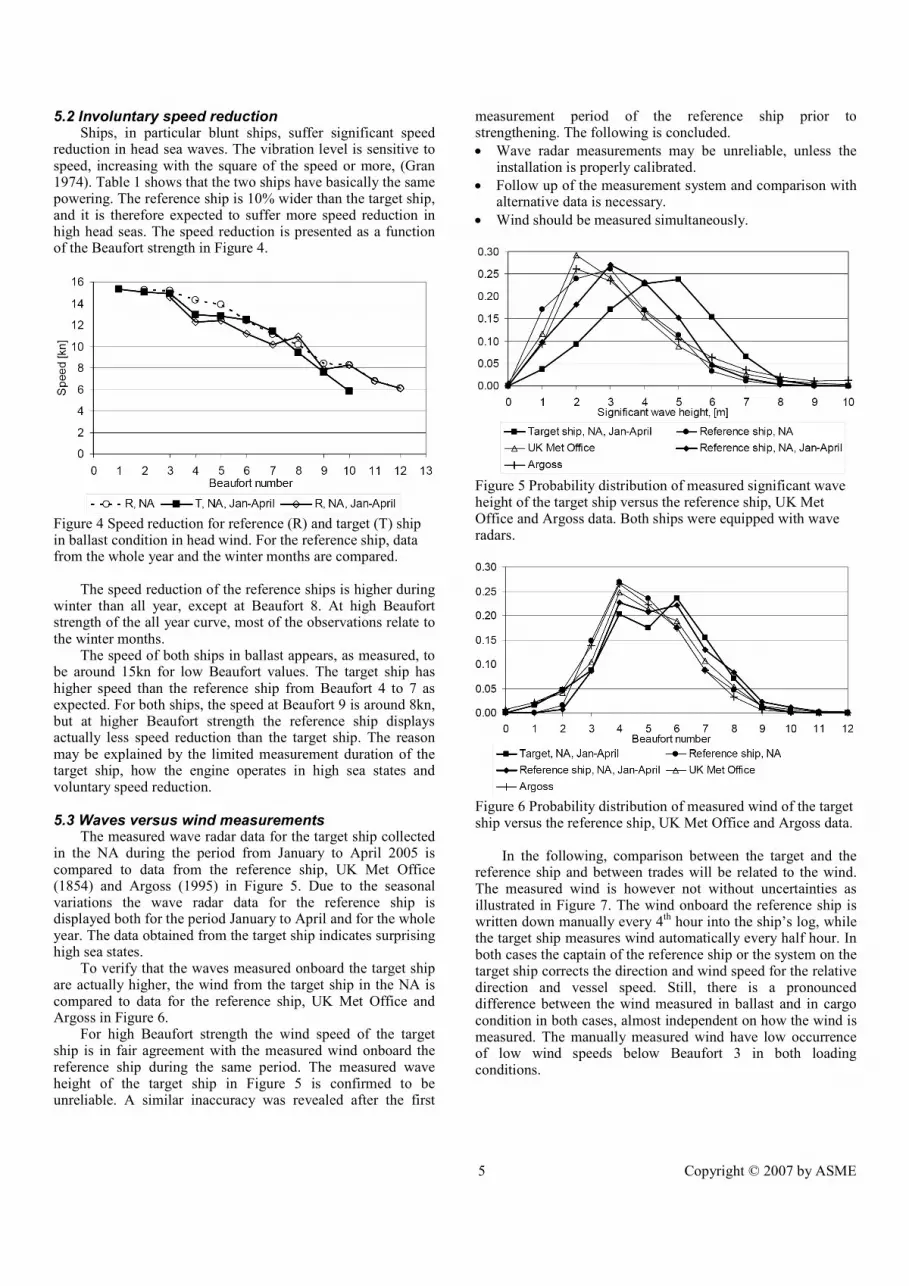
5.2 Involuntary speed reduction Ships, in particular blunt ships, suffer significant speed
reduction in head sea waves. The vibration level is sensitive to speed, increasing with the square of the speed or more, (Gran 1974). Table 1 shows that the two ships have basically the same powering. The reference ship is 10% wider than the target ship, and it is therefore expected to suffer more speed reduction in high head seas. The speed reduction is presented as a function of the Beaufort strength in Figure 4.
Figure 4 Speed reduction for reference (R) and target (T) ship in ballast condition in head wind. For the reference ship, data from the whole year and the winter months are compared.
The speed reduction of the reference ships is higher during
winter than all year, except at Beaufort 8. At high Beaufort strength of the all year curve, most of the observations relate to the winter months.
The speed of both ships in ballast appears, as measured, to be around 15kn for low Beaufort values. The target ship has higher speed than the reference ship from Beaufort 4 to 7 as expected. For both ships, the speed at Beaufort 9 is around 8kn, but at higher Beaufort strength the reference ship displays actually less speed reduction than the target ship. The reason may be explained by the limited measurement duration of the target ship, how the engine operates in high sea states and voluntary speed reduction.
5.3 Waves versus wind measurements The measured wave radar data for the target ship collected
in the NA during the period from January to April 2005 is compared to data from the reference ship, UK Met Office (1854) and Argoss (1995) in Figure 5. Due to the seasonal variations the wave radar data for the reference ship is displayed both for the period January to April and for the whole year. The data obtained from the target ship indicates surprising high sea states.
To verify that the waves measured onboard the target ship are actually higher, the wind from the target ship in the NA is compared to data for the reference ship, UK Met Office and Argoss in Figure 6.
For high Beaufort strength the wind speed of the target ship is in fair agreement with the measured wind onboard the reference ship during the same period. The measured wave height of the target ship in Figure 5 is confirmed to be unreliable. A similar inaccuracy was revealed after the first
measurement period of the reference ship prior to strengthening. The following is concluded.
• Wave radar measurements may be unreliable, unless the installation is properly calibrated.
• Follow up of the measurement system and comparison with alternative data is necessary.
• Wind should be measured simultaneously.
Figure 5 Probability distribution of measured significant wave height of the target ship versus the reference ship, UK Met Office and Argoss data. Both ships were equipped with wave radars.
Figure 6 Probability distribution of measured wind of the target ship versus the reference ship, UK Met Office and Argoss data.
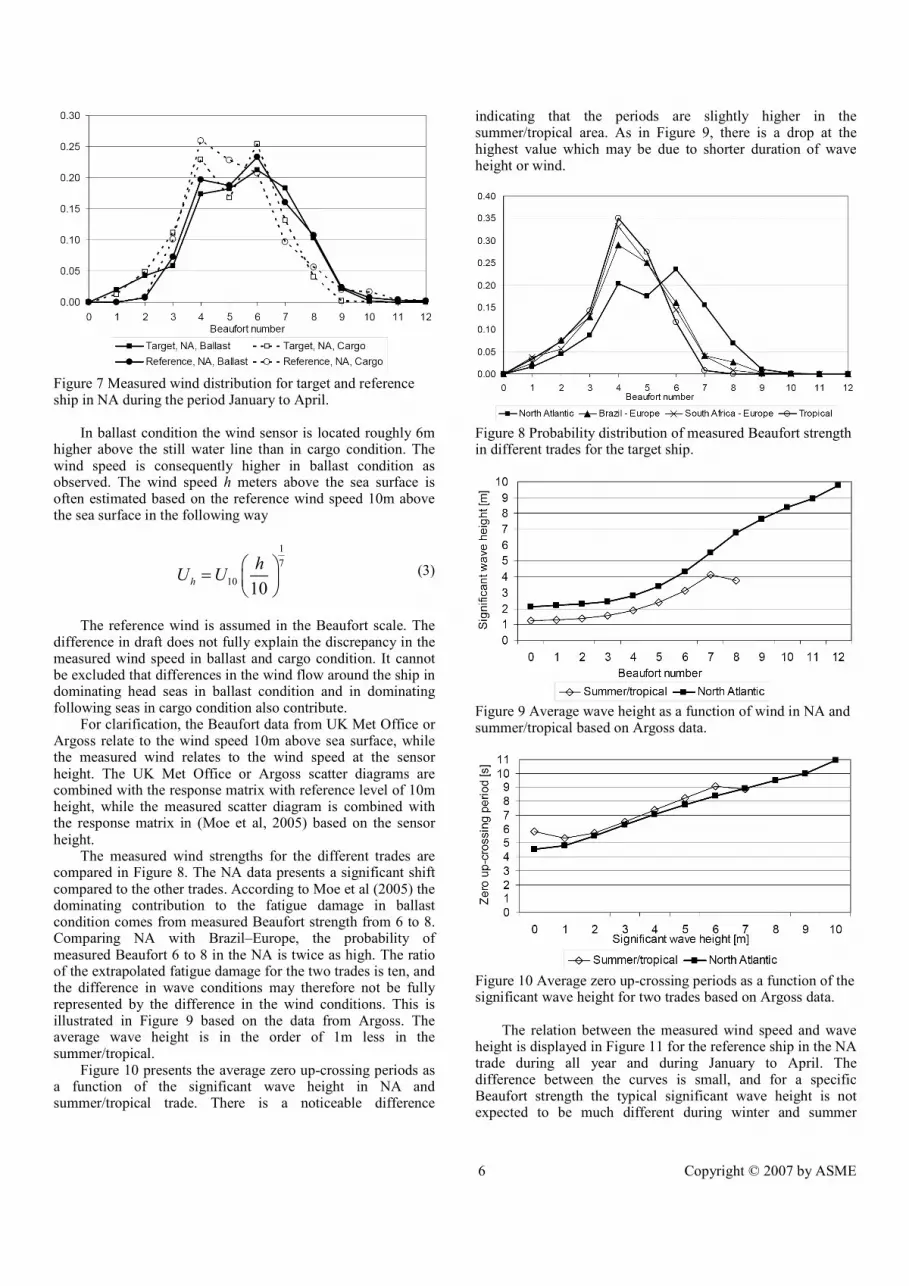
In the following, comparison between the target and the reference ship and between trades will be related to the wind. The measured wind is however not without uncertainties as illustrated in Figure 7. The wind onboard the reference ship is written down manually every 4
th hour into the ship’s log, while
the target ship measures wind automatically every half hour. In both cases the captain of the reference ship or the system on the target ship corrects the direction and wind speed for the relative direction and vessel speed. Still, there is a pronounced difference between the wind measured in ballast and in cargo condition in both cases, almost independent on how the wind is measured. The manually measured wind have low occurrence of low wind speeds below Beaufort 3 in both loading conditions.
6 Copyright © 2007 by ASME
Figure 7 Measured wind distribution for target and reference ship in NA during the period January to April.
In ballast condition the wind sensor is located roughly 6m
higher above the still water line than in cargo condition. The wind speed is consequently higher in ballast condition as observed. The wind speed h meters above the sea surface is often estimated based on the reference wind speed 10m above the sea surface in the following way
1
7
1010
h
hU U
=
(3)
The reference wind is assumed in the Beaufort scale. The
difference in draft does not fully explain the discrepancy in the measured wind speed in ballast and cargo condition. It cannot be excluded that differences in the wind flow around the ship in dominating head seas in ballast condition and in dominating following seas in cargo condition also contribute.
For clarification, the Beaufort data from UK Met Office or Argoss relate to the wind speed 10m above sea surface, while the measured wind relates to the wind speed at the sensor height. The UK Met Office or Argoss scatter diagrams are combined with the response matrix with reference level of 10m height, while the measured scatter diagram is combined with the response matrix in (Moe et al, 2005) based on the sensor height.
The measured wind strengths for the different trades are compared in Figure 8. The NA data presents a significant shift compared to the other trades. According to Moe et al (2005) the dominating contribution to the fatigue damage in ballast condition comes from measured Beaufort strength from 6 to 8. Comparing NA with Brazil–Europe, the probability of measured Beaufort 6 to 8 in the NA is twice as high. The ratio of the extrapolated fatigue damage for the two trades is ten, and the difference in wave conditions may therefore not be fully represented by the difference in the wind conditions. This is illustrated in Figure 9 based on the data from Argoss. The average wave height is in the order of 1m less in the summer/tropical.
Figure 10 presents the average zero up-crossing periods as a function of the significant wave height in NA and summer/tropical trade. There is a noticeable difference
indicating that the periods are slightly higher in the summer/tropical area. As in Figure 9, there is a drop at the highest value which may be due to shorter duration of wave height or wind.
Figure 8 Probability distribution of measured Beaufort strength in different trades for the target ship.
Figure 9 Average wave height as a function of wind in NA and summer/tropical based on Argoss data.
Figure 10 Average zero up-crossing periods as a function of the significant wave height for two trades based on Argoss data.
The relation between the measured wind speed and wave height is displayed in Figure 11 for the reference ship in the NA trade during all year and during January to April. The difference between the curves is small, and for a specific Beaufort strength the typical significant wave height is not expected to be much different during winter and summer

7 Copyright © 2007 by ASME
season. The measured wave height as a function of the Beaufort strength differs from the significant wave heights related to the Beaufort scale for fully developed sea. The reason for this difference is not clear. The routing is performed to avoid significant wave height above 5m, but disregarding wind conditions. The drop of the wave height at the highest wind speeds may be related to the duration of the wind and may be an anomaly also observed in the speed reduction curves in Figure 4. The difference in the typical speed during winter and all year for a given Beaufort strength in Figure 4 does not correlate with the limited difference in the typical measured significant wave height.
Figure 11 Measured wave height as a function of measured wind speed during all year and winter months for the reference ship in NA. The standard deviation refers to the dashed lines.
5.4 Contributions to measured fatigue damage The total damage, the wave damage and the vibration
damage is presented in Figure 12 for the target ship based on data from all trades and considering starboard strain gauge. The results are normalized so that the combined total damage from ballast and cargo condition is equal to one. Of the total damage 56% comes from the vibration damage.
Figure 12 Normalized fatigue damage for target ship based on data from all trades.
Similar results are displayed in Table 6 for the different
trades of the target ship and the reference ship. The contribution from the vibration damage of the target ship varies from 41 to 73%. In NA the figure is 57%. In the summer/tropical area the vibration damage actually exceeds the wave damage in cargo
condition. The results of the Brazil-Europe and South Africa-Europe trade are biased by the lack of winter voyages in these trades, and the Brazil-Europe trade is also biased by one single storm encountered in cargo condition.
Table 6 Normalized damage for target (T) and reference (R) ship in different trades, periods and loading conditions. The results are taken from the port side strain gauge.
Trade / Damage [%] Total Wave Vibration
T, All meas., All 100 44 56
T, All meas., Cargo 31 21 10
T, All meas., Ballast 69 23 46
T, NA, All 100 43 57
T, NA, Cargo 25 17 8
T, NA, Ballast 75 25 49
T, Brazil-Europe, All 100 59 41
T, Brazil-Europe, Cargo 97 57 40
T, Brazil-Europe, Ballast 3 2 1
T, South Afr.-Europe, All 100 27 73
T, South Afr.-Europe, Cargo 20 15 4
T, South Afr.-Europe, Ballast 80 12 68
T, Summer/tropical, All 100 29 71
T, Summer/tropical, Cargo 37 14 22
T, Summer/tropical, Ballast 63 15 48
R, NA, All 100 62 38
R, NA, Cargo 38 31 7
R, NA, Ballast 62 30 32
R, NA, Jan-April, All 100 59 41
R, NA, Jan-April, Cargo 25 21 4
R, NA, Jan-April, Ballast 75 38 37
The results for the reference ship in NA is also presented in
Table 6 based on the 3 years of operation, and for the winter period from January to April, which is the period the target ship is operating in the NA. The vibration contribution is 38% during the whole measurement period, and 41% for the winter months. The contribution from the vibration damage of the target ship is 16% higher than for the reference ship during the winter months.
5.5 Extrapolation of measured fatigue damage The measured fatigue damages are extrapolated to 20 years
trading. This is simply done by multiplying the measured fatigue damage with the ratio of the maximum possible number of recordings during 20 years and the number of recordings for that trade and loading condition. Port time is disregarded, and the total damage will lie between the ballast and cargo damage. The purpose is to visualize the relative importance of the fatigue damage in the different trades and loading conditions.
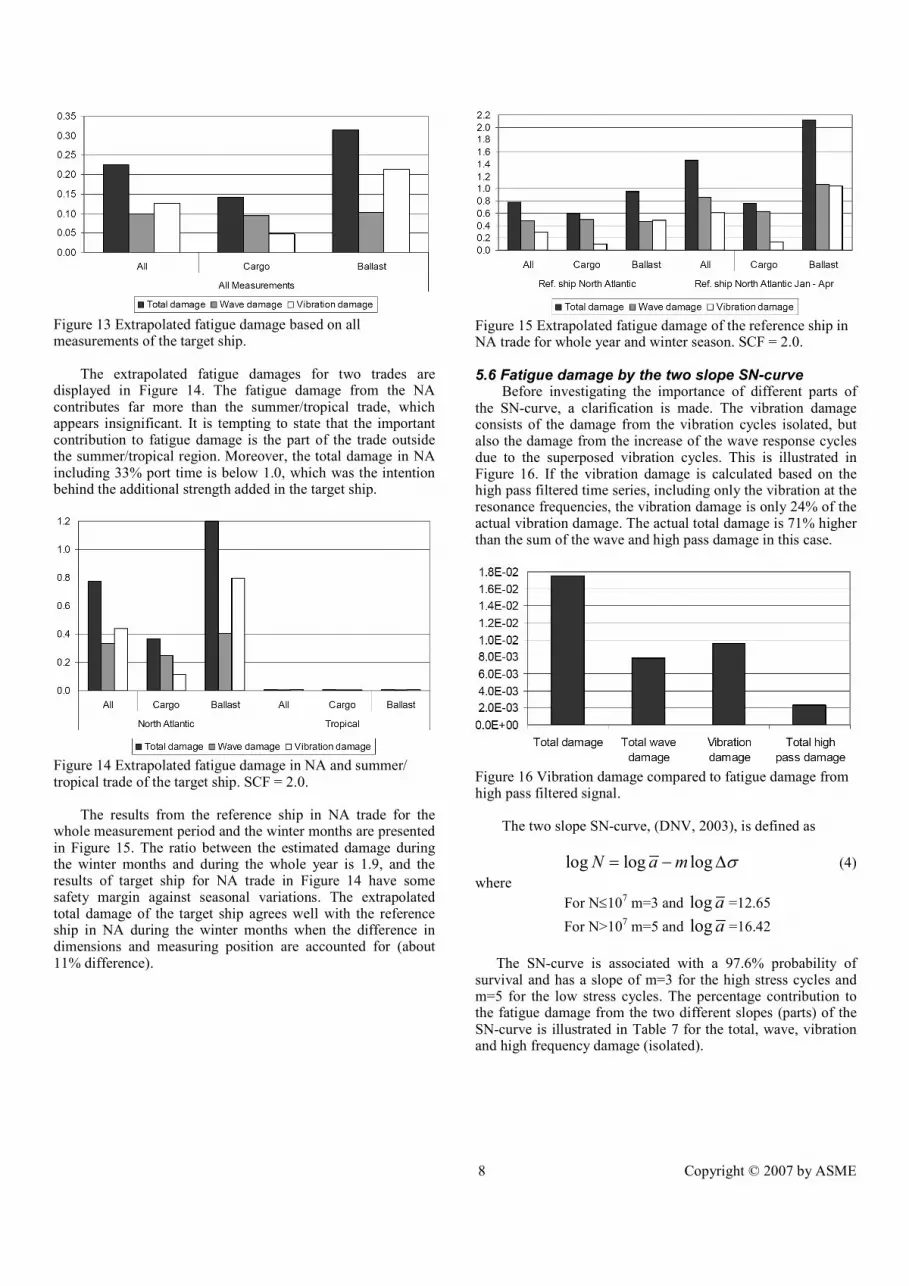
The extrapolated fatigue damage based on all measured data for the target ship is presented in Figure 13. The results confirm that the conventional fatigue sensitive structural details in deck are designed to meet the fatigue loading in the encountered trades. Ballast condition contributes more to the fatigue damage than cargo condition due to the contribution from the vibration damage.
8 Copyright © 2007 by ASME
Figure 13 Extrapolated fatigue damage based on all measurements of the target ship.
The extrapolated fatigue damages for two trades are
displayed in Figure 14. The fatigue damage from the NA contributes far more than the summer/tropical trade, which appears insignificant. It is tempting to state that the important contribution to fatigue damage is the part of the trade outside the summer/tropical region. Moreover, the total damage in NA including 33% port time is below 1.0, which was the intention behind the additional strength added in the target ship.
Figure 14 Extrapolated fatigue damage in NA and summer/ tropical trade of the target ship. SCF = 2.0.
The results from the reference ship in NA trade for the
whole measurement period and the winter months are presented in Figure 15. The ratio between the estimated damage during the winter months and during the whole year is 1.9, and the results of target ship for NA trade in Figure 14 have some safety margin against seasonal variations. The extrapolated total damage of the target ship agrees well with the reference ship in NA during the winter months when the difference in dimensions and measuring position are accounted for (about 11% difference).
Figure 15 Extrapolated fatigue damage of the reference ship in NA trade for whole year and winter season. SCF = 2.0.
5.6 Fatigue damage by the two slope SN-curve Before investigating the importance of different parts of
the SN-curve, a clarification is made. The vibration damage consists of the damage from the vibration cycles isolated, but also the damage from the increase of the wave response cycles due to the superposed vibration cycles. This is illustrated in Figure 16. If the vibration damage is calculated based on the high pass filtered time series, including only the vibration at the resonance frequencies, the vibration damage is only 24% of the actual vibration damage. The actual total damage is 71% higher than the sum of the wave and high pass damage in this case.
Figure 16 Vibration damage compared to fatigue damage from high pass filtered signal.
The two slope SN-curve, (DNV, 2003), is defined as
log log logN a m σ= − ∆ (4)
where
For N≤107 m=3 and log a =12.65
For N>107 m=5 and log a =16.42
The SN-curve is associated with a 97.6% probability of
survival and has a slope of m=3 for the high stress cycles and m=5 for the low stress cycles. The percentage contribution to the fatigue damage from the two different slopes (parts) of the SN-curve is illustrated in Table 7 for the total, wave, vibration and high frequency damage (isolated).

9 Copyright © 2007 by ASME
Table 7 Measured fatigue damage contribution from different parts of the SN-curve based on the target ship.
Damage Contribution m=3 [%]
Contribution m=5 [%]
Total 62 38
Wave 52 48
Vibration 69 21
High frequency 16 84
The 62% of the total damage comes from the upper part of
the SN-curve. The change in the fatigue damage by a change of the stress level or the SCF should be related to the difference in stress level to a power larger than 3, but less than 5.
The vibration damage contribution from the filtered HF stress for the upper part of the SN-curve is 16%, while the real vibration damage from this slope is 69%. This illustrates that the vibration cycles on top of the larger wave response cycles constitute the important contribution to the vibration damage.
5.7 Scaling of response matrix to other ship sizes. The measured stress of the target ship may be compared to
the reference ship, but then the stress has to be corrected for the difference in dimensions and section modulus for the important sea states. The wave stress is divided by a correction factor, Fw, which is defined as
9.1
,
,
,
,
)7.0(
)7.0(
+
+=
R
T
RB
TB
R
T
ActualT
ActualR
wL
L
C
C
B
B
Z
ZF (5)
The exponent of 1.9 is obtained by comparing the short
term response of the moment for the reference ship in ballast condition with and without the x-values (length direction) scaled with a factor of 280m/300m (the weight is scaled accordingly). The short term response is estimated in long crested head sea at full speed in the sea states that dominate the fatigue damage. In ballast conditions these are related to Beaufort number 6 to 8 or significant wave heights of 4 to 5m with a speed of 10kn. The 3D hydrodynamic panel program WASIM (DNV, 2004) is used. The applied Fw factor is 0.870 and it is the same in ballast and cargo condition.
The vibration stress is also corrected based the effect of speed and forward draft. The vibration is said to increase with the square of the speed (Bell and Taylor, 1967) or more (Gran, 1974), while the effect of draft is estimated by the difference in vibration damage in ballast and cargo condition of the reference ship in head seas. The correction factor for draft and speed, Fdr and Fv, are combined with the wave stress factor to obtain the vibration stress factor Fvib.
2
Tv
R
VF
V
=
0.4
/
/
R Rdr
T T
T LF
T L
=
vib v dr wF F F F= ⋅ ⋅ (6)
The vibration stress factors of the target ship are 0.933 in ballast and 0.929 in cargo condition for comparison with the reference ship in ballast and cargo condition.
The response matrix in Section 4 is supposed to be applied to the target ship, while it is developed based on the reference ship in ballast condition. In order for it to be applicable for a different design, the empirical relations defining the response matrices must be corrected. The two-slope SN-curve complicates this correction. To adjust the fatigue damage by the difference in the stress with an exponent of 3 is according to Table 7 inaccurate. The correction of the response matrix is carried out in the following way for e.g. the wave and vibration damage as a function of Beaufort strength
4
, ,
3.7
, ,
( , ) ( , )
( , ) ( , )
B T w w B
B T vib vib B
F B F F B
F B F F B
α α
α α
= ⋅
= ⋅
(7) The exponents of 4 and 3.7 depend on the stress level, and
for moderate changes of the stress level the selected factors are appropriate. They are based on evaluating the total measured fatigue damage of the target ship for different SCFs and performing linear fit to damage data. The exponent will be higher based on all measurements than based on the measurements in the NA. The results with respect to the exponent will be conservative when the procedure is applied to predict the damage of the target ship in the NA trade. The Fvib factor in cargo condition becomes 0.777 (instead of 0.929), while the other factors remain as above.
To calculate the fatigue damage for a specific trade is now straight forward by combining the corrected response matrices with the directional trade specific scatter diagrams.
The standard deviation wave and vibration stress in ballast condition for the reference and target are compared in Figure 17. It refers to head seas in the NA trade during the period of January to April. The scaled nominal vibration stress of the target ship is observed to exceed the reference ship somewhat except at Beaufort 6. The corresponding fatigue damages are displayed in Figure 19, confirming the same trend.
Figure 17 Standard deviation wave and vibration stress for target and reference ship as a function of Beaufort strength in ballast condition at head seas in NA between January and April (no SCF is included).
The comparison of the standard deviation stress for the cargo condition in following sea is shown in Figure 18. The agreement in the wave stress is fair. The vibration stress is

10 Copyright © 2007 by ASME
small, but present (each point corresponds to at least 10 records).
Figure 18 Standard deviation wave and vibration stress for target and reference ship as a function of Beaufort strength in cargo condition in following seas (no SCF is included).
Figure 19 Average half hour wave and vibration damage for target and reference ship as a function of Beaufort strength in ballast condition at head seas (includes SCF of 2.0).
5.8 Application of response matrix method The response matrix method, outlined in Section 4 and 5.7,
is developed based on data from the reference ship in ballast condition. It is applied to the target and reference ship to estimate the long term damage for the different trades.
As basis for the NA trade, directional wind and wave scatter diagrams are provided for 6 locations shown in Figure 1. The wave damage and vibration damage are predicted assuming same duration at each location. The applied vessel
heading is 270° westbound in ballast and 90° eastbound in cargo condition. Table 8 presents the predicted results based on the scatter diagrams provided by Argoss. The difference between the predicted results from wind and waves is significant. The extrapolated data from the target ship during the winter months are divided by a factor of 1.9. This corresponds to the difference in the total damage rate for all year and the winter months for the reference ship. For clarification, the total damage is referred to as WH+HF, wave damage as WF and vibration damage as HF, while Average refers to the average damage between ballast and cargo condition assuming the time at sea is the same.
The predicted damage from the response matrix method based on the Beaufort strength and significant wave height exceed the total extrapolated damage. The relative importance of the cargo condition and the vibration damage differs, and the target ship basically vibrates more than the reference ship. The
effect of routing apparently reduces the damage to half according to the wave height based prediction. Table 8 Predicted and extrapolated 20 years damage from the response matrix method applied to the target ship based on Argoss NA directional scatter diagrams.
Beaufort Significant wave height
Measured, extrapolated
Damage from
Bal. Car. Bal. Car. Bal. Car.
WF 0.58 0.58 1.07 1.07 0.41 0.25
HF 0.72 0.15 0.95 0.15 0.79 0.12
WF+HF 1.30 0.73 2.02 1.22 1.19 0.37
Average 1.02 1.62 0.78
The similar prediction is carried out for the
summer/tropical trade based on Argoss input. The average damage from the points inside the summer/tropical area in Figure 1 is presented in Table 9. For each position along the routes from Brazil and South Africa to Europe, a realistic vessel heading is applied. The predicted results are well above the extrapolated, and the damage from the Beaufort procedure is in this case higher than from the significant wave height. This deviation is explained by the different relation between wind and wave heights in Figure 9 for the summer/tropical area. In any case the predictions are conservative, but the target vessel lacks the winter months, which may at least have a significant
effect close to latitude 34° north. The wave height predicted damage is less than 10% of the damage in the NA trade.
Table 9 Predicted and extrapolated damage from the response matrix method applied to the target ship based on Argoss summer/tropical directional scatter diagrams.
Beaufort Significant wave height
Measured, extrapolated
Damage from
Bal. Car. Bal. Car. Bal. Car.
WF 0.22 0.22 0.05 0.05 0.002 0.003
HF 0.22 0.14 0.10 0.05 0.008 0.004
WF+HF 0.44 0.36 0.15 0.10 0.010 0.007
Average 0.40 0.12 0.009
Damages are predicted for the reference ship in NA trade
based on the Argoss, UK Met Office and measured scatter diagrams, in order to evaluate the influence of the environmental condition data. The Beaufort related response matrix is combined with both directional wind scatter diagrams and merged scatter diagrams (same scatter diagram but without directional properties). For the non-directional scatter diagrams
the course of the heading is stepped with 30° with even probability. This is referred to as all headings included (AHI). The results are presented in Table 10. In general, the Argoss scatter diagrams predict less average damage than based on the UK Met Office, but larger average damage than based on the measured scatter diagram. The probability distribution of the wind for the same three scatter diagrams are presented in Figure 6. It is observed that the UK Met Office and the measured wind are somewhat higher than the Argoss data at high Beaufort strength. This explains the lower damage from the Argoss scatter diagram relative to the UK Met Office data. If the measured wind at the sensor height is adjusted down to 10m above the sea surface, the measured wind is lower than the
11 Copyright © 2007 by ASME
Argoss and UK Met Office. This explains why the prediction based on the measured wind is lower. Moreover, the directional scatter diagrams predict higher vibration damage than the non-directional scatter diagrams in ballast condition, which increases the damage compared to all headings included.
Table 10 Predicted wind related damage of the reference ship in NA trade based on six wind scatter diagrams, three with directional properties and three non-directional.
3
Beaufort Argoss
Beaufort UK Met Off.
Beaufort measured
Directional scatter diagram, but fixed course
Damage from
Bal. Car. Bal. Car. Bal. Car.
WF 0.98 0.98 1.22 1.22 0.58 0.58
HF 0.92 0.19 1.09 0.21 0.59 0.16
WF+HF 1.90 1.17 2.31 1.43 1.17 0.74
Average 1.54 1.87 0.96
Non-directional, AHI (step 30°)
Bal. Car. Bal. Car. Bal. Car.
WF 0.96 0.96 1.19 1.19 0.56 0.56
HF 0.65 0.32 0.76 0.37 0.46 0.22
WF+HF 1.60 1.27 1.95 1.56 1.02 0.78
Average 1.44 1.76 0.90
The results based on the significant wave height related
response matrix are shown in Table 11. Again all headings included give less total damage than the directional scatter diagrams. This is because the contribution from ballast condition with it’s vibration damage is higher in the head seas encountered in the directional scatter diagram. Moreover, the predicted damages from the Argoss and UK Met Office scatter diagrams exceed the predicted damage from the measured scatter diagram as well as the Beaufort related damages with a significant margin. The probability distribution of the three scatter diagrams are displayed in Figure 5. For high sea states the Argoss data is above the UK Met Office data, which again is significantly above the measured wave heights. This agrees with the predicted results.
In (Moe et al 2005) it is stated that the effect of routing is estimated to reduce the fatigue damage by one third. If assuming the wave heights provided by Argoss and the measurements to be correct, routing appears to have reduced the fatigue damage to half in the NA. The routing is based on wave heights and not wind. This is reflected in the relative difference between the damage predicted based on wave heights and wind.
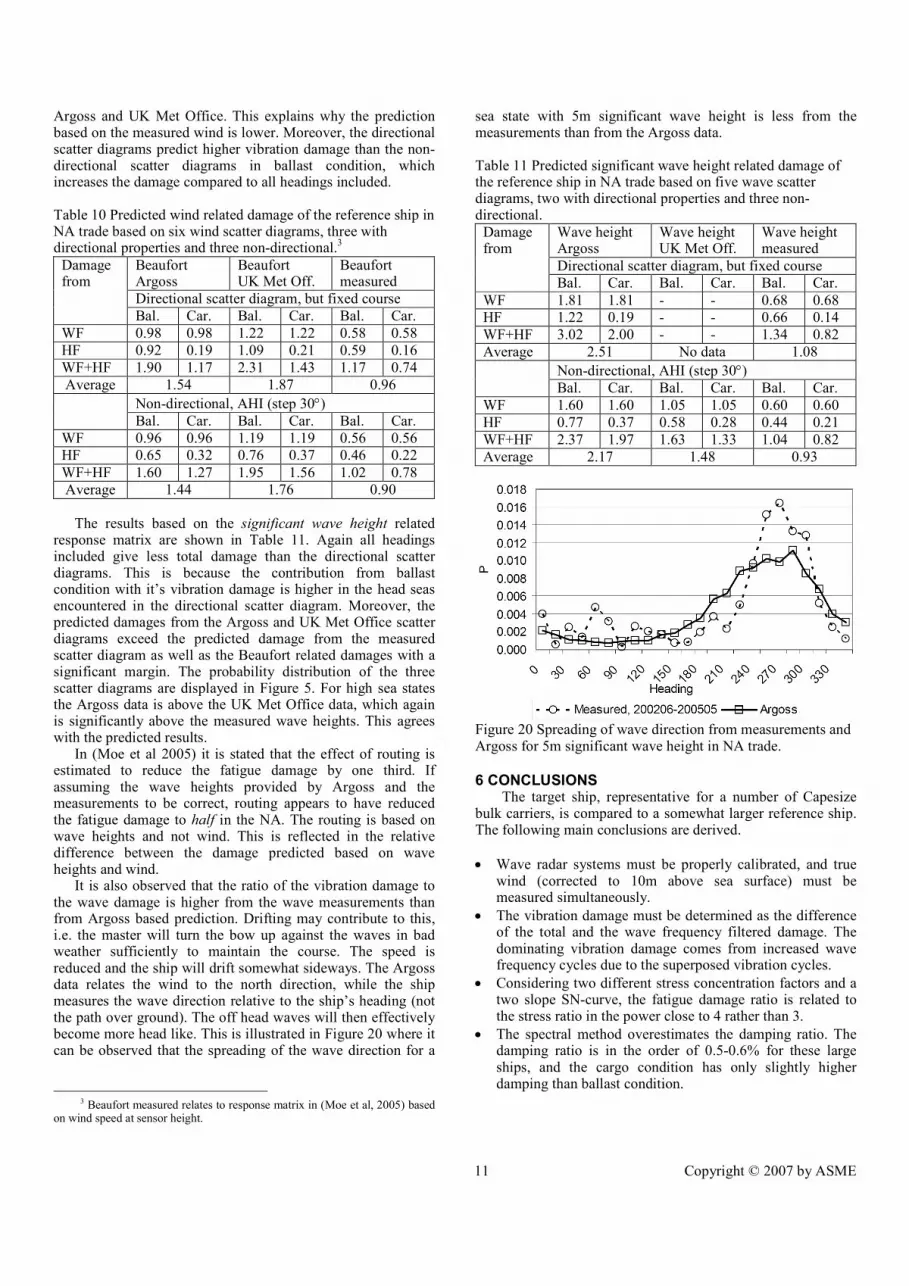
It is also observed that the ratio of the vibration damage to the wave damage is higher from the wave measurements than from Argoss based prediction. Drifting may contribute to this, i.e. the master will turn the bow up against the waves in bad weather sufficiently to maintain the course. The speed is reduced and the ship will drift somewhat sideways. The Argoss data relates the wind to the north direction, while the ship measures the wave direction relative to the ship’s heading (not the path over ground). The off head waves will then effectively become more head like. This is illustrated in Figure 20 where it can be observed that the spreading of the wave direction for a
3 Beaufort measured relates to response matrix in (Moe et al, 2005) based
on wind speed at sensor height.
sea state with 5m significant wave height is less from the measurements than from the Argoss data. Table 11 Predicted significant wave height related damage of the reference ship in NA trade based on five wave scatter diagrams, two with directional properties and three non-directional.
Wave height Argoss
Wave height UK Met Off.
Wave height measured
Directional scatter diagram, but fixed course
Damage from
Bal. Car. Bal. Car. Bal. Car.
WF 1.81 1.81 - - 0.68 0.68
HF 1.22 0.19 - - 0.66 0.14
WF+HF 3.02 2.00 - - 1.34 0.82
Average 2.51 No data 1.08
Non-directional, AHI (step 30°)
Bal. Car. Bal. Car. Bal. Car.
WF 1.60 1.60 1.05 1.05 0.60 0.60
HF 0.77 0.37 0.58 0.28 0.44 0.21
WF+HF 2.37 1.97 1.63 1.33 1.04 0.82
Average 2.17 1.48 0.93
Figure 20 Spreading of wave direction from measurements and Argoss for 5m significant wave height in NA trade.
6 CONCLUSIONS The target ship, representative for a number of Capesize
bulk carriers, is compared to a somewhat larger reference ship. The following main conclusions are derived.
• Wave radar systems must be properly calibrated, and true wind (corrected to 10m above sea surface) must be measured simultaneously.
• The vibration damage must be determined as the difference of the total and the wave frequency filtered damage. The dominating vibration damage comes from increased wave frequency cycles due to the superposed vibration cycles.
• Considering two different stress concentration factors and a two slope SN-curve, the fatigue damage ratio is related to the stress ratio in the power close to 4 rather than 3.
• The spectral method overestimates the damping ratio. The damping ratio is in the order of 0.5-0.6% for these large ships, and the cargo condition has only slightly higher damping than ballast condition.
12 Copyright © 2007 by ASME
• The speed reduction in higher head sea waves is considerable. The difference between the two ships is within one knot in North Atlantic head sea operation for most Beaufort numbers.
• During the winter months in the North Atlantic, the vibration damage constitutes with 57% and 41% for the target and reference ship. The target ship is observed to vibrate more for the same Beaufort strength. The difference is explained by slightly higher service speed and less forward draft of the target ship, but it may also originate from differences in the encountered sea states.
• The vibration damage of the target ship constitutes 56% of the total damage for typical fatigue sensitive details in deck amidships based on measurements in all trades. The reference ship had a contribution of 38% in North Atlantic trade.
• The vibration damage contribution increases in less harsh environment, and represents 71% in the summer/tropical area, but the total fatigue damage is insignificant compared to the North Atlantic area. The important contribution to fatigue damage comes from the operation outside the summer/tropical area, as only 2% of the damage is measured in the summer/tropical area.
• The predicted total damage by applying Argoss North Atlantic wave scatter diagram exceeds the UK Met Office based prediction. Both give significantly higher damage than predicted values from the measured wave scatter diagram. It indicates that the effect of routing based on waves in North Atlantic reduces the fatigue damage to roughly half.
• The Beaufort related response matrix method gives less difference with respect to the total (average) damage based on wind scatter diagrams from Argoss, UK Met Office and measured data for the North Atlantic. This agrees with the assumption that routing is based on waves and not wind.
• The directional scatter diagrams give somewhat higher total damage and relative vibration damage than the all headings included, based on both waves and wind in North Atlantic.
• While there is a fair agreement between the predicted damage and the measured extrapolated damage of the target ship in North Atlantic trade, the predicted damage for the summer/tropical area is highly conservative compared to the extrapolated measured damage. The Beaufort based prediction contributes to this conservatism, since the wave height for a given Beaufort is less in the summer/tropical area than in the North Atlantic. The wave height related prediction is also conservative, which could be explained by conservatism in the response matrices at low significant wave heights and the lack of winter voyages.
• The wave and Beaufort related response matrices underestimate the relative importance of the vibration damage compared to the extrapolated vibration damage of the target ship from the North Atlantic and summer/tropical operation.
• Due to limited number of voyages and lack of winter voyages, the response matrix method could not be compared to the measured damages of the Brazil-Europe and South Africa-Europe trades.
The high contribution from the vibration damage suggests that it should be included in the design phase for harsh environments, or whenever the fatigue strength is optimized with respect to the actual expected trade. The effect of routing in harsh environment should be disregarded as long as the vibration damage is disregarded in the fatigue design.
ACKNOWLEDGMENTS Many colleagues within DNV have been involved in one
way or in another, and we would like to thank them all. We would also like to give a special thank to the yards, owners and masters, who assisted in the execution of the measurement program. The input data from Argoss and UK Met Office are also appreciated.
REFERENCES Argoss, http://www.argoss.nl/, founded 1995, located in
Marknesse, Netherlands. Bell, A.O. and Taylor, K.V., ‘Wave-excited hull vibration’,
Shipping World and Shipbuilder, Feb. 1968, pp. 412-426. Cleary, W.A., Robertson, J.B., Yagle, R.A., ‘The results
and significance of the strength studies on the Great Lake bulk ore carrier Edvard L. Ryerson’, SNAME Symposium on hull stresses in bulk carriers, Ottawa, 1971, pp. G1-G69.
DNV, ‘Fatigue Assessment of Ship Structures’, DNV Classification Note No. 30.7, September 2003.
DNV, ‘SESAM user manual WASIM, Wave Loads on Vessels with Forward Speed, version 3.2’, 12
th of August 2004,
DNV report no. 2003-0209, rev. 3. Gran, S., ‘Full scale measurements of wave excited
vibrations of a 255 000 dwt. tanker in ballast condition (progress report no. 5)’, DNV technical report no. 74-41-S, September 1974.
Gran, S., ‘Full scale measurements of springing contribution to extreme stress and fatigue in a large tanker’, DNV technical report no. 76-417, December, 1976.
Lacey, P. and Chen, H., ‘Improved passage planning using weather forecasting, maneuvering guidance and instru-mentation feedback’, Marine Technology, Jan. 1995, no. 3, pp. 1-19.
Lopes, T.A.P. and Troyman, A.C.R., ‘Experimental study of springing vibration in waves’, 4
th Intern. Symp. On Practical
Design of Ships and Mobile Units, Oct., 1989, vol. 2, pp.46.1-46.6, Varna, Bulgaria.
Moe, E., Holtsmark, G. and Storhaug, G., ‘Full scale measurements of the wave induced hull girder vibrations of an ore carrier trading in the North Atlantic’, RINA, International Conference, Design and Operation of bulk carriers, pp. 57-85, 18-19th of October 2005, London, UK.
Storhaug, G., Vidic-Perunovic, J., Rüdinger, F., Holtsmark, G., Helmers, J.B. and Gu X., ‘Springing/whipping response of a large ocean going vessel – A comparison between numerical simulations and full scale measurements’, 3
rd international
conference on Hydroelasticity in Marine Technology, pp. 117-131, Oct. 2003, Oxford, UK.
UK Met Office, http://www.metoffice.gov.uk/, founded 1854, located in Exeter, UK.
Watanabe, I. and Soares C.G., ‘Comparative study on the time-domain analysis of non-linear ship motions and loads’, Marine Structures, no. 12, 1999, pp. 153-170.


