Embed Size (px)
Citation preview

UCSFUC San Francisco Electronic Theses and Dissertations
TitleDiscovery and Characterization of Inhibitory Mechanisms of Drugs and Antibodies Against Viral, Fungal, and Amoebic Human Pathogens, Including SARS-CoV-2, Zika Virus, Balamuthia mandrillaris, and Candida auris
Permalinkhttps://escholarship.org/uc/item/8ps1z42p
AuthorLaurie, Matthew Thomas
Publication Date2022 Peer reviewed|Thesis/dissertation
eScholarship.org Powered by the California Digital LibraryUniversity of California

by Submitted in partial satisfaction of the requirements for degree of in in the GRADUATE DIVISION of the UNIVERSITY OF CALIFORNIA, SAN FRANCISCO Approved: ______________________________________________________________________________
Chair
______________________________________________________________________________
______________________________________________________________________________
______________________________________________________________________________
______________________________________________________________________________ Committee Members
�����������
��++!�.���,)"�
�������������������
�"*�'-�)/��&���!�)��+�)"0�+"'&�'���&!"�"+')/����!�&"*%*�'���), *��&���&+"�'�"�*�� �"&*+��")�$��,& �$���&���%'��"���,%�&���+!' �&*���&�$,�"& �������'������"#���"),*����$�%,+!"��%�&�)"$$�)"*���&����&�"����,)"*
�"'�!�%"*+)/��&���'$��,$�)��"'$' /
��$�&"���++
'*�(!����"*"
��)+"&���%(%�&&

ii
Copyright 2022
by
Matthew Thomas Laurie

iii
To Inne and Mina, for bringing me the greatest joy I can imagine and the motivation to do
whatever I can to make the world a better place for you to live in

iv
Acknowledgements
I would first like to thank my Ph.D advisor and mentor Dr. Joseph DeRisi for teaching me
so much about how to be a thoughtful and creative scientist. When I entered graduate school at
UCSF I was looking for an exciting, fast-paced, and unique research experience and there is no
doubt that your lab was the right place for that. Something I have told every prospective student
thinking about joining the DeRisi lab is that there will never be a shortage of opportunities to lead
great projects and make a real impact. That was certainly true for me and I am very grateful to you
for providing the environment that facilitated those opportunities. I truly appreciate that you have
always led from the front and even though everyone works extremely hard in your lab, you’re
always there with us working tirelessly as well. I admire that you have consistently practiced and
advocated for a strong set of principles in the research your lab produces and the academic work
environment that we all create. As annoying as it can be for your students when you keep asking
for one more experiment or pitching another big spin-off project, I do still admire your attitude
that science is never truly finished and there are always ways to keep improving our research.
Lastly, I want to thank you for always believing in me and pushing me to try my hardest on
everything, I know my work and development as a scientist is much better for it.
My research and education also benefited greatly from the guidance of my thesis committee
members Dr. Melanie Ott and Dr. Martin Kampmann. Your expert advice, constructive
commentary, and thoughtful encouragement were critical for my success at every stage of my
graduate work. Thank you very much for your support through all of the ups and downs of my
research and everything you have done to help with my career development.
All of the work throughout my graduate career was made possible by collaboration with
many talented and thoughtful co-authors. To Sara Sunshine, Jamin Liu, Dr. Hanna Retallack, Dr.

v
Matthew Lohse, Dr. Corin, White, Dr. Alexander Johnson, Sophia Levan, Kelsey Zorn, Dr. Diane
Havlir, James Peng, Dr. Genay Pilarowski, Dr. Luis Rubio, Douglas Black, Dr. Eric Chow, Sabrina
Mann, Anthea Mitchell, Dr. Kristeene Knopp, Dr. Carolina Arias, Dr. Elizabeth Di Lullo, Dr.
Jayant Rajan, Dr. Vida Ahyong, Dr. Emily Crawford, Dr. Amy Kistler, Dr. Joseph Sabatino Jr.,
Dr. Judy Sakanri, Dr. Wesley Wu, Matthew Moser, Dr. Michael Wilson, and Dr. Joseph DeRisi,
thank you all so much for making the body of work that is presented here possible by sharing your
skills, knowledge, and effort. Thank you also to Armando Mis and Joselin Payan for bringing me
so much blood (and donuts).
By far the best part of my Ph.D has been the time spent working with and getting to know
an amazing group of people in the DeRisi lab and at the Biohub. Thank you so much to Manny De
Vera, Jennifer Mann, and Brittany Worth for everything you’ve done to support me and everyone
else in the lab, for solving all of the crazy problems that come up, and for somehow making it all
look easy by keeping the lab running smoothly. To the past and present post-docs that have taught
me so much, Dr. Corin White, Dr. Kristeene Knopp, Dr. Carolina Arias, Dr. Wesley Wu, Dr.
Jayant Rajan, Dr. Caleigh Mandel-Brehm, Dr. Madhura Raghavan, Dr. Chuka Didigu, and Dr.
Sharline Madera, thank you for being so patient and encouraging as you helped guide my research.
To the amazing technicians Sabrina Mann, Anthea Mitchell, and Grace Wang, thank you for being
incredibly dedicated, helpful, and flexible despite the immense amount of work thrown at you from
all sides. To the fearless and tireless CLIAhub leaders Dr. Emily Crawford and Dr. Vida Ahyong,
your effort and selflessness was truly inspiring and I am so grateful for what you accomplished.
To the Biohub group leaders that graciously and frequently assisted me, Dr. Manu Leonetti, Dr.
Andreas Puschnik, Dr. Leslie Goo, Dr. Amy Kistler, Dr. Ivan Ivanov, thank you for being so
generous with your time and going out of your way to help me so often. To Dr. Eric Chow, thank

vi
you for being the best person to talk to for troubleshooting equipment and protocols and when
looking for creative solutions to experimental problems, your help was consistently invaluable.
My fellow graduate students in the DeRisi lab made my time in the lab so enjoyable. Thank
you so much to Sara Sunshine, Jamin Liu, Dr. Valentina Garcia, Dr. Hanna Retallack, Andrew
Kung, Isobel Hawes, and Robert Puccinelli for all of your help and advice and for making the lab
a fun and supportive environment. Sara and Jamin, I am so happy to have had the chance to work
so closely with you on Covid projects throughout the pandemic, the stress and frustration of
working on endless urgent projects was made so much better by your support and friendship. I
consider myself incredibly fortunate to have been surrounded with such a kind and talented group
of people in the DeRisi lab.
I would also like to thank the generous donors who are responsible for funding the work
presented in this manuscript. This work was made possible by the Ruth L. Kirschstein National
Research Service Award, the University of California San Francisco COVID Fund, Marc and
Lynne Benioff, Howard Hughes Medical Institute, the Chan Zuckerberg Biohub, and the Chan
Zuckerberg Initiative.
I am immensely grateful to my family and friends for their support throughout my Ph.D.
You have all been so patient and understanding despite me often not being able to devote the time
that you deserve. To my mother- and father-in-law, thank you for everything you have done for
me, Inne, and Mina. You have worked tirelessly to support us in every situation from moving
across the country three times, to having a baby in the middle of a pandemic, and of course for
finishing the long and difficult road to my Ph.D. To my parents, thank you for all of the love and
support you’ve given me throughout my life. Neither of you had easy lives or many advantages
growing up, but I did. That is entirely thanks to your hard work and the sacrifices you’ve made for

vii
me. I know that I would not be where I am today without the advantages you provided for me, so
I hope you know that my accomplishments are your accomplishments as well.
To Mina, thank you for being such a bright light in my life and the lives of the many people
who love you. Already you are such a sweet, intelligent, funny, and loving child and I have no
doubt you will grow into an amazing person. The work you see in this dissertation came at the
enormous cost of time that I would otherwise have spent with you. I am sorry that you had to share
in this sacrifice, but I want you to know that I did this all with the belief that it would help make a
better world for you. Being your dad is the thing I am most proud of and I hope that you will be
proud of me too.
Inne, no part of the work presented here would have been possible without you. I have had
many difficult days in graduate school and life in general, but coming home to you never fails to
instantly make everything alright. Thank you for believing in me more than I believed in myself.
Thank you for all of your sacrifices that made it possible to meet all the challenges over the course
of my Ph.D. Thank you for always standing up for what is right, giving your all to everything you
do, and pushing me to do the same. Your love and support means everything to me. Thank you for
being the best partner I could ever ask for.

viii
Contributions
Chapter 2
Includes content previously published in:
Retallack H*, Di Lullo E*, Arias C, Knopp KA, Laurie MT, Sandoval-Espinosa C, Mancia Leon
WR, Krencik R, Ullian EM, Spatazza J, Pollen AA, Mandel-Brehm C, Nowakowski TJ,
Kriegstein AR, DeRisi JL. Zika virus cell tropism in the developing human brain and inhibition
by azithromycin. Proc Natl Acad Sci U S A. 2016;113(50):14408-14413.
doi:10.1073/pnas.1618029113
Chapter 3
Includes contributions by Dr. Hanna Retallack, Dr. Kristeene Knopp, Dr. Carolina Arias,
and Dr. Joseph DeRisi.
Chapter 4
Includes content previously published in:
Laurie MT*, White CV*, Retallack H, Wu W, Moser MS, Sakanari JA, Ang K, Wilson C, Arkin
MR, DeRisi JL. Functional Assessment of 2,177 U.S. and International Drugs Identifies the
Quinoline Nitroxoline as a Potent Amoebicidal Agent against the Pathogen Balamuthia
mandrillaris. mBio. 2018; Oct 30;9(5):e02051-18. doi: 10.1128/mBio.02051-18
Chapter 5
Includes contributions by Dr. Matthew Lohse, Sophia Levan, Dr. Naomi Ziv, Dr. Craig
Ennis, Dr. Clarissa Nobile, Dr. Alexander Johnson, and Dr. Joseph DeRisi.
Chapter 6
Includes content previously published in:

ix
Pilarowski G, Lebel P, Sunshine S, Liu J, Crawford E, Marquez C, Rubio L, Chamie G, Martinez
J, Peng J, Black D, Wu W, Pak J, Laurie MT, Jones D, Miller S, Jacobo J, Rojas S, Rojas S,
Nakamura R, Tulier-Laiwa V, Petersen M, Havlir DV; CLIAHUB Consortium, DeRisi J.
Performance Characteristics of a Rapid Severe Acute Respiratory Syndrome Coronavirus 2
Antigen Detection Assay at a Public Plaza Testing Site in San Francisco. J Infect Dis. 2021; Apr
8;223(7):1139-1144. doi: 10.1093/infdis/jiaa802.
Chapter 7
Includes content previously published in:
Peng J*, Liu J*, Mann SA*, Mitchell AM*, Laurie MT*, Sunshine S*, Pilarowski G*, Ayscue
P*, Kistler A, Vanaerschot M, Li LM, McGeever A, Chow ED, Marquez C, Nakamura R, Rubio
L, Chamie G, Jones D, Jacobo J, Rojas S, Rojas S, Tulier-Laiwa V, Black D, Martinez J, Naso J,
Schwab J, Petersen M, Havlir D, DeRisi J; IDseq Team. Estimation of Secondary Household
Attack Rates for Emergent Spike L452R Severe Acute Respiratory Syndrome Coronavirus 2
(SARS-CoV-2) Variants Detected by Genomic Surveillance at a Community-Based Testing Site
in San Francisco. Clin Infect Dis. 2022; Jan 7;74(1):32-39. doi: 10.1093/cid/ciab283.
Chapter 8
Includes content previously published in:
Sabatino JJ Jr, Mittl K, Rowles WM, McPolin K, Rajan JV, Laurie MT, Zamecnik CR, Dandekar
R, Alvarenga BD, Loudermilk RP, Gerungan C, Spencer CM, Sagan SA, Augusto DG,
Alexander JR, DeRisi JL, Hollenbach JA, Wilson MR, Zamvil SS, Bove R.
Multiple sclerosis therapies differentially affect SARS-CoV-2 vaccine-induced antibody and T
cell immunity and function. JCI Insight. 2022; Feb 22;7(4):e156978.
doi:10.1172/jci.insight.156978.

x
Chapter 9
Includes content previously published in:
Liu J, Laurie MT, Rubio L, Vazquez SE, Sunshine S, Mitchell AM, Hapte-Selassie M, Mann
SA, Pilarowski G, Black D, Marquez C, Rojas S, Lionakis MS, Petersen M, Whitman JD, Jain
V, Anderson M, Havlir D, DeRisi J. SARS-CoV-2 transmission dynamics and immune responses
in a household of vaccinated persons. Clin Infect Dis. 2022; Jan 17:ciac029. doi:
10.1093/cid/ciac029.
Chapter 10
Includes content previously published in:
Laurie MT, Liu J, Sunshine S, Peng J, Black D, Mitchell AM, Mann SA, Pilarowski G, Zorn KC,
Rubio L, Bravo S, Marquez C, Sabatino JJ Jr, Mittl K, Petersen M, Havlir D, DeRisi J. SARS-
CoV-2 variant exposures elicit antibody responses with differential cross-neutralization of
established and emerging strains including Delta and Omicron.
J Infect Dis. 2022; Jan 3:jiab635. doi: 10.1093/infdis/jiab635.

xi
Discovery and Characterization of Inhibitory Mechanisms of Drugs and Antibodies
Against Viral, Fungal, and Amoebic Human Pathogens, Including
SARS-CoV-2, Zika Virus, Balamuthia mandrillaris, and Candida auris
Matthew Thomas Laurie
Abstract
The development of effective approaches to prevent, diagnose, and treat infectious diseases
is made possible through a strong basis in the fundamental biology of pathogen lifecycles as well
as methods for direct discovery and validation of tools to fight infectious diseases. In this
dissertation, I discuss work that was performed with the primary goal of identifying actionable
countermeasure strategies against specific infectious diseases, while contributing to understanding
aspects of basic pathogen biology where possible. Chapters 2 through 5 of this dissertation discuss
efforts utilizing high-throughput small molecule screening to repurpose existing clinically-
approved compounds as potential inhibitors of specific human pathogens. Chapters 2 and 3
describe discovery, validation, and mechanistic investigation for the novel antiviral effect of
azithromycin. Chapter 4 describes a similar discovery pipeline for identification of the 8-
hydroxyquinoline nitroxoline as a novel inhibitor of the brain-eating amoeba Balamuthia
mandrillaris. In chapter 5, we apply a similar drug repurposing approach to validate the potent
antifungal effect of another 8-hydroxyquinoline, clioquinol, against the fungal pathogen Candida
auris. Chapters 6 through 10 describe studies pertaining to our team’s response to the SARS-CoV-
2 pandemic. Chapter 6 details a large team effort to validate the field performance of the Abbott
BinaxNOW rapid SARS-CoV-2 antigen test that is now in widespread over the counter use. This
antigen test was used extensively for the study described in chapter 7, which measured the
transmission dynamics of specific SARS-CoV-2 variants. Chapters 8, 9, and 10 investigate the

xii
magnitude and specificity of neutralizing antibody responses produced by individuals with prior
exposure to SARS-CoV-2 variants and/or vaccines.

xiii
Table of Contents
Chapter 1: An Introduction……………………………………………………………………......1
Chapter 1 references……………………………………………………………………....9
Chapter 2: Zika virus cell tropism and inhibition by azithromycin...............................................12
Chapter 2 references..........................................................................................................31
Chapter 3: Preliminary investigation of the antiviral mechanism of azithromycin.......................35
Chapter 3 references..........................................................................................................53
Chapter 4: Identification and characterization of nitroxoline as a novel inhibitor of the
amoebic pathogen Balamuthia mandrillaris................................................................56
Chapter 4 references..........................................................................................................87
Chapter 5: Identification and characterization of clioquinol as a potent inhibitor of Candida
Auris.............................................................................................................................99
Chapter 5 references........................................................................................................132
Chapter 6: Real-world performance testing of a SARS-CoV-2 rapid antigen test in San
Francisco, California..................................................................................................147
Chapter 6 references........................................................................................................160
Chapter 7: Differential secondary attack rates of SARS-CoV-2 variants measured by local
viral genomic surveillance.........................................................................................162
Chapter 7 references........................................................................................................180
Chapter 8: Neutralizing antibody responses to SARS-CoV-2 vaccination in Multiple
Sclerosis patients........................................................................................................184
Chapter 8 references........................................................................................................215

xiv
Chapter 9: Transmission dynamics of SARS-CoV-2 among vaccinated household members
and related immune responses...................................................................................220
Chapter 9 references........................................................................................................229
Chapter 10: Cross-neutralization of SARS-CoV-2 variants by immune sera elicited by a
range of infection and vaccination exposures..........................................................231
Chapter 10 references......................................................................................................242

xv
List of Figures
Chapter 2
Figure 2.1 Tropism of ZIKV for radial glia in the developing human brain.....................26
Figure 2.2 ZIKV infects astrocytes in later stages of human brain development..............28
Figure 2.3 Azithromycin (AZ) treatment inhibits ZIKV infection in glial cells...............30
Chapter 3
Figure 3.1 Antiviral activity of azithromycin and timing of inhibition.............................48
Figure 3.2 Characterization of azithromycin-resistant ZIKV mutants..............................49
Figure 3.3 Genetic modifiers of azithromycin anti-ZIKV activity....................................50
Figure 3.4 Synergistic activity of azithromycin in combination with entry inhibitors......52
Chapter 4
Figure 4.1 Primary drug repurposing screen against B. mandrillaris................................78
Figure 4.2 Activity of compounds structurally related to nitroxoline...............................79
Figure 4.3 Comparison of nitroxoline potency and selectivity to standard of care
drugs.................................................................................................................80
Figure 4.4 Drug-induced encystment and killing of B. mandrillaris cysts........................81
Figure 4.5 Nitroxoline prevention of brain explant destruction by B. mandrillaris...........82
Figure 4.6 Example brightfield images of B. mandrillaris trophozoites and cysts...........83
Figure 4.7 Efficacy of nitroxoline in combination with miltefosine and pentamidine
isethionate for inhibition of B. mandrillaris....................................................84
Figure 4.8 Inhibition of B. mandrillaris-mediated brain tissue explant destruction in
the presence of nitroxoline...............................................................................85

xvi
Chapter 5
Figure 5.1 A screen of 1990 clinically approved and investigational compounds
for in vitro inhibition of C. auris identified 89 candidates for further
evaluation.......................................................................................................128
Figure 5.2 Secondary screening and selectivity measurement identified five
promising compounds, including three hydroxyquinolines...........................129
Figure 5.3 Evolution of clioquinol resistance in a serial passaging selection
experiment......................................................................................................130
Figure 5.4 Dihalogenated 8-hydroxyquinolines are the most effective inhibitors of
C. auris and this activity is abrogated by the presence of Iron or Copper.....131
Chapter 6
Figure 6.1 Titration of in vitro grown severe acute respiratory syndrome coronavirus
2 and detection with Binax-CoV2 assay........................................................157
Figure 6.2 Comparison of Binax-CoV2 test with quantitative reverse-transcription
polymerase chain reaction (RT-PCR) test.....................................................158
Figure 6.3 Variability of signal intensity in Binax-CoV2 card lots.................................159
Chapter 7
Figure 7.1 Testing catchment area...................................................................................176
Figure 7.2 Variants observed at 24th & Mission.............................................................177
Chapter 8
Figure 8.1 Analysis of total spike and spike RBD IgG before and after SARS-CoV-2
vaccination of patients with MS receiving different DMTs..........................210

xvii
Figure 8.2 VirScan analysis of postvaccination Ab reactivity against the
SARS-CoV-2 spike proteome by MS DMT status........................................211
Figure 8.3 SARS-CoV-2 pseudovirus neutralization in seropositive patients treated
with S1P receptor modulators or anti-CD20 mAbs.......................................212
Figure 8.4 Evaluation of spike antigen–specific CD4+ and CD8+ T cells in patients
with MS treated with different DMTs...........................................................213
Figure 8.5 Ex vivo analysis of postvaccination spike-specific CD8+ T cells of
patients with MS treated with different DMTs, by pMHC I tetramer...........214
Chapter 9
Figure 9.1 Serum samples from household individuals reveal diverse neutralization
capabilities as well as presence of anti–IFN-α2 auto-antibodies in
Individual 1....................................................................................................227
Figure 9.2 Sequencing depth and coverage of recovered SARS-CoV-2 genomes..........228
Chapter 10
Figure 10.1 Neutralization of D614G and B.1.429 pseudoviruses by serum from
individuals with different exposures............................................................240
Figure 10.2 Change in variant pseudovirus neutralization titer relative to D614G.........241

xviii
List of Tables
Chapter 4
Table 4.1 Recrudescence time of active B. mandrillaris following drug treatment..........86
Chapter 7
Table 7.1 Characteristics of households included in the household attack rate
analysis, stratified by strain............................................................................178
Table 7.2 Secondary household attack rates for West Coast Variants, combined and
disaggregated by B.1.427 and B.1.429............................................................178
Table 7.3 Secondary attack rate disaggregated by covariates..........................................179

xix
List of Abbreviations
AZ – Azithromycin
CC50 – Half-maximal cytotoxic concentration
CNS – Central nervous system
Covid-19 – Coronavirus disease 2019
EC50 – Half-maximal effective concentration
hpi – Hours post-infection
IC50 – Half-maximal inhibitory concentration
MOI – Multiplicity of infection
NT50 – 50% neutralization titer
NX – Nitroxoline
qRT-PCR – Quantitative reverse transcriptase polymerase chain reaction
SARS-CoV-2 – Severe Acute Respiratory Syndrome Coronavirus 2

1
Chapter 1:
An Introduction
Science has afforded humanity the incredible ability to treat and prevent infectious diseases
through understanding the fundamental biology underlying pathogenesis and through empirical
discovery and validation of specific interventions. Although incredible medical advancements
have prevented and cured many terrible infectious diseases, there exists an equally incredible
diversity of endemic and emerging human and animal pathogens that present constant challenges
to our ability to develop effective countermeasures [1,2]. These challenges are apparent at every
level of infectious disease medicine, including the basic science research that supports
development of diagnostic tools and novel vaccine and treatment options. The available research
tools, experimental procedures, and existing bodies of literature vary greatly between different
pathogens. Furthermore, vast differences in the biology of diverse pathogens in terms of structure,
lifecycle, and mechanism of pathogenesis lead to inherently different opportunities for diagnostic
methods and treatment targets. Less common pathogens, particularly those with poorly understood
lifecycles, are highly unlikely to attract investment in commercial drug discovery programs and
even less likely to be studied in clinical trials. Finally, the evolution of drug resistance and immune
evasion creates a constant arms race between pathogens and strategies to mitigate their impact
[3,4]. Factors such as these heavily influence the ability to turn laboratory research studies into
medically useful outcomes and lead to large differences in the availability of tools to fight different
types of pathogens. A stark example of this is the very large number of antibiotic drugs that have
been discovered relative to the number of antiviral drugs [5,6]. Difficulties presented by the lack
of research tools and limitations of biology certainly do not mean that there is no viable way to

2
fight certain pathogens, rather that it is necessary to invest effort to adapt our approaches to the
biological context of each pathogen.
Much of the work presented in this dissertation was performed with the goal of identifying
opportunities to produce clinically relevant and potentially actionable findings through empirical
drug screening studies. These opportunities have presented themselves in the DeRisi lab in large
part due to the lab’s pioneering of metagenomic sequencing techniques for identifying mystery
pathogens and due to close associations with clinical scientists. As discussed here across multiple
chapters, these opportunities have presented themselves for pathogens ranging from the brain-
eating amoeba Balamuthia mandrillaris, a very rare infection, to SARS-CoV-2, which will
continue to affect the lives of nearly every person on Earth for decades to come. Studying Zika
virus during the 2016 outbreak presented the first way for me to contribute to infectious disease
research with a team of fantastic scientists in the DeRisi lab. Because the threat of Zika as a
pathogen was largely due to its effects in utero, our team focused our efforts on understanding the
virus in that context and searching for potential treatment options that would be safe in pregnancy.
For Balamuthia, the opportunity to make a significant impact in the study and clinical approach
towards this pathogen was apparent, as Balamuthia brain infections result in a greater than 95%
mortality rate even with treatment, reflective of a very poor standard of care and lack of specifically
effective treatment options [7]. For the fungal pathogen Candida auris, effective treatments
currently exist, but the recent emergence of strains that are resistant to all three major classes of
antifungals is a cause for concern and led us to design a study to address the need for novel
treatment options outside of the established classes of antifungal drugs [8,9]. Finally, although an
unprecedented number of researchers have focused their efforts on SARS-CoV-2 since the
beginning of the Covid-19 pandemic, our group has found several additional important ways to

3
contribute through verification of diagnostic test performance, viral genome surveillance, and
analysis of humoral immune responses to vaccination and infection with variants.
For certain highly prevalent pathogens such as SARS-CoV-2, significant investment has
been made to fast-track efforts to develop diagnostics, therapies, and vaccines [10,11]. However,
this is very much the exception within infectious disease research as for most pathogens, the
traditional drug and vaccine development pipelines are prohibitively costly and time consuming.
Several of the pathogens that I have studied fall under this category as they are either too rare or
emerged too rapidly for typical development timelines to be practical, resulting in unmet needs for
therapeutic options. Several of the studies described in this manuscript attempted to subvert some
of these issues using a strategy to identify clinically-approved compounds that are candidates for
repurposing using high-throughput screening. The primary advantage of this general approach is
that clinically-approved drugs have already undergone substantial testing to rigorously establish
pharmacological and safety profiles, which eliminates a significant hurdle in therapeutic
development. Repurposed drugs that have already been shown to be safe in humans can
theoretically be deployed much more rapidly against a novel indication compared to newly
discovered compounds with unknown safety profiles. For extremely rare pathogens, drug
repurposing may, in fact, be the only option available for finding new treatments. The most
significant limitation to drug repurposing screens is the relatively small set of approximately 2000
drugs that are currently approved for clinical use, which reduces the likelihood of finding inhibitors
with activity specific pathogens. Nevertheless, in vitro drug repurposing strategies have been
successfully employed by several groups and we have attempted to add to this field by adapting
screening and validation techniques to different pathogens by addressing the unique challenges
specific to each biological context [12–14].

4
A thorough and specific introduction for each study is included within each chapter, but a
broad overview will be provided here for context and to connect common themes and methods
used across different studies. Chapters 2 and 3 discuss efforts to identify inhibitors of the
arthropod-borne flavivirus Zika that would be safe for use in pregnancy [15]. We performed a
screen of nearly 2000 FDA- and internationally-approved drugs for inhibition of the cytopathic
effect caused by Zika virus in a human glioma cell line, selected to be somewhat representative of
one of the cell types observed to be infected in the developing brain. The lead candidate that we
identified from this screen was the macrolide antibiotic azithromycin, which is extremely widely
used, well-tolerated, and safe for use in pregnancy. Our in vitro studies with azithromycin showed
that the antiviral effect exists in multiple cell types in the low micromolar range and occurs at
concentrations that are not toxic to host cells. Preliminary investigations into the antiviral
mechanism of action of azithromycin are discussed in Chapter 3. Although these studies did not
definitively identify the antiviral mechanism, we produced circumstantial evidence that
azithromycin inhibits the entry of Zika virus into host cells by preventing the normal migration of
viral particles through host endosomes.
Chapter 4 details a drug repurposing study designed to identify inhibitors of the brain-
eating amoeba Balamuthia mandrillaris [16]. Although Balamuthia infections are extremely rare
with only a handful of documented cases per year, nearly all past cases have been fatal [7]. One
drug discovery challenge that is specific to Balamuthia is that this pathogen has both an active
trophozoite form as well as a highly robust cyst form that is resistant to many types of damage
including many drug treatments. The existing standard of care for Balamuthia infections
recommended by the CDC includes several drugs with significant side effects and a lack of proven
activity against Balamuthia, even in vitro [17]. Our drug repurposing screen identified nitroxoline,

5
an 8-hydroxyquinoline antibiotic approved for clinical use in Europe, as a potent inhibitor of
Balamuthia. We showed that nitroxoline, unlike the current standard of care drugs, inhibits
Balamuthia at concentrations below cytotoxicity to human cells. Importantly, we also showed that
nitroxoline inhibits both the trophozoite and cyst forms of Balamuthia and that nitroxoline
treatment prevented the recrudescence of Balamuthia trophozoites for at least one month. Finally,
we performed brain tissue explant experiments to show that nitroxoline treatment prevented
Balamuthia-mediated destruction of tissue. The publication of our study directly led to an
emergency investigational new drug authorization being granted for the use of nitroxoline in
patients with Balamuthia infection of the brain and, at the time of this writing, at least one patient
is currently being treated for Balamuthia with nitroxoline.
Chapter 5 describes another drug repurposing study, this time aimed at discovering novel
inhibitors of the fungal pathogen Candida auris, which is noteworthy for the frequent isolation of
highly drug-resistant strains, including those resistant to all three major classes of antifungal drugs
[8,9]. Because different C. auris strains have evolved a variety of mechanisms of resistance to
different drugs, we designed our drug repurposing pipeline to identify inhibitors that were broadly
effective against a wide range of genetically diverse strains. Our primary screen identified several
hit compounds that inhibited C. auris growth at sub-micromolar concentrations. Subsequent
experiments to determine the breadth of drug effects across many C. auris strains and the toxicity
to human cells narrowed the list of candidates down to a small handful of highly selective
inhibitors. Because the evolution of resistance even to novel drugs is a concern, we performed in
vitro selections for drug resistance for the lead compounds. We found that for clioquinol, an 8-
hydroxyquinoline antibiotic, C. auris gained only a very moderate 2- to 6- fold increase in
resistance after almost 200 generations of selection, a much lower magnitude of resistance

6
compared to other drugs [18–20]. Due to its potency, selectivity, and relatively low propensity for
resistance evolution, clioquinol was the clear lead compound identified in our study. Interestingly,
the mutations that confer resistance to clioquinol in our in vitro selection experiments increase
susceptibility to certain other antifungals including posaconazole, which is used frequently in the
current standard of care. We also provide strong evidence that clioquinol inhibits C. auris growth
through a metal chelation mechanism and structurally related compounds behave similarly to
clioquinol.
In addition to the drug repurposing studies mentioned above, this dissertation also describes
a separate set of projects focused on epidemiology, viral evolution, and host immune response
related to SARS-CoV-2. Because several members of the DeRisi lab already had significant
expertise in virology and interest in public health collaborations, we had several opportunities to
assist in rapid response efforts aiming to help mitigate aspects of the Covid-19 pandemic. One
such opportunity is detailed in Chapter 6, in which we evaluated the real-world performance of a
SARS-CoV-2 diagnostic rapid antigen test, the Abbott BinaxNOW test, in comparison to
established qRT-PCR tests [21]. Close collaboration with the Unidos en Salud community health
program in San Francisco enabled the validation study for BinaxNOW and opened the door for
subsequent efforts to utilize rapid testing at community Covid-19 testing sites in San Francisco to
support sequencing of SARS-CoV-2 samples from positive individuals for genomic surveillance
of viral variants. In chapter 7, we used this data to characterize the diversity of circulating variants
and to calculate the differential attack rate of certain variants relative to the wild-type virus [22].
Chapters 8 through 10 describe studies that examine aspects of humoral immunity acquired
by exposure to SARS-CoV-2 infection or vaccination. Neutralizing antibodies that are produced
in response to vaccination or natural infection strongly correlate with protective immunity against

7
SARS-CoV-2 infection and severe illness. To study neutralizing antibody responses in different
exposure contexts and understand the specificity of polyclonal responses, we used a pseudovirus
reporter assay that expresses different versions of the SARS-CoV-2 spike glycoprotein on the
outside of virus-like particles. In the work described in Chapter 8, we assessed neutralizing
antibody titers in healthy donors as well as patients undergoing multiple sclerosis treatment to
show that specific MS drugs, which are known to affect immune function, interfere with
production of neutralizing antibodies targeting SARS-CoV-2 [23]. In Chapter 9 we show that,
despite normal levels of anti-SARS-CoV-2 neutralizing antibodies, breakthrough infections of
vaccinated individuals can occur and may be exacerbated in several circumstances, including
infection with viral variants and underlying autoimmune disorders [24].
In Chapter 10, we address questions related to how the neutralizing antibody response
changes based on the SARS-CoV-2 variant that an individual was exposed to and how this
determines the specificity of cross-neutralization towards the landscape of circulating variants
[25]. The opportunity to perform this study came from a community testing and viral genome
surveillance partnership that was previously mentioned in Chapter 8. Since viral genomes were
sequenced for variant surveillance, we were able to acquire convalescent serum samples from
donors with known exposure to specific SARS-CoV-2 variants. Access to exposure-matched
serum allowed us to design a cross-reactivity matrix study in which the neutralization efficiency
of different serum exposure groups was tested against pseudoviruses representative of different
SARS-CoV-2 variants. The results of this study showed that polyclonal anti-sera is most efficient
at neutralizing variants sharing key spike mutations with the variant that the donor was exposed
to. Additionally, we showed that serial exposure to SARS-CoV-2 spike in the form of natural

8
infection and/or vaccination resulted in not only higher overall antibody titers, but also an
increased breadth of cross-reactive neutralization.
The ideas and study findings presented in this dissertation are products of the dedication
and creativity of many talented scientists that worked together in the collaborative, multi-
disciplinary environment of the DeRisi lab and the Chan Zuckerberg Biohub. It was a great
privilege to be a part of projects that successfully identified novel drug candidates against three
different pathogens, Zika virus, Candida auris, and Balamuthia Mandrillaris and may one day
contribute to the development of viable therapies. As a basic scientist, it has also been an important
experience to contribute to the understanding of pathogen lifecycles and identification of pathway
vulnerabilities that suggest potential treatment options. To study infectious disease during a global
pandemic was a unique challenge and call to action. I am very proud of the work that our team did
in helping to support Covid-19 diagnostics, track the transmission of viral variants, and
characterize the immune responses to different types of exposures. I am thankful for all of these
opportunities, but I hope there are far fewer of them in the future.

9
Chapter 1 References:
1. Dunn RR, Davies TJ, Harris NC, Gavin MC. Global drivers of human pathogen richness and
prevalence. Proc Biol Sci. 2010; 277(1694):2587–2595.
2. Murray KA, Preston N, Allen T, Zambrana-Torrelio C, Hosseini PR, Daszak P. Global
biogeography of human infectious diseases. Proceedings of the National Academy of Sciences.
Proceedings of the National Academy of Sciences; 2015; 112(41):12746–12751.
3. Nabel KG, Clark SA, Shankar S, et al. Structural basis for continued antibody evasion by the
SARS-CoV-2 receptor binding domain. Science. 2022; 375(6578):eabl6251.
4. Antimicrobial Resistance Collaborators. Global burden of bacterial antimicrobial resistance in
2019: a systematic analysis. Lancet. 2022; 399(10325):629–655.
5. Purssell E. Antimicrobials. Understanding Pharmacology in Nursing Practice. 2019; :147–165.
6. Adalja A, Inglesby T. Broad-Spectrum Antiviral Agents: A Crucial Pandemic Tool. Expert
Rev Anti Infect Ther. 2019; 17(7):467–470.
7. Martínez DY, Seas C, Bravo F, et al. Successful treatment of Balamuthia mandrillaris amoebic
infection with extensive neurological and cutaneous involvement. Clin Infect Dis. 2010;
51(2):e7-11.
8. Candida auris Clinical Update - September 2017 | Candida auris | Fungal Diseases | CDC
[Internet]. 2019 [cited 2022 Apr 12]. Available from: https://www.cdc.gov/fungal/candida-
auris/c-auris-alert-09-17.html
9. Forsberg K, Woodworth K, Walters M, et al. Candida auris: The recent emergence of a
multidrug-resistant fungal pathogen. Med Mycol. 2019; 57(1):1–12.

10
10. Kyriakidis NC, López-Cortés A, González EV, Grimaldos AB, Prado EO. SARS-CoV-2
vaccines strategies: a comprehensive review of phase 3 candidates. NPJ Vaccines. 2021;
6(1):28.
11. Research C for DE and. Coronavirus Treatment Acceleration Program (CTAP). FDA
[Internet]. FDA; 2022 [cited 2022 Apr 12]; . Available from:
https://www.fda.gov/drugs/coronavirus-covid-19-drugs/coronavirus-treatment-acceleration-
program-ctap
12. Sleigh SH, Barton CL. Repurposing Strategies for Therapeutics. Pharm Med. 2010; 24(3):151–
159.
13. Ashburn TT, Thor KB. Drug repositioning: identifying and developing new uses for existing
drugs. Nat Rev Drug Discov. 2004; 3(8):673–683.
14. Firth A, Prathapan P. Broad-spectrum therapeutics: A new antimicrobial class. Curr Res
Pharmacol Drug Discov. 2021; 2:100011.
15. Retallack H, Di Lullo E, Arias C, et al. Zika virus cell tropism in the developing human brain
and inhibition by azithromycin. Proc Natl Acad Sci U S A. 2016; 113(50):14408–14413.
16. Laurie MT, White CV, Retallack H, et al. Functional Assessment of 2,177 U.S. and
International Drugs Identifies the Quinoline Nitroxoline as a Potent Amoebicidal Agent against
the Pathogen Balamuthia mandrillaris. mBio. 2018; 9(5):e02051-18.
17. Treatment | Balamuthia | Parasites | CDC [Internet]. 2019 [cited 2022 Apr 12]. Available from:
https://www.cdc.gov/parasites/balamuthia/treatment.html
18. Rybak JM, Muñoz JF, Barker KS, et al. Mutations in TAC1B: a Novel Genetic Determinant
of Clinical Fluconazole Resistance in Candida auris. mBio. 2020; 11(3):e00365-20.

11
19. Bing J, Hu T, Zheng Q, Muñoz JF, Cuomo CA, Huang G. Experimental Evolution Identifies
Adaptive Aneuploidy as a Mechanism of Fluconazole Resistance in Candida auris. Antimicrob
Agents Chemother. 2020; 65(1):e01466-20.
20. Carolus H, Pierson S, Muñoz JF, et al. Genome-Wide Analysis of Experimentally Evolved
Candida auris Reveals Multiple Novel Mechanisms of Multidrug Resistance. mBio. 2021;
12(2):e03333-20.
21. Pilarowski G, Lebel P, Sunshine S, et al. Performance Characteristics of a Rapid Severe Acute
Respiratory Syndrome Coronavirus 2 Antigen Detection Assay at a Public Plaza Testing Site
in San Francisco. J Infect Dis. 2021; 223(7):1139–1144.
22. Peng J, Liu J, Mann SA, et al. Estimation of secondary household attack rates for emergent
spike L452R SARS-CoV-2 variants detected by genomic surveillance at a community-based
testing site in San Francisco. Clin Infect Dis. 2021; :ciab283.
23. Sabatino JJ, Mittl K, Rowles WM, et al. Multiple sclerosis therapies differentially affect SARS-
CoV-2 vaccine-induced antibody and T cell immunity and function. JCI Insight. 2022;
7(4):e156978.
24. Liu J, Laurie MT, Rubio L, et al. SARS-CoV-2 transmission dynamics and immune responses
in a household of vaccinated persons. Clin Infect Dis. 2022; :ciac029.
25. Laurie MT, Liu J, Sunshine S, et al. SARS-CoV-2 variant exposures elicit antibody responses
with differential cross-neutralization of established and emerging strains including Delta and
Omicron. J Infect Dis. 2022; :jiab635.

12
Chapter 2:
Zika virus cell tropism and inhibition by azithromycin
This chapter is a reprint of:
Retallack H*, Di Lullo E*, Arias C, Knopp KA, Laurie MT, Sandoval-Espinosa C, Mancia Leon
WR, Krencik R, Ullian EM, Spatazza J, Pollen AA, Mandel-Brehm C, Nowakowski TJ,
Kriegstein AR, DeRisi JL. Zika virus cell tropism in the developing human brain and inhibition
by azithromycin. Proc Natl Acad Sci U S A. 2016;113(50):14408-14413.
doi:10.1073/pnas.1618029113
*These authors contributed equally to this work
Supplemental files that are not figures can be found with the original work.

13
Abstract
The rapid spread of Zika virus (ZIKV) and its association with abnormal brain development
constitute a global health emergency. Congenital ZIKV infection produces a range of mild to
severe pathologies, including microcephaly. To understand the pathophysiology of ZIKV
infection, we used models of developing brain that faithfully recapitulate the tissue architecture in
early- to mid-gestation. We identify the brain cell populations that are most susceptible to ZIKV
infection in primary human tissue, provide evidence for a mechanism of viral entry, and show that
a commonly used antibiotic protects cultured brain cells by reducing viral proliferation. In the
brain, ZIKV preferentially infected neural stem cells, astrocytes, oligodendrocyte progenitor cells,
and microglia, whereas neurons were less susceptible to infection. These findings suggest
mechanisms for microcephaly and other pathologic features of infants with congenital ZIKV
infection that are not explained by neural stem cell infection alone, such as calcifications in the
cortical plate. Furthermore, we find that blocking the glia-enriched putative viral entry receptor,
AXL, reduced ZIKV infection of astrocytes in vitro and genetic knockdown of AXL in a glial cell
line nearly abolished infection. Finally, we evaluate 2,177 compounds, focusing on drugs safe in
pregnancy. We show the macrolide antibiotic, azithromycin, reduced viral proliferation and viral-
induced cytopathic effects in glial cell lines and human astrocytes. Our characterization of
infection in developing human brain clarifies the pathogenesis of congenital ZIKV infection and
provides the basis for investigating possible therapeutic strategies to safely alleviate or prevent the
most severe consequences of the epidemic.

14
Significance statement
Zika virus is a mosquito-borne flavivirus that has rapidly spread through the Americas and
has been associated with fetal abnormalities, including microcephaly. To understand how
microcephaly develops, it is important to identify which cell types of the developing brain are
susceptible to infection. We use primary human tissue to show that radial glia and astrocytes are
more susceptible to infection than neurons, a pattern that correlates with expression of a putative
viral entry receptor, AXL. We also perform a screen of FDA-approved compounds, with an
emphasis on drugs known to be safe in pregnancy. We identify an antibiotic, azithromycin, that
reduces viral proliferation in glial cells, and compare its activity to daptomycin and sofosbuvir,
two additional drugs with anti-ZIKV activity.
Main Text
A correlation between congenital exposure to the mosquito-borne and sexually transmitted
Zika flavivirus (ZIKV) and the increased incidence of severe microcephaly suggests a causal
relationship between ZIKV infection and neurodevelopmental abnormalities (1, 2). However, the
mechanisms of infection and specifically which cell populations are vulnerable to ZIKV during
the course of human brain development remain unclear. Major insights have been drawn from in
vitro models of human brain development and primary mouse tissues. In the developing mouse
brain, ZIKV has been shown to infect radial glia and neurons (3), whereas studies in human
pluripotent stem cell (hPSC)-derived neural cells have highlighted widespread infection and
apoptosis of neural progenitor cells (4, 5). Because these models do not fully recapitulate the
developmental events and cell types present during human brain development, these results may
not faithfully represent ZIKV-induced pathology in vivo.

15
During human brain development, radial glial cells, the neural stem cells, give rise to
diverse types of neuronal and glial cells, including neurons, oligodendrocytes, and astrocytes, in a
temporally controlled pattern. We reasoned that identifying cell types that are especially vulnerable
to viral infection would facilitate studies of the viral life cycle, including entry mechanisms and
host cell requirements. Building on studies that suggested that enriched expression of the candidate
entry factor AXL could confer vulnerability to ZIKV entry (6–8), we used AXL expression levels
to predict that radial glia, astrocytes, microglia, and endothelial cells would be particularly
vulnerable to infection (9). A recent study highlighted the utility of ex vivo models using primary
human tissue samples to analyze the consequences of ZIKV infection in the human prenatal brain
(7). Here we further use primary tissue samples from distinct stages of brain development
corresponding to periods of peak neurogenesis and early gliogenesis.
Determining the tropism of ZIKV for specific cell types will help identify suitable cellular
models for investigating potential therapeutic interventions. Although development of a vaccine
could provide a long-term solution to the current ZIKV epidemic, there remains an unmet clinical
need to identify drugs that can limit or prevent the consequences of congenital infection. A recent
screen of a subset of Food and Drug Administration (FDA)-approved compounds against ZIKV in
hepatic cells identified several anticancer, antimicrobial, antiparasitic, and antifungal drugs with
anti-ZIKV activity (10). Another screen, based on human neural progenitor cells, identified an
antifungal drug and several scaffold compounds for further development (11). However, the
majority of compounds with anti-ZIKV activity from these screens are contraindicated or of
unknown safety during pregnancy. Furthermore, two promising candidates that might be safe
during pregnancy, daptomycin and sofosbuvir, showed variable effectiveness by cell type
(7, 10, 12). Combining unbiased screens of approved compounds with comparisons of top

16
candidates with known antiviral activity may quickly narrow the search for drugs that could
mitigate the effects of congenital ZIKV infection.
Here we assessed ZIKV cell tropism in the developing human brain and performed a drug
screen on relevant cell types targeted by the virus with an emphasis on drugs known to be safe in
pregnancy. We found that radial glia and, later in development, astrocytes were especially
vulnerable to ZIKV infection. By screening FDA-approved compounds for anti-ZIKV activity in
a glial cell line with features of both cell types, we also found that the common antibiotic
azithromycin prevented viral production and virus-mediated cell death, which we further validated
in human astrocytes.
Results
To determine the cell populations most susceptible to ZIKV infection we investigated the
infectivity of ZIKV in the developing human brain using organotypic cultures from primary human
tissue. We exposed human cortical tissue slices to three strains of ZIKV: Cambodia 2010 (ZIKV-
CAM), Brazil 2015 (ZIKV-BR), and Puerto Rico 2015 (ZIKV-PR), cultured them for 72 hours
(h), and detected infection by immunostaining for the flavivirus envelope protein (ENV), an
approach that we validated in cultured cells (Fig. S1). Infection in tissue was confirmed by
immunostaining for the viral RNA- dependent RNA polymerase, nonstructural protein 5 (NS5),
present only during viral replication. In samples from mid-neurogenesis (13-16 post-conception
weeks (pcw)), we observed high rates of infection in the ventricular and subventricular zones
(Figure 2.1, and Fig. S2). We found that the virus preferentially infected both ventricular (vRG)
and outer radial glia (oRG) cells (Figure 2.1, A to F, and Fig. S2). Interestingly, we observed
clusters of infected radial glia (Fig. S2B), which may reflect local viral spread. A minor fraction

17
of cells positive for ENV at these stages included postmitotic neurons (Fig. 1H), and microglia
(Figure 2.1 1I). We observed similar patterns of infection across ZIKV strains (Fig. S2). We also
observed a small but significant increase in cell death of ENV+ cells as compared to ENV- cells
in ZIKV-infected tissue or mock-infected tissue (Fig. S3).
At later stages of development (after 17 pcw), we observed infection and viral replication
throughout the developing cortex, including the cortical plate and subplate, with production of
infectious virus by 48 hpi (Figure 2.2, and Fig. S4). Among cortical plate cells, we observed a high
rate of infection in astrocytes as distinguished by their location, morphology, and
immunoreactivity with the glial markers GFAP and SOX2 (Figure 2.2, A, B and D, and Fig. S4,
A, B, C, and D). We also observed cells immunoreactive for both ENV and the microglial marker
IBA1, indicating microglial infection or phagocytosis of other ZIKV infected cells (Figure 2.2,
and Fig. S4 G and H). This ENV+/IBA1+ microglial population was quantified at 7±1% of ENV+
cells, and represented 7±2% of the total IBA1+ population (n = 4, 15-22 pcw, see Methods). We
further observed infection of oligodendrocyte precursor cells (OPCs) (Figure 2.2G and Fig. S4I),
but limited infection of neurons (Figure 2.2, B and D, and Fig. S4, A and J). This pattern of
infectivity was consistent across ZIKV strains (Fig. S4) and matched viral tropism predicted by
AXL receptor expression (9).
To test the possible role of AXL in mediating ZIKV entry into human astrocytes, we
infected hPSC-derived astrocytes (13, 14) in the presence of a nonactivating antibody specific for
the extracellular domain of AXL. Blocking the AXL receptor substantially reduced infection (Fig.
2 I and J and Fig. S5A). To further test the requirement of AXL for ZIKV infection of glial cells,
we used the U87 glioblastoma line that expresses high levels of astrocyte marker genes and AXL

18
(15). U87 cells were readily infected with ZIKV, with strong virus production at 48 hpi (Fig. S1)
and robust cytopathic effect at 72 hpi (Fig. 3C and Fig. S6D). We then used CRISPR interference
(CRISPRi) to knock down AXL in this cell line (SI Materials and Methods; validated by Western
blot in Fig. S5B) and observed a substantial decrease in infection (Fig. 2K), confirming the
importance of this receptor for ZIKV infection in this cell type. Given that AXL is a receptor
tyrosine kinase with signaling pathways that could be involved in innate immune responses (16),
we tested whether the kinase activity of AXL was relevant for the decrease in infection observed
in the knockdown line. After pretreatment with a small-molecule inhibitor, R428, we observed no
decrease in infection at up to 1 µM, which is >70-fold the half-maximal effective concentration
(EC50) for AXL kinase inhibition (Fig. S5C) (17). Although we did observe a decrease in infection
at 3 µM R428, this high concentration of >200-fold the EC50 likely created off-target effects.
Together, these results suggest that AXL has an important role in glial cell infection that depends
more on its extracellular domain than on its intracellular kinase activity.
There is a pressing need to identify pharmacological compounds that can diminish the
effects of ZIKV infection in relevant human cell types. We performed a screen of 2177 clinically
approved compounds (2016 unique) by monitoring inhibition of virus- dependent cell death at 72
hpi in Vero cells. While our screen revealed compounds that rescued cell viability, including
antibiotics and inhibitors of nucleotide and protein synthesis, many showed toxicity in Vero or
U87 cells, or are contraindicated during pregnancy (Tables S1, S2, S3, S4). We focused on further
characterization of the macrolide antibiotic azithromycin (AZ), which rescued ZIKV-induced
cytopathic effect with low toxicity in our primary screens, and is generally safe during pregnancy
(18). AZ dramatically reduced ZIKV infection of U87 cells at an EC50 of 2-3 μM at multiplicities
of infection (MOIs) of 0.01-0.1, as evaluated by ENV staining (Figure 2.3, A and B, and Fig. S6A).

19
We further established a relationship between EC50 and baseline infection rate (Fig. S6B), and
showed that even at >60% infection, AZ consistently reduced infection at concentrations ten- to
twenty-fold below the half-maximal toxicity concentration (TC50) of 53 μM (Fig. S6, A and C).
AZ treatment also rescued cell viability (Figure 2.3C, Fig. S6D) and decreased viral production
(Figure 2.3D). Finally, we found that AZ substantially reduced infection in hPSC-derived
astrocytes without toxicity at the effective concentration (EC50 15 μM at 72% baseline infection)
(Fig. S6, E to G). To compare AZ with compounds identified in previous screens, we evaluated
the anti-ZIKV activity of daptomycin and sofosbuvir in U87 cells (EC50 2.2 μM and 12.4 μM
respectively) (Fig. S6H). We observed that treatment with daptomycin was insufficient to lower
the percentage of infected cells below 46% even at the highest dose in this cell type (20 μM) (Fig.
S6H), whereas AZ and sofosbuvir treatment decreased ZIKV infection from 78% to below 5%
infection at 20 μM and 50 μM respectively. These results highlight AZ as a potential tool
compound against ZIKV infection in glial cells.
Discussion
The rapid spread of ZIKV and its link to fetal abnormalities, including microcephaly, have
created a global health crisis. Understanding viral tropism for specific cell types in the developing
brain furthers our understanding of the pathophysiology of ZIKV-associated microcephaly and
provides a basis for investigating antiviral drugs in a relevant cell type. Our findings offer several
novel aspects. In particular, we show ZIKV tropism for astrocytes in addition to radial glia in the
primary developing human brain, demonstrate the importance of AXL for ZIKV infection of glial
cells, and identify a common antibiotic with anti-ZIKV activity, AZ, which we compare with two
other drugs with anti-ZIKV activity that may be safe in pregnancy.

20
Our finding that radial glia are preferentially infected during early neurogenesis is
consistent with experiments in cultured primary human brain cells (19), developing mouse cortex
(3, 20), and primary human organotypic brain slice culture (7). These studies also reported overall
survival of infected radial glia, in contrast to in vitro derived neural stem cells that undergo
apoptotic cell death following infection (4, 5, 21). Cell lines derived from primary neural
progenitors have variably shown infection with substantial apoptosis (7) or persistence (19). In our
organotypic slice culture, we observe a small increase in apoptosis of infected cells. The
discrepancy in levels of apoptosis in dissociated versus tissue cell culture may reflect differences
in gene expression, maturation, or experimental conditions. Besides causing cell death, ZIKV
infection could also affect cell-cycle progression (3, 21), differentiation, or the migration and
survival of newborn neurons—mechanisms thought to underlie genetic causes of microcephaly
and lissencephaly (22). Tissue disorganization in organotypic slice culture suggests these non–cell
death-mediated mechanisms may contribute to clinical phenotypes (7), but this remains to be
confirmed by directly analyzing cell behavior.
The high rate of infection in astrocytes at later developmental ages, many of which contact
microcapillaries, could link our understanding of initial infection with clinical findings of cortical
plate damage. For example, after prolonged infection, viral production in astrocytes could lead to
a higher viral load in the cortical plate, causing infection of additional cortical cell types, and
astrocyte loss could lead to inflammation and further damage, even in uninfected cells. Widespread
cell death in vivo, which may take days to weeks to occur and is therefore outside the time frame
of our experimental paradigm, is expected, given clinical reports of band-like calcifications in the
cortical plate, cortical thinning, and hydrocephalus (2, 23). On the basis of their susceptibility to
ZIKV infection and a central role in brain tissue homeostasis, human astrocytes provide a good

21
cellular model for further investigation of mechanisms of viral entry and a platform for testing the
efficacy of candidate therapeutic compounds.
Our observation that blocking or knocking down the AXL receptor prevents infection of
human astrocytes, but that blocking intracellular kinase activity does not, suggests that the
extracellular domain of AXL contributes to ZIKV infection whereas AXL signaling is dispensable.
This extends comparable findings in endothelial cells to a cell type relevant for understanding
microcephaly (6, 8) but does not address other viral receptors that may be important for ZIKV
infectivity in other cell types or rule out a role for AXL signaling in the context of a full immune
response in vivo. Although AXL knockout mice can be readily infected with ZIKV, disruption of
the blood–brain barrier in these mice could lead to atypical routes for infection of the brain (24).
In addition to characterizing brain cell tropism, we also sought to identify possible
therapeutic candidates with known safety profiles, especially in pregnancy. Several compounds
expected to inhibit ZIKV were identified by our drug screen. These positive controls include the
protein synthesis inhibitor cycloheximide, nucleic acid synthesis inhibitors such as mycophenolate
derivatives, and intercalating compounds such as doxorubicin and homidium bromide. We
additionally identified compounds that are known to be safe in pregnancy, including AZ. AZ is
recommended for the treatment of pregnant women with sexually transmitted infections or
respiratory infections due to AZ-susceptible bacteria (25, 26). Adverse events have not been
observed in animal reproduction studies, and studies in pregnant women show no negative effects
on pregnancy outcome or fetal health associated with AZ (18, 27). Orally administered AZ has
been shown to reach concentrations of ∼2.8 µM in the placenta, and is rapidly transported to
amniotic fluid and umbilical cord plasma in humans (28, 29). Moreover, AZ accumulates in fetal

22
tissue and in the adult human brain at concentrations from 4 to 21 µM (30, 31). Together, these
pharmacokinetic studies suggest that AZ could rapidly accumulate in fetal tissue, including the
placenta in vivo, at concentrations comparable to those that inhibit ZIKV proliferation in culture.
Nonetheless, it remains unknown whether these in vitro results would be recapitulated in humans.
We further compared AZ with two promising drug candidates that might be safe in
pregnancy and have reported anti-ZIKV activity in cell culture: daptomycin and sofosbuvir. Our
dose–response curves are in agreement with the documented activity of sofosbuvir in human
neuroepithelial stem cells (7), and extend the activity of daptomycin previously seen in HuH-7 and
HeLa cells (10) to glial cells. We noted that daptomycin would not have been highly ranked in our
initial screen due to the limited maximum effect of the drug as observed in dose–response curves.
Unlike sofosbuvir, which likely targets the ZIKV RNA-dependent RNA polymerase (NS5) based
on its mechanism against hepatitis C virus, daptomycin and AZ have unknown mechanisms of
action against ZIKV. Nonetheless, the difference in in vitro dose–response between AZ and
daptomycin is intriguing, and suggests different mechanisms of inhibition. Another important
factor for a drug candidate for ZIKV treatment is accessibility. Access to sofosbuvir and its
derivatives may be limited by its current price whereas AZ and daptomycin are available as generic
forms, although daptomycin is not available in oral formulation due to poor oral bioavailability.
Our comparison adds new data to consider alongside other antiviral activity data, safety, cost, and
accessibility in moving forward with further exploration of these and related compounds. In
parallel with direct comparisons in vitro, follow-up studies in animal models can be useful for
prioritizing candidates. However, as with in vitro studies, there are caveats in interpreting animal
models, such as substantial differences between human and mouse immune systems, placental
structure, and fetal brain development.

23
Together, our work identifies cell type-specific patterns of ZIKV infection in second-
trimester human developing brain, provides experimental evidence that AXL is important for
ZIKV infection of relevant human brain cell types, and highlights a common antibiotic with
inhibitory activity against ZIKV in glial cells. Ongoing studies will be required to determine
whether AZ, daptomycin, sofosbuvir, and other inhibitors or combinations are capable of reducing
ZIKV infection in the critical cell types identified here in vivo. Although preventative measures
such as mosquito abatement and a ZIKV vaccine are imperative for long-term control of this
pathogen, the study of ZIKV infection of primary human tissues and identification of inhibitors
with therapeutic potential remain important components of a global response to this emerging
threat.
Materials and Methods
Detailed Materials and Methods are available in SI Materials and Methods.
Cells and Viruses
Cell lines were Vero cells, U87 cells, and human astrocytes derived from human
pluripotent stem cells (13). ZIKV strains were SPH2015 (Brazil 2015; ZIKV-BR), PRVABC59
(Puerto Rico 2015; ZIKV-PR), and FSS13025 (Cambodia 2010; ZIKV-CAM).
Brain Samples
Deidentified primary tissue samples were collected with previous patient consent in strict
observance of the legal and institutional ethical regulations. Protocols were approved by the
Human Gamete, Embryo and Stem Cell Research Committee (institutional review board) at the
University of California, San Francisco (UCSF). Slices in organotypic culture were inoculated

24
with ZIKV or mock-infected, fixed at 72 hpi or 5 d postinfection, and processed for
immunohistochemistry. Quantification was performed on 13- to 22-pcw slices.
AXL
For 1 h before infection, cells were treated with AXL-blocking antibody or goat IgG control
at 100 μg/mL, or with 1 to 3 μM R428 or vehicle (<0.1% DMSO). For AXL knockdown, U87
cells stably expressing dCas9-KRAB (15) were transduced with lentiviral particles expressing a
pool of gRNAs targeting AXL or a gRNA targeting GFP as a control.
Drug Screen
A collection of 2,177 FDA-approved compounds, provided by the UCSF Small Molecule
Discovery Center, was tested at 2 µM in Vero cells infected with ZIKV-BR (MOIs of 1, 3, and 10)
and in U87 cells (MOI of 3). Toxicity screens in uninfected cells were performed in parallel. Cells
were pretreated for 2 h before addition of ZIKV-BR or media, and cell viability was assessed at
72 hpi using the CellTiter-Glo 2.0 assay (Promega). Candidates with cell viability >2.5-fold that
of untreated cells in every Vero cell screen were identified for follow-up.
Drug Validation
U87 cells or hPSC-derived astrocytes were treated with azithromycin, daptomycin,
sofosbuvir, or vehicle for >1 h, and then infected with ZIKV-PR. Cell-viability assays were
performed using CellTiter-Glo as above. To assess viral envelope production, cells were fixed and

25
stained at 48 hpi using anti-flavivirus envelope protein, and then quantified by plate imaging with
automated cell counting or by flow cytometry.

26
several scaffold compounds for further development (11). How-ever, the majority of compounds with anti-ZIKV activity from thesescreens are contraindicated or of unknown safety during pregnancy.Furthermore, two promising candidates that might be safe duringpregnancy, daptomycin and sofosbuvir, showed variable effective-ness by cell type (7, 10, 12). Combining unbiased screens of ap-proved compounds with comparisons of top candidates with known
antiviral activity may quickly narrow the search for drugs that couldmitigate the effects of congenital ZIKV infection.Here we assessed ZIKV cell tropism in the developing human
brain and performed a drug screen on relevant cell types targeted bythe virus with an emphasis on drugs known to be safe in pregnancy.We found that radial glia and, later in development, astrocytes wereespecially vulnerable to ZIKV infection. By screening FDA-approved
SOX2/ENV
ENV/IBA1
15 p
cw O
SVZ
maturing neuronSATB2+
radial gliaSOX2+
microgliaIBA1+
mmCP
OSV
ZVZ
A
CP
VZO
SVZ
Pia
SP
newbornneuronSATB2+
radial gliaSOX2+
% o
f EN
V+ c
ells
SATB2SOX2
% of ENV+ cells
CPO
SVZ
VZSP
SP
0 100
Distribution ofInfected Cells
80
0
40
ENV/SOX2
Cell Types Infected by ZIKV
Enric
hed
Infe
ctio
n in
Ger
min
al Z
one,
15
pcw SATB2
CPO
SVZ
VZ
ENV merge
Overview of the Infection
ENVSOX2 SATB2 merge
Neu
ron
Infe
ctio
n13
pcw
OSV
Z
ENV
13 p
cw S
PM
icro
glia
ENV/IBA1
SOX2 ENVGFAPSOX2GFAP
SOX2ENV
B C D
oRG
Cel
l Inf
ectio
n
E
Vira
l Rep
licat
ion
G
H
I
F
OSV
Z
ENVNS5 NS5/ENV
Fig. 1. Tropism of ZIKV for radial glia in the developinghuman brain. Human cortical organotypic brain sliceswere infected with ZIKV-BR and cultured for 72 h. (A andB) Low-magnification overview of ZIKV infection de-tected by ENV (green) within the cortex. (A) ENV stainingwas analyzed with respect to region and cell type. CP,cortical plate; OSVZ, outer subventricular zone; SP, subplate;VZ, ventricular zone. (Scale bar, 100 !m.) (B) High magnifi-cation of A. Notably, ENV staining (arrowheads) appears tobe preferentially enriched in the VZ and OSVZ. (Scale bars,20 !M.) (C) Quantification of ENV+ cells by region (Top) andcell type (Bottom) at 13 to 14 pcw. n = 2; mean ± SD [SIMaterials and Methods; an error bar is not shown where itis shorter than the line thickness (Top, CP; Bottom, SOX2)].(D) Schematic summary of cell types observed to be sus-ceptible to ZIKV infection (green) in the developing humanbrain during midneurogenesis. (E ) High-magnificationview of a ZIKV-infected radial glial cell in the OSVZ(arrow). oRG, outer radial glial. (Scale bar, 10 !m.) (F)Three-dimensional reconstruction of E, highlighting theintracellular presence of the ENV signal. (Scale bar,10 !m.) (G) ENV and NS5 signal in OSVZ cells (arrow-heads) suggested replicating ZIKV-PR. (Scale bars, 20 !m.)(H) Immature neurons (SATB2+, blue) infected withZIKV (arrows). (Scale bar, 20 !m.) (I) Microglia (IBA1+)immunopositive for ENV. High magnification (Right)shows ENV+ microglia with amoeboidmorphology (arrow),typical of activated microglia. (Scale bars, 10 !m.)
Retallack et al. PNAS | December 13, 2016 | vol. 113 | no. 50 | 14409
MICRO
BIOLO
GY

27
Figure 2.1 Tropism of ZIKV for radial glia in the developing human brain.
Human cortical organotypic brain slices were infected with ZIKV-BR and cultured for 72 h. (A to B) Low magnification overview of ZIKV infection detected by ENV (green) within the cortex. (A) ENV staining was analyzed with respect to region and cell type. Scale bar 100 μm. (B) High magnification of (A). Notably, ENV staining (arrowheads) appears to preferentially enriched in the ventricular zone (VZ) and outer subventricular zone (OSVZ). SP – subplate, CP – cortical plate, pcw – post-conception weeks. Scale bar 20 μM. (C) Quantification of ENV positive cells by region (top) and cell type (bottom) at 13-14 pcw. n = 2. mean ± SD (see Methods, error bar not shown where shorter than line thickness (top panel, CP, and bottom panel, SOX2)). (D) Schematic summary of cell types observed to be susceptible to ZIKV infection (green) in the developing human brain during mid- neurogenesis. (E) High magnification overview of a ZIKV-infected radial glial cell in the OSVZ. Scale bar 10 μm. (F) Three dimensional reconstruction of (E), highlighting intracellular presence of ENV signal. Scale bar 10 μm. (G) ENV and NS5 signal in OSVZ cells (arrowheads) suggested replicating ZIKV-PR. Scale bar 20 μm. (H) Immature neurons (SATB2+, blue) infected with ZIKV (arrows). Scale bar 20 μm. (I) Microglia (IBA1+) immunopositive for ENV. High magnification panel (right) shows ENV+ microglia with amoeboid morphology (arrow), typical of activated microglia. Scale bar 10μm.

28
CP
SPSATB2/SOX2ENV
I
ENV/
DAP
I
No treatment IgG control AXL block
A
CP
VZO
SVZ
Pia
SP
astrocyteGFAP+SOX2+
oligodendrocyteprecursor (OPC)
OLIG2+
microgliaIBA1+
radial gliaSOX2+
Cell Types Infected by ZIKVEn
riche
d In
fect
ion
in C
ortic
al P
late
, 22p
cwENV/GFAP
% of ENV+ cells0
CPO
SVZ
VZSP
20
% o
f EN
V+ c
ells 100
50
0SOX2 SATB2
Distribution of Infected Cells
Overview of the Infection
50
% o
f EN
V+ c
ells
Viru
s yi
eld
(FFU
/mL)
Notreatment
IgG AXLblock
40
30
20
10
0
% o
f EN
V+ c
ells
40
30
20
10
0 Un-
infectedGFP gRNA
AXL gRNA
****J
40
SOX2 SATB2GFAP ENV
20 p
cw S
P
merge
Astro
cyte
s
D
F ENV/IBA1
Mic
rogl
ia
22 p
cw O
SVZ
ENV/IBA1
B C
22 p
cw S
P
ENV/OLIG2
OPC
Infe
ctio
n
ENV/OLIG2G
K
ENV/NS5 GFAP
22 p
cw O
SVZ
Astro
cyte
ZI
KV-P
R re
plic
atio
n
E ENV NS5
ZIKV4 9648
***n.s.
H
100
101
102
103
104
105
106
Hours post infection
* **
Fig. 2. ZIKV infects astrocytes in later stages of human brain development. (A) Low-magnification overview of ZIKV infection detected by ENV (green) within humanorganotypic cortical slices during late neurogenesis/gliogenesis. (Scale bar, 100 !m.) (B) Quantification of ENV+ cells by region (Top) and cell type (Bottom) at 20 to22 pcw. n = 2; mean ± SD [SI Materials and Methods; an error bar is not shown where shorter than the line thickness (Top, VZ and second OSVZ)]. (C) Schematicsummary of cell types observed to be susceptible to ZIKV infection (green). (D and E) Immunohistochemical analysis reveals ZIKV infection in astrocytes by positivity forENV (arrows, D; arrowheads, E) or ENV and nonstructural protein NS5, indicating active viral replication (filled arrowheads, E). (Scale bars, 20 !m.) (F) Microgliacolabeled with ENV (arrows). (Scale bars, 50 !m.) (G) ZIKV infection of oligodendrocyte precursor cells (OPCs, arrow). (Scale bars, 20 !m.) (H) Viral production in 19-pcwcortical slices, quantified by focus-forming assay from combined homogenized tissue and conditioned media at 4, 48, and 96 h postinfection. FFU, focus-forming units.Two independent biological replicates with two technical replicates for each time point; mean ± SEM; one-way ANOVA with Tukey’s multiple comparisons test, *P !0.05, **P ! 0.01; see also Fig. S4F. (I and J) Analysis of ZIKV-BR infection in the presence of AXL-blocking antibody in hPSC-derived astrocytes (SI Materials andMethods). Note the reduced ENV stainingwith AXL block comparedwith IgG control. (Scale bar, 100 !m.) (J) Quantification of the experiment represented in I; see alsoFig. S5A; n = 3; mean ± SEM; one-way ANOVAwith Tukey’s multiple comparisons test, **P ! 0.01. (K) ZIKV-PR infection after knockdown of AXL using U87-dCas9 linesexpressing either GFP guide (g)RNA (nontargeting control) or AXL gRNAs (dCas9-mediated knockdown); see also Fig. S5B; two biological replicates in cell linesgenerated with independent transductions; mean ± SEM; two-way ANOVA with Tukey’s multiple comparisons test, n.s. (not significant), ***P ! 0.001.
14410 | www.pnas.org/cgi/doi/10.1073/pnas.1618029113 Retallack et al.

29
Figure 2.2. ZIKV infects astrocytes in later stages of human brain development.
(A) Low-magnification overview of ZIKV infection detected by ENV (green) within human organotypic cortical slices during late neurogenesis/gliogenesis. (Scale bar, 100 μm.) (B) Quantification of ENV+ cells by region (Top) and cell type (Bottom) at 20 to 22 pcw. n = 2; mean ± SD [SI Materials and Methods; an error bar is not shown where shorter than the line thickness (Top, VZ and second OSVZ)]. (C) Schematic summary of cell types observed to be susceptible to ZIKV infection (green). (D and E) Immunohistochemical analysis reveals ZIKV infection in astrocytes by positivity for ENV (arrows, D; arrowheads, E) or ENV and nonstructural protein NS5, indicating active viral replication (filled arrowheads, E). (Scale bars, 20 μm.) (F) Microglia colabeled with ENV (arrows). (Scale bars, 50 μm.) (G) ZIKV infection of oligodendrocyte precursor cells (OPCs, arrow). (Scale bars, 20 μm.) (H) Viral production in 19-pcw cortical slices, quantified by focus-forming assay from combined homogenized tissue and conditioned media at 4, 48, and 96 h postinfection. FFU, focus-forming units. Two independent biological replicates with two technical replicates for each time point; mean ± SEM; one-way ANOVA with Tukey’s multiple comparisons test, *P ≤ 0.05, **P ≤ 0.01; see also Fig. S4F. (I and J) Analysis of ZIKV-BR infection in the presence of AXL-blocking antibody in hPSC-derived astrocytes (SI Materials and Methods). Note the reduced ENV staining with AXL block compared with IgG control. (Scale bar, 100 μm.) (J) Quantification of the experiment represented in I; see also Fig. S5A; n = 3; mean ± SEM; one-way ANOVA with Tukey’s multiple comparisons test, **P ≤ 0.01. (K) ZIKV-PR infection after knockdown of AXL using U87-dCas9 lines expressing either GFP guide (g) RNA (nontargeting control) or AXL gRNAs (dCas9-mediated knockdown); see also Fig. S5B; two biological replicates in cell lines generated with independent transductions; mean ± SEM; two-way ANOVA with Tukey’s multiple comparisons test, n.s. (not significant), ***P ≤ 0.001.

30
Figure 2.3. Azithromycin treatment inhibits ZIKV infection in glial cells.
(A) U87 cells were treated with increasing concentrations of AZ and infected with ZIKV- PR at varying MOIs (0.01, 0.1, and 3, as indicated). The percentage of infected cells at 48 hpi was determined by flow cytometry of cells immunostained for ENV and normalized to untreated cells (for raw data, see Fig. S6A). EC50 values for AZ-mediated reduction of ZIKV infection were 5.1 μM for an MOI of 3 (n = 2),2.9μMforanMOIof0.1(n=2),and2.1μMforanMOIof0.01(n=2);mean ± SD. (B) Representative images of U87 cells treated with AZ and infected with ZIKV-PR at an MOI of 3 (as in A). At 48 hpi, cells were immunostained for ENV protein (green) and cellular DNA (DAPI, blue). (Scale bar, 100 μm.) (C) Rescue of cell viability with AZ. U87 cells were pretreated with AZ for 1 h and then in- fected with ZIKV-PR at an MOI of 10 in the presence of AZ. Cell viability was measured at 72 hpi using the CellTiter-Glo luminescence assay. The EC50 value for the AZ-mediated rescue of cell viability was 7.1 μM. The data point at the highest concentration of AZ (50 μM) showed reduced cell viability, likely due to drug toxicity (Fig. S6C). n = 2; mean ± SD. (D) Decrease of virus production with AZ treatment. U87 cells were pretreated with AZ for 1 h and then infected with ZIKV-PR at an MOI of 0.1 or 0.01 in the presence of AZ. Quantification of virus yield in conditioned media was performed by focus-forming assay at 0, 24, 48, and 72 hpi; n = 2 for each MOI; mean ± SD; two-way ANOVA with Tukey’s multiple comparisons testing, **P ≤ 0.01, ***P ≤ 0.001, ****P ≤ 0.0001.
compounds for anti-ZIKV activity in a glial cell line with features ofboth cell types, we also found that the common antibiotic azithromycinprevented viral production and virus-mediated cell death, which wefurther validated in human astrocytes.
ResultsTo determine the cell populations most susceptible to ZIKV in-fection, we investigated the infectivity of ZIKV in the developinghuman brain using organotypic cultures from primary human tis-sue. We exposed human cortical tissue slices to three strains ofZIKV: Cambodia 2010 (ZIKV-CAM), Brazil 2015 (ZIKV-BR),and Puerto Rico 2015 (ZIKV-PR), cultured them for 72 h, anddetected infection by immunostaining for the flavivirus envelopeprotein (ENV), an approach we validated in cultured cells (Fig.S1). Infection in tissue was confirmed by immunostaining for theviral RNA-dependent RNA polymerase nonstructural protein5 (NS5), present only during viral replication. In samples frommidneurogenesis [13 to 16 postconception wk (pcw)], we observedhigh rates of infection in the ventricular and subventricular zones(Fig. 1 and Fig. S2). We found that the virus preferentially infectedboth ventricular and outer radial glial cells (Fig. 1 A–F and Fig. S2).Interestingly, we observed clusters of infected radial glia (Fig. S2B),which may reflect local viral spread. A minor fraction of cells pos-itive for ENV at these stages included postmitotic neurons (Fig. 1H)and microglia (Fig. 1I). We observed similar patterns of infectionacross ZIKV strains (Fig. S2). We also observed a small but sig-nificant increase in cell death of ENV+ cells compared with ENV!
cells in ZIKV-infected or mock-infected tissue (Fig. S3).At later stages of development (after 17 pcw), we observed in-
fection and viral replication throughout the developing cortex,including the cortical plate and subplate, with production of in-fectious virus by 48 h postinfection (hpi) (Fig. 2 and Fig. S4).Among cortical plate cells, we observed a high rate of infection inastrocytes, as distinguished by their location, morphology, and im-munoreactivity with the glial markers GFAP and SOX2 (Fig. 2 A,B, and D and Fig. S4 A–D). We also observed cells immunoreactivefor both ENV and the microglial marker IBA1, indicating micro-glial infection or phagocytosis of other ZIKV-infected cells (Fig. 2Fand Fig. S4G andH). This ENV+/IBA1+microglial population wasquantified at 7 ± 1% of ENV+ cells, and represented 7 ± 2% of thetotal IBA1+ population (n = 4, 15 to 22 pcw; SI Materials andMethods). We further observed infection of oligodendrocyte pre-cursor cells (Fig. 2G and Fig. S4I) but limited infection of neurons(Fig. 2 B and D and Fig. S4 A and J). This pattern of infectivity wasconsistent across ZIKV strains (Fig. S4), and matched viral tropismpredicted by AXL receptor expression (9).To test the possible role of AXL in mediating ZIKV entry into
human astrocytes, we infected hPSC-derived astrocytes (13, 14) inthe presence of a nonactivating antibody specific for the extra-cellular domain of AXL. Blocking the AXL receptor substantiallyreduced infection (Fig. 2 I and J and Fig. S5A). To further test therequirement of AXL for ZIKV infection of glial cells, we used theU87 glioblastoma line that expresses high levels of astrocytemarker genes and AXL (15). U87 cells were readily infected withZIKV, with strong virus production at 48 hpi (Fig. S1) and robustcytopathic effect at 72 hpi (Fig. 3C and Fig. S6D). We then usedCRISPR interference (CRISPRi) to knock down AXL in this cellline (SI Materials and Methods; validated by Western blot in Fig.S5B) and observed a substantial decrease in infection (Fig. 2K),confirming the importance of this receptor for ZIKV infection inthis cell type. Given that AXL is a receptor tyrosine kinase withsignaling pathways that could be involved in innate immune re-sponses (16), we tested whether the kinase activity of AXL wasrelevant for the decrease in infection observed in the knockdownline. After pretreatment with a small-molecule inhibitor, R428, weobserved no decrease in infection at up to 1 !M, which is >70-foldthe half-maximal effective concentration (EC50) for AXL kinaseinhibition (Fig. S5C) (17). Although we did observe a decrease
in infection at 3 !M R428, this high concentration of >200-foldthe EC50 likely created off-target effects. Together, these resultssuggest that AXL has an important role in glial cell infection that
A
C
B ENV/DAPI
Unt
reat
edAZ
6 µ
MAZ
10
µM
0 0.01 0.1 1 10 100
0 24 48 72 0 24 48 72100
101
102
103
104
105
106
107
Viru
s yie
ld (F
FU/m
L)
0 µM AZ5 µM AZ
10 µM AZ20 µM AZ
hpi
** *******D
0.01 0.1 1 10 10000
25
50
75
100
125
[AZ] (µM)
[AZ] (µM)
AZ Inhibits ZIKV Infection
0
20
40
60
80
100
Cel
l via
bility
(% o
f unt
reat
ed)
AZ Rescue of Cell Viability
% In
fect
ion
MOI 3 (EC50 5.1 µM)MOI 0.1 (EC50 2.9 µM)MOI 0.01 (EC50 2.1 µM)
MOI 0.01 MOI 0.1
(Rel
ativ
e to
unt
reat
ed)
Fig. 3. Azithromycin treatment inhibits ZIKV infection in glial cells. (A) U87cells were treated with increasing concentrations of AZ and infected with ZIKV-PR at varying MOIs (0.01, 0.1, and 3, as indicated). The percentage of infectedcells at 48 hpi was determined by flow cytometry of cells immunostained forENV and normalized to untreated cells (for raw data, see Fig. S6A). EC50 valuesfor AZ-mediated reduction of ZIKV infection were 5.1 !M for an MOI of 3 (n =2), 2.9 !M for anMOI of 0.1 (n = 2), and 2.1 !M for anMOI of 0.01 (n = 2); mean± SD. (B) Representative images of U87 cells treated with AZ and infected withZIKV-PR at an MOI of 3 (as in A). At 48 hpi, cells were immunostained for ENVprotein (green) and cellular DNA (DAPI, blue). (Scale bar, 100 !m.) (C) Rescue ofcell viability with AZ. U87 cells were pretreated with AZ for 1 h and then in-fected with ZIKV-PR at an MOI of 10 in the presence of AZ. Cell viability wasmeasured at 72 hpi using the CellTiter-Glo luminescence assay. The EC50 valuefor the AZ-mediated rescue of cell viability was 7.1 !M. The data point at thehighest concentration of AZ (50 !M) showed reduced cell viability, likely due todrug toxicity (Fig. S6C). n = 2; mean ± SD. (D) Decrease of virus production withAZ treatment. U87 cells were pretreatedwith AZ for 1 h and then infectedwithZIKV-PR at an MOI of 0.1 or 0.01 in the presence of AZ. Quantification of virusyield in conditioned media was performed by focus-forming assay at 0, 24, 48,and 72 hpi; n = 2 for each MOI; mean ± SD; two-way ANOVA with Tukey’smultiple comparisons testing, **P " 0.01, ***P " 0.001, ****P " 0.0001.
Retallack et al. PNAS | December 13, 2016 | vol. 113 | no. 50 | 14411
MICRO
BIOLO
GY

31
Chapter 2 References
1. Brasil P, et al. (March 4, 2016) Zika virus infection in pregnant women in Rio de Janeiro—
Preliminary report. N Engl J Med, 10.1056/NEJMoa1602412.
2. Mlakar J, et al. (2016) Zika virus associated with microcephaly. N Engl J Med 374(10):951–
958.
3. Li C, et al. (2016) Zika virus disrupts neural progenitor development and leads to microcephaly
in mice. Cell Stem Cell 19(1):120–126.
4. Tang H, et al. (2016) Zika virus infects human cortical neural progenitors and attenuates their
growth. Cell Stem Cell 18(5):587–590.
5. Qian X, et al. (2016) Brain-region-specific organoids using mini-bioreactors for modeling
ZIKV exposure. Cell 165(5):1238–1254.
6. Hamel R, et al. (2015) Biology of Zika virus infection in human skin cells. J Virol 89(17):
8880–8896.
7. Onorati M, et al. (2016) Zika virus disrupts phospho-TBK1 localization and mitosis in human
neuroepithelial stem cells and radial glia. Cell Reports 16(10):2576–2592.
8. Liu S, DeLalio LJ, Isakson BE, Wang TT (September 20, 2016) AXL-mediated productive in-
fection of human endothelial cells by Zika virus. Circ Res,
10.1161/CIRCRESAHA.116.309866.
9. Nowakowski TJ, et al. (2016) Expression analysis highlights AXL as a candidate Zika virus
entry receptor in neural stem cells. Cell Stem Cell 18(5):591–596.
10. Barrows NJ, et al. (2016) A screen of FDA-approved drugs for inhibitors of Zika virus
infection. Cell Host Microbe 20(2):259–270.

32
11. Xu M, et al. (2016) Identification of small-molecule inhibitors of Zika virus infection and
induced neural cell death via a drug repurposing screen. Nat Med 22(10):1101–1107.
12. Sacramento CQ, et al. (2016) The clinically approved antiviral drug sofosbuvir impairs
Brazilian Zika virus replication. bioRxiv. Available at biorxiv.org/content/early/2016/
07/06/061671.
13. Krencik R, et al. (2015) Dysregulation of astrocyte extracellular signaling in Costello
syndrome. Sci Transl Med 7(286):286ra66.
14. Krencik R, Weick JP, Liu Y, Zhang Z-J, Zhang S-C (2011) Specification of transplantable
astroglial subtypes from human pluripotent stem cells. Nat Biotechnol 29(6):528–534.
15. Liu SJ, et al. (2016) Single-cell analysis of long non-coding RNAs in the developing human
neocortex. Genome Biol 17:67.
16. Rothlin CV, Ghosh S, Zuniga EI, Oldstone MBA, Lemke G (2007) TAM receptors are
pleiotropic inhibitors of the innate immune response. Cell 131(6):1124–1136.
17. Holland SJ, et al. (2010) R428, a selective small molecule inhibitor of Axl kinase, blocks tumor
spread and prolongs survival in models of metastatic breast cancer. Cancer Res 70(4):1544–
1554.
18. Lin KJ, Mitchell AA, Yau W-P, Louik C, Hernández-Díaz S (2013) Safety of macrolides
during pregnancy. Am J Obstet Gynecol 208(3):221.e1–221.e8.
19. Hanners NW, et al. (2016) Western Zika virus in human fetal neural progenitors persists long
term with partial cytopathic and limited immunogenic effects. Cell Reports 15(11):2315–2322.
20. Brault JB, et al. (2016) Comparative analysis between flaviviruses reveals specific neural stem
cell tropism for Zika virus in the mouse developing neocortex. EBioMedicine 10:71–76.

33
21. Cugola FR, et al. (2016) The Brazilian Zika virus strain causes birth defects in experi- mental
models. Nature 534(7606):267–271.
22. Thornton GK, Woods CG (2009) Primary microcephaly: Do all roads lead to Rome? Trends
Genet 25(11):501–510.
23. Hazin AN, et al.; Microcephaly Epidemic Research Group (2016) Computed tomo- graphic
findings in microcephaly associated with Zika virus. N Engl J Med 374(22): 2193–2195.
24. Miner JJ, et al. (2016) Zika virus infection in mice causes panuveitis with shedding of virus in
tears. Cell Reports 16(12):3208–3218.
25. Workowski KA, Bolan GA; Centers for Disease Control and Prevention (2015) Sexually
transmitted diseases treatment guidelines, 2015. MMWR Recomm Rep 64(RR-03):1–137.
26. DHHS Panel on Opportunistic Infections in HIV-Infected Adults and Adolescents (2016)
Guidelines for the Prevention and Treatment of Opportunistic Infections in HIV-Infected
Adults and Adolescents: Recommendations from the Centers for Disease Control and
Prevention, the National Institutes of Health, and the HIV Medicine As- sociation of the
Infectious Diseases Society of America. Available at https://aidsinfo.
nih.gov/contentfiles/lvguidelines/adult_oi.pdf. Accessed October 7, 2016.
27. Sarkar M, Woodland C, Koren G, Einarson ARN (2006) Pregnancy outcome following
gestational exposure to azithromycin. BMC Pregnancy Childbirth 6:18.
28. Ramsey PS, Vaules MB, Vasdev GM, Andrews WW, Ramin KD (2003) Maternal and
transplacental pharmacokinetics of azithromycin. Am J Obstet Gynecol 188(3):714–718.
29. Sutton AL, et al. (2015) Perinatal pharmacokinetics of azithromycin for cesarean prophylaxis.
Am J Obstet Gynecol 212(6):812.e1–812.e6.

34
30. Jaruratanasirikul S, Hortiwakul R, Tantisarasart T, Phuenpathom N, Tussanasunthornwong S
(1996) Distribution of azithromycin into brain tissue, cerebrospinal fluid, and aqueous humor
of the eye. Antimicrob Agents Chemother 40(3):825–826.
31. Kemp MW, et al. (2014) Maternal intravenous administration of azithromycin results in
significant fetal uptake in a sheep model of second trimester pregnancy. Antimicrob Agents
Chemother 58(11):6581–6591.
32. Stenglein MD, et al. (2014) Ball python nidovirus: A candidate etiologic agent for severe
respiratory disease in Python regius. MBio 5(5):e01484–e14.

35
Chapter 3:
Preliminary investigation of the antiviral mechanism of azithromycin
The work presented in this chapter includes contributions from: Dr. Hanna Retallack, Dr.
Kristeene Knopp, Dr. Carolina Arias, and Dr. Joseph DeRisi

36
Abstract
Zika virus (ZIKV), a mosquito-borne flavivirus, was responsible for a rapid outbreak in
South America and elsewhere in 2015 and 2016 and remains in circulation at low levels.
Gestational exposure to ZIKV is the likely cause of many thousands of birth defects, including
thousands of cases of severe microcephaly. Efforts to develop therapeutics for ZIKV and related
viruses have identified several promising candidates, including the macrolide antibiotic
azithromycin. Because azithromycin is FDA-approved, is in widespread use, is generally well-
tolerated, and is one of relatively few drugs that are safe for use in pregnancy, its potential activity
against ZIKV warrants further investigation. Here, we present preliminary findings related to the
mechanism of ZIKV inhibition by azithromycin. We show that inhibition of ZIKV by
azithromycin occurs early in the viral lifecycle. We also demonstrate that mutations in the ZIKV
envelope glycoprotein, which has several roles in the viral lifecycle including facilitating entry
into host cells, confer resistance to azithromycin inhibition. Furthermore, through CRISPR genetic
screening, we identify gene-drug interactions that augment or mitigate the anti-ZIKV effect of
azithromycin. We observe that several genes that affect azithromycin efficacy are involved in lipid
biosynthesis or vesicular trafficking. Although we do not establish a definitive antiviral mechanism
for azithromycin, the circumstantial evidence we present here suggests a role in inhibition of viral
entry into host cells.
Introduction
Zika virus (ZIKV) is a single-strand positive-sense RNA virus in the flavivirus family
transmitted primarily by the Aedes aegypti mosquito [1]. A large outbreak of ZIKV infections in
2015 and 2016 spread across over 30 countries and caused millions of infections [2]. While most

37
ZIKV cases are asymptomatic or cause mild symptoms, exposure of pregnant women to ZIKV has
been associated with cases of abnormal infant brain development ranging from mild to severe birth
defects [3]. The most severe of these effects is microcephaly, which is defined as a head
circumference at least two standard deviations below average in infants. Microcephaly associated
with congenital ZIKV infection has been reported in at least 5000 cases and remains a cause for
concern as ZIKV remains in circulation despite a large drop in incidence [4].
With no known treatment for ZIKV infection, previous studies have attempted to identify
novel therapeutic candidates that may help prevent the consequences of congenital ZIKV infection.
Previously, we reported on the identification and validation of the macrolide antibiotic
azithromycin as an inhibitor of ZIKV infection in vitro [5]. Azithromycin is an ideal candidate for
repurposing as a potential therapeutic for ZIKV as it has a long history of safe use in humans and
is one of relatively few drugs that is safe for use in pregnancy [6]. Azithromycin has in fact been
used in clinical trials for treatment of Covid-19, despite the lack of clear evidence for an in vitro
effect against the causative virus Severe Acute Respiratory Syndrome Coronavirus 2 [7].
To facilitate the development of azithromycin as a potential therapeutic for ZIKV and other
viruses, it will be critical to understand the antiviral mechanism of action.
The putative mechanism of action of azithromycin against bacteria is direct binding to the
50S subunit of the bacterial ribosome, which would not be expected to be relevant to viral
inhibition [8]. The antiviral mechanism of azithromycin has been investigated in several studies
(reviewed in [7]), but perhaps due to the pleiotropic effects of azithromycin in human cells, no
definitive mechanism has been established. Li et al. report evidence that azithromycin inhibits
ZIKV infection by upregulating type I and type III interferon responses [9]. A separate report
presents evidence that azithromycin, as well as several other drugs of related classes, may exert an

38
antiviral effect through a shared mechanism of induction of phospholipidosis in host cells [10].
Azithromycin and other drugs with similar properties are found to accumulate within mammalian
cell endosomes and lysosomes and may affect vesicular pH as well as disrupt lipid homeostasis,
potentially affecting vesicle composition [10–12]. Induction of phospholipidosis may therefore be
a non-specific antiviral mechanism that disrupts the host cell entry process for viruses such as
ZIKV that require the presence of specific factors in endosomes and lysosomes such as pH.
Mechanisms proposed by previous studies are not mutually exclusive with other potential antiviral
effects of azithromycin, and there remains a clear need to fully understand the breadth of drug
effects on host cells and viral pathways.
In this study, we investigate azithromycin’s mechanism using two primary approaches
which differ from previous studies: 1) selection of ZIKV for mutations that confer resistance to
azithromycin to identify viral genes related to the effect and 2) CRISPR-interference (CRISPRi)
gene knockdown screening to identify host genes that modulate the antiviral effect of
azithromycin. Selection for azithromycin resistance in ZIKV produced mutations in the viral
envelope protein adjacent to the fusion loop peptide, which is responsible for insertion into host
cell endosomal membranes to initiate the deposition of the viral genome into the host cytoplasm
[13]. Azithromycin-resistant ZIKV mutants were found to be more susceptible to neutralization
by antibodies that bind to cryptic epitopes near the envelope fusion loop, indicating that the
conformational dynamics of resistant mutants may differ from wild-type [13,14]. These viral
mutants are also significantly less stable at 37°C, again indicating potential changes to the outer
coat of the virion [15].
The CRISPRi genetic screen for host factors affecting ZIKV susceptibility to azithromycin
revealed several genes that reduce ZIKV-mediated cell death when knocked down, including

39
several that do so only in the presence of azithromycin. Many genes that appear to potentially
enhance the antiviral effect of azithromycin have likely roles in pathways related to lipid
metabolism or vesicular trafficking, indicating that those pathways may be related to the
azithromycin mechanism. Finally, we show that azithromycin exhibits synergistic activity with
two potential entry inhibitors: orlistat, a lipase and lipid synthesis inhibitor that interacts with
multiple genes found in our genetic screen, and the anti-flavivirus envelope protein monoclonal
antibody 4G2, which binds to and blocks parts of the envelope protein to prevent viral entry.
Results
We first assessed the antiviral activity of azithromycin against three different flaviviruses:
ZIKV, Dengue Virus (DENV), Yellow Fever Virus (YFV), as well as the alphavirus Chikungunya
virus (CHIKV). Azithromycin inhibition was strongest in ZIKV with a half-maximal effective
concentration (EC50) of 4.7µM (Fig. 3.1A). Lower potency was observed against other viruses
with EC50 values of 15.9µM, 21.7µM, and 29.4µM for YFV, CHIKV, and DENV, respectively. A
time course experiment to examine when inhibition of ZIKV replication and protein translation
occurs was performed by staining for the presence of ZIKV envelope protein (Env) at 8, 12, 16,
and 24 hours post infection (hpi) in the presence and absence of azithromycin treatment. The
inhibitory effect of azithromycin is apparent as early as 12hpi, the earliest timepoint at which viral
protein production is observed (Fig. 3.1B).
Selection for resistance to azithromycin was carried out with ZIKV in two parallel lineages
by serial passaging of virus in the presence of highly inhibitory concentrations of azithromycin
(roughly EC80 and EC90). Sequencing of resistant strains revealed one mutation in the viral
membrane protein in one lineage and four mutations in the viral envelope protein, including M68I
and H401Y, which were found in both azithromycin-selected lineages, but not in virus passaged

40
in the absence of azithromycin (Fig. 3.2A). The azithromycin-resistant strains had moderate shifts
in EC50 compared to wild-type, with 4.3-fold and 7.2-fold increases in EC50 for strains selected in
10µM and 20µM azithromycin, respectively (Fig. 3.2B). Because mutations in the viral envelope
glycoprotein may affect the conformational dynamics of the outer virion coat, we performed assays
to assess neutralization by monoclonal antibodies E53 and E60, which bind to cryptic epitopes in
envelope and measured the intrinsic decay rate of infectivity at 37°C. While wild-type ZIKV is
not neutralized effectively by E53 or E60, azithromycin-resistant ZIKV is neutralized partially at
0.4µg/mL and significantly at 40µg/mL (Fig. 3.2C). Infectivity of azithromycin-resistant ZIKV
was also considerably less stable at 37°C with a half-life 5.3-fold lower than wild-type ZIKV (Fig.
3.2D).
A CRISPRi genetic knockdown screen to identify interactions between host cell genes and
the anti-ZIKV effect of azithromycin was performed in K562-dCas9-KRAB cells using the H1
sub-library of sgRNAs targeting kinase, phosphatase, and known drug-target genes. The genetic
screen used selection for resistance to the cytopathic effect of ZIKV and was performed in the
presence and absence of azithromycin to differentiate gene knockdowns that promote resistance
to ZIKV infection in general versus gene knockdowns that enhance the survival effect of
azithromycin. Rho, a measurement of resistance phenotype of genetic perturbations, was
calculated for each gene and compared between screening conditions with and without
azithromycin (Fig. 3.3A). Genes with high rho resistance phenotype in the presence of
azithromycin but low or average rho in the absence of azithromycin are potential candidates for
gene-drug interactions. Several genes with potential functions in lipid synthesis or vesicular
trafficking pathways were among the genes with greater effect in the azithromycin treatment
condition. Follow-up validation of hit genes was performed by generating individual K562-dCas9-

41
KRAB cell lines expressing individual sgRNAs targeting hit genes. Validation of gene-drug
interactions showed the strongest augmentation of azithromycin effect with PTPN1, CES1, and
SPTLC2, which are involved in antiviral innate immune response, fatty acyl/cholesterol ester
metabolism, and sphingolipid biosynthesis, respectively [16].
Orlistat, a lipase and fatty acid synthase inhibitor that has previously characterized
interactions with pathways implicated in our genetic screen, was tested in combination with
azithromycin for inhibitory effect against ZIKV [17]. A potentially synergistic interaction between
orlistat and azithromycin was observed, as similar inhibition levels could be achieved with lower
concentrations of a combination of the drugs compared to each drug individually (Fig. 3.4A).
Similarly, azithromycin exhibited a potentially synergistic relationship with the anti-flavivirus
envelope monoclonal antibody 4G2. Increasing concentrations of 4G2 neutralized ZIKV and
inhibited infection when used individually. The combination of 4G2 neutralization and
azithromycin treatment achieved inhibition levels with lower concentrations of each agent
compared to treatment with the agents individually (Fig. 3.4B).
Discussion
Together, our results point to an antiviral mechanism of action of azithromycin related to
inhibiting the entry of virions into host cells. First, we observe that the timing of inhibition occurs
within the first 12 hours of the viral lifecycle, which suggests that inhibition likely occurs within
the timeframe of viral entry or early replication and translation. This does not rule out potential
additional effects at later stages of the viral lifecycle including host anti-viral defense, virion
assembly, or egress and is not mutually exclusive with other proposed mechanisms [9,10].
Next, we find that mutations that confer resistance to azithromycin are largely clustered in
the ZIKV envelope glycoprotein, which is responsible for virion stability, attachment to host cell

42
adhesion molecules, initiation of fusion between host endosome and viral membranes, and
assembly of nascent virions [18]. While the role of the specific residues mutated in azithromycin-
resistant strains is not known, the mutations cluster adjacent to the fusion loop peptide of the
protein. The H401Y mutation is of particular interest due to its location directly adjacent to the
fusion loop in the protein dimer and the potential role of histidine residues as pH sensors for the
envelope protein in the acidic environment of the host cell endosome [19]. We also made the
interesting observations that mutations conferring azithromycin resistance increase ZIKV
neutralization by antibodies that bind to cryptic envelope epitopes and also increase the rate of
intrinsic decay. These physical phenotypes are potentially indicative of changes to the
conformational dynamics of the mutant envelope proteins, which could conceivably affect the
efficiency of host cell entry in different contexts and may underly an ability to subvert the
inhibitory mechanism of azithromycin [14,15,20]. The observed mutant envelope phenotypes
would likely not be fit in the context of wild transmission, but in the context of azithromycin
treatment in cell culture they appear to promote more efficient infection, likely indicating a fitness
tradeoff that exists within envelope protein structure and dynamics.
Our genetic interaction screen in the context of azithromycin treatment and ZIKV infection
produced a set of potential gene-drug interaction targets. Several of the hit genes which increased
resistance to ZIKV-mediated cytotoxicity are potentially involved in vesicular trafficking or lipid
biosynthesis, which are pathways that could potentially affect viral entry or viral assembly and
egress [21]. The strongest validated gene-drug interactions were in the genes PTPN1, CES1, and
SPTLC2. Tyrosine-protein phosphatase nonreceptor type 1 (PTPN1) has been implicated in the
innate antiviral immune response, potentially supporting a previously suggest immunomodulatory
mechanism of azithromycin [22]. Carboxylesterase 1 (CES1) does not have a known antiviral

43
mechanism, but is involved in fatty acyl and cholesterol ester metabolism, pathways that are
known to play an important role for flavivirus infection. CES1 may also have roles in drug
metabolism, so knockdown of CES1 may impact azithromycin intracellular concentrations [23].
Serine Palmitoyltransferase Long Chain Base Subunit 2 (SPTLC) is similarly involved in lipid
biosynthesis and is a likely host dependency factor for other viruses, likely suggesting a role in
maintenance of endosomal membranes required for viral entry [24].
Finally, the observation of potentially synergistic effects of azithromycin in combination
with the lipid biosynthesis inhibitor orlistat and with the neutralizing antibody 4G2 suggest a
potential convergence of mechanism. It is expected that neutralizing antibodies primarily inhibit
the entry steps of the viral lifecycle and the lipid pathway involvement of orlistat suggests a
possible effect on viral entry as well. The mechanistic insight provided by these interactions is
limited, but may suggest an avenue for future drug development.
The collection of observations presented here provides only circumstantial and preliminary
evidence in support of an antiviral mechanism of action of azithromycin related to entry and
endosomal escape. There is ambiguity within each result presented here, making it critical to
consider alternative interpretations. The results of our study do not directly contradict previous
studies that have suggested different mechanisms and in fact is likely consistent with a non-specific
host cell effect such as induction of phospholipidosis [10]. Future work may seek to provide more
direct evidence of the cellular compartments of azithromycin’s action and the specific viral factors
with which azithromycin interacts. Additional studies should attempt to reconcile the multiple
potential mechanisms for which evidence exists and focus on factors related to the potential use of
azithromycin as an antiviral therapeutic.

44
Methods Cells lines
U87 (gift of Dr. Jonathan Weissman, University of California, San Francisco), H4 (ATCC
HTB-148), Vero (ATCC CCL-81) were cultured in Dulbecco’s modified Eagle’s medium (Gibco)
containing 10% (vol/vol) fetal bovine serum (FBS) (Gibco), 2 mM l-glutamine, 100 U/ml
penicillin/streptomycin (Gibco), and 10 mM HEPES buffer. K562-dCas9-KRAB cells (gift of Dr.
James Nunez, University of California, San Francisco), were cultured in RPMI 1640 (Gibco)
containing 10% (vol/vol) fetal bovine serum (FBS) (Gibco), 2 mM l-glutamine, 100 U/mL
penicillin/streptomycin (Gibco), and 10 mM HEPES buffer. For infection experiments, cells were
seeded at specific densities using the Accuri C6 cytometer (BD) for cell counting. All cells were
cultured at 37°C and 5% CO2. Cells were seeded into culture dishes 1 day prior to infection. For
all infection experiments, extra wells were seeded to be resuspended and counted on the day of
infection for MOI calculations. All cell lines were verified to be free of mycoplasma contamination
by MycoAlert (Lonza).
Virus propagation, selection, and titering
ZIKV strain PRVAB59 (Puerto Rico 2015; ZIKV-PR) was propagated in Vero cells
infected at an MOI of 0.01. Virus in the supernatant was harvested at 72 hpi, cell debris was
removed by centrifugation, viral supernatant was filtered through a 0.22µm PES syringe filter
(Millipore), and aliquots were frozen at -80°C to avoid freeze-thaw cycles.
Selection for azithromycin was carried out in H4 glial cells. Parallel cultures for untreated,
10 µM, and 20 µM azithromycin selection conditions were cultured simultaneously. For the initial
round of selection, large cultures of 1x10⁸ cells were infected with ZIKV-PR at an MOI of 0.5.

45
Each passage was cultured for 72-96h depending on the rate of cytopathic effect in the cells. For
subsequent passages, supernatant from the previous passage was transferred at a 1/50 dilution for
treated cultures and a 1/500 dilution for untreated. Selections were stopped when significant
cytopathic effect was observed within 48h following transfer of supernatant in treated cultures (25
passages, roughly 100 generations). All strains were sequenced using a previously published
protocol [25]. All viral stocks were verified to be free of mycoplasma contamination by MycoAlert
(Lonza).
Viral stocks were titered by focus assay in Vero cells. Briefly, viral stocks were serially
diluted in triplicate, added to Vero cells and allowed to infect for 24h before cells were fixed with
3.7% paraformaldehyde (PFA) for 15 minutes at room temperature. Fixed cells were stained with
a mouse monoclonal antibody against flavivirus envelope protein (clone D1-4G2-4-15).
Drug and antibody inhibition experiments
U87 cells were seeded into 12-well tissue culture treated plates (Corning 3513) 1 day prior
to treatment and infection. Cells were treated with azithromycin (Selleck) or vehicle only (water)
at various concentrations to create a concentration series. ZIKV-PR was added directly to cells 2
hours after drug treatment and allowed to infect cells for 24 hours (or specified times for time
course experiments). Following infection, cells were resuspended using trypsin (Gibco), pelleted
to remove supernatant, fixed in 3.7% PFA for 15 minutes at room temperature, and then stained
with mouse anti-flavivirus envelope primary antibody 4G2 and Alexa 488 goat anti-mouse
antibody (Invitrogen). Fluorescent (infected) and non-fluorescent (uninfected) cells were counted
using the LSRII flow cytometer (BD). Dose-response curves were generated in GraphPad Prism 7
using four parameter logistic regression and EC50 was calculated these curves.

46
For antibody neutralization experiments, anti-flavivirus envelope antibodies E53 and E60
(Dr. Leslie Goo, Chan Zuckerberg Biohub) and 4G2 (clone D1-4G2-4-15) were diluted in
complete media to specified concentrations and incubated with ZIKV-PR WT or azithromycin-
resistant ZIKV at 37°C for 1h. Following incubation, the antibody-virus mixture was added
directly to either treated or untreated U87 cells. Infection, staining, and cell counting was
performed as described above.
Virus intrinsic decay experiments
ZIKV-PR or azithromycin-resistant ZIKV was diluted to a concentration of 1x10⁵ ffu/mL
in complete media and aliquoted into separate tubes which were incubated at 37°C. At specified
time points, individual aliquots were removed from 37°C and transferred to -80°C storage. After
all time points were transferred and allowed to freeze fully, all aliquots were thawed and used to
infect Vero cells. Infected cells were cultured for 24h, fixed, stained, and counted by flow
cytometry as described above. Decay curves were generated in GraphPad Prism 7 using four
parameter logistic regression and infectivity half-life was calculated these curves.
CRISPRi screening and gene validation
K562 cells stably expressing dCas9-KRAB [26] were transduced with lentiviral particles
expressing a pool single-guide (sg)RNAs representing the CRISPRi V2 H1 sub-library (gift of
Ryan Pak, Innovative Genomics Institute) at an MOI of 0.3. The CRISPRi H1 sublibrary consists
of 5 different sgRNAs targeting each of 2555 human genes as well as 250 non-targeting sgRNAs.
Transduced K562-dCas9-KRAB cells were selected with Puromycin (Sigma) at 1µg/mL for 5 days
and allowed to recover from selection for 2 days. Transduced and selected cells were split into 4

47
parallel cultures for the following conditions: uninfected with no treatment, uninfected with 25µM
azithromycin treatment, ZIKV-PR-infected with no treatment, ZIKV-PR-infected with 25µM
azithromycin treatment. All cultures were split daily, fresh drug (or vehicle) was added, and
aliquots of cells were frozen for subsequent analysis. The experiment was carried out over 8 days,
at the end of which all remaining cells were harvested and genomic DNA was extracted using the
Machery Nagel NucleoSpin Blood kit. The sgRNA locus was amplified using primers TruSeq5’A:
AATGATACGGCGACCACCGAGATCTACACGATCGGAAGAGCACACGTCTGAACTCC
AGTCACCTTGTAGCACAAAAGGAAACTCACCCT and TruSeq3A’:
CAAGCAGAAGACGGCATACGAGATCGACTCGGTGCCACTTTTTC or TruSeq5’B:
AATGATACGGCGACCACCGAGATCTACACGATCGGAAGAGCACACGTCTGAACTCC
AGTCACGCCAATCGACTCGGTGCCACTTTTTC and TruSeq3’B:
CAAGCAGAAGACGGCATACGAGATGCACAAAAGGAAACTCACCCT. Libraries were
sequenced on the Illumina HiSeq using single-end 50 sequencing. Counts for each sgRNA were
extracted and analyzed using a previously published screen analysis pipeline [27]. Gene functions
were characterized using the KEGG pathway database [21]. Validation of hit genes was performed
by cloning and transducing individual sgRNAs into K562-dCas9-KRAB, selecting with
puromycin, verifying gene expression knockdown by qRT-PCR, and performing drug treatments
and infections as described above. The top 3 performing sgRNAs for each hit gene were cloned
and expressed individually for follow-up.

48
Figure 3.1. Antiviral activity of azithromycin and timing of inhibition. (A) Dose-response curves for azithromycin inhibition of Zika virus, Dengue virus, Yellow Fever virus, and Chikungunya virus infection in K562 cells. Cells were pre-treated for 2h prior to virus infection and incubated with virus for 24h. Values are the mean of three biological replicates and error bars show the standard error of the mean. (B) Representative images for time course of ZIKV infection in untreated and azithromycin-treated U87 cells. Cells were infected simultaneously, fixed at the indicated time points, and stained for DAPI (blue) and ZIKV envelope protein (green). The percentage of envelope positive (ZIKV infected) cells at each time point was counted and averaged across three biological replicate wells for each condition.
Uninfected
DAPIENV
100µm
20µMAZ
untreated
ZIKVMOI50
8hpi
0.0%infection
0.0%infection
0.0%infection
0.0%infection
7.9%infection
1.7%infection
0.0%infection
34.8%infection
3.2%infection
0.0%infection
76.4%infection
5.9%infection
12hpi 16hpi 24hpiB
Zika virus EC50= 4.7 µM
Dengue virus EC50= 29.4 µM
Yellow Fever virus EC50=15.9 µM
Chikungunya virus EC50=21.7 µM
A

49
Figure 3.2 Characterization of azithromycin-resistant ZIKV mutants. (A) Schematic of ZIKV genome labeled with location and identity of mutations observed in ZIKV strains selected for azithromycin resistance. Strains were serially passaged in the presence of no drug, 10µM azithromycin, or 20µM azithromycin for approximately 100 viral lifecycle generations. The prevalence of each observed mutation at the final passage is reported for each strain, where no number indicates the absence of the mutation in that strain. Envelope (E) mutations that were found in the no drug selection condition are colored in grey. (B) Dose-response curves for azithromycin inhibition of wild-type and azithromycin-resistant ZIKV strains. (C) Infectivity of wild-type and azithromycin-resistant ZIKV in the presence of 0, 0.4, and 40µg/mL of monoclonal antibodies E53 and E60. Lower infectivity indicates greater antibody neutralization of ZIKV. (D) Intrinsic decay rate of wild-type and azithromycin resistant ZIKV at 37°C. The infectivity of ZIKV at each time point is calculated relative to t0 and the half-life of infectivity is reported.
Incubation time at 37°C (hours)
AZ-resistant ZIKV t1/2 = 0.92h
WT ZIKV t1/2 = 4.91h
%infectivity
relativ
etot 0
00
25
50
75
100
5 10 15 20 25
EC50 = 1.96 µM
EC50 = 8.43 µM
EC50 = 14.10 µM
WT ZIKV
AZ-resistant ZIKV (10µM passage)
AZ-resistant ZIKV (20µM passage)
0 2 4 60
20
40
60
80
100
log10[azithromycin] (nM)
%of
cells
infected
Selection
No drugQ17H
86% 73% 86% 90% 90%
94% 91% 91% 95%72%
98% 94%
M68I N207K E393KA319V H401Y A501T K570R
10µM Azithromycin
20µM Azithromycin
0
25
50
75
100
WT ZIKVE53 antibody
WT ZIKVE60 antibody
AZ-resistant mut.E53 antibody
AZ-resistant mut.E60 antibody
0.4 µg/mL
Antibody treatment condition
%of
cells
infected
40 µg/mLUntreated
A
B C D

50
-1.0 -0.5 ALDH9A10.5 1.0
-1.0
-0.5
0.5
1.0
SPTLC2
ATP1A1
ATP6V1C1
DUSP14
CNR1
AXL
GGCX
PPP2CA
APOE
PTPN1
EIF2AK2
ACAT2
ATP6V1B2
FADS1
SPTLC3
ABCE1
CDK6
PTPLB
AARS
GNGT1
CHEK1
ATP6V1A
EEF2
TK1
SLC12A4PPP2R2B
CTSL
CTSS
BPI
SLC16A5
PPP2R2D
PTPRN
PTPRCHK3
Rho gene knockdown resistance phenotype in AZ-treated, ZIKV-infected K562 cells
Rho
gene
knoc
kdow
nre
sist
ance
phen
otyp
ein
untr
eate
d,ZI
KV-
infe
cted
K56
2ce
lls
CES1
SPTLC2
SPTLC3
PTPN1APOE
ATP6V1C
1
PPP2R2D
TUBA3CCTSL
FADS
CES1
SPTLC2
SPTLC3
PTPN1APOE
ATP6V1C
1
PPP2R2D
TUBA3CCTSL
FADS
non-targ
non-targ
0
20
40
60
80
100
Gene knocked down in K562
Perc
enti
nhib
ition
ofZI
KV
infe
ctio
nby
azith
rom
ycin 10µMAZ
20µMAZ
B
A

51
Figure 3.3 Genetic modifiers of azithromycin anti-ZIKV activity. (A) Comparison of CRISPRi gene knockdown resistance phenotype (rho) in ZIKV-infected K562 cells with (horizontal axis) and without (vertical axis) azithromycin treatment. Potential gene-drug interaction candidate genes are labeled with the gene name and categorized by previously reported involvement in ZIKV infection (red), vesicular function and trafficking (blue), lipid metabolism and synthesis (green). Non-targeting control sgRNAs are shown in grey. (B) Follow-up validation of top candidate genes in individual knockdown K562 cell lines. Percent inhibition of 10µM (dark grey) and 20µM (light grey) azithromycin-treated cells is shown for individual K562 gene knockdown cell lines and compared to cells expressing non-targeting sgRNAs. Dashed lines indicate the baseline infection percentage in non-targeting (no gene knockdown) cell lines. Values below the dashed lines indicate a reduction in the effect of azithromycin, whereas values above the dashed lines indicate enhancement of azithromycin inhibition. Values are the mean of the top three sgRNAs against each indicated gene, except for non-targeting, which is the mean of 6 sgRNAs. Error bars show the standard deviation.

52
Figure 3.4 Synergistic activity of azithromycin in combination with entry inhibitors. (A) Isobologram of anti-ZIKV effect of azithromycin in combination with orlistat. Points on the horizontal axis indicate azithromycin treatment only, while points on the vertical axis indicate orlistat treatment only, and points off the axis were treated with the indicated concentration of each drug. Points show the concentration of each drug in the combination needed to achieve 30% (red), 40% (blue), 50% (grey), or 70% (black) inhibition of ZIKV infection. Dashed lines show the expected concentration of each drug required to achieve the indicated inhibition assuming simple additivity of drug effects. Points to the bottom-left of the dashed lines indicate efficacy beyond additive interactions and potential drug synergy. (B) Isobologram of anti-ZIKV effect of azithromycin in combination with neutralization by anti-envelope monoclonal antibody (mAb) 4G2. ZIKV was incubated in the presence of the indicated concentrations of 4G2 mAb prior to adding to azithromycin treated cells. Points show the concentration of each drug in the combination needed to achieve 30% (red), 50% (blue), 70% (grey), or 90% (black) inhibition of ZIKV infection.
0 5 10 15 200
2
4
6
8
[Azithromycin] (µM)
[Orlistat](µM
)
50% ZIKV inhibition
30% ZIKV inhibition40% ZIKV inhibition
70% ZIKV inhibition
0 5 10 15 200
2
4
[Azithromycin] (µM)
[4G2neutralizingAb](µg/mL)
50% ZIKV inhibition70% ZIKV inhibition90% ZIKV inhibition
30% ZIKV inhibition
A B

53
Chapter 3 References
1. Du S, Liu Y, Liu J, et al. Aedes mosquitoes acquire and transmit Zika virus by breeding in
contaminated aquatic environments. Nat Commun. 2019; 10(1):1324.
2. Plourde AR, Bloch EM. A Literature Review of Zika Virus. Emerg Infect Dis. 2016;
22(7):1185–1192.
3. Oliveira WK de, França GVA de, Carmo EH, Duncan BB, Souza Kuchenbecker R de, Schmidt
MI. Infection-related microcephaly after the 2015 and 2016 Zika virus outbreaks in Brazil: a
surveillance-based analysis. Lancet. 2017; 390(10097):861–870.
4. Epidemiological Update Dengue, Chikungunya and Zika in the context of COVID-19: 23
December 2021 - PAHO/WHO | Pan American Health Organization [Internet]. [cited 2022
Apr 14]. Available from: https://www.paho.org/en/documents/epidemiological-update-
dengue-chikungunya-and-zika-context-covid-19-23-december-2021
5. Retallack H, Di Lullo E, Arias C, et al. Zika virus cell tropism in the developing human brain
and inhibition by azithromycin. Proc Natl Acad Sci U S A. 2016; 113(50):14408–14413.
6. Wehbeh HA, Ruggeirio RM, Shahem S, Lopez G, Ali Y. Single-dose azithromycin for
Chlamydia in pregnant women. J Reprod Med. 1998; 43(6):509–514.
7. Oliver ME, Hinks TSC. Azithromycin in viral infections. Rev Med Virol. 2020; :e2163.
8. Parnham MJ, Erakovic Haber V, Giamarellos-Bourboulis EJ, Perletti G, Verleden GM, Vos
R. Azithromycin: mechanisms of action and their relevance for clinical applications.
Pharmacol Ther. 2014; 143(2):225–245.
9. Li C, Zu S, Deng Y-Q, et al. Azithromycin Protects against Zika Virus Infection by
Upregulating Virus-Induced Type I and III Interferon Responses. Antimicrob Agents
Chemother. 2019; 63(12):e00394-19.

54
10. Tummino TA, Rezelj VV, Fischer B, et al. Drug-induced phospholipidosis confounds drug
repurposing for SARS-CoV-2. Science. 2021; 373(6554):541–547.
11. Abu-Farha M, Thanaraj TA, Qaddoumi MG, Hashem A, Abubaker J, Al-Mulla F. The Role of
Lipid Metabolism in COVID-19 Virus Infection and as a Drug Target. Int J Mol Sci. 2020;
21(10):3544.
12. Breiden B, Sandhoff K. Emerging mechanisms of drug-induced phospholipidosis. Biol Chem.
2019; 401(1):31–46.
13. Chao LH, Klein DE, Schmidt AG, Peña JM, Harrison SC. Sequential conformational
rearrangements in flavivirus membrane fusion. Elife. 2014; 3:e04389.
14. Goo L, DeMaso CR, Pelc RS, et al. The Zika virus envelope protein glycan loop regulates
virion antigenicity. Virology. 2018; 515:191–202.
15. Goo L, VanBlargan LA, Dowd KA, Diamond MS, Pierson TC. A single mutation in the
envelope protein modulates flavivirus antigenicity, stability, and pathogenesis. PLoS Pathog.
2017; 13(2):e1006178.
16. Reimer E, Stempel M, Chan B, Bley H, Brinkmann MM. Protein tyrosine phosphatase 1B is
involved in efficient type I interferon secretion upon viral infection. J Cell Sci. 2020;
134(5):jcs246421.
17. Kridel SJ, Axelrod F, Rozenkrantz N, Smith JW. Orlistat is a novel inhibitor of fatty acid
synthase with antitumor activity. Cancer Res. 2004; 64(6):2070–2075.
18. Zhang X, Jia R, Shen H, Wang M, Yin Z, Cheng A. Structures and Functions of the Envelope
Glycoprotein in Flavivirus Infections. Viruses. 2017; 9(11):338.
19. Bressanelli S, Stiasny K, Allison SL, et al. Structure of a flavivirus envelope glycoprotein in
its low-pH-induced membrane fusion conformation. EMBO J. 2004; 23(4):728–738.

55
20. Dowd KA, Pierson TC. The Many Faces of a Dynamic Virion: Implications of Viral Breathing
on Flavivirus Biology and Immunogenicity. Annu Rev Virol. 2018; 5(1):185–207.
21. Kanehisa M, Goto S. KEGG: Kyoto Encyclopedia of Genes and Genomes. Nucleic Acids Res.
2000; 28(1):27–30.
22. Xia T, Yi X-M, Wu X, Shang J, Shu H-B. PTPN1/2-mediated dephosphorylation of
MITA/STING promotes its 20S proteasomal degradation and attenuates innate antiviral
response. Proc Natl Acad Sci U S A. 2019; 116(40):20063–20069.
23. CES1 carboxylesterase 1 - NIH Genetic Testing Registry (GTR) - NCBI [Internet]. [cited 2022
Apr 14]. Available from:
https://www.ncbi.nlm.nih.gov/gtr/genes/1066/%20https://pubmed.ncbi.nlm.nih.gov/3045033
9/
24. Orchard RC, Wilen CB, Virgin HW. Sphingolipid biosynthesis induces a conformational
change in the murine norovirus receptor and facilitates viral infection. Nat Microbiol. 2018;
3(10):1109–1114.
25. Stenglein MD, Jacobson ER, Wozniak EJ, et al. Ball python nidovirus: a candidate etiologic
agent for severe respiratory disease in Python regius. mBio. 2014; 5(5):e01484-01414.
26. Liu SJ, Nowakowski TJ, Pollen AA, et al. Single-cell analysis of long non-coding RNAs in
the developing human neocortex. Genome Biol. 2016; 17:67.
27. Horlbeck MA, Gilbert LA, Villalta JE, et al. Compact and highly active next-generation
libraries for CRISPR-mediated gene repression and activation. Elife. 2016; 5:e19760.

56
Chapter 4:
Identification and characterization of nitroxoline as a novel inhibitor of the amoebic
pathogen Balamuthia mandrillaris
This chapter is a reprint of:
Laurie MT*, White CV*, Retallack H, Wu W, Moser MS, Sakanari JA, Ang K, Wilson C, Arkin
MR, DeRisi JL. Functional Assessment of 2,177 U.S. and International Drugs Identifies the
Quinoline Nitroxoline as a Potent Amoebicidal Agent against the Pathogen Balamuthia
mandrillaris. mBio. 2018; Oct 30;9(5):e02051-18. doi: 10.1128/mBio.02051-18
*These authors contributed equally to this work
Supplemental files that are not figures can be found with the original work.

57
Abstract
Balamuthia mandrillaris is a pathogenic free-living amoeba that causes a rare but almost
always fatal infection of the central nervous system called granulomatous amoebic encephalitis
(GAE). Two distinct forms of B. mandrillaris—a proliferative trophozoite form and a
nonproliferative cyst form, which is highly resistant to harsh physical and chemical conditions—
have been isolated from environmental samples worldwide and are both observed in infected
tissue. Patients suffering from GAE are typically treated with aggressive and prolonged multidrug
regimens that often include the antimicrobial agents miltefosine and pentamidine isethionate.
However, survival rates remain low, and studies evaluating the susceptibility of B. mandrillaris to
these compounds and other potential therapeutics are limited. To address the need for more-
effective treatments, we screened 2,177 clinically approved compounds for in vitro activity
against B. mandrillaris. The quinoline antibiotic nitroxoline (8-hydroxy-5-nitroquinoline), which
has safely been used in humans to treat urinary tract infections, was identified as a lead compound.
We show that nitroxoline inhibits both trophozoites and cysts at low micromolar concentrations,
which are within a pharmacologically relevant range. We compared the in vitro efficacy of
nitroxoline to that of drugs currently used in the standard of care for GAE and found that
nitroxoline is the most potent and selective inhibitor of B. mandrillaris tested. Furthermore, we
demonstrate that nitroxoline prevents B. mandrillaris-mediated destruction of host cells in cultured
fibroblast and primary brain explant models also at pharmacologically relevant concentrations.
Taken together, our findings indicate that nitroxoline is a promising candidate for repurposing as
a novel treatment of B. mandrillaris infections.

58
Introduction
The opportunistic protist pathogen Balamuthia mandrillaris causes rare but life-
threatening infections of the central nervous system (CNS), termed balamuthia or granulomatous
amoebic encephalitis (GAE) (1, 2). Onset of the disease is gradual and chronically develops over
a few weeks to months in both immunocompromised and immunocompetent individuals
worldwide (1, 3). Presenting clinical symptoms include but are not limited to fever, vomiting, neck
stiffness, headache, nausea, personality changes, and seizures (1, 3). These symptoms are
nonspecific and overlap symptoms caused by more common brain infections such as bacterial and
viral meningitis as well as noninfectious neuroinflammatory syndromes. Cutaneous presentation
is less common and can produce symptoms ranging from painless swelling to ulceration and
formation of large lesions (4,–6). Infections involving other organs ranging from the lungs to the
eye have also been documented (7, 8). Thus, B. mandrillaris-induced encephalitis often goes
unrecognized and diagnosis is frequently only made postmortem. Several hundred cases have been
reported; however, the actual disease burden is likely underestimated (2, 9).
While systematic ecological studies of B. mandrillaris have not been performed, free-
living B. mandrillaris amoebae have been isolated from water, soil, and dust across all continents
(10,–18). Cases of human and animal infections are also reported on all continents but are most
common in South America and the southern United States (19,–35) (reviewed in references 31, 32,
and 33). B. mandrillaris is thought to be transmitted by inhalation of contaminated aerosols or
exposure via broken skin (36). Fatal amoebic encephalitis has also occurred after solid-organ
transplantation (37, 38). Pathogenesis is believed to involve hematogenous spread to the CNS
through penetration of the blood-brain barrier, and amoebae are frequently observed around blood
vessels (3, 36).

59
Free-living amoebae such as Sappinia pedata, Acanthamoeba spp., and Naegleria
fowleri can also cause infection of the CNS with very poor prognosis (2, 39).
Acanthamoeba and Balamuthia are the most similar and are classified in the same eukaryote
supergroup (Amoebozoa: Acanthamoebidae) (40). The mode of infection employed by Sappinia
pedata and Acanthamoeba spp. is thought to be similar to that used by Balamuthia, as encephalitis
caused by these genera progresses over several weeks to months and is associated with water or
soil contact. Acute encephalitis caused by N. fowleri is specifically associated with recreation in
warm freshwater environments, with presumed neuroinvasion of the amoeba by passing up the
nose through the cribiform plate to the brain (41). All of these pathogenic amoebae have a
proliferative trophozoite form and a dormant, thick-walled cyst form, while N. fowleri also has a
motile flagellate form. The cyst form of free-living amoebae is notoriously more resistant to
antimicrobials (42,–47) and to a variety of abiotic stressors such as UV light (48,–50). Such
attributes, along with the fact that drug sensitivities differ among genera, species, and strains of
free-living amoebae, have complicated studies in drug discovery (51).
Infection of the CNS by B. mandrillaris is almost always fatal, and no specific and highly
successful treatment regimen is known (45, 52). The CDC recommends the following drugs for
treatment of B. mandrillaris CNS infection: pentamidine isethionate, miltefosine, fluconazole,
flucytosine, sulfadiazine, azithromycin, and/or clarithromycin (53). In vitro studies performed
with the CDC-recommended drugs have shown little to no inhibition of amoebic growth by
fluconazole, sulfadiazine, and flucytosine, while azithromycin, pentamidine isethionate,
miltefosine, and voriconazole (a fluconazole derivative) exhibit amoebicidal or amoebistatic
activity (11, 42, 51). Current treatments for B. mandrillaris CNS infections employing
experimental combinations of these drugs have produced inconsistent outcomes, including
60
survival in some cases and fatality in others (7, 19, 23, 27, 29, 30, 34, 54,–62). As the efficacy and
specificity of current treatments remain uncertain, there is a clear need to identify additional drugs
that can improve patient outcomes.
The goal of this study was to identify, from a set of clinically approved compounds,
candidates that have the potential to be repurposed for treatment of B. mandrillaris infections.
Here, we screened a library of 2,177 clinically approved compounds and found that the quinoline
antibiotic nitroxoline (8-hydroxy-5-nitroquinoline) exhibits amoebicidal activity at low
micromolar concentrations, well within the range of the estimated plasma concentrations achieved
with recommended oral dosing (63,–65). Through direct in vitrocomparisons, we found that
nitroxoline is a substantially more potent and selective inhibitor of B. mandrillaris than three
commonly used GAE treatments currently recommended by the CDC. In addition to killing B.
mandrillaris trophozoites, nitroxoline treatment also causes encystment and substantially delays
recrudescence of active amoebae, which is significant considering the rapid decompensation of
patients suffering from GAE. Nitroxoline, with its ease of delivery and favorable
pharmacodynamic properties, has the potential to be used as an effective treatment for GAE in
singularity or in combination with drugs in the current standard of care.
Results
Identification of nitroxoline as an inhibitor of B. mandrillaris trophozoites in vitro.
Due to the extremely high mortality rate associated with Balamuthia
mandrillaris infections and the limited efficacy of current treatments, there is a clear need to
identify additional therapeutic strategies to improve patient outcomes in these rare but deadly
infections. Here, we established replicating axenic cultures of B. mandrillaris (ATCC PRA-291)

61
and screened 2,177 clinically approved compounds for reduction of trophozoite viability following
72 h of treatment at 20 µM. Compounds with high percent inhibition (∼40% or above) and B-score
(∼5 or above) were nominated for secondary screening (Fig. 4.1A; see also Table S1A in the
supplemental material). The remaining compounds were annotated by class and delivery method
to eliminate drugs approved only for topical delivery or veterinary use, which have low therapeutic
potential (Table S1B). The selected candidate drugs were tested in dose-response assays with B.
mandrillaris trophozoites as well as HFF-1 and H4 human cell cultures to confirm their activity
and evaluate toxicity to human cells (Table S1C). Half-maximal inhibitory concentration (IC50)
values indicated that only two compounds, pentamidine isethionate and nitroxoline, demonstrated
adequate potency against B. mandrillaris without high toxicity to human cells. Since the
amoebistatic activity of pentamidine has previously been described (46), we focused on further
characterizing the novel activity of nitroxoline as the lead compound identified by this screen.
Nitroxoline structure-activity relationship (SAR) experiments.
Nitroxoline is currently in clinical use as an antimicrobial drug in certain European and
Asian countries. The hypothesized mechanism of action (MoA) is as a metal chelator that disrupts
biofilm formation (66). Nitroxoline and other 8-hydroxyquinolines have also previously
demonstrated in vitro anticancer activity, and free-radical metabolites are thought to be involved
in cell death (67). To test which of these mechanisms is applicable in killing B. mandrillaris, we
tested 19 commercially available analogs of nitroxoline for amoebicidal activity. While nitroxoline
itself remained the most potent compound tested, there was a clear necessity for the 8-position
hydroxyl group on the quinoline ring to retain high activity (Fig. 4.2; see also Table S2). As
demonstrated by the activity of 8-hydroxyquinoline (compound 2), the 5-position nitro group is
not necessary for activity, while in contrast, retaining the nitro group without the hydroxy group

62
(compound 3) significantly decreases activity. Replacing the nitro group at the 5 position of the 8-
hydroxyquinoline core with a variety of other functional groups, along with dual 5,7-position
functionalization (compounds 4 to 13) results in several active but less potent analogs with no clear
trend due to aromatic electronic affects. The sulfonic acid functionalized variant (compound 13)
was the sole inactive compound among compounds 4 to 13, which we speculate may have been
due to differences in uptake or permeability. Lastly, phenanthroline (compound 14), a structurally
similar bidentate metal binding ligand, also demonstrated activity against B. mandrillaris. Taken
together, these results indicate a likely metal binding mechanism for the original nitroxoline
compound.
Direct comparison of nitroxoline to standard-of-care drugs for GAE treatment.
To evaluate nitroxoline as a potential drug to treat B. mandrillaris infections, we compared
the in vitro performance of nitroxoline to that of pentamidine isethionate, miltefosine, and
azithromycin, three drugs recommended by the CDC and commonly used in treatment of GAE
(53). We performed side-by-side dose-response experiments to measure the efficacy of each drug
against B. mandrillaris trophozoites and the toxicity to different human cell types using the
following cell lines: HFF-1 (fibroblast), H4 (glial), U87 (glial), HEK-293T (kidney), and Hep-G2
(liver). Nitroxoline was the most potent inhibitor of B. mandrillaris trophozoites, with an IC50 of
2.84 µM compared to IC50 values of 9.14 µM, 63.23 µM, and 244.10 µM for pentamidine,
miltefosine, and azithromycin, respectively (Fig. 4.3A). Nitroxoline was also the only drug with
an IC50 against B. mandrillaris that was lower than the half-maximal cytotoxic concentration
(CC50) for all cell lines tested. The average Log10 selectivity index (CC50 for human cell
toxicity/IC50 for B. mandrillaris inhibition) of nitroxoline across all cell lines was 0.832, compared
to 0.049, −0.102, and −0.409 for pentamidine, miltefosine, and azithromycin, respectively

63
(Fig. 4.3B [summarized in Table S3]). Combinations of nitroxoline with miltefosine and with
pentamidine isethionate showed generally additive inhibitory effects on B. mandrillaris viability,
suggesting that nitroxoline can be combined with other amoebicidal drugs to produce greater
inhibition (see Fig. 4.7 in the supplemental material).
Encystment response of B. mandrillaris.
In addition to a dose-dependent reduction in B. mandrillaris trophozoite viability, we also
observed a general increase in the ratio of cysts to trophozoites correlated with increasing
concentrations of some drugs. We investigated the propensity of nitroxoline, pentamidine
isethionate, miltefosine, and azithromycin to induce encystment of B. mandrillaris by counting the
number of cysts and trophozoites in culture samples following 72 h of treatment with different
drug concentrations. We observed a dose-dependent reduction in the number of trophozoites in the
population for all four drugs. Nitroxoline and pentamidine isethionate caused an increase in both
the total number and the proportion of cysts in the population, while no substantial number of cysts
was observed at any concentration of miltefosine or azithromycin (Fig. 4.4A to D). Because
encystment appears to occur as a response to certain drug treatments, we also assessed the ability
of each drug to inhibit the viability of preformed B. mandrillaris cysts. We induced encystment by
sustained exposure to 12% galactose and conducted dose-response viability measurements for each
drug. Nitroxoline was again the most potent inhibitor of cysts, with an IC50 of 15.48 µM compared
to IC50 values of 26.26 µM, 76.48 µM, and 788.4 µM for pentamidine, miltefosine, and
azithromycin, respectively (Fig. 4.4E). While nitroxoline, pentamidine, and azithromycin were
considerably less potent inhibitors of cyst viability than of trophozoite viability, miltefosine
inhibited the two forms of B. mandrillaris at similar concentrations (Table S3).

64
Delayed recrudescence of B. mandrillaris treated with nitroxoline.
Nitroxoline and the tested standard-of-care drugs induce various combinations of distinct
and intermediate B. mandrillaris phenotypes, including death and encystment. Though it is
assumed that drug-induced phenotypes such as encystment affect the rate of amoeba population
growth and host cell destruction, the magnitude and duration of these effects are unknown. To
assess how rapidly amoeba populations recover and proliferate following drug treatment, we
developed a recrudescence assay wherein we treated B. mandrillaris trophozoite cultures with
various concentrations of nitroxoline, pentamidine, or miltefosine for 72 h, removed drug, and then
added the remaining amoebae to a monolayer of HFF-1 cells in the absence of drug. The
posttreatment recovery time was measured as the number of days required for each B.
mandrillaris population to clear 100% of the host cells. Treatments that completely eliminated B.
mandrillaris populations were determined by observing no live trophozoites or destruction of host
cells at any point during the 28-day experiment. We found that 7 µM and 14 µM pentamidine
delayed recovery of B. mandrillaris by 1 to 2 weeks but that increasing the dose from 14 µM to
56 µM delayed recovery by only an additional 3 days (Table S1). Consistent with the steep Hill
slope observed in dose-response experiments, miltefosine caused very little delay in clearance time
at 56 µM but completely eliminated B. mandrillaris populations at 112 µM. In contrast,
nitroxoline delayed amoeba recovery by 2 to 3 weeks at low micromolar concentrations and
completely eliminated B. mandrillaris populations at 28 µM.
Protective effect of nitroxoline in a primary human brain tissue model.
Findings from the recrudescence assays suggest that nitroxoline treatment may
significantly impede destruction of host cells in the context of B. mandrillaris infection. To further

65
explore this possibility, we performed experiments modeling B. mandrillaris infection and
nitroxoline treatment in primary human brain tissue. Human cortical tissue slices were exposed
to B. mandrillaris trophozoites and simultaneously treated with nitroxoline or vehicle (dimethyl
sulfoxide [DMSO]) for 20 h before media were changed to remove drug or vehicle. Tissues were
cultured for 4 days and then evaluated for damage by microscopic examination (Fig. 4.5; see
also Fig. 4.8). Untreated tissues showed widespread damage following B. mandrillaris exposure,
including loss of distinct tissue edges and reduction of cell density (Fig. 4.5B). Large numbers of
highly motile B. mandrillaris trophozoites were present at the edges of tissues and were intermixed
with human cells (see Movies S1 to S3 in the supplemental material). In contrast, nitroxoline-
treated tissues did not show signs of B. mandrillaris-mediated destruction and appeared to be
similar to uninfected tissues (Fig. 4.5A and C). Cysts with little to no motility were observed
outside the boundaries of tissues (Movie S4). While these findings are qualitative, the large-scale
differences in tissue morphology observed in this experiment are consistent with the possibility
that nitroxoline has a protective effect on host tissue in the context of B. mandrillaris infection.
Discussion
GAE caused by Balamuthia mandrillaris is almost always fatal (19,–34). Because there is
no established treatment for GAE, patients commonly receive experimental combinations of
antimicrobial agents in aggressive and prolonged treatment regimens with mixed outcomes
(7, 19, 23, 27, 29, 30, 34, 54,–62). In the present study, we aimed to address the critical need for
new treatments of GAE by identifying novel amoebicidal compounds. Because our goal was to
identify candidate drugs with established safety and pharmacodynamic profiles, we chose to screen
a library of 2,177 clinically approved compounds. Based on the criteria of B-score and percent

66
inhibition of B. mandrillaris viability, we selected 12 compounds from the primary screen for
follow-up screening (Fig. 4.1A; see also Table S1B in the supplemental material). Secondary
screening eliminated all candidate compounds on the basis of low potency for inhibition of B.
mandrillaris or high toxicity to human cells, with the exception of the quinoline antibiotic
nitroxoline. Nitroxoline demonstrated promising potency and selectivity for B.
mandrillaris inhibition, which led us to focus our efforts on further investigating its novel
amoebicidal activity.
We performed side-by-side experiments to directly compare the in vitro efficacy of
nitroxoline with respect to B. mandrillaris inhibition to the efficacy of pentamidine isethionate,
miltefosine, and azithromycin, three drugs recommended by the CDC for treatment of GAE and
commonly used in case reports (29, 30, 53,–55, 57). We found that nitroxoline was the most potent
inhibitor of B. mandrillaris trophozoite viability, with an IC50 of 2.84 µM and IC99 of 7.54 µM
(Fig. 4.3A). To estimate the selectivity of each drug, we also measured the toxicity of each
compound to five different human cell lines. For pentamidine, miltefosine, and azithromycin, drug
concentrations that reduced B. mandrillaris viability also caused significant toxicity to human
cells, giving very small selectivity indices (Fig. 4.3B). In contrast, nitroxoline had an IC50 for B.
mandrillaris inhibition that was lower than the CC50 for all cell lines tested and had the highest
mean selectivity index value (Fig. 4.3B; see also Table S3).
B. mandrillaris and other free-living amoebae have a dormant, thick-walled cyst form
which is highly resistant to several types of environmental stress, including exposure to some
compounds that are toxic to the trophozoite form (44, 46, 48, 50). A previous study postulated that
the transition from the trophozoite form to the cyst form can be triggered under a variety of
conditions, including chemical stress (68), raising the possibility that treatment with amoebicidal

67
or amoebistatic drugs may induce encystment. To investigate this possibility, we quantified the
frequency of cysts observed in B. mandrillaris populations treated with different drug
concentrations. We observed that low micromolar concentrations of nitroxoline and pentamidine
isethionate caused increases in the total number and proportion of cysts in B. mandrillaris
populations (Fig. 4.4A and B). In contrast, miltefosine and azithromycin were not observed to
induce encystment at any concentration (Fig. 4.4C and D). These data support the possibility
that B. mandrillaris encystment occurs as a response to some but not all compounds that are toxic
to trophozoites. We suggest that compounds which promote encystment in addition to killing
trophozoites may provide additional benefit in the context of infection by slowing or halting the
rapid tissue destruction by trophozoites.
Because it is common for both cysts and trophozoites to be found in B. mandrillaris-
infected tissue, it is important to understand the efficacy of amoebicidal drugs against both stages
(69). To address this issue, we performed side-by-side dose-response experiments with
homogenous populations of cysts or trophozoites treated with nitroxoline, pentamidine isethionate,
miltefosine, and azithromycin. We found that cysts were less sensitive than the trophozoites to all
four drugs (Table S3). The difference in sensitivity was marginal for miltefosine and greatest for
nitroxoline, which had an IC50 for cyst inhibition 6-fold higher than the IC50 for trophozoite
inhibition. Nevertheless, nitroxoline remained the most potent inhibitor of preformed B.
mandrillaris cysts, with an IC50 of 15.48 µM.
Viability measurements of drug-treated B. mandrillaris cultures reflect a complex
population phenotype that includes various degrees of both death and encystment. These
measurements are not sufficient to predict the rate at which populations recrudesce following
treatment, which is an important factor in evaluating the overall efficacy of different treatments.

68
We chose to address this aspect of treatment efficacy by performing recovery assays in which B.
mandrillaris populations were exposed to various drug treatments, removed from drug, and then
cocultured with monolayers of human cells until the host cells were fully consumed. As predicted,
increasing drug concentrations caused greater delays to B. mandrillaris recrudescence and host
cell destruction (Table 4.1). Surprisingly, even low micromolar concentrations of nitroxoline near
the IC50 for trophozoite inhibition delayed B. mandrillaris-mediated host cell destruction by 2 to
3 weeks. This assay also served as a sensitive method to detect very low numbers of surviving
amoebae due to the large population expansion occurring over the 28-day experiment duration.
Importantly, this sensitive assay allowed us to infer that B. mandrillaris populations had been
completely eliminated by drug treatment when we observed no signs of amoeba population
recovery after 28 days of coculture with host cells.
Using this method, we determined that concentrations of 28 µM nitroxoline and 112 µM
miltefosine completely eliminated B. mandrillaris populations. These data are consistent with
viability inhibition experiments in indicating that nitroxoline is the most potent inhibitor of B.
mandrillaris tested. The promising results of this experiment suggest that nitroxoline may be able
to fully eliminate B. mandrillaris infection if sufficiently high concentrations are reached and is
likely to cause substantial delays with respect to host tissue damage even at lower concentrations.
This is supported by our findings indicating that nitroxoline prevented B. mandrillaris activity and
tissue destruction in a primary human brain tissue model (Fig. 4.5; see also Movie S1 to S4 in the
supplemental material). Together, these findings suggest that nitroxoline substantially impedes
host tissue destruction by B. mandrillaris in vitro. Given the rapid progression of pathogenesis that
is characteristic of GAE, any impediment to tissue destruction could significantly improve patient
prognosis.

69
The known safety and pharmacokinetic properties of nitroxoline suggest further promise
for its therapeutic value as an inhibitor of B. mandrillaris. Nitroxoline has been safely used for
over 50 years in the treatment of urinary tract infections, with minimal adverse effects reported
(70). Nitroxoline is available in oral and intravenous administration forms and is typically dosed
at 600 to 800 mg/day for adults, resulting in maximal plasma concentrations (Cmax) of up to
approximately 30 µM (5.6 mg/liter) (63,–65), which is 10-fold higher than the IC50 for B.
mandrillaris trophozoites in vitro (Fig. 4.3A; see also Table S3). Although the extent to which
nitroxoline crosses the blood brain barrier is unknown, a recent study showed that systemically
delivered nitroxoline exhibits efficacy against gliomas in mice, implying that efficacious
concentrations reached the brain in that model (71). In addition, we previously noted that B.
mandrillaris frequently causes necrotizing vasculitis in the CNS with extensive blood-brain barrier
(BBB) breakdown, which may affect the bioavailability of systemically administered drugs in the
CNS of patients actively suffering from GAE (3, 36, 57). Furthermore, given the extreme severity
of GAE, intrathecal drug delivery can be performed to maximize drug concentrations reaching the
brain (2, 72). While many variables may affect the in vivo efficacy of nitroxoline as well as the
concentrations that can be achieved in relevant compartments, the literature suggests that the in
vitro efficacious concentrations that we demonstrated are well within a pharmacologically relevant
range.
The in vitro results presented in this study strongly indicate that nitroxoline warrants
further investigation as a potential treatment for B. mandrillaris infections. As there were many
variables that were untested in our study that may affect the efficacy of nitroxoline in vivo, future
work will ideally focus on providing in vivo validation of the amoebicidal activity of nitroxoline.
In particular, in vivo studies will determine if efficacious concentrations of nitroxoline reach the

70
relevant tissues as well as provide comparative evidence for amoebicidal activity with respect to
currently recommended compounds. We note that nitroxoline is an approved compound in several
countries, with an established safety profile (70), and it is possible that it could be considered as
an emergency experimental treatment in dire cases of GAE. In particular, since the current standard
of care generally consists of experimental combinations of several antimicrobial agents, adding
nitroxoline to these regimens may be a reasonable step in the effort to improve patient prognosis.
Although our SAR experiments did not identify any analog that matched the potency of
nitroxoline, medicinal chemistry optimization may still be beneficial for a better understanding of
possible mechanisms of action and efforts to improve drug specificity. The similarity of B.
mandrillaris to other free-living amoebae such as Acanthamoeba spp. and Naegleria
fowleri raises the intriguing possibility that nitroxoline or related compounds may also have
activity against these pathogens.
Materials and Methods
Human cell lines.
Hep-G2 (ATCC HB-8065), U87 (gift of Jonathan Weissman, University of California, San
Francisco [UCSF]), H4 (ATCC HTB-148), and HEK-293T (ATCC CRL-3216) cells were cultured
in Dulbecco’s modified Eagle’s medium (Gibco) containing 10% (vol/vol) fetal bovine serum
(FBS) (Gibco), 2 mM l-glutamine, 100 U/ml penicillin/streptomycin (Gibco), and 10 mM HEPES
buffer. HFF-1 cells (ATCC SCRC-1041) were cultured in DMEM containing 15% (vol/vol) FBS,
2 mM l-glutamine, 100 U/ml penicillin/streptomycin, and 10 mM HEPES buffer (Gibco). All
mammalian-cell incubation steps were carried out at 37°C with 5% CO2. All cell lines were tested
for mycoplasma contamination using a Lonza Mycoalert mycoplasma detection kit (Lonza).

71
Balamuthia mandrillaris propagation, handling, and encystment.
Balamuthia mandrillaris (ATCC PRA-291) was maintained axenically in 150-cm2 flasks
(Corning) containing modified Cerva’s medium (axenic medium) with the following formulation:
20 g of Bacto Casitone (Difco), 68 ml of 10× Hanks’ balanced salt solution (Gibco), 10% fetal
bovine serum, and 1× penicillin-streptomycin (200 IU/ml to 200 μg/ml) (73). Axenic growth of B.
mandrillaris resulted in 2 × 10⁵ to 3 × 10⁵ amoebae/ml in log phase. Routine subculturing was
performed every 3 to 4 days by transferring 5 ml of amoebae into 15 ml of fresh axenic media.
Following the findings of a previous study, encystment of B. mandrillaris was induced by
galactose exposure (74). B. mandrillaris trophozoites were grown to log phase in axenic media,
and galactose was added to reach a final concentration of 12% (vol/vol). Amoebae were cultured
in the induction medium until trophozoites were no longer observed (approximately 10 days).
Galactose-induced cysts transition back to trophozoites after approximately 3 days of incubation
in galactose-free axenic medium. Therefore, all assays with cysts were completed in the induction
medium. To quantify amoebae for use in experiments, actively growing trophozoites or recently
induced cysts were centrifuged at 3,000 rpm for 5 min, resuspended in axenic medium, and
counted with a disposable hemocytometer (SKC, Inc.). All incubation steps for B.
mandrillaris growth were carried out at 37°C with 5% CO2.
Primary drug screening of Balamuthia mandrillaris trophozoites in vitro.
Screening of a clinically approved library of compounds, compiled by the Small Molecule
Discovery Center (SMDC) at the UCSF, was completed at 20 µM in 0.2% DMSO. All 2,177 drugs
in the library were stored as 10 mM stocks dissolved in 100% DMSO (Sigma-Aldrich) at −20°C. B.
mandrillaris amoebae were resuspended in axenic medium and distributed into opaque 384-well

72
plates (Corning) at a density of 3,000 amoebae per well using a BioMek NX liquid handler.
Negative-control wells were treated with vehicle only (0.2% DMSO in axenic medium), and
positive-control wells simulating total destruction of amoebae were seeded with amoeba lysate
generated by 3 consecutive freeze-thaw cycles. Following 72 h of incubation, 30 µl of CellTiter
Glo reagent (CTG; Promega) was added to each well. The luminescence was measured with a
Promega GloMax-Multi+ plate reader at 2, 4, and 8 h after CTG addition. The percent inhibition
of B. mandrillaris was calculated based on the CTG luminescence measurements of treated wells
relative to both positive and negative controls using the following equation: percent inhibition =
100 − 100*[(test well intensity − positive-control intensity)/(negative-control intensity − positive-
control intensity)]. The B-score, representing a plate-based statistical approach for correcting row,
column, and edge effects, was also calculated for each compound in the library (75). Raw
luminescence measurements and computed inhibition values are displayed in Table S1A in the
supplemental material. Hits represented compounds with a B-score of approximately 5 or above
and percent inhibition of approximately 40% or above (Table S1B). Hit compounds that are
approved only for topical administration or veterinary use were not tested in secondary screening
(highlighted in yellow in Table S1B and Fig. 4.1B). Compounds identified in the primary screen
that did not exhibit activity upon repurchase of fresh compound were removed from consideration
in the screening funnel.
Secondary drug screening against B. mandrillaris trophozoites and HFF-1 and H4 human cells in
vitro.
Secondary screening of hit compounds consisted of dose-response experiments to measure
the toxicity of each compound to B. mandrillaris trophozoites, HFF-1 human fibroblast cells, and
73
H4 human neuroglioma cells. Four 384-well plates were prepared prior to addition of drug as
follows: one opaque plate (Corning) seeded with 3,000 HFF-1 cells per well in 60 µl complete
media, one opaque plate seeded with 2,000 H4 cells per well in 60 µl complete media, one opaque
plate containing 30 µl axenic media, and one clear plate (Corning) containing 30 µl axenic media.
Opaque plates were used to measure the viability of trophozoites in the CTG assay, and clear plates
were used for microscopic examination of cyst formation. HFF-1 and H4 plates were seeded 24 h
prior to drug addition. The selected primary screen hits were added from 10 mM DMSO stocks
into wells of all four test plates to reach final concentrations ranging from 0.06 µM to 30 µM (10
concentrations, 2-fold serial dilution). Negative-control wells received concentrations of DMSO
corresponding to the amount of DMSO in each tested drug well (reaching a maximum of 0.3%
DMSO). B. mandrillaris trophozoites were resuspended in axenic media and added to the plates
containing drug dilutions in axenic media at a density of 3,000 amoebae per well in a final volume
of 60 µl media. All plates were incubated for 72 h. Throughout the incubation period, the clear-
bottom B. mandrillaris plate was monitored for large-scale changes to population encystment in
response to drug treatment. After the 72-h incubation, 30 µl of CTG reagent was added to all wells
of the opaque assay plates and luminescence was measured with a Promega GloMax-Multi+ plate
reader at 2, 4, and 8 h after CTG addition. IC50 values for inhibition of B. mandrillaris viability
were determined using the GraphPad Prism 4-parametric sigmoidal curve-fitting model, with the
bottom and top constraints set to 0 and 1, respectively (Table S1C).
Nitroxoline structure-activity relationship experiments.
Nineteen commercially available analogs of nitroxoline were selected for structure-activity
relationship (SAR) experiments based on variances in functional groups that may play a role in

74
the observed mechanism of action (compound sourcing and data are presented in Table S2). B.
mandrillaris was grown to log phase axenically and plated at 4,000 amoebae per well in opaque
96-well plates. Each nitroxoline analog was dissolved in 100% DMSO at 10 mM. Analog stocks
were serially diluted in water to generate 8-point dilution series, which were then used to treat
assay wells containing B. mandrillaris trophozoites at final concentrations ranging from 0.14 µM
to 300 µM (8 concentrations, 3-fold serial dilution) in a final volume of 100 µl. After incubation
for 72 h, 50 µl of CTG was added to all assay wells. Luminescence was measured using a Promega
GloMax Multi+ luminometer 2, 4, and 8 h after CTG addition. IC50 values were determined using
the GraphPad Prism 4-parametric sigmoidal curve-fitting model with bottom and top constrains of
0 and 1, respectively.
Dose-response experiments with HFF-1, H4, U87, Hep-G2, and HEK 293T cells and Balamuthia
mandrillaris trophozoites and cysts.
B. mandrillaris trophozoites were seeded at 4,000 amoebae per well into opaque and clear-
bottom 96-well plates (Corning). Homogenous populations of B. mandrillaris cysts generated by
galactose induction were seeded at 4,000 amoebae per well into opaque 96-well plates. HFF-1
(fibroblast), H4 (glial), U87 (glial), HEK-293T (kidney), and Hep-G2 (liver) cells were seeded at
3,000 cells per well in opaque 96-well plates 24 h prior to addition of drug. Stocks of nitroxoline
(Selleck Chemicals) were dissolved in 100% DMSO at 10 mM. Stocks of azithromycin (Selleck
Chemicals), pentamidine isethionate (Selleck Chemicals), and miltefosine (Selleck Chemicals)
were dissolved in water at 10 mM. Drug stocks were serially diluted in water to generate 12-point
dilution series, which were then used to treat assay wells containing B. mandrillaris or human cells
at final concentrations ranging from 0.39 µM to 400 µM in 100-µl total well volumes. Control

75
wells were treated with vehicle (DMSO or water) at concentrations corresponding to the final
vehicle concentrations in each drug dilution series. After incubation for 72 h, 50 µl of CTG was
added to all assay wells. Luminescence was measured with a Promega GloMax-Multi+ plate reader
2, 4, and 8 h after CTG addition. All dose-response experiments were performed with at least three
independent biological replicates. IC50 values were determined as previously described. To
quantify encystment under treated and untreated conditions, amoebae in individual assay wells
were resuspended thoroughly and the number of cysts and number of trophozoites in 10-µl samples
were counted by the use of a hemocytometer (SKC, Inc.). Cysts and trophozoites are
morphologically distinct, making them simple to distinguish with bright-field microscopy
(example images are shown in Fig. 4.6 in the supplemental material). Encystment assays were
performed with three independent biological replicates.
Experiments measuring the effect of drug combinations were carried out similarly to the
dose-response experiments described above. B. mandrillaris trophozoites were seeded into opaque
96-well plates (Corning) at a density of 4,000 amoebae per well and then treated with
concentrations of nitroxoline that differed across the rows of each plate and with concentrations of
either miltefosine or pentamidine isethionate that differed down the columns to generate 7-by-7
dose combination matrices. Final drug concentrations ranged from 0.5 to 10 µM, from 10 to
100 µM, and from 1 to 100 µM for nitroxoline, miltefosine, and pentamidine isethionate,
respectively. After incubation with drug or vehicle was performed for 72 h, CTG was added to all
assay wells and luminescence was measured with a Promega Glomax-Multi+ plate reader. The
percent effect of each drug combination was calculated as the reduction in luminescence value
relative to vehicle-only controls. The additive effect of drug combinations was assessed using the
excess over highest single agent (EOHSA) model (76, 77). EOHSA values were calculated using

76
the equation EOHSA = Ecombo − EHSA, where Ecombo is the percent effect of a given dose
combination and EHSA is the percent effect of the most active (highest) single agent in the drug
pair. Drug combination experiments were performed with three independent replicates.
Balamuthia mandrillaris recrudescence assays.
Populations of B. mandrillaris were diluted to 2.5 × 10⁵ amoebae in 10 ml media and were
treated with 3.5, 7, 14, 28, 56, 84, and 112 μM nitroxoline, pentamidine isethionate, or miltefosine
and incubated for 72 h. Following incubation, all remaining amoebae in each population (various
mixtures of cysts and trophozoites) were pelleted at 3,000 rpm for 5 min and resuspended in drug-
free HFF-1 medium. Each resuspended B. mandrillaris population was placed on a monolayer of
HFF-1 cells that were seeded at 106 cells per flask in 10 ml at 24 h prior to inoculation. At that cell
density, untreated amoebae typically consume 100% of HFF-1 monolayers within 24 h. Coculture
flasks containing amoebae and HFF-1 cells were incubated until 100% of the HFF-1 monolayer
was consumed as observed by daily microscopic inspection or until the predetermined endpoint of
the experiment at 28 days post-B. mandrillaris inoculation was reached. The day on which
complete clearance of the HFF-1 monolayer occurred was recorded for all conditions. All
recrudescence assays were performed with three independent biological replicates. These methods
were adapted from a minimum trophozoite amoebicidal concentration (MTAC) assay that was
conducted with monolayers of MA104 monkey kidney cells (42).
Primary brain tissue model.
Deidentified tissue samples were collected with previous patient consent in strict
observance of the legal and institutional ethical regulations. Protocols were approved by the
Human Gamete, Embryo, and Stem Cell Research Committee (institutional review board) at the

77
University of California, San Francisco. Primary brain tissue samples were sectioned
perpendicularly to the ventricle to obtain slices 300 μm thick and ∼2.5 mm2 in surface area, using
a Leica VT1200S vibrating blade microtome and artificial cerebrospinal fluid containing 125 mM
NaCl, 2.5 mM KCl, 1 mM MgCl2, 1 mM CaCl2, and 1.25 mM NaH2PO4. Explants were transferred
to slice culture insertions (Millicell) in 6-well culture plates and were cultured with media
containing 66% Eagle’s basal medium, 25% Hanks balanced salt solution, 5% fetal bovine serum,
1% N-2 supplement, 1× penicillin-streptomycin, and glutamine in a 37°C incubator with 5% CO2.
At 12 h after plating, slices were inoculated with 104 B. mandrillaris trophozoites in 20 µl of
complete media containing vehicle (DMSO) or 35 µM nitroxoline, which was added dropwise to
the slice surface. Media below the cell culture insert was adjusted to matching vehicle or
nitroxoline concentrations. At 20 h postinoculation, media below the cell culture insertion were
replaced with fresh media containing no drug. At that time, amoebae on top of the insertion
surrounding and within the tissue were left undisturbed. Bright-field and phase contrast images
were captured during the live culture experiment at magnifications of ×4, ×10, and ×20 using an
Evos FL Cell Imaging System. At 4 days postinoculation, slices were gently fixed in 3.7%
paraformaldehyde (PFA) for 4 h at 4°C and then rinsed with phosphate-buffered saline (PBS),
stained for 2 h at room temperature with DAPI (4′,6-diamidino-2-phenylindole) (0.3 µM)–PBS–
1% Triton X-100, and then mounted with ProLong Gold antifade mountant (Thermo). Images of
stained tissue were obtained with a Nikon Ti spinning disk confocal microscope at ×20
magnification. Confocal z-stacks were projected and adjusted in ImageJ (78). Bright-field images
were stitched together using photomerge in Photoshop (Adobe). Bright-field time-lapse images
were processed as movies in ImageJ.

78
Figure 4.1. Primary drug repurposing screen against B. mandrillaris. (A) Workflow for screening of clinically approved compounds for in vitro activity against B. mandrillaris. A primary screen of 2,177 clinically approved compounds yielded 30 hits meeting the percent inhibition and B-score criteria, among which only 13 candidates were available for oral or intravenous (IV) administration (see panel B). Secondary screening identified only one novel lead compound, nitroxoline, which displayed high selectivity for inhibition of B. mandrillaris viability (Table S1C). Structure-activity relationship (SAR) experiments showed that 11 of 12 nitroxoline analogs tested with potential metal binding domains remained active against B. mandrillaris, suggesting that metal binding plays a role in the mechanism of inhibition by nitroxoline (Fig. 4.2). Comparison of nitroxoline to three drugs recommended by the CDC for treatment of B. mandrillaris CNS infections (pentamidine isethionate, miltefosine, and azithromycin) indicates that nitroxoline is the most potent and specific inhibitor of B. mandrillaris among the compounds tested (Fig. 4.3 and 4.4; see also Table S1). (B) Plot of percent inhibition relative to untreated controls and B-score measured for each compound in a library of 2,177 clinically approved compounds. Raw data used to calculate these values are compiled in Table S1A. Drugs recommended by the CDC for treatment of GAE are highlighted in blue. Drugs that are classified as antiseptic or topical and/or have not been used in humans are shown in yellow. The quinoline antibiotic nitroxoline, which was the top hit identified in this screen, is highlighted in red.
permeability. Lastly, phenanthroline (compound 14), a structurally similar bidentatemetal binding ligand, also demonstrated activity against B. mandrillaris. Taken together,these results indicate a likely metal binding mechanism for the original nitroxolinecompound.
Direct comparison of nitroxoline to standard-of-care drugs for GAE treatment.To evaluate nitroxoline as a potential drug to treat B. mandrillaris infections, wecompared the in vitro performance of nitroxoline to that of pentamidine isethionate,miltefosine, and azithromycin, three drugs recommended by the CDC and commonlyused in treatment of GAE (53). We performed side-by-side dose-response experimentsto measure the efficacy of each drug against B. mandrillaris trophozoites and thetoxicity to different human cell types using the following cell lines: HFF-1 (fibroblast),H4 (glial), U87 (glial), HEK-293T (kidney), and Hep-G2 (liver). Nitroxoline was the mostpotent inhibitor of B. mandrillaris trophozoites, with an IC50 of 2.84 !M compared to
A B
NOH
NO2
Nitroxoline
Clinically-approveddrug library
2,177
Hit by percent inhibitionand B-score
30
Primary screen at 20 µM
Secondaryscreen
Identification oflead compound
SARexperiments
Curation of hits
Topical, antiseptic,or veterinary
17
Oral and IVadminstration
13
High selectivityindex
1
Metal-bindingnitroxoline analogs
retain activity
11
High toxicity tohuman cells
3
CDCrecommended
drugs3
Low potencyagainst
B. mandrillaris7
Comparison of lead compound to CDC
recommended drugs
Nitroxoline exhibits greater potency, specificity, and
duration of B. mandrillaris inhibition than other
amebicidal drugs
-20 -10 0 10 20 30-40
-20
0
20
40
60
80
100
120
B-ScorePe
rcen
t inh
ibitio
n re
lativ
e to
unt
reat
ed c
ontro
l
NitroxolineNitroxolineCDC RecommendedTopical/Antiseptic/Veterinary
PentamidineSulfadiazineAzithromycinMiltefosineFlucytosineClarithromycinFluconazole
FIG 1 (A) Workflow for screening of clinically approved compounds for in vitro activity against B. mandrillaris. A primary screen of 2,177 clinicallyapproved compounds yielded 30 hits meeting the percent inhibition and B-score criteria, among which only 13 candidates were available for oralor intravenous (IV) administration (see panel B). Secondary screening identified only one novel lead compound, nitroxoline, which displayed highselectivity for inhibition of B. mandrillaris viability (Table S1C). Structure-activity relationship (SAR) experiments showed that 11 of 12 nitroxolineanalogs tested with potential metal binding domains remained active against B. mandrillaris, suggesting that metal binding plays a role in themechanism of inhibition by nitroxoline (Fig. 2). Comparison of nitroxoline to three drugs recommended by the CDC for treatment of B. mandrillarisCNS infections (pentamidine isethionate, miltefosine, and azithromycin) indicates that nitroxoline is the most potent and specific inhibitor of B.mandrillaris among the compounds tested (Fig. 3 and 4; see also Table S1). (B) Plot of percent inhibition relative to untreated controls and B-scoremeasured for each compound in a library of 2,177 clinically approved compounds. Raw data used to calculate these values are compiled inTable S1A. Drugs recommended by the CDC for treatment of GAE are highlighted in blue. Drugs that are classified as antiseptic or topical and/orhave not been used in humans are shown in yellow. The quinoline antibiotic nitroxoline, which was the top hit identified in this screen, ishighlighted in red.
Laurie et al. ®
September/October 2018 Volume 9 Issue 5 e02051-18 mbio.asm.org 4
Dow
nloa
ded
from
http
s://j
ourn
als.a
sm.o
rg/jo
urna
l/mbi
o on
12
Apr
il 20
22 b
y 73
.221
.147
.47.

79
Figure 4.2. Activity of compounds structurally related to nitroxoline. Structure-activity relationship experiments suggest that nitroxoline inhibits B. mandrillaris through a mechanism related to metal binding. Structures and IC50 values are shown for nitroxoline and select analogs; additional compounds are shown in Table S2. Nitroxoline is made up of a quinoline core with a nitro group at the 5 position and a hydroxyl group at the 8 position. Analogs lacking the 8-position hydroxyl group were generally inactive, with IC50 values greater than 80µM (e.g., 5-nitroquinoline [compound 3]). Twelve nitroxoline analogs with predicted metal binding activity were tested, and of these, 1,10-phenanthroline (compound 14) and 10 of 11 compounds with an 8-position hydroxyl group (e.g., 8-hydroxyquinoline [compound 2]) were active, with IC50 values ranging from 17 to 60 µM. The only inactive analog with an 8-position hydroxyl group was 8-hydroxy-5-quinolinesulfonic acid (compound 13). Variance of the 5-position nitro group reduced potency compared to nitroxoline, but no trend related to aromatic electronic effects is apparent.
IC50 values of 9.14 !M, 63.23 !M, and 244.10 !M for pentamidine, miltefosine, andazithromycin, respectively (Fig. 3A). Nitroxoline was also the only drug with an IC50
against B. mandrillaris that was lower than the half-maximal cytotoxic concentration(CC50) for all cell lines tested. The average Log10 selectivity index (CC50 for human celltoxicity/IC50 for B. mandrillaris inhibition) of nitroxoline across all cell lines was 0.832,compared to 0.049, !0.102, and !0.409 for pentamidine, miltefosine, and azithromy-cin, respectively (Fig. 3B [summarized in Table S3]). Combinations of nitroxoline withmiltefosine and with pentamidine isethionate showed generally additive inhibitoryeffects on B. mandrillaris viability, suggesting that nitroxoline can be combined withother amoebicidal drugs to produce greater inhibition (see Fig. S2 in the supplementalmaterial).
Encystment response of B. mandrillaris. In addition to a dose-dependent reduc-tion in B. mandrillaris trophozoite viability, we also observed a general increase in theratio of cysts to trophozoites correlated with increasing concentrations of some drugs.We investigated the propensity of nitroxoline, pentamidine isethionate, miltefosine,and azithromycin to induce encystment of B. mandrillaris by counting the number ofcysts and trophozoites in culture samples following 72 h of treatment with differentdrug concentrations. We observed a dose-dependent reduction in the number oftrophozoites in the population for all four drugs. Nitroxoline and pentamidine isethio-nate caused an increase in both the total number and the proportion of cysts in thepopulation, while no substantial number of cysts was observed at any concentration ofmiltefosine or azithromycin (Fig. 4A to D). Because encystment appears to occur as aresponse to certain drug treatments, we also assessed the ability of each drug to inhibitthe viability of preformed B. mandrillaris cysts. We induced encystment by sustainedexposure to 12% galactose and conducted dose-response viability measurements foreach drug. Nitroxoline was again the most potent inhibitor of cysts, with an IC50 of15.48 !M compared to IC50 values of 26.26 !M, 76.48 !M, and 788.4 !M for pentami-dine, miltefosine, and azithromycin, respectively (Fig. 4E). While nitroxoline, pentami-
Nitroxoline [1]IC50 = 4.77 µM
8-Hydroxyquinoline [2]IC50 = 30.51 µM
1,10-phenanthroline [14]IC50 = 15.89 µM
8-Hydroxy-5-quinolinesulfonic acid [13]
IC50 = 338 µM
5-Nitroquinoline [3]IC50 = 82.69 µM
NOH
R1R2
R3 NN
NOH
5
8
6
7
3
2
4
N1OH
NO2 NO2
N
OH
SO3H
N
5,6,7-substitutedhydroxyquinolines [4-12]
R1=F, Cl, Br, CH3, NH2, NO; R2=R3=HR1=R3=Cl, NO2; R2=H
R2=NO2; R1=R3=HIC50 = 16.80-60.41 µM
FIG 2 Structure-activity relationship experiments suggest that nitroxoline inhibits B. mandrillaris througha mechanism related to metal binding. Structures and IC50 values are shown for nitroxoline and selectanalogs; additional compounds are shown in Table S2. Nitroxoline is made up of a quinoline core witha nitro group at the 5 position and a hydroxyl group at the 8 position. Analogs lacking the 8-positionhydroxyl group were generally inactive, with IC50 values greater than 80 !M (e.g., 5-nitroquinoline[compound 3]). Twelve nitroxoline analogs with predicted metal binding activity were tested, and ofthese, 1,10-phenanthroline (compound 14) and 10 of 11 compounds with an 8-position hydroxyl group(e.g., 8-hydroxyquinoline [compound 2]) were active, with IC50 values ranging from 17 to 60 !M. The onlyinactive analog with an 8-position hydroxyl group was 8-hydroxy-5-quinolinesulfonic acid (compound13). Variance of the 5-position nitro group reduced potency compared to nitroxoline, but no trendrelated to aromatic electronic effects is apparent.
Inhibition of Balamuthia mandrillaris by Nitroxoline ®
September/October 2018 Volume 9 Issue 5 e02051-18 mbio.asm.org 5
Dow
nloa
ded
from
http
s://j
ourn
als.a
sm.o
rg/jo
urna
l/mbi
o on
12
Apr
il 20
22 b
y 73
.221
.147
.47.

80
Figure 4.3. Comparison of nitroxoline potency and selectivity to standard of care drugs. Potency and selectivity for inhibition of B. mandrillaris viability by nitroxoline, pentamidine isethionate, miltefosine, and azithromycin. (A) Dose-response curves show the effect of nitroxoline (red), pentamidine isethionate (black), miltefosine (blue), and azithromycin (gray) on the viability of B. mandrillaris trophozoite populations following 72 h of treatment. Data points represent means and standard errors of results from at least three independent biological replicates. Nitroxoline was the most potent inhibitor of B. mandrillaris viability, with an IC50 of 2.84 µM. (B) Heat map showing the Log10 selectivity index (human cell CC50/B. mandrillaris IC50) for nitroxoline, pentamidine, isethionate, miltefosine, and azithromycin calculated from the ratio of human cell CC50 to B. mandrillaris IC50. Nitroxoline exhibited the greatest mean Log10 selectivity index at 0.832 and was the only drug with a positive Log10 selectivity index (comparing B. mandrillaris inhibition to the results from all cell lines tested).
dine, and azithromycin were considerably less potent inhibitors of cyst viability than oftrophozoite viability, miltefosine inhibited the two forms of B. mandrillaris at similarconcentrations (Table S3).
Delayed recrudescence of B. mandrillaris treated with nitroxoline. Nitroxolineand the tested standard-of-care drugs induce various combinations of distinct andintermediate B. mandrillaris phenotypes, including death and encystment. Though it isassumed that drug-induced phenotypes such as encystment affect the rate of amoebapopulation growth and host cell destruction, the magnitude and duration of theseeffects are unknown. To assess how rapidly amoeba populations recover and proliferatefollowing drug treatment, we developed a recrudescence assay wherein we treated B.mandrillaris trophozoite cultures with various concentrations of nitroxoline, pentami-dine, or miltefosine for 72 h, removed drug, and then added the remaining amoebaeto a monolayer of HFF-1 cells in the absence of drug. The posttreatment recovery timewas measured as the number of days required for each B. mandrillaris population toclear 100% of the host cells. Treatments that completely eliminated B. mandrillarispopulations were determined by observing no live trophozoites or destruction of hostcells at any point during the 28-day experiment. We found that 7 !M and 14 !Mpentamidine delayed recovery of B. mandrillaris by 1 to 2 weeks but that increasing thedose from 14 !M to 56 !M delayed recovery by only an additional 3 days (Table S1).
B U87Mean H4 293T HFF-1 HepG2
Nitroxoline
Pentamidineisethionate
Miltefosine
Azithromycin
Log10 Selectivity Index
-0.5 0 0.5 1.0
A
0.1 1 10 100 1000 100000.0
0.5
1.0
[drug] (µM)
Viab
ility
ratio
to u
ntre
ated
con
trol
Nitroxoline IC50=2.84 µMPentamidine IC50=9.15 µMMiltefosine IC50=62.98 µMAzithromycin IC50=244.10 µM
FIG 3 Potency and selectivity for inhibition of B. mandrillaris viability by nitroxoline, pentamidineisethionate, miltefosine, and azithromycin. (A) Dose-response curves show the effect of nitroxoline (red),pentamidine isethionate (black), miltefosine (blue), and azithromycin (gray) on the viability of B. man-drillaris trophozoite populations following 72 h of treatment. Data points represent means and standarderrors of results from at least three independent biological replicates. Nitroxoline was the most potentinhibitor of B. mandrillaris viability, with an IC50 of 2.84 !M. (B) Heat map showing the Log10 selectivityindex (human cell CC50/B. mandrillaris IC50) for nitroxoline, pentamidine, isethionate, miltefosine, andazithromycin calculated from the ratio of human cell CC50 to B. mandrillaris IC50. Nitroxoline exhibited thegreatest mean Log10 selectivity index at 0.832 and was the only drug with a positive Log10 selectivityindex (comparing B. mandrillaris inhibition to the results from all cell lines tested).
Laurie et al. ®
September/October 2018 Volume 9 Issue 5 e02051-18 mbio.asm.org 6
Dow
nloa
ded
from
http
s://j
ourn
als.a
sm.o
rg/jo
urna
l/mbi
o on
12
Apr
il 20
22 b
y 73
.221
.147
.47.

81
Figure 4.4. Drug-induced encystment and killing of B. mandrillaris cysts. Relationship of drug treatment to B. mandrillaris encystment. (A to D) Changes in the number of trophozoites (blue) and cysts (red) in B. mandrillaris populations following 72 h of treatment with various concentrations of nitroxoline (A), pentamidine isethionate (B), miltefosine (C), and azithromycin (D). Low micromolar concentrations of nitroxoline and pentamidine isethionate caused an increase in the total number of cysts observed in B. mandrillaris populations and an increase in the ratio of cysts to trophozoites. No increase in encystment was observed in B. mandrillaris populations treated with miltefosine or azithromycin. (E) Dose-response curve showing the effect of nitroxoline (red), pentamidine isethionate (black), miltefosine (blue), and azithromycin (gray) on the viability of preformed B. mandrillaris cysts. Nitroxoline was the most potent inhibitor of cysts, with an IC50 of 15.48µM. Cysts were substantially less sensitive than trophozoites (Fig. 4.2A) to all drugs except for miltefosine, which had similar IC50 values for inhibition of both B. mandrillaris forms.
Consistent with the steep Hill slope observed in dose-response experiments, miltefos-ine caused very little delay in clearance time at 56 !M but completely eliminated B.mandrillaris populations at 112 !M. In contrast, nitroxoline delayed amoeba recoveryby 2 to 3 weeks at low micromolar concentrations and completely eliminated B.mandrillaris populations at 28 !M.
Protective effect of nitroxoline in a primary human brain tissue model. Findingsfrom the recrudescence assays suggest that nitroxoline treatment may significantlyimpede destruction of host cells in the context of B. mandrillaris infection. To furtherexplore this possibility, we performed experiments modeling B. mandrillaris infectionand nitroxoline treatment in primary human brain tissue. Human cortical tissue sliceswere exposed to B. mandrillaris trophozoites and simultaneously treated with nitroxo-
C
Miltefosine (µM)
105 a
moe
bae/
mL
0
0.5
1.0
1.5
10000 1 10 100
TrophozoitesCysts
B
1000 0.1 1 10Pentamidine isethionate (µM)
105 a
moe
bae/
mL
0
0.5
1.0
1.5 TrophozoitesCysts
A
Nitroxoline (µM)
105 a
moe
bae/
mL
1000 0.1 1 100
0.5
1.0
1.5 TrophozoitesCysts
0
0.5
1.0
1.5
Azithromycin (µM)
105 a
moe
bae/
mL
10000 1 10 100
TrophozoitesCysts
D
E
[drug] (µM)
Viab
ility
ratio
to u
ntre
ated
con
trol
0.1 1 10 100 10000.0
0.5
1.0
Nitroxoline IC50=15.48 µMPentamidine IC50=26.26 µMMiltefosine IC50=76.48 µMAzithromycin IC50=788.4 µM
FIG 4 Relationship of drug treatment to B. mandrillaris encystment. (A to D) Changes in the number oftrophozoites (blue) and cysts (red) in B. mandrillaris populations following 72 h of treatment with variousconcentrations of nitroxoline (A), pentamidine isethionate (B), miltefosine (C), and azithromycin (D). Lowmicromolar concentrations of nitroxoline and pentamidine isethionate caused an increase in the totalnumber of cysts observed in B. mandrillaris populations and an increase in the ratio of cysts totrophozoites. No increase in encystment was observed in B. mandrillaris populations treated withmiltefosine or azithromycin. (E) Dose-response curve showing the effect of nitroxoline (red), pentamidineisethionate (black), miltefosine (blue), and azithromycin (gray) on the viability of preformed B. mandril-laris cysts. Nitroxoline was the most potent inhibitor of cysts, with an IC50 of 15.48 !M. Cysts weresubstantially less sensitive than trophozoites (Fig. 2A) to all drugs except for miltefosine, which hadsimilar IC50 values for inhibition of both B. mandrillaris forms.
Inhibition of Balamuthia mandrillaris by Nitroxoline ®
September/October 2018 Volume 9 Issue 5 e02051-18 mbio.asm.org 7
Dow
nloa
ded
from
http
s://j
ourn
als.a
sm.o
rg/jo
urna
l/mbi
o on
12
Apr
il 20
22 b
y 73
.221
.147
.47.

82
Figure 4.5. Nitroxoline prevention of brain explant destruction by B. mandrillaris. Nitroxoline prevents B. mandrillaris-mediated destruction of human brain tissue explants. Each panel shows an image representative of two tissues 96 h after exposure to the indicated conditions. Media were changed at 20 h postinfection to remove nitroxoline or vehicle. (A) Uninfected, untreated (vehicle only) tissues had distinct edges and maintained cell density throughout culture. (B) B. mandrillaris-infected, untreated (vehicle only) tissues show widespread damage, particularly at edges, where loss of cell density and disorder of tissue structure are apparent. Large numbers of B. mandrillaris trophozoites are observed intermixed with human cells and outside the tissue (lower half of image). (C) B. mandrillaris-infected tissues treated with 35 µM nitroxoline simultaneously with inoculation do not show signs of tissue damage or loss of cell density and maintain distinct edges similar to those of uninfected tissues. Clusters of B. mandrillaris cysts are observed outside the boundaries of the tissue.
line or vehicle (dimethyl sulfoxide [DMSO]) for 20 h before media were changed toremove drug or vehicle. Tissues were cultured for 4 days and then evaluated fordamage by microscopic examination (Fig. 5; see also Fig. S3). Untreated tissues showedwidespread damage following B. mandrillaris exposure, including loss of distinct tissueedges and reduction of cell density (Fig. 5B). Large numbers of highly motile B.mandrillaris trophozoites were present at the edges of tissues and were intermixed withhuman cells (see Movies S1 to S3 in the supplemental material). In contrast, nitroxoline-treated tissues did not show signs of B. mandrillaris-mediated destruction and appearedto be similar to uninfected tissues (Fig. 5A and C). Cysts with little to no motility wereobserved outside the boundaries of tissues (Movie S4). While these findings arequalitative, the large-scale differences in tissue morphology observed in this experi-ment are consistent with the possibility that nitroxoline has a protective effect on hosttissue in the context of B. mandrillaris infection.
DISCUSSIONGAE caused by Balamuthia mandrillaris is almost always fatal (19–34). Because there
is no established treatment for GAE, patients commonly receive experimental combi-nations of antimicrobial agents in aggressive and prolonged treatment regimens withmixed outcomes (7, 19, 23, 27, 29, 30, 34, 54–62). In the present study, we aimed toaddress the critical need for new treatments of GAE by identifying novel amoebicidalcompounds. Because our goal was to identify candidate drugs with established safetyand pharmacodynamic profiles, we chose to screen a library of 2,177 clinically approvedcompounds. Based on the criteria of B-score and percent inhibition of B. mandrillarisviability, we selected 12 compounds from the primary screen for follow-up screening(Fig. 1A; see also Table S1B in the supplemental material). Secondary screening elimi-nated all candidate compounds on the basis of low potency for inhibition of B.mandrillaris or high toxicity to human cells, with the exception of the quinolineantibiotic nitroxoline. Nitroxoline demonstrated promising potency and selectivity for
FIG 5 Nitroxoline prevents B. mandrillaris-mediated destruction of human brain tissue explants. Eachpanel shows an image representative of two tissues 96 h after exposure to the indicated conditions.Media were changed at 20 h postinfection to remove nitroxoline or vehicle. (A) Uninfected, untreated(vehicle only) tissues had distinct edges and maintained cell density throughout culture. (B) B.mandrillaris-infected, untreated (vehicle only) tissues show widespread damage, particularly at edges,where loss of cell density and disorder of tissue structure are apparent. Large numbers of B. mandrillaristrophozoites are observed intermixed with human cells and outside the tissue (lower half of image). (C)B. mandrillaris-infected tissues treated with 35 !M nitroxoline simultaneously with inoculation do notshow signs of tissue damage or loss of cell density and maintain distinct edges similar to those ofuninfected tissues. Clusters of B. mandrillaris cysts are observed outside the boundaries of the tissue.
Laurie et al. ®
September/October 2018 Volume 9 Issue 5 e02051-18 mbio.asm.org 8
Dow
nloa
ded
from
http
s://j
ourn
als.a
sm.o
rg/jo
urna
l/mbi
o on
12
Apr
il 20
22 b
y 73
.221
.147
.47.

83
Figure 4.6. Example brightfield images of B. mandrillaris trophozoites and cysts. (A) Example images show B. mandrillaris trophozoites in log-phase growth. Trophozoites are pleomorphic and can be elongated or generally rounded, often with highly branched pseudopodia. (B) Example images show B. mandrillaris cysts induced by galactose exposure. Cysts are spherical, generally smaller in diameter than trophozoites, and can have visibly distinct layers. Some cysts show signs of vacuolization that may be indicative of cell death.
Figure S1. Example brightfield images of B. mandrillaris trophozoites and cysts. (A) Example images show B. mandrillaris trophozoites in log-phase growth. Trophozoites are pleomorphic and can be elongated or generally rounded, often with highly branched pseudopodia. (B) Example images show B. mandrillaris cysts induced by galactose exposure. Cysts are spherical, generally smaller in diameter than trophozoites, and can have visibly distinct layers. Some cysts show signs of vacuolization that may be indicative of cell death.
10 µm
Figure S1 A
B
10 µm

84
Figure 4.7. Efficacy of nitroxoline in combination with miltefosine and pentamidine isethionate for inhibition of B. mandrillaris. (A and B) Heat maps show mean treatment effect (percent inhibition of B. mandrillaris population viability relative to untreated control) across dose matrices for nitroxoline in combination with miltefosine (A) and pentamidine isethionate (B). The viability of B. mandrillaris trophozoite populations was measured following 72 hours of drug treatment in three independent replicates. (C and D) Heat maps of excess effect over highest single agent (EOHSA) showing the additional effect of dose combinations beyond the effect of the most active single agent in the combination (EOHSA = Ecombo - EHSA) across dose matrices for nitroxoline in combination with miltefosine (C) and pentamidine isethionate (D). For both drug pairs, mild antagonism (negative values colored in red) is observed for a small number of combinations, whereas most combinations produce a modest additive effect (positive values colored in blue). No strong antagonism or synergy is observed between nitroxoline and miltefosine or pentamidine isethionate. For reference, the reported Cmax values for nitroxoline, miltefosine, and pentamidine are approximately 30µM, 78µM, and 2.5µM, respectively [63, 65, 79].
Figure S2. Efficacy of nitroxoline in combination with miltefosine and pentamidine isethionate for inhibition of B. mandrillaris. (A and B) Heat maps show mean treatment effect (percent inhibition of B. mandrillaris population viability relative to untreated control) across dose matrices for nitroxoline in combination with miltefosine (A) and pentamidine isethionate (B). The viability of B. mandrillaris trophozoite populations was measured following 72 hours of drug treatment in three independent replicates. (C and D) Heat maps of excess effect over highest single agent (EOHSA) showing the additional effect of dose combinations beyond the effect of the most active single agent in the combination (EOHSA = E
combo - E
HSA) across dose matrices for nitroxoline in combination with
miltefosine (C) and pentamidine isethionate (D). For both drug pairs, mild antagonism (negative values colored in red) is observed for a small number of combinations, whereas most combinations produce a modest additive effect (positive values colored in blue). No strong antagonism or synergy is observed between nitroxoline and miltefosine or pentamidine isethionate.
A
Figure S2
B
C
Excess over highest single agent (%)
-20 0 20
[Milt
efo
sin
e]
(µM
)
[Nitroxoline] (µM)
0 0.5 2 2.5 3 5 10
100
80
60
50
30
10
0 0
-12
-13
19
44
91
96
-4
3
-5
13
37
89
95
28
37
30
33
38
85
96
31
38
34
38
50
89
96
34
40
37
50
66
93
97
92
92
91
92
93
95
97
93
93
92
93
93
96
98
[Nitroxoline] (µM)
[Pe
nta
mid
ine
] (µ
M)
0 0.5 2 2.5 3 5 10
100
50
20
10
5
1
0 0
-1
32
51
62
68
82
0
11
39
53
62
66
75
28
26
37
56
64
70
81
33
36
39
58
66
73
88
32
42
40
59
68
79
94
91
92
80
85
92
94
96
92
93
92
92
93
94
96
D
Percent inhibition of B. mandrillaris viability (%)
40 60 80 1000 20
[Nitroxoline] (µM)
[Milt
efo
sin
e]
(µM
)
0.5 2 2.5 3 5 10
100
80
60
50
30
10 6.5
-1.7
-5.3
-7.9
-2.0
-0.6
8.9
1.7
5.0
-6.7
-6.1
0.3
7.3
3.3
7.2
5.9
-1.5
0.5
5.8
2.3
15.6
31.2
2.4
0.8
0.2
-1.0
-0.8
0.2
4.5
1.1
0.4
-0.4
0.1
0.8
2.9
4.8
[Nitroxoline] (µM)
[Pe
nta
mid
ine
] (µ
M)
0.5 2 2.5 3 5 10
100
50
20
10
5
1 8.4
7.1
1.7
-0.2
-2.1
-7.7
-2.7
4.7
4.7
1.9
1.9
-0.8
3.0
7.2
6.9
4.5
4.9
5.7
9.7
8.2
8.4
5.6
10.4
11.6
1.0
-10.4
-5.8
1.4
3.2
5.4
0.7
-0.5
-0.5
0.5
2.0
2.3

85
Figure 4.8. Inhibition of B. mandrillaris-mediated brain tissue explant destruction in the presence of nitroxoline. (A and B) Brightfield images representative of two biological replicates for human brain tissue explants before and after exposure to the indicated conditions. Nitroxoline or vehicle was added simultaneously with B. mandrillaris trophozoites and removed after 20 hours. Four days after exposure to B. mandrillaris, untreated tissues show wide- spread damage and loss of cell density while nitroxoline treated tissues remain intact and appear similar to uninfected tissues. Large numbers of B. mandrillaris trophozoites can be seen at the edges of untreated tissues, while only clusters of cysts are observed in nitroxoline-treated tissues. (C) Images representative of two biological replicates of human brain tissue explants fixed and stained with DAPI four days after exposure to the indicated conditions (two images per condi- tion). The number of host cell nuclei is dramatically reduced in untreated, B. mandrillaris-infected tissues compared to uninfected tissues, whereas B. mandrillaris-infected tissues treated with nitroxoline show no apparent loss of nuclei.
APre-inoculation
Figure S3
B
C
4dpi
Pre-inoculation
4dpi
4dpi
UninfectedVehicle only
200 µm
+B. mandrillarisVehicle only
+B. mandrillaris+35 µM nitroxoline
200 µm
200 µm DAPI
Figure S3. (A and B) Brightfield images representative of two biological replicates for human brain tissue explants before and after exposure to the indicated conditions. Nitroxoline or vehicle was added simultaneously with B. mandrillaris trophozoites and removed after 20 hours. Four days after exposure to B. mandrillaris, untreated tissues show wide-spread damage and loss of cell density while nitroxoline treated tissues remain intact and appear similar to uninfected tissues. Large numbers of B. mandrillaris trophozoites can be seen at the edges of untreated tissues, while only clusters of cysts are observed in nitroxoline-treated tissues. (C) Images representative of two biological replicates of human brain tissue explants fixed and stained with DAPI four days after exposure to the indicated conditions (two images per condi-tion). The number of host cell nuclei is dramatically reduced in untreated, B. mandrillaris-infected tissues compared to uninfected tissues, whereas B. mandrillaris-infected tissues treated with nitroxoline show no apparent loss of nuclei.

86
Table 4.1. Recrudescence time of active B. mandrillaris following drug treatment.
ment when we observed no signs of amoeba population recovery after 28 days ofcoculture with host cells.
Using this method, we determined that concentrations of 28 !M nitroxoline and112 !M miltefosine completely eliminated B. mandrillaris populations. These data areconsistent with viability inhibition experiments in indicating that nitroxoline is the mostpotent inhibitor of B. mandrillaris tested. The promising results of this experimentsuggest that nitroxoline may be able to fully eliminate B. mandrillaris infection ifsufficiently high concentrations are reached and is likely to cause substantial delayswith respect to host tissue damage even at lower concentrations. This is supported byour findings indicating that nitroxoline prevented B. mandrillaris activity and tissuedestruction in a primary human brain tissue model (Fig. 5; see also Movie S1 to S4 inthe supplemental material). Together, these findings suggest that nitroxoline substan-tially impedes host tissue destruction by B. mandrillaris in vitro. Given the rapidprogression of pathogenesis that is characteristic of GAE, any impediment to tissuedestruction could significantly improve patient prognosis.
The known safety and pharmacokinetic properties of nitroxoline suggest furtherpromise for its therapeutic value as an inhibitor of B. mandrillaris. Nitroxoline has beensafely used for over 50 years in the treatment of urinary tract infections, with minimaladverse effects reported (70). Nitroxoline is available in oral and intravenous adminis-tration forms and is typically dosed at 600 to 800 mg/day for adults, resulting inmaximal plasma concentrations (Cmax) of up to approximately 30 !M (5.6 mg/liter)(63–65), which is 10-fold higher than the IC50 for B. mandrillaris trophozoites in vitro(Fig. 3A; see also Table S3). Although the extent to which nitroxoline crosses the bloodbrain barrier is unknown, a recent study showed that systemically delivered nitroxolineexhibits efficacy against gliomas in mice, implying that efficacious concentrationsreached the brain in that model (71). In addition, we previously noted that B. mandril-laris frequently causes necrotizing vasculitis in the CNS with extensive blood-brainbarrier (BBB) breakdown, which may affect the bioavailability of systemically adminis-tered drugs in the CNS of patients actively suffering from GAE (3, 36, 57). Furthermore,given the extreme severity of GAE, intrathecal drug delivery can be performed tomaximize drug concentrations reaching the brain (2, 72). While many variables mayaffect the in vivo efficacy of nitroxoline as well as the concentrations that can be
TABLE 1 Recrudescence time of active B. mandrillaris following drug treatment
TreatmentMean no. of days for hostcell clearance ! SE
Vehicle only0.28% (vol/vol) DMSO 1.33 ! 0.331.12% (vol/vol) water 1.67 ! 0.67
Nitroxoline (in DMSO)3.5 !M 15.33 ! 0.677 !M 19 ! 0.5814 !M 22 ! 2.0828 !M NRTa
Pentamidine isethionate (in water)3.5 !M 1.33 ! 0.337 !M 7 ! 1.1514 !M 13 ! 2.5128 !M 15.33 ! 2.5656 !M 16 ! 2
Miltefosine28 !M 1.5 ! 0.3356 !M 3.5 ! 2.6484 !M "28b
112 !M NRTa
aNRT, no recovery of trophozoites or host cell destruction observed through 28 days.bIncomplete recovery of trophozoites and destruction of host cells on day 28.
Laurie et al. ®
September/October 2018 Volume 9 Issue 5 e02051-18 mbio.asm.org 10
Dow
nloa
ded
from
http
s://j
ourn
als.a
sm.o
rg/jo
urna
l/mbi
o on
12
Apr
il 20
22 b
y 73
.221
.147
.47.

87
Chapter 4 References
1. Schuster FL, Yagi S, Gavali S, Michelson D, Raghavan R, Blomquist I, Glastonbury C, Bollen
AW, Scharnhorst D, Reed SL, Kuriyama S, Visvesvara GS, Glaser CA. 2009. Under the
radar: Balamuthia amebic encephalitis. Clin Infect Dis 48:879–887. doi:10.1086/597260.
2. Visvesvara GS, Moura H, Schuster FL. 2007. Pathogenic and opportunistic free-living
amoebae: Acanthamoeba spp., Balamuthia mandrillaris, Naegleria fowleri, and Sappinia
diploidea. FEMS Immunol Med Microbiol 50:1–26. doi:10.1111/j.1574-695X.2007.00232.x.
3. Visvesvara GS. 2011. Pathogenic and Opportunistic Free-Living Amebae Manual of Clinical
Microbiology, 10th ed American Society of Microbiology, Washington, DC.
4. Bravo FG, Alvarez PJ, Gotuzzo E. 2011. Balamuthia mandrillaris infection of the skin and
central nervous system: an emerging disease of concern to many specialties in medicine. Curr
Opin Infect Dis 24:112–117. doi:10.1097/QCO.0b013e3283428d1e.
5. Lehmer LM, Ulibarri GE, Ragsdale BD, Kunkle J. 2017. Cutaneous Balamuthia
mandrillaris infection as a precursor to Balamuthia amoebic encephalitis (BAE) in a healthy
84-year-old Californian. Dermatol Online J 23.
6. Chang OH, Liu F, Knopp E, Muehlenbachs A, Cope JR, Ali I, Thompson R, George E.
2016. Centrofacial Balamuthiasis: case report of a rare cutaneous amebic infection. J Cutan
Pathol 43:892–897. doi:10.1111/cup.12748.
7. Bodi I, Dutt N, Hampton T, Akbar N. 2008. Fatal granulomatous amoebic meningoencephalitis
due to Balamuthia mandrillaris. Pathol Res Pract 204:925–928.
doi:10.1016/j.prp.2008.06.005.
8. Wilson MR, Shanbhag NM, Reid MJ, Singhal NS, Gelfand JM, Sample HA, Benkli B,
O'Donovan BD, Ali IKM, Keating MK, Dunnebacke TH, Wood MD, Bollen A, DeRisi JL.

88
2015. Diagnosing Balamuthia mandrillaris encephalitis with metagenomic deep
sequencing. Ann Neurol 78:722–730. doi:10.1002/ana.24499.
9. da Rocha-Azevedo B, Tanowitz HB, Marciano-Cabral F. 2009. Diagnosis of infections caused
by pathogenic free-living amoebae. Interdiscip Perspect Infect Dis 2009:251406.
doi:10.1155/2009/251406.
10. Cabello-Vílchez AM, Reyes-Batlle M, Montalbán-Sandoval E, Martín-Navarro CM, López-
Arencibia A, Elias-Letts R, Guerra H, Gotuzzo E, Martínez-Carretero E, Piñero JE, Maciver
SK, Valladares B, Lorenzo-Morales J. 2014. The isolation of Balamuthia mandrillaris from
environmental sources from Peru. Parasitol Res 113:2509–2513. doi:10.1007/s00436-014-
3900-2.
11. Dunnebacke TH, Schuster FL, Yagi S, Booton GC. 2004. Balamuthia mandrillaris from soil
samples. Microbiology150:2837–2842. doi:10.1099/mic.0.27218-0.
12. Lares-Jiménez LF, Booton GC, Lares-Villa F, Velázquez-Contreras CA, Fuerst PA.
2014. Genetic analysis among environmental strains of Balamuthia mandrillaris recovered
from an artificial lagoon and from soil in Sonora, Mexico. Exp Parasitol 145:S57–S61.
doi:10.1016/j.exppara.2014.07.007.
13. Latifi AR, Niyyati M, Lorenzo-Morales J, Haghighi A, Seyyed Tabaei SJ, Lasjerdi Z.
2016. Presence of Balamuthia mandrillaris in hot springs from Mazandaran province,
northern Iran. Epidemiol Infect 144:2456–2461. doi:10.1017/S095026881600073X.
14. Niyyati M, Lorenzo-Morales J, Rezaeian M, Martin-Navarro CM, Haghi AM, Maciver SK,
Valladares B. 2009. Isolation of Balamuthia mandrillaris from urban dust, free of known
infectious involvement. Parasitol Res 106:279–281. doi:10.1007/s00436-009-1592-9.
89
15. Schuster FL, Dunnebacke TH, Booton GC, Yagi S, Kohlmeier CK, Glaser C, Vugia D,
Bakardjiev A, Azimi P, Maddux-Gonzalez M, Martinez AJ, Visvesvara GS.
2003. Environmental isolation of Balamuthia mandrillaris associated with a case of amebic
encephalitis. J Clin Microbiol 41:3175–3180. doi:10.1128/JCM.41.7.3175-3180.2003.
16. Saburi E, Rajaii T, Behdari A, Kohansal MH, Vazini H. 2017. Free-living amoebae in the water
resources of Iran: a systematic review. J Parasit Dis 41:919–928. doi:10.1007/s12639-017-
0950-2.
17. Taravaud A, Ali M, Lafosse B, Nicolas V, Féliers C, Thibert S, Lévi Y, Loiseau PM, Pomel
S. 2018. Enrichment of free-living amoebae in biofilms developed at upper water levels in
drinking water storage towers: an inter- and intra-seasonal study. Sci Total Environ 633:157–
166. doi:10.1016/j.scitotenv.2018.03.178.
18. Baquero RA, Reyes-Batlle M, Nicola GG, Martín-Navarro CM, López-Arencibia A,
Guillermo Esteban J, Valladares B, Martínez-Carretero E, Piñero JE, Lorenzo-Morales J.
2014. Presence of potentially pathogenic free-living amoebae strains from well water samples
in Guinea-Bissau. Pathog Glob Health 108:206–211.
doi:10.1179/2047773214Y.0000000143.
19. Schafer KR, Shah N, Almira-Suarez MI, Reese JM, Hoke GM, Mandell JW, Roy SL,
Visvesvara G. 2015. Disseminated Balamuthia mandrillaris infection. J Clin
Microbiol 53:3072–3076. doi:10.1128/JCM.01549-15.
20. van der Beek NA, van Tienen C, de Haan JE, Roelfsema J, Wismans PJ, van Genderen PJJ,
Tanghe HL, Verdijk RM, Titulaer MJ, van Hellemond JJ. 2015. Fatal Balamuthia
mandrillaris meningoencephalitis in the Netherlands after travel to The Gambia. Emerg Infect
Dis 21:896–898. doi:10.3201/eid2105.141325.

90
21. Shirabe T, Monobe Y, Visvesvara GS. 2002. An autopsy case of amebic meningoencephalitis.
The first Japanese case caused by Balamuthia mandrillaris. Neuropathology 22:213–217.
doi:10.1046/j.1440-1789.2002.00444.x.
22. Sangruchi T, Martinez AJ, Visvesvara GS. 1994. Spontaneous granulomatous amebic
encephalitis: report of four cases from Thailand. Southeast Asian J Trop Med Public
Health 25:309–313.
23. Tavares M, Correia da Costa JM, Carpenter SS, Santos LA, Afonso C, Aguiar A, Pereira J,
Cardoso AI, Schuster FL, Yagi S, Sriram R, Visvesvara GS. 2006. Diagnosis of first case
of Balamuthia amoebic encephalitis in Portugal by immunofluorescence and PCR. J Clin
Microbiol 44:2660–2663. doi:10.1128/JCM.00479-06.
24. Kodet R, Nohýnková E, Tichý M, Soukup J, Visvesvara GS. 1998. Amebic encephalitis caused
by Balamuthia mandrillaris in a Czech child: description of the first case from Europe. Pathol
Res Pract 194:423–429. doi:10.1016/S0344-0338(98)80033-2.
25. Deol I, Robledo L, Meza A, Visvesvara GS, Andrews RJ. 2000. Encephalitis due to a free-
living amoeba (Balamuthia mandrillaris): case report with literature review. Surg
Neurol 53:611–616. doi:10.1016/S0090-3019(00)00232-9.
26. Riestra-Castaneda JM, Riestra-Castaneda R, Gonzalez-Garrido AA, Moreno PP, Martinez AJ,
Visvesvara GS, Careaga FJ, Alba JLO, de Cornejo SG. 1997. Granulomatous amebic
encephalitis Due to Balamuthia mandrillaris (Leptomyxiidae): report of four cases from
Mexico. Am J Trop Med Hyg 56:603–607. doi:10.4269/ajtmh.1997.56.603.
27. Galarza M, Cuccia V, Sosa FP, Monges JA. 2002. Pediatric granulomatous cerebral
amebiasis: a delayed diagnosis. Pediatr Neurol 26:153–156. doi:10.1016/S0887-
8994(01)00360-5.

91
28. Hill CP, Damodaran O, Walsh P, Jevon GP, Blyth CC. 2011. Balamuthia amebic
meningoencephalitis and mycotic aneurysms in an infant. Pediatr Neurol 45:45–48.
doi:10.1016/j.pediatrneurol.2011.05.003.
29. Moriarty P, Burke C, McCrossin D, Campbell R, Cherian S, Shahab MS, Visvesvara GS,
Nourse C. 2014. Balamuthia mandrillaris encephalitis: survival of a child with severe
meningoencephalitis and review of the literature. J Pediatr Infect Dis Soc 3:e4–e9.
doi:10.1093/jpids/pit033.
30. Krasaelap A, Prechawit S, Chansaenroj J, Punyahotra P, Puthanakit T, Chomtho K,
Shuangshoti S, Amornfa J, Poovorawan Y. 2013. Fatal balamuthia amebic encephalitis in a
healthy child: a case report with review of survival cases. Korean J Parasitol 51:335–341.
doi:10.3347/kjp.2013.51.3.335.
31. Bravo FG, Seas C. 2012. Balamuthia Mandrillaris amoebic encephalitis: an emerging parasitic
infection. Curr Infect Dis Rep 14:391–396. doi:10.1007/s11908-012-0266-4.
32. Diaz JH. 2011. The public health threat from Balamuthia mandrillaris in the southern United
States. J La State Med Soc163:197–204.
33. Centers for Disease Control and Prevention (CDC). 2008. Balamuthia amebic encephalitis—
California, 1999–2007. MMWR Morb Mortal Wkly Rep 57:768–771.
34. Khurana S, Hallur V, Goyal MK, Sehgal R, Radotra BD. 2015. Emergence of Balamuthia
mandrillarismeningoencephalitis in India. Indian J Med Microbiol 33:298–300.
doi:10.4103/0255-0857.154887.
35. Cabello-Vílchez AM, Rodríguez-Zaragoza S, Piñero J, Valladares B, Lorenzo-Morales J.
2014. Balamuthia mandrillarisin South America: an emerging potential hidden pathogen in
Perú. Exp Parasitol 145:S10–S19. doi:10.1016/j.exppara.2014.05.007.

92
36. Martinez AJ, Visvesvara GS. 1997. Free-living, amphizoic and opportunistic amebas. Brain
Pathol 7:583–598. doi:10.1111/j.1750-3639.1997.tb01076.x.
37. Farnon EC, Kokko KE, Budge PJ, Mbaeyi C, Lutterloh EC, Qvarnstrom Y, da Silva AJ, Shieh
W-J, Roy SL, Paddock CD, Sriram R, Zaki SR, Visvesvara GS, Kuehnert MJ, Weiss J,
Komatsu K, Manch R, Ramos A, Echeverria L, Moore A, Zakowski P, Kittleson M,
Kobashigawa J, Yoder J, Beach M, Mahle W, Kanter K, Geraghty P, Navarro E, Hahn C, Fujita
S, Stinson J, Trachtenberg J, Byers P, Cheung M, Jie T, Kaplan B, Gruessner R, Bracamonte
E, Viscusi C, Gonzalez-Peralta R, Lawrence R, Fratkin J, Butt F. 2016. Transmission
of Balamuthia mandrillaris by organ transplantation. Clin Infect Dis63:878–888.
doi:10.1093/cid/ciw422.
38. Gupte AA, Hocevar SN, Lea AS, Kulkarni RD, Schain DC, Casey MJ, Zendejas-Ruiz IR,
Chung WK, Mbaeyi C, Roy SL, Visvesvara GS, da Silva AJ, Tallaj J, Eckhoff D, Baddley JW.
2014. Transmission of Balamuthia mandrillaris through solid organ transplantation: utility of
organ recipient serology to guide clinical management. Am J Transplant 14:1417–1424.
doi:10.1111/ajt.12726.
39. Qvarnstrom Y, da Silva AJ, Schuster FL, Gelman BB, Visvesvara GS. 2009. Molecular
confirmation of Sappinia pedataas a causative agent of amoebic encephalitis. J Infect
Dis 199:1139–1142. doi:10.1086/597473.
40. Adl SM, Simpson AGB, Farmer MA, Andersen RA, Anderson OR, Barta JR, Bowser SS,
Brugerolle G, Fensome RA, Fredericq S, James TY, Karpov S, Kugrens P, Krug J, Lane CE,
Lewis LA, Lodge J, Lynn DH, Mann DG, McCourt RM, Mendoza L, Moestrup O, Mozley-
Standridge SE, Nerad TA, Shearer CA, Smirnov AV, Spiegel FW, Taylor MFJR. 2005. The

93
new higher level classification of eukaryotes with emphasis on the taxonomy of protists. J
Eukaryot Microbiol 52:399–451. doi:10.1111/j.1550-7408.2005.00053.x.
41. Siddiqui R, Ali IKM, Cope JR, Khan NA. 2016. Biology and pathogenesis of Naegleria
fowleri. Acta Trop 164:375–394. doi:10.1016/j.actatropica.2016.09.009.
42. Ahmad AF, Heaselgrave W, Andrew PW, Kilvington S. 2013. The in vitro efficacy of
antimicrobial agents against the pathogenic free-living amoeba Balamuthia mandrillaris. J
Eukaryot Microbiol 60:539–543. doi:10.1111/jeu.12062.
43. Turner NA, Russell AD, Furr JR, Lloyd D. 2000. Emergence of resistance to biocides during
differentiation of Acanthamoeba castellanii. J Antimicrob Chemother 46:27–34.
doi:10.1093/jac/46.1.27.
44. Varga JH, Wolf TC, Jensen HG, Parmley VC, Rowsey JJ. 1993. Combined treatment
of Acanthamoeba keratitis with propamidine, neomycin, and polyhexamethylene
biguanide. Am J Ophthalmol 115:466–470. doi:10.1016/S0002-9394(14)74448-4.
45. Siddiqui R, Khan NA. 2015. Balamuthia mandrillaris: morphology, biology, and
virulence. Trop Parasitol 5:15–22. doi:10.4103/2229-5070.149888.
46. Schuster FL, Visvesvara GS. 1996. Axenic growth and drug sensitivity studies of Balamuthia
mandrillaris, an agent of amebic meningoencephalitis in humans and other animals. J Clin
Microbiol 34:385–388.
47. González-Robles A, Lares-Villa F, Lares-Jiménez LF, Omaña-Molina M, Salazar-Villatoro L,
Martínez-Palomo A. 2015. Balamuthia mandrillaris: further morphological observations of
trophozoites by light, scanning and transmission electron microscopy. Exp Parasitol 157:150–
155. doi:10.1016/j.exppara.2015.08.011.

94
48. Siddiqui R, Ortega-Rivas A, Khan NA. 2008. Balamuthia mandrillaris resistance to hostile
conditions. J Med Microbiol57:428–431. doi:10.1099/jmm.0.47694-0.
49. Aksozek A, McClellan K, Howard K, Niederkorn JY, Alizadeh H. 2002. Resistance
of Acanthamoeba castellanii cysts to physical, chemical, and radiological conditions. J
Parasitol 88:621–623. doi:10.1645/0022-3395(2002)088[0621:ROACCT]2.0.CO;2.
50. Fouque E, Trouilhé M-C, Thomas V, Hartemann P, Rodier M-H, Héchard Y. 2012. Cellular,
biochemical, and molecular changes during encystment of free-living amoebae. Eukaryot
Cell 11:382–387. doi:10.1128/EC.05301-11.
51. Schuster FL, Guglielmo BJ, Visvesvara GS. 2006. In-vitro activity of miltefosine and
voriconazole on clinical isolates of free-living amebas: Balamuthia
mandrillaris, Acanthamoeba spp., and Naegleria fowleri. J Eukaryot Microbiol 53:121–126.
doi:10.1111/j.1550-7408.2005.00082.x.
52. Perez MT, Bush LM. 2007. Fatal amebic encephalitis caused by Balamuthia mandrillaris in
an immunocompetent host: a clinicopathological review of pathogenic free-living amebae in
human hosts. Ann Diagn Pathol 11:440–447. doi:10.1016/j.anndiagpath.2006.04.003.]
53. Centers for Disease Control and Prevention (CDC). 2017. Treatment | Balamuthia | Parasites.
Centers for Disease Control and Prevention, Atlanta, GA.
54. Deetz TR, Sawyer MH, Billman G, Schuster FL, Visvesvara GS. 2003. Successful treatment
of Balamuthia amoebic encephalitis: presentation of 2 cases. Clin Infect Dis 37:1304–1312.
doi:10.1086/379020.
55. Vollmer ME, Glaser C. 2016. A Balamuthia survivor. JMM Case Rep 3:e005031.
doi:10.1099/jmmcr.0.005031.

95
56. Jung S, Schelper RL, Visvesvara GS, Chang HT. 2004. Balamuthia
mandrillaris meningoencephalitis in an immunocompetent patient: an unusual clinical course
and a favorable outcome. Arch Pathol Lab Med 128:466–468.
57. Roy SL, Atkins JT, Gennuso R, Kofos D, Sriram RR, Dorlo TP, Hayes T, Qvarnstrom Y,
Kucerova Z, Guglielmo BJ, Visvesvara GS. 2015. Assessment of blood-brain barrier
penetration of miltefosine used to treat a fatal case of granulomatous amebic encephalitis
possibly caused by an unusual Balamuthia mandrillaris strain. Parasitol Res 114:4431–4439.
doi:10.1007/s00436-015-4684-8.
58. Martínez DY, Seas C, Bravo F, Legua P, Ramos C, Cabello AM, Gotuzzo E. 2010. Successful
treatment of Balamuthia mandrillaris amoebic infection with extensive neurological and
cutaneous involvement. Clin Infect Dis 51:e7–e11. doi:10.1086/653609.
59. Doyle JS, Campbell E, Fuller A, Spelman DW, Cameron R, Malham G, Gin D, Lewin SR.
2011. Balamuthia mandrillarisbrain abscess successfully treated with complete surgical
excision and prolonged combination antimicrobial
60. Prasad K, Bhatia R, Srivastava MVP, Pardasani V, Garg A, Rishi A. 2008. Fatal subacute
necrotising brainstem encephalitis in a young man due to a rare parasitic (Balamuthia)
infection. Pract Neurol 8:112–117. doi:10.1136/jnnp.2007.142547.
61. Pritzker AS, Kim BK, Agrawal D, Southern PM, Pandya AG. 2004. Fatal granulomatous
amebic encephalitis caused by Balamuthia mandrillaris presenting as a skin lesion. J Am Acad
Dermatol 50:S38–S41. doi:10.1016/S0190.
62. Bakardjiev A, Azimi PH, Ashouri N, Ascher DP, Janner D, Schuster FL, Visvesvara GS,
Glaser C. 2003. Amebic encephalitis caused by Balamuthia mandrillaris: report of four
cases. Pediatr Infect Dis J 22:447–453. doi:10.1097/01.inf.0000066540.18671.f8.

96
63. Bergogne-Berezin E, Berthelot G, Muller-Serieys C. 1987. Present status of
nitroxoline. Pathol Biol (Paris) 35:873–878.
64. Mrhar A, Kopitar Z, Kozjek F, Presl V, Karba R. 1979. Clinical pharmacokinetics of
nitroxoline. Int J Clin Pharmacol Biopharm 17:476–481.
65. Sorel RH, Snelleman C, Hulshoff A. 1981. High-performance liquid chromatographic analysis
of nitroxoline in plasma and urine. J Chromatogr 222:241–248. doi:10.1016/S0378-
4347(00)81056-7.
66. Sobke A, Klinger M, Hermann B, Sachse S, Nietzsche S, Makarewicz O, Keller PM, Pfister
W, Straube E. 2012. The urinary antibiotic 5-nitro-8-hydroxyquinoline (nitroxoline) reduces
the formation and induces the dispersal of Pseudomonas aeruginosa biofilms by chelation of
iron and zinc. Antimicrob Agents Chemother 56:6021–6025. doi:10.1128/AAC.01484-12.
67. Prachayasittikul V, Prachayasittikul S, Ruchirawat S, Prachayasittikul V. 2013. 8-
Hydroxyquinolines: a review of their metal chelating properties and medicinal
applications. Drug Des Devel Ther 7:1157–1178. doi:10.2147/DDDT.S49763.
68. Lee X, Reimmann C, Greub G, Sufrin J, Croxatto A. 2012. The Pseudomonas
aeruginosa toxin L-2-amino-4-methoxy-trans-3-butenoic acid inhibits growth and induces
encystment in Acanthamoeba castellanii. Microbes Infect 14:268–272.
doi:10.1016/j.micinf.2011.10.004.
69. Bando Y, Takahashi T, Uehara H, Kagegi T, Nagahiro S, Izumi K. 2012. Autopsy case of
amebic granulomatous meningoencephalitis caused by Balamuthia mandrillaris in
Japan. Pathol Int 62:418–423. doi:10.1111/j.1440-1827.2012.02816.x.
70. Naber KG, Niggemann H, Stein G, Stein G. 2014. Review of the literature and individual
patients’ data meta-analysis on efficacy and tolerance of nitroxoline in the treatment of

97
uncomplicated urinary tract infections. BMC Infect Dis 14:628. doi:10.1186/s12879-014-
0628-7.
71. Lazovic J, Guo L, Nakashima J, Mirsadraei L, Yong W, Kim HJ, Ellingson B, Wu H, Pope
WB. 2015. Nitroxoline induces apoptosis and slows glioma growth in vivo. Neuro
Oncol 17:53–62. doi:10.1093/neuonc/nou139.
72. Seidel JS, Harmatz P, Visvesvara GS, Cohen A, Edwards J, Turner J. 1982. Successful
treatment of primary amebic meningoencephalitis. N Engl J Med 306:346–348.
doi:10.1056/NEJM198202113060607.
73. Lares-Jiménez LF, Gámez-Gutiérrez RA, Lares-Villa F. 2015. Novel culture medium for the
axenic growth of Balamuthia mandrillaris. Diagn Microbiol Infect Dis 82:286–288.
doi:10.1016/j.diagmicrobio.2015.04.007.
74. Siddiqui R, Jarroll EL, Khan NA. 2010. Balamuthia mandrillaris: role of galactose in
encystment and identification of potential inhibitory targets. Exp Parasitol 126:22–27.
doi:10.1016/j.exppara.2009.09.013.
75. Brideau C, Gunter B, Pikounis B, Liaw A. 2003. Improved statistical methods for hit selection
in high-throughput screening. J Biomol Screen 8:634–647. doi:10.1177/1087057103258285.
76. Borisy AA, Elliott PJ, Hurst NW, Lee MS, Lehar J, Price ER, Serbedzija G, Zimmermann GR,
Foley MA, Stockwell BR, Keith CT. 2003. Systematic discovery of multicomponent
therapeutics. Proc Natl Acad Sci U S A 100:7977–7982. doi:10.1073/pnas.1337088100.
77. Geary N. 2013. Understanding synergy. Am J Physiol Endocrinol Metab 304:E237–E253.
doi:10.1152/ajpendo.00308.2012.
78. Schindelin J, Arganda-Carreras I, Frise E, Kaynig V, Longair M, Pietzsch T, Preibisch S,
Rueden C, Saalfeld S, Schmid B, Tinevez J-Y, White DJ, Hartenstein V, Eliceiri K, Tomancak

98
P, Cardona A. 2012. Fiji: an open-source platform for biological-image analysis. Nat
Methods 9:676–682. doi:10.1038/nmeth.2019.
79. Kip AE, Schellens JHM, Beijnen JH, Dorlo TPC. Clinical Pharmacokinetics of Systemically
Administered Antileishmanial Drugs. Clin Pharmacokinet. 2018; 57(2):151–176.

99
Chapter 5:
Identification and characterization of clioquinol as a potent inhibitor of Candida auris
The work presented in this chapter includes contributions from:
Dr. Matthew Lohse, Sophia Levan, Dr. Naomi Ziv, Dr. Craig Ennis, Dr. Clarissa Nobile, Dr.
Joseph DeRisi, and Dr. Alexander Johnson

100
Abstract
The rapidly emerging fungal pathogen C. auris represents a growing threat to hospitalized
patients due to its frequent resistance to multiple classes of antifungal drugs and its ability to spread
and resist decontamination in health care settings. We screened two libraries with 1990 clinically-
approved and late stage investigational compounds for the potential to be repurposed as antifungal
drugs targeting C. auris. From the 89 candidate compounds identified in the initial screen, we
identified five FDA-approved compounds with inhibitory concentrations under 10 µM and at least
an order of magnitude lower than their toxicity to three human cell lines. These hits include the
dihalogenated 8-hydroxyquinolines broxyquinoline, chloroxine, and clioquinol. A structure-
activity relationship study of 32 quinoline derivatives found that 8-hydroxyquinolines, especially
those dihalogenated at the C5 and C7 positions, were the most effective quinoline inhibitors of C.
auris. Consistent with previous studies in Saccharomyces cerevisiae, we show that these
compounds are fungistatic, rather than fungicidal, and inhibit C. auris via chelation of divalent
metal ions. C. auris developed only 2- to 5- fold resistance to clioquinol in an extended
experimental evolution assay; the mechanism of resistance involved mutations in the
transcriptional regulator Cap1 (causing up-regulation of the drug transporter Mdr1) and the drug
transporter Cdr1. These mutations had only modest effects on resistance to traditional antifungal
agents and the Cdr1 mutation left C. auris more sensitive to posaconazole; this raises the
possibility that a combination treatment involving an 8-hydroxyquinoline and posaconazole might
prevent C. auris from developing resistance to this established antifungal agent.

101
Introduction
Candida auris is a rapidly emerging multi-drug resistant pathogen responsible for invasive
fungal infections in hospitalized patients. Similar to other Candida species, C. auris predominately
induces candidemia in the immunocompromised and those subjected to prolonged hospitalization
in ICU wards or long-term care facilities. In untreated patients, invasive candidemia has a mortality
rate of approximately 60%, which only improves to approximately 40% with antifungal therapy
[1,2]. The threat of C. auris is compounded by persistent colonization in previously exposed
patients and pervasive spread through hospital wards despite multiple rounds of decontamination
[3,4]. Furthermore, C. auris can spread through long term care and skilled nursing facilities with
older and ventilator-dependent patients especially at risk of developing infections; several C. auris
outbreaks associated with COVID-19 treatment units have been reported [5–9]. This pervasive
colonization, in combination with frequent resistance to one, two, or even all three major classes
of antifungals, cements C. auris as a growing threat to our most vulnerable patients (CDC) [10].
C. auris represents a relatively new threat to hospitalized patients. It was first reported in
Japan in 2009 [11], and was subsequently found to have five clades (I-V) that localize to distinct
geographic locations [12,13]. The five clades, which are geographically represented by South Asia
(I), East Asia (II), Africa (III), South America (IV), and Iran (V), have unique mechanisms of
antifungal resistance and two distinct mating types [12–15]. Clades I, III, IV, and V have been
linked to outbreaks of invasive infections while Clade II is more commonly associated with ear
infections [16,17]. While specific clades are predominant in much of the world, the US, Canada,
UK, and Kenya have identified infections associated with a range of isolates from multiple clades
[15,18–20]. Nearly all C. auris isolates are highly resistant to fluconazole; more than half
demonstrate resistance to voriconazole; a third are resistant to amphotericin B; and some isolates

102
have demonstrated resistance to all three major classes of antifungal drugs [15,21–25]. Given the
high mortality, limited treatment options, and growing threat to vulnerable patient populations,
there is an urgent need to mobilize new antifungals to combat C. auris.
Several approaches have been taken to identify new anitfungals effective against C. auris
(for more detail on this topic and the current state of the antifungal drug development pipeline, see
[26–32]). The most straightforward approach has focused on the evaluation of the effectiveness of
the newest members of common antifungal classes (e.g. the echinocandin Rezafungin (CD101))
[33,34]. A closely related line of investigation has focused on testing the lead compound(s) from
new classes of potential antifungal agents in development and/or in the clinical testing pipeline
(e.g. the fungal inositol acylase inhibitor Fosmanogepix / APX001 [35–37] and the glucan
synthesis inhibitor Ibrexafungerp / SCY-078 as well as the second generation Fungerp analog
SCY-247 [38–42]). A broader approach, and one less dependent on existing antifungal drug
development pipelines, involves screening libraries of FDA-approved compounds and/or drug like
compounds in order to repurpose existing clinical compounds for use against C. auris. These types
of screens have identified a number of promising compounds, including Ebselen, miltefosine, and
alexidine dihydrochloride. Interestingly, three of these screens were conducted with the same
library (the Prestwick Chemical Library with 1280 compounds) but the hits from these screens
were not always concordant (49 different compounds were identified in these screens: 3 in all
three, 18 in two, and 28 in only one) [43–48].
To identify potential drug repurposing candidates, our team conducted a broad primary
drug screen that examined the effect of 1990 clinically-approved or late stage investigational
compounds on three C. auris strains from the clades most associated with invasive infections (I,
III, and IV). From the 89 candidate compounds identified during this preliminary screen, five

103
FDA-approved compounds were identified with half-maximal inhibitory concentrations (IC50) that
were both less than 10 µM and at least an order of magnitude lower than their toxicity to three
human cell lines. For one of these compounds, the 8-hydroxyquinoline clioquinol, a secondary
screen was implemented to test for synergy or antagonism with other commonly used antifungal
drugs. In addition to an investigation of mechanism of action, two C. auris isolates were grown
for an extended period in the presence of clioquinol to identify possible determinants of resistance
through whole genome sequencing and reintroduction and testing of mutants.
Results
The hydroxyquinolines broxyquinoline, chloroxine, and clioquinol inhibit C. auris growth at sub-
micromolar concentrations
A primary screen of 1990 compounds, consisting of clinically approved drugs, late stage
investigational compounds, and drug-like compounds, was performed using three strains of C.
auris that were selected based on their range of resistance to the three main classes of antifungal
agents and to represent the three clades most associated with invasive infections (Figure 5.1A).
Strain AR-387 (B8441 / MLY1543) originated in Pakistan, belongs to the South Asian Clade, and
is sensitive to fluconazole, caspofungin, and amphotericin B. Strain AR-386 (B11245 / MLY1542)
originated in Venezuela, belongs to the South American Clade, is sensitive to both caspofungin
and amphotericin B , and is resistant to fluconazole. Strain AR-384 (B11222 / MLY1540)
originated in South Africa, belongs to the African Clade, is sensitive to amphotericin B , and is
resistant to both fluconazole and caspofungin. Antifungal resistance to nine commonly used
antifungal agents was verified for these three strains and these results are summarized in
Supplemental Table 1.

104
These three strains were screened for growth inhibition at two concentrations (1 µM and
10 µM) of drugs from a FDA-Approved Drug Library (Selleck Chemical, 1591 compounds) and
the Pandemic Drug Library (Medicines for Malaria Venture, 399 compounds) (Figure 5.1A).
Compounds with a B-score greater than 0.1 and greater than 50 percent inhibition (OD600) were
considered hits (Figure 5.1B). Of the 89 compounds that met both of these criteria, 59 did not have
known antifungal activity and 61 were not topical formulations (Figure 5.1B). The 89 hits include
10 established standard of care compounds, 48 compounds active against only two C. auris strains,
and 32 compounds active against all three C. auris strains. A secondary screen was then performed
to confirm the antifungal activity observed in the primary screen and to estimate the IC50 for these
compounds (Figure 5.1C). All 89 compounds were screened at 8 concentrations ranging from 0.3
to 100 µM against the same three strains (AR-387, AR-386, and AR-384) (Figure 5.2A). Based on
the results of this secondary screen, 11 non-topical compounds were selected that did not belong
to the three main known classes of antifungal drugs and that had estimated IC50s less than 10 µM.
Three additional drugs (sirolimus, everolimus, temsirolimus) that met these criteria were not
selected for further investigation because of their known immunosuppressive activity.
An optimal drug candidate would have antifungal activity against a wide range of C. auris
isolates at concentrations that are not toxic to human cells. To determine if any of the 11 non-
topical hits fulfilled both of these criteria, IC50s were determined for 16 Candida strains, including
13 C. auris strains, covering all five clades, and one strain each of Candida albicans, Candida
glabrata, and Candida dubliniensis. The IC50s of these 11 compounds were also determined for
three common human cell lines, HEK293 (kidney), HEPG2 (liver) and HFF1 (fibroblast) (Figure
5.1C). Of the 11 compounds, five had IC50s that were at least 10-fold less than their lowest IC50
for human cells, suggesting the possibility of a wider therapeutic window (Figure 5.2B). These

105
five compounds included three hydroxyquinolines, broxyquinoline, chloroxine, and clioquinol,
and two anti-protozoals, miltefosine and triclabendazole (Figure 5.2B). Unlike many of the
traditional antifungal agents, there was minimal variation in the IC50s observed for miltefosine,
broxyquinoline, chloroxine, and clioquinol across all 13 C. auris strains tested (Figure 5.2B).
These results are broadly consistent with previous repurposing screens, which have reported
effectiveness by miltefosine [45], several different hydroxyquinolines including chloroxine, and
clioquinol [44–46,48,49], as well as Pentamidine (one of the six compounds that performed poorly
in the human cell toxicity tests) [43,45].
C. auris develops only moderate resistance to clioquinol despite extended exposure
C. auris has repeatedly demonstrated a propensity for rapid acquisition of resistance when
exposed to antifungal drugs. Indeed, experimental evolution has produced 30- to more than 500-
fold increases in resistance to fluconazole or caspofungin in as few as two or three 48-hour
passages [50–52]. To evaluate the ability of C. auris to develop resistance to clioquinol, and to
assess the resulting determinants of resistance, two independent cultures each for two C. auris
isolates (AR-384 and AR-390, another South Asian Clade I strain with greater resistance to
fluconazole and amphotericin B than AR-387) were serially passaged 30 times (roughly 150-200
generations) in the presence of increasing concentrations of clioquinol, ranging from 0.4-0.75 µM
at the start to 2-8-4.4 µM at the end (Figure 5.1C). One of the two AR-390 cultures is not discussed
further due to cross contamination that developed early in the experiment. By the end of the drug
selection, the clioquinol IC50 increased 2.4- and 5.2- fold relative to parental strains (from 0.75 µM
to 1.80µM and from 0.29 µM to 1.48µM) in the AR-384 and AR-390 backgrounds, respectively
(Figures 5.3A, 5.3B). These IC50 increases occurred over multiple steps, had some variation in the

106
rate of resistance evolution, and plateaued around passage 16 for each parallel strain (Figure 5.3A).
Notably, the degree of resistance arising from more than two months of exposure to clioquinol was
less than has been observed for fluconazole or caspofungin over shorter time frames. Furthermore,
the clioquinol-evolved strains remained sensitive to clioquinol concentrations at least 5-fold below
the minimal toxic concentrations observed for human cells.
C. auris mutated Cap1 and Cdr1 in response to extended clioquinol exposure
The resistance of the evolved strains persisted even though these strains were regrown for
several days in the absence of clioquinol before evaluating sensitivity, suggesting that resistance
was linked to one or more genome mutations rather than a short-term transcriptional response to
clioquinol. To test this hypothesis and determine the determinant(s) of clioquinol resistance, whole
genome sequencing was performed on two single colony isolates from the endpoint of the
resistance assay for each culture as well as on populations harvested from selected intermediate
points. We observed premature termination mutations in the c-terminal end of the transcriptional
regulator Cap1 (B9J08_005344 / CJI97_005427) by the eighth passage in all three cultures (16
days growth or approximately 35 to 40 generations) (Figure 5.3A). Each mutation was distinct
(E398* in AR-390; either E441* or a 8-bp deletion resulting in T387* in AR-384) and were in 76
to 98% of the population sample reads at passage eight. The same Cap1 mutations were in 96 to
98% of population sample reads and in all six single cell samples at the endpoint of the experiment.
No Cap1 mutations were observed in the DMSO treated control samples.
Sometime after the eighth passage (by passage 12 in AR-390 and between passages 8 and
31 in AR-384) distinct mutations arose in the ATP-binding cassette (ABC) drug transporter Cdr1
(B9J08_000164 / CJI97_000167), in several cases in or before the N-terminal six transmembrane

107
region (E722* and V704L in AR-390; K909N or Q415* in one AR-384 culture, and Q548* or a
8bp deletion whose resulting frame shift affected 34 different amino acids at aa343-376 before a
premature stop codon at aa377 in the other AR-384 culture) (Figure 5.3A). These Cdr1 mutations
were not as penetrant as the Cap1 mutations, comprising between 25 and 97% of reads in
population samples and being observed in only four of the six single cell endpoint samples. No
Cdr1 mutations arose in the DMSO treated control samples. We note that the apparent selective
pressure to inactivate the Cdr1 drug pump suggests that hydroxyquinolines function against C.
auris, at least in part, at the cell surface or inside the cell rather than just by chelating iron, copper,
or zinc from the media; consistent with a previous report that hydroxyquinolines sequester metals
in S. cerevisiae’s plasmid membrane [53]. We also note that, in addition to export of antifungal
drugs, Cdr1 has been linked to the export of anti-cancer drugs, steroids, and fluorescent dyes as
well as being involved in the translocation of phosphoglycerides from the internal to the external
plasma membrane [54,55] and, as such, the hydroxyquinolines could be affecting a wide range of
Cdr1-associated functions instead of or in addition to exporting drugs from the cell.
To determine whether the Cap1 or Cdr1 mutations were indeed casual for increased
clioquinol resistance, the Cap1 E398* or the Cdr1 E722* mutations were introduced by Cas9 gene
editing into the parental AR-390 or AR-387 strain backgrounds. The Cap1 E398* mutation caused
a increase in resistance of 1.7 to 1.8-fold to clioquinol in both backgrounds (Figure 5.3B). No
significant difference in clioquinol IC50 was observed between evolved and CRISPR engineered
Cap1* mutants in the AR-390 background, indicating a strong recapitulation of the resistance
phenotype by the engineered strain. Introduction of the Cdr1 E722* mutation did not significantly
affect clioquinol resistance in AR-387 (nor did deletion of Cdr1) but did increase resistance 1.9-
fold in AR-390 (Figure 5.3B). Thus, the Cap1 truncation can explain much of the clioquinol

108
resistance to that arose during the experimental evolution and the subsequent Cdr1 mutation might
explain the smaller resistance increases observed later in the experiment.
Cap1 truncation results in increased Mdr1 expression
In C. albicans, Cap1 promotes expression of the major facilitator superfamily (MFS) drug
transporter Mdr1 and it has been reported that C-terminal truncations of Cap1 like we observed
cause a hyperactive phenotype which up-regulates Mdr1 expression and increases fluconazole
resistance [56–59]. Expression of Cdr1 in both C. albicans and C. auris, on the other hand, is
regulated by the transcriptional regulator Tac1/Tac1b [50,60,61]. In order to determine whether
the Cap1 mutants we observed affected Mdr1 expression and whether Cdr1 expression was
changing in the evolved strains, we used RT-qPCR to determine Cdr1, Cdr2, and Mdr1 transcript
levels. In the AR-384 background, Mdr1 expression was up-regulated more than 50-fold by
passage 8 and remained at this level at the end of the experiment (Figure 5.3C). In the AR-390
background, where expression started roughly 30-fold lower than AR-384, Mdr1 expression was
up-regulated nearly 300-fold by passage 8 and over 1500-fold by the final selection passage,
reaching a similar level to the evolved AR-384 strains (Figure 5.3C). In contrast to Mdr1,
expression of Cdr1 and Cdr2 changed minimally during the course of the selection experiment
(1.7-fold down and 1.1-fold up in AR-384, 1.4-fold down and 7-fold down in AR-390,
respectively) (Figure 5.3C). We note that we profiled transcript levels in the cells in the absence
of clioquinol, as such these reflect changes in the basal rather than drug induced expression of the
pumps.
Transcript levels were then assessed in the mutant stains constructed in the AR-387 and
AR-390 strain backgrounds, again in the absence of clioquinol. Consistent with the results for the

109
evolved strains, the introduction of the Cap1 E398* mutation resulted in minimal expression
change for either Cdr1 or Cdr2, but significant 150- and 390-fold increases in Mdr1 expression in
the AR-387 and AR-390 strain backgrounds, respectively (Figure 5.3C). Truncation of the Cdr1
gene resulted in moderate reductions in Cdr1 expression in both backgrounds (9-fold and 3-fold
down in AR-387 and AR-390, respectively), negligible changes to Cdr2 expression, and slight
increases in Mdr1 expression (1.7- and 3-fold up in AR-387 and AR-390, respectively) (Figure
5.3C).
Extended clioquinol exposure has modest effects on resistance to traditional antifungal agents
The rise of Cap1 mutations in response to exposure to clioquinol could plausibly affect
resistance to existing antifungal agents. Conversely, given the correlation between Cdr1 expression
and azole resistance as well as reports that drugs inhibiting Cdr1 increase azole sensitivity [47,62–
66], the Cdr1 mutations suggest that long term exposure to clioquinol could result in increased
sensitivity to existing antifungal agents. In order to determine how long term exposure to
clioquinol affected sensitivity to other drugs, the sensitivity of the evolved strains was measured
with respect to a second hydroxyquinoline, broxyquinoline, as well as to the traditional antifungal
agents voriconazole, posaconazole, micafungin, and amphotericin B. As expected, clioquinol
resistance was associated with modest resistance to the structurally similar Broxyquinoline (Figure
5.3D). Clioquinol resistance had only subtle, if any, effect on resistance to amphotericin B and
modestly increased susceptibility to micafungin (Figure 5.3D). Interestingly, although clioquinol
resistance was associated in a subtle increase in resistance to voriconazole, we found that the
evolved strain with truncated Cdr1 was in fact more sensitive to posaconazole (Figure 5.3D). These
findings were recapitulated using the engineered strains with the Cap1 E398* truncation (Suppl.

110
Table 4) (Figure 5.3D). These results suggest that mutations resulting long term exposure to
clioquinol will not necessarily result in increased resistance to commonly lused antifungal agents.
Dihalogenated hydroxyquinolines inhibit C. auris via chelation of divalent metal ions.
Three hydroxyquinolines were identified with sub-micromolar antifungal activity against
C. auris. To evaluate the structure-activity relationship (SAR) of quinolines, the activity of 32
quinoline derivatives (31 compounds plus clioquinol) was tested against three strains of C. auris
(AR-387, AR-384, AR-386) (Figure 5.1C). Seventeen of the compounds tested showed activity
against C. auris. All active compounds except for one [1,10-Phenanthroline monohydrate] were
hydroxyquinolines, which have a hydroxide at C8 position (Figure 5.4A). Five compounds had an
IC50 less than 1µM; all five of these compounds were dihalogenated at the C5 and C7 positions;
these results suggest that dihalogenated hydroxyquinolines are effective inhibitors of C. auris at
nanomolar concentrations. Compounds with single halogen or other chemical groups at either the
5- or 7-positions generally had an IC50 in the 2 to 20 µM range while a further 15 compounds
without an 8-position hydroxy group lacked activity against C. auris. (Figure 5.4A, Supplementary
Table 2). We note that these trends are largely consistent with those previously reported for
halogenated hydroxyquinoline activity against several fungal species (none of which were
Candida) [67–69].
Previous studies (including transcriptional profiling, enzyme activity assays, and cellular
metal abundance quantification by inductively coupled plasma mass spectrometry) have
demonstrated that Saccharomyces cerevisiae cells treated with clioquinol behave as if they are
starved for iron, copper, and zinc. These metals are sequestered in the plasmid membrane and
depleted in the cytosol of S. cerevisiae cells exposed to clioquinol [53,70,71]. To investigate this

111
effect with respect to C. auris and clioquinol, drug treated cells were grown in the presence of iron,
copper, or zinc (Figure 5.1C). The addition of iron (either Fe2+ or Fe3+) or, to a lesser extent, copper
to clioquinol-treated media abrogated the inhibitory effects of the drug and restored growth
(Figures 5.4B, 4C). Increasing concentrations of Cu2+, Fe2+, or Fe3+ strongly correlate with
increased clioquinol IC50, indicating that metal-mediated rescue of C. auris viability is
concentration dependent (Figure 5.4C). Increasing concentrations of Zn2+, on the other hand, had
no effect on clioquinol IC50 (Figure 5.4C). Addition of iron or copper also restored growth in the
presence of several other 8-hydroxyquinolines, suggesting that this family of compounds all inhibit
C. auris by the same mechanism (Figures 5.4B, 5.4C). These effects were agnostic to the order of
addition, either introducing iron to C. auris cells that had been pretreated for clioquinol for 21
hours or introducing metals to clioquinol-treated media prior to C. auris inoculation permitted
growth (Figures 5.4B). While the exact mechanism by which the hydroxyquinolines inhibit C.
auris growth remains to be determined, these experiments suggest that the inhibitory effects arise
from either metal chelation or metal sequestration in the fungal plasma membrane, analogous to
what has been observed in S. cerevisiae [53].
Clioquinol is fungistatic to C. auris
Previous reports have reached different conclusions as to whether clioquinol is fungistatic
or fungicidal against Saccharomycotina species like S. cerevisiae or C. albicans [72,73]. The metal
supplementation assay results, where addition of iron restored growth by cells exposed to
clioquinol for 21 hours (Figure S1), could be consistent with either (1) clioquinol having a
fungistatic effect on C. auris or (2) clioquinol killing only a subset of the cells present with the
surviving (possibly resistant) cells growing once the metal was added. Both of these possibilities

112
are also consistent with the observation that clioquinol-treated C. auris cell growth resumed after
washing with PBS and subsequent inoculation into fresh media or when clioquinol-treated C. auris
cells were diluted into fresh media (without washing). To distinguish between these two
possibilities, live/dead staining assays were performed with C. auris cells that were treated with
clioquinol for either 2 or 22 hours. After either incubation period, the population of Clioquinol-
treated C. auris cells resembled the live DMSO-treated cells rather than the isopropanol-killed
cells, consistent with a fungistatic effect (Figure S2). Furthermore, the viability of 22 hour
clioquinol-treated C. auris cells, as quantified by plating assays, changed little relative to DMSO-
treated controls (Figure S2). As such, we conclude that clioquinol is fungistatic, rather than
fungicidal, to C. auris (at least in the context of the 22 hour time frame examined in these assays).
Clioquinol does not interact synergistically or antagonistically with members of the three main
classes of antifungal drugs
Several reports have linked increased azole and echinocandin sensitivity of Candida
species, including C. auris, to the availability of or ability to use metals like iron or copper [74–
81]. To assess the potential for clioquinol to have sensitizing effects in the context of multidrug
combinations, four C. auris isolates were grown in the presence of amphotericin B, micafungin,
or posaconazole, together with clioquinol.
Discussion
C. auris represents a growing threat to hospitalized patients due to its robust resistance to
one or more of the three major classes of antifungal drugs, the propensity for sensitive C. auris
strains to rapidly develop resistance, and its ability to spread and resist decontamination in health

113
care settings. We screened 1990 compounds for the potential to be repurposed as antifungals
targeting C. auris. Among the most promising hits from this screen were the dihalogenated
hydroxyquinolines broxyquinoline, chloroxine, and clioquinol.
The hydroxyquinolines, five of which had IC50s less than 1 µM and several more of which
had IC50s less than 10 µM, are especially interesting candidates for repurposing for several reasons.
First, we observed little variation in the IC50s of individual hydroxyquinolines across the clinical
isolates tested (which included representatives of all five known clades), suggesting it is less likely
that any of the known C. auris clades contain strains already resistant to hydroxyquinolines.
Second, although the dihalogenated hydroxyquinolines were the most efficient hydroxyquinolines
in our SAR screen, a wide range of chemical space in this family remain to be explored (e.g.
different side groups at C2, replacing a halogen at either C5 or C7 with another active group).
Third, several hydroxyquinolines have (or have had) both topical and oral forms (both forms for
chloroxine and clioquinol, only an oral form for broxyquinoline) suggesting that
hydroxyquinolines might be effective against both internal and skin-based infections. Finally, the
hydroxyquinolines are of interest due to the limited degree to which C. auris developed resistance
despite long term exposure. The roughly 2- to 5-fold increases observed in our experiments remain
well below the minimum toxicities overserved with human cells and are significantly less than the
30- to 500- fold increases reported for fluconazole or caspofungin experiments [50–52].
Furthermore, the rise of hydroxyquinoline resistance translated to only modest, if any, increases
in resistance and in several cases to increased sensitivity to known antifungal agents. Given the
repeated correlations observed between Cdr1 expression and resistance to azoles as well as
previous studies suggesting that Cdr1 inhibitors increase sensitivity to azoles [47,62–65], the
increased posaconazole sensitivity of the evolved Cdr1 truncation strains is unsurprising. The

114
possibility that a combination treatment involving a hydroxyquinoline and posaconazole might
leave C. auris trapped between increasing Cdr1 expression to resist posaconazole, becoming more
sensitive to the hydroxyquinoline, or decreasing Cdr1 expression to resist the hydroxyquinoline,
becoming more sensitive to posaconazole, merits further examination, and, if promising in vitro,
eventual testing in an animal model. Likewise, it would be prudent to conduct experimental
evolution of C. auris exposed to clioquinol (or another hydroxyquinoline) in combination with a
known antifungal agent (e.g. posaconazole) to make sure the combination does not inadvertently
increase resistance to the known agent(s).
When considering repurposing the hydroxyquinolines as a treatment for C. auris, it is
important to note that the oral version of clioquinol was withdrawn from usage as an anti-parasitic
in the early 1970s following a report associating it with an outbreak of sub-acute myelo-optic
neuropathy (SMON) in Japan [82–84]. Since that time, however, the data in the report linking
SMON and Clioquinol has been questioned [85] and it has been noted that similar associations did
not occur in countries with higher clioquinol usage at the time [86]. As such, there has been recent
interest in using clioquinol to treat both Alzheimers Disease and cancer [82,83]. Although there
might not be a strong link between Clioquinol and neurotoxicity, animal studies to validate
clioquinol’s effectiveness in an in vivo context would be warranted before moving to efficacy
testing in humans (at least for internal usage).

115
Methods
Drug Libraries
Compounds for primary screening were from the Selleck FDA-Approved Drug Library
(Selleck Chemical, 1591 compounds) and the Pandemic Drug Library (Medicines for Malaria
Venture, 399 compounds).
Media
Cells were allowed to recover from glycerol stocks for at least two days at 30°C on yeast
extract peptone dextrose (YEPD) plates (2% BactoTM peptone, 2% dextrose, 1% yeast extract, 2%
Agar). Unless otherwise noted, overnight cultures for assays, recovery dilutions, and assays were
performed in RPMI-1640 media (containing L-glutamine and lacking sodium bicarbonate, MP
Biomedicals #0910601) supplemented with 34.5g/L MOPS (Sigma, M3183) and adjusted to pH
7.0 with Sodium Hydroxide before sterilizing with a 0.22 µm filter.
Strains
A full list of strains used in this study can be found in (DETAILS). Twelve of the thirteen
C. auris isolates used in this study were acquired from the Centers for Disease Control and
Prevention’s Antibiotic Resistance Isolate Bank Candida auris panel
(https://wwwn.cdc.gov/ARIsolateBank/Panel/PanelDetail?ID=2). The remaining C. auris isolate
was a previously reported isolate from a patient at UCSF, in short this strain is a member of the
South Asian clade that has some resistance to fluconazole (MIC 32 µg/mL) and was provided by
the UCSF Clinical Laboratories at China Basin [87]. For C. albicans (SC5314), Candida
dubliniensis (CD36), and Candida glabrata, we used the sequenced strains SC5314, CD36, and

116
CBS138/ATCC 2001, respectively. SC5314 was isolated from a patient with disseminated
candidiasis prior to 1968 [88–91], CD36 was isolated from the mouth of an Irish HIV patient
between 1988 and 1994 [92], and CBS138 is listed as coming form a Fecal Sample
(https://www.atcc.org/products/all/2001.aspx#history). Unless otherwise noted, assays used the
same three C. auris isolates (AR-384/MLY1540, Clade III; AR-386/MLY1542, Clade IV; AR-
387/MLY1543, Clade I) to ensure representation of the three clades most associated with serious
infections as well as wide distribution of sensitivities to fluconazole and caspofungin. A fourth
isolate, AR-390/MLY1546 from Clade I, was included in the synergy experiments and as the
second strain, in addition to AR-384/MLY1540, in the experimental evolution experiment.
A full list of oligonucleotides and plasmids used in the construction of strains can be found
in (Table S5). Strain construction took place in the AR-387 and AR-390 C. auris strain
backgrounds following previously described methods using the hygromycin B resistance
selectable marker [93]. The gRNA was designed using the gRNA selection tool in Benchling with
the following parameters: “Single guide”, “Guide Length” of 20, “PAM” of NGG. When deleting
genes, a 23bp ADDTAG was inserted at the location of the gene to aid further modifications, if
necessary. The gRNA fragments were amplified from pCE41 while the Cas9 construct was
prepared by digesting pCE38 with the restriction enzyme MssI. Transformations used a lithium
acetate competence / heat shock-based protocol with a 4 hour recovery before plating on
YPD+HYG600. Potentially successful transformations were verified by Colony PCR, after which
candidates were plated for 48 to 72 hours on SC -Leu plates to select for restoration of the Leu2
reading frame and removal of the hygromycin B marker associated with the Cas9 components. In
order to confirm the presence of desired mutations after the LEUpOUT step, DNA for sequencing
was extracted using a Quick-DNA Fungal/Bacterial Miniprep Kit (Zymo Research D6005)

117
coupled with a Mini-BeadBeater 16 (Biospec Products); bead beating consisted of two 4 minute
cycles separated by a five minute incubation on ice.
Antifungal Susceptibility Testing
Antifungal susceptibility testing assays were performed according to the 4th edition CLSI
M27 protocol [94] with the following modifications. Overnight cultures (3 mL, in test tubes) were
started in RPMI-1640 media on a roller drum at 30°C from two to three day old colonies grown
on YPD Agar Plates. The following morning, the OD600 of the overnight cultures was determined,
cultures were diluted back to OD600 = 0.25 in fresh RPMI-1640, and the diluted cultures were
allowed to recover at 30°C for at least three hours. After the recovery growth step, the OD600 of
the recovery cultures was determined and the cells were diluted to an OD600 = 0.00357 in fresh
RPMI-1640. Adding of 21 µL of the OD600 = 0.00357 resuspension to 54 µL of media/drug mixture
in each well resulted in a starting density of OD600 = 0.001 or approximately 1 x 10⁴ cells / mL.
54 µL of media was dispensed into wells (in two 27 µL steps) using a BioMek FX
(Beckman-Coulter). Drugs, DMSO loading controls, and other compounds (e.g. metals) were then
dispensed into the medis using a Labcyte Echo 525 . The 21 µL of cell solution was then added to
the 54 µL of media/drug mixture using a BioMek FX. Assays were performed in transparent,
sterile, flat-bottomed, non-tissue culture treated 384-well microtiter plates (Thermo 242765 or
242757) that were sealed with Breathe-Easy® sealing membranes (Diversified Biotech, BEM-1)
immediately following innoculation. Plates were then incubated at 35°C in a humidified incubator
(with 0.1% CO2) for 24 hours. After the 24 hour incubation, the absorbance (OD600) was
determined on a prewarmed (35°C) Tecan Spark10M, taking one read per well. In all experiments,
the percent inhibition was determined by first subtracting the background OD600 (culture wells

118
filled with media only) from the test well OD600, and then normalizing to the average OD600 of
untreated (vehicle only) control wells cultured side-by-side with the test wells. The percent
inhibition was then calculated using the following equation: % inhibition = 100*(1-(test well OD
- background OD)/(untreated control OD – background OD)).
Primary Screening
Initial screening was conducted with the three primary C. auris strains. All 1990 screening
compounds were evaluated for in vitro efficacy at concentrations of 1 and 10 µM. For each of the
strains, a single well was evaluated for each compound at each concentration. The efficacy of each
compound was determined by comparison to the average of untreated control wells on the same
culture plate as the tested compounds. Compounds with greater than 50% inhibition of C. auris
growth for at least two of the three tested strains were selected as hits for further evaluation (89
compounds total).
Secondary drug screening and IC50 determinations
The activity of 89 primary hit compounds was validated against the three primary C. auris
strains with dose-response growth inhibition experiments. Drugs were dispensed into test wells
using the Labcyte Echo 525 liquid handler to generate 8-point concentration ranges from 0.3 to
100 µM. All drugs were resuspended in DMSO and compared to appropriate vehicle-only controls.
Dose-response experiments were performed with two biological replicates, each consisting of two
technical replicates. Half maximal inhibitory concentrations (IC50) were calculated from dose-
response curves generated in GraphPad Prism 7 using four parameter logistic regression.
Subsequent experiments determined the IC50 of the top 5 hit drugs as well as 4 standard of care
drugs against 13 different C. auris strains, as well as one strain each of C. albicans, C. glabrata,

119
and C. dubliniensis with 22-point dose-response ranges (0.05-2600 µM for fluconazole; 0.001-
133.3 µM for caspofungin, miltefosine and triclabendazole; 0.001-20 µM for posaconazole,
amphotericin B, chloroxine, broxyquinoline, and clioquinol) performed as described above with
three biological replicates, each consisting of two technical replicates.
Human cell toxicity measurements
The human cell lines Hep-G2 (liver), HEK-293 (kidney), and HFF-1 (fibroblast) were
cultured in Dulbecco’s modified Eagle’s medium (Gibco) containing 10% (vol/vol) fetal bovine
serum (Gibco), 2 mM l-glutamine, 100 U/mL penicillin/streptomycin (Gibco), and 10 mM HEPES
buffer. For toxicity experiments, all human cell lines were seeded into sterile, opaque 384-well
culture plates (Corning 3570) one day prior to drug addition. Drugs were added using the Labcyte
Echo 525 liquid handler to generate 22-point dose-response concentration ranges. Cells were
cultured in the presence of drug for 72 hours prior to addition of CellTiter-Glo 2.0 reagent
(Promega) and collection of luminescence values in relative luminescence units (RLU) using the
Promega GloMax plate reader. The percent viability of each treated culture was calculated using
the following equation: % inhibition = 100*(test well RLU)/(untreated control RLU). IC50 values
for each drug against human cell lines were calculated as described above. Toxicity experiments
were performed with three biological replicates, each consisting of two technical replicates.
Drug susceptibility in evolved and genetically engineered C. auris strains
C. auris strains selected for clioquinol resistance or engineered for specific mutations were
generated and cultured as described previously and the IC50 of clioquinol and other drugs was
determined as described above using 15-point dose-response ranges (0.1-20 µM for clioquinol;

120
3.3-1333 µM for fluconazole; 0.03-66.7 µM for broxyquinoline and amphotericin B; 0.003-13.3
µM for posaconazole, voriconazole, and micafungin). All strains were tested simultaneously for
direct comparison of drug effects and three biological replicates were performed, each consisting
of two technical replicates. Fold-changes in IC50 were calculated relative to the parental strains
from which each mutant strain was derived.
Structure activity relationship (SAR) assays
A group of 32 commercially available drugs or compounds that are structurally related to
clioquinol were selected for SAR experiments. All drugs were resuspended in DMSO and tested
for inhibition of the three primary C. auris strains with 15-point dose-response ranges from 0.01
to 150 µM. Experiments were performed and IC50 values were calculated as described above with
three biological replicates, each consisting of two technical replicates.
Metal supplementation experiments
Stock 10 mM metal solutions for supplementation experiments were prepared in sterile
water as follows: Ca2+ solution from Calcium chloride (Sigma C79-500); Mg2+ solution from
Magnesium sulfate (Sigma 246972); Fe2+ solution from Ferrous(II) sulfate (Sigma F8048); Fe3+
solution from Ferric(III) chloride (Sigma F-2877); Cu2+ solution from Copper(II) sulfate (Sigma
C7631); Mn2+ solution from Manganese sulfate (Sigma M-1144); Zn2+ solution from Zinc sulfate
(Sigma 96500). For metal supplementation experiments, C. auris was grown in RPMI media
depleted of divalent metal ions using Chelex 100 resin (Biorad) following the manufacturer’s
protocol. Drugs and metals were dispensed into culture wells using the Labcyte Echo 525 liquid
handler prior to addition of C. auris cells. Ethylenediaminetetraacetic acid (EDTA) and N,N,N′,N′-

121
tetrakis(2-pyridinylmethyl)-1,2-ethanediamine (TPEN) were used as control chelating agents for
comparison to antifungal drugs. The percent inhibition for each drug/metal condition was
calculated as described above. For calculation of clioquinol IC50 in the context of different metal
concentrations, 8-point dose-responses ranges from 0.01-10 µM. Experiments were performed
with three biological replicates, each consisting of two technical replicates.
Viability Determination by Live Dead Staining and Plating
Viability assays were performed using the AR-384 strain. Live/dead staining was
performed using the recommended protocol for Molecular Probes’ LIVE/DEAD® FungaLight™
Yeast Viability Kit (#L34952). Flow Cytometry for the live/dead assays was performed on a BD
Accuri C6 Plus that used a 488nm laser with a 533/30 bandpass filter. Samples were loaded from
96-well U-bottom plates (Falcon 351177), and normal acquisition was 10 µL of sample on the
slow setting. In brief, overnight cultures (3 mL, in test tubes) were started in RPMI-1640 media
on a roller drum at 30°C from two to three day old colonies grown on YPD Agar Plates. The
following morning, the OD600 of the overnight cultures was determined, cultures were diluted back
to OD600 = 0.7 in 8 mL fresh RPMI-1640, and the diluted cultures were allowed to recover at 30°C
for three hours. After three hours, clioquinol (5 µM) and DMSO controls were added to the cultures
which were then incubated for a further two hours on a roller drum at 30°C. A second set of cultures
was prepared using the same protocol the previous day in order to provide sets of cells that were
exposed to clioquinol or DMSO for 22 hours. As a positive control for cell death, an independent
culture was pelleted and resuspended in 70% isopropanol for one hour at room temperature
(roughly 20-22°C) with vortexing every 15 minutes. Samples were PBS washed, resuspended at
OD600 = 0.1 in multiple 1 mL PBS aliquots, and then either not stained (controls), stained with

122
either SYTO®9 or propidium iodide, or stained with both SYTO9 and propidium iodide. Cells
were incubated at room temperature for 15 minutes prior to analysis by Flow Cytometry, 20,000
cells were analyzed for each sample.
As an alternative method to evaluate clioquinol’s effect on C. auris viability, a plate based
assay was conducted in parallel. In brief, alquots were taken from the 22 hour clioquinol and
DMSO treated cultures as well as the 1 hour isopropanol treated cultures. Cells were PBS washed
and preliminary 10x stocks of normalized cell density were created based on OD600. The cell
density of each sample was then determined by flow cytometry; cell counts were based on the
number of cells detected in a 10 µL sample. 1x normalized cell density stocks where then created
based on these measurements. The exact cell density of these 1x stocks was then determined by
flow cytometry of 10 µL of each solution. Next, both high density (1:20 dilution) and low density
(1:200 dilution) stocks were made from the 1x stock and plated (50 µL of high density, 60 µL of
low density) on YEPD plates at 30°C. Three low density and two high density plates were used
for clioquinol and DMSO samples; two low and one high density plate were used for isopropanol
samples. After two days, colony numbers were determined using a Protos 3 (Synbiosis) automated
colony counter. The input cell density (cells / µL) and detectable colonies (CFU) were both
normalized to their respective DMSO treated samples and normalized viability (relative to the
DMSO treated samples) was determined by dividing the normalized CFU for each sample by the
normalized input cell density.
Iron Supplementation Recovery Assay
Iron supplementation recovery assays were performed on the AR-384 strain and flow
cytometry for the iron supplementation recovery assays was performed on the previously described

123
BD Accuri C6 Plus. Overnight cultures (3 mL, in test tubes) were started in RPMI-1640 media on
a roller drum at 30°C from two to three day old colonies grown on YPD Agar Plates. The following
morning, the OD600 of the overnight cultures was determined, cultures were diluted back to OD600
= 0.5 in fresh RPMI-1640, and the diluted cultures were allowed to recover at 30°C for three hours
at which point 4 µM clioquinol was added to the cultures. Cultures were then incubated a further
21 hours on a roller drum at 30°C. After the 21 hour incubation, two 1 mL aliquots were pulled
from each clioquinol treated sample and either iron (2µM each of iron (II) sulfate and iron (III)
chloride) or water (equivalent volumes to the iron solutions) was added. The remaining volume of
the clioquinol treated samples were pelleted by centrifugation, washed once in PBS, resuspended
in PBS, diluted to an OD600 = 1.0 in PBS, and then diluted 1:10 in fresh RPMI for a final OD600 =
0.1. Four clioquinol samples were processed in this way. Iron (2 µM each of iron (II) sulfate and
iron (III) chloride) and water (equivalent volumes to the iron solutions, used as a loading control)
were then added to samples. The density of each culture was then determined by flow cytometry
and the strains were incubated on a roller drum at 30°C for 25 hours. At each subsequent time
point the cultures were vortexed after whch samples were removed and diluted with D-PBS. The
cell density of each sample was then determined by flow cytometry; cell counts were based on the
number of cells detected in a 10 µL sample.
Liquid Resistance Assay
Two overnights each of AR-384 and AR-390 were started from independent single
colonies, the following morning the overnight cultures were diluted back to OD600 = 0.05 in fresh
media and allowed to recover for three hours. At this point, clioquinol was added to the cultures
at 0.75 µM (AR-384) or 0.4 µM (AR-390) and were incubated for two days on a roller drum at

124
30°C. Samples were then diluted back to approximately OD600= 0.01 in the presence of fresh
media and drug. The four independent cultures were passaged a further 30 times in this manner
with passages occurring every three, rather than every two, days after passage 20 (we note that
samples were frozen down after passage 20, passage 21 was started from single colonies on plates
made from these frozen stocks). Clioquinol concentrations were slowly increased during the course
of the experiment in response to increased growth by strains, see File S# for the clioquinol
concentration present and estimates of the number of generations for each passage. In parallel to
this experiment, eighteen passages were made of two independent control cultures for each strain
where equivalent volumes of DMSO were added at each passage.
qRT-PCR methods
Three independent overnights for each strain were started from independent single colonies
on roller drum at 30°C, the following morning the overnight cultures were diluted back to OD600
= 0.35 in 5 mL fresh media and allowed to recover for six hours. We note that clioquinol was not
present in the overnight or recovery cultures and as such these samples reflect the basal, as opposed
to clioquinol-induced, expression levels. Cultures were then spun down, decanted, and the pellets
flash frozen with liquid nitrogen before storage at -80°C. Pellets were thawed and RNA was
extracted using the MasterPure Yeast RNA Purification Kit (Lucigen MPY03100) followed by
DNase treatment with the DNase TURBO DNA-free kit (Invitrogen AM1907). RNA was diluted
1:50 for RT-qPCR which was conducted using the Luna Universal One-Step RT-qPCR kit (New
England Biolabs E3005E) on a C1000 touch thermal Cycler / CFX384 Real-Time System
(Biorad). Reactions were performed in Hard-Shell PCR Plates (384-well, thin-wall, Biorad
HSP3805) sealed with Microseal B Adhesive Sealers (Biorad MSB-1001). Two independent

125
oligonucleotide sets each were used for Cdr1, Cdr2, and Mdr1; one of the Cdr1 oligonucleotide
sets was located downstream of the E772* mutation. One oligonucleotide set each was used for
the control genes Ubc4 and Act1. Two technical replicates were performed for each
oligonucleotide set for each biological replicate. The Cq values for the two technical replicates
were averaged for each set, after which the averaged Cq values for the Ubc4 and Act1 sets for each
biological replicate were then averaged. The ΔCt was then determined for each primer set versus
the averaged Ubc4/Act1 Cq, after which the ΔΔCt was calculated versus the parental strain and
the fold change determined by taking 2^(- ΔΔCt). The average was then calculated for the two
probe sets for each gene within each biological replicate, after which the average and standard
deviation were calculated for each gene across the three biological replicates.
DNA Sequencing
For endpoint samples of the evolved strains, two cultures were inoculated from
independent single colonies (single colony samples) and a third culture was started from the dense
portion of the streak on the plate (population samples). For samples from intermediate time points
for the evolved strains, single cultures was started from the dense portion of the streak on the plate
(population samples). A single culture was inoculated from an independent colonies for the
parental strains. One culture was inoculated from an independent coloniy (single colony samples)
and a second culture was started from the dense portion of the streak on the plate (population
samples) for the DMSO control cultures. Cultures for whole genome DNA sequencing were grown
in 8 mL media overnight on a roller drum at 30°C. Prior to harvesting the following morning, a
sample was pulled to freeze as a glycerol stock for future use. 6.2 mL of each culture was spun
down, decanted, flash frozen in liquid nitrogen, and stored at -80°C.

126
DNA was extracted using the Quick-DNA Fungal/Bacterial Miniprep Kit (Zymo Research
D6005) with two 5 minute cycles on a TissueLyser II (Qiagen) separated by a 5 minute incubation
on ice; final elution was in 60 µL water and concentrations were determined on a Nanodrop 2000c
(Thermo Scientific). The DNA was diluted to 100 µL at a concentration of 10 ng / µL and then
sheared using a Biorupter® Pico (diagenode) with 13 cycles of 30 s on followed by 30 s off and
quantified using an Agilent D1000 ScreenTape (Agilent Technologies); DNA fragment size after
this step averaged 240 bp.
Library preparation was performed using the NEBNext Ultra™ DNA Library Prep Kit for
Illumina (E7370), using the 200bp recommended bead volumes for step 3, 5 PCR cycles for step
4, and eluting in water for step 5. See Table S5 for a list of the i7_index_RC and i5_index_RC
oligonucleotides used for each sample. Eluted libraries for sequencing were then quantified via
Qubit, pooled, the pooled mixture quantified via Qubit, and then the pooled libraries were
quantified using an Agilent High Sensitivity D1000 ScreenTape (Agilent Technologies); DNA
fragment size after this step averaged 360 bp.
Sequences were aligned to the reference genomes using Bowtie2 with default settings. AR-
390 based strains were aligned to B8441 chromosome fasta and GFF features files from the
Candida Genome Database (version s01-m01-r-17, dating from 8/8/2021, downloaded on
9/10/2021). AR-384 based strains were aligned to B11221 chromosome fasta and GFF features
files from the Candida Genome Database (no version information, dating from 12/17/2019,
downloaded on 9/10/2021). Aligned reads were then filtered using Samtools to remove reads with
a Cigar Value of “*”. Mutations in genes were identified using Minority Report [95] in Python 2
with the parental AR-384 and AR-390 sequencing reads used as the basis for comparison, the
analyze Copy Number Variants (CNV) feature enabled, and the codon table changed to reflect the

127
use of “CTG” as Serine rather than Leucine. For single colony samples, the default settings were
used; these settings identified mutations that were present in at least 90 percent of the population.
For population samples, copy number variation (CNV) analysis was conducted and the following
settings were used: “vp” (minimum_variant_proportion) of 0.1, “wp”
(maximum_variant_proportion) of 0.04, “vc” (minimum_variant_counts) of 10, and “wc”
(maximum_wildtype_variant_counts) of 50. In other words, a mutation or variant must be present
in at least 10 percent of experimental sample reads with a minimum requirement for 10 reads and
must be present at no more than four percent of parental sequencing reads with a maximum limit
of 50 reads.

128
Figure 5.1. A screen of 1990 clinically approved and investigational compounds for in vitro inhibition of C. auris identified 89 candidates for further evaluation. (A) Workflow for the primary screening of 1990 clinically approved and investigational compounds for in vitro inhibition of three C. auris strains; compounds were screened at both 1 µM and 10 µM. (B) The percent inhibition relative to untreated controls for each compound at 10 µM. For each compound, the lowest percent inhibition achieved against any of the three screened C. auris strains is plotted on the x-axis and the average percent inhibition against the other two strains is plotted on the y-axis. Compounds in the upper left quadrant effectively inhibited two of the three C. auris strains; compounds in the upper right quadrant effectively inhibited all three strains. (C) The secondary screening pipeline for the 89 hit compounds which inhibitied at least two of the three C. auris strains by at least 50 percent. Selectivity screening for inhibition of additional C. auris strains and lack of toxicity to human cells yielded 5 highly selective candidates (Figure 5.2). Selection for resistance to the lead compound, clioquinol, resulted in 2- to 5-fold increases in IC50 values after serial passage for 100-200 generations in the presence of clioquinol (Figure 5.3). Structural analogs of clioquinol with potential metal binding activity maintain inhibition of C. auris which can be abrogated by supplementation of iron or copper (Figure 5.4).
5 high selectivityCandida inhibition belowcytotoxic concentrations
16 validated hits11 novel activity5 standard of care
11 low selectivityInhibition of 1 or moreCandida strains abovecytotoxic concentration
Clioquinol(+2 other 8-hydroxyquinolines:broxyquinoline and chloroxine)
Clioquinol2-6-fold IC50 increase in 180generations of selection
31 structural analogs8-hydroxyquinolines
with varying functional groups
7 supplemented metal ionsTested for rescue of C. auris
growth in presence of clioquinol
13 active analogsMetal binding strength correlateswith C. auris inhibition potency
Iron and copper supplementationrescue C. auris growthin presence of clioquinol
MiltefosinePreviously identified
activity against C. auris
TriclabendazoleAntihelminthic
Triclabendazole30-50-fold IC50 increase
in 40 generations
16 Candida strains13 C. auris strains, C. glabrata,C. albicans, C. dublinensis
3 human cell linesHep-G2 (liver)
HEK293T (kidney)HFF-1 (fibroblast)
Cytotoxicity Potency range
Serial passaging inpresence of drug
Structure-activity relationship
Metal supplementation assay
Selectivity
determ
ination
Hit
clas
sific
ation
Res
istanc
eprofi
ling
Mec
hanism
inve
stigation
3 C. auris strains1540 1542 1543
90 hit compoundsActive in primary screen
74Low potency in one ormore C. auris strains
Dose response validation
Seco
ndary
screen
32 >50% inhibition of all 3 C. auris strains
>50% average inhibition of 2 C. auris strains48
Standard of care antifungal10
90 hit compounds
1990 compoundsScreening library
1591 clinically approved399 investigational
1µM and 10µM
1900 ineffectiveNo C. auris
inhibition or highHep-G2 toxicity
Growth inhibition assay
Prim
arysc
reen
C. auris strain 1543 1540 1542Clade 1 3 4
Fluconazole MIC (µM) 8 128 >256
Caspofungin MIC (µM) 0.25 16 0.5
Amphotericin B MIC (µM) 0.75 0.5 0.5
Standard ofcare antifungal
<50% Hep-G2toxicity at 10µM
>50% inhibition at 1µM
Vehicle only(DMSO or water)
Lead compound:Clioquinol
-50 0 50 100
-50
0
50
100
Percent inhibition of least susceptible C. auris strain
Avg.
%inhibitio
nof
twomos
tsus
ceptibleC.aurisstrains
Ketoconazole Amphotericin B
CaspofunginFluconazole
Itraconazole Isavuconazole
AnidulafunginVoriconazole
ClioquinolMicafungin Posaconazole
A
B
C

129
Figure 5.2. Secondary screening and selectivity measurement identified five promising compounds, including three hydroxyquinolines. (A) IC50 values against three C. auris strains for 55 compounds calculated from 8-point dose-response curves. Points represent the mean of three biological replicates, error bars represent the standard error of the mean, and upwards arrows indicate IC50 values greater than the highest concentration tested, 100µM. IC50 values are not reported for the 34 compounds which had minimal or no activity in dose-response experiments in this screen. Representative standard of care compounds are indicated in orange. (B) IC50 values for 4 standard of care drugs and 5 top hits against 13 C. auris strains, strains from 3 additional Candida species, and 3 human cell lines. Pink shaded regions mark concentrations above the lowest observed IC50 for that compound against a human cell line. Greater differences between Candida strain IC50 and human cell IC50 indicate higher selectivity. Values represent the mean of three biological replicates, error bars represent the standard error of the mean, and right-pointing arrows indicate IC50 values greater than 1000 µM.
Pos
acon
azol
eIs
avuc
onaz
ole
Ketoconazole
Clio
quin
olItraconazole
Mic
afun
gin
Am
phot
eric
inB
Temsirolimus
Rapamycin
Everolimus
Anidulafungin
Chloroxine
Flucytosine
Butoconazole
Ciclopirox
Clotrimazole
Nitroxoline
Tioconazole
Miltefosine
MMV1593541
Chlorquinaldol
Triclabendazole
Cetylpyridinium
Nystatin
Econazole
OSU-03012
Disulfiram
Cetrimonium
Vori
cona
zole
Miconazole
Bleomycin
Fingolimod
Terbinafine
Cloxiquine
Triclosan
Cas
pofu
ngin
Domiphen
Hexachlorophene
Amorolfine
Clomifene
Ceritinib
Benzethonium
Pentamidine
Osimertinib
Bifonazole
Sulconazole
Aripiprazole
Declining
Climbable
Sertaconazole
Fenticonazole
Butenafine
Luliconazole
Bronopol
MMV1593539
0.001
0.01
0.1
1
10
100
Compound name
IC50
(µM
)
Strain 1540
Strain 1542
Strain 1543
A
10-2 1 102 10410-2 1 102 104 10-2 1 102 104 10-2 1 102 104
Concentration (µM)10-2 1 102 104 10-2 1 102 104 10-2 1 102 104 10-2 1 102 104 10-2 1 102 104
C. dublinensis B8C. glabrata B3C. albicans 124C. auris 1643C. auris 1642C. auris 1641C. auris 1546C. auris 1545C. auris 1544C. auris 1543C. auris 1542C. auris 1541C. auris 1540C. auris 1539C. auris 1538C. auris 1537
HEP-G2 (liver)HEK-293 (kidney)HFF-1 (fibroblast)
Fluconazole Posaconazole Caspofungin Amphotericin B Clioquinol Broxyquinoline Chloroxine Triclabendazole Miltefosine
Top hit compoundsStandard of care compoundsB

130
Figure 5.3. Evolution of clioquinol resistance in a serial passaging selection experiment. (A) Clioquinol IC50 against C. auris isolates that were selected for clioquinol resistance. Parallel selections were carried out with serial passaging of strains AR-384 (blue) and AR-390 (black) in the presence of clioquinol or vehicle (DMSO; grey). Whole genome sequencing was performed for a subset of C. auris passage populations or single cells and the mutations identified are indicated. (B) Comparison of clioquinol’s IC50 against parent, evolved, and CRISPR engineered C. auris mutant strains from three different backgrounds. The fold-changes in IC50 between relevant related strains are shown; the statistical significance of observed differences as determined with unpaired t-tests (two-tailed, equal variance) is indicated. (C) Changes in expression of the CDR1, CDR2, and MDR1 drug pump genes in evolved and CRISPR engineered C. auris mutant strains from three different backgrounds in the absence of clioquinol. Gene expression changes are shown as the Log2 fold-change relative to the parental (WT) strain for that background. Statistical significance was determined with unpaired t-tests (two-tailed, equal variance, * P<.05; ** P<.01; *** P<.001; **** P<.0001). (D) Comparison of IC50 values for 5 other drugs against parent, evolved, and CRISPR engineered mutant C. auris strains. Values represent the mean of three independent experiments; error bars represent the standard error of the mean.
0 5 10 15 20 25 30 350
1
2
3
Selection passage number
ClioquinolIC50
(µM)
1540 Clioquinol A1540 Clioquinol B1546 Clioquinol1540 vehicle (DMSO)1546 vehicle (DMSO)
Cap1 E441*
Cap1 E441*Cdr1 Q548*
Cap1 E398*
Cap1 E398*Cdr1 E722*
Cap1 T387*
Cap1 T387*Cdr1 E377*
WT
2.26xP<0.001
1.79xP<0.001
1.92xP<0.001 0.87x
P=0.47
1.96xP<0.001
1.70xP=0.002
5.15xP<0.001
2.39xP<0.001
1.04xP=1.04
EvolvedCap1*
EvolvedCap1* +Cdr1*
CRISPRCap1*
EvolvedCap1*
CRISPRCap1*
CRISPRCdr1*
EvolvedCap1* +Cdr1*
CRISPRCdr1*
WT WT0.1
1
10
C. auris strain
1540 background 1543 background 1546 background
ClioquinolIC50
(µM)
CDR1 CDR2 MDR1Gene
Log2
fold-changeingene
expression
relativetoparentalstrain
1540 evolved Cap1* + Cdr1*
1546 evolved Cap1*
1543 CRISPR Cdr1*1543 CRISPR Cap1*
1546 CRISPR Cap1*1546 CRISPR Cdr1*
1546 evolved Cap1* + Cdr1*
1540 evolved Cap1*
-6
-4
-2
0
2
4
6
8
10
12
****
**** ****
********
****
********
****
*
******
**
**
Amphotericin B Micafungin BroxyquinolineVoriconazole Posaconazole
0.01
0.1
1
10
DrugIC50
(µM)
WT EvolvedCap1*
EvolvedCap1* +Cdr1*
EvolvedCap1*
CRISPRCap1*
CRISPRCdr1*
EvolvedCap1* +Cdr1*
WT WT
C. auris strain
CRISPRCap1*
1540 background 1543 background 1546 background
A
B
C
D

131
Figure 5.4. Dihalogenated 8-hydroxyquinolines are the most effective inhibitors of C. auris and this activity is abrogated by the presence of Iron or Copper. (A) IC50 of clioquinol and 16 structural analogs against three C. auris strains. Clioquinol (upper left inset) is comprised of a quinoline core with a 5-position chlorine, 7-position iodine, and 8-position hydroxy group, the functional groups at these and other positions are indicated for each of the structural analogs. A further 15 clioquinol analogs that lacked activity against C. auris are not shown. (B) Heat map of C. auris growth in the presence of various combinations of metal ion supplementation and 8-hydroxyquinoline drugs or control metal chelators EDTA and TPEN. C. auris cultures were grown in metal-depleted media, as a result supplementation of metals enhances growth (blue on heat map) and treatment with 8-hydroxyquinolines or control chelators reduces growth (red on heat map). (C) Relationship between supplemented metal concentration and clioquinol IC50. The linear regression is shown for each metal. Data represent the mean of three independent experiments; error bars represent the standard error of the mean.
200%
150%
100%
50%
0%
Mn2+ Ca2+
Vehicle(DMSO)
EDTA
TPEN
Clioquinol
Chloroxine
Cloxiquine
Nitroxoline
Broxyquinoline
Mg2+ Zn2+ Cu2+ Fe2+ Fe3+Vehicle(water) All
10µM supplemented metal
2µM
drug
%gr
owth
rela
tive
tono
drug
/no
met
al
0.01
0.1
1
10
0.001 0.01 0.1 1 10[Supplemented Metal] (µM)
Clio
quin
olIC
50(µ
M)
Fe3+ R2=0.925Fe2+ R2=0.907
R2=0.848Cu2+
R2=0.109Zn2+
B
A
C
-Cl -Br -I -Cl -Cl -Cl-NO2 -NH2
(6)-NO2(2)-Me
-Me -F-Cl -Br-Cl -Br -Cl -Pyr-Cl-Br -I -Br-I
5-position7-position
(X)-position
1(CQ) 2(BQ) 3 4 5 6 7 8 9 10 11 12 13 14 15 16 17
OH
Cl
I N1
2
345
6
7
8
0.1
1
10
100
Clioquinol analog compound
Clioquinol (CQ)
Strain 1540
Strain 1542
Strain 1543
IC50
(µM
)

132
Chapter 5 References
1. Fraser, V.J.; Jones, M.; Dunkel, J.; Storfer, S.; Medoff, G.; Dunagan, W.C. Candidemia in a
Tertiary Care Hospital: Epidemiology, Risk Factors, and Predictors of Mortality. Clin. Infect.
Dis. 1992, 15, 414–421, doi:10.1093/clind/15.3.414.
2. Forsberg, K.; Woodworth, K.; Walters, M.; Berkow, E.L.; Jackson, B.; Chiller, T.;
Vallabhaneni, S. Candida Auris: The Recent Emergence of a Multidrug-Resistant Fungal
Pathogen. Med Mycol 2019, 57, 1–12, doi:10.1093/mmy/myy054.
3. Schelenz, S.; Hagen, F.; Rhodes, J.L.; Abdolrasouli, A.; Chowdhary, A.; Hall, A.; Ryan, L.;
Shackleton, J.; Trimlett, R.; Meis, J.F.; et al. First Hospital Outbreak of the Globally Emerging
Candida Auris in a European Hospital. Antimicrob Resist Infect Control 2016, 5, 35,
doi:10.1186/s13756-016-0132-5.
4. Eyre, D.W.; Sheppard, A.E.; Madder, H.; Moir, I.; Moroney, R.; Quan, T.P.; Griffiths, D.;
George, S.; Butcher, L.; Morgan, M.; et al. A Candida Auris Outbreak and Its Control in an
Intensive Care Setting. N. Engl. J. Med. 2018, 379, 1322–1331, doi:10.1056/NEJMoa1714373.
5. Pacilli, M.; Kerins, J.L.; Clegg, W.J.; Walblay, K.A.; Adil, H.; Kemble, S.K.; Xydis, S.;
McPherson, T.D.; Lin, M.Y.; Hayden, M.K.; et al. Regional Emergence of Candida Auris in
Chicago and Lessons Learned from Intensive Follow-Up at One Ventilator-Capable Skilled
Nursing Facility. Clin. Infect. Dis. 2020, doi:10.1093/cid/ciaa435.
6. Rossow, J.; Ostrowsky, B.; Adams, E.; Greenko, J.; McDonald, R.; Vallabhaneni, S.; Forsberg,
K.; Perez, S.; Lucas, T.; Alroy, K.A.; et al. Factors Associated With Candida Auris
Colonization and Transmission in Skilled Nursing Facilities With Ventilator Units, New York,
2016-2018. Clin Infect Dis 2021, 72, e753–e760, doi:10.1093/cid/ciaa1462.

133
7. Southwick, K.; Ostrowsky, B.; Greenko, J.; Adams, E.; Lutterloh, E.; NYS C. auris Team;
Denis, R.J.; Patel, R.; Erazo, R.; Fernandez, R.; et al. A Description of the First Candida Auris-
Colonized Individuals in New York State, 2016-2017. Am J Infect Control 2021, S0196-
6553(21)00716-1, doi:10.1016/j.ajic.2021.10.037.
8. Allaw, F.; Kara Zahreddine, N.; Ibrahim, A.; Tannous, J.; Taleb, H.; Bizri, A.R.; Dbaibo, G.;
Kanj, S.S. First Candida Auris Outbreak during a COVID-19 Pandemic in a Tertiary-Care
Center in Lebanon. Pathogens 2021, 10, doi:10.3390/pathogens10020157.
9. Prestel, C.; Anderson, E.; Forsberg, K.; Lyman, M.; de Perio, M.A.; Kuhar, D.; Edwards, K.;
Rivera, M.; Shugart, A.; Walters, M.; et al. Candida Auris Outbreak in a COVID-19 Specialty
Care Unit - Florida, July-August 2020. MMWR Morb Mortal Wkly Rep 2021, 70, 56–57,
doi:10.15585/mmwr.mm7002e3.
10. Centers for Disease Control and Prevention Candida Auris Clinical Update - September 2017
Available online: https://www.cdc.gov/fungal/candida-auris/c-auris-alert-09-17.html
(accessed on 25 March 2020).
11. Satoh, K.; Makimura, K.; Hasumi, Y.; Nishiyama, Y.; Uchida, K.; Yamaguchi, H. Candida
Auris Sp. Nov., a Novel Ascomycetous Yeast Isolated from the External Ear Canal of an
Inpatient in a Japanese Hospital. Microbiol. Immunol. 2009, 53, 41–44, doi:10.1111/j.1348-
0421.2008.00083.x.
12. Lockhart, S.R.; Etienne, K.A.; Vallabhaneni, S.; Farooqi, J.; Chowdhary, A.; Govender, N.P.;
Colombo, A.L.; Calvo, B.; Cuomo, C.A.; Desjardins, C.A.; et al. Simultaneous Emergence of
Multidrug-Resistant Candida Auris on 3 Continents Confirmed by Whole-Genome
Sequencing and Epidemiological Analyses. Clin. Infect. Dis. 2017, 64, 134–140,
doi:10.1093/cid/ciw691.

134
13. Chow, N.A.; de Groot, T.; Badali, H.; Abastabar, M.; Chiller, T.M.; Meis, J.F. Potential Fifth
Clade of Candida Auris, Iran, 2018. Emerging Infect. Dis. 2019, 25, 1780–1781,
doi:10.3201/eid2509.190686.
14. Muñoz, J.F.; Gade, L.; Chow, N.A.; Loparev, V.N.; Juieng, P.; Berkow, E.L.; Farrer, R.A.;
Litvintseva, A.P.; Cuomo, C.A. Genomic Insights into Multidrug-Resistance, Mating and
Virulence in Candida Auris and Related Emerging Species. Nat Commun 2018, 9, 5346,
doi:10.1038/s41467-018-07779-6.
15. Chow, N.A.; Muñoz, J.F.; Gade, L.; Berkow, E.L.; Li, X.; Welsh, R.M.; Forsberg, K.;
Lockhart, S.R.; Adam, R.; Alanio, A.; et al. Tracing the Evolutionary History and Global
Expansion of Candida Auris Using Population Genomic Analyses. mBio 2020, 11,
doi:10.1128/mBio.03364-19.
16. Kwon, Y.J.; Shin, J.H.; Byun, S.A.; Choi, M.J.; Won, E.J.; Lee, D.; Lee, S.Y.; Chun, S.; Lee,
J.H.; Choi, H.J.; et al. Candida Auris Clinical Isolates from South Korea: Identification,
Antifungal Susceptibility, and Genotyping. J Clin Microbiol 2019, 57,
doi:10.1128/JCM.01624-18.
17. Welsh, R.M.; Sexton, D.J.; Forsberg, K.; Vallabhaneni, S.; Litvintseva, A. Insights into the
Unique Nature of the East Asian Clade of the Emerging Pathogenic Yeast Candida Auris. J
Clin Microbiol 2019, 57, doi:10.1128/JCM.00007-19.
18. Chow, N.A.; Gade, L.; Tsay, S.V.; Forsberg, K.; Greenko, J.A.; Southwick, K.L.; Barrett,
P.M.; Kerins, J.L.; Lockhart, S.R.; Chiller, T.M.; et al. Multiple Introductions and Subsequent
Transmission of Multidrug-Resistant Candida Auris in the USA: A Molecular Epidemiological
Survey. Lancet Infect Dis 2018, 18, 1377–1384, doi:10.1016/S1473-3099(18)30597-8.

135
19. Rhodes, J.; Fisher, M.C. Global Epidemiology of Emerging Candida Auris. Curr. Opin.
Microbiol. 2019, 52, 84–89, doi:10.1016/j.mib.2019.05.008.
20. Borman, A.M.; Johnson, E.M. Candida Auris in the UK: Introduction, Dissemination, and
Control. PLoS Pathog 2020, 16, e1008563, doi:10.1371/journal.ppat.1008563.
21. Chowdhary, A.; Prakash, A.; Sharma, C.; Kordalewska, M.; Kumar, A.; Sarma, S.; Tarai, B.;
Singh, A.; Upadhyaya, G.; Upadhyay, S.; et al. A Multicentre Study of Antifungal
Susceptibility Patterns among 350 Candida Auris Isolates (2009-17) in India: Role of the
ERG11 and FKS1 Genes in Azole and Echinocandin Resistance. J. Antimicrob. Chemother.
2018, 73, 891–899, doi:10.1093/jac/dkx480.
22. Ostrowsky, B.; Greenko, J.; Adams, E.; Quinn, M.; O’Brien, B.; Chaturvedi, V.; Berkow, E.;
Vallabhaneni, S.; Forsberg, K.; Chaturvedi, S.; et al. Candida Auris Isolates Resistant to Three
Classes of Antifungal Medications - New York, 2019. MMWR Morb. Mortal. Wkly. Rep. 2020,
69, 6–9, doi:10.15585/mmwr.mm6901a2.
23. Kordalewska, M.; Lee, A.; Park, S.; Berrio, I.; Chowdhary, A.; Zhao, Y.; Perlin, D.S.
Understanding Echinocandin Resistance in the Emerging Pathogen Candida Auris.
Antimicrob. Agents Chemother. 2018, 62, doi:10.1128/AAC.00238-18.
24. Zhu, Y.; O’Brien, B.; Leach, L.; Clarke, A.; Bates, M.; Adams, E.; Ostrowsky, B.; Quinn, M.;
Dufort, E.; Southwick, K.; et al. Laboratory Analysis of an Outbreak of Candida Auris in New
York from 2016 to 2018: Impact and Lessons Learned. J. Clin. Microbiol. 2020, 58,
doi:10.1128/JCM.01503-19.
25. Kilburn, S.; Innes, G.; Quinn, M.; Southwick, K.; Ostrowsky, B.; Greenko, J.A.; Lutterloh, E.;
Greeley, R.; Magleby, R.; Chaturvedi, V.; et al. Antifungal Resistance Trends of Candida

136
Auris Clinical Isolates, New York-New Jersey, 2016-2020. Antimicrob Agents Chemother
2022, aac0224221, doi:10.1128/aac.02242-21.
26. Kean, R.; Ramage, G. Combined Antifungal Resistance and Biofilm Tolerance: The Global
Threat of Candida Auris. mSphere 2019, 4, doi:10.1128/mSphere.00458-19.
27. Billamboz, M.; Fatima, Z.; Hameed, S.; Jawhara, S. Promising Drug Candidates and New
Strategies for Fighting against the Emerging Superbug Candida Auris. Microorganisms 2021,
9, doi:10.3390/microorganisms9030634.
28. Seiler, G.T.; Ostrosky-Zeichner, L. Investigational Agents for the Treatment of Resistant
Yeasts and Molds. Curr Fungal Infect Rep 2021, 1–12, doi:10.1007/s12281-021-00419-5.
29. Aghaei Gharehbolagh, S.; Izadi, A.; Talebi, M.; Sadeghi, F.; Zarrinnia, A.; Zarei, F.; Darmiani,
K.; Borman, A.M.; Mahmoudi, S. New Weapons to Fight a New Enemy: A Systematic Review
of Drug Combinations against the Drug-Resistant Fungus Candida Auris. Mycoses 2021,
doi:10.1111/myc.13277.
30. Bandara, N.; Samaranayake, L. Emerging and Future Strategies in the Management of
Recalcitrant Candida Auris. Med Mycol 2022, myac008, doi:10.1093/mmy/myac008.
31. Lamoth, F.; Lewis, R.E.; Kontoyiannis, D.P. Investigational Antifungal Agents for Invasive
Mycoses: A Clinical Perspective. Clin Infect Dis 2022, ciab1070, doi:10.1093/cid/ciab1070.
32. Giacobbe, D.R.; Magnasco, L.; Sepulcri, C.; Mikulska, M.; Koehler, P.; Cornely, O.A.;
Bassetti, M. Recent Advances and Future Perspectives in the Pharmacological Treatment of
Candida Auris Infections. Expert Rev Clin Pharmacol 2021, 1–16,
doi:10.1080/17512433.2021.1949285.

137
33. Berkow, E.L.; Lockhart, S.R. Activity of CD101, a Long-Acting Echinocandin, against
Clinical Isolates of Candida Auris. Diagn Microbiol Infect Dis 2018, 90, 196–197,
doi:10.1016/j.diagmicrobio.2017.10.021.
34. Kovács, R.; Tóth, Z.; Locke, J.B.; Forgács, L.; Kardos, G.; Nagy, F.; Borman, A.M.; Majoros,
L. Comparison of In Vitro Killing Activity of Rezafungin, Anidulafungin, Caspofungin, and
Micafungin against Four Candida Auris Clades in RPMI-1640 in the Absence and Presence of
Human Serum. Microorganisms 2021, 9, doi:10.3390/microorganisms9040863.
35. Berkow, E.L.; Lockhart, S.R. Activity of Novel Antifungal Compound APX001A against a
Large Collection of Candida Auris. J Antimicrob Chemother 2018, 73, 3060–3062,
doi:10.1093/jac/dky302.
36. Zhu, Y.; Kilburn, S.; Kapoor, M.; Chaturvedi, S.; Shaw, K.J.; Chaturvedi, V. In Vitro Activity
of Manogepix against Multidrug-Resistant and Panresistant Candida Auris from the New York
Outbreak. Antimicrob Agents Chemother 2020, 64, doi:10.1128/AAC.01124-20.
37. Hager, C.L.; Larkin, E.L.; Long, L.; Zohra Abidi, F.; Shaw, K.J.; Ghannoum, M.A. In Vitro
and In Vivo Evaluation of the Antifungal Activity of APX001A/APX001 against Candida
Auris. Antimicrob Agents Chemother 2018, 62, doi:10.1128/AAC.02319-17.
38. Berkow, E.L.; Angulo, D.; Lockhart, S.R. In Vitro Activity of a Novel Glucan Synthase
Inhibitor, SCY-078, against Clinical Isolates of Candida Auris. Antimicrob Agents Chemother
2017, 61, doi:10.1128/AAC.00435-17.
39. Larkin, E.; Hager, C.; Chandra, J.; Mukherjee, P.K.; Retuerto, M.; Salem, I.; Long, L.; Isham,
N.; Kovanda, L.; Borroto-Esoda, K.; et al. The Emerging Pathogen Candida Auris: Growth
Phenotype, Virulence Factors, Activity of Antifungals, and Effect of SCY-078, a Novel Glucan

138
Synthesis Inhibitor, on Growth Morphology and Biofilm Formation. Antimicrob Agents
Chemother 2017, 61, doi:10.1128/AAC.02396-16.
40. Zhu, Y.C.; Barat, S.A.; Borroto-Esoda, K.; Angulo, D.; Chaturvedi, S.; Chaturvedi, V. Pan-
Resistant Candida Auris Isolates from the Outbreak in New York Are Susceptible to
Ibrexafungerp (a Glucan Synthase Inhibitor). Int J Antimicrob Agents 2020, 55, 105922,
doi:10.1016/j.ijantimicag.2020.105922.
41. Wiederhold, N.P.; Najvar, L.K.; Olivo, M.; Morris, K.N.; Patterson, H.P.; Catano, G.;
Patterson, T.F. Ibrexafungerp Demonstrates In Vitro Activity against Fluconazole-Resistant
Candida Auris and In Vivo Efficacy with Delayed Initiation of Therapy in an Experimental
Model of Invasive Candidiasis. Antimicrob Agents Chemother 2021, 65,
doi:10.1128/AAC.02694-20.
42. Chu, S.; Long, L.; Sherif, R.; McCormick, T.S.; Borroto-Esoda, K.; Barat, S.; Ghannoum,
M.A. A Second-Generation Fungerp Analog, SCY-247, Shows Potent In Vitro Activity against
Candida Auris and Other Clinically Relevant Fungal Isolates. Antimicrob Agents Chemother
2021, 65, doi:10.1128/AAC.01988-20.
43. Wall, G.; Chaturvedi, A.K.; Wormley, F.L.; Wiederhold, N.P.; Patterson, H.P.; Patterson, T.F.;
Lopez-Ribot, J.L. Screening a Repurposing Library for Inhibitors of Multidrug-Resistant
Candida Auris Identifies Ebselen as a Repositionable Candidate for Antifungal Drug
Development. Antimicrob. Agents Chemother. 2018, 62, doi:10.1128/AAC.01084-18.
44. Mamouei, Z.; Alqarihi, A.; Singh, S.; Xu, S.; Mansour, M.K.; Ibrahim, A.S.; Uppuluri, P.
Alexidine Dihydrochloride Has Broad-Spectrum Activities against Diverse Fungal Pathogens.
mSphere 2018, 3, doi:10.1128/mSphere.00539-18.

139
45. Wall, G.; Herrera, N.; Lopez-Ribot, J.L. Repositionable Compounds with Antifungal Activity
against Multidrug Resistant Candida Auris Identified in the Medicines for Malaria Venture’s
Pathogen Box. J Fungi (Basel) 2019, 5, doi:10.3390/jof5040092.
46. de Oliveira, H.C.; Monteiro, M.C.; Rossi, S.A.; Pemán, J.; Ruiz-Gaitán, A.; Mendes-Giannini,
M.J.S.; Mellado, E.; Zaragoza, O. Identification of Off-Patent Compounds That Present
Antifungal Activity Against the Emerging Fungal Pathogen Candida Auris. Front Cell Infect
Microbiol 2019, 9, 83, doi:10.3389/fcimb.2019.00083.
47. Iyer, K.R.; Camara, K.; Daniel-Ivad, M.; Trilles, R.; Pimentel-Elardo, S.M.; Fossen, J.L.;
Marchillo, K.; Liu, Z.; Singh, S.; Muñoz, J.F.; et al. An Oxindole Efflux Inhibitor Potentiates
Azoles and Impairs Virulence in the Fungal Pathogen Candida Auris. Nat Commun 2020, 11,
6429, doi:10.1038/s41467-020-20183-3.
48. Cheng, Y.-S.; Roma, J.S.; Shen, M.; Mota Fernandes, C.; Tsang, P.S.; Forbes, H.E.; Boshoff,
H.; Lazzarini, C.; Del Poeta, M.; Zheng, W.; et al. Identification of Antifungal Compounds
against Multidrug-Resistant Candida Auris Utilizing a High-Throughput Drug-Repurposing
Screen. Antimicrob Agents Chemother 2021, 65, doi:10.1128/AAC.01305-20.
49. Fuchs, F.; Hof, H.; Hofmann, S.; Kurzai, O.; Meis, J.F.; Hamprecht, A. Antifungal Activity of
Nitroxoline against Candida Auris Isolates. Clin Microbiol Infect 2021, S1198-
743X(21)00366-9, doi:10.1016/j.cmi.2021.06.035.
50. Rybak, J.M.; Muñoz, J.F.; Barker, K.S.; Parker, J.E.; Esquivel, B.D.; Berkow, E.L.; Lockhart,
S.R.; Gade, L.; Palmer, G.E.; White, T.C.; et al. Mutations in TAC1B: A Novel Genetic
Determinant of Clinical Fluconazole Resistance in Candida Auris. mBio 2020, 11,
doi:10.1128/mBio.00365-20.

140
51. Bing, J.; Hu, T.; Zheng, Q.; Muñoz, J.F.; Cuomo, C.A.; Huang, G. Experimental Evolution
Identifies Adaptive Aneuploidy as a Mechanism of Fluconazole Resistance in Candida Auris.
Antimicrob Agents Chemother 2020, 65, doi:10.1128/AAC.01466-20.
52. Carolus, H.; Pierson, S.; Muñoz, J.F.; Subotić, A.; Cruz, R.B.; Cuomo, C.A.; Van Dijck, P.
Genome-Wide Analysis of Experimentally Evolved Candida Auris Reveals Multiple Novel
Mechanisms of Multidrug Resistance. mBio 2021, 12, doi:10.1128/mBio.03333-20.
53. Li, C.; Wang, J.; Zhou, B. The Metal Chelating and Chaperoning Effects of Clioquinol:
Insights from Yeast Studies. J. Alzheimers Dis. 2010, 21, 1249–1262, doi:10.3233/jad-2010-
100024.
54. Prasad, R.; Banerjee, A.; Khandelwal, N.K.; Dhamgaye, S. The ABCs of Candida Albicans
Multidrug Transporter Cdr1. Eukaryot Cell 2015, 14, 1154–1164, doi:10.1128/EC.00137-15.
55. Prasad, R.; Balzi, E.; Banerjee, A.; Khandelwal, N.K. All about CDR Transporters: Past,
Present, and Future. Yeast 2019, 36, 223–233, doi:10.1002/yea.3356.
56. Znaidi, S.; Barker, K.S.; Weber, S.; Alarco, A.-M.; Liu, T.T.; Boucher, G.; Rogers, P.D.;
Raymond, M. Identification of the Candida Albicans Cap1p Regulon. Eukaryot Cell 2009, 8,
806–820, doi:10.1128/EC.00002-09.
57. Feng, W.; Yang, J.; Yang, L.; Li, Q.; Zhu, X.; Xi, Z.; Qiao, Z.; Cen, W. Research of Mrr1,
Cap1 and MDR1 in Candida Albicans Resistant to Azole Medications. Exp Ther Med 2018,
15, 1217–1224, doi:10.3892/etm.2017.5518.
58. Sasse, C.; Schillig, R.; Reimund, A.; Merk, J.; Morschhäuser, J. Inducible and Constitutive
Activation of Two Polymorphic Promoter Alleles of the Candida Albicans Multidrug Efflux
Pump MDR1. Antimicrob Agents Chemother 2012, 56, 4490–4494, doi:10.1128/AAC.00264-
12.

141
59. Schubert, S.; Barker, K.S.; Znaidi, S.; Schneider, S.; Dierolf, F.; Dunkel, N.; Aïd, M.; Boucher,
G.; Rogers, P.D.; Raymond, M.; et al. Regulation of Efflux Pump Expression and Drug
Resistance by the Transcription Factors Mrr1, Upc2, and Cap1 in Candida Albicans.
Antimicrob Agents Chemother 2011, 55, 2212–2223, doi:10.1128/AAC.01343-10.
60. Coste, A.T.; Karababa, M.; Ischer, F.; Bille, J.; Sanglard, D. TAC1, Transcriptional Activator
of CDR Genes, Is a New Transcription Factor Involved in the Regulation of Candida Albicans
ABC Transporters CDR1 and CDR2. Eukaryot Cell 2004, 3, 1639–1652,
doi:10.1128/EC.3.6.1639-1652.2004.
61. Liu, T.T.; Znaidi, S.; Barker, K.S.; Xu, L.; Homayouni, R.; Saidane, S.; Morschhäuser, J.;
Nantel, A.; Raymond, M.; Rogers, P.D. Genome-Wide Expression and Location Analyses of
the Candida Albicans Tac1p Regulon. Eukaryot Cell 2007, 6, 2122–2138,
doi:10.1128/EC.00327-07.
62. Shukla, S.; Sauna, Z.E.; Prasad, R.; Ambudkar, S.V. Disulfiram Is a Potent Modulator of
Multidrug Transporter Cdr1p of Candida Albicans. Biochem Biophys Res Commun 2004, 322,
520–525, doi:10.1016/j.bbrc.2004.07.151.
63. Xu, Y.; Lu, H.; Zhu, S.; Li, W.-Q.; Jiang, Y.-Y.; Berman, J.; Yang, F. Multifactorial
Mechanisms of Tolerance to Ketoconazole in <i>Candida Albicans,/I>. Microbiol Spectr
2021, 9, e0032121, doi:10.1128/Spectrum.00321-21.
64. Wasi, M.; Khandelwal, N.K.; Moorhouse, A.J.; Nair, R.; Vishwakarma, P.; Bravo Ruiz, G.;
Ross, Z.K.; Lorenz, A.; Rudramurthy, S.M.; Chakrabarti, A.; et al. ABC Transporter Genes
Show Upregulated Expression in Drug-Resistant Clinical Isolates of Candida Auris: A
Genome-Wide Characterization of ATP-Binding Cassette (ABC) Transporter Genes. Front
Microbiol 2019, 10, 1445, doi:10.3389/fmicb.2019.01445.
142
65. Zhang, H.; Niu, Y.; Tan, J.; Liu, W.; Sun, M.-A.; Yang, E.; Wang, Q.; Li, R.; Wang, Y.; Liu,
W. Global Screening of Genomic and Transcriptomic Factors Associated with Phenotype
Differences between Multidrug-Resistant and -Susceptible Candida Haemulonii Strains.
mSystems 2019, 4, e00459-19, doi:10.1128/mSystems.00459-19.
66. Saini, P.; Gaur, N.A.; Prasad, R. Chimeras of the ABC Drug Transporter Cdr1p Reveal
Functional Indispensability of Transmembrane Domains and Nucleotide-Binding Domains,
but Transmembrane Segment 12 Is Replaceable with the Corresponding Homologous Region
of the Non-Drug Transporter Cdr3p. Microbiology (Reading) 2006, 152, 1559–1573,
doi:10.1099/mic.0.28471-0.
67. Gershon, H.; McNeil, M.W.; Parmegiani, R.; Godfrey, P.K. Antifungal Activity of 7- and 5,7-
Substituted 8-Quinolinols. J Med Chem 1972, 15, 987–989, doi:10.1021/jm00279a028.
68. Gershon, H.; Parmegiani, R.; Godfrey, P.K. Antifungal Activity of 5-, 7-, and 5,7-Substituted
2-Methyl-8-Quinolinols. Antimicrob Agents Chemother 1972, 1, 373–375,
doi:10.1128/aac.1.5.373.
69. Gershon, H.; McNeil, M.W.; Parmegiani, R.; Godfrey, P.K. Secondary Mechanisms of
Antifungal Action of Substituted 8-Quinolinols. 3. 5,7,8-Substituted Quinolines. J Med Chem
1972, 15, 105–106, doi:10.1021/jm00271a033.
70. Treiber, C.; Simons, A.; Strauss, M.; Hafner, M.; Cappai, R.; Bayer, T.A.; Multhaup, G.
Clioquinol Mediates Copper Uptake and Counteracts Copper Efflux Activities of the Amyloid
Precursor Protein of Alzheimer’s Disease. J. Biol. Chem. 2004, 279, 51958–51964,
doi:10.1074/jbc.M407410200.
71. Tardiff, D.F.; Brown, L.E.; Yan, X.; Trilles, R.; Jui, N.T.; Barrasa, M.I.; Caldwell, K.A.;
Caldwell, G.A.; Schaus, S.E.; Lindquist, S. Dihydropyrimidine-Thiones and Clioquinol
143
Synergize To Target β-Amyloid Cellular Pathologies through a Metal-Dependent Mechanism.
ACS Chem Neurosci 2017, 8, 2039–2055, doi:10.1021/acschemneuro.7b00187.
72. Yan, C.; Wang, S.; Wang, J.; Li, H.; Huang, Z.; Sun, J.; Peng, M.; Liu, W.; Shi, P. Clioquinol
Induces G2/M Cell Cycle Arrest through the up-Regulation of TDH3 in Saccharomyces
Cerevisiae. Microbiol. Res. 2018, 214, 1–7, doi:10.1016/j.micres.2018.05.006.
73. You, Z.; Zhang, C.; Ran, Y. The Effects of Clioquinol in Morphogenesis, Cell Membrane and
Ion Homeostasis in Candida Albicans. BMC Microbiol 2020, 20, 165, doi:10.1186/s12866-
020-01850-3.
74. Hunsaker, E.W.; Franz, K.J. Candida Albicans Reprioritizes Metal Handling during
Fluconazole Stress. Metallomics 2019, 11, 2020–2032, doi:10.1039/c9mt00228f.
75. Hunsaker, E.W.; Franz, K.J. Copper Potentiates Azole Antifungal Activity in a Way That Does
Not Involve Complex Formation. Dalton Trans 2019, 48, 9654–9662,
doi:10.1039/c9dt00642g.
76. Hunsaker, E.W.; Yu, C.-H.A.; Franz, K.J. Copper Availability Influences the Transcriptomic
Response of Candida Albicans to Fluconazole Stress. G3 (Bethesda) 2021, 11,
doi:10.1093/g3journal/jkab065.
77. Eldesouky, H.E.; Lanman, N.A.; Hazbun, T.R.; Seleem, M.N. Aprepitant, an Antiemetic
Agent, Interferes with Metal Ion Homeostasis of Candida Auris and Displays Potent
Synergistic Interactions with Azole Drugs. Virulence 2020, 11, 1466–1481,
doi:10.1080/21505594.2020.1838741.
78. Savage, K.A.; Parquet, M. del C.; Allan, D.S.; Davidson, R.J.; Holbein, B.E.; Lilly, E.A.; Fidel,
P.L. Iron Restriction to Clinical Isolates of Candida Albicans by the Novel Chelator DIBI

144
Inhibits Growth and Increases Sensitivity to Azoles In Vitro and In Vivo in a Murine Model of
Experimental Vaginitis. Antimicrob Agents Chemother 2018, 62, doi:10.1128/AAC.02576-17.
79. Sun, L.; Hang, C.; Liao, K. Synergistic Effect of Caffeic Acid Phenethyl Ester with
Caspofungin against Candida Albicans Is Mediated by Disrupting Iron Homeostasis. Food
Chem Toxicol 2018, 116, 51–58, doi:10.1016/j.fct.2018.04.014.
80. Fiori, A.; Van Dijck, P. Potent Synergistic Effect of Doxycycline with Fluconazole against
Candida Albicans Is Mediated by Interference with Iron Homeostasis. Antimicrob Agents
Chemother 2012, 56, 3785–3796, doi:10.1128/AAC.06017-11.
81. Polvi, E.J.; Averette, A.F.; Lee, S.C.; Kim, T.; Bahn, Y.-S.; Veri, A.O.; Robbins, N.; Heitman,
J.; Cowen, L.E. Metal Chelation as a Powerful Strategy to Probe Cellular Circuitry Governing
Fungal Drug Resistance and Morphogenesis. PLoS Genet 2016, 12, e1006350,
doi:10.1371/journal.pgen.1006350.
82. Mao, X.; Schimmer, A.D. The Toxicology of Clioquinol. Toxicol Lett 2008, 182, 1–6,
doi:10.1016/j.toxlet.2008.08.015.
83. Perez, D.R.; Sklar, L.A.; Chigaev, A. Clioquinol: To Harm or Heal. Pharmacol Ther 2019,
199, 155–163, doi:10.1016/j.pharmthera.2019.03.009.
84. Nakae, K.; Yamamoto, S.; Shigematsu, I.; Kono, R. Relation between Subacute Myelo-Optic
Neuropathy (S.M.O.N.) and Clioquinol: Nationwide Survey. Lancet 1973, 1, 171–173,
doi:10.1016/s0140-6736(73)90004-4.
85. Asao, M. Clioquinol and S.M.O.N.: Reanalysis of Original Data. Lancet 1979, 1, 446,
doi:10.1016/s0140-6736(79)90928-0.
86. Meade, T.W. Subacute Myelo-Optic Neuropathy and Clioquinol. An Epidemiological Case-
History for Diagnosis. Br J Prev Soc Med 1975, 29, 157–169, doi:10.1136/jech.29.3.157.

145
87. Woodworth, M.H.; Dynerman, D.; Crawford, E.D.; Doernberg, S.B.; Ramirez-Avila, L.;
Serpa, P.H.; Nichols, A.; Li, L.M.; Lyden, A.; Tato, C.M.; et al. Sentinel Case of Candida
Auris in the Western United States Following Prolonged Occult Colonization in a Returned
Traveler from India. Microb. Drug Resist. 2019, 25, 677–680, doi:10.1089/mdr.2018.0408.
88. Odds, F.C.; Brown, A.J.; Gow, N.A. Candida Albicans Genome Sequence: A Platform for
Genomics in the Absence of Genetics. Genome Biol 2004, 5, 230.
89. Aszalos, A.; Robison, R.S.; Lemanski, P.; Berk, B. Trienine, an Antitumor Triene Antibiotic.
J Antibiot (Tokyo). 1968, 21, 611–615.
90. Maestrone, G.; Semar, R. Establishment and Treatment of Cutaneous Candida Albicans
Infection in the Rabbit. Naturwissenschaften 1968, 55, 87–88.
91. Meyers, E.; Miragila, G.J.; Smith, D.A.; Basch, H.I.; Pansy, F.E.; Trejo, W.H.; Donovick, R.
Biological Characterization of Prasinomycin, a Phosphorus-Containing Antibiotic. Appl
Microbiol 1968, 16, 603–608.
92. Sullivan, D.J.; Westerneng, T.J.; Haynes, K.A.; Bennett, D.E.; Coleman, D.C. Candida
Dubliniensis Sp. Nov.: Phenotypic and Molecular Characterization of a Novel Species
Associated with Oral Candidosis in HIV-Infected Individuals. Microbiology (Reading, Engl.)
1995, 141 ( Pt 7), 1507–1521, doi:10.1099/13500872-141-7-1507.
93. Ennis, C.L.; Hernday, A.D.; Nobile, C.J. A Markerless CRISPR-Mediated System for Genome
Editing in Candida Auris Reveals a Conserved Role for Cas5 in the Caspofungin Response.
Microbiol Spectr 2021, 9, e0182021, doi:10.1128/Spectrum.01820-21.
94. CLSI Reference Method for Broth Dilution Antifungal Susceptibility Testing of Yeasts. 4th
Edition, CLSI Standard M27; 4th ed.; Clinical and Laboratory Standards Institute: Wayne, PA,
2017;

146
95. Horst, J.A.; Wu, W.; DeRisi, J.L. MinorityReport, Software for Generalized Analysis of Causal
Genetic Variants. Malar J 2017, 16, 90, doi:10.1186/s12936-017-1730-2.

147
Chapter 6:
Real-world performance testing of a SARS-CoV-2 rapid antigen test in San Francisco,
California
This chapter is a reprint of:
Pilarowski G, Lebel P, Sunshine S, Liu J, Crawford E, Marquez C, Rubio L, Chamie G, Martinez
J, Peng J, Black D, Wu W, Pak J, Laurie MT, Jones D, Miller S, Jacobo J, Rojas S, Rojas S,
Nakamura R, Tulier-Laiwa V, Petersen M, Havlir DV; CLIAHUB Consortium, DeRisi J.
Performance Characteristics of a Rapid Severe Acute Respiratory Syndrome Coronavirus 2
Antigen Detection Assay at a Public Plaza Testing Site in San Francisco. J Infect Dis. 2021; Apr
8;223(7):1139-1144. doi: 10.1093/infdis/jiaa802.
Supplemental files that are not figures can be found with the original work.

148
Abstract
We evaluated the performance of the Abbott BinaxNOW rapid antigen test for coronavirus
disease 2019 (Binax-CoV2) to detect virus among persons, regardless of symptoms, at a public
plaza site of ongoing community transmission. Titration with cultured severe acute respiratory
syndrome coronavirus 2 yielded a human observable threshold between 1.6 × 10⁴-4.3 × 10⁴ viral
RNA copies (cycle threshold [Ct], 30.3-28.8). Among 878 subjects tested, 3% (26 of 878) were
positive by reverse-transcription polymerase chain reaction, of whom 15 of 26 had a Ct <30,
indicating high viral load; of these, 40% (6 of 15) were asymptomatic. Using this Ct threshold
(<30) for Binax-CoV2 evaluation, the sensitivity of Binax-CoV2 was 93.3% (95% confidence
interval, 68.1%-99.8%) (14 of 15) and the specificity was 99.9% (99.4%-99.9%) (855 of 856).
Main Text
The global pandemic of severe acute respiratory syndrome coronavirus 2 (SARS-CoV-2)
infection has spread at an unprecedented pace [1] fueled by efficient transmission of infection by
the respiratory route, including by asymptomatic and presymptomatic persons. Instances of
successful control make use of masking, social distancing, and aggressive testing, tracing, and
quarantine [2].
To date, the cornerstone of testing has been reverse-transcription polymerase chain reaction
(RT-PCR) examination of respiratory secretions, which has excellent sensitivity and specificity
but is expensive and requires sophisticated equipment and highly trained personnel [3]. In practice,
these features have often generated testing delays compromising their utility [4]. As a result, there
is interest in rapid and economical assays that circumvent these limitations [5]. However, methods
that do not include an amplification step are inherently less sensitive; their proper deployment will

149
therefore require a rigorous evaluation of performance characteristics in different epidemiologic
settings.
Lateral flow antigen detection diagnostics have been deployed for a variety of infectious
diseases including malaria, RSV, and influenza. The Abbott BinaxNOW COVID-19 Ag Card
(hereafter referred to as Binax-CoV2) is one such assay that detects viral nucleocapsid (N) protein
directly from nasal swab samples. The test requires no instrumentation; results are scored visually
and returned within 15 minutes. In August 2020, the Food and Drug Administration issued an
emergency use authorization for the diagnosis of SARS-CoV-2 infection in symptomatic patients
within 7 days of symptom onset [6]. The US Department of Health and Human Services has
distributed 150 million test kits. Given the value of a rapid assessment of infectiousness, there is
anticipated use in a broad range of subjects, including those who are asymptomatic. Here we
present a systematic examination of the performance characteristics of the Binax-CoV2 test in a
community screening setting where testing was offered for symptomatic and asymptomatic
subjects.
Methods Study Population and Specimen Collection
Over 3 days in September 2020, we offered testing in the Mission District, a Latinx-
predominant neighborhood, known from prior surveys to have an elevated prevalence of SARS-
CoV-2 infection [7, 8]. Walk-up, free testing was conducted at a plaza located at an intersection
of the Bay Area-wide subway system (BART) and the San Francisco city bus/streetcar system
(MUNI). On the day of testing, participants self-reported symptoms and date of onset,
demographics, and contact information, as required by state and federal reporting guidelines. A
laboratory technician performed sequential anterior swab (both nares) for the Binax-CoV2 assay

150
followed by a second swab (both nares) for RT-PCR. Participants were notified of RT-PCR test
results. For this study, Binax-CoV2 results were not reported back to study subjects.
Laboratory Testing for SARS-CoV-2
RT-PCR detection of SARS-CoV-2 was performed at the Clinical Laboratory
Improvement Amendments–certified laboratory operated by the University of California, San
Francisco (UCSF), and the Chan Zuckerberg Biohub, as described elsewhere [9, 10].
Field Testing Using Binax-CoV2 Assay
The Binax-CoV2 assay was performed by technicians on site as described by the
manufacturer using the supplied swabs. Each assay was read by 2 independent observers, and a
site supervisor served as a tiebreaker. Beginning on day 2 of the study, each Binax-CoV2 assay
card was scanned onsite using a color document scanner (CanoScan LIDE 400; Canon). Sample
bands were retrospectively quantified from image data. Sample and background regions were
localized by offset from the control band, and relative mean pixel intensity decreases were
calculated from blue and green channels averaged with respect to background.
Titration of in vitro Cultured SARS-CoV-2 on Binax-CoV2 Cards
SARS-CoV-2 from a UCSF clinical specimen was isolated, propagated and plaqued on
Huh7.5.1 cells overexpressing angiotensin-converting enzyme 2 and transmembrane serine
protease 2 (TMPRSS2) [11]. Viral titers were determined using standard plaque assays [12]. For
titration experiments, SARS-CoV-2 was diluted in Dulbecco phosphate-buffered saline, and 40
µL of each dilution was absorbed onto the supplied swab samples. Images of Binax-CoV2 cards

151
were taken with an Apple iPhone 6. All experiments using cultured SARS-CoV-2 were conducted
in a biosafety level 3 laboratory.
N Protein Titration Assay
SARS-CoV-2 N protein (1–419) was expressed in BL21(DE3) Escherichia coli and
purified by nickel–nitrilotriacetic acid chromatography, incorporating a 1-mol/L sodium chloride,
50-mmol/L imidazole wash to remove bound RNA. Six concentrations of N protein were tested
on 10 lots of Binax-CoV2 kits, and 40 µL of N protein was absorbed onto the provided swab
sample.
Ethics Statement
The UCSF Committee on Human Research determined that the study met criteria for public
health surveillance. All participants provided informed consent for dual testing.
Results Binax-CoV2 Performance Using a Titration of in vitro Cultured SARS-CoV-2
To explore the relationship of RT-PCR cycle threshold (Ct), viral load, and the
corresponding visual Binax-CoV2 result, a dilution series of laboratory-cultured SARS-CoV-2
with known titers was assayed with both RT-PCR and Binax-CoV2 (Figure 6.1). For this stock of
virus, the threshold for detectability by human eye on the Binax-CoV2 assay was between 1.6 and
4.3 × 10⁴ viral copies (100–250 plaque-forming units), corresponding to t values (average of N
and E genes) of 30.3 and 28.8, respectively, in this assay.

152
Community RT-PCR Testing Results
Of the 878 subjects tested, 54% were male, 77% were 18–50 years of age, 81% self-
identified as Latinx, and 84% reported no symptoms in the 14 days before testing. Twenty-six
persons (3%) were RT-PCR positive; of these, 15 (58%) had a Ct <30, and 6 of the 15 (40%) were
asymptomatic. Among asymptomatic individuals with a Ct <30, 4 of 6 developed symptoms within
2 days after testing. Of the 11 persons RT-PCR–positive with a Ct >30, 4 reported symptom onset
≥7 days before testing, 1 reported symptom onset 3 days before testing, and the remainder reported
no symptoms.
Comparison of RT-PCR and Binax-CoV2 Testing Results from Community Testing
Because the readout of the Binax-CoV2 assay is by visual inspection, results may be
subjective, especially when bands are faint or partial. The manufacturer’s instructions suggest
scoring any visible band as positive. On day 1 of testing, these reading instructions were used and
217 samples tested, of which 214 yielded valid Binax-CoV2 results: 7 of 214 (3.3%) were RT-
PCR positive; using the manufacturer’s proposed criteria, 5 of these 7 were Binax-CoV2 positive.
Of 214, a total of 207 were RT-PCR negative, 9 (4.3%) of which were Binax-CoV2 positive. Thus,
using the manufacturer’s criteria, 9 of 14 Binax-CoV2–positive tests (64%) in this population of
217 tests had false-positive results (Binax-CoV2 positive/RT-PCR negative). We thought that
these initial criteria used on day 1 of testing were insufficient for classifying faint Binax-CoV2
assay bands, resulting in excessive false-positive calls.
On subsequent testing days, we evaluated additional criteria for classifying a band as
positive, in consultation with experts from the manufacturer’s research staff. Optimal performance
occurred when the bands were scored as positive, if they extended across the full width of the strip,

153
irrespective of the intensity of the band. Updated scoring criteria were implemented by the third
day of testing, when a total of 292 tests were administered. Of this total, 283 were RT-PCR
negative, all of which scored Binax-CoV2 negative, demonstrating these updated reading criteria
markedly alleviated false-positive readings. Of the 292 total day 3 tests, 9 were RT-PCR positive,
of which 5 were Binax-CoV2 positive for antigen with these updated scoring criteria. Of the 9 RT-
PCR–positive samples, the 4 that were Binax-CoV2 negative had a Ct >30, consistent with our
laboratory-observed limit of detection for Binax-CoV2. We find that scoring a test as positive if
bands extend across the full width of the strip, irrespective of band intensity, is the least subjective
and easiest method to implement in the field, and we have developed a training tool
(https://unitedinhealth.org/binax-training).
The results of the 26 RT-PCR–positive individuals identified throughout the 3-day study
were stratified by RT-PCR test Ct value and categorized according to Binax-CoV2 result (Figure
6.2). The rapid antigen detection test performed well in samples with higher viral loads: 15 of 16
samples with a Ct<32 were Binax-CoV2 positive (Figure 6.2A). By contrast, none of the 10
samples with a Ct ≥34 were positive by Binax-CoV2 antigen detection. Retrospective image
quantification of Binax-CoV2 sample band intensity is correlated with RT-PCR Ct values for those
individuals (Figure 6.2B). In each case, the corresponding image is shown to demonstrate the
correspondence between RT-PCR and the visual result (Figure 6.2C).
Sensitivity and Specificity
RT-PCR is considered a reference standard [3] and, in the RT-PCR assay used in this study,
has a limit of detection of 100 viral RNA copies/mL. Direct antigen assays are inherently not as
sensitive as RT-PCR. In the context of community based testing, we defined a threshold for high

154
virus levels corresponding to the range of highest probability of transmissibility: a Ct of 30, which
corresponds to a viral RNA copy number of approximately 1.9 × 10⁴ in this assay [10, 13]. Using
this Ct <30 case definition and 95% confidence intervals (CIs), the sensitivity of the Binax-CoV2
was 93.3% (95% CI, 68.1%–99.8%) (14 of 15), and the specificity was 99.9% (99.4%–99.9%)
(855 of 856). Adjusting the threshold to a more conservative Ct value of 33 (2.6 × 10³ viral RNA
copies), the sensitivity was 93.8% (95% CI, 69.8%–99.8%) (15 of 16), and the specificity was
100% (99.6%–100%) (855 of 855). Without a Ct threshold, the sensitivity of the Binax-CoV2
assay was (57.7%; 95% CI, 36.9%–76.6%) (15 of 26), and the specificity was (100%; 99.6%–
100%) (845 of 845). Given that the Binax-CoV2 assay detects infected individuals with high levels
of virus (>104), the sensitivity of the assay in the absence of a threshold will largely depend on the
viral kinetics within the testing population. Sensitivity and specificity calculations were completed
with the final scoring criteria, using retroactive Binax-CoV2 scores from images covering all 3
study days.
Evaluation of Binax-CoV2 Lot-to-Lot Variation
We quantified lot-to-lot variability in 10 different lots of Binax-CoV2 card tests using a
dilution series of N protein. (Figure 6.3). At protein concentrations of ≥17.2 ng/mL, a sample band
was detected in all lots and thus would not affect the outcome of this binary assay (Figure 6.3A).
Discussion
The data reported here describe the performance characteristics of the Binax-CoV2 antigen
detection kit in the context of community testing including asymptomatic subjects. These results
indicate a clear relationship between relative viral load and test positivity and provide a practical,

155
real-world criterion to assist calling results in this setting. We found that small training
modifications reduced the presence of false-positives, a legitimate concern for the rollout of these
tests.
The currently approved emergency use authorization for the Binax-CoV2 assay specifies
use only in symptomatic individuals. The results presented here suggest that the Binax-CoV2 test
should not be limited to symptomatic testing alone. Many asymptomatic individuals have high
viral loads (corresponding to low Ct values) and, therefore, have a high probability of being
infectious and transmitting the virus, a feature and likely driver of the pandemic that we and others
have observed previously [7, 14]. Limiting use of Binax-CoV2 to symptomatic individuals would
have missed nearly half of the SARS-CoV-2 infections in the current study.
Furthermore, the impact of testing on forward transmission is hampered by long wait times.
Our group reported previously that in the community setting, by the time a person is tested,
counseled, and situated under isolation conditions, the effective isolation period is often nearly
over [8]. This is particularly true for many communities of color, where reported delays in
accessing tests and results are even longer [4, 15]. Rapid tests could reduce these delays and
maximize the time of effective isolation. Limitations of our study include its cross-sectional design
and the overall small number of RT-PCR positive cases. Additional field performance of this assay
is needed and will help inform optimal use strategies. We recommend evaluating the Binax-CoV2
assay side by side with RT-PCR in each context where it will be used before using Binax-CoV2
without RT-PCR.
During the early stages of infection, viral load may be too low to detect by direct antigen
assays such as Binax-CoV2. This inherent lower sensitivity may be offset by faster turn-around
and higher frequency of testing, with overall lower cost, relative to RT-PCR methods. That said,

156
for persons who present with a high index of suspicion of coronavirus disease 2019 and a negative
Binax-CoV2 result, the test should be complemented with RT-PCR or a repeated Binax-CoV2 test
at a later time to make sure cases are not missed.
In summary, under field conditions with supplementary technician training, the Binax-
CoV2 assay accurately detected SARS-CoV-2 infection with high viral loads in both
asymptomatic and symptomatic individuals. The Binax-CoV2 test could be a valuable asset in an
arsenal of testing tools for the mitigation of SARS-CoV-2 spread, as rapid identification of highly
infectious individuals is critical.
Supplementary Data
Supplementary materials are available at The Journal of Infectious Diseases online.
Consisting of data provided by the authors to benefit the reader, the posted materials are not
copyedited and are the sole responsibility of the authors, so questions or comments should be
addressed to the corresponding author.
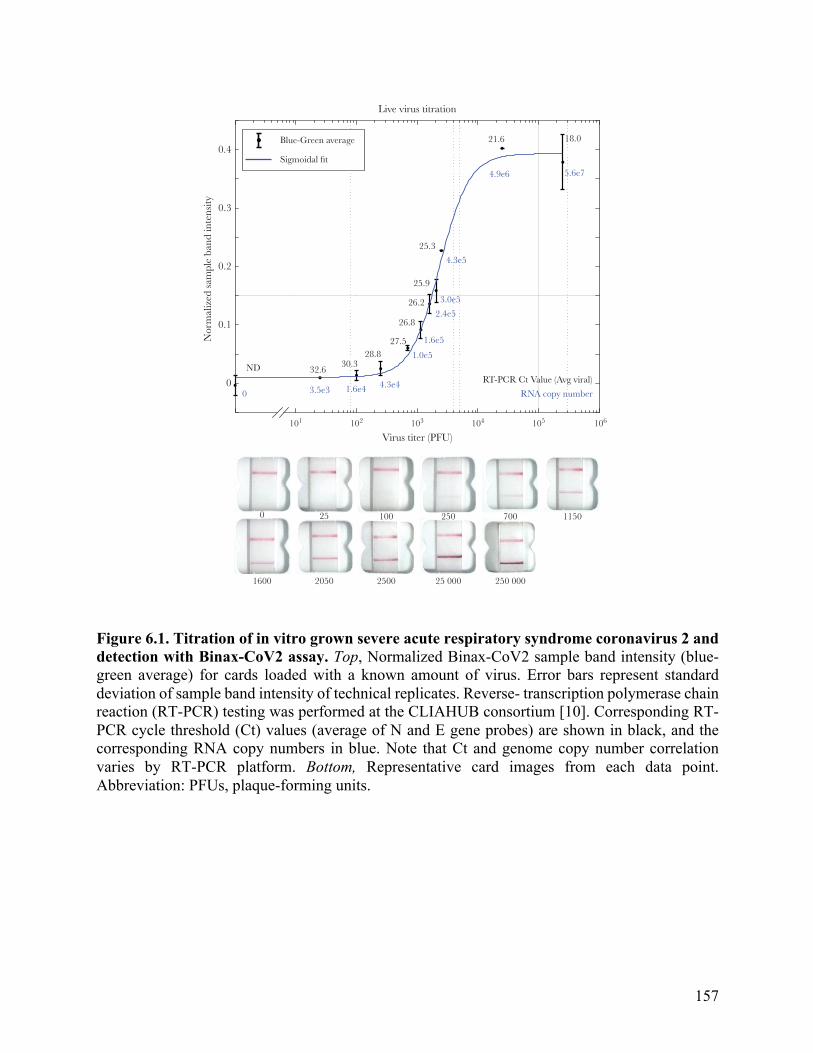
157
Figure 6.1. Titration of in vitro grown severe acute respiratory syndrome coronavirus 2 and detection with Binax-CoV2 assay. Top, Normalized Binax-CoV2 sample band intensity (blue-green average) for cards loaded with a known amount of virus. Error bars represent standard deviation of sample band intensity of technical replicates. Reverse- transcription polymerase chain reaction (RT-PCR) testing was performed at the CLIAHUB consortium [10]. Corresponding RT-PCR cycle threshold (Ct) values (average of N and E gene probes) are shown in black, and the corresponding RNA copy numbers in blue. Note that Ct and genome copy number correlation varies by RT-PCR platform. Bottom, Representative card images from each data point. Abbreviation: PFUs, plaque-forming units.
BRIEF REPORT • JID 2021:223 (1 April) • 1141
which 5 were Binax-CoV2 positive for antigen with these up-dated scoring criteria. Of the 9 RT-PCR–positive samples, the 4 that were Binax-CoV2 negative had a Ct >30, consistent with our laboratory-observed limit of detection for Binax-CoV2. We !nd that scoring a test as positive if bands extend across the full width of the strip, irrespective of band intensity, is the least subjective and easiest method to implement in the !eld, and we have developed a training tool (https://unitedinhealth.org/binax-training).
"e results of the 26 RT-PCR–positive individuals identi-!ed throughout the 3-day study were strati!ed by RT-PCR test Ct value and categorized according to Binax-CoV2 result (Figure#2). "e rapid antigen detection test performed well in samples with higher viral loads: 15 of 16 samples with a Ct<32
were Binax-CoV2 positive (Figure#2A). By contrast, none of the 10 samples with a Ct !34 were positive by Binax-CoV2 antigen detection. Retrospective image quanti!cation of Binax-CoV2 sample band intensity is correlated with RT-PCR Ct values for those individuals (Figure#2B). In each case, the corresponding image is shown to demonstrate the correspondence between RT-PCR and the visual result (Figure#2C).
Sensitivity and Specificity
RT-PCR is considered a reference standard [3] and, in the RT-PCR assay used in this study, has a limit of detection of 100 viral RNA copies/mL. Direct antigen assays are inherently not as sensitive as RT-PCR. In the context of community based testing, we defined a threshold for high virus levels corresponding to the range of highest
0.4
Live virus titration
Blue-Green average 21.6
25.3
25.9
26.2
26.8
27.5
RT-PCR Ct Value (Avg viral)
Virus titer (PFU)
0
1600 2050 2500 25 000 250 000
25 250 700 1150100
28.830.3
32.6
18.0
5.6e7
4.3e5
3.0e52.4e5
1.6e5
1.0e5
4.3e4RNA copy number1.6e43.5e30
4.9e6
Sigmoidal fit
0.3
0.2
0.1
Nor
mal
ized
sam
ple
band
inte
nsity
0
101 102 103 104 105 106
ND
Figure 1. Titration of in vitro grown severe acute respiratory syndrome coronavirus 2 and detection with Binax-CoV2 assay. Top, Normalized Binax-CoV2 sample band in-tensity (blue-green average) for cards loaded with a known amount of virus. Error bars represent standard deviation of sample band intensity of technical replicates. Reverse-transcription polymerase chain reaction (RT-PCR) testing was performed at the CLIAHUB consortium [10]. Corresponding RT-PCR cycle threshold (Ct) values (average of N and E gene probes) are shown in black, and the corresponding RNA copy numbers in blue. Note that Ct and genome copy number correlation varies by RT-PCR platform. Bottom, Representative card images from each data point. Abbreviation: PFUs, plaque-forming units.
Dow
nloaded from https://academ
ic.oup.com/jid/article/223/7/1139/6061974 by guest on 12 April 2022

158
Figure 6.2. Comparison of Binax-CoV2 test with quantitative reverse-transcription polymerase chain reaction (RT-PCR) test. A, Average viral cycle threshold (Ct) values from all 26 RT-PCR–positive individuals from the community study, plotted in ascending order. Blue circles indicate Binax-CoV2–positive samples; yellow squares, Binax- CoV2–negative samples. Open symbols represent individuals who were asymptomatic on the day of the test and filled symbols, those who reported symptoms on that day. B, Normalized sample band signal from retrospective image analysis of Binax-CoV2 cards was plotted as a function of Ct value for all available scanner images (19 of 26 RT-PCR–positive samples and a random subset of RT-PCR–negative samples). Binax-CoV2 true-positives are shown in blue and labeled TP; false-negatives, shown in yellow and labeled FN; and true-negatives, shown in red and labeled TN. C, Corresponding Binax-CoV2 card images from the data in B.
1142 • JID 2021:223 (1 April) • BRIEF REPORT
probability of transmissibility: a Ct of 30, which corresponds to a viral RNA copy number of approximately 1.9!!!104 in this assay [10, 13]. Using this Ct <30 case definition and 95% confidence intervals (CIs), the sensitivity of the Binax-CoV2 was 93.3% (95% CI, 68.1%–99.8%) (14 of 15), and the specificity was 99.9% (99.4%–99.9%) (855 of 856). Adjusting the threshold to a more conservative Ct value of 33 (2.6!!!103 viral RNA copies), the sensitivity was 93.8% (95% CI, 69.8%–99.8%) (15 of 16), and the specificity was 100% (99.6%–100%) (855 of 855). Without a Ct threshold, the sensitivity of the Binax-CoV2 assay was (57.7%; 95% CI, 36.9%–76.6%) (15 of 26), and the specificity was (100%; 99.6%–100%) (845 of 845). Given that the Binax-CoV2 assay detects infected individuals with high levels of virus (>104), the sensitivity of the assay in the absence of a threshold will largely depend on the viral kinetics within the testing population. Sensitivity and specificity calculations were completed with the final scoring criteria, using retroactive Binax-CoV2 scores from images covering all 3 study days.
Evaluation of Binax-CoV2 Lot-to-Lot Variation
We quantified lot-to-lot variability in 10 different lots of Binax-CoV2 card tests using a dilution series of N pro-tein. (Supplementary Figure 1). At protein concentrations
of "17.2! ng/mL, a sample band was detected in all lots and thus would not affect the outcome of this binary assay (Supplementary Figure 1A).
DISCUSSION
The data reported here describe the performance character-istics of the Binax-CoV2 antigen detection kit in the con-text of community testing including asymptomatic subjects. These results indicate a clear relationship between relative viral load and test positivity and provide a practical, real-world criterion to assist calling results in this setting. We found that small training modifications reduced the pres-ence of false-positives, a legitimate concern for the rollout of these!tests.
"e currently approved emergency use authorization for the Binax-CoV2 assay speci#es use only in symptomatic individuals. "e results presented here suggest that the Binax-CoV2 test should not be limited to symptomatic testing alone. Many asymptomatic individuals have high viral loads (corresponding to low Ct values) and, therefore, have a high probability of being infectious and transmitting the virus, a feature and likely driver of the pandemic that we and others have observed previously [7, 14]. Limiting use
50 0.3 TP1
TP2TP3
TP5
TP6
TP7
FN3FN1
FN2FN5
FN4FN7 FN9 TN1
TN9FN8FN6
TP8
TP9TP10
TP4
0.25
0.2
0.15
0.1
0.05
0
–0.05
A B
C
40
30
Binax-CoV2 (+)asymptomatic
Binax-CoV2 (+)symptomatic
Binax-CoV2 (–)asymptomatic
Binax-CoV2 (–)symptomatic
20
10
Ave
rage
vir
al g
ene
Ct (
RT
-PC
R)
Bin
ax-C
oV2
norm
aliz
edsa
mpl
e ba
nd in
tens
ity
00
TP1 TP2 TP3 TP4 TP5 FN1
FN6 FN7 FN8 FN9
FN2 FN3 FN4 FN5 TN1 TN2 TN3 TN4 TN5
TN9TN8TN7TN6TP6 TP7 TP8 TP9 TP10
10Sample (ordered by Ct)
20 30 15 20 25 30 35 40
Ct value (RT-PCR)
ND
Figure 2. Comparison of Binax-CoV2 test with quantitative reverse-transcription polymerase chain reaction (RT-PCR) test. A, Average viral cycle threshold (Ct) values from all 26 RT-PCR–positive individuals from the community study, plotted in ascending order. Blue circles indicate Binax-CoV2–positive samples; yellow squares, Binax-CoV2–negative samples. Open symbols represent individuals who were asymptomatic on the day of the test and filled symbols, those who reported symptoms on that day. B, Normalized sample band signal from retrospective image analysis of Binax-CoV2 cards was plotted as a function of Ct value for all available scanner images (19 of 26 RT-PCR–positive samples and a random subset of RT-PCR–negative samples). Binax-CoV2 true-positives are shown in blue and labeled TP; false-negatives, shown in yellow and labeled FN; and true-negatives, shown in red and labeled TN. C, Corresponding Binax-CoV2 card images from the data in B.
Dow
nloaded from https://academ
ic.oup.com/jid/article/223/7/1139/6061974 by guest on 12 April 2022

159
Figure 6.3. Variability of signal intensity in Binax-CoV2 card lots. (A) Normalized sample band signal intensity of Binax-CoV2 cards from different lots run with a dilution series of purified SARS-CoV-2 N protein with known concentration. N=4 cards per lot per concentration. Each point represents one card. (B) Images of each card test for the highest (126029) and lowest (126028) performing lots.
Binax-CoV2 lot-to-lot variation
Protein concentration (ng/mL)
-0.05
0
0.05
0.1
0.15
0.2
0.25
0.3
0.35
Bin
ax-C
oV2
norm
aliz
edsa
mpl
e ba
nd in
tens
ity
126028125605128503128910126692128524128427128430127426126029
172.0
34.4
17.2
8.6
126029126028
2.2 4.3 8.6 17.2 34.4 172.0
Prot
ein
conc
entra
tion
(ng/
mL)
A
B
Supplementary Figure 1. Variability of signal intensity in Binax-CoV2 card lots. (A) Normalized sample band signal intensity of Binax-CoV2 cards from different lots run with a dilution series of purified SARS-CoV-2 N protein with known concentration. N=4 cards per lot per concentration. Each point represents one card. (B) Images of each card test for the highest (126029) and lowest (126028) performing lots.
SUPPLEMENTARY FIGURES

160
Chapter 6 References 1. Johns Hopkins Coronavirus Resource Center. COVID-19 dashboard by the Center for Systems
Science and Engineering (CSSE) at Johns Hopkins University
(JHU). https://coronavirus.jhu.edu/map.html. Accessed 23 October 2020.
2. Baker MG, Wilson N, Anglemyer A. Successful elimination of Covid-19 transmission in New
Zealand. N Engl J Med 2020; 383:e56.
3. Esbin MN, Whitney ON, Chong S, Maurer A, Darzacq X, Tjian R. Overcoming the bottleneck
to widespread testing: a rapid review of nucleic acid testing approaches for COVID-19
detection. RNA 2020; 26:771–83.
4. Chwe H, Quintana A, Lazer D, et al. . The state of the nation: a 50-state COVID-19 survey.
Report #17: COVID-19 test result times. October
2020. http://www.kateto.net/covid19/COVID19%20CONSORTIUM%20REPORT%2017%2
0TESTING%20OCT%202020.pdf. Accessed 23 October 2020.
5. Mina MJ, Parker R, Larremore DB. Rethinking Covid-19 test sensitivity—a strategy for
containment. N Engl J Med 2020; 383:e120.
6. Abbott Diagnostics. Abbott BinaxNOW COVID-19 Ag package insert, version 1.6.
2020. https://www.fda.gov/media/141570/download. Accessed 20 October 2020.
7. Chamie G, Marquez C, Crawford E, et al. . SARS-CoV-2 community transmission
disproportionately affects Latinx population during shelter-in-place in San Francisco
[published online ahead of print August 21, 2020]. Clin Infect Dis 2020;
doi:10.1093/cid/ciaa1234
8. Kerkhoff AD, Sachdev D, Mizany S, et al. . Evaluation of a novel community-based COVID-
19 ‘Test-to-Care’ model for low-income populations. PLoS One 2020; 15:e0239400.

161
9. Crawford ED, Acosta I, Ahyong V, et al. . Rapid deployment of SARS-CoV-2 testing: the
CLIAHUB. PLoS Pathog 2020; 16:e1008966.
10. Vanaerschot M, Mann SA, Webber JT, et al. . Identification of a polymorphism in the N gene
of SARS-CoV-2 that adversely impacts detection by RT-PCR. J Clin
Microbiol 2020; 59:e02369-20.
11. Wang R, Simoneau CR, Kulsuptrakul J, et al. . Functional genomic screens identify human
host factors for SARS-CoV-2 and common cold coronaviruses. bioRxiv [Preprint: not peer
reviewed]. 24 September 2020. Available
from: https://www.biorxiv.org/content/10.1101/2020.09.24.312298v1. [Google Scholar]
12. Honko AN, Storm N, Bean DJ, Vasquez JH, Downs SN, Griffiths A. Rapid quantification and
neutralization assays for novel coronavirus SARS-CoV-2 using Avicel R RC-591 semi-solid
overlay. 2020. https://www.preprints.org/manuscript/202005.0264/v1. Accessed 23 October
2020.
13. Wölfel R, Corman VM, Guggemos W, et al. . Virological assessment of hospitalized patients
with COVID-2019. Nature2020; 581:465–9.
14. Oran DP, Topol EJ. Prevalence of asymptomatic SARS-CoV-2 infection : a narrative
review. Ann Intern Med 2020:362–7.
15. Kim HN, Lan KF, Nkyekyer E, et al. . Assessment of disparities in COVID-19 testing and
infection across language groups in Seattle, Washington. JAMA Netw
Open 2020; 3:e2021213.

162
Chapter 7:
Differential secondary attack rates of SARS-CoV-2 variants measured by local viral
genomic surveillance
This chapter is a reprint of:
Peng J*, Liu J*, Mann SA*, Mitchell AM*, Laurie MT*, Sunshine S*, Pilarowski G*, Ayscue
P*, Kistler A, Vanaerschot M, Li LM, McGeever A, Chow ED, Marquez C, Nakamura R, Rubio
L, Chamie G, Jones D, Jacobo J, Rojas S, Rojas S, Tulier-Laiwa V, Black D, Martinez J, Naso J,
Schwab J, Petersen M, Havlir D, DeRisi J; IDseq Team. Estimation of Secondary Household
Attack Rates for Emergent Spike L452R Severe Acute Respiratory Syndrome Coronavirus 2
(SARS-CoV-2) Variants Detected by Genomic Surveillance at a Community-Based Testing Site
in San Francisco. Clin Infect Dis. 2022; Jan 7;74(1):32-39. doi: 10.1093/cid/ciab283.
*These authors contributed equally to this work
Supplemental files that are not figures can be found with the original work.

163
Abstract Background
Sequencing of the severe acute respiratory syndrome coronavirus 2 (SARS-CoV-2) viral
genome from patient samples is an important epidemiological tool for monitoring and responding
to the pandemic, including the emergence of new mutations in specific communities.
Methods
SARS-CoV-2 genomic sequences were generated from positive samples collected, along
with epidemiological meta- data, at a walk-up, rapid testing site in the Mission District of San
Francisco, California during 22 November to 1 December, 2020, and 10–29 January 2021.
Secondary household attack rates and mean sample viral load were estimated and compared across
observed variants.
Results
A total of 12 124 tests were performed yielding 1099 positives. From these, 928 high-
quality genomes were generated. Certain viral lineages bearing spike mutations, defined in part by
L452R, S13I, and W152C, comprised 54.4% of the total sequences from January, compared to
15.7% in November. Household contacts exposed to the “California” or “West Coast” variants
(B.1.427 and B.1.429) were at higher risk of infection compared to household contacts exposed to
lineages lacking these variants (0.36 vs 0.29, risk ratio [RR] = 1.28; 95% confidence interval [CI]:
1.00–1.64). The reproductive number was estimated to be modestly higher than other lineages
spreading in California during the second half of 2020. Viral loads were similar among persons
infected with West Coast versus non-West Coast strains, as was the proportion of individuals with
symptoms (60.9% vs 64.3%).

164
Conclusions
The increase in prevalence, relative household attack rates, and reproductive number are consistent
with a modest transmissibility increase of the West Coast variants.
Main Text
Genomic surveillance during the severe acute respiratory syndrome coronavirus 2 (SARS-
CoV-2) pandemic is a critical source of situational intelligence for epidemiological control
measures, including outbreak investigations and detection of emergent variants [1]. Countries with
robust, unified public health systems and systematic genomic surveillance have been able to
rapidly detect SARS-CoV-2 variants with increased transmission characteristics, and mutations
that potentially subvert both naturally acquired or vaccination-based immunity (eg, COVID-19
Genomics UK Consortium). Examples include the rapidly spreading B.1.1.7 lineage documented
in the United Kingdom and the B.1.351 lineage described from South Africa, or the P.1/P.2
lineages that harbor the spike E484K mutation that is associated with reduced neutralization in
laboratory experiments [2–5].
In the United States, genomic surveillance is sparse relative to the number of confirmed
cases (27.8 million as of 20 February 2021), with 123 672 genomes deposited in the GISAID
database, representing only 0.4% of the total reported cases. Despite the low rates of US genomic
surveillance, independent local programs and efforts have contributed to our understanding of
variant emergence and spread [6–8]. The appearance of new nonsynonymous mutations highlight
the utility of this approach in the United States [9].
Genomic sequencing of SARS-CoV-2 in California has predominantly been conducted by
academic researchers and non-profit biomedical research institutions (eg, the Chan Zuckerberg
Biohub and the Andersen Lab at the Scripps Research Institute) in conjunction with state and local

165
public health partners. These efforts identified an apparent increase in the prevalence of lineages
B.1.427 and B.1.429 (“California” or “West Coast” variant), which share S gene nonsynonymous
mutations at sites 13, 152, 452, and 614, during December 2020 to February 2021 when California
was experiencing the largest peak of cases observed during the pandemic. Although the cluster of
mutations was first observed in a sample from May 2020, these variants rose from representing
<1% of the consensus genomes recovered from California samples collected in October 2020
(5/546; 0.91%) to over 50% of those collected during January 2021 (2309/4305; 53.6%; GISAID
accessed 20 February 2021).
The majority of sequencing efforts in the United States utilize samples from symptomatic
individuals or out- breaks, introducing selection bias making interpretation of trends, such as the
rise in lineage prevalence, complex. Furthermore, clinical remnant samples are most often de-
linked from case information, thus eliminating the possibility of evaluating genotypes with detailed
household information, and other metadata useful for investigation of transmission dynamics.
Sequencing cases identified during intensive, longitudinal community-based testing may
help address both limitations. Here we describe an investigation of the prevalence of the West
Coast variants as well as other variants among persons tested at a community testing site situated
in the Mission District of San Francisco, a neighborhood with high coronavirus disease 2019
(COVID-19) incidence, during 2 periods: 22 November to 1 December 2020 and 10–29 January
2021. Using metadata collected at the testing site and supplementary household testing, we
estimated secondary household attack rate with respect to viral genotype to evaluate relative
transmissibility of identified variants.

166
Methods
Study Setting and Population
Over 22 November to 1 December 2020 and 10–29 January 2021, BinaxNOWTM rapid
antigen tests were performed at the 24th & Mission BART (public transit) station in the Mission
District of San Francisco, a setting of ongoing community transmission, predominantly among
Latinx persons [10, 11]. Tests for SARS-CoV-2 were performed free of charge on a walk-up, no-
appointment basis, including persons ≥1 year of age and regardless of symptoms, through “Unidos
en Salud,” an academic, community (Latino Task Force) and city partnership. Certified lab
assistants collected 2 bilateral anterior nasal swabs. The first was tested with BinaxNOWTM,
immediately followed by a separate bilateral swab for SARS-CoV-2 genomic sequencing [11, 12].
Results were reported to participants within 2 hours, and all per- sons in a household (regardless
of symptom status) corresponding to a positive BinaxNOW case were offered BinaxNOW testing.
All persons testing BinaxNOW positive were offered participation in longitudinal Community
Wellness Team support program [13, 14].
SARS-CoV-2 Genomic Sequence Recovery and Consensus Genome Generation
SARS-CoV-2 genomes were recovered using ARTIC Network V3 primers [15] and
sequenced on an Illumina NovaSeq plat- form. Consensus genomes generated from the resulting
raw. fastq files using IDseq [16] were used for subsequent analysis. Full details are included in
Supplementary materials.

167
Household Attack Rate Analyses
Households (n = 328) tested in January and meeting the following inclusion criteria were
eligible for secondary attack rate analyses: 1) ≥1 adult (aged ≥ 18 years) with a positive
BinaxNOW result; 2) ≥1 case in household sequenced; and 3) ≥2 persons tested with BinaxNOW
during the study period. Households in which sequences represented both West Coast and non-
West Coast variants were excluded (n = 9). The index was defined as the first adult to test positive.
Crude household attack rates, stratified by variant classification, were calculated as i) the
proportion of positive BinaxNOW results among tested household contacts; and ii) the mean of
the household- specific secondary attack rate, with 95% confidence interval (CI) based on cluster-
level bootstrap. Generalized estimating equations were used to fit Poisson regressions, with
cluster- robust standard errors and an exchangeable working covariance matrix. Because
symptoms and disease severity may be affected by strain, these factors were not included in the a
priori adjustment set. We evaluated for overdispersion [17] and conducted sensitivity analyses
using targeted maximum likelihood estimation (TMLE) combined with Super Learning to relax
parametric model assumptions; influence curve-based standard error estimates used household as
the unit of independence [18].
Bayesian Phylogenetic Analysis
We compared the growth rates of B.1.427 and B.1.429 Phylogenetic Assignment of Named
Global Outbreak (PANGO) lineages against 2 other lineages, B.1.232 and B.1.243, that had been
circulating in California during the latter half of 2020. To do this, we built a Bayesian phylogeny
for each lineage in BEAST v.1.10.4 and estimated the effective population size over time using
the Bayesian SkyGrid model. We fit an exponential model to the median SkyGrid curve and

168
inferred the reproductive numbers based on the exponential growth rates and generation time
estimates from literature. Full analysis details are included in Supplementary materials.
Ethics Statement
The UCSF Committee on Human Research determined that the study met criteria for public
health surveillance. All participants provided informed consent for dual testing.
Results
Low-Barrier SARS-CoV-2 Testing and Sequencing
From 22 November to 1 December 2020, 3302 rapid direct antigen tests were performed
on 3122 unique individuals; sample characteristics from this testing have been previously
described [11]. From 10–29 January, using identical methods, 8822 rapid direct antigen tests were
performed on 7696 unique individuals, representing 5239 households; household attack rate
analyses were restricted to January samples, described here (Supplementary Table 1).
Test subjects originated from addresses in 8 Bay Area counties, indicating a wide
catchment area (Figure 7.1). During this time period, there were 885 (10.0%) samples from 863
unique persons that were BinaxNOW positive for SARS-CoV-2 infection. From this set, a total of
80 samples were sequenced for the S gene only, of which 58 had S gene coverage over 92%. In
addition, full SARS-CoV-2 genome sequencing was attempted on a total of 775 samples, of which
737 (95%) samples resulted in a genome coverage over 92% (Supplementary Table 2, sequences
deposited in GISAID). These 986 samples, together with an additional 191 SARS-CoV-2 genome
sequences generated from the same testing site during the period of 22 November to 1 December
2020 [11, 19] had adequate coverage of the full genome or spike protein for further analysis based

169
on S gene sequence (Supplementary Table 3). Classification as either a West Coast variant or a
non-West Coast variant was determined for 846 of all samples sequenced.
Similar to previous observations in San Francisco [20], full length sequences were
distributed among the major clades (Supplementary Figure 1) [21]. Notably, mutations at spike
position 501 were not observed, and thus no instances of the B.1.1.7 strain or any other strain
bearing the N501Y mutation were detected in any sample during this period in January 2021. A
single individual was found to have been infected with the P.2 strain, which carries the spike
E484K mutation and was described in Brazil from a reinfection case [5]. This mutation has been
associated with decreased neutralization in laboratory experiments [2, 4].
We observed SARS-CoV-2 genome sequences that be- longed to PANGO lineages B.1.427
and B.1.429, both of which share a trio of recent mutations in the spike protein (S13I, W152C, and
L452R) (Figure 7.2). These lineages are separated by differing mutations ORF1a and ORF1b,
including ORF1b:P976L and ORF1a:I4205V, respectively. Sequencing of 191 viral genomes from
22 November to 1 December 2020 revealed that sequences carrying this trio of mutations
represented only 15.7% of the total. A trend of increasing frequency was observed on a daily basis
during the January testing period (Figure 7.2A), and the frequency of these lineages were observed
to have increased to 54.4% of the total, representing an increase of more than 3-fold in
approximately 1.5 months (Figure 7.2B, 7.2C). This increase in frequency is consistent with an
expansion of viruses more broadly in California carrying these same mutations [23].
Additional nonsynonymous mutations were observed throughout the genome, including
108 unique non- synonymous mutations in the spike gene, several within functionally-significant
regions of the protein (Figure 7.2C, Supplementary Table 3). Twelve unique mutations were
observed in the receptor binding domain, most of which have yet to be investigated for functional

170
effects. Additionally, 8 unique mutations were found adjacent to the polybasic furin cleavage site
at the S1/S2 junction, which is reported to have a potential role in determination of virulence and
host cell tropism [24–27]. Moderately prevalent mutations were observed at spike position 681
(P681H, n = 34 and P681R, n = 1), which is within the furin recognition site, and at spike position
677, where 2 different amino acid substitutions were observed in this cohort (Q677H, n = 22 and
Q677P, n = 11). Multiple mutations at both of these sites have been previously observed [9].
Disease Severity
The SARS-CoV-2 reverse transcription polymerase chain reaction (RT-PCR) cycle
thresholds (Ct) for nasal swab samples from which whole genomes corresponding to the West
Coast variant were recovered were compared to parallel non-West Coast variant samples. Mean
Ct values did not differ significantly between persons infected with West Coast (mean Ct 23.56;
interquartile range [IQR] 6.4) versus non-West Coast (mean Ct 23.67; IQR 7.8) strains (95% CI:
−.77 to .50, P-value = .67) (Supplementary Figure 2, Supplementary Table 2). The proportion of
individuals with symptoms was similar among persons infected with West Coast (273/448, 60.9%)
versus non-West Coast (250/389, 64.3%) strains. Among 364 sequenced cases with longitudinal
follow-up by the Community Wellness Team, 4 (1.1%) were hospitalized (3/183, and 1/181, for
West Coast and non-West Coast, respectively).
Household Secondary Attack Rate
A total of 328 households met inclusion criteria for evaluation of secondary attack rate; of
these, 9 households had individuals with mixed strains and thus were excluded from analyses.
Among the remaining 319 households, characteristics including race/ethnicity, ages of other

171
household members, household size, density, and location were similar, regardless of whether the
members were positive for West Coast or non-West Coast variants. (Table 1, Supplementary Table
4).
The 319 index cases had a total of 1241 nonindex household members; of these, 867
(69.9%) had a BinaxNOW test result available (452/658 [68.7%] for West Coast variant
households; 415/583 [71.2%] of non-West Coast variant households). A total of 35.6% (161/452)
of household contacts exposed to the West Coast variant tested BinaxNOW positive (33.2%,
78/235 for B1.427; 40.3%, 79/196 for B.1.429), whereas 29.4% (122/415) of contacts exposed to
non-West Coast variant tested positive (Table 2). Secondary cases were identified a median of 1
day after index cases (IQR 0–4).
Based on unadjusted Poisson regression with cluster-robust standard errors, household
contacts exposed to the West Coast variant had an estimated 28% higher risk of secondary
infection, compared to household contacts exposed to a non-West Coast variant (RR: 1.28, 95%
CI: 1.00–1.64, P-value = .05). When exposure to West Coast variants was disaggregated by
B.1.427 and B.1.429, corresponding risks of secondary infections relative to exposure to non-West
Coast variants were 1.19 (95% CI: .89– 1.59, P-value = .20) and 1.43 (95% CI: 1.07–1.91, P-value
= .02), respectively. Dispersion ratios were >0.9 in all regression ana- lyses. Estimated relative
risks of infection after household exposure to West Coast versus non-West Coast variants were
similar after adjustment for household and individual-level characteristics of secondary contacts
(adjusted risk ratio [aRR]: 1.25, 95% CI: .98–1.59, P-value: .07 for West Coast vs non-West Coast
variants; aRR: 1.19, 95% CI: .90–1.59, P-value = .20 and aRR: 1.36, 95% CI: 1.01–1.83, P-value
= .04 for B.1.427 and B.1.429, respectively). Relative attack rates were generally similar when
stratified by household characteristics and by the characteristics of secondary contacts (Table 3);

172
secondary attack rates among children aged <12 years were 51.9% (41/79) and 39.7% (31/78)
when exposed to West Coast and non-West Coast strains, respectively. Sensitivity analyses in
which parametric assumptions were relaxed using TMLE and Super Learning yielded similar
estimates (Supplementary Table 5).
Estimation of Reproductive Number
Using Bayesian phylogenetic analysis, we estimated the reproductive number to be 1.27
(95% CI: 1.10–1.46) for B.1.427 and 1.18 (95% CI: 1.05–1.32) for B.1.429 during the second half
of 2020. These values were slightly higher than 2 other lineages spreading in California during the
same time period: 1.12 (95% CI: 1.10– 1.14) for B.1.232, and 1.02 (95% CI: .98–1.05) for B.1.243.
As the reproductive numbers are very similar and were calculated from the median SkyGrid
estimates, we cannot conclude any statistically significant differences between the lineages.
Discussion
We monitored SARS-CoV-2 viral variants by genomic sequencing and integration of
metadata from households at a community based “test-and-respond” program. We found that the
West Coast variants (PANGO lineages B.1.427 and B.1.429) increased in prevalence relative to
wild type from November to January in the San Francisco Bay Area among persons tested in the
same community-based lo- cation. These data extend and confirm prior observations from
convenience, outbreak, and clinical samples reporting apparent increases in relative prevalence of
the West Coast variants [23].
Household secondary attack rates of the West Coast variants were modestly higher than
for non-West Coast variants, suggesting the potential for increased transmissibility. The West

173
Coast variants compromise two closely related lineages (B.1.427 and B.1.429) that share identical
sets of mutations in the spike protein but differ by additional synonymous and nonsynonymous
mutations in other genes. Although the frequency of both lineages increased in this study and in
California more widely [23], and the estimated increase in risk of secondary household infection
relative to non-West Coast variants was fairly consistent across lineages, the point estimate was
somewhat higher for B.1.429. Although moderate compared to increased transmissibility of other
previously identified variants, even small increases in transmissibility could contribute to a
substantial increase in cases, particularly in the context of reproductive numbers just below 1.
Although this finding may be due to chance, future work should continue to monitor individual
lineages.
The household attack rate observed here was higher than that reported in a recent global
meta-analysis [28], even for the non- West Coast variants. It was similar to, or lower than, attack
rates reported in other US settings. Prior US reports, however, were based on substantially smaller
sample sizes.
Our findings that the West Coast variants increased in relative prevalence and had higher
household secondary attack rates potentially suggest higher transmissibility. However, the West
Coast variant has been detected in multiple locations and has been detected since May 2020 in
California without relative expansion until the peak associated with the holiday season of
November–January. Using Bayesian phylogenetic analysis, the estimated reproductive number for
both West Coast lineages was found to be modestly higher than other circulating lineages.
We found no significant differences in viral load (using Ct) be- tween West Coast and non-
West Coast variants (Supplementary Figure 2), and recorded hospitalizations (n = 5/388) remained
rare, despite the West Coast variant representing 54.4% of positive cases. This highlights the

174
importance of studying walk-up populations, whether they are symptomatic or asymptomatic, as
hospitalized populations often are confounded by comorbidities and subject to selection bias.
At the time of this sampling, no instances of B.1.1.7, or in- dependent N501Y mutations
were detected in our sample population of 830, despite sporadic observations elsewhere in CA
(approximately 3% [69/2423] of genomes reported in California during the January study period;
accessed from GISAID 24 February 2021), suggesting that introductions of B.1.1.7 have been rare
in this catchment area, despite high SARS-CoV-2 incidence [29]. A single case of the P.2 variant,
which carries the E484K mutation [2], was detected in this study. Surprisingly, this case did not
have a travel history, highlighting the risk of cryptic transmission.
In addition to the mutations associated with spike L452R in the West Coast variants, we
observed, at lower frequencies, other mutations of interest, such as those at spike positions 677
and 681, both of which have been reported previously on their own [9].
This study has several limitations. First, testing was con- ducted at a walk-up testing site,
and thus these are inherently convenience samples; however, this would not be expected to impose
a differential selection bias for those with or without any particular variant. Second, clear
classification of the index case was not always possible, particularly when multiple adults from a
household tested positive on the same date; furthermore, secondary household attack rate
calculations do not account for potential external sources of infection other than the index case.
However, the relative risk of secondary infection from house- hold exposure to West Coast versus
non-West Coast variants was similar among children, a group less likely to have been misclassified
as non-index or to be exposed to external infection. Third, household testing coverage was
incomplete and, in some cases, consisted of only a single follow-up test; this might contribute to

175
an underestimate (or overestimate) of secondary attack rate, and although we again have no reason
to suspect differential ascertainment by strain, this could bias estimates of relative risk.
The occurrence of variants in SARS-CoV-2 was always expected; however, it is often
difficult to understand the clinical and epidemiological importance of any given single or set of
co-occurring mutations. Although further epidemiological and laboratory experiments will be
required to fully understand the community impact and mechanistic underpinnings of each variant,
it is clear that enhanced genomic surveillance paired with community engagement, testing, and
response capacity is an important tool in the arsenal against this pandemic.

176
Figure 7.1. Testing catchment area. The location of the 24th & Mission testing site is denoted by the yellow symbol. Negative tests are in gray, and positive tests are shown in red. Household locations shown have a random offset of up to 750 meters to obfuscate the precise addresses of individuals. The testing catchment area encompasses a substantial number of individuals in the surrounding 8 Bay Area counties (A). The greatest concentration of individuals reside within San Francisco county (B), Map tiles by Stamen Design and data by OpenStreetMap.
34 • CID 2022:74 (1 January) • Peng et al
been circulating in California during the latter half of 2020. To do this, we built a Bayesian phylogeny for each lineage in BEAST v.1.10.4 and estimated the effective population size over time using the Bayesian SkyGrid model. We fit an exponential model to the median SkyGrid curve and inferred the reproduc-tive numbers based on the exponential growth rates and gen-eration time estimates from literature. Full analysis details are included in Supplementary materials.
Ethics Statement
The UCSF Committee on Human Research determined that the study met criteria for public health surveillance. All participants provided informed consent for dual testing.
RESULTS
Low-Barrier SARS-CoV-2 Testing and Sequencing
From 22 November to 1 December 2020, 3302 rapid direct an-tigen tests were performed on 3122 unique individuals; sample characteristics from this testing have been previously described [11]. From 10–29 January, using identical methods, 8822 rapid direct antigen tests were performed on 7696 unique individ-uals, representing 5239 households; household attack rate analyses were restricted to January samples, described here (Supplementary Table 1).
Test subjects originated from addresses in 8 Bay Area coun-ties, indicating a wide catchment area (Figure 1). During this time period, there were 885 (10.0%) samples from 863 unique persons that were BinaxNOW positive for SARS-CoV-2 infec-tion. From this set, a total of 80 samples were sequenced for the S gene only, of which 58 had S gene coverage over 92%. In ad-dition, full SARS-CoV-2 genome sequencing was attempted on a total of 775 samples, of which 737 (95%) samples resulted in a genome coverage over 92% (Supplementary Table 2, sequences deposited in GISAID). !ese 986 samples, together with an ad-ditional 191 SARS-CoV-2 genome sequences generated from the same testing site during the period of 22 November to 1 December 2020 [11, 19] had adequate coverage of the full ge-nome or spike protein for further analysis based on S gene se-quence (Supplementary Table 3). Classi"cation as either a West Coast variant or a non-West Coast variant was determined for 846 of all samples sequenced.
Similar to previous observations in San Francisco [20], full length sequences were distributed among the major clades (Supplementary Figure 1) [21]. Notably, mutations at spike position 501 were not observed, and thus no instances of the B.1.1.7 strain or any other strain bearing the N501Y mutation were detected in any sample during this period in January 2021. A#single individual was found to have been infected with the P.2 strain, which carries the spike E484K mutation and was de-scribed in Brazil from a reinfection case [5]. !is mutation has
Figure 1. Testing catchment area. The location of the 24th & Mission testing site is denoted by the yellow symbol. Negative tests are in gray, and positive tests are shown in red. Household locations shown have a random offset of up to 750 meters to obfuscate the precise addresses of individuals. The testing catchment area encompasses a substantial number of individuals in the surrounding 8 Bay Area counties (A). The greatest concentration of individuals reside within San Francisco county (B), Map tiles by Stamen Design and data by OpenStreetMap.
Dow
nloaded from https://academ
ic.oup.com/cid/article/74/1/32/6206738 by guest on 12 April 2022

177
Figure 7.2. Variants observed at 24th & Mission. A, Proportion of daily cases belonging to West Coast and non-West Coast variants. B, Total number of samples per day. C, D, Area maps [22] showing the relative proportion of PANGO lineages acquired from full length genomes from the November (N = 191) and January (N = 737) time periods, respectively. E, Genome maps for variants detected in this study. Dominant mutations (filled black circles), and nonsynonymous mutations detected at lower frequency in combination with existing lineages (filled gray circles) are shown in gray. Abbreviation: PANGO, Phylogenetic Assignment of Named Global Outbreak.
Attack Rate for Emergent SARS-CoV-2 Variant • CID 2022:74 (1 January) • 35
been associated with decreased neutralization in laboratory ex-periments [2, 4].
We observed SARS-CoV-2 genome sequences that be-longed to PANGO lineages B.1.427 and B.1.429, both of which share a trio of recent mutations in the spike protein (S13I, W152C, and L452R) (Figure 2). !ese lineages are sep-arated by di"ering mutations ORF1a and ORF1b, including
ORF1b:P976L and ORF1a:I4205V, respectively. Sequencing of 191 viral genomes from 22 November to 1 December 2020 revealed that sequences carrying this trio of mutations repre-sented only 15.7% of the total. A#trend of increasing frequency was observed on a daily basis during the January testing pe-riod (Figure 2A), and the frequency of these lineages were ob-served to have increased to 54.4% of the total, representing
23 November 01 December 2020 10–29 January 2021
Figure 2. Variants observed at 24th & Mission. A, Proportion of daily cases belonging to West Coast and non-West Coast variants. B, Total number of samples per day. C, D, Area maps [22] showing the relative proportion of PANGO lineages acquired from full length genomes from the November (N!=!191) and January (N!=!737) time periods, respectively. E, Genome maps for variants detected in this study. Dominant mutations (filled black circles), and nonsynonymous mutations detected at lower frequency in combination with existing lineages (filled gray circles) are shown in gray. Abbreviation: PANGO, Phylogenetic Assignment of Named Global Outbreak.
Dow
nloaded from https://academ
ic.oup.com/cid/article/74/1/32/6206738 by guest on 12 April 2022

178
Table 7.1. Characteristics of households included in the household attack rate analysis, stratified by strain.
Table 7.2. Secondary household attack rates for West Coast Variants, combined and disaggregated by B.1.427 and B.1.429.
36 • CID 2022:74 (1 January) • Peng et al
an increase of more than 3-fold in approximately 1.5!months (Figure 2B, 2C). "is increase in frequency is consistent with an expansion of viruses more broadly in California carrying these same mutations [23].
Additional nonsynonymous mutations were observed throughout the genome, including 108 unique non-synonymous mutations in the spike gene, several within functionally-signi#cant regions of the protein (Figure 2C, Supplementary Table 3). Twelve unique mutations were ob-served in the receptor binding domain, most of which have yet to be investigated for functional e$ects. Additionally, 8 unique mutations were found adjacent to the polybasic furin cleavage site at the S1/S2 junction, which is reported to have a potential role in determination of virulence and host cell tropism [24–27]. Moderately prevalent mutations were ob-served at spike position 681 (P681H, n! =! 34 and P681R, n!=!1), which is within the furin recognition site, and at spike position 677, where 2 di$erent amino acid substitutions were observed in this cohort (Q677H, n!=!22 and Q677P, n!=!11). Multiple mutations at both of these sites have been previously observed [9].
Disease Severity
The SARS-CoV-2 reverse transcription polymerase chain reac-tion (RT-PCR) cycle thresholds (Ct) for nasal swab samples from which whole genomes corresponding to the West Coast variant were recovered were compared to parallel non-West Coast var-iant samples. Mean Ct values did not differ significantly between
persons infected with West Coast (mean Ct 23.56; interquartile range [IQR] 6.4) versus non-West Coast (mean Ct 23.67; IQR 7.8) strains (95% CI: %.77 to .50, P-value!=!.67) (Supplementary Figure 2, Supplementary Table 2). The proportion of individ-uals with symptoms was similar among persons infected with West Coast (273/448, 60.9%) versus non-West Coast (250/389, 64.3%) strains. Among 364 sequenced cases with longitudinal follow-up by the Community Wellness Team, 4 (1.1%) were hospitalized (3/183, and 1/181, for West Coast and non-West Coast, respectively).
Household Secondary Attack!Rate
A total of 328 households met inclusion criteria for evaluation of secondary attack rate; of these, 9 households had individ-uals with mixed strains and thus were excluded from analyses. Among the remaining 319 households, characteristics including race/ethnicity, ages of other household members, household size, density, and location were similar, regardless of whether the members were positive for West Coast or non-West Coast variants. (Table 1, Supplementary Table 4).
"e 319 index cases had a total of 1241 nonindex household members; of these, 867 (69.9%) had a BinaxNOW test result available (452/658 [68.7%] for West Coast variant households; 415/583 [71.2%] of non-West Coast variant households). A!total of 35.6% (161/452) of household contacts exposed to the West Coast variant tested BinaxNOW positive (33.2%, 78/235 for B1.427; 40.3%, 79/196 for B.1.429), whereas 29.4% (122/415) of contacts exposed to non-West Coast variant tested positive
Table 1. Characteristics of Households Included in the Household Attack Rate Analysis, Stratified by Strain
Non-West Coast (N!=!156)
West Coast
Total (N!=!319)B.1.427 (N!=!90) B.1.429 (N!=!65) All West Coast (N!=!163)a
Race/Ethnicity (most common in household)
Hispanic/Latinx 143 (91.7%) 78 (86.7%) 62 (95.4%) 146 (89.6%) 289 (90.6%)
Asian 5 (3.2%) 5 (5.6%) 1 (1.5%) 8 (4.9%) 13 (4.1%)
White/Caucasian 4 (2.6%) 3 (3.3%) 0 (0%) 3 (1.8%) 7 (2.2%)
Black or African American 2 (1.3%) 2 (2.2%) 2 (3.1%) 4 (2.5%) 6 (1.9%)
Other 2 (1.3%) 2 (2.2%) 0 (0%) 2 (1.2%) 4 (1.3%)
Has children
Does not have children 105 (67.3%) 69 (76.7%) 35 (53.8%) 110 (67.5%) 215 (67.4%)
Has children 51 (32.7%) 21 (23.3%) 30 (46.2%) 53 (32.5%) 104 (32.6%)
Location
San Francisco 118 (75.6%) 71 (78.9%) 39 (60.0%) 115 (70.6%) 233 (73.0%)
Outside San Francisco 38 (24.4%) 19 (21.1%) 26 (40.0%) 48 (29.4%) 86 (27.0%)
Household size
2 persons 14 (9.0%) 12 (13.3%) 5 (7.7%) 20 (12.3%) 34 (10.7%)
3–4 persons 63 (40.4%) 33 (36.7%) 22 (33.8%) 57 (35.0%) 120 (37.6%)
5+ persons 79 (50.6%) 45 (50.0%) 38 (58.5%) 86 (52.8%) 165 (51.7%)
Household densityb
Mean (SD) 1.86 (0.858) 1.91 (0.881) 2.27 (1.22) 2.04 (1.03) 1.95 (0.955)
Median [min, max] 1.88 [0.250, 7.00] 1.67 [0.444, 5.00] 2.00 [0.714, 6.00] 1.69 [0.444, 6.00] 1.75 [0.250, 7.00]
a8 households with S gene only sequence available.bHousehold density missing for 17 households.
Dow
nloaded from https://academ
ic.oup.com/cid/article/74/1/32/6206738 by guest on 12 April 2022
Attack Rate for Emergent SARS-CoV-2 Variant • CID 2022:74 (1 January) • 37
(Table 2). Secondary cases were identi!ed a median of 1" day a#er index cases (IQR 0–4).
Based on unadjusted Poisson regression with cluster-robust standard errors, household contacts exposed to the West Coast variant had an estimated 28% higher risk of secondary infection, compared to household contacts exposed to a non-West Coast variant (RR: 1.28, 95% CI: 1.00–1.64, P-value"=".05). When ex-posure to West Coast variants was disaggregated by B.1.427 and B.1.429, corresponding risks of secondary infections relative to exposure to non-West Coast variants were 1.19 (95% CI: .89–1.59, P-value"=".20) and 1.43 (95% CI: 1.07–1.91, P-value"=".02), respectively. Dispersion ratios were >0.9 in all regression ana-lyses. Estimated relative risks of infection a#er household expo-sure to West Coast versus non-West Coast variants were similar a#er adjustment for household and individual-level character-istics of secondary contacts (adjusted risk ratio [aRR]: 1.25, 95%
CI: .98–1.59, P-value: .07 for West Coast vs non-West Coast variants; aRR: 1.19, 95% CI: .90–1.59, P-value"=" .20 and aRR: 1.36, 95% CI: 1.01–1.83, P-value"=".04 for B.1.427 and B.1.429, respectively). Relative attack rates were generally similar when strati!ed by household characteristics and by the characteristics of secondary contacts (Table 3); secondary attack rates among children aged <12"years were 51.9% (41/79) and 39.7% (31/78) when exposed to West Coast and non-West Coast strains, re-spectively. Sensitivity analyses in which parametric assump-tions were relaxed using TMLE and Super Learning yielded similar estimates (Supplementary Table 5).
Estimation of Reproductive!Number
Using Bayesian phylogenetic analysis, we estimated the reproduc-tive number to be 1.27 (95% CI: 1.10–1.46) for B.1.427 and 1.18 (95% CI: 1.05–1.32) for B.1.429 during the second half of 2020.
Table 3. Secondary Attack Rate Disaggregated by Covariates
Non-West Coast Strain West Coast Strain
Positives Among
Tested Contacts (%)Mean Household
Attack Rate (95% CI)Positives Among
Tested Contacts (%)Mean Household
Attack Rate (95% CI)
Location San Francisco 88/321 (27.4%) 22.9% (17.2–28.8) 113/316 (35.8%) 37.5% (30.2–44.9) Outside of San Francisco 34/94 (36.2%) 34% (22.1–46.2) 48/136 (35.3%) 32.1% (22.2–42.1)Age group Age ! 12 31/78 (39.7%) … 41/79 (51.9%) … Age > 12 91/337 (27%) … 120/373 (32.2%) …Race/Ethnicity Latinx/Hispanic 107/372 (28.8%) … 136/379 (35.9%) … Not Latinx/Hispanic 15/43 (34.9%) … 25/73 (34.2%) …Household size 2 persons 1/14 (7.1%) 7.1% (0–21.4) 12/20 (60%) 60% (40–80) 3–4 persons 30/115 (26.1%) 26.5% (17.7–35.7) 35/102 (34.3%) 33.3% (23.7–43.6) 5+ persons 91/286 (31.8%) 28.1% (21.1–35.4) 114/330 (34.5%) 32% (25.1–39.2)Household density Bottom half 43/159 (27%) 23.8% (15.7–32.2) 52/176 (29.5%) 33% (24.2–42.3) Top half 76/243 (31.3%) 27.4% (20.1–35) 101/262 (38.5%) 35.7% (27.9–43.6)
Mean household secondary attack rate only reported disaggregated by household level characteristics.
Abbreviation: CI, confidence interval.
Table 2. Secondary Household Attack Rates for West Coast Variants, Combined and Disaggregated by B.1.427 and B.1.429
Unadjusted Adjusted
Positives Among Tested
Contacts (%)Mean Household Attack Rate
(95% CI) RR (95% CI) P-value aRR P-value
Class Non-West Coast 122/415 (29.4%) 25.6% (20.3–31) … … … …West Coast 161/452 (35.6%) 35.9% (30.1–41.9) 1.28 (1.00–1.64) .05 1.25 (.98–1.59) .07
Lineage B.1.427 78/235 (33.2%) 32.9% (25.4–40.6) 1.19 (0.89–1.59) .20 1.19 (.90–1.59) .20B.1.429 79/196 (40.3%) 40.9% (31.5–50.5) 1.43 (1.07–1.91) .02 1.36 (1.01–1.83) .04
Relative risks estimated based on Poisson regression using generalized estimating equations and cluster-robust standard errors. Adjustment variables included age group, Latinx/Hispanic race, household size, and household density.
Abbreviations: aRR, adjusted risk ratio; CI, confidence interval; RR, risk ratio.
Dow
nloaded from https://academ
ic.oup.com/cid/article/74/1/32/6206738 by guest on 12 April 2022

179
Table 7.3. Secondary attack rate disaggregated by covariates.
Attack Rate for Emergent SARS-CoV-2 Variant • CID 2022:74 (1 January) • 37
(Table 2). Secondary cases were identi!ed a median of 1" day a#er index cases (IQR 0–4).
Based on unadjusted Poisson regression with cluster-robust standard errors, household contacts exposed to the West Coast variant had an estimated 28% higher risk of secondary infection, compared to household contacts exposed to a non-West Coast variant (RR: 1.28, 95% CI: 1.00–1.64, P-value"=".05). When ex-posure to West Coast variants was disaggregated by B.1.427 and B.1.429, corresponding risks of secondary infections relative to exposure to non-West Coast variants were 1.19 (95% CI: .89–1.59, P-value"=".20) and 1.43 (95% CI: 1.07–1.91, P-value"=".02), respectively. Dispersion ratios were >0.9 in all regression ana-lyses. Estimated relative risks of infection a#er household expo-sure to West Coast versus non-West Coast variants were similar a#er adjustment for household and individual-level character-istics of secondary contacts (adjusted risk ratio [aRR]: 1.25, 95%
CI: .98–1.59, P-value: .07 for West Coast vs non-West Coast variants; aRR: 1.19, 95% CI: .90–1.59, P-value"=" .20 and aRR: 1.36, 95% CI: 1.01–1.83, P-value"=".04 for B.1.427 and B.1.429, respectively). Relative attack rates were generally similar when strati!ed by household characteristics and by the characteristics of secondary contacts (Table 3); secondary attack rates among children aged <12"years were 51.9% (41/79) and 39.7% (31/78) when exposed to West Coast and non-West Coast strains, re-spectively. Sensitivity analyses in which parametric assump-tions were relaxed using TMLE and Super Learning yielded similar estimates (Supplementary Table 5).
Estimation of Reproductive!Number
Using Bayesian phylogenetic analysis, we estimated the reproduc-tive number to be 1.27 (95% CI: 1.10–1.46) for B.1.427 and 1.18 (95% CI: 1.05–1.32) for B.1.429 during the second half of 2020.
Table 3. Secondary Attack Rate Disaggregated by Covariates
Non-West Coast Strain West Coast Strain
Positives Among
Tested Contacts (%)Mean Household
Attack Rate (95% CI)Positives Among
Tested Contacts (%)Mean Household
Attack Rate (95% CI)
Location San Francisco 88/321 (27.4%) 22.9% (17.2–28.8) 113/316 (35.8%) 37.5% (30.2–44.9) Outside of San Francisco 34/94 (36.2%) 34% (22.1–46.2) 48/136 (35.3%) 32.1% (22.2–42.1)Age group Age ! 12 31/78 (39.7%) … 41/79 (51.9%) … Age > 12 91/337 (27%) … 120/373 (32.2%) …Race/Ethnicity Latinx/Hispanic 107/372 (28.8%) … 136/379 (35.9%) … Not Latinx/Hispanic 15/43 (34.9%) … 25/73 (34.2%) …Household size 2 persons 1/14 (7.1%) 7.1% (0–21.4) 12/20 (60%) 60% (40–80) 3–4 persons 30/115 (26.1%) 26.5% (17.7–35.7) 35/102 (34.3%) 33.3% (23.7–43.6) 5+ persons 91/286 (31.8%) 28.1% (21.1–35.4) 114/330 (34.5%) 32% (25.1–39.2)Household density Bottom half 43/159 (27%) 23.8% (15.7–32.2) 52/176 (29.5%) 33% (24.2–42.3) Top half 76/243 (31.3%) 27.4% (20.1–35) 101/262 (38.5%) 35.7% (27.9–43.6)
Mean household secondary attack rate only reported disaggregated by household level characteristics.
Abbreviation: CI, confidence interval.
Table 2. Secondary Household Attack Rates for West Coast Variants, Combined and Disaggregated by B.1.427 and B.1.429
Unadjusted Adjusted
Positives Among Tested
Contacts (%)Mean Household Attack Rate
(95% CI) RR (95% CI) P-value aRR P-value
Class Non-West Coast 122/415 (29.4%) 25.6% (20.3–31) … … … …West Coast 161/452 (35.6%) 35.9% (30.1–41.9) 1.28 (1.00–1.64) .05 1.25 (.98–1.59) .07
Lineage B.1.427 78/235 (33.2%) 32.9% (25.4–40.6) 1.19 (0.89–1.59) .20 1.19 (.90–1.59) .20B.1.429 79/196 (40.3%) 40.9% (31.5–50.5) 1.43 (1.07–1.91) .02 1.36 (1.01–1.83) .04
Relative risks estimated based on Poisson regression using generalized estimating equations and cluster-robust standard errors. Adjustment variables included age group, Latinx/Hispanic race, household size, and household density.
Abbreviations: aRR, adjusted risk ratio; CI, confidence interval; RR, risk ratio.
Dow
nloaded from https://academ
ic.oup.com/cid/article/74/1/32/6206738 by guest on 12 April 2022

180
Chapter 7 References
1. Grubaugh ND, Hodcroft EB, Fauver JR, Phelan AL, Cevik M. Public health actions to control
new SARS-CoV-2 variants. Cell 2021; 184:1127–32.
2. Liu Z, VanBlargan LA, Bloyet L-M, et al. Identification of SARS-CoV-2 spike mutations that
attenuate monoclonal and serum antibody neutralization. Cell Host & Microbe 2021; 29:477–
488.e4.
3. Voloch CM, Francisco R da S, Almeida LGP de, et al. Genomic characterization of a novel
SARS-CoV-2 lineage from Rio de Janeiro, Brazil. J Virol 2021; 95. Available at:
https://jvi.asm.org/content/95/10/e00119-21. Accessed 17 May 2021.
4. Weisblum Y, Schmidt F, Zhang F, et al. Escape from neutralizing antibodies by SARS-CoV-
2 spike protein variants. eLife 2020;9:e61312.
5. Ferrareze PAG, Franceschi VB, Mayer A de M, et al. E484K as an innovative phylogenetic
event for viral evolution: genomic analysis of the E484K spike mutation in SARS-CoV-2
lineages from Brazil. bioRxiv 2021;2021.01.27.426895.
6. Zeller M, Gangavarapu K, Anderson C, et al. Emergence of an early SARS-CoV-2 epidemic
in the United States. medRxiv 2021;2021.02.05.21251235.
7. Fauver JR, Petrone ME, Hodcroft EB, et al. Coast-to-coast spread of SARS-CoV-2 during the
early epidemic in the United States. Cell 2020; 181:990–996.e5.
8. Kalinich CC, Jensen CG, Neugebauer P, et al. Real-time public health communication of local
SARS-CoV-2 genomic epidemiology. PLoS Biol 2020; 18:e3000869. 9.
9. Hodcroft EB, Domman DB, Oguntuyo K, et al. Emergence in late 2020 of multiple lineages
of SARS-CoV-2 spike protein variants affecting amino acid position 677. medRxiv
2021;2021.02.12.21251658.

181
10. COVID Testing Pop-up site Established at 24th & Mission to Help Combat Surge in the City’s
Most Impacted Community During this Holiday Season. 2020. Available at:
https://www.sfdph.org/dph/alerts/files/12.20.20_CCSF_Press_ Release.pdf.
11. Pilarowski G, Marquez C, Rubio L, et al. Field performance and public health response using
the BinaxNOWTM rapid severe acute respiratory syndrome coronavirus 2 (SARS-CoV-2)
Antigen Detection Assay During Community-Based Testing. Clin Infect Dis 2021; 73:e3098–
101.
12. Pilarowski G, Lebel P, Sunshine S, et al. Performance characteristics of a rapid severe acute
respiratory syndrome coronavirus 2 antigen detection assay at a public plaza testing site in San
Francisco. J Infect Dis 2021; 223:1139–1144.
13. Rubio LA, Peng J, Rojas S, et al. The COVID-19 symptom to isolation cascade in a Latinx
community: a call to action. Open Forum Infect Dis 2021; 8:ofab023. 14.
14. Kerkhoff AD, Sachdev D, Mizany S, et al. Evaluation of a novel community-based COVID-
19 ‘test-to-care’ model for low-income populations. PLoS One 2020; 15:e0239400.
15. ARTIC Project. hCoV-2019/nCoV-2019 version 3 amplicon set. Available at:
https://artic.network/resources/ncov/ncov-amplicon-v3.pdf. Accessed 25 February 2021.
16. Kalantar KL, Carvalho T, de Bourcy CFA, et al. IDseq—an open source cloud-based pipeline
and analysis service for metagenomic pathogen detection and monitoring. GigaScience 2020;
9. doi:10.1093/gigascience/giaa111.
17. Gelman A, Hill J. Data analysis using regression and multilevel/hierarchical models. New
York: Cambridge University Press, 2007.

182
18. Laan MJ van der, Rose S. Targeted learning in data science: causal inference for complex
longitudinal studies. London: Springer International Publishing, 2018. Available at:
https://www.springer.com/gp/book/9783319653037. Accessed 24 February 2021.
19. Elbe S, Buckland-Merrett G. Data, disease and diplomacy: GISAID’s innovative contribution
to global health. Glob Chall 2017; 1:33–46.
20. Chamie G, Marquez C, Crawford E, et al. Community transmission of severe acute respiratory
syndrome coronavirus 2 disproportionately affects the Latinx population during Shelter-in-
Place in San Francisco. Clin Infect Dis 2021; 73(Suppl. 2):S127–35.
21. Hadfield J, Megill C, Bell SM, et al. Nextstrain: real-time tracking of pathogen evolution.
Bioinformatics 2018; 34:4121–3.
22. Laserson U. laserson/squarify. 2021. Available at: https://github.com/laserson/ squarify.
Accessed 26 February 2021.
23. Zhang W, Davis BD, Chen SS, Martinez JMS, Plummer JT, Vail E. Emergence of a novel
SARS-CoV-2 strain in Southern California, USA. medRxiv 2021;2021.01.18.21249786.
24. Hoffmann M, Kleine-Weber H, Pöhlmann S. A Multibasic cleavage site in the spike protein
of SARS-CoV-2 is essential for infection of human lung cells. Mol Cell 2020; 78:779–784.e5.
25. Örd M, Faustova I, Loog M. The sequence at spike S1/S2 site enables cleavage by furin and
phospho-regulation in SARS-CoV2 but not in SARS-CoV1 or MERS- CoV. Sci Rep 2020;
10:16944.
26. Johnson BA, Xie X, Bailey AL, et al. Loss of furin cleavage site attenuates SARS- CoV-2
pathogenesis. Nature 2021; 591:293–299.
27. Jaimes JA, Millet JK, Whittaker GR. Proteolytic cleavage of the SARS-CoV-2 spike protein
and the role of the novel S1/S2 site. iScience 2020; 23:101212.

183
28. Madewell ZJ, Yang Y, Longini IM Jr, Halloran ME, Dean NE. Household Transmission of
SARS-CoV-2: a systematic review and meta-analysis. JAMA Netw Open 2020; 3:e2031756.
29. Volz E, Mishra S, Chand M, et al. Assessing transmissibility of SARS-CoV-2 lineage B.1.1.7
in England. Nature 2021; 593:266–269.

184
Chapter 8:
Neutralizing antibody responses to SARS-CoV-2 vaccination in Multiple Sclerosis patients
This chapter is a reprint of:
Sabatino JJ Jr, Mittl K, Rowles WM, McPolin K, Rajan JV, Laurie MT, Zamecnik CR, Dandekar
R, Alvarenga BD, Loudermilk RP, Gerungan C, Spencer CM, Sagan SA, Augusto DG,
Alexander JR, DeRisi JL, Hollenbach JA, Wilson MR, Zamvil SS, Bove R.
Multiple sclerosis therapies differentially affect SARS-CoV-2 vaccine-induced antibody and T
cell immunity and function. JCI Insight. 2022; Feb 22;7(4):e156978.
doi:10.1172/jci.insight.156978.
Supplemental files that are not figures can be found with the original work.

185
Abstract
Background
Vaccine-elicited adaptive immunity is a prerequisite for control of SARS-CoV-2 infection.
Multiple sclerosis (MS) disease-modifying therapies (DMTs) differentially target humoral and
cellular immunity. A comprehensive comparison of the effects of MS DMTs on SARS-CoV-2
vaccine–specific immunity is needed, including quantitative and functional B and T cell responses.
Methods
Spike-specific Ab and T cell responses were measured before and following SARSCoV-2
vaccination in a cohort of 80 study participants, including healthy controls and patients with MS
in 6 DMT groups: untreated and treated with glatiramer acetate (GA), dimethyl fumarate (DMF),
natalizumab (NTZ), sphingosine-1-phosphate (S1P) receptor modulators, and anti-CD20 mAbs.
Anti–spike-Ab responses were assessed by Luminex assay, VirScan, and pseudovirus
neutralization. Spike-specific CD4+ and CD8+ T cell responses were characterized by
activationinduced marker and cytokine expression and tetramer.
Results
Anti-spike IgG levels were similar between healthy control participants and patients with
untreated MS and those receiving GA, DMF, or NTZ but were reduced in anti-CD20 mAb– and
S1P-treated patients. Anti-spike seropositivity in anti-CD20 mAb–treated patients was correlated
with CD19+ B cell levels and inversely correlated with cumulative treatment duration. Spike
epitope reactivity and pseudovirus neutralization were reduced in anti-CD20 mAb– and S1P-
treated patients. Spike-specific CD4+ and CD8+ T cell reactivity remained robust across all

186
groups, except in S1P-treated patients, in whom postvaccine CD4+ T cell responses were
attenuated.
Conclusion
These findings from a large cohort of patients with MS exposed to a wide spectrum of MS
immunotherapies have important implications for treatment-specific COVID-19 clinical
guidelines. FUNDING. NIH grants 1K08NS107619, K08NS096117, R01AI159260,
R01NS092835, R01AI131624, and R21NS108159; NMSS grants TA-1903-33713 and RG1701-
26628; Westridge Foundation; Chan Zuckerberg Biohub; Maisin Foundation.
Introduction
Multiple sclerosis (MS) is an inflammatory demyelinating condition of the central nervous
system that is treated with more than 20 different, approved disease modifying therapies (DMTs)
(1). MS DMTs differ considerably in their mechanisms of action, with variable impacts on humoral
and cellular immune functions that can lead to associated risks of certain infections (2). COVID-
19 is an infectious disease caused by SARS-CoV-2, which has resulted in a pandemic that has been
ongoing since early 2020. Control of SARS-Cov-2 infection involves mobilization of Ab- and T
cell–mediated immunity (3–5). Evidence suggests that patients with MS who receive anti-CD20
mAb therapies are at higher risk for hospitalization due to COVID-19 infection (6, 7). Recent
reports have demonstrated that patients with MS treated with an anti-CD20 mAb or S1P receptor
modulators have reduced or undetectable spike antigen–specific IgG following COVID-19
infection (8–12).

187
Vaccines based on the SARS-CoV-2 spike protein have proven to be highly effective in
preventing serious sequelae of COVID-19, in which protective immunity involves a combination
of robust Ab and CD4+ and CD8+ T cell responses (13–16). Given the variable effects of different
classes of MS DMTs on humoral and cellular immunity, there is much concern that SARS-CoV-
2 vaccine immunity may be blunted by certain MS treatments and thus result in increased risk of
serious complications from COVID-19. Indeed, most MS DMTs have been reported to at least
partially affect vaccine-elicited Ab and/or T cell immunity (17, 18). To date, the majority of studies
evaluating SARS-CoV-2 vaccine responses in patients with MS have been limited to measuring
Ab titers, demonstrating reduced spike antigen–specific Ab responses in patients with MS treated
with anti-CD20 mAbs and S1P receptor modulators (8, 19–22). No studies to date, to our
knowledge, have investigated how MS DMTs affect the functional reactivity against the spike
protein, which is vital for Ab-mediated protection against COVID-19 (4, 23). Although several
reports have also indicated largely intact spike antigen–specific T cell responses in vaccinated
patients with MS treated with anti-CD20 mAbs (19, 24), there currently are no available data
comparing SARS-CoV-2 vaccine– specific CD4+ and CD8+ T cell reactivity across patients
treated with different DMTs. This represents an important gap in our understanding of COVID-19
susceptibility in at-risk patient populations.
The goal of this study was to systematically analyze SARS-CoV-2 vaccine–induced
humoral and cellular immune responses in patients with MS treated with an array of different
immunotherapies. Spike antigen–specific IgG and CD4+ and CD8+ T cell responses were
measured before and after SARS-CoV-2 vaccination in a cohort of healthy control individuals
(HCs; n = 13) and patients with MS (n = 67) across 6 different types of treatment: untreated,
glatiramer acetate (GA), dimethyl fumarate (DMF), natalizumab (NTZ), S1P receptor modulators,

188
and anti-CD20 mAbs. Patients with MS treated with anti-CD20 mAbs or S1P receptor modulators
had substantially reduced levels of total spike IgG and spike receptor-binding domain–specific
(RBD-specific) IgG with binding to a restricted array of spike immune determinants. Spike-Ab
seropositivity in anti-CD20 mAb–treated patients was associated with higher CD19+ B cell levels
and was inversely correlated with cumulative duration of anti-CD20 mAb therapy. In patients
treated with anti-CD20 mAbs and S1P receptor modulators who had detectable anti–spike Abs,
pseudovirus neutralization was markedly blunted and directly correlated with reduced levels of
spike RBD IgG levels. In contrast to the humoral response, spike antigen–specific CD4+ and
CD8+ T cell responses were similar overall in frequency in all MS-treatment groups and had
similar cytokine and memory profiles. However, spike-specific CD4+ T cell frequencies did not
significantly increase in patients treated with S1P receptor modulators following vaccination.
These findings, therefore, provide new critical insights into the differential effects of MS DMTs
on SARS-CoV-2 vaccine–elicited adaptive immunity with important consequences for clinical
decision-making in vulnerable immunosuppressed patients.
Results
Study overview
To study the effects of different MS DMTs on SARS-CoV-2 vaccine–induced immune
responses, we recruited a cohort of 80 participants comprising HCs (n = 13) and patients with MS
who were receiving no treatment (n = 9) or were treated with GA (n = 5), DMF (n = 5), NTZ (n =
6), S1P receptor modulators (n = 7), or anti-CD20 mAbs, including rituximab (RTX; n = 13) or
ocrelizumab (OCR; n = 22) (Table 1). Baseline samples were collected prior to SARS-CoV-2
vaccination (mean 7.2 days, range 0–34 days before first vaccine) and postvaccination samples

189
were collected approximately 2 weeks following the second mRNA COVID-19 vaccination
(BNT162b2 or mRNA-1273; mean 15.7 days, range 11–40 days) or 4 weeks following adenoviral
vaccination (Ad26.COV2.S; mean 28.5 days, range 28–29 days).
Overview of basic immune cell subsets
The percentages of immune cell subsets, including CD4+ and CD8+ T cells, CD19+ B
cells, CD14+, CD14+ CD16+, and CD16+ cells, were evaluated in all participants before and after
SARS-CoV-2 vaccination, using the gating strategy shown in Supplemental Figure 1A
(supplemental material available online with this article;
https://doi.org/10.1172/jci.insight.156978DS1). Except for CD14+ CD16+ cells in GA-treated
patients (P = 0.0425), no significant differences were observed in any of the immune cell subsets
before and after SARS-CoV-2 vaccination in all other cohorts (Supplemental Figure 1, B–G).
Although the percentage of CD8+ T cells was not significantly affected by treatment status, the
percentage of CD4+ T cells was significantly reduced before (P < 0.0001) and after (P < 0.0001)
vaccination in S1P receptor modulator–treated patients compared with patients in the untreated
group, consistent with the known mechanism of action of S1P receptor modulators (25)
(Supplemental Figure 1B). As expected, the percentages of CD19+ B cells were also significantly
reduced at both collection time points in patients treated with S1P receptor modulators (P <
0.0001), RTX (P < 0.0001), and OCR (P < 0.0001) compared with patients with untreated MS
(Supplemental Figure 1D).
Semiquantitative analysis of anti–spike Abs by MS treatment type
Total spike IgG and spike RBD IgG levels were measured as net MFI after normalization
to a background BSA control (26). HCs, patients with untreated MS, and patients with MS treated

190
with GA, DMF, or NTZ demonstrated significantly increased total spike IgG (Figure 8.1A) and
spike RBD IgG (Figure 8.1B) levels following SARS-CoV-2 vaccination, compared with their
respective prevaccination time points. Of note, the one patient with untreated MS who received
the single-injection Ad26.COV2.S vaccine also had the lowest total spike and spike RBD IgG Ab
levels. In contrast, vaccine-elicited total spike and spike RBD IgG levels were variable among
patients treated with S1P receptor modulators, RTX, and OCR, with undetectable Ab levels in
some patients and near-normal IgG levels in others (Figure 8.1, A and B). Overall, patients treated
with S1P receptor modulators and RTX had no significant increase in postvaccination total spike
IgG compared with prevaccination levels, whereas spike RBD IgG levels in the S1P receptor
modulator, RTX, and OCR groups were not significantly increased following COVID-19
vaccination (Figure 8.1, A and B). Postvaccination total spike IgG levels in HCs and patients with
MS treated with GA, DMF, or NTZ were similar to those in patients with untreated MS, but spike
RBD IgG levels were significantly higher in the DMF (P = 0.038) and NTZ (P < 0.0001) groups.
In contrast, postvaccination total spike and spike RBD IgG levels were significantly reduced in
patients with MS treated with S1P receptor modulators (P = 0.02 and P = 0.01, respectively), RTX
(P = 0.001 and P = 0.002, respectively), and OCR (P = 0.005 and P = 0.0004, respectively) (Figure
8.1, A and B). IgG seropositivity to total spike protein and spike RBD following SARS-CoV-2
vaccination was also compared between patients in the untreated MS group and all other cohorts.
Only patients treated with RTX had a significant decrease in total spike IgG seropositivity (23.1%
± 12.2% SEM; P < 0.0001), whereas those treated with S1P receptor modulators, RTX, and OCR
had significant reductions in spike RBD IgG seropositivity (42.9 ± 20.2% SEM, P = 0.01; 7.7 ±
7.7% SEM, P < 0.0001; and 36.4 ± 10.5% SEM, P = 0.0002, respectively) (Figure 8.1C). These
findings are consistent with recent reports indicating reductions in SARS-CoV-2 spike-specific

191
Abs in SARS-CoV-2 vaccinated patients with MS treated with S1P receptor modulators and anti-
CD20 mAbs (8, 19, 20).
Factors associated with anti-spike IgG seropositivity in patients with MS treated with anti-CD20
mAbs and S1P receptor modulators
Given the variations in total spike and spike RBD IgG levels in patients with MS receiving
anti-CD20 mAbs, we investigated factors associated with SARS-CoV-2 vaccine-elicited Ab
responses. Within the anti-CD20 mAb cohorts (i.e., RTX and OCR), we conducted a univariate
analysis of anti–spike-Ab responses by age, sex, vaccine type, cumulative treatment duration prior
to vaccination, total IgG levels, interval between last anti-CD20 infusion and first vaccine dose,
lymphocyte subsets before and after vaccination, and HLA-DRB1*15:01 status, given its well-
established association with MS susceptibility (27).
There was no significant association between total spike or spike RBD IgG seropositivity
and age, sex, mRNA-vaccine type, last measured total IgG levels, percentages of CD4+ and CD8+
T cells, or HLADRB1*15:01 status (Supplemental Table 1). Although there was not a significant
difference between the percentage of prevaccination CD19+ B cells and total spike and spike RBD
serostatus, there was a significant increase in patients seropositive for postvaccination CD19+ B
cells and total spike (P = 0.0021) and spike RBD (P = 0.0158) compared with those who were
seronegative (Figure 8.1, D and E, and Supplemental Table 1). Similarly, although there was no
significant correlation with total spike and spike RBD IgG levels and percentages of CD19+ B
cells prior to vaccination (Supplemental Figure 2, A and B), there was a strong positive correlation
between the percentage of postvaccination CD19+ B cells and total spike IgG (r = 0.6084; P =
0.0001) and spike RBD IgG (r = 0.4166; P = 0.0128) levels (Supplemental Figure 2, C and D).

192
The mean interval between blood sample collection at prevaccination and postvaccination
in patients receiving anti-CD20 mAb treatment was 6.6 weeks; therefore, we reasoned a potential
difference for the discrepancy in correlations of CD19+ B cell levels at the 2 time points was
possible interim B cell reconstitution during the vaccination period. We calculated the differences
in percentages of CD19+ B cells between the postvaccine and prevaccine time points and observed
a significant correlation between CD19+ B cell changes and total spike (r = 0.4903; P = 0.0028)
and spike RBD (r = 0.4005; P = 0.0171) IgG levels (Supplemental Figure 2, E and F), providing
support for this hypothesis.
Given variability in the timing of anti-CD20 mAb infusions caused by the ongoing SARS-
CoV-2 pandemic, we also assessed whether differences in the interval between the last prior anti-
CD20 mAb infusion and first SARS-CoV-2 vaccination could be related to vaccine-induced IgG
responses, which have been reported previously (19, 20). In the combined anti-CD20 mAb cohorts,
we did not observe any significant association of infusion to vaccination interval and total spike
and spike RBD IgG levels (Supplemental Figure 2, G and H, and Supplemental Table 1). We also
assessed the cumulative duration of anti-CD20 mAb treatment (i.e., time from start of anti-CD20
mAb treatment until first SARS-CoV-2 vaccination). Longer cumulative duration of anti-CD20
mAb treatment was significantly inversely correlated with total spike IgG and spike RBD IgG
levels (Figure 8.1, F and G) and was significantly associated with serostatus (Supplemental Table
1). Although there was no significant difference between the last infusion to vaccination interval
in patients treated with RTX and OCR (median 5.0 months and 4.3 months, respectively; P = 0.90),
the significant reduction in total spike IgG seropositivity in the RTX group compared with the
OCR group (Figure 8.1C) was explained by a significantly increased cumulative duration of
therapy in the RTX group compared with the OCR cohort (median 56.4 months and 36.4 months,

193
respectively; P = 0.0017) (Figure 8.1H). We did not find a significant correlation between
cumulative duration of anti-CD20 mAb therapy and the percentages of CD19+ B cells before or
after vaccination (P = 0.99 and P = 0.29, respectively).
Given reports of variable anti-spike seropositivity among patients treated with S1P receptor
modulators (8, 22), we also assessed factors contributing to differences in Ab outcomes. Although
S1P receptor modulator–treated patients composed a smaller cohort, we observed a nonsignificant
trend between longer cumulative duration of S1P receptor modulator therapy and lower total spike
and spike RBD IgG levels (Figure 8.1, I and J). There was no significant relationship between total
spike and spike RBD IgG levels and absolute lymphocyte count and numbers of CD19+ B cells,
CD4+ T cells, or CD8+ T cells.
Identification of anti-spike protein IgG determinants by coronavirus VirScan
We further explored the immune determinants of SARS-CoV-2 vaccine–induced IgG using
VirScan analysis (https://www.virscan.org/) of patient sera from pre- and postvaccination time
points. Sera samples were probed against a library of overlapping peptides (n = 38 amino acids
each) spanning the entire proteomes of 9 different human coronaviruses (including SARS-CoV-2)
as well as a peptide library of the spike protein of SARS-CoV-1 and SARS-CoV-2, as previously
demonstrated in patients with COVID-19 (26).
No signal was detected against spike peptide sequences from any of the sera samples from
individuals before they were vaccinated, indicating that all measured spike-specific IgG responses
resulted from SARS-CoV-2 vaccination rather than preexisting cross-reactive immunity against
other coronaviruses. Multiple Ab-binding determinants were revealed throughout the spike
protein, including against the N-terminal domain, regions flanking the RBD, the S1/S2 cleavage
site, the fusion site, as well as the C-terminal region, in HCs and untreated patients with MS (Figure

194
8.2). Of note, neutralizing Abs targeting RBD epitopes are largely conformation dependent (28),
which is generally not well represented by phage-displayed linear peptides. Anti–spike-Ab
reactivity was slightly more narrowed in patients treated with GA, DMF, or NTZ, with some loss
of reactivity in subdominant N-terminal domain and C-terminal regions. In patients treated with
anti-CD20 mAbs and S1P receptor modulators, however, seroreactivity against the spike protein
was primarily restricted to determinants flanking the RBD and the C-terminal regions (Figure 8.2,
signal-intensity column). In addition, several in the OCR group also had detectable reactivity to
portions of the S2 subunit. These findings, therefore, highlight that anti-CD20 mAb and S1P
receptor modulator treatments may lead to qualitative changes in the breadth of anti-spike IgG
epitopes in addition to quantitative changes in the overall spike IgG titer.
Functional assessment of anti-SARS-CoV-2 Abs by pseudoviral neutralization
Given the reduction in anti-spike levels and binding determinants in patients treated with
anti-CD20 mAbs and S1P receptor modulators, we investigated whether virus neutralization might
be consequently affected. Using a pseudovirus neutralization assay (see Methods), we compared
neutralization in patients treated with anti-CD20 mAbs (n = 5) and S1P receptor modulators (n =
3) who were seropositive by VirScan with neutralization in representative HCs (n = 5) and
untreated patients with MS (n = 5) from our cohort. Although pseudovirus neutralization was
robust among HCs and untreated patients with MS, neutralization was significantly reduced in
patients treated with anti-CD20 mAbs and S1P receptor modulators (Figure 8.3A). Consistent with
prior reports (29), pseudovirus neutralization was significantly correlated with spike RBD IgG
levels (Figure 8.3B). A weaker but still significant correlation was found between total spike IgG

195
levels and neutralization (r = 0.5604; P = 0.0156), providing support that not all anti–spike Abs
are capable of neutralization.
Overall, we found that the reduced pseudovirus neutralization in patients treated with anti-
CD20 mAbs and S1P receptor modulators was highly correlated with reduced spike RBD IgG
levels (Figures 8.3C). These findings, therefore, indicate that SARS-CoV-2 neutralization appears
to be compromised among the subset of patients treated anti-CD20 mAbs and S1P receptor
modulators who had detectable anti–spike Abs (i.e., seropositive patients).
Evaluation of spike antigen-specific CD4+ and CD8+ T cells
We investigated the frequency and phenotype of spike antigen-specific CD4+ and CD8+
T cells, using pools of spike peptides spanning the entire spike protein by activation-induced
marker (AIM) expression and intracellular cytokine stimulation (ICS) (see gating strategies in
Supplemental Figure 3). In the AIM assay, antigen reactivity was assessed by CD137 and OX-40
co-expression in CD4+ T cells and CD137 and CD69 co-expression by CD8+ T cells (Figure 8.4,
A and D), as previously demonstrated (30). Cytokine analysis included IFN-γ, TNF-α, and IL-2,
the dominant cytokines produced by spike-specific T cells (30, 31), as well as IL-4 and IL-10,
which can be upregulated by certain MS DMTs (32).
A significant increase in spike-specific CD4+ T cells was observed by AIM in all
postvaccination groups apart from the S1P receptor modulators cohort (Figure 8.4B), likely due to
the pronounced S1P-mediated CD4+ T cell lymphopenia. Importantly, none of the postvaccination
MS treatment groups showed a significant reduction in spike-specific CD4+ T cells compared with
untreated patients with MS (Figure 8.4B). CD4+ T cells from all postvaccination cohorts produced
similar frequencies of IFN-γ, TNF-α, and IL-2, indicating broad polyfunctionality regardless of

196
MS treatment status (Figure 8.4C). In contrast, frequencies of IL-4– and IL-10– producing CD4+
T cells were minimal with no changes in any of the DMT MS cohorts. The numbers of spike
antigen–specific CD8+ T cells were significantly increased in all postvaccination MS cohorts
except the GA-treated group (Figure 8.4E), which was likely influenced by the smaller sample size
of that group. Moreover, none of the postvaccination MS treatment groups had a significant
reduction of spike-specific CD8+ T cells measured by AIM, compared with untreated patients with
MS (Figure 8.4E).
Cytokine production by postvaccination spike antigen–specific CD8+ T cells revealed
similar polyfunctionality, with significant production of IFN-γ, TNF-α, and IL-2, but minimal IL-
4 and IL-10 production (Figure 8.4F). Although cytokine responses were similar overall among
all MS treatment cohorts, a significant increase in IFN-γ+ CD8+ T cells was observed in patients
receiving RTX and OCR and in TNF-α+ CD8+ T cells in patients treated with S1P receptor
modulators and RTX, compared with HCs (Figure 8.4F). In addition, no significant relationship
was found between the frequencies of spike-specific CD4+ and CD8+ T cells measured by AIM
and total spike and spike RBD IgG levels or serostatus in anti-CD20 mAb–treated patients.
Ex vivo evaluation of spike antigen–specific CD8+ T cells by peptide MHC tetramers
Having demonstrated robust expansion of spike-specific T cells following SARS-CoV-2
vaccination, we sought to further characterize the individual SARS-CoV-2 vaccine-elicited CD8+
T cell response at the individual epitope level. Ex vivo analysis of spike-specific CD8+ T cells by
peptide MHC (pMHC) tetramers was performed in a subset of postvaccination participants from
the HCs and each MS cohort (Supplemental Table 2). Several panels of pMHC tetramers were
generated using previously published spike epitopes (16, 31, 33–35). Combinatorial tetramer

197
staining (Supplemental Table 3) and enrichment were performed as previously described (36, 37).
Spike-specific CD8+ T cells identified by tetramer enrichment were subsequently assessed for
memory status by CCR7 and CD45RA expression (Figure 8.5A).
The proportion of samples with detectable spike tetramer–positive CD8+T cells was
similar across all MS cohorts, ranging from 27% to 56% tetramer positivity (Figure 8.5B). The
mean frequencies of spike tetramer–positive CD8+ T cells did not significantly differ between MS
cohorts (Figure 8.5C), although there were variations in spike-specific CD8+ T cell population
sizes, which was at least partially related to differences in the HLA genotypes available for
tetramer analysis across the different patient cohorts (Supplemental Table 2). Consistent with a
postvaccination response measured in peripheral blood samples, spike-specific CD8+ T cells were
predominantly effector memory (Tem), which were significantly higher than corresponding naive
T cell (Tn) populations in all cohorts (Figure 8.5D). In addition, the proportion of Tn, T central
memory (Tcm), Tem, and Tem cells reexpressing CD45RA (Temra) spike-specific CD8+ T cells
did not significantly differ across any of the MS cohorts. Overall, these findings indicate that the
magnitude and activation state of SARS-CoV-2 vaccine–elicited T cell responses are not
substantially changed by the various MS immunotherapies evaluated in this study.
Discussion
MS DMTs differentially affect humoral and cell-mediated immunity, both of which are
essential for protection against COVID-19 (3, 5). In support of this, recently reported data indicate
that unvaccinated patients with MS receiving anti-CD20 mAb treatments are at higher risk for
severe COVID-19 (6, 7). To date, the majority of studies evaluating SARS-CoV-2 vaccine
responses in patients with MS have been limited to measuring Ab levels (9–12, 22), and those that

198
have explored T cell reactivity have primarily focused on anti-CD20 mAb–treated patients (19,
24, 38). Moreover, no MS studies to date, to our knowledge, have investigated how DMTs affect
neutralization against SARS-CoV-2, a key correlate of immune protection (4). Thus, there is a
significant need to comprehensively investigate how different MS DMTs affect SARSCoV-2
vaccine–elicited Ab and CD4+ and CD8+ T cell immunity
Following vaccination, untreated patients with MS and those treated with GA, DMF, or
NTZ mounted similar total spike and spike RBD IgG responses, compared with HCs. In contrast,
patients treated with S1P receptor modulators or anti-CD20 mAbs had significantly reduced levels
of total spike and spike RBD IgG, consistent with findings in recent reports (9–12). We did not
observe a clear relationship between spike-Ab seropositivity and anti-CD20–mAb infusion
interval and SARS-CoV-2 vaccination, in contrast to findings of several other studies (8, 19, 20,
22, 24). This disparity could be due to differences in patient populations or methodology. Our
finding that the percentage of CD19+ B cells following vaccination, but not prior to vaccination,
was significantly associated with spike-Ab seropositivity suggests that interval B cell
reconstitution occurring in lymphoid tissue prior to circulation in the blood may be sufficient for
Ab generation. Indeed, this idea is supported by a recent finding that spike–IgG seropositivity is
present in a portion of anti-CD20 mAb–treated patients with MS despite the absence of circulating
spike-specific B cells (19). Furthermore, the negative effect of cumulative anti-CD20 mAb
treatment duration on spike–IgG seropositivity suggests that although essentially all circulating B
cells are rapidly depleted following anti-CD20 mAb treatment, B cells may initially persist in
smaller numbers in secondary lymphoid tissue (39) but are ultimately depleted with long-term
treatment. It is also interesting to note that certain S1P receptor modulator–treated patients had
near-normal total spike and spike RBD IgG levels, while other patients did not seroconvert. S1P

199
receptor modulators sequester B cells and T cells in secondary lymphoid tissues and disrupt
germinal center formation (40), which is an important part of humoral reactivity following SARS-
CoV-2 mRNA vaccination (41). It is possible the differences in Ab outcomes are related to S1P
receptor modulator treatment duration; however, this conclusion is limited by lower patient
numbers in the S1P receptor modulators cohort.
A strength of our study was the ability to assess high-resolution Ab reactivity across the
entire spike protein using programmable phage display (VirScan) and to assess functional
reactivity by pseudovirus neutralization. Ab reactivity against a broad range of spike determinants
was observed among HCs and untreated patients with MS, including regions vital for SARS-CoV-
2 entry into cells. In contrast, Ab reactivity was restricted to a narrower range of spike epitopes in
seropositive patients with MS treated with S1P receptor modulators and anti-CD20 mAbs.
Moreover, pseudovirus neutralization was significantly attenuated in patients receiving anti-CD20
mAb and S1P receptor modulator therapies, which directly correlated with reduced spike RBD
IgG titers. These findings are clinically important because they highlight the limited applicability
of using anti-spike seropositivity alone as a marker of immune protection. Rather, these data
emphasize the importance of achieving high-titer spike RBD seroreactivity to infer adequate viral
neutralization ability in patients with MS who are receiving certain immunotherapies. The SARS-
CoV-2 sequences used in the VirScan (ancestral Wuhan-1) and neutralization assays (B.1 D614G)
did not assess reactivity to more recent variants that harbor multiple mutations in the spike protein,
such as B.1.617.2 (Delta) and B.1.1.529 (Omicron). Given the impacts of anti-CD20 mAbs and
S1P receptor modulators on spike reactivity and neutralization, our findings raise the concern that
protective Ab immunity will be further compromised against spike protein mutants.

200
We also performed an extensive analysis of spike-specific CD4+ and CD8+ T cells in all
participants before and after SARS-CoV-2 vaccination. In contrast to the humoral response, spike-
specific CD4+ and CD8+ T cell responses were largely intact across all MS cohorts irrespective
of DMT status. Vaccine-elicited CD4+ T cell responses were diminished in patients treated with
S1P receptor modulators, which is consistent with the preferential reduction of circulating CD4+
T cells by S1P receptor modulators (25). In addition, spike-specific CD4+ and CD8+ T cells from
all MS treatment groups produced multiple effector cytokines, suggesting DMT exposure did not
alter T cell polyfunctionality. Interestingly, we observed a trend toward increased CD8+ T cell
cytokine production in anti-CD20 mAb–treated patients compared with untreated patients with
MS, which was significantly increased in the case of IFN-γ+ CD8+ T cells in both anti-CD20 mAb
cohorts. These findings support those in recent similar reports of increased SARS-CoV-2-specific
CD8+ T cell activation in anti-CD20 mAb–treated patients with MS (19, 24) and suggest that B
cell depletion may result in compensatory changes in certain aspects of cellular immunity.
However, the mechanism of such T cell–mediated changes and whether this has a protective effect
against COVID-19 remain unknown.
A limitation of our study was the relatively smaller number of patients in certain MS
treatment groups. Nonetheless, the results of our study have important potential implications for
clinical guidance about treatment of patients with MS and other autoimmune conditions with
similar immunotherapies. Our findings support similar findings of impaired SARS-CoV-2
vaccine–elicited humoral immunity in a variety of vulnerable, immunocompromised patient
populations (42, 43). The finding that certain MS immunotherapies preferentially disrupt SARS-
CoV-2 vaccine–induced humoral immune responses both quantitatively and functionally raises the
concern that patients receiving such therapies may be at higher risk of contracting vaccine-

201
breakthrough COVID-19 (44). In addition, our data highlight the cumulative negative impact of
prolonged anti-CD20 mAb treatment on the generation of de novo humoral immunity. On the other
hand, the preservation of cell-mediated immunity provides reassurance that most
immunosuppressed patients with MS will obtain at least partial protection from more severe
COVID-19 outcomes. An outstanding question is whether immunosuppressed patients with MS
will benefit from booster SARS-CoV-2 vaccinations, either by Ab seroconversion and/or
augmentation of cell-mediated immunity. The data from our study, therefore, provide important
insights regarding COVID-19 risk assessment and SARS-CoV-2 vaccination practices for
immunosuppressed patient populations.
Methods
Study design
In this prospective observational study, participants included patients with clinically
definite MS (by 2017 McDonald criteria) (45) and HCs (i.e., not immunocompromised or
receiving immunosuppressive therapy) aged 18 to 75 years. MS cohorts included patients not
receiving any treatment (no DMT in the prior 6 months) or treated with GA, DMF, NTZ, any S1P
receptor modulator, or i.v. anti-CD20 mAb therapy (i.e., RTX or OCR). No patients were treated
with chronic daily steroids or high-dose steroids within 3 months of sample collection; however,
most anti-CD20 mAb–treated patients received steroids as part of their preinfusion treatment
regimen. Only participants with no history of COVID-19 and not previously vaccinated against
SARS-CoV-2 prior to enrollment were included. All study participants completed full SARS-
CoV-2 vaccination with one of the FDA-approved or authorized vaccines (i.e.,
Comiranty/BNT162b2 from Pfizer/BioNTech, mRNA-1273 from Moderna, or Ad26.COV2 from
Johnson & Johnson). Blood samples were collected from all individuals before and 2 weeks (for

202
Comirnaty/BNT162b2 and mRNA-1273) or 4 weeks (for Ad26. COV2) after final SARS-CoV-2
vaccination. Basic participant characteristics and vaccine-related variables are outlined in
Supplementary Table 1. Treatment-specific characteristics were recorded from the medical record
for anti-CD20 mAb– and S1P receptor modulator–treated patients with MS. For patients receiving
anti-CD20 mAb therapy, total IgG (last measured prior to vaccine), total cumulative treatment
duration (i.e., time from start of antiCD20 mAb treatment until first vaccine dose), and treatment
interval between last anti-CD20 mAb infusion and first vaccine dose were recorded. Absolute
lymphocyte count (last measured prior to vaccine) and total cumulative treatment duration were
also recorded for patients treated with S1P receptor modulators.
Sample collection and processing
Blood samples were collected from consented participants at the Neurosciences Clinical
Research Unit at the University of California, San Francisco, or the patient’s residence through
ExamOne (a Quest Diagnostics company). At each time point, 90 mL of whole blood was collected
in heparinized tubes and an additional 10 mL of blood was collected in serum separator tubes. All
samples were processed within 24 hours of collection. Blood samples were spun at 500g for 10
minutes and plasma and serum were removed and frozen at –80°C until ready for use. Whole-
blood pellets were resuspended in 1× Dulbecco’s PBS and PBMCs were isolated over Ficoll
gradient. PBMCs were frozen in freezing medium (10% DMSO and 90% FBS) and stored in liquid
nitrogen until the day of experimentation.

203
Semiquantitative spike-Ab analysis by Luminex assay
Spectrally distinct Luminex beads were conjugated with trimeric spike protein (residues
1–1213), spike RBD (residues 328–533) (provided by John Pak, Chan Zuckerberg Biohub), or
BSA fraction V (Sigma-Aldrich, catalog 10735094001) at a concentration of 5 μg of protein per 1
million beads. Conjugation was done via an EDC/sulfo–N-hydroxysuccinimide coupling strategy
to terminal amines using Ab coupling kit following manufacturer’s instructions (Luminex, catalog
40-50016), as performed previously (26). All serological analyses were performed in duplicate,
and beads were pooled on the day of use. Thawed serum samples were diluted in PBS + 0.05%
Tween 20 (PBST) containing 1% nonfat milk and mixed with pooled protein-coated beads (2000–
2500 beads per protein) at a final serum dilution of 1:500. Samples were incubated for 1 hour at
room temperature, washed, and stained with 1:2000 anti–human IgG Fc Ab PE (BioLegend,
catalog 637310) in PBST for 30 minutes at room temperature. Beads were washed with PBST and
analyzed in a 96-well format on a Luminex LX 200 cytometer. The net MFI was recorded for each
set of beads. The mean net MFI for total spike and spike RBD for each sample was divided by the
net MFI for the corresponding BSA negative control. A net MFI ≥5.0 was used as a cutoff for total
spike and spike RBD seropositivity, which has been previously demonstrated to be highly sensitive
and specific (46).
Ab analysis by CoV VirScan
Coronaphage library design and construction, immunoprecipitation, and generation of
peptide count tables were performed as previously described (26). All peptide counts were
converted to reads/100,000 reads (rp100k). For each vaccinated individual, peptide enrichment
was calculated relative to the corresponding prevaccination sample as

204
rp100kpostvaccination/rp100kprevaccination. For each sample, enrichments were log
transformed, and a z score calculated for each peptide in each sample. Peptides with z scores > 3
in postvaccination samples were considered significantly enriched over prevaccination.
Seroreactivity maps were generated for each sample by aligning each significantly enriched
peptide to the concatenated ORFs of SARS-CoV-2, focusing on the spike protein. Signal intensity
at each position in the spike protein was the sum of signal for all peptides covering each position
and was used to generate heatmaps as well as plots depicting the proportion of individuals with
seroreactivity at each position in each treatment group.
SARS-CoV-2 pseudovirus neutralization assay
SARS-CoV-2 pseudoviruses were generated using a previously described recombinant
vesicular stomatitis virus expressing GFP in place of the VSV glycoprotein (47). The SARS-CoV-
2 spike gene bearing the D614G mutation was cloned in a CMV-driven expression vector and used
to produce SARS-CoV-2 spike reporter pseudoviruses. Pseudoviruses were titered on Huh7.5.1
cells overexpressing ACE2 and TMPRSS2 (a gift from Andreas Puschnik, Chan Zuckerberg
Biohub) using GFP expression to measure the concentration of focus-forming units (ffu), as
recently described (48). Huh7.5.1-ACE2-TMPRSS2 cells were seeded in 96-well plates at a
density of 7000 cells/well 1 day prior to pseudovirus inoculation. Cells were verified to be free of
mycoplasma contamination with the MycoAlert Mycoplasma Detection Kit (Lonza). Serum
samples (heat inactivated at 56°C for 30 minutes prior to neutralization) were diluted into complete
culture media (DMEM with 10% FBS, 10 mM HEPES, 1× Pen-Strep-Glutamine) using the
LabCyte Echo 525 liquid handler. To each well we added 1500 ffu of SARS-CoV-2 pseudovirus
to reach final dilutions ranging from 1:20 to 1:2560, including no-serum and no-pseudovirus

205
controls. Serum/pseudovirus mixtures were incubated at 37°C for 1 hour before being added
directly to cells. Cells inoculated with serum/pseudovirus mixtures were incubated at 37°C and
5% CO2 for 24 hours, resuspended using 10× TrypLE Select (Gibco), and cell fluorescence was
measured with the BD Celesta flow cytometer. All neutralization assays were repeated for a total
of 3 independent experiments, with each experiment containing 2 technical replicates for each
condition. Flow cytometry data were analyzed with FlowJo to determine the percentage of cells
transduced with pseudovirus (i.e., GFP positive). Percent neutralization for each serum dilution
was calculated by normalizing GFP-positive cell percentage to no-serum control wells. Fifty
percent neutralization titers (NT50) were calculated from 8-point response curves generated in
GraphPad Prism 7 using 4-parameter logistic regression.
Flow cytometry analysis of basic immune cell subsets.
PBMCs were thawed, washed, and equilibrated in RPMI medium with 10% FBS for 2
hours at 37°C and stained with the indicated cell-surface panel for identifying immune cell subsets,
as shown in Supplemental Table 4. All samples were collected on an LSR Fortessa (BD). The
gating strategy used is shown in Supplemental Figure 1A. Flow cytometry analysis was completed
using FlowJo (BD).
T cell analysis by AIM expression and ICS
PBMCs were thawed, washed, and equilibrated in RPMI medium with 10% FBS for 2
hours at 37°C prior to initiation of functional T cell studies. PBMCs were washed and resuspended
in serum-free RPMI medium for AIM studies or resuspended in serum-free RPMI medium
containing 1:500 GolgiStop (BD), 1:500 GolgiPlug (BD), and 1:200 FastImmune (BD) for ICS

206
studies. For all studies, PBMCs were plated at 1 × 10⁶ cells/well in 96-well round-bottom plates.
PBMCs were stimulated in parallel with spike peptide pools (n = 2 pools of 157 and 158 peptides;
JPT Peptide Technologies) at a final concentration of 1 μg/mL/peptide. In all assays, 0.2% DMSO
vehicle control was used for no stimulation. PBMCs were stimulated for 24 hours for AIM assays
and 16 hours for ICS assays. Cells were washed with FACS wash buffer (1× Dulbecco’s PBS
without calcium or magnesium, 0.1% sodium azide, 2 mM EDTA, 1% FBS) and stained with the
Ab panels for AIM and ICS listed in Supplemental Table 4.
In the case of AIM assays, cells were washed with FACS wash buffer, fixed with 2%
paraformaldehyde (BD), and stored in FACS wash buffer in the dark at 4°C until ready for flow
cytometry analysis, as described in the preceding sentence. For ICS assays, cells were washed after
cell-surface staining and stained with a cocktail of intracellular cytokine Abs (see Supplemental
Table 4 for Ab panel) in permeabilization buffer for 1 to 2 hours at 4°C. ICS samples were then
fixed, washed, and stored as done for AIM samples until ready for flow cytometry analysis.
The gating strategy for AIM and ICS is shown in Supplemental Figure 3, A and B. The
frequencies of spike-specific T cells were calculated by subtracting the no-stimulation background
from the corresponding S1 and S2 pool-stimulated samples, which were then summed together.
HLA genotyping
Genomic DNA was isolated using the QiaAmp DNA Blood Mini Kit (Qiagen). A total of
100 ng of high-quality DNA was fragmented using the KAPA HyperPlus Kit (Roche).
Subsequently, the ends of the fragmented DNA were repaired, poly-A tail was added and ligated
through PCR to Illumina-compatible dual index adapters that were uniquely barcoded. After
ligation, fragments were purified with 0.8× ratio AMPure XP magnetic beads, followed by double-

207
size selection (0.42× and 0.15× ratios) to select libraries of approximately 800 bp. Finally, libraries
were amplified and purified with magnetic beads.
After fluorometric quantification, 30 ng of each sample was precisely pooled using
ultrasonic acoustic energy, and the targeted capture was performed with HyperCap kit (Roche).
Briefly, the volumes were reduced using magnetic beads, and the DNA libraries were bound to
1394 biotinylated probes specific to the HLA region, covering all exons, introns, and regulatory
regions of HLA-A, HLA-B, HLA-C, HLADRB1, HLA-DRA, HLA-DQB1, HLA-DQA1, HLA-
DPB1, and HLA-DPA1. Fragments targeted by the probes were captured with streptavidin
magnetic beads and then amplified and purified. Enriched libraries were analyzed in BioAnalyzer
(Agilent) and quantified by digital-droplet PCR. Finally, enriched libraries were sequenced with
the HiSeq4000 platform (Illumina) with a paired-end 150 bp sequencing protocol. After
sequencing, data were analyzed with HLA Explorer software (Omixon).
Spike antigen–specific CD8+ T cell analysis by pMHC tetramer
pMHC I tetramers loaded with spike peptides and labeled with the fluorophores
(Supplemental Table 2) were generated from UV-photolabile monomers for HLA-A*01:01, HLA-
A*02:01, HLA-A*03:01, HLA-A*11:01, and HLA-B*07:02 monomers (NIH Tetramer Core) by
UV peptide exchange, as previously described (36, 49). To each tetramer, 500 μM d-biotin was
added, and tetramers were pooled as indicated in Supplemental Table 2 on the day of use. All
tetramer experiments were completed within 3 weeks of tetramer generation. For each tested
sample, 2–3 × 10⁷ PBMCs were thawed, washed, and equilibrated in RPMI medium with 10%
FBS for 1 hour at 37°C. The frequencies of spike antigen–specific CD8+ T cells were calculated
as previously described (36, 50). In brief, an aliquot of PBMCs was used for cell-surface staining

208
(Supplemental Table 1) and counted with 123count eBeads (Invitrogen) prior to tetramer
enrichment. The remainder of PBMCs were stained with the indicated tetramer pools for 30
minutes at room temperature, washed, and enriched using anti-PE magnetic microbeads (Miltenyi)
over a magnetic column. Tetramer-enriched cells were cell surface-stained and counted as done
for pre-enrichment.
The gating strategy is outlined in Supplemental Figure 3C. A stringent tetramer gating
strategy was used whereby CD8+ T cells labeled with only 2 fluorophores were considered antigen
specific (i.e., cells that stained positive with ±2 fluorophores were excluded from the analysis).
Spike tetramer–positive CD8+ T cells with frequencies greater than 1 × 10⁻⁵ per total CD8+ T
cells were considered positive.
Statistics
Prevaccine and postvaccine Ab and T cell responses were compared by multiple paired 2-
way, 2-tailed t tests. Univariate analysis by serostatus was performed by Mann-Whitney test.
Kruskal-Wallis with multiple comparisons was used to analyze postvaccination Ab and T cell
responses across different groups; untreated patients with MS were used as the comparison group
for statistical significance, unless stated otherwise. Simple linear regression was to analyze IgG
levels with the indicated independent variables, and Spearman’s rank was used for correlation
analysis. The level of significance was set at P < 0.05.

209
Study approval
All enrolled participants provided written, informed consent for this study, which was
approved by the University of California, San Francisco, Committee on Human Research (IRB no.
21-33240)
Author contributions
JJS, RB, SSZ, and MRW designed and supervised the study. WMR, K Mcpolin, and JRA
performed clinical recruitment and sample acquisition. Patient data were collected and managed
by JJS, WR, and K Mcpolin. JJS, K. Mittl, WR, CG, CMS, and SAS carried out sample processing.
Luminex analysis was completed by JJS, K Mittl, CRZ, RPL, and CG. BDA completed VirScan
library preparation immunoprecipitations and JVR and RD performed VirScan analysis. MTL and
JLD performed pseudovirus neutralization and analysis. JJS and K Mittl performed all T cell
studies. DGA and JAH performed HLA genotyping. Statistical analysis was completed by JJS and
JAH. JJS wrote the initial draft of the manuscript. All authors contributed to data interpretation
and manuscript review.

210
Figure 8.1. Analysis of total spike and spike RBD IgG before and after SARS-CoV-2 vaccination of patients with MS receiving different DMTs. (A and B) Mean net MFI (± SEM) of total spike IgG (A) and spike RBD IgG (B) at pre- and postvaccination time points (multiple paired t tests). (C) Percent seropositivity of total spike IgG and spike RBD IgG following vaccination for each cohort (Kruskal-Wallis test with multiple comparisons; significance was based on comparison between untreated MS and other MS treatment groups). (D and E) Percent CD19+ B cells following vaccination in total spike IgG (D) and spike RBD (E) seronegative and seropositive patients treated with anti-CD20 mAbs (Mann-Whitney test). (F and G) Simple linear regression of cumulative duration of anti-CD20 mAb treatment prior to SARS-CoV-2 vaccination total spike IgG (F) and spike RBD (G) (correlation by Spearman’s rank). (H) Comparison of cumulative duration of therapy by type of anti-CD20 mAb treatment (Mann-Whitney test). (I and J) Simple linear regression of net MFI of total spike IgG (I) and spike RBD IgG (J) by duration of S1P receptor modulator duration (correlation by Spearman’s rank). NS, P > 0.05; *P < 0.05; **P < 0.01; ***P < 0.001; ****P < 0.0001.
4
C L I N I C A L M E D I C I N E
JCI Insight 2022;7(4):e156978 https://doi.org/10.1172/jci.insight.156978
There was no significant association between total spike or spike RBD IgG seropositivity and age, sex, mRNA-vaccine type, last measured total IgG levels, percentages of CD4+ and CD8+ T cells, or HLA-DRB1*15:01 status (Supplemental Table 1). Although there was not a significant difference between the percentage of prevaccination CD19+ B cells and total spike and spike RBD serostatus, there was a significant increase in patients seropositive for postvaccination CD19+ B cells and total spike (P = 0.0021) and spike RBD (P = 0.0158) compared with those who were seronegative (Figure 1, D and E, and Supplemental Table 1). Similarly, although there was no significant correlation with total spike and spike RBD IgG levels and
Figure 1. Analysis of total spike and spike RBD IgG before and after SARS-CoV-2 vaccination of patients with MS receiving di!erent DMTs. (A and B) Mean net MFI (± SEM) of total spike IgG (A) and spike RBD IgG (B) at pre- and postvaccination time points (multiple paired t tests). (C) Percent seropositivity of total spike IgG and spike RBD IgG following vaccination for each cohort (Kruskal-Wallis test with multiple comparisons; significance was based on comparison between untreated MS and other MS treatment groups). (D and E) Percent CD19+ B cells following vaccination in total spike IgG (D) and spike RBD (E) seroneg-ative and seropositive patients treated with anti-CD20 mAbs (Mann-Whitney test). (F and G) Simple linear regression of cumulative duration of anti-CD20 mAb treatment prior to SARS-CoV-2 vaccination total spike IgG (F) and spike RBD (G) (correlation by Spearman’s rank). (H) Comparison of cumulative duration of therapy by type of anti-CD20 mAb treatment (Mann-Whitney test). (I and J) Simple linear regression of net MFI of total spike IgG (I) and spike RBD IgG (J) by duration of S1P receptor modulator duration (correlation by Spearman’s rank). NS, P > 0.05; *P < 0.05; **P < 0.01; ***P < 0.001; ****P < 0.0001.

211
Figure 8.2. VirScan analysis of postvaccination Ab reactivity against the SARS-CoV-2 spike proteome by MS DMT status. The left column indicates the proportion of individuals seroreactive against the different regions of the spike protein, and the right column indicates the relative signal intensity of Ab binding, with each individual separated by row. The corresponding regions of the spike protein are indicated below the plots.
7
C L I N I C A L M E D I C I N E
JCI Insight 2022;7(4):e156978 https://doi.org/10.1172/jci.insight.156978
Figure 2. VirScan analysis of postvaccination Ab reactivity against the SARS-CoV-2 spike proteome by MS DMT status. The left column indicates the proportion of individuals seroreactive against the di!erent regions of the spike protein, and the right column indicates the relative signal intensity of Ab binding, with each individual separated by row. The corresponding regions of the spike protein are indicated below the plots.

212
Figure 8.3. SARS-CoV-2 pseudovirus neutralization in seropositive patients treated with S1P receptor modulators or anti-CD20 mAbs. (A) Mean 50% pseudovirus neutralization titer reciprocal dilution (NT50 ± SEM) of serum from anti-spike seropositive HCs (n = 5), untreated patients with MS (n = 5), patients treated with S1P receptor modulators (n = 3), and those treated with anti-CD20 mAbs (n = 5) (Kruskal-Wallis test with multiple comparisons). (B) Nonlinear regression of spike RBD IgG (net MFI) of all samples by NT50 (correlation by Spearman’s rank). (C) Spike RBD IgG (mean net MFI ± SEM) versus 50% neutralization titer (NT50 ± SEM) by the indicated treatment groups.
8
C L I N I C A L M E D I C I N E
JCI Insight 2022;7(4):e156978 https://doi.org/10.1172/jci.insight.156978
differences in the HLA genotypes available for tetramer analysis across the different patient cohorts (Sup-plemental Table 2). Consistent with a postvaccination response measured in peripheral blood samples, spike-specific CD8+ T cells were predominantly effector memory (Tem), which were significantly higher than corresponding naive T cell (Tn) populations in all cohorts (Figure 5D). In addition, the proportion of Tn, T central memory (Tcm), Tem, and Tem cells reexpressing CD45RA (Temra) spike-specific CD8+ T cells did not significantly differ across any of the MS cohorts. Overall, these findings indicate that the magnitude and activation state of SARS-CoV-2 vaccine–elicited T cell responses are not substantially changed by the various MS immunotherapies evaluated in this study.
DiscussionMS DMTs differentially affect humoral and cell-mediated immunity, both of which are essential for protec-tion against COVID-19 (3, 5). In support of this, recently reported data indicate that unvaccinated patients with MS receiving anti-CD20 mAb treatments are at higher risk for severe COVID-19 (6, 7). To date, the majority of studies evaluating SARS-CoV-2 vaccine responses in patients with MS have been limited to measuring Ab levels (9–12, 22), and those that have explored T cell reactivity have primarily focused on anti-CD20 mAb–treated patients (19, 24, 38). Moreover, no MS studies to date, to our knowledge, have investigated how DMTs affect neutralization against SARS-CoV-2, a key correlate of immune protection (4). Thus, there is a significant need to comprehensively investigate how different MS DMTs affect SARS-CoV-2 vaccine–elicited Ab and CD4+ and CD8+ T cell immunity.
Following vaccination, untreated patients with MS and those treated with GA, DMF, or NTZ mount-ed similar total spike and spike RBD IgG responses, compared with HCs. In contrast, patients treated with S1P receptor modulators or anti-CD20 mAbs had significantly reduced levels of total spike and spike RBD IgG, consistent with findings in recent reports (9–12). We did not observe a clear relationship between spike-Ab seropositivity and anti-CD20–mAb infusion interval and SARS-CoV-2 vaccination, in contrast to findings of several other studies (8, 19, 20, 22, 24). This disparity could be due to differences in patient populations or methodology. Our finding that the percentage of CD19+ B cells following vac-cination, but not prior to vaccination, was significantly associated with spike-Ab seropositivity suggests that interval B cell reconstitution occurring in lymphoid tissue prior to circulation in the blood may be sufficient for Ab generation. Indeed, this idea is supported by a recent finding that spike–IgG seroposi-tivity is present in a portion of anti-CD20 mAb–treated patients with MS despite the absence of circulat-ing spike-specific B cells (19). Furthermore, the negative effect of cumulative anti-CD20 mAb treatment duration on spike–IgG seropositivity suggests that although essentially all circulating B cells are rapidly depleted following anti-CD20 mAb treatment, B cells may initially persist in smaller numbers in second-ary lymphoid tissue (39) but are ultimately depleted with long-term treatment. It is also interesting to note that certain S1P receptor modulator–treated patients had near-normal total spike and spike RBD IgG levels, while other patients did not seroconvert. S1P receptor modulators sequester B cells and T cells in secondary lymphoid tissues and disrupt germinal center formation (40), which is an important part of
Figure 3. SARS-CoV-2 pseudovirus neutralization in seropositive patients treated with S1P receptor modulators or anti-CD20 mAbs. (A) Mean 50% pseudovirus neutralization titer reciprocal dilution (NT50 ± SEM) of serum from anti-spike seropositive HCs (n = 5), untreated patients with MS (n = 5), patients treated with S1P receptor modulators (n = 3), and those treated with anti-CD20 mAbs (n = 5) (Kruskal-Wallis test with multiple comparisons). (B) Nonlinear regression of spike RBD IgG (net MFI) of all samples by NT50 (correlation by Spearman’s rank). (C) Spike RBD IgG (mean net MFI ± SEM) versus 50% neutralization titer (NT50 ± SEM) by the indicated treatment groups.

213
Figure 8.4. Evaluation of spike antigen–specific CD4+ and CD8+ T cells in patients with MS
treated with different DMTs. (A and D) AIM analysis of CD4+ (A) and CD8+ (D) T cells from a representative patient with MS before and after SARS-CoV-2 vaccination. Summarized AIM and ICS analysis of CD4+ (B and C) and CD8+ T cells (E and F) across all cohorts. AIM data are shown for pre- and postvaccination time points (multiple paired t tests); ICS data depict post- vaccination analysis only (Kruskal-Willis test with multiple comparisons). Stim, stimulation.
9
C L I N I C A L M E D I C I N E
JCI Insight 2022;7(4):e156978 https://doi.org/10.1172/jci.insight.156978
humoral reactivity following SARS-CoV-2 mRNA vaccination (41). It is possible the differences in Ab outcomes are related to S1P receptor modulator treatment duration; however, this conclusion is limited by lower patient numbers in the S1P receptor modulators cohort.
A strength of our study was the ability to assess high-resolution Ab reactivity across the entire spike protein using programmable phage display (VirScan) and to assess functional reactivity by pseudovirus neutralization. Ab reactivity against a broad range of spike determinants was observed among HCs and untreated patients with MS, including regions vital for SARS-CoV-2 entry into cells. In contrast, Ab reac-tivity was restricted to a narrower range of spike epitopes in seropositive patients with MS treated with S1P receptor modulators and anti-CD20 mAbs. Moreover, pseudovirus neutralization was significantly attenuated in patients receiving anti-CD20 mAb and S1P receptor modulator therapies, which directly correlated with reduced spike RBD IgG titers. These findings are clinically important because they high-light the limited applicability of using anti-spike seropositivity alone as a marker of immune protection. Rather, these data emphasize the importance of achieving high-titer spike RBD seroreactivity to infer adequate viral neutralization ability in patients with MS who are receiving certain immunotherapies. The SARS-CoV-2 sequences used in the VirScan (ancestral Wuhan-1) and neutralization assays (B.1 D614G) did not assess reactivity to more recent variants that harbor multiple mutations in the spike protein, such as B.1.617.2 (Delta) and B.1.1.529 (Omicron). Given the impacts of anti-CD20 mAbs and S1P receptor modulators on spike reactivity and neutralization, our findings raise the concern that protective Ab immu-nity will be further compromised against spike protein mutants.
We also performed an extensive analysis of spike-specific CD4+ and CD8+ T cells in all participants before and after SARS-CoV-2 vaccination. In contrast to the humoral response, spike-specific CD4+ and CD8+ T cell responses were largely intact across all MS cohorts irrespective of DMT status. Vaccine-elicited CD4+ T cell responses were diminished in patients treated with S1P receptor modulators, which is consistent with the preferential reduction of circulating CD4+ T cells by S1P receptor modulators (25). In addition, spike-specific CD4+ and CD8+ T cells from all MS treatment groups produced multiple effector cytokines,
Figure 4. Evaluation of spike antigen–specific CD4+ and CD8+ T cells in patients with MS treated with di!erent DMTs. (A and D) AIM analysis of CD4+ (A) and CD8+ (D) T cells from a representative patient with MS before and after SARS-CoV-2 vaccination. Summarized AIM and ICS analysis of CD4+ (B and C) and CD8+ T cells (E and F) across all cohorts. AIM data are shown for pre- and postvaccination time points (multiple paired t tests); ICS data depict post-vaccination analysis only (Kruskal-Willis test with multiple comparisons). Stim, stimulation.

214
Figure 8.5. Ex vivo analysis of postvaccination spike-specific CD8+ T cells of patients with MS treated with different DMTs, by pMHC I tetramer. (A) Repre- sentative analysis of enriched spike peptide tetramer–positive CD8+ T cells (left panel) and memory analysis by tetramer status (right panel). (B and C) The proportion of tested participants in each cohort with detectable spike tetramer–positive CD8+ T cells (B) and their frequencies (C) are shown. (D) Heatmap analysis of memory subsets of spike tetramer–positive CD8+ T cells in each cohort. APC, allophycocyanin; PE, phycoerythrin.
1 0
C L I N I C A L M E D I C I N E
JCI Insight 2022;7(4):e156978 https://doi.org/10.1172/jci.insight.156978
suggesting DMT exposure did not alter T cell polyfunctionality. Interestingly, we observed a trend toward increased CD8+ T cell cytokine production in anti-CD20 mAb–treated patients compared with untreated patients with MS, which was significantly increased in the case of IFN-γ+ CD8+ T cells in both anti-CD20 mAb cohorts. These findings support those in recent similar reports of increased SARS-CoV-2-specific CD8+ T cell activation in anti-CD20 mAb–treated patients with MS (19, 24) and suggest that B cell depletion may result in compensatory changes in certain aspects of cellular immunity. However, the mechanism of such T cell–mediated changes and whether this has a protective effect against COVID-19 remain unknown.
A limitation of our study was the relatively smaller number of patients in certain MS treatment groups. Nonetheless, the results of our study have important potential implications for clinical guidance about treatment of patients with MS and other autoimmune conditions with similar immunotherapies. Our find-ings support similar findings of impaired SARS-CoV-2 vaccine–elicited humoral immunity in a variety of vulnerable, immunocompromised patient populations (42, 43). The finding that certain MS immuno-therapies preferentially disrupt SARS-CoV-2 vaccine–induced humoral immune responses both quantita-tively and functionally raises the concern that patients receiving such therapies may be at higher risk of contracting vaccine-breakthrough COVID-19 (44). In addition, our data highlight the cumulative negative impact of prolonged anti-CD20 mAb treatment on the generation of de novo humoral immunity. On the other hand, the preservation of cell-mediated immunity provides reassurance that most immunosuppressed patients with MS will obtain at least partial protection from more severe COVID-19 outcomes. An out-standing question is whether immunosuppressed patients with MS will benefit from booster SARS-CoV-2 vaccinations, either by Ab seroconversion and/or augmentation of cell-mediated immunity. The data from our study, therefore, provide important insights regarding COVID-19 risk assessment and SARS-CoV-2 vaccination practices for immunosuppressed patient populations.
MethodsStudy design. In this prospective observational study, participants included patients with clinically definite MS (by 2017 McDonald criteria) (45) and HCs (i.e., not immunocompromised or receiving immunosuppressive therapy) aged 18 to 75 years. MS cohorts included patients not receiving any treatment (no DMT in the prior 6 months) or treated with GA, DMF, NTZ, any S1P receptor modulator, or i.v. anti-CD20 mAb therapy (i.e., RTX or OCR). No patients were treated with chronic daily steroids or high-dose steroids within 3 months of
Figure 5. Ex vivo analysis of postvaccination spike-specific CD8+ T cells of patients with MS treated with di!erent DMTs, by pMHC I tetramer. (A) Repre-sentative analysis of enriched spike peptide tetramer–positive CD8+ T cells (left panel) and memory analysis by tetramer status (right panel). (B and C) The proportion of tested participants in each cohort with detectable spike tetramer–positive CD8+ T cells (B) and their frequencies (C) are shown. (D) Heatmap analysis of memory subsets of spike tetramer–positive CD8+ T cells in each cohort. APC, allophycocyanin; PE, phycoerythrin.

215
Chapter 8 References
1. McGinley MP, et al. Diagnosis and treatment of multiple sclerosis: a review. JAMA.
2021;325(8):765–779.
2. Luna G, et al. Infection risks among patients with multiple sclerosis treated with fingolimod,
natalizumab, rituximab, and injectable therapies. JAMA Neurol. 2020;77(2):184–191.
3. Sette A, Crotty S. Adaptive immunity to SARS-CoV-2 and COVID-19. Cell.
2021;184(4):861–880.
4. Khoury DS, et al. Neutralizing antibody levels are highly predictive of immune protection from
symptomatic SARS-CoV-2 infection. Nat Med. 2021;27(7):1205–1211.
5. Goldman-Israelow B, et al. Adaptive immune determinants of viral clearance and protection
in mouse models of SARS-CoV-2. Sci Immunol. 2021;6(64):eabl4509.
6. Salter A, et al. Outcomes and risk factors associated with SARS-CoV-2 infection in a North
American registry of patients with multiple sclerosis. JAMA Neurol. 2021;78(6):699–708.
7. Sormani MP, et al. Disease-modifying therapies and Coronavirus disease 2019 severity in
multiple sclerosis. Ann Neurol. 2021;89(4):780–789.
8. Achiron A, et al. Humoral immune response to COVID-19 mRNA vaccine in patients with
multiple sclerosis treated with high-efficacy disease-modifying therapies. Ther Adv Neurol
Disord. 2021;14:17562864211012835.
9. van Kempen ZLE, et al. SARS-CoV-2 antibodies in adult patients with multiple sclerosis in
the Amsterdam MS cohort. JAMA Neurol. 2021;78(7):880–882.
10. Louapre C, et al. Anti-CD20 therapies decrease humoral immune response to SARS-CoV-2 in
patients with multiple sclerosis or neuromyelitis optica spectrum disorders. J Neurol Neurosurg
Psychiatry. 2021;93(1):24–31.

216
11. Sormani MP, et al. SARS-CoV-2 serology after COVID-19 in multiple sclerosis: an
international cohort study [published online July 30, 2021]. Mult Scler.
https://doi.org/10.1177/13524585211035318.
12. Bigaut K, et al. Impact of disease-modifying treatments of multiple sclerosis on anti–SARS-
CoV-2 antibodies. Neurol Neuroimmunol Neuroinflamm. 2021;8(5):e1055.
13. Widge AT, et al. Durability of responses after SARS-CoV-2 mRNA-1273 vaccination. N Engl
J Med. 2020;384(1):80–82.
14. Walsh EE, et al. Safety and immunogenicity of two RNA-based Covid-19 vaccine candidates.
N Engl J Med. 2020;383(25):2439–2450.
15. Anderson EJ, et al. Safety and immunogenicity of SARS-CoV-2 mRNA-1273 vaccine in older
adults. N Engl J Med. 2020;383(25):2427–2438.
16. Sahin U, et al. BNT162b2 vaccine induces neutralizing antibodies and poly-specific T cells in
humans. Nature. 2021;595(7868):572–577.
17. Ciotti JR, et al. Effects of MS disease-modifying therapies on responses to vaccinations: a
review. Mult Scler Relat Disord. 2020;45:102439.
18. Bar-Or A, et al. Effect of ocrelizumab on vaccine responses in patients with multiple sclerosis:
the VELOCE study. Neurology. 2020;95(14):e1999–e2008.
19. Apostolidis SA, et al. Altered cellular and humoral immune responses following SARS-CoV-
2 mRNA vaccination in patients with multiple sclerosis on anti-CD20 therapy. Nat Med.
2021;27(11):1990–2001.
20. Tallantyre EC, et al. COVID-19 vaccine response in people with multiple sclerosis. Ann
Neurol. 2022;91(1):89–100.

217
21. Novak F, et al. Humoral immune response following SARS-CoV-2 mRNA vaccination
concomitant to anti-CD20 therapy in multiple sclerosis. Mult Scler Relat Disord.
2021;56:103251.
22. Disanto G, et al. Association of disease-modifying treatment and anti-CD20 infusion timing
with humoral response to 2 SARSCoV-2 vaccines in patients with multiple sclerosis. JAMA
Neurol. 2021;78(12):1529–1531.
23. Cao Y, et al. Potent neutralizing antibodies against SARS-CoV-2 identified by high-
throughput single-cell sequencing of convalescent patients’ B cells. Cell. 2020;182(1):73–84.
24. Gadani SP, et al. Discordant humoral and T cell immune responses to SARS-CoV-2
vaccination in people with multiple sclerosis on anti-CD20 therapy. EBioMedicine.
2021;73:103636.
25. Mehling M, et al. FTY720 therapy exerts differential effects on T cell subsets in multiple
sclerosis. Neurology. 2008;71(16):1261–1267.
26. Zamecnik CR, et al. ReScan, a multiplex diagnostic pipeline, pans human sera for SARS-CoV-
2 antigens. Cell Rep Med. 2020;1(7):100123.
27. Sawcer S, et al. Genetic risk and a primary role for cell-mediated immune mechanisms in
multiple sclerosis. Nature. 2011;476(7359):214–219.
28. Barnes CO, et al. SARS-CoV-2 neutralizing antibody structures inform therapeutic strategies.
Nature. 2020;588(7839):682–687.
29. Premkumar L, et al. The receptor binding domain of the viral spike protein is an
immunodominant and highly specific target of antibodies in SARS-CoV-2 patients. Sci
Immunol. 2020;5(48):eabc8413.

218
30. Grifoni A, et al. Targets of T cell responses to SARS-CoV-2 Coronavirus in humans with
COVID-19 disease and unexposed individuals. Cell. 2020;181(7):1489–1501.
31. Nelde A, et al. SARS-CoV-2-derived peptides define heterologous and COVID-19-induced T
cell recognition. Nat Immunol. 2021;22(1):74–85.
32. Rommer PS, et al. Immunological aspects of approved MS therapeutics. Front Immunol.
2019;10:1564.
33. Schulien I, et al. Characterization of pre-existing and induced SARS-CoV-2-specific CD8+ T
cells. Nat Med. 2021;27(1):78–85.
34. Kared H, et al. SARS-CoV-2-specific CD8+ T cell responses in convalescent COVID-19
individuals. J Clin Invest. 2021;131(5):145476.
35. Ferretti AP, et al. Unbiased screens show CD8+ T cells of COVID-19 patients recognize shared
epitopes in SARS-CoV-2 that largely reside outside the spike protein. Immunity.
2020;53(5):1095–1107.
36. Sabatino JJ, et al. Anti-CD20 therapy depletes activated myelin-specific CD8+ T cells in
multiple sclerosis. Proc Natl Acad Sci U S A. 2019;116(51):25800–25807.
37. Oberhardt V, et al. Rapid and stable mobilization of CD8+ T cells by SARS-CoV-2 mRNA
vaccine. Nature. 2021;597(7875):268–273.
38. Brill L, et al. Humoral and T-cell response to SARS-CoV-2 vaccination in patients with
multiple sclerosis treated with ocrelizumab. JAMA Neurol. 2021;78(12):1510–1514.
39. Häusler D, et al. Functional characterization of reappearing B cells after anti-CD20 treatment
of CNS autoimmune disease. Proc Natl Acad Sci U S A. 2018;115(39):9773–9778.
40. Han S, et al. FTY720 suppresses humoral immunity by inhibiting germinal center reaction.
Blood. 2004;104(13):4129–4133.

219
41. Turner JS, et al. SARS-CoV-2 mRNA vaccines induce persistent human germinal centre
responses. Nature. 2021;596(7870):109–113.
42. Marinaki S, et al. Immunogenicity of SARS-CoV-2 BNT162b2 vaccine in solid organ
transplant recipients. Am J Transplant. 2021;21(8):2913–2915.
43. Deepak P, et al. Effect of immunosuppression on the immunogenicity of mRNA vaccines to
SARS-CoV-2: a prospective cohort study. Ann Intern Med. 2021;174(11):1572–1585.
44. Brosh-Nissimov T, et al. BNT162b2 vaccine breakthrough: clinical characteristics of 152 fully
vaccinated hospitalized COVID-19 patients in Israel. Clin Microbiol Infect.
2021;27(11):1652–1657.
45. Thompson AJ, et al. Diagnosis of multiple sclerosis: 2017 revisions of the McDonald criteria.
Lancet Neurol. 2018;17(2):162–173.
46. Fenwick C, et al. Changes in SARS-CoV-2 spike versus nucleoprotein antibody responses
impact the estimates of infections in population-based seroprevalence studies. J Virol.
2021;95(3):e01828–20.
47. Hoffmann M, et al. A multibasic cleavage site in the spike protein of SARS-CoV-2 is essential
for infection of human lung cells. Mol Cell. 2020;78(4):779–784.
48. Laurie MT, et al. SARS-CoV-2 variant exposures elicit antibody responses with differential
cross-neutralization of established and emerging strains including Delta and Omicron
[published online January 3, 2022]. J Infect Dis. https://doi.org/10.1093/ infdis/jiab635.
49. Rodenko B, et al. Generation of peptide-MHC class I complexes through UV-mediated ligand
exchange. Nat Protoc. 2006;1(3):1120–1132.
50. Moon JJ, et al. Tracking epitope-specific T cells. Nat Protoc. 2009;4(4):565–581.

220
Chapter 9:
Transmission dynamics of SARS-CoV-2 among vaccinated household members and related
immune responses
This chapter is a reprint of:
Liu J, Laurie MT, Rubio L, Vazquez SE, Sunshine S, Mitchell AM, Hapte-Selassie M, Mann
SA, Pilarowski G, Black D, Marquez C, Rojas S, Lionakis MS, Petersen M, Whitman JD, Jain
V, Anderson M, Havlir D, DeRisi J. SARS-CoV-2 transmission dynamics and immune responses
in a household of vaccinated persons. Clin Infect Dis. 2022; Jan 17:ciac029. doi:
10.1093/cid/ciac029.
Supplemental files that are not figures can be found with the original work.

221
Abstract
While SARS-CoV-2 vaccines prevent severe disease effectively, post-vaccination
‘breakthrough’ COVID-19 infections and transmission among vaccinated individuals remain
ongoing concerns. We present an in-depth characterization of transmission and immunity among
vaccinated individuals in a household, revealing complex dynamics and unappreciated
comorbidities, including autoimmunity to type1 interferon in the presumptive index case.
Introduction
COVID-19 has caused over 230 million cases of infection worldwide, leading to more than
4.7 million deaths due to coronavirus disease (COVID-19) [1]. Global vaccination efforts have so
far administered 6.1 billion vaccine doses [2]. In the United States, three FDA-authorized vaccines
have been widely distributed: BNT162b2 by Pfizer/BioNTech, mRNA-1273 by Moderna, and
JNJ-78436735 by J&J/Janssen. Each has demonstrated, through clinical trials and retrospective
studies, the capacity to prevent symptomatic infection and severe disease [3].
Approximately 50% of the United States population is considered fully vaccinated. Many
households have mixed populations of adults and children with variable completion of COVID-19
vaccination [2]. Furthermore, most SARS-CoV-2 lineages have been outcompeted and replaced
by newer variants of concern including the Delta and Gamma variants. Further, many spike protein
mutations associated with neutralizing antibody escape (K417N/T, R346K, L452R, T478K,
E484K/Q, N501Y) have emerged [4,5]. Given these factors, COVID-19 infections in fully
vaccinated people (i.e., breakthrough) are well documented [6]. However, there have been
relatively few detailed studies to date of household transmission trajectories, especially in

222
households with individuals who received different vaccines, or who have different vaccine
completion statuses.
Here, we describe a household cluster of Gamma variant COVID-19 cases occurring in
vaccinated family members living in co-residence that resulted in mixed clinical outcomes. A
detailed inspection of the epidemiological and clinical features of these cases, together with
serology testing and genomic sequencing, suggest complex factors including partial immunity and
unrecognized underlying autoimmunity, as potential contributors to breakthrough infections. Our
data add to rapidly emerging literature on SARS-CoV-2 transmission dynamics within households
of vaccinated persons.
Description of individuals in the study household
Individuals 1-5 lived together in the same residence, where they ate, slept, and socialized
with one another in an unmasked setting. Individual 6 lived separately but frequented the home of
Individuals 1-5. Together, these individuals also attended weekly community events, such as
religious services, together as one large group. Each individual was thus exposed to one another
either through co-residence or frequent visitation.
Individual 1 is an 80-year-old man with diabetes and asthma who received
BNT162b2/Pfizer vaccine on April 20 and May 10, 2021. On May 13, malaise, myalgia and
diarrhea developed. On May 19, a SARS-CoV-2 PCR test was positive and on May 20, he
presented to a local hospital, had hypoxia, and was admitted for inpatient management. Due to
severe COVID-19, acute respiratory distress syndrome (ARDS), and respiratory failure, he
required mechanical ventilation. He received remdesivir, dexamethasone and tociluzimab and
improved, was weaned from ventilator, and was discharged home on June 2.
223
Individual 2 is a 36-year-old woman who received JNJ-78436735/Janssen vaccine on April
10, 2021. On May 16, she had onset of fever, cough, rhinorrhea, and headache. On May 19, a PCR
test was positive. On May 23, a BinaxNOW (Abbott) rapid antigen test was positive. She did not
require care at a health facility and improved with self-monitoring at home.
Individual 3 is a 60-year-old woman who received mRNA-1273/Moderna vaccine on
March 9 and April 6, 2021. On May 19, she had onset of fever, chills, cough and rhinorrhea. On
May 20, a SARS-CoV-2 PCR test was positive and on May 23, a BinaxNOW test was positive.
She also did not require care at a health facility and improved with self-monitoring at home.
Individual 4 is an 84-year-old woman who received mRNA-1273/Moderna vaccine on
February 25 and March 26, 2021. After members of her family tested positive for COVID-19, she
began home-based quarantine on May 20th. On May 23, a BinaxNOW test was negative.
Individual 5 is a 40-year-old man who had tested positive for SARS-CoV-2 the previous
year on July 24, 2020. At that time, he isolated with Individual 6. Individual 5 received the JNJ-
78436735/Janssen vaccine on April 10, 2021. Although he did not quarantine separately from
family members who tested positive, a SARS-CoV-2 PCR test on May 22 was negative.
Individual 6 is a 60-year-old woman who directly cared for Individual 5 when he tested
positive for SARS-CoV-2 in July 2020. Despite being unable to quarantine, she tested negative for
SARS-CoV-2 and did not develop any COVID-like symptoms. On May 17, 2021, she received
the first dose of BNT162b2/Pfizer vaccine. Although she lived apart from Individuals 1-5, she
visited their home frequently and attended community events with them. When her BinaxNOW
test was negative on May 23, she had not yet received a second dose of the vaccine.
Timelines of vaccination, COVID-19 symptom onset, and testing history are summarized
in Figure 9.1A and Supplementary Table 1.

224
Results
SARS-CoV-2 positivity as determined by qPCR amplification of the nasal swab samples
corroborated the BinaxNOW results for each household member. Viral genome sequences were
recovered from the three individuals who tested positive. Sequences consistent with the Gamma
variant were recovered from Individual 2 (90% genome coverage; GISAID: EPI_ISL_2508365)
and Individual 3 (98% genome coverage; GISAID: EPI_ISL_2508366). (Figure 9.2, BioProject
PRJNA790937) Despite incomplete recovery, the partial sequence from Individual 1 (17%)
contained mutations consistent with the Gamma variant (Supplementary Table 2). Characteristic
mutations of concern (K417T, E484K, and N501Y) were observed [4,5]. Analysis of the consensus
genomes from Individuals 2 and 3 revealed only a single nucleotide difference (G17122T, leading
to a ORF1b:A1219S amino acid substitution).
Serum samples from the five household members were analyzed for SARS-CoV-2
neutralizing antibodies using a pseudovirus neutralization assay [7]. Sera from members of this
household demonstrated a wide range of neutralization (Figure 9.1B). Individual 1 had a much
lower neutralizing antibody titer compared to the fully vaccinated individuals (D614G NT50=4.4x
lower, Gamma NT50=6.3x lower), despite being measured 14 days post-symptom onset, and 17
days after his second vaccine dose. Conversely, despite only partial vaccination, Individual 6 had
a very high neutralizing antibody titer (D614G NT50=4.5x higher, Gamma NT50=5.0x higher)
versus the healthy vaccinated cohort. Although this may have been related to caring for Individual
5 a year prior, Individual 6 had negative serology on the anti-SARS-CoV-2-N IgG Abbott
Architect test. Finally, while Individuals 2, 3, and 4 had neutralizing antibody titers in the typical
range of fully vaccinated individuals, Individuals 2 and 3 ultimately tested positive for COVID-
19. Taken together, our observations indicate that fully vaccinated individuals may be at risk of

225
breakthrough infection when living in households with sustained close contact with infected
individuals.
The neutralization efficacy of patients’ sera against the Gamma variant pseudotype was
approximately 2-fold lower than the measured NT50 against wild-type virus (D614G spike
mutation only). This observation is consistent with previously described decreases in
neutralization against variants, especially those harboring mutations at E484K [4,5,8].
Additionally, we tested for anti-IFN-α2 auto-antibodies, a marker correlated with severe
COVID-19 and poor patient outcomes [9,10]. Using serum from patients with Autoimmune
Polyglandular Syndrome Type 1 (APS1), an autoimmune syndrome where patients frequently
develop an abundance of anti-IFN-α2 antibodies, as a benchmark for verified interferon
autoimmunity, we measured for anti-IFN-α2 antibody presence using a radioligand binding assay
(RLBA) [9]. Serum from Individual 1, who had the most severe response to infection, exhibited
positive anti-IFN-α2 antibody signal while the other family members had negative titers (Figure
9.1C).
Discussion
We describe a family of mixed vaccination statuses who experienced various clinical
trajectories after a Gamma variant COVID-19 exposure in the household. Although coverage of
the recovered SARS-CoV-2 genome from Individual 1 is incomplete, and Individuals 2 and 3
differ by one amino acid substitution, the rarity of the Gamma variant (6.5% of all sequences
submitted to GISAID from San Francisco County from April to June) supports the conjecture that
infection of this household is derived from a common source. Furthermore, all other Gamma
variant sequences from this time period had 3-32 (mean=13; median=14) nucleotide substitutions

226
compared to this household, strongly suggesting direct transmission between household
individuals as opposed to coincidental, simultaneous infection outside the home.
Clinical trajectories experienced by household individuals ranged from severe illness
requiring hospitalization to mild symptomatic illness to avoiding COVID-19 infection altogether.
Individual 1, who had low titers of neutralizing antibodies following vaccination, still developed
severe COVID-19 infection. Testing for anti-IFN-α2 auto-antibodies revealed that serum from
Individual 1 contained high levels of antibodies against IFN-α2, a trait enriched among patients
with life-threatening COVID-19 pneumonia [10]. Although the presence of such auto-antibodies
can be clinically silent, they appear to play an influential role in patient outcomes for SARS-CoV-
2 infection [12].
Comorbidities such as autoimmune caused by anti-IFN auto-antibodies can lead to
decreased protection against circulating variants with spike mutations conferring neutralization
escape and thus raise the risk of breakthrough infections [10]. With household exposure to
COVID- 19, even fully vaccinated individuals with typical levels of neutralizing antibodies are at
risk of infection. This data is strongly consistent with intrahousehold transmission amongst three
vaccinated household members in this study, and this data highlights the inherent complexities of
individuals, including unrealized underlying autoimmunity, that may contribute to transmission
dynamics. This data supports the urgency for continued vaccination, boosters, and next-generation
vaccines that contain mutations known to confer immune escape potential.

227
Figure 9.1. Serum samples from household individuals reveal diverse neutralization capabilities as well as presence of anti–IFN-α2 auto-antibodies in Individual 1. (A) Timeline illustrating the order of events experienced by individuals in the study household, including vaccination, symptom onset, and test results. Additional details are available in Supplementary Table 1. (B) Plot of 50% pseudo-virus neutralization titers (NT50) of serum samples from healthy vaccinated controls (n = 11) collected 12–60 days post–second dose (average = 26.4 days; details of serum collection timing relative to vaccination and positive COVID-19 tests are described in Supplementary Table 3). For the healthy vaccinated donor cohort, geometric mean titer (dashed lines), interquartile range (boxes), and full range (shaded region) are shown for D614G (black) and Gamma (red) pseudo-viruses. NT50 values for Gamma variant pseudo-virus were approximately 2-fold lower than D614G pseudo-virus for the healthy vaccinated cohort and most house- hold members sera, apart from Individual 2. All household member serum neutralization titers were within or above the range of healthy donor titers, except for Individual 1, whose
BRIEF REPORT • CID 2022:XX (XX XX) • 3
Figure 1. Serum samples from household individuals reveal diverse neutralization capabilities as well as presence of anti–IFN-!2 auto-antibodies in Individual 1. (A) Timeline illustrating the order of events experienced by individuals in the study household, including vaccination, symptom onset, and test results. Additional details are available in Supplementary Table 1. (B) Plot of 50% pseudo-virus neutralization titers (NT50) of serum samples from healthy vaccinated controls (n = 11) collected 12–60 days post–second dose (average = 26.4 days; details of serum collection timing relative to vaccination and positive COVID-19 tests are described in Supplementary Table 3). For the healthy vaccinated donor cohort, geometric mean titer (dashed lines), interquartile range (boxes), and full range (shaded region) are shown for D614G (black) and Gamma (red) pseudo-viruses. NT50 values for Gamma variant pseudo-virus were approximately 2-fold lower than D614G pseudo-virus for the healthy vaccinated cohort and most house-hold members sera, apart from Individual 2. All household member serum neutralization titers were within or above the range of healthy donor titers, except for Individual 1, whose neutralization titers for D614G and Gamma were 4.4-fold and 6.3-fold lower than those in healthy controls, respectively. (C) Detection by radioligand binding assay reveals that anti–IFN-!2 autoantibodies are absent from all assayed prepandemic healthy controls (n = 42) and vaccinated healthy controls (n = 11) [7]. In this household, only Individual 1 demonstrated the presence of anti–IFN-!2 auto-antibodies. Autoimmune polyglandular syndrome type 1 (APS1) patient sera are used as positive controls [8]; negative controls are from pre-COVID healthy blood donor plasma or the healthy vaccinated donor cohort. Abbreviations: COVID-19, coronavirus disease 2019; F, female; IFN, interferon; M, male; PCR, polymerase chain reaction.
Dow
nloaded from https://academ
ic.oup.com/cid/advance-article/doi/10.1093/cid/ciac029/6509064 by guest on 12 April 2022

228
neutralization titers for D614G and Gamma were 4.4-fold and 6.3-fold lower than those in healthy controls, respectively. (C) Detection by radioligand binding assay reveals that anti–IFN-α2 autoantibodies are absent from all assayed prepandemic healthy controls (n = 42) and vaccinated healthy controls (n = 11) [7]. In this household, only Individual 1 demonstrated the presence of anti–IFN-α2 auto-antibodies. Autoimmune polyglandular syndrome type 1 (APS1) patient sera are used as positive controls [8]; negative controls are from pre-COVID healthy blood donor plasma or the healthy vaccinated donor cohort. Abbreviations: COVID-19, coronavirus disease 2019; F, female; IFN, interferon; M, male; PCR, polymerase chain reaction.
Figure 9.2. Sequencing depth and coverage of recovered SARS-CoV-2 genomes. Genome depth and coverage of SARS-CoV-2 Gamma variant recovered from (A) Individual 1, (B) Individual 2, and (C) Individual 3.

229
Chapter 9 References
1. COVID-19 Dashboard. Available at: https://coronavirus.jhu.edu/map.html. Accessed 11
September 2021.
2. Ritchie H, Mathieu E, Rodés-Guirao L, et al. Our World in Data: Coronavirus Pandemic
(COVID-19). Our World in Data 2020; Available at: https://ourworldindata.org/covid-
vaccinations. Accessed 11 September 2021.
3. Moline HL, Whitaker M, Deng L, et al. Effectiveness of COVID-19 Vaccines in Preventing
Hospitalization Among Adults Aged ≥65 Years - COVID-NET, 13 States, February-April
2021. MMWR Morb Mortal Wkly Rep 2021; 70:1088–1093.
4. Garcia-Beltran WF, Lam EC, St Denis K, et al. Multiple SARS-CoV-2 variants escape
neutralization by vaccine-induced humoral immunity. Cell 2021; 184:2372-2383.e9.
5. Wang Z, Schmidt F, Weisblum Y, et al. mRNA vaccine-elicited antibodies to SARS-CoV-2
and circulating variants. Nature 2021; 592:616–622.
6. Vignier N, Bérot V, Bonnave N, et al. Breakthrough Infections of SARS-CoV-2 Gamma
Variant in Fully Vaccinated Gold Miners, French Guiana, 2021. Emerg Infect Dis 2021;
27:2673–2676.
7. Hoffmann M, Kleine-Weber H, Pöhlmann S. A Multibasic Cleavage Site in the Spike Protein
of SARS-CoV-2 Is Essential for Infection of Human Lung Cells. Mol Cell 2020; 78:779-
784.e5.
8. Laurie MT, Liu J, Sunshine S, et al. Exposures to different SARS-CoV-2 spike variants elicit
neutralizing antibody responses with differential specificity towards established and emerging
strains. medRxiv 2021; :2021.09.08.21263095.

230
9. van der Wijst MGP, Vazquez SE, Hartoularos GC, et al. Type I interferon autoantibodies are
associated with systemic immune alterations in patients with COVID-19. Sci Transl Med 2021;
13:eabh2624.
10. Bastard P, Rosen LB, Zhang Q, et al. Autoantibodies against type I IFNs in patients with life-
threatening COVID-19. Science 2020; 370:eabd4585.
11. Ferre EMN, Rose SR, Rosenzweig SD, et al. Redefined clinical features and diagnostic criteria
in autoimmune polyendocrinopathy-candidiasis-ectodermal dystrophy. JCI Insight 2016;
1:e88782.
12. Bastard P, Gervais A, Le Voyer T, et al. Autoantibodies neutralizing type I IFNs are present
in ~4% of uninfected individuals over 70 years old and account for ~20% of COVID-19 deaths.
Sci Immunol 2021; 6:eabl4340.

231
Chapter 10:
Cross-neutralization of SARS-CoV-2 variants by immune sera elicited by a range of
infection and vaccination exposures
This chapter is a reprint of:
Laurie MT, Liu J, Sunshine S, Peng J, Black D, Mitchell AM, Mann SA, Pilarowski G, Zorn KC,
Rubio L, Bravo S, Marquez C, Sabatino JJ Jr, Mittl K, Petersen M, Havlir D, DeRisi J. SARS-
CoV-2 variant exposures elicit antibody responses with differential cross-neutralization of
established and emerging strains including Delta and Omicron.
J Infect Dis. 2022; Jan 3:jiab635. doi: 10.1093/infdis/jiab635.
Supplemental files that are not figures can be found with the original work.

232
Abstract
The wide spectrum of SARS-CoV-2 variants with phenotypes impacting transmission and
antibody sensitivity necessitates investigation of the immune response to different spike protein
versions. Here, we compare the neutralization of variants of concern, including B.1.617.2 (Delta)
and B.1.1.529 (Omicron) in sera from individuals exposed to variant infection, vaccination, or
both. We demonstrate that neutralizing antibody responses are strongest against variants sharing
certain spike mutations with the immunizing exposure. We also observe that exposure to multiple
spike variants increases the breadth of variant cross- neutralization. These findings contribute to
understanding relationships between exposures and antibody responses and may inform booster
vaccination strategies.
Background
Genomic surveillance of SARS-CoV-2 continues to identify a diverse spectrum of
emerging variants possessing mutations in the spike gene, the main viral determinant of cellular
entry and primary target of neutralizing antibodies [1]. Many spike mutations likely result from
selective pressure which improves viral fitness through increased transmissibility or evasion of
host immunity [2,3]. Studies have demonstrated that sera from vaccinated and naturally infected
individuals yield diminished neutralizing activity against certain variants, including the globally
dominant Delta variant [4]. Because serum neutralization titer is an important correlate of real-
world protective immunity, these findings suggest that antibody responses elicited by exposure to
ancestral spike versions (Wuhan or D614G) will be less effective at preventing future infection by
certain variants [5]. However, the diversity and prevalence of variants have fluctuated greatly
throughout the pandemic, creating a complex population of individuals that may have inherently

233
different capacity to neutralize certain variants depending on the specific genotype of their
previous exposures, including vaccination [6].
In this study, we address the question of variant-elicited immune specificity by determining
the breadth of neutralizing activity elicited by exposure to specific SARS-CoV-2 variants,
vaccines, or both. To accomplish this, we collected serum from subjects with prior infections by
variants B.1 (D614G mutation only), B.1.429 (Epsilon), P.2 (Zeta), B.1.1.519, and B.1.617.2
(Delta), which were identified by viral sequencing. We also collected serum from mRNA vaccine
recipients who were infected with the B.1 ancestral spike lineage prior to vaccination, infected
with B.1.429 prior to vaccination, or had no prior infection. We measured and compared the
neutralization titer of each serum cohort against a panel of pseudoviruses representing each
different exposure variant plus the variants of concern B.1.351 (Beta), P.1 (Gamma), B.1.617,
B.1.617.2 (Delta), and B.1.1.529 (Omicron), which have one or more spike mutations of interest
in common with one of the exposure variants. Our results provide a quantitative comparison of the
degree of neutralization specificity produced by different exposures. We also demonstrate the
effect of serial exposure to different spike versions in broadening the cross-reactivity of
neutralizing antibody responses. Together, these findings describe correlates of protective
immunity within the rapidly evolving landscape of SARS-CoV-2 variants and are highly relevant
to the design of future vaccination strategies targeting spike antigens.
Methods
Serum collection
Samples for laboratory studies were obtained under informed consent from participants in
an ongoing community program ―Unidos en Salud, which provides SARS-CoV-2 testing,

234
genomic surveillance, and vaccination services in San Francisco, California [7]. Subjects with and
without symptoms of COVID-19 were screened with the BinaxNOW rapid antigen assay (supplied
by California Department of Public Health). Positive rapid tests were followed by immediate
disclosure and outreach to household members for testing, supportive community services, and
academic partnership for research studies. All samples were sequenced using ARTIC Network V3
primers on an Illumina NovaSeq platform and consensus genomes generated from the resulting
raw .fastq files using IDseq [8].
Convalescent serum donors were selected based on sequence-confirmed infection with the
following variants of interest: B.1 (D614G mutation only; n=10 donors), B.1.429 (Epsilon; n=15),
B.1.1.519 (n=6), P.2 (Zeta; n=1), B.1.526 (Iota; n=1), B.1.617.2 (Delta; n=3), D614G infection
with subsequent BNT162b2 vaccination (n=8), and B.1.429 infection with subsequent BNT162b2
vaccination (n=17). Serum was also collected from healthy recipients of two (n=11) or three (n=7)
doses of BNT162b2 or mRNA-1273 vaccines who were confirmed to have no prior SARS-CoV-
2 infection by anti-SARS-CoV-2 nucleocapsid IgG assay [9]. All serum was collected from donors
an average of 34 days (standard deviation 16.6 days) after exposure to either SARS-CoV-2 or the
most recent dose of mRNA vaccine. For pooled serum experiments, samples from the same
exposure group were pooled at equal volumes. Serum samples from the closely related exposures
P.2 and B.1.526 were pooled together for the ―E484K exposureǁ pool, and samples from
BNT162b2 and mRNA-1273 exposures were pooled together for the ―vaccine exposureǁ pool
because of the very similar neutralization specificity observed in individual tests of these sera.
Serum samples were heat inactivated at 56°C for 30 minutes prior to experimentation. Relevant
serum sample metadata and exposure grouping is shown in Table S1.

235
Pseudovirus production
SARS-CoV-2 pseudoviruses bearing spike proteins of variants of interest were generated
using a recombinant vesicular stomatitis virus expressing GFP in place of the VSV glycoprotein
(rVSV∆G-GFP) described previously [10]. The following mutations representative of specific
spike variants were cloned in a CMV-driven expression vector and used to produce SARS-CoV-2
spike pseudoviruses: B.1 (D614G), B.1.429/Epsilon (S13I, W152C, L452R, D614G), P.2/Zeta
(E484K, D614G), B.1.351/Beta (D80A, D215G, ∆242- 244, K417N, E484K, N501Y, D614G,
A701V), P.1/Gamma (L18F, T20N, P26S, D138Y, R190S, K417T, E484K, N501Y, D614G,
H655Y, T1027I, V1176F), B.1.1.519 (T478K, D614G, P681H, T732A), B.1.617 (L452R, E484Q,
D614G, P681R), B.1.617.2/Delta (T19R, T95I, G142D, ∆157-158, L452R, T478K, P681R,
D614G, D950N), and B.1.1.529/Omicron (32 spike mutations). All pseudovirus spike mutations
are listed in Table S2. Pseudoviruses were titered on Huh7.5.1 cells overexpressing ACE2 and
TMPRSS2 (gift of Andreas Puschnik) using GFP expression to measure the concentration of focus
forming units (ffu).
Pseudovirus neutralization experiments
Huh7.5.1-ACE2-TMPRSS2 cells were seeded in 96-well plates at a density of 7000
cells/well one day prior to pseudovirus inoculation. Serum samples were diluted into complete
culture media (DMEM with 10% FBS, 10mM HEPES, 1x Pen-Strep-Glutamine) using the
LabCyte Echo 525 liquid handler and 1500 ffu of each pseudovirus was added to the diluted serum
to reach final dilutions ranging from 1:40-1:5120, including no-serum and no-pseudovirus
controls. Serum/pseudovirus mixtures were incubated at 37°C for 1h before being added directly
to cells. Cells inoculated with serum/pseudovirus mixtures were incubated at 37°C and 5% CO2

236
for 24h, resuspended using 10x TrypLE Select (Gibco), and cells were assessed with the BD
Celesta flow cytometer. The WHO International Reference Standard 20/150 was used to validate
the pseudovirus assay and compare serum neutralization titers (Table S3) [11]. All neutralization
assays were repeated in a total of three independent experiments with each experiment containing
two technical replicates for each condition. Cells were verified to be free of mycoplasma
contamination with the MycoAlert Mycoplasma detection kit (Lonza).
Data Analysis
Pseudovirus flow cytometry data was analyzed with FlowJo to determine the percentage
of GFP-positive cells, indicating pseudovirus transduction. Percent neutralization for each
condition was calculated by normalizing GFP-positive cell percentage to no-serum control wells.
Neutralization titers (NT50 and NT90) were calculated from eight-point response curves generated
in GraphPad Prism 7 using four-parameter logistic regression. The fold-change in pseudovirus
neutralization titer in each serum group was calculated by normalizing each variant NT50 and NT90
value to D614G pseudovirus NT50 and NT90 values in the same serum group. To compare
neutralization titer across a panel of different pseudoviruses and serum groups, the Log2 fold-
change compared to D614G pseudovirus was reported.
Results
We compared the 50% and 90% neutralization titers (NT50 and NT90) of D614G and
B.1.429 (Epsilon) pseudoviruses in individual serum samples from subjects exposed to D614G
infection, B.1.429 infection, mRNA vaccination, D614G infection with subsequent mRNA
vaccination, and B.1.429 infection with subsequent mRNA vaccination (Figure 10.1). Fold-

237
changes in both NT50 and NT90 are reported since these values often differ in magnitude due to
differences in neutralization curve slope between different variants and sera. In D614G- exposed
and vaccine-exposed serum, we observed approximately 2 to 3-fold decreases in average
neutralization titer against B.1.429 pseudovirus compared to D614G pseudovirus. As expected,
B.1.429-exposed serum neutralized B.1.429 pseudovirus more efficiently than D614G
pseudovirus. Of note, previous infection with either D614G or B.1.429 followed by vaccination
led to substantially higher neutralization titers against both pseudoviruses. In contrast to other
exposure groups, serum from vaccine recipients previously infected by B.1.429 neutralized D614G
and B.1.429 at similar titers, with only a 1.3-fold difference in NT90, indicating that exposure to
multiple spike variants elicits a potent response with specificity toward the breadth of prior
exposures.
We next investigated how exposure impacts neutralization specificity by crossing a panel
of eight different spike variants against serum pools elicited by nine different prior exposures.
(Figure 10.2; Table S3). A range of reductions in neutralization titer relative to D614G pseudovirus
were observed, with B.1.617.2 (Delta), B.1.351 (Beta), and B.1.1.529 (Omicron) exhibiting the
greatest resistance to neutralization in serum from vaccinated or D614G- exposed individuals with
up to 4-fold, 12-fold, and 65-fold reductions in NT90, respectively. However, for most variants,
reductions in neutralization titer were considerably smaller or absent in serum from subjects
previously exposed to a variant bearing some or all of the same spike mutations as the variant
being tested. Specifically, prior exposure to the E484K mutation in the spike receptor binding
domain (RBD) produced the greatest neutralization of four tested variants with mutations at the
E484 position: B.1.617, P.1 (Gamma), P.2 (Zeta), and B.1.351 (Beta). Similarly, B.1.617.2 (Delta)
was neutralized more effectively by serum elicited by partially homologous exposures B.1.1.519

238
and B.1.429 and was neutralized most effectively by serum elicited by fully homologous B.1.617.2
exposure. Conversely, in B.1.617.2-exposed serum we observed the least efficient neutralization
of the highly divergent spike variants P.1 and B.1.351. Interestingly, although B.1.1.529
(Omicron) substantially escaped neutralization in all convalescent sera and serum from recipients
of two vaccine doses, a much more modest 4 to 8-fold reduction in neutralization titer was
observed in sera from individuals with previous infection plus vaccination or three vaccine doses.
Discussion
In this study, we observe that vaccination and natural SARS-CoV-2 infection elicit
neutralizing antibody responses that are most potent against variants that bear spike mutations
present in the immunizing exposure. This trend is exemplified by variants with mutations at the
spike E484 position, which were neutralized more effectively by E484K- exposed serum than other
serum types. Importantly, we also show that B.1.617.2 (Delta) is neutralized more effectively by
serum elicited by prior exposure to three different variants — B.1.429, B.1.1.519, and B.1.617.2
— which have separate sets of spike mutations partially or fully overlapping with mutations in
B.1.617.2. These effects are presumably due to the shared L452R RBD mutation in B.1.429 and
B.1.617.2, and the shared T478K RBD mutation and P681 furin cleavage site mutation found in
both B.1.1.519 and B.1.617.2. The poor neutralization of P.1 and B.1.351 by Delta-exposed serum
further reinforces the notion that cross-neutralization is heavily impacted by antigenic distance
between variants [12]. Together, these results demonstrate that serum neutralization specificity is
strongest against variants fully homologous to the exposure, but even single shared spike
mutations, particularly those in highly antigenic regions such as the RBD, can enhance cross-
neutralization as supported in other studies [3,6,13].

239
This study also demonstrates the effect of serial exposure to repeated or novel versions of
spike on neutralizing antibody response. Infection with B.1.429 (Epsilon) followed by vaccination
led to greater cross-neutralization of B.1.429 and B.1.617.2 (Delta) compared to vaccination alone
or D614G infection plus vaccination, supporting the notion that exposure to multiple spike variants
expands neutralization breadth. Repeated immunizing exposures from infection plus vaccination
or booster vaccination led to both an overall increase in neutralization titers and generally
broadened neutralization specificity, particularly towards B.1.1.529 (Omicron), which was
neutralized most effectively by serum from recipients of three vaccine doses. A limitation of this
study is the relatively small number of serum samples, however the shift in neutralization titer
between D614G and variant pseudoviruses shows strong consistency between samples.
These serology data leverage human exposures to an array of naturally occurring spike
mutations, including those relevant to the globally dominant B.1.617.2 and recently ascendant
B.1.1.529 variants, providing a real-world complement to previous animal studies investigating
heterologous boosting or multivalent vaccination strategies [14,15]. Our findings suggest that
immunity acquired through natural infection will differ significantly between populations in
different regions of the world due to highly variable prevalence of different SARS-CoV-2 variants
throughout the course of the ongoing pandemic. These results also reinforce the urgent need for
widespread booster vaccination and contribute additional evidence suggesting that heterologous
or multivalent boosting strategies may be important and effective measures to address newly
emergent variants such as the highly immune evasive B.1.1.529 (Omicron). Future studies
investigating immune responses to additional emerging variants in vaccinated and unvaccinated
individuals will contribute to identifying spike antigen versions that elicit broadly neutralizing
antibody responses.

240
Figure 10.1. Neutralization of D614G and B.1.429 pseudoviruses by serum from individuals with different exposures. Plot of 50% and 90% pseudovirus neutralization titers (NT50 and NT90) of serum samples obtained from donors with the indicated infection and/or vaccination exposures. Grey lines connect neutralization titer values for D614G (black dots) and B.1.429 (blue dots) pseudoviruses within each individual serum sample. Geometric mean neutralization titers for each serum group are marked with red lines and fold-change in NT50 and NT90 between D614G and B.1.429 pseudoviruses is shown along with P value. Dark grey shading marks the interquartile range of titer values in each group and light grey shading marks the 10th–90th percentile of the range. P values were calculated with a Wilcoxon matched-pairs signed-rank test.
BRIEF REPORT • JID 2022:XX (XX XX) • 3
neutralization curve slope between different variants and sera. In D614G-exposed and vaccine-exposed serum, we ob-served approximately 2- to 3-fold decreases in average neutral-ization titer against B.1.429 pseudovirus compared to D614G pseudovirus. As expected, B.1.429-exposed serum neutralized B.1.429 pseudovirus more efficiently than D614G pseudovirus. Of note, previous infection with either D614G or B.1.429 fol-lowed by vaccination led to substantially higher neutralization titers against both pseudoviruses. In contrast to other exposure groups, serum from vaccine recipients previously infected by B.1.429 neutralized D614G and B.1.429 at similar titers, with only a 1.3-fold difference in NT90, indicating that exposure to multiple spike variants elicits a potent response with specificity toward the breadth of prior exposures.
We next investigated how exposure impacts neutralization speci!city by crossing a panel of 8 di"erent spike variants against serum pools elicited by 9 di"erent prior exposures (Figure 2 and Supplementary Table 3). A range of reductions in neutraliza-tion titer relative to D614G pseudovirus were observed, with B.1.617.2 (delta), B.1.351 (beta), and B.1.1.529 (omicron) ex-hibiting the greatest resistance to neutralization in serum from
vaccinated or D614G-exposed individuals with up to 4-fold, 12-fold, and 65-fold reductions in NT90, respectively. However, for most variants, reductions in neutralization titer were con-siderably smaller or absent in serum from subjects previously exposed to a variant bearing some or all of the same spike mu-tations as the variant being tested. Speci!cally, prior exposure to the E484K mutation in the spike receptor binding domain (RBD) produced the greatest neutralization of 4 tested variants with mutations at the E484 position: B.1.617, P.1 (gamma), P.2 (zeta), and B.1.351 (beta). Similarly, B.1.617.2 (delta) was neu-tralized more e"ectively by serum elicited by partially homolo-gous exposures B.1.1.519 and B.1.429, and was neutralized most e"ectively by serum elicited by fully homologous B.1.617.2 ex-posure. Conversely, in B.1.617.2-exposed serum we observed the least e#cient neutralization of the highly divergent spike variants P.1 and B.1.351. Interestingly, although B.1.1.529 (om-icron) substantially escaped neutralization in all convalescent sera and serum from recipients of 2 vaccine doses, a much more modest 4- to 8-fold reduction in neutralization titer was observed in sera from individuals with previous infection plus vaccination or three vaccine doses.
104
–1.8xP = .004
–3.1xP = .002
–1.1xns
1.7xP = .0001
–1.8xP = .001
–2.7xP = .001
–2.2xP = .008
–2.1xP = .008
–1.5xP = .0001
–1.3xP < .0001
103
102
NT50
D614G B.1.429 mRNA vaccine
Exposure of serum donor
D614G +mRNA vaccine
B.1.429 +mRNA vaccine
NT90 NT50 NT90 NT50 NT90 NT50 NT90 NT50 NT90
Pseu
dovi
rus n
eutr
aliz
atio
n tit
er(re
cipr
ocal
dilu
tion)
101 D614G pseudovirusB.1.429 pseudovirusGeometric mean titer25–75th percentile10–90th percentile
100
Figure 1. Neutralization of D614G and B.1.429 pseudoviruses by serum from individuals with different exposures. Plot of 50% and 90% pseudovirus neutralization titers (NT50 and NT90) of serum samples obtained from donors with the indicated infection and/or vaccination exposures. Grey lines connect neutralization titer values for D614G (black dots) and B.1.429 (blue dots) pseudoviruses within each individual serum sample. Geometric mean neutralization titers for each serum group are marked with red lines and fold-change in NT50 and NT90 between D614G and B.1.429 pseudoviruses is shown along with P value. Dark grey shading marks the interquartile range of titer values in each group and light grey shading marks the 10th–90th percentile of the range. P values were calculated with a Wilcoxon matched-pairs signed-rank test.
Dow
nloaded from https://academ
ic.oup.com/jid/advance-article/doi/10.1093/infdis/jiab635/6494558 by guest on 12 April 2022

241
Figure 10.2. Change in variant pseudovirus neutralization titer relative to D614G. Matrix of normalized neutralization titers for 8 different variant pseudoviruses (rows) neutralized by 9 different pools of individual sera grouped by exposure (columns). Data are represented as a heat map of the log2 fold-change in NT50 (top left of each box) and NT90 (bottom right of each box) of each variant relative to D614G pseudovirus. All serum samples were collected at least 14 days after the date of the subject’s positive COVID-19 test or date of most recent vaccine dose. All titer measurements are the mean of at least 3 independent experiments, each performed with 2 technical replicates. Positive log2 fold-change (blue) indicates an increase in neutralization titer for that variant relative to D614G pseudovirus, while negative log2 fold-change (red) indicates a decrease relative to D614G. Statistical significance was determined with unpaired t tests. All values are statistically significant (P value < .05) except where noted with ns to indicate the difference in variant neutralization titer is not significantly different from D614G pseudovirus neutralization titer in that serum pool. Abbreviations: COVID-19, coronavirus disease 2019; NT50 and NT90, 50% and 90% neutralization titer.
4 • JID 2022:XX (XX XX) • BRIEF REPORT
DISCUSSION
In this study, we observe that vaccination and natural SARS-CoV-2 infection elicit neutralizing antibody responses that are most potent against variants that bear spike mutations present in the immunizing exposure. This trend is exemplified by vari-ants with mutations at the spike E484 position, which were neu-tralized more effectively by E484K-exposed serum than other serum types. Importantly, we also show that B.1.617.2 (delta) is neutralized more effectively by serum elicited by prior expo-sure to 3 different variants—B.1.429, B.1.1.519, and B.1.617.2—which have separate sets of spike mutations partially or fully overlapping with mutations in B.1.617.2. These effects are pre-sumably due to the shared L452R RBD mutation in B.1.429 and B.1.617.2, and the shared T478K RBD mutation and P681 furin cleavage site mutation found in both B.1.1.519 and B.1.617.2. The poor neutralization of P.1 and B.1.351 by delta-exposed
serum further reinforces the notion that cross-neutralization is heavily impacted by antigenic distance between variants [12]. Together, these results demonstrate that serum neutralization specificity is strongest against variants fully homologous to the exposure, but even single shared spike mutations, particularly those in highly antigenic regions such as the RBD, can enhance cross-neutralization as supported in other studies [3, 6, 13].
!is study also demonstrates the e"ect of serial exposure to repeated or novel versions of spike on neutralizing antibody re-sponse. Infection with B.1.429 (epsilon) followed by vaccina-tion led to greater cross-neutralization of B.1.429 and B.1.617.2 (delta) compared to vaccination alone or D614G infection plus vaccination, supporting the notion that exposure to multiple spike variants expands neutralization breadth. Repeated im-munizing exposures from infection plus vaccination or booster vaccination led to both an overall increase in neutralization
Log2 fold-change
Previous exposure of serum donor
SAR
S-C
oV-2
var
iant
pse
udov
irus
2 mRNAvaccinedoses
3 mRNAvaccinedoses
D614G +2 mRNAvaccinedoses
B.1.429 +2 mRNAvaccinedosesD614G B.1.429 B.1.1.519 E484K B.1.617.2
–6
NT50
NT90 –4
B.1.429 (Epsilon)S13I, W152C, L452R, D614G
–1.0 0.4(ns)
–1.5
–0.8
–1.2
–0.4
–1.2
–1.2
–1.0
–1.2
–1.5
–1.4
–1.2
–1.5
–1.6
–0.9
–0.3(ns)
–0.2(ns)
–0.4(ns)
–0.5
–0.3(ns)
–0.5
–0.4
–0.7
–0.5
1.1
–0.4 –0.3(ns)
–0.6
0.8
0.7
–0.6
–0.2(ns)
–0.2(ns)
–0.4
–0.5
–0.7
–1.0
–0.5
–0.6
–0.7
–0.8
–0.6
–0.6
–0.3(ns)
–0.8
–0.7
–0.7
–1.3
0.6
1.6 –1.1
–1.2
–1.2
–1.2
–1.8
–0.9
–1.7
–0.7
–1.0
–0.7
–1.4
–0.9 –1.0
–1.4
–1.4
––2.5
0.1(ns)
–0.4 –4.8
–2.8
–1.5
–2.3
–3.4
–1.5
–2.0
–1.4
–1.6
–1.1
–1.1
–2.2 –2.2
–3.6
–2.4
––3.6
–0.4(ns)
–1.1 –4.6
–3.2
–2.5
–1.7
–1.9
–1.3
–1.0
–1.1
–1.2
–1.3
–0.9
–1.4 –1.8
–0.9
–1.3
––1.5
–0.5
–0.2(ns)
–1.9
–2.1
–1.9
–1.6
–1.4
–1.2
–1.0
–1.5
–1.5
–0.8
–0.5
–1.8 –0.8
–2.0
–0.4
0.3(ns)
–1.1
–1.7 0.5
0.1(ns)
–0.3
–4.0
–3.8
–2.1
–3.0
–2.0
–2.2
–2.0
–2.3
–4.7 –3.7
–6.0
–3.9
–4.4
–3.4
–2.5 –5.3
–3.7
–3.6
B.1.1.519T478K, D614G, P681H, T732A
P.2 (Zeta)E484K, D614G
P.1 (Gamma)L18F, T20N, P26S, D138Y,
R190S, K417T, E484K, N501Y,D614G, H655Y, T10271, V1176F
B.1.351 (Beta)D80A, D215G, !242–244, K417N,
E484K, N501Y, D614G, A701V
B.1.617L452R, E484Q, D614G, P681R
B.1.617.2 (Delta)T19R, T95I, G142D, !157–158, L452R,
T478K, D614G, P681R, D950N
B.1.1.529 (Omicron)32 Spike mutations including:
T951, G142D, !143–145, K417N, N440KT478K, E484A, N501Y, D614G, P681H
–2 0 2
Figure 2. Change in variant pseudovirus neutralization titer relative to D614G. Matrix of normalized neutralization titers for 8 different variant pseudoviruses (rows) neutral-ized by 9 different pools of individual sera grouped by exposure (columns). Data are represented as a heat map of the log2 fold-change in NT50 (top left of each box) and NT90 (bottom right of each box) of each variant relative to D614G pseudovirus. All serum samples were collected at least 14 days after the date of the subject’s positive COVID-19 test or date of most recent vaccine dose. All titer measurements are the mean of at least 3 independent experiments, each performed with 2 technical replicates. Positive log2 fold-change (blue) indicates an increase in neutralization titer for that variant relative to D614G pseudovirus, while negative log2 fold-change (red) indicates a decrease relative to D614G. Statistical significance was determined with unpaired t tests. All values are statistically significant (P value < .05) except where noted with ns to indicate the difference in variant neutralization titer is not significantly different from D614G pseudovirus neutralization titer in that serum pool. Abbreviations: COVID-19, coronavirus disease 2019; NT50 and NT90, 50% and 90% neutralization titer.
Dow
nloaded from https://academ
ic.oup.com/jid/advance-article/doi/10.1093/infdis/jiab635/6494558 by guest on 12 April 2022
242
Chapter 10 References
1. CDC. Coronavirus Disease 2019 (COVID-19) [Internet]. Centers for Disease Control and
Prevention. 2020 [cited 2021 Sep 1]. Available from: https://www.cdc.gov/coronavirus/2019-
ncov/variants/variant-info.html
2. Teyssou E, Delagrèverie H, Visseaux B, et al. The Delta SARS-CoV-2 variant has a higher
viral load than the Beta and the historical variants in nasopharyngeal samples from newly
diagnosed COVID-19 patients. J Infect. 2021; :S0163-4453(21)00416–3.
3. Greaney AJ, Starr TN, Barnes CO, et al. Mapping mutations to the SARS-CoV-2 RBD that
escape binding by different classes of antibodies. Nat Commun. 2021; 12(1):4196.
4. Liu J, Liu Y, Xia H, et al. BNT162b2-elicited neutralization of B.1.617 and other SARS-CoV-
2 variants. Nature. 2021; 596(7871):273–275.
5. Corbett KS, Nason MC, Flach B, et al. Immune correlates of protection by mRNA- 1273
vaccine against SARS-CoV-2 in nonhuman primates. Science [Internet]. American
Association for the Advancement of Science; 2021 [cited 2021 Sep 1]; . Available from:
https://www.science.org/doi/abs/10.1126/science.abj0299
6. Liu C, Ginn HM, Dejnirattisai W, et al. Reduced neutralization of SARS-CoV-2 B.1.617 by
vaccine and convalescent serum. Cell. 2021; 184(16):4220-4236.e13.
7. Peng J, Liu J, Mann SA, et al. Estimation of secondary household attack rates for emergent
spike L452R SARS-CoV-2 variants detected by genomic surveillance at a community-based
testing site in San Francisco. Clin Infect Dis. 2021; :ciab283.
8. Kalantar KL, Carvalho T, de Bourcy CFA, et al. IDseq—An open source cloud-based pipeline
and analysis service for metagenomic pathogen detection and monitoring. GigaScience

243
[Internet]. 2020 [cited 2021 Jul 14]; 9(10). Available from:
https://doi.org/10.1093/gigascience/giaa111
9. Elledge SK, Zhou XX, Byrnes JR, et al. Engineering luminescent biosensors for point-of-care
SARS-CoV-2 antibody detection. Nat Biotechnol. 2021; :1–8.
10. Hoffmann M, Kleine-Weber H, Pöhlmann S. A Multibasic Cleavage Site in the Spike Protein
of SARS-CoV-2 Is Essential for Infection of Human Lung Cells. Mol Cell. 2020; 78(4):779-
784.e5.
11. Mattiuzzo G, Bentley EM, Hassall M, et al. Establishment of the WHO International Standard
and Reference Panel for anti-SARS-CoV-2 antibody. World Health Organization. 2020; :60.
12. Liu C, Zhou D, Nutalai R, et al. The antibody response to SARS-CoV-2 Beta underscores the
antigenic distance to other variants. Cell Host Microbe. 2021; :S1931- 3128(21)00519–9.
13. McCallum M, Walls AC, Sprouse KR, et al. Molecular basis of immune evasion by the Delta
and Kappa SARS-CoV-2 variants. Science. 2021; :eabl8506.
14. Wu K, Choi A, Koch M, et al. Variant SARS-CoV-2 mRNA vaccines confer broad
neutralization as primary or booster series in mice. Vaccine. 2021; 39(51):7394–7400.
15. Corbett KS, Gagne M, Wagner DA, et al. Protection against SARS-CoV-2 Beta variant in
mRNA-1273 vaccine-boosted nonhuman primates. Science. 2021; 374(6573):1343–1353.

Publishing Agreement It is the policy of the University to encourage open access and broad distribution of all theses, dissertations, and manuscripts. The Graduate Division will facilitate the distribution of UCSF theses, dissertations, and manuscripts to the UCSF Library for open access and distribution. UCSF will make such theses, dissertations, and manuscripts accessible to the public and will take reasonable steps to preserve these works in perpetuity. I hereby grant the non-exclusive, perpetual right to The Regents of the University of California to reproduce, publicly display, distribute, preserve, and publish copies of my thesis, dissertation, or manuscript in any form or media, now existing or later derived, including access online for teaching, research, and public service purposes. __________________________ ________________
Author Signature Date
���������
���