Embed Size (px)
Citation preview
e u p a o p e n p r o t e o m i c s 3 ( 2 0 1 4 ) 152–170
Available online at www.sciencedirect.com
ScienceDirect
jou rn al hom epage : ht tp : / /www.e lsev ier .com/ locate /euprot
Mass spectrometric characterization of thecrustacean neuropeptidome
Qing Yu, Chuanzi OuYang, Zhidan Liang, Lingjun Li ∗
School of Pharmacy and Department of Chemistry, University of Wisconsin – Madison, Madison, WI, USA
a r t i c l e i n f o
Article history:
Available online 12 March 2014
Keywords:
Neuropeptide
NP
a b s t r a c t
Neuropeptides (NPs) are the largest class of signaling molecules used by nervous systems.
Despite their functional importance, numerous challenges exist to characterize the full
complement of NPs – the neuropeptidome. In this review, we discuss recent advances in
MS-based techniques for NP identification and quantitation, as well as sample preparation
strategies for various applications in several crustacean model organisms. By surveying
published examples of crustacean neuropeptidomic analyses, we highlight challenges and
Peptidomics
Mass spectrometry
Crustacean
progress in this dynamic field, and summarize the current state of knowledge about crus-
tacean NPs and MS-based methodologies for NP analysis.
© 2014 Published by Elsevier B.V. on behalf of European Proteomics Association (EuPA).
This is an open access article under the CC BY-NC-ND license
(http://creativecommons.org/licenses/by-nc-nd/3.0/).
fication of new peptide families, significantly expanding the
1. Introduction
Animal behaviors are precisely controlled by the nervoussystem which employs a myriad of signaling molecules tomediate this control process. One of the most diverse signalingmolecules are neuropeptides (NPs), which are synthesized aslarger precursor proteins, and undergo extensive processingand modification to become bioactive NPs to participate incell–cell signaling. Since they are directly involved in mod-ulating many physiological processes, such as feeding, painsensing and reproduction [1,2], there is growing interest instudying their structures, functions and distributions. Becauseof the relatively simple nervous system and accessible electro-physiology at the single-cell and neural circuit level, decapod
crustacean has long been used as an attractive model prepara-tion for neuromodulation and NP research [3,4], as evidencedby the large number of NPs discovered since 2000 (Table 1).∗ Corresponding author at: School of Pharmacy and Department of CheMadison, Wisconsin 53705-2222, USA. Tel.: +1 608 265 8491; fax: +1 608
E-mail address: [email protected] (L. Li).http://dx.doi.org/10.1016/j.euprot.2014.02.0152212-9685/© 2014 Published by Elsevier B.V. on behalf of European ProteCC BY-NC-ND license (http://creativecommons.org/licenses/by-nc-nd/3
Traditional studies on NPs often use biochemical techniquesthat can be imprecise and cumbersome. Mass spectrome-try (MS) has evolved as a powerful tool to characterize NPs,due to its capability to precisely determine the identity andprimary structure of a NP as well as its ability to quantifythese signaling molecules in a complex mixture. A new con-cept, peptidomics, was introduced in 2001, largely due to therapid growth of MS-based large-scale peptide and proteinanalysis [5–7]. By exploring the utility of MS based methods,various NP families with multiple isoforms that differ fromeach other by a single amino acid can be distinguished incontrast to antibody-based immunochemical techniques. Thecombined use of MS and MS/MS scans enable the discoveryof novel members of established NP families and the identi-
mistry, University of Wisconsin – Madison, 777 Highland Avenue, 262 5345.
neuropeptidome in a model organism [3,8]. With their struc-tural information available, the next step for NP study is todetermine its function during various physiological processes.
omics Association (EuPA). This is an open access article under the.0/).
e u p a o p e n p r o t e o m i c s 3 ( 2 0 1 4 ) 152–170 153
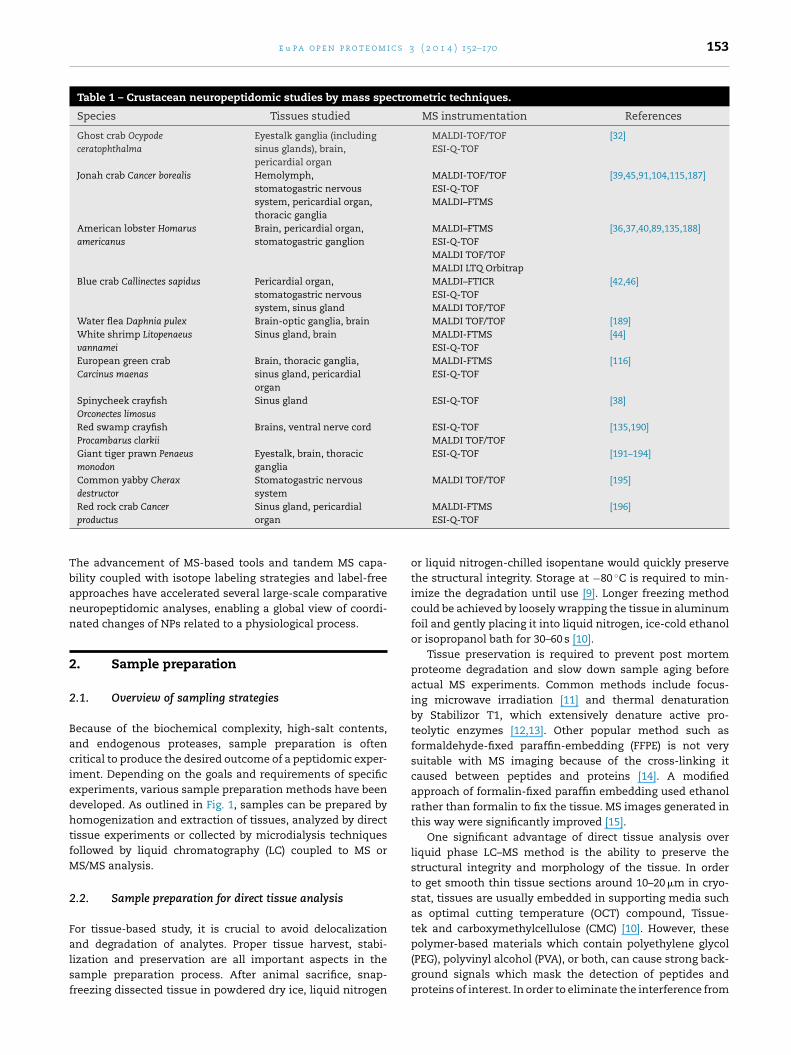
Table 1 – Crustacean neuropeptidomic studies by mass spectrometric techniques.
Species Tissues studied MS instrumentation References
Ghost crab Ocypodeceratophthalma
Eyestalk ganglia (includingsinus glands), brain,pericardial organ
MALDI-TOF/TOFESI-Q-TOF
[32]
Jonah crab Cancer borealis Hemolymph,stomatogastric nervoussystem, pericardial organ,thoracic ganglia
MALDI-TOF/TOFESI-Q-TOFMALDI–FTMS
[39,45,91,104,115,187]
American lobster Homarusamericanus
Brain, pericardial organ,stomatogastric ganglion
MALDI–FTMSESI-Q-TOFMALDI TOF/TOFMALDI LTQ Orbitrap
[36,37,40,89,135,188]
Blue crab Callinectes sapidus Pericardial organ,stomatogastric nervoussystem, sinus gland
MALDI–FTICRESI-Q-TOFMALDI TOF/TOF
[42,46]
Water flea Daphnia pulex Brain-optic ganglia, brain MALDI TOF/TOF [189]White shrimp Litopenaeusvannamei
Sinus gland, brain MALDI-FTMSESI-Q-TOF
[44]
European green crabCarcinus maenas
Brain, thoracic ganglia,sinus gland, pericardialorgan
MALDI-FTMSESI-Q-TOF
[116]
Spinycheek crayfishOrconectes limosus
Sinus gland ESI-Q-TOF [38]
Red swamp crayfishProcambarus clarkii
Brains, ventral nerve cord ESI-Q-TOFMALDI TOF/TOF
[135,190]
Giant tiger prawn Penaeusmonodon
Eyestalk, brain, thoracicganglia
ESI-Q-TOF [191–194]
Common yabby Cheraxdestructor
Stomatogastric nervoussystem
MALDI TOF/TOF [195]
Tbann
2
2
BaciedhtfM
2
Falsf
Red rock crab Cancerproductus
Sinus gland, pericardialorgan
he advancement of MS-based tools and tandem MS capa-ility coupled with isotope labeling strategies and label-freepproaches have accelerated several large-scale comparativeeuropeptidomic analyses, enabling a global view of coordi-ated changes of NPs related to a physiological process.
. Sample preparation
.1. Overview of sampling strategies
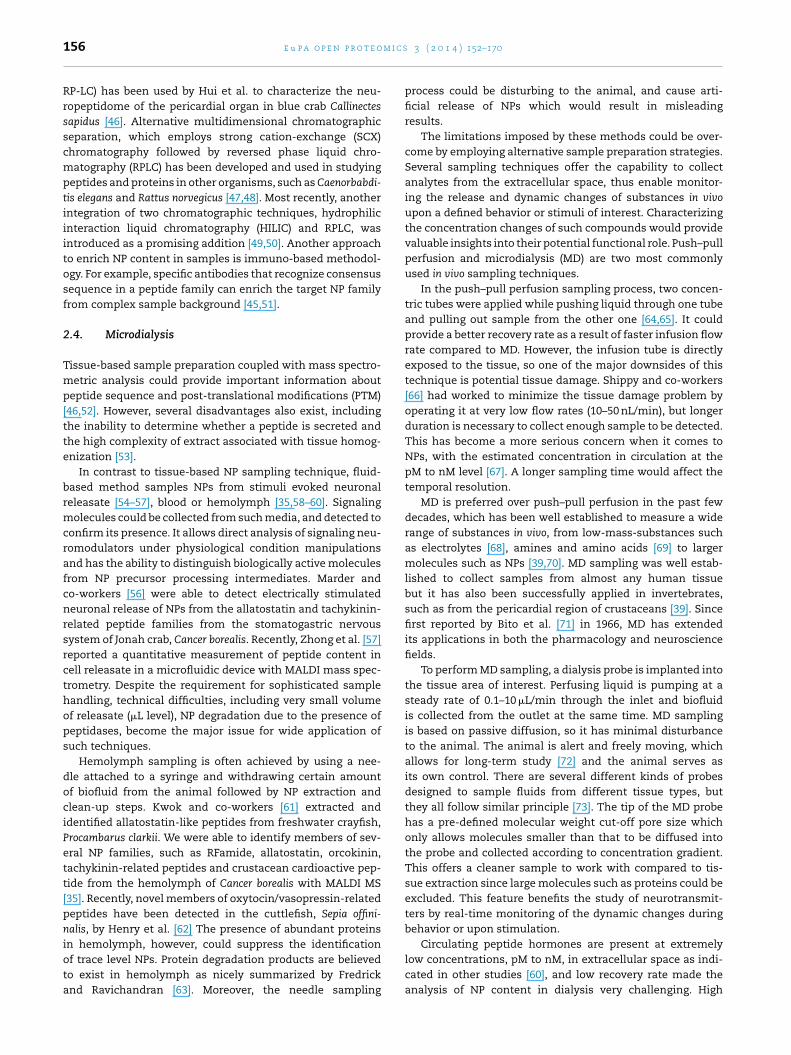
ecause of the biochemical complexity, high-salt contents,nd endogenous proteases, sample preparation is oftenritical to produce the desired outcome of a peptidomic exper-ment. Depending on the goals and requirements of specificxperiments, various sample preparation methods have beeneveloped. As outlined in Fig. 1, samples can be prepared byomogenization and extraction of tissues, analyzed by directissue experiments or collected by microdialysis techniquesollowed by liquid chromatography (LC) coupled to MS orS/MS analysis.
.2. Sample preparation for direct tissue analysis
or tissue-based study, it is crucial to avoid delocalization
nd degradation of analytes. Proper tissue harvest, stabi-ization and preservation are all important aspects in theample preparation process. After animal sacrifice, snap-reezing dissected tissue in powdered dry ice, liquid nitrogenMALDI-FTMSESI-Q-TOF
[196]
or liquid nitrogen-chilled isopentane would quickly preservethe structural integrity. Storage at −80 ◦C is required to min-imize the degradation until use [9]. Longer freezing methodcould be achieved by loosely wrapping the tissue in aluminumfoil and gently placing it into liquid nitrogen, ice-cold ethanolor isopropanol bath for 30–60 s [10].
Tissue preservation is required to prevent post mortemproteome degradation and slow down sample aging beforeactual MS experiments. Common methods include focus-ing microwave irradiation [11] and thermal denaturationby Stabilizor T1, which extensively denature active pro-teolytic enzymes [12,13]. Other popular method such asformaldehyde-fixed paraffin-embedding (FFPE) is not verysuitable with MS imaging because of the cross-linking itcaused between peptides and proteins [14]. A modifiedapproach of formalin-fixed paraffin embedding used ethanolrather than formalin to fix the tissue. MS images generated inthis way were significantly improved [15].
One significant advantage of direct tissue analysis overliquid phase LC–MS method is the ability to preserve thestructural integrity and morphology of the tissue. In orderto get smooth thin tissue sections around 10–20 �m in cryo-stat, tissues are usually embedded in supporting media suchas optimal cutting temperature (OCT) compound, Tissue-tek and carboxymethylcellulose (CMC) [10]. However, these
polymer-based materials which contain polyethylene glycol(PEG), polyvinyl alcohol (PVA), or both, can cause strong back-ground signals which mask the detection of peptides andproteins of interest. In order to eliminate the interference from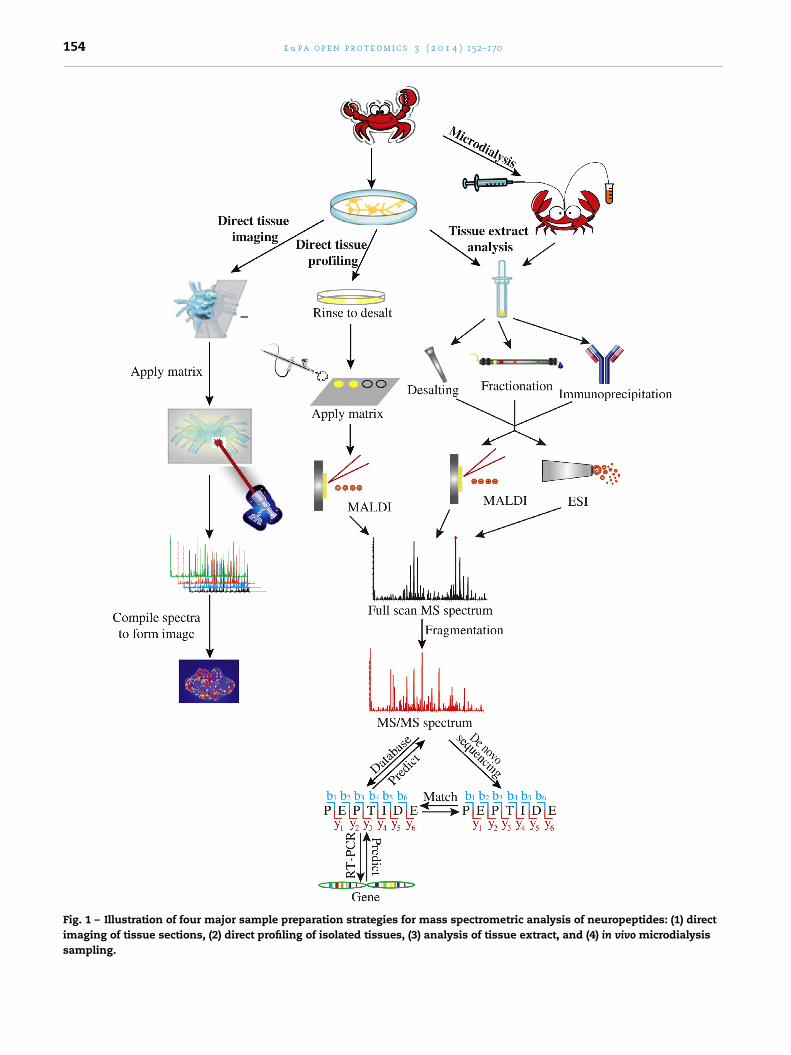
154 e u p a o p e n p r o t e o m i c s 3 ( 2 0 1 4 ) 152–170
Fig. 1 – Illustration of four major sample preparation strategies for mass spectrometric analysis of neuropeptides: (1) directimaging of tissue sections, (2) direct profiling of isolated tissues, (3) analysis of tissue extract, and (4) in vivo microdialysissampling.
c s 3
elt[V[mmm
aoTrlbsh(sfsa
wropyecpcoawp
stbsattttsteofipxp
eic
e u p a o p e n p r o t e o m i
mbedding materials, ice is commonly used for analytes atow m/z [16]. At medium and high mass range, gelatin is ableo provide high-quality MS images with minimal interference17,18]. Sucrose is also a promising alternative as reported byerhaert et al. in their study of the NPs in a cockroach brain
19]. Strohalm et al. were able to use poly[N-(2-hydroxypropyl)ethacrylamide] (pHPMA) as a novel embedding/supportingaterial to enhance the signal intensity from bumblebee andouse lung samples without visible background peaks [20].Fixation of tissue slices onto sample plate is commonly
chieved by thaw-mounting [10]. When the analysis is carriedut on a matrix-assisted laser desorption/ionization (MALDI)OF instrument, an electrically conductive sample plate isequired, such as gold-coated, ITO-coated glass slides or stain-ess steel metal plates [21,22]. For MALDI linear ion trap (LIT)ased mass spectrometric study, regular microscopic glasslides work as well [19]. Transparent glass slides also allowistological tissue staining after mass spectrometric imaging
MSI) studies to enable the correlation on the same tissueection. When reversible matrix-wash-up step is requiredor subsequent study, such as histological staining, adhe-ive double-sided conductive tape is preferred as the fixativepproach.
When the interest of study is peptides and proteins in MSI,ashing the fixed tissue before matrix deposition is often car-
ied out to remove salts and lipids. When the composition ofrganic washing solution is optimized for specific tissue sam-le, the acquired MS spectra show enhanced signal and ionields [23]. Commonly used washing solution contains differ-nt combinations of methanol, ethanol, acetone, hexane andhloroform [24,25]. It is important to point out that the com-osition of the washing solution and the washing protocol isrucial to the success of the following MSI investigation. Sub-ptimal washing solutions could cause hydrophilic peptidesnd low abundance analytes to be washed off. Inappropriateashing procedure could lead to delocalization of protein andeptides on tissue surface.
After the tissue section is prepared, one could do either tis-ue profiling or tissue imaging to acquire MS information fromhe sample. To intentionally and quickly make comparisonsetween and among distinct areas on tissue without precisepatial information, tissue profiling is usually preferred. Thispproach normally samples 5–20 discrete spots on the tissueo give representative MS spectra in each area [26]. For bet-er statistical confidence, the number of acquisitions needso be adjusted for specific studies. Under longer experimentalime, tissue imaging approach obtains complete chemical andpatial information over the entire tissue with higher resolu-ion. Depending on the definition of raster step-size in specificxperiment, one tissue section is divided into a number ofrderly aligned pixel fractions. The instrument samples eachraction and generates MS data with corresponding locationnformation. By combining the results from all the fractions,eptides and proteins of interest could be plotted over the
and y axes on the 2D tissue map to show the localizationattern.
A matrix with the ability to absorb and transfer lasernergy is required in MALDI MS to trigger desorption andonization of the analyte. For NP analysis, common matri-es include �-cyano-4-hydroxy-cinnamic acid (CHCA) and
( 2 0 1 4 ) 152–170 155
2,5-dihydroxybenzoic acid (DHB). Peptides and proteins areextracted from thin tissue sections while matrix is depositedonto the tissue surface. The composition of solvents inthe matrix solution needs to be optimized for the bestextraction efficiency. To preserve the localization informa-tion of analyte on the tissue surface, two matrix applicationmethods are common: microspotting and spray coating [27].Several well-developed techniques are available to producehomogenous thin layer deposition for high resolution MSIexperiments. Airbrush, TM sprayer and thin layer chromatog-raphy sprayer are pneumatic-spray-based, while ImagePrepfrom Bruker Daltonics is vibrational-spray-based. Others likeacoustic, piezoelectric, ink-jet printer, capillary-depositionand mist-nebulizing spray coating techniques are roboticand commercially available. Size of the matrix solutiondroplet could be adjusted in most of the above approaches.Smaller droplet size results in finer spatial resolution howeverdecrease the extraction efficiency and sensitivity of detection.Spectral quality and reproducibility is improved when matrixsolution is densely spotted in arrays with the tradeoff of lowerspatial resolution.
When migration and diffusion of the analytes become amajor concern for specific tissue samples, dry matrix appli-cation could minimize the disadvantages. However, becauseof the lack of efficient extraction and cocrystallization-interaction between analytes and matrix, the sensitivity ofthese approaches is somewhat limited [28–30].
2.3. Tissue extraction analysis
Many neuropeptidomic analyses employ tissue homogeniza-tion followed by extraction method. In this approach, specifictissues from multiple animals are often pooled and homog-enized, followed by extraction with acidic buffer and thenfurther separated or fractionated. The resulting extract isthen analyzed by MS, generally either online or offlinewith electrospray ionization (ESI) type of instruments, andsometimes MALDI instruments. Advantages of this approachare the feasibility with any organism regardless of thetissue size. With pooling method, significant amounts ofNPs can be extracted followed by LC–MS/MS for identifica-tions, which is suitable for MS instruments with modestsensitivity.
Homogenization and extraction are performed in the pres-ence of solvent buffers which can deactivate proteases fromdegrading proteins and peptides in the sample. Acidifiedmethanol [31,32] is most commonly used in studying crus-tacean NPs, with other examples being acidified acetone[33,34], a combination of acidified methanol spiked with EDTAand protease inhibitors [35]. Following the homogenizationand extraction, centrifugation is typically performed to elim-inate cell debris. The supernatant is then concentrated and,if necessary, a C18 desalting protocol can be applied. Inmany cases, reversed-phase liquid chromatography (RPLC) isadapted to fractionate complex crustacean NP mixtures as toincrease neuropeptidome coverage by enabling detections of
low abundance NPs [36–38].This strategy has been successfully used to characterizeNPs in many crustacean species [32,36,37,39–45]. In addition,two-dimensional reversed-phase liquid chromatography (2D
m i c s
156 e u p a o p e n p r o t e oRP-LC) has been used by Hui et al. to characterize the neu-ropeptidome of the pericardial organ in blue crab Callinectessapidus [46]. Alternative multidimensional chromatographicseparation, which employs strong cation-exchange (SCX)chromatography followed by reversed phase liquid chro-matography (RPLC) has been developed and used in studyingpeptides and proteins in other organisms, such as Caenorbabdi-tis elegans and Rattus norvegicus [47,48]. Most recently, anotherintegration of two chromatographic techniques, hydrophilicinteraction liquid chromatography (HILIC) and RPLC, wasintroduced as a promising addition [49,50]. Another approachto enrich NP content in samples is immuno-based methodol-ogy. For example, specific antibodies that recognize consensussequence in a peptide family can enrich the target NP familyfrom complex sample background [45,51].
2.4. Microdialysis
Tissue-based sample preparation coupled with mass spectro-metric analysis could provide important information aboutpeptide sequence and post-translational modifications (PTM)[46,52]. However, several disadvantages also exist, includingthe inability to determine whether a peptide is secreted andthe high complexity of extract associated with tissue homog-enization [53].
In contrast to tissue-based NP sampling technique, fluid-based method samples NPs from stimuli evoked neuronalreleasate [54–57], blood or hemolymph [35,58–60]. Signalingmolecules could be collected from such media, and detected toconfirm its presence. It allows direct analysis of signaling neu-romodulators under physiological condition manipulationsand has the ability to distinguish biologically active moleculesfrom NP precursor processing intermediates. Marder andco-workers [56] were able to detect electrically stimulatedneuronal release of NPs from the allatostatin and tachykinin-related peptide families from the stomatogastric nervoussystem of Jonah crab, Cancer borealis. Recently, Zhong et al. [57]reported a quantitative measurement of peptide content incell releasate in a microfluidic device with MALDI mass spec-trometry. Despite the requirement for sophisticated samplehandling, technical difficulties, including very small volumeof releasate (�L level), NP degradation due to the presence ofpeptidases, become the major issue for wide application ofsuch techniques.
Hemolymph sampling is often achieved by using a nee-dle attached to a syringe and withdrawing certain amountof biofluid from the animal followed by NP extraction andclean-up steps. Kwok and co-workers [61] extracted andidentified allatostatin-like peptides from freshwater crayfish,Procambarus clarkii. We were able to identify members of sev-eral NP families, such as RFamide, allatostatin, orcokinin,tachykinin-related peptides and crustacean cardioactive pep-tide from the hemolymph of Cancer borealis with MALDI MS[35]. Recently, novel members of oxytocin/vasopressin-relatedpeptides have been detected in the cuttlefish, Sepia offini-nalis, by Henry et al. [62] The presence of abundant proteins
in hemolymph, however, could suppress the identificationof trace level NPs. Protein degradation products are believedto exist in hemolymph as nicely summarized by Fredrickand Ravichandran [63]. Moreover, the needle sampling3 ( 2 0 1 4 ) 152–170
process could be disturbing to the animal, and cause arti-ficial release of NPs which would result in misleadingresults.
The limitations imposed by these methods could be over-come by employing alternative sample preparation strategies.Several sampling techniques offer the capability to collectanalytes from the extracellular space, thus enable monitor-ing the release and dynamic changes of substances in vivoupon a defined behavior or stimuli of interest. Characterizingthe concentration changes of such compounds would providevaluable insights into their potential functional role. Push–pullperfusion and microdialysis (MD) are two most commonlyused in vivo sampling techniques.
In the push–pull perfusion sampling process, two concen-tric tubes were applied while pushing liquid through one tubeand pulling out sample from the other one [64,65]. It couldprovide a better recovery rate as a result of faster infusion flowrate compared to MD. However, the infusion tube is directlyexposed to the tissue, so one of the major downsides of thistechnique is potential tissue damage. Shippy and co-workers[66] had worked to minimize the tissue damage problem byoperating it at very low flow rates (10–50 nL/min), but longerduration is necessary to collect enough sample to be detected.This has become a more serious concern when it comes toNPs, with the estimated concentration in circulation at thepM to nM level [67]. A longer sampling time would affect thetemporal resolution.
MD is preferred over push–pull perfusion in the past fewdecades, which has been well established to measure a widerange of substances in vivo, from low-mass-substances suchas electrolytes [68], amines and amino acids [69] to largermolecules such as NPs [39,70]. MD sampling was well estab-lished to collect samples from almost any human tissuebut it has also been successfully applied in invertebrates,such as from the pericardial region of crustaceans [39]. Sincefirst reported by Bito et al. [71] in 1966, MD has extendedits applications in both the pharmacology and neurosciencefields.
To perform MD sampling, a dialysis probe is implanted intothe tissue area of interest. Perfusing liquid is pumping at asteady rate of 0.1–10 �L/min through the inlet and biofluidis collected from the outlet at the same time. MD samplingis based on passive diffusion, so it has minimal disturbanceto the animal. The animal is alert and freely moving, whichallows for long-term study [72] and the animal serves asits own control. There are several different kinds of probesdesigned to sample fluids from different tissue types, butthey all follow similar principle [73]. The tip of the MD probehas a pre-defined molecular weight cut-off pore size whichonly allows molecules smaller than that to be diffused intothe probe and collected according to concentration gradient.This offers a cleaner sample to work with compared to tis-sue extraction since large molecules such as proteins could beexcluded. This feature benefits the study of neurotransmit-ters by real-time monitoring of the dynamic changes duringbehavior or upon stimulation.
Circulating peptide hormones are present at extremelylow concentrations, pM to nM, in extracellular space as indi-cated in other studies [60], and low recovery rate made theanalysis of NP content in dialysis very challenging. High
c s 3
surccyaei
tceaaliueauosrwtrocp[
tHcabtialmr
3
Tcdsnimt
3
Wg
e u p a o p e n p r o t e o m i
ensitivity detection methods, which handle �L volumes, aresually coupled with MD sampling. Immunoassays, usuallyadioimmunoassays (RIA), were used to measure NP releaseollected from MD [74], but it has limited specificity due toross reactivity, which is not suitable for complex sample anal-sis and novel peptide discovery. Mass spectrometry offers anttractive tool to be coupled with MD to detect NPs at pM orven lower concentrations [39,75], and it enables simultaneousdentification and quantitation.
The recovery rate is calculated by dividing the concen-ration of the substance collected in the probe over itsoncentration in the extracellular space. According to in vitroxperiments, MD recovery rate for NPs is at 20–30% [70]. Therere several factors that could affect the recovery rate suchs molecular size and flow rate, which could be manipu-ated to improve the recovery rate. Significant improvementn recovery rate has been achieved for amines and drugssing ultraslow flow rate [76,77]. However, improving recov-ry could be challenging for larger molecules, like NPs. Roynd co-workers [78] have constructed a microdialysis probesing material with a larger pore size (molecular weight cut-ff 50 kDa and 100 kDa) to get better recovery. But it is moreuitable for sampling proteins instead of NPs whose massange is around 500–10 kDa [79–83]. Affinity-enhanced MD,here an affinity agent is added into the perfusing liquid
o increase the recovery rate, has been applied in a wideange of studies [70,81,84,85], including a recent study fromur group using RFamide antibody linked magnetic nanoparti-les as affinity agents to enhance recovery of RFamide-relatedeptides in microdialysate from Jonah crab, Cancer borealis
75].Temporal resolution is defined as the shortest time dura-
ion over which a dynamic change event can be observed.igh temporal resolution could be achieved by MD, which isritical for the functional study targeted compounds. To beble to accurately correlate the concentration of analytes withehavior or stimuli, the analysis time must be shorter thanhe duration of measured events. Working with high sensitiv-ty analysis assay, temporal resolution is defined by flow ratend detection limit. If the flow rate is 1 �L/min, and the ana-yte concentration in the perfusate is around �M, then a few
inutes or even seconds of sampling duration interval can beeached with LC–MS coupling to MD [86–88].
. Structural elucidation
he structures of NPs were previously determined by theombination of chromatographic separation and Edmanegradation, which would require a large amount of pureample and is very time-consuming. However, MS-based tech-iques enable high throughput acquisition of NP fragment
nformation. Even without available genome information,ass spectrometry can still be used to profile and characterize
he neuropeptidome of a specific organism.
.1. Characterization of the neuropeptidome
ith its multifaceted capabilities, mass spectrometry hasreatly shifted discovery of NPs from the identification of a
( 2 0 1 4 ) 152–170 157
single peptide to the characterization of the entire peptidome.MALDI-based mass spectrometers feature high sensitivity, tol-erance to contaminants and convenient sample preparations.The ability to do in situ sequencing of NPs, mapping the spa-tial distribution and localization offers unique advantagescompared to other MS techniques and has enabled characteri-zation of NP sequences and distributions [89–91]. Preference togenerate singly charged ions in MALDI-MS simplifies spectrainterpretation [92]. MALDI MS also enables detection of someNPs that otherwise could be missed in ESI quadrupole time-of-flight (Q-TOF) mass spectrometry because of sample loss ordilution during LC separations. ESI interfaced mass spectro-meters, on the other hand, are advantageous in that they canproduce multiply charged ions, effectively extending the massrange of the analyzer to accommodate proteins and peptideswith masses up to MDa. ESI-based MS platforms work wellwith pooled samples and upstream online LC separation. Dueto the reduced sample complexity, multiple charging effectsand resulting efficient fragmentation, the ESI source in gen-eral offers greater coverage of the peptidome. ESI is a softionization process so that intact molecular ions are observed.Thermally labile bio-molecules or some non-covalent interac-tions that are not amenable to traditional ionization methodscould be well preserved in ESI [93,94].
While it is feasible to predict peptide sequences froma genome sequence and match with accurate mass, frag-mentation of multiply charged ions yields more detectablefragment ions [95]. Fragmentation fingerprints are especiallynecessary when working with crustaceans as little genomicinformation is known about these organisms. Traditionally,collision-induced dissociation (CID) is employed for fragmen-tation. Upon collision with neutral gas molecules, increasedvibrational energy redistributes over the peptide. Fragmenta-tion ideally occurs along the backbone amide bond leading tothe formation of b- and y-type daughter ions.
The CID process is highly effective, or somewhat biased, forsmall (∼20 amino acid residues), low-charged peptides (∼+3).Additionally the fragmentation efficiency highly depends onmobile protons, yet the presence of several basic amino acidsin the sequence can prevent the random protonation andtherefore produce more site specific fragments rather thansequence-specific fragment ions covering the whole sequence[96]. Another drawback of CID is that several PTMs, such asphosphorylation and glycosylation, are labile to collisions andthus result in incomplete or even wrong sequence assignment.Higher-energy collision dissociation (HCD) [97] and electrontransfer dissociation (ETD) [98] serve as two alternatives to CIDto solve these problems. HCD employs higher energy dissocia-tions than those used in ion trap CID, enabling a wider range offragmentation pattern including the low-mass region diagnos-tic immonium ions. ETD induces fragmentation of cations bytransferring electrons to them via an anion reagent. In contrastto CID, ETD can preserve labile PTMs, and has no preferredcleavage sites except for resistance to cleavage at proline,which leads to a more uniform fragment ions following a lowerenergy pathway and it outperforms CID in fragmenting higher
charged parent ions [99] which will be discussed below. ETDgenerates a different set of fragment ions, that is c- and z-ions[100–102] compared to CID and HCD which generate b- andy-ions.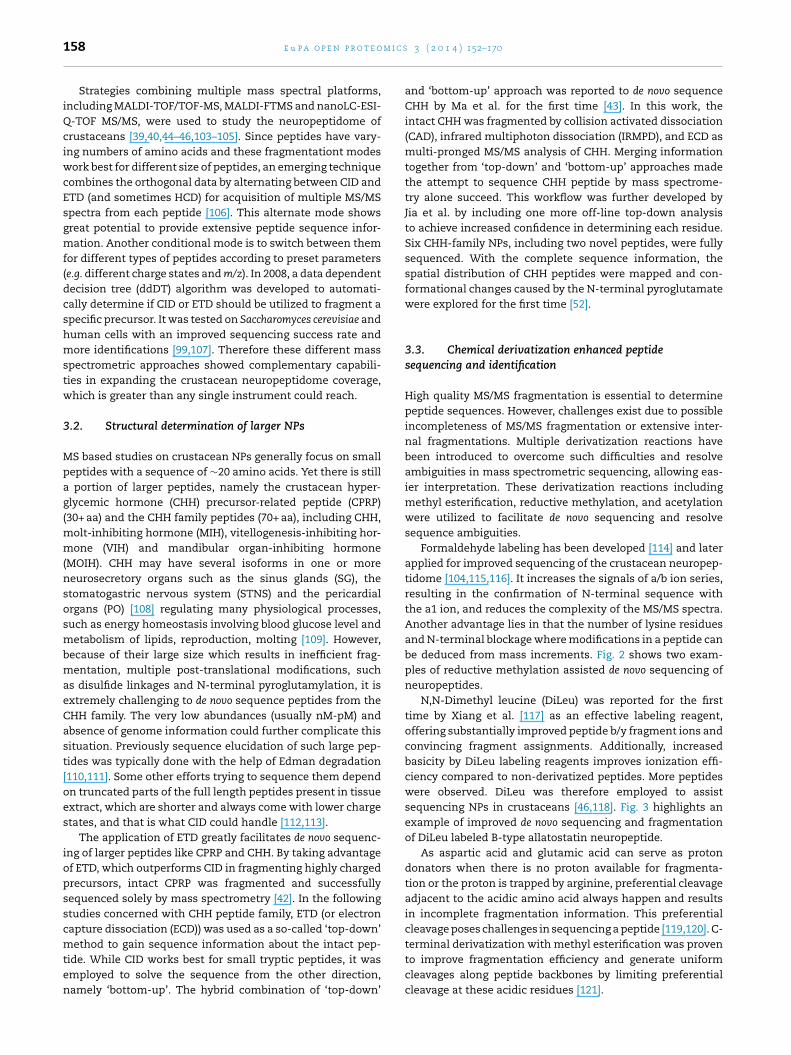
m i c s
158 e u p a o p e n p r o t e oStrategies combining multiple mass spectral platforms,including MALDI-TOF/TOF-MS, MALDI-FTMS and nanoLC-ESI-Q-TOF MS/MS, were used to study the neuropeptidome ofcrustaceans [39,40,44–46,103–105]. Since peptides have vary-ing numbers of amino acids and these fragmentationt modeswork best for different size of peptides, an emerging techniquecombines the orthogonal data by alternating between CID andETD (and sometimes HCD) for acquisition of multiple MS/MSspectra from each peptide [106]. This alternate mode showsgreat potential to provide extensive peptide sequence infor-mation. Another conditional mode is to switch between themfor different types of peptides according to preset parameters(e.g. different charge states and m/z). In 2008, a data dependentdecision tree (ddDT) algorithm was developed to automati-cally determine if CID or ETD should be utilized to fragment aspecific precursor. It was tested on Saccharomyces cerevisiae andhuman cells with an improved sequencing success rate andmore identifications [99,107]. Therefore these different massspectrometric approaches showed complementary capabili-ties in expanding the crustacean neuropeptidome coverage,which is greater than any single instrument could reach.
3.2. Structural determination of larger NPs
MS based studies on crustacean NPs generally focus on smallpeptides with a sequence of ∼20 amino acids. Yet there is stilla portion of larger peptides, namely the crustacean hyper-glycemic hormone (CHH) precursor-related peptide (CPRP)(30+ aa) and the CHH family peptides (70+ aa), including CHH,molt-inhibiting hormone (MIH), vitellogenesis-inhibiting hor-mone (VIH) and mandibular organ-inhibiting hormone(MOIH). CHH may have several isoforms in one or moreneurosecretory organs such as the sinus glands (SG), thestomatogastric nervous system (STNS) and the pericardialorgans (PO) [108] regulating many physiological processes,such as energy homeostasis involving blood glucose level andmetabolism of lipids, reproduction, molting [109]. However,because of their large size which results in inefficient frag-mentation, multiple post-translational modifications, suchas disulfide linkages and N-terminal pyroglutamylation, it isextremely challenging to de novo sequence peptides from theCHH family. The very low abundances (usually nM-pM) andabsence of genome information could further complicate thissituation. Previously sequence elucidation of such large pep-tides was typically done with the help of Edman degradation[110,111]. Some other efforts trying to sequence them dependon truncated parts of the full length peptides present in tissueextract, which are shorter and always come with lower chargestates, and that is what CID could handle [112,113].
The application of ETD greatly facilitates de novo sequenc-ing of larger peptides like CPRP and CHH. By taking advantageof ETD, which outperforms CID in fragmenting highly chargedprecursors, intact CPRP was fragmented and successfullysequenced solely by mass spectrometry [42]. In the followingstudies concerned with CHH peptide family, ETD (or electroncapture dissociation (ECD)) was used as a so-called ‘top-down’
method to gain sequence information about the intact pep-tide. While CID works best for small tryptic peptides, it wasemployed to solve the sequence from the other direction,namely ‘bottom-up’. The hybrid combination of ‘top-down’3 ( 2 0 1 4 ) 152–170
and ‘bottom-up’ approach was reported to de novo sequenceCHH by Ma et al. for the first time [43]. In this work, theintact CHH was fragmented by collision activated dissociation(CAD), infrared multiphoton dissociation (IRMPD), and ECD asmulti-pronged MS/MS analysis of CHH. Merging informationtogether from ‘top-down’ and ‘bottom-up’ approaches madethe attempt to sequence CHH peptide by mass spectrome-try alone succeed. This workflow was further developed byJia et al. by including one more off-line top-down analysisto achieve increased confidence in determining each residue.Six CHH-family NPs, including two novel peptides, were fullysequenced. With the complete sequence information, thespatial distribution of CHH peptides were mapped and con-formational changes caused by the N-terminal pyroglutamatewere explored for the first time [52].
3.3. Chemical derivatization enhanced peptidesequencing and identification
High quality MS/MS fragmentation is essential to determinepeptide sequences. However, challenges exist due to possibleincompleteness of MS/MS fragmentation or extensive inter-nal fragmentations. Multiple derivatization reactions havebeen introduced to overcome such difficulties and resolveambiguities in mass spectrometric sequencing, allowing eas-ier interpretation. These derivatization reactions includingmethyl esterification, reductive methylation, and acetylationwere utilized to facilitate de novo sequencing and resolvesequence ambiguities.
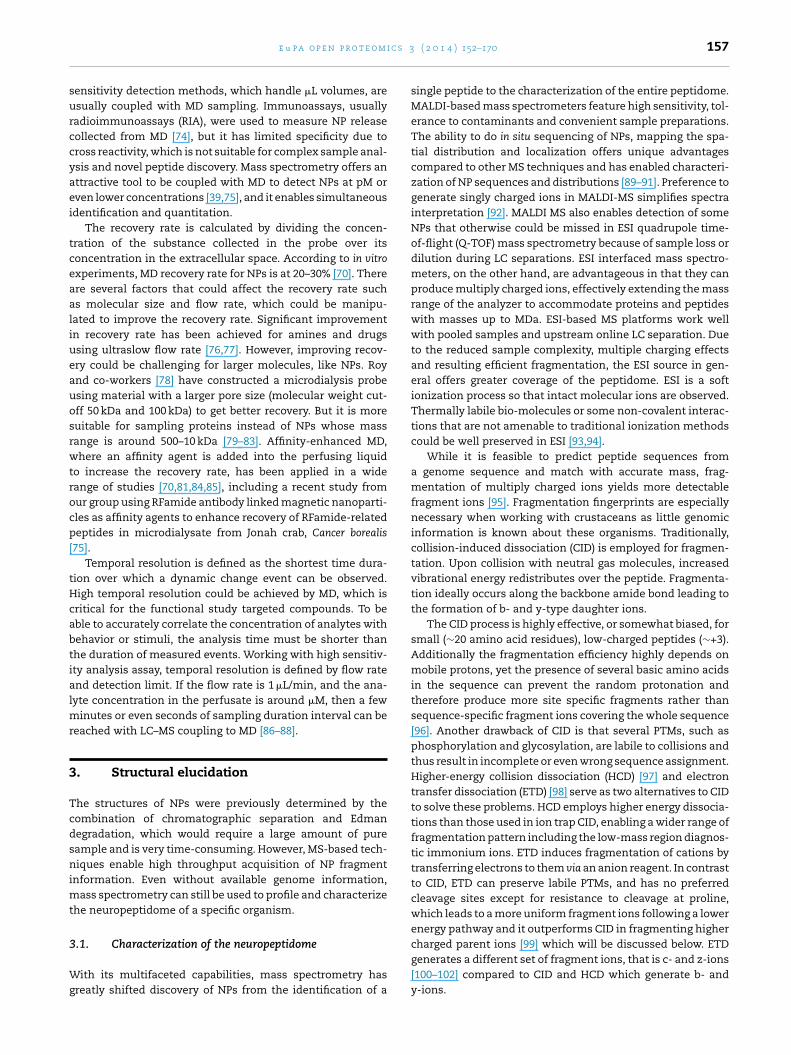
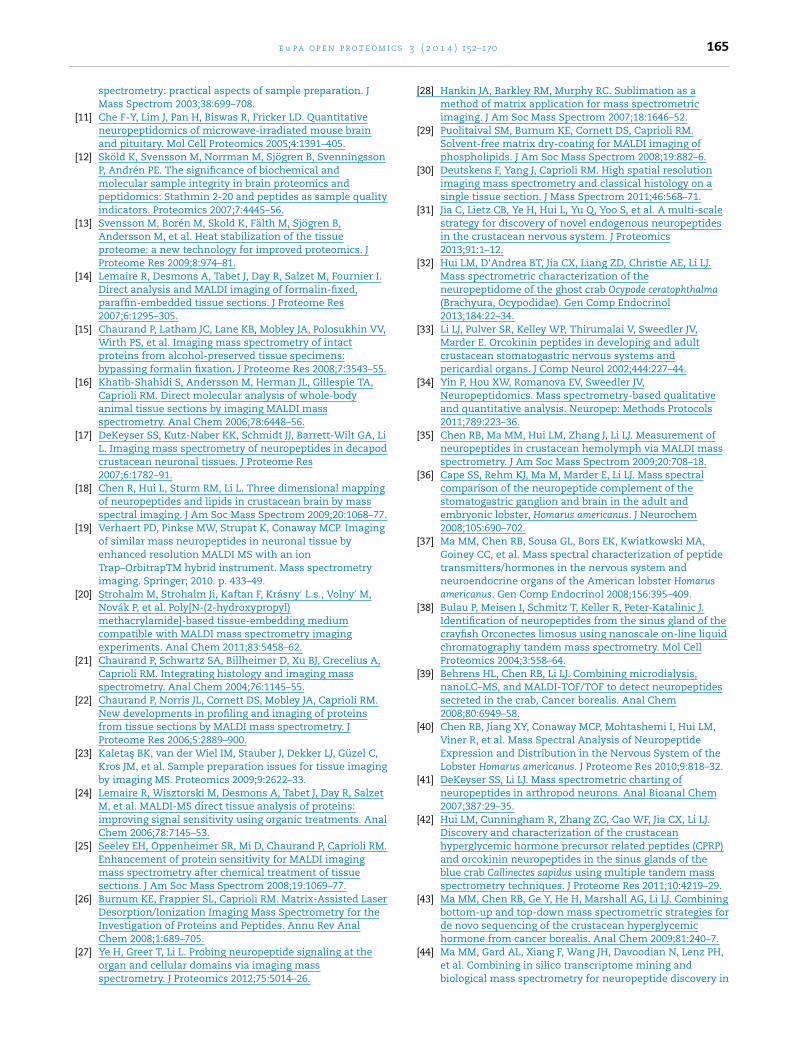
Formaldehyde labeling has been developed [114] and laterapplied for improved sequencing of the crustacean neuropep-tidome [104,115,116]. It increases the signals of a/b ion series,resulting in the confirmation of N-terminal sequence withthe a1 ion, and reduces the complexity of the MS/MS spectra.Another advantage lies in that the number of lysine residuesand N-terminal blockage where modifications in a peptide canbe deduced from mass increments. Fig. 2 shows two exam-ples of reductive methylation assisted de novo sequencing ofneuropeptides.
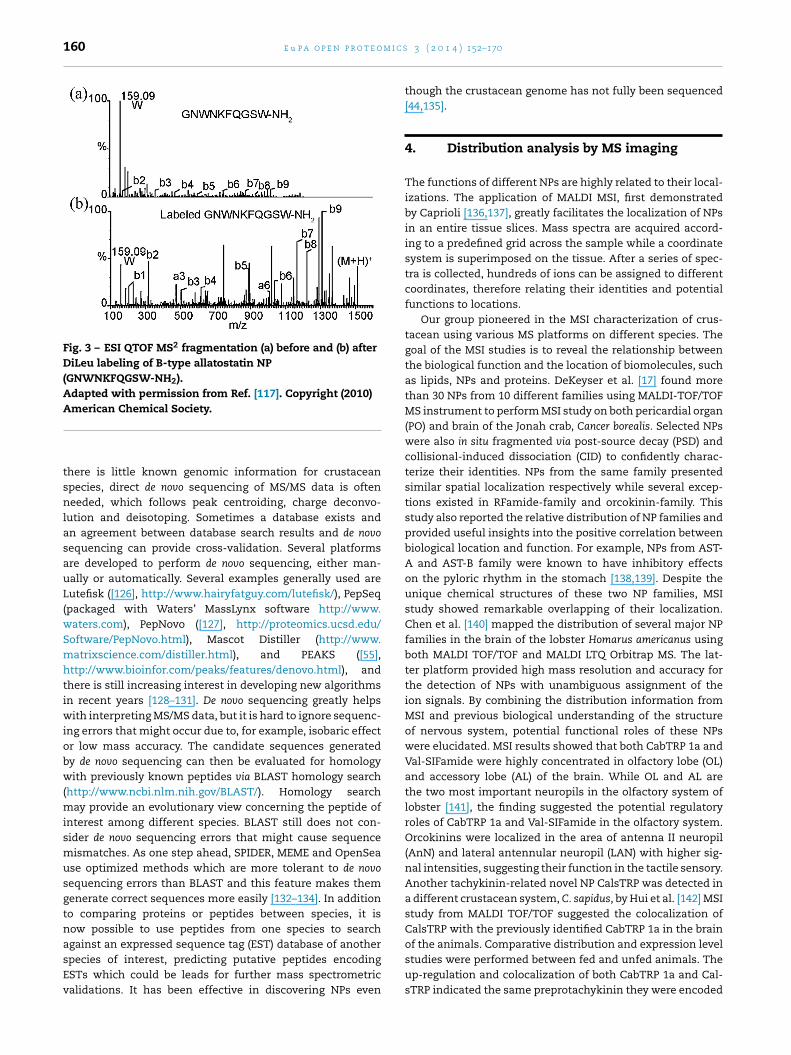
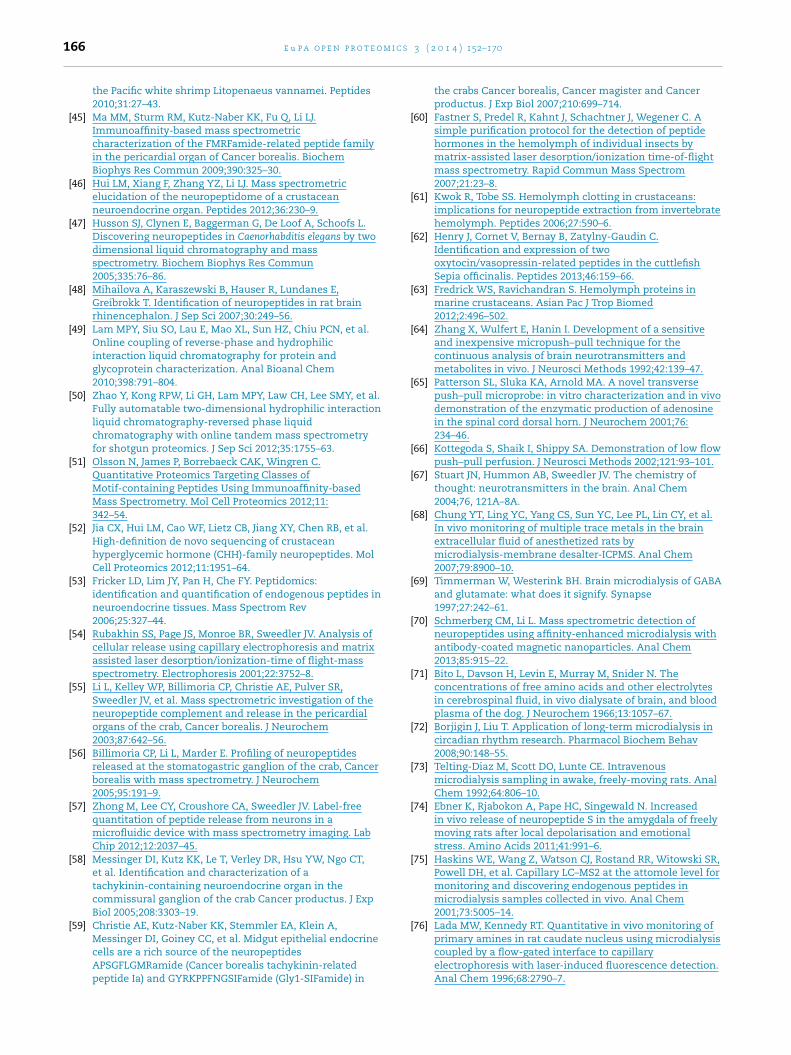
N,N-Dimethyl leucine (DiLeu) was reported for the firsttime by Xiang et al. [117] as an effective labeling reagent,offering substantially improved peptide b/y fragment ions andconvincing fragment assignments. Additionally, increasedbasicity by DiLeu labeling reagents improves ionization effi-ciency compared to non-derivatized peptides. More peptideswere observed. DiLeu was therefore employed to assistsequencing NPs in crustaceans [46,118]. Fig. 3 highlights anexample of improved de novo sequencing and fragmentationof DiLeu labeled B-type allatostatin neuropeptide.
As aspartic acid and glutamic acid can serve as protondonators when there is no proton available for fragmenta-tion or the proton is trapped by arginine, preferential cleavageadjacent to the acidic amino acid always happen and resultsin incomplete fragmentation information. This preferentialcleavage poses challenges in sequencing a peptide [119,120]. C-
terminal derivatization with methyl esterification was provento improve fragmentation efficiency and generate uniformcleavages along peptide backbones by limiting preferentialcleavage at these acidic residues [121].
e u p a o p e n p r o t e o m i c s 3 ( 2 0 1 4 ) 152–170 159
Fig. 2 – ESI-Q-TOF MS/MS spectra of an A-type AST peptide AGLYSYGLamide (842.461+) before (a) and after (b) reductivemethylation. In panel B, the a-, b-, and y-ion series are labeled according to the MS/MS of (CH3)2AGLYSYGLamide (870.491+).(c) ESI-Q-TOF MS/MS spectra of an A-type AST peptide after reductive methylation (967.511+). No mass shift is observed forthis peptide after the reaction, which indicates the pyroglutamylation (pyr) at the N-terminus.Adapted with permission from Ref. [14]. Copyright (2009) American Chemical Society.
onohs
In addition to the reactions described above, there are stillther derivatization strategies reported to be beneficial for deovo sequencing, either by reacting with N-terminus [122,123]
r C-terminus [124,125], not yet applied to crustaceans. It isighly possible to use them for crustacean neuropeptidomictudies.3.4. Database searching and software assisted NPidentification
To identify peptides present in a sample, MS/MS data can besearched against a sequence database or a database consist-ing of predicted sequences from an organism’s genome. Since
160 e u p a o p e n p r o t e o m i c s
Fig. 3 – ESI QTOF MS2 fragmentation (a) before and (b) afterDiLeu labeling of B-type allatostatin NP(GNWNKFQGSW-NH2).Adapted with permission from Ref. [117]. Copyright (2010)American Chemical Society.
of the animals. Comparative distribution and expression level
there is little known genomic information for crustaceanspecies, direct de novo sequencing of MS/MS data is oftenneeded, which follows peak centroiding, charge deconvo-lution and deisotoping. Sometimes a database exists andan agreement between database search results and de novosequencing can provide cross-validation. Several platformsare developed to perform de novo sequencing, either man-ually or automatically. Several examples generally used areLutefisk ([126], http://www.hairyfatguy.com/lutefisk/), PepSeq(packaged with Waters’ MassLynx software http://www.waters.com), PepNovo ([127], http://proteomics.ucsd.edu/Software/PepNovo.html), Mascot Distiller (http://www.matrixscience.com/distiller.html), and PEAKS ([55],http://www.bioinfor.com/peaks/features/denovo.html), andthere is still increasing interest in developing new algorithmsin recent years [128–131]. De novo sequencing greatly helpswith interpreting MS/MS data, but it is hard to ignore sequenc-ing errors that might occur due to, for example, isobaric effector low mass accuracy. The candidate sequences generatedby de novo sequencing can then be evaluated for homologywith previously known peptides via BLAST homology search(http://www.ncbi.nlm.nih.gov/BLAST/). Homology searchmay provide an evolutionary view concerning the peptide ofinterest among different species. BLAST still does not con-sider de novo sequencing errors that might cause sequencemismatches. As one step ahead, SPIDER, MEME and OpenSeause optimized methods which are more tolerant to de novosequencing errors than BLAST and this feature makes themgenerate correct sequences more easily [132–134]. In additionto comparing proteins or peptides between species, it isnow possible to use peptides from one species to searchagainst an expressed sequence tag (EST) database of another
species of interest, predicting putative peptides encodingESTs which could be leads for further mass spectrometricvalidations. It has been effective in discovering NPs even3 ( 2 0 1 4 ) 152–170
though the crustacean genome has not fully been sequenced[44,135].
4. Distribution analysis by MS imaging
The functions of different NPs are highly related to their local-izations. The application of MALDI MSI, first demonstratedby Caprioli [136,137], greatly facilitates the localization of NPsin an entire tissue slices. Mass spectra are acquired accord-ing to a predefined grid across the sample while a coordinatesystem is superimposed on the tissue. After a series of spec-tra is collected, hundreds of ions can be assigned to differentcoordinates, therefore relating their identities and potentialfunctions to locations.
Our group pioneered in the MSI characterization of crus-tacean using various MS platforms on different species. Thegoal of the MSI studies is to reveal the relationship betweenthe biological function and the location of biomolecules, suchas lipids, NPs and proteins. DeKeyser et al. [17] found morethan 30 NPs from 10 different families using MALDI-TOF/TOFMS instrument to perform MSI study on both pericardial organ(PO) and brain of the Jonah crab, Cancer borealis. Selected NPswere also in situ fragmented via post-source decay (PSD) andcollisional-induced dissociation (CID) to confidently charac-terize their identities. NPs from the same family presentedsimilar spatial localization respectively while several excep-tions existed in RFamide-family and orcokinin-family. Thisstudy also reported the relative distribution of NP families andprovided useful insights into the positive correlation betweenbiological location and function. For example, NPs from AST-A and AST-B family were known to have inhibitory effectson the pyloric rhythm in the stomach [138,139]. Despite theunique chemical structures of these two NP families, MSIstudy showed remarkable overlapping of their localization.Chen et al. [140] mapped the distribution of several major NPfamilies in the brain of the lobster Homarus americanus usingboth MALDI TOF/TOF and MALDI LTQ Orbitrap MS. The lat-ter platform provided high mass resolution and accuracy forthe detection of NPs with unambiguous assignment of theion signals. By combining the distribution information fromMSI and previous biological understanding of the structureof nervous system, potential functional roles of these NPswere elucidated. MSI results showed that both CabTRP 1a andVal-SIFamide were highly concentrated in olfactory lobe (OL)and accessory lobe (AL) of the brain. While OL and AL arethe two most important neuropils in the olfactory system oflobster [141], the finding suggested the potential regulatoryroles of CabTRP 1a and Val-SIFamide in the olfactory system.Orcokinins were localized in the area of antenna II neuropil(AnN) and lateral antennular neuropil (LAN) with higher sig-nal intensities, suggesting their function in the tactile sensory.Another tachykinin-related novel NP CalsTRP was detected ina different crustacean system, C. sapidus, by Hui et al. [142] MSIstudy from MALDI TOF/TOF suggested the colocalization ofCalsTRP with the previously identified CabTRP 1a in the brain
studies were performed between fed and unfed animals. Theup-regulation and colocalization of both CabTRP 1a and Cal-sTRP indicated the same preprotachykinin they were encoded
e u p a o p e n p r o t e o m i c s 3 ( 2 0 1 4 ) 152–170 161
Fig. 4 – Reconstructed 3D images of the distribution of (a) CabTRP 1a and (b) lipid PC 38:6 in the brain of Cancer borealis byMALDI MSI using (a) regular matrix coating and (b) dry matrix spraying which favors the detection of lipids.A
br
ibcetstbipitr
radstl
fatcto(ti
5
Atc
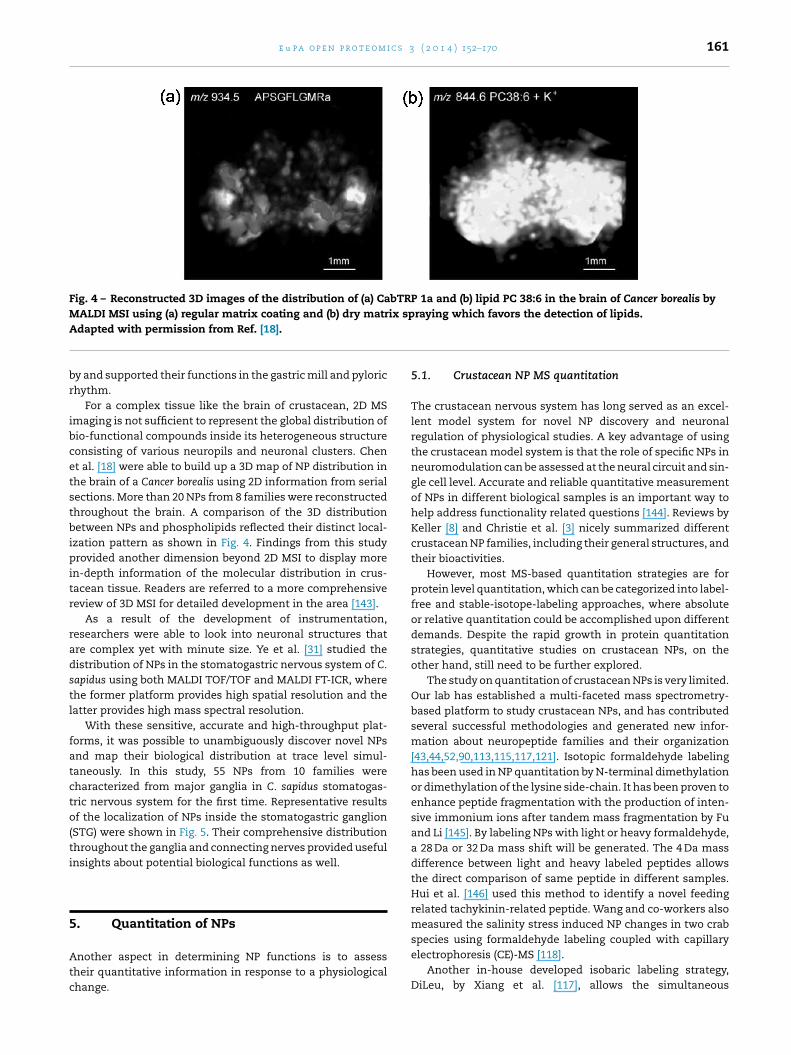
dapted with permission from Ref. [18].
y and supported their functions in the gastric mill and pylorichythm.
For a complex tissue like the brain of crustacean, 2D MSmaging is not sufficient to represent the global distribution ofio-functional compounds inside its heterogeneous structureonsisting of various neuropils and neuronal clusters. Chent al. [18] were able to build up a 3D map of NP distribution inhe brain of a Cancer borealis using 2D information from serialections. More than 20 NPs from 8 families were reconstructedhroughout the brain. A comparison of the 3D distributionetween NPs and phospholipids reflected their distinct local-
zation pattern as shown in Fig. 4. Findings from this studyrovided another dimension beyond 2D MSI to display more
n-depth information of the molecular distribution in crus-acean tissue. Readers are referred to a more comprehensiveeview of 3D MSI for detailed development in the area [143].
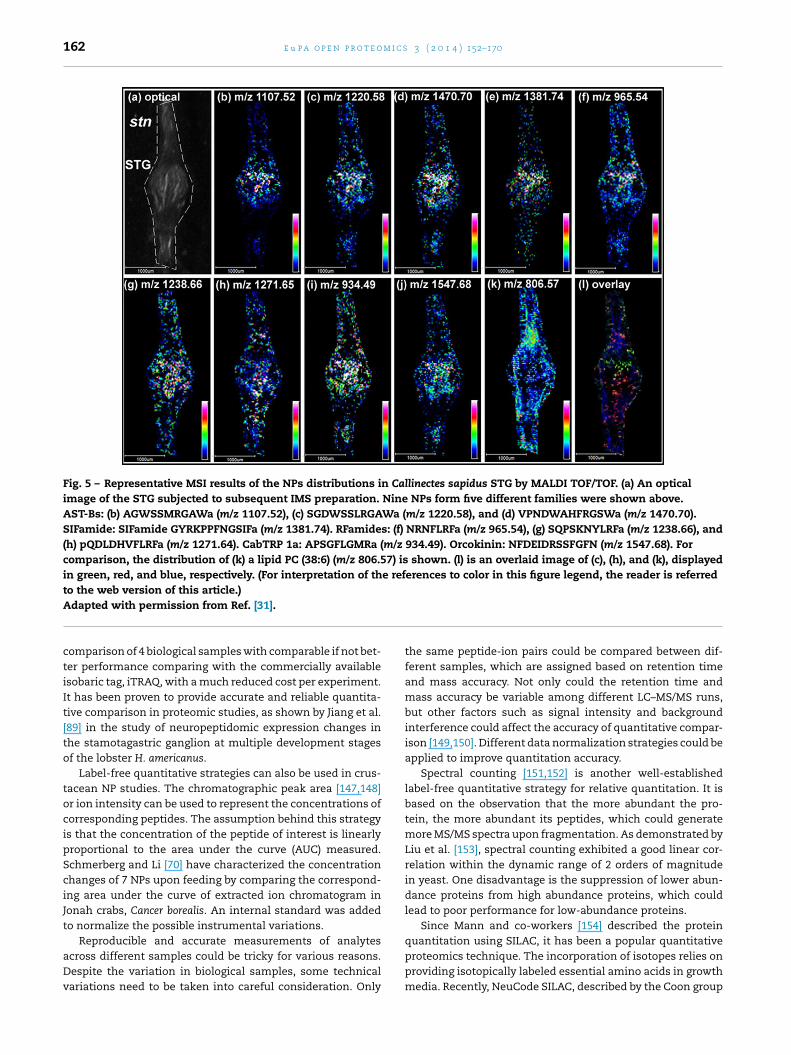
As a result of the development of instrumentation,esearchers were able to look into neuronal structures thatre complex yet with minute size. Ye et al. [31] studied theistribution of NPs in the stomatogastric nervous system of C.apidus using both MALDI TOF/TOF and MALDI FT-ICR, wherehe former platform provides high spatial resolution and theatter provides high mass spectral resolution.
With these sensitive, accurate and high-throughput plat-orms, it was possible to unambiguously discover novel NPsnd map their biological distribution at trace level simul-aneously. In this study, 55 NPs from 10 families wereharacterized from major ganglia in C. sapidus stomatogas-ric nervous system for the first time. Representative resultsf the localization of NPs inside the stomatogastric ganglion
STG) were shown in Fig. 5. Their comprehensive distributionhroughout the ganglia and connecting nerves provided usefulnsights about potential biological functions as well.
. Quantitation of NPs
nother aspect in determining NP functions is to assessheir quantitative information in response to a physiologicalhange.
5.1. Crustacean NP MS quantitation
The crustacean nervous system has long served as an excel-lent model system for novel NP discovery and neuronalregulation of physiological studies. A key advantage of usingthe crustacean model system is that the role of specific NPs inneuromodulation can be assessed at the neural circuit and sin-gle cell level. Accurate and reliable quantitative measurementof NPs in different biological samples is an important way tohelp address functionality related questions [144]. Reviews byKeller [8] and Christie et al. [3] nicely summarized differentcrustacean NP families, including their general structures, andtheir bioactivities.
However, most MS-based quantitation strategies are forprotein level quantitation, which can be categorized into label-free and stable-isotope-labeling approaches, where absoluteor relative quantitation could be accomplished upon differentdemands. Despite the rapid growth in protein quantitationstrategies, quantitative studies on crustacean NPs, on theother hand, still need to be further explored.
The study on quantitation of crustacean NPs is very limited.Our lab has established a multi-faceted mass spectrometry-based platform to study crustacean NPs, and has contributedseveral successful methodologies and generated new infor-mation about neuropeptide families and their organization[43,44,52,90,113,115,117,121]. Isotopic formaldehyde labelinghas been used in NP quantitation by N-terminal dimethylationor dimethylation of the lysine side-chain. It has been proven toenhance peptide fragmentation with the production of inten-sive immonium ions after tandem mass fragmentation by Fuand Li [145]. By labeling NPs with light or heavy formaldehyde,a 28 Da or 32 Da mass shift will be generated. The 4 Da massdifference between light and heavy labeled peptides allowsthe direct comparison of same peptide in different samples.Hui et al. [146] used this method to identify a novel feedingrelated tachykinin-related peptide. Wang and co-workers alsomeasured the salinity stress induced NP changes in two crabspecies using formaldehyde labeling coupled with capillary
electrophoresis (CE)-MS [118].Another in-house developed isobaric labeling strategy,DiLeu, by Xiang et al. [117], allows the simultaneous
162 e u p a o p e n p r o t e o m i c s 3 ( 2 0 1 4 ) 152–170
Fig. 5 – Representative MSI results of the NPs distributions in Callinectes sapidus STG by MALDI TOF/TOF. (a) An opticalimage of the STG subjected to subsequent IMS preparation. Nine NPs form five different families were shown above.AST-Bs: (b) AGWSSMRGAWa (m/z 1107.52), (c) SGDWSSLRGAWa (m/z 1220.58), and (d) VPNDWAHFRGSWa (m/z 1470.70).SIFamide: SIFamide GYRKPPFNGSIFa (m/z 1381.74). RFamides: (f) NRNFLRFa (m/z 965.54), (g) SQPSKNYLRFa (m/z 1238.66), and(h) pQDLDHVFLRFa (m/z 1271.64). CabTRP 1a: APSGFLGMRa (m/z 934.49). Orcokinin: NFDEIDRSSFGFN (m/z 1547.68). Forcomparison, the distribution of (k) a lipid PC (38:6) (m/z 806.57) is shown. (l) is an overlaid image of (c), (h), and (k), displayedin green, red, and blue, respectively. (For interpretation of the references to color in this figure legend, the reader is referredto the web version of this article.)
Adapted with permission from Ref. [31].comparison of 4 biological samples with comparable if not bet-ter performance comparing with the commercially availableisobaric tag, iTRAQ, with a much reduced cost per experiment.It has been proven to provide accurate and reliable quantita-tive comparison in proteomic studies, as shown by Jiang et al.[89] in the study of neuropeptidomic expression changes inthe stamotagastric ganglion at multiple development stagesof the lobster H. americanus.
Label-free quantitative strategies can also be used in crus-tacean NP studies. The chromatographic peak area [147,148]or ion intensity can be used to represent the concentrations ofcorresponding peptides. The assumption behind this strategyis that the concentration of the peptide of interest is linearlyproportional to the area under the curve (AUC) measured.Schmerberg and Li [70] have characterized the concentrationchanges of 7 NPs upon feeding by comparing the correspond-ing area under the curve of extracted ion chromatogram inJonah crabs, Cancer borealis. An internal standard was addedto normalize the possible instrumental variations.
Reproducible and accurate measurements of analytesacross different samples could be tricky for various reasons.Despite the variation in biological samples, some technicalvariations need to be taken into careful consideration. Only
the same peptide-ion pairs could be compared between dif-ferent samples, which are assigned based on retention timeand mass accuracy. Not only could the retention time andmass accuracy be variable among different LC–MS/MS runs,but other factors such as signal intensity and backgroundinterference could affect the accuracy of quantitative compar-ison [149,150]. Different data normalization strategies could beapplied to improve quantitation accuracy.
Spectral counting [151,152] is another well-establishedlabel-free quantitative strategy for relative quantitation. It isbased on the observation that the more abundant the pro-tein, the more abundant its peptides, which could generatemore MS/MS spectra upon fragmentation. As demonstrated byLiu et al. [153], spectral counting exhibited a good linear cor-relation within the dynamic range of 2 orders of magnitudein yeast. One disadvantage is the suppression of lower abun-dance proteins from high abundance proteins, which couldlead to poor performance for low-abundance proteins.
Since Mann and co-workers [154] described the protein
quantitation using SILAC, it has been a popular quantitativeproteomics technique. The incorporation of isotopes relies onproviding isotopically labeled essential amino acids in growthmedia. Recently, NeuCode SILAC, described by the Coon group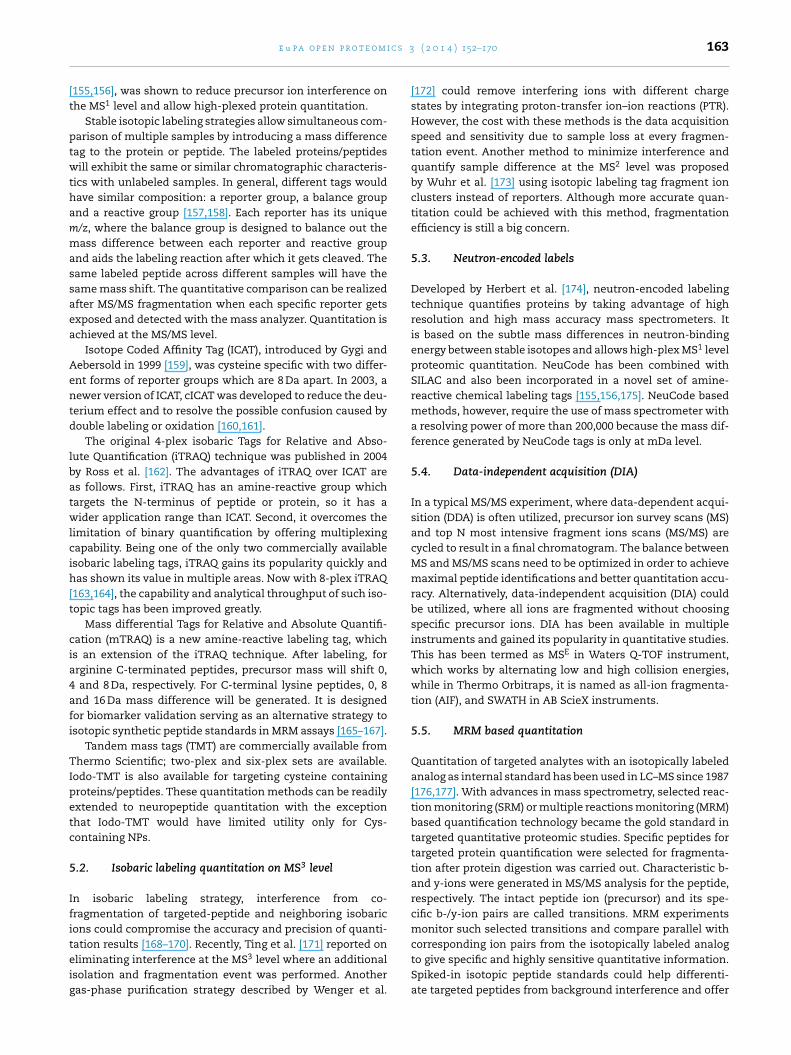
c s 3
[t
ptwthammassaea
Aentd
lbatwlcih[t
cia4afi
TIpetc
5
Ifiteig
e u p a o p e n p r o t e o m i
155,156], was shown to reduce precursor ion interference onhe MS1 level and allow high-plexed protein quantitation.
Stable isotopic labeling strategies allow simultaneous com-arison of multiple samples by introducing a mass differenceag to the protein or peptide. The labeled proteins/peptidesill exhibit the same or similar chromatographic characteris-
ics with unlabeled samples. In general, different tags wouldave similar composition: a reporter group, a balance groupnd a reactive group [157,158]. Each reporter has its unique/z, where the balance group is designed to balance out theass difference between each reporter and reactive group
nd aids the labeling reaction after which it gets cleaved. Theame labeled peptide across different samples will have theame mass shift. The quantitative comparison can be realizedfter MS/MS fragmentation when each specific reporter getsxposed and detected with the mass analyzer. Quantitation ischieved at the MS/MS level.
Isotope Coded Affinity Tag (ICAT), introduced by Gygi andebersold in 1999 [159], was cysteine specific with two differ-nt forms of reporter groups which are 8 Da apart. In 2003, aewer version of ICAT, cICAT was developed to reduce the deu-erium effect and to resolve the possible confusion caused byouble labeling or oxidation [160,161].
The original 4-plex isobaric Tags for Relative and Abso-ute Quantification (iTRAQ) technique was published in 2004y Ross et al. [162]. The advantages of iTRAQ over ICAT ares follows. First, iTRAQ has an amine-reactive group whichargets the N-terminus of peptide or protein, so it has aider application range than ICAT. Second, it overcomes the
imitation of binary quantification by offering multiplexingapability. Being one of the only two commercially availablesobaric labeling tags, iTRAQ gains its popularity quickly andas shown its value in multiple areas. Now with 8-plex iTRAQ
163,164], the capability and analytical throughput of such iso-opic tags has been improved greatly.
Mass differential Tags for Relative and Absolute Quantifi-ation (mTRAQ) is a new amine-reactive labeling tag, whichs an extension of the iTRAQ technique. After labeling, forrginine C-terminated peptides, precursor mass will shift 0,
and 8 Da, respectively. For C-terminal lysine peptides, 0, 8nd 16 Da mass difference will be generated. It is designedor biomarker validation serving as an alternative strategy tosotopic synthetic peptide standards in MRM assays [165–167].
Tandem mass tags (TMT) are commercially available fromhermo Scientific; two-plex and six-plex sets are available.
odo-TMT is also available for targeting cysteine containingroteins/peptides. These quantitation methods can be readilyxtended to neuropeptide quantitation with the exceptionhat Iodo-TMT would have limited utility only for Cys-ontaining NPs.
.2. Isobaric labeling quantitation on MS3 level
n isobaric labeling strategy, interference from co-ragmentation of targeted-peptide and neighboring isobaricons could compromise the accuracy and precision of quanti-
ation results [168–170]. Recently, Ting et al. [171] reported onliminating interference at the MS3 level where an additionalsolation and fragmentation event was performed. Anotheras-phase purification strategy described by Wenger et al.( 2 0 1 4 ) 152–170 163
[172] could remove interfering ions with different chargestates by integrating proton-transfer ion–ion reactions (PTR).However, the cost with these methods is the data acquisitionspeed and sensitivity due to sample loss at every fragmen-tation event. Another method to minimize interference andquantify sample difference at the MS2 level was proposedby Wuhr et al. [173] using isotopic labeling tag fragment ionclusters instead of reporters. Although more accurate quan-titation could be achieved with this method, fragmentationefficiency is still a big concern.
5.3. Neutron-encoded labels
Developed by Herbert et al. [174], neutron-encoded labelingtechnique quantifies proteins by taking advantage of highresolution and high mass accuracy mass spectrometers. Itis based on the subtle mass differences in neutron-bindingenergy between stable isotopes and allows high-plex MS1 levelproteomic quantitation. NeuCode has been combined withSILAC and also been incorporated in a novel set of amine-reactive chemical labeling tags [155,156,175]. NeuCode basedmethods, however, require the use of mass spectrometer witha resolving power of more than 200,000 because the mass dif-ference generated by NeuCode tags is only at mDa level.
5.4. Data-independent acquisition (DIA)
In a typical MS/MS experiment, where data-dependent acqui-sition (DDA) is often utilized, precursor ion survey scans (MS)and top N most intensive fragment ions scans (MS/MS) arecycled to result in a final chromatogram. The balance betweenMS and MS/MS scans need to be optimized in order to achievemaximal peptide identifications and better quantitation accu-racy. Alternatively, data-independent acquisition (DIA) couldbe utilized, where all ions are fragmented without choosingspecific precursor ions. DIA has been available in multipleinstruments and gained its popularity in quantitative studies.This has been termed as MSE in Waters Q-TOF instrument,which works by alternating low and high collision energies,while in Thermo Orbitraps, it is named as all-ion fragmenta-tion (AIF), and SWATH in AB ScieX instruments.
5.5. MRM based quantitation
Quantitation of targeted analytes with an isotopically labeledanalog as internal standard has been used in LC–MS since 1987[176,177]. With advances in mass spectrometry, selected reac-tion monitoring (SRM) or multiple reactions monitoring (MRM)based quantification technology became the gold standard intargeted quantitative proteomic studies. Specific peptides fortargeted protein quantification were selected for fragmenta-tion after protein digestion was carried out. Characteristic b-and y-ions were generated in MS/MS analysis for the peptide,respectively. The intact peptide ion (precursor) and its spe-cific b-/y-ion pairs are called transitions. MRM experimentsmonitor such selected transitions and compare parallel with
corresponding ion pairs from the isotopically labeled analogto give specific and highly sensitive quantitative information.Spiked-in isotopic peptide standards could help differenti-ate targeted peptides from background interference and offer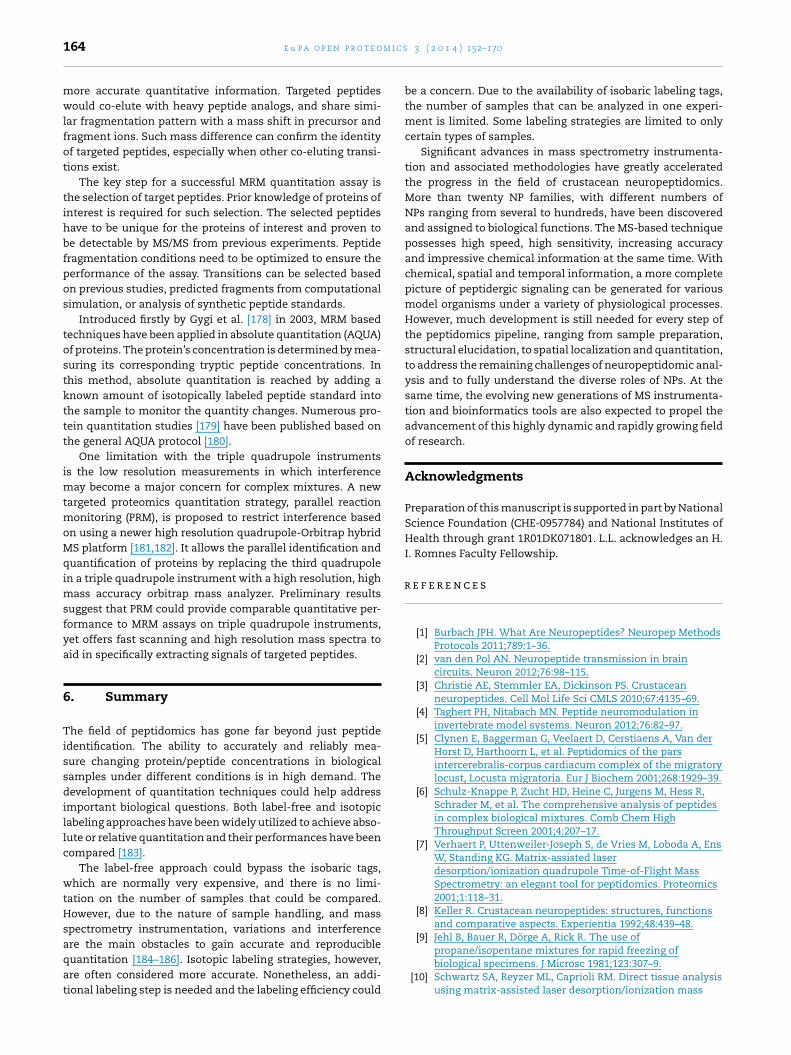
m i c s
r
164 e u p a o p e n p r o t e o
more accurate quantitative information. Targeted peptideswould co-elute with heavy peptide analogs, and share simi-lar fragmentation pattern with a mass shift in precursor andfragment ions. Such mass difference can confirm the identityof targeted peptides, especially when other co-eluting transi-tions exist.
The key step for a successful MRM quantitation assay isthe selection of target peptides. Prior knowledge of proteins ofinterest is required for such selection. The selected peptideshave to be unique for the proteins of interest and proven tobe detectable by MS/MS from previous experiments. Peptidefragmentation conditions need to be optimized to ensure theperformance of the assay. Transitions can be selected basedon previous studies, predicted fragments from computationalsimulation, or analysis of synthetic peptide standards.
Introduced firstly by Gygi et al. [178] in 2003, MRM basedtechniques have been applied in absolute quantitation (AQUA)of proteins. The protein’s concentration is determined by mea-suring its corresponding tryptic peptide concentrations. Inthis method, absolute quantitation is reached by adding aknown amount of isotopically labeled peptide standard intothe sample to monitor the quantity changes. Numerous pro-tein quantitation studies [179] have been published based onthe general AQUA protocol [180].
One limitation with the triple quadrupole instrumentsis the low resolution measurements in which interferencemay become a major concern for complex mixtures. A newtargeted proteomics quantitation strategy, parallel reactionmonitoring (PRM), is proposed to restrict interference basedon using a newer high resolution quadrupole-Orbitrap hybridMS platform [181,182]. It allows the parallel identification andquantification of proteins by replacing the third quadrupolein a triple quadrupole instrument with a high resolution, highmass accuracy orbitrap mass analyzer. Preliminary resultssuggest that PRM could provide comparable quantitative per-formance to MRM assays on triple quadrupole instruments,yet offers fast scanning and high resolution mass spectra toaid in specifically extracting signals of targeted peptides.
6. Summary
The field of peptidomics has gone far beyond just peptideidentification. The ability to accurately and reliably mea-sure changing protein/peptide concentrations in biologicalsamples under different conditions is in high demand. Thedevelopment of quantitation techniques could help addressimportant biological questions. Both label-free and isotopiclabeling approaches have been widely utilized to achieve abso-lute or relative quantitation and their performances have beencompared [183].
The label-free approach could bypass the isobaric tags,which are normally very expensive, and there is no limi-tation on the number of samples that could be compared.However, due to the nature of sample handling, and massspectrometry instrumentation, variations and interference
are the main obstacles to gain accurate and reproduciblequantitation [184–186]. Isotopic labeling strategies, however,are often considered more accurate. Nonetheless, an addi-tional labeling step is needed and the labeling efficiency could3 ( 2 0 1 4 ) 152–170
be a concern. Due to the availability of isobaric labeling tags,the number of samples that can be analyzed in one experi-ment is limited. Some labeling strategies are limited to onlycertain types of samples.
Significant advances in mass spectrometry instrumenta-tion and associated methodologies have greatly acceleratedthe progress in the field of crustacean neuropeptidomics.More than twenty NP families, with different numbers ofNPs ranging from several to hundreds, have been discoveredand assigned to biological functions. The MS-based techniquepossesses high speed, high sensitivity, increasing accuracyand impressive chemical information at the same time. Withchemical, spatial and temporal information, a more completepicture of peptidergic signaling can be generated for variousmodel organisms under a variety of physiological processes.However, much development is still needed for every step ofthe peptidomics pipeline, ranging from sample preparation,structural elucidation, to spatial localization and quantitation,to address the remaining challenges of neuropeptidomic anal-ysis and to fully understand the diverse roles of NPs. At thesame time, the evolving new generations of MS instrumenta-tion and bioinformatics tools are also expected to propel theadvancement of this highly dynamic and rapidly growing fieldof research.
Acknowledgments
Preparation of this manuscript is supported in part by NationalScience Foundation (CHE-0957784) and National Institutes ofHealth through grant 1R01DK071801. L.L. acknowledges an H.I. Romnes Faculty Fellowship.
e f e r e n c e s
[1] Burbach JPH. What Are Neuropeptides? Neuropep MethodsProtocols 2011;789:1–36.
[2] van den Pol AN. Neuropeptide transmission in braincircuits. Neuron 2012;76:98–115.
[3] Christie AE, Stemmler EA, Dickinson PS. Crustaceanneuropeptides. Cell Mol Life Sci CMLS 2010;67:4135–69.
[4] Taghert PH, Nitabach MN. Peptide neuromodulation ininvertebrate model systems. Neuron 2012;76:82–97.
[5] Clynen E, Baggerman G, Veelaert D, Cerstiaens A, Van derHorst D, Harthoorn L, et al. Peptidomics of the parsintercerebralis-corpus cardiacum complex of the migratorylocust, Locusta migratoria. Eur J Biochem 2001;268:1929–39.
[6] Schulz-Knappe P, Zucht HD, Heine C, Jurgens M, Hess R,Schrader M, et al. The comprehensive analysis of peptidesin complex biological mixtures. Comb Chem HighThroughput Screen 2001;4:207–17.
[7] Verhaert P, Uttenweiler-Joseph S, de Vries M, Loboda A, EnsW, Standing KG. Matrix-assisted laserdesorption/ionization quadrupole Time-of-Flight MassSpectrometry: an elegant tool for peptidomics. Proteomics2001;1:118–31.
[8] Keller R. Crustacean neuropeptides: structures, functionsand comparative aspects. Experientia 1992;48:439–48.
[9] Jehl B, Bauer R, Dörge A, Rick R. The use of
propane/isopentane mixtures for rapid freezing ofbiological specimens. J Microsc 1981;123:307–9.[10] Schwartz SA, Reyzer ML, Caprioli RM. Direct tissue analysisusing matrix-assisted laser desorption/ionization mass
c s 3
e u p a o p e n p r o t e o m ispectrometry: practical aspects of sample preparation. JMass Spectrom 2003;38:699–708.
[11] Che F-Y, Lim J, Pan H, Biswas R, Fricker LD. Quantitativeneuropeptidomics of microwave-irradiated mouse brainand pituitary. Mol Cell Proteomics 2005;4:1391–405.
[12] Sköld K, Svensson M, Norrman M, Sjögren B, SvenningssonP, Andrén PE. The significance of biochemical andmolecular sample integrity in brain proteomics andpeptidomics: Stathmin 2-20 and peptides as sample qualityindicators. Proteomics 2007;7:4445–56.
[13] Svensson M, Borén M, Skold K, Fälth M, Sjögren B,Andersson M, et al. Heat stabilization of the tissueproteome: a new technology for improved proteomics. JProteome Res 2009;8:974–81.
[14] Lemaire R, Desmons A, Tabet J, Day R, Salzet M, Fournier I.Direct analysis and MALDI imaging of formalin-fixed,paraffin-embedded tissue sections. J Proteome Res2007;6:1295–305.
[15] Chaurand P, Latham JC, Lane KB, Mobley JA, Polosukhin VV,Wirth PS, et al. Imaging mass spectrometry of intactproteins from alcohol-preserved tissue specimens:bypassing formalin fixation. J Proteome Res 2008;7:3543–55.
[16] Khatib-Shahidi S, Andersson M, Herman JL, Gillespie TA,Caprioli RM. Direct molecular analysis of whole-bodyanimal tissue sections by imaging MALDI massspectrometry. Anal Chem 2006;78:6448–56.
[17] DeKeyser SS, Kutz-Naber KK, Schmidt JJ, Barrett-Wilt GA, LiL. Imaging mass spectrometry of neuropeptides in decapodcrustacean neuronal tissues. J Proteome Res2007;6:1782–91.
[18] Chen R, Hui L, Sturm RM, Li L. Three dimensional mappingof neuropeptides and lipids in crustacean brain by massspectral imaging. J Am Soc Mass Spectrom 2009;20:1068–77.
[19] Verhaert PD, Pinkse MW, Strupat K, Conaway MCP. Imagingof similar mass neuropeptides in neuronal tissue byenhanced resolution MALDI MS with an ionTrap–OrbitrapTM hybrid instrument. Mass spectrometryimaging. Springer; 2010. p. 433–49.
[20] Strohalm M, Strohalm Ji, Kaftan F, Krásny′ L.s., Volny′ M,Novák P, et al. Poly[N-(2-hydroxypropyl)methacrylamide]-based tissue-embedding mediumcompatible with MALDI mass spectrometry imagingexperiments. Anal Chem 2011;83:5458–62.
[21] Chaurand P, Schwartz SA, Billheimer D, Xu BJ, Crecelius A,Caprioli RM. Integrating histology and imaging massspectrometry. Anal Chem 2004;76:1145–55.
[22] Chaurand P, Norris JL, Cornett DS, Mobley JA, Caprioli RM.New developments in profiling and imaging of proteinsfrom tissue sections by MALDI mass spectrometry. JProteome Res 2006;5:2889–900.
[23] Kaletaş BK, van der Wiel IM, Stauber J, Dekker LJ, Güzel C,Kros JM, et al. Sample preparation issues for tissue imagingby imaging MS. Proteomics 2009;9:2622–33.
[24] Lemaire R, Wisztorski M, Desmons A, Tabet J, Day R, SalzetM, et al. MALDI-MS direct tissue analysis of proteins:improving signal sensitivity using organic treatments. AnalChem 2006;78:7145–53.
[25] Seeley EH, Oppenheimer SR, Mi D, Chaurand P, Caprioli RM.Enhancement of protein sensitivity for MALDI imagingmass spectrometry after chemical treatment of tissuesections. J Am Soc Mass Spectrom 2008;19:1069–77.
[26] Burnum KE, Frappier SL, Caprioli RM. Matrix-Assisted LaserDesorption/Ionization Imaging Mass Spectrometry for theInvestigation of Proteins and Peptides. Annu Rev AnalChem 2008;1:689–705.
[27] Ye H, Greer T, Li L. Probing neuropeptide signaling at theorgan and cellular domains via imaging massspectrometry. J Proteomics 2012;75:5014–26.
( 2 0 1 4 ) 152–170 165
[28] Hankin JA, Barkley RM, Murphy RC. Sublimation as amethod of matrix application for mass spectrometricimaging. J Am Soc Mass Spectrom 2007;18:1646–52.
[29] Puolitaival SM, Burnum KE, Cornett DS, Caprioli RM.Solvent-free matrix dry-coating for MALDI imaging ofphospholipids. J Am Soc Mass Spectrom 2008;19:882–6.
[30] Deutskens F, Yang J, Caprioli RM. High spatial resolutionimaging mass spectrometry and classical histology on asingle tissue section. J Mass Spectrom 2011;46:568–71.
[31] Jia C, Lietz CB, Ye H, Hui L, Yu Q, Yoo S, et al. A multi-scalestrategy for discovery of novel endogenous neuropeptidesin the crustacean nervous system. J Proteomics2013;91:1–12.
[32] Hui LM, D‘Andrea BT, Jia CX, Liang ZD, Christie AE, Li LJ.Mass spectrometric characterization of theneuropeptidome of the ghost crab Ocypode ceratophthalma(Brachyura, Ocypodidae). Gen Comp Endocrinol2013;184:22–34.
[33] Li LJ, Pulver SR, Kelley WP, Thirumalai V, Sweedler JV,Marder E. Orcokinin peptides in developing and adultcrustacean stomatogastric nervous systems andpericardial organs. J Comp Neurol 2002;444:227–44.
[34] Yin P, Hou XW, Romanova EV, Sweedler JV,Neuropeptidomics. Mass spectrometry-based qualitativeand quantitative analysis. Neuropep: Methods Protocols2011;789:223–36.
[35] Chen RB, Ma MM, Hui LM, Zhang J, Li LJ. Measurement ofneuropeptides in crustacean hemolymph via MALDI massspectrometry. J Am Soc Mass Spectrom 2009;20:708–18.
[36] Cape SS, Rehm KJ, Ma M, Marder E, Li LJ. Mass spectralcomparison of the neuropeptide complement of thestomatogastric ganglion and brain in the adult andembryonic lobster, Homarus americanus. J Neurochem2008;105:690–702.
[37] Ma MM, Chen RB, Sousa GL, Bors EK, Kwiatkowski MA,Goiney CC, et al. Mass spectral characterization of peptidetransmitters/hormones in the nervous system andneuroendocrine organs of the American lobster Homarusamericanus. Gen Comp Endocrinol 2008;156:395–409.
[38] Bulau P, Meisen I, Schmitz T, Keller R, Peter-Katalinic J.Identification of neuropeptides from the sinus gland of thecrayfish Orconectes limosus using nanoscale on-line liquidchromatography tandem mass spectrometry. Mol CellProteomics 2004;3:558–64.
[39] Behrens HL, Chen RB, Li LJ. Combining microdialysis,nanoLC–MS, and MALDI-TOF/TOF to detect neuropeptidessecreted in the crab, Cancer borealis. Anal Chem2008;80:6949–58.
[40] Chen RB, Jiang XY, Conaway MCP, Mohtashemi I, Hui LM,Viner R, et al. Mass Spectral Analysis of NeuropeptideExpression and Distribution in the Nervous System of theLobster Homarus americanus. J Proteome Res 2010;9:818–32.
[41] DeKeyser SS, Li LJ. Mass spectrometric charting ofneuropeptides in arthropod neurons. Anal Bioanal Chem2007;387:29–35.
[42] Hui LM, Cunningham R, Zhang ZC, Cao WF, Jia CX, Li LJ.Discovery and characterization of the crustaceanhyperglycemic hormone precursor related peptides (CPRP)and orcokinin neuropeptides in the sinus glands of theblue crab Callinectes sapidus using multiple tandem massspectrometry techniques. J Proteome Res 2011;10:4219–29.
[43] Ma MM, Chen RB, Ge Y, He H, Marshall AG, Li LJ. Combiningbottom-up and top-down mass spectrometric strategies forde novo sequencing of the crustacean hyperglycemichormone from cancer borealis. Anal Chem 2009;81:240–7.
[44] Ma MM, Gard AL, Xiang F, Wang JH, Davoodian N, Lenz PH,et al. Combining in silico transcriptome mining andbiological mass spectrometry for neuropeptide discovery in
m i c s
166 e u p a o p e n p r o t e othe Pacific white shrimp Litopenaeus vannamei. Peptides2010;31:27–43.
[45] Ma MM, Sturm RM, Kutz-Naber KK, Fu Q, Li LJ.Immunoaffinity-based mass spectrometriccharacterization of the FMRFamide-related peptide familyin the pericardial organ of Cancer borealis. BiochemBiophys Res Commun 2009;390:325–30.
[46] Hui LM, Xiang F, Zhang YZ, Li LJ. Mass spectrometricelucidation of the neuropeptidome of a crustaceanneuroendocrine organ. Peptides 2012;36:230–9.
[47] Husson SJ, Clynen E, Baggerman G, De Loof A, Schoofs L.Discovering neuropeptides in Caenorhabditis elegans by twodimensional liquid chromatography and massspectrometry. Biochem Biophys Res Commun2005;335:76–86.
[48] Mihailova A, Karaszewski B, Hauser R, Lundanes E,Greibrokk T. Identification of neuropeptides in rat brainrhinencephalon. J Sep Sci 2007;30:249–56.
[49] Lam MPY, Siu SO, Lau E, Mao XL, Sun HZ, Chiu PCN, et al.Online coupling of reverse-phase and hydrophilicinteraction liquid chromatography for protein andglycoprotein characterization. Anal Bioanal Chem2010;398:791–804.
[50] Zhao Y, Kong RPW, Li GH, Lam MPY, Law CH, Lee SMY, et al.Fully automatable two-dimensional hydrophilic interactionliquid chromatography-reversed phase liquidchromatography with online tandem mass spectrometryfor shotgun proteomics. J Sep Sci 2012;35:1755–63.
[51] Olsson N, James P, Borrebaeck CAK, Wingren C.Quantitative Proteomics Targeting Classes ofMotif-containing Peptides Using Immunoaffinity-basedMass Spectrometry. Mol Cell Proteomics 2012;11:342–54.
[52] Jia CX, Hui LM, Cao WF, Lietz CB, Jiang XY, Chen RB, et al.High-definition de novo sequencing of crustaceanhyperglycemic hormone (CHH)-family neuropeptides. MolCell Proteomics 2012;11:1951–64.
[53] Fricker LD, Lim JY, Pan H, Che FY. Peptidomics:identification and quantification of endogenous peptides inneuroendocrine tissues. Mass Spectrom Rev2006;25:327–44.
[54] Rubakhin SS, Page JS, Monroe BR, Sweedler JV. Analysis ofcellular release using capillary electrophoresis and matrixassisted laser desorption/ionization-time of flight-massspectrometry. Electrophoresis 2001;22:3752–8.
[55] Li L, Kelley WP, Billimoria CP, Christie AE, Pulver SR,Sweedler JV, et al. Mass spectrometric investigation of theneuropeptide complement and release in the pericardialorgans of the crab, Cancer borealis. J Neurochem2003;87:642–56.
[56] Billimoria CP, Li L, Marder E. Profiling of neuropeptidesreleased at the stomatogastric ganglion of the crab, Cancerborealis with mass spectrometry. J Neurochem2005;95:191–9.
[57] Zhong M, Lee CY, Croushore CA, Sweedler JV. Label-freequantitation of peptide release from neurons in amicrofluidic device with mass spectrometry imaging. LabChip 2012;12:2037–45.
[58] Messinger DI, Kutz KK, Le T, Verley DR, Hsu YW, Ngo CT,et al. Identification and characterization of atachykinin-containing neuroendocrine organ in thecommissural ganglion of the crab Cancer productus. J ExpBiol 2005;208:3303–19.
[59] Christie AE, Kutz-Naber KK, Stemmler EA, Klein A,Messinger DI, Goiney CC, et al. Midgut epithelial endocrine
cells are a rich source of the neuropeptidesAPSGFLGMRamide (Cancer borealis tachykinin-relatedpeptide Ia) and GYRKPPFNGSIFamide (Gly1-SIFamide) in3 ( 2 0 1 4 ) 152–170
the crabs Cancer borealis, Cancer magister and Cancerproductus. J Exp Biol 2007;210:699–714.
[60] Fastner S, Predel R, Kahnt J, Schachtner J, Wegener C. Asimple purification protocol for the detection of peptidehormones in the hemolymph of individual insects bymatrix-assisted laser desorption/ionization time-of-flightmass spectrometry. Rapid Commun Mass Spectrom2007;21:23–8.
[61] Kwok R, Tobe SS. Hemolymph clotting in crustaceans:implications for neuropeptide extraction from invertebratehemolymph. Peptides 2006;27:590–6.
[62] Henry J, Cornet V, Bernay B, Zatylny-Gaudin C.Identification and expression of twooxytocin/vasopressin-related peptides in the cuttlefishSepia officinalis. Peptides 2013;46:159–66.
[63] Fredrick WS, Ravichandran S. Hemolymph proteins inmarine crustaceans. Asian Pac J Trop Biomed2012;2:496–502.
[64] Zhang X, Wulfert E, Hanin I. Development of a sensitiveand inexpensive micropush–pull technique for thecontinuous analysis of brain neurotransmitters andmetabolites in vivo. J Neurosci Methods 1992;42:139–47.
[65] Patterson SL, Sluka KA, Arnold MA. A novel transversepush–pull microprobe: in vitro characterization and in vivodemonstration of the enzymatic production of adenosinein the spinal cord dorsal horn. J Neurochem 2001;76:234–46.
[66] Kottegoda S, Shaik I, Shippy SA. Demonstration of low flowpush–pull perfusion. J Neurosci Methods 2002;121:93–101.
[67] Stuart JN, Hummon AB, Sweedler JV. The chemistry ofthought: neurotransmitters in the brain. Anal Chem2004;76, 121A–8A.
[68] Chung YT, Ling YC, Yang CS, Sun YC, Lee PL, Lin CY, et al.In vivo monitoring of multiple trace metals in the brainextracellular fluid of anesthetized rats bymicrodialysis-membrane desalter-ICPMS. Anal Chem2007;79:8900–10.
[69] Timmerman W, Westerink BH. Brain microdialysis of GABAand glutamate: what does it signify. Synapse1997;27:242–61.
[70] Schmerberg CM, Li L. Mass spectrometric detection ofneuropeptides using affinity-enhanced microdialysis withantibody-coated magnetic nanoparticles. Anal Chem2013;85:915–22.
[71] Bito L, Davson H, Levin E, Murray M, Snider N. Theconcentrations of free amino acids and other electrolytesin cerebrospinal fluid, in vivo dialysate of brain, and bloodplasma of the dog. J Neurochem 1966;13:1057–67.
[72] Borjigin J, Liu T. Application of long-term microdialysis incircadian rhythm research. Pharmacol Biochem Behav2008;90:148–55.
[73] Telting-Diaz M, Scott DO, Lunte CE. Intravenousmicrodialysis sampling in awake, freely-moving rats. AnalChem 1992;64:806–10.
[74] Ebner K, Rjabokon A, Pape HC, Singewald N. Increasedin vivo release of neuropeptide S in the amygdala of freelymoving rats after local depolarisation and emotionalstress. Amino Acids 2011;41:991–6.
[75] Haskins WE, Wang Z, Watson CJ, Rostand RR, Witowski SR,Powell DH, et al. Capillary LC–MS2 at the attomole level formonitoring and discovering endogenous peptides inmicrodialysis samples collected in vivo. Anal Chem2001;73:5005–14.
[76] Lada MW, Kennedy RT. Quantitative in vivo monitoring ofprimary amines in rat caudate nucleus using microdialysis
coupled by a flow-gated interface to capillaryelectrophoresis with laser-induced fluorescence detection.Anal Chem 1996;68:2790–7.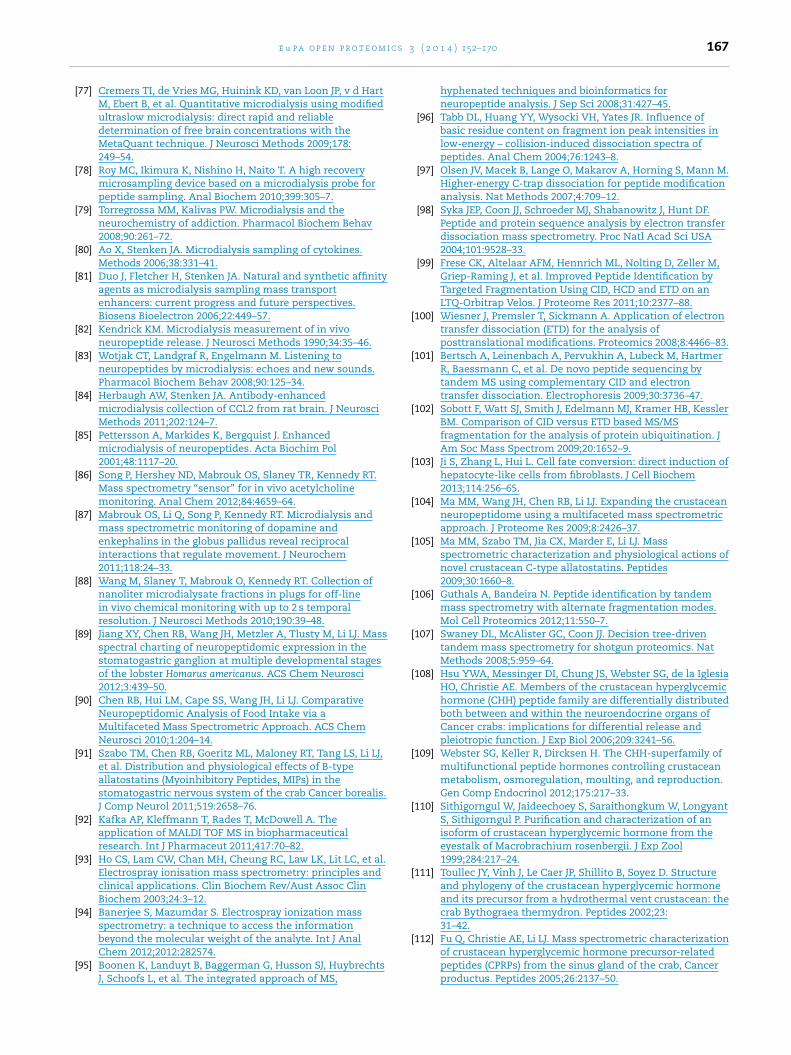
c s 3
e u p a o p e n p r o t e o m i[77] Cremers TI, de Vries MG, Huinink KD, van Loon JP, v d HartM, Ebert B, et al. Quantitative microdialysis using modifiedultraslow microdialysis: direct rapid and reliabledetermination of free brain concentrations with theMetaQuant technique. J Neurosci Methods 2009;178:249–54.
[78] Roy MC, Ikimura K, Nishino H, Naito T. A high recoverymicrosampling device based on a microdialysis probe forpeptide sampling. Anal Biochem 2010;399:305–7.
[79] Torregrossa MM, Kalivas PW. Microdialysis and theneurochemistry of addiction. Pharmacol Biochem Behav2008;90:261–72.
[80] Ao X, Stenken JA. Microdialysis sampling of cytokines.Methods 2006;38:331–41.
[81] Duo J, Fletcher H, Stenken JA. Natural and synthetic affinityagents as microdialysis sampling mass transportenhancers: current progress and future perspectives.Biosens Bioelectron 2006;22:449–57.
[82] Kendrick KM. Microdialysis measurement of in vivoneuropeptide release. J Neurosci Methods 1990;34:35–46.
[83] Wotjak CT, Landgraf R, Engelmann M. Listening toneuropeptides by microdialysis: echoes and new sounds.Pharmacol Biochem Behav 2008;90:125–34.
[84] Herbaugh AW, Stenken JA. Antibody-enhancedmicrodialysis collection of CCL2 from rat brain. J NeurosciMethods 2011;202:124–7.
[85] Pettersson A, Markides K, Bergquist J. Enhancedmicrodialysis of neuropeptides. Acta Biochim Pol2001;48:1117–20.
[86] Song P, Hershey ND, Mabrouk OS, Slaney TR, Kennedy RT.Mass spectrometry “sensor” for in vivo acetylcholinemonitoring. Anal Chem 2012;84:4659–64.
[87] Mabrouk OS, Li Q, Song P, Kennedy RT. Microdialysis andmass spectrometric monitoring of dopamine andenkephalins in the globus pallidus reveal reciprocalinteractions that regulate movement. J Neurochem2011;118:24–33.
[88] Wang M, Slaney T, Mabrouk O, Kennedy RT. Collection ofnanoliter microdialysate fractions in plugs for off-linein vivo chemical monitoring with up to 2 s temporalresolution. J Neurosci Methods 2010;190:39–48.
[89] Jiang XY, Chen RB, Wang JH, Metzler A, Tlusty M, Li LJ. Massspectral charting of neuropeptidomic expression in thestomatogastric ganglion at multiple developmental stagesof the lobster Homarus americanus. ACS Chem Neurosci2012;3:439–50.
[90] Chen RB, Hui LM, Cape SS, Wang JH, Li LJ. ComparativeNeuropeptidomic Analysis of Food Intake via aMultifaceted Mass Spectrometric Approach. ACS ChemNeurosci 2010;1:204–14.
[91] Szabo TM, Chen RB, Goeritz ML, Maloney RT, Tang LS, Li LJ,et al. Distribution and physiological effects of B-typeallatostatins (Myoinhibitory Peptides, MIPs) in thestomatogastric nervous system of the crab Cancer borealis.J Comp Neurol 2011;519:2658–76.
[92] Kafka AP, Kleffmann T, Rades T, McDowell A. Theapplication of MALDI TOF MS in biopharmaceuticalresearch. Int J Pharmaceut 2011;417:70–82.
[93] Ho CS, Lam CW, Chan MH, Cheung RC, Law LK, Lit LC, et al.Electrospray ionisation mass spectrometry: principles andclinical applications. Clin Biochem Rev/Aust Assoc ClinBiochem 2003;24:3–12.
[94] Banerjee S, Mazumdar S. Electrospray ionization massspectrometry: a technique to access the informationbeyond the molecular weight of the analyte. Int J Anal
Chem 2012;2012:282574.[95] Boonen K, Landuyt B, Baggerman G, Husson SJ, HuybrechtsJ, Schoofs L, et al. The integrated approach of MS,
( 2 0 1 4 ) 152–170 167
hyphenated techniques and bioinformatics forneuropeptide analysis. J Sep Sci 2008;31:427–45.
[96] Tabb DL, Huang YY, Wysocki VH, Yates JR. Influence ofbasic residue content on fragment ion peak intensities inlow-energy – collision-induced dissociation spectra ofpeptides. Anal Chem 2004;76:1243–8.
[97] Olsen JV, Macek B, Lange O, Makarov A, Horning S, Mann M.Higher-energy C-trap dissociation for peptide modificationanalysis. Nat Methods 2007;4:709–12.
[98] Syka JEP, Coon JJ, Schroeder MJ, Shabanowitz J, Hunt DF.Peptide and protein sequence analysis by electron transferdissociation mass spectrometry. Proc Natl Acad Sci USA2004;101:9528–33.
[99] Frese CK, Altelaar AFM, Hennrich ML, Nolting D, Zeller M,Griep-Raming J, et al. Improved Peptide Identification byTargeted Fragmentation Using CID, HCD and ETD on anLTQ-Orbitrap Velos. J Proteome Res 2011;10:2377–88.
[100] Wiesner J, Premsler T, Sickmann A. Application of electrontransfer dissociation (ETD) for the analysis ofposttranslational modifications. Proteomics 2008;8:4466–83.
[101] Bertsch A, Leinenbach A, Pervukhin A, Lubeck M, HartmerR, Baessmann C, et al. De novo peptide sequencing bytandem MS using complementary CID and electrontransfer dissociation. Electrophoresis 2009;30:3736–47.
[102] Sobott F, Watt SJ, Smith J, Edelmann MJ, Kramer HB, KesslerBM. Comparison of CID versus ETD based MS/MSfragmentation for the analysis of protein ubiquitination. JAm Soc Mass Spectrom 2009;20:1652–9.
[103] Ji S, Zhang L, Hui L. Cell fate conversion: direct induction ofhepatocyte-like cells from fibroblasts. J Cell Biochem2013;114:256–65.
[104] Ma MM, Wang JH, Chen RB, Li LJ. Expanding the crustaceanneuropeptidome using a multifaceted mass spectrometricapproach. J Proteome Res 2009;8:2426–37.
[105] Ma MM, Szabo TM, Jia CX, Marder E, Li LJ. Massspectrometric characterization and physiological actions ofnovel crustacean C-type allatostatins. Peptides2009;30:1660–8.
[106] Guthals A, Bandeira N. Peptide identification by tandemmass spectrometry with alternate fragmentation modes.Mol Cell Proteomics 2012;11:550–7.
[107] Swaney DL, McAlister GC, Coon JJ. Decision tree-driventandem mass spectrometry for shotgun proteomics. NatMethods 2008;5:959–64.
[108] Hsu YWA, Messinger DI, Chung JS, Webster SG, de la IglesiaHO, Christie AE. Members of the crustacean hyperglycemichormone (CHH) peptide family are differentially distributedboth between and within the neuroendocrine organs ofCancer crabs: implications for differential release andpleiotropic function. J Exp Biol 2006;209:3241–56.
[109] Webster SG, Keller R, Dircksen H. The CHH-superfamily ofmultifunctional peptide hormones controlling crustaceanmetabolism, osmoregulation, moulting, and reproduction.Gen Comp Endocrinol 2012;175:217–33.
[110] Sithigorngul W, Jaideechoey S, Saraithongkum W, LongyantS, Sithigorngul P. Purification and characterization of anisoform of crustacean hyperglycemic hormone from theeyestalk of Macrobrachium rosenbergii. J Exp Zool1999;284:217–24.
[111] Toullec JY, Vinh J, Le Caer JP, Shillito B, Soyez D. Structureand phylogeny of the crustacean hyperglycemic hormoneand its precursor from a hydrothermal vent crustacean: thecrab Bythograea thermydron. Peptides 2002;23:31–42.
[112] Fu Q, Christie AE, Li LJ. Mass spectrometric characterization
of crustacean hyperglycemic hormone precursor-relatedpeptides (CPRPs) from the sinus gland of the crab, Cancerproductus. Peptides 2005;26:2137–50.
m i c s
168 e u p a o p e n p r o t e o[113] Fu Q, Goy MF, Li LJ. Identification of neuropeptides from thedecapod crustacean sinus glands using nanoscale liquidchromatography tandem mass spectrometry. BiochemBiophys Res Commun 2005;337:765–78.
[114] Hsu JL, Huang SY, Shiea JT, Huang WY, Chen SH. Beyondquantitative proteomics: signal enhancement of the a(1)ion as a mass tag for peptide sequencing using dimethyllabeling. J Proteome Res 2005;4:101–8.
[115] Fu Q, Li LJ. De novo sequencing of neuropeptides usingreductive isotopic methylation and investigation of ESIQTOF MS/MS fragmentation pattern of neuropeptides withN-terminal dimethylation. Anal Chem 2005;77:7783–95.
[116] Ma MM, Bors EK, Dickinson ES, Kwiatkowski MA, Sousa GL,Henry RP, et al. Characterization of the Carcinus maenasneuropeptidome by mass spectrometry and functionalgenomics. Gen Comp Endocrinol 2009;161:320–34.
[117] Xiang F, Ye H, Chen RB, Fu Q, Li LJ. N,N-Dimethyl leucinesas novel isobaric tandem mass tags for quantitativeproteomics and peptidomics. Anal Chem 2010;82:2817–25.
[118] Wang JH, Zhang YZ, Xiang F, Zhang ZC, Li LJ. Combiningcapillary electrophoresis matrix-assisted laserdesorption/ionization mass spectrometry and stableisotopic labeling techniques for comparative crustaceanpeptidomics. J Chromatogr A 2010;1217:4463–70.
[119] Qin J, Chait BT. Preferential fragmentation of protonatedgas-phase peptide ions adjacent to acidicamino-acid-residues. J Am Chem Soc 1995;117:5411–2.
[120] Wattenberg A, Organ AJ, Schneider K, Tyldesley R, Bordoli R,Bateman RH. Sequence dependent fragmentation ofpeptides generated by MALDI quadrupole time-of-flight(MALDI Q-TOF) mass spectrometry and its implications forprotein identification. J Am Soc Mass Spectrom2002;13:772–83.
[121] Ma MM, Kutz-Naber KK, Li LJ. Methyl esterification assistedMALDI FTMS characterization of the orcokininneuropeptide family. Anal Chem 2007;79:673–81.
[122] Miyashita M, Hanai Y, Awane H, Yoshikawa T, Miyagawa H.Improving peptide fragmentation by N-terminalderivatization with high proton affinity. Rapid CommunMass Spectrom 2011;25:1130–40.
[123] Hennrich ML, Boersema PJ, van den Toorn H, MischerikowN, Heck AJR, Mohammed S. Effect of chemicalmodifications on peptide fragmentation behavior uponelectron transfer induced dissociation. Anal Chem2009;81:7814–22.
[124] Frey BL, Ladror DT, Sondalle SB, Krusemark CJ, Jue AL, CoonJJ, et al. Chemical derivatization of peptide carboxyl groupsfor highly efficient electron transfer dissociation. J Am SocMass Spectrom 2013;24:1710–21.
[125] Kim JS, Shin M, Song JS, An S, Kim HJ. C-terminal de novosequencing of peptides using oxazolone-basedderivatization with bromine signature. Anal Biochem2011;419:211–6.
[126] Johnson RS, Taylor JA. Searching sequence databases via denovo peptide sequencing by tandem mass spectrometry.Mol Biotechnol 2002;22:301–15.
[127] Frank A, Pevzner P. PepNovo: de novo peptide sequencingvia probabilistic network modeling. Anal Chem2005;77:964–73.
[128] Chi H, Sun RX, Yang B, Song CQ, Wang LH, Liu C, et al.pNovo: de novo peptide sequencing and identificationusing HCD spectra. J Proteome Res 2010;9:2713–24.
[129] Grossmann J, Roos FF, Cieliebak M, Liptak Z, Mathis LK,Muller M, et al. AUDENS: a tool for automated peptide denovo sequencing. J Proteome Res 2005;4:1768–74.
[130] Pan C, Park BH, McDonald WH, Carey PA, Banfield JF,VerBerkmoes NC, et al. A high-throughput de novosequencing approach for shotgun proteomics using
3 ( 2 0 1 4 ) 152–170
high-resolution tandem mass spectrometry. BMCBioinform 2010:2010.
[131] Mo LJ, Dutta D, Wan YH, Chen T. MSNovo A dynamicprogramming algorithm for de novo peptide sequencingvia tandem mass spectrometry. Anal Chem 2007;79:4870–8.
[132] Searle BC, Dasari S, Turner M, Reddy AP, Choi DS, WilmarthPA, et al. High-throughput identification of proteins andunanticipated sequence modifications using a mass-basedalignment algorithm for MS/MS de novo sequencingresults. Anal Chem 2004;76:2220–30.
[133] Ma B, Johnson R. De novo sequencing and homologysearching. Mol Cell Proteomics 2012;11.
[134] Li LJ, Sweedler JV. Peptides in the brain: massspectrometry-based measurement approaches andchallenges. Annu Rev Anal Chem 2008;1:451–83.
[135] Dickinson PS, Stemmler EA, Barton EE, Cashman CR,Gardner NP, Rus S, et al. Molecular, mass spectral, andphysiological analyses of orcokinins and orcokininprecursor-related peptides in the lobster Homarusamericanus and the crayfish Procambarus clarkii. Peptides2009;30:297–317.
[136] Caldwell RL, Caprioli RM. Tissue profiling by massspectrometry – a review of methodology and applications.Mol Cell Proteomics 2005;4:394–401.
[137] Caprioli RM, Farmer TB, Gile J. Molecular imaging ofbiological samples: localization of peptides and proteinsusing MALDI-TOF MS. Anal Chem 1997;69:4751–60.
[138] Skiebe P, Schneider H. Allatostatin peptides in the crabstomatogastric nervous system: inhibition of the pyloricmotor pattern and distribution of allatostatin-likeimmunoreactivity. J Exp Biol 1994;194:195–208.
[139] Fu Q, Tang LS, Marder E, Li L. Mass spectrometriccharacterization and physiological actions ofVPNDWAHFRGSWamide, a novel B type allatostatin in thecrab, Cancer borealis. J Neurochem 2007;101:1099–107.
[140] Chen R, Jiang X, Prieto Conaway MC, Mohtashemi I, Hui L,Viner R, et al. Mass spectral analysis of neuropeptideexpression and distribution in the nervous system of thelobster Homarus americanus. J Proteome Res 2010;9:818–32.
[141] Yasuda A, Yasuda-Kamatani Y, Nozaki M, Nakajima T.Identification of GYRKPPFNGSIFamide(crustacean-SIFamide) in the crayfish Procambarus clarkii bytopological mass spectrometry analysis. Gen CompEndocrinol 2004;135:391–400.
[142] Hui L, Zhang Y, Wang J, Cook A, Ye H, Nusbaum MP, et al.Discovery and functional study of a novel crustaceantachykinin neuropeptide. Acs Chem Neurosci2011;2:711–22.
[143] Ye H, Greer T, Li L. From pixel to voxel: a deeper view ofbiological tissue by 3D mass spectral imaging. Bioanalysis2011;3:313–32.
[144] Schmerberg CM, Li LJ. Function-driven discovery ofneuropeptides with mass spectrometry-based tools.Protein Peptide Lett 2013;20:681–94.
[145] Fu Q, Li L. Fragmentation of peptides with N-terminaldimethylation and imine/methylol adduction at thetryptophan side-chain. J Am Soc Mass Spectrom2006;17:859–66.
[146] Hui LM, Zhang YZ, Wang JH, Cook A, Ye H, Nusbaum MP,et al. Discovery and functional study of a novel crustaceantachykinin neuropeptide. ACS Chem Neurosci2011;2:711–22.
[147] Leon IR, Schwammle V, Jensen ON, Sprenger RR.Quantitative assessment of in-solution digestion efficiencyidentifies optimal protocols for unbiased protein analysis.
Mol Cell Proteomics 2013;12:2992–3005.[148] Perrin RJ, Payton JE, Malone JP, Gilmore P, Davis AE, Xiong C,et al. Quantitative label-free proteomics for discovery of
c s 3
e u p a o p e n p r o t e o m ibiomarkers in cerebrospinal fluid: assessment of technicaland inter-individual variation. PLoS ONE 2013;8:e64314.
[149] Old WM, Meyer-Arendt K, Aveline-Wolf L, Pierce KG,Mendoza A, Sevinsky JR, et al. Comparison of label-freemethods for quantifying human proteins by shotgunproteomics. Mol Cell Proteomics 2005;4:1487–502.
[150] Wolters DA, Washburn MP, Yates 3rd JR. An automatedmultidimensional protein identification technology forshotgun proteomics. Anal Chem 2001;73:5683–90.
[151] Cunningham R, Jany P, Messing A, Li L. Protein changes inimmunodepleted cerebrospinal fluid from a transgenicmouse model of Alexander disease detected using massspectrometry. J Proteome Res 2013;12:719–28.
[152] Ma D, Cao W, Kapur A, Felder M, Scarlett CO, Patankar MS,et al. Differential expression of proteins in naive and IL-2stimulated primary human NK cells identified by globalproteomic analysis. J Proteomics 2013;91C:151–63.
[153] Liu H, Sadygov RG, Yates 3rd JR. A model for randomsampling and estimation of relative protein abundance inshotgun proteomics. Anal Chem 2004;76:4193–201.
[154] Ong SE, Blagoev B, Kratchmarova I, Kristensen DB, Steen H,Pandey A, et al. Stable isotope labeling by amino acids incell culture, SILAC, as a simple and accurate approach toexpression proteomics. Mol Cell Proteomics 2002;1:376–86.
[155] Rose CM, Merrill AE, Bailey DJ, Hebert AS, Westphall MS,Coon JJ. Neutron encoded labeling for peptideidentification. Anal Chem 2013;85:5129–37.
[156] Hebert AS, Merrill AE, Bailey DJ, Still AJ, Westphall MS,Strieter ER, et al. Neutron-encoded mass signatures formultiplexed proteome quantification. Nat Methods2013;10:332–4.
[157] Ong SE, Mann M. Mass spectrometry-based proteomicsturns quantitative. Nat Chem Biol 2005;1:252–62.
[158] Elliott MH, Smith DS, Parker CE, Borchers C. Current trendsin quantitative proteomics. J Mass Spectrom2009;44:1637–60.
[159] Gygi SP, Rist B, Gerber SA, Turecek F, Gelb MH, Aebersold R.Quantitative analysis of complex protein mixtures usingisotope-coded affinity tags. Nat Biotechnol 1999;17:994–9.
[160] Hansen KC, Schmitt-Ulms G, Chalkley RJ, Hirsch J, BaldwinMA, Burlingame AL. Mass spectrometric analysis of proteinmixtures at low levels using cleavable 13C-isotope-codedaffinity tag and multidimensional chromatography. MolCell Proteomics 2003;2:299–314.
[161] Li J, Steen H, Gygi SP. Protein profiling with cleavableisotope-coded affinity tag (cICAT) reagents: the yeastsalinity stress response. Mol Cell Proteomics2003;2:1198–204.
[162] Ross PL, Huang YN, Marchese JN, Williamson B, Parker K,Hattan S, et al. Multiplexed protein quantitation inSaccharomyces cerevisiae using amine-reactive isobarictagging reagents. Mol Cell Proteomics 2004;3:1154–69.
[163] Ow SY, Cardona T, Taton A, Magnuson A, Lindblad P,Stensjo K, et al. Quantitative shotgun proteomics ofenriched heterocysts from Nostoc sp. PCC 7120 using8-plex isobaric peptide tags. J Proteome Res 2008;7:1615–28.
[164] Pierce A, Unwin RD, Evans CA, Griffiths S, Carney L, ZhangL, et al. Eight-channel iTRAQ enables comparison of theactivity of six leukemogenic tyrosine kinases. Mol CellProteomics 2008;7:853–63.
[165] Yin HR, Zhang L, Xie LQ, Huang LY, Xu Y, Cai SJ, et al.Hyperplex-MRM: a hybrid multiple reaction monitoringmethod using mTRAQ/iTRAQ labeling for multiplexabsolute quantification of human colorectal cancerbiomarker. J Proteome Res 2013;12:3912–9.
[166] DeSouza LV, Taylor AM, Li W, Minkoff MS, Romaschin AD,Colgan TJ, et al. Multiple reaction monitoring ofmTRAQ-labeled peptides enables absolute quantification of
( 2 0 1 4 ) 152–170 169
endogenous levels of a potential cancer marker incancerous and normal endometrial tissues. J Proteome Res2008;7:3525–34.
[167] Zhang S, Wen B, Zhou B, Yang L, Cha C, Xu S, et al.Quantitative analysis of the human AKR family membersin cancer cell lines using the mTRAQ/MRM approach. JProteome Res 2013;12:2022–33.
[168] Karp NA, Huber W, Sadowski PG, Charles PD, Hester SV,Lilley KS. Addressing accuracy and precision issues iniTRAQ quantitation. Mol Cell Proteomics 2010;9:1885–97.
[169] Shirran SL, Botting CH. A comparison of the accuracy ofiTRAQ quantification by nLC-ESI MSMS and nLC-MALDIMSMS methods. J Proteomics 2010;73:1391–403.
[170] Ow SY, Salim M, Noirel J, Evans C, Rehman I, Wright PC.iTRAQ underestimation in simple and complex mixtures:the good, the bad and the ugly. J Proteome Res2009;8:5347–55.
[171] Ting L, Rad R, Gygi SP, Haas W. MS3 eliminates ratiodistortion in isobaric multiplexed quantitative proteomics.Nat Methods 2011;8:937–40.
[172] Wenger CD, Lee MV, Hebert AS, McAlister GC, Phanstiel DH,Westphall MS, et al. Gas-phase purification enablesaccurate, multiplexed proteome quantification withisobaric tagging. Nat Methods 2011;8:933–5.
[173] Wuhr M, Haas W, McAlister GC, Peshkin L, Rad R, KirschnerMW, et al. Accurate multiplexed proteomics at the MS2level using the complement reporter ion cluster. AnalChem 2012;84:9214–21.
[174] Hebert AS, Merrill AE, Bailey DJ, Still AJ, Westphall MS,Strieter ER, et al. Neutron-encoded mass signatures formultiplexed proteome quantification. Nat Methods2013;10, 332–+.
[175] Hebert AS, Merrill AE, Stefely JA, Bailey DJ, Wenger CD,Westphall MS, et al. Amine-reactive neutron-encodedlabels for highly-plexed proteomic quantitation. Mol CellProteomics 2013;12:3360–9.
[176] Gaskell SJ, Rollins K, Smith RW, Parker CE. Determination ofserum cortisol by thermospray liquidchromatography/mass spectrometry: comparison with gaschromatography/mass spectrometry. Biomed Environ MassSpectrom 1987;14:717–22.
[177] Yergey AL, Esteban NV, Liberato DJ. Metabolic kinetics andquantitative analysis by isotope dilution thermosprayLC/MS. Biomed Environ Mass Spectrom 1987;14:623–5.
[178] Gerber SA, Rush J, Stemman O, Kirschner MW, Gygi SP.Absolute quantification of proteins and phosphoproteinsfrom cell lysates by tandem MS. Proc Natl Acad Sci USA2003;100:6940–5.
[179] Sturm R, Sheynkman G, Booth C, Smith LM, Pedersen JA, LiL. Absolute quantification of prion protein (90–231) usingstable isotope-labeled chymotryptic peptide standards in aLC-MRM AQUA workflow. J Am Soc Mass Spectrom2012;23:1522–33.
[180] Kirkpatrick DS, Gerber SA, Gygi SP. The absolutequantification strategy: a general procedure for thequantification of proteins and post-translationalmodifications. Methods 2005;35:265–73.
[181] Peterson AC, Russell JD, Bailey DJ, Westphall MS, Coon JJ.Parallel reaction monitoring for high resolution and highmass accuracy quantitative, targeted proteomics. Mol CellProteomics 2012;11:1475–88.
[182] Gallien S, Duriez E, Crone C, Kellmann M, Moehring T,Domon B. Targeted proteomic quantification onquadrupole-orbitrap mass spectrometer. Mol Cell
Proteomics 2012;11:1709–23.[183] Patel VJ, Thalassinos K, Slade SE, Connolly JB, Crombie A,Murrell JC, et al. A comparison of labeling and label-free
m i c s
170 e u p a o p e n p r o t e omass spectrometry-based proteomics approaches. JProteome Res 2009;8:3752–9.
[184] Sutton J, Richmond T, Shi X, Athanas M, Ptak C, Gerszten R,et al. Performance characteristics of an FT MS-basedworkflow for label-free differential MS analysis of humanplasma: standards, reproducibility, targeted featureinvestigation, and application to a model of controlledmyocardial infarction. Proteomics Clin Appl 2008;2:862–81.
[185] Kim YJ, Zhan P, Feild B, Ruben SM, He T. Reproducibilityassessment of relative quantitation strategies for LC–MSbased proteomics. Anal Chem 2007;79:5651–8.
[186] Koziol JA, Feng AC, Yu J, Griffin NM, Schnitzer JE. Rangecharts for agreement in measurement comparison studies,with application to replicate mass spectrometryexperiments. J Proteomics Bioinform 2008;1:287–92.
[187] Huybrechts J, Nusbaum MP, Vanden Bosch L, Baggerman G,De Loof A, Schoofs L. Neuropeptidomic analysis of thebrain and thoracic ganglion from the Jonah crab, Cancerborealis. Biochem Biophys Res Commun 2003;308:535–44.
[188] Dickinson PS, Stevens JS, Rus S, Brennan HR, Goiney CC,Smith CM, et al. Identification and cardiotropic actions ofsulfakinin peptides in the American lobster Homarusamericanus. J Exp Biol 2007;210:2278–89.
[189] Dircksen H, Neupert S, Predel R, Verleyen P, Huybrechts J,Strauss J, et al. Genomics, transcriptomics, andpeptidomics of Daphnia pulex neuropeptides and protein
hormones. J Proteome Res 2011;10:4478–504.[190] Yasuda-Kamatani Y, Yasuda A. Identification of orcokiningene-related peptides in the brain of the crayfishProcambarus clarkii by the combination of MALDI-TOF and
3 ( 2 0 1 4 ) 152–170
on-line capillary HPLC/Q-Tof mass spectrometries andmolecular cloning. Gen Comp Endocrinol 2000;118:161–72.
[191] Chansela P, Goto-Inoue N, Zaima N, Sroyraya M, Sobhon P,Setou M. Visualization of neuropeptides inparaffin-embedded tissue sections of the central nervoussystem in the decapod crustacean, Penaeus monodon, byimaging mass spectrometry. Peptides 2012;34:10–8.
[192] Johnsen AH, Duve H, Davey M, Hall M, Thorpe A. Sulfakininneuropeptides in a crustacean – isolation, identificationand tissue localization in the tiger prawn Penaeusmonodon. Eur J Biochem 2000;267:1153–60.
[193] Sithigorngul P, Pupuem H, Krungkolsem C, Longyant S,Panchan N, Chaivisuthangkura P, et al. Four novel PYFs:members of NPY/PP peptide superfamily from the eyestalkof the giant tiger prawn Penaeus monodon. Peptides2002;23:1895–906.
[194] Sithigorngul P, Pupuem J, Krungkasem C, Longyant S,Chaivisuthangkura P, Sithigorngul W, et al. Seven novelFMRFamide-like neuropeptide sequences from the eyestalkof the giant tiger prawn Penaeus monodon. Comp BiochemPhysiol B 2002;131:325–37.
[195] Skiebe P, Dreger M, Meseke M, Evers JF, Hucho F.Identification of orcokinins in single neurons in thestomatogastric nervous system of the crayfish, Cheraxdestructor. J Comp Neurol 2002;444:245–59.
[196] Fu Q, Kutz KK, Schmidt JJ, Hsu YWA, Messinger DI, Cain SD,
et al. Hormone complement of the Cancer productus sinusgland and pericardial organ: an anatomical and massspectrometric investigation. J Comp Neurol2005;493:607–26.


![[Paranasal sinus mycoses]](https://img.dokumen.tips/doc/110x75/634c670f0953e73f8109bde5/paranasal-sinus-mycoses.jpg)


