Embed Size (px)
Citation preview

MARCET BOILER1.0 ABSTRACT
In order to determine the relationship between pressure and temperature of saturated
steam in equilibrium with water and demonstrate of the vapor pressure curve, this
experiment was designed. For the study of thermodynamics, the research concerning
the system that can be observed and measured is important. By measuring both
pressure and temperature, it was obvious to find out the graph (dT/dP) was almost
same with the slope obtained from the calculated one which was Tvfg/hfg. In this
experiment, the ideal gas equation will be applied and the calculation according to the
steam table will be needed too.
2.0 OBJECTIVE
2.1 To determine the relationship between pressure and temperature of saturated
steam in equilibrium with water.
2.2 To demonstrate of the vapor pressure curve.
3.0 INTRODUCTION
To complete and get results in this experiment, the measurement of pressure and
temperature is not enough. It is also important to apply the ideal gas equation and
make the calculation based on steam table correctly. Derived from the kinetic theory,
an ideal gas is consisted by three state variables: absolute pressure (P), volume (V),
and absolute temperature (T). And it is ideal gas law that can determine the
relationship between them. The equation which includes both P, V and T can be
presented as PV = nRT. Where, P = Absolute pressure; V = Volume; n = Amount of
substances (moles); R = Ideal gas constant; T = Absolute temperature (K). When it
comes to calculation which is based on the steam tables, the formular should be
Tvfg/hfg = T (vf - vg)/(hf - hg). And hf + hfg = hg, hence, T (vf - vg)/hfg = Tvg/hfg.
As vg >> vf, in which, vf =specific volume of saturated liquid; vg = specific volume

of saturated vapor; hf = enthalpy of saturated liquid; hg = enthalpy of saturated liquid;
hfg = latent heat of vaporization.
As is shown in the Figure 3.1, the Marcet Boiler is the unit where the whole process
take place. It has been developed for investigating the relationship between the
pressure and temperature of saturated steam,


Figure 3.1
4.0 APPARATUS
Figure 4.1
1 Pressure transducer 6 Bourdon tube pressure gauge
2 Temperature controller / indicator 7 Temperature sensor
3 Pressure indicator 8 Pressure relief valve
4 Control panel 9 Water inlet port and valve
5 Bench 10 Heater
Table 4.2

5.0 EXPERIMENTAL METHODS
A. General start-up procedures
1. A quick inspection was performed to ensure that the unit is in proper
operating condition.
2. The unit was connected to the nearest power supply.
3. The valves was opened at the feed port and the level sight tube.
4. The boiler was filled with distilled water through the feed port and made
sure that the water level was at about the half of the boiler’s height. Then,
the valves were closed at the level sight tube.
5. The power supply switch was turned on.
6. The experiment was ready to carried on.
B. General shut-down procedures
1. The heater was switched off to allow the boiler temperature to drop. (Note:
Do not open the valve at the water inlet port as it is highly pressurized at
high temperature).
2. Both main switch and main power supply were turned off .
3. Retained the water next use.
C. Experiment: The fundamental Pressure – Temperature Relationship of
saturated steam in equilibrium.
1. Performed the general start-up procedures.
2. If the boiler is initially filled with water, open the valves at the level side
tube to check the water level. Poured in additional distilled water if
necessary. Then, closed the valves.
3. The temperature controller was set to 170.7˚C which was slightly above
the expected boiling point of the water at 8.0 bar (abs).
4. The valve was opened at feed port and the heater was turned on.
(Important: Always make sure that the valves at the level sight tube are

closed before turning on the heater as the sight tube is not designed to
withstand high pressure and temperature.)
5. Observed the steam temperature rise as the water boils.
6. Steam was allowed to come out from the valve for about 30 seconds, and
then closed the valve. This step was important to remove air from the
boiler as the accuracy of the experimental result will be significantly
affected when air is present.
7. The steam temperature and pressure were recorded when the boiler was
heated until the steam pressure reaches 10.0 bars (abs). ( Never open the
valve when the boiler is heated as pressurized steam can cause severe
injury.)
8. Then, the heater was turned off and the steam temperature and pressure
began to drop. The boiler was allowed to cool down to room temperature.
The steam temperatures was recorded at different pressure readings when
the boiler was heated and cooled.
6.0 RESULTS
Pressure, P
(bar)
Temperature, T
(˚C)
Measured
slope,
dT/dP
Calculated
slope,
Gauge AbsoluteIncrease
(˚C)
Decrease
(˚C)
Average
Tavc(˚C)
Average
Tavc (K)
0.0 1.0 100.0 99.2 99.6 372.6 0.037 0.279
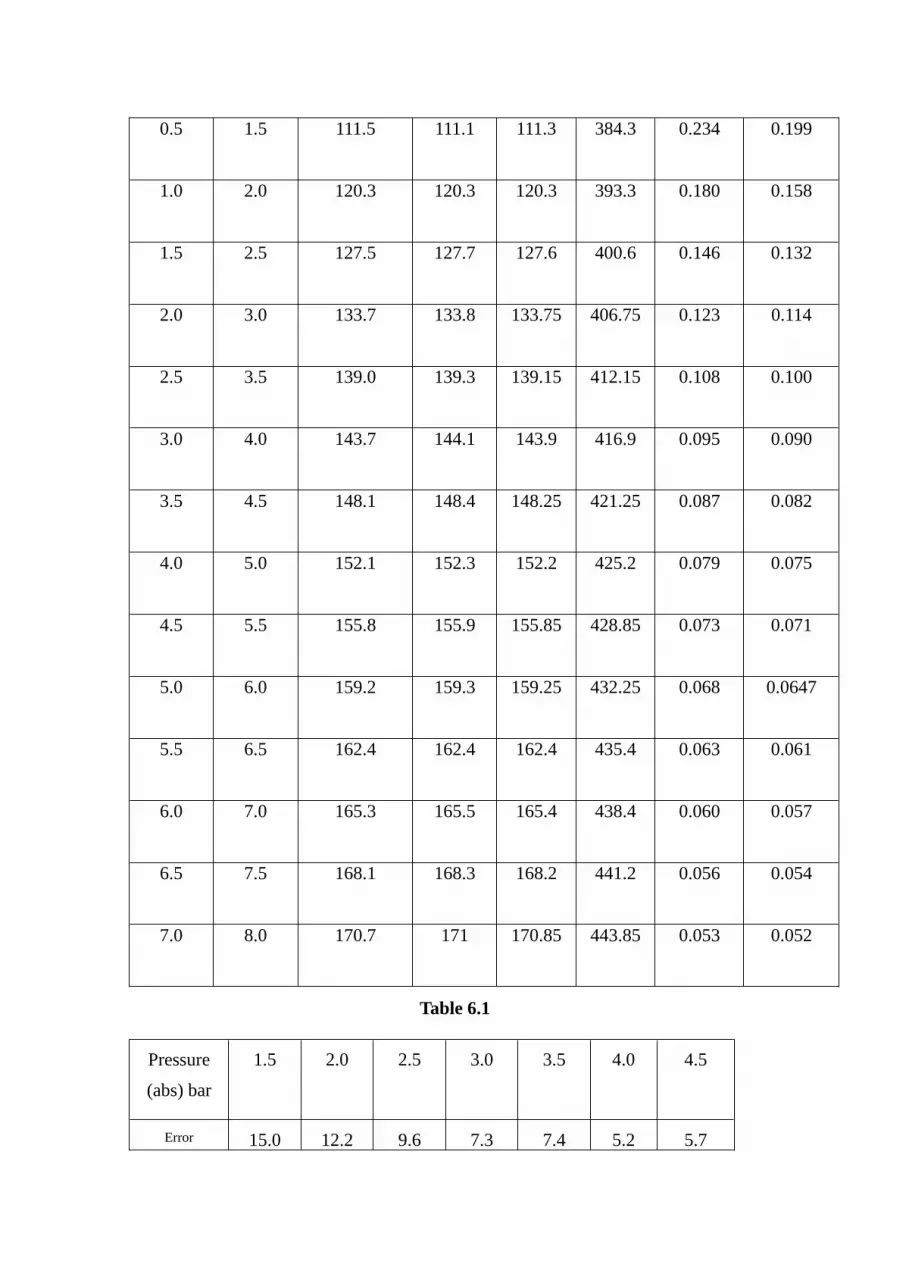
0.5 1.5 111.5 111.1 111.3 384.3 0.234 0.199
1.0 2.0 120.3 120.3 120.3 393.3 0.180 0.158
1.5 2.5 127.5 127.7 127.6 400.6 0.146 0.132
2.0 3.0 133.7 133.8 133.75 406.75 0.123 0.114
2.5 3.5 139.0 139.3 139.15 412.15 0.108 0.100
3.0 4.0 143.7 144.1 143.9 416.9 0.095 0.090
3.5 4.5 148.1 148.4 148.25 421.25 0.087 0.082
4.0 5.0 152.1 152.3 152.2 425.2 0.079 0.075
4.5 5.5 155.8 155.9 155.85 428.85 0.073 0.071
5.0 6.0 159.2 159.3 159.25 432.25 0.068 0.0647
5.5 6.5 162.4 162.4 162.4 435.4 0.063 0.061
6.0 7.0 165.3 165.5 165.4 438.4 0.060 0.057
6.5 7.5 168.1 168.3 168.2 441.2 0.056 0.054
7.0 8.0 170.7 171 170.85 443.85 0.053 0.052
Table 6.1
Pressure
(abs) bar
1.5 2.0 2.5 3.0 3.5 4.0 4.5
Error 15.0 12.2 9.6 7.3 7.4 5.2 5.7

percentage(%)
Table 6.2
Pressure
(abs) bar
5.0 5.5 6.0 6.5 7.0 7.5 8.0
Error
percentage(%)5.0 2.7 4.9 3.2 5 3.6 1.9
Table 6.3
6.1 Sample Calculation
Take the calculation when the absolute pressure is 7.0 bar as an example.
dT = 438.4K - 435.4K = 3K
dP = 7.0 - 6.5 = 0.5 bar = 50 kpa
dT/dP = 3/50 = 0.06
According to steam table;
When the pressure is 7.0 bar, T = 483.4 K; vg = 0.2729m3/kg; hfg = 2066.3 kJ/kg
Tvg/hfg = 483.4×0.2729÷2066.3 = 0.057
error percentage = |((measured – calculated) /measured)| × 100% = |((0.057 – 0.060)
/0.057)| × 100% = 5%
6.2 Graphs

Graph 6.1
Graph 6.2
7.0 DISCUSSION
From this experiment, the relationship between pressure and temperature of saturated
steam in equilibrium with water was figured out which is directly proportional.
Although there did exist some deviation between experimental slope and theoretical
one. According to the Table 6.2 and Table 6.3, the error percentage was between
1.9% to 15%. Also in this experiment, it is necessary to remove the air from the
boiler, because this may affect the accuracy of the experimental results.

When it comes to errors in this laboratory, there were four main reasons caused the
error. They were reading accuracy, room temperature and pressure, the stability of
materials respectively. And when the liquid absorbed enough heat energy, it will
change to vapour form. As the steam is not allowed to exit, it will cause an increase in
pressure and thus causing the temperature to increase. There are many applications of
this theorem in industrial area. For example, power plant, gasifier and water boiler.
8.0 CONCLUSION
By doing this experiment, the the relationship between pressure and temperature of
saturated steam in equilibrium with water was determined and the demonstrate of the
vapor pressure curve was made. It is directly proportional between pressure and
temperature. And because of the certain errors existed in this laboratory, the error
percentage was between 1.9% to 15% which can validate this experiment.
9.0 REFERENCE
[1] Conor, J. (2012), Marcet Boiler Lab Report, [online], Available:
http://zh.scribd.com/doc/51634867/Marcet-Boiler-Lab-Report.
[2] Mardhiah, A (2010), Marcet Boiler lab report, [online],
Available:http://zh.scribd.com/doc/159694163/Marcet-Boiler-lab-report