Embed Size (px)
Citation preview
Biotechnology IndustryResearch Assistance Council
MAPPING REGIONAL INNOVATION ECOSYSTEMS: A study of four life sciences clusters in southern India
A report from the BIRAC Regional Innovation Centre (BRIC) at IKP Knowledge Park, October 2016

MAPPING REGIONAL INNOVATION ECOSYSTEMS: A study of four life sciences clusters in southern India
TEAM
Ms. Deepanwita Chattopadhyay
Dr. Rakshambikai R
Mr. Rajendher Vadlakonda
Dr. Satya Prakash Dash
Dr. Vinita Jindal
MAPPING REGIONAL INNOVATION ECOSYSTEMS: A study of four life sciences clusters in southern India
TEAM
Ms. Deepanwita Chattopadhyay
Dr. Rakshambikai R
Mr. Rajendher Vadlakonda
Dr. Satya Prakash Dash
Dr. Vinita Jindal
MESSAGE
BIRAC established BRIC (BIRAC Regional Innovation Centre) in partnership with IKP Knowledge Park
in Hyderabad to gain a deeper understanding of India’s biotechnology sector, especially in
South India, which has been growing over the last decade. BRIC has catalysed several other roles
including helping start-ups in understanding issues such as business models, IP, licensing and in
navigating regulatory requirements for productisation, creating platforms such as technology
showcasing, and connecting start-ups to relevant networks, especially with investors.
The report highlights the dynamism of the biotech sector in South India, particularly in the clusters of
Hyderabad, Bengaluru, Chennai and Thiruvananthapuram through a detailed mapping of
stakeholders, the drivers, the opportunities and the gaps that exist. The report has highlighted the
unique elements for each cluster studied and their rapid evolution. BIRAC will endeavour to foster
and facilitate the growth of the biotech sector and the learnings from the report would help distill
possible routes to create further impact.
The teams at BRIC, IKP Knowledge Park and Strategy Partnership & Entrepreneurship Development
(SPED) division at BIRAC have synergistically collaborated to bring out this report. We appreciate the
contributions by the experts of the BRIC Advisory Committee and all experts who have shared their
insights for the report that will help us take the Indian biotechnology industry to the next level.
Dr. Renu Swarup
MD, BIRAC & Senior Adviser/Scientist H DBT
This report was prepared by BRIC, a joint initiative by BIRAC and IKP Knowledge Park. The report leveraged from
primary and secondary data as well as information drawn from various sources such as articles (peer reviews &
general) including interviews with leading experts. The views expressed by experts are personal and should not
be ascribed to the organisations that they are professionally engaged with. While due care has been taken to
acknowledge all available sources and ensure accuracy of the information, however, no warranty, express or
implied, is being made or will be made by BIRAC and IKP as regards to accuracy of the information contained
within the report. Any omission is inadvertent and the copyright of the secondary information resides with the
original source of information. The information and the views expressed in this document are not the stated
official policy of BIRAC or the Government of India. This document intends to provide a general guide to the life
sciences sector in the clusters of Hyderabad, Bengaluru, Chennai and Thiruvananthapuram.
DISCLAIMER
COPYRIGHT: © 2016 BIRAC and IKP Knowledge Park
PRODUCED BY: BIRAC Regional Innovation Centre (BRIC)
DESIGNED BY: RBC Worldwide, Hyderabad, India www.rbcworldwide.com
PRINTED AT: Kala Jyothi Process Pvt. Ltd., Hyderabad, India www.kalajyothi.com
COVER PAGE IMAGE: Collaboration Maps of Anna University (Chennai), Centre for DNA
Fingerprinting and Diagnostics (Hyderabad), National Centre for Biological Sciences (Bengaluru),
& Rajiv Gandhi Centre for Biotechnology (Thiruvananthapuram)

Foreword vii
Acknowledgements ix
Abbreviations xii
List of Figures xiv
List of Tables xvi
Executive Summary xvii
Chapter 1: Setting the context 23-31
1.1 Overview 23
1.2 An introductory note on innovation mapping 24
1.2.1 Need for mapping 24
1.2.2 Models for studying innovation 26
1.2.3 Framework used in the current study 28
1.2.4 Mapping innovation at various levels 31
Chapter 2: Analysis of four life sciences clusters 33-83
2.1 Framework and rationale used for the study 33
2.1.1 Definition of some key terms 33
2.1.2 Data sources 36
2.1.3 Assumptions, hypothesis, limitations 36
2.1.4 Dataset 38
2.2 Analysis of clusterwise data 40
2.2.1 Study of academic output 41
2.2.1.1 Publication output, growth, quality, impact 41
2.2.1.2 Knowledge exchange/transfer from academic perspective 57
2.2.1.3 Knowledge exchange/transfer from industry perspective 62
2.2.2 Analysis of industry and start-up data 64
2.2.2.1 Clusterwise focus areas in industry 64
2.2.2.2 Research output from industry 66
CONTENTS
2.2.3 Supporting ecosystem 70
2.2.3.1 Basic statistics 70
2.2.3.2 Funding support 71
2.2.4 Other observations 73
2.3 Key findings from KOL survey 74
2.3.1 Advantages in various south Indian clusters 75
2.3.2 Key challenges 76
2.3.3 A deeper dive into challenges 78
2.3.3.1 Collaboration 79
2.3.3.2 Intellectual property rights 79
2.3.3.3 Regulatory hurdles 80
2.3.3.4 Funding 80
2.3.4 Expectations of KOLs to improve the ecosystem 81
2.3.4.1 National level policy incentives from the government 81
2.3.4.2 State level policy changes 82
2.3.4.3 Stakeholder level changes 83
Chapter 3: Summarising current status and recommendations 85-89
3.1 Current status of ecosystem and classification of
capabilities of stakeholders 85
3.2 Recommendations from BRIC 87
References 90-91
FOREWORD
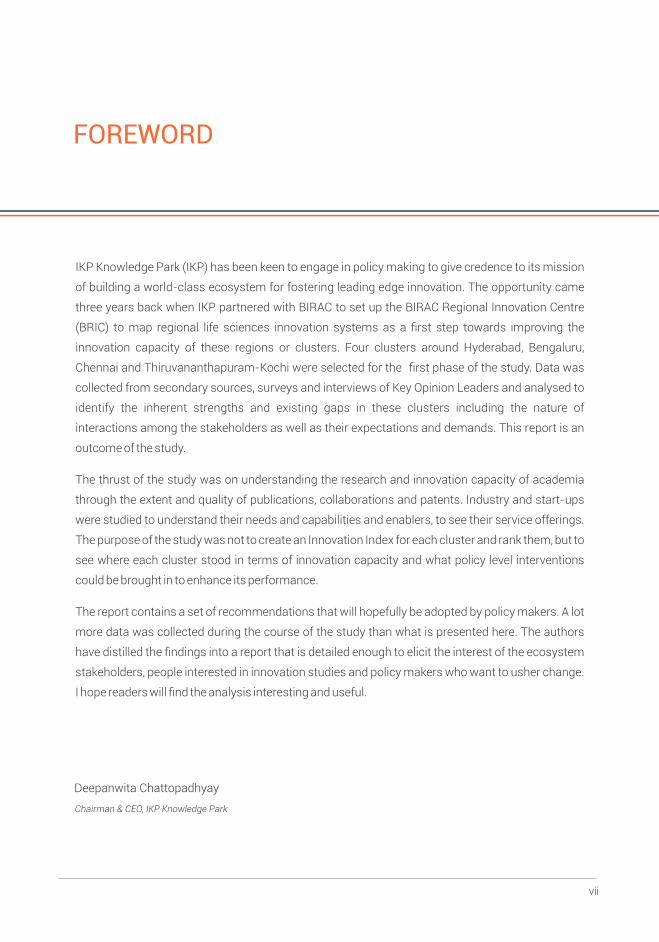
IKP Knowledge Park (IKP) has been keen to engage in policy making to give credence to its mission
of building a world-class ecosystem for fostering leading edge innovation. The opportunity came
three years back when IKP partnered with BIRAC to set up the BIRAC Regional Innovation Centre
(BRIC) to map regional life sciences innovation systems as a first step towards improving the
innovation capacity of these regions or clusters. Four clusters around Hyderabad, Bengaluru,
Chennai and Thiruvananthapuram-Kochi were selected for the first phase of the study. Data was
collected from secondary sources, surveys and interviews of Key Opinion Leaders and analysed to
identify the inherent strengths and existing gaps in these clusters including the nature of
interactions among the stakeholders as well as their expectations and demands. This report is an
outcome of the study.
The thrust of the study was on understanding the research and innovation capacity of academia
through the extent and quality of publications, collaborations and patents. Industry and start-ups
were studied to understand their needs and capabilities and enablers, to see their service offerings.
The purpose of the study was not to create an Innovation Index for each cluster and rank them, but to
see where each cluster stood in terms of innovation capacity and what policy level interventions
could be brought in to enhance its performance.
The report contains a set of recommendations that will hopefully be adopted by policy makers. A lot
more data was collected during the course of the study than what is presented here. The authors
have distilled the findings into a report that is detailed enough to elicit the interest of the ecosystem
stakeholders, people interested in innovation studies and policy makers who want to usher change.
I hope readers will find the analysis interesting and useful.
Deepanwita Chattopadhyay
Chairman & CEO, IKP Knowledge Park
vii
2.2.3 Supporting ecosystem 70
2.2.3.1 Basic statistics 70
2.2.3.2 Funding support 71
2.2.4 Other observations 73
2.3 Key findings from KOL survey 74
2.3.1 Advantages in various south Indian clusters 75
2.3.2 Key challenges 76
2.3.3 A deeper dive into challenges 78
2.3.3.1 Collaboration 79
2.3.3.2 Intellectual property rights 79
2.3.3.3 Regulatory hurdles 80
2.3.3.4 Funding 80
2.3.4 Expectations of KOLs to improve the ecosystem 81
2.3.4.1 National level policy incentives from the government 81
2.3.4.2 State level policy changes 82
2.3.4.3 Stakeholder level changes 83
Chapter 3: Summarising current status and recommendations 85-89
3.1 Current status of ecosystem and classification of
capabilities of stakeholders 85
3.2 Recommendations from BRIC 87
References 90-91
FOREWORD
IKP Knowledge Park (IKP) has been keen to engage in policy making to give credence to its mission
of building a world-class ecosystem for fostering leading edge innovation. The opportunity came
three years back when IKP partnered with BIRAC to set up the BIRAC Regional Innovation Centre
(BRIC) to map regional life sciences innovation systems as a first step towards improving the
innovation capacity of these regions or clusters. Four clusters around Hyderabad, Bengaluru,
Chennai and Thiruvananthapuram-Kochi were selected for the first phase of the study. Data was
collected from secondary sources, surveys and interviews of Key Opinion Leaders and analysed to
identify the inherent strengths and existing gaps in these clusters including the nature of
interactions among the stakeholders as well as their expectations and demands. This report is an
outcome of the study.
The thrust of the study was on understanding the research and innovation capacity of academia
through the extent and quality of publications, collaborations and patents. Industry and start-ups
were studied to understand their needs and capabilities and enablers, to see their service offerings.
The purpose of the study was not to create an Innovation Index for each cluster and rank them, but to
see where each cluster stood in terms of innovation capacity and what policy level interventions
could be brought in to enhance its performance.
The report contains a set of recommendations that will hopefully be adopted by policy makers. A lot
more data was collected during the course of the study than what is presented here. The authors
have distilled the findings into a report that is detailed enough to elicit the interest of the ecosystem
stakeholders, people interested in innovation studies and policy makers who want to usher change.
I hope readers will find the analysis interesting and useful.
Deepanwita Chattopadhyay
Chairman & CEO, IKP Knowledge Park
vii

ACKNOWLEDGEMENTS
This Report by BRIC was prepared by a team led by Ms. Deepanwita Chattopadhyay at IKP
Knowledge Park and BRIC. The work was carried out under the general guidance of
Dr. Rakshambikai Ramaswamy with Mr. Rajendher Vadlakonda, Mr. Vikraman Venu Saranyan,
Mr. Neeraj Kathuria and Ms. Neeta Rai contributing at various phases. Dr. Satya Prakash Dash and
Dr. Vinita Jindal at BIRAC also contributed throughout the study and preparation of the report.
Our appreciation to the BRIC Advisory Committee chaired by Dr. Renu Swarup with expert members
consisting of Prof. Gowrishankar J, Dr. Ajith Kamath and Dr. Ramesh Byrapaneni for overall
guidance to BRIC as well as for this report. We acknowledge the generous support from BIRAC to
BRIC overall and for this study in particular.
The initial findings of the Report were also discussed at several conferences and workshops and
annual stakeholder meetings especially at the focused Roundtables held during IKP’s International
Knowledge Millennium Conferences, IKMC2014 and IKMC2015, chaired by Dr. MK Bhan.
We appreciate the guidance and contributions made by the experts at the Roundtables.
Several experts in the four clusters covered by the study provided helpful comments and insights,
made other contributions, and participated in consultative meetings/interviews. The team would
like to thank the following:
A. Veerareddy, Suven Lifesciences
Abhishek Sen, Biosense Technologies Pvt. Ltd.
Adarsh Natarajan, Aindra Systems
Ajith Kamath, Pfizer India
Anand Anandkumar, Bugworks Research Inc.
Anand Sivaraman, Remidio Innovative Solutions Pvt. Ltd.
Anil Prabhakar, IIT Madras
Anna Pulimood, CMC&H
Arabinda Chaudhuri, IICT
Arun Chandru, Pandorum Technologies Pvt. Ltd.
Arun Janakiraman, SGS Life Sciences Services
Ashok Pandey, NIIST
Ashwini Nangia, Crystallin Research Pvt. Ltd.
Avin Agarwal, Uber Diagnostics Pvt. Ltd.
B. Gurumoorthy, IISc
ix
Balachandran A, VIT-TBI
Balganesh S. Tanjore, Gangagen Biotechnologies Pvt. Ltd.
Balram S, TIMED-SCTIMST
Bishor Ibrahim, Ubio Biotechnology Pvt. Ltd.
C Satyanarayana, Laurus Labs
Chadrasekhar Srivari, IICT
Dhananjaya Dendukuri, Achira Labs Pvt. Ltd.
Dinesh Bindiganavale, Pradin Technologies
Ekta Ahuja, Mithros Chemicals Pvt. Ltd.
Florida Tilton, Biozone Research Technologies Pvt. Ltd.
Ganapathy Krishnan, Apollo Telemedicine
Ganesh Sambashivam, Anthem Biosciences Pvt. Ltd.
Gayatri Sabarwal, IBAB
George Joseph, CMC&H
Gowrishankar J, CDFD
Guhan Jayaraman, IIT Madras
Jagadish Mittur, KBITS, Govt. of Karnataka
Jugnu Jain, Sapien Biosciences
KMS Rao, Ion Exchange India Limited
Kiranam Chatti, Zephase Therapeutics Pvt. Ltd.
Kishore Parsa, Reddy's Institute of Life Sciences
Lakshmi Kantam M, IICT
MNA Rao, Divis Laboratories Limited
MA Vijayalakshmi, VIT
Manivannan M, IIT Madras
Manjula Reddy, CCMB
Meenakshi Sundaram, Anna University
Mukesh Doble, IIT Madras
Nagaraju Karumuri, Sai Prani Biopharma Pvt. Ltd.
Nandakumar S, Perfint Healthcare Pvt. Ltd.
Navakant Bhat, IISc
Nihal Thomas, CMC&H
Nitya Venkataraman, H3Me Lifesciences
NV Satyanarayana, IICT
P Gautham, Anna University
P Kaliraj, Anna University
PR Ganapathy, Villgro Foundation
PN Rangarajan, IISc
Purushothaman Gempuraj, Purius Nanosystems Pvt. Ltd.
Radha Rangarajan, Vitas Pharma
Raghu Dharmaraju, Embrace Innovations
Rajeshwari K, Bioklone Biotech Pvt. Ltd.
Ramaswamy S, CCAMP
Rashna Bhandari, CDFD
Ravi Bhogu, Monitra Healthcare Pvt. Ltd.
Ravichandra Beeerum, Revelations Biotech Pvt. Ltd.
Ravikumar Banda, Xcyton Diagnostics Ltd.
Redanna P, University of Hyderabad
Rudrapratap P, IISc
S Dayananda, University of Hyderabad
Sai Siva Gorthi, IISc
Sambaru Prasad, Lipicard Technologies Ltd.
Sateesh Andra, Endiya Partners
Shanti Bhattacharya, IIT Madras
Shantikumar Nair, Amrita Vishwa Vidyapeetham (Amrita University)
Shrikumar Suryanarayan, Sea6Energy
Sidhant Jena, Jana Care
Siraj Dhanani, InnAccel
Sivaram Pillai, Proklean Technologies Pvt. Ltd.
Soma Guhathakurta, IITM
Subadra Dravida, Transcell Biologics
Subramani Ramachandrappa, Richcore Lifesciences Pvt. Ltd.
Sudha Nair, Golden Jubilee Biotech Park for Women Society
Sudheshna Adak, OmiX Research and Diagnostics Laboratories Pvt. Ltd.
Sukesh Narayan Sinha, NIN
Sumathy K, Bharat Biotech International Ltd.
Suresh Devasahayam, CMC&H
Taslimarif Sayeed, CCAMP
Uday Kumar Ranga, JNCASR
Uday Saxena, Kareus Therapeutics, DRILS
Udit Parekh, Sabio Innovative Solutions Pvt. Ltd.
VS Ravindran, Caprienzymes
Valluri Venkata Satyavathi, CDFD
Vamsee Krishna Muppidi, Crystalmorphix Technologies Pvt. Ltd.
Vanaja Kumar, Sathyabama University
Varaprasad Reddy, Shantha Biotechnics
Venkat Jasti, Suven Life sciences
Vijay Gunasekaran, e-Bionary Technologies Pvt. Ltd. and Bionary Bioproducts Pvt. Ltd.
Vijay Simha, Onebreath India Pvt. Ltd.
Vijayaraghavan K, Sathguru Management Consultants
The team apologises to any individuals or organisations inadvertently omitted from
this list.
xix
API Active Pharmaceutical Ingredient
BIRAC Biotechnology Industrial Research Assistance Council
BMCRI Bangalore Medical College and Research Institute
BRIC BIRAC Regional Innovation Centre
CCMB Centre for Cellular and Molecular Biology
CDFD Centre for DNA Fingerprinting and Diagnostics
CDSCO Central Drug Standard Control Organisation
CIFT Centre for Fisheries Technology
CLRI Central Leather Research Institute
CMC&H Christian Medical College and Hospital
CPCB Central Pollution Control Board
CRAMS Contract Research and Manufacturing Services
CRO Contract Research Organisation
DBT Department of Biotechnology
DeitY Department of Electronics and Information Technology
DIPP Department of Industrial Policy and Promotion
DSIR Department of Scientific and Industrial Research
DST Department of Science and Technology
FDF Finished Dosage Form
GM Crops Genetically Modified crops
IBAB Institute of Bioinformatics and Applied Biotechnology
ICMR Indian Council for Medical Research
IDPL Indian Drugs and Pharmaceuticals Limited
IICT Indian Institute of Chemical Technology
LIST OF ABBREVIATIONS IISc Indian Institute of Science
IISER-TVM Indian Institute of Science Education and Research, Thiruvananthapuram
IITM Indian Institute of Technology Madras
INPADOC International Patent Documentation
InSTEM Institute of Stem Cell Biology and Regenerative Medicine
IOB Institute of Bioinformatics
IT Information Technology
JNCASR Jawaharlal Nehru Centre for Advanced Scientific Research
KMIO Kidwai Memorial Institute of Oncology
KOL Key Opinion Leaders
LVPEI LV Prasad Eye Institute
mAbs Monoclonal Antibodies
MNC Multi-National Corporation
MSME Micro, Small and Medium Enterprises
NCBS National Centre for Biological Sciences
NIIST National Institute for Interdisciplinary Science and Technology
NIMHANS National Institute for Mental Health and Neurosciences
NIN National Institute for Nutrition
NIRT National Institute for Research in Tuberculosis
PSU Public Sector Unit
R&D Research and Development
RCGM Review Committee on Genetic Manipulation
RGCB Rajiv Gandhi Centre for Biotechnology
SCTIMST Sree Chitra Tirunal Institute for Medical Sciences and Technology
SME Small and Medium-sized Enterprises
TTO Technology Transfer Office
UAS University of Agricultural Sciences
UGC University Grants Commission
US-FDA United Stated Food and Drug Administration
VIT Vellore Institute of Technology
xiiixii
LIST OF FIGURES
1.1 Factors impacting innovation at the global scale, Adapted from M. Nair, 2011
1.2 Linear and dynamic models of innovation
1.3 Framework used in the study
1.4 a) Table summating main differences between various approaches to study innovation
b) Schematic representation differentiating NIS, RIS and SIS approaches; SIS may be at
three levels spanning internationally, across multiple RISs and within an RIS (indicated
as black boxes)
2.1 Distribution of stakeholders (academia, industry, suppliers and enablers) in Hyderabad,
Bengaluru, Chennai+Vellore and Thiruvananthapuram+Kochi; the scale represented
gives the raw numbers of these stakeholders
2.2 Distribution of academic institutes in four south Indian clusters
2.3 A glimpse into knowledge creation in academic institutes through publications, patents
and collaborations.
2.4 Graphical representation of average number of publications per scientist in the
institutes under study
2.5 Yearwise growth in publication number in the four clusters
2.6 Yearwise trend of clusterwise normalised citation index across institutes in the four
clusters under study
2.7 Variation of normalised citation index within each institute across the four clusters
under study.
2.8 Yearwise growth of publications with zero citations
2.9 Trends across subjects: Number of publications that have citations in median range
2.10 Trends in number of publications on the basis of subject areas in Hyderabad
2.11 Trends in number of publications on the basis of subject areas in Bengaluru
2.12 Trends in number of publications on the basis of subject areas in Chennai + Vellore
2.13 Trends in number of publications on the basis of subject areas in
Thiruvananthapuram+Kochi.
2.14 Number of collaborators of select academic institutes in four clusters
2.15 A) Percentage of collaborators for select institutes B) Distribution of collaborators
within India in institutes within the four clusters
2.16 Collaboration maps of A) NCBS B) NIRT C) InSTEM D) IOB E) LVPEI showing different
types of topologies
2.17 Classification of important interactions identified through network maps
2.18 Comparison of publication focus areas in academia (A, C, E, G) and industry (B, D, F, H)
across four clusters
2.19 Distribution of different types of organisations in four clusters under study
2.20 Distribution showing number of patents, publications and collaborators for industries in
each cluster under study
2.21 Normalised citation index for select industry publications in the four clusters
2.22 Citations of patents from select industries in the four clusters
2.23 Revenue (FY 2015-16) and Human Resources of anchor companies in four clusters
2.24 Distribution of various start-up enablers in the clusters under study
2.25 Distribution of chemical and lab/medical suppliers in the four clusters under study.
2.26 Funding raised by life sciences start-ups in India
2.27 Number of companies in the 4 clusters by sectors that have raised private funds
(based on Tracxn data)
2.28 Distribution in terms of quantum of funding raised by life sciences companies across
various cities in India
2.29 Experiences of BRIC in IP culture in the ecosystem
2.30 Advantages in various south Indian clusters as pointed out by KOLs
2.31 Summary of issues pointed out by various stakeholders
2.32 Major hurdles discussed by KOLs; percentage of KOLs pointing out various issues
in (A) collaboration (B) intellectual property rights (C) regulatory hurdles and
(D) funding are represented
2.33 Various levels of solutions or expectations from KOLs to improve innovation ecosystem
3.1 Current status of the Indian innovation ecosystem - green, yellow and red boxes
indicate vibrant, intermediary and poor status respectively
xvxiv
1.1 Various bodies to be studied while understanding current status of ecosystem
2.1 The list of institutes selected for detailed study in Hyderabad, Bengaluru,
Chennai+Vellore and Thiruvananthapuram+Kochi
2.2 List of publications causing sudden increase in normalised citation index
in selected institutes in four clusters
2.3 List of subject areas considered in figures 2.10 to 2.13;
the numbers correspond to the number in the figure on the Y axis
2.4 Industry publications causing peaks in normalised citation index
2.5 Products/Services of anchor companies in the clusters
LIST OF TABLES
xviixvi
EXECUTIVE SUMMARY
In the current global scenario of liberalisation, globalisation and digitisation, several factors affect
growth and changes in economies thus creating a need to study innovation. Innovation can be
visualised as a complex interlinked network of various stakeholders in the ecosystem.
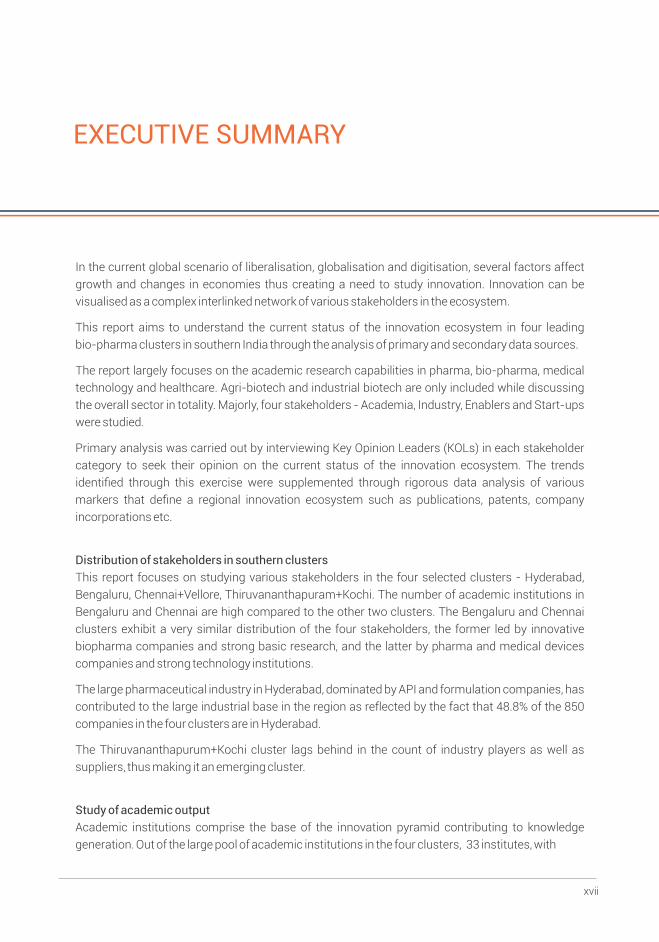
This report aims to understand the current status of the innovation ecosystem in four leading
bio-pharma clusters in southern India through the analysis of primary and secondary data sources.
The report largely focuses on the academic research capabilities in pharma, bio-pharma, medical
technology and healthcare. Agri-biotech and industrial biotech are only included while discussing
the overall sector in totality. Majorly, four stakeholders - Academia, Industry, Enablers and Start-ups
were studied.
Primary analysis was carried out by interviewing Key Opinion Leaders (KOLs) in each stakeholder
category to seek their opinion on the current status of the innovation ecosystem. The trends
identified through this exercise were supplemented through rigorous data analysis of various
markers that define a regional innovation ecosystem such as publications, patents, company
incorporations etc.
Distribution of stakeholders in southern clusters
This report focuses on studying various stakeholders in the four selected clusters - Hyderabad,
Bengaluru, Chennai+Vellore, Thiruvananthapuram+Kochi. The number of academic institutions in
Bengaluru and Chennai are high compared to the other two clusters. The Bengaluru and Chennai
clusters exhibit a very similar distribution of the four stakeholders, the former led by innovative
biopharma companies and strong basic research, and the latter by pharma and medical devices
companies and strong technology institutions.
The large pharmaceutical industry in Hyderabad, dominated by API and formulation companies, has
contributed to the large industrial base in the region as reflected by the fact that 48.8% of the 850
companies in the four clusters are in Hyderabad.
The Thiruvananthapurum+Kochi cluster lags behind in the count of industry players as well as
suppliers, thus making it an emerging cluster.
Study of academic output
Academic institutions comprise the base of the innovation pyramid contributing to knowledge
generation. Out of the large pool of academic institutions in the four clusters, 33 institutes, with
1.1 Various bodies to be studied while understanding current status of ecosystem
2.1 The list of institutes selected for detailed study in Hyderabad, Bengaluru,
Chennai+Vellore and Thiruvananthapuram+Kochi
2.2 List of publications causing sudden increase in normalised citation index
in selected institutes in four clusters
2.3 List of subject areas considered in figures 2.10 to 2.13;
the numbers correspond to the number in the figure on the Y axis
2.4 Industry publications causing peaks in normalised citation index
2.5 Products/Services of anchor companies in the clusters
LIST OF TABLES
xviixvi
EXECUTIVE SUMMARY
In the current global scenario of liberalisation, globalisation and digitisation, several factors affect
growth and changes in economies thus creating a need to study innovation. Innovation can be
visualised as a complex interlinked network of various stakeholders in the ecosystem.
This report aims to understand the current status of the innovation ecosystem in four leading
bio-pharma clusters in southern India through the analysis of primary and secondary data sources.
The report largely focuses on the academic research capabilities in pharma, bio-pharma, medical
technology and healthcare. Agri-biotech and industrial biotech are only included while discussing
the overall sector in totality. Majorly, four stakeholders - Academia, Industry, Enablers and Start-ups
were studied.
Primary analysis was carried out by interviewing Key Opinion Leaders (KOLs) in each stakeholder
category to seek their opinion on the current status of the innovation ecosystem. The trends
identified through this exercise were supplemented through rigorous data analysis of various
markers that define a regional innovation ecosystem such as publications, patents, company
incorporations etc.
Distribution of stakeholders in southern clusters
This report focuses on studying various stakeholders in the four selected clusters - Hyderabad,
Bengaluru, Chennai+Vellore, Thiruvananthapuram+Kochi. The number of academic institutions in
Bengaluru and Chennai are high compared to the other two clusters. The Bengaluru and Chennai
clusters exhibit a very similar distribution of the four stakeholders, the former led by innovative
biopharma companies and strong basic research, and the latter by pharma and medical devices
companies and strong technology institutions.
The large pharmaceutical industry in Hyderabad, dominated by API and formulation companies, has
contributed to the large industrial base in the region as reflected by the fact that 48.8% of the 850
companies in the four clusters are in Hyderabad.
The Thiruvananthapurum+Kochi cluster lags behind in the count of industry players as well as
suppliers, thus making it an emerging cluster.
Study of academic output
Academic institutions comprise the base of the innovation pyramid contributing to knowledge
generation. Out of the large pool of academic institutions in the four clusters, 33 institutes, with
xixxviii
It also has a large pool of service providers and contract research/outsourcing companies. This
trend has led to Bengaluru being one of the most sought after innovation clusters in India. Chennai
has had a strong pharma and automobile/engineering background. With a strong base of
universities, engineering and medical schools, and knowledge transfer from academia, several
medical device companies have come up in this region.
The number of biopharma companies are fairly low in Thiruvananthapuram, which could be
attributed to the prevailing industrial environment in the State. There is, however, immense potential
in this cluster.
Of the total number of industries in the four clusters, 85 companies (including start-ups) were
selected for deeper analysis. A general view of the total number of patents, total number of
publications and total number of collaborators in each cluster clearly points towards the focus on
patents in companies, a trend which is starkly different from academia. The Indian Patent Act, 1970
and the thriving generics industry have greatly increased the number of process patents from
several cities. The number of collaborators are not as high as in academia possibly associated with
the mismatches in focus areas of research.
Collaborations
Collaboration is an essential aspect of research activities today. It serves various purposes including
leveraging expertise and sharing of equipment and infrastructure. Particularly, collaborations have
far reaching impact in interdisciplinary work or co-development projects with industries and
hospitals.
The data revealed that most cities have a larger number of collaborators outside India than within
the country with an average of about 40% of the collaborations within India.
The number of truly interdisciplinary research highlights the translation output from an programmes
institute and the underlying culture and attitude towards collaboration. Interdisciplinary research is
still nascent in these clusters.
There are mismatches in certain focus areas between academia and industry present in the
clusters. Although, in principle, collaboration is possible across cities, geographical proximity plays a
crucial role especially in co-development projects. There might be a mismatch in focus areas if a
niche institute is present in a city without industries in that area. Likewise, there might be industries
of a specific sector in a city without much research expertise in that area.
Support structure
For entrepreneurs to thrive, in addition to research infrastructure, an entire support structure is
required especially during initial stages. Bengaluru, Hyderabad and Chennai are well-developed
clusters with a good support structure. Also, these states have start-up policies specifically focused
on improving the overall hygiene factors that attract enterprise. Kerala is catching up with these
cities with its new start-up policy.
six from Hyderabad, eleven from Bengaluru, nine from Chennai+Vellore and seven from
Thiruvananthapurum+Kochi, were chosen based on their research capabilities and focus for
analysing their research output and contribution to the innovation ecosystem. The primary focus in
most academic institutes is on publications and not patents. Chennai and Bengaluru have large
institutes that are multidisciplinary and with a good number of scientists which is conducive for a
vibrant collaborating environment. Scientists from Hyderabad have the maximum number of
patents. It was observed that faculty in medical institutes tend to collaborate more for clinical trials
and those from smaller institutes for access to equipment and expertise.
The research productivity has been a clear focus area and therefore, several government and
international funding schemes have been made available after the early 2000s. Several new
schemes such as INSPIRE in 2011-2012, Ramalingaswamy fellowship in 2006 and other
International Science and Technology collaboration schemes for promoting research were
introduced in 2009-2010 . The yearwise number of publications per institution therefore shows a
steady increase over the last 19 years. Although there was an exponential growth in the number of
publications, there were several publications with poor citations. This phenomenon was observed in
all clusters, but Hyderabad displayed a significantly better performance over other cities, having
been able to maintain less than 10% publications with zero citation since 1998. There were very few
publications in Thiruvananthapuram in the early 2000s and in comparison to other clusters, a larger
fraction of these publications haven't been well cited.
Subject areas
Across clusters, India's strength in life sciences seemed to be in various disciplines of chemistry
followed by biochemistry & molecular biology and pharmacology. Certain cities have expertise in
specific disciplines that are related to the presence of specialised institutes and in some cases
presence of a particular industry.
It is important to note that out of a total of 90 subject areas related to life sciences, not a single city
had a good representation of all the fields. In fact the four clusters had very few subject areas where
the minimum threshold of 50 publications in any year was exceeded.
Industry
The economic liberalisation in India which was initiated in 1991 led to a large number of companies
being incorporated and created the much needed entrepreneurial culture.
The Hyderabad cluster is dominated by the pharmaceutical sector. In 1961, the incorporation of
Indian Drugs and Pharmaceuticals Limited (IDPL) had a significant role in the city’s growth as a
pharma innovation cluster.
Bengaluru has a strong research culture owing to the presence of IISc for over a century and more
recently, JNCASR and NCBS as well as several other research institutes and PSUs. Several MNCs
started their operations in this region from the 70s leading to the creation of a huge wealth of
knowledge and talent pool that has translated into growth in applied and interdisciplinary areas.
xxixx
• Greater fiscal and tax credits to support innovation driven R&D in industry; special tax
provisions/incentives in VC/Angel investments for R&D core companies in defined focus
areas; these could be adapted from Israel, Singapore or New Zealand
• Antidumping duties on imported goods in specific focus areas would benefit DIPP
recognised start-ups by enabling competitive pricing of their technologies
3. Capacity-building in enabling ecosystems
• Training programmes for individuals in Technology Transfer Offices (TTOs) in academic
institutes to be able to market technologies and negotiate for reasonable valuations
• Setting up regional professionally managed TTOs to help institutes that cannot run their own
TTOs effectively
• One-on-one networking forums especially for entrepreneurs, through incubators; although
this is implicit, certain number of unique, value-added interactions should be mandated
• Presence of active clinical advisors in incubators to help improve connect with clinical
requirements and enable easier acceptance when clinicians are end users
• Setting up Technology Business Incubators in veterinary institutes for conducting large
animal studies and trials
• Incubators, science parks to be supplemented with pilot scale plants and packaging facilities
to accelerate the manufacturing capabilities of start-ups
• Setting up LARTA like bodies as a one stop solution for start-up queries under a PPP
• Establishing more institutes for technical training to strengthen the vendor base with
possible global collaborations
4. Funding
• Need for follow-on funding: To initiate a greater number of follow-on funding schemes
through public agencies as well as through PPP models
• Large ticket size grants: There is a need for larger quantum of grants especially beyond the
proof of concept stage for high risk product development; this could be both in the areas of
national priority and in high global opportunity segments
• Sensitisation: Sensitising Angel and VC funders on the intricacies of life science product
development and need for more events connecting start-ups to private funders
• Creating a ‘CIBIL’ like organisation to help funding bodies manage their funding better and
also help innovators secure funding on better terms. This should be available to all bodies to
track good start-ups. The information could be used by VCs to encourage investment in
technology heavy start-ups
• Policies on engaging the diaspora would be advantageous in the long run not only monetarily
but also in the transfer of technological knowhow
Recommendations from BRIC
The Indian biopharma and life sciences industry is expected to grow at about an average of 15% year
on year. India is a leader in generic and API production with several companies recording over 50% of
their revenues from international markets. The strong talent pool, government policies and
purchasing power further advance the potential of the sector. The stated goal of the Government of
India is to achieve a US$100 billion bioeconomy by 2025. The biotech clusters, including those in
south India, will play a critical role in achieving the stretched target. However, there exist several gaps
in the ecosystem - as highlighted in the report - that need to be addressed to be able to realise the
growth potential. These gaps have been analysed and expectations from the stakeholders in the
ecosystem have been captured to provide the following recommendations:
1. Knowledge generation
Ensuring quality and relevance:
• Making it mandatory to include parameters such as H index for appraisals and promotions;
Tenure track positions to be awarded on review after a few years
• Encouraging sabbaticals to explore new frontiers and stay up-to-date with emerging
applications
• Incentivising younger faculty by reducing number of years of service to qualify for
sabbaticals; promotions and incentives to be given for faculty who manage to succeed and
return back to academia
• Institutions with good publishing records could be selected for targeted translational
programmes primarily to promote truly interdisciplinary collaborations; such collaborations
could look beyond publications and include co-development of products
• Bringing in the culture of translational research in academia and research institutions
through sensitisation and awareness programmes, and create a vibrant conducive
ecosystem
• Change in academic policy to include performance matrix which takes into account
entrepreneurial achievements, IP, technology licensing for faculty promotion
• Capacity-building of promising private institutions through increased funding for research
• Connecting private academic institutions with public institutions for joint innovation
research
• Greater emphasis on academia-industry collaborations especially in the realm of product
development
2. Regulations and regulatory bodies
• Improving the human resource capacity of the regulatory agencies especially provision for
wider backgrounds of regulators rather than purely pharma graduates. PhDs/industry
experience in various streams of science and engineering would enable better guidelines,
clearances and due diligence
• Policy changes in public procurement of innovative products, greater transparency in public
procurement

Chapter 1SETTING THE CONTEXT
1.1 Overview
BIRAC Regional Innovation Centre (BRIC)
The Biotechnology Industrial Research Assistance Council (BIRAC) in partnership with IKP
Knowledge Park (IKP) set up the BIRAC Regional Innovation Centre (BRIC) in 2013, to further BIRAC's
mandate of building a deeper understanding of the capacity and gaps in innovation,
commercialisation and technology absorption ecosystems and developing targeted programmes
to fulfil its broad vision of stimulating, fostering and enhancing biotech innovation and
entrepreneurship in the country.
To understand the evolving nature of regional ecosystems, an extensive Regional Innovation
Systems (RIS) study was undertaken largely around four biopharma and medical technology
clusters in southern India. The aim was to understand the knowledge generation capacity and
interaction between various stakeholders in the ecosystem and identify gaps that hinder
commercialisation of innovations.
This report summarises the findings of the study and is intended to provide inputs for framing
science and technology policies for sustained development of life sciences innovation ecosystems.
BIRAC
BIRAC is a Section 8 (not for profit) company setup by the Department of Biotechnology (DBT),
GoI in 2012 to stimulate, foster and enhance strategic research and innovation capabilities of the
Indian Biotech Industry and to serve as DBT's interface agency for supporting Industry-Academia
interaction.
BIRAC's mandates include providing targeted funding for all aspects of bio innovation,
incubation, technical and business mentoring, IP support, creating and providing access to global
and national networks for bio innovation.
IKP Knowledge Park
IKP is a science park and incubator with over fifteen years experience in promoting research-
based companies and creating an ecosystem for fostering leading-edge innovation. IKP has
partnered with BIRAC on several programmes including the Biotechnology Ignition Grant (BIG),
Biotechnology Incubation Support Scheme, Grand Challenges in TB Control and Grand Challenges
Explorations in health.
Chapter 1 2016 23
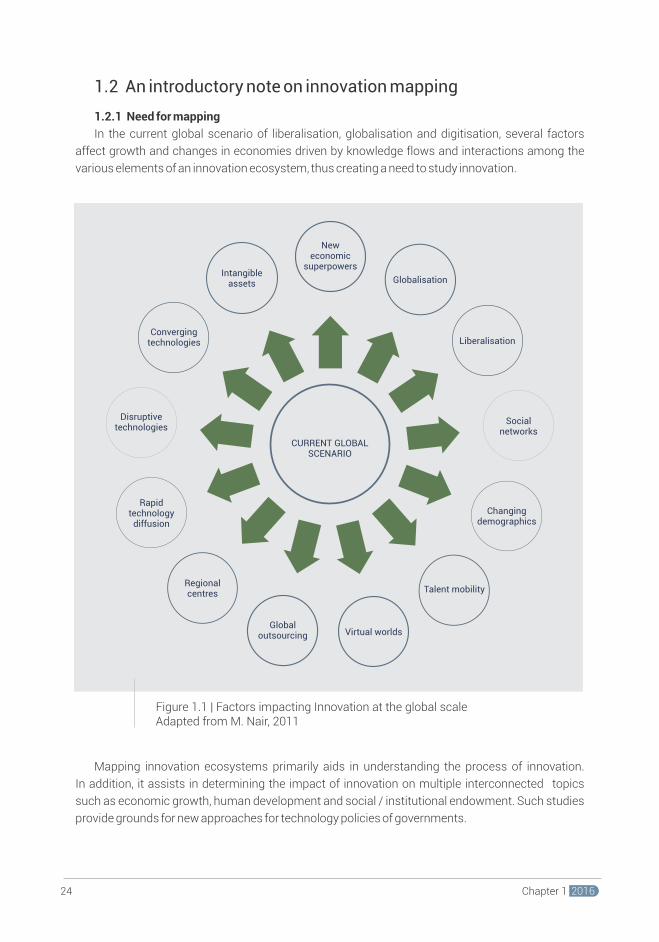
1.2 An introductory note on innovation mapping
1.2.1 Need for mapping
In the current global scenario of liberalisation, globalisation and digitisation, several factors
affect growth and changes in economies driven by knowledge flows and interactions among the
various elements of an innovation ecosystem, thus creating a need to study innovation.
Mapping innovation ecosystems primarily aids in understanding the process of innovation.
In addition, it assists in determining the impact of innovation on multiple interconnected topics
such as economic growth, human development and social / institutional endowment. Such studies
provide grounds for new approaches for technology policies of governments.
Traditionally, most government interventions in the technological areas have been directed
towards correcting market failures. With the motive of maximising returns to the society,
governments have relied on instruments such as R&D tax credits and subsidies. Understanding
National Innovation Systems as a concept provides a systemic approach and directs the attention of
policy makers to systemic failures that impede innovation in industries and public agencies. Several
factors such as lack of interaction between the actors in the system, mismatch between basic
research in academia and applied research in industry, malfunctioning of technology transfer
institutions, and information and absorptive deficiencies on the part of enterprises may all
contribute to the poor innovation performance of a country.
A systemic study could help identify networking schemes, lay emphasis on improving
interaction between stakeholders in enterprises and institutions, enhance the innovative capacity of
firms, and promote research and advanced technology partnerships with government. Technology
policies should aim at increasing the capability to innovate and adapt new technologies, as well as
the diffusion of available equipment and technologies.
Such an exercise can provide insight into areas requiring further study and / or intervention.
Moreover, tracking the changes in inputs, capabilities and outputs over time can help ascertain the
success / failure and effectiveness of interventions in these areas. It also forms a platform to identify
indices for measurement of outputs. Thus, beyond passive reporting of facts, such studies would
provide actionable insights to policymakers.
The trick for governments is to strike the balance between trying to let
as many flowers bloom as possible and recognising those which are really *not going to bloom and to stop feeding that pot plant.
David GillManaging Director of St. John's Innovation Centre
In the Indian context, studying innovation ecosystems at sectoral and regional levels are
particularly relevant to identify important systemic roadblocks which may be lost within an
aggregate measure.
Finally, innovation mapping is an evolving process. Several shortcomings in data collection
processes could be revealed in the course of undertaking an innovation assessment exercise, which
could eventually lead to more robust data and better analysis.
The past few decades have seen significant interest in innovation studies among research
scholars, national governments and global agencies. The Global Innovation Index, co-published by
Cornell University, INSEAD, and the World Intellectual Property Organisation (WIPO), for example,
with its rich database of detailed indicators serving as a tool for evaluation and improvement, has
attracted much attention. The box on the adjoining page captures some important innovation
measurement frameworks.
New economic
superpowersIntangible
assets
Converging technologies
Disruptive technologies
Globalisation
Liberalisation
Social networks
Changing demographics
Talent mobility
Virtual worldsGlobal
outsourcing
Regional centres
Rapid technology
diffusion
CURRENT GLOBAL SCENARIO
““
Figure 1.1 | Factors impacting Innovation at the global scale Adapted from M. Nair, 2011
*Lawlor, A. "Innovation ecosystems. Empowering entrepreneurs and powering economies."
The Economist Intelligence Unit (2014)
Chapter 1 2016 25Chapter 1 201624
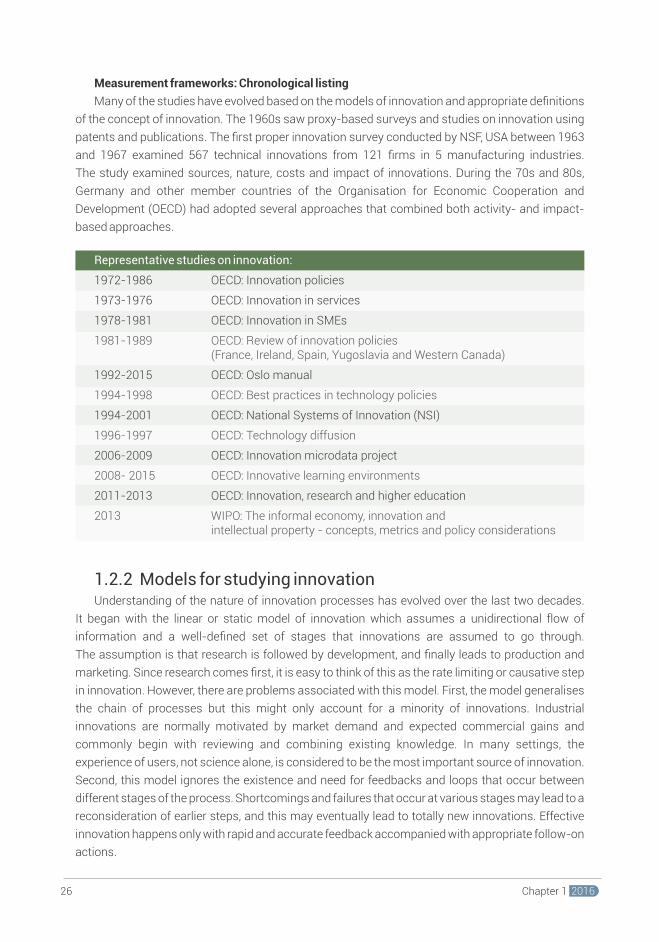
Measurement frameworks: Chronological listing
Many of the studies have evolved based on the models of innovation and appropriate definitions
of the concept of innovation. The 1960s saw proxy-based surveys and studies on innovation using
patents and publications. The first proper innovation survey conducted by NSF, USA between 1963
and 1967 examined 567 technical innovations from 121 firms in 5 manufacturing industries.
The study examined sources, nature, costs and impact of innovations. During the 70s and 80s,
Germany and other member countries of the Organisation for Economic Cooperation and
Development (OECD) had adopted several approaches that combined both activity- and impact-
based approaches.
1.2.2 Models for studying innovationUnderstanding of the nature of innovation processes has evolved over the last two decades.
It began with the linear or static model of innovation which assumes a unidirectional flow of
information and a well-defined set of stages that innovations are assumed to go through.
The assumption is that research is followed by development, and finally leads to production and
marketing. Since research comes first, it is easy to think of this as the limiting or causative step rate
in innovation. However, there are problems associated with this model. First, the model generalises
the chain of processes but this might only account for a minority of innovations. Industrial
innovations are normally motivated by market demand and expected commercial gains and
commonly begin with reviewing and combining existing knowledge. In many settings, the
experience of users, not science alone, is considered to be the most important source of innovation.
Second, this model ignores the existence and need for feedbacks and loops that occur between
different stages of the process. Shortcomings and failures that occur at various stages may lead to a
reconsideration of earlier steps, and this may eventually lead to totally new innovations. Effective
innovation happens only with rapid and accurate feedback accompanied with appropriate follow-on
actions.
Considering the dynamic nature of innovation processes, scientists and policymakers have
often argued to look at innovation from its systemic characteristics instead of the traditional linear
model. The concept of innovation system stresses that innovation should be seen as an
evolutionary, non-linear and iterative process requiring intensive communication and collaboration
between different actors of the system including within companies, and between firms and other
organisations such as universities, research institutes, funding institutions, standard setting bodies,
industry associations and government agencies (Figure 1.2). This necessitates policy makers to
strengthen the innovation system so that knowledge is generated and flows smoothly among
different actors of the system.
Enterprises
EntrepreneursKnowledge
transfercentres
Researchcentres
Financiers Associations
Innovationecosystem
Government
Dynamic model of innovation
Linear model of innovation
Research Development Commercialisation
The Dynamic model differs from the Linear model in a number of ways. There are multiple paths
from which innovations may arise with many forms of feedback. Research is not normally
considered to be the initiating step and is a contributing factor to all phases in the innovation
process. Therefore, a holistic model of innovation attempts to understand the role of knowledge,
design and development capacity in the context of a dynamic interaction between markets,
production, design and development (D&D), industrial research and development (R&D) and basic
research.
Figure 1.2 | Linear and dynamic models of innovation
Chapter 1 2016 27Chapter 1 201626
Representative studies on innovation:
1972-1986 OECD: Innovation policies
1973-1976 OECD: Innovation in services
1978-1981 OECD: Innovation in SMEs
1981-1989 OECD: Review of innovation policies (France, Ireland, Spain, Yugoslavia and Western Canada)
1992-2015 OECD: Oslo manual
1994-1998 OECD: Best practices in technology policies
1994-2001 OECD: National Systems of Innovation (NSI)
1996-1997 OECD: Technology diffusion
2006-2009 OECD: Innovation microdata project
2008- 2015 OECD: Innovative learning environments
2011-2013 OECD: Innovation, research and higher education
2013 WIPO: The informal economy, innovation and intellectual property - concepts, metrics and policy considerations
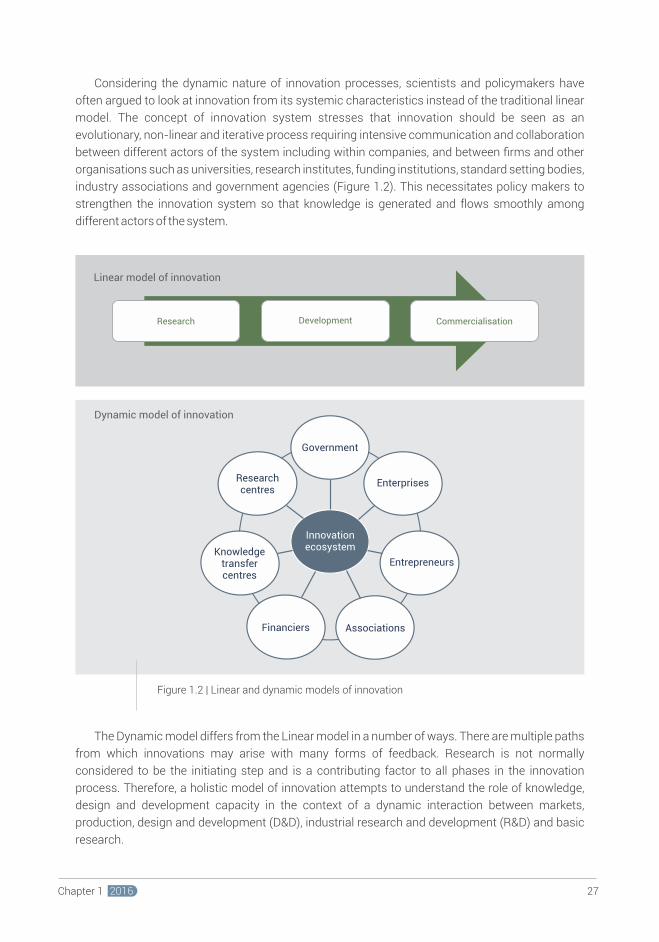
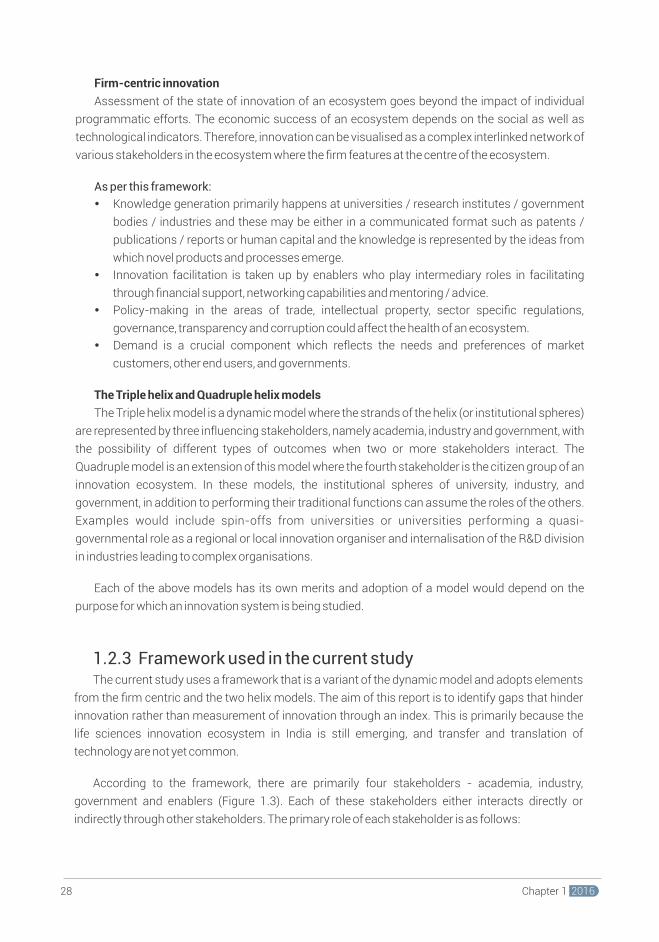
1.2.3 Framework used in the current studyThe current study uses a framework that is a variant of the dynamic model and adopts elements
from the firm centric and the two helix models. The aim of this report is to identify gaps that hinder
innovation rather than measurement of innovation through an index. This is primarily because the
life sciences innovation ecosystem in India is still emerging, and transfer and translation of
technology are not yet common.
According to the framework, there are primarily four stakeholders - academia, industry,
government and enablers (Figure 1.3). Each of these stakeholders either interacts directly or
indirectly through other stakeholders. The primary role of each stakeholder is as follows:
Firm-centric innovation
Assessment of the state of innovation of an ecosystem goes beyond the impact of individual
programmatic efforts. The economic success of an ecosystem depends on the social as well as
technological indicators. Therefore, innovation can be visualised as a complex interlinked network of
various stakeholders in the ecosystem where the firm features at the centre of the ecosystem.
As per this framework:
Ÿ Knowledge generation primarily happens at universities / research institutes / government
bodies / industries and these may be either in a communicated format such as patents /
publications / reports or human capital and the knowledge is represented by the ideas from
which novel products and processes emerge.
Ÿ Innovation facilitation is taken up by enablers who play intermediary roles in facilitating
through financial support, networking capabilities and mentoring / advice.
Ÿ Policy-making in the areas of trade, intellectual property, sector specific regulations,
governance, transparency and corruption could affect the health of an ecosystem.
Ÿ Demand is a crucial component which reflects the needs and preferences of market
customers, other end users, and governments.
The Triple helix and Quadruple helix models
The Triple helix model is a dynamic model where the strands of the helix (or institutional spheres)
are represented by three influencing stakeholders, namely academia, industry and government, with
the possibility of different types of outcomes when two or more stakeholders interact. The
Quadruple model is an extension of this model where the fourth stakeholder is the citizen group of an
innovation ecosystem. In these models, the institutional spheres of university, industry, and
government, in addition to performing their traditional functions can assume the roles of the others.
Examples would include spin-offs from universities or universities performing a quasi-
governmental role as a regional or local innovation organiser and internalisation of the R&D division
in industries leading to complex organisations.
Each of the above models has its own merits and adoption of a model would depend on the
purpose for which an innovation system is being studied.
Knowledge generationTechnical mentorship
ConsultancyInnovation organiser
Liaison betweenmarket and fundamentalresearch
PoliciesRegulation
ProcurementFinance
Financial supportNetworking capabilitiesLegal, IP and taxation supportMentorship
Enablers
GovernmentAcademia
Industry and Start-ups
Academia: The primary role of academia is knowledge generation, technical mentorship,
providing of consultancy to industry projects and it can therefore be seen as an innovation organiser.
Industry and start-ups: Large industries and start-ups are very different in their focus on
innovation and the obstacles that plague them. Since industries are profit driven, they serve as a
liaison between market and research and are responsible for commercialisation of innovations that
exist in the ecosystem.
Enablers: Enablers play various roles in supporting SMEs and start-ups through incubation,
financial support, business, and legal and regulatory mentorship. In an ecosystem that is in its
infancy, enablers take a central role in networking between stakeholders.
Government: The government plays a crucial role in catalysing innovation through policies and
regulation. In a growing ecosystem, the government also plays a crucial role in funding innovation
and procuring innovations that are supported through various programmes.
Since transfer of technology is not common, the innovation potential is studied through an
analysis of publications and collaborations between scientists in industry and academia. A detailed
survey with various stakeholders in each city aims to capture the current status in terms of
knowledge, interaction and support.
Figure 1.3 | Framework used in the study
Innovation Ecosystem
Chapter 1 2016 29Chapter 1 201628
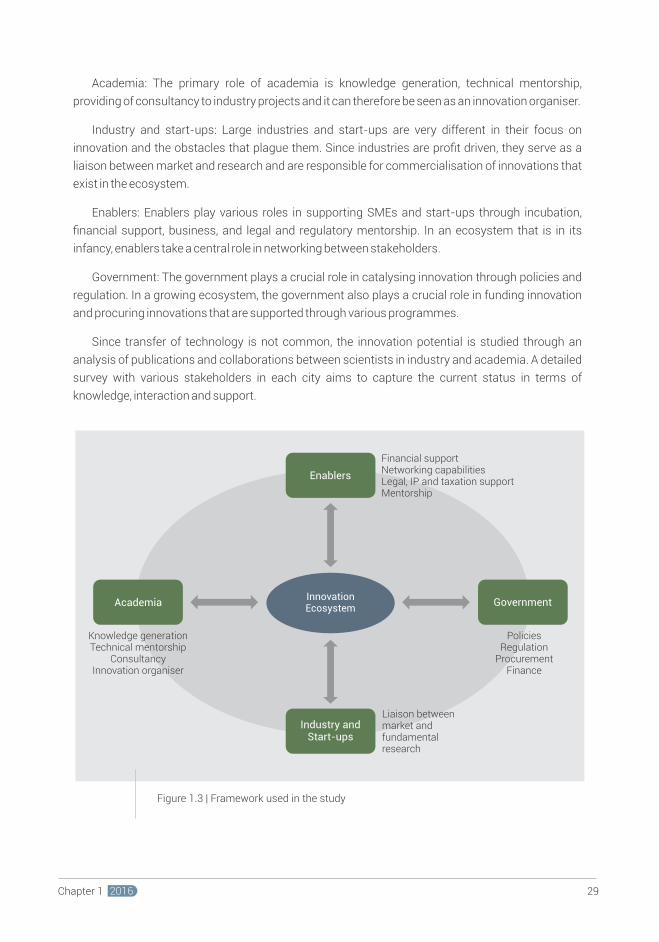
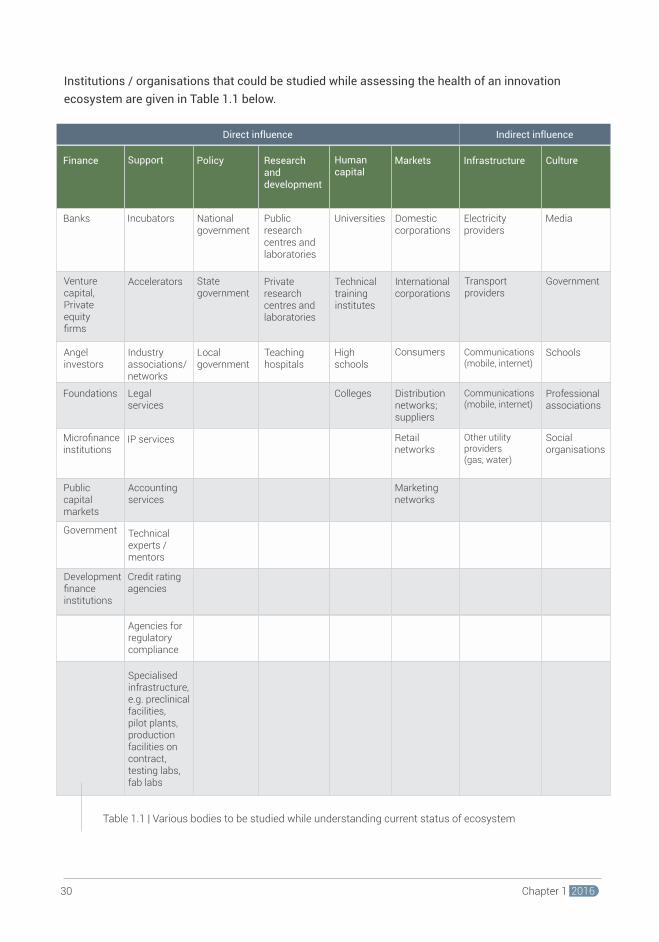
Figure 1.4 | a) Table summating main differences between various approaches to study innovation b) Schematic representation differentiating NIS, RIS and SIS approaches; SIS may be at three levels spanning internationally, across multiple RISs and within an RIS (indicated as black boxes) - Adapted from S. Gao et al
Finance Support Policy Researchanddevelopment
Humancapital
Markets Infrastructure Culture
Banks Incubators Nationalgovernment
Publicresearchcentres andlaboratories
Universities Domesticcorporations
Electricityproviders
Media
Venturecapital,Privateequityfirms
Accelerators Stategovernment
Privateresearchcentres andlaboratories
Technicaltraininginstitutes
Internationalcorporations
Transportproviders
Government
Angelinvestors
Industryassociations/networks
Localgovernment
Teachinghospitals
Highschools
Consumers Communications(mobile, internet)
Schools
Foundations Colleges Distributionnetworks;suppliers
Communications(mobile, internet)
Professionalassociations
Microfinanceinstitutions
Retailnetworks
Other utilityproviders(gas, water)
Socialorganisations
Publiccapitalmarkets
Marketingnetworks
Government
Developmentfinanceinstitutions
Legalservices
IP services
Accountingservices
Technicalexperts /mentors
Credit ratingagencies
Agencies for regulatorycompliance
Specialisedinfrastructure,e.g. preclinicalfacilities, pilot plants, production facilities on contract, testing labs, fab labs
Institutions / organisations that could be studied while assessing the health of an innovation
ecosystem are given in Table 1.1 below.1.2.4 Mapping innovation at various levelsInnovation can be mapped at various levels depending on the scope of the study and the inputs
that may be derived from it. The National Innovation System (NIS) and the Regional Innovation
System (RIS) approaches use geographic demarcations to elucidate the systems while the Sectoral
Innovation System (SIS) approach focuses on innovations pertaining to specific sectors of the
economy (Figure 2.4).
Studying sectoral systems are particularly useful since these are prone to change that may be
caused by technology advancements in the sector coupled with patterns of innovation which require
new competencies. Consumer demand can also serve as another source which may cause the birth
of new firms that are disruptive in nature.
Overall, these dynamics are co‐evolutionary in nature, eliciting change at the levels of technology,
knowledge, actors and institutions. Therefore, a multilevel model has been adopted in this report
where we have used a combination of regional and sectoral innovation (SIS in this study involves a
specific sector within the RIS) systems mapping in light of national level policies to be able to capture
the finer details while retaining the systemic flavour.
Main actors
Institution
Main interaction
• Industry
• Government
• Education and research organisations
• National policies
• Laws
• National finance supports
• Joint industry activities
• R&D collaboration
• Technology diffusion
• Personnel mobility
• Universities
• Industrial establishments
• Public research organisation
• Local government /city councils
• Informal institutions depending on trust and reliability among actors
• Support institutions (VCs, incubators, law firms etc.)
• Informal associations (angel networks, mentors, associations)
• Inter-firms activities
• External interactions for firms with research organisations
• R&D collaboration
• Firms
• Universities
• Government
• Technical associations
• Individuals
• Standards
• Regulations
• Inter-industry interactions
• Interactions among firms and non-firm organisations
NIS RIS SIS
NIS 1
RIS1
RIS1
RIS3
RIS2
RIS2
RIS2
RIS1
RIS3
RIS2
NIS 1
NIS 3 NIS 4
RIS1
Table 1.1 | Various bodies to be studied while understanding current status of ecosystem
Direct influence Indirect influence
A B
Chapter 1 2016 31Chapter 1 201630
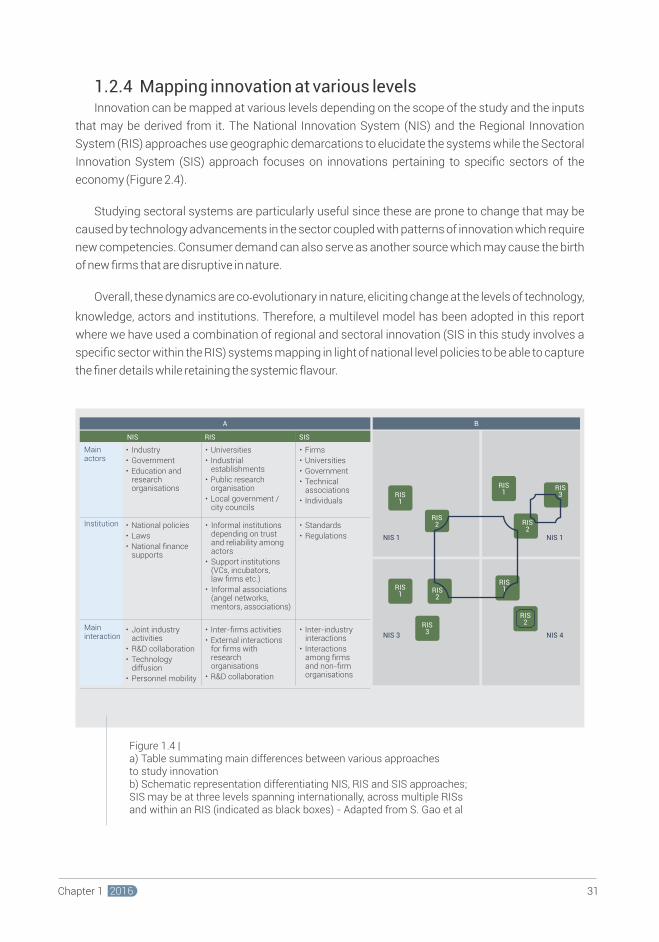

2.1 Framework and rationale used for the studyThis report aims to understand the current status of the innovation ecosystem in four leading
life sciences clusters in southern India through analysis of primary and secondary data sources.
The report largely focuses on the academic research capabilities in pharma, bio-pharma, medical
technology and healthcare. Agri-biotech, and industrial biotech are only included while discussing
the overall sector in totality. Majorly, four stakeholders - Academia, Industry, Enablers and Start-ups
were studied. The role of academia in an innovation system is very significant as it is involved in the
generation of technological knowledge and skilled human resource. It also participates in diffusion
of knowledge through publications, conferences and other knowledge exchange platforms. Industry
plays a key role in the innovation system in which it looks to exploit the generated knowledge and use
it to provide products and services to consumers. It also plays a major role in the employment of
human resource. Enablers play a key role in the innovation ecosystem as intermediaries at various
stages of product development and commercialisation. While start-ups are a part of industry, they
have been studied as a separate category because of their ability to innovate rapidly and disrupt the
system.
Primary analysis was carried out by interviewing Key Opinion Leaders in each stakeholder
category to seek their opinion on the current status of the innovation ecosystem. The trends
identified through this exercise were supplemented through rigorous data analysis of various input
markers that define a regional innovation ecosystem such as publications, patents, company
incorporations etc.
2.1.1 Definition of some key termsAcademia: In this study we have considered universities, technical institutes with research
programmes, research institutes and teaching hospitals as academia. Undergraduate colleges
have been included only while referring to the total size of the academic fraternity in a cluster.
Academic organisation: Internationally recognised establishment of professional scholars and
students - usually a college, technical institute, university or deemed university engaged in
higher education and research.
Research institute: An establishment endowed for doing research. A research institute may
specialise in basic research or may be oriented to applied research.
Chapter 2ANALYSIS OF FOUR LIFE-SCIENCES CLUSTERS
Chapter 2 2016 33
Teaching hospital / Medical school: A tertiary educational institution or part of such an
institution that teaches medicine and awards a professional degree for physicians and
surgeons.
Industry: Large companies, Small and Medium Enterprises (SMEs) and Start-ups, in a particular
domain, either collectively or individually constitute that domain industry and are often named after
the principle product.
In this study, pharmaceutical, biopharmaceutical, bioinformatics and healthcare companies,
pharma contract research and manufacturing firms, and commercial hospitals have been included
as part of the bio-pharma industry.
Pharmaceutical company: A company that develops, produces, and markets drugs or
pharmaceuticals for use as medication
Biopharmaceutical company: A company that uses biological systems, living organisms or
derivatives thereof, to make or modify products or processes for pharmaceutical use
Bioinformatics company: A company that employs computational tools for the
management of biological information
Healthcare company: A company that designs, develops and manufactures medical
appliances, devices, technologies and diagnostics including those that use sensors and
embedded systems
Contract Research and Manufacturing Services (CRAMS) / Contract Research
Organisation (CRO): An organisation that provides support to the pharmaceutical,
biotechnology, and medical device industries in the form of research services outsourced on
a contract basis
Start-up: An entrepreneurial venture which is typically a newly emerged, fast-growing business
that aims to meet a marketplace need by developing or offering an innovative product, process or
service. A start-up is usually a company such as a small business, a partnership or an organisation
designed to rapidly develop scalable business model.
As per the Startup India policy, a private limited company or registered partnership firm or limited
liability partnership would qualify as a start-up under the following conditions:
Ÿ Up to 5 years from the date of its incorporation / registration, and
Ÿ If its turnover for any of the financial years has not exceeded INR 25 crore, and
Ÿ It is working towards innovation, development, deployment or commercialisation of new
products, processes or services driven by technology or intellectual property
Government: Governing bodies play a major role by formulating policies, providing funding and
infrastructure to the innovation ecosystem. Examples of Central Government institutes that govern
biopharma innovation include the Department of Biotechnology (DBT), Ministry of Science and
Technology, Government of India; BIRAC, Regulatory agencies like the Central Drugs Standard
Control Organisation (CDSCO); Review Committee on Genetic Manipulation (RCGM); Central
Pollution Control Board (CPCB); Indian Council for Medical Research (ICMR) etc. In addition, the
state governments have dedicated departments and units catering to start-ups and life sciences.
Funding agencies: Funding agencies enable knowledge generation and knowledge exploitation
through financing. Various types of funding bodies such as Government funding agencies, venture
capitalists, angel investors, private equity players, and national and global foundations are covered
in the report.
Enablers: Different categories of enablers have been studied in this report, including:
Technology mediating organisation: An organisation that helps in knowledge diffusion from
academia to industry and within industry such as Technology Transfer Office (TTO).
Science park and incubator: An organisation that promotes innovation by incubating
start-ups and providing various services and customised space to innovative companies
and institutions and helps in knowledge and technology exchange between various actors.
Business associations: They represent the cause of businesses at local, national or
international level and convey industry requirements to the government.
Law firms and consultants: They provide consultancy on legal, business, policy issues and
help in innovation protection and technology transfer.
Supplier & vendors: Suppliers and vendors are those firms that provide input material for
research including chemicals, reagents, equipment etc. They play a key role in the research and
innovation system.
Citation index: A measure of productivity defined as the number of citations per publication.
Normalised citation index = ((Number of citations in a year in an institute / total number of
citations for an institute) / (number of publications in a year from the institute / total number of
publications from the institute)).
Clusterwise normalised citation index = (Normalised citation index / number of institutes).
Average number of publications per scientist = (Number of publications / Number of scientists
in the organisation).
Network analysis
Node: An author who is either one of the ten top performing faculty in the institute or his / her
collaborator.
Edge: A collaboration between one of the top ten performing authors with his / her collaborator.
Degree of a node: Number of collaborators of the author (redness indicates higher degree).
Degree of an edge: Number of collaborations (thickness indicates higher degree).
Chapter 2 2016 35Chapter 2 201634
Centrality: It measures the importance of the node or the edge in the network by means of
number of times it features in shortest paths. Centrality of nodes measures the importance of the
author (size). Centrality of edge measures importance of the collaboration (redness).
Classification of collaboration type in network analysis
Ÿ Across field: Collaboration between engineering / medical / science authors
Ÿ Other faculties in same field: Collaboration with different branches within above fields
Ÿ Similar areas: Collaboration within branches / departments
2.1.2 Data sourcesIn this report, all the publication and patent datasets were collected from Thomson Reuters
database. More specifically, publication data was sourced from Thomson Reuters database
underlying Web of Science, which gives access to conference proceedings, patents, websites and
chemical structures in addition to journals.
Tracxn database was used to collect information related to companies. Details such as year and
city of incorporation, sector of operation, funding information and founder details are available.
In addition to this, various web searches and other databases like PubMed, Google scholar,
Google patents were used to augment the data set.
2.1.3 Assumptions, hypothesis, limitationsŸ The research and innovation capacity of an innovation ecosystem was analysed on the
basis of patents and publications as the primary parameters. Since the focus of Indian
academia has historically been more on publications rather than on patents, the number of
patents was found to be too few for analysis, and therefore, publications were considered
as a surrogate marker of research capacity for the study.
Ÿ The list of academic institutions considered in the study was selected based on the
number of publications. Though not exhaustive, it is certainly indicative of the trends.
Ÿ All scientific publications for a particular scientist were taken for the study which included
articles, book chapters, proceedings papers, biographical items, erratum, articles about an
individual, meeting abstracts, letters, notes, reprints and reviews. However, documents
other than articles were very few.
Ÿ There are organisations working on research areas other than life sciences. To focus on
articles pertinent to life sciences, scientific literature search results were restricted using
the standardised subject category feature of Thomson Innovation Literature search.
Ÿ For organisations with patents in areas other than life sciences, the IPC code restriction
feature of Thomson Innovation was used for restricting patents to life sciences. This was
done by selecting only those patents that fall under IPC codes (A61, C07, C12)
corresponding to life sciences.
Ÿ There are scientists who have worked with organisations other than those under the study
and have publications and patents with them. For data on scientific literature, only those
publications were considered that had an organisation under the study as an affiliated
organisation. For example, Author A has 2 publications with Org. 1 and 3 publications with
Org.2 in the last 10 years but organisation under study is Org.1. So, publication count for
Author A is 2, not 5. In the case of patents, all patents in which the scientist is an inventor
were captured. Eg. if Scientist A has 2 patents with Org. A as assignee and 3 patents with
Org. B as assignee and Org. A is an organisation under study, then the patent count was
taken as 5, rather than 2.
Ÿ Patent count is unique. One member per family of an International Patent Documentation
(INPADOC) family was considered.
Ÿ Hospitals / Medical schools include veterinary colleges / schools, dental colleges, medical
centres, research institutes dedicated to a particular disease.
Ÿ If no publication for a particular scientist has been recorded, it does not mean that the
scientist is not publishing. He may have published with organisations that are not part of
the study.
Ÿ Research publications have a citation count when they are referred by other publications.
Citation count refers to the number of times a publication gets cited by others and it
reflects the value of the publication. Hence, citation count is taken as a marker for the
relevance of the publication. However, a high citation count does not always correlate to
translation and commercialisation of the technology. In addition, the database does not
provide yearwise increase in the number of citations for a publication.
Ÿ For scientific publications, the period of study was from year 1996 to 2014, whereas that
for patents was all years. Thomson Innovation Literature Search service was used for
scientific literature search and Thomson Innovation Patent Search service was used for
patent search.
Ÿ Collaborations were captured from the affiliation section of any publication. Individual
collaborator data was obtained by unique sorting. Different departments of a particular
collaborating institute were taken as individual collaborators. For example, if two
departments in IISc, say, the Dept. of Physics and the Dept. of Chemistry collaborated with
JNCASR that resulted in two publications, these were counted as two collaborators.
In case of national institutes in different campuses, each centre was considered as an
individual collaborator.
3736 Chapter 2 2016Chapter 2 2016
Ÿ Sorting of unique collaborators - For publications, an institute or department was
considered as a unique collaborator and not individual scientists in the publication. This
was to remove any bias that would arise for publications of multicentric clinical trials or
databases that usually involve a large number of authors. Individuals have been
considered as unique collaborators for network analysis only.
Ÿ Collaboration across four categories - within the institute, with other institutes within the
State, across the states in India and across the countries in the world - was analysed to see
the extent of collaboration by faculty in the four clusters.
Ÿ In network analysis, the top ten authors on the basis of highest citation index were chosen
to understand their collaboration networks. Individual collaborating authors were uniquely
sorted. Organic layouts were chosen to understand the interaction patterns. Further, the
extent and importance of collaboration were studied using measures of degree and
centrality as described in section 2.1.1.
Ÿ In network analysis, edges between various authors collaborating with a high performing
author in an institute were not considered separately. To elaborate, if a publication has five
authors all collaborating with one primary author of an institute, the number of edges
would be five. Although directionality is not represented, it is implicitly considered since the
driving force for the collaboration comes from the faculty and not every author listed in a
publication. The values of centrality and degree are with respect to an individual institute
and cannot be compared across maps.
Ÿ Traxcn (a data analytics company) data provides details only on companies that have
registered websites and are start-ups with a limited database of their own. Therefore,
several early stage companies might not have been included.
Ÿ IP analysis is based on the requests received by BRIC and not an exhaustive
representation of the ecosystem.
2.1.4 DatasetTo understand the life sciences innovation ecosystem in southern India, a detailed study of key
stakeholders, academia, industry, suppliers and enablers around the cities of Hyderabad, Bengaluru,
Chennai+Vellore and Thiruvananthapuram+Kochi regions was performed.
Chennai+Vellore cluster includes the city of Vellore as it has renowned colleges such as VIT and
CMCH and is proximal to Chennai. In Kerala, Thiruvananthapuram+Kochi were studied together as a
single emerging cluster.
33 key academic institutes, 85 key industry players, and 94 KOLs (33 in Hyderabad, 31 in
Bengaluru, 26 in Chennai+Vellore and 4 in Thiruvananthapuram+Kochi) were selected across the
four clusters for the study. Scientific and innovation capacity and knowledge generation were
analysed from publication and patent data of these academic institutes and industries. KOL
interviews were used to understand gaps in innovation policy, funding, infrastructure and enablers.
The list of academic institutes in the four clusters is provided in Table 2.1. UAS in Bengaluru was
considered due to its proximity to NCBS and involvement in several agri-biotech projects for field
trials.
CCMB BMCRI Anna University Amrita University
CDFD IBAB CLRI CIFT
IICT IISc CMC&H IISER-TVM
LVPEI InSTEM IIT-M NIIST
NIN IOB NIRT RGCB
University of Hyderabad JNCASR Sathyabama University SCTIMST
KMIO SRM University University of Kerala
NCBS University of Madras
NIMHANS VIT UNIV
ST. JOHNS
UAS
Hyderabad Bengaluru Chennai+Vellore Thiruvananthapuram+Kochi
Table 2.1 | The list of institutes selected for detailed study in Hyderabad, Bengaluru, Chennai+Vellore and Thiruvananthapuram+Kochi
3938 Chapter 2 2016Chapter 2 2016
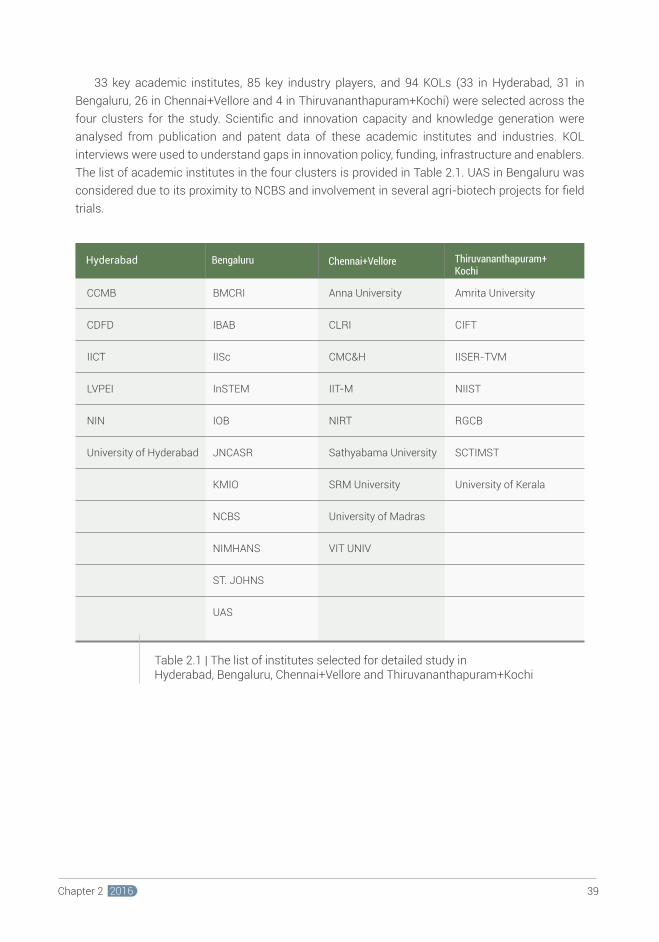
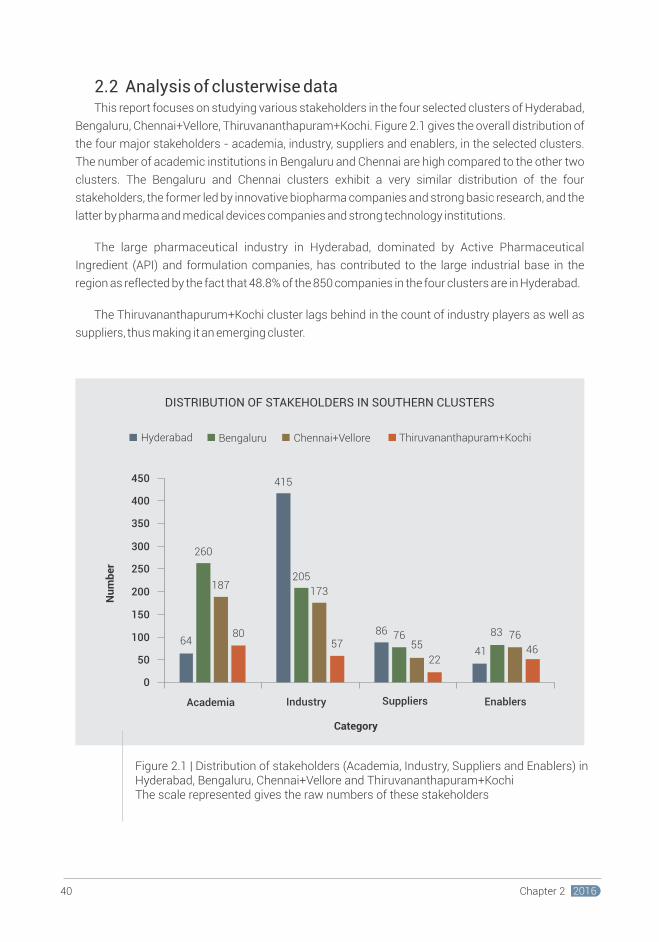
2.2 Analysis of clusterwise dataThis report focuses on studying various stakeholders in the four selected clusters of Hyderabad,
Bengaluru, Chennai+Vellore, Thiruvananthapuram+Kochi. Figure 2.1 gives the overall distribution of
the four major stakeholders - academia, industry, suppliers and enablers, in the selected clusters.
The number of academic institutions in Bengaluru and Chennai are high compared to the other two
clusters. The Bengaluru and Chennai clusters exhibit a very similar distribution of the four
stakeholders, the former led by innovative biopharma companies and strong basic research, and the
latter by pharma and medical devices companies and strong technology institutions.
The large pharmaceutical industry in Hyderabad, dominated by Active Pharmaceutical
Ingredient (API) and formulation companies, has contributed to the large industrial base in the
region as reflected by the fact that 48.8% of the 850 companies in the four clusters are in Hyderabad.
The Thiruvananthapurum+Kochi cluster lags behind in the count of industry players as well as
suppliers, thus making it an emerging cluster.
Figure 2.1 | Distribution of stakeholders (Academia, Industry, Suppliers and Enablers) in Hyderabad, Bengaluru, Chennai+Vellore and Thiruvananthapuram+KochiThe scale represented gives the raw numbers of these stakeholders
2.2.1 Study of academic output
2.2.1.1 Publication output, growth, quality, impact
Academic institutions comprise the base of the innovation pyramid contributing to knowledge
generation. The report classifies these institutions into three categories - academic organisations,
research institutes and teaching hospitals / medical schools, to be able to ascertain the role played
by each one of them. Academic organisations constitute internationally recognised establishments
of professional scholars and students, usually centred in colleges and universities engaged in higher
education and research. Research Institutes are establishments endowed for doing research, may
be in basic research or applied research streams. Teaching hospitals / Medical schools are tertiary
institutes that teach medicine and award professional degrees to physicians and surgeons.
Figure 2.2 depicts the distribution of academic institutions in the four clusters. It has been
globally observed and also shown in our study that a good number of research institutes have been
attributed to knowledge creation and access to several sophisticated equipment. Institutes such as
IISc, IITM, CMC, IICT have been instrumental in creating the wealth of knowledge in these clusters.
They also contribute to a large number of highly trained personnel at senior positions to lead the
research setups in the industry. Bengaluru is an innovation hub largely due to the fact that it has a
good mix and balance in the number of institutions across categories.
Chennai and Bengaluru have a large number of academic organisations, especially private
colleges affiliated to universities, providing basic degree courses and thereby creating a large pool of
students that are employable in the nearby industries. However, in the stream of life sciences,
academic institutes alone cannot contribute to all aspects of innovation for commercialisation.
Support through the clinical community provides an edge to the Bengaluru cluster.
Thiruvananthapuram seems to have fewer numbers of institutions across all categories
indicating that it is still an emerging cluster.
DISTRIBUTION OF STAKEHOLDERS IN SOUTHERN CLUSTERS
Hyderabad Bengaluru Chennai+Vellore Thiruvananthapuram+Kochi
Nu
mb
er
Academia Industry Suppliers Enablers
Category
450
400
350
300
250
200
150
100
50
0
6480
187
260
415
205
173
5786 76
55
2241
83 76
46
Figure 2.2 | Distribution of academic institutes in four south Indian clusters
ACADEMIA
City
120
100
80
60
40
20
0
Nu
mb
er
11 13
40
89
61
110 111
3343
48
5
27
Hyderabad Bengaluru Chennai+Vellore Thiruvananthapuram + Kochi
Academic organisation Research institute Hospital / Medical school
4140 Chapter 2 2016Chapter 2 2016
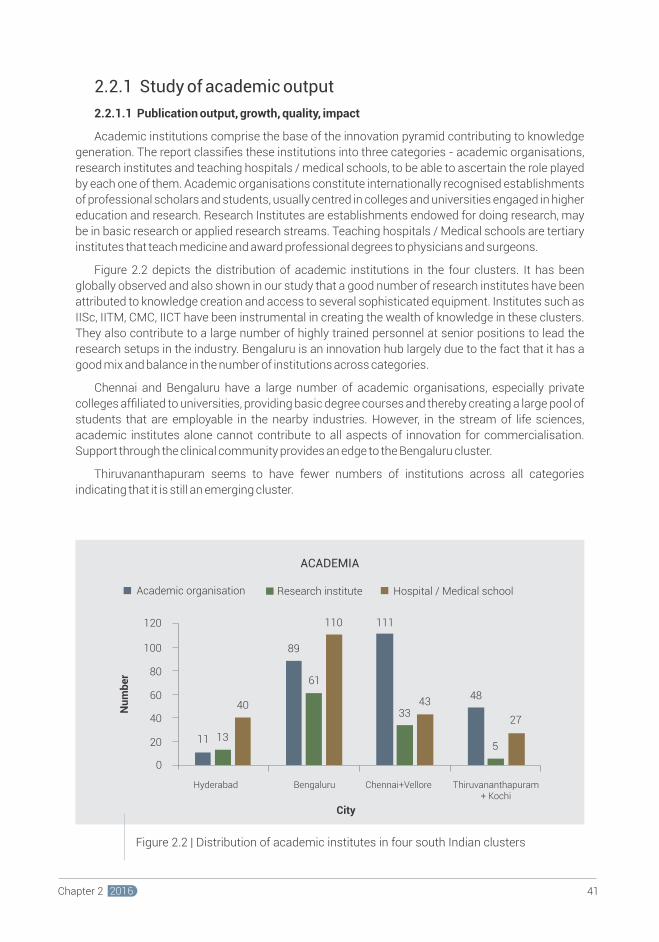
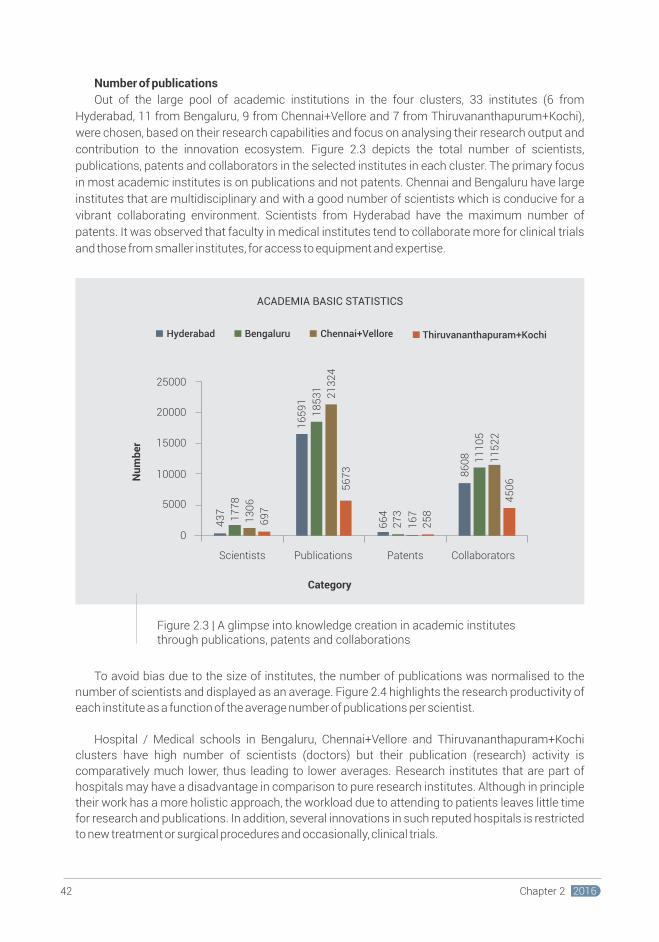
Number of publications
Out of the large pool of academic institutions in the four clusters, 33 institutes (6 from
Hyderabad, 11 from Bengaluru, 9 from Chennai+Vellore and 7 from Thiruvananthapurum+Kochi),
were chosen, based on their research capabilities and focus on analysing their research output and
contribution to the innovation ecosystem. Figure 2.3 depicts the total number of scientists,
publications, patents and collaborators in the selected institutes in each cluster. The primary focus
in most academic institutes is on publications and not patents. Chennai and Bengaluru have large
institutes that are multidisciplinary and with a good number of scientists which is conducive for a
vibrant collaborating environment. Scientists from Hyderabad have the maximum number of
patents. It was observed that faculty in medical institutes tend to collaborate more for clinical trials
and those from smaller institutes, for access to equipment and expertise.
To avoid bias due to the size of institutes, the number of publications was normalised to the
number of scientists and displayed as an average. Figure 2.4 highlights the research productivity of
each institute as a function of the average number of publications per scientist.
Hospital / Medical schools in Bengaluru, Chennai+Vellore and Thiruvananthapuram+Kochi
clusters have high number of scientists (doctors) but their publication (research) activity is
comparatively much lower, thus leading to lower averages. Research institutes that are part of
hospitals may have a disadvantage in comparison to pure research institutes. Although in principle
their work has a more holistic approach, the workload due to attending to patients leaves little time
for research and publications. In addition, several innovations in such reputed hospitals is restricted
to new treatment or surgical procedures and occasionally, clinical trials.
From Figure 2.4, it is seen that some institutes have a very high average number of publications
per scientist while others have poor averages. Some of the reasons for the same are hypothesised
below:
Ÿ Institutes such as IISc, IICT and JNCASR have very high average number of publications.
In institutes such as IISc and JNCASR, there are a few scientists (at least three in our
study) who have more than 300 publications and several more with an average number of
publications around 100.
Ÿ In addition, larger institutes have several scientists working in theoretical areas where the
churn rate of publications is higher than those working in areas that involve clinical inputs
or cell lines.
Ÿ Older institutes always have an advantage over newer institutes with respect to funding,
access to sophisticated equipment and other facilities. It takes several years to establish
such facilities, and the faculty in newer institutes are dependent on the established ones
through collaborations or sharing of facilities which pose logistical difficulties to publish
more frequently. For example, institutes such as IISc and IICT were established in 1909
and 1944 respectively and have almost a century of experience in research activities in
comparison to institutes such as Amrita University and InSTEM that were established
only in 2003 and 2009 respectively.
Figure 2.3 | A glimpse into knowledge creation in academic institutes through publications, patents and collaborations
Hyderabad Bengaluru Chennai+Vellore Thiruvananthapuram+Kochi
25000
20000
15000
10000
5000
0
Nu
mb
er
Scientists Publications Patents Collaborators
43
7
17
78
13
06
69
7
16
59
1
18
53
1
21
32
4
56
73
66
4
27
3
16
7
25
8
86
08 11
10
5
11
52
2
45
06
ACADEMIA BASIC STATISTICS
Category
Figure 2.4 | Graphical representation of average number of publications per scientist in the institutes under study
AVERAGE NUMBER OF PUBLICATIONS PER SCIENTIST
Av
era
ge
Nu
mb
er
of
pu
bli
ca
tio
ns
pe
r s
cie
nti
st
Institute
4342 Chapter 2 2016Chapter 2 2016
52
.74
51
.90
49
.37
48
.33
45
.46
41
.81
40
.40
39
.55
32
.29
31
.79
31
.27
31
.10
30
.46
26
.78
21
.98
14
.64
14
.62
14
.34
13
.27
10
.25
8.3
0
4.7
1
4.2
6
4.2
0
4.0
1
3.4
2
3.3
3
3.0
0
2.3
8
2.3
4
1.5
2
1.0
9
0.3
5
0
10
20
30
40
50
60
UN
IV M
AD
RA
S
IIT-
M
JN
CA
SR
UN
IV H
YD
IIC
T
CL
RI
IIS
c
LVP
EI
NIM
HA
NS
AN
NA
UN
IV
CC
MB
UN
IV K
ER
AL
A
NII
ST
CD
FD
NC
BS
SC
TIM
ST
NIR
T
CM
CH
NIN
RG
CB
VIT
UN
IV
CIF
T
IIS
ER
-TV
M
IBA
B
UA
S
SR
M U
NIV
KM
IO
IOB
ST
JO
HN
S
AM
RIT
A U
NIV
SA
TH
YA
BA
MA
UN
IV
InS
TE
M
BM
CR
I
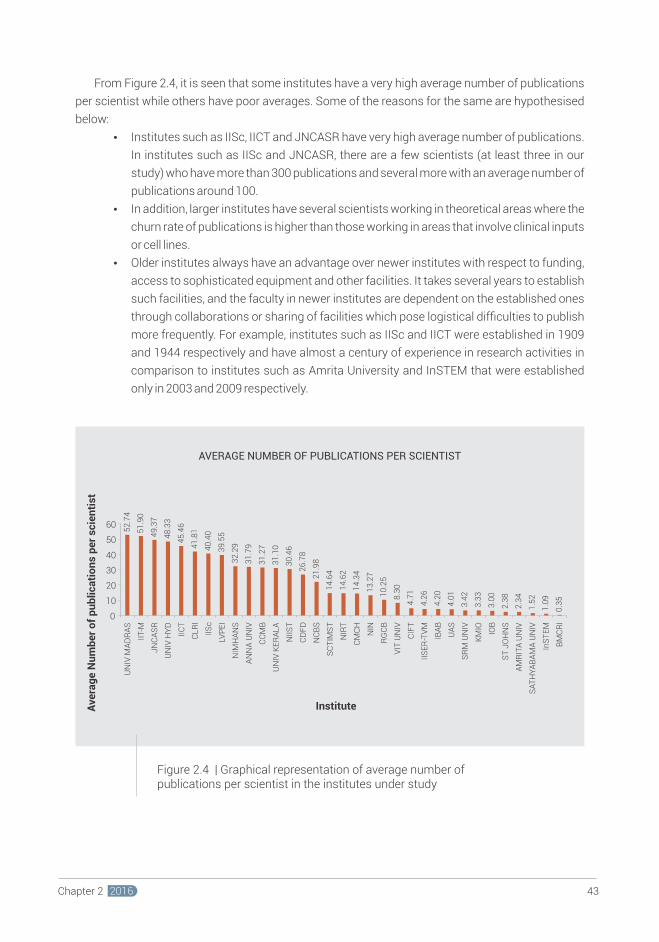
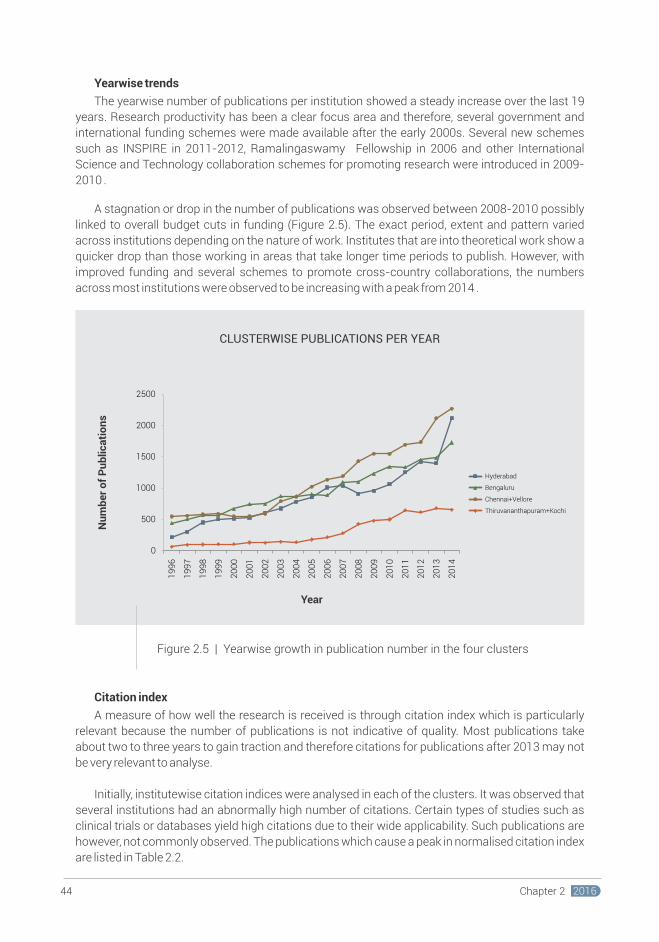
Yearwise trends
The yearwise number of publications per institution showed a steady increase over the last 19
years. Research productivity has been a clear focus area and therefore, several government and
international funding schemes were made available after the early 2000s. Several new schemes
such as INSPIRE in 2011-2012, Ramalingaswamy Fellowship in 2006 and other International
Science and Technology collaboration schemes for promoting research were introduced in 2009-
2010 .
A stagnation or drop in the number of publications was observed between 2008-2010 possibly
linked to overall budget cuts in funding (Figure 2.5). The exact period, extent and pattern varied
across institutions depending on the nature of work. Institutes that are into theoretical work show a
quicker drop than those working in areas that take longer time periods to publish. However, with
improved funding and several schemes to promote cross-country collaborations, the numbers
across most institutions were observed to be increasing with a peak from 2014 .
Citation index
A measure of how well the research is received is through citation index which is particularly
relevant because the number of publications is not indicative of quality. Most publications take
about two to three years to gain traction and therefore citations for publications after 2013 may not
be very relevant to analyse.
Initially, institutewise citation indices were analysed in each of the clusters. It was observed that
several institutions had an abnormally high number of citations. Certain types of studies such as
clinical trials or databases yield high citations due to their wide applicability. Such publications are
however, not commonly observed. The publications which cause a peak in normalised citation index
are listed in Table 2.2.
CLUSTER INSTITUTE YEAR TITLENO. OF TIMES CITED
AUTHOR
Figure 2.5 | Yearwise growth in publication number in the four clusters
Nu
mb
er
of
Pu
bli
ca
tio
ns
Year
CLUSTERWISE PUBLICATIONS PER YEAR
0
500
1000
1500
2000
2500
19
96
19
97
19
98
19
99
20
00
20
01
20
02
20
03
20
04
20
05
20
06
20
07
20
08
20
09
20
10
20
11
20
12
20
13
20
14
Hyderabad
Bengaluru
Chennai+Vellore
Thiruvananthapuram+Kochi
4544 Chapter 2 2016Chapter 2 2016
2005 285Mechanism of thioflavin T binding to amyloid fibrils
Singh, SCCMBHYDERABAD
CDFD 2000 Beta- and gamma-turns in proteins revisited: A new set of amino acidturn-type dependent positionalpreferences and potentials
103Guruprasad, K
CDFD 2002 Distinct role of CD80 and CD86 in the regulation of the activation of B cell and B cell lymphoma
115Agrewala, JN
CDFD 2005 Single-walled carbon nanotube induces oxidative stress and activates nuclear transcription factor-kappa B in human keratinocytes
372
CDFD 2005 Human resistin stimulates the pro-inflammatory cytokines TNF-alpha andIL-12 in macrophages by NF-kappa B-dependent pathway
238
IICT 2002 Layered double hydroxide supported nanopalladium catalyst for Heck-, Suzuki-, Sonogashira-, and Stille-type coupling reactions of chloroarenes
552
LV PRASAD
1998 The epidemiology of dry eye in Melbourne, Australia
289
NIN 2000 Prevention of diarrhoea and pneumonia by zinc supplementation in children in developing countries: Pooled analysis of randomised controlled trials
386
IICT 2003 Natural product hybrids as new leads for drug discovery
228
IICT 2001 Lithium perchlorate catalysed reactions of indoles: An expeditious synthesis of bis(indolyl)methanes
242
Manna, SK
Mukhopa-dhyay, S
Sreedhar, B
Bansal, AK
Shankar, A
Chandra-sekhar, S
Yadav, JS
NIN 2005 Human resistin stimulates the pro-inflammatory cytokines TNF-alpha andIL-12 in macrophages by NF-kappaB-dependent pathway
238Silswal, N
UNIV. OF HYD.
1998 Crystal engineering and organometallic architecture
1097Desiraju, GR
UNIV. OF HYD.
1998 C-H center dot center dot center dot F interactions in the crystal structures of some fluorobenzenes
488Desiraju, GR
UNIV. OF HYD.
2002 Hydrogen bridges in crystal engineering: Interactions without borders
1377Desiraju, GR
UNIV. OF HYD.
2003 Recent advances in the Baylis-Hillman reaction and applications
1366Basavaiah, D
BENGALURU
INSTEM 2012 Abramson,Jeff
132
IISc 2000 Dielectric relaxation and solvation dynamics of water in complex chemical and biological systems
Biman Bagchi 558
Harnessing the Mesenchymal Stem Cell Secretome for the Treatment of Cardiovascular Disease
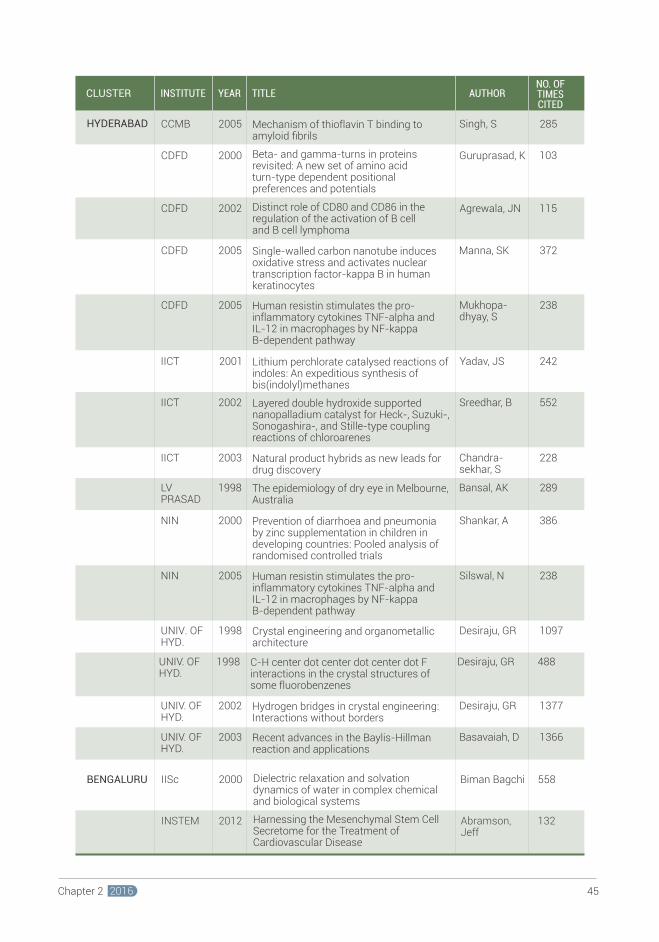
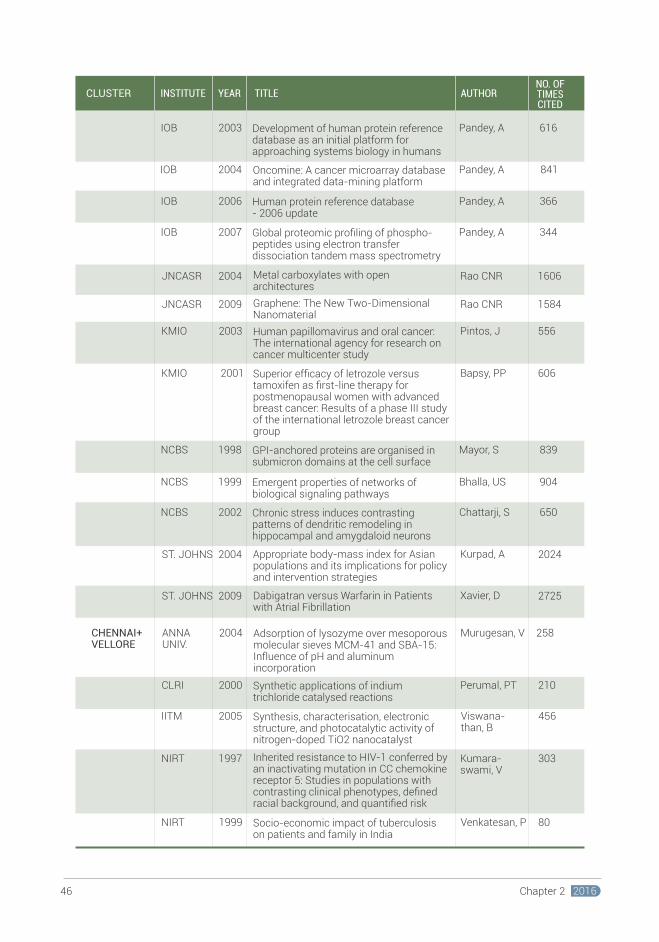
CLUSTER INSTITUTE YEAR TITLENO. OF TIMES CITED
AUTHOR CLUSTER INSTITUTE YEAR TITLENO. OF TIMES CITED
AUTHOR
RGCB 2003 Emodin induces apoptosis of human cervical cancer cells through poly(ADP-ribose) polymerase cleavage and activation of caspase-9
104Karuna-garan, D
AMRITA 2004 Effect of intravenous corticosteroids on death within 14 days in 10008 adults with clinically significant head injury (MRC CRASH trial): Randomised placebo-controlled trial
Olldashi, F 362
AMRITA 2010 Novel chitin and chitosan nanofibers in biomedical applications
Jayakumar, R 298
THIRUVANAN-THAPURAM+ KOCHI
4746 Chapter 2 2016Chapter 2 2016
SCTIMST 1997 Use of chitosan as a biomaterial: Studies on its safety and hemostatic potential
354Rao, SB
IOB 2004 Oncomine: A cancer microarray database and integrated data-mining platform
841
IOB 2007 Global proteomic profiling of phospho-peptides using electron transfer dissociation tandem mass spectrometry
344
IOB 2006 Human protein reference database - 2006 update
366
IOB 2003 Development of human protein reference database as an initial platform for approaching systems biology in humans
616
NCBS
NCBS
1998
1999
GPI-anchored proteins are organised in submicron domains at the cell surface
Emergent properties of networks of biological signaling pathways
839
904
NCBS 2002 Chronic stress induces contrasting patterns of dendritic remodeling in hippocampal and amygdaloid neurons
650
Pandey, A
Pandey, A
Pandey, A
Pandey, A
Mayor, S
Bhalla, US
Chattarji, S
KMIO 2003 Human papillomavirus and oral cancer: The international agency for research on cancer multicenter study
556
KMIO 2001 Superior efficacy of letrozole versus tamoxifen as first-line therapy for postmenopausal women with advanced breast cancer: Results of a phase III study of the international letrozole breast cancer group
606
ST. JOHNS
ST. JOHNS
2004
2009
Pintos, J
Bapsy, PP
Kurpad, A
Xavier, D
2024
2725
Appropriate body-mass index for Asian populations and its implications for policy and intervention strategies
Dabigatran versus Warfarin in Patients with Atrial Fibrillation
JNCASR
JNCASR
2004
2009
Metal carboxylates with open architectures
Graphene: The New Two-Dimensional Nanomaterial
Rao CNR
Rao CNR
1606
1584
CHENNAI+VELLORE
ANNAUNIV.
2004 Adsorption of lysozyme over mesoporous molecular sieves MCM-41 and SBA-15: Influence of pH and aluminum incorporation
Murugesan, V 258
NIRT 1999 Socio-economic impact of tuberculosis on patients and family in India
Venkatesan, P 80
NIRT 1997 Inherited resistance to HIV-1 conferred by an inactivating mutation in CC chemokine receptor 5: Studies in populations with contrasting clinical phenotypes, defined racial background, and quantified risk
Kumara-swami, V
303
CLRI 2000 Synthetic applications of indium trichloride catalysed reactions
Perumal, PT 210
IITM 2005 Synthesis, characterisation, electronic structure, and photocatalytic activity of nitrogen-doped TiO2 nanocatalyst
Viswana-than, B
456
NIRT 2003 Origins of highly mosaic mycobacteriophage genomes
Kumar, V 333
NIRT 2001 Genetic polymorphisms in molecules of innate immunity and susceptibility to infection with Wuchereria bancrofti in South India
Kumara-swami, V
84
SRM 2001 Dimethylnitrosamine-induced liver injury in rats: the early deposition of collagen
Chandra-kasan, G
84
SRM 2012 A comparative risk assessment of burden of disease and injury attributable to 67 risk factors and risk factor clusters in 21 regions, 1990-2010: a systematic analysis for the Global Burden of Disease Study 2010
Bala-krishnan, K
1440
KERALA UNIV.
KERALA UNIV.
2004
2008
KrishnaPillai, S
200
375
Synthesis of 1, 2, 4-triazoles and thiazoles from thiosemicarbazide and its derivatives
Biological activities of curcumin and its analogues (Congeners) made by man and Mother Nature
IISER-TVM 2011 Soft optical devices from self-healing gels formed by oil and sugar-based organogelators
Sureshan, KM 73
NIIST 2007 pi-organogels of self-assembled p-phenylenevinylenes: Soft materials with distinct size, shape, and functions
AjayaGhosh, A
556
NIIST 2003 Fluorescent chromophore functionalised single-wall carbon nanotubes with minimal alteration to their characteristic one-dimensional electronic states
Kim, Y 83
Rajasekharan, KN
NIIST 1998 Avidin-biotin immobilization of unilamellar liposomes in gel beads for chromatographic analysis of drug-membrane partitioning
Miyake, J 70
Table 2.2 | List of publications causing sudden increase in normalised citation index in selected institutes in four clusters in South India
Note: Some institutes display a steady pattern of normalised citation index; publications from these institutes, although impactful, may not be captured after normalisation and therefore were not listed in the table
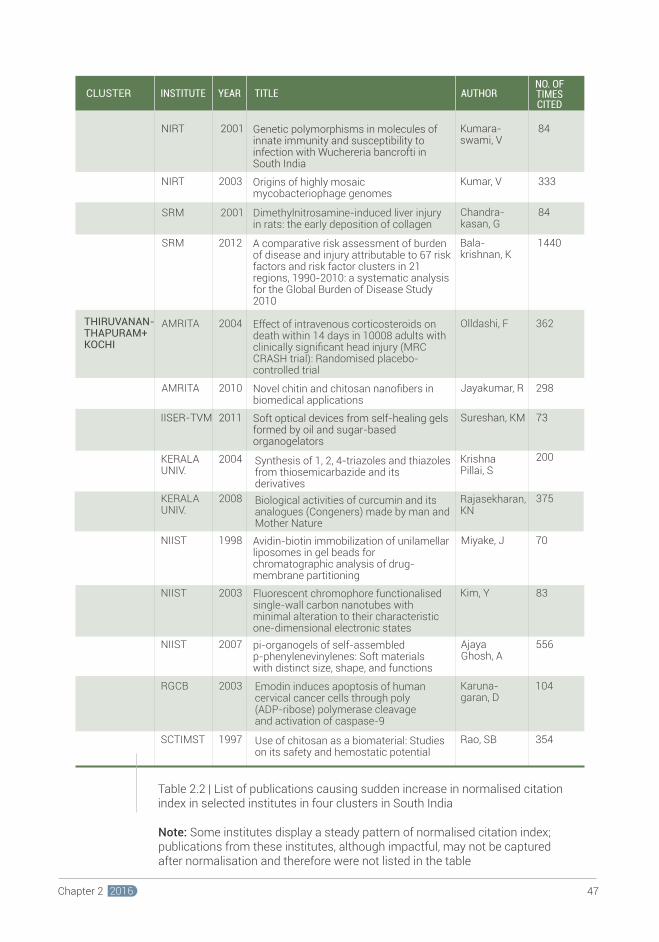
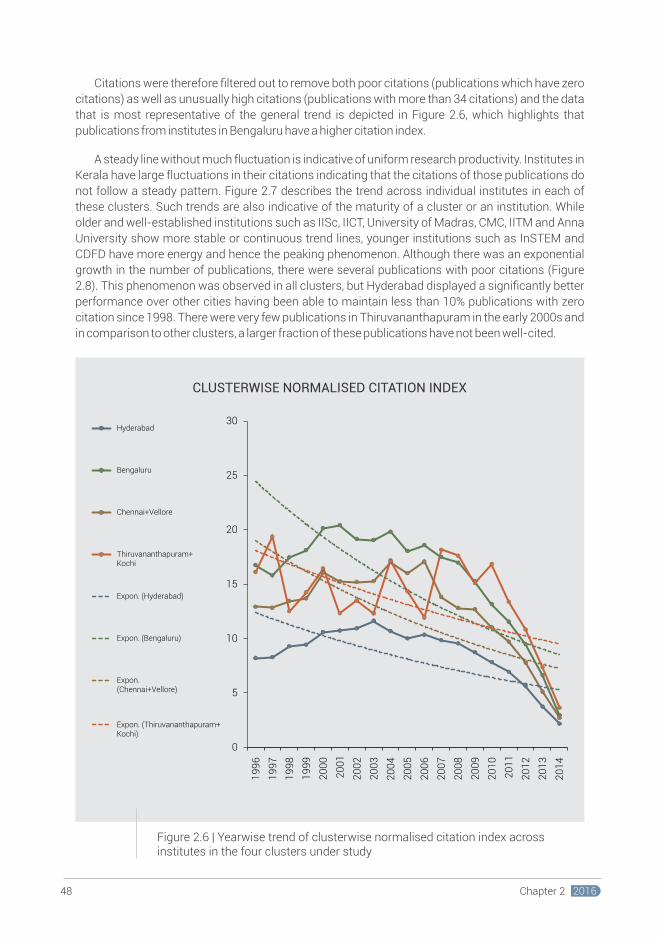
Citations were therefore filtered out to remove both poor citations (publications which have zero
citations) as well as unusually high citations (publications with more than 34 citations) and the data
that is most representative of the general trend is depicted in Figure 2.6, which highlights that
publications from institutes in Bengaluru have a higher citation index.
A steady line without much fluctuation is indicative of uniform research productivity. Institutes in
Kerala have large fluctuations in their citations indicating that the citations of those publications do
not follow a steady pattern. Figure 2.7 describes the trend across individual institutes in each of
these clusters. Such trends are also indicative of the maturity of a cluster or an institution. While
older and well-established institutions such as IISc, IICT, University of Madras, CMC, IITM and Anna
University show more stable or continuous trend lines, younger institutions such as InSTEM and
CDFD have more energy and hence the peaking phenomenon. Although there was an exponential
growth in the number of publications, there were several publications with poor citations (Figure
2.8). This phenomenon was observed in all clusters, but Hyderabad displayed a significantly better
performance over other cities having been able to maintain less than 10% publications with zero
citation since 1998. There were very few publications in Thiruvananthapuram in the early 2000s and
in comparison to other clusters, a larger fraction of these publications have not been well-cited.
Figure 2.6 | Yearwise trend of clusterwise normalised citation index across institutes in the four clusters under study Figure 2.8 | Yearwise growth of publications with zero citations
0
5
10
15
20
25
30
19
96
19
97
19
98
19
99
20
00
20
01
20
02
20
03
20
04
20
05
20
06
20
07
20
08
20
09
20
10
20
11
20
12
20
13
20
14
CLUSTERWISE NORMALISED CITATION INDEX
Hyderabad
Bengaluru
Chennai+Vellore
Thiruvananthapuram+
Expon. (Hyderabad)
Expon. (Bengaluru)
(Chennai+Vellore)
Kochi
Expon.
Kochi)Expon. (Thiruvananthapuram+
Bengaluru
0
5
10
15
20
25
30
19
96
19
97
19
98
19
99
20
00
20
01
20
02
20
03
20
04
20
05
20
06
20
07
20
08
20
09
20
10
20
11
20
12
20
13
20
14
BMRI
IBAB
IISC
INSTEM
IOB
JNCASR
NCBS
NIMHANS
ST. JOHNS
UAS
KMIO
Expon. (IISC)
Expon. (JNCASR)
Expon. (NCBS)
Expon. (NIMHANS)
Expon. (NIMHANS)
Expon. (ST. JOHNS)
Expon. (UAS)
Expon. (KMIO)
Chennai+Vellore
0
5
10
15
20
25
30
19
96
19
97
19
98
19
99
20
00
20
01
20
02
20
03
20
04
20
05
20
06
20
07
20
08
20
09
20
10
20
11
20
12
20
13
20
14
ANNA UNIV.
CLRI
CMC&H
IITM
VIT
NIRT
UNIV. OF MADRAS
SATHYABAMA UNIV.
SRM UNIV.
Expon. (ANNA UNIV.)
Expon. (CLRI)
Expon. (CMC&H)
Expon. (IITM)
Expon. (VIT)
Expon. (NIRT)
Expon. (UNIV. OF MADRAS)
Expon. (SATHYABAMA UNIV.)
Expon. (SRM UNIV.)
Figure 2.7 | Variation of normalised citation index within each institute across the four clusters under study
0
5
10
15
20
25
30
35
40
45
50
19
96
19
97
19
98
19
99
20
00
20
01
20
02
20
03
20
04
20
05
20
06
20
07
20
08
20
09
20
10
20
11
20
12
20
13
20
14
PE
RC
EN
TA
GE
OF
PU
BL
ICA
TIO
NS
YEAR
PERCENTAGE OF YEARWISE PUBLICATIONS WITH ZERO CITATIONS
Hyderabad
Bengaluru
Chennai+Vellore
Thiruvananthapuram+ Kochi
Hyderabad
0
2
4
6
8
10
12
19
96
19
97
19
98
19
99
20
00
20
01
20
02
20
03
20
04
20
05
20
06
20
07
20
08
20
09
20
10
20
11
20
12
20
13
20
14
CCMB
CDFD
IICT
LV PRASAD
NIN
UNIV. OF HYD.
Expon. (CCMB)
Expon. (CDFD)
Expon. (IICT)
Expon. (LV PRASAD)
Expon. (NIN)
Expon. (UNIV. OF HYD.)
4948 Chapter 2 2016Chapter 2 2016
Thiruvananthapuram+Kochi
SCTIMST
NIIST
IISER-TVM
RGCB
AMRITA UNIV.
CIFT
KERAL UNIV.
Expon. (SCTIMST)
Expon. (RGCB)
Expon. (KERALA UNIV.)
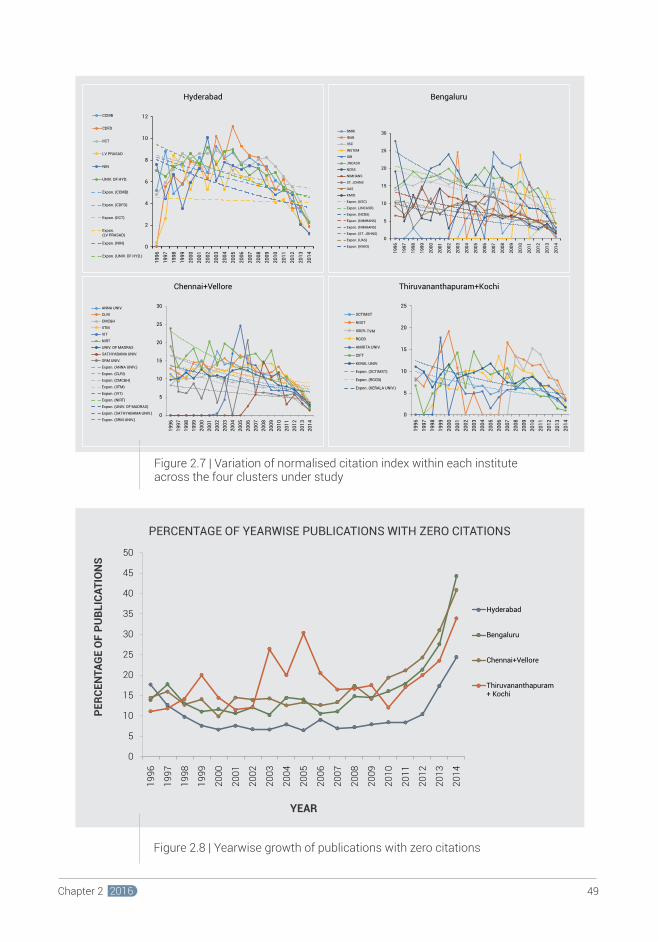
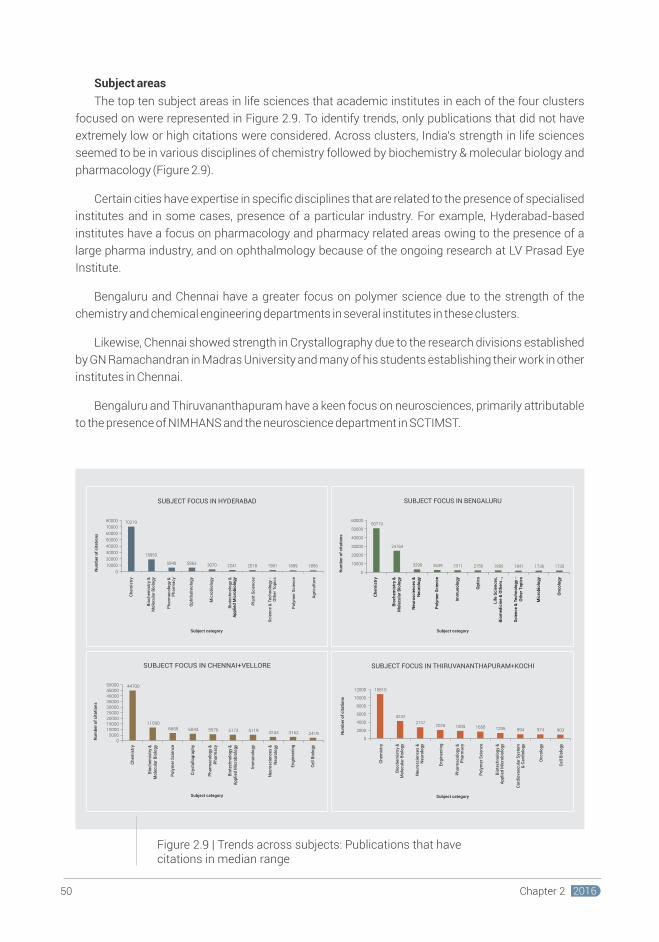
Subject areas
The top ten subject areas in life sciences that academic institutes in each of the four clusters
focused on were represented in Figure 2.9. To identify trends, only publications that did not have
extremely low or high citations were considered. Across clusters, India's strength in life sciences
seemed to be in various disciplines of chemistry followed by biochemistry & molecular biology and
pharmacology (Figure 2.9).
Certain cities have expertise in specific disciplines that are related to the presence of specialised
institutes and in some cases, presence of a particular industry. For example, Hyderabad-based
institutes have a focus on pharmacology and pharmacy related areas owing to the presence of a
large pharma industry, and on ophthalmology because of the ongoing research at LV Prasad Eye
Institute.
Bengaluru and Chennai have a greater focus on polymer science due to the strength of the
chemistry and chemical engineering departments in several institutes in these clusters.
Likewise, Chennai showed strength in Crystallography due to the research divisions established
by GN Ramachandran in Madras University and many of his students establishing their work in other
institutes in Chennai.
Bengaluru and Thiruvananthapuram have a keen focus on neurosciences, primarily attributable
to the presence of NIMHANS and the neuroscience department in SCTIMST.
Figure 2.9 | Trends across subjects: Publications that have citations in median range
Yearwise trends in each subject category
As mentioned before, an overall strength in chemistry followed by biochemistry & molecular
biology were noticed with good quality research across cities. Each city, in addition to its strengths
as mentioned in the earlier section, has also been developing strengths in other scientific areas.
Number of publications grouped and colour coded in four bands of >50, 50 – 99, 100 – 500 and <500
were plotted subjectwise over time for each cluster to observe the emergence of expertise in various
fields over time (Fig.2.10 -2.13). It is important to note that out of a total of 90 subject areas (Table
2.3) related to life sciences, not a single city had a good representation of all the fields. In fact, the four
clusters had very few subject areas where the minimum threshold of 50 publications in any year was
exceeded.
Hyderabad due to strong pharma presence, had the best record in chemistry and microbiology.
As pointed out earlier, in certain areas e.g. LVPEI in ophthalmology.niche institutes publish
Bengaluru had several publications in the area of protein structure analysis and crystallography
which can be traced to GN Ramachandran's stint at IISc. Further, the presence of several ICAR and
regional institutes in agriculture and allied fields in Bengaluru showed potential in these areas.
Bengaluru was also gaining strength in oncology, polymer sciences and materials research. On an
interesting note, although Hyderabad displayed a strong pursuit in chemistry, an applied area,
biochemistry grew faster in Bengaluru than in Hyderabad.
Chennai showed growing popularity in biotechnology and applied microbiology with several
institutes establishing departments / centres of excellence in these areas. Chennai was also gaining
strong momentum in the areas of applied engineering, internal medicine, immunology,
neurosciences, optics and public health - a large chunk of which was because of the research from
CMC Vellore.
Thiruvananthapuram+Kochi showed emerging strengths in medicine-related areas such as
anaesthetics, biotech, cardiology, neurosciences, oncology and imaging and radiology with two
medical institutes in this region stressing on research capabilities.
70219
18953
5940 5863 3070 2241 2018 1987 1889 1855
0
10000
20000
30000
40000
50000
60000
70000
80000
Ch
em
istr
y
Bio
ch
em
istr
y &
M
ole
cu
lar
Bio
log
y
Ph
arm
ac
olo
gy
&
Ph
arm
ac
y
Op
hth
alm
olo
gy
Mic
rob
iolo
gy
Bio
tec
hn
olo
gy
&
Ap
pli
ed
Mic
rob
iolo
gy
Pla
nt
Sc
ien
ce
s
Sc
ien
ce
& T
ec
hn
olo
gy
-
Oth
er
To
pic
s
Po
lym
er
Sc
ien
ce
Ag
ric
ult
ure
Nu
mb
er
of
cit
ati
on
s
Subject category
SUBJECT FOCUS IN HYDERABAD
44700
11590
6655 6043 5576 5173 5119 3243 3152 2419
0
5000
10000
15000
20000
25000
30000
35000
40000
45000
50000
Ch
emis
try
Bio
chem
istr
y &
Mo
lecu
lar
Bio
log
y
Po
lym
er S
cien
ce
Cry
sta
llog
rap
hy
Ph
arm
aco
log
y &
P
ha
rma
cy
Bio
tech
no
log
y &
Ap
plie
d M
icro
bio
log
y
Imm
un
olo
gy
Neu
rosc
ien
ces
&N
euro
log
y
En
gin
eeri
ng
Cel
l Bio
log
y
Nu
mb
er
of
cit
ati
on
s
Subject category
SUBJECT FOCUS IN CHENNAI+VELLORE
50719
24764
3290 2639 2311 2150 1895 1841 1738 1735
0
10000
20000
30000
40000
50000
60000
Ch
em
istr
y
Bio
ch
em
istr
y &
Mo
lec
ula
r B
iolo
gy
Ne
uro
sc
ien
ce
s &
Ne
uro
log
y
Po
lym
er
Sc
ien
ce
Imm
un
olo
gy
Op
tic
s
Lif
e S
cie
nc
es
,B
iom
ed
icin
e &
Oth
ers
... -
Sc
ien
ce
& T
ec
hn
olo
gy
-O
the
r T
op
ics
Mic
rob
iolo
gy
On
co
log
y
Nu
mb
er
of
cit
ati
on
s
Subject category
SUBJECT FOCUS IN BENGALURU
10810
4232
27372025 1805 1650 1295 994 974 903
0
2000
4000
6000
8000
10000
12000
Ch
em
istr
y
Bio
ch
em
istr
y &
Mo
lec
ula
r B
iolo
gy
Ne
uro
sc
ien
ce
s &
Ne
uro
log
y
En
gin
ee
rin
g
Ph
arm
ac
olo
gy
&P
ha
rma
cy
Po
lym
er
Sc
ien
ce
Bio
tec
hn
olo
gy
&
Ap
pli
ed
Mic
rob
iolo
gy
Ca
rdio
vas
cu
lar
Sys
tem
&
Ca
rdio
log
y
On
co
log
y
Ce
ll B
iolo
gy
Nu
mb
er
of
cit
ati
on
s
SUBJECT FOCUS IN THIRUVANANTHAPURAM+KOCHI
Subject category
5150 Chapter 2 2016Chapter 2 2016
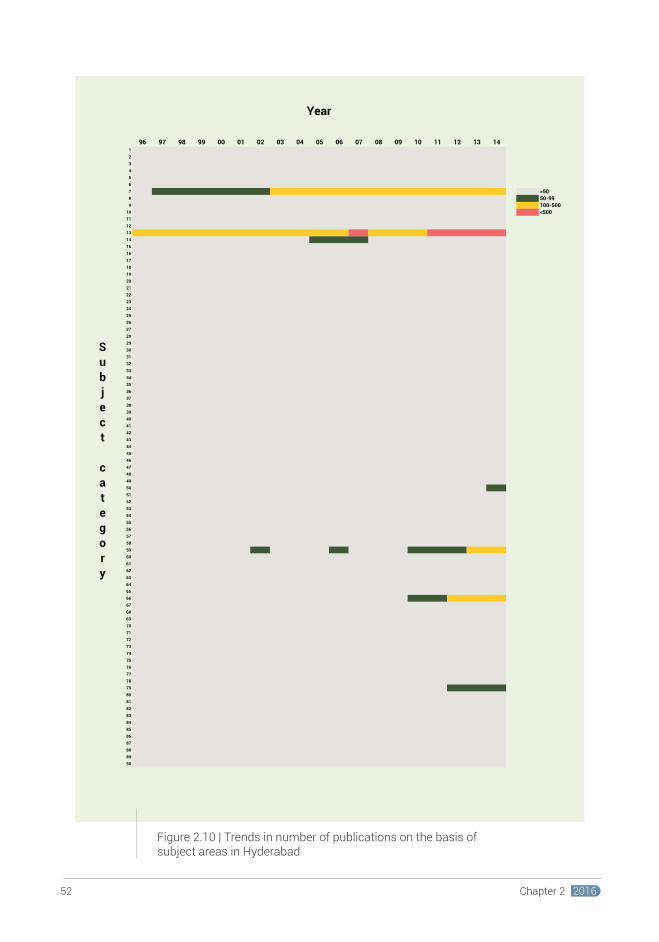
Figure 2.11 | Trends in number of publications on the basis of subject areas in Bengaluru
Figure 2.10 | Trends in number of publications on the basis of subject areas in Hyderabad
Year
S
u
b
j
e
c
t
c
a
t
e
g
o
r
y
96 97 98 99 00 01 02 03 04 05 06 07 08 09 10 11 12 13 141
2
3
4
5
6
7 >508 50-999 100-500
10 <50011
12
13
14
15
16
17
18
19
20
21
22
23
24
25
26
27
28
29
30
31
32
33
34
35
36
37
38
39
40
41
42
43
44
45
46
47
48
49
50
51
52
53
54
55
56
57
58
59
60
61
62
63
64
65
66
67
68
69
70
71
72
73
74
75
76
77
78
79
80
81
82
83
84
85
86
87
88
89
90
S
u
b
j
e
c
t
c
a
t
e
g
o
r
y
Year
96 97 98 99 00 01 02 03 04 05 06 07 08 09 10 11 12 13 141
2
3
4
5
6 >507 50-998 100-5009 <500
10
11
12
13
14
15
16
17
18
19
20
21
22
23
24
25
26
27
28
29
30
31
32
33
34
35
36
37
38
39
40
41
42
43
44
45
46
47
48
49
50
51
52
53
54
55
56
57
58
59
60
61
62
63
64
65
66
67
68
69
70
71
72
73
74
75
76
77
78
79
80
81
82
83
84
85
86
87
88
89
90
5352 Chapter 2 2016Chapter 2 2016
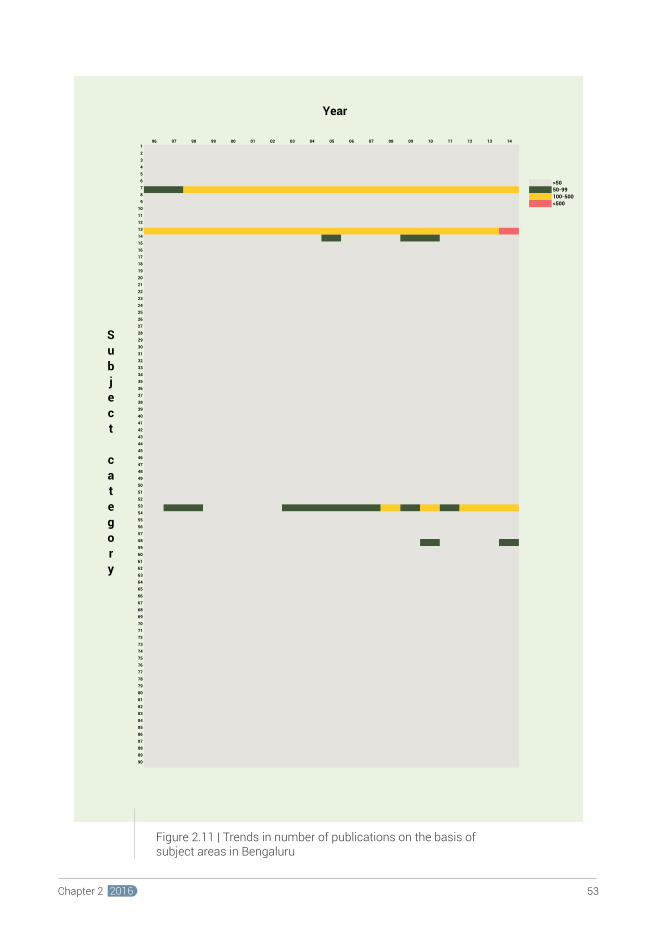
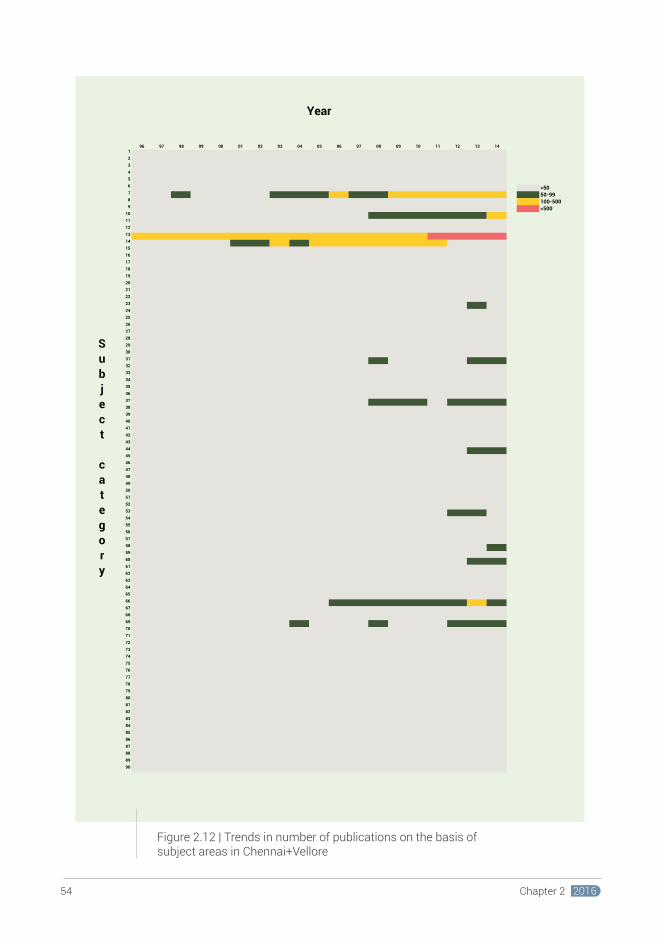
Figure 2.13 | Trends in number of publications on the basis of subject areas in Thiruvananthapuram+Kochi
Figure 2.12 | Trends in number of publications on the basis of subject areas in Chennai+Vellore
S
u
b
j
e
c
t
c
a
t
e
g
o
r
y
Year
96 97 98 99 00 01 02 03 04 05 06 07 08 09 10 11 12 13 141
2
3
4
5
6 >507 50-998 100-5009 <500
10
11
12
13
14
15
16
17
18
19
20
21
22
23
24
25
26
27
28
29
30
31
32
33
34
35
36
37
38
39
40
41
42
43
44
45
46
47
48
49
50
51
52
53
54
55
56
57
58
59
60
61
62
63
64
65
66
67
68
69
70
71
72
73
74
75
76
77
78
79
80
81
82
83
84
85
86
87
88
89
90
Year
S
u
b
j
e
c
t
c
a
t
e
g
o
r
y
96 97 98 99 00 01 02 03 04 05 06 07 08 09 10 11 12 13 141
2
3
4
5
6 >507 50-998 100-5009 <500
10
11
12
13
14
15
16
17
18
19
20
21
22
23
24
25
26
27
28
29
30
31
32
33
34
35
36
37
38
39
40
41
42
43
44
45
46
47
48
49
50
51
52
53
54
55
56
57
58
59
60
61
62
63
64
65
66
67
68
69
70
71
72
73
74
75
76
77
78
79
80
81
82
83
84
85
86
87
88
89
90
5554 Chapter 2 2016Chapter 2 2016
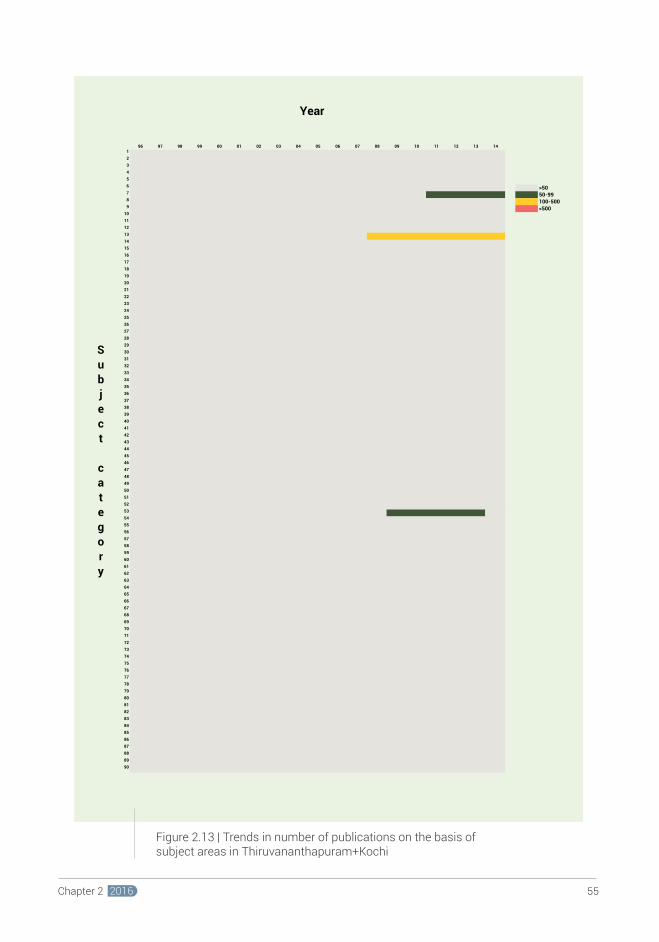
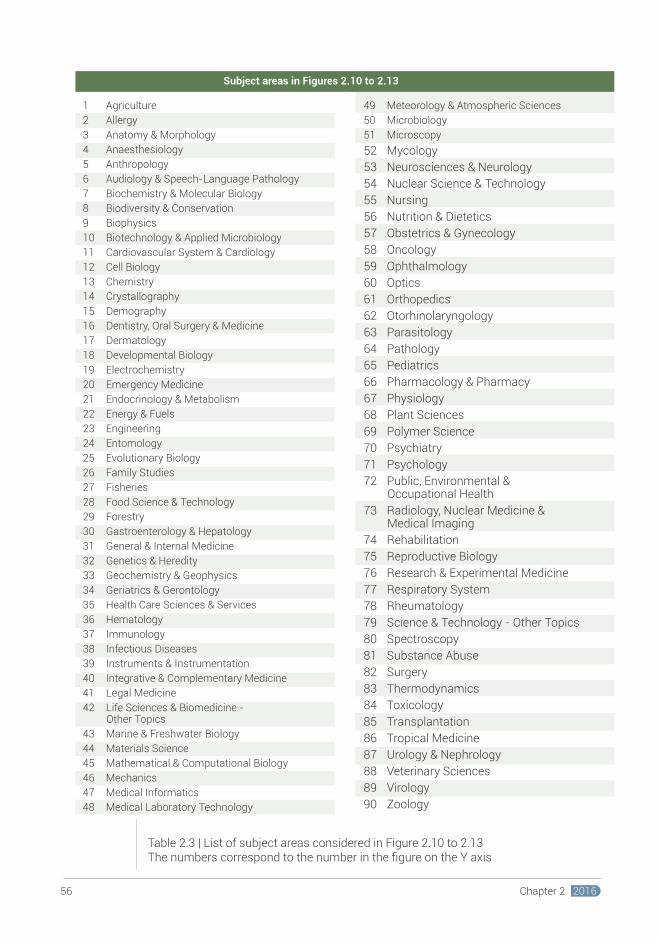
Subject areas in Figures 2.10 to 2.13
49 Meteorology & Atmospheric Sciences
50 Microbiology
51 Microscopy
52 Mycology
53 Neurosciences & Neurology
54 Nuclear Science & Technology
55 Nursing
56 Nutrition & Dietetics
57 Obstetrics & Gynecology
58 Oncology
59 Ophthalmology
60 Optics
61 Orthopedics
62 Otorhinolaryngology
63 Parasitology
64 Pathology
65 Pediatrics
66 Pharmacology & Pharmacy
67 Physiology
68 Plant Sciences
69 Polymer Science
70 Psychiatry
71 Psychology
72 Public, Environmental & Occupational Health
73 Radiology, Nuclear Medicine & Medical Imaging
74 Rehabilitation
75 Reproductive Biology
76 Research & Experimental Medicine
77 Respiratory System
78 Rheumatology
79 Science & Technology - Other Topics
80 Spectroscopy
81 Substance Abuse
82 Surgery
83 Thermodynamics
84 Toxicology
85 Transplantation
86 Tropical Medicine
87 Urology & Nephrology
88 Veterinary Sciences
89 Virology
90 Zoology
2.2.1.2 Knowledge exchange / transfer from academic perspective
Collaboration is an essential aspect of research activities today. It serves various purposes
including leveraging expertise and sharing of equipment and infrastructure. Particularly,
collaborations have a far reaching impact in interdisciplinary work or co-development projects with
industries and hospitals. For this study, collaborators working within India with foreign universities,
and those who work with collaborators both within and outside India have been identified and
included. Within India, they have been categorised based on geography as described in section 2.1.3.
Data revealed that most cities have a larger number of collaborators outside India than within the
country (Figure 2.14) with an average of about 40% of the collaborations within India. Indian medical
institutes like KMIO, St. John's and NIMHANS are associated with several multicentre trials and
therefore have a greater tendency to collaborate with institutes outside the Country (Figure 2.15A).
However, institutes such as Sathyabama University, University of Kerala, Anna University, BMCRI,
CLRI have maximum number of collaborations within the Country, perhaps indicating collaboration
within their peer groups and a focus on local problems (Figure 2.15A).
Upon analysis of collaborations within India, the largest fraction constituted collaborations
within the state followed by collaboration across states and lastly within the institute (Figure 2.15B).
Proximity within the city seemed to promote far greater chances for networking and discussions
that are likely to culminate into collaborations. Other modes of networking could possibly include
conferences facilitating scientists to reach out to peers in other states.
An analysis of the key areas and universities from the top five collaborating countries for each of
these institutes was mapped. Apart from USA, UK, Germany and a few other European nations, there
have been only a handful of interactions with other countries. Examples would include InSTEM's
collaboration with institutes in Uruguay primarily in the area of RNA biology and developmental
neurobiology mediated through Prof. John Mercer, and KMIO's collaborations with Poland on phase
2 and phase 3 studies of several anticancer drugs (both small molecules and mAbs).
The study revealed that inducting faculty from foreign universities was a large contributing
factor to expanding collaborations.
Table 2.3 | List of subject areas considered in Figure 2.10 to 2.13The numbers correspond to the number in the figure on the Y axis
Figure 2.14 | Number of collaborators of selected academic institutes in the four clusters
3620 4124 5416
2022
4988
6981
6106
2484
0
2000
4000
6000
8000
10000
12000
14000
Hyderabad Bengaluru Chennai+ Vellore
Thiruvananthapuram+ Kochi
Nu
mb
er
City
COLLABORATOR TRENDS
India Foreign
1 Agriculture
2 Allergy
3 Anatomy & Morphology
4 Anaesthesiology
5 Anthropology
6 Audiology & Speech-Language Pathology
7 Biochemistry & Molecular Biology
8 Biodiversity & Conservation
9 Biophysics
10 Biotechnology & Applied Microbiology
11 Cardiovascular System & Cardiology
12 Cell Biology
13 Chemistry
14 Crystallography
15 Demography
16 Dentistry, Oral Surgery & Medicine
17 Dermatology
18 Developmental Biology
19 Electrochemistry
20 Emergency Medicine
21 Endocrinology & Metabolism
22 Energy & Fuels
23 Engineering
24 Entomology
25 Evolutionary Biology
26 Family Studies
27 Fisheries
28 Food Science & Technology
29 Forestry
30 Gastroenterology & Hepatology
31 General & Internal Medicine
32 Genetics & Heredity
33 Geochemistry & Geophysics
34 Geriatrics & Gerontology
35 Health Care Sciences & Services
36 Hematology
37 Immunology
38 Infectious Diseases
39 Instruments & Instrumentation
40 Integrative & Complementary Medicine
41 Legal Medicine
42 Life Sciences & Biomedicine - Other Topics
43 Marine & Freshwater Biology
44 Materials Science
45 Mathematical & Computational Biology
46 Mechanics
47 Medical Informatics
48 Medical Laboratory Technology
5756 Chapter 2 2016Chapter 2 2016
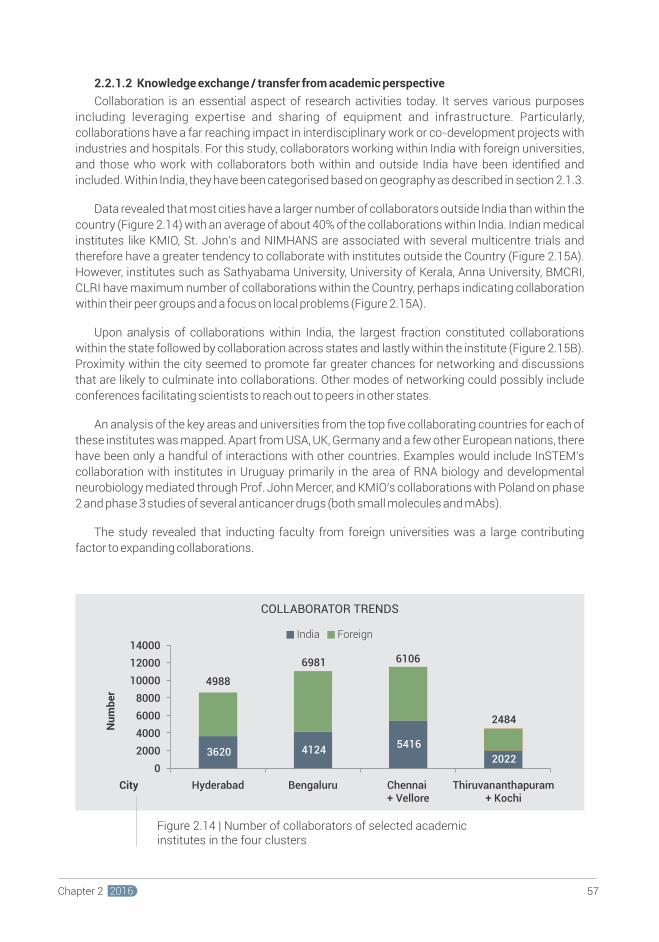
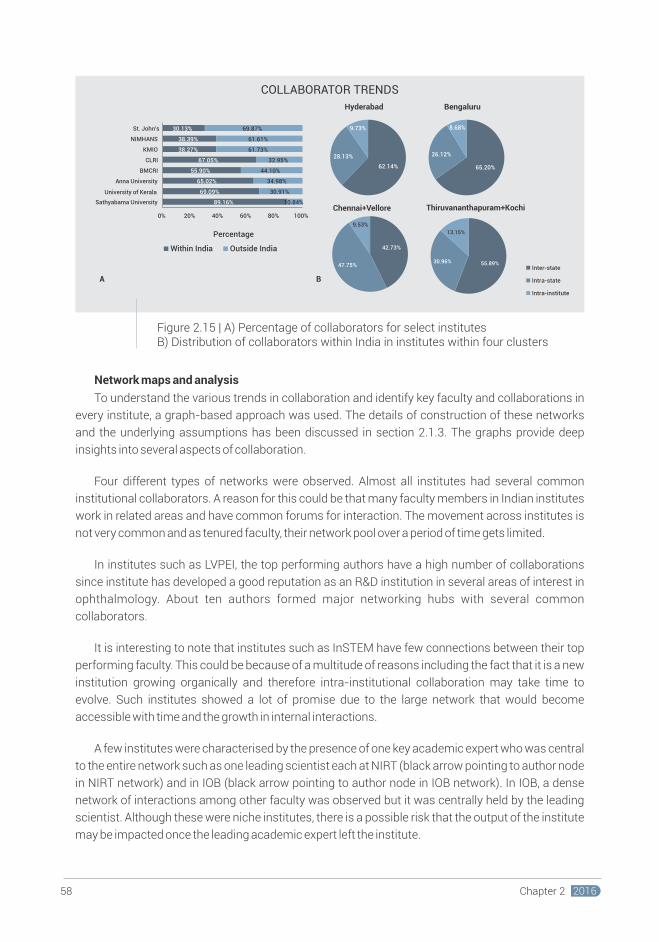
Network maps and analysis
To understand the various trends in collaboration and identify key faculty and collaborations in
every institute, a graph-based approach was used. The details of construction of these networks
and the underlying assumptions has been discussed in section 2.1.3. The graphs provide deep
insights into several aspects of collaboration.
Four different types of networks were observed. Almost all institutes had several common
institutional collaborators. A reason for this could be that many faculty members in Indian institutes
work in related areas and have common forums for interaction. The movement across institutes is
not very common and as tenured faculty, their network pool over a period of time gets limited.
In institutes such as LVPEI, the top performing authors have a high number of collaborations
since institute has developed a good reputation as an R&D institution in several areas of interest in
ophthalmology. About ten authors formed major networking hubs with several common
collaborators.
It is interesting to note that institutes such as InSTEM have few connections between their top
performing faculty. This could be because of a multitude of reasons including the fact that it is a new
institution growing organically and therefore intra-institutional collaboration may take time to
evolve. Such institutes showed a lot of promise due to the large network that would become
accessible with time and the growth in internal interactions.
A few institutes were characterised by the presence of one key academic expert who was central
to the entire network such as one leading scientist each at NIRT (black arrow pointing to author node
in NIRT network) and in IOB (black arrow pointing to author node in IOB network). In IOB, a dense
network of interactions among other faculty was observed but it was centrally held by the leading
scientist. Although these were niche institutes, there is a possible risk that the output of the institute
may be impacted once the leading academic expert left the institute.
The NCBS network displayed several networking hubs and spatial proximity of scientists in diverse
fields, highlighting interdisciplinary research. The networks help identify upcoming authors (black
arrow pointing to author node in NCBS network) whose work has started showing in the growing
networks being laid by the scientists.
Figure 2.15 | A) Percentage of collaborators for select institutesB) Distribution of collaborators within India in institutes within four clusters
65.20%
26.12%
8.68%
Bengaluru
55.89%30.96%
13.15%
Thiruvananthapuram+Kochi
Inter-state
Intra-state
Intra-institute
62.14%
28.13%
9.73%
Hyderabad
42.73%
47.75%
9.53%
Chennai+Vellore89.16%
69.09%
65.02%
55.90%
67.05%
38.27%
38.39%
30.13%
10.84%
30.91%
34.98%
44.10%
32.95%
61.73%
61.61%
69.87%
0% 20% 40% 60% 80% 100%
Sathyabama University
University of Kerala
Anna University
BMCRI
CLRI
KMIO
NIMHANS
St. John's
Percentage
Within India Outside India
A B
5958 Chapter 2 2016Chapter 2 2016
(A) NCBS
(B) NIRT
COLLABORATOR TRENDS
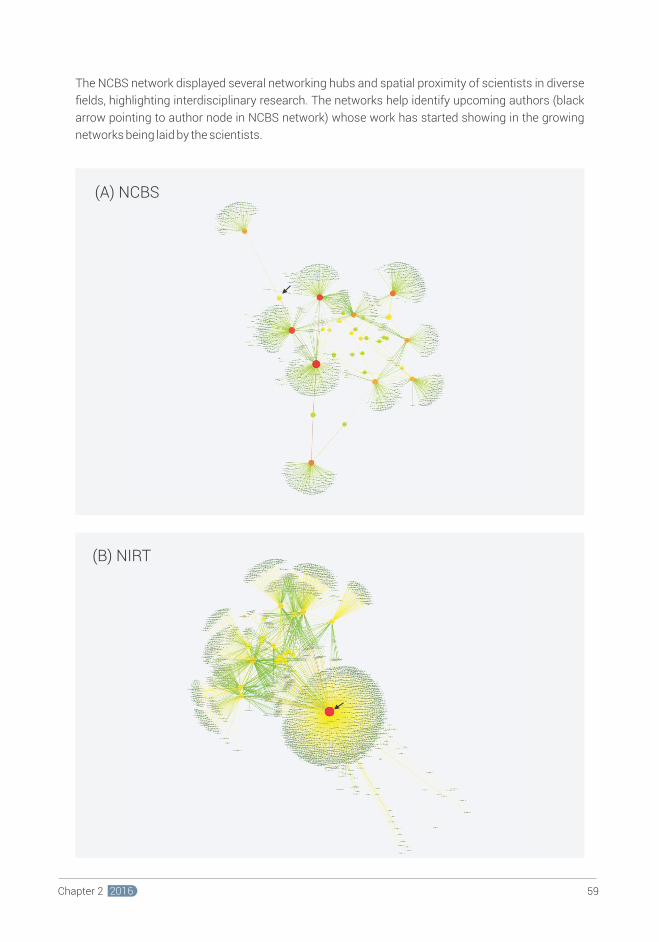
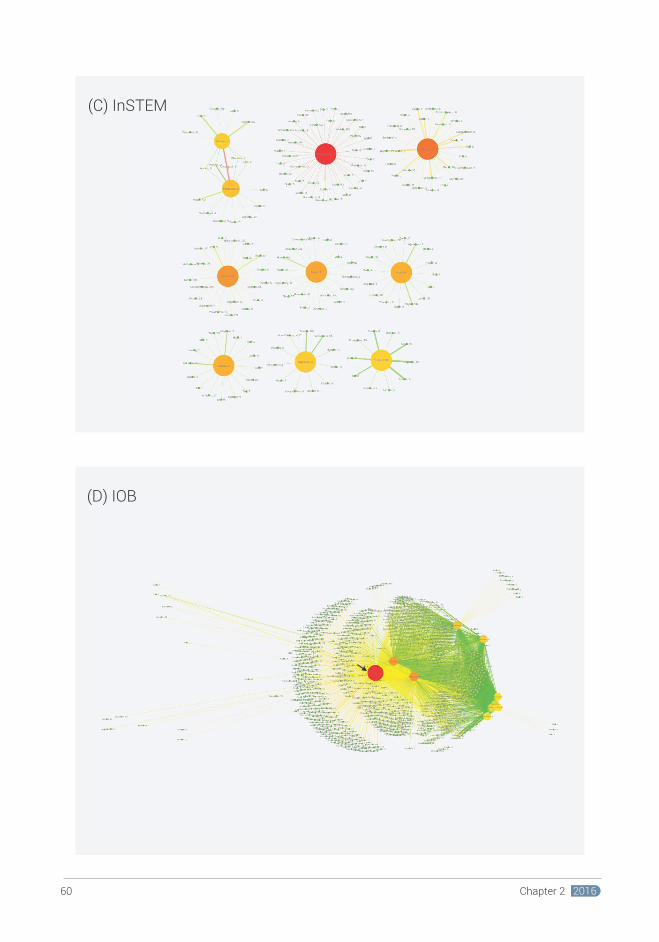
Figure 2.16 | Collaboration maps of A) NCBS B) NIRT C) InSTEMD) IOB E) LVPEI showing different types of topologies
(E) LVPEI
Analysis on nature of collaborations from networks
Each of the institute networks was analysed to identify important authors and important
collaborations as described in section 2.1.3. Once this was done, the focus areas of the authors were
identified to classify the nature of the interactions. The 'number' of important interactions was one pf
the parameters to assess the patterns in an institute.
Too few important interactions in an institute indicate that the network relies on select faculty
and their collaborations reflecting a skewness in the collaborative nature of the institute.
The data revealed that interdisciplinary research was nascent in these clusters (Figure 2.17).
The four clusters have strength in chemistry and molecular biology. The network patterns also
indicate high collaboration within these areas.
The number of interactions that are interdisciplinary in nature indicate the translation potential of
research from the institute and the underlying culture and attitude. Very few institutes - Amrita
Institute, IITM, InSTEM were found to be truly involved in interdisciplinary research.
(C ) InSTEM
(D) IOB
6160 Chapter 2 2016Chapter 2 2016
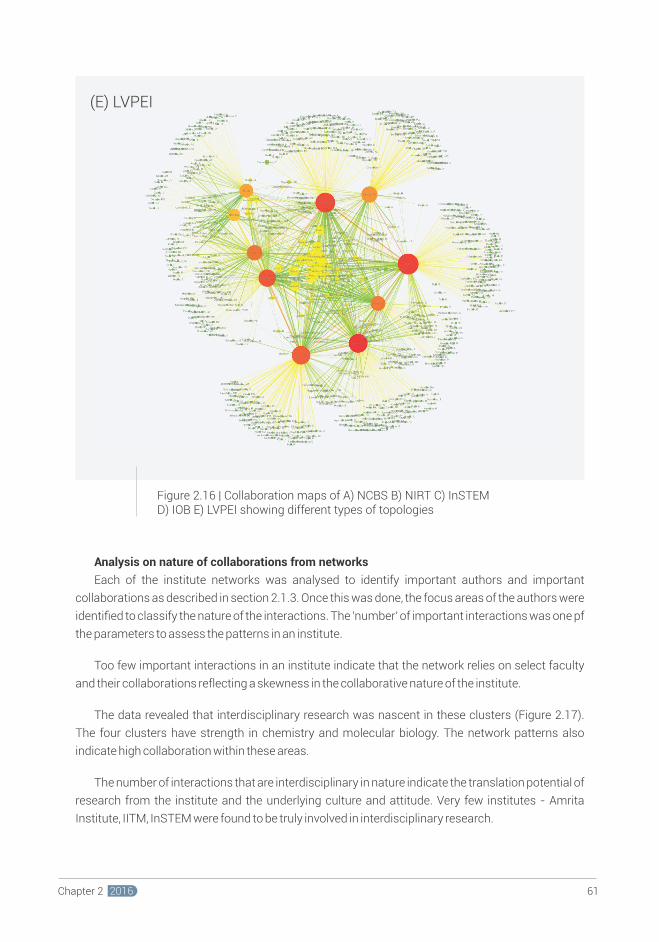
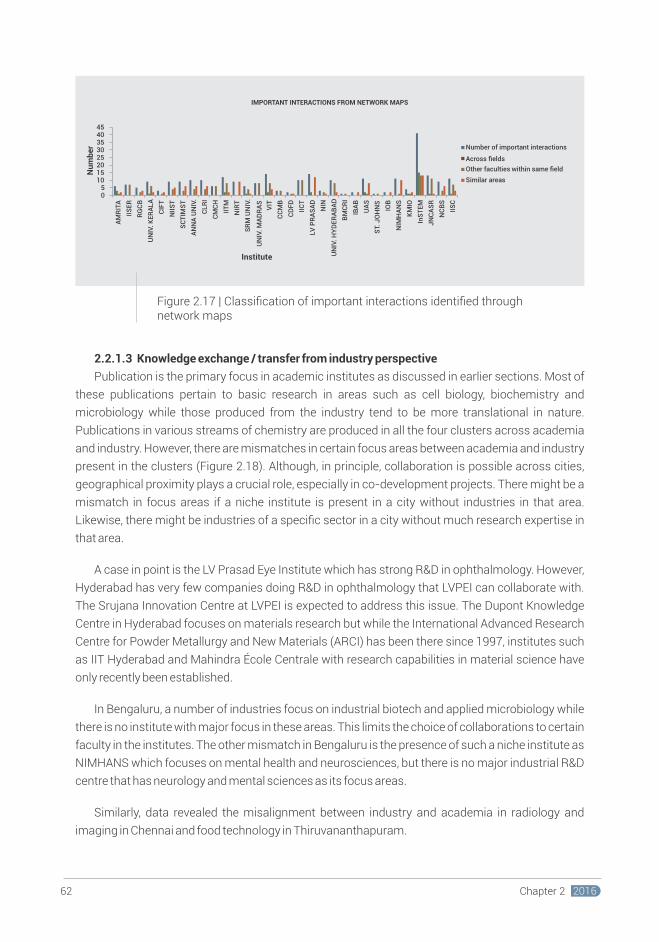
2.2.1.3 Knowledge exchange / transfer from industry perspective
Publication is the primary focus in academic institutes as discussed in earlier sections. Most of
these publications pertain to basic research in areas such as cell biology, biochemistry and
microbiology while those produced from the industry tend to be more translational in nature.
Publications in various streams of chemistry are produced in all the four clusters across academia
and industry. However, there are mismatches in certain focus areas between academia and industry
present in the clusters (Figure 2.18). Although, in principle, collaboration is possible across cities,
geographical proximity plays a crucial role, especially in co-development projects. There might be a
mismatch in focus areas if a niche institute is present in a city without industries in that area.
Likewise, there might be industries of a specific sector in a city without much research expertise in
that area.
A case in point is the LV Prasad Eye Institute which has strong R&D in ophthalmology. However,
Hyderabad has very few companies doing R&D in ophthalmology that LVPEI can collaborate with.
The Srujana Innovation Centre at LVPEI is expected to address this issue. The Dupont Knowledge
Centre in Hyderabad focuses on materials research but while the International Advanced Research
Centre for Powder Metallurgy and New Materials (ARCI) has been there since 1997, institutes such
as IIT Hyderabad and Mahindra École Centrale with research capabilities in material science have
only recently been established.
In Bengaluru, a number of industries focus on industrial biotech and applied microbiology while
there is no institute with major focus in these areas. This limits the choice of collaborations to certain
faculty in the institutes. The other mismatch in Bengaluru is the presence of such a niche institute as
NIMHANS which focuses on mental health and neurosciences, but there is no major industrial R&D
centre that has neurology and mental sciences as its focus areas.
Similarly, data revealed the misalignment between industry and academia in radiology and
imaging in Chennai and food technology in Thiruvananthapuram. Figure 2.18 | Comparison of publication focus areas in academia (A, C, E, G) and industry (B, D, F, H) across four clusters
Figure 2.17 | Classification of important interactions identified through network maps
UN
IV.
MA
DR
AS
UN
IV.
HY
DE
RA
BA
D
Institute
05
1015202530354045
AM
RIT
A
IIS
ER
RG
CB
UN
IV.
KE
RA
LA
CIF
T
NII
ST
SC
TIM
ST
AN
NA
UN
IV.
CL
RI
CM
CH
IIT
M
NIR
T
SR
M U
NIV
.
VIT
CC
MB
CD
FD
IIC
T
LV
PR
AS
AD
NIN
BM
CR
I
IBA
B
UA
S
ST.
JO
HN
S
IOB
NIM
HA
NS
KM
IO
InS
TE
M
JN
CA
SR
NC
BS
IIS
C
Nu
mb
er Number of important interactions
Across fields
Other faculties within same field
Similar areas
70219
18953
5940 5863 3070 2241 2018 1987 1889 1855
0
10000
20000
30000
40000
50000
60000
70000
80000
Ch
em
istr
y
Bio
ch
em
istr
y &
M
ole
cu
lar
Bio
log
y
Ph
arm
ac
olo
gy
&
Ph
arm
ac
y
Op
hth
alm
olo
gy
Mic
rob
iolo
gy
Bio
tec
hn
olo
gy
&
Ap
pli
ed
Mic
rob
iolo
gy
Pla
nt
Sc
ien
ce
s
Sc
ien
ce
& T
ec
hn
olo
gy
-
Oth
er
To
pic
s
Po
lym
er
Sc
ien
ce
Ag
ric
ult
ure
Nu
mb
er
of
cit
ati
on
s
Subject category
SUBJECT FOCUS IN HYDERABAD (ACADEMIA)
44700
11590
6655 6043 5576 5173 5119 3243 3152 2419
0
5000
10000
15000
20000
25000
30000
35000
40000
45000
50000
Ch
emis
try
Bio
chem
istr
y &
Mo
lecu
lar
Bio
log
y
Po
lym
er S
cien
ce
Cry
sta
llog
rap
hy
Ph
arm
aco
log
y &
P
ha
rma
cy
Bio
tech
no
log
y &
Ap
plie
d M
icro
bio
log
y
Imm
un
olo
gy
Neu
rosc
ien
ces
&N
euro
log
y
En
gin
eeri
ng
Cel
l Bio
log
y
Nu
mb
er
of
cit
ati
on
s
Subject category
SUBJECT FOCUS IN CHENNAI+VELLORE (ACADEMIA)
50719
24764
3290 2639 2311 2150 1895 1841 1738 1735
0
10000
20000
30000
40000
50000
60000
Ch
em
istr
y
Bio
ch
em
istr
y &
Mo
lec
ula
r B
iolo
gy
Ne
uro
sc
ien
ce
s &
Ne
uro
log
y
Po
lym
er
Sc
ien
ce
Imm
un
olo
gy
Op
tic
s
Lif
e S
cie
nc
es
&B
iom
ed
icin
e -
Oth
er.
.. -
Sc
ien
ce
& T
ec
hn
olo
gy
-O
the
r T
op
ics
Mic
rob
iolo
gy
On
co
log
y
Nu
mb
er
of
cit
ati
on
s
Subject category
SUBJECT FOCUS IN BENGALURU (ACADEMIA)
10810
4232
27372025 1805 1650 1295 994 974 903
0
2000
4000
6000
8000
10000
12000
Ch
em
istr
y
Bio
ch
em
istr
y &
Mo
lec
ula
r B
iolo
gy
Ne
uro
sc
ien
ce
s &
Ne
uro
log
y
En
gin
ee
rin
g
Ph
arm
ac
olo
gy
&P
ha
rma
cy
Po
lym
er
Sc
ien
ce
Bio
tec
hn
olo
gy
&
Ap
pli
ed
Mic
rob
iolo
gy
Ca
rdio
vas
cu
lar
Sys
tem
&
Ca
rdio
log
y
On
co
log
y
Ce
ll B
iolo
gy
Nu
mb
er
of
cit
ati
on
s
SUBJECT FOCUS IN THIRUVANANTHAPURAM+KOCHI (ACADEMIA)
Subject category
Nu
mb
er
of
cit
ati
on
s
Subject category
SUBJECT FOCUS IN HYDERABAD (INDUSTRY)
Nu
mb
er
of
cit
ati
on
s
Subject category
SUBJECT FOCUS IN BENGALURU (INDUSTRY)
Nu
mb
er o
f ci
tati
on
s
Subject category
SUBJECT FOCUS IN THIRUVANANTHAPURAM+KOCHI (INDUSTRY)
Nu
mb
er
of
cit
ati
on
s
Subject category
SUBJECT FOCUS IN CHENNAI+VELLORE (INDUSTRY)
6362 Chapter 2 2016Chapter 2 2016
IMPORTANT INTERACTIONS FROM NETWORK MAPS
75
59
31
47
0
1000
2000
3000
4000
5000
6000
7000
8000
Ch
em
istr
y
Ph
arm
ac
olo
gy
&
28
29
Ph
arm
ac
y
Bio
ch
em
istr
y &
31
2
12
5
10
3
10
1
99
75
74
Mo
lec
ula
r B
iolo
gy
Pla
nt
Sc
ien
ce
s
Ne
uro
sc
ien
ce
s &
Ne
uro
log
y
Bio
ph
ys
ics
En
do
cri
no
log
y &
Me
tab
oli
sm
Ge
ne
ral
& I
nte
rna
l
Me
dic
ine
Sc
ien
ce
& T
ec
hn
olo
gy
-O
the
r T
op
ics
He
ma
tolo
gy
15
64
0200400600800
10001200140016001800
Bio
ch
em
istr
y &
M
ole
cu
lar
Bio
log
y
12
38
11
97
Ch
em
istr
y
Ph
arm
ac
olo
gy
&
Ph
arm
ac
y
51
3
50
4
27
0
26
8
23
9
15
7
14
0
Bio
tec
hn
olo
gy
&
Ap
pli
ed
Mic
rob
iolo
gy
Ga
str
oe
nte
rolo
gy
&
He
pa
tolo
gy
Ma
rin
e &
Fre
sh
wa
ter
Bio
log
y
Lif
e S
cie
nc
es
&
Bio
me
dic
ine
- O
the
r T
op
ics
On
co
log
y
Fis
he
rie
s
Sc
ien
ce
&
Te
ch
no
log
y -
Oth
er
To
pic
s
16
2
10
6
10
1
82
16
12
10
10
7 5
020406080
100120140160180
Bio
tec
hn
olo
gy
&
Ap
pli
ed
Mic
rob
iolo
gy
Ch
em
istr
y
Po
lym
er
Sc
ien
ce
Ma
teri
als
Sc
ien
ce
Ph
arm
ac
olo
gy
&P
ha
rma
cy
Ra
dio
log
y, N
uc
lea
rM
ed
icin
e &
Me
dic
al
Ima
gin
g
Cry
sta
llo
gra
ph
y
Fo
od
Sc
ien
ce
&T
ec
hn
olo
gy
Co
mp
ute
r S
cie
nc
e
Inte
gra
tiv
e &
Co
mp
lem
en
tary
Me
dic
ine
12
5
57
52
24
14
4 3 2 2
020406080
100120140
Imm
un
olo
gy
He
ma
tolo
gy
Nu
trit
ion
&
Die
teti
cs
En
gin
ee
rin
g
Ch
em
istr
y
Fo
od
Sc
ien
ce
&
Te
ch
no
log
y
Imm
un
olo
gy
Pla
nt
Sc
ien
ce
s
Bio
ch
em
istr
y &
Mo
lec
ula
r
Bio
log
y
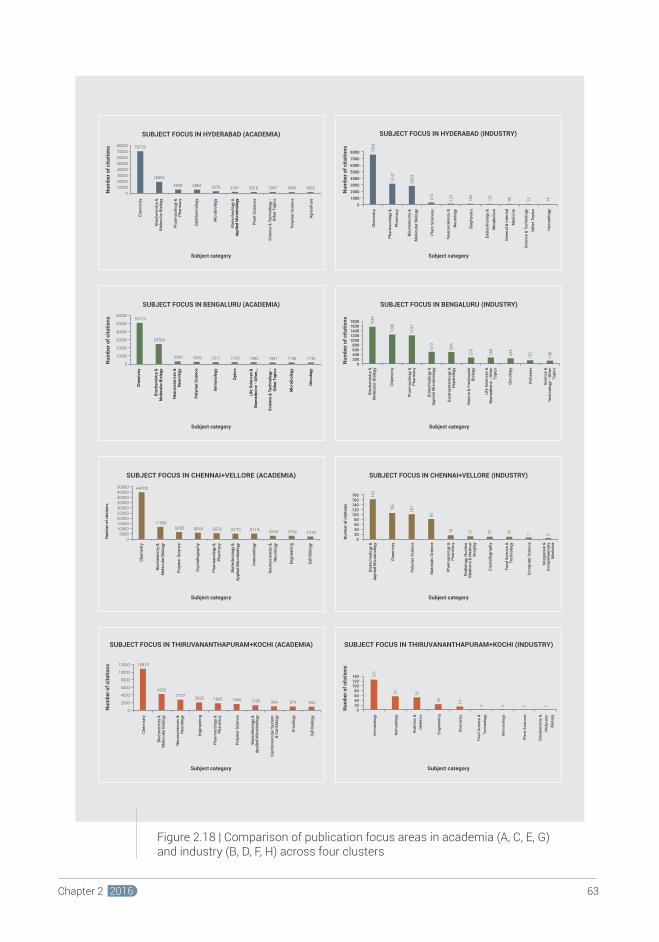
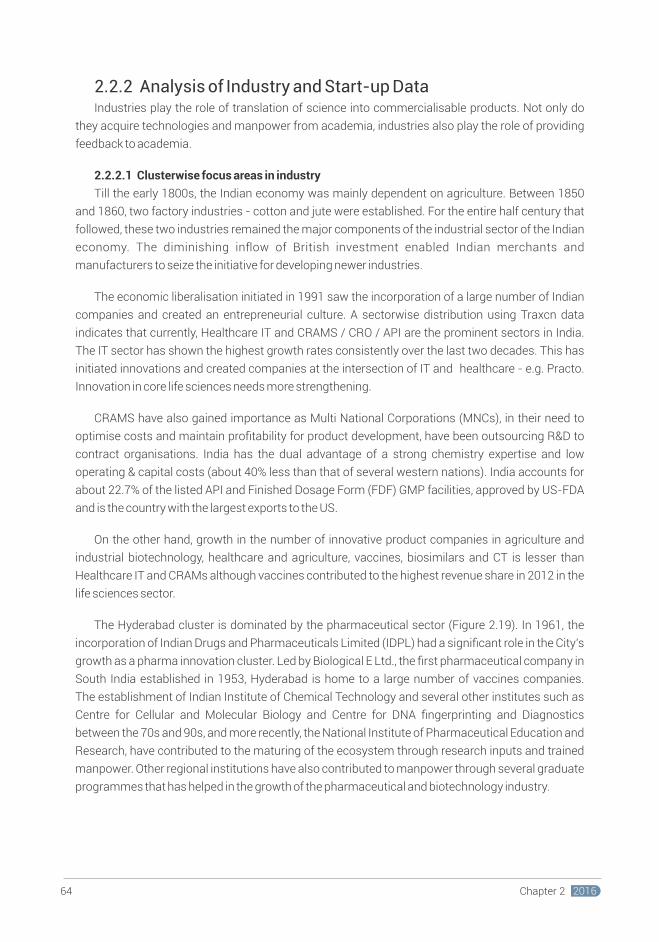
2.2.2 Analysis of Industry and Start-up DataIndustries play the role of translation of science into commercialisable products. Not only do
they acquire technologies and manpower from academia, industries also play the role of providing
feedback to academia.
2.2.2.1 Clusterwise focus areas in industry
Till the early 1800s, the Indian economy was mainly dependent on agriculture. Between 1850
and 1860, two factory industries - cotton and jute were established. For the entire half century that
followed, these two industries remained the major components of the industrial sector of the Indian
economy. The diminishing inflow of British investment enabled Indian merchants and
manufacturers to seize the initiative for developing newer industries.
The economic liberalisation initiated in 1991 saw the incorporation of a large number of Indian
companies and created an entrepreneurial culture. A sectorwise distribution using Traxcn data
indicates that currently, Healthcare IT and CRAMS / CRO / API are the prominent sectors in India.
The IT sector has shown the highest growth rates consistently over the last two decades. This has
initiated innovations and created companies at the intersection of IT and healthcare - e.g. Practo.
Innovation in core life sciences needs more strengthening.
CRAMS have also gained importance as Multi National Corporations (MNCs), in their need to
optimise costs and maintain profitability for product development, have been outsourcing R&D to
contract organisations. India has the dual advantage of a strong chemistry expertise and low
operating & capital costs (about 40% less than that of several western nations). India accounts for
about 22.7% of the listed API and Finished Dosage Form (FDF) GMP facilities, approved by US-FDA
and is the country with the largest exports to the US.
On the other hand, growth in the number of innovative product companies in agriculture and
industrial biotechnology, healthcare and agriculture, vaccines, biosimilars and CT is lesser than
Healthcare IT and CRAMs although vaccines contributed to the highest revenue share in 2012 in the
life sciences sector.
The Hyderabad cluster is dominated by the pharmaceutical sector (Figure 2.19). In 1961, the
incorporation of Indian Drugs and Pharmaceuticals Limited (IDPL) had a significant role in the City's
growth as a pharma innovation cluster. Led by Biological E Ltd., the first pharmaceutical company in
South India established in 1953, Hyderabad is home to a large number of vaccines companies.
The establishment of Indian Institute of Chemical Technology and several other institutes such as
Centre for Cellular and Molecular Biology and Centre for DNA fingerprinting and Diagnostics
between the 70s and 90s, and more recently, the National Institute of Pharmaceutical Education and
Research, have contributed to the maturing of the ecosystem through research inputs and trained
manpower. Other regional institutions have also contributed to manpower through several graduate
programmes that has helped in the growth of the pharmaceutical and biotechnology industry.
Figure 2.19 | Distribution of different types of organisations in four clusters under study
Bengaluru has a strong research culture with the presence of IISc for over a century and more
recently, JNCASR and NCBS as well as several other research institutes and Public Sector Units
(PSUs). Several MNCs started their operations in this region from the 70s leading to the creation of a
huge wealth of knowledge and talent pool that has translated into growth in applied and
interdisciplinary areas. Biocon led the growth of a vibrant biotech industry in Bengaluru. The City also
has a large pool of service providers and contract research / outsourcing companies. This trend has
led to Bengaluru being one of the most sought after innovation clusters in India.
Chennai has a strong pharma and automobile / engineering presence. With a strong base of
universities, engineering and medical schools, and knowledge transfer from academia, several
medical devices companies have come up in this region.
The number of life sciences companies are fairly low in Thiruvananthapuram which could be
attributed to the prevailing industrial environment in the state. A cascading effect of this is the lack of
availability of proper support structure for life sciences start-ups in Thiruvananthapuram+Kochi.
The State Government has been promoting the IT industry and IT start-ups in a big way. The life
sciences sector is expected to get similar support as new policies by the State Government seek to
plug the gaps.
33
79
4016
3214 14 38
296 7
325
39
92
274 8 6 213
3615
20
50
100
150
200
250
300
350
Hyderabad Bengaluru Chennai+Vellore Thiruvananthapuram+Kochi
Nu
mb
er
City
CLUSTERWISE ORGANISATIONS DISTRIBUTION
Biotech Healthcare
Pharmaceuticals
CRAMS / CRO
Bioinformatics Service providers
6564 Chapter 2 2016Chapter 2 2016
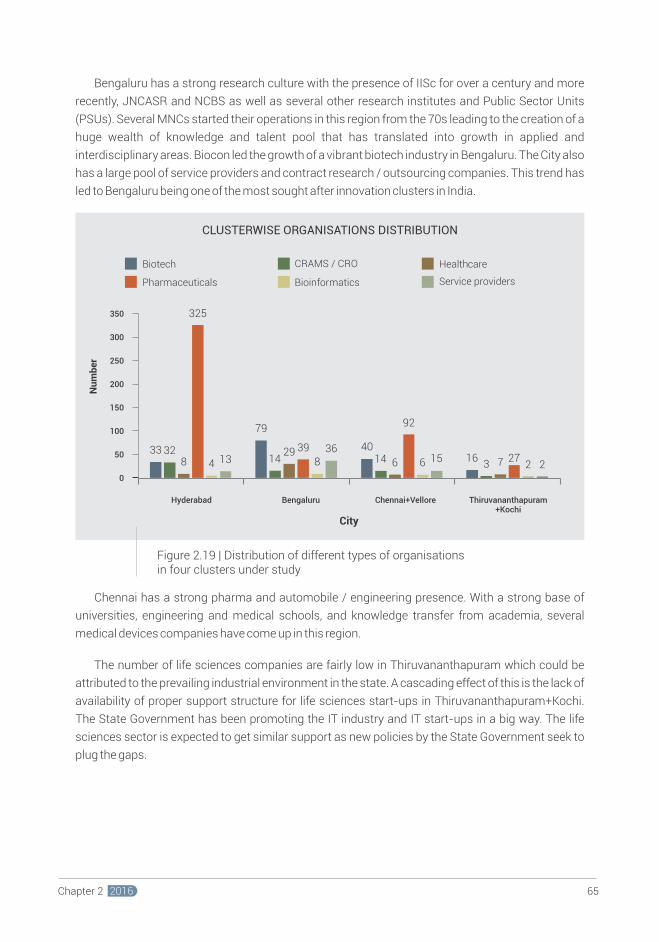
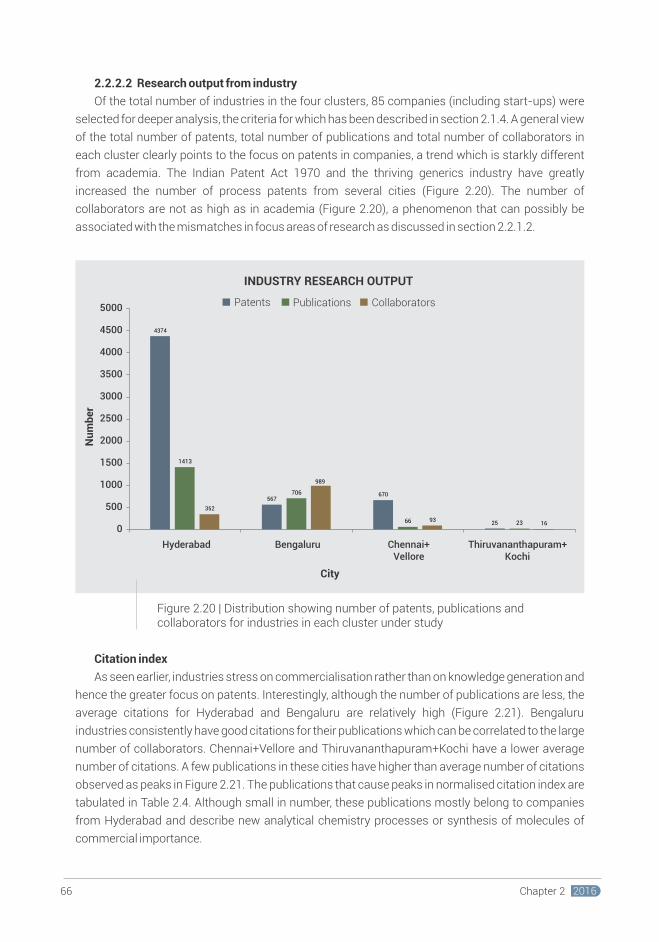
Figure 2.21 | Normalised citation index for select industrypublications in the four clusters
2.2.2.2 Research output from industry
Of the total number of industries in the four clusters, 85 companies (including start-ups) were
selected for deeper analysis, the criteria for which has been described in section 2.1.4. A general view
of the total number of patents, total number of publications and total number of collaborators in
each cluster clearly points to the focus on patents in companies, a trend which is starkly different
from academia. The Indian Patent Act 1970 and the thriving generics industry have greatly
increased the number of process patents from several cities (Figure 2.20). The number of
collaborators are not as high as in academia (Figure 2.20), a phenomenon that can possibly be
associated with the mismatches in focus areas of research as discussed in section 2.2.1.2.
Citation index
As seen earlier, industries stress on commercialisation rather than on knowledge generation and
hence the greater focus on patents. Interestingly, although the number of publications are less, the
average citations for Hyderabad and Bengaluru are relatively high (Figure 2.21). Bengaluru
industries consistently have good citations for their publications which can be correlated to the large
number of collaborators. Chennai+Vellore and Thiruvananthapuram+Kochi have a lower average
number of citations. A few publications in these cities have higher than average number of citations
observed as peaks in Figure 2.21. The publications that cause peaks in normalised citation index are
tabulated in Table 2.4. Although small in number, these publications mostly belong to companies
from Hyderabad and describe new analytical chemistry processes or synthesis of molecules of
commercial importance.
CLUSTER COMPANY YEAR TITLENO. OFTIMES CITED
Table 2.4 | Industry publications causing peaks in normalised citation index
HYDERABAD Dr.Reddy’s 2002 Cu(I)-catalyzed three component coupling protocol 132
for the synthesis of quinoline derivatives
Dr.Reddy’s 2003 Pd/C mediated synthesis of 2-substituted
benzo[b]furans/ nitrobenzo[b]furans in water 74
Suven Life 2004 Quantitation of tadalafil in human plasma by liquid
Sciences chromatography-tandem mass spectrometry with
electrospray ionisation 45
Dr.Reddy’s 2004 Anticancer and immunostimulatory compounds
from Andrographis paniculata 170
Divis Labs 2005 A newly synthetic chromium complex - chromium
(phenylalanine)(3) improves insulin responsiveness
and reduces whole body glucose tolerance 43
Suven Life 2005 Liquid chromatography/electrospray ionisation
Sciences mass spectrometry method for the
quantification of valproic acidin human plasma 43
BENGALURU Strides 2005 Synthesis, characterisation and antimicrobial
Arcolab Ltd. activity of some substituted 1,2,3-triazoles 118
Strides 2006 Synthesis of some novel pyrazolo[3,4-d]pyrimidine
Arcolab Ltd derivatives as potential antimicrobial agents 119
CHENNAI+ Evolva Biotech 2010 Improved vanillin production in baker's yeast 56
VELLORE through in silico design
Figure 2.20 | Distribution showing number of patents, publications andcollaborators for industries in each cluster under study
Hyderabad Bengaluru Chennai+
VelloreThiruvananthapuram+
Kochi
Nu
mb
er
City
INDUSTRY RESEARCH OUTPUT
Patents Publications Collaborators
CLUSTERWISE NORMALISED CITATION INDEX
Hyderabad
Bengaluru
Chennai+Vellore
Thiruvananthapuram+Kochi
6766 Chapter 2 2016Chapter 2 2016
4374
567670
25
1413
706
66 23
352
989
9316
0
500
1000
1500
2000
2500
3000
3500
4000
4500
5000
0
10
20
30
40
50
60
70
80
19
96
19
97
19
98
19
99
20
00
20
01
20
02
20
03
20
04
20
05
20
06
20
07
20
08
20
09
20
10
20
11
20
12
20
13
20
14
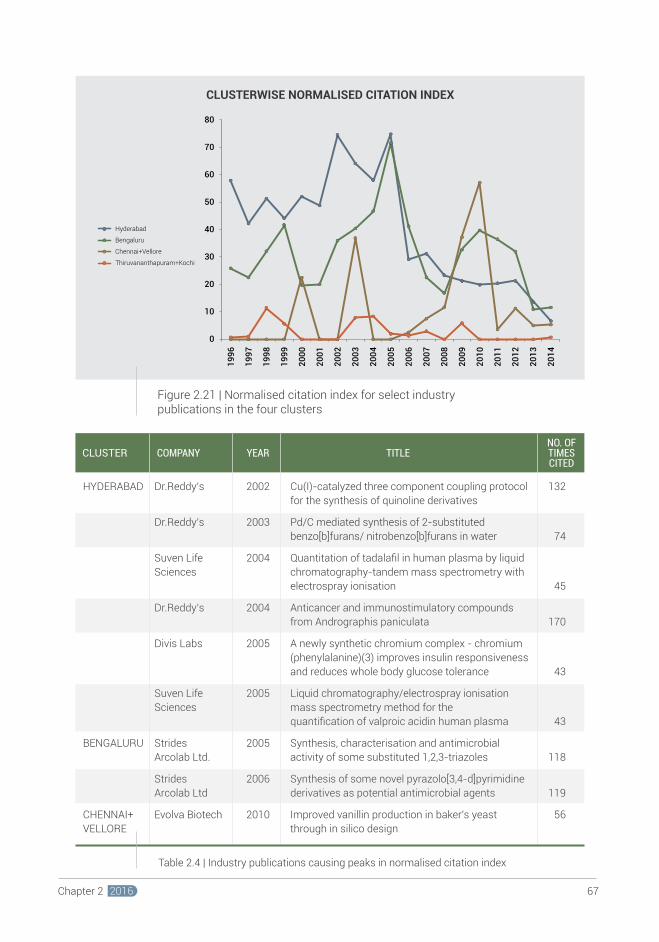
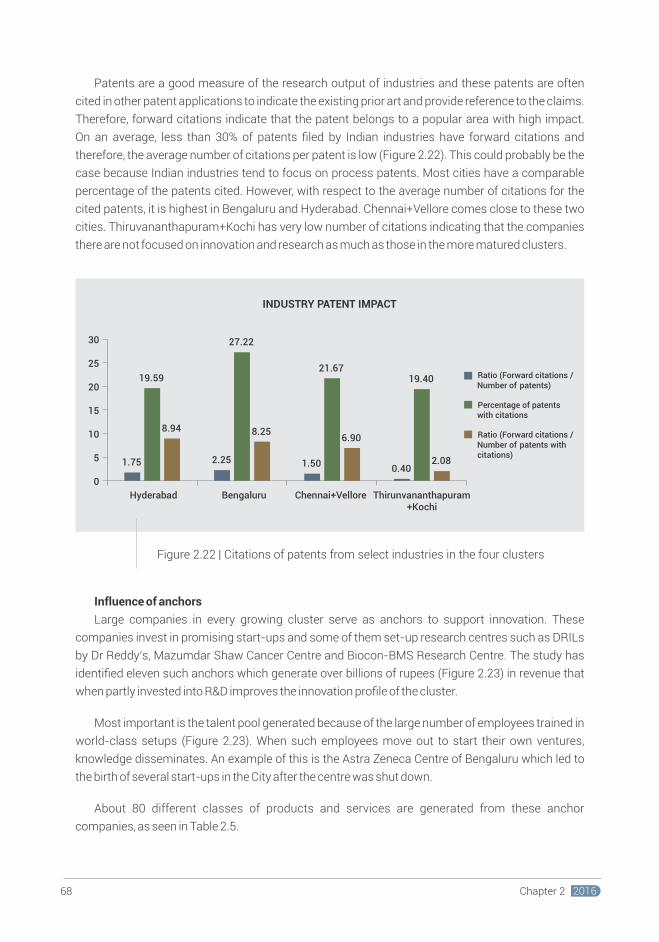
Patents are a good measure of the research output of industries and these patents are often
cited in other patent applications to indicate the and provide reference to the claims. existing prior art
Therefore, forward citations indicate that the patent belongs to a popular area with high impact.
On an average, less than 30% of patents filed by Indian industries have forward citations and
therefore, the average number of citations per patent is low (Figure 2.22). This could probably be the
case because Indian industries tend to focus on process patents. Most cities have a comparable
percentage of the patents cited. However, with respect to the average number of citations for the
cited patents, it is highest in Bengaluru and Hyderabad. Chennai+Vellore comes close to these two
cities. Thiruvananthapuram+Kochi has very low number of citations indicating that the companies
there are not focused on innovation and research as much as those in the more matured clusters.
Influence of anchors
Large companies in every growing cluster serve as anchors to support innovation. These
companies invest in promising start-ups and some of them set-up research centres such as DRILs
by Dr Reddy’s, Mazumdar Shaw Cancer Centre and Biocon-BMS Research Centre. The study has
identified eleven such anchors which generate over billions of rupees (Figure 2.23) in revenue that
when partly invested into R&D improves the innovation profile of the cluster.
Most important is the talent pool generated because of the large number of employees trained in
world-class setups (Figure 2.23). When such employees move out to start their own ventures,
knowledge disseminates. An example of this is the Astra Zeneca Centre of Bengaluru which led to
the birth of several start-ups in the City after the centre was shut down.
About 80 different classes of products and services are generated from these anchor
companies, as seen in Table 2.5.
Table 2.5 | Products / Services of anchor companies in the clusters
Ÿ Anabolic Steroid
Ÿ Analgesic
Ÿ Anti-Cholinergic
Ÿ Anti-Emetic
Ÿ Anti-Fungal
Ÿ Anti-Hypercholestrolemia
Ÿ Anti-Migrane
Ÿ Anti-Ulcer
Ÿ Anti-Alzheimers
Ÿ Antiarrhythmic
Ÿ Antibacterials
Ÿ Anti-Cancer
Ÿ Anticonvulsants / Antiepileptics
Ÿ Antidepressants / Antipsychotics
Ÿ Antidiabetics
Ÿ Antidiarrheals
Ÿ Antiglaucoma
Ÿ Antihistaminics, Antiasthamatics
Ÿ Antihyperlipoproteinemics
Ÿ Antihyperparathyroid
Ÿ Antihypertensives
Ÿ Anti-Infective
Ÿ Anti-Inflammatory
Ÿ Antineoplastic
Ÿ Antiobesity
Ÿ Antiosteoporotics
Ÿ Antiparkinsonian
Ÿ Antipsoriatic/ Antiacne
Products / Services of anchor companies in the clusters
Ÿ Antiretroviral
Ÿ Antispasmodic
Ÿ Antithrombotics
Ÿ Antivirals
Ÿ Anxiolytics
Ÿ Bronchodilator
Ÿ Calcimimetic
Ÿ Carotenoids
Ÿ Cephalosporins
Ÿ Clinical Trial Intelligence
Ÿ CNS Agents
Ÿ Commercial Products
Ÿ Cough Suppressant
Ÿ Curcuminoids
Ÿ Custom Curation Services (Biology, Chemistry and Clinical Trial )
Ÿ Diabetes Drugs
Ÿ Diuretics
Ÿ Drugs for Memory Impairments with Aging
Ÿ Drugs for Cardiovascular Disease
Ÿ Drugs for Feeding Disorders
Ÿ Entry Inhibitors
Ÿ Erectile Dysfunction Drugs
Ÿ Eugeroics
Ÿ Flavonoids
Ÿ Drugs for Chronic Constipation
Ÿ Drugs for Hyper Uracemia
Ÿ Drugs for Overactive Bladder
Ÿ Genome Data Analysis
Ÿ Glargine
Ÿ Heavy Metal Chelator
Ÿ Hematinics
Ÿ Hydroxycinnamic
Ÿ Hyperphosphataemia
Ÿ Immnunomodulator
Ÿ Immunosupressant
Ÿ Itolizumab
Ÿ Lispro & Aspart
Ÿ mAb Biosimilars
Ÿ Metabolic Disorders
Ÿ Muscle Relaxant
Ÿ New Drug Delivery Systems
Ÿ Pain Management
Ÿ Patient Monitoring, Computer Tomography, Diagnostic ECG etc.
Ÿ Pediatrics
Ÿ Peptide Biosimilars
Ÿ Pharma IT Services
Ÿ Polyphenols
Ÿ Pulmonary Arterial Hypertension
Ÿ Rh-Insulin
Ÿ Target Intelligence and Analytics
Ÿ Urinary Incontinence Drugs
Ÿ Vitamins
Figure 2.22 | Citations of patents from select industries in the four clusters
1.75 2.25 1.50 0.40
19.59
27.22
21.67
19.40
8.94 8.25 6.90
2.08
0
5
10
15
20
25
30
Hyderabad Bengaluru Chennai+Vellore Thirunvananthapuram+Kochi
INDUSTRY PATENT IMPACT
Ratio (Forward citations /Number of patents)
Percentage of patents with citations
Ratio (Forward citations /Number of patents with citations)
Figure 2.23 | Revenue (FY 2015-16) and Human Resources of anchor companies in four clusters
5000
9039
0
Dr Reddys
lab
Divis l
abs
Aurobin
do phar
ma
Suve
n life s
cience
s
Natco
Phar
ma
Lauru
s lab
s
Synge
ne
Bioco
n
Jubila
nt Life
Scie
nces
Orchid
phar
ma a
nd chem
icals
154700
38160
138960
1152417808
11131
31429
58023
20000
40000
60000
80000
100000
120000
140000
160000
180000
FY15-16 REVENUE (IN MILLION)
800 0
Nu
mb
er
of
em
plo
ye
es
(R
ou
nd
ed
do
wn
)
Dr Reddys
labs
Divis l
abs
Aurobin
do Phar
ma
Suve
n Life
Scie
nces
Natco
Phar
ma
Lauru
s Lab
s
Synge
ne
Bioco
n
Jubila
nt Life
Scie
nces
Orchid
Phar
ma a
nd Chem
icals
20000
9000
15000
2500 2200 2500
75005000 5000
5000
10000
15000
20000
25000
HUMAN RESOURCE
6968 Chapter 2 2016Chapter 2 2016
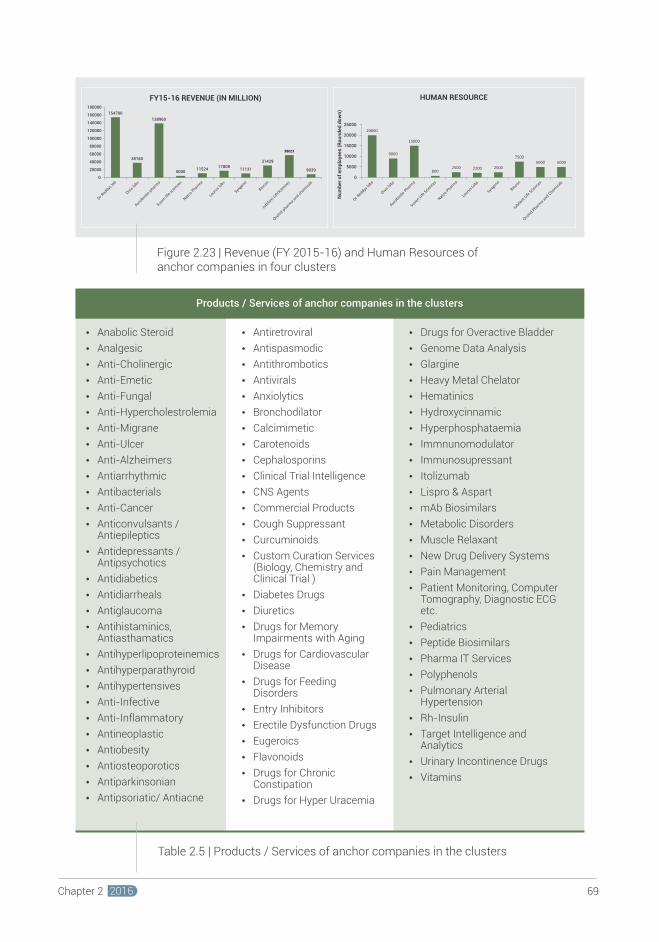
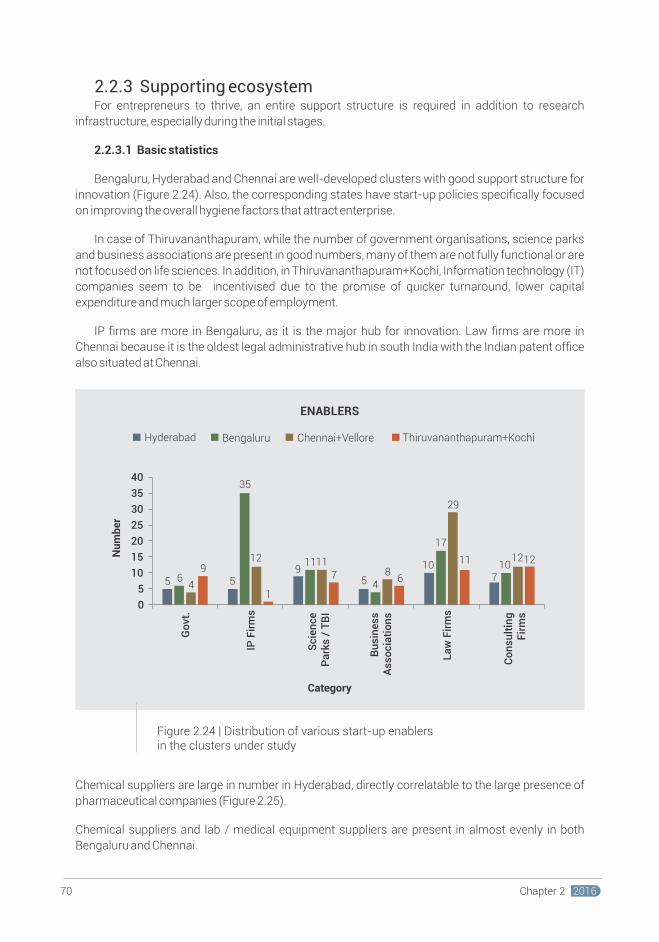
2.2.3 Supporting ecosystemFor entrepreneurs to thrive, an entire support structure is required in addition to research
infrastructure, especially during the initial stages.
2.2.3.1 Basic statistics
Bengaluru, Hyderabad and Chennai are well-developed clusters with good support structure for
innovation (Figure 2.24). Also, the corresponding states have start-up policies specifically focused
on improving the overall hygiene factors that attract enterprise.
In case of Thiruvananthapuram, while the number of government organisations, science parks
and business associations are present in good numbers, many of them are not fully functional or are
not focused on life sciences. In addition, in Thiruvananthapuram+Kochi, Information technology (IT)
companies seem to be incentivised due to the promise of quicker turnaround, lower capital
expenditure and much larger scope of employment.
IP firms are more in Bengaluru, as it is the major hub for innovation. Law firms are more in
Chennai because it is the oldest legal administrative hub in south India with the Indian patent office
also situated at Chennai.
Chemical suppliers are large in number in Hyderabad, directly correlatable to the large presence of
pharmaceutical companies (Figure 2.25).
Chemical suppliers and lab / medical equipment suppliers are present in almost evenly in both
Bengaluru and Chennai.
Kerala, in general, has less number of suppliers in both categories but the number of medical
suppliers is proportionately higher due to well-established medical centres such as Amrita Institute
and SCTIMST.
2.2.3.2 Funding support
Funding is considered the fuel on which a business runs. The pharmaceutical industry in India
ranks 3rd in the world in terms of volume and 14th in terms of value. The provision of process patents
fuelled the growth of the generics pharma industry. With 70 per cent of market share (in terms of
revenues), generic drugs form the largest segment of the Indian pharmaceutical sector. India has a
competitive edge over several other developed nations due to a significant difference in the cost of
production. It is not surprising that as per Tracxn data, the pharma generics sector raised the
maximum amount (nearly 40%) out of the total funds raised by 101 ventures across India (Figure
2.26). The next major sector that attracted funding was CRAMS / CRO / API. Other areas such as
Medical Devices and Healthcare IT have also been able to garner around 12% and 9% funding
respectively. Bioinformatics and Biosimilars have also started getting popular.
Figure 2.26 | Funding raised by life sciences start-ups in India
Agriculture - Veterinary
Bioinformatics
Biosimilars
CRAMS / CRO / API
Diagnostics
Drug Discovery
Healthcare and Agriculture
Healthcare IT
Industrial Biotech
Medical Devices
Nutraceuticals
Pharma Suite
Pharma-Generics
Vaccines
SECTORWISE FUNDS RAISED
Category
ENABLERS
Hyderabad Bengaluru Chennai+Vellore Thiruvananthapuram+Kochi
Nu
mb
er
5 5 9
5
10
76
35
11
4
17
10
4
12
11
8
29
129
1
7 6
11
12
0
5
10
15
20
25
30
35
40
Go
vt.
IP F
irm
s
Sc
ien
ce
Pa
rks
/ T
BI
Bu
sin
es
sA
ss
oc
iati
on
s
La
w F
irm
s
Co
ns
ult
ing
Fir
ms
Figure 2.24 | Distribution of various start-up enablers in the clusters under study
68
39
29
8
18
37
26
14
01020304050607080
Hyderabad Bengaluru Chennai+Vellore
Thiruvananthapuram+Kochi
Nu
mb
er
City
SUPPLIERS
Chemicals Lab / Medical Equipment
Figure 2.25 | Distribution of chemical and lab / medical suppliers in the four clusters under study
7170 Chapter 2 2016Chapter 2 2016
Food, Healthcare
Agriculture, Industrial Biotech
Agriculture
1.03
0.51
1.14
3.74
0.67
0.32
1.59
1.98
0.90
0.41
0.15
36.15
10.05
8.55
27.05
4.21
1.53
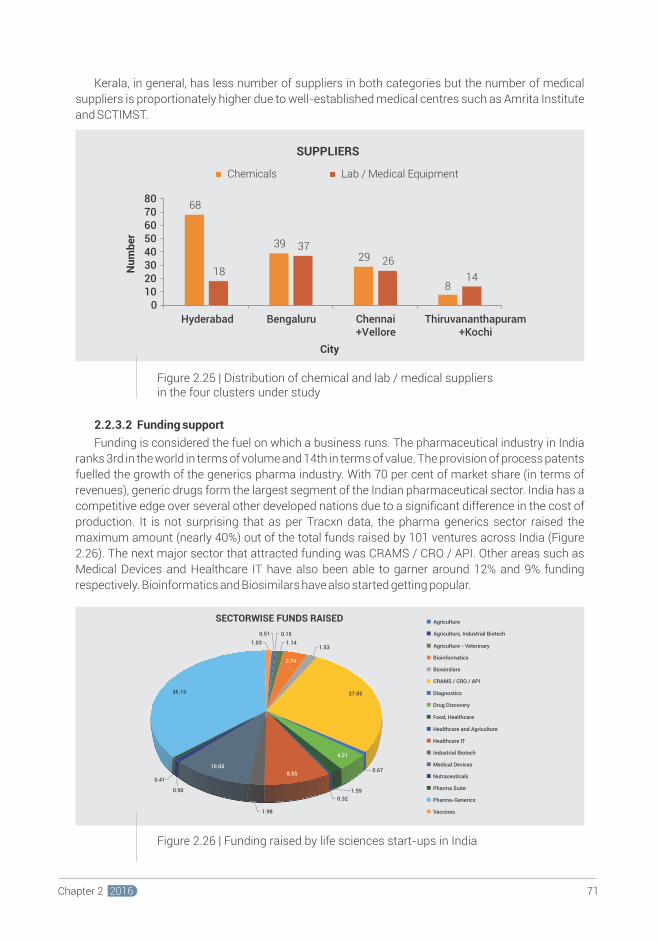
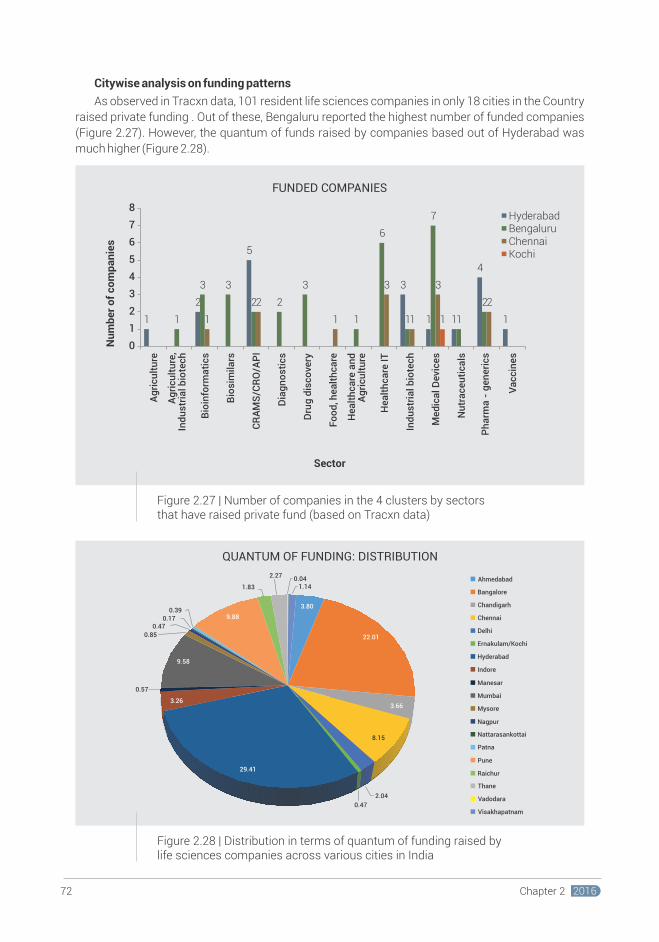
Figure 2.27 | Number of companies in the 4 clusters by sectors that have raised private fund (based on Tracxn data)
Citywise analysis on funding patterns
As observed in Tracxn data, 101 resident life sciences companies in only 18 cities in the Country
raised private funding . Out of these, Bengaluru reported the highest number of funded companies
(Figure 2.27). However, the quantum of funds raised by companies based out of Hyderabad was
much higher (Figure 2.28).
Hyderabad is also known to be the Indian Pharmaceuticals capital. As of 2010, the city
manufactured one third of India's bulk drugs and 16% of biotechnology products. CRAMS/CRO/API
and Pharma generics are the major sectors. As mentioned earlier, the establishment of Indian Drugs
and Pharmaceuticals Limited (IDPL), a public sector undertaking, in 1961 was followed over the
decades by many national and global companies opening manufacturing and research facilities in
the city. Dr. Reddy’s Laboratories played a seminal role in building the pharma cluster around
Hyderabad by establishing an innovation culture among its employees, encouraging spin offs,
imparting high quality training, setting up a translational research centre - Dr. Reddy’s Institute of
Life Sciences, supporting research at LVPEI and several other activities that made Hyderabad a
vibrant biopharma cluster.
Bengaluru is one of the most hi-tech entrepreneurial cities in India. It has the highest number of
venture-funded life sciences companies, largely in healthcare IT and medical devices. These sectors
do not require as much funding as pharma and also have shorter gestation periods which correlates
well with Hyderabad receiving a greater quantum of funding. Bengaluru contributed to a major
proportion of India's IT exports. This was probably the reason for a strong healthcare IT sector in
Bengaluru.
Chennai displayed similar trends as Bengaluru with healthcare IT and medical devices start-ups
receiving most funding. Chennai has been the major hub of economic activities for several decades.
Medical tourism is a source of the city's economy accompanied by the presence of automobile and
manufacturing industry which has laid the foundation for the medical devices sector in Chennai.
2.2.4 Other observationsIP experiences from BRIC
The IP cell of BRIC closely interacts with several individuals and organisations who seek help in
patent related matters. An analysis of this showed that the maximum interest in IP services was
among individuals who wish to start a venture, and start-ups (Figure 2.26). The interest levels in
availing IP services and also awareness varied among institutions. National level institutes with in-
house Technology Transfer Offices or IP cells mostly sought help in technology transfer services,
while universities and colleges needed help with IP awareness among faculty and students and
patentability search. Interest levels in most institutions were found to be tepid even with incentives
such as highly subsidized or free services.
Data from 87 IP search services provided by BRIC showed that 48% of the patentability search
queries were not novel pointing to poor awareness about and existing competition. 14% prior art
technologies were found to be truly novel indicating that Indian innovators are working on low
hanging fruits and not exploring disruptive technology.
Figure 2.28 | Distribution in terms of quantum of funding raised by life sciences companies across various cities in India
Ahmedabad
Bangalore
Chandigarh
Chennai
Delhi
Ernakulam/Kochi
Hyderabad
Manesar
Mumbai
Mysore
Nagpur
Nattarasankottai
Patna
Pune
Thane
Vadodara
Visakhapatnam
Raichur
22.01
3.66
8.15
29.41
2.04
3.26
9.58
0.85
0.470.17
0.399.88
1.83
2.270.04
3.80
7372 Chapter 2 2016Chapter 2 2016
QUANTUM OF FUNDING: DISTRIBUTION
1
2
5
3
1 1
4
11
3 3
2 2
3
1
6
1
7
1
2
1
2
1
3
1
3
2
1
0
1
2
3
4
5
6
7
8
Ag
ric
ult
ure
Ag
ric
ult
ure
, In
du
str
ial b
iote
ch
Bio
info
rma
tic
s
Bio
sim
ila
rs
CR
AM
S/C
RO
/AP
I
Dia
gn
os
tic
s
Dru
g d
isc
ove
ry
Fo
od
, he
alt
hc
are
He
alt
hc
are
an
d
Ag
ric
ult
ure
He
alt
hc
are
IT
Ind
us
tria
l bio
tec
h
Me
dic
al
De
vic
es
Nu
tra
ce
uti
ca
ls
Ph
arm
a -
ge
ne
ric
s
Va
cc
ine
s
Sector
FUNDED COMPANIES
Nu
mb
er
of
co
mp
an
ies
HyderabadBengaluruChennaiKochi
Indore
0.57
0.47
1.14
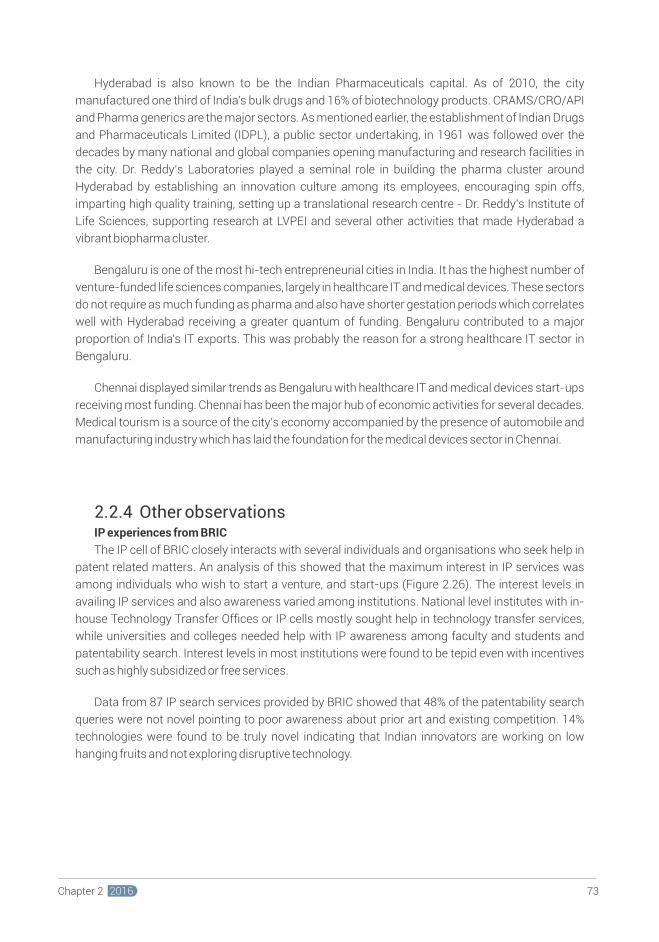
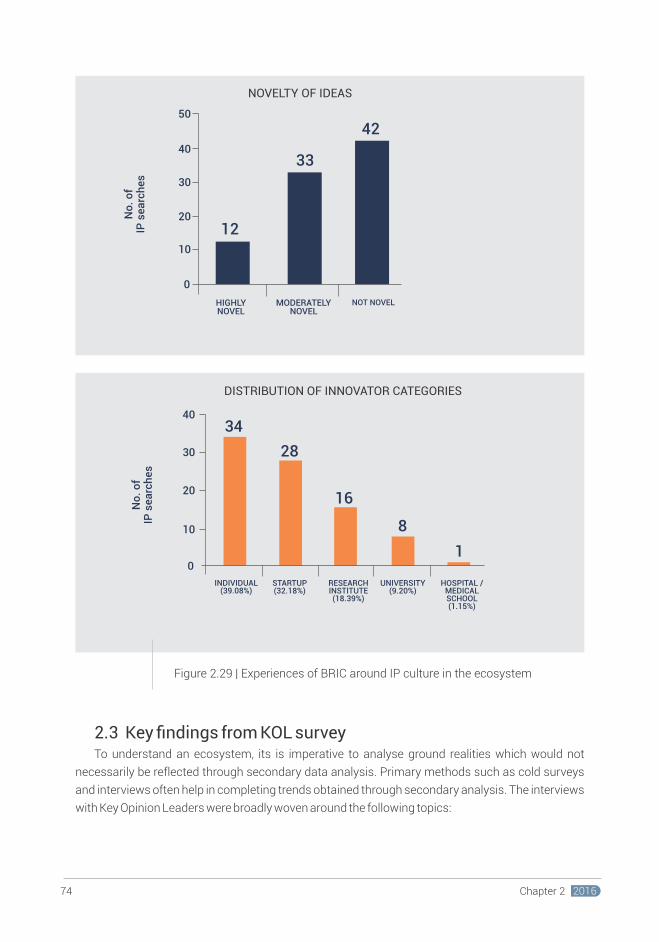
• Current status of innovation ecosystem in their respective cities in terms of strengths and
weaknesses and what can be done to increase the innovation level
• Collaboration status with other stakeholders
• Availability of funding
• Issues related to intellectual property rights
• Regulatory hurdles in commercialisation
• Expectations towards policy level changes
The commonalities have been compared and discussed. The advantages have been compared
and contrasted among the four major clusters. Disadvantages were found to be specific to
stakeholders across cities. Finally, the expectations from the players have been captured.
2.3.1 Advantages in various south Indian clusters
Hyderabad came out as a moderately well-developed cluster with features and incubation
support similar to Bengaluru although highly skewed towards the pharma sector. The support from
both these state governments for start-up policies and establishment of state-supported
incubation are an added advantage.
Bengaluru appeared to be the most mature cluster with a conducive start-up environment as felt
by those who strategically chose Bengaluru for their operations as well as several others based
elsewhere in southern India. Presence of strong clinical community and support from institutions
like St. Johns Medical College was a huge value addition for companies looking to partner for clinical
validation. Bengaluru has a large and diverse experienced talent pool, alumni networks of several
renowned institutions and networking forums that help entrepreneurs exchange ideas and benefit
from experiences of their peers. Finally, several entrepreneurs preferred Bengaluru because of its
pleasant weather, cosmopolitan nature and diversity of job opportunities across a wide range of
sectors.
Chennai has had a history of strong manufacturing capabilities especially in the automobile
sector. This, coupled with a tech-savvy clinical community and presence of institutes like CMC,
Vellore has led to the growth of the medical devices sector. Chennai also instituted the Golden
Jubilee Women's Biotech Park which was pointed out by several women entrepreneurs as a mark of
a friendly, gender sensitive and supportive innovation environment.
Thiruvananthapuram and Kochi were together found to be an emerging cluster, with several life
sciences research institutions and a biotech park in Kochi. The presence of Sree Chitra Tirunal
Institute of Medical Sciences and Technology clearly stood out as a high point for this cluster since it
was the only facility in the country to carry out large animal studies in addition to bio-compatibility
studies.
MODERATELY NOVEL
NOT NOVEL
No
. o
f IP
se
arc
he
s
HIGHLYNOVEL
50
40
30
20
10
12
33
42
0
Figure 2.29 | Experiences of BRIC around IP culture in the ecosystem
RESEARCHINSTITUTE(18.39%)
UNIVERSITY(9.20%)
HOSPITAL /MEDICALSCHOOL (1.15%)
INDIVIDUAL(39.08%)
STARTUP(32.18%)
No
. o
f IP
se
arc
he
s
1
8
16
3440
30
20
10
0
28
2.3 Key findings from KOL survey
To understand an ecosystem, its is imperative to analyse ground realities which would not
necessarily be reflected through secondary data analysis. Primary methods such as cold surveys
and interviews often help in completing trends obtained through secondary analysis. The interviews
with Key Opinion Leaders were broadly woven around the following topics:
7574 Chapter 2 2016Chapter 2 2016
NOVELTY OF IDEAS
DISTRIBUTION OF INNOVATOR CATEGORIES
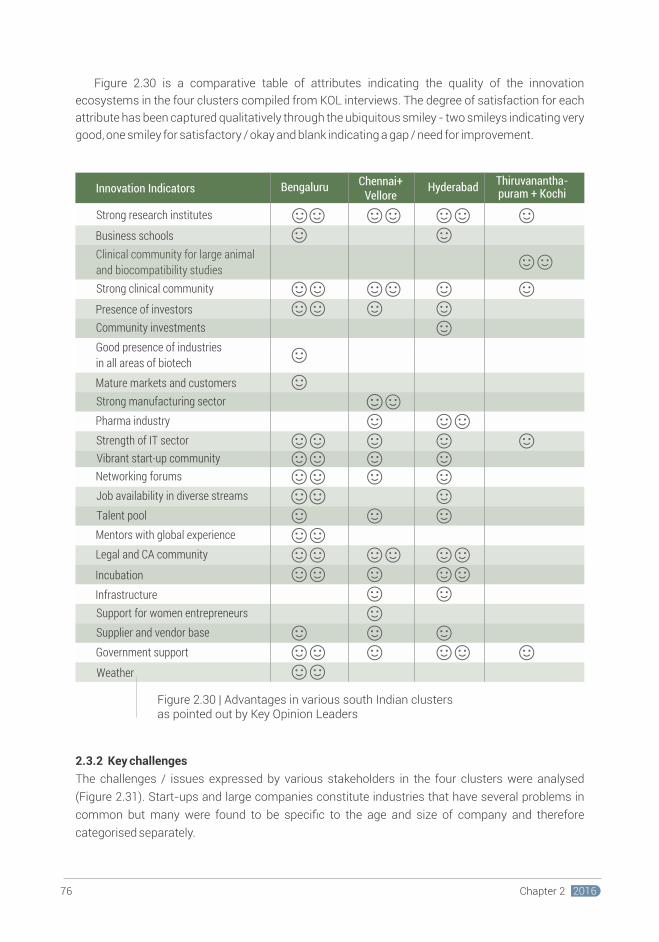
The biggest hurdle faced by all stakeholders was with regulatory compliances. It ranged from
lack of guidelines for several areas such as medical devices, stem cells to conflicting opinions on the
procedures to be followed. The red-tape and bureaucratic delays added to the uncertainties.
Conducting large animal studies, seeking ethical clearances and conducting clinical trials were
stated as most difficult by small companies.
Duty and taxation also adversely affect several innovative projects. Minimum alternative tax of
18% was mentioned as a severe impediment especially in the life sciences sector since most
companies have large gestation periods and survival of R&D projects is purely through grants and
revenues from the services arms. While this has been addressed in Startup India policy where
companies incorporated after April 2016 and notified for innovative capacity are exempt from this,
it does not apply retrospectively. High import duties of 30% on raw materials as opposed to less than
10% on finished goods was pointed out as one of the major hurdles for Indian innovators against
their competitors from countries such as China and South Korea. Ophthalmology products are
exempt from such duties and hence extending this to several other key areas would help several
entrepreneurs flourish. In addition, antidumping duties on imported goods in these areas would
benefit notified start-ups towards following competitive pricing for their technologies.
Vendor base for engineering prototypes / manufacturing was a problem faced by SMEs and
start-ups.
Goods and Services Tax (GST) and its implications on start-ups
The GST bill that will be implemented from April 2017 aims to unify all indirect taxes. This is
expected to benefit all businesses and favour start-ups.
1. The ease of starting a business in India by rationalising taxes through GST is expected to
encourage entrepreneurs to enter into the manufacturing and industrial sector.
Currently, several registrations such as VAT registration, CST registration, import /
export registration are required to avail duty benefits. This will be eliminated on
implementation of GST.
2. The significant aspect of GST is that this tax will be levied only on the final destination or
on consumption of goods or services based on the value added (addition of value would
be the taxable event) . This helps to eliminate economic distortions in taxation amongst
the states and helps in the free movement of goods.
3. GST also seeks to reduce the discretion exercised by the assessing authority to ensure a
more transparent taxation system. This is expected to provide better opportunities for
new businesses.
4. The tax is levied only on finished product movement and not at every stage of production
or distribution, thus removing the complexity of taxation.
5. Individuals are expected to benefit from reduced prices due to GST resulting in
increased consumption and its ripple effect on the economy.
7776
Figure 2.30 is a comparative table of attributes indicating the quality of the innovation
ecosystems in the four clusters compiled from KOL interviews. The degree of satisfaction for each
attribute has been captured qualitatively through the ubiquitous smiley - two smileys indicating very
good, one smiley for satisfactory / okay and blank indicating a gap / need for improvement.
Figure 2.30 | Advantages in various south Indian clustersas pointed out by Key Opinion Leaders
Bengaluru HyderabadChennai+Vellore
Thiruvanantha-puram + Kochi
Strong research institutes
Community investments
Good presence of industries
in all areas of biotech
Mature markets and customers
Strong manufacturing sector
Pharma industry
Strength of IT sector
Mentors with global experience
Vibrant start-up community
Networking forums
Job availability in diverse streams
Talent pool
Legal and CA community
Incubation
Infrastructure
Support for women entrepreneurs
Supplier and vendor base
Government support
Weather
Innovation Indicators
Business schools
Clinical community for large animal
and biocompatibility studies
Strong clinical community
Presence of investors
2.3.2 Key challenges
The challenges / issues expressed by various stakeholders in the four clusters were analysed
(Figure 2.31). Start-ups and large companies constitute industries that have several problems in
common but many were found to be specific to the age and size of company and therefore
categorised separately.
Chapter 2 2016Chapter 2 2016
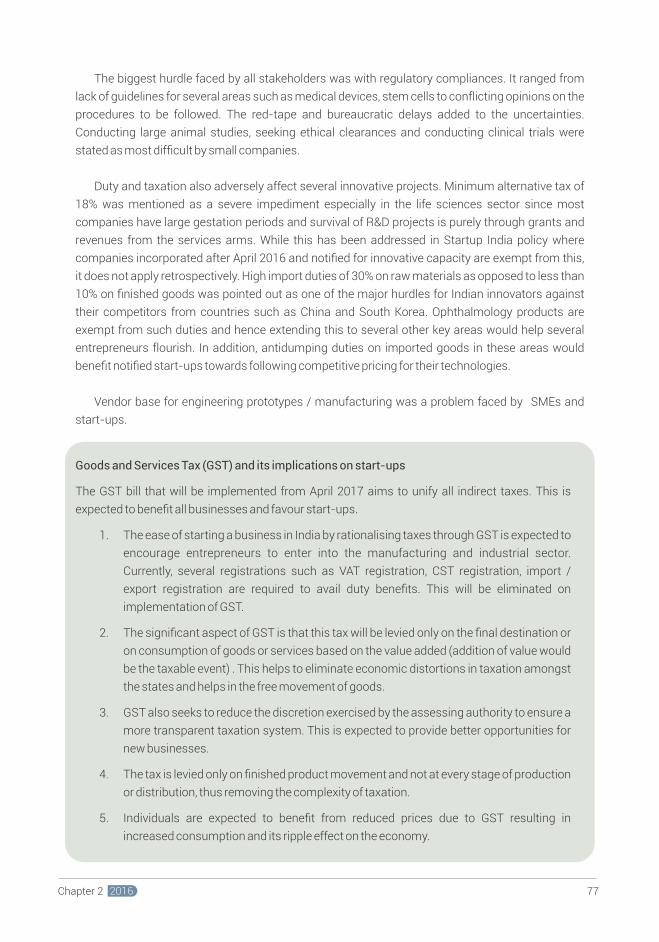
2.3.3.1 Collaboration
Knowledge transfer and information flow across stakeholders is necessary for establishing
feedback loops and long term sustenance of the ecosystem.
Several institutes were found to have restriction on sabbaticals and rules in permitting students
from starting their ventures. Over 60% KOLs felt such attitude and archaic rules in academic
institutions were important bottlenecks that needed reforms to enable a conducive innovation
ecosystem in academia.
The lack of strong technology transfer offices in institutes with well-trained negotiators was
highlighted as an issue by all KOLs from the academic fraternity who felt they were often denied a fair
deal by the industry and opined that there was a need for bridging partners who could mediate
collaboration with industries. Collaborations therefore tended to exist more as consulting projects
rather than as co-development of products.
Most of Indian academia was still caught up in the proverbial 'publish or perish' mode and other
activities such as industry collaborations and spin-offs were not encouraged. This reflected in the
absence of criteria like translational prospects of research or sourcing funds from alternate routes in
faculty performance metrics.
Industries and start-ups opined that the pace of work in Indian academia was often slow
because of lack of motivation to quickly commercialise a technology with only relevant experiments.
While enquiry and fundamental research were paramount in establishing a sound research
foundation, this often led to mismatches in timelines required by a profit-driven organisation that
has to align with shareholder demands.
Also, the industry KOLs felt that Indian academia do not take their technology to a stage where it
was commercialisable either readily or within a short time frame. Prolonged periods for licensing
negotiations added a huge uncertainty not only in the potential of the technology but also in the
patent timelines. This often led to undervaluation or termination of collaboration over IP rights.
2.3.3.2 Intellectual property rights
Protecting technologies from infringement or copying through filing of patents was recognised
by academia as important. Awareness and ability to protect IP was not evidenced beyond top tier
institutes. About 40% of the KOLs said that prohibitive costs in obtaining Patent Cooperation Treaty
(PCT) filings, budget cuts and competitive funding landscape made patenting take a back seat
especially in academic institutes because of lack of clarity in valuation of patents and their ability to
provide reasonable return on investments. However, with increasing early stage funding, seed
grants and funding schemes specifically for filing patents, these problems are expected to diminish
over time.
In addition, University Grants Commission (UGC) norms mandates publications for graduating
students which often interferes with timelines of filing.
Procedural delays and lack of trained manpower to manage patent cells / TTOs caused
technologies to become obsolete or lose their relevance with industry.
7978
Large companies have deep pockets to either outsource or hire trained personnel for design and
productisation of their prototypes especially in the area of medical devices. Local vendors with
smaller manufacturing factories were usually approached by entrepreneurs. While most of these
vendors possessed good skills, they lacked design capabilities or creativity to be able to
manufacture from drawings or explanation. Start-ups were often found to import the initial
prototype from elsewhere and then needed several iterations to obtain a desired quality product.
Although it served as a work-around, these problems could pose serious issues in the
establishment of strong long-term manufacturing capabilities in the Country.
Indian academia seemed to lack awareness of industry needs and often appeared to be out-of-sync
with current trends and practices leading to poor knowledge flow within the ecosystem. On the other
hand, several academics felt that Indian industry was risk averse and not geared to taking up new
innovations. Discussion on poor collaboration trends often led each stakeholder (industry and
academia) to point at the severe lack of capabilities in the other. A more detailed discussion on
issues with collaboration have been taken up in the subsequent section.
Figure 2.31 | Summary of issues pointed out by various stakeholders
Funding
Sales / Marketing expertise
Compliances
Duty and taxation
Vendor base
Innovation talent
Perception of working with
other stakeholders
Collaboration with other stakeholders
Awareness on commercialisation,
IP & regulations
StartupsSMEs / LargeCompanies
Industry Academia Enablers
2.3.3 A deeper dive into challenges
Collaboration, intellectual property, regulatory guidelines and funding were found to be the four
major hurdles to innovation and for each hurdle, five likely causes were identified. For each hurdle,
KOLs were asked to select from the five probable causes which they felt were important. Figure 2.32
gives a glimpse of what % of KOLs thought what the critical issues were for each challenge.
The findings are discussed below.
Chapter 2 2016Chapter 2 2016
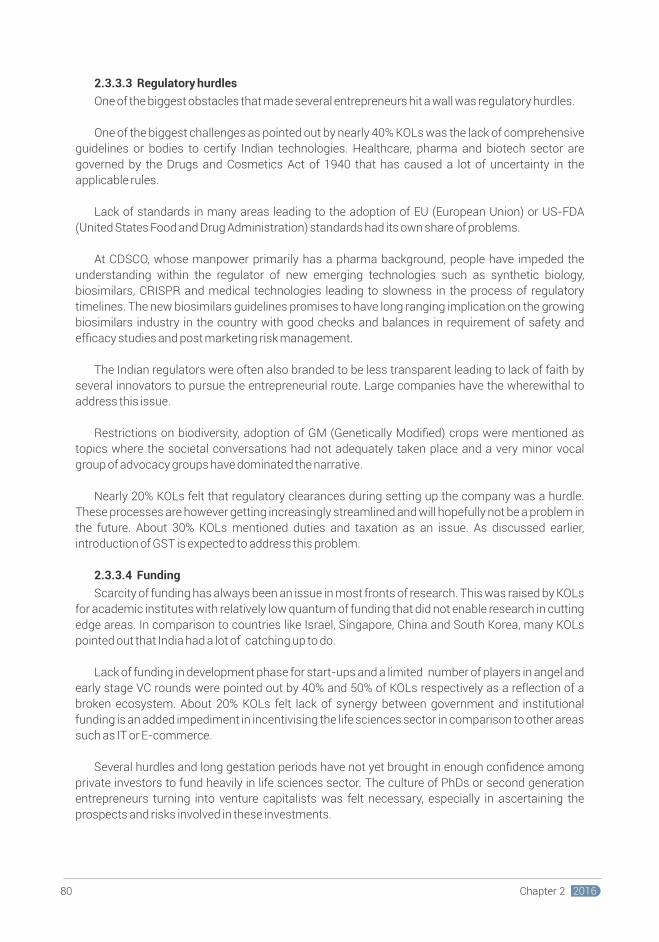
2.3.4 Expectations of KOLs to improve the ecosystem
During interviews, KOLs were asked to list changes they would expect in order to improve the
regional innovation ecosystem. The expectations of KOLs were classified into three broad levels,
national government, state government and individual players based on who would drive the change
(Figure 2.33).
2.3.4.1 National level policy incentives from the government
Globally, governments bear the technology risk of disruptive innovations. Invention-based
technology innovations like what is needed in life sciences cannot happen without long-term
focused investment by the government in translational research and product development.
Establishment of BIRAC with innovation funding schemes for industry at various stages of growth
was a move in the right direction. Larger investment ticket sizes from government funding would be
possible only if the budgets of DBT, the Department of Science and Technology (DST), Council for
Scientific and Industrial Research (CSIR), ICMR, Department of Electronics and Information
Technology (DeitY) and other science and technology led departments were increased and a higher
percentage of India's GDP was invested in R&D activities.
Collaboration
Need for bridgingpartner
Domineering big companies
Conservativeinstitute policies
Disconnect from end users
Discrepancy in pace of working
Evaluation of facultyand studentsA
Intellectual Property
Professionalism in legal setup
Funding
Awareness
Attitude in academia
Clarity on valuation
Procedural hurdlesB
80
60
40
20
0
Regulatory hurdles
Bureaucraticdelays
Duty structureand taxation
No guidelines or
clarity
Intial setting up
Lack of awareness
C
Funding
Disconnectbetween players
Quantum / Budget cuts
Lack of funds for
development
Delayed disbursement
Lack of VC private funding
D
60
40
20
0
60
40
20
0
40
30
20
10
0
Figure 2.32 | Major hurdles discussed by KOLs - Percentage of KOLs pointing out various issues in collaboration (A) intellectual property rights (B) regulatory hurdles (C) and funding (D) are represented
8180
2.3.3.3 Regulatory hurdles
One of the biggest obstacles that made several entrepreneurs hit a wall was regulatory hurdles.
One of the biggest challenges as pointed out by nearly 40% KOLs was the lack of comprehensive
guidelines or bodies to certify Indian technologies. Healthcare, pharma and biotech sector are
governed by the Drugs and Cosmetics Act of 1940 that has caused a lot of uncertainty in the
applicable rules.
Lack of standards in many areas leading to the adoption of EU (European Union) or US-FDA
(United States Food and Drug Administration) standards had its own share of problems.
At CDSCO, whose manpower primarily has a pharma background, people have impeded the
understanding within the regulator of new emerging technologies such as synthetic biology,
biosimilars, CRISPR and medical technologies leading to slowness in the process of regulatory
timelines. The new biosimilars guidelines promises to have long ranging implication on the growing
biosimilars industry in the country with good checks and balances in requirement of safety and
efficacy studies and post marketing risk management.
The Indian regulators were often also branded to be less transparent leading to lack of faith by
several innovators to pursue the entrepreneurial route. Large companies have the wherewithal to
address this issue.
Restrictions on biodiversity, adoption of GM (Genetically Modified) crops were mentioned as
topics where the societal conversations had not adequately taken place and a very minor vocal
group of advocacy groups have dominated the narrative.
Nearly 20% KOLs felt that regulatory clearances during setting up the company was a hurdle.
These processes are however getting increasingly streamlined and will hopefully not be a problem in
the future. About 30% KOLs mentioned duties and taxation as an issue. As discussed earlier,
introduction of GST is expected to address this problem.
2.3.3.4 Funding
Scarcity of funding has always been an issue in most fronts of research. This was raised by KOLs
for academic institutes with relatively low quantum of funding that did not enable research in cutting
edge areas. In comparison to countries like Israel, Singapore, China and South Korea, many KOLs
pointed out that India had a lot of catching up to do.
Lack of funding in development phase for start-ups and a limited number of players in angel and
early stage VC rounds were pointed out by 40% and 50% of KOLs respectively as a reflection of a
broken ecosystem. About 20% KOLs felt lack of synergy between government and institutional
funding is an added impediment in incentivising the life sciences sector in comparison to other areas
such as IT or E-commerce.
Several hurdles and long gestation periods have not yet brought in enough confidence among
private investors to fund heavily in life sciences sector. The culture of PhDs or second generation
entrepreneurs turning into venture capitalists was felt necessary, especially in ascertaining the
prospects and risks involved in these investments.
Chapter 2 2016Chapter 2 2016
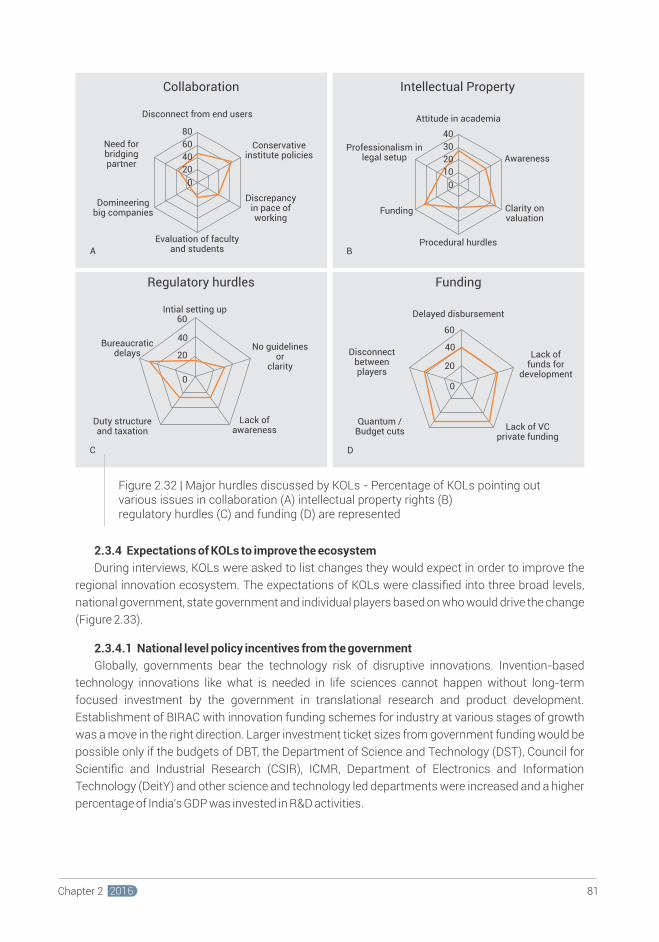
2.3.4 Expectations of KOLs to improve the ecosystem
During interviews, KOLs were asked to list changes they would expect in order to improve the
regional innovation ecosystem. The expectations of KOLs were classified into three broad levels,
national government, state government and individual players based on who would drive the change
(Figure 2.33).
2.3.4.1 National level policy incentives from the government
Globally, governments bear the technology risk of disruptive innovations. Invention-based
technology innovations like what is needed in life sciences cannot happen without long-term
focused investment by the government in translational research and product development.
Establishment of BIRAC with innovation funding schemes for industry at various stages of growth
was a move in the right direction. Larger investment ticket sizes from government funding would be
possible only if the budgets of DBT, the Department of Science and Technology (DST), Council for
Scientific and Industrial Research (CSIR), ICMR, Department of Electronics and Information
Technology (DeitY) and other science and technology led departments were increased and a higher
percentage of India's GDP was invested in R&D activities.
Collaboration
Need for bridgingpartner
Domineering big companies
Conservativeinstitute policies
Disconnect from end users
Discrepancy in pace of working
Evaluation of facultyand studentsA
Intellectual Property
Professionalism in legal setup
Funding
Awareness
Attitude in academia
Clarity on valuation
Procedural hurdlesB
80
60
40
20
0
Regulatory hurdles
Bureaucraticdelays
Duty structureand taxation
No guidelines or
clarity
Intial setting up
Lack of awareness
C
Funding
Disconnectbetween players
Quantum / Budget cuts
Lack of funds for
development
Delayed disbursement
Lack of VC private funding
D
60
40
20
0
60
40
20
0
40
30
20
10
0
Figure 2.32 | Major hurdles discussed by KOLs - Percentage of KOLs pointing out various issues in collaboration (A) intellectual property rights (B) regulatory hurdles (C) and funding (D) are represented
8180
2.3.3.3 Regulatory hurdles
One of the biggest obstacles that made several entrepreneurs hit a wall was regulatory hurdles.
One of the biggest challenges as pointed out by nearly 40% KOLs was the lack of comprehensive
guidelines or bodies to certify Indian technologies. Healthcare, pharma and biotech sector are
governed by the Drugs and Cosmetics Act of 1940 that has caused a lot of uncertainty in the
applicable rules.
Lack of standards in many areas leading to the adoption of EU (European Union) or US-FDA
(United States Food and Drug Administration) standards had its own share of problems.
At CDSCO, whose manpower primarily has a pharma background, people have impeded the
understanding within the regulator of new emerging technologies such as synthetic biology,
biosimilars, CRISPR and medical technologies leading to slowness in the process of regulatory
timelines. The new biosimilars guidelines promises to have long ranging implication on the growing
biosimilars industry in the country with good checks and balances in requirement of safety and
efficacy studies and post marketing risk management.
The Indian regulators were often also branded to be less transparent leading to lack of faith by
several innovators to pursue the entrepreneurial route. Large companies have the wherewithal to
address this issue.
Restrictions on biodiversity, adoption of GM (Genetically Modified) crops were mentioned as
topics where the societal conversations had not adequately taken place and a very minor vocal
group of advocacy groups have dominated the narrative.
Nearly 20% KOLs felt that regulatory clearances during setting up the company was a hurdle.
These processes are however getting increasingly streamlined and will hopefully not be a problem in
the future. About 30% KOLs mentioned duties and taxation as an issue. As discussed earlier,
introduction of GST is expected to address this problem.
2.3.3.4 Funding
Scarcity of funding has always been an issue in most fronts of research. This was raised by KOLs
for academic institutes with relatively low quantum of funding that did not enable research in cutting
edge areas. In comparison to countries like Israel, Singapore, China and South Korea, many KOLs
pointed out that India had a lot of catching up to do.
Lack of funding in development phase for start-ups and a limited number of players in angel and
early stage VC rounds were pointed out by 40% and 50% of KOLs respectively as a reflection of a
broken ecosystem. About 20% KOLs felt lack of synergy between government and institutional
funding is an added impediment in incentivising the life sciences sector in comparison to other areas
such as IT or E-commerce.
Several hurdles and long gestation periods have not yet brought in enough confidence among
private investors to fund heavily in life sciences sector. The culture of PhDs or second generation
entrepreneurs turning into venture capitalists was felt necessary, especially in ascertaining the
prospects and risks involved in these investments.
Chapter 2 2016Chapter 2 2016
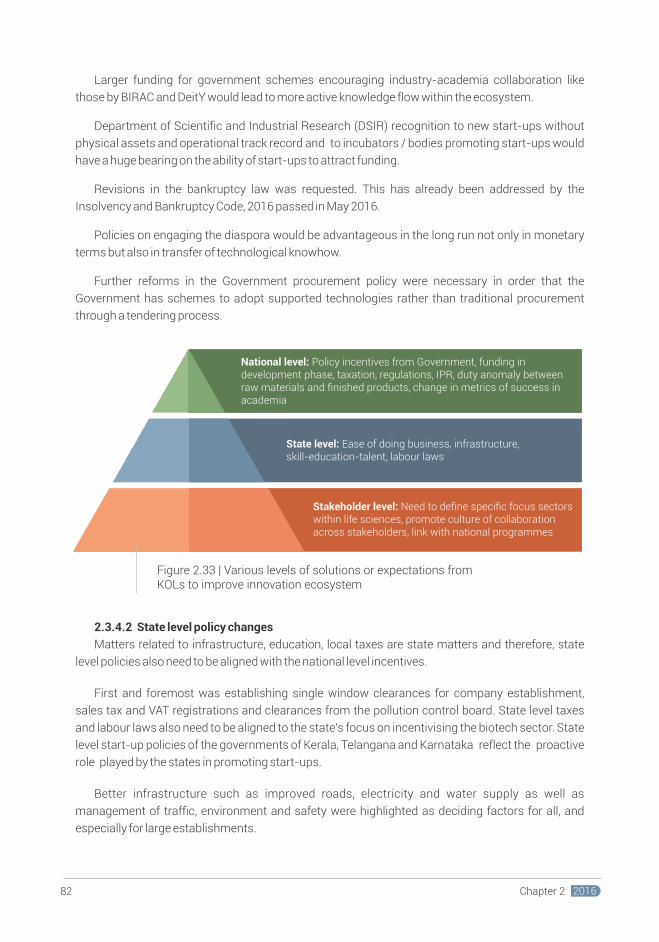
Several KOLs pointed out that a big challenge in availability of good creative talent was linked to
the education system. While there are central boards of education, many students graduate through
schools that adhere to state decided syllabus. The current education system was primarily
dependent on rote learning which in the long run impedes the creativity and problem solving
capabilities of students. Revision in teaching methods would be the first step towards talent
generation.
2.3.4.3 Stakeholder level changes
With the government incentivising start-ups through various schemes, it was also the
responsibility of the individual players to adopt changes that favour and nurture innovation.
Information portals on funding, regulation, vendors would improve awareness. Specifically,
if this role were to be played by large academic institutes and incubators, the reach would be deeper
and farther. Establishment of LARTA like bodies would be crucial in knowledge dissemination to new
age entrepreneurs and academic spin-offs as a one stop solution for myriad issues faced by them.
Such bodies could be part of public private partnerships.
Academic institutions have a huge role in improving the state of education. While syllabus is a
state matter, offering elective courses, mandating industry internships or short-term courses on
business fundamentals is a decision for individual institutes to make. This would be particularly
useful in generating industry-ready talent.
Individual companies could start acceleration centres either in partnership with incubators or by
themselves. This trend is increasingly gaining popularity. This would help in nurturing entrepreneurs
at an early stage and aligning industry-start-up-academia goals.
Since funding was scarce, it would be important that individual institutions and companies
accessing government grants use equipment procured responsibly. Redundancy in equipment
leads to insufficient use and on the whole reduces productivity. Lastly, veterinary colleges should
also consider establishing Technology Business Incubators to be able to conduct large animal
studies and trials.
National level: Policy incentives from Government, funding in development phase, taxation, regulations, IPR, duty anomaly between raw materials and finished products, change in metrics of success in academia
State level: Ease of doing business, infrastructure, skill-education-talent, labour laws
Stakeholder level: Need to define specific focus sectors within life sciences, promote culture of collaboration across stakeholders, link with national programmes
2.3.4.2 State level policy changes
Matters related to infrastructure, education, local taxes are state matters and therefore, state
level policies also need to be aligned with the national level incentives.
First and foremost was establishing single window clearances for company establishment,
sales tax and VAT registrations and clearances from the pollution control board. State level taxes
and labour laws also need to be aligned to the state's focus on incentivising the biotech sector. State
level start-up policies of the governments of Kerala, Telangana and Karnataka reflect the proactive
role played by the states in promoting start-ups.
Better infrastructure such as improved roads, electricity and water supply as well as
management of traffic, environment and safety were highlighted as deciding factors for all, and
especially for large establishments.
Figure 2.33 | Various levels of solutions or expectations fromKOLs to improve innovation ecosystem
Larger funding for government schemes encouraging industry-academia collaboration like
those by BIRAC and DeitY would lead to more active knowledge flow within the ecosystem.
Department of Scientific and Industrial Research (DSIR) recognition to new start-ups without
physical assets and operational track record and to incubators / bodies promoting start-ups would
have a huge bearing on the ability of start-ups to attract funding.
Revisions in the bankruptcy law was requested. This has already been addressed by the
Insolvency and Bankruptcy Code, 2016 passed in May 2016.
Policies on engaging the diaspora would be advantageous in the long run not only in monetary
terms but also in transfer of technological knowhow.
Further reforms in the Government procurement policy were necessary in order that the
Government has schemes to adopt supported technologies rather than traditional procurement
through a tendering process.
8382 Chapter 2 2016Chapter 2 2016
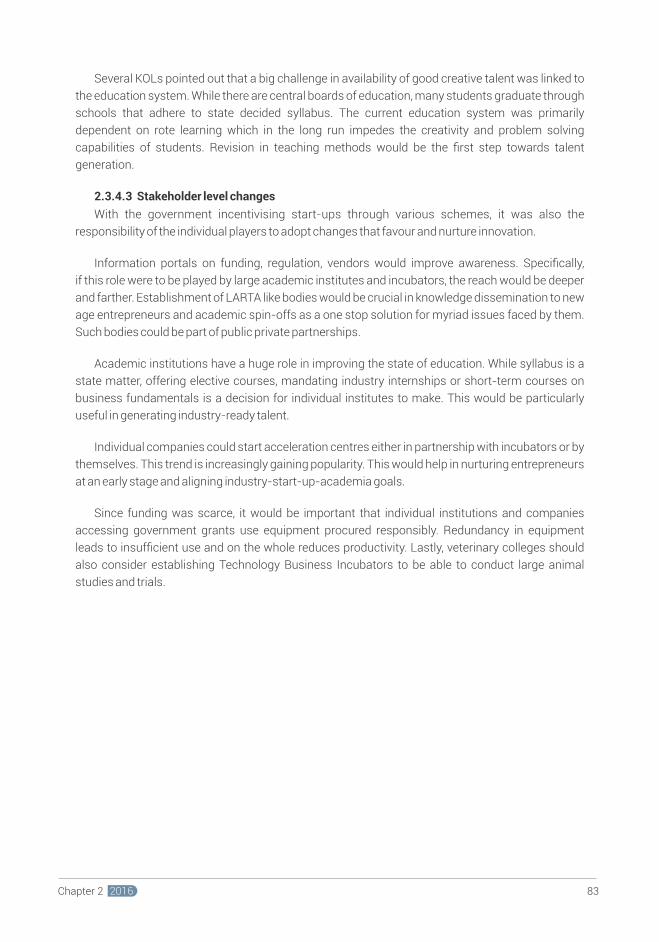

3.1 Current status of ecosystem and classification of capabilities
of stakeholders
As discussed in the introductory chapter, the innovation capability of an ecosystem is affected by
several stakeholders and the type of interactions amongst them. In Figure 3.1, a colour coding
classifies the stakeholders and their interactions into vibrant (green), improving but needs more
focus (yellow) and lastly those that need serious attention and support (red) to achieve the desired
growth.
The present study focused on the underlying dynamics of four clusters spread across south India
- viz Bengaluru, Hyderabad, Chennai and Thiruvananthapuram. Through this report, we have shown
the inherent strengths and existing gaps in each of these clusters including the nature of interactions
amongst the four stakeholders. Two of the four clusters, Hyderabad and Bengaluru that the report
focused on, are recognised as leading clusters in pharma and biotech in the Country thus attracting
new talent in industry, academia and enablers that come together to create a virtuous cycle. Chennai
is rapidly growing as a biopharma cluster and is leveraging its lessons from being the automotive hub
of the Country while Thiruvananthapuram is still a nascent hub that shows potential for future
growth.
Through a combinatorial approach of primary, secondary data and interviews with KOL, the
present study has teased apart the underlying tendencies of the four clusters.
Procurement by Government and public agencies is slowly improving in several areas. Many
PHCs and district-level hospitals exercise their discretionary option to procure affordable equipment.
The most viable model seems to be a Business to Business (B2B) model because convincing the
clinical community on the benefit of a device is easier as compared to B2G or B2C. B2G models work
well for public heath related and low cost technologies. However, when higher value products are
involved, going through a tendering process could often be cumbersome for start-ups. With the
Government encouraging entrepreneurship, further support in the last mile of public procurement
would further add to the success of translation of innovation. B2C models are often difficult for
entrepreneurs considering the sales, distribution and marketing costs.
India has over 100 Technology Business Incubators (TBIs) and incubation facilities and the
Government has played a significant role in providing support for initial establishment of several
Chapter 3SUMMARISING CURRENT STATUS ANDRECOMMENDATIONS
85Chapter 3 2016
Enablers
Academia
Industry and start-ups
Figure 3.1 | Current status of the Indian innovation ecosystem -Green, Yellow and Red boxes indicate vibrant, intermediary and poor status respectively
Innovation Ecosystem
3.2 Recommendations from BRICThe Indian biopharma and life sciences industry is expected to grow at about an average of 15%
Year on Year. India is a leader in generic and API producer with several companies recording over
50% of their revenues in international markets. The strong talent pool, government policies and
purchasing power further advance the potential of the sector. The stated goal of the Government of
India is to achieve a US$100 billion bioeconomy by 2025. The biotech clusters, including those in
south India, will play a critical role for achieving the stretched target. However, there exist several
gaps in the ecosystem - as highlighted in the report - that need to be addressed to be able to realise
the growth potential. These gaps have been analysed and expectations from the stakeholders in the
ecosystem have been captured to provide the following recommendations:
1. Knowledge generation
Ensuring quality and relevance:
• Making it mandatory to include parameters such as H index for appraisals and
promotions. Tenure track positions to be awarded on review after few years.
• Encouraging sabbaticals to explore new frontiers and stay up-to-date with emerging
applications.
TechnicalmentorshipConsultancy
Financial support
Networking capabilitiesLegal, IP and Taxationsupport, Mentorship
PoliciesProcurement
Finance
Liaison betweenmarket and fundamental research
Government
RegulationKnowledge generationInnovation organiser
bio-incubation centres in the four clusters. As per the new Startup India Action Plan, there is a
proposal to increase this number manifold. Many of these enablers currently play an important role
in not only providing access to high end instrumentation to entrepreneurs and SMEs, but also
facilitate networking and cross-talk and more crucially, mentorship on various fronts including
business and technical aspects. While infrastructural support for incubators is important, merely
setting up more facilities would not address the numerous challenges that entrepreneurs face.
Incubators need to improve the quality of mentoring support. This is a challenge given the fact that
the ecosystem in each of these clusters is young, with limited supply of mentors. On the funding
front, grant support in India is very positive which now enables several people to receive funding at
the crucial stage of taking an idea to the proof-of-concept - the first hurdle in the productisation
value chain. While there are a few instances of follow-on funding programmes by the Government,
the present study found that there is a case for initiating several other follow-on funding
programmes which would help start-ups to transition to the next level. Also, there is a need for
synergy between institutional funding and government grants so that deserving start-ups do not
become victims of the so called “valley of death.”
While launch of several schemes by the Government has created a conducive environment for
entrepreneurs, lack of regulatory transparency, standards and guidelines would pose a huge
obstacle in the coming years. This lack of clarity also creates an unfriendly environment for early
stage investors to fund start-ups.
Academia plays a crucial role in any innovation ecosystem. There has been a significant
improvement in the research capacity of Indian academia, however several challenges still persist,
especially in the realm of high quality basic research, as well as ‘translational research.’ Basic
research and translational research are intertwined and need significant funding to attract talent
such that there is a critical mass of well-trained innovators in the future. There is an urgent need to
create a vibrant ecosystem in the innovation capacity of Indian academia to especially encourage
translation of academic research into products and processes that benefit the society. Faculty-led
entrepreneurship has taken roots in at least three of the clusters that this report studied (Bengaluru,
Hyderabad and Chennai) and is growing. This needs further policy impetus and changes in
academic policies especially in assessment frameworks for promotion of faculty such that the
faculty who wish to combine research with entrepreneurship are not disadvantaged. There is a
noticeable trend of establishment of new private universities in southern India. Some of the private
universities are transforming themselves from ‘teaching only’ institutions to combine research
components. This is a positive trend. It will be important to find policy instruments that can help
private universities to transition from only teaching universities to research universities.
Overall, reforms could be classified into short-term and long-term; short-term involves
immediate fixing of gaps in support, procurement and funding obstacles; long-term involves
reforms in education, research and regulations that are crucial in creating a culturally suitable
environment for innovation and entrepreneurship.
8786 Chapter 3 2016Chapter 3 2016
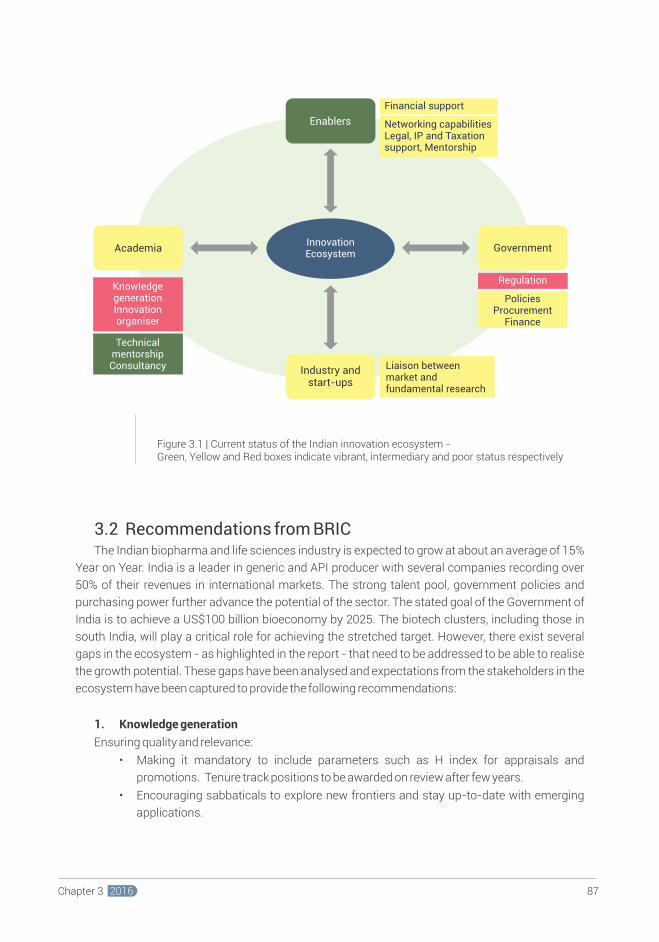
• Setting up Technology Business Incubators in veterinary institutes for conducting large
animal studies and trials.
• Incubators, science parks to be supplemented with pilot scale plants and packaging
facilities to accelerate manufacturing capabilities of start-ups.
• Setting up LARTA like bodies as one-stop solution for start-up queries under a public
private partnership.
• Establishing more institutes for technical training to strengthen vendor base with
possible global collaborations.
4. Funding
• Need for follow-on funding: To initiate greater number of follow-on funding schemes
through public agencies as well as through PPP models.
• Large ticket size grants: There is a need for larger quantum of grants especially beyond
the proof of concept stage for high risk product development. This could be both in areas
of national priority and in high global opportunity segments.
• Sensitizing angel and VC funders on intricacies of life science product development and
need for more events connecting start-ups to private funders.
• Creating a ‘CIBIL’ like organisation to help funding bodies manage their funding better
and also helping innovators secure funding on better terms. This should be available to
all bodies to track good start-ups. The information could be used by VCs to encourage
investment in technology heavy start-ups.
• Policies on engaging the diaspora would be advantageous in the long run not only in
monetary terms but also in transfer of technological knowhow.
• Incentivising younger faculty: Reducing number of years of service to qualify for
sabbaticals. Promotions and incentives to be given for faculty who manage to succeed
and return back to academia.
• Institutions with good publishing records could be selected for targeted translational
programmes, primarily to promote truly interdisciplinary collaborations. Such
collaborations could look beyond publications and include co-development of products.
• Bringing in the culture of translational research in academia and research institutions
through sensitisation and awareness programmes and creating a vibrant, conducive
ecosystem.
• Change in academic policy to include a performance matrix that takes into account
entrepreneurial achievements, IP, technology licensing for faculty promotion.
• Capacity building of promising private institutions through increased funding for
research.
• Connecting private academic institutions with public institutions for joint innovation
research.
• Greater emphasis on academia-industry collaborations especially in the realm of
product development.
2. Regulations and regulatory bodies
• Improving the human resource capacity of the regulatory agencies, especially provision
for wider backgrounds of regulators rather than purely pharma graduates. PhDs /
industry experience in various streams of science and engineering would enable better
guidelines, clearances and due diligence.
• Policy changes in public procurement of innovative products, greater transparency in
public procurement.
• Greater fiscal and tax credits to support innovation-driven R&D in industry. Special tax
provisions / incentives in VC / Angel investments for R&D core companies in defined
focus areas. These could be adapted from Israel, Singapore or New Zealand.
• Antidumping duties on imported goods in specific focus areas would benefit DIPP
recognised start-ups towards competitive pricing of their technologies.
3. Capacity building in enabling ecosystems:
• Training programmes for individuals in Technology Transfer Offices (TTOs) in academic
institutes to be able to market technologies and negotiate for reasonable valuations.
• Setting up regional professionally managed TTOs to help institutes that cannot run their
own TTOs effectively.
• One on one networking forums especially for entrepreneurs, through incubators.
Although this is implicit, certain number of unique value added interactions should be
mandated.
• Presence of active clinical advisors in incubators to help improve connect with clinical
requirements and enable easier acceptance when clinicians are end users.
8988 Chapter 3 2016Chapter 3 2016
Kerala technology Startup Policy "Retrieved from
https://startupmission.kerala.gov.in/sites/default/files/Kerala%20Technology%20Startup%20Poli
cy.pdf", (2014).
Lawlor, A. "Innovation ecosystems. Empowering entrepreneurs and powering economies." The
Economist Intelligence Unit (2014).
Leydesdorff, Loet, and Henry Etzkowitz. "The triple helix as a model for innovation studies." Science
and public policy 25.3 (1998).
Life Sciences Policy for the state of Telangana 2015-2020 "Retrieved from
http://tsiic.telangana.gov.in/telangana-state-industrial-policy/" (2015).
Mahdjoubi, Darius. "The mapping of Innovation." Ðprepared for Joint Adjustment Committee of
Etobicoke 122 (1997).
Mahroum, Sami, and Yasser Alsaleh. "Measuring innovation efficacy: an operational framework for
mapping and measuring innovation capacity and performance of countries." (2012).
Malik, Aisha Y., and Charles Foster. "The revised Declaration of Helsinki: cosmetic or real change?."
Journal of the Royal Society of Medicine 109.5 (2016).
Nair, M. “Inclusive innovation and sustainable development: leap-frogging strategies to a high
income economy,” in editor Ramasamy, R., ICT Strategic Review PIKOM and MOSTI, Malaysia,
Chapter 11 (2011).
Peña-López, Ismael. "World Development Report 2016: Digital Dividends." (2016).
Robehmed, Natalie. "What is a Startup." Retrieved from site forbes: http://www. forbes.
com/sites/natalierobehmed/2013/12/16/what-is-a-startup (2013).
Schrempf, Benjamin, David Kaplan, and Doris Schroeder. "National, Regional, and Sectoral
Systems of Innovation–An overview." Report for FP7 Project" Progress". European Comission.
Obtenido de https://www. google. com. co/url (2013).
Srivastava, Rhit, and S. K. Banerjee. "Indian Pharmaceutical Industry-A plethora of Sustainable
Growth Opportunities for pharma business aspirants." PharmaTutor 4.3 (2016).
Startup India policy, Retrieved from site
http://startupindia.gov.in/uploads/pdf/Startup_India_FAQs.pdf (2016)
The Aspen Institute, "Entrepreneurial Ecosystem Diagnostic Toolkit, Aspen network of
development entrepreneurs". (2013)
REFERENCES
Ahuja, Sandeep, et al. "Economic Reform in India: Task Force Report." Harris School of Public Health,
University of Chicago (2005).
Biospectrum bureau "India biopharma revenues rise to $2.5 bn" Retrieved from site
http://www.biospectrumasia.com/biospectrum/analysis/2804/biopharma-accounts-62-indian-
bt-industry (2012)
Council of Canadian Academies,. "Innovation Impacts: Measurement and Assessment. The Expert
Panel on the Socioeconomic Impacts of Innovation Investments." (2013)
De Beer, Jeremy, Kun Fu, and Sacha Wunsch-Vincent. "The informal economy, innovation and
intellectual property-Concepts, metrics and policy considerations." WIPO Economics and Statistics
Series, Economic Research Working Paper 10 (2013).
Department of Science and Technology, GoI. "Annual report 2009-10." Retrieved from
http://dst.gov.in/annual-report-2009-2010 (2015)
Dornbusch, Friedrich, and Peter Neuhäusler. "Academic Knowledge as a Driver for Technological
Innovation?: Comparing Universities, Small and Large Firms in Knowledge Production and
Dissemination". Fraunhofer ISI (2013).
Edquist, Charles. "Systems of innovation: perspectives and challenges." African Journal of Science,
Technology, Innovation and Development 2.3 (2011).
Fagerberg, Jan. "Innovation: a guide to the literature." (2004).
Gao, Shu, and Harro Van Lente. "Comparing approaches to systems of innovation: Confronting to
the Chinese telecommunication sector." (2008).
Godin, Benoit. "The rise of innovation surveys: Measuring a fuzzy concept." Canadian Science and
Innovation Indicators Consortium, Project on the History and Sociology of S&T Statistics, Paper 16
(2002).
Karnataka Startup Policy 2015-2020 "Retrieved from
http://Bengaluruitbt.in/docs/2015/Startup_Policy.pdf" (2015).
9190 Chapter 3 2016Chapter 3 2016

IKP Knowledge Park is a 200-acre premier Science Park and Incubator in Hyderabad and
Bengaluru, India. It is set up with the mission to create a world-class ecosystem for fostering
leading-edge innovation in the Country. IKP promotes the advancement of technology-based
innovators, entrepreneurs and small and large companies through customised space, shared
equipment, incubation, mentorship, and funding. In the last 16 years of operations, IKP has
supported over 220 companies from seven countries, 80% of which are startups.
Inspired by TechShop and MIT FabLab, IKP set up IKP-EDEN™ to help the product development
ecosystem in Bengaluru. IKP-EDEN™ is a membership-based Do-It-Yourself fabrication studio
and a startup accelerator. Building on the vast experience gained from helping Med-Tech
startups and managing scientific research facilities, IKP is working towards furthering
engineering and hardware product design startups.
IKP Knowledge Park launched its Grants Management Programme in 2011 and conducts Grand
Challenges and other innovation scouting programmes in partnership with the Bill & Melinda
Gates Foundation, USAID, DFID, BIRAC, DBT, NSTEDB, DST and the Government of Karnataka.
The Biotechnology Industry Research Assistance Council (BIRAC), in partnership with IKP, set up
the BIRAC Regional Innovation Centre (BRIC) in 2013 to further BIRAC's mandate of building a
deeper understanding of the capacity and gaps in innovation, commercialisation and technology
absorption ecosystems, and developing targeted programmes.
Biotechnology IndustryResearch Assistance Council
BIRAC is a Section 8 (not for profit) company setup by the Department of Biotechnology (DBT),
GoI in 2012 to stimulate, foster and enhance strategic research and innovation capabilities
of the Indian Biotech Industry and to serve as DBT's interface agency for supporting Industry-
Academia interaction.
BIRAC's mandates include providing targeted funding for all aspects of bio innovation, incubation,
technical and business mentoring, IP support, creating and providing access to global and
national networks for bio innovation.
The study was undertaken with a mandate to build a deeper understanding of the capacity
and gaps in the life sciences innovation ecosystem in India and develop targeted
programmes to stimulate, foster and enhance biotech innovation and entrepreneurship in
the Country.
This report maps the knowledge generation capacity, interaction between various
stakeholders and gaps that hinder commercialisation of innovations largely around
four biopharma and medical technology clusters in southern India (Hyderabad, Bengaluru,
Chennai+Vellore and Thiruvananthapuram+Kochi). The findings of the study are intended
to provide inputs for framing policies for sustained development of life sciences
innovation ecosystems.
ABOUT THE REPORT


