Embed Size (px)
Citation preview

MANUAL FOR ASSESSING WALKING TRACKS IN PROTECTED AREAS
Wendy Hill and Catherine Pickering

MANUAL FOR ASSESSING WALKING TRACKS IN PROTECTED AREAS
ii
Technical Reports The technical report series present data and its analysis, meta-studies and conceptual studies, and are considered to be of value to industry, government and researchers. Unlike the Sustainable Tourism Cooperative Research Centre’s Monograph series, these reports have not been subjected to an external peer review process. As such, the scientific accuracy and merit of the research reported here is the responsibility of the authors, who should be contacted for clarification of any content. Author contact details are at the back of this report.
National Library of Australia Cataloguing-in-Publication Entry
Title: Manual for assessing walking tracks in protected areas / Wendy Hill, Catherine Pickering. Edition: 1st ed. ISBNs: 9781921521805 (pdf), 9781921521799 (pbk.) Notes: Bibliography. Subjects: Trails—Australia—Management—Handbooks, manuals, etc. Protected areas—Australia. Environmental protection—Australia—Handbooks, manuals, etc. Other Authors/Contributors: Pickering, Catherine Marina. Cooperative Research Centre for Sustainable Tourism. Dewey Number: 333.78160994 Copyright © CRC for Sustainable Tourism Pty Ltd 2009 All rights reserved. Apart from fair dealing for the purposes of study, research, criticism or review as permitted under the Copyright Act, no part of this book may be reproduced by any process without written permission from the publisher. Any enquiries should be directed to: General Manager, Communications and Industry Extension or Publishing Manager, via [email protected]. First published in Australia in 2009 by CRC for Sustainable Tourism Pty Ltd Printed in Australia (Gold Coast, Queensland) Cover images courtesy of Tourism QLD, Tourism WA, SATC and Tourism Australia Acknowledgements The Sustainable Tourism Cooperative Research Centre, established and supported under the Australian Government’s Cooperative Research Centres Program, funded this research.

MANUAL FOR ASSESSING WALKING TRACKS IN PROTECTED AREAS
iii
CONTENTS
SUMMARY ____________________________________________________________________________ IV OBJECTIVES ___________________________________________________________________________ IV SUMMARY_____________________________________________________________________________ IV
Condition class survey_________________________________________________________________ iv Track problem assessment_______________________________________________________________v Point sampling track assessment__________________________________________________________v
LIMITATIONS AND RECOMMENDATIONS ______________________________________________________ V CHAPTER 1: TRACK ASSESSMENT METHODS____________________________________________ 1 CHAPTER 2: CONDITION CLASS ASSESSMENT ___________________________________________ 2
MATERIALS____________________________________________________________________________ 2 PROCEDURES___________________________________________________________________________ 2
Step 1: Where to measure ______________________________________________________________ 2 Step 2: How to measure________________________________________________________________ 2 Condition Class Assessment Form _______________________________________________________ 4 Condition Class Definitions_____________________________________________________________ 5 Overall Condition Class Descriptions_____________________________________________________ 6
CHAPTER 3: TRACK PROBLEM ASSESSMENT ____________________________________________ 7 MATERIALS____________________________________________________________________________ 7 PROCEDURES___________________________________________________________________________ 7
Step 1: Where to measure ______________________________________________________________ 7 Step 2: How to measure________________________________________________________________ 7 Track Problem Assessment Form _______________________________________________________ 11 Track Problem Assessment Definitions and Codes __________________________________________ 12
CHAPTER 4: POINT SAMPLING_________________________________________________________ 13 MATERIALS___________________________________________________________________________ 13 PROCEDURES__________________________________________________________________________ 13
Step 1: Where to measure _____________________________________________________________ 13 Step 2: How to measure_______________________________________________________________ 13 Point Sampling Assessment Form _______________________________________________________ 16 Point Sampling Definitions and Codes ___________________________________________________ 18 Soil Texture Codes___________________________________________________________________ 18 Vegetation Community Codes __________________________________________________________ 18
APPENDIX A: PROCEDURES FOR MEASURING TRACK WIDTH AND MAXIMUM INCISION _ 19 REFERENCES _________________________________________________________________________ 20
List of Figures Figure 1: Decision Tree for When/Were to Use Three Common Track Assessment Methods _______________ 1

MANUAL FOR ASSESSING WALKING TRACKS IN PROTECTED AREAS
iv
SUMMARY
Objectives This report is one of a series in the Sustainable Tourism Corporative Research Centre’s overall project to develop a framework, guidelines and tools to enhance assessment, evaluation and reporting of visitor use in protected areas.
In this manual three methods (including indicators, protocols and proformas) are presented for surveying and
monitoring walking tracks based on a desktop evaluation of methods used overseas and in Australia (Hill & Pickering in review A) and field testing of methods by researchers (Hill & Pickering in review B). Two of the methods are census based techniques (condition class assessment and track problem assessment) and the third method is point sampling which is more appropriate for detailed measurement such as those used in temporal monitoring.
This track monitoring manual provides:
• detailed procedures for conducting condition class assessment; track problem assessment; and point sampling assessment
• associated proformas for recording track data on indicators.
Summary Three main methods have been developed to survey and monitor walking tracks in protected areas. Basically managers have a choice between making accurate detailed measurements at few sites providing data which can be used for temporal monitoring - that is checking condition over time. For this they can use a point sampling method. Or they can make less accurate surveys over a greater spatial scale for inventories using condition class assessment or a track problem assessment method (Marion & Leung 2001; Marion & Olive 2006) (Figure 1). These three different track assessment methods and their use in Australia are reviewed in Hill and Pickering (in review A). Hill and Pickering (in review B) reports on field testing of these methods in New South Wales protected areas.
In practice managers are often likely to conduct track inventories using condition class assessment or a track
problem assessment method and then at a few priority sites or to address a few specific impacts they may want to use a more detailed method such as point sampling.
Condition class survey Protocols involve a staff member walking along tracks and assigning a pre-defined categorical condition class rating to each track section based on visual assessment of the surface condition (Marion and Leung 2001). Condition classes are defined by the severity of impacts—principally loss of vegetation and soil (Cole 1989). Management purpose: Inventory and survey; objective basis for assigning work priorities. Indicators: A pre-defined range of condition classes are described based on impacts such as: average width, maximum erosion, rate of deterioration, braiding. Pros: Rapid, comprehensive picture of track condition; can identify major change over time. Cons: Qualitative data; ordinal data; small or medium changes cannot be detected; not always suitable for repeated surveys over time (i.e. monitoring) as different surveyors can have different views on severity of impact. Used in Australia: Used to compile an inventory of the 1000 km track system in the Tasmanian Wilderness World Heritage Area in the early 1990s over an 8 year period (PWS 1994).

MANUAL FOR ASSESSING WALKING TRACKS IN PROTECTED AREAS
v
Track problem assessment Protocols involve two field staff walking along tracks pushing a measuring wheel and recording data on the condition of the track surface (Leung 1998; Leung & Marion 1999). Management purpose: Inventory and survey; objective basis for assigning work priorities. Indicators: Three types of data (1) the frequency, lineal extent and severity of track problems such as soil erosion and excessive track width; (2) information correlated with problems (e.g. track grade and soil texture); and (3) the location, extent and effectiveness of track maintenance features. Pros: Detailed track profiles; documents location and extent of track degradation problems in relation to environmental variables and design and maintenance features. Cons: Doesn’t generate qualitative data on width or erosion. May not be accurate for repeated surveys over time (i.e. monitoring) as surveyors have different views on beginning or end points of impacts. Used in Australia: Both track problem and point sampling assessment were used in Stirling Range National Park Western Australia to determine the effectiveness of each method in assessing mountain track systems (Mende & Newsome 2006).
Point sampling track assessment Protocols involve field staff systematically locating transects at permanent or non-permanent points along selected tracks. Impacts indicators (e.g. depth of erosion, width of track etc) are measured and environmental and track maintenance factors are recorded at each point (Dixon, Hawes & McPherson 2004; Marion & Olive 2006). Management purpose: Monitoring to assess change in condition over time; adaptive management – i.e. was the management action effective. Frequently used in recreation ecology to show causal relationship between use and impact, and between impact and environmental variables. Indicators: Primarily track width and maximum depth of erosion but also environmental factors - soil and vegetation type, elevation as well as track maintenance features such as slope. Pros: Repeatable standardised techniques and indicators; describes average track conditions; can identify subtle and major changes over time. Cons: Intensive; time consuming; costly; requires high level of training; samples only a small portion of the track. Not suitable for survey or inventory. Used in Australia: Used to model relationship between track impacts and environmental conditions in Tasmanian Wilderness World Heritage Area (Dixon et al. 2004).
Limitations and Recommendations The protocols described in this manual are intended as a guide. It is highly recommended that protocols are specifically trialed and adapted for the individual circumstances of different protected areas.

MANUAL FOR ASSESSING WALKING TRACKS IN PROTECTED AREAS
vi

MANUAL FOR ASSESSING WALKING TRACKS IN PROTECTED AREAS
1
Chapter 1
TRACK ASSESSMENT METHODS
A number of methods have been developed by researchers to survey and monitor walking tracks in protected areas. There are two main approaches. Basically managers have a choice between making accurate detailed measurements at few sites for the purpose of temporal monitoring (that is checking condition over time) using a point sampling method (Cole 1989; Farrell & Marion 2001) (Figure 1). On the other hand managers can make surveys over a larger number of sites for inventories. Condition class assessment and track problem assessment methods are appropriate for surveys and inventories (Leung & Marion 1999; Marion & Leung 2001; Marion & Olive 2006).
A recent report by Hill and Pickering (in review A) provides a comprehensive review of track assessment
methods and indicators and their use in Australia. In practice managers are often likely to conduct track inventories using condition class assessment or a track
problem assessment method and then at a few priority sites or to address a few specific impacts they may want to use a more detailed method such as point sampling.
Figure 1: Decision Tree for When/Were to Use Three Common Track Assessment Methods
Spatial track inventory Temporal track monitoring
Condition class survey Track problem assessment Point sampling
Less detailed assessment Detailed assessment
Census based methods
MANUAL FOR ASSESSING WALKING TRACKS IN PROTECTED AREAS
2
Chapter 2
CONDITION CLASS ASSESSMENT
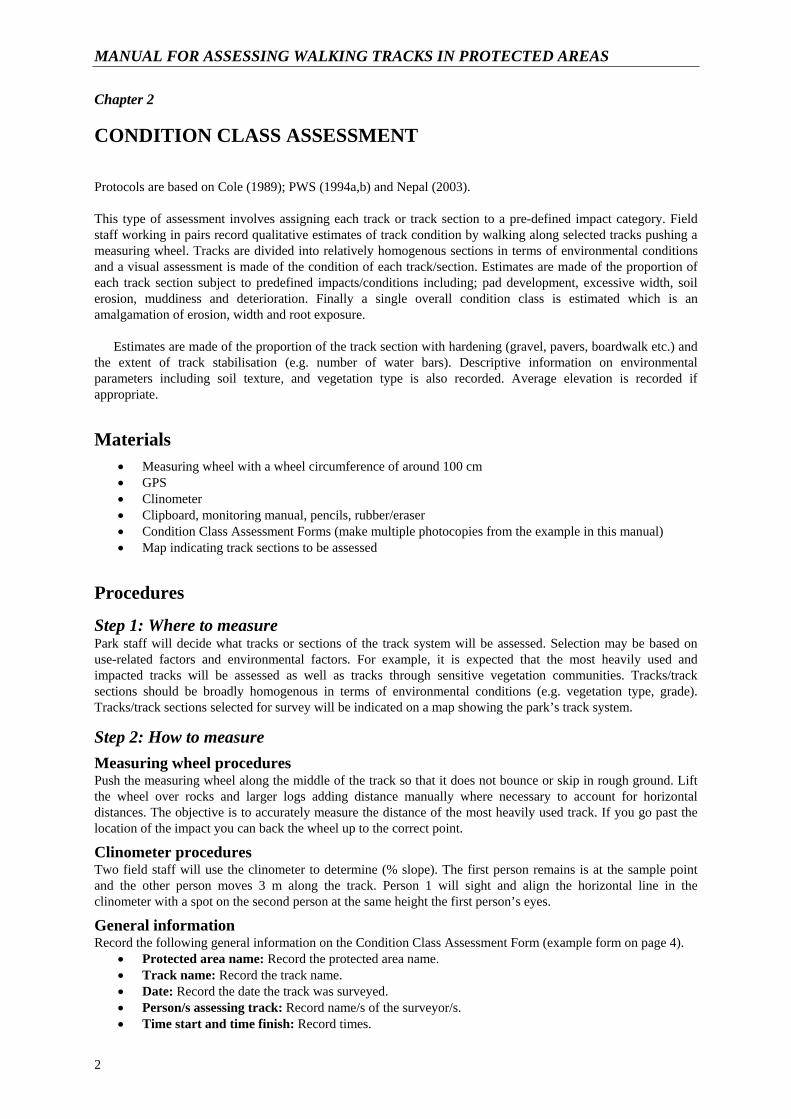
Protocols are based on Cole (1989); PWS (1994a,b) and Nepal (2003). This type of assessment involves assigning each track or track section to a pre-defined impact category. Field staff working in pairs record qualitative estimates of track condition by walking along selected tracks pushing a measuring wheel. Tracks are divided into relatively homogenous sections in terms of environmental conditions and a visual assessment is made of the condition of each track/section. Estimates are made of the proportion of each track section subject to predefined impacts/conditions including; pad development, excessive width, soil erosion, muddiness and deterioration. Finally a single overall condition class is estimated which is an amalgamation of erosion, width and root exposure.
Estimates are made of the proportion of the track section with hardening (gravel, pavers, boardwalk etc.) and
the extent of track stabilisation (e.g. number of water bars). Descriptive information on environmental parameters including soil texture, and vegetation type is also recorded. Average elevation is recorded if appropriate.
Materials • Measuring wheel with a wheel circumference of around 100 cm • GPS • Clinometer • Clipboard, monitoring manual, pencils, rubber/eraser • Condition Class Assessment Forms (make multiple photocopies from the example in this manual) • Map indicating track sections to be assessed
Procedures
Step 1: Where to measure Park staff will decide what tracks or sections of the track system will be assessed. Selection may be based on use-related factors and environmental factors. For example, it is expected that the most heavily used and impacted tracks will be assessed as well as tracks through sensitive vegetation communities. Tracks/track sections should be broadly homogenous in terms of environmental conditions (e.g. vegetation type, grade). Tracks/track sections selected for survey will be indicated on a map showing the park’s track system.
Step 2: How to measure Measuring wheel procedures Push the measuring wheel along the middle of the track so that it does not bounce or skip in rough ground. Lift the wheel over rocks and larger logs adding distance manually where necessary to account for horizontal distances. The objective is to accurately measure the distance of the most heavily used track. If you go past the location of the impact you can back the wheel up to the correct point.
Clinometer procedures Two field staff will use the clinometer to determine (% slope). The first person remains is at the sample point and the other person moves 3 m along the track. Person 1 will sight and align the horizontal line in the clinometer with a spot on the second person at the same height the first person’s eyes.
General information Record the following general information on the Condition Class Assessment Form (example form on page 4).
• Protected area name: Record the protected area name. • Track name: Record the track name. • Date: Record the date the track was surveyed. • Person/s assessing track: Record name/s of the surveyor/s. • Time start and time finish: Record times.

MANUAL FOR ASSESSING WALKING TRACKS IN PROTECTED AREAS
3
• Track use type: Record the type of use the track receives (including illegal uses). These uses should be provided by a knowledgeable staff member. Use categories include: pedestrian only, horse riding, vehicle, bike, other.
• Track use level: Record the amount of use the track receives based on advice from a knowledgeable park staff member. Use categories high, medium and low. Working with the staff member quantify these use levels (e.g. low use < 100 users / week for the high use season, < 30 users / week for the shoulder season, < 10 users / week for the off season).
• Starting point: Include a brief description of the start of the track section. Try to choose identifiable locations such as intersections with other tracks or permanent signs that will allow someone else to relocate precisely where to start in order to replicate the survey. Take a GPS reading and record this. Begin the measuring wheel at this location.
• Ending point: Include a brief description of the end of the track section which can be readily identified for future reference. Take GPS reading and record this.
• Length of track: Record the length distance (in metres) from the measuring wheel.
Conditions classes Track condition is visually assessed by a staff member who walks the track and estimates the percentage of the track subject to a range of impacts/conditions. More detailed descriptions of condition classes are found on the Condition Class Assessment Form (page 4 this manual). 1. Track development: Proportion of track in each of three categories: (1) no pad; (2) visible pad; or (3) track
(visibly trampled route). 2. Average width: Proportion of track in each of five increasing width categories: < 0.5 m; 0.5–0.9 m; 1–1.9
m; 2–3 m; > 3 m. 3. Average gradient/slope: Proportion of track in each of three grade categories: grade greater than 15–20o;
21–30o; > 30o. 4. Track erosion: Proportion of track in each of three depth/erosion categories: moderate > 10 cm; heavy > 25
cm; severe > 50 cm. 5. Track muddiness: Proportion of track affected by muddiness including running water. 6. Degree of deterioration: Proportion of track in each of five deterioration categories: stable; slow;
moderate; fast; very fast. (See Condition Class Assessment Form for definitions). 7. Overall condition: Proportion of track in each of five overall impact categories: Class 1 – minimal damage;
Class 2 – low damage; Class 3 – moderate damage; Class 4 – highly damaged; Class 5 – severely damaged or hotspot. (See Condition Class Assessment Form for definitions).
Track design and maintenance features • Track hardening: Record presence of significant amounts of track hardening (i.e. > 10% of track is
gravel, pavers, boardwalk etc.). Estimate amount of track hardened with each material. • Track stabilisation measures: Record presence of maintenance measures including track relocation,
closure and drainage features (e.g. water bars, drains).
Environmental parameters • Soil texture: Use the descriptions on the Condition Class Definition Form to record the most common
soil texture/s over the length of the track segment. • Vegetation type: Record the most common vegetation type/s over the track.

MANUAL FOR ASSESSING WALKING TRACKS IN PROTECTED AREAS
4
Condition Class Assessment Form Protected area name
Person/s assessing track Date of assessment
Track name
Use level Low Med High (park staff to define – record definitions)
Track use type (including illegal): Pedestrian Bike Horse Vehicle Other (specify) Time Start Time finish Total time Starting point description Start GPS location Datum Start N Start E Ending point description Ending GPS location Datum End N End E Total length of assessed track/ track section (m)
Track hardening/stabilisation (if > 10 % of track is hardened)
Gravel: percentage of track graveled
Pavers: percentage of track
Boardwalk Other (specify)
Track improvements: e.g. comment on track drainage. e.g. estimate number of water bars, drains, earth roll overs etc.
Additional comments: e.g. presence of weeds on track verge
Estimate number of informal tracks branching from the main track
Vegetation type (tick dominant – can be more than one) Grassland Rainforest Wet Schlerophyl Dry Schlerophyl Woodland Wet heath Dry heath Dune Other (specify)
Soil texture on track: record only if track is unhardened.
Tick dominant – can be more than one Clay Sandy Silty – like flour or talcum powder Loamy – Combinations of the above, typically in roughly equal parts Organic –dark organic soil absorbs/retains water (like peat moss) and mucky when wet

MANUAL FOR ASSESSING WALKING TRACKS IN PROTECTED AREAS
5
Condition Class Definitions
Track development Indicate proportion (%) of track in each category
• No pad • Visibly trampled route with original vegetation mostly intact • Visibly trampled route mostly bare soil or litter
Average track width Indicate proportion (%) of track in each category. If track is braided, width is estimated as the sum of the widths of braided sections.
• <0.5 m • 0.5–0.9 m • 1–1.9 m • 2–3 m • > 3 m • Braided
Average track gradient/slope Indicate proportion (%) of track in each category. Average gradients are recorded only when they exceed 15o.
Gradient refers to the average absolute (i.e. positive) gradient of a track or route over sections. E.g. if half of the section descends at 15o into a valley and the other half climbs back out at 30o then the average gradient will be recorded as 20o.
• 15–20o • 21–30o • >30o
Track erosion Indicate proportion (%) of track in each category. Moderate is defined as all erosion > 10 cm and not just erosion 10–25 cm. Therefore moderate erosion also includes sections where heavy or severe erosion has occurred.
• Moderate > 10 cm • Heavy > 25 cm • Severe > 50 cm
Track muddiness
• Indicate proportion (%) of track subject to muddiness including presence of running water on track

MANUAL FOR ASSESSING WALKING TRACKS IN PROTECTED AREAS
6
Degree of track deterioration
Indicate proportion (%) of track in each category.
• Stable • Slow = (conditions appear likely to remain stable over 90% of section for at least 20
years) • Moderate = (percentage of section subject to erosional factors likely to increase
significantly and/or severity over at least 20% of the track in 10–20 years) • Fast = as for moderate but 5–10 years • Very fast = as for moderate but < 5 years
Overall Condition Class Descriptions
Indicate proportion (%) of track in each category. Class Description Class 1
Minimal damage
Minimal impact
Class 2 Lightly damaged
Either one or a combination of several impact factors is present. Track width is > 2.5 m, no more than three treads apparent, low to moderate potential for expansion, some muddy spots, incision is < 5 cm, some exposed and loose soil may be present. Overall a track at this classification may be considered stable and does not require further maintenance as long as conditions do not deteriorate further.
Class 3 Moderately damaged
Track segments clearly show deteriorating conditions. Either a single impact feature with significant damage or a combination of two or more impact features is present. Track is wider than 2.5 m; incision between 5–30 cm; (incision of more than 45 cm will satisfy this condition on its own); more than three threads are present; muddiness and running water on track; track is displaced and soil is unconsolidated. The degree and magnitude of the damage is significant enough to prescribe some management actions.
Class 4 Highly damaged
This is a potential hotspot showing either one type of impact feature or a combination of several features. Both magnitude and extend are significant. Excessive track width and incision are present as well as multiple tracks; track braiding has led to excessive width, some of which can be deeply incised (more than 45 cm); frequently exposed bedrock and roots are present. A track affected by landslides or localised slope failure also qualifies as a highly damaged track.
Class 5 Severely damaged or hotspot
Either a single criterion or a combination of several impact features qualifies this category. Basic parameters are track width, multiple tracks and track incision: excessive with more than 3 m; multiple tracks (more than 5); and incision (more than 45 cm). It may also show signs of down hill sliding; soil on track is unconsolidated; no organic layer is present; exposed bedrock is frequent; trackside is highly eroded; root exposure is excessive; track is very muddy requiring circumvention; track slope is more than 10 degrees. A track under this classification requite urgent repair, without which land degradation is inevitable in the near future. Damage is likely to spread out vertically as well as horizontally.

MANUAL FOR ASSESSING WALKING TRACKS IN PROTECTED AREAS
7
Chapter 3
TRACK PROBLEM ASSESSMENT
Procedures are based on Leung (1998) and Leung and Marion (1999a). Field staff working in pairs will record impact, environmental and maintenance parameters by walking along selected tracks pushing a measuring wheel. Coded impact indicator names are recorded on the Track Problem Assessment Form, along with the cumulative distance from the track start point. Environmental parameters (soil texture, vegetation type, track grade/slope) associated with each impact are also recorded to allow relational analyses. Elevation is recorded if appropriate.
The location and extent of maintenance and design features are recorded and an estimate of effectiveness can
be made for each drainage feature. For point features (e.g. water bars) a single distance from the start point is recorded.
Only track problems that exceed a pre-defined severity are recorded. For the impact indicator ‘soil erosion’—
only track depth exceeding 5 cm for a length of at least 3 m will be recorded. For the impact indicator ‘excessive track width’—only width more than 1 m greater than the normal track width for a distance of at least 3 m will be recorded. For the indicator ‘root exposure’ only exposed roots for a distance of at least 3 m will be recorded.
Three types of indicators/parameters are measured: 1. Impact indicators: location, extent and severity of track degradation problems. 2. Environmental parameters: soil texture and vegetation type at which each impact event occurred are
recorded to allow relational analyses. Track slope is also recorded and elevation (if required). 3. Maintenance and design features location of track hardening and drainage features. A subjective
assessment can be made of the effectiveness of drainage features.
Materials • Measuring wheel with a wheel circumference of around 100 cm • Clinometer • GPS • Tape measure (8 m) • Clipboard, monitoring manual, pencils, rubber/eraser • Track Monitoring Manual • Track Problem Assessment Forms (make multiple photocopies from manual) • Map indicating tracks/ track sections to be assessed
Procedures
Step 1: Where to measure Park staff and researcher/s will decide what sections of the track system will be assessed. The sample would be expected to include the most heavily used and impacted tracks, and representative tracks from the various geographic regions or vegetation communities in the park. Tracks (or track sections) selected for survey will be indicated on a map showing the protected area track system.
Step 2: How to measure Measuring wheel procedures Push the measuring wheel along the middle of the track so that it does not bounce or skip in rough ground. Lift the wheel over rocks and larger logs adding distance manually where necessary to account for horizontal distances. The objective is to accurately measure the distance of the most heavily used track. If you go past the location of the impact you can back the wheel up to the correct point.

MANUAL FOR ASSESSING WALKING TRACKS IN PROTECTED AREAS
8
Clinometer procedures Two field staff will use the clinometer to determine (% slope). The first person remains is at the sample point and the other person moves 3 m along the track. Person 1 will sight and align the horizontal line in the clinometer with a spot on the second person at the same height the first person’s eyes.
General information Record the following information on the top section of the Point Sampling Assessment Form:
• Protected area name: Record the protected area name. • Track name: Record the track name. • Date: Record the date the track was surveyed. • Person/s assessing track: Record name/s of the surveyor/s. • Time start and time finish: Record times. • Track use type: Record the type of use the track receives (including illegal uses). These uses should be
provided by a knowledgeable staff member. Use categories include: pedestrian only, horse riding, vehicle, bike, other.
• Track use level: Record the amount of use the track receives based on advice from a knowledgeable park staff member. Use categories high, medium and low. Working with the staff member quantify these use levels (e.g. low use < 100 users / week for the high use season, < 30 users / week for the shoulder season, < 10 users / week for the off season).
• Starting point: Include a brief description of the start of the track/track segment. Try to choose identifiable locations such as intersections with other tracks or permanent signs that will allow someone else to relocate precisely where to start in order to replicate the survey. Take a GPS reading. Begin the measuring wheel at this location.
• Ending point: Include a brief description of the end of the track segment which can be readily identified for future reference. Take GPS reading.
• Length of track: Record the distance (in metres) from the measuring wheel.
Impact indicators and parameters Six impact indicators have been defined which give information on track condition. These are recorded in the tabular section of the Track Problem Assessment Form. For each pre-defined parameter record the two or three letter code in the Code column (see Track Problem Code Form).
In the Distance 1 column record the cumulative distance on the measuring wheel (to the nearest metre) from
the track section start point to the beginning of the pre-defined parameter. Parameters whose codes start with ‘B’ require ‘beginning’ AND ‘ending’ distances or the data will be incomplete. For those, record the beginning distance under Dist 1 and the ending distance under Dist 2.
For point features (e.g. water bars) a single distance is recorded from the start point.
*Notes: Only track problems that exceed a pre-defined severity are recorded. For example, for the impact indicator ‘soil erosion’—only track depth exceeding 5 cm for a length of at least 3 m will be recorded. For the impact indicator ‘excessive track width’—only width more than 1 m greater than the normal track width for a distance of at least 3 m will be recorded. Do not discontinue a problem if the gap between two sections showing the same problem is less than 3 m.
All impact parameters are a begin/end type so be VERY careful to watch for and record beginning and
ENDING points. The ‘B’ designation for impact indicators is to remind recorders that a Begin and End code must be recorded.
Record only those problems that exceed a lineal extent of 3 m. Do not discontinue a problem if the gap
between two sections showing the same problem is less than 3 m. Record erosion only when the track exhibits a depth greater than 5 cm.
1. BE - Soil Erosion Begin/End (a range of parameters) BE1: Track depth 5–10 cm between track side berms BE2: Track depth 11–20 cm between track side berms BE3: Track depth 21–30 cm between track side berms BE4: Track depth 31–40 cm between track side berms
And so on for more highly eroded sections.
MANUAL FOR ASSESSING WALKING TRACKS IN PROTECTED AREAS
9
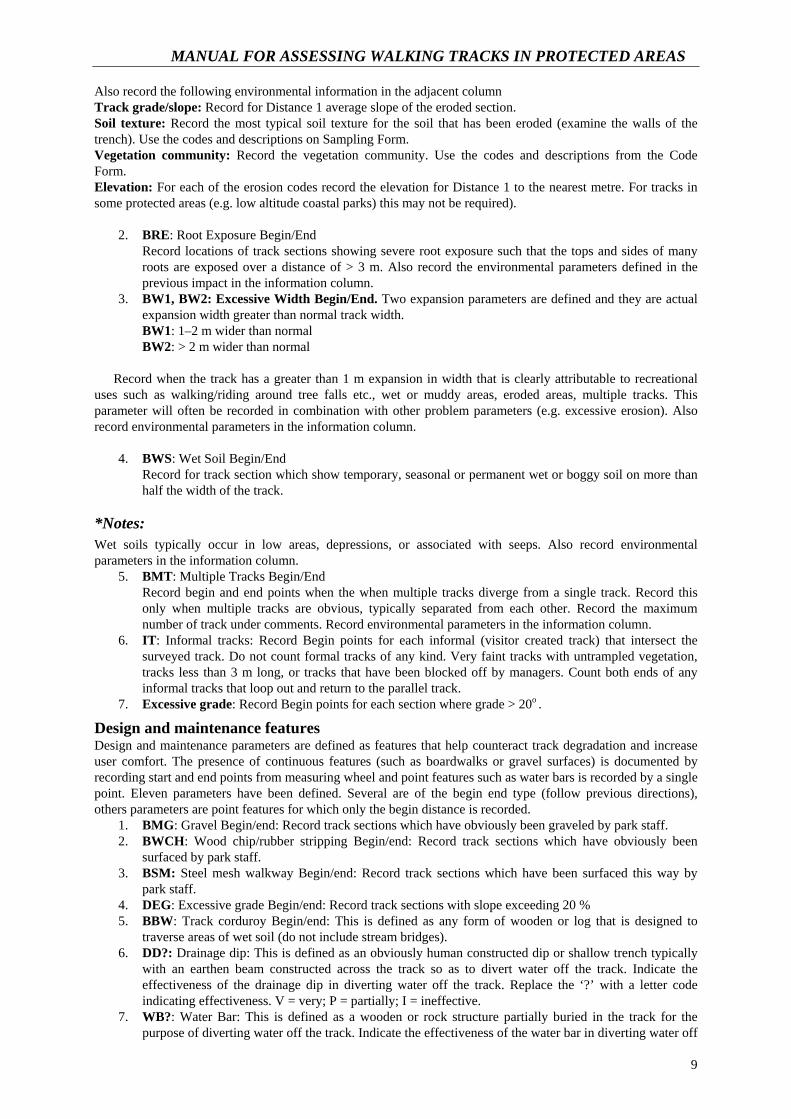
Also record the following environmental information in the adjacent column Track grade/slope: Record for Distance 1 average slope of the eroded section. Soil texture: Record the most typical soil texture for the soil that has been eroded (examine the walls of the trench). Use the codes and descriptions on Sampling Form. Vegetation community: Record the vegetation community. Use the codes and descriptions from the Code Form. Elevation: For each of the erosion codes record the elevation for Distance 1 to the nearest metre. For tracks in some protected areas (e.g. low altitude coastal parks) this may not be required).
2. BRE: Root Exposure Begin/End
Record locations of track sections showing severe root exposure such that the tops and sides of many roots are exposed over a distance of > 3 m. Also record the environmental parameters defined in the previous impact in the information column.
3. BW1, BW2: Excessive Width Begin/End. Two expansion parameters are defined and they are actual expansion width greater than normal track width. BW1: 1–2 m wider than normal BW2: > 2 m wider than normal
Record when the track has a greater than 1 m expansion in width that is clearly attributable to recreational
uses such as walking/riding around tree falls etc., wet or muddy areas, eroded areas, multiple tracks. This parameter will often be recorded in combination with other problem parameters (e.g. excessive erosion). Also record environmental parameters in the information column.
4. BWS: Wet Soil Begin/End
Record for track section which show temporary, seasonal or permanent wet or boggy soil on more than half the width of the track.
*Notes: Wet soils typically occur in low areas, depressions, or associated with seeps. Also record environmental parameters in the information column.
5. BMT: Multiple Tracks Begin/End Record begin and end points when the when multiple tracks diverge from a single track. Record this only when multiple tracks are obvious, typically separated from each other. Record the maximum number of track under comments. Record environmental parameters in the information column.
6. IT: Informal tracks: Record Begin points for each informal (visitor created track) that intersect the surveyed track. Do not count formal tracks of any kind. Very faint tracks with untrampled vegetation, tracks less than 3 m long, or tracks that have been blocked off by managers. Count both ends of any informal tracks that loop out and return to the parallel track.
7. Excessive grade: Record Begin points for each section where grade > 20o .
Design and maintenance features Design and maintenance parameters are defined as features that help counteract track degradation and increase user comfort. The presence of continuous features (such as boardwalks or gravel surfaces) is documented by recording start and end points from measuring wheel and point features such as water bars is recorded by a single point. Eleven parameters have been defined. Several are of the begin end type (follow previous directions), others parameters are point features for which only the begin distance is recorded.
1. BMG: Gravel Begin/end: Record track sections which have obviously been graveled by park staff. 2. BWCH: Wood chip/rubber stripping Begin/end: Record track sections which have obviously been
surfaced by park staff. 3. BSM: Steel mesh walkway Begin/end: Record track sections which have been surfaced this way by
park staff. 4. DEG: Excessive grade Begin/end: Record track sections with slope exceeding 20 % 5. BBW: Track corduroy Begin/end: This is defined as any form of wooden or log that is designed to
traverse areas of wet soil (do not include stream bridges). 6. DD?: Drainage dip: This is defined as an obviously human constructed dip or shallow trench typically
with an earthen beam constructed across the track so as to divert water off the track. Indicate the effectiveness of the drainage dip in diverting water off the track. Replace the ‘?’ with a letter code indicating effectiveness. V = very; P = partially; I = ineffective.
7. WB?: Water Bar: This is defined as a wooden or rock structure partially buried in the track for the purpose of diverting water off the track. Indicate the effectiveness of the water bar in diverting water off

MANUAL FOR ASSESSING WALKING TRACKS IN PROTECTED AREAS
10
the track. Replace the ‘?’ with a letter code indicating effectiveness. V = very; P = partially; I = ineffective.
8. LD: Lateral Drain: This is defined as an obviously human constructed trench dug along the 9. RW: Retaining wall: This is defined as an obvious human constructed wall of rocks and/or logs/timber
to retain soil typically on the down slope of tracks. 10. CU: Culvert. This is defined as a conduit used to enclose a flowing body of water. 11. ST: Step/s
AF: Attraction feature: Outstanding scenic natural or historical feature that leads to increased concentrations of use. Record these features whenever they are significant enough to attract the visitors’ attention. They will typically have well defined social tracks leading to them. These are point features so record a distance under D1. Briefly describe the feature e.g. vista.
REF: Reference point: Record the code and the distance for this parameter periodically when you come across a permanent feature which can be used by future workers to compare and or recalibrate their wheel reading to those you record. Wheels tend to be inaccurate over long distances. Try to include a reference point every 500 m.

MANUAL FOR ASSESSING WALKING TRACKS IN PROTECTED AREAS
11
Track Problem Assessment Form Protected area name
Person/s assessing track Date of assessment
Track name Time start Time finish Total time Starting point description
Start location Datum GPS North GPS South
Ending point description
End location Datum GPS North GPS South
Track length Use type P = Pedestrian/hiker use only H = Horse and pedestrian use B = Bike and pedestrian
Use level (park staff to define) Low Medium High
Code Dist 1 Dist 2 Environmental information: elevation (if required), slope, vegetation type, soil type).
Page number ____
MANUAL FOR ASSESSING WALKING TRACKS IN PROTECTED AREAS
12
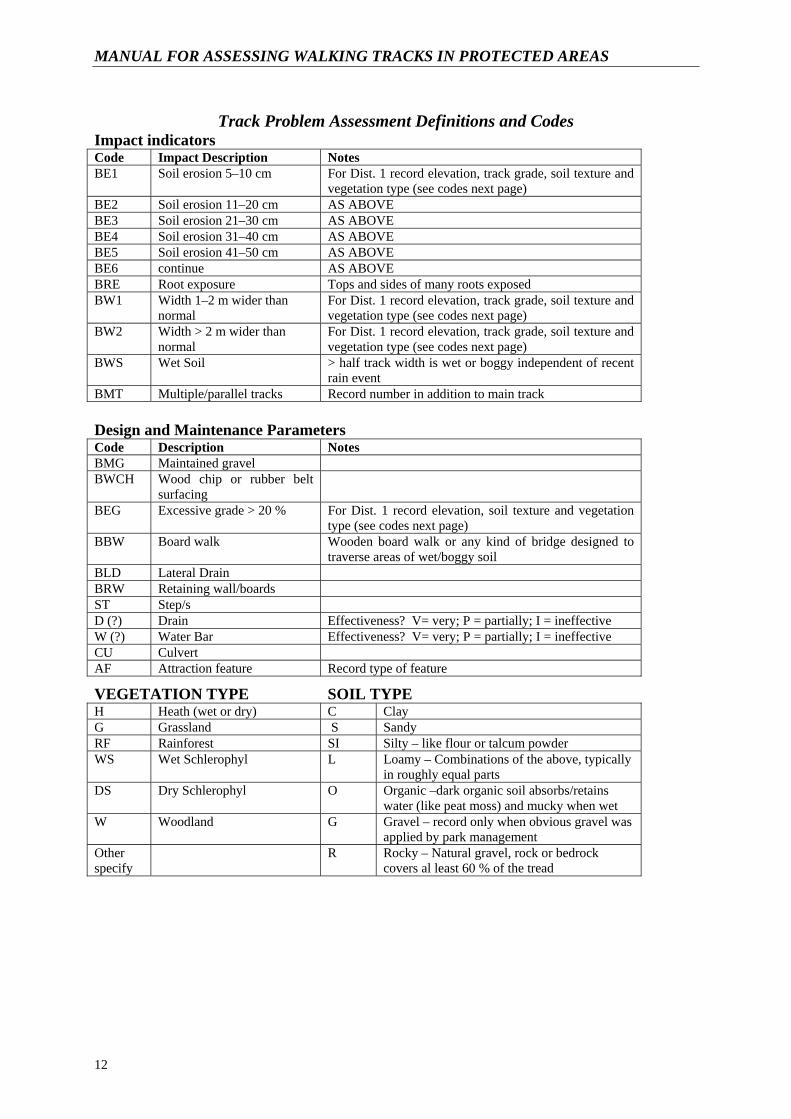
Track Problem Assessment Definitions and Codes Impact indicators Code Impact Description Notes BE1 Soil erosion 5–10 cm For Dist. 1 record elevation, track grade, soil texture and
vegetation type (see codes next page) BE2 Soil erosion 11–20 cm AS ABOVE BE3 Soil erosion 21–30 cm AS ABOVE BE4 Soil erosion 31–40 cm AS ABOVE BE5 Soil erosion 41–50 cm AS ABOVE BE6 continue AS ABOVE BRE Root exposure Tops and sides of many roots exposed BW1 Width 1–2 m wider than
normal For Dist. 1 record elevation, track grade, soil texture and vegetation type (see codes next page)
BW2 Width > 2 m wider than normal
For Dist. 1 record elevation, track grade, soil texture and vegetation type (see codes next page)
BWS Wet Soil > half track width is wet or boggy independent of recent rain event
BMT Multiple/parallel tracks Record number in addition to main track Design and Maintenance Parameters Code Description Notes BMG Maintained gravel BWCH Wood chip or rubber belt
surfacing
BEG Excessive grade > 20 % For Dist. 1 record elevation, soil texture and vegetation type (see codes next page)
BBW Board walk Wooden board walk or any kind of bridge designed to traverse areas of wet/boggy soil
BLD Lateral Drain BRW Retaining wall/boards ST Step/s D (?) Drain Effectiveness? V= very; P = partially; I = ineffective W (?) Water Bar Effectiveness? V= very; P = partially; I = ineffective CU Culvert AF Attraction feature Record type of feature
VEGETATION TYPE SOIL TYPE H Heath (wet or dry) C Clay G Grassland S Sandy RF Rainforest SI Silty – like flour or talcum powder WS Wet Schlerophyl L Loamy – Combinations of the above, typically
in roughly equal parts DS Dry Schlerophyl O Organic –dark organic soil absorbs/retains
water (like peat moss) and mucky when wet W Woodland G Gravel – record only when obvious gravel was
applied by park management Other specify
R Rocky – Natural gravel, rock or bedrock covers al least 60 % of the tread

MANUAL FOR ASSESSING WALKING TRACKS IN PROTECTED AREAS
13
Chapter 4
POINT SAMPLING
Procedures are based on Dixon et al. (2004); Marion and Olive (2006) and Marion (2007).
Field staff working in pairs will record impact, environmental and maintenance parameters by walking along selected tracks pushing a measuring wheel. The objective is to document and monitor changes in track condition based on measurements at transect located every 100 m along selected track segments. Distances are measured with a measuring wheel. Impact measurements record the track’s condition (width and depth). Other parameters recorded at each transect include track drainage features, track position (valley bottom, ridge or mid-slope), slope, soil texture, vegetation type and elevation (if required). The number of informal/unplanned tracks between successive transects are also recorded.
Procedures take approximately three minutes to apply at each sample point. Data are summarised through
statistical analyses to characterise resource conditions for each track segment and for the entire track system. During future assessments it is not necessary to relocate the same sample points for repeat measures (Marion & Olive 2006; Marion 2007).
Materials • Measuring wheel with a wheel circumference of around 100 cm • Clinometer • GPS • Tape measure (8 m) • Clipboard, monitoring manual, pencils, rubber/eraser • Track Monitoring Manual • Track Problem Assessment Forms (make multiple photocopies from manual) • Map indicating tracks/ track sections to be assessed • Tent pegs (4) • String (5 m—to stretch between tent pegs)
Procedures
Step 1: Where to measure Park staff and researchers will decide what segments of the track system will be assessed based on use-related factors and environmental factors. For example, segments of the most heavily used and impacted tracks should be measured to document baseline condition of impacted tracks. Tracks from the range of geographic regions/habitats in the park should be measured to document average track conditions for these habitats.
*Notes: Use characteristics should be relatively uniform over the entire track segment. Where substantial variation in the type and/or amount of use occurs the track should be split into two segments and assigned different names and field data sheets upon which the differences can be described. Tracks may have substantial changes in the type or amount of use over their length. For example, one section may allow horse use or bike use or a track may join the study track, significantly altering use levels. This will allow statistical analyses and summaries.
Track segments selected for survey will be indicated on a map showing the park’s track system.
Step 2: How to measure Measuring wheel procedures At the track segment start point use a random number table to select a random number from 0–100. Record this number on the first row of the form. This will be the first sample point from which all subsequent sample points will be located at 100 m intervals. This procedure ensures that all points along the track segment have an equal

MANUAL FOR ASSESSING WALKING TRACKS IN PROTECTED AREAS
14
chance of being selected for sampling. Once you have the first point, reset the wheel counter and use it to stop at 100 m intervals thereafter. Sample points will be measured until the end of the track /track segment has been completed.
Push the measuring wheel along the middle of the track so that it does not bounce or skip in rough ground.
Lift the wheel over rocks and larger logs adding distance manually where necessary to account for horizontal distances. The objective is to accurately measure the distance of the most heavily used track. Monitor the wheel counter and stop every 100 m to conduct the point sampling measures. If you go over the distance you can back the wheel up to the correct distance.
Rejection of a sample point In some circumstances e.g. the presence of boulders, fallen logs, stream crossings, road crossings or other uncharacteristic situations including hardened section of track (e.g. gravel, human placed wood) the point may need to be relocated. The data collected at sample points should be representative of 80 m sections on either side of the points. The point should be relocated by moving 10 m forward on the track. If the new point is problematic then move another 10 m.
Clinometer procedures Two field staff will use the clinometer to determine (% slope). The first person remains is at the sample point and the other person moves 3 m along the track. Person 1 will sight and aligning the horizontal line in the clinometer with a spot on the second person at the same height the first person’s eyes.
General information Three types of indicators/parameters are measured: (1) impact indicators; (2) environmental parameters; and (3) design and maintenance parameters.
Record the following information on the top section of the Point Sampling Assessment Form
• Protected area name: Record the protected area name. • Track name: Record the track name. • Date: Record the date the track was surveyed. • Person/s assessing track: Record name/s of the surveyor/s. • Time start and time finish: Record times. • Track use type: Record the type of use the track receives (including illegal uses). These uses should be
provided by a knowledgeable staff member. Use categories include: pedestrian only, horse riding, vehicle, bike, other.
• Track use level: Record the amount of use the track receives based on advice from a knowledgeable park staff member. Use categories high, medium and low. Working with the staff member quantify these use levels (e.g. low use < 100 users / week for the high use season, < 30 users / week for the shoulder season, < 10 users / week for the off season).
• Starting point: Include a brief description of the start of the track/track segment. Try to choose identifiable locations such as intersections with other tracks or permanent signs that will allow someone else to relocate precisely where to start in order to replicate the survey. Take a GPS reading. Begin the measuring wheel at this location.
• Ending point: Include a brief description of the end of the track segment which can be readily identified for future reference. Take GPS reading.
• Length of track: Record the distance (in metres) from the measuring wheel.
Impact indicators These measures are recorded in the tabular lower section of the Point Sampling Form.
1. Distance (Dist): Use a random number table to select a random number from 0–100. In the first column of the form record the measuring wheel distance in metres to the first sample point. This will be the first sample point from which all subsequent sample points will be located at 100 m intervals. Once you have the first point, reset the wheel counter and use it to stop at 100 m intervals thereafter.
2. Informal tracks: Sum and record your tally of informal or visitor created tracks that intersect with the main track since the last sample point. Do not count formal roads or tracks of any type. Informal tracks are those created by visitors to access streams, scenic attraction features, camping areas, to create switchbacks, go around mud holes, or downed trees, or run parallel to the main track. Count both ends of any informal track longer than 7 m that loop out or parallel the survey track.
3. Secondary tracks: Count the number of tracks that run parallel to the main track at the sample point. Count all—regardless of their length. Do not count the main track.

MANUAL FOR ASSESSING WALKING TRACKS IN PROTECTED AREAS
15
4. Track width: The distance between tent pegs will be measured for two parameters. See Appendix A for how to measure width.
i. Width bare: width free of living vegetation (nearest cm) and ii. Width trampled: total width of ground visibly affected by trampling and or track
erosion (nearest cm) 5. Maximum incision (MIC): Maximum depth from the base of the taut string tied to the base of each
tent peg to the point of deepest incision is to be measured as maximum incision (MIC)—an indicator of soil erosion (Appendix A). Minimal erosion (< 5 cm) and will be recorded as < 5 cm.
6. Track grade (Grade): Two field staff will use the clinometer to determine (% slope).
Environmental parameters • Track position (Track Pos): Use the descriptions on Code Form to determine the track position of the
sample point. • Soil texture (Soil TEX): Use the descriptions on Code Form to assign soil texture in the vicinity of the
sample point. • Vegetation community (VEG): Use the descriptions on Code Form to assign the vegetation type in the
vicinity of the sample point.
Maintenance features • Track drainage features (TD): Estimate distance to nearest metre (up to 30 m) to any human
constructed water bar or drainage dip, or drain upslope from the sample point. Record ‘0’ if no drainage feature present within 30 m.
• Track grade: record slope at sample point.

MANUAL FOR ASSESSING WALKING TRACKS IN PROTECTED AREAS
16
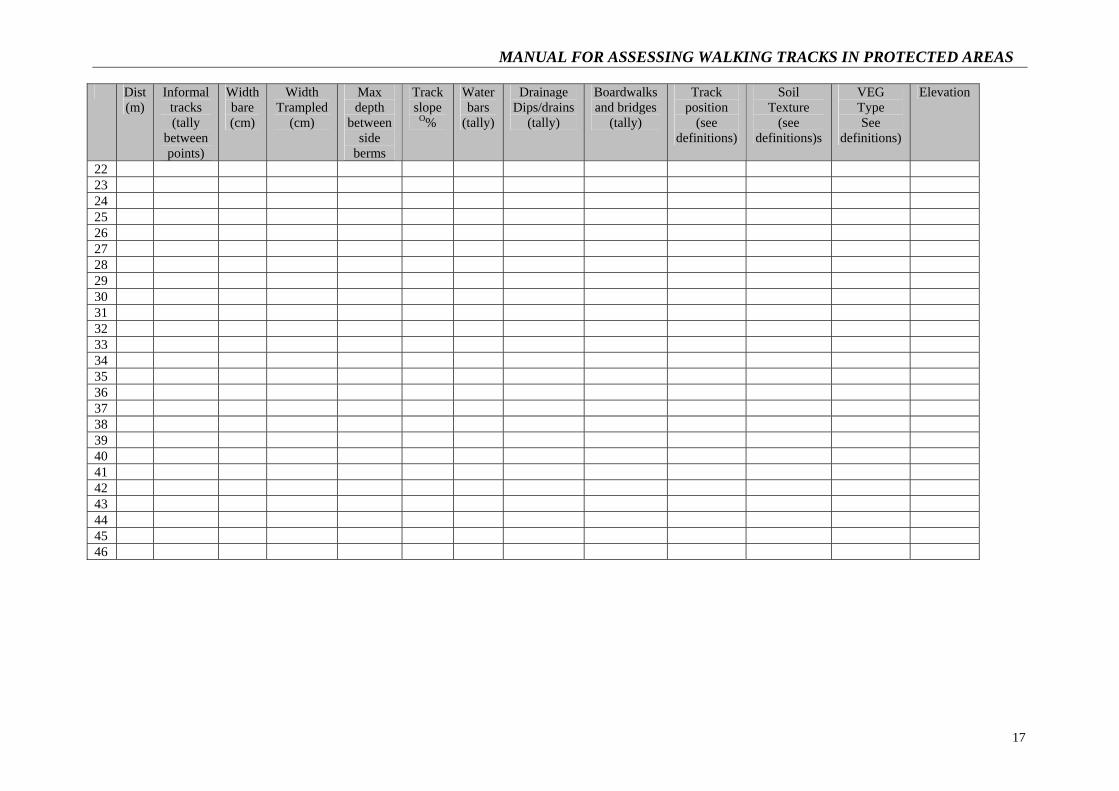
Point Sampling Assessment Form Protected area name: Person/s assessing track: Date of assessment: Time Start: Time finish: Total time: Track Name:
Track segment ID code: e.g.#1 Use level: Low Med High Use type: Pedestrian only Bikes and pedestrian Horses and pedestrian
Starting point description GPS location start/end: Datum
(use lat long decimal degree coordinates) Start N: Start E: End N: End E:
Point
Dist (m)
Informal tracks (tally
between points)
Width bare (cm)
Width Trampled
(cm)
Max depth
between side
berms
Track slope
O%
Water bars
(tally)
Drainage Dips/drains
(tally)
Boardwalks and bridges
(tally)
Track position
(see definitions)
Soil Texture
(see definitions)s
VEG Type See
definitions)
Elevation
1 2 3 4 5 6 7 8 9 10 11 12 13 14 15 16 17 18 19 20 21
MANUAL FOR ASSESSING WALKING TRACKS IN PROTECTED AREAS
17
Dist (m)
Informal tracks (tally
between points)
Width bare (cm)
Width Trampled
(cm)
Max depth
between side
berms
Track slope
O%
Water bars
(tally)
Drainage Dips/drains
(tally)
Boardwalks and bridges
(tally)
Track position
(see definitions)
Soil Texture
(see definitions)s
VEG Type See
definitions)
Elevation
22 23 24 25 26 27 28 29 30 31 32 33 34 35 36 37 38 39 40 41 42 43 44 45 46

MANUAL FOR ASSESSING WALKING TRACKS IN PROTECTED AREAS
18
Point Sampling Definitions and Codes Dist = Wheel distance Track Pos: Valley (V), mid slope (M), Ridge-top (R), Flat land (F) Missing data = 1 Soil texture (see below) Not applicable = 0 VEG type: Vegetation Community (see below)
Soil Texture Codes C Clay S Sandy SI Silty – like flour or talcum powder L Loamy – Combinations of the above, typically in roughly equal parts O Organic –dark organic soil absorbs/retains water (like peat moss) and mucky when wet G Gravel – record only when obvious gravel was applied by park management R Rocky – Natural gravel, rock or bedrock covers al least 60 % of the tread
Vegetation Community Codes H Heath (wet or dry) G Grassland RF Rainforest WS Wet Schlerophyl DS Dry Schlerophyl W Woodland Others/specify

MANUAL FOR ASSESSING WALKING TRACKS IN PROTECTED AREAS
19
APPENDIX A: PROCEDURES FOR MEASURING TRACK WIDTH AND MAXIMUM INCISION
Track width From the sample point extend a line transect in both directions perpendicular to the track. Identify the endpoints as the most pronounced outer boundary of the obvious human disturbance from track use—not track maintenance such as vegetation clearing. Boundaries are defined as pronounced trampling related changes in vegetation height, cover composition or when vegetation is reduced or absent. Place tent pegs at the boundary points. Step back and verify their horizontal and vertical placement along the track. Measure and record the transect length to the nearest centimetre.
Maximum incision Maximum depth is measured from the line stretched between the end points you have selected (see above) to the point of deepest incision. Minimal erosion (< 5 cm) and will be recorded as < 5 cm.

MANUAL FOR ASSESSING WALKING TRACKS IN PROTECTED AREAS
20
References Cole, D.N. (1989) Wilderness Campsites Monitoring Methods: a Sourcebook, General Technical Report,
Intermountain Research Station, Ogden. Utah. Dixon, G. Hawes, M. and McPherson G. (2004) ‘Monitoring and modelling walking track impacts in the
Tasmanian Wilderness World Heritage Area, Australia’, Journal of Environmental Management, 71: 305-320.
Farrell, T.A. and Marion J.L. (2001) ‘Identifying and assessing ecotourism visitor impacts at eight protected areas in Costa Rica and Belize’, Environmental Conservation, 28(3): 215-225.
Hill, W.M. and Pickering, C.M. (In review A) review of Walking Track Survey and Monitoring Methods, Technical Report, Sustainable Tourism CRC, Griffith University, Gold Coast.
Hill, W.M. and Pickering, C.M. (In review B) Field testing of Walking Track Survey and Monitoring Methods, Technical Report, Sustainable Tourism CRC, Griffith University, Gold Coast.
Leung, Y-F. (1998) ‘Assessing and Evaluating Recreation Resource Impacts: Spatial Analytical Approaches’, PhD Thesis, Virginia Polytechnic Institute Blacksburg, and Virginia State University, Petersburg.
Leung, Y-F. and Marion, J.L. (1999a) ‘Assessing trail conditions in protected areas: Application of a problem assessment method in Great Smoky Mountains National Park’, Environmental Conservation, 26: 270-279.
Leung, Y-F. and Marion, J.L. (1999b) ‘The influence of sampling interval on the accuracy of trail impact assessment’, Landscape and Urban Planning, 43: 167-171.
Leung, Y-F, Marion J.L. and Ferguson J.Y. (1997) ‘Methods for assessing and monitoring backcountry trail conditions: an empirical comparison’, Making Protection Work: Proceeding of the 9th George Wright Conference on Research and resource Management in Parks and on Private Lands (ed.), Harmon, D. pp 406-414. The George Wright Society, Hancock, M.I.
Manning, R. Jacobi, C. and Marion J.L. (2006) ‘Recreation monitoring at Acadia National Park’, The George Wright Forum, 23(2) 59-72.
Marion (2007) Monitoring Manual for Formal Trails: Great Falls Park Version 4/25/07. USDI, U.S. Geological Survey, Patuxent Wildlife Research Centre, Virginia Tech Field Station, Dept. of Forestry , Blacksburg VA.
Marion, J.L. and Leung Y-F (2001) ‘Trail resource impacts and an examination of alternative assessment techniques’, Journal of Park and Recreation Administration, 19(3): 17-37.
Marion J.L. and Olive, T. (2006) Assessing and Understanding Trail Degradation: Results from Big South Fork National River and Recreation Area, U.S. Department of the Interior, NPS Research/resources Mgmt Report. Onieda, TN.
Mende, P. and Newsome, D. (2006) ‘The assessment, monitoring and management of hiking trails: a case study from the Stirling Range National Park, Western Australia’, Conservation Science, 5(3): 285-295.
Nepal, S.K. (2003) ‘Trail impacts in Sagarmatha (Mt. Everest) National Park, Nepal: a logistical regression analysis’, Environmental Management, 32: 312-321.
PWS [Parks and Wildlife Service] (1994a) Walking Track Monitoring Strategy for the Tasmanian Wilderness World Heritage Area Volume 2 Appendix A, Department of Environment and Land Management, Hobart.
PWS [Parks and Wildlife Service] (1994b) Walking Track Monitoring Strategy for the Tasmanian Wilderness World Heritage Area Volume 3 Appendices B – G and References, Department of Environment and Land Management, Hobart.
PWS [Parks and Wildlife Service] (2004) State of the Tasmanian Wilderness World Heritage Area – an evaluation of management effectiveness, Report No. 1, Department of Tourism, Parks, Heritage and the Arts, Hobart.
Randall and Newsome (In Press, 2007) ‘Assessment, evaluation and comparison of planned and unplanned walk trails in coastal south-western Australia’, Conservation Science Western Australia.

Chairman: Stephen GreggChief Executive: Ian KeanDirector of Research: Prof. David Simmons
CRC For Sustainable Tourism Pty LtdGold Coast Campus Griffith University Queensland 4222 Australia ABN 53 077 407 286
Telephone: +61 7 5552 8172 Facsimile: +61 7 5552 8171Website: www.crctourism.com.auBookshop: www.crctourism.com.au/bookshopEmail: [email protected]
coMMercIALIse
reseArcHANd
deVeLopMeNt
educAtIoNANd
trAINING
utILIse
coLLABorAtIoN
coM
Mu
NI c A t I o N
I NN
oV
AtI
oN
• Travel and tourism industry• Academic researchers• Government policy makers
• New products, services and technologies• Uptake of research finding by business, government and academe• Improved business productivity• Industry-ready post-graduate students• Public good benefits for tourism destinations
I N d u s t r y p A r t N e r s u N I V e r s I t y p A r t N e r s c o M M e r c I A L I s A t I o N
EC3, a wholly-owned subsidiary company, takes the outcomes from the relevant STCRC research; develops them for market; and delivers them to industry as products and services. EC3 delivers significant benefits to the STCRC through the provision of a wide range of business services both nationally and internationally.
TOURISM NT NORTHERN TERRITORYAUSTRALIA
K e y e c 3 p r o d u c t s

Sustainable Tourism Cooperative Research Centre (STCRC) is established under the Australian Government’s Cooperative Research Centres Program.
STCRC is the world’s leading scientific institution delivering research to support the sustainability of travel and tourism—one of the world’s largest and fastest growing industries.
IntroductionSTCRC has grown to be the largest dedicated tourism research organisation in the world, with $187 million invested in tourism research programs, commercialisation and education since 1997.
STCRC was established in July 2003 under the Commonwealth Government’s CRC program and is an extension of the previous Tourism CRC, which operated from 1997 to 2003.
Role and responsibilitiesThe Commonwealth CRC program aims to turn research outcomes into successful new products, services and technologies. This enables Australian industries to be more efficient, productive and competitive.
The program emphasises collaboration between businesses and researchers to maximise the benefits of research through utilisation, commercialisation and technology transfer.
An education component focuses on producing graduates with skills relevant to industry needs.
STCRC’s objectives are to enhance:the contribution of long-term scientific and • technological research and innovation to Australia’s sustainable economic and social development;
the transfer of research outputs into • outcomes of economic, environmental or social benefit to Australia;
the value of graduate researchers to • Australia;
collaboration among researchers, • between searchers and industry or other users; and
efficiency in the use of intellectual and • other research outcomes.