Embed Size (px)
Citation preview

Management Theory andOccam’s RazorHow Public Organizations Bufferthe EnvironmentKenneth J. MeierTexas A&M University, College StationCardiff University, Wales, UKLaurence J. O’Toole Jr.The University of Georgia, Athens
Because organizations are open systems, environmental forces can both ben-efit the organization and cause it harm. The empirical theory of O’Toole andMeier suggests buffering is related to organizational performance in nonlin-ear ways by interacting with environmental forces, managerial networking,and organizational structures. This article examines the organization’s historyto generate an estimate of environmental buffering and then incorporates thismeasure to study buffering in a more contemporary data set. The authors findbuffering is related to a variety of performance indicators and has an espe-cially strong influence on performance in regard to a more disadvantagedclientele. The article then assesses the functional form of the buffering rela-tionship and the potential interaction with other variables. Although the logicof Occam’s razor implies that the simple linear relationship best fits the data,significant research needs to be done on other measures of buffering andother data sets before definitive conclusions can be drawn.
Keywords: organizational buffering; management; organizational perfor-mance; networks; education
Administration & SocietyVolume 39 Number 8
January 2008 931-958© 2008 Sage Publications
10.1177/0095399707309355http://aas.sagepub.com
hosted athttp://online.sagepub.com
931
Authors’ Note: This article is part of an ongoing research agenda on the role of public man-agement in complex policy settings. We have benefited from the helpful comments of GeorgeBoyne, Stuart Bretschneider, Amy Kneedler Donahue, Sergio Fernandez, H. GeorgeFrederickson, Holly Goerdel, Carolyn Heinrich, Patricia Ingraham, J. Edward Kellough,Laurence E. Lynn Jr., H. Brinton Milward, David Peterson, Hal G. Rainey, Bob Stein, andRichard Walker on various aspects of this research program. We also acknowledge the helpfulcomments from referees for Administration and Society.
Editor’s Note: This article was selected for the Herbert Kaufman Award as the Best Paper inPublic Administration presented at the 2006 APSA meetings.
by guest on July 29, 2016aas.sagepub.comDownloaded from

Public organizations operate in environments that offer both potentialbenefits and threats to the organization involved; these factors influence
management’s effectiveness in achieving public policy objectives as well (forinstance, L. Lynn, 1987; Moore, 1995; Rainey, 2003). Successful public man-agers, we are told, can play a key role in exploiting opportunities that arise inthe environment and in mitigating external dangers when they materialize.1
These generalizations are supported by a rich, persuasive, case-study literatureregarding the importance of managerial functions that are directed, at leastin part, outward from the organization. An incontrovertible proposition,therefore, is that public management encompasses far more than internalorganizational housekeeping.
Just how such functions play out, however, is considerably less clear.Many specific questions in this regard could be posed, but few have beenanswered through systematic research. For instance, what is the appropri-ate balance between tapping environmental opportunities and protectingagainst environmental threats? How do managers apportion their effortsbetween these two activities and what difference does it make? Which tac-tics are especially effective in implementing an approach of actively seek-ing out new opportunities or buttressing against possible disturbances, andunder what circumstances? How, if at all, do these efforts interact with arange of other relevant variables? And how much difference do these func-tions make for overall organizational performance? M. Lynn’s (2005)review of the literature finds theoretical notions covering a variety ofbuffering possibilities but only five direct empirical studies of buffering andenvironmental turbulence, and none of those directly link buffering to orga-nizational performance.
How might one begin a systematic examination of buffering in public orga-nizations? In a research program begun several years ago, O’Toole and Meier(1999) developed a formal model from the primarily inductive literature tospecify some hypothesized answers to certain of these questions and others.Since then they and other researchers have explored the operations of publicmanagement empirically and made some progress toward estimating impacts.Thus far, however, little of this work has been devoted to what might be calledthe buffering function of public management, despite its obvious importance.In the present article, we focus on this particular facet of public managementand build on the earlier work of O’Toole and Meier to explore whether andhow management’s buffering function affects public organizational perfor-mance. In doing so, we also probe the functional form that such bufferingefforts might take as they shape performance. We do so both because the ques-tion is important and also because O’Toole and Meier suggested a rather
932 Administration & Society
by guest on July 29, 2016aas.sagepub.comDownloaded from

complex answer to it. The issue needs to be examined carefully if we are toclarify the role of this managerial function as well as others in the perfor-mance of government agencies.
Buffering, Public Organizations,and Public Management: A Perspective and a Model
From the extensive empirical work documenting cases of public organi-zations operating in often complex and turbulent environments—settings inwhich the organizations are charged with carrying out policy objectives asthey face interdependence with other actors, including organizational andpolitical ones—it seems clear that two broad classes of forces can con-tribute to protecting, insulating, or mitigating impacts on the organizationfrom the external environment: structural or procedural elements that helpsecure an administrative system, on one hand, and managerial contributionsto protection, on the other (see O’Toole & Meier, 2003a, p. 112).2 As ashorthand, we refer to any of these influences that reduce the impacts ofenvironmental forces on organizational or performance results as buffers,and we refer to the dynamic of reducing such influences as buffering.
Whether structural or managerial (or both), several types of bufferingfunctions can be envisioned. Various particular forms of adaptive responsehave been shown to be used in organizations to protect core tasks fromenvironmental perturbations, including the development of organizationalsubunits to handle uncertainty and instability generated externally (see, forinstance, Fennell & Alexander, 1987). Indeed, even the development ofinterorganizational linkages can be a means of buffering core organiza-tional activities (Miner, Amburgey, & Stearns, 1990).
If one frames the variety of buffering forms at an abstract level, the protec-tive mechanism or effort could serve as a blockade insulating the administra-tive system from external shocks up to but not past a particular size (much likelevees around New Orleans), or a selective filter allowing some but not allexternal influences through the apparatus (a legislative affairs office for contactwith public officials), or a dampener reducing the amplitude of any externalinfluences (O’Toole & Meier 2003a, pp. 113-114; see also M. Lynn, 2005, pp.38-39). Modeling the impacts of such different forms of buffering would meantaking into account several rather distinct forms of insulation, each with its ownsomewhat different effect on the administrative systems in question. Indeed,some public organizations might employ simultaneously several differentkinds of buffering devices or effort. Investigating all such buffers would be
Meier, O’Toole / Management Theory 933
by guest on July 29, 2016aas.sagepub.comDownloaded from

a useful task, but modeling and estimating the impacts of buffering acrossmany such organizations requires some simplification.
In 1999, O’Toole and Meier provided a parsimonious model of public man-agement that incorporated these environmental functions of public management,including a specification of the buffering function. Specifically, after reviewingthe extensive case study and qualitative literature on public management, theyposited the following model:
Ot = β1(S+M1)Ot–1 + β2(Xt/S)(M3/M4) + εt (1)
whereO is some measure of outcome,S is a measure of stability, denoting structural, procedural, and other ele-ments that support unperturbed production,M denotes management, which can be divided into three parts:
M1 management’s contribution to organizational stability through addi-tions to hierarchy/structure as well as regular operations,
M3 management’s efforts to exploit the environment,M4 management’s effort to buffer environmental shocks,
X is a vector of environmental forces,ε is an error term,the other subscripts denote time periods, andβ1 and β2 are estimable parameters.
Where does buffering, as we have defined it, appear in the model? Ourconception of buffering is similar to Lynn’s (2005) idea of moving buffersout into the interface with the environment. Hence, buffering is present asthe denominator of the second, or environmental, term:
β2(Xt/S)(M3/M4) (2)
or, after rearranging,
β2(XtM3)/(SM4) (3)
This term models the impact of the set of environmental forces Xt onoutcome Ot. The impact can be leveraged by managerial effort (M3) orbuffered by the combined impacts of stabilizing forces (S) like structure aswell as managerial influences aimed at protecting the production system(M4). Note that this model simplifies by treating the buffering function inmathematical terms solely as a dampener. This reciprocal function (1/SM4)
934 Administration & Society
by guest on July 29, 2016aas.sagepub.comDownloaded from

essentially reduces the size of impact that an X or environmental variablecan have (hence the division into X), by dampening the impact over time.Eventually, other functional forms can be formally specified and tested,drawing once more from the extensive case-study literature, but this partic-ular version is a useful first step. It is the “SM4” denominator as a whole,then, that serves as the model’s term for buffering.3
O’Toole and Meier (1999) note that the two terms related to managingthe environment could be combined where M2 = M3/M4.
4 Thus M2 incorpo-rates all efforts to manage externally in the environment, in contrast to man-aging the organization, M1:
Ot = β1(S+M1)Ot–1 + β2(Xt/S)(M2) + εt (4)
Although much of their work has used this combined M2 term in a seriesof papers that demonstrate that management matters and that its effects canbe nonlinear, as the model indicates, they have not addressed four funda-mental elements of equation 1. They have not proposed and validated ameasure of M4,
5 the efforts of managers to buffer the environment; theyhave not incorporated the structural elements of stability6; they have notaddressed whether their M2 measure contains the M3 and M4 elements orwhether there might be other elements of M4 that have yet to be measured;and they have not addressed the hypothetical functional form specified intheir model (that is, the reciprocal function).
This article addresses three of these questions. First, we propose a mea-sure of environmental buffering that encompasses both structural and man-agerial activities. Second, we incorporate this measure into an explanationof organizational performance that includes several other management andstabilizing factors as well as measures of resources and constraints. Third,we then brave Occam’s razor7 to determine if the complex nonlinear rela-tionship specified by O’Toole and Meier (1999) is the most appropriatefunctional form, or if a simpler estimation will provide equally goodresults. In regard to the fourth question, we will assume that because previ-ous measures of M2 did not specifically address the buffering function, thatprior analysis does not explicitly include buffering actions. The model canthus be expanded to contain both M2, composed of actions seeking envi-ronmental opportunities and M4, an explicit buffering function.
Measuring Buffering
An organization’s effort to buffer environmental influences is likely tobe accomplished through a complex combination of both structures (along
Meier, O’Toole / Management Theory 935
by guest on July 29, 2016aas.sagepub.comDownloaded from

with associated procedures8) and managerial actions (Meyer & Rowan, 1977;Miner et al., 1990; Sorenson, 2003). Faced with a turbulent (for a classictreatment see Lawrence and Lorsch [1967]) or a relatively stable but hos-tile environment, organizational leadership has two options. First, decisionmakers could establish structures (S) that interact with the environment toabsorb the environmental pulses and in the process shelter the organiza-tion’s core technologies (Thompson, 1967). In business firms, these struc-tural elements would include organizational units that deal with inventorycontrol for inputs or postproduction marketing and distribution of outputs.In a public organization, such structural features might include special leg-islative affairs or public affairs units designed to handle requests from out-side the organization, or an emergency response unit such as a SWAT teamor Delta Force.9 For school districts, the organizations examined here, theresponse to the children of migrant workers provides an excellent illustra-tion of buffering. The Houston Independent School District (HISD) beginsthe school year with about 176,000 students with enrollment peaking at210,000 in November. To buffer its schools from this turbulence, HISD hascreated student intake units that operate at the school level to conductimmediate assessments of the students (language, grade level, specialneeds) and assign them to appropriate classes. These bilingual assessmentunits operate as what M. Lynn (2005) terms “absorbed slack,” and thusprocess the environmental influx and allow schools to continue to functionin regular ways.10
Second, management itself could engage in a set of buffering activities.Management might decide that certain environmental events or influenceswill be ignored, whereas others will require the intervention of top man-agement, and still others should be programmed for response by specificunits—say, an accounting office primed to handle external audits or otherchallenges regarding expenditures. School systems sometimes establishtheir own police forces to deal with security and crime problems rather thanrely on the double environmental shock of a crime and the arrival of an out-side police force. Such a unit allows management to set procedures fordealing with minor crimes without involving local law enforcement. Thisbuffering component of management (which is termed M4) might be anancillary function of management’s effort to interact with the environment(M2); that is, while seeking external opportunities, managers can also iden-tify negative or threatening forces.
Because the buffering function is a combination of both structure andmanagement, we opt for a unified measure of overall buffering, in lieu oftrying to separate the two processes, stipulate operational definitions of
936 Administration & Society
by guest on July 29, 2016aas.sagepub.comDownloaded from

each, and then simultaneously test these concepts and the various ways theycould combine. This simplification then allows as a first step a validation ofthe measure of buffering as dampening, and an effort to probe how it affectsperformance. If this effort is successful, future research will permit an exami-nation of exactly how the buffering process is developed and operated.
How might one get an organizational measure of buffering? If one startswith the basic principle that organizations are autoregressive systems—thatwhat they do today reflects what they did yesterday—then an examinationof how autoregressive processes respond to novel events should be useful.Consider the following simple autoregressive system:
Ot = β1Ot–1 + β2Xt + εt (5)
where O is the organization’s outcome and X is some type of environmentalshock,11 whether positive or negative from the standpoint of performance.
One unit of any X variable affects output by β2 in the current year; butbecause this output then becomes part of the production base of the organi-zation (Ot–1), the impact of one unit of X in the second year becomes β1β2.Subsequent years see additional impacts with the size of each year’s impactdeclining in what is termed a geometrically distributed lag. Although abuffering process could operate either on the X term through β2 or on theOt–1 term via β1, in this assessment our attention will focus on the latter.12
Assume two organizations, one with an autoregressive parameter of 0.9and another with an autoregressive parameter of 0.7. Further assume theoccurrence of some environmental disturbance that has an impact of Y onthe organization. The following illustrates the impact that this Y-level dis-ruption has on the two organizations in future years:
Parameter Year 0 Year 1 Year 2 Year 3 Year 4 Year 5
.9 Y .9Y .81Y .73Y .66Y .59Y
.7 Y .7Y .49Y .34Y .24Y .17Y
Note how even 5 years later, all other things being equal, the environ-mental disturbance still retains nearly 60% of its impact for the first orga-nization but has fallen all the way to a 17% impact in the second.13 Inorganization-theoretical terms, we think of the first unit as tightly coupledinternally; any disturbance, however slight, will reverberate through theorganization for a substantial period of time (see Meyer & Rowan, 1977;Powell & DiMaggio, 1991).14 The second organization is more loosely cou-pled internally (likely decentralized but with absorbed slack, see M. Lynn
Meier, O’Toole / Management Theory 937
by guest on July 29, 2016aas.sagepub.comDownloaded from

[2005, p. 41]); events dissipate more quickly over time.15 This is the patternthat one would expect to see if the organization had established structuresand used managerial processes to buffer or reduce the impact of environ-mental events or forces over time.16 Loose coupling permits an organizationto make a mistake and correct that mistake without endangering the orga-nization (M. Lynn, 2005). In this way it lessens the threat of environmentalshocks on the entire organization. This view is consistent with Meyer andRowan (1977), who suggest that organizations “tend to buffer their formalstructures from uncertainties of technical activities by becoming looselycoupled” (p. 341).
How might one get an estimate of the impact of such buffering or looselycoupled internal structure on program performance? A simple autoregres-sive estimation will not work because this coefficient essentially uses apanel of this year’s and last year’s performance for many organizations; andone cannot, as a result, get an organization-specific estimate with only twopoints. Because we have several years of prior data, our solution is to usethe historical data on each of the organizations to establish a baseline mea-sure of buffering in a subsequent period. Because our analysis here investi-gates the years 1995 to 2002 (see below for the set of organizationsanalyzed), we use data from 1986 to 1994 for each organization to estimatethis buffering process (incorporating therefore both structural and manage-rial aspects). This approach allows us to have an a priori estimate of buffer-ing that is independent of the actual data used in the study. The specificbuffering measure correlates output (Texas Assessment of Academic SkillsScores) at time t with output from time t+1 for the 1986 to 1994 period.17
This correlation coefficient is transformed into a buffering measure bysubtracting it from 1.0 so that larger numbers indicate greater levels ofbuffering (looser coupling) and lower levels indicate less buffering.18
Three aspects of this measure merit additional discussion. First, the mea-sure is essentially a system component rather than an event component. Itseeks to assess the organization’s response to the environment in generalrather than in relation to any one specific event or type of external event. Itis quite likely that certain events might generate much greater effort atbuffering, depending on their salience and centrality for the organization inquestion. At the same time, a systematic buffering element is likely to playa role even in these one-time unique occasions because systemic bufferingobviously provides some of the experience and capacity to deal with themore idiosyncratic incidents.
Second, the measure is focused on outcomes. We are ultimately inter-ested in explaining the policy performance of systems rather than, forinstance, their internal operations. For that reason, the buffering measure
938 Administration & Society
by guest on July 29, 2016aas.sagepub.comDownloaded from

directly taps how an administrative system is or is not protected from hav-ing its production—in terms of results—shaped over time by reverberationsfrom earlier events.
Third, the measure opts for parsimony in the composition of the measure-ment—that is, it is a single measure generalized from past behavior anddoes not attempt to separate out the individual influences of structure andmanagement. We use this strategy because we are interested in probing thecomplex functional forms in the O’Toole-Meier model of management. Inessence, we treat this buffering measure as operating similarly to both theM4 and the S in the second term of the management model.
Our strategy of analysis is to make some simplifying assumptions in themodel and proceed to test this notion of buffering-as-dampening and itsvarious functional forms in a step-by-step process. We start with the basemodel in equation 1, and regroup the elements in the second term of themodel to cluster structure and M4 together in equation 6:
Ot = β1(S+M1)Ot–1 + β2(XtM3)/(SM4) + εt (6)
In this model, buffering generates a highly complex reciprocal relation-ship that interacts with M3 and Xt (that is, SM4 is divided into XtM3). Wethen simplify this model by focusing solely on the second term of themodel, thus eliminating the autoregressive term as in equation 7.19 Therationale is that the current investigation focuses entirely on how environ-mental influences (the X vector) shape performance and may be mitigatedby buffering. These elements of the model all appear in the second term.20
Ot = β2(XtM3)/(SM4) + εt (7)
Because [7] is a highly nonlinear form, we investigate whether the rela-tionships are actually this complex. To do so, we move to the simplest pos-sible option, a linear additive model for all variables. Equation 8 displaysthis linear model and also includes another term (M, operationalized below)to represent any other relevant management influences:
Ot = β1M + β2Xt + β3M3 + β4(SM4) + εt (8)
Equation 8 becomes the basis for the first model that we test. The exactmodel to be tested is based on measures developed earlier, particularly ameasure of M2 that we will use in place of M3.
Ot = β1M + β2Xt + β3M2 + β4(SM4) + εt (9)
Meier, O’Toole / Management Theory 939
by guest on July 29, 2016aas.sagepub.comDownloaded from

This model now contains a direct test of whether buffering, the last-listed term in equation 9, contributes to performance.21 Then we add to thismodel in a series of incremental steps to determine if more complex formsof the relationships are warranted. First, we determine if including a recip-rocal relationship for buffering adds any additional information to theanalysis, by estimating equation 10:
Ot = β1M + β2Xt + β3M2 + β4(SM4) + β5(1/SM4) + εt (10)
Because a linear relationship is simpler and more direct, our approach totesting is to employ Occam’s razor as a selection criterion—that is, of twocompeting explanations the simpler one is to be preferred unless the morecomplex explanation adds significantly to our knowledge. From this per-spective, therefore, both the linear and the nonlinear terms (β4 and β5)should be included in the same equation. Because the theoretical modelcontains not only a reciprocal function but also an interaction, we also testequation 11, which includes an interaction of buffering with managerialnetworking (M2), and equation 12, which interacts the reciprocal functionwith the environmental variables (X).
Ot = β1M + β2Xt + β3M2 + β4(SM4) + β5(M2/SM4) + εt (11)
Ot = β1M + β2Xt + β3M2 + β4(SM4) + β5(X/SM4) + εt (12)
Data and Measurement
The empirical approach used places heavy demands on a data set, espe-cially when numerous alternative functional forms are incorporated into themodeling strategy. Our task is facilitated by using the Texas school districtdata set, an empirical source with a significant number of well-developedmanagerial concepts that have been used by a number of public manage-ment scholars (Fernandez, 2005; Goerdel, 2006; Gonzalez Juenke, 2005;Hicklin, 2004; Hill, 2005; Pitts, 2005). The data set includes considerableinformation regarding the more than 1,000 school districts in the state ofTexas that represent approximately one of every 14 school districts in theUnited States. The districts range widely on a variety of dimensions, includ-ing student composition (race, ethnicity, etc.), resources, setting (urban, rural,suburban), and performance. Our analysis includes a survey administered in2000 to the top managers in each unit to ask questions about variousapproaches to managing the organization. That survey had a 55% response
940 Administration & Society
by guest on July 29, 2016aas.sagepub.comDownloaded from

rate; and respondents were no different from nonrespondents on key variablessuch as enrollment, enrollment growth, students’ race, ethnicity and poverty, ortest scores. To these survey responses, we added 8 years of data (1995-2002)from the Texas Education Agency on organizational performance, resources,student composition, and other relevant factors. Because this is a pooled time-series analysis, we included dummy variables for the individual years to dealwith serial correlation. We then assessed the degree of heteroscedasticity withpooled diagnostics and found the levels well within acceptable limits.
Our measure of buffering as explicated in the preceding section wasunity minus the correlation of school-district outcomes for the period of1986 to 1994. Given that the primary statewide standardized test (theTAAS) is the central outcome in the state’s performance appraisal system,we calculated the buffering measure for that outcome and used it as a mea-sure of buffering in equations using TAAS or other outcomes as the depen-dent variable. The final measure has a mean of .49 with a standard deviationof .20; it ranges from .03 (a very tightly coupled system with reverberationsimportant over time) to .999 (a school district well protected from theimpacts over time of environmental disturbances).
O Outcome Measures
Although virtually all programs have multiple goals and thus are subjectto multiple performance indicators, some objectives are defined by thepolitical environment as more important than are others (O’Toole & Meier,2004). Buffering might well be an approach used to protect some goals andnot others. This study incorporates 10 different performance indicators inan effort to determine how public management affects a variety of organi-zational outcomes.
Although each performance indicator is salient to some portion of theeducational environment, the most noticeable by far is the overall studentpass rate on the TAAS.22 The TAAS was a standardized, criterion-based testthat all students in grades 3 through 8 and 11 had to take. The grade 11exam was a high-stakes test, and students were required to pass it to receivea regular diploma from the state of Texas. TAAS scores were used to rankdistricts, and the examination results were without question the most visi-ble indicator of performance used to assess the quality of schools. Our mea-sure is the percentage of students in a district who passed all (reading,writing, and math) sections of the TAAS.
Four other TAAS measures were also useful as performance indicators. Thestate accountability system assesses performance of subgroups of students, and
Meier, O’Toole / Management Theory 941
by guest on July 29, 2016aas.sagepub.comDownloaded from

districts must perform well on all these indicators to attain various staterankings. TAAS scores for Anglo, Black, Latino, and low-income studentswere included as measures of performance.23
Many parents and policy makers are also concerned with the performanceof school districts regarding college-bound students. Four measures of col-lege-bound student performance were used—the percentage of student whotook either of the college board exams, the average ACT score, the averageSAT score, and the percentage of students who score above 1110 on theSAT (or its ACT equivalent). Texas is one of a few states where both theACT and the SAT are taken by sufficient numbers to provide reliable indi-cators of both. As with statewide samples, where there is no correlationbetween these scores and the number of students taking them if the pro-portion of tested students is more than 30% of the total eligible to be tested(Smith, 2003), Texas scores on the ACT and SAT are generally uncorrelatedwith the percentage of students taking the exams. The 1110 measure isdefined by the state of Texas as an indicator of college readiness.
The final measure of performance might be termed a bottom-endindicator—attendance rates.24 High attendance rates are valued for tworeasons. Students are unlikely to learn if they are not in class, and state aid isallocated to the school district based, in part, on average daily attendance.Attendance, as a result, is a good indicator of low-end performance by theseorganizations; the measure is simply the average percentage of students whoare not absent.
M Management Variables
Managerial networking. This measure (M2) is intended to get at thereported behavior of school district top managers as they interact with theimportant parties in the district’s environment. Because school districts oper-ate within a network of other organizations and actors who influence theirstudents, resources, programs, goals, and reputation, the extent to which asuperintendent manages in the school district’s interdependent environment isrelated to school district performance (Meier & O’Toole, 2001, 2003).
To measure the behavioral networking activity of school superintendents,Meier and O’Toole (2001) selected four sets of actors from the organization’senvironment: local business leaders, other school superintendents, state legisla-tors, and the Texas Education Agency. In their mail survey, they asked eachsuperintendent how often he or she interacted with each actor, on a 6-pointscale ranging from daily to never. Assuming that superintendents with a net-working managerial approach should interact more frequently with all fouractors than would a superintendent with an approach focused on internal
942 Administration & Society
by guest on July 29, 2016aas.sagepub.comDownloaded from

management, a composite network-management-style scale was created viafactor analysis. All four items loaded positively on the first factor, producing aneigenvalue of 1.82; no other factors were statistically significant. Factor scoresfrom this analysis were then used as a measure of managerial networking, withhigher scores indicating a greater networking orientation.25 This network mea-sure may contain elements of buffering although it was designed to capture theextent of networking action rather than buffering or exploiting. Because it doesnot explicitly ask about buffering behavior, it can be treated as conceptually dis-tinct from our measure of buffering, which is also likely to include a structuralelement (the correlation between the two measures is –.05).
Managerial quality (Mq) is a notoriously difficult concept to measure.Meier and O’Toole (2002) validated a measure based on the residual froma model explaining salaries of district superintendents. The salary-settingprocess in Texas school districts approximates a competitive labor marketwith full information. As a result, management skills should be positivelyrewarded by the market. To isolate this quality component, they predict loggedsuperintendent salaries with 11 variables measuring job size, human-capitalfactors, personal characteristics, and prior school-district outputs similar tocommon salary models in the literature (see Ehrenberg, Chaykowski, &Ehrenberg, 1988).26 We replicated that analysis for the years 2000 to 2002and created a measure for 1995 to 2002.
The resulting model predicts 81% of the variance in salaries, thus compar-ing favorably to other models in the literature (and explaining 3% more thandid the original Meier and O’Toole [2002] estimation). The objective was toremove as many “nonquality” factors as possible from the superintendent’ssalary. The remaining residuals were then standardized (converted to a meanof 0 and a standard deviation of 1) for use in the subsequent analysis as a roughindicator of management quality. This measure is clearly a messy one becausethe residual contains all factors not included in the model. The impact of thismeasurement error, however, attenuates any relationships between a qualitymeasure and other variables such as organizational outputs.
Managing upward. In addition to managing in the environment andalso on the internal operations of the organization, public managers alsohave to deal with political sovereigns. O’Toole, Meier, and Nicholson-Crotty (2005) revealed that interactions between the superintendent and theschool board were fundamentally different from interactions with otherenvironmental actors. Interactions with the school board as an oversightbody fit what Moore (1995) describes as managing upward. The measure isa 6-point scale on the reported frequency of interactions with the schoolboard, with responses ranging from daily to never.
Meier, O’Toole / Management Theory 943
by guest on July 29, 2016aas.sagepub.comDownloaded from

Stability. O’Toole and Meier (2003b) have developed and validated twoaspects of personnel stability. They note in their study, however, that thesemeasures are, as much managerially driven as they are, separate influences,so we interpret both as aspects of management (M). Managerial stabilityseeks to measure constancy in top leadership; it is simply the number ofyears the superintendent has been employed by the district in any capac-ity.27 Workforce stability moves this concept down to the street level. It ismeasured as the percentage of teachers employed by the district during thepreceding year who continue to work for the district. For both measures,then, higher scores mean more stability. Data on managerial stability wereobtained from the survey respondents; data on teacher stability were pro-vided by the Texas Education Agency. Although these measures were ini-tially designed as stability features, we consider them here as aspects ofmanagement: specifically, what is usually referred to as personnel manage-ment. Although not totally under the control of school district leaders, thesevariables are susceptible to influence by the individuals who make deci-sions about how such organizations are run.
X Environmental Factors
Any assessment of public program performance must control for bothtask difficulty and program resources. For school districts, neither of thesetypes of elements is under the substantial control of the districts them-selves, and therefore they can be considered key parts of the vector of envi-ronmental forces. Fortunately, a well-developed literature on educationalproduction functions (Hanushek, 1996; Hedges & Greenwald, 1996) can beused for guidance. Eight variables, all commonly used, are included in ouranalysis—three measures of task difficulty and five measures of resources.
Schools and school districts clearly vary in how difficult it is to educatetheir students. Some districts have homogeneous student populations fromupper middle-class backgrounds. Students such as these are quite likely to dowell in school regardless of what the school does (see Burtless, 1996). Otherdistricts with a large number of poor students and a highly diverse studentbody will find it more difficult to attain high levels of performance because theschools will have to make up for a less supportive home environment and dealwith more complex and more varied learning problems (Jencks & Phillips,1998). Our three measures of task difficulty are the percentages of studentswho are Black, Latino, and poor. The last-mentioned variable is measured bythe percentage who are eligible for free or reduced-price school lunch. Allthree measures should be negatively related to performance.
944 Administration & Society
by guest on July 29, 2016aas.sagepub.comDownloaded from

Although the linkage between resources and performance in schools hasbeen controversial (see Hanushek, 1996; Hedges & Greenwald, 1996), agrowing literature of well-designed longitudinal studies confirms that, likeother organizations, schools with more resources generally fare better(Wenglinsky, 1997). Five measures of resources are included. The averageteacher salary, percentage state aid, and class size are directly tied to mon-etary resources. The average years of teaching experience and the percent-age of teachers who are not certified are related to the human resources ofthe school district. Class size and noncertified teachers should be negativelyrelated to student performance; teacher experience, instructional funds, andteacher salaries should be positively related to performance.
Findings
The linear model estimates for the specification in Equation 9 with thedependent variable as the most prominent outcome measure—overall TAASpass rate—are found in Table 1. The buffering variable is positively related tooverall performance, even controlling for a series of management variables(M) as well as a set of variables covering a series of resources and constraints(X). The inclusion of these controls supports the conclusion that bufferingitself matters rather than some combination of positive environmental factors.Although the unstandardized coefficient looks large, the range of the bufferingvariable is between 0 and 1, so this slope indicates a maximum impact of 3.2percentage points on the TAAS. In comparison, this size represents approxi-mately half the possible impact of that attributable to the managerial network-ing variable. Although our concern is with the buffering measure, the otherrelationships for the management variables are consistent with earlierresearch: Each variable is statistically significant and all of them except con-tact with the school board are positively associated with performance. Thecontrol variables are fairly collinear because there are five different measuresof resources included. All of the variables except teacher experience, however,are statistically significant; and only the state-aid variable which had anambiguous sign was not in the predicted direction.
Table 2 presents abbreviated information from nine additional regres-sions, each representing the model specified in Equation 9 and one for eachof the other dependent variables. The top four lines deal with the impact onTAAS scores for various subsets of students. In each case, greater bufferingis associated with higher student scores. The pattern of these coefficients isinteresting. Without question the greatest impact of buffering is for African
Meier, O’Toole / Management Theory 945
by guest on July 29, 2016aas.sagepub.comDownloaded from
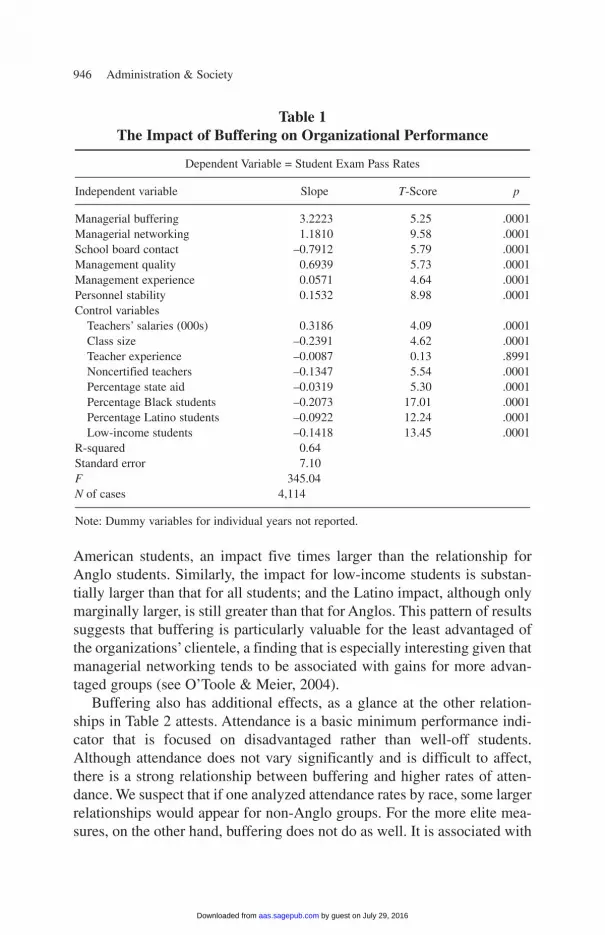
American students, an impact five times larger than the relationship forAnglo students. Similarly, the impact for low-income students is substan-tially larger than that for all students; and the Latino impact, although onlymarginally larger, is still greater than that for Anglos. This pattern of resultssuggests that buffering is particularly valuable for the least advantaged ofthe organizations’ clientele, a finding that is especially interesting given thatmanagerial networking tends to be associated with gains for more advan-taged groups (see O’Toole & Meier, 2004).
Buffering also has additional effects, as a glance at the other relation-ships in Table 2 attests. Attendance is a basic minimum performance indi-cator that is focused on disadvantaged rather than well-off students.Although attendance does not vary significantly and is difficult to affect,there is a strong relationship between buffering and higher rates of atten-dance. We suspect that if one analyzed attendance rates by race, some largerrelationships would appear for non-Anglo groups. For the more elite mea-sures, on the other hand, buffering does not do as well. It is associated with
946 Administration & Society
Table 1The Impact of Buffering on Organizational Performance
Dependent Variable = Student Exam Pass Rates
Independent variable Slope T-Score p
Managerial buffering 3.2223 5.25 .0001Managerial networking 1.1810 9.58 .0001School board contact –0.7912 5.79 .0001Management quality 0.6939 5.73 .0001Management experience 0.0571 4.64 .0001Personnel stability 0.1532 8.98 .0001Control variables
Teachers’ salaries (000s) 0.3186 4.09 .0001Class size –0.2391 4.62 .0001Teacher experience –0.0087 0.13 .8991Noncertified teachers –0.1347 5.54 .0001Percentage state aid –0.0319 5.30 .0001Percentage Black students –0.2073 17.01 .0001Percentage Latino students –0.0922 12.24 .0001Low-income students –0.1418 13.45 .0001
R-squared 0.64Standard error 7.10F 345.04N of cases 4,114
Note: Dummy variables for individual years not reported.
by guest on July 29, 2016aas.sagepub.comDownloaded from

more students taking college boards, but it is also associated with lowerscores on the ACT. Neither SAT scores nor the college-ready percentage issignificantly related to buffering. Again, these relationships could be inter-preted as consistent with the notion that buffering benefits the more disad-vantaged clientele. Expanding the number of students who take the collegeboards is a policy that benefits students who would not otherwise go on tocollege. If an increase in the number of test takers is responsible for thesedeclines, a slight drop in ACT scores is a modest price to pay for this greateraccess to educational opportunities.
Having established that buffering is associated with organizational per-formance, we turn to the next step: determining if the functional form spec-ified by the theory is correct. Table 3 adds the reciprocal of the bufferingvariable to the 10 equations represented in Tables 1 and 2, thus summariz-ing 10 estimations for Equation 10, one for each of the performance mea-sures. If the reciprocal functional form were to add explanatory power, overand above a linear specification, we should find that the coefficients for thisreciprocal variable are statistically significant. In 7 of the 10 cases, the rec-iprocal relationship fails to attain the .05 level of statistical significance.Given the large number of cases, the .05 level is not an onerous test. If onedismisses the case of SAT scores with the negative relationship, there areonly two cases for which the nonlinear form appears to contribute—lowincome pass rates and attendance. In both cases, the relationship is notstrictly linear, but the increase in the overall level of explained variation is
Meier, O’Toole / Management Theory 947
Table 2Impact of Buffering on Alternative Indicators of Performance
Performance Measure Slope T-score R-Square n
Black TAAS pass rate 13.0681 7.23 .48 2,503Latino TAAS pass rate 2.9283 2.73 .45 3,745Anglo TAAS pass rate 2.5750 4.26 .50 4,068Low income pass rate 4.8122 6.08 .58 4,087Attendance 0.3847 5.94 .25 4,114Taking college boards % 4.8069 3.38 .12 3,776ACT scores –0.3265 2.60 .39 3,522SAT scores –10.9686 1.54* .48 2,902College ready % 1.5563 1.72* .32 3,798
Note: TAAS = Texas Assessment of Academic Skills. All equations control for the five man-agement variables; teachers’ salaries; per student instructional funds; class size; teacher expe-rience; percentage of teachers not certified; percentage of Black, Latino, and low-incomestudents; and yearly dummy variables.*not significant p < .05, two-tailed test.
by guest on July 29, 2016aas.sagepub.comDownloaded from

minimal. Even in the face of the collinearity necessarily generated by includ-ing the variable and its reciprocal in the same equation, the linear coefficientholds up better than the nonlinear version. An overall conclusion, then, shouldbe that—in trimming with Occam’s razor—the relationship between bufferingand organizational performance is linear rather than nonlinear.28
Table 3 tests a simple reciprocal relationship, although the full theoryspecifies that buffering as a reciprocal relationship interacts with manager-ial networking and/or environmental resources and constraints, as indicatedin Equations 11 and 12. Table 4 shows abridged results from 10 regressionsthat include an interaction term between the reciprocal and the managerialnetworking variable. Because that equation also includes linear terms for bothnetworking and buffering, those coefficients are reported in the table as well, incase the interaction achieves statistical significance at the expense of inducingcollinearity in the other parameter estimates. In only three cases—overallTAAS scores, the Latino TAAS rate, and SAT scores—is the interaction termstatistically significant. In all three cases, the sign of the ratio interaction coef-ficient is the opposite of the two nonlinear terms (one indicator of collinear-ity),29 the size of the coefficients is not large, and the coefficients ofdetermination increase only marginally (not shown). A conservative inter-pretation of the results in Table 4 would generate the conclusion that the
948 Administration & Society
Table 3Buffering: Is the Relationship Linear or Reciprocal?
Linear Reciprocal
Performance Measure Slope T-Score Slope T-Score
Overall TAAS pass rate 2.2877 2.13 –.1934 1.06*Black TAAS pass rate 13.3745 3.51 .0591 0.09*Latino TAAS pass rate 4.4454 2.00 .3307 0.78*Anglo TAAS pass rate .9695 0.92* –.3294 1.85*Low-income pass rate 7.1709 5.18 .4855 2.07Attendance .9084 8.03 .1084 5.64Taking college boards % 6.5834 2.27 .3805 0.70*ACT scores –.3426 1.32* –.0034 0.07*SAT scores –52.1820 3.58 –8.1818 3.23College ready % 1.4133 0.76* –.0305 0.09*
Note: TAAS = Texas Assessment of Academic Skills. All equations control for the five man-agement variables; teachers’ salaries; per student instructional funds; class size; teacher expe-rience; percentage of teachers not certified; percentage of Black, Latino, and low-incomestudents; and yearly dummy variables.*not significant p < .05, two-tailed test.
by guest on July 29, 2016aas.sagepub.comDownloaded from

relationship between networking and buffering regarding performance islinear rather than a more complex nonlinear interaction.
The other possible nonlinear interaction is with the X variables repre-senting external resources and constraints (Equation 12).30 Because thereare eight such X variables, and a set of eight interaction terms would gen-erate an excessive number of coefficients, we converted and simplified theinteraction term by first regressing performance on the eight environmentalfactors and saving the predicted values. This step creates a vector that con-tributes the full amount of explained variation to the dependent variable.Then we ran 10 regressions, one for each of the dependent variables, withthe complete set of independent and control variables and included an inter-action term between this new resources vector and the reciprocal of thebuffering measure. Those results are reported in Table 5. Again the findingsare not impressive enough to conclude that the nonlinear interaction term isa superior specification to the linear additive specification, at least for thisset of data. Only three of the interaction terms meet the minimum level ofstatistical significance, and only one of these, for attendance, appears to addanything more than a minimum level of explained variation.
By examining the functional form of the buffering relationships in com-parison with a linear additive model, we find that the nonlinear estimations
Meier, O’Toole / Management Theory 949
Table 4Does the Interaction with M2 Add Explanation to a Linear Model?
Performance Measure Networking Buffering Ratio T-Score
Overall TAAS pass rate 1.9468 3.1950 –.3199 2.88Black TAAS pass rate 0.0948* 13.1852 .2337 0.78*Latino TAAS pass rate 1.7959 2.9230 –.5877 3.03Anglo TAAS pass rate 1.6782 2.5435 –.1876 1.73*Low-income pass rate 1.2212 4.7917 –.1714 1.20*Attendance 0.0908 0.3841 –.0067 0.57*Taking college boards % 0.3583* 4.8161 .0971 0.39*ACT scores 0.1893 –.3369 –.0315 1.45*SAT scores –0.6654* –10.4876* 3.1806 2.69College ready % 0.3205* 1.5781* .1927 1.20*
Note: TAAS = Texas Assessment of Academic Skills. All equations control for the five man-agement variables; teachers’ salaries; per student instructional funds; class size; teacher expe-rience; percentage of teachers not certified; percentage of Black, Latino, and low-incomestudents; and yearly dummy variables.*not significant p < .05, two tailed test.
by guest on July 29, 2016aas.sagepub.comDownloaded from

produce some interesting individual results but are not demonstrably supe-rior to the linear additive ones. In such a circumstance, the principle ofOccam’s razor holds that the simpler linear models are to be preferred. Thisfinding does not mean that these relationships are linear or noninteractivein all circumstances. For instance, in this analysis we have not probed sub-sets of the sample to determine if high performers or low performers oper-ate in a manner different from the median organization.31 Nor have weexamined different or unusual combinations of the resources and con-straints provided or imposed by the environment (turbulent or stable envi-ronments) to see if selected configurations might produce different resultsregarding the functional form among these variables. Still, the results heredo indicate that the rather more complicated specification entailed in thefull model is not necessary in at least some important empirical cases.
Conclusion
In the last few years, increasing evidence has buttressed the propositionthat public management matters positively for performance, that multiplefunctions entailed by management can contribute, and that some of theways that management shapes performance indeed function in complex(that is, nonlinear) fashions. Furthermore, the evidence has shown that
950 Administration & Society
Table 5Does Buffering Interact With Resources in a Reciprocal Manner?
Performance Measure Resources Buffering X/M4 T-Score
Overall TAAS pass rate 1.1810 3.1165 –.0003 0.13*Black TAAS pass rate 0.7132 14.0069 .0023 0.29*Latino TAAS pass rate 0.3863* 5.3821 .0069 1.30*Anglo TAAS pass rate 1.2284 1.6955* –.0023 1.06*Low-income pass rate 0.8097 7.5907 .0073 2.59Attendance 0.0749 0.9529 .0015 6.46Taking college boards % 0.6006 7.1153 .0063 0.95*ACT scores 0.1124 –.4044* –.0002 0.35*SAT scores 7.2452 –50.9109 –.1011 3.25College ready % 0.7871 1.8649* .0008 0.20*
Note: TAAS = Texas Assessment of Academic Skills. All equations control for the five man-agement variables; teachers’ salaries; per student instructional funds; class size; teacher expe-rience; percentage of teachers not certified; percentage of Black, Latino, and low-incomestudents; and yearly dummy variables.*not significant p < .05, two tailed test.
by guest on July 29, 2016aas.sagepub.comDownloaded from

“management” can be construed quite broadly, to entail not merely its opera-tional and short-term manifestations but also stabilizing features of the insti-tutional setting like personnel constancy that are shaped in part by the actionsof management, and also the strategy content of public organizations as theyoperate in their context (Meier, O’Toole, Boyne, & Walker, 2007).
These findings, and the theoretical arguments on which they are devel-oped, suggest the wisdom of exploring more broadly for the effects of addi-tional managerial influences on what public organizations do. The resultsalso suggest that protecting such an organization’s operations, whetherdirectly by management action or indirectly via structural design, can pro-vide performance payoffs. In this light, therefore, an examination of theperformance impacts of buffering seems sensible—indeed overdue, in thatorganizational buffering has been a conceptual and theoretical staple fordecades but has not until now been analyzed systematically.
In this study, we have treated buffering as a combination of managerialefforts and structural features that limit the impact of environmental forces onpublic organizations’ performance over time. Rather than differentiating themicro-details of managerial buffering activities, which could be quite subtleand varied, or the structural forms that buffers might take, we have developeda buffering measure that is designed to tap all of these by encompassingresults of buffering over a several-year period prior to the empirical periodunder direct examination. Developing such a measure is particularly helpful,in that it does not rely on the details of structural form or managerial action,but instead gathers their accumulated influences into a single measurableterm—one that can be tapped for many organizations. We have used the mea-sure to estimate the impacts of buffering, and also to explore some theoreti-cal expectations about the functional form of its influence.
Rather than adopt a heavily inductive approach to these research questions,we have been guided by, and have sought to test, promising modeling ideasoffered in recent years in the research literature. The work of O’Toole andMeier has provided the grounding for this effort. Their model offers a fairlydirect specification of buffering and its functional form, although it does obvi-ously oversimplify somewhat by including only one buffering variant—thebuffer as dampener—whereas other possibilities are clearly both plausible andextant in at least some organizational circumstances.
The results provide some support for the model’s assertions but alsosome Occam-guided negative findings. A key bottom line is that bufferingcan help performance. In 7 of the 10 linear estimations, this conclusion issupported. In only 1 of the 10 equations does buffering have a statisticallysignificant impact in the direction of impairing performance. This general
Meier, O’Toole / Management Theory 951
by guest on July 29, 2016aas.sagepub.comDownloaded from

support for the buffering function, it is important to note, appears in a set ofwell-specified models that contain five other management influences andeight controls for resources and constraints. These control variables rule outmany alternative explanations for performance fluctuations such as socio-economic differences among the districts or personnel and managementactivities. It seems clear, therefore, that protection of organizational pro-duction from potentially disturbing influences can be an important functionfor those who care about performance, even if “protection” sometimescomes at the price of missed opportunities to tap new resources or acquirenew support or jurisdiction. To put the point another way, public organiza-tions can benefit both from protecting their operations internally—forinstance, by stabilizing their personnel in front-line and managerial posi-tions (note the full estimation sketched in Table 1, as an example), and alsoby insulating internal operations from externally generated perturbations.
The results of these analyses offer more than a simple brief for theadvantages of buffering, however. For school districts in Texas, bufferingclearly helps improve performance as measured by criteria pertaining, or ofmost interest, to disadvantaged students. It helps little or not at all for thosewho are advantaged. This distributional dimension of the results is strikingand also highly interesting. In an earlier study, O’Toole and Meier (2004)showed that managerial networking also carries distributional conse-quences but with a pattern opposite to that found here for buffering.Networking by top managers in school districts benefits the most advan-taged students and does little for those at the other end.
Tapping the opportunities and potential payoffs in the environment cer-tainly has its merits, but it is also clear that the theoretical expectation thatbuffering can be an important organizational function with performanceimplications is also valid. Furthermore, it is not surprising that the benefitsare particularly apparent for the less advantaged, at least so far as publiceducation is concerned. Poor, minority, and at-risk students typically haveprecious little in their own personal environments to provide direction, sup-port, and constancy. They and their educational performance should be par-ticularly responsive to the benefits provided by a relatively insulatedorganizational context for their efforts to achieve. This point in turn carriespractical implications for such salient policy questions as whether theapparent mobility (and dynamism) offered by voucher systems is likely tocarry costs for the least advantaged, ceteris paribus, and whether the politi-cization of educational issues like financing and curriculum (as with intel-ligent design) create distributional negative consequences affecting theleast advantaged.
952 Administration & Society
by guest on July 29, 2016aas.sagepub.comDownloaded from

The results of this study also raise questions about the functional formthrough which buffering operates. The model tested here includes com-plexity: a reciprocal for buffering, plus interactions with both managerialbehavior (networking) and external forces (resources and constraints). Theempirical results, however, show only limited and sporadic support forthese features over the considerably more straightforward linear form. Thelatter represents the notion that buffering serves as a simple input to pro-duction. In a sense, this set of findings is surprising because it seems rea-sonable to hypothesize that buffering elements do more than dampen; onemight expect that at least some aspects interact directly with externalforces. There is little direct evidence of such interaction in this empiricalanalysis, however, and Occam’s razor, in this circumstance, calls for trim-ming to the simpler explanation as the preferred one. We should thereforecritically appraise the complex specification offered by O’Toole and Meier.If a linear functional form can be regularly shown to be just as efficient inexplanation as one involving the nonlinearities and reciprocal they hadincorporated, these features of the model should be rejected. Indeed, thoseauthors indicated early in their research program that they expected theirmodel to be eventually proven incorrect in at least some respects, but theyopted explicitly for clear and precise theorizing that could indeed be tested.
This article has offered such tests of certain portions of that model and hasraised questions regarding functional form. But we are a long way fromclearly rejecting—or accepting—such theoretical expectations in toto. Forone thing, Meier and O’Toole (2003) have shown evidence of other nonlin-earities supportive of certain complexities in functional form—interactionsbetween managerial networking and some external influences, to be precise.A prudent additional step, therefore, would be to concentrate on additionalanalysis of selected resources in the environment, those showing nonlinearrelationships with managerial networking, to see if these also interact withbuffering. For another, as suggested earlier, different portions of the samplemay behave differently (high or low performers, for instance), and interac-tions can be probed systematically in this regard as well.
In addition, although the measure of buffering developed here holds con-siderable promise and is validated by the empirical results, the complexfunctional form specified for testing represents but one among several fash-ions through which buffering might have its influence. The one studied hereis consistent with the mathematics of the model tested, but it may be thatother buffering forms both operate in some organizations of interest andalso have nonlinear effects. The tests conducted here do not allow us to sortthrough these possibilities but instead commingle all school districts into a
Meier, O’Toole / Management Theory 953
by guest on July 29, 2016aas.sagepub.comDownloaded from

common data set analyzed via a common specification. So caution isadvised. Finally, it is useful to remember that despite the value and richnessof the Texas school district data set, it does represent but one public orga-nizational form in one policy domain in one U.S. state. The results of suchanalysis can be valuable and suggestive but surely not definitive.
Still, this analysis pushes our understanding of public management andperformance forward and in nontrivial ways. Buffering matters, it mattersdifferently for different performance criteria and constituencies, and it maymatter in a linear fashion rather than a more complex one. Additionalresearch is needed to clarify these and related questions, as we have justsuggested, but we are now further along the road to a systematic under-standing of the determinants of public organizational performance.
Notes
1. Managers can also prevent some environmental threats from materializing by cultivat-ing and coopting key portions of the environment. Such strategies have their drawbacks (seeO’Toole & Meier, 2004; Selznick, 1949) and should be judged by whether the costs are out-weighed by the benefits provided.
2. Of course these two are related. Management can undertake actions that build or alterstructural features of the organizations, for instance.
3. As indicated below, we do not develop separate measures for each of the S and the M4
terms of the model. The measure used in this article is one for the entire buffering term,encompassing both elements. The model’s incorporation of the buffering concept suggests thatits effects on performance are likely to be similar across outcomes. It may nonetheless be thatsome kinds of performance, affecting certain kinds of groups, are more or less sensitive to theimpacts of organizational buffering. This notion is not included in the general theoretical argu-ment being examined but is analyzed in the empirical portion of this article.
4. Their argument is theoretical rather than empirical—that is, they have not demon-strated that their measures of these concepts actually combine in this way nor have theydemonstrated that their measures cover the full extent of the two concepts (see below).
5. Nor have they proposed and validated a measure of M3, the efforts of managers to tapor exploit the environment.
6. They have estimated the impacts of personnel stability and develop results consistentwith their model (O’Toole & Meier, 2003b).
7. Entia non sunt multiplicanda praeter necessitatem, or, no more things should be pre-sumed to exist than are absolutely necessary. The principle is attributed to William of Ockham,14th-century philosopher and logician.
8. For the remainder of the article we refer to the combination simply as structure.9. Many school districts require school board members and other elected officials to fun-
nel all contacts with school personnel through the superintendent’s office. This allows thesuperintendent to filter the contacts and limits their effect on operating personnel. It also givesthe elected official a sense of being a higher priority.
10. Such structures can buffer other events. When 5,000 students arrived at HoustonIndependent School District in September 2005 as the result of relocations from HurricaneKatrina, they were assessed and assigned in the same manner.
954 Administration & Society
by guest on July 29, 2016aas.sagepub.comDownloaded from

11. The logic works whether the O variable is defined either as outputs or outcomes.12. Again, here we assume the buffering process operates as a dampener rather than as a
barrier or a filter. This treatment fits the modeling simplification of O’Toole and Meier (1999)and is consistent with the empirical treatment in this article.
13. All things are not equal, of course, because new environmental events enter this sys-tem every year. More recent events could swamp the later-year effects of this initial event,depending on their size.
14. Coupling could actually be considered on two dimensions: extensiveness of the inter-dependent links with the environment and reverberation through time. Here we focus on thelatter and assume the former as constant. For the empirical part of the analysis in this article,this assumption is reasonable because the full sample of organizations are structurally alikeand similarly specialized.
15. Near the end of this continuum are networks of organizations, because in the typicalcase, networked units are somewhat interdependent but more loosely coupled. The less autore-gressive feature of networks, by comparison with organizations, is explicitly incorporated intothe model developed by O’Toole and Meier (1999; see also 2003a).
16. There can be both internal and external drivers of the autoregressive parameter. Weassume the main source of influence over variations in the parameter, among organizations ofsimilar structure and function, is the set of externally generated influences—the X’s of themodel—during the preceding cycles.
17. We essentially estimate more than 1,000 regression equations, one for each school dis-trict, to produce these estimates.
18. This measure, it should be noted, is specific to a buffering function that takes on thedampening form. All the systems to be examined empirically, furthermore, are open systemsrather than hermetically sealed ones, so systems buffered by dampening can be expected toexperience fluctuations—but with the externally driven forces quickly losing their impact.
19. Some of our management and structural variables contain an element of this internaldimension. The choice is between leaving out management elements that are more general orincluding them even though they might operate within the organization.
20. Meier and O’Toole (2004) have recently speculated that the first S term in the modelmay actually be composed of different elements than the second. This point also suggests cau-tion in trying to treat both as identical, and therefore a focus on the second term absent the firstis advised.
21. We are including measures of management developed in other studies to build on theliterature in the field. We could simplify the model by dropping all these management terms,but then we would need to add them back into the model to make sure buffering rather thansome other factor influenced performance.
22. The Texas Assessment of Academic Skills was replaced in 2003 by the TexasAssessment of Knowledge and Skills.
23. The various pass rates do not correlate as highly as one might imagine. The intercor-relations between the Anglo, Black, and Latino pass rates are all in the neighborhood of .6,thus suggesting the overlap is only a bit more than one third.
24. We considered using dropouts as a performance measure but dropout data are veryunreliable. In addition, the state of Texas made one significant change in the dropout measureduring this time period so that early dropout rates are not comparable to later ones.Accordingly, we omitted this measure from the analysis.
25. O’Toole and Meier use this as a measure of M2 rather than M3, but their analysisseems to indicate that the behavior associated with networking is essentially seeking toexploit opportunities.
Meier, O’Toole / Management Theory 955
by guest on July 29, 2016aas.sagepub.comDownloaded from

26. District characteristics included as predictors are the district’s total budget, tax rate,and average revenue per student; these district characteristics are logged. Four human-capitalcharacteristics are included: experience as a superintendent, tenure in the current job, age, andpossession of a doctorate. Personal characteristics included are whether the superintendent isfemale, Black, or Latino. The adjustment for prior year’s test scores is also included becausewe think managerial quality is affected by prior performance, and quality then affects futureperformance. Over time, in other words, there is reciprocal correlation. The adjustment for thisendogeneity is handled via an instrumental variables technique. Six student characteristics anddistrict resources are used as instruments; the purged measure of prior performance is thenincluded in the model.
27. The measure as a result taps both stability and capacity—the latter in the sense ofknowledge about the organization.
28. We also experimented with a quadratic estimation and got similar results.29. As an illustration, Table 2 shows that networking is positively and significantly related
to SAT scores whereas Table 4 produces a negative and insignificant coefficient.30. Meier and O’Toole (2003) have already shown evidence of nonlinearity between man-
agerial networking and certain resources variables, thus supporting the notion that at leastsome complex relationships indicated in the full specification of the model are supported byevidence.
31. In published work, Meier and O’Toole (2003) show that segmenting a sample intoslices by performance does demonstrate potentially important differences.
References
Burtless, G. (1996). Does money matter? Washington, DC: Brookings.Ehrenberg, R. G., Chaykowski, R. P., & Ehrenberg, R. A. (1988). Are school superintendents
rewarded for performance? In D. H. Monk (Ed.), Micro-level school finance: Issues andimplications for policy (pp. 337-364). Cambridge, MA: Ballinger.
Fennell, M. L., & Alexander, J. A. (1987). Organizational boundary spanning in institutional-ized environments. Academy of Management Journal, 30(3), 456-476.
Fernandez, S. (2005). Developing and testing an integrative framework of public sector lead-ership: Evidence from the public education arena. Journal of Public AdministrationResearch and Theory, 15(2), 197-217.
Goerdel, H. T. (2006). Taking initiative: Proactive management in networks and program per-formance. Journal of Public Administration Research and Theory, 16(3), 351-367.
Gonzalez Juenke, E. (2005). Management tenure and network time: How experience affectsbureaucratic dynamics. Journal of Public Administration Research and Theory, 15(1),113-131.
Hanushek, E. (1996). School resources and student performance. In G. Burtless (Ed.), Doesmoney matter? (pp. 43-73). Washington, DC: Brookings.
Hedges, L. V., & Greenwald, R. (1996). Have times changed? The relation between schoolresources and student performance. In G. Burtless (Ed.), Does money matter? (pp. 74-92).Washington, DC: Brookings.
Hicklin, A. K. (2004). Network stability: Opportunity or obstacle? Public OrganizationReview, 4,121-133.
Hill, G. (2005). The effects of managerial succession on organizational performance. Journalof Public Administration Research and Theory, 15(4), 585-598.
956 Administration & Society
by guest on July 29, 2016aas.sagepub.comDownloaded from

Jencks, C., & Phillips, M. (Eds.). (1998). The black-white test score gap. Washington, DC:Brookings.
Lawrence, P. R., & Lorsch, J. W. (1967). Organization and environment. Cambridge, MA:Harvard University Press.
Lynn, L. E., Jr. (1987). Managing public policy. Boston: Little, Brown.Lynn, M. L. (2005). Organizational buffering: Managing boundaries and cores. Organization
Studies, 26(1), 37-61.Meier, K. J., & O’Toole, L. J., Jr. (2001). Managerial strategies and behavior in networks: A
model with evidence from U.S. public education. Journal of Public AdministrationResearch and Theory, 11(3), 271-295.
Meier, K. J., & O’Toole, L. J., Jr. (2002). Public management and organizational performance: Theimpact of managerial quality. Journal of Policy Analysis and Management, 21(3), 629-643.
Meier, K. J., & O’Toole, L. J., Jr. (2003). Public management and educational performance:The impact of managerial networking. Public Administration Review, 63(6), 675-685.
Meier, K. J., & O’Toole, L. J., Jr. (2004). Conceptual issues in modeling and measuring man-agement and its impacts on performance. In P. Ingraham and L. E. Lynn Jr. (Eds.), The artof governance: analyzing management and administration. (pp. 195-223) Washington:Georgetown University Press.
Meier, K. J., O’Toole, L. J., Jr., Boyne, G. A., & Walker, R. M. (2007). Strategic managementand the performance of public organizations: Testing venerable ideas against recent theo-ries. Journal of Public Administration Research and Theory, 17(3), 357-377.
Meyer, J., & Rowan, B. (1977). Institutionalized organizations: Formal structure as myth andceremony. American Journal of Sociology, 83(2), 340-363.
Miner, A. S., Amburgey, T. L., & Stearns, T. M. (1990). Interorganizational linkages and pop-ulation dynamics: Buffering and transformational shields. Administrative Science Quarterly,35(4), 689-713.
Moore, M. H. (1995). Creating public value: Strategic management in government. Cambridge,MA: Harvard University Press.
O’Toole, L. J., Jr., & Meier, K. J. (1999). Modeling the impact of public management: Theimplications of structural context. Journal of Public Administration Research and Theory,9(4), 505-526.
O’Toole, L. J., Jr., & Meier, K. J. (2003a). Bureaucracy and uncertainty. In B. C. Burden (Ed.),Uncertainty in American politics (pp. 98-117). New York: Cambridge University Press.
O’Toole, L. J., Jr., & Meier, K. J. (2003b). Plus ça Change: Public management, personnel sta-bility, and organizational performance. Journal of Public Administration Research andTheory, 13(1), 43-64.
O’Toole, L. J., Jr., & Meier, K. J. (2004). Desperately seeking Selznick: Cooptation andthe dark side of public management in networks. Public Administration Review, 64(6),681-693.
O’Toole, L. J., Jr., Meier, K. J., & Nicholson-Crotty, S. (2005). Managing upward, downward,and outward: Networks, hierarchical relationships and performance. Public ManagementReview, 7(1), 45-68.
Pitts, D. W. (2005). Diversity, representation, and performance: Evidence about race and eth-nicity in public organizations. Journal of Public Administration Research and Theory,15(4), 615-631.
Powell, W. W., & DiMaggio, P. J. (1991). The new institutionalism in organizational analysis.Chicago: University of Chicago Press.
Rainey, H. G. (2003). Understanding and managing public organizations (3rd ed.). SanFrancisco: Jossey-Bass.
Meier, O’Toole / Management Theory 957
by guest on July 29, 2016aas.sagepub.comDownloaded from

Selznick, P. (1949). TVA and the grass roots. Berkeley: University of California Press.Smith, K. B. (2003). The ideology of education: The commonwealth, the market and America’s
schools. Albany, NY: SUNY Press.Sorenson, O. (2003). Interdependence and adaptability: Organizational learning and the long-
term effect of integration. Management Science, 49(4), 446-463.Thompson, J. D. (1967). Organizations in action. New York: McGraw-Hill.Wenglinsky, H. (1997). How educational expenditures improve student performance and how
they don’t. Princeton, NJ: Educational Testing Service.
Kenneth J. Meier is the Charles H. Gregory Chair in Liberal Arts and distinguished profes-sor of political science at Texas A&M University. He is also a professor of public manage-ment in the Cardiff School of Business, Cardiff University (Wales). In addition to his majorresearch agenda on empirical studies of public management, he is interested in race and publicpolicy, methodological innovations in public administration, and the relationship betweendemocracy and bureaucracy.
Laurence J. O’Toole Jr. is the Margaret Hughes and Robert T. Golembiewski professor ofpublic administration and head of the Department of Public Administration and Policy at theUniversity of Georgia. His research interests include public management in complex institu-tional settings, policy implementation, and environmental policy and management.
958 Administration & Society
by guest on July 29, 2016aas.sagepub.comDownloaded from


