Embed Size (px)
Citation preview
Mammal Hip Morphology and Function:Coxa Recta and Coxa Rotunda
HEINSE W. BOUMA,1* STEFAN F. DE BOER,2 JOHN DE VOS,3
PAULIEN M. VAN KAMPEN,1 AND TOM HOGERVORST1
1Department of Orthopedic Surgery, HAGA Hospital, The Hague, The Netherlands2Viecurie Medical Centre, Venlo, the Netherlands
3Department of Geology, Naturalis Biodiversity Centre, RA Leiden, The Netherlands
ABSTRACTUsing 15 parameters, we provide a systematic description of mammal
proximal femoral morphology. We established two types of proximal femo-ral morphology, termed coxa recta and coxa rotunda, characterized by lowversus high concavity of the head–neck junction. Concavity is a measureof the sphericity of the femoral head as it meets the femoral neck thatcan be quantified by angular measurements. We asked whether the pa-rameter of concavity corresponds with the classification of mammal proxi-mal femoral morphology based on coalesced versus separate ossificationpatterns and locomotor patterns. Statistical analysis demonstrated a dis-tinction between coxa recta and coxa rotunda with significant differencesbetween the two groups in all but 3 of the 15 parameters examined. Wefound the most discriminating measurement between mammal hips to bethe concavity of the posterior head–neck junction (beta angle). Coxa recta(small concavity) and coxa rotunda (large concavity) relate to the ossifica-tion pattern seen in proximal femoral development, and species-specificpatterns of locomotion. We interpret the two hip types to reflect optimiza-tion for strength (recta) versus mobility (rotunda). Conceptually, both hiptypes can be recognized in humans, where coxa recta can berelated to the development of osteoarthritis. Anat Rec, 296:250–256,2013. VC 2012 Wiley Periodicals, Inc.
Key words: hip morphology; coxa recta; coxa rotunda;mammal; human; hip impingement; proximalfemur
Mammal hip joint morphology varies markedlybetween species. Some species have round femoral headsthat may allow a large range of motion of the head inthe acetabulum, for example, the large apes such as go-rilla and chimpanzee. Others species have femoral headsthat are not round at all, but oval or globular-shaped,for example, bovids such as bison.
To classify mammal hip morphology, Serrat et al. (2007)described two patterns of proximal femoral ossification.Briefly, the proximal femur starts with one chondroepiph-ysis, which subsequently separates into a trochanteric andcapital physis, or remains as one coalesced epiphysis.These ossification patterns, separate and coalesced, affordonly global description of proximal femoral anatomy, andappear to have no clear relationship to body size, phylog-eny, or locomotion categories (Serrat et al., 2007).Conversely, when locomotion is assessed on a finer scaleby looking at habitat specific patterns of locomotion,
Kappelman (1988) found a clear relation between the typeof hip loading and movement and femoral head shapewithin the family of bovids. Bovid species living in openhabitats (savanna) depend on speed for survival, andtherefore, rely on maximum power development at thehip. Their hips have laterally expanded (less spherical)femoral heads that largely restrict movement to the para-sagittal plane, increasing locomotor power. In contrast,
*Correspondence to: Heinse W. Bouma, MD, Department ofOrthopaedic Surgery, HAGA Hospital The Hague, Sportlaan6002566, MJ Den Haag, The Netherlands. Fax (þ31) 70-2106519;E-mail: [email protected]
Received 31 January 2012; Accepted 24 October 2012.
DOI 10.1002/ar.22634Published online 10 December 2012 in Wiley Online Library(wileyonlinelibrary.com).
THE ANATOMICAL RECORD 296:250–256 (2013)
VVC 2012 WILEY PERIODICALS, INC.
forest bovids have more spherical femoral heads allowingmore abduction and rotational movement, facilitatingmovement through dense vegetation (Kappelman, 1988).
Human hip joint morphology can be quantified clini-cally by radiography, CT or MRI scans, but acomprehensive description of proximal femoral morphol-ogy in the normal human population was given only
recently by Toogood et al. (2009) using 10 parameters. Inthis study, femoral head sphericity at the head neckjunction was quantified by the parameter ‘‘concavity.’’ Asimilar, systematic description of mammal proximal fem-oral morphology is lacking, yet it may help better todescribe and understand proximal femoral morphologyin relation to ossification and locomotion patterns.
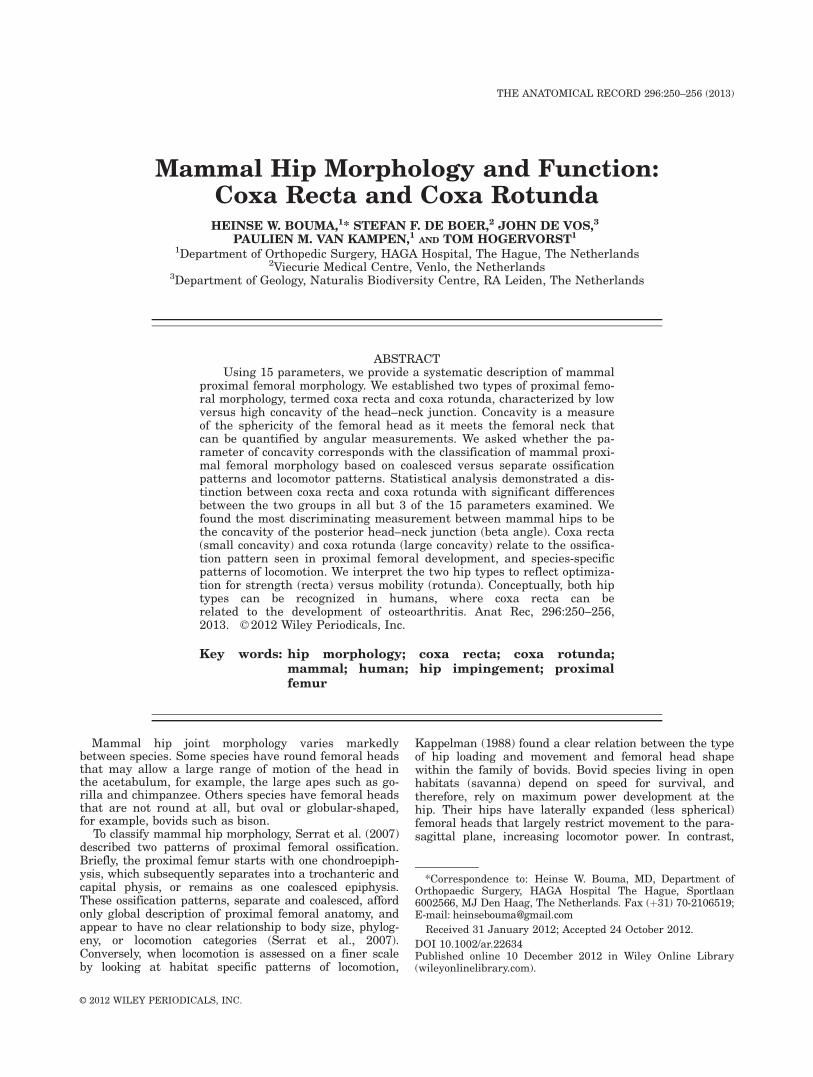
Fig. 1. Coxa recta AP and lateral photographs (not to scale): (A) kangaroo (Macropus giganteus), (B)dog (Canis lupus familiaris), (C) bison (Bos bison), (D) horse (Equus caballus). Note oval femoral head andlack of offset. Also the coalesced epiphyseal line is visible.
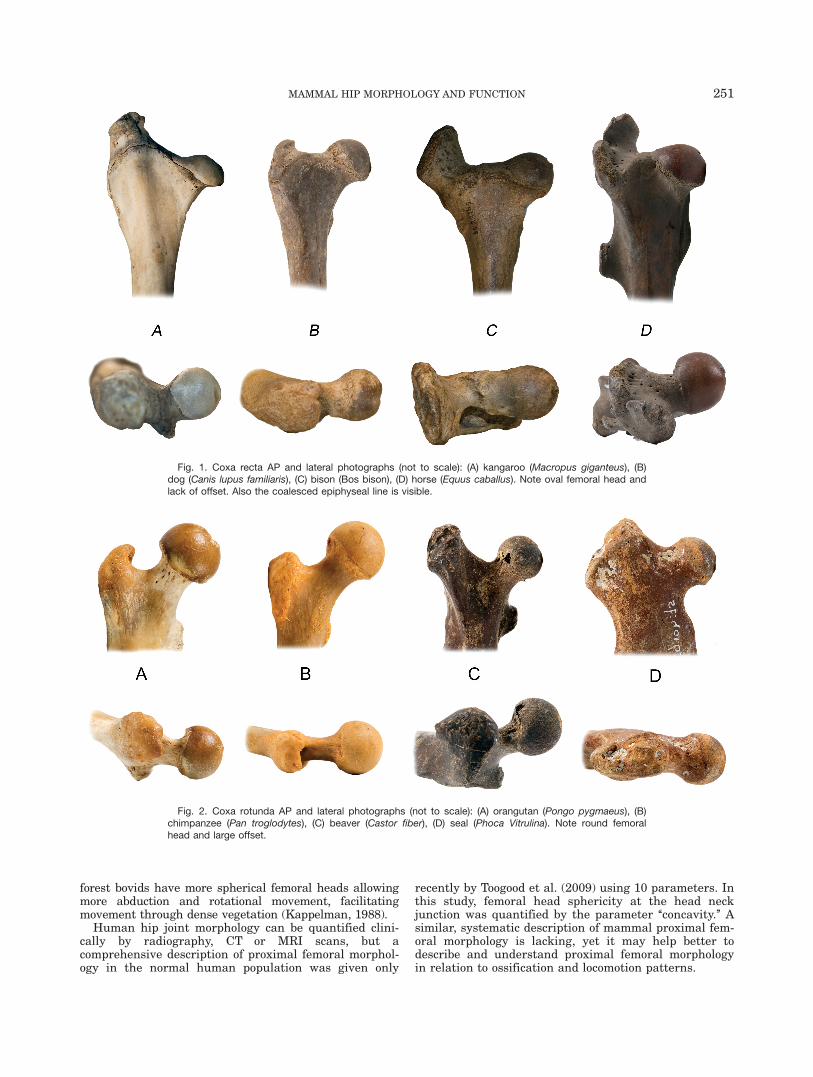
Fig. 2. Coxa rotunda AP and lateral photographs (not to scale): (A) orangutan (Pongo pygmaeus), (B)chimpanzee (Pan troglodytes), (C) beaver (Castor fiber), (D) seal (Phoca Vitrulina). Note round femoralhead and large offset.
MAMMAL HIP MORPHOLOGY AND FUNCTION 251
We asked whether the parameter of concavity corre-sponds with the classification of coalesced versusseparate ossification pattern and locomotion patterns.
Specifically, we aim,
1. to provide a comprehensive description using 15 mor-phologic parameters of mammal proximal femoral mor-phology that can be used for large museum collections.
2. to asses which parameter distinguishes best betweenthe two ossification patterns and locomotion patterns.
MATERIALS AND METHODS
The selection of species was based on femoral ossifica-tion pattern and corresponding locomotion patterns. Onegroup consists of cursorial and saltatorial mammals witha coalesced epiphysis, characterized by an asphericalfemoral head at the junction of the head and the femoralneck (low concavity). Often, the head is positioned asym-metrically on the femoral neck and there is a straightsection on the head–neck junction (Fig. 1). We use theterm coxa recta for this type of proximal femoral mor-phology (Hogervorst et al., 2009).
The other group consists of aquatic/amphibious andclimbing mammals. These femora have a spherical femo-ral head, positioned more symmetrically on the femoralneck. Due to the roundness of the head and symmetricalpositioning on the femoral neck, there is high concavityof the femoral neck (Fig. 2). We use the term coxa ro-tunda for this type of proximal femoral morphology(Hogervorst et al., 2009).
Specimens
Specimens studied are listed in Table 1, and form partof the collection of Naturalis, the Dutch Natural HistoryMuseum in Leiden, the Netherlands. We examined 76dried femora of eight mammalian species. The rectagroup consists of 35 femora (bovids, carnivores, marsu-pials, equids), the rotunda group 41 femora (hominoids,rodents, pinnipeds). The sample was restricted to adults,assessed by epiphyseal closure. Sex was known for allprimate specimens, not for the other mammals.
Photography
Photographs were taken in two standardized posi-tions. Anteroposterior (AP) photographs were taken withthe femoral neck aligned parallel to the examination ta-ble, by placing 1-mm-thick cards under one of thefemoral condyles. For femora with anteversion,cards were placed under the lateral femoral condyle.For femora with retroversion, cards were placed underthe medial femoral condyle. Parallelism of the femoralneck with the examination table was assessed visually.
Lateral (LAT) photographs of the femoral neck weretaken with the femoral neck aligned parallel with theedge of the table as seen from above. Both femoral con-dyles were resting flat on the examination table for thisview. The camera was leveled with the examination ta-ble to allow measurement of version of the femoral neck(ante- or retro-version).
Reference of Proximal Femoral Morphology
We use the terms anterior, posterior, superior, and in-ferior to define positions in both mammal and human
TA
BL
E1.
Av
era
ges,
sta
nd
ard
dev
iati
on
,a
nd
on
e-w
ay
AN
OV
Afo
rea
ch
specie
sp
er
pa
ra
mete
r
Ora
ngu
tan
(Pon
go
pyg
ma
eus)
Aver
age
(SD
)
Ch
imp
an
zee
(Pa
n)
Aver
age
(SD
)
Bea
ver
(Ca
stor
fiber
)A
ver
age
(SD
)S
eal
(Ph
oca)
Aver
age
(SD
)
Kan
garo
o(M
acr
opu
s)A
ver
age
(SD
)
Dog
(Ca
nis
lup
us
fam
ilia
ris)
Aver
age
(SD
)
Bis
on(B
osbis
on)
Aver
age
(SD
)
Hor
se(E
qu
us)
Aver
age
(SD
)S
ig.
n13
810
10
610
910
CC
D137.2
(4.5
)126.8
(5.1
)130.9
(5.8
)11
8.0
(6.2
)11
0.7
(1.8
)127.2
(4.5
)11
9.1
(4.0
)11
8.3
(5.8
)F
(7,6
8)¼
27.6
9,
P<
0.0
01
MP
FA
87.2
(7.2
)70.0
(6.5
)60.4
(1.9
)51.4
(6.1
)47.9
(4.1
)68.6
(3.1
)56.7
(3.2
)44.3
(3.2
)F
(7,5
8)¼
79.0
5,
P<
0.0
01
Alp
ha
22.3
(2.4
)24.8
(5.5
)22.3
(8.4
)43.8
(15.0
)53.4
(7.4
)17.8
(11.7
)66.2
(10.7
)26.0
(6.1
)F
(7,6
7)¼
33.0
2,
P<
0.0
01
Bet
a31.2
(3.4
)38.5
(5.1
)34.8
(8.5
)30.8
(7.6
)58.7
(3.3
)63.2
(12.5
)67.7
(16.0
)74.4
(11.4
)F
(7,6
7)¼
35.0
5,
P<
0.0
01
Gam
ma
36.3
(7.9
)39.4
(2.2
)46.4
(9.0
)79.1
(18.5
)97.3
(13.4
)69.5
(12.7
)92.7
(9.5
)101.1
(12.0
)F
(7,6
8)¼
51.2
2,
P<
0.0
01
Del
ta40.7
(6.2
)40.3
(3.3
)41.7
(5.1
)58.9
(6.4
)50.8
(4.3
)52.6
(6.9
)67.3
(15.6
)71.7
(4.8
)F
(7,6
8)¼
26.0
9,
P<
0.0
01
Ep
iph
ysi
sA
P88.3
(5.6
)85.7
(6.0
)84.7
(8.8
)81.5
(5.1
)52.1
(3.3
)76.3
(8.3
)59.9
(6.9
)74.1
(8.2
)F
(7,6
4)¼
28.7
1,
P<
0.0
01
Ep
iph
ysi
sL
AT
94.2
(5.0
)95.8
(6.2
)98.5
(13.0
)98.7
(12.4
)92.2
(7.1
)104.3
(7.1
)97.9
(10.5
)88.6
(7.2
)F
(7,6
0)¼
2.8
5,
P<
0.0
2T
ran
slati
onA
P1.3
(2.4
)0.0
(0.0
)�
1.5
(2.7
)�
3.4
(3.0
)�
12.5
(2.3
)�
3.7
(3.2
)�
4.0
(2.4
)�
5.9
(2.4
)F
(7,6
8)¼
21.7
8,
P<
0.0
01
Tra
nsl
ati
onL
AT
3.9
(2.0
)5.2
(3.5
)6.1
(3.4
)�
4.7
(7.3
)0.4
(4.0
)12.4
(6.7
)3.4
(3.4
)12.6
(3.4
)F
(7,6
7)¼
15.3
7,
P<
0.0
01
Ver
sion
�1.6
(6.9
)0.4
(13.3
)15.5
(7.5
)�
2.4
(5.7
)27.6
(5.0
)�
8.1
(9.9
)�
0.3
(6.6
)15.7
(5.1
)F
(7,6
6)¼
19.3
6,
P<
0.0
01
Off
set
an
teri
or28.8
(3.2
)27.6
(4.3
)29.5
(7.3
)15.1
(9.6
)10.8
(3.4
)32.7
(10.2
)19.8
(4.4
)24.7
(5.3
)F
(7,6
7)¼
11.2
8,
P<
0.0
01
Off
set
pos
teri
or22.9
(2.7
)18.3
(2.4
)21.3
(4.9
)23.2
(5.7
)11
.0(4
.1)
13.5
(4.3
)16.6
(3.8
)5.6
(3.2
)F
(7,6
7)¼
23.3
1,
P<
0.0
01
Off
set
infe
rior
19.2
(7.0
)16.9
(2.3
)16.2
(2.4
)6.9
(2.6
)8.3
(3.7
)9.6
(3.3
)3.2
(2.0
)3.0
(2.7
)F
(7,6
8)¼
27.3
5,
P<
0.0
01
Off
set
sup
erio
r21.8
(6.1
)19.1
(1.6
)12.6
(2.7
)2.0
(2.4
)0.0
(0.0
)4.1
(2.7
)0.0
(0.0
)0.0
(0.0
)F
(7,6
8)¼
87.5
4,
P<
0.0
01
Sig
.,si
gn
ific
an
ce;
F,
F-d
istr
ibu
tion
;V
ersi
on,
neg
ati
ve
valu
ed
enot
esre
trov
ersi
on,
pos
itiv
evalu
ean
tever
sion
ofth
efe
mor
al
nec
k.
252 BOUMA ET AL.
proximal femora (Toogood et al., 2009: #2889). Superiordenotes (toward) the femoral head aspect of the femur,anterior toward the patellar aspect of the femur.
Measurements
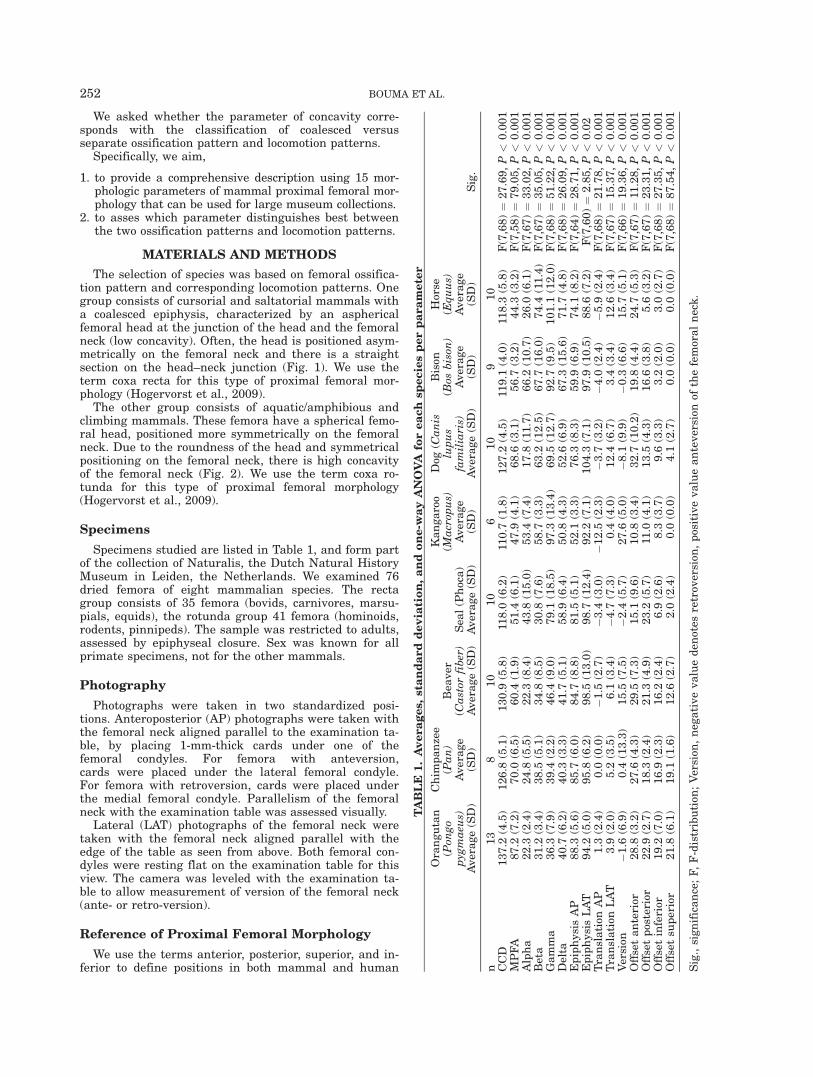
We used the GNU Image Manipulation Program 2.6(http://www.gimp.org/) to measure all specimens. In Figs.3 and 4, all measurements are outlined. To determinethe center of rotation of the femoral head, a circle wasdrawn over the femoral head. Version of the neck was
assessed on the lateral view; the neck-shaft angle wasassessed on the AP view. Parameters studied and theirresults are listed in Tables 1 and 2. One observer meas-ured all of the specimens. These measurements were inpart repeated to calculate an intra-observer reliability.Also a second observer repeated these measurements tocalculate an inter-observer reliability.
Definitions
Femoral neck axis. To determine this axis, two oroccasionally three circles were drawn in the neck. Then,a line was drawn, connecting the centers of these circles.Notably, in the coxa recta group, the neck axis can behard to find due to the short and broad trapezoidalshape of the neck in extreme forms, for example, thekangaroo.
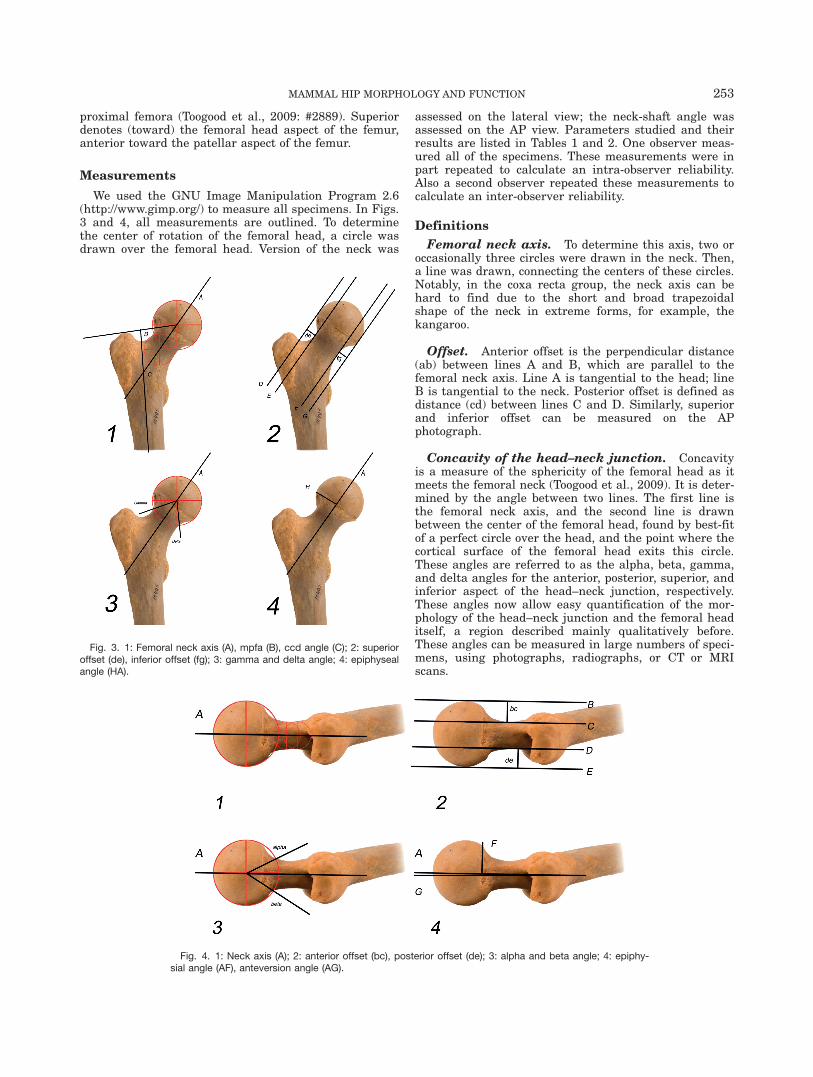
Offset. Anterior offset is the perpendicular distance(ab) between lines A and B, which are parallel to thefemoral neck axis. Line A is tangential to the head; lineB is tangential to the neck. Posterior offset is defined asdistance (cd) between lines C and D. Similarly, superiorand inferior offset can be measured on the APphotograph.
Concavity of the head–neck junction. Concavityis a measure of the sphericity of the femoral head as itmeets the femoral neck (Toogood et al., 2009). It is deter-mined by the angle between two lines. The first line isthe femoral neck axis, and the second line is drawnbetween the center of the femoral head, found by best-fitof a perfect circle over the head, and the point where thecortical surface of the femoral head exits this circle.These angles are referred to as the alpha, beta, gamma,and delta angles for the anterior, posterior, superior, andinferior aspect of the head–neck junction, respectively.These angles now allow easy quantification of the mor-phology of the head–neck junction and the femoral headitself, a region described mainly qualitatively before.These angles can be measured in large numbers of speci-mens, using photographs, radiographs, or CT or MRIscans.
Fig. 3. 1: Femoral neck axis (A), mpfa (B), ccd angle (C); 2: superioroffset (de), inferior offset (fg); 3: gamma and delta angle; 4: epiphysealangle (HA).
Fig. 4. 1: Neck axis (A); 2: anterior offset (bc), posterior offset (de); 3: alpha and beta angle; 4: epiphy-sial angle (AF), anteversion angle (AG).
MAMMAL HIP MORPHOLOGY AND FUNCTION 253
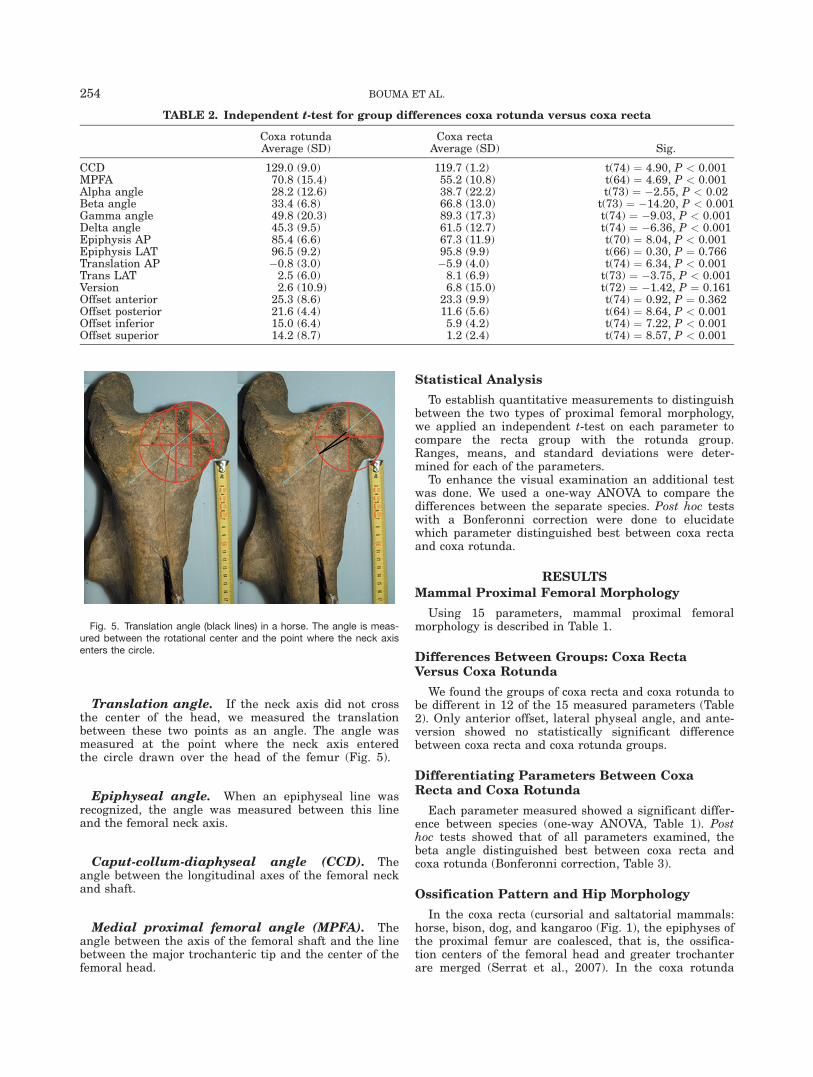
Translation angle. If the neck axis did not crossthe center of the head, we measured the translationbetween these two points as an angle. The angle wasmeasured at the point where the neck axis enteredthe circle drawn over the head of the femur (Fig. 5).
Epiphyseal angle. When an epiphyseal line wasrecognized, the angle was measured between this lineand the femoral neck axis.
Caput-collum-diaphyseal angle (CCD). Theangle between the longitudinal axes of the femoral neckand shaft.
Medial proximal femoral angle (MPFA). Theangle between the axis of the femoral shaft and the linebetween the major trochanteric tip and the center of thefemoral head.
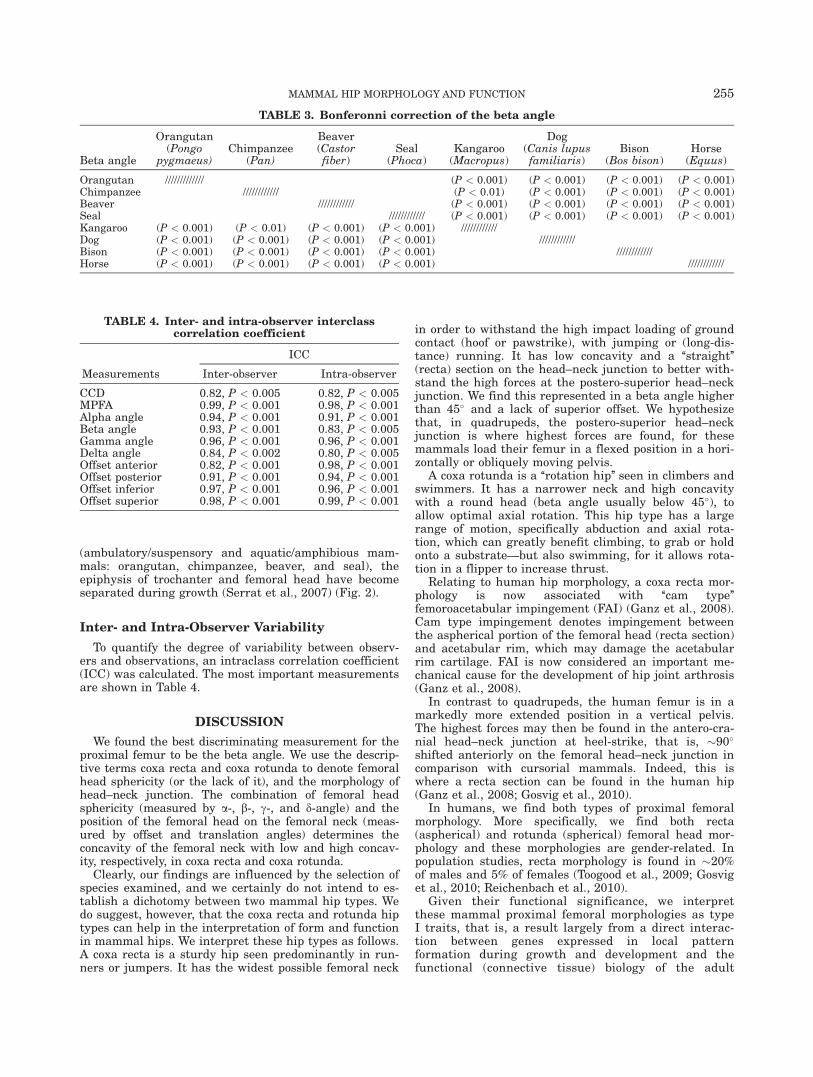
Statistical Analysis
To establish quantitative measurements to distinguishbetween the two types of proximal femoral morphology,we applied an independent t-test on each parameter tocompare the recta group with the rotunda group.Ranges, means, and standard deviations were deter-mined for each of the parameters.
To enhance the visual examination an additional testwas done. We used a one-way ANOVA to compare thedifferences between the separate species. Post hoc testswith a Bonferonni correction were done to elucidatewhich parameter distinguished best between coxa rectaand coxa rotunda.
RESULTS
Mammal Proximal Femoral Morphology
Using 15 parameters, mammal proximal femoralmorphology is described in Table 1.
Differences Between Groups: Coxa RectaVersus Coxa Rotunda
We found the groups of coxa recta and coxa rotunda tobe different in 12 of the 15 measured parameters (Table2). Only anterior offset, lateral physeal angle, and ante-version showed no statistically significant differencebetween coxa recta and coxa rotunda groups.
Differentiating Parameters Between CoxaRecta and Coxa Rotunda
Each parameter measured showed a significant differ-ence between species (one-way ANOVA, Table 1). Posthoc tests showed that of all parameters examined, thebeta angle distinguished best between coxa recta andcoxa rotunda (Bonferonni correction, Table 3).
Ossification Pattern and Hip Morphology
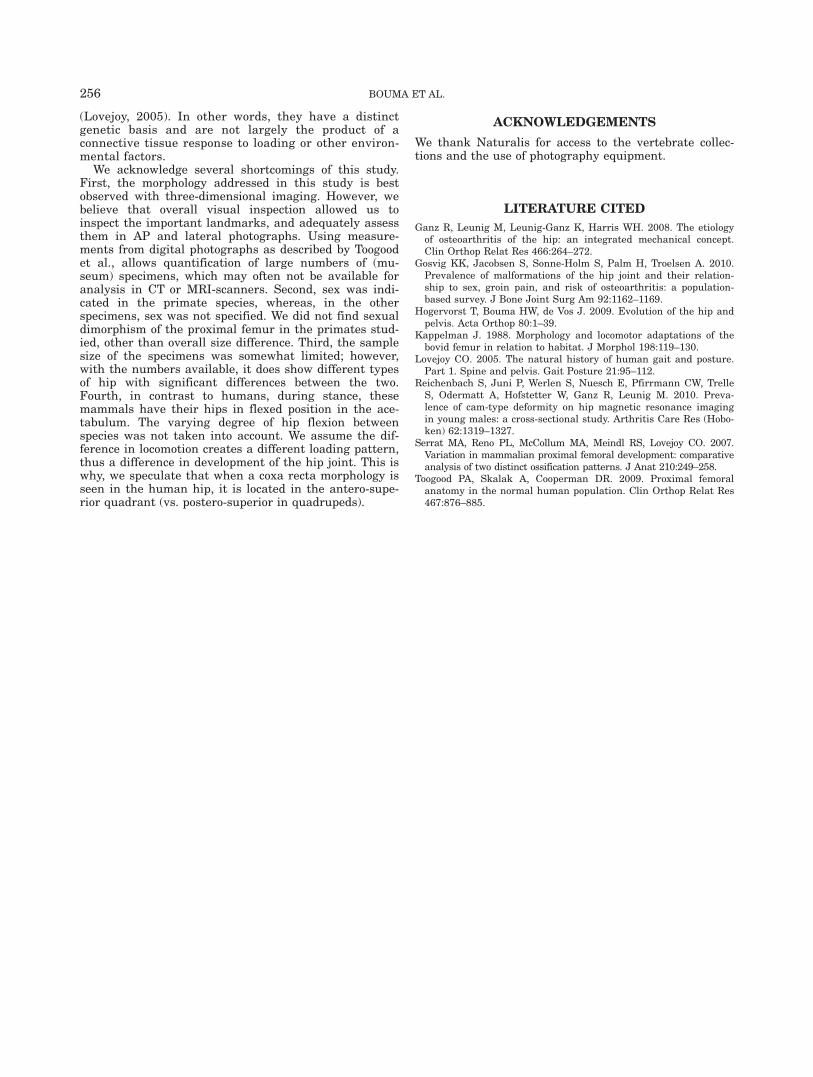
In the coxa recta (cursorial and saltatorial mammals:horse, bison, dog, and kangaroo (Fig. 1), the epiphyses ofthe proximal femur are coalesced, that is, the ossifica-tion centers of the femoral head and greater trochanterare merged (Serrat et al., 2007). In the coxa rotunda
TABLE 2. Independent t-test for group differences coxa rotunda versus coxa recta
Coxa rotundaAverage (SD)
Coxa rectaAverage (SD) Sig.
CCD 129.0 (9.0) 119.7 (1.2) t(74) ¼ 4.90, P < 0.001MPFA 70.8 (15.4) 55.2 (10.8) t(64) ¼ 4.69, P < 0.001Alpha angle 28.2 (12.6) 38.7 (22.2) t(73) ¼ �2.55, P < 0.02Beta angle 33.4 (6.8) 66.8 (13.0) t(73) ¼ �14.20, P < 0.001Gamma angle 49.8 (20.3) 89.3 (17.3) t(74) ¼ �9.03, P < 0.001Delta angle 45.3 (9.5) 61.5 (12.7) t(74) ¼ �6.36, P < 0.001Epiphysis AP 85.4 (6.6) 67.3 (11.9) t(70) ¼ 8.04, P < 0.001Epiphysis LAT 96.5 (9.2) 95.8 (9.9) t(66) ¼ 0.30, P ¼ 0.766Translation AP �0.8 (3.0) �5.9 (4.0) t(74) ¼ 6.34, P < 0.001Trans LAT 2.5 (6.0) 8.1 (6.9) t(73) ¼ �3.75, P < 0.001Version 2.6 (10.9) 6.8 (15.0) t(72) ¼ �1.42, P ¼ 0.161Offset anterior 25.3 (8.6) 23.3 (9.9) t(74) ¼ 0.92, P ¼ 0.362Offset posterior 21.6 (4.4) 11.6 (5.6) t(64) ¼ 8.64, P < 0.001Offset inferior 15.0 (6.4) 5.9 (4.2) t(74) ¼ 7.22, P < 0.001Offset superior 14.2 (8.7) 1.2 (2.4) t(74) ¼ 8.57, P < 0.001
Fig. 5. Translation angle (black lines) in a horse. The angle is meas-ured between the rotational center and the point where the neck axisenters the circle.
254 BOUMA ET AL.
(ambulatory/suspensory and aquatic/amphibious mam-mals: orangutan, chimpanzee, beaver, and seal), theepiphysis of trochanter and femoral head have becomeseparated during growth (Serrat et al., 2007) (Fig. 2).
Inter- and Intra-Observer Variability
To quantify the degree of variability between observ-ers and observations, an intraclass correlation coefficient(ICC) was calculated. The most important measurementsare shown in Table 4.
DISCUSSION
We found the best discriminating measurement for theproximal femur to be the beta angle. We use the descrip-tive terms coxa recta and coxa rotunda to denote femoralhead sphericity (or the lack of it), and the morphology ofhead–neck junction. The combination of femoral headsphericity (measured by a-, b-, c-, and d-angle) and theposition of the femoral head on the femoral neck (meas-ured by offset and translation angles) determines theconcavity of the femoral neck with low and high concav-ity, respectively, in coxa recta and coxa rotunda.
Clearly, our findings are influenced by the selection ofspecies examined, and we certainly do not intend to es-tablish a dichotomy between two mammal hip types. Wedo suggest, however, that the coxa recta and rotunda hiptypes can help in the interpretation of form and functionin mammal hips. We interpret these hip types as follows.A coxa recta is a sturdy hip seen predominantly in run-ners or jumpers. It has the widest possible femoral neck
in order to withstand the high impact loading of groundcontact (hoof or pawstrike), with jumping or (long-dis-tance) running. It has low concavity and a ‘‘straight’’(recta) section on the head–neck junction to better with-stand the high forces at the postero-superior head–neckjunction. We find this represented in a beta angle higherthan 45� and a lack of superior offset. We hypothesizethat, in quadrupeds, the postero-superior head–neckjunction is where highest forces are found, for thesemammals load their femur in a flexed position in a hori-zontally or obliquely moving pelvis.
A coxa rotunda is a ‘‘rotation hip’’ seen in climbers andswimmers. It has a narrower neck and high concavitywith a round head (beta angle usually below 45�), toallow optimal axial rotation. This hip type has a largerange of motion, specifically abduction and axial rota-tion, which can greatly benefit climbing, to grab or holdonto a substrate—but also swimming, for it allows rota-tion in a flipper to increase thrust.
Relating to human hip morphology, a coxa recta mor-phology is now associated with ‘‘cam type’’femoroacetabular impingement (FAI) (Ganz et al., 2008).Cam type impingement denotes impingement betweenthe aspherical portion of the femoral head (recta section)and acetabular rim, which may damage the acetabularrim cartilage. FAI is now considered an important me-chanical cause for the development of hip joint arthrosis(Ganz et al., 2008).
In contrast to quadrupeds, the human femur is in amarkedly more extended position in a vertical pelvis.The highest forces may then be found in the antero-cra-nial head–neck junction at heel-strike, that is, �90�
shifted anteriorly on the femoral head–neck junction incomparison with cursorial mammals. Indeed, this iswhere a recta section can be found in the human hip(Ganz et al., 2008; Gosvig et al., 2010).
In humans, we find both types of proximal femoralmorphology. More specifically, we find both recta(aspherical) and rotunda (spherical) femoral head mor-phology and these morphologies are gender-related. Inpopulation studies, recta morphology is found in �20%of males and 5% of females (Toogood et al., 2009; Gosviget al., 2010; Reichenbach et al., 2010).
Given their functional significance, we interpretthese mammal proximal femoral morphologies as typeI traits, that is, a result largely from a direct interac-tion between genes expressed in local patternformation during growth and development and thefunctional (connective tissue) biology of the adult
TABLE 3. Bonferonni correction of the beta angle
Beta angle
Orangutan(Pongo
pygmaeus)Chimpanzee
(Pan)
Beaver(Castorfiber)
Seal(Phoca)
Kangaroo(Macropus)
Dog(Canis lupusfamiliaris)
Bison(Bos bison)
Horse(Equus)
Orangutan ///////////// (P < 0.001) (P < 0.001) (P < 0.001) (P < 0.001)Chimpanzee //////////// (P < 0.01) (P < 0.001) (P < 0.001) (P < 0.001)Beaver //////////// (P < 0.001) (P < 0.001) (P < 0.001) (P < 0.001)Seal //////////// (P < 0.001) (P < 0.001) (P < 0.001) (P < 0.001)Kangaroo (P < 0.001) (P < 0.01) (P < 0.001) (P < 0.001) ////////////Dog (P < 0.001) (P < 0.001) (P < 0.001) (P < 0.001) ////////////Bison (P < 0.001) (P < 0.001) (P < 0.001) (P < 0.001) ////////////Horse (P < 0.001) (P < 0.001) (P < 0.001) (P < 0.001) ////////////
TABLE 4. Inter- and intra-observer interclasscorrelation coefficient
Measurements
ICC
Inter-observer Intra-observer
CCD 0.82, P < 0.005 0.82, P < 0.005MPFA 0.99, P < 0.001 0.98, P < 0.001Alpha angle 0.94, P < 0.001 0.91, P < 0.001Beta angle 0.93, P < 0.001 0.83, P < 0.005Gamma angle 0.96, P < 0.001 0.96, P < 0.001Delta angle 0.84, P < 0.002 0.80, P < 0.005Offset anterior 0.82, P < 0.001 0.98, P < 0.001Offset posterior 0.91, P < 0.001 0.94, P < 0.001Offset inferior 0.97, P < 0.001 0.96, P < 0.001Offset superior 0.98, P < 0.001 0.99, P < 0.001
MAMMAL HIP MORPHOLOGY AND FUNCTION 255
(Lovejoy, 2005). In other words, they have a distinctgenetic basis and are not largely the product of aconnective tissue response to loading or other environ-mental factors.
We acknowledge several shortcomings of this study.First, the morphology addressed in this study is bestobserved with three-dimensional imaging. However, webelieve that overall visual inspection allowed us toinspect the important landmarks, and adequately assessthem in AP and lateral photographs. Using measure-ments from digital photographs as described by Toogoodet al., allows quantification of large numbers of (mu-seum) specimens, which may often not be available foranalysis in CT or MRI-scanners. Second, sex was indi-cated in the primate species, whereas, in the otherspecimens, sex was not specified. We did not find sexualdimorphism of the proximal femur in the primates stud-ied, other than overall size difference. Third, the samplesize of the specimens was somewhat limited; however,with the numbers available, it does show different typesof hip with significant differences between the two.Fourth, in contrast to humans, during stance, thesemammals have their hips in flexed position in the ace-tabulum. The varying degree of hip flexion betweenspecies was not taken into account. We assume the dif-ference in locomotion creates a different loading pattern,thus a difference in development of the hip joint. This iswhy, we speculate that when a coxa recta morphology isseen in the human hip, it is located in the antero-supe-rior quadrant (vs. postero-superior in quadrupeds).
ACKNOWLEDGEMENTS
We thank Naturalis for access to the vertebrate collec-tions and the use of photography equipment.
LITERATURE CITED
Ganz R, Leunig M, Leunig-Ganz K, Harris WH. 2008. The etiologyof osteoarthritis of the hip: an integrated mechanical concept.Clin Orthop Relat Res 466:264–272.
Gosvig KK, Jacobsen S, Sonne-Holm S, Palm H, Troelsen A. 2010.Prevalence of malformations of the hip joint and their relation-ship to sex, groin pain, and risk of osteoarthritis: a population-based survey. J Bone Joint Surg Am 92:1162–1169.
Hogervorst T, Bouma HW, de Vos J. 2009. Evolution of the hip andpelvis. Acta Orthop 80:1–39.
Kappelman J. 1988. Morphology and locomotor adaptations of thebovid femur in relation to habitat. J Morphol 198:119–130.
Lovejoy CO. 2005. The natural history of human gait and posture.Part 1. Spine and pelvis. Gait Posture 21:95–112.
Reichenbach S, Juni P, Werlen S, Nuesch E, Pfirrmann CW, TrelleS, Odermatt A, Hofstetter W, Ganz R, Leunig M. 2010. Preva-lence of cam-type deformity on hip magnetic resonance imagingin young males: a cross-sectional study. Arthritis Care Res (Hobo-ken) 62:1319–1327.
Serrat MA, Reno PL, McCollum MA, Meindl RS, Lovejoy CO. 2007.Variation in mammalian proximal femoral development: comparativeanalysis of two distinct ossification patterns. J Anat 210:249–258.
Toogood PA, Skalak A, Cooperman DR. 2009. Proximal femoralanatomy in the normal human population. Clin Orthop Relat Res467:876–885.
256 BOUMA ET AL.


