Embed Size (px)
Citation preview
Documents de Travail du Centre d’Economie de la Sorbonne
Malaria and Education: Evidence from Mali
Josselin THUILLIEZ, Hippolyte d’ALBIS,
Hamidou NIANGALY, Ogobara DOUMBO
2016.09
Maison des Sciences Économiques, 106-112 boulevard de L'Hôpital, 75647 Paris Cedex 13 http://centredeconomiesorbonne.univ-paris1.fr/
ISSN : 1955-611X
Malaria and Education: Evidence from Mali.∗
Josselin Thuilliez† Hippolyte d’Albis‡ Hamidou Niangaly§
Ogobara Doumbo¶
February 3, 2016
∗We are very grateful to Hoyt Bleakley, Lauwrence Katz, Maria Kuecken, Nigel Rice, Andrew Street,Marie-Anne Valfort, and numerous seminar participants for helpful comments and advice. We especiallythank the children of Diankabou and their families for their cooperation. We are also grateful to Diankabouschool teachers, the Malaria Research and Training Center employees for expert research assistance, for helpacquiring the necessary data and for answering our many questions. In particular, we would like to thankPr. Abdoulaye Djimde, Dr. Alasseini Balam, Dr. Yamoussa Keita, Dr. Abdoul Karim Sangare, SaılaDoumbo, Ismaila Thera; and the Department of Immunology of Stockholm University, especially StephanieBostrom, Leif Rogell and Marita Troye Blomberg. We thank the European Research Council (ERC StartingGrant DU 283953), the French School of Public Health, the Fondation pour les Etudes et Recherches sur leDeveloppement International, and University Paris 1 for financial support. This work also benefited fromthe support of the French National Research Agency, as part of the program “Investissements d’avenir”,ANR-10-LABX-14-01. The usual caveat applies.†CNRS - University Paris 1. E-mail: [email protected]‡Paris School of Economics - University Paris 1. E-mail: [email protected]§Malaria Research and Training Center - University of Bamako. E-mail: [email protected]¶Malaria Research and Training Center - University of Bamako. E-mail: [email protected]
Documents de travail du Centre d'Economie de la Sorbonne - 2016.09
Abstract
This article examines the influence of malaria on human capital accumulation in the
village of Diankabou in Mali. To account for malaria endogeneity and its interaction
with unobservable risk factors, we exploit natural variations in malaria immunity across
individuals of several sympatric ethnic groups - the Fulani and the non-Fulani - who
differ in their susceptibility to malaria. The Fulani are known to be less susceptible to
malaria infections, despite living with a similar malaria transmission intensity to those
seen among other ethnic groups. We also use natural variation of malaria intensity in
the area (during and after the malaria transmission season) and utilize this seasonal
change as a treatment. We find that malaria has an impact on cognitive and educational
outcomes in this village. We discuss the implications of this result for human capital
investments and fertility decisions with the help of a quantity-quality model.
Keywords: Malaria, Immunity, Education, Cognition, Fertility
JEL: O12, I15, I25
Documents de travail du Centre d'Economie de la Sorbonne - 2016.09
1 Introduction
Malaria is considered to be among the oldest of human diseases with profound impact on
human evolution. Indeed, the “malaria hypothesis” posits that certain human genetic poly-
morphisms1 have been naturally selected in high frequencies because they have protected
against the effects of malaria infections. Such protection involves the immune system, i.e.
the ability of an organism to resist disease2. Moreover, the employment of such defense
mechanisms against malaria is recognized as a costly life-history trait (Williams, 2006). For
instance it is well known that inherited conditions such as sickle cell anaemia and beta-
thalassaemia, which cause deformities in red blood cells and are common in people from
malaria regions, make it more difficult for malaria parasites to infect red blood cells.
Though tentative, our investigation exploits immunity to malaria in an attempt to ex-
plain the effects of malaria on human capital accumulation. One of the possible approaches
in the study of human variation in the susceptibility to malaria compares malariological
indicators between populations that differ in their genetic background but living in the same
epidemiological context, i.e., exposed to the same transmission level and to the same par-
asite strains. The possible observation of inter-ethnic differences of susceptibility in such
conditions provides an opportunity to detect factors associated with protection (Modiano
et al., 1995, 2001). In Sub-Saharan Africa, and in Mali specifically, the Fulani ethnic group
has proved to be less susceptible to malaria3 as reflected by their lower parasite rate (the
proportion of the population found to carry asexual blood-stage parasites), their lower para-
sitemia (the quantitative content of parasites in the blood) and the fewer clinical symptoms
that they exhibit when compared to than other sympatric ethnic groups (Dolo et al., 2005;
Farouk et al., 2005). Sympatric in this context refers to the fact that they inhabit the same
1The recurrence within a population of two or more discontinuous genetic variants of a specific trait.2The immune system is the collection of cells, tissues and molecules that protects the body from numerous
pathogenic microbes and toxins in our environment. Such defense can be divided into two general types ofreactions: reactions of innate immunity and reactions of adaptive immunity. The innate system is the firstline of defense and comprises mechanisms that defend the host from infection by other organisms in a non-specific manner. The adaptive immune system, or acquired immune system, is specialized and eliminatesor prevents pathogen growth. In acquired immunity, pathogen-specific receptors are “acquired” during thelifetime of the organism.
3Four species of these protozoan parasites account for almost all infections seen in humans: Plasmodiumfalciparum, Plasmodium vivax, Plasmodium ovale and Plasmodium malariae. Plasmodium falciparum is themost aggressive of all and accounts for the majority of infections in Africa. Malaria stands for Plasmodiumfalciparum malaria in this article.
1
Documents de travail du Centre d'Economie de la Sorbonne - 2016.09
overlapping geographical area but the gene pools are not mixed. Therefore, we use this fact
to identify the possible impacts of malaria on cognition and on education at the pupil level
and we use it to understand the complex links between infection, educational investment
and fertility at the household level.
Our analysis is divided into two main parts. First, we study the direct impact of malaria
on educational outcomes. In the area we consider, there are two ethnic groups (Fulanis and
non-Fulanis) and two seasons (high and low malaria transmission seasons). The Fulani have
some immunity to malaria so that their infection rates are much lower when compared to
those seem among the non-Fulani during the high season. However, they are comparable
during the low season. Given this, by comparing the change in cognitive and educational
scores across seasons between the Fulani and the non-Fulani, and rescaling this change based
on the difference in infection rate changes across ethnic groups, one can assess the specific
impact of malaria on cognitive and educational scores.
We improve upon the literature in two ways: (i) Improving the measurement of malaria
by using a polymerase chain reaction (PCR)4, and (ii) Assessing a “natural” treatment effect
and potential coping mechanisms. Cognitive outcomes are Raven Progressive Matrices tests
scores (Raven, 1984). Educational achievement outcomes, on the other hand are measured
with a set of educational variables taken from previous studies (Jukes et al., 2006; Thuilliez
et al., 2010) as well as French models for primary educational tests (BatelemR and Boehm3).
We find that malaria and notably asymptomatic malaria (i.e., the infection without any
symptoms) have an impact on cognitive and educational outcomes in Diankabou, the village
used in this study, located in the North of Mali. These results are in line with Venkataramani
(2012) for cognition and Bleakley (2010b), Cutler et al. (2010), Lucas (2010) or Barofsky,
Anekwe and Chase (2015) for literacy rates or years of educational attainment. Moreover,
although we focus on short-run impacts and the external validity of our study is limited
4PCR (polymerase chain reaction) is a technique in molecular genetics that permits the analysis of anyshort sequence of DNA (or RNA), even in samples containing only minute quantities of DNA or RNA. PCRis used to reproduce (amplify) selected sections of DNA or RNA for analysis. PCR is now extensively usedfor malaria diagnosis as PCR can distinguish between the different species of human malaria parasites. Whenused in the best possible conditions, the PCR technique has been reported capable of detecting parasitaemiaof less than 0.00002%, which corresponds to one parasite per mm3, or 5 parasites per 5 l sample of blood. Bycomparison, microscopy has been reported capable of detecting parasitaemia of 0.0001%. PCR is thereforemuch more sensitive and specific than microscopy, generally used in other microeconomic studies. Putdifferently, PCR is more specific and sensitive than previous techniques used such as microscopy (Anchinmaneand Shedge, 2011)
2
Documents de travail du Centre d'Economie de la Sorbonne - 2016.09
to the place of study, we improve the understanding of potential competing mechanisms.
As Angus Deaton has observed, even though such studies do not have the righteousness of
randomization they do concern actual policies playing out in a real life environment (Deaton,
2010).
We discuss the long-run economic implications of this result by considering a quantity-
quality model where parents choose their fertility and their investment in the education of
their surviving children. The framework is similar to Ehrlich and Lui (1991), Kalemli-Ozcan
(2003), Lagerlof (2003), Cervellati and Sunde (2005), Estevan and Baland (2007), Bell and
Gersbach (2009) and Baudin (2012), except that we focus on early child mortality, which
occurs before the schooling period, and distinguish it from child morbidity. The main novelty
here is that we consider a differential exposure to malaria between the Fulani and non-Fulani
ethnic groups. The model also explores the potential cost of immunity for populations at
a lower risk of disease, when the disease reduces the returns to education. It shows that if
malaria increases the child mortality rate and reduces educational outcomes, the unprotected
group (the group with a higher probability of being infected) will invest more in education
and will have more children. The predictions of the model are illustrated using some results
of the literature and stylized facts collected at the family level at baseline.
The paper is organized as follows. Section 2 describes the historical difference between
sympatric ethnic groups in Mali and gives previous evidence on the links between malaria,
cognition and education. We analyse the effect of malaria on education in section 3. We
discuss the economic implications of this result in section 4. Finally, Section 5 summarizes
and discusses implications of the results.
2 Background evidence
2.1 Differential malaria prevalence amongst sympatric ethnic groups
in Mali
Malaria is one of the most serious public health problems in Mali. It accounts for 37.5% of
health clinic consultations and 72% of deaths amongst children under 5 years old, and is the
main cause of anaemia amongst pregnant women (Systeme Local d’Information Sanitaire
3
Documents de travail du Centre d'Economie de la Sorbonne - 2016.09
or SLIS, 2007). Immunity to malaria is dependent on both the innate and the adaptive
arms (both cell- and antibody-mediated) of the immune system, which are required for
adequate protection. Previous studies have shown that the Fulani children have a stronger
inflammatory and antibody responses against malaria parasites compared to the Dogon, and
that these differences are already evident at an early age, therefore probably depending on
the innate arm.
The Fulani traditionally were nomadic pastoral people and have now settled in various
parts of the African continent. One such site of settlement is northern Mali where they have
lived for at least 200 years. The Dogon, on the other hand, are farmers that migrated to
the study area of northern Mali about 500 years ago. The inhabitants of the Fulani and the
Dogon villages in this area do not inter-marry and are therefore considered sympatric ethnic
groups. The Dogon population constitutes the majority in this area, but other marginal
ethnic groups (the Malinke, Bambara, Bobo and Mossi) also live in the study area. We
thus refer to the Dogon ethnic group and other minority groups as the “Non-Fulani” ethnic
group. However, we also perform specific analysis using the Dogon group alone (referred to
as the “Dogon only” ethnic group).
When assessing malaria parasite rate, parasite density and malaria-specific antibodies of
several sympatric ethnic groups in West Africa, inter-ethnic differences were found (Modiano
et al., 1995). The Fulani were less infected and had lower parasitemia than other ethnic
groups. Findings from Modiano et al. (1995) suggest that the Fulani were more resistant to
malaria. Further studies from Sudan showed consistent inter-ethnic differences in malaria
infection rates, malaria morbidity, prevalence and levels of anti-malarial antibodies (the
Fulani also inhabit Sudan) (Nasr et al., 2009). The Fulani were again less infected by
parasites, less affected by the infection and more responsive to the antigens tested. These
differences could not be explained by the use of malarial protective measures such as bednets,
various other protective measures, or exposure to infective bites, nor did socio-cultural or
environmental factors seem to play a role in the relatively better protection against malaria
seen amongst the Fulani. In addition, the Fulani did not show higher frequencies of known
genetic factors of malaria resistance (Modiano et al., 1995, 2001).
When studying differences in susceptibility to malaria between two sympatric ethnic
groups in Mali (see for instance (Dolo et al., 2005)), it was shown that the Fulani had higher
4
Documents de travail du Centre d'Economie de la Sorbonne - 2016.09
spleen enlargement rates5, lower parasite density and were less affected by malaria than the
Dogon group. The Fulani also had higher titers of antimalarial antibodies than the Dogon
group (Dolo et al., 2005) which means that they had stronger immune responses.
In other previous studies, inter-ethnic differences were observed in some cytokines. Cy-
tokines and chemokines are essential mediators during malaria infection, and the balance
between pro- and anti-inflammatory cytokines may be important for the clinical outcome of
malaria responses amongst the Dogon (Arama et al., 2011).
Attempts to link this relatively better protection during malaria infection seen among
the Fulani to different polymorphisms in candidate genes have so far not given a satisfying
explanation of the underlying cause of the protection, and the more pro-inflammatory re-
sponse seen in the Fulani but not in other sympatric ethnic groups: they could not provide
a convincing explanation of the relatively better protection against malaria seen among the
Fulani (Driss et al., 2011). Put differently, genetic factors - usually associated with malaria
protection and common to different populations - do not seem to be the key explanatory
variables of this protection. Epigenetic studies6 could help understanding what regulates
these differences, but research has not yet reached this stage.
2.2 Previous evidence on malaria, cognition and education
Malaria can impact children’s educational achievement through a number of ways. First,
malaria during pregnancy can lead to foetal growth retardation, which translates into cog-
nitive and physical impairments among children. Barreca (2010) analyzes the long-term
impact of in utero and post-natal exposure to malaria. He finds that such exposure leads to
considerably lower levels of educational attainment, and higher rates of poverty later in life.
Second, during early childhood (under the age of five), complicated forms of malaria may
develop rapidly. Indeed, acquired immunity in children does not play an efficient protective
role until the ages of 5 to 6 years old, even in highly endemic areas. This highlights the
5Splenomegaly is an enlargement of the spleen resulting from an abnormal immune response to repeatedattacks of malaria. Many of the mechanisms leading to an enlarged spleen are exaggerated forms of normalspleen function, and a wide variety of diseases (schistosomiasis, post-necrotic cirrhosis, thalassemia, leukemia,lymphoma, myelofibrosi) are associated with enlargement of the spleen. The role of the spleen during malariain humans remains unclear.
6Epigenetics is the study of inherited changes in phenotype or gene expression caused by mechanismsother than changes in the underlying DNA sequence (Bird, 2007).
5
Documents de travail du Centre d'Economie de la Sorbonne - 2016.09
reason why malaria continues to be a major threat to child survival. The effects of severe
malaria, better known as cerebral malaria, have been quantified by numerous studies 7.
For instance, Ngoungou et al. (2007) provide a quantification of the burden on educational
achievement in West Africa. In their study, 101 subjects (mean age of 5.6 ± 3.6 years)
who had had cerebral malaria in Mali were followed from 1999 to 2001. The authors found
that 28 children exhibited persistent neurological sequelae (26.7 %). Among them, eight
(7.9 %) children had developed these sequelae just after cerebral malaria, and 20 (19.8 %)
a few months later. These sequelae included headaches, mental retardation, speech delay,
bucco-facial dyspraxia, diplegia and frontal syndrome (one case each), dystonia (two cases),
epilepsy (five cases), as well as behaviour and attention disorders (15 cases).
Third, even during late childhood, which usually extends from 6 to 16 years of age, the
protection conferred by acquired immunity is only partial. If cerebral malaria is rare at this
stage, “simpler” cases of clinical malaria (called “uncomplicated malaria”), in addition to
repeated illness or chronic malaria infections, are not. They can have a non-cognitive im-
pact on educational achievement through school absenteeism, general health conditions, and
investment in curative strategies (coping strategies against the disease detrimental to edu-
cational investments). For instance in a Kenyan case study, Brooker et al. (2000) attribute
13 % to 50% of medically-related school absences to malaria. In Kenya, primary school
students were found to miss 11% of the school year (20 school days missed per child-year).
In Nigeria, school days missed varied between 2% to 6% of the school year (3 to 12 days per
year per student). In the specific case of Mali, malaria was the primary cause of absenteeism
during the full school year (Thuilliez et al., 2010). Moreover, although the age distribution
of uncomplicated malaria and asymptomatic malaria depends on transmission intensity, the
total burden of the disease may be similar or even higher in settings of low transmission due
to patterns of acquired immunity. Malaria morbidity among school-age children increases
as transmission intensity decreases, but asymptomatic infections are more frequent in high
transmission settings (Clarke et al., 2004).
Fernando et al. (2003) show that there exists a significant negative correlation between
the total number of malarial attacks experienced by children and test scores during a six year
follow-up. Fernando et al. (2006) and Jukes et al. (2006) also show a substantial effect of pre-
7Refer to Mung’ala-Odera, Snow and Newton (2004) for a literature review.
6
Documents de travail du Centre d'Economie de la Sorbonne - 2016.09
ventive treatment in two randomized studies. Despite these results, however, asymptomatic
malaria specifically has proven to have detrimental effects on children’s cognitive and edu-
cational skills in three studies, one being a cluster-randomized control trial which suggests
either a direct effect of the disease or an antimalarial treatment effect (Clarke et al., 2008;
Thuilliez et al., 2010; Nankabirwa et al., 2013). The mechanism of this potential causal
relationship could include a “toxicity effect, leading to biochemical changes in the central
nervous system (CNS); excitation of the immune system, leading to changes in behaviours
related to appetite and reaction time; and physiological effects such as discomfort and dis-
turbed sleep,leading to reductions in activity levels or causing behavioural change” (Holding
and Snow, 2001).
3 Short-run impacts of malaria on cognitive test scores
and educational performance
3.1 Study area and survey methods
The study took place from early October to early December 2010 in the village of Diankabou
in the Mopti area, 850 km northeast of Mali’s capital, Bamako. Malaria is mesoendemic8
The entomological inoculation rate9 was previously shown to be similar in both ethnic groups
under study - the Fulani and the non-Fulani. Transmission is seasonal from July to October
every year (Farouk et al., 2005; Dolo et al., 2005; Bereczky et al., 2006; Vafa et al., 2007,
2009). Economic activity has been strongly impacted by tourism over the last two decades
since the Dogon Country was listed as part of UNESCO’s natural and cultural world heritage
in 1989. Moreover, convergence of production systems between the Fulani and other ethnic
groups, as a result of farmers engaging in cattle breeding and herdsmen in agriculture, has
been documented (Breusers, Nederlof and Van Rheenen, 1998).
The sample design consists of an exhaustive survey of all the children living in Diankabou
and enrolled in the school of Diankabou, who accepted to participate in the study. A total
8Mesoendemic malaria endemicity is defined by a parasite rate (PR) between 0.11 and 0.5 in this areawith P. falciparum being the main prevalent parasite species.
9The “entomological inoculation rate” is the commonly-used measure of the intensity of malaria trans-mission. EIR is a commonly used metric that estimates the number of bites by infectious mosquitoes perperson per unit time (Smith et al., 2007).
7
Documents de travail du Centre d'Economie de la Sorbonne - 2016.09
of 300 children were enrolled in the village’s school in September 2010. Our study includes
296 children at baseline and 291 at endline (5 children were lost at the endline mostly
due to absences at the endline)10. Data was collected at the beginning of the school year
during two cross-sectional surveys, in October 2010 and December 2010. As illustrated by
New et al. (2002a), October still corresponds to the malaria season whereas December is
not considered anymore a transmission season in this area11 Notably, this seasonal change
leads to a differential decline in malaria infection in both groups. As it is naturally more
susceptible, the non-Fulani group is more affected by this decline.. Once informed consent
had been obtained, all participating pupils received clinical and laboratory examinations12
during two “active” follow-ups. Tests were administered the same day directly in the school13.
The data collected included the children’s malaria infection status, measured with high
precision through PCR, anthropometrics, cognitive outcomes, and the ethnic group. Defini-
tions and details on the variables are provided in Appendix A.
3.2 Natural experiment and empirical equation
In order to provide evidence on the effects of malaria on educational outcomes, we use a
quasi-experimental approach in which we exploit ethnic variations across individuals of the
two sympatric ethnic groups, and the natural variation of malaria intensity in the village (at
the end of the malaria transmission season which fixes our before/after framework). Two
factors combine to determine the identification strategy of this first part: (i) the exogenous
origin of change in malaria exposure (pre- and post-seasonal change); (ii) the use of the
Fulani ethnic group for comparison (the Fulani are less susceptible and provide a good
counterfactual).
10Note that we also have a limited number of missing values for some of the variables under study heredue to the difficulties inherent in biomedical data collection and storage in remote areas, refusals to conformto particular procedures or to perform some tests.
11Malaria transmission in this area increases from July to October. It then declines during the othermonths of year. New et al. (2002a) show similar seasonal trends from 1960 to 1990, and epidemiologicalstudies in this area confirm the timing of this seasonal shift (Farouk et al., 2005; Dicko et al., 2005; Doloet al., 2005; Bereczky et al., 2006; Vafa et al., 2007, 2009).
12Clinical refers to the assessment of symptoms while laboratory refers to the biomedical measurement ofinfections.
13The study protocol was approved by the institutional review board (IRB) ethics committee of theNational School of Medicine and Pharmacy of Mali. Community and individual written informed consentwere obtained before starting the study. Panel data were collected directly in the field by the authors.
8
Documents de travail du Centre d'Economie de la Sorbonne - 2016.09
To estimate the average treatment effect (ATE), a natural approach is to estimate equa-
tion (1):
Eit = α0 + γ1[Postt ×NonFulanii] + γ2Postt + ωXit + FEi + εit, (1)
where E represents the outcomes of interest here (cognitive or educational outcomes)14, Post
is the period of observation (taking a value of 1 for early December (just after the seasonal
change), and 0 for early October (just before the seasonal change)). NonFulani is a dummy
variable for non-Fulani ethnic groups, whereas X is a set of covariates at individual level that
vary across time, including other health covariates (malaria symptoms, splenomegaly, BMI
for age z-score, haemoglobin concentration). FE are child fixed effect intended to capture
time invariant effects (including ethnicity, educational practice effects), other baseline para-
site infections and socioeconomic factors at baseline), and finally ε is an individual-specific
error term.
However, the natural immunity of the Fulani (the control group) is not fully protective
against the disease and the reduction in malaria infection after the exogenous seasonal change
amongst the non-Fulani is not fully efficient to eliminate all infections. It is useful for our
approach to think about the infection status with respect to seasonal change.
We have four groups of pupils: (i) those who were infected at baseline and uninfected
at endline, (ii) those who were uninfected at baseline and endline, (iii) those uninfected at
baseline and infected at endline, (iv) those infected at baseline and endline15. Indeed, our
control group (Fulani) and treated group (non-Fulani) are a mixture of these four categories
and we want to estimate the average treatment for those individuals whose malaria infection
and parasite density were affected negatively by seasonal change, knowing that the non-
Fulani have a higher probability to be affected by this change over the three months of study.
Consequently, there is no subpopulation available for whom the probability of treatment is
zero. In this case, instead of a simple difference-in-difference analysis, Imbens and Angrist
14We define cognition as the mental process involved in knowing, learning, and understanding things.The cognitive outcome is more particularly defined as the Raven Progressive Matrices test - a non-verbalassessment comprised of pattern matching exercises that progressively increase in difficulty (Raven, 1984).Educational outcome, or educational achievement, refers to the ability of succeeding in education, as mea-sured here by a synthetic primary educational test score.
15These four categories can be defined on the basis of a binary infection status or on the basis of thecontinuous parasite density. In the last case, the reasoning is made in terms of density increase or decreaseinstead of binary infection status.
9
Documents de travail du Centre d'Economie de la Sorbonne - 2016.09
(1994) recommend to use the Local Average Treatment Effect (LATE) approach, based on
natural experiments. LATE is the average treatment effect for individuals whose treatment
status is influenced by changing an exogenous regressor that satisfies an exclusion restriction.
Therefore, we rely on an instrumental variable strategy, where we instrument for malaria
status using the interaction term between Ethnicity and Post with main effects for Ethnicity
and Post to rescale the simple difference-in-difference, provided in Table 1, in a within -
child fixed-effects model, following equations (2) and (3), where equation (3) corresponds
to a difference-in-difference design applied to malaria infections. We identify the treatment
effect for “compliers”, i.e. the average treatment effect for those individuals whose malaria
infection and parasite density were negatively affected by the seasonal change (a local average
treatment effect, LATE).
Eit = α1 + βMalit + ωXit + FEi + εit, (2)
where Mal is a measure of malaria infection, and β is the coefficient of interest. We estimate
equation 2 by two-stage least squares (2SLS), using the following first-stage equation:
Malit = α2 + γ1[Postt ×NonFulanii] + γ2Postt + FEi + µit, (3)
where Post is the period of observation (taking a value of 1 for early December (just after
the seasonal change), and 0 for early October (just before the seasonal change)), NonFulani
is a dummy variable for non-Fulani ethnic groups, and FE is a child fixed - effect intended
to capture time invariant effects (including ethnicity).
The identifying assumption is that there are no unobserved factors directly affecting the
outcomes that (i) are correlated with seasonal change and (ii) are correlated with ethnic spe-
cific malaria infectious status. To our knowledge, there is no evidence that ethnic differences,
a marker of risk for malaria infection, plays any role in the education production function.
There is also no reason to believe that ethnic differences per se should play any role in this
function. In addition, there is no reason that the difference in performance between infected
and uninfected individuals shoulGrant DU 283953),d be smaller during the low malaria sea-
son than during the high malaria season. As a consequence, the main strong assumption
is that the seasonal changes in outcomes between the two groups can only be attributable
10
Documents de travail du Centre d'Economie de la Sorbonne - 2016.09
to malaria. Note that malaria transmission decline does not fit exactly with agricultural
activities in this area. As shown by Figure A1, average precipitations in Diankabou are
declining between September and October whereas the highest drop in malaria transmission
takes place in November in this area (Coulibaly et al., 2013). However a number of threats
to inference in the LATE design can still jeopardise our results. We discuss theses issues
in greater detail in section 3.5. The identifying assumption is that there are no unobserved
factors directly affecting the outcomes that (i) are correlated with seasonal change and (ii)
are correlated with ethnic specific malaria infectious status. To our knowledge, there is no
evidence that ethnic differences, a marker of risk for malaria infection, plays any role in the
education production function. There is also no reason to believe that ethnic differences per
se should play any role in this function. In addition, there is no reason that the difference
in performance between infected and uninfected individuals should be smaller during the
low malaria season than during the high malaria season. As a consequence, the main strong
assumption is that the seasonal changes in outcomes between the two groups can only be
attributable to malaria. Note that malaria transmission decline does not fit exactly with
agricultural activities in this area. As shown by Figure A1, average precipitations in Di-
ankabou are declining between September and October whereas the highest drop in malaria
transmission takes place in November in this area (Coulibaly et al., 2013). However a num-
ber of threats to inference in the LATE design can still jeopardise our results. We discuss
theses issues in greater detail in section 3.5.
3.3 Descriptive statistics and simple difference-in-difference
The results from the simple difference-in-difference approach are provided in Table 1 and A1.
Table 1 provides the results of the descriptive analysis for selected variables but does not
rescale the difference-in-difference based on the differential change in infection rates across
ethnic groups. Our results are similar to various other research findings from other villages
located in the same area. Comparing the two groups, the Fulani were less affected by malaria
than the Non-Fulani, as expected. For instance, in November 1998 and November 1999 (cor-
responding approximately to our baseline survey made at the end of rainy season), in the
same area and with a similar sample size, Dolo et al. (2005) find a parasite prevalence dif-
ference of 15.6% and 13% respectively (P-values<0.001). We find a 19.2% (P-values<0.001)
11
Documents de travail du Centre d'Economie de la Sorbonne - 2016.09
difference in October 2010. Moreover, at the very end of the dry season in July 2004, they
find a parasite prevalence difference of -2.2% (P-value=0.220) between the Non-Fulani and
the Fulani. We find a non-significant difference of -0.015% (P-value=0.825) in December
2010, at the beginning of the dry season.The same was observed for malaria symptoms in
our data and across research papers: the Fulani ethnic group has fewer clinical symptoms.
By contrast spleen enlargements, lower nutritional status and anaemia were more preva-
lent within Fulani children, still in accordance with the literature on this topic (Dolo et al.,
2012a). However, all educational and cognitive test results were not statistically different
between the two groups and no other factors (except age at the baseline, P-values<0.100)
differed across groups. The prevalence of other parasite infections (urinary schistosoma and
intestinal parasites) was similar in the two groups at the baseline.
Amongst the non-Fulani ethnic group, the parasite rate fell from 87.1% to 25% (i.e. a 62
percentage point decline) between October and December 2010. Amongst the Fulani ethnic
group, the parasite rate fell from 67.9% to 23.5% (i.e. a 44.4 percentage point decline). The
decline was thus large. The last column presents the OLS regression results (standard errors
are clustered at the family level) from a simple difference-in-difference analysis. The decline
in malaria exhibited significant variation across ethnic groups (17.8 percentage point differ-
ential decline between the non-Fulani and the Fulani).16 The only other differential changes
observed across time are malaria - related symptoms (cephalgia and vomiting decreased
more amongst the non-Fulani ethnic group) whereas haemoglobin concentration increased
significantly more amongst the non-Fulani. Notably, the last column of Table 1 shows no
significant effect of the interaction term (Postt ×NonFulanii) on cognition and education.
Table A1 provides additional results and shows no significant effect of the interaction term
(Postt ×NonFulanii) on cognition and education.
Table 1 about here.
16Note that similar results are found with the Dogon “alone” ethnic group instead of the non-Fulanicategory.
12
Documents de travail du Centre d'Economie de la Sorbonne - 2016.09
3.4 Results
Table 2 presents the regression results on the effects of malaria on cognitive and educational
outcomes, using the LATE approach. Column (1) presents the coefficients from the OLS
estimation of equation 2 (not equation 1). All other columns provide the coefficients from the
2SLS estimates. Robust standard errors are clustered at the family level. The within-child
fixed-effects results are given in columns (5) and (6)17. The low p-values from the Durbin-
Wu-Hausman test indicate that malaria infections should be treated as endogenous. Note
that PCR detects very low parasite loads, which is useful to detect diagnose asymptomatic
malaria, knowing that symptomatic aspects are just the tip of the iceberg. However the
PCR technique used here only provides us a dummy variable for cases tested positive for
malaria. As an alternative measure of malaria infection we also use malaria positive cases
detected through microscopy and the parasite loads measured by microscopy. Microscopy-
based parasite density, though less sensible and sensitive than PCR, enables us to rely on a
continuous variable, and thus much more variation. The results are provided in Table A2.
Column (1) from this table shows that the microscopy measures suffer from measurement
error.
Table 2 about here.
The results show significant negative effects of malaria infection on cognitive and ed-
ucational outcomes. The regressions with controls include all malaria symptoms provided
in Table 1 (five dummies for fever, cephalgia, vomiting, diarrhea, and abdominal pain), in
addition to health status characteristics (splenomegaly, BMI-for-age, haemoglobin concen-
tration). Notably, the coefficients of interest do not change significantly as fixed effects and
control variables are added to the specifications, thus providing some validation to the iden-
tification strategy. More particularly, adding symptom controls does not change the size of
the coefficients, suggesting an effect of the presence of the parasite per se. When reducing
the sample size to the Fulani and “Dogon alone” ethnic groups, the sample size is reduced
by 28 to 30 observations, but the results remain unchanged.
To put this in context, the estimates imply that a malaria infection increase resulted in
a decrease in the cognition score of 0.887, a decrease in PCA score of 1.157 and a decrease
17Note that the F -statistics mitigate “weak instrument” concerns.
13
Documents de travail du Centre d'Economie de la Sorbonne - 2016.09
in educational average score of 0.424 (Table 2, column 5). Since the range of these vari-
ables respectively are [−2.217; 3.832], [−3.780; 4.631] and [−1.884; 1.978], the magnitudes of
the coefficients imply that being infected by malaria decreases the cognition score by 0.89
standard deviation, decreases the PCA educational score by 0.84 standard deviation and
decreases the average educational score by 0.648 standard deviation. The latter suggests
that results are also robust across educational outcomes. Table 3 provides the first - stage
estimates. We show the results of a linear probability model where we regress a dummy
variable equal to one if the child was infected on ethnicity, the period of observation and the
interaction term.
Table 3 about here.
To further understand the mechanisms through which malaria might affect cognition
and education, table 4 reports estimates for competing channels (haemoglobin levels and
having at least one malaria symptom). One hypothesis suggested in the medical literature
on the effects of malaria on cognition and education is through decreases in haemoglobin
concentrations. Clinical longitudinal follow-up data showed that the Fulani children have
lower hemoglobin levels than Dogon children (Dolo et al., 2012b). Put differently, the Fulani
suffer more from anaemia than the Dogon, despite their lower susceptibility to malaria18.
We could also expect a greater effect of malaria symptoms on cognition and education
compared to parasite infections. Malaria infection could thus have both a direct effect on
education and an indirect effect through symptoms. The direct mechanism could include a
“toxicity effect,”19 leading to biochemical changes in the central nervous system (Holding and
Snow, 2001). Moreover, if malaria infection had a direct impact on symptoms but no direct
impact on cognition and education, the PCR measure could just be a proxy for symptomatic
infections. This does not seem to be the case.
The coefficients of interest do not change significantly when new channels are added and
instrumented. In addition, none of the variables tested in these tables and instrumented with
the same procedure (haemoglobin levels and having at least one malaria symptom) seem to
have an impact on education.
18Malaria is a major cause of anaemia (Kurtzhals et al., 1999).19Toxicity involves harmful effects in the brain through a single or short-term exposure.
14
Documents de travail du Centre d'Economie de la Sorbonne - 2016.09
However, there could be a two-fold penalty here, as the presence of malaria parasites had
a direct effect on the educational achievement and cognitive performance, but symptoms also
have a negative impact on education (Fernando et al., 2003). The number of symptomatic
cases was rather limited during the two “active follow-ups” (as opposed to continuous clinical
case detection or clinical consultations), in accordance with previous studies (Dicko et al.,
2005). This fact may explain why we do not find any effects on symptoms here.
Acute cases of illness (of any type) were treated immediately and monitored by the
medical team directly in the field. This could bias our estimates of the treatment effect.
Nonetheless, for the specific cases of malaria, it is important to highlight that even after
receiving an antimalarial treatment, patients can still be at risk of treatment failure in the
short-term (within 14 days), of late recrudescence (28 days) and of re-infection with new
parasite strains. Indeed, after a treatment, a period of 14 days is generally used for consid-
ering a second malaria infection as a new case (Dorsey et al., 2002). Consequently, as there
were more than 14 days between the baseline (October) and the endline (December), infec-
tions at the endline can be considered as new cases. However, we test the robustness of our
results by including treatments in our regression models. The results are provided in Table
4 and do not change our main conclusions. The following section discusses systematically
the potential threats to the estimation strategy and provides a series of robustness tests.
Table 4 about here.
3.5 Potential threats to validity
The first among threats to the validity of our research is related to ethnic-specific elasticities
of cognition and education with respect to health. One concern is that the responsiveness of
education to health improvements might differ by ethnic group. As suggested by Jayachan-
dran and Lleras-Muney (2009) for gender, if a given improvement in health has a larger
effect on the education of the Fulani than the non-Fulani, then our results could be driven
the differential sensitivity to this health improvement between the ethnicities, not by the
differentially larger improvement in health for the non-Fulani due to seasonal change. This
differing elasticity to health improvements by ethnic group could operate through morbidity
affecting absences or improvements in family members’ health. We tested for ethnic-specific
15
Documents de travail du Centre d'Economie de la Sorbonne - 2016.09
cognitive or educational effects of other health improvements that were common to the Fulani
and the non-Fulani (such as BMI-for-age z-scores) in Table 5. There is no strong evidence
for a greater elasticity of the non-Fulani or the “Dogon alone” as the results do not change
our main conclusions.
Second, pre-existing endowment differences could also drive the results. For instance, if
the non-Fulani are drawn from the sicker part of the distribution, then one might retrieve
similar results. This could be particularly true for aneamia and splenomegaly, which could
reflect differences in other investments made in the Fulani children that have a seasonal
pattern. Indeed, anaemia is a marker of malaria severity but is also driven by other factors
(nutritional intake for instance). Appendix Figures A2 to A6 provide densities of hemoglobin
concentrations, splenomegaly, BMI-for-age, cognition and education variables. These figures
show that the anaemia level is relatively high on average for both ethnic groups and there
is no evidence that the non-Fulani are drawn from the sicker part of the distribution. We
note that the prevalence of anaemia among school-age children is generally defined as a
hemoglobin concentration of less than 11.0g/dL. Similarly the distributions of splenomegaly,
BMI-for-age, cognitive or educational outcomes do not show major differences across ethnic
groups. In order to confirm that differences in baseline health do not affect our results, Table
A3 provides estimates by interacting malaria infections with baseline anaemia - as defined by
the previous threshold - and with baseline splenomegaly to estimate the effects on cognitive
and educational outcomes. Table A3 also analyzes the question of cross-group spillovers (e.g.,
malaria among non-Fulani children could impact learning among Fulani either positively or
negatively due to classroom effects) by interacting classrooms with malaria. Therefore our
results do not seem to be influenced by potential heterogeneity.
The third potential threat to validity relates to cross-seasonal behavior that reinforces
or compensates investments in education, which could differ by ethnic group or to their
differential access to health care across seasons. Though we have limited information about
ethnic-specific activities across seasons in Diankabou, as the time frame of the survey was
limited, we did check in the Mali Demographic and Health Survey (DHS) collected from
2001, 2006 and 2012-2013 in rural areas of the Mopti region across different months (couple
recode) that there are no particular cross-seasonal ethnic-specific differences (Figure A7
and A8) based on the month of interview. We do not find any significant difference across
16
Documents de travail du Centre d'Economie de la Sorbonne - 2016.09
groups and seasons for the wealth index distribution or bednet ownership. Moreover, malaria
transmission decline does not fit exactly with agricultural activities in the village. As shown
by Figure A1, average precipitations in Diankabou are declining between September and
October whereas malaria transmission declines between October and November in this area.
In the same area, Coulibaly et al. (2013) have shown similar patterns. The first malaria
clinical episodes had a lag of four weeks after the onset of the rainy season (from June to
October). The main decline in malaria incidence in this area occurs generally in November.
Moreover, we also provide a robustness test of our results in another context that in-
volves the Fulani ethnic group by using data from another village in Mali. This village,
Doneguebougou, is a small village located in a malaria-endemic area near Bamako (17 km,
North of Bamako) providing free access to health care to all villagers. However, it is not a
place where the Fulanis settled in the past and thus their representation is very low, which
is the reason why we did not use it in the main analysis. Details about this second village
and the survey procedure - that is similar to the one used in Diankabou - can be found
in (Thuilliez et al., 2010). A total of 12 Fulani children were surveyed across 8 follow-ups
compared to 213 non-Fulanis across 8 follow-ups from November 2007 to June 2008 (hence
with much more seasonal variation). Still, this different village provides a useful test of our
LATE approach because it provides a distinct set of cultural characteristics. For a start,
the non-Fulani ethnic groups are different and are represented by the Sarakole and Bam-
bara. Second, economic and agricultural activities are different in this area as the climate
is slightly different. Finally, there was no attrition in this village among the Fulani ethnic
group leading to a total of 96 Fulani observations. The results, provided in Table A4, are
similar to the ones found in Diankabou.
Another concern is that Diankabou is a remote village (65 km from the nearest city and
850 km northeast of Bamako, the capital of Mali) with difficult field work conditions. No
research programs were undertaken previously in this village to our knowledge. Therefore,
we face a number of missing values for some of the variables under study here due to the
difficulties inherent in the biomedical data collection and storage in remote areas, and refusals
to conform to particular procedures or to perform some tests. For instance, the data on
cognition comprises 550 observations instead of 587 (data are missing for 6% of observations)
and there are 583 observations for the educational average score (data are missing for 0.6%
17
Documents de travail du Centre d'Economie de la Sorbonne - 2016.09
of observations) and 503 for the PCA score (data are missing for 14% of observations).
Although we cannot directly rule out this concern, sample size variation across variables
does not change the conclusions. In addition, restricting the non-Fulani sample to the Dogon
ethnic group alone (and thus changing the sample size) does not affect our results. As yet
another additional check, we coded all the missing educational outcomes for the Fulani at the
maximum value of the outcome in the post period and all the missing educational outcomes
for the Non-Fulani at the minimum value of the outcome. The results provided in Table 5
are robust to this check.
Finally, considering the very short time period of the study and the limited size of the
village, it is highly improbable that the village of Diankabou underwent major changes during
the study period, such as unobserved education-related changes. The identification would
have been threatened if changes had ethnic-specific effects that varied by individual in a
manner correlated with the malaria seasonal changes. We are not aware of any major ethnic-
specific changes between October and December, apart from the potential ones discussed
above.
The discussion section below provides other arguments on long-term potential compen-
sating mechanisms that differ by ethnic group and could explain the observed difference
between Table 1 and Table 2. We notice that the conclusion of our empirical test confirms
other research papers (Clarke et al., 2008; Thuilliez et al., 2010; Nankabirwa et al., 2013)
on the effect of malaria on education, as applied to the two ethnic groups. In addition, as
malaria is endemic in this area, the short term effect of malaria on educational and cognitive
outcomes is potentially permanent in this area, as far as malaria has not been eliminated.
Table 5 about here.
4 Discussion
In the previous Section, we have shown that malaria decreases the return to educational
investment. It has an impact on cognitive test scores and educational performance. Nev-
ertheless, Table 1 has shown that the non-Fulanis do not outperform the Fulanis at the
baseline or the endline separately. Moreover, the simple difference-in-difference estimates
18
Documents de travail du Centre d'Economie de la Sorbonne - 2016.09
provided in Table 1 and A1 show no significant difference between both groups. This sug-
gest that malaria has a short-run impact and that catch-up effects may take place. Indeed,
although malaria is endemic in the village, i.e. transmitted all over the year, its intensity of
transmission varies with the seasons.
In order to provide a discussion on the possible long-run implications of short-run impacts
of malaria on educational performance, we build a model characterizing economic and fertility
decisions within the household. The theoretical predictions are then illustrated by utilizing
some stylized facts collected at the family level at the baseline, in addition to some facts
from the Mali Demographic and Health Surveys (from 2001 to 2013) and the literature on
the topic. An extensive test of the predictions of our model is beyond the scope of this paper
as our data do not permit it.
We consider a quantity-quality model, in which parents choose their fertility and their
investment in the education of their surviving children, and apply it to the case of a dif-
ferential susceptibility to malaria. The probability to be infected (i.e. the infection rate),
denoted p with p ∈ (0, 1), is exogenous and varies across ethnic groups.
Malaria has two impacts. First, it increases the child mortality rate, which is a well-
established fact (Murray et al., 2012). We define a survival function that measures the
probability of reaching schooling age, and assume it decreases with the infection rate of the
considered ethnic group. The survival function is denoted s (p) and satisfies 0 < s (p) < 1
and s′ (p) < 0. We denote the fertility rate by n and therefore consider that s (p)n is the
number of children that reach schooling age in the considered household. We notice that
according to the model, malaria has no impact on adult longevity. The second impact of
malaria is to reduce educational outcomes (which is the result obtained in section (3). We
denote by e the monetary cost of education per child made by the parents. We then assume
that returns to education are equal to Re provided that the child has been ill and to δRe
otherwise. We consider in the model that δ ≥ 1, which allows us to distinguish two cases:
δ = 1 means that malaria has no impact on educational outcomes, whereas δ > 1 implies
that children who were ill exhibit lower outcomes (which is the result of Section 3).
Parents share their income, denoted w, between consumption, c, and the costs of their
surviving children:
w = c+ (e+ λ) s (p)n, (4)
19
Documents de travail du Centre d'Economie de la Sorbonne - 2016.09
where λ ≥ 0 accounts for fixed costs per child. The expected utility of the parents
depends on consumption, net fertility and returns to education. It can be written as:
u (c) + s (p)n [pv (Re) + (1− p) v (δRe)] , (5)
where functions u and v are increasing and strictly concave and v (0) = 0. We notice
that considering the utility of expected returns rather than (5) would not affect the re-
sults presented below. The optimization problem of the parents is to choose (c, n, e) that
maximize (5) subject to (4). We assume that solutions are interior and denote them by
(c∗, n∗, e∗). They satisfy two first-order conditions where e∗ is such that the marginal utility
of consumption is equal to the expected marginal utility of education and that n∗ is such
that the marginal utility of consumption is equal to the “return” of one additional surviving
child; a “return” that is given by the ratio of the expected utility of education over the cost
(e+ λ). Using those conditions, we derive below some theoretical relationships between the
exogenous parameters and the optimal pair (e∗, n∗). Below are the predictions of the model
concerning the education choices.
Proposition 1. The optimal investment in education e∗,
i) does not depend on parental income w,
ii) increases with the infection rate p provided that the relative risk aversion is constant
or increasing and that δ > 1.
Proof. See Appendix B.
By combining the first-order conditions of the problem, the expected marginal utility
of education should equal the “return” of one surviving child. This relationship gives the
optimal investment in education, which therefore does not depend on parental income. The
main result of Proposition 1 is to exhibit a condition such that the relationship between
infection rates and investment in education is positive. This relationship, however, is a
priori ambiguous as the “return” of a child’s education decreases with p while the expected
marginal utility of education increases with p. If the relative risk aversion is increasing or
constant (which is empirically evident in Holt and Laury (2002) and Chiappori and Paiella
(2011)), the second effect would dominate the first. Hence, parents compensate a lower
expected return to education by making a larger investment. We notice that our result still
20
Documents de travail du Centre d'Economie de la Sorbonne - 2016.09
holds if the relative risk aversion is decreasing, provided that the fixed cost of each child is
not too large, which is also generally considered to be the case in rural Africa, and more
notably when considering the high opportunity cost of schooling (Estevan and Baland, 2007;
Bargain, Donni and Kwenda, 2011; Dunbar, Lewbel and Pendakur, 2013).
The theoretical result of Proposition 1 might be surprising. One would expect that a
decrease in the return to education would lower the investment in education (see, most
notably, the nice presentation by Bleakley (2010a)). Nevertheless, as argued by Soares
(2005) and Hazan and Zoabi (2006), the quantity-quality trade-off challenges this intuition
as changes in morbidity also influence the return of educational investment on the quantity
of children.
To discuss the empirical relevance of Proposition 1 we recall that δ > 1 is the main result
we presented in section 3. Let us now establish some stylized facts to illustrate the sign of
the theoretical relationships. Table 6 uses data collected at the family level in October 2010
during the baseline survey to illustrate this proposition. In particular, Column (1) shows
that investments in education do not depend on parental income, and that they increase
with the probability of being infected.
We now turn to the predictions of the model concerning the fertility choices.
Proposition 2. The optimal fertility, n∗,
i) increases with parental income w,
ii) increases with the probability to be infected, p, if δ is not too large.
Proof. See Appendix B
The relationship between fertility and the infection rate depends on two factors. First,
as malaria negatively impacts the survival rate of infants, the infection rate tends to increase
fertility trough a compensation effect. Second, as we have seen in Proposition 1, the infection
rate may increase investments in education, which in turn decreases fertility through a
quantity-quality trade-off. Proposition 2 says that if the second effect is not too strong (i.e.
if the relative advantage of healthy pupils measured by δ− 1 is not too large), the first effect
dominates.
This condition fits well with the estimates we presented in Section 3 where we showed that
δ is significant but not too large (less than one standard deviation for all outcomes). Before
21
Documents de travail du Centre d'Economie de la Sorbonne - 2016.09
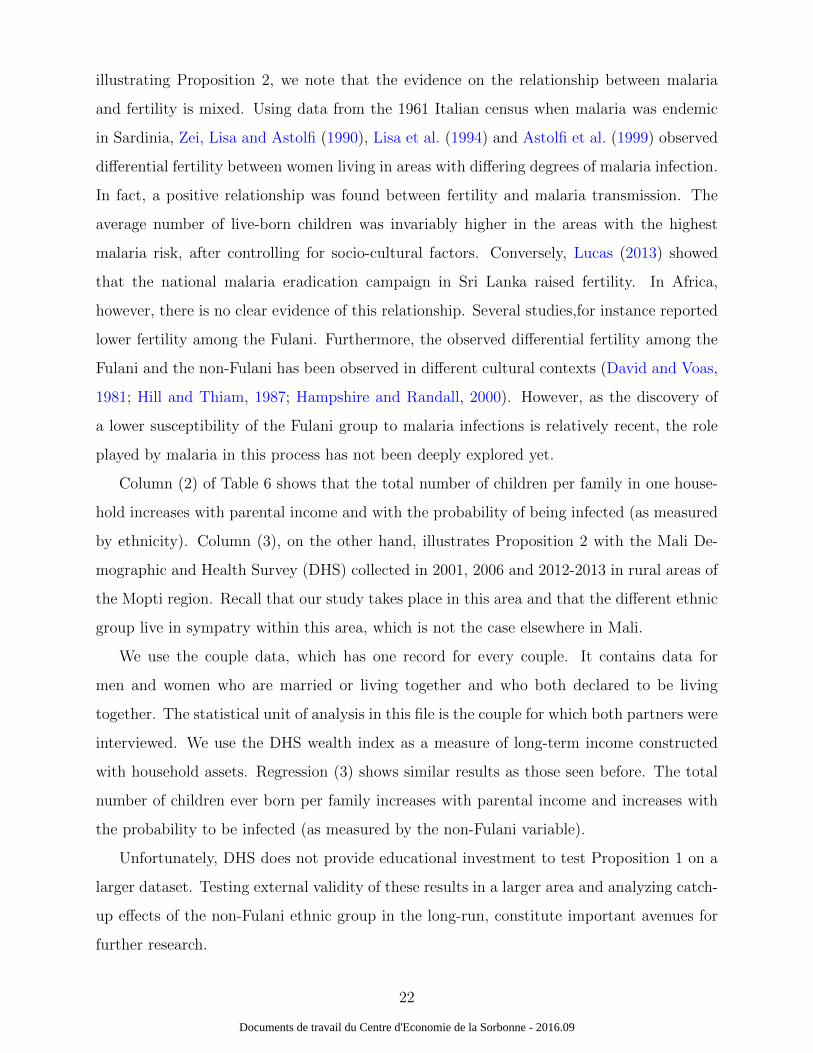
illustrating Proposition 2, we note that the evidence on the relationship between malaria
and fertility is mixed. Using data from the 1961 Italian census when malaria was endemic
in Sardinia, Zei, Lisa and Astolfi (1990), Lisa et al. (1994) and Astolfi et al. (1999) observed
differential fertility between women living in areas with differing degrees of malaria infection.
In fact, a positive relationship was found between fertility and malaria transmission. The
average number of live-born children was invariably higher in the areas with the highest
malaria risk, after controlling for socio-cultural factors. Conversely, Lucas (2013) showed
that the national malaria eradication campaign in Sri Lanka raised fertility. In Africa,
however, there is no clear evidence of this relationship. Several studies,for instance reported
lower fertility among the Fulani. Furthermore, the observed differential fertility among the
Fulani and the non-Fulani has been observed in different cultural contexts (David and Voas,
1981; Hill and Thiam, 1987; Hampshire and Randall, 2000). However, as the discovery of
a lower susceptibility of the Fulani group to malaria infections is relatively recent, the role
played by malaria in this process has not been deeply explored yet.
Column (2) of Table 6 shows that the total number of children per family in one house-
hold increases with parental income and with the probability of being infected (as measured
by ethnicity). Column (3), on the other hand, illustrates Proposition 2 with the Mali De-
mographic and Health Survey (DHS) collected in 2001, 2006 and 2012-2013 in rural areas of
the Mopti region. Recall that our study takes place in this area and that the different ethnic
group live in sympatry within this area, which is not the case elsewhere in Mali.
We use the couple data, which has one record for every couple. It contains data for
men and women who are married or living together and who both declared to be living
together. The statistical unit of analysis in this file is the couple for which both partners were
interviewed. We use the DHS wealth index as a measure of long-term income constructed
with household assets. Regression (3) shows similar results as those seen before. The total
number of children ever born per family increases with parental income and increases with
the probability to be infected (as measured by the non-Fulani variable).
Unfortunately, DHS does not provide educational investment to test Proposition 1 on a
larger dataset. Testing external validity of these results in a larger area and analyzing catch-
up effects of the non-Fulani ethnic group in the long-run, constitute important avenues for
further research.
22
Documents de travail du Centre d'Economie de la Sorbonne - 2016.09
Table 6 about here.
5 Conclusions
Our empirical results suggest that malaria infection (as measured by PCR) has a direct
impact on cognitive and educational outcomes. These results are also robust to including
a number of control variables and to a series of tests. We use a natural experiment which
differs from a randomized control trial.
Although an extensive biomedical literature analyzes the costs of immunity, the social
costs of immunity have not yet been explored. The findings of the model proposed in the
discussion section suggest that, for the ethnic groups under study here, a higher probability
to be infected by malaria might increase fertility and human capital investments. On the
other hand, the survival of those groups that are partially immunized against malaria might
be threatened. Indeed and interestingly, despite having lower malaria-specific mortality
rates, the survival of the Fulani ethnic group will depend on fertility decision when they
live in sympatry with other ethnic groups. This is certainly not a negligible consequence
of immunity, from an economic evolution perspective. Notably, the model converges with
observed unexplained fertility behaviors of the Fulani in different contexts and with our
aggregate data. Therefore, though stylized, this discussion could be highly relevant for the
further development of these issues in the future.
Our article also emphasizes coping mechanisms and catch-up effects that may be at play
in the long-run across ethnic groups. Indeed the seasonal shock under study here is only
a temporary shock that does not affect the probability of being infected by ethnic group
in the long run or the average probability of being infected over a full year of schooling.
Moreover, this seasonal change is an imperfect treatment to eliminate malaria amongst all
ethnic groups. The originality of our results lies in that they go beyond the findings of
the above-mentioned previous studies on income or human capital accumulation and we
emphasize potential coping mechanisms that can cause the estimation of that effect to be
biased or difficult to assess with a simple difference-in-difference framework. We emphasize
the potential changing behavior of those households that have a lower probability of infection
because of natural protection against the disease. This is particularly important, considering
23
Documents de travail du Centre d'Economie de la Sorbonne - 2016.09
malaria-selective pressure on the human genome.
The findings of this paper also suggest that the increase in human capital accumulation
that results from malaria decrease is an important component of malaria control policies and
cost-benefit analyses of malaria control programmes. First, protective factors against malaria
might be taken into account in defining the target population of malaria control programmes
to avoid disadvantaging specific groups. This could be particularly relevant for Glucose-6-
phosphate dehydrogenase deficiency (G6PD deficiency) in Africa. Carriers of the G6PD
allele appear to be protected to some extent against malaria. Hight median prevalence of
G6PD deficiency (peaking at 32.5%) was predicted across sub-Saharan Africa (Howes et al.,
2012). Second, testing the relative impacts of malaria, nutritional status and hemoglobin
levels on education is necessary in defining health policy priorities. Our analysis suggests
that for school-age children, malaria might be a priority compared to other health problems.
However, proper nutrition, especially from conception to age two, along with early childhood
stimulation play a critical role in the process of brain formation and development. Low levels
of child development are associated with lower school participation and worse performance,
and increased reliance on health care, potentially perpetuating inter-generational poverty
cycles. Therefore, the timing of interventions is probably crucial here.
24
Documents de travail du Centre d'Economie de la Sorbonne - 2016.09
References
Anchinmane, Vyankatesh T., and Rakesh T. Shedge. 2011. “A Review of Malaria
Diagnostic Tools: Microscopy and Rapid Diagnostic Test.” Asian Journal of Medical Sci-
ences, 1(2): 75–79.
Arama, Charles, Pablo Giusti, Bostrom Stephanie, Dara Victor, Traore
Boubacar, Dolo Amagana, Doumbo Ogobara, Varani Stefania, and Troye-
Blomberg Marita. 2011. “Interethnic differences in antigen-presenting cell activation
and TLR responses in Malian children during Plasmodium falciparum malaria.” PloS
One, 6(3): e18319.
Astolfi, P., A. Lisa, A. Degioanni, A. Tagarelli, and G. Zei. 1999. “Past malaria,
thalassemia and woman fertility in southern Italy.” Annals of Human Biology, 26(2): 163–
173.
Bargain, Olivier, Olivier Donni, and Prudence Kwenda. 2011. “Intrahousehold dis-
tribution and child poverty: Theory and evidence from Cote d’Ivoire.” Discussion Paper
series, Forschungsinstitut zur Zukunft der Arbeit.
Barofsky, Jeremy, Tobenna D. Anekwe, and Claire Chase. 2015. “Malaria eradica-
tion and economic outcomes in sub-Saharan Africa: Evidence from Uganda.” Journal of
Health Economics, 44: 118–136.
Barreca, Alan I. 2010. “The long-term economic impact of in utero and postnatal exposure
to malaria.” Journal of Human Resources, 45(4): 865–892.
Bartlett, Maurice S. 1937. “The statistical conception of mental factors.” British Journal
of Psychology. General Section, 28(1): 97–104.
Baudin, Thomas. 2012. “The Optimal Trade-Off Between Quality and Quantity with
Unknown Number of Survivors.” Mathematical Population Studies, 19(2): 94–113.
Bell, Clive, and Hans Gersbach. 2009. “The macroeconomics of targeting: the case of
an enduring epidemic.” Journal of Health Economics, 28(1): 54–72.
25
Documents de travail du Centre d'Economie de la Sorbonne - 2016.09
Bereczky, S., A. Dolo, B. Maiga, M. Hayano, F. Granath, S. M. Montgomery, M.
Daou, C. Arama, M. Troye-Blomberg, O. K. Doumbo, and A. Farnert. 2006.
“Spleen enlargement and genetic diversity of Plasmodium falciparum infection in two
ethnic groups with different malaria susceptibility in Mali, West Africa.” Transactions of
the Royal Society of Tropical Medicine and Hygiene, 100(3): 248–257.
Bird, Adrian. 2007. “Perceptions of epigenetics.” Nature, 447(7143): 396–398.
Bleakley, Hoyt. 2010a. “Health, human capital, and development.” Annual Review of
Economics, 2(1): 283–310.
Bleakley, Hoyt. 2010b. “Malaria eradication in the Americas: A retrospective analysis of
childhood exposure.” American Economic Journal: Applied Economics, 1–45.
Boehm, Ann E. 2001. Boehm Test of Basic Concepts–3: Preschool. San Antonio, TX: The
Psychological Corporation.
Breusers, Mark, Suzanne Nederlof, and Teunis Van Rheenen. 1998. “Conflict or
symbiosis? Disentangling farmer-herdsman relations: the Mossi and Fulbe of the Central
Plateau, Burkina Faso.” The Journal of Modern African Studies, 36(03): 357–380.
Brooker, S., H. Guyatt, J. Omumbo, R. Shretta, L. Drake, and J. Ouma. 2000.
“Situation Analysis of Malaria in School-aged Children in Kenya–What Can Be Done?”
Parasitology Today, 16(5): 183–186.
Cervellati, Matteo, and Uwe Sunde. 2005. “Human capital formation, life expectancy,
and the process of development.” American Economic Review, 1653–1672.
Chiappori, Pierre-Andre, and Monica Paiella. 2011. “Relative Risk Aversion Is
Constant: Evidence from Panel Data.” Journal of the European Economic Association,
9(6): 1021–1052.
Clarke, Sian E., Matthew CH Jukes, J. Kiambo Njagi, Lincoln Khasakhala,
Bonnie Cundill, Julius Otido, Christopher Crudder, Benson Estambale, and
Simon Brooker. 2008. “Effect of intermittent preventive treatment of malaria on health
and education in schoolchildren: a cluster-randomised, double-blind, placebo-controlled
trial.” The Lancet, 372(9633): 127–138.
26
Documents de travail du Centre d'Economie de la Sorbonne - 2016.09
Clarke, Sian E., Simon Brooker, Joseph Kiambo Njagi, Eliud Njau, Benson
Estambale, Eric Muchiri, and Pascal Magnussen. 2004. “Malaria Morbidity Among
School Children Living in Two Areas of Contrasting Transmission in Western Kenya.” The
American Journal of Tropical Medicine and Hygiene, 71(6): 732–738.
Coulibaly, Drissa, Stanislas Rebaudet, Mark Travassos, Youssouf Tolo, Matthew
Laurens, Abdoulaye K. Kone, Karim Traore, Ando Guindo, Issa Diarra,
Amadou Niangaly, Modibo Daou, Ahmadou Dembele, Mody Sissoko, Bourema
Kouriba, Nadine Dessay, Jean Gaudart, Renaud Piarroux, Mahamadou A.
Thera, Christopher V. Plowe, and Ogobara K. Doumbo. 2013. “Spatio-temporal
analysis of malaria within a transmission season in Bandiagara, Mali.” Malaria Journal,
12: 82.
Cutler, David, Winnie Fung, Michael Kremer, Monica Singhal, and Tom Vogl.
2010. “Early-life malaria exposure and adult outcomes: Evidence from malaria eradication
in India.” American Economic Journal: Applied Economics, 72–94.
David, Nicholas, and David Voas. 1981. “Societal causes of infertility and population
decline among the settled Fulani of North Cameroon.” Man, 644–664.
Deaton, Angus. 2010. “Instruments, Randomization, and Learning about Development.”
Journal of Economic Literature, 48(2): 424–455.
Dicko, Alassane, Carsten Mantel, Boureima Kouriba, Issaka Sagara, Ma-
hamadou A. Thera, Seydou Doumbia, Mouctar Diallo, Belco Poudiougou, Ma-
hamadou Diakite, and Ogobara K. Doumbo. 2005. “Season, fever prevalence and
pyrogenic threshold for malaria disease definition in an endemic area of Mali.” Tropical
medicine & international health, 10(6): 550–556.
Dolo, A., B. Maıga, V. Dara, A. Tapily, Y. Tolo, C. Arama, M. Daou, and
O. Doumbo. 2012a. “Place du paludisme dans les syndromes febriles dans deux groupes
ethniques vivant en sympatrie au Mali de 1998 a 2008.” Bulletin de la Societe de Pathologie
Exotique, 105(5): 377–383.
27
Documents de travail du Centre d'Economie de la Sorbonne - 2016.09
Dolo, A., B. Maiga, Y. Tolo, A. Tapily, C. Arama, M. Daou, M. Baby, B. Traore,
and O. Doumbo. 2012b. “Relation entre l’anemie et le paludisme dans deux groupes
ethniques vivant en sympatrie au Mali.” Bulletin de la Societe de Pathologie Exotique,
105(5): 370–376.
Dolo, Amagana, David Modiano, Boubacar Maiga, Modibo Daou, Guimogo
Dolo, Hamadoun Guindo, Mamadou Ba, Hama Maiga, Drissa Coulibaly,
and Hedvig Perlman. 2005. “Difference in susceptibility to malaria between two sym-
patric ethnic groups in Mali.” The American Journal of Tropical Medicine and Hygiene,
72(3): 243–248.
Dorsey, Grant, Denise Njama, Moses R Kamya, Adithya Cattamanchi, Daniel
Kyabayinze, Sarah G Staedke, Anne Gasasira, and Philip J Rosenthal. 2002.
“Sulfadoxine/pyrimethamine alone or with amodiaquine or artesunate for treatment of
uncomplicated malaria: a longitudinal randomised trial.” The Lancet, 360(9350): 2031–
2038.
Driss, Adel, Jacqueline M. Hibbert, Nana O. Wilson, Shareen A. Iqbal,
Thomas V. Adamkiewicz, and Jonathan K. Stiles. 2011. “Genetic polymorphisms
linked to susceptibility to malaria.” Malaria Journal, 10: 271.
Dunbar, Geoffrey R., Arthur Lewbel, and Krishna Pendakur. 2013. “Children’s
Resources in Collective Households: Identification, Estimation, and an Application to
Child Poverty in Malawi.” The American Economic Review, 103(1): 438–471.
Ehrlich, Isaac, and Francis T. Lui. 1991. “Intergenerational trade, longevity, and eco-
nomic growth.” Journal of Political Economy, 1029–1059.
Estevan, Fernanda, and Jean-Marie Baland. 2007. “Mortality risks, education and
child labor.” Journal of Development Economics, 84(1): 118–137.
Farouk, Salah E., Amagana Dolo, Sandor Bereczky, Bourema Kouriba, Boubacar
Maiga, Anna Farnert, Hedvig Perlmann, Masashi Hayano, Scott M. Mont-
gomery, and Ogobara K. Doumbo. 2005. “Different antibody-and cytokine-mediated
28
Documents de travail du Centre d'Economie de la Sorbonne - 2016.09
responses to Plasmodium falciparum parasite in two sympatric ethnic tribes living in
Mali.” Microbes and Infection, 7(1): 110–117.
Fernando, Deepika, Damani De Silva, Richard Carter, Kamini N. Mendis, and
Rajitha Wickremasinghe. 2006. “A randomized, double-blind, placebo-controlled, clin-
ical trial of the impact of malaria prevention on the educational attainment of school
children.” The American Journal of Tropical Medicine and Hygiene, 74(3): 386–393.
Fernando, Deepika, D. M. Gunawardena, M. Bandara, D. De Silva, R. Carter,
K. N. Mendis, and A. R. Wickremasinghe. 2003. “The impact of repeated malaria
attacks on the school performance of children.” The American Journal of Tropical Medicine
and Hygiene, 69(6): 582–588.
Hampshire, Kate, and Sara Randall. 2000. “Pastoralists, agropastoralists and migrants:
interactions between fertility and mobility in northern Burkina Faso.” Population Studies,
54(3): 247–261.
Hazan, Moshe, and Hosny Zoabi. 2006. “Does longevity cause growth? A theoretical
critique.” Journal of Economic Growth, 11(4): 363–376.
Hill, A. G., and A. Thiam. 1987. “Marriage inheritance and fertility amongst the Malian
Fulani.” Population Studies Center working paper.
Holding, P. A., and R. W. Snow. 2001. “Impact of Plasmodium falciparum malaria
on performance and learning: review of the evidence.” The American journal of tropical
medicine and hygiene, 64(1 suppl): 68–75.
Holt, Charles A., and Susan K. Laury. 2002. “Risk aversion and incentive effects.”
American Economic Review, 92(5): 1644–1655.
Howes, Rosalind E., Frederic B. Piel, Anand P. Patil, Oscar A. Nyangiri, Pe-
ter W. Gething, Mewahyu Dewi, Mariana M. Hogg, Katherine E. Battle,
Carmencita D. Padilla, J. Kevin Baird, and Simon I. Hay. 2012. “G6PD Defi-
ciency Prevalence and Estimates of Affected Populations in Malaria Endemic Countries:
A Geostatistical Model-Based Map.” PLoS Medicine, 9(11): e1001339.
29
Documents de travail du Centre d'Economie de la Sorbonne - 2016.09
Imbens, Guido W., and Joshua D. Angrist. 1994. “Identification and Estimation of
Local Average Treatment Effects.” Econometrica, 62(2): 467–475.
Jayachandran, Seema, and Adriana Lleras-Muney. 2009. “Life Expectancy and Hu-
man Capital Investments: Evidence from Maternal Mortality Declines.” The Quarterly
Journal of Economics, 124(1): 349–397.
Jukes, Matthew CH, Margaret Pinder, Elena L. Grigorenko, Helen Banos Smith,
Gijs Walraven, Elisa Meier Bariau, Robert J. Sternberg, Lesley J. Drake, Paul
Milligan, and Yin Bun Cheung. 2006. “Long-term impact of malaria chemoprophy-
laxis on cognitive abilities and educational attainment: follow-up of a controlled trial.”
PLOS Hub for Clinical Trials, 1(4): e19.
Kalemli-Ozcan, Sebnem. 2003. “A stochastic model of mortality, fertility, and human
capital investment.” Journal of Development Economics, 70(1): 103–118.
Kurtzhals, Jørgen AL, Mark M. Addae, Bartholomew D. Akanmori, Samuel
Dunyo, Kwadjo A. Koram, Maxwell A. Appawu, Francis K. Nkrumah, and
Lars Hviid. 1999. “Anaemia caused by asymptomatic Plasmodium falciparum infection
in semiimmune African schoolchildren.” Transactions of the Royal Society of Tropical
Medicine and Hygiene, 93(6): 623–627.
Lagerlof, Nils-Petter. 2003. “From Malthus to Modern Growth: Can Epidemics Explain
the Three Regimes?*.” International Economic Review, 44(2): 755–777.
Lisa, A., P. Astolfi, A. Degioanni, C. Di Pasquale, and G. Zei. 1994. “Differen-
tial fertility as a mechanism maintaining balanced polymorphisms in Sardinia.” Human
Biology, 66(4): 683–698.
Lucas, Adrienne M. 2010. “Malaria eradication and educational attainment: evi-
dence from Paraguay and Sri Lanka.” American Economic Journal: Applied Economics,
2(2): 46–71.
Lucas, Adrienne M. 2013. “The impact of malaria eradication on fertility.” Economic
Development and Cultural Change, 61(3): 607–631.
30
Documents de travail du Centre d'Economie de la Sorbonne - 2016.09
Modiano, David, Gaia Luoni, Bienvenu Sodiomon Sirima, Alessandra Lanfran-
cotti, Vincenzo Petrarca, Fulvio Cruciani, Jacques Simpore, Bianca Maria
Ciminelli, Enrica Foglietta, and Paola Grisanti. 2001. “The lower susceptibility to
Plasmpdium falciparum malaria of Fulani of Burkina Faso (West Africa) is associated with
low frequencies of classic malaria-resistance genes.” Transactions of the Royal Society of
Tropical Medicine and Hygiene, 95(2): 149–152.
Modiano, D., V. Petrarca, B. S. Sirima, A. Bosman, I. Nebie, D. Diallo, L.
Lamizana, F. Esposito, and M. Coluzzi. 1995. “Plasmodium falciparum malaria in
sympatric ethnic groups of Burkina Faso, west Africa.” Parassitologia, 37(2-3): 255–259.
Mung’ala-Odera, Victor, Robert W. Snow, and Charles R. J. C. Newton. 2004.
“The Burden of the Neurocognitive Impairment Associated with Plasmodium Falciparum
Malaria in Sub-Saharan Africa.” The American Journal of Tropical Medicine and Hygiene,
71(2 suppl): 64–70.
Murray, Christopher JL, Lisa C. Rosenfeld, Stephen S. Lim, Kathryn G. An-
drews, Kyle J. Foreman, Diana Haring, Nancy Fullman, Mohsen Naghavi,
Rafael Lozano, and Alan D. Lopez. 2012. “Global malaria mortality between 1980
and 2010: a systematic analysis.” The Lancet, 379(9814): 413–431.
Nankabirwa, Joaniter, Bonnie Wandera, Noah Kiwanuka, Sarah G. Staedke,
Moses R. Kamya, and Simon J. Brooker. 2013. “Asymptomatic Plasmodium Infec-
tion and Cognition among Primary Schoolchildren in a High Malaria Transmission Setting
in Uganda.” The American Journal of Tropical Medicine and Hygiene, 88(6): 1102–1108.
Nasr, Amre, Nnaemeka C. Iriemenam, Hayder A. Giha, Halima A. Balo-
gun, Robin F. Anders, Marita Troye-Blomberg, Gehad ElGhazali, and Klavs
Berzins. 2009. “FcRIIa (CD32) polymorphism and anti-malarial IgG subclass pattern
among Fulani and sympatric ethnic groups living in eastern Sudan.” Malaria Journal,
8(1): 43.
New, Mark, David Lister, Mike Hulme, and Ian Makin. 2002a. “A high-resolution
data set of surface climate over global land areas.” Climate Research, 21(1): 1–25.
31
Documents de travail du Centre d'Economie de la Sorbonne - 2016.09
New, Mark, David Lister, Mike Hulme, and Ian Makin. 2002b. “A high-resolution
data set of surface climate over global land areas.” Climate research, 21(1): 1–25.
Ngoungou, E. B., B. Poudiougou, O. Dulac, A. Dicko, M. P. Boncoeur, A. M.
Traore, D. Coulibaly, M. M. Keita, P. M. Preux, and O. K. Doumbo.
2007. “Sequelles neurologiques persistantes dues au paludisme cerebral dans une cohorte
d’enfants au Mali.” Revue Neurologique, 163(5): 583–588.
Raven, J. C. 1984. “JH Court, and J. Raven. 1984.” Manual for Raven’s progressive ma-
trices and vocabulary scales. Section 2: Coloured progressive matrices.
Savigny, M., C. Barbier, R. Coupey-Le Roy, J. Girard, and G. Roussel. 2001.
“Batelem-R.” Batterie d’epreuves pour l’ecole elementaire. Cycle II et premiere annee du
cycle III. Paris: EAP.
Smith, David L., F. Ellis McKenzie, Robert W. Snow, and Simon I. Hay. 2007.
“Revisiting the basic reproductive number for malaria and its implications for malaria
control.” PLoS Biology, 5(3): e42.
Soares, Rodrigo R. 2005. “Mortality reductions, educational attainment, and fertility
choice.” American Economic Review, 580–601.
Thuilliez, Josselin, Mahamadou S. Sissoko, Ousmane B. Toure, Paul Kamate,
Jean-Claude Berthelemy, and Ogobara K. Doumbo. 2010. “Malaria and primary
education in Mali: A longitudinal study in the village of Doneguebougou.” Social Science
& Medicine, 71(2): 324–334.
Vafa, Manijeh, Bakary Maiga, Klavs Berzins, Masashi Hayano, Sandor Bereczky,
Amagana Dolo, Modibo Daou, Charles Arama, Bourema Kouriba, Anna
Farnert, Ogobara K. Doumbo, and Marita Troye-Blomberg. 2007. “Associations
between the IL-4 -590 T allele and Plasmodium falciparum infection prevalence in asymp-
tomatic Fulani of Mali.” Microbes and Infection / Institut Pasteur, 9(9): 1043–1048.
Vafa, Manijeh, Elisabeth Israelsson, Bakary Maiga, Amagana Dolo, Ogobara K.
Doumbo, and Marita Troye-Blomberg. 2009. “Relationship between immunoglobu-
lin isotype response to Plasmodium falciparum blood stage antigens and parasitological
32
Documents de travail du Centre d'Economie de la Sorbonne - 2016.09
indexes as well as splenomegaly in sympatric ethnic groups living in Mali.” Acta Tropica,
109(1): 12–16.
Venkataramani, Atheendar S. 2012. “Early life exposure to malaria and cognition in
adulthood: Evidence from Mexico.” Journal of Health Economics, 31(5): 767–780.
Williams, Thomas N. 2006. “Human red blood cell polymorphisms and malaria.” Current
Opinion in Microbiology, 9(4): 388–394.
Zei, G., A. Lisa, and P. Astolfi. 1990. “Fertility and malaria in Sardinia.” Annals of
Human Biology, 17(4): 315–330.
33
Documents de travail du Centre d'Economie de la Sorbonne - 2016.09
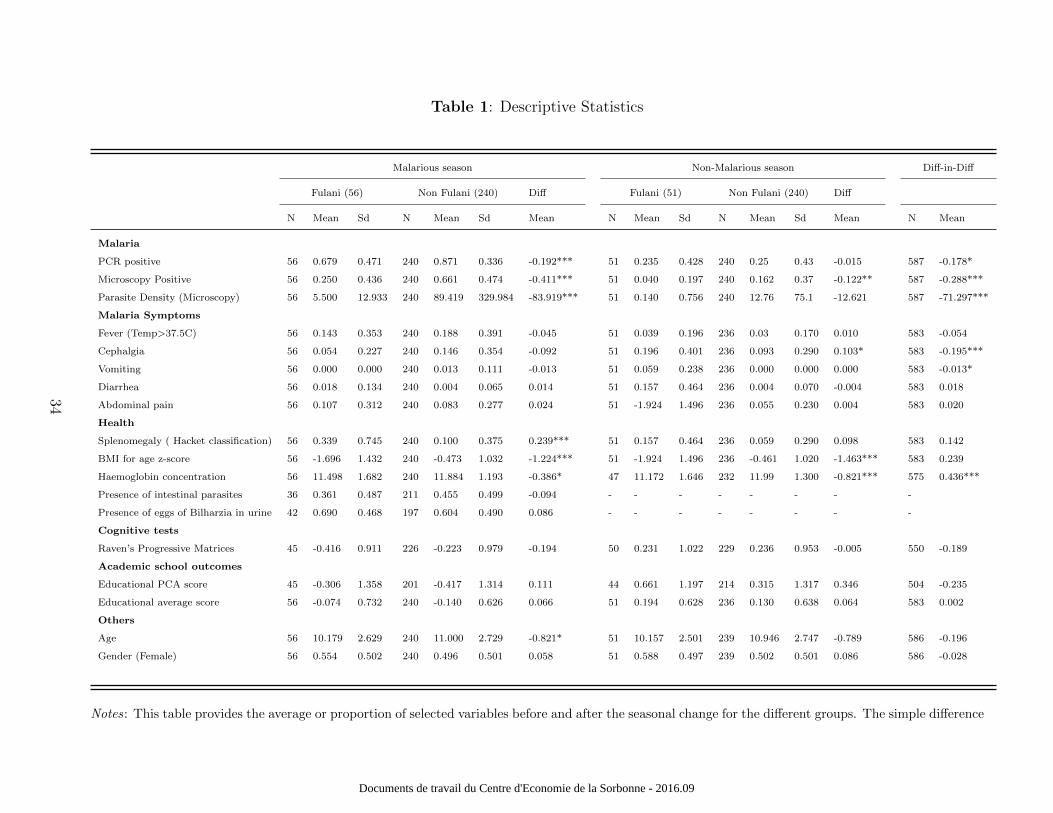
Table 1: Descriptive Statistics
Malarious season Non-Malarious season Diff-in-Diff
Fulani (56) Non Fulani (240) Diff Fulani (51) Non Fulani (240) Diff
N Mean Sd N Mean Sd Mean N Mean Sd N Mean Sd Mean N Mean
Malaria
PCR positive 56 0.679 0.471 240 0.871 0.336 -0.192*** 51 0.235 0.428 240 0.25 0.43 -0.015 587 -0.178*
Microscopy Positive 56 0.250 0.436 240 0.661 0.474 -0.411*** 51 0.040 0.197 240 0.162 0.37 -0.122** 587 -0.288***
Parasite Density (Microscopy) 56 5.500 12.933 240 89.419 329.984 -83.919*** 51 0.140 0.756 240 12.76 75.1 -12.621 587 -71.297***
Malaria Symptoms
Fever (Temp>37.5C) 56 0.143 0.353 240 0.188 0.391 -0.045 51 0.039 0.196 236 0.03 0.170 0.010 583 -0.054
Cephalgia 56 0.054 0.227 240 0.146 0.354 -0.092 51 0.196 0.401 236 0.093 0.290 0.103* 583 -0.195***
Vomiting 56 0.000 0.000 240 0.013 0.111 -0.013 51 0.059 0.238 236 0.000 0.000 0.000 583 -0.013*
Diarrhea 56 0.018 0.134 240 0.004 0.065 0.014 51 0.157 0.464 236 0.004 0.070 -0.004 583 0.018
Abdominal pain 56 0.107 0.312 240 0.083 0.277 0.024 51 -1.924 1.496 236 0.055 0.230 0.004 583 0.020
Health
Splenomegaly ( Hacket classification) 56 0.339 0.745 240 0.100 0.375 0.239*** 51 0.157 0.464 236 0.059 0.290 0.098 583 0.142
BMI for age z-score 56 -1.696 1.432 240 -0.473 1.032 -1.224*** 51 -1.924 1.496 236 -0.461 1.020 -1.463*** 583 0.239
Haemoglobin concentration 56 11.498 1.682 240 11.884 1.193 -0.386* 47 11.172 1.646 232 11.99 1.300 -0.821*** 575 0.436***
Presence of intestinal parasites 36 0.361 0.487 211 0.455 0.499 -0.094 - - - - - - - -
Presence of eggs of Bilharzia in urine 42 0.690 0.468 197 0.604 0.490 0.086 - - - - - - - -
Cognitive tests
Raven’s Progressive Matrices 45 -0.416 0.911 226 -0.223 0.979 -0.194 50 0.231 1.022 229 0.236 0.953 -0.005 550 -0.189
Academic school outcomes
Educational PCA score 45 -0.306 1.358 201 -0.417 1.314 0.111 44 0.661 1.197 214 0.315 1.317 0.346 504 -0.235
Educational average score 56 -0.074 0.732 240 -0.140 0.626 0.066 51 0.194 0.628 236 0.130 0.638 0.064 583 0.002
Others
Age 56 10.179 2.629 240 11.000 2.729 -0.821* 51 10.157 2.501 239 10.946 2.747 -0.789 586 -0.196
Gender (Female) 56 0.554 0.502 240 0.496 0.501 0.058 51 0.588 0.497 239 0.502 0.501 0.086 586 -0.028
Notes: This table provides the average or proportion of selected variables before and after the seasonal change for the different groups. The simple difference
34
Documents de travail du Centre d'Economie de la Sorbonne - 2016.09
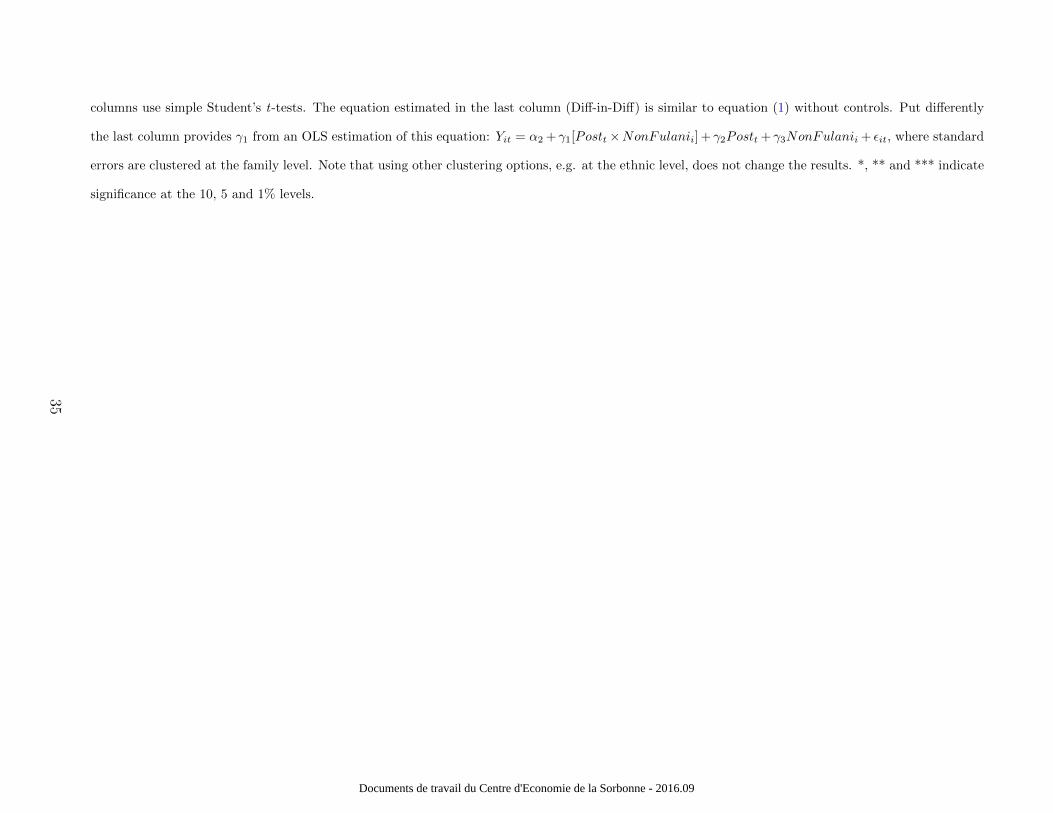
columns use simple Student’s t-tests. The equation estimated in the last column (Diff-in-Diff) is similar to equation (1) without controls. Put differently
the last column provides γ1 from an OLS estimation of this equation: Yit = α2 + γ1[Postt×NonFulanii] + γ2Postt + γ3NonFulanii + εit, where standard
errors are clustered at the family level. Note that using other clustering options, e.g. at the ethnic level, does not change the results. *, ** and *** indicate
significance at the 10, 5 and 1% levels.
35
Documents de travail du Centre d'Economie de la Sorbonne - 2016.09
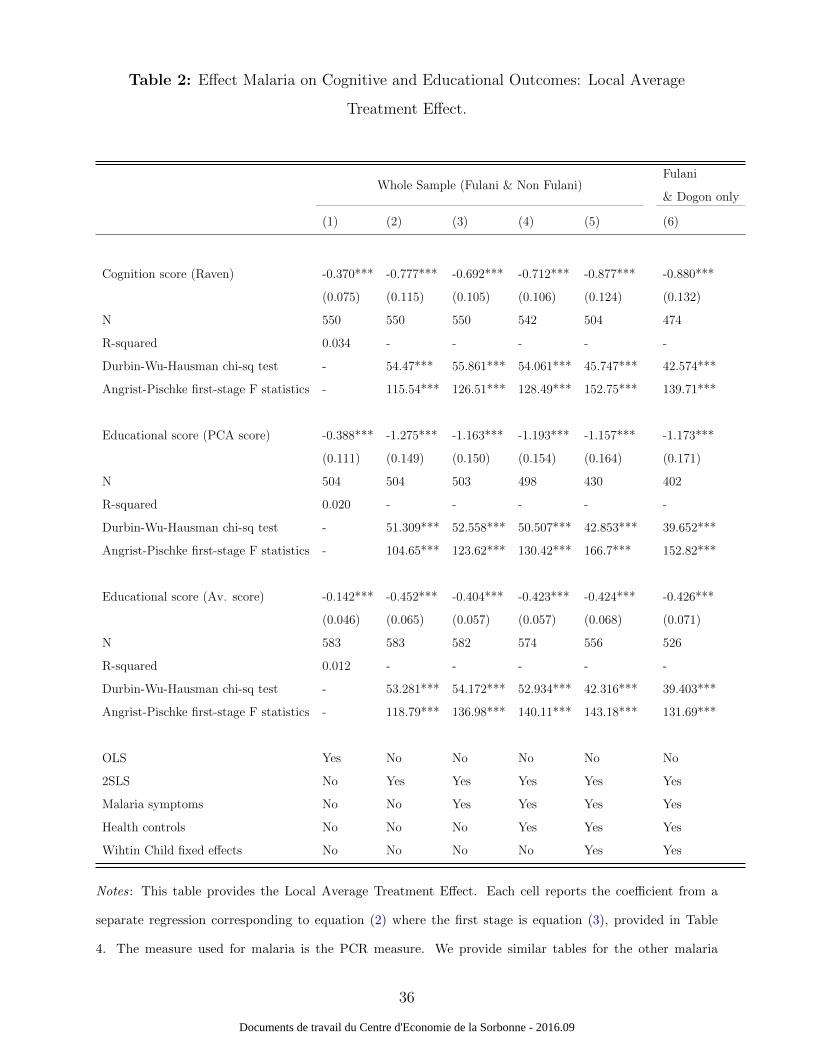
Table 2: Effect Malaria on Cognitive and Educational Outcomes: Local Average
Treatment Effect.
Whole Sample (Fulani & Non Fulani)Fulani
& Dogon only
(1) (2) (3) (4) (5) (6)
Cognition score (Raven) -0.370*** -0.777*** -0.692*** -0.712*** -0.877*** -0.880***
(0.075) (0.115) (0.105) (0.106) (0.124) (0.132)
N 550 550 550 542 504 474
R-squared 0.034 - - - - -
Durbin-Wu-Hausman chi-sq test - 54.47*** 55.861*** 54.061*** 45.747*** 42.574***
Angrist-Pischke first-stage F statistics - 115.54*** 126.51*** 128.49*** 152.75*** 139.71***
Educational score (PCA score) -0.388*** -1.275*** -1.163*** -1.193*** -1.157*** -1.173***
(0.111) (0.149) (0.150) (0.154) (0.164) (0.171)
N 504 504 503 498 430 402
R-squared 0.020 - - - - -
Durbin-Wu-Hausman chi-sq test - 51.309*** 52.558*** 50.507*** 42.853*** 39.652***
Angrist-Pischke first-stage F statistics - 104.65*** 123.62*** 130.42*** 166.7*** 152.82***
Educational score (Av. score) -0.142*** -0.452*** -0.404*** -0.423*** -0.424*** -0.426***
(0.046) (0.065) (0.057) (0.057) (0.068) (0.071)
N 583 583 582 574 556 526
R-squared 0.012 - - - - -
Durbin-Wu-Hausman chi-sq test - 53.281*** 54.172*** 52.934*** 42.316*** 39.403***
Angrist-Pischke first-stage F statistics - 118.79*** 136.98*** 140.11*** 143.18*** 131.69***
OLS Yes No No No No No
2SLS No Yes Yes Yes Yes Yes
Malaria symptoms No No Yes Yes Yes Yes
Health controls No No No Yes Yes Yes
Wihtin Child fixed effects No No No No Yes Yes
Notes: This table provides the Local Average Treatment Effect. Each cell reports the coefficient from a
separate regression corresponding to equation (2) where the first stage is equation (3), provided in Table
4. The measure used for malaria is the PCR measure. We provide similar tables for the other malaria
36
Documents de travail du Centre d'Economie de la Sorbonne - 2016.09
measurements (microscopy either binary or continuous) in Table A2. The last column reduces the sample
to the Dogon ethnic group for the non-Fulani group, whereas all other columns include all non-Fulani
groups. Malaria controls include all malaria symptoms provided in Table 1 (five dummies for fever, cephalgia,
vomiting, diarrhea, and abdominal pain). Health controls include splenomegaly, BMI-for-age, haemoglobin
concentration. The low p-values from the Durbin-Wu-Hausman test indicate that malaria infections should
be treated as endogenous. The Angrist-Pischke (AP) first-stage F statistics are tests of weak identification
and show that endogenous regressor is not ”weakly identified”. Standard errors are reported in parenthesis
and clustered at the family level. Note that using other clustering options, e.g. at the ethnic level, does not
change the results. *, ** and *** indicate significance at the 10, 5 and 1% levels.
37
Documents de travail du Centre d'Economie de la Sorbonne - 2016.09
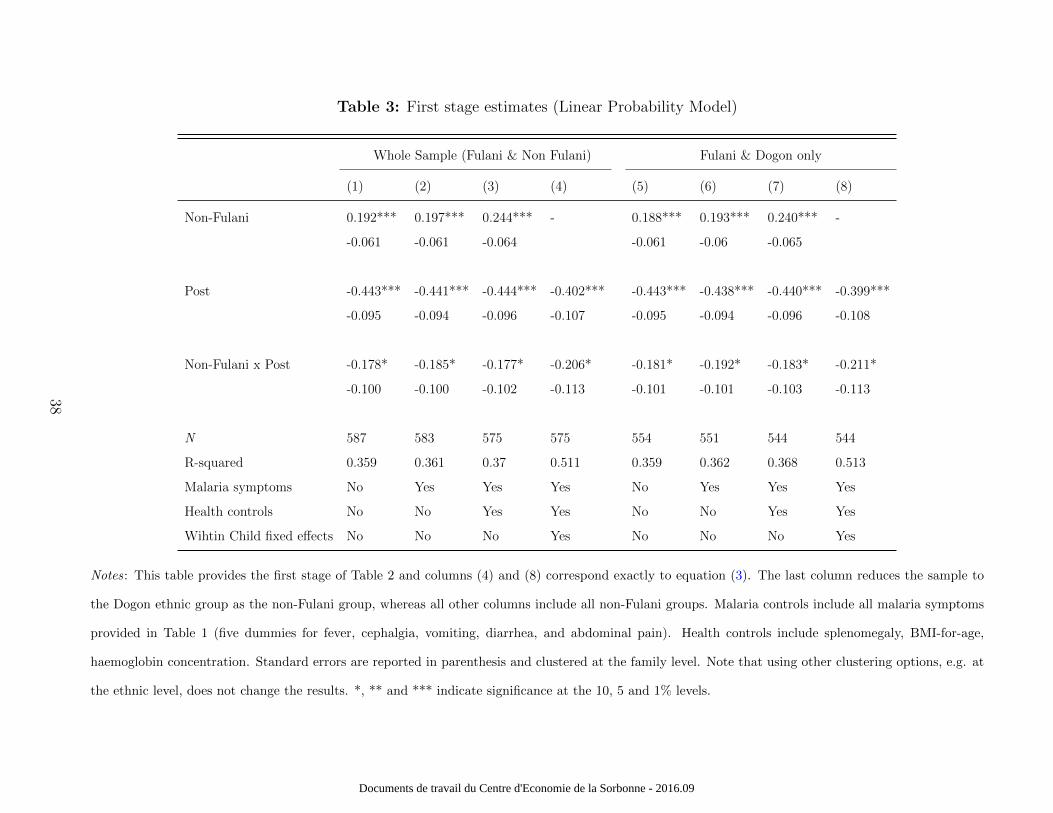
Table 3: First stage estimates (Linear Probability Model)
Whole Sample (Fulani & Non Fulani) Fulani & Dogon only
(1) (2) (3) (4) (5) (6) (7) (8)
Non-Fulani 0.192*** 0.197*** 0.244*** - 0.188*** 0.193*** 0.240*** -
-0.061 -0.061 -0.064 -0.061 -0.06 -0.065
Post -0.443*** -0.441*** -0.444*** -0.402*** -0.443*** -0.438*** -0.440*** -0.399***
-0.095 -0.094 -0.096 -0.107 -0.095 -0.094 -0.096 -0.108
Non-Fulani x Post -0.178* -0.185* -0.177* -0.206* -0.181* -0.192* -0.183* -0.211*
-0.100 -0.100 -0.102 -0.113 -0.101 -0.101 -0.103 -0.113
N 587 583 575 575 554 551 544 544
R-squared 0.359 0.361 0.37 0.511 0.359 0.362 0.368 0.513
Malaria symptoms No Yes Yes Yes No Yes Yes Yes
Health controls No No Yes Yes No No Yes Yes
Wihtin Child fixed effects No No No Yes No No No Yes
Notes: This table provides the first stage of Table 2 and columns (4) and (8) correspond exactly to equation (3). The last column reduces the sample to
the Dogon ethnic group as the non-Fulani group, whereas all other columns include all non-Fulani groups. Malaria controls include all malaria symptoms
provided in Table 1 (five dummies for fever, cephalgia, vomiting, diarrhea, and abdominal pain). Health controls include splenomegaly, BMI-for-age,
haemoglobin concentration. Standard errors are reported in parenthesis and clustered at the family level. Note that using other clustering options, e.g. at
the ethnic level, does not change the results. *, ** and *** indicate significance at the 10, 5 and 1% levels.
38
Documents de travail du Centre d'Economie de la Sorbonne - 2016.09
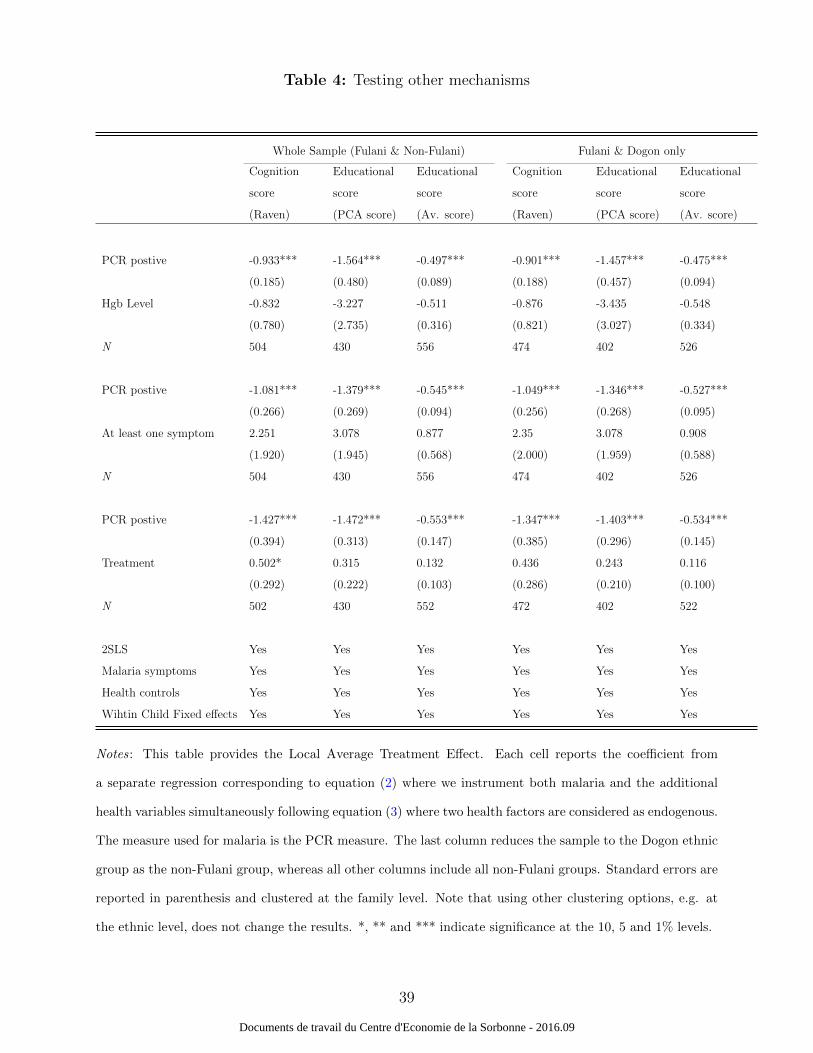
Table 4: Testing other mechanisms
Whole Sample (Fulani & Non-Fulani) Fulani & Dogon only
Cognition
score
(Raven)
Educational
score
(PCA score)
Educational
score
(Av. score)
Cognition
score
(Raven)
Educational
score
(PCA score)
Educational
score
(Av. score)
PCR postive -0.933*** -1.564*** -0.497*** -0.901*** -1.457*** -0.475***
(0.185) (0.480) (0.089) (0.188) (0.457) (0.094)
Hgb Level -0.832 -3.227 -0.511 -0.876 -3.435 -0.548
(0.780) (2.735) (0.316) (0.821) (3.027) (0.334)
N 504 430 556 474 402 526
PCR postive -1.081*** -1.379*** -0.545*** -1.049*** -1.346*** -0.527***
(0.266) (0.269) (0.094) (0.256) (0.268) (0.095)
At least one symptom 2.251 3.078 0.877 2.35 3.078 0.908
(1.920) (1.945) (0.568) (2.000) (1.959) (0.588)
N 504 430 556 474 402 526
PCR postive -1.427*** -1.472*** -0.553*** -1.347*** -1.403*** -0.534***
(0.394) (0.313) (0.147) (0.385) (0.296) (0.145)
Treatment 0.502* 0.315 0.132 0.436 0.243 0.116
(0.292) (0.222) (0.103) (0.286) (0.210) (0.100)
N 502 430 552 472 402 522
2SLS Yes Yes Yes Yes Yes Yes
Malaria symptoms Yes Yes Yes Yes Yes Yes
Health controls Yes Yes Yes Yes Yes Yes
Wihtin Child Fixed effects Yes Yes Yes Yes Yes Yes
Notes: This table provides the Local Average Treatment Effect. Each cell reports the coefficient from
a separate regression corresponding to equation (2) where we instrument both malaria and the additional
health variables simultaneously following equation (3) where two health factors are considered as endogenous.
The measure used for malaria is the PCR measure. The last column reduces the sample to the Dogon ethnic
group as the non-Fulani group, whereas all other columns include all non-Fulani groups. Standard errors are
reported in parenthesis and clustered at the family level. Note that using other clustering options, e.g. at
the ethnic level, does not change the results. *, ** and *** indicate significance at the 10, 5 and 1% levels.
39
Documents de travail du Centre d'Economie de la Sorbonne - 2016.09
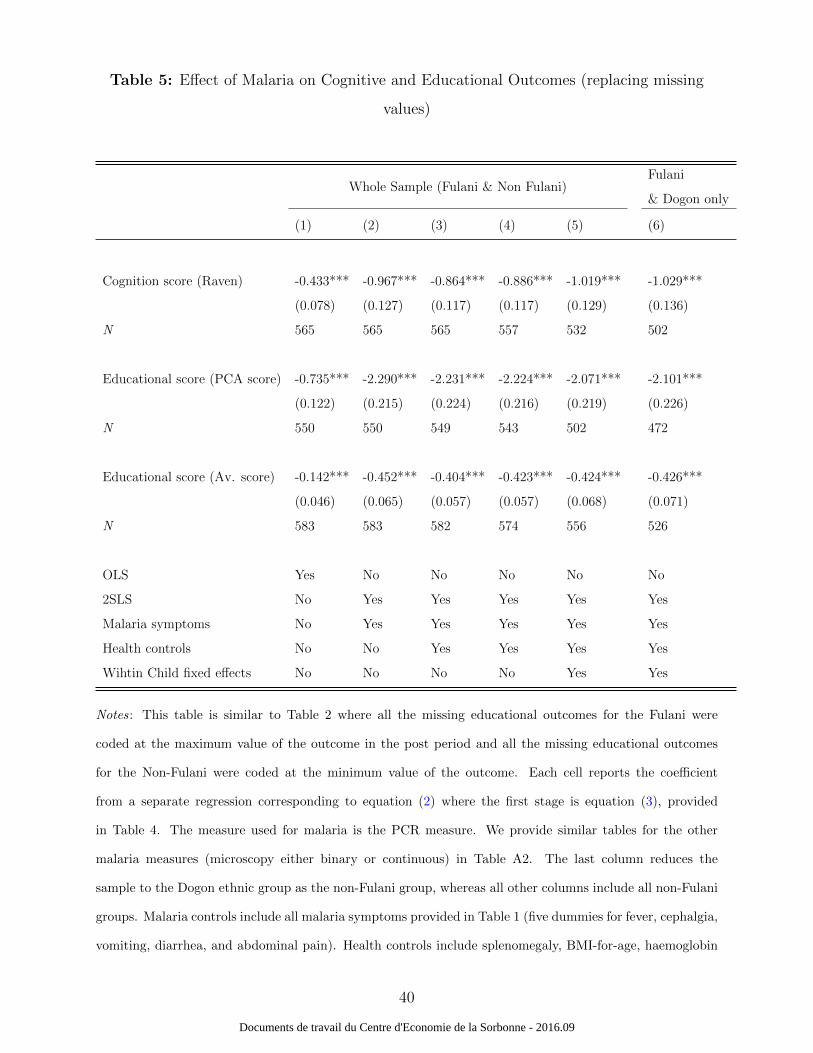
Table 5: Effect of Malaria on Cognitive and Educational Outcomes (replacing missing
values)
Whole Sample (Fulani & Non Fulani)Fulani
& Dogon only
(1) (2) (3) (4) (5) (6)
Cognition score (Raven) -0.433*** -0.967*** -0.864*** -0.886*** -1.019*** -1.029***
(0.078) (0.127) (0.117) (0.117) (0.129) (0.136)
N 565 565 565 557 532 502
Educational score (PCA score) -0.735*** -2.290*** -2.231*** -2.224*** -2.071*** -2.101***
(0.122) (0.215) (0.224) (0.216) (0.219) (0.226)
N 550 550 549 543 502 472
Educational score (Av. score) -0.142*** -0.452*** -0.404*** -0.423*** -0.424*** -0.426***
(0.046) (0.065) (0.057) (0.057) (0.068) (0.071)
N 583 583 582 574 556 526
OLS Yes No No No No No
2SLS No Yes Yes Yes Yes Yes
Malaria symptoms No Yes Yes Yes Yes Yes
Health controls No No Yes Yes Yes Yes
Wihtin Child fixed effects No No No No Yes Yes
Notes: This table is similar to Table 2 where all the missing educational outcomes for the Fulani were
coded at the maximum value of the outcome in the post period and all the missing educational outcomes
for the Non-Fulani were coded at the minimum value of the outcome. Each cell reports the coefficient
from a separate regression corresponding to equation (2) where the first stage is equation (3), provided
in Table 4. The measure used for malaria is the PCR measure. We provide similar tables for the other
malaria measures (microscopy either binary or continuous) in Table A2. The last column reduces the
sample to the Dogon ethnic group as the non-Fulani group, whereas all other columns include all non-Fulani
groups. Malaria controls include all malaria symptoms provided in Table 1 (five dummies for fever, cephalgia,
vomiting, diarrhea, and abdominal pain). Health controls include splenomegaly, BMI-for-age, haemoglobin
40
Documents de travail du Centre d'Economie de la Sorbonne - 2016.09
concentration. Standard errors are reported in parenthesis and clustered at the family level. Note that
using other clustering options, e.g. at the ethnic level, does not change the results. *, ** and *** indicate
significance at the 10, 5 and 1% levels.
41
Documents de travail du Centre d'Economie de la Sorbonne - 2016.09
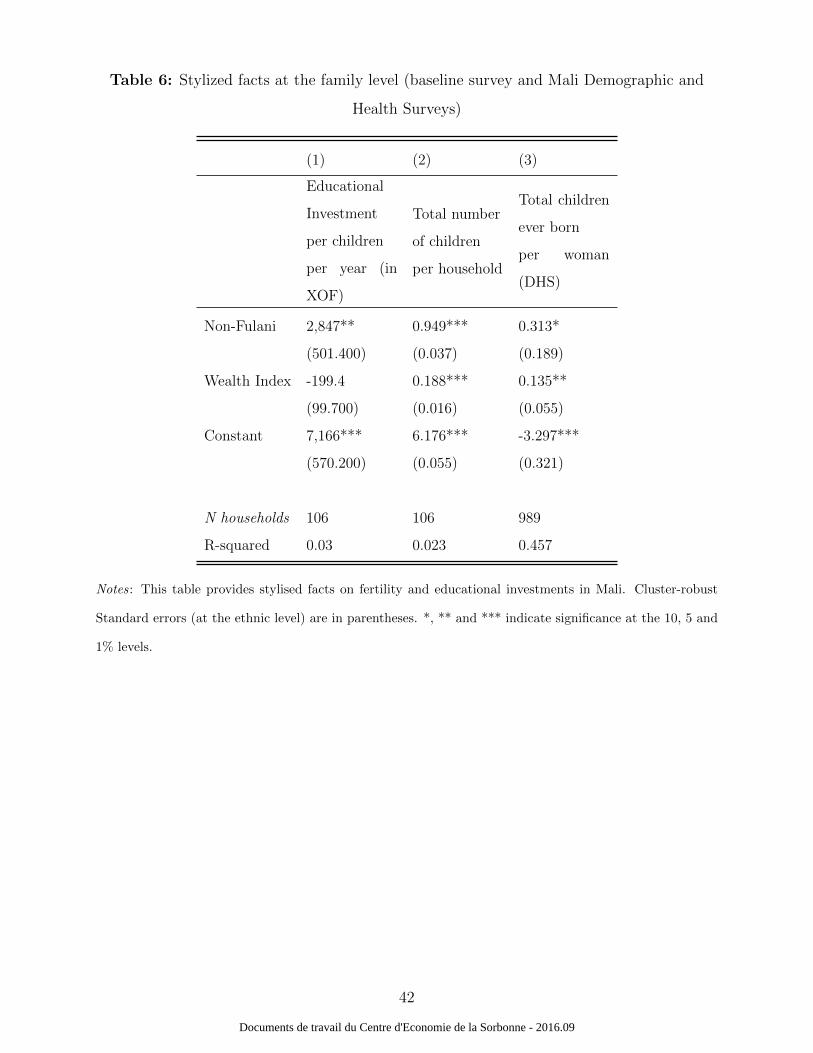
Table 6: Stylized facts at the family level (baseline survey and Mali Demographic and
Health Surveys)
(1) (2) (3)
Educational
Investment
per children
per year (in
XOF)
Total number
of children
per household
Total children
ever born
per woman
(DHS)
Non-Fulani 2,847** 0.949*** 0.313*
(501.400) (0.037) (0.189)
Wealth Index -199.4 0.188*** 0.135**
(99.700) (0.016) (0.055)
Constant 7,166*** 6.176*** -3.297***
(570.200) (0.055) (0.321)
N households 106 106 989
R-squared 0.03 0.023 0.457
Notes: This table provides stylised facts on fertility and educational investments in Mali. Cluster-robust
Standard errors (at the ethnic level) are in parentheses. *, ** and *** indicate significance at the 10, 5 and
1% levels.
42
Documents de travail du Centre d'Economie de la Sorbonne - 2016.09
6 Appendix
6.1 Appendix A: Data
6.1.1 Cognitive tests and educational outcomes
We focused on a set of outcomes that are intended to capture a child’s human capital
accumulation. These include specific tests which have already been used before in Mali.
Tests were grade-specific, but not time-specific for two main reasons. First, children get
used to the procedure quickly, and second, it is possible to account for learning progression
and achievement.
Cognitive outcomes are Raven’s Progressive Matrices test scores (Raven, 1984). Raven
matrices are available in three different forms for participants of different abilities. Only
two of them were used for the purpose of this study: Raven’s Standard Progressive Matrices
and Raven’s Coloured Progressive Matrices. Raven tests measure general mental ability
and offer information about individual capacity for analyzing and solving problems, abstract
reasoning, and the ability to learn. Colored Progressive Matrices were used for children aged
5 to 11 years old and Standard Progressive Matrices were used for older children, following
Raven’s recommendation. Results from these tests were then standardized by grade across
the two follow-ups.
Specific educational tests were developed with the team of Diankabou teachers. They
were derived from validated questions already used in other studies (Jukes et al., 2006; Thuil-
liez et al., 2010) and French models for primary educational tests: BatelemR (Savigny et al.,
2001) and Boehm3 (Boehm, 2001). They were then adapted to the village context. This
was a multi-step process. First, new questions or statements were developed, based on the
format of the original test questions. Next, the content of the assessment was modified but
the basic format remained the same. The teachers assessed the suitability of the content
to the age and grade-level programs and defined five categories: mathematics, vocabulary,
writing, reading, and visual memory. All tests were administered by the teachers in one ses-
sion lasting around 45 minutes in the school. All tests were standardized by class, but not by
cross-sectional follow-up to take into account the evolution of scores over time. A principal
component analysis was then performed on the five variables to calculate an educational
43
Documents de travail du Centre d'Economie de la Sorbonne - 2016.09
function score (Bartlett, 1937). Condensing the information contained in the original vari-
ables into one dimension is justified as the aim is not to assess the impact of malaria only on
particular skills, but on the common underlying process involved in knowing, learning, and
understanding. In addition, the validity of such an educational function score as a measure
of educational achievement in Mali has been tested in Thuilliez et al. (2010), where a high
significant correlation between the annual average standardized academic school marks and
the annual educational function score was found. However, although the educational func-
tion score seems to be a good measure of educational achievement, we also use an arithmetic
average as a robustness test20.
6.1.2 Health status
In order to detect an ongoing P. falciparum malaria infection, finger prick blood was collected
on filter papers for PCR analyses. Malaria infection is defined as a PCR positive sample
(binary variable). This technique is much more sensitive and specific than miscroscopy, as
previously noted by Anchinmane and Shedge (2011). In addition, each participant underwent
a full clinical examination. Clinical symptoms compatible with malaria are body temperature
higher than 37.5 Celsius degrees, cephalgia, vomiting, diarrhea or abdominal pain. Note that
most malaria cases were asymptomatic cases (i.e., without any symptoms; Table 1). This is
consistent with epidemiological studies (Clarke et al., 2004; Dicko et al., 2005). School-age
children are the age group most commonly infected with malaria parasites. These infections
are usually asymptomatic (without clinical symptoms), so go undetected and thus never
get treated. In this study, only acute cases of clinical illness (of any type) were treated
immediately and monitored by the medical team directly in the field21. Splenomegaly, an
enlargement of the spleen resulting from an abnormal immune response to repeated attacks
of malaria, was assessed via spleen measurement using the Hackett classification (Hackett,
1944).
The weight and height of each child was measured using an electronic scale and stadiome-
ter respectively. The age of each child was calculated in years and months using the date of
birth given by the birth certificate, according to school records and confirmed, if necessary,
20Note that the number of observations for the two academic school outcomes differ slightly because thePCA score excludes all missing values whereas the arithmetic average ignores missing values.
21Treatment against asymptomatic forms was provided to all pupils at the end of the study.
44
Documents de travail du Centre d'Economie de la Sorbonne - 2016.09
by the village census. In order to compare children of different ages by sex, the anthropo-
metric measurements were converted into Body Mass Index (BMI)-for-age z-score, using the
2000 Centre for Disease Control and Prevention growth charts. Blood was obtained by a
finger prick under aseptic conditions and the haemoglobin level was determined using a field
haemoglobin analyzer. Intestinal parasites such as hookworms, roundworms or microscopic
parasites (Hymenolepis nana, Giardia intestinalis and Ascaris lumbricoıdes were detected)
and bilharzia (urinary schistosomiasis due to Schistosoma haematobium) were detected using
WHO recommended methods22. As these procedures (collecting feces or urine) are demand-
ing for the children and families, these variables were only collected at the baseline. However,
no significant differences were found between the Fulani and the non-Fulani at the baseline
and all children were treated preventively for urinary and intestinal parasite diseases at the
end of the baseline survey23. Note that including other parasite baseline infections in the
regression analysis does not affect our results but decreases the size of the sample for the
reasons mentioned above.
22To detect a maximum number of intestinal parasite cases, three methods were used for the analysis: (i)direct analysis for detecting vegetative forms of protozoan, (ii) Kato-Katz technique (used for the detectionof helminthes eggs such as Ascaris lumbricoıdes). (iii) Ritchie method, a quantitative method that allowslow density of parasite eggs and cysts to be detected. For urinary helminthes, the test consists of detectingthe presence of Schistosoma haematobium eggs in urine. The filtration method with a Whatman filter wasused to quantify egg densities per milliliter of urine.
23At the baseline, we could not perform these tests for 49 and 57 pupils among the 296 participants (forintestinal and urinary tests respectively) due to refusals
45
Documents de travail du Centre d'Economie de la Sorbonne - 2016.09
6.2 Appendix B: Proof of propositions
Proof of Proposition 1. The first order conditions of the optimization problem can be
written as:
−u′ (w − [(e+ λ) s (p)]n) +R [pv′ (Re) + (1− p) δv′ (δRe)] = 0, (6)
− (e+ λ)u′ (w − [(e+ λ) s (p)]n) + [pv (Re) + (1− p) v (δRe)] = 0. (7)
By replacing (6) in (7), we obtain that e∗ is the solution of:
− (e+ λ)R [pv′ (Re) + (1− p) δv′ (δRe)] + [pv (Re) + (1− p) v (δRe)] = 0. (8)
We immediately conclude thatde
dw
∣∣∣∣e=e∗
= 0, (9)
which proves the first claim of the proposition. By applying the implicit function theorem
to (8), we can compute the derivative of e∗ with respect to λ and p and obtain:
de
dλ
∣∣∣∣e=e∗
=−R [pv′ (Re) + (1− p) δv′ (δRe)]
(e∗ + λ)R2 [pv′′ (Re∗) + (1− p) δ2v′′ (δRe∗)], (10)
de
dp
∣∣∣∣e=e∗
=− (e∗ + λ)R [v′ (Re∗)− δv′ (δRe∗)] + [v (Re∗)− v (δRe∗)]
(e∗ + λ)R2 [pv′′ (Re∗) + (1− p) δ2v′′ (δRe∗)]. (11)
For δ = 1, we immediately see that de∗/dp = 0. For δ > 1, we replace (6) and (7) in (11) to
obtain:de
dp
∣∣∣∣e=e∗
=(e+ λ)Rδv′ (δRe)− v (δRe)
(e+ λ) pR2 [pv′′ (Re) + (1− p) δ2v′′ (δRe)]. (12)
The sign of de∗/dp is thus the opposite of the one of
f (λ) = (e (λ) + λ)Rδv′ (δRe (λ))− v (δRe (λ)) (13)
where e (λ) denote the relationship between e∗ and λ, which is given by the implicit function
(8). We first notice that the strict concavity of v implies xv′ (x) < v (x) and, thus f (0) < 0.
46
Documents de travail du Centre d'Economie de la Sorbonne - 2016.09
Second, using (10), we obtain:
f ′ (λ) = pRδv′′ (Re) v′ (δRe)− v′ (Re) δv′′ (δRe)
[pv′′ (Re) + (1− p) δ2v′′ (δRe)]. (14)
Thus, we have for all x > 0:
f ′ (λ) ≥ 0⇔d(−xv′′(x)
v′(x)
)dx
≤ 0. (15)
We conclude that if the relative risk aversion is constant or increasing f (λ) < 0 for all
λ ≥ 0. If the relative risk aversion is decreasing, we use a continuity argument to state that
f (λ) < 0 for λ is sufficiently small.
Proof of Proposition 2. Let e∗, which is the solution of (8), be expressed as a function of
the infection rate e∗ := e (p) where e′ (p) is given by (12). Using (7), the optimal fertility is
given by:
− (e (p) + λ)u′ (w − [(e (p) + λ) s (p)]n) + [pv (Re (p)) + (1− p) v (δRe (p))] = 0. (16)
By applying the implicit function theorem, we compute:
dn∗
dw=
1
(e (p) + λ) s (p)> 0, (17)
which proves the first claim of the proposition. Similarly, we have:
dn∗
dp=v (δRe (p))− v (Re (p))
(e (p) + λ)2 s (p)u′′ (.)− e′ (p) n
(e (p) + λ)− s′ (p) n
s (p). (18)
Using the fact that de∗/dp = 0 if δ = 1 (that has been proved in the proof of Proposition 1),
we obtain thatdn∗
dp
∣∣∣∣δ=1
= −s′ (p) n
s (p)> 0, (19)
and we conclude by continuity.
47
Documents de travail du Centre d'Economie de la Sorbonne - 2016.09
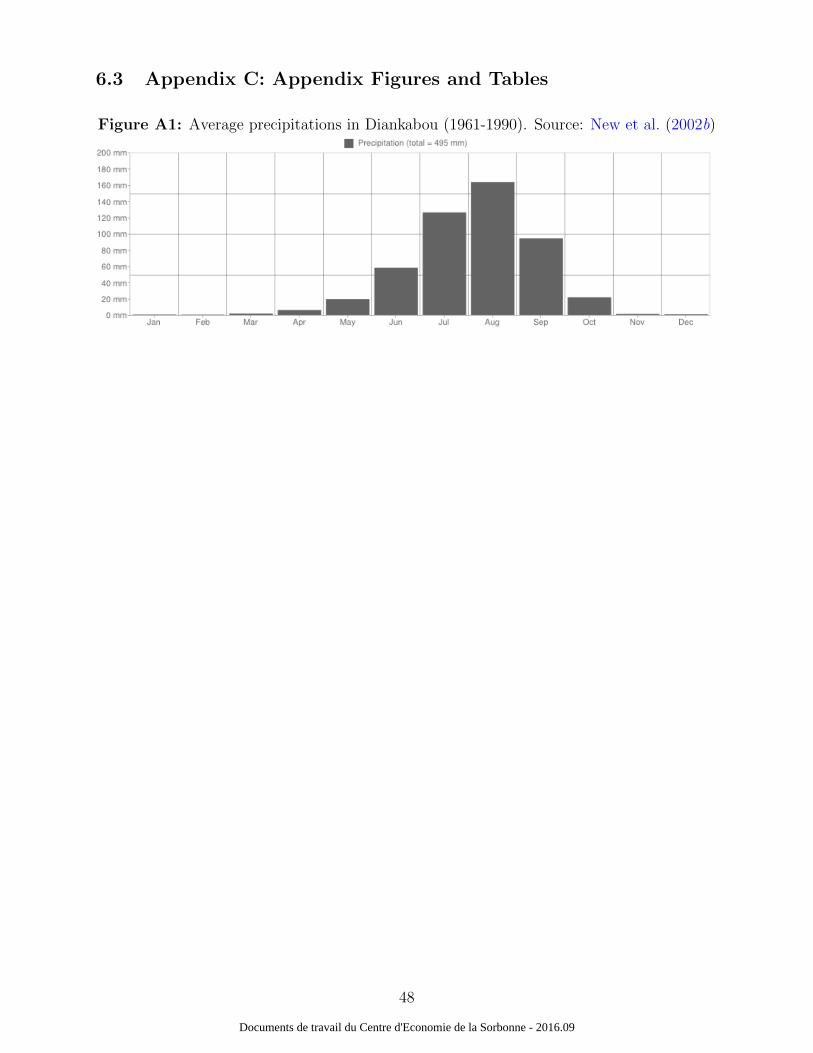
6.3 Appendix C: Appendix Figures and Tables
Figure A1: Average precipitations in Diankabou (1961-1990). Source: New et al. (2002b)
48
Documents de travail du Centre d'Economie de la Sorbonne - 2016.09
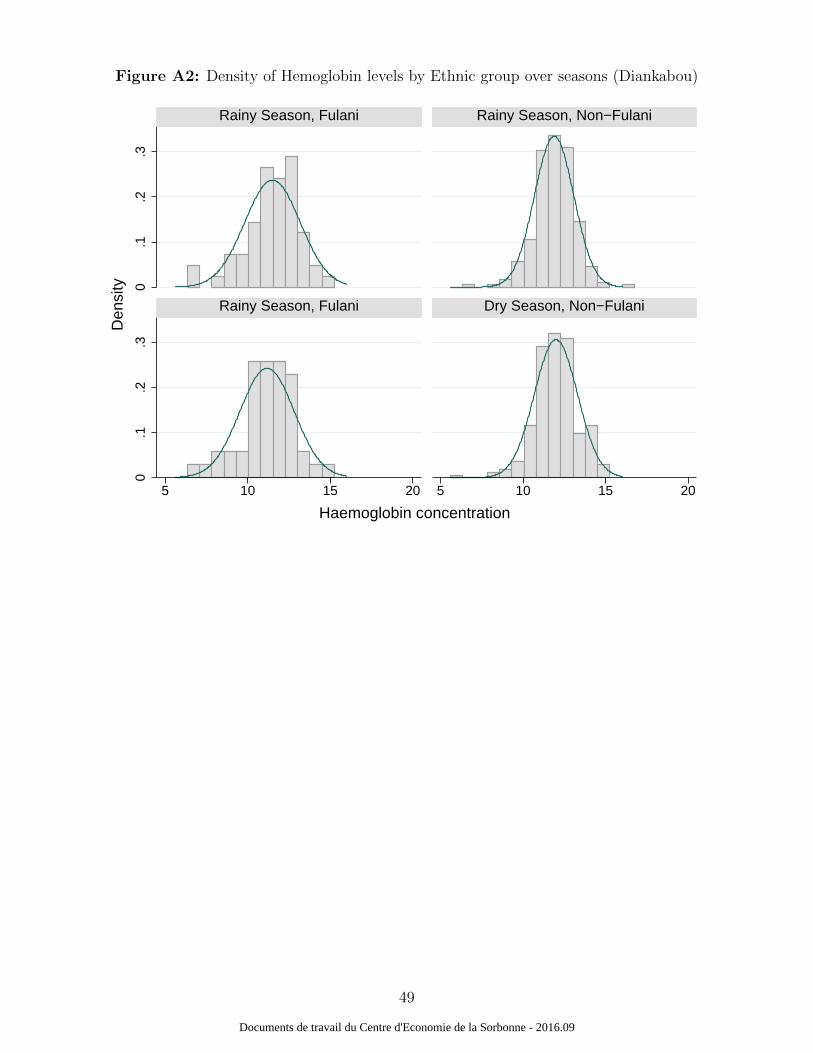
Figure A2: Density of Hemoglobin levels by Ethnic group over seasons (Diankabou)
0.1
.2.3
0.1
.2.3
5 10 15 20 5 10 15 20
Rainy Season, Fulani Rainy Season, Non−Fulani
Rainy Season, Fulani Dry Season, Non−Fulani
Den
sity
Haemoglobin concentration
49
Documents de travail du Centre d'Economie de la Sorbonne - 2016.09
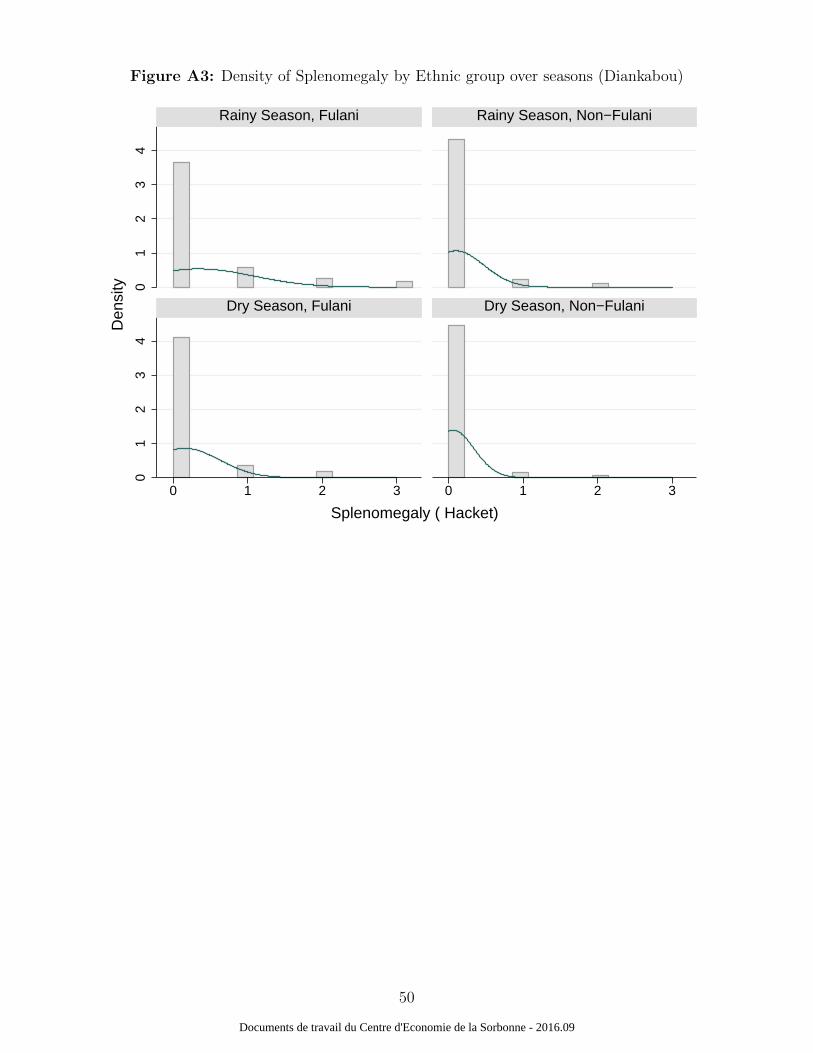
Figure A3: Density of Splenomegaly by Ethnic group over seasons (Diankabou)
01
23
40
12
34
0 1 2 3 0 1 2 3
Rainy Season, Fulani Rainy Season, Non−Fulani
Dry Season, Fulani Dry Season, Non−Fulani
Den
sity
Splenomegaly ( Hacket)
50
Documents de travail du Centre d'Economie de la Sorbonne - 2016.09
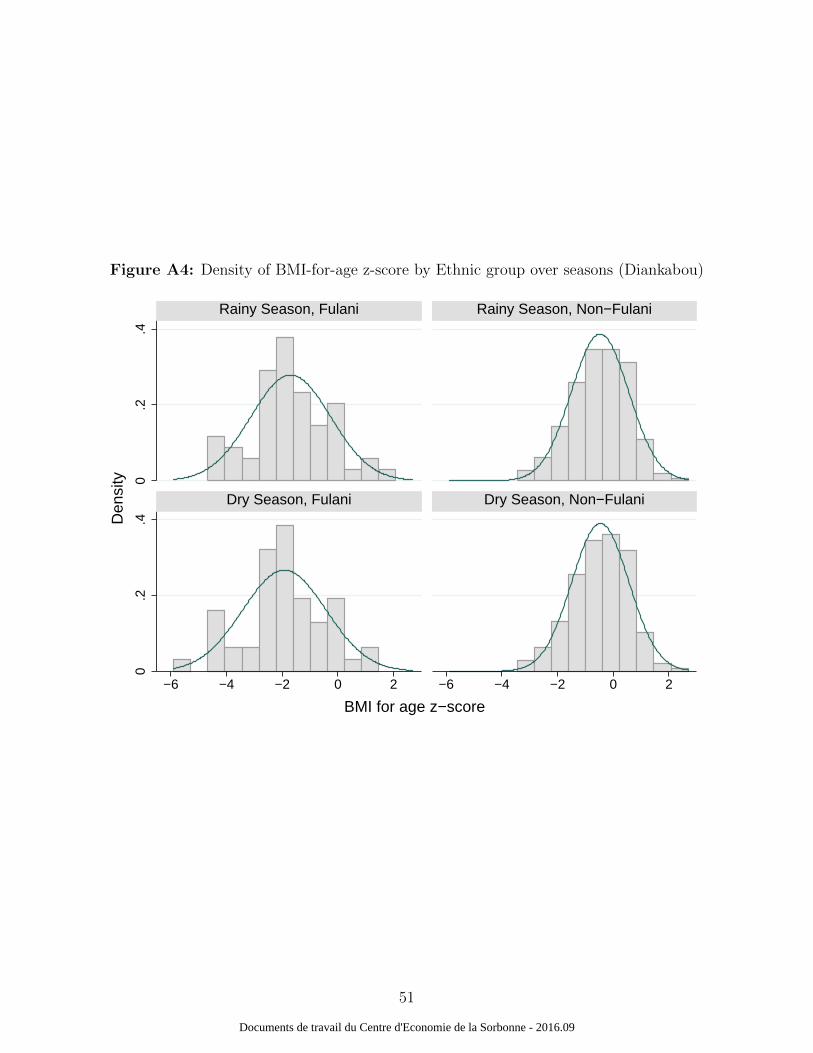
Figure A4: Density of BMI-for-age z-score by Ethnic group over seasons (Diankabou)
0.2
.40
.2.4
−6 −4 −2 0 2 −6 −4 −2 0 2
Rainy Season, Fulani Rainy Season, Non−Fulani
Dry Season, Fulani Dry Season, Non−Fulani
Den
sity
BMI for age z−score
51
Documents de travail du Centre d'Economie de la Sorbonne - 2016.09
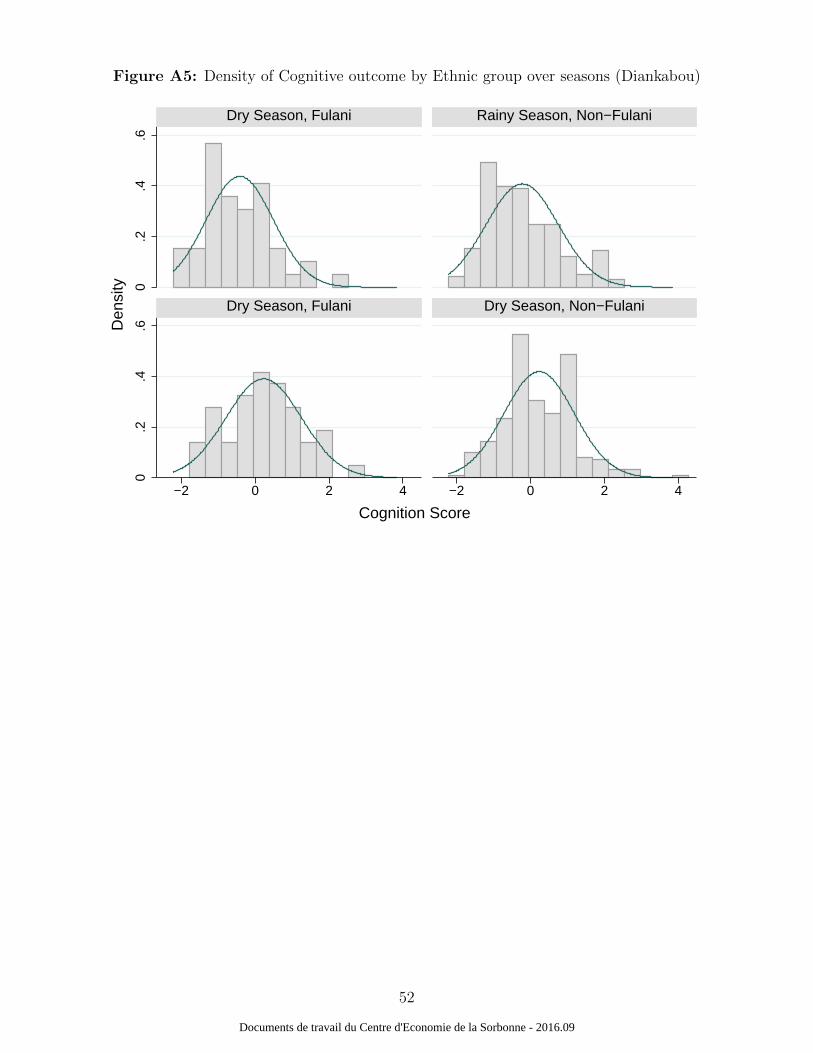
Figure A5: Density of Cognitive outcome by Ethnic group over seasons (Diankabou)
0.2
.4.6
0.2
.4.6
−2 0 2 4 −2 0 2 4
Dry Season, Fulani Rainy Season, Non−Fulani
Dry Season, Fulani Dry Season, Non−Fulani
Den
sity
Cognition Score
52
Documents de travail du Centre d'Economie de la Sorbonne - 2016.09
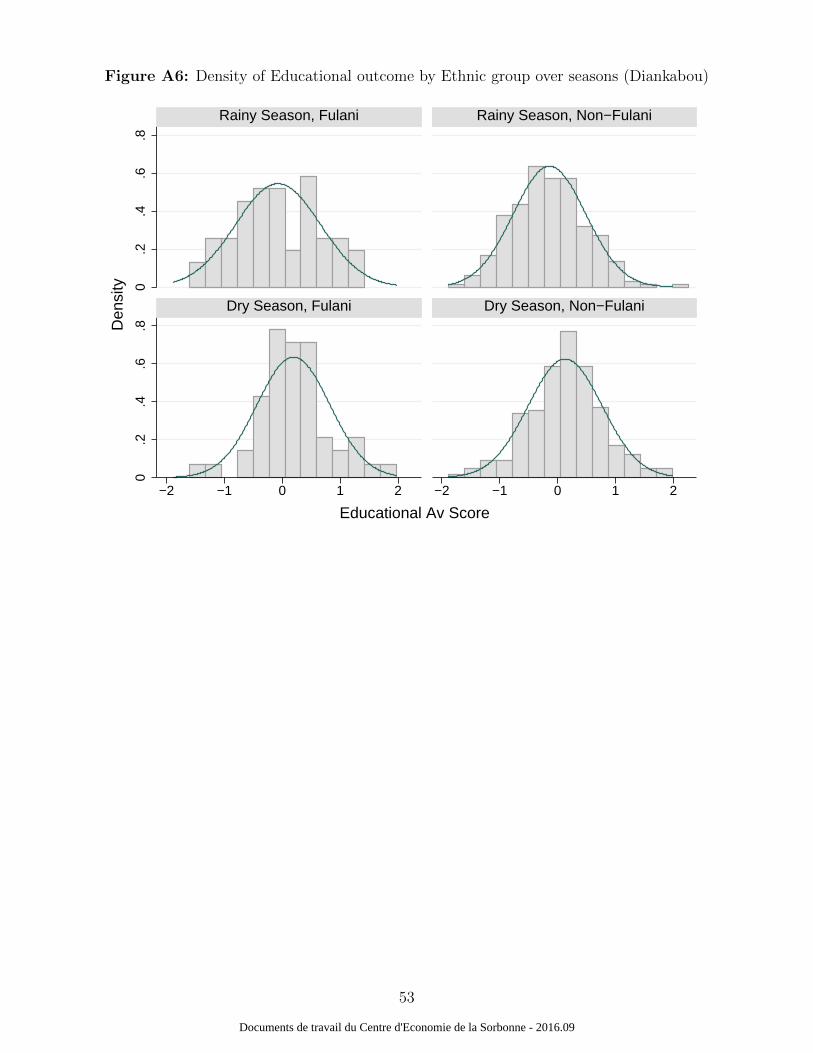
Figure A6: Density of Educational outcome by Ethnic group over seasons (Diankabou)
0.2
.4.6
.80
.2.4
.6.8
−2 −1 0 1 2 −2 −1 0 1 2
Rainy Season, Fulani Rainy Season, Non−Fulani
Dry Season, Fulani Dry Season, Non−Fulani
Den
sity
Educational Av Score
53
Documents de travail du Centre d'Economie de la Sorbonne - 2016.09
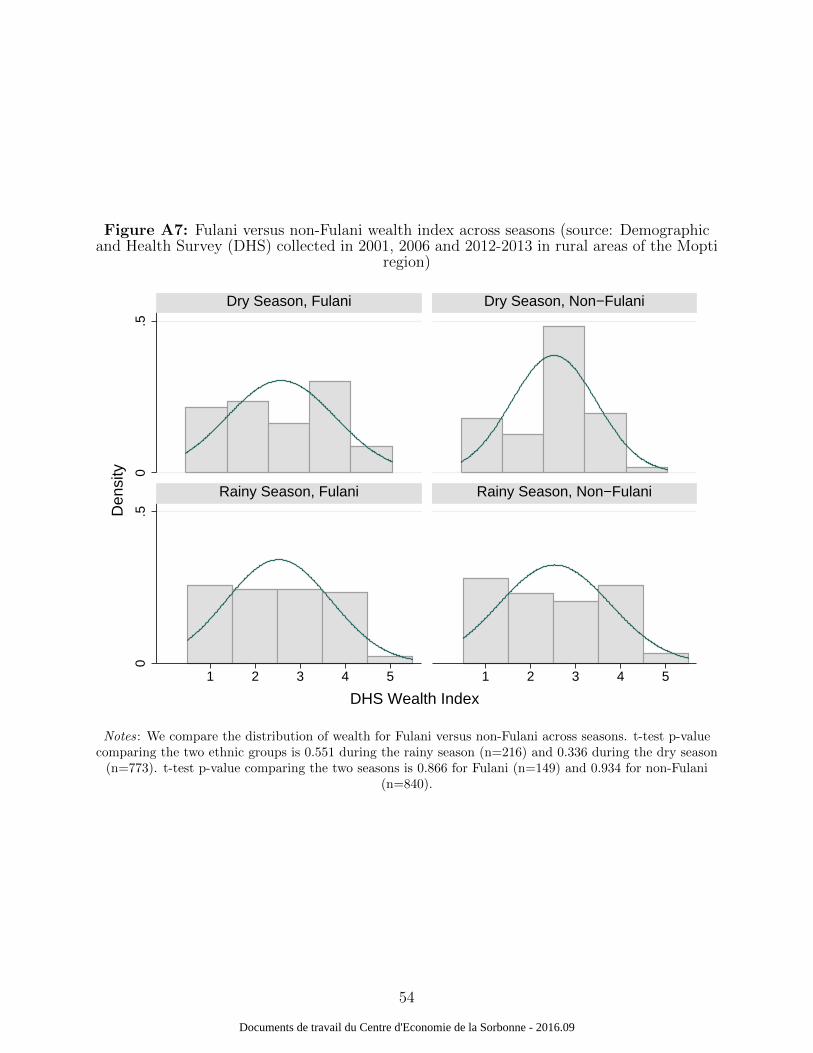
Figure A7: Fulani versus non-Fulani wealth index across seasons (source: Demographicand Health Survey (DHS) collected in 2001, 2006 and 2012-2013 in rural areas of the Mopti
region)
0.5
0.5
1 2 3 4 5 1 2 3 4 5
Dry Season, Fulani Dry Season, Non−Fulani
Rainy Season, Fulani Rainy Season, Non−Fulani
Den
sity
DHS Wealth Index
Notes: We compare the distribution of wealth for Fulani versus non-Fulani across seasons. t-test p-valuecomparing the two ethnic groups is 0.551 during the rainy season (n=216) and 0.336 during the dry season
(n=773). t-test p-value comparing the two seasons is 0.866 for Fulani (n=149) and 0.934 for non-Fulani(n=840).
54
Documents de travail du Centre d'Economie de la Sorbonne - 2016.09
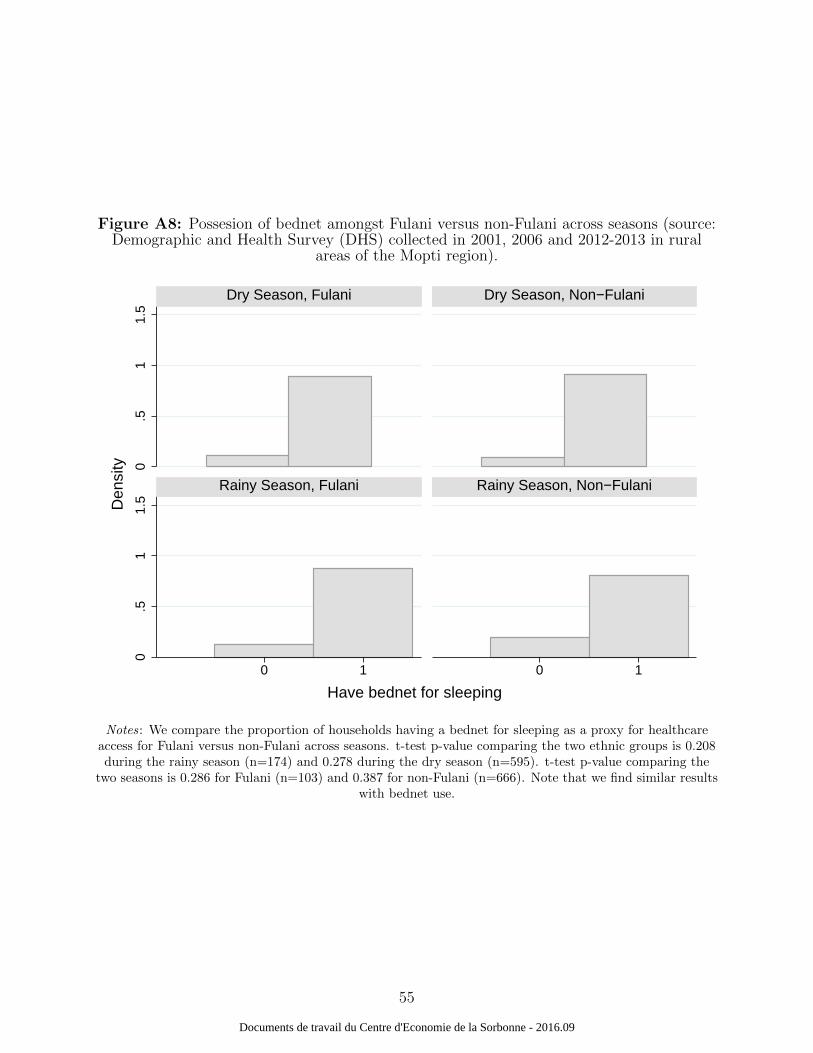
Figure A8: Possesion of bednet amongst Fulani versus non-Fulani across seasons (source:Demographic and Health Survey (DHS) collected in 2001, 2006 and 2012-2013 in rural
areas of the Mopti region).
0.5
11.
50
.51
1.5
0 1 0 1
Dry Season, Fulani Dry Season, Non−Fulani
Rainy Season, Fulani Rainy Season, Non−Fulani
Den
sity
Have bednet for sleeping
Notes: We compare the proportion of households having a bednet for sleeping as a proxy for healthcareaccess for Fulani versus non-Fulani across seasons. t-test p-value comparing the two ethnic groups is 0.208during the rainy season (n=174) and 0.278 during the dry season (n=595). t-test p-value comparing the
two seasons is 0.286 for Fulani (n=103) and 0.387 for non-Fulani (n=666). Note that we find similar resultswith bednet use.
55
Documents de travail du Centre d'Economie de la Sorbonne - 2016.09
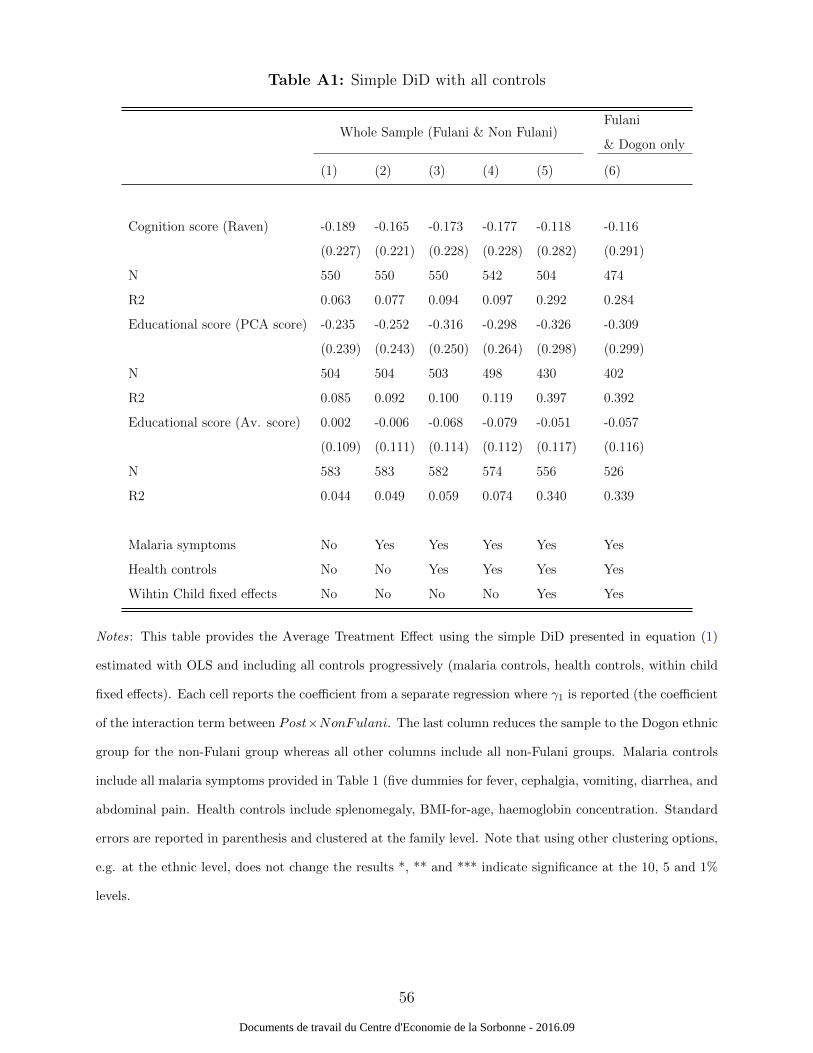
Table A1: Simple DiD with all controls
Whole Sample (Fulani & Non Fulani)Fulani
& Dogon only
(1) (2) (3) (4) (5) (6)
Cognition score (Raven) -0.189 -0.165 -0.173 -0.177 -0.118 -0.116
(0.227) (0.221) (0.228) (0.228) (0.282) (0.291)
N 550 550 550 542 504 474
R2 0.063 0.077 0.094 0.097 0.292 0.284
Educational score (PCA score) -0.235 -0.252 -0.316 -0.298 -0.326 -0.309
(0.239) (0.243) (0.250) (0.264) (0.298) (0.299)
N 504 504 503 498 430 402
R2 0.085 0.092 0.100 0.119 0.397 0.392
Educational score (Av. score) 0.002 -0.006 -0.068 -0.079 -0.051 -0.057
(0.109) (0.111) (0.114) (0.112) (0.117) (0.116)
N 583 583 582 574 556 526
R2 0.044 0.049 0.059 0.074 0.340 0.339
Malaria symptoms No Yes Yes Yes Yes Yes
Health controls No No Yes Yes Yes Yes
Wihtin Child fixed effects No No No No Yes Yes
Notes: This table provides the Average Treatment Effect using the simple DiD presented in equation (1)
estimated with OLS and including all controls progressively (malaria controls, health controls, within child
fixed effects). Each cell reports the coefficient from a separate regression where γ1 is reported (the coefficient
of the interaction term between Post×NonFulani. The last column reduces the sample to the Dogon ethnic
group for the non-Fulani group whereas all other columns include all non-Fulani groups. Malaria controls
include all malaria symptoms provided in Table 1 (five dummies for fever, cephalgia, vomiting, diarrhea, and
abdominal pain. Health controls include splenomegaly, BMI-for-age, haemoglobin concentration. Standard
errors are reported in parenthesis and clustered at the family level. Note that using other clustering options,
e.g. at the ethnic level, does not change the results *, ** and *** indicate significance at the 10, 5 and 1%
levels.
56
Documents de travail du Centre d'Economie de la Sorbonne - 2016.09
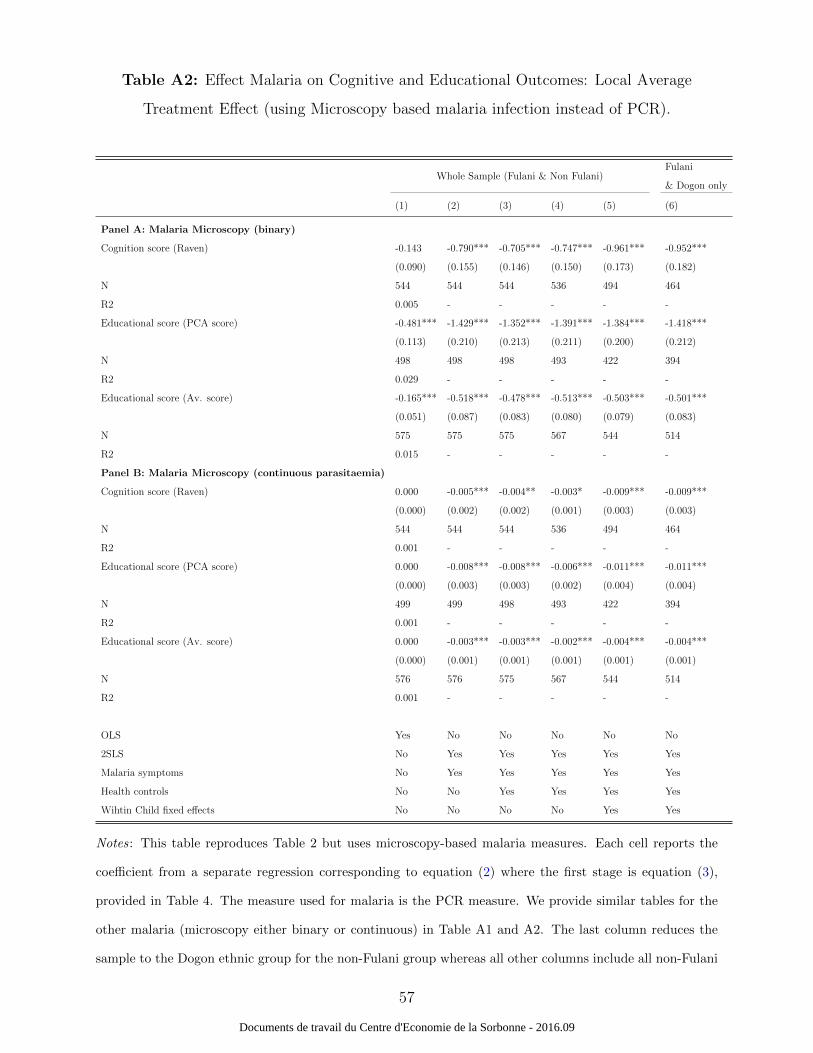
Table A2: Effect Malaria on Cognitive and Educational Outcomes: Local Average
Treatment Effect (using Microscopy based malaria infection instead of PCR).
Whole Sample (Fulani & Non Fulani)Fulani
& Dogon only
(1) (2) (3) (4) (5) (6)
Panel A: Malaria Microscopy (binary)
Cognition score (Raven) -0.143 -0.790*** -0.705*** -0.747*** -0.961*** -0.952***
(0.090) (0.155) (0.146) (0.150) (0.173) (0.182)
N 544 544 544 536 494 464
R2 0.005 - - - - -
Educational score (PCA score) -0.481*** -1.429*** -1.352*** -1.391*** -1.384*** -1.418***
(0.113) (0.210) (0.213) (0.211) (0.200) (0.212)
N 498 498 498 493 422 394
R2 0.029 - - - - -
Educational score (Av. score) -0.165*** -0.518*** -0.478*** -0.513*** -0.503*** -0.501***
(0.051) (0.087) (0.083) (0.080) (0.079) (0.083)
N 575 575 575 567 544 514
R2 0.015 - - - - -
Panel B: Malaria Microscopy (continuous parasitaemia)
Cognition score (Raven) 0.000 -0.005*** -0.004** -0.003* -0.009*** -0.009***
(0.000) (0.002) (0.002) (0.001) (0.003) (0.003)
N 544 544 544 536 494 464
R2 0.001 - - - - -
Educational score (PCA score) 0.000 -0.008*** -0.008*** -0.006*** -0.011*** -0.011***
(0.000) (0.003) (0.003) (0.002) (0.004) (0.004)
N 499 499 498 493 422 394
R2 0.001 - - - - -
Educational score (Av. score) 0.000 -0.003*** -0.003*** -0.002*** -0.004*** -0.004***
(0.000) (0.001) (0.001) (0.001) (0.001) (0.001)
N 576 576 575 567 544 514
R2 0.001 - - - - -
OLS Yes No No No No No
2SLS No Yes Yes Yes Yes Yes
Malaria symptoms No Yes Yes Yes Yes Yes
Health controls No No Yes Yes Yes Yes
Wihtin Child fixed effects No No No No Yes Yes
Notes: This table reproduces Table 2 but uses microscopy-based malaria measures. Each cell reports the
coefficient from a separate regression corresponding to equation (2) where the first stage is equation (3),
provided in Table 4. The measure used for malaria is the PCR measure. We provide similar tables for the
other malaria (microscopy either binary or continuous) in Table A1 and A2. The last column reduces the
sample to the Dogon ethnic group for the non-Fulani group whereas all other columns include all non-Fulani
57
Documents de travail du Centre d'Economie de la Sorbonne - 2016.09
groups. Malaria controls include all malaria symptoms provided in Table 1 (five dummies for fever, cephalgia,
vomiting, diarrhea, and abdominal pain. Health controls include splenomegaly, BMI-for-age, haemoglobin
concentration. Standard errors are reported in parenthesis and clustered at the family level. Note that
using other clustering options, e.g. at the ethnic level, does not change the results. *, ** and *** indicate
significance at the 10, 5 and 1% levels.
58
Documents de travail du Centre d'Economie de la Sorbonne - 2016.09
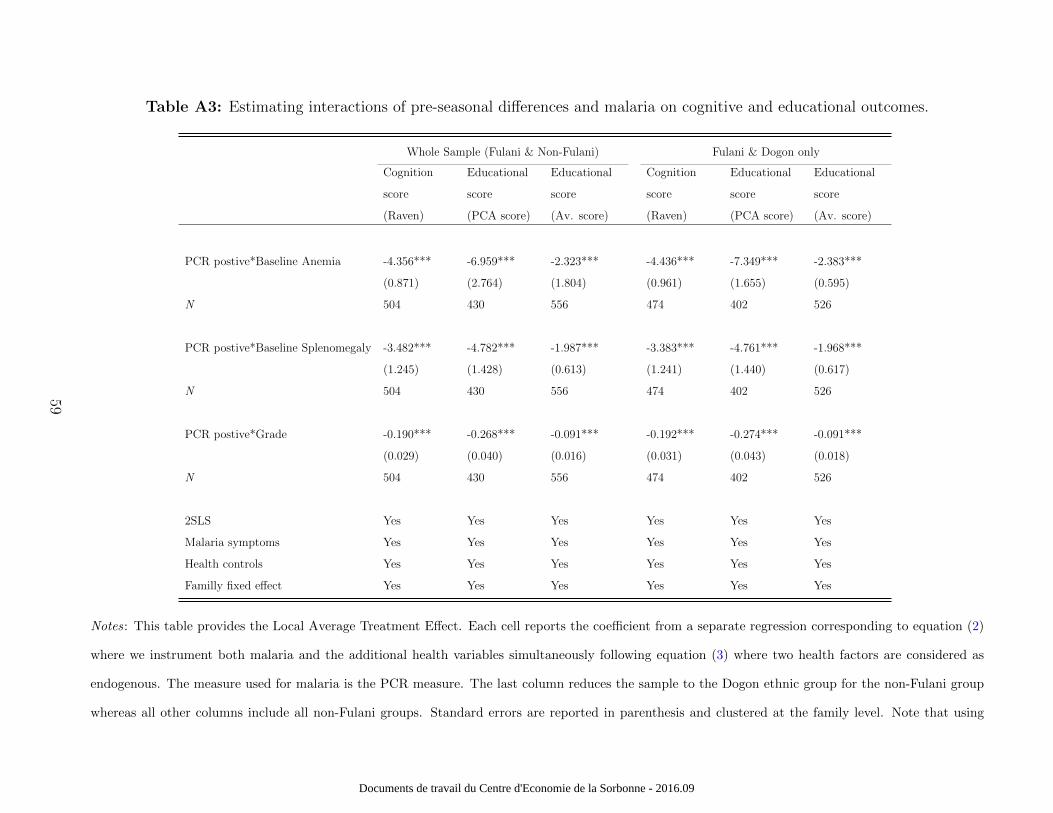
Table A3: Estimating interactions of pre-seasonal differences and malaria on cognitive and educational outcomes.
Whole Sample (Fulani & Non-Fulani) Fulani & Dogon only
Cognition
score
(Raven)
Educational
score
(PCA score)
Educational
score
(Av. score)
Cognition
score
(Raven)
Educational
score
(PCA score)
Educational
score
(Av. score)
PCR postive*Baseline Anemia -4.356*** -6.959*** -2.323*** -4.436*** -7.349*** -2.383***
(0.871) (2.764) (1.804) (0.961) (1.655) (0.595)
N 504 430 556 474 402 526
PCR postive*Baseline Splenomegaly -3.482*** -4.782*** -1.987*** -3.383*** -4.761*** -1.968***
(1.245) (1.428) (0.613) (1.241) (1.440) (0.617)
N 504 430 556 474 402 526
PCR postive*Grade -0.190*** -0.268*** -0.091*** -0.192*** -0.274*** -0.091***
(0.029) (0.040) (0.016) (0.031) (0.043) (0.018)
N 504 430 556 474 402 526
2SLS Yes Yes Yes Yes Yes Yes
Malaria symptoms Yes Yes Yes Yes Yes Yes
Health controls Yes Yes Yes Yes Yes Yes
Familly fixed effect Yes Yes Yes Yes Yes Yes
Notes: This table provides the Local Average Treatment Effect. Each cell reports the coefficient from a separate regression corresponding to equation (2)
where we instrument both malaria and the additional health variables simultaneously following equation (3) where two health factors are considered as
endogenous. The measure used for malaria is the PCR measure. The last column reduces the sample to the Dogon ethnic group for the non-Fulani group
whereas all other columns include all non-Fulani groups. Standard errors are reported in parenthesis and clustered at the family level. Note that using
59
Documents de travail du Centre d'Economie de la Sorbonne - 2016.09
other clustering options, e.g. at the ethnic level, does not change the results *, ** and *** indicate significance at the 10, 5 and 1% levels.
60
Documents de travail du Centre d'Economie de la Sorbonne - 2016.09
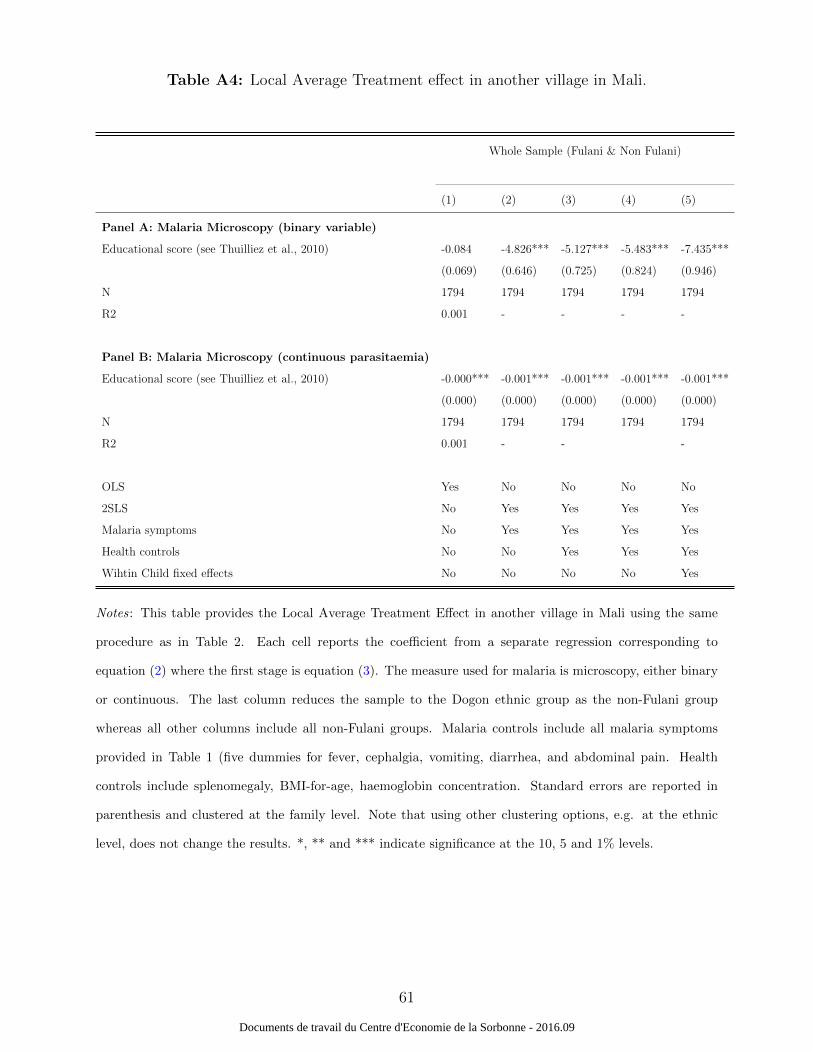
Table A4: Local Average Treatment effect in another village in Mali.
Whole Sample (Fulani & Non Fulani)
(1) (2) (3) (4) (5)
Panel A: Malaria Microscopy (binary variable)
Educational score (see Thuilliez et al., 2010) -0.084 -4.826*** -5.127*** -5.483*** -7.435***
(0.069) (0.646) (0.725) (0.824) (0.946)
N 1794 1794 1794 1794 1794
R2 0.001 - - - -
Panel B: Malaria Microscopy (continuous parasitaemia)
Educational score (see Thuilliez et al., 2010) -0.000*** -0.001*** -0.001*** -0.001*** -0.001***
(0.000) (0.000) (0.000) (0.000) (0.000)
N 1794 1794 1794 1794 1794
R2 0.001 - - -
OLS Yes No No No No
2SLS No Yes Yes Yes Yes
Malaria symptoms No Yes Yes Yes Yes
Health controls No No Yes Yes Yes
Wihtin Child fixed effects No No No No Yes
Notes: This table provides the Local Average Treatment Effect in another village in Mali using the same
procedure as in Table 2. Each cell reports the coefficient from a separate regression corresponding to
equation (2) where the first stage is equation (3). The measure used for malaria is microscopy, either binary
or continuous. The last column reduces the sample to the Dogon ethnic group as the non-Fulani group
whereas all other columns include all non-Fulani groups. Malaria controls include all malaria symptoms
provided in Table 1 (five dummies for fever, cephalgia, vomiting, diarrhea, and abdominal pain. Health
controls include splenomegaly, BMI-for-age, haemoglobin concentration. Standard errors are reported in
parenthesis and clustered at the family level. Note that using other clustering options, e.g. at the ethnic
level, does not change the results. *, ** and *** indicate significance at the 10, 5 and 1% levels.
61
Documents de travail du Centre d'Economie de la Sorbonne - 2016.09


