Embed Size (px)
Citation preview
Tectonophysics, 90 (1982) 77-90 77
Elsevier Scientific Publishing Company, Amsterdam - Printed in The Netherlands
MAGNETOTELLURIC AND AUDIOMAGNETOTELLURIC
MEASUREMENTS IN FINLAND
A. ADAM ‘, P. KAIKKONEN *, SE. HJELT *, K. PAJUNP~~ *, L. SZARKA ‘,
J. VER6 ’ and A. WALLNER ’
Geodetical and Geophysical Research Institute of the Hungarian Academy of Sciences, P.O. Box 5, H-9401
Sopron (Hungary]
’ Department of Geophysics, University of Oulu, SF-90570 Oulu 57 (Finland)
(Final version received December 29, 1981)
ABSTRACT
Ad&n. A., Kaikkonen, P., Hjelt, SE., Pajunpti, K., Szarka, L., Verii, J. and Wallner, A., 1982.
Magnetotelluric and audiomagnetote~luric measurements in Finland. In: E.S. Husebye (Editor), The
Structure of the Lithosphere-Asthenosphere in Europe and the North Atlantic. Tectonophysics. 90: 77-90.
Joint Finnish-Hungarian MT (magnetotelluric) and AMT (audiomagnetotelluric) measurements
were carried out in Finland in the framework of the international ELAS project. The conditions for MT
measurements are favorable at these latitudes. Five MT and 150 AMT stations gave information on the
electrical conductivity distribution in the area: AMT results guided the choice of MT sites with minimal
near-surface distortion effects and helped the interpretation of the MT soundings; the MT measurements
indicate the presence of large conductivity anomalies and can be best interpreted as lateral induction
effects of near-surface dyke structures. This result is confirmed by a certain correspondence between the
directions of the maximum impedances and of the tectonic zones of the area.
Any information about the upper mantle would require the use of Sg harmonics because of the crustal
conductivity anomalies detected by the MT measurements.
INTRODUCTION
The Department of Geophysics, University of Oulu and the Geodetic and
Geophysical Research Institute of the Hungarian Academy of Sciences in Sopron
have cooperated since 1973 for the adaptation and the application of the magnetotel-
luric (MT) method in Finland.
Following the introduction of the audio-frequency magnetotelluric method (AMT)
in Finland in 1974 (Benderitter et al., 1978), a demand has arisen to extend the
period range in order to study deeper geological formations. This is motivated by the
following reasons:
(a) Finland belongs geologically to the crystalline Baltic shield area. The shield
0 1982 Elsevier Scientific Publishing Company
78
very often contains extremely well-conducting metallic or graphitic schists embedded
in crystalline formations having resistivities of several lo4 Qm. To trace the
conductors to greater depths, or to study the crustal structure underneath them,
electromagnetic variations with frequencies less than ELF have to be studied. The
lowest frequency used by the AMT instrument ECA 541-O is 8 Hz.
(b) The interest in the physical properties of the Earth’s crust and upper mantle is
increasing. A number of international projects ensure the framework of these
studies. The International Association of Geomagnetism and Aeronomy (IAGA)
started its ELAS project (Electrical Conductivity of the Asthenosphere) in Seattle in
1977 to study the electrical conductivity of the asthenosphere. Finland is also
participating in this project. Electric properties of the lithosphere, and of the
underlying asthenosphere cannot be measured in the Baltic Shield using ELF above
8 Hz.
This paper describes Finnish-Hungarian experimental MT/AMT investigations
carried out in Finland during the summer 1980.
GEOLOGICAL AND GEOPHYSICAL BACKGROUND
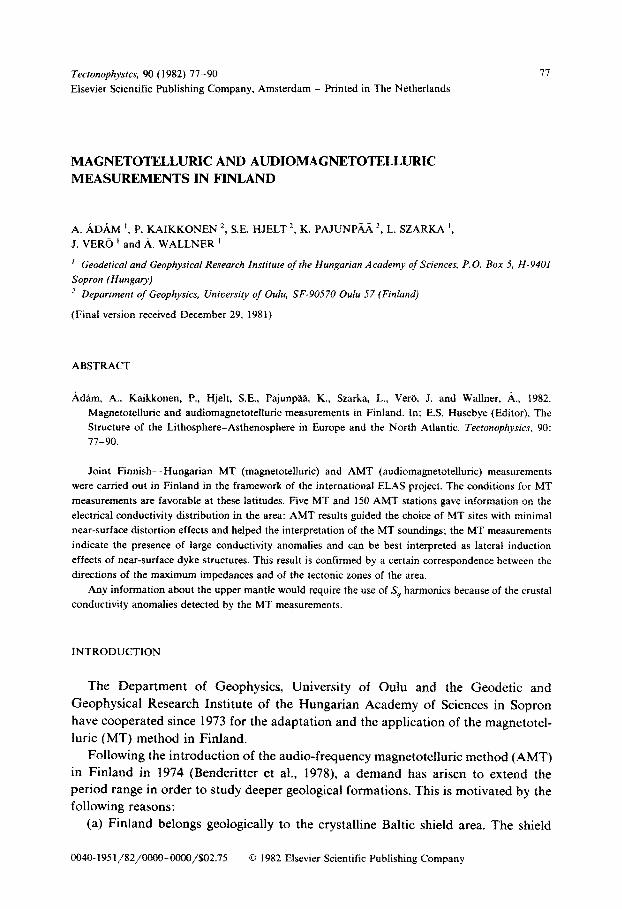
Two main points were decisive when choosing the measuring sites (Fig. 1):
(1) For some of the measuring points, geologically homogeneous sites were looked
for and especially it was tried to avoid metallic conducting rocks such as graphite,
pyrite and pyrrhotite. The site MT1 on the 1800-1900 Ma old Svecokarelidic block
and sites MT2 and MT3 on the 2600-2800 Ma old Presvecokarelidic basement,
belong to this “normal” group of the measuring points, from which information
about the deep structures was expected.
(2) The measurements MT4 and MT5 were made on a major tectonic zone, the
Lake Ladoga-Bothnian Bay zone, which was expected to be indicated by MT
soundings. The zone contains a great part of the known sulfide ores in Finland.
Rokityansky et al. (1979) had found conducting embeddings on the continuation of
this zone in the environment of Lake Ladoga.
Zhamaletdinov (1976) found, from geoelectric investigations of the deep structure
of the Kola-peninsula, a well-conducting anomaly which inferred a conducting layer
at a depth of lo-20 km. The anomaly is not connected to one single conductive
layer, but to several zones of immense dimensions, being structurally more or less
independent from each other. The significance of the distorting effect of such a
structure had not been so far properly considered for the “normal” areas.
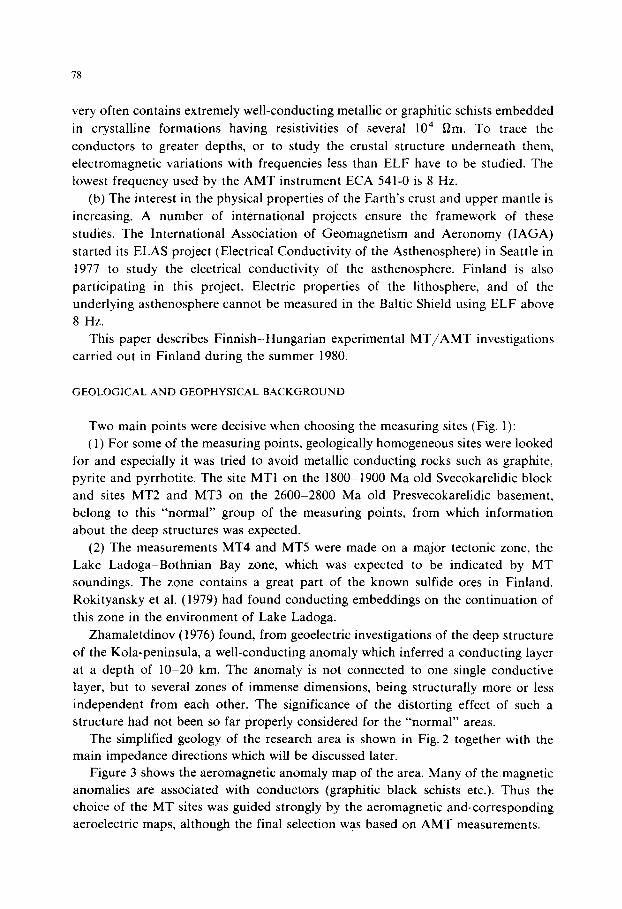
The simplified geology of the research area is shown in Fig. 2 together with the
main impedance directions which will be discussed later.
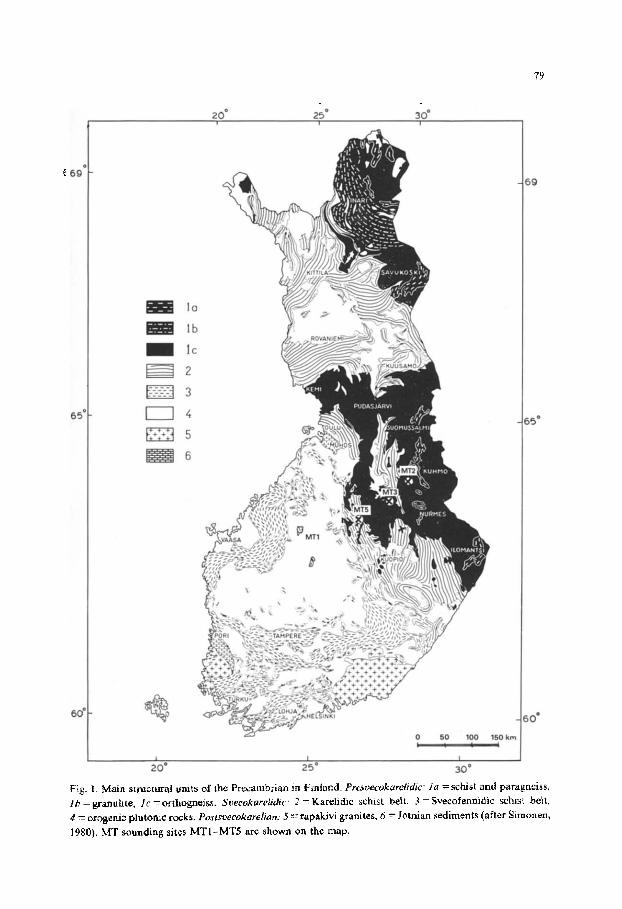
Figure 3 shows the aeromagnetic anomaly map of the area. Many of the.magnetic
anomalies are associated with conductors (graphitic black schists etc.). Thus the
choice of the MT sites was guided strongly by the aeromagnetic and.corresponding
aeroelectric maps, although the final selection was based on AMT measurements.
79
69
6’
lb
IC
2
3
4
5
6
-6O*
150 km -4 !
8 I I
20’ 25” 30’
Fig. 1. Main structural units of the Precambrian in Firdand. Preswcakareiidic: ia = schist and paragneiss.
Ib =granulite, Ic =orthogneiss. Suecokawitdic: I* -- 7 - Karefidic schist belt. 3 = Svecofennidic schist belt,
4 - erogenic plutotuc rocks. Pasfsuecdr~lrelian; 5 y rapakivi granites, 6 = Jotnian sediments (after Simonen,
1980). MT sounding sites MTI-MT5 are shown on the map.
0 IO
N
W 49
E 2x’ max (TI
S
6980.
Fig. 2. Simplified geology of the research area and the directions of the maximum values of Z,,, (T) at the
measuring sites MTl-MT5. The black area indicates the variation of direction over the period range.
GEOLOGINEN TUTKIMUSLAITOS
AEROMAGNEETTINEN KARTTA
Fig. 3. The aeromagnetic anomaly map of the research area. Measurement sites MTI-MTS.
81
INSTRUMENTATION
AMT measurements
The Department of Geophysics at the University of Oulu has been using since
1976 a French scalar audio-magnetotelluric equipment manufactured by Societe Eta,
Paris. The equipment was o~ginally developed at the Centre de Rfxherches
Geophysiques, Garchy (Benderitter et al., 1973).
The amplitudes of the telluric and magnetic fields were measured at nine fixed
frequencies from 8 to 3700 Hz. Two induction coils were used, one for the lower
(from 8 to 370 Hz) and one for the higher (from 170 to 3700 Hz) frequencies. The
telluric field was measured galvanically with steel electrodes. After integration and
electronic division of the amplitudes the scalar value of the apparent resistivity at
each frequency was read directly from the scale of the resistivity meter. In addition
short samples of signals were tape recorded at almost every measuring point for later
analysis.
MT meu~urements
The Hungarian group measured the time-varying electromagnetic field in the
period range from about 10 to 2500 s. The equipment consisted of telluric and
magnetic sensors and an analogue recording instrument. The minimum scale value
for electric potentials was 10 ~V/mm. Magnetic variations were transformed into
electric signals by Hungarian-made MTV-2 variometers with a minimum scale value
of 0.02 nT/mm (Adam and Major, 1967).
There were no man-made electrical disturbances, partly because the research area
is sparsely populated and distances between neighbouring farms are as a minimum
l-2 km, and partly because the electric network is not overloaded. Furthermore,
pulsation activity is present at geographical latitudes of 63-64” around summer
solstice at all times except for a short time during the night. Thus, a sufficient
coverage in the period spectrum could be.attained in 2; days (2 days and 3 nights).
DATA PROCES3NG
AMT measurements
The AMT measurements are of scalar type. Thus the processing of AMT data is
much simpler than that of MT measurements. The final apparent resistivity value for
each discrete frequency at every AMT station is determined as an average of five
successive readings. The maximum differences between these individual readings can
vary quite a lot, but generally around 1056, depending e.g. on geological conditions
and on the frequency. AMT measurements were made in four directions, differing

82
by 45”. The four sounding curves are a good approximation of tensorial data,
provided the measured field is stationary during the whole measuring time at the
corresponding AMT point.
MT measurements
As a first step an appropriate number of recording intervals with different
frequency content (and low noise level) were chosen at each measuring point. The
length of the intervals was determined by the acceptable signal/noise ratio, the
length being generally between 10 min and several hours. Several sections with
overlapping frequency content were processed. From each of these, 600-800 digital
values (sometimes more than 2000) were obtained with At from 0.7 to several tens of
seconds.
The digital data were processed on the HP 2100A computer of the Geodetic and
Geophysical Research Institute in Sopron, using the program described by Vera
(1972). This program calculates the impedance elements by filtering in the time-do-
main. The level of acceptance for every sequence of ten points is that the
coherencies yL- H I t and yE H should be greater than 0.9. The output of the program r 1 consists of impedance polar diagrams, resistivities in different directions, of the
extrema, pma, and pmin and phase characteristics of the impedance. From these data,
different kinds of sounding curves can be determined.
RESULTS AND DISCUSSION
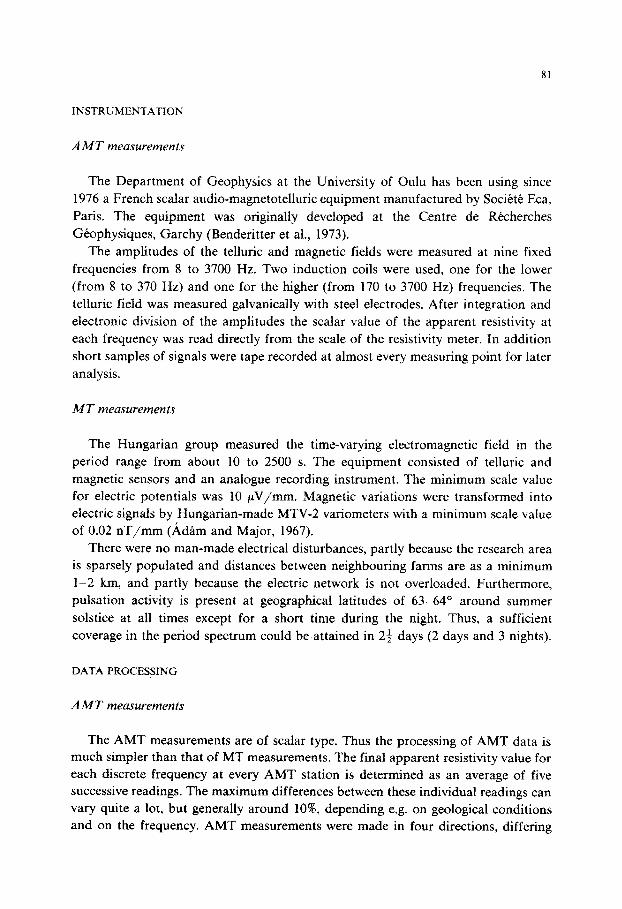
The final choice of the MT sites was based on the AMT measurements. We
looked for sites as free as possible from electric near-surface inhomogeneities. Figure
4 shows that the AMT-results at all five MT points have very small directional
variations.
In spite of local homogeneity being ensured, the directions of the extrema of the
main impedance ( Z,Y.,,maX and ZXJ,,.) at longer periods are characteristic and well-cor-
related with the nearby geology, though changes of this direction vs. period occur
(Fig. 2). The points MT1 and MT5 are characterized by a direction stability of Z.,, mr.
(T). These stations lie close to narrow zones of well-conducting dykes. The site MT5
lies most likely very near the contact between the more conducting Lake Ladoga-
Bothnian Bay zone and the resistive Presvecokarelidic basement (the Karelian
megablock) (Kaikkonen and Pajunpaa, 198 1; see also Fig. 7). The point MT2 has
also a quite constant direction of ZXY,,, (T) and its maximum change with
increasing period is only 15-30’. On the contrary MT3 and MT4 have a great
change of the direction of ZX_“,,, (T). These changes of the directions depend on the
ratio of the penetration depth and the distance to the nearest conducting anomalous
body. In MT2 and MT3 average direction of the maximum impedance is roughly
perpendicular to nearby elongated phyllite-quartzite zones (see Fig. 2).
83
-1 MT3
N
MT2 N
MTL N
W.‘. . . E k
S.‘
MT5 N
\
wa-’ YE Y S
Mil
S
Fig. 4. AMT-sounding curves in four directions at the measuring sites MTl-MT5 (partly completed by
VLF-R results).
5 (a)
2
i
pqmox
4 Konnonkoski 10 “x
51 Rm
2 1
1o3k-
MT3
MT2
Rm ‘n 2 Sotkamo-Hokolo “4
2- 4 ~
Id
5-
2-
85
,o, Kontumakl / d 1
“t
2
IO"
5
y i-;-
P mm
2
10' tn I
1
_/
5-
'4-1 o
2t
1 1 I / I, -,-
12 5 10 2 5 lOW&
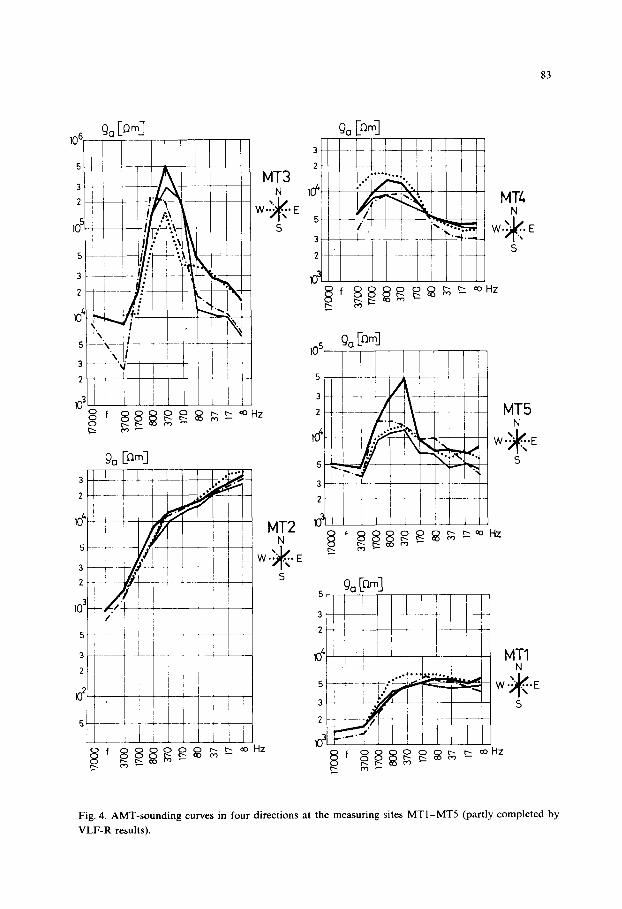
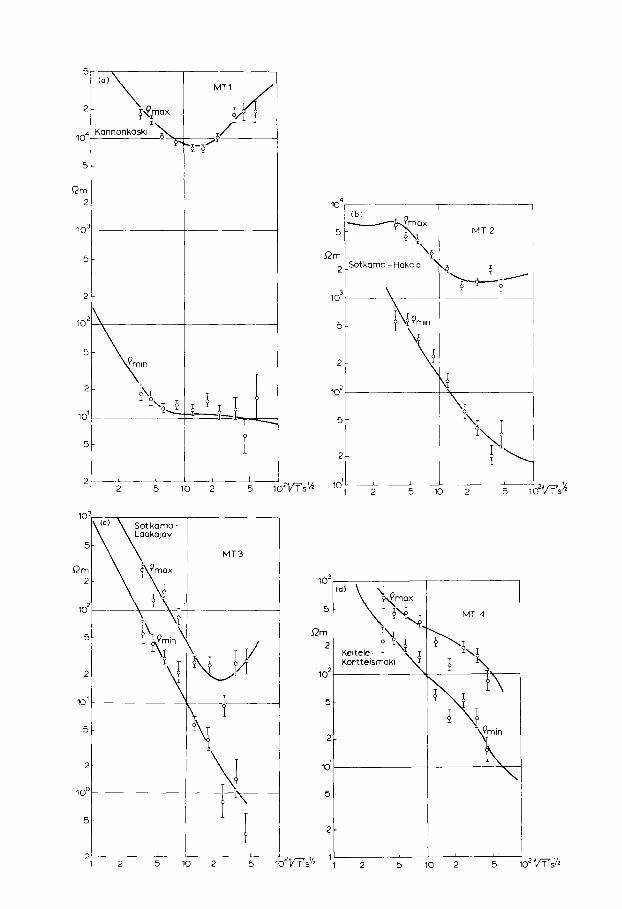
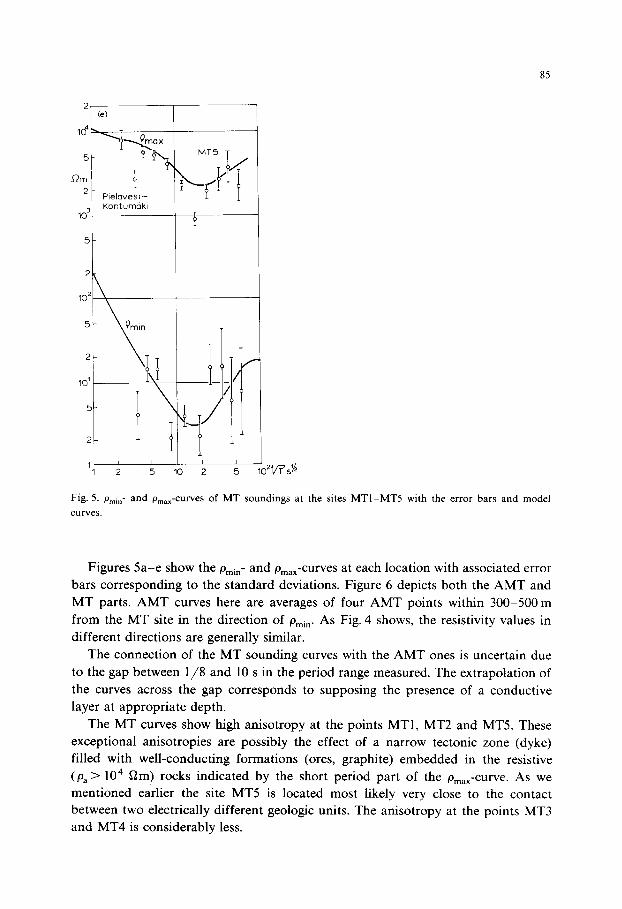
Fig.5. pm,,- and P,,, -curves of MT soundings at the sites MTI-MT5 with the error bars and model
ClllV%S.
Figures 5a-e show the pmin- and pm,,- curves at each location with associated error
bars corresponding to the standard deviations. Figure 6 depicts both the AMT and
MT parts. AMT curves here are averages of four AMT points within 300-500 m
from the MT site in the direction of pmi,. As Fig. 4 shows, the resistivity values in
different directions are generally similar.
The connection of the MT sounding curves with the AMT ones is uncertain due
to the gap between l/8 and 10 s in the period range measured. The extrapolation of
the curves across the gap corresponds to supposing the presence of a conductive
layer at appropriate depth.
The MT curves show high anisotropy at the points MTl, MT2 and MT5. These
exceptional anisotropies are possibly the effect of a narrow tectonic zone (dyke)
filled with well-conducting formations (ores, graphite) embedded in the resistive
(pa > lo4 Qm) rocks indicated by the short period part of the pmax-curve. As we
mentioned earlier the site MT5 is located most likely very close to the contact
between two electrically different geologic units. The anisotropy at the points MT3
and MT4 is considerably less.
86
-i -4
---_ 3 _.._.._ 5 . . . . . . . I I) 3
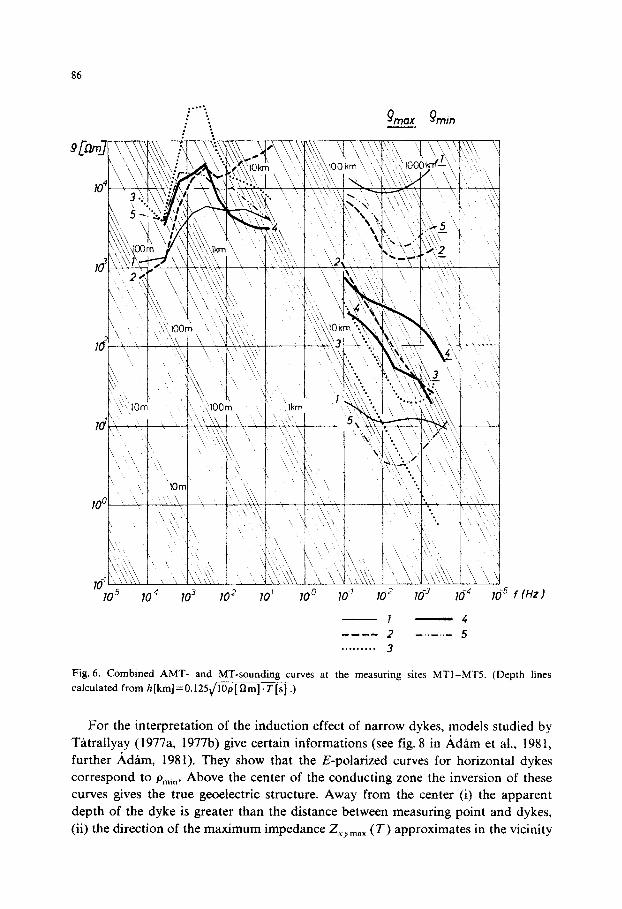
Fig. 6. Combined AMT- and MT-sounding curves at the measuring sites MTI-MT5. (Depth lines
calculated from h[km]=O.l25~~[~m].T[s] .)
For the interpretation of the induction effect of narrow dykes, models studied by
TBtrallyay (1977a, 1977b) give certain informations (see fig. 8 in Adam et al., 1981,
further Adam, 1981). They show that the E-polarized curves for horizontal dykes
correspond to P,,,~,. Above the center of the conducting zone the inversion of these
curves gives the true geoelectric structure. Away from the center (i) the apparent
depth of the dyke is greater than the distance between measuring point and dykes,
(ii) the direction of the maximum impedance Zxymax (T) approximates in the vicinity
87
of the dyke the direction perpendicular to its strike, (iii) the resistivity anisotropy
increases with decreasing distance between measuring point and dyke.
Close to, but outside the conducting zone neither of the curves (p,i,, p,,,) gives
quantatively precise results about the parameters of the dyke, only qualitative
deductions can be made about its existence.
More far away from the anomalous body the H-polarized pmax curves do not show
distortion due to the conducting body, therefore p,,,,, curves yield here more realistic
layer sequence without any apparent conducting layer.
A tentative 1-D interpretation of the 5 MT pmin curves give conducting bodies at
depths of 4 (MTl); 4.8 (MT5); 10.5 (MT3); 16.5 (MT4) and 34 km (MT2). Since the
results vary greatly from point to point, the depths probably do not refer to a
realistic layer structure of the Earth’s crust. (The depths of the conductive bodies of
the Rtl,, curves have even greater scatter.)
If the model of Tatrallyay is used for a qualitative discussion of the measurements
at points MT2, MT3 and MT4, one obtains results which are in contradiction with
earlier conclusions drawn from the direction of the impedances and the anisotropy
of the apparent resistivity. Therefore, in order to find the real structure of the
Earth’s crust and to understand distorting effects and their connections to the
anomalous bodies more detailed MT-measurements and further investigations are
necessary. These will include the construction of a 2-D model for the research area.
The near-surface resistivity conditions can be obtained from the H-polarized
P max -curve, which so to say steps across the narrow conductivity anomaly. The
P ,,,-curves indicate at the sites MT1 and MT5 2 X 10³-2 X lo4 Qm resistivities for
the near-surface rocks.
It is not probable that the well-conducting zone appearing on the p,,,-curves at a
depth between 100 and 200 km would indicate a real structure of the upper mantle.
It can be, however, said, that on the basis of the right-hand side ascending (MT5) or
flat (MTl) part of the Pmin-curves, a possible asthenosphere must he deeper than 100
km. For a more exact determination, records containing longer period variations are
necessary. Jones (198 1) has recently reported an asthenospheric layer in the Kiruna
region (Sweden, on the northwestern edge of the Baltic Shield), between 155-185 km
depths. Jones has obtained his result by using the HSG (Horizontal Spatial Gradi-
ent) method on magnetometer array data.
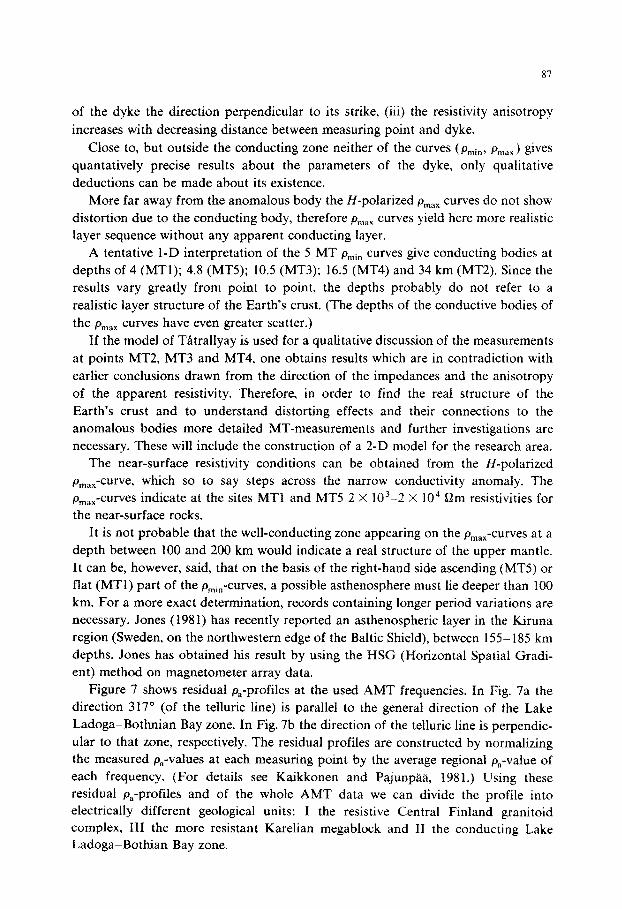
Figure 7 shows residual p,-profiles at the used AMT frequencies. In Fig. 7a the
direction 317” (of the telluric line) is parallel to the general direction of the Lake
Ladoga-Bothnian Bay zone. In Fig. 7b the direction of the telluric line is perpendic-
ular to that zone, respectively. The residual profiles are constructed by normalizing
the measured p,-values at each measuring point by the average regional p,-value of
each frequency. (For details see Kaikkonen and PajunpHa, 1981.) Using these
residual p,-profiles and of the whole AMT data we can divide the profile into
electrically different geological units: I the resistive Central Finland granitoid
complex, III the more resistant Karelian megablock and II the conducting Lake
Ladoga-Bothian Bay zone.
2 M
T3
MT2
-2
3703
HZ
317
0
2 M
T1
MT4
M
T5
MT3
4 J
4
E
-2
3795
HZ
227
3
!
-2
liOH
Z
-
2l
I
-2-
37nz
31
7 9
2y
i
-2
17nz
31
7 0
en2
317
0 1
I 50
K
M
RESI
DURL
(L
OG
M
EAN1
(a
) (b
)
L
17C
lShZ
22
7 3
-?-
173h
Z 22
7 3
2
-2-
3Lin
z 22
7 3
21
I
-2
37fiz
22
1 0

89
CONCLUSIONS
Magnetotelluric deep sounding was found to be effective in Finland. In compari-
son with middle latitude stations only l/2 or l/3 of recording time was necessary.
Since the level of artificial noise was low and the amplitudes of the variations were
greater, the signal/noise ratio and the average quality of the records were better
than for example in Hungary.
Our measurements give information about the general distribution of the electri-
cal conductivity in the crystalline shield of Finland. The AMT results have paramount
importance for the interpretation of the MT soundings and for the analysis of the
near-surface distorting effects. However, in deep sounding the distorting effects of
large conductivity anomalies due to near-surface inhomogeneities might be felt even
in places where near-surface rocks are found to be electrically homogeneous by
AMT measurements.
The main information from MT measurements are the depth of the apparent
conductive layers and the direction of the maximum impedances. The depths of the
conductive layers from SW to NE along the studied profile are: 4 km, 16.5 km, 4.8
km, 10.5 km, 34 km. As the distances between the points are 35-75 km, the
conductive layers cannot be explained by the effect of a single conductive body. On
the AMT profile, however, conductive formations can be identified at distances from
the MT sites corresponding to the apparent depths. The small number of measure-
ments, lack of electromagnetic information outside of the profile make it hard to
definitely associate these formations with the conductors seen in the MT Pm!,,-curves.
However, the main information deducable from MT measurements, i.e. the
existence (and location) of conductive bodies in the Baltic shield, as already
supposed by Zhamaletdinov (1976), is supported. This suggestion is further con-
firmed by the directions of the maximum impedances which are stable in case of
nearby conductive bodies, while in case of more distant bodies they turn toward the
direction corresponding to the conductive structure when the penetration depth
increases.
In order to get information about the upper mantle it is necessary to use
variations at periods longer than substorms periods, e.g. harmonics of the daily
variations. The MT method is able, due to its direction sensitivity, to determine the
direction of tectonic lines and disturbed zones on crystalline shields.
Fig. 7. Residual p,-profiles (MTI-MT2) at all nine AMT frequencies (after Kaikkonen and Pajunpti,
1981). The values of log p,(measured)/p,(regional average) are shown on the ordinate axis. The sites
MTl-MT5 are indicated by arrows.
90
ACKNOWLEDGEMENTS
We wish to thank the Finnish Academy, the Hungarian Academy of Sciences, the
Ministry of Labour in Finland, the University of Oulu and those private people
giving facilities at the measuring sites for making this research work possible. We
would like also to thank Dr. J. Talvitie and professor M.T. Porkka for useful
discussions as well as our referee, Dr. Alan G. Jones for valuable comments on the
manuscript.
REFERENCES
Adam, A., 1981. Statistische Zusammenhange zwischen elektrischen Leitfahigkeitsverteilung und Bruch-
tektonik in Transdanubien (Westungarn). Acta Geod. Geophys. Mont. Hung., 16: 97-l 13.
Adam, A. and Major, L., 1967. Stabilized high-sensitivity immersion magnetic variometer for magnetotel-
luric investigations (Type MTV-2). Acta Geod. Geophys. Mont. Hung., 2: 21 l-215.
Adam, A., M&z, F., Vera, J., Wallner, A., Duma, G. and Gutdeutsch, R., 1981. Magnetotelluric
sounding in the transitional zone between the Eastern Alps and Pannonian Basin. J. Geophys., 50:
37-44.
Benderitter, Y., Ngoc Thach, H. and Jolivet, A., 1973. Magnetotelluric method for mining exploration.
Paper read at the 35th EAEG meeting in Brighton, June 1973, 27 pp., mimeographed.
Benderitter, A., Htrisson, C., Korhonen, H. and Pernu, T., 1978. Magneto-telluric experiments in
northern Finland. Geophys. Prospect. 26: 562-571.
Jones, A.G., 1981. The electrical crust-mantle structure in Fennoscandia: coast effect and asthenosphere.
Paper read at the 4th IAGA Scientific Assembly in Edinburgh, August 1981, mimeographed.
Kaikkonen, P. and Pajunpti, K., 1981. Audiomagnetotelluric measurements across the Lake Ladoga-
Bothnian Bay zone in central Finland. Paper read at the 4th IAGA Scientific Assembly in Edinburgh,
August 198 1, mimeographed.
Rokityansky, II., Vasin, N.D., Golod, M.I., Novicky, G.P., Rokityanskaya, D.A. and Sokolov, S.Ya.,
1979. Electric conductivity anomalies in S-Karelia. Geofiz. Sb. Akad. Nauk USSR, 89: 36-39 (in
Russian).
Simonen, A., 1980. Precambrian in Finland. Geological Survey of Finland, Bull. 304, 58 pp.
Tatrallyay, M., 1977a. On the interpretation of EM sounding curves by numerical modelling using the
S.O.R. method. In: A. Adam and U. Schmucker (Editors), Special Issue based on the 3rd Workshop
on Electromagnetic Induction in the Earth and Moon, held in Sopron, July 1976. Acta Geod.
Geophys. Mont. Hung., 12: 279-285.
Tatrallyay, M., 1977b. Determination of alternating electromagnetic fields in 2-D structures with finite
difference method. Dissertation, Sopron, 122 pp. (in Hungarian).
Vera, J., 1972. On the determination of the magnetotelluric impedance tensor. Acta Geod. Geophys.
Mont. Hung., 7: 339-351.
Zhamaletdinov, A.A., 1976. Electric conductive formations in NW of Kola-peninsula and their effect on
results of deep soundings. Thesis, Leningrad, 21 pp. (in Russian).


