Embed Size (px)
Citation preview

MAGNETIC RESONANCE IMAGING OF THE INITIAL ACTIVE STAGE
OF EQUINE LAMINITIS AT 4.7T
JASON B. ARBLE, JOHN S. MATTOON, WM. TOD DROST, STEVEN E. WEISBRODE, PETER A. WASSENAAR,XUELIANG PAN, ROBERT J. HUNT, JAMES K. BELKNAP
Equine laminitis is a severely debilitating disease. There is a poor understanding of the underlying pathophys-
iology, and traditional imaging modalities have limited diagnostic capacity. High field strength magnetic
resonance (MR) imaging allows direct visualization of the laminae, which other modalities do not. This would
prove useful both in assessment of clinical patients and in further investigation into the pathophysiology of the
disease. The objective of this study was to characterize the anatomic changes within the equine foot associated
with the initial active stage of laminitis. Images obtained using a 4.7T magnet were compared with digital
radiographs using histologic diagnosis as the reference standard. Objective measurements and subjective eval-
uation for both modalities were evaluated for the ability to predict the histologic diagnosis in horses with clinical
signs of laminitis as well as in clinically normal horses and horses that were in a population at risk for developing
laminitis. Signal intensity and architectural changes within the corium and laminae were readily seen at 4.7T,
and there was a strong association with the histologic diagnosis of active laminitis. Measurements obtained with
MR imaging were more sensitive and specific predictors of laminitis than those obtained radiographically.
Subjective evaluation with MR imaging was more sensitive than with radiography and should become more
specific with greater understanding of normal anatomy. Veterinary Radiology & Ultrasound, Vol. 50, No. 1,
2009, pp 3–12.
Key words: equine, laminitis, MRI.
Introduction
LAMINITIS, CHARACTERIZED BY loss of the support of the
distal phalanx due to separation of the dermal and
epidermal laminae, can occur secondary to equine systemic
inflammatory disease, dietary change, or carbohydrate
overload. The exact pathophysiologic basis of laminitis
is unclear.1–3 An imaging modality that allowed direct
visualization of the laminae might enhance the under-
standing of laminitis.
The appearance of chronic laminitis has been described
using magnetic resonance (MR) imaging,4,5 but the changes
seen with MR imaging during the initial phase are unchar-
acterized. It was our purpose to identify the specific changes
seen in horses during the initial active phase of laminitis
using MR imaging and compare the imaging findings with
histologic appearance of the laminae. Further, we compared
radiographic and MR imaging findings using the histologic
appearance as the reference standard. We also assessed
whether the changes seen in horses with initial active
laminitis may be seen in horses that are at risk for devel-
oping acute laminitis but do not yet exhibit clinical signs.
Materials and Methods
Adult, full-sized horses with acute active laminitis, or
current disease known to predispose to acute laminitis,
having undergone euthanasia were considered for inclusion
in this study. All horses were euthanized due to normal
clinical course without regard to this study. Horses with
a prior history of laminitis in the affected limbs were
excluded. The initial active phase of laminitis was defined
as foot pain with increased temperature of the dorsal hoof
surface, with or without bounding digital pulses, for a
duration of less than 15 days.
Twenty-eight horses ranging in age from 2 to 23 years
met the criteria for inclusion in the study. If laminitis was
detected clinically in the front limbs, then both front limbs
and one hind limb were collected. If laminitis was detected
Funded by the American College of Veterinary Radiology and TheOhio State University Intramural Equine Research Fund.
Presented at the International Society for Magnetic Resonance in Med-icine, Berlin, Germany, May 2007, and in part at the Joint ACVR/IVRAMeeting, Vancouver, Canada, August 2006.
Address correspondence and reprint requests to Jason B. Arble, at theabove address. E-mail: [email protected]
Dr. Arble’s present address is Center for Veterinary Health Sciences,Oklahoma State University, Stillwater, OK.
Dr. Mattoon’s present address is Department of Veterinary ClinicalSciences, Washington State University, Pullman, WA.
Received November 5, 2007; accepted for publication December 6,2008.
doi: 10.1111/j.1740-8261.2008.01483.x
From the Department of Veterinary Clinical Sciences (Arble, Mattoon,Drost, Belknap), Department of Veterinary Biosciences, College of Vet-erinary Medicine (Weisbrode), Department of Radiology, College ofMedicine (Wassenaar), Department of Statistics (Pan), The Ohio StateUniversity, Columbus, OH 43210, and Hagyard-Davidson-McGee, Lex-ington, KY (Hunt).
3

only in the hind limbs, then both hind limbs and one front
limb were collected. All four extremities were collected if
the horse had laminitis in both the front and rear limbs.
This resulted in 81 feet being studied.
Horses were divided into three groups based on clinical
presentation and possible risk for developing acute lamini-
tis. Group 1 consisted of nine horses that were suffering
from an initial active onset of laminitis for less than 14 days
at the time of euthanasia. Group 2 consisted of 10 horses
that were suffering from diseases known to predispose
to acute laminitis but did not have clinical signs of acute
laminitis at the time of euthanasia. Diseases in Group 2
horses consisted of gastrointestinal disease in nine and cat-
astrophic skeletal injury in one. The nine horses in Group 3
were used as normal controls. These horses had no prior
history of laminitis and were euthanized for causes that are
not associated with a predisposition to acute laminitis.
After euthanasia, the shoes were removed if present and
the distal extremity was disarticulated from the limb at the
metacarpo(tarso)phalangeal joint. The feet were cleaned
and all inorganic and metallic material removed. Speci-
mens were stored in a walk-in cooler until imaging could
be performed. Specimens that could not be imaged within
4 days were frozen at �201C. Frozen specimens were
allowed to thaw 18–24 h before imaging.
Radiographs of each foot were made with an indirect flat
panel digital radiography system.� Lateral-to-medial and
dorsal 601 proximal–palmarodistal/plantarodistal projec-
tions were made for each foot and stored on a server
maintained onsite and dedicated to storage of digital im-
ages. Images were stored in DICOM format and evaluated
using an eFilmw imaging workstation. Any metallic debris
detected radiographically was removed before MR imaging.
All distal extremities were imaged on a 4.7T/40 cm
magnet controlled by a Bruker Avancez console. After a
localizer spin echo sequence, T2�-weighted images were
acquired in transverse and sagittal planes using a 3D gra-
dient echo (GRE) sequence. T1 and proton density (PD)-
weighted images were acquired in the transverse plane. The
sequence parameters are summarized in Table 1.
All feet were sectioned within 2 hours of completion of
imaging. Using a band saw, sagittal and transverse cuts
were made through the dorsal hoof wall and distal phalanx
and sections from the mid-portion of the dorsal hoof wall
in both planes were harvested. Tissues specimens were fixed
in formalin for a minimum of 48 h before being trimmed
for paraffin embedding and tissue sectioning. Each slide
contained both a sagittal and transverse section that in-
cluded as much of the corium and keratinized hoof wall as
possible and was stained with hemotoxylin and eosin. All
slides were evaluated by a board-certified veterinary
pathologist (S.E.W.) experienced in equine disease; the
pathologist was not aware of the history or imaging find-
ings. Histologic diagnosis of normal or laminitis was made
based on laminar disorganization and necrosis, pyknosis,
and rhexis of the epidermal laminae.6 All samples were
evaluated for separation between the dermal and epidermal
laminae and evidence of freezing-induced artifacts and
tissue necrosis.
All radiographic and MR images were randomized sep-
arately and reviewed by two board-certified veterinary ra-
diologists (J.S.M. and W.T.D.) and one board-certified
equine surgeon (J.K.B.). All reviewers were unaware of
the clinical status and histologic findings. Measurements
included proximal and distal dorsal hoof wall thickness and
the dorsal hoof wall-to-distal phalanx ratio.7 Representative
transverse T2� 3D GRE images from the proximal, middle,
and distal one-third of each foot were identified by dividing
the soft tissues dorsal to the distal phalanx into equal thirds
and then selecting a slice from the center of each region
(Fig. 1). Each image was evaluated for alteration of the
following: corium architecture, corium signal intensity,
laminar architecture, laminar signal intensity, and laminar
separation. Each change was graded normal, mild, moder-
ate, or severe: grades 1–4, respectively. Quantitative
measurements of the MR images included: thickness of
the corium, laminae, dermal tissue (laminae plus corium),
and the ratio of laminae to total dermal tissue (Fig. 2). The
laminae-to-dermis ratio was calculated by dividing the
thickness of the laminae by the total thickness of the dermal
tissue at the same location. All radiographic and MR image
measurements were made by a single individual (J.B.A.).
Changes noted by one author (J.B.A.) on a pilot study
were used as categories to be evaluated by each observer
when reviewing the representative MR images from each
foot. Pearson correlation was used to evaluate the associ-
ation between a change noted with MR imaging and a
histologic diagnosis of laminitis. Each category was also
assigned a numeric qualifier from 1 (normal) to 4 (severe
change). A chi-squared analysis was performed for each
category at each level (proximal, middle, distal) to detect
any significant difference for the number values assigned
for each category between normal and laminitic feet. The
Table 1. Magnetic Resonance Imaging Sequence Parameters
FOV(cm3/cm2) Matrix
TR(ms)
TE(ms)
Thickness/Gap (mm)
T2�-weighted3DGRE
12 � 12 � 8 384 � 384 � 40 16.5 3.7 1.3 � 1.3
T1 weighted 12 � 12 256 � 256 700 4.3 2.5 � 2.5PD weighted 12 � 12 256 � 256 3000 4.3 2.5 � 2.5
FOV, field of view; TR, time to repetition; TE, time to echo; 3DGRE,
three-dimensional gradient recall echo; PD, proton density.
�Eklin Medical Systems, Santa Clara, CA.wMerge Healthcare, Milwaukee, WI.zBruker, Ettlingen, Germany.
4 ARBLE ET AL. 2009

probability of a change being detected was also calculated
with respect to the histologic diagnosis.
A two-sample Student’s t-test was used to compare the
mean differences in measurements obtained radiographi-
cally vs. MR imaging, in normal vs. laminitic feet. Dot
plots were constructed to compare the distribution of mea-
surement values and to determine cut points for the lami-
nae-to-dermis ratio in MR images and dorsal hoof wall-
to-distal phalanx ratio in radiographs. The sensitivity,
specificity, positive predictive value, and negative predictive
value for the three different foot levels were calculated us-
ing the derived cut point.
The ability to specifically identify laminar separation us-
ing MR imaging and radiography was evaluated in terms of
sensitivity and specificity using histologically evident sepa-
ration as the standard. The ability to predict a histologic
diagnosis of laminitis based on the observed changes was
evaluated by calculating the sensitivity and specificity for
the detection of an abnormality in each separate category.
Sensitivity and specificity for each abnormality were calcu-
lated with two different cut-off points. A cut point of 1
denoted that any abnormality from mild to severe (2–4) was
a prediction of disease. A cut point of 2 denoted that mild
changes (2) were considered normal while moderate to se-
vere changes (3 or 4) were predictors of laminitis. Sensitivity
and specificity were also calculated for each observer for the
ability to correctly come to the diagnosis of laminitis or
normal for both MR imaging and radiography.
Results
Data from one foot in Group 2 was corrupted beyond
retrieval. A single foot from a horse suffering from a
nonweight-bearing injury in the contralateral limb was in-
cluded, as the weight-bearing foot was at risk for support-
limb laminitis.
Nineteen of 27 feet in Group 1 horses, and two of 27 feet
in Group 2 horses were laminitic. All remaining feet were
normal.
The 3D GRE sequence transverse images (Fig. 3) were
characterized by the best anatomic detail and contrast
Fig. 3. T2�-weighted transverse image of a normal equine digit.
Fig. 2. Transverse T2�-weighted image illustrating the measurementsmade of the laminae and corium used to derive the laminae-to-dermis ratio.
Fig. 1. Sagittal T2�-weighted image of the equine digit. The transverselines represent the locations of the three transverse images provided to theobservers for evaluation of each foot.
5MRI OF INITIAL ACTIVE EQUINE LAMINITIS USING 4.7 TVol. 50, No. 1

resolution of the three MR imaging sequences performed
and was therefore exclusively used in the MR evaluations.
The normal corium and laminae had greater signal inten-
sity than the hoof wall and the cortical bone of the distal
phalanx. The internal portion of the hoof wall and the
medullary cavity of the distal phalanx had similar inter-
mediate signal intensity. The peripheral borders of the hoof
wall were not detectable due to a lack of signal from this
structure. The individual primary laminae were easily iden-
tified. Although differentiation between sensitive and
insensitive primary laminae was not possible in the MR
images, the epidermal laminae typically had a less intense
signal which was similar to the interior hoof wall, while the
dermal laminae were more hyperintense. The architecture
of the corium was readily identifiable with a heterogeneous
pattern that was interspersed with hyper- and hypointense
blood vessels. The margin between the corium and the
cortex of the distal phalanx was distinct and had an
undulating pattern. When compared with histologic
samples at 4 � magnification (Fig. 4), all of the anatomic
architecture was identifiable except the secondary laminae.
Ability to see the secondary laminae and consistently
differentiate the sensitive from insensitive primary laminae
was a limitation in MR anatomic resolution.
Examining the MR images, five specific changes were
identified that were likely associated with the initial active
stage of laminitis. Pearson correlation confirmed the asso-
ciation of histologically evident laminitis with all five
changes which included loss of normal corium architecture,
loss of laminar architecture, increased signal intensity in
the corium, increased signal intensity in the laminae, and
separation within the laminae (Table 2). When compared
with a transverse T2�-weighted MR image from a histo-
logically normal foot (Fig. 5), the above changes were
readily identified (Fig. 6).
There was marked alteration in the appearance of the
corium characterized by the lack of normal vasculature and
a homogeneous appearance with overall increased signal
intensity. The laminar layer was altered with multiple foci
of detail loss and, less commonly, a focal increase in signal
intensity. Disruption and distinct separation within the
laminae were readily seen beyond merely loss of normal
architectural distinction (Fig. 7).
There was a significant difference (Po0.001) in the
means of the laminae-to-dermis ratios between histologi-
cally normal vs. laminitic feet for proximal, middle, and
Fig. 6. Magnified transverse T2� image of the dorsal foot with initialactive laminitis. Note the change in corium intensity and homogeneity com-pared with Fig. 5. There is disruption and loss of uniformity in the laminae.A line of separation is identified by the arrowheads. HW, hoof wall; L,lamina; C, corium; P3, distal phalanx.
Fig. 5. Magnified transverse T2� image of a normal dorsal foot. Notethe heterogeneous appearance of the corium and uniform appearance ofthe laminae. HW, hoof wall; L, lamina; C, corium; P3, distal phalanx.
Table 2. Pearson Correlation of Magnetic Resonance Changes andHistological Diagnosis of Laminitis
CorrelationsLaminar
ArchitectureLaminarIntensity
CoriumArchitecture
CoriumIntensity Separation
Laminar intensity 0.762Coriumarchitecture
0.793 0.672
Corium intensity 0.738 0.643 0.888Separation 0.804 0.749 0.759 0.724Histological Dx 0.743 0.559 0.727 0.685 0.653
Fig. 4. Histological section of the interdigitation of normal laminae.H and E stain at 4� magnification.
6 ARBLE ET AL. 2009
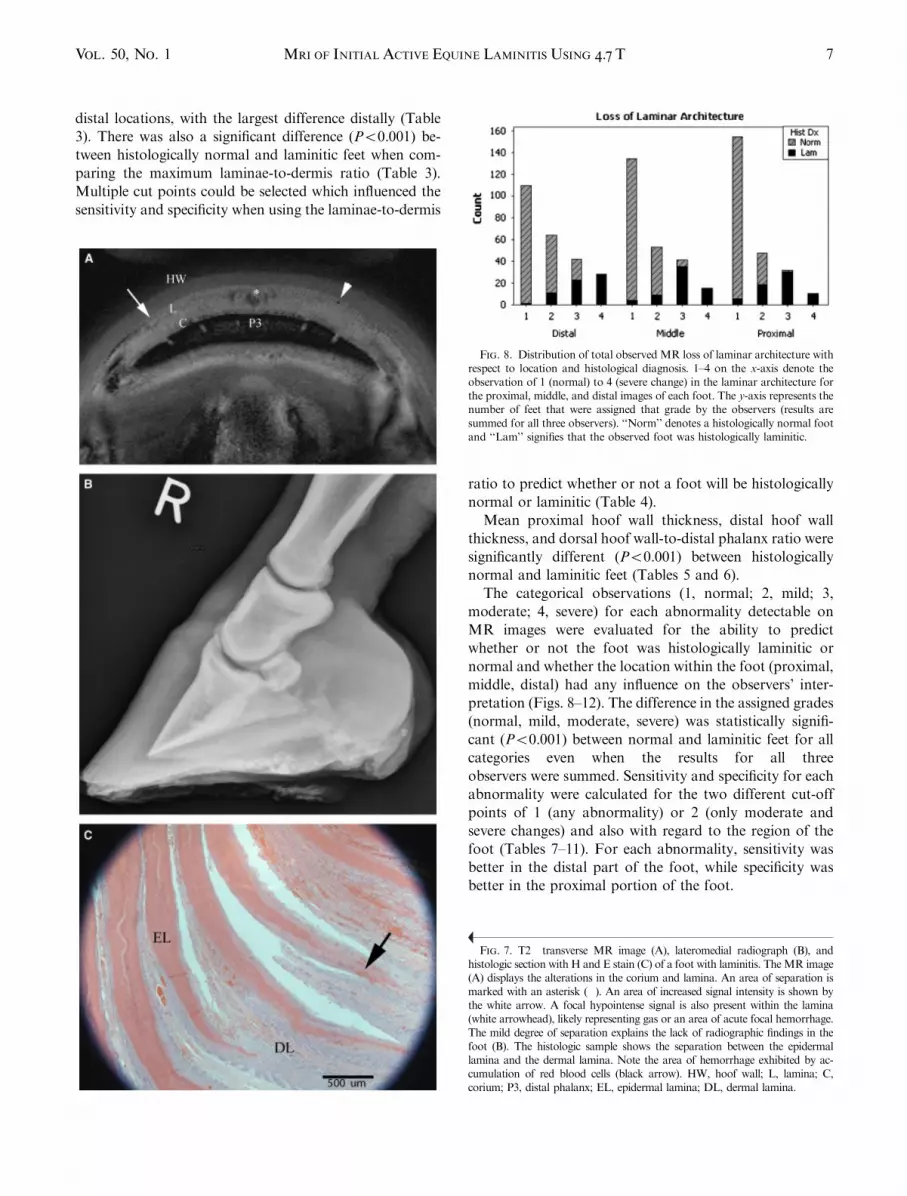
distal locations, with the largest difference distally (Table
3). There was also a significant difference (Po0.001) be-
tween histologically normal and laminitic feet when com-
paring the maximum laminae-to-dermis ratio (Table 3).
Multiple cut points could be selected which influenced the
sensitivity and specificity when using the laminae-to-dermis
ratio to predict whether or not a foot will be histologically
normal or laminitic (Table 4).
Mean proximal hoof wall thickness, distal hoof wall
thickness, and dorsal hoof wall-to-distal phalanx ratio were
significantly different (Po0.001) between histologically
normal and laminitic feet (Tables 5 and 6).
The categorical observations (1, normal; 2, mild; 3,
moderate; 4, severe) for each abnormality detectable on
MR images were evaluated for the ability to predict
whether or not the foot was histologically laminitic or
normal and whether the location within the foot (proximal,
middle, distal) had any influence on the observers’ inter-
pretation (Figs. 8–12). The difference in the assigned grades
(normal, mild, moderate, severe) was statistically signifi-
cant (Po0.001) between normal and laminitic feet for all
categories even when the results for all three
observers were summed. Sensitivity and specificity for each
abnormality were calculated for the two different cut-off
points of 1 (any abnormality) or 2 (only moderate and
severe changes) and also with regard to the region of the
foot (Tables 7–11). For each abnormality, sensitivity was
better in the distal part of the foot, while specificity was
better in the proximal portion of the foot.
Fig. 7. T2� transverse MR image (A), lateromedial radiograph (B), andhistologic section with H and E stain (C) of a foot with laminitis. TheMR image(A) displays the alterations in the corium and lamina. An area of separation ismarked with an asterisk (�). An area of increased signal intensity is shown bythe white arrow. A focal hypointense signal is also present within the lamina(white arrowhead), likely representing gas or an area of acute focal hemorrhage.The mild degree of separation explains the lack of radiographic findings in thefoot (B). The histologic sample shows the separation between the epidermallamina and the dermal lamina. Note the area of hemorrhage exhibited by ac-cumulation of red blood cells (black arrow). HW, hoof wall; L, lamina; C,corium; P3, distal phalanx; EL, epidermal lamina; DL, dermal lamina.
Fig. 8. Distribution of total observed MR loss of laminar architecture withrespect to location and histological diagnosis. 1–4 on the x-axis denote theobservation of 1 (normal) to 4 (severe change) in the laminar architecture forthe proximal, middle, and distal images of each foot. The y-axis represents thenumber of feet that were assigned that grade by the observers (results aresummed for all three observers). ‘‘Norm’’ denotes a histologically normal footand ‘‘Lam’’ signifies that the observed foot was histologically laminitic.
7MRI OF INITIAL ACTIVE EQUINE LAMINITIS USING 4.7 TVol. 50, No. 1

Comparing MR and radiographic images, there was a
distinct difference in the sensitivity and specificity when
using objective measurements. Both were statistically sig-
nificant when comparing the means of normal vs. laminitic
feet for each test, but there was a large overlap of radio-
graphic measurements between normal and abnormal feet.
This was clearly demonstrated when comparing dot plots
derived from the radiographic measurements with dot plots
of the laminae-to-dermis ratio calculated from the MR
images (data not shown).
Comparing the subjective ability to make a diagnosis of
a laminitis vs. normal using radiography, the results for all
three observers were similar. The sensitivity for detecting
active laminitis was low (47.6–57.2%). The specificity,
however, was high (80.0–91.7%). The sensitivity for cor-
rectly identifying histologically laminitic feet with MR
imaging was much higher (95.2–100%), but the specificity
was more variable between observers (46.7–93.3%). This
indicates a large number of false-negative predictions of
laminitis using radiography, while there was a tendency for
a larger number of false-positive results with MR imaging.
Discussion
Based on our results, there are definitive changes that
occur with the initial active stage of laminitis and are
readily detected with MR imaging and these changes can-
not be detected with radiography. Fine anatomic detail is
readily achievable using high field strength magnets, which
makes direct evaluation of the laminae and corium possi-
ble.4,8 After subjective assessment of all sequences, it was
felt that the T2�-weighted 3D GRE sequence gave the best
anatomic detail coupled with the best contrast resolution in
both normal and laminitic feet. Distortion artifacts caused
by local field inhomogeneities as a result of residual metal
in the hoof did not impact the area of interest and were
only evident within millimeters of the shavings. The ability
to detect disruption within the primary laminae is very
important for evaluation of the laminitic horse and makes
MR imaging more sensitive in the initial phase of the dis-
ease when compared with radiography. The small foci of
increased signal intensity which may indicate focal edema
or necrosis were only visible with MR imaging. Addition-
Fig. 9. Distribution of total observed MR loss of corium architecture withrespect to location and histological diagnosis. 1–4 on the x-axis denote theobservation of 1 (normal) to 4 (severe change) in the corium architecture forthe proximal, middle, and distal images of each foot. The y-axis represents thenumber of feet that were assigned that grade by the observers (results aresummed for all three observers). ‘‘Norm’’ denotes a histologically normal footand ‘‘Lam’’ signifies that the observed foot was histologically laminitic.
Table 3. Student’s t-Test Results Comparing Means of Normal vs.Laminitic Feet Using MR-Derived Maximum Laminae-to-Dermis Ratio
for Proximal, Middle, and Distal Portions of the Foot and OverallMaximum
Mean (mm) SD (mm) T-value P-value
Maximum ratio of footNormal 0.64 0.05 �7.69 0.001Laminitic 0.83 0.11
Maximum ratio proximalNormal 0.6 0.05 �8.59 0.001Laminitic 0.78 0.1
Maximum ratio middleNormal 0.61 0.05 �8.12 0.001Laminitic 0.8 0.1
Maximum ratio distalNormal 0.62 0.06 �8.51 0.001Laminitic 0.82 0.1
Table 4. Sensitivity, Specificity, Positive Predictive Value (PPV), andNegative Predictive Value (NPV) for Maximum Laminae-to-Dermis Ra-tio for Proximal, Middle, and Distal Portions of the Foot and Overall
Maximum
Cut-OffValue
Sensitivity(%)
Specificity(%)
PPV(%)
NPV(%)
Maximum ratio of foot 0.7 81 93.3 81.0 93.30.75 81 98 94.4 93.70.81 81 100 100 93.8
Maximum ratio proximal 0.7 81 98 94.4 93.7Maximum ratio middle 0.7 81 98 94.4 93.7Maximum ratio distal 0.7 81 95 85.0 93.4
0.75 81 98 94.4 93.7
Table 5. Student’s t-Test Results Comparing Means of Normal vs.Laminitic Feet Using Dorsal Hoof Wall-to-Distal Phalanx Ratio,Proximal Hoof Wall Thickness, and Distal Hoof Wall Thickness
Measured Radiographically
Mean (mm) SD (mm) T-value P-value
Dorsal hoof wall-to-distal phalanx ratioNormal 26.99 2.13 �4.2 0.001Laminitic 30.56 3.69
Proximal dorsal hoof wall thickness (mm)Normal 18.38 1.54 �3.24 0.004Laminitic 20.76 3.24
Distal dorsal hoof wall thickness (mm)Normal 17.98 1.52 �3.95 0.001Laminitic 20.9 3.27
8 ARBLE ET AL. 2009

ally, the high detail allowed evaluation of adjacent struc-
tures such as the corium, which is often overlooked when
collecting specimens for histologic evaluation. The decrease
in vascular conspicuity and altered signal distribution
within the corium is a reminder that the laminar separation
may be an end product and not the only pathophysiologic
process responsible for the pain and inflammation during
the initial phase of the disease. The images obtained using
a high field strength magnet allowed more extensive
evaluation of the tissues adjacent to and associated with
the laminae.
Many studies have focused on the microenvironment of
the laminae and on the blood flow of the foot during acute
laminitis.9–22 However, seeing these changes in the corium
leads us to question the pathophysiologic processes occur-
ring in the tissue supporting and sustaining the laminae.
Further investigation into the hemodynamics and possible
inflammatory changes specifically within the dermal layer
would provide much needed insight into the mechanisms
that result in laminar necrosis and separation. Changes in
this location may also explain the hemodynamic alterations
in the larger vessels feeding the foot. MR imaging provides
a method for evaluation of this tissue that is difficult to
harvest and often overlooked.
The increased ability to detect changes in MR images
before radiographic evidence of physical breakdown of the
laminae not only allows avenues for further investigation
but also increases the ability of clinical evaluation. The
use of laminar separation as criteria for diagnosing acute
laminitis had a lower sensitivity and specificity than other
categories but may be a better prognostic indicator
regarding the outcome of the disease. Horses that had
histologic evidence of laminitis but were labeled normal in
regard to laminar separation onMR images are likely early
in the disease process.
Another potentially useful criterion in the evaluation of
the laminitic horse is the use of the laminae-to-dermis ratio.
This may have more clinical utility in lower field strength
Table 6. Sensitivity, Specificity, Positive Predictive Value (PPV), andNegative Predictive Value (NPV) for Radiographic Dorsal Hoof Wall-to-
Distal Phalanx Ratio
Cut-OffValue Sensitivity Specificity
PPV(%)
NPV(%)
Dorsal hoofwall-to-P3 ratio
0.3 11/21¼ 52.4% 55/60¼ 91.7% 42.30 84.60
Fig. 10. Distribution of total observedMR-altered laminar signal intensitywith respect to location and histological diagnosis. 1–4 on the x-axis denotethe observation of 1 (normal) to 4 (severe change) in laminar signal intensityfor the proximal, middle, and distal images of each foot. The y-axis representsthe number of feet that were assigned that grade by the observers (results aresummed for all three observers). ‘‘Norm’’ denotes a histologically normal footand ‘‘Lam’’ signifies that the observed foot was histologically laminitic.
Fig. 11. Distribution of total observed MR-altered corium signal intensitywith respect to location and histological diagnosis. 1–4 on the x-axis denote theobservation of 1 (normal) to 4 (severe change) in the corium signal intensity forthe proximal, middle, and distal images of each foot. The y-axis represents thenumber of feet that were assigned that grade by the observers (results aresummed for all three observers). ‘‘Norm’’ denotes a histologically normal footand ‘‘Lam’’ signifies that the observed foot was histologically laminitic.
Fig. 12. Distribution of total observed MR separation with respect tolocation and histological diagnosis. 1–4 on the x-axis denote the observationof 1 (normal) to 4 (severe change) of separation for the proximal, middle,and distal images of each foot. The y-axis represents the number of feet thatwere assigned that grade by the observers (results are summed for all threeobservers). ‘‘Norm’’ denotes a histologically normal foot and ‘‘Lam’’ sig-nifies that the observed foot was histologically laminitic.
9MRI OF INITIAL ACTIVE EQUINE LAMINITIS USING 4.7 TVol. 50, No. 1

magnets where individual laminae may not be seen but a
distinction between the corium and laminae is still possible.
Based on our results, a laminae-to-dermis ratio greater
than 0.7 is a good indicator of laminitis. It has been shown
that the laminae lengthen and attenuate in laminitis.4,5,16 It
may be inferred that an increased laminae-to-dermis ratio
is likely due to mechanical breakdown at the level of the
secondary laminae. Additionally, by using a ratio to eval-
uate the relative increase in laminae thickness, the cut point
is likely to be influenced less than an arbitrary measure-
ment if the angle of the image slice is not perpendicular to
the dorsal hoof wall.
We noticed a trend of abnormalities being more evident
in the distal region of the foot vs. the middle or proximal
regions. The increase in maximum laminae-to-dermis ratio
in the toe region of laminitic feet gave a greater disparity
between histologically normal vs. laminitic feet, allowing
greater sensitivity and specificity. These objective data sup-
port the toe region being most affected in chronic laminits.4
This is most evident with the loss of corium architecture
and increase in corium signal intensity. This is consistent
with the mechanical stresses being greatest in the toe region.
All subjective changes identified were highly correlated
with a histologic diagnosis of laminitis. Additionally,
despite the variation introduced by using three observers,
the grading of each category was significantly different
between histologically normal and laminitic feet. Further
investigation is necessary to evaluate the specific associa-
tion of MR changes to the specific histologic change. This
process is hampered by the necessity to section the exact
tissue in question on the MR image. One limitation of our
study was that a single sample from the middle of the foot
was obtained for histologic diagnosis. Another fact to
consider is that the process of preparing specimens for
histologic examination will alter the tissue samples such as
the increased sheering stress from the cutting process and
the dehydration of the tissue during processing and fixa-
tion. The latter impedes full evaluation for the presence of
edema which remains a question in regard to the patho-
physiologic mechanisms of laminitis. It is unclear whether
full histological evaluation of the corium is possible or if
the corium is overlooked during postmortem examination.
Histologically, acute laminitis should display hyperemia,
hemorrhage, marked edema, and occasional thrombosis
within the dermis, and progression of the disease leads to
laminar disorganization and necrosis of the laminar tips
with limited inflammatory cell infiltration.6 This congestion
and edema would explain the changes seen in the corium;
however, upon histologic examination of the corium, there
were no specific differences in vascularity or tissue orga-
nization between normal and laminitic feet.
While all radiographic measurements were characterized
by a significant difference between normal and laminitic
feet, there was a large overlap, illustrated by the fact that
sensitivity for the dorsal hoof wall-to-distal phalanx length
ratio at a cut-off value of 0.3 has a sensitivity of 52% and a
positive predictive value of only 42%. In contrast, the
maximum laminae-to-dermis ratio obtained with MR
imaging has a much more segregated distribution between
normal and laminitic feet with sensitivity of 81% and
specificity of 93–98% depending on which portion of the
foot is measured.
Table 7. Sensitivity and Specificity Using Loss of Laminar Architecturein the Distal, Middle, and Proximal Foot as a Predictor of Histological
Laminitis Using a Categorical Cut-Off Value of 1 and 2
Cut Point Distal Middle Proximal
1Specificity (%) 60.0 72.2 82.8Sensitivity (%) 98.4 93.7 92.1
2Specificity (%) 89.4 96.7 98.9Sensitivity (%) 81.0 79.4 63.5
Table 8. Sensitivity and Specificity Using Loss of Corium Architecture inthe Distal, Middle, and Proximal Foot as a Predictor of Histological
Laminitis Using a Categorical Cut-Off Value of 1 and 2
Cut Point Distal Middle Proximal
1Specificity (%) 51.7 71.7 90.6Sensitivity (%) 100.0 88.9 82.5
2Specificity (%) 83.3 96.7 100.0Sensitivity (%) 87.3 76.2 63.5
Table 9. Sensitivity and Specificity Using Altered Laminar Signal Inten-sity in the Distal, Middle, and Proximal Foot as a Predictor of Histo-
logical Laminitis Using a Categorical Cut-Off Value of 1 and 2
Cut Point Distal Middle Proximal
1Specificity (%) 52.8 62.8 77.8Sensitivity (%) 87.3 79.4 76.2
2Specificity (%) 85.0 93.9 97.8Sensitivity (%) 69.8 55.6 47.6
Table 10. Sensitivity and Specificity Using Loss of Corium SignalIntensity in the Distal, Middle, and Proximal Foot as a Predictor ofHistological Laminitis Using a Categorical Cut-Off Value of 1 and 2
Cut Point Distal Middle Proximal
1Specificity (%) 43.9 70.6 90.6Sensitivity (%) 100.0 93.7 84.1
2Specificity (%) 80.0 96.1 100.0Sensitivity (%) 82.5 66.7 55.6
10 ARBLE ET AL. 2009

The results for all three observers were similar with re-
gard to the subjective ability to make a diagnosis of a
laminitic vs. normal foot using radiographs. The sensitivity
for detecting initial active laminitis was low (47.6–57.2%),
because until there is mechanical breakdown of the lami-
nae, there are no distinct radiographic changes. The spec-
imens that did have radiographic changes may have been in
transition to chronic laminitis.23,24 Horses with radio-
graphic changes are arguably classified as having chronic
laminitis, according to commonly used definitions. For the
purpose of our study, however, this was a continuation of
the same inciting event and was within the initial active
phase. The fact that changes such as laminar separation
may be detected earlier with MR imaging before radio-
graphic rotation and distal displacement occur may neces-
sitate revisiting the definition between acute and chronic
laminitis. Other than laminar separation, there were no
histologic findings to indicate a chronic disease process.
There was a tendency for over-interpreting the MR im-
ages in making a subjective diagnosis of laminitis. Two
factors need to be considered. First, the observers were
only asked to evaluate three out of the 64 total images that
comprised an entire study of the foot. The discontinuity
made reading of each individual image more objective;
however, this prohibited following structures over the
entire length of the foot. Second, the observers were only
given short tutorials on the specific changes they were
detecting, and there are no published observations on what
constitutes expected MR imaging findings in horses with
acute laminitis.
With regard to the Group 2 horses that were at risk for
developing laminitis, only two feet from one horse had
histologic changes characteristic of laminitis. Most likely,
this horse was misclassified because both histologic
and MR imaging changes were diagnostic for laminitis.
Unfortunately, using clinical evaluation to group the
horses introduced another variable. This horse was endo-
toxemic which placed it in the at risk category; however,
the horse was also being treated for a front foot abscess
which has many clinical signs in common with laminitis,
including foot pain, increased hoof wall temperature, and
altered digital blood flow. An abscess was not identified on
necropsy or on MR images, leading us to speculate that the
clinical signs of laminitis were misinterpreted. It then
follows that subclinical laminitis does not produce changes
detectable with MR imaging, or was not present in Group
2 horses. This conclusion is premature given the small
sample size and the limited staining and histologic descrip-
tion in our study.
We recognize that the fine anatomic detail seen at 4.7T is
currently not achievable clinically. However, distinction
between the corium and laminae is possible in magnets that
are used for clinical imaging, and the ratio of the laminae-
to-dermal thickness within the foot and the changes seen
within the corium can be extrapolated. Further work is
necessary to characterize the changes seen with laminitis
when using clinically available magnets. Further study into
the pathophysiologic mechanisms of laminitis will benefit
from studies of live animals, particularly with serial exam-
inations.
In conclusion, alterations in laminar and corium archi-
tecture and signal intensity as well as separation within the
laminae are readily seen at 4.7T and are highly correlated
with a histologic diagnosis of acute laminitis. The sensitiv-
ity of diagnosing laminitis is much higher with high field
strength MR imaging than with radiography. Sensitivity
and specificity are high for predicting laminitis using a
laminae-to-dermis ratio of 0.7. The sensitivity and speci-
ficity of quantitative MR imaging measurements are better
than those obtained by radiography. The sensitivity of
subjective evaluation is higher with MR imaging than with
radiography, and the specificity is likely to improve with
greater familiarity of the MR appearance of the equine
foot. Finally, there was no evidence to confirm the
hypothesis that subclinical changes are present in the soft
tissues of the digit in horses that are at risk for laminitis.
ACKNOWLEDGMENTS
The authors would like to thank Dr. Schmalbrock from the Depart-ment of Radiology, The Ohio State College of Medicine, for her valu-able assistance and expertise and Dr. Wharton from Lexington, KY, forher aid in data collection.
REFERENCES
1. Moore RM, Eades SC, Stokes AM. Evidence for vascular andenzymatic events in the pathophysiology of acute laminitis: which pathwayis responsible for initiation of this process in horses? Eq Vet J 2004;36:204–209.
2. Bailey SR, Marr CM, Elliot J. Current research and theories on thepathogenesis of acute laminitis in the horse. Vet J 2004;167:129–142.
3. Hunt RJ. The pathophysiology of acute laminitis. Compend ContinEd Pract Vet 1991;13:1003–1010.
Table 11. Sensitivity and Specificity Using Separation in the Distal,Middle, and Proximal Foot as a Predictor of Histological Laminitis Using
a Categorical Cut-Off Value of 1 and 2
Cut Point Distal Middle Proximal
1Specificity (%) 71.1 83.3 95.6Sensitivity (%) 87.3 82.5 73.0
2Specificity (%) 91.1 98.3 98.9Sensitivity (%) 66.7 54.0 33.3
11MRI OF INITIAL ACTIVE EQUINE LAMINITIS USING 4.7 TVol. 50, No. 1

4. Murray RC, Dyson SJ, Schramme MC, Branch M, Woods S.Magnetic resonance imaging of the equine digit with chronic laminitis.Vet Radiol Ultrasound 2003;44:609–617.
5. Denoix J-M, Crevier N, Roger B, Lebas J. Magnetic resonanceimaging of the equine foot. Vet Radiol Ultrasound 1993;34:405–411.
6. Yager JA, Scott DW. The skin and appendages. In: Jubb KVF,Kennedy PC, Palmer N (eds): Pathology of domestic animals, 4th ed. SanDiego, CA: Academic Press, Inc., 1993;697–699.
7. Linford RL, O’Brien TR, Trout DR. Qualitative and morphometricradiographic findings in the distal phalanx and digital soft tissues of soundthoroughbred racehorses. Am J Vet Res 1993;54:38–51.
8. Keller MD, Galloway GJ, Pollitt CC. Magnetic resonance micros-copy of the equine hoof wall: a study of resolution and potential. Eq Vet J2006;38:461–466.
9. Adair HS, Goble DA, Schmidhammer JL, Shires GMH. Laminarmicrovascular flow, measured by means of laser Doppler flowmetry, duringthe prodromal stages of black walnut-induced laminitis in horses. Am J VetRes 2000;61:862–866.
10. Allen D, Clark ES, Moore JN, Prasse KW. Evaluation of equinedigital Starling forces and hemodynamics during early laminitis. Am J VetRes 1990;51:1930–1934.
11. Eaton SA, Allen D, Eades SC, Schneider DA. Digital Starling forcesand hemodynamics during early laminitis induced by an aqueous extract ofblack walnut (Juglans nigra) in horses. Am J Vet Res 1995;56:1338–1344.
12. Fontaine GL, Belknap JK, Allen D, Moore JN, Kroll DL. Expres-sion of interleukin 1-beta in the digital laminae of horses in the prodromalstage of experimentally induced laminitis. Am J Vet Res 2001;62:714–720.
13. Hinckley KA, Fearn S, Howard BR, Henderson IW. Near infraredspectroscopy of pedal haemodynamics and oxygenation in normal andlaminitic horses. Eq Vet J 1995;27:465–470.
14. Morgan SJ, Hood DM, Wagner IP, Postl SP. Submural histopatho-logic changes attributable to peracute laminitis in horses. Am J Vet Res2003;64:829–834.
15. Mungall BA, Pollitt CC, Collins R. Localisation of gelatinaseactivity in epidermal hoof lamellae by in situ zymography. Histochem CellBiol 110:535–540.
16. Pollit CC. Basement membrane pathology: a feature of acute equinelaminitis. Eq Vet J 1996;28:38–46.
17. Pollit CC, Davies CT. Equine laminitis: its developmentcoincides with increased sublamellar blood flow. Eq Vet J Suppl 1998;26:125–132.
18. Pollit CC, Daradka M. Equine laminitis basement membranepathology: loss of type IV collagen, type VII collagen laminin immuno-staining. Eq Vet Suppl 1998;26:139–144.
19. Robinson NE. Digital blood flow, ateriovenous anatomoses andlaminitis. Eq Vet J 1990;22:416–421.
20. Trout DR, Hornof WJ, Linford RL, O’Brien TR. Scintigraphicevaluation of digital circulation during the developmental and acute phasesof equine laminitis. Eq Vet J 1990;22:416–421.
21. Waguespack RW, Kemppainen RJ, Cochran A, Lin HC, BelknapJK. Increased expression of MAIL, a cytokine-associated nuclear protein, inthe prodromal stage of black walnut-induced laminitis. Eq Vet J 2004;36:285–291.
22. Waguespack RW, Cochran A, Belknap JK. Expression of thecyclooxygenase isoforms in the prodromal stage of black walnut-inducedlaminitis in horses. Am J Vet Res 2004;65:1724–1729.
23. Riedesel EA. The phalanges. In: Thrall DE (ed.): Veterinary diag-nostic radiology, 4th ed. Philadelphia: Elsevier Saunders, 2002;284.
24. Stashak TS. Lameness. In: Stashak TS (ed.): Adam’s lameness inhorses, 5th ed. Baltimore: Lippincott, Williams and Wilkins, 2002;650.
12 ARBLE ET AL. 2009


