Embed Size (px)
Citation preview
IBU Publications
24 - 25 April, 2014Sarajevo, Bosnia and Herzegovina
International Conference on Economic and Social Studies 4
REGIONAL ECONOMIC DEVELOPMENT
REGIONAL ECONOMIC DEVELOPMENT
PUBLISHER:International Burch University
EDITED BY:Teoman DUMANMerdžana OBRALIĆ
DTP&DESIGN:Alen ČAMDŽIĆInternational Burch University, IT Center
DTP AND PREPRESS:International Burch University, IT Center
PRINTED BY:International Burch University
CIRCULATION: 400 copies
PLACE OF PUBLICATION: Sarajevo
Copyright: International Burch University, 2014International Burch University Publication No:
Reproduction of this Publication for Educational or other non-commercial purposes is authorized without prior permission from the copyright holder. Reproduction for resale or other commercial purposes prohibited without prior written permission of the copyright holder.
Disclaimer: While every e ort has been made to ensure the accuracy of the information, contained in this publication, Burch University will not assume liability for writing and any use made of the proceedings, and the presentation of the participating organizations concerning the legal status of any country, territory, or area, or of its authorities, or concerning the delimitation of its frontiers or boundaries.
CIP - Katalogizacija u publikacijiNacionalna i univerzitetska bibliotekaBosne i Hercegovine, Sarajevo
330.34(063)(082)
INTERNATIONAL Conference on Economic and Social Studies (2014 ; Sarajevo)Regional economic development / International Conference on Economicand Social Studies Regional economic development, 24-25 April, 2014, Sarajevo ; edited by Teoman Duman, Merdžana Obralić. -Sarajevo : International Burch University, 2014. -
980 str. : ilustr. ; 30 cm
Bibliogra�ja i bilješke uz tekst.
ISBN 978-9958-834-39-4
1. Duman, TeomanCOBISS.BH-ID 21522950
IBU Publications
MACROECONOMIC DETERMINANTS OF NONPERFORMING LOANS IN ALBANIAN
BANKING SYSTEM
Riada Berhani
Epoka University / Tirana, Albania [email protected]
Urmat Ryskulov
Epoka University / Tirana, Albania [email protected]
ABSTRACT The aim of this paper is to study the impact of macroeconomic factors in the amount of nonperforming loans in Albanian banking sectors by using multi regression analysis model from 1999 to 2012 and a time series forecasting analysis for the coming decade. In this paper is studied the relationship between the amount of non-performing loans and five important macroeconomic factors which are: Gross Domestic Product (GDP) growth rate, Inflation Rate, Money supply (M2) annual growth rate, Interest Rate and Unemployment Rate. The multi regression analysis suggest that all the variable except Unemployment Rate have a negative impact in the non-performing loan. Moreover the time forecasting analysis predict an increase in NPL level in Albanian Banking System. Keywords: Albania, Banking System, Macroeconomics, NPL, Credit risk
2nd International Conference on Economic and Social Studies 2014
INTRODUCTION The recent financial crisis has shift the interest toward the importance in studying the determinants that may cause a banking crises. (Laeven et al., 2010). According to Demirgüç-Kunt et al. (1998) and Llewellyn (2002) macroeconomic factor play a significant role in these crises. Moreover, in their studies was implied that unfavorable economic conditions such as low or negative economic growth, high interest and Inflation Rate impact in the deterioration of banking crisis. One of the main reason why a banking crisis may occur is due to the fact that banks may be suffering from liquidity problems triggered by an increase in their balance sheet of the amount of bad or nonperforming loans (NPL). Due to this reason it is essential to study the reasons that caused this increase of NPLs rather than studying only the cause of banking crisis. Changes in macroeconomic conditions impact the quality of loan portfolio of banks. Favorable macroeconomic conditions are positively related with the capability in loan repayment and a lower share of NPLs (Festić et al., 2011). The goal of this paper is to explore how macroeconomic factors such as Gross Domestic Product (GDP), Inflation Rate, Money supply growth rate, Real Interest Rate, and Unemployment Rate impact the amount of NPLs in Albanian banking system. To study this impact is used time series data from 2003-2012 for multi regression analysis and time series forecasting analysis. Literature Review Four dimensions of banking stability are: regulations, other banking and financial attributes, environment of the institution and macroeconomic conditions (Gagani et al., 2010). Moreover, Figlewski et al. (2012) implied that there should exist a macro factor that have a significant and broader impact on the major part of firms’ creditworthiness. They classified the macroeconomic factors in three groups regarding to their relation with:
• General Macroeconomic condition such as unemployment rate, inflation, etc. • Direction in which economy is moving such as Real Gross Domestic Product (GDP) growth, etc. • Financial market conditions such as Interest Rate, stock market return rate etc.
Jiménez et al. (2006) explained that the relationship between economic cycle and exposure of bank risk is dialectical. As economic condition of the business worsen during a recession period in economy, the risk of intermediations tend to rise. In their study their found a negative relationship between GDP and nonperforming loans. The same result was found also by Salas et al. (2002), Gunsel (2008) and Thiagarajan et al. (2011). On the other hand, Fofack (2005), who studied the relationship between GPD and credit risk in Sub Saharan Africa, and Aver (2008) who studied this relation is the Slovenian banking system, have concluded that GPD and credit risk have no relationship with each other. Another macroeconomic factor which affect the NPLs is also the Inflation Rate. The study of Gunsel (2008) implies that inflation is positively related with the credit risk in Euro Zone. Moreover, Vogiazas et al. (2011) and Zribi et al. (2011) found a negative relationship between inflation and credit risk on their cases of Romanian and Tunisian banking system. Also, in some other studies such as of Aver (2008) in Slovenian banking system, Bofondi et al. (2011) in Italian banking system and Castro (2013) in GIPSIi banking system was found no relation between inflation and credit risk. Furthermore an important macroeconomic determinant of credit risk, thus of NPLs is also the Money supply (MS). An increase in MS will stimulate the investment and consumption and as result will increase the income. However, this increase will lower the Interest Rates thus customers will have cheaper funds.
310
MACROECONOMIC DETERMINANTS OF NONPERFORMING LOANS IN ALBANIAN BANKING SYSTEM
The relationship of MS and credit risk in Malaysia is studied by Ahmad (2003) and it is found to exist a significant and negative relationship between them. Similar results were found by Vogiazas et al. (2011) in Romanian banking system. The opposite results were found by Bofondi et al. (2011) in Italian banking system and no relationship was found by Fofack (2005) in Sub Saharan Africa banking system. Interest Rate affect the debt burden of customers, as a result having an important effect in credit risk of banks. A rise in Interest Rate will rise the debt burden, thus will lead to an increase of the amount of NPLs. This statement is supported by many studies. According to Cebula (1999) Real Interest Rate has a significant negative relationship with bank failure. Fofack (2005) found a positive relationship between Interest Rates and credit risk in Sub-Saharan Africa. Moreover, an important of macroeconomic determinant of nonperforming loans is also unemployment in the economy. According to many studies such as Vogiazas et al. (2011), and Bofondi et al. (2011), unemployment is positively related with the amount of nonperforming loans. An increase in unemployment decreases the income of individuals, thus increase their debt burden and decrease their probabilities in paying their debts to their banks. (Louzis et al., 2012).
In this paper are studied the following hypothesis which are based on the literatures mentioned above.
• H1: GDP is has a negative impact in the amount of nonperforming loans. • H2: An increase in Money Supply has a negative impact in the amount of non-performing loans. • H3: Real Interest Rate has a positive impact in the amount of nonperforming loans. • H4: Inflation Rate have a positive impact in the amount of nonperforming loans. • H5: Unemployment rate have a positive impact in the amount of nonperforming loans.
Loans in Albanian Banking System Loan repayment continues to be a major problem in the banking system of Albania where the major of non-performing loans are from the corporate sector. According to manual of Bank of Albania the loans are classified in five groups:
1. Standard loans are those loans that do not have problems and are well-secured and fully guaranteed by a third party.
2. Special mentioned loans are those loans whose borrower’s position is adequate, but some possible weaknesses in his financial position do exist and sign in delay of payments are present. Still, this loans are not classified as problematic loans.
3. Substandard loans are those loans that are not adequately secured by the market of collateral value and the borrower’s financial position is less than satisfactory. This loans usually have a delay of payment of 90-180 days. This is the first type of loan classified as problematic loan.
4. Doubtful loans are those loans that include all the weakness of substandard loans and also a disclosure of a review conduct by the bank that indicates that most probably the borrow will not be able to pay the debt, thus there is a high risk that the borrowers will be declared insolvent. This loans have a delay in payment for more than 180-3860 days. This is the second type of problematic loans.
5. Lost loans are the uncollectable loans. In this case the borrower has most probably filed for bankruptcy and the loan has a delay on payment for more than 360 days.
311
2nd International Conference on Economic and Social Studies 2014
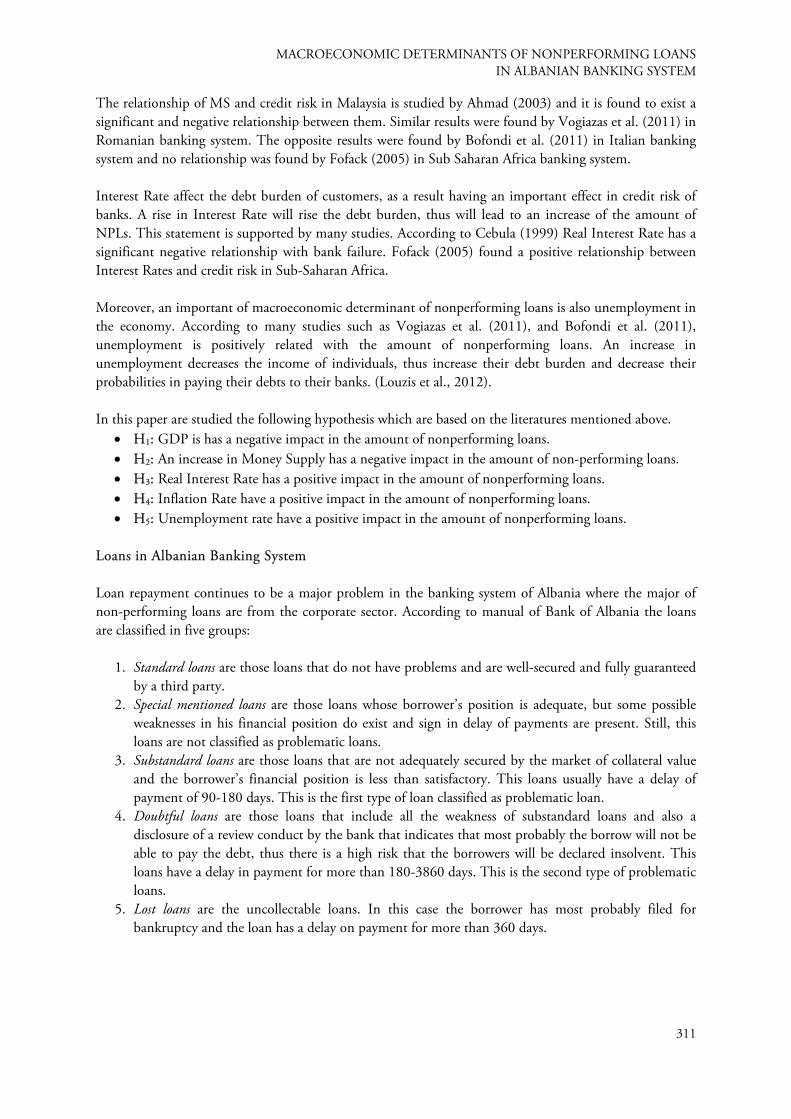
Figure 1: Non-performing level from 1999 to 2012
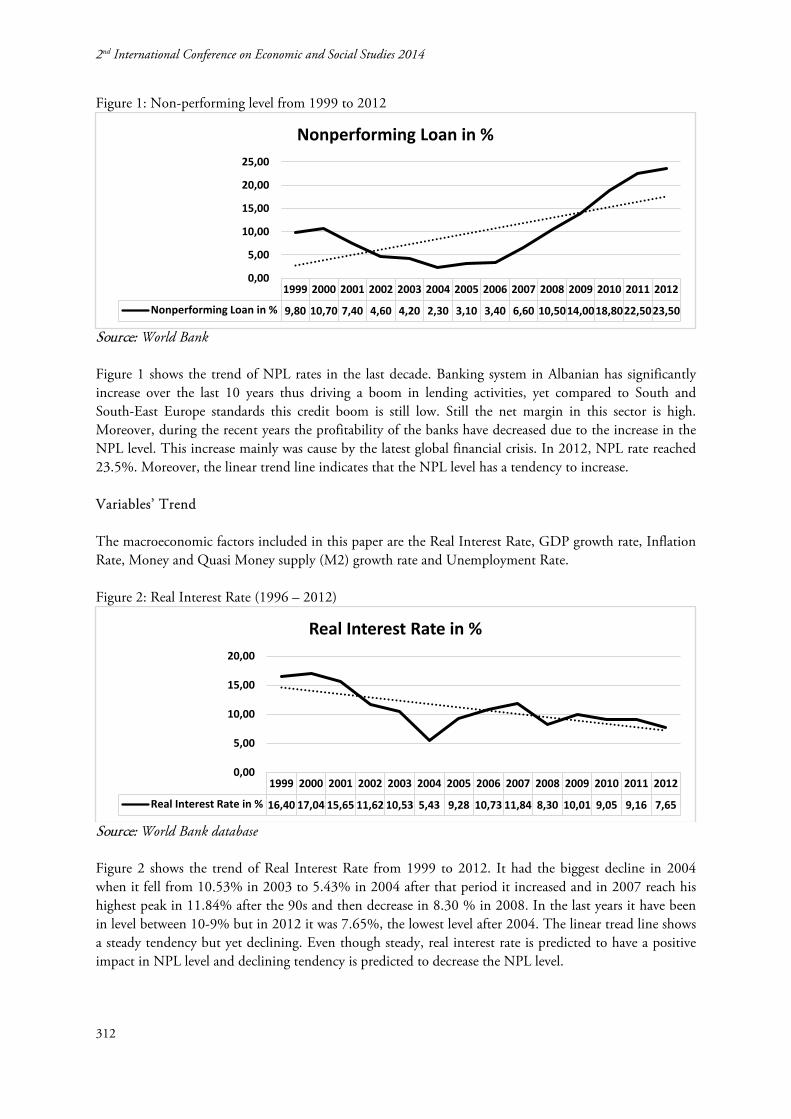
Source: World Bank Figure 1 shows the trend of NPL rates in the last decade. Banking system in Albanian has significantly increase over the last 10 years thus driving a boom in lending activities, yet compared to South and South-East Europe standards this credit boom is still low. Still the net margin in this sector is high. Moreover, during the recent years the profitability of the banks have decreased due to the increase in the NPL level. This increase mainly was cause by the latest global financial crisis. In 2012, NPL rate reached 23.5%. Moreover, the linear trend line indicates that the NPL level has a tendency to increase. Variables’ Trend The macroeconomic factors included in this paper are the Real Interest Rate, GDP growth rate, Inflation Rate, Money and Quasi Money supply (M2) growth rate and Unemployment Rate. Figure 2: Real Interest Rate (1996 – 2012)
Source: World Bank database Figure 2 shows the trend of Real Interest Rate from 1999 to 2012. It had the biggest decline in 2004 when it fell from 10.53% in 2003 to 5.43% in 2004 after that period it increased and in 2007 reach his highest peak in 11.84% after the 90s and then decrease in 8.30 % in 2008. In the last years it have been in level between 10-9% but in 2012 it was 7.65%, the lowest level after 2004. The linear tread line shows a steady tendency but yet declining. Even though steady, real interest rate is predicted to have a positive impact in NPL level and declining tendency is predicted to decrease the NPL level.
1999 2000 2001 2002 2003 2004 2005 2006 2007 2008 2009 2010 2011 2012
Nonperforming Loan in % 9,80 10,70 7,40 4,60 4,20 2,30 3,10 3,40 6,60 10,5014,0018,8022,5023,50
0,00
5,00
10,00
15,00
20,00
25,00
Nonperforming Loan in %
1999 2000 2001 2002 2003 2004 2005 2006 2007 2008 2009 2010 2011 2012
Real Interest Rate in % 16,40 17,04 15,65 11,62 10,53 5,43 9,28 10,73 11,84 8,30 10,01 9,05 9,16 7,65
0,00
5,00
10,00
15,00
20,00
Real Interest Rate in %
312
MACROECONOMIC DETERMINANTS OF NONPERFORMING LOANS IN ALBANIAN BANKING SYSTEM
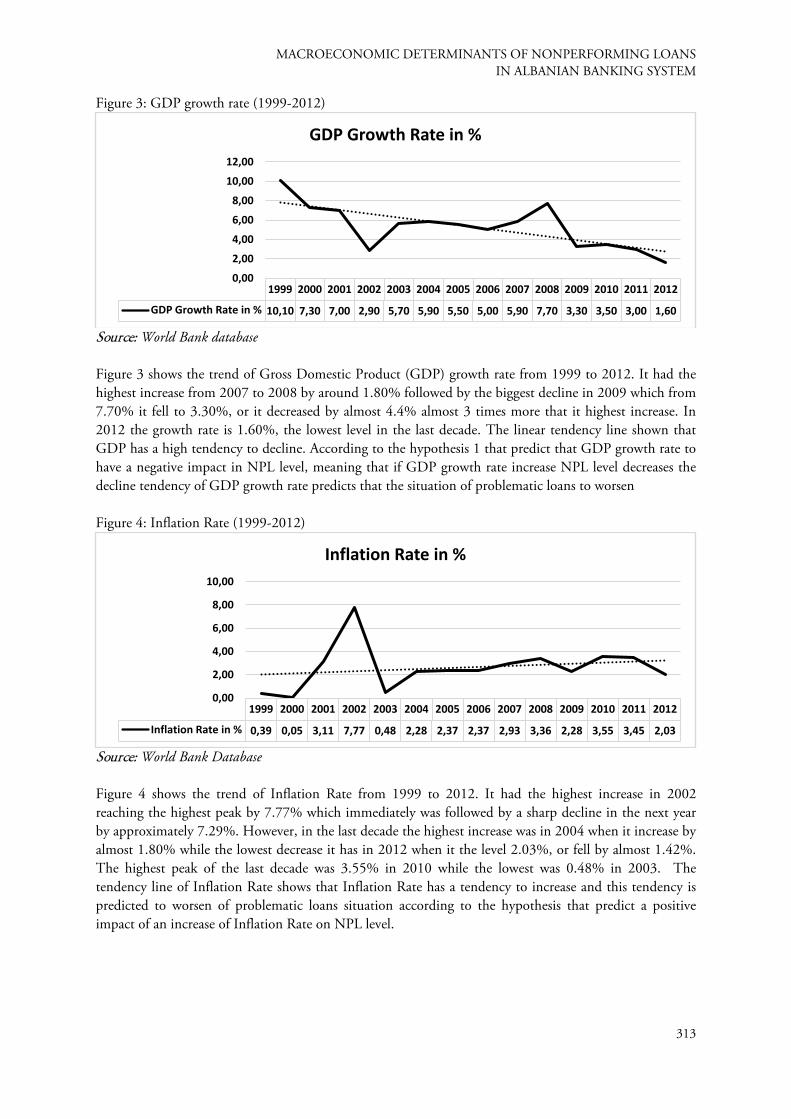
Figure 3: GDP growth rate (1999-2012)
Source: World Bank database Figure 3 shows the trend of Gross Domestic Product (GDP) growth rate from 1999 to 2012. It had the highest increase from 2007 to 2008 by around 1.80% followed by the biggest decline in 2009 which from 7.70% it fell to 3.30%, or it decreased by almost 4.4% almost 3 times more that it highest increase. In 2012 the growth rate is 1.60%, the lowest level in the last decade. The linear tendency line shown that GDP has a high tendency to decline. According to the hypothesis 1 that predict that GDP growth rate to have a negative impact in NPL level, meaning that if GDP growth rate increase NPL level decreases the decline tendency of GDP growth rate predicts that the situation of problematic loans to worsen Figure 4: Inflation Rate (1999-2012)
Source: World Bank Database Figure 4 shows the trend of Inflation Rate from 1999 to 2012. It had the highest increase in 2002 reaching the highest peak by 7.77% which immediately was followed by a sharp decline in the next year by approximately 7.29%. However, in the last decade the highest increase was in 2004 when it increase by almost 1.80% while the lowest decrease it has in 2012 when it the level 2.03%, or fell by almost 1.42%. The highest peak of the last decade was 3.55% in 2010 while the lowest was 0.48% in 2003. The tendency line of Inflation Rate shows that Inflation Rate has a tendency to increase and this tendency is predicted to worsen of problematic loans situation according to the hypothesis that predict a positive impact of an increase of Inflation Rate on NPL level.
1999 2000 2001 2002 2003 2004 2005 2006 2007 2008 2009 2010 2011 2012
GDP Growth Rate in % 10,10 7,30 7,00 2,90 5,70 5,90 5,50 5,00 5,90 7,70 3,30 3,50 3,00 1,60
0,00
2,00
4,00
6,00
8,00
10,00
12,00
GDP Growth Rate in %
1999 2000 2001 2002 2003 2004 2005 2006 2007 2008 2009 2010 2011 2012
Inflation Rate in % 0,39 0,05 3,11 7,77 0,48 2,28 2,37 2,37 2,93 3,36 2,28 3,55 3,45 2,03
0,00
2,00
4,00
6,00
8,00
10,00
Inflation Rate in %
313
2nd International Conference on Economic and Social Studies 2014
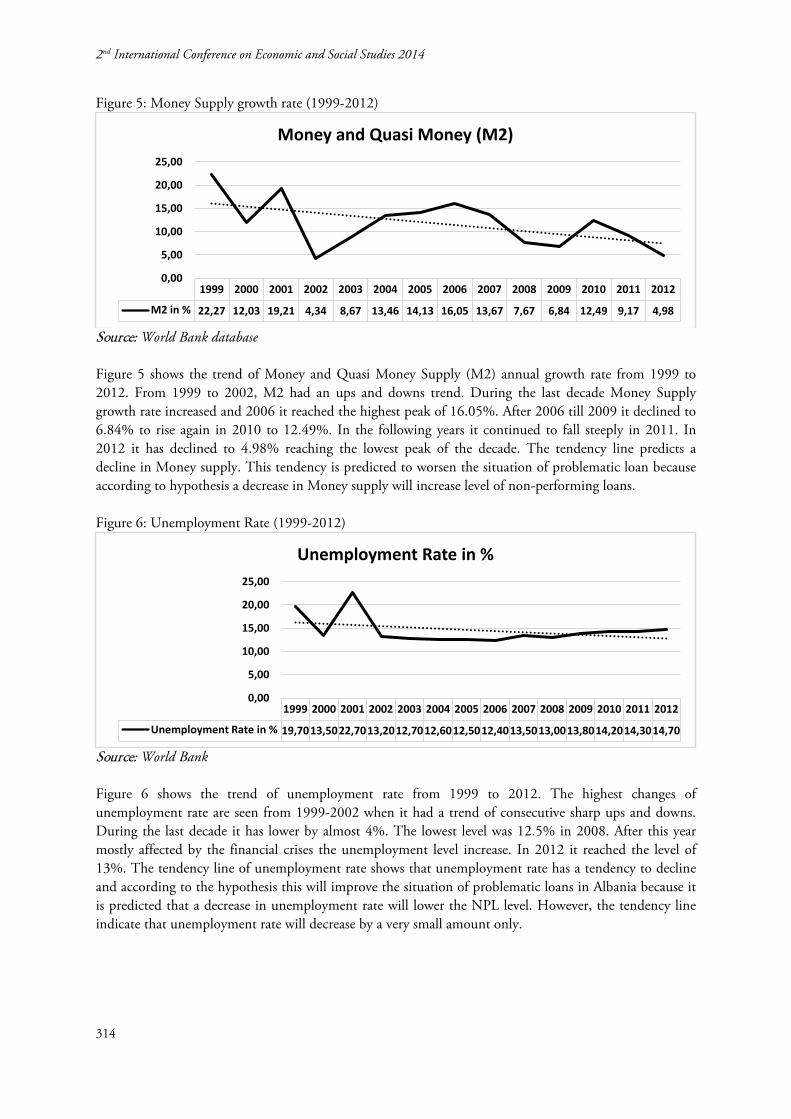
Figure 5: Money Supply growth rate (1999-2012)
Source: World Bank database Figure 5 shows the trend of Money and Quasi Money Supply (M2) annual growth rate from 1999 to 2012. From 1999 to 2002, M2 had an ups and downs trend. During the last decade Money Supply growth rate increased and 2006 it reached the highest peak of 16.05%. After 2006 till 2009 it declined to 6.84% to rise again in 2010 to 12.49%. In the following years it continued to fall steeply in 2011. In 2012 it has declined to 4.98% reaching the lowest peak of the decade. The tendency line predicts a decline in Money supply. This tendency is predicted to worsen the situation of problematic loan because according to hypothesis a decrease in Money supply will increase level of non-performing loans. Figure 6: Unemployment Rate (1999-2012)
Source: World Bank Figure 6 shows the trend of unemployment rate from 1999 to 2012. The highest changes of unemployment rate are seen from 1999-2002 when it had a trend of consecutive sharp ups and downs. During the last decade it has lower by almost 4%. The lowest level was 12.5% in 2008. After this year mostly affected by the financial crises the unemployment level increase. In 2012 it reached the level of 13%. The tendency line of unemployment rate shows that unemployment rate has a tendency to decline and according to the hypothesis this will improve the situation of problematic loans in Albania because it is predicted that a decrease in unemployment rate will lower the NPL level. However, the tendency line indicate that unemployment rate will decrease by a very small amount only.
1999 2000 2001 2002 2003 2004 2005 2006 2007 2008 2009 2010 2011 2012
M2 in % 22,27 12,03 19,21 4,34 8,67 13,46 14,13 16,05 13,67 7,67 6,84 12,49 9,17 4,98
0,00
5,00
10,00
15,00
20,00
25,00
Money and Quasi Money (M2)
1999 2000 2001 2002 2003 2004 2005 2006 2007 2008 2009 2010 2011 2012
Unemployment Rate in % 19,7013,5022,7013,2012,7012,6012,5012,4013,5013,0013,8014,2014,3014,70
0,00
5,00
10,00
15,00
20,00
25,00
Unemployment Rate in %
314
MACROECONOMIC DETERMINANTS OF NONPERFORMING LOANS IN ALBANIAN BANKING SYSTEM
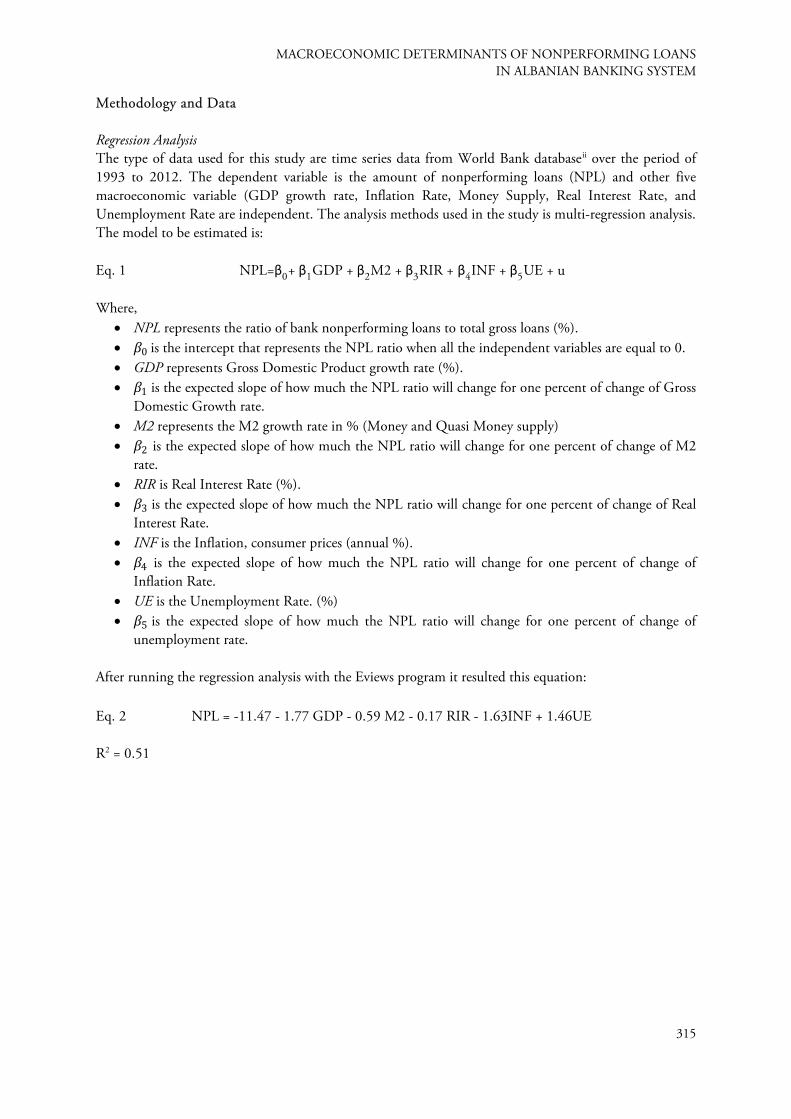
Methodology and Data Regression Analysis The type of data used for this study are time series data from World Bank databaseii over the period of 1993 to 2012. The dependent variable is the amount of nonperforming loans (NPL) and other five macroeconomic variable (GDP growth rate, Inflation Rate, Money Supply, Real Interest Rate, and Unemployment Rate are independent. The analysis methods used in the study is multi-regression analysis. The model to be estimated is: Eq. 1 NPL=β0+ β1GDP + β2M2 + β3RIR + β4INF + β5UE + u Where,
• NPL represents the ratio of bank nonperforming loans to total gross loans (%). • 𝛽𝛽0 is the intercept that represents the NPL ratio when all the independent variables are equal to 0. • GDP represents Gross Domestic Product growth rate (%). • 𝛽𝛽1 is the expected slope of how much the NPL ratio will change for one percent of change of Gross
Domestic Growth rate. • M2 represents the M2 growth rate in % (Money and Quasi Money supply) • 𝛽𝛽2 is the expected slope of how much the NPL ratio will change for one percent of change of M2
rate. • RIR is Real Interest Rate (%). • 𝛽𝛽3 is the expected slope of how much the NPL ratio will change for one percent of change of Real
Interest Rate. • INF is the Inflation, consumer prices (annual %). • 𝛽𝛽4 is the expected slope of how much the NPL ratio will change for one percent of change of
Inflation Rate. • UE is the Unemployment Rate. (%) • 𝛽𝛽5 is the expected slope of how much the NPL ratio will change for one percent of change of
unemployment rate. After running the regression analysis with the Eviews program it resulted this equation: Eq. 2 NPL = -11.47 - 1.77 GDP - 0.59 M2 - 0.17 RIR - 1.63INF + 1.46UE R2 = 0.51
315
2nd International Conference on Economic and Social Studies 2014
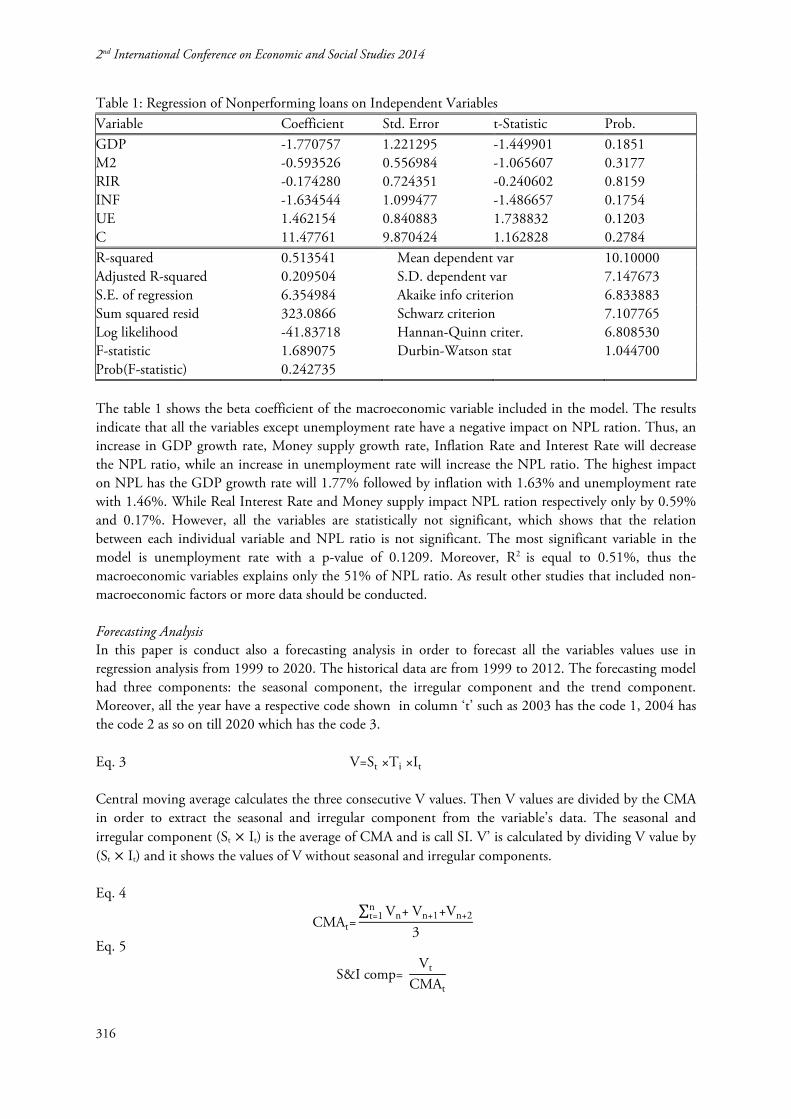
Table 1: Regression of Nonperforming loans on Independent Variables Variable Coefficient Std. Error t-Statistic Prob. GDP -1.770757 1.221295 -1.449901 0.1851 M2 -0.593526 0.556984 -1.065607 0.3177 RIR -0.174280 0.724351 -0.240602 0.8159 INF -1.634544 1.099477 -1.486657 0.1754 UE 1.462154 0.840883 1.738832 0.1203 C 11.47761 9.870424 1.162828 0.2784 R-squared 0.513541 Mean dependent var 10.10000 Adjusted R-squared 0.209504 S.D. dependent var 7.147673 S.E. of regression 6.354984 Akaike info criterion 6.833883 Sum squared resid 323.0866 Schwarz criterion 7.107765 Log likelihood -41.83718 Hannan-Quinn criter. 6.808530 F-statistic 1.689075 Durbin-Watson stat 1.044700 Prob(F-statistic) 0.242735 The table 1 shows the beta coefficient of the macroeconomic variable included in the model. The results indicate that all the variables except unemployment rate have a negative impact on NPL ration. Thus, an increase in GDP growth rate, Money supply growth rate, Inflation Rate and Interest Rate will decrease the NPL ratio, while an increase in unemployment rate will increase the NPL ratio. The highest impact on NPL has the GDP growth rate will 1.77% followed by inflation with 1.63% and unemployment rate with 1.46%. While Real Interest Rate and Money supply impact NPL ration respectively only by 0.59% and 0.17%. However, all the variables are statistically not significant, which shows that the relation between each individual variable and NPL ratio is not significant. The most significant variable in the model is unemployment rate with a p-value of 0.1209. Moreover, R2 is equal to 0.51%, thus the macroeconomic variables explains only the 51% of NPL ratio. As result other studies that included non-macroeconomic factors or more data should be conducted. Forecasting Analysis In this paper is conduct also a forecasting analysis in order to forecast all the variables values use in regression analysis from 1999 to 2020. The historical data are from 1999 to 2012. The forecasting model had three components: the seasonal component, the irregular component and the trend component. Moreover, all the year have a respective code shown in column ‘t’ such as 2003 has the code 1, 2004 has the code 2 as so on till 2020 which has the code 3. Eq. 3 V=St ×Ti ×It Central moving average calculates the three consecutive V values. Then V values are divided by the CMA in order to extract the seasonal and irregular component from the variable’s data. The seasonal and irregular component (St × It) is the average of CMA and is call SI. V’ is calculated by dividing V value by (St × It) and it shows the values of V without seasonal and irregular components. Eq. 4
CMAt=∑ Vn+ Vn+1+Vn+2
nt=1
3
Eq. 5
S&I comp= Vt
CMAt
316
MACROECONOMIC DETERMINANTS OF NONPERFORMING LOANS IN ALBANIAN BANKING SYSTEM
Eq. 6
V'=V
St×It
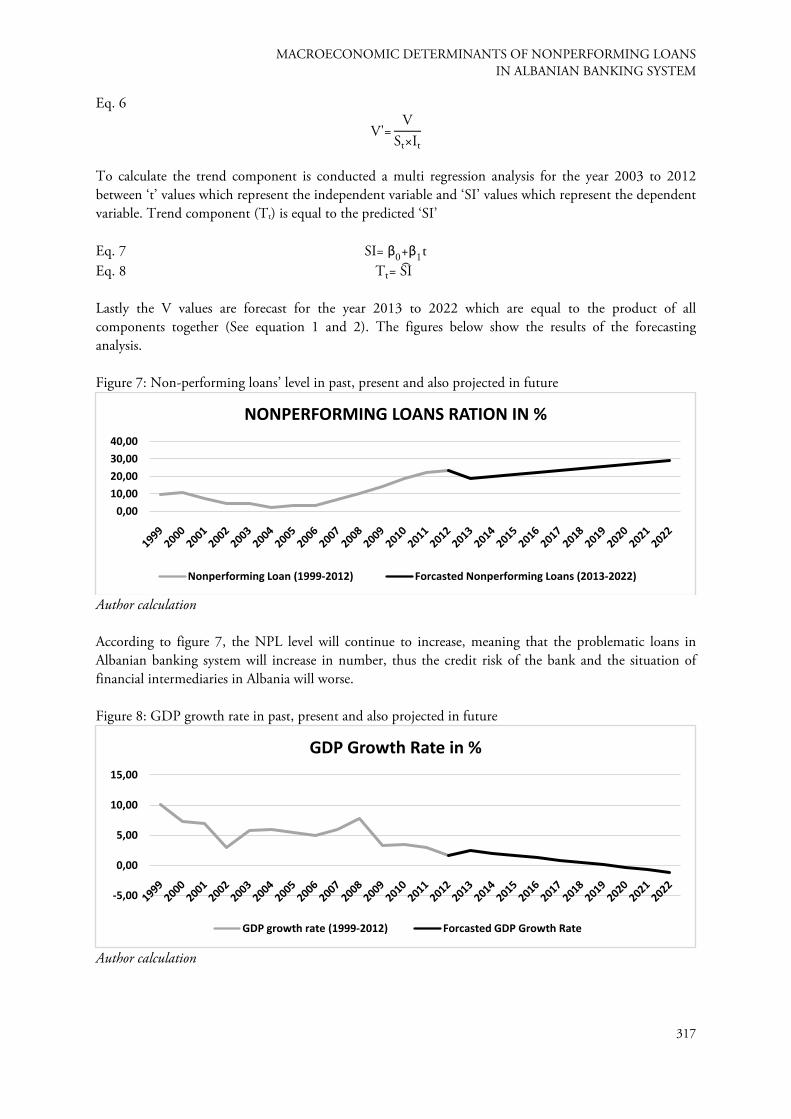
To calculate the trend component is conducted a multi regression analysis for the year 2003 to 2012 between ‘t’ values which represent the independent variable and ‘SI’ values which represent the dependent variable. Trend component (Tt) is equal to the predicted ‘SI’ Eq. 7 SI= β0+β1t Eq. 8 Tt= SI� Lastly the V values are forecast for the year 2013 to 2022 which are equal to the product of all components together (See equation 1 and 2). The figures below show the results of the forecasting analysis. Figure 7: Non-performing loans’ level in past, present and also projected in future
Author calculation According to figure 7, the NPL level will continue to increase, meaning that the problematic loans in Albanian banking system will increase in number, thus the credit risk of the bank and the situation of financial intermediaries in Albania will worse. Figure 8: GDP growth rate in past, present and also projected in future
Author calculation
0,0010,0020,0030,0040,00
NONPERFORMING LOANS RATION IN %
Nonperforming Loan (1999-2012) Forcasted Nonperforming Loans (2013-2022)
-5,00
0,00
5,00
10,00
15,00
GDP Growth Rate in %
GDP growth rate (1999-2012) Forcasted GDP Growth Rate
317
2nd International Conference on Economic and Social Studies 2014
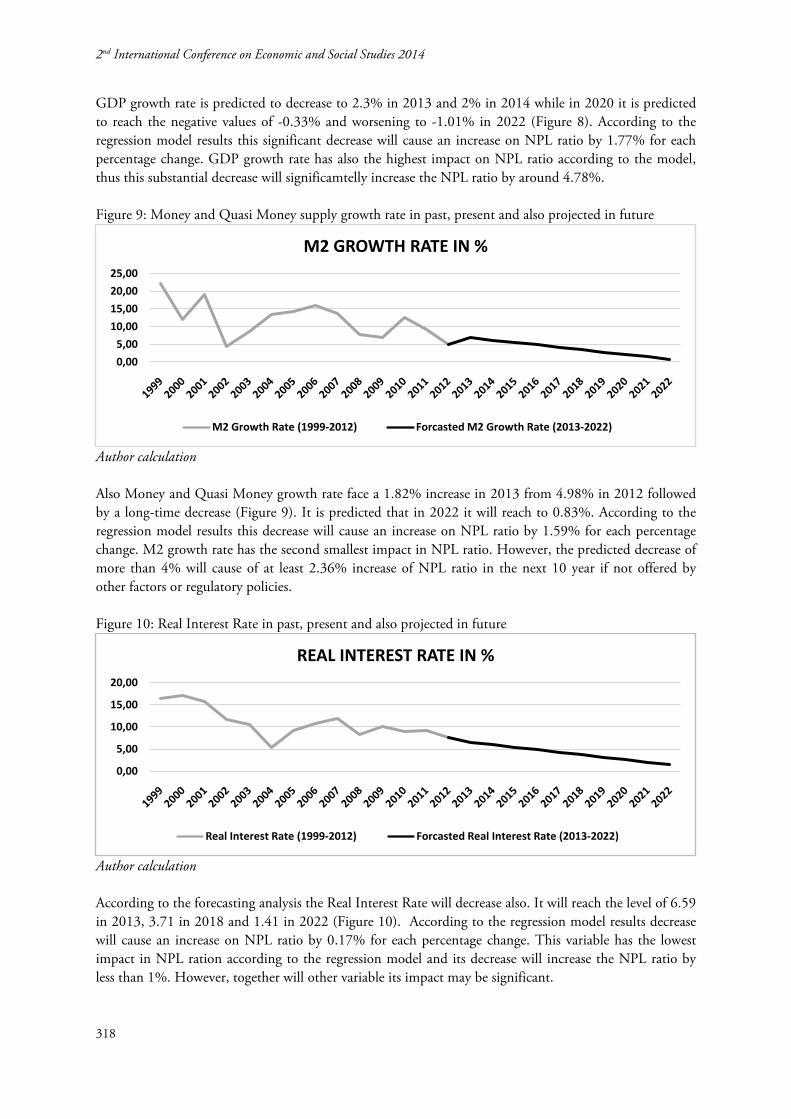
GDP growth rate is predicted to decrease to 2.3% in 2013 and 2% in 2014 while in 2020 it is predicted to reach the negative values of -0.33% and worsening to -1.01% in 2022 (Figure 8). According to the regression model results this significant decrease will cause an increase on NPL ratio by 1.77% for each percentage change. GDP growth rate has also the highest impact on NPL ratio according to the model, thus this substantial decrease will significamtelly increase the NPL ratio by around 4.78%. Figure 9: Money and Quasi Money supply growth rate in past, present and also projected in future
Author calculation Also Money and Quasi Money growth rate face a 1.82% increase in 2013 from 4.98% in 2012 followed by a long-time decrease (Figure 9). It is predicted that in 2022 it will reach to 0.83%. According to the regression model results this decrease will cause an increase on NPL ratio by 1.59% for each percentage change. M2 growth rate has the second smallest impact in NPL ratio. However, the predicted decrease of more than 4% will cause of at least 2.36% increase of NPL ratio in the next 10 year if not offered by other factors or regulatory policies. Figure 10: Real Interest Rate in past, present and also projected in future
Author calculation According to the forecasting analysis the Real Interest Rate will decrease also. It will reach the level of 6.59 in 2013, 3.71 in 2018 and 1.41 in 2022 (Figure 10). According to the regression model results decrease will cause an increase on NPL ratio by 0.17% for each percentage change. This variable has the lowest impact in NPL ration according to the regression model and its decrease will increase the NPL ratio by less than 1%. However, together will other variable its impact may be significant.
0,005,00
10,0015,0020,0025,00
M2 GROWTH RATE IN %
M2 Growth Rate (1999-2012) Forcasted M2 Growth Rate (2013-2022)
0,00
5,00
10,00
15,00
20,00
REAL INTEREST RATE IN %
Real Interest Rate (1999-2012) Forcasted Real Interest Rate (2013-2022)
318
MACROECONOMIC DETERMINANTS OF NONPERFORMING LOANS IN ALBANIAN BANKING SYSTEM
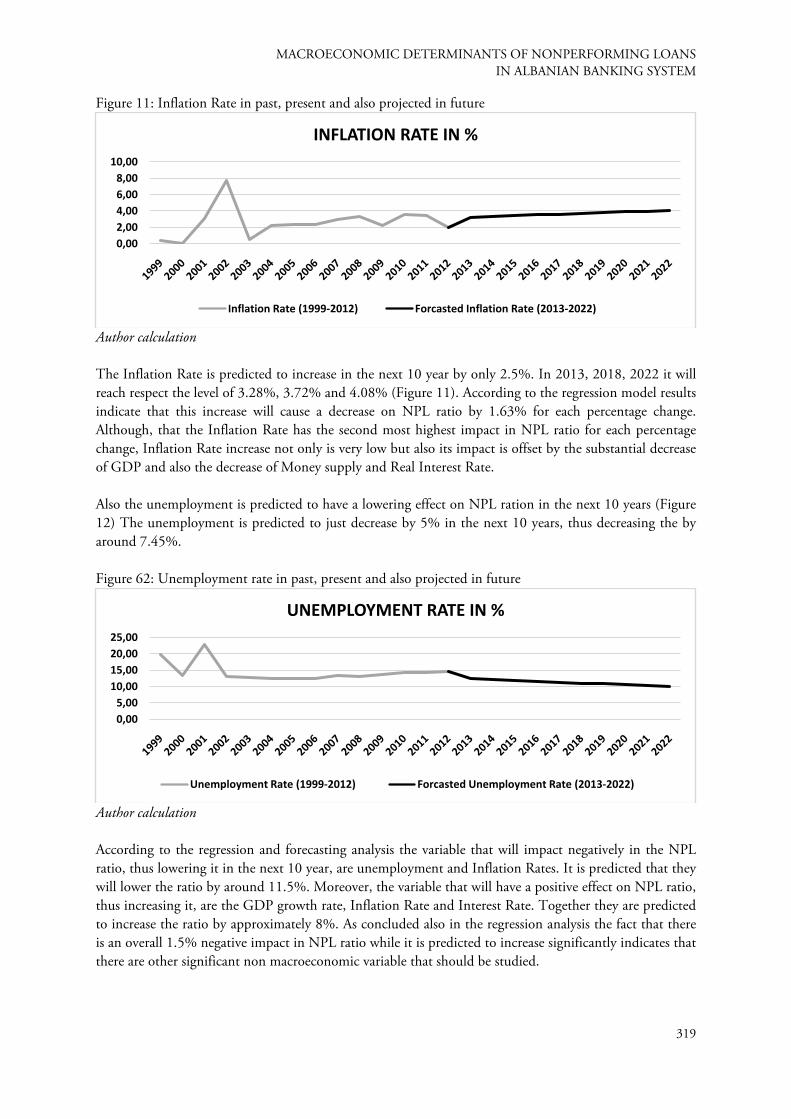
Figure 11: Inflation Rate in past, present and also projected in future
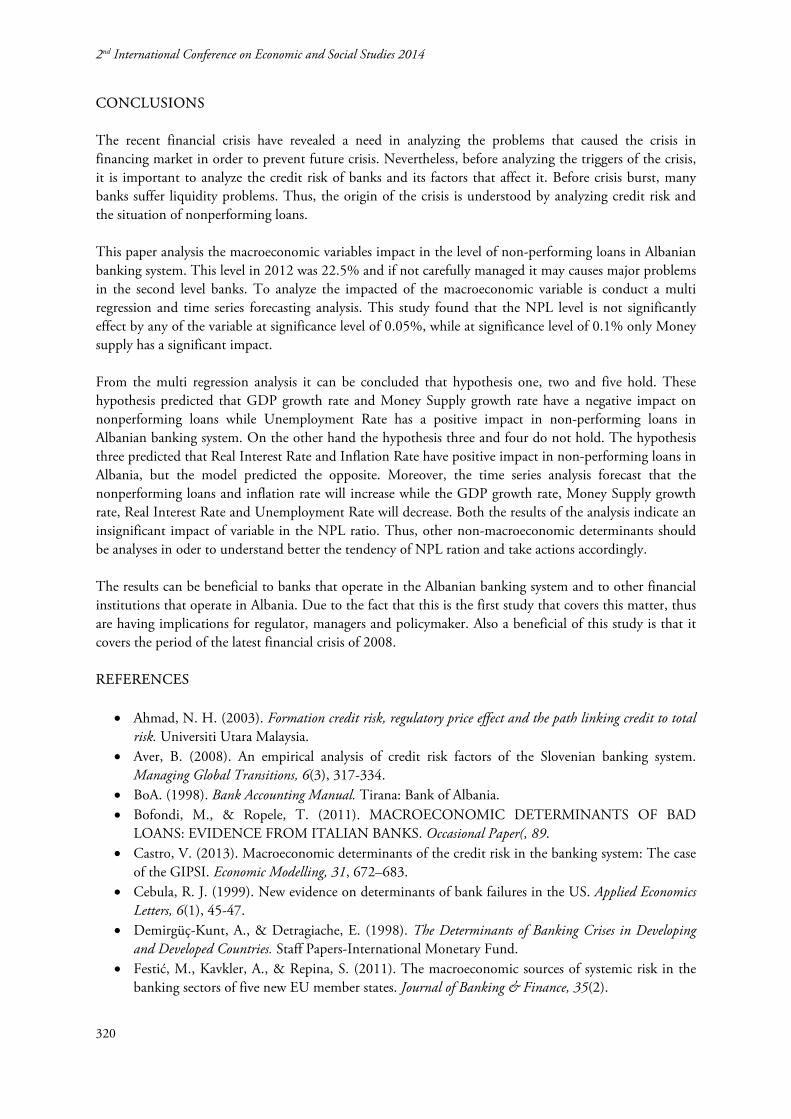
Author calculation The Inflation Rate is predicted to increase in the next 10 year by only 2.5%. In 2013, 2018, 2022 it will reach respect the level of 3.28%, 3.72% and 4.08% (Figure 11). According to the regression model results indicate that this increase will cause a decrease on NPL ratio by 1.63% for each percentage change. Although, that the Inflation Rate has the second most highest impact in NPL ratio for each percentage change, Inflation Rate increase not only is very low but also its impact is offset by the substantial decrease of GDP and also the decrease of Money supply and Real Interest Rate. Also the unemployment is predicted to have a lowering effect on NPL ration in the next 10 years (Figure 12) The unemployment is predicted to just decrease by 5% in the next 10 years, thus decreasing the by around 7.45%. Figure 62: Unemployment rate in past, present and also projected in future
Author calculation According to the regression and forecasting analysis the variable that will impact negatively in the NPL ratio, thus lowering it in the next 10 year, are unemployment and Inflation Rates. It is predicted that they will lower the ratio by around 11.5%. Moreover, the variable that will have a positive effect on NPL ratio, thus increasing it, are the GDP growth rate, Inflation Rate and Interest Rate. Together they are predicted to increase the ratio by approximately 8%. As concluded also in the regression analysis the fact that there is an overall 1.5% negative impact in NPL ratio while it is predicted to increase significantly indicates that there are other significant non macroeconomic variable that should be studied.
0,002,004,006,008,00
10,00
INFLATION RATE IN %
Inflation Rate (1999-2012) Forcasted Inflation Rate (2013-2022)
0,005,00
10,0015,0020,0025,00
UNEMPLOYMENT RATE IN %
Unemployment Rate (1999-2012) Forcasted Unemployment Rate (2013-2022)
319
2nd International Conference on Economic and Social Studies 2014
CONCLUSIONS The recent financial crisis have revealed a need in analyzing the problems that caused the crisis in financing market in order to prevent future crisis. Nevertheless, before analyzing the triggers of the crisis, it is important to analyze the credit risk of banks and its factors that affect it. Before crisis burst, many banks suffer liquidity problems. Thus, the origin of the crisis is understood by analyzing credit risk and the situation of nonperforming loans. This paper analysis the macroeconomic variables impact in the level of non-performing loans in Albanian banking system. This level in 2012 was 22.5% and if not carefully managed it may causes major problems in the second level banks. To analyze the impacted of the macroeconomic variable is conduct a multi regression and time series forecasting analysis. This study found that the NPL level is not significantly effect by any of the variable at significance level of 0.05%, while at significance level of 0.1% only Money supply has a significant impact. From the multi regression analysis it can be concluded that hypothesis one, two and five hold. These hypothesis predicted that GDP growth rate and Money Supply growth rate have a negative impact on nonperforming loans while Unemployment Rate has a positive impact in non-performing loans in Albanian banking system. On the other hand the hypothesis three and four do not hold. The hypothesis three predicted that Real Interest Rate and Inflation Rate have positive impact in non-performing loans in Albania, but the model predicted the opposite. Moreover, the time series analysis forecast that the nonperforming loans and inflation rate will increase while the GDP growth rate, Money Supply growth rate, Real Interest Rate and Unemployment Rate will decrease. Both the results of the analysis indicate an insignificant impact of variable in the NPL ratio. Thus, other non-macroeconomic determinants should be analyses in oder to understand better the tendency of NPL ration and take actions accordingly. The results can be beneficial to banks that operate in the Albanian banking system and to other financial institutions that operate in Albania. Due to the fact that this is the first study that covers this matter, thus are having implications for regulator, managers and policymaker. Also a beneficial of this study is that it covers the period of the latest financial crisis of 2008. REFERENCES
• Ahmad, N. H. (2003). Formation credit risk, regulatory price effect and the path linking credit to total risk. Universiti Utara Malaysia.
• Aver, B. (2008). An empirical analysis of credit risk factors of the Slovenian banking system. Managing Global Transitions, 6(3), 317-334.
• BoA. (1998). Bank Accounting Manual. Tirana: Bank of Albania. • Bofondi, M., & Ropele, T. (2011). MACROECONOMIC DETERMINANTS OF BAD
LOANS: EVIDENCE FROM ITALIAN BANKS. Occasional Paper(, 89. • Castro, V. (2013). Macroeconomic determinants of the credit risk in the banking system: The case
of the GIPSI. Economic Modelling, 31, 672–683. • Cebula, R. J. (1999). New evidence on determinants of bank failures in the US. Applied Economics
Letters, 6(1), 45-47. • Demirgüç-Kunt, A., & Detragiache, E. (1998). The Determinants of Banking Crises in Developing
and Developed Countries. Staff Papers-International Monetary Fund. • Festić, M., Kavkler, A., & Repina, S. (2011). The macroeconomic sources of systemic risk in the
banking sectors of five new EU member states. Journal of Banking & Finance, 35(2).
320
MACROECONOMIC DETERMINANTS OF NONPERFORMING LOANS IN ALBANIAN BANKING SYSTEM
• Figlewski, S., Frydman, H., & Liang, W. (2012). Modeling the effect of macroeconomic factors on corporate default and credit rating transitions. International Review of Economics & Finance, 1, 87-105.
• Fofack, H. (2005). Nonperforming loans in Sub-Saharan Africa: causal analysis and macroeconomic implications. Policy Research Working Paper Series(3769).
• Gaganis, C., Pasiouras, F., Doumpos, M., & Zopounidis, C. (2010). Modelling banking sector stability with multicriteria approaches. Optimization Letters, 4(4), 543-558.
• Gunsel, N. (2008). Micro and Macro determinants of bank fragility in North Cyprus economy. African Journal of Business Management, 6(4), 1323-1329.
• Jiménez, G., & Saurina, J. (2006). Credit Cycles, Credit Risk, and Prudential Regulation. International Journal of Central Banking, 2(2), 65-98.
• Laeven, L., & Valencia, F. (2010). Resolution of Banking Crises: The Good, the Bad, and the Ugly. International Monetary Fund.
• Llewellyn, D. (2002). An analysis of the causes of recent banking crises. The European journal of finance, 8(2), 152-175.
• Louzis, D. P., Vouldis, A. T., & Metaxas, V. L. (2012). Macroeconomic and bank-specific determinants of non-performing loans in Greece: A comparative study of mortgage, business and consumer loan portfolios. Journal of Banking & Finance, 36(4), 1012–1027.
• Salas, V., & Saurina, J. (2002). Credit Risk in Two Institutional Regimes: Spanish Commercial and Savings Banks. Journal of Financial Services Research, 22(3), 203-224.
• Thiagarajan, S., Ayyappan, S., & Ramachandran, A. (2011). Credit Risk Determinants of Public and Private Sector Banks in India. European Journal of Economics, Finance & Administrative Sciences(34), 147-154.
• Vogiazas, S. D., & Nikolaidou, E. (2011). Credit risk determinants in the Bulgarian banking system and the Greek twin crises. MIBES, 177-189.
• Zameer, S., & Siddiqi, M. W. (2010). The Impact of Exports, FDI and External Debt on Exchange Rate Volatility in Pakistan. Interdisciplinary Journal of Contemporary Research in Business, 2(7), 337-354.
• Zribi, N., & Boujelbène, Y. (2011). The factors influencing bank credit risk: The case of Tunisia. Journal of Accounting and Taxation, 3(4), 70-78.
321
2nd International Conference on Economic and Social Studies 2014
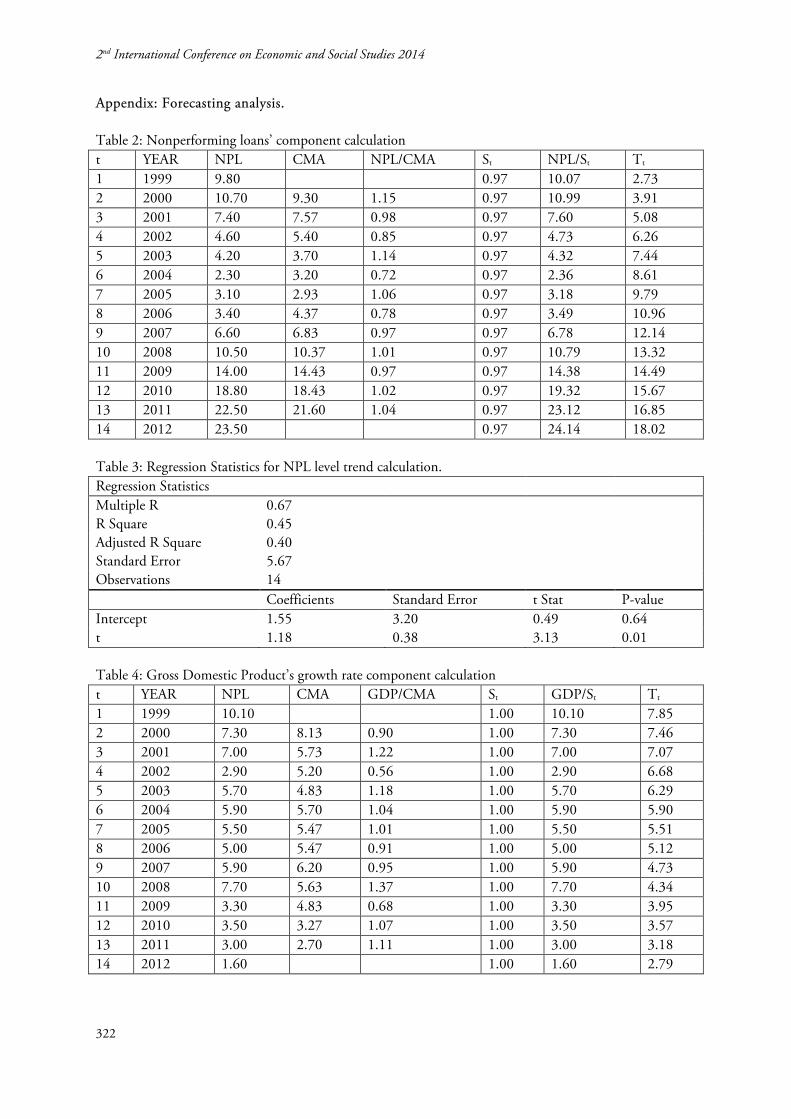
Appendix: Forecasting analysis. Table 2: Nonperforming loans’ component calculation t YEAR NPL CMA NPL/CMA St NPL/St Tt
1 1999 9.80 0.97 10.07 2.73 2 2000 10.70 9.30 1.15 0.97 10.99 3.91 3 2001 7.40 7.57 0.98 0.97 7.60 5.08 4 2002 4.60 5.40 0.85 0.97 4.73 6.26 5 2003 4.20 3.70 1.14 0.97 4.32 7.44 6 2004 2.30 3.20 0.72 0.97 2.36 8.61 7 2005 3.10 2.93 1.06 0.97 3.18 9.79 8 2006 3.40 4.37 0.78 0.97 3.49 10.96 9 2007 6.60 6.83 0.97 0.97 6.78 12.14 10 2008 10.50 10.37 1.01 0.97 10.79 13.32 11 2009 14.00 14.43 0.97 0.97 14.38 14.49 12 2010 18.80 18.43 1.02 0.97 19.32 15.67 13 2011 22.50 21.60 1.04 0.97 23.12 16.85 14 2012 23.50 0.97 24.14 18.02 Table 3: Regression Statistics for NPL level trend calculation. Regression Statistics
Multiple R 0.67 R Square 0.45 Adjusted R Square 0.40 Standard Error 5.67 Observations 14 Coefficients Standard Error t Stat P-value
Intercept 1.55 3.20 0.49 0.64 t 1.18 0.38 3.13 0.01 Table 4: Gross Domestic Product’s growth rate component calculation t YEAR NPL CMA GDP/CMA St GDP/St Tt
1 1999 10.10 1.00 10.10 7.85 2 2000 7.30 8.13 0.90 1.00 7.30 7.46 3 2001 7.00 5.73 1.22 1.00 7.00 7.07 4 2002 2.90 5.20 0.56 1.00 2.90 6.68 5 2003 5.70 4.83 1.18 1.00 5.70 6.29 6 2004 5.90 5.70 1.04 1.00 5.90 5.90 7 2005 5.50 5.47 1.01 1.00 5.50 5.51 8 2006 5.00 5.47 0.91 1.00 5.00 5.12 9 2007 5.90 6.20 0.95 1.00 5.90 4.73 10 2008 7.70 5.63 1.37 1.00 7.70 4.34 11 2009 3.30 4.83 0.68 1.00 3.30 3.95 12 2010 3.50 3.27 1.07 1.00 3.50 3.57 13 2011 3.00 2.70 1.11 1.00 3.00 3.18 14 2012 1.60 1.00 1.60 2.79
322
MACROECONOMIC DETERMINANTS OF NONPERFORMING LOANS IN ALBANIAN BANKING SYSTEM
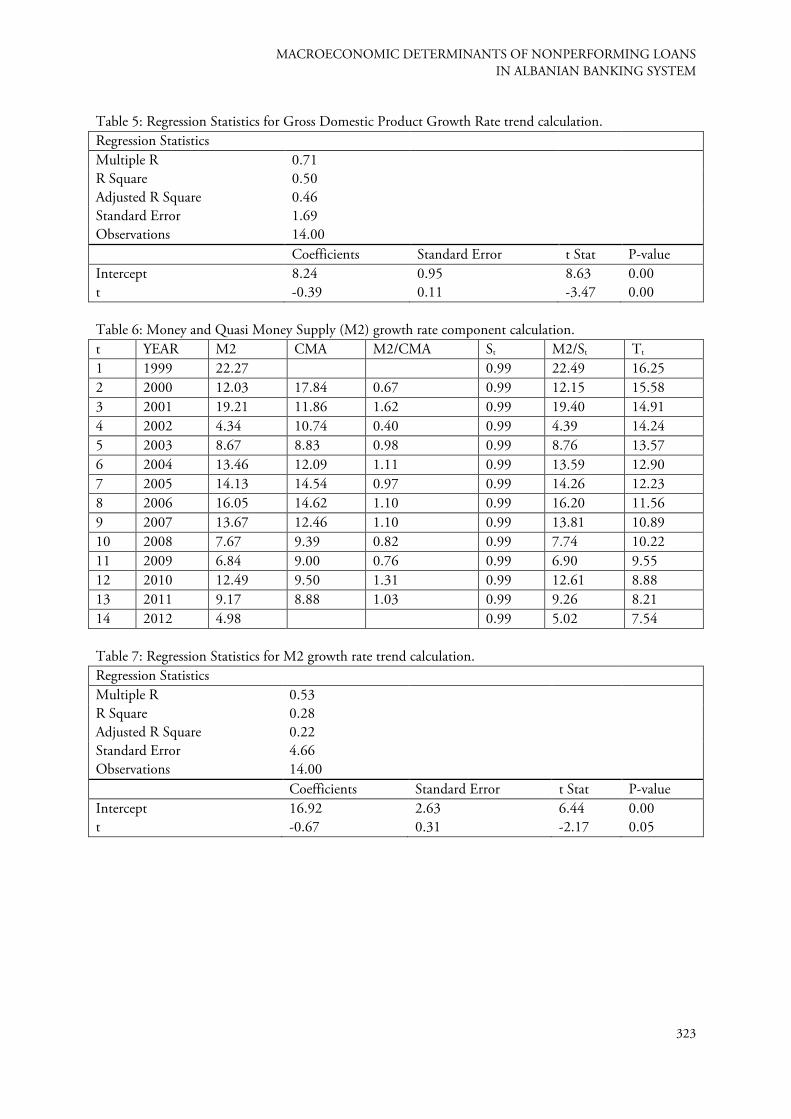
Table 5: Regression Statistics for Gross Domestic Product Growth Rate trend calculation. Regression Statistics
Multiple R 0.71 R Square 0.50 Adjusted R Square 0.46 Standard Error 1.69 Observations 14.00 Coefficients Standard Error t Stat P-value
Intercept 8.24 0.95 8.63 0.00 t -0.39 0.11 -3.47 0.00 Table 6: Money and Quasi Money Supply (M2) growth rate component calculation. t YEAR M2 CMA M2/CMA St M2/St Tt
1 1999 22.27 0.99 22.49 16.25 2 2000 12.03 17.84 0.67 0.99 12.15 15.58 3 2001 19.21 11.86 1.62 0.99 19.40 14.91 4 2002 4.34 10.74 0.40 0.99 4.39 14.24 5 2003 8.67 8.83 0.98 0.99 8.76 13.57 6 2004 13.46 12.09 1.11 0.99 13.59 12.90 7 2005 14.13 14.54 0.97 0.99 14.26 12.23 8 2006 16.05 14.62 1.10 0.99 16.20 11.56 9 2007 13.67 12.46 1.10 0.99 13.81 10.89 10 2008 7.67 9.39 0.82 0.99 7.74 10.22 11 2009 6.84 9.00 0.76 0.99 6.90 9.55 12 2010 12.49 9.50 1.31 0.99 12.61 8.88 13 2011 9.17 8.88 1.03 0.99 9.26 8.21 14 2012 4.98 0.99 5.02 7.54 Table 7: Regression Statistics for M2 growth rate trend calculation. Regression Statistics
Multiple R 0.53 R Square 0.28 Adjusted R Square 0.22 Standard Error 4.66 Observations 14.00 Coefficients Standard Error t Stat P-value
Intercept 16.92 2.63 6.44 0.00 t -0.67 0.31 -2.17 0.05
323
2nd International Conference on Economic and Social Studies 2014
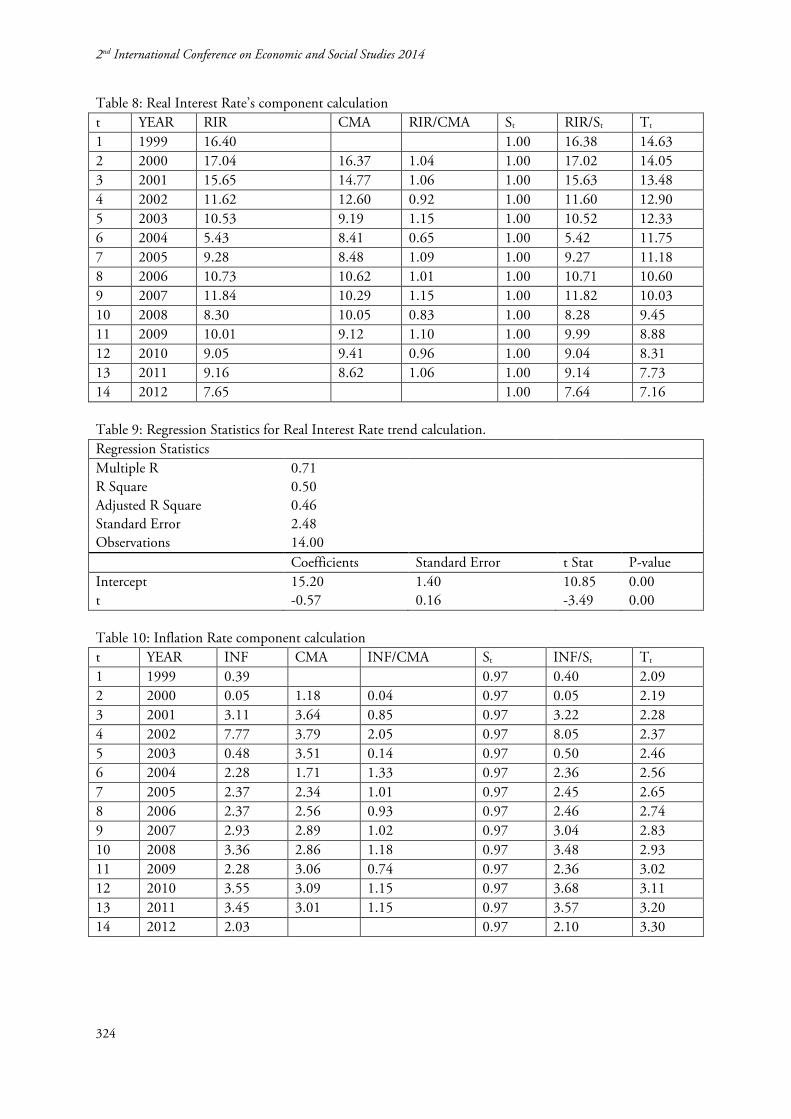
Table 8: Real Interest Rate’s component calculation t YEAR RIR CMA RIR/CMA St RIR/St Tt
1 1999 16.40 1.00 16.38 14.63 2 2000 17.04 16.37 1.04 1.00 17.02 14.05 3 2001 15.65 14.77 1.06 1.00 15.63 13.48 4 2002 11.62 12.60 0.92 1.00 11.60 12.90 5 2003 10.53 9.19 1.15 1.00 10.52 12.33 6 2004 5.43 8.41 0.65 1.00 5.42 11.75 7 2005 9.28 8.48 1.09 1.00 9.27 11.18 8 2006 10.73 10.62 1.01 1.00 10.71 10.60 9 2007 11.84 10.29 1.15 1.00 11.82 10.03 10 2008 8.30 10.05 0.83 1.00 8.28 9.45 11 2009 10.01 9.12 1.10 1.00 9.99 8.88 12 2010 9.05 9.41 0.96 1.00 9.04 8.31 13 2011 9.16 8.62 1.06 1.00 9.14 7.73 14 2012 7.65 1.00 7.64 7.16 Table 9: Regression Statistics for Real Interest Rate trend calculation. Regression Statistics
Multiple R 0.71 R Square 0.50 Adjusted R Square 0.46 Standard Error 2.48 Observations 14.00 Coefficients Standard Error t Stat P-value
Intercept 15.20 1.40 10.85 0.00 t -0.57 0.16 -3.49 0.00 Table 10: Inflation Rate component calculation t YEAR INF CMA INF/CMA St INF/St Tt
1 1999 0.39 0.97 0.40 2.09 2 2000 0.05 1.18 0.04 0.97 0.05 2.19 3 2001 3.11 3.64 0.85 0.97 3.22 2.28 4 2002 7.77 3.79 2.05 0.97 8.05 2.37 5 2003 0.48 3.51 0.14 0.97 0.50 2.46 6 2004 2.28 1.71 1.33 0.97 2.36 2.56 7 2005 2.37 2.34 1.01 0.97 2.45 2.65 8 2006 2.37 2.56 0.93 0.97 2.46 2.74 9 2007 2.93 2.89 1.02 0.97 3.04 2.83 10 2008 3.36 2.86 1.18 0.97 3.48 2.93 11 2009 2.28 3.06 0.74 0.97 2.36 3.02 12 2010 3.55 3.09 1.15 0.97 3.68 3.11 13 2011 3.45 3.01 1.15 0.97 3.57 3.20 14 2012 2.03 0.97 2.10 3.30
324
MACROECONOMIC DETERMINANTS OF NONPERFORMING LOANS IN ALBANIAN BANKING SYSTEM
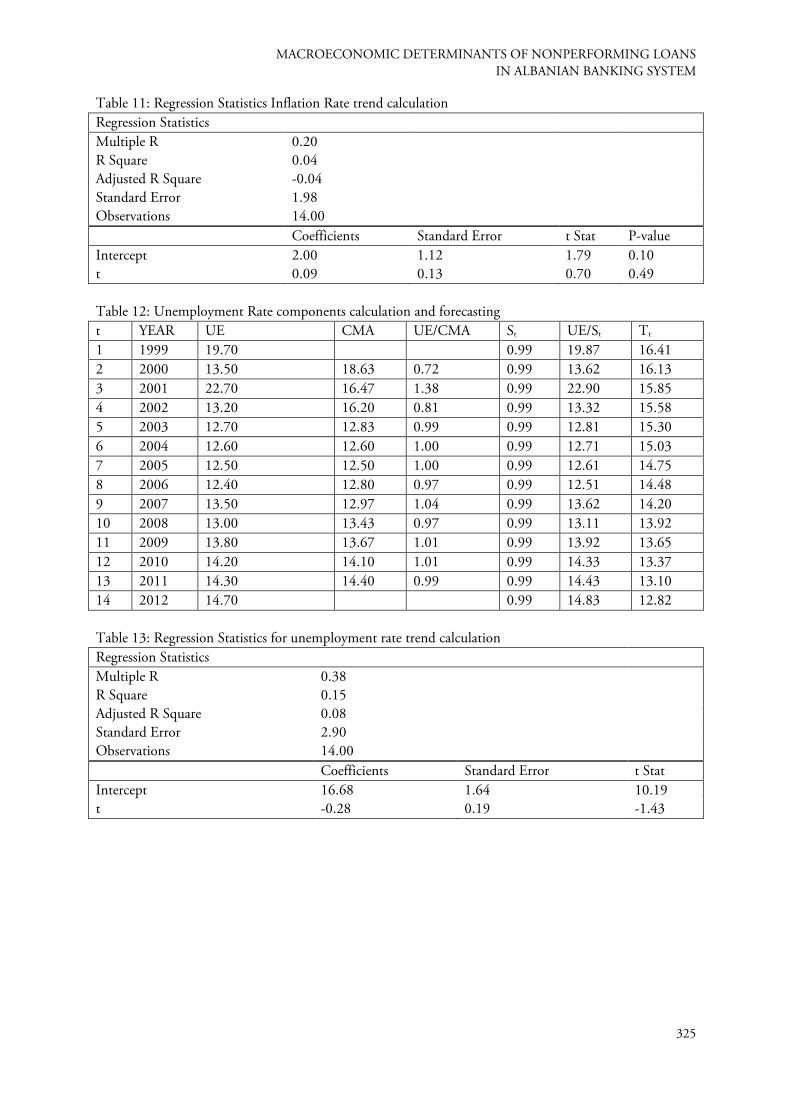
Table 11: Regression Statistics Inflation Rate trend calculation Regression Statistics
Multiple R 0.20 R Square 0.04 Adjusted R Square -0.04 Standard Error 1.98 Observations 14.00 Coefficients Standard Error t Stat P-value
Intercept 2.00 1.12 1.79 0.10 t 0.09 0.13 0.70 0.49 Table 12: Unemployment Rate components calculation and forecasting t YEAR UE CMA UE/CMA St UE/St Tt
1 1999 19.70 0.99 19.87 16.41 2 2000 13.50 18.63 0.72 0.99 13.62 16.13 3 2001 22.70 16.47 1.38 0.99 22.90 15.85 4 2002 13.20 16.20 0.81 0.99 13.32 15.58 5 2003 12.70 12.83 0.99 0.99 12.81 15.30 6 2004 12.60 12.60 1.00 0.99 12.71 15.03 7 2005 12.50 12.50 1.00 0.99 12.61 14.75 8 2006 12.40 12.80 0.97 0.99 12.51 14.48 9 2007 13.50 12.97 1.04 0.99 13.62 14.20 10 2008 13.00 13.43 0.97 0.99 13.11 13.92 11 2009 13.80 13.67 1.01 0.99 13.92 13.65 12 2010 14.20 14.10 1.01 0.99 14.33 13.37 13 2011 14.30 14.40 0.99 0.99 14.43 13.10 14 2012 14.70 0.99 14.83 12.82 Table 13: Regression Statistics for unemployment rate trend calculation Regression Statistics
Multiple R 0.38 R Square 0.15 Adjusted R Square 0.08 Standard Error 2.90 Observations 14.00 Coefficients Standard Error t Stat
Intercept 16.68 1.64 10.19 t -0.28 0.19 -1.43
325
2nd International Conference on Economic and Social Studies 2014
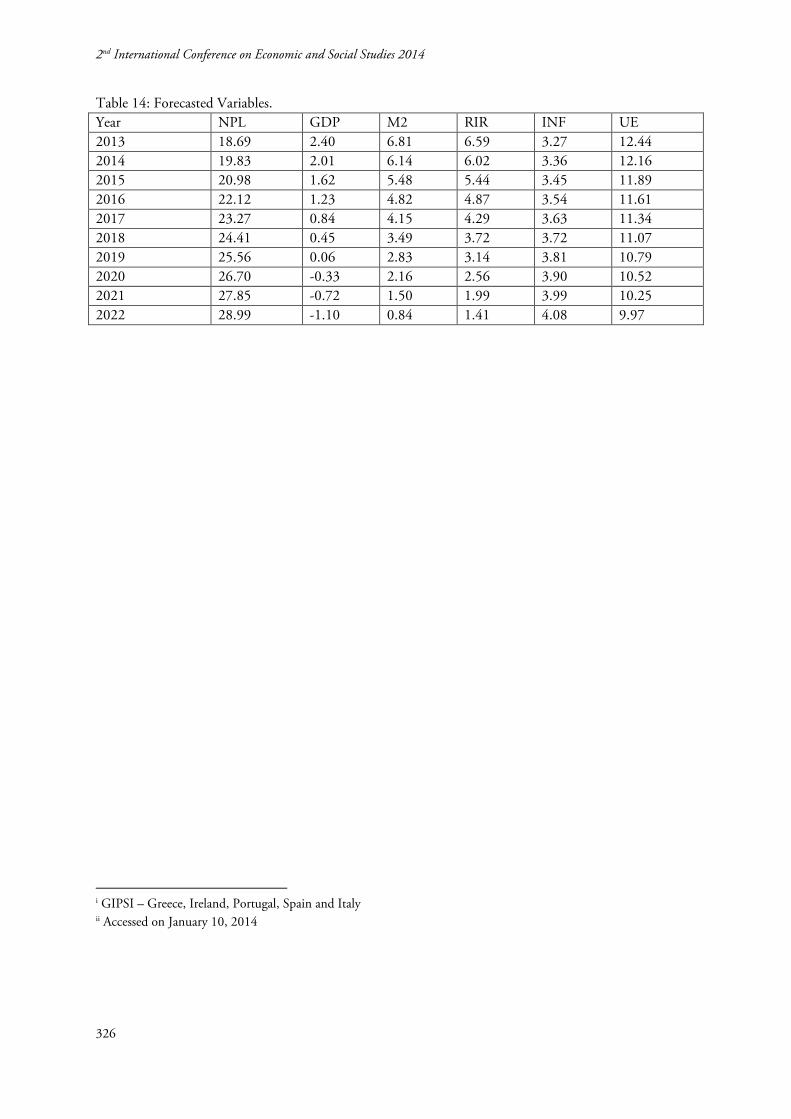
Table 14: Forecasted Variables. Year NPL GDP M2 RIR INF UE 2013 18.69 2.40 6.81 6.59 3.27 12.44 2014 19.83 2.01 6.14 6.02 3.36 12.16 2015 20.98 1.62 5.48 5.44 3.45 11.89 2016 22.12 1.23 4.82 4.87 3.54 11.61 2017 23.27 0.84 4.15 4.29 3.63 11.34 2018 24.41 0.45 3.49 3.72 3.72 11.07 2019 25.56 0.06 2.83 3.14 3.81 10.79 2020 26.70 -0.33 2.16 2.56 3.90 10.52 2021 27.85 -0.72 1.50 1.99 3.99 10.25 2022 28.99 -1.10 0.84 1.41 4.08 9.97
i GIPSI – Greece, Ireland, Portugal, Spain and Italy ii Accessed on January 10, 2014
326


