Embed Size (px)
Citation preview
M l LIMITED ST/CEPAL/Conf.59/L. 10 25 October 1976 ORIGINAL: ENGLISH
Ik mmniimttmitmmmimmiiniiHHntiiiiittiiMtiitiiitHimiHfiiHinm
C E P .A L Economic Commission for Latin America SEMINAR ON EXPORT PROMOTION POLICIES Jointly sponsored by the Economic Commission for Latin America (CEPAL), the International Bank for Reconstruction and Development (IBRD) and the United Nations Development Programme (UNDP) Santiago, Chile, 5-7 November 1976
If A 3 !
^OIR'.
t" ',
'c-
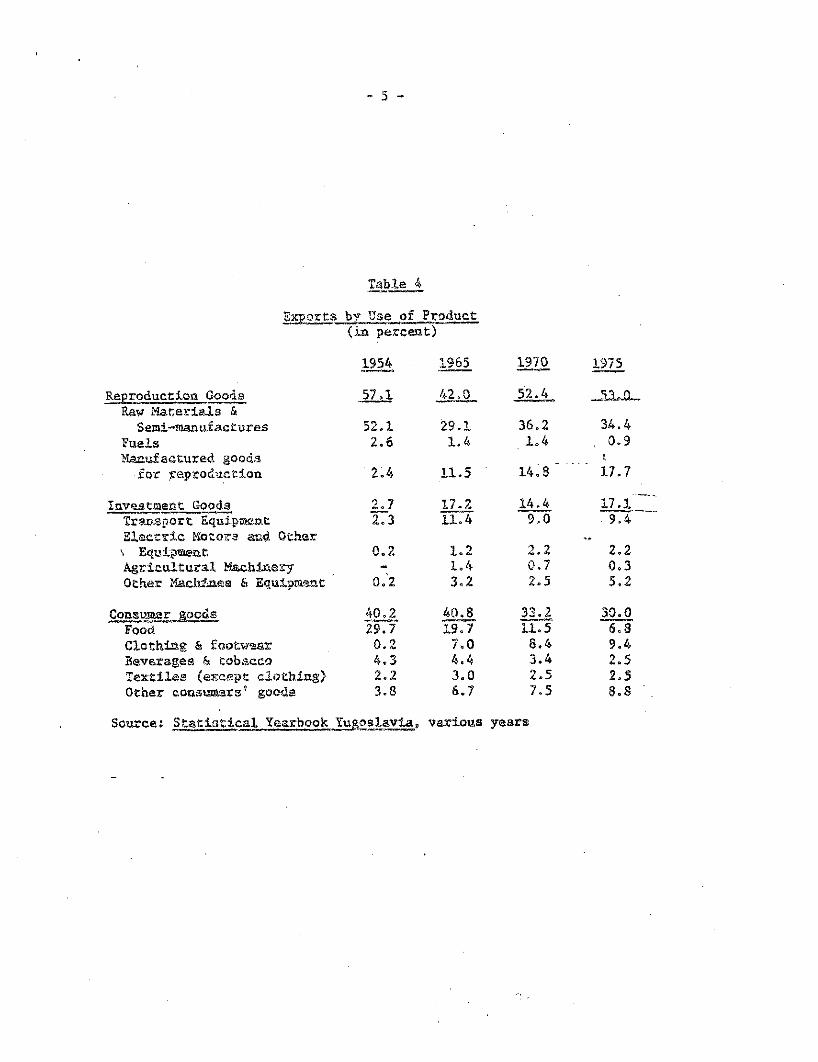
YUGOSLAVIA: COMMODITY EXPORTS AND EXPORT POLICIES
ty
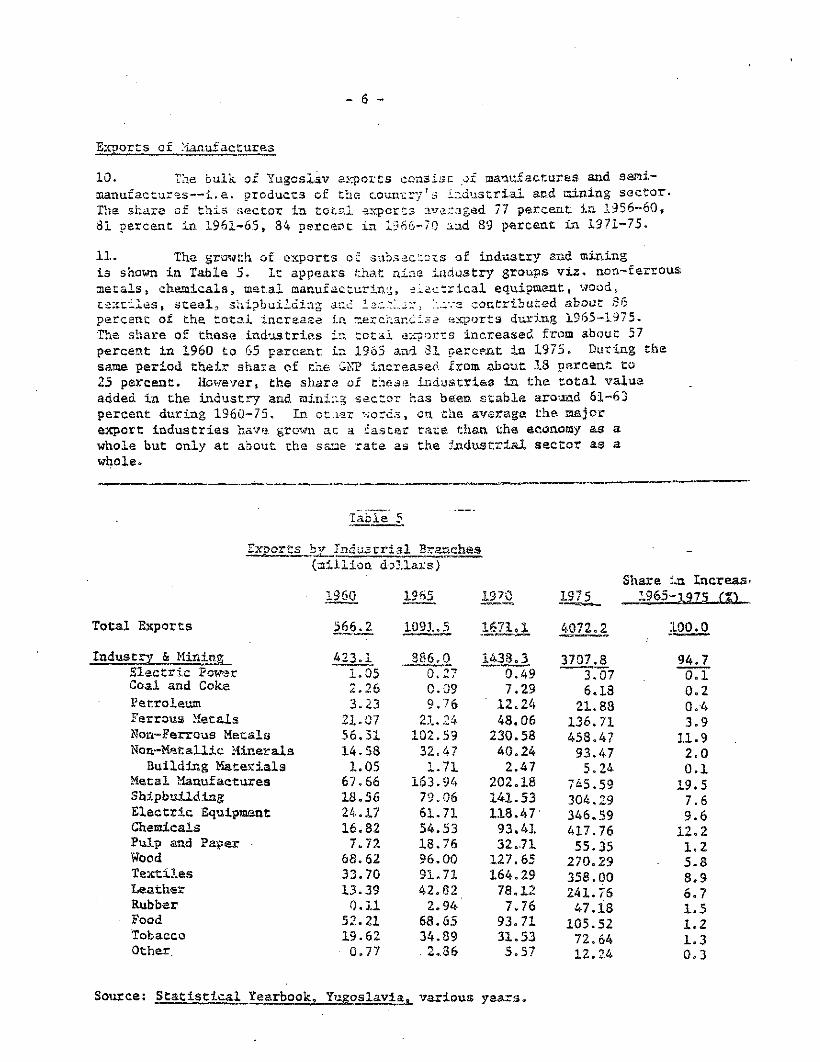
Vinod Dubey
76-10-2198-350


YUGOSLAVIA: COMMODITY EXPORTS M D EXPORT' POLICIES
by
Vlnod Dubey
October 1976
Paper"prepared for the ECLA/IBRD Conference on Export Promotion Policies
Santiago, Chile November 5 ~ 7S 1376

CONTENTS
Page
A. INTRODUCTION 1
B. THE DEVELOPMENT QF EXPORT TRADE 2
Growth of Merchandise Trade and Trade Balance 2 Growth and Cojamodity Composition of Exports 3 Exports of Manufactures 6 Export Orientation of Industry 7 Export Diversification 8 Import Dependence of Exports 9 Direction of Export Trade 10 Export Performance 12
C. EXPORT PROMOTION POLICIES 16
Development Strategy 16 General Economic Policies 16 Tariff and Trade Policy Fiscal and Credit Instruments 19 Foreign. Exchange System 20 Encouragement of Joint Ventures and Cooperation Agreements 22
Import Policies of Developed Countries 23
Do CONCLUSION 23
Tables 1 Growth of Merchandise Trade 2 Commodity Composition of Merchandise Exports 3 Structure of Exports by Degree of Manufacturing 4 Exports by Use of Product 5 Exports by Industrial Branches 6 Ratio of Exports to Value, of Production (%) 7 Import Content (Direct and Indirect) by Industrial Bras.cb.es 3 Destination of Exports by Regions 9 Regional.Distribution of Incraa&e.fxv gxpcrts 1965-70 and 1970-74 10 Growth of Export Trade, 1960-1971 .„_.. 11 " Export Growth of OECD Countries 71X9.65-73 12 Share of Yugoslavia in Total Imports,, 0ECD Europe 13 Yugoslavia and the 0ECD Countries : Percentage Increase in Exports
of Manufactures, 1965-1973 14 Nominal and Effective Tariffs by Industry 15 Import and Export Charges; 1973-74
Annex Tablas
1 Growth of Industry and Mining 2 YUGOSLAVIA: Exports of Engineering Products 1965» 1970, 1974 3 Number of Export Items of Manufactures 4 . Retention Quota Rates


October 7, 1976
1/ YUGOSLAVIA: Commodity Exports and Export Policies
A. INTRODUCTION
1. Yugoslavia has managed to combine rapid economic growth with fundamental structural institutional and social change during the last two decades. The annual growth of real GNP has averaged about 6 percent with constant price value added in manufacturing and saining increasing at around 10 percent par year.
2. The Yugoslav growth experience cannot ba fully appreciated or understood without viewing it in the contest of the development of the unique Yugoslav economic system characterised by workers self-management and increased decentralization of decision makiag. Unfortunate this fascinating evolution fro® a centrally administered orthodox communis system and its implications cannot be discussed here—only its relevance i indicated.
3. Any discussion of export experience and export promotion in Yugoslavia should, ideally, discuss development strategy, general trade and balance of payments policies and particularly the relation of imports and export. This task is not attempted in this paper which concentrates mainly on exports of manufactures. Only incidental remarks on the broader and related issues are made where necessary.
Section B of the paper presents a quick review of the development experience in export trade. Section C outlines the export promotion policies of the country. Section D presents the conclusions.
1/ The views expressed are those of the author and not necessarily those, of the World Bank.

B« THE DEVELOPMENT OF EXPORT TRAM
Growth of Merchandise Trade- and Trade Balance
5. Yugoslavia's merchandise trade has grown, rapidly during the last two decades, with an acceleration in the rate of growth in current values during the recent years of high international inflation.
Tab3 e 1
Growth of Marchandise Trada
1954 1965 1970 1975
Value (Current US$ millions)
Growth Rate <J)__ 1954-65 1965-75
Exports 240.4 1091.5 1679,1 4072.2 14.7 14.0 Imports 339*4 1288.0 2874,0 7696,7 12.9 19.6 Experts as % of Imports 71 85 58 53
Indices 1/
Export Volurae 100 329 434 555 11.4 ' 5.,4 Export Prices 100 138 161 • 305 3,0 8,2 Import Volume. 1/ 100 312 609 807 10.9 9,9 Import Prices 100 122 139 281 1.9 8.7
1/ Index of exports and imports ia. currant dollars deflated by the index of export and inport prices respectively.
Source: Statistical Yearbook, Yugoslavia? various years
The growth of imports has exceeded that of experts and the ratio of the value of exports to that, of imports has declined sharply after 1965, The rapidly increasing merchandise trade gap has been, mat partly by workers' remittances and tourism receipts {which were growing rapidly till the recant.world recession and amounted to §2.2 billion in 1974). During 1954-65 the growth of exports aad imports was largely the result of increase in volumes. During the last decade the increase in export volume has declined sharply.
- 3 -
6, The rapid growth of foreign trade shows that Yugoslavia is a relatively open economy. The ratio of merchandise trade to GDP was around 35 percent in 1965., 33 percent in 1970 and 45 percent in 1974. The reliance on trade is high given the country's size and per capita incoae. 1/
Growth aad Commodity Coigposition of Exports
7. The rapid growth of merchandise exports hag been, accompanied by changes in the commodity composition in line with the development of the economy. The importance of agricultural goods has declined -ar.d the relative share of manufactures (SITC 5-8) in total exports has more than doubled (Table 2). Within manufactures the increase in the share of machinery and equipment (SITC 7) is particularly noteworthy.
Table 2
Commodity Composition of Merchandise Exports (in percent)
195^-56 1964-66 1369-70 1975
SITC
0+1+4 33.0 26.4 19.3 11,8
2 27.6 10,7 9.6 6.9
3 1.2 1.4 0,7 0,7
5+6+7+8 37,5 61.4 70.4 80^4
5 4.8 5,1 6.0 9,3
6 26.6 22.9 29,5 29.0
7 3.3 21.7 21.6 28.1
3 2,8 11,7 13,2 14,0
9 0.1 0.1 0,1 ~ 0.3
Source; Yugoslavia 1945-64 sad Statistical Yearbook, Yugoslavia, various issues.
1/ U.N.B.C.E. Economic Bulletin for Europe, Volume 21, No, 1, "Trade Dependence in European Countries, 1953 to 1967".
3. The Impact of domestic economic development on the structure of exports is also seen in the shift away frcra exporting raw materials towards simply processed senl-manufactures and highly processed manufactures, (Table 3)
Table 3
Structure of Exports by Degras oz Manufacturing
(in percent)
• 1954-56
Raw Materials 38
Simply Processed Materials and Semi Manufactures 45
Highly Processed Manufactures 17
Source: Yugoslavia 1945-64, and Statistical Yearbook Yugoslavia, 1975
1964-66 1969-70 3.975
12 .
35 34 28
51 54 63
The bulk of the change in this direction at tha- highly aggregated level of this classification,, would sppea? to "hava occurred by 1965» However,, significant shift towards mere coop1er, products have occurred within the group of "highly processed œanufasCures", for example the increased importance of machinery and transport equipment noted in paragraph 7.
9. A slightly diffsrent classification of the composition of exports~"by use of prQduct,f-also broadly exhibits tha nature of structural changes la the economy (Table 4). Again it would appear that at a broad level of aggregation (investment goods, intermediates aad consumer goods) significant chasge had occurred by 1965« However» within these broad groups change towards more complas: and sophisticated items has continued since then.
- 5 -
Table 4
Exports by Use of Product (in percent)
1954 1965 1970 1975
Reproduction Goods 5? .1 42. Q 52.4 Raw Materials &
Semi-manufactures 52.1 29.1 36.2 34.4 Fuels 2.6 1.4 1.4 , 0.9 Manufactured goods I
•for reproduction 2.4 11.5 • 14.8" ' 17.7
Investment Goods 2 J 17»2 14.4 17,1 Transport Equipment 2. e 3 11.4 9,0 9,4 Electric Motors sad Ofchar s Equipment: 0.2 1.2 2.2 2.2 Agricultural Machinery - 1.4 0.7 0.3 Other Jfachlaes & Equipment 0.2 3.2 2.5 5.2
Consumer goods 40.2 40.8 33.2 30.0 Food 29.7 19.7 11.5 6c 8 Clothing & footwsar 0,2 7.0 8.4 9.4 Beverages k tobacco 4.3 4.4 3.4 2.5 Textiles (except clothing) <4* * 3 3.0 2.5 2.5 Other cousisasrs' goods 3.8 6.7 7.5 8.8 ' .
Source: Statistical Yearbook Yugoslavia,, various years
- 6 -
Exports of Manufactures
10. The bulk of Yugoslav exports consist pi manufactures and semi-manufactures—i.e. products of the. country's industrial and aining sector. The share of this sector in total exports averaged 77 percent in 1956-60, 81 percent in 1961-65, 84 percent in 1966-70 and 89 percent ia 1971-75.
11. The growth of exports of subsactors of industry and mining is shown in Table 5. It appears that nine industry groups vis. non-ferrous metals, chemicals, metal manufacturing, electrical equipment, wood, textiles, steel, shipbuilding and leaser, h-va contributed about 86 percent of the total increase in aerchancise exports during 1965-1975. The share of these industries in. total exports increased from about 57 percent in 1960 to 65 percent in 1965 and 81 percent in 1975. During the same period their share of the GNP increased from about 18 percent to 25 percent. However, the share of tr.esa industries ia the total value added in the industry and mining sector has beien stable around 61-63 percent during 1960-75, In other words, on the average tha major export industries have, grown, at a faster rate, than the economy as a whole but only at about the saiae. rate as the industrial sector as a whole.
Table 5
Exports by Industrial Branchas (million dollars)
Share in Increase 1960 1965 1320 1975_ 1965-jQ75fr>
Total Exports 566. .1 1091. r-j 1671» A 4072, _2 100. JO
Industry & Mining 423. . X. 886. 0. 1438. 3 3707. 8 94. ,7 Electric Power X « .05 0, 27 0. 49 3. 07 0. 1 Coal and Coke 2, . 26 0. 09 7. 23 6, 18 0. 2 Petroleum 3. .23 9. 76 12. 24 21. 88 0. 4 Ferrous Metals 21. ,07 21. 24 48. 06 136. 71 3. 9 Non-Ferrous Metals 56, ,51 102. 59 230. 58 .458. 47 11. 9 Non-Metallic Minerals 14. ,58 32. 47 40. 24 93. 47 2. 0
Building Materials 1« ,05 1. 71 2. 47 5. 24 0. 1 Metal Manufactures 67, ,66 153. 94 202. 18 745. 59 19. 5 Shipbuilding 18, ,56 79. 06 141. 53 304. 29 7. 6 Electric Equipment 24. .17 61. 71 118. 47 346. 59 9. 6 Chemicals 16. ,82 54. 53 QU y-j* 41 417. 76 12. 2 Pulp and Paper • 7, ,72 18. 76 33-« 71 55. 35 1. 2 Wood 68. .62 96. 00 127. 65 270. 29 5. 8 Textiles 33. ,70 91. 71 164. 29 358. 00 8. 9 Leather 13. ,39 42. 82 78. 12 241. 76 6. 7 Rubber 0. ,11 2. 94 7. 76 47. 18 1. 5 • Food 52, ,21 68. 65 93. 71 105. 52 1. 2 Tobacco 19. .62 34. 89 31. 53 72. 64 1. 3 Other. 0, ,77 , 2. .36 5. 57 12. 24 0. 3
Source: Statistical Yearbook, Yugoslavia, various years.

_ 7 -
12. Certain aspects of the growth experience of the different branches of industry are presented in Annex Table 1 with a viaw to indicating the 'distinguishing characteristics of the major exporting industries. First, the major export industries tend to be characterised by lower capital intensity. Both capital output and capital labour ratios are lower than average for these industries. Non-ferrous metals and stael—two resource based industries—stand out among the export industries tor their relative capital intensity. Secondly, the major export industries include both slow growing traditional industries like textiles, leather and wood manufacturing as well as new, rapidly growing ones like chemicals and electrical equipment. Thirdly, the major export industries include industries which have experienced rapid as well as some (e.g. textiles, leather and aecal manufactures) with low growth and stagnation in productivity as indicated by trends'in value added and production per worker. These comments•indicate that.the successful export experience of different branches has to be explained not in general terms but in terms of specific industry situations,, market relations and the impact of export policy,
Export Orientation of Industry
13. The export orientation of industry as a whole has not changed significantly over the lae'c decade (Table 6",,
-Table 6
• Ratio of ..Ex5?> orts to Value of Production (Currant Prises and Zy, ;change Races)
1965 1970 1973
Industry & Mining 13.3 11.3 12.1
Major Export Industries 17.3 15.0 17.1 Non ferrous metals 3377 28.2 23.9 Chemicals 12.3 9.7 14.0 Metal Manufactures 14,9 9.1 13.3 Electrical Equipment 19.4 15.5 22,2 Wood 25.0 15.6 22.3 Textiles 11.5 12.5 12.1 Ferrous Metals 4.7 8.3 10,3 Shipbuilding 62.2 56.2 44,6 Leather 22,3 23,8 24.5
Other Industries 6.7 4.9 3.6 Pulp and Fapar 11.8 10.7 10.9 Non metallic minerals 24.5 "17.5 16.5 Food 6.3 4.4 2,8 Rubber 4.5 6,5 7.4 Petroleum 6.0 4.0 2.0 Coal and Coke 0.5 2.7 1.6 Tobacco 24.5 19.0 10.1 Electric Power - . 0.1 0.4 Building Materials Q.3 0.7 0.5
Source". Calculated from data in Stratistlcal Yearbook, Yugoslavia, various years.

There is some indication that with rapid increase in personal incomes, in line with deliberate policy, after the Economic Reform of 1965 and the subsequent inflationary pressures, there was a greater absorption of production in the domestic, market. The drop in the share of exports in value of production for a number of major export-industries, e.g. chemicals, metal manufactures, electrical equipment and wood manufactures during the boom year of 1970 is suggestive. There is a secular decline in the share of exports in the case of non-ferrous metals and non-metallic minerals (as they are increasingly processed to a higher degree within the country), and because of domestic consumption in the case of tobacco and processed food.
14. It is also evident from the Table 6 that if the major export industries were defined not in terms of their contribution to export growth during 1965-1975, but in terms of their export orientation, pulp and paper, non-metallic minerals and tobacco would also be included in the group. On that definition only the obviously inssobile industries (e.g. building materials and electric power) and clearly import substituting industries (e.g. petroleum and rubber products) would remain outside the group of major export industries. This only serves to underline the relative outward looking pattern of Yugoslav development.
Export Diversification
15. A striking feature of the development of export trade has been the increased diversification and the vary wide range of manufactured . products that are exported. Annex Table 2 shows the growth of exports of engineering goods. Alsoa Annex Table 3 shows the rapid growth in the number of products of manufacturing (defined at the seven digit SITC level) that are exported. The extremely wide range of export commodities should have contributed to greater stability in export trade relative to countries with a high degree of concentration of exports on a few commodities. In fact the growth of exports has fluctuated widely both because of international and domestic economic factors. The average annual increase in the value of merchandise exports was 14 percent during 1965-1975s but the growth rate ranged from about 1 percent in 1968 to over 33 percent in 1974. 1J
If It is noteworthy that the export volume increased by about 3 percent in 1968 and by less than 1 percent in 1974. The growth of export volume during 1965-75 ranged between 0,8 percent in 1974 and 17.5 percent in 1972.
- 9 -
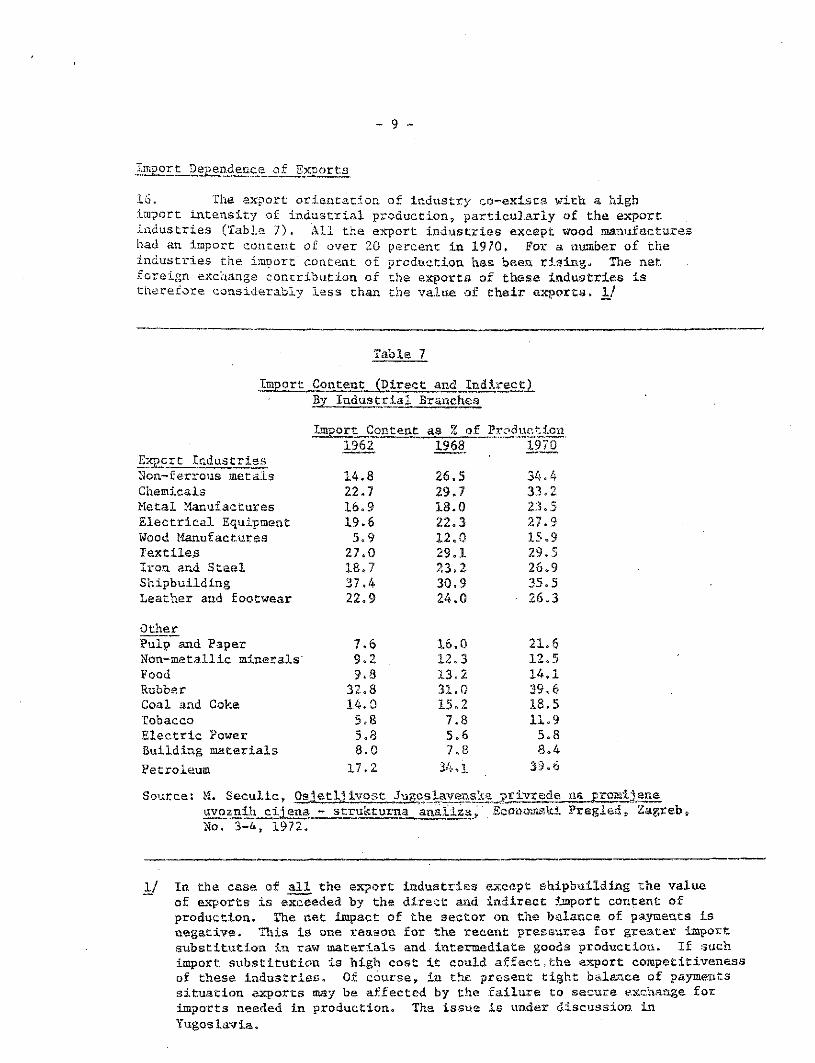
Import Dependence of Exports
16. The export orientation of industry co-exists with a high import intensity of industrial production, particularly of the export industries (Table 7). All the export industries except wood manufactures had an import concent of over 20 percent in 1970. For a number of the industries the import' content of production has been rising. The net foreign exchange contribution of the exports of these industries is therefore considerably less than the value of their exports. Ij
Table 7
Import Content (Direct and Indirect) By Industrial Branches
Import Content as % of Production 1962 1968 1970
Export Industries Non-ferrous metals 14,8 26,5 34.4 Chemicals 22.7 29.7 33,2. Metal Manufactures 16.9 18.0 23,5 Electrical Equipment 19.6 22,3 27.2 Wood Manufactures 5,9 12,0 15.9 Textiles 27.0 29.1 29,5 Iron and Steel 18,7 23.2 26.9 Shipbuilding 37.4 30.9 35,5 Leather and footwear 22.9 24,0 • 26.3
Other Pulp and Paper 7.6 16,0 ¿ J» «> i? Non-metallic minerals' 9.2 12.3 12.5 Food 9.8 13.2 14,1 Rubber 32.8 31,0 39,6 Coal and Coke 14.0 15.2 18,5 Tobacco 5.8 7.8 11.9 Electric Power 5.8 5.6 5.8 Building materials 8.0 7.8 8.4 Petroleum 17.2 34,1 39. ó
Source: M. Seculic, Osjetlj ivost Jugoslavenskaprivrede na prosai jene uvoznlh cilena - strukturna analiza» Eeonomski Pregled. Zagreb, No. 3-4, 1972.
1/ In the case of all the export industries except shipbuilding the value of exports is exceeded by the direct and indirect import content of production. The net impact of the sector on the balance of payments is negative. This is one reason for the recent pressures for greater import substitution in raw materials and intermediate goods production. If such import substitution is high cost it could affect,the export competitiveness of these industries. Of course, in the present tight balance of payments situation exports may be affected by the. failure to secure exchange for imports needed in production. The issue Is under discussion in Yugoslavia.
- 10 «
Direction of Export Trade
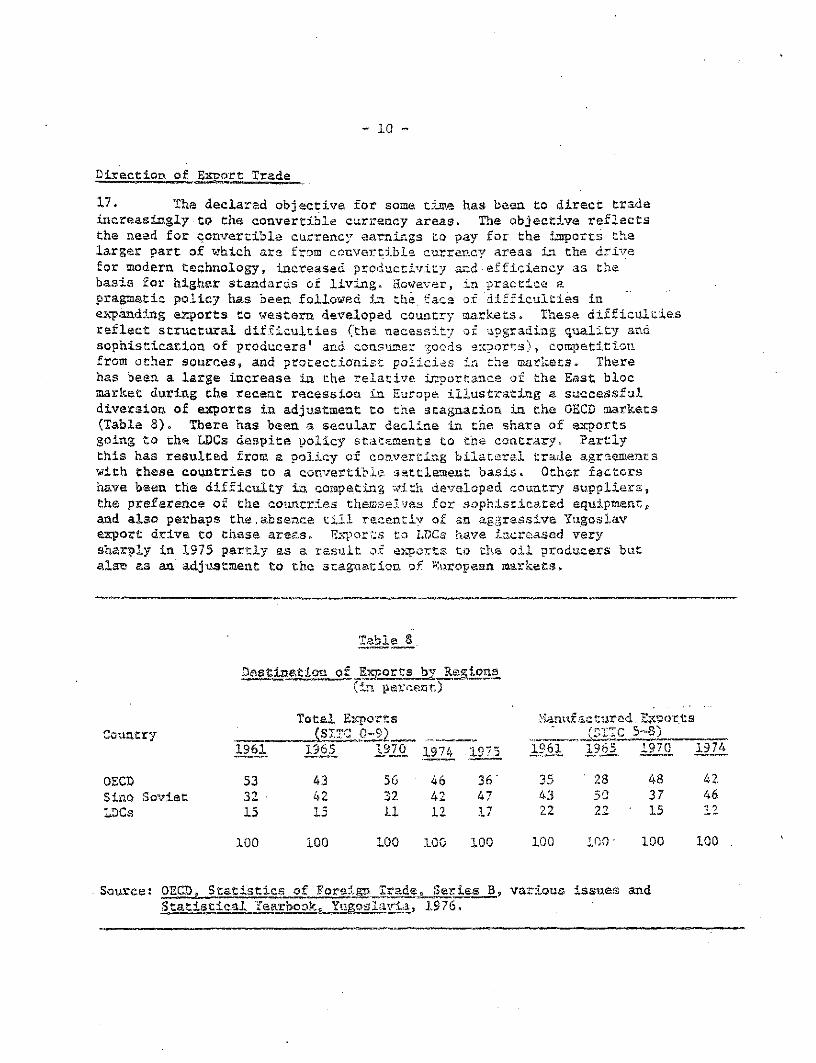
17. The declared objective for some time has been to direct trade increasingly to the convertible currency areas. The objective reflects the need for convertible currency earnings to pay for the imports the larger part of which are from convertible currency areas in. the drive for modern technology, increased productivity and efficiency as'the basis for higher standards of living. However, in practice a pragmatic policy has been followed in the face of "difficulties in expanding exports to western developed country markets. These difficulties reflect structural difficulties (the necessity of upgrading quality and sophistication of producers® and consumer goods exports), competition from other sources, and protectionist, policies in the markets. There has been a large increase in the relative importance of the East bloc market during the recant recession in Europe illustrating a successful diversion of exports in adjustment to the stagnation in the GECB markets (Table 8). There has been a secular decline in the share of exports going to the LDCs despite policy statements to the contrary« Partly this has resulted from a policy of converting bilateral trade agraemenfcs with these countries to a convertible settlement basis. Other factors have been the d i f f iculty in competing with developed country suppliers, the preference of the countries theieselvss for sophisticated equipments, and also perhaps the,absence till recently of an aggressive Yugoslav export drive to these areas. Exports to LDCs have increased very sharply in 1975 partly as of exports to the oil producers but ala-e as an adjustment to the stagnation of European markets.
Table -3
Destination of Exports by Ragions (in percent)
Total Exports Manufactured. Exports Country (ST.TC 0--9) f rTTr 5-8) Country
1961 1965 1970 1974 . 1975 1961 1965 1970 1974
OECD 53 43 56 46 36' 35 ' 28 48 42 Sino Soviet 32 • 42 32 42 47 43 50 37 46 LDCs 15 15 11 12 17 22 22 ' 15
100 100 100 100 100 100 100 • 100 100
Source: OECD, Statistics of Foreign Trade „ Series 3, various issues and Statistical Year! iookjlfugos. lavi-i, IS 76.

- 11 -
1 3 . E f f o r t s to penetrate the OECD market were especially successful during 1965-1970 (Table 9). During this period about four-fifths of the increase in total exports and three-fourths of the increase in manufactured goods exports vent to the OECD countries. The relative share of the OECD market in the increase of both total and manufactured goods exports declined sharply during 1970-74 to lass than half the proportion in 1965-1970. The decline' reflects the increasing difficulty Yugoslavia faced in selling to the convertible currency areas during the recession and the marginal nature of .aany of Yugoslav exports to the OECD countries.
Table 9
. Distribution of Increase in Exports 1965-70 and 1970-74 (in percent)
Share in Increase 1965 - 1970 . 1970 - 1974
Region S ITC 0-9
SITC 5-8
SITC 0-9
SITC 5-8
ÛECB • 81 76 39. .... . 37
Sino-Soviet 15 19 49 52
LDCs 4 5 12 11
.100 100 .100 100
Source: QECD, Statistics of Foreign Iradag Series B„ various issues.

Export Performance
Yugoslavia's export grovth is compared to that of other groups of countries in Table 10. It is evident that during the 1960's Yugoslavia's exports have increased faster than those of developed market economies and the fast growing exporters of manufactures among developing countries. The relationship was reversed during 1970-73. 1/ However given differences in commodity composition and in the country distribution of exports such aggregative comparisons are of Halted value as indicators of export performance.
Table 10
Growth of Export Trade, 1960-1973 (percent per annum)
I960 - 1970 1970 - 1973
Yugoslavia . 11.5 . 19.2
Developed Market Economies 10.1 22.0
Socialist economies -8.3 20.3
Developing Countries . 7.2 23.2
Major fast-growing exporters of manufactures 9.7 31.0
Source: UN,Review of International Trade and Development, 1975
1/ In fact the slowdown in the export growth rate of Yugoslavia started before 1970. The growth rate of exports was 14 percent in 1960-1965 and 9 percent in 1965-1970.
- 13 -
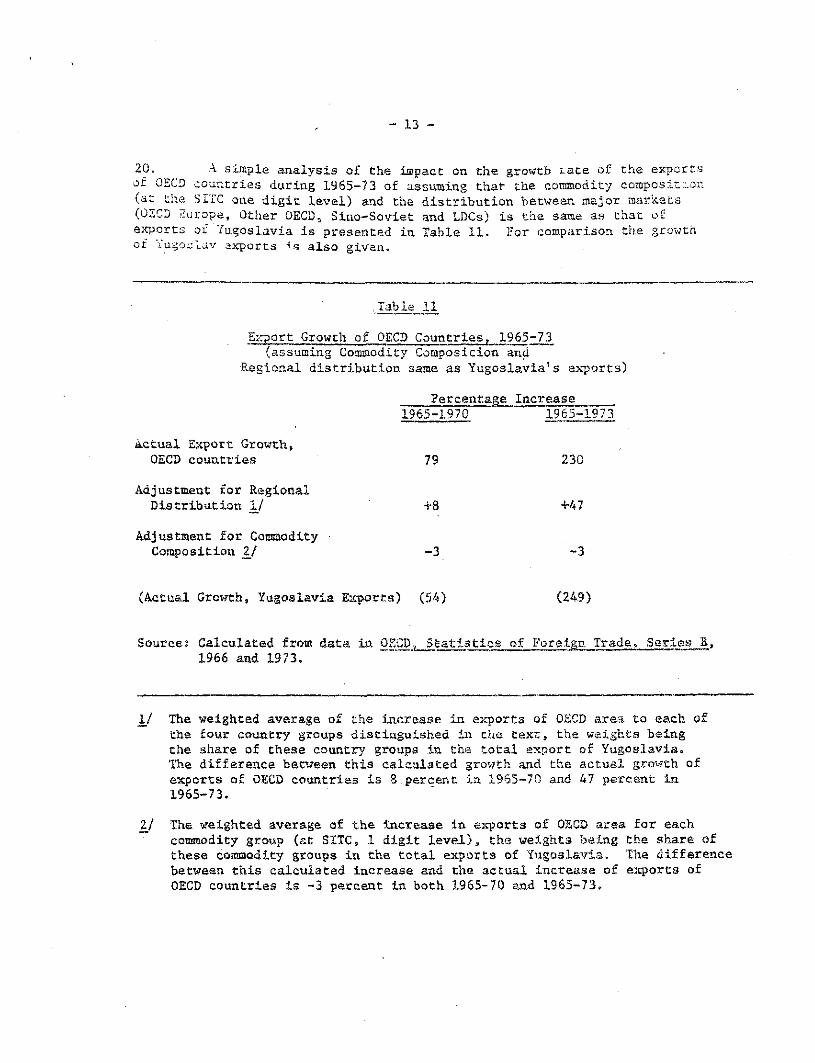
20. A simple analysis of the impact on the growth ¿ate of the exports of OECD countries during 1965-73 of assuming that the commodity composition (at the SITC one digit level) and the distribution between major markets (OECD ¿urope, Other OECD, Sino-Soviet and LDCs) is the same as that of exports or Yugoslavia is presented in Table 11. For comparison the growth of Yugoslav exports also given.
.Table 11
Export Growth of OECD Countries, 1965-73 (assuming Commodity Composition and
Regional distribution same as Yugoslavia's exports)
Percentage Increase 1965-1970 1965-1973
actual Export Growth, OECD countries 79 230
Adjustment for Regional Distribution 1/ +8 +47
Adjustment for Commodity Composition 2/ -3 -3
(Actual Growths Yugoslavia Exports) (54) (249)
Source: Calculated from data in OECD; Statistics of Foreign Trade, Series B, 1966 and 1973.
1/ The weighted average of the increase in exports of OECD ares to each of the four country groups distinguished in the text, the weights being the share of these country groups in the total export of Yugoslavia. The difference between this calculated growth and the actual growth of exports of OECD countries is 8.percent in 1965-70 and 47 percent in 1965-73.
2j The weighted average of the increase in exports of OECD area for each commodity group (at SITC, 1 digit level), the weights being the share of these commodity groups in the total exports of Yugoslavia. The difference between this calculated increase and the actual increase of exports of OECD countries is -3 percent in both 1965-70 and 1965-73.
- 14 -
It appears that the commodity composition, of Yugoslav exports has a small negative effect on export growth while adjusting for the destination of these exports (as between major country groups) has a somewhat larger positive impact. Overall, one would conclude that even though Yugoslav exports increased somewhat faster than those of OECD councries during 1965-73„ when allowance is made for commodity composition and regional distribution of exports the Yugoslav performance was somewhat poorer. However, the analysis is at a highly aggregate level. In fact, the favourable impact on the. OECD export growth when adjustment is made to the Yugoslav regional distribution of exports largely reflects the relatively greater Importance of the Sino Soviet countries in the pattern of Yugoslav trade. The exports of OECD countries to the Sino Sovietc-CQuntries increased about 25 percent faster than their total exports during 1965-1973 (over 20 percent per year as compared to total export growth rate of 16 percent per year). Yugoslav exports to these countries increased much roore slowly, for Yugoslav policy during this period was to divert exports to the convertible currency areas, parti-cularly to Western Europe, and to reduce tha size of Yugoslav clearing account balances in bilateral trade.
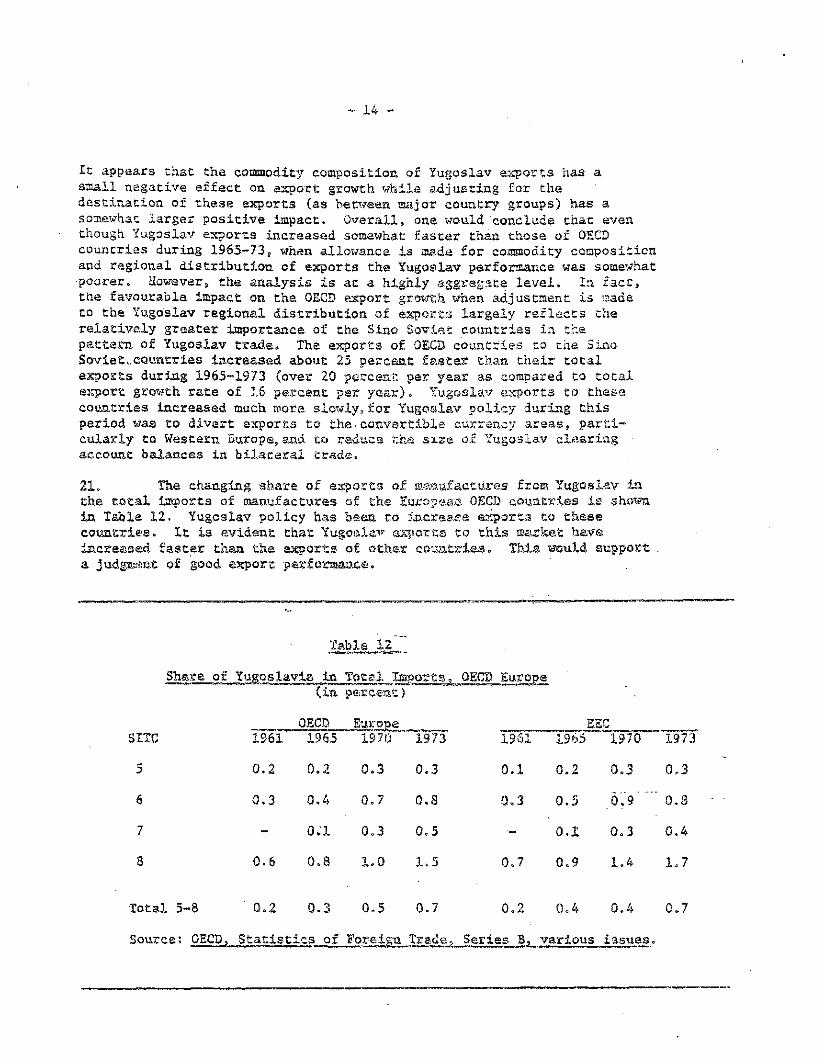
21. The changing share of exports of manufactures from Yugoslav in the total imports of manufactures of the Europaas OECD countries is shown, in Table 12, Yugoslav policy has been to increase exports to these countries. It is evident that Yugoslav exports to this market have increased faster than tha exports of other countries. This would support . a judgment of good export perforaaace.
Share of Yugoslavia in Total Xsports, QECB Europe (in percent)
OECD Europe 1961
EEC SITC 1961 1965 1970 "1973' 1961 1965 1970 1973
5 0.2 0.2 0.3 0.3 0.1 0.2 0.3 0.3
6 0.3 0.4 0.7 0.8 0,3 0.5 0.9 " " 0.8
7 - o : i 0.3 0,5 0.1 0.3 0.4
8 0.6 0.8 1.0 1.5 0.7 0.9 1.4 1.7
Total 5-8 0.2 0.3 0.5 0.7
Source; OECD, Statistics of Foreign Trade,
0,2 0.4 0.4
Series B, various issues.
0.7
- 15 -
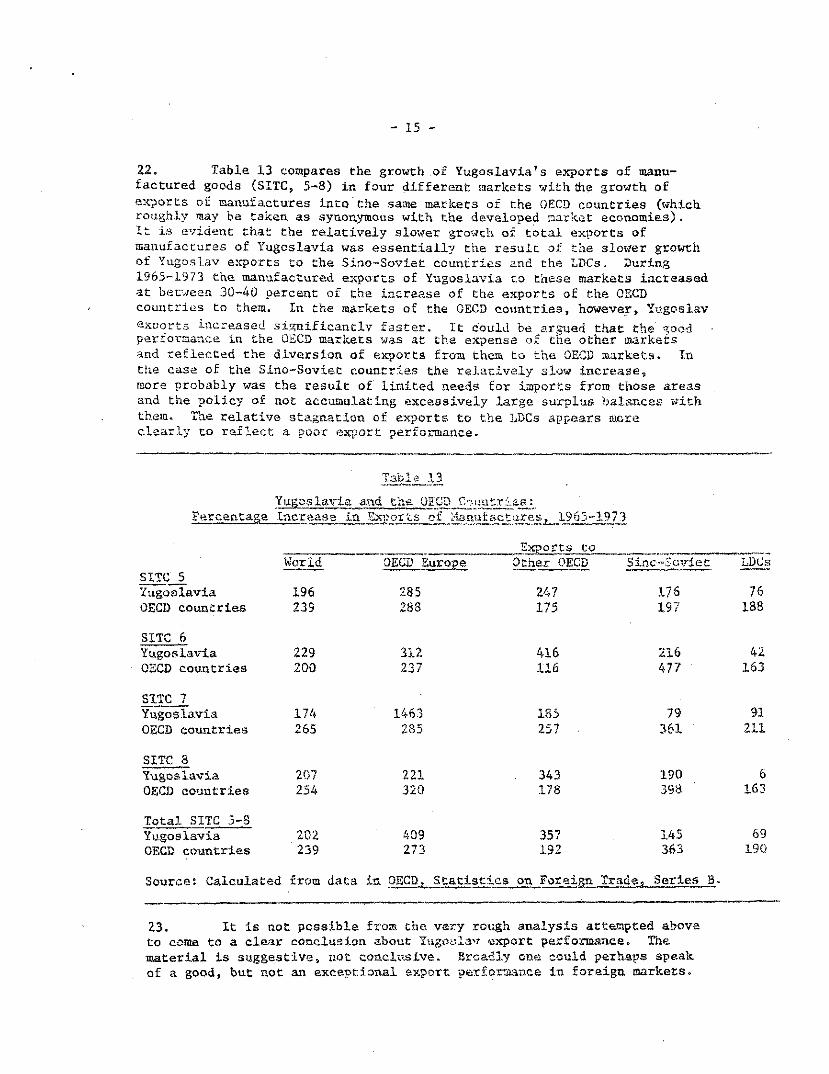
22» Table 13 compares the growth of Yugoslavia's exports of manu-factured goods (SITC, 5-8) in four different markets with the growth of exports of manufactures into the same markets of the OECD countries (which roughly may be taken as synonymous with the developed market economies). It is evident that the relatively slower growth of total exports of manufactures of Yugoslavia was essentially the result of the slower growth of Yugoslav exports to the Sino-Soviet countries and the LDCs. During 1965-1973 the manufactured exports of Yugoslavia to these markets increased at between 30-40 percent of the increase of the exports of the OECD countries to them. In the markets of the OECD countries, however, Yugoslav exports increased significantly faster. It could be argued that the =;ood performance in the OECD markets was at the expense of the other markets and reflected the diversion of exports from them to the OECD markets. In the case of the Sino-Soviet countries the relatively slow increase, more probably was the result of limited needs for imports from those areas and the policy of not accumulating excessively large, surplus balances with them. The relative stagnation of exports to the LDCs appears more clearly to reflect a poor export performance.
Table 13 Yugoslavia and the OECD Countries:
Percentage Increase in Exports of Mannfactures, 1965-1973
Exports to World OECD Europe Other OECD Si.no-Soviet LDCs
SITC 5 Yugoslavia 196 285 247 176 76 OECD countries 239 288 175 197 188
SITC 6 Yugoslavia 229 312 416 216 42 OECD countries 200 237 116 477 ' 163
SITC 7 Yugoslavia 174 1463 185 79 91 OECD countries 265 285 257 361 211
SITC 8 Yugoslavia 207 221 343 190 6 OECD countries 254 320 178 398 163
Total SITC 5-8 Yugoslavia 202 409 357 145 69 OECD countries 239 273 192 363 190
Source: Calculated from data in OECD, Statistics on Foreign Trade, Series 3.
23. It is not possible from the very rough analysis attempted above to come to a clear conclusion about Yugoslav export performance. The material is suggestive, not conclusive. Broadly one could perhaps speak of a good, but not an exceptional export performance in foreign markets.
C. EXPORT PROMOTION POLICIES development Strategy
•4» It is difficult to classify Yugoslav development strategy into :he import-substitution export promotion dichotomy. • Import substitution tnd export promotion do not appear to have been seen as alternatives but rere followed in different sectors at different times. Thus in the >arly postwar period of inward-looking development,industries were protected )ut their exports were subsidised. At the s«is* time the producers of basic raw materials and agricultural goods ware not orotaccad but their exports /ere taxed. In the later 3tage. of outward orientation of jnwch import substituting investments and export promoting aficrts ware carried on simultaneously.
25. During the in i t ia l postwar period a distinctly autartlc. development strategy was adopted and despite the movement towards self-nanagemant and decentralization from around the fifties an inward-looking development strategy continued for some time- Unsuccessful attempts at foreign trade reform were made in 1952 and 1961. During this period exports of certain commodities were encouraged„ but essentially to secure foreign exchange exchange to pay for necessary imports. An exchange reform in 1961' devalued the currency and established a customs tariff. A major shift In policy occurred with the Economic Reform cf_ 1965...„The .Economic. Reform.had .. _ . as one of i ts "ob jec t i ves the better integration of tha Yugoslav economy with the world economy as an essential element ia. eh© drivu towards economic efficiency, increased productivity, sad higher standards of living. The dinar was devalued, customs tar i f f rates were halved, imports ware liberalized and the foreign exchange regime overhauled. Since Chen the development strategy has beasa strongly outward looking. Foreign. trade has bean clearly viewed as an engine of growth. Following tha very savers balance o£ payments problem after the rise is international o i l prices aad the subsequent world recession, attention has shifted, in the preparation of the 1376-30 Five Yaar Plan,, towards developing domestic production of dsmastic_raw materials and. _ intermediate g o o d s ^ r e g a r d i n g reducing 'import'"dependence had_ireen made in earlier five year plans but investmeat__de.aisioja,s wera not geared to_that objective. The situation 'could be different. The "new" system of planning that has now bean instituted aims to make tha plaa targets (which are still arrived at by a process of discussion,consultation and agreement from the enterprises up, within general guidelines provided from above) into a binding commitment rather than an indicate guide. However, i t is too early to be conclusive.
General Economic Policies
' General economic policies _auid__ the evolution of the institutional frame--worlcJms. had implications. . f o r . . f oi^nca. ... Since the Economic Reform . Yugoslavia has experienced rates of inflation significantly, higher than those

- 17 -
prevailing in its main foreign markets..' The cost of living index, increased at around 3 percent per year during the 1966-1970 and at about 19 percent per year during 1970-1975, During the same periods the wage per person in the social sector increased at about 14 percent and 22, percent per annum respectively. Industrial producer prices which increased at about 3.5 percent per year in the latter half of the 1960's rose at a rate of afrout 18 percent par year during the first half of tha seventies.
2 7 T h e impact of tha domestic inflation—reflecting both cost push, and excess agsra^sta daoan-i—exports was cushioned by tha flexible exchange rate policy that; was followed. The dinar was devalued twice in 1971--D7 15.7 percent in January and 11.3 percent vis-a-vis the dollar in December —to a rata of 17 dinars to the dollar. In February 1973 the dinar followed tha US dollar devaluation of 10 percent, and the effective (trade weighted) devaluation of the dinar against the OECD countries was about 3 percent, Since 1973. there has existed a limited foreign exchange "market" in which authorised commercial banks buy and sell exchange at rates which tha National Bank controls through market intervention. The "market" exchange rate averaged 17.39 dinars to the dollar in 1975 and 18.18 dinars to tha dollar in January-April 1976.
28. ^ The anti-inflationary measures taken in tha past were also geared to work is, favour of exports. An important element, cf price control policy has been to keep prices of basic raw materials low as an anti-inflationary stsp to prevent escalating price increases. This would tend to increase profitability of the processing sad finished products industries most of which, as has bean discussed earlier,are export industries. The policy could ba viewed as providing a subsidy to the export industries. Also restrictive credit policies adopted, on several occasions have not been applied to export credits. For example, in 1972 the expansion of bank credit was limited to 2 percentage points between end August and and December, but credit for exports was exasapted,•
Tariff and Trade Policy
23. The general trend towards import l iberalization till the temporary reversal following tha severe balance of payments pressures of last year have also worked towards.strengthening the basis of industrial development and should have, therefore, had a favourable impact on exports in the long run. The trend has been towards lower tariffs, though, short-term measures to protect the balance of payments have operated in the reverse direction. The average level of customs ta r i f f s was reduced from about 23 percent to about 12 percent in 1965. Average tariffs„ admittedly, are notoriously misleading, and protection for specific items may still be quit® high. While average tariff levels are low the tariff protection enjoyed by the metal products and che electrical equipment industries is almost twice as high. In fflid-1972 J tariffs on 1,100 import iteiaa—mainly investment goods, transport equipment and raw materials—-were reduced by 1 to 12 percent.(This could raise effective protection levels in certain sectors, and consequently the overall effect on protection levels of such measures requires study,) Effective tariff rates for metal products and electric equipment range from 7 percent (shipbuilding) to 80 percent (cables and conductors) (Table 14) .

18 -
TABLE 14: ¡Nominal and Effective Tariffs by Indusiry N orninal EtTective Taritt ' Tarif! •. ' •Te) : •' 'i )
Ener;y Electricitv 0.0 Coal o.o • — 2.29 Coke and cas 3.0 30.29 • ' Crude petroleum sr.d natural eas 7.0' 7.73 Crude pstrcleum products Î0.0 ',«.73
Metallurgy Iron ore 3.0 Ferrous metallurgy IL: 7.3.90 Nor.ierrous metallic ores 1 — ! .53 Alumina r.r.d aluminum 4.23 Other r.or.fcrrous metals . j.'jy Rolling mills of nonferrous metals' 9.1 33.34
Nonmctals Nunmctailic roitterals 2.7 l M Glass 13.3 • 21.24 Refractory material 5.S . S.46 Porcelain and ceramics 15.0 11.72 •' Other processing of .-jonmetals 7.1 . 9,19 Stone, sand and lime 3,0 2.64 Bricks and tiles 4.0 .4.56-Cement 10.0 : • i'j.&S ' Other building materials 11.0 • ! 3:02
Metal products ur.d electric equipment Metal semiproducts :.2.9 ' 45.63' Agrictilwr.il (rachitics 20.6 ' ."'33.18. Other machines and cuuiprr.em IX J f-.-ratiia -u;j •¿ii,;.;, ;. fW SsH vcaicUa iî'.ï ' 33.6S Road vehicles 26.7 • 41.77 Met.il prixiucts. rto; elsewhere specified M.j ' 26.17-Shipbuilding 13.3 . 6.97 Electrica! machinery and apparatus : 9 . s 49.Ï3 Electrical apparatus tor household use 30.5 ft 1.37 Cables and conductors 79,'J i
Radio ar.d tckcomtrntnicaiion equipment 16 A Other electrical products 20.0 .W.22
Chemicals Nonorganic and organic chcmtcals 5.7 . 7.74 Plastic materials and fillers X.6 11.09 Pharmaceutical products 10.6 ' 13.5 lï Soap and cosmetics 17.5 35.54 plastic articles 18.3 . 3S.90 Oilier chemicals 10.7 -.. • 16.75 Paper and cellulose 7.3 19.34 Paper products 1Î.0 32.44
N 'eminai £i>.et;v-TUM;! ¡"-rift
Wood products Timber and boards ! .2 0.33 rir.al wood products 10.S • li'.iO ' Chemical -.vood products IU.0 ;X.24
Textiles ard clothing Hemp and fax ttber 5.0 9.69 Cotton yarn and i.brics ift.; . 35.54 Wcoix-n yarn ami fabrics 14.5 56 Kj Other yarn and fabrics 12.8 20.4j Knitted gonds Mi> ' 4 I. ') Made-up clothing 22.» 4;. ! a Other K'.itiie products 17. .3 30.30
Leather and rubber LeatÎKr ;,nd fur ¡0,5 33.66 Lea'her footwear :i.i 41.51 Leather fancy goods and made-up arttuiei 18.7 33.44 Rubber 12.7 i s.r.0
Fo;>d Products .Milling of cereal« •3.0 2.80 Bread and pastes 11.6 Livestock slaughter sett meat preparations i».-!. 26.3 Ü Fruit and vegetable preparations 6.1 4.3 K Sugar 26.45 Sweets ami eocou products "9.1 IB.JH Vegetable oils and fats 5.5 16.22 Alcuhol and beverages 21.0 ' 39.74 Other foodstuffs hi) ÜS.97 P»f!!WWe»l '«hueeo Sil 12.il fuBacsu maiiufactprca 20 .U 66.2!
Others Criming, publishing and allied industries 0.0 — 3.03 Motion picture production 'Mi — Mi. Miscellaneous Industries 21/. 40,-iX
Agriculture Cre? farm!»« J < ! .07 Fruit ¡¿rowing and viticulture r>.'> t>.2;: IJvestocit breeding i.'j Fishiiig 2.0 0.06
Forestry Forestry 1.0 0.6<i
SOURCE: Eickiivna Carinsku Zoicita v ¡¡¡notisriie (liubljana: fikonomski Institut, Pravne Fakultetc. ÎV72).
30. The import aystain distinguishes betweea liberalized' imports, conditionally liberalized imports, imports under global exchange quota, and those under coassadity quotas and licenses. The proportion of imports under the Sully liberalized category was 15.9 percent in 196?, 28.7 percent in 19 71, and sbnut 50 percent in 1973. In April 1974 a further 5 percent of imports was shifted to this category. The balance of payments pressures of 1974 led ta a temporary reversal of tha policy. Iwport deposits were introduced in 1974. In .1975, import surcharges were increased from the existing 2 percent and 6 percent to 5 percent and 10 percent respectively depending -on the type of commodity that was imported. A procedure of special licensing for imports was instituted in 1975 covering nearly a third of total imports. The measures were clearly short run. The impox't deposit requirements lapsed at. the end of 1974 and the special licensing procedure at the end of 1975, The experian.ce indicates that whila the policy objective is liberalisation, the government takes a pragn»stic approach and does not hesitate to adopt measures which temporarily reverse the tread.
Fiscal and Cred.it Installants
31. Extension of credit through the National Bank for selective regional/sectoral objectives has been a major instrrment for achievirig national objectives. Selective credit policy hay been gearsd to ezj-oxt promotion both in teraa of acre favourable availability conditions during periods of credit restriction aaô concessionary Carras. In ''.he setting of annual monetary targets.,, privileged rediscount facilities «1th the National Bank up to a certain amount are. earmarked for extc-rt refinaa-jing. The rediscount rate is 3 parc^st caapar-ed to the general, rediscount cr.;?. of 6 percent. Tha interest rates eotsmereisi beaks charge ou «sport crédité is 4 percent compared to the usual rate charged for other cxadit of arcsuai 11 pjsreewt, If Almost the whole increase in Nafcloaal s credits during recent years has consisted of rediscount aad. otbar cr«aifcs for selective purposes,.
32. Yugoslavia ha3 also developed a facility for providing tasélua-term finance credit to the exports of jaachinery and equipment. With decentralisation the Export Credit and Insurance Fund has beïosie m autonomous as&oclacioa of enterprises and banks with participation ' also from the republics and the Fédérai government, About $24 million were extended as suppliers credits in 1960. The flow increased to about $140 million ia 1969, but declined to $72 million in 1971. ' It. increased again, to a level of $150 million Is 1973, About §3 percent of the credits disbursed during IS69-73 were to cQO.vftrt.ible currency areas. The disbursement of export credits during this period average • about 23 percent, of the experts of machinery and transport equipment during this period. The total export credits outstanding at the end of 1974 was over $700 million. The balance of payne&ts pressures of recent year« lias constrained Yugoslavia's ability to Increase exports of capital goccp particularly to tha non-oil developing countries which are shore of exchange themselves,
1J Credit for agriculture is also given at similar subsidised rates.

33. There aix-o arista a. system of rvbaues of- customs due las oa exports. It appears thai rab.t¿as ara ¡.-'¿.id on an avarage basis and are calculated for 21 sectors to cover direct and indirect import content en the basis of the latest input/output table. Table .15 shows the average races of rebate by sectors* Thf-- rebates ice not related to ens import duty paid on .imported inputs by Ub". exporting, enterprises» nor are they calculated for: ->.aoh enterprise- l*be aystem reflects the difficulty of working a more specific rabat« syst<5©s given this Yugoslav systeo of portmanteau eaterprisao ct*vf>r.ing a large variety of activities and extended self-manageaout within the ¿uitarpviaas.
Foreign Exchange System
31, a system of multiple ar.chaage raciD waa used as an instru«y;.at of trade policy esseuciaiiy tili In 1937 far examol;- the a--<?.rag» export exchange rate was about 40 pur c.euf. higher for export'.- tnan for imports. Withia exports r.ha rati-.'; varied for" different cowric-ditie.s, with agricultural exports racing an unfavourable rata (equivalent to s-i enport tax averaging 7.0 percsx-.t) and industrial exports a favourable exchange rate (equivalent to an average export sv.bsi.dy of 21 percent), la 1961 a unitary exchange rate a .id a aystaw of export prexcia, taxes end subsidies was introduced. T'(waa a2v;lijl»«ci in 1963. Since then retention quotas have been the: "^in dcvi-ic f.sr export stimulation. The percentage of export receipts that ccuid be retained by expcrfc<»r3 varied from 7 zo ¿0 fercis-::, with i<3'-rc-.ct-iug share of experts in output and with iacrcasi;»^ g-r:vch in the. aiiunvo.t of exports, (See Ax»nex Table 4) . The enterprise a r.rt: allow« d tc use the urefca?a»ad': exchange in any way they deaire. I'!. -Kwi 197?., retention qvcc&& 'vera increased to 20 perceat tor nearly all aborts of goods sad service» £5 peree-nt for tourism earnings a m 300 -pwrce^t for eaxiriwgs of saterpriss* operating .'¡.broad (e.g. eor.e true tier. sufapprises engaged :in coz-.? t. ruction abroad). With increased 3 Iberali^f.tioG of tiia Jseport regis:® aad tlva current account surpluses of .19'/. rex' 1973 the incentiveteffc.et of the device was perhaps limited. For «xassp?.«. J.a October 1973 enterprises were no .longer required to pay for aerwln irr- rt.? fross fchfcir fsraign exchange, retention quotas but ailevM ca obtain foreign arch?n.he directly from the cornierci«.i b.r::ks (which « » s operating In the "lieitod" foreign exchange market so.t r.p that ye.-.r). In the present tight foreign exchange situation the svarU.ability of exchange is an advantage and the retention quota devise io f.-,; ¿u.c«ntive for expert'-'?,
35. A sysfcsm of explicit lirbin? of the. right to imports to exports performance has also been recantlv tortitntecl, The sch&iae v m starred o-.» an experimental btsis; la tha spring oi 1>S75. It appears tc operats on the. basis of an agreed izapoxt-<?3rpcrt p.'.ar. fwr the eutarprises in a gJ.v«n. branch of 5r<dustrys, wirh the export coatr ibution of each enterprise and its shf,ra in imposts (of inpvts, k.c„) ,?piciiiad. Enterprises failing in meeting agrcad ««port: lavals eo<-.ud be p e j v b y reduced allocation of imports. The perfonaanca ou the. pZgx* x" :c5£.v:<..rv.<ed by a control board set up by the branch, of industry Itr-slf, 7. he ays tew. appears to. he coicplcs and difficult to isipleMunt and is iihisiy to be reviewed and modified.

l'afa le 15
BiFOR? ìl'ÌD KFOHT OVJJ&TZÌ i?'7>7h
Irsport Duties ™ Exrort Hr
Inter- Inrest-.cediate Tieni Gons'ur.er
Aversi ^pqds grog*
ilectric pcvar 0 0 0 Goal and coke - 1.1 1 „1 1-0 PetrolriUTì and dsrUaiss ' 2.3 2.3 15.0 2.5' "errcus netallarrj 9.7 9.,7 • 1,0 "on-ferrous raevallurgT 2.1 2.1 1.0 iren-rretslic minéral productsr 10,6 ?.T 20.6 1.0 Metal prcducis * 1L.9 16,9 12.5 21;Jt 1 .5 Shìps ' 0.5 0,6 i;.0 Electrical amarai,us 1iu7 15.3 13,2 18,0 2.0 Ch«ìc«ls 9.0 8.3 16.1 . 15-7 . 1 .5 Building material 3.8 >Jood urcducts 6,8 Ji.it 16,2 17,?- 1.0 ,;:ulp and paper 9.7 6.5 17 = 1+ 19.2 1.0 Testile; s 10,0 5» 9 Ili. 6 19,-2 2,2 Leather rhoes . 12.k 1C.9 19.1
Rubber -nrcduets 12,3 12.0 15.1 2.5 Food wcduets 2.0 1.8 2,li 0 Frisi ed material 3 >7 0 8.2 1.0 Tabacco pro-iucts ; 10.5 • 1Q.5 0 FÌLT.S 3.9 '5.9 3-7 0
Ali industriai prcdnets 9,3 8.0 11.8 15.6 (1.5) Agriet.ivaral pr eduets 2.3 1,0 3-1 G ITorestr?* prodaets OJJ. 0.3 6,2 0-
Total 9.1 7,5 11.3 11.6 (1.3) il.
/J_ All rates are computed as weighted averages (through actus.], vol~air.es c-f irqports) » In addition, one pez'cent service charges and three percent equalization tax are levied-across the boaxd«
/2 Investment good importe Tor "priority industries " receive a reimbursement of the difference between actual rate and five percent.
/3, Standardised rebates for incorporated imported inputs, presuBafcly canputed from input-output table,
75 ©feragèsl " ~ " ~
Rncouragecent of Joint yantur.33 aad Cbc-jaAjg taemeats
36. Direct foreign investment has been encouraged as part of the process of fuller integration in the 'world economy and the search for efficiency that accelerated with the EeaaoJiic Refotui. The permitting legislation, was enacted in 196?. The access to technology, skills, and marketj.ng channels provided by foreign investment» in addition to finance, were viewed as having favourable economic, effects. Joint ventures are expected to be. "export-oriented"'. The joint venture enjoys the normal retention quota of 20 percent of export earnings plus another 33 percent to be used for profit remittances and capital repatriation- A large nuraber of joint ventures have been started, though the direct investment of foreign capital involved is fairly modest. 1/ The ventures have been concentrated largely in the natal, electrical equipment and chemical industries, indicating their r,3porta.ice as a vehicle for kno-ihow. Thtir direct contribution to the growth of sxparts is not very clear. Joint ventures are expected to be. ''export-oriented" but whether In fact and the extent to which they have had an ianact on exports is a matter for detailed study, 2/
37. Yugoslav enterprises have also adopted widely the practice of entering into long-term coooerat:? ou agree»enta with foreign aianuf&cturers either for producing for export to third oaxksts or for producing parts fox production lines of the origins! manufacturers, About ¿37 such agreements had been signed by n>id-li-76. Such agreements have been parti-cularly important in chs a?ta.l and the electronics Jadiistriaa. It is esti&stad that cooperation j*gr«sma©tR account for about 1 , 5 — F J percent of iraports and 3.4 to 4.4 poscer.t of exports. 3/ It would appear that they have had only a sa-ali net .brpaet cm net foreign eAx-haage receipts especially when one recalls that total isKpoxta are about half the level of total imports.
If About 145 joint ventures had bees reglsfcsvead by did 1976,' More than 60% of these were from the USA » Germany (21%) and Italy (17%
2/ See also C.R. Chittle, "direct Foreign Invsefcaent in 8 Socialist. Labour Managed Econcray—The Yugoslav Experience", Welfcwirtsr.haftlisfecs Archlv, Band 111, Heft 4, 1975, " :
3/ In 1975 goods valued at about $29.1 ail.lica were imported for processing and re-export and goods valued at $384 million were exported. This indicates a 10117 level of do® as tic value added in this trade. It is not clear whether all the trad« to he att ributed r.o long-term cooperation, agreements consists of what the Yugoslavs call "active Improvement trade"—imports for processing-, and re-exports. One would itsagine that not all cooperation agreements would involve imports for processing/ manufacture and exports, lite Yugoslav producer may be using local supplies and inputs r.o provide components for production lines for the European manufacturers.
Import Folicias OL .J 7 eie ped Cotrtitries
38. The lepore restrictions in che developed country aarket.s on co mino di tied of axporc interest Co Yugoslavia have been, as for other developing countries, an important constraint, on export: growth. This constraint has been tackled in international fora and by direct trade -negotiations. Yugoslavia Is one of the major beneficiaries of the genacai preferences scheme. About S370 million of Yugoslav exports to the EEC in 1974 were under the community's generalized preference system. However some of these exports would have occurred even without Che scher.a, A cures-year trade agrees&ent was negotiated wi ii EEC in ¡larch 1970, under which Yugoslavia. secured preferential treatment for a number of agricultural products particularly baby beef. Yugoslavia has a a;ajpr meat exporting industry with 90 percent, of the exports of live anirsals 'and meat going to the EEC, Exports of these item increased from $159 million in 1970 to $251 million ir. 1973 but collapsed to $.148 million following a ban on beef imports by the EEC in 19/4. This incident highlights the impact of the import and protection policies of the. developed areas on Yugoslavia5s economic fortunes
h CONCLUSION
39, Yugoslavia has sustained a fairly successful record of economic growth and structural change for a long period of fiats. - It has followed a pragmatic but broadly outward oriented development strategy. Again broadly, and with short-tars reversals to the trenda it baa been following a policy of greater liaport liberaliz&tioa asd lewar protection with the object of developing a «ora competitiva Industria! base. vKrlla there has also been the objective of rs-orisn«:!»? trad« to the convertible currency areas and the developing countries Yugoslavia has had lixsitad success in penetrating tfae&a oarkets. Particularly during, the last two years there has been a sharp return to the traditional pattern with bulK of the exports going to the Comecon countries, Yugoslavia has used and still uses most of the traditional export pzoraocion techniques. It is difficult to quantify the export subsidy squiva.Ie.nt of these measures. It would appear that the retention quota ax*d the availability of credit for export production on concessionary tsrn&a are the major promotional devices. However, more important than these in datarraiaiag futuie expert growth wemid appear to be the. continuation of the acceleration in growth of the developed countries and success in multinational trade negotiations for increased access to these markets including reduction in non-tariff restrictions.


fcn ex
P 3 vö V 5-w t» JJ o
Siri SCí ^g? " I-«». W> o » e « « « ^ ni» w si a <t n e » K «ivo „-r c* m -o- f w va 1 ^ W IM ^ H w ÍN
5Í cj »1
a H a "SI
«I
•W W f * 3 ®
JÍ O
jij: wji
O Ci »V LT
«y-J-*
^ m ¿D o c-j cj r-*
co en go o c?, crv o M C Cl í» ÍN1 C-: W< n N
t v ;*•> f»ú ç j U"*> w t'J <rt S3 Ô N ?< H H ri H
CA uVC <3 «5 fs « tft f-^ cr* tn .H va rv e* sw H !»1 wi tM H
fn|c»> r>* p*: q*. 4 CO W "A c?> «-Jo o o iA 04 ci N'O O (M Ci) C2 N O' .'tí C«*
ü"t r-f í-i r*-. w Ot co f-O a? ••£> r-«. sí «3 "P**.
fJ VO tA O fi OA ^ <A ^ vf tn £n <- co v*¡ r*i •.«••: j-r? oW r*«f
S"1 O O H H O r-M IT. n N í*H*í Q ^ I v*< p»; i^Í evi
S SIS; cole*. ra >s « m » com f-3 PM ^ ^ p ^ ^ Pri ^ pri
a «
LHf
ai
•si
SI O asiui m <3 wiw ^ ai w s i/. rn m n rt H H N c-l
« . «t «i
6 S -w O ^ J2 y TI H W 0.« W ¡i X W ¡í
O C.I ÇJ ^ ^ 2? H* vi
® C> rs ve m Q fj o
">\ Ük sk
ai : X! (1 ¿j Os
ço c «J ^ b U V 'A «1 VM « *-< S O « 63 •H S
© W s* » a w •U » 0 0 Q S3 'w 53 S 53 c ÎJ 3 •c O feO i s» C 0 G «ni <?i =1 0 U G «ni u M g «y 0 A4 -es & u jri "H O ^ 0 nÛ a? «J T* 0 0 Î3 ® 0 0 t-H 73 uS K: «S 0 H M eß 3

O'I ó»!
Si O cr. f-S O co •u O U-V •J3 VO -¿y r-j r-* lO ¡N .-4 •o 'Z1 IN 53
y;-'- O i--i •:,• t¡
.w es OS] ir « fN i VRJ
U •*1 T tó »
en < • r- O t-« O <r v¡ o. fi un Sf o <rM C*ì «N: C". f-s «v.
ot & O CU p cy> fí f«* M c» 0. u Vi f.' 'P. tai
O «5 f» IO JV c" CM <*7 í-v'
Oft s <*> ív ri O O O
rjj »•O i»I £ vo
Os «A VÔ C*» e© T-t t-j CO -ÎT O
ív fv es ÇV . M CO r«. O o W5 y» o. ON O T«t
ai! 51 i-« tu r¡<
RI p.l
kJ¡
«1 OI
Cl ir ¡-. r'i •••• n jw a I
i « i- s-l <n í-» i tii Ti lET M
05 r» <c4 0-* r-4
53 SU 'Z O o <\f
<r<i o Ó
f» tn r-v c- «n tt es» '3 «n c m? fV.
«S i-A JHI
o* «V o O •Pi
o .
w o O
u fv. 0 U CJ »a V
h c c fry w aJ S í-« í » c
o f ! ÍJ f - 45
•v» JZ Ci ñj íí»
'J
• 1
¿J o g « £ K
A w
3-
i M I"
i-i >rl 'b V'
'J
• 1 ci er
Ü r'j rj
& •y w fis »
c «H
« & •y c d «w AJ
c f j r 0 J-» «a
a Ü
o •H e
G 01 U) y í V «LÌ •X ^ i» i. u ^ <ü « é-t ?» O
^ O •H " r
•H c . C u y y CI s . O u u S2 « ti K < 3
s . c > o —4
C3 ü ¿i- y «y <¡~* V OS « ^ n í S.l
sä o V.; «Î » & f j a O '•a sä v> ta
s-' Ci y if u « g M 1» ffS ü a« u r." M f-y O a . 's i* U-¡ X IV aj s . - o e¡ Ol M «S-I o 00 i:) O* M B .•J e o O «et < O t/3 o w w H Sí O XXC M < M
m «i W -Î? «o «5 Os C >i en -a* vn <3\ CS en vt- 4T* iM SM si ex CM CM <N O m O í-s r«. r». S**. r— f-» r-. H

Annex
Table 3
1/ NUMBEB. OF EXPORT ITEMS OF MANUFACTURES
SITC 1961 1971 1975 Category Product
5 'Chemicals , 101 246 235 51 Chemical elements and components 34 102 105 52 Mineral tar, chemicals from coal 5 c. 2 53 Dying and tanning materials 17 • 21 23' 54 Medicinal and pharmaceutical products 9 31 36 55 Oi ls j perfumes and cleaning materials 11 24 10 56 Fer t i l i z e rs manufactured 2 7 6 57 Explosives and pyrotecline products - 9 8 58 Plast ics - 19 19 59 Other chemicals 23 31 26
6 Manufactured goods c lass i f i ed by inaterial 293 - <**
J> V 618 61 Leather and skin manufactures 16 "25 22 62 Rubber manufacturing 10 26 2.6 63 Wood and cork manufactures 40 46 47 64 Paper manufacturing 12 50 46 65 Text i l e yarn and fabrics ' 49 110 96 66 Non-metallic mineral nsanufactures 39 83 89 67 Iron and stee l manufactures - 3 67 84 68 Non-ferrous raetala 59 58 66 69 Other isetal manufactures 65 128 142.
7 Machinery and Transport Equipment 196 372 427 71 Non-alectrical machinery 98 175 209" 72 . Electr ica l machinery ' 63 140 144 73 Transport equipment 35 57 74
3 Miscellaneous manufactures 147 272 293 81 Sanitary» plumbing, heating manufactures 5 10 12 " 12 82' Furniture . 10 20 21 83 Travel goods» handbags 5 8 8 84 Clothing 39 63 . 58 85 Footwear 14 15 16 86 Sc i en t i f i c , optical goods, watches 29 - 64 76 87 Other 40 90 102
Total 737 1 $483 la573
1/ Seven d ig i t i teas in the SITC - c lass i f i ca t ion
Sources Stat is t ics of Foreign Trade of the SFR Yugoslavia, 1961, 1971 and 1975

Annex
Table 4
Rétention Quota Rates
I I .
Ratea based on ratio of œjports salea to total
21 W~~2Q per c a t
— 30 par cesjt 31 ®> Uo por cant hl ~ 50 per cost Si » 60 per cent 61 »100
íscestlvo ratas oa tha rat© of is-cr©seo of exports G¥®r th@ past ye®
Arnual tgsporz-s
10 2b por cost O Qj? 2S pe^ Rsat
Per-ccata^s S'-.?0}*' Espartera
of Selected
Basle Gooda arad Goods P3ciara&eots.tica3.s
?o0 Soil 9,3
XX a 2 12 <,6 lU.o
10,0 12 „0 Iko 0 16,0 18,0 20 « 0
as .so
© ^
of Road Motor
Vehicles and
Tractors
12.0 XUBIa 16 «8 19*2 21.6 2à„Q
Xg0Q 18 o0
Exchange Receipts
fros Catering Services
20.0 2!io0 28 »0 32.0 36 » 0 hO,Q
25.0 30c0
I l l s SpeeiaX fixed goods sad serviea
? to averts of spoelfie
Orgaaiaiag of intsrmtiossl fairs Wswly aisisd gold sold to th© fatieasl BaMr Eota.ls
of foroiga firsso for philatolie ptarpoaes
agency services sad orgosisisji testing trips Seles of ps-lntod susfcter, f i l es , gr©pyg>hoaa raeerda Construction, «sgiasering, GM ofcbar grojsets abroad Foreign ©xchsng© receipts of aosseoaonie iaatitntioas
Sales of s
20o0Q per cent • 20®00 per ceat
20,00 p@r east 50,00 par e eat $Q„QQ p e r ceat 60»00 per CQSt
100,00 p@r seat ICOoOO per cent XQQoGO pör cant
A Applicable only to firsas «hose osçort solas ar© less tMa 20 per e eat of their total saleao
Source s Bata supplied by Yugoslav authorities„


