Embed Size (px)
Citation preview
DOCUMENT RESUME
ED 343 366 EC 301 052
TITLE Annual Report of the Rehabilitation ServicesAdministration to the President and to the Congresson Federal Activities Related to the Administrationof the Rehabilitation Act of 1973, as Amended. FiscalYear 1990.
INSTITUTION Retnt,Jlitation Services Administration (ED),Wai;linr*ton, DC.
REPORT NO ED/OSERS-91-20PUB DATE 91
NOTE 505p.
PUB TYPE Reports - Descriptive (141) -- Statistical Data (110)
EDRS PRICE MF02/PC21 Plus Postage.DESCRIPTORS Compliance (Legal' Demonstration Programs;
*Disabilities; Employment; Federal Aid; *FederalLegislation; Government Role; Grants; IndependentLiving; Information Centers; Migrant Workers; ProgramEvaluation; Recreation; *Rehabilitation; SupportedEmpioyment; *Vocational Rehabilitation
IDENTIFIERS Americans with Disabilities Act 1990; *RehabilitationAct 1973
ABSTRACTThis annual report describes activities under the
Rehabilitation Act of 1973 (as amended) from October 1, 1989, throughSeptember 20, 1990. The report presents activities by each sectionunder General Provisions and by each of seven Titles. An executivesummary highlights specific activities. These include; continuationof Rehati2.itation Services Administration priorities; publication of"American Rehabilitation"; program evaluation activities; activitiesof the Clearinghouse on Disability Infor-ation; revision of theprogram monitoring system; the Client Assistance Program; theAmerican Indian program; activities of the National Institute onDisability anti Rehabilitation Research; rehabilitation training;supported employment demonstration projects; vocationalrehabilitation services to handicapped migratory and seasonalfarmwcrkers; special recreation programs for individuals withhandicaps; the National Council on Disability; employment of peoplwith disabilities in the federal government; the Architectural andTransportation Barriers Compliance Board; the Offic2 of FederalContract Compliance Programs; nondiscrimination activities; theInteragency Coordinating Council; the Projects with Industry Program;the Supported Employment Program; the State Comprehensive Servicesfor Independent Living Program; Centers for Independent Living; andindependent living services for older blind individuals. Nineappendices provide additional detail. (DB)
***********************************************************************
Reproductions supplied by EDRS are the best that can be madefrom the original document.
**** ****** *********m******************************%********************

LED t '1/4fIt1MENT OF EDUCATIONMet at L tat Ressiercn end onprover
EDUCATICE 4ESOURCES INFORIVAIZNTER tERtCt
C This tioci"ant nes been reoroduceofecente0 tr0m PletSon 0' 090n#le041610.TIng 4
r Minor chenges nave teen made to imp .reprotiocenn qustity
Points ot vie.* oontions stated in ',trackrnent 60 not necessanty represent oftOEM position or polley
Annual Report
of the
Rehabilitation Services Administration
on(
Federal ActiviOves Related to the Administration ofthe Lhabiiitation Act of 1973, as Amended
United States Department of EducationOffice of Special Education and Rehabilitative Services
Rehabilitation Services Administration
FOREWORD
The Rehabilitation Services Administration (RSA) entered thefirst year of a new decade with new leadership, new priorities, anda renewed commitment to the State-Federal vocational rehabilitationprogram which provides essential rehabilitation services andopportunities to individuals with disabilities. This reportprovides a comprehensive description of the activities of RSAduring Fiscal Year (FY) 1990. The report also contains informationon the activities of the other Feder-141 agencies responsible foradministering sections of the Act. The Rehabilitation Act of 1973,as amended, provides the legislative basis for programs andactivities to assist individuals with disabilities in the pursuitcf employment, independence and integration into the community.This report describes our successes in meeting the mandates of theAct.
Many new and innovative strategies for programs and serviceswere developed ard implemented in FY 1990. A stronger monitoringsystem was put in place to assure compliance with theRehabilitation Act and related regulations. The development of anew RSA Policy Manual was begun in 1990 and will provide directionto grantees. A revised system for developing and issuing policywas established. RSA implemented a five-year strategic managementplan to provide the framework for future priorities. Consumers,rehabilitation professionals, rehabilitation educators, servicesproviders, parents and advocates continue to have a strong role andinput in RSA's planning and activities.
In 1990, landmark legislation was passed that assures therights of individuals with disabilities. RSA is strongly committedto assisting in the implementation of the Americans withDisabilities Act (ADA). RSA is working to ensure that individualswith disabilities are aware of their rights under the ADA and thatemployers and the public are aware of their responsibilities toassure nondiscrimination on the basis of disability.
RSA is committed to providing programs that help provideopportunities for individuals with disabilities to participate inthe mainstream of society through increased employment andindependence. With the implementation of the Americans withDisabilities Act, the rights of these individuals are assured.With our continued hard work, we can bring about significantchanges in society to enhance the lives and independence ofindividuals with disabilities.
Nel C. Carney
CONTENTSPage
Executive Summary 1
General Provisions
Sections 3 and 12 - Office of the Commissioner 12Section 12(a) (4) - American Rehabilitation Magazine 15Section 14 - Evaluation 17Section 15 - Office of Information and Resources
for the Handicapped (Information Clearinghouse) . . . 21
Title I
Sections 100-111 - The Vocational Rehabilitation ServicesProgram 22Caseload Trends 25Resolution of Applicant/Client Appeals 28Post Employment Services and Annual Reviews ofIneligibility Determinations and Workshop Placements 30Characteristics of Rehabilitated Clients 32Comparison of Economic Gains Achieved: Persons with Severe
and Nonsevere Disabilities 37Section 112 - Client Assistance Program 46Section 130 - American Indian Rehabilitation Services
Projects 49
Title II
Section 200 - National Institute of Disability andRehabilitation Research 51Rehabilitation Research and Training Centers . . . 52Rehabilitation Engineering Centers 52Field Initiated Research Grants Program 53Research and Demonstration Projects 54Mary Switzer Fellowship Program 54Research Utilization and Dissemination Projects . . 54Research Training and Career Develoccment . . . . 55Innovation Grants 56International Programs 56Spinal Cord Injury Program (See also Title III) . . 56Technology Assistance 57Small Business Innovative Research Program 57Interagency Agreements 58
Title III
Section 304 - Rehabilitation Training 59Section 311(a) (1) - Special Demonstration Projects:
VR Services for Individuals with Severe Handicaps . 64Head Injury Centers 66
Supported Employment Services Projects 68
Supported Employment Technical Assistance 69
Section 312 - Migratory Workers 71
Section 316 - Special Recreation Programs 72
Title IV
Section 400 - The National Council on Disability .
Title V
74
Section 501 - Employment of Handicapped Individuals . 78
Section 502 - Architectural and Transportation BarriersCompliance Board 80
Section 503 - Employment under Federal Contracts . . 84
Section 504 - Nondiscrimination under Federal Grantsand Programs 87
Section 507 - Interagency Coordinating Council 95
Title VI
Section 621 - Projects With Industry 97
Section 631 - Supported Employment Services 106
Title VII
Section 701 - Comprehensive Services forIndependent Living 109
Section 711 - Centers for Independent Living 112
Section 721 - Independent Living Services for Older Blind
Individuals 121
APPENDICES
A. Glossary of Terms
B. Financial Tables
123
127
C. Historical National Trends and Detailed CurrentActivity, by State agency 136
Historical National Trends 136Detailed Current Activity by State Agency, FY 1989 136
D. Characteristics of Persons Rehabilitated andReasons for Closure 239
E. Post-employment Services and Annual Review ofIneligibility Determinations andWorkshop Placements 272
F. Client Assistance Program 276
G. Client and Applicant Appeals 288
H. Comprehensive Services for Independent Living . . . 296
I. Services to and Outcomes for Personswith Severe Disabilities and Personswith Nonsevere Disabilities 304

a r y

EXECUTIVE SUMMARY
This report to the President and to the Congress is requiredby Section 13 of the Rehabilitation Act of 1973, as amended (theAct). The report describes activities under the Act from October1, 1989 through September 30, 1990. The report is organizedfollowing the titles and sections in the Act. The appendicescontain data from various reports required in the Act andregulations. Summaries of the data in the appendices and theirimport are included in the body of the report where appropriate.
This executive summary contains brief information about theprograms reported on and some highlights of what will be found inthe various sections of the report.
GENERAL PROVISIONS
Sections 3 and 12Office of the Commissioner
The Act makes the Commissioner of the Rehabilitation ServicesAdministration (RSA) the principal Federal official responsible foradministration of the State-Federal vocational rehabilitationsystem, evaluating the programs funded under the Act, andmonitoring discretionary grant program grantees and the StateVocational Rehabilitation (VR) agencies' execution of Stateresponsibilities under the Act. RSA's central and ten regionaloffices provide technical assistance and leadership to assistStates and other grantees in strengthening programs providingservices to individuals with handicaps, especially individuals withsevere handicaps.
Commissioner Nell C. Carney completed her first full year ofadministration in FY 1990 and continued the four priorities for RSAthat she established upon her appointment. These priorities are:
o Responsible implementation of the Rehabilitation Act, asamended;
o RSA policy reform;
o Strong internal management; and
o Building nationwide constituency relations.
Section 12(a)(4)American Rehabilitation Magazine
Publication of American Rehabilitation is an ongoing activityunder this section of the Act. Three issues were published in FY
1
1990 reaching about 15,000 readers. Fifteen different topics wereaddressed in addition to reqular features.
Section 14EvaluationFederal Funds $988,000
Section 14 of the Act mandates that the Commissioner evaluateall programs authorized by the Act, their effectiveness in relationto their cost, their impact on related programs, and theirstructure and mechanisms for delivery of services, usingappropriate methodology and evaluative research design. It
requires that standards be established and used for the evaluationsand that the evaluations be corducted by persons not immediatelyinvolved in the administration of the program or project beingevaluated.
Section 15Office of Information and Resources for the Handicapped(Clearinghouse on Disability Information)
The Clearinghouse on Disability Information responds to
inquiries about disability. Major areas of emphasis are
information on Federal funding and federally-supported special
education, rehabilitation, and disability research projects;
Federal legislation affecting persons with disabilities; andidentification of other information resources. The Clearinghouseresponded to 4,334 written requests and 1,022 telephone inquiriesduring FY 1990.
TITLE I
Sections 100-111The Vocational Rehabilitation (VR) Services ProgramFederal Funds $1,524,677,000
The Act authorizes Federal allocations on a formula grantbasis, with a State matching requirement. Except for the costs ofconstructing rehabilitation facilities where the match is 50
percent, the State matching share is 20 percent of the amountallotted to the State in 1988. Beginning in FY 1989, any increasedamount a State receives above its 1988 allotment is matched at anadditional 1 percent per year for five years.
Program emphasis in FY 1990 continued to be placed on therevision of the monitoring system for all formula and discretionarygrantees; technical assistance to rehabilitation facilities; andplanning for the implementation of findings from the evaluationstudy on services to individuals with long-term mental illness.
2
L
Section 112Client Assistance Program (CAP)Federal Funds $7,901,000
CAP is a formula grant program that States participate in asa condition of receipt of funds for the VR Services program. Theprogram advises clients and potential clients of, and assists themin obtaining, all available services under the Act.
Part D
Section 130American Indian Vocational Rehabilitation ServicesFederal Funds $3,821,000
In FY 1990, RSA functld eight new projects and six continuationprojects. RSA is suppGrting initiatives resulting from anevaluation of the American Indian Program conducted in 1986.
TITLE II
Section 200 - 204The National Institute on Disability and Rehabilitation ResearchFederal Funds $54,318,000
The National Institute on Disability and RehabilitationResearch (NIDRR) provides leadership and support for a nationaland international program of rehabilitation research and theutilization of the knowledge gained through this program. Inaddition, the Director of the Institute chairs the InteragencyCommittee on Disability Research (ICDR), which coordinatesrehabilitation research efforts across the Federal Government.NIDRR also administers the Spinal Cord Injury program and theTechnology Assistance program.
In FY 1990, the NIDRR program budget was $54.318 million,which supported:
40 Rehabilitation Research and Training Centers($22,755,000),
18 Rehabilitation Engineering Centers ($10,600,000),
60 Field-Initiated Research Projects ($6,650,000),
29 Research and Demonstration Projects ($5,964,000),
20 Research Dissemination and Utilization Programs($4,200,000),
21 Innovation Grants ($1,050,000),
3
8 Research Training and Career Development grants
($1.061,000),
10 Mary E. Switzer Fellowships ($326,500),
16 Small Rosiness Innovative Research grants($600,000), and
Miscellaneous Expenditures ($800,000).
In addition, NIDRR administered programs funding:
13 Model Spinal Cord Injury projects ($5,000,000),
23 Technology Assistance State grants ($20,900,000).
Spinal Cord Injury funds are appropriated under Section 311
of the Act and transferred to NIDRR to administer. Technology
Assistance funds are appropriated under the Technology Related
Assistance for Individuals with Disabilities Act of 1988,
although the program is administered by NIDRR.
TITLE III
Section 304(a)Rehabilitation TrainingFederal Funds $31,110,999
Under the Rehabilitation Training program, grants and
contracts may be made to States and public or nonprofit agencies
and organizations, including institutions of higher education, to
pay part of the costs of projects for scholarship/training
awards, traineeships, and related activities designed to assist
in increasing the numbers of qualified personnel trained in
providing services to individuals with handicaps.
In FY 1990, the 320 funded projects were required to provide
training that focused on skills development directly relevant to
the placement of individuals with severe disabilities in
employment. In FY 1990, RSA funded projects in response to
program priorities to ensure the availability of rehabilitation
personnel who are skilled in (1) developing jobs for ard placing
individuals with severe disabilities in competitive employment
and (2) providing improved community-based supported employment
services to individuals with severe disabilities.
4
Section 304(d)Rehabilitation Training (Training of interpreters for individualswho are deaf.)Federal funds $1,510,000
In FY 1990, twelve projects received funding to train newinterpreters and maintain and upgrade the skills of existinginterpreters to meet the communication needs of individuals whoare deaf.
Section 311(a) (1)Special Projects and Demonstrations for Providing VocationalRehabilitation Services to Individuals with Severe HandicapsFederal Funds $17,455,000
Section 311(a) (1) authorizes grants to demonstrateinnovative approaches to the rehabilitation of individuals withsevere handicaps, regardless of their age or the severity oftheir handicaps. In FY 1990, this program supported 88 projects.
Section 311(a) (1)Special Projects and Demonstrations for Providing VocationalRehabilitation Services to Individuals with Severe Handicaps --Head Injury CentersFederal Funds $14,813,000
A one time appropriation was made for the purpose of fundingone-time startup costs for regional (multistate) system ofcomprehensive head injury rehabilitation and prevention centers.Four projects were funded.
Section 311(d)(1)(A)Supported Employment Demonstration ProjectsFederal Funds $9,009,815
This program supported 27 participating State grantees tomake "system changes" from sheltered day and work activityprograms to competitive work in integrated settings via supportedemployment. The first ten awards, fumed in 1985, received theirfinal year of funding in FY 1989. The remaining 17 awards wervfunded under the 1986 amendments to the Act and received theirfinal year of funding in FY 1990. Twelve community-basedprojects, awarded in 1989 to stimulate the development ofinnovative appraaches for improving and expanding the provisionof supported employment services to individuals with severehandicaps and to enhance local capacity to provide supportedemployment services, were continued in 1990.
5
Section 311(d)(2)(A)Special Projects and Demonstrations for Providing SupportedEmployment Technical AssistanceFederal Funds $866,'85
These technical assistance projects assist State ocationalrehabilitation agencies to develop and implement the T.Ltle VI,
Part C State Supported Employment Services program. Two
cooperative agreements, for three-year periods, were awarded in
FY 1990.
Section 312Handicapped Migratory and Seasonal FarmworkersFederal Funds $1,086,000
This discretionary grant program provides vocationalrehabilitation services for migratory agricultural and seasonal
farmworkers. Project activities are coordinated with other
Federal programs that serve this same target population,including those administered by the Department of Labor, Public
Health Service, and other programs in the Department of
Education. State VR agencies conduct these projects. In FY
1990, eleven grants were awarded; five were new awards and six
were continuation awards.
Section 316Special Recreation Programs for Individuals with Handicaps
Federal Funds $2,588,000
Section 316 of the Act authorizes special service projects
to initiate recreation programs for individuals with handicaps.
Twenty-eight new projects were funded in FY 1990 for a three-year
period. This is the second three-year project period for this
program. Prior to 1987, special recreation projects were funded
for only one year. These special recreation programs offer
persons with disabilities opportunities to develop new interests,
specific skills, and the confidence to take risks in integrated
settings that impact on all aspects of their quality of life.
TITLE IV
Section 400National Council on DisabilityFederal Funds $1,540,000
The National Council on Disability is an independent Federal
agency comprised of 15 members appointed by the President and
confirmed by the Senate. The National Council has specific
statutory duties, which include establishing general policies for
the National Institute of Disability and Rehabilitation Research
and providing advice to the Rehabilitation Services
Administration.
6
TIME V
Section 501Employment of People with Disabilities in the Federal Government
The Equal Employment Opportunity Commission (EEOC) hasresponsibility for enforcing the nondiscrimination and affirmativeaction provisions of laws and regulations concerning Federalemployment of people with disabilities. During FY 1990, EEOCmonitored Federal affirmative employment programs by combining itsevaluation of employment programs for minorities, women, and peoplewith disabilities. As part of EEOC"s oversight responsibilities,EEOC staff also conducted combined onsite reviews of employmentprograms for minorities, women, and people with disabilities atseveral Federal agencies, both at their headquarters and selectedfield installations.
The Interagency Committee on Employment of People withDisabilities (ICEPD), formerly known as the Interagency Committeeon Handicapped Employees (TCHE), has responsibility for co-operating with and assisting 4-he EEOC in its efforts to ensure thatFederal agencies in the Executive Branch are in compliance withFederal laws and regulations for the hiring, placement, andadvancement of people with disabilities. During FY 1990, ICEPDdeveloped new policies and issued guidance to Federal agencies thatenhance employment of people with disabilities.
Section 502Architectural and Transportation Barriers Compliance BoardFederal Funds $1,950,000
The Architectural and Transportation Barriers Compliance Board(ATBCB) is an independent Federal agency charged with ensuring thatcertain facilities designed, constructed, leased or altered withFederal funds since September 1969 are accessible to and usable bypersons with disabilities. The Board revised its mission in 1990and states that the new mission is: "To enhance the quality of lifeby ensuring accessibility and broadening the public awareness thataccess makes economic and practical sense for all."
The ATBCB has a governing board of 23 members. The Presidentappoints 12 public members (six must be persons with disabilities)to three-year terms, and the other 11 are the heads (or designees)of the Departments of Defense, Education, Health and HumanServices, Housing and Urban Development, Interior, Justice, Labor,Transportation, Veterans Affairs; the General ServicesAdministration, and the U.S. Postal Service.
ATBCB's legislative mandate is to:
o ensure compliance with standards prescribed under theArchitectural Barriers Act (Public Law 90-480);
7
o propose alternative solutions to barriers facing persons with
disabilities in housing, transportation, communications,
education, recreation, and attitudes;
o determine what Federal, State, and local governments and other
public or private agencies and groups are doing to eliminate
barriers;
o recommend to the President and the Congress legislation to
eliminate barriers;
o establish minimum guidelines and requirements for standards
issued under the Architectural Barriers Act;
o prepare plans for adequate transportation and housing for
people with disabilities, including proposals to cooperate
with other agencies, organizations, and individuals working
toward such goals;
o develop standards and provide technical assistance to any
entity affected by regulations issued under Title V of the
Rehabilitation Act of 1973;
o provide technical assistance on the removal of barriers and
answer other questions on architectural, transportation,
communication, and attitudinal barriers affecting persons with
disabilities; and
o ensure that public conveyances, including rolling stock, are
usable by persons with disabilities.
Section 503Office of Federal Contract Compliance Programs
The Office of Federal Contract Compliance Programs (OFCCP) in
the U.S. Department of Labor is responsible for implementing and
enforcing Section 503 of the Act. Section 503 requires employers
with Federal contracts in excess of $2,500 to take affirmative
action to employ, and advance in employment, qualified individuals
with handicaps and to make reasonable accommodations to their
physical or mental limitations. Individuals with handicaps, or
organizations or representatives on their behalf, may file
complaints if they believe they have been discriminated against by
Federal contractors or subcontractors.
The day-to-day enforcement activities, which protect the
employment rights of individuals with handicaps, are carried out by
the ten regional offices, located in the standard Federal regions,
and the national Office.
8
Section 504Nondiscrimination in Federally Assisted and FederallyConducted Programs and Activities
The Civil Rights Division of the Department of Justice (DOJ)is responsible for the consistent and effective enforcement byExecutive agencies of what are commonly referred to as the "cross-cutting" civil rights statutes, including section 504 of the Act.Executive Order 12250 charges the Attorney General with thisresponsibility, which has been delegated to the Assistant AttorneyGennral for Civil Rights. Under Executive Order 12250, theDivision undertakes a diverse array of regulatory andadministrative initiatives. The Division reviews all proposedcivil rights regulations for consistency, adequacy, and clarity,and assists Federal agencies in the development of appropriateregulations. The Division also issues interpretations of theseregulations in individual administrative cases and providesguidance to the agencies on new civil rights issues. The Divisionannually reviews the civil rights implementation plans of eachFederal agency as required by Section 1-403 of Executive Order1225u, and offers training and technical assistance to arlencies toimprove their civil rights enforcement procedures and prcgrams. Italso promotes interagency information sharing and cooperationthrough delegation agreements.
Section 507Interagency Coordinatirg Council
The Assistant Attorney General for Civil Rights serves as thechairperson of the Interagency Coordinating Council. The Councilcoordinates the enforcement of the provisions of Title V. EightFederal agencies with major enforcement or coordination functionsregerding the provision of Title V are represented on the Council.
During FY 1990, the Council met three times to consider issuesregarding the availability of government records in accessibleformats for use by persons with disabilities; the TelevisionDecoder Circuitry Act; and the Americans with Disabilities Act.
TITLE VI
Part B
Section 621Projects With Industry (PWI)Federal Funds $18,765,000
WI is a partnership between business, industry, labor, andthe rehabilitation community. The primary goal of thisdiscretionary grant program is to expand job opportunities forindividuals with handicaps in the competitive labor market. In FY
9
19900 112 continu7tion projects were funded. In addition, 13 newprojects were awa..ded in geographically unserved and underserved
areas.
Part C
Section 631Supported Employment ProgramFederal Funds $27,630000
This formula grant program provides State VR agencies with
financial assistance to develop and implement collaborative
programs with appropriate public and private nonprofitorganizations leading to supported employment for individuals with
severe handicaps. As a condition for receipt of VR Servicesprogram funds, State VR agencies must assure that the State has an
acceptable plan to provide supported employment services.
TITLE VII
Part A
Section 701The State Comprehensive Services for Independent Living programFederal Funds $12,938,000
This program provides formula grant allotments to assist State
agencies in providing comprehensive independent living services to
enable severely disabled individuals whose disabilities are sosevere that they do not presently have the potential for employment
to live and function more independently.
Part B
Section 711Centers for Independent LivingFederal Funds $26,666,000
Centers for Independent Living provide services that enable
severely disabled persons to live more independently in the family
or community or to secure and maintain employment with the maximum
degree of self dixection. In FY 19900 97 grants were funded for
the operation of 202 centers, including 10 branches or satellites.
10
16
Fart C
Section 721Independent Living Services for Older Blind IndividualsFederal Funds $5/8271000
//
This program authorizes discretionary grants to State VRagencies to provide independent living services for individuals whohave severe visual impairments and who are aged 55 and older tohelp them adjust to their disability and to live more independentlyin the home and community. In FY 1990/ 28 grantees receivedcontinuation awards for the operation of a wide variety ofdemonstration programs.
1

General Provisions

Sections 3 and 12
Office of the Commissioner
REHABILITATION SERVICES ADMINISTRATION
Office of the Commissioner
Sections 3 and 12Office of the Commissioner
Nell C. Carney completed her first full year of administrationin 1990 and continued the four priorities for RSA that sheestablished upon her appointment as Commissioner. These prioritiesare: (1) responsible implementation of the Rehabilitation Act, asamended; (2) policy reform; (3) strong internal management; and (4)building nationwide constituency relations.
RESPONSIBLE IMPLEMENTATION OF THE REHABILITATION ACT
A new initiative to increase competitive employmentopportunities for individuals with disabilities was begun in 1990.This effort resulted in the identification and dissemination ofinformation on exemplary programs that have shown significantsuccess in placing individuals with disabilities in competitiveemployment. A plan for highlighting placement and marketingstrategies was also developed for implementation in the future.
A multilayered personnel training needs assessment wasconducted that included input at the State, regional and nationallevels. State agencies, client assistance programs, independentliving centers, rehabilitation educators, national organizations,service providers and consumers participated by contributing theirinsights on personnel training needs.
Accountability initiatives continued with the development andrefinement of standardized instruments for program monitoring inthe formula and discretionary grant programs. These monitoringtools included the State Plan Assurance Reviews (SPARS), the CaseReview System (CRS), and instruments to review Client AssistancePrograms. Plans for the computerization of review findings wereimplemented, and a standardized procedure for recovery of funds wasdrafted.
Efforts to address the technical assistance needs of variousgrantees, including State VR agencies, were initiated in acomprehensive manner. RSA staff recorded all contacts withgrantees, potential grantees, constituents and the general publicin order to ident-fy and summarize the existing need for technicalassistance. The cooperative agreements with the RehabilitationContinuing Education Programs were amended to include funding f-,rthe provision of technical assistance to rehabilitation facilities.
In 1990, the deregulation efforts continued for both 34 CFRPart 361, regulations for the State VR Services program and Part
12
365, regulations for the State Comprehensive Services for
Independent Living program. Proposed revisions to existingregulations were also developed for 34 CFR Part 3631 the StateSupported Employment program, in response to comments received fromthe public in 1989. Publication of these revised regulations isexpected in late 1991 or early in 1992.
POLICY REFORM
RSA established a revised system for the development andissuance of policy. The System for Issuing Policy and Informationwill assure that grantees have access to clear and consistentpolicy statements that are grounded in legislation and regulations.The new system also provides a mech..alism for grantees, consumers,and constituent organizations to raise policy issues that should beaddressed by RSA.
Revision and reissuance of the Rehabilitation Services Manual(RSM), last updated in 1976, began in 1990 with the development offive chapters. Input was sought from State VR agencies and otherconstituent groups in drafting these chapte...s. Chapters developedin 1990 include: Eligibility for Services, the IndividualizedWritten Rehabilitation Program, Standards for Closure, theEstablishment Grant Authority, and the Client Assistance Program.
Efforts continue to identify and retire obsolete policies andother issuances no longer relevant to the administration ofprograms under the Act.
STRONG INTERNAL MANAGEMENT
A five-year Strategic Management Plan was developed to provide
a framework and vision for the future direction of RSA. A FY 1990Operational Plan, including four goals and eight objectives, wasdeveloped and implemented. The process for monitoringaccomplishments under the RSA Operational Plan is in place. As aresult of the activities undertaken in FY 1990, RSA prepared acomprehensive Operational Plan for 1991 that includes 5 major goals
and 23 objectives.
During 1990, emphasis continued on increased computerizationof in-house activities and the development of procedures to enhancethe use of data generated by grantees. The recruitment ofqualified staff for vacancies resulted in RSA exceeding its
staffing level for the first time in many years. An internalcommittee developed recommendations for the Commissioner toconsider in enhancing employee development of RSA staff. Effortsto address the reasonable accommJation needs of RSA employees withdisabilities continued.
13
CONLMITUENCY RELATIONS
The Commissioner continued to hold regional constituencyrelations meetings during 1990 to increase the effectiveness ofcommunication and cooperation between RSA and related agencies andconstituency organizations. The purposes of these meetings was toreceive information and questions from area service providers andindividuals with disabilities, establish and develop channels ofcommunication; and share the Administration's plans and prioritiesfor 1991, as well as RSA's goals and future directions. A summaryof the ten regional meetings was prepared and disseminated.
During FY 1990, Commissioner Carney continued to hold meetingswith other Federal agencies, service provider organizations/consumer and advocacy groups, and other related agencies andorganizations to advise these groups of her plans and priorities.
14
Section 12(a)(4)
American Rehabilitation Magazine
Section 12(a)(4)American Rehabilitation Magazine
In 1990, RSA celebrated its 30th year as publisher of amagazine for professionals in the field of rehabilitation. Americanpehabilitation (AR), RSA's quarterly professional journal, beganpublication in 1960 as the Rehabilitation Record In 1975 the namewas changed to American Rehabilitation. Despite the name change,the magazine's format and constituency -- rehabilitation adminis-trators, supervisors and counselors; physiatrists; rehabilitationengineers; and a variety of professionals in education,rehabilitation and medicine throughout the world -- remain thesame.
The magazine is designed to disseminate information onrehabilitation programs funded by RSA and other Federal agencies,as well as any material relevant to the performance of professionalduties related to RSA interest. Therefore, any topic related torehabilitation, such as innovative programs, agency administrativepractices, research, and technique, is considered. Occasionallyentire issues are devoted to one area of disability or to aspecific approach to rehabilitation; however, most issues reflecta balance of subject matter. The ideal article describes a new andsuccessful approach to providing services for people withdisabilities that can and should be replicated. AR also usesseparate sections, or "departments," of the magazine to featurereviews of books, films and other resources on disability andrehabilitation, to present materials on what individual States aredoing; to announce conferences and events; and to disseminate otheritems of interest to rehabilitation professionals.
In FY 1990, 15 articles, written by professionals in the fieldof rehabilitation, were published. Article topics includedrehabilitation technology, choices in rehabilitation, achievingexcellence in rehabilitation education, integrated employment,Native Americans, computers in rehabilitation, litigationavoidance, the Americans with Disabilities Act (ADA), supportedpostsecondary education for people withergonomics of disability, traumaticrehabilitation research applications.
mentalbrain
illness,injury,
theand
The Autumn issue offered articles on "Choices inRehabilitation," "Computer Access and Visual Disability: RemainingBarriers," "Disability and its Prevention in Indian Populations,""Litigation Avoidance Through Conflict Resolution," and "IntegratedEmployment for People with Severe Disabilities."
The Spring issue included articles on " Achieving Excellencein Rehabilitation Education," "Physical Disability and TechnologyNeeds," "Service, Resource and Training Needs of American Indians,"
15
"Take Charge: A Strategic Guide for blind Job Seekers -- a bookreview," and "Common Deficiencies of Research Applications."
The Summer issue contained articles on "Computer Revolution:Beyond Automation to Empoverment," "The Americans with DisabilitiesAct," "Supported Postsecondary Education for People with MentalIllness," "Toward Universal Design: an ongoing project on theergonomics of disability," and "Conclusion of a National Think Tankon TBI."
Due to a number of circumstances, the Winter issue was notproduced. In an effort to improve the production schedule of themagazine, a large amount of staff time was devoted to training andplanning for the transition to electronic publishing.
Subscriptions are available thror0 the Superintendent ofDocuments, U.S. Government Printing Office, Washington, D.C. 20402;yearly rates are $5 domestic, $6.25 foreign; single copies are$1.75 domestic, $2.18 foreign.
Authors interested in submitting their manuscripts to ARshould contact: Frank Romano, Editor, Room 3127 Switzer Building,330 C Street, SW, Washington, D.C. 20202-2531.Telephone 202 732-1296

Section 14
Evaluation
REHABILITATION SERVICES ADMINISTRATION
Planning Policy and Evaluation Staff
Section 14EvaluationFederal Funds $988,000
Section 14 of the Act mandates that the Commissioner evaluateall programs authorized by the Act, their effectiveness in relationto their cost, their impact on related programs, and theirstructure and mechanisms for delivery of services, usingappropriate methodology and evaluative research design. Itrequires that standards be established and used for the evaluationsand that the evaluations be conducted by persons not immediatelyinvolved in the administration of the program or project evaluated.
EVALUATION ACTIVITIES
Projects completed in FY 1990
o Development of Program Performance Measures - CompletedOctober 1990. The purposes of this study were: (1) todevelop state-of-the-art accountability measures for the VRServices program and (2) to produce a model of proposedprogram performance measures of effectiveness.
The study produced a candidate set of statistical indicatorsas a foundation for the development of standards against whichto assess accountability; developed methods to increase thevalidity and fairness in the application and interpretation ofthose indicators; and refined a data display format thatallows evaluation simultaneously across multiple aspects ofaccountability.
Contact person: Suzanne Choisser (202) 732-1337
o Evaluation, of the Impact of the State VR Agency ManagementControl Project (MCP) - Completed April 1990. The purposes ofthis study were: (1) to evaluate the effectiveness of theState projects using MCP as it pertains to achieving the sixgoals of the MCP and (2) to determine whether any of thepractices under review should be cited as exemplary andwhether other State agencies should be encouraged to adoptsuch practices.
Since 1987 all the agencies adopting the MCP appeared to bebenefitting significantly from their participation. Thissuggests that modifications in approach and experience gainedwith earlier efforts were translating into more responsive andeffective technical and training support; and/or that the
17
r
agencies opting for the approach were better suited andprepared for its implementation.
Contact person: Francoise C. Hall (202) 732-1338
Projects continued into FY 1990 from prior year
o Evaluation of Vocational Assespment Procedures and the IWRPProcess used by State VR Agencies - Expected completionSeptember 1992. The purposes of this study are: (1) toexamine, analyze, and evaluate client assessment policies andpractices used by State VR agencies throughout therehabilitation process; (2) to assess policies and practicesused by State 'YR agencies involved in developing,implementing, and modifying client IWRP's; (3) to determinethe extent to which, and ways in which client diagnostic andassessment data are actually used in making key decisions(e.g. eligibility); (4) to identify effective assessment andIWRP practices in use in State VR agencies and the outcomesassociated with these exemplary practices; and (5) to makerecommendations to RSA about options for addressing problemsencountered and for fostering more widespread use of exemplaryvocational assessment and 1WRP related policies and practicesidentified by this study.
Contact person: Suzanne Choisser (202) 732-1337
o Evaluation of State Vocational Rehabilitation Activities inDrug/Alcohol Rehabilitation - Expected completion November1991. This evaluation focuses on those clients whoparticipate in State VR agency rehabilitation programs benauseof alcohol or drug problems, either as a primary or seconiarycondition. The evaluation is studying the characteristics; ofthese clients, the patterns of service offered by 'VP% agencies,
rehabilitation outcomes, and interrelationships with otheragencies offering services for alcoholism and drug dependency.Model service mechanisms will be identified. The study isintended to lead to suggestions for policy which mightstrengthen the milieu of rehabilitation services for theseclients.
Contact person: Francoise C. Hall (202) 732-1338
o Evaluation of Youth Transition from School to WorK - Expectedcompletion December 1992. The RSA substudy to this five-yearlongitudinal study conducted by the Office of SpecialEducation Programs (OSEP) is of those youths who are referredto VR by the schools or who otherwise become participants inthe VR program following completion of secondary school.Patterns of referral and service in the schools and inrehabilitation, and the results of rehabilitation are being
evaluated. Recommendations for improvement of linkages
18
3 P.
between the schools and VR and fur improvement of servicepatterns for youths with disabilities are expected.
Contact person: Fran,-,ise C. Hall (202) 732-1338
Projects started ip FY 1990
o Evaluationot_Qualltystems in State VocationalRehabilitation Agencies - Expected completion September 1997..The purposes of this procurement are:
(1) to describe the nature and scope of quality assurance(QA) systems* subsystems or subsystem elements existingin State VR agencies, particularly as the three essentialelements of QA (monitoring, standards, and correctivemechanisms) pertain to the four principal phases of theVR process: Eligibility Determination; Development ofindividualized Written Rehabilitation Plan (IWRP);Provision of Services; and Closure;
(2) utilizing specified criteria, to nominate exemplary QAsystems, subsystems or subsystems elements, as theyrelate to: (a) quality of performance measures; (b)
appropriateness of standards; and (c) effectiveness ofcorrective mechanisms; and
(3) to develop a manual that provides guidance: (a) to StateVR agencies for evaluating their QA systems or developingnew QA syst Ls; and (b) to RSA for evaluating State VRagency QA s. .tems and subsystems, especially those QAsubsystems focusing on case reviews to see if thosereviews at least meet Federal requirements and providingtechnical assistance to State VR agencies on mattersconcerning quality assurance systems.
Contac'' person: Suzanne Choisser (202) 732-1337
o Evaluation of Procedures to Recruit and Retain Qualified FieldService Delivery Personnel in the State-Federal "RehabilitationProaram - Expected completion September 1991. The purposes ofthis study are:
(1) to identify factors that facilitate or impede therecruitment and retention of qualified field staffservices delivery personnel by State VR agencies,including the contribution of post-employment training;
(2) to document cases of exemplary practices used by State VRagencies to recruit and retain qualified service deliverypersonnel;
19
(3) tct identify the level oi info-mation that selected pre-service training programs have on their graduates,including whether graduates are going to work in State VRagencies, and identifying the representation ofindividuals with disabilities or minority groups in thepre-service training program student population; and
(4) to identify factors that encourage employment ofindividuals with disabilities and persons from minoritygroups in field service delivery positions in State VRagencies.
Contact person: Francoise C. Hall (202) 732-1338
o Traumatic Brain Injury ptilt Practice Study. Expectedcompletion September 1992. Tne purposes of this study are:
(1) to identity (a) the vocational rehabilitation and relatedservice needs of persons with TBI and, (b) the currentpractices that the VR system has implemented to addressthese needs;
(2) to assess the strengths and weaknesses of current VRsystom practices in serving persons with TBI; and
(3) to identify effective practices that RSA might considerfor persons with TBI.
Contact person: Francoise C. Hall (202) 732-1338
20

Section 15
Information Clearinghouse
OFFICE OF THE ASSISTANT SECRETARY FOR SPECIAL EDUCATION ANDREHABILITATIVE SERVICES
Section 15Office of Information and Resources for the Handicapped(Clearinghouse on Disability Information)
The Clearinghouse on Disability Information responds toagencies and information providers who serve individuals withdisabilities, as well as families where disabilities are present.Major areas of emphasis are information on Federal funding, Federallegislation affecting persons with disabilities and identificationof other information resources.
Aatiyities
During FY 1990, the Clearinghouse responded to 4/334 writtenrequests and 1,022 telephone inquiries. Two issues of OSERS Newsin Print were published and distributed to 24,000 requestors. Twoissues cf OSERS News Update/ a bi-monthly print communicationinitiated in FY 1990/ were published and distributed to some 300disability organizations and parent groups. The Summary ofPasting Legtslation Affecting Persons with Disabilities and ThePocket Guide to Federal Hejp for Individuals with Disabilities werealso distributed.
21

Title I
Sections 100 - 111
Vocational RehabilitaGonServices Program
REHABILITATION SERVICES ADMINISTRATION
Office of Program Operations
Sections 100 - 111The Vocational Rehabilitation (1/R) Services programFederal Funds $1,524,677,000
Title I of the Act authorizes grants to the States to conductcomprehensive vocational rehabilitation programs that meet the"needs of Individuals with handicaps so that such individuals mayprepare for and engage in gainful employment to the extent of theircapabilities."
The Act requires each administering State agency to submit aState plan every three years. This plan, which must be approvedbefore the State agency can receive Federal funds, expresses theStatets commitment to the requirements of the Act and lays out itsprogram. It also serves as the major reference point for RSA inmonitoring performance, as measured against the setting andachievement of client goals, program operations, and delivery ofservices. Eighty-three State agencies administer VR Servicesprograms in the 50 States, District of Columbia, Puerto Rico,Virgin Islands, Guam, American Samoa, Republic of Palau, and theCommonwealth of the Northern Marianna Islands. In 26 States, thereare two agencies, one for people who are blind and one for peoplewith other disabilities. In 24 States, a single State VR agencyprovides services to persons with any disability. Approximatelyone-half of the State VR agencies are located in multi-programagencies, for instance, Departments of Human Resources. About one-fourth of the States place their VR agency in Departments ofEducation. The remaining State VR agencies are independentagencies responsible to the Office of the Governor.
Allocations of Federal Funds
The Act authorizes Federal allocations on a formula basis witha State fund matching requirement. The State matching share is 20percent of the amount allotted to the State in 1988. Beginning inFY 1989, any increased amount a State receives above its 1988allotment is matched at an additional one percent per year for fiveyears. Program emphasis continued to be placed on providingservices to individuals with the most severe handicaps.
New and continuing efforts by RSA were conducted to help Stateagencies improve management and programmatic efforts in severalareas.
22
VR SERVICES PROGRAM ACTrVITIES
Monitoring
RSA is in the process of revising its system for monitoringall formula and discretionary grantees in order to developstandardized approaches to permit development of national databases.
The major areas for on-site monitoring under the new system
will continue to be State plan compliance, eligibility, auditfollow-up, and internal controls for fiscal management. A newinstrument entitled the State Plan Assurance Review (SPAR) has beendeveloped to monitor State plan compliance under Titles If VI-C,and VII-A, while the Case Review System (CRS) has been revised tobe applicable to all three formula grant programs and to reflectregulatory changes based on the 1986 amendments to the Act.
Computer programs have also been developed to report datagenerated by the application of both the SPAR and CRS. Aninteractive program is in the process of development to permit acomparative analysis of SPAR, CRS, and audit data at the local,regional, and national levels.
Initial activities in the development of standardizedmonitoring instruments for the other formula grant programs arealso under way. The new instruments and system evolving from them
will permit targeting of resources to areas of identifieddeficiencies as well as long-term planning for monitoring,technical assistance, training, and evaluation priorities.
Mental Illness
In a continuing effort to improve the rehabilitation outcomesof VR clients who have severe mental illness, the RSA Office ofProgram Operations has initiated activities focused on this
disability group. Plans have been developed for a national ProgramAdministrative Review of VR client records and State VR agencyprogram and administrative practices in order to define thevariables that contribute to effective rehabilitation of VR clients
with severe mental illness. Developmental work has begun on twoinitiatives responding to recommendations generated by the PolicyStudies Associates evaluation study entitled "Best Practice Studyof Vocational Rehabilitation Services to Severely Mentally IllPersons" completed in 1989. These initiatives, focusing onrevision of the VR definitions and criteria applicable to severemental illness and on dissemination of information about the VRsystem and process targeted to providers of mental health services,are intended to facilitate interagency cooperation between State VRand mental health agencies.
23
The Office of Program Operations is also participating inintra and interagency efforts to improve vocational outcomes forpersons with severe mental illness. Information and technicalassistance has been provided to the RSA Office of DevelopmentalPrograms for the development of special demonstration and traininggrant priorities that will enhance the capability of State VRagencies to serve persons with severe mental illness. RSA nationalcaseload data from 1984 through 1988 has been provided to theNational Institute of Mental Health for their longitudinal study ofthe VR system and the progress of clients with severe mentalillness through the system. This analysis will be useful in thedevelopment of the Program Administrative Review and theimplementation of strategies that will enable State VR agencies tobetter serve this population.
Program Audits
During FY 1990, the Department of Education, Office ofInspector General, issued 44 audits involving vocationalrehabilitation programs, either directly or as a collateral action.Many of the audits were made by independent auditors in accordancewith the Single Audit Act of 1981, P.L. 98-502 and the Office ofManagement and Budget Circular No. A-128 which established auditrequirements for State and local governments that receive Federalfunds. Four of the audits were later suspended. Thirty-two of theforty audit reports have been resolved and closed. On ten of theseaudits, RSA was the primary action official. Approximately half ofthese involved no monetary findings. The monetary findingsamounted to more than 2 million dollars.
Major audit problems were related to weaknesses in accountingsystems, records, and monitoring; lack of documentation(eligibility); weaknesses in internal controls; and reports notfiled on a timely basis and/or not completed correctly. Otheraudit findings included excessive Federal cash balances, impropercharges to indirect costs, improper handling of reimbursements,monitoring of subrecipients, inadequate time distribution records,inadequate case files, and property and equipment not beingproperly monitored and controlled. State officials agreed withmost of the audit findings.
CASELOAD TRENDS THROUGH FY 1990
UMMARY
FY 1990 was a year in which mixed, but generally positive,caseload trends were noted. State rehabilitation agencies providedservices to increased numbers of persons with disabilities for thethird year in a row and saw their total workload of applicants andclients expand for the sixth consecutive year, yet theysuccessfully rehabilitated fewer individuals than in FY 1989. At
24
the same time, the intake of new cases, whether as applicants orclients accepted for services, declined slightly.
The caseload results among persons with a severn disabilitywere quite favorable with increases to record levels occurring in
those served and newly accepted for services. A slight decline wasseen in the number of successful rehabilitations of persons with
severe disabilities in comparison to FY 1989. More than two-thirds
of the caseloads of State agencies are now composed of individualswith severe disabilities. Regardless of the caseload measurement:record percentages were set in FY 1990 of severely disabled personsamong the total clientele served by State agencies.
Tbe dual trends of increases in cases of persons with severedisabilities and losses among those who were not severely disabledcontinued into FY 1990. Overall increases in a given caseload
statistic occurred when the rise among persons with severedisabilities exceeded the decline among the nonsevere group for
that statistic.
Key caseload highlights are described more fully in AppendixC, which contains 13 historical tables and 6 charts. These tables
and charts reflect national data whose trends depict the net
effects of changes occurring in caseloads of individual Stateagencies. National trends, therefore, do not necessarily representtrends in particular agencies.
REHABILITATIONS
A. All Persons Rehabilitated
State agencies vocationally rehabilitated 216,109 persons inFY 1990, a 2.0 percent loss from the number rehabilitated in FY
1989 (220,408). This marked the fourth year in the last five of a
declining trend and reflects continuing reductions in
rehabilitations of persons not having severe disabilities and a
decrease in the rehabilitation rate. (Appendix C, Tables 1 and 3,
Figure A)
B. The Rehabilitation Rate
The rehabilitation rate -- defined as the percent of casesclosed from the active statuses that represent successfulrehabilitations -- fell to 62.2 percent in FY 1990 from 63.0percent in the previous year. The rehabilitation rate of 62.2
percent was calculated by dividing the number of rehabilitations(216,109) by the sum of rehabilitations and non-rehabilitations(347,480). Had the rehabilitation rate remained at the previousyear's level of 63.0 percent, another 2,800 persons would have been
rehabilitated. (Appendix CI Table 3, Figure A)
25
4C
C. Severely Disabled Persons Rehabilitated
Successful rehabilitations among persons with severedisabilities numbered 1460238 in FY 1990, 0.2 percent less than the
FY 1989 total of 146,487. This slight loss broke a six-year
increase, but caseloads of persons with severe disabilitiescontinued to increase steadily in FY 1990. Severely disabledpersons in receipt of rehabilitation services on September 30, 1990
totaled 402,663, or 3.3 percent more than on "le same date one year
earlier (389,865). (Appendix CI Tables 9 and _0, Figure 8)
Overall, more than two-thirds of all persons rehabilitated in
FY 1990 were severely disabled (67.7 percent), the highestpercentage observed in the 17-y:dr history of this statisticalseries. (Appendix C, Table 10, Figure 8)
D. The Rehabilitation Rate for Severely Disabled Persons
Severely disabled persons rehabilitated in FY 1990 accountedfor 61.6 percent of all such individuals whose cases were closed
from the active statuses. This represented a decline from the 62.4
percent rate that occurred in the previous fiscal year.
Concurrently, the rehabilitation rate among individuals not
classified as being severely disabled was 63.6 percent in FY 1990compared to 64.1 percent in FY 1989. Seen over a five-yearperspective, the rehabilitation rates for persons with severedisabilities have declined by less than one percentage point while
those for persons without severe disabilities by nearly 4
percentage points. (Appendix C, Table 11)
PERSONS sERIT7D
A. All Persons Served
State agencies served 937,951 persons in FY 1990, a 1.0
percent increase from the 928,998 persons served one year earlier.
This was the third consecutive increase in persons served --
defined as the number of persons accepted for vocationalrehabilitation services whose cases were open at some time during
the year -- after 12 years in a row of steady decreases. Persons
seried in FY 1990 represented the largest total in seven years.The latest outcome is the product of a gain in the number of
persons with severe disabilities served, which exceeded the loss in
the number served who did not have a severe disability. (Appendix
Cf Tables 1,2 and 12; Figure C)
The largest segment of persons sarved was represented by those
still in receipt of serviceD on September 30, 1990, or 590,471
persons (63.0 percent of all persons served). This was 2.0 percent
more than on the same date one year earlier and was the largest
carryover of cases in nine years. (Appendix Cf Table 6)
26
B. Severely Disabled Persons Served
Persons with severe disabilities in receipt of rehabilitationservices at some time during FY 1990 totaled 640,203, or 2.5percent more than the 624,552 persons served in FY 1989. For thesecond year in a row, a record number of severely disabled personsserved was attained. The increase in just the last three yearsalone has been fairly substantial, exceeding 56,000 persons. Inthe same interval, some 36,000 fewer persons with nonseveredisabilities were served. The latter group declined by 2.2 percentin FY 1990 to 297,748 falling below 300,000 for the first tint:.(Appendix CO Table 12, Figure C)
The proportion of all persons served who were severelydisabled reached its highest level ever in FY 1990, 68.3 percent.There has never been a year in which this percentage declined.(Appendix C, Table 12, Figure C)
NEW ACCEPTANcES
A. All Persons Accepted for Services
State agencies accepted 357,549 persons for rehabilitationservices in FY 1990, a decrease of 0.5 percent from the 359,431acceptances in FY 1989. This decline was produced by a loss inacceptances of nonseverely disabled persons, which exceeded theincrease in acceptances of persons with severe disabilities.Despite the overall decline in persons accepted for services, thetotal in FY 1990 was the second highest in the last nine years.(Appendix C, Table 4, Figure D)
B. The Acceptance Rate
While the number of individuals accepted for services in FY1990 declined by 0.5 percent to 357,549, the number whose caseswere closed as not accepted rose by 1.2 percent to 267,023, a nine-year high. Those accepted for services, therefore, were 57.2percent of all individuals whose application for rehabilitationservices was acted on. This percentage is referred to as theacceptance rate, which in FY 1989 was 57.7 percent. In 12 of thelast 15 years, the acceptance rate was approximately 57 or 58percent. (Appendix C, Table 4, Figure D)
C. Severely Disabled Persons Accepted for Services
State agencies accepted 247,152 persons with a severedisability for services in FY 1990, a gain of 0.9 percent from244,990 in the year before. FY 1990 was notable because itrepresented the highest number of persons with a severe disabilityaccepted for rehabilitation in any year and was also the seventhyear in the last eight of an annual increase in such acceptances.The lowest number of acceptances of persons with a severe
27
disability was set in FY 1982 at 200,600. (Appendix C, Table 13,Figure E)
The number of nonseverely disabled persons accepted forservices declined by 3.5 percent in FY 1990 to 110,397 from 114,441in FY 1989. When this statistical series began in FY 1976, nearlya quarter of a million new acceptances were of persons who did nothave a severe disability. The proportion of all new acceptances inFY 1990 accounted for by persons with severe disabilities reached69.1 percent, another record level. (Appendix C, Table 13, FigureE)
rEW APPLICANTS
The number of individuals applying for vocationalrehabilitation services in FY 1990 was 624,875, a 1.0 percentdecline from the number applying in FY 1989 (630,950). Despite thedecrease, the FY 1990 level was the second highest in nine years.There was a concurrent increase in the backlog of applicationsawaiting determination of eligibility on September 30, 1990 to270,700 from 268,192 on September 30, 1989, a gain of 0.9 percent.(Appendix C, Tables 5 and 6)
TOTAL AGENCY WORXLOAD
The total agency workload of cases, made up of both applicantsand cli'..Ints in all stages of the rehabilitation process, edgedupwar6 for the sixth year in a row, this time to 1,494,774, or 0.9percent more than in FY 1989. This was the highest workload totalsince FY 1981. Total workload is the sum of all case closuresduring a fiscal year (regardless of the type of closure) and thenumber of cases in various statuses of the rehabilitation processon the last day of the fiscal year. The FY 1990 experience showsthat the workload increase from the previous year was a function ofan increase in the number of cases open on September 30, 1990. Thetotal of such cases in all caseload statuses was 880,271, about13,400 more than on September 30, 1989 while the number of closuresin FY 1990 (347,480) was 2,543 less than 1989. (Appendix C, Tables2 and 6, Figure E)
THE RESOLUTION OF APPLICANT/CLIENT APPEALS
Section 102(d) of the Act, as amended in 1986 outlines theprocedures to be followed when applicants to and clients of StateVR agencies wish to appeal the decisions made by rehabilitationcounselors and coordinators. Such appeals are first reviewed by animpartial hearing officer (IHO) who must hear and decide theissues. Decisions of the IHO may then be reviewed by the StateDirector if he or she chooses to do so. In States where fairhearing boards were authorized under State law before January 1985to review rehabilitation counselor or coordinator determinations,
28
the fair hearing boards are authorized to review applicant/clientappeals.
Subsections 5(A) and (B) of Section 102(d) specify therequirements for and the type of data State agencies must collectand report annually to the Commissioner on applicant/client
appeals. The data presented in Appendix G were reported by 73 of
the 80-plus State agencies using Form RSA-722 (Resolution ofApplicant/Client Appeals) and are preliminary. Twenty-three of the
73 agencies who reported had no activity involving appeals.Therefore, what follows is a preliminary statistical summary of theinformation transmitted to RSA by 50 State VR agencies.
Impartial hearing officers handled 984 appeals during FY 1990.
Three quarters of these cases were resolved in this period. More
than half (58.4percent) of the appeals filed were withdrawn before
the IHO could render a decision; slightly less than a third (31.0
percent) were decisions favoring the agency; and 10.6 percent
favored the individual.
Most of the complaints were filed because an applicant did not
agree with the initial determination made by the counselor orcoordinator's regarding eligibility for VR or extended evaluation
(EE) services. This complaint was reported by 22.4 percent of the
individuals who filed appeals. Clients whose major issue involvedtheir continued eligibility for services accounted for 13.3 percent
and the nature and contents of the individualized writtenrehabilitation program (IWRP) was an issue for 12.1 percent of the
appeals. Complaints or issues not reported represented 17.6
percent of the total.
A total of 307 IHO decisions were made available for review by
the State Director in FY 1990. Most of these (97.4 percent) wereconcluded during the year. Half of those concluded were not
reviewed by the State Director, 40.5 percent were reviewed and 5.7
percent were concluded before the director made a decision. Of the
121 decisions reviewed, 78, or 64 percent, were decisions favoring
the State agency which were sustained.
Eligibility for VR or EE services was the most common issueidentified for IHO decisions handled by the State Director (16.3
percent). This was followed by eligibility for further services(14.7 percent) and nature and contents of IWRP (8.8 percent).
Three out of every ten IHO decisions handled by the State Director
had complaints which were not reported on the reporting instrument.
Client Assistance Program (CAP) agencies provided assistance
to 232 (or 31.7 percent) of the 733 appeals resolved during FY
1990. The greatest amount of CAP involvement was reported for IHO
decisions made favoring the individual where 43.6 percent wereresolved with CAP assistance. Slightly more than a third (36.6percent) of the decisions favoring the State agency were resolved
29
with help from the CAP agency, and 26.9 percent of the appealsresolved before an IHO decision was rendered were assisted by CAP.
One-third of the total 299 IHO decisions reviewed by StateDirectors and concluded during this year .eceived assistance fromCAP. The percent distribution for CAP Assistance among casesconcluded ranged from no CAP assistance for IHO decisions concludedbefore the Director made a decision to 48.0 percent with CAP assis-tance for decisions favoring the individual which were sustained.
POST-EMPLOYMENT SERVICES AND ANNUAL REVIEWS OF INELIGIBILITYDETERMINATIONS AND WORKSHOP PLACEMENTS, FY 1980 to 1990
The report on Post-Employment Services and Annual Reviews(Form RSA-62) submitted each year by State VR agencies containsstatistical information on three separate activities conductedunder the VR Services program. These activities are (a) thedelivery of post-employment services to previously rehabilitatedpersons; (b) the conduct of ineligibility determination reviews;and (c) the conduct of reviews of placements into extendedemployment, especially sheltered workshops. A decaae-long summaryof activity in these three areas at the national level is shownbelow and in four tables in Appendix E.
(Data displayed for FY 1990 represent reported informationfrom 73 State rehabilitation agencies and estimates for theremainder who either did not submit Form RSA-62 or sent the form intoo late for inclusion in this report.)
Post-employment services (Appendix E. Tables 1 and 2)
Section 103(a) (2) of the Act identifies the many types of VRservices which can be provided to individuals with handicaps.Included among these services are post-employment servicesnecessary to assist previously rehabilitated clients to maintain orregain employment. State agencies can provide these relativelyminor services, such as medical treatment and transportationassistance, without having to re-open the recipient's case.
The ten-year period from FY 1980 to FY 1990 has seen threedistinct trends in the frequency of delivery of post-employmentservices starting with a rise thl7ough FY 1981, then a decline fortwo years and a steady increase ever since. By FY 1990, the totalnumber of persons receiving post-employment services reached anall-time high of 19,546. The large majority of these individuals,15,890 or 81.3 percent of the total, were classified as severelydisabled, another record high. The primary goal of post-employnentservices, maintaining or regaining employment, ,..;as met by more thanfour-fifths of all individuals for whom services were completed.
The utilization rate, or the number of persons getting post-employment services as a percent oi the number rehabilitated in the
3 0
previous fiscal year, has increased, maintaining the trend notedsince FY 1982. Individuals receiving post-employment services in
FY 1990 (19,546) were 8.9 percent of all individuals rehabilitatedin FY 1988 (220,408). The utilization rate was 10.8 percent forindividuals with severe disabilities and only 4.9 percent for the
nonseverely disabled. By type of State agency, the rate was 20.2percent for agencies for the blind and 8.3 percent for
general/combined agencies.
Review of ineligibility determinations (Appendix El Table 3)
State agencies are required by Section 101(a)(9)(c) of the Act
to review each determination of ineligibility no later than 12months following such determination. The review makes it possible:or some individuals to be accepted for rehabilitation servicesafter previously being declared ineligible for such services. Thisprovision in law was designed to be of particular assistance topersons with severe handicaps, to afford them a "second chance" toreceive services.
There were 29,315 reviews of ineligibility determinations:.:onducted during FY 1990, a slight increase from FY 1989 but wellbelow the totals experienced in the early 19801s. Despite thechange in total reviews, however, the results of the reviews havechanged very little in the last decade.
Only 2.2 percent of the individuals whose reviews werecompleted in FY 1990 were accepted for services; 2.7 percent were,once again, not accepted for services; and 2.2 percent had re-entered the rehabilitation process, but their eligibility forservices had not yet been determined. The majority, or 92.9percent, of the reviews completed required no further considerationfrom the State agency.
Reviews of extended employment in rehabilitation facilitieslincluding workshops) (Appendix E, Table 4)
Section 101(a)(16) of the Act requires State agencies toconduct periodic reviews and reevaluations of the status of
rehabilitated persons placed into extended employment in
rehabilitation facilities (including sheltered workshops) to
determine the feasibility of their employment in the competitivelabor market.
There were 44,385 reviews of non-competitive employmentplacement conducted by State VR agencies in FY 1990, a slightincrease from FY 1989. Of the 41,954 reviews/reevaluationscompleted in FY 1990, 6.8 percent resulted in placements into
competitive or self-employment, the highest rate of success in this
regard during the last decade. Four out of five individuals, or81.2 percent, had to be maintained in non-competitive employment.Most of the remaining individuals were not available for a review
31
(8.7 percent) while a few (3.3 percent) had re-entered the VRprocess.
CHARACTERISTICS oF REHABILITATED CLIENTS
Introduction
The Commissioner of the Rehabilitation Services Administration(RSA) is required by Section 13 of the Rehabilitation Act of 1973,as amended, to prepare a report which includes specific personaland program-related data on the individuals whose cases are closedout each year. The following is a profile of the clients rehabili-tated by the State-Federal Program of Vocational Rehabilitation(VR) during fiscal years 1988 and 1989. Also included are thereasons for unsuccessful case closures (non-acceptances and non-rehabilitations) during the same period. The Case Service ReportSystem is the source for the data presented here and is used byeach State agency to collect the information needed to comply withthis requirement. The data shown in Appendix D for FY 1989 wereextracted from preliminary tabulations and will be updated at alater date (very few changes are expected to be made to percentagesand means).
The Client Profile
Age at application
This item is based on the reported date of birth at the timeof application. The mean or average age at application for personsrehabilitated during FY 1989 was 33.8 years, slightly more than themean age reported by individuals rehabilitated a year ago (33.3years). This slight increase in mean age was accompanied by aslight increase in the proportion of clients 55 years and older(9.6 percent in FY 1989, up from 9.0 percent in FY 1988). Thepercentage of rehabilitants under the age of 25 years declined from32.3 percent in FY 1988 to 30.8 percent in FY 1989. The remainingindividuals (those between the ages of 25 and 54) represented thelargest age group. This group, which accounted for 58.6 percent inFY 1988 increased to 59.5 percent in FY 1989.
Sex
The majority (55.9 percent) of the individuals who wererehabilitated during FY 1989 were men. The proportion of womenincreased slightly from 43.9 percent in FY 1988 to 44.1 percent inFY 1989.
RagelgthnigitY
One out of every five rehabilitated persons was a member of aracial minority group. Although this percentage has not changedsignificantly for several years, slight changes occurred in the
32
proportions of White (upward) and Black (downward; clients. The
percentage of Hispanics, regardless of racial origin, rose from 7.5
percent in FY 1988 to 8.1 percent in FY 1989.
Riahest grade completed
Individuals who were at least high school graduates when theyapplied for services accounted for more than half (56.6 percent) of
the clients rehabilitated by State VR agencies during FY 1989.
Clients who had completed at least one year of postsecondaryeducation before they came to the program increased from 17.4percent in FY 1988 to 17.8 percent in FY 1989. The average number
of grades completed was 11.5 grades (mean excludes clients whose
major or secondary disabling condition is mental retardation).Tndividuals who were mentally retarded and who were recipients of
special education represented 15.9 percent of the FY 1989
rehabilitants.
Marital status
Most of the clients rehabilitated have never been married whenthey apply for VR services. This group accounted for 47.9 percentof the total in FY 1989. Individuals who were married and still
living with their spouses when they applied for services
represented 27.7 percent. Persons who have lost their spousesbecause of death, separation or divorce comprised the remaining24.4 percent.
Primary snmrce of support
Family and friends continue to be the most common primarysource of support. This source provided support for 45.3 percent
of the individuals rehabilitated in FY 1989. Persons primarilysupported by their own earnings increased slightly from 17.6percent in FY 198$t to 17.9 percent in FY 1989. Public assistance
was the primary source of support for 15.3 percent of the casessuccessfully closed in FY 1989 (up from 14.7 percent one year ago).
Type of institution at application
Nine percent of the persons rehabilitated during FY 1989 were
residing in an institution at the time of application for VRservices. Compared to the previous fiscal year, the proportions ofclients residing in drug abuse treatment centers, treatment centers
for alcoholics and unidentified institutions at application in-
creased. Decreases were noted in the percentages residing in
mental health facilities, general hospitals and juvenile
correctional institutions.
33
Source of referral
Traditionally, 23 percent of the clients rehabilitated byState VR agencies come to the agency on their own. Self-referralcontinued to be the most common single source of referral for casessuccessfully closed in FY 1989. Referrals from individuals otherthan physicians and the clients themselves (12.7 percent) andreferrals from elementary and high schools (11.0 percent) rankedsecond and third. Individuals (physicians, self and others), thelargest referral group, accounted for 43.4 percent of the total inFY 1989 (a drop from 43.6 percent a year ago). Additional declineswere reported in referrals from educational institutions, hospitalsand sanatoriums, welfare agencies, and other public sources such asSocial Security. Increases occurred in referrals from healthorganizations and agencies, and private sources such as artificialappliance companies.
Major disabling condition
Orthopedic impairments (20.9 percent), mental illness (16.3percent) and mental retardation (13.5 percent) were the mostprevalent major disabling condition groups. Collectively, thesethree disability categories were reported by half of the individ-uals rehabilitated during FY 1989. Increasing proportions werenoted for those groups of clients rehabilitated who were disabledfrom visual impairments, nearing impairments, substance abuse,mental retardation, and learning disabilities.
More than sixty percent (62.3 percent) of the clients withorthopedic impairments rehabilitated in FY 1989 were so impaired bysome type of accident. Orthopedic impairments caused by spinalcord injuries increased from 10.9 percent in FY 1988 to 11.6percent in FY 1989. Accidents and injuries also accounted for themajority (62.4 percent) of the absences of extremities reported forFY 1989.
Secondary disabling condition
More than a third (39.1 percent) of the clients who success-fully completed the VR program during FY 1989 had a secondarydisabling condition.
Severely disabled
Two out of every three persons rehabilitated during FY 1989were classified as severely disabled. This is the highest propor-tion reported since the definition for severe disability wasdeveloped in 1974.
34
Previsms VR eXperience
Eight percent of the individuals rehabilitated in FY 1989 hadpreviously experienced the VR program within three years of theirmost recent date of application. Clients who were previously reha-bilitated accounted for 5.8 percent of the FY 1989 rehabilitants.
Time spent in VR_Drocess
Persons rehabilitated during FY 1989 spent, on the average,21.6 months in the VR process from date of application to closure.
This compares to an average of 22.6 months for clients
rehabilitated in FY 1988.
Cost_of purchased services
The mean cost of purchasing services for all clients reha-bilitated during the current fiscal year (served with or withoutcost to agency) was $2,125, roughly $200 more than the $1,918 spent
on the typical person rehabilitated one year earlier.
Tvve of services provided
More than half (53.3 percent) of the clients rehabilitatedduring FY 1989 received some type of training. The most common
type of training is personal and vocatinnal adjustment training,
which was provided to 21.8 percent of the FY 1989 rehabilitants.The three newly reported services: job referral, job placement, and
transportdtion, were provided to 41.6 percent, 34.9 percent, and
3317 percent, respectively.
Type of facility_or agency furnishing services
Rehabilitation facilities provided services to 29.4 percent of
the persons rehabilitated during FY 1989, while one-fifth received
services from unspecified private organizations and agencies.Private individuals, such as physicians and other persons whocannot be classified with another organization or agency, providedservices to 44.1 percent of the clients rehabilitated.
Work status at application and closure
Historically, the majority of the individuals with disabili-ties accepted for the VR program are unemployed when they apply for
services. For individuals rehabilitated during FY 1989, 75.8
percent were not working at the time of application. Among the
persons who were working at application, 17.2 percent were
competitively employed. Most of the clients rehabilitated (82.1percent) during this period were placed into the competitive labor
market at closure. This percentage represented a slight increase
from the previous fiscal year when 81.7 percent were so closed.
3 5
Homemaker closures also increased slightly during this two-yearperiod from 8.9 percent in FY 1988 to 9.1 percent in FY 1989.
Weekly earnings at application and closure
Four out of every five persons rehabilitated in FY 1988 had noearnings when they applied for the vocational rehabilitationprogram. By the time of rehabilitation closure, only 9.4 percentwere without earnings. The overall mean or average weekly earningsfor FY 1989 rehabilitants increased from $34.90 at application to$185.60 at closure.
Week4 hours at ppplication and closure
Hours worked in the week before application were tabulated for85.8 percent of the clients rehabilitated during FY 1989. The meannumber of hours worked at application for all clients (employed andnot employed) was six hours per week. For individuals working atapplication the mean was 32.5 hours. At closure, the averagenumber of hours worked for all clients increased to 33 hours orroughly 27 hours more than the mean at the time of application.More than two-thirds (69.1 percent) of the FY 1989 rehabilitantswere working full-time (35 hours or more) at closure.
Hourly wAge rate at application and closure
The average mean hourly rate at application for all clientsrehabilitated for the two years shown in the table was only 90cents. Individuals who were working at application averagedroughly $5.00 per hour during this period. There were approxi-mately 35,000 persons working when they applied for VR services.Of this total, 25,216 or 72.1 percent were earning at least minimumwage ($3.35 per hour). By the time of case closure, the gapbetween mean hourly wage rates for all clients and clients workinghad closed considerably. The mean wage rates for cases closedsuccessfully during FY 1989 were $5.20 for all clientsrehabilitated and $5.70 for individuals who were working. Theproportion of working clients earning at least minimum wage atclosure for FY 1989 was 86.1 percent.
Occupation at closure
Although the number placed into industrial occupations hasdeclined in recent years, these jobs still are the most common forrehabilitated clients. For FY 1989, 27.4 percent of theindividuals rehabilitated were so placed (down from 27.7 percent inthe previous fiscal year). The only other decline was reported forclients placed into occupations other than those presented in thetable, such ls placements into shel'_ered workshops and unpaidfamily work.
3 6
Reasons for closure
Reasons for non-acceptance
Individuals who refused services or failed to cooperate
accounted for the largest proportions of those not accepted for
vocational rehabilitation (VR) services during FY 1989 (27.2
percent and 21.5 percent, respectively). Whether or not the client
has a disabling condition that will significantly hamper his/her
ability to work is declining as a reason for ineligibility.
Applicants whose conditions were classified as being "too severe"
accounted for seven percent of the non-acceptances in FY 1989.
Reasons for _non-rehabilitation
Inability to locate a client (27.3 percent), refusal of
services (24.1 percent) and failure to cooperate (21.4 percent)
were the reasons used most frequently for clients whose cases were
closed not rehabilitated during FY 1989. Together these rezsoils
encompassed 72.8 percent of the non-rehabilitations for that year.
As with non-acceptances, the proportion of clients who could not
successfully complete the VR program because their major
disabilities were "too severe" did not change during this two-year
period (7.8 percent were closed fo,: this reason).
COMPARISON OF ECONOMIC GAINS ACGIEVED BY PERSONS WITH SEVERE AND
NONSEVERE DISABILITIES REHABILITATED BY STATE VOCATIONALREHABILITATION AGENCIES IN FY 1990
Introduction
The 1986 amendments to the Rehabilitation Act included a
provision calling for "an evaluation of the status of individuals
with severe handicaps participating in programs under the Act" to
be made part of the Annual Report to the Congress and the President
(Section 13). This report provides a starting point for such an
evaluation through the analysis of program data on severely
disabled persons reported to the Rehabilitation Services
Administration with the individual client Case Service Report (RSA-
911). The RSA-911 system contains many personal and program-
related characteristics for over 600,000 clients of State
vocational rehabilitation agencies whose cases are closed each year
as rehabilitated, not rehabilitated, or not accepted for services.
In this report, severe disability (a statement about the degree of
medical impairment) is made to stand as the closest possible proxy
to severe handicap (an indication of the loss in functioning with
respect to employment).
37
Data from the Case Service Report can provide details on (a)client demographics, (b) types of disabling conditions, (c) theclient's economic status at application, (d) the nature of his orher interaction with the rehabilitation process, (e) types of reha-bilitation outcomes, and (f) economic gains from application forservices to rehabilitation closure. In this report, however, only(e) and (f) on rehabilitation outcomes and economic gains arerepresented. The data must be considered as preliminary becausesubmittals for several agencies were still being reviewed as thisreport was being prepared. This review may result in subsequentrevisions of the statistics for FY 1989, but, at the nationallevel, these are not likely to be of consequence.
Virtually all of the tables presented with this report displaythree zolumns of data (See Appendix I). The first columnrepresents characteristics associated with all personsrehabilitated in FY 1989, regardless of the severity of disability.The second column displays the same characteristics for personswith severe disabilities and the third column pertains to personswho were not severely disabled. The tables also show column andpercents, which are derived frk,A totals at the top of each columnand help to develop a separate profile for persons with severedisabilities and persons with nonsevere disabilities. These totalswill change somewhat from table to table and represent the numberof persons for whom the particular item was successfully reported.
For this report, persons with a severe disability are, ingeneral terms, defined as those (a) having stated types of majordisabling conditions such as blindness, deafness and orthopedicimpairments involving three or more limbs; (b) having disabilitiesas qualified in some instances such as hearing impairments with acertain degree of decibel loss; or (c) being so impaired so thatthey were receiving Social Security Disability Insurance benefitsor Supplemental Security Income payments at some time whileundergoing rehabilitation services; c d) having a documented lossin functioning such as the inability to perform sustained workactivity for six hours or more and requiriN nuli-iple vocationalrehabilitation services over an extended period of time.
Rehabilitation Outc,ur:Ts
The work status and earnings situation at closure for personswith severe disabilities lagged behind that for persons withnonsevere disabilities especially with respect to (a) whether theyhad earned income at closure and, (b) if working, whether they wereemployed in the competitive labor market. It is instructive tonote, however, that some disparities between wageearners within thetwo groups were not large. The typical worker with severedisabilities, for example, earned about 13 percent less than his orher nonseverely disabled counterpart, worked about 6 percent fewerhours and had ar hourly wage rate about 8 percent less.
38
A fairly large and expected difference in the work status atrehabilitation closure was observed between persons with severe and
persons with nonsevere disabilities. Placed into the competitivelabor market were 77.9 percent of persons with severe disabilitiesand 91.9 percent of their nonsevere counterparts. Homemaking wasthe rehabilitation choice for 11.0 percent of the clients withsevere disabilities and 4.5 percent of the nonseverely disabled.
In addition/ 7.9 percent of persons with severe disabilities andonly 1.2 percent of the nonsevere group were placed into stteltered
workshops.
Smaller proportions of persons with severe disabilities wereplaced into standard occupational groupings because more of them
were rehabilitated into homemaking, sheltered workshop work andunpaid family work, activities frequently not classifiable intoregular occupations. For example/ 12.8 percent of the clientele
who were severely disabled and 15.4 percent of clients withnonsevere disabilities were placed into professional, technical and
managerial positions. Industrial occupations accounted for the
largest proportions of persons with severe disabilities and personswith nonsevere disabilities, 25.6 percent and 31.8 percent,
respectively. More than twenty percent of botn groups were placedinto service occupations (22.7 percent of persons with severedisabilities and 23.5 percent of persons with nonsevere
disabilities).
As reflected in the work status at closure, more persons with
a severe disability had no earnings in the week beforerehabilitation closure -- 11.3 percent versus 4.8 percent of the
persons with nonsevere disabilities. This helped to depress the
mean weekly earnings for clients with severe disabilities,
including those with no earnings, which came to $173.60 compared to
$214.40 for the nonsevere cohort. This difference narrowedsomewhat when mean earnings were calculated only for clients who
had earnings. For wage-earners only, persons with severe
disabilities averaged $195.70 and persons with nonsevere
disabilities, $225.10. The remaining difference in the two means
is primarily a function of the more than six times greaterlikelihood of persons with severe disabilities being placed into
the generally low-paying jobs in sheltered workshops.
The large majority of clients in both groups were working
full-time at rehabilitation closure (35 hours per week or more).With more of the group of persons with severe disabilitiesrehabilitated into nonremunerative activities, their mean hours of
work in the week before closure were less than for the nonseverelydisabled, 31.7 hours versus 36.0 hours, respectively. Even when
the nonwage earners were removed from the calculations, however,the worker with severe disabilities averaged fewer hours of work,35.6 hours per week compared to 37.7 hours for the worker with
nonsevere disabilities.
39
The lower wage-earning capacity of persons with severedisabilities is seen not only in their smaller average weeklyearnings, but also in their lower hourly wage rates. As a group,they averaged $4.90 per hour compared to $5.70 per hour for personswith nonsevere disabilities. Excluding the zero wage-earnersbrings the means closer, but the group with severe disabilitiesstill lagged behind at $5.50 per hour vs. $6.00 for the nonseveregroup. Examining the rehabilitated wage-earners only, 16.3percentof persons with severe disabilities and 8.3 percent of the personswith nonsevere disabilities were earning below the minimum wagerate of $3.35 per hour. The more frequent placement of personswith severe disabilities into sheltered workshops would explainthis variation to some degree.
Overview of Improvement in Economic Functioning:
A. All Work Statuses at Closure (Table A)
Improvements in a client's economic status is one of the mosthighly valued outcomes in the State-Federal program of vocationalrehabilitation. Data in the Case Service Report system (RSA-911)permit these gains to be measured in several ways. The measure-ments used here relate to changes in a client's (a) work status,(b) earnings, (c) hours of work, (d) full-tiluu work status, (e)minimum wage rate status and (f) hourly wage rate from entranceinto the rehabilitation program to departure from the program as arehabilitated person. For each of these six paired measurementsconsiderable gains were noted for both severely and persons withnonsevere disabilities who were rehabilitated in FY 1989. Asexpected, however, application-to-closure gains for persons withsevere disabilities were not as large as those for persons withnonsevere disabilities because many more of the severely impairedwere rehabilitated as non-wage-earning homemakers or low wage-earning sheltered workshop workers. The figures presented in thissection retain the influence of the homemakers and shelteredworkshop workers to provide the broadest comparison of outcomes andgains for persons with severe disabilities and ',az...Ions withnonsevere disabilities. In the next section, however, comparisonswill be limited to members of both groups who were rehabilitatedinto the competitive labor market to see whether and to what extentdifferences between the two groups persist.
The large majority of both persons with severe disabilitiesand persons with nonsevere disabilities were not employed at thetime of application for services with only 14.5 percent of clientswith severe disabilicies and 23.7 percent of clients with nonseveredisabilities working in the competitive labor market. Byrehabilitation closure, however, 77.9 percent of those with severedisabilities and 91.9 percent of the nonsevere group werecompetitively employed. This constituted a gain of 63 percentagepoints for the severely disabled group and 68 percentage points forthe nonsevere group.
40
Similarly, persons with severe disabilities averaged $30.10 in
earnings in the week before aprlication and persons with nonsevere
disabilities averaged $46.20 while in the week before
rehabilitation closure the two groups averaged $173.60 and $214.40,
respectively. The average gain, then, for persons with severedisabilities was $143.50 per week and for persons with nonsevere
disabilities, $168.20 per week.
As a group, persons with severe disabilities averaged 5.3
hours of work in the week before application and persons with
nonsevere disabilities averaged 7.7 hours. By the time ofrehabilitation closure, the two groups were averaging 31.7 hours
and 36.0 hours, respectively, or a gain of 26.4 hours for the
cohort of persons with severe disabilities and 28.3 hours for
persons with nonsevere disabilities.
The proportion of both persons with severe and persons with
nonsevere disabilities who could work full-time following a
successful regimen of rehabilitation services increased markedly
from application to closure. At application, only 9.1 percent of
clients with st.vere disabilities and 14.1 percent of clients with
nonsevere disabilities were working full-time. At closure,
however, 64.4 percent and 80.0 percent of the tw., groups,
respectively, were full-time workers. For those with severedisabilities, then, there was a 55 percentage point increase in
full-time workers compared to an increase of 66 percentage points
for those with nonsevere disabilities.
Taken altogether, only 11.3 percent of the grmip of persons
with severe disabilities were earning at or above the minimum wage
rate of $3.35 an hour at application compared to 17.9 percent of
the group with nonsevere disabilities. By the time of
rehabilitation closure, 74.8 percent of clients with severe
disabilities and 87.4 percent of the clients with nonsevere
disabilities were earning at or above the minimum wage rate, a gain
of about 63.5 and 69.5 percentage points for the two groups,
respectively.
Finally, as a group, persons with severe disabilities were
earning only $0.80 per hour at application (including the
overwhelming majority who were not working at all) compared to
$1.20 per hour for persons with nonsevere disabilities. By
rehabilitation closure, the cohort of persons with severe
disabilities was averaging $4.90 per hour and those not severely
disabled, $5.70. The application-to-closure gain in this
measurement for persons with severe disabilities was $4.10 an hour
compared to $4.50 an hour for the nonsevere group.
0 ew o I roveueit i co o C n tio .
B. Persons Rehabilitated into the Competitive Labor Market(Table B)
41
r;Al
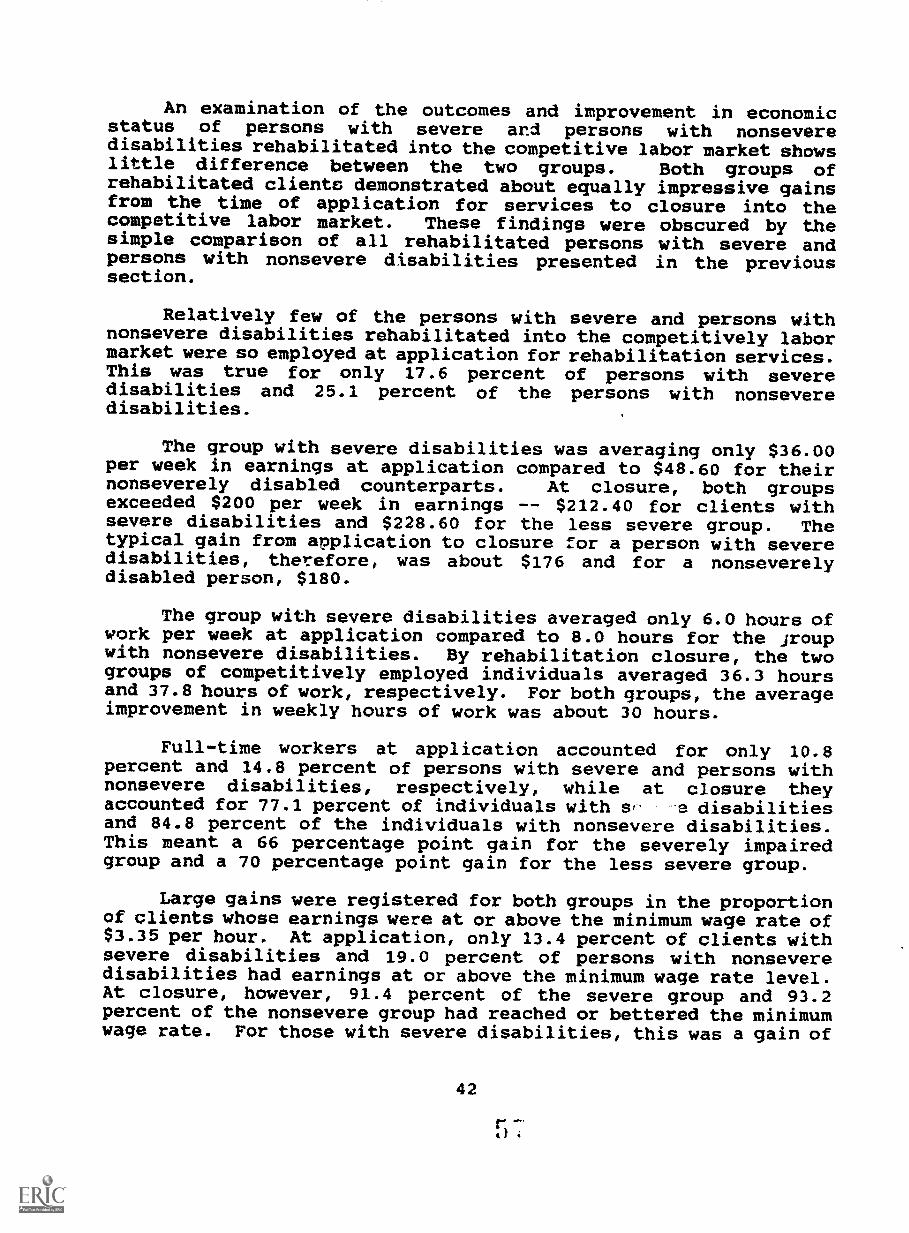
An examination of the outcomes and improvement in economicstatus of persons with severe and persons with nonseveredisabilities rehabilitated into the competitive labor market showslittle difference between the two groups. Both groups ofrehabilitated clients demonstrated about equally impressive gainsfrom the time of application for services to closure into thecompetitive labor market. These findings were obscured by thesimple comparison of all rehabilitated persons with severe andpersons with nonsevere disabilities presented in the previoussection.
Relatively few of the persons with severe and persons withnonsevere disabilities rehabilitated into the competitively labormarket were so employed at application for rehabilitation services.This was true for only 17.6 percent of persons with severedisabilities and 25.1 percent of the persons with nonseveredisabilities.
The group with severe disabilities was averaging only $36.00per week in earnings at application compared to $48.60 for theirnonseverely disabled counterparts. At closure, both groupsexceeded $200 per week in earnings -- $212.40 for clients withsevere disabilities and $228.60 for the less severe group. Thetypical gain from application to closure for a person with severedisabilities, therefore, was about $176 and for a nonseverelydisabled person, $180.
The group with severe disabilities averaged only 6.0 hours ofwork per week at application compared to 8.0 hours for the jroupwith nonsevere disabilities. By rehabilitation closure, the twogroups of competitively employed individuals averaged 36.3 hoursand 37.8 hours of work, respectively. For both groups, the averageimprovement in weekly hours of work was about 30 hours.
Full-time workers at application accounted for only 10.8percent and 14.8 percent of persons with severe and persons withnonsevere disabilities, respectively, while at closure theyaccounted for 77.1 percent of individuals with e disabilitiesand 84.8 percent of the individuals with nonsevere disabilities.This meant a 66 percentage point gain for the severely impairedgroup and a 70 percentage point gain for the less severe group.
Large gains were registered for both groups in the proportionof clients whose earnings were at or above the minimum wage rate of$3.35 per hour. At application, only 13.4 percent of clients withsevere disabilities and 19.0 percent of persons with nonseveredisabilities had earnings at or above the minimum wage rate level.At closure, however, 91.4 percent of the severe group and 93.2percent of the nonsevere group had reached or bettered the minimumwage rate. For those with severe disabilities, this was a gain of
42
r
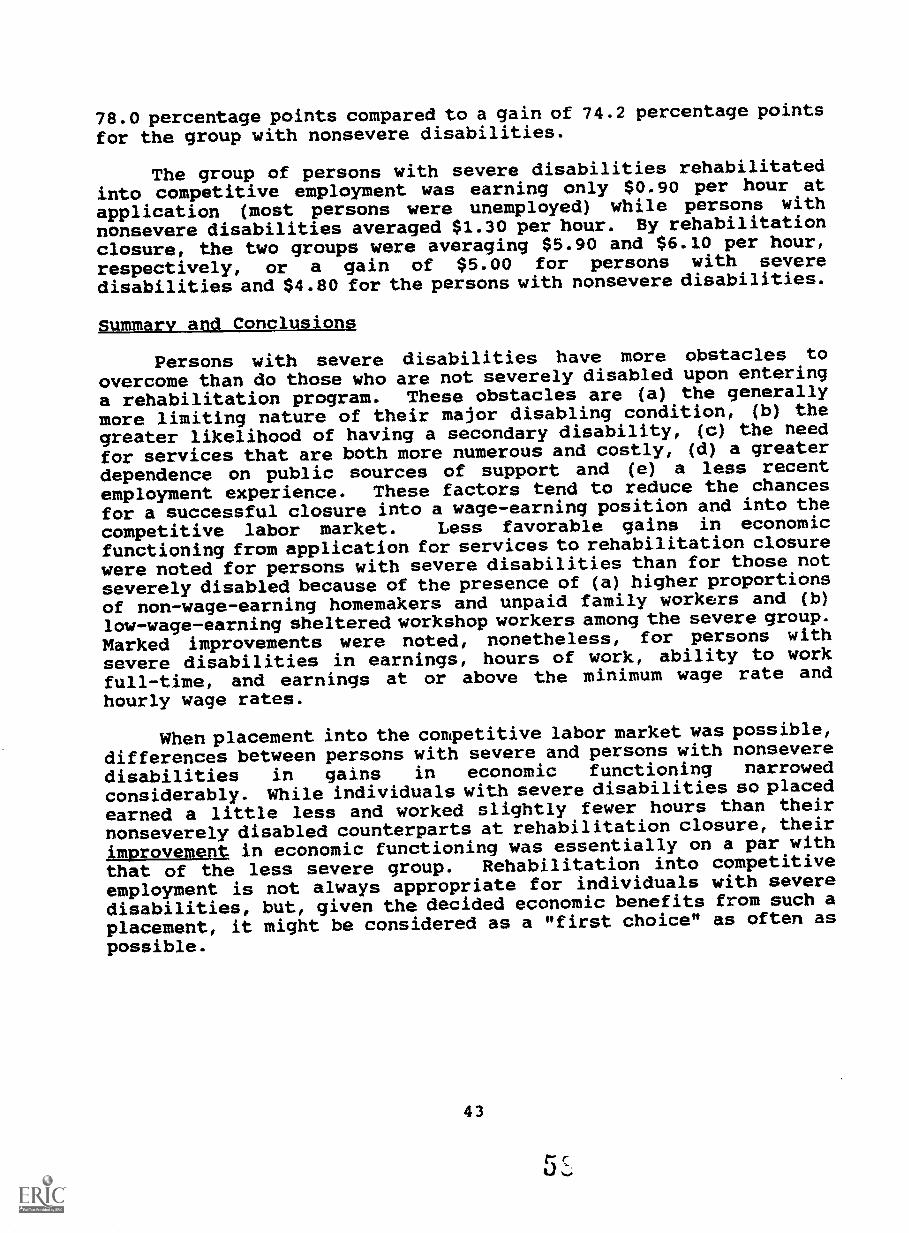
78.0 percentage points compared to a gain of 74.2 percentage points
for the group with nonsevere disabilities.
The group of persons with severe disabilities rehabilitatedinto competitive employment was earning only $0.90 per hour at
application (most persons were unemployed) while persons withnonsevere disabilities averaged $1.30 per hour. By rehabilitationclosure, the two groups were averaging $5.90 and $6.10 per hour,
respectively, or a gain of $5.00 for persons with severe
disabilities and $4.80 for the persons with nonsevere disabilities.
Summary and Conclusions
Persons with severe disabilities have more obstacles to
overcome than do those who are not severely disabled upon entering
a rehabilitation program. These obstacles are (a) the generally
more limiting nature of their major disabling condition, (b) the
greater likelihood of having a secondary disability, (c) the need
for services that are both more numerous and costly, (d) a greater
dependence on public sources of support and (e) a less recentemployment experience. These factors tend to reduce the chances
for a successful closure into a wage-earning position and into the
competitive labor market. Less favorable gains in economicfunctioning from application for services to rehabilitation closure
were noted for persons with severe disabilities than for those not
severely disabled because of the presence of (a) higher proportions
of non-wage-earning homemakers and unpaid family workers and (b)
low-wage-earning sheltered workshop workers among the severe group.
Marked improvements were noted, nonetheless, for persons with
severe disabilities in earnings, hours of work, ability to workfull-time, and earnings at or above the minimum wage rate and
hourly wage rates.
When placement into the competitive labor market was possible,
differences between persons with severe and persons with nonsevere
disabilities in gains in economic functioning narrowed
considerably. While individuals with severe disabilities so placed
earned a little less and worked slightly fewer hours than their
nonseverely disabled counterparts at rehabilitation closure, their
,improvement in economic functioning was essentially on a par with
that of the less severe group. Rehabilitation into competitiveemployment is not always appropriate for individuals with severe
disabilities, but, given the decided economic benefits from such a
placement, it might be considered as a "first choice" as often as
possible.
43
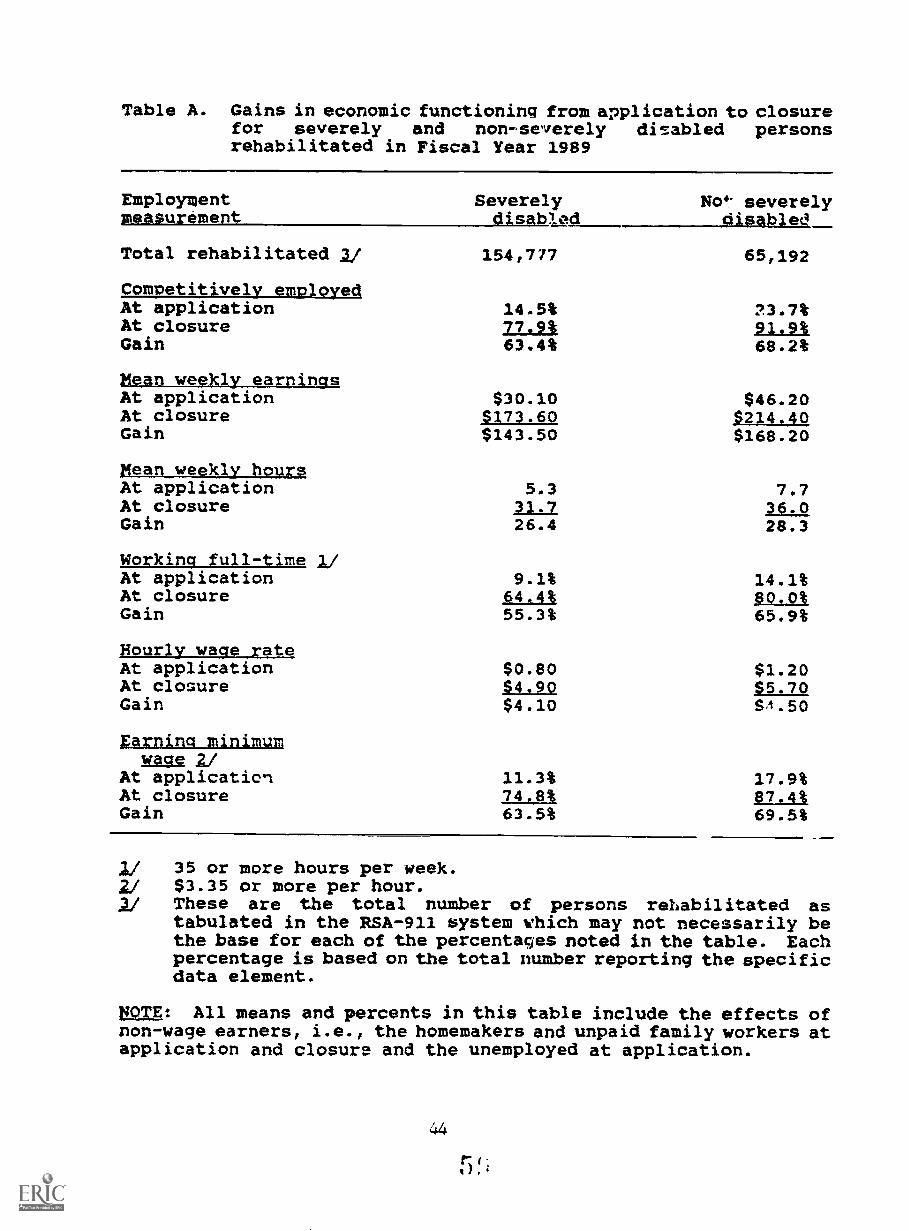
Table A. Gains in economic functioning from application to closurefor severely and non-severely disabled personsrehabilitated in Fiscal Year 1989
Employment Severely No'' severelymeasurement disablgd disabjeq,
Total rehabilitated 2/ 154,777 65,192
Comretitivelv employedAt application 14.5% 23.7%At closure 77.9% 91,9%Gain 63.4% 68.2%
Mean weekly earningsAt application $30.10 $46.20At closure $173.60 $214.40Gain
rean weekly hour.1
$143.50 $168.20
At application 5.3 7.7At closure 21,7Gain 26.4 28.3
Working full-timeAt application 9.1% 14.1%At closure 64.4% 80.0%Gain 55.3% 65.9%
Hourly wage rateAt application $0.80 $1.20At closure $4.90 $5.7QGain
garning_minimumwage 2/
$4.10 SA.50
At applicatien 11.3% 17.9%At closure 74.8% 1/11.
63.5%Gain 69.5%
35 or more hours per week.$3.35 or more per hour.These are the total number of persons rehabilitated astabulated in the RSA-911 system which may not necessarily bethe base for each of the percentages noted in the table. Eachpercentage is based on the total number reporting the specificdata element.
rOTE: All means and percents in this table include the effects ofnon-wage earners, i.e., the homemakers and unpaid family workers atapplication and closure and the unemployed at application.
44
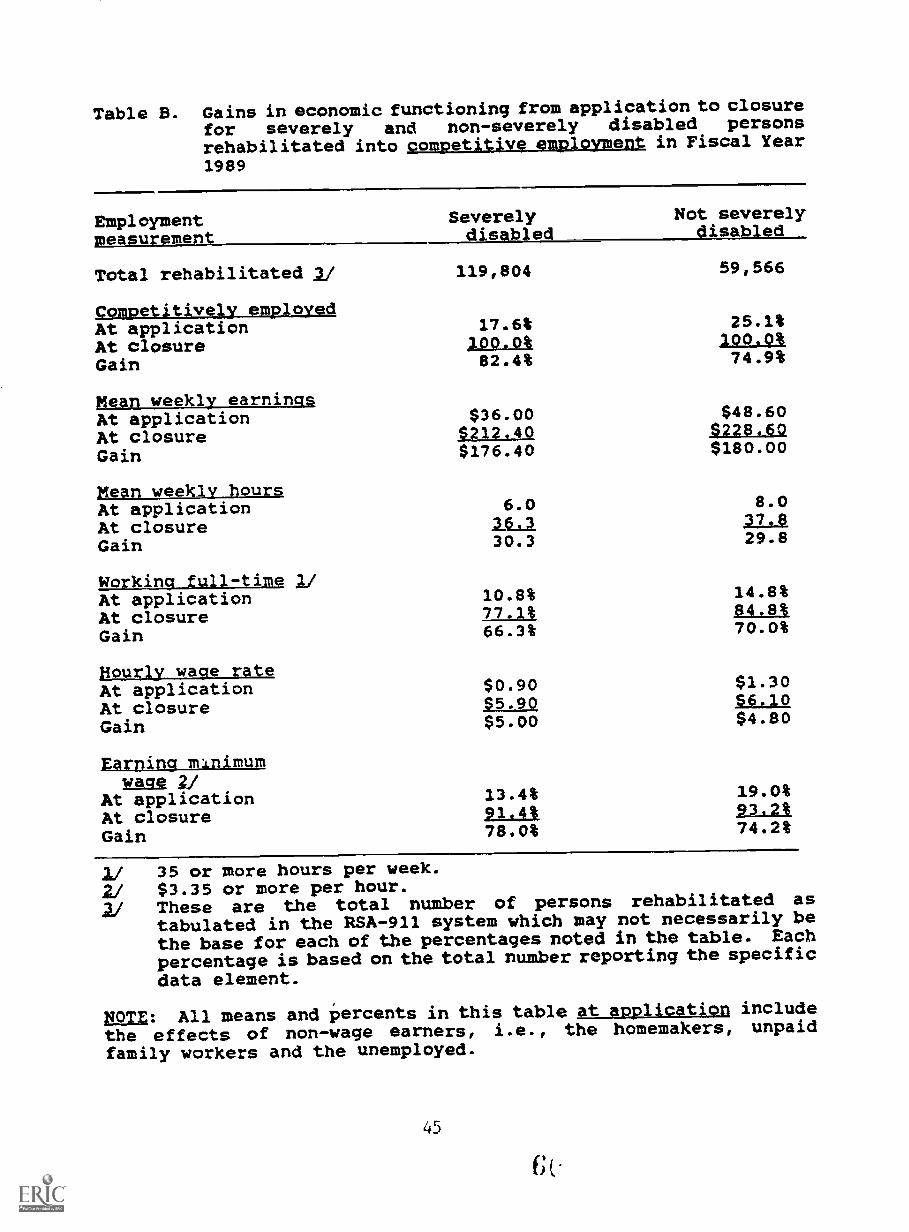
Table B. Gains in economicfor severely andrehabilitated into1989
functioning from application to closurenon-severely disabled persons
competitive employment in Fiscal Year
Employmentpeasurement
Severelydisabled
Not severelydisabled
Total rehabilitated 2/ 119,804 59,566
Competitivqly employedAt application 17.6% 25.1%
At closure 1100.0% ;00.Q%
Gain 82.4% 74.9%
Mean weekly earningsAt application $36.00 $48.60
At closure $212.40 $228.60
Gain $176.40 $180.00
Mean weekly hoursAt application 6.0 8.0
At closure 224130.3Gain 29.8
Working full-time 1/At application 10.8% 14.8%
At closure 77t13 84.83
Gain
rouris wage rate
66.3% 70.0%
At application $0.90 $1.30
At closure S5.9Q $6,40
Gain $5.00 $4.80
FArning minimumwage V
At application 13.4% 19.0%
At closure 93.2%
Gain 78.0% 74.2%
11 35 or more hours per week.
21 $3.35 or more per hour.2/ These are the total number of persons rehabilitated as
tabulated in the RSA-911 system which may not necessarily bethe base for each of the percentages noted in the table. Each
percentage is based on the total number reporting the specific
data element.
MOTE: All means and percents in this table at application include
the effects of non-wage earners, i.e., the homemakers, unpaidfamily workers and the unemployed.
45

Section 112
Client Assistance Program
11 :
REHABILITATrVE SERVICES ADMINISTRATIONOffice of Program Operations
Section 112Client Assistance Program (CAP)Federal Funds $7,901,000
This formula grant program advises clients and potentialclient applicants of all available services under the Act andassists these individuals in their relationships with serviceagencies under the Act. States are required to have a CAP as acondition for receiving VR program funding.
Grants are nade to the States for a CAP to be administered byagencies designated by the Governors. Such agencies must beindependent of any agency that provides services under the Actunless an agency had, prior to the 1984 amendments, served as aclient assistance agency under Section 112 and received Federalfinancial assistance under the Act. In FY 1990, 57 States andterritories conducted CAPs, with 38 States and territoriesoperating their programs in agencies independent of any agency thatprovides rehabilitation services under the Act. In 1990, grantstotaling $7,901,000 were awarded to the 50 States, the District ofColumbia, Puerto Rico, and the 5 territories. The minimumallotment, in accordance with the Act, is $75,000 to a State and$45,000 to a territory.
Standardized monitoring instruments were developed during FY1990 for the Client Assistance Program. These instruments will beused by RSA Regional Office staff to assess the compliance of thedesignated CAP agencies with the applicable statutory andregulatory requirements. Two instruments were developed and fieldtested during the fiscal year. The first instrument, the GovernorAssurances Compliance Review Guide, is used to assess the State'sadherence to the written assurances submitted by the Governor inorder to receive the CAP grant. The second instrument, the CAPCase Review Schedule, is used to evaluate casefile documentationand assess whether or not the individuals served by the CAP wereeligible for services and received appropriate services. Bothstandardized instruments focus on compliance requirements and willbe fully implemented in FY 1991.
Statistical Summary of Client Assistance Program (CAP)
FY 1985 - 1990
The following is a statistical summary of program activitiesin 56 of the 57 agencies designated to administer the CAP. Thedata shown in Appendix F were transmitted to RSA from CAP agenciesvia Form ED-RSA-227, the Annual Client Assistance Program (CAP)Report.
46
CAP agencies have provided information to and assisted morethan 250,000 disabled individuals in the six-year period from FY1985 through FY 1990. The total number of persons served (casesand non-cases) during FY 1990 totalled 530044. This represented afive percent increase in total individuals served from the previousfiscal year. This increase was primarily due to the continual risein non-cases (informational/referral services) handled (up by 7.6percent from the prior year). The number of cases handled droppedfor the third year in a row to 11,742. Declines were also notedfor the remaining caseload items - new cases decreased by 2.5percent and cases pending at the end of the fiscal year were downby 1.4 percent compared to last year.
This year new program data items were added to the annualreport form to gather information on demographics, additionalproblem areas and additional services provided to the individualsserved by CAP agencies. Several agencies were able to provide thisinformation for FY 1990.
Age (as of October 1) was reported for close to ten percent ofthe total cases handled during this period. Individuals betweenthe ages of 26 and 40 years accounted for the largest proportion(47.3 percent). This group was followed by those between the agesof 41 and 59 years (25.9 percent). Clients and client applicantsunder the age of 21 represented nine percent of the total reportingage and less than one percent (0.6 percent) were at least 65 yearsold.
The sex of the person served was reported in more than a third(34.3 percent) of the cases handled. Males accounted for 57.6percent and females represented 42.4 percent of the total reportingthis item.
Racia3/ethnic identities were recorded for eight percent ofthe total case available. The majority (81.4 percent) were white.
Applicants and clients of the VR Services program accountedfor the majority (93.7 percent) of the cases handled during FY1990. Client applicants and clients of independent living programs(discretionary or formula grant) represented three percent of thecases handled and applicants/clients of the remaining discretionarygrants programs and non-VR facilities each accounted for onepercent of the total.
Since the majority of the individuals classified as cases inthe current fiscal year were applicants for and clients of the VRServices program, it follows that the State VR agency would be theprimary source of concern. The State VR agency was the sole sourceof concern for 84.3 percent of the cases handled. OtherRehabilitation Act programs, projects and facilities were the solesource of concern for 5.5 percent and 10.2 percent had problems
47
with a combination of the State VR agency and another
Rehabilitation Act source.
Problems related to the quantity, quality and expediency ofrehabilitation services was the most prevalent problem areaaccounting for 53.0 percent. Concerns about eligibilitydetermination, application, and reapplication for services or other
issues pertaining to the individualized written rehabilitationprogram (IWRP) were reported by 24.6 percent of CAP cases. The two
new problem areas--information desired, and communication related
were noted by 12.2 percent and 5.1 percent, respectively.
The physical or mental conditions most responsible for thevocational limitations of the individuals whose cases were handledduring FY 1990 were orthopedic impairments (25.4 percent)/ mentalillness (15.3 percent), and neurological disorders (10.4 percent).
Advisory/interpretational services were received by more CAP
clients than any other type of service. These services, whichinclude advising persons of the benefits available under the Act
and their rights and responbibilities in connection with thosebenefits, were provided to 67.3 percent of the cases. Information
and referral services (a close second) were received by 67.1
percent and mediation/negotiation services were provided to 45.2
percent. CAP agencies reported that 1.2 percent of the CAP caseshandled received legal services. Assistance with administrativereviews (informal reviews) and fair hearings (formal appeals) wasprovided to 7.9 percent and 1.8percent, respectively. Individuals
who received CAP assistance with transportation accounted for 1.2
percent of the total cases handled.
Contact person: Barbara Sweeney, Telephone: 202-732-1403For data contact: Patricia Nash, Telephone: 202-732-1412
48

Section 130
American Indian Rehabilitation Services
REHABILITATION SERVICES ADMINISTRATION
Office of Developmental Programs
Section 130American Indians with Handicaps Vocational Rehabilitation ServiceProjectsFederal Funds $3,821,000
Mission, andyurpose:
The purpose of this program is to support projects providingvocational rehabilitation services to American Indians withdisabilities who live on Federal or State reservations. OnlyAmerican Indian tribes or consortia of such tribes may apply forsupport under this program. Projects funded under Section 130 arerequired to provide a broad spectrum of vocational rehabilitationservices in a manner comparable to those services provided by theState vocational rehabilitation units.
Activities and Accomplishments:
Four new projects were funded in FY 1990; ten cher projectswere in continuation status. Approximately 3,500 clients wereserved by the 14 projects in FY 1990.
EXEMPLARY PROJECTS
o The Navajo Nation Vocational Rehabilitation Program, WindowRock, Arizona, is the largest and most established of theSection 130 projects. In FY 19901 the Navajo project served600 - 1,000 clients dispersed across the Tribes reservationlands in Arizona, Colorado, and Utah. Over 75 clients wereplaced in permanent employment. Over 150 clients were inactive service throughout the year, and 50 percent of theclients in the active caseload were severely disabled.
o The Confederated Salish and Kootenai Tribes VocationalRehabilitation Project, Pablo, Montana, is closely tied to thetribal community college, which provides both academic and in-service training for rehabilitation professionals. During1989-90, 49 tribal members with disabilities receivedvocational rehabilitation service; 25 completed individualizedwritten rehabilitation plans; 22 received independent livingservices, including information on special recreationopportunities for persons with disabilities and guidance ontechnology assistive to persons with disabilities; and 10 wereplaced in competitive employment. Eighty percent of theseplacements were permanent, lasting 60 days or more.
49
11 o
o The Shoshone-Bannock Tribes' Vocational RehabilitationProject, Fort Hall, Idaho, is administered by the Tribe'sBusiness Council. During FY 1990, this project providedvocational rehabilitation services to 160 clients, includingcounseling; appropriate referral to other agencies; mental andphysical restorative services; training services, includingbooks, supplies and tools. The project placed 16 personsthrough direct project funds and 20 persons through referralto other organizations.
Contact person: Edward Holler, 202-732-1332
50
Title IINational Institute on Disvbility and
Rehabilitation Research
NATIONAL INSTITUTE ON DISABILITY AND REHABILITATIONRESEARCH
Sections 200 - 204The National Institute on Disability and Rehabilitation ResearchFederal Funds $54,300,000
The National Institute on Disability and RehabilitationResearch (NIDRR) provides leadership and support for a national andinternational program of rehabilitation research and theutilization of the information acquired through this program. Inaddition, the Director of the Institute serves as Chairman of theInteragency CLAmittee on Disability Research (ICDR), which ischarged with coordinating rehabilitation research effortsthroughout the Federal government. NIDRR also administers theSpinal Cord Injury program and the Technology Assistance program,which are funded from sources other than Title II of the Act.
In FY 1990, the NIDRR program budget was $54,318,000. Thesefunds supported:
40 Rehabilitation Research and Training Centers($22,755,000);
18 Rehabilitation Engineering Centers ($10,600,000);
61 Field-Initiated Research Projects ($6,650,000);
Iesearch and Demonstration Programs ($5,964,000);
2C Researcl- Dissemination and Utilization Projects($4,200,000);
8 Research Training grants ($1,061,000);
21 Innovation Grants ($1,050,000);
10 Mary E. Switzer Fellowships ($326,500);
16 Small Business 3nnovative Research grants($600,000); and
Miscellaneous Expenditures ($800,000).
In addition, NIDRR administered programs funding:
13 Model Spinal Cord Injury Centers ($5,000,000);
23 Technology Related Grants ($20,900,000);
51
Spinal Cord Injury funds are appropriated under Section 311 ofthe Act and transferred to NIDRR to administer. TechnologyAssistance funds are appropriated under the Technology RelatedAssistance for Individuals with Disabilities Act of 19880 althoughthe program is administered by NIDRR.
Rehabilitation Research and Training CentersFederal Funds $22,755,000
Each of the 40 Rehabilitation Research and Training Centers(RRTCs) focuses on a particular aspect of the medical,psychosocial, or vocational rehabilitation of persons withdisabilities. For some centers, this means concentrating on aspecific disabling condition, such as traumatic brain injury,deafness, low vision, spinal cord injury, arthritis, long-termmental illness, or neuromuscular disorders. Others studyactivities and services that affect the lives of disabled people.These include independent living, housing, service delivery,rehabilitation strategies, and information systems. Knowledgecontributed by the RRTCs has influenced the fields ofrehabilitation medicine, vocational counseling, social work, and,to some extent, architecture.
HIGHLIGHTS
o The University of Pennsylvania Research and Training Centerfor Rehabilitation of Elderly Disabled Persons has developeda computerized functional assessment package for use in therehabilitation of older persons. Using this approach, theCenter has gathered sufficient data to justify the conclusionthat older persons with disabilities improve in function asmuch as or more than younger people after rehabilitation.
o In cooperation with the Kiwanis Pediatric Trauma Institute,the Tufts University Medical Center in Rehabilitation andChildhood Trauma has published a booklet titled: "When YourChild Is Seriously Injured: The Emotional Impact on
Families." Subsequent booklets are planned to help preparefamilies for major transition points, such as earlyintervention, special educati(al, and vocationalrehabilitation.
Rehabilitation Engineering CentersFederal Funds $10,600,000
NIDRR funded 18 Rehabilitation Engineering Centers (RECs) in
FY 1990. These centers seek solutions to disability-relatedproblems through the application of technological advances. Areasof interest include sensory loss, mobility impairment, chronicpain, communication difficulties, and the evaluation and adaptationof assistive devices.
52
HIGHLIGHTS
o Case Western Reserve University uses a Functional ElectricalStimulation (FES) implant to help restore hand movement forpersons with high-level spinal cord injury. The goal is toreduce dependence on adaptive equipment and personalattemdants and increase the number of activities performedindependently. To test and evaluate the technology, CaseWestern Reserve is collaborating with four other centers: TheUniversity of Alberta, Toronto University's Hugh MacmillanRehabilitation Center, the Shriners Hospital for Children withDisabilities in Philadelphia, and Rancho Los Amigos Hospitalin Los Angeles. Although the two-year study is not yetcomplete, preliminary data show that 70 percent of thepatients were helped significantly by the FES implant.
o The National Rehabilitation Hospital REC on Evaluation ofRehabilitation Technology has produced "Product Testing andEvaluation: A Guide for Designers and Manufacturers ofAssistive Technology Devices." The source book containscritical information on product development, from originalconcept to commercialization. Included are lists oi experts,sources of materials on disabling conditions and relatedservices, databases on research, independent testingfacilities, funding sources, consumer evaluation guidelines,universal design considerations, requirements for documentingproduct performance, and FDA classification and reportingrequirements.
Field-Initiated ResearchFederal Funds $6,650,000
Under this category NIDRR funds activities that blend wellwith its overall research mandate but which fall outside the usualrange of priorities. State and public agencies or organizations,institutions of higher education, private agencies ororganizations, and Indian tribes and tribal organizations areeligible to apply for this type of grant.
HIGHLIGHTS
o Among the 60 Field-Initiated Research projects supported byNIDRR in FY 1990 was the completion of a project by theInstitute for Rehabilitation Research for the development ofa light-weight, inexpensive leg brace for paraplegics. TheInternational Society for Prosthetics and Orthotics has calledthe brace the most outstanding innovation in the field. Thismodular knee-ankle-foot device assists patients in standingand walking during the early stages of rehabilitation.
o The Institute of Health Professions Program in PhysicalTherapy at Massachusetts General Hospital is developing
53
tI
vestibular rehabilitation protocols for patients with balancedysfunctions. The study also seeks to determine therelationship of commonly used balance tests to stabilityduring activities of daily living. Vestibular rehabilitationis an exercise program to treat problems with dizziness, gaze,instability, and balance.
Research and Demonstration ProgramsFederal Funds $5,964,000
To augment the work of the RRTCs and RECs, NIDRR fundsResearch and Demonstration programs (R and D) that focus onspecific problems encountered by individuals with disabilities andthe rehabilitation and other professionals who serve them. NIDRRsupported 29 such programs in FY 1990.
HIGHLIGHTS
o Two R and D grants are supporting 3-year studies of chroniclow back pain. The University of Rochester will do a cost-benefit analysis of a multi-disciplinary approach to treatinglow back pain and preparing patients to return to work.
o The University of Miami Department of Neurological Surgery isdeveloping criteria and tests for determining the degree ofdisability and readiness to return to work of low back painpatients.
Mary E. Switzer FellowshipsFederal Funds $326,500
The purpose of this program is to build research capacity byproviding two levels of Fellowship awards. In FY 1990,
Distinguished Fellowships were given to ten persons of doctorate orcomparable academic status who have had seven or more yearsexperience relevant to rehabilitation research. Four otherindividuals, in earlier stages of their research careers, received
Merit Fellowships.
Some of the awarded projects included research related toself-concept among college students with learning disabilities,determination of aerobic fitness of persons with multiple
sclerosis, the design and evaluation of a contact lens fieldexpander, quantification of the effects of treatment of spasticcerebral palsy, and research trends in deafness.
Research Dissemination and UtilizationFederal Funds $4,2000000
NIDRR's mission includes not only research but the effectiveuse of that research. Through 20 Research Dissemination and
54
Utilization grants in FY 1990, NIDRR is placing the products ofother programs in the hands of rehabilitation professionals,educators, technology developers, and individuals withdisabilities.
HIGHLIGHTS
Regional Ingormation Exchanges
Five regional Information Exchanges (RIE's), in RegionsIV, VI and IX, were continued in FY 1990. These Exchanges enablethe rapid replication of outstanding programs in particular areasof rehabilitation. The RIE's examine and validate the quality ofthese models, identify those that are "exemplary" and then, throughwell-planned technical assistance, promote their adoption oradaptation by others throughout the region. They also buildinformation networks with newsletters, regional conferences, andthe development and distribution of technical assistanceguidelines.
The competition for the contract to operate the NationalRehabilitation Information Center (NARIC) was held in FY 1990, andMacro Systems, Inc., of Silver Spring, Maryland, again received theaward. NARIC's library now contains more than 26,000 volumes ofarchival material and rehabilitation literature. A quarterly 20-page newsletter was circulated to approximately 20,000 people.During FY 1990, NARIC responded to more than 8,500 inquiries bytelephone, letter, or visit. NARIC is now fully capable ofproviding responses on documents in braille, large print or ontape.
ABLEDATA was continued under the Adaptive Equipment Center ofthe Newington Children's Hospital, Newington, Connecticut. Thedatabase contains information on more than 18,000 commerciallyavailable products from 2,200 manufacturers that assist disabledpeople to live and work more indPpendently. As a result of acooperative agreement with the Trace Center of the University ofWisconsin-Madison, copies of the entire ABLEDATA database areavailable for installation in MacIntosh personal computers. An IBMedition will be available by the end of FY 1991.
Research Training and Career Development GrantsFederal Funds $1,061,000
Eight programs received funds during FY 1990. These grantsare designed to acquaint professionals in rehabilitation-relateddisciplines with research methods and statistical analysis.Psychiatrists and other physicians, speech therapists,rehabilitation engineers, physical therapists, neurophysiologistsand others receive training for periods of one to three years.
55
Innovation GrantsFederal Funds $1,0501000
Twenty-one Innovation Grants were awarded during FY 1990.Innovation grants are for one year.
HIGHLIGHTS
o The University of Virginia is studying ways to improvetraction equipment used in treating spinal cord injuries.Traditional devices, with three hinged weights, have alwayscaused discomfort for the patient, interfered with transportof the patient and hindered diagnostic examinations.
o Emory University, Atlanta, is conducting research on geriatricpatients with mild or moderate traumatic brain injury.Neurobehavioral data on these patients will be compared withsimilar information on elderly patients who have not sufferedbrain injury.
o The Community Service Center for the Disabled in San Diego,CA, is establishing and testing a comprehensive informationand referral network on independent living and educationservices for persons with disabilities in San Diego County.The innovation involves the use of an automated 24-houranswering system.
International Programs
NIDRR is assisting the Self-Managed Community of Interest forScience of Croatia in developing an electrokinesiological methodfor objective assessment of spinal dysfunctions. Results havedemonstrated that this method is reliable for the simultaneousassessment of lumbar muscle activity and spinal mobility. It can
be a valuable tool for diagnosing and monitoring low-backdysfunctions during rehabilitation and for preventing low-back pain
disabilities.
The Institute is also assisting the government of India in the
creation of job development centers for persons with disabilities.Some of NIDRR's grantees will act as consultants on the project.
Spinal Cord Injury ProgramsFederal Funds $5,000,000
Thirteen grants were awarded in FY 1990 to provide delivery,demonstration and evaluation of comprehensive medical, voL.tional
and other rehabilitation services to meet the wide range of needs
of persons with spinal cord injury. These projects form a multi-disciplinary service system. In addition, these grants establish
a research environment within the system. Areas of concentratedinterest include demonstration and evaluation of improved methods
56
1.4
and equipment and national studies of the benefits of the spinalcord injury service system.
Technology AssistanceFederal Funds $20,900,000
NIDRR administers funds for this program under Titles I and IIof P.L. 100-407, the Technology-Related Assistance for Individualswith Disabilities Act (Technology Act), which was enacted August19, 1988. Title I established a program of grants, with a minimumof $500,000, to assist States in developing statewide, consumer-responsive service delivery systems for technology-relatedassistance. This assistance will cover all ages and alldisabilities. During FY 1990, NIDRR awarded grants to 14 States:Alaska, Indiana, Iowa, Massachusetts, Mississippi, New Mexico,Nevada/ New York, North Carolina, Oregon, Tennessee, Virginia,Vermont and Wisconsin.
Title II-D of the Technology Act provides support fordemonstration and innovation projects of national significance.Ten such grants were awarded in FY 1990, three of which willexperiment with income-contingent direct loan programs.
One grant was made under Title II-B of the Act. TheUniversity of South Carolina Center for Developmental Disabilitieswill study the feasibility of a national information and referralnetwork on assistive technology.
Small Business Innovative Research GrantsFederal Funds $600,000
This program encourages research into and the development ofnew products and ideas in rehabilitation through a uniform three-phase process. NIDRR made 16 such grants in FY 1990.
HIGHLIGHTS
o Academic Software/ Inc., of Lexington, Kentucky, has producedan "adaptive device locator system" which employs a uniquecategorical model for associating generic device descriptionswith functional descriptions of disabilities. The systemprompts the user to maYe decisions that narrowly define thearea of interest and then pr-ovides lists of vendors andadditional information souirces. This software package runs onApple II, Macintosh and IBM computers.
o Netrologic, Inc., of San Diego, California, is researching thefeasibility of a full-screen tactile display ta assist deaf-blind and visually impaired computer users. Phase I willproduce a small, partial-screen version to test the usefulnessof the device. The company will seek evaluations of itsproducts by blind computer professionals.
57
Interagency Agreements
The Interagency Committee on Disability Research (ICDR),
chaired by the Director of NIDRR, is a forum and resource forFederal agencies conducting or supporting rehabilitation research.Nine interagency agreements, some new and some continuations, wereconcluded by NIDRR during FY 1990.
Areas of cooperative effort included:
o mental retardation: a conference to assess current preventionefforts and plan for the coming decade;
o infant mortality: a national meeting on steps for improvingthe full learning potential of all children;
o assistive technology: to determine, through the NationalHealth Information Survey, how, where and when persons withdisabilities use assistive technology, and to find ways forindividuals to finance acquisition of the devices; and
o neural disorders: a conference to promote new applications offunctional electrical stimulation.
Contact person: For additional information about any particularprogram administered by NIDRR, please contact the Office of theDirector, William H. Graves, at 202-732-1134.
58

Title III
Section 304
Rehabilitation Training
REHABILITATION SERVICES ADMINISTRATION
Office of Developmental Programs
Section 304Rehabilitation TrainingFederal Funds $31,110,000
The Rehabilitation Training Program is designed to: (1)increase the supply of qualified personnel available for employmentin public and private agencies and institutions involved in thevocational and independent living rehabilitation of individualswith physical and mental disabilities, especially those individualswith the most severe disabilities; and (2) maintain and upgradebasic skills and knowledge of personnel employed as providers ofvocational, medical, social, or psychological rehabilitationservices. The Rehabilitation Training Program is authorized underSection 304 of the Act, which permits grants and contracts to bemade to States and public or non-profit agencies and organizations,including institutions of higher education, to pay part of thecosts of projects for training, scholarships/training awards, andrelated activities. Grants may be made for long-term and short-term training, in-service training of employees in Staterehabilitation agencies and public and private facilities,rehabilitation continuing education programs, training ofinterpreters for deaf individuals, and special training projects ofan experimental and innovative nature.
In FY 1990, funds were awarded to 320 projects as follows:
(In thousands)Rehabilitation Long-Term Training $20,321Rehabilitation Continuing Education Training 4,041State Vocational Rehabilitation Unit
In-Service Training 3,333Experimental and Innovative Training 1,60"Interpreter Training for Deaf Individuals 1,511
TOTAL $30,812
As authorized by Section 16(b) of the Act, $530100 inRehabilitation Training Program funds was used for expenses relatedto peer review of applications.
Grants awarded included:
o long-term training in rehabilitation engineering,rehabilitation medicine, rehabilitation counseling,prosthetics and orthotics, rehabilitation facilityadministration, vocational evaluation and work adjustment,occupational therapy, specialized training in supportedemployment services, rehabilitation of the mentally ill,rehabilitation of the deaf and the blind, rehabilitation
59
administration, job development/job placement, andrehabilitation workshop and facility personnel.
o continuing education programs to upgrade and maintain theskills of rehabilitation personnel employed in both public andprivate rehabilitation agencies;
o in-service training for the development of State vocationalrehabilitation unit personnel; and
o special training projects of an experimental and innovativenature that are designed to train new types of rehabilitationpersonnel or to demonstrate innovative training techniques.
Examples of Rehabilitation Long-Term Training Projectssupported include:
o Oregon Health Sciences University. Po7-tland, Oregon. Theprimary focus of this project is to train rehabilitationtrainers in each of the ten RSA regions to utilize twosimulation training packages which train employmentspecialists and managers in supported employment programs and
train executive directors and rehabilitation managers ofrehabilitation facilities. The simulation models have beenused since their development three years ago. The projectprovides hands on "in-vivo" training with real participants to
train other trainers.
o Medtcal College of Wisconsin. Milwaukeel Wisconsin. This
project supports residency training in the field of medicalrehabilitation. The project also supports early exposure of
medical students to the field of medical rehabilitation, in aneffort to attract more qualified physicians to the field. The
program also trains residents in geriatric rehabilitation,with special emphasis on meeting the needs of patients 55 andolder, who, although disabled, are employable.
o Illlpois Institute cf Technology, Chicago, Illinois. This
project addresses the need for training in assistivetechnology in a variety of ways. It integrates coursework onassistive technology into the curriculum for rehabilitation
counseling students; trains a core of specializedrehabilitation counseling masters level students who, aftergraduation, will provide assistive technology services andconsult with other counselors on assistive technology; trainsexisting counselors as assistive technology specialists; andintroduces engineering and computer science students to thefield of rehabilitative assistive technology in an effort toattract more students to the field.
60
RihaPilitation Continuing Education Programs
Rehabilitation Continuing Education Programs train newemployees in basic rehabilitation service delivery knowledge andskills and assist experienced rehabilitation personnel to upgradetheir skills and master new developments and technological advancesin rehabilitation service delivery. Rehabilitation ContinuingEducation programs provide training for both State vocationalrehabilitation agency and rehabilitation facility staff. Trainingprovided under these programs focuses on meeting needs common toseveral States in a geographic area. In FY 1990? the eleven grantsawarded included the following emphases:
o activities initiated under a 1990 initiative for "VocationalRehabilitation of Drug-Free Youth";
o improved utilization of supported employment concepts andprocedures and specialized training in implementing supportedemployment programs;
o specialized training in implementing competitive employmentprograms for individuals with severe disabilities in non-segregated environments;
o job development and job placement in competitive employmentfor fndividuals with severe disabilities, including placementof individuals who are deaf, individuals who are blind (underthe Randolph-Sheppard Vending Facility Program), andindividuals who are deaf-blind;
o training for rehabilitation counselors in the applicabilityand implications of Section 504 as related to job placement;
o coordination of vocational rehabilitation, special education,and vocational education;
o co,rdinated service delivery to facilitate the transition ofyouth with disabi/ities from school to employment;
o improved management in the areas of program planning andmonitoring, including case reviews and application ofstandards in program evaluation;
o rehabilitation of individuals who are learning disabled,individuals with long-term mental illness, and individualswho are deaf-blind;
o improved use of rehabilitation technology and rehabilitationengineering services; and
o technical assistance to rehabilitation facilities.
61
State Vocational Rehabilitation Unit In-Service Training
Activities supported under the State Vocational RehabilitationUnit In-Service Training Program focus primarily on program areasrelevant to each unit's immediate operation, including training toresolve deficiencies identified in audits and other reviews of theState program. Eighty in-service training prGjects were funded inFY 1990. To the extent consistent with the State unit's owndetermination of training needs, those projects emphasized:
o improved use of supported employment concepts and proceduresand specialized training in the implementation of supportedemployment programs;
o specialized training in implementation of competitiveemployment programs for individuals with severe disabilitiesin non-segregated environments;
o improved skills in job identification, job development, andjob placement for individuals with severe disabilities,including placement of individuals who are deaf, individualswho are blind (under the Randolph-Sheppard Vending Facilityprogram), and individuals who are deaf-blind;
o improved use of independent living (ILI programs throughestablishing linkages of Parts A and C II, programs with thePart B IL Center program, and training tt,r counselors toenhance their use of IL as an available resourc:e;
o implementing coordinative activities between State VR unitsand State education agencies, including coordinativeactivities to facilitate the transition of youth who aredisabled from school to employment;
o improved management in the areas of program planning,monitoring, and evaluation;
o improved use of preliminary and thorough diagnosticinformation in order to determine eligibility for services andthe nature and scope of services to be provided, especiallyfor individuals with learning disabilities, individuals whoare deaf-blind, individuals with traumatic brain injury andindividuals with long-term mental illness; and
o improved use of rehabilitation technology, includingrehabilitation engineering services.
Experimental and Innovative Training
The purpose of the Experimental and Innovative TrainingProgram is to develop new types of rehabilitation personnel anddemonstrate the effectiveness of these new types of personnel in
62
providing rehabilitation services to persons with ...:tvere handicaps.This program also develops new and improved metnods of trainingrehabilitation personnel to achieve more effective delivery ofrehabilitation services by State and other rehabilitation agencies.
A FY 1990 priority was established under the Experimental andInnovative Training Program to address the need for direct servicedelivery personnel skilled in providing community-based supportedemployment services. In addition, funds were made available undera "Non-Priority" category for experimental and innovative trainingprojects that had significant potential to facilitate moreeffective rehabilitation service delivery in areas other thansupported employment.
Examples of FY 1990 experimental and innovative projectsfunded are:
son i, S lo ie t ASRic4.3. This project increases the supply andupgrades the skills of supported employment personnel so thatthey are more competent to serve individuals with: (1) long-term mental illness [LTMI]; (2) traumatic brain injury (TBI);(3) autism, and (4) deaf-blindness. The APSE developscurricula and provides training to address the needs ofindividuals in the various disbbility groups listed above.
o Eugerje This project providesin-service training seminars, develops training materials, andprov:de follow-up support in order to expand the number ofbusiness perscnnel with kr-Iv/ledge and skills necessary forachievin.; supperted employment cutcomes and increases thenumber of rehabilitation personnel with knowledge and skillsnecessary to support employees, ss well as employees withdisabilities.
Contact: Richard Melia, Ph.D., TC.cphone: 202-732-1400
63

Part B
Special Projects
REHABILITATION SERVICES ADMINISTRATION
Office of Developmental Programs
VR Services for Individuals with Severe Handicaps
Section 311(a) (1)Special Projects and Demonstrations for Providing VocationalRehabilitation Services to Individuals with Severe HandicapsFederal Funds $17,455,000
The purpose of the program is to provide financial assistanceto States and other public and private agencies and organizationsfor expanding or otherwise improving vocational and otherrehabilitation services for individuals with severe disabilities,irrespective of age or vocational potential. This is accomplishedthrough the support of projects, for up to 36 months, that willdemonstrate new procedures or desirable employment outcomes. It isexpected that successful project results will be replicated, inwhole or in part, to resolve or alleviate rehabilitation problemsthat are nationally significant or common to several States.
Under Section 311(a) (1), 26 continaation projects and 62 newprojects were funded for FY 1990 (Continuation projects included 13spinal cord injury projects administered by the National Instituteon Disability and Rehabilitation Research (NIDRR). New FY 1990applications were submitted under this program in the followingpriority categories:(1) Rehabilitation r.achnology; (2) Innovative Strategies to PromoteVocational and Independent Living Rehabilitation Outcomes forIndividuals with Severe Handicaps; and (3) AIDS (invitationalpriority). Applications were also submitted under the program ina "Non-Priority" category that permitted the support ofapplications that were not responsive to one of the describedpriorities. For FY 1990, twenty applications were funded under theRehabilitation Technology priority, thirty-four under theInnovative Strategies priority, five under the AIDS priority, andthree under tne "Non-Priority" category.
Highlights of Projects Funded in FY 1990
Rehatiilitation Technoloav
o Simian Aides for the Disabled, Inc.. Boston. Massachusetts,provides people with mid- and high- level quadriplegia withmonkey helpers that assist in performing certain vocationalactivities as well as activities of daily living.
o The State University of New York Research Foundation,Buffaloj New York, is developing and implementing a model thatimproves rehabilitation services by increasing the productionof assistive devices for unique needs by involving university
64
faculty and students in the design and construction ofassistive devices.
Innovative Strategies
o Employment Opportunities, Inc., Raleigh, North Carolina,utilizes a holistic consumer responsive model thatfacilitates consumer outcomes by adding components that willincrease client control over daily life choices.
o Counseling for Independent Living, Inc., Middletown, RhodeIsland, is developing and demonstrating a program of supportsand services that enhances self-actualization amongindividuals with severe disabilities to become more directlyinvolved and motivated in directing their own vocational andindependent living program.
AIDS
o Multitasking Systems of New York, Inc.4 New York, New York,formalizes and expands job referral activities for personsinfected with HIV/AIDS. Skilled clients with HIV infection,including persons with AIDS, are placed in competitive jobs.
o Whitman-Walker Clinic, Inc., Washington, D.C., initiates,coordinates, and facilitates the delivery of vocationalrehabilitation services to people who are HIV-infected.
"Non-Priority"
o To steer individuals with severe disabilities out of daytreatment programs and into the mainstream workplace, VeraInstitute of Justice of New York_ New York, is utilizing asix-phase demonstration for the placement of 42 individuals.
o Association for Habilit#tion and Employment of theDevelopmentally Disabled (MUD), Inc., Lemoyne, Pennsylvania,utilizes a supported employment approach with companyemployers taking the responsibility and initiative to identifystiff persons to coordinate and/or provide internal supportand training services for people with severe disabilitieshired by the company.
Contact: D. Ray Fuller, Jr. Telephone: 202-732-1494(Voice) 202-732-1349 (TDD)
65
Head Injury Centers
Section 311(a) (1)Special Projects and Demonstrations for Providing VocationalRehabilitation Services to Individuals with Severe Handicaps --Head Injury CentersFederal Funds $14,814,000
A one time appropriation was made under Section 311(a) (1) forthe purpose of funding one-time startup costs for projects designedto initiate a regional (nultistate) system of comprehensive headinjury rehabilitation and prevention centers. These centers weredesigned to demonstrate improved systems of prevention, acute care,and rehabilitation directed at reducing the human and economicconsequences of traumatic head/brain injury (TBI), with specialemphasis on vocational rehabilitation, retraining, and placement.The activities of the centers emphasize prevention, outreach,identification and elimination of barriers to effectiverehabilitation services, systemization of care, and followup Lyfamilies, schools, and rehabilitation providers.
The following four projects were funded for four years each:
o Mount Sinai Medical Center. New York, New York. This projectlinks ten organizations in New York, New Jersey, Connecticut,and Puerto Rico. The project has five core activities: (1)innovative programs and technical assistance; (2) eliminationof barriers to service provision and examination of ways toimprove access to services by minority group survivors; (3)primary and secondary prevention; (4) models of communityreintegration; and (5) evaluation of a model service deliverysystem developed through the project.
o The Institute for Rehabilitation and Research, Houston. Texas.This project links Arkansas, Louisiana, New Mexico, Oklahomaand Texas. The goals are to improve the quality and number ofbrain injury prevention programs, develop and implementtraining institutes in each Stat to expand the knowledge andskills of personnel that provide services to persons with TBI;identify and eliminate barriers to services; improve tiesbetween services and their providers; improve the followup ofbrain injury survivors; promote empowerment; and strengthenthe involvement of brain inju4T survivors and families in theproposed system.
o The Reha4S1itatiptn Institute of Chicago, Chicago, Illinois.This project eLphasizes vocational rehabilitation,
retraining and job placement through a system of collaborativearrangements and subcontracts with State VR agencies,independent living centers, university based rehabilitationcounselor education programs, head injury associations, andprevention agencies. The project serves Region V (Illinois,
66
Indiana, Michigan, Minnesota, Ohio, and Wisconsin). Centeractivities focus on: (1) expansion and evaluation of a modelsystem of head injury rehabilitation; (2) development anddissemination of training products; (3) prevention of headinjury; (4) substance abuse prevention following head injury;(5) facilitation of an information exchange network; (6)
identification and elimination of barriers to effectiverehabilitation services; and (7) consumer and family outreach.
o Colorado Rehabilitation Serviws. Denver. CoXorado. The goalof this project is to provide a coordinated regional network(Colorado, Montana, North Dakota, South Dakota, Utah, Wyoming,
and New Mexico) of organizations, service providers andindividuals to serve as a catalyst for head injury prevention,treatment, policy formation, and service development directedt reducing the human and economic consequences of TBI and at
empowering head injured persons to achieve societal
2 'ntegration. The program focuses on TBI with special_A:4 given to State rehabilitation clients and services
integrating the full spectrum of services from prevention tolong-term support. To accomplish this goal, the project willconcentrate on prevention; research; acute management andrehabilitation; vocational rehabilitation; education andtraining; long-term support services; and information andreferral.
Contact: Timothy C. Muzzio, Ph.D.202-732-2061
67
Supported Employment Services Projects
Section 311(d)(1)(A)Special Projects and Demonstrations for
Providing Supported Employment ServicesFederal Funds $9,009,815
The supported employment (SE) initiative was advanced in FY1985 and FY 1986 through the award of 27 statewide discretionarygrants by the Rehabilitation Services Administration (RSA) whichestablished demonstration projects to assist States inrehabilitation "systems changes" from day and work activityprograms to competitive work through SE. The mission of the SEstatewide demonstration grants is to:
o convert State dollars toward long-term funding of SE;
o promote community awareness of SE as a viable VR model;
o provide technical assistance to agencies that develop SEprograms;
o encourage community advocacy to create SE options; and
o levelop interagency SE agreements.
SE is designated by regulation to serve individuals withsevere handicaps who, due to the severity of their handicaps, havebeen unable to succeed in competitive employment. The first tengrants, funded in FY 1985 from appropriations provided under theauthority of Section 311(a) (1) of the Act, received their finalyear of funding in FY 1989. The Administration on DevelopmentalDisabilities of the Department of Health and Human Servicescontributed $500,000 for two years in support of this effort. Thesecond set of 17 awards, funded under the 1986 amendments toSection 311(d)(1)(A) of the Act, received their final year offunding in FY 1990.
In 1988, RSA collaborated on the development of an instrumentfor data collection with the Research and Training Center at Vir-ginia Commonwealth University. In 1988 and 1989, the Centersurveyed all 50 States and the District of Columbia. Initial dataindicate that the total number of individuals in SE has risen fromless than 10,000 in FY 1986 to over 52,000 in FY 1989. In 1990,the majority of individuals (70.5 percent) participating in SE werepersons diagnosed as mentally retarded. Individuals with long-termmental illnesses constituted 16.7 percent of the pexsons reported.The remaining 12.8 percent were comprised of persons with cerebralpalsy (1.8 percent), sensory impairment (2.5 percent) and "other"constituting 8.5 percent. More comprehensive data on thisprogram's impact are available in the June 1, 1990, Annual Reportto Congress on Supported Employment.
68
In FY 1989, 12 community-based projects were awarded tostimulate the development of innovative approaches for improvingand expanding the provision of supported employment services toindividuals with severe handicaps and to enhance local capacity toprovide supported employment services. Individuals with severehandicaps, such as mental retardation, cerebral palsy, mentalillnesses, traumatic brain injury, and individuals who are blindwith at least one other handicapping condition, are being servedthrough these programs. These 12 programs are funded for a three-year period.
Supported Employment Technical Assistance
Section 311(d)(2)(A)Special Projects and Demonstrations for Providing
Supported Employment Technical AssistanceFederal Funds $860,777
In FY 1990, two technical assistance cooperative agreementswere awarded to assist State vocational rehabilitation agenciesdevelop and implement the Title VI, Part C State SupportedEmployment Services program. The recipients of the technicalassistance cooperative agreements, awarded for a three-year period,are the University of Oregon and Virginia Commonwealth University.
The cooperative agreements with the University of Oregon andVirginia Commonwealth University for the provision of technicalassistance in supported employment have five objectives: (1) toparticipate in a minimum of quarterly management conferences withthe RSA Project Officer to identify and solve problems which arise,to modify existing objectives when appropriate, and to coordinateefforts with the recipient of the other cooperative agreement andwith RSA Regional Office Supported Employment Specialists; (2) toidentify and disseminate national and regional supported employmentresource information to RSA Regional Office staff and Statevocational rehabilitation agency staff; (3) to organize and convenean Advisory Committee, composed of individuals with specificexperience and knowledge in supported employment, which will meetsemiannually to ensure program effectiveness; (4) to hold annuallyone national meeting on supported employment; and (5) to developtechnical assistance plans with all States and to revise theseplans when necessary.
The following objectives are unique to the cooperativeagreement with the University of Oregon: (1) to plan and conductissues forums in multiple locations and to document and evaluatetheir effectiveness; and (2) to coordinate the exchange of
supported employment information on a national scope.
The following objectives are unique to the cooperativeagreement with Virginia Commonwealth University: (1) to establisha Supported Employment Technical Assistance Center which provides
69

expertise to State vocational rehabilitation agencies in creatingor expanding supported employment capacity in all States served bythe project; and (2) to provide six national videoconferences basedon the Supported Employment Telecourse Network for large scaletopical conferences recommended from State technical assistanceplans.
Contact Person: Fred Isbister, 202-732-1297.
70
MIGRATORY AGRICULTURAL AND SEASONAL FARMWORKERS
Section 312Handicapped Migratory Agricultural and Seasonal Farmworker
Vocational Rehabilitation Service Projects.
Federal Funds: $1,086,000
Mission and Purpose:
The purpose of this program is to provide vocational
rehabilitation services to migratory and seasonal farmworkers(MSFWs) with handicaps, and to members of their families who are
with them, including the maintenance and transportation of the
individual with handicaps and members of their families where
necessary for the rehabilitation of the individual.
Activities and Accomplishments:
In FY 1990, 11 projects were funded under this program; fivewere new in 1990 and six were continued from previous years. Over
2,500 MSYW's with handicaps were served in FY 1990. Examples of
Section 312 projects funded in FY 1990 are as follows:
o Texas Rehabilitation Commission has operated a migrant project
in Southwest Texas for 16 years. The Commission serves anMSFW population of 330,000, second only to California. In
1990, the Texas Rehabilitation Commission received 285 MSFW
referrals; 69 were provided training; 175 were placed incompetitive employment, 127 of which placements were in non-
farmwork positions.
o The Virginia Department of Rehabilitative Services (DRS) haspioneered in tracking migrant farmworkers as they move fromVirginia to other States, particularly Washington, Texas, and
Illinois, in order to provide a continuity of services. In FY
1990, Virginia DRS served approximately 450 clients under this
program and sucfnassfully rehabilitated some 60 migratory or
seasonal farmworkers with disabilities.
Contact person: Edward Hofler, 202-732-1332
71
RECREATION
Section 316Projects for Initiating Epecial Recreation Programs for Individuals
with Handicaps.Federal Funds: $21588,000
Mission eknd Purpose
The purpose of this program is to initiate special programs ofrecreational activities for persons with disabilities in order toincrease their mobility, socialization, independence, and community
integration.
Activities and Accomplishmqnts
Inperiod.program.for only
FY 1990, 28 new projects were funded for a three-yearThis is the second three-year project period for thisPrior to 1987, special recreation projects were funded
one year.
The FY 1987-90 project period established this program as acomponent part of the independent living and rehabilitation system.Thirty-one projects offered persons with disabilities opportunitiesto develop new interests, specific skills, and the confidence totake risks in an integrated setting that has impacted on allaspects of their quality of life, including employability.
Emphasis during the first three-year project period was on
providing large groups of consumers with recreational
opportunities, on the education and training of recreationprofessionals in service to persons with disabilities, and onparticipation of persons with disabilities with nondisabled persons
in physically challenging activities.
NOTABLE PROJECTS
o The gAster Seal Society of Connecticut developed a partnershipwith community programs to facilitate the integration ofpersons with disabilities into community-based recreation
programs in eight Easter Seal affiliate agencies throughout
Connecticut. Participating organizations included the YMCA,
a Center for Independent Living, an Association for Retarded
Citizens, and five Parks and Recreation organizations. Eight
training manuals were developed for the participating
organizations. Recreational activities included integrated
swimming, travel/adventure, camping, and wheelchair basketball
pro9rams. During FY 1990 over 400 consumers were served.
o Jetferson Parish Public School System, Louisiana, initiated,
replicted, and disseminated a program entitled CommunityRecreation Education on Leisure Education (C.R.E.O.L.E.).
72
Project achievements include the development of a C.R.E.O.L.E.Curriculum Guide and a Wheelchair Sports and MobilityCurriculum. In 1990, service was provided to 600 students inJefferson Parish and 3,000 students statewide. In the lastyear of the project, 46 peer tutors participated in activitiesproviding mobility skills, fitness programs, board gameactivities, and creative arts projects in 12 secondaryschools. Teacher feedback yielded a positive response. TheLouisiana Department of Education t s adopted C.R.E.O.L.E. asits official secondary curriculum for Adapted PhysicalEducation statewide.
o Summit Independent Living Center,Inc., Missoula, Montana,through its Disabled Outdoor Group (DOG) pad, as its goal toincrease interaction between 240 people with disabilities andthe same number of nondisabled persons, through recreationaland socialization activities, equipment loans, supportservices, recreational consume.: forums, and training einics.During FY 1989, its last year of funding, Summit ILC served595 persons and provided 14,902 service hours offering skilldevelopment and confidence-building through such activities asdownhill and cross-country skiing, snowmobiling, fitness andaquatics programs, whitewater and flatwater rafting, archery,horseback riding, wheelchair basketball and tennis, campingand fishing trips, as well as game, movie, and social nights.
The 28 special recreation projects approvsd for funding in FY1990 focus on service to smaller groups of consumers. Projects areto be measured not just by numbers of persons served, but by theskills developed and service hours provided. Significant emphasis.s placed on recreational opportunities for persons with severedisabilities, and even on specific populations, such as personswith hearing impairments, persons with traumatic brain injury, andpersons with mental illness.
Contact person: Edward Hofler, 202-732-1332
73

Title IVNational Council on Disability
NATIONAL COUNCIL ON DISABILITY
Section 400National Council on DisabilityFederal Funds $1,540,000
The National Council on Disability (the National Council) isan independent Federal agency comprised of 15 members appointed bythe Presiient and confirmed by the Senate. The National Councilhas the following statutory duties:
o establish general policies for and review the operation of theNational Institute on Disability and Rehabilitation Research(NIDRR);
o establish policies for the President's Committee on theEmployment of People with Disabilities;
o provide advice to the Commissioner of Rehabilitation ServicesAdministration (RSA) on policies and conduct;
o provide advice to the President, the Congress, the RSACommissioner, the Assistant Secretary of the Office of SpecialEducation and Rehabilitative Services (OSERS), and theDirector of NIDRR on programs authorized under the Act;
o provide to the Congress, on a continuing basis, advice,n°commendations, and any additional information which theNational Council or the Congress considers appropriate;
o review and evaluate on a continuous basis the effectiveness ofall policies, programs, and activities concerning individualswith disabilities conducted or assisted by Federal departmentsor agencics, and all statutes pertaining to Federal programs,and assess the extent to which they provide incentives tocommunity-based services, promote full integration, andcontribute to the independence and dignity of individuals withdisabilities;
o make recommendations for ways to improve rese rch, service,adminiatratioa, and the collection, dissemination, andimplementation of research findings affecting persons withdisabilities;
o review and approve standards for the Independent Living andProjects Witb Industry programs;
o submit an annual report with appropriate reccmmendations tothe Congress and the President regarding the status ofresearch affecting persons with disabilities and theactivities of RSA and NIDRR; and
74
o issue an annual report to the President and the Congress onthe progress that has been made in implementing therecommendations contained in the National Council's January30, 1986, report, Toward IndepenOgnce.
While many government agencies deal with issues and programsaffecting people with iisabilities, the National Council is theonly rederal agency charged with addressing, analyzing, and makingrecommendations on issues of public policy which affect people withdisabilities regardless of age, disability type, perceivedemployment potential, economic need, specific functional ability,status as a veteran, or other individual circumstance. TheNational Council recognizes its unique opportunity to facilitateindependent living, community integration, and employmentopportunities for people with disabilities by assuring an informedand coordinated approach to addressing the concerns of persons withdisabilities and eliminating barriers to their active participationin community and family life.
MAJOR ACTIVITIES AND ACCOMPLISHMENTS DURING 1990
Arpricans witb Disabilities Act
On July 26, 1990, Presieent Bush signed into law the Americanswith Disabilities Act (P.L. 101-336), a landmark piece of civilrights legislation for people with disabilities. The NationalCouncil on Disability originated and developed this new law, whichwill affect 43 million Americans with disabilities and theirfamilies.
Input and Feedback from persons with Disabilities
The National Council continuously seeks to receive input andfeedback from persons with disabilities. In addition to the fourmandated meetings held by the National Council, forums were held onsuch subjects as the reauthorization of the Rehabilitation Act of1973; wilderness accessibility; the special problems facing personswith disabilities and families living on islands and away from themainland; infants at risk; and employment tomorrow: opportunitiesfor people with disabilities.
Prevention of Primary and Secondarv_Disabilities
The National Council drafted the 1990 version of theDisabilities Prevention Act, which will be reintroduced when the102nd Congress convenes in January 1991. In addition, the NationalCouncil, in conjunction with the Centers for D5sease Control, beganplanning for a national conference on the prevention of primary andsecondary disabilities.
75
gducation
A contract for a study on education entitled "TheEffectiveness of Educational Programs for Children withDisabilities" was finalized. The study will examine the outcomesof elementary and secondary educational programs and specialservices for children with disabilities, including specialeducation. In addition, the study will examine the outcomes ofacademic achievement, work readiness, and quality of life.
Technology
"Assistive Technology for Individuals with Disabilities" wasanother study commissioned in FY 1990. The study, which ismandated by the Technology Related Assistance for Individuals withDisability Act of 1986, will examine Federal laws, zegulations, andprocedures that affect a State's ability to develop consumer-responsible, statewide systems of technology-related assistance forindividuals with disabilities. It will also consider financingmechanisms in the public and private sectcrs which affect theavailability of technology-related services for people withdisabilities.
Kealt0 Insurance
A study on "Health Insurance and Health-related Services forIndividuals with Disabilities" was initiated in FY 1990 by theNational Council. The study, cofunded by the National Institute onDisability Rehabilitation Research (NIDRR), will focus on toeneeds of, and possible solutions for, individuals with disabilitiesin accessing health insurance.
Establishing_General policies
The National Council held regular meetings with the Directorand NIDRR staff to discuss the developments of the NIDRR five-yearplan and other areas of interest to the National Council.Communication
Participation in a variety of interagency committees enabledthe National Council to keep abreast of activities in the Federalgovernment, and to keep others informed of the National Council'sactivities. A membership on the Interagency Committee onDisability Research, the Federal Agency Council, the Federal TaskForce on Disability, and the Interagency Committee on DevelopmentalDisabilities reflects this policy.
In order to better inform the disability community and othersabout the activities of the National Council, circulation of FOCUS,the National Council's newsletter, was expanded. The newslettercontinues to be a vehicle for communication and helps the NationalCouncil solicit input regarding its activities and policy
76
development. In addition, the National Council will continue to
publish special reports and annual reports to keep those in the
disability community aware of its activities.
The National Council also increased its outreach effort to
people with disabilities through the news media.
Other Focus Areas:
Employment
As employment continues to be a significant area of concern
for people with disabilities, the National Council will be
addressing this issue through the development of a national
employment policy for persons with disabilities. Hearings are
scheduled for FY 1991.
Bargonal_AgogiatAr.ce services
With the signing into law of the Americans with Disabilities
Act of 1990, one of the biggest problems facing persons with
disabilities and their families is the overwhelming need for
personal assistance services. The National Council will be
conducting hearings on this issue in FY 1991 to highlight the
critical nature of this problem.
77

Title V
IN:

Section 501
Employment of Individuals withHandicaps
THE U.S. EQUAL EMPLOYMENT OPPORTUNITY COMMISSION
Federal Sector ProgramsOffice of Federal Operations
Section 501Employment of People with Disabilities in the Federal Government
The Equal Employment Opportunity Commission (EEOC) hasresponsibility for enforcing the nondiscrimination and affirmativeaction provisions of laws and regulations concerning Federalemployment of people with disabilities. Each year EEOC reviews andevaluates the progress made by Federal agencies in hiring,placement, and advancement of people with disabilities when theysubmit their annual accomplishment reports. From this information,EEOC prepares an annual report to Congress regarding employment ofpeople with disabilities in the Federal government. Data gatheredduring FY 1990 (the last year for which data are available),indicates that there was a slight improvement in the employment ofpeople with disabilities, although people with disabilities stillcomprise a much smaller proportion of the Federal work force thanthey do of the working age population as a whole.
During FY 1990, EEOC combined its monitoring of Federalaffirmative employment programs for minorities, women, and peoplewith disabilities. As part of EE0Cfs oversight responsibilities,EEOC staff also conducted combined onsite reviews of theaffirmative employment programs for minorities, women, and peoplewith disabilities at the U.S. Department of the Navy, the GeneralServices Administration and the U.S. Department of Interior (attheir headquarters and selected field installations).
Executive Order 12704, issued February 26, 1990, changed thename of the Interagency Committee on Handicapped Employees (ICHE)to The Interagency Committee on Employment of People withDisabilities (ICEPD). This interagency committee, established bySection 501 (a) of the Act, has responsibility for co-operatingwith and assisting the EEOC in its efforts to ensure that Federalagencies in the Executive Branch are in compliance with Federallaws and regulations for the hiring, placement, and advancement ofpeople with disabilities. In FY 1990, ICEPD developed new policiesand procedures and issued guidance to heads of agencies in thefollowing areas:
o The Committee developed Standard Form 800, Request forReasonable Accommodation and/or Barrier Removal. Thedevelopment of this form was coordinated with the GeneralServices Administration (GSA) and was issued with a memorandumfrom the Chairman of EEOC in October 1990. The memorandumreminded Federal agencies of their responsibility to complywith the provisions of 29 CFR 1613.704 to provide reasonable
78
accommodation and/or barrier removal to
employees with disabilities.
o EEOC issued a memorandum on January 30, 1990,
of agencies of their responsibilitycommunication with applicants and employees
impaired.
o Home-based employment is a selective placement option for
individuals who, because of their disabilities and/or required
medical treatment, are unable to participate in a standard
work setting. The Committee issued a report and made
recommendations regarding home-based employment to the Office
of Personnel Management (OPM). In January 1990, OPM
introduced a government-wide pilot program which permits some
Federal employees of participating agencies, including those
with disabilities, to work at home or at other approved sites
away from the office.
applicants and
to remind headsto facilitatewho are hearing
ICEPD continues to address issues that impact employment of
people with disabilities and has several proposals and/or projects
currently under consideration that should enhance their employment
opportunities.
79
1
SectiorL_MZ
Architectural and TransportationBarriers Compliance Board
ARCHITECTURAL AND TRANSPORTATION CARRIERS COMPLIANCE BOARD
Section 502Architectural and Transportation Barriers Compliance BoardFederal Funds $1,950,000
The Architectural and Transportation Barriers Compliance Board(ATBCB) is an independent Federal agency charged with ensuring thatcertain facilities designed, constructed, leased or altered witiFederal funds since September 1969 are accessible to and usable bypersons with disabilities. The Board revised its mission in 1990and states that the new mission is: "To enhance the quality of lifeby ensuring accessibility and broadening the public awareness thataccess makes economic and practical sense for all."
The ATBCB has a governing board of 23 members. The Presidentappoints 12 public members (six must be persons with disabilities)to three-year terms, and the other 11 are the heads (or designees)of the Departments of Defense, Education, Health and HumanServices, Housing and Urban Development, Interior, Justice, Labor,Transportation, Veterans Affairs; the General ServicesAdministration, and the U.S. Postal Service.
The ATBCB's legislative mandate is to:
o ensure compliance with standards prescribed under theArchitectural Barriers Act (Public Law 90-480);
o propose alternative solutions to barriers facing persons withdisabilities in housing, transportation, communications,education, recreation, and attitudes;
o determine what Federal, State, and local governments and otherpublic or private agencies and groups are doing to eliminatebarriers;
o recommend to the President and Congress legislation toeliminate barriers;
o establish minimum guidelines and requirements for standardsissued under the Architectural Barriers Act;
o prepare plans for adequate transportation and housing forpeople with disabilities, including proposals to cooperatewith other agencies, organizations, and individuals workingtoward such goals;
o develop standards and provide technical assistance to anyentity affected by regulations issued under Title V of theRehabilitation Act of 1973;
80
o provide technilml assistance on the removal of barriers and
answer other questions on architectural, transportation,
communication, and attitudinal barriers affecting persons with
disabilities; and
o ensure that public conveyances, including rolling stock, are
usable by persons with disabilities.
HIGHLIGHTS
The Board had a significant year of accomplishments as it:
o began preparing to implement the Americans with Disabilities
Act (ADA);
o inaugurated toll-free number 1-800-USA-ABLE (Voice or TDD) to
provide information of the ADA;
o began widespread activities based on a new public affairs
plan:
o awarded the first Chairman's Award for Accessibility;
o held the third annual "Design America Accessible" student
design project;
o developed a plan to provide government-wide technical
assistance for ADA;
o conducted 72 accessibility training sessions;
o oistributed 6,366 information packages, five times as many as
in 1989;
o completed eight research projects;
o published seven new technical publications; and
o took action to have barriers removed.
Americarks with DisOili,ties Act: Before and after_passage
Before ADA was signed in July 1990, the Board provided advice
and technical assistance to those drafting the legislation.
Assistance included preparing discussion papers on accessible
transportation and public accommodations for a task force of the
President's Domestic Policy Council; providing technical
information and explanations to Senate and House leaders and
committees; and giving testimony before two House Subcommittees --
the Energy and Commerce Subcommittee on Transportation and
Hazardous Materials and the Public Works Subcowmittee on Surface
Transportation. Further, ATBCB Chairman William H. McCabe formed
81

a task force of Board members to begin to develop the Board's ADAaccessibility guidelines for buildings and facilities.
On the day of the signing ceremony, a toll-free (1-800-USA-ABLE, voice or TDD) number was inaugurated to provide ADAinformation and a pamphlet, The Americans with Disabilities Ikct:AQ4 in Prief, was available for distribution. Also, an ADA factsheet was issued, which provided an overview of the accessibilityrequirements, effective dates, and agencies that will issue andenforce the four tftles of the ADA. Demand for copies of thispublication remain high.
Under the ADA, the Board's main responsibilities are twofold:(1) to develop accessbility guidelines for buildings andfacilities and transit vllicles to serve as minimum requirementsfor standards to be issued by the departments of Justice andTransportation and (2) to give technical assistance to coveredentities. The Board must publish its accessibility guidelines byApril 26, 1991. To meet this deadline, the Board developed itsguidelines in two parts: One part covers public buildings andfacilities; and the other, transit facilities and vehicles. Alsothe Board is one of a number of agencies working with theDepartment of Justice on a government-wide technical assistanceplan. In addition, it will prepare for 30 ADA training sessionsnationwide to provide technical assistance to entities coveredunder Titles II and III of the ADA.
New Agency Goals
In 1990, the Board revised its mission statement and set forthnew goals. The new mission is: "To enhance the quality of life byensuring accessibility and broadening the public awareness thataccess makes economic and practical sense for all." Two new publicaffairs goals placed greater emphasis on promoting accessibilitythroughout society and taking a lead Federal role in bringing aboutgreater accessibility. Three goals outline the agency's ongoingtechnical assistance and compliance roles, and management wascovered under the sixth goal.
Public Wairs Achievements
An ad hoc committee on public affairs was created to proposeways to increase the Board's visibility and a public affairs planwas developed to promote accessibility. In 1990, the Boardinaugurated a program to recognize corporations and other privateorganizations that show a commitment to accessibility and presentedthe first Chairman's Award for Accessibility to the Exxon Company,USA. The Board also jointly sponsored a fire-safe andaccessible/adaptable house, constructed in the Washington, D. C.area, for demonstration purposes. This house is being toured bymany consumers, builders, and other groups. The Board increasedcontacts with congressional leaders, including delivering ADA
82
informational materials to all members of Congress; continued to
hold public forums around the nation; and provided technical
assistance to diverse individuals and groups, including
accessibility of the Capitol and other Federal buildings and
grounds on capitol hill.
Technical Information and Assistance
During the year, a review was begun of the Board's minimum
accessibility guidelines and the Uniform Federal Accessibility
Standards, and the results will be used in developing the Board's
ADA guidelines. Agency technical staff participated with the ANSI
A117 Committee to develop recommendations for revisions to the
upcoming 1991 ANSI standard. In 1990, the Board conducted 72
training sessions and sent out 6,366 information packages, 60
percent of which were mailed in the last five months of the year,
following the passage of the ADA. As part of its ongoing technical
assistance and research efforts, Board technical staff oversaw the
completion of eight projects, monitored existing efforts, and
initiated new technical research projects. Further, the Board
produced numerous technical publications on a wide range of
subjects, including two on the ADA.
Compliance and qnforcemsnt
Two trends were noted this year -- an increase, in the number
of cases in which corrective action was taken and, for the third
year, the resolution of more complaints than were opened. In FY
1990, 52 percent of the closed cases entailed corrective actions to
remove an architectural barrier and of these, 25 percent involved
voluntary actions by the responsible agency or organization. In
addition, a backlog of cases amassed over the past few years was
reduced by 91 percent, and the Board's automated Complaint Tracking
System was further refined.
Management Accomplishments
The Board was able to achieve its goal of effective and
efficient operations through improved planning, review, and
evaluation of its activities and performance; enhanced use of
computers, including refinement of its local area network (LAN)
capabilities and applications; and efficient use of its small staff
and resources.
For more information see the ATBCB's Annual Report to the President
and tc the Congress for FY 1990.
Contact Person: Larry Allison, Voice/TDD (202) 653-7834
83
irL

Section 503
Employment Under Federal Contracts
U.S. DEPARTMENT OF LABOR
Office of Federal Contract Compliance Programs
Section 503Office of Federal Contract Compliance Programs
The Office of Federal Contract Compliance Programs (OFCCP) inthe U.S. Department of Labor has the sole responsibility forimplementing and enforcing Section 503 of the Act. Section 503requires most employers doing business with the Federal governmentto take affirmative action to employ individuals with handicaps.OFCCP also prohibits employment discrimination on the basis ofhandicap. The day-to-day enforcement activities which protect theemployment rights of persons with disabilities are carried out bya network of ten regional offices, located in the standard Federalregions, and the national office.
Affirmative Action and Reasonable Accommodation
Every employer doing business with the Federal governmentunder a contract in excess of $2,500 must take affirmative actionin employment with respect to individuals with handicaps. Thesemeasures cover the full range of employment and personnelpractices, such as recruitment, hiring, rates of pay, upgrading,demotion, and selection for training. Federal contractors are alsorequired to make reasonable accommodations to the physical ormental l:Juitations of qualified individuals with disabilities.This applies to contracts awarded by Federal agencies andsubcontracts awarded by prime contractors. Employers with Federalcontracts of $50,000 or more and 50 or more employees must prepare,implement, and maintain a written affirmative action program foreach establishment, The programs must be reviewed and updatedannually.
Right to File a Complaint
Individuals with disabilities who are protected by thecontract compliance programs may file complaints if they believethey have been discriminated against by Federal contractors orsubcontractors. Complaints may also be filed by organizations orother individuals on behalf of the person or persons affected. Acontractor's failure to make reasonable accommodation to thedisability of a qualified disabled employee, may be the basis foradministrative sanctions and the possible loss of Federalcontracts.
MISSION AND PURPOSE
OFCCP's mission continues to be the enforcement of regulationsrequiring Federal contractors to take affirmative action andeliminate discrimination from the workplace, and to obtain redress
84
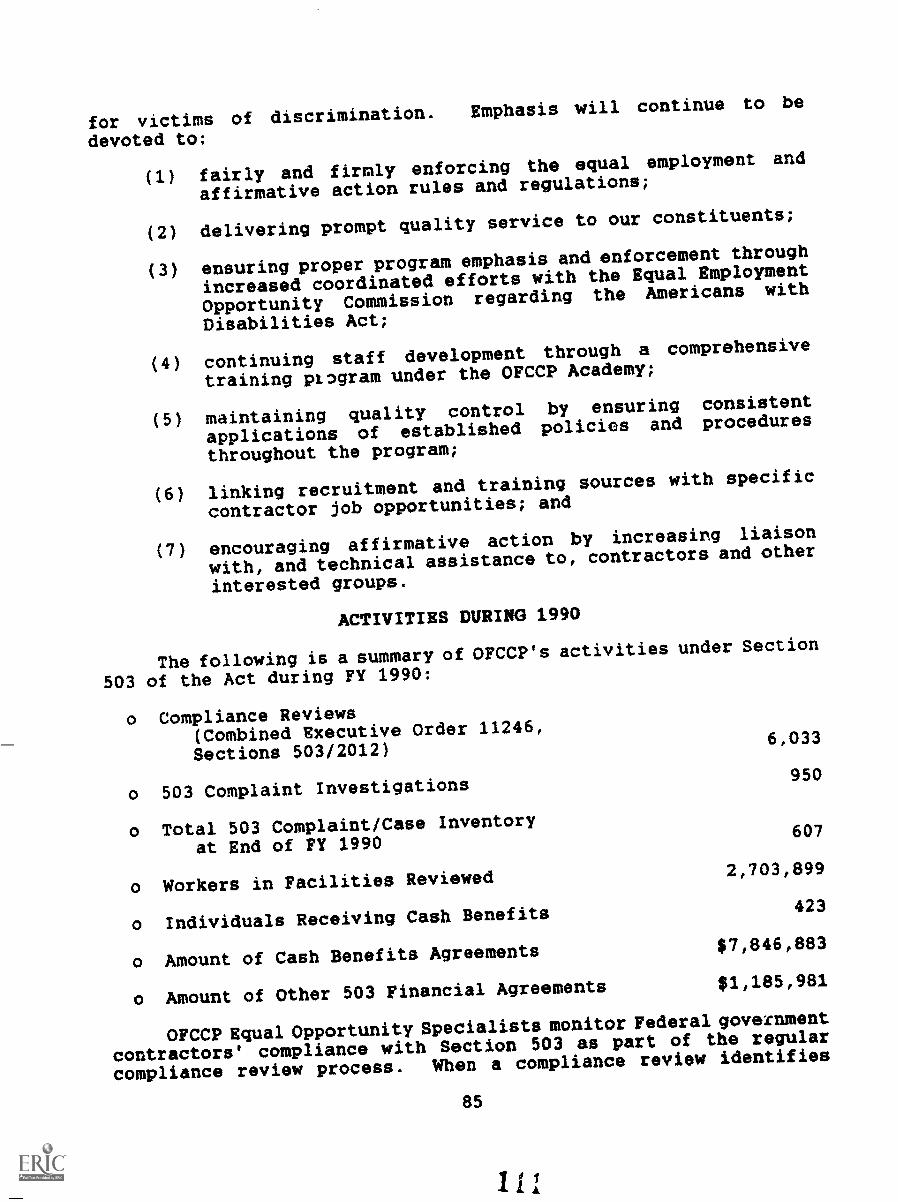
for victims of discrimination. Emphasis will continue to be
devoted to:
(1) fairly and firmly enforcing the equal employment and
affirmative action rules and regulations;
(2) delivering prompt quality service to our constituents;
(3) ensuring proper program emphasis and enforcement through
increased coordinated efforts with the Equal Employment
Opportunity Commission regarding the Americans with
Disabilities Act;
(4) continuing staff development through a comprehensive
training plwram under the OFCCP Academy;
(5) maintaining quality control by ensuring consistent
applications of established policies and procedures
throughout the program;
(6) linking recruitment and training sources with specific
contractor job opportunities; and
(7) encouraging affirmative action by increasing liaison
with/ and technical assistance to, contractors and other
interested groups.
ACTIVITIES DURING 1990
The following is a summary of OFCCP's activities under Section
503 of the Act during FY 1990:
o Compliance Reviews(Combined Executive Order 11246,
Sections 503/2012)6,033
o 503 Complaint Investigations950
o Total 503 Complaint/Case Inventoryat End of FY 1990
607
o Workers in Facilities Reviewed2,703,899
o Individuals Receiving Cash Benefits423
o Amount of Cash Benefits Agreements$70846,883
o Amount of Other 503 Financial Agreements $1/185,981
OFCCP Equal Opportunity Specialists monitor Federal government
contractors' compliance with Section 503 as part of the regular
compliance review process. When a compliance review identifies
85
problems which cannot be easily resolved/ OFCCP attempts toconciliate with the employer. When conciliation efforts foil,OFCCP may recommend the administrative enforcement process.Federal rules and regulations set forth administrative proceduresto be followed when enforcement actions are necessary.
I 1 Dili 111=1 . ns t
OFCCP will continue assisting Americans with disabilities tobecome gainfully employed and advance the employment opportunitiesof special disabled veterans. OFCCP will act in a coordinatingrole with the Equal Employment Opportunities Commission (EEOC) todevelop regulations for implementing the Americans withDisabilities Act (ADA). Pertinent regulations governing OFCCP'senforcement activities will be reviewed to assure compatibilitywith the ADA.
86
Section 504
Nondiscrimination Under Federal Grantsand Programs
DEPARTMENT OF JUSTICE
Civil Rights Division
Section 504Nondiscrimination in Federally Assisted and FederallyConducted Programs and Activities
The Civil Rights Division (the Division or CRD) of theDepartment of Justice (D0J) is responsible for the consistent andeffective enforcement by Executive agencies of what are commonlyreferred to as the "cross-cutting" civil rights statutes, includingsection 504 of the Act. Executive Order 12250 charges the AttorneyGeneral with this responsibility, which has been delegated to theAssistant Attorney General for Civil Rights. Under Executive Order12250, the Division undertakes a diverse array of regulatory andadministrative initiatives. The Division reviews all proposedcivil rights regulations for consistency, adequacy, and clarity,and assists Federal agencies in the development of appropriateregulations. Tke Division also issues interpretations of theseregulations in individual administrative cases and providesguidance to the agencies on new civil rights issues. The Divisionannually reviews the civil rights implementation plans of eachFederal agency as required by Section 1-403 of Executive Order12250 and offers training and technical assistance to agencies toimprove their civil rights enforcement procedures and programs.The CRD also promotes interagency information sharing andcooperation through &legation agreements.
REGULATION DEVELOPMENT AND REVIEW
Regulations (;)r Federally assisted Program%
During FY 1990, the CRD continued to provide guidance toFederal agencies on regulations that apply to Federally assistedprograms. Comments were provided to four agencies that submittedregulations implementing Section 504 in Federally assistedprograms. Some examples of activities on Section 504 Federallyassisted regulations and related guidelines and manuals aresummarized below.
o During FY 1990, CRD staff worked closely with representativesof the Office of Management and Budget, the Department ofTransportation (DOT), and the White House to resolve issuesrelated to DOTts proposed rule amending the existing Section504 regulation applicable to Federally assisted mass transit.The rule was drafted in response to a February 13, 1989,decision of the Third Circuit in ADAPT V. Skinner, 881 F.2d19,9, that invalidated the cost cap contained in the existingrule cnd directed D0T to redraft its rule. On September 18,1990v CRD provided comments on the draft final rule to reviseDOTts existing regulation implementing Section 504 and Section
87
16 of the Urban Mass Transportation Act of 1964 to make the
rule conform to the Apjor court order. DOT's final draft rule
also amended the existing regulation to provide that failure
to comply with the Americans with Disabilities Act (ADA) will
constitute noncompliance with Section 504.
o During FY 1990, the Division continued with its efforts to
assist agencies to amend their regulations implementing
Section 504 to include a cross-reference to the Uniform
Federal Accessibility Standards (UFAS). The Division
previously issued a prototype regulatory amendment designed as
a model for agencies to use to the extent appropriate in
developing an amendment to reference UFAS. On March 2, 1990,
CRD sent to appropriate agencies transmittal letters and
memoranda concerning four sets of draft final rules prepared
by CRD to effect the UFAS cross-reference amendments. One
draft was the common rule of 15 agencies that jointly
published a notice of proposed rulemaking (NPRM) in March
1989. The other three drafts were individual rules i ,r the
Departments of Commerce and Interior, and the Office of
Personnel Management. On July 11, 1990, CRD both the
departments final UFAS amendments for publication in the
Federal Recapter.
o On November 29, 1989, Division staff met with representatives
of the Department of Housing and Urban Development (HUD),
Program Compliance Division, to present comments on a Section
504 manual prepared by a private organization to assist Public
Housing Authorities in conducting self-evaluations and needs
assessments of their programs, activities, and facilities to
ensure compliance with Section 504. CRD also provided
guidance to HUD on implementing Section 504 in the agency's
Section 202 Program (Housing for the Elderly and Handicapped).
Regulations for Zederallv Cqnduct-ed Proarqms
The Division continued with its efforts to provide guidance to
agencies required to issue regulations implementing Section 504 in
Federally conducted programs. During FY 1990, the Division
assisted one agency to publish a notice of proposed rulemaking and
one agency published a final rule implementing Section 504 in
Federally conducted programs. Continued use of the Division's
prototype regulation, first issued in 1983, was encouraged, as was
issuance of regulations by joint publication. Joint publication
eliminates most of the paperwork and administrative burdens for
agencies issuing regulations. To date, 52 agencies have published
final Section 504 Federally conducted regulations using the joint
publication process, resulting in sav:tngs of ..iver $350,000 to the
Federal Government in printing costs slone. During FY 1990, an
additional ten agencies were targeted tor participation in a fourth
joint publication that CRD is preparing. Several activities
88
exemplify the Division's accomplishments in this area of regulatorydevelopment.
o Early in FY 1990, the General Services Administration (GSA)issued guidelines concerning accessibility in leasedbuildings that reflected CRD's suggestions to promoteconsistency in Federally conducted Section 504 regulations andguidelines. The Division had written several letters to GSArequesting that its standard solicitation for offers used inleasing buildings be revised to reflect the government'spreference for buildings that comply with the Uniform FederalAccessibility Standards (UFAS) requirements for newconstruction.
o CRD staff continued with efforts to assemble a draft NPRM toimplement Section 504 for Federal agencies that have not yetissued Section 504 regulations. The latest pool of agenciestargeted for participation in the joint publication processincludes: Arctic Research Commission, Commission on theBicentennial of the United States Constitution, James MadisonMemorial Fellowship Foundation, United States HolocaustMemorial Council, United States Institute of Peace,Christopher Columbus Quincentenary Jubilee Commission, FederalMediation and Conciliation Service, National Council onDisability, Federal Housing Finance Board, and the NationalMediation Board.
o The Division has consistently interpreted the 1978 amendmentto Section 504 as requiring all entities in the ExecutiveBranch to be covered by a regulation implementing Section 504.During FY 1990, CRD continued its efforts to identify existingor newly established agencies to determine whether any of themshould be considered "Executive agencies" for purposes ofSection 504. On July 18, 1990, the Division sent letters tothe Smithsonian Institution and to the John F. Kennedy Centerfor the Performing Arts requesting the views of each agency onwhether it should be viewed as an Executive agency. Bothagencies were found by the Equal Employment OpportunityCommission to be Executive agencies for purposes of coverageunder Title VII of the Civil Rights Act of 1964.
o On September 71 1990, the Department of Education's finalregulation implementing Section 504 in federally conductedprograma was published in the Federal Negister, 55 FR 37166(1990) (to be codified at 34 CFR Part 105).
COORDINATION INITIATIVBS
In addition to direct liaison with individual agencies, theDivision conducts projects that cut across all Executive agencies.These initiatives are directed to the elimination of duplicativerequirements, to the introduction of more cost-effective procedures
89
to reduce burdens on Federal agencies and on their recipients, and
to the provision of technical assistance to Federal agencies.
Accomplishments in this area include:
o On December 4, 1989, the Division sent a letter to the General
Services Administration (GSA) seeking consistency with Section
504 in provisions of a recently proposed rule and publications
to implement the Telecommunications Accessibility Enhancement
Act of 1988 (TAEA). That law directed GSA, in consultation
with "affected Federal agencies," by regulation to take the
action necessary to assure that the Federal telecommunications
system (FTS) is "fully accessible" to individuals with
impaired hearing and speech. The Section 504-related issues
included accessibility requirements for automated telephone
information systems, agency responsibilities for providing
telecommunications accessibility, access numbers in the
Federal Register and commercial telephone books,
accessibility of pay phones in agency facilities, and
accessible toll-free telephone lines.
o The Division continued to encourage development of delegation
agreements, under which agencies delegate specified civil
rights compliance functions (e.g., complaint investigations
and compliance reviews) to a lead agency. These delegation
agreements reduce overlap and duplication in the compliance
activities of the various agencies and increase the overall
effectiveness of Federal civil rights enforcement. Two
agencies, the Environmental Protection Agency and the
Department of State, completed delegation agreements with the
Department of Education (ED) during FY 1990. Also, in March,
IVO, ED sent a delegation agreement par.:kage containing DOJ's
model agreement to the Departments of Housing and Urban
Development and Interior, and to the Office of Justice
Programs.
o In past years the Division issued memoranda (Technical
Assistance Guides or TAG'S) on Section 504 for distribution to
the public and for use by other agencies in training and in
providing technical assistance to recipierts. During FY 1990,
CRD staff continued to improve the documents and to promote
their wide distribution. The TAGs were republished in double
column format for ease of reading, current and correct address
information was added, information on the ADA was incorporated
where necessary, and the TAGs were printed in space saving
format and to allow binding. The TAGs continue to be widely
requested and distributed, both to implement Section 5041E
provisions and for implementation of the newly enacted
Americans with Disabilities Act (ADA).
o The Division continued the review and implementation of
legislation affecting its responsibilities under Executive
Order 12250 and under Section 504, both directly and
90
1 it
indirectly. During FY 1990, CRD staff remained as activeparticipants in the government-wide task force established bythe White House to formulate the Administration's position onthe Americans with Disabilities Act (ADA), which waa signed bythe President on July 26, 1990. Immediately upon passage ofthe ADA, the Division established a telephone information lineto respond to questions on the requirements of the ADA. CRDstaff also developed ADA fact sheets and brochures, andoperates a Department of Justice ADA exhibit that will bepresent during FY 1991 at conventions and meetings of entitiesand individuals directly affected by the passage of the ADA.Currently, the Division is developing public accommodationsand public services regulations and a technical assistanceplan for the implementation of the ADA.
o CRD continued to spearhead implementation of Section 504within DOJ. During FY 1990/ Division staff met with civilrights officials of the Departments of Education and Healthand Human Services, Office of Justice Programs, and NationalInstitute of Corrections (NIC) to clarify the responsibilitiesof these agencies with respect to the investigation ofdiscrimination complaints, primarily involving allegations ofviolations of Section 504, against recipients of Federalfinancial assistance that are corrections institutions. Also,on February 25, 1990, a delegation agreement between NIC andthe Civil Rights Division was signed, which provided thatstaff from the Coordination and Review Section, working undera previously signed reimbursement agreement, will investigateopen complaints and new filings against NIC's recipients ofFederal financial assistance. NIC's existing complaintworkload consisted primarily of complaints filed by inmates orcorrections employees alleging violations of Section 504.o CRD continued to implement the agreement made with theDepartment of Treasury's Office of Revenue Sharing (ORS) in1987 when the Revenue Sharing Program expired. Under theagreement the Division (1) refers to appropriate agencies forprocessing complaints filed with ORS alleging violations ofthe nondiscrimination requirements in the Revenue Sharing Actduring the time in which the Revenue Sharing fwads werereceived by a locality; and (2) monitors compliance agreementssigned by ORS but not yet fully implemented. During FY 19900the CRD monitored three compliance agreements submitted bycounty governments that involved Section 504 issues. Forexample, on November 81 1989, the CRD advised Whitley County,Kentucky, that based on documentation that the county hascomplied with the Section 504 compliance agreement with ORS,the CRD is closing the file. Similarly, on February 2, 1990,the CRD received a supplemental compliance report fromPushmataha County, Oklahoma, addressing the county's effort tocomply with the administrative requirements of its agreementwith ORS, e.g., to appoint a Section 504 coordinator, to
91
establish a complaint adjudication procedure, to conduct an
evaluation of the county's programs, and to develop a
transition plan, if necessary. The CRD's Revenue Sharing
complaint caseload totaled approximately 115 during FY 1990,
and many involved allegations of Section 504 violations.
AGOICY LIAISON
Review Agency Iimpkementation Plans
The Division received and reviewed civil rights implementation
plans from 25 agencies that administered programs of Federal
financial assistance in FY 1990. These plans were drafted as base-
year documents, covering FY 1990-1c,93, and established the long-
range civil rights enforcement goals and priorities along with the
short-term FY 1990 activities undertaken to achieve them. The plans
included projected FY 1990 activities to enforce Section 504 and
the other cross-cutting civil rights statutes and addressed major
compliance and enforcement functions, such as complaint
investigations, compliance reviews, legal and administrative
enforcement, technical assistance, and regulatory and policy
development.
Co Wor d Per o n - t 9 -
The Division issued guidance for the collection and reporting
of civil rights workload and performance data by agencies
administering programs of Federal financial assistance. These
data, which are submitted concurrently with each agency's
implementation plan, addressed activities in the major components
of a civil rights compliance program, such as complaint
investigations, compliance reviews, and legal and administrative
enforcement. The CRD's collection and analysis of Section 504
workload and performance data from agencies responsible for
enforcement of the statute continued.
o Division staff provided technical assistance to agency staff
responsible for preparing the final FY 1989 data on civil
rights workload and performance that was received from
agencies in FY 1990. Division staff analyzed the individual
agency submissions and produced a summary that provided an
all-agency picture of civil rights compliance activities. The
Division issued guidelines on August 20, 1990, for updated FY
1991 implementation plans, including the submission by October
15, 1990, of FY 1990 civil rights enforcement workload and
performance data.
MaintAAmAssistance Network and Respond to Training Needs
The Division maintained its liaison activities with civil
rights and other appropriate program and legal staff of the more
than 25 agencies that administer Federal financial assistance
92
programs and more than 95 Federal Executive agencies that operateFederally conducted programs. These activities help to identifytechnical assistance needs and opportunities that will address thespecific problems of individual agencies and improve theircompliance programs, and to assess the compliance status andeffectiveness of each agency in enforcing civil rights laws. TheDivision staff also provides training for agencies enforcingstatutes covered by Executive Order 12250, especially Section 504.Efforts to promote a smooth transition for DOS's coordinationefforts during FY 1990 and to continue vigorous enforcement ofSection 504 are highlighted.
o On July 12/ 1990, Assistant Attorney General for Civil RightsJohn R. Dunne met with representatives of more that 90 FederalExecutive agencies to discuss the Divisions agenda for Federalagencies with the purpose of invigorating the relationshipbetween the Civil Rights Division and the agencies whoseenforcement efforts in Federally assisted and Federallyconducted programs are coordinated by DOS under ExecutiveOrder 12250. Mr. Dunne emphasized the Administration's strongsupport for vigorous enforcement of Section 504 and for thepending ADA legislation. Attendees included agency generalcounsels and legal staff, and key civil rights directors andofficials.
o Division staff continued to represent DOS on the Federal TaskForce on Disabled Persons. The Task Force is an informalgroup composed or representatives from over 45 differentFederal agencies and 11 private organizations, including theDisabled American Veterans, Goodwill Industries, and theNational Organization on Disability. Its mission is toprovide coordination and communication among Federal agencieson programs and persons with disabilities; to support theDecade of Disabled Persons; and to promote Federal-privatesector partnerships.
t Polio etat.o s
The Division continued to provide guidance to Federal agencieson the legal requirements of the civil rights statutes covered byExecutive Order 12250 and their enforcement obligations under thecivil rights statutes. Examples of CRD"s assistance activities arediscussed.
o The Division, in November 1989, assisted HUD"s GeneralCounsel's office in determining legal strategies for a case inwhich the New York City Public Housing Authority sued HUD toenjoin deferral of funds. After consultation between varioussections in the Division, HUD was advised on various issues,including the application of pinpointing provisions, theadvisability of deferral, and recommended enforcement routes.
93
o On March 7, 1990, CRD staff met with and advised
representatives of the State Department on the proposed
settlement agreement in gabby v. Paker, a suit brought by a
blind man seeking a position as a foreign service officer.
The primary issues were the accommodations to be provided to
furnish plaintiff access to written information.
ASSIST AGENCIES TO CONDUCT SECTION 504 SELF-EVALUATIONS
During FY 1990, the Division continued to encourage, assist,
and assess the efforts of Federal agencies to carry out the self-
evaluation requirement contained in their final Section 504
regulations for Federally conducted programs. Having guided the
regulatory development pa.acess nearly to completion, the Division
has focused its attention on coordinating the enforcement of these
nondiscrimination requirements in the ongoing operation of the
Federal government's programs and activities.
Through the self-evaluation, each agency identifies and
changes any of its policies or practices that discriminate against
qualified individuals with handicaps. This requirement parallels
the self-evaluation required and found useful by recipients of
Federal financial assistance. Section 504 regulations for
Federally conducted programs also require each agency to develop a
transition plan when structural changes are necessary to make one
or more of its programs accessible to individuals with handicaps.
The effect of these requirements is to cause Federal agencies to
review their facilities, programs, policies, and practices and to
make changes required to permit qualified individuals with
handicaps to participate fully in the agency's programs and
activities.
Division staff continued to meet during FY 1990 with
representatives of agencies that have published final regulations.
CRD staff provided essential basic information on what the self-
evaluation requirement entailed and practical iriformation on how to
carry it out. CRD staff also provided assistance to a number of
other agencies that had begun their self-evaluations, suggested
areas of inquiry and identified issues that required Division
policy attention. CRD staff provided written and oral comments on
the products resulting from agency self-evaluations. Finally, the
Division systematically monitored the corrective actions planned or
taken by these agencies as a result of self-evaluation or
transition plan findings.
Contact person: Ms. Stewart B. Oneglial 202-307-2222
94
1 71

Section 507
Interagency Coordinating Council
INTERAGENCY COORDINATING COUNCIL
Section 507Interagency Coordinating Council
The Interagency Coordinating Council was established by the1978 amendments to the Rehabilitation Act to coordinate andfacilitate the effective Federal implementation of Title V of theAct. Eight Federal agencies viith enforcement or coordinationfunctions with regard to these provisions are represented on theCouncil. These agencies are: the Departments of Justice, Labor,Health and Human Services, Education, and Interior; theArchitectural and Transportation Barriers Compliance Board; theOffice of Personnel Management; and the Equal EmploymentOpportunity Commission. The Council is chaired by the AssistantAttorney General for Civil Rights.
The Council submitted its annual report to Congress and to thePresident on July 23, 1990, covering its activities for July 1989to June 1990. During FY 1990, the Council met three times andconsidered three major issues: the availability of governmentrecords in acce.;sible formats for use by persons with disabilities;the Television Decoder Circuitry Act; and the Americans withDisabilities itct. Consideration of these three issues by theCouncil during FY 1990 are highlighted in its annual report asfollows:
o On June 20, 1990, thes Council adopted a policy statement toFederal agencies on their obligation to make governmentdocuments, publications, films, and other video presentationsavailable in accessible formats for persons who havedisabilities that prevent them from using conventionallyprinted or filmed material. The policy emphasizes that it isthe obligation of the agency to take affirmative steps toensure that it provides access to its printed, filmed, orvideotaped material for persons with disabilities. Agenciesmust provide such material in an appropriate, accessibleformat, at agency expense, to any person with a disability whorequests it, unless providing the accessible material wouldconstitute an undue burden on the agency. With respect tomaterial prepared for mass distribution to the public, thepolicy statement notes that although agencies may initiallyelect to prepare the material in the accessible format that isusable by the largest number of people (e.g., audiotapeversions of printed matertal or open-caption video material),the agency should be prepared to provide the material in anaccessible format upon request. During FY 1991, the policystatement will be distributed to the heads of FederalExecutive agencies and will be published in the Federalpegister.
95
o The Council studied issues related to legislative proposals
that new televisions should have built-in decoder circuitry
capable of receiving closed-captioned programming. The
Television Decoder Circuitry Act (P.L. 101-431) was signed
into law by the President on October 15, 1990, and requires
that all new televisions, 13 inches or larger, sold in the
United States after July 1993, must be equipped with
microchips to decode closed-captioned signals.
o The Council monitored the development and passage of the
Americans with Disabilities Act (ADA). All of the Council's
member agencies are affected by the substantive changes in
section 504 coverage under the ADA, and their enforcement
efforts may be affected by new responsibilities imposed on
their grant recipients and contractors. In addition, three
Council members, EE0C, DOJ, and the ATBCB, will have
significant roles in the implementation of the ADA.
Contact person: Ms. Stewart B. Oneglia202-307-2222

Title VI

Part B
Projects With Industry
REHABILITATION SERVICES ADMINISTRATION
Office of Developmental Programs
Section 621Projects With Industry (PWI)Federal Funds $18,765,000
MISSION AND PURPOSE
The purpose of the PWI program is to create a uniquepartnership between business, industry, labor, and therehabilitation community ultimately leading to competitiveemployment for individuals with disabilities. The primary goal ofthis discretionary grant program is to expand job opportunities forpeople with disabilities in the competitive labor market.
PWI is a Federal government/private industry initiativeinvolving corporations, labor organizations, trade associations,foundations, and voluntary agencies that operate through apartnership with the rehabilitation community. The programcreates, and expands job opportunities for people with disabilitiesin the competi- kve labor market. As part of this program, trainingis provided fo jobs in realistic work settings, generally withincommercial or industrial establishments, coupled with supportiveservices to enhance pre-employment and post-employment success ofpeople with disabilities in the marketplace. During FY 1990, over14,000 individuals with disabilities were competitively employed,with an estimated average earnings of $205 a week, through PWIprogram services.
TRAINING GEARED TO JOB OPENINGS
The FY 1990 appropriation funded 112 continuation projects and13 new awards, which were affiliated with more than 4,000 privatecorporations. Each project is required by law to have a BusinessAdvisory Council (BAC) that provides the mechhnism for privatesector business participation in policy making. This affordsbusiness and industry the opportunity to provide input into thedesign and character of training programs that are geared toexisting job openings.
Jobs obtained under the program generally range from service-type positions to those that are highly technical or managerial.Examples of successful projects that were site visited are asfollows:
97
NOTABLE PROJECTS
fignapry_Aids_Foyndwaon. Palo Alto. California
Sensory Aids Foundation (SAF) is a non-profit, charitable
corporation whi:.41 helps people with visual or hearing impairments
to compete successfully in the job market by utilizing the latest
in technology-based sen=ry aids. Sensory aides are devices such
as talking computers or tztlephohe communication aids which enable
an individual with a loss of vision or hearing to access
information which would not normally be accessible. In fourteen
years of operation, SAF has assisted more than 600 people in
obtaining, keeping, and advancing in jobs that otherwise would not
have been open to them.
SAF placed 50 individuals during FY 1990 in high-tech
positions. To assist employers with the issues related to hiring
individuals with r;ensory disabilities, monthly seminars were held.
Representatives of more than 50 corporations attended the seminars
to explore such issues as: evaluating jobs for accessibility,
discussing available technologies for evaluating materials, and
integrating the sensory disabled into the workforce. These
seminars, along with all other SAF services, helped clients achieve
a.n average annual salary of $23,268. The Business Advisory Council
for this project was comprised of representatives from corporations
such as Lockheed, IBM, Hewlett Packard, and Ford Aerospace, and
great assistance in achieving many of these high-tech placements.
usr Design., Inc.. Omaha, Nebras)ca
Career Design is a job placement program that works wAh a
general population of individuals with disabilities. The project
reported a rctention rate of 88 percent of all clients placed in
jobs. During the FY 90 project year, $236,454 Federal PWI dollars
enabled Career Design to place lo3 clients in employment. The
clients total wages for the yea: were over $1,580,000. The average
:till time wages of clients p1a-ed was $11,500 with employment in
jobs ranging from entry level to top management. Over 80 percent
of clients placed had severe disabilities. During FY 1990, the
project achieved its 2,000th placement.
Human Resgurces Develqpment Institute, Washington. DC
The goal of the AFL-CIO Human Resources Development
Institute's (HRDI) Project With Industry program is to bring
labor's resources to bear nationally in cooperative efforts to
increase employment and training opportunities for people with
disabilities. This is the only PWI project with access to the
national structure of the AFL-CIO and as such enables it to draw
support from a wide range of unions to prepare people with
disabilities who work in industrial, construction, services, and
other settings.
98
The HRDI PWI program placed 314 persons with disabilities inhighly paid, competitive employment during FY 1990 at an averageannual salary of $14,664. Placements were made in a variety ofjobs w1th salaries ranging up to $31,000 a year. Placements weremade in both the public and private sectors. People were employedas computer analysts, drafters, civil engineering technicians, andmanagement analysts. People with disabilities were also placed inmany Federal jobs, which have good promotion potential. Theproject exceeded many of its performance goals and objectives.Placements were 25 percent above requirements. Placements in unionjobs earned 25 percent more per hour than those in non-union jobs,and staff continued to strengthen its relationship with unions,employers, and the local rehabilitation community.
PWI GOES INTERNATIONAL
During FY 1990, RSA received requests for information andassistance in developing PwI model programs in Africa and Israel.
PROGRAM ACCOUNTABILITY
Performance Indicators
The PWI program has entered into a phase of greater programaccountability with the development and implementation of programcompliance indicators and on-site compliance reviews. Inaccordance with the 1986 Amendments to the Act, indicators havebeen developed for use in determining the extent to which eachgrantee is in compliance with the evaluation standards previouslydeveloped and used to evaluate the PWI program. Complianceindicators, minimum performance levels, performance ranges andpoints for each indicator to measure the effectiveness ofindividual projects in critical performance areas were published inthe Federal,Register on August 31, 1989. Beginning with FY 1990,these indicators were used to evaluate performance to determinewhether a current grantee snould receive continued funding. As ameasure of past performance, complianLe with the indicators may beused as a factor in recommending new awards beginning in FY 1991.
The compliance indicators measure performance in the followingnine areas:
o percent of persons served with severe disabilities;
o percent of persons served who have been unemployed for sixmonths;
o cost per placement;
o projected cost per placement;
o placement rate;
99
o projected placement rate;
o change in earnings;
o percent placed who have severe disabilities; and
o percent placed who were unemployed for six months or
longer.
Under the regulations for the program, current grantees must
have attained a minimum composite score of 70 points on thecompliance indicators for the period October 1, 1988 to September
30, 1989 and must have met other application requirements in order
to receive continuation funding in FY 1990.
To satisfy the minimum standards for the two indicators that
relate to persons served and placed with severe disabilities, at
least 50 percent of those placed and served must have severe
disabilities. To attain the maximum score for these indicators, at
least 76 percent of the persons served and placed must have severe
disabilities. Other indicators of severity of disability are the
indicators which relate to the length of time that clients who are
served and placed by the project are unemployed prior to entrance
into the PWI program.
0 -site Comoliance Reyiews
Congressionally mandated on-site compliance reviews commenced
in FY 1989 and will continue through FY 1991. Ome- third (36) of
the PWI projects funded in 1987 will be site-visited before the end
of FY 1991. At least 15 percent of the grantees funded annually
in subsequent years will receive on-site compliance reviews.
ANALYSIS OF PWI ON-SITE COMPLIANCE REVIEWS
In FY 1990 15 on-site compliance reviews were completed. RSA
conducted site visits at the following grantee locations;
-Career Design, Inc. -City Wide Colleges of
Omaha, NE Chicago, Chicago, IL
- Adult Special ED ProgramWilmington, DE
-Tulsa Speech and HearingTulsa, OK
-Maurice Warshaw FoundationSalt Lake City, UT
- Jewish Vocational ServicesChicago, IL
100
-Employment ConnectionSpecialists, Manchester, NH
-Goodwill of AmericaBethesda, MD
-Sensory Aids FoundationPalo Alto, CA
-Menninger ClinicTopeka, KS
- The Development TeamBaltimore, MD
- Hearing, Speech and DeafnessCenter, Seattle, WA
-Goodwill Industries of FortWorth, Fort Worth, TX
-Goodwill of New JerseyHarrison, NJ
-Easter Seal Societyof Dade County, Miami, FL
Backaround of the Site Visits
Each PWI project is required to report to RSA at the end ofeach project year the extent to which the project is in compliancewith the evaluation standards. The Rehabilitation Amendments of1986 further required RSA to conduct on-site compliance reviews ofat least one-third of the projects, selected at random, thatreceived funds in FY 1967 (108 projects were funded). Insubsequent years, 15 percent of grantees must receive an onsitecompliance review.
RSA, in fulfilling this legislative mandate, has developed aprotocol and operational framework within which the compliancereviews are conducted for the PWI program. The design, planningand implementation of the reviews are based on the followingobjectives:
o to assess the quality of services provided by the grantee;
o to determine whether the grant is managed in accordance withFederal requirements;
o to identify areas in need of improvement;
o to make suggestions which will eliminate or minimize alldeficiencies noted in the review; and
o to acquaint projects with the RSA mission.
miLthatfolstgy
A review team is assembled for each site survey, comprised oftwo RSA Regional Office representatives: a PWI Program Specialistand a Grants Management Specialist. A representative from theState VR agency, who has a working knowledge of PWI, is invited toparticipate. The remaining team member, as required by law, is anon-Federal employee with experience in conducting a PK, whousually resides in a State other than where the project is located.
Upon completion of the site visit, the chairperson isresponsible for coordinating input from all site reviewers and forpreparing the following:
101
131
o A draft report of the on-site findings containing
recommendations for corrective action is sent to the team and
RSA Central Office within 45 days;
o A draft report incorporating the team's and RSA's comments and
recommendations for corrective action is then sent to the
grantee within 60 days so that the grantee may review and
respond;
o The grantee responds to RSA within 20 days with a corrective
action plan;
o A final report is issued to the grantee by RSA within 90 days;
and
o The Central Office/Regional Office reviews the corrective
action plan, establishes a follow-up schedule; and as
necessary, schedules any future on-site visits.
KEY FINDINGS
RSA conducted 15 compliance reviews in FY 1990. An analysis
of the compliance reviews is broken down into the following three
areas, utilizing a format identical to the site survey instrument:
performance indicators, organization and administration, and grants
management. The types of projects site visited were randomly
selected and included the following: disability-specific, non-
profit foundations, and a city-wide college system.
PERFORMANCE INDICATORS
No project funds were terminated as a result of an on-site
compliance review. However, the following problem areas emerged
from the site visits related to the performance indicators:
Improvement of the Project Evaluation System
Several projects needed to improve their evaluation system in
order to retrieve data collected for required reports. Not all
data was tracked by grantees, i.e. change in earnings, severity of
disability, and the actual number of placements achieved with RSA
Federal grant funds.
Review team members informed grantees of the actual data
required by the indicators.
Improved documentation and implementation of an evaluation
system capable of retrieving the necessary data enabled grantees
to provide RSA with an accurate year-end evaluation report.
102
post Per _Placement
Some of the grantees were not achieving the primary objectiveof the project, i.e securing competitive placements at minimumcost to the Federal government.
Grantees were instructed to work more closely with their StateVR agency to develop written agreements with the State agencies andto more fully utilize their Business Advisory Councils throughemployer contacts in order to increase the number of individualswith disabilities placed in employment.
Note: Failure to pass this indicator in and of itself, doesnot subject a grantee to the termination of Federal funding.
Wsiness Advisory Council (BAC)
In ten instances, the Business Advisory Council was notconducting activities specific to PWI and the composition of theseBAC's was comprised of minimal, if any representation by laborunions and trade associations. Other projects experienced a highturn-over rate in their BAC membership.
It was suggested that grantees seek to broaden the membershipof their BAC. The grantees were provided with copies of by-lawsconsidered exemplary that would create more structure for theirBAC. RSA recommended the formulation of ad hoc committees and thatspecific assignments be given to BAC members between meetings.
Working Relationships
The majority of grantees were found to have excellent workingrelationships within the community and utilized other supportservices when necessary. However, these ongoing workingrelationships had not been formalized through written agreements,which would enable grantees to better determine the role andresponsibility of each agency in the absence of key personnel.
Grantees must develop formalized written agreements with Statevocational rehabilitation agencies and other cooperatingorganizations.
ORGANIZATION AND ADMINISTRATION
The issue of eligibility for services under PWI projects wasraised at four site reviews. This issue was raised becausemonitoring teams found that grantees were not having their clientsdetermined by the State VR agency to be individuals with handicapssuitable for these services prior to providing PWI services.
103
Grantees were advised that they should secure the
determination of their clients as suitable for PWI services asrequired by 34 CFR 379.43(f).
Client Files and Case Record Management
A random sample of 20 case files were reviewed at each site.Numerous files disclosed that case records usually did not containsufficient documentation on severity of disability, client referral
information, as well as contacts with clients, employers, andfollow-up activities. The breadth of the case documentation seemed
to relate to the experience level of the particular staff
specialists.
Grantees were instructed to strengthen client records byobtaining more complete referral information and by trainingplacement specialists when necessary in case documentation andavailable support service areas such as job accommodations andadaptive devices.
GRANTS MANAGEMENT
Grantee cost sharing or matching support was not properlydocumented in grantee records as required by the Department ofEducation Grants Administration Regulations (EDGAR). Costs andthird-party in-kind contributions counting toward satisfying acost-sharing or matching requirement must be verifiable from therecords of grant recipients or cost-type contractors as required in
EDGAR.
Other fiscal deficiencies disclosed in the reviews included:tequired continuing annual or at least, bi-annual independentaudits are not being conducted; audit reports are not being
provided to the Department of Education; written policies for staff
travel, procurement or consultants had not been established;program income is not being reported to and authorized by theDepartment of Education for use on the project; and some proposedprogram/budget modifications are not being reported for approval to
the Department.
Grantees were instructed to follow the appropriate regulatoryrequirements in EDGAR, 34 CFR Parts 74 and 80. The GrantsManagement Specialist reviewed each section with the grantee andprovided the project with the most recent copy of EDGAR. By
adhering to the corrective actions recommended, grantees would thenbe following all fiscal, accounting and reporting procedures asrequired by the Department.
RSA continues to work with the projects that received sitevisits to ensure that corrective action has been taken in all those
areas where deficiencies have been noted. To date, 21 site visits
104
13.;
have been completed.September 30, 1991.
Contact person: Thomas
The remaining 15 will be completed by
Finch, Ph.D., 202-732-1396
105
Part CSupported Employment Services
1.?6
REHABILITATION SERVICES ADMINISTRATION
Office of Prograt Operations
Section 631State Supported Employment Services programFederal Funds $27,630,000
This formula grant program (Title VI, Part C) assists Statesto develop collaborative supported employment (SE) programs withappropriate public and private nonprofit organizations. Theprogram is intended to enable State VR agencies to provideindividuals with severe handicaps time-limited, post-employmentservices which lead to SE. The State VR agency is responsible forthe administration of the program and for establishing cooperativeagreements or letters of understanding with private sources orother public agencies in which the commitment for extended servicesfor long-term job support is secured. Funds for the program aredistributed on the basis of population, with no State receivingless than $250,000.
Historically, SE developed as an alternative service deliverymodel to traditional rehabilitation programs that had difficultyassisting individuals with severe handicaps achieve mainstream,integrated employment. SE has demonstrated that these individualscan engage in real work for competitive pay as part of America'swork force.
One of the eligibility criteria for SE is based upon eachparticipant's inability to function independently in mainstreamemployment without intensive extended job support services. Jobsupport services may be provided at the workplace for mostdisability groups, or if appropriate, away from the workplace forindividuals who are seriously mentally ill. These extendedservices must be required for the duration of the employment andtypically involve the continued provision of training, supervisionand other services to the participant on a scheduled basis throughthe use of a "job coach" or employment specialist.
The impact of the State Supported Employment Services programis noted in FY 1989 data collected by the Research and TrainingCenter at Virginia Commonwealth University (VCU) in their survey ofall 50 States and the District of Columbia. VCU's databaseincluded "merged" data of the Title VI, Part C program and the 27Title III systems change grants (see Section 311(d)(1)(A)). High-lights of VCU's data for FY 1989 are: (1) the number ofindivideals in SE grew from fewer than 10,000 in FY 1986 to over52,000 in FY 1989; (2) State VR agencies were able to leveragealmost $170,000,000 for SE extended services from other Stateagencies/sources in FY 1989; (3) State VR agencies spent$17,757,000 in Title I funds for SE in FY 1989--a 31.8 percentincrease over the preceding year; (4) State VR agencies increased
106
137
the number of individuals entering SE in FY 1989 to 14,487--a 70.0
percent increase over the preceding year; and (5) the number of SE
providers increased to 2,273 in FY 1989--a 21.1 percent increase
over the preceding year. More comprehensiva data on this program's
impact are available in the June 1, 1990 Annual Report to Congress
on Supported Employment.
RESEARCH AND TRAINING CEWTER ON SUPPORTED EMPLOYMENT
The School of Education at Virginia Commonwealth University
was awarded a grant by the National Institute on Disability and
Rehabilitation Research to develop and implement a Rehabilitation
Research and Training Center (RRTC) in SE for persons with
developmental disabilities and other severe disabilities. The
project period began on May 1, 1988, and extends to April 30, 1993.
This Center will expand the work of the current RRTC, which focused
on improving the employability of persons with mental retardation.
There are six major research projects in the expanded Center
which correspond to the conceptual and regulatory framework of SE:
1. Conduct a study of SE policv. This will involve a
determination of which local and State SE policies are most
effective.
2. Study the implementation of the SE program at the local level.
3. Investigate SE program implementation at the consumer level
and identify methods of job retention.
4. Undertake a( program evaluation and compare the efficacy of
different SE models. Studies are proposed which will use
cost-benefit methodology and build on the management
information system already in place.
5. Research integration at the work site and associated communitv
6. e t s ti n f SC o wor er ons with
developmental disabilities.
A broad-based training and implementation plan accompanied
these research initiatives. Training activities will be provided
for field-based internships directed at job trainers; a train-the-
trainer course; technical assistance to transition personnel; a
series of short two- or three-day introductory seminars; and two
national symposia for consensus-building and information sharing in
SE.
107
WORK GROUP ON SUPPORTED EMPLOYMENT
NIDRR, at the request of RSA, formed a work group on supportedemployment in 1988 as a subcommittee of the Interagency Committeeon Disability Research to address issues related to extendedservices funding, data collection and other program issues in SE.The work group meets quarterly to promote the development ofcoordinated policies and funding initiatives in supportedemployment.
Contact Person: Fred Isbister, (202) 732-1297.
108

Title VII
ith

Part AComprehensive Services for Independent
Living
I 11
REHABILITATION SERVICES ADMINISTRATION
Office of Program Operations
Section 701Comprehensive Services for Independent Living ProgramFederal Funds $12,938,000
Title VII, Part A (IL Part A) of the Act authorizes grants toassist State VR agencies to provide comprehensive services forindependent living to those individuals whose disabilities are sosevere that they do not presently have the potential foremployment, but who may benefit from vocational or othercomprehensive rehabilitation services which will enable them tolive and function independently, or to maintain appropriatgemployment. Priority for services is given to those persons notserved by other provisions of the Act.
HIGHLIGHTS OF THE YEAR
The source for the data used for this summary is the AnnualReport on State Agency Independent Living Rehabilitation Services,Title VII, Part A (Form ED-RSA-7A). A new version of thisreporting instrument was developed during FY 1990. Informationadded to this version included: 1) amount of non-Federal funds overthe required 10 percent match used for the IL program; 2) amount ofFederal funds subgranted; 3) number of subgrants awarded; 4) numberof subgrantee staff; 5) reasons for closure; and 6) time in theactive caseload. Fifteen agencies (less than 20 percent of thetotal) reported FY 1990 data using the new format. Not all of theagencies using the new form reported information for every newitem. Because of the limitations in reporting, no data from thenew items will be shown for FY 1990. Tables and charts presentingthese data can be found in Appendix H.
Caseload Statistics
Applicant status
During FY 1990, 17,239 individuals were in applicant status(pre-active caseloads). Of this, 12,599, or 73.1percent, were newapplicants. Over half (54.7 percent) of the persons in this statuswere determined eligible for ILRS, an additional 19.1 percent weredetermined ineligible for services and 26.1 percent were awaitingtheir eligibility determinations at the end of the year.
Compared with pre-active caseload activity in the previousfiscal year, increases occurred in all areas except cases acceptedfor =during this period. However, the decline experienced in newacceptances was less than 1 percent (0.2 percent). The largestincrease (31.1 percent) was reported in the number of cases on handat the beginning of the fiscal year.
109
Active caselpad
The 91436 individuals with severe disabilities accepted for IL
services during FY 1990 accounted for 51.8 percent of the total
180223 clients in the active caseload. Clients whose cases were
closed during the year for various reasons represented 45.5 percent
of the total available, and 9,938 cases (54.5 percent of the total)
were still in receipt of services at the end of FY 1990.
With the exception of newly accepted cases, active caseload
activity was up from a year ago. Total persons served during FY
1990 were 5.5 percent more than the total number served during FY
1989. The 8,285 cases closed during this period represented anincrease of 12.2 percent from the prior year, and the total on hand
in the active caseload at the end of FY 1990 is 0.5 percent more
than the number on hand on the same date one year earlier.
Client Profile
Age (at closure or at the end of the year)
Age is reported annually for each client served by State ILR
agencies. Less than a third (30.2 percent) of those served during
FY 1990 were 65 years old and over. Individuals who were between
the ages of 23 and 54 years (working age) accounted for the largest
proportion (45.6 percent), and clients under 23 years old
represented 11 percent of the total.
sszOver half (53.5 percent) of the persons served in FY 1990 were
females. This differs from the vocational rehabilitation (VR)
program where the majority of the individuals served are males.
Race/ethnicity
Minorities accounted for 19.3 percent of the 18,223 personsserved during FY 1990. Hispanics, regardless of race, represented
4.2 percent of the total served.
Disability 1:major disabling condition)
Visual impairments (blindness and other visual impairments)
were the most common disabling conditions for persons served in FY
1990. More than one-third (34.2 percent) were so impaired. Ortho-
pedic impairments (excluding spinal cord injuries and some
neuromuscular disorders) represented 30.5 percent. Spinal cordinjuries accounted for 8.6 percent of the total available. Of the
total, there were 7,731 IL clients served who had multiple
disabilities and 4.6 percent (841) had conditions related totraumatic brain injuries.
110
Services provide4
Of the 16 broad ILRS categories, counseling was the servicemost frequently provided. More than half (58.6 percent) of theindividuals served during FY 1990 received some kind of counselingservice. Additional services received by large percentages of ILclients served in FY 1990 included: 1) advocacy and referralservices (31.8 percent); 2) daily living services (30.1 percent);and 3) physical and mental restoration (29.6 percent). Anadditional 12 specific services and other nonspecific services wereprovided, as needed.
XL IWRP gogls
Each client who receives comprehensive services for indepen-dent living is required to have an individualized written rehabil-itation program which states specific goals and the servicesrequired to meet those goals. The RSA-7A collects information onthe number of individuals who achieve their IWRP goals. Themajotity (60.2 percent) of the individuals whose cases were closedduring FY 1990 had programs which specified services necessary toimprove their ability to take care of themselves (self-care), andhalf of the IWRP's included mobility as a goal. The distributionfor the remaining categories ranged from 1.3 percent for goalsother than the six identified to 30.3 percent for goals to improvecommunication skills.
Three-fourths of the clients with goals in 5 of the 6 specificgoal areaA achieved those goals. Persons with unspecified goalsachieved 92.7 percent of their goals. Employment was a goal foronly 6.5 percent of the clients who completed their ILR programsduring FY 1990, but 79.9 percent of persons setting goals in thisarea met these goals. Unlike the VR program, achievement of avocational goal following the completion of ILR services primarilyinvolves maintaining suitable employment, not job placement. Largeproportions of individuals with goals to improve their residentialconditions (78.4 percent) and mobility (77.3 percent) were alsosuccessful. The lowest level of achievement (60.5 percent) wasreported for the 792 clients who had education goals.
111

Part B
Centers for Independent Living
REHABILITATION SERVICES ADPUNISTRATION
Office of Developmental Programs
Section 711Centers for Independent LivingFederal Funds $26,666,000
MISSION AND PURPOSE
The purpose of this program is to provide funds to designatedState vocational rehabilitation units or local public agencies andprivate nonprofit organizations for the establishment and operationof Centers for Independent Living (CIL). These community-based,nonresidential centers provide independent living services designedto meet the current and future needs of individuals whosedisabilities are so severe that they do not presently have thepotential for employment, but who may benefit from vocational orother comprehensive rehabilitation services which will enable themto live and function independently, or to maintain appropriateemployment. These services will help them to live and functionindependently.
The varied combination of independent living services providedto individuals with severe disabilities through this programinclude independent living skills training, counseling and personaladvocacy services with respect to income benefits and legal rights,information and referral, peer counseling, education and trainingnecessary for living in the community and participation incommunity activities, housing referral and assistance,transportation, equipment and adaptive aid loans, and personal careattendant training and referral.
Other equally important services are outreach/communityeducation, technical assistance to other community agencies,transitional services to assist youth in making the transition fromschool to the community, intake and assessment, servicecoordination, emergency intervention, social and recreationactivities, and vocational/educational/employment services.
Section 711 of the Act requires that individuals withhandicaps be substantially involved in policy direction andmanagement of such centers. All Centers operated with funds underthis program must have a principal governing board composed of amajority of persons with handicaps.
ACTIVITIES AND ACCOMPLISHMENTS
o 144 awards were made to 97 grantees, averaging $185,181 peraward. These funds were used to operate 202 Centers in 50States, the District of Columbia and 3 territories.
112
o The number of consumers with severe disabilities that received
direct services was approximately 76 , 2 00 including
information and referral.
o Through education and advocacy, the Centers worked to
influence positive community change and increase access
throughout the country.
o On-site compliance reviews were conducted at 14 Centers. In
most instances, the centers provided fully satisfactory to
superior services and were deemed in compliance with program
regulations.
FUNDING DISTRIBUTION PATTERNS
The State VR agencies are the primary grantee for funds under
this program. If, within three months after the date in each
fiscal year on which the Secretary of Education begins to accept
applications from State VR agencies, a State agency in a State has
not submitted such an application, the Secretary may accept
applications for grants under this program from local public
agencies or private nonprofit organizations within that state.
State VR agencies may directly operate centers or contract with
nonprofit and public agencies for the operation of centers for
independent living.
State VR agencies are the recip)ents of 94 of the 144 grants.
Forty-one grants are awarded to general State agencies, 33 to
combined State agencies, 15 to State agenciesfor the blind, and 5 to co-applicant general State agencies and
State agencies for the blind. Of the 50 grants awarded to
nonprofit organizations, 44 are awarded to organizations
incorporated as centers for independent living, 5 to community
services organizations with independent living program components,
and one to a university.
The Title VII, Part B grantees may retain their awards and let
contracts to establish and operate CILs. State agency grantees
that retain the entire award operate the CILs themselves. Other
State agency grantees establish and operate CILs through contracts
to nonprofit organizations. When a State agency retains a portion
of the original award, that portion is used to administer the
contract.
Nonprofit organization grantees are the direct providers of
CIT services and retain all or, in a small number of cases,contract a portion of their grant awards to other centers or
community services agencies.
113
General _4ate Agencies
In FY 19900 general State agencies subcontracted 93 percent,or 38/ of their 41 grants to nonprofit organizations. Twenty-twoof these 38, or 53 percent of the grants, were given entirely tononprofit organizations. For sixteen of these grants, or 40percent of the total, a portion of the grant was retained foradministrative purposes. The amounts retained ranged from 3.2percent to 16 percent of the award. Seven percent, or 3, of thegrants were retained in their entirety for the State operation ofCIL programs.
Combined State Agencieg
Of the 33 grants to combined State agencies, 27/ or 82percent, were contracted in their entirety to ncnprofitorganizations for the establishment and operation of CILs. Another40 or 12 rercent, were contracted with a portion retained foradministrative purposes, bringing the total contracts let to 31, or96 percent of the total. The amounts retained for administrativepurposes in the 4 grants was typically 5 percent/ but in one casewas 25 percent, of the grant awArd. The remaining 2 awards, or 6percent, were retained for the establishment and operation oi StateCenters for IndepcIdent Living programs.
State Agencies for the Blind
ree of the 15 grants awarded to State agencies for theblind/ or 20 percent, were subcontracted in their entirety tononprofit organizations for the establishment and operation ofCILs. Ten, or 67 percent, of the grants were retained in theirentirety for the operation of CIL programs by the State agency.Another 2 awards, or 13 percent, were contracted with a portionretained by the State agency for administrative purposes. Theamounts used to administer the contracts ranged from less than 1percent to 6.6 percent of the grant award.
Co-Appkicant Agencies
In one State/ the blind and general State agencies applied asco-applicants were awarded five grants. All five awards weresubcontracted to nonprofit organizations for the establishment andoperation of CILs. The State agencies retained less than 1 percentof each award for administrative purposes.
Nonprofit Organizations
All of the 50 awards to nonprofit organizations were used forthe direct operation of centers for independent living programs.Forty-seven, or 94 percent, of the 50 grants to nonprofitorganizations were retained in their entirety. Three, or 6p3rcent, of the center grantees subcontracted a portion of their
114
1 S
awards to other centers or community services organizations to
provide independent living services.
MANDATORY SITE VISITS
Section 711(f) (3) of the Act requires on-site compliance
reviews of one third of the grantees under this program in 1987 by
the end of FY 1991. Site visits were conducted to ascertain the
following:
o to assess compliance with Section 711(c) of the Act;
o to study the program operation, organizational structure, and
administration of the center;
o to verify that the center is managed in accord with Federal
requirements contained in the Education Department General
Administrative Regulations (EDGAR) and 34 CFR Part 366;
o to assess project conformance with the goals, objectives,
outcomes, activities, and conditions of the approved
application;
o to identify areas of needed improvements in the project; and
o to identify technical assistance needed to minimize or
eliminate deficiencies.
In accordance with the requirements in the Act, the grantees
were selected randomly by sumputcr. Because most of the grants are
awarded to State agencies but the State agencies do not operate the
CILs, it was decided that tlie actual. CIL, roc the grantee, was to
be visited. RSA began the on-site reviews in the summer of 1990.
Each review team had a non-Federal individual who was an expert in
the provision of independent living services and two staff persons
representing RSA with program and fiscal expertise. The results of
these site visits have been positive. Interviews with individuals
served were most valuable as they showed how the CILs were making
an impact on their lives.
The reviewers found that services were comprehensive and
consistent, yet varied to reflect divergent community needs. The
independent living philosophy of self-determination and empowerment
was well embroidered into the fabric of these CILs. The site
visits provided an opportunity for the exchange of information.
115
SITE VISIT HIGHLIGHTS
Nqrtheast ligNpendent Living Pr gram, Inc.Lawrence. Massachusetts
This center provides independent living services for personswith severe disabilities in all disability catagories. Reviewerscited this center as a model for being "cross disability" at alllevels. The center has separate components for the specific needsof discrete disability groups, while functioning as an integratedunit. In addition, the center has a strong outreach program tomulticultural populations and an excellent personal care attendantprogram.
Resource Center for Independent Living, Inc._Utica, New Ygrk
The center provides a wide array of consumer directed servicesand operates a rehabilitation technology center. It has over 100employees and an operating budget in excess of 2 million dollars.The center has a special separate component that meets the needs ofsenior citizens with disabilities, an interpreter training program,and an adaptive equipment and technology center for toddlers toseniors with disabilities.
ARISE., Inc.Syracuse. New York
Operating in the heart of this university town, this centerbas a strong program component for youth with disabilities in highschool to prepare them for transition to higher education or workenvironments. It also has a program for individuals with traumaticbrain injury in need of independent living services.
Center for Independent Living of Southwestern PennsylvaniaPittsburgh, Pennsylvania
Exemplary fundraising efforts have enabled this center topurchase its own building. The center is part of a large communityservice organization. Its diverse financial resources havecontributed to its operating capital, which is in excess of amillion dollars.
Erie Independence House CenterWe. Pennsylvania
This center has a supported employment program, anindependent living skills training program, and a consumer-directed peer counseling program. Its diversified non-Title VIIfunding has enabled the center to expand its services.
116
Jackson Center for Independent Living. Inc.Jacksm Mlssissippi
This center utilizes the resources of the vocational
rehabilitation agency to enhance the comprehensiveness of
independent living services provided to its consumers. There is a
close working relationship between the Part A and Part B
components. In addition, the peer support program works with many
disability organizations within the community, and operates a
personal care attendant program.
Urban-Rural_Centers for ;ndependent LivingLansing and Gaylord, Michigan
The center follows a more traditional rehabilitation servicedelivery model than that typically found in other CILs. Policies
and procedures are well organized. Ttm CIL serves a wide range of
persons with severe multiple disabiliti,,s who could otherwise "fall
through the cracks" of other service delivery systems.
New Vistas Independent Living Centers. Inc.Santa Fe and Las Cruces. New Mexico
Apses support program for Native American Indians with severedisabilities is available at this center. The CIL has established
an innovative job development/placement program and transitional
services program. The CIL is also extensively involved in the
Rural Independent Living Program.
o InTopeka. Kansas
An exemplary independent living initiative at this CIL is aunique social security advocacy program. Through this program, alawyer on staff provides counseling and represents consumers athearings regarding contested claims for social security benefits.The CIL also has a fee-for-service program where materials areproduced in all accessible forms (e.g. braille/ large print, and
tape) for consumers and other community organizations, and apersonal attendant care program.
Denver Center fqr Independent Living, Inc.Denver, Colorado
This center places emphasis on housing services, technicalassistance on barrier reductions, and independent living skills
training. This is a consumer-directed CIL at all levels.
117
1 5 ./t
Disal?ility Resource Center of TucsonTucson. Arizona
This center occupies a state-of- the-art facility and is amodel of accessibility. The center has an excellent independentliving skills program and an outstanding benefits advocacy program.There is a staff person assigned to work with consumers who havebeen denied Social Security Income or Social Security DisabilityIncome benefits. The center has been successfull in reversingdenials of benefits and gaining back payments for many consumers.
Stepping StoneAl Inc.Mpspow. Idaho
This center is a strong rural center with an extended outreachprogram to reach people with disabilities in remote areas. It hasa good independent living skills training program and coordinateswith many other organizations to provide comprehensive independentliving services.
EXAMPLES OF gOW SERVICES HAVE HELrED CONSUMERS
o Advocacy: Diana, who is hearing impaired and a single motherwith a daughter, had been frustrated because a schoolprincipal consistently refused to provide interpreter servicesnecessary to enable her to fully participate in teacherconferences and PTA meetings. A friend suggested that shecall the local CIL and ask for help.
Diana called the CIL for help. The Director of Deaf andHearing Impaired Services explained to Diana theprotections afforded her by Section 504 of the Act. Shewas not aware that there was a law ensuring her rights forinterpreter services during teacher conferences and PTAmeetings. The Director accompanied Diana to the school andinformed the school principal of the requirements ofSection 504, resulting in approval of the mother's request.With the help of an interpreter, Diana is now able toparticipate in various school meetings.
o Indapendence: Nancy is in her thirties and is mentallyretarded, although not severely enough to require traditionalhabilitation services. She has always lived with her parentsand is dependent on them for daily living needs. The familysought assistance from the CIL to assist this consumer toacquire money management skills. Initially she had noconfidence in her ability to learn or perform tasks such ascounting change and writing checks. She would becomefrustrated, cry and run to her room. Gradually with the helpof her independent living adviser she would stay and solve theproblem. She is now able to write checks and to count change
118
152
independently. More recently this consumer has also learncd
through "experiential" training techniques the ability to
utilize the bus service. Previously, she lacked the self-
confidence to take the bus independently but now she takes the
bus alone to her new volunteer job. This consumer continues
to learn and explore new skills that enhance her independence.
o Accessibility: Bobby was a school age child who used a
wheelchair. The house had always been inaccessible to him.
His parents would carry him in and out of the front door. The
CIL staff designed an appropriate ramp for the house and
worked with the [State] Department of Social Services for
funding. The Housing and Design Specialist let the bids and
monitored the construction. Upon completion and final
inspection, CIL staff were able to share in the pleasure that
this young child felt as he came out of the house andindependently wheeled down the ramp for the first time.
o Training: This 44-year-old man experiences a T4-T5 spinal
cord injury and uses a manual wheelchair. When he firstapproached the CIL for services he was homeless, moving from
friend to friend. He is an immigrant and speaks only broken
English. At the intake interview it was explair..ad that he was
crawling up 13 steps to use the bathroom and was using a
wheelchair which was falling apart and was the wrong size. He
had no income, no job, no health insurance, and no physician.
He needed medical attention, supplies and medical
prescriptions. He desperately wanted to see his son and to do
something worthwhile with his life. His inability to speak
English well had interfered with access to benefits and
services. He was injured 10 years ago and lived in this
community the past two years, but r asked for or received
any services. This person has been an active consumer for the
past three years. His accomplishments in this period of time
have been impressive. He has set 19 goals thus far and
achieved 90% of them. All of the aforementioned problems have
been resolved.
Through the use of resources, training and advocacy services
provided by the CIL he now has a new wheelchair, lives in a
subsidized accessible apartment, receives medical attention
and benefits, works at the [State] Goodwill Industries, owns
and drives his own modified car, and feels he has realized his
life goal to do something "worthwhile" and to function
independently.
o Attendant Care: In a very remote area, an adviser met with a
54-year-old woman with terminal cancer, who had difficulty
finding anyone close enough to provide attendant care.
Previously, issues of being vulnerable and easily takenadvantage of by caregivers had come to the attention of
[State] Adult Protective cervices. Until her death this fall,
119
the adviser supported her efforts at attendant management,task setting for her personal care attendants, and expressingher wants.
o Assistive Devices: A 32-year-old mother and her 5-year- olddaughter both experienced muscular dystrophy. Duringassessment it was realized that they had received few of theservices and little of the equipment for which they couldqualify. There was a large range of available equipment. Themother became very interested in learning processes as she andthe adviser located suppliers, types of equipment, and thenlocated various funding sources. They now have a newcustomized wheelchair for the child, roll-in shower, a fundingsource for a specialized nutrition formula, a van lift and tiedown system, ramps at two doors, diapers/ a standing table, aself-propelled vacuum cleaner, and dishwasher. The mother hasdeveloped excellent assertiveness skills to seek resources anddeal with agencies.
120

Part CIndependent Living Services for Older
Blind Individuals
REHABILITATION SERVICES ADMINISTRATION
Office of Developmental Programs
Section 721Independent Living Services For Older Blind IndividualsFederal Funds $5,827,000
Section 721 of the Act authorizes grants to State VR agenciesfor projects that provide independent living serv4ces for olderblind individuals. This specialized program provides independentliving services for persons who are blind and age 55 and older tohelp them adjust to blindness and live more independently in theirhomes and communities. Twenty-eight continuation projects werefunded in FY 1990.
Services frequently provided by this program includeorientation and mobility skills training, communication skillstraining, communication aids, daily living skills training, lowvision services, peer and family counseling, and cor unityintegration. During FY 1990, these projects opened new cas-,..s forover 70500 individuals.
Grants under this program are for demonstration projects.Funded projects provide a wide variety of service options and havea number of different focuses. Examples of activities conductedunder these grants follow:
EXAMPLES OF PROJECT ACTIVITIES
o Several projects were able to provide or arrange for a widearray of comprehensive, independent living services to elderlyindividuals who are blind by establishing a community supportnetwork of service providers using existing community agenciesand organizations or by expanding services through contractualrelationships.
o One project has qualified consumers who are blind providingthe bulk of the services for elderly persons who are blind atall of their contracted Independent Living Centers.
o One project established a comprehensive State network ofservices by involving 20 area agencies on aging, 25 vocationalrehabilitation area offices, a statewide itinerantrehabilitation teaching network, and the statewide blindvendors program.
o Several of the older blind projects had particular emphasessuch as services for persons who are blind and visuallyimpaired who live in residential care facilities, retirementhomes, and senior citizen housing.
121
1 5 f;
o Many of the projects addressed the needs of persons who are
blind and visually impaired by instituting statewide, locally
managed loan equipment services; free adaptive device
servicing programs; linkages with mental health providers for
senior citizens who are blind and visually impaired; networks
of volunteers, and responses to unique needs of individuals
who are blind and visually impaired, especially those in
underserved areas.
o Many of the older blind projects had peer helpers for
persons beginning to experience severe visual loss. These
peer helpers are former clients of the project who have
achieved their independent living goals and are living active
lives in the community.
o Several projects also concentrated on mainstreaming older
blind individuals into existing community services and
activities provided by other community organizations.
o In several States, there has been interaction between the
older blind projects and the other independent living programs
funded through Title VII. Collaboration with Part A and Part
B programs has resulted in the provision of information and
referral data to consumers and staff, coordination of
transportation services, production of materials into braille
and peer counseling training.
122

Appendices

Glossary of Terms
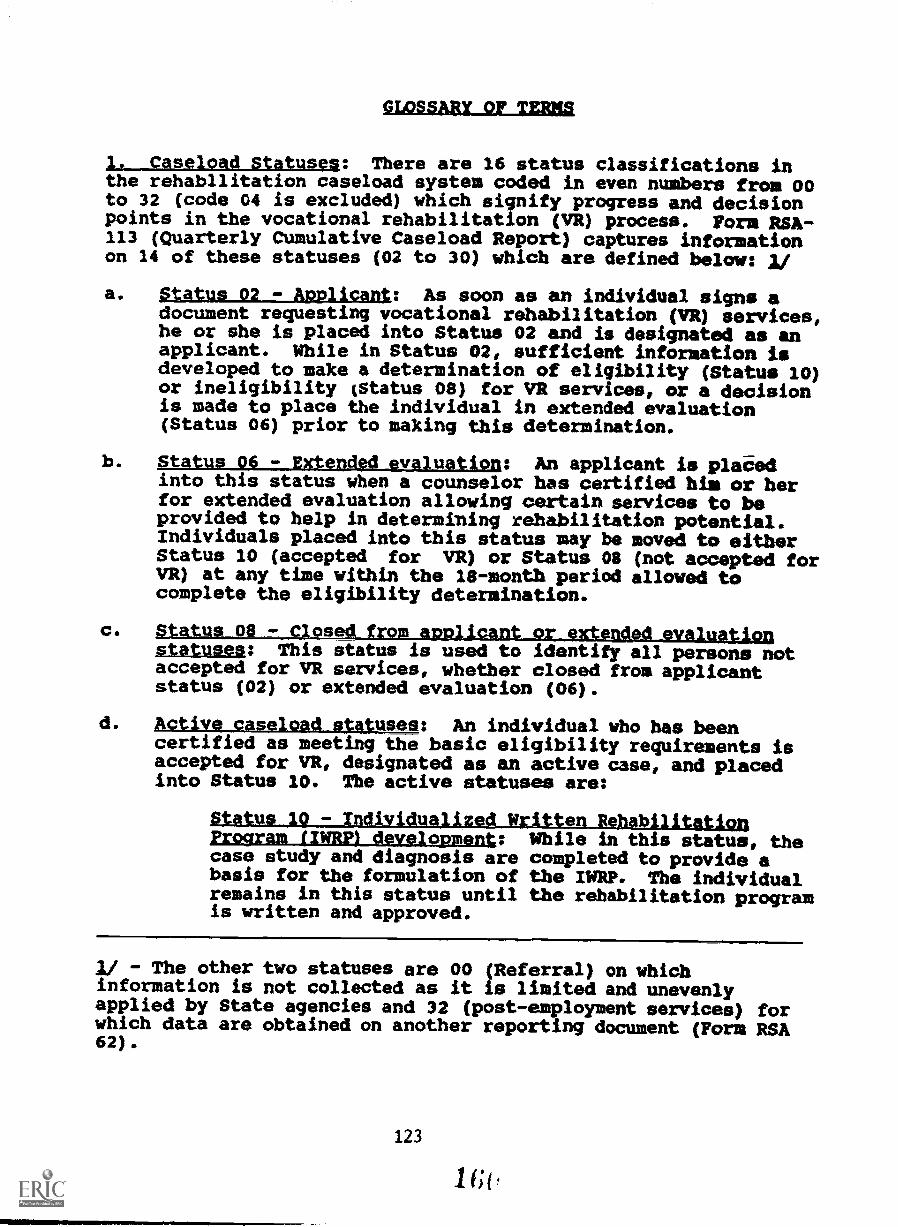
GLOSSARY OF TERMS
1. Caseload Statuses: There are 16 status classifications inthe rehabilitation caseload system coded in even numbers from 00to 32 (code 04 is excluded) which signify progress and decisionpoints in the vocational rehabilitation (VR) process. Form RSA-113 (Quarterly Cumulative Caseload Report) captures informationon 14 of these statuses (02 to 30) which are defined below: 2/
a. Stptus 02 - pplicant: As soon as an individual signs adocument requesting vocational vihtbilitation (VR) services,he or she is placed into Status 02 amd is designated as anapplicant. While in Status 02, sufficient information isdeveloped to make a determination of eligibility (Status 10)or ineligibility (Status 08) for YR services, or a decisionis made to place the individual in extended evaluation(Status 06) prior to making this determination.
b. Status 06 -_Extended evaluation; An applicant is plaiedinto this status when a counselor has certified him or herfor extended evaluation allowing certain services to beprovided to help in determining rehabilitation potential.Individuals placed into this status may be moved to eitherStatus 10 (accepted for VP) or Status 08 (not accepted forVR) at any time within the 18-month period allowed tocomplete the eligibility determination.
C. 0 !1.11 : 10. At I
statuses: This status is used to identify all persons notaccepted for VR services, whether closed from applicantstatus (02) or extended evaluation (06).
d. Active caseload statuses: An individual who has beencertified as meeting the basic eligibility requirements isaccepted for VR, designated as an active case, and placedinto Status 10. The active statuses are:
Status 10 - Individualized Written Rehabilitatipnprogram (IWRP) development; While in this status, thecase study and diagnosis are completed to provide abasis for the formulation of the IMP. The individualremains in this status until the rehabilitation programis written and approved.
1/ - The other two statuses are 00 (Referral) on whichinformation is not collected as it is limited and unevenlyapplied by State agencies and 32 (post-employsent services) forwhich data are obtained on another reporting document (Form RSA62).
123
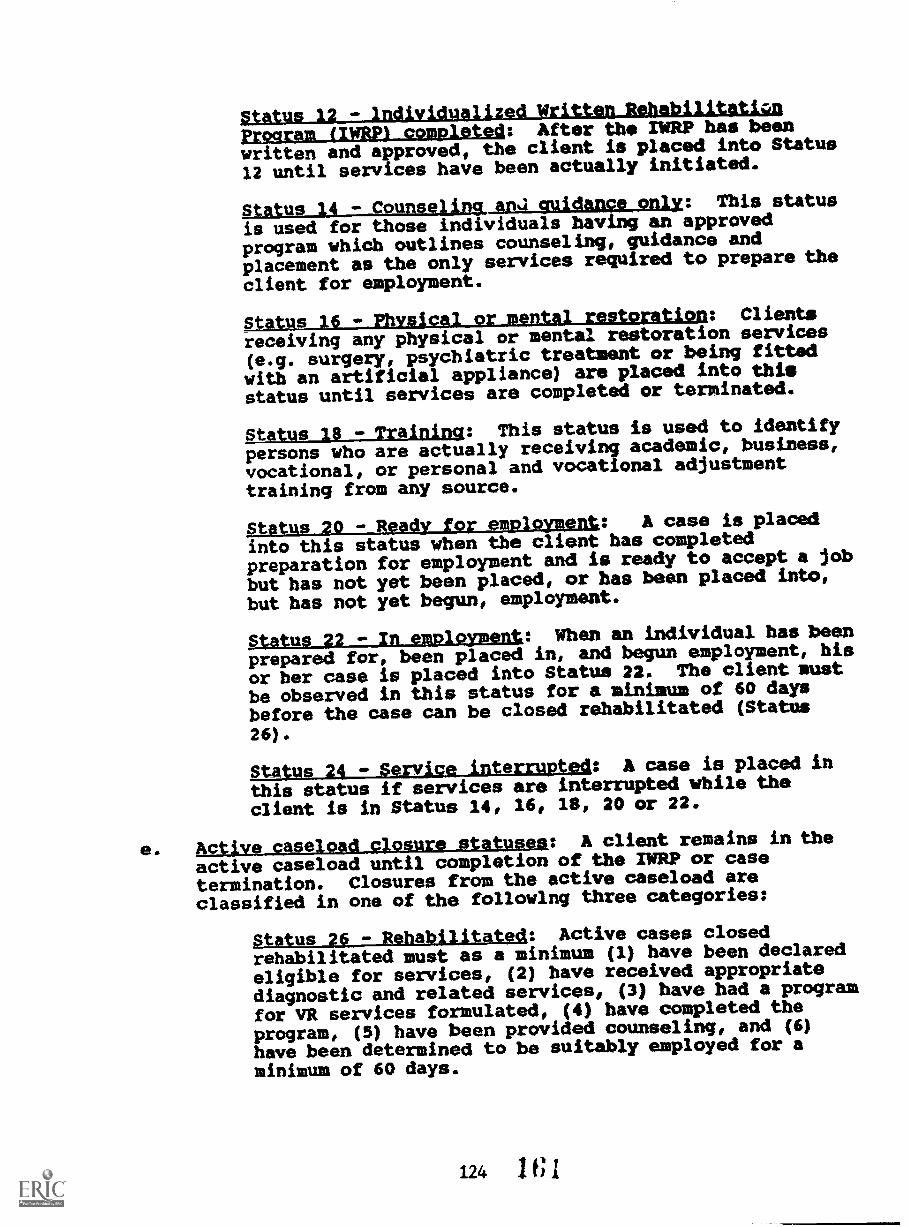
status 12_ - Individualized Written RehabilitatiQnErsgramaLER: After the rwRp has been
written and approved, the client is placed into Status
12 until services have been actually initiated.
Status 14 - Counseling and guidance only: This status
is used for those individuals having an approved
program which outlines counseling, guidance andplacement as the only services required to prepare the
client for employment.
Status - Physical or mental restoration: Clients
receiving any physical or mental restoration services
(e.g. surgery, psychiatric treatment or being fitted
with an artificial appliance) are placed into this
status until services are completed or terminated.
Status 18 - Training: This status is used to identify
persons who are actually receiving academic, business,
vocational, or personal and vocational adjustmenttraining from any source.
Status 20 - Rea4y for employment: A case is placed
into this status when the client has completedpreparation for employment and is ready to accept a job
but has not yet been placed, or has been placed into,
but has not yet begun, employment.
Status fl - In employment: When an individual has beenprepared for, been placed in, and begun employment, his
or ber case is placed into Status 22. The client must
be observed in this status for a minimum of 60 days
before the case can be closed rehabilitated (Status
26).
Status 24 - Serxice interrupte4: A case is placed in
this status if services are interrupted while the
client is in Status 14, 16, 18, 20 or 22.
e. Active caseload closure statusea: A client remains in the
active caseload until completion of the IWRP or case
termination. Closures from the active caseload areclassified in one of the following three categories:
Status 20 - Rehabilitated: Active cases closedrehabilitated must as a minimum (1) have been declaredeligible for services, (2) have received appropriatediagnostic and related services* (3) have had a program
for VR services formulated, (4) have completed the
program, (5) have been provided counseling, and (6)
have been determined to be suitably employed for aminimum of 60 days.
124
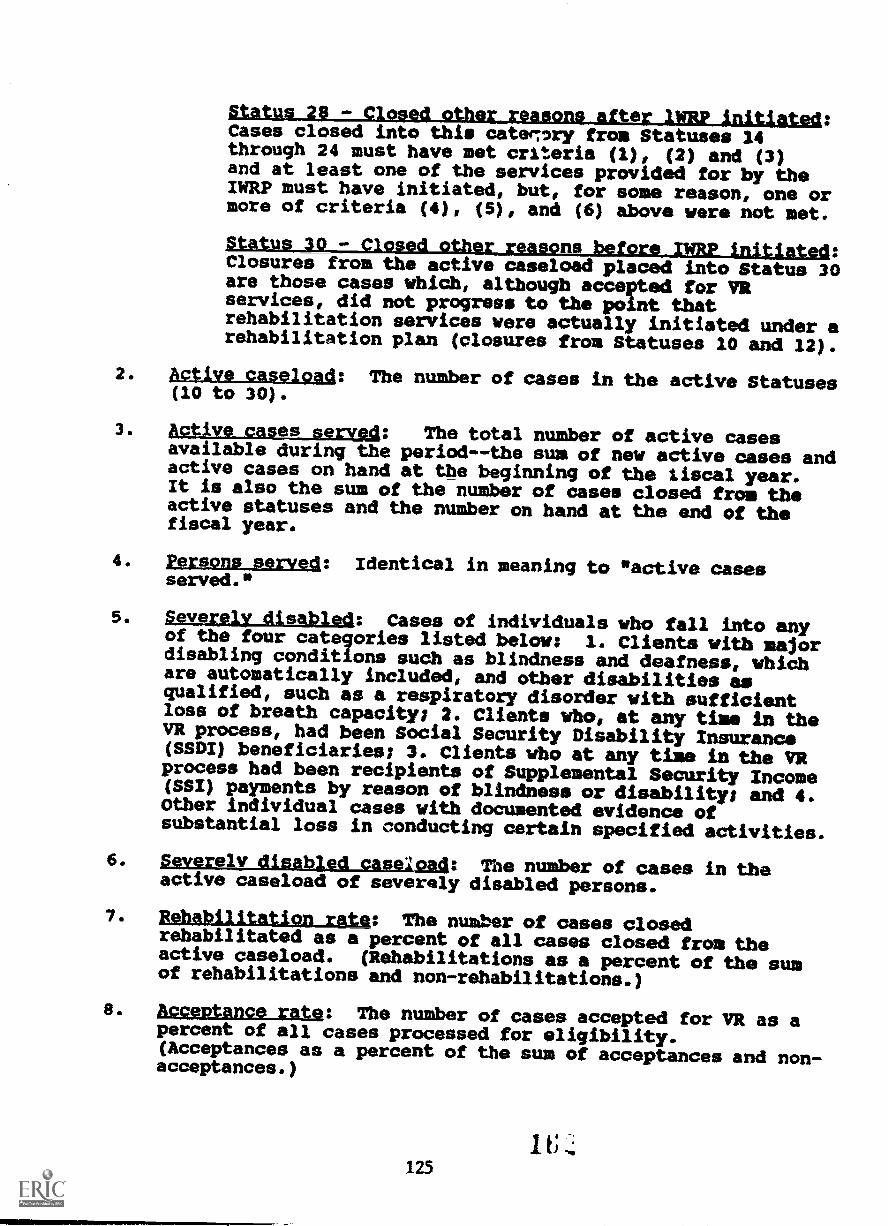
Status 28 - Closed other reasons after 1WRP initiated:Cases closed into this caterT,ry from Statuses 14through 24 must have met criteria (1), (2) and (3)and at least one of the services provided for by theIWRP must have initiated, but, for some reason, one ormore of criteria (4), (5), and (6) above were not met.
Closures from the active caseload placed into Status 30are those cases which, although accepted for VRservices, did not progress to the point thatrehabilitation services were actually initiated under arehabilitation plan (closures from Statuses 10 and 12).
2. Active caseload: The number of cases in the active Statuses(10 to 30).
3 . Active cases served: The total number of active casesavailable during the period--the sum of new active cases andactive cases on hand at the beginning of the iiscal year.It is also the sum of the number of cases closed from theactive statuses and the number on hand at the end of thefiscal year.
4. persons served: Identical in meaning to "active casesserved.*
5. Severely disabled: Cases of individuals who fall into anyof the four categories listed below: 1. Clients with majordisabling conditions such as blindness and deafness, whichare automatically included, and other disabilities asqualified, such as a respiratory disorder with sufficientloss of breath capacity; 2. Clients who, at any time in theVR process, had been Social Security Disability Insurance(SSDI) beneficiaries; 3. Clients who at any time in the VRprocess had been recipients of Supplemental Security Income(SSI) payments by reason of blindness or disability; and 4.Other individual cases with documented evidence ofsubstantial loss in conducting certain specified activities.
6. Severely disabled caselgaa: The number of cases in theactive caseload of severely disabled persons.
7. Rehabilitation rate: The number of cases closedrehabilitated as a percent of all cases closed from theactive caseload. (Rehabilitations as a percent of the sumof rehabilitations and non-rehabilitations.)
8. Acceptance rate: The number of cases accepted for VR as apercent of all cases processed for eligibility.(Acceptances as a percent of the sum of acceptances and non-acceptances.)
125

Financial Tables
f
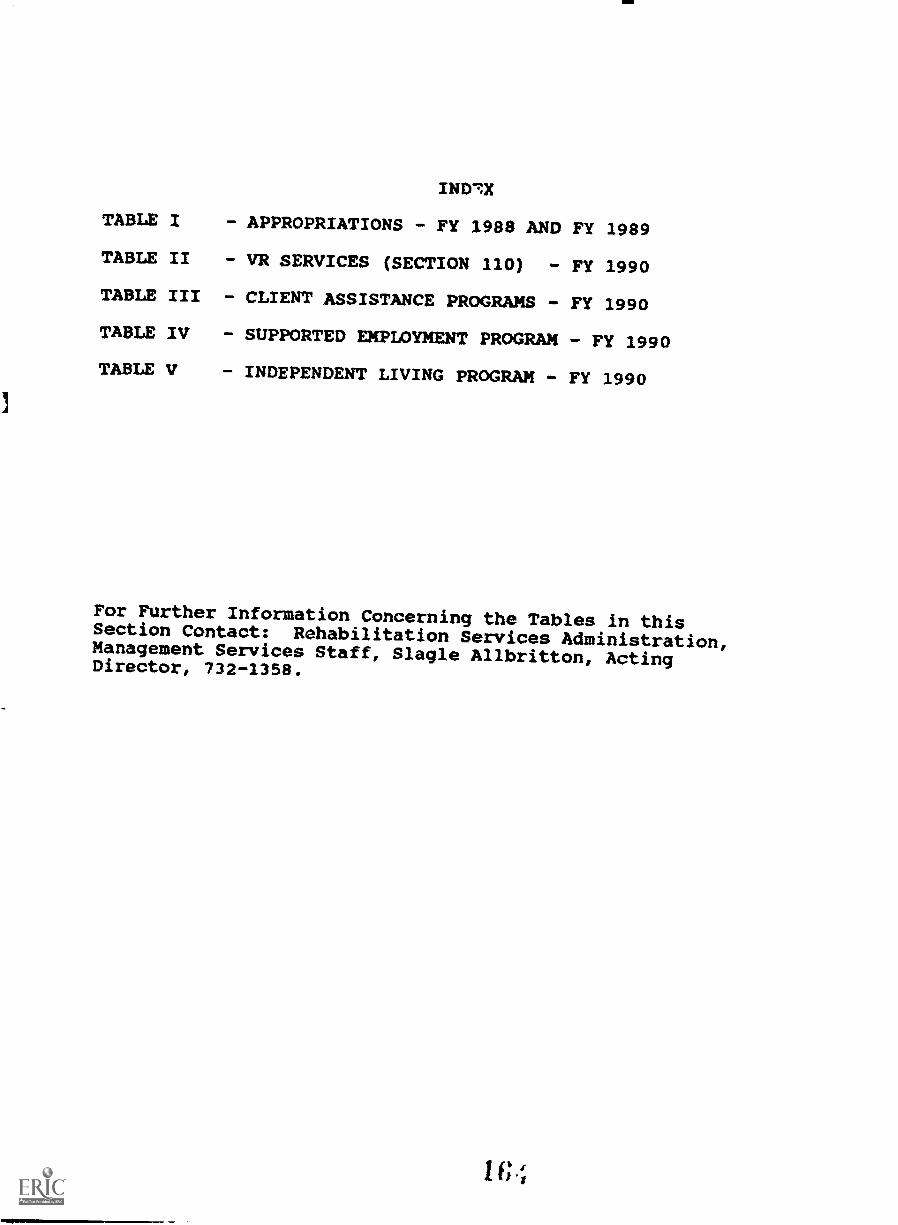
IND7X
TABLE I - APPROPRIATIONS - FY 1988 AND FY 1989
TABLE II - VR SERVICES (SECTION 110) - FY 1990
TABLE III - CLIENT ASSISTANCE PROGRAMS - FY 1990
TABLE IV - SUPPORTED EMPLOYMENT PROGRAM - FY 1990
TABLE V - INDEPENDENT LIVING PROGRAM - FY 1990
For Further Information Concerning the Tables in thisSection Contact: Rehabilitation Services Administration,Management Services Staff, Slagle Allbritton, ActingDirector, 732-1358.
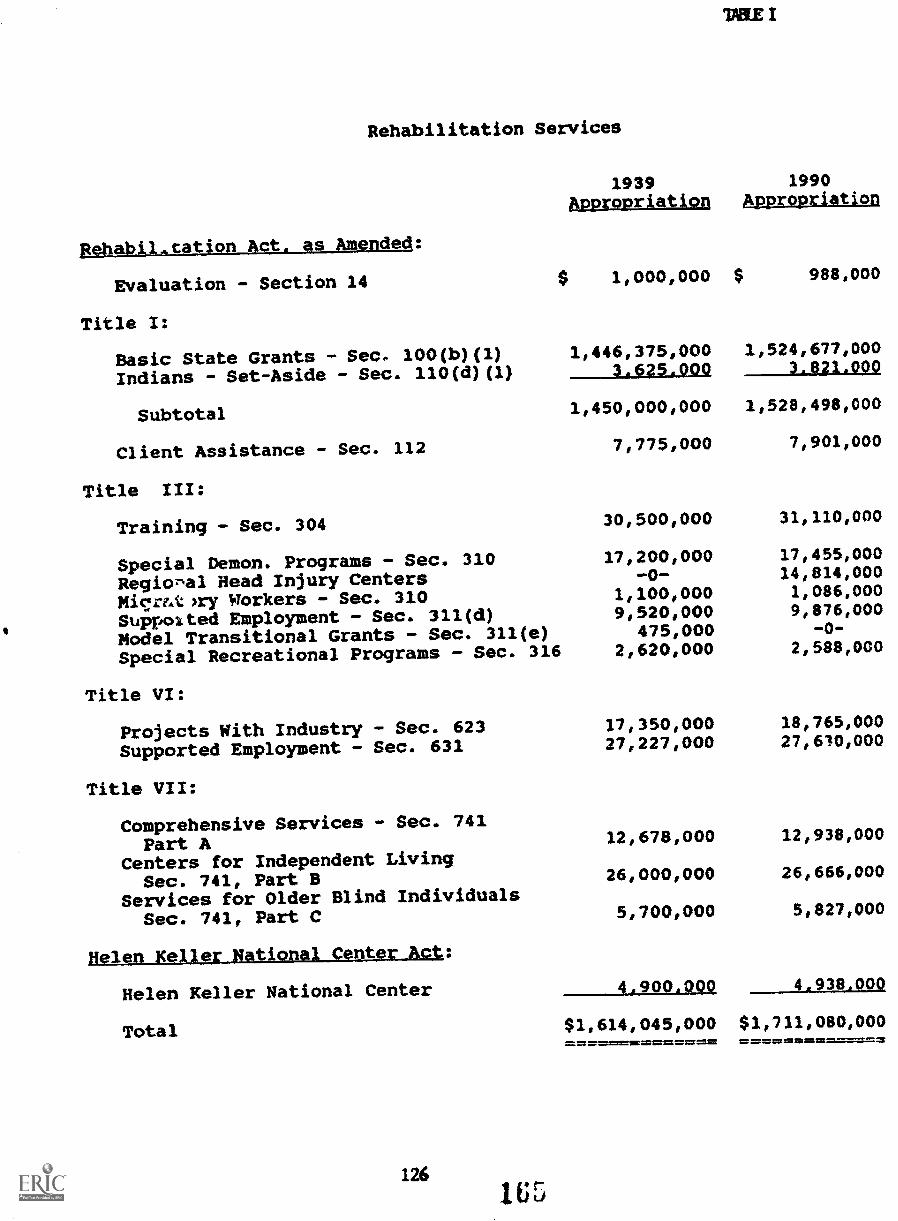
Rehabilitation Services
Rehatoil.tatjon Act. as Amended:
1939Appropriation
$ 1,000,000
1,446,375,0003/6?5.000
1990Appropriatiqn
$ 988,000
1,524,677,000).821090
Evaluation - Section 14
Title I:
Basic State Grants - Sec. 100(b)(1)Indians - Set-Aside - Sec. 110(d) (1)
Subtotal 1,450,000,000 1,528,498,000
Client Assistance - Sec. 112 7,775,000 7,9010000
Title III:
Training - Sec. 304 30,500,000 31, 110,000
Special Demon. Programs - Sec. 310 17,200,000 17,455,000
Regional Head Injury Centers -0,- 14,814,000
Mirg,mtsry Workers - Sec. 310 111000000 1,086,000
Suppoited Employment - Sec. 311(d) 9,520,000 9,876,000
Model Transitional Grants - Sec. 311(e) 475,000 -0-
Special Recreational Programs - Sec. 316 2,620,000 2, 588,000
Title VI:
Projects With Industry - Sec. 623 17,350,000 18, 765,000
Supported Employment - Sec. 631 27,227,000 271610,000
Title VII:
Comprehensive Services - Sec. 741Part A 12/678,000 12,938,000
Centers for Independent LivingSec. 741, Part B 26,000,000 26, 666,000
Services for Older Blind IndividualsSec. 741, Part C 51700,000 5,827,000
Pelen Kelln_MatiDDAISADIVIZAQ&=
Helen Keller National Center 4/900000Q 4.938_.000
Total $1,614,045,000 $1,711,080,000============== ======..1=1".=
1261U5
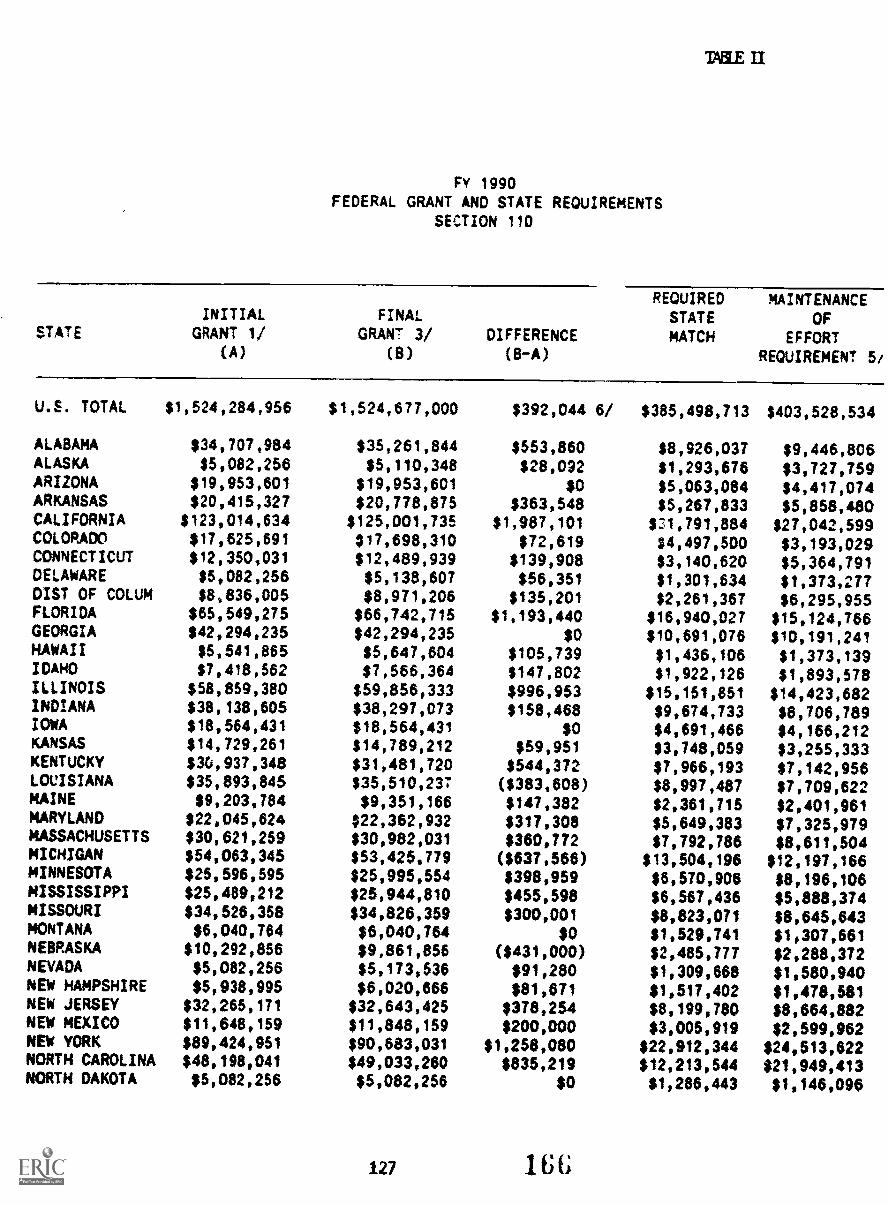
FY 1990
FEDERAL GRANT AND STATE REQUIREMENTSSECTION 110
STATEINITIAL
GRANT 1/(A)
FINALGRANT 3/
(B)
DIFFERENCE(8-A)
REQUIREDSTATEMATCH
MAINTENANCEOF
EFFORT
REQUIREMENT 5/
U.S. TOTAL $1,524,284,956 $1,524,677,000 $392,044 6/ $385,498,713 $403,528,534
ALABAMA $34,707,984 $35,261,844 $553,860 $81926,037 $9,446,806ALASKA $5,082,256 $5,110,348 $28,092 $10293,676 $3,727,759ARIZONA $19,953,601 $19,953,601 $0 $5,0631084 $4,417,074ARKANSAS $20,415,327 $20,778,875 $363,548 $5,267,833 $5,8581480CALIFORNIA $123,014,634 $125,001,735 $1,987,101 $21,791,884 $27,042,599COLORADO $17,625.691 417,698,310 $72,619 $4,497,500 $3,193,029CONNECTICUT $12,350,031 $12,489,939 $139,908 $3,140,620 $5,364,791DELAWARE $5,082,256 $5,138,607 $56,351 $1,301,634 $1,373,217DIST OF COLUM $8,836,005 $8,971,206 $135,201 $2,261,367 $6,295,955FLORIDA $65,549,275 $66,7421715 $1,193,440 $16,940,027 $15,124,766GEORGIA $42,294,235 342,294,235 $0 $10,691,076 $10,191,241HAWAII $5,541,865 $5,647,604 $105,739 $1,436,106 $1,373,139IDAHO $7,418,562 $7,566,364 $147,802 $1,922,126 $1,893,578ILLINOIS $58,859,380 $59,856,333 $996,953 $15,151,851 $14,423,682INDIANA $38,138,605 $38,297,073 $158,468 $9,674,733 $8,706,789IOWA $18,564,431 $18,564,431 $0 $4,691,466 $4,166,212KANSAS $14,729,261 $14,789,212 $59,951 $3,748,059 $3,255,333KENTUCKY $30,937,348 $31,481,720 $544,372 $7,966,193 $7,142,956LOCISIANA $35,893,845 $35,510,23T ($383,606) $8,997,487 $7,709,622MAINE $9,203,784 $9,351,166 $147,382 $2,361,715 $2,401,961MARYLAND $22,045,624 $22,362,932 $317,308 $5,649,383 $7,325,979MASSACHUSETTS $30,621,259 $30,982,031 $380,772 $7,792,786 $8,611,504MICHIGAN $54,063,345 $53,425,779 ($837,566) $13,504,196 $12,197,166MINNESOTA $25,596,595 $25,995,554 $398,959 $6,570,906 $8,196,106MISSISSIPPI $25,489,212 $25,944,810 $455,598 $6,567,436 $5,888,374MISSOURI $34,526,358 $34,828,359 $300,001 $8,823,071 $8,645,843MONTANA $6,040,764 $6,040,764 $0 $1,529,741 $1,307,661NEBRASKA $10,292,856 $9,861,856 ($431,000) $2,485,777 $2,288,372NEVADA $5,082,256 $5,173,536 $91,280 $1,309,668 $1,580,940NEW HAMPSHIRE $5,938,995 $6,020,666 $81,671 $1,517,402 $1,478,581NEW JERSEY $32,265,171 $32,643,425 $378,254 $8,199,780 $8,664,882NEW MEXICO $11,648,159 $11,848,159 $200,000 $3,005,919 $2,599,862NEW YORK $89,424,951 $90,6831031 $1,258,080 $22,912,344 $24,613,622NORTH CAROLINA $48,198,041 $49,033,260 $835,219 $121213,544 $21,949,413NORTH DAKOTA $5,082,256 $5,082,256 $0 $1,286,443 $1,146,096
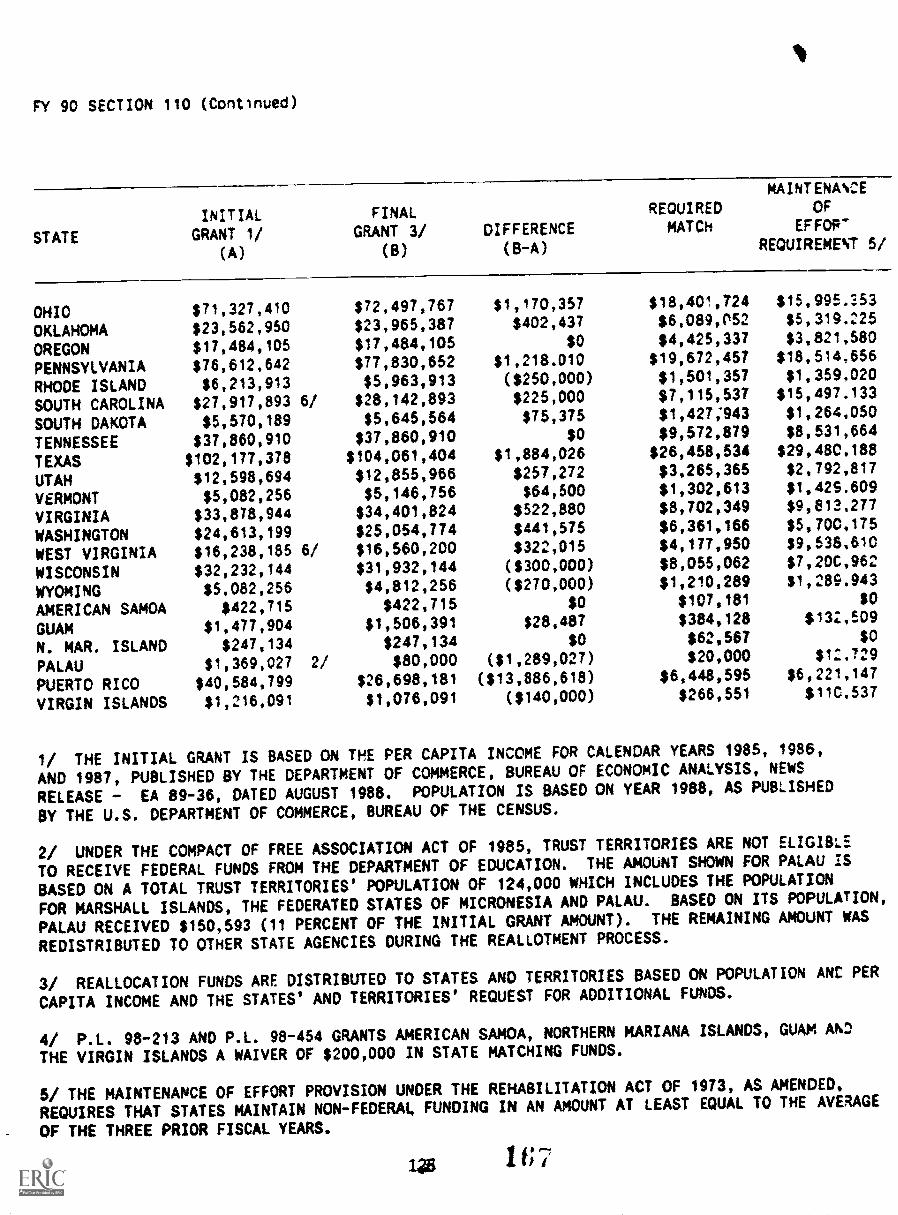
FY 90 SECTION 110 (Contlnued)
STATE
INITIALGRANT 1/
(A)
FINALGRANT 3/
(8)
DIFFERENCE(B-A)
REQUIREDMATCH
MAINTENWEOF
EFFOP-REQUIREMENT 5/
OHIO $71,327,410 $72,497,767 $1,170,357 $18,401,724 $15,995.53
OKLAHOMA $23,562,950 $23,965,387 $402,437 $6,089,P52 $5,319.225
OREGON $17,484,105 $17,484,105 $0 $4,425,337 $3,821,580
PENNSYLVANIA $76,612,642 $77,830,652 $1,218.010 $19,672,457 $18.514,656
RHODE ISLAND $6,213,913 $5,963,913 ($250,000) $1,501,357 $1,359,020
SOUTH CAROLINA $27,917,893 6/ $28,142,893 $225,000 $7,115,537 $15,497.133
SOUTH DAKOTA $5,570,189 $5.645,564 $75,375 $1,427;943 $1,264,050
TENNESSEE $37,660,910 $37,860,910 $O $9,572,879 $8,531,664
TEXAS $102,177,378 $104,061,404 $1,884,026 $26,458,534 $29,480.188
UTAH $12,598,694 $12,855,966 $257,272 $3.265,365 $2,792.817
VERMONT $5,082,256 $5,146,756 $64,500 $1,302,613 $1,429.609
VIRGINIA $33,878,944 $34,401,824 $522,880 $8,702,349 $9,813.277
WASHINGTON $24,613,199 $25,054,774 $441,575 $6,361,166 $5,700,175
WEST VIRGINIA $16,238,185 6/ $16,560,200 $322,015 $4,177,950 $9,536,610
WISCONSIN $32,232,144 $31,932,144 ($300,000) $8,055,062 $7,20C,962
WYOMING $5,082,256 $4,812,258 ($270,000) $1,210,289 $1,289.943
AMERICAN SAMOA $422,715 $422,715 $0 $107,181 $0
GUAM $1,477,904 $1,506,391 $28,487 $384,128 $13:,509
N. MAR. ISLAND $247,134 $247,134 $0 $62,567 $0
PALAU $1,369,027 2/ $80,000 ($1,289,027) $20,000 $12.729
PUERTO RICO $40,584,799 $26,698,181 ($13,886,618) $6,448,595 $6,221,147
VIRGIN ISLANDS $1,216,091 $1,076,091 ($140,000) $266,551 $11C.537
1/ THE INITIAL GRANT IS BASED ON THE PER CAPITA INCOME FOR CALENDAR YEARS 1985, 1986,
AND 1987, PUBLISHED BY THE DEPARTMENT OF COMMERCE, BUREAU OF ECONOMIC ANALYSIS, NEWS
RELEASE - EA 89-36, DATED AUGUST 1988. POPULATION IS BASED ON YEAR 1988, AS PUBLISHED
BY THE U.S. DEPARTMENT OF COMMERCE, BUREAU OF THE CENSUS.
2/ UNDER THE COMPACT OF FREE ASSOCIATION ACT OF 1985, TRUST TERRITORIES ARE NOT ELIGIBLE
TO RECEIVE FEDERAL FUNDS FROM THE DEPARTMENT OF EDUCATION. THE AMOUNT SHOWN FOR PALAU IS
BASED ON A TOTAL TRUST TERRITORIES' POPULATION OF 124,000 WHICH INCLUDES THE POPULATION
FOR MARSHALL ISLANDS, THE FEDERATED STATES OF MICRONESIA AND PALAU. BASED ON ITS POPULATION,
PALAU RECEIVED $150,593 (11 PERCENT OF THE INITIAL GRANT AMOUNT). THE REMAINING AMOUNT WAS
REDISTRIBUTED TO OTHER STATE AGENCIES DURING THE REALLOTMENT PROCESS.
3/ REALLOCATION FUNDS ARE DISTRIBUTED TO STATES AND TERRITORIES BASED ON POPULATION ANC PER
CAPITA INCOME AND THE STATES' AND TERRITORIES' REQUEST FOR ADDITIONAL FUNDS.
4/ P.L. 98-213 AND P.L. 98-454 GRANTS AMERICAN SAMOA, NORTHERN MARIANA ISLANDS, GUAM AK?
THE VIRGIN ISLANDS A WAIVER OF $200,000 IN STATE MATCHING FUNDS.
5/ THE MAINTENANCE OF EFFORT PROVISION UNDER THE REHABILITATION ACT CW 1973, AS AMENDED,
REQUIRES THAT STATES MAINTAIN NON-FEDERAL FUNDING IN AN AMOUNT AT LEAST EQUAL TO THE AVERAGE
OF THE THREE PRIOR FISCAL YEARS.
167
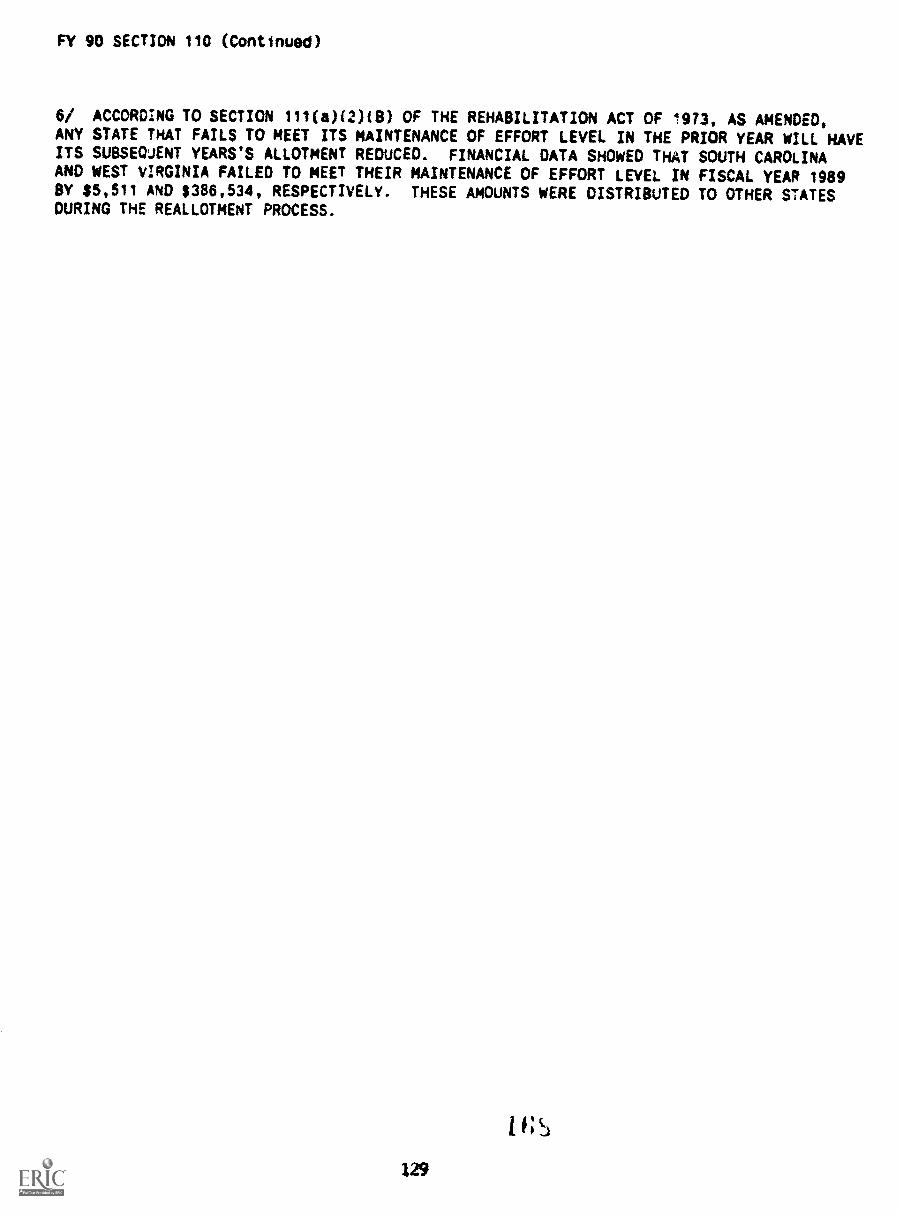
FY 90 SECTION 110 (Continued)
6/ ACCORDING TO SECTION 111(a)(2)(B) OF THE REHABILITATION ACT OF 1973, AS AMENDED,ANY STATE THAT FAILS TO MEET ITS MAINTENANCE OF EFFORT LEVEL IN THE PRIOR YEAR WILL NAVEITS SUBSEWENT YEARS'S ALLOTMENT REDUCED. FINANCIAL DATA SHOWED THAT SOUTH CAROLINAAND WEST VIRGINIA FAILED TO MEET THEIR MAINTENANCE OF EFFORT LEVEL IN FISCAL YEAR 1989BY $5,511 AND $356,534, RESPECTIVELY. THESE AmOUNTS WERE DISTRIBUTED TO OTHER STATESDURING THE REALLOTMENT PROCESS.
I CS
129
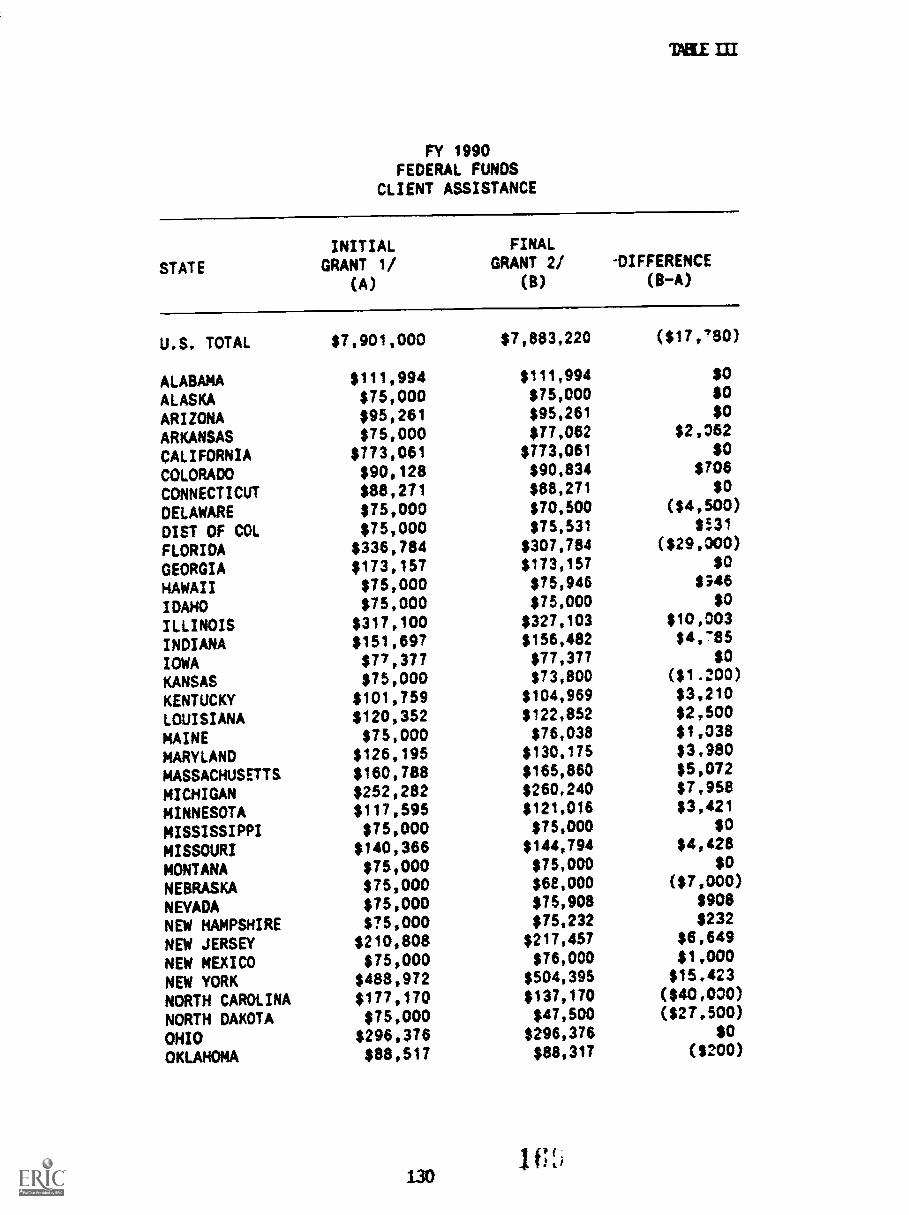
FY 1990FEDERAL FUNDS
CLIENT ASSISTANCE
STATE
INITIALGRANT 1/
(A)
FINALGRANT 2/
(8)
-DIFFERENCE(B-A)
U.S. TOTAL $7,901,000 $7,883,220 ($17,/10)
ALABAMA $111,994 $111,994 $0
ALASKA $75,000 $75,000 $0
ARIZONA $95,261 $95,281 $0
ARKANSAS $75,000 $77,062 $2.062
CALIFORNIA $773,081 $773,061 $0
COLORADO $90,128 $90,834 $706
CONNECTICUT $88,271 $88,271 $0
DELAWARE $75,000 $70,500 ($4,500)
DIST OF COL $75,000 $75,531 $531
FLORIDA $336,784 $307,784 ($29,000)
GEORGIA $173,157 $173,157 $0
HAWAII $75,000 $75,948 $;46
IDAHO $75,000 $75,000 $0
ILLINOIS $317,100 $327,103 $10,003
INDIANA $151,697 $156,482 $4,765
IOWA $77,377 $77,377 $0
KANSAS $75,000 $73,800 ($1.200)
KENTUCKY $101,759 $104,969 $3.210
LOUISIANA $120,352 $122,852 $2,500
MAINE $75,000 $76,038 $1,038
MARYLAND $126,195 $130,175 $3,980
MASSACHUSETTS $160,788 $165,860 $5,072
MICHIGAN $252,282 $260,240 $7,958
MINNESOTA $117,595 $121,016 $3,421
MISSISSIPPI $75,000 $15,000 $0
MISSOURI $140,366 $144,794 $4,428
MONTANA $75,000 $75,000 $0
NEBRASKA $75,000 $62,000 ($7,000)
NEVADA $75,000 $75,908 $908
NEW HAMPSHIRE $75,000 $75,232 $232
NEW JERSEY $210,808 $217,457 $6,649
NEW MEXICO $75,000 $76,000 $1,000
NEW YORK $488,972 $504,395 $15,423
NORTH CAROLINA $177,170 $137,170 ($40,030)
NORTH DAKOTA $75,000 $47,500 ($27.500)
OHIO $296,376 $296,376 $0
OKLAHOMA $88,517 $88,317 ($200)
130
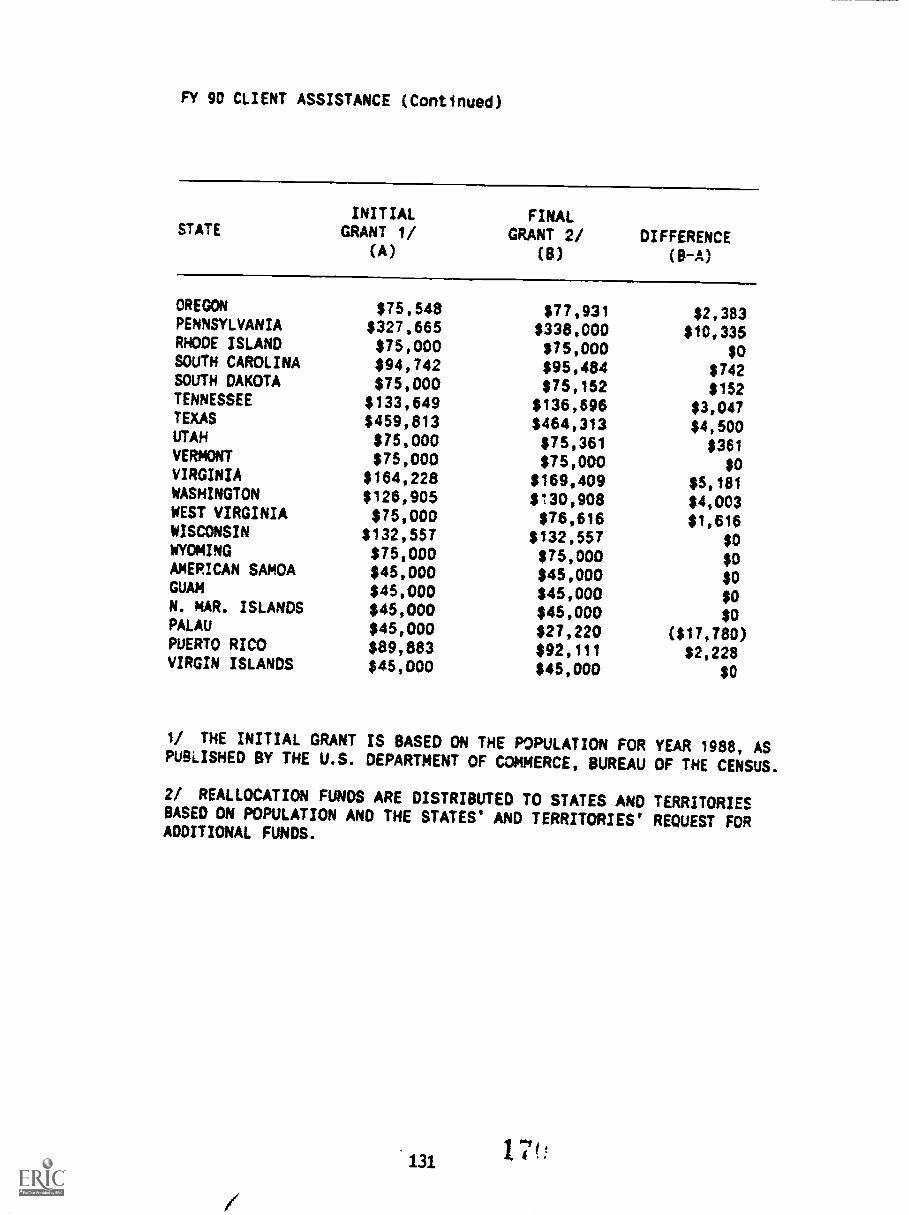
FY 90 CLIENT ASSISTANCE (Continued)
STATEINITIALGRANT 1/
(A)
FINALGRANT 2/
(B)DIFFERENCE
(0-A)
OREGON $75,548 $77,931 $2,383PENNSYLVANIA $327,665 $338,000 $10,335RHODE ISLAND $75,000 $75,000 $0SOUTH CAROLINA $94,742 $95,484 $742SOUTH DAKOTA $75,000 $75,152 $152TENNESSEE $133,649 $136,696 $3,047TEXAS $459,813 $464,313 $4,500UTAH $75,000 $75,361 $361VERMONT $75,000 $75,000 $0VIRGINIA $164,228 $169,409 $5,181WASHINGTON $126,905 $130,908 $4,003WEST VIRGINIA $75,000 $76,616 $1,616WISCONSIN $132,557 $132,557 $0WYOMING $75,000 $75,000 $0AMERICAN SAMOA $45,000 $45,000 $0GUAM $45,000 $45,000 $0N. MAR. ISLANDS $45,000 $45,000 $0PALAU $45,000 $27,220 ($17,780)PUERTO RICO $89,883 $92,111 $2,228VIRGIN ISLANDS $45,000 $45,000 $0
1/ THE INITIAL GRANT IS BASED ON THE POPULATION FORPUBLISHED BY THE U.S. DEPARTMENT OF COMMERCE, BUREAU
2/ REALLOCATICW FUNDS ARE DISTRIBUTED TO STATES ANDBASED ON POPULATION AND THE STATES' AND TERRITORIES'ADDITIONAL FUNDS.
131
YEAR 1988, ASOF THE CENSUS.
TERRITORIESREQUEST FOR

FY 1990FEDERAL FUNDS
SUPPORTED EMPLOYMENT
STATE
INITIALGRANT 1/
(A)
FINALGRANT 2/
(8)
DIFFERENCE(8-A)
U.S. TOTAL $27,630,000 $27,630,000 $0
ALABAMA $407,477 $412,726 $5,249
ALASKA $250,000 $250,671 $671
ARIZONA $346,584 $3460584 $0
ARKANSAS $250,000 $253,065 $3,065
CALIFORNIA $2,812,604 $2,848,834 $36,230
COLORADO $327,908 $331,409 $3,501
CONNECTICUT $321,154 $321,154 $0
DELAWARE $250,000 $250,845 $845
DIST OF COL $250,000 $250,000 $0
FLORIDA $1,225,311 $1,241,095 $15,784
GEORGIA $629,990 $629,990 $0
HAWAII $250,000 $250,000 $0
IDAHO $250,000 $251,284 $1,284
ILLINOIS $1,153,689 $1,168,550 $14,861
INDIANA $551,911 $551,911 $0
IOWA $281,518 $281,518 $0
KANSAS $250,000 $250,000 $0
KENTUCKY $370,226 $370,226 $0
LOUISIANA $437,873 $437,673 $0
MAINE $250,000 $251,542 $1,542
MARYLAND $459,131 $465,045 $5,914
MASSACHUSETTS $584,991 $592,527 $7,536
MICHIGAN $917,865 $9170865 $0
MINNESOTA $427,840 $433,351 $5,511
MISSISSIPPI $260,260 $263,613 $3,353
MISSOURI $510,687 $516,139 $5,452
MONTANA $250,000 $250,000 $0
NEBRASKA $250,000 $252,050 $2,050
NEVADA $250,000 $251,349 $1,349
NEW HAMPSHIRE $250,000 $251,389 $1,389
NEW JERSEY $766,975 $776,855 $9,880
NEW MEXICO $250,000 $250,000 $0
NEW YORK $1,7790010 $1,801,926 $22,916
NORTH CAROLINA $644,592 $652,895 $81303
NORTH DAKOTA $250,000 $2501853 $853
132 171
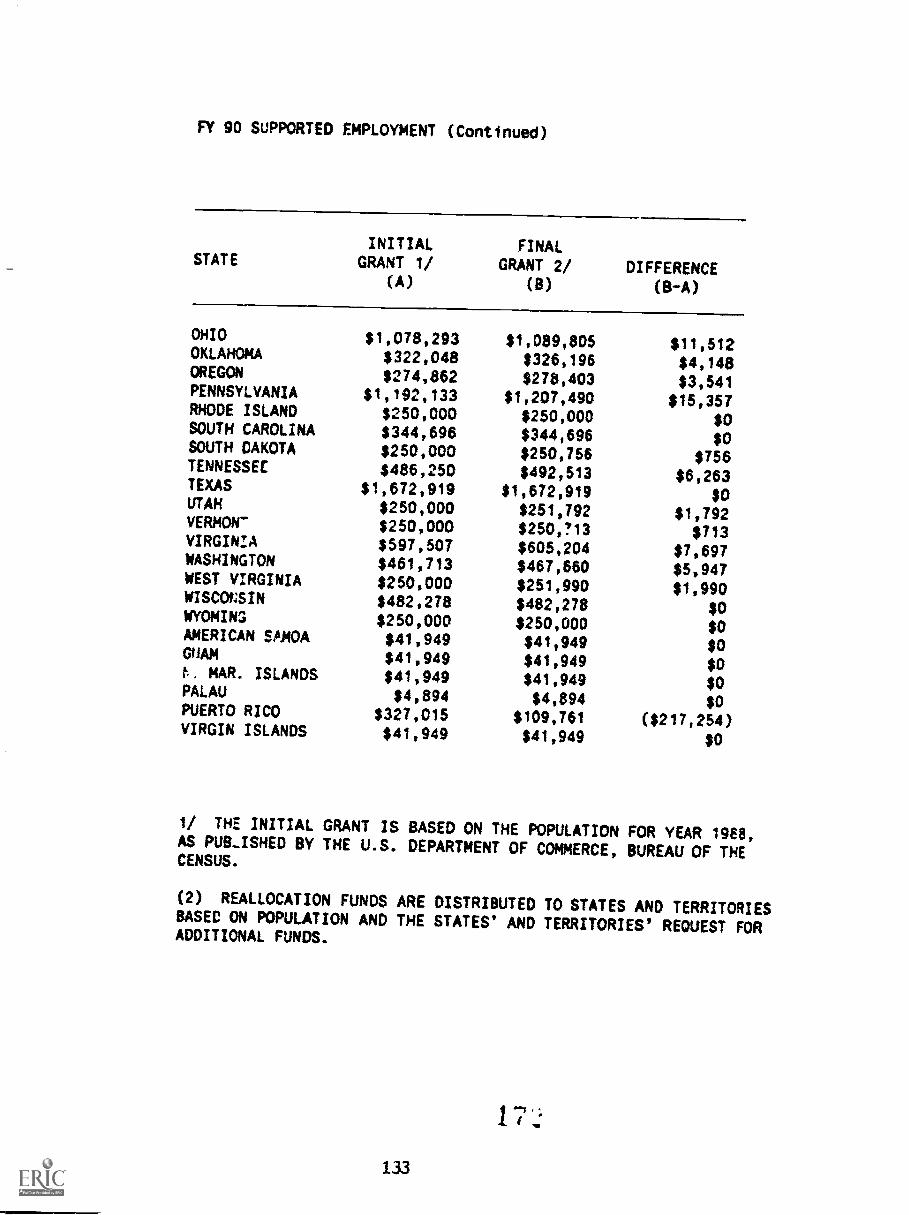
FY 90 SUPPORTED EMPLOYMENT (Continued)
STATEINITIAL
GRANT 1/(A)
FINAL
GRANT 2/(0)
DIFFERENCE(S-A)
OHIO $1,078,293 $1,089,805 $11,512OKLAHOMA $322,048 $326,196 $4,148OREGON $274,862 $278,403 $3,541PENNSYLVANIA $1,192,133 $1,207,490 $15,357RHODE ISLAND $250,000 $250,000 $0SOUTH CAROLINA $344,696 $344,696 $0SOUTH DAKOTA $250,000 $250,756 $756TENNESSEE $486,250 $492,513 $6,263TEXAS $1,672,919 $1,672,919 $0UTAH $250,000 $251,792 $1,792VERNON- $250,000 $250,713 $713VIRGINIA $597,507 $605,204 $7,697WASHINGTON $461,713 $467,660 $5,947WEST VIRGINIA $250,000 $251,990 $1,990WISCOCSIN $482,278 $482,278 $0WYOMING $250,000 $250,000 $0AMERICAN SAMOA $41,949 $41,949 $0GUAM $41,949 $41,949 $0t. MAR. ISLANDS $41,949 $41,949 $0PALAU $4,894 $4,894 $0PUERTO RICO $327,015 $109,761 ($217,254)VIRGIN ISLANDS $41,949 $41,949 $0
I/ THE INITIAL GRANT IS BASED ON THE POPULATION FOR YEAR 19E8,AS PUILISHED BY THE U.S. DEPARTMENT OF COMMERCE, BUREAU OF THECENSUS.
(2) REALLOCATION FUNDS ARE DISTRIBUTED TO STATES AND TERRITORIESBASED ON POPULATION AND THE STATES' AND TERRITORIES' REOUEST FORADDITIONAL FUNDS.
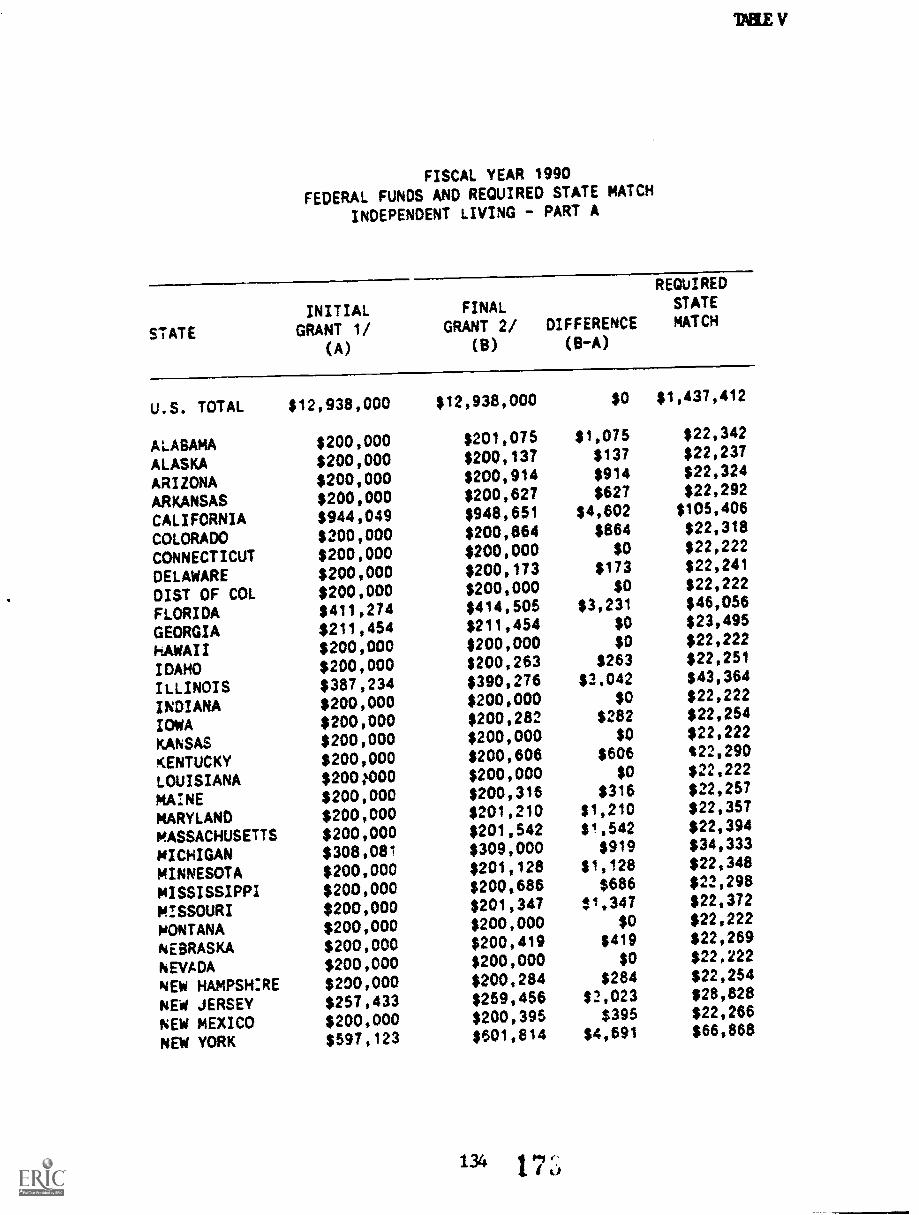
FISCAL YEAR 1990
FEDERAL FUNDS AND REQUIRED STATE MATCH
INDEPENDENT LIVING - PART A
STATE
INITIALGRANT 1/
(A)
FINALGRANT 2/
(B)
DIFFERENCE(B-A)
REQUIREDSTATEMATCH
U.S. TOTAL $12,938,000 $12,938,000 $0 $1,437,412
ALABAMA $200,000 $201,075 $1,075 $22,342
ALASKA $200,000 $200,137 $137 $22,237
ARIZONA $200,000 $200,914 $914 $22,324
ARKANSAS $200,000 $200,627 $627 $22,292
CALIFORNIA $944,049 $948,651 $4,602 $105,406
COLORADO $200,000 $200,864 $864 $22,318
CONNECTICUT $200,000 $200,000 $0 $22,222
DELAWARE $200,000 $200,173 $173 $22,241
DIST OF COL $200,000 $200,000 $0 $22,222
FLORIDA $411,274 $414,505 $3,231 $46,056
GEORGIA $211,454 $211,454 $0 $23,495
HAWAII $200,000 $200,000 $0 $22,222
IDAHO $200,000 $200,263 $263 $22,251
ILLINOIS $387,234 $390,276 $2.042 $43,364
INDIANA $200,000 $200,000 $0 $22,222
IOWA $200,000 $200,282 $282 $22,254
KANSAS $200,000 $200,000 $0 $22,222
KENTUCKY $200,000 $200,606 $606 22,290
LOUISIANA $200000 $200,000 $0 $22,222
mA:NE $200,000 $200,316 $316 $22,257
mARYLAND $200,000 $201,210 $1,210 $22,357
MASSACHUSETTS $200,000 $201,542 $1,542 $22,394
MICHIGAN $308,081 $309,000 $919 $34,333
MINNESOTA $200,000 $201,128 $1028 $22,348
MISSISSIPPI $200,000 $200,686 $686 $22,298
MISSOURI $200,000 $201,347 :1,347 $22,372
MONTANA $200,000 $200,000 $0 $22,222
NEBRASKA $200,000 $200,419 $419 $220269
NEvADA $200,000 $200,000 $0 $22,222
NEW HAMPSH:RE $200,000 $200,284 $284 $22,254
NEW JERSEY $257,433 $259,456 $2,023 $28,828
NEW MEXICO $200,000 $200,395 $395 $22,266
NEW YORK $597,123 $601,814 $4,691 $66,868
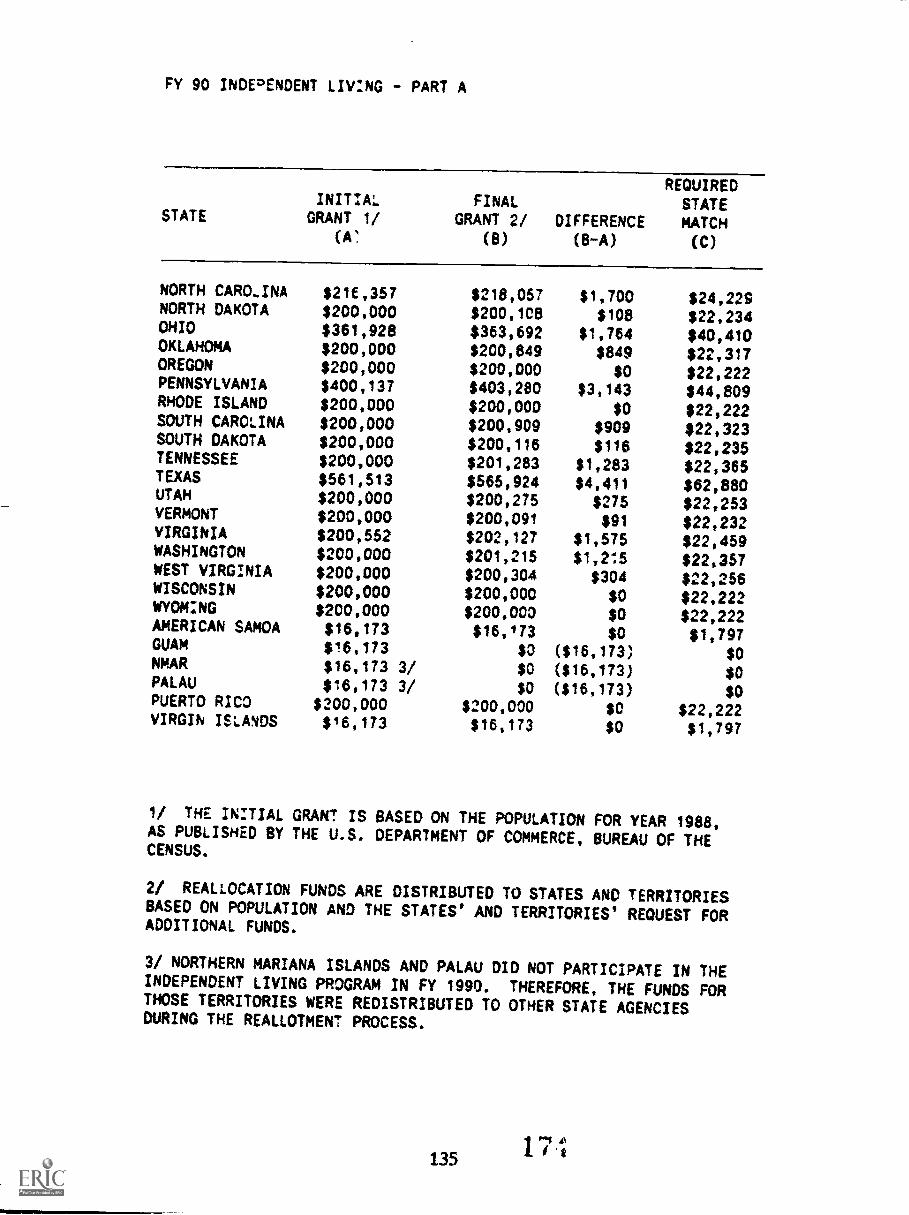
Fy 90 INDEDENDENT LIVING - PART A
STATEINITIAL
GRANT 1/(AV
FINALGRANT 2/
(B)
DIFFERENCE(B-A)
REQUIREDSTATEMATCH(C)
NORTH CAROLINA $216,357 $218,057 $1,700 $24,229NORTH DAKOTA $200,000 $200,108 $108 $22,234OHIO $361,928 $363,692 $1,764 $40,410OKLAHOmA $200,000 $200,849 $849 $22,317OREGON $200,000 $200,000 $0 $22,222PENNSYLVANIA $400,137 $403,280 $3,143 $44,809RHODE ISLAND $200,000 $200,000 $0 $22,222SOUTH CAROLINA $200,000 $200,909 $909 $22,323SOUTH DAKOTA $200,000 $200,116 $116 $22,235TENNESSEE $200,000 $201,283 $1,283 $22,365TExAS $561,513 $565,924 $4,411 $62,880UTAH $200,000 $200,275 $275 $22,253VERMONT $200,000 $200,091 $91 $22,232VIRGINIA $200,552 $202,127 $1,575 $22,459WASHINGTON $200,000 $201,215 $1,215 $22,357WEST VIRGINIA $200,000 $200,304 $304 $22,256WISCONSIN $200,000 $2001000 $0 $22,222WYOMING $200,000 $200,000 $0 $22,222AmERICAN SAm0A $16,173 $16,/73 $0 $1,797GUAM $16,173 $0 ($16,173) $0WAR $16,173 3/ $0 ($16,173) $0PALAU $16,173 3/ $0 ($16,173) $0PUERTO RICO $200,000 $200,000 $0 $22,222VIRGIN ISLANDS $16,173 $16,173 $0 $1,797
1/ THE INITIAL GRANT IS BASED ON THE POPULATION FOR YEAR 1988,AS PUBLISHED BY THE U.S. DEPARTMENT oF COMMERCE, BUREAU OF THECENSUS.
2/ REALLOCATION FUNDS ARE DISTRIBUTED TO STATES AND TERRITORIESBASED ON POPULATION AND THE STATES' AND TERRITORIES' REQUEST FORADDITIONAL FUNDS.
3/ NORTHERN MARIANA ISLANDS AND PALAU DID NOT PARTICIPATE IN THEINDEPENDENT LIVING PROGRAM IN FY 1990. THEREFORE, THE FUNDS FORTHOSE TERRITORIES WERE REDISTRIBUTED TO OTHER STATE AGENCIESDURING THE REALLOTMENT PROCESS.
135 171

Caseload Statistics:
Historical National Trends andDetailed Current Activity, by State
Agency
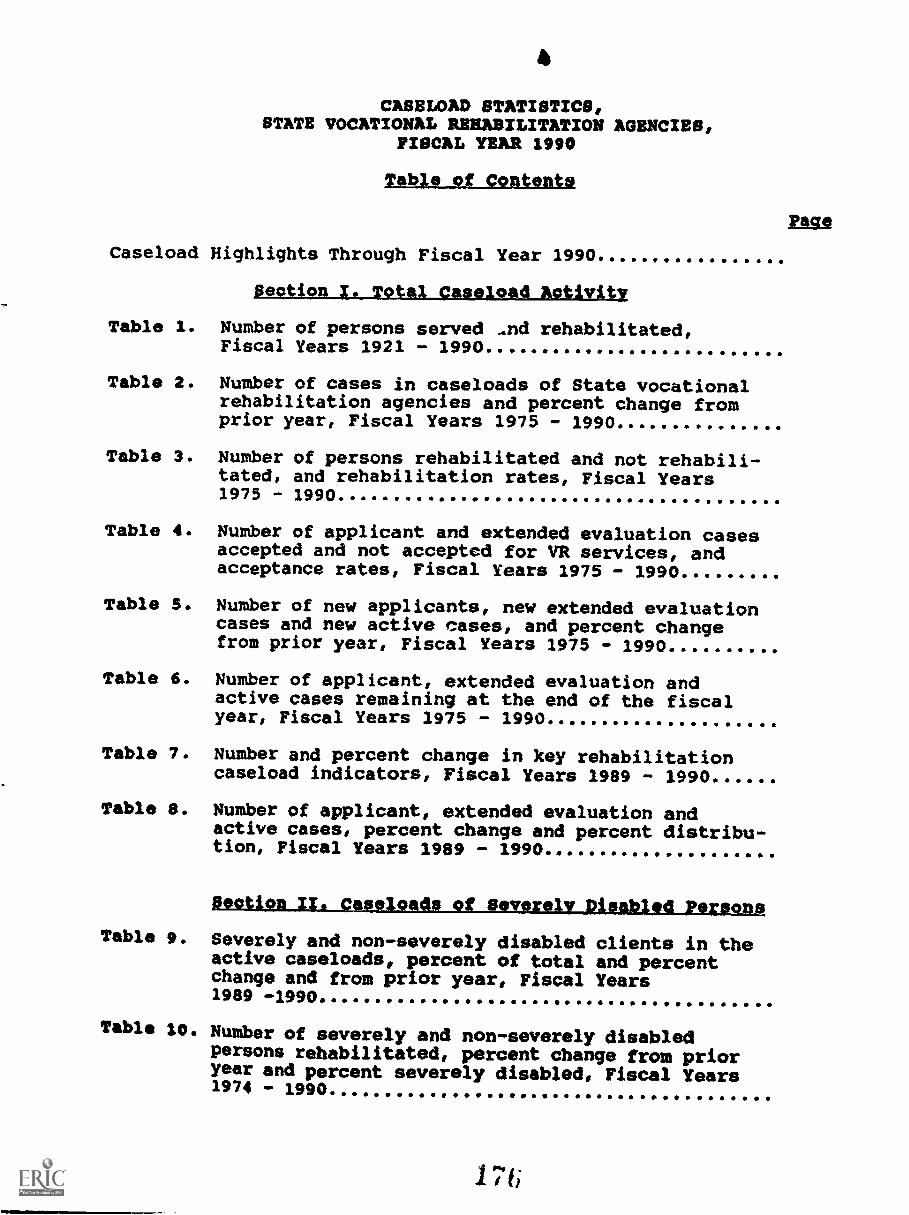
CASELOAD STATISTICS,STATE VOCATIONAL REHABILITATION AGENCIES,
FISCAL YEAR 1990
Table of Contents
Caseload Highlights Through Fiscal Year 1990
Sectien Z. To01 Caseload Activity
Table 1. Number of persons served ..nd rehabilitated,Fiscal Years 1921 - 1990
Table 2. Number of cases in caseloads of State vocationalrehabilitation agencies and percent change fromprior year, Fiscal Years 1975 - 1990
Table 3. Number of persons rehabilitated and not rehabili-tated, and rehabilitation rates, Fiscal Years1975 - 2990
Table 4. Number of applicant and extended evaluation casesaccepted and not accepted for VR services, andacceptance rates, Fiscal Years 1975 - 1990
Table 5. Number of new applicants, new extended evaluationcases and new active cases, and percent changefrom prior year, Fiscal Years 2975 - 1990
Table 6. Number of applicant, extended evaluation andactive cases remaining at the end of the fiscalyear, Fiscal Years 2975 - 1990
Table 7. Number and percent change in key rehabilitationcaseload indicators, Fiscal Years 1989 - 1990
Table S. Number of applicant, extended evaluation andactive cases, percent change and percent distribu-tion, Fiscal Years 2989 - 1990
110
Table 9. Severely and non-severely disabled clients in theactive caseloads, percent of total and percentchange and from prior year, Fiscal Years2989 -1990
Table 10. Number of severely and non-severely disabledpersons rehabilitated, percent change from prioryear and percent severely disabled, Fiscal Years1974 - 1990
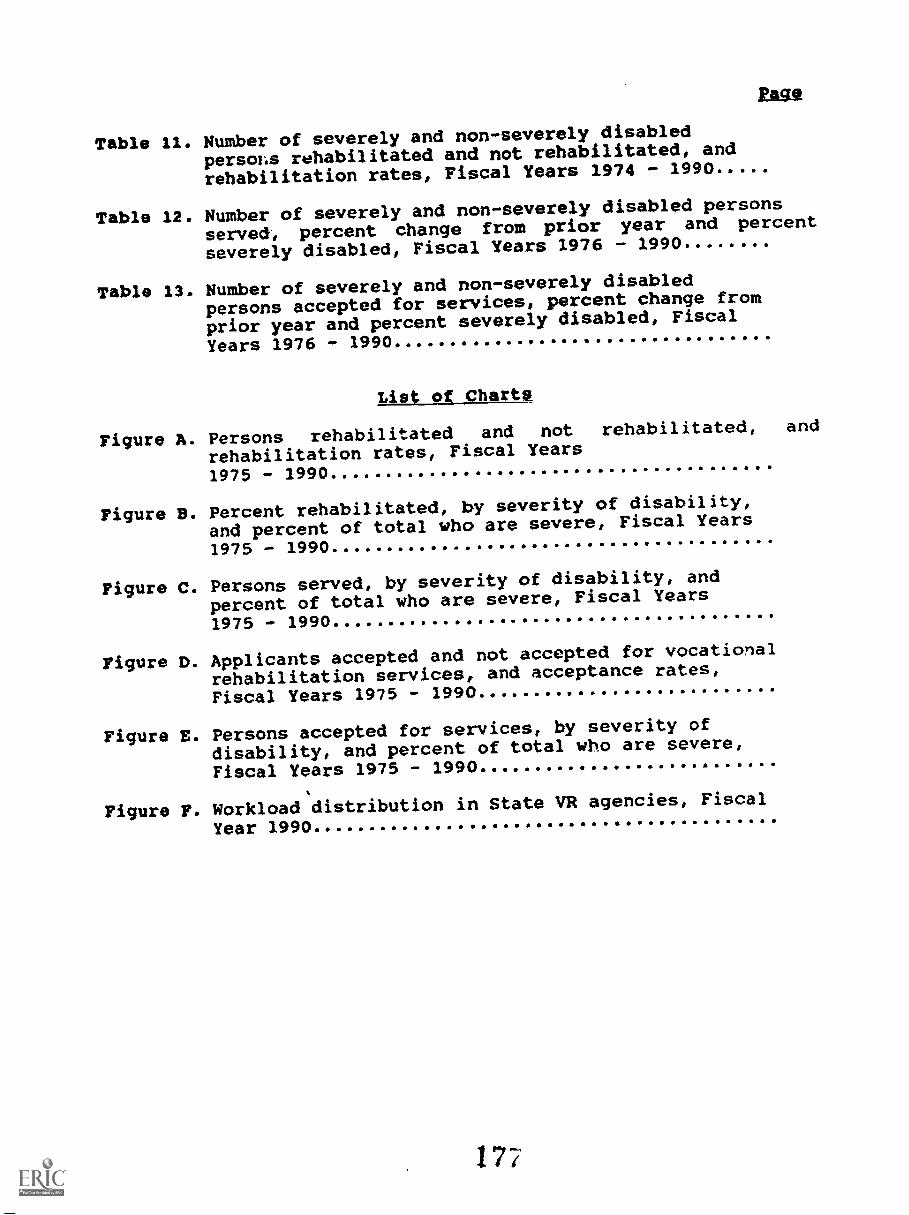
Table 11. Number of severely and non-severely disabled
persol:s rehabilitated and not rehabilitated, and
rehabilitation rates, Fiscal Years 1974 - 1990
Table 12. Number of severely and non-severely disabled persons
served, percent change from prior year and percent
severely disabled, Fiscal Years 1976 - 1990
Table 13. Number of severely and non-severely disabled
persons accepted for services, percent change from
prior year and percent severely disabled, Fiscal
Years 1976 - 1990
List og ChaXta
Figure A. Persons rehabilitated and not rehabilitated, and
rehabilitation rates, Fiscal Years1975 - 1990
Figure B. Percent rehabilitated, by severity of disability,
and percent of total who are severe, Fiscal Years
1975 - 1990
Figure C. Persons served, by severity of disability, and
percent of total who are severe, Fiscal Years
1975 - 1990
Figure D. Applicants accepted and not accepted for vocational
rehabilitation services, and acceptance rates,Fiscal Years 1975 - 1990 ..
Figure E. Persons accepted for services, by severity of
disability, and percent of total who are severe,Fiscal Years 1975 - 1990
Figure F. Workload distribution in State VR agencies, Fiscal
Year 1990
177
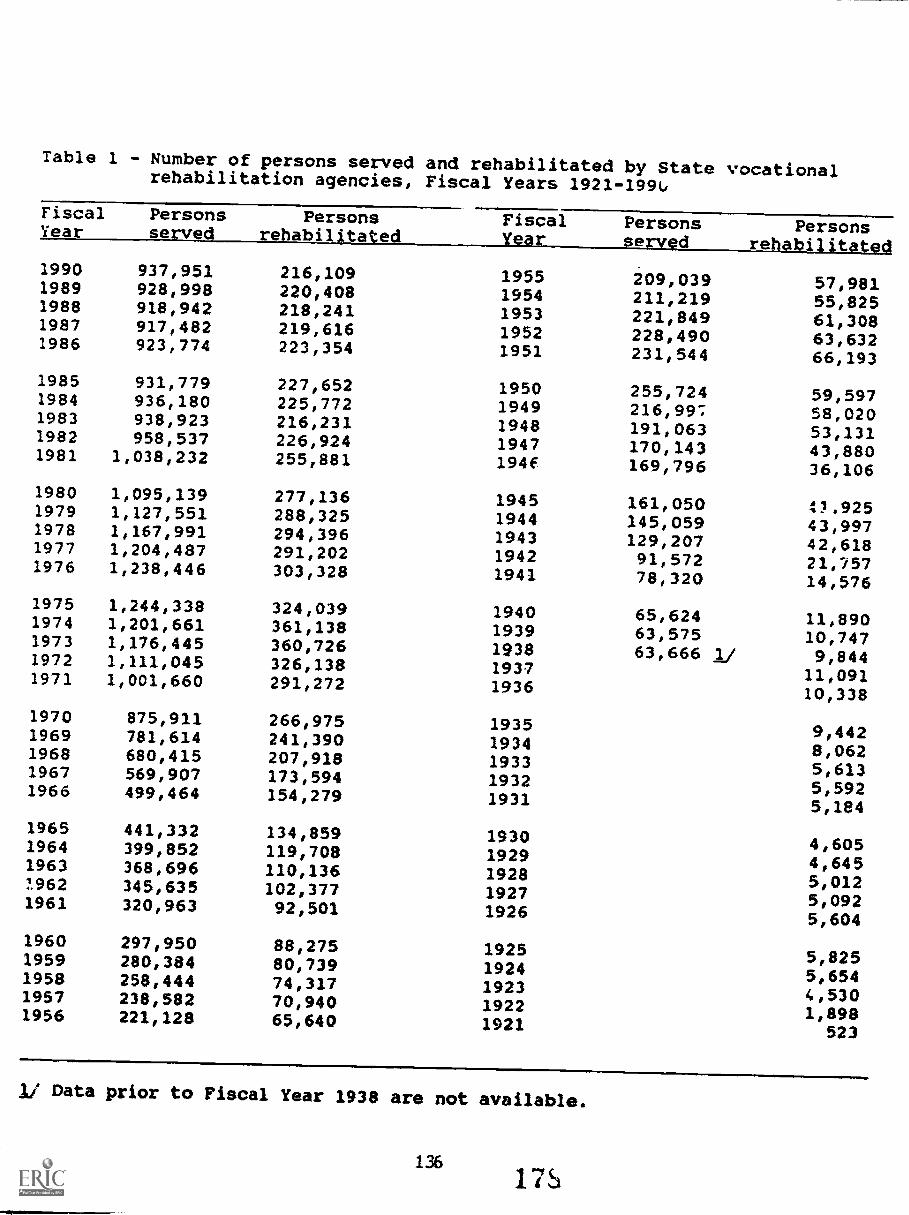
Table 1 - Number of persons served and rehabilitated by State vocationalrehabilitation agencies, Fiscal Years 1921-1991.,
Fiscal PersonsYear served
Personsrehabilitated
Fiscal Persons PersonsYear
1990 9370951 216,109 1955 209,039 57,9811989 928,998 220,408 1954 211,219 55/8251988 918,942 218,241 1953 221,849 61,3081987 917,482 219,616 1952 228,490 63,6321986 923,774 2231354 1951 231,544 66,1931985 931,779 227,652 1950 255,724 59,5971984 936,180 225,772 1949 216,99. 58,0201983 938,923 216,231 1948 191,063 53,1311982 958,537 226,924 1947 1700143 43,8801981 1,038,232 2551881 194f 169,796 36,1061980 1,095,139 277,136 1945 161,050 41.9251979 1,127,551 288,325 1944 145,059 4309971978 1,167,991 294,396 1943 129,207 42,6181977 1,204,487 291,202 1942 91,572 21,7571976 1,238,446 303,328 1941 78,320 1405761975 1,244,338 324,039 1940 65,624 11,8901974 1,201,661 361,138 1939 63,575 10,7471973 1,176,445 360,726 1938 63,666 11 9,8441972 1,111,045 326,138 1937 11,0911971 1,001,660 291,272 1936 10,3381970 875,911 266,975 1935 9,4421969 781,614 241,390 1934 8,0621968 680,415 207,918 1933 5,6131967 569,907 173,594 1932 5,5921966 499,464 154,279 1931 5,1841965 441,332 134,859 1930 4,6051964 399,852 119,708 1929 406451963 368,696 110,136 1928 5,0121962 345,635 102,377 1927 5,0921961 320,963 92,501 1926 5,6041960 297,950 88,275 1925 5,8251959 280,384 80,739 1924 5,6541958 258,444 74,317 1923 4,5301957 238,582 70,940 1922 1,8981956 221,128 65,640 1921 523
1/ Data prior to Fiscal Year 1938 are not available.
13617S

Table 2 - Number of cases in caseloads of State vocational rehabilitation
agencies and percent change from prior year, Fiscal Years 1975 -
1990
FiscilYear
Applicpnts ond active_cases A/ Active caseload only 21
Number of cases(Statuses 02-30)
Percent changefrom prior year
Number of cases Percent chang(Statuses 10-30) from prior ye
1990 1,494,774 + 0.9 937,951 + 1.0
1989 1,480,880 + 1.7 928,998 + 1.1
1988 1,456,566 + 0.7 918,942 + 0.2
1987 1,446,117 + 0.3 917,482 - 0.7
19e6 1,442,316 + 0.3 923,774 - 0.9
1985 1,440,239 + 0.4 931,779 - 0.5
1984 1,434,453 - 0.7 936,180 - 0.3
1983 1 144,714 - 1.9 938,923 - 2.0
1982 1,473,3:3 - 9.7 958,537 - 7.7
1981 1,631,167 - 5.7 1,038,232 - 5.2
1980 1,728,987 - 1 : 1,095,139 - 2.9
1979 1,751,862 - 3.5 1,127,551 - 3.5
1978 1,815,564 - 2.7 1,167,991 3.0
1977 1,866,707 - 3.0 1,204,487 - 2.7
1975 1,n25,049 - 0.7 1,238,446 - 0.5
1975 1,937,872 + 5.2 1,244,338 + 3.6
1/ Total State agency workload of cases.
- a/ Number of persons served.
13717,(1
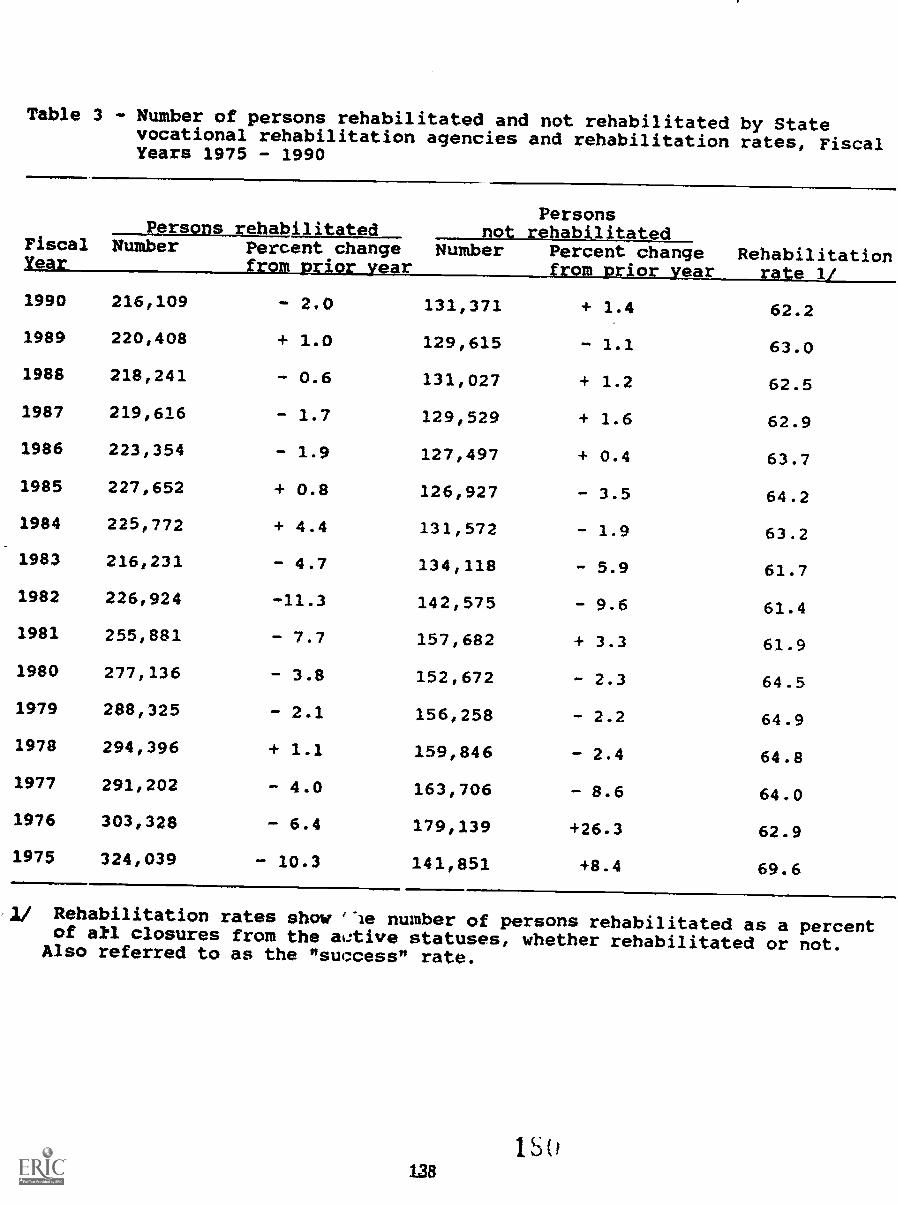
Table 3 - Number of persons rehabilitated and not rehabilitated by Statevocational rehabilitation agencies and rehabilitation rates, FiscalYears 1975 - 1990
FiscalPersons rehabilitated
PersonsRot rehabilitated
Rehabilitation1
Number Percent changeA ear
Number Percent changeo ear
1990 216,109 - 2.0 131,371 + 1.4 62.2
1989 220,408 + 1.0 129,615 - 1.1 63.0
1988 218,241 0.6 131,027 + 1.2 62.5
1987 219,616 ..- 1.7 129,529 + 1.6 62.9
1986 223,354 - 1.9 127,497 + 0.4 63.7
1985 227,652 + 0.8 126,927 - 3.5 64.2
1984 225,772 + 4.4 131,572 - 1.9 63.2
1983 216,231 - 4.7 134,118 - 5.9 61.7
1982 226,924 -11.3 142,575 - 9.6 61.4
1981 255,881 - 7.7 157,682 + 3.3 61.9
1980 277,136 - 3.8 152,672 - 2.3 64.5
1979 288,325 ^. 2.1 156,258 - 2.2 64.9
1978 294,396 + 1.1 159,846 - 2.4 64.8
1977 291,202 - 4.0 163,706 - 8.6 64.0
1976 303,328 - 6.4 179,139 +26.3 62.9
1975 3241039 - 10.3 141,851 +8.4 69.6
2/ Rehabilitation rates show '"le number of persons rehabilitated as a percentof akl closures from the atAive statuses, whether rehabilitated or not.Also referred to as the "success" rate.
1S tt138
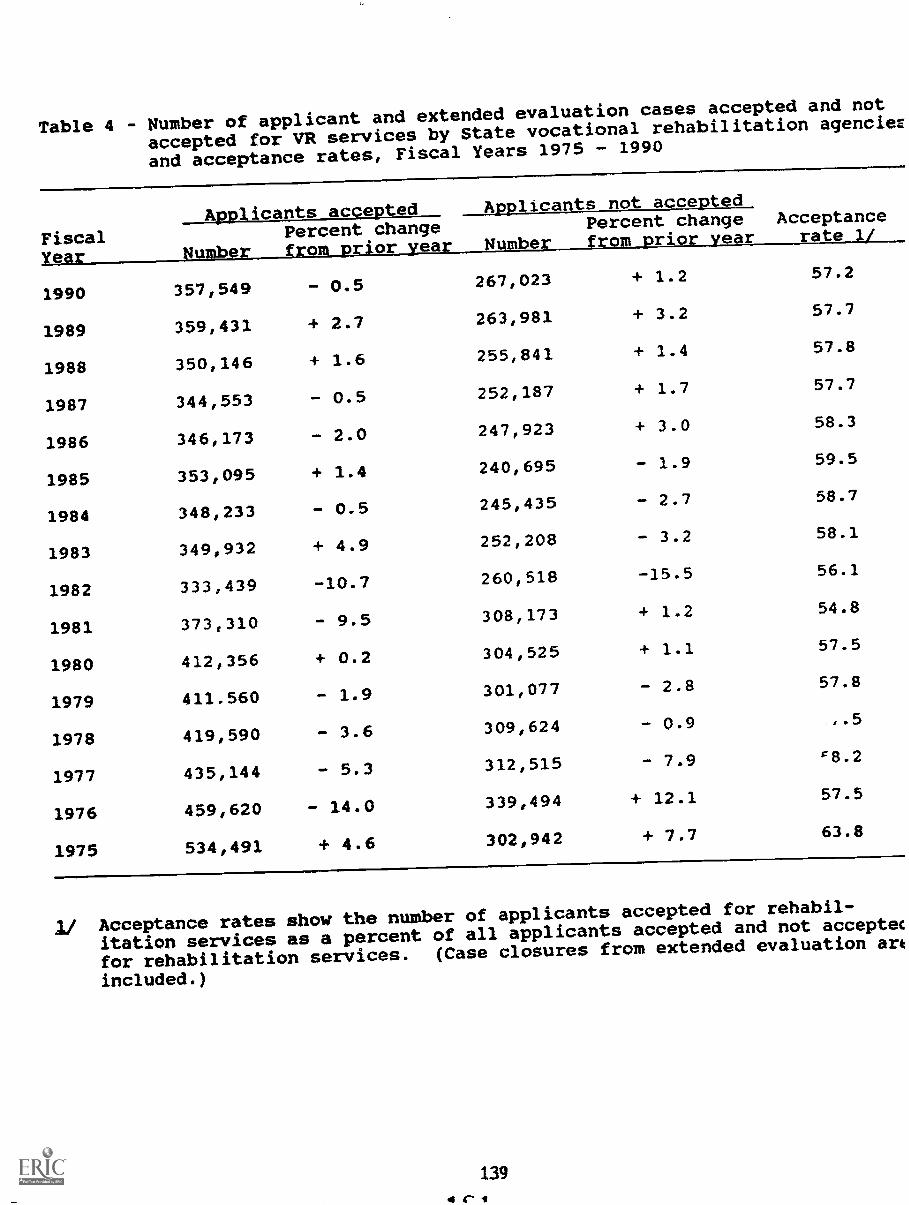
Table 4 - Number of applicant and extended evaluation cases accepted and not
accepted for VR services by State vocational rehabilitation agencieE
and acceptance rates, Fiscal Years 1975 - 1990
Fiscal
Applicants accepted Appl,icants not acceptedAcceptance
atePercent changeH-r r. r ea
Percent changember 4bIL rior ar
1990 357,549 - 0.5 267,023 + 1.2 57.2
1989 359,431 + 2.7 2630981 + 3.2 57.7
1988 350,146 + 1.6 255,841 + 1.4 57.8
1987 344,553 0.5 252,187 + 1.7 57.7
1986 346,173 2.0 247,923 + 3.0 58.3
1985 353.095 + 1.4 240,695 1.9 59.5
1984 348,233 0.5 245,435 - 2.7 58.7
1983 349,932 + 4.9 252,208 - 3.2 58.1
1982 333,439 -10.7 260,518 -15.5 56.1
1981 373,310 - 9.5 308,173 + 1.2 54.8
1980 412,356 + 0.2 3040525 + 1.1 57.5
1979 411.560 - 1.9 301,077 - 2.8 57.8
1978 419,590 3.6 309,624 - 0.9 ..5
1977 435,144 5.3 312,515 - 7.9 91.2
1976 459,620 - 14.0 339,494 + 12.1 57.5
1975 534,491 + 4.6 302,942 + 7.7 63.8
1/ Acceptance rates show the number of applicants accepted for rehabil-
itation services as a percent of all applicants accepted and not acceptec
for rehabilitation services. (Case closures from extended evaluation ark
included.)
1394 C"
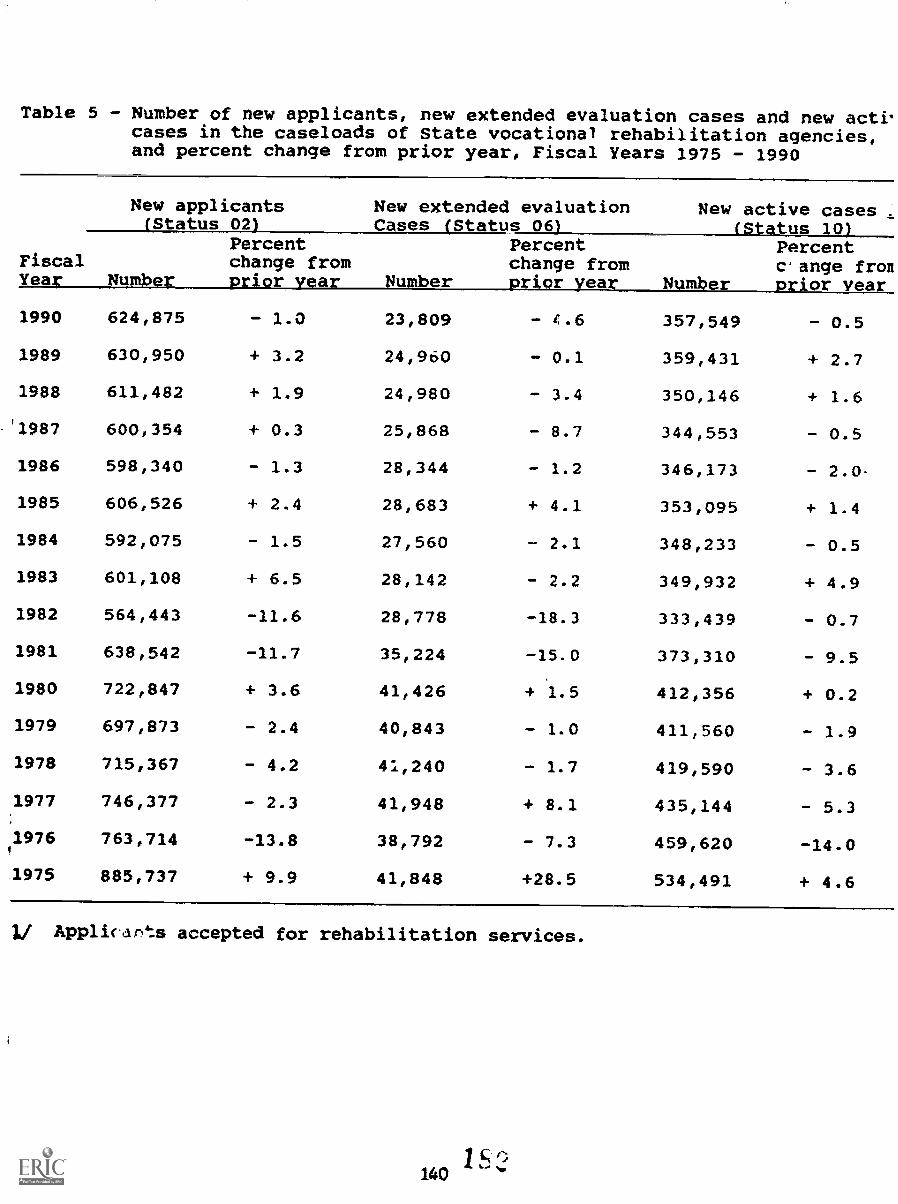
I
Table 5 - Number of new applicants, new extended evaluation cases and new activcases in the caseloads of State vocational rehabilitation agencies,and percent change from prior year, Fiscal Years 1975 - 1990
New applicants(Status 02)
New extended evaluationCases iStatus 06)
New active(Status
cases ,10)
Percentc' ange fronrior_vea
Fiscalea
Percentchange from
N IL.- r or
Percentchange from
u ber or ea mber
1990 624,875 - 1.0 23,809 - 4.6 357,549 - 0.5
1989 630,950 + 3.2 24,960 - 0.1 359,431 + 2.7
1988 611,482 + 1.9 24,980 - 3.4 350,146 + 1.6
1987 600,354 + 0.3 25,868 - 8.7 344,553 - 0.5
1986 598,340 - 1.3 28,344 - 1.2 346,173 - 2.0-
1985 6060526 + 2.4 28,683 + 4.1 353,095 + 1.4
1984 592,075 - 1.5 27,560 - 2.1 348,233 - 0.5
1983 601,108 + 6.5 28,142 - 2.2 3490932 + 4.9
1982 564,443 -11.6 28,778 -18.3 333,439 - 0.7
1981 638,542 -11.7 35,224 -15.0 373,310 - 9.5
1980 722,847 + 3.6 41,426 1.5 412,356 + 0.2
1979 697,873 - 2.4 40,843 - 1.0 411,560 - 1.9
1978 715,367 - 4.2 41,240 - 1.7 419,590 - 3.6
1977 746,377 - 2.3 41,948 + 8.1 435,144 - 5.3
1976 763,714 -13.8 38,792 - 7.3 459,620 -14.0
1975 885,737 + 9.9 41,848 +28.5 534,491 + 4.6
1/ Appli(apts accepted for rehabilitation services.
140
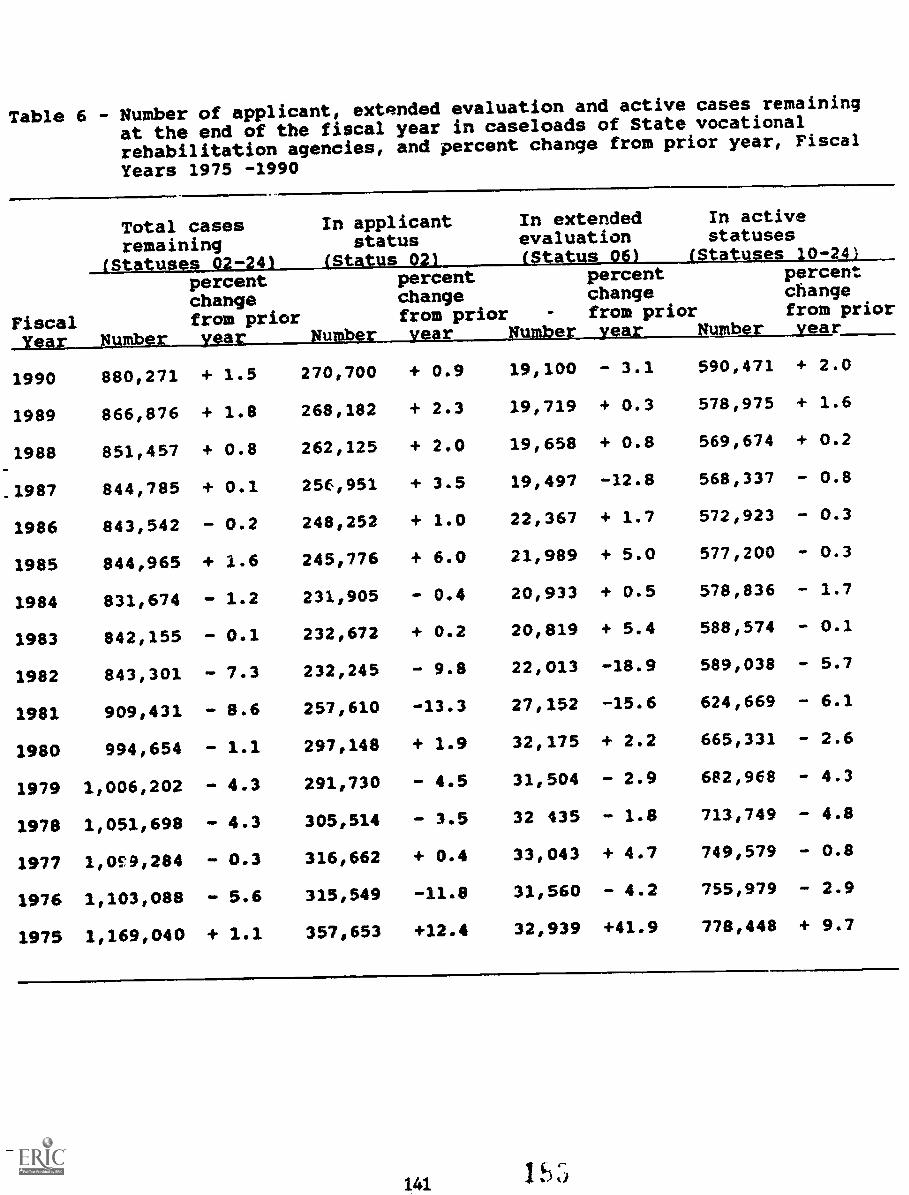
Table 6 - Number of applicant, extended evaluation and active cases remaining
at the end of the fiscal year in caseloads of State vocational
rehabilitation agencies, and percent change from prior year, Fiscal
Years 1975 -1990
Fiscal
Total casesremaining
_IStatuse%_02-241percentchangefrom prior
In applicantstatus
(Status Q2)percentchangefrom prior
In extendedevaluation(Status 06)
percentchangefrom prior
In activestatuses
(Statuses 10-24)percentchangefrom prior
be ar
1990 880,271 + 1.5 270,700 + 0.9 19,100 - 3.1 590,471 + 2.0
2989 866,876 + 1.8 268,182 + 2.3 19,719 + 0.3 578,975 + 1.6
1988 852,457 + 0.8 262,225 + 2.0 19,658 + 0.8 569,674 + 0.2
_1987 844,785 + 0.1 256,951 + 3.5 19,497 -12.8 568,337 - 0.8
1986 843,542 - 0.2 248,252 + 1.0 22,367 + 1.7 572,923 - 0.3
1985 844,965 + 1.6 245,776 + 6.0 21,989 + 5.0 5771200 - 0.3
1984 831,674 - 1.2 231,905 - 0.4 20,933 + 0.5 578,836 - 1.7
1983 842,155 - 0.1 232,672 + 0.2 20,819 + 5.4 588,574 - 0.1
1982 843,301 - 7.3 232,245 - 9.8 22,013 -28.9 589,038 - 5.7
1981 909,431 - 8.6 257,610 -13.3 27,152 -25.6 624,669 - 6.1
1980 994,654 - 1.1 297,148 + 1.9 32,175 + 2.2 665,331 - 2.6
1979 1,006,202 - 4.3 291,730 - 4.5 31,504 - 2.9 682,968 - 4.3
1978 1,051,698 - 4.3 305,514 - 3.5 32 435 - 1.8 713,749 - 4.8
1977 1,0S9,284 - 0.3 316,662 + 0.4 33,043 + 4.7 749,579 - 0.8
1976 1,103,088 - 5.6 315,549 -11.8 31,560 - 4.2 755,979 - 2.9
1975 2,169,040 + 1.1 357,653 +12.4 32,939 +41.9 778,448 + 9.7
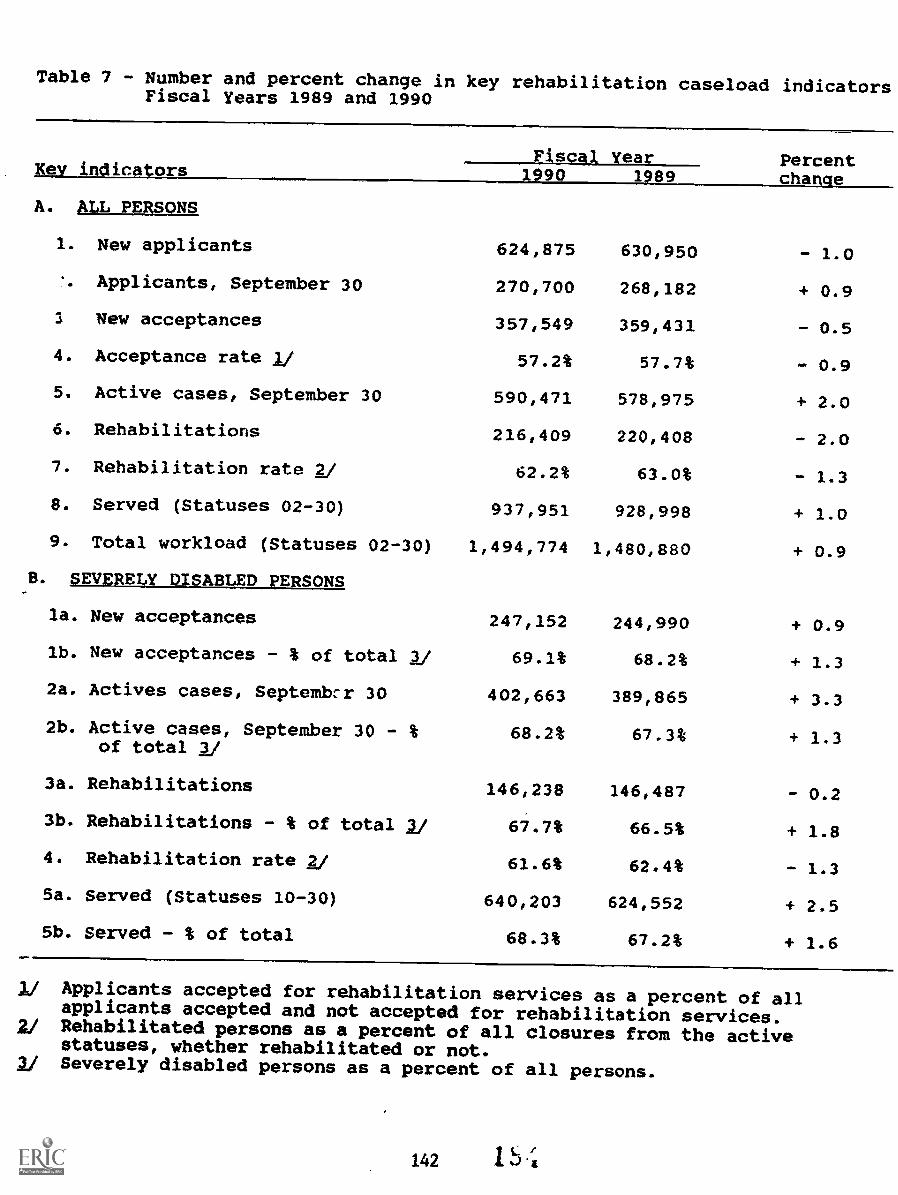
Table 7 - Number and percent change in key rehabilitation caseload indicatorsFiscal Years 1989 and 1990
indica orsFiscal Year Percent
1 9 1.9 c a eA. ALL PERSONS
1. New applicants 624,875 630,950 - 1.0
Applicants, September 30 270,700 268,182 + 0.9
S New acceptances 357,549 3590431 - 0.5
4. Acceptance rate 1/ 57.2% 57.7% - 0.9
5. Active cases/ September 30 590/471 578,975 + 2.0
6. Rehabilitations 216,409 220,408 - 2.0
7. Rehabilitation rate V 62.2% 63.0% - 1.3
8. Served (Statuses 02-30) 937,951 928,998 + 1.0
9. Total workload (Statuses 02-30) 1,494,774 1,480,880 + 0.9
B. SEVERELY DISABLED PERSONS
247/152 244,990 + 0.9la. New acceptances
lb. New acceptances - % of total 2/ 69.1% 68.2% + 1.3
2a. Actives cases, Septemb:r 30 402/663 389,865 + 3.3
2b. Active cases, September 30 - %of total 2/
68.2% 67.3% + 1.3
3a. Rehabilitations 146,238 146,487 - 0.2
3b. Rehabilitations - % of total 2/ 67.7% 66.5% + 1.8
4. Rehabilitation rate 2/ 61.6% 62.4% - 1.3
5a. Served (Statuses 10-30) 640,203 624,552 + 2.5
5b. Served - % of total 68.3% 67.2% + 1.6
// Applicants accepted for rehabilitation services as a percent of allapplicants accepted and not accepted for rehabilitation services.
2/ Rehabilitated persons as a percent of all closures from the activestatuses, whether rehabilitated or not.
2/ Severely disabled persons as a percent of all persons.
142
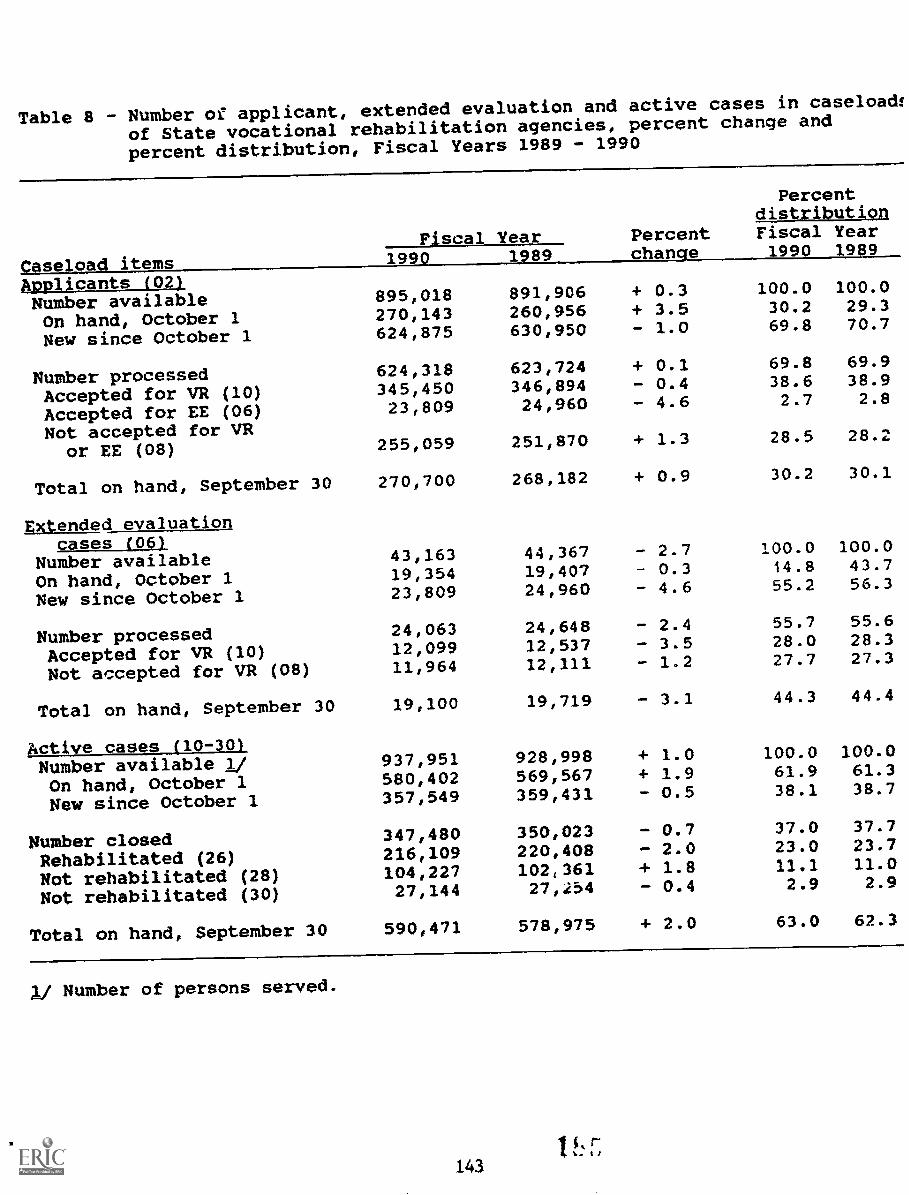
Table 8 - Number of applicant, extended evaluation and active cases in caseload;
of State vocational rehabilitation agencies, percent change and
percent distribution, Fiscal Years 1989 - 1990
Caseload items
Fiscal Year Percentchange
PercentdistributionFiscal Year1990 19891990 1989
Applicants (02)Number available 895,018 891,906 + 0.3 100.0 100.0
On hand, October 1 270,143 260/956 + 3.5 30.2 29.3
New since October 1 624,875 630,950 - 1.0 69.8 70.7
Number processed 6240318 623,724 + 0.1 69.8 69.9
Accepted for VR (10) 345,450 346,894 - 0.4 38.6 38.9
Accepted for EE (06) 23,809 24,960 - 4.6 2.7 2.8
Not accepted for VRor EE (08) 255,059 251,870 + 1.3 28.5 28.2
Total on hand, September 30 270,700 268,182 + 0.9 30.2 30.1
Extended evaluationcases (06)
Number available 43,163 44,367 - 2.7 100.0 100.0
On hand, October 1 19,354 191407 0.3 14.8 43.7
New since October 1 23,809 24,960 - 4.6 55.2 56.3
Number processed 24,063 24,648 - 2.4 55.7 55.6
Accepted for VR (10) 12,099 12,537 - 3.5 28.0 28.3
Not accepted for VR (08) 11,964 12,111 - 1.2 27.7 27.3
Total on hand, September 30 19,100 19,719 - 3.1 44.3 44.4
Active cases (10-30)Number available 1/ 937,951 928,998 + 1.0 100.0 100.0
On hand, October 1 580,402 569,567 + 1.9 61.9 61.3
New since October 1 357,549 359,431 - 0.5 38.1 38.7
Number closed 347,480 350,023 - 0.7 37.0 37.7
Rehabilitated (26) 216,109 220,408 2.0 23.0 23.7
Not rehabilitated (28) 104,227 102,361 + 1.8 11.1 11.0
Not rehabilitated (30) 27,144 27,.4 - 0.4 2.9 2.9
Total on hand, September 30 590,471 578,975 4- 2.0 63.0 62.3
1/ Number of persons served.
143
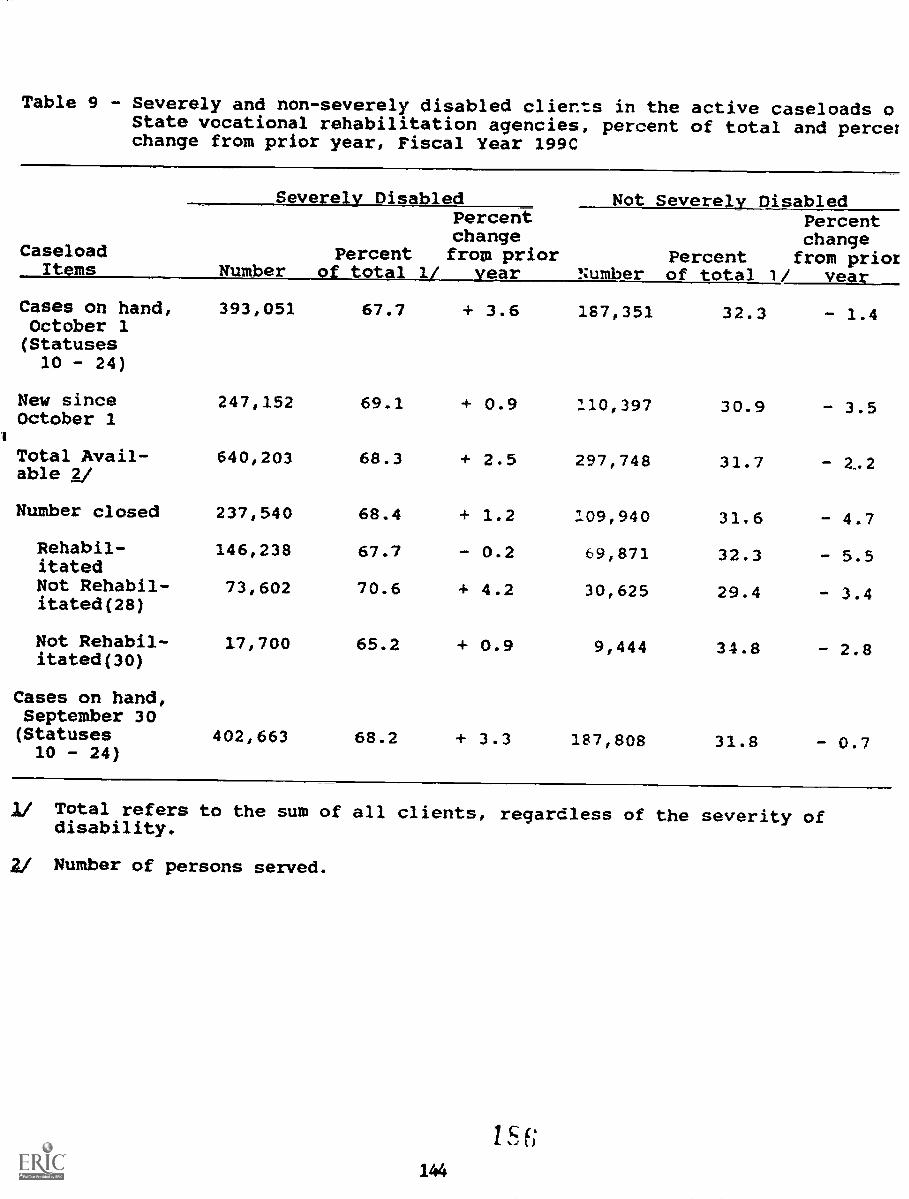
Table 9 - Severely and non-severely disabled clients in the active caseloads oState vocational rehabilitation agencies, percent of total and percerchange from prior year, Fiscal Year 199C
Severely Disabled Not Severely Disabled
CaseloadItems
Percentchange
Percent from priorNumber of total 1/ year Number
Percentchange
Percent from priorof total 1/ year
Cases on hand, 3930051 67.7 + 3.6 187,351 32.3 - 1.4October 1(Statuses10 - 24)
New since 247,152 69.1 + 0.9 110,397 30.9 - 3.5October 1
Total Avail-able 2/
640,203 68.3 + 2.5 297,748 31.7 2.2
Number closed 237,540 68.4 + 1.2 1090940 31.6 - 4.7
Rehabil-itated
146,238 67.7 - 0.2 69,871 32.3 - 5.5
Not Rehabil-itated(28)
73,602 70.6 + 4.2 30,625 29.4 - 3.4
Not Rehabil-itated(30)
17,700 65.2 + 0.9 9,444 34.8 - 2.8
Cases on hand,September 30(Statuses 402,663 68.2 + 3.3 1E17,808 31.8 - 0.710 - 24)
1/ Total refers to the sum of all clients, regardless of the severity ofdisability.
2/ Number of persons served.
144
c f'
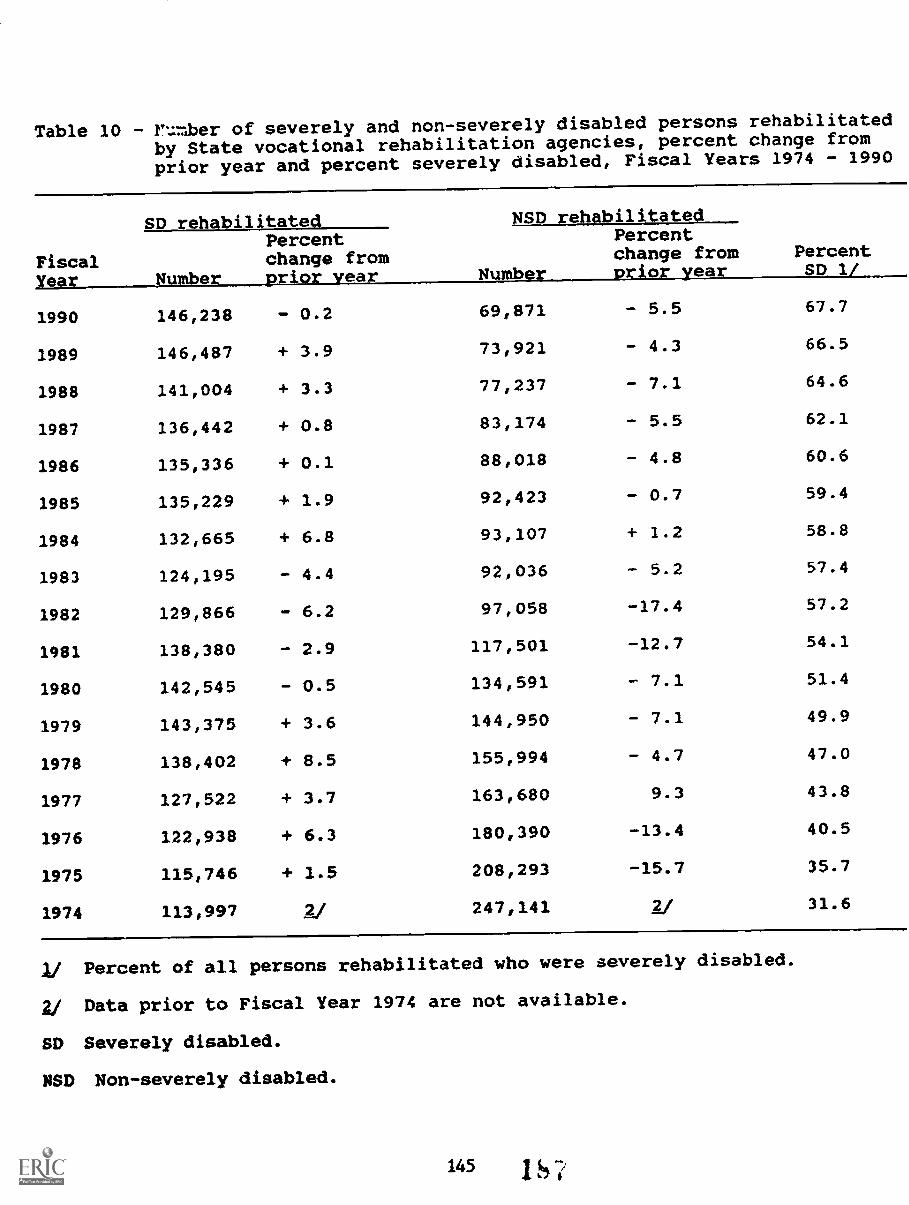
Table 10 - ?umber of severely and non-severely disabled persons rehabilitated
by State vocational rehabilitation agencies, percent change from
prior year and percent severely disabled, Fiscal Years 1974 - 1990
Fiscalea
SD rehabilitated NSD rehabilitated
PercentSD 1
Percentchange
Percentfrom change fromea Numb rio e r
1990 146,238 - 0.2 69,871 - 5.5 67.7
1989 146,487 + 3.9 73,921 - 4.3 66.5
1988 141,004 + 3.3 77,237 - 7.1 64.6
1987 136,442 + 0.8 83,174 - 5.5 62.1
1986 135,336 + 0.1 88,018 - 4.8 60.6
1985 135,229 + 1.9 92,423 - 0.7 59.4
1984 132,665 + 6.8 93,107 + 1.2 58.8
1983 124,195 - 4.4 920036 - 5.2 57.4
1982 129,866 - 6.2 97,058 -17.4 57.2
1981 138,380 - 2.9 117,501 -12.7 54.1
1980 142,545 - 0.5 134,591 - 7.1 51.4
1979 143,375 + 3.6 144,950 - 7.1 49.9
1978 138,402 + 8.5 155,994 - 4.7 47.0
1977 127,522 + 3.7 163,680 9.3 43.8
1976 122,938 + 6.3 180,390 -13.4 40.5
1975 115,746 + 1.5 208,293 -15.7 35.7
1974 113,997 2/ 247,141 g/ 31.6
1/ Percent of all persons rehabilitated who were severely disabled.
a/ Data prior to Fiscal Year 1974 are not available.
SD Severely disabled.
NSD Non-severely disabled.
145 1. S
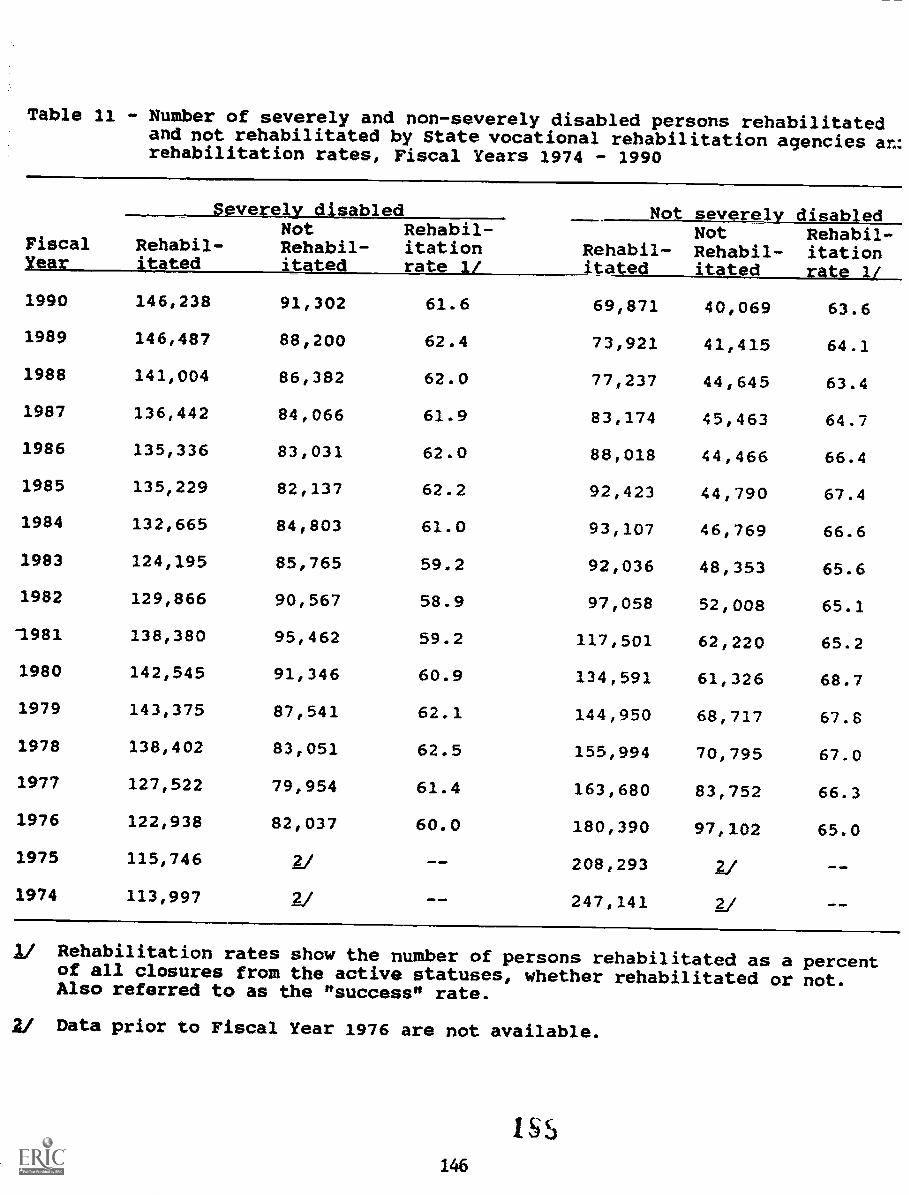
Table 21 - Number of severely and non-severely disabled persons rehabilitatedand not rehabilitated by State vocational rehabilitation agencies an:rehabilitation rates, Fiscal Years 1974 - 1990
Fiscal
Severely disabled Not severely disabledNot
Rehabil- Rehabil-tated it te
Rehabil-itationrate
Not Rehabil-Rehabil- Rehabil- itationita e it ted
1990 146,238 91,302 61.6 69,871 40,069 63.6
1989 146,487 88,200 62.4 73,921 41,415 64.1
1988 141,004 86,382 62.0 77,237 44,645 63.4
1987 136,442 84,066 61.9 83,174 45,463 64.7
1986 135,336 83,031 62.0 88,018 44,466 66.4
1985 135,229 82,137 62.2 92,423 44,790 67.4
1984 132,665 84,803 61.0 93,107 46,769 66.6
1983 124,195 85,765 59.2 92,036 48,353 65.6
1982 129,866 90,567 58.9 97,058 52,008 65.1
-1981 138,380 95,462 59.2 117,501 62,220 65.2
1980 142,545 91,346 60.9 134,591 61,326 68.7
1979 143,375 87,541 62.1 144,950 68,717 67.8
1978 138,402 83,051 62.5 155,994 700795 67.0
1977 127,522 79,954 61.4 163,680 83,752 66.3
1976 122,938 82,037 60.0 180,390 97,102 65.0
1975 115,746 21 208,293
1974 113,997 21 01 Os 247,141 2/
1/ Rehabilitation rates show the number of persons rehabilitated as a percentof all closures from the active statuses, whether rehabilitated or not.Also referred to as the "success" rate.
2/ Data prior to Fiscal Year 1976 are not available.
I s146
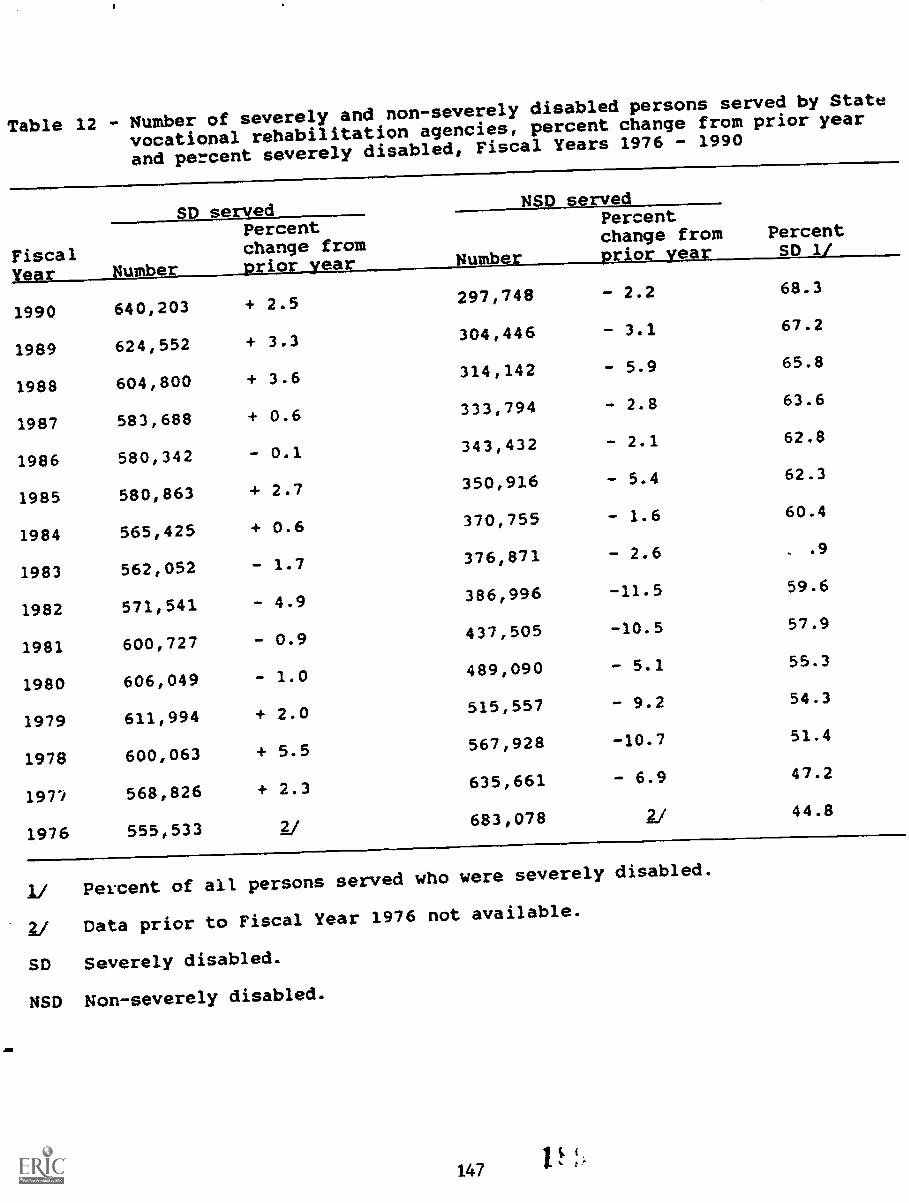
Table 12 - Number of severely and non-severely disabled persons served by State
vocational rehabilitation agencies, percent change from prior year
and percent severely disabled, Fiscal Years 1976 - 1990
Fiscal;
SD servedNSD served
PercentSD
I
Percentchange
lofromea be
Percentchange from
1990 640,203 + 2.5 297,748 - 2.2 68.3
1989 624,552 + 3.3 304,446 3.1 67.2
1988 604,800 + 3.6 314,142 - 5.9 65.8
1987 583,688 + 0.6 333,794 - 2.8 63.6
1986 580,342 - 0.1 343,432 - 2.1 62.8
1985 580,863 + 2.7 350,916 - 5.4 62.3
1984 565,425 + 0.6 370,755 - 1.6 60.4
1983 562,052 - 1.7 376,871 - 2.6 . .9
1982 571,541 - 4.9 386,996 -11.5 59.6
1981 600,727 - 0.9 437,505 -10.5 57.9
1980 606,049 - 1.0 489,090 - 5.1 55.3
1979 611,994 + 2.0 515,557 - 9.2 54.3
1978 600,063 + 5.5 567,928 -10.7 51.4
1971 568,826 + 2.3 635,661 - 6.9 47.2
1976 555,533683,078 21 44.8
Percent of all persons served who were severely disabled.
Data prior to Fiscal Year 1976 not available.
SD Severely disabled.
NSD Non-severely disabled.
147
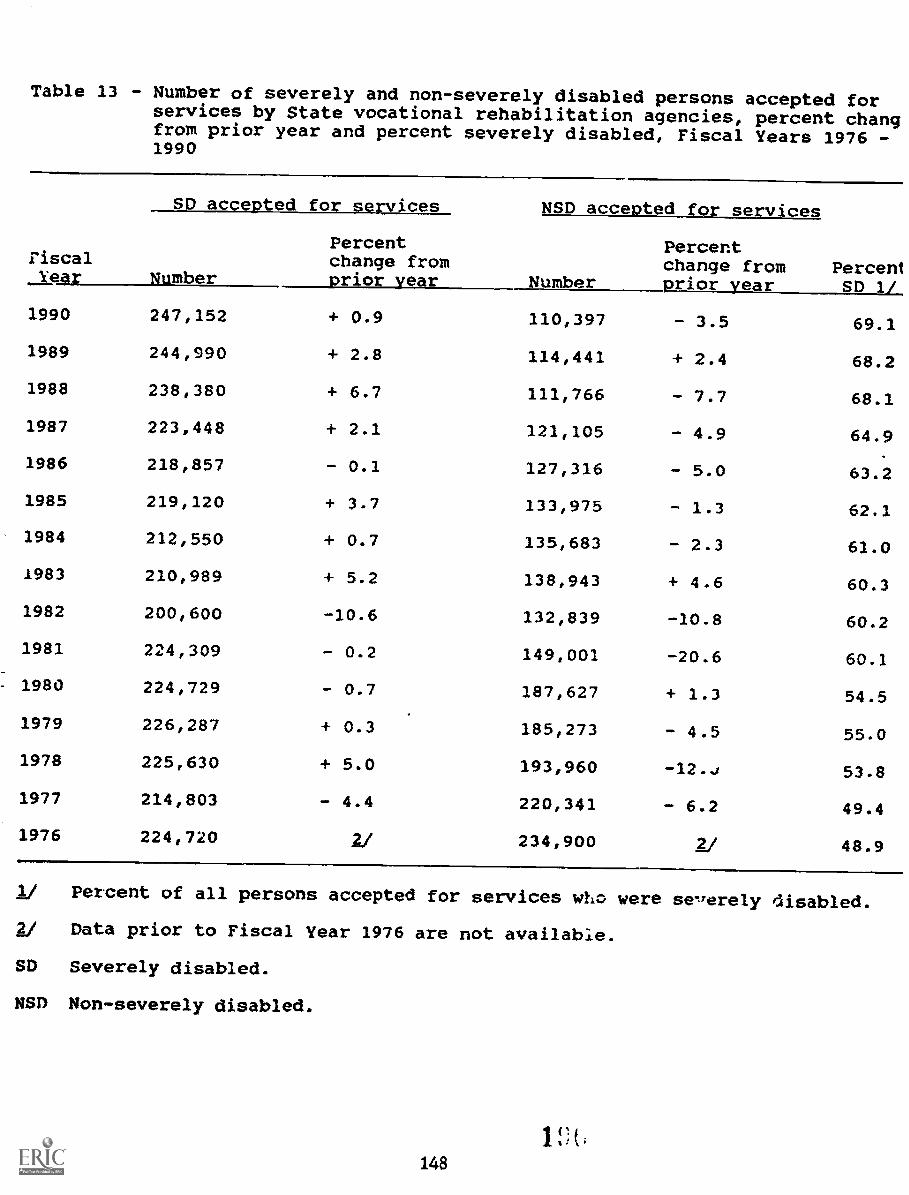
Table 13 - Number of severely and non-severely disabled persons accepted forservices by State vocational rehabilitation agencies, percent changfrom prior year and percent severely disabled, Fiscal Years 1976 -1990
SD accepted for services NSD accented for services
riscalNumber
Percentchange fromprior year Number
Percentchange fromprior year
PercentSD 11_IPAr
1990 247,152 + 0.9 110,397 - 3.5 69.1
1989 244,990 + 2.8 114,441 + 2.4 68.2
1988 238,380 + 6.7 111,766 - 7.7 68.1
1987 223,448 + 2.1 121,105 4.9 64.9
1986 218,857 - 0.1 127,316 - 5.0 63.2
1985 219,120 + 3.7 133,975 - 1.3 62.1
1984 212,550 + 0.7 135,683 - 2.3 61.0
i983 210,989 + 5.2 138,943 -4- 4.6 60.3
1982 200,600 -10.6 132,839 -10.8 60.2
1981 224,309 - 0.2 149,001 -20.6 60.1
1980 224,729 - 0.7 187,627 + 1.3 54.5
1979 226,287 + 0.3 185,273 - 4.5 55.0
1978 225,630 + 5.0 193,960 -12.J 53.8
1977 214,803 - 4.4 220,341 - 6.2 49.4
1976 224,720 2/ 234,900 2 j 48.9
1/ Percent of all persons accepted for services who were seerely disabled.
21 Data prior to Fiscal Year 1976 are not available.
SD Severely disabled.
NSD Non-severely disabled.
148
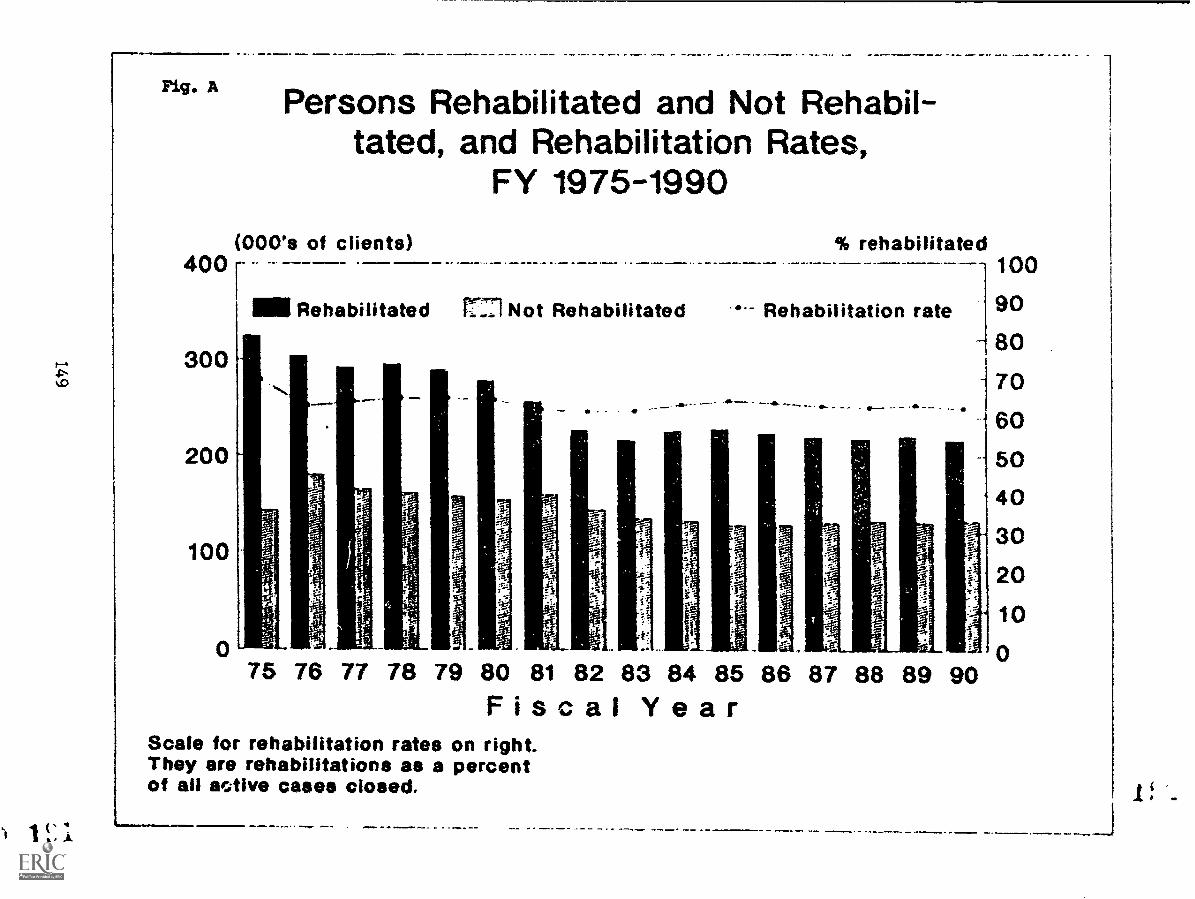
Pig. APersons Rehabilitated and Not Rehabil-
tated, and Rehabilitation Rates,FY 1975-1990
(OOO's of clients)400
MI Rehabilitated rzi Not Rehabilitated
300
200
100
% rehabilitated100
--- Rehabilitation rate 9°80
70VV 60
50
40
30r'
.1: 20
-7 10
085 86 87 88 89 9075 76 77 78 79 80 81 82 83 84
Fiscal YearScale for rehabilitation rates on right.They are rehabilitations as a percentof all active cases closed.
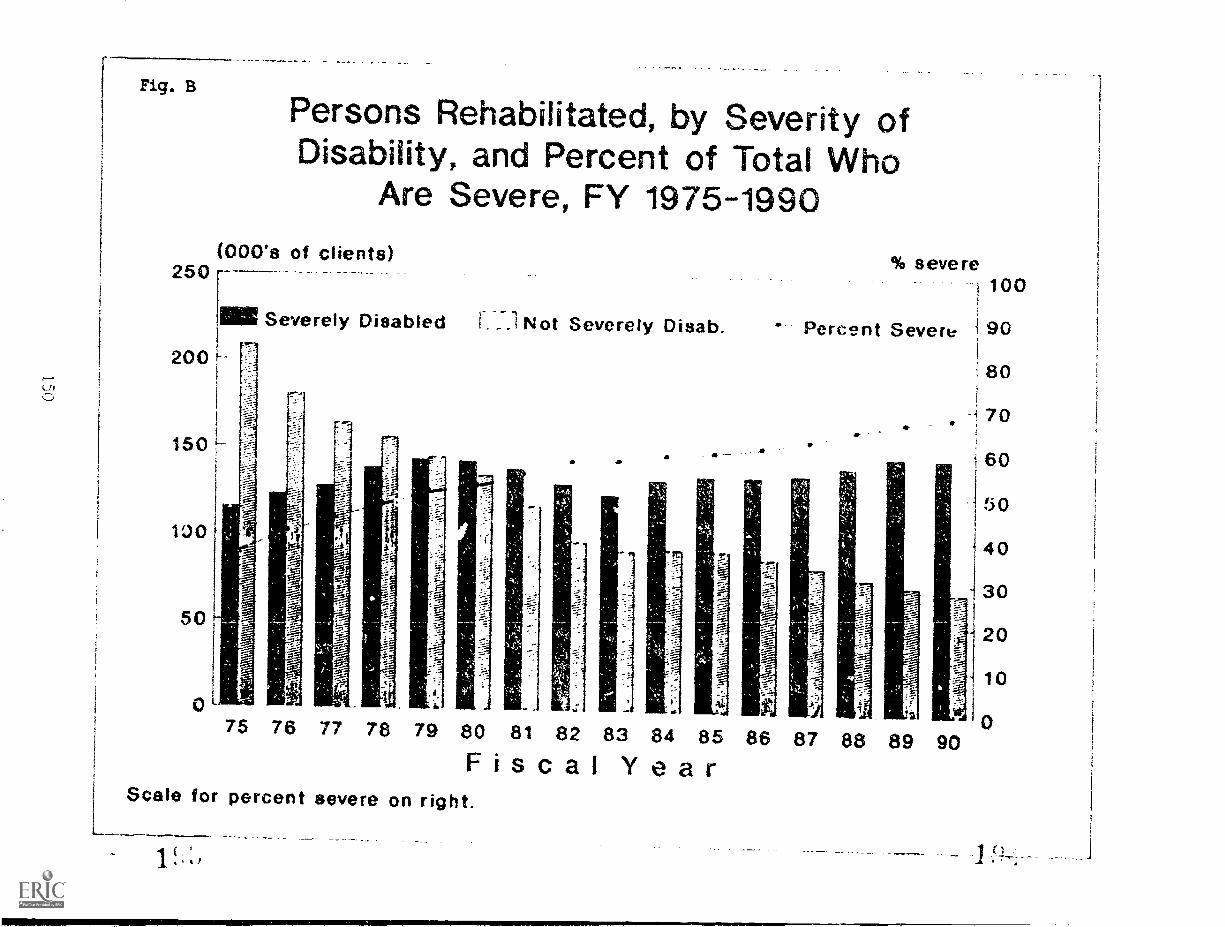
Fig. 15
Persons Rehabilitated, by Severity ofDisability, and Percent of Total Who
Are Severe, FY 1975-1990(000's of clients)
250
Severely Disabled 11-::.1Not Severely Disab.
% severe100
Percent Severe 90
80
-170
75 76 77 78 79 80 81 82 83 84 85 86Fiscal Year
Scale for percent severe on right.
87 88 89 90
160
50
40
30
20
10
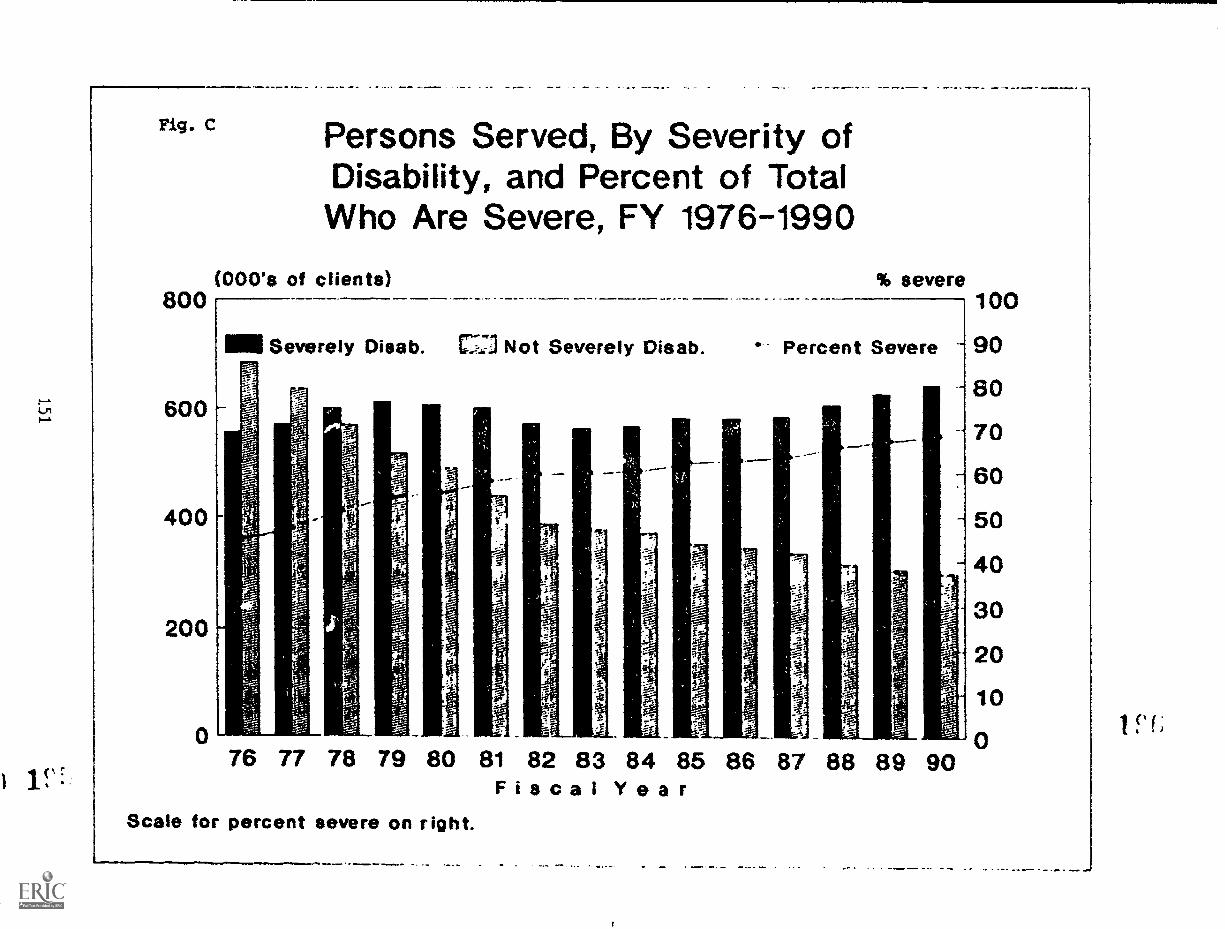
Fig. C
800
600
400
200
Persons Served, By Severity ofDisability, and Percent of TotalWho Are Severe, FY 1976-1990
(000's of clients) % severe
OM Severely Disab. r.-1:3 Not Severely Disab. Percent Severe
sT.
76 77 78 79 80 81
Scale for percent severe on right.
82 83 84 85 86 87 88 89 90Fiscal Year
100
90
80
70
80
50
40
30
20
10
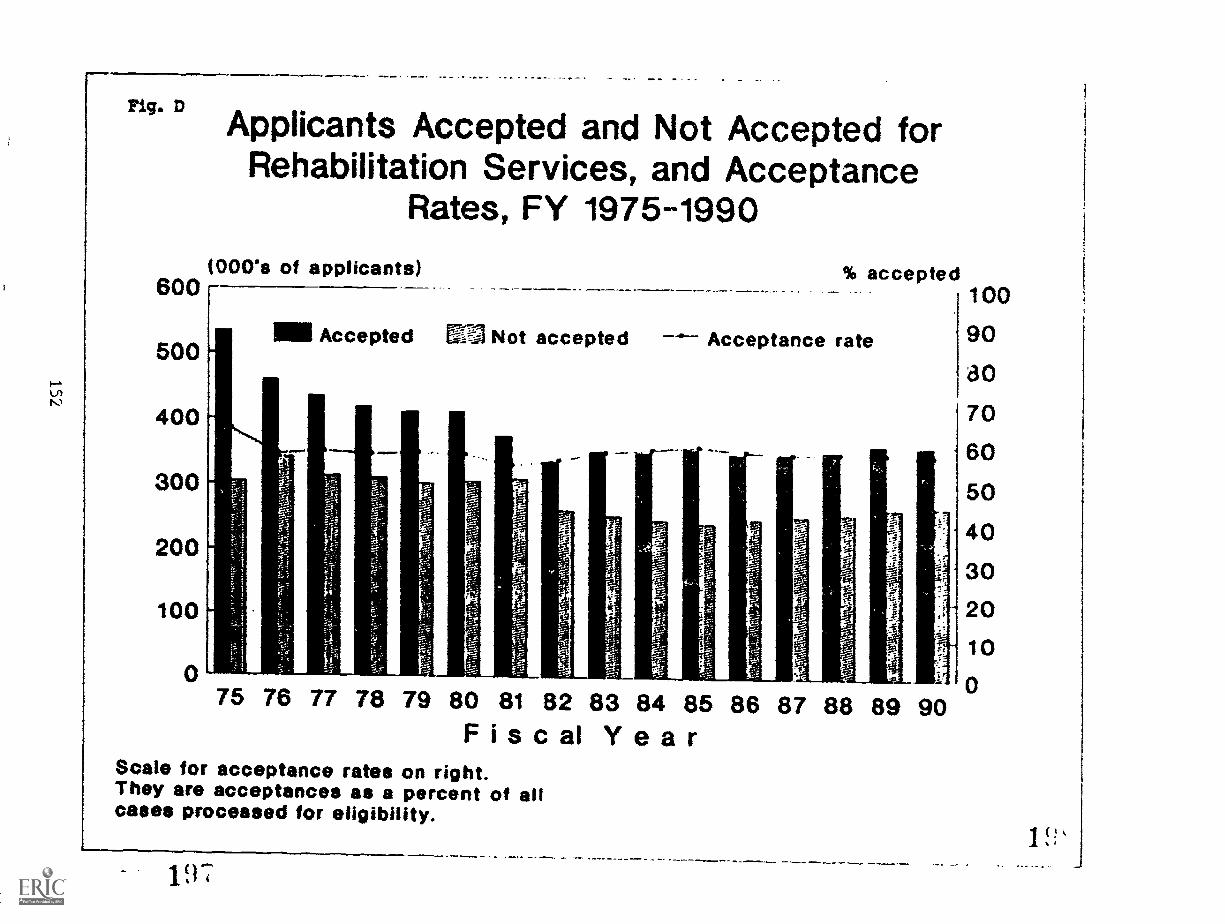
Fig. DApplicants Accepted and Not Accepted for
Rehabilitation Services, and AcceptanceRates, FY 1975-1990
1000's of applicants)600
500
400
300
200
100
0
% accepted100
90
80
70
60
50
-
s
40
30
20
10
088 89 90
MO Accepted Ui-U Not accepted Acceptance rate
75 76 77 78 79 80 81 82 83 84 85 86 87Fiscal Year
Scale for acceptance rates on right.They are acceptances as a percent of allcases processed for eligibility.
197
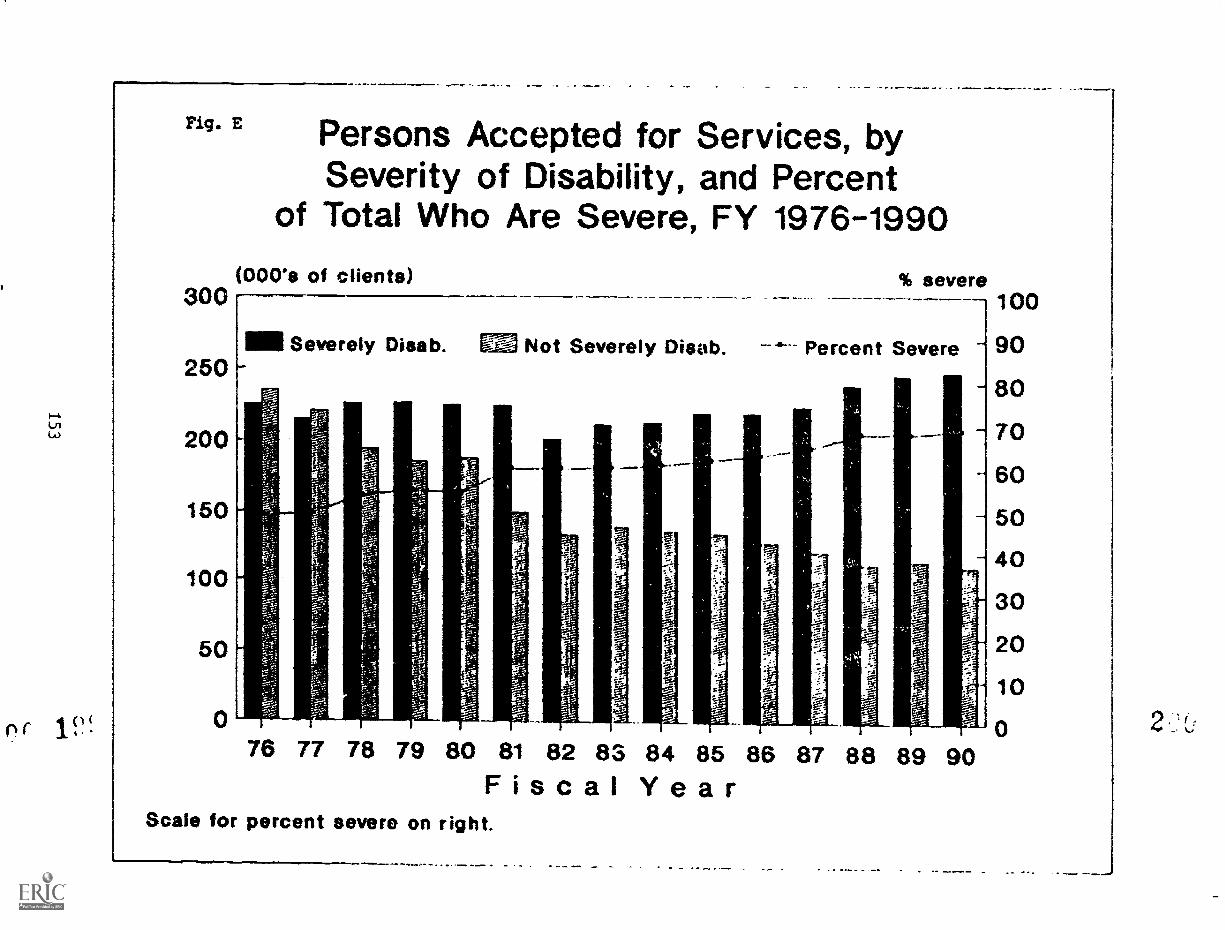
Fig. E Persons Accepted for Services, bySeverity of Disability, and Percent
of Total Who Are Severe, FY 1976-1990
(000's of clients)300
250
200
150
100
50
% severe100
90
80
70
60
50
40
30
20
10
0
1.1 Severely Disab. EM-- Not Severely Disab. ---- Percent Severe
76 77 78 79 80 81 82 83 84 85 86 87 88 89 90Fiscal Year
Scale for percent severe on right.
Section Ill. Caseload Activity, by State Agency
Report Number Page
01 Caseload distribution of applicants and percentchange from a year ago
03 Caseload distribution of active cases and percentchange from a year ago
03A Sequential agency rehabilitation rates among activecases closed, by type of agency
04 Caseload distribution of active cases of severelydisabled persons and percent change from a year ago.....
04A Sequential agency rehabilitation rates among severeactive cases closed, by type of agency
06 Total and severe cases and severe as a percent oftotal active caseload
06A Sequential acency percents of cases served that aresevere cases, by type of agency
068 Sequential agency percents of cases rehabilitatedthat are severe cases, by type of agency
07 Cases processed for eligibility during period,acceptance rates and percent change from a year ago
07A Sequential agency acceptance rates among applicantcases processed for eligibility, by type of agency
Section IV Caseload Activity, Regional Summarie's
13 Caseload distribution of applicants and percentchange from a year ago
14 Caseload distribution of extended evaluation casesand percent change from a year ago
15 Caseload distribution of active cases and percentchange from a year ago
Report Numberpage
16 Caseload distribution of active cases of severely
disabled persons and percent change from a year ago
17 Caseload distribution of active cases of non-
severely disabled persons and percent change from
a year ago
18 Total and severe cases and severe as a percent of
total active caseload
19 Cases processed for eligibility during period,
acceptance rates and percent change from a year ago
20 Total caseload levels, components of change and
percent change from a year ago
21 Cases closed during period and percent change from
a year ago
22 Total caseload during period and percent change
from a year ago
Glossary of Terms
2,
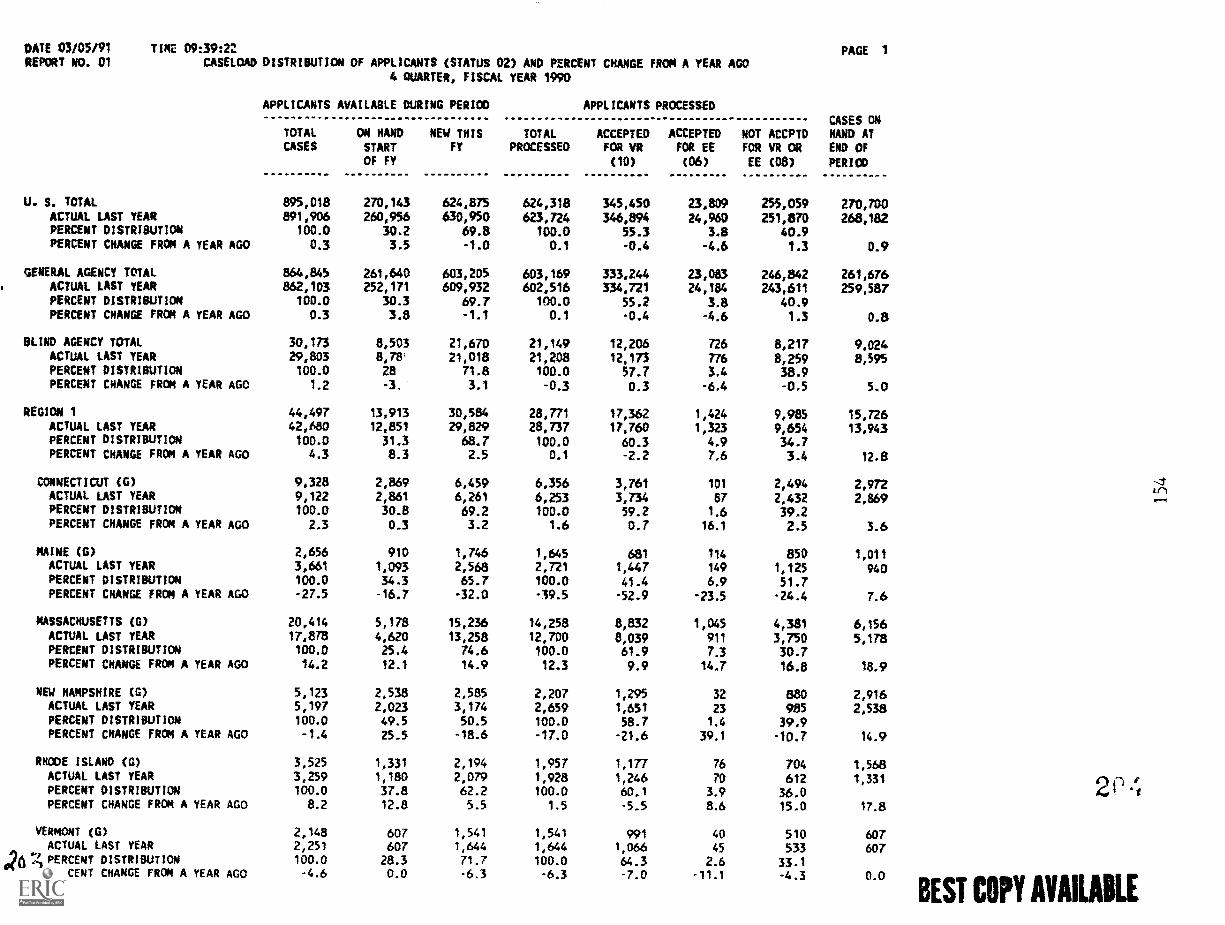
DATE 03/05191REPORT NO. 01
TIME 09:39:22
CASELOAD DISTRIBUTICW OF APPLICANTS (STATUS 02) AND PERCENT CHANGE FROM A YEAR AGO4 QUARTER, FISCAL YEAR 1990
PAGE 1
APPLICANTS AVAILABLE DURING PERIOD
TOTAL ON HAND NEW THISCASES START FY
OF FY
TOTALPROCESSED
APPLICANTS PROCESSED
ACCEPTED ACCEPTEDFOR VR FOR EE
(10) (06)
NOT ACCPTDFOR VR OR
EE (08)
CASES ONHAND ATEND OF
PERIOD
U. S. TOTAL 895,018 270,143 624,875 624,318 345,450 23,809 255,059 270,700ACTUAL LAST YEAR 891,906 260,956 630,950 623,724 346,894 24,960 251,870 268,182PERCENT DISTRIBUTION 100.0 30.2 69.8 100.0 55.3 3.8 40.9PERCENT CHANGE FROM A YEAR AGO 0.3 3.5 -1.0 0.1 -0.4 -4.6 1.3 0.9
GENERAL AGENCY TOTAL 864,845 261,640 603,205 603,169 333,244 23,083 246,842 261,676ACTUAL LAST YEAR 862,103 252,171 609,932 602,516 334,721 24,184 243,611 259,587PERCENT DISTRIBUTION 100.0 30.3 69.7 100.0 55.2 3.8 40.9PERCENT CHANGE FROM A YEAR AGO 0.3 3.8 -1.1 0.1 -0.4 -4.6 1.3 0.8
BLIND AGENCY TOTAL 30,173 8,503 21,670 21,149 12,206 726 8,217 9,024ACTUAL LAST YEAR 29,803 8,7E 21,018 21,208 12,173 776 8,259 8,5915PERCENT DISTRIBUTION 100.0 28 71.8 100.0 57.7 3.4 38.9PERCENT CHANGE FROM A YEAR AGO 1.2 -3. 3.1 -0.3 0.3 -6.4 -0.5 5.0
REGION 1 44,497 13,913 30,5E4 28,771 17,362 1,424 9,985 15,726ACTUAL LAST YEAR 42,680 12,851 29,829 28,737 17,760 1,323 9,654 13,943PERCENT DISTRIBUTION 100.0 31.3 68.7 100.0 60.3 4.9 34.7PERCENT CHANGE FROM A YEAR AGO 4.3 8.3 2.5 0.1 -2.2 7.6 3.4 12.8
CONNECTICUT (G) 9,328 2,869 6,459 6,356 3,761 101 2,494 2,972ACTUAL LAST YEAR 9,122 2,861 6,261 6,253 3,734 87 2,432 2,869PERCENT DISTRIBUTION 100.0 30.8 69.2 100.0 59.2 1.6 39.2PERCENT CHANGE FROM A YEAR AGO 2.3 0.3 3.2 1.6 0.7 16.1 2.5 3.6
MAINE (0) 2,656 910 1,746 1,645 681 114 850 1,011ACTUAL LAST YEAR 3,661 1,093 2,568 2,721 1,447 149 1,125 940PERCENT DISTRIBUTION 100.0 34.3 65.7 100.0 41.4 6.9 51.7PERCENT CHANGE FROM A YEAR AGO -27.5 -16.7 -32.0 -39.5 -52.9 -23.5 -24.4 7.6
MASSACHUSETTS (G) 20,414 5,178 15,236 14,258 8,832 1,045 4,381 6,156ACTUAL LAST YEAR 17,878 4,620 13,258 12,700 8,039 911 3,750 5,178PERCENT DISTRIBUTION 100.0 25.4 74.6 100.0 61.9 7.3 30.7PERCENT CHANGE FROM A YEAR AGO 14.2 12.1 14.9 12.3 9.9 14.7 16.8 18.9
NEW HAMPSHIRE (0) 5,123 2,538 2,585 2,207 1,295 32 am 2,916ACTUAL LAST YEAR 5,197 2,023 3,174 2,659 1,651 23 985 2,538PERCENT DISTRIBUTION 100.0 49.5 50.5 100.0 58.7 1.4 39.9PERCENT CHANGE FROM A YEAR AGO -1.4 25.5 -18.6 -17.0 -21.6 39.1 -10.7 14.9
RHODE ISLAND (G) 3,525 1,331 2,194 1,957 1,177 76 704 1,568ACTUAL LAST YEAR 3,259 1,180 2,079 1,928 1,246 70 612 1,331PERCENT DISTRIBUTION 100.0 37.8 62.2 100.0 60.1 3.9 36.0PERCENT CHANGE FROM A YEAR AGO 8.2 12.8 5.5 1.5 -5.5 8.6 15.0 17.8
VERMONT (G) 2,148 607 1,541 1,541 991 40 510 607ACTUAL LAST YEAR 2,251 607 1,644 1,644 1,066 45 533 607
2074,PERCENT DISTRIBUTIONPERCENT CHANGE FROM A YEAR AGO
100.0-4.6
28.30.0
71.7-6.3
100.0
-6.364.3-7.0
2.6-11.1
33.1-4.3 0.0
2e 4
BEST COPY AVAILABLE
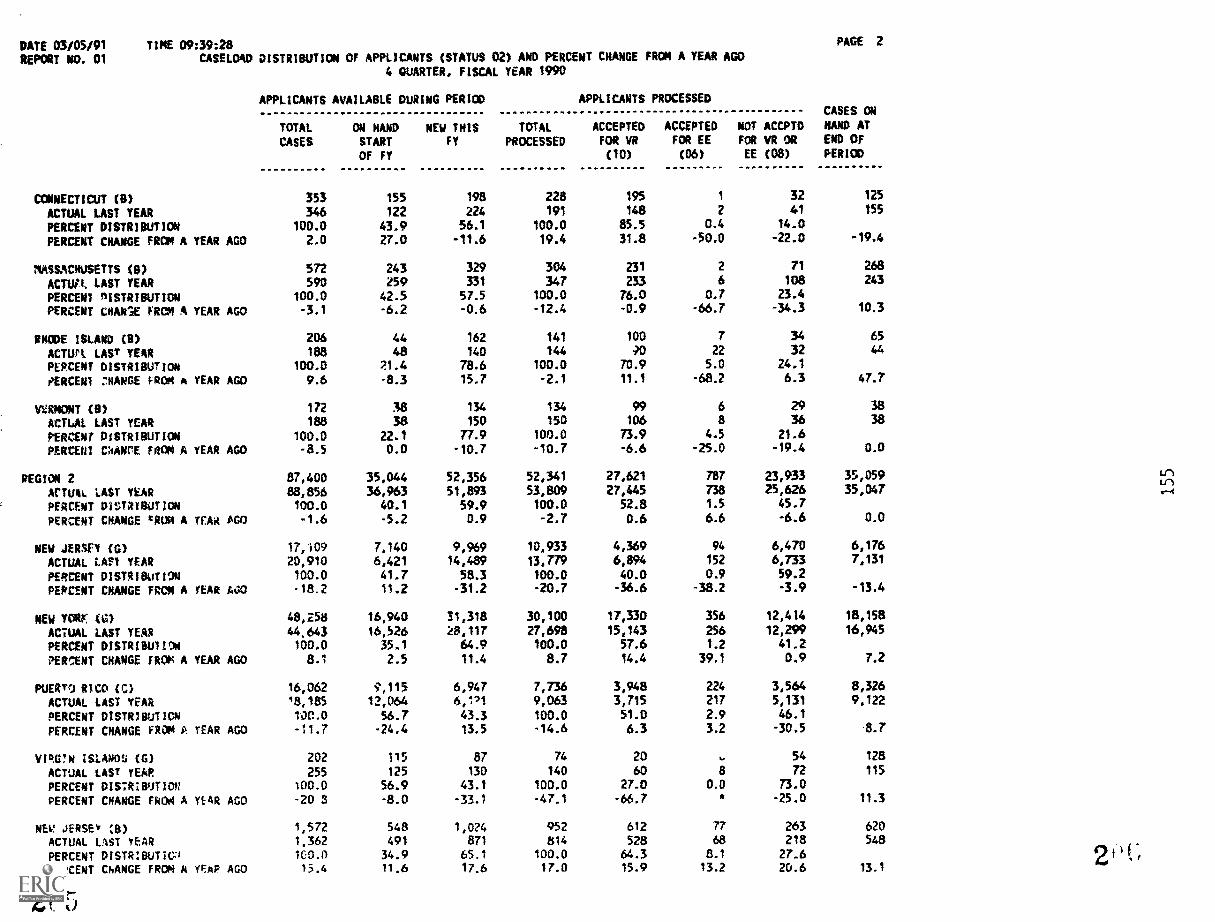
DATE 03/05/91 TIME 09:39:28REPORT NO. 01 CASELOAD DISTRIOUTION OF APPLICANTS (STATUS 02) AND PERCENT CHANGE FROM A YEAR AGO
4 QUARTER, FISCAL YEAR 1990
APPLICANTS AVAILABLE DURING PERIOD APPLICANTS PROCESSED
TOTAL ON HAND NEW THIS TOTAL ACCEPTED ACCEPTED NOT ACCPTO
CASES START FY PROCESSED FOR VR FOR EE FOR VR OR
OF FY (10) (06) EE (08)
PAGE 2
CASES ON
HAND ATEND OfPERICO
CONNECTICUT (8) 353 155 198 228 195 1 32 125
ACTUAL LAST YEAR 346 122 224 191 148 2 41 155
PERCENT DISTRIBUTION 100.0 43.9 56.1 100.0 85.5 0.4 14.0
PERCENT CHANGE FROI A YEAR AGO 2.0 27.0 -11.6 19.4 31.8 -50.0 -22.0 -19.4
MASSACNUSETTS (8) 572 243 329 304 231 2 71 268
ACTUPL LAST YEAR 590 259 331 347 233 6 108 243
PERCENT RISTRIBUTION 100.0 42.5 57.5 100.0 76.0 0.7 23.4
PERCENT COANIE MEM A YEAR AGO -3,1 -6.2 -0.6 -12.4 -0.9 -66.7 -34.3 10.3
RHODE ISLAND (8) 206 44 162 141 100 7 34 65
ACTUPL LAST YEAR 188 48 140 144 RO 22 32 44
PEPCENT DISTRIBUTIoN 100.0 ?1.4 78.6 100.0 70.9 5.0 24.1
RERCEN1 .711ANGE fROM A YEAR AGO 9.6 -8.3 15.7 -2.1 11.1 -68.2 6.3 47.7
V2RMONT (0) 172 38 134 134 99 6 29 38
ACTUAL LAST YEAR 188 38 150 150 106 8 36 38
PERCENT DiSTRIBUTION 100.0 22.1 77.9 100.0 73.9 4.5 21.6
PERCEN1 OANCE FROM A YEAR AGO -8.5 0.0 -10.7 -10.7 -6.6 -25.0 -19.4 0.0
REGION 2 87,400 35,044 52,356 52,341 27,621 787 23,933 35,059
ACTUAL LAST YEAR 88,856 36,963 51,893 53,809 27,445 738 25,626 35,047
PERCENT 01:J218010N 100.0 40.1 59.9 100.0 52.8 1.5 45.7
PERCENT CHANGE rRUM A trAa AGO -1.6 -5.2 0.9 -2.7 0.6 6.6 -6.6 0.0
NEW JERSEY (G) 17,109 7,140 9,969 10,933 4,369 94 6,470 6,176
ACTUAL LAM YEAR 20,910 6,421 14,489 13,779 6,894 152 6,733 7,131
PERCENT DISTRIBuTION 100.0 41.7 58.3 100.0 40.0 0.9 59.2
PERCENT CHANGE FRCM A TEAR AGO -18.2 11.2 -31.2 -20.7 -36.6 -38.2 -3.9 -13.4
NEW YORK () 48,258 16,940 31,318 30,100 17,330 356 12,414 18,158
ACTUAL LAST YEAR 44,643 16,526 28,117 27,698 15,143 256 12,299 16,945
PERCENT DISTRI0U1ION 100.0 35.1 64.9 100.0 57.6 1.2 41.2
PERCUT CHANGE TROIA A YEAR AGO 8.1 2.5 11.4 8.7 14.4 39.1 0.9 7.2
PUERTO RICO (C) 16,062 R,115 6,947 7,736 3,948 224 3,564 8,326
ACTUAL LAST YEAR 18,185 12,064 6,111 9,063 3,715 217 5,131 9,122
PERCENT DISTRIBUTION 10(1.0 56.7 433 100.0 51.0 2.9 46.1
PERCENT CHANGE FROM P TEAR AGO -11.7 -24.4 13.5 -14.6 6.3 3.2 -30.5 8.7
VIWN ISLANDS (G) 202 115 87 74 20 ,.. 54 128
ACTUAL LAST TEAR 255 125 130 140 60 8 72 115
PERCENT DISTRIBUTION 100.0 56.9 43.1 100.0 27.0 0.0 73.0
PERCENT CHANGE FROM A 11-8R AGO -20 3 -8.0 -33.1 -47.1 -66.7 -25.0 11.3
MEV JERSE" :E1) 1,572 548 1,024 952 612 77 263 620
ACTUAL LAST YEAR 1,362 491 871 814 528 68 218 548
PERCENT DISTR:BUTIO 10.0 34.9 65.1 100.0 64.3 8.1 27.6
PERCENT CHANGE FROM A TEMP AGO 13.4 11.6 17.6 17.0 15.9 13.2 20.6 13.1
2( 5
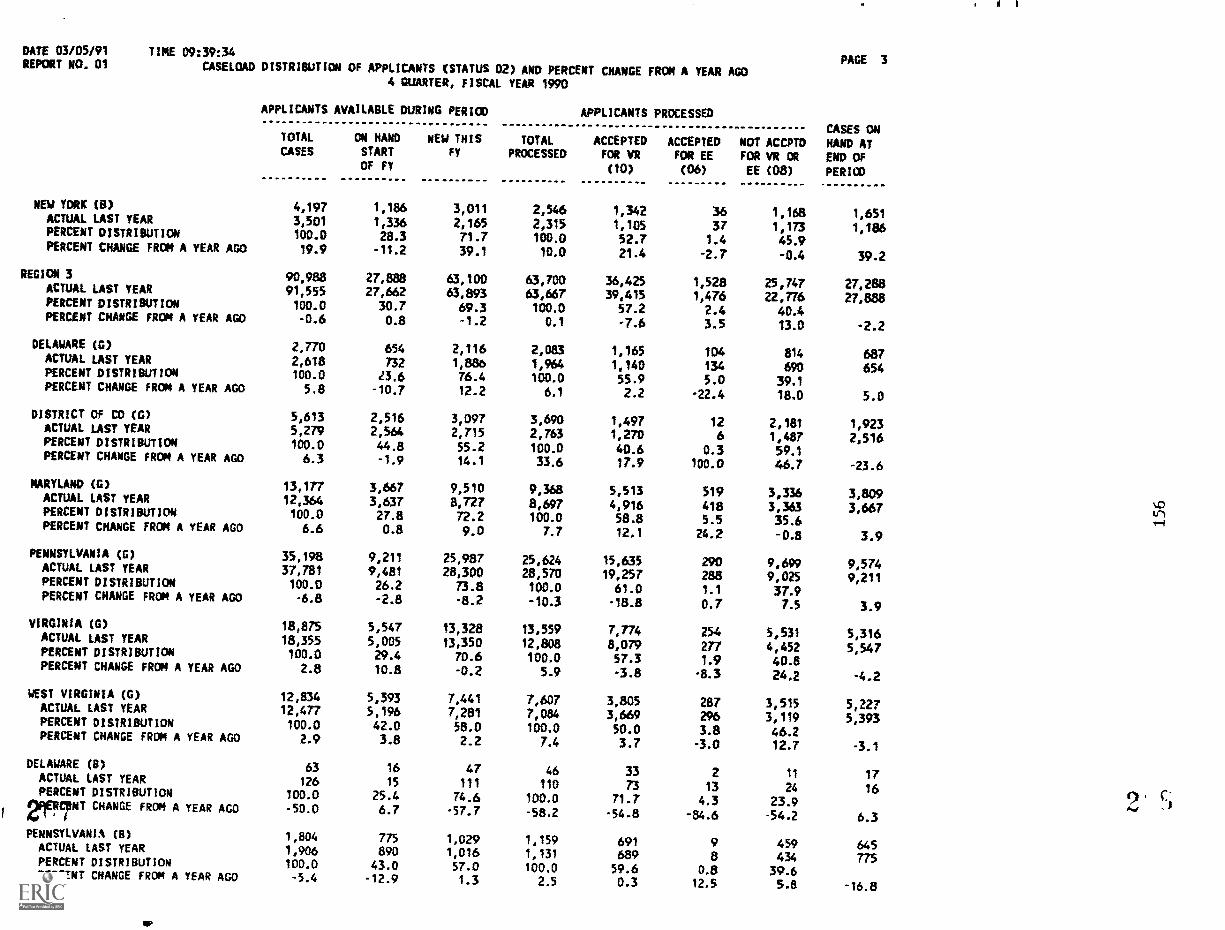
DATE 03/05/91REPORT NO. 01
TIME 09:39:34
CASELOAD DISTRIBUTION OF APPLICANTS (STATUS 02) AND PERCENT CHANGE FROM A YEAR AGO4 QUARTER, FISCAL YEAR 1990
NEW YORK (8)ACTUAL LAST YEARPERCENT DISTRIBUTION
PERCENT CHANGE FROM A YEAR AGO
REGICN 3ACTUAL LAST YEAR
PERCENT DISTRIBUTIONPERCENT CHANGE FROM A YEAR AGO
DELAWARE (0)
ACTUAL LAST YEARPERCENT DISTRIBUTIONPERCENT CHANGE FROM A YEAR AGO
DISTRICT Of CO (0)ACTUAL LAST YEARPERCENT DISTRIBUTIONPERCENT CHANGE FROM A YEAR AGO
MARYLAND (G)ACTUAL LAST YEARPERCENT DISTRIBUTIONPERCENT CHANGE FROM A YEAR AGO
PENNSYLVANIA (0)ACTUAL LAST YEARPERCENT DISTRIBUTIONPERCENT CHANGE FROM A YEAR AGO
VIRGINIA (G)ACTUAL LAST YEARPERCENT DISTRIBUTIONPERCENT CHANGE FROM A YEAR AGO
WEST VIRGINIA (0)ACTUAL LAST YEAR
PERCENT DISTRIBUTIONPERCENT CHANGE FROM A YEAR AGO
DELAWARE (8)
ACTUAL LAST YEARPERCENT DISTRIBUTION21ER7NT CHANGE FROM A YEAR AGO
PENNSYLVANIA (8)ACTUAL LAST YEAR
PERCENT DISTRIBUTIONPERCENT CHANGE FRom A YEAR AGO
It I
PAGE 3
APPLICANTS AVAILABLE DURING PERICO
TOTAL ON HAND NEW THISCASES START FY
OF FY
TOTALPROCESSED
APPLICANTS PROCESSED
ACCEPTED ACCEPTEDFOR VR FOR EE(10) (06)
NOT ACCPTDFOR VR OR
EE (08)
CASES 04HAND ATEND OF
PERIOD
4,197 1,186 3,011 2,546 1,342 36 1,168 1,6513,501 1,336 2,165 2,315 1,105 37 1,173 1,186100.0 28.3 71.7 100.0 52.7 1.4 45.919.9 -11.2 39.1 10.0 21.4 -2.7 -0.4 39.2
90,988 27,888 63,100 63,700 36,425 1,528 25,747 27,28851,555 27,662 63,893 63,667 39,415 1,476 22,776 27,888100.0 30.7 69.3 100.0 57.2 2.4 40.4-0.6 0.8 -1.2 0.1 -7.6 3.5 13.0 -2.2
2,770 654 2,116 2,0113 1,165 104 814 6872,618 732 1,886 1,964 1,140 134 690 654100.0 23.6 76.4 100.0 55.9 5.0 39.15.8 -10.7 12.2 6.1 2.2 -22.4 18.0 5.0
5,613 2,516 3,097 3,690 1,497 12 2,181 1,9235,279 2,564 2,715 2,763 1,270 6 1,487 2,516100.0 44.8 55.2 100.0 40.6 0.3 59.16.3 -1.9 14.1 33.6 17.9 100.0 46.7 -23.6
13,177 3,667 9,510 9,368 5,513 519 3,336 3,80912,364 3,637 8,727 8,697 4,916 418 3,363 3,667 QD
U-1100.0 27.8 72.2 100.0 58.8 5.5 35.6 ,--#
6.6 0.8 9.0 7.7 12.1 24.2 -0.8 3.9
35,198 9,211 25,987 25,624 15,635 290 9,699 9,57437,781 9,481 28,300 28,570 19,257 288 9,025 9,211100.0 26.2 73.8 100.0 61.0 1.1 37.9-6.8 -2.8 -8.2 -10.3 -18.8 0.7 7.5 3.9
18,875 5,547 13,328 13,559 7,774 254 5,531 5,31618,355 5,005 13,350 12,808 8,079 277 4,452 5,547100.0 29.4 70.6 100.0 57.3 1.9 40.82.8 10.8 -0.2 5.9 -3.8 -8.3 24.2 -4.2
12,834 5,393 7,441 7,607 3,805 287 3,515 5,22712,477 5,196 7,281 7,084 3,669 296 3,119 5,393100.0 42.0 58.0 100.0 50.0 3.8 46.2
2.9 3.8 2.2 7.4 3.7 -3.0 12.7 -3.1
63 16 47 46 33 2 11 17126 15 111 110 73 13 24 16100.0 25.4 74.6 100.0 71.7 4.3 23.9
-50.0 6.7 -57.7 -58.2 -54.8 -84.6 -54.2 6.3
1,804 775 1,029 1,159 691 9 459 6451,906 890 1,016 1,131 689 8 434 775100.0 43.0 57.0 100.0 59.6 0.8 39.6-5.4 -12.9 1.3 2.5 0.3 12.5 5.8 -16.8
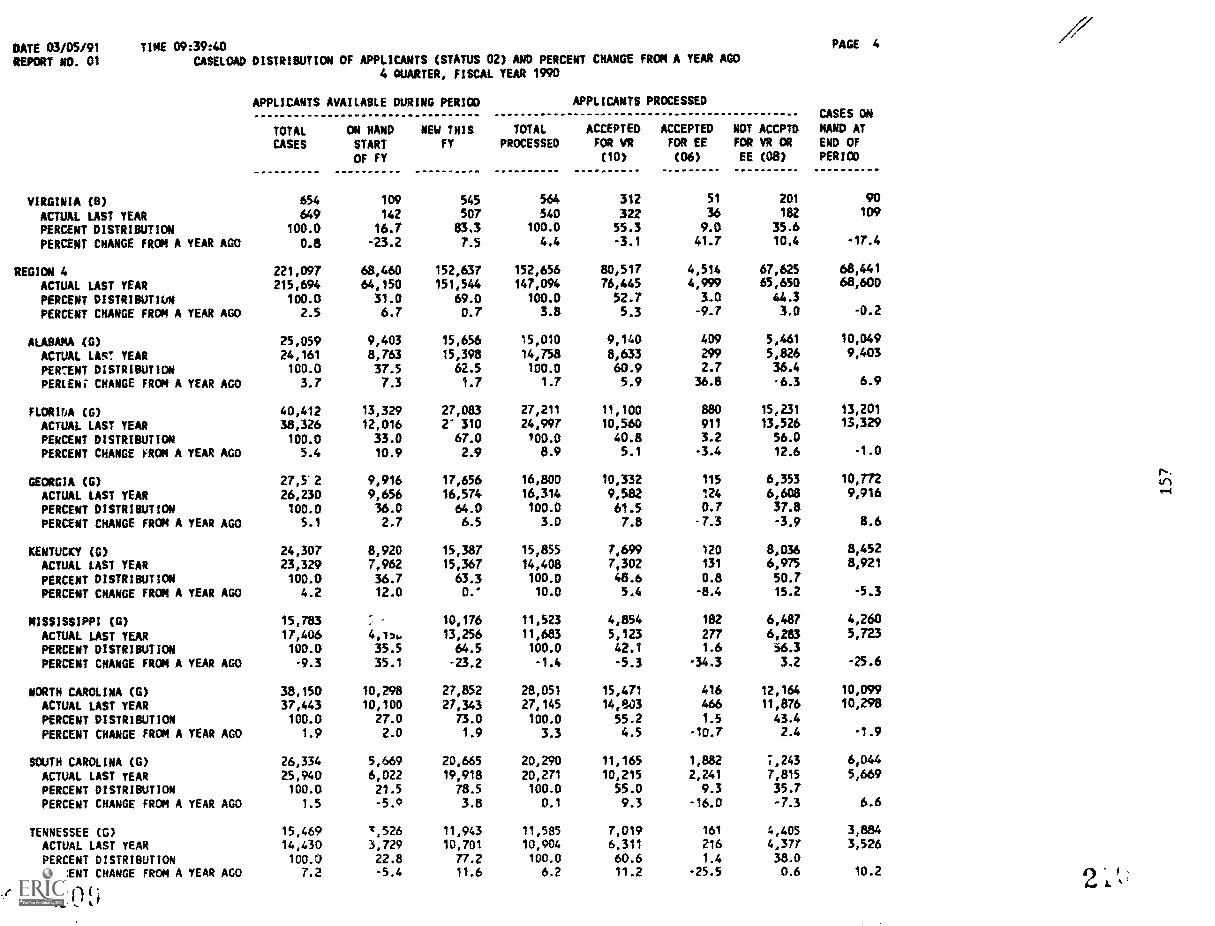
DATE 03/05/91REPORT ND. 01
TIME e9:39:40CASELOAD DISTRIBUTION OF APPLICANTS (STATUS 02) AND PERCENT CHANGE FRCM A YEAR AGO
4 DUARTER, FISCAL YEAR 1990
PAGE 4
APPLICANTS AVAILABLE DURING PERIOD
TOTAL ON HAND NEW THIS
CASES START FY
OF FY
TOTALPROCESSED
APPLICANTS PROCESSED
ACCEPTED ACCEPTEDFOR VR FOR EE
(10) (06)
NOT ACCPTDFOR VR OR
EE (08)
CASES ON
HAND ATEND OFPERICO
VIRGINIA (8) 654 109 545 564 312 51 201 90
ACTUAL LAST YEAR 649 142 507 540 322 36 182 109
PERCENT DISTRIBUTION 100.0 16.7 83.3 100.0 55.3 9.0 35.6
PERCENT CHANGE FROM A YEAR AGO 0.8 -23.2 7.5 4.4 -3.1 41.7 10.4 -17.4
REGION 4 221,097 68,460 152,637 152,656 80,517 4,514 67,625 68,441
ACTUAL LAST YEAR 215,694 64,150 151,544 147,094 76,445 4,999 65,650 68,600
PERCENT DISTRIBUTION 100.0 31.0 69.0 100.0 52.7 3.0 44.3
PERCENT CHANGE FROM A YEAR AGO 2.5 6.7 0.7 3.8 5.3 -9.7 3.0 -0.2
ALABAMA (G) 25,059 9,403 15,656 15,010 9,140 409 5,461 10,049
ACTUAL LAST YEAR 24,161 8,763 15,398 14,753 8,633 299 5,826 9,403
PEKINT DISTRIBUTION 100.0 37.5 62.5 100.0 60.9 2.7 36.4
PERLIN; CHANGE FROM A YEAR AGO 3.7 7.3 1.7 1.7 5.9 36.8 -6.3 6.9
FLORIDA (6) 40,412 13,329 27,083 27,211 11,100 880 15,231 13,201
ACTUAL LAST YEAR 38,326 12,016 2' 310 24,997 10,560 911 13,526 13,329
PERCENT DISTRIBUTION 100.0 33.0 67.0 100.0 40.8 3.2 56.0
PERCENT CHANGE FROM A YEAR AGO 5.4 10.9 2.9 8.9 5.1 -3.4 12.6 -1.0
GEORGIA (6) 27,5' 2 9,916 17,656 16,800 10,332 115 6,353 10,772
ACTUAL LAST YEAR 26,230 9,656 16,574 16,314 9,582 124 6,608 9,916
PERCENT DISTRIBUTION 100.0 36.0 64.0 100.0 61.5 0.7 37.8
PERCENT CHANGE FROM A YEAR AGO 5.1 2.7 6.5 3.0 7.8 -7.3 -3.9 8.6
KENTUCKY (G) 24,307 8,920 15,387 15,855 7,649 120 8,036 8,452
ACTUAL LAST YEAR 23,329 7,962 15,367 14,408 7,302 131 6,975 8,921
PERCENT DISTRIBUTION 100.0 36.7 63.3 100.0 48.6 0.8 50.7
PERCENT CHANGE FROM A YEAR AGO 4.2 12.0 0.' 10.0 5.4 -8.4 15.2 -5.3
MISSISSIPPI (G) 15,783_
10,176 11,523 4,854 182 6,487 4,260
ACTUAL LAST YEAR 17,406 4,1)L. 13,256 11,683 5,123 277 6,283 5,723
PERCENT DISTRIBUTION 100.0 35.5 64.5 100.0 42.1 1.6 56.3
PERCENT CHANGE FROM A YEAR AGO -9.3 35.1 -23.2 -1.4 -5.3 -34.3 3.2 -25.6
NORTH CAROLINA (6) 38,150 10,298 27,852 28,051 15,471 416 12,164 10,099
ACTUAL LAST YEAR 37,443 10,100 27,343 27,145 14,e4)3 466 11,876 10,298
PERCENT DISTRIBUTION 100.0 27.0 73.0 100.0 55.2 1.5 43.4
PERCENT CHANGE FROM A YEAR AGO 1.9 2.0 1.9 3.3 4.5 -10.7 2.4 -1.9
SOUTH CAROLINA (G) 26,334 5,669 20,665 20,290 11,165 1,882 7,243 6,044
ACTUAL LAST YEAR 25,940 6,022 19,918 20,271 10,215 2,241 7,815 5,669
PERCENT DISTRIBUTION 100.0 21.5 78.5 100.0 55.0 9.3 35.7PERCENT CHANGE FROM A YEAR AGO 1.5 -5.9 3.8 0.1 9.3 -16.0 -7.3 6.6
TENNESSEE (6) 15,469 1,526 11,943 11,585 7,019 161 4,405 3,884
ACTUAL LAST YEAR 14,430 3,729 10,701 10,904 6,311 216 4,377 3,526
PERCENT DISTRIBUTION 100.0 22.8 77.2 100.0 60.6 1.4 38.0PERCENT CHANGE FROM A YEAR AGO 7.2 -5.4 11.6 6.2 11.2 -25.5 0.6 10.2
2'L
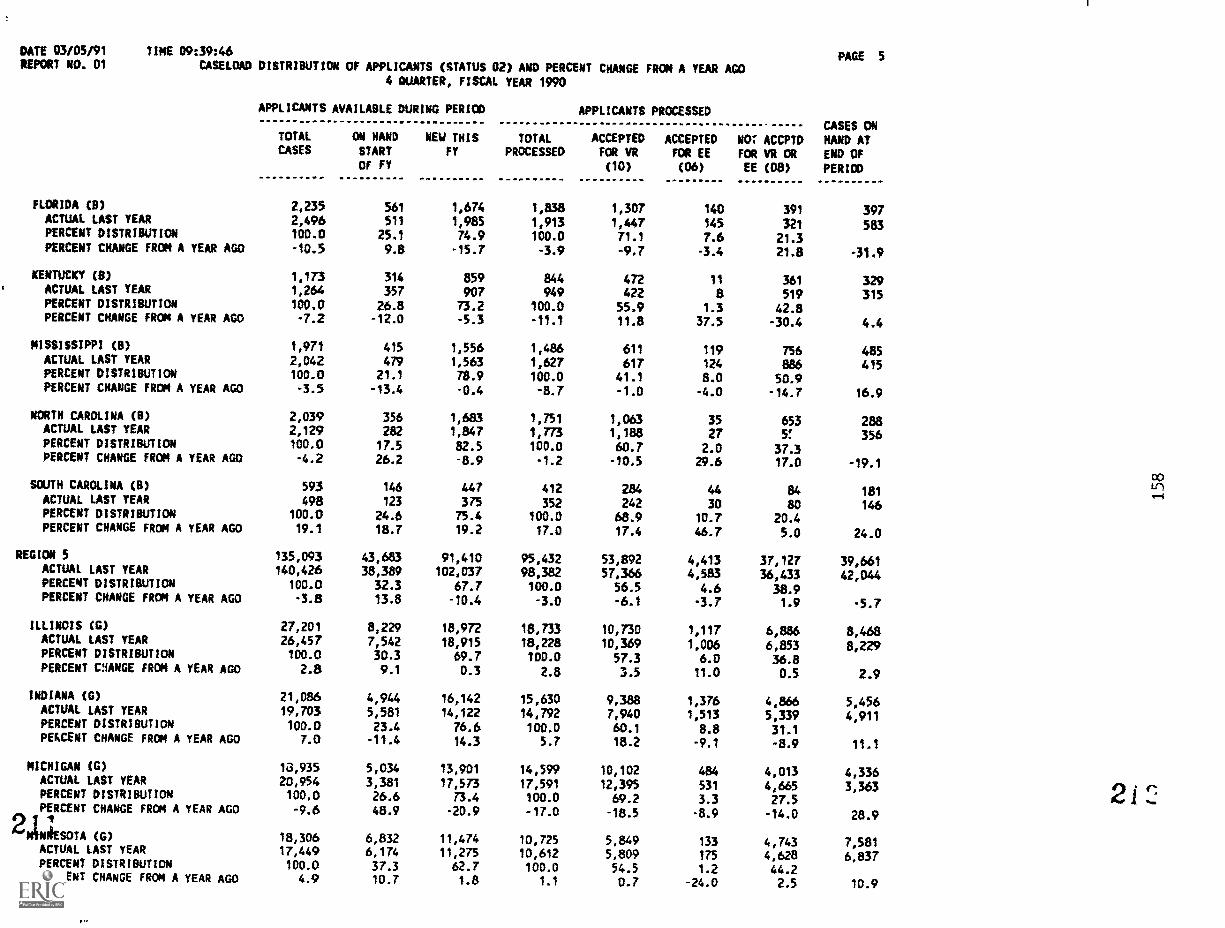
DATE 03/05/91 TIME 09:3946REPORT NO. 01 CASELOAD DISTRIOUTION OF APPLICANTS (STATUS 02) AND PERCENT CHANGE FROM A YEAR AGO
4 QUARTER, FISCAL YEAR 1990
APPLICANTS AVAILABLE DURING PERIOD APPLICANTS PROCESSED
TOTAL OM HAND NEW THIS TOTAL ACCEPTED ACCEPTED NO; ACCPTDCASES START FY PROCESSED FOR VR FOR EE FOR VR OR
OF FY (10) (06) EE (08)
PAGE 5
CASES ONHAND ATENO OF
PERIOD
FLORIDA (B) 2,235 561 1,674 1,838 1,307 140 391 397ACTUAL LAST YEAR 2,496 511 1,985 1,913 1,447 145 321 583PERCENT DISTRIBUTION 100.0 25.1 74.9 100.0 71.1 7.6 21.3PERCENT CHANGE FROM A YEAR AGO -10.5 9.8 -15.7 -3.9 -9.7 -3.4 21.8 -31.9
KENTUCKY (8) 1,173 314 859 844 472 11 361 329ACTUAL LAST YEAR 1,264 357 907 949 422 a 519 315PERCENT DISTRIBUTION 100.0 26.8 73.2 100.0 55.9 1.3 42.8PERCENT CHANGE FROM A YEAR AGO -7.2 -12.0 -5.3 -11.1 11.8 37.5 -30.4 4.4
MISSISSIPPI (B) 1,971 415 1,556 1,486 611 119 756 485ACTUAL LAST YEAR 2,042 479 1,563 1,627 617 124 886 415PERCENT DISTRIBUTION 100.0 21.1 78.9 100.0 41.1 8.0 50.9PERCENT CHANGE FROM A YEAR AGO -3.5 -43.4 -0.4 -8.7 -1.0 -4.0 -14.7 16.9
NORTH CAROLINA (B) 2,039 356 1,683 1,751 1,063 35 653 288ACTUAL LAST YEAR 2,129 282 1,847 1,773 1,188 27 5' 356PERCENT DISTRIBUTION 100.0 17.5 82.5 100.0 60.7 2.0 37.3PERCENT CHANGE FROM A YEAR AGO
SOUTH CAROLINA (B)
-4.2
593
26.2
146
-8.9
447
-1.2
412
-10.5
254
29.6
44
17.0
84
-19.1
181
opoo
u-1
ACTUAL LAST YEAR 498 123 375 352 242 30 80 146PERCENT DISTRIBUTION 100.0 24.6 75.4 100.0 68.9 10.7 20.4PERCENT CHANGE FROM A YEAR AGO 19.1 18.7 19.2 17.0 17.4 46.7 5.0 24.0
REGION 5 135,093 43,683 91,410 95,432 53,892 4,413 37,127 39,661ACTUAL LAST YEAR 140,426 38,389 102,037 98,382 57,366 4,583 36,433 42,044PERCENT DISTRIBUTION 100.0 32.3 67.7 100.0 56.5 4.6 38.9PERCENT CHANGE FROM A YEAR AGO -3.8 13.8 -10.4 -3.0 -6.1 -3.7 1.9 -5.7
ILLINOIS (0 27,201 8,229 18,972 18,733 10,730 1,117 6,886 8,468ACTUAL LAST YEAR 26,457 7,542 18,915 18,228 10,369 1,006 6,853 8,229PERCENT DISTRIBUTION 100.0 30.3 69.7 100.0 57.3 6.0 36.8PERCENT CHANGE FROM A YEAR AGO 2.8 9.1 0.3 2.8 3.5 11.0 0.5 2.9
INDIANA (6) 21,056 4,944 16,142 15,630 9,388 1,376 4,866 5,456ACTUAL LAST YEAR 19,703 5,581 14,122 14,792 7,940 1,513 5,339 4,911PERCENT DISTRIBUTIoN 100.0 23.4 76.6 100.0 60.1 $.8 31.1PERCENT CHANGE FROM A YEAR AGO 7.0 -11.4 14.3 5.7 18.2 -9.1 -8.9 11.1
MICHIGAN (G) 13,935 5,034 13,901 14,599 10,102 484 4,013 4,336ACTUAL LAST YEAR 20,954 3,381 17,573 17,591 12,395 531 4,665 3,363PERCENT DISTRIBUTION 100.0 26.6 73.4 100.0 69.2 3.3 27.5PERCENT CHANGE FROM A YEAR AGO
21/4ESOTA (0)
-9.6
18,306
48.9
6,832
-20.9
11,474
-17.0
10,725
-18.5
5,849
-8.9
133
-14.0
4,743
28.9
7,581ACTUAL LAST YEAR 17,449 6,174 11,275 10,612 5,809 175 4,628 6,837PERCENT DISTRIBUTION 100.0 37.3 62.7 100.0 54.5 1.2 44.2PERCENT CHANGE FROM A YEAR AGO 4.9 10.7 1.8 1.1 0.7 -24.0 2.5 10.9
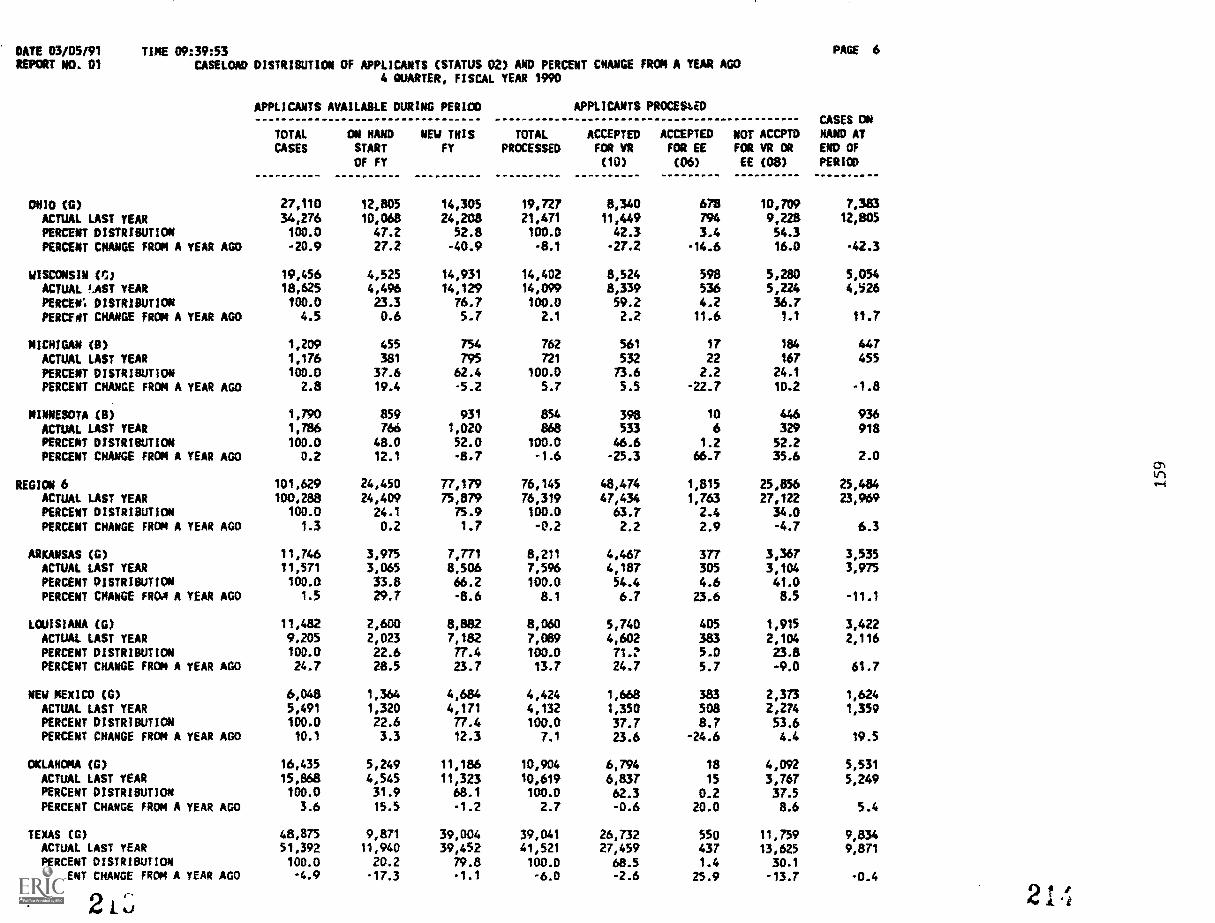
DATE 03/05/91REPORT NO. 01
TIME 09:39:53CASELOAD DISTRIBUTION OF APPLICANTS (STATUS 02) AND PERCENT CHANGE FRON A YEAR AGO
4 QUARTER, FISCAL YEAR 1990
PAGE 6
APPLICANTS AVAILABLE DURING PERIOD
TOTAt ON HAND NEW THISCASES START FY
OF FY
TOTALPROCESSED
APPLICANTS PROCEStED
ACCEPTED ACCEPTEDFOR VR FOR EE
(10) (06)
NOT ACCPTDFOR VR OR
EE (08)
CASES ONNAND ATEND OFPERIOD
OHIO (G) 27,110 12,805 14,305 19,727 8,340 678 10,709 7,383
ACTUAL LAST YEAR 34,276 10,068 24,208 21,471 11,449 794 9,228 12,805
PERCENT DISTRIBUTICW 100.0 47.2 52.8 100.0 42.3 3.4 54.3
PERCENT CHANGE FROM A YEAR AGO -20.9 27.2 -40.9 -8.1 -27.2 -14.6 16.0 -42.3
WISCONSIN (1;) 19,456 4,525 14,931 14,402 8,524 598 5,280 5,054ACTUAL !AST YEAR 18,625 4,496 14,129 14,099 8,339 536 5,224 4,526
PERCEC DISTRIBUTICW 100.0 23.3 76.7 100.0 59.2 4.2 36.7PERCFNT CHANGE FROM A YEAR AGO 4.5 0.6 5.7 2.1 2.2 11.6 1.1 11.7
MICHIGAN (8) 1,209 455 754 762 561 17 184 447ACTUAL LAST YEAR 1,176 381 795 721 532 22 167 455
PERUNT DISTRIBUTION 100.0 37.6 62.4 100.0 73.6 2.2 24.1
PERCENT CHANGE FROM A YEAR AGO 2.8 19.4 -5.2 5.7 5.5 -22.7 10.2 -1.8
MINNESOTA (8) 4,790 859 931 854 398 10 446 936ACTUAL LAST YEAR 1,786 766 1,020 868 533 6 329 918PERCENT DISTRIBUTION 100.0 48.0 52.0 100.0 46.6 1.2 52,2PERCENT CHANGE FROM A YEAR AGO 0.2 12.1 -8.7 -1.6 -25.3 66.7 35.6 2.0
REGION 6 101,629 24,450 77,179 76,145 48,474 1,815 25,856 25,484ACTUAL LAST YEAR 100,288 24,409 75,879 76,319 47,434 1,763 27,122 23,969PERCENT DISTRIBUTICW 100.0 24.1 75.9 100.0 63.7 2.4 34.0PERCENT CHANGE FROM A YEAR AGO 1.3 0.2 1.7 -0.2 2.2 2.9 -4.7 6.3
ARKANSAS (G) 11,746 3,975 7,771 8,211 4,467 377 3,367 3,535ACTUAL LAST YEAR 11,571 3,065 8506 7,596 4,187 305 3,104 3,975PERCENT DISTRIBUTION 100.0 33.8 66.2 100.0 54.4 4.6 41.0PERCENT CHANGE FROA A YEAR AGO 1.5 29.7 -8.6 8.1 6.7 23.6 8.5 -11.1
LOUISIANA (0) 11,482 2,600 8,882 8,060 5,740 405 1,915 3,422ACTUAL LAST YEAR 9,205 2,023 7,182 7,089 4,602 383 2,104 2,116PERCENT DISTRIBUTION 100.0 22.6 77.4 100.0 71.? 5.0 23.8PERCENT CHANGE FROM A YEAR AGO 24.7 28.5 23.7 13.7 24.7 5.7 -9.0 61.7
NEW MEXICO (G) 6,048 1,364 4,684 4,424 1,668 383 2,373 1,624ACTUAL LAST YEAR 5,491 1,320 4,171 4,132 1,350 508 2,274 1,359PERCENT DISTRIBUTION 100.0 22.6 77.4 100.0 37.7 8.7 53.6PERCENT CHANGE FROM A YEAR AGO 10.1 3.3 12.3 7.1 23.6 -24.6 4.4 19.5
OKLAHOMA (G) 16,435 5,249 11,186 10,904 6,794 18 4,092 5,531ACTUAL LAST YEAR 15,868 4,545 11,323 10,619 6,837 15 3,767 5,249PERCENT DISTRIBUTION 100.0 31.9 68.1 100.0 62.3 0.2 37.5PERCENT CHANGE FROM A YEAR AGO 3.6 15.5 -1.2 2.7 -0.6 20.0 8.6 5.4
TEXAS (G) 48,875 9,871 39,004 39,041 26,732 550 11,759 9,834ACTUAL LAST YEAR 51,392 11,940 39,452 41,521 27,459 437 13,625 9,871PERCENT DISTRISUTIoN 100.0 20.2 79.8 100.0 68.5 1.4 30.1PERCENT CHANGE FROM A YEAR AGO -4.9 -17.3 -1.1 -6.0 -2.6 25.9 -13.7 -0.4
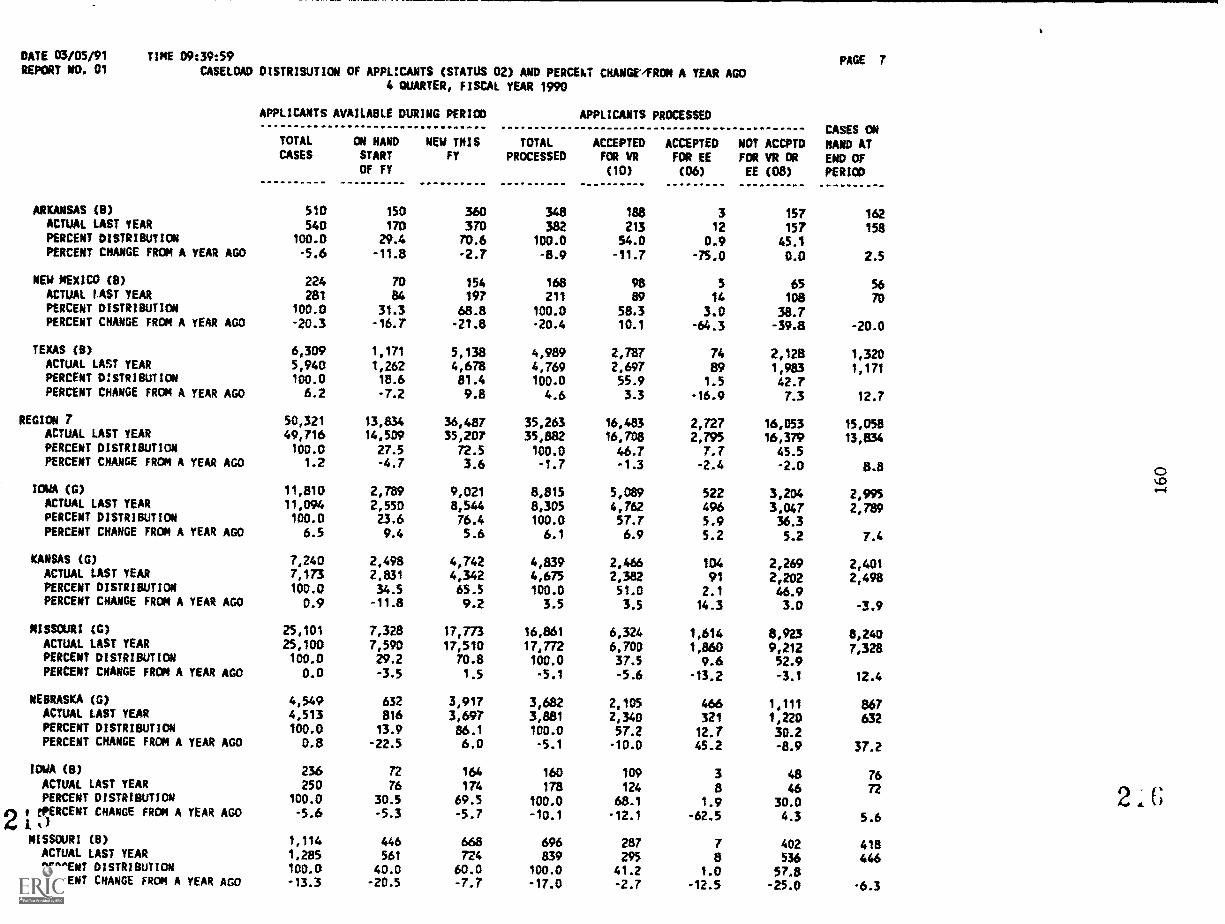
DATE 03/05/91REPORT NO. 01
TIME 09:3959
CASELOAD DISTRIBUTION OF APPLICANTS (STATUS 02) AND PERCEIT CHANGE/FROM A YEAR AGO4 QUARTER, FISCAL YEAR 1990
ARKANSAS (0)ACTUAL LAST YEARPERCENT DISTRIBUTIONPERCENT CHANGE FROM A YEAR AGO
MEW MEXICO (8)ACTUAL IAST YEARPERCENT DISTRIBUTIONPERCENT CHANGE FROM A YEAR AGO
TEXAS (0)ACTUAL LAST YEARPERCENT DISTRIBUTION
PERCENT CHANGE FROM A YEAR AGO
REGION 7ACTUAL LAST YEARPERCENT DISTRIBUTICNPERCENT CHANGE FROM A YEAR AGO
IOWA (G)
ACTUAL LAST YEARPERCENT DISTRIBUTIONPERCENT CHANGE FROM A YEAR AGO
KANSAS (0)ACTUAL LAST YEARPERCENT DISTRIBUTIONPERCENT CHANGE FROM A YEAR AGO
MISSOURI CG)ACTUAL LAST YEARPERCENT DISTRIBUTIONPERCENT CHANGE FROM A YEAR AGO
NEBRASKA (G)ACrUAL LAST YEARPERCENT DISTRIBUTIONPERCENT CHANGE FROM A YEAR AGO
IOWA (B)
ACTUAL LAST YEARPERCENT DISTRIBUTION
2t rPERCENT CHANGE FROM A YEAR AGOI. t)MISSOURI (B)ACTUAL LAST YEARPERCENT DISTRIBUTIONPERCENT CHANGE FROM A YEAR AGO
APPLICANTS AVAILABLE DURING PERIOD
TOTAL ON HAND NEW THISCASES START FY
OF FY
TOTALPROCESSED
APPLICANTS PROCESSED
ACCEPTED ACCEPTEDFOR YR FOR EE
(10) (06)
NOT ACCPTDFOR VR DR
EE (08)
510 150 360 348 188 3 157540 170 370 382 213 12 157
100.0 29.4 70.6 100.0 54.0 0.9 45.1-5.6 -11.8 -2.7 -8.9 -11.7 -75.0 0.0
224 ro 154 168 98 5 65281 84 197 211 89 14 108
100.0 31.3 68.8 100.0 58.3 3.0 38.7-20.3 -16.7 -21.8 -20.4 10.1 -64.3 -39.8
6,309 1,171 5,138 4,989 2,787 74 2,1285,940 1,262 4,678 4,769 2,697 89 1,983100.0 18.6 81.4 100.0 55.9 1.5 42.76.2 -7.2 9.8 4.6 3.3 -16.9 7.3
50,321 13,834 36,487 35,263 16,483 2,727 16,05349,716 14,509 35,207 35,882 16,708 2,795 16,379100.0 27.5 72.5 100.0 46.7 7.7 45.5
1.2 -4.7 3.6 -1.7 -1.3 -2.4 -2.0
11,810 2,789 9,021 8,815 5,089 522 3,20411,094 2,550 8,544 8,305 4,762 496 3,047100.0 23.6 76.4 100.0 57.7 5.9 36.36.5 9.4 5.6 6.1 6.9 5.2 5.2
7,240 2,498 4,742 4,839 2,466 104 2,2697,173 2,831 4,342 4,675 2,382 91 2,202100.0 34.5 65.5 100.0 51.0 2.1 46.90.9 -11.8 9.2 3.5 3.5 14.3 3.0
25,101 7,328 17,773 16,861 6,324 1,614 8,92325,100 7,590 17,510 17,772 6,700 1,860 9,212100.0 29.2 70.8 100.0 37.5 9.6 52.90.0 -3,5 1.5 -5.1 -5.6 -13.2 -3.1
4,549 632 3,917 3,682 2,105 466 1,1114,513 816 3,697 3,881 2,340 321 1,220100.0 13.9 86.1 100.0 57.2 12.7 30.20.8 -22.5 6.0 -5.1 -10.0 45.2 -8.9
236 72 164 160 109 3 48250 76 174 178 124 8 46
100.0 30.5 69.5 100.0 68.1 1.9 30.0-5.6 -5.3 -5.7 -10.1 -12.1 -62.5 4.3
1,114 446 668 696 287 7 4021,285 561 724 839 295 a 536100.0 40.0 60.0 100.0 41.2 1.0 57.8-13.3 -20.5 -7.7 -17.0 -2.7 -12.5 -25.0
PAGE 7
CASES ONHAND ATEND OF
PERIOD
162
158
2.5
5670
-20.0
1,3201,171
12.7
15,058
13,834
8.8
2,9952,789
7.4
2,4012,498
-3.9
8,2407,328
12.4
867632
37.2
76
ra
5.6
418446
-6.3
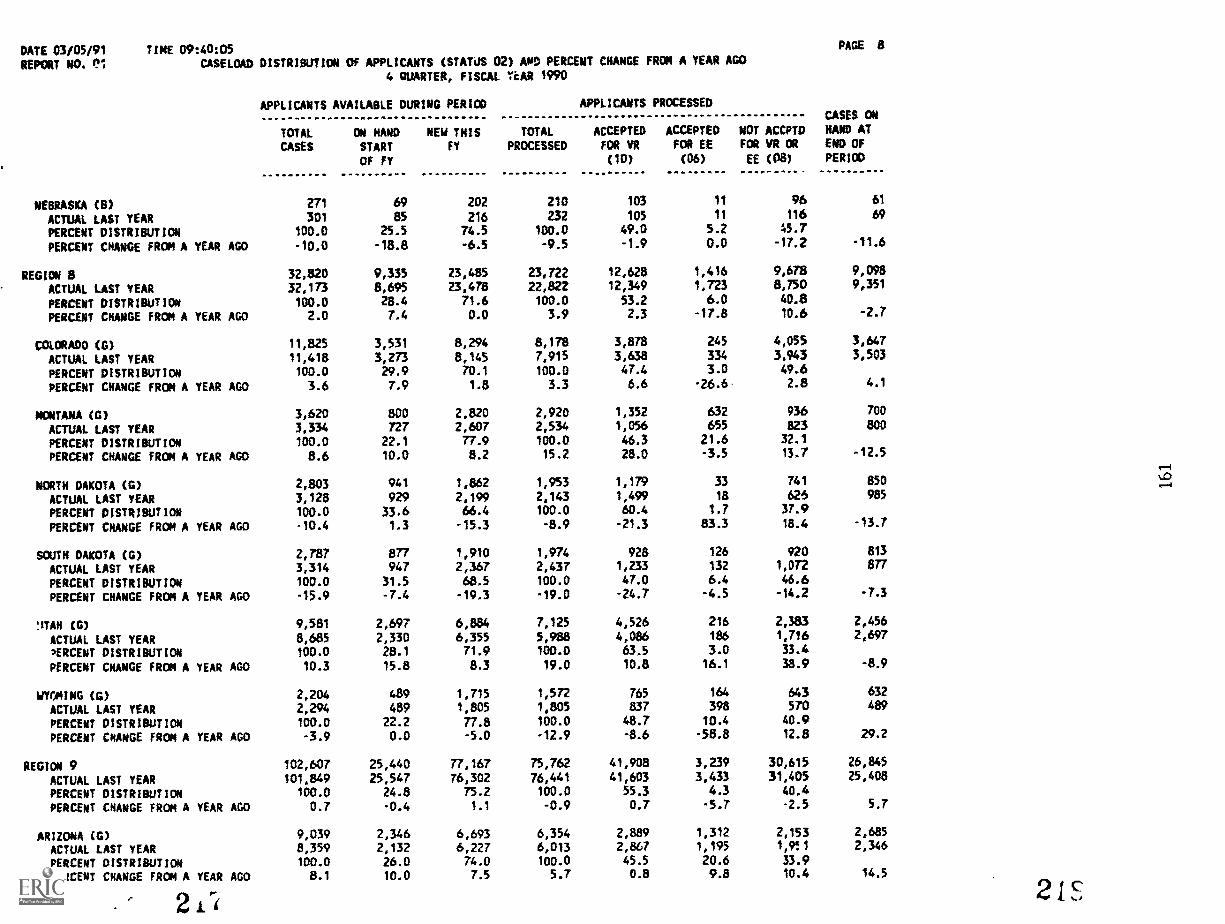
DATE 03/05/91REPORT NO. el
TIME 09:40:05CASELOAD DISTRIBUTION CI APPLICANTS (STATUS 02) AND PERCENT CHANGE FROM A YEAR AGO
4 QUARTER, FISCAL YEAR 1990
PAGE 8
APPLICANTS AVAILABLE DURING PERIOD
TOTAL ON HAND NEW TNIS
CASES START FY
OF FY
TOTALPROCESSED
APPLICANTS PROCESSED
ACCEPTED ACCEPTEDFOR VR FCR EE
(10) (06)
NOT ACCPTDFOR VR OR
EE (08)
CASES ONNANO ATEND OF
PERIOD
NEBRASKA (B) 271 69 202 210 103 11 96 61
ACTUAL LAST YEAR 301 85 216 232 105 11 116 69
PERCENT DISTRIBUTICN 100.0 25.5 74.5 100.0 49.0 5.2 45.7
PERCENT CHANGE FROM A YEAR AGO -10.0 -18.8 -6.5 -9.5 -1.9 0.0 -17.2 -11.6
REGION 8 32,820 9,335 23,485 23,722 12,628 1,416 9,678 9,098
ACTUAL LAST YEAR 32,173 8,695 23,478 22,822 12,349 1,723 8,750 9,351
PERCENT DISTRIBUTION 100.0 28.4 71.6 100.0 53.2 6.0 40.8
PERCENT CHANGE FROM A YEAR Aro 2.0 7.4 0.0 3.9 2.3 -17.8 10.6 -2.7
COLORADO (0) 11,825 3,531 8,294 8,178 3,878 245 4,055 3,647
ACTUAL LAST YEAR 11,418 3,273 8,145 7,915 3,638 334 3,943 3,503
PERCENT DISTRIBUTION 100.0 29.9 70.1 100.0 47.4 3.0 49.6
PERCENT CHANGE FROM A YEAR AGO 3.6 7.9 1.8 3.3 6.6 -26.6 2.8 4.1
MCNTANA (0) 3,620 800 2,820 2,920 1,352 632 936 700
ACTUAL LAST YEAR 3,334 727 2,607 2,534 1,056 655 823 800
PERCENT DISTRIBUTION 100.0 22.1 77.9 100.0 46.3 21.6 32.1
PERCENT CHANGE FROM A YEAR AGO 8.6 10.0 8.2 15.2 28.0 -3.5 13.7 -12.5
NORTH DAKOTA (G) 2,803 941 1,862 1,953 1,179 33 741 850
ACTUAL LAST YEAR 3,128 929 2,199 2,143 1,499 18 626 985
PERCENT DISTRIBUTION 100.0 33.6 66.4 100.0 60.4 1.7 37.9
PERCENT CHANGE FROM A YEAR AGO -10.4 1.3 -15.3 -8.9 -21.3 83.3 18.4 -13.7
SOUTH DAKOTA (G) 2,7137 877 1,910 1,974 928 126 920 813
ACTUAL LAST YEAR 3,314 947 2,367 2,437 1,233 132 1,072 877
PERCENT DISTRIBUTION 100.0 31.5 68.5 100.0 47.0 6.4 46.6
PERCENT CHANGE FROM A YEAR AGO -15.9 -7.4 -19.3 -19.0 -24.7 -4.5 -14.2 -7.3
'ITAH (0) 9,581 2,697 6,884 7,125 4,526 216 2,383 2,456
ACTUAL LAST YEAR 8,685 2,330 6,355 5,988 4,086 186 1,716 2,697
PERCENT DISTRIBUTION 100.0 28.1 71.9 100.0 63.5 3.0 33.4
PERCENT CHANGE FROM A YEAR AGO 10.3 15.8 8.3 19.0 10.8 16.1 38.9 -8.9
WYCMING (0) 2,204 489 1,715 1,572 765 164 643 632
ACTUAL LAST YEAR 2,294 489 1,805 1,805 837 398 570 489
PERCENT DISTRIBUTICN 100.0 22.2 77.8 100.0 48.7 10.4 40.9
PERCENT CHANGE FROM A YEAR AGO -3.9 0.0 -5.0 -12.9 -8.6 -58.8 12,8 29.2
REGION 9 102,607 25,440 77,167 75,762 41,908 3,239 30,615 26,845
ACTUAL LAST YEAR 101,849 25,547 76,302 76,441 41,603 3,433 31,405 25,408
PERCENT DISTRIBUTICW 100.0 24.8 75.2 100.0 55.3 4.3 40.4
PERCENT CHANGE FROM A YEAR AGO 0.7 -0.4 1.1 -0.9 0.7 -5.7 -2.5 5.7
ARIZONA (0) 9,039 2,346 6,693 6,354 2,889 1,312 2,153 2,685
ACTUAL LAST YEAR 8,359 2,132 6,227 6,013 2,867 1,195 1,951 2,346
PERCENT DISTRIBUTION 100.0 26.0 74.0 100.0 45.5 20.6 33.9
PERCENT CHANGE FROM A YEAR AGO 8.1 10.0 7.5 5.7 0.8 9.8 10.4 14.5
2 't
2 c
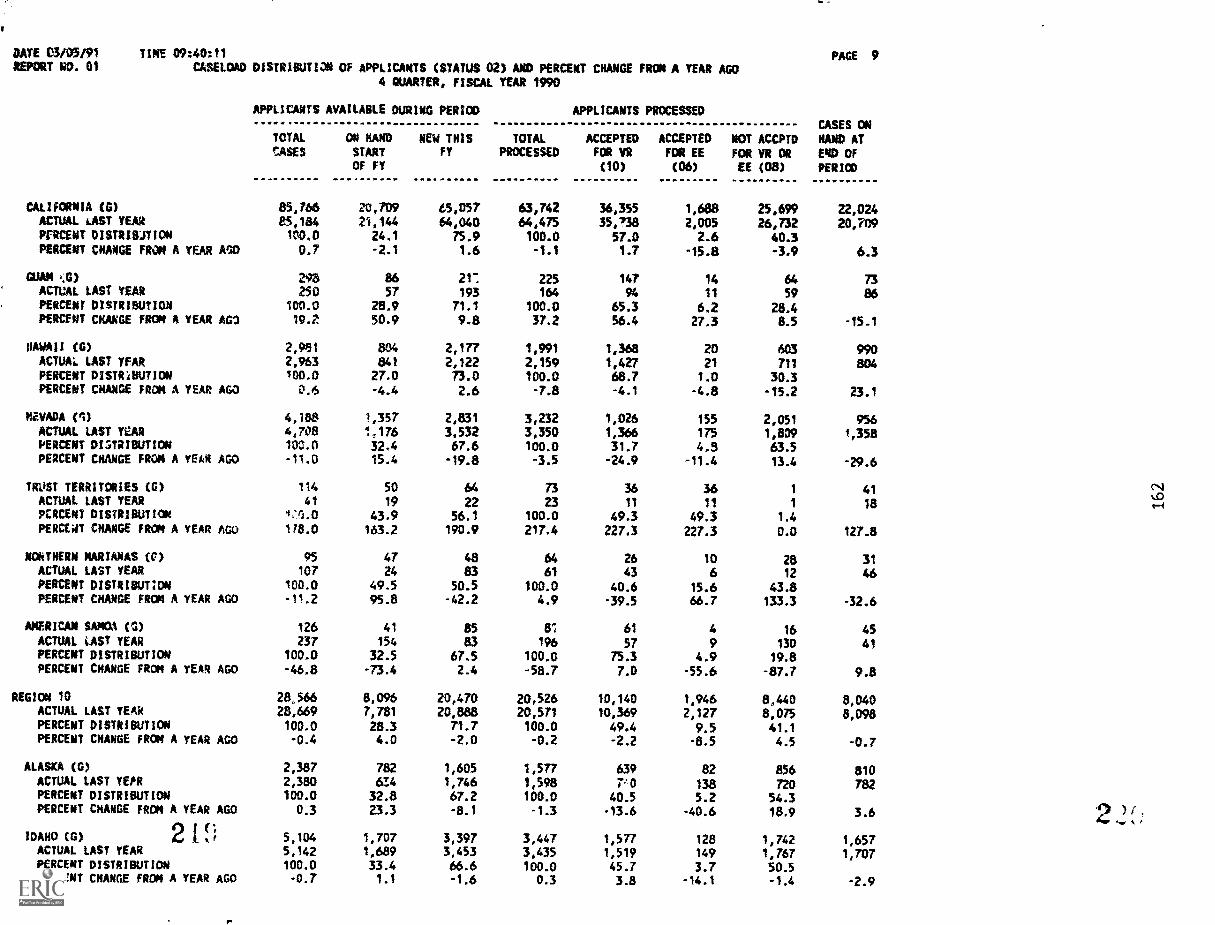
DATE 03/05/91REPORT NO. 01
TINE 09:4001CASELOAD DISTRIBUTION OF APPLICANTS (STATUS 02) AND PERCENT CHANGE FROM A YEAR AGO
4 QUARTER, FISCAL YEAR 1990
CALIFORNIA CO)ACTUAL LAST YEARPERCENT DISTRIBJTION
PERCENT CHANGE FRON A TEAR ASO
GUAM 01)ACTUAL LAST YEARPERCENT DISTRIBUTIONPERCENT CRANGE FROM A YEAR AO
HAWAII (G)ACTUAL LAST YEARPERCENT DISTRiBUTIONPERCENT CHANGE FROM A YEAR AGO
NEVADA (S)
ACTUAL LAST YEARPERCENT DIGTRIBUTIONPERCENT CHANGE FROM A YEAR AGO
TROST TERRITORIES (G)ACTUAL LAST YEARPERCENT DISTRIBUTIONPERCEWT CNANGE FROM A YEAR AGO
AMTHERN KARIANAS (0)ACTUAL LAST YEAR
PERCENT DISTRIBUTIONPERCENT CHANGE FROP1 A YEAR AGO
AMERICAN SAMOA (2)
ACTUAL LAST YEARPERCENT DISTRIBUTIONPERCENT CHANGE FROM A YEAR AGO
REGION 10ACTUAL LAST YEAR
PERCENT DISTRIBUTICWPERCENT CHANGE FROM A YEAR AGO
ALASKA COACTUAL LAST YEPRPERCENT DISTRIBUTIONPERCENT CHANGE FROM A YEAR AGO
IDAHO (G) 2 1 (.3ACTUAL LAST YEARPERCENT DISTRIBUTIONPERCENT CHANGE FROM A YEAR AGO
PAGE 9
APPLICANTS AVAILABLE DURING PERIOD
TOTAL ON HAND NEW THISCASES START FY
OF FY
TOTALPROCESSED
APPLICANTS PROCESSED
ACCEPTED ACCEPTEDFOR VR FOR EE(10) (06)
NOT ACCPTD
FOR VR OREE (08)
CASES ONHAND ATEND OF
PERIOD
85,766 20,709 65,057 63,742 36,355 1,688 25,699 22,02485,184 21,144 64,040 64,475 35,738 2,005 26,732 20,709100.0 24.1 75.9 100.0 57.0 2.6 40.30.7 -2.1 1.6 -1.1 1.7 -15.8 -3.9 6.3
243 86 21-. 225 147 14 64 73250 57 193 164 94 11 59 86
100.0 28.9 71.1 100.0 65.3 6.2 28.419.2 50.9 9.8 37.2 56.4 273 8.5 -15.1
2,981 804 2,177 1,991 1,368 20 603 9902,963 841 2,122 2,159 1,427 21 711 804100.0 27.0 73.0 100.0 68.7 1.0 30.30.6 -4.4 2.6 -7.8 -4.1 -4.8 -15.2 23.1
4,188 1,357 2,831 3,232 1,026 155 2,051 9564,708 1,176 3,532 3,350 1,366 175 1,809 1,35810.1.0 32.4 67.6 100.0 31.7 4.3 63.5-11.0 15.4 -19.8 -3.5 -24.9 -11.4 13.4 -29.6
114 50 64 73 36 36 1 4141 19 22 23 11 11 1 18
1;0.0 43.9 56.1 100.0 49.3 49.3 1.4178.0 163.2 190.9 217.4 227.3 227.3 0.0 127.8
95 47 48 64 26 10 28 31107 24 83 61 43 6 12 46
100.0 49.5 50.5 100.0 40.6 15.6 43.8-11.2 95.8 -42.2 4.9 -39.5 66.7 133.3 -32.6
126 41 85 81 61 4 16 45237 154 83 196 57 9 130 41
100.0 32.5 67.5 100.0 75.3 4.9 19.8-46.8 -73.4 2.4 -58.7 7.0 -55.6 -87.7 9.8
28,566 8,096 20,470 20,526 10,140 1,946 8.440 8,04028,669 7,781 20,888 20,571 10,369 2,127 8,075 8,098100.0 28.3 71.7 100.0 49.4 9.5 41.1-0.4 4.0 -2.0 -0.2 -2.2 -8.5 4.5 -0.7
2,387 782 1,605 1,577 639 82 856 8102,380 61.4 1,746 1,598 70 138 720 782100.0 32.8 67.2 100.0 40.5 5.2 54.30.3 23.3 -8.1 -1.3 -13.6 -40.6 18.9 3.6
5,104 1,707 3,397 3,447 1,577 128 1,742 1,6575,142 1,689 3,453 3,435 1,519 149 1,767 1,707100.0 33.4 66.6 100.0 45.7 3.7 50.5-0.7 1.1 -1.6 0.3 3.8 -14.1 -1.4 -2.9
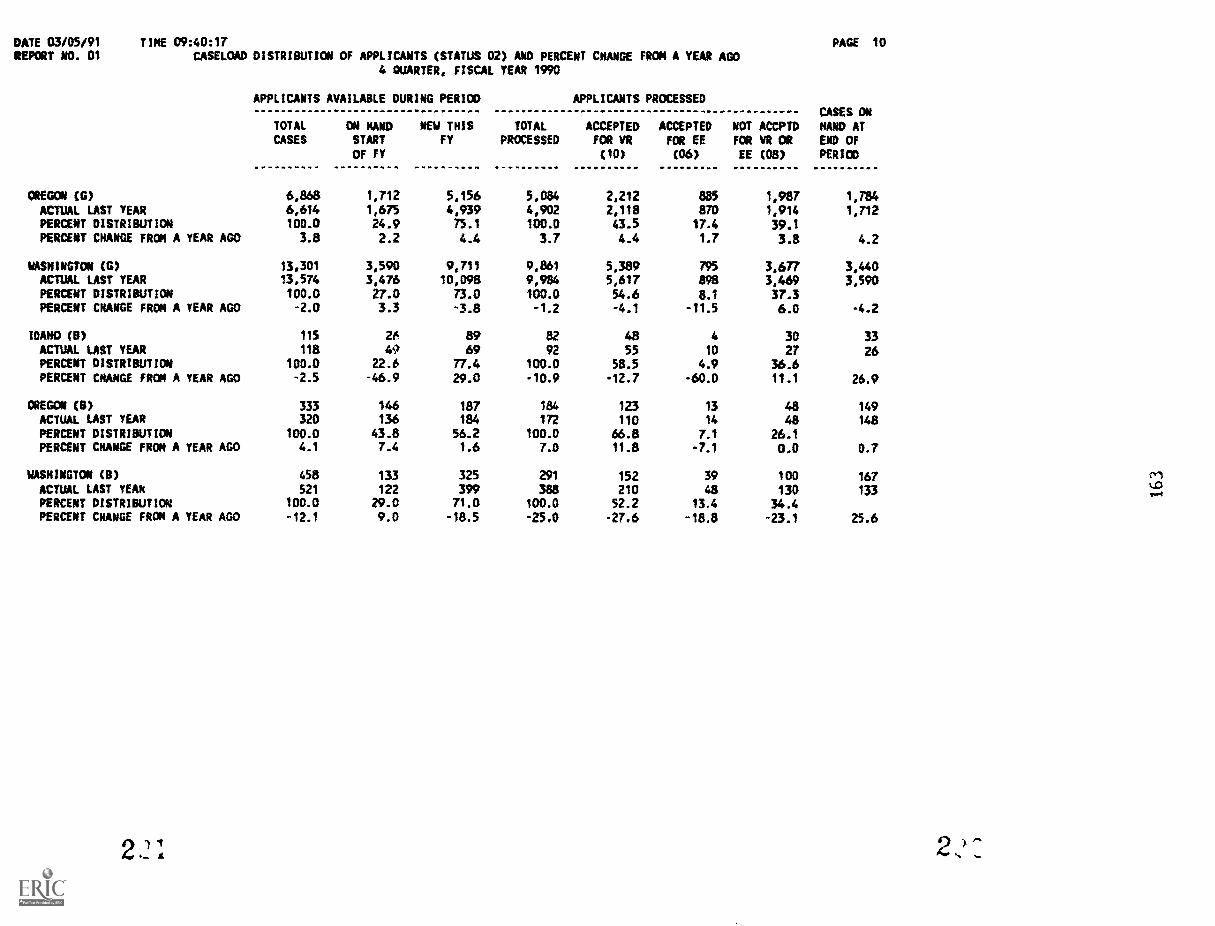
DATE 03/05/91REPORT NO. 01
TINE 09:40:17CASELOAD DISTRIBUTION OF APPLICANTS (STATUS 02) AND PERCENT CHANGE FROM A YEAR AGO
4 QUARTER. FISCAL YEAR 1990
PAGE 10
APPLICANTS AVAILABLE DURING PERIOD
TOTAL ON RAND MEW THISCASES START FY
CW FY
TOTALPRCCESSED
APPLICANTS PROCESSED
ACCEPTED ACCEPTEDFOR VR FOR EE(10) (06)
NOT ACCPTDFOR WV OREE (08)
CASES ON
HAND AT
END OFPERIOD
0*EGCN (0) 6,868 1,712 5,156 5,084 2,212 885 1,987 1,784ACTUAL LAST YEAR 6,614 1,675 4,939 4,902 2,118 870 1,914 1,712PERCENT DISTRIBUTION 100.0 24.9 75.1 100.0 43.5 17.4 39.1PERCENT CHANGE FROM A YEAR AGO 3.8 2.2 4.4 3.7 4.4 1.7 3.8 4.2
WASHINGTON (6) 13,301 3,590 9,711 9,861 5,389 795 3,677 3,440ACTUAL LAST YEAR 13,574 3,476 10,098 9,914 5,617 898 3,469 3,590PERCENT DISTRIBUTION 100.0 27.0 73.0 100.0 54.6 8.1 37.3PERCENT CHANGE FRON A YEAR AGO -2.0 3.3 -3.8 -1.2 -4.1 -11.5 6.0 -4.2
IDAHO (8) 115 26 89 82 48 4 30 33ACTUAL LAST YEAR 118 49 69 92 55 10 27 26PERCENT DISTRIBUTION 100.0 22.6 77.4 100.0 58.5 4.9 36.6PERCENT CHANGE FROM A YEAR AGO -2.5 -46.9 29.0 -10.9 -12.7 -60.0 11.1 26.9
OREGON (0) 333 146 187 184 123 13 48 149ACTUAL LAST YEAR 320 136 184 172 110 14 48 148PERCENT DISTRIBUTION 100.0 43.8 56.2 100.0 66.8 7.1 26.1PERCENT CHANGE FROM A YEAR AGO 4.1 7.4 1.6 7.0 11.8 -7.1 0.0 0.7
WASHINGTON (B) 458 133 325 291 152 39 100 167ACTUAL LAST YEAR 521 122 399 388 210 48 130 133PERCENT DISTRIBUTION 100.0 29.0 71.0 100.0 52.2 13.4 34.4PERCENT CHANGE FROM A YEAR AGO -12.1 9.0 -18.5 -25.0 -27.6 -18.8 -23.1 25.6
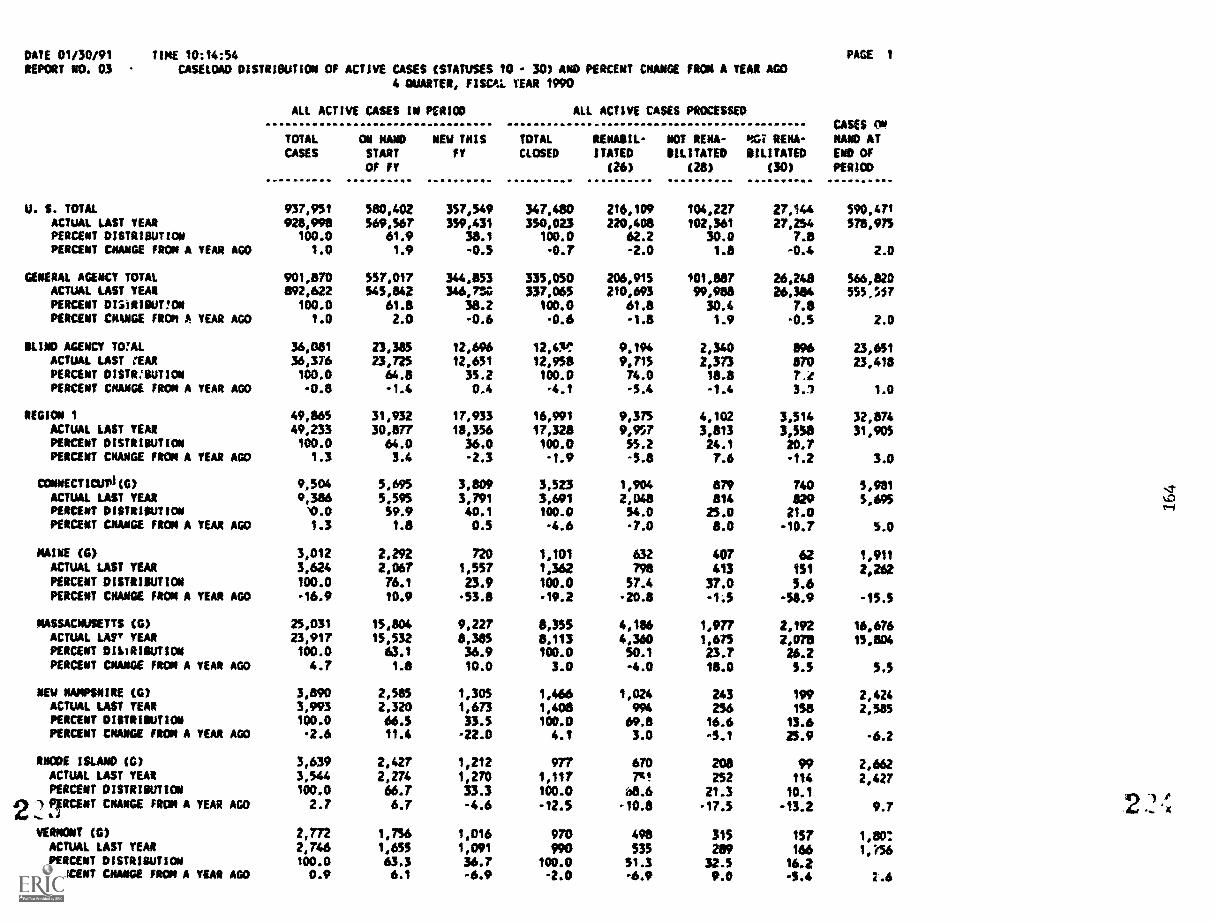
DATE 01/30/91REPORT NO. 03
TIME 10:14:54CASELOAD DISTRIBUTION Of ACTIVE CASES (wAruses ut 30) AND PERCENT CHANGE FRON A YEAR A00
4 QUARTER, FISCAL TEAR 1990
PAGE 1
ALL ACTIVE CASES IN PERIOD
TOTAL ON NAND NEW THISCASES START FY
CW FY
ALL ACTIVE CASES PROCESSED
TOTAL RENABIL- NOT RENA-
CLOSED !TATER BILITATED(26) (28)
k07 RENA-BILITATED
(30)
CASES 01NAND ATEND Of
PERIOD
U. S. TOTAL 937,951 580,402 357,549 347,480 216,109 104,227 27,144 590,471ACTUAL LAST YEAR 928,998 569.567 359,431 350,023 220,408 102,361 27,254 578.975PERCENT DISTRIBUTION 100.0 61.9 38.1 100.0 62.2 30.0 7.8PERCENT CHANGE FROM A YEAR AGO 1.0 1.9 -0.5 -0.7 -2.0 1.8 -0.4 2.0
GENERAL AGENCY TOTAL 901,870 557,017 344,853 335,050 206,915 101,887 26,248 566,820ACTUAL LAST YEAR 892,622 545,842 346,730 337,063 210,693 99,988 26,384 555,557PERCENT DISiRIBUT!ON 100.0 61.8 38.2 100.0 61.8 30.4 7.8PERCENT CRUM FROM A YEAR AGO 1.0 2.0 -0.6 -0.6 -1.8 1.9 -0.5 2.0
BLIND AGENCY TOTAL 36,081 23,385 12,696 12,471: 9,194 2,340 896 23,651ACTUAL LAST MAR 36,376 23,725 12,651 12,958 9,715 2,373 870 23,418PERCENT DISTR:BUTION 100.0 64.8 35.2 100.0 74.0 18.8 7 ePERCENT CHANGE FROM A YEAR AGO -0.8 -1.4 0.4 4.1 -5.4 -1.4 3., 1.0
REGION 1 49,865 31,932 17,933 16,991 9,375 4,102 3,514 32,874ACTUAL LAST YEAR 49,233 30,877 18,356 17,328 9,957 3,813 3,558 31,905PERCENT DISTRIBUTION 100.0 64.0 36.0 100.0 55.2 24.1 20.7PERCENT CNANGE FROM A YEAR AGO 1.3 3.4 -2.3 -1.9 -5.8 7.6 -1.2 3.0
CONNECT10.011(0) 9,504 5,695 3,809 3,523 1,904 879 740 5,981ACTUAL LAST YEAR 0,386 5.595 3,791 3,691 2,048 814 829 5,695PERCENT DISTRISUTION 10.0 59.9 40.1 100.0 54.0 25.0 21.0PERCENT GRANGE FROM A TEAR AGO 1.3 1.8 0.5 -4.6 -7.0 8.0 -10.7 5.0
MAINE (G) 3,012 2,292 720 1,101 632 407 62 1,911ACTUAL LAST YEAR 3,624 2,067 1,557 1,362 798 413 151 2,262PERCENT DISTRIBUTION 100.0 76.1 23.9 100.0 57.4 37.0 5.6PERCENT CHANGE FROM A YEAR AGO -16.9 10.9 -53.8 -19.2 -20.8 -1.5 -58.9 -15.5
MASSACHUSETTS (0) 25,031 15,804 9,227 8,355 4,166 1,977 2,192 16,676ACTUAL LAfT YEAR 23,917 15,532 8,365 8,113 4,360 1,675 2,078 15,804PERCENT DISIRIBUTION 100.0 63.1 36.9 100.0 50.1 23.7 26.2PERCENT OWE FROM A YEAR AGO 4.7 1.8 10.0 3.0 -4.0 18.0 5.5 5.5
NEW NAMPSAIRE (G) 3,890 2,585 1,305 1,466 1,024 243 199 2,424ACTUAL LAST YEAR 3,993 2,320 1,673 1,408 994 256 158 2,585PERCENT DISTRIBUTION 100.0 66.5 33.5 100.0 69.8 16.6 13.6PERCENT CNANGE FROM A YEAR AGO -2.6 11.4 -22.0 4.1 3.0 -5.1 25.9 -6.2
RHODE ISLAND (G) 3,639 2,427 1,212 977 670 208 99 2,662ACTUAL LAST YEAR 3,544 2,274 1,270 1,117 7q, 252 114 2,427PERCENT DISTRIBUTION 100.0 66.7 33.3 100.0 is8.6 21.3 10.1
,fIRCENT CHANGE FROM A YEAR AGOi
2.7 6.7 -4.6 -12.5 -10.8 -17.5 -13.2 9.7
VERMONT (G) 2,772 1,756 1,016 970 498 315 157 1,80:ACTUAL LAST YEAR 2,746 1,655 1,091 990 535 289 tadPERCENT DISTRIBUTION 100.0 63.3 36.7 100.0 51.3 32.5 16.2PERCENT CAME FROM A YEAR AGO 0.9 6.1 -6.9 -2.0 -6.9 9.0 -5.4 2.6
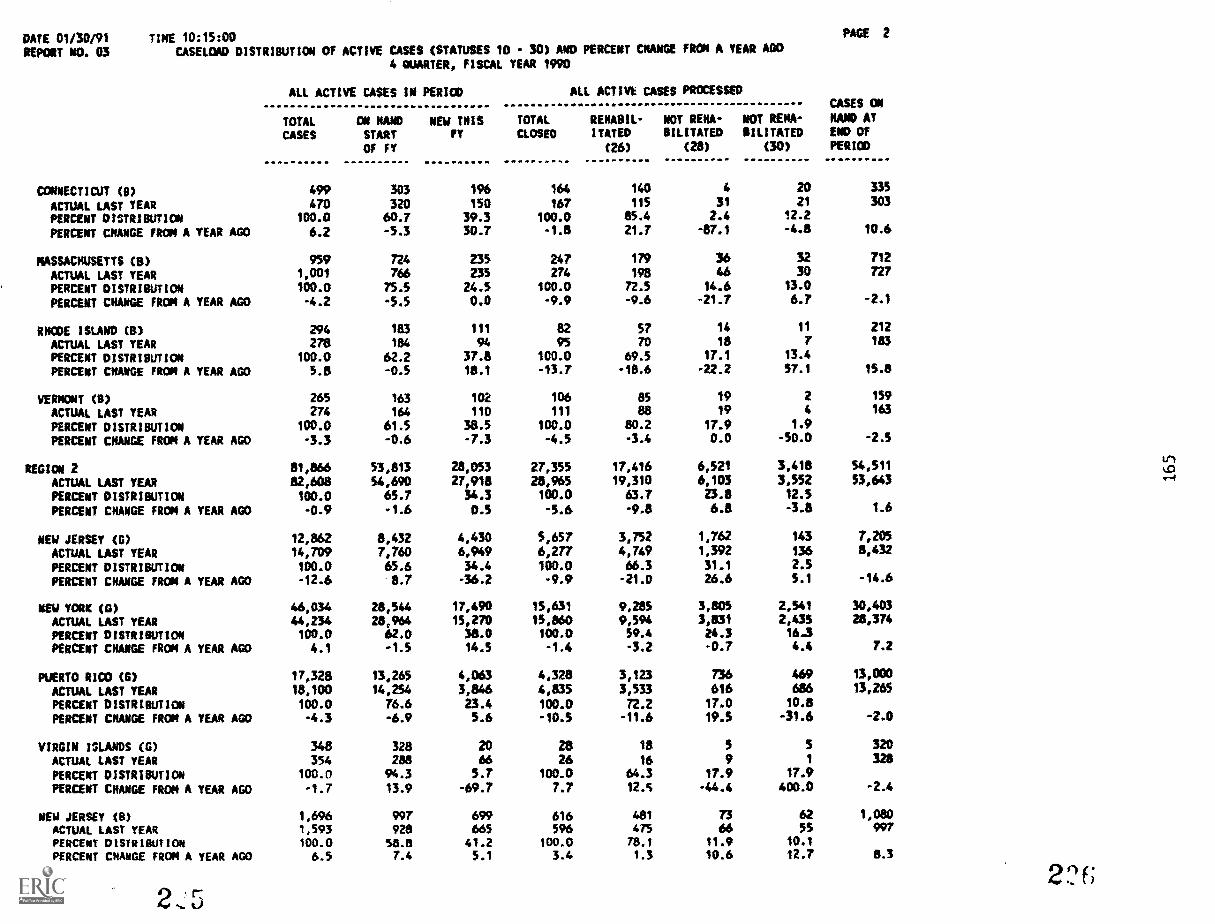
DATE 01/30(91REPORT NO. 03
TIME 10:15:00CASELOAD DISTRIBUTION Of ACTIVE CASES (STATUSES 10 - 30) AND PERCENT CHANGE FROM A YEAR AGO
4 OUARTER, FISCAL YEAR 1990
PAGE 2
ALL ACTIVE CASES IN PERIOD
TOTAL ON NAND NEW THISCASES START FY
OF FY
ALL ACTIVt CASES PROCESSED
TOTAL RENABIL- NOT RENA-
CLOSED ITATED BILITATED
(26) (20)
NOT RENA-RILITATED
(30)
CASES ONRAND ATEND OFPERIOD
CONNECTICUT (B) 499 303 196 164 140 4 20 335
ACTUAL LAST YEAR 470 320 150 167 115 31 21 303
PERCENT DISTRIBUTION 100.0 60.7 39.3 100.0 85.4 2.4 12.2
PERCENT CHANGE FROM A YEAR AGO 6.2 -5.3 30.7 -1.8 21.7 -87.1 -4.8 104
MASSACHUSETTS (8) 959 724 235 247 179 36 32 712
ACTUAL LAST YEAR 1,001 766 235 274 198 46 30 727
PERCENT DISTRIBUTION 100.0 75.5 24.5 100.0 72.5 14.6 13.0
PERCENT CHANGE FROM A YEAR AGO -4.2 -5.5 0.0 -9.9 -9.6 -21.7 6.7 -2.1
RHODE ISLAND CB) 294 183 111 82 57 14 11 212
ACTUAL LAST YEAR 278 184 94 95 70 18 7 183
PERCENT DISTRIBUTION 100.0 62.2 37.8 100.0 69.5 17.1 13.4
PERCENT CHANGE FROM A YEAR AGO 5.8 -0.5 18.1 -13.7 -18.6 -22.2 57.1 15.8
VERMONT (0) 265 163 102 106 85 19 2 159
ACTUAL LAST YEAR 274 164 110 111 88 19 4 163
PERCENT DISTRIBUTION 100.0 61.5 38.5 100.0 80.2 17.9 1.9
PERCENT CHANGE FROM A YEAR AGO -3.3 -0.6 -7.3 -4.5 -3.4 0.0 -50.0 -2.5
REGION 2 81,866 53,813 28,053 27,355 17,416 6,521 3,418 54,511
ACTUAL LAST TEAR 82,608 54,690 27,918 28,965 19,310 6,103 3,552 53,643
PERCENT DISTRIBUTION 100.0 65.7 34.3 100.0 63.7 23.8 12.5
PERCENT CHANGE FROM A YEAR AGO -0.9 -1.6 0.5 -5.6 -9.8 6.8 -3.8 1.6
NEW JERSEY (0) 12,862 8,432 4,430 5,657 3,752 1,762 143 7,205
ACTUAL LAST YEAR 14,709 7,760 6,949 6,277 4,749 1,392 136 8,432
PERCENT DISTRIBUTION 100.0 65.6 34.4 100.0 66.3 31.1 2.5
PERCENT CRANGE FROM A YEAR AGO -12.6 8.7 -36.2 -9.9 -21.0 26.6 5.1 -14.6
NEW YORK (0) 46,034 28,544 17,490 15,631 9,285 3,805 2,541 30,403
ACTUAL LAST YEAR 44,234 28,964 15,270 15,860 9,594 3,831 2,435 28,374
PERCENT DISTRIBUTION 100.0 62.0 38.0 100.0 59.4 24.3 16.3
PERCENT CHANGE FROM A YEAR AGO 4.1 -1.5 143 -1.4 -3.2 -0.7 4.4 7.2
PUERTO RICO (G) 17,328 13,265 4,063 4,328 3,123 736 469 13,000
ACTUAL LAST YEAR 18,100 14,254 3,846 4,835 3,533 616 686 13,265
PERCENT DISTRIBUTION 100.0 76.6 23.4 100.0 72.2 17.0 10.8
PERCENT CHANGE FROM A YEAR AGO -4.3 -6.9 5.6 -10.5 -11.6 19.5 -31.6 -2.0
VIRGIN ISLANDS (G) 348 328 20 28 18 5 5 320
ACTUAL LAST YEAR 354 288 66 26 16 9 1 328
PERCENT DISTRIBUTION 100.0 94.3 5.7 100.0 64.3 17.9 17.9
PERCENT CHANGE FROM A YEAR AGO -1.7 13.9 -69.7 7.7 12.6 -44.4 400.0 -2.4
NEW JERSEY (B) 1,696 997 699 616 481 73 62 1,080
ACTUAL LAST YEAR 1,593 928 665 596 475 66 55 997
PERCENT DISTRIBUTICW 100.0 58.8 41.2 100.0 78.1 11.9 40.1
PERCENT CHANGE FROM A YEAR AGO 6.5 7.4 5.1 3.4 1.3 10.6 12.7 8.3
2 52?f;

DATE 01/30/91REPORT NO. 03
TIME 10:15:06
CASELOAD DISTRIBUTION OF ACTIVE CASES (STATUSES 10 - 30) AND PERCENT CHANGE FROM A YEAR A034 QUARTER, FISCAL YEAR 1990
PAGE 3
ALL ACTIVE CASES IN PERICO
TOTAL ON HAND NEW THISCASES START FY
OF FY
ALL ACTIVE CASES PROCESSED
TOTAL REKABIL- NOT RSNA-CLOSED ITATED BILITATED
(26) (28)
MOT RENA-RILITATED
(30)
CASES ONNAND ATEN0 OF
PERIOD
NEW YORK (8) 3,598 2,247 1,351 1,095 757 140 198 2,503ACTUAL LAST YEAR 3,618 2,496 1,122 1,371 943 189 239 2,247PERCENT DISTRIBUTION 100.0 62.5 37.5 100.0 69.1 12.8 18.1PERCENT CHANGE FROM A YEAR AGO -0.6 -10.0 20.4 -20.1 -19.7 -25.9 -17.2 11.4
REGION 3 103,275 66,043 37,232 39,519 23,289 11,659 4,571 63,756ACTUAL LAST YEAR 107,206 66,976 40,230 41,161 24,993 11,240 4,928 66,045PERCENT DISTRIBUTION 100.0 63.9 36.1 100.0 58.9 29.5 11.6PERCENT CHANGE FROM A YEAR AGO -3.7 -1.4 -7.5 -4.0 -6.8 3.7 -7.2 -3.5
DELAWALc (0) 2,337 1,107 1,230 1,193 732 322 139 1,144ACTUAL LAST YEAR 2,325 1,123 1,202 1,218 800 292 126 1,107PERCENT DISTRIBUTION 100.0 47.4 52.6 100.0 61.4 27.0 11.7PERCENT CKANGE FRCP A YEAR AGO 0.5 -1.4 2.3 -2.1 -8.5 10.3 10.3 3.3
DISTRICT OF CO (0) 2,784 1,285 1,499 1,400 912 318 170 1,384ACTUAL LAST YEAR 2,741 1,463 1,278 1,456 968 271 217 1,285PERCENT DISTRIBUTION 100.0 46.2 53.8 100.0 65.1 22.7 12.1PERCENT CHANGE FROM A YEAR AGO 1.6 -12.2 17.3 -3.8 -5.8 17.3 -21.7 7.7
MARYLAND (0) 13,388 7,610 5,778 5,438 3,308 1,500 630 7,950ACTUAL LAST YEAR 13,066 7,947 5,121 5,456 3,500 1,462 4% 7,610PERCENT DISTRIBUTION 100.0 56.8 43.2 100.0 60.8 27.6 11.6PERCENT CHANGE FROM A YEAR AGO 2.4 -4.2 12.8 -0.4 -5.5 2.6 27.0 4.5
PENNSYLVANIA (0) 49,568 33,776 15,792 18,328 10,878 5,559 1,891 31,240ACTUAL LAST YEAR 54,908 35,478 19,430 21,132 12,341 6,167 2,624 33,776PERCENT DISTRIBUTION 100.0 68.1 31.9 100.0 59.4 30.3 10.3PERCENT CHANGE FROM A YEAR AGO -9.7 -4.8 -la.? -13.3 -11.9 -9.9 -27.9 -7.5
VIRGINIA (0) 18,820 10,922 7.898 7,738 4,110 2,658 970 11,082ACTUAL LAST YEAR 17,248 9,013 8,235 6,326 3,756 1,849 721 10,922PERCENT DISTRIBUTION 100.0 58.0 42.0 100.0 53.1 34.3 12.5PERCENT CHANGE FROM A YEAR AGO 9.1 21.2 -4.1 22.3 9.4 43.8 34.5 1.5
WEST VIRGINIA (0) 12,123 8,150 3,973 4,188 2,619 974 595 7,935ACTUAL LAST YEAR 12,311 8,454 3,857 4,161 2,686 871 604 8,150PERCENT DISTRIBUTION 100.0 67.2 32.8 100.0 62.5 23.3 14.2PERCENT CHANGE FROM A YEAR AGO -1.5 -3.6 3.0 0.6 -2.5 11.8 -1.5 -2.6
DELAWARE (B) 144 110 34 62 41 15 6 82ACTUAL LAST YEAR 158 76 82 46 29 13 4 112PERCENT DISTRIBUTION 100.0 76.4 23.6 100.0 66.1 24.2 9.7PERCENT CHANGE FROM A YEAR AGO -8.9 44.7 -58.5 34.8 41.4 15.4 50.0 -26.8
PENNSYLVANIA (B) 3,104 2,408 696 795 449 191 155 2,309ACTUAL LAST YEAR 3.193 2,502 691 785 503 158 124 2,408PERCENT DISTRIBUTION 100.0 77.6 22.4 100.0 56.5 24.0 19.5PERCENT CHANGE FROM A YEAR AGO -2.8 -3.8 0.7 1.3 -10.7 20.9 25.0 -4.1
9
2.)5
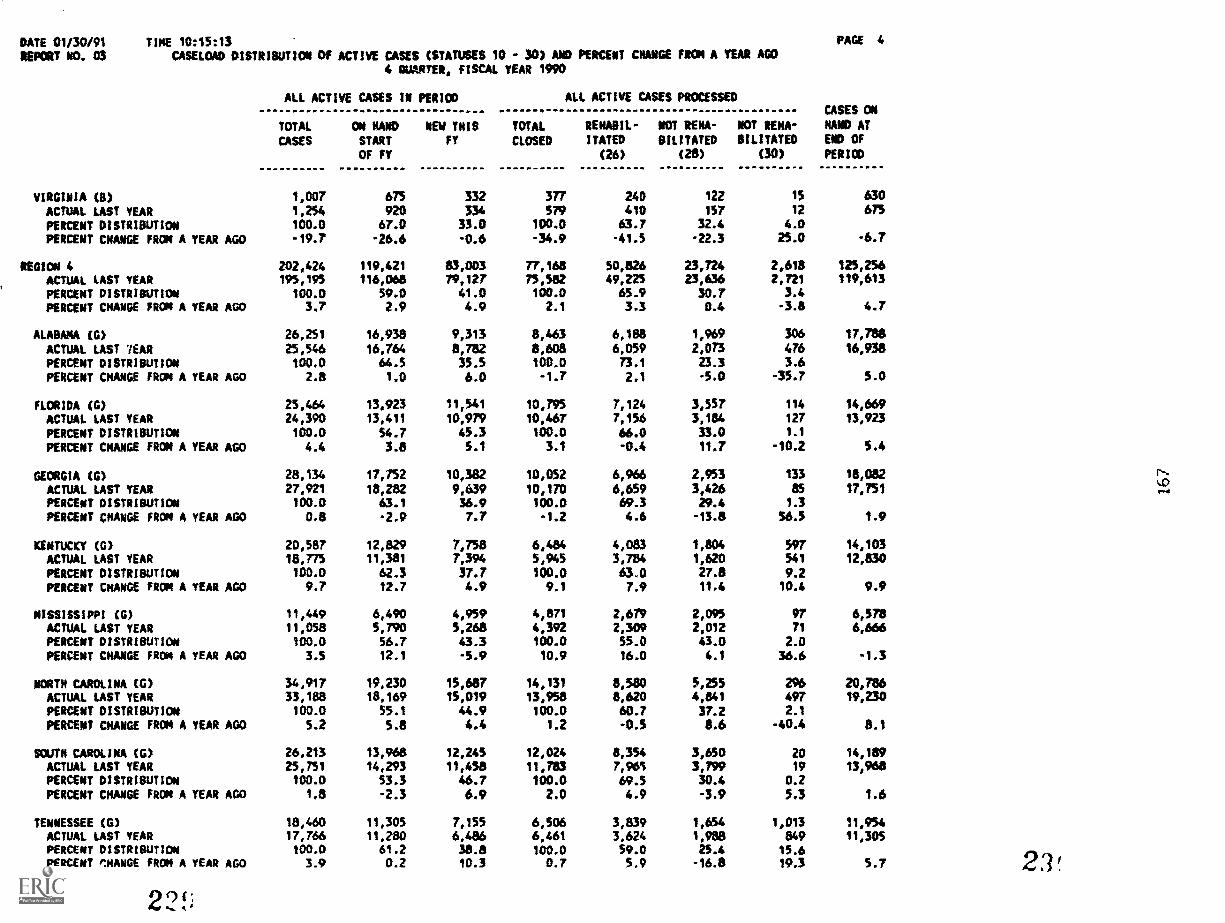
DATE 01/30/91REPORT NO. 03
TINE 10:15:13CASELOAD DISTRIBUTION Of ACTIVE CASES (STATUSES 10 - 30) AND PERCENT CHANGE FROM A YEAR AGO
4 QUARTER, FISCAL YEAR 1990
PAGE 4
ALL ACTIVE CASES IX PERIOD
TOTAL ON NAND NEW THIS
CASES START FY
OF FY
ALL ACTIVE CASES PROCESSED
TOTAL RENABIL- NOT RENA-
CLOSED ITATED BILITATED
(26) (28)
NOT RENA-
BILITATED(30)
CASES ON
NAND ATEND Of
PERIOD
VIRGINIA (0) 1,007 675 332 377 240 122 15 630
ACTUAL LAST YEAR 1,254 920 334 579 410 157 12 675
PERCENT DISTRIBUTION 100.0 67.0 33.0 100.0 63.7 32.4 4.0
PERCENT CHANGE FROM A YEAR AGO -19.7 -26.6 -0.6 -34.9 -41.5 -22.3 25.0 -6.7
REGION 4 202,424 119,421 83,003 77,168 50,826 23,724 2,618 123,256ACTUAL LAST YEAR 195,195 116,068 79,127 75,582 49,225 23,636 2,721 119,613
PERCENT DISTRIBUTION 100.0 59.0 41.0 100.0 65.9 30.7 3.4
PERCENT CHANGE FROM A YEAR AGO 3.7 2.9 4.9 2.1 3.3 0.4 -3.8 4.7
ALABAMA (6) 26,251 16,938 9,313 8,463 6,188 1969, 306 17,788
ACTUAL LAST 7EAR 25,546 16,764 8,782 8,608 6,059 2,073 476 16,938
PERCENT DISTRIBUTION 100.0 64.5 35.5 100.0 73.1 23.3 3.6PERCENT CHANGE FROM A YEAR AGO 2.8 1.0 6.0 -1.7 2.1 -5.0 -35.7 5.0
FLORIDA (6) 25,464 13,923 11,541 10,795 7,124 3,557 114 14,669
ACTUAL LAST YEAR 24,390 13,411 10,979 10,467 7,156 3,184 127 13,923
PERCENT DISTRIBUTION 100.0 54.7 453 100.0 66.0 33.0 1.1
PERCENT CHANGE FROM A YEAR AGO 4.4 3.8 5.1 3.1 -0.4 11.7 -10.2 5.4
GEORGIA (6) 28,134 17,752 10,382 10,052 6,966 2,953 133 18,082
ACTUAL LAST YEAR 27,921 18,282 9,639 10,170 6,659 3,426 as 17,751
PERCENT DISTRISUTION 100.0 63.1 36.9 100.0 69.3 29.4 1.3
PERCENT CHANGE FROM A YEAR AGO 0.8 -2.9 7.7 -1.2 4.6 -13.8 56.5 1.9
KENTUCKY (6) 20,587 12,829 7,758 6,484 4,083 1,804 597 14,103
ACTUAL LAST YEAR 18,775 11,381 7,394 5,945 3,784 1,620 541 12,830
PERCENT DISTRIBUTION 100.0 62.3 37.7 100.0 63.0 27.8 9.2PERCENT CHANGE FROM A YEAR AGO 9.7 12.7 4.9 9.1 7.9 11.4 10.4 9.9
MISSISSIPPI (G) 11,449 6,490 4,959 4,871 2,679 2,095 97 6,578ACTUAL LAST YEAR 11,058 5,790 5,268 4,392 2,309 2,012 71 6,666PERCENT DISTRIBUTION 100.0 56.7 43.3 100.0 55.0 43.0 2.0PERCENT CHANGE FROM A YEAR AGO 3.5 12.1 -5.9 10.9 16.0 4.1 36.6 -1.3
NORTH CAROLINA (G) 34,917 19,230 15,687 14,131 8,580 5,255 296 20,786ACTUAL LAST YEAR 33,188 18,169 15,019 13,958 8,620 4,841 497 19,230PERCENT DISTRIBUTION 100.0 55.1 44.9 100.0 60.7 37.2 2.1
PERCENT CHANGE FROM A YEAR AGO 5.2 5.8 4.4 1.2 -0.5 8.6 -40.4 8.1
SOUTH CAROLINA (5) 26,213 13,968 12,245 12,024 8,354 3,650 20 14,189ACTUAL LAST YEAR 25,751 14,293 11,458 11,783 7,965 3,799 19 13,968PERCENT DISTRIBUTION 100.0 53.3 46.7 100.0 69.5 30.4 0.2PERCENT CHANGE FROM A YEAR AGO 1.8 -2.3 6.9 2.0 4.9 -3.9 5.3 1.6
TENNESSEE (0) 18,460 11,305 7,155 6,506 3,839 1,654 1,013 11,954ACTUAL LAST YEAR 17,766 11,280 6,486 6,461 3,624 1,988 849 11,305PERCENT DISTRIBUTION 100.0 61.2 38.8 100.0 59.0 25.4 15.6PERCENT 1:HANGE FROM A YEAR AGO 3.9 0.2 10.3 0.7 5.9 -16.8 19.3 5.7 21'
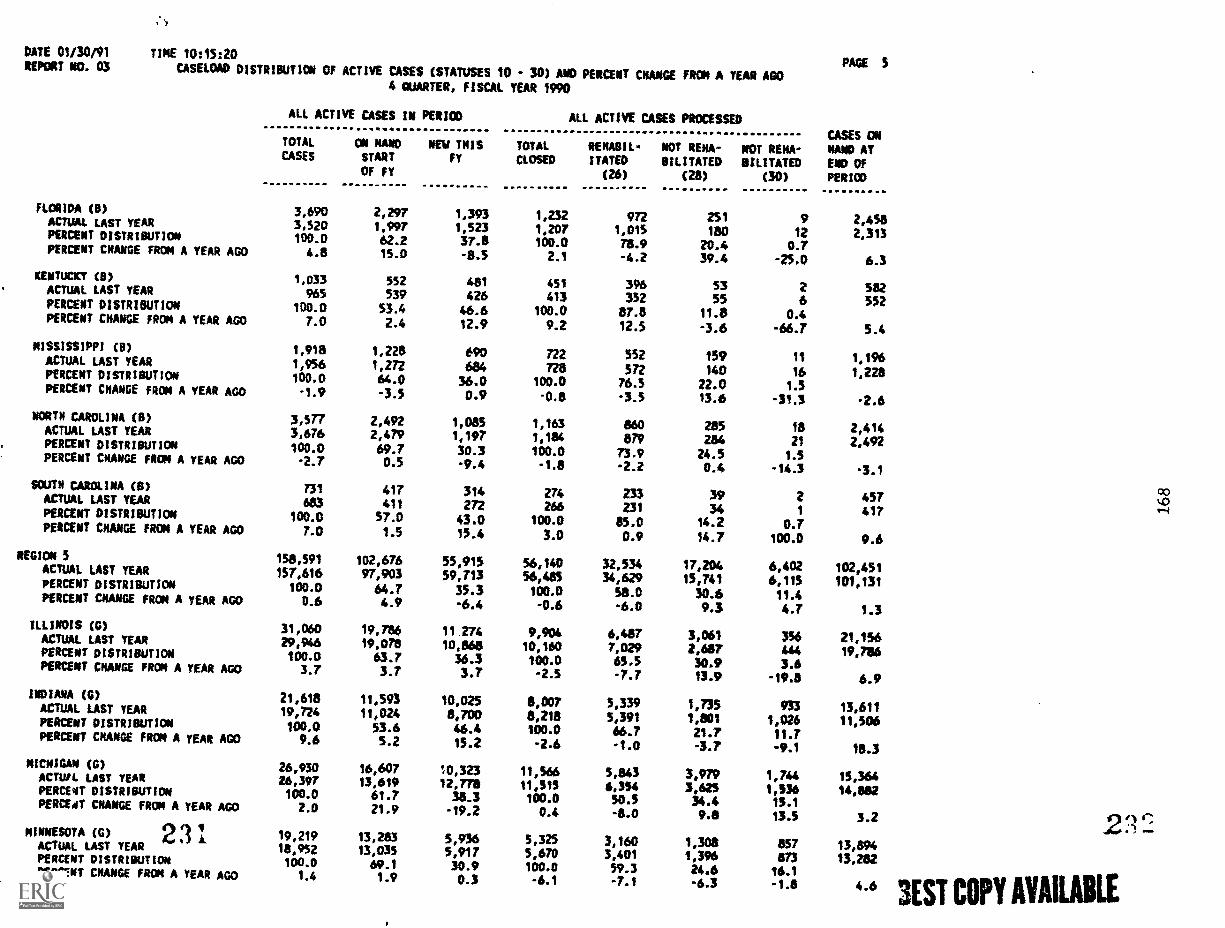
DATE 01/30/91
REPORT NO. 03TINE 10:15:20
CASELEMO DISTRIBUTION OF ACTIVE CASES (STATUSES 10 30) AND PERCENT CHANGE FROM A YEAR AGO4 QUARTER, FISCAL YEAR 1990
FLORIDA (9)ACTUAL LAST YEARPERCENT DISTRIBUTIONPERCENT CHANGE FROM A YEAR AGO
KENTUCKY (0)ACTUAL LAST YEAR
PERCENT DISTRIBUTIONPERCENT CHANGE FROM A YEAR AGO
NISSISSIPPI (8)ACTUAL LAST YEARPERCENT DISTRIOUTION
PERCENT CHANGE FROM A YEAR AGO
NORTH CAROLINA (0)ACTUAL LAST YEARPERCENT DISTRINuTIONPERCENT CHANGE FROM A YEAR AGO
SOUTH CAROLINA (0)ACTUAL LAST YEARPERCENT DISTRIBUTION
PERCENT CHANGE FROM A YEAR AGO
REGION 5ACTUAL LAST YEARPERCENT DISTRIBUTIONPERCENT ORANGE FROM A YEAR AGO
ILLINOIS (0)ACTUAL LAST YEARPERCENT DISTRIBUTIONPERCENT CRANGE FROM A YEAR AGO
INDIANA (0)AC/UAL LAST YEARPERCENT DISTRIBUTIONPERCENT CHANGE FROM A YEAR AGO
MICNIGAN (0)ACTUrL LAST YEARPERCENT DISTRIBUTIONPERMAY ORANGE FROM A YEAR AGO
MINNESOTA (G) 2 3ACTUAL LAST YEARPERCENT DISTRIBuTIONPERCENT CHANGE FR0,1 A YEAR AGO
ALL ACTIVE CASES IN PERIOD
TOTAL ON NANO NEW TNISCASES START FY
OF FY
ALL ACTIVE CASES PROCESSED
TOTAL RENABIL- NOT RENA-CLOSED STAYED MIMED
(26) (28)
NOT RENA-BILITATED
(30)
3,690 2,297 1,393 1,232 072 251 93,520 1,997 1,523 1,207 1,015 itio 12100.0 62.2 37.8 100.0 78.9 20.4 0.74.8 15.0 -8.5 2.1 -4.2 39.4 -25.0
1,033 552 481 451 396 53 2965 539 426 413 352 55 6
100.0 53.4 46.6 100.0 87.8 11.8 0.47.0 2.4 12.9 9.2 12.5 -3.6 -66.7
1,918 1,228 690 722 552 159 111,956 1,272 684 728 572 140 16100.0 64.0 36.0 100.0 76.5 22.0 1.5-1.9 -3.5 0.9 -0.8 -3.5 13.6 -31.3
3,577 2,492 1,083 1,163 860 285 183,676 2,479 1,197 1,184 am 284 21100.0 69.7 30.3 100.0 73.9 24.5 1.5-2.7 0.5 -9.4 -1.8 -2.2 0.4 -14.3
731 417 314 274 233 39 2683 411 272 266 231 34 1
100.0 57.0 43.0 100.0 85.0 14.2 0.77.0 1.5 15.4 3.0 0.9 14.7 100.0
158,591 102,676 55,915 56,140 32,534 17,204 6,402157,616 97,903 59,713 56,40 34,629 15,741 6,113
100.0 64.7 35.3 loox 58.0 30.6 11.40.6 4.9 -6.4 -0.6 -6.0 9.3 4.7
31,060 19.706 11 274 9,904 6,487 3,061 35629,946 19.07e 10.868 10,160 7,029 2,607 444100.0 63.7 36.3 100.0 65.5 30.9 3.6
3.7 3.7 3.7 -2.5 -7.7 13.9 -19.8
21,618 11,593 10,025 8,007 5,339 1,735 93319,724 11,024 8,700 8,218 5,391 1,801 1,026100.0 53.6 46.4 100.0 46J 21.7 11.79.6 5.2 15.2 -2.6 -1.0 -3.7 -9.1
26,930 16,607 10,323 11,566 5,843 3,979 1,74426,397 13,449 12,778 11,515 6,354 3,625 1,536100.0 61.7 38.3 100.0 50.5 34.4 15.12.0 21.9 -19.2 0.4 -8.0 9.8 13.5
19,219 13,283 5,936 5,325 3,160 1,308 85718,952 13,035 5,917 5,670 3,401 1,396 873100.0 69.1 30.9 100.0 59.3 24.6 16.11.4 1.9 0.3 -6.1 -7.1 -6.3 -1.8
PAGE 5
CASES ONNANO ATEND Of
PERIOD
2,4582,313
6.3
582552
5.4
1,1961,228
-2.6
2,4142,492
-3.1
00457'
+.0
417 rq
9.6
102,451
101,131
1.3
21,15619,786
6.9
13,611
11,506
18.3
15,36414,882
3.2
13,89413,282
4.6
2 3 r:
3EST COPY AVAILABLE
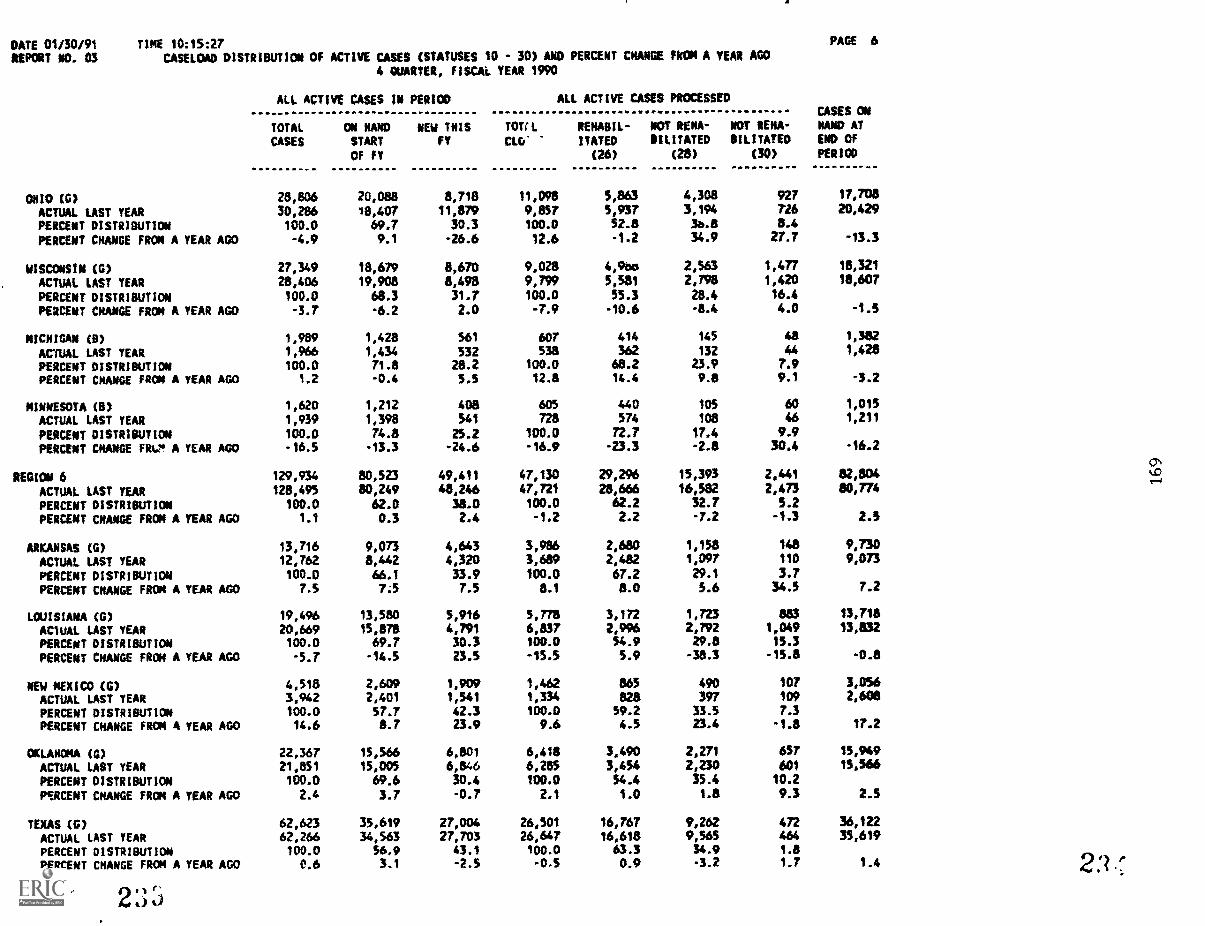
DATE 01/30/91REPORT ND. 03
TIME 10:15:27CASELOAD DISTRIBUTION OF ACTIVE CASES (STATUSES 10 - 30) AND PERCENT CHANGE FROM A YEAR AGO
4 QUARTER, FISCAL YEAR 1990
PAGE 6
ALL ACTIVE CASES IN PERIOD
TOTAL ON NAND NEW THISCASES START FT
OF FT
ALL ACTIVE CASES PROCESSED
TOUL RENABIL- NOT RENA-
CEO' !TATE) DILITATED
(26) (28)
NOT RENA-BILITATED
(30)
CASES ONNAND ATEND OF
PERIOD
ONIO (0) 28,806 20,088 8,718 11,098 5,863 4,308 927 17,708
ACTUAL LAST YEAR 30,286 18,407 11,879 9,857 5,937 3,194 726 20,429
PERCENT DISTRIBUTION 100.0 69.7 30.3 100.0 52.8 3a.8 8.4
PERCENT CHANGE FRON A YEAR AGO 4.9 9.1 -26.6 12.6 -1.2 34.9 27.7 -13.3
WISCONSIN (0) 27,349 18,679 8,670 9,028 4,000 2,563 1,477 18,321
ACTUAL LAST YEAR 28,406 19,908 8,498 9,799 5,581 2,798 1,420 18,607
PERCENT DISTRIBUTION 100.0 68.3 31.7 100.0 55.3 28.4 16.4
PERCENT CNANGE FROM A YEAR AGO -3.7 -6.2 2.0 -7.9 -10.6 -8.4 4.0 -1.5
MICHIGAN (8) 1,989 1,428 561 607 414 145 48 1,382
ACTUAL LAST YEAR 1,966 1,434 532 538 362 132 44 1,428
PERCENT DISTRIBUTION 100.0 71.8 28.2 100.0 68.2 23.9 7.9
PERCENT CHANGE FROM A YEAR AG° 1.2 -0.4 5.5 12.8 14.4 9.8 9.1 -3.2
MINNESOTA (0) 1,620 1,212 408 605 440 105 60 1,015
ACTUAL LAST YEAR 1,939 1,398 541 728 574 108 46 1,211
PERCENT DISTRIBUTION 100.0 74.8 25.2 100.0 72.7 17.4 9.9
PERCENT CHANGE Fitt:4 A YEAR AGO -16.5 -13.3 -24.6 -16.9 -23.3 -2.8 30.4 -16.2
aN
REGION 6ACTUAL LAST YEAR
129,934
128,495
80,52380,249
49,411
48,24647,13047,721
29,2%28,666
15,39316,582
2,441
2,473
82,80480,774
vaT.-4
PERCENT insimisinIca 100.0 62.0 38.0 100.0 62.2 32.7 5.2
PERCENT CHANGE FROM A YEAR AGO 1.1 0.3 2.4 -1.2 2.2 -7.2 -1.3 2.5
ARKANSAS (0) 13,716 9,073 4,643 3,986 2,680 1,158 148 9,730
ACTUAL LAST YEAR 12,762 8,442 4,320 3,689 2,482 1,097 110 9,073
PERCENT DISTRIBUTION 100.0 66.1 33.9 100.0 67.2 29.1 3.7
PERCENT CNANGE FROM A YEAR AGO 7.5 7.5 7.5 8.1 8.0 5.6 34.5 7.2
LOUISIANA (0) 19,496 13,580 5,916 5,778 3,172 1,723 am 13,718
AC1UAL LAST YEAR 20,669 15,878 4,791 6,837 2,996 2,792 1,049 13,832
PERCENT DISTRIBUTION 100.0 69.7 30.3 100.0 54.9 29.8 15.3
PERCENT CHANGE FROM A YEAR AGO -5.7 -14.5 23.5 -15.5 5.9 -38.3 -15.8 -0.8
NEW MEXICO (0) 4,518 2,609 1,909 1,462 865 490 107 3,056
ACTUAL LAST YEAR 3,942 2,401 1,541 1,334 les 397 100 2,608
PERCENT DISTRIBUTION 100.0 57.7 42.3 100.0 59.2 33.5 7.3
PERCENT CHANGE FROM A YEAR AGO 14.6 8.7 23.9 9.6 4.5 23.4 -1.8 17=2
OKLAHOMA (0) 22,167 15,566 6,801 6,418 3,490 2,271 657 15,949
ACTUAL LAST YEAR 21,851 15,005 6,846 6,285 3,454 2,230 601 15,566
PERCENT DISTRIBUTION 100.0 69.6 30.4 100.0 54.4 35.4 10.2
PSFICENT CHANGE FROM A TEAR AGO 2.4 3.7 -0.7 2.1 1.0 1.8 9.3 2.5
TEXAS (0) 62,623 35,619 27,004 26,501 16,767 9,262 472 36,122
ACTUAL LAST YEAR 62,266 34,563 27,703 26,647 16,618 9,565 464 35,619
PERCENT DISTRIBUTION 100.0 56.9 43.1 100.0 63.3 34.9 1.8
PERCENT CNANGE FROM A YEAR AGO 0.6 3.1 -2.5 -0.5 0.9 -3.2 1.7 1.4
233
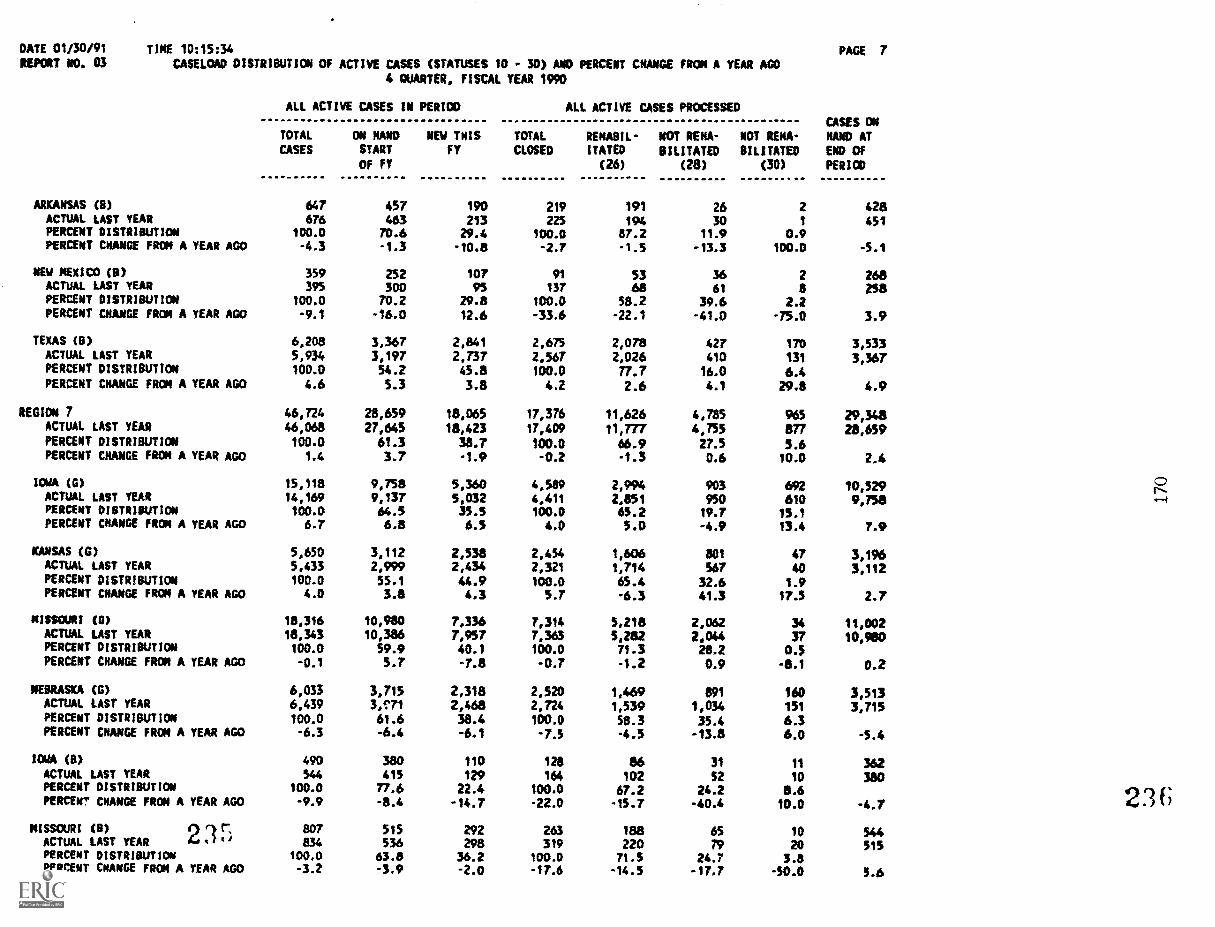
DATE 01/30/91 TIME 1015:34REPORT NO. 03 CASELOAD DISTRIBUTION Of ACTIVE CASES (STATUSES 10 - 30) AND PERCENT CHANGE FROM A YEAR AGO
4 QUARTER, FISCAL YEAR 1990
ALL ACTIVE CASES IN PERIOD ALL ACTIVE CASES PROCESSED
TOTAL ON NAND NEW TNIS TOTAL RENABIL- NOM REHA- NOT RENA-CASES START FY CLOSED ITATED BILITATED BILITATED
OF FY (26) (28) (30)
PAGE 7
CASES ON
NAND ATENO Of
PERICO
ARKANSAS (II) 647 457 190 219 191 26 2 428ACTUAL LAST YEAR 676 463 213 225 194 30 1 451PERCENT DISTRIBUTION 100.0 70.6 29.4 100.0 87.2 11.9 0.9PERCENT CHANGE FROM A YEAR AGO -4.3 -1.3 -10.8 -2.7 -1.5 -13.3 100.0 -5.1
NEW MEXICO (B) 359 252 107 91 53 NS 2 268ACTUAL LAST YEAR 395 300 95 137 68 61 8 258PERCENT DISTRIBUTION 100.0 70.2 29.8 100.0 58.2 39.6 2.2PERCENT CHANGE FROM A YEAR AGO -9.1 -16.0 12.6 -33.6 -22.1 -41.0 -75.0 3.9
TEXAS (a) 6,208 3,367 2,841 2,675 2,078 427 170 3,533ACTUAL LAST YEAR 5,934 3,197 2,737 2,567 2,026 410 131 3,367PERCENT DISTRIBUTION 100.0 54.2 45.8 100.0 77.7 16.0 6.4PERCENT CHANGE FROM A YEAR AGO 4.6 5.3 3.8 4.2 2.6 4.1 29.8 4.9
REGION 7 46,724 28,659 18,065 17,376 11,626 4,785 965 29,343ACTUAL LAST YEAR 46,068 27,645 18,423 17,409 11,777 4,755 877 28,659PERCENT DISTRIBUTION 100.0 61.3 38.7 100.0 66.9 27.5 5.6PERCENT CHANGE FRCM A YEAR AGO 1.4 3.7 -1.9 -0.2 -1.3 0.6 10.0 2.4
IOWA (G) 15,118 9,758 5,360 4,589 2,994 903 692 10,529ACTUAL LAST YEAR 14,169 9,137 5,032 4,411 2,851 950 610 9,758PERCENT DISTRIBUTION 100.0 64.5 35.5 100.0 65.2 19.7 15.1PERCENT CHANGE FROM A YEAR AGO 6.7 6.8 6.5 4.0 5.0 -4.9 13.4 7.9
KANSAS (G) 5,650 3,112 2,538 2,454 1,606 801 47 3,196ACTUAL LAST YEAR 5.433 2,999 2,434 2,321 1,714 567 40 3,112PERCENT DISTRIBUTION 100.0 55.1 44.9 100.0 65.4 32.6 1.9PERCENT CHANGE FROM A YEAR AGO 4.0 3.8 4.3 5.7 -6.3 41.3 17.5 2.7
MISSOURI (G) 18,316 10,980 7,336 7,314 5,218 2,062 34 11,002ACTUAL LAST YEAR 18,343 10,386 7,957 7,363 5,282 2,044 37 10,980PERCENT DISTRIBUTION 100.0 59.9 40.1 100.0 71.3 28.2 0.5PERCENT CHANGE FROM A YEAR AGO -0.1 5.7 -7.8 -0.7 -1.2 0.9 -8.1 0.2
NEBRASKA (G) 6,033 3,715 2,318 2,520 1,469 891 160 3,513ACTUAL LAST YEAR 6,439 3,471 2,468 2,724 1,539 1,034 151 3,715PERCENT DISTRIBUTION 100.0 61.6 38.4 100.0 58.3 35.4 6.3PERCENT CHANGE FRCM A YEAR AGO -6.3 -6.4 -6.1 -7.5 -4.5 -13.8 6.0 -5,4
IOWA (Et) 490 380 110 128 86 31 11 362ACTUAL LAST YEAR 544 415 129 164 102 52 10 380PERCENT DISTRIBUTION 100.0 77.6 22.4 100.0 67.2 24.2 8.6PERCENT CHANGE FROM A YEAR AGO -9.9 -8.4 -14.7 -22.0 -15.7 -40.4 10.0 -4.7
MISSOURI (8)ACTUAL LAST YEAR 2 :141
807834
515536
292298
263319
188220
6579
10
20544515
PERCENT DISTRIBUTION 100.0 63.8 36.2 100.0 71.5 24.7 3.8PERCENT CHANGE FRON A YEAR AGO -3.2 -3.9 -2.0 -17.6 -14.5 -17.7 -50.0 5.6
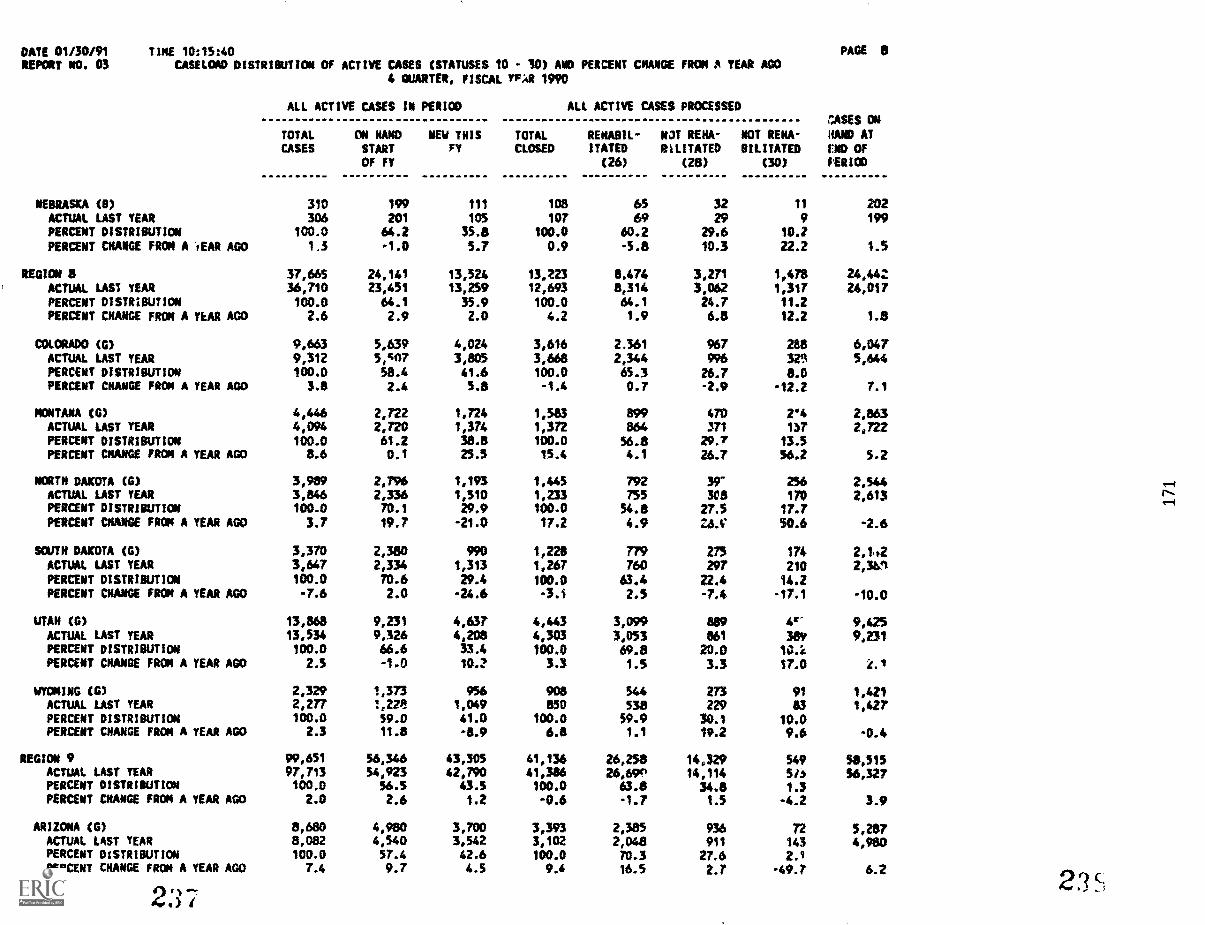
DATE 01/30/91REPORT NO. 03
TIME 10:15:40CASELCMD DISTRIBUTION OF ACTIVE CASES (STATUSES 10 - 30) AND PERCENT CHANCE FROM A YEAR A00
4 QUARTER, FISCAL YFA 1990
PAGE 8
ALL ACTIVE CASES IN PERIOD
TOTAL ON NAND NEW THISCASES START Fy
OF FY
ALL ACTIVE CASES PROCESSED
TOTAL REHABIL- N3T REHA-CLOSED ITATED RILITATED
(26) (28)
NOT RENA-IMITATED
(30)
:VISES ON
HAND ATEND OFPERIOD
NEBRASKA (8) 310 199 111 108 65 32 11 202ACTUAL LAST YEAR 306 201 105 107 69 29 9 199PERCENT DISTRIBUTION 100.0 64.2 35.8 100.0 60.2 29.6 10.2
PERCENT CHANGE FROM A rEAR AGO 1 3 -1.0 5.7 0.9 -5.8 10.3 22.2 1.5
4601011 37,665 24,141 13,524 13,223 8.474 3,271 1,478 24,442ACTUAL LAST YEAR 36,710 23,451 13,259 12,693 8,314 3,062 1,317 24,017PERCENT DISTRIBUTION 100.0 64.1 35.9 100.0 64.1 24.7 11.2PERCENT CHANGE FROM A YEAR AGO 2.6 2.9 2.0 4.2 1.9 6.8 12.2 1.8
COLORADO (6) 9,663 5,639 4,024 3,616 2.561 967 268 6,047ACTUAL LAST YEAR 9,312 5,607 3,805 3,668 2,344 976 321 5,644PERCENT DISTRIBUTION 100.0 58.4 41.6 100.0 65.3 26.7 8.0PERCENT CHANGE FRON A YEAR AGO 3.8 2.4 5.8 -1.4 0.7 -2.9 -12.2 7.1
MONTANA (0) 4,446 2,722 1,724 1,583 899 470 2'4 2,863ACTUAL LAST YEAR 4,094 2,720 1,374 1,372 864 371 137 2,722PERCENT DISTRIBUTION 100.0 61.2 38.8 100.0 56.8 29.7 13.5PERCENT CHANGE FROM A YEAR AGO 8.6 0.1 25.5 15.4 4.1 26.7 56.2 5.2
NORTH DAKOTA (6) 3,989 2,796 1,193 1,445 792 39" 256 2,544ACTUAL LAST YEAR 3,846 2,336 1,510 1,233 755 308 170 2,613PERCENT DISTRIBUTION 100.0 70.1 29.9 100.0 54.8 27.5 17.7PERCENT CHANGE FROM A YEAR AGO 3.7 19.7 -21.0 17.2 4.9 7.4.1' 50.6 -2.6
SOUTH DAKOTA (G) 3,370 2,380 990 1,224 779 275 174 2,1,2ACTUAL LAST YEAR 3,647 2,334 1,313 1,267 760 297 210 2,30PERCENT DISTRIBUTION 100.0 70.6 29.4 100.0 63,4 22.4 14.2PERCENT CHANGE FROM A YEAR AGO -7.6 2.0 -24.6 -3.4 2.5 -7.4 -17.1 -10.0
UTAH (G) 13,864 9,231 4,637 4,443 3,099 889 4' 9,425ACTUAL LAST YEAR 13,534 9,326 4,208 4,303 3,053 461 389 9,231PERCENT DISTRIBUTION 100.0 66.6 13.4 100.0 69.8 20.0 10.kPERCENT CHANGE FRCM A YEAR AGO 2.5 -1.0 10.2 3.3 1.5 3.3 17.0 2.1
WYOMING (6) 2,329 1,373 956 908 544 273 91 1,421ACTUAL LAST YEAR 2,277 1,22,8 1,049 830 538 229 83 1,427PERCENT DISTRIBUTICN 100.0 59.0 41.0 100.0 59.9 30.1 10.0PERCENT CNANGE FROM A YEAR AGO 2.3 11.8 -8.9 6.8 1.1 19.2 9.6 -0.4
REGION 9 99,651 56,346 43,305 41,136 26,254 14,329 549 51,515ACTUAL LAST YEAR 97,713 54,923 42,790 41,346 26,690 14,114 51 3 56,327PERCENT DISTRIBUTION 100.0 56.5 43.5 100.0 63.8 34.8 1.3PERCENT CHANGE FROM A YEAR AGO 2.0 2.6 1.2 -0.6 -1.7 1.5 -4.2 3.9
ARIZONA (6) 8,680 4,980 3,700 3,393 2,385 936 72 5,287ACTUAL LAST YEAR 8,082 4,540 3,542 3,102 2,048 911 143 4,980PERCENT DISTRIBUTION 100.0 57.4 42.6 100.0 70.3 27.6 2.1PERCENT CHANGE FROM A YEAR AGO 7.4 9.7 4.5 9.4 16.5 2.7 -49.7 6.2
2"-0 A,23s
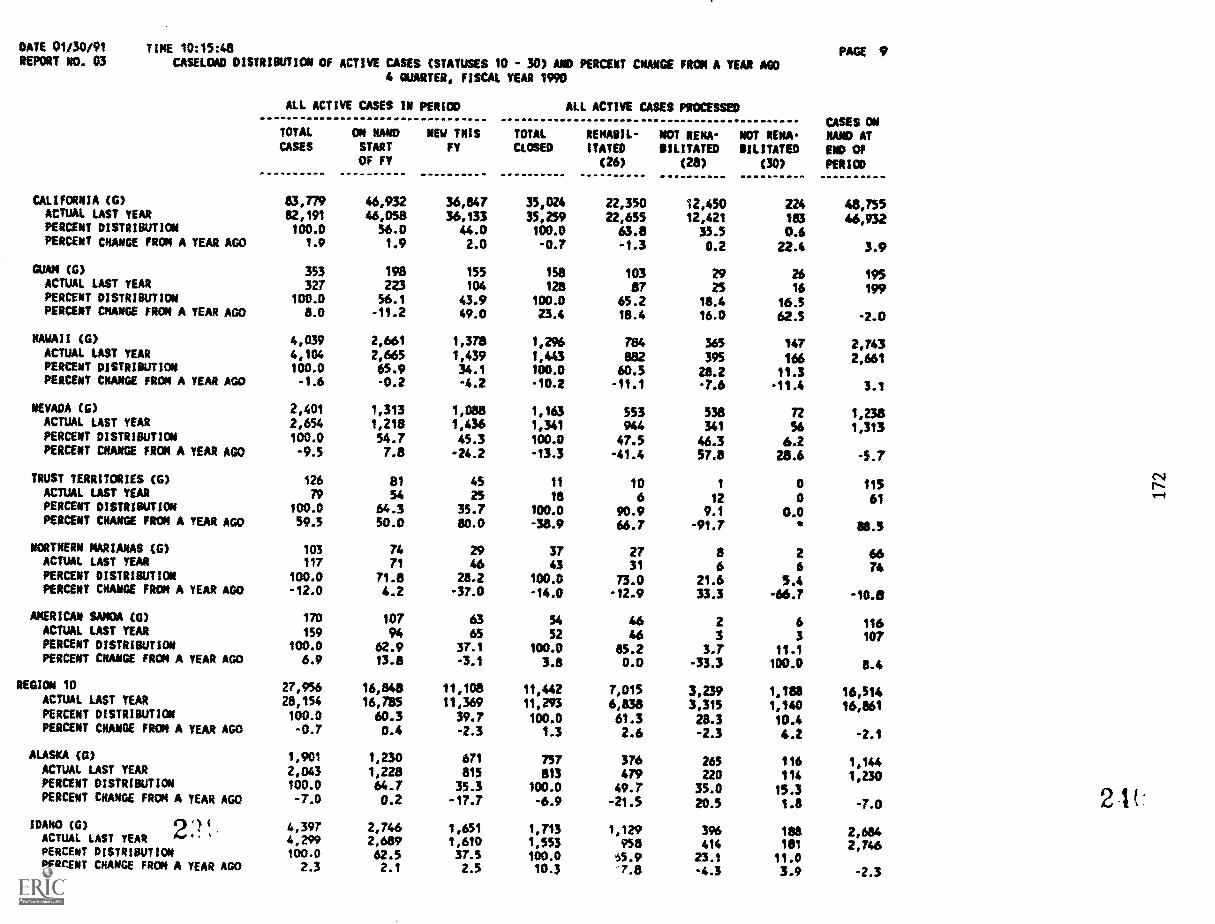
DATE 01130/91REPORT NO. 03
TIME 10:15:48
CASELOAD DISTRIBUTION OF ACTIVE CASES (STATUSES 10 - 30) AND PERCENT CAANGE FROM A YEAR ASO4 QUARTER, FISCAL YEAR 1990
CALIFORNIA (G)ACTUAL LAST YEARPERCENT DISTRIBUTIONPERCENT CHANGE FROM A YEAR AGO
GUNN (G)ACTUAL LAST YEARPERCENT DISTRIBUTIONPERCENT CHANGE FROM A YEAR AGO
HAWAII (6)ACTUAL LAST YEARPERCENT DISTRIBUTIONPERCENT CHANGE FROM A YEAR AGO
NEVADA (6)ACTUAL LAST YEAAPERCENT DISTRIBUTIONPERCENT CHANGE FRON A YEAR AGO
TRUST TERRITORIES (G)ACTUAL LAST YEARPERCENT DISTRIBUTIONPERCENT CHANGE FROM A YEAR AGO
NORTHERN MARIANAS (G)ACTUAL LAST YEARPERCENT DISTRIBUTIONPERCENT CHANGE FRON A YEAR AGO
AMERICAN SAMOA (0)ACTUAL LAST YEARPERCENT DISTRIBUTIONPERCENT CHANGE FROM A YEAR AGO
REGION 10
ACTUAL LAST YEARPERCENT DISTRIBUTIONPERCENT CHANGE FRON A YEAA AGO
ALASKA (0)ACTUAL LAST YEARPERCENT DISTRIBUTION
PERCENT CHANGE FROM A YEAR AGO
IDAHO (6) 2`,ACTUAL LAST YEAR . s
PERCENT DISTRIBUTIONPERCENT CHANGE FROM A YEAR AGO
PAGE 9
ALL ACTIVE CASES IN PERIOD
TOTAL ON HAND NEW 'THIS
CASES START FYOf FY
ALL ACTIVE CASES PRCCESSED
TOTAL RENABIL- NO1 RENA-CLOSED ITATED BILITATED
CM (28)
NOT RENA-SILITATED
(30)
CASES ONNAND ATEND Of
PERKO
83,779 46,932 36,847 35,024 22,350 12,450 224 48,75582,191 46,058 36.133 35,259 22,655 12,421 183 46,932100.0 56.0 44.0 100.0 63.8 35.5 0L6
1.9 1.9 2.0 -0.7 -1.3 0.2 22.4 3.9
353 198 155 158 103 29 26 195327 223 104 128 87 25 16 199
100.0 56.1 43.9 100.0 65.2 18.4 16.58.0 -11.2 49.0 23.4 18.4 16.0 62.5 -2.0
4,039 2,661 1,378 1,296 784 365 147 2,7434,104 2,665 1,439 1,443 882 395 166 2,661100.0 65.9 34.1 100.0 60.5 21.2 11.3-1.6 -0.2 -4.2 -10.2 -11.1 -7.6 -11.4 3.1
2,401 1,313 1,088 1,163 553 538 72 1,2382,654 1,218 1,436 1,341 944 341 56 1,313100.0 54.7 45.3 100.0 47.5 46.3 6.2-9.5 7.8 -24.2 -13.3 -41.4 57.8 28.6 -5.7
126 81 45 11 10 1 0 11579 54 25 18 6 12 0 61
100.0 64.3 35.7 100.0 90.9 9.1 0.059.5 50.0 80.0 -38.9 66.7 -91.7 * 88.5
103 74 29 37 27 8 2 66117 71 46 43 31 6 6 74
100.0 71.8 28.2 100.0 73.0 21.6 5.4-12.0 4.2 -37.0 -14.0 -12.9 33.3 -66.7 -10.8
170 107 63 54 46 2 6 116159 94 65 52 46 3 3 107
100.0 62.9 37.1 100.0 85.2 3.7 11.16.9 13.8 -3.1 3.8 0.0 -33.3 100.0 8.4
27,956 16,848 11,108 11,442 7,015 3,239 1,188 16,51428,154 16,785 11,369 11,293 6,838 3,315 1,140 16,861100.0 60.3 39.7 100.0 61.3 28.3 10.4-0.7 0.4 -2.3 1.3 2.6 -2.3 4.2 -2.1
1,901 1,230 671 757 376 265 116 1,1442,043 1,228 815 813 479 220 114 1,230100.0 64.7 35.3 100.0 49.7 35.0 15.3-7.0 0.2 -17.7 -6.9 -21.5 20.5 1.41 -7.0
4,397 2,746 1,651 1,713 1,129 396 188 2,6844,294 2,689 1,610 1,553 958 414 181 2,746100.0 62.5 37.S 100.0 55.9 23.1 11.02.3 2.1 2.5 10.3 7.8 -4.3 3.9 -2.3
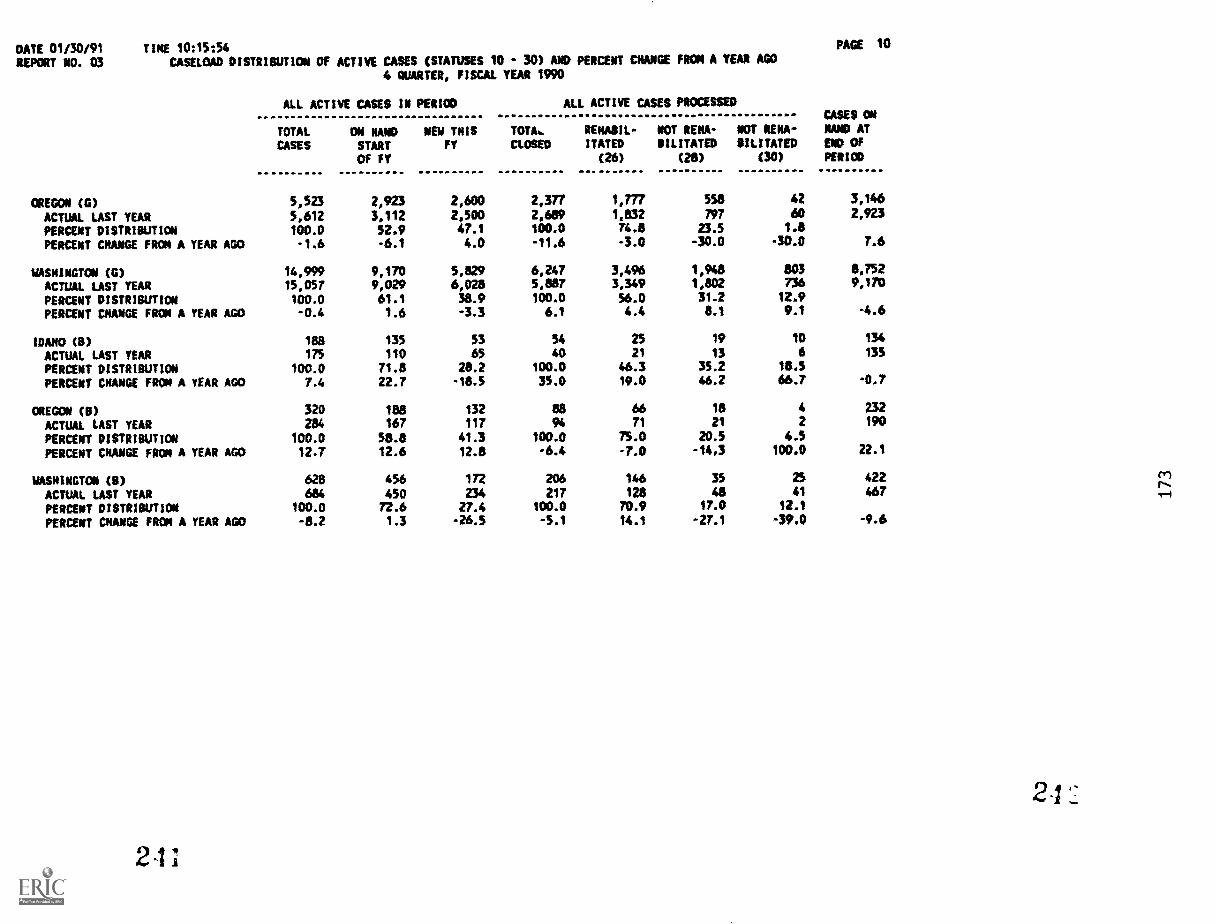
DATE 01/30/91REPORT AO. 03
TINE 10:15:54CASELOAD DISTRIBUTION OF ACTIVE CASES (STATUSES 10 - 30) AND PERCENT CHANGE FROM A YEAR AGO
4 QUARTER. FISCAL YEAR 1990
PAGE 10
ALL ACTIVE CASES IN PERIOD
TOTAL ON RAND NEW THISCASES START FY
Of FY
ALL ACTIVE CASES PROCESSED
'TWA, RENASIL- NOT RENA-
CLOSED ITATED BILItATED
(26) (28)
NOT RENA-SILITATED
(30)
CASES ONNAND ATEND CWPERIOD
OREGON (0) 5,523 2,923 2,600 2,377 1,777 558 42 3,146
ACTUAL LAST YEAR 5,612 3,112 2,500 2,669 1,832 797 60 2,923
PERCENT DISTRIBUTION 100.0 52.9 47.1 100.0 74.8 23.5 1.8
PERCENT CHANGE FROM A YEAR AGO -1.6 -6.1 4.0 -11.6 -3.0 -30.0 -30.0 7.6
UASNINGTON (0) 14,999 9,170 5,829 6,247 3,496 1,948 803 8.752
ACTUAL LAST YEAR 15,057 9,029 6,028 5,8117, 3,349 1,802 736 9,170
PERCENT DISTRIBUTION 100.0 61.1 38.9 100.0 56.0 31.2 12.9
PERCENT CHANGE FROM A YEAR AGO -0.4 1.6 -3.3 6.1 4.4 8.1 9.1 -4.6
IDAHO (8) 188 135 53 54 25 19 10 134
ACTUAL LAST YEAR 175 110 65 40 21 13 6 135
PERCENT DISTRIBUTION 100.0 71.8 28.2 100.0 46.3 35.2 18.5
PERCENT CHANGE FROM A YEAR AGO 7.4 22.7 -18.5 35.0 19.0 46.2 66.7 -0.7
OREGON (8) 320 188 132 as 66 18 4 232
ACTUAL LAST YEAR 284 167 117 94 71 21 2 190
PERCENT DISTRIBUTION 100.0 58.8 41.3 100.0 75.0 20.5 4.5
PERCENT CHANGE FROM A YEAR AGO 12.7 12.6 12.8 -6.4 -7.0 -14.3 100.0 22.1
WASHINGTON (B) 628 456 172 206 146 35 25 422
ACTUAL LAST YEAR 684 450 234 217 128 48 41 467
PERCENT DISTRIBUTION 100.0 72.6 27.4 100.0 70.9 17.0 42.1
PERCENT CHANGE FROM A YEAR AGO -8.2 1.3 -26.5 -5.1 14.1 -27.1 -39.0 -9.6
24
2 4 ;
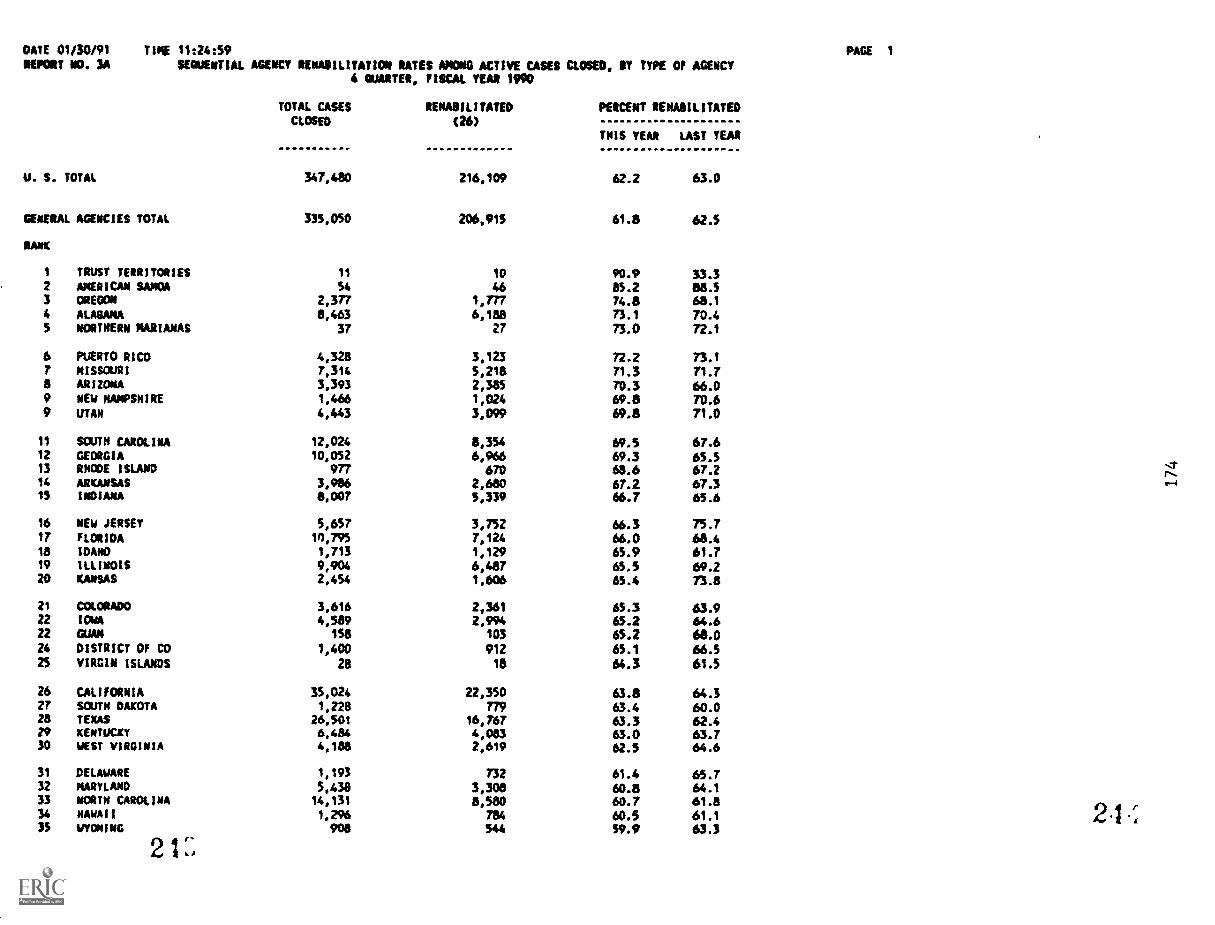
DATE 01/30/91
REPORT NO, 3AYII 11:24:59
siouseTIAL AGENCY RENASILITATION SATES AMONG ACTIVE CASES CLOSED, SY TYPE OF AGENCYPAGE 1
U. S. TOTAL
GENERAL AGENCIES TOTAL
RANK
4 SUARTER, FISCAL YEAR 1990
TOTAL CASES RENABILITATEDCLOSED (26)
347,488 216,109
335,050 206,915
PERCENT REHABILITATED
THIS YEAR LAST YEAR
62.2 63.0
61.8 62.5
1 TRUsT TERRITORIES 11 10 90.9 33.32 AMERICAN SAVA 54 46 85.2 8833 OREGON 2,377 1,777 74.8 68.14 ALABAMA 6,463 6,188 73.1 70.45 NORTHERN MARIANAS 37 27 73.0 72.1
6 PUERTO RICO 4,328 3,123 72.2 73.17 MISSOURI 7,314 5,218 71.3 71.78 ARIZONA 3,393 2,385 70.3 66.09 NEW HAMPSHIRE 1,466 1,024 69.8 70.69 UTAH 4,443 3,099 69.8 71.0
11 SOUTH CAROLINA 12,024 8,354 69.3 67.612 GEORGIA 10,052 6,966 69.5 65.513 RHODE ISLAND 977 670 63.6 67.214 ARKANSAS 3,986 2,680 67.2 67315 INDIANA 8,007 5,339 66.7 65.6
16 NEW JERSEY 5,657 3,752 66.3 75.717 FLORIDA in,795 7,124 66.0 68.418 IDAHO 1,713 1,129 65.9 61.719 ILLINOIS 9,904 6,487 65.5 69.220 KANSAS 2,454 1,606 65.4 73.8
21 COLORADO 3,616 2,361 65.3 63.922 IONA 4,589 2,994 65.2 64.622 GUAM 158 103 65.2 65.024 DISTRICT OF CO 1,400 912 65.1 66.525 VIRGIN ISLANDS 28 18 64.3 61.5
26 CALIFORNIA 35,024 22,350 63.8 64.327 SOUTH DAKOTA 1,228 779 63.4 60.028 TEXAS 26,501 16,767 63.3 62.429 KENTUCKY 6.484 4,083 63.0 63.730 WEST VIRGINIA 4,188 2,619 62.5 64.6
31 DELAWARE 1,193 732 61.4 65.732 NARTLAND 5,438 3,308 60.5 64.133 NORTH CAROLINA 14,131 8,580 60.7 61.834 HAWAII 1,296 784 60.5 61.135 WYOMING 908 544 59.9 63.3
2 4`.;
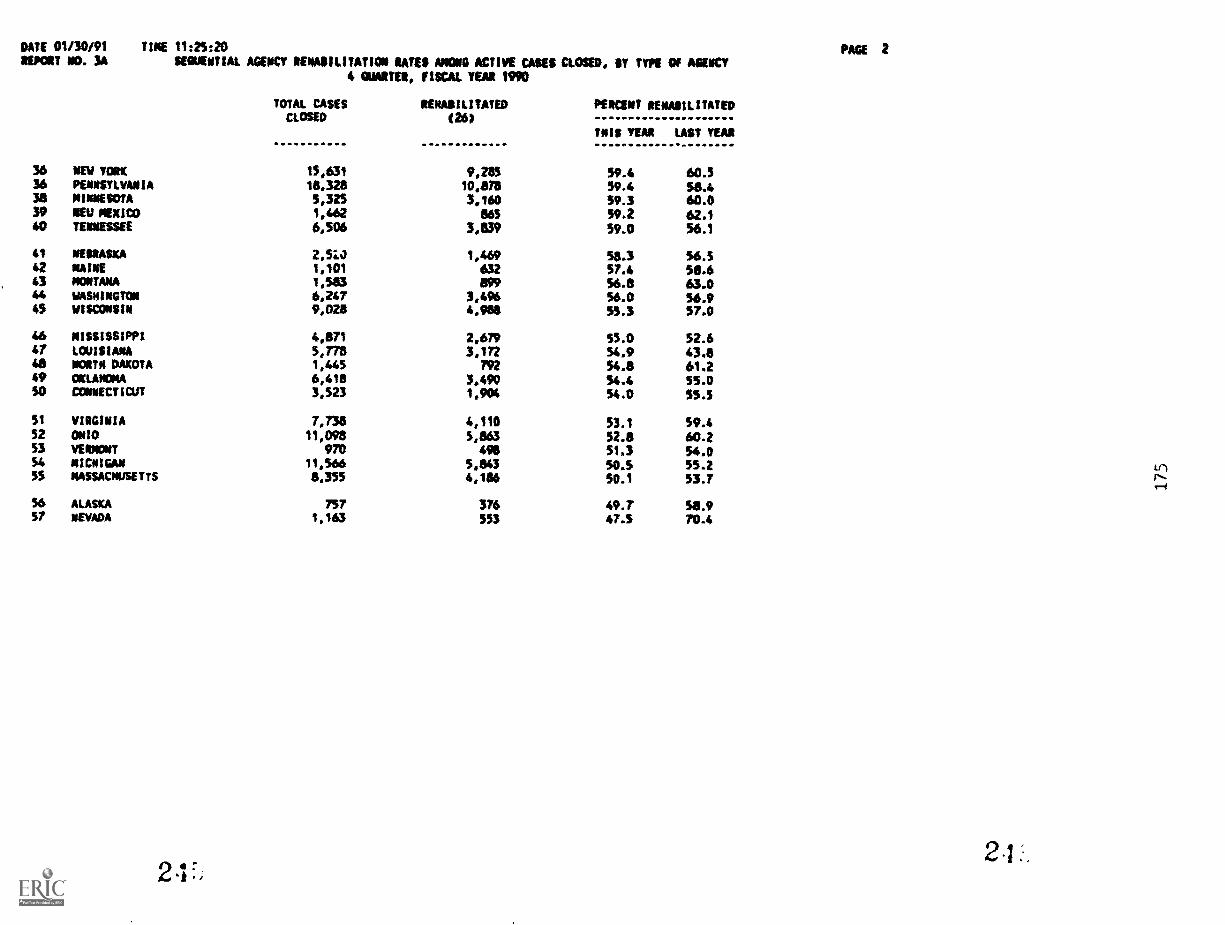
DATE 01/30/91MORT NO. 3A
TINE 11:25:20
SEQUENTIAL AGENCY RENABILITATION RATES AMONG ACTIVE CASES CLOSED, SY TYPE Of MACYPAGE 2
TOTAL CASESCLOSED
4 QUARTER, FISCAL YEAR 1990
RENOILITATED(26)
PERCENT RENASILITATED
TNIS YEAS LAST YEAR
36 NEW YORK 15,631 9,285 59.4 60.536 PENNSYLVANIA 18,328 10,018 59.4 $81.438 MIAMESOTA 5,325 3,160 59.3 60.039 AEU MEXICO 1,462 865 59.2 62.140 TENNESSEE 6,506 3,109 59.0 56.1
41 NEWASKA 2.510 1,469 58.3 56.542 MAINE 1,101 632 57.4 58.643 NCOTANA 1,583 899 56.8 63.044 wm6mINGTON 6,247 3,496 56.0 56.945 WISCONSIN 9,028 4,988 55.3 57.0
46 MISSISSIPPI 4,871 2,679 35.0 52.647 LOUISIANA 5,778 3,172 54.9 43.848 AORTA DAKOTA 1,445 792 54.8 61.249 OKLAHOMA 6,418 3,490 54.4 55.0SO CONNECTICUT 3,523 1,904 54.0 55.5
51 VIRGINIA 7,738 4,110 53.1 59.452 WM 11,098 5,863 52.8 60.253 VERMONT 970 498 51.3 54.054 MICNIGAN 11,566 5,843 50.5 55.255 MASSACNUSETTS 8,355 4,186 50.1 53.7
56 ALASKA 757 376 44.7 58.957 NEvA94 1063 553 473 70.4
2 42-1 .
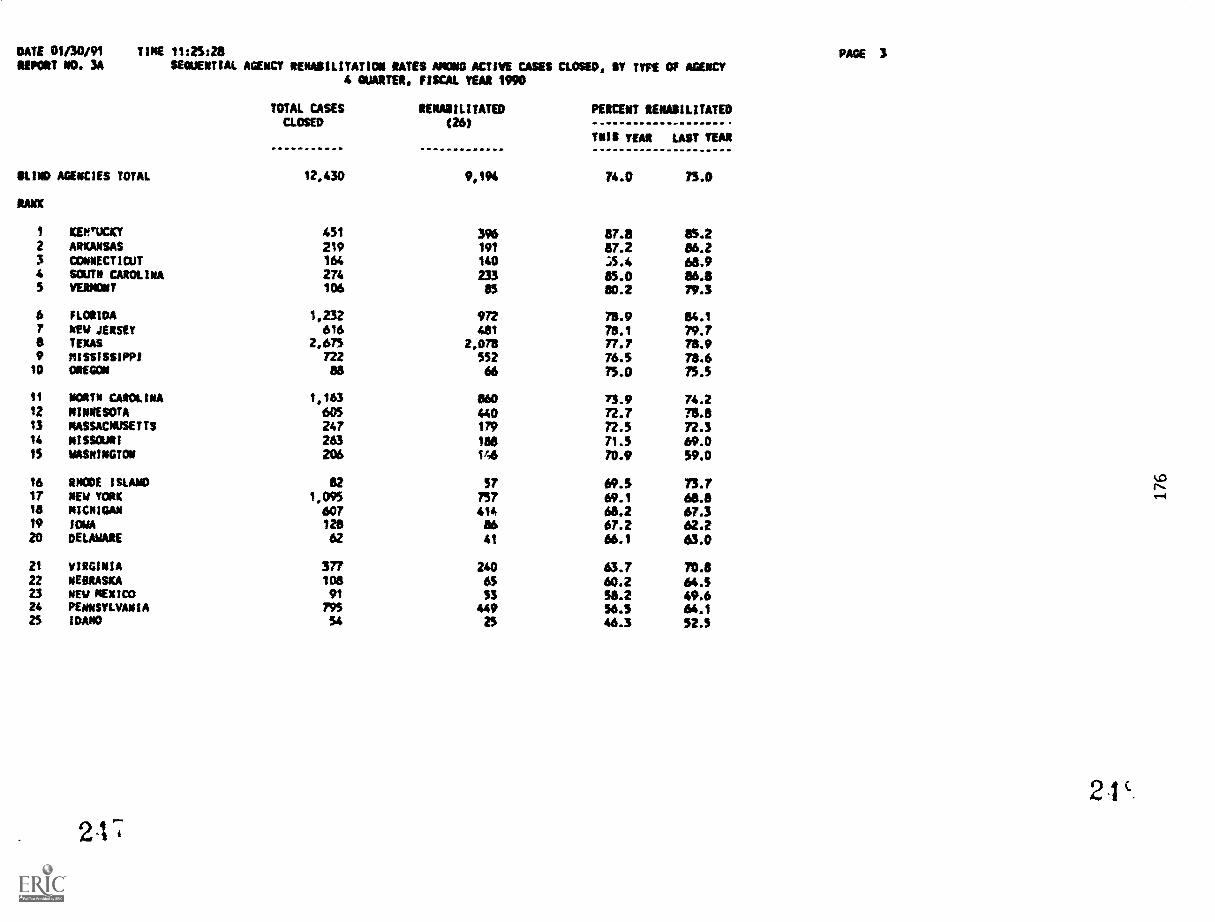
DATE 01/30/91REPORT NO. 3A
TINE 11:245:28
SEQUENTIAL AGENCY RINASILITATION SATES AMONG ACTIVE CASES CLOSED, SY TYPE OF AGENCY
BLIND AGENCIES TOTAL
RANK
4 QUARTER, FISCAL YEAR 1990
TOTAL CASES RENAMILITATEDCLOSED (26)
12,430 9,194
PERCENT RENABILITATED
TIMIS YEAR LAST YEAR
74.0 75.0
1 KWUCKY 451 396 87.8 85.22 ARKANSAS 219 191 87.2 86.23 CONNECTICUT 164 140 ;5.4 68.94 SOUTA CAROLINA 274 233 85.0 86.8S VERMONT 106 85 80.2 79.3
6 FLORIDA 1,232 972 71.9 84,17 NEW JERSEY 616 461 78.1 79.78 TEXAS 2,675 2,078 ?T.? 78.99 MISSISSIPPI 722 552 76.5 78.610 OREGON as 66 75.0 75.5
11 NONTN CAROLINA 1,163 860 73.9 74.212 MINNESOTA 605 440 72.7 78.813 MASSACHUSETTS 247 179 72.5 72.314 MISSOURI 263 188 71.5 69.015 WASNINGTON 206 146 70.9 59.0
16 RNCOE ISLAND az sr 69.5 73.717 NEW YORK 1,095 757 69.1 68.818 NICNIGAN 607 414 68.2 67.319 IOWA 128 86 67.2 62.220 DELAWARE 62 41 66.1 63.0
21 VIRGINIA 377 240 63.7 70.822 NEBRASKA 108 65 60.2 64.523 Nu mExtc0 91 53 58.2 49.624 PENNSYLVANIA 795 449 56.5 64.125 IDANO 34 25 46.3 52.5
21
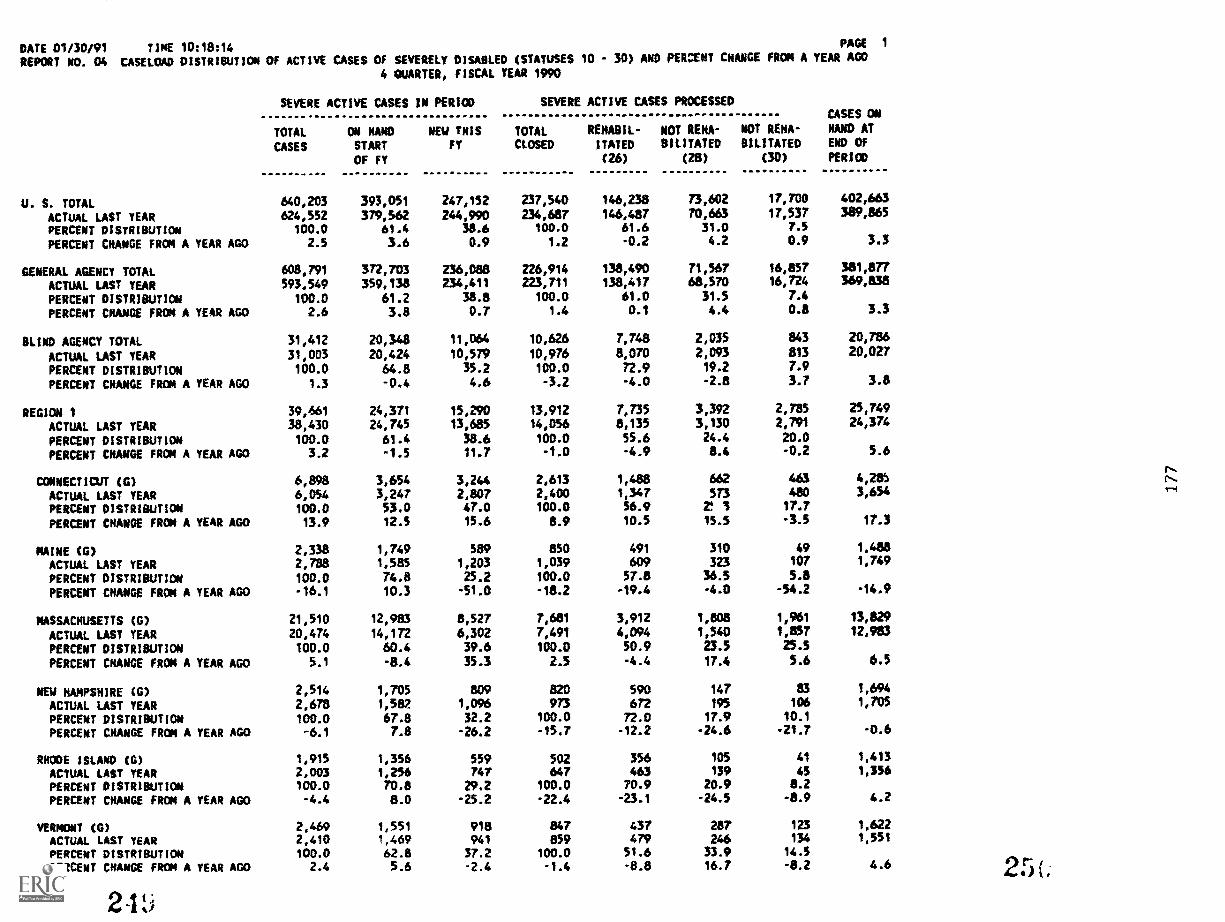
DATE 01/30191 TIME 10:18:14 PAGE 1
REPORT W3. 04 CASELOAD DISTRIBUTION OF ACTIVE CASES OF SEVERELY DISABLED (STATUSES 10 - 30) AND PER:ERT CHANGE FROM A YEAR AGO
4 QUARTER, FISCAL YEAR 1990
SEVERE ACTIVE CASES IN PERIOD
TOTAL ON NANO NEW THIS
CASES START FY
OF FY
SEVERE ACTIVE CASES PROCESSED
TOTAL REHABIL- NOT RENA-
CtOSED !TATE) BILITATED
(26) (28)
WOT RENA-
BILITATED(30)
CASES ON
HAND ATEND OF
PERIOD
U. S. TOTAL 640,203 393,051 247,152 237,540 146,238 73,602 17,700 402,663
ACTUAL LAST YEAR 624,552 379,562 244,990 234,687 146,487 70,663 17,537 389,865
PERCENT DISTRIBUTION 100.0 61.4 38.6 100.0 61.6 31.0 7.5
PERCENT CHANGE FROM A YEAR AGO 2.5 3.6 0.9 1.2 -0.2 4.2 0.9 3.3
GENERAL AGENCY TOTAL 608.791 372,703 236,088 226,914 138,490 71,567 16,857 381,877
ACTUAL LAST YEAR 593,549 359,138 234,411 223,711 138,417 68,570 16,724 369,838
PERCENT DISTRIBUTION 100.0 61.2 38.8 100.0 61.0 31.5 7.4
PERCENT CRANGE FROM A YEAR AGO 2.6 3.8 0.7 1.4 0.1 4.4 0.8 3.3
BLIND AGENCY TOTAL 31,412 20,348 11,064 10,626 7,748 2,035 843 20,786
ACTUAL LAST YEAR 31,003 20,424 10,579 10,976 8,070 2,093 813 20,027
PERCENT DISTRIBUTION 100.0 64.8 35.2 100.0 72.9 19.2 7.9
PERCENT CHANGE FROM A YEAR AGO 1.3 -0.4 4.6 -3.2 -4.0 -2.8 3.? 3.8
REGIN 1 39,661 24,371 15,290 13,912 7,735 3,392 2,785 25,749
ACTUAL LAST YEAR 38,430 24,745 13,685 14,056 8,135 3,130 2,791 24,374
PERCENT DISTRIBUTION 100.0 61.4 38.6 100.0 55.6 24.4 20.0
PERCENT CHANGE FROM A YEAR AGO 3.2 -1.5 11.7 -1.0 -4.9 8.4 -0.2 5.6
CONNECTICUT (G) 6,898 3,654 3,244 2,613 1,488 662 463 4,21b
ACTUAL LAST YEAR 6,054 3,247 2,807 2,400 1,347 573 480 3,654
PERCENT DISTRIBUTION 100.0 53.0 47.0 100.0 56.9 2! 3 17.7
PERCENT CHANGE FROM A YEAR AGO 13.9 12.5 15.6 8.9 10.5 15.5 -3.5 17.3
MAINE (G) 2,338 1,749 589 850 491 310 49 1,488
ACTUAL LAST YEAR 2,788 1,585 1,203 1,039 609 323 107 1,749
PERCENT DISTRIBUTION 100.0 74.8 25.2 100.0 57.8 36.5 5.8
PERCENT CHANGE FROM A YEAR AGO -16.1 10.3 -51.0 -18.2 -19.4 -4.0 -54.2 -14.9
MASSACHUSETTS (0) 21,510 12,983 8,527 7,681 3,912 1,808 1,961 13,829
ACTUAL LAST YEAR 20,474 14,172 6,302 7,491 4,094 1,540 1,857 12,983
PERCENT DISTRIBUTION 100.0 60.4 39.6 100.0 50.9 23.5 25.5
PERCENT CRANGE FROM A YEAR AGO 5.1 -8.4 35.3 2.5 -4.4 17.4 5.6 6.5
NEW HAMPSHIRE (G) 2,514 1,705 809 820 590 147 83 1,694
ACTUAL LAST YEAR 2,678 1,582 1,096 973 672 195 106 1,705
PERCENT DISTRIBUTION 100.0 67.8 32.2 100.0 72.0 17.9 10.1
PERCENT CHANGE FROM A YEAR AGO -6.1 7.8 -26.2 -15.7 -12.2 -24.6 -21.7 -0.6
RHCOE ISLAND (G) 1,915 1,356 559 502 356 105 41 1,413
ACTUAL LAST YEAR 2,003 1,256 747 647 463 139 45 1,356
PERCENT DISTRIBUTION 100.0 70.8 29.2 100.0 70.9 20.9 8.2
PERCENT CHANGE FROM A YEAR AGO -4.4 8.0 -25.2 -22.4 -23.1 -24.5 -8.9 4.2
VERMONT (G) 2,469 1,551 918 847 437 287 123 1,622
ACTUAL LAST YEAR 2,410 1,469 941 659 479 246 134 1,551
PERCENT DISTRIBUTION 100.0 62.8 37.2 100.0 51.6 33.9 14.5
PERCENT GRANGE FROM A YEAR AGO 2.4 5.6 -2.4 -1.4 -8.8 16.7 -8.2 4.6 2.5
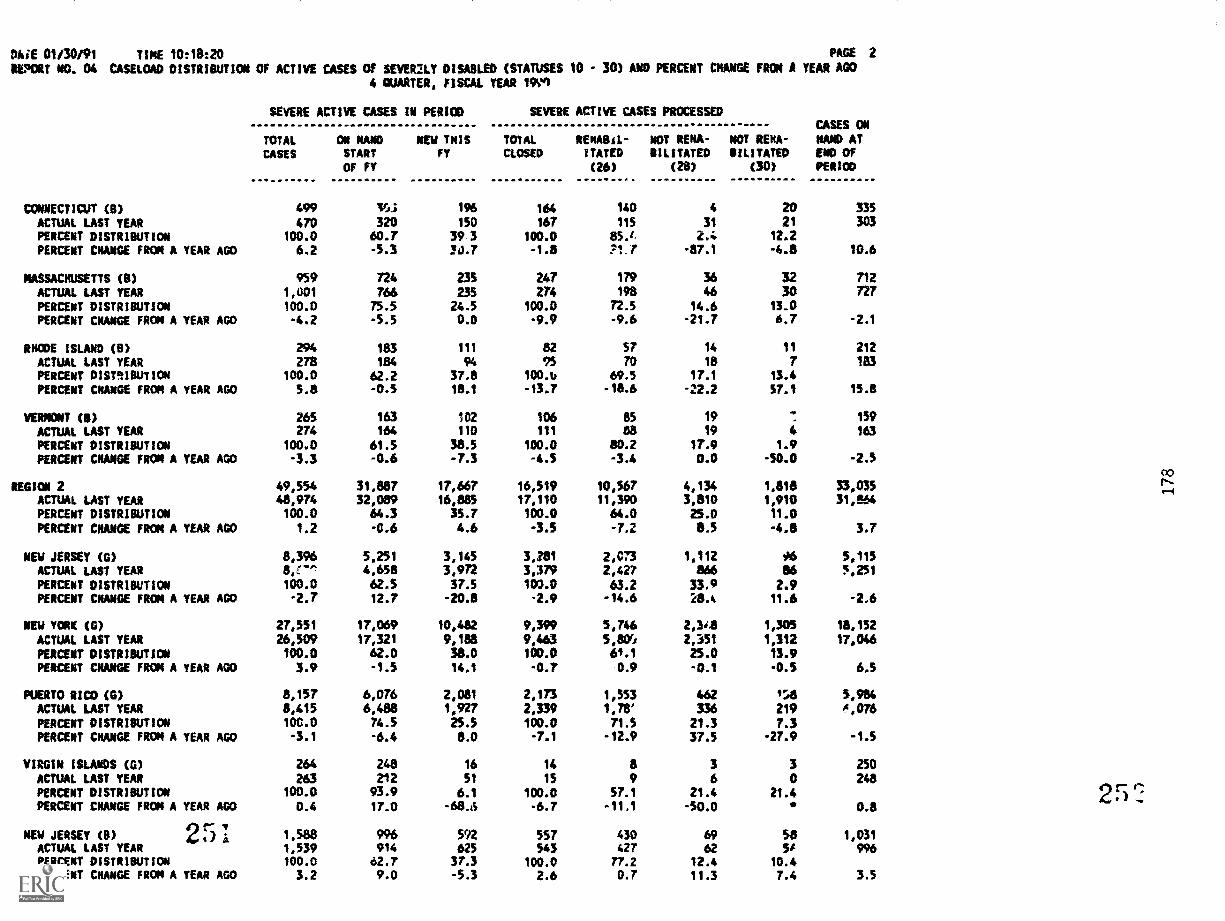
DIWE 01/30191 TIME 10:18:20 PAGE 2
REPORT NO. 04 CASELOAD DISTRIBUTICW OF ACTIVE CASES Of SEVER2LY DISABLED (STATUSES 10 - 30) AND PERCENT CHANGE FROM A YEAR A00
4 QUARTER, FISCAL YEAR 190
CONNECTICUT (0)ACTUAL LAST YEARPERCENT DISTRIBUTIONPERCENT CHANGE FROM A YEAR AGO
MASSACHUSETTS (8)ACTUAL LAST YEAR
PERCENT DISTRIBUTIONPERCENT CNANGE FROM A YEAR AGO
RHODE ISLAND CB/ACTUAL LAST YEARPERCENT DISTqIBUTIONPERCENT CHANGE FROM A YEAR AGO
VERMONT (8)ACTUAL LAST YEARPERCENT DISTRI8UTIONPERCENT CMANGE FROM A YEAR AGO
REGION 2ACTUAL LAST YEARPERCENT DISTRIBUTION
PERC1NT CHANGE FROM A YEAR AGO
NEW JERSEY (0)ACTUAL LAST YEARPERCENT DISTRIBUTIONPERCENT CHANGE FRON A YEAR AGO
NEW YORK (0)ACTUAL LAST YEARPERCENT DISTRIBUTIONPERCENT CRANE FROM A YEAR A00
PUERTO RICO (0)ACTUAL LAST YEAR
PERCENT DISTRIBUTIONPERCENT CHANGE FROM A YEAR AGO
VIRGIN ISLANDS (0)ACTUAL LAST YEARPERCENT DISTRIBUTIONPERCENT CHANGE FROM A YEAR A03
NEW JERSEY (8) 25 1ACTUAL LAST YEARPERCENT DISTRIBUTIONPERCENT CHANGE FROM A YEAR AGO
SEVERE ACTIVE CASES IN PERIOD
TOTAL ON NAND NEw THISCASES START FY
OF FY
SEVERE ACTIVE CASES PROCESSED
TOTAL RENABAL- MOT RENA-CLOSED ITATED BILITATED
(26) (28)
NOT RENA-8ILITATED
(30)
CASES ONNAND ATENO OFPERIOD
499 loI 196 164 140 4 20 335
470 320 150 167 115 31 21 303100.0 60.7 39 3 100.0 85.1 2.4 12.2
6.2 -5.3 34.1.7 -1.8 ?I r -87.1 -4.8 10.6
959 724 235 247 179 36 32 712
1,001 766 235 274 198 46 30 727
100.0 75.5 24.5 100.0 72.5 14.6 13.0
-4.2 -5.5 0.0 -9.9 -9.6 -21.7 6.7 -2.1
294 183 111 82 57 14 11 212278 184 94 95 70 18 7 ma
100.0 62.2 37.8 100.Ik 69.5 17.1 13.4
5.8 -0.5 18.1 -13.7 -18.6 -22.2 57.1 15.8
265 163 102 106 85 19.
159
274 164 110 111 sa 19 4 163
100.0 61.5 38.5 100.0 80.2 17.9 1.9
-3.3 -0.6 -7.3 -4.5 -3.4 0.0 -50.0 -2.5
49,554 31,887 17,667 16,519 10,567 4,134 1,818 33,03548,974 32,089 16,885 17,110 11,390 3,810 1,910 31,564100.0 64.3 35.7 100.0 64.0 25.0 11.0
1.2 -0.6 4.6 -3.5 -7.2 8.5 -4.8 3.7
8,396 5,251 3,145 3,281 2013, 1,112 06 5,1158,C'''' 4,658 3,972 3,379 2,427 866 86 5,251
100.0 62.5 37.5 100.0 63.2 33.9 2.9-2.7 12.7 -20.8 -2.9 -14.6 28.k 11.6 -2.6
27,551 17,069 10,482 9,399 5,746 2,3*8 1,305 18,152
26,509 17,321 9,188 9,463 5,80'.t 2,351 1,312 17,046100.0 62.0 38.0 100.0 61.1 25.0 13.93.9 -1.5 14.1 -0.7 0.9 -0.1 -0.5 6.5
8,157 6,076 2,081 2,173 1,553 462 158 5,9148,415 6,488 1,927 2,339 1,78' 336 219 A,076100.0 74.5 25.5 100.0 71.5 21.3 7.3-3.1 -6.4 8.0 -7.1 -12.9 37.5 -27.9 -1.5
264 248 16 14 a 3 3 250
263 212 51 15 9 6 0 248100.0 93.9 6.1 100.0 57.1 21.4 21.40.4 17.0 -68.6 -6.7 -11.1 -50.0 0.8
1,588 996 592 557 430 69 58 1,0311,539 914 625 543 427 62 St 996100.0 62.7 37.3 100.0 77.2 12.4 10.43.2 9.0 -5.3 2.6 0.7 11.3 7.4 3.5
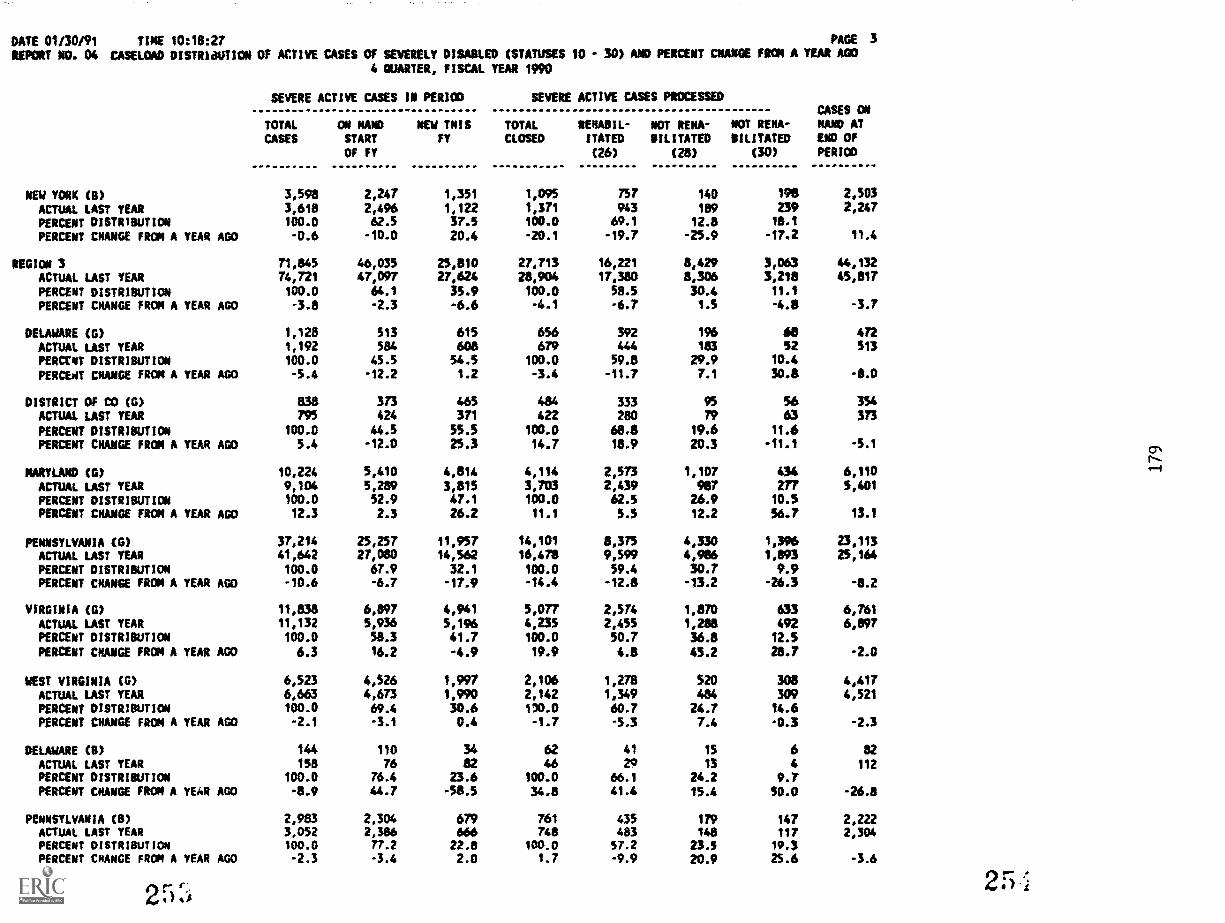
DATE 01/30/91 TIME 10:18:27 PAGE 3
REPORT NO. 04 CASELOAD DISTRINTION OF ACTIAT CASES OF SEVERELY DISABLED (STATUSES 10 - 30) AND PERCENT CRANE FROM A YEAR A004 QUARTER, FISCAL YEAR 1990
SEVERE ACTIVE CASES IN PERIOD
TOTAL ON NAND NEW TNISCASES START FY
OF FY
SEVERE ACTIVE CASES PROCESSED
TOTAL REHABIL- NOT RfNA-CLOSED ITATED BILITATED
(26) (28)
NOT RENA-RILITATED
(30)
CASES ONNANO ATEND OfPERIOD
NEW YORK (8) 3,598 2,247 1,351 1,055 757 140 196 2,503
ACTUAL LAST YEAR 3,618 2,496 1,122 1,371 943 109 239 2,247
PERCENT DISTRIgulum 100.0 62.5 37.5 100.0 69.1 12.8 18.1
PERCENT CHANGE FROM A YEAR AGO -0.6 -10.0 20.4 -20.1 -19.7 -25.9 -17.2 11.4
REGION 3 71,845 46,035 25,810 27,713 16,221 8,429 3,063 44,132
ACTUAL LAST YEAR 74,721 47,097 27,624 28,904 17,380 8,306 3,218 45,817
PERCENT DISTRIBUTION 100.0 64.1 35.9 100.0 58.5 30.4 11.1
PERCENT CHANGE FRON A YEAR AGO -3.8 -2.3 -6.6 -4.1 -6.7 1.5 -4.8 -3.7
DELAWARE (G) 1,128 513 615 656 392 196 so 472ACTUAL 44ST YEAR 1,192 584 608 679 444 183 52 513PERCCNT DISTRIBUTION 100.0 45.5 54.5 100.0 59.8 29.9 10.4
PERCE4T CNANGE FROM A YEAR AGO -5.4 -12.2 1.2 -3.4 -11.7 7.1 30.8 -8.0
DISTRICT OF CO (G) am 373 465 484 333 95 56 354
ACTUAL LAST YEAR 795 424 371 422 280 r; 63 373
PERCENT DISTRIBUTION 100.0 44.5 55.5 100.0 68.8 19.6 11.6PERCENT CKANGE FROM A YEAR AGO 5.4 -12.0 25.3 14.7 18.9 20.3 -11.1 -5.1
MARYLAND (0) 10,224 5,410 4,814 4,114 2,573 1,107 434 6,110ACTUAL LAST YEAR 9,104 5,289 3,815 3,703 2,439 987 277 5,401
PERCENT DISTRIBUTION 100.0 52.9 47.1 100.0 62.5 26.9 10.5
PERCENT CHANGE FROM A YEAR AGO 12.3 2.3 26.2 11.1 3.5 12.2 56.7 13.1
PENNSYLVANIA (6) 37,214 25,257 11,957 14,101 8,375 4,330 1,396 23,113ACTUAL LAST YEAR 41,642 27,080 14,562 16,478 9,599 4,986 1,893 25,164PERCENT DISTRIBUTION 100.0 67.9 32.1 100.0 59.4 30.7 9.9PERCENT CHANGE FROM A YEAR AGO -10.6 -6.7 -17.9 -14.4 -12.8 -13.2 -26.3 -8.2
VIRGINIA (0) 11,838 6,897 4,941 5,077 2,574 1,870 633 6,761ACTUAL LAST YEAR 11,132 5,936 5,196 4,235 2,455 1,288 492 6,897PERCENT DISTRIBUTICN 100.0 58.3 41.7 100.0 50.7 36.8 12.5
PERCENT CHANGE FROM A YEAR AGO 6.3 16.2 -4.9 19.9 4.8 45.2 28.7 -2.0
WEST VIRGINIA (G) 6,523 4,526 1,997 2,106 1,278 520 308 4,417ACTUAL LAST YEAR 6,6E3 4,673 1,990 2,142 1,349 484 309 4,521
PERCENT DISTRIBUTION 100.0 69.4 30.6 1)0.0 60.7 24.7 14.6PERCENT CHANGE FROM A YEAR AGO -2.1 -3.1 0.4 -1.7 -5.3 7.4 -0.3 -2.3
DELAWARE (8) 144 110 34 62 41 15 6 82ACTUAL LAST YEAR 158 76 82 46 20 13 4 112PERCENT DISTRIBUTION 100.0 76.4 23.6 100.0 66.1 24.2 9.7PERCENT CHANGE FROM A YEAR AGO -8.9 44.7 -58.5 34.8 41.4 15.4 50.0 -26.8
PENNSYLVANIA (e) 2,983 2.304 679 761 435 179 147 2,222ACTUAL LAST YEAR 3,052 2,386 666 748 483 148 117 2,304PERCENT DISTRIBUTION 100.0 77.2 22.8 100.0 57.2 23.5 19,3PERCENT CHANGE FROM A YEAR AGO -2.3 -3.4 2.0 1.7 -9.9 20.9 25.6 -3.6
2r 20 .1
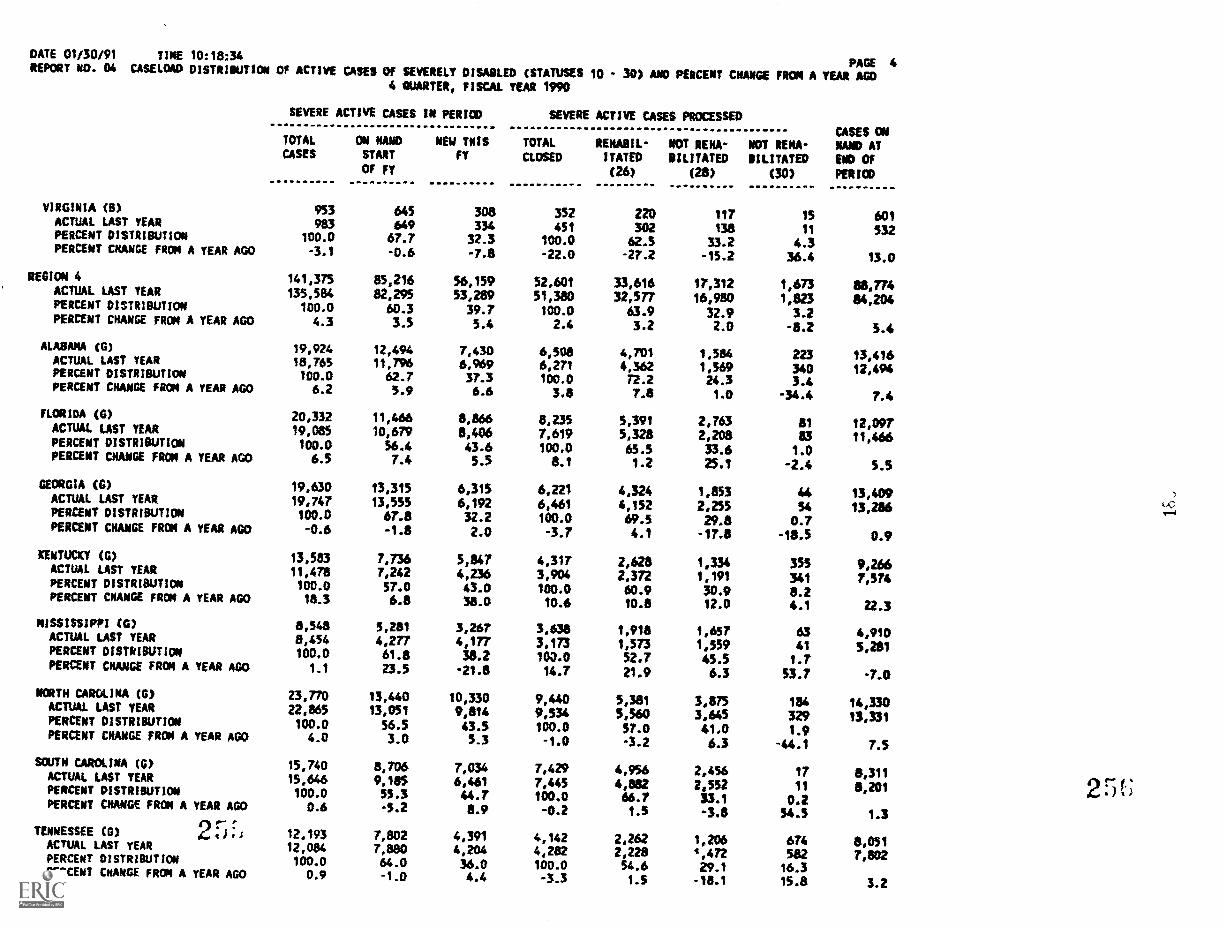
DATE 01/30/91 TINE 10:18:34PAGE 4REPORT NO. 04 CASELOAD DISTRIWJTION Of ACTIVE CASES Of SEVERELY DISABLED (STATUSES 10 - 30) ARO PERCENT CHANGE FROM A YEAR AGO
4 QUARTER, FISCAL TEAR 1990
VIRGINIA (0)ACTUAL LAST YEARPERCENT DISTRIBUTIONPERCENT CHANGE FROM A TEAR AGO
REGION 4ACTUAL LAST YEARPERCENT DISTRIBUTION
PERCENT CHANGE FROM A YEAR AGO
ALABAMA (0)ACTUAL LAST YEARPERCENT DISTRIBUTIONPERCENT CHANGE FROM A YEAR AGO
FLORIDA (0)
ACTUAL LAST YEARPERCENT DISTRVIUTIONPERCENT CHANGE FROM A YEAR AGO
GEORGIA (0)ACTUAL LAST YEARPERCENT DISTRIBUTION
PERCENT CHANGE FROM A YEAR AGO
KENTUCXY (0)ACTUAL LAST YEARPERCENT DISTRIBUTIONPERCENT CHANGE FROM A YEAR AGO
MISSISSIPPI (0)ACTUAL LAST YEARPERCENT DISTRIBUTIONPERCENT CHANGE FROM A YEAR A00
NORTH CAROLINA (G)ACTUAL LAST YEARPERCENT DISTRIBUTIONPERCENT CHANGE FROM A YEAR AGO
SOUTH CAROLINA (0)ACTUAL LAST TEARPERCENT DISTRIBUTIONPERCENT CHANGE FROM A YEAR AGO
TENNESSEE (0) 2 5 ;`-.1ACTUAL LAST YEARPERCENT DISTRIBUTIONPERCENT CHANGE FRON A YEAR AGO
SEVERE ACTIVE CASES IN PERICO
TOTAL ON NANO NEW TNISCASES START FY
OF FT
SEVERE ACTIVE CASES PROCESSED
TOTAL RENABIL- NOT RENA-CLOSED ITATED OILITATED
(26) (26)
NOT UNA-BILITATED
(30)
CASES ONNAND ATEND OF
PERIOD
953 645 308 352 220 117 15 601983 649 334 451 302 138 11 532
100.0 67.7 32.3 100.0 62.5 33.2 4.3-3.1 -0.6 -7.8 -22.0 -27.2 -15.2 36.4 13.0
141,375 85,216 56,159 52,604 33,616 17,312 1,673 88,774135,384 82,295 53,289 51,380 32,577 16,980 1,823 84,204100.0 60.3 39.7 100.0 63.9 32.9 3.24.3 3.5 5.4 2.4 3.2 2.0 -8.2 5.4
19,924 12,494 7,430 6,508 4,701 1,584 223 13,41618,745 11,796 6,969 6,271 4,362 1,569 340 12,494100.0 62.7 37.3 100.0 72.2 24.3 3.46.2 5.9 6.6 3.8 7.8 1.0 -34.4 7.4
20,332 11,466 8,866 8,235 5,391 2,763 81 12,09719,085 10,679 8,406 7,619 5,328 2,208 83 11,456100.0 56.4 43.6 100.0 65.5 33.6 1.06.5 7.4 5.5 8.1 1.2 25.1 -2.4 5.5
19,630 13,315 6,315 6,221 44324 1,853 44 13,40917,747 13,555 6,192 6,461 4,152 2,255 54 13,286100.0 67.8 32.2 100.0 69.5 29.8 0.7-0.6 -1.8 2.0 -3.7 4.1 -17.8 -18.5 0.9
13,583 7,736 5,847 4,317 2,628 1,334 355 9,26611,478 7,242 4,236 3,904 2,372 1,191 341 7,574100.0 57.0 43.0 100.0 60.9 50.9 8.218.3 6.8 38.0 10.6 10.8 12.0 4.1 22.3
8,548 5,281 3,267 3,638 1,918 1,657 63 4,9108,454 4,277 4,177 3,173 1,573 1,559 41 5,281100.0 61.8 382 100.0 52.7 45.5 1.7
1.1 23.5 -21.8 14.7 21.9 6.3 53.7 -7.0
23,770 13,440 10,330 9,440 5,381 3,875 184 14,33022,865 13,051 9,814 9,534 5,560 3,645 329 13,331100.0 56.5 43.5 100.0 57.0 41.0 1.94.0 3.0 5.3 -1.0 -3.2 6.3 -44.1 7.5
15,740 8,706 7,034 7,429 4,956 2,456 17 5,31115,646 9,185 6,461 7,445 4,882 2,552 11 8,201100.0 55.3 44.7 100.0 66.7 33.4 0.2
0.6 -5.2 8.9 -0.2 13 -3.8 54.5 1.3
12,193 7,802 4,391 4,142 2,262 1,206 674 8,05112,084 7,880 4,204 4,282 2,228 4,472 582 7,802100.0 64.0 36.0 100.0 54.6 29.1 16.3
0.9 -1.0 4.4 -3.3 1.5 -18.1 15.8 3.2
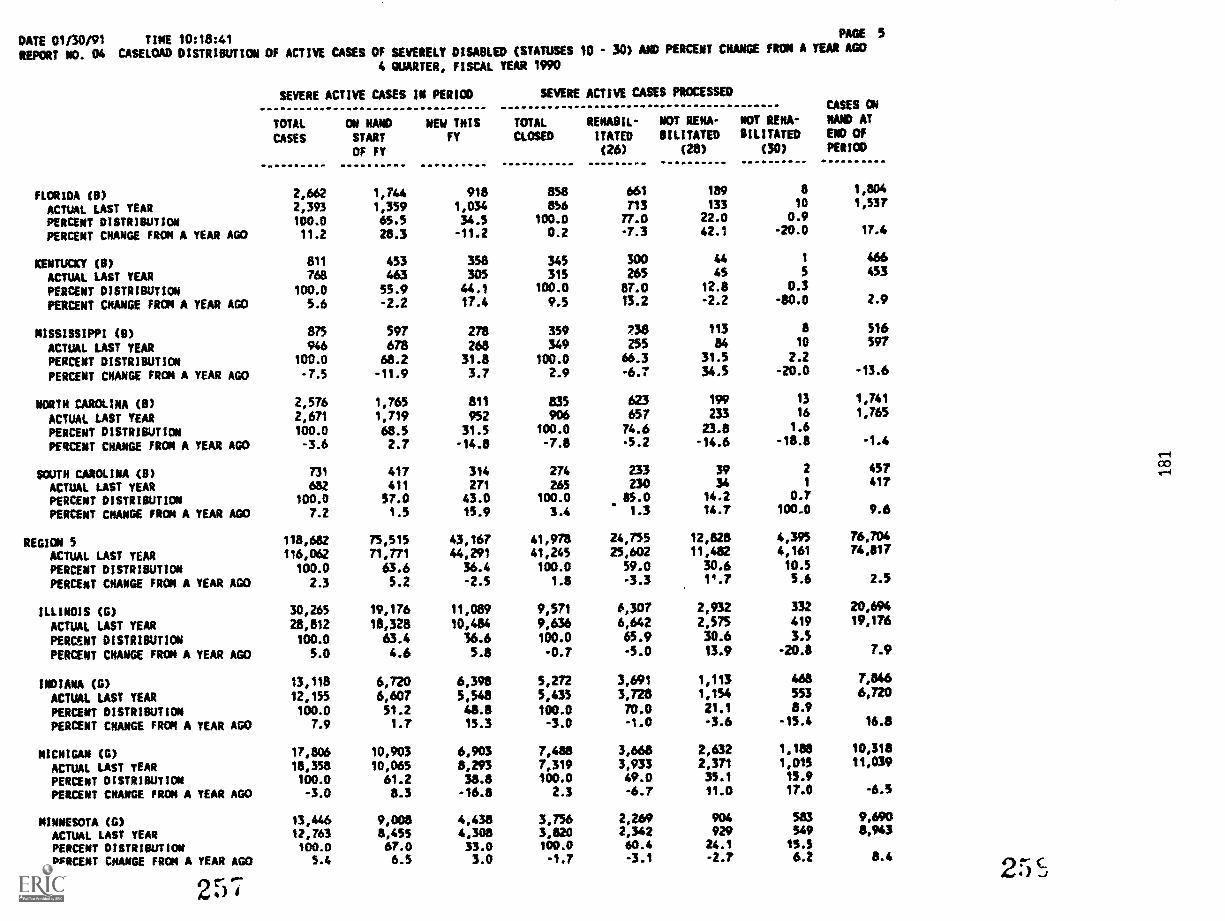
DATE 01/30/91 TIME 10:18:41PAGE 5
REPORT NO. 04 CASELOAD DISTRIBUTION OF ACTIVE CASES OF SEVERELY DISABLED (STATUSES 10 - 30) AMC PERCENT CHANGE FROM A YEAR AGO
4 QUARTER, FISCAL YEAR 1990
SEVERE ACTIVE CASES IN PERIOD
TOTAL ON HAND NEW THIS
CASES START FY
OF FY
SEVERE ACTIVE CASES PROCESSED
TOTAL REHABIL- MOT REKA-
CLOSED ITATED BILITATED
(26) (28)
NOT RENA-8ILITATED
(30)
CASES ON
NAND Aa
END OfPERIOD
FLORIDA (B) 2,662 1,744 918 858 661 189 a 1,804
ACTUAL LAST YEAR 2,393 1,359 1,034 856 713 133 10 1,537
PERCENT DISTRIBUTION 100.0 63.5 34.5 100.0 77.0 22.0 0.9
PERCENT CNANGE FROM A YEAR AW, 11.2 28.3 -11.2 0.2 -7.3 42.1 -20.0 17.4
KENTUCKY (8) 811 453 358 345 300 44 1 466
ACTUAL LAST YEAR 768 463 305 315 265 43 5 453
PERCENT DISTRIBUTION 100.0 55.9 44.1 100.0 87.0 12.8 0.3
PERCENT CHANGE FROM A YEAR AGO 5.6 -2.2 17.4 9.5 13.2 -2.2 -80.0 2.9
MISSISSIPPI (B) 875 597 278 359 738 113 8 516
ACTUAL LAST YEAR 946 678 268 349 255 84 10 597
PERCENT DISTRIBUTION 100.0 68.2 31.8 100.0 66.3 31.5 2.2
PERCENT CHANGE FROM A YEAR AGO -7.5 -11.9 3.7 2.9 -6.7 34.5 -20.0 -13.6
NORTH CAROLINA (8) 2,576 1,765 811 835 623 199 13 1,741
ACTUAL LAST YEAR 2,671 1,719 952 906 657 233 16 1,765
PERCENT DISTRISUTION 100.0 68.5 31.5 .100.0 74.6 23.8 1.6
PERCENT CHANGE FRON A YEAR AGO -3.6 2.7 -14.8 -7.8 -5.2 -14.6 -18.8 -1.4
SOUTH CAROLINA (B) 731 417 314 274 233 39 2 457
ACTUAL LAST YEAR 682 411 271 265 230 34 1 417
PERCENT DISTRIBUTION 100.0 57.0 43.0 100.0 85.0 14.2 0.7
PERCENT CHANGE FROm A YEAR AGO 7.2 1.5 15.9 3.4 1.3 14.7 100.0 9.6
REG/ON 5 118,682 75,515 43,167 41,978 24,755 12,828 4,395 76,704
ACTUAL LAST YEAR 116,062 71,771 44,291 41,245 25,602 11,482 4,161 74,817
PERCENT DISTRIBUTION 100.0 63.6 36.4 100.0 59.0 30.6 10.5
PERCENT CHANGE FROM A YEAR AGO 2.3 5.2 -2.5 1.8 -3.3 1q.7 5.6 2.5
ILLINOIS (0) 30,265 19,176 11,089 9,571 6,307 2,932 332 20,694
ACTUAL LAST YEAR 28,812 18,328 10,484 9,636 6,642 2,575 419 19,176
PERaNT DISTRIBUTION 100.0 63.4 36.6 100.0 65.9 30.6 3.5
PERCENT CHANGE FROM A YEAR AGO 5.0 4.6 5.8 -0.7 -5.0 13.9 -20.8 7.9
INDIANA (8) 13,118 6,720 6,398 5,272 3,691 1,113 468 7,846
ACTML LAST YEAR 12,155 6,607 5,548 5,455 3,728 1,154 553 6,720
PERCENT DISTRIBUTION 100.0 51.2 48.8 100.0 70.0 21.1 8.9
PERCENT CHANGE FROM A YEAR AGO 7.9 1.7 15.3 -3.0 -1.0 -3.6 -15.4 16.8
MICHIGAN (6) 17,806 10,903 6,903 7,488 3,668 2,632 1,188 10,318
ACTUAL LAST YEAR 18,358 10,065 8,293 7,319 3,933 2,371 1,015 11,039
PERCENT DISTRIBUTION 100.0 61.2 38.8 100.0 49.0 35.1 15.9
PERCENT CHANGE FROm A YEAR AGO -3.0 8.3 -16.8 2.3 -6.7 11.0 17.0 -6.3
MINNESOTA (G) 13,446 9,008 4,438 3,756 2,269 904 583 9,690
ACTUAL LAST YEAR 12,763 8,455 4,308 3,820 2,342 929 549 8,943
PERCENT DISTRIBuTION 100.0 67.0 33.0 100.0 60.4 24.1 13.5
PERCENT CHANGE FROM A YEAR AGO 5.4 6.5 3.0 -1.7 -3.1 -2.7 6.2 8.4
2"0 4
25 Si
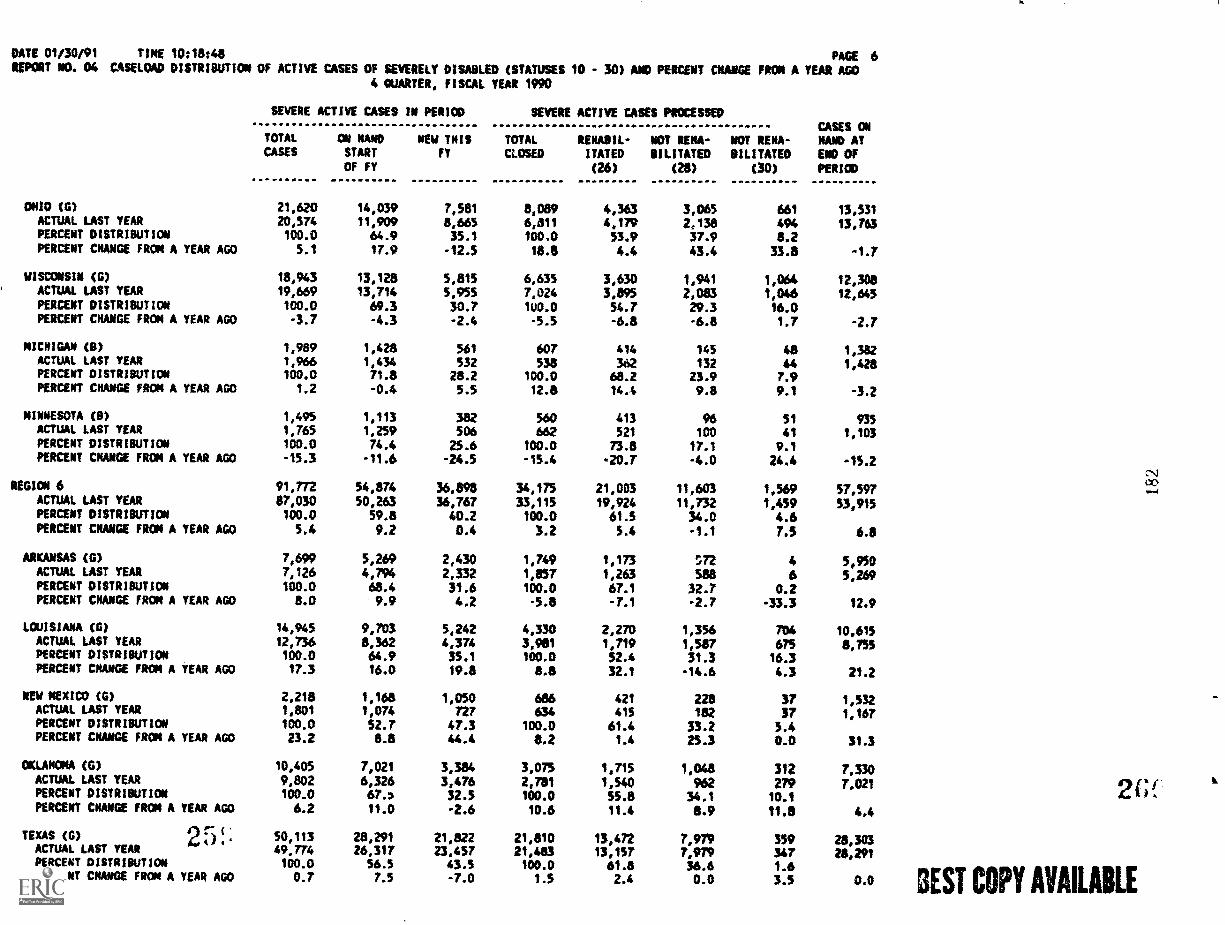
DATE 01/30/91 TINE 10:18:48 PACE 6REPORT NO. 04 CASELOAD DISTRIBUTION OF ACTIVE CASES CW SEVERELY DISABLED (STATUSES 10 - 30) AND PERCENT LUNGE FROM A YEAR AGO
4 QUARTER, FISCAL TEAR 1990
ONIO (0)ACTUAL LAST YEARPERCENT DISTRIBUTION
PERCENT CHANGE FROM A YEAR AGO
WISCONSIN (0)ACTUAL LAST YEAR
PERCENT DISTRIBUTIONPERCENT CHANGE FROM A YEAR AGO
MICHIGAN (0)ACTUAL LAST YEARPERCENT DISTRIBUTIONPERCENT CHANGE FROM A YEAR AGO
MINNESOTA (8)ACTUAL LAST YEARPERCENT DISTRIBUTIONPERCENT CAANGE FROM A YEAR AGO
REGION 6ACTUAL LAST YEARPERCENT DISTRIBUTION
PERCENT CAANGE FROM A YEAR AGO
ARKANSAS (0)ACTUAL LAST YEAR
PERCENT DISTRIBUTIONPERCENT CNANGE FROM A YEAR AGO
LOUISIANA (0)ACTUAL LAST YEARPERCENT DISTRIBUTION
PERCENT CMAAGE FROM A YEAR AGO
NEW MEXICO (0)ACTUAL LAST YEARPERCENT DISTRIBUTIONPERCENT CHANGE FROM A YEAR AGO
OKLANOKA (0)ACTUAL LAST YEARPERCENT DISTRIBUTION
PERCENT CNANGE FROM A YEAR AGO
TEXAS (G) 25!,ACTUAL LAST YEARPERCENT DISTRIBUTIONPERCENT CHANGE FROM A YEAR AGO
SEVERE ACTIVE CASES IN PERIOD
TCaAL OM NAND NEW THISCASES START FT
OF FY
SEVERE ACTIVE CASES PROCESSED
TOTAL RENABIL- NOT RENA-CLOSED ITATED BILUTATED
(26) (28)
NOT RENA-BILITATE0
(30)
CASES ONNAND ATEND Of
PERIOD
21,620 14,039 7,581 8,089 4,363 3,065 661 13,53120,574 11,909 8,665 6,811 4,179 2,138 494 13,763100.0 64.9 35.1 100.0 53.9 37.9 $.25.1 17.9 -12.5 18.8 4.4 43.4 33.8 -1.7
18,943 13,128 5,815 6,635 3,630 1,941 1,064 12,30819,669 13,714 5,955 7,024 3,895 2,083 1,046 12,645100.0 69.3 30.7 1U0.0 54.7 29.3 16.0-3.7 -4.3 -2.4 -5.5 -6.8 -6.8 1.7 -2.7
1,989 1,428 561 607 414 145 48 1,3821,966 1,434 532 538 362 132 44 1,42$100.0 71.8 28.2 100.0 68.2 23.9 7.91.2 -0.4 5.5 12.8 14.4 9.8 9.1 -3.2
1,495 1,113 382 560 413 96 51 9351,765 1,259 506 662 521 100 41 1,103100.0 74.4 25.6 100.0 73.8 17.1 9.1-15.3 -11.6 -24.5 -15.4 -20.7 -4.0 24.4 -15.2
91,772 54,874 36,898 34,175 21,003 11,603 1,569 57,59787,030 50,263 36,767 33,115 19,924 11,732 1,459 53,915100.0 59.8 40.2 100.0 61.5 34.0 4.65.4 9.2 0.4 3.2 5.4 -1.1 7.5 6.8
7,699 5,269 2,430 1,749 1,173 :72 4 5,9507,126 4,794 2,332 1,857 1,263 588 6 5,269100.0 68.4 31.6 100.0 67.1 32.7 0.28.0 9.9 4.2 -5.8 -7.1 -2.7 -33.3 12.9
14,945 9,703 5,242 4,330 2,270 1,356 704 10,61512,736 8,362 4,374 3,981 1,719 1,587 675 8,755100.0 64.9 35.1 100.0 52.4 31.3 16.317.3 16.0 19.8 8.8 32.1 -14.6 4.3 21.2
2,218 1,168 1,050 686 421 228 37 1,5121,801 1,074 727 634 415 182 37 1,167100.0 52.7 47.3 100.0 61.4 33.2 5.423.2 8.8 44.4 8.2 1.4 25.3 0.0 31.3
10,405 7,021 3,3E4 3,075 1,115 1,048 312 7,3309,802 6,326 3,476 2,781 1,540 962 279 7,021100.0 67.) 32.5 100.0 55.8 34.1 10.16.2 11.0 -2.6 10.6 11.4 8.9 11.8 4.4
50,113 28,291 21,822 21,810 13,472 7,979 359 28,30349.774 26,317 23,457 21.403 13057 7,979 347 211,291100.0 56.5 43.5 100.0 61.8 56.6 1.60.7 7.5 -7.0 1.5 2.4 0.0 3.5 0.0
26:
3EST COPY AVAILABLE
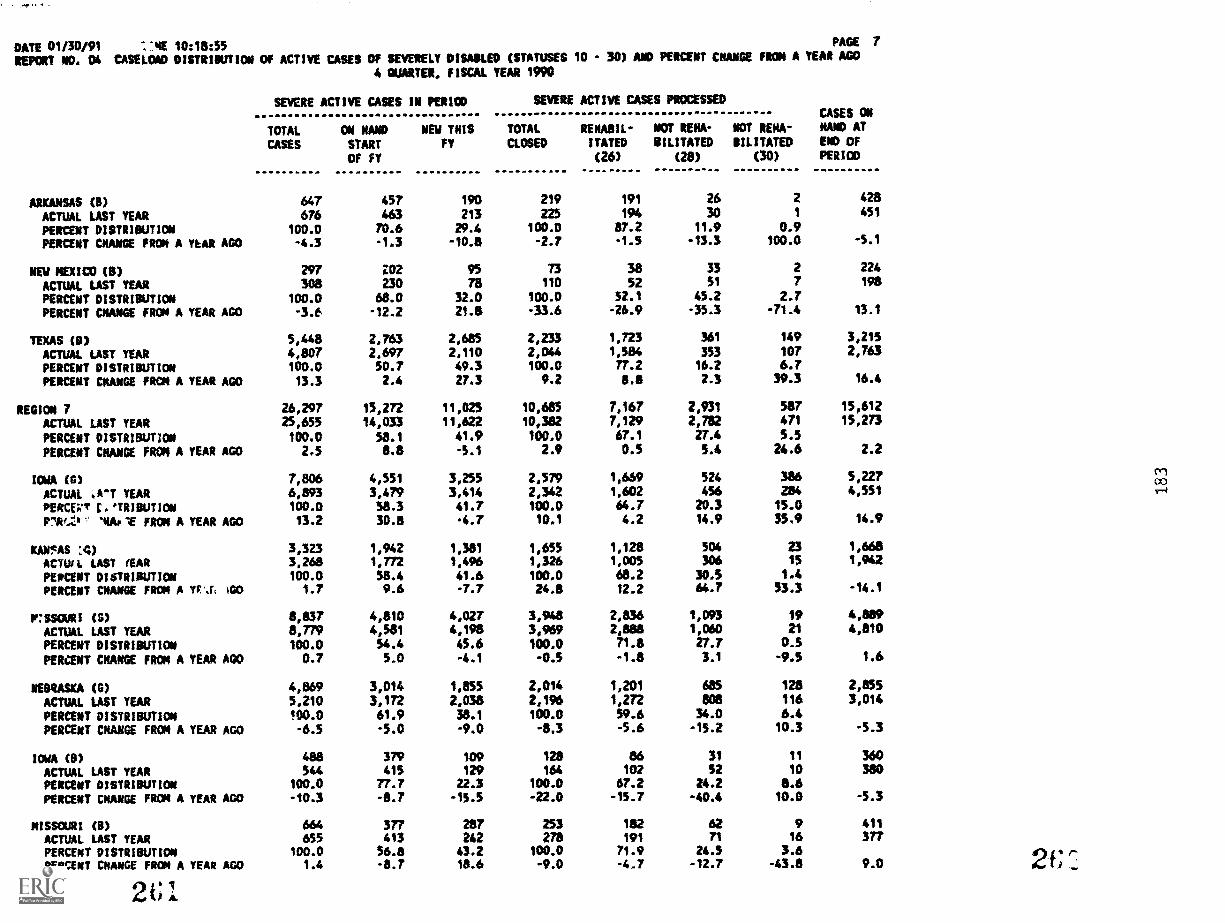
DATE 01/30/91 '.'ME 10:18:55 PAGE 7
REPORT AO. 04 CASELOAD DISTRIBUTION Of ACTIVE CASES OF SEVERELY DISABLED (STATUSES 10 - 30) AND PERCENT CHANGE FROM A YEAR AGO
4 QUARTER, FISCAL TEAR 1990
SEVERE ACTIVE CASES IN PERIOD SEVERE ACTIVE CASES PROCESSEDCASES ON
TOTAL ON NAND NEW THIS TOTAL REHABIL- NOT RENA- NOT RENA- NAND AT
CASES START FT CLOSED ITATED MUTATED IMITATED ENO Of
CW FT (26) (28) (30) PERIOD
ARKANSAS (B) 647 457 190 219 191 26 2 428
ACTUAL LAST YEAR 676 463 213 225 194 30 1 451
PERCENT DISTRIBUTION 100.0 70.6 29.4 100.0 87.2 11.9 0.9
PERCENT CHANCE FRC* A ThAR AGO -4.3 -1.3 -10.8 -2.7 -1.5 -13.3 100.0 -5.1
NEW MEXICO (8) 297 ;02 95 73 38 33 2 224
ACTUAL LAST YEAR 308 230 78 110 52 51 7 198
PERCENT DISTRIBUTION 100.0 68.0 32.0 100.0 52.1 45.2 2.7
PERCENT CHANGE FROM A YEAR AGO -3.6 -12.2 21.8 -33.6 -26.9 -35.3 -71.4 13.1
TEXAS (S) 5,448 2,763 2,685 2,233 1,723 361 149 3,215
ACTUAL LAST YEAR 4,807 2,697 2,110 2,044 1,384 353 107 2,763
PERCENT DISTRISUTION 100.0 50.7 49.3 100.0 77.2 16.2 6.7
PERCENT CHANGE FRCA A YEAR AGO 13.3 2.4 27.3 9.2 8.8 2.3 39.3 16.4
REGION 7 26,297 15,272 11,025 10,685 7,167 2,931 587 15,612
ACTUAL LAST YEAR 25,655 14,033 11,622 10,382 7,129 2,782 471 15,273
PERCENT DISTRISUTION 100.0 58.1 41.9 100.0 67.1 27.4 5.5
PERCENT CHANGE FRCM A YEAR AGO 2.5 8.8 -5.1 2.9 0.5 5.4 24.6 2.2
IOWA (GI 7,806 4,551 3,255 2,579 1,659 524 386 5,227
ACTUAL .A"T YEAR 6,893 3,479 3,414 2,342 1,602 456 284 4,551
PERCEPT C.*TRIBUTION 100.0 58.3 41.7 100.0 64.7 20.3 15.0
PIA: 1U4 'E FROM A YEAR AGO 13.2 30.8 -4.7 10.1 4.2 14.9 35.9 14.9
KAN1tAS :4) 3,323 1,942 1,381 1,655 1,128 504 23 1,668
ACTUIL LAST MAR 3,268 1,772 1,496 1,326 1,005 306 15 1,942
PERCENT DISTRIOUTION 100.0 58.4 41.6 100.0 68.2 30.5 1.4
PERCENT CHANGE FROM A Yr.r, 40 1.7 9.6 4.7 24.8 12.2 64.7 53.3 -14.1
P:SSOURI (S) 6,837 4,810 4,027 3,948 2,836 1,093 19 .4,109
ACTUAL LAST YEAR 8.779 4,581 4,198 3,969 2,888 1,060 21 4,810
PERCENT DISTRIWION 100.0 54.4 45.6 100.0 71.8 27.7 0_3
PERCENT CRANE FROM A YEAR AGO 0.7 5.0 -4.1 -0.5 -1.8 3.1 -9.5 1.6
NEBRASKA (S) 4,869 3,014 1,855 2,014 1,201 60 128 2,05ACTUAL LAST YEAR 5,210 3,172 2,038 2,196 1,272 808 116 3,014
PERCENT DISTRIBUTION 100.0 61.9 38.1 100.0 59.6 34.0 6.4
PERCENT CHANGE FROM A YEAR AGO -6.5 -5.0 -9.0 -8.3 -5.6 -15.2 10.3 -5.3
IOWA (8) 488 379 109 128 ao 31 If 360
ACTUAL LAST YEAR 544 415 129 164 102 52 10 380PERCENT DISTRIBUTION 100.0 77.7 22.3 100.0 67.2 24.2 0.6
PERCENT CHANGE FROM A YEAR AGO -10.3 -8.7 -15.5 -22.0 -15.7 -40.4 10.0 -5.3
MISSOURI (11) 664 377 287 253 182 62 9 411
ACTUAL LAST YEAR 655 413 242 278 191 71 16 377PERCENT DISTRIBUTION 100.0 56.8 43.2 100.0 71.9 24.3 3.6PERCENT CHANGE FROM A YEAR AGO 1.4 -8.7 18.6 -9.0 -4.7 -12.7 -43.8 9.0
C 1
2C('
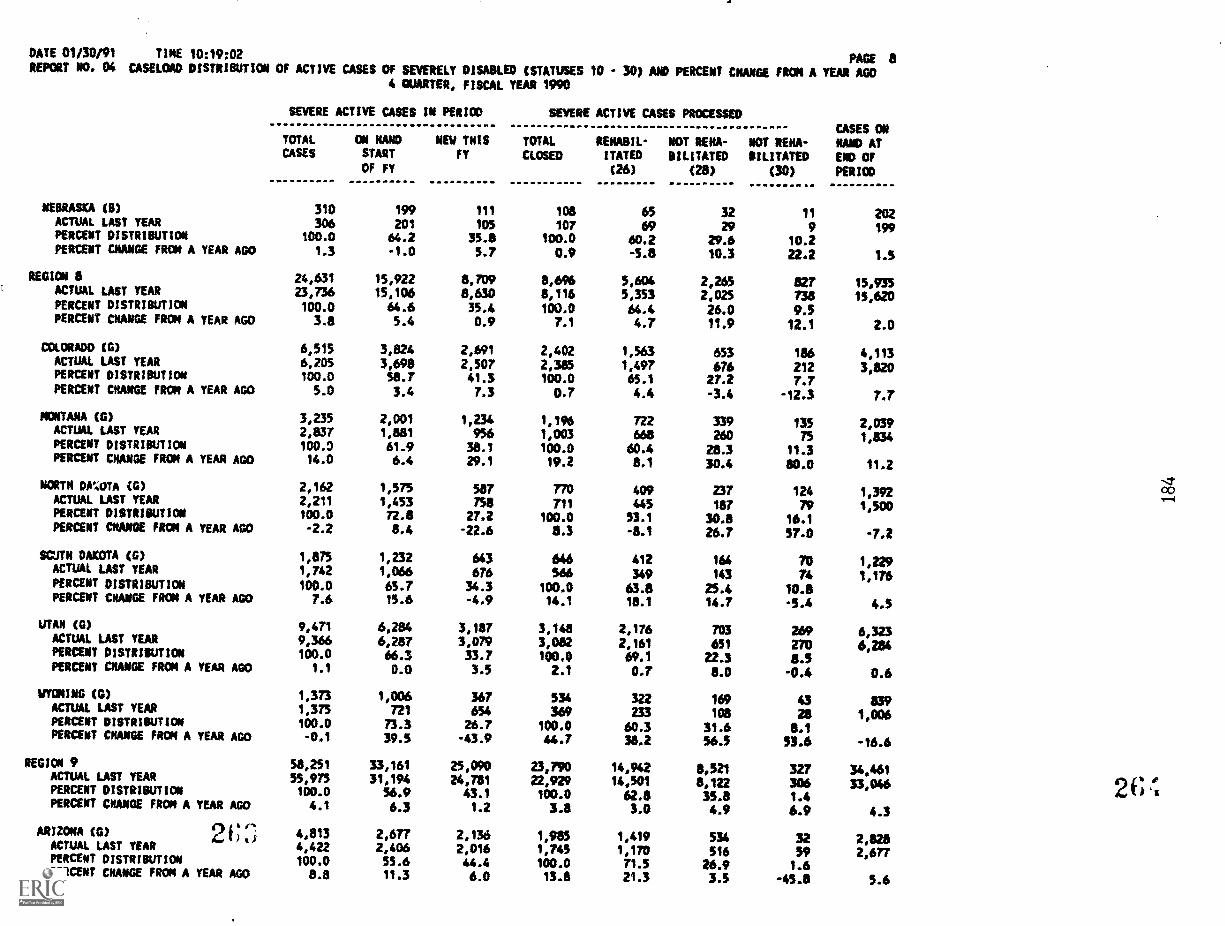
DATE 01/30/91 TIME 10:19:02 PAGE aREPORT NO. 04 CASELOAD DISTRIBUTION OF ACTIVE CASES CW SEVERELY DISAILED (STATUSES 10 - 30) AND PERCENT CNANGE FROM A YEAR AGO
4 QUARTER, FISCAL YEAR 1990
NEBRASKA (8)ACTUAL LAsT YEARPERCENT DISTRINTIONPERCENT CHANGE FROM A YEAR AGO
REGION 8ACTUAL LAST YEARPERCENT DISTRIBUTIONPERCENT CHANGE FROM A YEAR AGO
COLORADO (0)ACTUAL LAST YEARPERCENT DISTRIBUTI0N
PERCENT CHANGE FROM A YEAR AGO
MONTANA (G)AcTUAL LAsT YEARPERCENT DISTRIBUTIONPERCENT CHANGE FROM A YEAR AGO
NORTH DE.cnA (G)ACTUAL LAST YEARPERCENT DISTRIBUTIONPERCENT CHANGE FROM A YEAR AGO
SCJTA DAKOTA (G)ACTUAL LAST YEARPERCENT DISTRIBUTIONPERCENT CNANGE FR0M A YEAR AGO
UTAH (G)
ACTUAL LAST YEARPERCENT DISTRIBUTIONPERCENT GUNGE FROM A YEAR AGO
WYOMING (G)ACTUAL LAST YEARPERCENT DISTRIBUTIONPERCENT CHANGE FROM A YEAR AGO
REGION 9ACTUAL LAST YEARPERCENT DISTRIBUTIONPERCENT CHANGE FROM A YEAR A0D
ARIZONA (0) 2f;.`;ACTUAL LAST YEARPERCENT DISTRIBUTIONPERCENT CHANGE FR0M A YEAR AGO
SEVERE ACTIVE CASES IN PERIOD
TOTAL ON NAND NEW THISCASES START FY
OF FY
SEVERE ACTIVE CASES PROCESSED
TOTAL RENABIL- NOT RENA-CLOSED ITATED BILITATED
(26) (28)
NOT RENA-BILITATED
(30)
CASES ONNAND ATEND Of
PERIOD
310 199 111 108 65 32 11 202306 201 105 107 69 29 9 199
100.0 64.2 35.8 100.0 60.2 29.6 10.21.3 -1.0 5.7 0.9 -5.8 10.3 22.2 1.5
24,631 15,922 8,709 8,696 5,604 2,265 027 15,93523,736 15,106 8,630 8,116 5,353 2,025 738 15,620100.0 64.6 35.4 100.0 64.4 26.0 9.53.8 5.4 0.9 7.1 4.7 11.9 12.1 2.0
6,515 3,824 2,691 2,402 1,563 653 186 4,1136,205 3,698 2,507 2,385 1,497 676 212 3,820100.0 58.7 41.3 100.0 65.1 27.2 7.75.0 3.4 7.3 0.7 4.4 -3.4 -12.3 7.7
3,235 2,001 1,234 1,196 722 339 135 2,0392,837 1,881 956 1,003 660 260 75 1,834100.0 61.9 38.1 100.0 60.4 28.3 11.314.0 6.4 29.1 19.2 8.1 30.4 80.0 11.2
2,162 1,575 587 770 409 237 124 1,3922,211 1,453 758 711 445 187 79 1,500100.0 72.8 27.2 100.0 53.1 30.8 16.1-2.2 $.4 -22.6 143 -8.1 26.7 57.0 -7.2
1,875 1,232 643 646 412 164 ra 1,2291,742 1,066 676 566 349 143 74 1,176100.0 65.7 34.3 100.0 63.8 25.4 10.87.6 15.6 -4.9 14.1 18.1 14.7 -5.4 4.5
9,471 6,284 3,187 3,148 2,176 703 269 6,3239,366 6,287 3,079 3,082 2,161 651 270 6,284100.0 66.3 33.7 100.0 69.1 22.3 8.5
1.1 0.0 3.5 2.1 0.7 8.0 -0.4 0.6
1,373 1,006 367 534 322 169 43 8391,375 721 $54 369 233 108 28 1,006100.0 73.3 26.7 100.0 60.3 31.6 8.1-0.1 39.5 -43.9 44.7 38.2 56.5 53.0 -16.6
58,251 33,161 25,090 23,790 14,942 8,521 327 34,46155,975 31,194 24,781 22,929 14,501 8,122 306 33,046100.0 56.9 43.1 100.0 62.8 35.8 1.44.1 6.3 1.2 3.8 3.0 4.9 6.9 4.3
4,813 2,677 2,136 1,985 1,419 534 32 2,8284,422 2,406 2,016 1,745 1,170 516 39 2,677100.0 55.6 44.4 100.0 71.5 26.9 1.68.8 11.3 6.0 13.8 21.3 3.3 -45.8 5.6
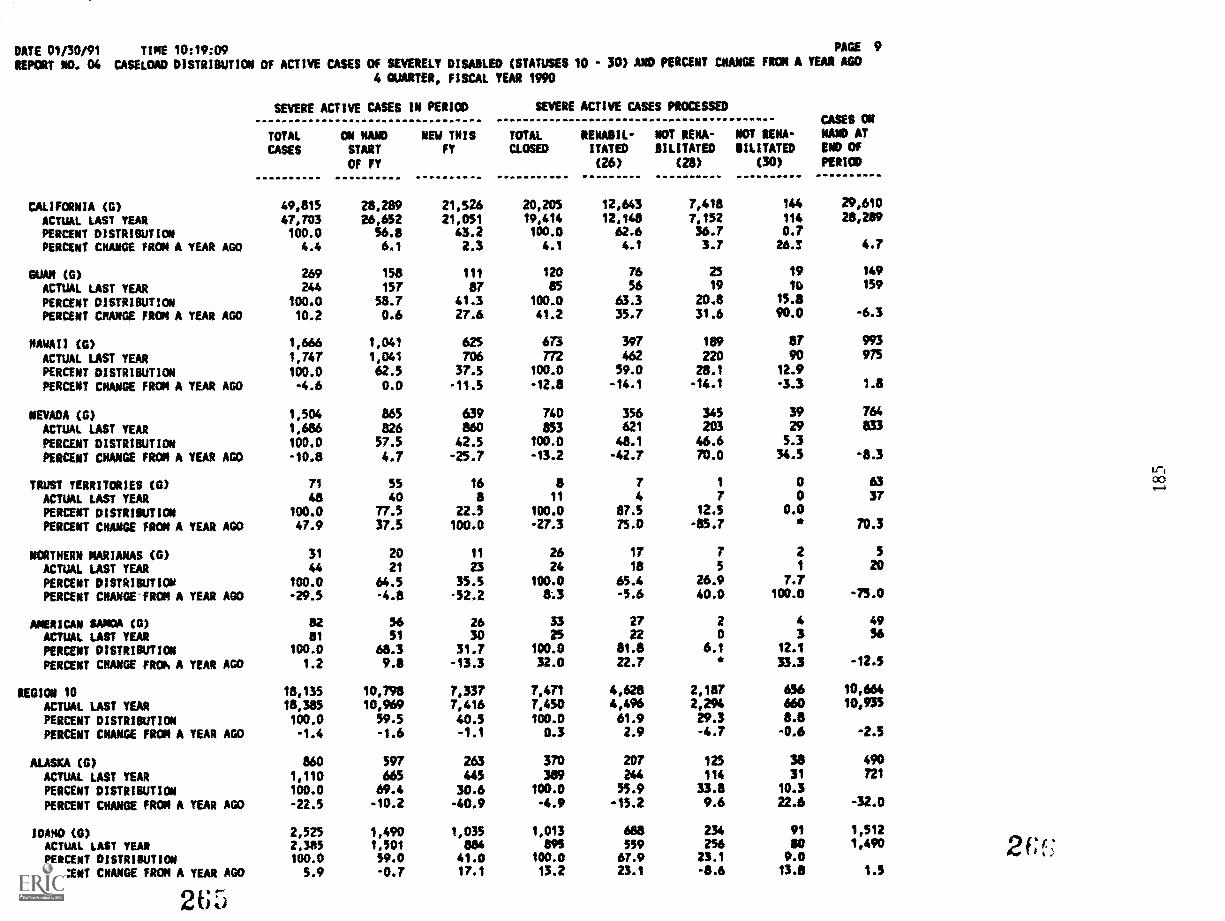
DATE 01/30/91 TINE 10:19:09 PAGE 9
REPORT NO. 04 CASELOAD DISTRIBUTION OF ACTIVE CASES Of SEVERELY DISABLED (STATUSES 10 - 30) AND PERCENT CHANCE FRON A YEAR AGO
4 QUARTER, FISCAL YEAR 1990
SEVERE ACTIVE CASES IN PERIOD
TOTAL Ok NAND NEW THISCASES START FY
OF FY
SEVERE ACTIVE CASES PROCESSED
TOTAL RENOIL- NOT RENA-CLOSED ITATED BILITATED
(26) (28)
NOT RENA-OILITATED
(30)
CASES ONNAND ATEND CW
PfR1OD
CALIFEWNIA (0) 49,815 28,289 21,526 20,205 12,643 7,418 144 29,610
ACTUAL LAST YEAR 47,703 26,652 21,051 19,414 12,148 7,152 114 28,289
PERCENT DISTRIBUTION 100.0 56.8 43.2 100.0 62.6 36.7 0.7
PERCENT CHANGE FROM A YEAR AGO 4.4 6.1 2.3 4.1 4.1 3.7 26.! 4.7
GUAM (0) 269 158 111 120 76 25 19 149
ACTUAL LAST YEAR 244 157 87 SS 56 19 10 159
PERCENT DISTRIBUTION 100.0 58.7 41.3 100.0 63.3 20.8 154PERCENT CHANGE FROM A YEAR AGO 10.2 0.6 27.6 41.2 35.7 31.6 90.0 -6.3
HAWAII (0) 1,666 1,041 625 673 397 189 87 993
ACTUAL LAST YEAR 1,747 1,041 706 772 462 220 90 975
PERCENT DISTRIBUTION 100.0 62.5 37.5 100.0 59.0 28.1 12.9
PERCENT CHANGE FROM A YEAR AGO -4.6 0.0 -11.5 -12.8 -14.4 -14.1 -3.3 1.8
NEVADA (0) 1,504 865 639 740 356 345 39 764
ACTUAL LAST YEAR 1,686 826 Imo 853 621 203 29 833
PERCENT DISTRIBUTION 100.0 57.5 42.5 100.0 48.4 46.6 5.3
PERCENT CMANGE FRON A YEAR AGO -10.8 4.7 -25.7 -13.2 -42.7 70.0 34.5 -8.3
TRUST TERRITORIES (0) 71 55 16 8 7 1 0 63
ACTUAL LAST YEAR 48 40 8 11 4 7 0 37
PERCENT DISTRIBUTION 100.0 77.5 22.5 100.0 87.5 123 0.0
PERCENT CHANGE FROM A YEAR A00 47.9 37.5 100.0 -27.3 75.0 -85.7 * 70.3
NORTHERN MARIANAS (G) 31 20 11 26 17 7 2 5
ACTUAL LAST YEAR 44 21 23 24 18 5 1 20PERCENT DISTRIBUTION 100.0 64.5 353 100.0 65.4 26.9 7.7
PERCENT CNANGE FROM A YEAR AGO -29.5 -4.8 -52.2 8.3 -5.6 40.0 100.0 -75.0
AMERICAN SAMOA (0) 82 56 26 33 27 2 4 49
ACTUAL LAST YEAR 81 51 30 25 22 0 3 56
PERCENT DISTRINTION 100.0 68.3 31.7 100.0 81.8 6.1 12.1
PERCENT CHANGE FRO.. A YEAR AGO 1.2 9.8 -13.3 32.0 22.7 33.3 -12.5
REGION 10 18,135 10,798 7,337 7,471 4,628 2,187 656 10,664
ACTUAL LAST YEAR 18,385 10,969 7,416 7,450 4,496 2,294 660 10,935
PERCENT DISTRIBUTION 100.0 59.5 40.5 100.0 64.9 29.3 8.8
PERCENT CHANGE FROM A YEAR AGO -1.4 -1.6 -1.1 0.3 2.9 -4.7 -0.6 -2.5
ALASKA (0) 860 597 263 370 207 125 38 490
ACTUAL LAST YEAR 1,110 665 445 389 244 114 31 721
PERCENT DISTRIBUTION 100.0 69.4 30.6 100.0 55.9 33.8 10.3
PERCENT CHANGE FRON A YEAR AGO -22.5 -10.2 -40.9 -4.9 -15.2 9.6 22.6 -32.0
IDAHO (0) 2,525 1,490 1,035 1,013 688 234 91 1,512ACTUAL LAST YEAS 2.385 1,501 WA $ri 559 256 80 1,490
PERCENT DISTRIBUTION 100.0 59.0 41.0 100.0 67.9 23.1 9.0
PERCENT CHANGE FROM A YEAR AOD 5.9 -0.7 17.1 13.2 23.1 -8.6 13.8 1.5
265
2f;f;
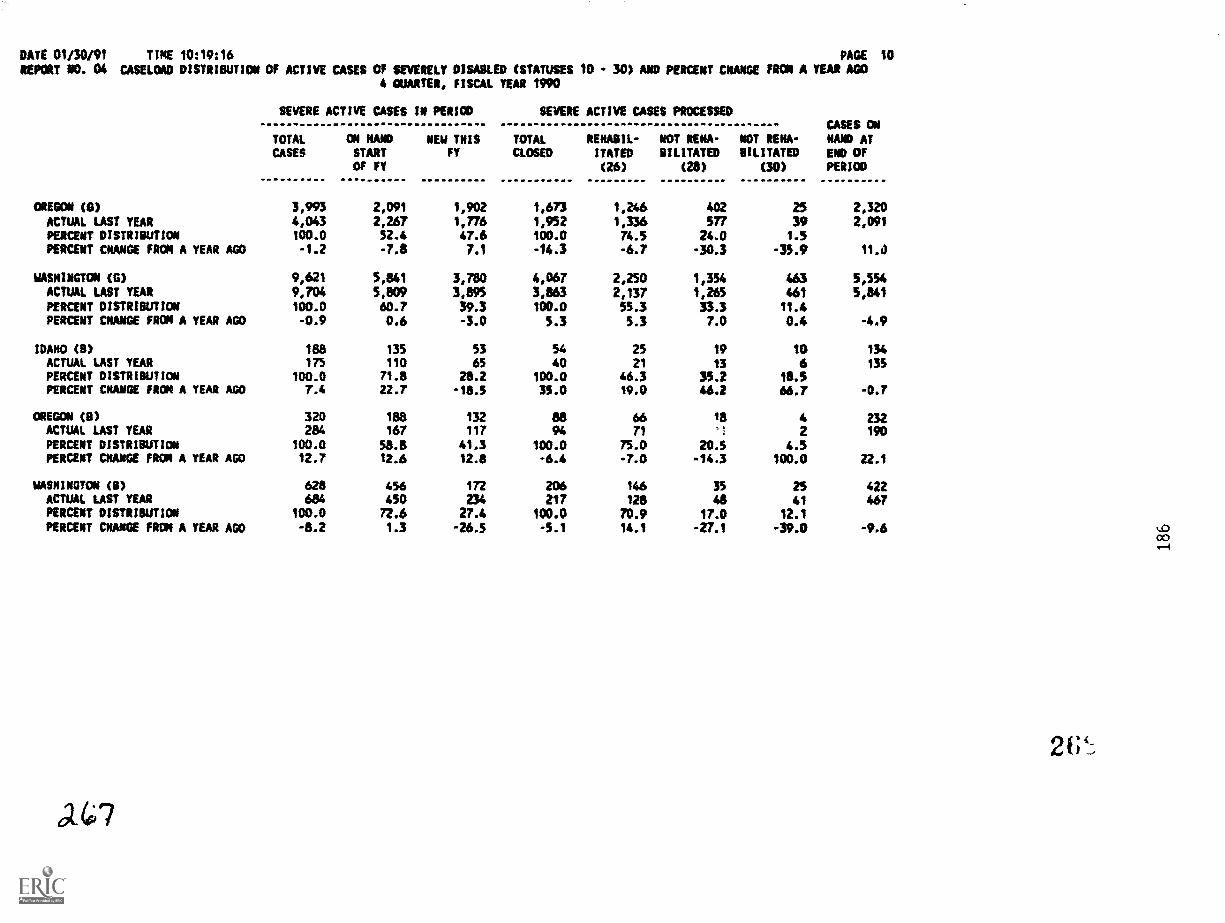
DATE 01/30/91 TIME 10:19:16 PAGE 10
REPORT NO. 04 CASELOAD DISTRIBUTION Of ACTIVE CASES Of SEVERELY DISABLED (STATUSES 10 - 30) AND PERCENT MANGE FROM A YEAR AGO4 QUARTER, FISCAL YEAR 1990
SEVERE ACTIVE CASES IN PERIOD
TOTAL ON NAND NEW THISCASES START FY
OF FY
SEVERE ACTIVE CASES PROCESSED
TOTAL RENABIL- NOT RENA-CLOSED ITATED BILITATED
(26) (28)
NOT RENA-BILITATED
(30)
CASES ONNAND ATEND OWPERIOD
OREGON (0) 3,993 2,091 1,902 1,673 1,246 402 25 2,320ACTUAL LAST YEAR 4,043 2,267 1,776 1,952 1,336 577 39 2,091PERCENT DISTRIBUTION 100.0 52.4 47.6 100.0 74.5 24.0 1.5PERCENT CHANGE FROM A YEAR AGO -1.2 -7.8 7.1 -14.3 -6.7 -30.3 -35.9 11.0
WASHINGTON (3) 9,621 5,841 3,780 4,067 2,250 1,354 463 5,554ACTUAL LAST YEAR 9,704 5,809 3,895 3,863 2,137 1,265 461 5,841PERCENT DISTRIBUTION 100.0 60.7 39.3 100.0 55.3 33.3 11.4PERCENT CHANGE FROM A YEAR AGO -0.9 0.6 -3.0 5.3 5.3 7.0 0.4 -4.9
IDAHO (5) 188 135 53 54 25 19 10 134ACTUAL LAST YEAR 175 110 65 40 21 13 6 135PERCENT DISTRIBUTION 100.0 71.8 23.2 100.0 46.3 35.2 18.5PERCENT CHANGE FRON A YEAR AGO 7.4 22.7 -18.5 35.0 19.0 46.2 66.7 -0.7
OREGON (8) 320 188 132 as 66 18 4 232ACTUAL LAST YEAR 284 167 117 94 71 ' I 2 190PERCENT DISTRIBUTION 100.0 53.8 41.3 100.0 15.0 20.5 4.5PERCENT CHANGE FROM A YEAR AGO 12.7 12.6 12.8 -6.4 -7.0 -14.3 100.0 22.1
WASHINGTON (8) 628 456 172 206 146 35 25 422ACTUAL LAST YEAR 684 450 234 217 128 48 41 467PERCENT DISTRIBUTION 100.0 72.6 27.4 100.0 70.9 17.0 12.1PERCENT CNANGE FRON A YEAR AGO -8.2 1.3 -26.5 -5.1 14.1 -27.1 -39.0 -9.6 ..")
co,-I
21.,),
010
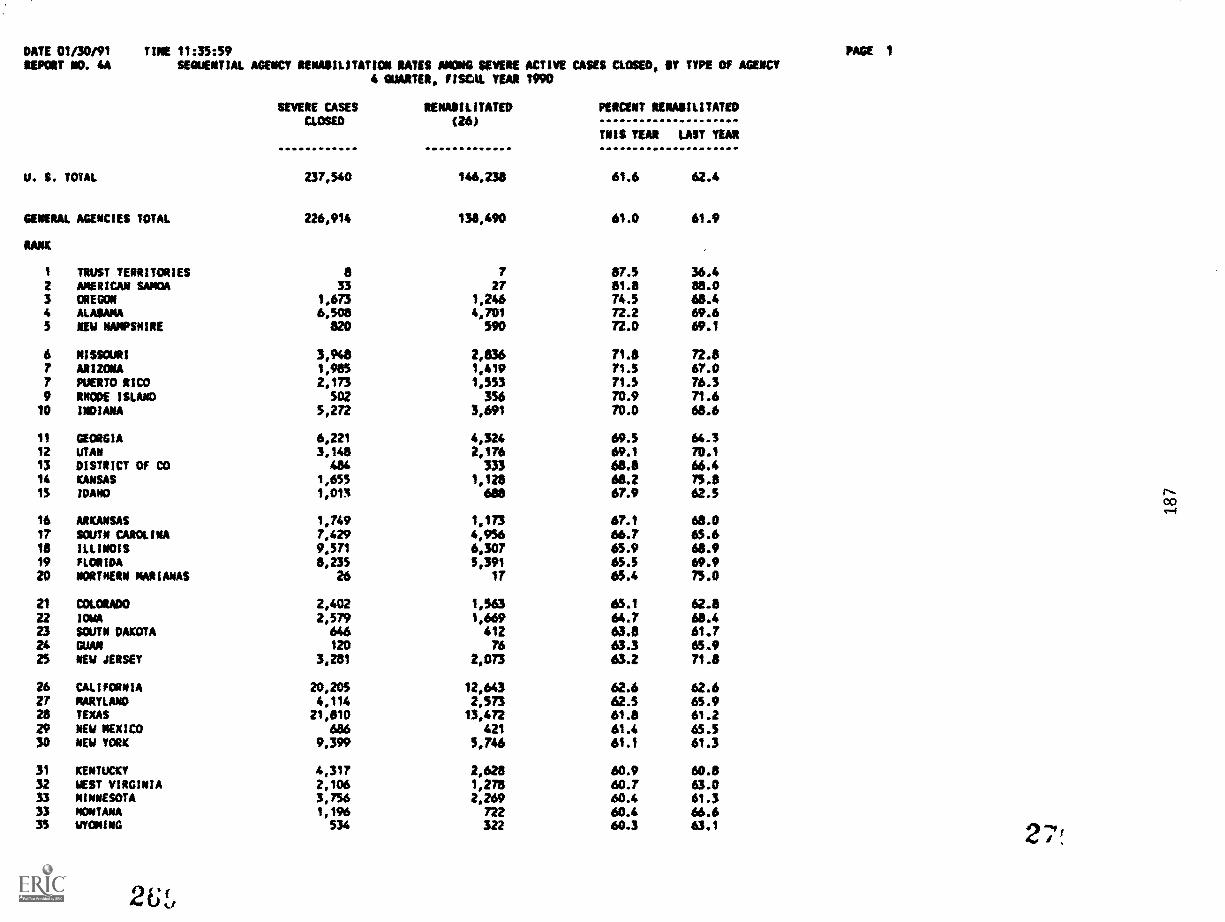
DATE 01/30191REPORT NO. 4A
TINE 11:35:59SEQUENTIAL AGENCY RENASILITATION RATES AMONG SEVERE ACTIVE CASES CLOSED, SY TYPE OF AGENCY
U. S. TOTAL
GENERAL AGENCIES TOTAL
RANK
SEVERE CASESCLOSED
237,540
226,914
4 QUARTER, FISCAL YEAR IWO
RENASILITATED(26)
146,238
138,490
PERCENT RENASILITATED
TNIS YEAR LAST YEAR
61.6 62.4
61.0 61.9
1 TRUST TERRITORIES a 7 87.5 15.42 ANERICAN SAMOA 33 27 81.8 88.03 OREGON 1,673 1,246 74.5 68.44 ALASAMA 6,508 4,701 72.2 69.65 NEW NAMPSNIRE 820 590 72.0 69.1
6 MISSOURI 3,948 2,836 71.8 72.87 ARIZONA 1,985 1,419 713 67.07 PUERTO RICO 2,173 1,553 71.5 76.39 ERODE ISLAND 502 356 70.9 71.610 INDIANA 5,272 3,691 70.0 68.6
11 GEORGIA 6,221 4,324 69.5 64.312 uTAN 3,148 2,176 69.1 70.113 DISTRICT OF CO 484 333 68.8 66.414 KANSAS 1,655 1,128 68.2 75.815 IDAHO 1,013 688 67.9 62.5
16 ARKANSAS 1,749 1,173 67.1 68.017 ROUT* CAROLINA 7,429 4,956 66.7 65.6IS ILLINOIS 9,571 6,307 65.9 68.919 FLORIDA 8,235 5,391 0.5 69.920 NORTHERN MARIANAS 26 17 65.4 75.0
21 COLORADO 2,402 1,563 65.1 62.822 IOWA 2,579 1,669 64.7 68.423 SOUTH DAKOTA 646 412 63.8 61.724 GUAR 120 76 63.3 65.925 NEW JERSEY 3,281 2,073 63.2 71.8
26 CALIFORNIA 20,205 12,643 62.6 62.627 MARYLAND 4,114 2,573 62.5 65.928 TEXAS 21,810 13,472 61.8 61.229 NEW MEXICO 686 421 61.4 65.530 NEW YORK 9,399 5,746 61.1 61.3
31 KENTUCKY 4,317 2,628 60.9 60.832 WEST VIRGINIA 2,106 1,278 60.7 63.033 MINNESOTA 3,756 2,269 60.4 61.333 MONTANA 1,196 722 60.4 66.635 WYOMING 534 322 60.3 63,1
PACE 1
271
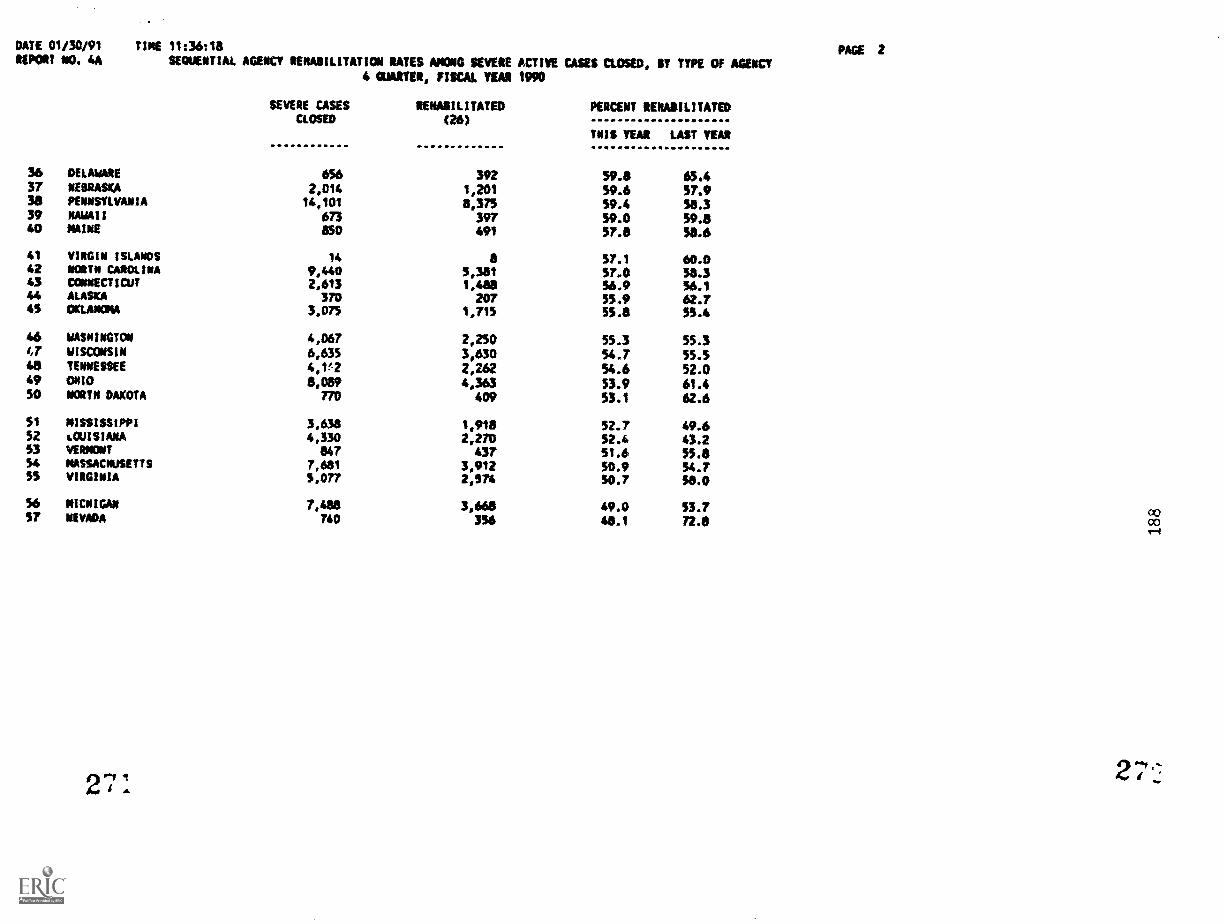
DATE 01/30/91REPORT SC 4A
TINE 11:3618
SEQUENTIAL AGENCY REHABILITATION RATES AMONG SEVERE ACTIVE CASES CLOSED, $Y TYPE OF AGENCY4 QUARTER, FISCAL YEAR 1990
PAGE 2
SEVERE CASESCLOSED
RENAIIILITATED
(26)PERCENT RENAOILITATED
TN1S YEAR LAST TEAR
36 DELAWARE 656 392 $9.8 65.437 NESRASKA 2,014 1,201 59.6 5T.938 PENNSYLVANIA 14,101 8,375 59.4 58.339 HAWAII 673 397 59.0 59.840 MAINE 850 491 57.8 54.6
41 VIRGIN ISLANDS 14 8 57.1 60.042 NORTH CAROLINA 9,440 5,381 57.0 58.343 CONNECTICUT 2,613 1,488 56.9 56.144 ALASKA 370 207 55.9 62.743 OKLAMOMA 3,075 1,715 55.8 55.4
46 WASHINGTON 4,067 2,250 55.3 55.347 WISCONSIN 6,635 3,630 54.7 55.548 TENNESSEE 4,1'2 2,262 54.6 52.049 ONIO 8,089 4,363 53.9 61.450 NORTH DAKOTA 770 409 53.1 62.6
51 MISSISSIPPI 3,638 1,918 52.7 49.652 LOUISIANA 4,330 2,270 52.4 43.253 VERMONT 847 437 51.6 55.854 MASSACHUSETTS 7,681 3,912 50.9 54.7SS VIRGINIA 5,077 2,574 50.7 58.0
56 MICNIGAN 7,488 3,668 49.0 53.7 0057 NEVADA 740 356 48.1 72.8 CO1-4
2'
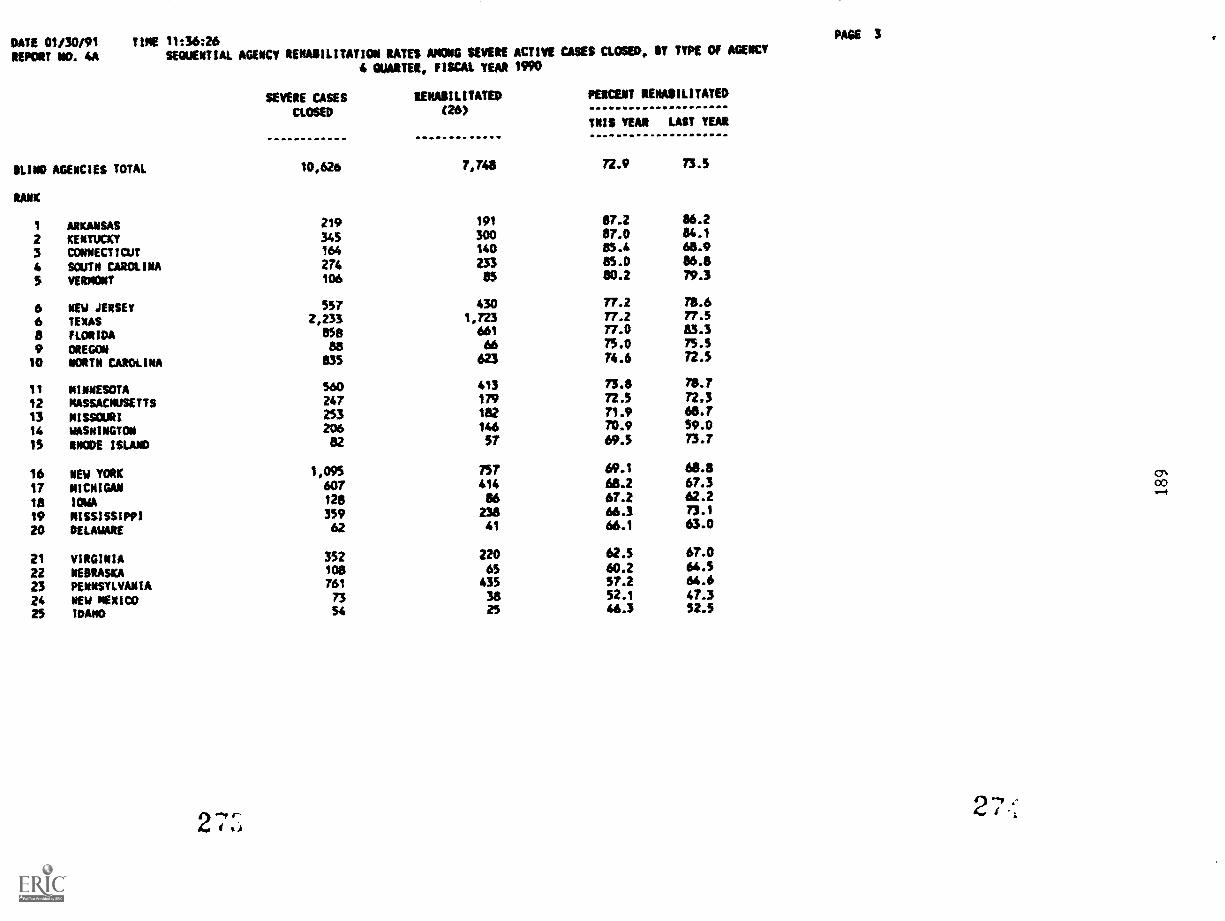
DATE 01/30/91REPORT NKO. 4A
TIME 11:36:26SEQUENTIAL AGENCY REHANILITATICe RATES AMONG SEVERE ACTIVE CASES CLOSED, 8Y TYPE OF AGENCY
SEVERE CASESCLOSED
4 QUARTER, FISCAL YEAR 1990
RENASILITATED(26)
PERCENT RENABILITATED
TNI8 YEAR LAST YEAR
OLDS AGENCIES TOTAL 10,626 7,748 72.9 73.5
RANK
I ARKANSAS 219 191 87.2 86.2
2 KENTUCKY 345 300 87.0 84.1
3 CONNECTICUT 164 140 85.4 68.9
4 SOUTN CARCtINA 274 233 85.0 86.8
5 VERMONT 106 85 80.2 79.3
6 NEW JERSEY 557 430 77.2 75.6
6 TEXAS 2,233 1,723 77.2 77.5
8 FLORIDA 858 661 77.0 83.3
9 OREGON att 66 75.0 75.5
10 AORTA CAROLINA 835 623 74.6 72.5
11 MINNESOTA 560 413 73.8 71.7
12 MASSACNUSETTS 247 179 72.5 72.3
13 MISSOURI 253 182 71.9 68.7
14 WASHINGTON 206 146 70.9 59.0
15 INODE ISLAND 82 57 69.5 73.7
16 NEW YORK 1,095 757 69.1 68.8
17 MICHIGAN 607 414 68.2 67.3
18 IOWA 128 86 67.2 62.2
19 NISSISSIPPI 359 238 66.3 73.1
20 DELAWARE 62 41 66.1 63.0
21 VIRGINIA 352 220 62.5 67.0
22 NEBRASKA 108 65 60.2 64.5
23 PENNSYLVANIA 761 435 57.2 64.6
24 NEW MEXICO 73 38 52.1 47.3
25 IDAHO 54 25 46.3 52.5
2'
PAGE 3
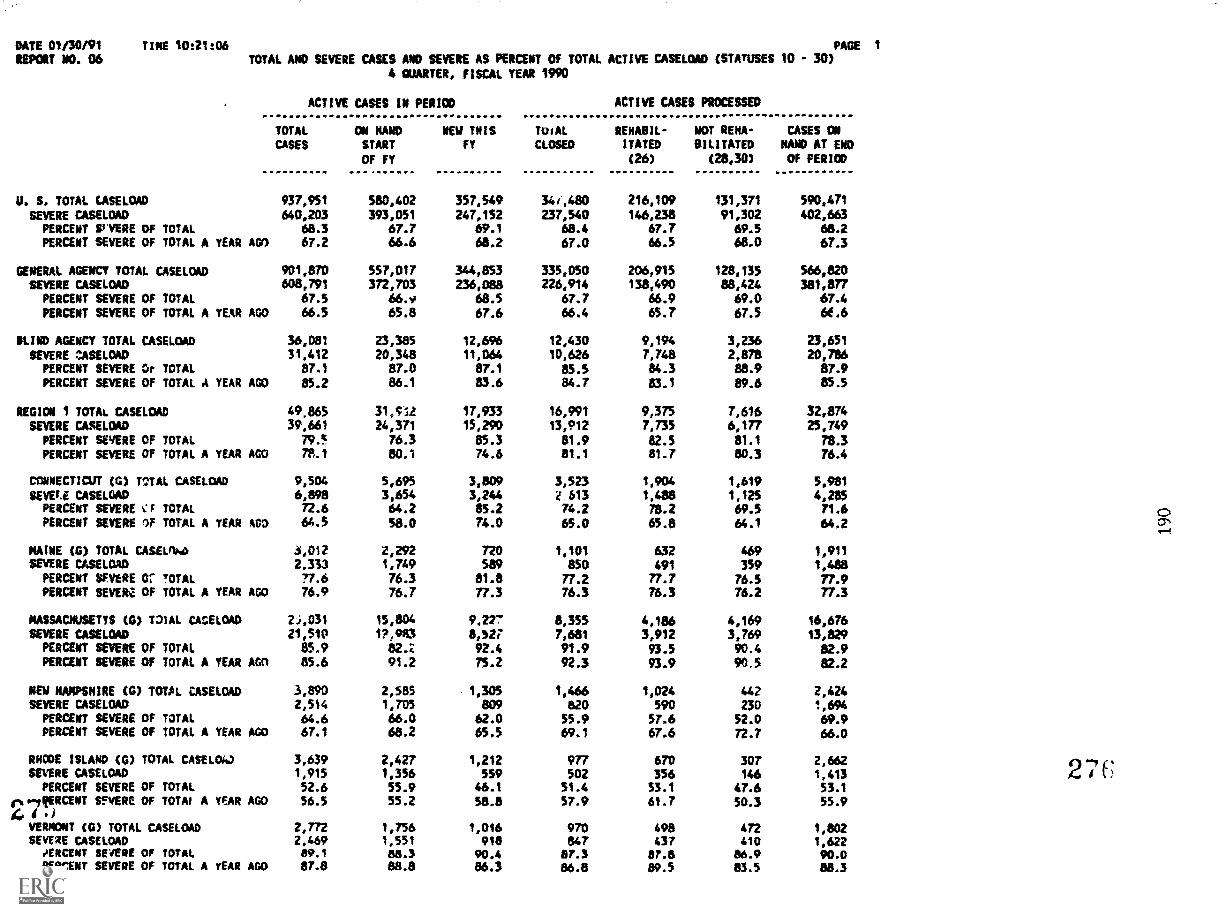
DATE 01/30/91 TINE 1021:06REPORT MO. 06
PAGE 1
TOTAL AND SEVERE CASES AND SEVERE AS PERCENT OF TOTAL ACTIVE CASELOAD (STATUSES 10 30)4 QUARTER, FISCAL TEAR 1990
ACTIVE CASES IN PERIOD
TOTAL ON NAND NEW THISCASES START FY
OF FY
ToiAL
CLOSED
ACTIVE CASES PROCESSED
REHABIL-MOT REHA-ITATED BILITATED
(26) (28,30)
CASES ONNAND AT EMDOF PERIOD
U. S. TOTAL CASELOAD 937,951 580,402 357,549 34/,480 216,109 131,371 590,471
SEVERE CASELOAD 640,203 393,051 247,152 237,540 146,238 91,302 402,663PERCENT SIVERE OF TOTAL 66.3 67.7 69.1 68.4 67.7 69.5 68.2PERCENT SEVERE Of TOTAL A YEAR AGO 67.2 66.6 61.2 67.0 66.5 68.0 67.3
GENERAL AGENCY TOTAL CASELOAD 901,870 557,017 344,653 335,050 206,915 128,135 566,820SEVERE CASELOAD 608,791 372,703 236,088 226,914 138,490 88,424 381,877
PERCENT SEVERE OF TOTAL 67.5 66.v 68.5 67.7 66.9 69.0 67.4PERCENT SEVERE OF TOTAL A YEAR AGO 66.5 65.8 67.6 66.4 65.7 67.5 66.6
BLIND AGENCY TOTAL CASELOAD 36,081 23,385 12,696 12,430 9,194 3,236 23,651
SEVERE CASELOAD 31,412 20,348 11,064 10,626 7,748 2,878 20,786PERCENT SEVERE Or TOTAL 87.1 87.0 87.1 85.5 84.3 88.9 87.9PERCENT SEVERE CW TOTAL A YEAR AGO 85.2 86.1 83.6 84.7 83.1 89.6 85.5
REGICN 1 TOTAL CASELOAD 49,865 31,912 17,933 16,991 9,375 7,616 32,874
SEVERE CASELOAD 39,661 24,371 15,290 13,912 7,735 6,177 25,749PERCENT SEYERE OF TOTAL 79.5 76.3 85.3 81.9 82.5 81.1 78.3PERCENT SEVERE OF TOTAL A YEAR AGO 78.1 80.1 74.6 81.1 81.7 80.3 76.4
CONNECTICUT (G) TSTAL CASELOAD 9,504 5,695 3,809 3,523 1,904 1,619 5,981SEVEll CASELOAD 6,898 3,654 3,244 2 613 1,488 1,125 4,285
PERCENT SEVERE tiF TOTAL 72.6 64.2 85.2 74.2 78.2 69.5 71.6PERCENT SEVERE OF TOTAL A YEAR ACO 64.5 58.0 74.0 65.0 65.8 64.1 64.2
MAINE (G) TOTAL CASELnha .i,012 2,292 720 1,101 632 469 1,911SEVERE CASELOAD 2.333 1,749 589 850 491 359 1,488
PERCENT SEVERE Or !DIAL 77.6 76.3 81.8 77.2 77.7 76.5 77.9PERCENT SEVERi Of TOTAL A YEAR AGO 76.9 76.7 77.3 76.3 76.3 76.2 77.3
MASSACHUSETTS (a) TOIAL CACELOAD 2J,031 15,804 9.227 8,355 4,186 4,169 16,676SEVERE CASELOAD 21,510 12,983 8,527 7,681 3,912 3,769 13,829
PERCENT SEVERE OF TOTAL 85.9 82.2 92.4 91.9 93.5 90.4 82.9PERCENT SEVERE Of TOTAL A YEAR AGn 85.6 91.2 75.2 92.3 93.9 90.5 82.2
NEW HAMPSHIRE (0) TOTAL CASELOAD 3,890 2,585 1,305 1,466 1,024 442 2,424SEVERE CASELOAD 2,514 1,705 809 820 590 230 1,694
PERCENT SEVERE OF TOTAL 64.6 66.0 62.0 55.9 57.6 52.0 69.9PERCENT SEVERE OF TOTAL A YEAR AGO 67.1 68.2 65.5 69.1 67.6 72.7 66.0
RHODE ISLAND (0) TOTAL CASEL040 3,639 2,427 1,212 977 670 307 2,662SEVERE CASELOAD 1,915 1,356 559 502 356 146 1,413
PERCENT SEVERE OF TOTAL 52.6 55.9 46.1 51.4 53.1 47.6 53.1".-IRERCENT SFVERE OF TOTA1 A YEAR AGO 56.5 55,2 58.8 57.9 61.7 50.3 55.9
VERMONT CO) TO1AL CASELOAD 2,772 1,756 1,016 970 498 472 1,802SEVERE CASELOAD 2.469 1,551 918 847 437 410 1,622
VERCENT SEVERE OF TOTAL 89.1 86.3 90.4 87.3 87.8 86.9 90.0PERCENT SEVERE OF TOTAL A YEAR AGO 87.8 88.8 86.3 86.8 89.5 83.5 88.3
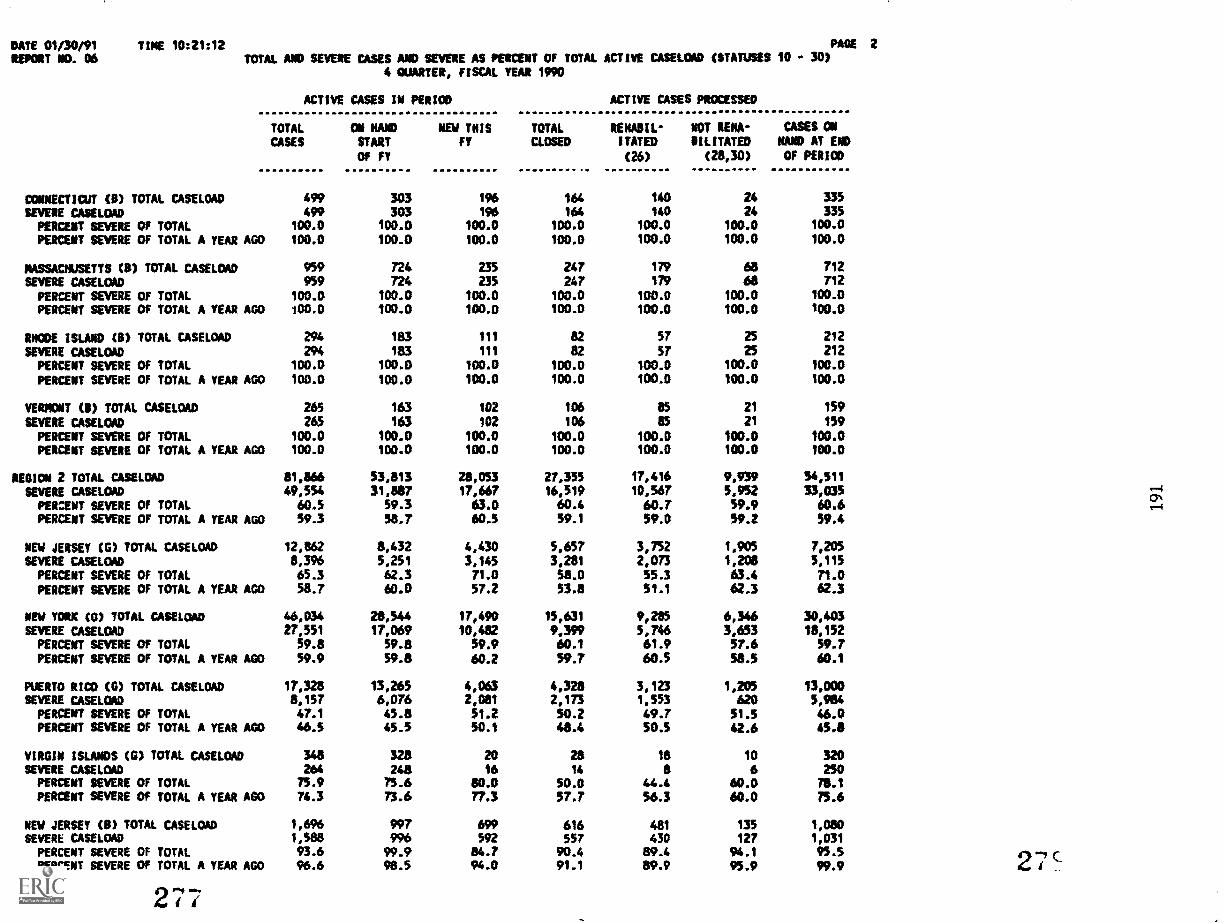
DATE 01/30,91 TINE 10:21:12REPORT NO. 06
PAGE 2TOTAL AND SEVERE CASES AND SEVERE AS PERCENT OF TOTAL ACTIVE CASELOAD (STATUSES 10 - 307
4 QUARTER, FISCAL YEAR 1990
ACTIVE CASES IN PERIOD
TOTAL ON HAND NEW THISCASES START FY
OF FY
TOTALCLOSED
ACTIVE CASES PROCESSED
REKABIL- NOT RENA-ITATED SILITATED
(26) (28,30)
CASES ONNAND AT END
OF PERIOD
CONNECTICUT (B) TOTAL CASELOAD 499 303 196 164 140 24 335
SEVERE CASELOAD 499 303 196 164 140 24 335
PERCENT SEWRE OF TOTAL 100.0 100.0 100.0 100.0 100.0 100.0 100.0
PERCENT SEVERE OF TOTAL A YEAR AGO 100.0 100.0 100.0 100.0 100.0 100.0 100.0
MASSACHUSETTS CS) TOTAL CASELOAD 959 724 235 247 179 68 712
SEVERE CASELOAD 959 724 235 247 179 se 712
PERCENT SEVERE OF TOTAL 100.0 100.0 100.0 100.0 100.0 100.0 100.0PERCENT SEVERE OW TOTAL A YEAR AGO 100.0 100.0 100.0 100.0 100.0 100.0 100.0
MK ISLAND (B) TOTAL CASELOAD 294 183 111 le 57 25 212
SEVERE CASELOAD 294 183 111 az 57 25 212PERCENT SEVERE OF TOTAL 100.0 100.0 100.0 100.0 100.0 100.0 100.0
PERCENT SEVERE CW TOTAL A YEAR AGO 100.0 100.0 100.0 100.0 100.0 100.0 100.0
VERMONT (S) TOTAL CASELOAD 265 153 102 106 85 21 159
SEVERE CASELOAD 265 163 102 106 85 21 159
PERCENT SEVERE OF TOTAL 100.0 100.0 100.0 100.0 100.0 100.0 100.0PERCENT SEVERE Of TOTAL A YEAR AGO 100.0 100.0 100.0 100.0 100.0 100.0 100.0
REGION 2 TOTAL CASELCAD 81,866 53,813 28,053 27,355 17,416 9,939 54,311
SEVERE CASELOAD 49,554 31,887 17,667 16,519 10,567 5,952 33,035PERCENT SEVERE CW TOTAL 60.5 59.3 63.0 60.4 60.7 59.9 60.6PERCENT SEVERE OF TOTAL A YEAR AGO 59.3 58.7 60.5 59.1 59.0 59.2 59.4
NEW JERSEY (0) TOTAL CASELOAD 12,862 8,432 4,430 5,657 3,752 1905, 7,205
SEVERE CASELOAD 8,396 5,251 3,145 3,281 2,073 4,208 5,115PERCENT SEVERE OF TOTAL 65.3 62.3 71.0 58.0 55.3 63.4 71.0PERCENT SEVERE OF TOTAL A YEAR AGO 58.7 60.0 57.2 53.8 51.1 62.3 62.3
NEW YORK CO) TOTAL CASELOAD 46,034 28,544 17,490 15,631 9,285 6,346 30,403SEVERE CASELOAD 27,551 17,069 10,482 9,390 5,746 3,653 18,152PERCENT SEVERE CW TOTAL 59.8 59.8 59.9 60.1 61.9 57.6 59.7PERCENT SEVERE CW TOTAL A YEAR AGO 59.9 59.8 60.2 59.7 60.5 58.5 60.1
PUERTO RICO (G) TOTAL CASELOAD 17,328 13,265 4,063 4,328 3,123 1,205 13,000SEVERE CASELOAD 8,157 6,076 2,001 2,173 1,553 620 5,984PERCENT SEVERE OF TOTAL 47.1 45.8 $1.2 50.2 49.7 51.5 46.0PERCENT SEVERE Of TOTAL A YEAR AOD 46.5 45.5 50.1 48.4 50.5 42.6 45.8
VIRGIN ISLANDS (0) TOTAL CASELOAD 348 328 20 28 18 10 320SEVERE CASMAD 264 248 16 14 8 6 250PERCENT SEVERE OF TOTAL 75.9 75.6 80.0 50.0 44.4 60.0 is.1
PERCENT SEVERE OF TOTAL A YEAR AGO 74.3 73.6 77.3 57.7 56.3 60.0 75.6
NEW JERSEY (8) TOTAL CASELOAD 1,696 997 699 616 481 135 1,080SEVERE CASELOAD 1,588 996 592 557 430 127 1,031PERCENT SEVERE OF TCMAL 93.6 99.9 84.7 90.4 89.4 94.1 95.5PERCENT SEVERE OF TOTAL A YEAR AGO 96.6 98.5 94.0 91.1 89.9 95.9 99.9 2" c
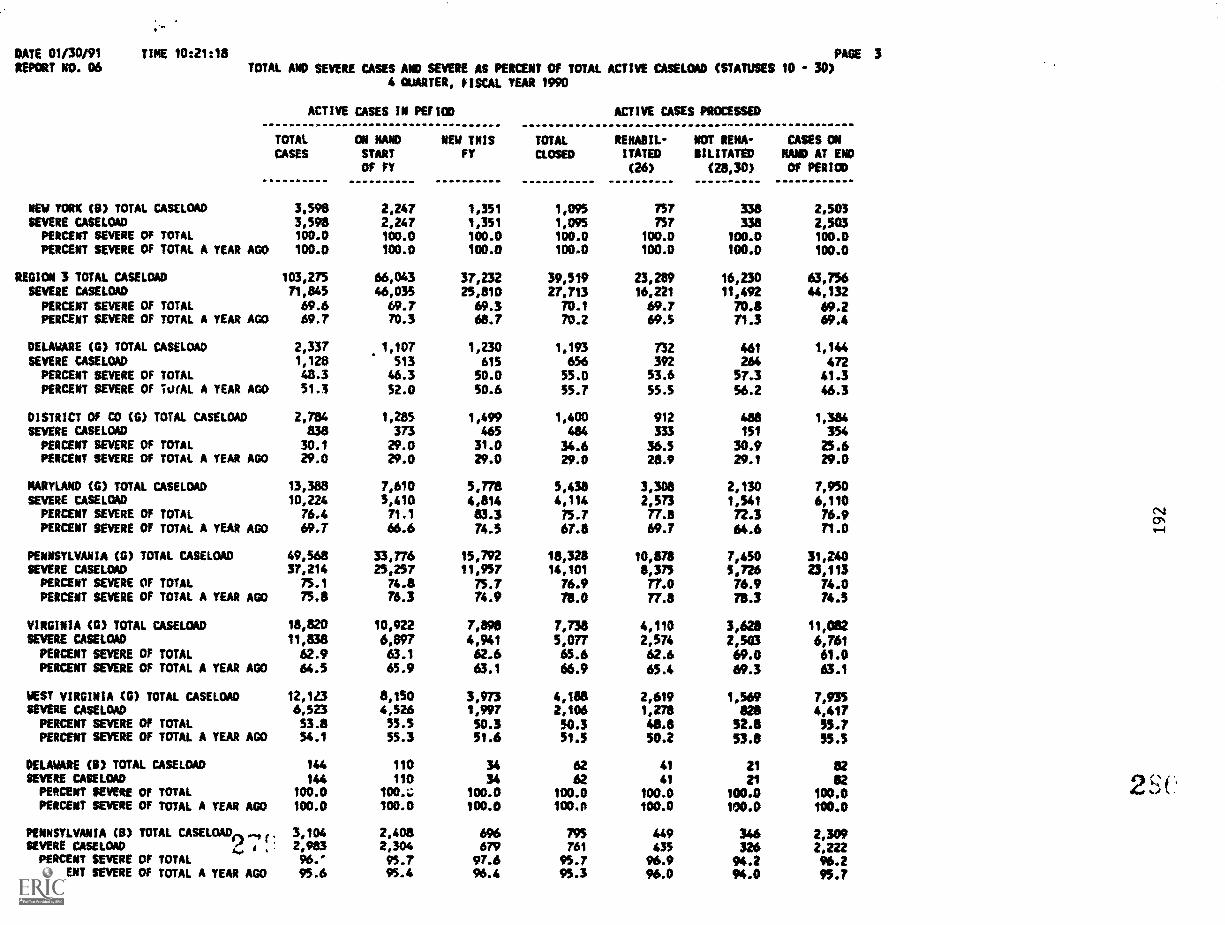
DATE 01/30/91 TIME 10:21:18REPORT NO. 06
PAGE 3TOTAL AND SEVERE CASES AND SEVERE AS PERCENT CW TOTAL ACTIVE CASELCM (STATUSES 10 - 30)
4 QUARTER, FISCAL YEAR 1990
ACTIVE CASES IN PEFIOD
TOTAL ON NANO NEW TNISCASES START FY
OF FY
TOTALCLOSED
ACTIVE CASES manseREHABIL-NOT REHA-ITATED BILITATED(26) (28,30)
CASES ONNANO AT ENOOF PERIOD
NEW YORX (0) TOTAL CASELOAD 3,598 2,247 1,351 1,095 757 338 2,503SEVERE CASELCAD 3,598 2,247 1,351 1,095 757 338 2,503
PERCENT SEVERE Of TOTAL 100.0 100.0 100.0 100.0 100.0 100.0 100.0PERCENT SEVERE Of TOTAL A YEAR AGO 100.0 100.0 100.0 100.0 100.0 100.0 100.0
REGION 3 'TOTAL CASELOAD 103,275 66,043 37,232 39,519 23,289 16,230 63,756SEVERE CASELOAD 71,845 46,035 25,810 27,713 16,221 11,492 44,132PERCENT SEVERE OF TOTAL 69.6 69.7 69.3 70.1 69.7 70.8 69.2PERCENT SEVERE OF TOTAL A YEAR AGO 69.7 70.3 68.7 70.2 69.5 71.3 69.4
DELAWARE (0) TOTAL CASELOAD 2,337 1.107 1,230 1,193 732 461 1,144SEVERE CASELOAD 1,128 513 615 656 392 264 472
PERCENT SEVERE OF TOTAL 48.3 46.3 50.0 55.0 53.6 57.3 41.3PERCENT SEVERE OF TO(AL A YEAR AGO 51.3 52.0 50.6 55.7 55.5 56.2 46.3
DISTRICT OF CO (G) TOTAL CASELOAD 2,784 1,285 1,499 1,400 912 488 1,384SEVERE CASELOAD 838 373 465 464 333 451 354
PERCENT SEVERE OF TOTAL 30.1 29.0 31.0 34.6 36.5 30.9 25.6PERCENT SEVERE Of TOTAL A YEAR AGO 29.0 29.0 29.0 29.0 28.9 29.1 29.0
NARTLAND (G) TOTAL CASELOAD 13,388 7,610 5,778 5,438 3,308 2,130 7,950SEVERE CASELOAD 10,224 5,410 4,814 4,114 2,573 1,541 6,110
PERCENT SEVERE OF TOTAL 76.4 71.1 83.3 75.7 77.8 72.3 76.9PERCENT SEVERE OF TOTAL A YEAR AGO 69.7 66.6 74.5 67.8 69.7 64.6 71.0
PENNSYLVANIA (G) TOTAL CASELOAD 49,568 33,776 15,792 18,328 10,878 7,450 31,240SEVERE CASELOAD 37,214 25,257 11,957 14,101 8,375 5,726 23,113PERCENT SEVERE OF TOTAL 75.1 74.8 75.7 76.9 77.0 76.9 74.0PERCENT SEVERE OF TOTAL A YEAR AGO 75.8 76.3 74.9 78.0 77.8 78.3 74.5
VIRGINIA (0) TOTAL CASELOAD 18,820 10,922 7,898 7,738 4,110 3,628 11,082SEVERE CASELOAD 11,838 6,897 4,941 5,077 2,574 2,503 6,761PERCENT SEVERE OF TOTAL 62.9 63.1 62.6 65.6 62.6 69.0 61.0PERCENT SEVERE OF TOTAL A YEAR AGO 64.5 65.9 63.1 66.9 65.4 69.3 63.1
WEST VIRGINIA (0) TOTAL CASELOAD 12,123 8,150 3,973 4,188 2,149 1,569 7,935SEVERE CASELOAD 6.523 4,526 1,997 2,106 1,278 828 4,417
PERCENT SEVERE CW TOTAL 53.8 55.5 50.3 50.3 48.8 52.8 55.7PERCENT SEVERE OF TOTAL A YEAR AGO 54.1 55.3 51.6 51.5 50.2 53.8 55.5
DELAWARE (0) TOTAL CASELOAD 144 110 34 62 41 21 82SEVERE CASELOAD 144 110 34 re 41 21 82
PERCENT SEVERE CW TOTAL 100.0 100..; 100.0 100.0 100.0 100.0 100.0PERCENT SEVERE CW TOTAL A YEAR AGO 100.0 100.0 100.0 100.0 100.0 100.0 100.0
PENNSYLVANIA (0) TOTAL CASELOAD 3,104 2,408 696 795 449 346 2,309SEVERE CASELOAD 2,983 2,304 679 761 435 326 2,222
PERCENT SEVERE OF TOTAL 96.' 95.7 97.6 95.7 96.9 94.2 96.2PERCENT SEVERE CW TOTAL A YEAR AGO 95.6 95.4 96.4 95.3 96.0 94.0 95.7
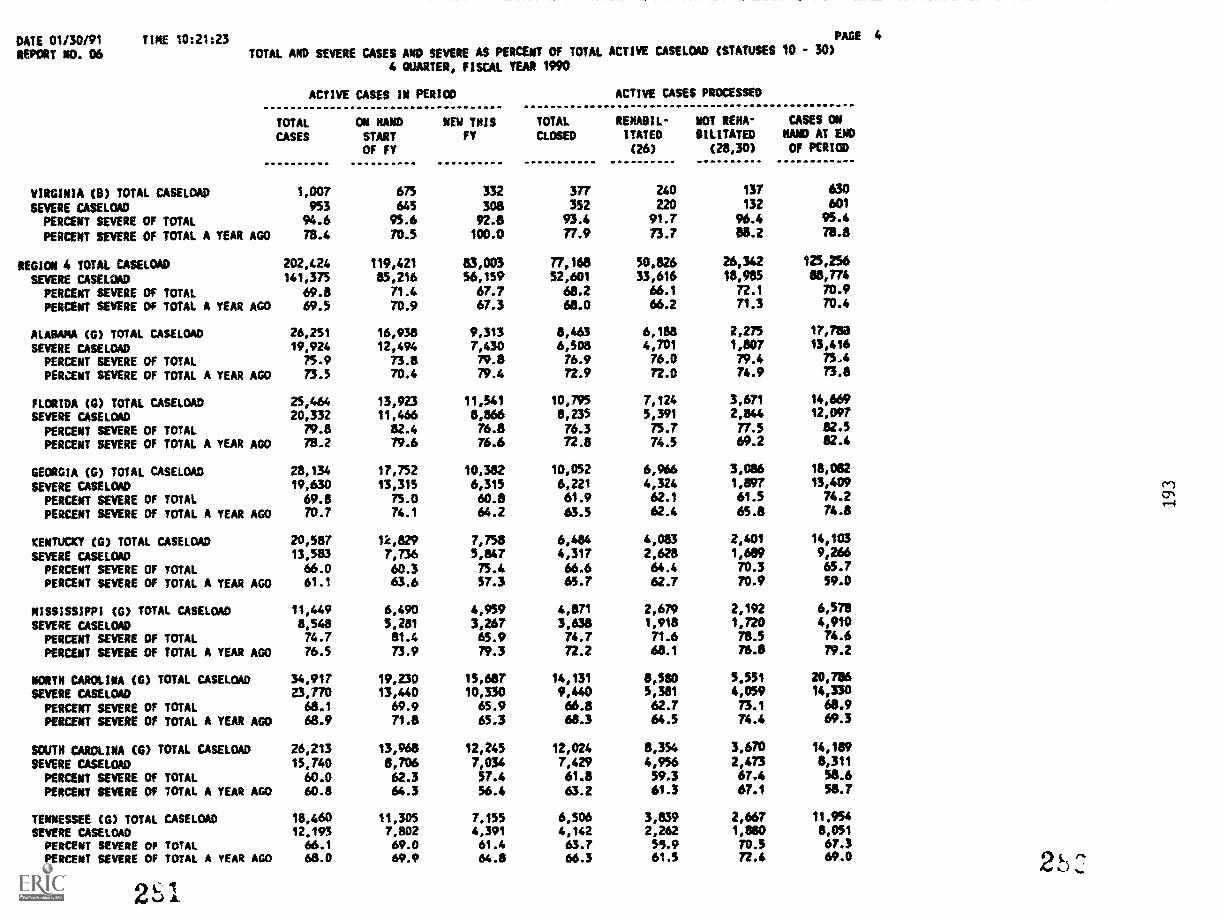
DATE 01/30/91 TINE 10:21:23
REPORT NO. 06
PAGE 4
TOTAL AND SEVERE CASES AND soma AS PERCENT CW TOTAL ACTIVE CASELOAD (STATUSES 10 - 30)4 QUARTER, FISCAL YEAR 1990
ACTIVE CASES IN PERIOD
TOTAL ON NAND NEW THIS
CASES START FY
Of FY
TOTALCLOSED
ACTIVE CASES PROCESSED
RENASIL- NOT RENA-ITATED SILITATED
(26) (28,30)
CASES ONNAND AT ENDOF PERIOD
VIRGINIA (8) TOTAL CASELOAD 1,007 675 332 377 240 137 630
SEVERE CASELOAD 953 645 308 352 220 132 601
PERCENT SEVERE OF TOTAL 94.6 95.6 92.8 93.4 91.7 96.4 95.4
PERCENT SEVERE OF TOTAL A YEAR AGO 75.4 70.5 100.0 77.9 73.7 88.2 78.8
REGION 4 TOTAL CASELOAD 202,424 119,421 83,003 77,168 50,826 26,342 125,256
SEVERE CASELOAD 141,375 85,216 56,159 52,601 33,616 18,985 88,774
PERCENT SEVERE OF TOTAL 69.8 71.4 67.7 68.2 66.1 72.1 70.9
PERCENT SEVERE OF TOTAL A YEAR AGO 69.5 70.9 67.3 68.0 66.2 71.3 70.4
ALABAMA (G) TOTAL CASELOAD 26,251 16,938 9,313 8,463 6,188 2,275 17,763
SEVERE CASELCAD 19,924 12,494 7,430 6,508 4,701 1,807 13,416
PERCENT SEVERE Of TOTAL 75.9 73.8 79.8 76.9 76.0 79.4 75.4
PERCENT SEVERE OF TOTAL A YEAR AGO 73.5 70.4 79.4 72.9 72.0 74.9 73.8
FLORIDA (0) TOTAL CASELOAD 25,464 13,923 11,541 10,795 7,124 3,671 14,669
SEVERE CASELOAD 20,332 11,466 8,866 8,235 5,391 2,844 12,097
PERCENT SEVERE OF TOTAL 79.8 82.4 76.8 76.3 75.7 77.5 82.5
PERCENT SEVERE OF TOTAL A YEAR AGO 78.2 rods 76.6 72.8 74.5 69.2 82.4
GEORGIA (0) TOTAL CASELOAD 28,134 17,752 10,382 10,052 6,966 3,086 18,062
SEVERE CASELOAD 19,630 13,315 6,315 6,221 4,324 1,897 13,409
PERCENT SEVERE OF TOTAL 69.8 75.0 60.8 61.9 62.1 61.5 74.2
PERCENT SEVERE OF TOTAL A YEAR AGO 70.7 74.1 64.2 63.5 62.4 65.8 74.8
KENTUCKY (G) TOTAL CASELOAD 20,587 1,829 7,758 6,484 4,083 2,401 14,103
SEVERE CASELOAD 13,583 7,736 5,847 4,317 2,628 1,689 9,266
PERCENT SEVERE OF TOTAL 66.0 60.3 75.4 66.6 64.4 70.3 65.7
PERCENT SEVERE OF TOTAL A YEAR AGO 61.1 63.6 57.3 65.7 62.7 70.9 59.0
MISSISSIPPI (G) TOTAL CASELOAD 11,449 6,490 4,959 4,871 2,679 2,192 6,578
SEVERE CASELOAD 8,548 5,281 3,267 3,638 1,915 1,720 4,910
PERCENT SEVERE OF TOTAL 74.7 81.4 65.9 74.7 71.6 78.5 74.6
PERCENT SEVERE OF TOTAL A YEAR AGO 76.5 73.9 79.3 72.2 68.1 76.8 79.2
AORTA CAROLINA (0) TOTAL CASELOAD 34,917 19,230 15,687 14,131 8,580 5,551 20,786
SEVERE CASELOAD 23,770 13,440 10,330 9,440 5,381 4,059 14,330
PERCENT SEVERE OF TOTAL 68.1 69.9 65.9 66.8 62.7 73.1 68.9
PERCENT SEVERE OF TOTAL A YEAR AGO 68.9 71.8 65.3 68.3 64.5 74.4 69.3
SWIM CAROLINA (0) TOTAL CASELOAD 26,213 13,968 12,245 12,024 8,354 3,670 14,189
SEVERE CASELOAD 15,740 8,706 7,034 7,429 4,956 2,473 8,311
PERCENT SEVERE OF TOTAL 60.0 62.3 57.4 61.8 59.3 67.4 58.6
PERCENT SEVERE OF TOTAL A YEAR AGO 60.8 64.3 56.4 63.2 61.3 67.1 58.7
TENNESSEE (G) TOTAL CASELOAD 18,460 11,305 7,155 6,506 3,839 2,667 11.954
SEVERE CASELOAD 12,193 7,802 4,391 4,142 2,262 1,880 8,051
PERCENT SEvERE OF TOTAL 66.1 69.0 61.4 65.7 54.9 ro.s 67.3PERCENT SEVERE OF TOTAL A YEAR AGO 68.0 69.9 64.8 66.3 613 72.4 69.0 2' ("4
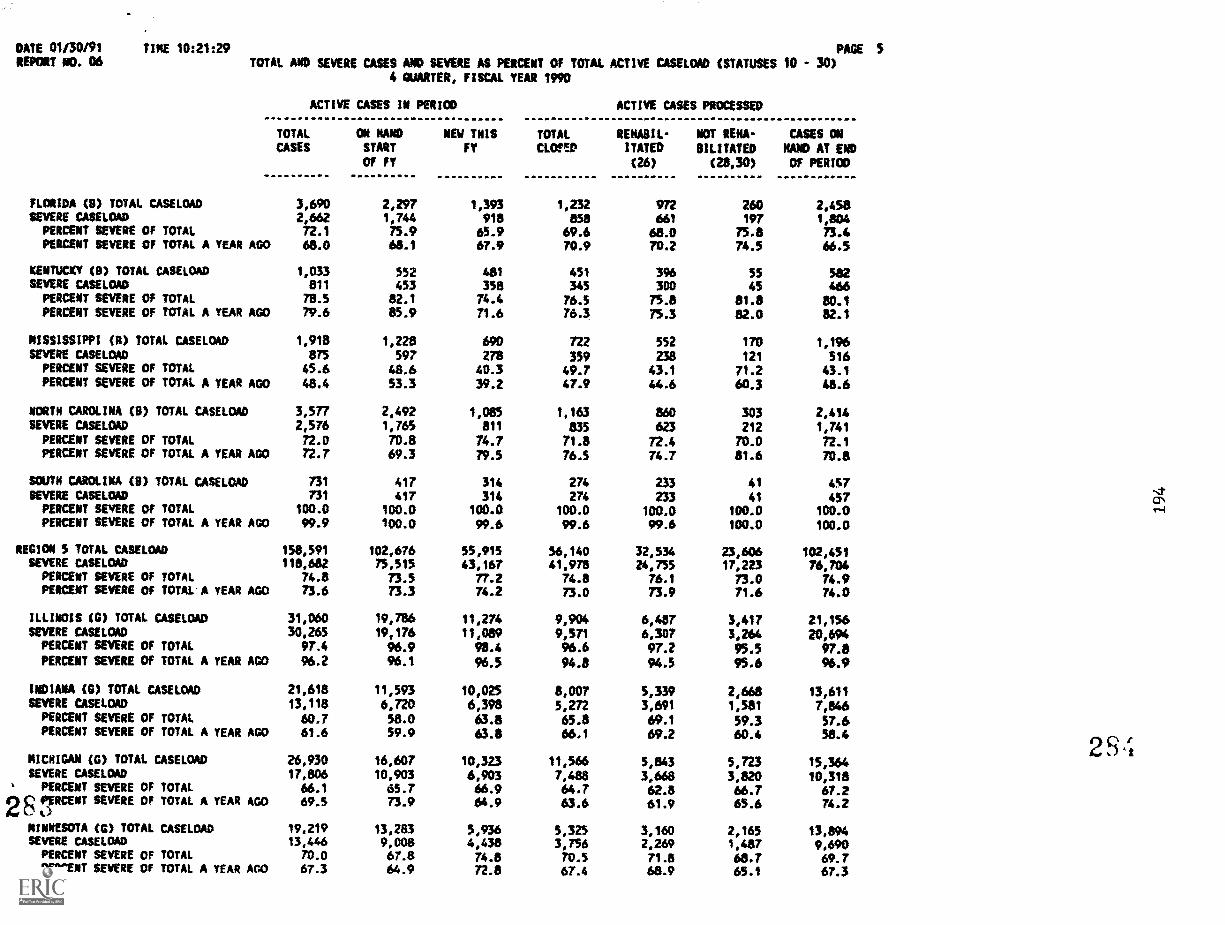
DATE 01/30191 TINE 10:21:29REPORT NO. 06
PAGE 5TOTAL AND SEVERE CASES AND SEVERE AS PERCENT OF TOTAL ACTIVE CASELOAD (STATUSES 10 - 30)
F. QUARTER, FISCAL YEAR 1990
ACTIVE CASES IN PERIOD
TOTAL OM KANO NEW THISCASES START FY
Of FT
TOTALCLOFED
ACTIVE CASES PROCESSED
RENABIL- NOT RENA-ITATED BILITATED(26) (2109)
CASES ONRAND AT END
Of PERIOD
FLORIDA (8) TOTAL CASELOAD 3,690 2,297 1,393 1,232 972 260 2,458SEVERE CASELOAD 2,662 1,744 918 argi 661 197 1,804
PERCENT SEVERE OF TOTAL 72.1 75.9 65.9 69.6 68.0 75.8 73.4PERCENT SEVERE Of TOTAL A YEAR AGO 68.0 68.1 67.9 70.9 70.2 74.5 66.5
KENTUCKY (8) TOTAL CASELOAD 1,033 552 481 451 396 55 582SEVERE CASELOAD 811 453 358 345 300 45 466PERCENT SEVERE OF TOTAL 783 82.1 74.4 76.5 75.8 81.8 80.1PERCENT SEVERE OF TOTAL A YEAR AGO 79.6 85.9 71.6 76.3 75.3 82.0 82.1
MISSISSIPPI (R) TOTAL CASELOAD 1,918 1,228 690 722 552 170 1,196SEVERE CASELOAD $75 597 278 359 238 121 516
PERCENT SEVERE OF TOTAL 45.6 48.6 40.3 49.7 43.1 71.2 43.1PERCENT SEVERE CW TOTAL A TEAR AGO 48.4 53.3 39.2 47.9 44.6 60.3 48.6
NORTH CAROLINA (B) TOTAL CASELOAD 3,577 2,492 1,085 1,163 860 303 2,414SEVERE CASELOAD 2,576 1,765 811 835 623 212 1,741
PERCENT SEVERE OF TOTAL 72.0 70.8 74.7 71.8 72.4 70.0 72.1PERCENT SEVERE OF TOTAL A YEAR AGO 72.7 69.3 793 76.5 74.7 81.6 70.8
SOUTH CAROLINA (9) TOTAL CASELOAD 731 417 314 274 233 41 457SEVERE CASELOAD 731 417 314 274 233 41 457
PERCENT SEVERE OF TOTAL 100.0 100.0 100.0 100.0 100.0 100.0 100.0PERCENT SEVERE Of TOTAL A YEAR AGO 99.9 100.0 99.6 99.6 99.6 100.0 100.0
REGION S TOTAL CASELOAD 158,591 102,676 55,915 56,140 32,534 23,606 102,451SEVERE CASELOAD 118,682 75,515 43,167 41,978 24,755 17,223 76,704
PERCENT SEVERE OF TOTAL 74.8 73.5 77.2 74.8 76.1 73.0 74.9PERCENT SEVERE OF TOTAL A YEAR AGO 73.6 73.3 74.2 73.0 73.9 71.6 74.0
ILLINOIS (G) TOTAL CASELOAD 31,060 19,786 11,274 9,904 6,487 3,417 21,156SEVERE CASELOAD 30,265 19,176 11,089 9,571 6,307 3,264 20,694PERCENT SEVERE OF TOTAL 97.4 96.9 98.4 96.6 97.2 95.5 97.8PERCENT SEVERE OF TOTAL A YEAR AGO 96.2 96.1 96.5 94.8 94.5 95.6 96.9
INDIANA (0) TOTAL CASELOAD 21,618 11,593 10,025 8,007 5,339 2,668 13,611SEVERE CASELOAD 13,118 6,720 6,398 5,272 3,691 1,581 7,846PERCENT SEVERE OF TOTAL 60.7 58.0 63.8 65.8 69.1 59.3 57.6PERCENT SEVERE OF TOTAL A YEAR AGO 61.6 59.9 63.8 66.1 69.2 60.4 58.4
MICHIGAN (G) TOTAL CASELOAD 26,930 16,607 10,323 11,566 5,843 5,723 15,364SEVERE CASELOAD 17,806 10,903 6,903 7,488 3,668 3,820 10,318
t PERCENT SEVERE OF TOTAL 66.1 65.7 66.9 64.7 62.8 66.7 67.2gle PERCENT SEVERE OF TOTAL A YEAR AGO,C, 0 t)
69.5 73.9 64.9 63.6 61.9 65.6 74.2
MINNESOTA (G) TOTAL CASELOAD 19,219 13,283 5,936 5,325 3,160 2,165 13,894SEVERE CASELOAD 13,446 9,008 4,439 3,756 2,269 1,487 9,690PERCENT SEVERE OF TOTAL 70.0 67.8 74.8 70.5 71.8 68.7 69.7PERCENT SEVERE OF TOTAL A YEAR AGO 67.3 64.9 72.8 67.4 68.9 65.1 67.3
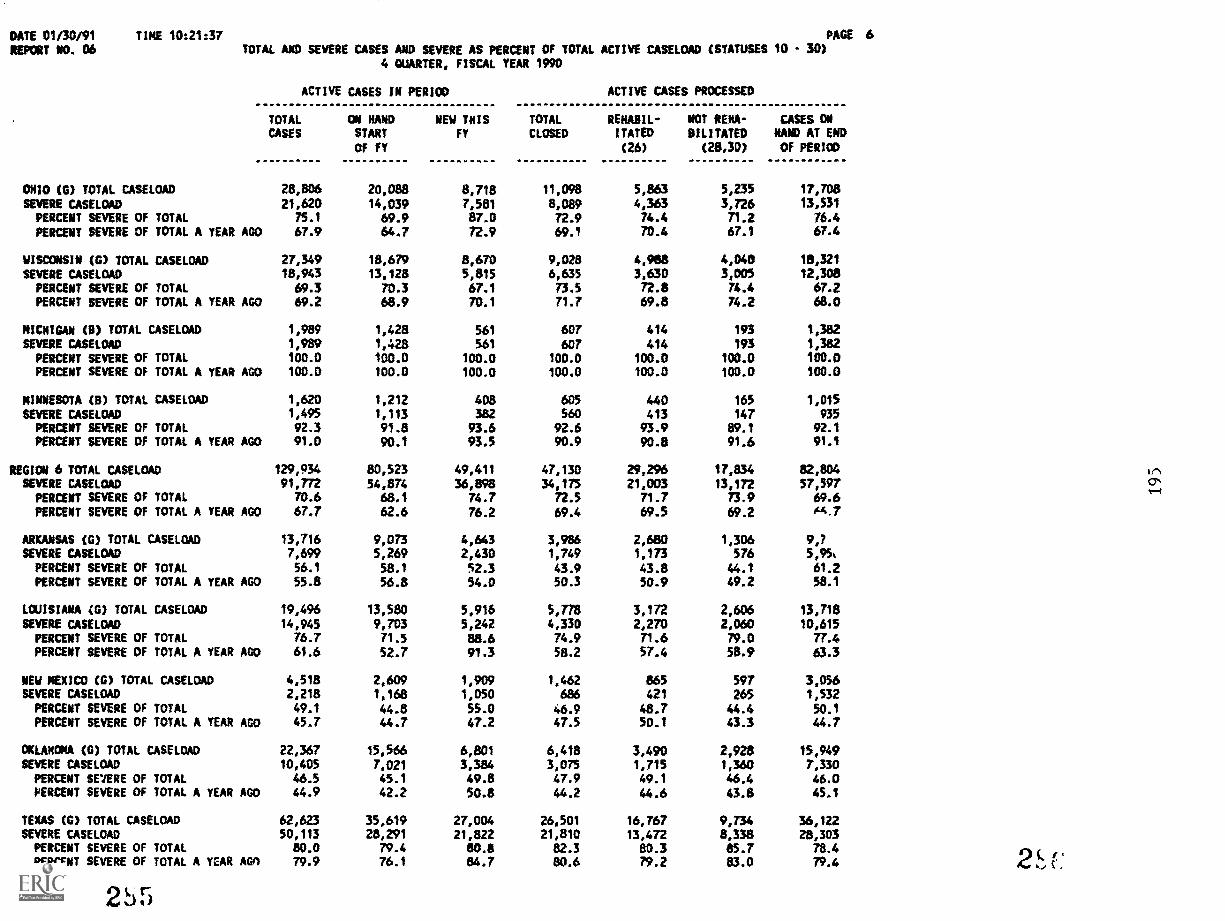
DATE 01/30/91 TINE 10:21:37
REPORT NO. 06
PAGE 6TOTAL AND SEVERE CASES AND SEVERE AS PERCENT OF TOTAL ACTIVE CASELOAD (STATUSES 10 30)
4 QUARTER, FISCAL YEAR 1990
ACTIVE CASES IN PERIOD
TOTAL ON HAND MEW THISCASES START FY
OF FY
TOTAL
CLOSED
ACTIVE CASES PROCESSED
REHABIL- NOT RENA-
ITATED BILITATED
(26) (28,30)
CASES ONNAND AT END
OF PERIOD
OHIO (0) TOTAL CASELOAD 28,806 20,088 8,718 11,098 5,863 5,235 17,708
SEVERE CASELOAD 21,620 14,039 7,581 8,089 4,363 3,726 13,531
PERCENT SEVERE OF TOTAL 75.1 69.9 87.0 72.9 74.4 71.2 76.4
PERCENT SEVERE OF TOTAL A YEAR AGO 67.9 64.7 72.9 69.1 70.4 67.1 67.4
WISCONSIN (G) TOTAL CASELOAD 27,349 18,679 8,670 9,028 4,988 4,040 18,321
SEVERE CASELOAD 18,943 13,128 5,815 6,635 3,630 3,005 12,308
PERCENT SEVERE OF TOTAL 69.3 70.3 67.1 73.5 72.8 74.4 67.2PERCENT SEVERE CP TOTAL A YEAR AGO 69.2 68.9 70.1 71.7 69.8 74.2 68.0
MICHIGAN (8) TOTAL CASELOAD 1,989 1,428 561 607 414 193 1,382
SEVERE CASELOAD 1,989 1,428 561 607 414 193 1,382PERCENT SEVERE OF TOTAL 100.0 100.0 100.0 100.0 100.0 100.0 100.0PERCENT SEVERE CI TOTAL A YEAR AGO 100.0 100.0 100.0 100.0 100.0 100.0 100.0
MINNESOTA (8) TOTAL CASELOAD 1,620 1,212 408 605 440 165 1,015SEVERE CASELOAD 1,495 1,113 382 560 413 147 935PERCENT SEVERE OF TOTAL 92.3 91.8 93.6 92.6 93.9 89.1 92.1
PERCENT SEVERE OF TOTAL A YEAR AGO 91.0 90.1 93.5 90.9 90.8 91.6 91.1
REGION 6 TOTAL CASELOAD 129,034 80,523 49,411 47,130 29,296 17,834 82,804 LnSEVERE CASELOAD 91,772 54,874 36,898 34,175 21,003 13,172 57,597 cr
PERCENT SEVERE OF TOTAL 70.6 68.1 74.7 72.5 71.7 73.9 69.6,--1
PERCENT SEVERE OF TOTAL A YEAR AGO 67.7 62.6 76.2 69.4 69.5 69.2 45.7
ARKANSAS (G) TOTAL CASELOAD 13,716 9,073 4,643 3,986 2,680 1,306 9,7
SEVERE CASELOAD 7,699 5,269 2,430 1,749 1,173 576 5,95.
PERCENT SEVERE OF TOTAL 56.1 58.1 52.3 43.9 43.8 44.1 61.2PERCENT SEVERE OF TOTAL A YEAR AGO 55.8 56.8 54.0 50.3 50.9 49.2 58.1
LOUISIANA (G) TOTAL CASELOAD 19,496 13,580 5,916 5,778 3,172 2,606 13,718SEVERE CASELOAD 14,945 9,703 5,242 4,330 2,270 2,060 10,615PERCENT SEVERE OF TOTAL 76.7 71.5 88.6 74.9 71.6 79.0 77.4PERCENT SEVERE OF TOTAL A YEAR AOD 61.6 52.7 91.3 58.2 57.4 58.9 63.3
NEW MEXICO (G) TOTAL CASELOAD 4,518 2,609 1,909 1,462 865 597 3,056SEVERE CASELOAD 2,218 1,168 1,050 686 421 265 1,532PERCENT SEVERE OF TOTAL 49.1 44.8 55.0 46.9 48.7 44.4 50.1PERCENT SEVERE OF TOTAL A YEAR AG0 45.7 44.7 47.2 47.5 50.1 43.3 44.7
MAMMA (0) TOTAL CASELOAD 22,367 15,566 6,801 6,418 3,490 2,928 15,949SEVERE CASELOAD 10,405 7,021 3,384 3,075 1,715 1,360 7,330
PERCENT SEVERE OF TOTAL 46.5 45.1 49.8 47.9 49.1 46.4 46.0PERCENT SEVERE OF TOTAL A YEAR AGO 44.9 42.2 50.8 44.2 44.6 43.8 45.1
TEXAS (G) TOTAL CASELOAD 62,623 35,619 27,004 26,501 16,767 9,734 36,122SEVERE CASELOAD 50,113 28,291 21,822 21,810 13,472 8,338 28,303
PERCENT SEVERE OF TOTALPERCENT SEVERE OF TOTAL A YEAR Am
80.079.9
79.476.1
80.884.7
82.380.6
80.379.2
85.783.0
78.479.4 2( I.,(
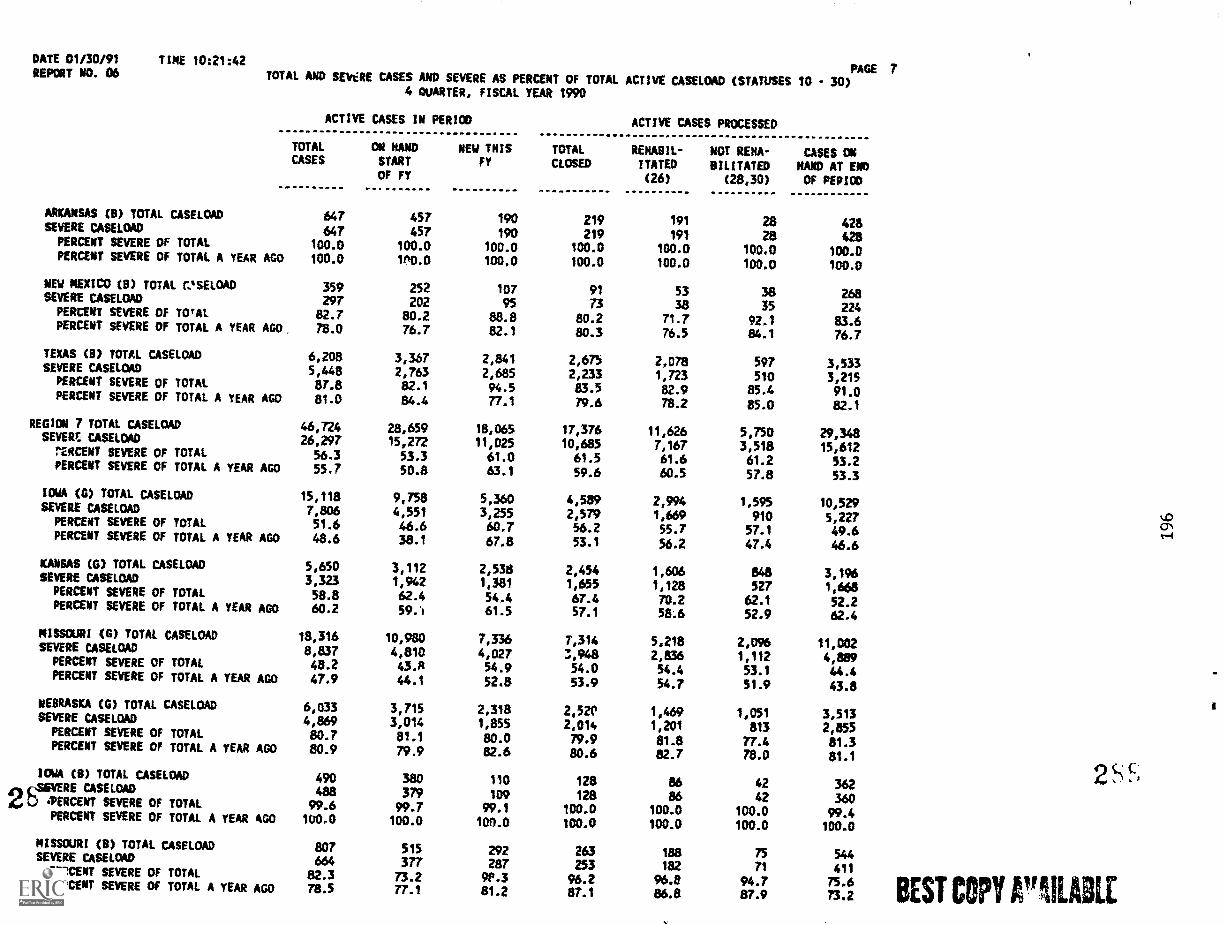
DATE 01/30/91 TINE 10:21:42REPORT NO. 06 PAGE 7
TOTAL AND SEVERE CASES AND SEVERE AS PERCENT OF TOTAL ACTIVE CASELOAD (STATUSES 10 30)4 QUARTER, FISCAL YEAR 1990
ARKANSAS (B) TOTAL CASELOADSEVERE CASELOAD
PERCENT SEVERE OF TOTAL
PERCENT SEVERE OF TOTAL A YEAR AGO
NEW MEXICO (0) TOTAL CnELOADSEVERE CASELOAD
PERCENT SEVERE OF TOTAL
PERCENT SEVERE OF TOTAL A YEAR AGO.
TEXAS (0) TOTAL CASELOADSEVERE CASELOAD
PERCENT SEVERE OF TOTAL
PERCENT SEVERE OF TOTAL A YEAR AGO
REGION 7 TOTAL CASELOADSEVERE CASELOAD
PERCENT SEVERE OF TOTALPERCENT SEVERE OF TOTAL A YEAR AGO
ICWA (G) TOTAL CASELOAD
SEVERE CASELOADPERCENT SEVERE OF TOTAL
PERCENT SEVERE OF TOTAL A YEAR AGO
KANSAS CS) TOTAL CASELOADSEVERE CASELOAD
PERCENT SEVERE OF TOTALPERCENT SEVERE OF TOTAL A YEAR AGO
MISSOURI (G) TOTAL CASELOADSEVERE CASELOAD
PERCENT SEVERE OF TOTAL
PERCENT SEVERE OF TOTAL A YEAR AGO
NEBRASKA (G) TOTAL CASELOADSEVERE CASELOAD
PERCENT SEVERE OF TOTAL
PERCENT SEVERE OF TOTAL A YEAR AGO
IOWA (0) TOTAL CASELOAD
8sswRE CASELOAD2 :PERCENT SEVERE OF TOTAL
PERCENT SEVERE OF TOTAL A YEAR AGO
MISSOURI (B) TOTAL CASELOADSEVERE CASELOAD
PERCENT SEVERE OF TOTALPERCENT SEVERE OF TOTAL A YEAR AGO
ACTIVE CASES IN PERIOD
TOTAL ON HAND NEW THISCASES START FY
OF FY
TOTAL
CLOSED
ACTIVE CASES PROCESSED
REHABIL-NOT REHA-ITATED BILITATED(26) (28,30)
CASES ONNAND AT ENOOF PERIOD
647 457 190 219 191 28 428647 457 190 219 191 28 428
100.0 100.0 100.0 100.0 100.0 100.0 100.0100.0 11'10.0 100.0 100.0 100.0 100.0 100.0
359 252 107 91 53 38 268297 202 95 73 38 05 22482.7 80.2 88.8 80.2 71.7 92.1 83.678.0 76.7 82.1 80.3 76.5 84.1 76.7
6,208 3,367 2,841 2,675 2,078 597 3,5335,448 2,763 2,685 2,233 1,723 510 3,21587.8 82.1 94.5 83.5 82.9 85.4 91.081.0 84.4 77.1 79.6 78.2 85.0 82.1
46,724 28,659 18,065 17,376 11,626 5,750 29,34826,297 15,272 11,025 10,685 7,167 3,518 15,612
56.3 53.3 61.0 61.5 61.6 61.2 53.255.7 50.8 63.1 59.6 60.5 57.8 53.3
15,118 9,758 5,360 4,589 2,994 1,595 10,5297,806 4,551 3,255 2,579 1,669 910 5,22751.6 46.6 60.7 56.2 55.7 57.1 49.648.6 38.1 67.8 53.1 56.2 47.4 46.6
5,650 3,112 2,538 2,454 1,606 848 3,1963,323 1,942 1,381 1,655 1,128 527 1,66858.8 62.4 54.4 67.4 70.2 62.1 52.260.2 59.1 61.5 57.1 58.6 52.9 62.4
18,316 10,980 7,336 7,314 5,218 2,096 11,0028,837 4,810 4,027 3,948 2,836 1,112 4,88948.2 43.R 54.9 54.0 54.4 53.1 44.447.9 44.1 52.8 53.9 54.7 51.9 43.8
6,033 3,715 2,318 2,520 1,469 1,051 3,5134,869 3,014 1,855 2,014 1,201 813 2,85580.7 81.1 80.0 79.9 81.8 77.4 81.380.9 79.9 82.6 80.6 82.7 78.0 81.1
490 380 110 128 86 42 362488 379 109 128 86 42 360
99.6 99.7 99.1 100.0 100.0 100.0 99.4100.0 100.0 100.0 100.0 100.0 100.0 100.0
807 515 292 263 188 75 544664 377 287 253 182 71 411
82.3 73.2 9P.3 96.2 96.8 94.7 75.678.5 77.1 81.2 87.1 86.8 87.9 73.2 BEST COPY MILIEU
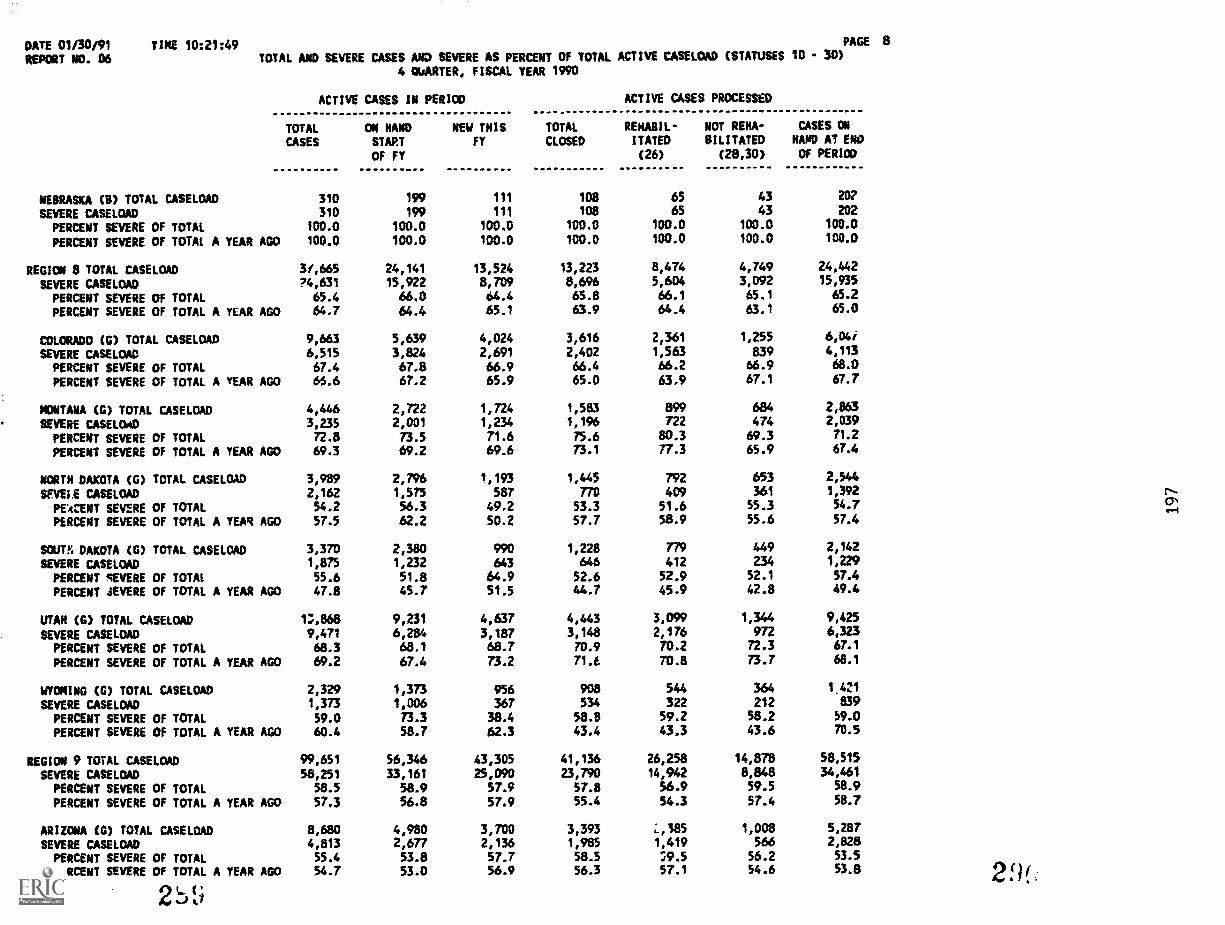
DATE 01/30191 TINE 10:21:49REPORT NO. 06
PAGE 8TOTAL AND SEVERE CASES A= SEVERE AS PERCENT OF TOTAL ACTIVE CASELOAD (STATUSES 10 - 30)
4 QUARTER, FISCAL YEAR 1990
ACTIVE CASES IN PERIOD
TOTAL ON HAND NEW THISCASES START FY
OF FY
TOTAL
CLOSED
ACTIVE CASES PROCESSED
REHABIL-NOT REKA-ITATED SILITATED
(26) (28,30)
CASES ONHAND AT ENO
Of PERIOD
NEBRASKA (B) TOTAL CASELOAD 310 199 111 108 65 43 20?
SEVERE CASELOAD 310 199 111 108 65 43 202
PERCENT SEVERE CW TOTAL 100.0 100.0 100.0 100.0 100.0 100.0 100.0
PERCENT SEVERE OF TOTAL A YEAR AGO 100.0 100.0 100.0 100.0 100.0 100.0 100.0
REGION 8 TOTAL CASELOAD 3/,665 24,141 13,524 13,223 8,474 4,749 24,442
SEVERE CASELOAD '4,631 15,922 8,709 8,696 5,604 3,092 15,935
PERCENT SEVERE Of TOTAL 65.4 66.0 64.4 65.8 66.1 65.1 65.2
PERCENT SEVERE OF TOTAL A YEAR AGO 64.7 64.4 65.1 63.9 64.4 63.1 65.0
COLORADO CO) TOTAL CASELOAD 9,663 5,639 4,024 3,616 2,361 1,255 6,041
SEVERE CASELOAD 6,515 3,824 2,691 2,402 1,563 839 4,113
PERCENT SEVERE OF TOTAL 67.4 67.8 66,9 66.4 66.2 66.9 68.0
PERCENT SEVERE OF TOTAL A YEAR AGO 66.6 67.2 65.9 65.0 63.9 67.1 67.7
MONTANA (G) TOTAL CASELOAD 4,446 2,722 1,724 1,583 899 684 2,863
SEVERE CASELOAD 3,235 2,001 1,234 1,196 722 474 2,039
PERCENT SEVERE CW TOTAL 72.8 73.5 71.6 75.6 80.3 69.3 71.2
PERCENT SEVERE CT TOTAL A YEAR AGO 69.3 69.2 69.6 73.1 77.3 65.9 67.4
NORTH DAKOTA (G) TOTAL CASELOAD 3,989 2,796 1,193 1,445 792 653 2,544
SFVUE CASELOAD 2,162 1,575 587 770 409 361 1,392
PEACENT SEVERE C/ TOTAL 54.2 56.3 49.2 53.3 51.6 55.3 54.7
PERCENT SEVERE OF TOTAL A YEAR AGO 57.5 62.2 50.2 57.7 58.9 55.6 57.4
SOUTN DAKOTA (G) TOTAL CASELOAD 3,370 2,380 990 1,228 779 449 2,142
SEVERE CASELOAD 1,875 1,232 643 646 412 234 1,229
PERCENT gEVERE OF TOTAL 55.6 51.8 64.9 52.6 52.9 52.1 57.4
PERCENT SEVERE OF TOTAL A YEAR AGO 47.8 45.7 51.5 44.7 45.9 42.8 49.4
UTAH (G) TOTAL CASELOAD 11%868 9,231 4,637 4,443 3,099 1,344 9,425
SEVERE CASELOAD 9,471 6,284 3,187 3,148 2,176 972 6,323
PERCENT SEVERE CT TOTAL 68.3 68.1 68.7 70.9 70.2 72.3 67.1
PERCENT SEVERE CW TOTAL A YEAR AGO 69.2 67.4 73.2 71.6 70.8 73.7 68.1
WYOMING (G) TOTAL CASELOAD 2,329 1,373 956 908 544 364 141SEVERE CASELOAD 1,373 1,006 367 534 322 212 839
PERCENT SEVERE OF TOTAL 59.0 73.3 38.4 58.8 59.2 58.2 59.0
PERCENT SEVERE Of TOTAL A YEAR AGO 60.4 58.7 62.3 43.4 43.3 43.6 70.5
REGION 9 TOTAL CASELOAD 99,651 56,346 43,305 41,136 26,258 14,878 58,515
SEVERE CASELOAD 58,251 33,161 25,090 23,790 14,942 8,848 34,461
PERCENT SEVERE OF TOTAL 58.5 58.9 57.9 57.8 56.9 59.5 58.9
PERCENT SEVERE OF TOTAL A YEAR AGO 57.3 56.8 57.9 55.4 54.3 57.4 58.7
ARIZONA (G) TOTAL CASELOAD 8,680 4,980 3,700 3,393 L,385 1,008 5,287
SEVERE CASELOAD 4,813 2,677 2,136 1,985 1,419 566 2,828
PERCENT SEVERE Of TOTAL 55.4 53.8 57.7 58.5 79.5 56.2 53.5
PERCENT SEVERE OF TOTAL A YEAR AGO 54.7 53.0 56.9 56.3 57.1 54.6 53.8
2"'2fJf.
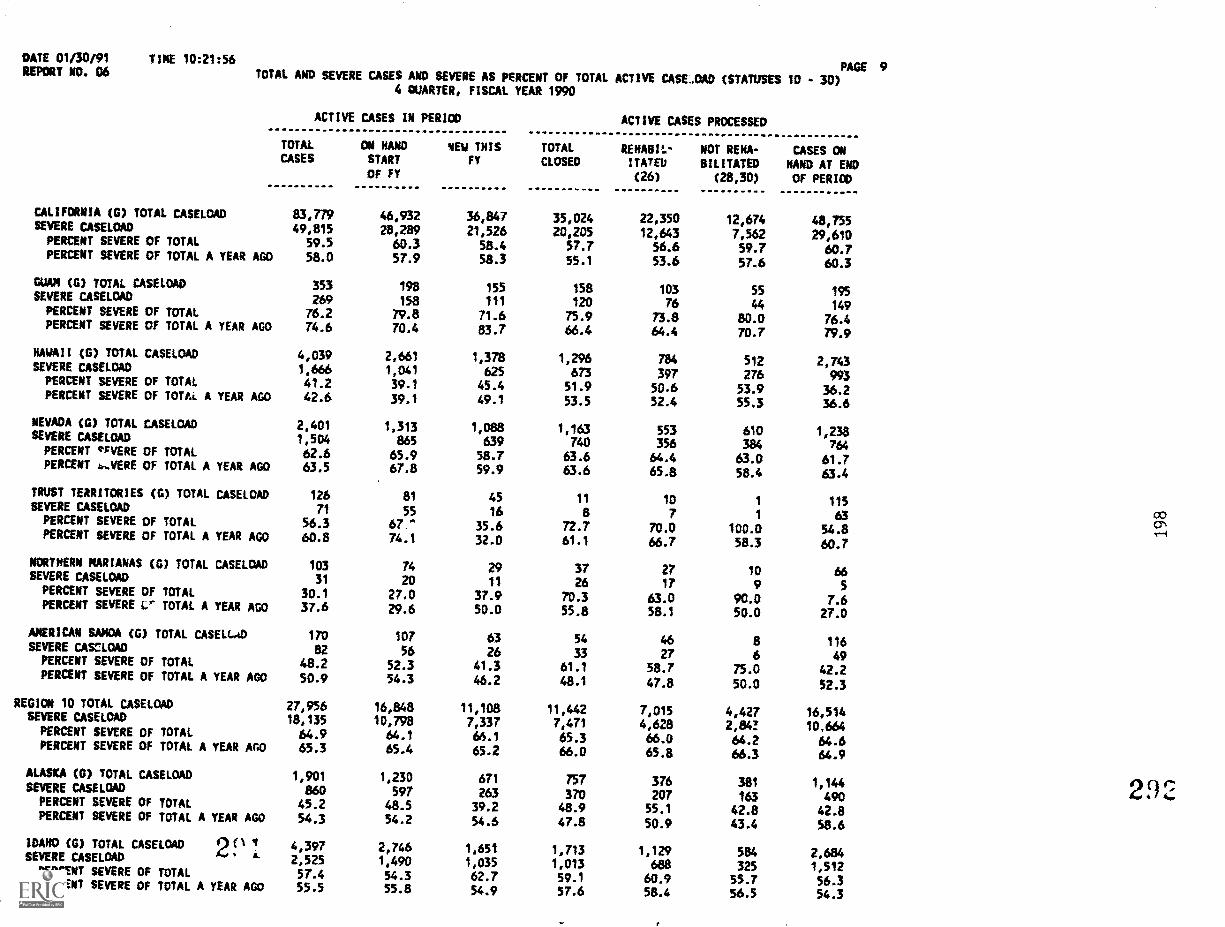
CATE 01/30/91REPORT NO. 06
TIME 10:21:56PAGE 9
TOTAL AND SEVERE
CALIFORNIA (0) TOTAL CASELOADSEVERE CASELOADPERCENT SEVERE OF TOTAL
PERCENT SEVERE OF TOTAL A YEAR AGO
GUAM (0) TOTAL CASELOADSEVERE CASELOAD
PERCENT SEVERE OF TOTALPERCENT SEVERE OF TOTAL A YEAR AGO
HAWAII (G) TOTAL CASELOAD
SEVERE CASELOADPERCENT SEVERE OF TOTAL
PERCENT SEVERE OF TOTAL A YEAR AGO
NEVADA (G) TOTAL CASELOADSEVERE CASELOAD
PERCENT eFVERE OF TOTALPERCENT 4..VERE Of TOTAL A YEAR AGO
TRUST TERRITORIES (0) TOTAL CASELOADSEVERE CASELOADPERCENT SEVERE Of TOTAL
PERCENT SEVERE OF TOTAL A YEAR AGO
NORTHERN MARIANAS (G) TOTAL CASELOADSEVERE CASELOAD
PERCENT SEVERE OF TOTALPERCENT SEVERE Cr TOTAL A YEAR AGO
AMERICAN SAMOA (G) TOTAL CASEL(.ADSEVERE CASCLOADPERCENT SEVERE OF TOTAL
PERCENT SEVERE OF TOTAL A YEAR AGO
REGION 10 TOTAL CASELOADSEVERE CASELOAD
PERCENT SEVERE OF TOTALPERCENT SEVERE OF TOTAL A YEAR AGO
ALASKA (0) TOTAL CASELOADSEVERE CASELOAD
PERCENT SEVERE OF TOTAL
PERCENT SEVERE OF TOTAL A YEAR AGO
IDAHO (G) TOTAL CASELOAD 20SEVERE CASELOAD .
PERCENT SEVERE OF TOTALPERCENT SEVERE OF TOTAL A YEAR AGO
CASES AND SEVERE AS PERCENT OF TOTAL ACTIVE CASLOAD (STATUSES 10 - 30)4 QUARTER, FISCAL YEAR 1990
ACTIVE CASES IN PERIOD
TOTAL ON HAND NEW THISCASES START FY
OF FY
TOTAL
CLOSED
ACTIVE CASES PROCESSED
REHABIL-MOT RENA-ITATED BILITATED(26) (28,30)
CASES ONHAAT AT ENO
OF PERIOD
83,779 46,932 36,847 35,024 22,350 12,674 48,75549,815 28,28; 21,526 20,205 12,643 7,562 29,61059.5 60.3 58.4 57.7 56.6 59.7 60.758.0 57.9 58.3 55.1 53.6 57.6 60.3
353 198 155 158 103 55 195269 158 111 120 76 44 14976.2 79.8 71.6 75.9 73.8 80.0 76.474.6 70.4 83.7 66.4 64.4 70.7 79.9
4,039 2,661 1,378 1,296 784 512 2,7431,666 1,041 625 673 397 276 99341.2 39.1 45.4 51.9 50.6 53.9 36.242.6 39.1 49.1 53.5 52.4 55.3 36.6
2,401 1,313 1,088 1,163 553 610 1,2381,504 865 639 740 356 384 76462.6 65.9 58.7 63.6 64.4 63.0 61.763.5 67.8 59.9 63.6 65.8 58.4 63.4
126 81 45 11 10 1 11571 55 16 a 7 1 63
56.3 67 35.6 72.7 70.0 100.0 54.860.8 74.1 32.0 61.1 66.7 58.3 60.7
103 74 29 37 27 10 6631 20 11 26 17 9 5
30.1 27.0 37.9 70.3 63.0 90.0 7.637.6 29.6 50.0 55.8 58.1 50.0 27.0
170 107 63 54 46 a 11682 56 26 33 27 6 49
48.2 52.3 41.3 61.1 58.7 75.0 42.250.9 54.3 46.2 48.1 47.8 50.0 52.3
27,956 16,848 11,108 11,442 7,015 4,427 16,51418,135 10,798 7,337 7,471 4,628 2,84! 10,66464.9 64.1 64.1 65.3 66.0 64.2 64.665.3 65.4 65.2 66.0 65.8 66.3 64.9
1,901 1,230 671 757 376 381 1,144860 597 263 30 207 163 49045.2 48.5 39.2 48.9 55.1 42.8 42.854.3 54.2 54.6 47.8 50.9 43.4 58.6
4,397 2,746 1,651 1,713 1,129 584 2,6842,525 1,490 1,035 1,013 688 325 1,51257.4 54.3 62.7 59.1 60.9 55.7 56.355.5 55.8 54.9 57.6 58.4 56.5 54.3
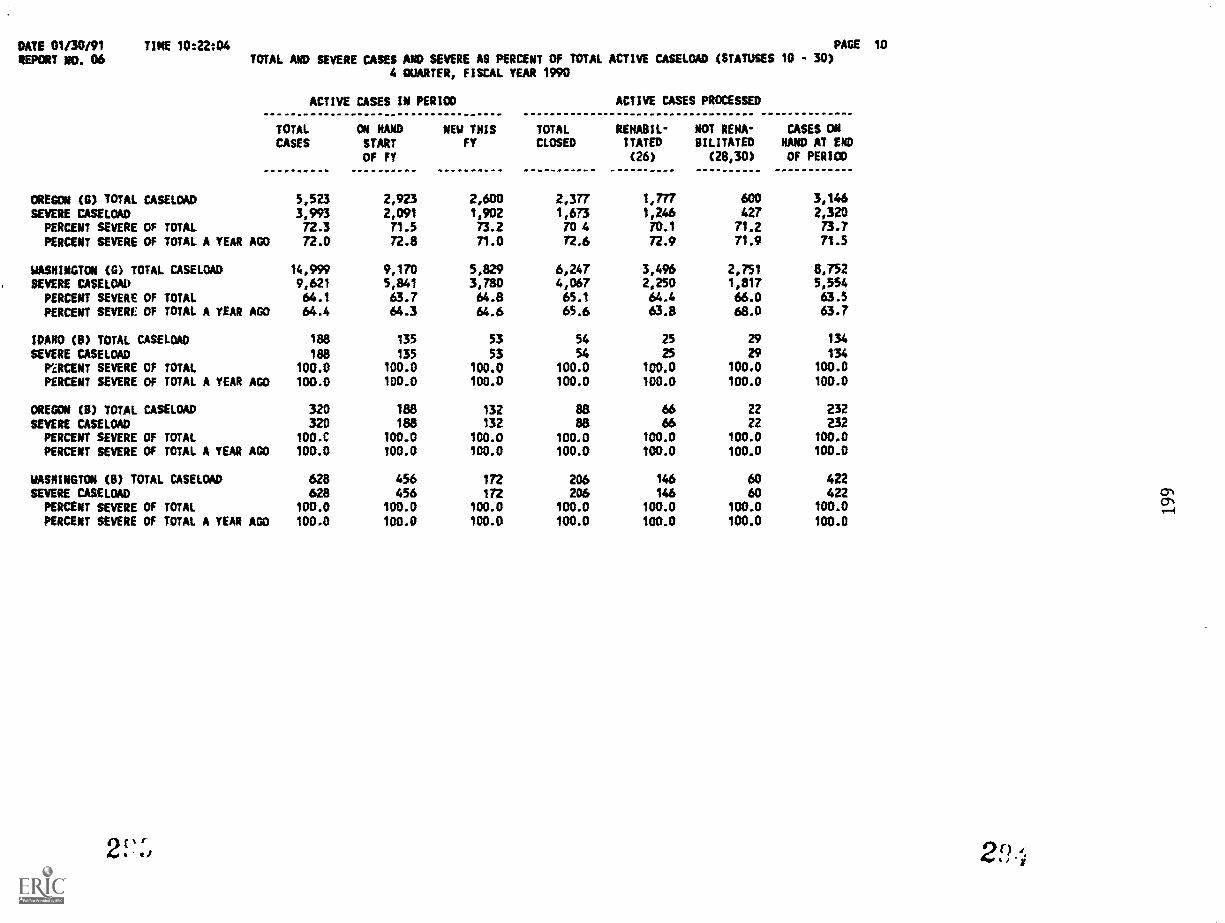
DATE 01/30191 TIME 10:22:04REPORT NO. 06
PAGE 10
TOTAL AND SEVERE CASES ANO SEVERE AS PERCENT OF TOTAL ACTIVE CASELOAD (STATUSES 10 - 30)4 QUARTER, FISCAL YEAR 1990
ACTIVE CASES IN PERIOD
TOTAL ON HAND NEW THISCASES START FY
OF FY
TOTALCLOSED
ACTIVE CASES PROCESSED
REHASIL- NOT RENA-ITATED MILITATED
(26) (28,30)
CASES ONHAND AT END
OF PERICO
OREGON (G) TOTAL CASELOAD 5,523 2,923 2,600 2,377 1,777 600 3,146
SEVERE CASELOAD 3,993 2,091 1,902 1,673 1,246 427 2,320PERCENT SEVERE OF TOTAL 72.3 71.5 73.2 70 4 70.1 71.2 73.7
PERCENT SEVERE OF TOTAL A YEAR AGO 72.0 72.8 71.0 72.6 72.9 71.9 71.5
WASHINGTON (G) TOTAL CASELOAD 14,999 9,170 5,829 6,247 3,496 2,751 8,752
SEVERE CASELOAD 9,621 5,841 3,780 4,067 2,250 1,817 5,554
PERCENT SEVERE OF TOTAL 64.1 63.7 64.8 65.1 64.4 66.0 63.5PERCENT SEVERE OF TOTAL A YEAR AGO 64.4 64.3 64.6 65.6 63.8 68.0 63.7
IDAHO (8) TOTAL CASELOAD las 135 53 54 25 29 134
SEVERE CASELOAD 188 135 53 54 25 29 134
PACENT SEVERE OF TOTAL 100.0 100.0 100.0 100.0 100.0 100.0 100.0
PERCENT SEVERE OF TOTAL A YEAR AGO 100.0 100.0 100.0 100.0 100.0 100.0 100.0
OREGON (8) TOTAL CASELOAD 320 188 132 ss 66 22 232SEVERE CASELOAD 320 188 132 es 66 22 232
PERCENT SEVERE OF TOTAL 100.0 100.0 100.0 100.0 100.0 100.0 100.0
PERCENT SEVERE OF TOtAL A YEAR AGO 100.0 100.0 100.0 100.0 100.0 100.0 100.0
WASHINGTON (8) TOTAL CASELOAD 628 456 172 206 146 60 422SEVERE CASELOAD 628 456 172 206 146 ito 422
PERCENT SEVERE OF TOTAL 100.0 100.0 100.0 100.0 100.0 100.0 100.0
PERCENT SEVERE OF TOTAL A YEAR AGO 100.0 100.0 100.0 100.0 100.0 100.0 100.0
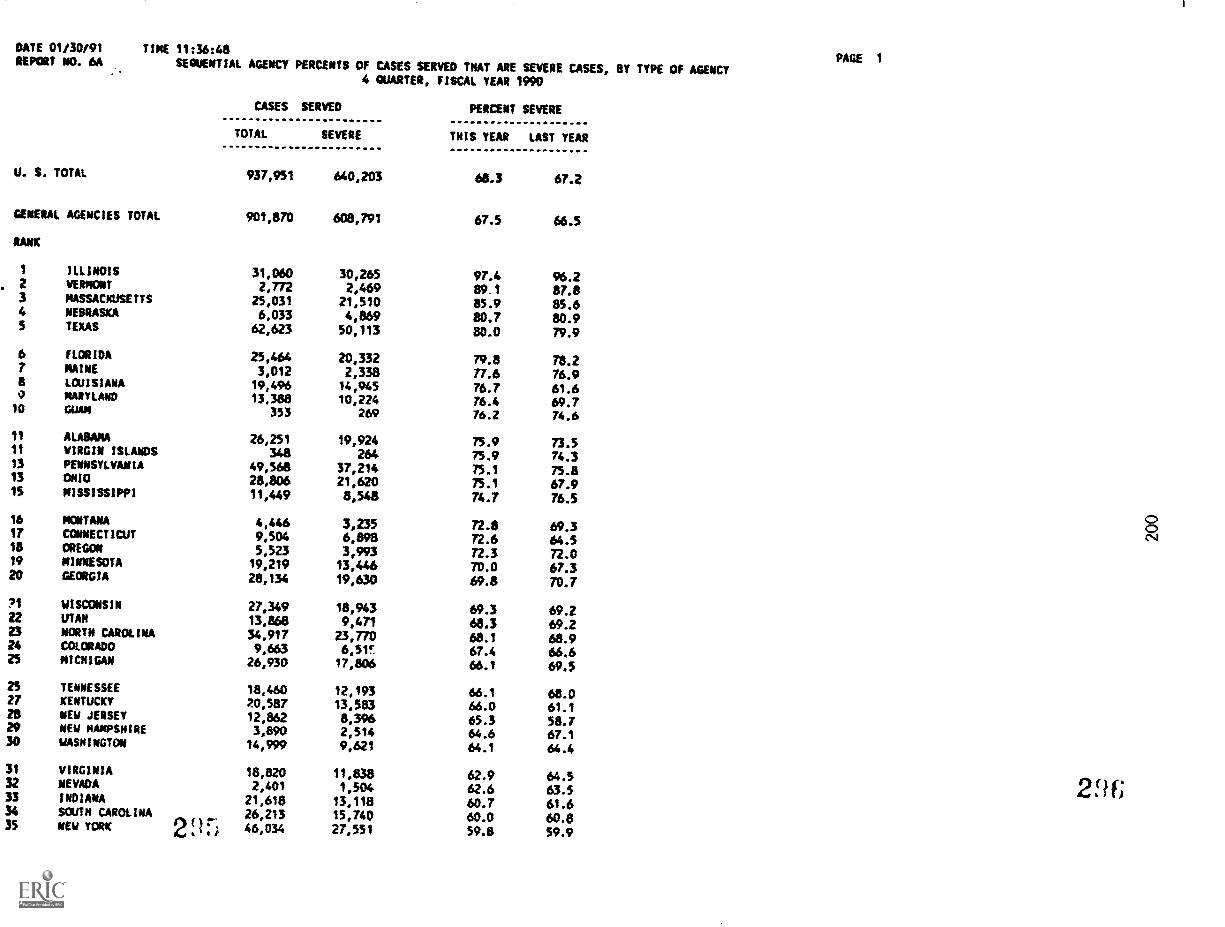
DATE 01/30/91REPORT NO. 64
U. S. TOTAL
TIME 11:36:48
SEQUENTIAL AGENCY PERCENTS Of CASES SERVED THAT ARE SEVERE CASES, BY TYPE OF AGENCY
GENERAL AGENCIES TOTAL
RANK
ILLINOIS2 VERMONT3 MASSACHUSETTS4 NEBRASKA5 TEXAS
6 FLORIDA7 MAINEa LOUISIANA4 MARYLAND10 GUM
11 ALABAMA11 VIRGIN ISLANDS13 PENNSYLVANIA13 OMIO15 MISSISSIPPI
16 MONTANA17 CONNECTICUT18 OREGON19 MINNESOTA20 GEORGIA
?1 WISCONSIN22 UTAH23 NORTH CAROLINA24 COLORADO25 MICHIGAN
25 TENNESSEE27 KENTUCKY28 NEW JERSEY29 NEW NANPSHIRE30 WASHINGTON
31 VIRGINIA32 NEVADA33 INDIANA34 SOUTH CAROLINA35 NEW YORK 2(.15
CASES
TOTAL
4 QUARTER, FISCAL YEAR 1990
SERVED PERCENT SEVERE
SEVERE THIS YEAR LAST YEAR
937,951 640,203 68.3 67.2
901,870 608,791 67.5 66.5
31,060 30,265 97.4 96.22,772 2,469 89.1 87.8
25,031 21,510 85.9 85.66,033 4,869 80.7 80.962,623 50,113 80.0 79.9
25,464 20,332 79.8 78.23,012 2,338 77.6 76.919,496 14,945 76.7 61.613.388 10,224 76.4 69.7
353 269 76.2 74.6
26,251 19,924 75.9 73.5348 264 75.9 74.3
49,568 37,214 75.1 75.828,806 21,620 75.1 67.911,449 8,548 74.7 76.5
4,446 3,235 72.8 69.39,504 6,898 72.6 64.55,523 3,993 72.3 72.019,219 13,446 70.0 67.328,134 19,630 69.8 70.7
27,349 18,943 69.3 69.213,868 9,471 68.3 69.234,917 23,770 68.1 68.99,663 6,51' . 67.4 66.626,930 17,806 66.1 69.5
18,460 12,193 66.1 68.020,587 13,583 66.0 61.112,862 8,396 65.3 58.73,890 2,514 64.6 67.1
14,999 9,621 64.1 64.4
18,820 11,838 62.9 64.52,401 1,504 62.6 63.521,618 13,118 60.7 61.626,213 15,740 60.0 60.846,034 27,551 59.8 59.9
PAGE 1
2n
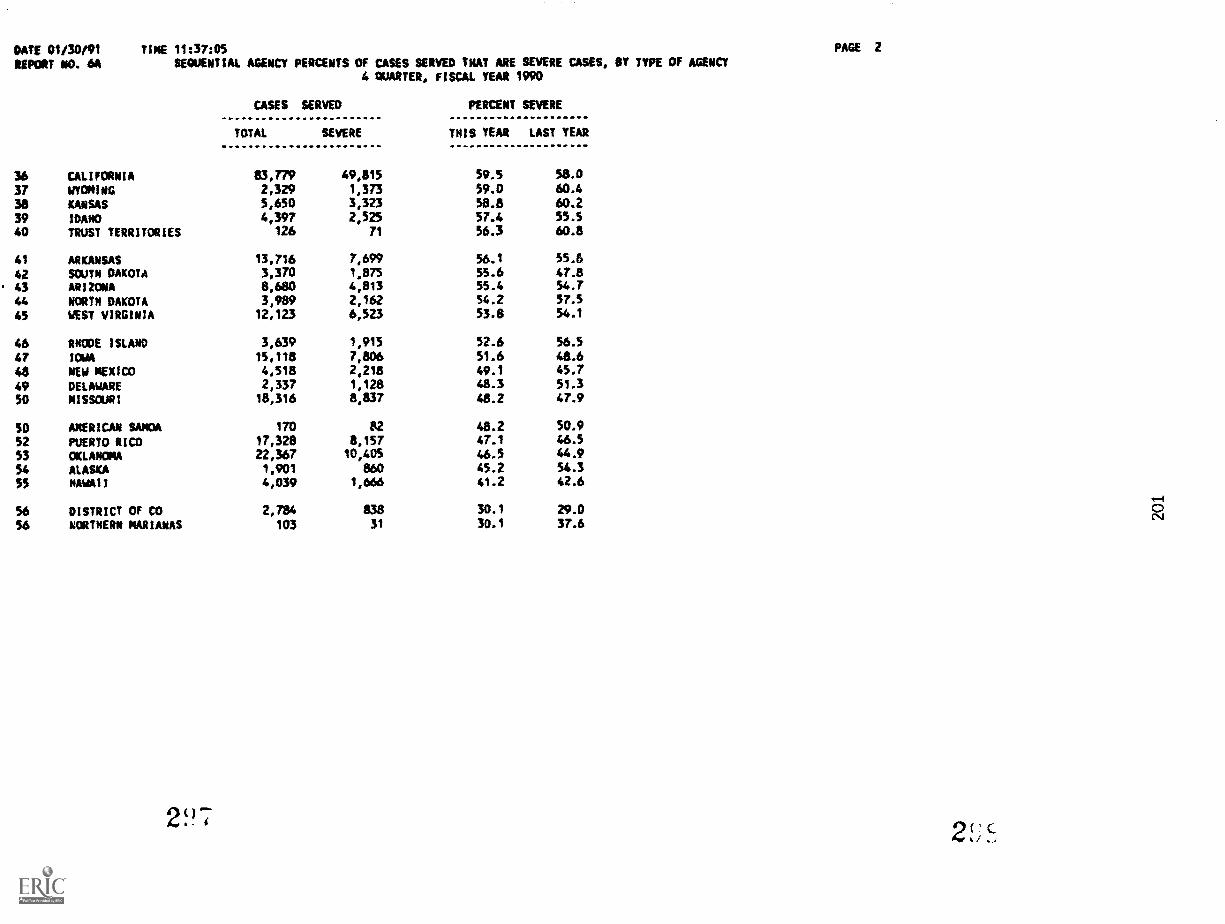
DATE 01/30f91REPORT NO. 6A
TINE 11:37:05SEQUENTIAL AGENCY PERCENTS OF CASES SERVED THAI ARE SEVERE CASES, BY TYPE Of AGENCY
CASES
TOTAL
4 QUARTER, FISCAL YEAR 1990
SERVED PERCENT SEVERE
SEVERE THIS YEAR LAST YEAR
36 CALIFORNIA 83,779 49,815 59.5 58.0
37 WOWING 2,329 1,373 59.0 60.4
38 KANSAS 5,650 3,323 58.8 60.2
39 IDAHO 4,397 2,525 57.4 55.5
40 TRUST TERRITORIES 126 71 56.3 60.8
41 ARKANSAS 13,716 7,699 56.1 55.6
42 SOUTH DAKOTA 3,370 1,875 55.6 47.8
43 ARIZONA 8,680 4,813 55.4 54.7
44 NORTH DAKOTA 3,989 2,162 54,2 57.5
45 WEST VIRGINIA 12,123 6,523 53.8 54.1
46 RHODE ISLAND 3,639 1,915 52.6 56.5
47 IOWA lsola 7,806 51.6 48.6
48 NEW MEXICO 4,518 2,218 49.1 45.7
49 DELAwARE 2,337 1,128 48.3 51.3
50 MISSOURI 18,316 8,837 48.2 47.9
SO ANERICAN SAMOA 170 82 48.2 50.9
52 PUERTO RICO 17,328 8,157 47.1 46.5
53 OKLAHOMA 22,367 10,405 46.5 44.9
54 ALASKA 1,901 860 45.2 54.3
55 HAWAII 4,039 1,666 41.2 42.6
56 DISTRICT OF CO 2,784 838 30.1 29.0
56 NORTHERN MARIANAS 103 31 30.1 37.6
2 7
PAGE 2
2 !;
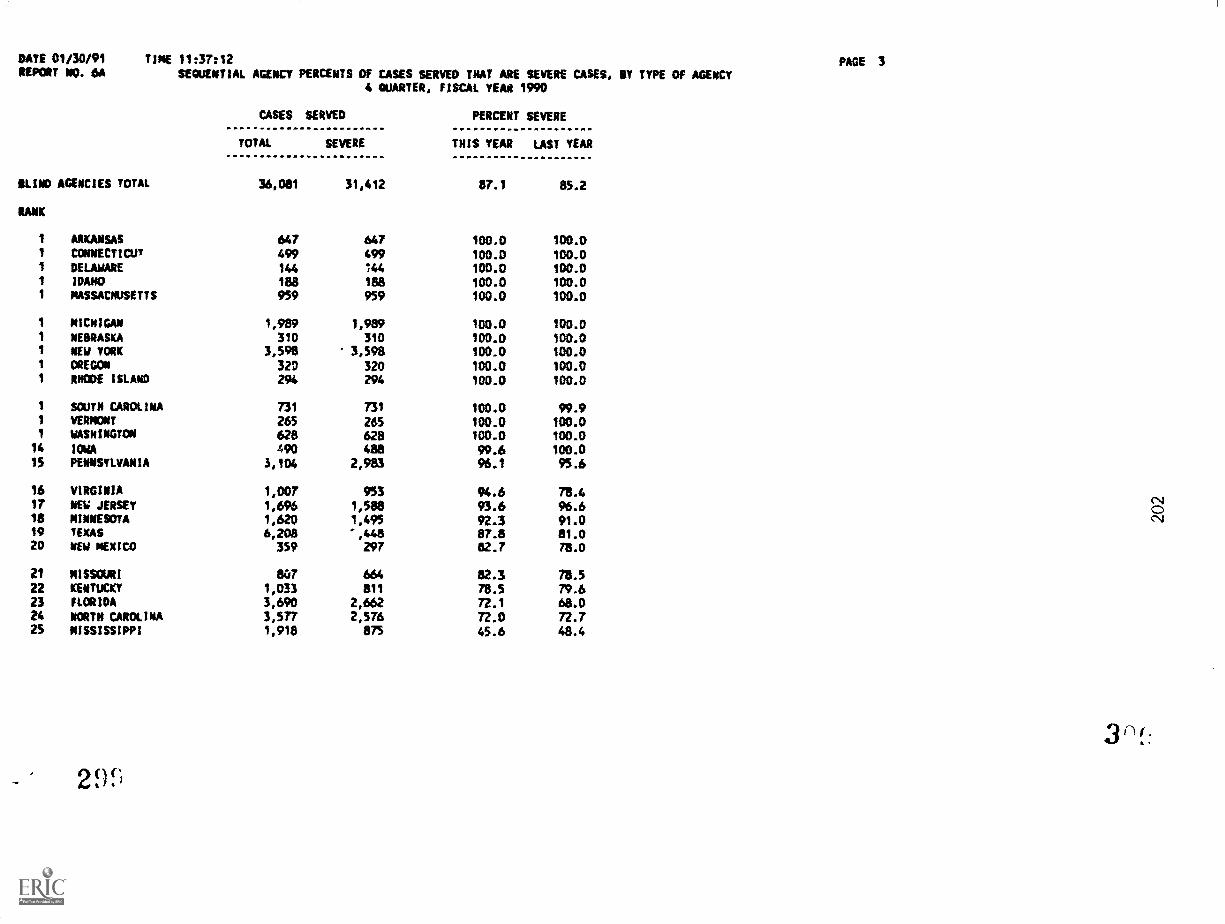
DATE 01130/91REPORT NO. 64
TIME 11:37:12
SEQUENTIAL AGENCY PERCENTS CW CASES SERVED THAT ARE SEVERE CASES, BY TYPE OF AGENCY
KIND AGENCIES TOTAL
RANK
CASES
TOTAL
36,041
4 QUARTER, FISCAL YEA* 1990
SERVED PERCENT SEVERE
SEVERE THIS YEAR LAST YEAR
31,412 87.1 85.2
1 ARKANSAS 647 647 100.0 100.01 CONNECTICUT 499 499 100.0 100.01 DELAWARE 144 144 100.0 100.01 IDAHO 188 188 100.0 100.01 MASSACHUSETTS 959 959 100.0 100.0
1 MICHIGAN 1,989 1,989 100.0 100.01 NEBRASKA 310 310 100.0 100.01 NEW YORK 3,598 3,598 100.0 100.0I OREGON 32D 320 100.0 100.01 RHODE ISLAND 294 294 100.0 100.0
1 SOUTH CAROLINA 731 731 100.0 99.91 VERMCNT 265 265 100.0 100.01 WASHINGTON 628 628 100.0 100.0
14 IOWA 490 488 99.6 100.015 PENNSYLVANIA 3,104 2,983 96.1 95.6
16 VIRGINIA 1,007 953 94.6 78.417 NEW JERSEY 1,696 1,588 93.6 96.618 MINNESOTA 1,620 1,495 92.3 91.019 TEXAS 6,208 -,448 87.8 81.020 NEW MEXICO 359 297 82.7 78.0
21 NISSOURI 807 664 82.3 713.5
22 KENTUCKY 1,033 811 78.5 79.623 FLORIDA 3,690 2,662 72.1 68.024 NORTH CAROLINA 3,577 2,576 72.0 72.725 MISSISSIPPI 1,918 875 45.6 48.4
295
PAGE 3
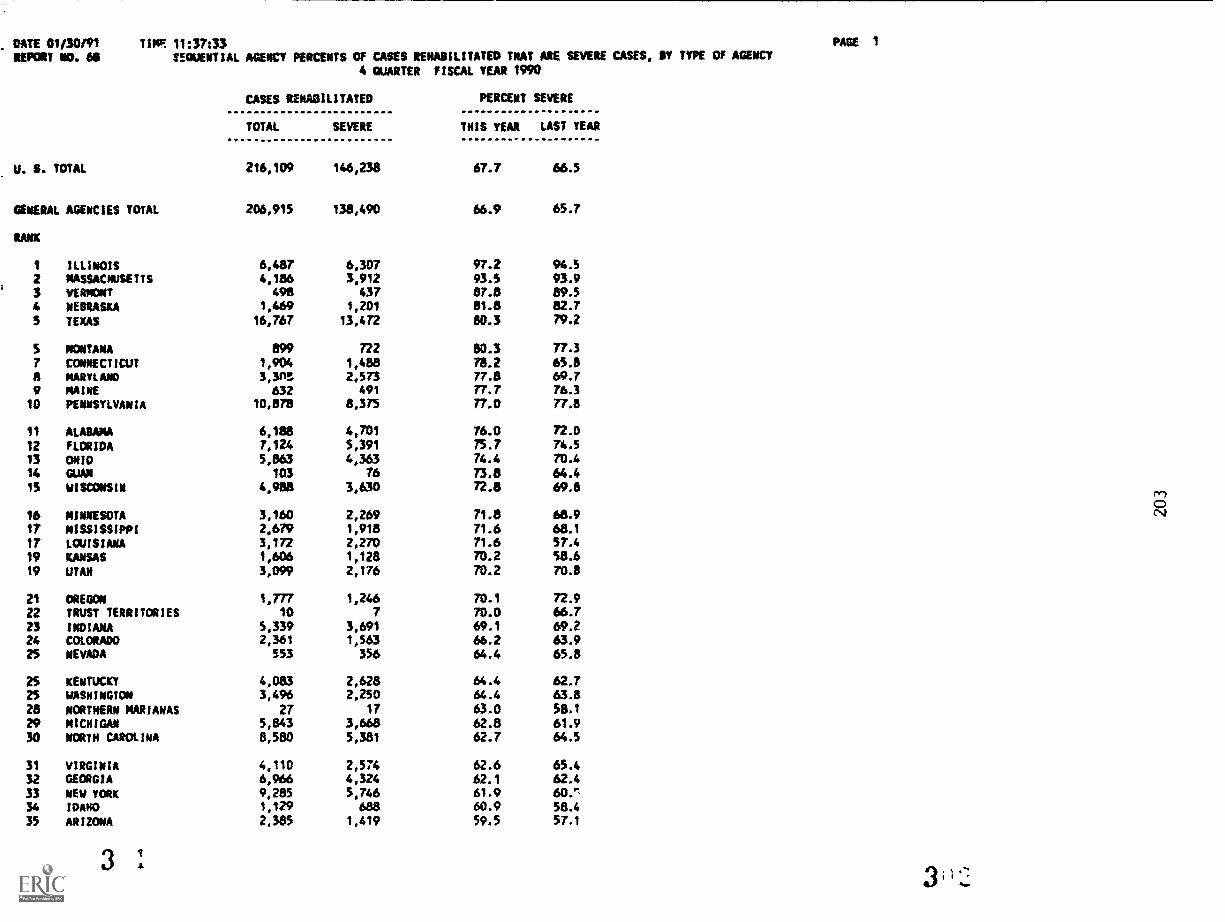
DATE 01/30,91REPORT NO. 68
TIMF 11:37:33MUENTIAL AGENCY PERCENTS Of CASES RENASILITATED TNAT ARE SEVERE CASES, SY TYPE OF AGENCY
PAGE 1
4 QUARTER
CASES RENAOILITATED
TOTAL SEVERE
FISCAL YEAR 1990
PERCENT SEVERE
THIS YEAR LAST YEAR
U. S. TOTAL 216,109 146,238 67.7 66.5
GENERAL AGENCIES TOTAL 206,915 138,490 66.9 65.7
RANK
1 ILLINOIS 6,487 6,307 97.2 9432 MASSACAUSETTS 4,186 3,912 93.5 93.9
3 VERMONT 498 437 87.8 89.54 NEBRASKA 1,469 1,201 81.8 82.7
5 TEXAS 16,767 13,472 80.3 79.2
5 MONTANA 899 722 80.3 77.3
7 CONNECTICUT 1,904 1,488 78.2 65.8
8 HARTLAND 3,3ne 2,573 77.8 69.79 MINE 632 491 77.7 76.3
10 PENNSYLVANIA 10,878 8,375 77.0 77.8
11 ALABAMA 6,188 4,701 76.0 72.0
12 FLORIDA 7,124 5,391 75.7 74.5
13 ONIO 5,863 4,363 74.4 70.4
14 GUAN 103 76 73.8 64.415 WISCONSIN 4,988 3,630 72.8 660.8
ryl
016 MINNESOTA 3,160 2,269 71.8 68.9 04
17 MISSISSIPPI 2,679 1,918 71.6 68.1
17 LOUISIANA 3,172 2,270 71.6 57.4
19 KANSAS 1,606 1,128 70.2 58.6V? UTAH 3,099 2,176 70.2 70.8
21 OREGON 1,777 1,246 70.1 72.9
22 TRUST TERRITORIES 10 7 70.0 66.723 INDIANA 5,339 3,691 69.1 69.224 COLORADO 2,361 1,563 66.2 63.925 NEVADA 553 356 64.4 65.8
25 KENTUCKY 4,083 2,628 64.4 62.7
25 WASHINGTON 3,496 2,250 64.4 63.828 NORTHERN MARIANAS 27 17 63.0 58.1
29 MICHIGAN 5,843 3,668 62.8 61.930 NORTH CAROLINA 8,580 5,381 62.7 64.5
31 VIRGINIA 4.110 2,574 62.6 65.4
32 GEORGIA 6,966 4,324 62.1 62.4
33 NEW YORK 9,285 5,746 61.9
34 IDAHO 1,129 688 60.9 58.4
35 ARIZONA 2,385 1,419 59.5 57.1
3 '
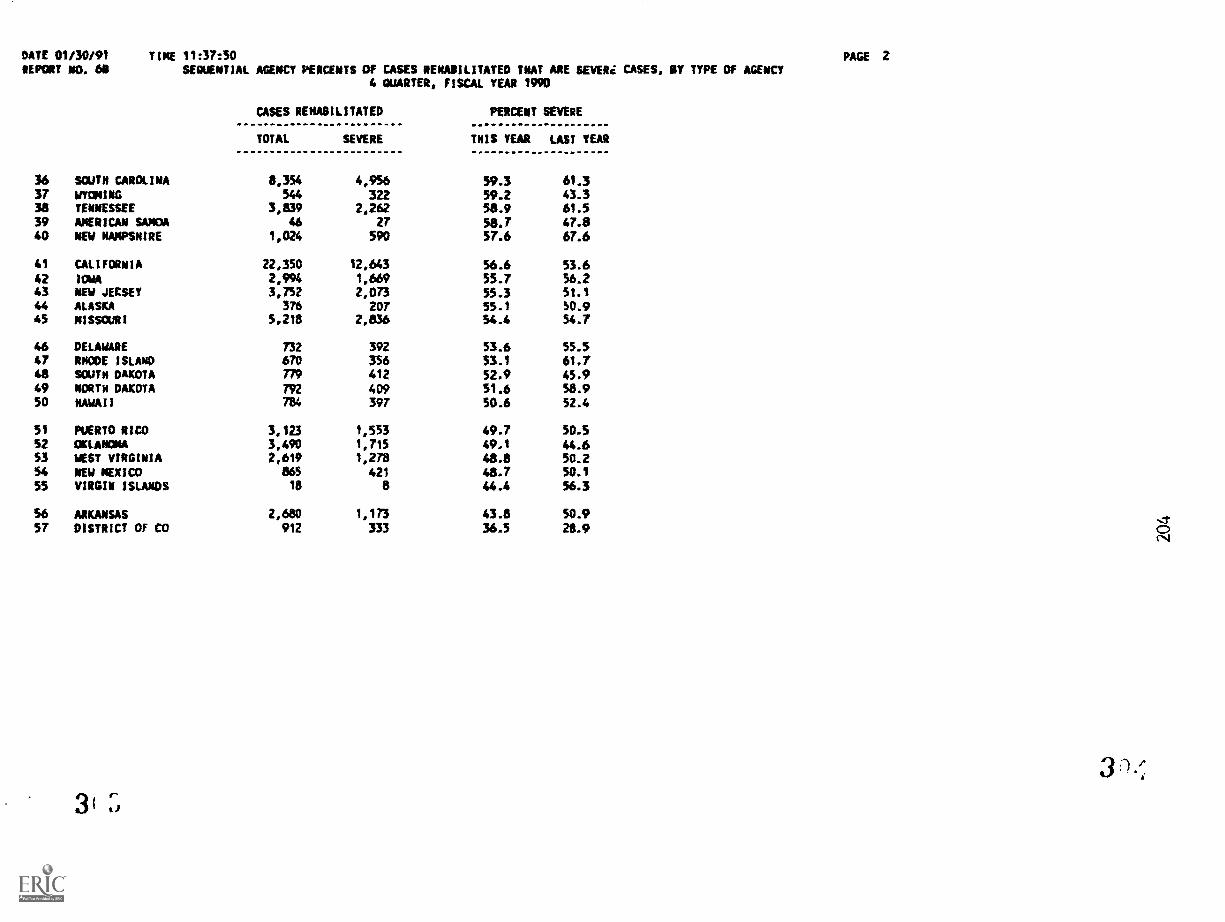
DATE 01130191REPORT NO. 68
TIME 11:37:50SEQUENTIAL AGENCY PERCENTS LW CASES REHABILITATED THAT ARE SEVERC CASES, BY TYPE Of AGENCY
PAGE 2
4 QUARTER, FISCAL YEAR ISVO
CASES REHABILITATED PERCENT SEVERE
TOTAL SEVERE THIS YEAR LAST YEAR
NS SOUTH CAROLINA 8,354 4,956 59.3 61.337 WYOMING 544 322 59.2 43.338 TENNESSEE 3,839 2,262 58.9 61.539 AMERICAN SAMOA 46 27 58.7 47.840 NEW HAMPSHIRE 1,024 590 57.6 67.6
41 CALIFORNIA 22,350 12,643 56.6 53.642 IOWA 2,994 1,669 55.7 56.243 NEW JEKSEY 3,752 2,073 55.3 51.144 ALASKA 376 207 55.1 50.945 MISSOURI 5,218 2,836 54.4 54.7
46 DELAWARE 732 392 53.6 55.547 RHODE ISLAND 670 356 53.1 61.748 SOUTH DAKOTA 779 412 52.9 45.949 NORTH DAKOTA 792 409 51.6 58.950 HAWAII 784 397 50.6 52.4
51 PUERTO RICO 3,123 1,553 49.7 50.552 OKLAHOMA 3,490 1,715 49.1 44.653 WEST VIRGINIA 2,619 1,278 48.8 50.254 NEW MEXICO am 421 48.7 50.155 VIRGIN ISLANDS 18 a 44.4 56.3
56 ARKANSAS 2,680 1,173 43.8 50.9 ,757 DISTRICT OF CO 912 333 36.5 28.9 C)
cs4
3
3
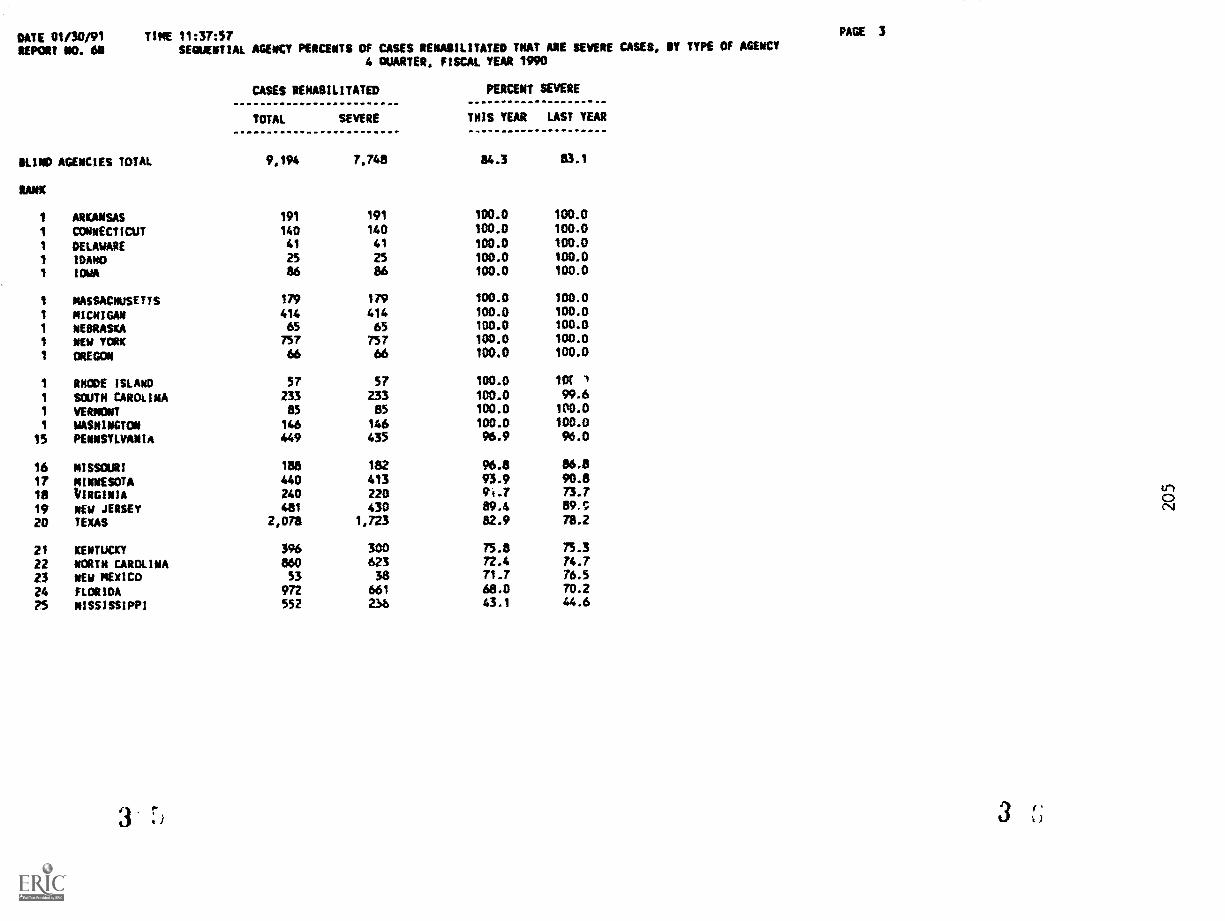
DATE 01/30/91REPORT MO. 61I
TIME 11:37:57SEGUENTIAL AGENCY PERCENTS Of CASES REHABILITATED THAT ARE SEVERE CASES, BY TYPE Of AGENCY
4 QUARTER, FISCAL YEAR 1990
CASES REHABILITATED PERCENT SEVERE
TOTAL SEVERE THIS YEAR LAST YEAR
BLIMP AGENCIES TOTAL 9,194 7,748 84.3 83.1
RANK
1 ARKANSAS 191 191 100.0 100.0
1 CONNECTICUT 140 140 100.0 100.0
1 DELAWARE 41 41 100.0 100.0
1 IDAHO 25 25 100.0 100.0
1 IOWA 86 86 100.0 100.0
1 MASSACHUSETTS 179 179 100.0 100.0
1 MICHIGAN 414 414 100.0 100.0
1 NEBRASKA 65 65 100.0 100.0
1 NEw YORK 757 757 100.0 100.0
1 OREGON 66 66 100.0 100.0
1 RHODE ISLAND 57 57 100.0 10f 3
1 SOUTH CAROLINA 233 233 100.0 99.6
1 VERMONT 85 85 100.0 100.0
1 WASHINGTON 146 146 100.0 100.0
15 PENNSYLVANIA 449 435 96.9 96.0
16 MISSOURI 158 132 96.8 86.8
17 MINNESOTA 440 413 93.9 90.8
18 VIRGINIA 240 220 94.7 73.7
19 RD/ JERSEY 481 430 89.4 89,C
20 TEXAS 2,078 1,723 82.9 78.2
21 KENTUCKY 396 300 75.8 75.3
22 NORTH CAROLINA 860 623 72.4 74.7
23 NEW MEXICO 53 38 71.7 76.5
24 FLORIDA 972 661 68.0 70.2
75 MISSISSIPPI 552 23b 43.1 44.6
PAGE 3
3
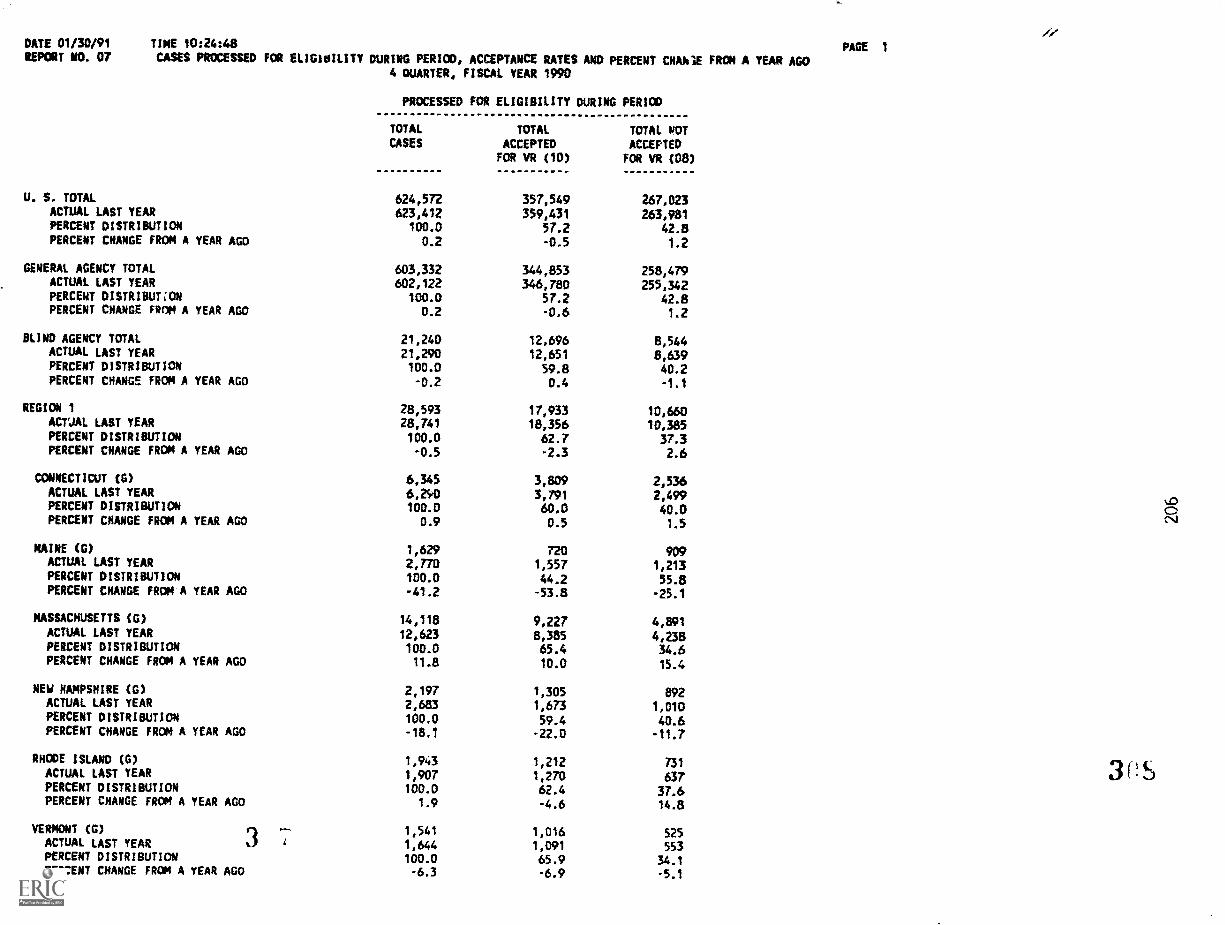
DATE 01/30191REPORT NO. 07
TIME 10:24:48
CASES PROCESSED FOR ELIGIOILITY DURING PERIOD, ACCEPTANCE RATES AND PERCENT CHANT& FROM A YEAR AGO4 QUARTER, FISCAL YEAR 1990
U. S. TOTAL
ACTUAL LAST YEARPERCENT DISTRIBUTICWPERCENT CHANGE FROM A YEAR AGO
GENERAL AGENCY TOTALACTUAL LAST YEARPERCENT DISTRIBUT;ONPERCENT CHANGE FRoM A YEAR AGO
BLIND AGENCY TOTALACTUAL LAST YEARPERCENT DISTRIBUTIONPERCENT CHANGE FROM A YEAR AGO
REGION 1
ACTUAL LAST YEARPERCENT DISTRIBUTIONPERCENT CHANGE FROM A YEAR AGO
CONNECTICUT (G)ACTUAL LAST YEARPERCENT DISTRIBUTIONPERCENT CHANGE FROM A YEAR AGO
MAINE (G)ACTUAL LAST YEARPERCENT DISTRIBUTIONPERCENT CHANGE FROM A YEAR AGO
MASSACHUSETTS (G)ACTUAL LAST YEARPERCENT DISTRIBUTIONPERCENT CHANGE FROM A YEAR AGO
NEW HAMPSHIRE (G)ACTUAL LAST YEAR
PERCENT DISTRIBUTIONPERCENT CHANGE FROM A YEAR AGO
RHODE ISLAND (G)ACTUAL LAST YEARPERCENT DISTRIBUTIONPERCENT CHANGE FROM A YEAR AGO
VERMONT (G) --ACTUAL LAST YEAR 3 ,PERCENT DISTRIBUTIONPERCENT CHANGE FROM A YEAR AGO
PROCESSED FOR ELIGIBILITY DURING PERIOD
TOTAL
CASESTOTAL
ACCEPTEDFOR VW (10)
TOTAL POT
ACCEPTEDFOR VR (OS)
624,572 357,549 267,023623,412 359,431 263,981
100.0 57.2 42.80.2 -0.5 1.2
603,332 344,853 258,479602,122 346,780 255,342
100.0 57.2 42.80.2 -0.6 1.2
21,240 12,696 8,54421,290 12,651 8,639100.0 59.8 40.2-0.2 0.4 -1.1
28,593 17,933 10,66028,741 18,356 10,385100.0 62.7 37.3-0.5 -2.3 2.6
6,345 3,809 2,5366,290 3,791 2,499100.0 60.0 40.00.9 0.5 1.5
1,629 720 9092,770 1,557 1,213100.0 44.2 55.8-41.2 -53.8 -25.1
14,118 9,227 4,89112,623 8,385 4,238100.0 65.4 34.611.8 10.0 15.4
2,197 1,305 8922,683 1,673 1,010100.0 59.4 40.6-18.1 -22.0 -11.7
1,943 1,212 7311,907 1,270 637100.0 62.4 37.6
1.9 -4.6 14.8
1,541 1,016 5251,644 1,091 553100.0 65.9 34.1-6.3 -6.9 -5.1
PAGE 1
3CS
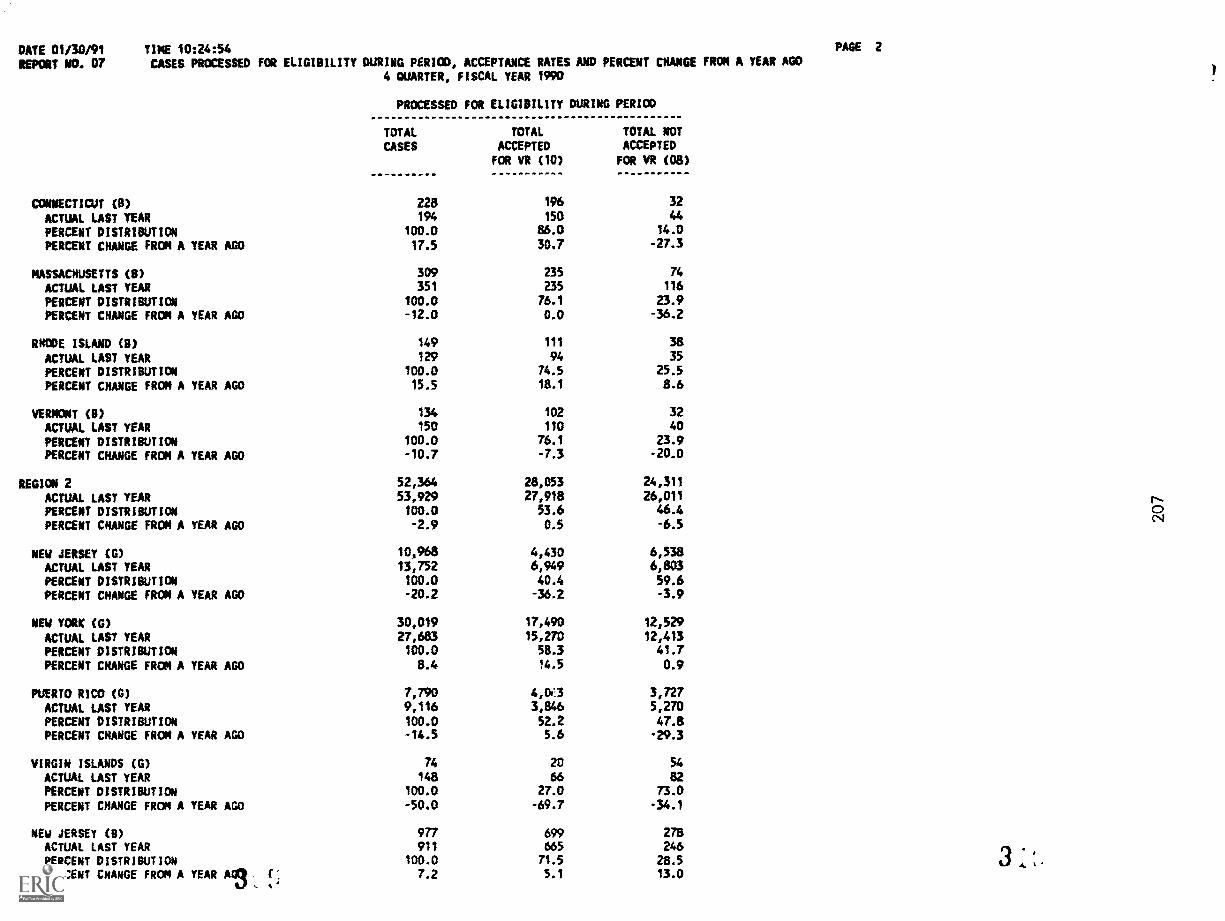
DATE 01/30/91REPORT ND. 07
TIME 10:24:54CASES PROCESSED FOR ELIGIBILITY DURING PERIOD, ACCEPTANCE RATES AND PERCENT CHANGE FROM A YEAR AGO
4 QUARTER, FISCAL YEAR 1990
PROCESSED FOR ELIGIBILITY DURING PERICO
PAGE 2
TOTALCASES
TOTAL
ACCEPTED
FOR YR (10)
TOTAL NOTACCEPTED
FOR YR (08)
CONNECTICUT (B) 228 196 32
ACTUAL LAST YEAR 194 150 44
PERCENT DISTRIBUTION 100.0 86.0 14.0
PERCENT CHANGE FROM A YEAR AGO 17.5 30.7 -27.3
MASSACHUSETTS (0) 309 235 74
ACTUAL LAST YEAR 351 235 116
PERCENT DISTRIBUTION 100.0 76.1 23.9PERCENT CHANGE FROM A YEAR AGO -12.0 0.0 -36.2
RNODE ISLAND (B) 149 111 38
ACTUAL LAST YEAR 129 94 35
PERCENT DISTRIBUTION 100.0 74.5 25.5
PERCENT CHANGE FROM A YEAR AGO 15.5 18.1 8.6
VERMONT (0) 134 102 32
ACTUAL LAST YEAR 150 110 40
PERCENT DISTRIBUTION 100.0 76.1 23.9
PERCENT CHANGE FROM A YEAR AGO -10.7 -7.3 -20.0
REGION 2 52,364 28,053 24,311
ACTUAL LAST YEAR 53,929 27,918 26,011 rPERCENT DISTRIBUTION 100.0 53.6 46.4 0PERCENT CHANGE FROM A YEAR AGO -2.9 0.5 -6.5
C4
NEW JERSEY (G) 10,968 4,430 6,538
ACTUAL LAST YEAR 13,752 6,949 6,803
PERCENT DISTRIBUTION 100.0 40.4 59.6
PERCENT CHANGE FROM A YEAR AGO -20.2 -36.2 -3.9
NEW YORK (G) 30,019 17,490 12,529
ACTUAL LAS/ YEAR 27,683 15,270 12,413
PERCENT DISTRIBUTION 100.0 58.3 41.7PERCENT CHANGE FROM A YEAR AGO 8.4 14.5 0.9
PUERTO RICO CG) 7,790 4,011 3,727
ACTUAL LAST YEAR 9,116 3,846 5,270
PERCENT DISTRIBUTICN 100.0 52.2 47.8PERCENT CHANGE FROM A YEAR AGO -14.5 5.6 .29.3
VIRGIN ISLANDS (G) 74 20 54
ACTUAL LAST YEAR 148 66 82
PERCENT DISTRIBUTICM 100.0 27.0 73.0PERCENT CHANGE FROM A YEAR AGO -50.0 -69.7 -34.1
NEW JERSEY (0) 977 699 278ACTUAL LAST YEAR 911 665 246
PERCENT DISTRIBUTION 100.0 71.5 28.5 4./ 4 v.
PERCENT CHANGE FROM A YEAR Alae.,
r. 7.2 5.1 13.0
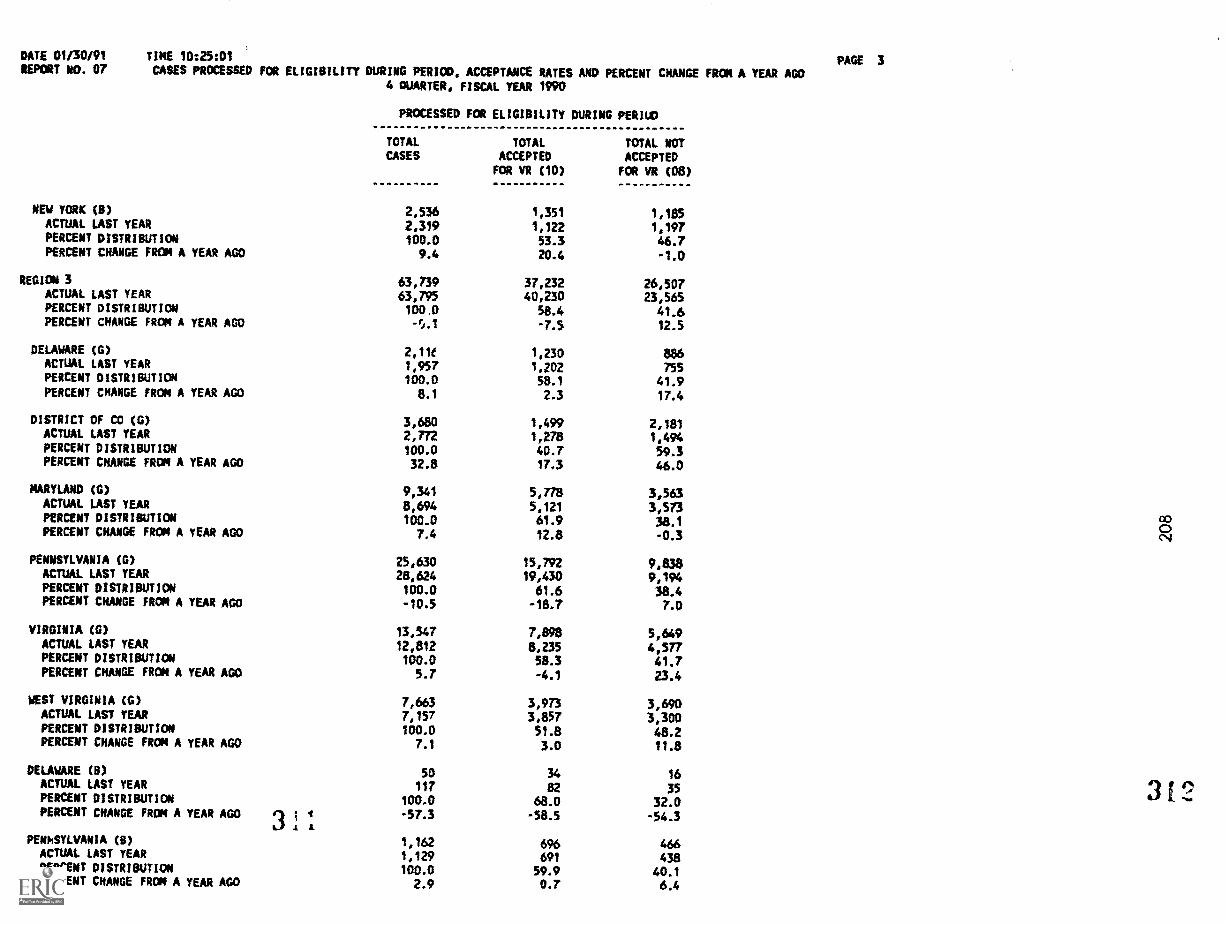
DATE 01/30191REPORT NO. 07
TIME 10:25:01
CASES PROCESSED FOR ELIGIBILITY DURING PERIOD, ACCEPTANCE RATES AND PERCENT CHANGE FROM A YEAR AGO4 OUARTER, FISCAL YEAR 1990
PROCESSED FOR ELIGIBILITY DURING PERIUD
TOTAL TOTAL TOTAL NOTCASES ACCEPTED ACCEPTED
FOR VR (10) FOR VR (08)
NEW YORK (B) 2,536 1,351 1,185ACTUAL LAST YEAR 2,319 1,122 1,197PERCENT DISTRIBUTION 100.0 53.3 46.7PERCENT CHANGE FROM A YEAR AGO 9.4 20.4 -1.0
REGION 3 63,739 37,232 26,507ACTUAL LAST YEAR 63,795 40,230 23,565PERCENT DISTRIBUTION 100,0 58.4 41.6PERCENT CHANGE FROM A YEAR AGO -0:8.1 -7.5 12.5
DELAWARE (G) 2,11e 1,230 886ACTUAL LAST YEAR 1,957 1.202 755PERCENT DISTRIBUTION 100.0 58.1 41.9PERCENT CHANGE FROM A YEAR AGO 8.1 2.3 17.4
DISTRICT OF CO (G) 3,680 1,499 2,181ACTUAL LAST YEAR 2,772 1,278 1,494PERCENT DISTRIBUTIEW 100.0 40.7 59.3PERCENT CHANCE FROM A YEAR AGO 32.8 17.3 46.0
PACE 3
MARYLAND (G) 9,341 5,778 3,563ACTUAL LAST YEAR 8,694 5,121 3,573PERCENT DISTRIBUTION 100.0 61.9 38.1 OD0PERCENT CHANGE FROM A YEAR AGO 7.4 12.8 -0.3 0.4
PENNSYLVANIA (G) 25,630 15,792 9,838ACTUAL LAST YEAR 28,624 19,430 9,194PERCENT DISTRIBUTION 100.0 61.6 38.4PERCENT CHANGE FROM A YEAR AGO -10.5 -18.7 7.0
VIRGINIA (G) 13,547 7,898 5,649ACTUAL LAST YEAR 12,812 8,235 4,577PERCENT DISTRIBUTION 100.0 58.3 41.7PERCENT CHANGE FROM A YEAR AGO 5.7 -4.1 23.4
WEST VIRGINIA (G) 7,663 3,973 3,690ACTUAL LAST YEAR 7,157 3,857 3,300PERCENT DISTRIBUTION 100.0 51.8 48.2PERCENT CHANGE FROM A YEAR AGO 7.1 3.0 11.8
DELAWARE (B)ACTUAL LAST YEARPERCENT DISTRIBUTICOPERCENT CHANGE FROM A YEAR AGO
PENMSYLVANIA (B)ACTUAL LAST YEARPERCENT DISTRIBUTIONPERCENT CHANGE FROM A YEAR AGO
3
50 34 16117 82 35
100.0 68.0 32.0i
4 -57.3 -58.5 -54.3A i
1,162 696 4661,129 691 438100.0 59.9 40.12.9 0.7 6.4
3i2
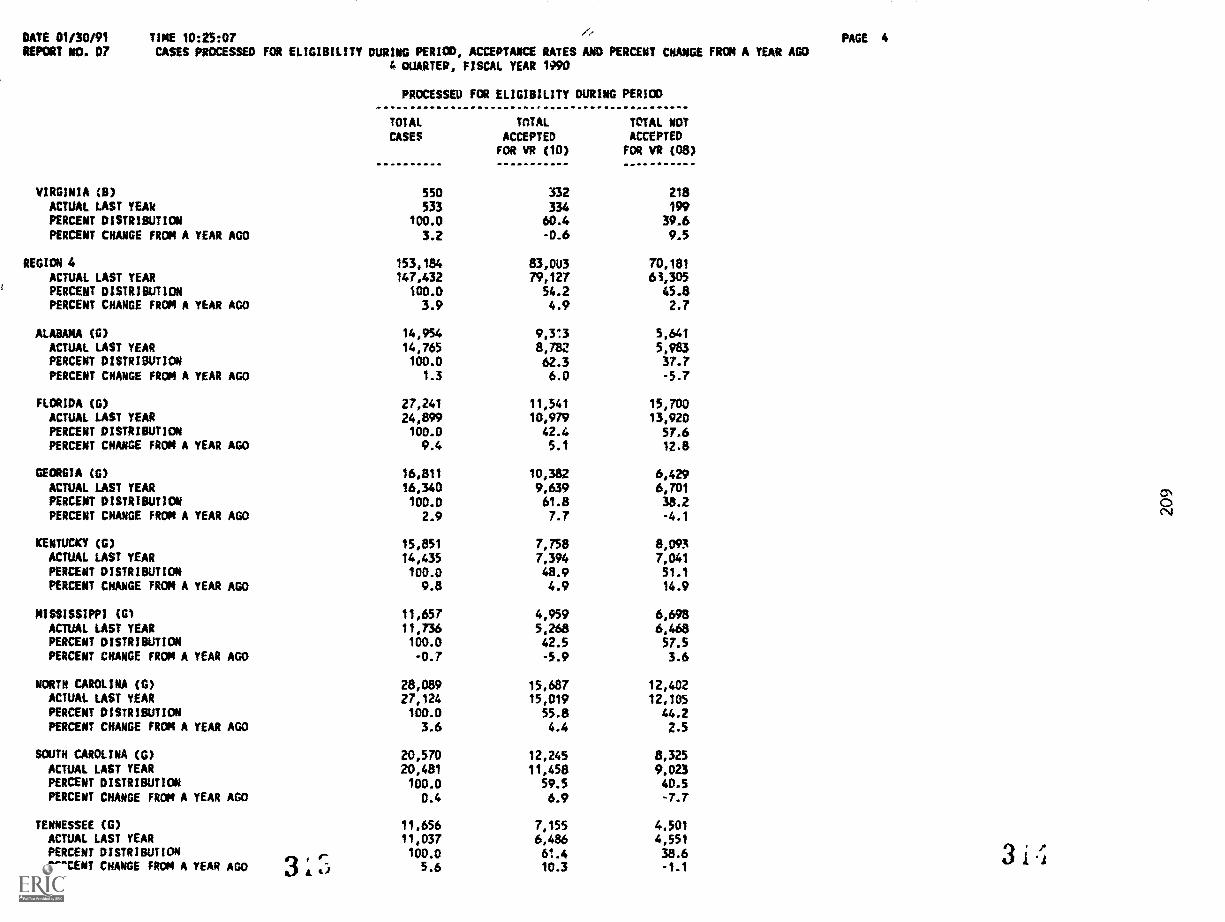
DATE 01/30/91REPORT NO. 07
TINE 10:25:07CASES PROCESSED FOR ELIGIBILITY DURING PERIOD, ACCEPTANCE RATES AND PERCENT CHANGE FROM A YEAR AGO
4 QUARTER, FISCAL YEAR 1990
PROCESSED FOR ELIGIBILITY DURING PERIOD
VIRGINIA (II)
TOTAL
CASES
SSD
TOTAL
ACCEPTEDFOR VR (10)
332
TOTAL NOTACCEPTEDFOR VR (08)
218ACTUAL LAST YEAk 533 334 199PERCENT DISTRIBUTION 100.0 60.4 39.6PERCENT CHANGE FROM A YEAR AGO 3.2 -0.6 9.5
REGION 4 153,184 83,003 70,181ACTUAL LAST YEAA 147,432 79,127 61,305PERCENT DISTRIBUTION 100.0 54.2 45.8PERCENT CHANGE FROM A YEAR AGO 3.9 4.9 2.7
ALABAMA (6) 14,954 9,33 5,641
ACTUAL LAST YEAR 14,765 8,782 5,983PERCENT DISTRIBUTICN 100.0 62.3 37.7PERCENT CHANGE FROM A YEAR AGO 1.3 6.0 -5.7
FLORIDA (6) 27,241 11,541 15,700ACTUAL LAST YEAR 24,899 10,979 13,920PERCENT DISTRIBUTION 100.0 42.4 57.6PERCENT CHANGE FROM A YEAR AGO 9.4 5.1 12.8
GEONGIA (6) 16,811 10,382 6,429ACTUAL LAST YEAR 16,340 9,639 6,701PERCENT DISTRIBUTION 100.0 61.8 38.2PERCENT CHANGE FROM A YEAR AGO 2.9 7.7 -4.1
KENTUCKY (6) 15,851 7,758 8,093ACTUAL LAST YEAR 14,435 7,394 7,041PERCENT DISTRIBUTION 100.0 48.9 51.1PERCENT CHARGE FROM A YEAR AGO 9.8 4.9 14.9
MISSISSIPPI (61 11,657 4,959 6,698ACTUAL LAST YEAR 11,736 5,268 6,468PERCENT DISTRIBUTION 100.0 42.5 57.5PERCENT CHANGE FROM A YEAR AGO -0.7 -5.9 3.6
NORTH CAROLINA (0) 28,089 15,687 12,402ACTUAL LAST YEAR 27,124 15,019 12,105PERCENT DISTRIBUTION 100.0 55.8 44.2PERCENT CHANGE FROM A YEAR AGO 3.6 4.4 2.5
SOUTH CAROLINA (6) 20,570 12,245 8,325ACTUAL LAST YEAR 20,481 11,458 9,023PERCENT DISTRIBUTION 100.0 59.5 40.5PERCENT CHARGE FROM A YEAR AGO 0.4 6.9 -7.7
TENNESSEE (6) 11,656 7,155 4,501ACTUAL LAST YEAA 11,037 6,486 4,551PERCENT DISTRIBUTION
#100.0 61.4 38.6
PERCENT CHANGE FROM A YEAR AGO A. al 5.6 10.3 -1.1
PAGE 4
3 i
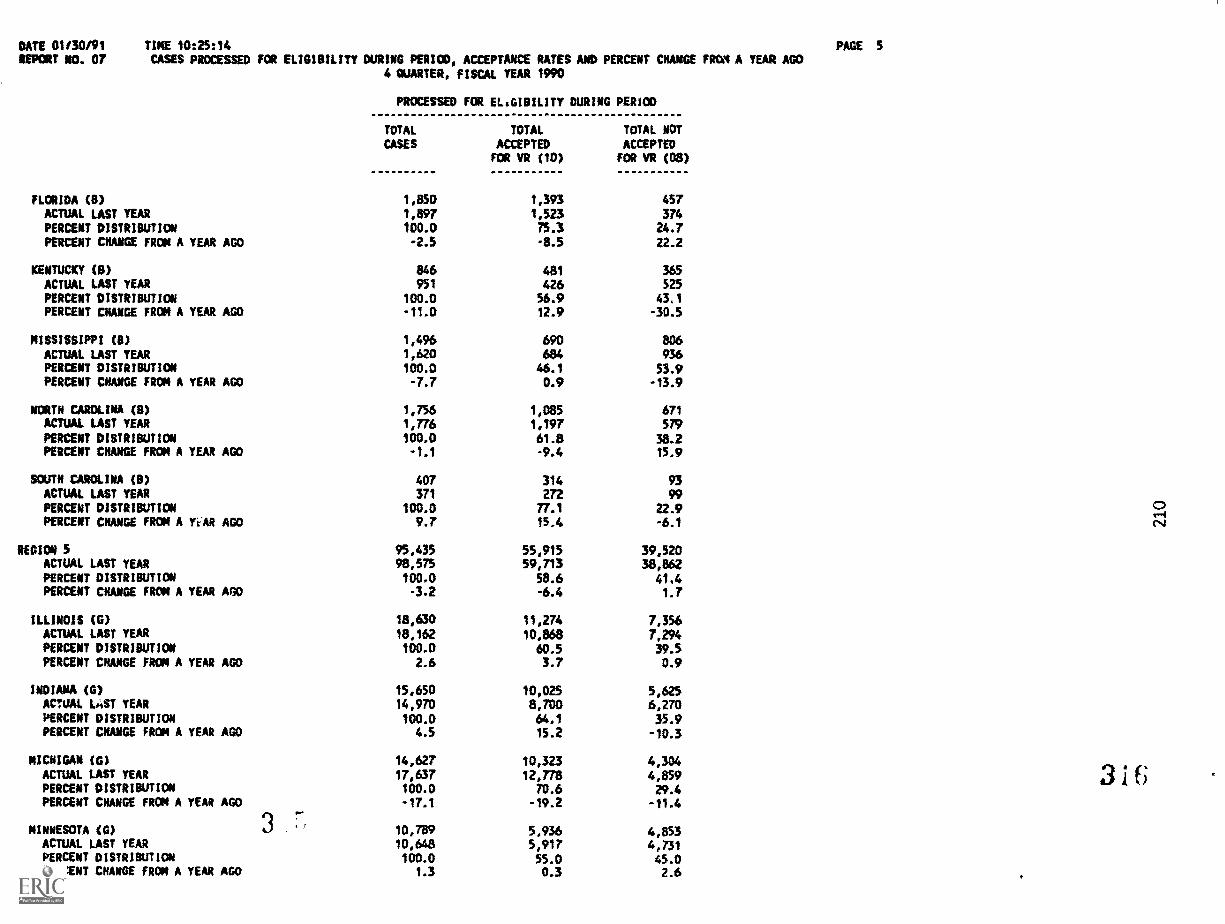
DATE 01130/91REPORT NO. 07
TIME 10:25:14CASES PROCESSED FOR ELIGIBILITY DURING PERIOD, ACCEPTANCE RATES AND PERCENT CHANGE FROM A YEAR AGO
4 QUARTER, FISCAL YEAR 1990
FLORIDA (s)ACTUAL LAST YEARPERCENT DISTRIBUTIONPERCENT CHANGE FROM A YEAR AGO
KENTUCKY (B)ACTUAL LAST YEARPERCENT DISTRIBUTIONPERCENT CHANGE FROM A YEAR ASO
MISSISSIPPI (0)ACTUAL LAST YEARPERCENT DISTRIBUTIONPERCENT CHANGE FROM A YEAR AGO
NORTH CAROLINA (B)ACTUAL LAST YEAR
PERCENT DISTRIBUTICWPERCENT CHANGE FROM A YEAR AGO
SOUTH CAROLINA (0)ACTUAL LAST YEARPERCENT DISTRIBUTIONPERCENT CHANGE FROM A YrAR AGO
REGION 5ACTUAL LAST YEARPERCENT DISTRIBUTIONPERCENT CHANGE FROM A YEAR Ano
ILLINOIS (G)ACTUAL LAST YEARPERCENT DISTRIBUTICWPERCENT CHANGE FROM A YEAR AGO
INDIANA (G)ACTUAL L.IST YEAR
PERCENT DISTRIBUTIONPERCENT CHANGE FROM A YEAR AGO
MICHIGAN (G)ACTUAL LAST YEARPERCENT DISTRIBUTIONPERCENT CHANGE FROM A YEAR AGO
MINNESOTA (G)ACTUAL LAST YEARPERCENT DISTRIBUTIONPERCENT CHANGE FROM A YEAR AGO
3
PRCCESSED FOR EL,GIBILITY DURING PERIOD
TOTAL
CASESTOTAL
ACCEPTEDFOR VR (10)
TOTAL NOTACCEPTED
FOR VR (08)
1,850 1,393 4571,897 1,523 374100.0 75.3 24.7-2.5 -8.5 22.2
846 481 365951 426 525
100.0 56.9 43.1-11.0 12.9 -30.5
1,496 690 8061,620 684 936100.0 46.1 53.9-7.7 0.9 -13.9
1,756 1,085 671
1,776 1,197 579100.0 61.8 38.2-1.1 -9.4 15.9
407 314 93371 272 99
100.0 77.1 22.99.7 15.4 -6.1
95,435 55,915 39,52098,575 59,713 38,862100.0 58.6 41.4-3.2 -6.4 1.7
18,630 11,274 7,35618,162 10,868 7,294100.0 60.5 39.5
2.6 3.7 0.9
15,650 10,025 5,62514,970 8,700 6,270100.0 64.1 35.94.5 15.2 -10.3
14,627 10,323 4,30417,637 12,778 4,859100.0 70.6 29.4-17.1 -19.2 -11.4f
1
10,789 5,936 4,85310,648 5,917 4,731100.0 55.0 45.0
1.3 0.3 2.6
PAGE 5
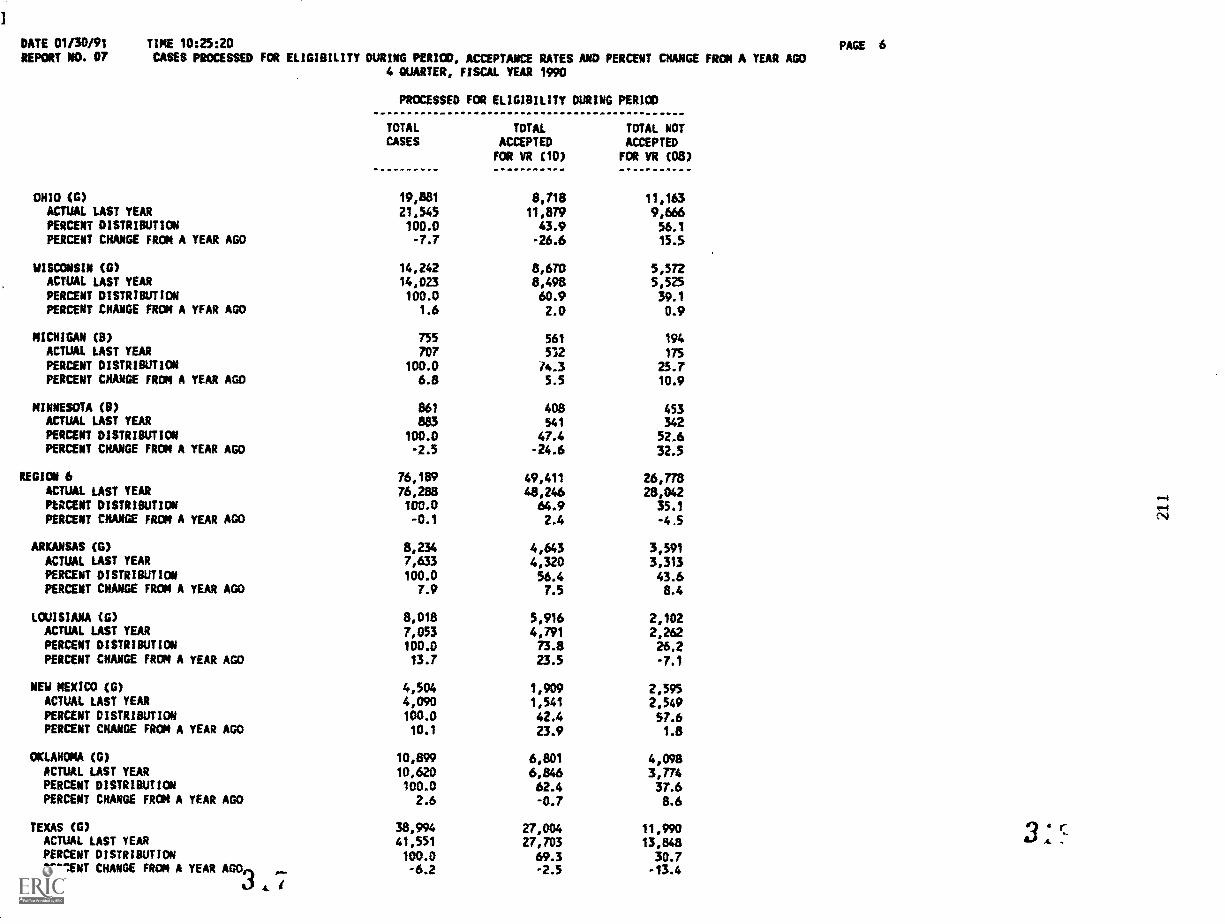
DATE 01/30/91REPORT NO. 07
TIME 10:25:20CASES PROCESSED FOR ELIGIBILITY DURING PERIOD, ACCEPTANCE RATES AND PERCENT CHANGE FROM A YEAR AGO
4 QUARTER, FISCAL YEAR 1990
PROCESSED FOR ELIGIBILITY DURING PERIOD
TOTAL TOTAL TOTAL NOTCASES ACCEPTED ACCEPTED
FOR VR (10) FOR VR (08)
OHIO (5) 19,881 8,718 11,163ACTUAL LAST YEAR 21,545 11,879 9,666PERCENT DISTRIBUTION 100.0 43.9 56.1PERCENT CHANGE FROM A YEAR AGO -7.7 -26.6 15.5
WISCONSIN (G) 14,242 8,670 5,572ACTUAL LAST YEAR 14,023 8,498 5,525PERCENT DISTRIBUTION 100.0 60.9 39.1PERCENT CHANGE FROM A YFAR AGO 1.6 2.0 0.9
MICHIGAN (8) 755 561 194ACTUAL LAST YEAR 707 512 175PERCENT DISTRIBUTION 100.0 14.3 25.7PERCENT CHANGE FROM A YEAR AGO 6.8 5.5 10.9
MINNESOTA (8) 861 408 453ACTUAL LAST YEAR 883 541 342PERCENT DISTRIBUTION 100.0 47.4 52.6PERCENT CHANGE FROM A YEAR AGO -2.5 -24.6 32.5
REGION 6 76,189 49,411 26,778ACTUAL LAST YEAR 76,288 48,246 28,042PERCENT DISTRIBUTION 100.0 64.9 35.1PERCENT CHANGE FROM A YEAR AGO -0.1 2.4 -4.5
ARKANSAS (G) 8,234 4,643 3,591ACTUAL LAST YEAR 7,633 4,320 3,313PERCENT DISTRIBUTION 100.0 56.4 43.6PERCENT CHANGE FROM A YEAR AGO 7.9 7.5 8.4
LOUISIANA (5) 8,018 5,916 2,102ACTUAL LAST YEAR 7,053 4,791 2,262PERCENT DISTRIBUTION 100.0 73.8 26.2PERCENT CHANGE FROM A YEAR AGO 13.7 23.5 -7.1
NEW MEXICO (G) 4,504 1,909 2,595ACTUAL LAST YEAR 4,090 1,541 2,549PERCENT DISTRIBUTION 100.0 42.4 57.6PERCENT CHANGE FROM A YEAR AGO 10.1 23.9 1.8
OKLAHOMA (G) 10,899 6,801 4,098ACTUAL LAST YEAR 10,620 6,846 3,774PERCENT DISTRIBUTION 100.0 62.4 37.6PERCENT CHANGE FROM A YEAR AGO 2.6 -0.7 8.6
TEXAS (G) 38,994 27,004 11,990ACTUAL LAST YEAR 41,551 27,703 13,848PERCENT DISTRIBUTION 100.0 69.3 30.7PERCENT CHANGE FROM A YEAR AGO -6.2 -2.5 -13.4
PAGE 6
3 cA
C*4
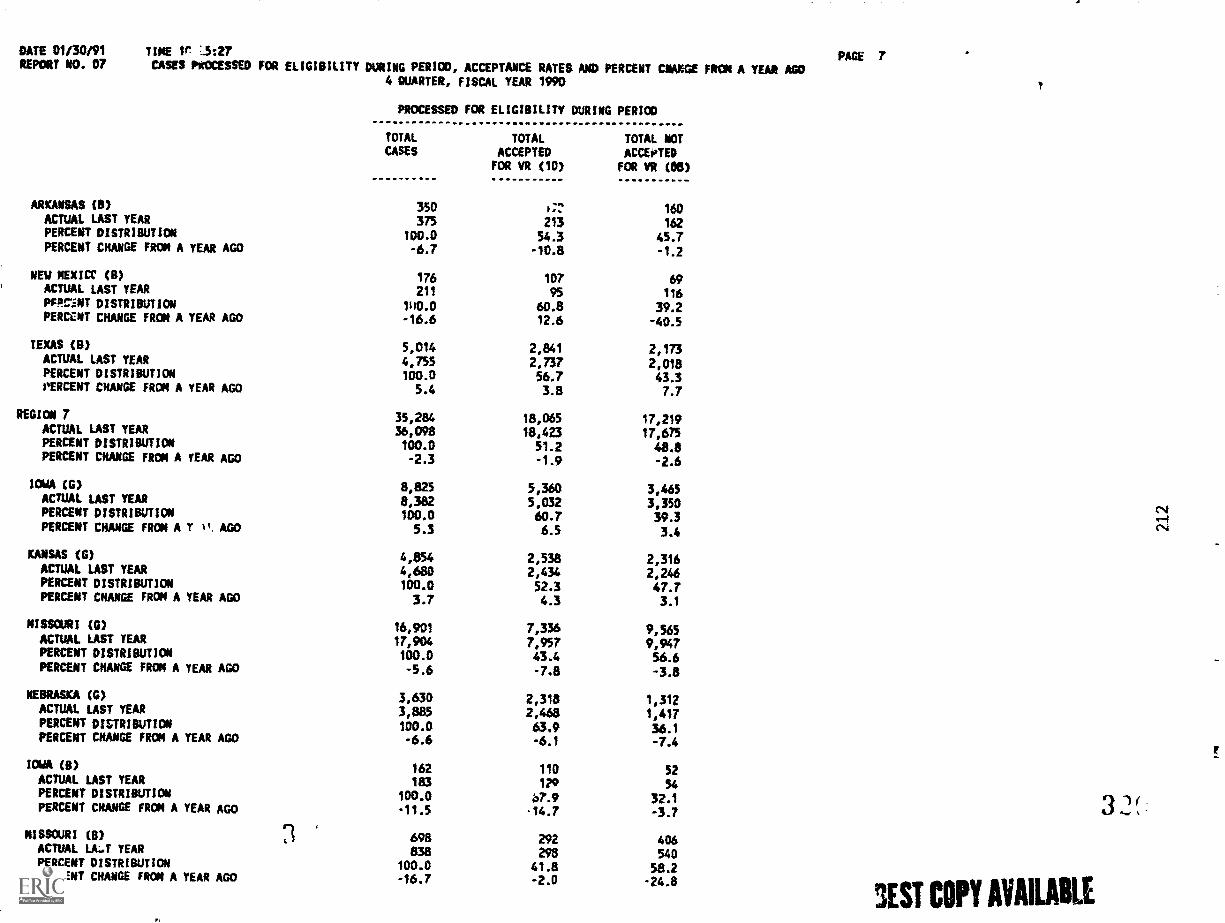
DATE 01130/91REPORT NO. 07
TINE 1r 5:27
CASES PxOCESSED FOR ELIGIBILITY DURING PERIOD, ACCEPTANCE RATES AND PERCENT CNAXGE FROM A YEAR AGO4 QUARTER, FISCAL YEAR 1990
PROCESSED FOR ELIGIBILITY DURING PERIOD
TOTAL TOTAL TOTAL ROTCASES ACCEPTED ACCEPTED
FOR VR (10) FOR VR (es)
ARKANSAS ce) 350 )::: 160ACTUAL LAST YEAR 375 213 162PERCENT DISTRIBUTICN 100.0 54.3 45.7PERCENT CHANGE FROM A YEAR AGO -6.7 -10.8 -1.2
NEW HEX= (S) 176 107 69ACTUAL LAST YEAR 211 95 116PFR.r.r.:NT DISTRIBUTION 110.0 60.8 39.2PERCCNT CHANGE FRoM A YEAR AGO -16.6 12.6 -40.5
TEXAS (II) 5,014 2,841 2,173ACPJAL LAST YEAR 4,755 2,737 2,018PERCENT DISTRIBUTION 100.0 56.7 43.3PERCENT CHANGE FROM A YEAR AGO 5.4 3.8 7.7
REGION 7 35,284 18,065 17,219ACTUAL LAST YEAR 36,098 18,423 17,675PERCENT DISTRIBUTION 100.0 51.2 48.8PERCENT CHANGE FROM A YEAR AGO -2.3 -1.9 -2.6
IOWA (G) 8,825 5,360 3,465ACTUAL LAST YEAR 8,382 5,032 3,350PERCENT DISTRIBUTICN 100.0 60.7 39.3PERCENT CHANGE FROM A T AGO 5.3 6.5 3.4
KANSAS (G) 4,854 2,538 2,316ACTUAL LAST YEAR 4,680 2,434 2,246PERCENT DISTRISUTION 100.0 52.3 47.7PERCENT CHANGE FROM A YEAR AGO 3.7 4.3 3.1
MISSOURI (G) 16,901 7,336 9,565ACTUAL LAST TEAR 17,904 7,957 9,947PERCENT DISTRIBUTION 100.0 43.4 56.6PERCENT CHANGE FROM A YEAR AGO -5.6 -7.8 -3.8
NEBRASKA (G) 3,630 2,318 1,312ACTUAL LAST YEAR 3,885 2,468 1,417PERCENT DISTRIBUTION 100.0 63.9 36.1PERCENT CHANGE FROM A YEAR AGO -6.6 -6.1 -7.4
IOWA (0) 162 110 52ACTUAL LAST YEAR 183 129 54PERCENT DISTRIBUTION 100.0 07.9 32.1PERCENT CHANGE FROM A YEAR AGO -11.5 -14.7 -3.7
MISSOURI (B) 698 292 406ACTUAL LA...T YEAR 838 298 540PERCENT DISTRIBUTION 100.0 41.8 58.2PERCENT CHANGE FROM A YEAR AG0 -16.7 -2.0 -24.8
PAGE 7
3EST COPY AVAILABLE
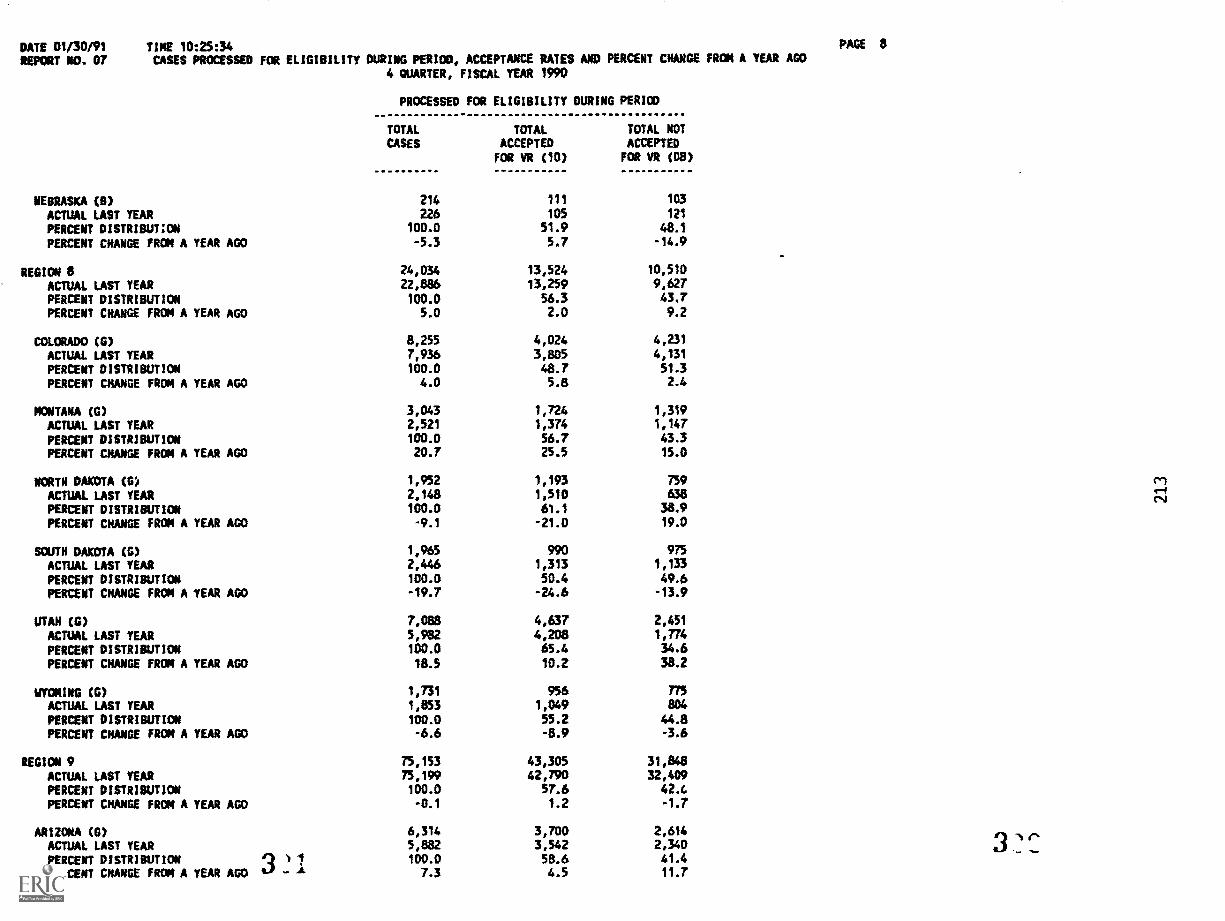
DATE 01/30/91REPORT NO. 07
TINE 10:25:34CASES PROCESSED FOR ELIGIBILITY DURING PERIOD, ACCEPTANCE RATES AND PERCENT CHANGE FROM A YEAR AGO
4 QUARTER, FISCAL YEAR 1990
NEBRASKA (B)
ACTUAL LAST YEARPERCENT DISTRIBUT:ONPERCENT CHANGE FROM A YEAR AGO
REGION 8ACTUAL LAST YEARPERCENT DISTRIBUTIONPERCENT CHANGE FROM A YEAR AGO
COLORADO (G)ACTUAL LAST YEARPERCENT DISTRIBUTIONPERCENT CHANGE FROM A YEAR AGO
MONTANA (0)ACTUAL LAST YEARPERCENT DISTRIBUTIONPERCENT CHANGE FROM A YEAR AGO
NORTH DACTA (0)ACTUAL LAST YEARPERCENT DISTRIBUTIONPERCENT CHANGE FROM A YEAR AGO
SOUTH DAKOTA (0)ACTUAL LAST YEARPERCENT DISTRIBUTIONPERCENT CHANGE FROM A YEAR AGO
UTAH (0)ACTUAL LAST YEARPERCENT DISTRIBUTICWPERCENT CHANGE FROM A YEAR AGO
WYOMING (0)ACTUAL LAST YEAR
PERCENT DISTRIBUTIONPERCENT CHANGE FROM A YEAR AGO
REGION 9AcruAt LAST YEARPERCENT DISTRIBUTICWPERCENT CHANGE FROM A YEAR AGO
ARIZONA (G)ACTUAL LAST YEARPERCENT DISTRIBUTIONPERCENT CHANGE FROM A YEAR AGO 3
PROCESSED FOR ELIGIBILITY DURING PERIOD
PAGE 8
TOTAL
CASESTOTAL
ACCEPTEDFOR VR (10)
TOTAL NOTACCEPTED
FOR VR (08)
214 111 103
226 105 121
100.0 51.9 48.1
-5.3 5.7 -14.9
24,034 13,524 10,510
22,886 13,259 9,627
100.0 56.3 43.75.0 2.0 9.2
8,255 4,024 4,231
7,936 3,805 4,131
100.0 48.7 51.34.0 5.8 2.4
3,043 1,724 1,319
2,521 1,374 1,147100.0 56.7 43.3
20.7 25.5 15.0
1,952 1,193 759
2,148 1,510 638100.0 61.1 38.9
-9.1 -21.0 19.0
1,965 990 975
2,446 1,313 1,133
100.0 50.4 49.6
-19.7 -24.6 -13.9
7,088 4,637 2,451
5,982 4,208 1,774100.0 65.4 34.6
18.5 10.2 38.2
1,731 956 775
1,853 1,049 804
100.0 55.2 44.8-6.6 -8.9 -3.6
75,153 43,305 31,84375,199 42,790 32,409100.0 57.6 42.4
-0.1 1.2 -1.7
6,3145,882
3,7003,542
2,6142,340
lttr
CAP =1 1 100.0 58.6 41.4
7.3 4.5 11.7
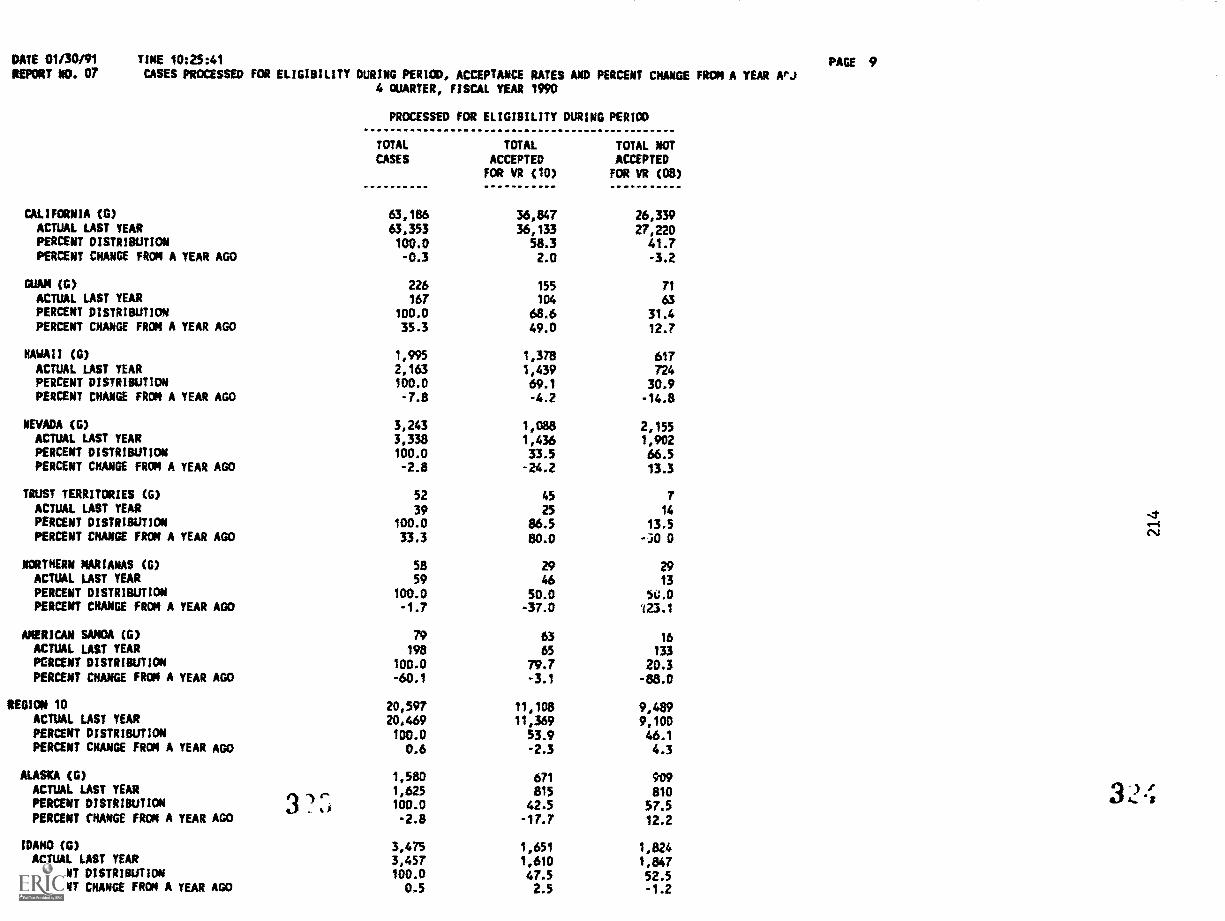
DATE 01/30/91REPORT NO. 07
TINE 10:25:41
CASES PROCESSED FOR ELIGIBILITY DURING PERIOD, ACCEPTANCE RATES AND PERCENT CHANGE FROM A YEAR ArJ4 QUARTER, FISCAL YEAR 1990
CALIFORNIA (G)ACTUAL LAST YEARPERCENT DISTRIBUTION
PERCENT CHANGE FROM A YEAR AGO
GUAM (G)ACTUAL LAST YEARPERCENT DISTRIBUTIONPERCENT CHANGE FROM A YEAR AGO
HAWAII (0)
ACTUAL LAST YEARPERCENT DISTRIBUTIONPERCENT CHANGE FROM A YEAR AGO
NEVADA (0)ACTUAL LAST YEARPERCENT DISTRIBUTIONPERCENT CHANGE FROM A YEAR AGO
TRUST TERRITORIES (G)ACTUAL LAST YEARPERCENT DISTRIBUTIONPERCENT CHANGE FROM A YEAR AGO
NORTHERN MARIANAS (G)ACTUAL LAST YEARPERCENT DISTRIBUTIONPERCENT CHANGE FROM A YEAR AGO
AMERICAN SAMOA (G)ACTUAL LAST YEARPERCENT DISTRIBUTIONPERCENT CHANGE FROM A YEAR AGO
REGION 10ACTUAL LAST YEARPERCENT DISTRIBUTIONPERCENT CHANGE FROM A YEAR AGO
ALASKA (0)ACTUAL LAST YEARPERCENT DISTRIBUTIONPERCENT CHANGE FRON A YEAR AGO
IDAHO (0)ACTUAL LAST YEARPERCENT DISTRIBUTIONPERCENT CHANGE FROM A YEAR AGO
3
PROCESSED FOR ELIGIBILITY DURING PERIOD
TCTAL
CASESTOTAL
ACCEPTEDFOR VR (10)
TOTAL NOTACCEPTEDFOR VR (08)
4.0
63,18663,353100.0-0.3
226167
100.0
35.3
1,995
2,163100.0
-7.8
3,2433,338100.0-2.8
5239
100.0
33.3
58
59100.0-1.7
79
198100.0
-60.1
20,59720,469100.00.6
1,5801,625100.0
-2.8
3,4753,457100.0
0.5
36,847
15,13358.32.0
155104
68.649.0
1,378
1,43969.1
-4.2
1,0881,43633.5
-24.2
45
2586.5
80.0
2946
50.0-37.0
6365
79.7-3.1
11,10811,369
53.9-2.3
671
81542.5-17.7
1,651
1,610
47.52.5
26,33927,22041.7-3.2
71
63
31.412.7
61772430.9-14.8
2,1551,90266.513.3
714
13.5
-50 0
2913
W.0123.1
16
133
20.3-88.0
9,4899,10046.1
4.3
909810
57.512.2
1,8241,84752.5-1.2
PAGE 9
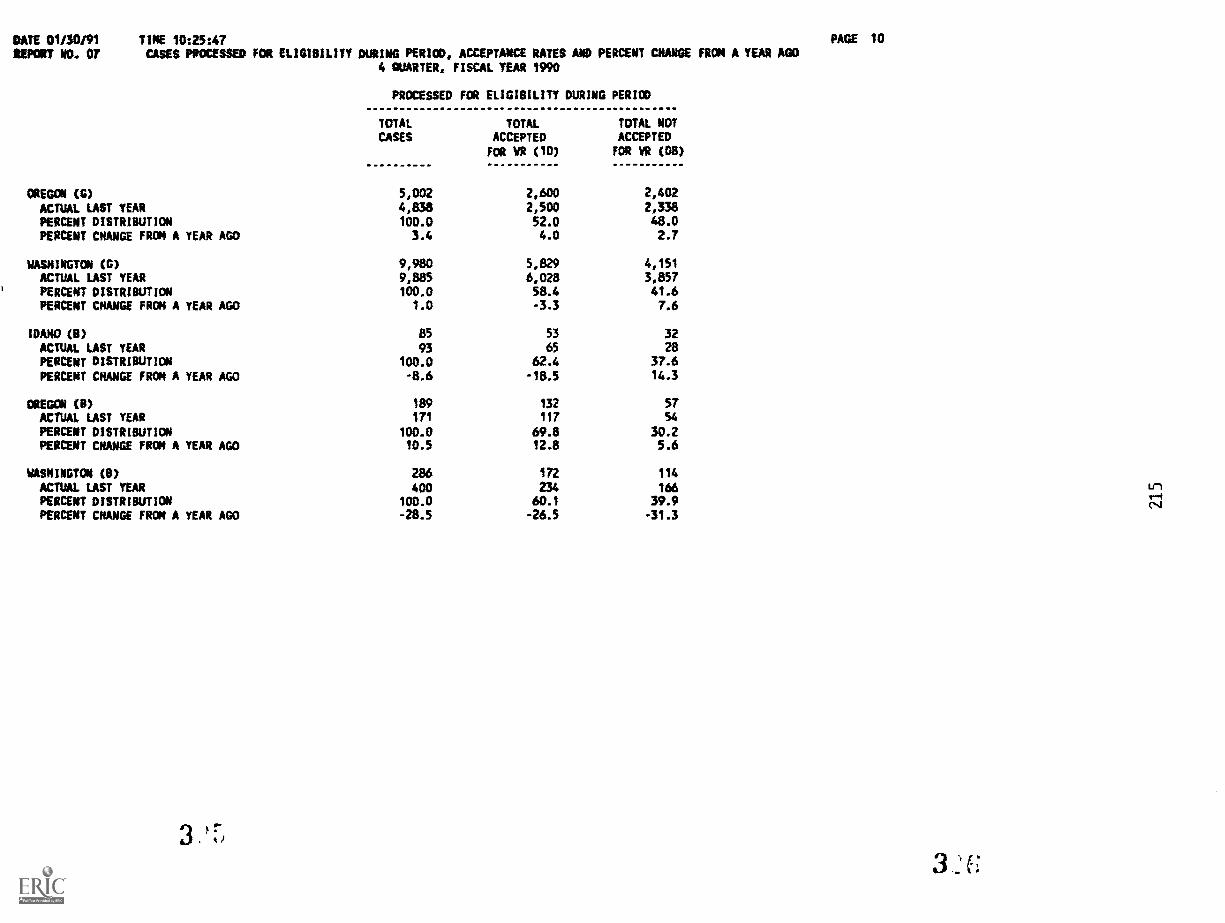
DATE 01/30/91REPORT VO. 07
TINE 10:25:47CASES PROCESSED FOR ELIGIBILITY DURING PERICO, ACCEPTANCE RATES AND PERCENT CHANGE FROM A YEAR AGO
4 QUARTER, FISCAL YEAR 1990
PROCESSED FOR ELIGIBILITY DURING PERIOD
TOTAL TOTAL TOTAL NOT
CASES ACCEPTED ACCEPTED
FOR VR (10) FOR VR (08)
OREGON (G) 5,002 2,600 2,402
ACTUAL LAST TEAR Ajos 2,500 2,338PERCENT DISTRIBUTION 100.0 52.0 48.0
PERCENT CHANGE FROM A YEAR AGO 3.4 4.0 2.7
WASHINGTON (G) 9,980 5,829 4,151
ACTUAL LAST YEAR 9,885 6,028 3,857
PERCENT DISTRIBUTICM 100.0 58.4 41.6PERCENT CHANGE FROM A YEAR AGO 1.0 -3.3 7.6
IDAHO (II) 85 53 32ACTUAL LAST YEAR 93 65 28PERCENT DISTRIOUTION 100.0 62.4 37.6
PERCENT CHANGE FROM A YEAR AGO -8.6 -18.5 14.3
OREGON (0) 189 132 57ACTUAL LAST YEAR 171 117 54
PERCENT DISTRIBUTION 100.0 69.8 30.2PERCENT CHANGE FROM A YEAR AGO 10.5 12.8 5.6
WASHINGTON (B) 286 172 114
ACTUAL LAST YEAR 400 234 166PERCENT DISTRIBUTION 100.0 60.1 39.9PERCENT CHANGE FROM A YEAR AGO -28.5 -26.5 -31.3
3
PAGE 10
3
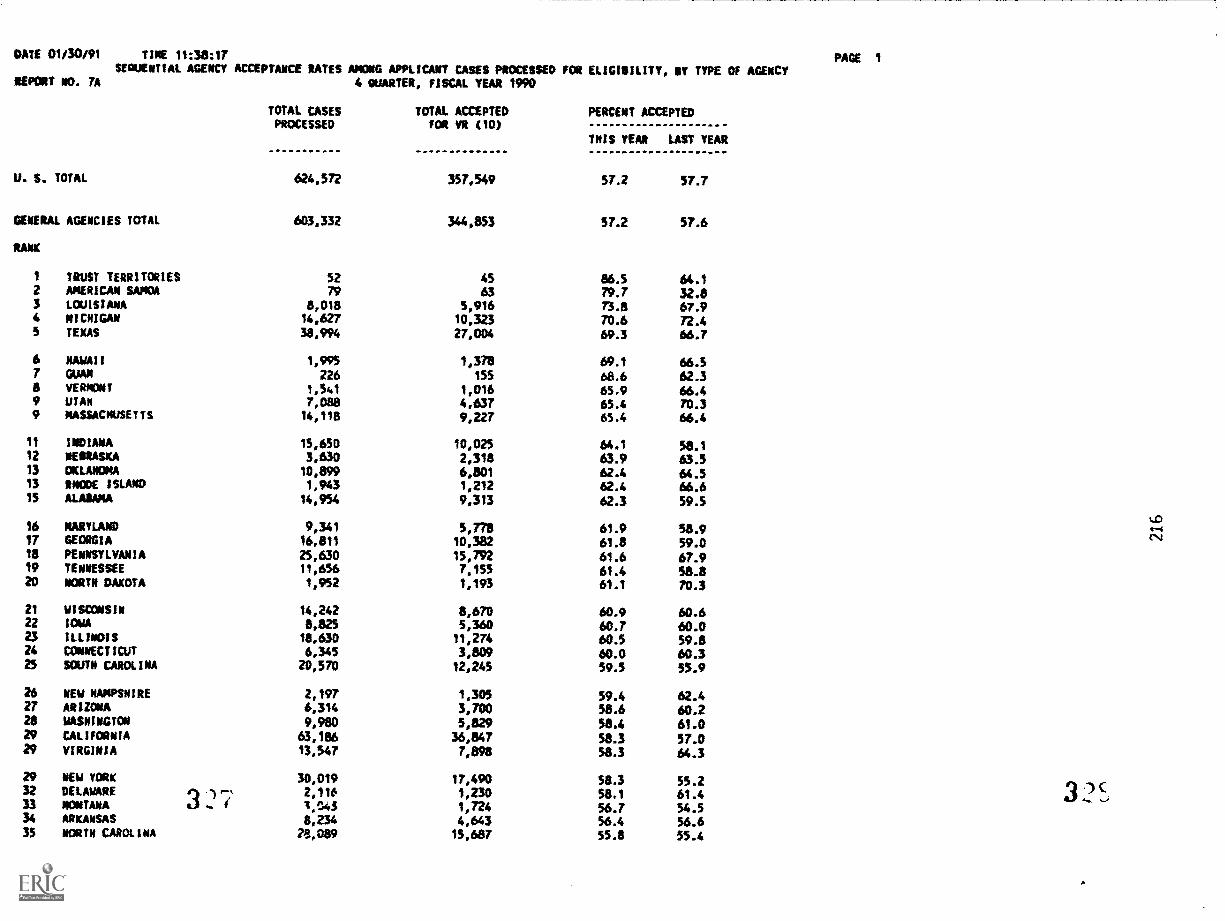
DATE 01/30191
REPORT NO. 7A
TINE 11:38:17
SEQUENTIAL AGENCY ACCEPTANCE RATES Amoma APPLICANT CASES PROCESSED FOR ELIGIBILITY, BY TYPE OF AGENCY4 QUARTER, FISCAL YEAR 1990
U. S. TOTAL
GENERAL AGENCIES TOTAL
RANK
1 TRUST TERRITORIES2 AMERICAN SAMOA3 LCVISIANA4 MICHIGAN5 TEXAS
6 NAWAII7 GUAM8 VERMONT9 UTAH9 MASSACHUSETTS
11 INDIANA12 WESIASKA13 OKLANONA13 RHODE ISLANDIS ALUM%
16 MARYLAND17 GEORGIA18 PENNSYLVANIA19 TENNESSEE20 NORTH DAKOTA
21 WISCONSIN22 IOWA23 ILLINOIS24 CONNECTICUT25 SOUTH CAROLINA
26 NEW HAMPSHIRE27 ARIZONA25 WASHINGTON29 CALIFORNIA29 VIRGINIA
29 NEW YORK32 DELAWARE13 MONTANA34 ARKANSAS35 NORTH CARCLINA
II P".1
TOTAL CASESPROCESSED
624,572
603,332
5279
8,01814,627
38,994
1,995
2261,5417,08814,118
15,6503,63010,8991,943
14,954
9,34116,811
25,63011,6561,952
14,2428,82518,6306,345
20,570
2,1976,314
9,98063,18613,547
30,0192,116'1,045
8,23428,089
TOTAL ACCEPTEDFOR VR (10)
357,549
344,853
4563
5,91610,32327,004
1,378
1551,0164,6379,227
10,0252,3186,8011,2129,313
5,77810,38215,7927,1551,193
8,6705,36011,2743,80912,245
1,305
3,7005,82936,8477,898
17,4901,2301,7244,64315,687
PERCENT ACCEPTED
THIS YEAR LAST YEAR
57.2 57.7
57.2 57.6
86.5 64.179.7 32.873.8 67.970.6 72.469.3 66.7
69.1 66.568.6 62.365.9 66.465.4 70.365.4 66.4
64.1 5e.163.9 63.562.4 64.562.4 66.662.3 59.5
61.9 58.961.8 59.061.6 67.961.4 58.861.1 70.3
60.9 60.660.7 60.060.5 59.860.0 60.359.5 55.9
59.4 62.458.6 60.258.4 61.058.3 57.058.3 64.3
58.3 55.258.1 61.456.7 54.556.4 56.655.8 55.4
PAGE 1
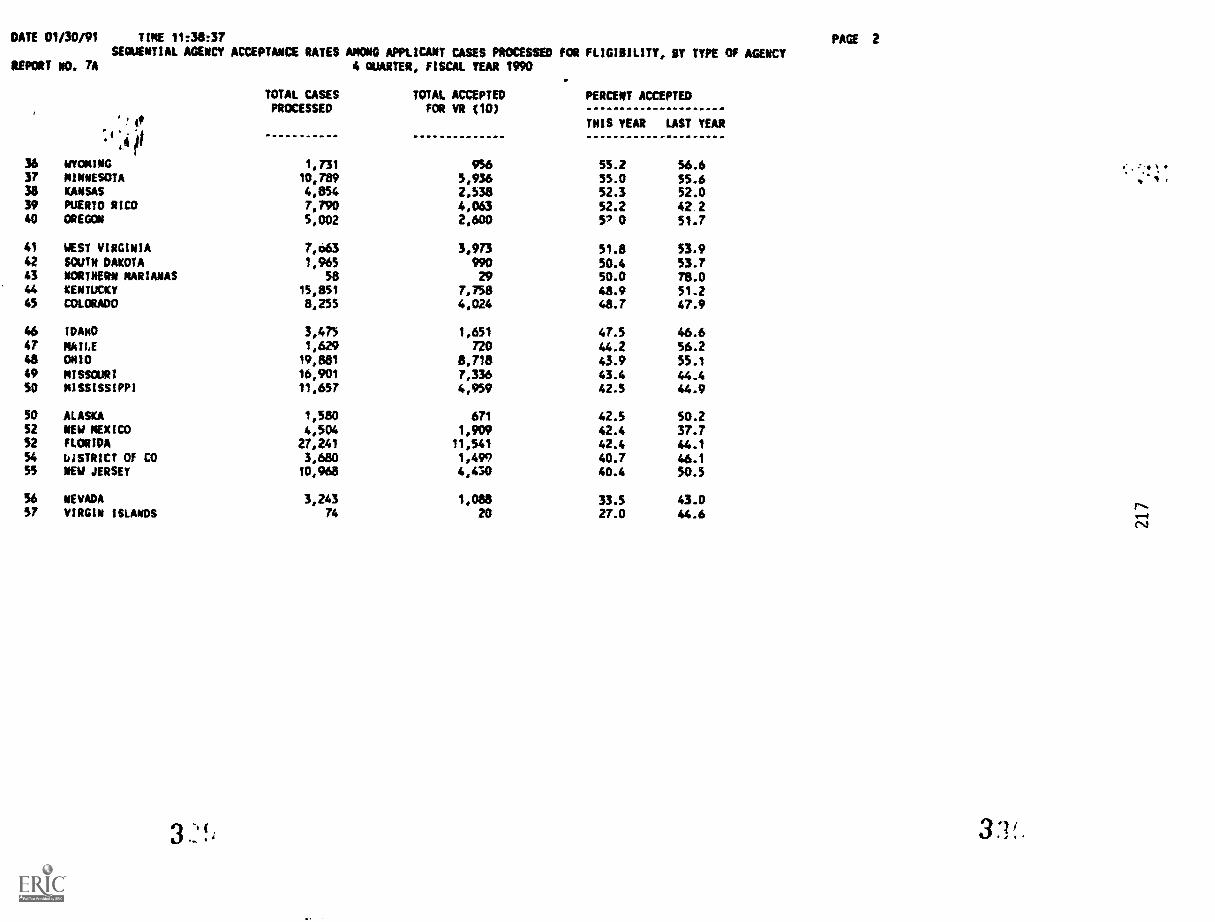
DATE 01/30/91 TIME 11:3837 PAGESEQUENTIAL AGENCY ACCEPTANCE RATES AMONG APPLICANT CASES PROCESSED FOR FLIGIBILITY, SY TYPE OF AGENCY
REPORT NO. 7A 4 QUARTER, FISCAL TEAR 1990
TOTAL CASES TOTAL ACCEPTED PERCENT ACCEPTEDPROCESSED FOR VR (10)
, , 0THIS YEAR LAST YEAR
:+:4111
36 WYOMING 1,731 956 55.2 56.637 MINNESOTA 10,789 5,936 55.0 55.638 KANSAS 4,854 2,538 52.3 52.039 PUERTO RICO 7,790 4,063 52.2 42 240 OREGON 5,002 2,600 5/ 0 51.7
41 WEST VIRGINIA 7,063 3,973 51.8 53.942 SOUTH DAKOTA 1,965 990 50.4 53.743 NORTHERN MARIANAS se 29 50.0 78.044 KENTUCKY 15,851 7,758 48.9 51.245 COLORADO 8,255 4,024 48.7 47.9
46 IDAHO 3,475 1,651 47.5 46.647 MAII,E 1,629 720 44.2 56.248 OHIO 19,881 8,718 43.9 55.149 MISSOURI 16,901 7,336 43.4 44.4SO MISSISSIPPI 11,657 4,959 42.5 44.9
SO ALASKA 1,580 671 42.5 50.232 NEW MEXICO 4,504 1,909 42.4 37.752 FLORIDA 27,241 11,541 42.4 44.154 DISTRICT OF CO 3,680 1,499 40.7 46.155 NEU JERSEY 10,968 4,450 40.4 50.5
56 NEVADA 3,243 1,088 33.5 43.037 VIRGIN ISLANDS 74 20 27.0 44.6
2

DATE 01/30/91 TIME 11:38:45
SEDUENTIAL AGENCY ACCEPTANCE RATES AMONG APPLICANT CASES PROCESSED FOR ELIGIBILITY, BY TYPE OF AGENCYREPORT NO, TA 4 QUARTER, FISCAL YEAR 1990
PAGE 3
TOTAL CASESPROCESSED
TOTAL ACCEPTEDFOR VR (16)
PERCENT ACCEPTED
THIS YEAR LAST YEAR
"ILIAD AGENCIES TOTAL 21,240 12,696 59.8 59.4
RANK
1 CONNECTICUT 228 196 86.0 77.32 SOUTH CAROLINA 407 314 72.1 73.33 VERMONT 134 102 76.1 73.33 MASSACHUSETTS 309 235 76.1 67.05 FLORIDA 1,850 1,393 75.3 80.3
6 RHODE ISLAND 149 111 74.5 72.97 MICHIGAN 755 561 74.3 75.28 NEW JERSEY 977 699 71.5 73.09 OREGON 189 132 69.6 66.410 DELAWARE 50 34 68.0 70,1
11 IOWA 162 110 67.9 70.512 IDAHO 85 53 62.4 69.913 NORTH CAROLINA 1,256 1,085 61.8 67.414 NEW MEXICO 176 107 60.8 45.015 VIRGINIA 550 332 60.4 62.7
16 WASHINGTON 286 172 60.1 58.5, PENNSYLVANIA 1,162 696 59.9 61.2
18 KENTUCKY 846 481 56.9 44.8 CO19 TEXAS20 ARKANsAS
5,014350
2,841190
56.754.3
57.656.8 Cs4
21 NEW YORK 2,536 1,351 53,3 48.422 NEBRASKA 214 111 51.9 46.523 MINNESOTA 861 408 47.4 61.324 MISSISSIPPI 1,496 690 46.1 42.225 MISSOURI 698 292 41.8 35.6
3:4332
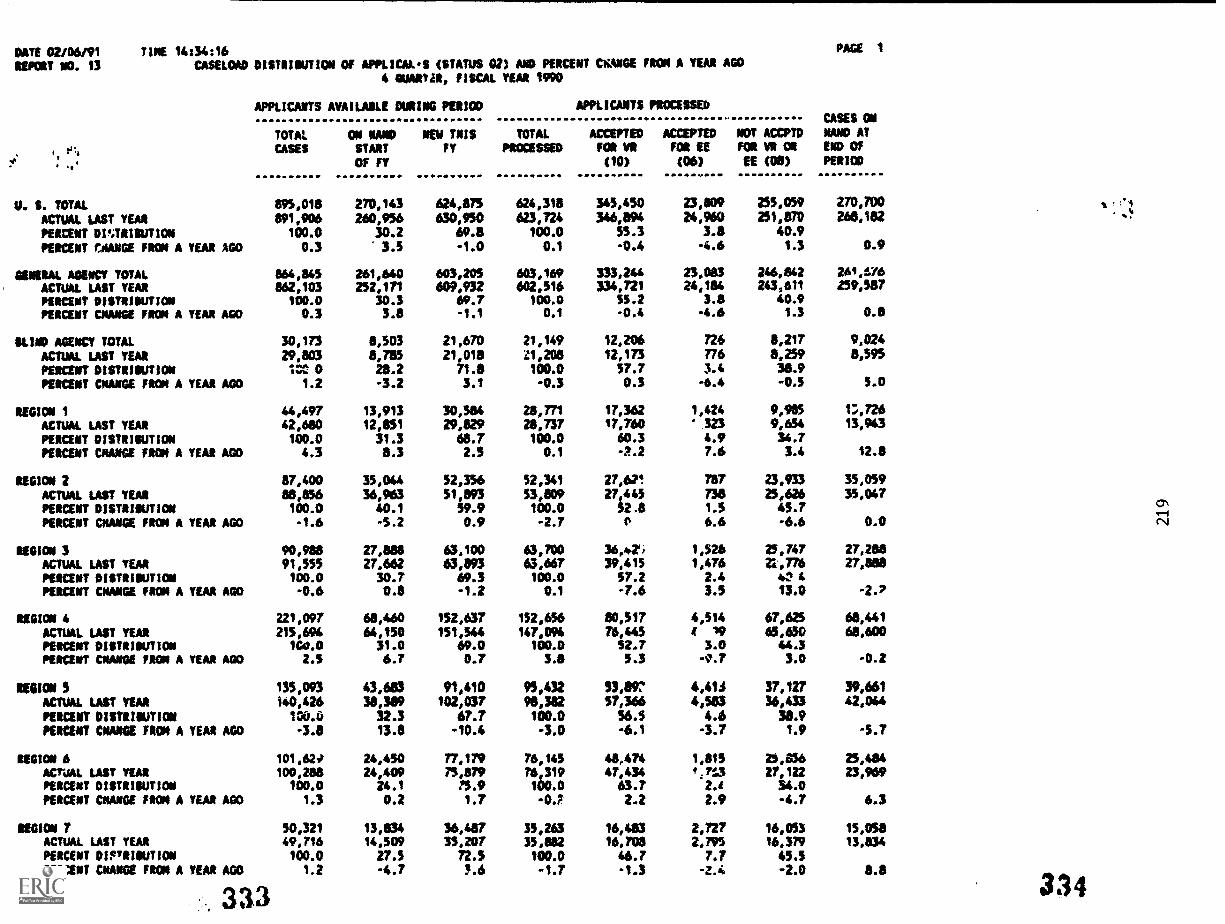
DATE 02106/91REPORT NO. 13
TINE 14:34:16CASELOAD OISTRIOUTIOM OF APPLICAL4 (STATUS 02) AND PERCENT CHANGE FROM A YEAR AGO
4 OUWAR, FISCAL YEAR 1990
PAGE 1
144It
APPLICANTS AVAILAILE DURING PERIOD
TOTAL ON NANO NEW THISCASES START FY
Of FY
TOTALPROCESSED
APPLICANTS PROCESSED
ACCEPTED ACCEPTEDFOR VR FOR El
(10) (06)
NOT ACCPTDFOR IR OR
SE (08)
CASES OMNAND ATEND CI
PERICO
U. S. TOTAL 895,018 270,143 624,875 624,318 345,450 23,809 255,059 270,700
ACTUAL LAST YEAR 891,906 260,956 630,950 623,724 346,894 24,960 251,870 268,182
PERMIT DI:TRIBUTION 100.0 30.2 69.8 100.0 55.3 3.8 40.9
PERCENT COARSE FROM A YEAR AGO 0.3 3.5 -1.0 0.1 -0.4 4.6 1.3 0.9
SIIMERAL AGENCY TOTAL 866,865 261,640 603,205 603,169 333,244 23,083 246,842 2614.76
ACTUAL LAST YEAR 862,103 232,171 609,932 602,516 334,721 24,184 243,611 259,587
PERCENT DISTRIBLITION 100.0 30.3 69.7 100.0 55.2 3.8 40.9
PERCENT CNANGE FRON A YEAR AGO 03 3.8 -1.1 0.1 -0.4 -4.6 1.3 0.8
SUMO AGENCY TOTAL 30,173 8,503 21,670 21,149 12,206 726 8,217 9,024
ACTUAL LAST YEAR 29,803 8,785 21,018 0,208 12,173 776 8,259 8,595
PERCENT DISTRIOUTION ICC 0 28.2 71.8 100.0 57.7 3.4 38.9
PERCENT CRANGE FRON A YEAR AGO 1.2 -3.2 3.1 -0.3 0.3 -6.4 -0.5 5.0
REGION 1 44,497 13,913 30,584 28,771 17,362 1,424 9,905 1:3,726
ACTUAL LAST YEAR 42,680 12,851 29,829 26,737 17,760 ' 523 9,654 13,943
PERCENT DISTRIBUTION 100.0 31.3 68.7 100.0 60.3 4.9 34.7PERCENT CHANGE PION A YEAR AGO 4.3 8.3 2.5 0.1 -2.2 74 3.4 12.8
REGION 2 87,400 35,044 52,356 52,341 27,621 787 23,933 35,059
ACTUAL LAST YEAR 88,856 36,963 51,893 53,809 27e445 738 25,626 35,047PERCENT DISTRIOUTION 100.0 40.1 59.9 100.0 52.8 1.5 45.7PERCENT CHANGE FROM A YEAR AGO -1.6 -5.2 0.9 -2.7 0 6.6 -6.6 0.0
RION* 3 90,988 27,888 63,100 63,700 36e42) 1,528 25,747 27,288ACTUAL LAST YEAR 91,555 27,662 63,893 63,667 39,415 1,476 22,776 27,888
PERCENT DISTRISUTION 100.0 30.7 69.3 100.0 57.2 2.4 4,4PEICENT CNANGIE FRON A YEAR AGO -0.6 0.8 -1.2 0.1 -7.6 3.5 13.9
AEOION 4 221,097 68,460 152,637 152,656 80,517 4,514 67,625 68,441
ACTUAL LAST YEAR 215,694 64,150 151,544 147,094 76,445 4 19 65,650 68,600PERCENT DISTRINTION 100.0 31.0 69.0 100.0 52.7 3.0 44.3
PERCENT MANGE FAC44 A YEAR A00 2.5 6.7 0.7 3.8 5.3 -ii.7 3.0 -0.2
RESION 5 135,093 43,683 91,410 95,432 33,69? 4,41A 37,127 39,661ACTUAL LAST YEAR 140,426 38,389 102,037 98,382 57,366 4,563 36,433 42,044
PERCENT 01E7E1811710N 100.0 32.3 67.7 180.0 56.5 4.6 38.9
PERCENT CRANE PION A 1141 400 -3.8 13.8 -10.4 -3.0 -6.1 -3.7 1.9 -5.7
REGION 6 101,621 24,450 77,179 76,145 48,474 1,815 2,,836 25,484ACTuAL LAST YEAR 100,288 24,409 75,879 rs 319 47,434 /. To 27,122 23,969PERCENT DISTRISUTION 100.0 24.1 75.9 160.0 63.7 2.4 34.0PERCENT CRANE FROM A YEAR AGO 1.3 0.2 1.7 -0.7 2.2 2.9 -4.7 6.3
REGION 7 50,321 13,834 36,487 35,263 16,483 2,727 16,053 15,058ACTUAL LAST YEAR 49,716 14,509 35,207 35,882 16,708 2,795 16,379 13,834PERCENT DIFTRIOUTION 100.0 27.5 72.5 100.0 46.7 7.7 45.5PERCENT CRANE FIC91 A YEA* AGO 1.2 -4.7 P.6 -1.7 -1.3 -7..ft -2.0 8.8
313 334
'1
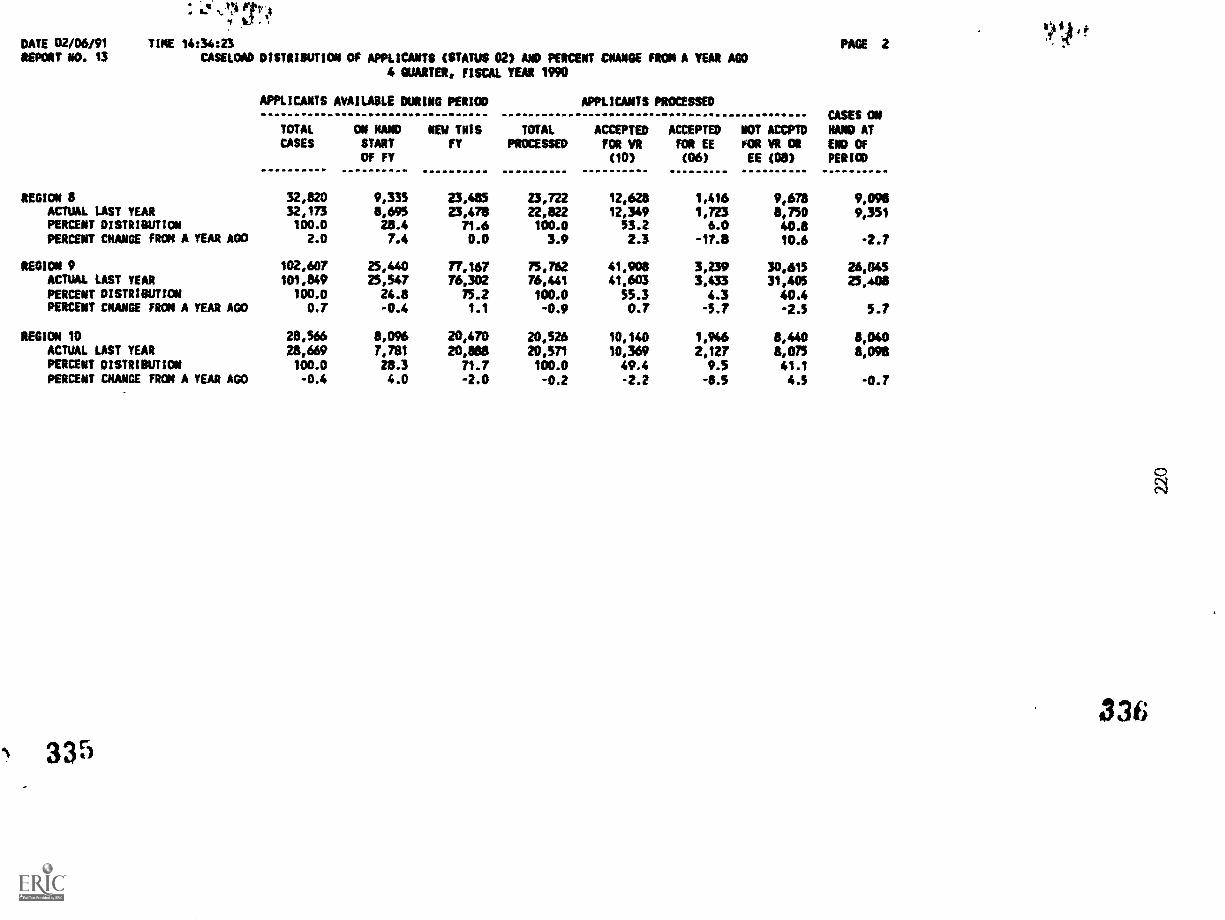
DATE 02/06191REPORT NO. 13
TINE 14:34:23
CASELOAD DISTRISUTION Of APPLICANTS (STATUS 02) AND PERCENT CRAM FROM A YEAR AGO4 QUARTER, FISCAL YEAR 1990
PAGE 2
APPLICANTS AVAILABLE DURING PERIOD
TOTAL ON NANO NEW TNISCASES START rt.
Of FY
TOTALPROCESSED
APPLICANTS PROCESSED
ACCEPTED ACCEPTEDFOR VR FOR EE
(10) (06)
NOT ACCFIDfOR VR OREE (08)
CASES OM
NAND ATEND OFPERIOD
REGION 8 32,020 9,335 23,485 23,722 12,628 1,416 9,678 9,098ACTUAL LAST YEAR 32,173 8,695 23,478 22,822 12,349 1,723 8,750 9,351PERCENT DISTRIBUTION 100.0 25.4 71.6 100.0 53.2 6.0 40.8PERCENT CHANGE FROM A YEAR AGO 2.0 7.4 0.0 3.9 2.3 -17.15 10.6 -2.7
REGION 9 102,607 25,440 77,1167 75,762 41,908 3,239 30,615 26,845ACTUAL LAST YEAR 101,849 25,547 76,302 76,441 41,603 3,433 31,405 25,408PERCENT DISTRIBUTION 100.0 24.8 75.2 100.0 55.3 4.3 40.4PERCENT CNANGE FROM A YEAR AGO 0.7 -0.4 1.1 -0.9 0.7 -5.7 -2.5 5.7
REGION 10 28,566 8,096 20,470 20,526 10,140 1,946 8,440 8,040ACTUAL LAST YEAR 28,669 7,781 20,888 20,571 10,369 2,127 8,075 8,098PERCENT DISTRIBUTION 100.0 28.3 71.7 100.0 49.4 9.5 41.1PERCENT CHANGE FROM A YEAR AGO -0.4 4.0 -2.0 -0.2 -2.2 -83 4.5 -0.7
336335
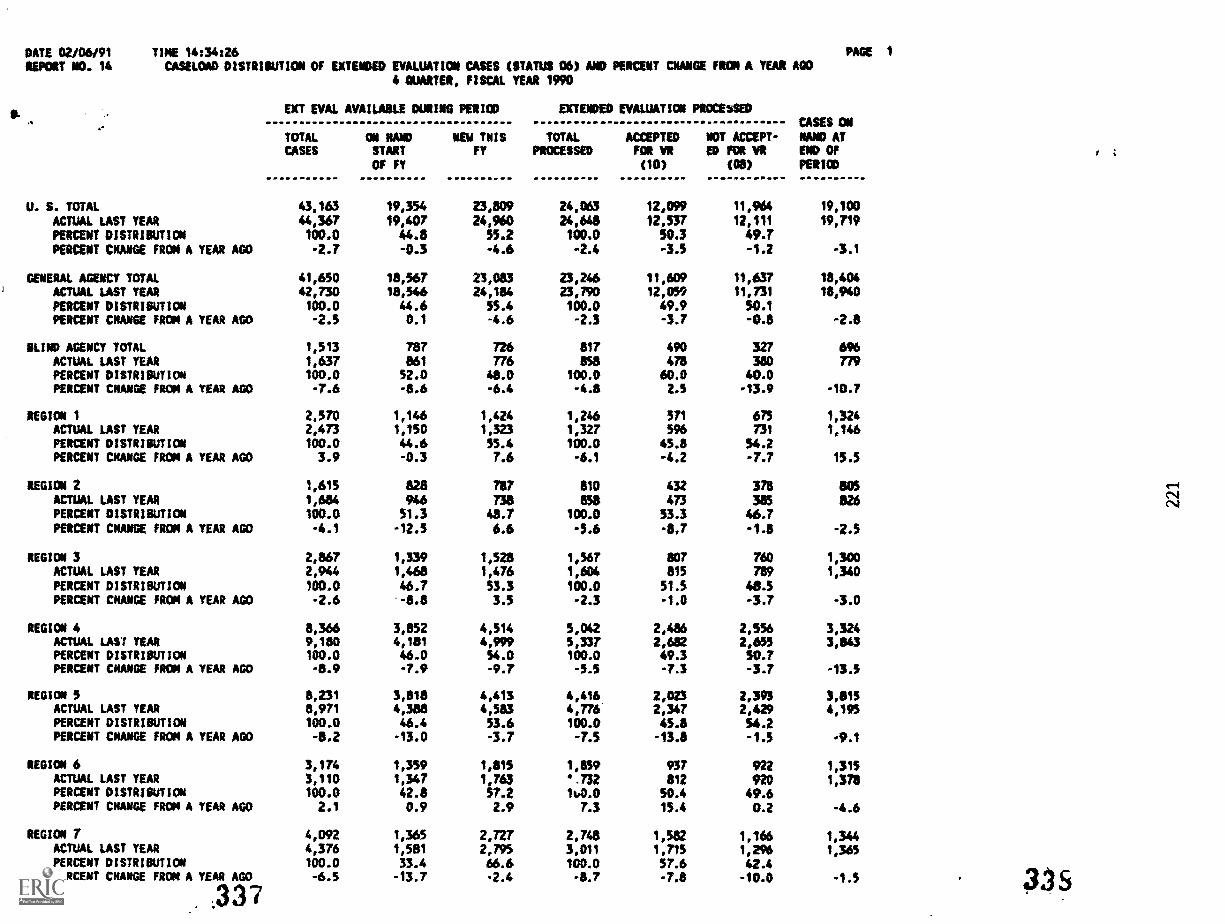
DATE 02/06/91REPORT NO. 14
TIME 14:34:26CASELOAD DISTRIBUTION OF EXTENDED EVALUATION CASES (STATUS 06) AND PERCENT CHANGE FRON A YEAR AGO
4 QUARTER, FISCAL YEAR 1990
PAGE
EXT EVAL AVAILABLE CURING PERIOD
TOTAL ON NAND WEN THISCASES START FY
CW FY
EXTENDED EVALUATION PROCEsSED
TOTAL ACCEPTED NOT ACCEPT-PRCCESSED FOR VI ED FOR VR
(10) (08)
CASES ONNAND ATEND CWPERIOD
0
U. S. TOTAL 43,163 19,3% 23,809 24,063 12,099 11,964 19,100
ACTUAL LAST YEAR 44,367 19,407 24,960 24,646 12,537 12,111 19,719PERCENT DISTRIBUTION 100.0 44.8 55.2 100.0 50.3 49,7PERCENT CNANGE FROM A YEAR AGO -2.7 -0.3 -4.6 -2.4 -3.5 -1.2 -3.1
GENERAL AGENCY TOTAL 41,650 18,567 23,083 23,246 11,609 11,637 18,404
ACTUAL LAST YEAR 42,730 18,546 24,184 23,790 12,059 11,731 18,940
PERCENT DISTRIBUTION 100.0 44.6 55.4 100.0 49.9 50.1PERCENT CHANGE FROM A YEAR AGO -2.5 0.1 -4.6 -2.3 -3.7 -0.8 -2.8
BLIND AGENCY TOTAL 1,513 787 726 817 490 327 696ACTUAL LAST YEAR 1,637 861 776 895 478 310 779PERCENT DISTRIBUTION 100.0 52.0 48.0 100.0 60.0 40.0PERCENT CHANGE FROM A YEAR AGO -7.6 -8.6 -6.4 -4.8 2.5 -13.9 -10.7
REGION 1 2,570 1,146 1,424 1,246 571 675 1,324ACTUAL LAST YEAR 2,473 1,150 1,323 1,327 596 731 1,146PERCENT DISTRIBUTION 100.0 44.6 55.4 100.0 45.8 54.2PERCENT CHANGE FROM A YEAR AGO 3.9 -0.3 7.6 -6.1 -4.2 -7.7 15.5
REGION 2 1,615 828 787 810 432 376 805 0-4
ACTUAL LAST YEAR 1,684 946 73$ 858 473 385 8260,4CV
PERCENT DISTRIBUTION 100.0 51.3 48.7 100.0 53.3 46.7PERCENT CNANGE FROM A YEAR AGO -4.1 -12.5 6.6 -5.6 -8,7 -1.8 -2.5
REGION 3 2,867 1,339 1,528 1,567 807 760 1,300ACTUAL LAST YEAR 2,944 1,468 1,476 1,604 815 789 1,340
PERCENT DISTRIBUTION 100.0 46.7 53.3 100.0 513 48.5PERCENT CNANGE FROM A YEAR AGO -2.6 -8.8 3.5 -2.3 -1.0 -3.7 -3.0
REGION 4 8,366 3,852 4,514 5,042 2,486 2,556 3,324ACTUAL LAST YEAR 9,180 4,181 4,999 5,337 2,682 2,655 3,843PERCENT DISTRIBUTION 100.0 46.0 54.0 100.0 49.3 50.7PERCENT CHANGE FROM A YEAR AGO -8.9 -7.9 -9.7 -5.5 -7.3 -3.7 -13.3
REGION 5 8,231 3,818 4,413 4,446 2,023 2,393 3,815ACTUAL LAST YEAR 8,971 4,388 4,583 4,776 2,347 2,429 4,195PERCENT DISTRIBUTICW 100.0 46.4 53.6 100.0 45.8 54.2PERCENT CHANGE FRON A YEAR AGO -8.2 -13.0 -3.7 -7.5 -13.8 - 1.5 -9.1
REGION 6 3,174 1,359 1,815 1,859 937 922 1,315ACTUAL LAST YEAR 3,110 1,347 1,763 ',732 812 920 1,378PERCENT DISTRIBUTION 100.0 42.8 57.2 10.0 50.4 49.6PERCENT CHANGE FROM A YEAR AGO 2.1 0.9 2.9 7.3 15.4 0.2 -4.6
REGION 7 4,092 1,365 2,727 2,748 1,582 1,166 1,344ACTUAL LAST YEAR 4,376 1,581 2,795 3,011 1,715 1,296 1,365PERCENT DISTRIBUTION 100.0 33.4 66.6 100.0 57.6 42.4PERCENT CAANGE FROM A YEAR AGO -6.5 -13.7 -2.4 -8.7 -7.8 -10.0 -4.5
337
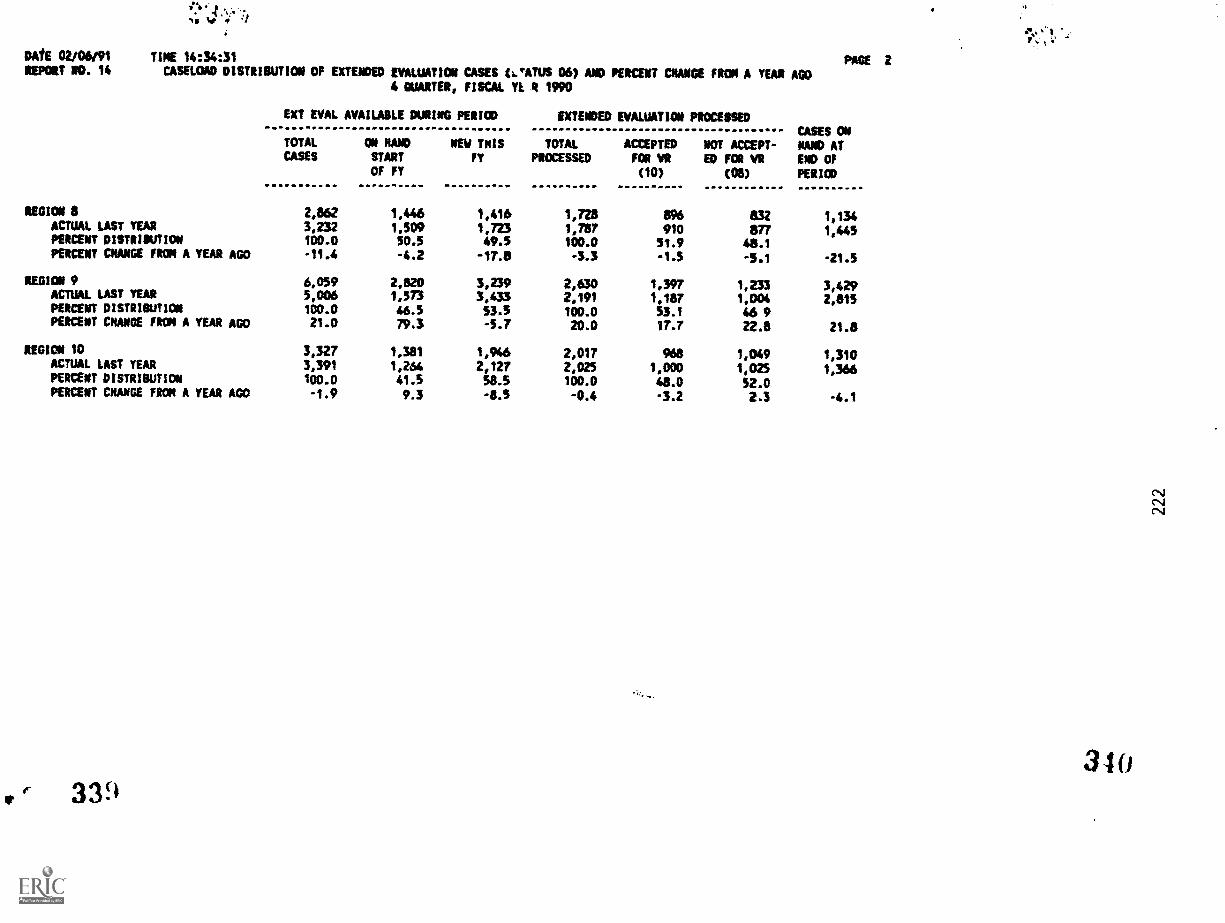
v":"'4fw, 1
t,
DAff 02/06/91REPORT VD. 14
TIME 1434:31CASELOAD DISTRIBUTION OF EXTENDED EVALUATION CASES ().'ATUS 06) AND PERCENT CHANGE FROM A YEAR AGO
4 QUARTER, FISCAL YE 1, 1990
PAGE 2
EXT EVAL AVAILABLE DURING PERIOD
TOTAL ON NAND NEW THISCASES START FY
OF FY
EXTENDED EVALUATION PROCESSED
TOTAL AUEPTED NOT ACCEPT-PROCESSED FOR VN ED FOR VI
(10) (08)
CASES ON
NAND ATEND OFPERIOD
REGION 8 2,862 1,446 1,416 1,728 896 832 1,134ACTUAL LAST YEAR 3,232 1,509 1,723 1,787 sno 877 1,445PERCENT DISTRIOUTICW 100.0 50.5 49.5 100.0 51.9 48.1PERCENT CHANGE FROM A YEAR AGO -11.4 -4.2 -17.8 -3.3 -1.5 -5.1 -21.5
REGION 9 6,059 2,820 3,219 2,630 1,397 1,233 3,429ACTUAL LAST YEAR 5,006 1,573 3,433 2,191 1,187 1,004 2,815PERCENT DISTRIBUTION 100.0 46.5 53.5 100.0 53.1 46 9PERCENT CHANGE FROM A YEAR AGO 21.0 79.3 -5.7 20.0 17.7 22.8 21.8
REGION 10 3,327 1,381 1,946 2,017 968 1,049 1,310ACTUAL LAST YEAR 3,391 1,264 2,127 2,025 1,000 1,025 1,366PERCENT DISTRIBUTION 100.0 41.5 58.5 100.0 48.0 52.0PERCENT CHANGE FROM A YEAR AGO -1.9 9.3 -8.5 -0.4 -3.2 2.3 -4.1
r 33931 0
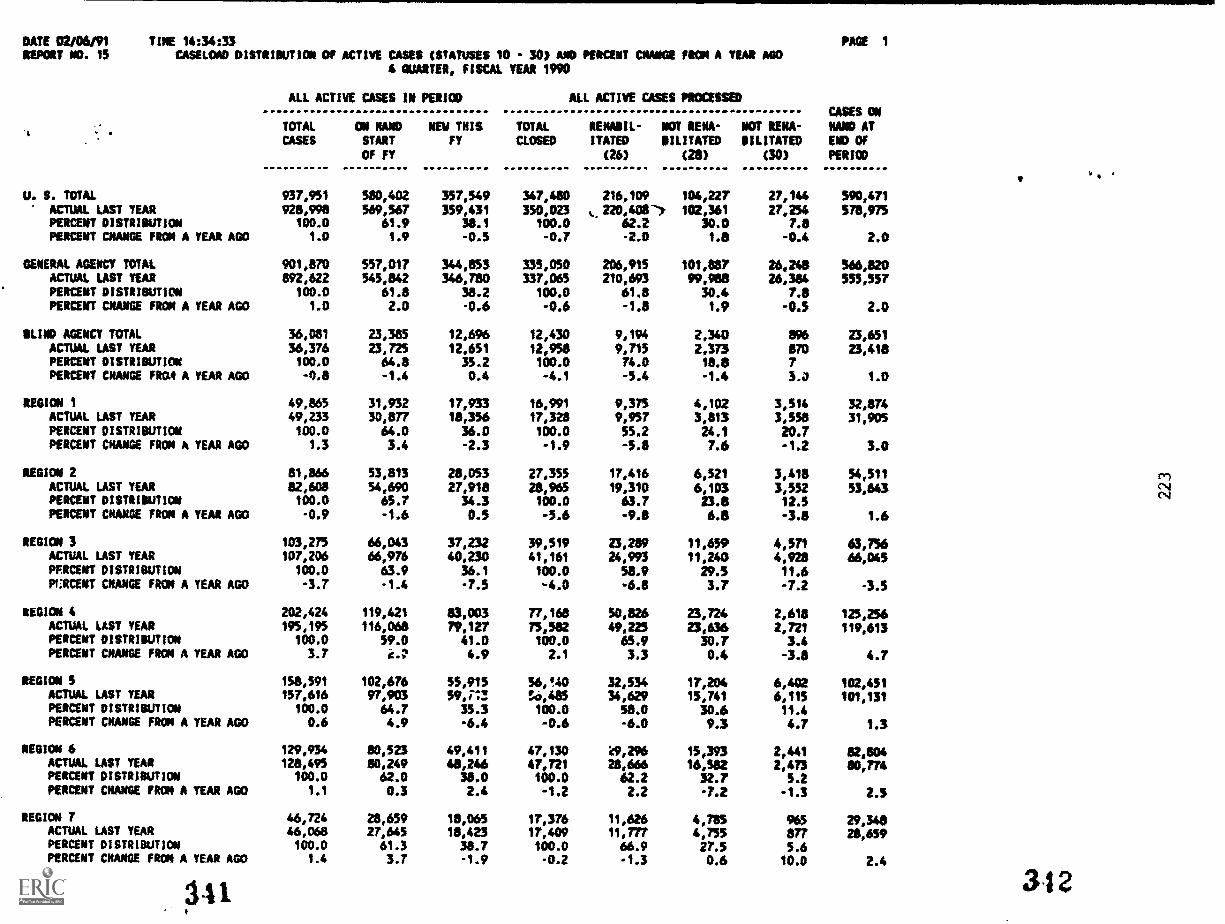
DATE 0210091 TINE 14:34:33REPORT ND. 15 CASELOAD DISTRIBuTION OF ACTIvE CAsEs (sTATusEs 10 - 30) AND PERCENT OWN 'Mon A YEAR AGO
4 QUARTER, FISCAL TEAR 1990
ALL ACTIVE CASES IN PERIOD ALL ACTIVE CASES PROCESSED
TOTAL ON NAND NEN THIS TOTAL AENASIL- NOT RENA- NCW RENA-CASES START FY CLOSED ITATED IMITATED !IMITATED
OF FY (26) (28) (30)
PAGE 1
CASES ONSAND AT
FM OfPERIOD
U. S. TOTAL 937,951 580,402 357,549 347,480 216,109 104,227 27,144 590,471ACTUAL LAsT TEAR 928,998 569,567 359,431 350,023 220,408-, 102,361 27,254 578,975PERCENT DIsTRIOUTION 100.0 61.9 38.1 100.0 62.2 30.0 7.8PERCENT CHANGE Finn A YEAR AGo 1.0 1.9 -0.5 -0.7 -2.0 1.8 -0.4 2.0
GENERAL AGENCY TOTAL 901,870 557,017 344,853 335,050 206,915 101,887 26,248 566,820ACTUAL LAST YEAR 892,622 545,842 346,780 337,065 210,693 99,988 26,384 555,557PERCENT DISTRIBuTioN 100.0 61.8 38.2 100.0 61.8 30.4 7.8PERCENT CNANGE FROM A YEAR AGO 1.0 2.0 -0.6 -0.6 -1.8 1.9 -0.5 2.0
SLIND AGENCY TOTAL 36,081 23,385 12,696 12,430 9,194 2,340 896 23,651ACTUAL LAsT TEAR 36,376 23,725 12,651 12,958 9,715 2,373 870 23,418PERCENT DISTRIBUTION 100.0 64.8 35.2 100.0 74.0 18.8 7PERCENT CHANGE FROA A YEAR AGO -0.8 -1.4 0.4 -4.1 -5.4 -1.4 3.4 1.0
REGION 49,865 31,932 17,933 16,991 9,375 4,102 3,514 32,874ACTUAL LAST TEAR 49,233 30,877 18,356 17,326 9,957 3,813 3,558 31,905PERCENT DISTRIBUTION 100.0 64.0 36.0 100.0 55.2 24.1 20.7PERCENT CHANGE FRoM A YEAR AGO 1.3 3.4 -2.3 -1.9 -5.8 7.6 -1.2 3.0
REGION 2 81,866 53,813 28,053 27,355 17,416 6,521 3,418 54,511ACTUAL LAsT YEAR 82,608 54,690 27,918 28,965 19,310 6,103 3,552 53,643pERcENT DISTRIBuTION 100.0 65.7 34.3 100.0 63.7 23.8 12.5PERCENT CHANGE FROM A TEAR AGO -0.9 -1.6 0.5 -5.6 -9.8 6.8 -3.8 1.6
REGION 3 103,275 66,043 37,232 39,519 25,289 11,659 4,571 63,736ACIVAL LAW YEAR 107,206 66,976 40,230 41,161 24,993 11,240 4,928 66,045PERCENT DISTRIBUTION 100.0 63.9 36.1 100.0 58.9 29.5 11.6PERCENT CHANGE FROM A YEAR AGO -3.7 -1.4 -7.5 -6.8 3.7 -7.2 -3.5
NEGION 4 202,424 119,421 83,003 77,168 50,826 23,724 2,618 125,256ACTUAL LAST YEAR 195,195 116,068 70,127 75,582 49,225 23,636 2,721 119,613PERCENT DISTRIBUTION 100.0 59.0 41.0 100.0 65.9 30.7 3.4PERCENT CHANGE FRom A yEAR AGo 3.7 k.17 4.9 2.1 3.3 0.4 -3.8 4.7
REGION 5 158,591 102,676 55,915 56,q40 32,534 17,204 6,402 102,451AcTuAL LAST TEAR 157,616 97,903 59,713 !o,485 34,629 15,741 6,115 101,131PERCENT DISTRIBUTIoN 100.0 64.7 35.3 100.0 58.0 30.6 11.4PERCENT CHANGE Ron A TEAR AGO 0.6 4.9 -6.4 -0.6 -6.0 9.3 4.7 1.3
REGION 4 129,934 80,523 49,411 47,130 '6,296 15,393 2,441 82,804ACTUAL LAST YEAR 128,495 80,249 48,246 47,721 28,666 16,582 2,473 00,774PERCENT DISTRIBUTION 100.0 62.0 38.0 100.0 62.2 32.7 5.2PERCENT CNANGE FRom A TEAR AGO 1.1 0.3 2.4 -1.2 2.2 -7.2 -1.3 2.5
REGlom 7 46,724 28,659 18,065 17,376 11,626 4,785 965 29,348ACTUAL LAST YEAR 46,068 27,645 18,423 17,409 11,777 4,755 877 28,699pERCENT DISTRIBUTION 100.0 61.3 38.7 100.0 66.9 27.5 5.6PERCENT CHANGE FRon A TEAR AGO 1.4 3.7 -1.9 -0.2 -1.3 0.6 10.0 2.4
341 312
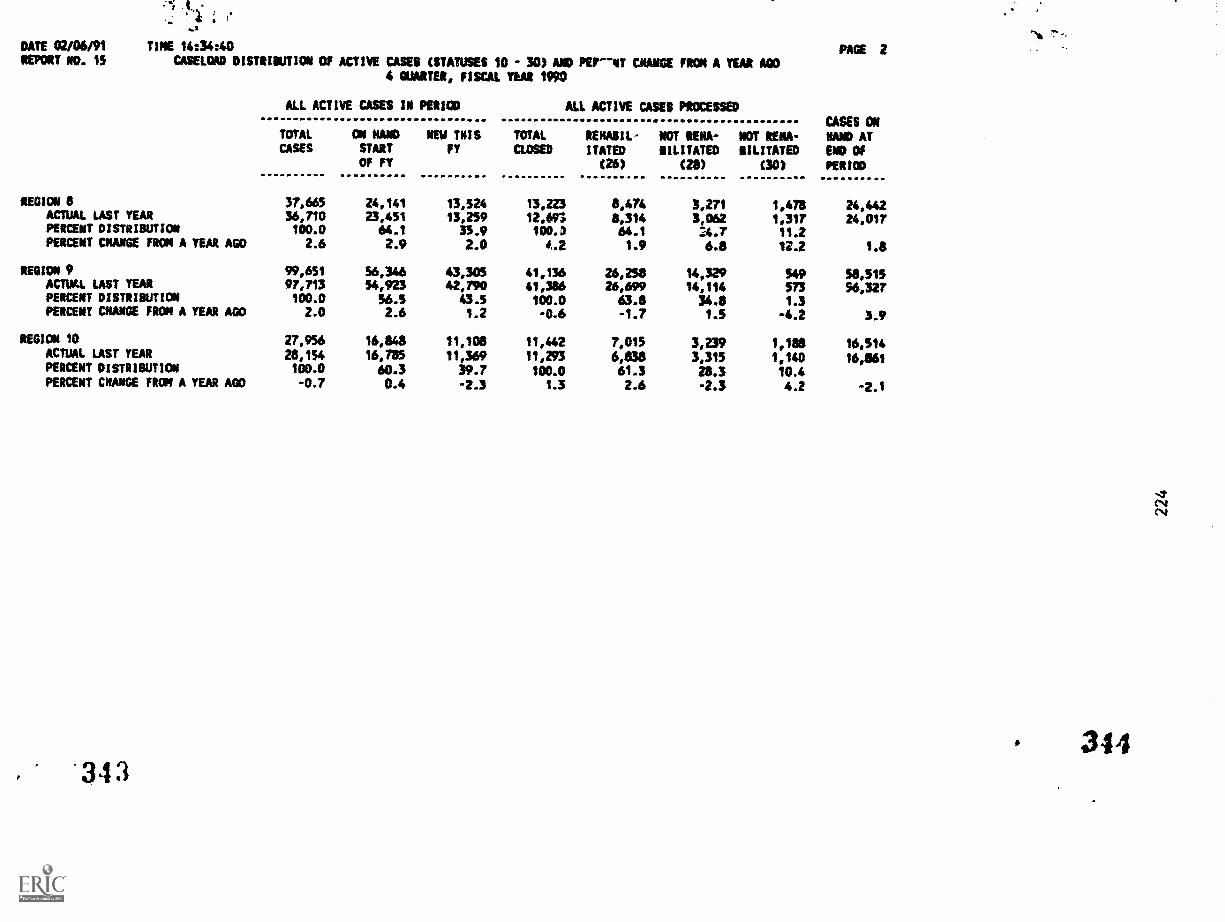
DATE 02106/91REPORT ND. 15
.t.
! ;
..;
TINE 14:34:40
CASELSID DISTRIBUTION OF ACTIVE CASES (STATUSES 10 - 30) AND PEP-NT CHANGE FRON A YEAR AGO4 QUARTER, FISCAL YEAR 11190
PAGE 2
ALL ACTIVE CASES IN PERIOD
TOTAL ON NAND NEW THISCASES START FY
OF FY
ALL ACTIVE CASES PROCESSED
TOTAL RENABIL- NOT RENA-CLOSED ITATED IMITATED
(26) (28)
NOT RENA-IMITATED
(30)
CASES ONNAND ATEND Of
PERIOD
REGION 8 37,665 24,141 13,524 13,223 8,474 3,271 1,475 24,442ACTUAL LAST YEAR 36,710 23,451 13,259 12,693 8,314 3,062 1,317 24,017PERCENT DISTRIBUTION 100.0 64.1 35.9 100.3 64.1 24.7 11.2PERCENT CHASSE MINA YEAR AGO 2.6 2.9 2.0 A.2 1.9 6.8 12.2 1.8
REGION 9 99,651 56,346 43,305 41,136 26,258 14,329 549 58,515ACTUAL LAST YEAR 97,713 54,923 42,790 41,386 26,699 14,114 573 56,327PERCENT DISTRIBUTION 100.0 56.5 43.5 100.0 63.8 34.8 1.3PERCENT CHANGE FROM A YEAR AGO 2.0 2.6 1.2 -0.6 -1.7 1.5 -4.2 3.9
REGION 10 27,956 16,848 11,108 11,442 7,015 3,239 1,188 16,514ACTUAL LAST YEAR 28,154 16,785 11,369 11,293 6,838 3,315 1,140 16,861PERCENT DISTRIBUTION 100.0 60.3 39.7 100.0 61.3 28.3 10.4PERCENT CRAKE FRON A YEAR AGO -0.7 0.4 -2.3 1.3 2.6 -2.3 4.2 -2.1
"343
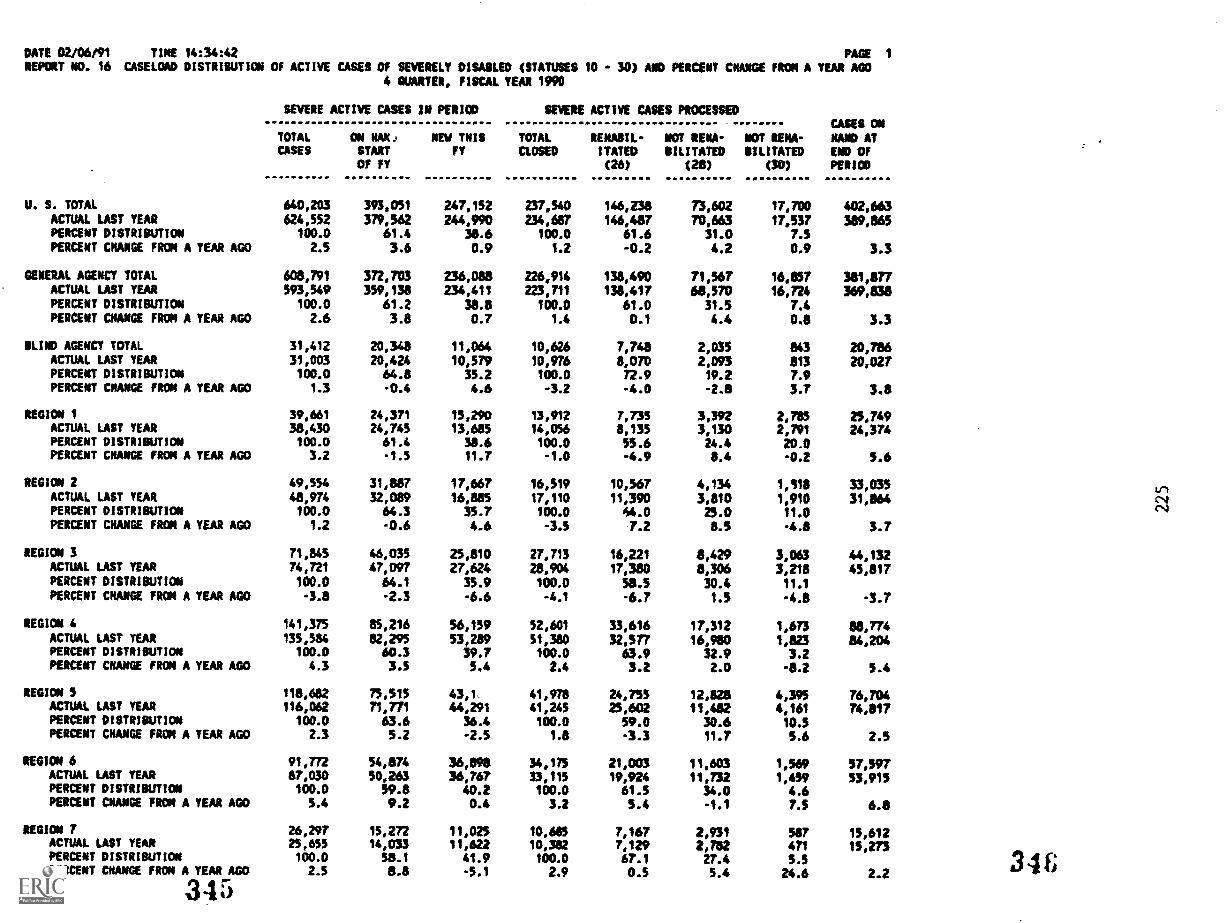
DATE 02/06/91 TIRE 14:34:42 PAGE 1
REPORT NO. 16 CASELOAD DISTRIBUTION OF ACTIVE CASES Of SEVERELY DISAILED (STATUSES 10 - 30) AND PERCENT CHANGE FROM A YEAR A404 GUARTER, FISCAL YEAR 1990
U. S. TOTALACTUAL LAST YEARPERCENT DISTRIBUTION
PERCENT CHANGE FROM A YEAR AGO
GENERAL AGENCY TOTALACTUAL LAST YEARPERCENT DISTRIBUTION
PERCENT CHANGE FRON A YEAR AGO
KIND AGENCY TOTALACTUAL LAST YEARPERCENT DISTRIBUTIONPERCENT CHANGE FROR A YEAR AGO
REGION 1ACTUAL LAST YEARPERCENT DISTRIBUTIONPERCENT CHANGE FROM A YEAR AGO
REGION 2
ACTUAL LAST YEARPERCENT DISTRIBUTIONPERCENT CHANGE FROM A YEAR AGO
REGION 3ACTUAL LAST YEARPERCENT DISTRIBUTION
PERCENT CHANGE FROM A YEAR AGO
REGION F.
ACTUAL LAST YEARPERCENT DISTRIBUTIONPERCENT CHANGE FROM A YEAR AGO
REGION 5ACTUAL LAST YEARPERCENT DISTRISUTION
PERCENT CAANGE FROM A YEAR AGO
REGION 6ACTUAL LAST YEARPERCENT DISTRIBUTIONPERCENT CHANGE FROM A YEAR AGO
REGION 7ACTUAL LAST YEARPERCENT DISTRIBUTIONPERCENT CHANGE FROR A YEAR AGO
345
SEVERE ACTIVE CASES IN PERIOD
TOTAL ON NAK.t NEW TNISCASES START FT
CW FY
REVERE ACTIVE CASES PROCESSED
TOTAL RENAIIIL- NO7 RENA-CLOSED ITATED BILITATED
(26) (28)
NOT RENA-BILITATED
(30)
CASES ONNAND ATEND CWPERIOD
640,203 393,051 247,132 237,540 146,238 73,602 17,700 402,663624,552 379,562 244,990 234,687 146,487 70,663 17,537 389,865
100.0 61.4 38.6 100.0 61.6 31.0 7.52.5 3.6 0.9 1.2 -0.2 4.2 0.9 3.3
608,791 372,703 236,088 226,914 138,490 71,567 16,857 381,877593,569 359,138 234,411 223,711 138,417 68,570 16,724 369,838
100.0 61.2 38.8 100.0 61.0 31.5 7.42.6 3.8 0.7 1.4 0.1 4.4 0.8 3.3
31,412 20,348 11,064 10,626 7,748 2,035 843 20,78631,003 20,424 10,579 10,976 8,070 2,093 813 20,027100.0 64.8 35.2 100.0 72.9 19.2 7.9
1.3 -0.4 4.6 -3.2 -4.0 -2.8 3.7 3.8
39,661 24,371 15,290 13,912 7,735 3,392 2,715 25,74938,430 24,745 13,685 14,056 8,135 3,130 2,791 24,374100.0 61.4 38.6 100.0 53.6 24.4 20.0
3.2 -1.5 11.7 -1.0 -4.9 8.4 -0.2 5.6
49,554 31,887 17,667 16,519 10,567 4,134 1,118 33,03548,974 32,089 16,885 17,110 11,350 3,810 1,910 31,864100.0 64.3 35.7 100.0 44.0 25.0 11.0
1.2 -0.6 4.6 -3.5 7.2 8.5 -4.8 3.7
71,845 46,035 25,810 27,713 16,221 8,429 3,063 44,13274,721 47,097 27,624 28,504 17,380 8,306 3,218 45,817100.0 64.1 55.9 100.0 58.5 30.4 11.1-3.8 -2.3 -6.6 -4.1 -6.7 1.5 -4.8 -3.7
141,375 85,216 56,159 52,601 33,616 17,312 1,673 88,774135,584 82,295 53,289 51,380 32,577 16,980 1,823 84,204
100.0 60.3 39.7 100.0 63.9 32.9 3.24.3 3.5 5.4 2.4 3.2 2.0 -8.2 5.4
118,682 75,515 43,1 41,978 24,755 12,828 4,395 76,704116,062 71,771 44,291 41,245 25,602 11,482 4,161 74,817
100.0 63.6 36.4 100.0 59.0 30.6 10.52.3 5.2 -2.5 1.8 -3.3 11.7 5.6 2.3
91,772 54,874 36,898 34,175 21,003 11,603 1,569 57,59787,030 50,263 36,767 33,115 19,924 11,732 1,459 53,915100.0 59.8 40.2 100.0 61.5 34.0 4.6
5.4 9.2 0.4 3.2 5.4 -1.1 7.5 6.8
26,297 15,272 11,025 10,685 7,167 2,931 587 15,61225,655 14,033 11,622 10,382 7,129 2,782 471 15,273100.0 58.1 41.9 100.0 67.1 27.4 5.52.5 8.8 -5.1 2.9 0.5 5.4 24.6 2.2 346
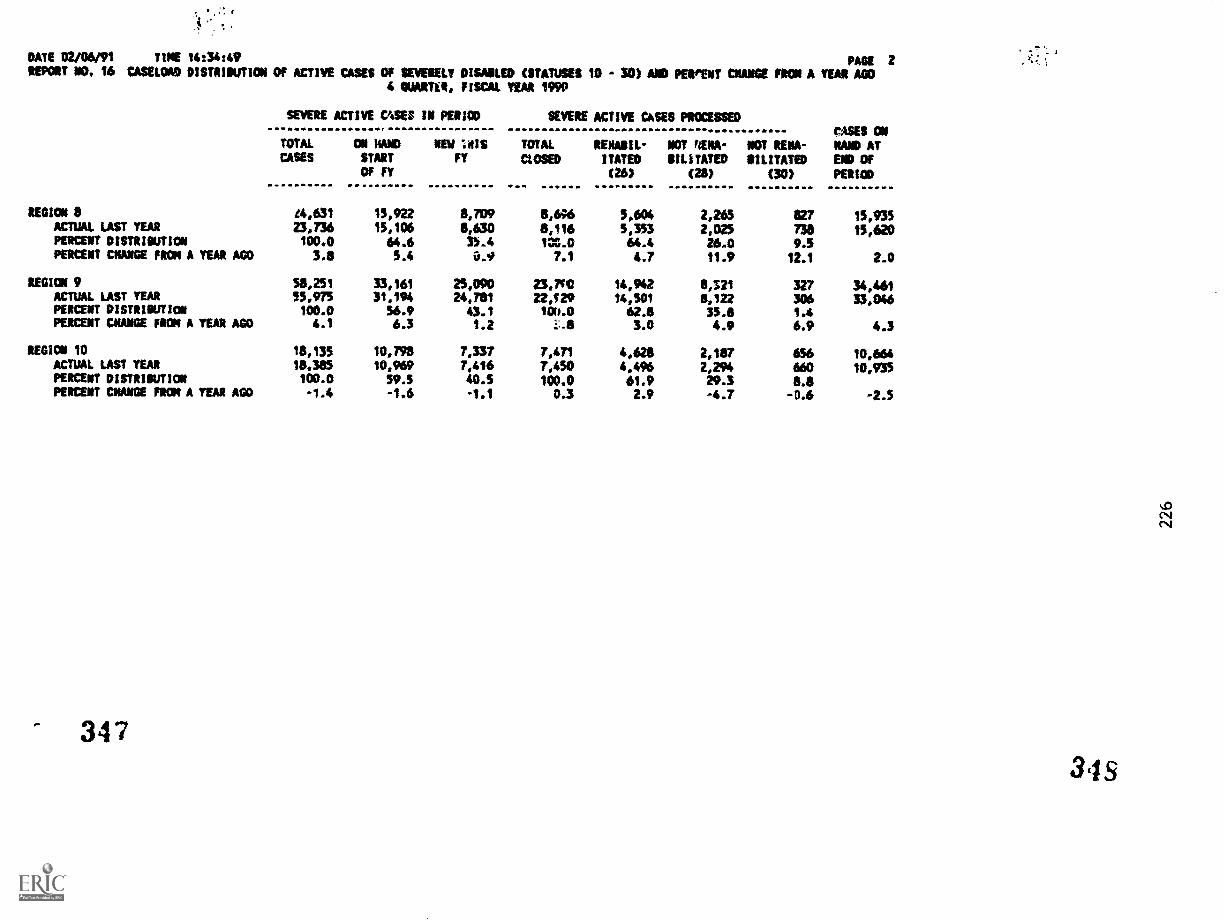
DATE 02106/91 TINE 14:34:49 PAGE 2REPORT NO. 16 CASEVON) DISTRIOUTION CW ACTIVE CASES Of SEVERELY DISANLED (STATUSES 10 - 30) AND PERrENT MANGE FROM A YEAR AGO
4 WARM, FISCAL YEAR 1990
-7.: s
SEVERE ACTIVE MEI IN PERIOD SEVERE ACTIVE CASES PROCESSED
CASES ONrOTAL ON NAND NEW AIS TOTAL RENABIL- NOT 4ENA- NOT RENA- NAND ATCASES START ry ClOSED ITATED BILITATED MUTATED END CW
CW FY (26) (28) (30) PERKO
REGION 8 £4,631 15,922 8,709 8,696 5,604 2,265 827 15,935AClUAL LAST YEAR 23,736 45,106 8,630 8,116 5,353 2,025 738 15,620PERCENT DISTRIBUTION 100.0 64.6 31.4 1G.0 64.4 26.0 9.5PERCENT CHANGE FRON A YEAR AGO 3.8 5.4 O. 7.4 4.7 11.9 12.1 2.0
REGION 9 58,251 33,161 25,090 23,7C0 14,942 8,521 327 34,461ACTUAL LAST YEAR 55,975 31,194 24,781 22,129 14,501 8,122 306 33,046PERCENT DISTRIBUTION 100.0 56.9 43.1 100.0 62.8 35.8 1.4PERCENT WAGE FRON A YEAR AGO 4.1 6.3 1.2 1.8 3.0 4.9 6.9 4.3
REGION 10 18,135 10,798 7,137 7,471 4,628 2,187 656 10,664ACTUAL LAST YEAR 18,385 10,969 7,416 7,450 4,496 2,294 660 10,935PERCENT DISTRIBUTION 100.0 59.5 40.5 100.0 61.9 29.3 8.8PERCENT CHANGE MON A YEAR AGO -1.4 -1.6 -1.1 0.3 2.9 -4.7 -0.6 -2.5
3473.1
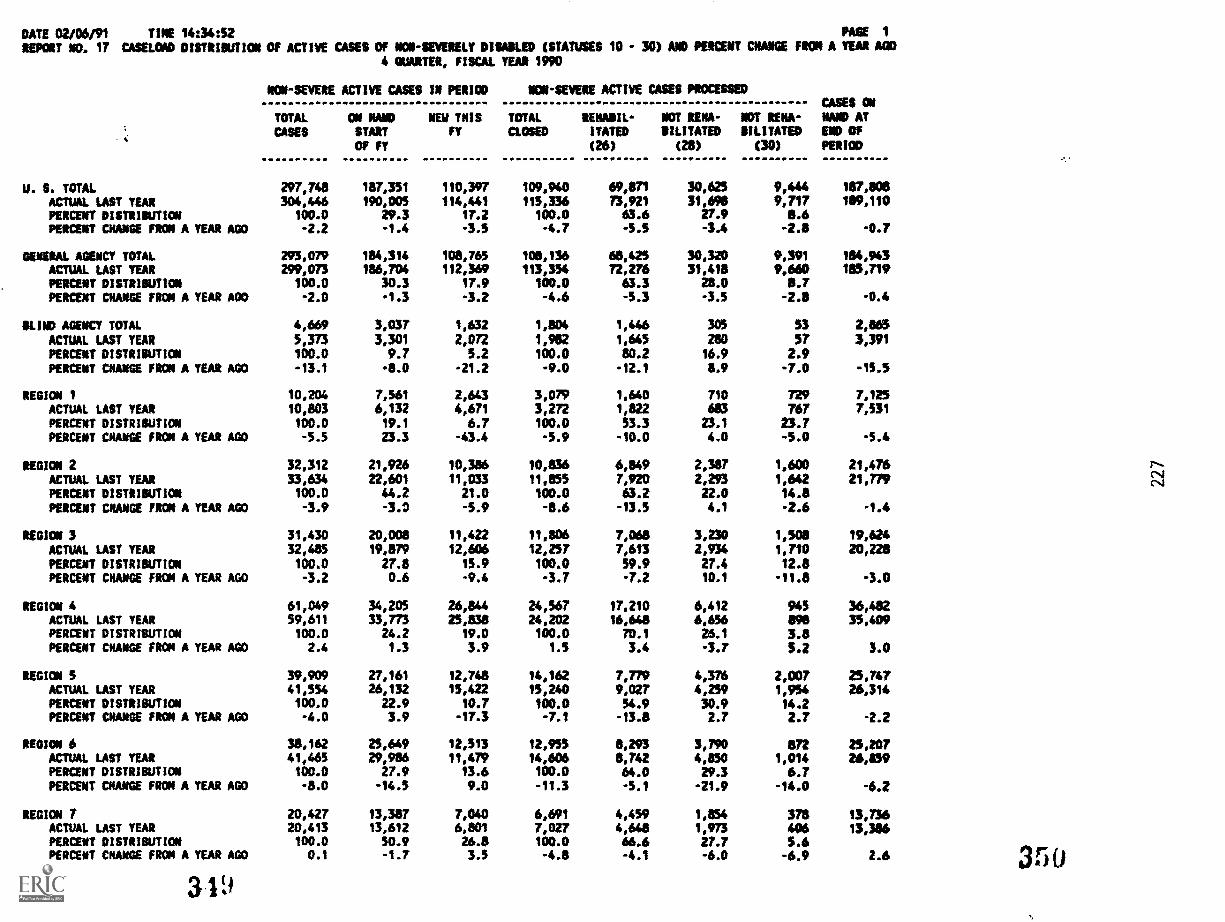
DATE 02/06191 TINE 1413462 PAGE 1
REPORT NO. 17 CASELOAD DISTRIBUTION Of ACTIVE CASES Of NON-SEVERELY DISABLED (STATUSES 10 - 30) AND PERCENT CNANGE MOM A YEAA A004 QUARTER, FISCAL YEAR 1990
NON-SEVERE ACTIVE CASES IN PERIOD
TOTAL ON NAND MEW THISCASES sum ry
OF FT
NON-SEVERE ACTIVE CASES PROCESSED
TOTAL RENABIL- NOT RENA- NOT RENA-
ctcoul ITATED ILITATED BILITATED
(20 (28) (30)
CASES ONNAND ANEND OFPERIOD
U. S. TOTAL 297,748 157,351 110,397 109,940 69,871 30,625 9,444 187,808
ACTUAL LAST YEAR 304,446 190,005 114,441 115,336 73,921 31,698 9,717 109,110PERCEMT DISTRISUTION 100.0 29.3 17.2 100.0 63.6 27.9 8.6PENCENT CHANGE MIA YEAR A00 -2.2 -1.4 -3.5 -4.7 -5.5 -3.4 -2.8 -0.7
GENERAL AGENCY TOTAL 293,07, 184,314 108,765 101,136 68,425 30,320 9,391 184,143ACTUAL LAST TEAR 291,073 186,704 112,369 113,354 72,276 31,418 9,660 1E5,719PERCENT DISTRIBUTION 100.0 30.3 17.9 100.0 63.3 28.0 0.7PERCENT CNANGE FROM A YEAR AGO -2.0 -1.3 -3.2 -4.6 -5.3 -3.5 -2.8 -0.4
BLIND AGENCY TOTAL 4,669 3,037 1,632 1,804 1,446 305 53 2,863
ACTUAL LAST YEAR 5,373 3,301 2,072 1,982 1,645 280 57 3,391PERCENT DIPRIIIUTION 100.0 9.7 5.2 100.0 80.2 16.9 2.9PERCENT CNANGE FRON A YEAR AGO -13.1 -8.0 -21.2 -9.0 -12.1 8.9 -7.0 -15.5
REGION 1 10,204 7,561 2,643 3,079 1,640 710 729 7,125ACTUAL LAST YEAR 10,803 6,132 4,671 3,272 1,822 683 767 7,531
PERCENT DISTRIBUTION 100.0 19.1 6.7 100.0 53.3 23.1 23.7PERCENT CHANGE FRON A YEAR AGO -5.5 23.3 -43.4 -5.9 -10.0 4.0 -5.0 -5.4
REGION 2 32,312 21,926 10,386 10,836 6,849 2,387 1,600 21,476ACTUAL LAST YEAR 33,634 22,601 11,033 11,855 7,920 2,293 1,642 21,779PERCENT DISTRIBUTION 100.0 44.2 21.0 100.0 63.2 22.0 14.8PERCENT CNANGE FROM A YEAR AGO -3.9 -3.2 -5.9 -8.6 -13.5 4.1 -2.6 -1.4
REGION 3 31,430 20,008 11,422 11,806 7,068 3,230 1,508 19,624ACTUAL LAST YEAR 32,485 19,879 12,606 12,257 7,613 2,934 1,710 20,228PERCENT DISTRIBUTION 100.0 27.8 15.9 100.0 59.9 27.4 12.8PERCENT CHANGE FROM A YEAR AGO -3.2 0.6 -9.4 -3.7 -7.2 10.1 -11.8 -3.0
REGION 4 61,049 34,205 26,844 24,567 17,210 6,412 945 36,482ACTUAL LAST YEAR 59,611 33,773 25,838 24,202 16,648 6,656 898 35,409PERCENT DISTRIBUTION 100.0 24.2 19.0 100.0 70.1 26.1 3.8PERCENT CHANGE FROM A YEAR AGO 2.4 1.3 3.9 1.5 3.4 -3.7 5.2 3.0
REGION 5 39,909 27,161 12,7445 14,162 7,779 4,376 2,007 25,747ACTUAL LAST YEAR 41,554 26,132 15,422 15,240 9,027 4,259 1,954 26,314PERCENT DISTRIBUTION 100.0 22.9 10.7 100.0 54.9 30.9 14.2PERCENT CNANGE FROM A YEAR AGO -4.0 3.9 -17.3 -7.1 -13.8 2.7 2.7 -2.2
REGION 6 38,162 25,649 12,513 12,955 8,293 3,790 872 25,207ACTUAL LAST YEAR 41,465 29,986 11,479 14,606 8,742 4,850 1,014 26,139PERCENT DISTRIBUTION 100.0 27.9 13.6 100.0 64.0 29.3 6.7PERCENT CHANGE FROM A TEAR AGO -8.0 -14.5 9.0 -11.3 -5.1 -21.9 -14.0 -6.2
REGION 7 20,427 13,387 7,040 6,691 4,459 1,854 378 13,736ACTUAL LAST YEAR 20,413 13,612 6,801 7,027 4,648 1,973 406 13,386PERCENT DISTRIBUTICe 100.0 50.9 26.8 100.0 66.6 27.7 5.6PERCENT CHANGE FROM A YEAR AGO 0.1 -1.7 3.5 -4.8 -4.1 -6.0 -6.9 2.6
319350
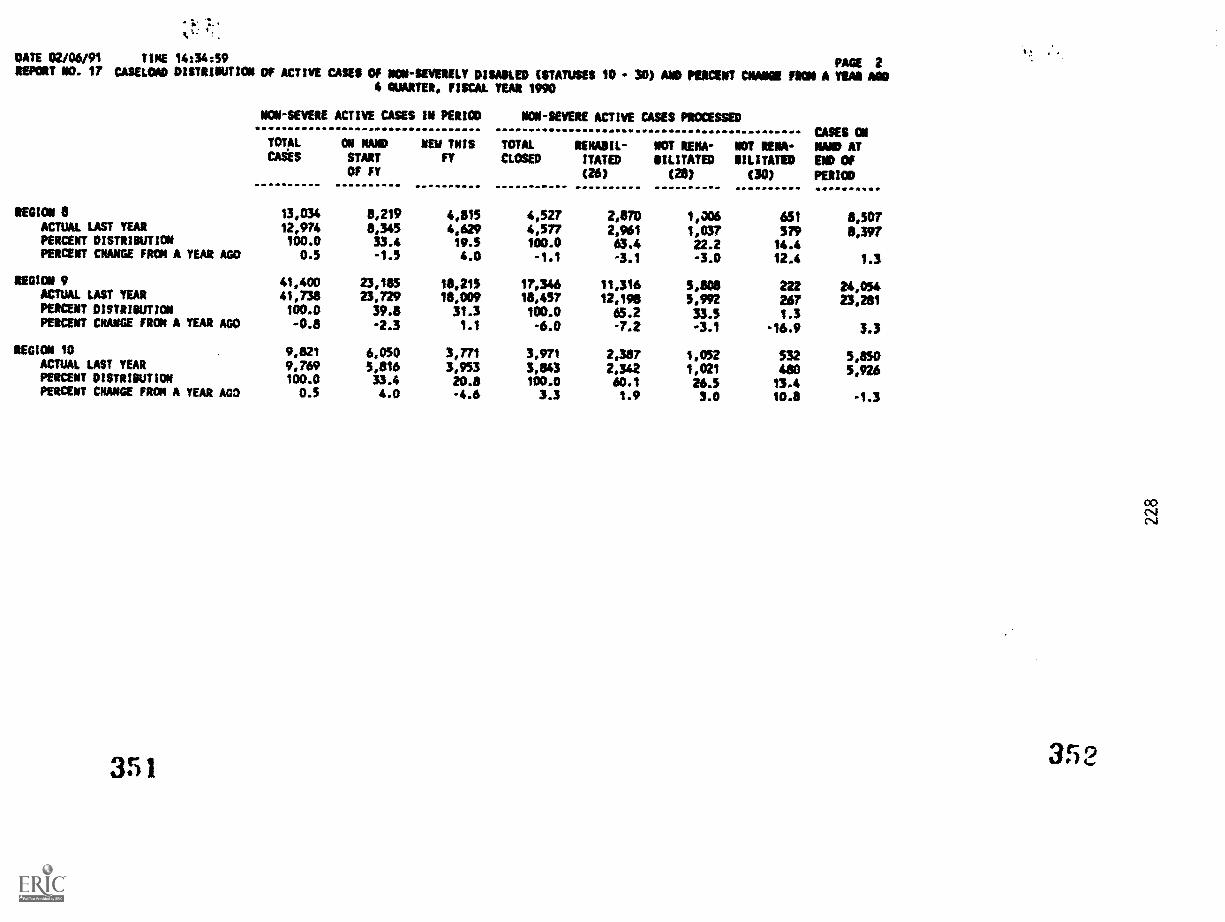
-
DATE 02/06/91 TIME 14234:59 PACE 2IMPORT NO. 17 CASELCMD DISTRIOUTION OF ACTIVE CASES OF NON-SEVERELY DISABLED EITATUSES 10 30) AND PERCENT COMO FROM A YEAR MD
4 QUARTER, FISCAL YEAR 1990
NON-SEVERE ACTIVE CASES IN PERIOD
TOTAL ON NAND NEW TNISCASES START FY
OF FT
NON-SEVERE ACTIVE CASES PROCESSED
TOTAL RENABIL- NOT RENA- NOT RENA..CLOSED ITATED VILITATED SILITATID
(26) (n) (30)
CARSONNAND ATEND OFPERIOD
REGION 8 13,034 8,219 4,815 4,527 2,170 1,006 651 8,507ACTUAL LAST YEAR 12,974 8,345 4,629 4,577 2,961 1,037 579 8,397PERCENT DISTRIBUTION 100.0 33.4 19.5 400.0 63.4 22.2 14.4PERCENT CHANGE FROM A YEAR ACC 0.5 -1.5 4.0 -1.1 -3.1 -3.0 12.4 1.3
REGION 9 41,400 23,185 11,215 17,346 11,316 59808 222 24,054ACTUAL LAST YEAR 41,738 23,729 18,009 18,457 12,190 5,992 267 23,291PERCENT DISTRIOUTION 100.0 39.8 31.3 100.0 65.2 33.5 1.3PERCENT CHANGE FROM A YEAR AGO -0.8 4.3 1.1 -6.0 -7.2 -3.1 -16.9 3.3
REGION 10 9,821 6,050 3,771 3,971 2,387 1,052 532 5,850ACTUAL LAST YEAR 9,769 5,816 3,953 3,843 2,342 1,021 480 5,926PERCENT DISTRIBUTION 100.0 33.4 20.8 100.0 60.1 26.5 13.4PERCENT CNANGE PROP A YEAR AGO 0.5 4.0 -4.6 3.3 1.9 3.0 10.8 -1.3
351 352

DATE 02/06f91 TIME 14:35:02REPORT AO. 18
PAGE 1
TOTAL AND SEVERE CASES ADD SEVERE AS PERCENT OF TOTAL ACTIVE CASELOAD (STATUSES 10 - 30)4 QUARTER, FISCAL YEAR 1990
ACTIVE CASES IN PERIOD
TOTAL
CASESOM NANDSTARTOf FY
U. S. TOTAL CASELOAD 937,951 580,402SEVERE CASELOAD 640,203 393,051
PERCENT SEVERE CW TOTAL 68.3 67.7PERCENT SEVERE Of TOTAL A YEAR AGO 67.2 66.6
GENERAL AGENCY TOTAL CASELOAD 901,870 557,017SEVERE CASELOAD 608,791 372,703PERCENT SEVERE OF TOTAL 67.5 66.9PERCENT SEVERE OF TOTAL A YEAR AGO 66.5 65.8
BLIND AGENCY TOTAL CASELOAD 36,081 23,313SEVERE CASELOAD 31,412 20,348
PESCENT SEVERE OF TOTAL 87.1 87.0PERCENT SEVERE OF TOTAL A YEAR AGO 05.2 $6.1
REGION 1 TOTAL CASELOAD 49,865 31,932SEVERE CASELOAD 39,661 24,371PERCENT SEVERE OF TOTAL 79.5 76.3PERCENT SEVERE Of TOTAL A YEAR AGO 78.1 80.1
REGIEW 2 TOTAL CASELOAD 81,866 53,813SEVERE CASELOAD 49,554 31,887PERCENT SEVERE OF TOTAL 00.5 59.3PERCENT SEVERE Of TOTAL A YEAR AGO 59.3 58.7
REGION 3 TOTAL CASELOAD 103,275 66,043MERE CASELOAD 71,845 46,035PERCENT SEVERE OF TOTAL 69.6 69.7PERCENT SEVERE Cf TOTAL A YEAR AGO 69.7 70.3
REGION 4 TOTAL CASELOAD 202,424 119,421SEVERE CASELOAD 141,375 83,216PERCENT SEVERE OF MAL 69.8 71.4PERCENT SEVERE Cf TOTAL A YEAR AGO 69.5 79.9
REGICW S TOTAL CASELOAD 158,591 102,676SEVERE CASELOAD lima 75,515
PERCENT SEVERE OF TOTAL 74.8 73.5PERCENT SEVERE OF TOTAL A YEAR AGO 73.6 73.3
mom 6 TOTAL CASELOAD 129,934 80.523SEVERE CASELOAD 91,772 54,874
PERCENT SEVERE OF TOTAL 70.6 68.1PERCENT SEVERE CW TOTAL A YEAR AGO 67.7 62.6
REGION 7 TOTAL CASELOAD 46,724 28,659SEVERE CASELOAD 26,297 15,272
PERCENT SEVERE OF TOTAL 56.3 53.3PERCENT SEVERE Of TOTAL A YEAR AGO 55.7 50.8
353
NEW TN1SFY
357,549247,152
69.168.2
344,853236,048
68.567.6
12,69611,064
87.1
83.6
17,93315,29085.374.6
28,05317,66763.060.5
37,23225,81069.366.7
83,00356,15967,767.3
55,91543,167
77.274.2
49,41136 09$ha76.2
18,06511,02561.063.1
TOTAL
CLOSED
347,480237,340
68.467.0
335,050226,914
67.766.4
ACTIVE CASES PROCESSED
RENABIL- MOT RENA-TIMED MUTATED(26) (28,30)
216,109 131,371
146,238 91,30267.7 69.566.5 68.0
206,915 128,135138,490 88,424
66.9 69.065.7 dms
CASES ONNAND AT ENDOf PERIOD
590,471
402,66368.267.3
566,820381,877
67.466.6
12,430 9,194 3,236 23,65110,626 7,748 2,871 20,78685.5 84.3 88.9 87.984.7 83.1 89.6 83.5
16,991 9,375 7,616 32,87413,912 7,735 6,177 25,74981.9 82.5 81.1 78.381.1 81.7 804 76.4
ch27,3155 17,416 9,939 54,511 04
16,519 10,567 5,932 33,03504
60.4 60.7 59.9 60.659.1 59.0 5412 59.4
39,519 23,289 16,230 63,75627,713 16,221 11,492 44,132
70.1 69.7 70.8 610.2
70.2 69.5 71.3 69.4
77,168 50,826 26,342 125,256
52,601 33,616 18,915 18,77468.2 66.1 72.1 70.968.0 66.2 71.3 70.4
56,140 32,534 23,606 102,45141,978 24,755 17,223 76,704744 76.1 73.0 74.973.0 73.9 71.6 74.0
47,130 29,296 17,834 82,80434,175 21,003 13 172 57,597
72.5 71. 733.9
641.6
69.4 69.5 69.2 66.7
17,376 11,626 5,750 29,34810,685 7,167 3,518 15,61261.5 61.6 64.2 53.259.6 60.5 57.8 53.5
354
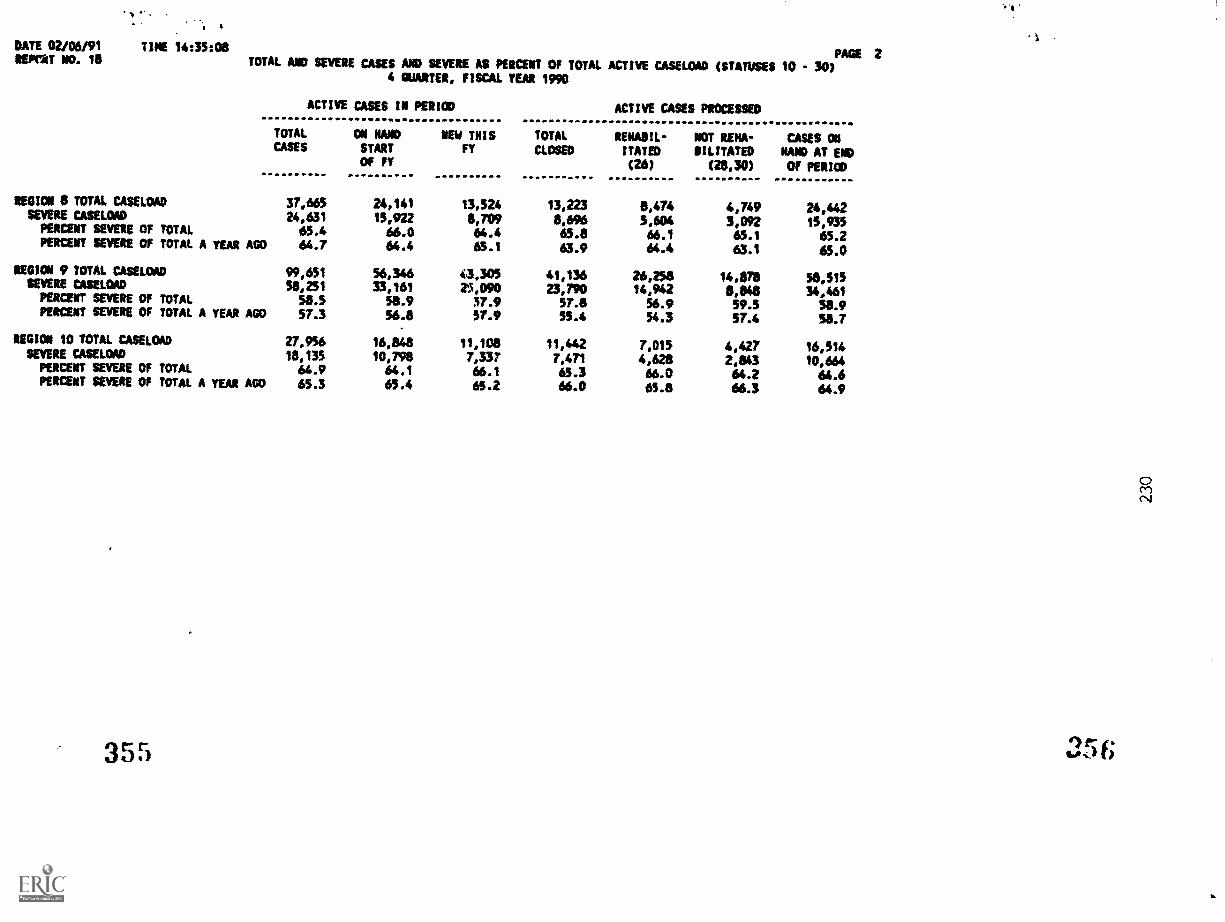
DATE 02/06/91SEPCAT MO. 18
TINE 14:35:08 PAGE 2TOTAL AND SEVERE CASES AND SEVERE AS PERCENT OW TOTAL ACTIVE CASELOAD (STATUSES 10 - 30)
4 QUARTER, FISCAL TEAR 1990
ACTIVE CASES IN PERIOD
TOTAL ON NAND NEW TNISCASES START FY
Of FY
TOTAL
CLOSED
ACTIVE CASES PROCESSED
RENABIL- MOT RENA-ITATED IMITATED(26) (28,30)
CASES OANAM AT ENDOf PERIOD
REGION 8 run CASELOAD 37,665 24,141 13,524 13,223 8,474 4,749 24,442SEVERE CASELOAD 24,631 14,922 8,709 8,696 5,604 3,092 15,935
PERCENT SEVERE OF TOTAL 64.4 66.0 64.4 0.8 66.1 65.1 65.2PERCENT SEVERE OF TOTAL A YEAR AGO 64.7 64.4 65.1 63.9 64.4 63.1 65.0
REGION 9 TOTAL CASELOAD 99,651 46,346 43,305 41,136 26,258 14,878 48,515MERE CASELOAD 58,251 33,161 25,090 23,790 14,942 8,848 34,461PERCENT SEVERE CW TOTAL 58.5 58.9 47.9 47.11 56.9 49.4 58.9PERCENT SEVERE OF TOTAL A YEAR AGO 57.3 56.8 57.9 54.4 54.3 47.4 58.7
REGION 10 TOTAL CASELOAD 27,956 16,848 11,108 11,442 7,014 4,427 16,414SEVERE CASELOAD 18,134 10,798 7,337 7,471 4,628 2,843 10,664
PERCENT SEVERE Cf TOTAL 64.9 64.1 66.1 65.3 66.0 64.2 64.6PERCENT SEVERE CW TOTAL A YEAR AGO 64.3 65.4 65.2 66.0 64.8 66.3 64.9
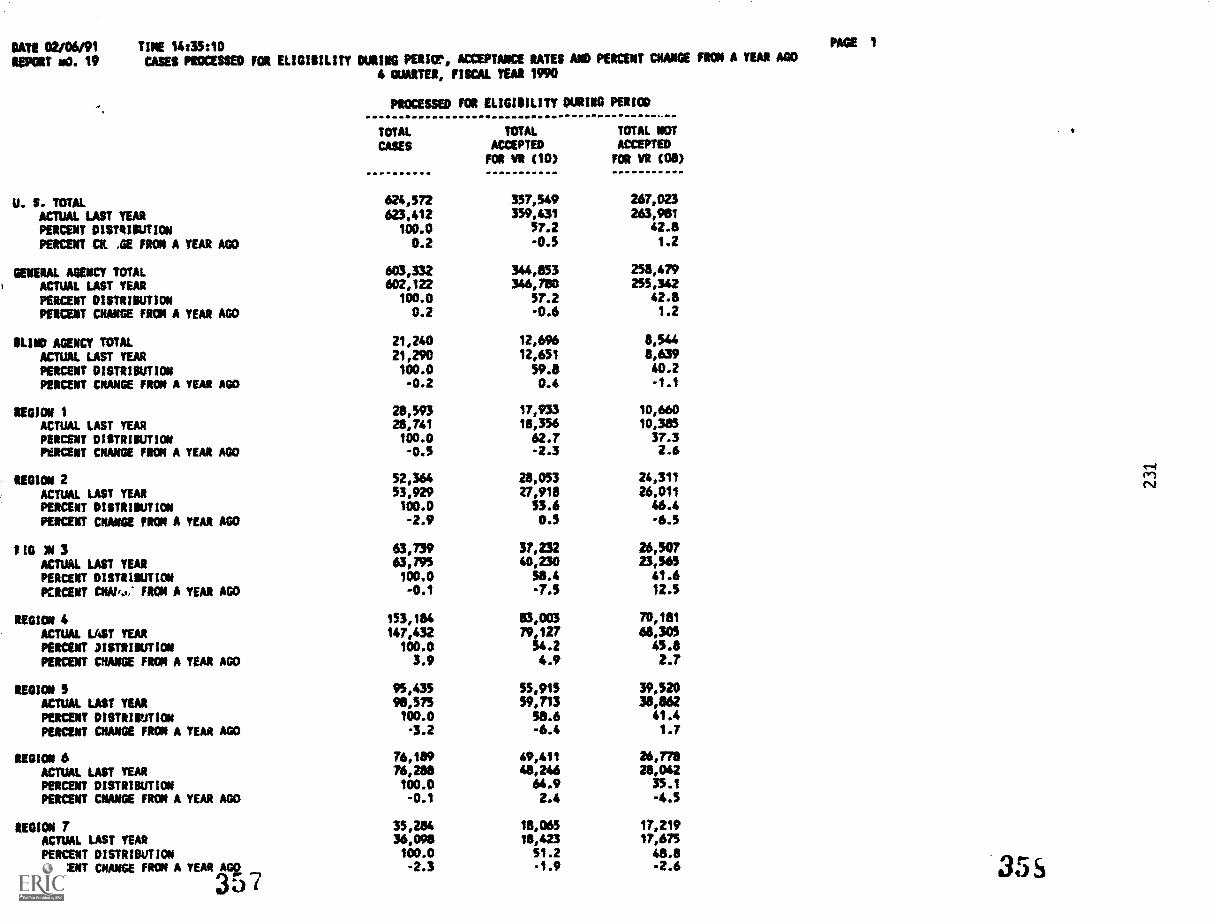
DATE 02/05/91IMPORT :10. 19
TIME 14:3500CASES PROCESSED FOR ELIGISILITY DURING PERIM`, ACCEPTANCE RATES AND PERCENT CHANGE RON A YEAR AGO
4 QUARTER, FISCAL YEAR 1990
U. S. TOTALACTUAL LAST YEARPERCENT DIST41SUTIONPERCENT CR. A FRON A YEAR AGO
GENERAL AGENCY TOTALACTUAL LAST YEARPERCENT DISTRIBUTIONPEICENT CHANGE FROM A YEAR AGO
KIND AGENCY TOTALACTUAL LAST YEARPERCENT DISTRIBUTIONPERCENT CHANGE FROM A YEAR AGO
REGION 1ACTUAL LAST YEARPERCENT DISTRIBUTIONPOCENT CHANGE FROM A YEAR AGO
REGION 2ACTUAL LAST YEARPERCENT DISTRIBUTIONPERCENT MANGE MON A YEAR AGO
PIG NI 3ACTUAL LAST YEARPERCENT DISTRIBUTIONPERCENT CNAP..,' FRON A YEAR AGO
REGION 4ACTUAL LAST YEARPERCENT MSTRIBUTIONPERCENT MANGE MON A TEAR AGO
REGION 5ACTUAL LAST YEARPERCENT DISTRISUTIONPERCENT CHARGE FROM A YEAR AGO
REGION 6ACTUAL LAST YEARPERCENT DISTRIBUTIONPERCENT MANGE FROM A YEAR AGO
REGION 7ACTUAL LAST YEARPERCENT DISTRIBUTIONPERCENT CMANGE FRON A YEAR AS
3 0 7
PROCESSED FOR ELIGISILITT DURING PERIOD
TOTAL
CASES
TOTALACCEPTEDFOR VA (10)
TOTAL NOTACCEPTEDFOR VI (08)
624,572 357,549 267,023
623,412 3159,431 263,981
100.0 57.2 42.8
0.2 -0.5 1.2
603,332 344,853 258,479602,122 346,780 255,342
100.0 57.2 42.8
0.2 -0.6 1.2
21,240 12,696 8,544
21,290 12,651 8,639
100.0 59.8 40.2
-0.2 0.4 -1.1
28,593 17,933 10,660
28,741 18,336 10,385
100.0 62.7 37.3-0.5 -2.3 2,6
52,364 28,053 24,311
53,929 27,918 26,011100.0 53.6 46.4-2.9 0.5 -6.5
63,739 37,232 26,50763,795 40,230 23,565
100.0 58.4 41.6-0.1 -7.5 12.5
153,184 83,003 70,181
147,432 79,127 68,305
100.0 54.2 45.83.9 4.9 2.7
95,435 55,915 39,52098,375 59,713 38,862100.0 58.6 41.4
-3.2 -6.4 1.7
76,189 49,411 26,77876,288 41,246 28,042100.0 64.9 35.1
-0.1 2.4 -4.5
35,284 18,065 17,21936,098 18,423 17,675
100.0 51.2 48.8-2.3 -1.9 -2.6
PAGE 1
35S
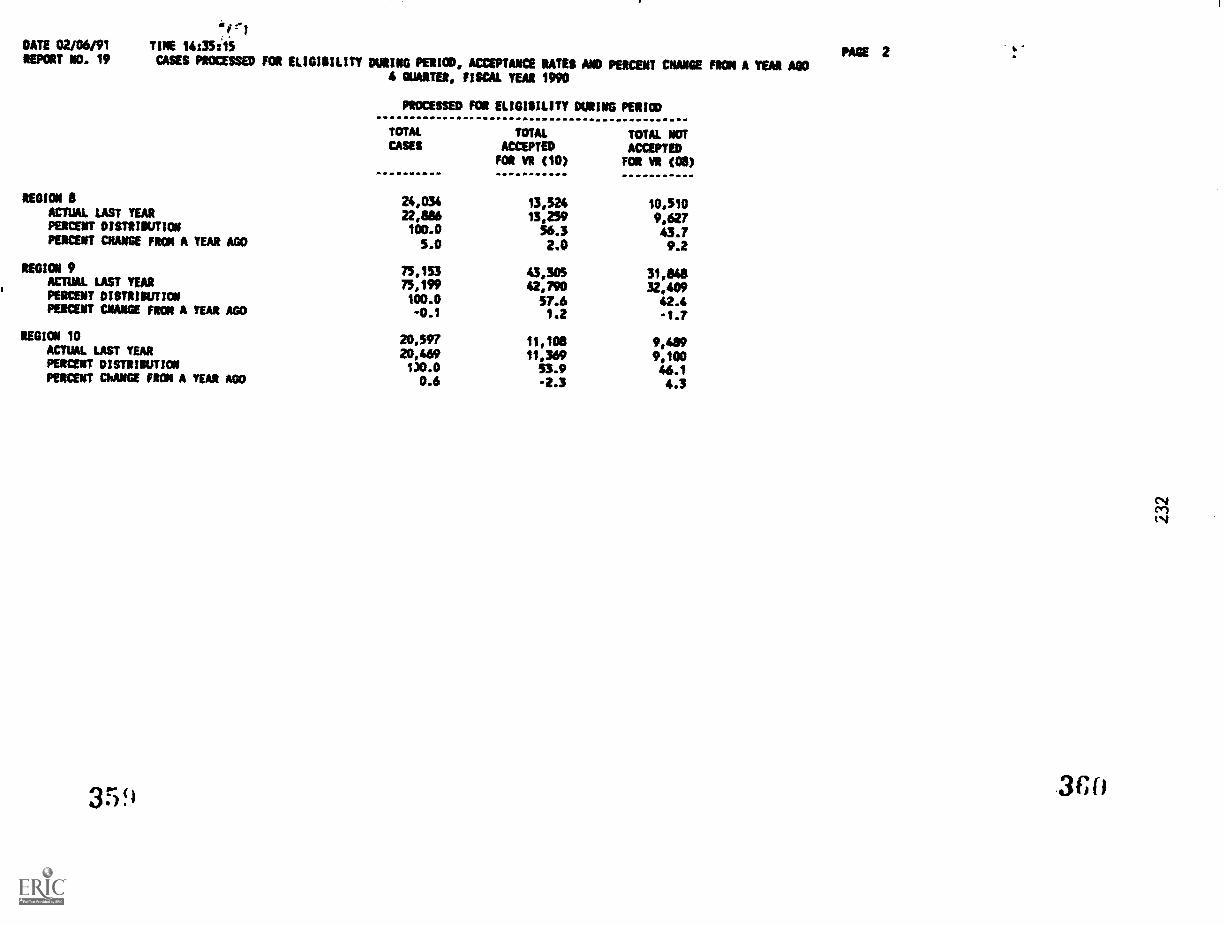
DATE 02/06/91REPORT ND. 19
af el
TINE 14:35i15
CASES PROCESSED FOR ELIGIRILITY DURING PERIOD, ACCEPTANCE RATES AND PERCENT CNANGE FRON A TEAR A004 QUARTER, FISCAL YEAR 1990
PROCESSED FOR ELIOISILITY DURING PERIOD
TOTAL TOTAL TOTAL NOTCASES ACCEPTED ACCEPTED
FOR VR (10) FOR VR (08)
REGION 8 24,034 13,524 10,510ACTUAL LAST YEAR 22,886 13,259 9,627PERCENT DISTRIOUTION 100.0 56.3 43.7PERCENT CRANE FROM A YEAR A00 5.0 2.0 9.2
REGION 9 75,153 43,305 31,846ACTUAL LAST YEAR 75,199 42,790 32,409PERCENT DISTRIBUTION 100.0 57.6 42.4PERCENT WNW FROM A YEAR AGO -0.1 1.2 - 1.7
REGION 10 20,597 11,108 9,469ACTUAL LAST YEAR 20,469 11,369 9,100PERCENT DISTRIBUTION 130.0 53.9 46.1PERCENT MANGE FRON A YEAR AGO 0.6 -2.3 4.3
3 5
PAGE 2
3 f;
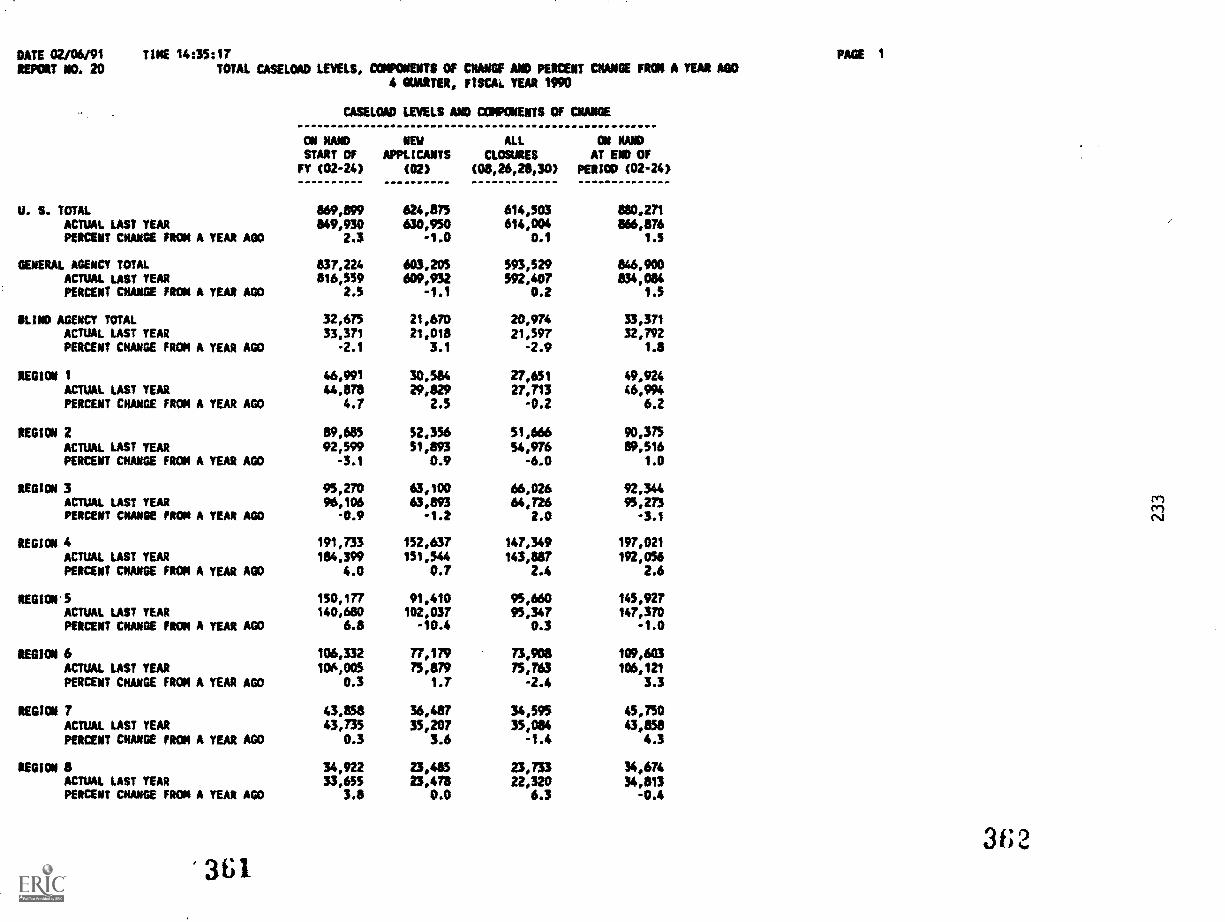
DATE 02/06/91REPORT NO. 20
TINE 14:35:17TOTAL CASELOAD LEVELS, COMPONENTS OF CRAM AND PERCENT WAGE FROM A YEAR AGO
4 QUARTER, FISCAo. YEAR 1990
CASELOAD LEVELS AND COMPONENTS Of CHANGE
ON NAND NEW ALL ON NANDSTART Of APPLICANTS CLOSURES AT END OF
FY (02-24) (02) (08,26,28,30) PERIOD (02-24)
U. S. TOTAL 869,899 624,875 614,503 880,271
ACTUAL LAST YEAR 849,930 630,950 614,004 866,876PERCENT CNANGE FROM A YEAR AGO 2.3 -1.0 0.1 1.5
GENERAL AGENCY TOTAL 837,224 603,205 593,529 846,900ACTUAL LAST YEAR 816,559 609,932 592,407 834,084PERCENT CHANGE FROM A YEAR A00 2.5 -1.1 0.2 1.5
BLIND AGENCY TOTAL 32,675 21,670 20,974 33,371ACTUAL LAST YEAR 33,371 21,018 21,597 32,792PERCENT CHANGE FROM A YEAR AGO -2.1 3.1 -2.9 1.8
REGION 1 46,991 30,584 27,651 49,924ACTUAL LAST YEAR 44,878 29,829 27,713 46,994PERCENT CHANGE FROM A YEAR AGO 4.7 2.5 -0.2 6.2
REGION 2 09,605 52.356 51,666 90,375
ACTUAL LAST YEAR 92,599 51,893 54,976 19,516PERCENT CHANGE FROM A YEAR AGO -3.1 0.9 -6.0 1.0
RUIN 3 95,270 63,100 66,026 92,344ACTUAL LAST YEAR 96,106 63,893 64,726 95,273PERCENT CNANGE FROM A YEAR AGO -0.9 -1.2 2.0 -3.1
REGION 4 191,733 152,637 147,349 197,021
ACTUAL LAST YEAR 184,399 151,544 143,887 192,056PERCENT CHANGE FROM A YEAR AGO 4.0 0.7 2.4 2.6
REGION 5 150,177 91,410 95,660 145,927ACTUAL LAST YEAR 140,680 102,037 95,347 147,370PERCENT CHANGE FROM A YEAR AGO 6.8 -10.4 0.3 -1.0
REGICQ 6 106,332 77,179 73,908 109,603
ACTUAL LAST YEAR 106,005 75,879 75,763 106,121
PERCENT CHANGE FROM A YEAR AGO 0.3 1.7 -2.4 3.3
REGION 7 43,858 36,487 34,595 45,750
ACTUAL LAST YEAR 43,735 35,207 35,084 43,858PERCENT CHANGE FROM A YEAR AGO 0.3 3.6 -1.4 4.3
REGION 8 34,922 23,485 23,733 34,674ACTLAL LAST YEAR 33,655 23,478 22,320 34,813PERCENT CHANGE FROM A YEAR AGO 3.8 0.0 6.3 -0.4
'361
PAGE 1
3f;2
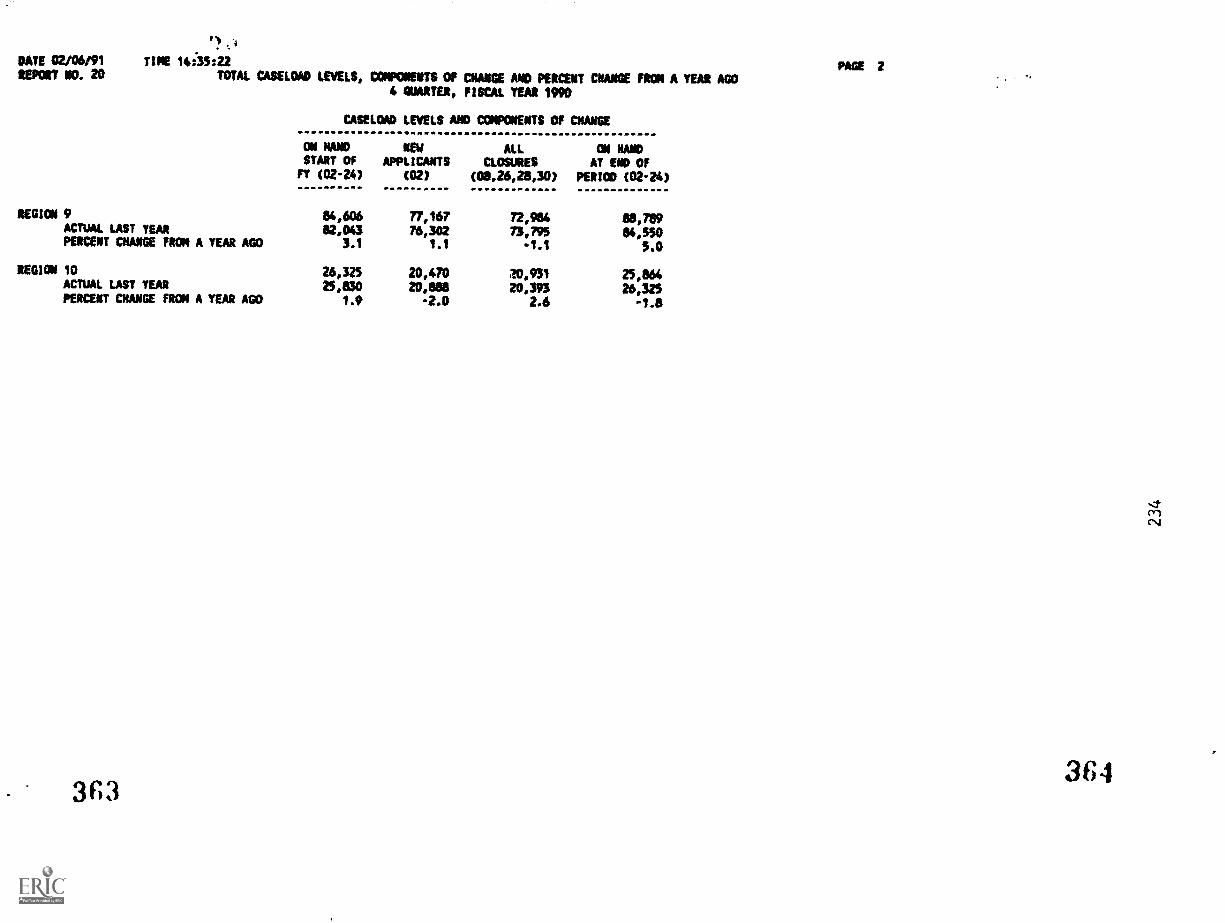
DATE 02/06191REPORT 00. 20
TIME 105:22TOTAL CASELOAD LEVELS, COMPONENTS OF CNANGE AND PERCENT CHANCE FROM A YEAR AGO
4 QUARTER, FISCAL YEAR 1990
CASELOAD LEVELS AND COMPONENTS OF CHANGE
CM NAND NEW ALL ON NANDSTART Of APPLICANTS CLOSURES AT END OFFT (02-24) (02) (00.26,20,30) PERIOD (02-24)
REGION 9 84,606 77,167 72,944 501,709ACTUAL LAST YEAR 82,043 76,302 73,795 84,550PERCENT CHANGE FROM A YEAR AGO 3.1 1.1 -1.1 5.0
REGION 10 26,325 20,470 20,931 25,864ACTUAL LAST YEAR 25,830 20,81111 20,393 26,325PERCENT CHANGE FROM A YEAR AGO 1.9 -2.0 2.6 -1.8
3 fl 3
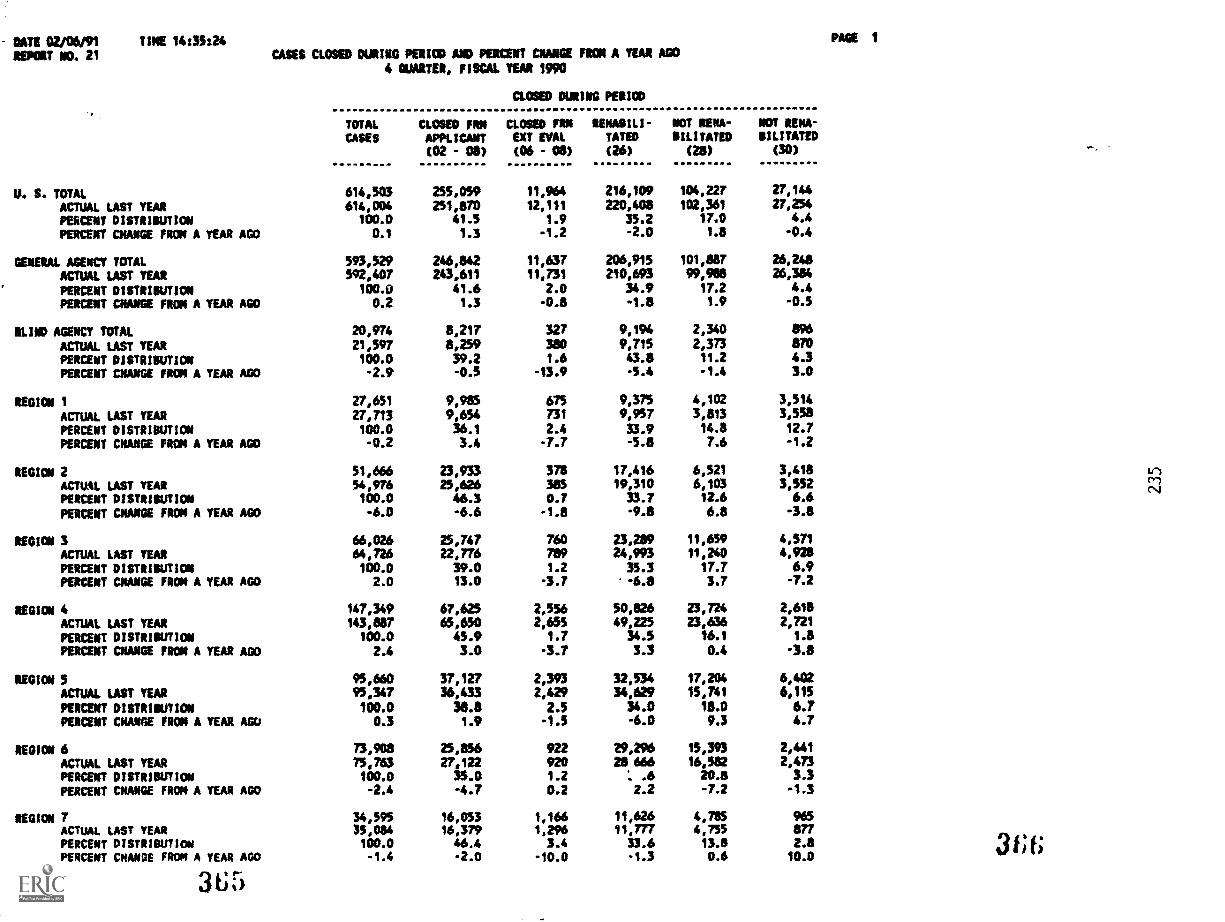
DATE 02106191 TINE 14:35:24 PAGE 1
REPORT NO. 21 CASES CLOSED DURING PERIOD AND PERCENT CRAKE FROM A YEAR AGO
4 GLUTEI, FISCAL YEAR 1990
TOTALCASES
CLOSED FRSAPPLICART(02 - 08)
CLOSED DURING PERIOD
CLOSED FRN REMABILI-EXT EVA& TATED
(06 - 08) (26)
NOT RENA-SILITATED
(28)
NOT REMA-SILITATED
(30)
U. S. TOTAL 614,503 255,050 11,964 216,109 104,227 27,144
ACTUAL LAST YEAR 614,004 251,870 12,111 220,408 102,361 27,254
PERCENT DIsTalsinlow 100.0 41.5 1.9 35.2 17.0 4.4
PERCENT CHANGE FROM A YEAR AGO 0.1 1.3 -1.2 -2.0 1.8 -0.4
GENERAL AGENCY TOTAL 593,529 246,842 11,637 206,915 101,887 26,248
ACTUAL LAST YEAR 592,407 243,611 11,731 210,693 99,988 26,384
PERCENT DISTRIBUTION 100.0 41.6 2.0 34.9 17.2 4.4
PERCENT CNANGE FROM A YEAR AGO 0.2 1.3 -0.8 -1.8 1.9 -0.5
BLIND AGENCY TOTAL 20,974 8,217 327 9,194 2,340 896
ACTUAL LAST YEAR 21,597 8,259 380 9,715 2,373 870
PERCENT DISTRIBUTION 100.0 39.2 1.6 43.8 11.2 4.3
PERCENT CMANGE FROM A YEAR AGO -2.9 -0.5 -13.9 -5.4 -1.4 3.0
REGION 1 27,651 9,985 675 9,375 4,102 3,514
ACTUAL LAST YEAR 27,713 9,654 731 9,957 3,813 3,558
PERCENT DISTRIBUTION 100.0 36.1 2.4 33.9 14.8 12.7
PERCENT GRANGE FROM A YEAR AGO -0.2 3.4 -7.7 -5.8 7.6 -1.2
REGION 2 51,666 23,933 378 17,416 6,521 3,418
ACTUAL LAST YEAR 54,976 25,626 385 19,310 6,103 3,552PERCENT DISTRISUTION 100.0 46.3 0.7 33.7 12.6 6.6
PERCENT CHANGE FROM A YEAR AGO -6.0 -6.6 -1.8 -9.8 6.8 -3.8
REGION 3 66,026 25,747 760 23,289 11,659 4,571
ACTUAL LAST YEAR 64,726 22,776 789 24,993 14,240 4,928
PERCENT DISTRISUTION 100.0 39.0 1.2 35.3 17.7 6.9PERCENT MANGE FROM A YEAR AGO 2.0 13.0 -3.7 -6.8 3.7 -7.2
REGION 4 147,349 67,625 2,556 50,826 23,724 2,618
ACTUAL LAST YEAR 143,887 65,650 2,655 49,225 23,636 2,721
PERCENT DISTRIBUTION 100.0 45.9 1.7 34.5 16.1 1.8
PERCENT CRANE FROM A YEAR AGO 2.4 3.0 -3.7 3.3 0.4 -3.8
REGION 5 95,660 37,127 2,393 32,534 17,204 6,402
ACTUAL LAST YEAR 95,347 36,433 2,429 34,629 15,741 6,115
PERCENT DISTRIBUTION 100.0 38.8 2.5 34.0 18.0 6.7PERCENT CRANE FROM A YEAR AGO 0.3 1.9 -1.5 -6.0 9.3 4.7
REGION 6 73,908 25,856 922 29,296 15,393 2,441
ACTUAL LAST YEAR 75,763 27,122 920 28 666 164582 2,473
PERCENT DISTRISUTION 100.0 35.0 1.2 : .6 20A5 3.3
PERCENT CHARGE FROM A YEAR AGO -2.4 -4.7 0.2 2.2 -7.2 -1.3
REGION 7 34,595 16,053 1,166 11,626 4,785 965ACTUAL LAST YEAR 35,084 16,379 1,296 11,777 4,755 877PERCENT DISTRIBuTION 100.0 46.4 3.4 33.6 13.8 2.8PERCENT CRANGE FMMN A YEAR AGO -1.4 -2.0 -40.0 -1.3 0.6 10.0
365
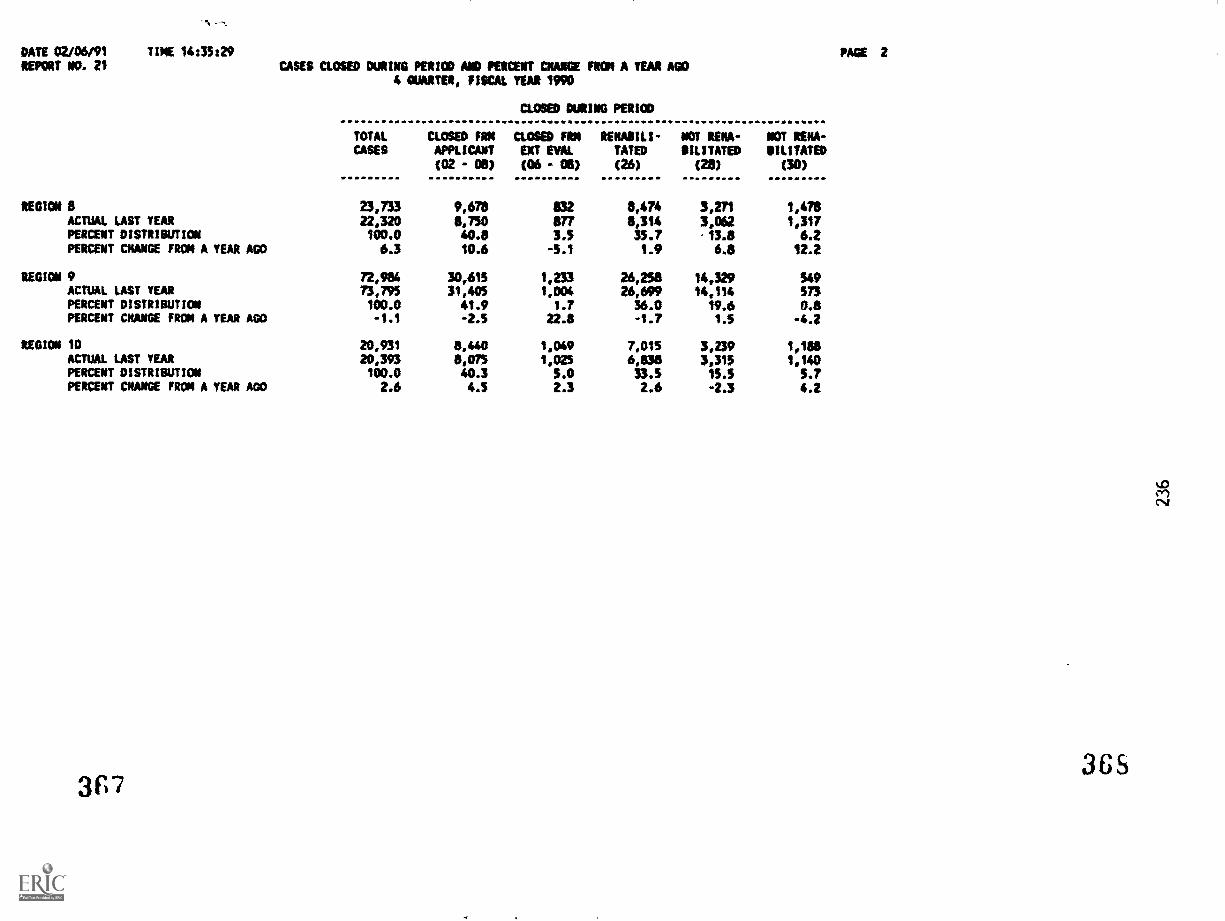
DATE 02/0091 TINE 14:35:29REPORT NO. 21 CASES CLOSED DURING PERIOD AND PERCENT CHANGE FRON A YEAR AGO
4 QUARTER, FISCAL YEAR 1990
CLOSED DURING PERIOD
TOTAL CLOSED FRA CLOSED FRN MAIM- NOT RENA-CASES APPLICANT EAT EVAL TATO OILITATED
(02 - 08) (06 - 08) (26) (28)
PAGE
NOT RENA-MUTATED
(30)
REGION 3 23,733 9,673 1132 3,474 3,271 1,473ACTUAL LAST YEAR 22,320 8,750 877 8,314 3,062 1,317PERCENT DISTRIBUTION 100.0 40.8 3.5 35.7 13.8 6.2PERCENT CANOE FRON A YEAR AGO 6.3 10.6 -5.1 1.9 6.8 12.2
REGION 9 72,984 30,615 1,233 26,258 14,329 549ACTUAL LAST YEAR 73,795 31,445 1,004 26,699 14,114 573PERCENT DISTRIBUTION 100.0 41.9 1.7 36.0 19.6 0.8PERCENT CHANGE FRON A YEA* AGO -1.1 -2.5 22.8 -1.7 1.5 -4.2
REGION 10 20,931 8,440 1,049 7,015 3,239 1,188ACTUAL LAST YEAR 20,393 8,075 1,025 6,11118 3,315 1,140PERCENT DISTRIBUTION 100.0 40.3 5.0 33.5 15.5 5.7PERCENT CHANGE FROM A YEAR AGO 2.6 4.5 2.3 2.6 -2.3 4.2
317
2
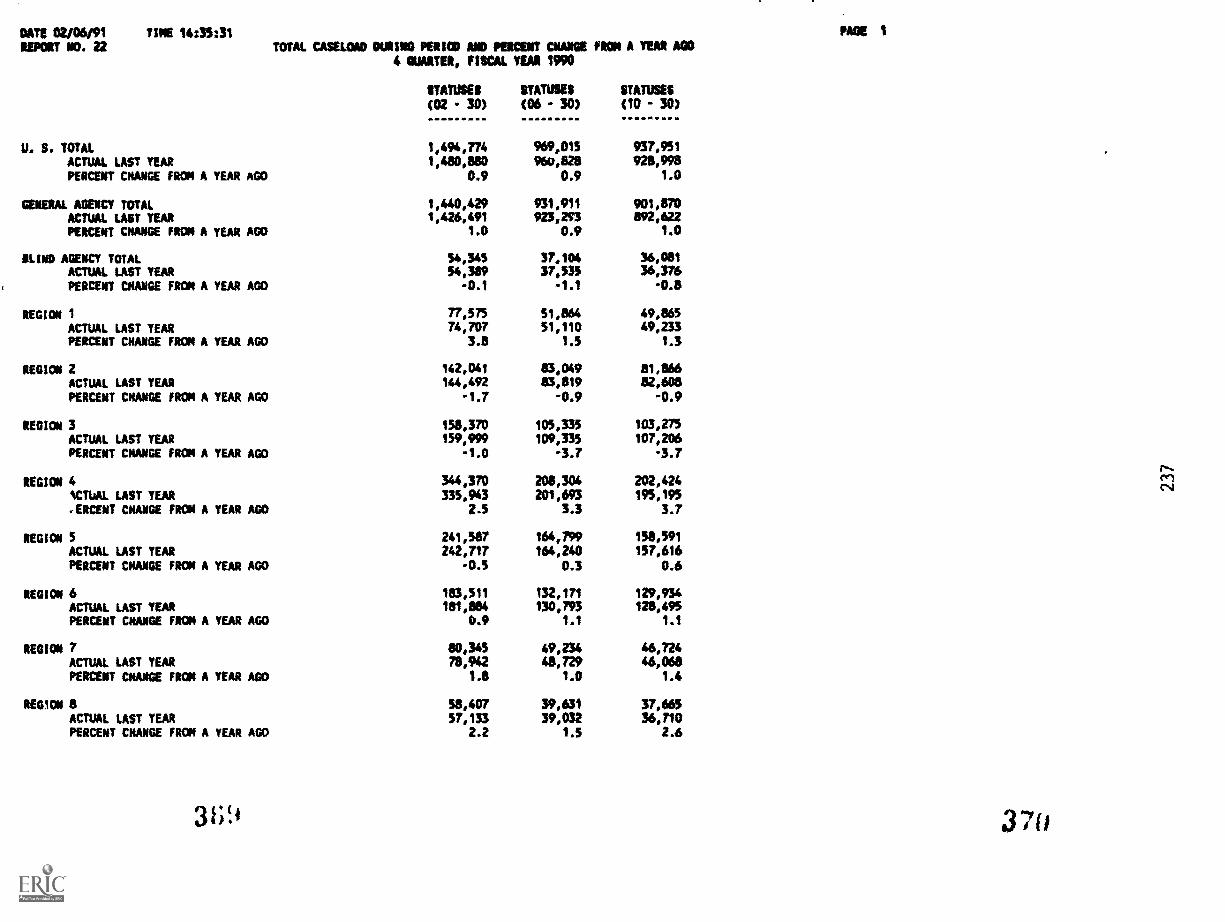
DATE 02/06/91 TIME 14:35:31
REPORT NO. 22 TOTAL CASELOAD DURING me AND PERCENT NAME FROM A YEAR A004 QUARTER, FISCAL YEAR 1990
STATUSES STATUSES STATUSES
(02 - 30) (06 - 30) (10 - 30)
U. S. TOTAL 1,494,774 969,015 937,951
ACTUAL LAST YEAR 1,480,880 960,828 928,998PERCENT CHANGE FROM A YEAR AGO 0.9 0.9 1.0
GENERAL AGENCY TOTAL 1,440,429 934,914 901,870ACTUAL LAST YEAR 1,426,491 923,293 892,622PERCENT CHANGE FEIN A YEAR AGO 1.0 0.9 1.0
KIND AGENCY TOTAL 54,345 37,104 36,081ACTUAL LAST YEAR 54,319 37,535 36,376PERCENT CHANGE FROM A YEAR AGO -0.1 -1.1 -0.8
REGION 1 77,515 51,864 49,865ACTUAL LAST YEAR 74,707 51,110 49,233PERCENT CHANGE FROM A YEAR AGO 3.8 1.5 1.3
REGION 2 142,041 83,049 81,866ACTUAL LAST YEAR 144,492 83,819 82,608PERCENT MANGE FROM A YEAR AGO -1.7 -0.9 -0.9
REGION 3 158,370 105,335 103,275
ACTUAL LAST YEAR 159,999 109,335 107,206PERCENT CHANGE FROM A YEAR AGO -1.0 -3.7 -3.7
REGION 4 344,370 208,304 202,424CTUAL LAST YEAR 335,943 201,693 195,195.-ERCENT CHANGE FROM A YEAR AGO 2.5 3.3 3.7
REGION 5 241,587 164,799 158,591ACTUAL LAST YEAR 242,717 164,240 157,616
PERCENT DIANE FROM A YEAR AGO -0.5 0.3 0.6
REGION 6 183,511 132,171 129,934ACTUAL LAST YEAR 181,884 130,793 128,495PERCENT CHANGE FROM A YEAR AGO 0.9 1.1 1.1
REGION 7 80,345 49,234 46,724ACTUAL LAST YEAR 78,942 48,729 46,068PERCENT CHANGE FROM A YEAR AGO 1.8 1.0 1.4
REGION 8 58,407 39,634 37,665ACTUAL LAST YEAR 57,133 39,032 36,710PERCENT CHANGE FROM A YEAR AGO 2.2 1.5 2.6
369
PAGE
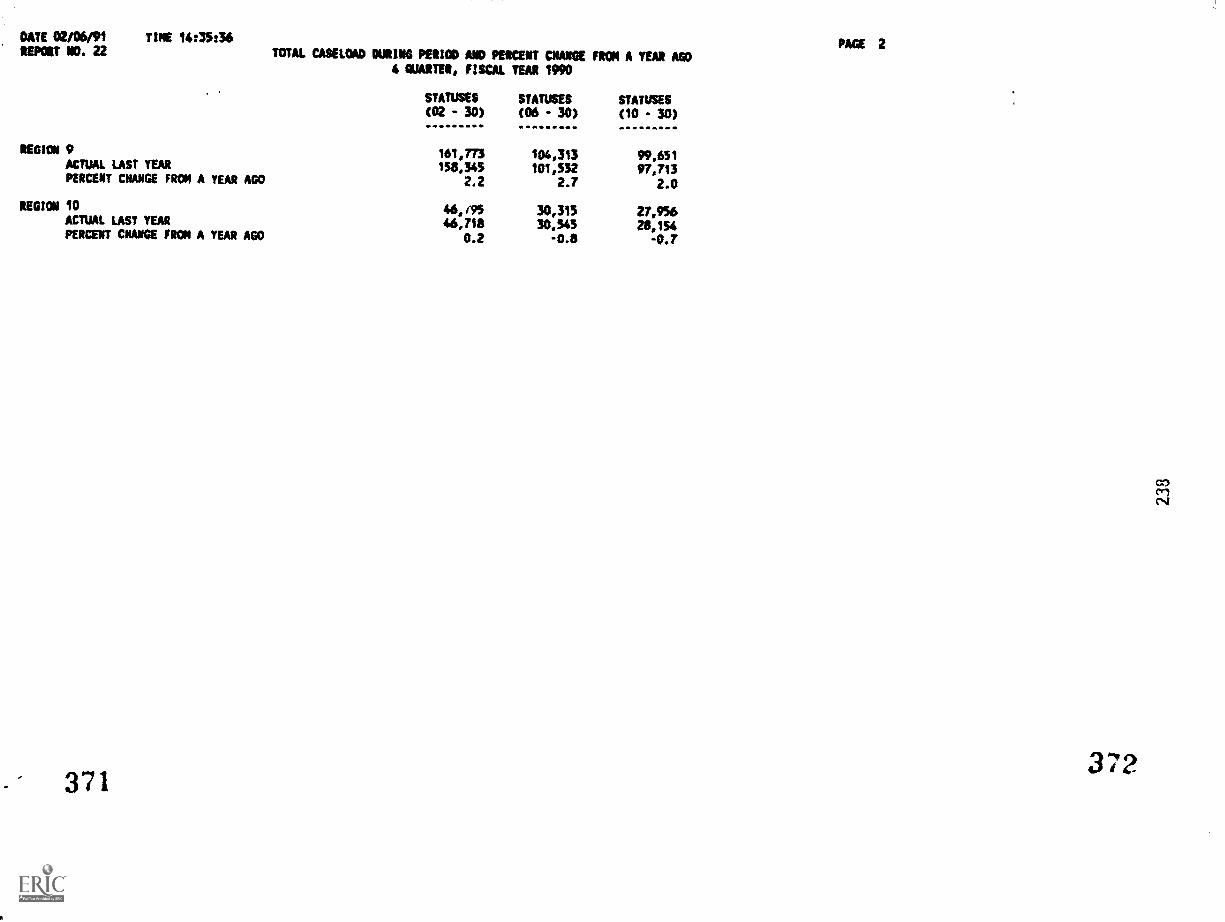
DATE 02/06/91 TIME 14:35:36REPORT ND. 22
PA( E 2TOTAL CASELOAD DURING PERIOD AND PERCENT CRAM FROM A YEAR AGO
4 QUARTER, FISCAL TEAR 1990
STATUSES STATUSES STATUSES(02 - 30) (08 - 30) (10 - 30)
REGION 9 161,773 104,313 99,651ACTUAL LAST YEAR 158,345 101,532 97,713PERCENT CHANGE FROM A YEAR AGO 2.2 2.7 2.0
REGION 10 46, #95 30,315 27,956ACTUAL LAST YEAR 46,718 30,545 28,154PERCENT CHANGE FRCM A YEAR AGO 0.2 -0.8 -0.7
371
Characteristics of Persons Rehabilitatedand Reasons for Closure
373
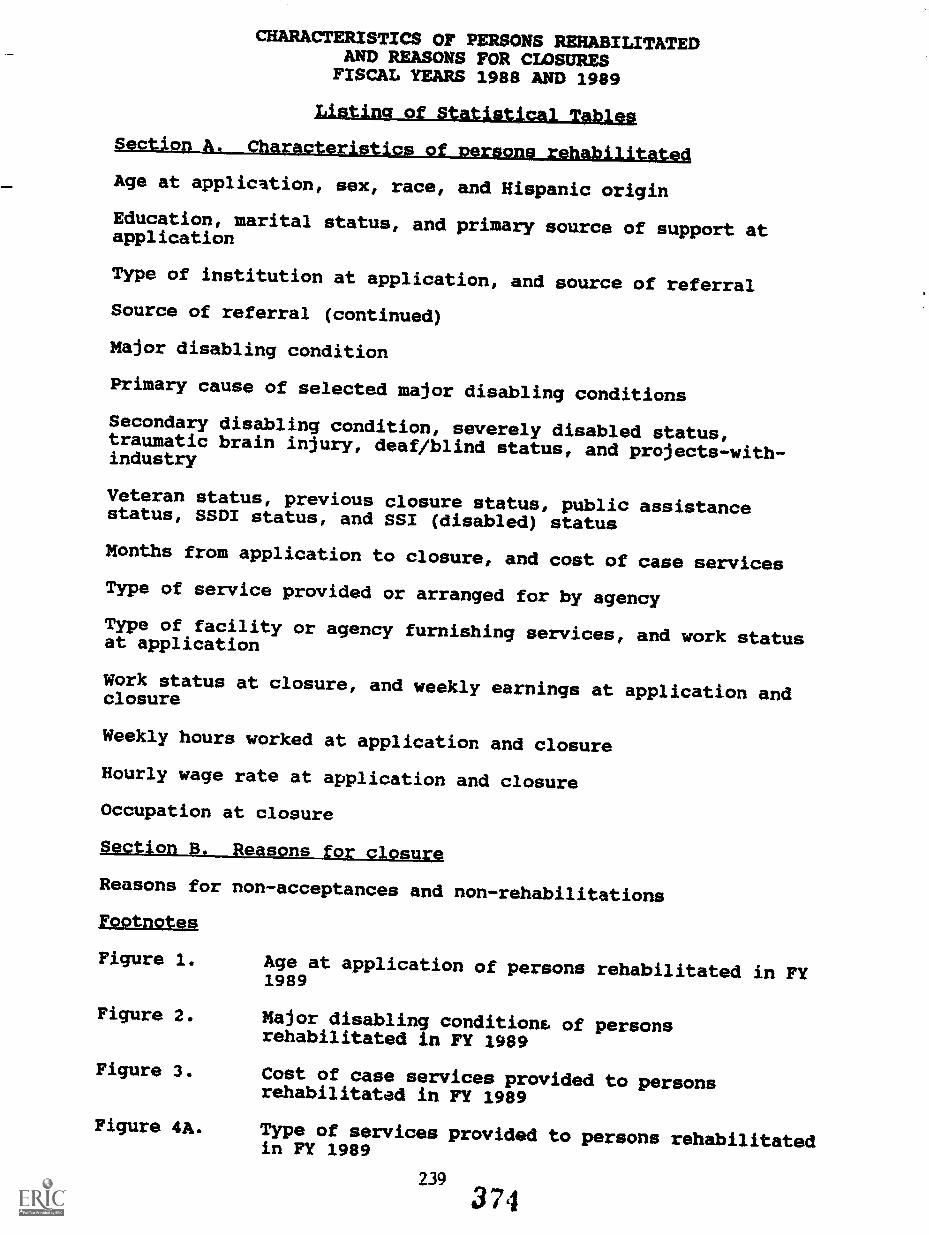
CHARACTERISTICS OF PERSONS REHABILITATEDAND REASONS FOR CLOSURESFISCAL YEARS 1988 AND 1989
lasting of StatistIcal Tables
?faction A. Characteristic* of persons rehabilitate4
Age at application, sex, race, and Hispanic origin
Education, marital status, and primary source of support atapplication
Type of institution at application, and source of referral
Source of referral (continued)
Major disabling condition
Primary cause of selected major disabling conditions
Secondary disabling condition, severely disabled status,traumatic brain injury, deaf/blind status, and projects-with-industry
Veteran status, previous closure status, public assistancestatus, SSDI status, and SSI (disabled) status
Months from application to closure, and cost of case services
Type of service provided or arranged for by agency
Type of facility or agency furnishing services, and work statusat application
Work status at closure, and weekly earnings at application andclosure
Weekly hours worked at application and closure
Hourly wage rate at application and closure
Occupation at closure
Section B. Reasons for closgre
Reasons for non-acceptances and non-rehabilitations
Favtnotes
Figure 1. Age at application of persons rehabilitated in FY1989
Figure 2. Major disabling conditions of personsrehabilitated in FY 1989
Figure 3. Cost of case services provided to personsrehabilitated in FY 1989
Figure 4A. Type of services provided to persons rehabilitatedin FY 1989
239
374
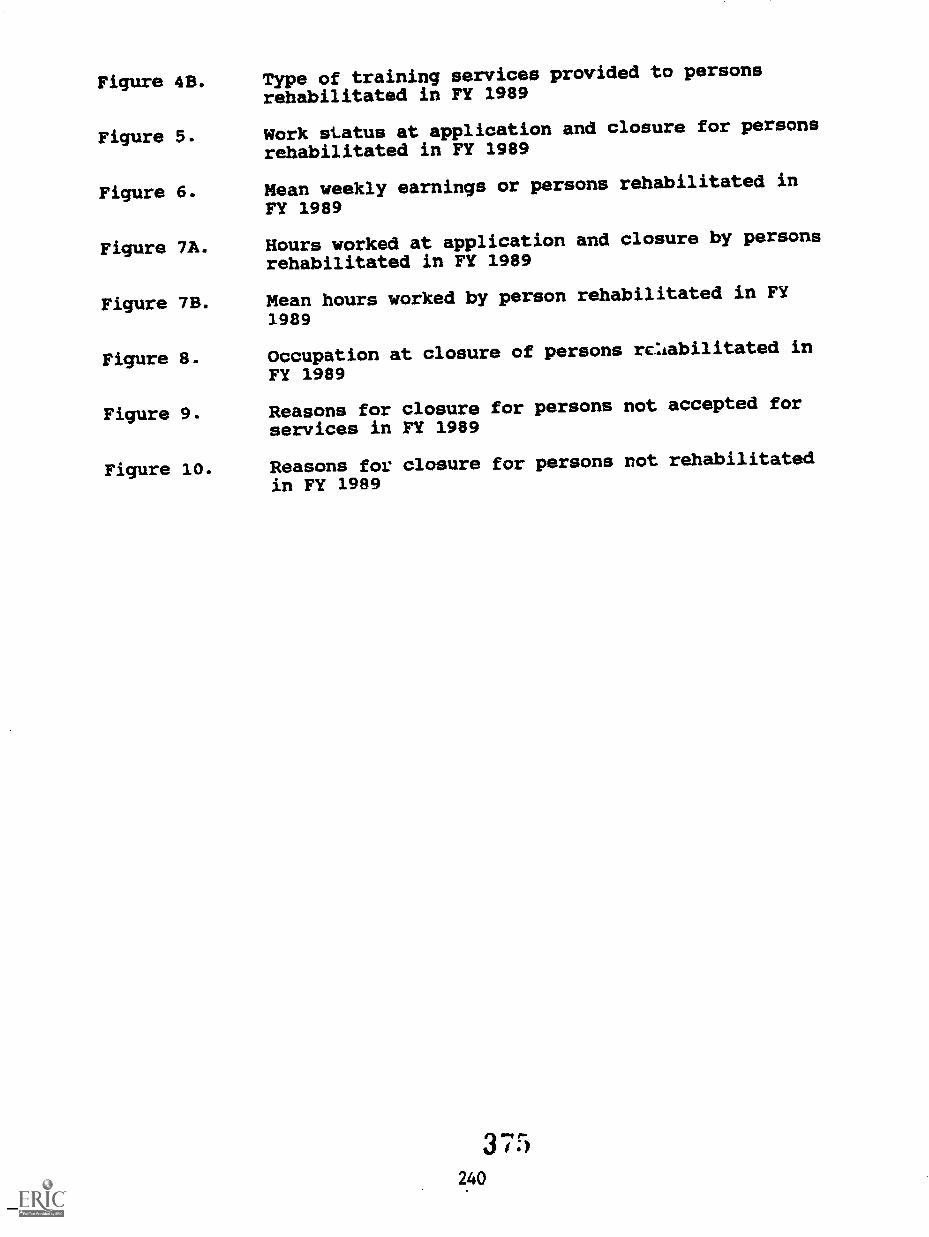
Figure 4B. Type of training services provided to personsrehabilitated in FY 1989
Figure 5. Work status at application and closure for personsrehabilitated in FY 1989
Figure 6. Mean weekly earnings or persons rehabilitated in
FY 1989
Figure 7A. Hours worked at application and closure by personsrehabilitated in FY 1989
Figure 7B. Mean hours worked by person rehabilitated in FY
1989
Figure 8. Occupation at closure of persons re.labilitated in
FY 1989
Figure 9. Reasons for closure for persons not accepted forservices in FY 1989
Figure 10. Reasons for closure for persons not rehabilitated
in FY 1989
375240
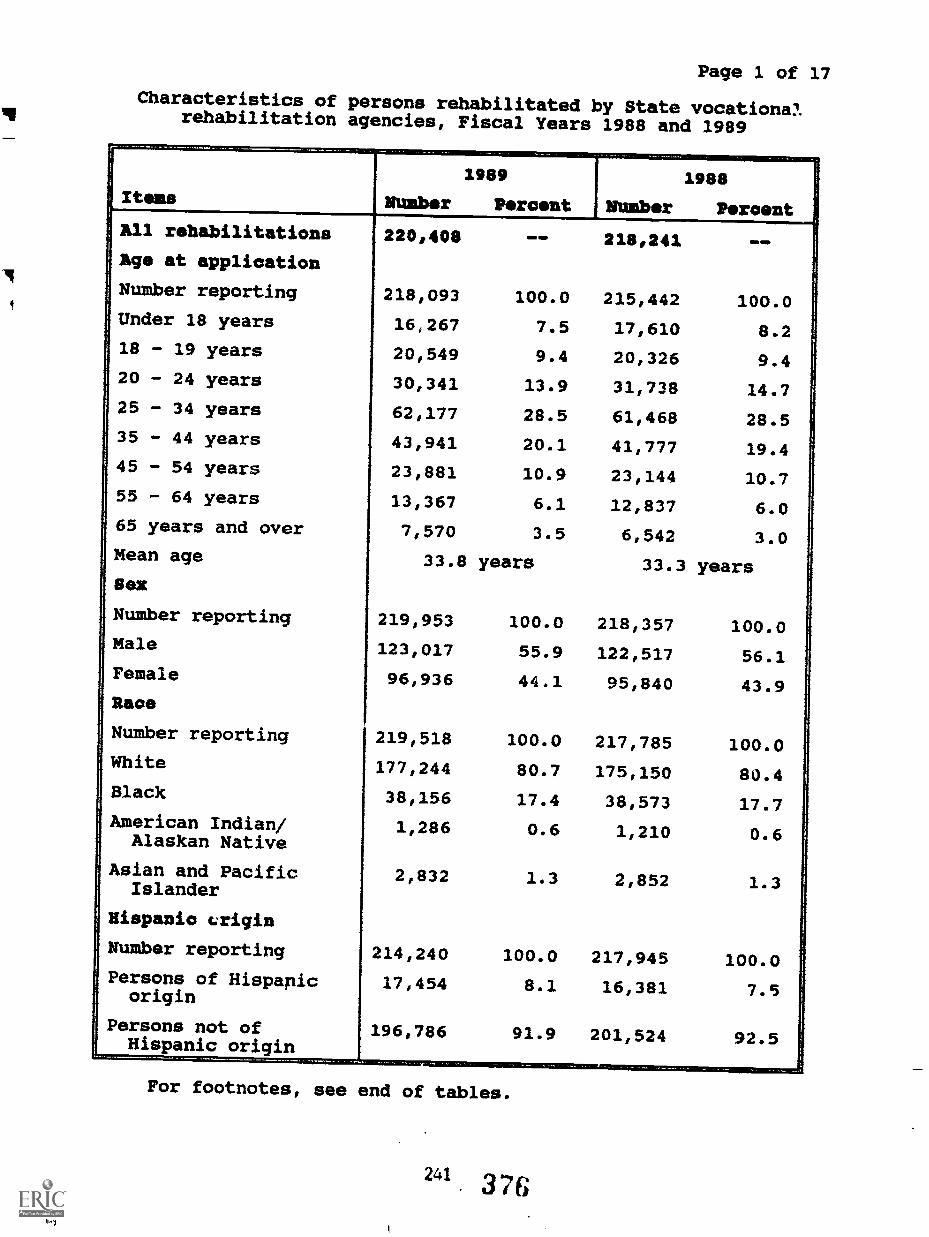
0,1
Page 1 of 17
Characteristics of persons rehabilitated by State vocationalrehabilitation agencies, Fiscal Years 1988 and 1989
r-
Items Number
1989
Percent Number
1988
PercentAll rehabilitations 220,408 NM NM 218,241 GO MR
Age at application
Number reporting 218,093 100.0 215,442 100.0Under 18 years 16,267 7.5 17,610 8.218 - 19 years 20,549 9.4 20,326 9.420 - 24 years 30,341 13.9 31,738 14.725 - 34 years 62,177 28.5 61,468 28.535 - 44 years 43,941 20.1 41,777 19.445 - 54 years 23,881 10.9 23,144 10.755 - 64 years 13,367 6.1 12,837 6.065 years and over 7,570 3.5 6,542 3.0Mean age 33.8 years 33.3 years8ex
Number reporting 219,953 100.0 218,357 100.0Male 123,017 55.9 122,517 56.1Female 96,936 44.1 95,840 43.9Race
Number reporting 219,518 100.0 217,785 100.0White 177,244 80.7 175,150 80.4Black 38,156 17.4 38,573 17.7American Indian/ 1,286 0.6 1,210 0.6Alaskan Native
Asian and Pacific 20832 1.3 2,852 1.3Islander
Hispanic vrigin
Number reporting 2140240 100.0 217,945 100.0Persons of Hispanicorigin
17,454 8.1 16,381 7.5
Persons not of 196,786 91.9 201,524 92.5Hispanic origin
For footnotes, see end of tables.
241 376
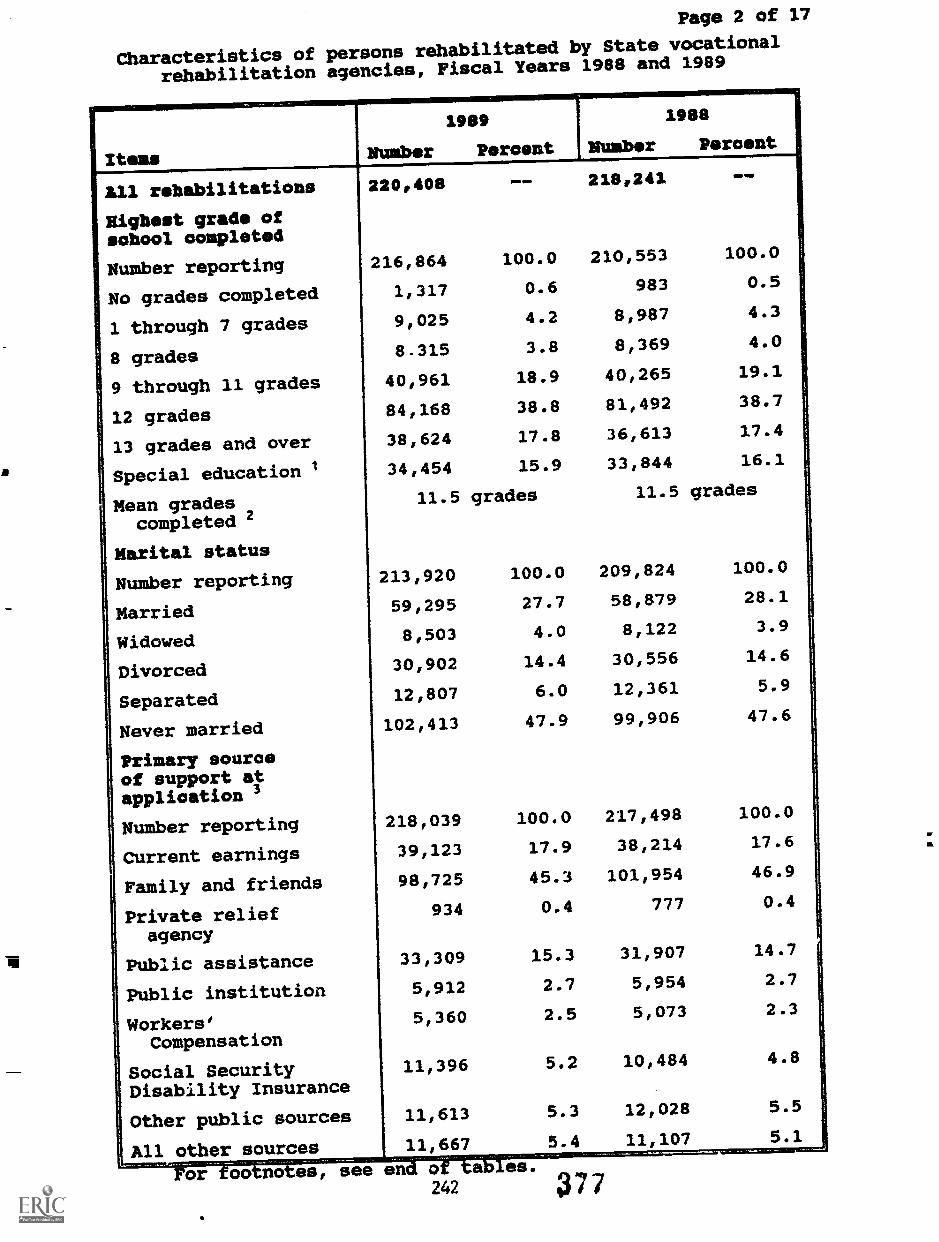
Page 2 of 17
Characteristics of persons rehabilitated by State vocational
rehabilitation agencies, Fiscal Years 1988 and 1989
Items Number
1989
Percent Number
1988
Percent
All rehabilitations
Nighoot grade ofschool completed
Number reporting
No grades completed
1 through 7 grades
8 grades
9 through 11 grades
12 grades
13 grades and over
Special education
Mean gradescompleted 2
Marital status
220,408
216,864 100.0
1,317 0.6
9,025 4.2
8.315 3.8
40,961 18.9
84,168 38.8
38,624 17.8
34,454 15.9
11.5 grades
218,241
210,553 100.0
983 0.5
8,987 4.3
8,369 4.0
40,265 19.1
81,492 38.7
36,613 17.4
33,844 16.1
11.5 grades
Number reporting 213,920 100.0 209,824 100.0
Married 59,295 27.7 58,879 28.1
Widowed 8,503 4.0 8,122 3.9
Divorced 30,902 14.4 30,556 14.6
Separated 12,807 6.0 12,361 5.9
Never married 102,413 47.9 99,906 47.6
Primary sourceof support atapplication 3
Number reporting 218,039 100.0 217,498 100.0
Current earnings 39,123 17.9 38,214 17.6
Family and friends 98,725 45.3 101,954 46.9
Private reliefagency
934 0.4 777 0.4
Public assistance 33,309 15.3 31,907 14.7
Public institution 5,912 2.7 5,954 2.7
Workers' 5,360 2.5 5,073 2.3
Compensation
Social Security 11,396 5.2 10,484 4.8
Disability Insurance
Other public sources 11,613 5.3 12,028 5.5
All other sources 11,667 5.4 11 107 5.1
For oo no es, see en242
es.37 7
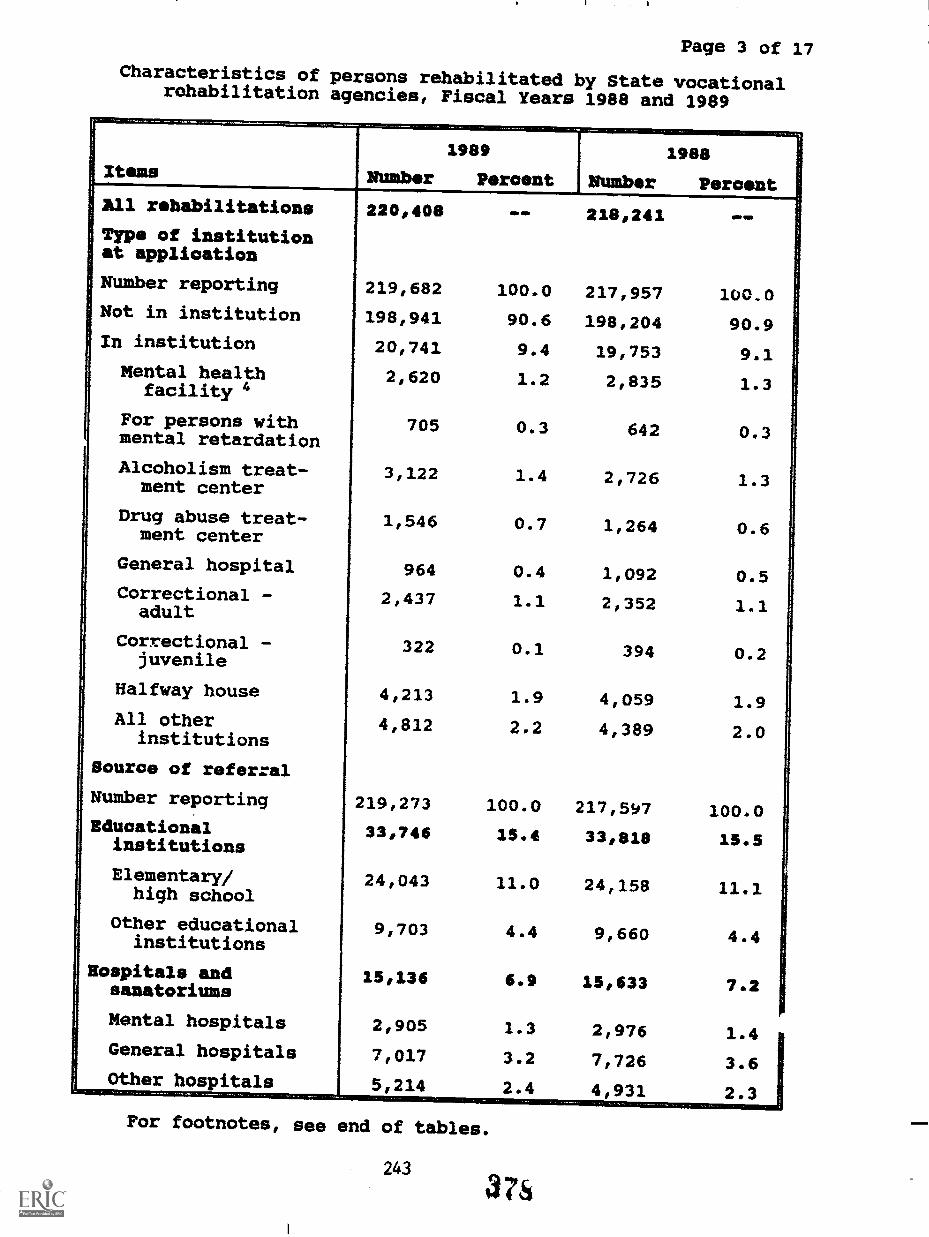
Page 3 of 17
Characteristics of persons rehabilitated by State vocationalrehabilitation agencies, Fiscal Years 1988 and 1989
Items1989
EUmber Percent
All rehabilitations
Type of institutionat application
NUmber reporting
Not in institution
In institution
Mental healthfacility"
For persons withmental retardation
Alcoholism treat-ment center
Drug abuse treat-ment center
General hospital
Correctional -adult
Correctional -juvenile
Halfway house
All otherinstitutions
Source of referral
Number reporting
Educationalinstitutions
Elementary/high school
Other educationalinstitutions
Kospitals andsanatoriums
Mental hospitals
General hospitals
Other hospitals
220,408
219,682
198,941
20,741
2,620
100.0
90.6
9.4
1.2
705 0.3
3,122 1.4
1,546 0.7
964 0.4
2,437 1.1
322 0.1
4,213 1.9
4,812 2.2
100.0
15.4
11.0
4.4
6.9
2,905 1.3
7,017 3.2
5 214 2.4
378
219,273
33,746
24,043
9,703
15,136
For footnotes, see end of tables.
243
1988
NUmber Percent
218,241 MI INV
217,957 100.0
198,204 90.9
19,753 9.1
2,835 1.3
642 0.3
21726 1.3
1,264 0.6
1,092 0.5
2,352 1.1
394 0.2
41059 1.9
4,389 2.0
217,597 100.0
33,818 15.5
24,158 11.1
9,660 4.4
13,633 7.2
2,976 1.4
7,726 3.6
4 931 2.3
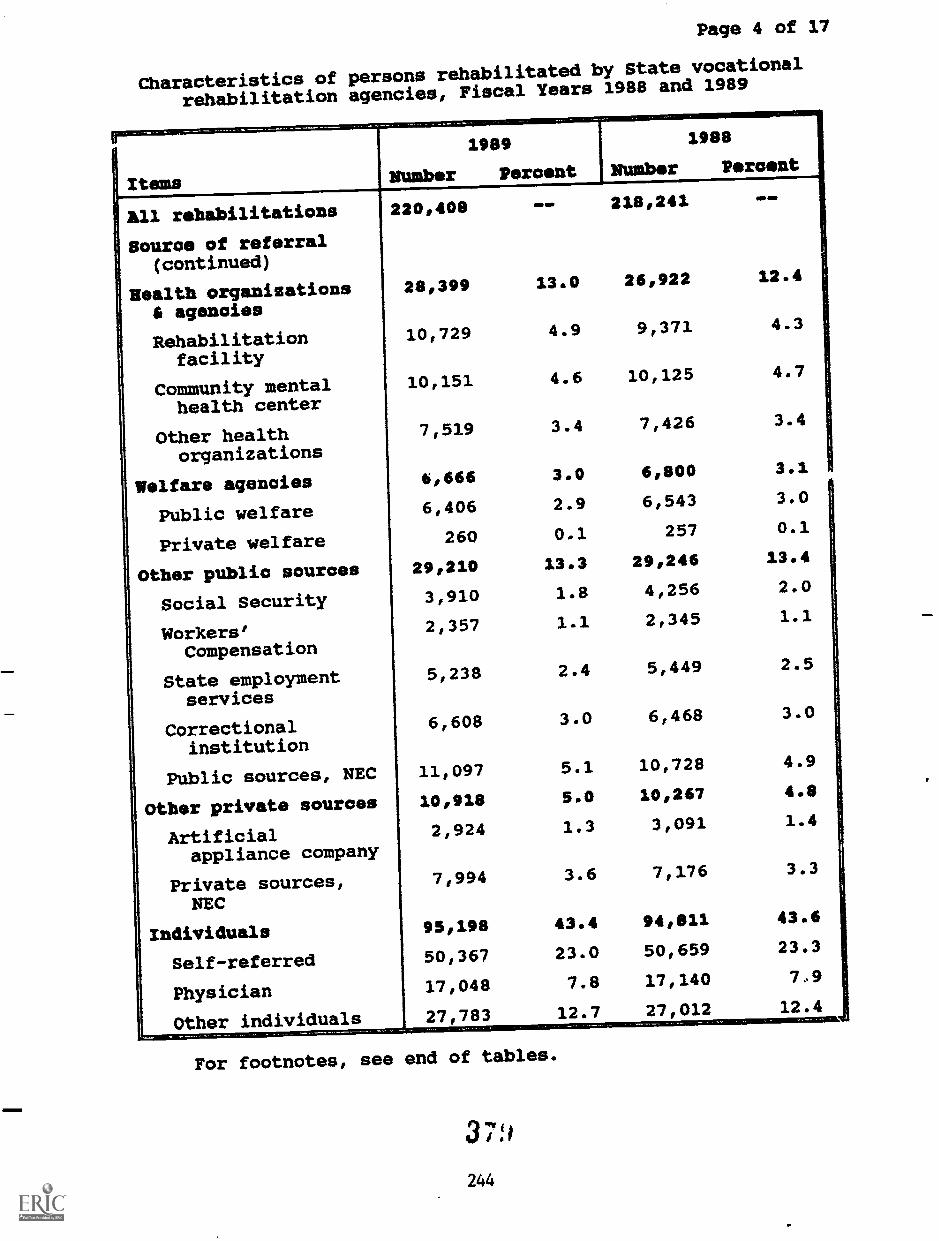
Page 4 of 17
Characteristics of persons rehabilitated by State vocational
rehabilitation agencies, Fiscal Years 1988 and 1989
1989 1988
Items Number Percent NUmber Percent
All rehabilitations 220,408 =PIM 218,241 11111.
Source of referral(continued)
Wealth organizations 28,399 13.0 26,922 12.4
6 agencies
Rehabilitationfacility
10,729 4.9 9,371 4.3
Community mentalhealth center
10,151 4.6 10,125 4.7
Other healthorganizations
7,519 3.4 7,426 3.4
Welfare agencies 6/666 3.0 6,800 3.1
Public welfare 6,406 2.9 6,543 3.0
Private welfare 260 0.1 257 0.1
Other public sources 29,210 13.3 29,246 13.4
Social Security 3,910 1.8 4,256 2.0
Workers' 2,357 1.1 2,345 1.1
Compensation
State employmentservices
5,238 2.4 5,449 2.5
Correctionalinstitution
6,608 3.0 6,468 3.0
Public sources, NEC 11,097 5.1 10,728 4.9
Other private sources 10,918 5.0 10/267 4.8
Artificialappliance company
2,924 1.3 3,091 1.4
Private sources, 7,994 3.6 7,176 3.3
NEC
Individuals 95,198 43.4 94,811 43.6
Self-referred 50,367 23.0 50,659 23.3
Physician 17,048 7.8 17,140 7,9
Other individuals 27,783 12.7 27,012 12.4
For footnotes, see end of tables.
379244
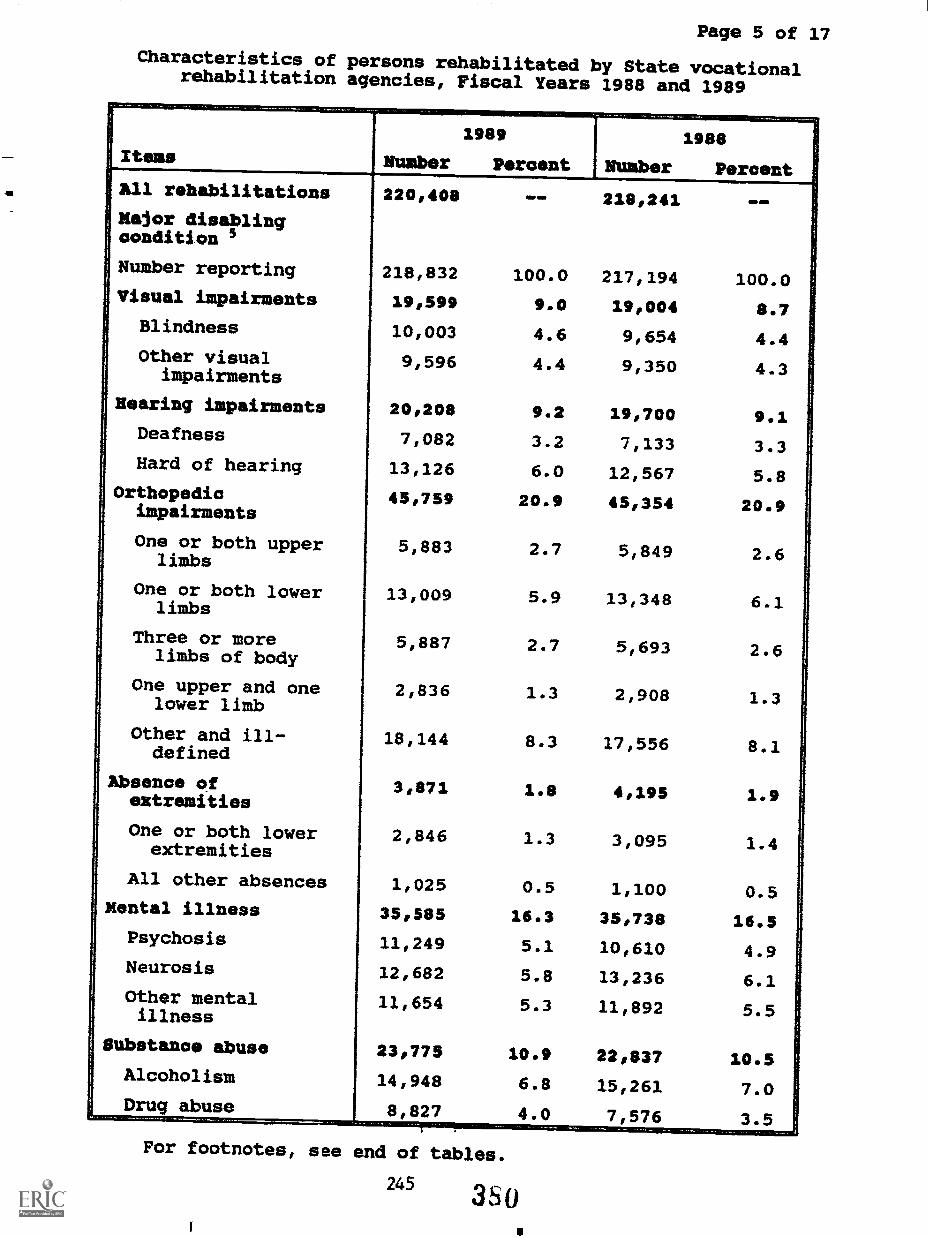
Page 5 of 17
Characteristics of persons rehabilitated by State vocationalrehabilitation agencies, Fiscal Years 1988 and 1989
1989 1988Items MUmber Percent MUmber PercentAll rehabilitations 220,408 MP SR 218,241Major disablingconditions
Number reporting 218,832 100.0 217,194 100.0Visual impairments 19,599 9.0 19,004 8.7
Blindness 10,003 4.6 9,654 4.4Other visual
impairments9,596 4.4 9,350 4.3
Hearing impairments 20,208 9.2 19,700 9.1Deafness 70082 3.2 7,133 3.3Hard of hearing 13,126 6.0 12,567 5.8
Orthopedicimpairments
45,759 20.9 43,334 20.9
One or both upperlimbs
5,883 2.7 51849 2.6
One or both lowerlimbs
13,009 5.9 13,348 6.1
Three or morelimbs of body
5,887 2.7 5,693 2.6
One upper and onelower limb
2,836 1.3 20908 1.3
Other and ill-defined
18,144 8.3 171556 8.1
Absence ofextremities
3,871 1.8 4,195 1.9
One or both lowerextremities
2,846 1.3 31095 1.4
All other absences 10025 0.5 1,100 0.5Mental illness 35,383 16.3 35,738 16.3
Psychosis 11,249 5.1 10,610 4.9Neurosis 12,682 5.8 13,236 6.1Other mentalillness
11,654 5.3 110892 5.5
Substance abuse 23,775 10.9 22,837 10.5Alcoholism 14,948 6.8 15,261 7.0Drug abuse 8,827 4.0 7 576 3.5
For footnotes, see end of tables.
245 3so
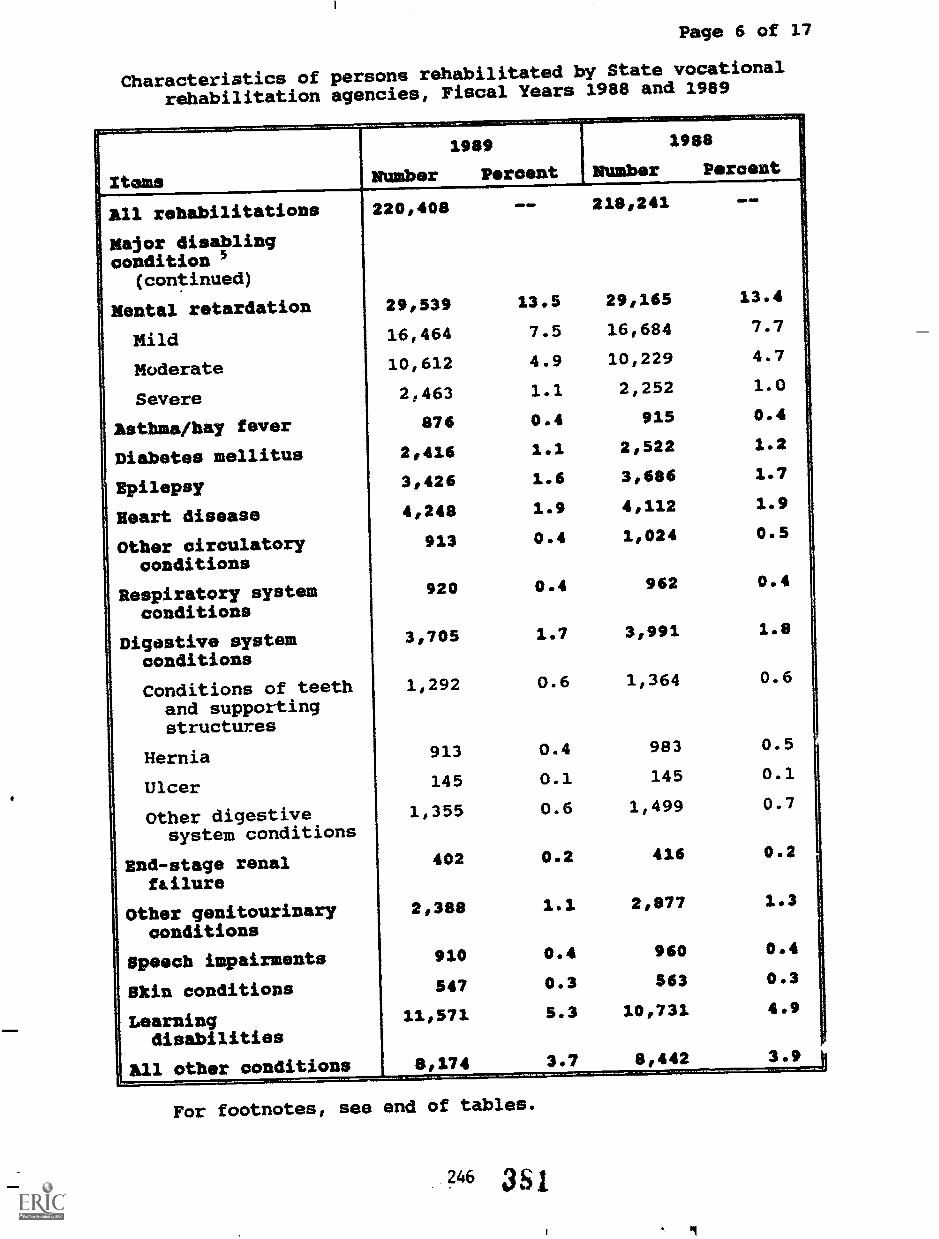
Page 6 of 17
Characteristics of persons rehabilitated by State vocational
rehabilitation agencies, Fiscal Years 1988 and 1989
Stems
Ail rehabilitations
major disablingcondition 5
(continued)
Mental retardation
Mild
Moderate
Severe
Rsthma/hay fever
Diabetes mellitus
Epilepsy
Heart disease
Other circulatoryconditions
Respiratory systemconditions
Digestive systemconditions
Conditions of teethand supportingstructures
Hernia
Ulcer
Other digestivesystem conditions
End-stage renalfailure
Other genitourinaryconditions
Speech impairments
Skin conditions
Learningdisabilities
All other conditions
MUmber
1989
Percent MUmber
1988
Percent
220,408 ODIN. 218,241 OMANI
29,539 13.5 29,165 13.4
16,464 7.5 16,684 7.7
10,612 4.9 10,229 4.7
2,463 1.1 2,252 1.0
876 0.4 915 0.4
2,416 1.1 2,522 1.2
3,426 1.6 3,686 1.7
4,248 1.9 4,112 1.9
913 0.4 1,024 0.5
920 0.4 962 0.4
3,705 1.7 3,991 1.8
18292 0.6 1,364 0.6
913 0.4 983 0.5
145 0.1 145 0.1
1,355 0.6 1,499 0.7
402 0.2 416 0.2
2,388 1.1 2,877 1.3
910 0.4 960 0.4
547 0.3 563 0.3
11,571 5.3 10,731 4.9
8 174 3.7 8 442 3.9
For footnotes, see end of tables.
246 3S1
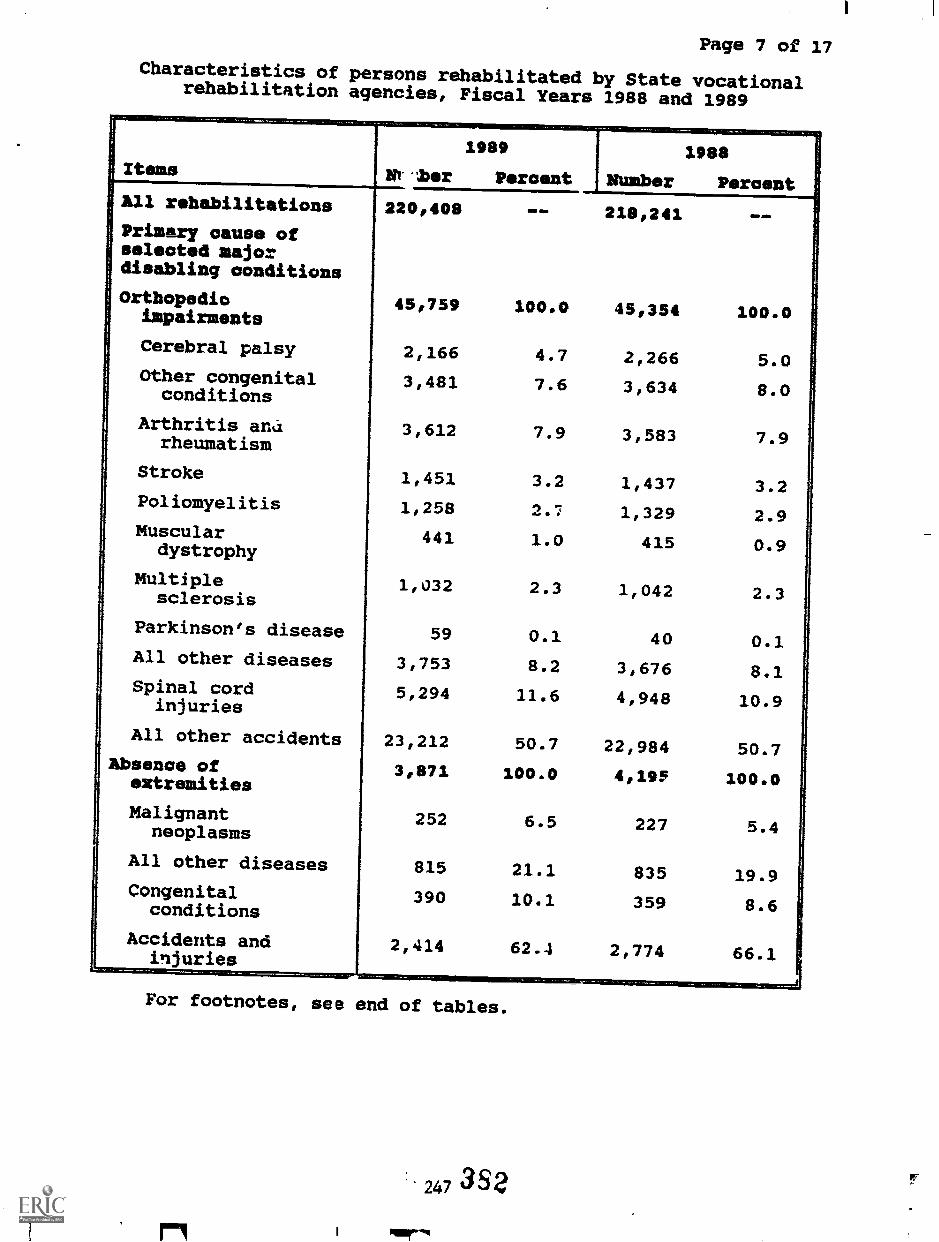
All rehabilitations
Primary cause ofselected majordisabling conditions
Orthopediciapairments
Cerebral palsy
Other congenitalconditions
Arthritis emu.rheumatism
Stroke
Poliomyelitis
Musculardystrophy
Multiplesclerosis
Parkinson's disease
All other diseases
Spinal cordinjuries
All other accidents
Absence ofextremities
Malignantneoplasms
All other diseases
Congenitalconditions
Accidents andinjuriesL.
N,-;ber
1989
Percent NUmber
3.988
Percent
220,408 218,241 .111aw
45,759 100.0 45,354 100.0
2,166 4.7 2,266 5.03,481 7.6 3,634 8.0
3,612 7.9 3,583 7.9
1,451 3.2 1,437 3.210258 2.7 1,329 2.9
441 1.0 415 0.9
1,032 2.3 1,042 2.3
59 0.1 40 0.13,753 8.2 3,676 8.15,294 11.6 4,948 10.9
23,212 50.7 22,984 50.730871 100.0 4,19, 100.0
252 6.5 227 5.4
815 21.1 835 19.9390 10.1 359 8.6
2,414 62.4 2,774 66.1
Page 7 of 17
Characteristics of persons rehabilitated by State vocationalrehabilitation agencies, Fiscal Years 1988 and 1989
Items
For footnotes, see end of tables.
2473S2
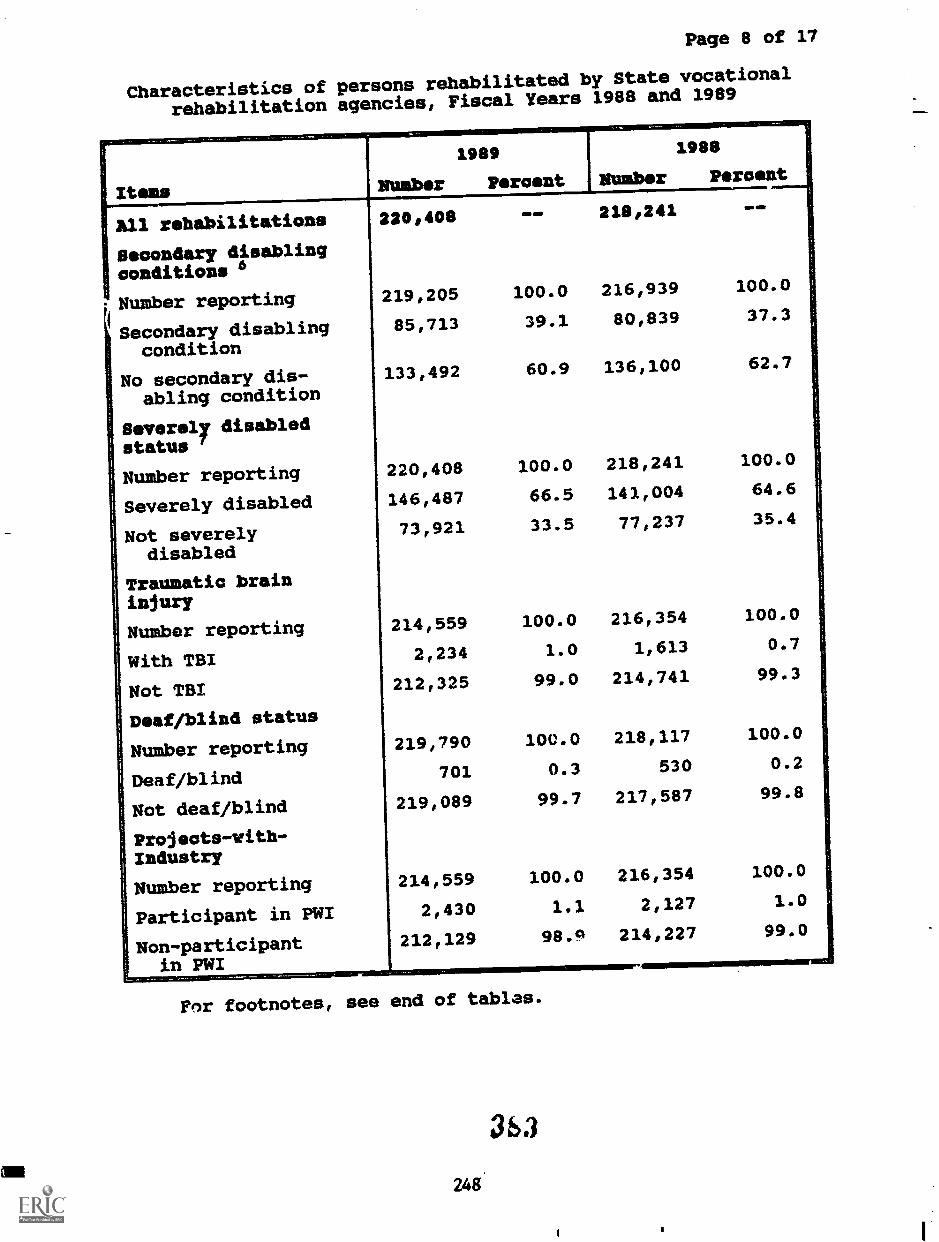
Page 8 of 17
Characteristics of persons rehabilitated by State vocational
rehabilitation agencies, Fiscal Years 1988 and 1989
Items NUaber
1989
Percent NUmber
1988
Percent
All rehabilitations 220,408 .. 218,241 ..
Secondary disablingconditions 6
Number reporting 219,205 100.0 216,939 100.0
Secondary disablingcondition
85,713 39.1 80,839 37.3
No secondary dis-abling condition
133,492 60.9 136,100 62.7
Severely disabledstatus f
Number reporting 220,408 100.0 218,241 100.0
Severely disabled 146,487 66.5 141,004 64.6
Not severelydisabled
73,921 33.5 77,237 35.4
Traumatic braininjury
Number reporting 214,559 100.0 216,354 100.0
With TBI 2,234 1.0 1,613 0.7
Not TBI 212,325 99.0 214,741 99.3
Deaf/blind status
Number reporting 219,790 100.0 218,117 100.0
Deaf/blind 701 0.3 530 0.2
Not deaf/blind 219,089 99.7 217,587 99.8
Projects-with-Industry
Number reporting 214,559 100.0 216,354 100.0
Participant in PWI 2,430 1.1 2,127 1.0
Non-participantin PWI
212,129 98.P 214,227 99.0
For footnotes, see end of tablas.
363
248
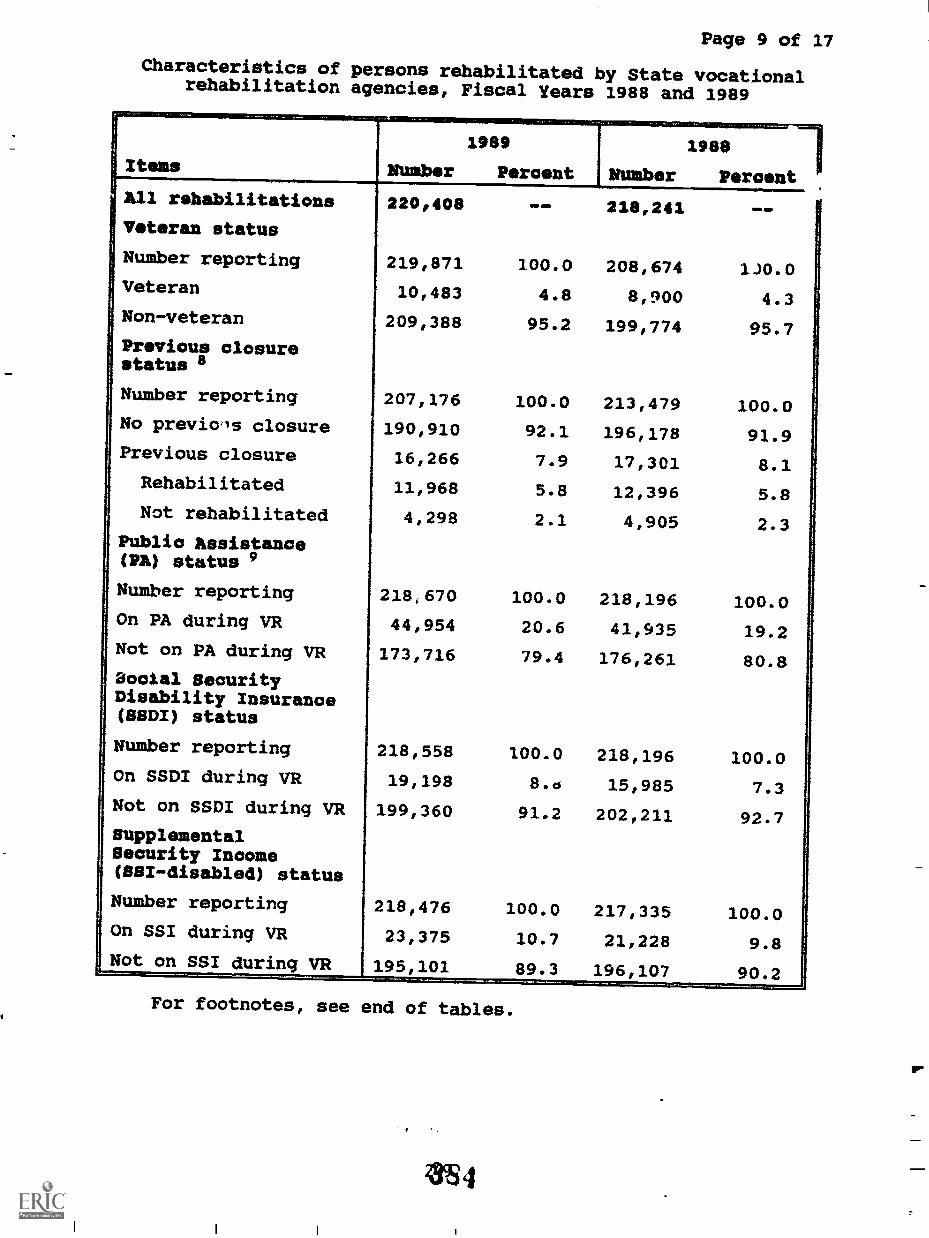
Page 9 of 17
Characteristics of persons rehabilitated by State vocationalrehabilitation agencies, Fiscal Years 1988 and 1989
Items
All rehabilitations
Veteran status
Number reporting
Veteran
Non-veteran
Previous closurestatus a
Number reporting
No previo.'s closure
Previous closure
Rehabilitated
Not rehabilitated
Public Assistance(PA) status 9
Number reporting
On PA during VR
Not on PA during VR
Social SecurityDisability Insurance(SSDI) status
Number reporting
On SSDI during VR
Not on SSDI during VR
SupplementalSecurity Income(BSI-disabled) status
Number reporting
On SSI during VR
Not on SSI during VR
1989 1988
NUmber Percent Number Percent
220,408
219,871
10,483
209,388
207,176
190,910
16,266
11,968
4,298
218,670
44,954
173,716
218,558
19,198
199,360
218,476
23,375
195 101
218,241
100.0 208,674
4.8 8,900
95.2 199,774
100.0 213,479
92.1 196,178
7.9 17/301
5.8 12,396
2.1 4,905
100.0 218,196
20.6 41,935
79.4 176,261
100.0 218,196
8.d 15,985
91.2 202,211
100.0 217,335
10.7 21,228
89.3 196 107
For footnotes, see end of tables.
2354
130.0
4.3
95.7
100.0
91.9
8.1
5.8
2.3
100.0
19.2
80.8
100.0
7.3
92.7
100.0
9.8
90.2
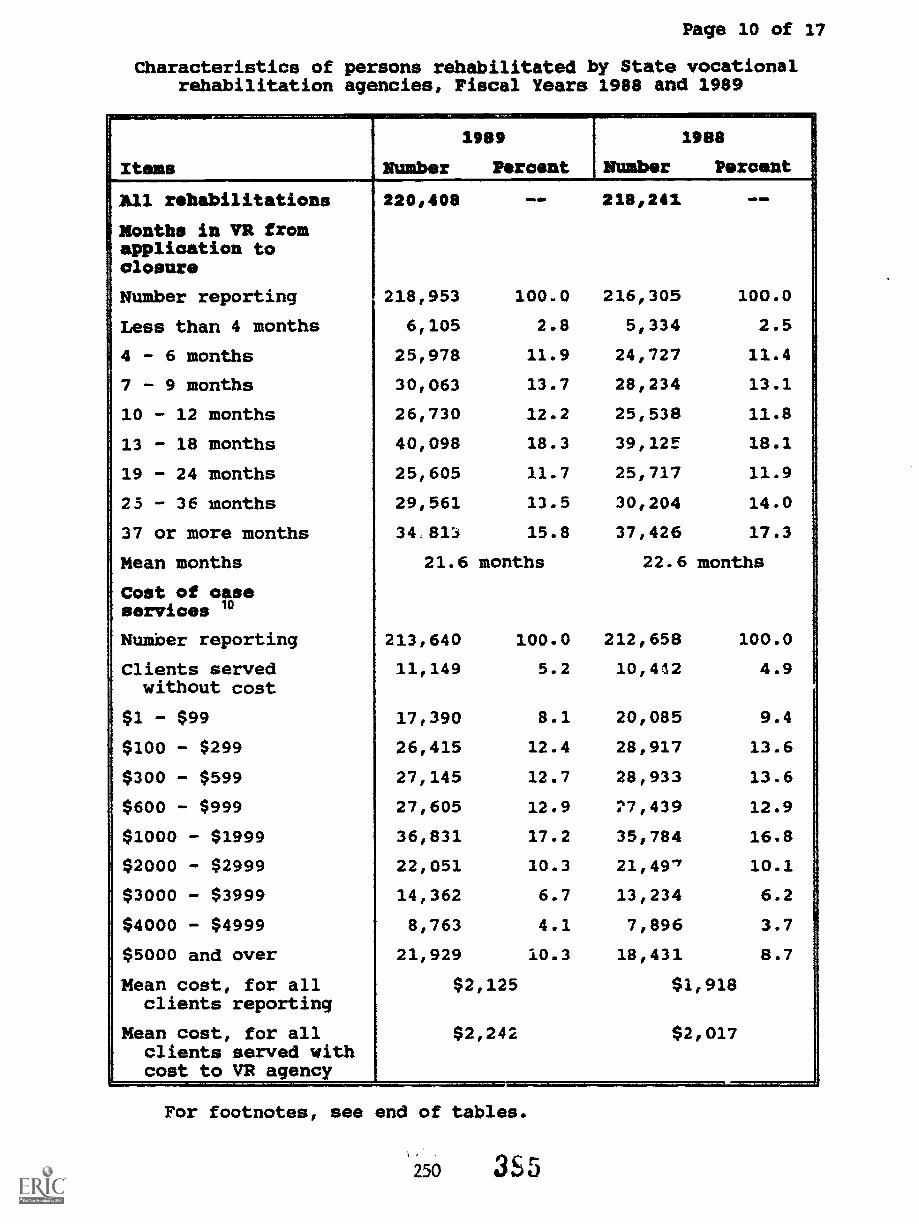
Page 10 of 17
Characteristics of persons rehabilitated by State vocationalrehabilitation agencies, Fiscal Years 1988 and 1989
Items
All rehabilitations
Months in VR fromapplication to
1 closure
iNumber reporting
Less than 4 months
4 - 6 months
7 - 9 months
10 - 12 months
13 - 18 months
19 - 24 months
! 23 - 36 months
1 37 or more months
iMean months
1Cost of case1 services "
Number reporting
Clients servedwithout cost
i $1 - $99
! $100 - $299
i $300 - $599
$600 - $999
$1000 - $1999
i $2000 - $2999
$3000 - $3999
$4000 - $4999
$5000 and over
IMean cost, for allclients reporting
Mean cost, for allclients served withcost_to VR agency
Number
1989
Percent Number
1988
Percent
220,408 218/241
218,953 100.0 216,305 100.0
6,105 2.8 5,334 2.5
25,978 11.9 24,727 11.4
30,063 13.7 28,234 13.1
26,730 12.2 25,538 11.8
40,098 18.3 39,12E 18.1
25,605 11.7 25,717 11.9
29,561 13.5 30,204 14.0
15.8 37,426 17.3
21.6 months 22.6 months
213,640 100.0 212,658 100.0
11,149 5.2 10,412 4.9
17,390 8.1 20,085 9.4
26,415 12.4 28,917 13.6
27,145 12.7 28,933 13.6
27,605 12.9 27,439 12.9
36,831 17.2 35,784 16.8
22,051 10.3 21,497 10.1
14,362 6.7 13,234 6.2
8,763 4.1 7,896 3.7
21,929 10.3 18,431 8.7
$2,125
$2,242
$1,918
$2,017
1
1
I
For footnotes, see end of tables.
250 355
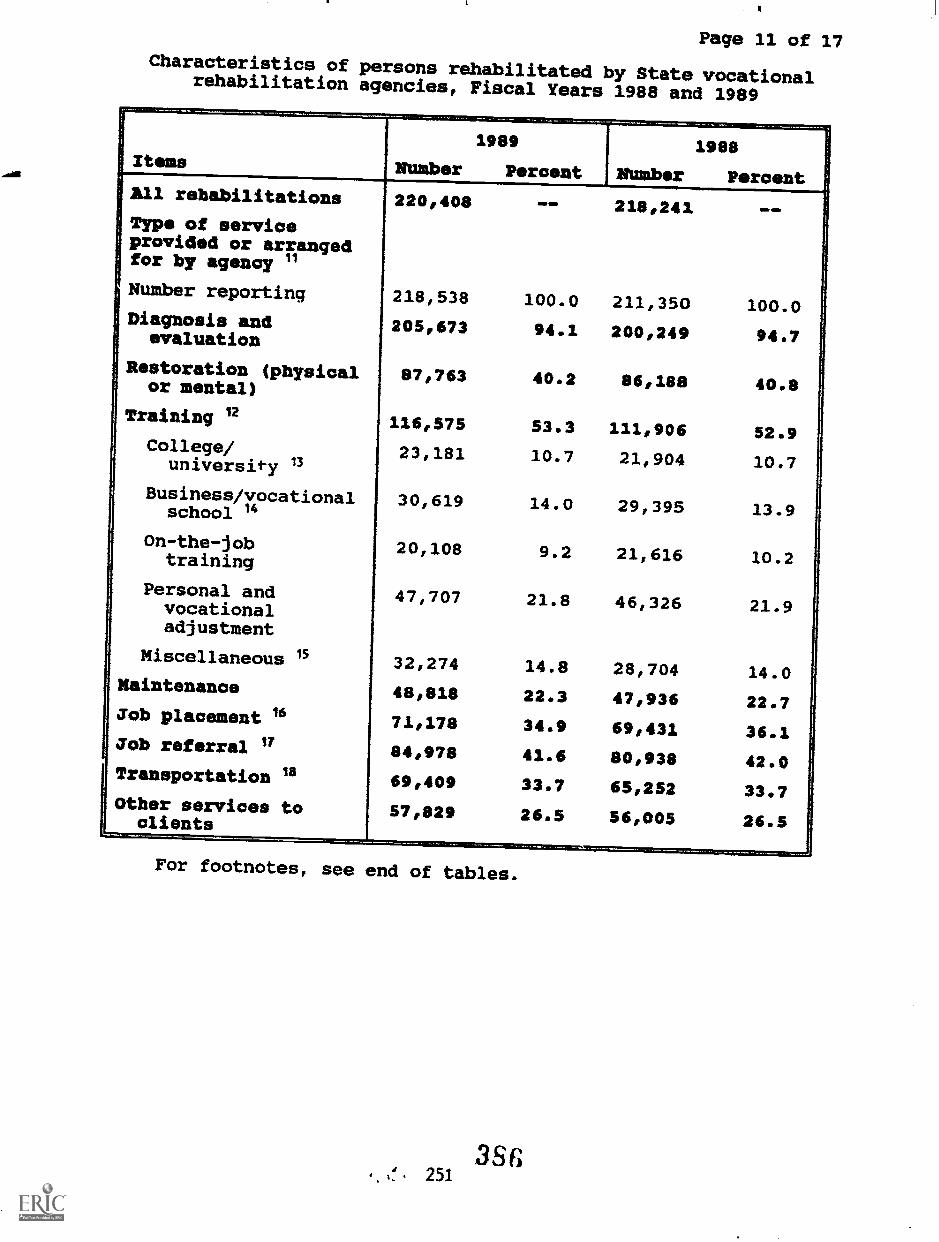
Page 11 of 17
Characteristics of persons rehabilitated by State vocationalrehabilitation agencies, Fiscal Years 1988 and 1989
Items MUmber
1989
Force t Number
1988
PercentAll rehabilitations 220,408 .. 218,241 ...
Type of serviceprovided or arrangedfor by agency "
Number reporting 218,538 100.0 211,350 100.0Diagnosis and
evaluation205,673 94.1 200,249 94.7
Restoration (physicalor mental)
87,763 40.2 86,188 40.8
Training g 116,575 53.3 111,906 52.9College/university "
23,181 10.7 21,904 10.7
Business/vocationalschool 14
300619 14.0 29,395 13.9
0n-the-jobtraining
20,108 9.2 21,616 10.2
Personal andvocationaladjustment
47,707 21.8 46,326 21.9
Miscellaneous " 32,274 14.8 28,704 14.0Maintenance 48,818 22.3 47,936 22.7Job placement 16 71,178 34.9 69,431 36.1Job referral 17
16
84,978 41.6 80,938 42.0
1
Transportation
Other services toclients
69,409
57,829
33.7
26.5
65,252
56,005
33.7
26.5
For footnotes, see end of tables.
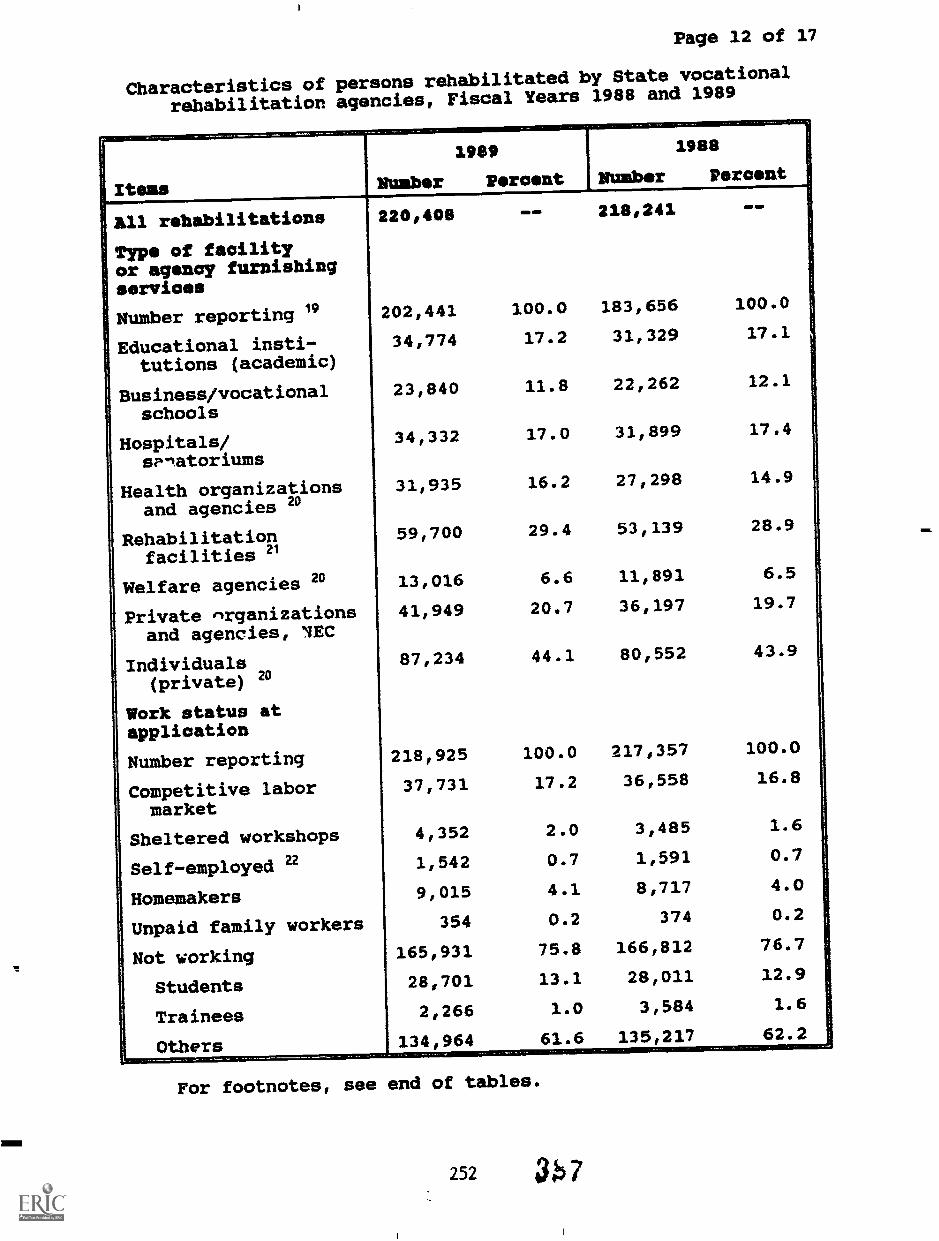
Page 12 of 17
Characteristics of persons rehabilitated by State vocational
rehabilitation agencies, Fiscal Years 1988 and 1989
Items Number
1999
Percent NUmber
1988
Peroent
Ail rehabilitations 220,409 =PIM 218,241
Type of facilityor agency furnishingservices
Number reporting19 202,441 100.0 183,656 100.0
Educational insti-tutions (academic)
34,774 17.2 31,329 17.1
Business/vocationalschools
23,840 11.8 22,262 12.1
Hospitals/sPnatoriums
341332 17.0 31,899 17.4
Health organizationsand agencies 29
31,935 16.2 27,298 14.9
Rehabilitationfacilities 21
59,700 29.4 53,139 28.9
Welfare agencies 29 13,016 6.6 11,891 6.5
Private nrganizationsand agencies, NIEC
41,949 20.7 36,197 19.7
Individuals(private) 20
87,234 44.1 80,552 43.9
Work status atapplication
Number reporting 218,925 100.0 2171357 100.0
Competitive labormarket
37,731 17.2 36,558 16.8
Sheltered workshops 4,352 2.0 3,485 1.6
Self-employed 22 1,542 0.7 1,591 0.7
Homemakers 9,015 4.1 8,717 4.0
Unpaid family workers 354 0.2 374 0.2
Not working 165,931 75.8 166,812 76.7
Students 28,701 13.1 28,011 12.9
Trainees 2,266 1.0 3,584 1.6
Others 134,964 61.6 135,217 62.2
For footnotes, see end of tables.
252
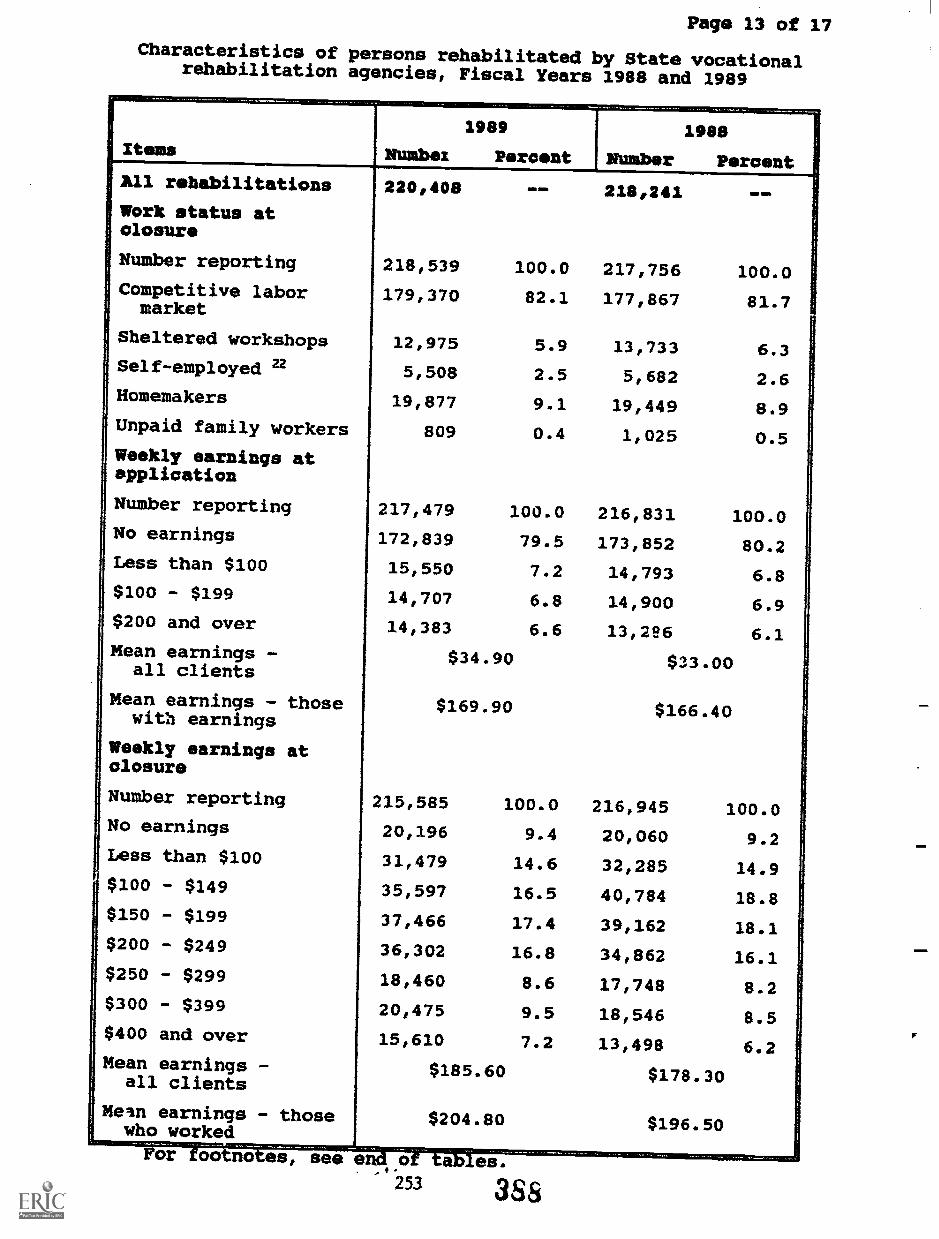
Page 13 of 17
Characteristics of persons rehabilitated by State vocationalrehabilitation agencies, Fiscal Years 1988 and 1989
Items Numbez
1989
Percent
1988
NUmber PercentAll rehabilitations 229,498 MI= IMAM218,241Work status atclosure
Number reporting 218,539 100.0 217,756 100.0Competitive labormarket
179,370 82.1 177,867 81.7
Sheltered workshops 12,975 5.9 13,733 6.3Self-employed 22 5,508 2.5 5,682 2.6Homemakers 19,877 9.1 19,449 8.9Unpaid family workers 809 0.4 1,025 0.5Weekly earnings atapplication
Number reporting 217,479 100.0 216,831 100.0No earnings 172,839 79.5 173,852 80.2Less than $100 15,550 7.2 14,793 6.8$100 - $199 14,707 6.8 14,900 6.9$200 and over 14,383 6.6 13,2e6 6.1Mean earnings -
all clients$34.90 $33.00
Mean earnings - thosewith earnings
$169.90 $166.40
Weekly earnings atclosure
Number reporting 215,585 100.0 216,945 100.0No earnings 20,196 9.4 20,060 9.2Less than $100 31,479 14.6 32,285 14.9$100 - $149 35,597 16.5 40,784 18.8$150 - $199 37,466 17.4 39,162 18.1$200 - $249 36,302 16.8 34,862 16.1$250 - $299 18,460 8.6 17,748 8.2$300 - $399 20,475 9.5 18,546 8.5$400 and over 15,610 7.2 13,498 6.2Mean earnings -
all clients$185.60 $178.30
Mean earnings - thosewho worked
$204.80 $196.50
For foofranrimMend of tables.253 3SS
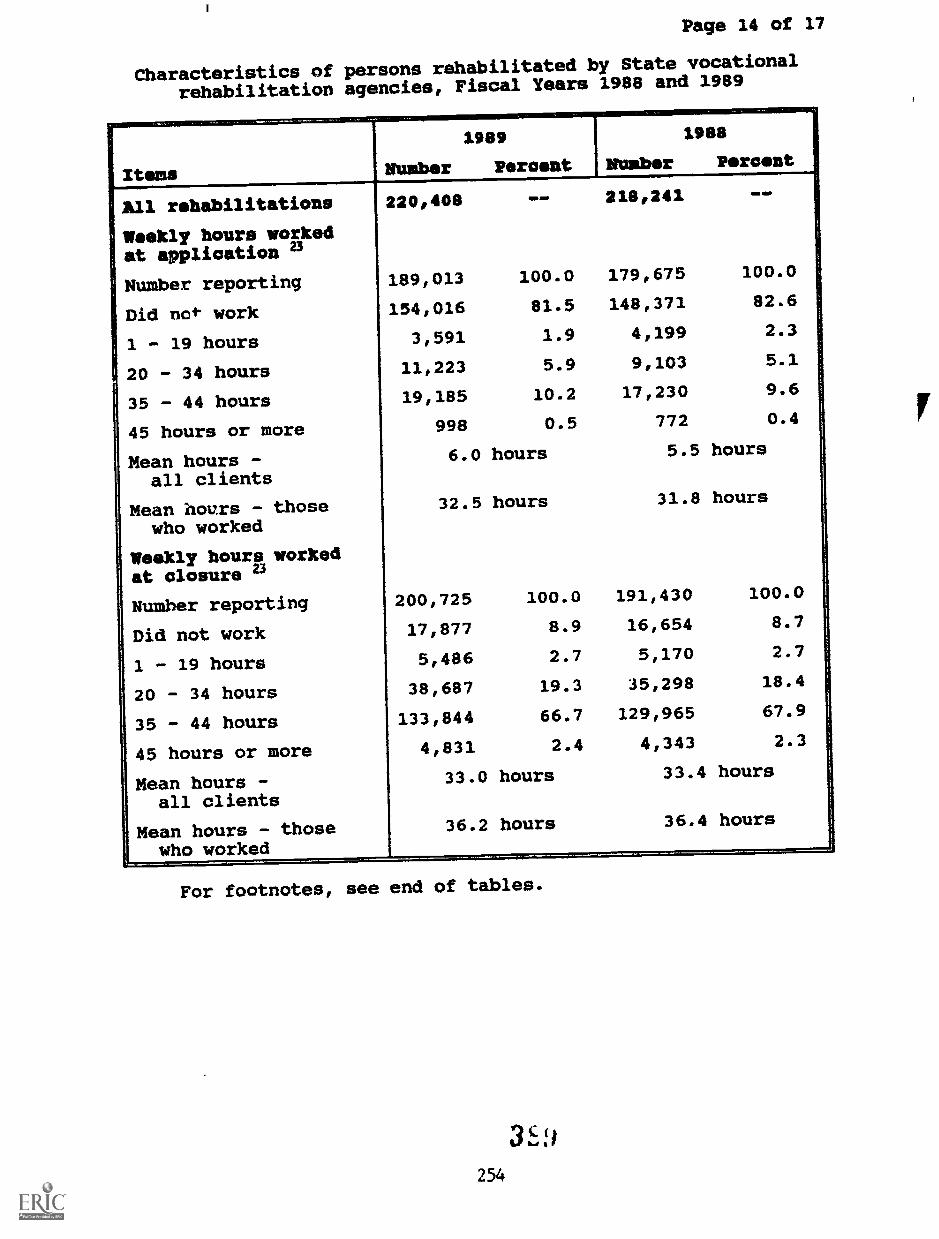
Page 14 of 17
Characteristics of persons rehabilitated by State vocational
rehabilitation agencies, Fiscal Years 1988 and 1989
IteSSAll rehabilitations
Weekly hours workedat application 23
Number reporting
Did not work
1 - 19 hours
20 - 34 hours
35 - 44 hours
45 hours or more
Mean hours -all clients
Mean hours - thosewho worked
Weekly hours workedat closure 23
Number reporting
Did not work
1 - 19 hours
20 - 34 hours
35 - 44 hours
45 hours or more
Mean hours -all clients
Mean hours - thosewho worked
11,
INUnber Percent WUnber Percent1989 1988
220,408 218,241
189,013
1540016
3,591
11,223
19,185
998 0.5
6.0 hours
100.0
81.5
1.9
5.9
10.2
32.5 hours
200,725
17,877
5,486
38,687
133,844
4,831
33.0 hours
100.0
8.9
2.7
19.3
66.7
2.4
36.2 hours
179,675
148,371
4,199
9,103
17,230
772
100.0
82.6
2.3
5.1
9.6
0.4
5.5 hours
31.8 hours
1910430 100.0
16,654 8.7
5,170 2.7
35,298 18.4
129,965 67.9
4,343 2.3
33.4 hours
36.4 hours
For footnotes, see end of tables.
254
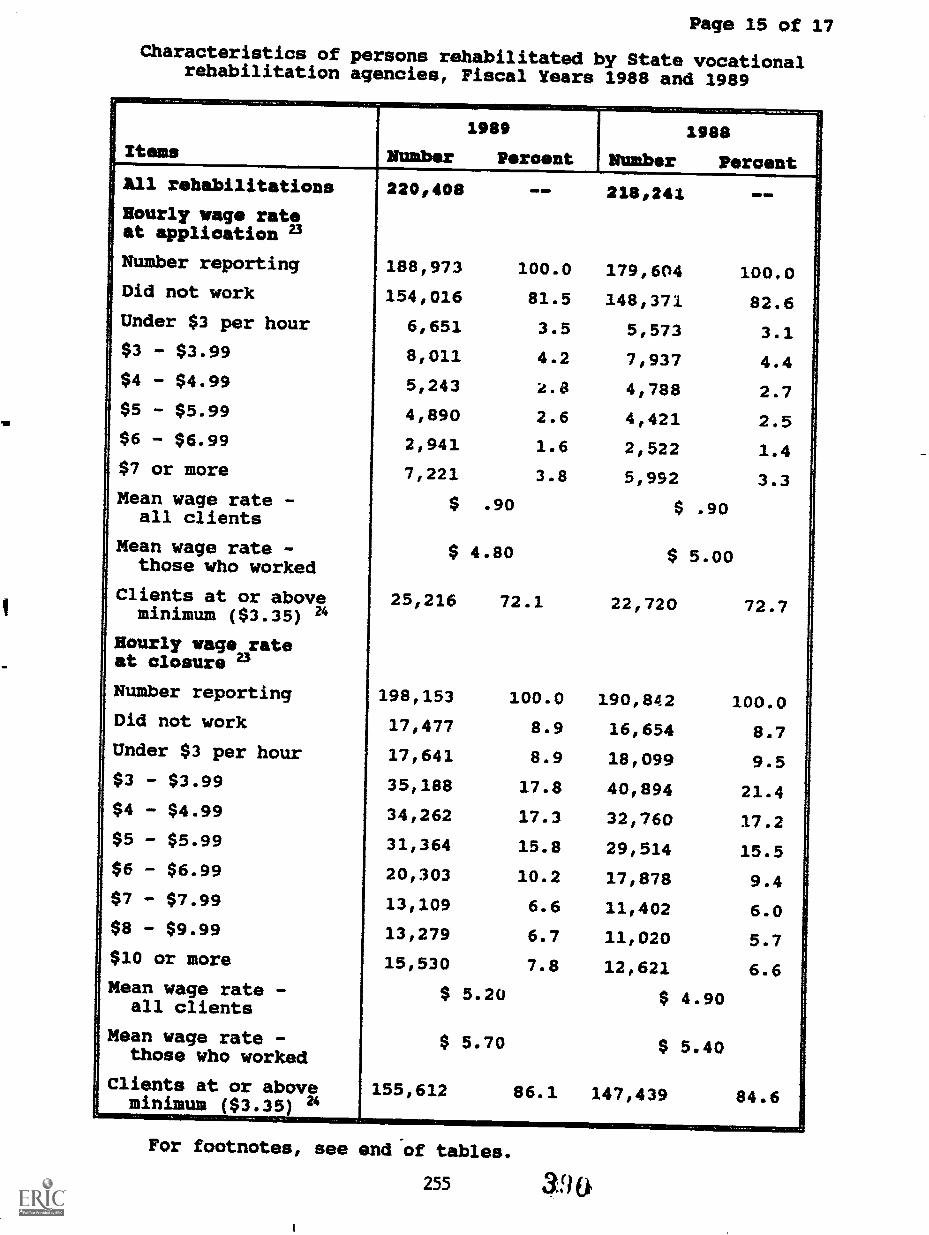
Page 15 of 17
Characteristics of persons rehabilitated by State vocationalrehabilitation agencies, Fiscal Years 1988 and 1989
Items Number
1989
Percent
1988
NUmber PercentAll rhabilitations 220,408 218,241 OW-
Hourly rage rateat application 23
Number reporting 188,973 100.0 179,604 100.0Did not work 154,016 81.5 148/371 82.6Under $3 per hour 6,651 3.5 5,573 3.1$3 - $3.99 8,011 4.2 7,937 4.4$4 - $4.99 5,243 '2.8 4/788 2.7$5 - $5.99 4,890 2.6 4,421 2.5$6 - $6.99 2,941 1.6 2,522 1.4$7 or more 7,221 3.8 5,992 3.3Mean wage rate -
all clients$ .90 $ .90
Mean wage rate -those who worked
$ 4.80 $ 5.00
Clients at or aboveminimum ($3.35) 24
25/216 72.1 22,720 72.7
Hourly wage rateat closure 23
Number reporting 198,153 100.0 190,842 100.0Did not work 17,477 8.9 16,654 8.7Under $3 per hour 17,641 8.9 18,099 9.5$3 - $3.99 35,188 17.8 40,894 21.4$4 - $4.99 34,262 17.3 32,760 17.2$5 - $5.99 31,364 15.8 29,514 15.5$6 - $6.99 20,303 10.2 17,878 9.4$7 - $7.99 13,109 6.6 11,402 6.0$8 - $9.99 13,279 6.7 11,020 5.7$10 or more 15/530 7.8 12,621 6.6Mean wage rate -
all clients$ 5.20 $ 4.90
Mean wage rate -those who worked
$ 5.70 $ 5.40
Clients at or aboveminimum ($3.35) 24
155,612 86.1 147,439 84.6
For footnotes, see end of tables.
255 31)&
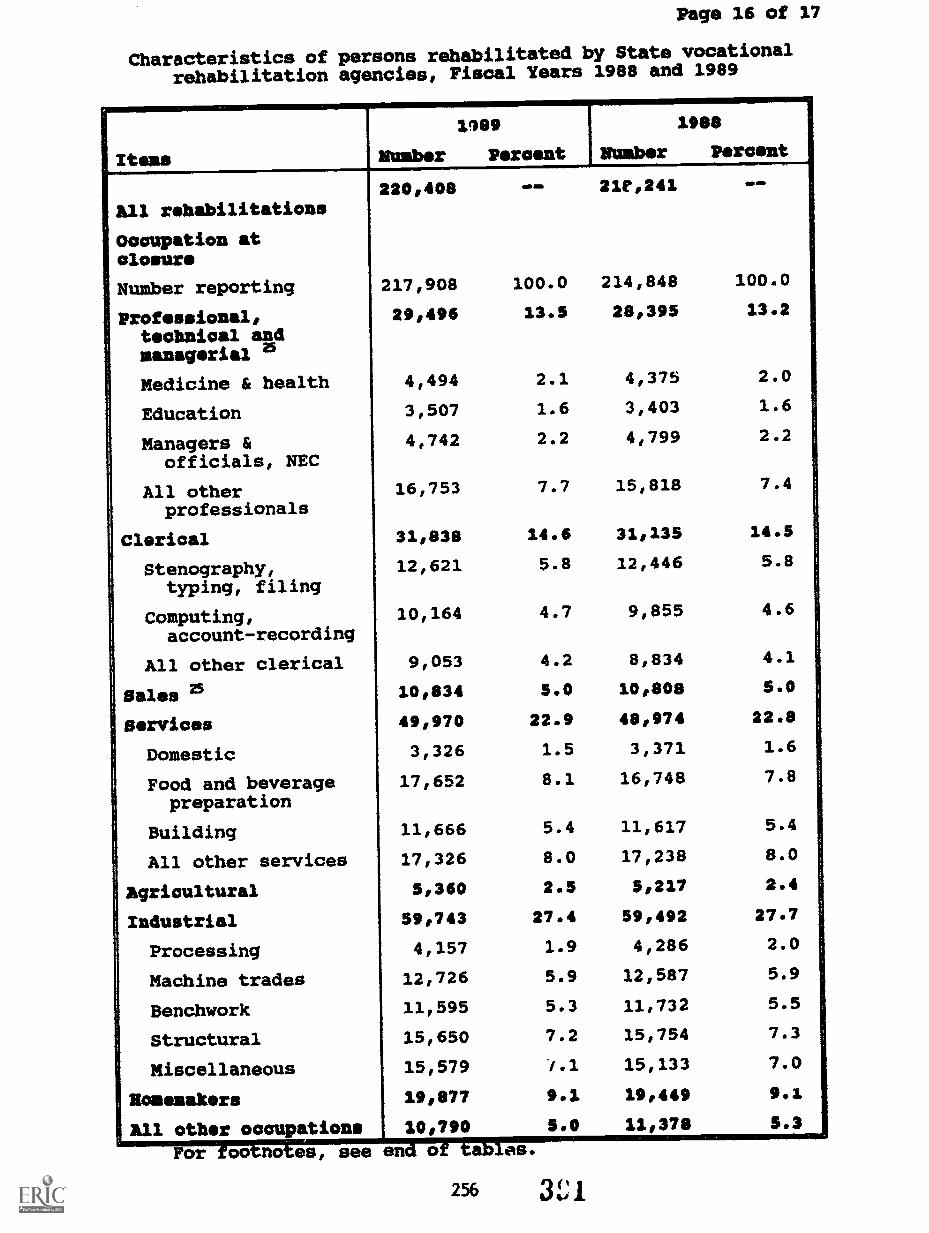
Page 16 of 17
Characteristics of persons rehabilitated by State vocationalrehabilitation agencies, Fiscal Years 1988 and 1989
1989 1988
Items Number Percent NUmber Percent
220,408 21E441 OP MI
All rehabilitations
Occupation atclosure
Number reporting 217,908 100.0 214,848 100.0
Professional,technical andmanagerial 3
29,496 13.5 28,395 13.2
Medicine & health 4,494 2.1 4,375 2.0
Education 3,507 1.6 3,403 1.6
Managers &officials, NEC
4,742 2.2 4,799 2.2
All otherprofessionals
16,753 7.7 15,818 7.4
Clerical 31,838 14.6 31,135 14.5
Stenography,typing, filing
12,621 5.8 12,446 5.8
Computing,account-recording
10,164 4.7 9,855 4.6
All other clerical 9,053 4.2 8,834 4.1
Sales 3 10,834 5.0 10,808 5.0
Services 49,970 22.9 48,974 22.8
Domestic 3,326 1.5 3,371 1.6
Food and beveragepreparation
17,652 8.1 16,748 7.8
Building 11,666 5.4 11,617 5.4
All other services 17,326 8.0 17,238 8.0
Agricultural 5,360 2.5 5,217 2.4
Industrial 59,743 27.4 59,492 27.7
Processing 4,157 1.9 4,286 2.0
Machine trades 12,726 5.9 12,587 5.9
Benchwork 11,595 5.3 11,732 5.5
Structural 15,650 7.2 15,754 7.3
Miscellaneous 15,579 '/.1 15,133 7.0
lomenakers 19,877 9.1 19,449 9,s
All other occupations 10,790 5.0 11,378 5.3
For footnoarm=wend of tables.
256 3!;1
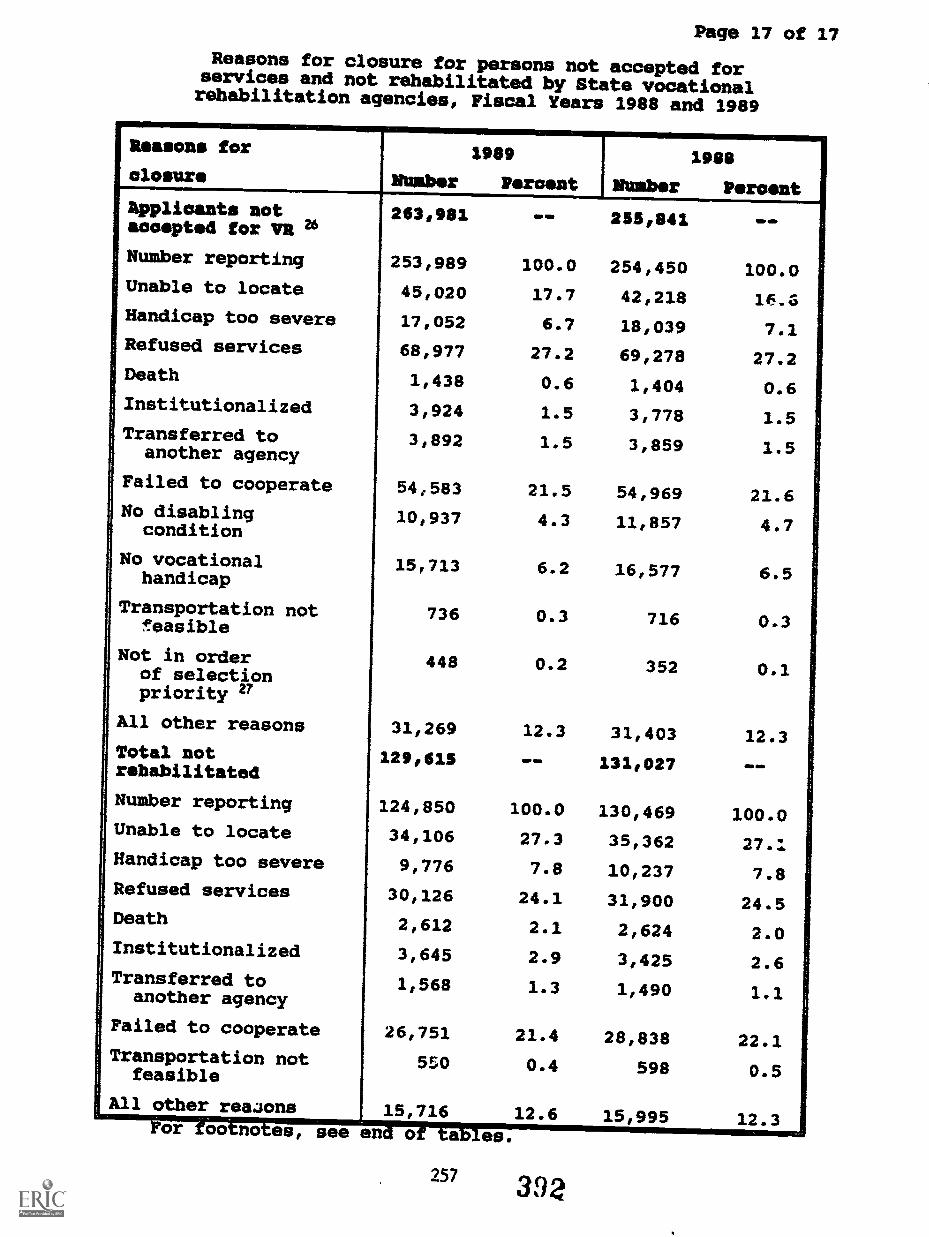
Page 17 of 17
Reasons for closure for persons not accepted forservices and not rehabilitated by State vocationalrehabilitation agencies, Fiscal Years 1988 and 1989
Reasons for
closure
Applicants notaccepted tor VA 26
Number reporting
Unable to locate
Handicap too severe
Refused services
Death
Institutionalized
Transferred toanother agency
Failed to cooperate
No disablingcondition
No vocationalhandicap
Transportation nott'easible
Not in orderof selectionpriority 27
All other reasons
Total notrehabilitated
Number reporting
Unable to locate
Handicap too severe
Refused services
Death
Institutionalized
Transferred toanother agency
Failed to cooperate
Transportation notfeasible
All other reaaons
2989
NUmber Percent
1988
Maher Prcent263,981 IIMP 2550141 IMR IMP
253,989 100.0 254,450 100.045,020 17.7 42,218 16.617,052 6.7 18,039 7.168,977 27.2 69,278 27.21,438 0.6 1,404 0.63,924 1.5 3,778 1.53,892 1.5 3,859 1.5
54,583 21.5 54,969 21.610,937 4.3 11,857 4.7
15,713 6.2 16,577 6.5
736 0.3 716 0.3
448 0.2 352 0.1
31,269 12.3 31,403 12.33.29,63.5 WI ZS 131,027 NS WO
124,850 100.0 130,469 100.034,106 27.3 35,362 27.19,776 7.8 10,237 7.8
30,126 24.1 31,900 24.52,612 2.1 2,624 2.03,645 2.9 3,425 2.61,568 1.3 1,490 1.1
26,751 21.4 28,838 22.1550 0.4 598 0.5
15,716 12.6 15,995 12.3For footnotes, see end of tables.
257 392
1. Includes all clients with mental retardation as a major or
secondary disabling condition.
2. Computed for clients not receiving special education.
3. This is the client's largest single source of economic
support.
4. Includes mental hospitals, psychiatric inpatient units ot
general hospitals and community mental health centers.
5 A physical or mental condition, impairment, or disease most
responsible for the client's work limitation.
6. A physical or mental condition, impairment, or disease that
contributes to, but is not the major basis of, the client's
work limitation.
7. Data obtained from the Quarterly Cumulative Caseload Report
(Form RSA-113).
8. Limited to closures within three years of the most recent date
of application.
9. Public assistance includes Supplemental Security Income by
reason of age, disability or blindness; Aid to Families with
Dependent Children; and General Assistance.
10. These are expenditures made by rehabilitation agencies for the
purchase of services on behalf of their clients. Excluded are
administrative costs and counselor and other staff salaries.
11. Encompasses the receipt of services by clients regardless of
the source of funding. Figures are not additive because some
clients receive more than one type of service.
12. This is an unduplicated count of clients receiving one or more
types of training.
13. Based on 215,933 rehabilitations in FY 1989 and 2040650
rehabilitations in FY 1988.
14. This is non-collegiate post-secondary education.
15. Based on 204,650 rehabilitations in FY 1988.
16. Based on 204,193rehabilitations in
17. Based on 204,193rehabilitations in
18. Based on 205,906rehabilitations in
rehabilitationsFY 1988.
rehabilitationsFY 1988.
rehabilitationsFY 1988.
in FY 1989 and
in FY 1989 and
in FY 1989 and
258 1:3
192,198
192,853
193,500
19. Figures are not additive because some clients will receiveservices from more than one source as arranged for by theState VR agency.
20. Based on 197,614 rehabilitations in FY 1989.
21. Based on 2021993 rehabilitations in FY 1989.
22. Includes placement into State-agency managed businessenterprises.
23. Clients who did not work are those who did not receive wages.24. Percentages based on clients who worked.
25. Includes vending stand personnel under the Randolph-SheppardAct.
26. Composed of closures from applicant and extended evaluationstatuses.
27. In some agencies, applicants are placed on a waiting list ifthey du not meet the order of selection priority which usuallyinvolves serving severely disabled persons first.
NEC - Not elsewhere classified
259 394
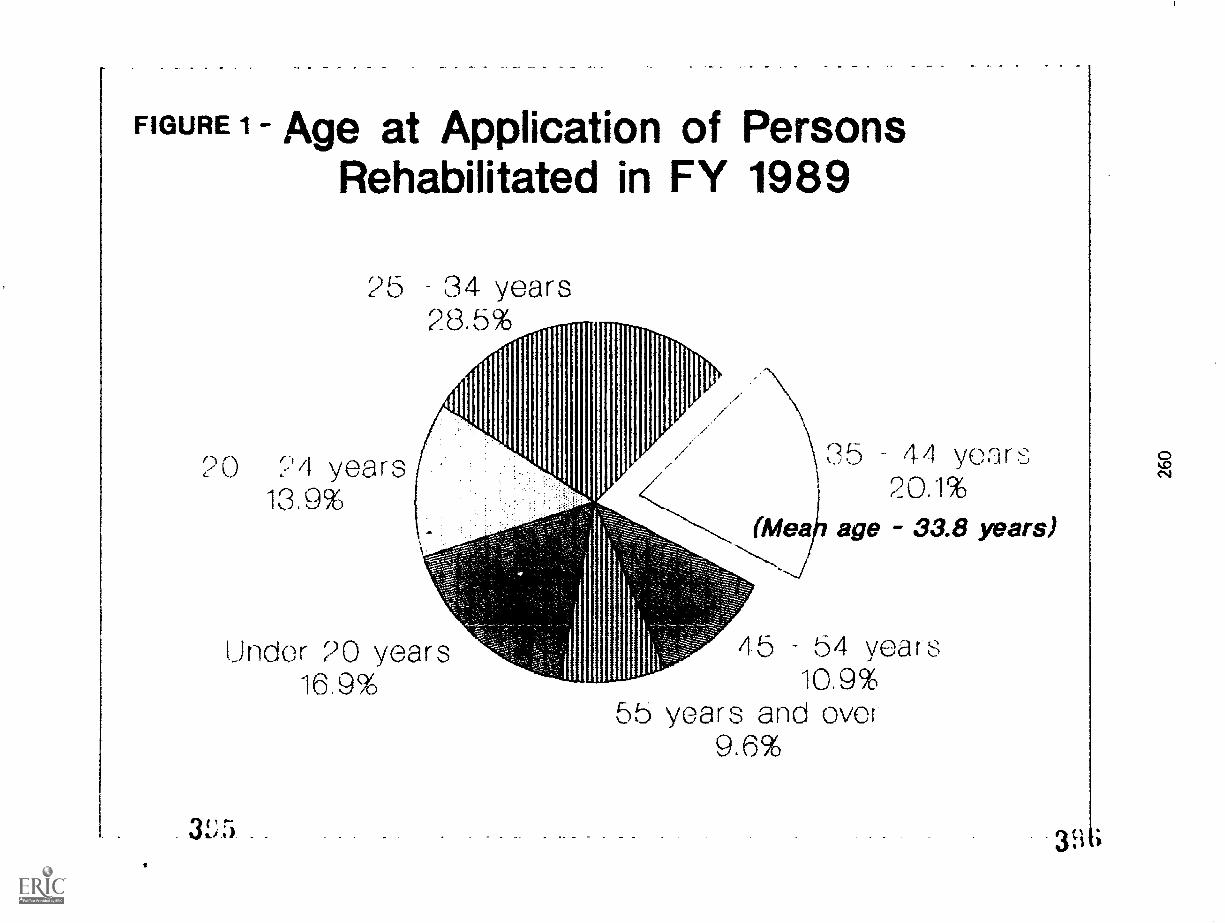
FIGURE 1 - Age at Application of PersonsRehabilitated in FY 1989
25 34 years28,5%
C) /I years13.9%
Under 20 years16,9%
31;5
95 44 years20.1%
age 33.8 years)
45 54 years10.9%
55 years and over9.6%
;
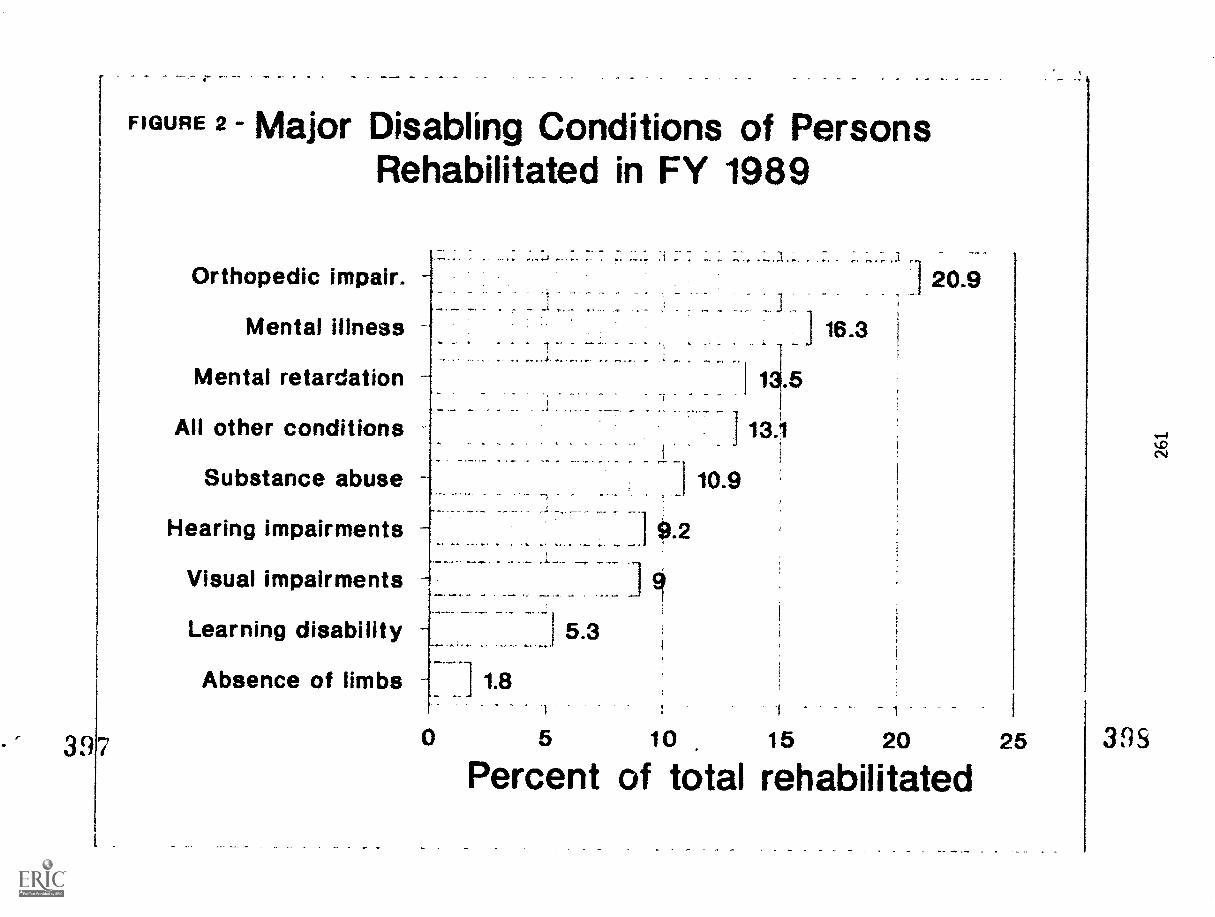
FIGURE 2 - Major Disabling Conditions of PersonsRehabilitated in FY 1989
Orthopedic impair.
Mental illness
Mental retardation
All other conditions
Substance abuse
Hearing impairments
Visual impairments
Learning disability
Absence of limbs
397
16.3
13.5
I 13.1
10.9
20.9
0 5 10 15 20 25
Percent of total rehabilitated39S
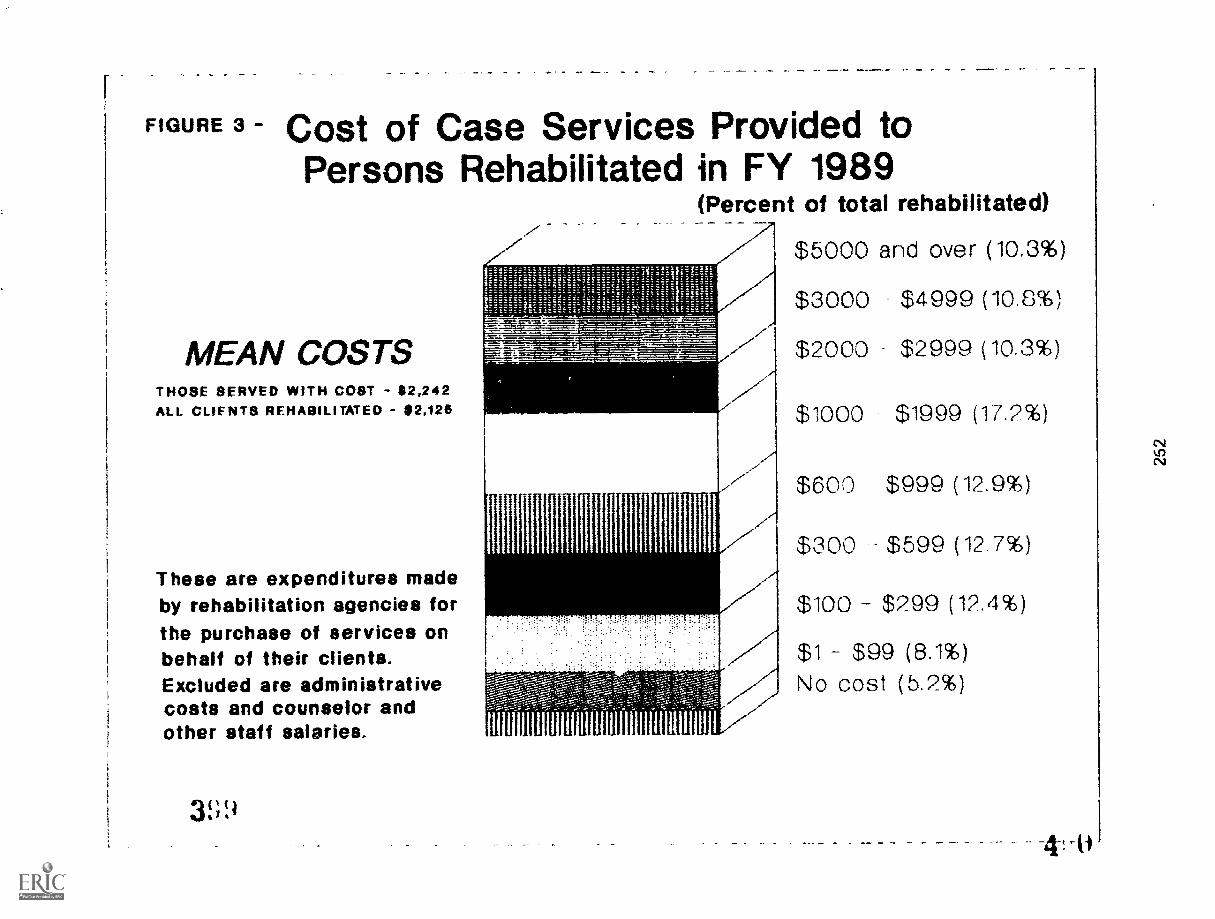
FIGURE 3 - Cost of Case Services Provided toPersons Rehabilitated in FY 1989
(Percent of total rehabilitated)
$5000 and over (10.3%)
$3000 $4999 (10.B%)
$2000 $2999 (10.3%)MEAN COSTSTHOSE SERVED WITH COST - $2,242ALL CLIENTS REHABILITATED 182,126
These are expenditures madeby rehabilitation agencies forthe purchase of services onbehalf of their clients.Excluded are administrativecosts and counselor andother staff salaries.
3 S9
$1000 $1999 (17.2%)
$600 $999 (12.9%)
$300 $599 (12 7%)
$100 $299 (12.4%)
$1 $99 (8.1%)No cost (5.2%)
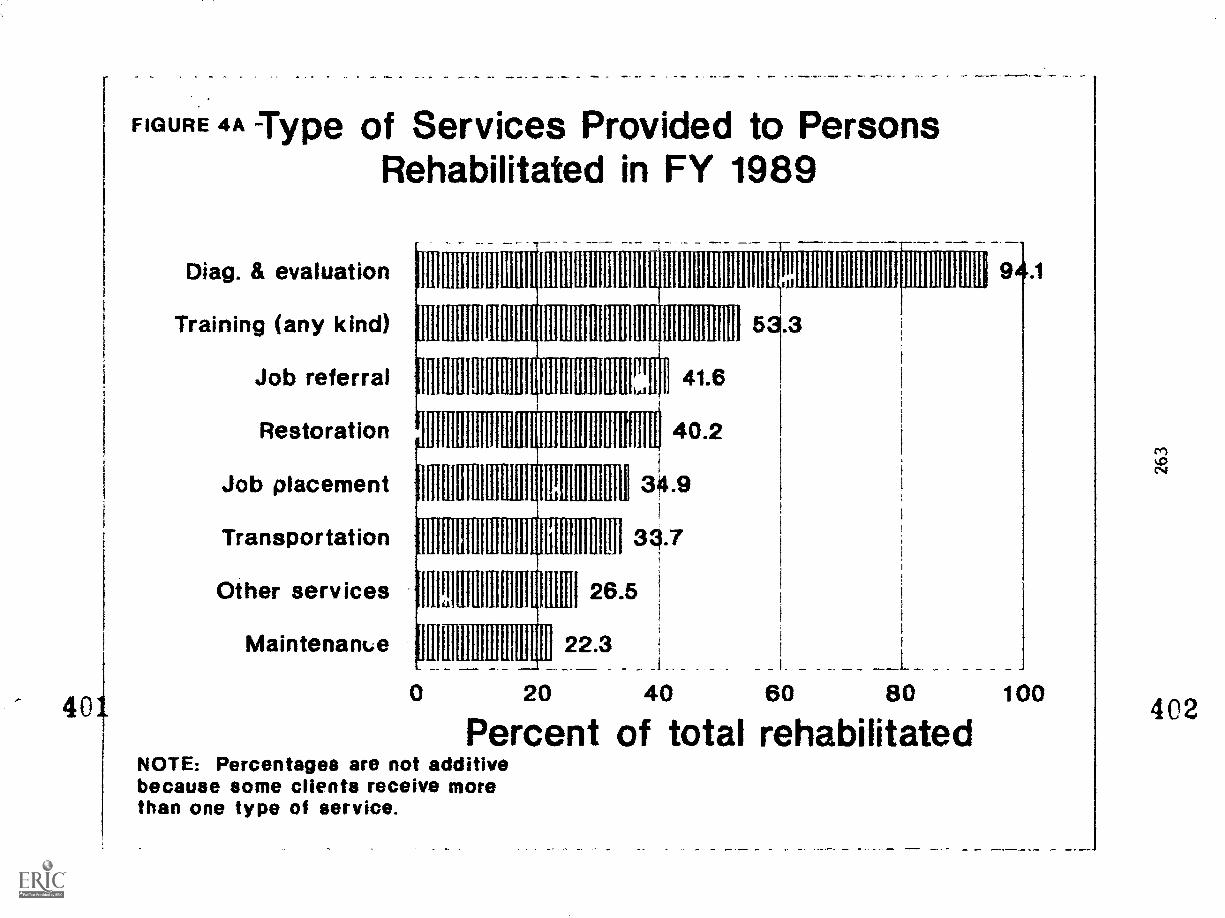
FIGURE 4A -Type of Services Provided to PersonsRehabilitated in FY 1989
Diag. & evaluation
Training (any kind)
Job referral
Restoration
Job placement
Transportation
Other services
MaintenanLe
LIIIIIIIMM1111111111
DIE TERIMEllif
111E11111 II IIWIIII WI EIL
111111111111M11
I H1111110111111311111111 34-9
1111111 11111111111 371111111101M111 26.5
11111111111111111111{122.3
41.6
40.2
20 40
.3
60 80
Percent of total rehabilitatedNOTE: Percentages are not additivebecause some clients receive morethan one type of service.
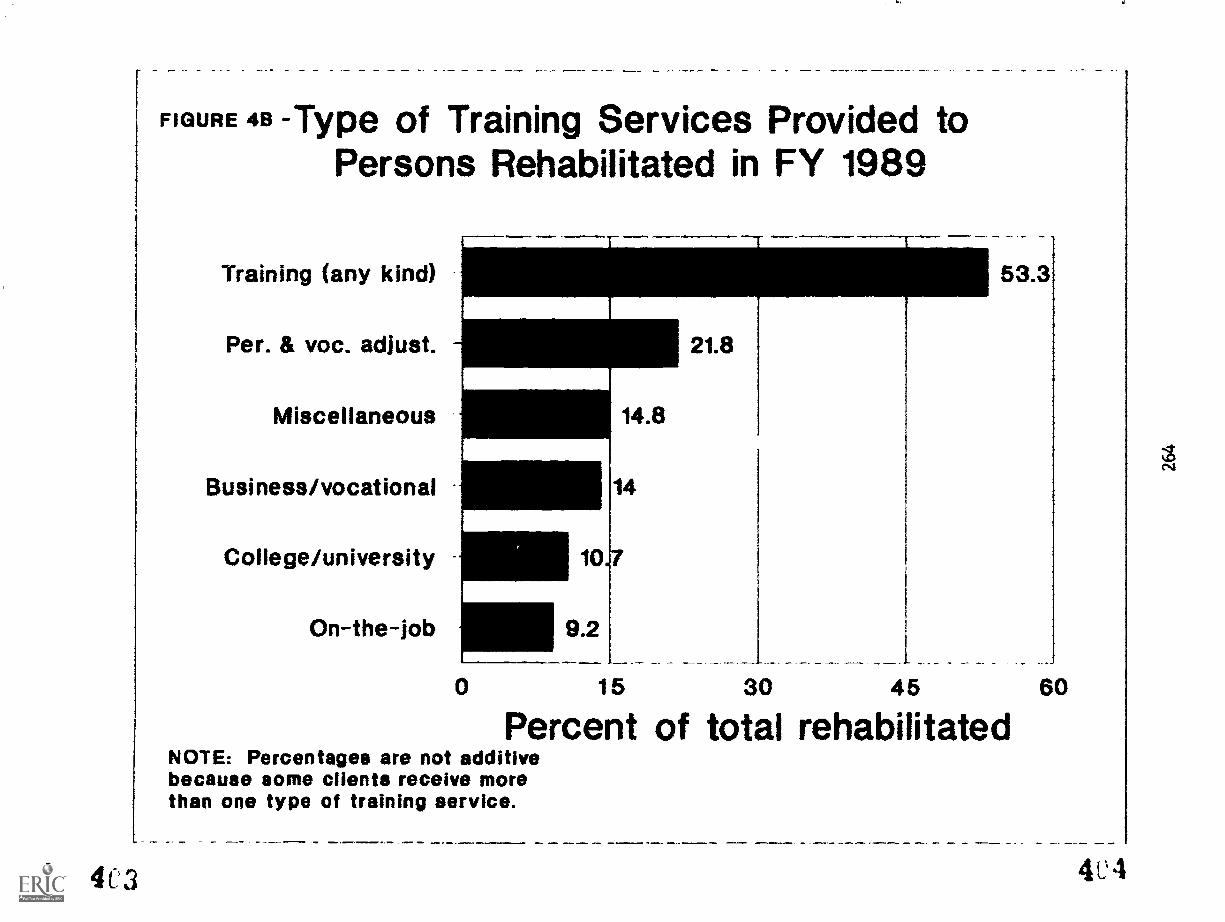
I
_ - -
FIGURE 4B -Type of Training Services Provided toPersons Rehabilitated in FY 1989
Training (any kind)
Per. & voc. adjust.
Miscellaneous
Business/vocational
College/university
On-the-job_
53.3
0 15 30 45 60
Percent of total rehabilitatedNOTE: Percentages are not additivebecause some clients receive morethan one type of training service.
-1_
. r- 4C3 4(24
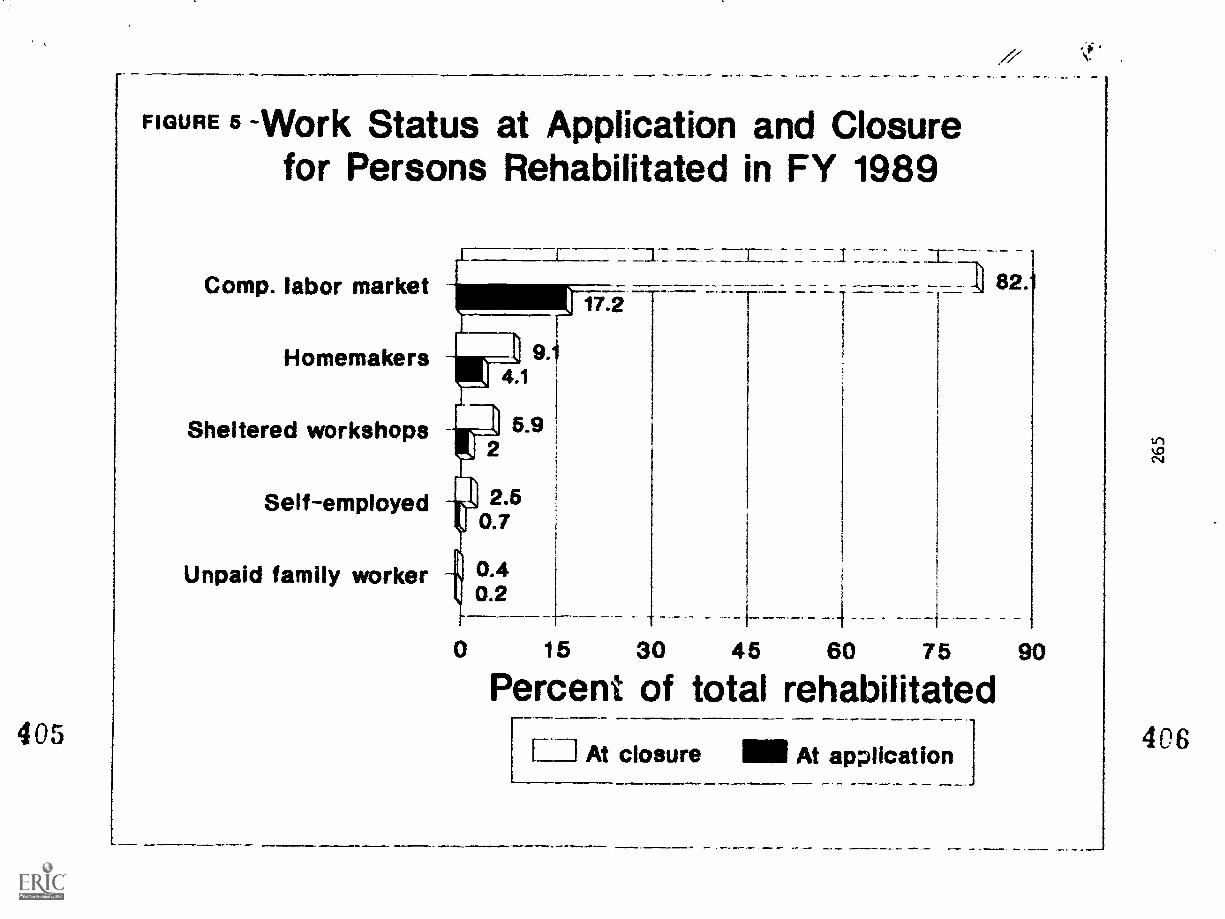
405
FIGURE 5 -Work Status at Application and Closurefor Persons Rehabilitated in FY 1989
Comp. labor market
Homemakers
Sheltered workshops
Self-employed
Unpaid family worker
/7
0 15 30 45 60 75 90
Percent of total rehabilitated
r 1 At closure III At application 1
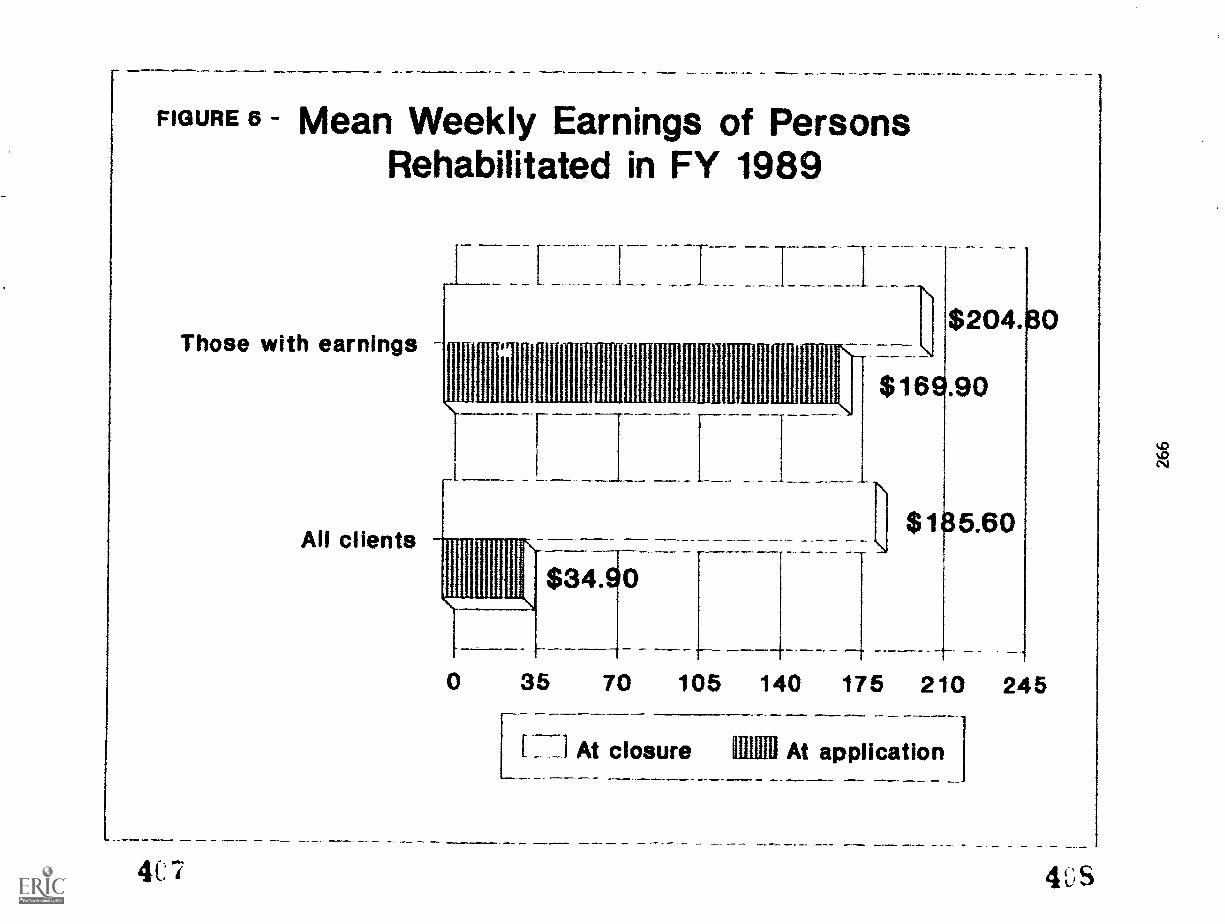
FIGURE 6 Mean Weekly Earnings of PersonsRehabilitated in FY 1989
Those with earnings
All clients
4e7
1
0 35 70 105 140 175 210 245
[17] At closure Min At application I
4US
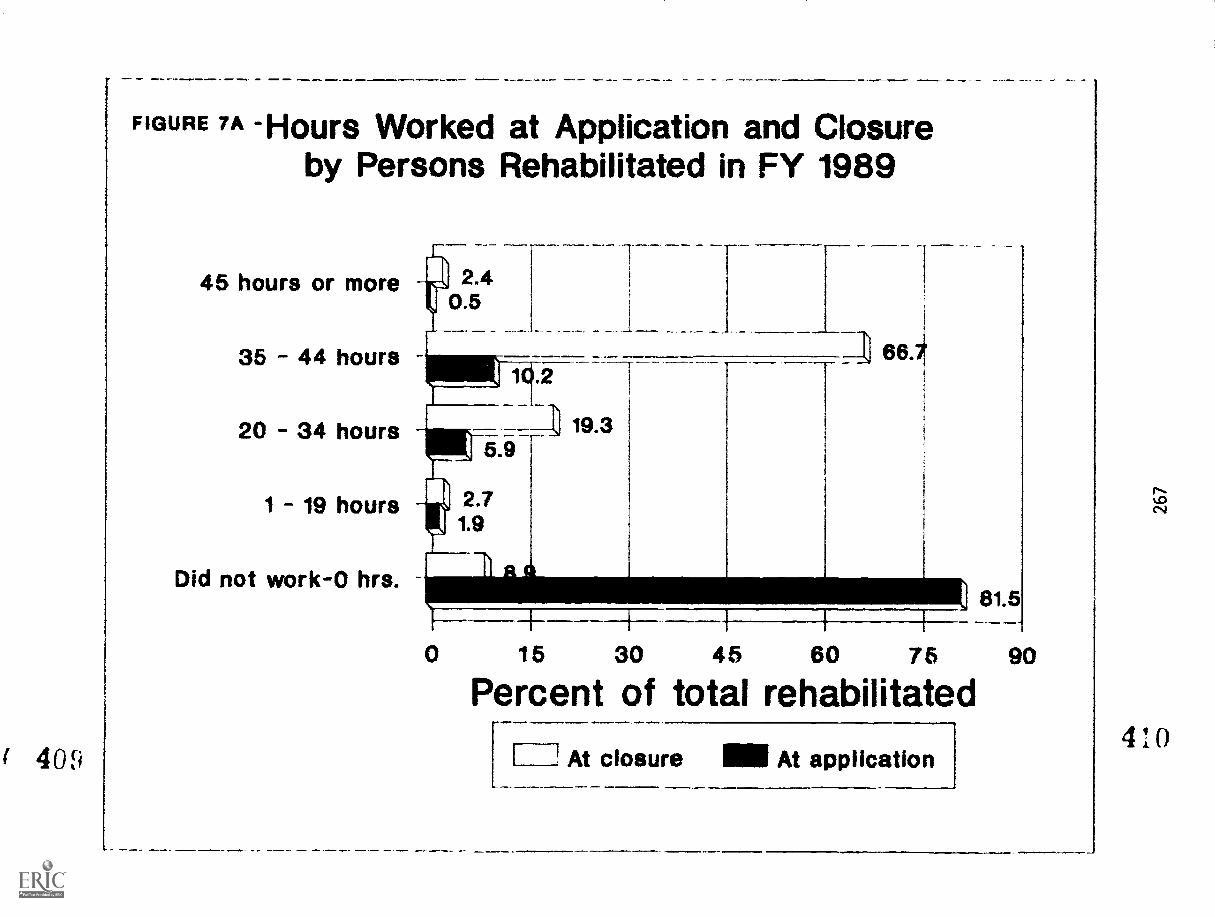
FIGURE 7A -Hours Worked at Application and Closureby Persons Rehabilitated in FY 1989
45 hours or more
35 44 hours
20 34 hours
1 19 hours
Did not woric-0 hrs.
0 15 30 45 60 75
Percent of total rehabilitated
FLAt closure 11111 At application
81.5
90
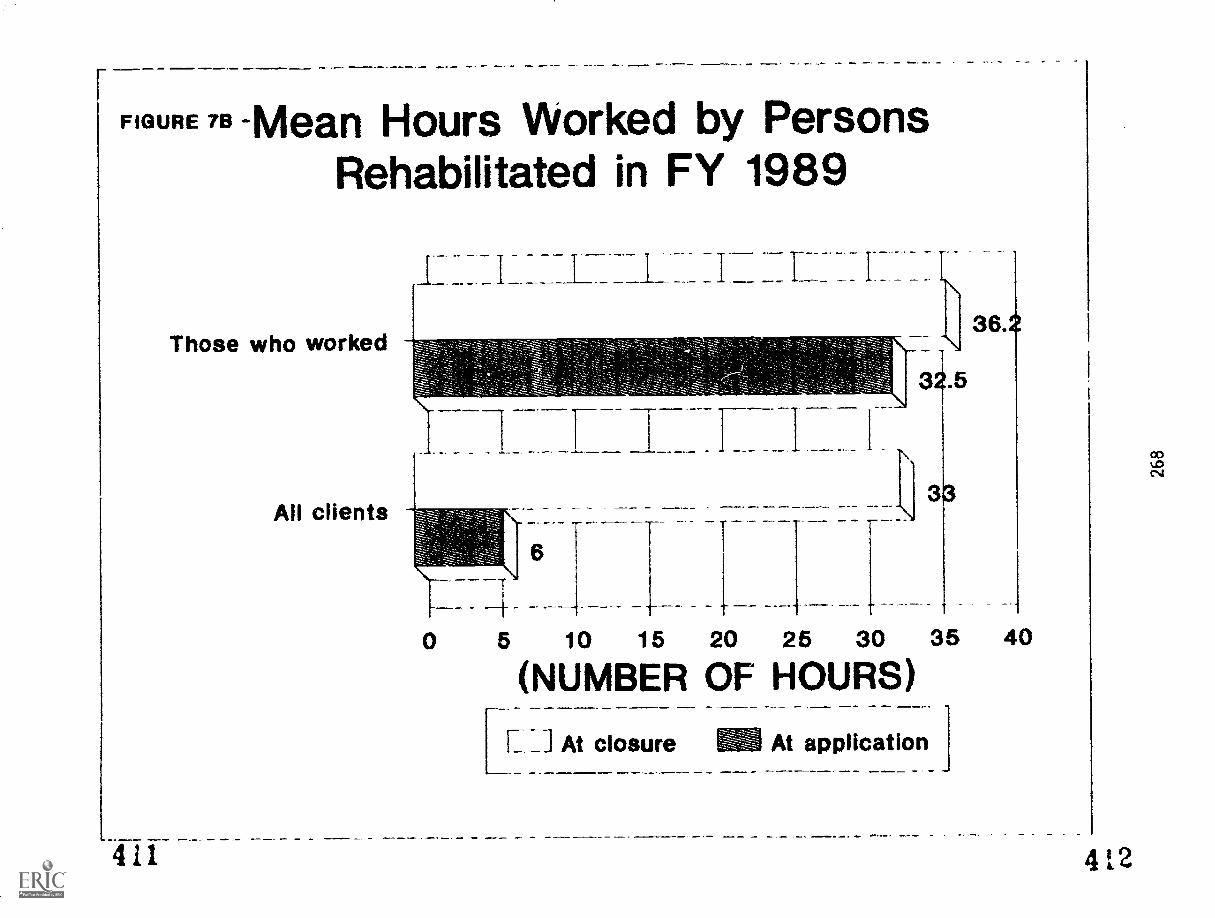
FIGURE 78-Mean Hours Worked by PersonsRehabilitated in FY 1989
Those who worked
All clients
411
JIIIIIIIITIIILIII 11-1
0 5 10 15 20 25 30 35 40
(NUMBER_ OF HOURS)..
At closure -----_ At application
412
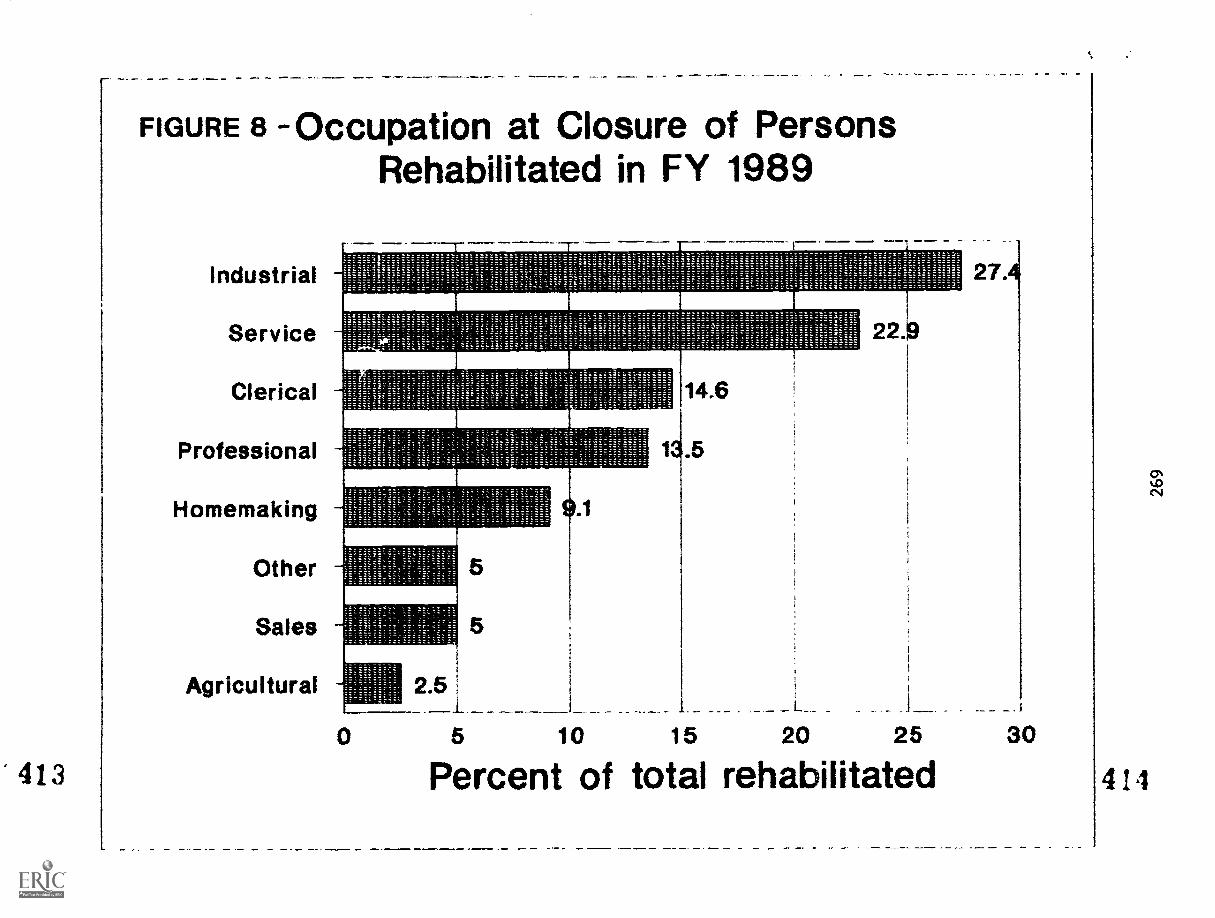
FIGURE 8 Occupation at Closure of PersonsRehabilitated in FY 1989
Industrial
Service
Clerical
Professional
Homemaking
Other
Sales
Agricultural
0 5 10 15 20 25
Percent of total rehabilitated30
414
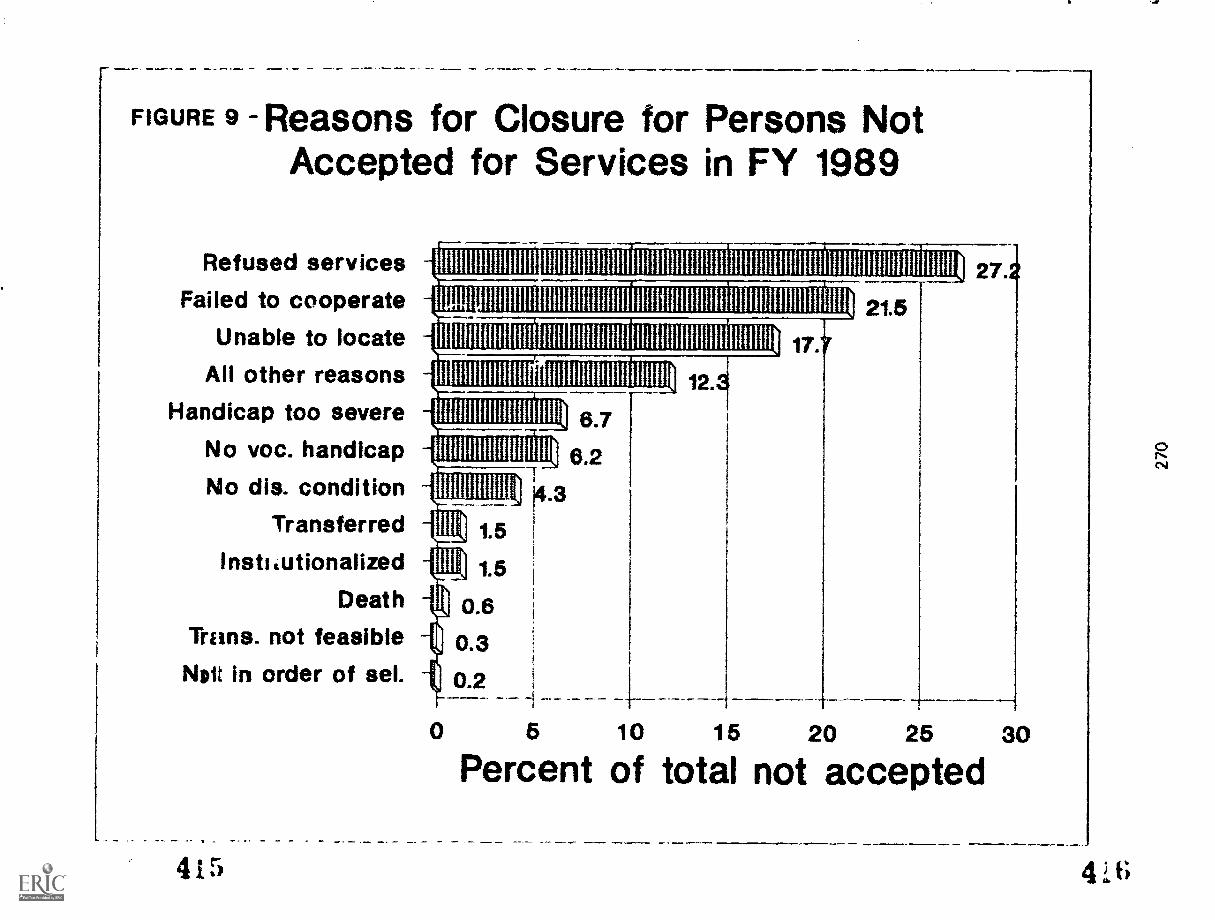
FIGURE Reasons for Closure for Persons NotAccepted for Services in FY 1989
Refused servicesFailed to cooperate
Unable to locateAll other reasons
Handicap too severe
No voc. handicap
No dis. conditionTransferred
I nsti tutionalized
Death
Trans. not feasible
Npit in order of sel.
IIllhIIIIIIIIIIIlIlll 11111111 ttllllhlIIitIllhlIIIIIIIIIllhIIllIllhIlItIIiIIIIIIIIIiII1llhEIi1IIiiIIll
II 1 M11111111 IIIIIII11111111111111111111111111111111111111
11 11 11 11111 11111 11111
III 11111 111111111 IIIIIIIIIIIIIIIIIII1111111
IIIIIIIIIIIIIIIIIIIIIIIIIII
11 111111
IIIII 11111111 I
iiiri
MI
LI
1.5
1.5
0.6
0.3
0.2
6.7
6.2
4.3
12
5 10 15
17
20
21.5
27
25 30
Percent of total not accepted
415 4i
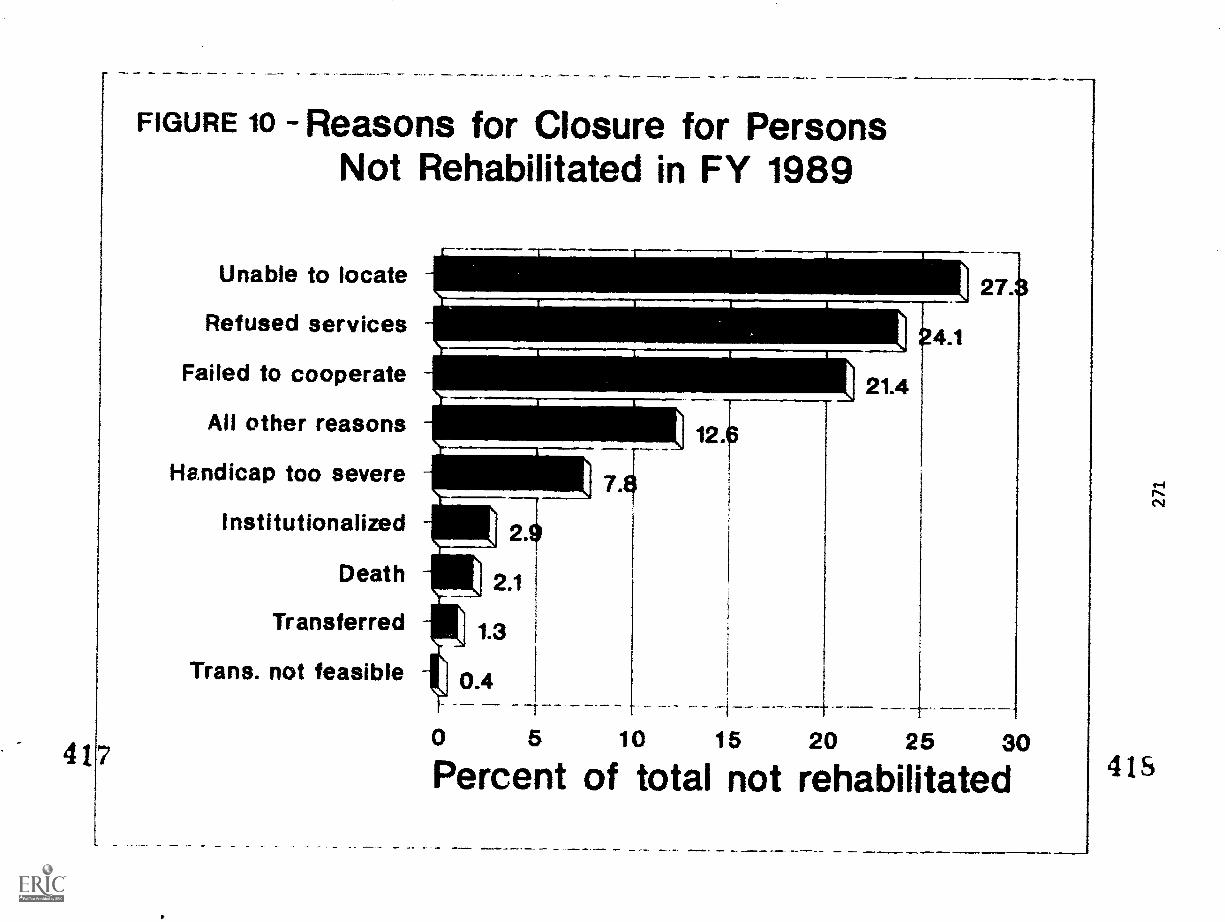
FIGURE 10 Reasons for Closure for PersonsNot Rehabilitated in FY 1989
Unable to locate
Refused services
Failed to cooperate
All other reasons
Handicap too severe
Institutionalized
Death
Transferred
Trans. not feasible
40 10 15 20 25 3017Percent of total not rehabilitated 415
E
Post-employment Services and AnnualReviews of Ineligibility Determinations
and Workshop Placements
419
POST-EMPLOYMENT SERVICES AND ANNUAL REVIEWS OFINELIGIBILITY DETERMINAT/ONS AND WORKSHOP PLACEMENTS
FISCAL YEAR 1990
List,ing of Itatisti94.1 Tables
Table 1. Number and percent of persons rehabilitated by Statevocational rehabilitation agencies receiving post-employment services (PES) and percent maintainingemployment, Fiscal Years 1980 - 1990
Table 2. Number and percent of persons rehabilitated by Statevocational rehabilitation agencies receiving post-employment services (PES), by type of agency and severityof disability, Fiscal Year 1990
Table 3. Number of ineligibility de.ermination reviews conducted byState vocational rehabilitation agencies, and percentresulting in acceptance for services, Fiscal Years 1980 -1990
Table 4. Number of workshop reviews conducted by State vocationalrehabilitation agencies, and percent resulting inplacements into competitive and self-employment, FiscalYears 1980 - 1990
4.20
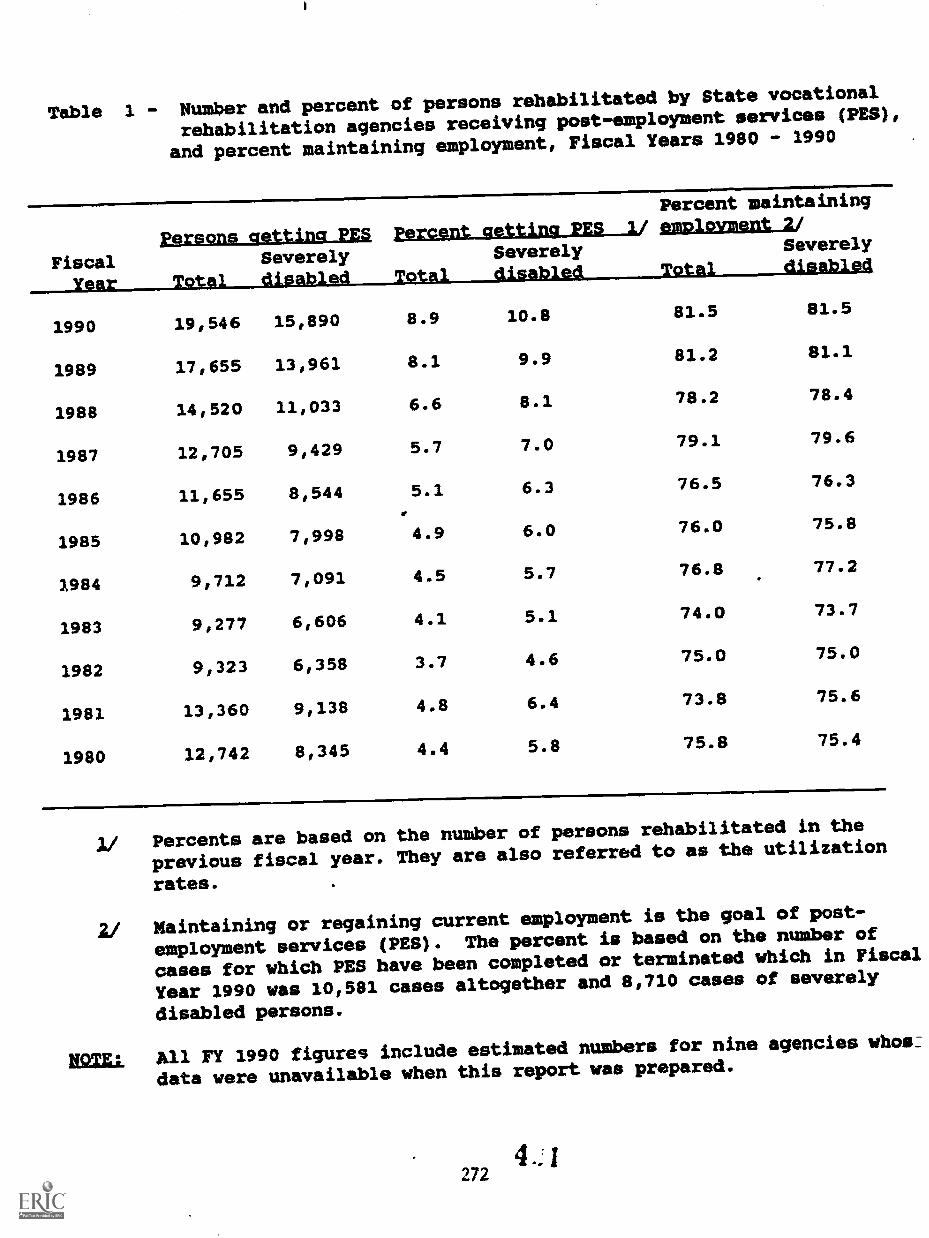
Table 1 - Number and percent of persons rehabilitated by State vocational
rehabilitation agencies receiving post-employment services (PES),
and percent maintaining employment, Fiscal Years 1980 - 1990
FiscalYear
persons aettina PES Percent getting PES 1/
Percent maintainingemploymept 2/
Severely
Total disab3j 4SeverelyTotal disabled Total
Severelyjasabled
1990 19,546 15,890 8.9 10.8 81.5 81.5
1989 17,655 13,961 8.1 9.9 81.2 81.1
1988 14,520 11,033 6.6 8.1 78.2 78.4
1987 12,705 9,429 5.7 7.0 79.1 79.6
1986 11,655 8,544 5.1 6.3 76.5 76.3
,
1985 10,982 7,998 4.9 6.0 76.0 75.8
1984 9,712 7,091 4.5 5.7 76.8 77.2
1983 9,277 6,606 4.1 5.1 74.0 73.7
1982 9,323 6,358 3.7 4.6 75.0 75.0
1981 13,360 9,138 4.8 6.4 73.8 75.6
1980 12,742 8,345 4.4 5.8 75.8 75.4
2/ Percents are based on the number of persons rehabilitated in the
previous fiscal year. They are also referred to as tbe utilization
rates.
2/ Maintaining or regaining current employment is the goal of post-
employment services (PES). The percent is based on the number of
cases for which PES have been completed or terminated which in Fiscal
Year 1990 was 10,581 cases altogether and 8,710 cases of severely
disabled persons.
HQ= All FY 1990 figures include estimated numbers for nine agencies whoa=
data were unavailable when this report was prepared.
4.J272
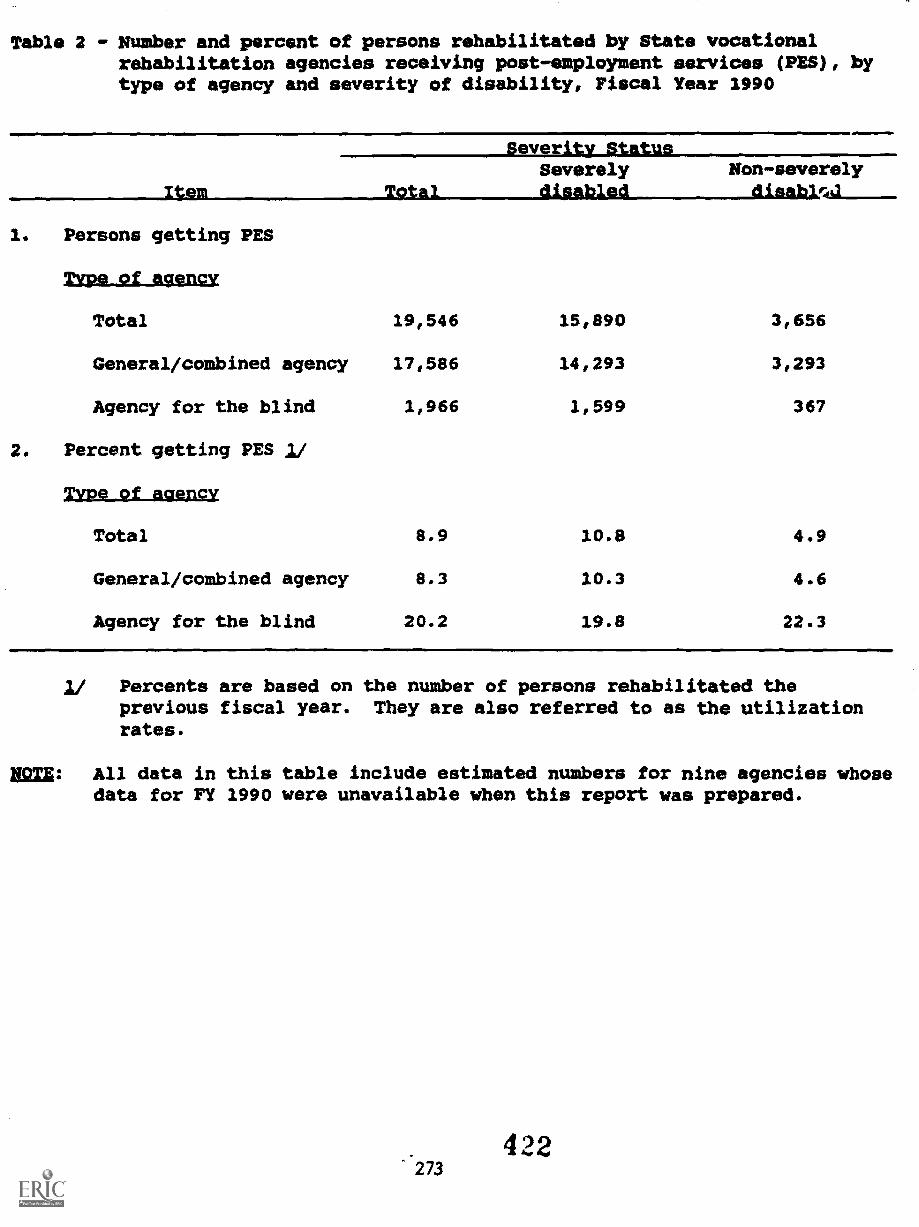
Table 2 - Number and percent of persons rehabilitated by State vocationalrehabilitation agencies receiving post-employment services (PES), bytype of agency and severity of disability, Fiscal Year 1990
Seviamity StatusSeverely Non-severely
Item Tgltal disabled
1. Persons getting PES
172,we gf agency
Total 19,546 15,890 3,656
General/combined agency 17,586 14,293 3,293
Agency for the blind 1,966 1,599 367
2. Percent getting PES .1/
npe of agency
Total 8.9 10.8 4.9
General/combined agency 8.3 10.3 4.6
Agency for the blind 20.2 19.8 22.3
1/ Percents are based on the number of persons rehabilitated theprevious fiscal year. They are also referred to as the utilizationrates.
Nang: All data in this table include estimated numbers for nine agencies whosedata for FY 1990 were unavailable when this report was prepared.
'.273
422
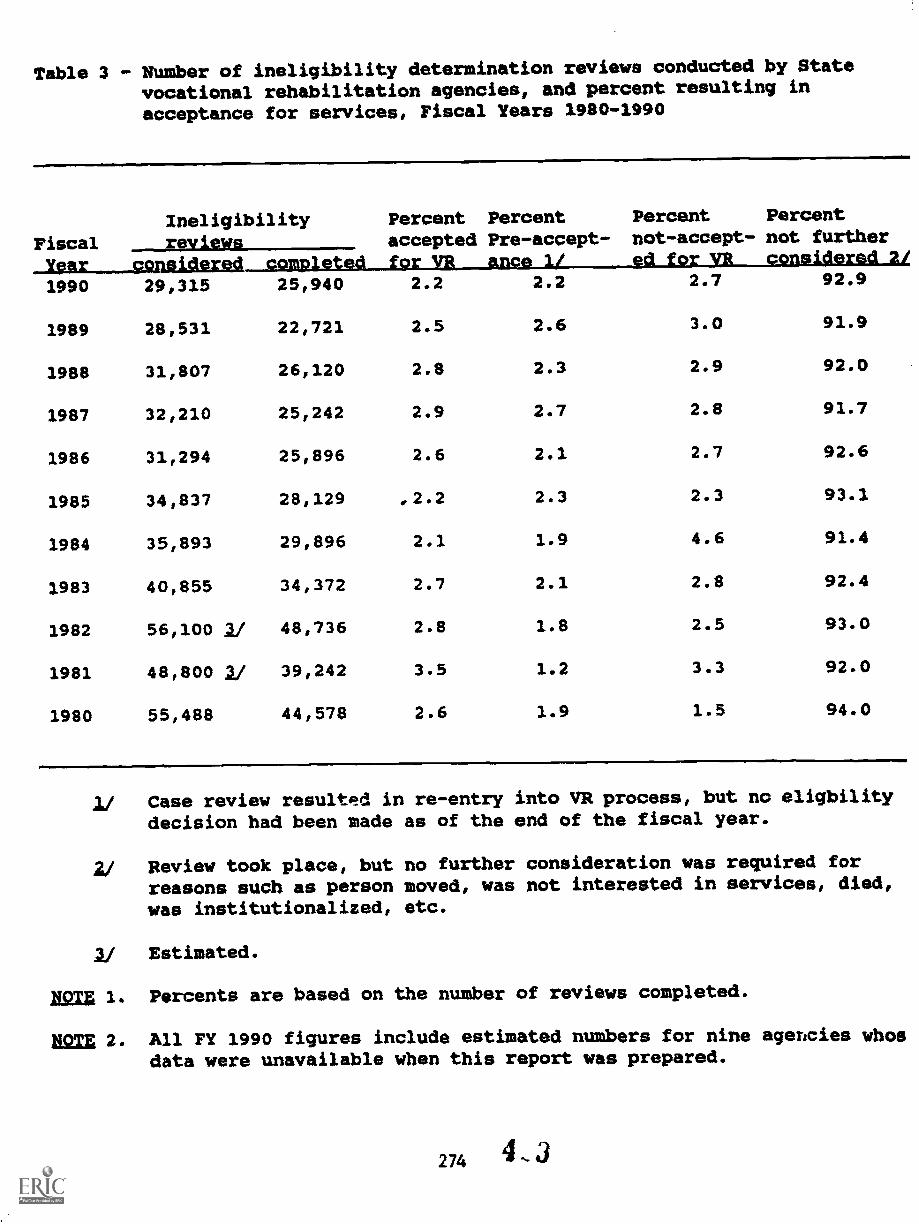
Table 3 - NUmber of ineligibility determination reviews conducted by Statevocational rehabilitation agencies, and percent resulting in
acceptance for services, Fiscal Years 1980-1990
FiscalIneligibilityreviews
Percentacceptedfor vg
PercentPre-accept-ance 1/
Percent Percentnot-accept- not further0 Vit considered A/coppleted
1990 29,315 25,940 2.2 2.2_for
2.7 92.9
1989 28,531 22,721 2.5 2.6 3.0 91.9
1988 31,807 26,120 2.8 2.3 2.9 92.0
1987 32,210 25,242 2.9 2.7 2.8 91.7
1986 31,294 25,896 2.6 2.1 2.7 92.6
1985 34,837 28,129 2.3 2.3 93.1
1984 35,893 29,896 2.1 1.9 4.6 91.4
1983 40,855 34,372 2.7 2.1 2.8 92.4
1982 56,100 2/ 48,736 2.8 1.8 2.5 93.0
1981 48,800 2/ 39,242 3.5 1.2 3.3 92.0
1980 55,488 44,578 2.6 1.9 1.5 94.0
V Case review resulted in re-entry into VR process, but no eligbilitydecision had been made as of the end of the fiscal year.
2/ Review took place, but no further consideration was required forreasons such as person moved, was not interested in services, died,
WAS institutionalized, etc.
21 Estimated.
ulg 1. Percents are based on the number of reviews completed.
Hoig 2. Ail FY 1990 figures include estimated numbers for nine agencies whosdata were unavailable when this report was prepared.
274 4 ,3
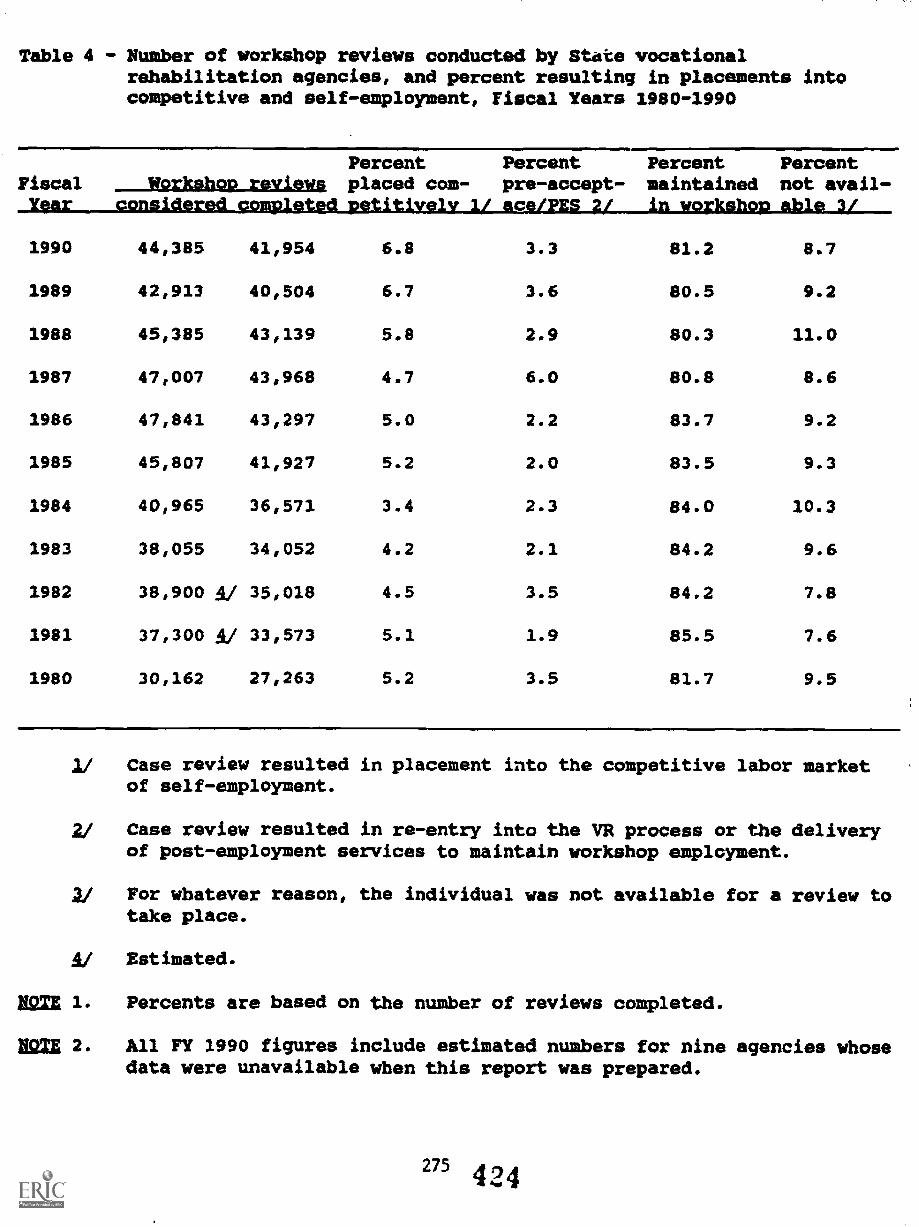
Table 4 - Number of workshop reviews conducted by State vocationalrehabilitation agencies, and percent resulting in placements intocompetitive and self-employment, Fiscal Years 1980-1990
Percent Percent Percent PercentFiscal Workshop reviewg placed com- pre-accept- maintained not avail -Yip:1r considered completed petitivelv_li_aceiTES aie in workshop ablei 3/
1990 44,385
1989 42,913
1988 45,385
1987 47,007
1986 47,841
1985 45,807
1984 40,965
1983 38,055
1982 38,900 4/
1981 37,300 4/
1980 30,162
41,954 6.8 3.3 81.2 8.7
40,504 6.7 3.6 80.5 9.2
43,139 5.8 2.9 80.3 11.0
43,968 4.7 6.0 80.8 8.6
43,297 5.0 2.2 83.7 9.2
41,927 5.2 2.0 83.5 9.3
36,571 3.4 2.3 84.0 10.3
34,052 4.2 2.1 84.2 9.6
35,018 4.5 3.5 84.2 7.8
33,573 5.1 1.9 85.5 7.6
27,263 5.2 3.5 81.7 9.5
2/ Case review resulted in placement into the competitive labor marketof self-employment.
2/ Case review resulted in re-entry into the VR process or the deliveryof post-employment services to maintain workshop employment.
2/ For whatever reason, the individual was not available for a review totake place.
A/ Estimated.
hIgn 1. Percents are based on the number of reviews completed.
fign 2. All FY 1990 figures include estimated numbers for nine agencies whosedata were unavailable when this report was prepared.
275 424

Client Assistance Program
4 25
1
CLIENT ASSISTANCE PROGRAMFY 1990
Listing of Statistical Tables
Page
Table 1. Non-cases (informational/referral services) andcases handled by State Client Assistance Program(CAP) agencies: Number and percent change fromprevious year, FY 1985 1990
Table 2. Total number of individuals served, non-cases(informational/referral services) and cases handledby State Client Assistance Program (CAP) agencies,FY 1985 - 1990
Figure 1. Number of individuals served by State CAP agencies,FY 1985 - 1990
Table 3. Total cases handled by State Client Assistance Pro-gram (CAP) agencies: Number and percent distribu-tion, FY 1989 and 1990
Table 4. Percent distribution of program data items,FY 1990
Figure 2. Types of individuals served by 3tate CAP agencies,FY 1990
Figure 3. Source of person's concern for CAP cases handledduring FY 1'.490
Figure 4. Problem areas for CAP cases handled during FY 1990
Figure 5. Major disabling conditions of cases handled byCAP agencies during FY 1990
Figure 6. Types of services provided to CAP cases duringFY 1990
426
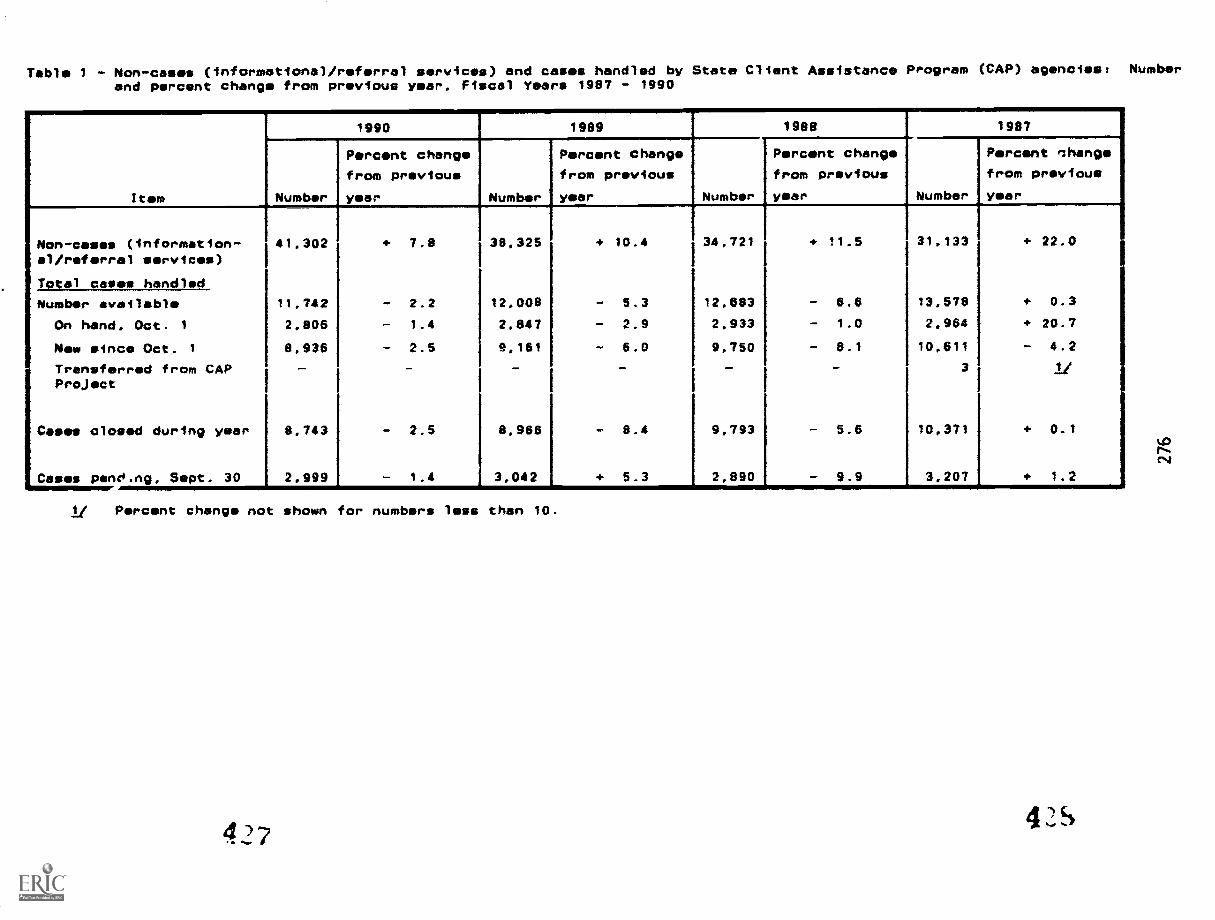
Tabl 1 - Non-cases (informational/referral services) and cass handled by State Client Assistance Program (CAP) agencies: Numberand percent change from previous year, fiscal Years 1907 - 1990
Item
1990 1909 1988 1987
Number
Prcnt changefrom previous
year Number
Percent change
from previous
year Number
Percnt changefrom previous
year Number
Percent e:hange
from previous
year
Non-cases (information-al/referral ervices)
41,302 + 7.8 38,325 + 10.4 34,721 + 11,5 31,133 + 22.0
Total cases handled
Number available 11,742 - 2.2 12,000 - 5.3 12.683 - 6.6 13.578 + 0.3
On hand. Oct. 1 2,806 - 1.4 2.847 - 2.9 2.933 - 1.0 2.964 + 20.7
New since Oct. 1 8,936 - 2.5 9,161 - 6.0 9,750 - 8.1 10,611 - 4.2
Transferred from CAP - - - - - - 3 ifProject
Cages closed during year 8,743 - 2.5 8,966 0.4 9,793 - 5.6 10,371 + 0.1
Cases pen0,ng, Sept. 30,
2,999 1.4 3,042 + 5.3 2,890 - 9.9 3,207 1.2
jJ Percent change not shown for numbers less than 10.
427 4
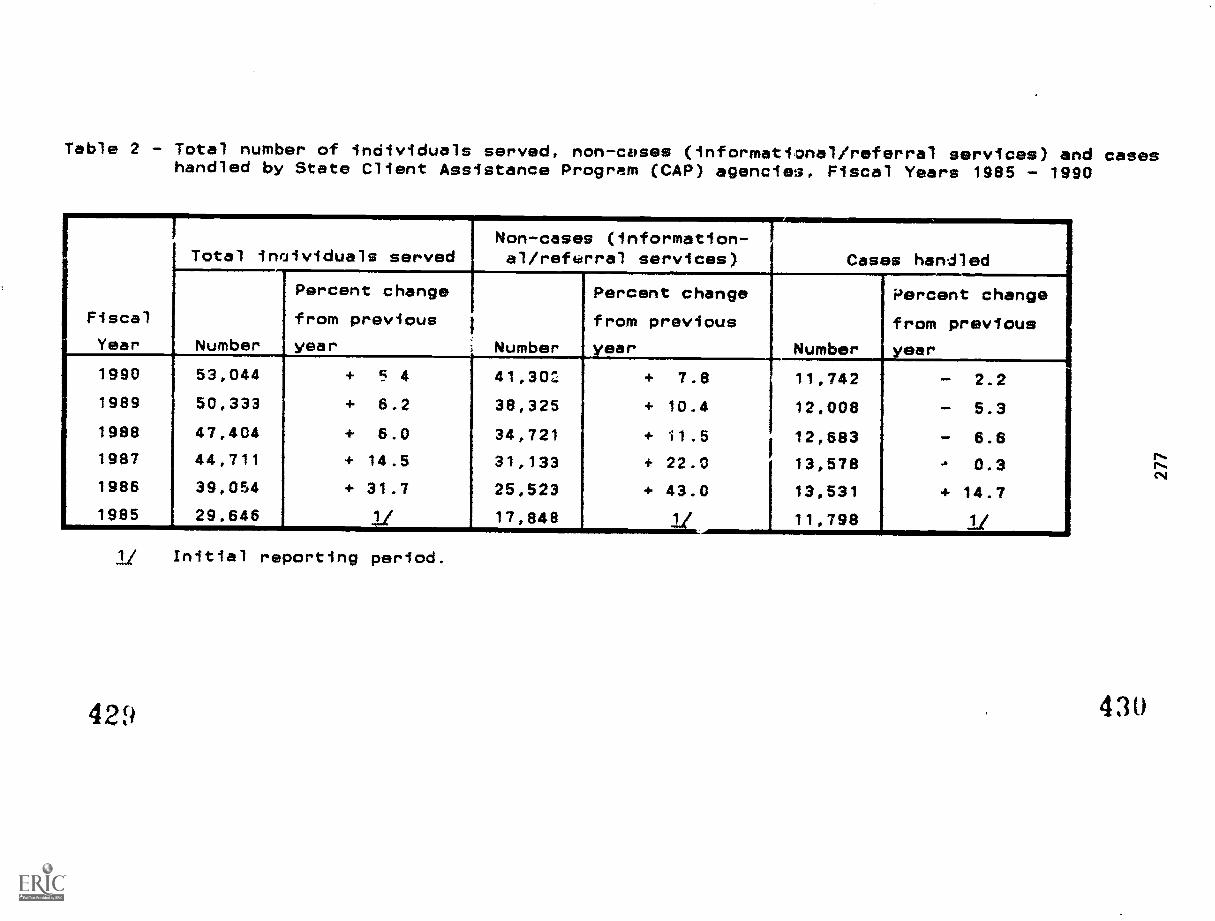
Table 2 - Total number of individuals served, non-cases (informational/referral services) and caseshandled by State Client Assistance Program (CAP) agencies, Fiscal Years 1985 - 1990
Total individuals servedNon-cases (information-al/referral services) Cases handled
Percent change Percent change Percent changeFiscal from previous from previous from previousYear Number year i Number year Number year
1990 53,044 + 5 4 41,302 + 7.8 11,742 - 2.2
1989 50,333 + 6.2 38,325 + 10.4 12,008 - 5.3
1988 47,404 + 6.0 34,721 + 11.5 12,683 - 6.61987 44,711 + 14.5 31,133 + 22.0 13,578 -' 0.31986 39,054 + 31.7 25,523 + 43.0 13,531 + 14.71985 29,645 1/ 17,848 1/ 11,798 11
11 Initial reporting period.
429 430
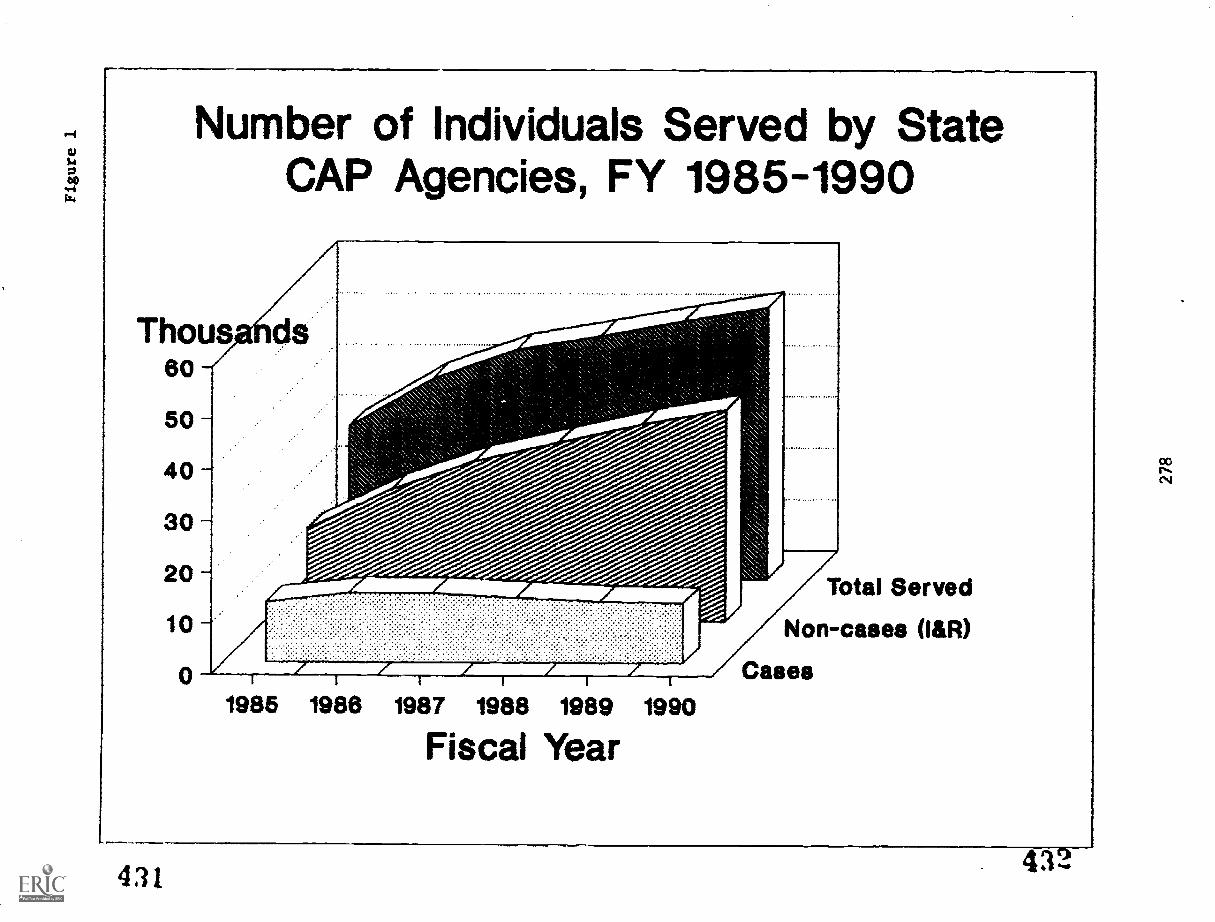
Number of Individuals Served by StateCAP Agencies, FY 1985-1990
T 1 1 1 I i
1985 1988 1987 1988 1989 1990
Fiscal Year
Total Served
Non-cases (laR)
Cases
431 43..
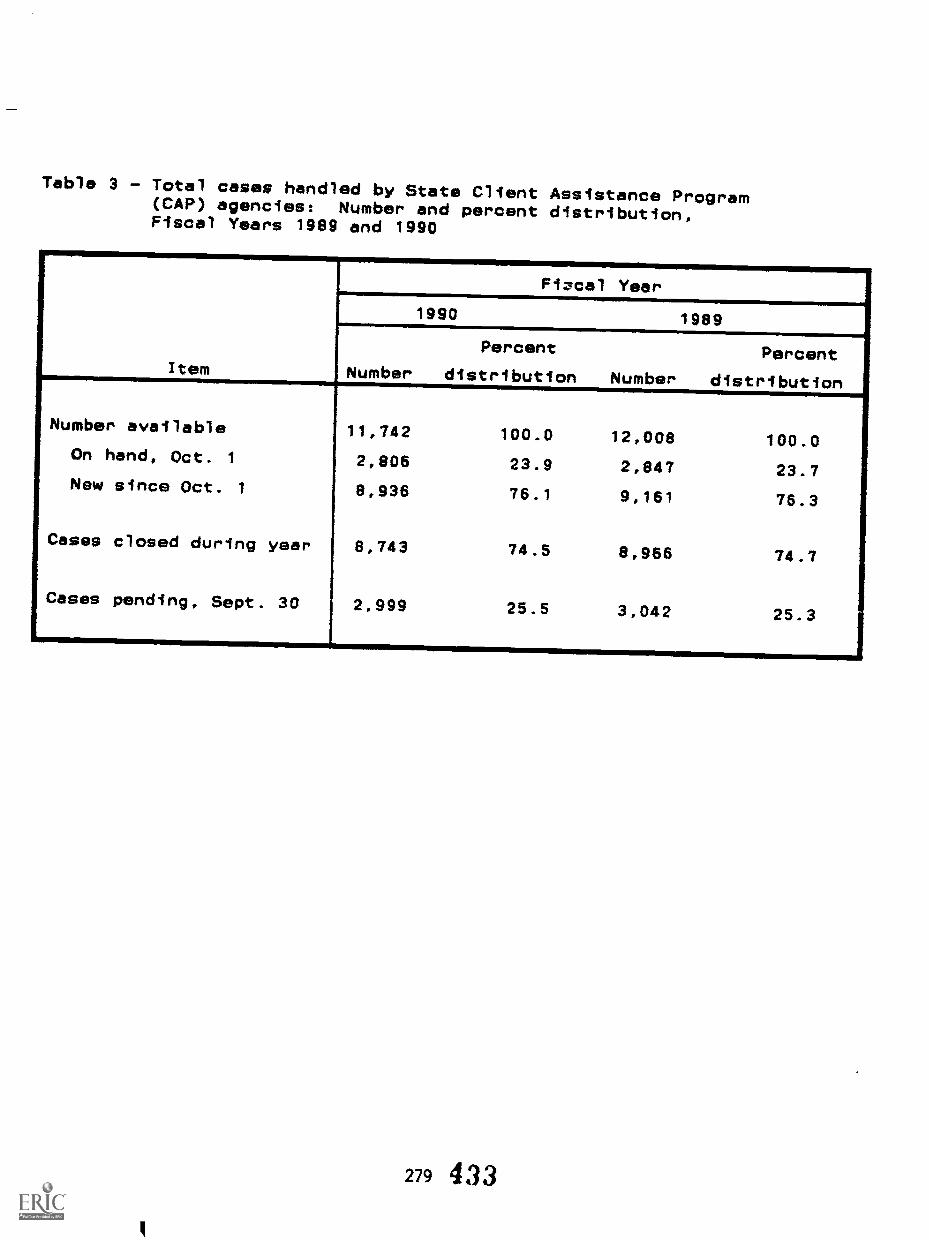
Table 3 - Total cases handled by State Client Assistance Program(CAP) agencies: Number and percent distribution,Fiscal Years 1989 and 1990
Item
Fizcal Year
1990 1969
Number
Percent
distribution Number
1
Percent
distribution
Number available 11,742 100.0 12,008 100.0On hand, Oct. 1 2,806 23.9 2,847 23.7New since Oct. 1 8,936 76.1 9,161 76.3
Cases closed during year 8,743 74.5 8,966 74.7
Cases pending, Sept. 30 2,999 25.5 3,042 25.3/
279 433
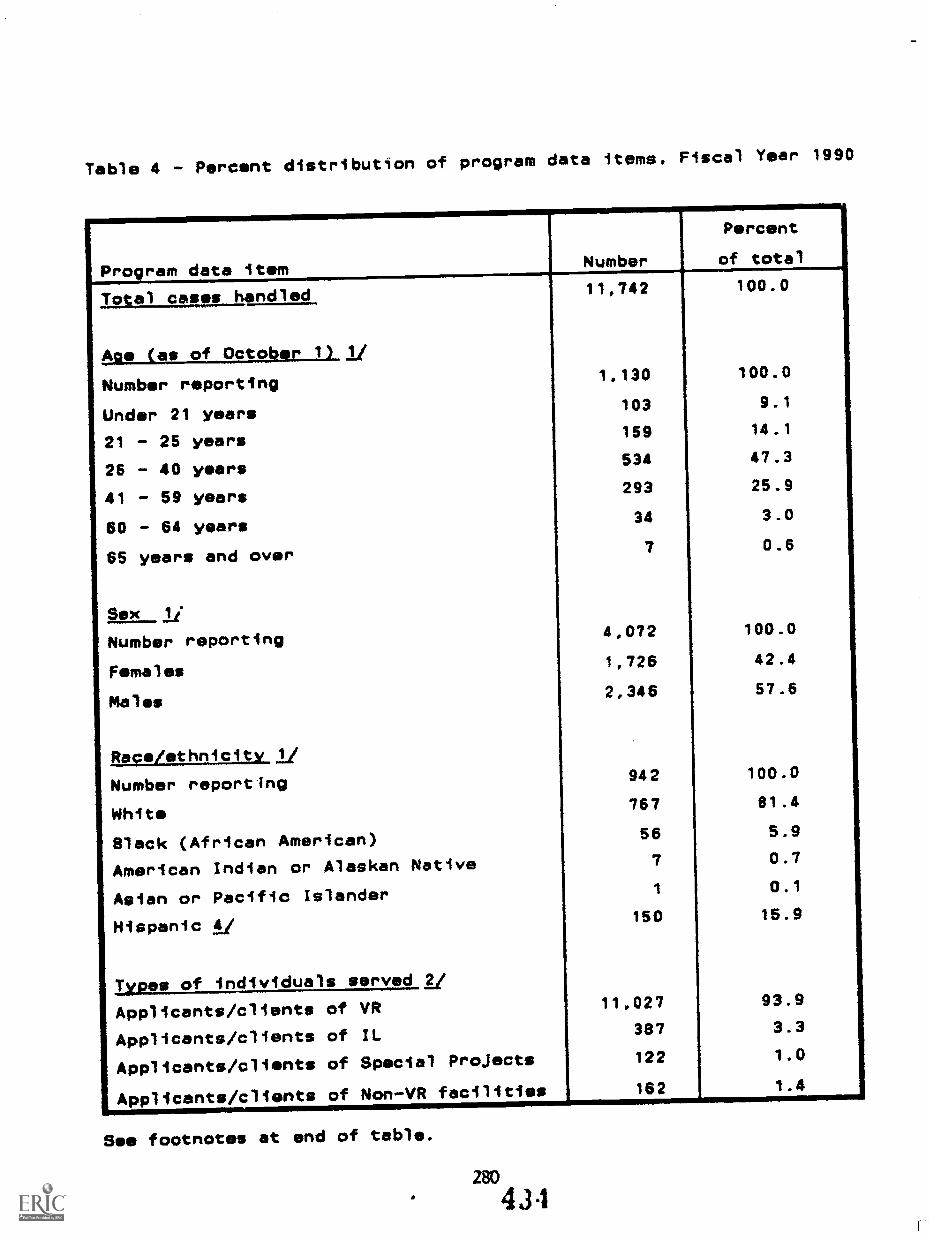
Table 4 - Percent distribution of program data items, Fiscal Year 1990
Pro.ram data item Number
Percent
of total
Total cases handled 11,742 100.0
Age (as of October 1) li
Number reporting1,130 100.0
Under 21 years103 9.1
21 - 25 years159 14.1
26 - 40 years534 47.3
41 - 59 years293 25.9
60 - 64 years34 3.0
65 years and over7 0.6
Sex li
Number reporting4,072 100.0
Females1,726 42.4
Males2,346 57.6
Race/ethnicitY 1/
Number reporting 942 100.0
White767 81.4
Slack (African American) 56 5.9
American Indian or Alaskan Native 7 0.7
Asian or Pacific Islander 1 0.1
Hispanic iii150 15.9
Types of individuals served 2/
Applicants/clients of VR 11,027 93.9
Applicants/clients of IL 387 3.3
Applicants/clients of Special Projects 122 1.0
Applicants/clients of Non-VR facilities 162 1.4
See footnotes at end of table.
280
434
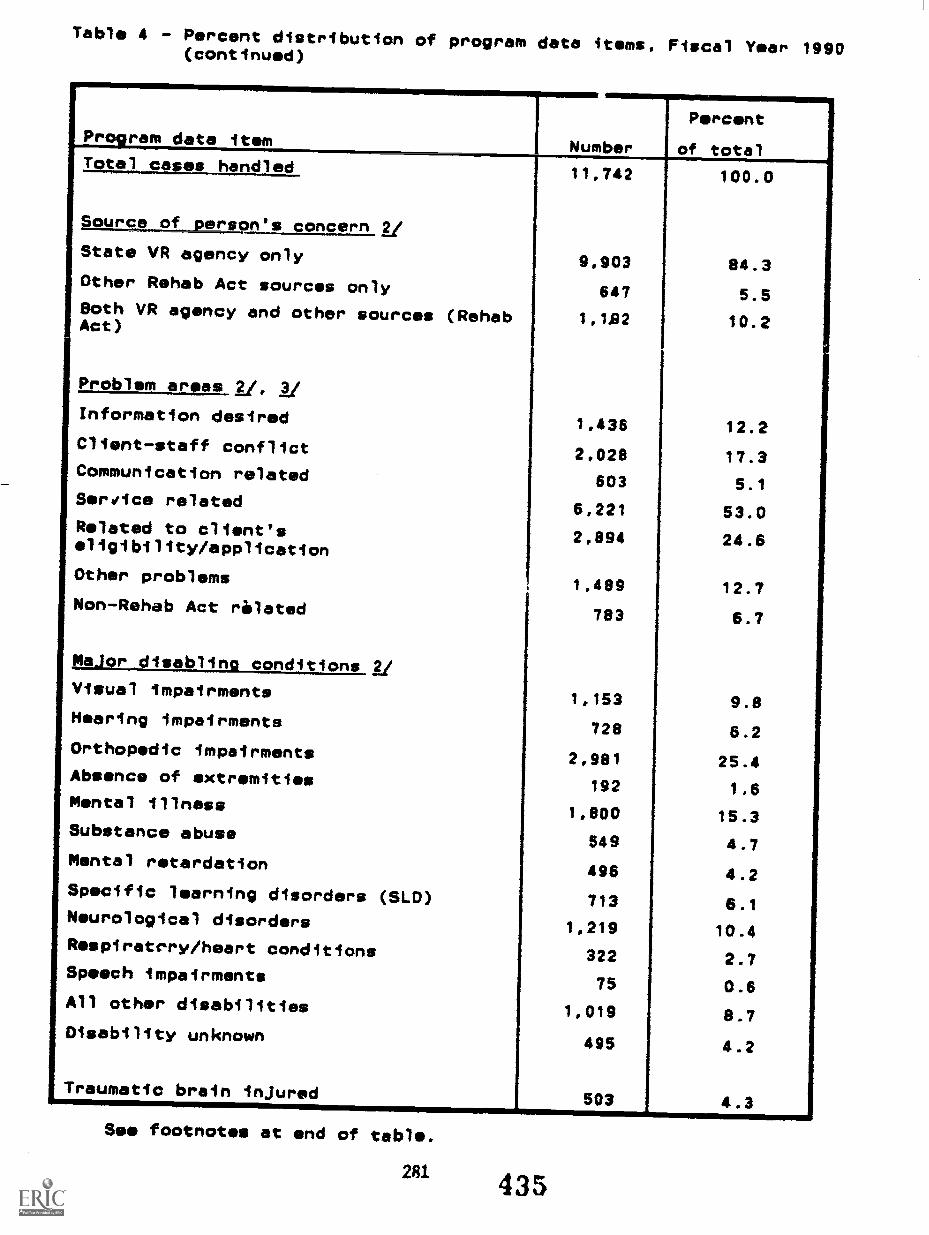
Table 4 - Percent distribution of program data items, Fiscal Year 1990(continued)
Pro9ram data item
Total cases handledJ
Source of person's concern 2/
State VR agency only
Other Rehab Act sources onlyBoth VR agency and other sourcs (RehabAct)
Problem areas 21
Information desired
Client-staff conflict
Communication related
Service related
Related to client'seligibility/application
Other problems
Non-Rehab Act related
Major disabling conditions Al
Visual impairments
Hearing impairments
Orthopedic impairments
Absence of extremities
Mental illness
Substance abuse
Mental retardation
Specific learning disorders (SLD)
Neurological disorders
Rospiratrry/heart conditions
Speech impairments
All other disabilities
Disability unknown
Traumatic brain injured
See footnotes at end of table.
281
Number
Percent
of total
11,742 100.0
9,903 84.3
647 5.5
1,1.82 10.2
1,435 12.2
2,028 17.3
603 5.1
6,221 53.0
2.894 24.6
1,489 12.7
703 6.7
1,153 9.8
728 6.2
2,901 25.4
192 1.6
1,000 15.3
549 4.7
496 4.2
713 6.1
1,219 10.4
322 2.7
75 0.6
1,019 8.7
495 4.2
503 4.3
435
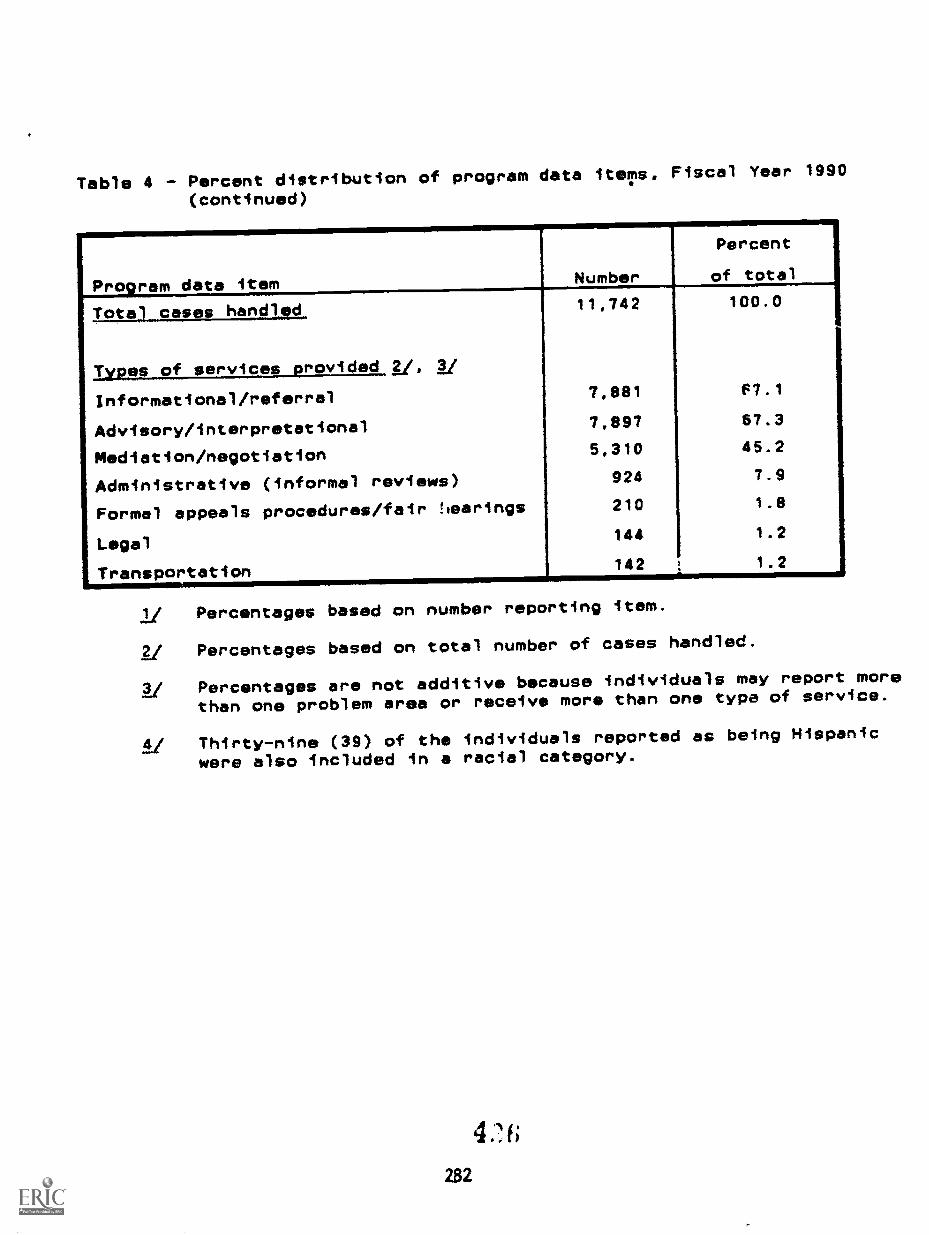
Table 4 - Percent distribution of program data items, Fiscal Year 1990
(continued)
Program data item Number
Percent
of total
Total cases handled, 11,742 100.0
IX291-9.1_112=10212-9triiA24.2/. 2/
Informational/referral 7,881 f7.1
Advisory/interpretational 7,997 67.3
Mediation/negotiation 5,310 45.2
Administrative (informal reviews) 924 7.9
Formal appeals procedures/fair !learings 210 1.8
Legal144 1.2
Transportation 142l
1.2/
'k
1/ Percentages based on number reporting item.
1/ Percentages based on total number of cases handled.
2/ Percentages are not additive because individuals may report more
than one problem area or receive more than one type of service.
Af Thirty-nine (39) of the individuals reported as being Hispanic
were also included in a racial category.
4.1.0
282
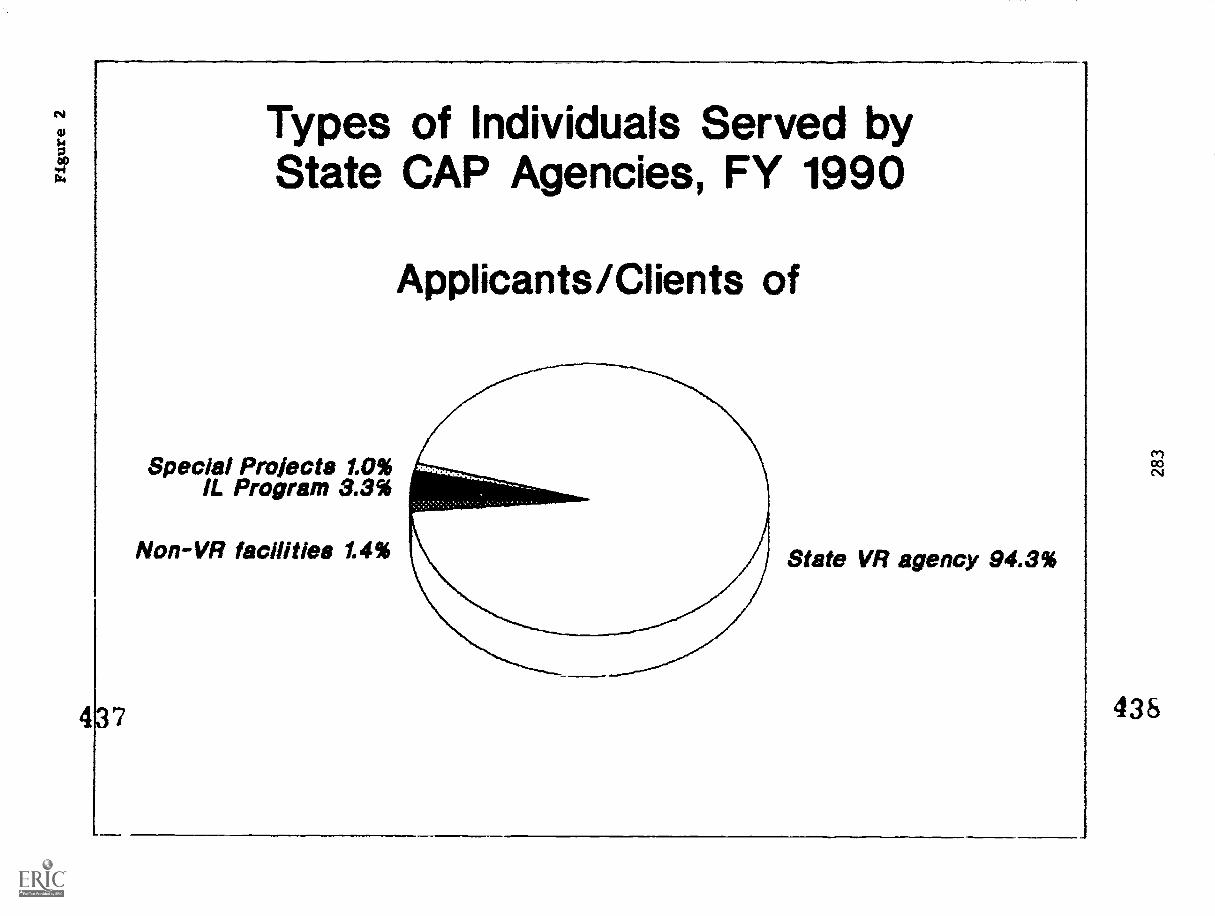
Types of Individuals Served byState CAP Agencies, FY 1990
Special Proiects 1.0%IL Program 3.3%
Non-VR facilities 1.4%
Applicants/Clients of
State VR agency 94.3%
436
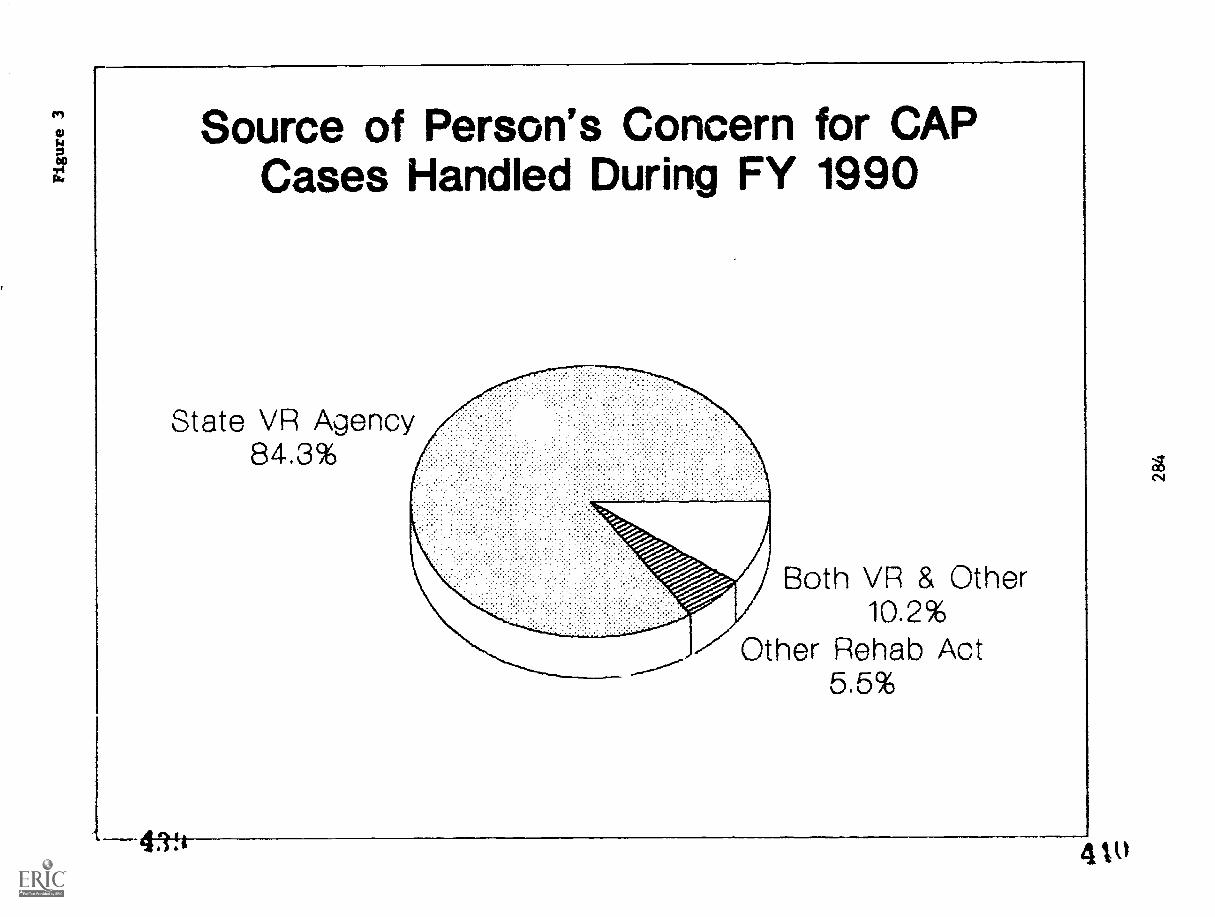
Source of Person's Concern for CAPCases Handled During FY 1990
State VR Agency84.3%
431.
Both VR & Other10.2%
Other Rehab Act5.5%
4 W
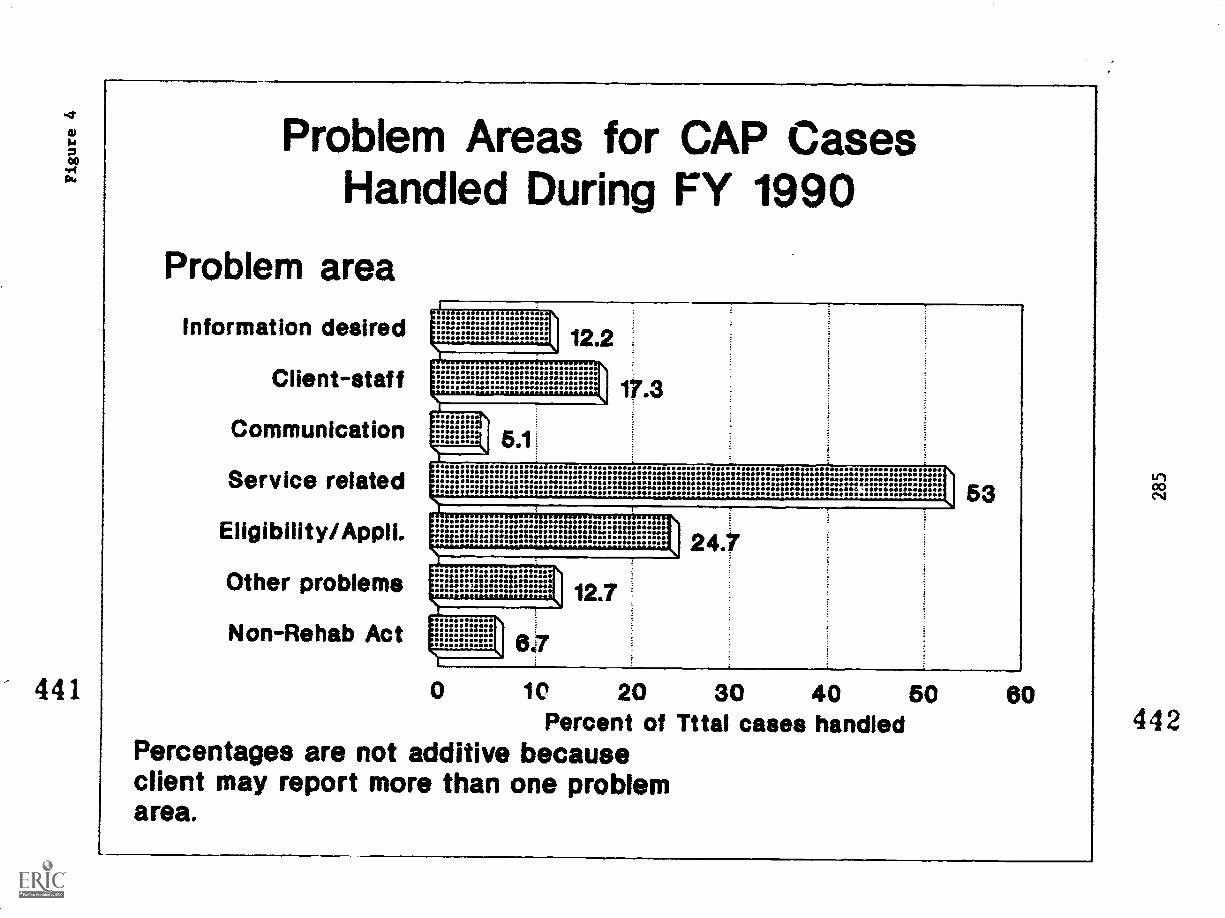
Problem Areas for CAP CasesHandled During FY 1990
Problem area
Information desired
Client-staff
Communication
Service related
Eligibility/14)pH.
Other problems
Non-Rehab Act
12.2
1
17.3
V
07
63
0 le 20 30 40 50 60Percent of Tttal cases handled
Percentages are not additive becauseclient may report more than one problemarea.
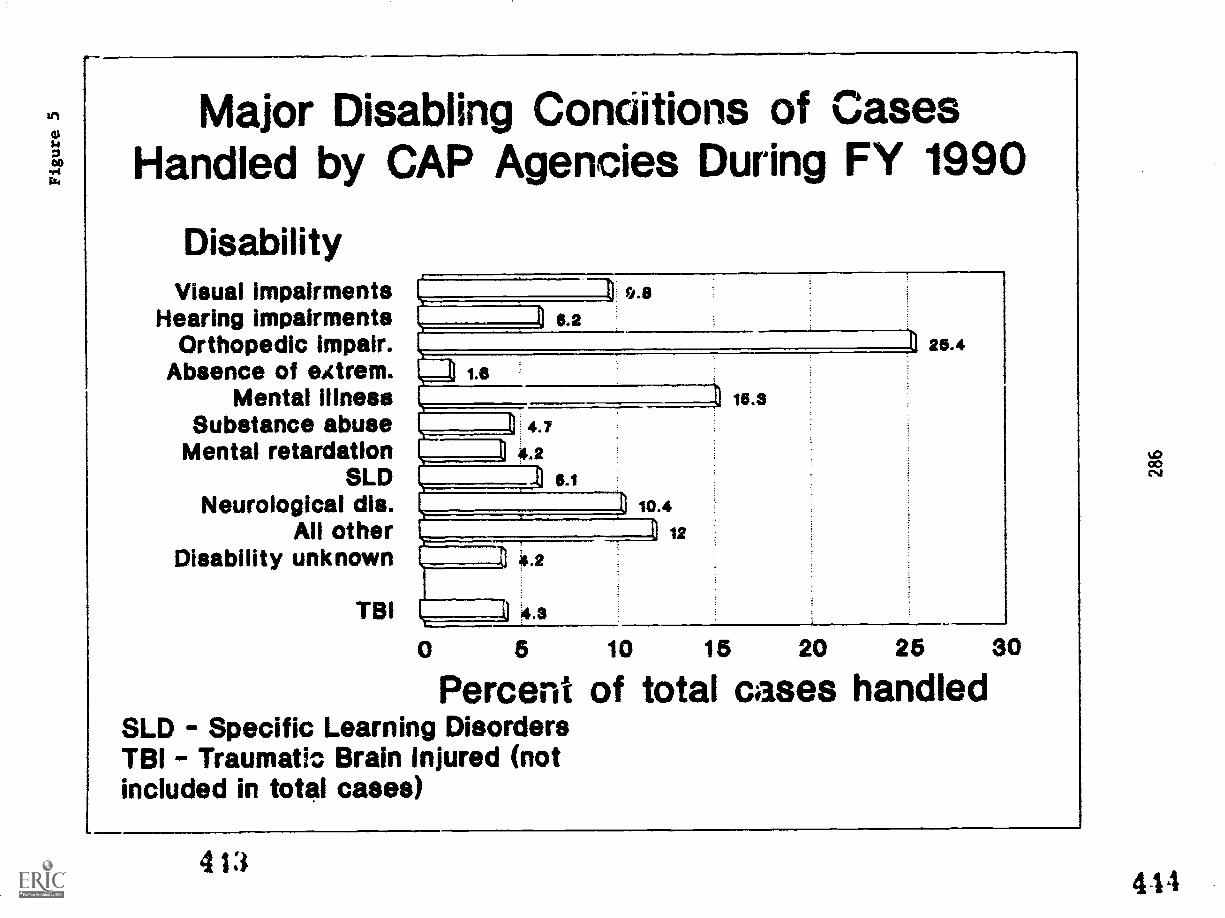
Major Disabling Conditions of CasesHandled by CAP Agencies During FY 1990
DisabilityVisual impairments
Hearing impairmentsOrthopedic impair.
Absence of eietrem.Mental iliness
Substance abuseMental retardation
SLDNeurological dis.
All otherDisability unknown
TBI
11 0.8
6.2
15.3
0 10.4
_11 124.2
4.9
25.4
6 10 15 20 25 30
Percent of total cases handledSLD - Specific Learning DisordersTBI - Traumatic Brain Injured (notincluded in total cases)
4 13
1/40co
4 14
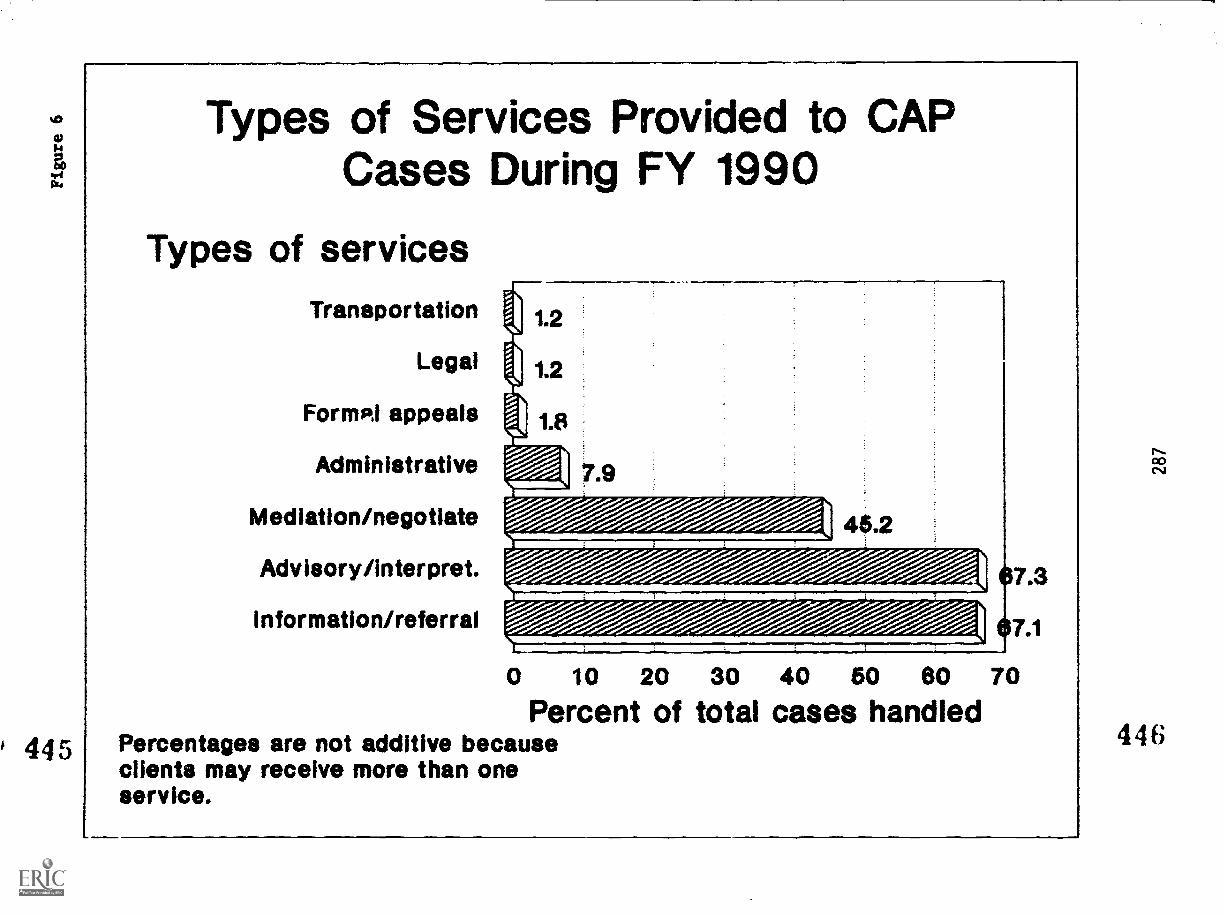
Types of Services Provided to CAPCases During FY 1990
Types of servicesTransportation
Legal
FormP,I appeals
Administrative
Mediation/negotiate
Advisory/interpret.
Information/referral
1.2
1.2
1.8
7.9
o 10 20 30 40 50 60 70
Percent of total cases handledPercentages are not additive becauseclients may receive more than oneservice.
446
G
Client/Applicant Appeals
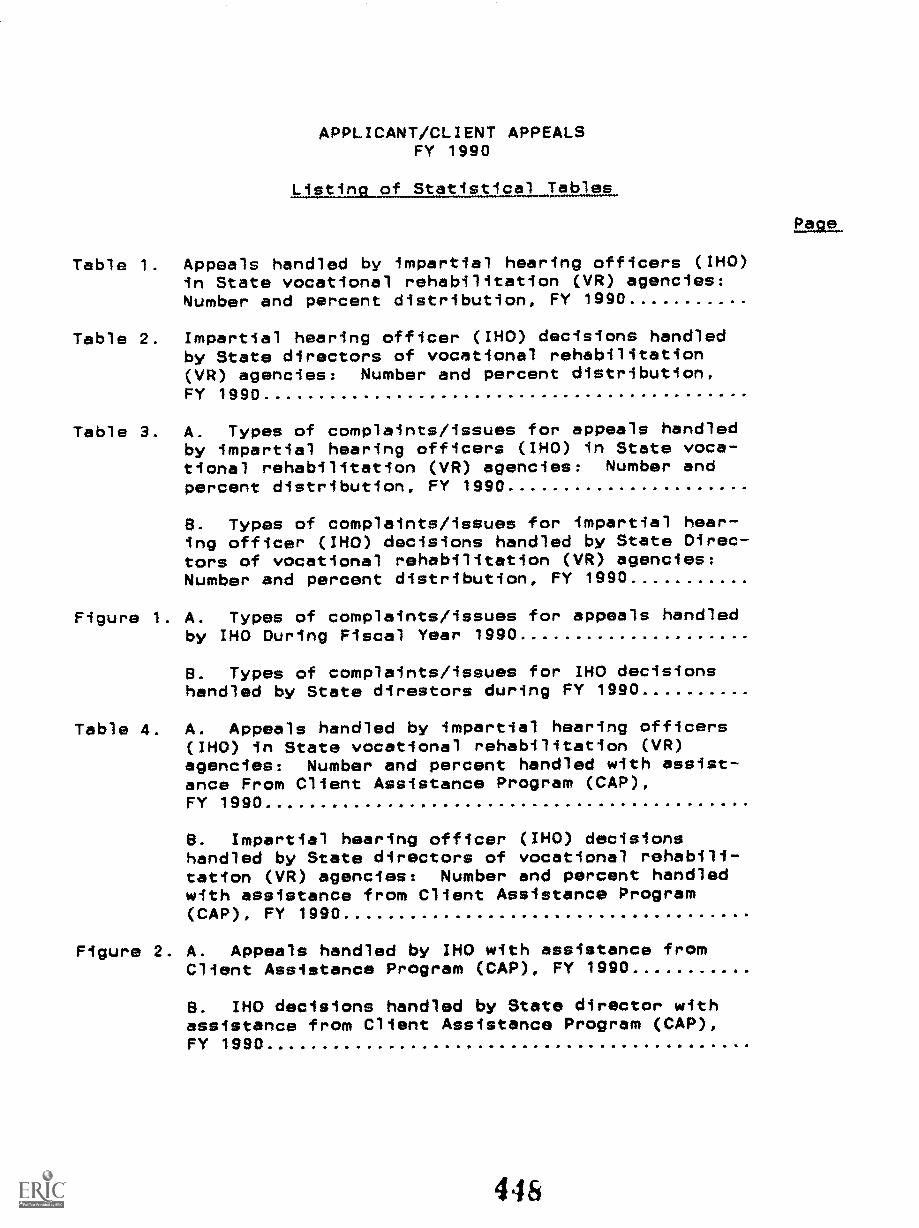
APPLICANT/CLIENT APPEALSFY 1990
Listin f Statistical Tables
Table 1. Appeals handled by impartial hearing officers (IHO)in State vocational rehabilitation (VR) agencies:Number and percent distribution, FY 1990
Table 2. Impartial hearing officer (IHO) decisions handledby State directors of vocational rehabilitation(VR) agencies: Number and percent distribution,FY 1990
Table 3. A. Types of complaints/issues for appeals handledby impartial hearing officers (IHO) in State voca-tional rehabilitation (VR) agencies: Number andpercent distribution, FY 1990
8. Types of complaints/issues for impartial hear-ing officer (IHO) decisions handled by State Direc-tors of vocational rehabilitation (VR) agencies:Number and percent distribution, FY 1990
Figure 1. A. Types of complaints/issues for appeals handledby IHO During Fiscal Year 1990
B. Types of complaints/issues for IHO decisionshandled by State direstors during FY 1990
Table 4. A. Appeals handled by impartial hearing officers(IHO) in State vocational rehabilitation (VR)agencies: Number and percent handled with assist-ance From Client Assistance Program (CAP),FY 1990
B. Impartial hearing officer (IHO) decisionshandled by State directors of vocational rehabili-tation (VR) agencies: Number and percent handledwith assistance from Client Assistance Program(CAP), FY 1990
Figure 2. A. Appeals handled by IHO with assistance fromClient Assistance Program (CAP), FY 1990
B. IHO decisions handled by State director withassistance from Client Assistance Program (CAP),FY 1990
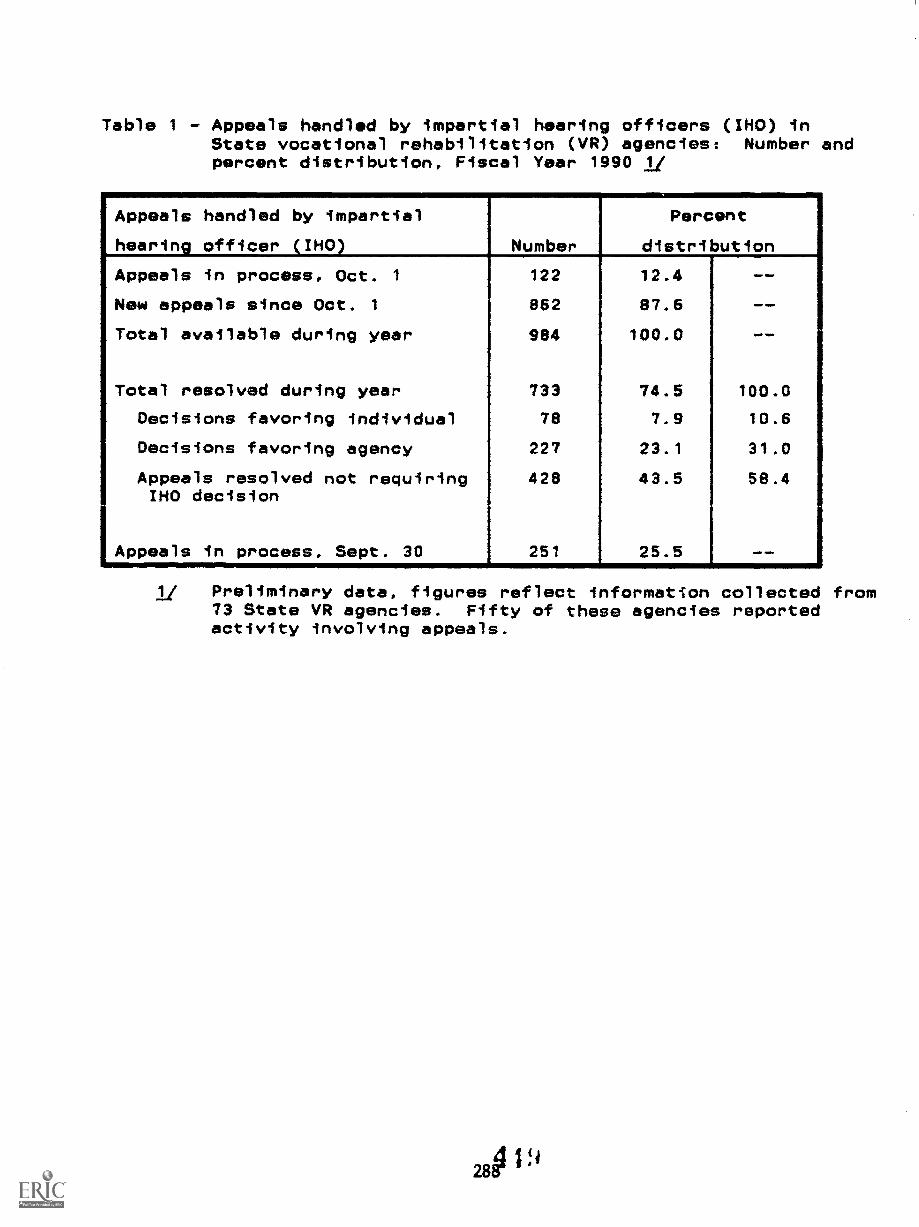
Table 1 - Appeals handled by impartial hearing officers (IHO) inState vocational rehabilitation (VR) agencies: Number andpercent distribution, Fiscal Year 1990 1/
Appeals handled by impartial
hearing officer (IMO) Number
Percent
distribution
Appeals in process, Oct. 1 122 12.4 --
New appeals since Oct. 1 862 87.6 --
Total available during year 984 100.0 --
Total resolved during year 733 74.5 100.0
Decisions favoring individual 78 7.9 10.6
Decisions favoring agency 227 23.1 31.0
Appeals resolved not requiring 428 43.5 58.4INO decision
IAppeals in process, Sept. 30 251 25.5 _-
1/ Preliminary data, figures reflect information collected from73 State VR agencies. Fifty of these agencies reportedactivity involving appeals.
280 1"
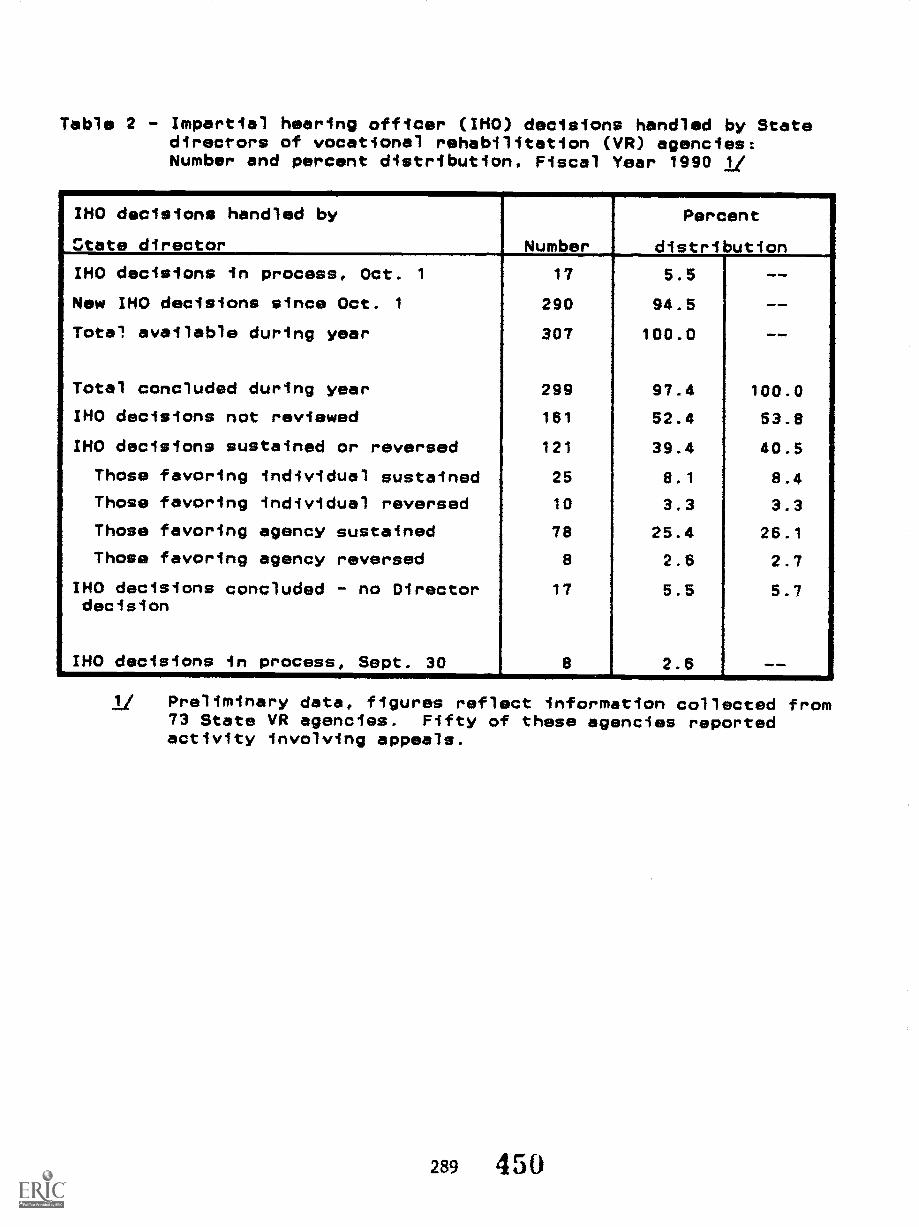
Table 2 - Impartial hearing officer (IHO) decisions handled by Statedirectors of vocational rehabilitation (VR) agencies:Number and percent distribution, Fiscal Year 1990 1/
..
IHO decisions handled by
Ctate director Number
.
Percent
distribution,
IHO decisions In process, Oct. 1 17 5.5 --
New IHO decisions since Oct. 1 290 94.5 --
Total available during year 307 100.0 __
Total concluded during year 299 97.4 100.0
IHO decisions not reviewed 181 52.4 53.8
IHO decisions sustained or reversed 121 39.4 40.5
Those favoring individual sustained 25 8.1 8.4
Those favoring individual reversed 10 3.3 3.3
Those favoring agency sustained 78 25.4 26.1
Those favoring agency reversed 8 2.8 2.7
IHO decisions concluded - no Directordecision
17 5.5 5.7
IHO decisions in process, Sept. 30 8 2.6 __. .
1/ Preliminary data, figures reflect information collected from73 State VR agencies. Fifty of these agencies reportedactivity involving appeals.
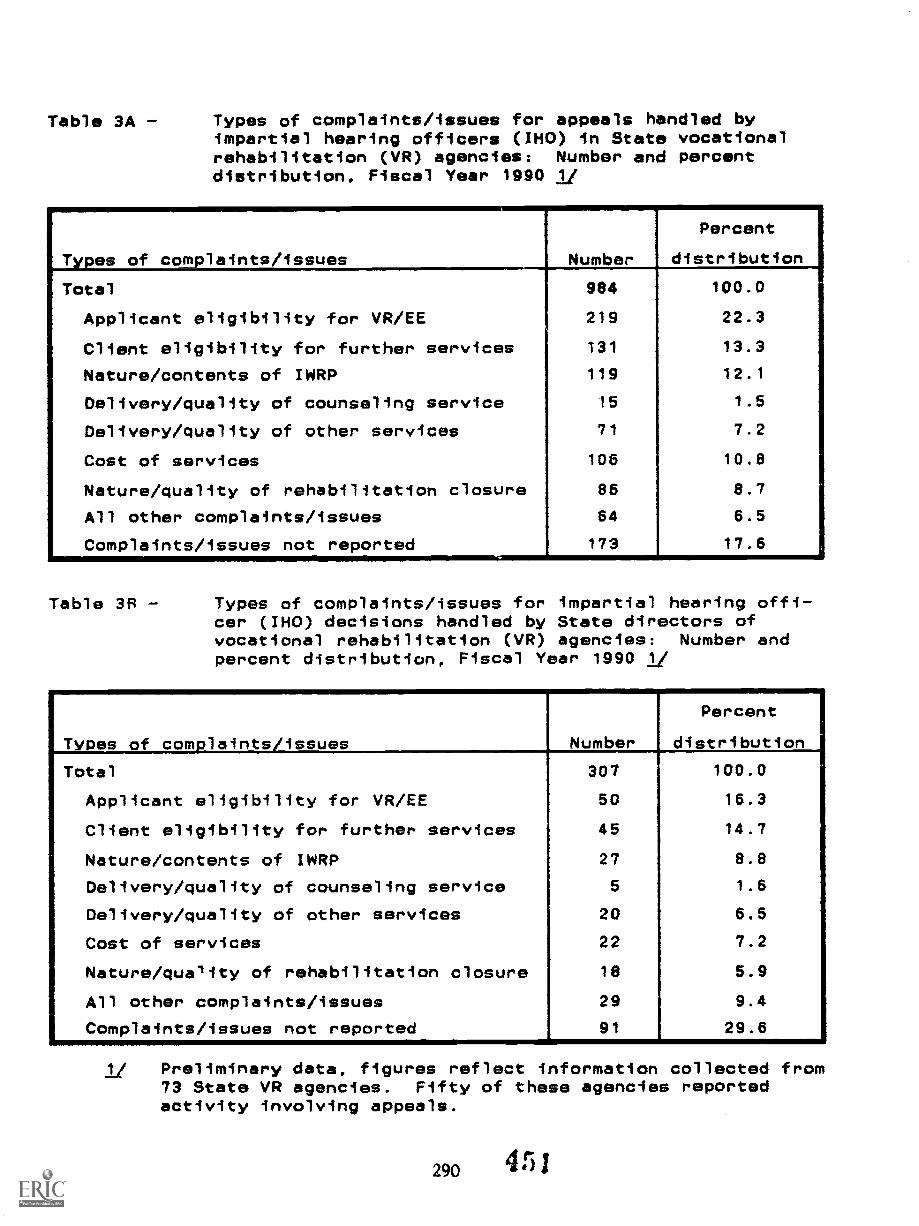
Table 3A Types of complaints/issues for appeals handled byimpartial hearing officers (IHO) in State vocationalrehabilitation (VR) agencies: Number and percentdistribution, Fiscal Year 1990 1/
of complaints/issues Number
Percent
distribution_apes
Total 984 100.0
Applicant eligibility for VR/EE 219 22.3
Client eligibility for further services 131 13.3
Nature/contents of IWRP 119 12.1
Delivery/quality of counseling service 15 1.5
Delivery/quality of other services 71 7.2
Cost of services 106 10.8
Nature/quality of rehabilitation closure 86 8.7
All other complaints/issues 64 6.5
Complaints/issues not reported 173 17.6
Table 3R - Types of complaints/issues for impartial hearing offi-cer (IHO) decisions handled by State directors ofvocational rehabilitation (VR) agencies: Number andpercent distribution, Fiscal Year 1990 1/
.
Types of complaints/issues Number
PercentI
distribution
Total 307 100.0
Applicant eligibility for VR/EE 50 16.3
Client eligibility for further services 45 14.7
Nature/contents of IWRP 27 8.8
Delivery/quality of counseling service 5 1.6
Delivery/quality of other services 20 6.5
Cost of services 22 7.2
Nature/quality of rehabilitation closure 18 5.9
All other complaints/issues 29 9.4
Complaints/issues not reported 91 29.6A
1/ Preliminary data, figures reflect information collected from73 State VR agencies. Fifty of these agencies reportedactivity involving appeals.
451290
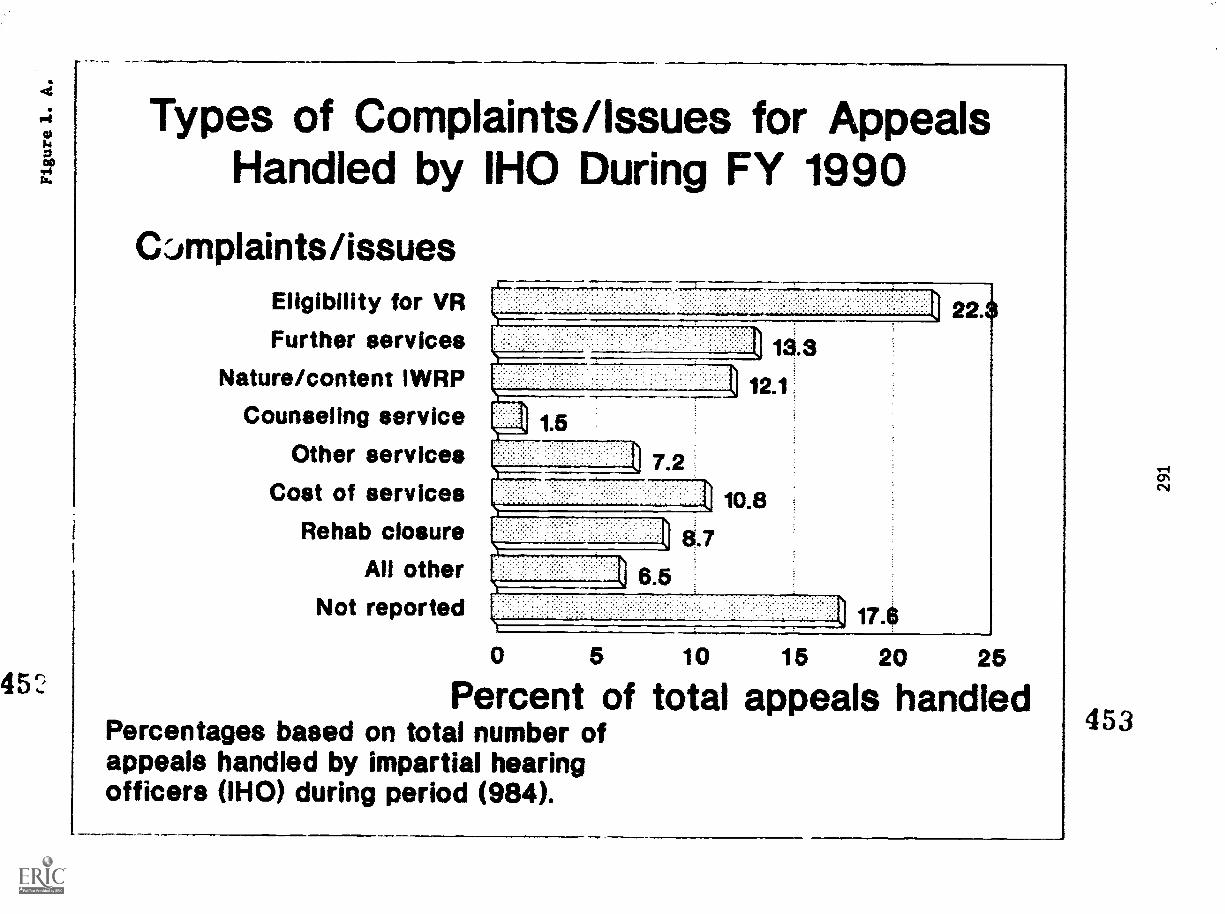
Types of Complaints/Issues for AppealsHandled by IHO During FY 1990
Cimplaints/issuesEligibility for VRFurther services
Nature/content IWRP
Counseling service
Other servicesCost of services
Rehab closure
All otherNot reported
o 5 10 15 20 25
Percent of total appeals handledPercentages based on total number ofappeals handled by impartial hearingofficers (IHO) during period (984).
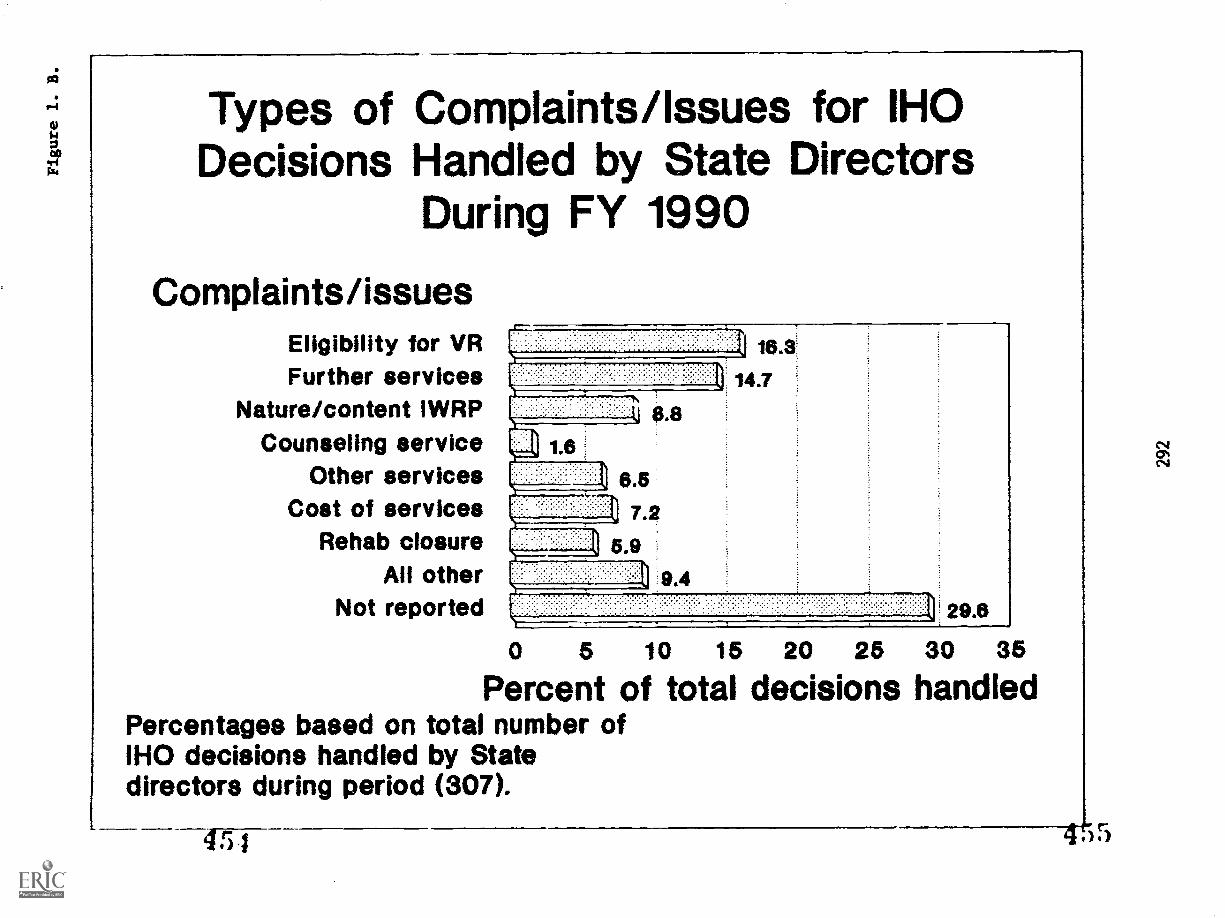
Types of Complaints/Issues for IHODecisions Handled by State Directors
During FY 1990
Complaints/issuesEligibility for VRFurther services
Nature/content IWRPCounseling service
Other servicesCost of services
Rehab closureAll other
Not reported
0 5 10 15 20 26 30 35
Percent of total decisions handledPercentages based on total number of1HO decisions handled by Statedirectors during period (307).
4ri F 5
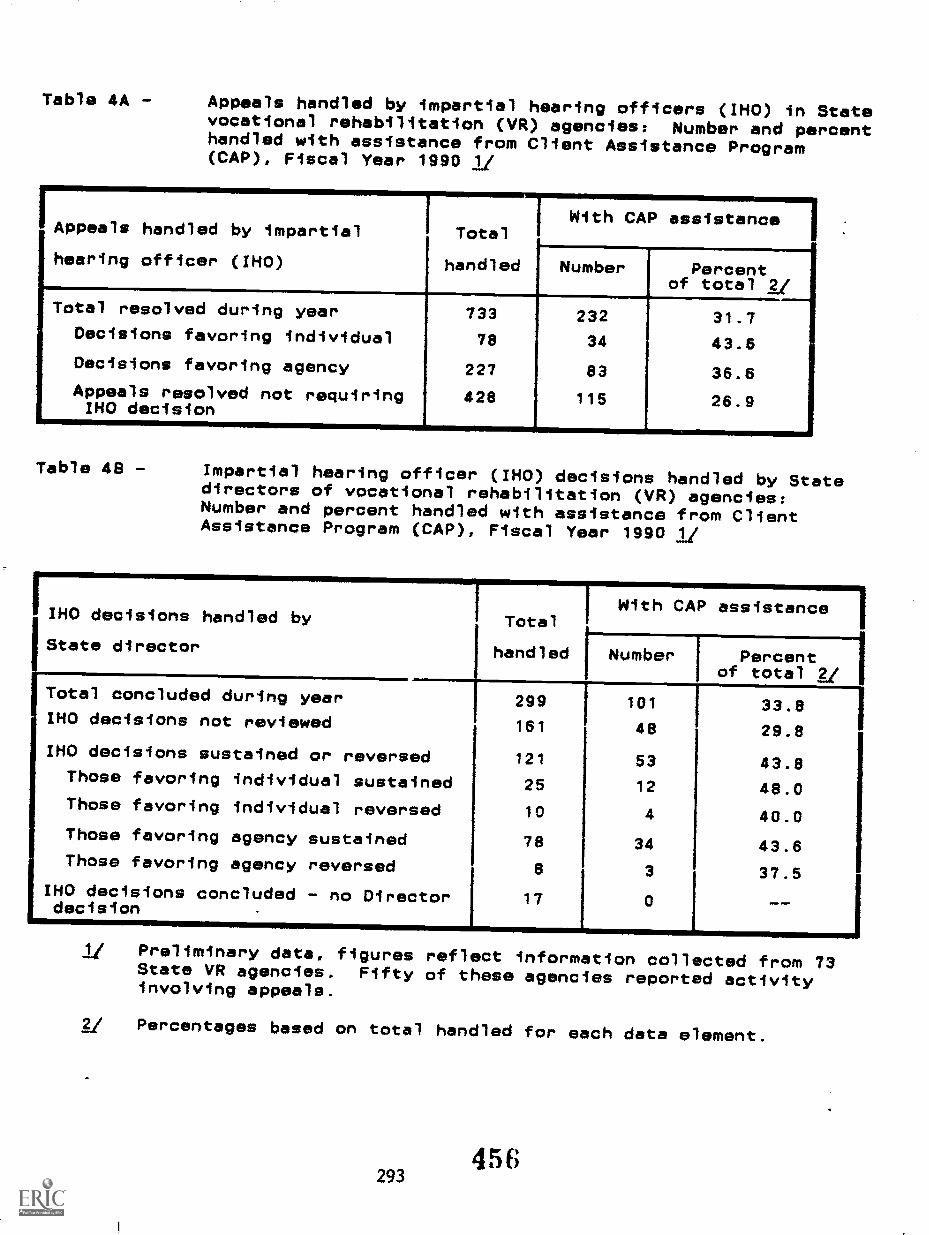
Table 4A - Appeals handled by impartial hearing officers (IHO) in Statevocational rehabilitation (VR) agencies: Number and percenthandled with assistance from Client Assistance Program(CAP), Fiscal Year 1990 1/
Appeals handled by impartial
hearing officer (IMO)
Total
handled
With CAP assistance
Number Percentof total 2/
Total resolved during year 733 232 31.7Decisions favoring individual 78 34 43.6Decisions favoring agency 227 83 36.6Appeals resolved not requiring 42e 115 26.9IHO decision
Table 48 - Impartial hearing officer (IHO) decisions handled by Statedirectors of vocational rehabilitation (VR) agencies:Number and percent handled with assistance from ClientAssistance Program (CAP), Fiscal Year 1990 1/
IWithIHO decisions handled by
State director
1
Total
handled
CAP assistance
Number Percentof total gi
Total concluded during year 299 101J
33.8IHO decisions not reviewed 161 48 29.8IMO decisions sustained or reversed 121 53 43.8Those favoring individual sustained 25 12 48.0Those favoring individual reversed 10 4 40.0Those favoring agency sustained 78 34 43.6Those favoring agency reversed 8 3 37.5
IHO decisions concluded - no Directordecision _
17 0 --
1/ Preliminary data, figures reflect information collected from 73State VR agencies. Fifty of these agencies reported activityinvolving appeals.
1/ Percentages based on total handled for each data element.
293456
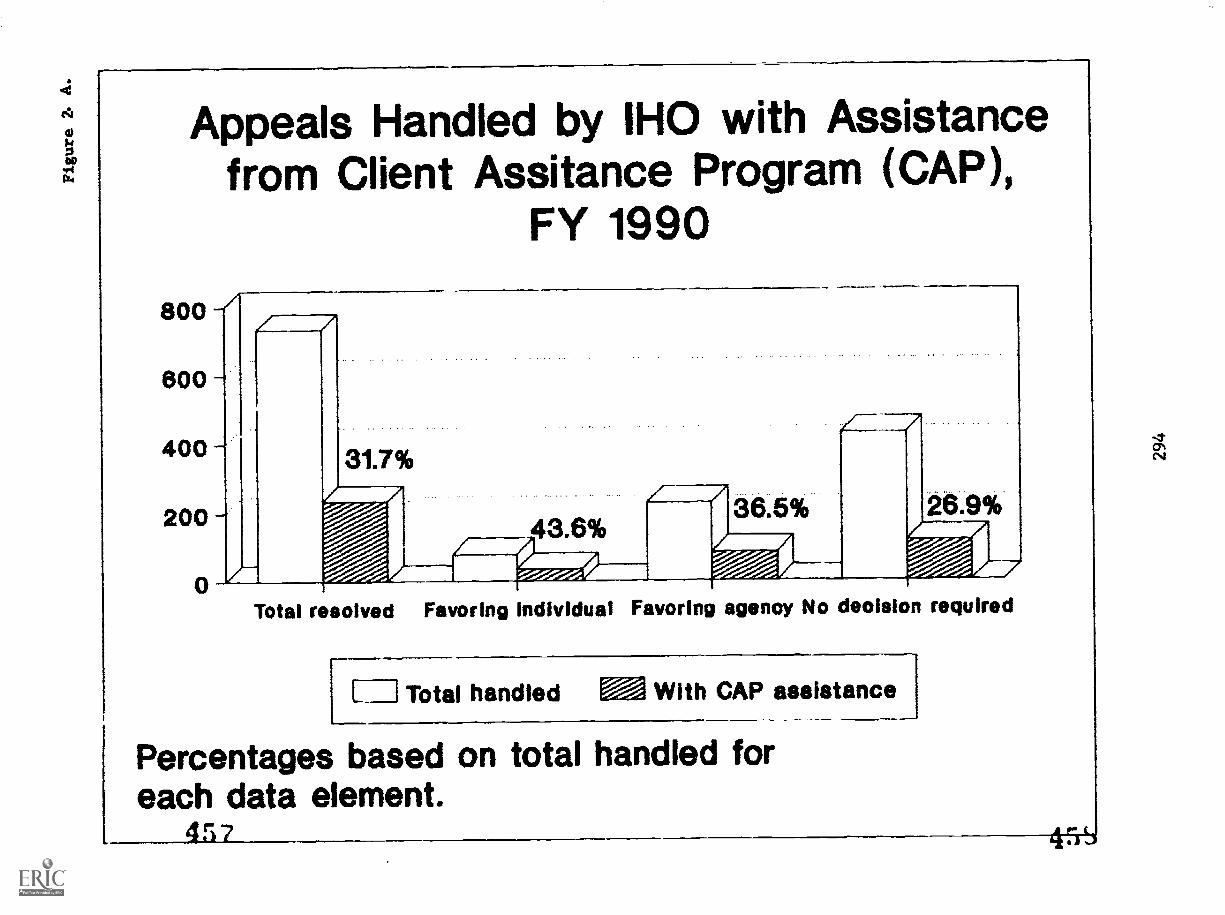
Appeals Handled by 1HO with Assistancefrom Client Assitance Program (CAP),
FY 1990
800 -/
600
400 -
200 -
0
31.7%
43.6%36.5% 26.9%
Total resolved Favoring individual Favoring agency No deolsion required
Total handled - With CAP assistance
Percentages based on total handled foreach data element.
457
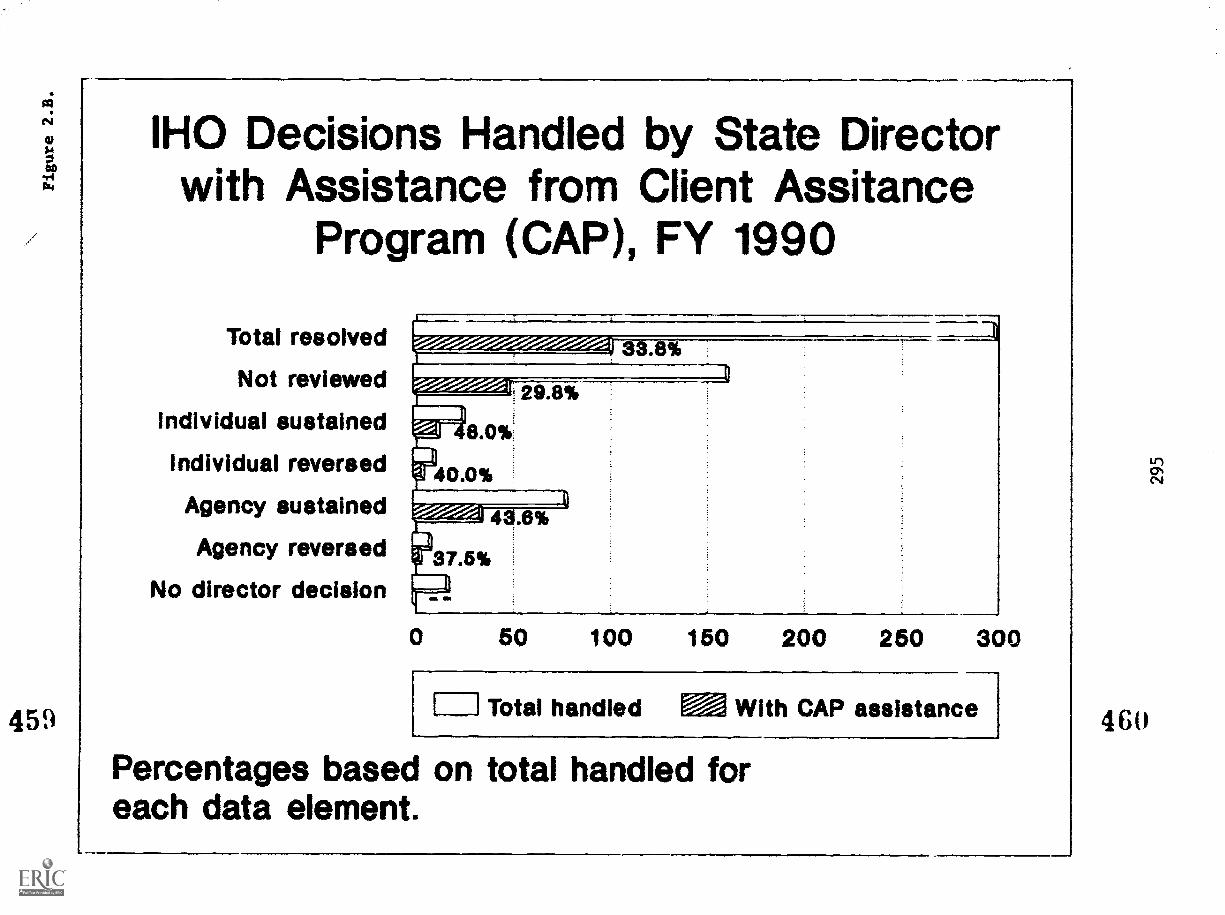
IHO Decisions Handled by State Directorwith Assistance from Client Assitance
Program (CAP), FY 1990
Total resolved
Not reviewed
Individual sustained
Individual reversed
Agency sustained
Agency reversed
No director decision
3 .8%
29.8%
43.8%
37.5%
Ii0 50 100 150 200 250 300
Total handled With CAP assistance
Percentages based on total handled foreach data element.
Comprehensive Services forIndependent Living
461
COMPREHENSIVE SERVICES FOR INDEPENDENT LIVINGFY 1990
Listing of Statistical Tables
Table 1. Caseload data reported by State IndependentLiving Rehabilitation (ILR) agencies: Numberand percent change, FY 1909 and 1990
Table 2. Caseload data reported by State IndependentLiving Rehabilitation (I(R) agencies: Percentdistribution, FY 1090
Table 3. Profile of clients served by State IndependentLiving Rehabilitation (ILR) agencies. FY 1990....
Figure 1. Major disabling conditions of clients served byState ILR agencies during FY 1990
Figure 2.
Table 4.
Types of srvics provided to clents served byState ILR agencies during FY 1990
Independent Living IWRP goals and percent ofgoals met by clients closed during FY 1990
462
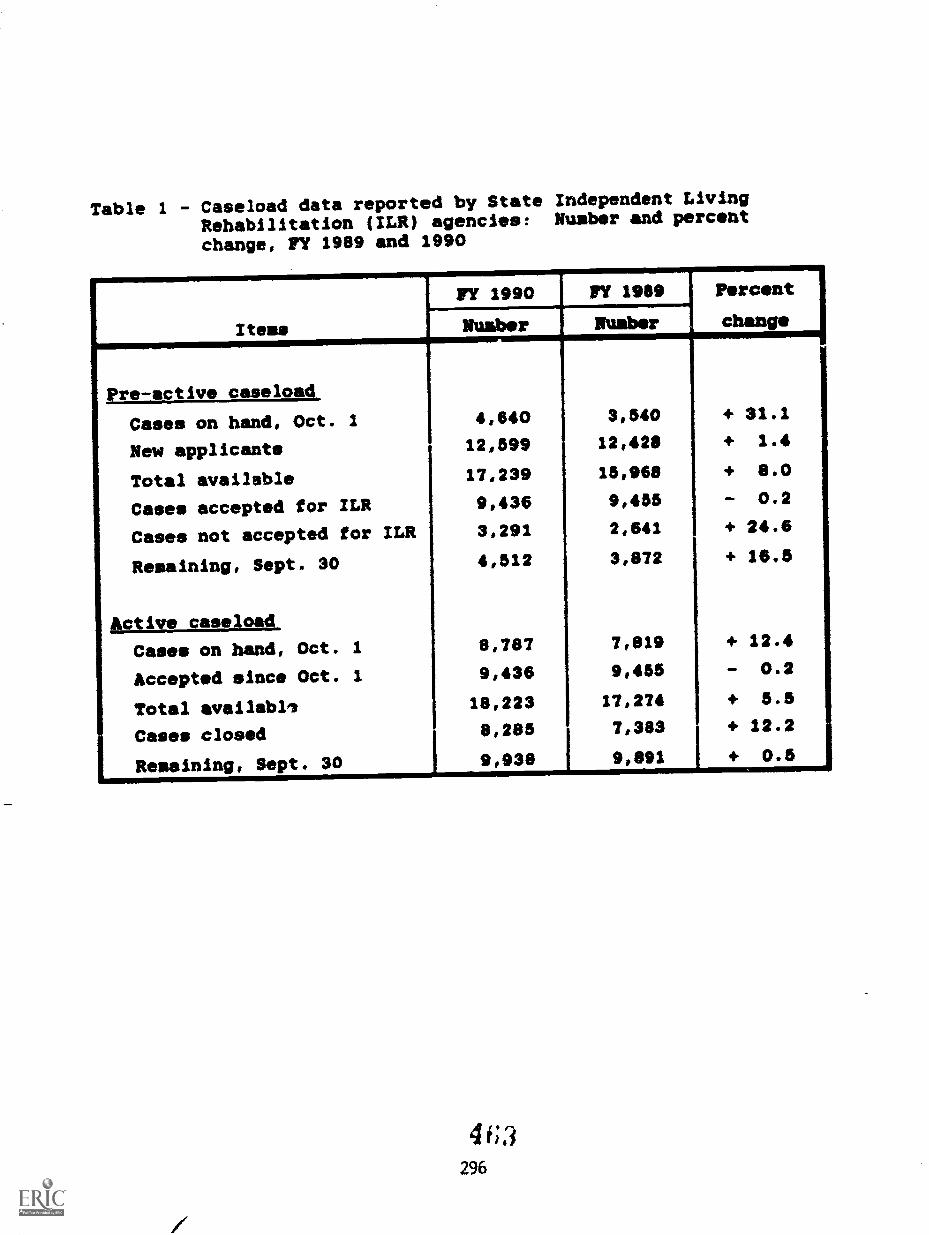
Table 1 - Caseload data reported by State Independent LivingRehabilitation (ILR) agencies: Number and percent
change, FY 1989 and 1990
Items
FY 1990 FY 1989 Percent
NUmber !Maher change
Pre-active caseload
Cases on hand, Oct. 1 4,640 3,540 + 31.1 I
New applicants 128599 12,428 + 1.4
Total available 17,239 15,968 + 8.0
Cases accepted for ILR 9,436 9,455 - 0.2
Cases not accepted for ILR 3,291 20641 + 24.6
Remaining, Sept. 30 4,512 30872 + 16.5
Active caseload
Cases on hand, Oct. 1 8,787 7,819 + 12.4
Accepted since Oct. 1 98436 9,455 - 0.2
Total availabli 18,223 17,274 + 5.5
Cases closed 8,285 7,383 + 12.2
Remaining, Sept. 301
9,938 9,891 + 0.5
46,3296
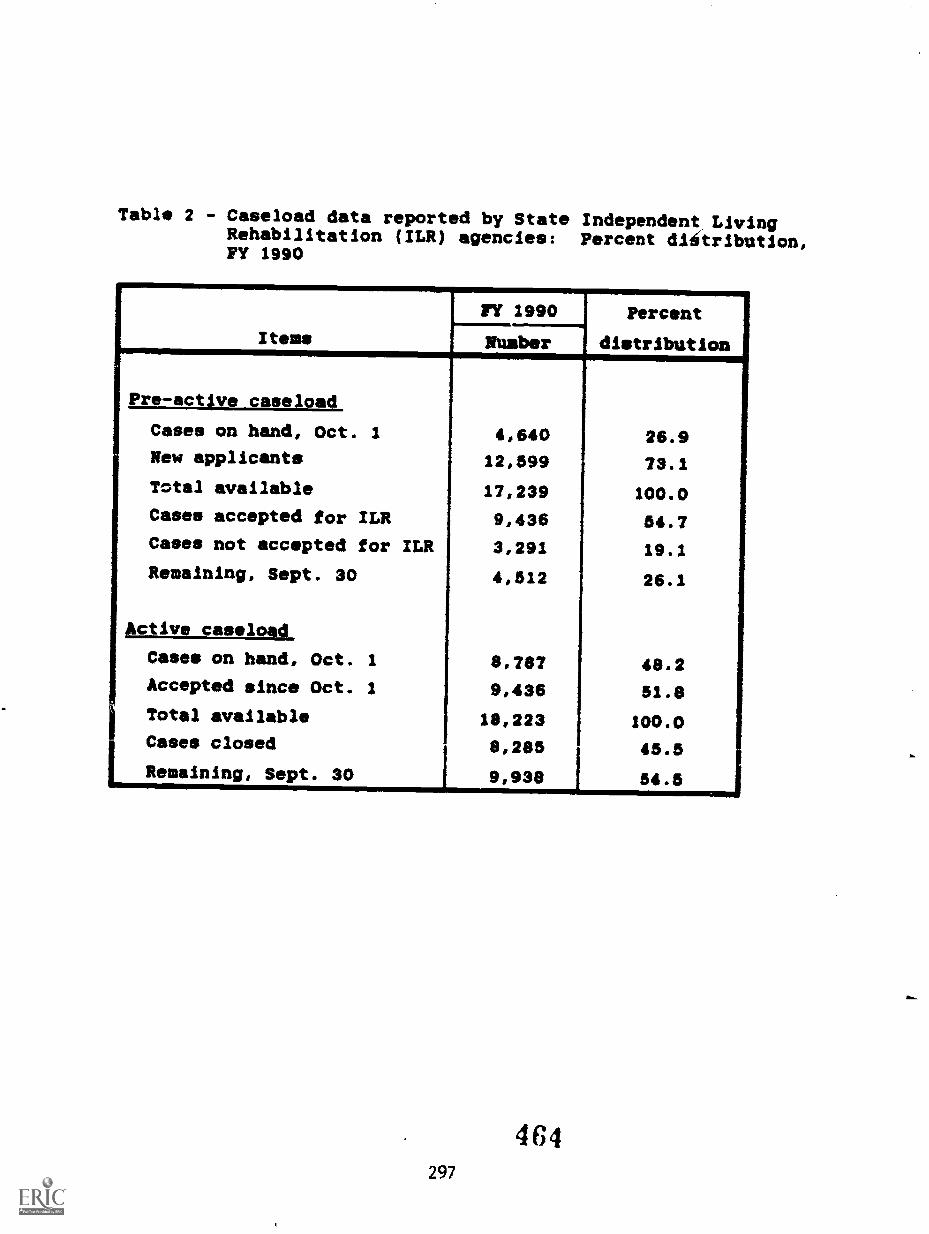
Table 2 - Caseload data reported by State Independent LivingRehabilitation (ILR) agencies: Percent dlitribution,FY 1990
Items
FY 1990 Percent
NUmber distribution
Pre-active caseload
Cases on hand, Oct. 1 4,640 26.9New applicants 12,599 73.1
Total available 17,239 100.0
Cases accepted for ILR 9,436 54.7
Cases not accepted for ILR 3,291 19.1
Remaining, Sept. 30 4,512 26.1
Active caseload
Cases on hand, Oct. 1 8,787 48.2Accepted since Oct. 1 9,436 51.8
iTotal available 18,223 100.0Cases closed 8,285 45.5
Remaining, Sept. 301 9,938 54.5
464297
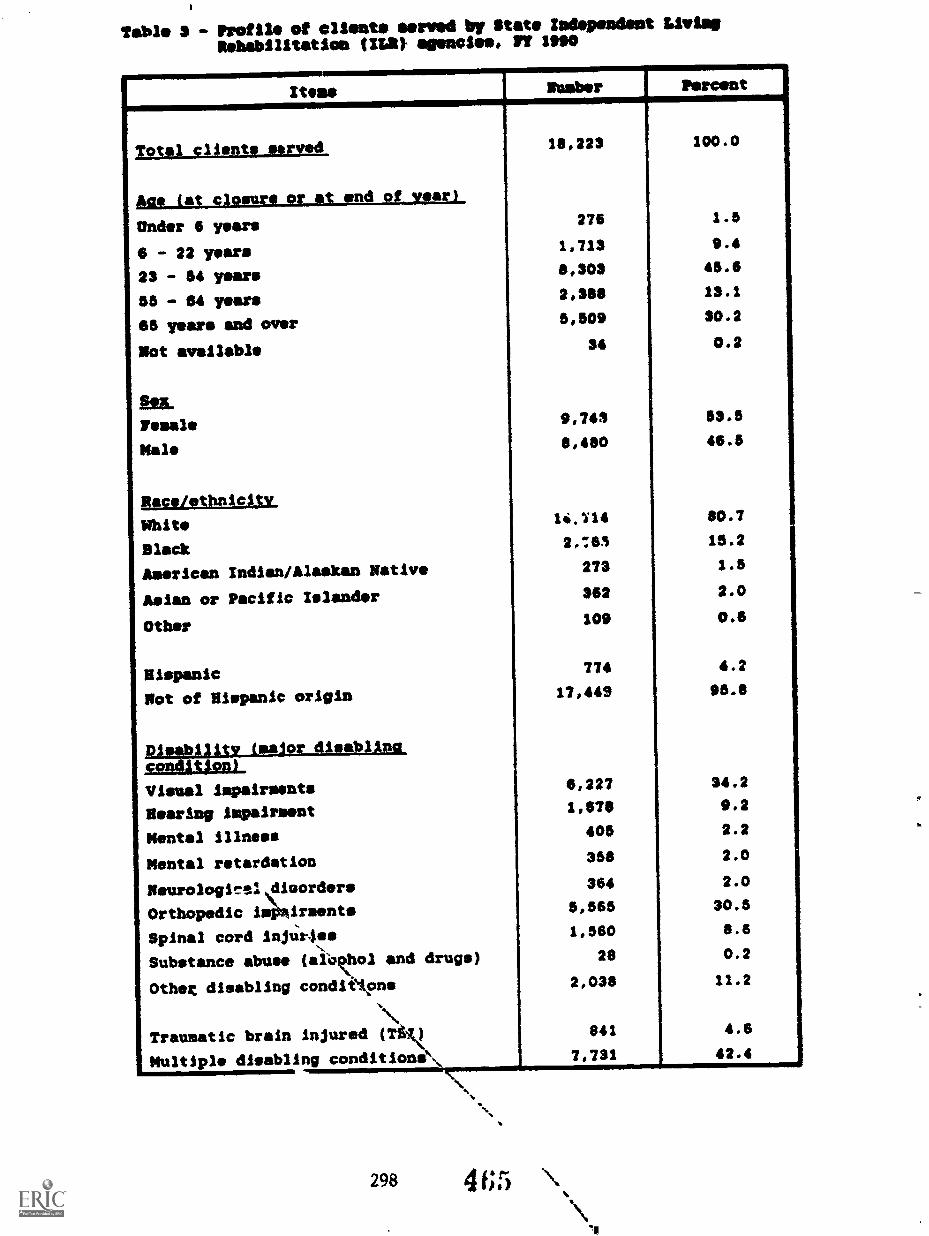
Table $ - Profile of clients served by state independent LivingRehabilitation (Mt meenclm4 Vir 1990
Items I Nuaber Percent
Total client, served 18.223 100.0
Aae ja$ closure or at end of year)
276 1.5ender 6 years
- 22 years 1,713 9.4
23 - 84 years 8,303 45.6
55 - 64 years 2,398 13.1
65 years and over 5,509 30.2
Not available 34 0.2
Female 9,748 53.5
Nile 8,460 46.5
Race/ethnicitv
White 14.714 80.7
Black 2,63 15.2
American Indian/Alaskan Native 273 2,6
Asian or Pacific Islander 362 2.0
Other 209 0.6
Hispanic 774 4.2
Not of Hispanic origin
pleabAlitv imalor disablina
27,449 95.8
conattoni
Visual impairments 6,227 34.2
Hearing impairment 1,678 9.2
Mental illness 405 2.2
Mental retardation 358 2.0
Neurologiceldimorders 364 2.0
Orthopedic imiairments 5,565 30.5
Spinal cord injuries 1,560 8.6N
Substance alms, (a1421o1 and drugs) 28 0.2
Othez disabling condit*ons 2,038 11.2
\Traumatic brain injured (Tit4,1 841 4.6
NUltiple disabling conditione, 7 731 42.4
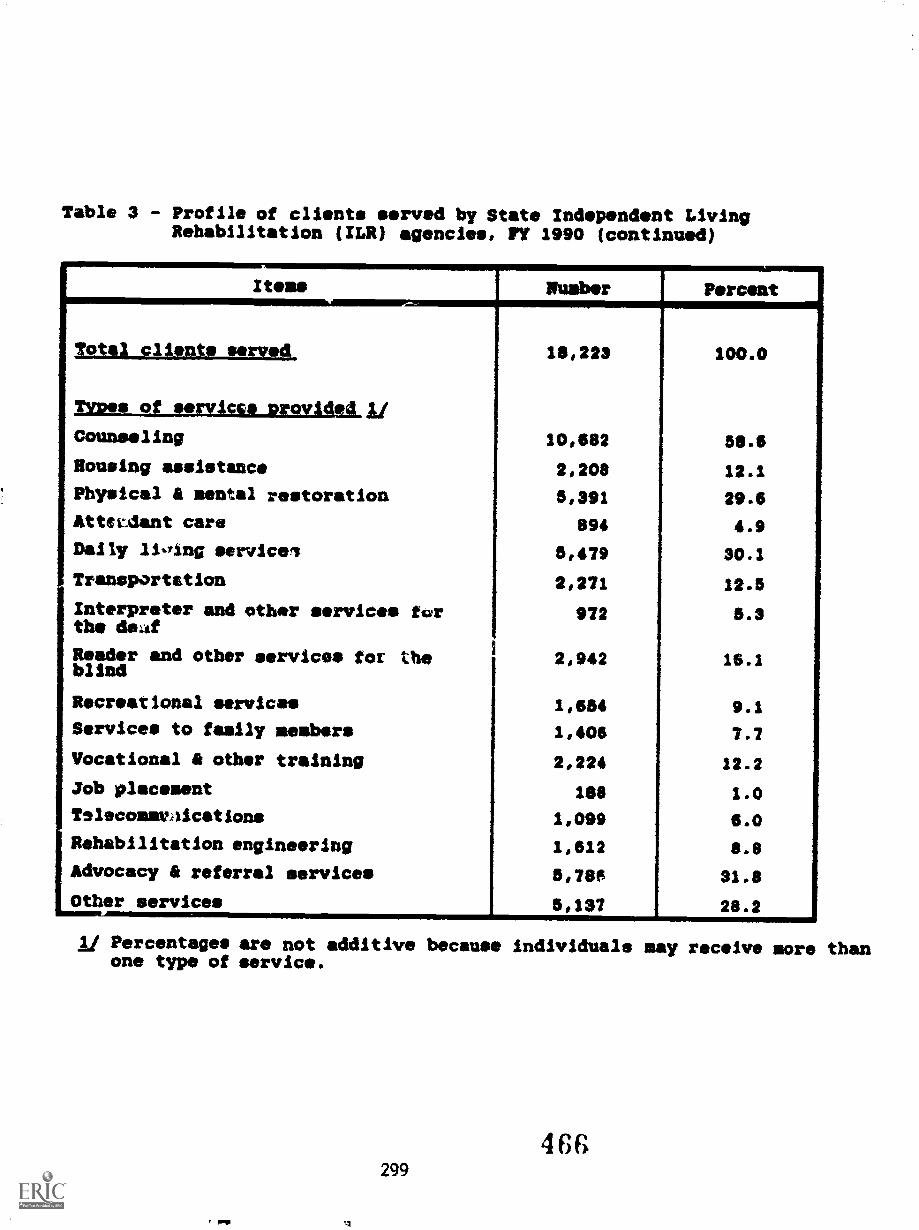
Table 3 - Profile of clients served by State Indpendent LivingRehabilitation (ILR) agencies, FY 1990 (continued)
Items Juaber Percent
Total cl4ppts served 18,223 100.0
MaiMMI-421.-MUSSI-21E2MAUSLEU
Counseling 10,682 58.6
Rousing assistance 2,208 12.1
Physical A mental restoration 5,391 29.6
Attmdant care 894 4.9
Daily lioing service, 5,479 304Transportation 2,271 12.5
Interpreter and other services furthe deaf
972 5.3
Reader and other services for theblind
2,942 164
Recreational service's 1,654 9.1
Services to family members 1,406 7.7
Vocational A other training 2,224 12.2
Job placement 168 1.0
TslecommvAications 1,099 6.0
Rehabilitation engineering 1,612 8.8
Advocacy A referral services 5,78* 31.8
Other services 5,137 28.2
li Percentages are not additive because individuals may receive more thanone type of service.
4 66299

a.
467
FIGURE 1Major Disabling Conditions of ClientsServed by State ILR agencies During
FY 1990
DisabilityVisual impairmentsOrthopedic impair.
Other disabling con.Hearing ImpairmentsSpinal cord injuries
Mental IllnessMental retardation
Neurological dia.Substance abuse
TS!
34.2
30.5
11.2
9.2
0.2
4.3Multiple die. cond. 42.4
0 5 10 15 20 25 30 36 40 45 50
Percent of total clients servedMultiple disabling conditions andTBI (Traumatic Brain Injured) notincluded In total served.
4G5
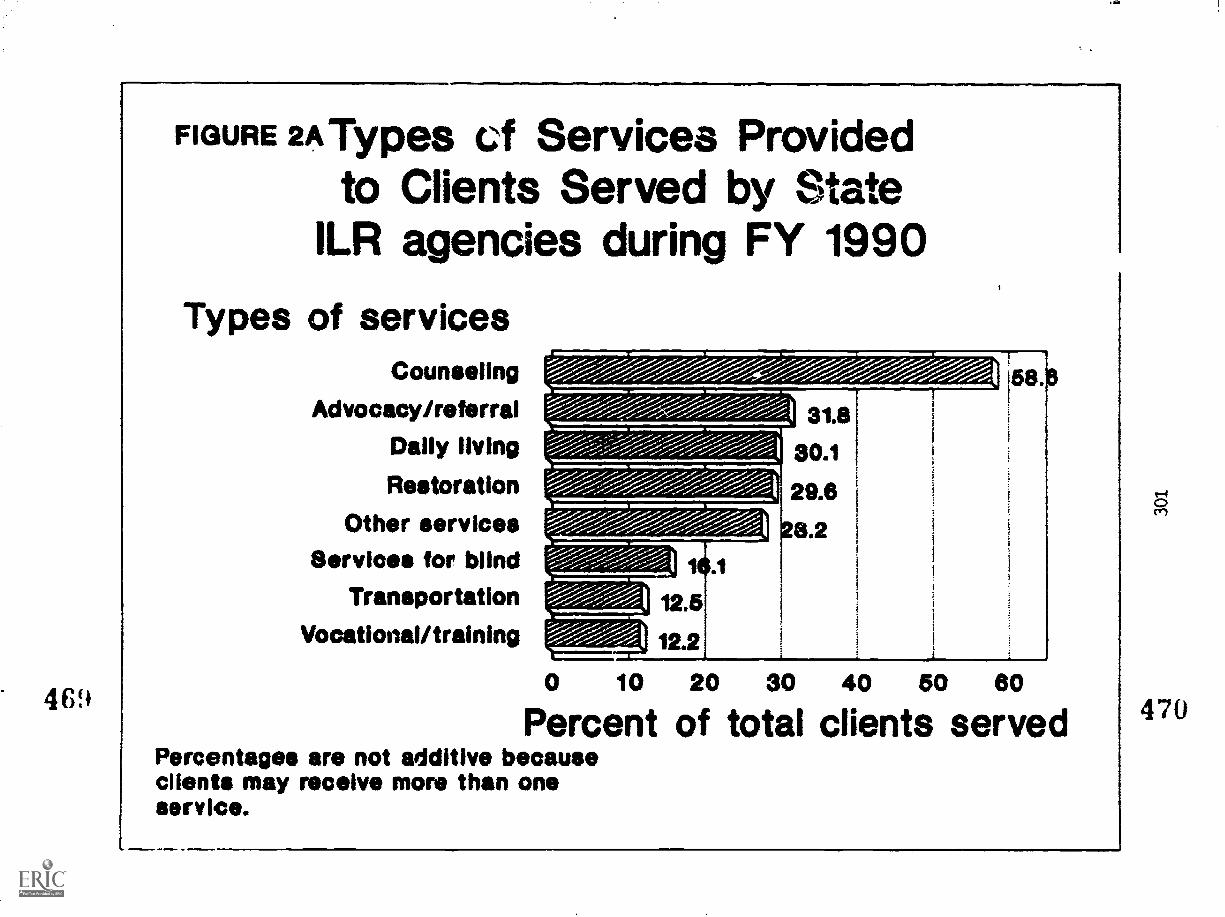
FIGURE 2A Types cf Services Providedto Clients Served by State
ILR agencies during FY 1990
Types of servicesCounseling
Advocacy/referralDaily living
Restoration
Other servicesServics for blind
TransportationVocational/training
I
31.8
30.1
29.8
8.2I
0 10 20 30 40 80 80
Percent of total clients servedPercentages are not additive becauseclients may receive more than oneservice.
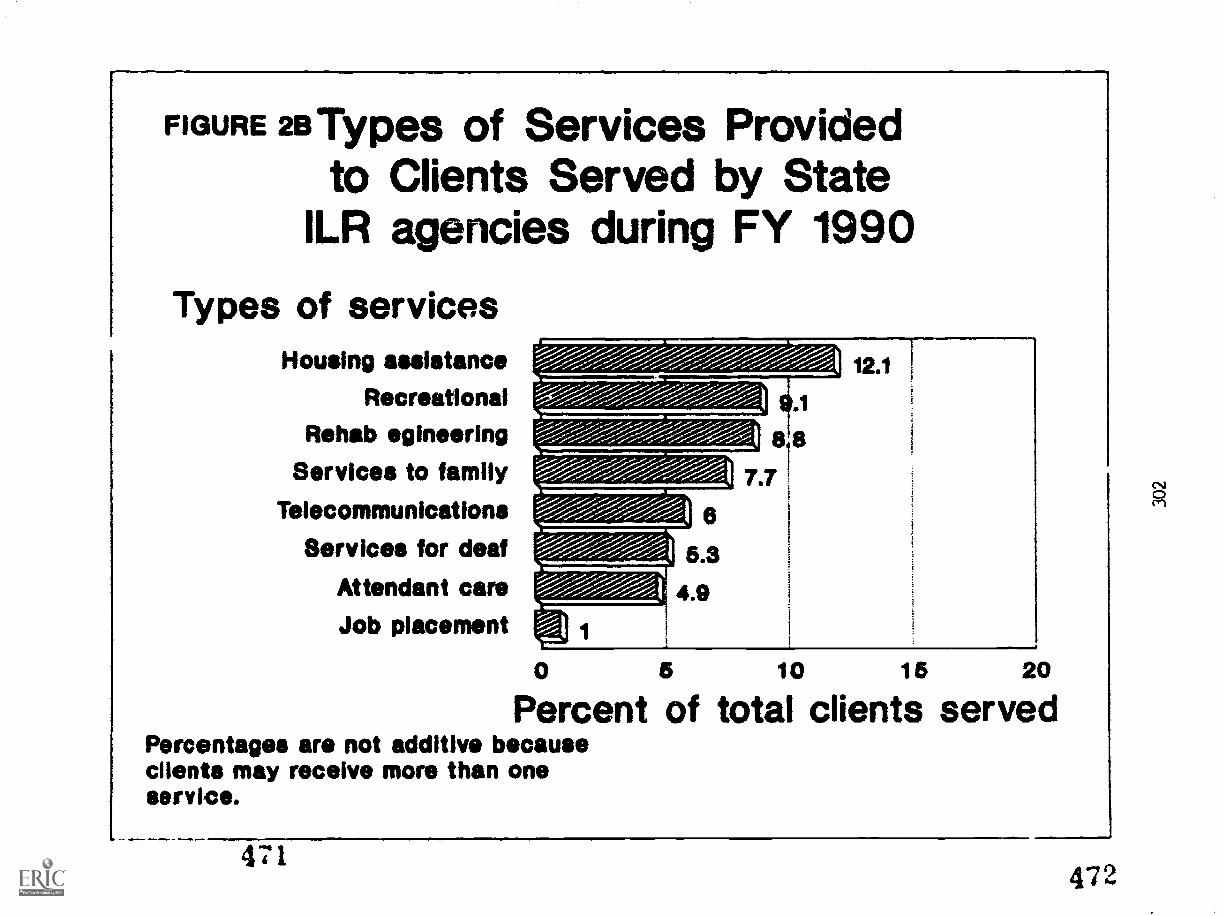
FIGURE 213 Types of Services Providedto Clients Served by State
ILR agencies during FY 1990
Types of servicesHousing assistance
RecreationalRehab egineering
Services to familyTelecommunications
Services for deaf
Attendant careJob placement
0 5 10 16 20
Percent of total clients servedPercentages are not additive becauseclients may receive more than oneservice.
471.47'2
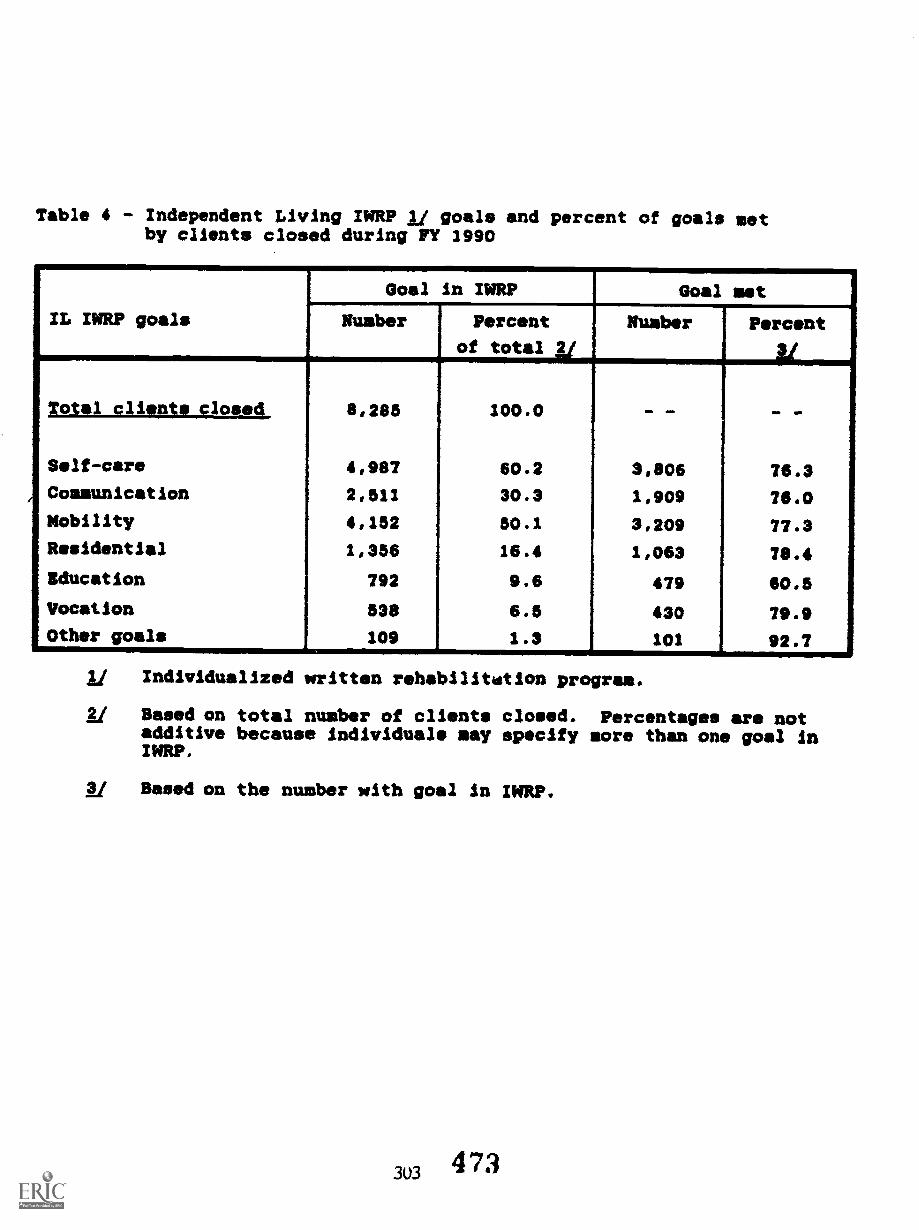
Table 4 - Independent Living INRP goals and percent of goals metby clients closed during FY 1990
IL INRP goals
Goal in IWRP Goal met.
Number Percent
of total li1
Nuabor Prcnt
Va
Total clients close4, 8,285 100.0 - - - -
Self-care 4,987 60.2 30806 76.3
Coamunication 2,511 30.3 1,909 7610Nobility 4,152 50.1 3209, 77.3Residential 1,356 16.4 1,063 78.4
Education 792 9.6 479 60.5
Vocation 538 6.5 430 79.9Other goals 109 2.3 101 92.7
Individualized written rehabilitation program.
Based on total number of clients closed. Percentages are notadditive because individuals may specify more than one goal inINRP.
Based on the number with goal in IWRP.
303 473
I
Services to and Outcomes forPersons with Severe Disabilities and
Persons with Non-severe Disabilities
!
4 74
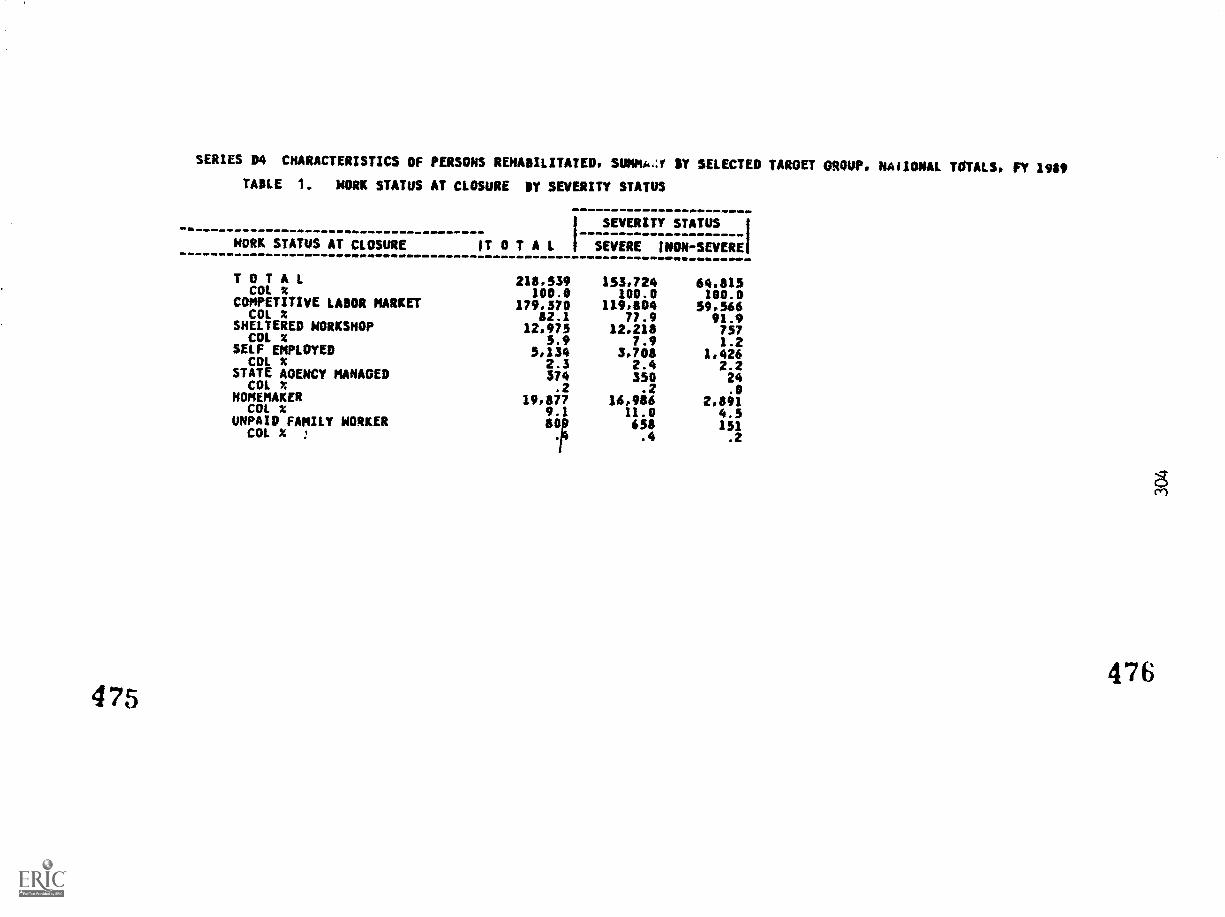
SERIES D4 CHARACTERISTICS OF PERSONS REHABILITATED, SUMM44Y BY SELECTED TARGET GROUP, NAIIONAL TOTALS, FY 1989
TABLE 1. WORK STATUS AT CLOSURE IY SEVERITY STATUS
I SEVERITY STATUS I
WORK STATUS AT CLOSuRE IT OTALI SEVERE INON-SEVEREI
T OTALCOL x
COMPETITIVE LABOR MARKETCOL x
SHELTERED WORKSHOPcoL %
SELF EmPLOYEDCOL x
STATE AGENCY MANAGEDcOL x
HOMEMAKERcOl %
UNPAID FAMILY WORKERcOL x !
475
218,539 153,724 64,815100.0 100.0 100.0
179,370 119,804 59,56682.1 77.9 91.9
12,975 12,218 7575.9 7.9 1.2
5,134 3,708 1,4262.3 2.4 2.2374 350 24.2 .2 .0
19,877 16,986 2,8919.1 11.0 4.5
65$ 151. .4 .2
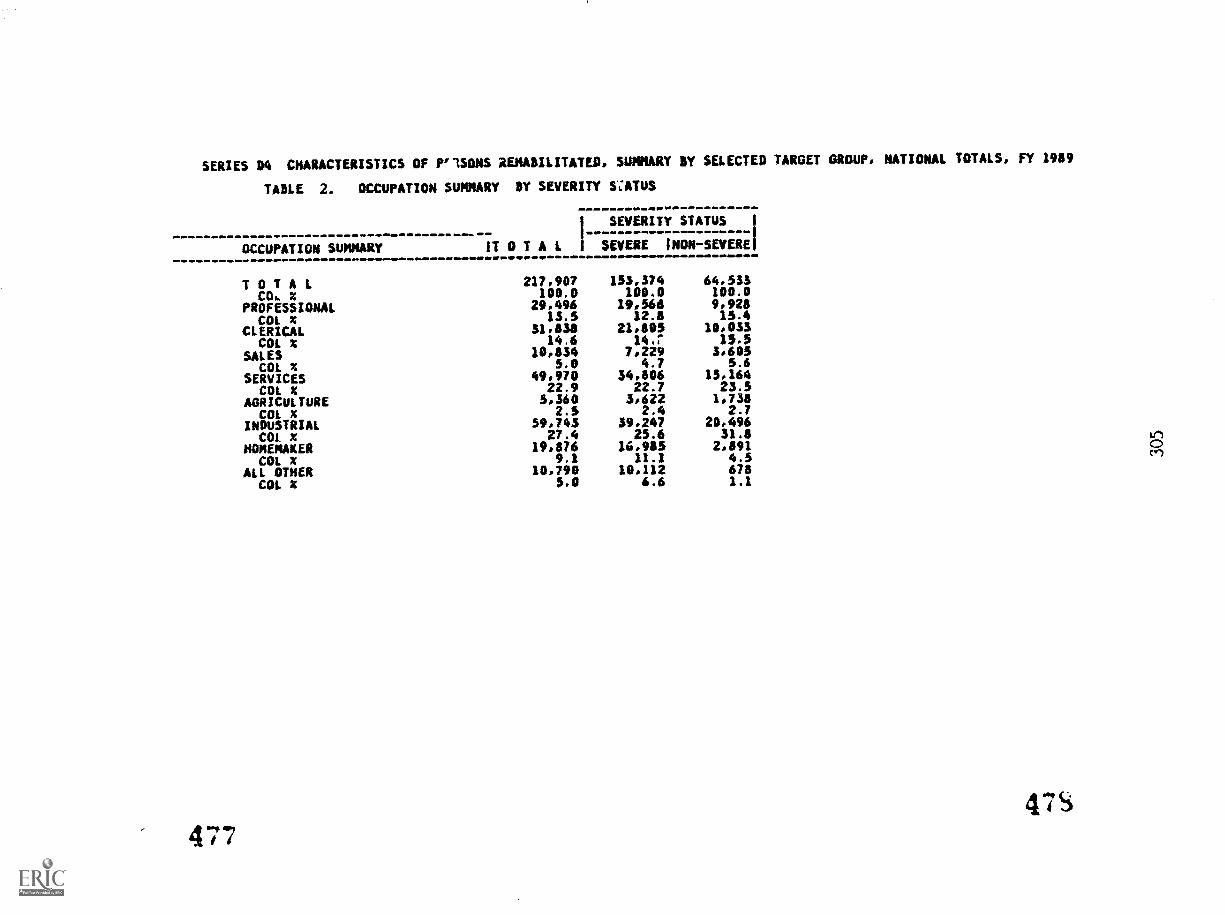
SERIES 04 CHARACTERISTICS OF P'1SONS REHABILITATED, SUMMARY BY SELECTED TARGET GROUP, NATIONAL TOTALS, FY 1939
TIME 2. OCCUPATION SUMMARY DY SEVERITY SALTO
OCCUPATION SUMMARY
I SEVERITY STATUS I
IT OTAL I SEVERE INON -SEVERE'
T OTALCO*. z
PROFESSIONALCOL x
CLERICALCOL x
SALESCOL x
SERVICESCOL x
AGRICULTURECOL x
INDUSTRIALCOL x
HOMEMAKERCOL x
ALL OTHERCOL x
477
217.907 155,574 64,533100.0 100.0 100.0
29,496 19,566 9.92813.5 12.3 15.4
31,838 21.805 10,03314.6 I4.r 15.5
10,334 7,229 3,6055.0 4.7 5.6
49,970 34,806 15.16422.9 22.7 23.5
5,360 3,622 1.7332.5 2.4 2.7
59,743 39,247 20,49627.4
19,8769.1
25.614.985
11.1
31.82,891
4.5
inC)en
10,790 10.112 6735.0 6.6 1.1
47S
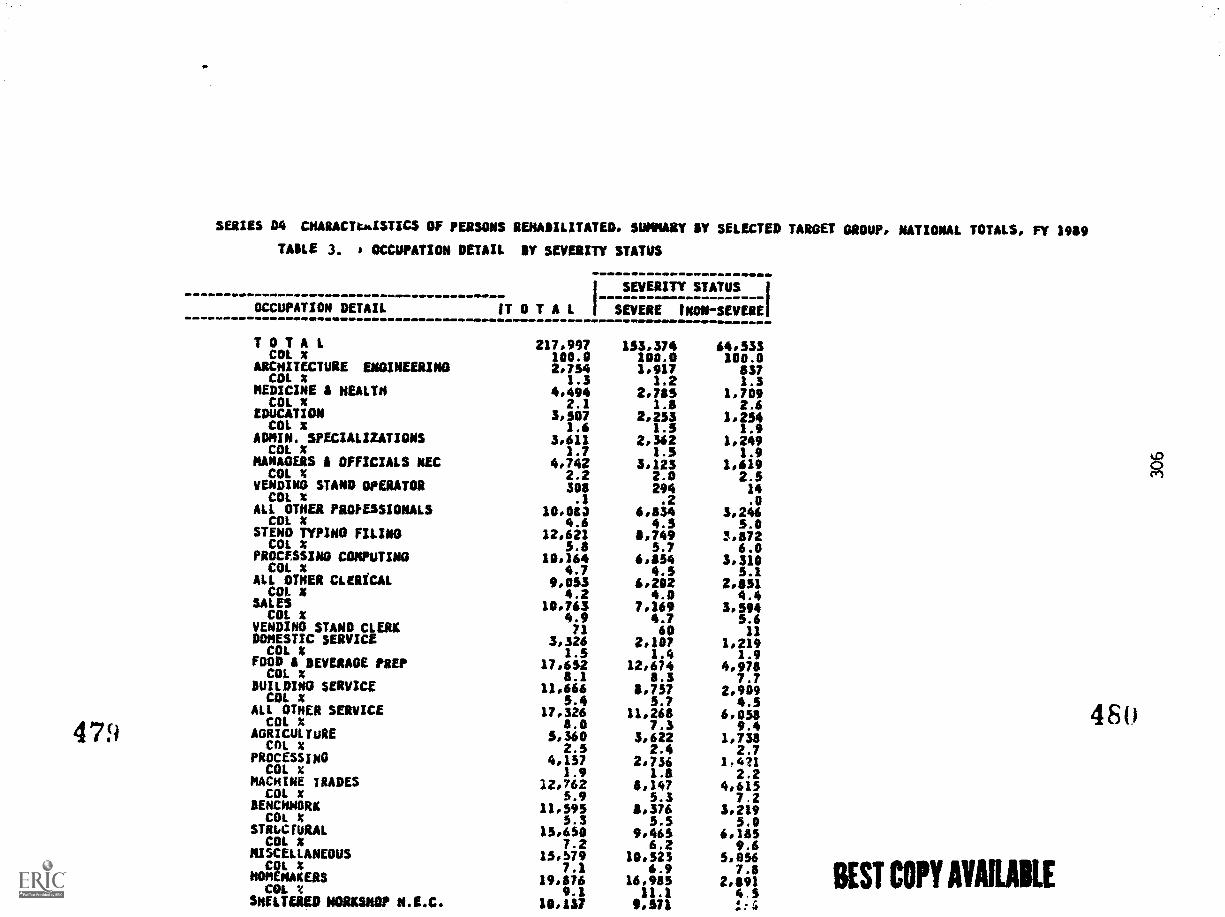
EMMY Ad03 1S38 itt'ot '3'3'N JONSIMON 631121131IS
CV 111 16 % 103 161'Z S96'91 919'14 S03191#340$1
l't 6'9 I'L % 103 9S0'S S25'01 6LS'St WO3111111g3S114 96 Z*9 Z't X 103
SW, 590'6 059'St 1VVIII:I1viS 0.5 S*S t'S % 103
Mit 91f40 565'1T NUOKM3N30 2't f'S 65 % 103 Mit, LW, 29/42t MOIL UMW Z*2 91 6't % 103
tav't cz
91'L'Z O'Z
M.!, s'Z
0g1ss330VJ x 10 net 229'f OW5 mittn3IV0ll
,*6 t*L 09 x 103 050'9 99Z'1t 9Zf'LT 33tAfas V3m10 11v vo L'S O*5 x 10³ 606.2 ISL.'S 999'11 23tAfvS emialinf VI, ill i'f x 103
0Let, tL9421 Z59'a J3V, 30111M30 9 000J 6*1 o't c't x 103 612'1 LOt'Z 9zf'f 3316/13t =MOO tt 09 It 99313 ONvit ONION3A 9'5 V* CO x 103 t6Sgt 6914t t9L'Ot 1531V5 CO 0'10 Z't x 103 tat'Z t's
Ur, S'O
fS0.6 L*0
111,3M13 V3M10 11V x 103 Ott't osv't o9t'Ot ONLLOA03 0ftssI30fd
09 L*5 f*S % 103 ZiV't 6OL'f 129'Zt 01111Ii OVUM 0143I5 05 S*0 9*o x 103
96Z'f 0.
atiV9 r
C90"Ot v
S1vfO1ts240041 V31410 11v 2 103
ot 06Z 90t V0IVV3J0 ONVIS Mom S'Z 0*2 Z*Z x 103 Mit tZtit ZOL'O 33f S1Vt3IJi0 V SV30vvVW
6*1 CI L*1 x 10³ 02'1 291.2 tt9't SNOUTZ11V131J5 'KIM CI S't 9.1 x 10³ OSZ't t5Z.Z L05"f NOILv31102
9'Z 9't t*z x 103 60L11 sfL1Z 060'0 0119311 V 3141310314
t't Z't c't x 103 itf i16't o5L'Z Ofiri3INION3 3013211,13$9
0001 0001 0001 x 103 ffS'99 9if'SS1 tir6't12 1X10 i
MWMIMM.41.411110MMIMVO41.1.1M1 1301/43S -NOM 3V3A35 I 1 V 1 0 II 119130 N0Ilvin320
snivis Al1f3A35
SALIM AiMAIS AO 190130 Nemo= -E 31991 6961 Ai 'SlviOL lvfOIL911 'dOOVO 130ffi 03132135 Af moms '0301t1IIIVOlf 51405034 AO 53tisp,11395,113 90 5311135
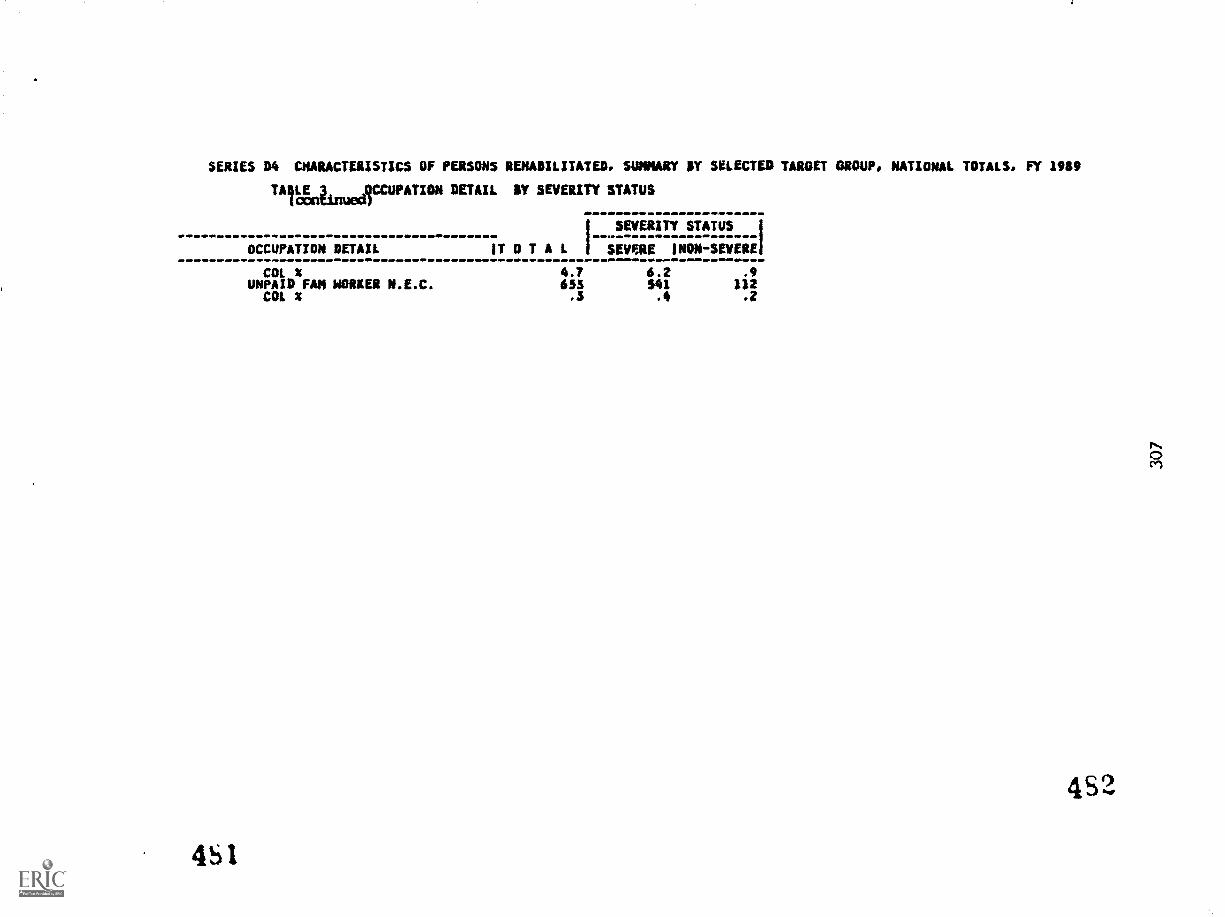
SERIES 04 CMARACTERISTICS OF PERSONS REM/MUTATED, SUMMARY 5Y SELECTED TAROET OROUP, NATIONAL TOTALS, FY 1959
TAlgaimmed3CCUPATION DETAIL BY SEVERITY STATUS
I SEVERITY STATUS I
OCCUPATION DETAIL ITOTALI SEVERE iNON-SEVERE1
COL xUNPAID FAR WORKER N.E.C.
COL
4S1
4.7 6.2 .9655 541 112.3 .4 .2
4s2
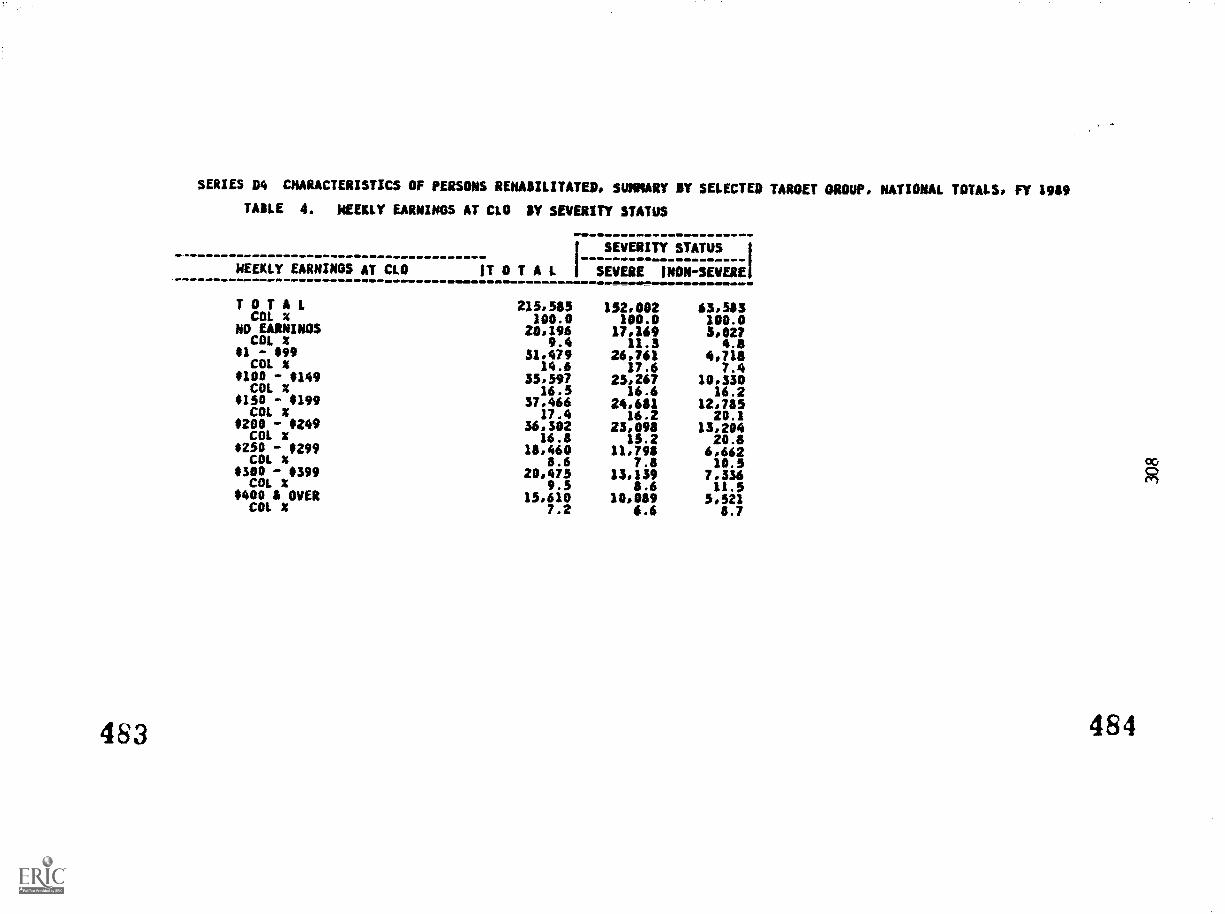
SERIES 04 CHARACTERISTICS OF PERSONS REHABILITATED. SUMMARY BY SELECTED TARGET GROUP. NATIONAL TOTALS, FY 1989
TABLE 4. MEEKLY EARNINGS AT CLO BY SEVERITY STATUS
WEEKLY EARNINGS AT CLO
TOTALCOL x
NO EARNINGSCOL X
$1 - $99COL X
$100 - $149COL x
4150 - $199COL X
$200 - $249COL x
*250 - 0299cOL x
4300 - *399COL x
$400 A OVERCOL X
483
I SEVERITY STATUS I
!TOTAL I SEVERE INON-SEVEREIWHOM
215,585 152,802 63,583100.0 100.0 100.0
20,196 17.169 3,0279.4 11.3 4.8
31.479 26,761 4,71814.6 17.6 7.4
35,597 25,267 10,33016.5 16.6 16.2
37,466 24.601 12,73517.4 16.2 20.1
36,302 23,098 13,29416.3 15.2 20.8
18,460 11,791 6,6623.6 7.0 10.5
20,475 15,159 7.3569.5 8.6 11.5
15.610 10,089 5,5217.2 6.6 8.7
484
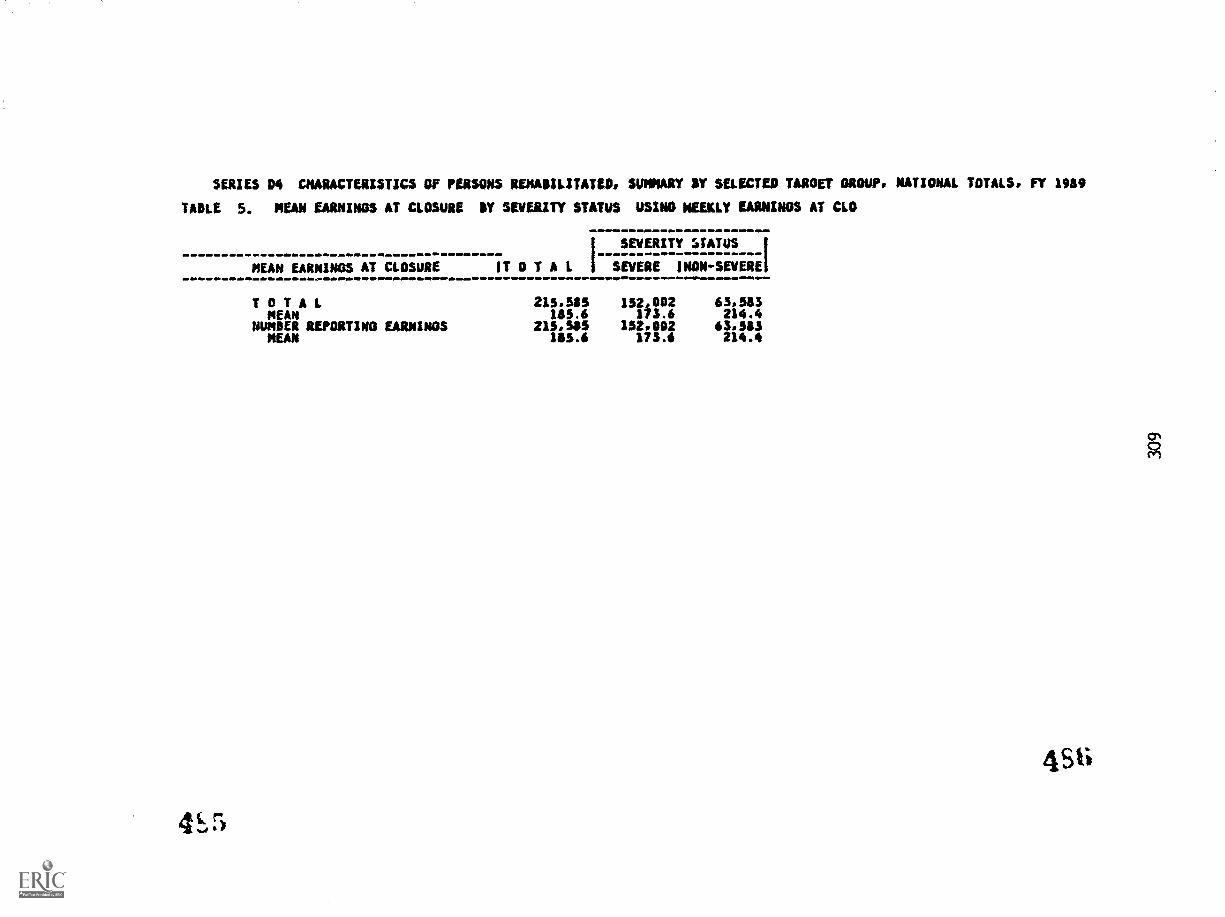
SERIES 04 CHARACTERISTICS OF PERSONS REMADILITATED. SUMMARY SY SELECTED TARGET GROUP, NATIONAL TOTALS. FY 19119
TABLE 5. MEAN EARNINGS AT CLOSURE SY SEVERITY STATUS USING MEEKLY EARNINGS AT CLO
I SEVERITY STATUS I
MEAN EARNINGS AT CLOSURE IT OTAL I SEVERE INON-SEVEREI
T OTALMEAN
NUMBER REPORTING EARNINGSMEAN
4
01111..111
215.515 152.002 65.543165.6 173.6 214.4
215.515 152.002 63,543165.6 173.6 214.4
4 9
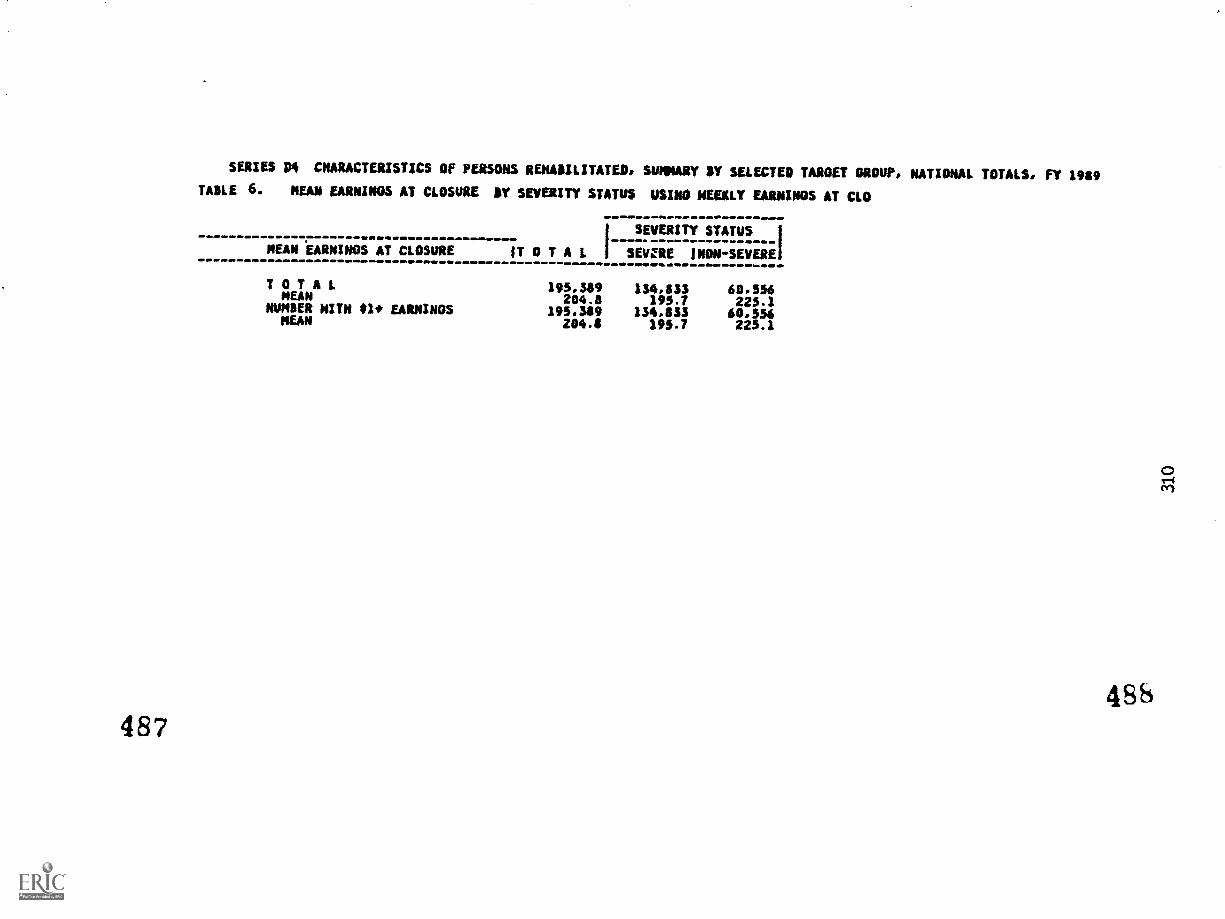
SERIES D4 CHARACTERISTICS OF PERSONS REHADILITATED, SUMMARY DT SELECTED TARGET mow, NATIONAL TOTALS, FY 1989TABLE 6. MEAN EARNINGS AT CLOSURE BY SEVERITY STATUS USING MEEKLY EARNINGS AT CLO
487
MEAN EARNINGS AT CLOSURE IT OTAL
OTAL 195.319MEAN 204.8
NUMBER MITN 014, EARNINGS 195.349MEAN 284.8
I SEVERITY STATUS I
I SEVZRE INON-SEVEREI
154,833 60.556195.7 225.1
134.853 60.556195.7 225.1
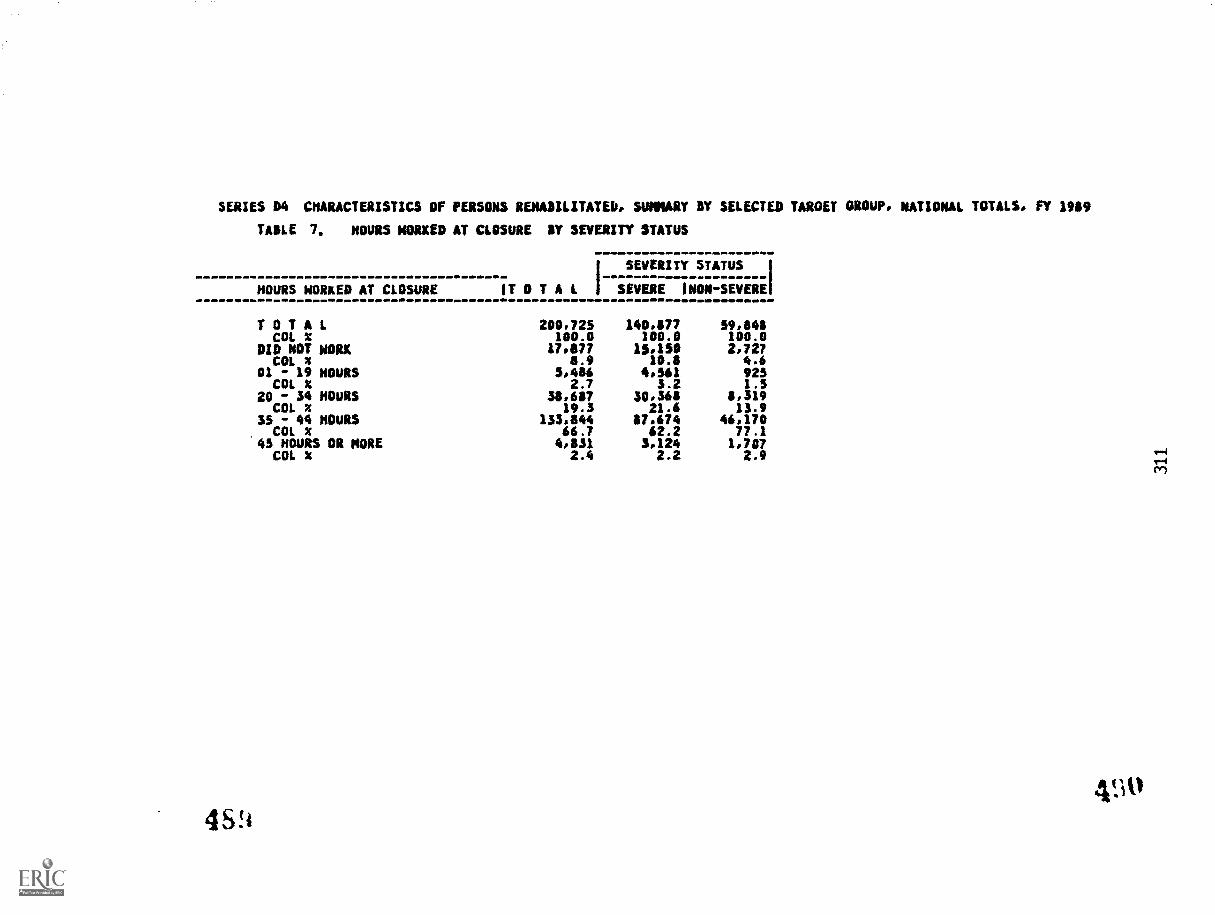
SERIES D4 CHARACTERISTICS OF PERSONS REHABILITATED. SUMMARY BY SELECTED TARGET GROUP, NATIONAL TOTALS. FY 1989
TABLE 7. HOURS WORKED AT CLOSURE BY SEVERITY STATUS
HOURS WORKED AT CLOSURE fT OTAL
T OTAL 280.725COL X 180.8
DID NOT WORK 17.877COL X 8.9
01 .. 19 HOURS 5.486COL % 2.7
20 .- 34 HOURS 38.687COL X 19.3
35 ' 44 HOURS 133.844COL X 66.7
43 HOURS OR MORE 4,831COL H 2.4
4 S
I SEVERITY STATUS
SEVERE INOW.SEVERE
140.877 59.848100.0 100.0
15,130 2.72710.8 4.6
4.561 9253.2 1.5
30,368 8,31921.6 13.9
17.674 46,17062.2 77.1
3,124 1,7072.2 2.9
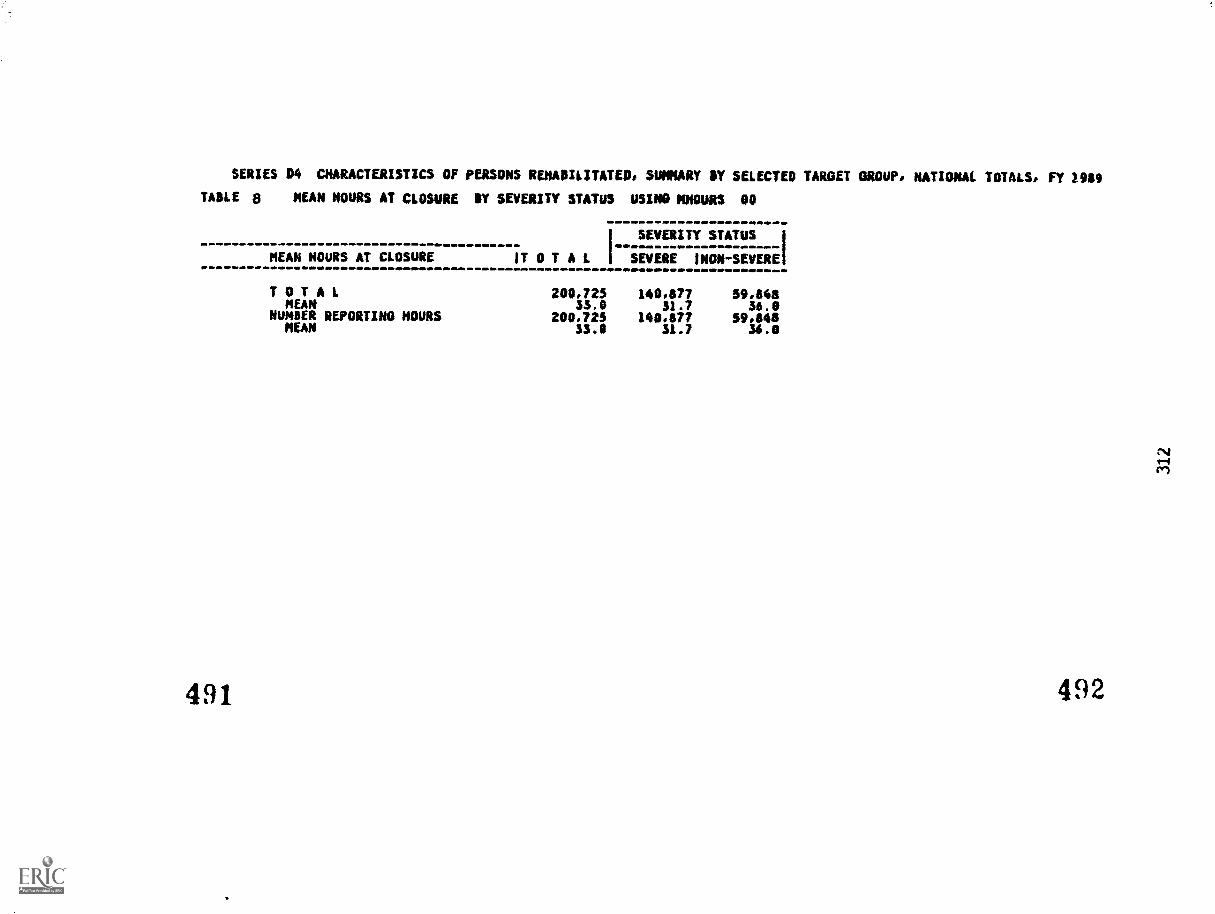
SERIES D4 CHARACTERISTICS OF PERSONS REHADILITATED, SUMMARY SY SELECTED TARGET GROUP, NATIONAL TOTALS, FY 1969
TABLE MEAN HOURS AT CLOSURE SY SEVERITY STATUS USING MHOURS 00
MEAN MOURS AT CLOSURE
I SEVERITY STATUSSeefleIT OTAL I SEVERE MON-SEVERE'
T OTALMEAN
NUMBER REPORTING HOURSMEAN
491
200,125 140,677 59.84033.0 31.7 36.0
200.725 140.877 59.84833.0 31.7 36.0
492
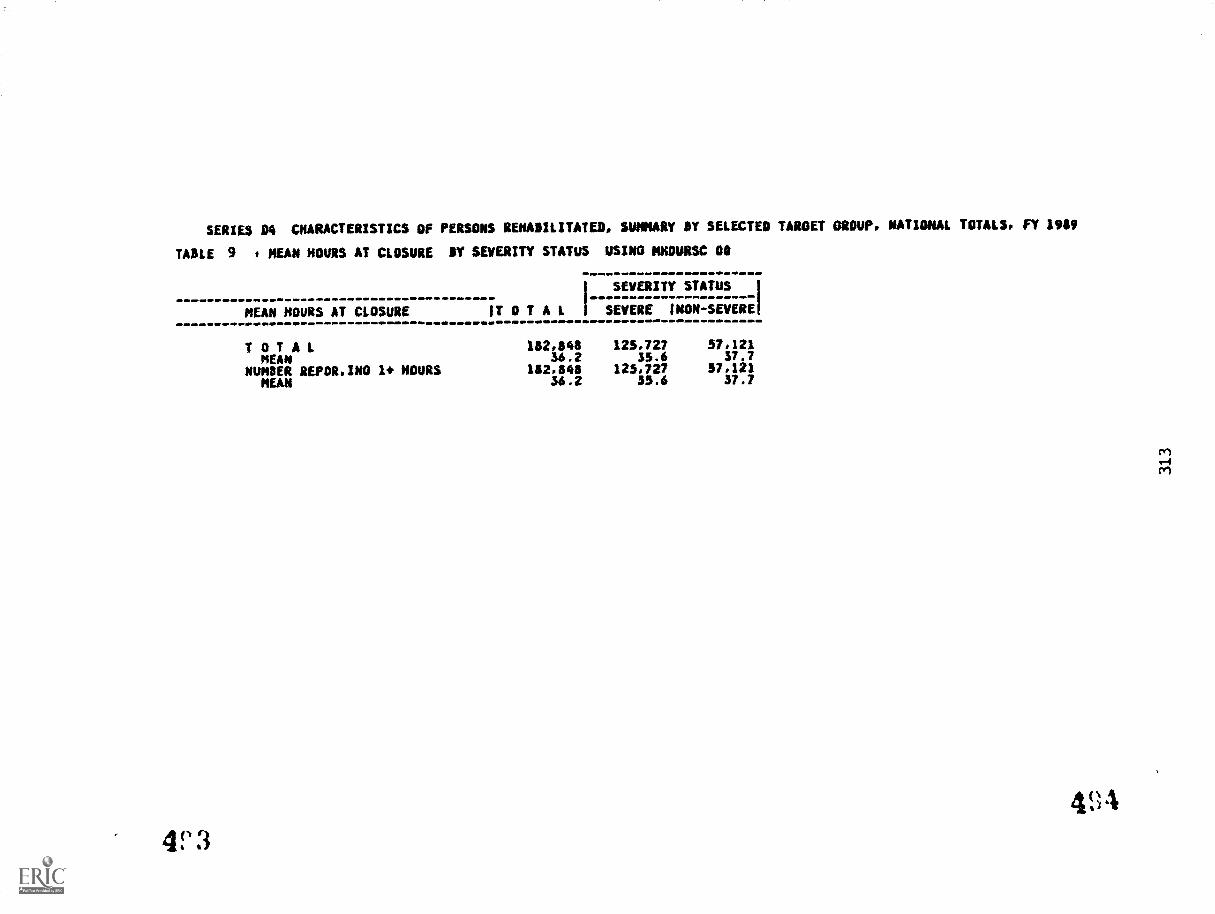
SERIES 04 CHARACTERISTICS OF PERSONS REHASILITATED, SUMMARY $Y SELECTED TARGET OROUP, NATIONAL TOTALS, FY 1909
TASLE 9 I MEAN HOURS AT CLOSURE SY SEVERITY STATUS USING MNOURSC OO
MEAN HOURS AT CLOSURE
I SEVERITY STATUS I
IT OTAL I SEVERE INON-SEVEREI
T OTALMEAN
NUMBER REPOR,INO I+ HOURSMEAN
182,848 125,727 57,12156.2 35.6 37.7
1112,11411 125,727 57,12136.2 35.6 37.7
44"
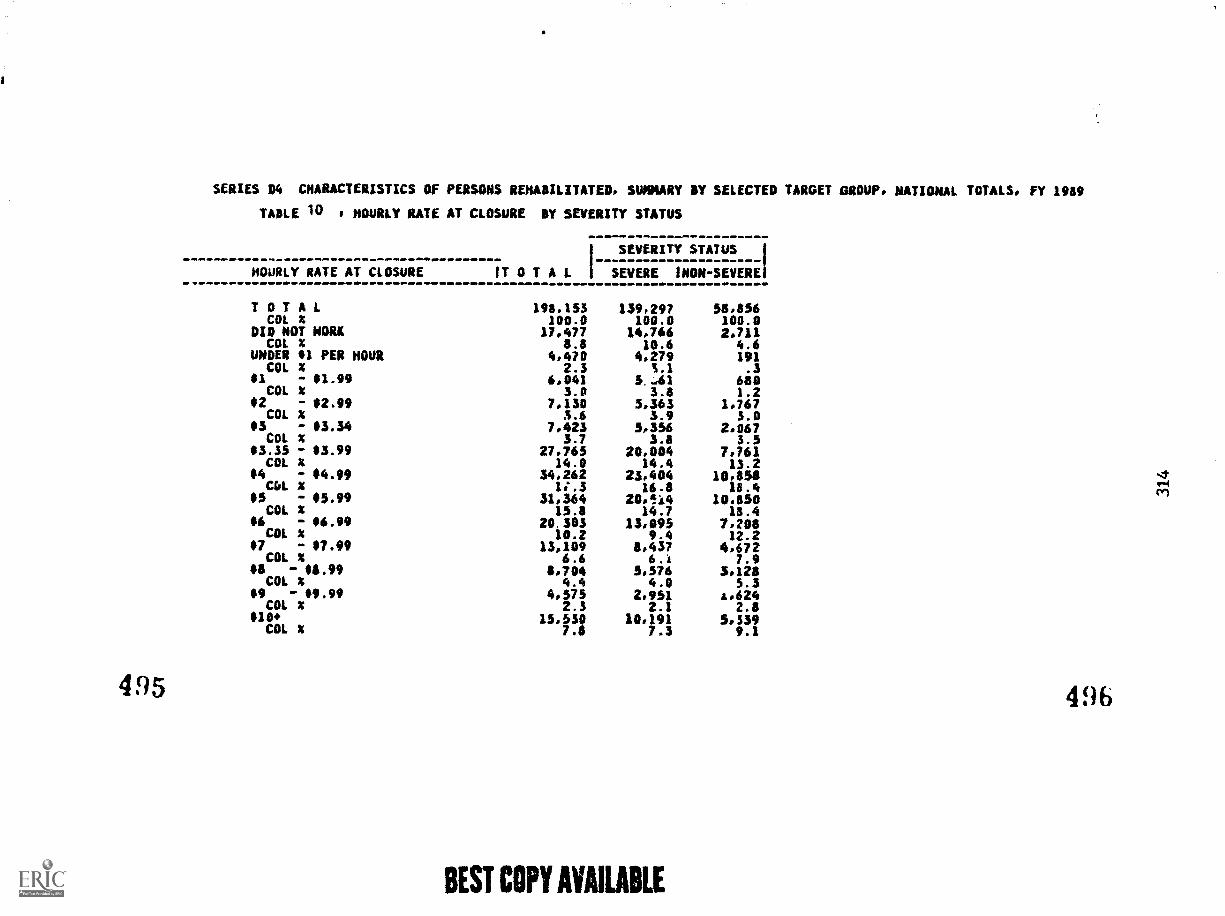
SERIES D4 CHARACTERISTICS OF PERSONS REHAAILITATED, SUMMARY AY SELECTED TARGET GROUP. NATIONAL TOTALS, FY 1969
TAKE 10 HOURLY RATE AT CLOSURE SY SEVERITY STATUS
HOURLY RATE AT CLOSURE
I SEVERITY STATUS I
IT OTAL ' SEVERE ICON-SEVERE'
TOTALCOL %
DID NOT WORKCOL X
UNDER 91 PER HOURCOL X
$1 $1.99COL X
$2 - $2.99COL X
03 - $3.34COL X
$3.35 - $3.99COL X
$4 - 44.99C61. X
05 '.. 65.99COL X
96 - 16.99COL X
$7 - $7.99COL X
OS - $6.99COL X
$9 - $9.99COL X
010+COL X
495
198.153 139,297 58,856100.0 100.0 100.0
17,477 14.766 2,7118.6 10.6 4.6
4.470 4.279 1912.3 LI .3
6,041 5..41 6503.0 3.6 1.2
7,130 5,363 1,7673.6 3.9 3.0
7,423 5,356 2.0673.7 3.8 3.5
27,765 20,004 7,76114.0 14.4 13.2
34.262 23.404 10.658 -..7
11-.331,364
16.820.144
18.410.850
r.4el
15.3 14.7 16.420.503 13.095 7.208
10.2 9.4 12.213.109 8,437 4,672
6.6 6.1 7.98,704 5,576 3,128
4.4 4.0 5.34.575 2,951 4,624
2.3 2.1 2.815,530 10,191 5,339
7.6 7.3 9.1
BEST COPY AVAILABLE
496
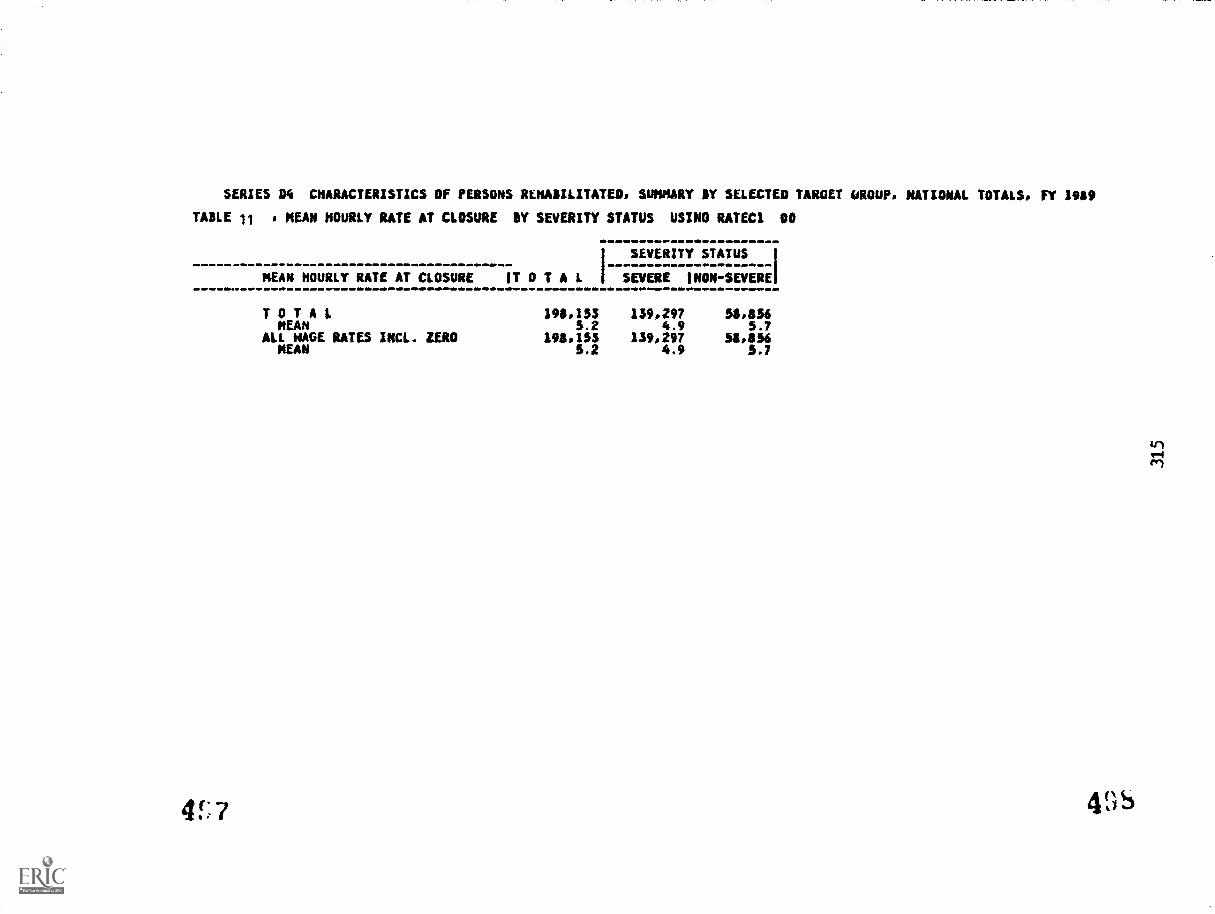
SERIES 44 CHARACTERISTICS OF PERSONS REHAAILITATED, SUMMARY AY SELECTED TARGET UROUP, NATIONAL TOTALS. FY 1949
TABLE 11 I MEAN HOURLY RATE AT CLOSURE BY SEVERITY STATUS USING RATEC1 00
MEAN HOURLY RATE AT CLOSURE IT OTAL I SEVERE INONSEVEREI
SEVERITY STATUS
T OTAL 190.155 139,297 54454MEAN 5.2 4.9 5.7
ALL NAGE RATES INCL. ZERO 194,153 139.297 54,454MEAN 5.2 4.9 5.7
4!;7
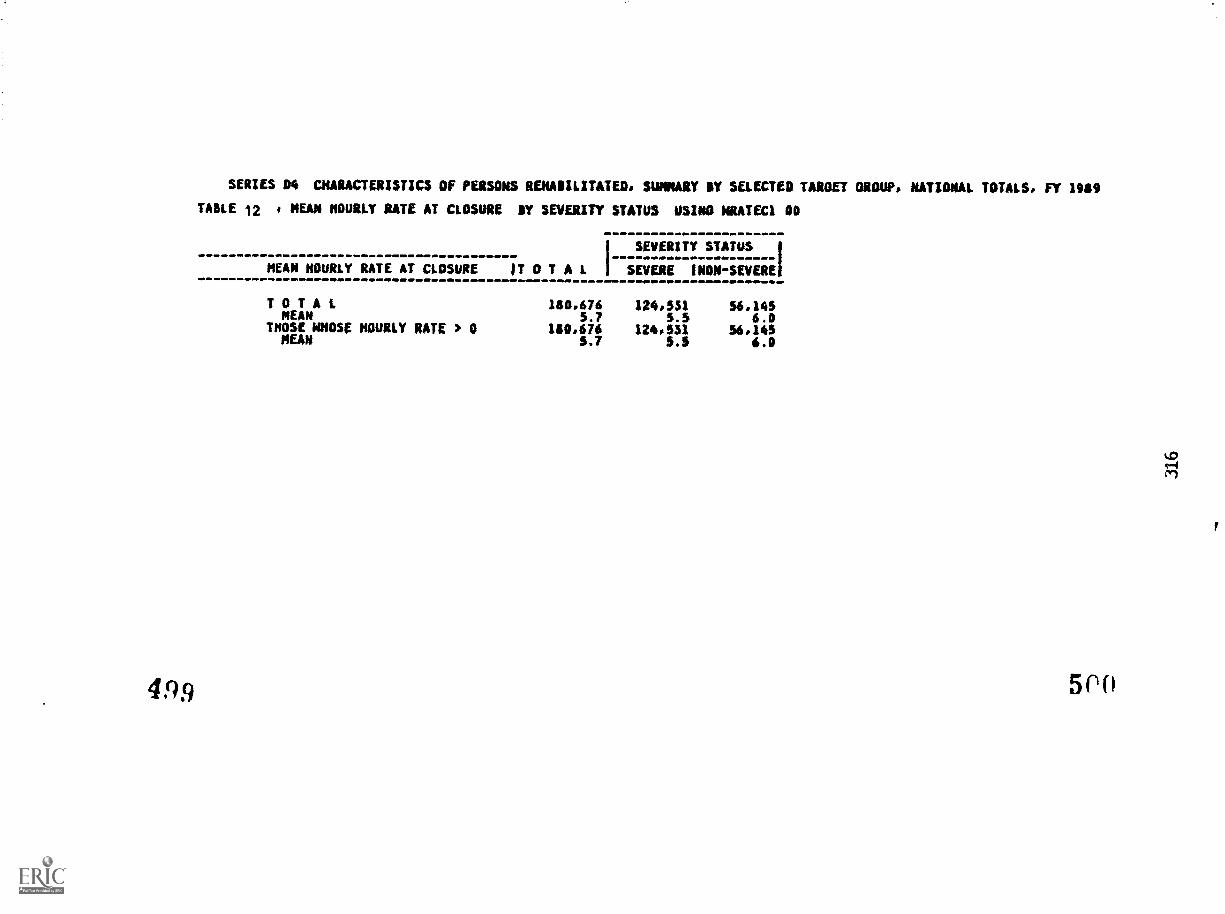
StRIES 04 CHARACTERISTICS OF PERSONS REHABILITATED, SUMMARY CY SELECTED TARGET GROUP, NATIONAL TOTALS, FY 1919
TABLE 12 I MEAN HOURLY RATE AT CLOSURE BY SEVERITY STATUS USING NRATEC1 00
I SEVERITY STATUS I
MEAN HOURLY RATE AT CLOSURE !TOTAL SEVERE INCH-SEVERE'...... ---------.-
T OTALMEAN
THOSE MOSE HOURLY RATE > 0MEAN
499
110,676 124,531 56,1455.7 3.5 6.0
110,676 124.531 56.1455.7 5.5 6.0
500
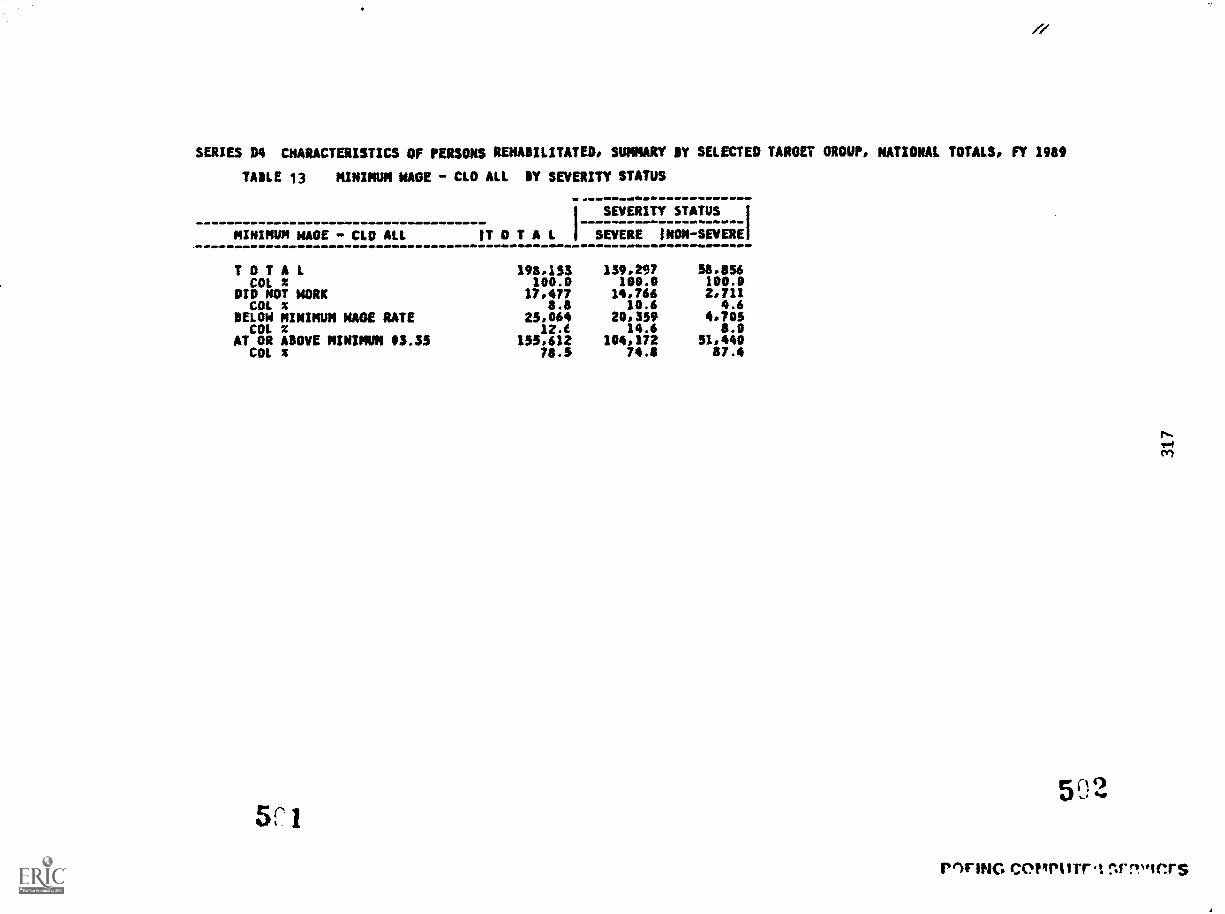
l/
SERIES 04 CHARACTERISTICS OF PERSONS REHABILITATED. SUMMARY SY SELECTED TAROET GROUP, NATIONAL TOTALS, FY 1910
TABLE 13 MINIMUM NAGE CLO ALL SY SEVERITY STATUS
ISEVERITY STATUS
SEVERE 114011 -SEVEREaaaaflflflflaflMINIMUM HAOE CLO ALL IT OTALas ...M.! . ... eneaeesaeana
TOTAL 198.153 139,297 58,856COL N 100.0 108.0 108.0
DIO NOT MORK 17.477 14.766 2.711COL x 8.8 10.6 4.6
BELOW MINIMUM NAGE RATE 25,064 20,359 4,705COL 12.t 14.6 8.0
AT OR ABOVE MINIMUM *3.35 155.612 104.172 51,440COL X 78.5 74.1 17.4
5r15 ri
rew ipic. corptur-t rxri."iers
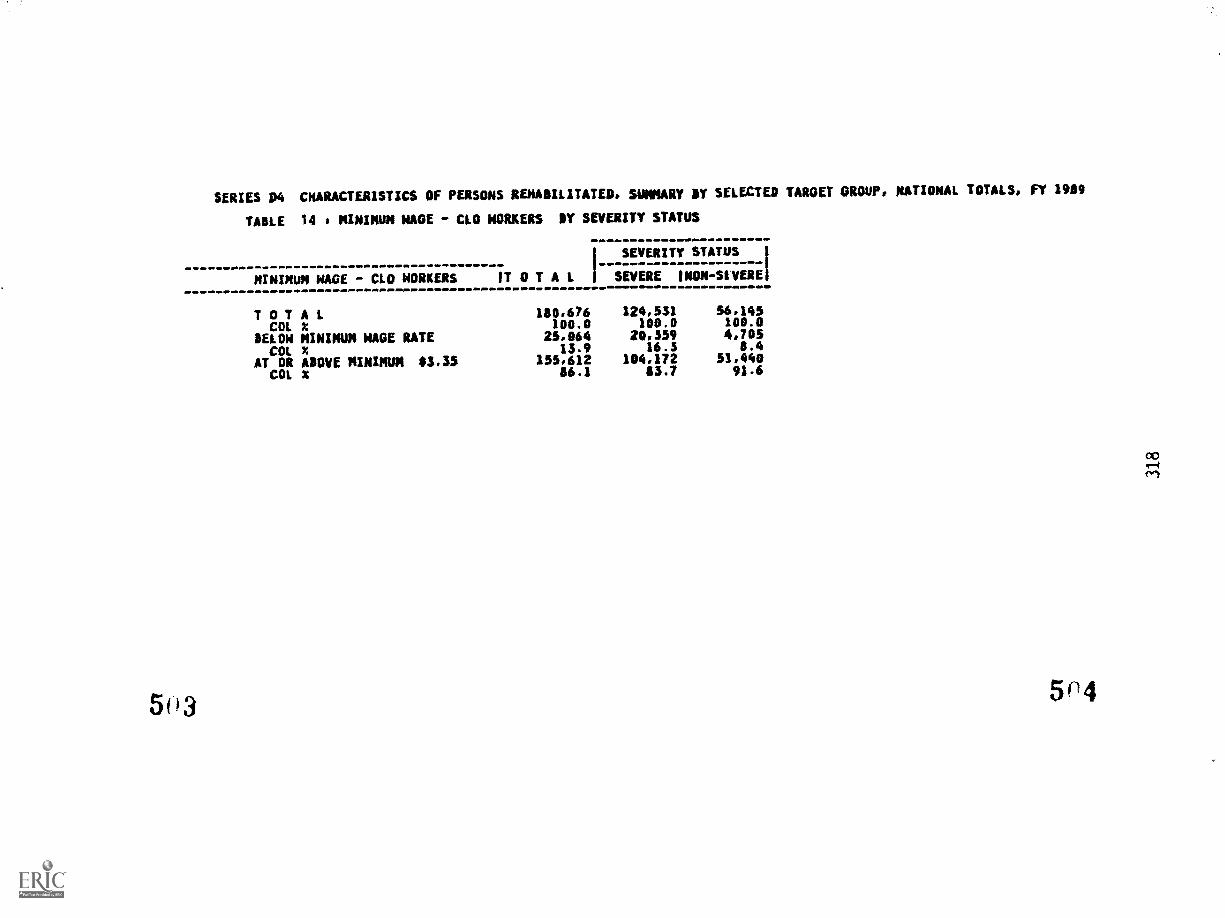
SERIES D4 CHARACTERISTICS OF PERSONS REHABILITATED, SUMMARY BY SELECTED TARGET GROUP, NATIONAL TOTALS, FY 1989
TABLE 14 i MJNINUN WAGE CLO WORKERS BY SEVERITY STATUS
I SEVERITY STATUS I
MINIMUM NAGE - CLO WORKERS fT OTAL SEVERE Imm-stistad
TOTALCOL X
BELOW MINIMUM WAGE RATECOL x
AT OR ABOVE MINIMUM 3.35COL X
160,676 124,531 56.145100.0 100.0 100.0
25,064 20,359 4,70513.9 16.3 8.4
155,612 104,172 51,44086.1 05.7 91.6
5o3 504

Publication Code: ED/OSERS 91-20
31951 5


