Embed Size (px)
Citation preview
Neurobiology of Disease 63 (2014) 74–84
Contents lists available at ScienceDirect
Neurobiology of Disease
j ourna l homepage: www.e lsev ie r .com/ locate /ynbd i
Longitudinal assessment of blood–brain barrier leakage duringepileptogenesis in rats. A quantitative MRI study
E.A. van Vliet a,b,⁎, W.M. Otte c,d, J.A. Gorter a,b, R.M. Dijkhuizen c, W.J. Wadman a,b
a Center for Neuroscience, Swammerdam Institute for Life Sciences, University of Amsterdam, Amsterdam, The Netherlandsb Epilepsy Institute in The Netherlands Foundation (Stichting Epilepsie Instellingen Nederland, SEIN), Heemstede, The Netherlandsc Biomedical MR Imaging and Spectroscopy Group, Image Sciences Institute, University Medical Center Utrecht, Utrecht, The Netherlandsd Department of Pediatric Neurology, Rudolf Magnus Institute of Neuroscience, University medical Center Utrecht, Utrecht, The Netherlands
Abbreviations: BBB, blood–brain barrier; FSC, fluoresepilepticus.⁎ Corresponding author at: Swammerdam Institute
Neuroscience, University of Amsterdam, Science Park 9Netherlands. Fax: +31 20 5257709.
E-mail address: [email protected] (E.A. van Vliet).Available online on ScienceDirect (www.sciencedirect.c
0969-9961/$ – see front matter © 2013 Elsevier Inc. All rihttp://dx.doi.org/10.1016/j.nbd.2013.11.019
a b s t r a c t
a r t i c l e i n f oArticle history:Received 19 July 2013Revised 22 November 2013Accepted 27 November 2013Available online 7 December 2013
Keywords:Blood–brain barrierMagnetic resonance imagingGadoliniumTemporal lobe epilepsyStatus epilepticusFluorescein
The blood–brain barrier (BBB) plays an important role in the homeostasis of the brain. BBB dysfunction has beenimplicated in the pathophysiology of various neurological disorders, including epilepsy in which it may contrib-ute to disease progression. Precise understanding of BBB dynamics during epileptogenesis may be of importancefor the assessment of future therapies, including BBB leakage blocking-agents. Longitudinal changes in BBB integ-rity can be studied with in vivo magnetic resonance imaging (MRI) in combination with paramagnetic contrastagents. Although this approach has shown to be suitable to detect major BBB leakage during the acute phase inexperimental epilepsy models, so far no studies have provided information on dynamics of the extent of BBBleakage towards later phases. Therefore a sensitive and quantitative approach was used in the present study, in-volving fast T1 mapping (dynamic approach) during a steady-state infusion of gadobutrol, as well as pre- andpost-contrast T1-weighted MRI (post–pre approach). This was applied in an experimental epilepsy model inwhich previous MRI studies failed to detect BBB leakage during epileptogenesis.Adult male Sprague–Dawley rats were injected with kainic acid to induce status epilepticus (SE). MRI experi-ments were performed before SE (control) and during the acute (1 day) and chronic epileptic phases(6 weeks after SE). BBB leakage was quantified by fast T1 mapping (Look–Locker gradient echo MRI) with atime resolution of 48 s from 5 min before up to 45 min after 20 min step-down infusion of 0.2 M gadobutrol.In addition, T1-weighted MRI was acquired before and 45 min after infusion. MRI data were compared to post-mortem microscopic analysis using the BBB tracer fluorescein.Our MRI data showed BBB leakage, which was evident at 1 day and 6 weeks after SE in the hippocampus, ento-rhinal cortex, amygdala and piriform cortex. These findingswere confirmed bymicroscopic analysis of fluoresce-in leakage. Furthermore, ourMRI data revealed non-uniform BBB leakage throughout epileptogenesis. This studydemonstrates BBB leakage in specific brain regions during epileptogenesis, which can be quantified using MRI.Therefore, MRI may be a valuable tool for experimental or clinical studies to elucidate the role of the BBB inepileptogenesis.
© 2013 Elsevier Inc. All rights reserved.
Introduction
The blood–brain barrier (BBB) plays an important role in the homeo-stasis of the brain. Endothelial cells that are tightly connected via tightjunctions protect the brain from the entry of potentially harmful sub-stances in the blood stream. BBB dysfunction that results in the entryof blood components in the extracellular space of the brain is observedin several disorders of the central nervous system, including epilepsy
cein; KA, kainic acid; SE, status
for Life Sciences, Center for04, 1098 XH Amsterdam, The
om).
ghts reserved.
(Abbott et al., 2010). BBB dysfunction may also contribute to progres-sion of the disease (Friedman, 2011; Marchi et al., 2012; Van Vlietet al., 2007a; Vezzani et al., 2011). In experimental epilepsy modelsBBB leakage is detected using BBB tracers, commonly by post-mortemanalysis of tracer accumulation in brain tissue. Longitudinal studies arewarranted to more specifically relate BBB dysfunction to disease pro-gression, which could be achieved using in vivo contrast-enhancedmagnetic resonance imaging (MRI). In patients' gadolinium (Gd)-based MR contrast agents such as Gd-diethylenetriaminepentacetate(Gd-DTPA) are routinely used to detect BBB opening (Dijkhuizen,2011; Kassner and Thornhill, 2011). When the BBB is disrupted, theintravenously administered MR contrast agent leaks out of the bloodvessels and accumulates in the brain parenchyma. This results in localshortening of the longitudinal MR relaxation time, T1. The changes inMR signal can be used to localize BBB disruption and to quantify the
75E.A. van Vliet et al. / Neurobiology of Disease 63 (2014) 74–84
degree of BBB permeability (Dijkhuizen, 2011; Kassner and Thornhill,2011; Nagaraja et al., 2011). Contrast agents are usually injected as anintravenous bolus, leading to a sharp rise and subsequent drop duringfirst passage of the contrast agent through the vasculature. Contrast-enhanced BBB permeability imaging has been conventionally carriedout by performing T1-weighted MRI at a specific time-point aftercontrast agent injection (typically 10–30 min) to detect extravasatedcontrast agent (Dijkhuizen, 2011). In experimental epilepsy modelsthis method detected major BBB leakage shortly after an initial insult(Bouilleret et al., 2000; Roch et al., 2002), but it failed to detect thesmaller BBB leakage during the chronic epileptic phase. However,post-mortem analysis using microscopic detection of BBB tracers or al-bumin immunocytochemistry (Ravizza et al., 2008; Rigau et al., 2007;Van Vliet et al., 2007a) suggests that more subtle BBB leakage is indeedpresent in the chronic phase.
Previous studies in a rat model of transient cerebral ischemia dem-onstrated that, in contrast to bolus injection, prolonged infusion of thecontrast agent improves the sensitivity of BBB permeability measure-ments (Knight et al., 2009;Nagaraja et al., 2007) and allows accurate de-tection, delineation and quantification of BBB injury. This step-downinfusion protocol leads to a fast rise of contrast agent concentration inthe blood, which is then maintained at a constant level for the durationof infusion (Nagaraja et al., 2007).
In the present study we used the step-down gadobutrol infusionprotocol in order to quantify BBB leakage at two highly relevant timepoints during epileptogenesis in an experimental epilepsy model: theacute (one day after SE) and the chronic (six weeks after SE) epilepticphase and compared them with the control situation before SE. Fastrepetitive T1 mapping was executed with a high temporal resolution(Dijkhuizen, 2011; Nagaraja et al., 2011) to assess the dynamics ofcontrast agent concentration accumulation in different brain regionsas a function of time.
Materials and methods
Experimental animals
Twelve adult male Sprague–Dawley rats (HarlanNetherlands, Horst,The Netherlands) weighing 400–500 g were used in this study whichwas approved by the Amsterdam University Animal Welfare commit-tee. The rats were housed in a controlled environment (21 ± 1 °C;humidity 60%; lights on 08:00 AM–8:00 PM; food and water availablead libitum).
Status epilepticus induction and video monitoring
Status epilepticus (SE) was evoked by hourly i.p. injections ofkainic acid (KA; 10 mg/ml; first dose 14 mg/kg; subsequent injection7 mg/kg, Cayman Europe, Tallinn, Estonia). During the injection periodseizure activity was rated behaviorally according to Racine's scale. KAinjections were continued until class IV and V seizures were elicitedfor ≥4 h. Seizures were not terminated pharmacologically.
Video recordings were used to verify that rats did not have a behav-ioral seizure in the time period of at least 2 h prior to each MRI record-ing session. However, this method does not guarantee detection of allfocal seizures. Video recordings were also made during one week afterthe last MRI session to determine the seizure frequency and the occur-rence of the last seizure. Hereafter, rats were injected with fluorescein(see below) and perfused.
Magnetic resonance imaging
Magnetic resonance imaging was conducted on a 4.7 T horizontalbore Varian MR system (Palo Alto, CA, USA). A Helmholtz volume coil(diameter, 9 cm) and an inductively coupled surface coil (diameter,2.5 cm) were used for radiofrequency excitation respectively signal
detection. Three rats were repeatedly scanned at three critical timepoints: before SE (control), one day after SE (the acute phase) and6 weeks after SE (the chronic phase). Each rat served as its own control.During MRI, rats were anesthetized and mechanically ventilated with 1to 2% isoflurane in air/O2 (2:1). Expired CO2, blood oxygen saturationand heart ratewere continuouslymonitored and keptwithin physiolog-ical range. Body temperature was maintained at 37 ± 0.5 °C with afeedback-controlled heating pad.
For registration purposes, T2*-weighted images were acquiredbefore gadobutrol infusion (repetition/echo time, 6/2.28 ms; field ofview, 40 × 40 × 40 mm3; acquisition matrix, 192 × 192 × 192; voxelresolution, 0.2083 × 0.2083 × 0.3125 mm3; flip angle, 40°).
BBB permeability was determined with two MRI protocols: 1) T1-weighted MRI in which differences between scans before and aftertracer infusion are calculated (post–pre approach) and 2) fast T1 map-ping which detects dynamic changes during tracer infusion (dynamicapproach).
T1-weighted MR images were acquired before and 45 min after thestart of the 20 min step-down gadobutrol infusion (gradient echo; rep-etition/echo time, 160/4 ms; acquisitionmatrix, 256 × 128 × 19; voxelresolution, 0.25 × 0.125 × 1 mm3, flip angle, 90°).
Fast T1 mapping was conducted from 5 min before up to 45 minafter step-down infusion. Each scan lasted 48 s (Look–Locker gradientecho MRI; repetition/echo time, 5000/3.4 ms; inversion time, 10 ms;image repetition time, 24 × 8 ms; flip angle, 10°; slice gap 0.5 mm,voxel resolution 0.5 × 0.5 × 2 mm3).
The advantage of T1-weighted MRI is the higher spatial resolution(0.25 × 0.125 × 1 mm3) as compared with fast T1 mapping (0.5 ×0.5 × 2 mm3). This protocol was used to calculate the spatial aspectsof gadobutrol leakage. Fast T1 mapping provided a higher temporalresolution (48 s) compared with T1-weighted MRI (45 min), and thisprotocol was used to calculate the gadobutrol leakage rate.
Gadobutrol infusion
Gadobutrol (0.2 Mdiluted in saline; Gadovist®, Schering, Kenilworth,NJ, USA)was injected via the tail vein using a syringe pump (Model 944,Harvard Apparatus, South Natick, MA, USA) programmed to reach thehighest possible almost steady-state level in 20 min. The step-downinfusion schedule is illustrated in Fig. 1A (black line) and Table 1.Under influx only conditions the concentration of gadobutrol in bloodis assumed to change as given in Fig. 1A (grey line). The signal recordedin the sagittal sinus (Fig. 1B) allows estimating the kinetics of theclearance of gadobutrol from the blood. The exponential decay gives atime constant of 41 min. Combined influx + clearance estimates thegadobutrol concentration in the blood as illustrated in Fig. 1A (dottedline). BBB permeability is quite low under most of our conditions, soin most regions we only see a small increase in gadobutrol signal fromthe brain tissue. It may also take quite a long time before the gradientreverses and accumulation switches to clearance (Fig. 1C: piriformcortex). In many regions there is hardly any BBB leakage (Fig. 1C:motor cortex).
In preliminary experiments, lower infusion concentrations ofgadobutrol (0.05 M and 0.1 M) or a bolus injection (0.1 M) did notresult in a detectable brain entry of the tracer (data not shown).
Data analysis
T2*-weighted images were matched to a three-dimensional modelof a rat brain atlas (Paxinos and Watson, 1998), by first matchingthem with a reference image (the average of all T2*-weighted imagesin the present study) using affine-only registration which was thenfollowed by nonlinear registration to the rat brain atlas as previouslydescribed (Otte et al., 2012; van Meer et al., 2012).
Regional gadobutrol leakage (Gd-leakage map) was quantifiedas the relative enhancement of the gadobutrol signal: pre-contrast
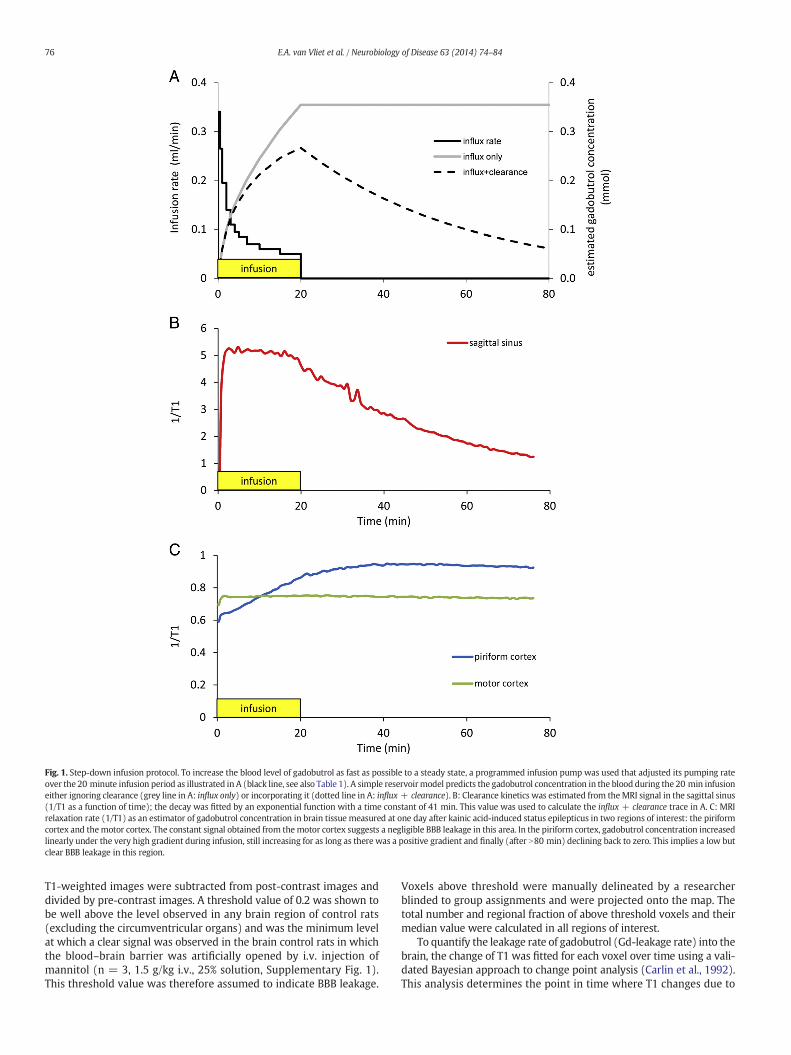
Fig. 1. Step-down infusion protocol. To increase the blood level of gadobutrol as fast as possible to a steady state, a programmed infusion pump was used that adjusted its pumping rateover the 20 minute infusion period as illustrated in A (black line, see also Table 1). A simple reservoirmodel predicts the gadobutrol concentration in the blood during the 20 min infusioneither ignoring clearance (grey line in A: influx only) or incorporating it (dotted line in A: influx + clearance). B: Clearance kinetics was estimated from theMRI signal in the sagittal sinus(1/T1 as a function of time); the decay was fitted by an exponential function with a time constant of 41 min. This value was used to calculate the influx + clearance trace in A. C: MRIrelaxation rate (1/T1) as an estimator of gadobutrol concentration in brain tissue measured at one day after kainic acid-induced status epilepticus in two regions of interest: the piriformcortex and themotor cortex. The constant signal obtained from themotor cortex suggests a negligible BBB leakage in this area. In the piriform cortex, gadobutrol concentration increasedlinearly under the very high gradient during infusion, still increasing for as long as there was a positive gradient and finally (after N80 min) declining back to zero. This implies a low butclear BBB leakage in this region.
76 E.A. van Vliet et al. / Neurobiology of Disease 63 (2014) 74–84
T1-weighted images were subtracted from post-contrast images anddivided by pre-contrast images. A threshold value of 0.2 was shown tobe well above the level observed in any brain region of control rats(excluding the circumventricular organs) and was the minimum levelat which a clear signal was observed in the brain control rats in whichthe blood–brain barrier was artificially opened by i.v. injection ofmannitol (n = 3, 1.5 g/kg i.v., 25% solution, Supplementary Fig. 1).This threshold value was therefore assumed to indicate BBB leakage.
Voxels above threshold were manually delineated by a researcherblinded to group assignments and were projected onto the map. Thetotal number and regional fraction of above threshold voxels and theirmedian value were calculated in all regions of interest.
To quantify the leakage rate of gadobutrol (Gd-leakage rate) into thebrain, the change of T1 was fitted for each voxel over time using a vali-dated Bayesian approach to change point analysis (Carlin et al., 1992).This analysis determines the point in time where T1 changes due to
Table 1Gadobutrol infusion schedule.
Rate (ml/min) Time Volume (ml)
0.340 0–30 s 0.170.265 30–60 s 0.130.195 1–2 min 0.200.140 2–3 min 0.140.110 3–4 min 0.110.095 4–5 min 0.100.085 5–7 min 0.170.070 7–10 min 0.210.060 10–15 min 0.300.050 15–20 min 0.25
77E.A. van Vliet et al. / Neurobiology of Disease 63 (2014) 74–84
the start of the infusion of gadobutrol and the point in time where T1reaches the stable phase of the curve. The rate of gadobutrol leakageinto the brain can then be calculated for each voxel from the slope ofthe curve between these two time points. This Gd-leakage rate wasprojected for each voxel onto T1 maps and the median values werecalculated in all regions of interest. The conventional Patlak approachcould not be used during infusion of 0.2 M gadobutrol in most rats,since the MRI signal in blood saturated and became indistinguishablefrom the noise level.
Confirmation of MRI data
The MRI data was compared with data obtained with the conven-tional tracer fluorescein (FSC; 100 mg/kg i.v., Merck, Darmstadt,Germany) that was injected via the tail vein under isoflurane anesthesia(4 vol.%) in rats thatwere used in theMRI experiment (n = 3). FSCwasinjected sevenweeks after SE induction,which is oneweek after the lastMRI recording. FSC was also injected in three additional non-epilepticrats and in three rats that underwent MRI and were killed one dayafter kainic acid-induced SE (acute phase). Rats were deeply anesthe-tized with pentobarbital (Nembutal, intraperitoneally, 60 mg/kg)2.5 h after tracer injection and perfused through the ascending aortawith 300 ml of 0.37% Na2S solution and 300 ml 4% paraformaldehydein 0.1 M phosphate buffer, pH 7.4. The brains were post-fixed in situovernight at 4 °C, dissected, and cryoprotected in 30% phosphate-buffered sucrose solution, pH 7.4. After the overnight incubationat 4 °C, the brains were frozen in isopentane (−30 °C) and storedat −80 °C until sectioning on a sliding microtome. Whole brains werecut in 40 μm coronal sections and a cresylviolet (Nissl) staining wasperformed.
To detect extravasation of FSC, sections were mounted on slides(SuperFrost Plus, Menzel, Braunschweig, Germany) and coverslippedwithmountingmedium for fluorescence (Vectashield, Vector Laborato-ries, Burlingame, CA, USA) containing DAPI to identify nuclei. FSC wasdetected using a confocal-laser scanning microscope (Zeiss LSM 510;excitation 488 nm, emission 520 nm). Images were made using Zeisssoftware (Zeiss LSM Image Browser). Quantification of FSC on sectionswas performed for the same regions of interest that were used forMRI (hippocampus, entorhinal cortex, piriform cortex, amygdala andthalamus; all limbic brain regions that are thought to be involved inthe generation and/or spread of seizure activity, and in the motorcortex; a non-limbic structure). The confocal grid (271 × 271 μm) waspositioned over the selected brain region and the intensity of the FSCsignal was measured using Adobe Photoshop CS5 (version 12.0).
Statistical analysis
Unless otherwise mentioned, data are reported as mean and stan-dard error of the mean (s.e.m.). Statistical analysis of Gd-leakagemaps, Gd-leakage rate maps and fluorescein data was performedusing the Kruskall–Wallis test followed by a post-hoc Mann–Whitneytest. The Kolmogorov–Smirnov test was used to test whether BBB
leakage within a region of interest was distributed differently fromnormal. Correlation of Gd-leakage with fluorescein leakage was donewith Pearson's correlation analysis. p b 0.05 was always assumed toindicate a significant difference.
Results
Infusion of gadobutrol
Step-down infusion of gadobutrol via the tail vein into the blood-stream (black line in Fig. 1A) raised the gadobutrol level within 20 minas fast as possible almost the maximum level attainable. A simplereservoir model with exponential clearance illustrates the predictedgadobutrol concentration in blood without clearance (Fig. 1A: greyline, influx only) and with clearance (Fig. 1A: dotted line, influx +clearance) during and after the 20 min of infusion, assuming that theraise in brain gadobutrol concentration is small compared to the onein blood. The MRI relaxation rate (1/T1) was used as an estimate ofthe instantaneous gadobutrol concentration. Clearance of gadobutrolfrom the blood was determined from the signal recorded in the sagittalsinus (Fig. 1B), which decay could be fit well with an exponentialfunction with a time constant of 41 min. As an illustration, we give inFig. 1C the dynamics of gadobutrol concentration at one day after kainicacid-induced SE in two regions of interest: the piriform cortex and themotor cortex. In the motor cortex the recorded 1/T1 signal (Fig. 1C:green line) is constant, suggesting a negligible BBB leakage in thisregion. In contrast, the 1/T1 signal and the associated gadobutrolconcentration increased almost linearly in the piriform cortex duringthe 20 minute infusion (Fig. 1C: blue line). Once the blood level ofgadobutrol starts to decay, the increase levels off, but stays positivefor as long as the concentration gradient over the BBB does not reverse.This indicates a small but significant BBB leakage for gadobutrol in thepiriform cortex. It also underscores the fact that there are considerableregional differences in BBB leakage.
T1-weighted MRI (post–pre approach) and fast T1 mapping(dynamic approach)
T1-weighted MRI (post–pre approach, Figs. 2A–C and 3A and B) wasperformed to detect gadobutrol leakage (Gd-leakage) into the brain.Gd-leakage and its spatial leakage extent (defined as a fraction of voxelsin a specific region that showed a significant difference) one day after SEwere larger in the entorhinal cortex, amygdala, piriform cortex, hippo-campus and thalamus than the values determined before SE (compareFigs. 2A with B, 3A and B). Fast T1 mapping (dynamic approach) wasperformed to calculate the Gd-leakage rate (Figs. 5A–C), which at oneday after SEwashigher in the hippocampus, entorhinal cortex, amygdala,piriform cortex and thalamus than before SE (Figs. 3C and 5B).
Gd-leakage and the spatial extent of BBB leakage were lower in thechronic epileptic phase (6 weeks after SE) than at one day after SE inall limbic brain regions (Figs. 2B and 3A), indicating that BBB functionwas restored to some extent. However, compared to the values beforeSE, Gd-leakage was still higher in all analyzed brain regions, exceptthe motor cortex and thalamus, indicating chronic BBB leakage inthose regions (Figs. 2C and 3A). Gd-leakage rate was also lower at sixweeks after SE than one day after SE in all limbic brain regions. Howev-er, especially in the hippocampus and the piriform cortex, Gd-leakagerate in the chronic phase was still higher than before SE (Figs. 3C and5C).
We could not detect a significant difference between the values inthe left and the right hemisphere at any time-point.
We also determined the gadobutrol concentration distributionwithin each defined anatomical structure (Fig. 4). The Kolmogorov–Smirnov test showed that the data were not normally distributed(p b 0.05), suggesting non-uniform BBB leakage within each region.

Fig. 2. Contrast-enhanced T1-weighted MRI during epileptogenesis. To identify brain regions with gadobutrol leakage, pre-contrast T1-weighted images were subtracted frompost-contrast images and divided by pre-contrast images (Gd-leakage maps). No significant gadobutrol enhancement was detected in the brain before SE, except for the ventricles/circumventricular organs, which have an incomplete BBB (A). Gd-leakage increased bilaterally during the acute phase, mainly in ventral brain regions (hippocampus, entorhinal cortex,amygdala, piriform cortex and thalamus) along the whole anterior–posterior axis (B). During the chronic epileptic phase, Gd-leakage was reduced compared to that in one day after SE,but remained elevated bilaterally in the most ventral brain regions (arrows in C) as compared with that before SE. A magnified image of the amygdala/piriform cortex area (whiterectangle) is shown for each time point. The color bar indicates the Gd-leakage value. a = amygdala, e = entorhinal cortex, h = hippocampus, p = piriform cortex.
78 E.A. van Vliet et al. / Neurobiology of Disease 63 (2014) 74–84
Seizure activity and fluorescein leakage
Rats had on average 6 ± 1 (mean ± s.e.m.) seizures/day in the lastweek and the last detected seizure occurred at 17 ± 5 h before ratswere perfused. MRI-based BBB leakage measurements were comparedto post-mortem microscopic assessment of the BBB tracer fluorescein(FSC). FSC could not be detected in limbic brain regions of control rats(Fig. 6A). During the acute phase (one day after SE), an increase inFSC intensity compared to that in controls was observed in the sameregions thatwere identified usingMRI: hippocampus, entorhinal cortex,amygdala, piriform cortex and thalamus (Figs. 6B and 7A). During the
chronic epileptic phase (6 weeks after SE), FSC intensity was not asprominent as at one day after SE (confirming the MRI data), but washigher than in the corresponding regions of controls. Regions were spa-tially defined using the identified T1-weighted MRI: the hippocampus,entorhinal cortex, amygdala and the piriform cortex (Figs. 6C and 7A).Interestingly, extensive neurodegeneration occurred specifically in ven-tral brain regions (amygdala and piriform cortex) where BBB leakagewas detected (Figs. 6B and C). Neurodegeneration could not be detectedin controls (Fig. 6A). Gd-leakagewas correlatedwith FSC intensity at thetwo relevant points in time after SE (Fig. 7B, r = 0.97, p = 0.002,Pearson's correlation analysis).
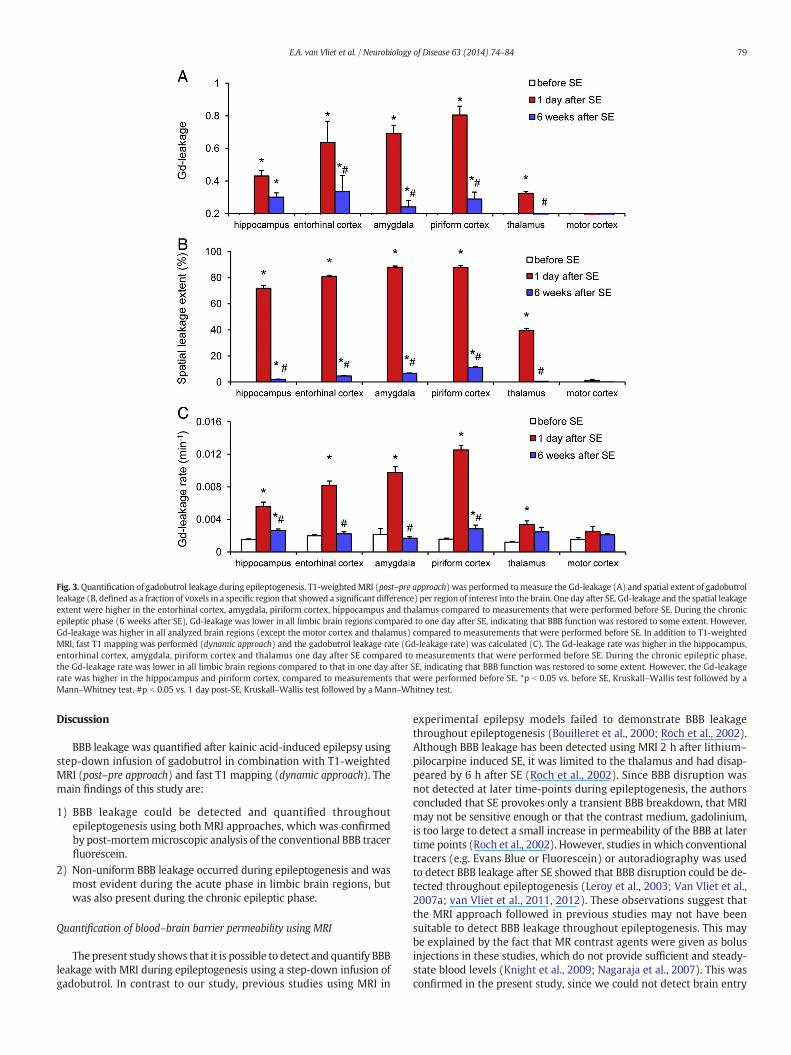
Fig. 3.Quantification of gadobutrol leakage during epileptogenesis. T1-weightedMRI (post–pre approach) was performed to measure the Gd-leakage (A) and spatial extent of gadobutrolleakage (B, defined as a fraction of voxels in a specific region that showed a significant difference) per region of interest into the brain. One day after SE, Gd-leakage and the spatial leakageextent were higher in the entorhinal cortex, amygdala, piriform cortex, hippocampus and thalamus compared to measurements that were performed before SE. During the chronicepileptic phase (6 weeks after SE), Gd-leakage was lower in all limbic brain regions compared to one day after SE, indicating that BBB function was restored to some extent. However,Gd-leakage was higher in all analyzed brain regions (except the motor cortex and thalamus) compared to measurements that were performed before SE. In addition to T1-weightedMRI, fast T1 mapping was performed (dynamic approach) and the gadobutrol leakage rate (Gd-leakage rate) was calculated (C). The Gd-leakage rate was higher in the hippocampus,entorhinal cortex, amygdala, piriform cortex and thalamus one day after SE compared to measurements that were performed before SE. During the chronic epileptic phase,the Gd-leakage rate was lower in all limbic brain regions compared to that in one day after SE, indicating that BBB function was restored to some extent. However, the Gd-leakagerate was higher in the hippocampus and piriform cortex, compared to measurements that were performed before SE. *p b 0.05 vs. before SE, Kruskall–Wallis test followed by aMann–Whitney test. #p b 0.05 vs. 1 day post-SE, Kruskall–Wallis test followed by a Mann–Whitney test.
79E.A. van Vliet et al. / Neurobiology of Disease 63 (2014) 74–84
Discussion
BBB leakage was quantified after kainic acid-induced epilepsy usingstep-down infusion of gadobutrol in combination with T1-weightedMRI (post–pre approach) and fast T1 mapping (dynamic approach). Themain findings of this study are:
1) BBB leakage could be detected and quantified throughoutepileptogenesis using both MRI approaches, which was confirmedby post-mortemmicroscopic analysis of the conventional BBB tracerfluorescein.
2) Non-uniform BBB leakage occurred during epileptogenesis and wasmost evident during the acute phase in limbic brain regions, butwas also present during the chronic epileptic phase.
Quantification of blood–brain barrier permeability using MRI
Thepresent study shows that it is possible to detect and quantify BBBleakage with MRI during epileptogenesis using a step-down infusion ofgadobutrol. In contrast to our study, previous studies using MRI in
experimental epilepsy models failed to demonstrate BBB leakagethroughout epileptogenesis (Bouilleret et al., 2000; Roch et al., 2002).Although BBB leakage has been detected using MRI 2 h after lithium–
pilocarpine induced SE, it was limited to the thalamus and had disap-peared by 6 h after SE (Roch et al., 2002). Since BBB disruption wasnot detected at later time-points during epileptogenesis, the authorsconcluded that SE provokes only a transient BBB breakdown, that MRImay not be sensitive enough or that the contrast medium, gadolinium,is too large to detect a small increase in permeability of the BBB at latertime points (Roch et al., 2002). However, studies in which conventionaltracers (e.g. Evans Blue or Fluorescein) or autoradiography was usedto detect BBB leakage after SE showed that BBB disruption could be de-tected throughout epileptogenesis (Leroy et al., 2003; Van Vliet et al.,2007a; van Vliet et al., 2011, 2012). These observations suggest thatthe MRI approach followed in previous studies may not have beensuitable to detect BBB leakage throughout epileptogenesis. This maybe explained by the fact that MR contrast agents were given as bolusinjections in these studies, which do not provide sufficient and steady-state blood levels (Knight et al., 2009; Nagaraja et al., 2007). This wasconfirmed in the present study, since we could not detect brain entry
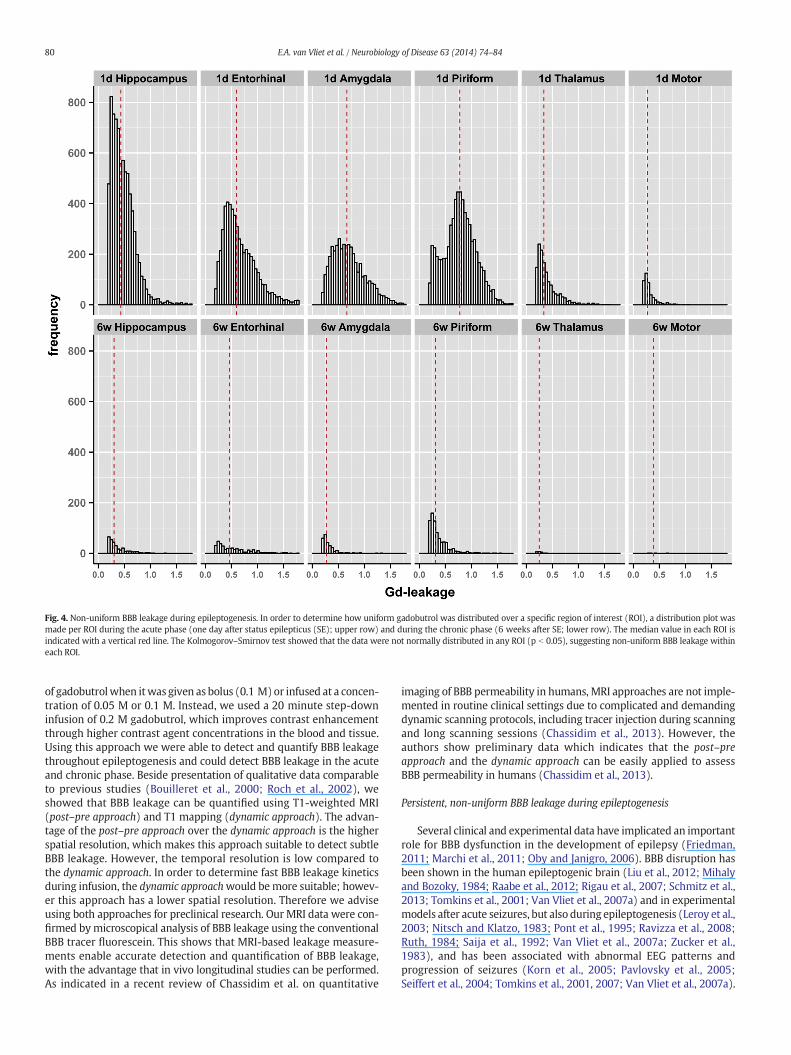
Fig. 4. Non-uniform BBB leakage during epileptogenesis. In order to determine how uniform gadobutrol was distributed over a specific region of interest (ROI), a distribution plot wasmade per ROI during the acute phase (one day after status epilepticus (SE); upper row) and during the chronic phase (6 weeks after SE; lower row). The median value in each ROI isindicated with a vertical red line. The Kolmogorov–Smirnov test showed that the data were not normally distributed in any ROI (p b 0.05), suggesting non-uniform BBB leakage withineach ROI.
80 E.A. van Vliet et al. / Neurobiology of Disease 63 (2014) 74–84
of gadobutrolwhen itwas given as bolus (0.1 M)or infused at a concen-tration of 0.05 M or 0.1 M. Instead, we used a 20 minute step-downinfusion of 0.2 M gadobutrol, which improves contrast enhancementthrough higher contrast agent concentrations in the blood and tissue.Using this approach we were able to detect and quantify BBB leakagethroughout epileptogenesis and could detect BBB leakage in the acuteand chronic phase. Beside presentation of qualitative data comparableto previous studies (Bouilleret et al., 2000; Roch et al., 2002), weshowed that BBB leakage can be quantified using T1-weighted MRI(post–pre approach) and T1 mapping (dynamic approach). The advan-tage of the post–pre approach over the dynamic approach is the higherspatial resolution, which makes this approach suitable to detect subtleBBB leakage. However, the temporal resolution is low compared tothe dynamic approach. In order to determine fast BBB leakage kineticsduring infusion, the dynamic approachwould bemore suitable; howev-er this approach has a lower spatial resolution. Therefore we adviseusing both approaches for preclinical research. Our MRI data were con-firmed bymicroscopical analysis of BBB leakage using the conventionalBBB tracer fluorescein. This shows that MRI-based leakage measure-ments enable accurate detection and quantification of BBB leakage,with the advantage that in vivo longitudinal studies can be performed.As indicated in a recent review of Chassidim et al. on quantitative
imaging of BBB permeability in humans, MRI approaches are not imple-mented in routine clinical settings due to complicated and demandingdynamic scanning protocols, including tracer injection during scanningand long scanning sessions (Chassidim et al., 2013). However, theauthors show preliminary data which indicates that the post–preapproach and the dynamic approach can be easily applied to assessBBB permeability in humans (Chassidim et al., 2013).
Persistent, non-uniform BBB leakage during epileptogenesis
Several clinical and experimental data have implicated an importantrole for BBB dysfunction in the development of epilepsy (Friedman,2011; Marchi et al., 2011; Oby and Janigro, 2006). BBB disruption hasbeen shown in the human epileptogenic brain (Liu et al., 2012; Mihalyand Bozoky, 1984; Raabe et al., 2012; Rigau et al., 2007; Schmitz et al.,2013; Tomkins et al., 2001; Van Vliet et al., 2007a) and in experimentalmodels after acute seizures, but also during epileptogenesis (Leroy et al.,2003; Nitsch and Klatzo, 1983; Pont et al., 1995; Ravizza et al., 2008;Ruth, 1984; Saija et al., 1992; Van Vliet et al., 2007a; Zucker et al.,1983), and has been associated with abnormal EEG patterns andprogression of seizures (Korn et al., 2005; Pavlovsky et al., 2005;Seiffert et al., 2004; Tomkins et al., 2001, 2007; Van Vliet et al., 2007a).
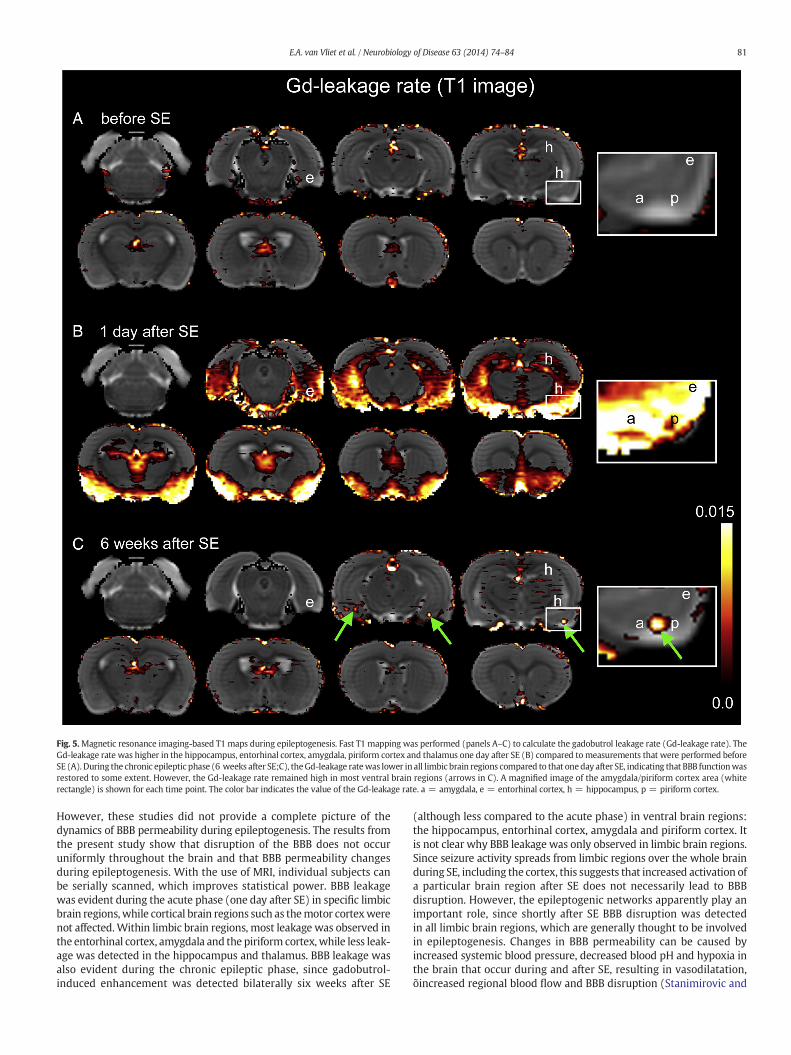
Fig. 5.Magnetic resonance imaging-based T1 maps during epileptogenesis. Fast T1 mapping was performed (panels A–C) to calculate the gadobutrol leakage rate (Gd-leakage rate). TheGd-leakage rate was higher in the hippocampus, entorhinal cortex, amygdala, piriform cortex and thalamus one day after SE (B) compared tomeasurements that were performed beforeSE (A). During the chronic epileptic phase (6 weeks after SE;C), theGd-leakage ratewas lower in all limbic brain regions compared to that oneday after SE, indicating that BBB functionwasrestored to some extent. However, the Gd-leakage rate remained high in most ventral brain regions (arrows in C). A magnified image of the amygdala/piriform cortex area (whiterectangle) is shown for each time point. The color bar indicates the value of the Gd-leakage rate. a = amygdala, e = entorhinal cortex, h = hippocampus, p = piriform cortex.
81E.A. van Vliet et al. / Neurobiology of Disease 63 (2014) 74–84
However, these studies did not provide a complete picture of thedynamics of BBB permeability during epileptogenesis. The results fromthe present study show that disruption of the BBB does not occuruniformly throughout the brain and that BBB permeability changesduring epileptogenesis. With the use of MRI, individual subjects canbe serially scanned, which improves statistical power. BBB leakagewas evident during the acute phase (one day after SE) in specific limbicbrain regions, while cortical brain regions such as themotor cortexwerenot affected.Within limbic brain regions, most leakage was observed inthe entorhinal cortex, amygdala and the piriform cortex, while less leak-age was detected in the hippocampus and thalamus. BBB leakage wasalso evident during the chronic epileptic phase, since gadobutrol-induced enhancement was detected bilaterally six weeks after SE
(although less compared to the acute phase) in ventral brain regions:the hippocampus, entorhinal cortex, amygdala and piriform cortex. Itis not clear why BBB leakage was only observed in limbic brain regions.Since seizure activity spreads from limbic regions over the whole brainduring SE, including the cortex, this suggests that increased activation ofa particular brain region after SE does not necessarily lead to BBBdisruption. However, the epileptogenic networks apparently play animportant role, since shortly after SE BBB disruption was detectedin all limbic brain regions, which are generally thought to be involvedin epileptogenesis. Changes in BBB permeability can be caused byincreased systemic blood pressure, decreased blood pH and hypoxia inthe brain that occur during and after SE, resulting in vasodilatation,õincreased regional blood flow and BBB disruption (Stanimirovic and
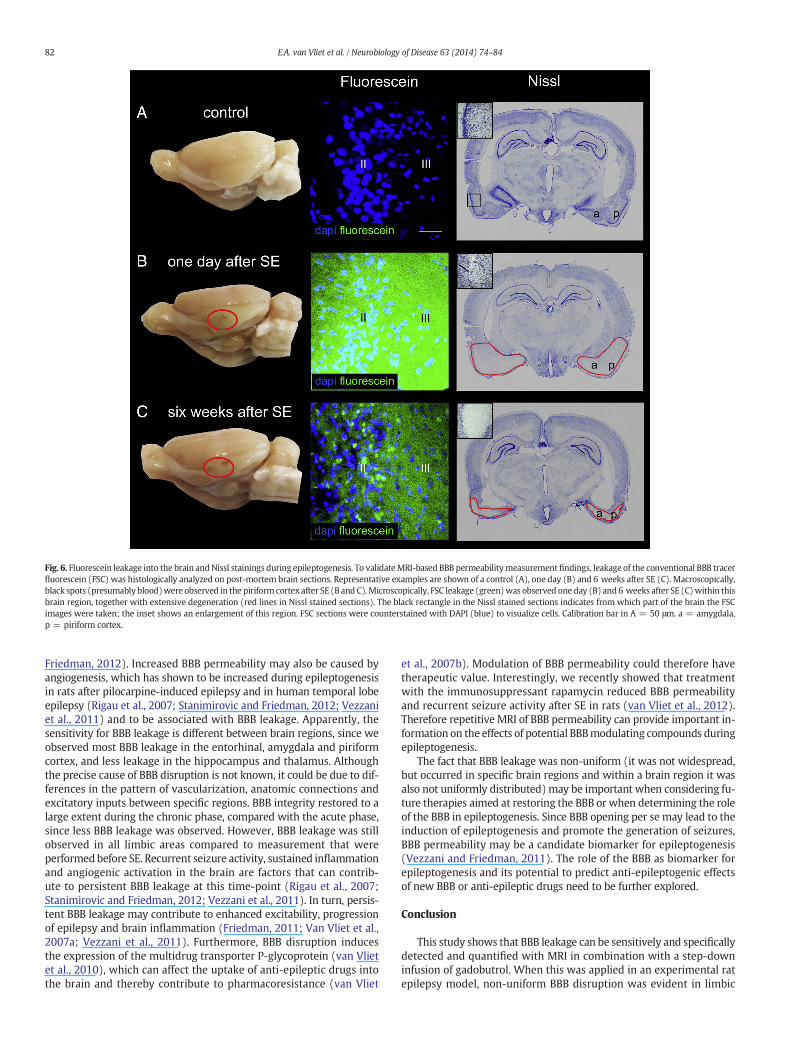
Fig. 6. Fluorescein leakage into the brain andNissl stainings during epileptogenesis. To validateMRI-based BBB permeabilitymeasurementfindings, leakage of the conventional BBB tracerfluorescein (FSC) was histologically analyzed on post-mortem brain sections. Representative examples are shown of a control (A), one day (B) and 6 weeks after SE (C). Macroscopically,black spots (presumably blood)were observed in the piriform cortex after SE (B and C).Microscopically, FSC leakage (green)was observed one day (B) and 6 weeks after SE (C)within thisbrain region, together with extensive degeneration (red lines in Nissl stained sections). The black rectangle in the Nissl stained sections indicates from which part of the brain the FSCimages were taken; the inset shows an enlargement of this region. FSC sections were counterstained with DAPI (blue) to visualize cells. Calibration bar in A = 50 μm. a = amygdala,p = piriform cortex.
82 E.A. van Vliet et al. / Neurobiology of Disease 63 (2014) 74–84
Friedman, 2012). Increased BBB permeability may also be caused byangiogenesis, which has shown to be increased during epileptogenesisin rats after pilocarpine-induced epilepsy and in human temporal lobeepilepsy (Rigau et al., 2007; Stanimirovic and Friedman, 2012; Vezzaniet al., 2011) and to be associated with BBB leakage. Apparently, thesensitivity for BBB leakage is different between brain regions, since weobserved most BBB leakage in the entorhinal, amygdala and piriformcortex, and less leakage in the hippocampus and thalamus. Althoughthe precise cause of BBB disruption is not known, it could be due to dif-ferences in the pattern of vascularization, anatomic connections andexcitatory inputs between specific regions. BBB integrity restored to alarge extent during the chronic phase, compared with the acute phase,since less BBB leakage was observed. However, BBB leakage was stillobserved in all limbic areas compared to measurement that wereperformedbefore SE. Recurrent seizure activity, sustained inflammationand angiogenic activation in the brain are factors that can contrib-ute to persistent BBB leakage at this time-point (Rigau et al., 2007;Stanimirovic and Friedman, 2012; Vezzani et al., 2011). In turn, persis-tent BBB leakage may contribute to enhanced excitability, progressionof epilepsy and brain inflammation (Friedman, 2011; Van Vliet et al.,2007a; Vezzani et al., 2011). Furthermore, BBB disruption inducesthe expression of the multidrug transporter P-glycoprotein (van Vlietet al., 2010), which can affect the uptake of anti-epileptic drugs intothe brain and thereby contribute to pharmacoresistance (van Vliet
et al., 2007b). Modulation of BBB permeability could therefore havetherapeutic value. Interestingly, we recently showed that treatmentwith the immunosuppressant rapamycin reduced BBB permeabilityand recurrent seizure activity after SE in rats (van Vliet et al., 2012).Therefore repetitive MRI of BBB permeability can provide important in-formation on the effects of potential BBBmodulating compounds duringepileptogenesis.
The fact that BBB leakage was non-uniform (it was not widespread,but occurred in specific brain regions and within a brain region it wasalso not uniformly distributed)may be important when considering fu-ture therapies aimed at restoring the BBB or when determining the roleof the BBB in epileptogenesis. Since BBB opening per se may lead to theinduction of epileptogenesis and promote the generation of seizures,BBB permeability may be a candidate biomarker for epileptogenesis(Vezzani and Friedman, 2011). The role of the BBB as biomarker forepileptogenesis and its potential to predict anti-epileptogenic effectsof new BBB or anti-epileptic drugs need to be further explored.
Conclusion
This study shows that BBB leakage can be sensitively and specificallydetected and quantified with MRI in combination with a step-downinfusion of gadobutrol. When this was applied in an experimental ratepilepsy model, non-uniform BBB disruption was evident in limbic
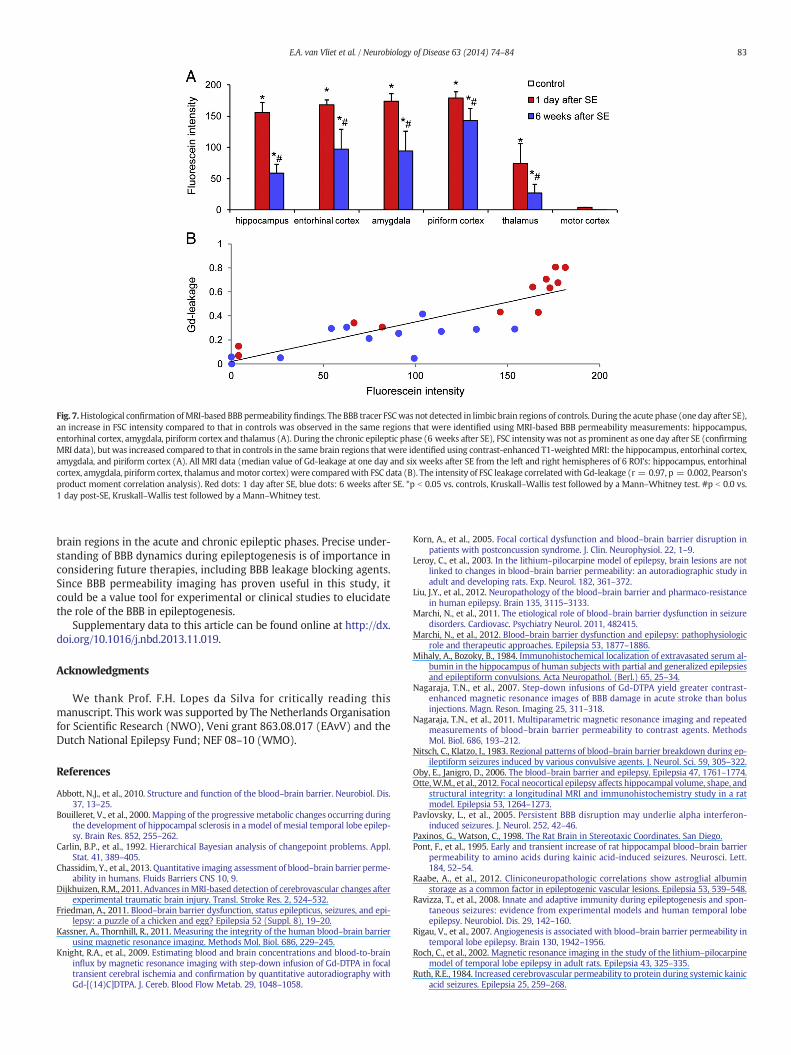
Fig. 7.Histological confirmation ofMRI-based BBB permeability findings. The BBB tracer FSCwas not detected in limbic brain regions of controls. During the acute phase (one day after SE),an increase in FSC intensity compared to that in controls was observed in the same regions that were identified using MRI-based BBB permeability measurements: hippocampus,entorhinal cortex, amygdala, piriform cortex and thalamus (A). During the chronic epileptic phase (6 weeks after SE), FSC intensity was not as prominent as one day after SE (confirmingMRI data), but was increased compared to that in controls in the same brain regions that were identified using contrast-enhanced T1-weighted MRI: the hippocampus, entorhinal cortex,amygdala, and piriform cortex (A). All MRI data (median value of Gd-leakage at one day and six weeks after SE from the left and right hemispheres of 6 ROI's: hippocampus, entorhinalcortex, amygdala, piriform cortex, thalamus andmotor cortex) were comparedwith FSC data (B). The intensity of FSC leakage correlatedwith Gd-leakage (r = 0.97, p = 0.002, Pearson'sproduct moment correlation analysis). Red dots: 1 day after SE, blue dots: 6 weeks after SE. *p b 0.05 vs. controls, Kruskall–Wallis test followed by a Mann–Whitney test. #p b 0.0 vs.1 day post-SE, Kruskall–Wallis test followed by a Mann–Whitney test.
83E.A. van Vliet et al. / Neurobiology of Disease 63 (2014) 74–84
brain regions in the acute and chronic epileptic phases. Precise under-standing of BBB dynamics during epileptogenesis is of importance inconsidering future therapies, including BBB leakage blocking agents.Since BBB permeability imaging has proven useful in this study, itcould be a value tool for experimental or clinical studies to elucidatethe role of the BBB in epileptogenesis.
Supplementary data to this article can be found online at http://dx.doi.org/10.1016/j.nbd.2013.11.019.
Acknowledgments
We thank Prof. F.H. Lopes da Silva for critically reading thismanuscript. This work was supported by The Netherlands Organisationfor Scientific Research (NWO), Veni grant 863.08.017 (EAvV) and theDutch National Epilepsy Fund; NEF 08–10 (WMO).
References
Abbott, N.J., et al., 2010. Structure and function of the blood–brain barrier. Neurobiol. Dis.37, 13–25.
Bouilleret, V., et al., 2000. Mapping of the progressive metabolic changes occurring duringthe development of hippocampal sclerosis in a model of mesial temporal lobe epilep-sy. Brain Res. 852, 255–262.
Carlin, B.P., et al., 1992. Hierarchical Bayesian analysis of changepoint problems. Appl.Stat. 41, 389–405.
Chassidim, Y., et al., 2013. Quantitative imaging assessment of blood–brain barrier perme-ability in humans. Fluids Barriers CNS 10, 9.
Dijkhuizen, R.M., 2011. Advances inMRI-based detection of cerebrovascular changes afterexperimental traumatic brain injury. Transl. Stroke Res. 2, 524–532.
Friedman, A., 2011. Blood–brain barrier dysfunction, status epilepticus, seizures, and epi-lepsy: a puzzle of a chicken and egg? Epilepsia 52 (Suppl. 8), 19–20.
Kassner, A., Thornhill, R., 2011. Measuring the integrity of the human blood–brain barrierusing magnetic resonance imaging. Methods Mol. Biol. 686, 229–245.
Knight, R.A., et al., 2009. Estimating blood and brain concentrations and blood-to-braininflux by magnetic resonance imaging with step-down infusion of Gd-DTPA in focaltransient cerebral ischemia and confirmation by quantitative autoradiography withGd-[(14)C]DTPA. J. Cereb. Blood Flow Metab. 29, 1048–1058.
Korn, A., et al., 2005. Focal cortical dysfunction and blood–brain barrier disruption inpatients with postconcussion syndrome. J. Clin. Neurophysiol. 22, 1–9.
Leroy, C., et al., 2003. In the lithium–pilocarpine model of epilepsy, brain lesions are notlinked to changes in blood–brain barrier permeability: an autoradiographic study inadult and developing rats. Exp. Neurol. 182, 361–372.
Liu, J.Y., et al., 2012. Neuropathology of the blood–brain barrier and pharmaco-resistancein human epilepsy. Brain 135, 3115–3133.
Marchi, N., et al., 2011. The etiological role of blood–brain barrier dysfunction in seizuredisorders. Cardiovasc. Psychiatry Neurol. 2011, 482415.
Marchi, N., et al., 2012. Blood–brain barrier dysfunction and epilepsy: pathophysiologicrole and therapeutic approaches. Epilepsia 53, 1877–1886.
Mihaly, A., Bozoky, B., 1984. Immunohistochemical localization of extravasated serum al-bumin in the hippocampus of human subjects with partial and generalized epilepsiesand epileptiform convulsions. Acta Neuropathol. (Berl.) 65, 25–34.
Nagaraja, T.N., et al., 2007. Step-down infusions of Gd-DTPA yield greater contrast-enhanced magnetic resonance images of BBB damage in acute stroke than bolusinjections. Magn. Reson. Imaging 25, 311–318.
Nagaraja, T.N., et al., 2011. Multiparametric magnetic resonance imaging and repeatedmeasurements of blood–brain barrier permeability to contrast agents. MethodsMol. Biol. 686, 193–212.
Nitsch, C., Klatzo, I., 1983. Regional patterns of blood–brain barrier breakdown during ep-ileptiform seizures induced by various convulsive agents. J. Neurol. Sci. 59, 305–322.
Oby, E., Janigro, D., 2006. The blood–brain barrier and epilepsy. Epilepsia 47, 1761–1774.Otte,W.M., et al., 2012. Focal neocortical epilepsy affects hippocampal volume, shape, and
structural integrity: a longitudinal MRI and immunohistochemistry study in a ratmodel. Epilepsia 53, 1264–1273.
Pavlovsky, L., et al., 2005. Persistent BBB disruption may underlie alpha interferon-induced seizures. J. Neurol. 252, 42–46.
Paxinos, G., Watson, C., 1998. The Rat Brain in Stereotaxic Coordinates. San Diego.Pont, F., et al., 1995. Early and transient increase of rat hippocampal blood–brain barrier
permeability to amino acids during kainic acid-induced seizures. Neurosci. Lett.184, 52–54.
Raabe, A., et al., 2012. Cliniconeuropathologic correlations show astroglial albuminstorage as a common factor in epileptogenic vascular lesions. Epilepsia 53, 539–548.
Ravizza, T., et al., 2008. Innate and adaptive immunity during epileptogenesis and spon-taneous seizures: evidence from experimental models and human temporal lobeepilepsy. Neurobiol. Dis. 29, 142–160.
Rigau, V., et al., 2007. Angiogenesis is associated with blood–brain barrier permeability intemporal lobe epilepsy. Brain 130, 1942–1956.
Roch, C., et al., 2002. Magnetic resonance imaging in the study of the lithium–pilocarpinemodel of temporal lobe epilepsy in adult rats. Epilepsia 43, 325–335.
Ruth, R.E., 1984. Increased cerebrovascular permeability to protein during systemic kainicacid seizures. Epilepsia 25, 259–268.

84 E.A. van Vliet et al. / Neurobiology of Disease 63 (2014) 74–84
Saija, A., et al., 1992. Blood–brain barrier dysfunctions following systemic injection ofkainic acid in the rat. Life Sci. 51, 467–477.
Schmitz, A.K., et al., 2013. Albumin storage in neoplastic astroglial elements ofgangliogliomas. Seizure 22, 144–150.
Seiffert, E., et al., 2004. Lasting blood–brain barrier disruption induces epileptic focus inthe rat somatosensory cortex. J. Neurosci. 24, 7829–7836.
Stanimirovic, D.B., Friedman, A., 2012. Pathophysiology of the neurovascular unit: diseasecause or consequence? J. Cereb. Blood Flow Metab. 32, 1207–1221.
Tomkins, O., et al., 2001. Frequent blood–brain barrier disruption in the human cerebralcortex. Cell. Mol. Neurobiol. 21, 675–691.
Tomkins, O., et al., 2007. Blood–brain barrier disruption results in delayed functional andstructural alterations in the rat neocortex. Neurobiol. Dis. 25, 367–377.
van Meer, M.P., et al., 2012. Extent of bilateral neuronal network reorganization andfunctional recovery in relation to stroke severity. J. Neurosci. 32, 4495–4507.
Van Vliet, E.A., et al., 2007a. Blood–brain barrier leakage may lead to progression oftemporal lobe epilepsy. Brain 130, 521–534.
van Vliet, E.A., et al., 2007b. Region specific overexpression of P-glycoprotein at theblood–brain barrier affects brain uptake of phenytoin in epileptic rats. J. Pharmacol.Exp. Ther. 322, 141–147.
van Vliet, E.A., et al., 2010. COX-2 inhibition controls P-glycoprotein expression andpromotes brain delivery of phenytoin in chronic epileptic rats. Neuropharmacology58, 404–412.
van Vliet, E.A., et al., 2011. Atorvastatin treatment during epileptogenesis in a rat modelfor temporal lobe epilepsy. Epilepsia 52, 1319–1330.
van Vliet, E.A., et al., 2012. Inhibition of mammalian target of rapamycin reducesepileptogenesis and blood–brain barrier leakage but not microglia activation.Epilepsia 53, 1254–1263.
Vezzani, A., Friedman, A., 2011. Brain inflammation as a biomarker in epilepsy. Biomark.Med 5, 607–614.
Vezzani, A., et al., 2011. The role of inflammation in epilepsy. Nat. Rev. Neurol. 7, 31–40.Zucker, D.K., et al., 1983. Blood–brain barrier changes with kainic acid-induced limbic
seizures. Exp. Neurol. 79, 422–433.


