Embed Size (px)
Citation preview
1
The changing nature of central London office demand
London: Where we work


06
14
18
22
How is London’s office employment base changing?
The changing nature of office demand
Occupational Costs
Central London’s Submarkets
CONTENTS

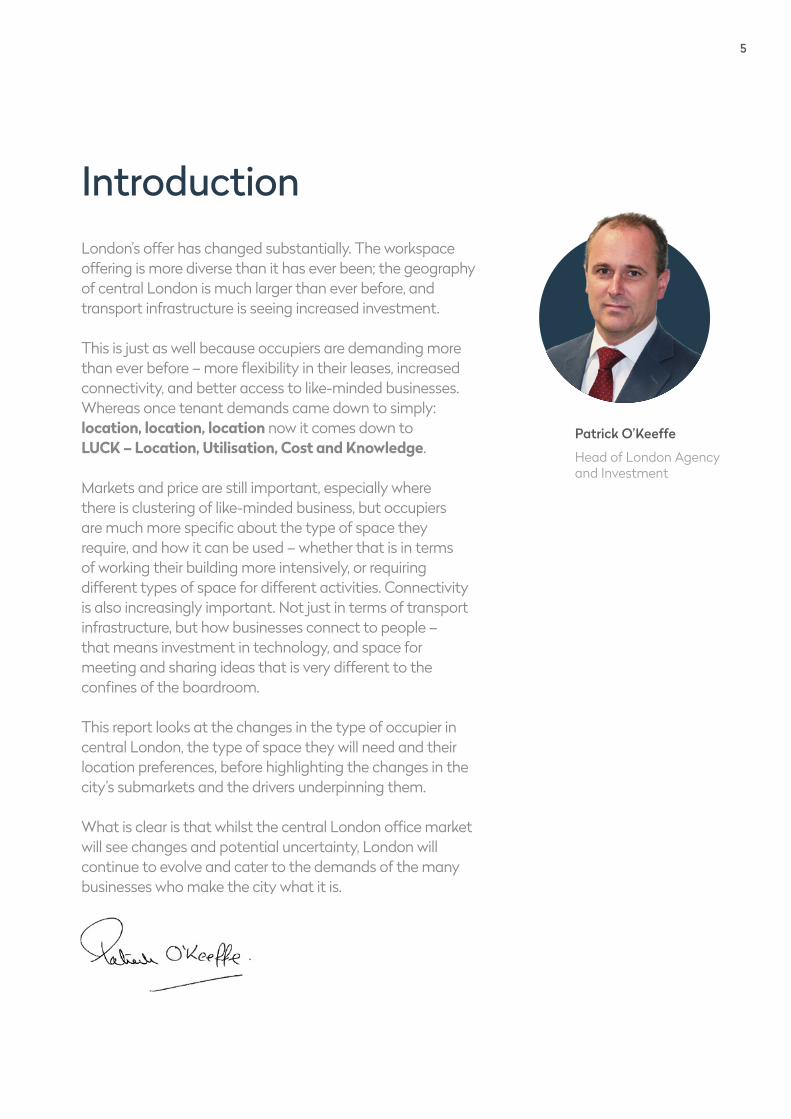
London’s offer has changed substantially. The workspace offering is more diverse than it has ever been; the geography of central London is much larger than ever before, and transport infrastructure is seeing increased investment. This is just as well because occupiers are demanding more than ever before – more flexibility in their leases, increased connectivity, and better access to like-minded businesses. Whereas once tenant demands came down to simply: location, location, location now it comes down to LUCK – Location, Utilisation, Cost and Knowledge. Markets and price are still important, especially where there is clustering of like-minded business, but occupiers are much more specific about the type of space they require, and how it can be used – whether that is in terms of working their building more intensively, or requiring different types of space for different activities. Connectivity is also increasingly important. Not just in terms of transport infrastructure, but how businesses connect to people – that means investment in technology, and space for meeting and sharing ideas that is very different to the confines of the boardroom. This report looks at the changes in the type of occupier in central London, the type of space they will need and their location preferences, before highlighting the changes in the city’s submarkets and the drivers underpinning them. What is clear is that whilst the central London office market will see changes and potential uncertainty, London will continue to evolve and cater to the demands of the many businesses who make the city what it is.
Introduction
5
Patrick O’Keeffe
Head of London Agency and Investment
6
In this section – The rise and rise of London
– London’s growing office employment
– The supply challenge
– Potential impacts of Brexit
HOW IS LONDON’S OFFICE EMPLOYMENT BASE CHANGING?
PART 1
77
How is London’s office employment base changing?
The rise and rise of London
London has been undergoing a period of rapid growth and change over the last decade. Its population has grown by circa 16%, twice the national average, and an addition of 1.2 million people.
Significantly, London’s growth is also focused on those people below retirement age, unlike the national trend. The average Londoner is aged 34, five years younger than the rest of the country. The South East and East, from which London draws considerable workforce has also seen significant population growth of 9% during the last ten years.
This population growth reflects London’s economic success. In the last decade, London’s economy grew by 33%. In comparison, the UK as a whole grew by just 12% in the same time period.
London’s growth is set to continue, with 820,000 more people expected to be living in the capital in eight years’ time. Of course, this will depend on London’s continued economic success.
London’s economy has faced many changes and challenges over the years, including the ‘Big Bang’ in 1986, Britain’s departure from the ERM in 1992, and the financial crisis of the late 2000s.
London has challenges, with cost and connectivity significant concerns. Furthermore, Brexit will present its own challenges. However, London is a global powerhouse, due to its geographical position; its political, legal and financial transparency, and its historic position as a centre of culture, trade and economic activity. These characteristics make it one of the most attractive and competitive business locations in the world, and it will continue to evolve.
As London’s employment base grows and changes, so do the locations that provide its office space, with the emergence of new office areas to cater for growth, and shifts in the nature of existing markets.
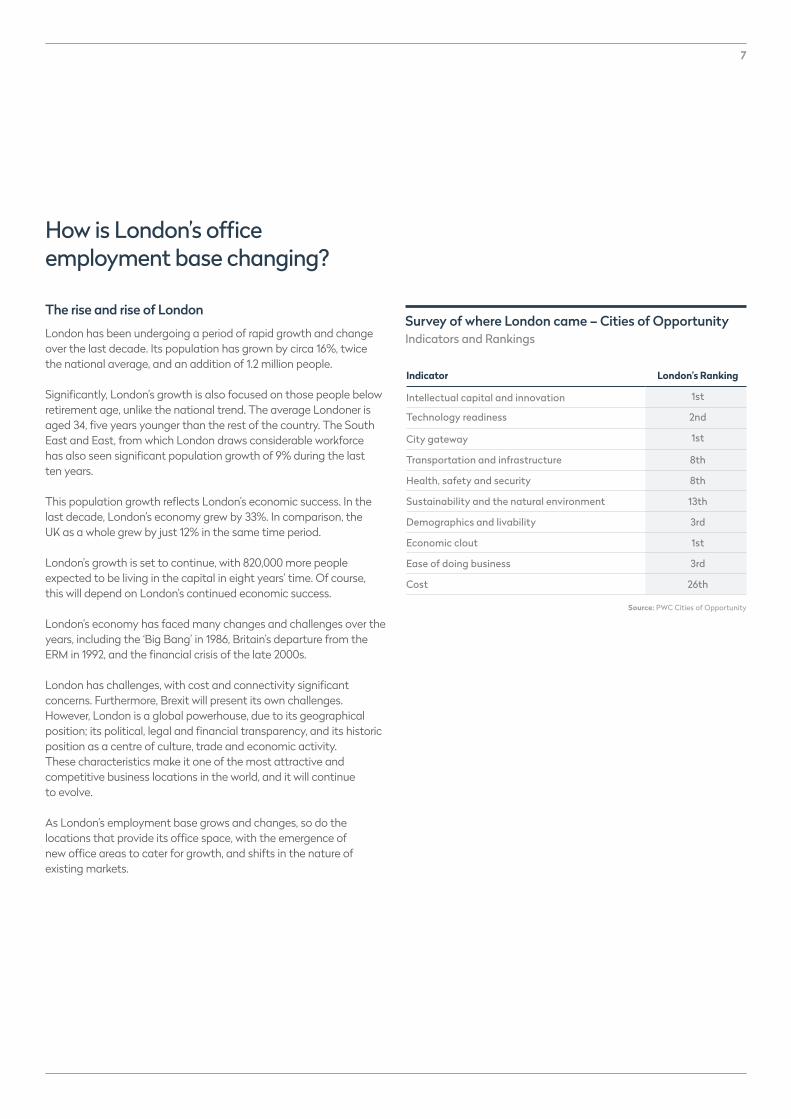
Indicator London’s Ranking
Intellectual capital and innovation 1st
Technology readiness 2nd
City gateway 1st
Transportation and infrastructure 8th
Health, safety and security 8th
Sustainability and the natural environment 13th
Demographics and livability 3rd
Economic clout 1st
Ease of doing business 3rd
Cost 26th
Survey of where London came – Cities of OpportunityIndicators and Rankings
Source: PWC Cities of Opportunity
8
London’s growing office employment
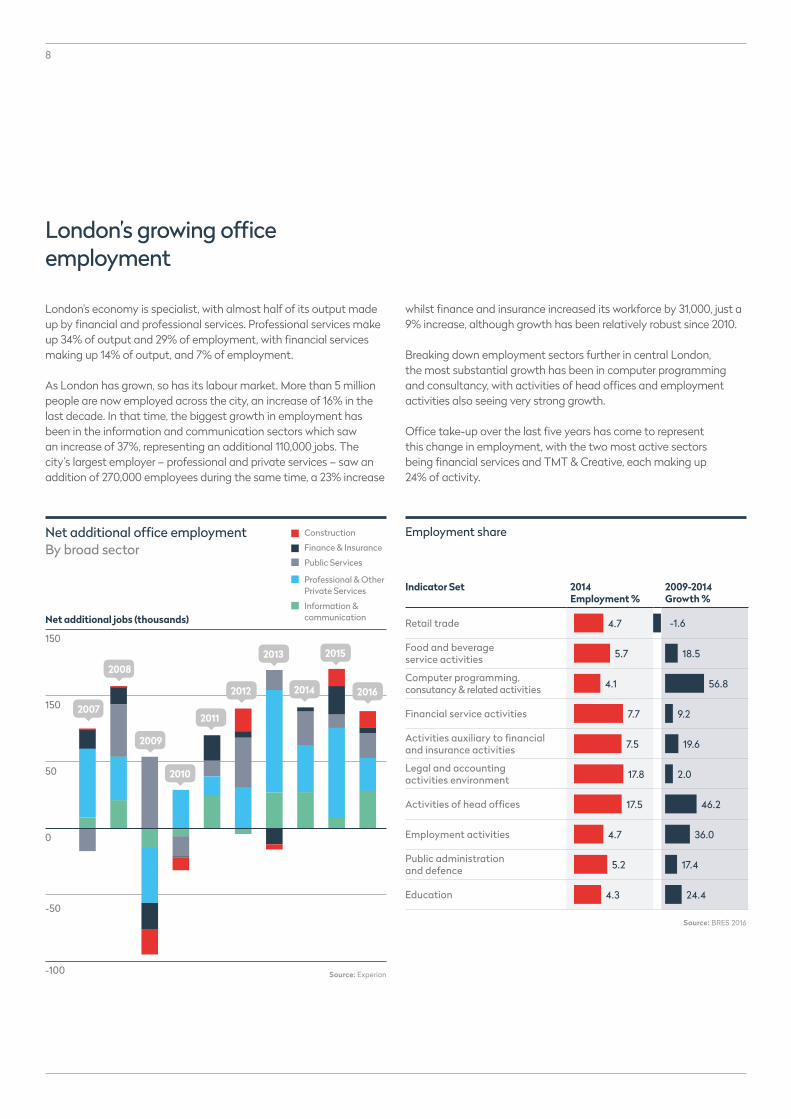
London’s economy is specialist, with almost half of its output made up by financial and professional services. Professional services make up 34% of output and 29% of employment, with financial services making up 14% of output, and 7% of employment.
As London has grown, so has its labour market. More than 5 million people are now employed across the city, an increase of 16% in the last decade. In that time, the biggest growth in employment has been in the information and communication sectors which saw an increase of 37%, representing an additional 110,000 jobs. The city’s largest employer – professional and private services – saw an addition of 270,000 employees during the same time, a 23% increase
Net additional jobs (thousands)
150
150
50
0
-50
-100
2007
2008
2009
2010
2011
2012
2013
2014
2015
2016
Construction
Finance & Insurance
Professional & Other Private Services
Information & communication
Public Services
Net additional office employment By broad sector
whilst finance and insurance increased its workforce by 31,000, just a 9% increase, although growth has been relatively robust since 2010.
Breaking down employment sectors further in central London, the most substantial growth has been in computer programming and consultancy, with activities of head offices and employment activities also seeing very strong growth.
Office take-up over the last five years has come to represent this change in employment, with the two most active sectors being financial services and TMT & Creative, each making up 24% of activity.
Indicator Set 2014 Employment %
2009-2014 Growth %
Retail trade 4.7 -1.6
Food and beverage service activities 5.7 18.5
Computer programming, consutancy & related activities 4.1 56.8
Financial service activities 7.7 9.2
Activities auxiliary to financial and insurance activities 7.5 19.6
Legal and accounting activities environment 17.8 2.0
Activities of head offices 17.5 46.2
Employment activities 4.7 36.0
Public administration and defence 5.2 17.4
Education 4.3 24.4
Employment share
Source: BRES 2016
Source: Experian

9
Central London office take-up 2012-2016By sector
Source: GVA
Business Services
Consumer Services
Financial Services
Public Sector
Manufacturing & Industry
Professional Services
TMT & Creative
Undisclosed
7%7%
24%
6%4%18%
24%
11%
London is an important corporate headquarters location. According to Deloitte, it is home to 40% of the European Headquarters of world’s top companies, with 60% of non-European companies with presence in Europe choosing London as their base. This continues to be a growth area, with the number of head offices in London increasing by 36% since 2010. This can be seen in the increase in jobs relating to activities of head offices.
HQ location of Fortune 250 companies with global or European HQ in Europe
Source: Deloitte
London
Paris
Madrid
Amsterdam
Brussels
Luxembourg
Moscow
Geneva
Other European cities
0% 5% 15% 30%10% 25%20% 35% 40% 45%
% of HQs
10
The supply challenge
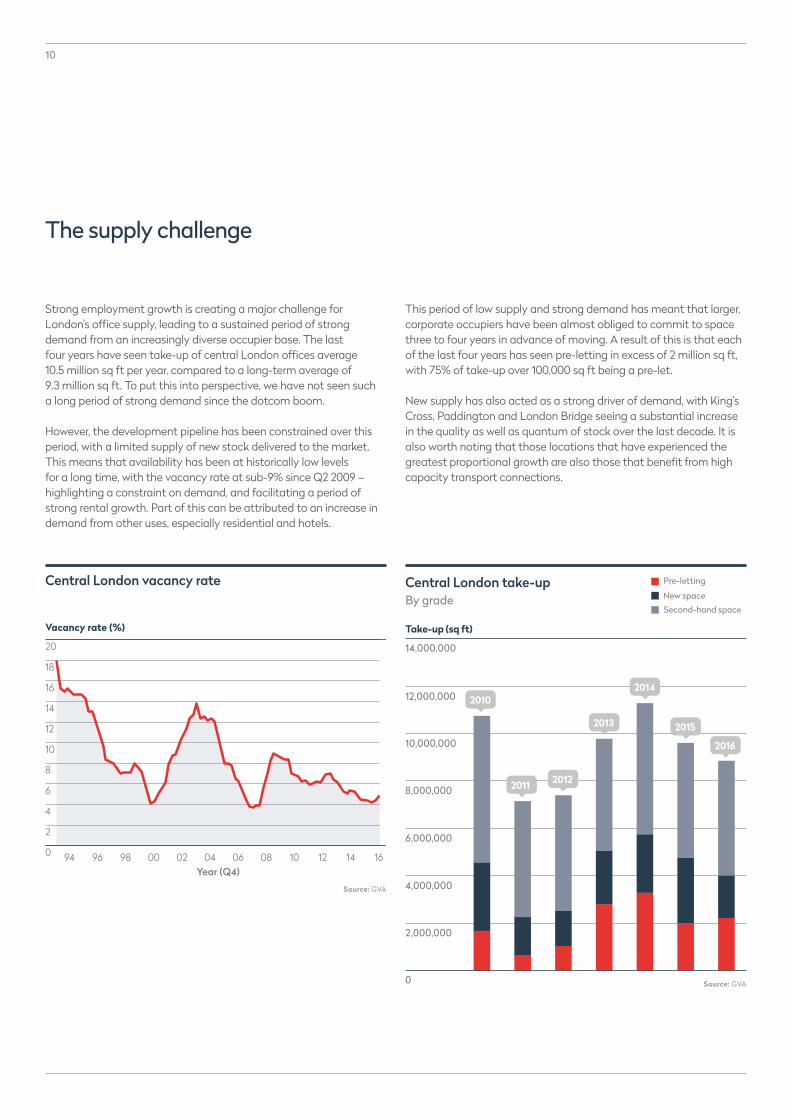
Strong employment growth is creating a major challenge for London’s office supply, leading to a sustained period of strong demand from an increasingly diverse occupier base. The last four years have seen take-up of central London offices average 10.5 million sq ft per year, compared to a long-term average of 9.3 million sq ft. To put this into perspective, we have not seen such a long period of strong demand since the dotcom boom.
However, the development pipeline has been constrained over this period, with a limited supply of new stock delivered to the market. This means that availability has been at historically low levels for a long time, with the vacancy rate at sub-9% since Q2 2009 – highlighting a constraint on demand, and facilitating a period of strong rental growth. Part of this can be attributed to an increase in demand from other uses, especially residential and hotels.
20
18
16
14
12
10
8
6
4
2
0
Vacancy rate (%)
94 96 98 00 02 04Year (Q4)
06 08 10 12 14 16
This period of low supply and strong demand has meant that larger, corporate occupiers have been almost obliged to commit to space three to four years in advance of moving. A result of this is that each of the last four years has seen pre-letting in excess of 2 million sq ft, with 75% of take-up over 100,000 sq ft being a pre-let.
New supply has also acted as a strong driver of demand, with King’s Cross, Paddington and London Bridge seeing a substantial increase in the quality as well as quantum of stock over the last decade. It is also worth noting that those locations that have experienced the greatest proportional growth are also those that benefit from high capacity transport connections.
Take-up (sq ft)
14,000,000
12,000,000
10,000,000
8,000,000
6,000,000
4,000,000
2,000,000
0
Pre-letting
New space Second-hand space
Central London take-upBy grade
2010
2011 2012
2013
2014
2015
2016
Central London vacancy rate
Source: GVA
Source: GVA
11
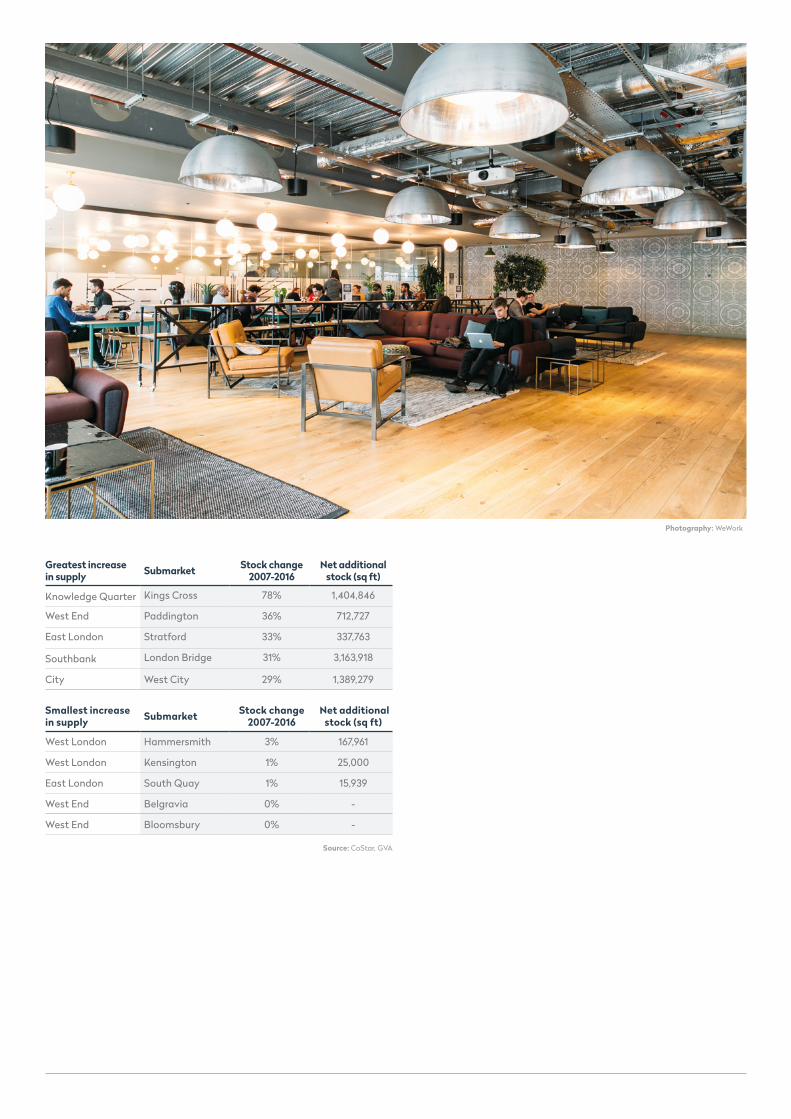
Greatest increase in supply Submarket Stock change
2007-2016Net additional
stock (sq ft)
Knowledge Quarter Kings Cross 78% 1,404,846
West End Paddington 36% 712,727
East London Stratford 33% 337,763
Southbank London Bridge 31% 3,163,918
City West City 29% 1,389,279
Smallest increase in supply Submarket Stock change
2007-2016 Net additional
stock (sq ft)
West London Hammersmith 3% 167,961
West London Kensington 1% 25,000
East London South Quay 1% 15,939
West End Belgravia 0% -
West End Bloomsbury 0% -
Source: CoStar, GVA
Photography: WeWork

12
Potential impacts of Brexit
As has been well documented since June, the EU is based on four principles, namely free movement of: goods, services, capital and people. Once the UK leaves the EU, the loss of these freedoms will almost certainly change the way overseas businesses perceive London. To what extent this impacts business decisions remains to be seen.
The EU passport is a legal mechanism introduced in 1995 that permits financial services companies based and regulated in one country of the EU to do business in other member states purely on the basis of their home state authorisation. There are 5,500 British registered companies who use this law to do business in the EU, with 8,000 European businesses doing business in the UK.
It is likely that once the UK leaves the single market, it will no longer have access to these passporting rights. London is currently the key financial centre in Europe, with foreign exchange and derivatives key specialisations. No other European city has comparable infrastructure.
There has been plenty of rhetoric from the banking industry in particular, of leaving London. Fortune estimated that 40,000 jobs could leave London and a poll conducted by PWC, released in December 2016 of 664 professionals from 400 asset management firms found that 70% think the loss of passporting rights will negatively affect their business, with 85% deeming it necessary to relocate at least part of their business.
So far there has been little evidence of banks looking to sub-let large amounts of space, or of slowing construction on their new headquarters in the case of Goldman Sachs. Many large occupiers are likely to have long term leases, with HSBC telling a parliamentary sub-committee that it would take three years to relocate staff, should the situation arise
It is worth pointing out that many banks already have offices in the Eurozone. It is feasible that a bank could continue to trade in London, with the ability to book trades in an EU member state, via a small number of Compliance and IT staff. Although this might be relatively inefficient due to regulation and liquidity.
Another potential solution could be equivalence. Equivalence is a legal concept which has emerged over the last 30 years to facilitate cross border trading between markets that choose to recognise another’s standards. However, some but not all EU financial institutions accept the principle of equivalence, and there is no provision for commercial banking or insurance.
A more significant issue could be the supply of a skilled workforce. Access to talented staff is critical to the success of London, which sometimes means recruiting overseas. The political pressure to cut immigration is high, and this is a key risk that could negatively affect one of London’s greatest strengths.
The annual population survey highlights the industries likely to be most at risk by any reduction in overseas recruitment, with construction, admin and support service activities and financial and insurance activities all seeing employment from those born in the European Economic Area, although it is worth noting however that many industries are more reliant on those from non-European countries.
Jobs by industry in London by country of birth
Born in the UK or British Overseas Territory
Born elsewhere in the EEA (excluding UK)
Born in any other country (excluding UK and EEA)
Total in all industries
Accomodation and food services
Administrative and support service
Construction
Manufacturing
Education
Information and communication
Financial and insurance activities
Primary and utilities
Real estate
Professional, scientific and technical
Arts, entertainment and recreation
Public administration and defence
Source: Annual Population Survey 2015
0% 100%50% 75%25%% of jobs
13
14
In this section – New technology and the way we work
– Open workspaces
– Infrastructure
THE CHANGING NATURE OF OFFICE DEMAND
PART 2
15
The changing nature of office demand
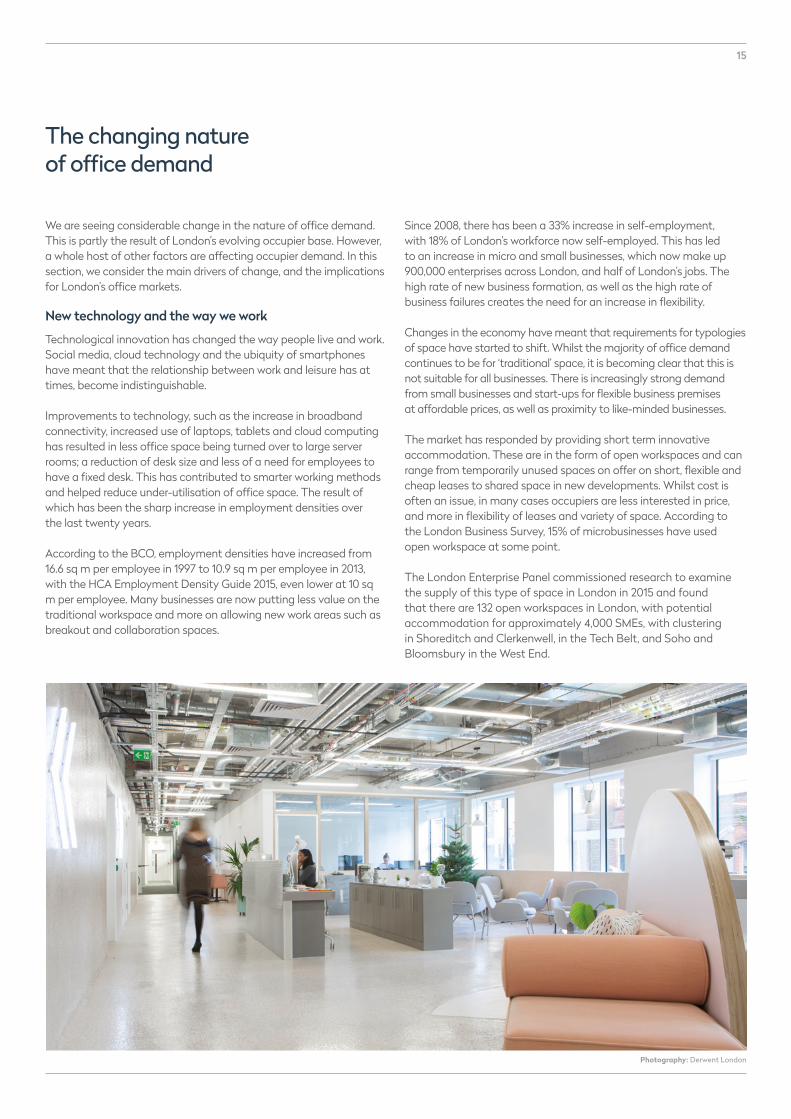
We are seeing considerable change in the nature of office demand. This is partly the result of London’s evolving occupier base. However, a whole host of other factors are affecting occupier demand. In this section, we consider the main drivers of change, and the implications for London’s office markets.
New technology and the way we work
Technological innovation has changed the way people live and work. Social media, cloud technology and the ubiquity of smartphones have meant that the relationship between work and leisure has at times, become indistinguishable.
Improvements to technology, such as the increase in broadband connectivity, increased use of laptops, tablets and cloud computing has resulted in less office space being turned over to large server rooms; a reduction of desk size and less of a need for employees to have a fixed desk. This has contributed to smarter working methods and helped reduce under-utilisation of office space. The result of which has been the sharp increase in employment densities over the last twenty years.
According to the BCO, employment densities have increased from 16.6 sq m per employee in 1997 to 10.9 sq m per employee in 2013, with the HCA Employment Density Guide 2015, even lower at 10 sq m per employee. Many businesses are now putting less value on the traditional workspace and more on allowing new work areas such as breakout and collaboration spaces.
Since 2008, there has been a 33% increase in self-employment, with 18% of London’s workforce now self-employed. This has led to an increase in micro and small businesses, which now make up 900,000 enterprises across London, and half of London’s jobs. The high rate of new business formation, as well as the high rate of business failures creates the need for an increase in flexibility.
Changes in the economy have meant that requirements for typologies of space have started to shift. Whilst the majority of office demand continues to be for ‘traditional’ space, it is becoming clear that this is not suitable for all businesses. There is increasingly strong demand from small businesses and start-ups for flexible business premises at affordable prices, as well as proximity to like-minded businesses.
The market has responded by providing short term innovative accommodation. These are in the form of open workspaces and can range from temporarily unused spaces on offer on short, flexible and cheap leases to shared space in new developments. Whilst cost is often an issue, in many cases occupiers are less interested in price, and more in flexibility of leases and variety of space. According to the London Business Survey, 15% of microbusinesses have used open workspace at some point.
The London Enterprise Panel commissioned research to examine the supply of this type of space in London in 2015 and found that there are 132 open workspaces in London, with potential accommodation for approximately 4,000 SMEs, with clustering in Shoreditch and Clerkenwell, in the Tech Belt, and Soho and Bloomsbury in the West End.
Photography: Derwent London
16
CityTower Hamlets
Newham
Barking and Dagenham
HaveringRedbridge
WalthamForest
HackneyIslingtonCamden
Westminster
Greenwich
Bexley
Bromley
LewishamLambeth
Southwark
Croydon
Merton
Kingston
Sutton
Hillingdon
Harrow
Kensington
and Chelsea
Hamm
ersmith
and Fulham
WandsworthRichmond
Hounslow
Ealing
Brent
Barnet
Haringey
Enfield4
5
1
2
8
28
6
0
1
4
2 3
33
40
31
30 35 93
51
7
51
10
20
2
1
2
1
12
9
10
5
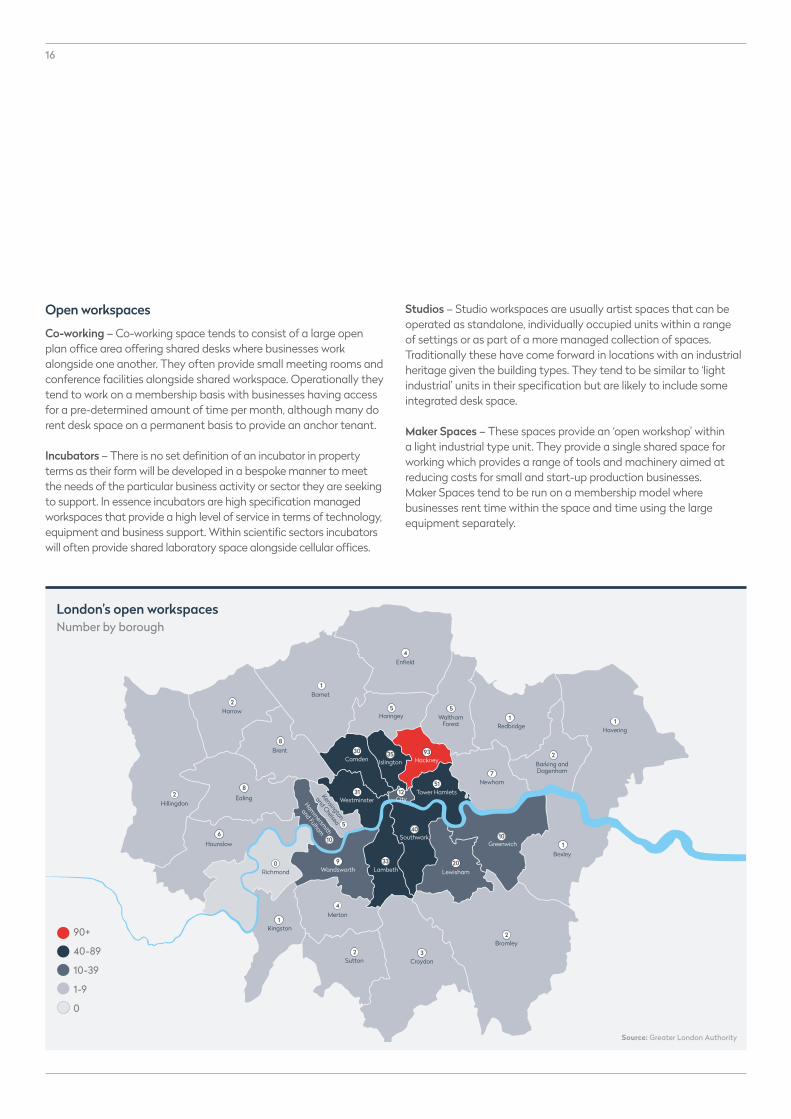
London’s open workspaces Number by borough
90+
40-89
10-39
1-9
0
Source: Greater London Authority
Open workspaces
Co-working – Co-working space tends to consist of a large open plan office area offering shared desks where businesses work alongside one another. They often provide small meeting rooms and conference facilities alongside shared workspace. Operationally they tend to work on a membership basis with businesses having access for a pre-determined amount of time per month, although many do rent desk space on a permanent basis to provide an anchor tenant.
Incubators – There is no set definition of an incubator in property terms as their form will be developed in a bespoke manner to meet the needs of the particular business activity or sector they are seeking to support. In essence incubators are high specification managed workspaces that provide a high level of service in terms of technology, equipment and business support. Within scientific sectors incubators will often provide shared laboratory space alongside cellular offices.
Studios – Studio workspaces are usually artist spaces that can be operated as standalone, individually occupied units within a range of settings or as part of a more managed collection of spaces. Traditionally these have come forward in locations with an industrial heritage given the building types. They tend to be similar to ‘light industrial’ units in their specification but are likely to include some integrated desk space.
Maker Spaces – These spaces provide an ‘open workshop’ within a light industrial type unit. They provide a single shared space for working which provides a range of tools and machinery aimed at reducing costs for small and start-up production businesses. Maker Spaces tend to be run on a membership model where businesses rent time within the space and time using the large equipment separately.
17
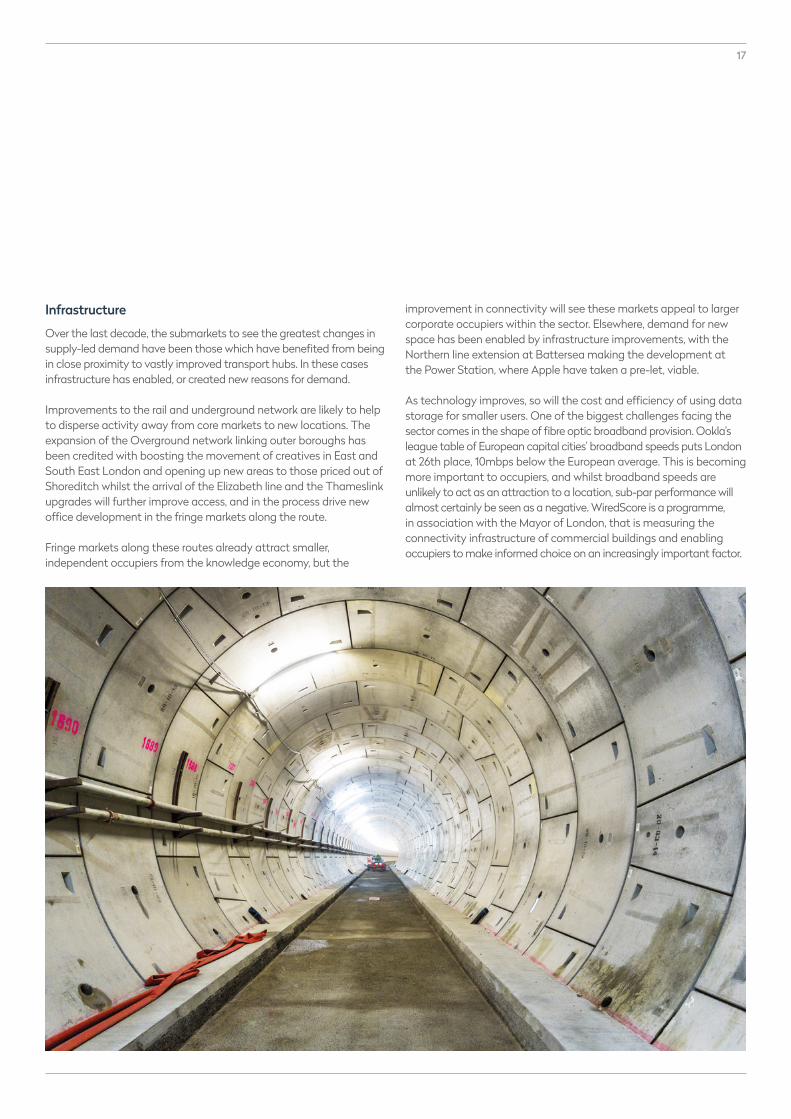
Infrastructure
Over the last decade, the submarkets to see the greatest changes in supply-led demand have been those which have benefited from being in close proximity to vastly improved transport hubs. In these cases infrastructure has enabled, or created new reasons for demand.
Improvements to the rail and underground network are likely to help to disperse activity away from core markets to new locations. The expansion of the Overground network linking outer boroughs has been credited with boosting the movement of creatives in East and South East London and opening up new areas to those priced out of Shoreditch whilst the arrival of the Elizabeth line and the Thameslink upgrades will further improve access, and in the process drive new office development in the fringe markets along the route.
Fringe markets along these routes already attract smaller, independent occupiers from the knowledge economy, but the
improvement in connectivity will see these markets appeal to larger corporate occupiers within the sector. Elsewhere, demand for new space has been enabled by infrastructure improvements, with the Northern line extension at Battersea making the development at the Power Station, where Apple have taken a pre-let, viable.
As technology improves, so will the cost and efficiency of using data storage for smaller users. One of the biggest challenges facing the sector comes in the shape of fibre optic broadband provision. Ookla’s league table of European capital cities’ broadband speeds puts London at 26th place, 10mbps below the European average. This is becoming more important to occupiers, and whilst broadband speeds are unlikely to act as an attraction to a location, sub-par performance will almost certainly be seen as a negative. WiredScore is a programme, in association with the Mayor of London, that is measuring the connectivity infrastructure of commercial buildings and enabling occupiers to make informed choice on an increasingly important factor.

18
OCCUPATIONAL COSTSPART 3
In this section – Pricing
– Conclusions
19
Occupational Costs
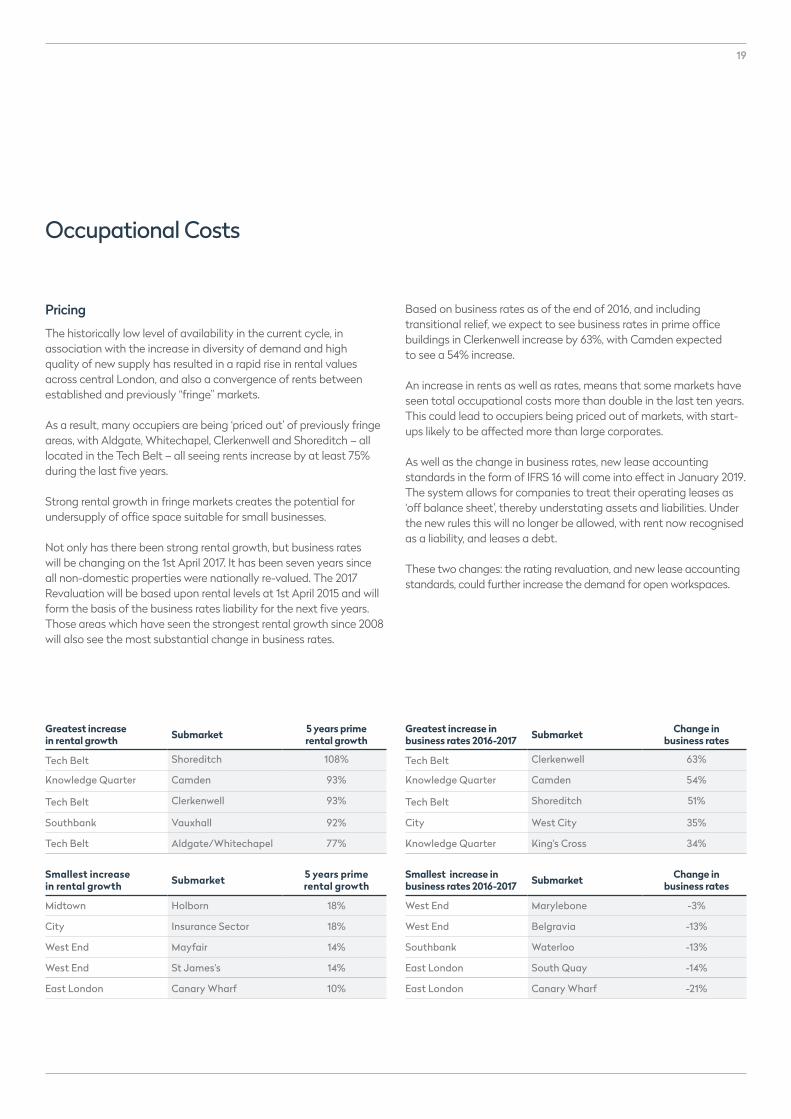
Pricing
The historically low level of availability in the current cycle, in association with the increase in diversity of demand and high quality of new supply has resulted in a rapid rise in rental values across central London, and also a convergence of rents between established and previously “fringe” markets.
As a result, many occupiers are being ‘priced out’ of previously fringe areas, with Aldgate, Whitechapel, Clerkenwell and Shoreditch – all located in the Tech Belt – all seeing rents increase by at least 75% during the last five years.
Strong rental growth in fringe markets creates the potential for undersupply of office space suitable for small businesses.
Not only has there been strong rental growth, but business rates will be changing on the 1st April 2017. It has been seven years since all non-domestic properties were nationally re-valued. The 2017 Revaluation will be based upon rental levels at 1st April 2015 and will form the basis of the business rates liability for the next five years. Those areas which have seen the strongest rental growth since 2008 will also see the most substantial change in business rates.
Based on business rates as of the end of 2016, and including transitional relief, we expect to see business rates in prime office buildings in Clerkenwell increase by 63%, with Camden expected to see a 54% increase.
An increase in rents as well as rates, means that some markets have seen total occupational costs more than double in the last ten years. This could lead to occupiers being priced out of markets, with start-ups likely to be affected more than large corporates.
As well as the change in business rates, new lease accounting standards in the form of IFRS 16 will come into effect in January 2019. The system allows for companies to treat their operating leases as ‘off balance sheet’, thereby understating assets and liabilities. Under the new rules this will no longer be allowed, with rent now recognised as a liability, and leases a debt.
These two changes: the rating revaluation, and new lease accounting standards, could further increase the demand for open workspaces.
Greatest increase in rental growth Submarket 5 years prime
rental growth
Tech Belt Shoreditch 108%
Knowledge Quarter Camden 93%
Tech Belt Clerkenwell 93%
Southbank Vauxhall 92%
Tech Belt Aldgate/Whitechapel 77%
Smallest increase in rental growth Submarket 5 years prime
rental growth
Midtown Holborn 18%
City Insurance Sector 18%
West End Mayfair 14%
West End St James's 14%
East London Canary Wharf 10%
Greatest increase in business rates 2016-2017 Submarket Change in
business rates
Tech Belt Clerkenwell 63%
Knowledge Quarter Camden 54%
Tech Belt Shoreditch 51%
City West City 35%
Knowledge Quarter King's Cross 34%
Smallest increase in business rates 2016-2017 Submarket Change in
business rates
West End Marylebone -3%
West End Belgravia -13%
Southbank Waterloo -13%
East London South Quay -14%
East London Canary Wharf -21%
20
Conclusions
London’s growth has put pressure on its traditional office markets and central London’s office stock has grown rapidly over the last decade to cater for this increased demand. With the physical constraints of the core markets, an increasing proportion of development is occurring in more ‘fringe’ areas, resulting in a rise in both the quantity and quality of their office stock. This has given occupiers a more diverse choice in where they locate.
Locational preferences are determined by an increasing number of considerations. Cost clearly remains important, particularly in view of the significant rises in rental and rateable values over the current cycle. These increases have been strongest in some of the fringe markets, where development and place-making have also improved the overall quality of provision.
Factors other than cost are becoming increasingly important, including accessibility, the desire to be near similar occupiers, the character and ‘feel’ of an area, and access to competitive broadband speeds.
Offices are increasingly becoming places for people to meet and collaborate rather than simply to produce work, and connectivity via public transport infrastructure is now vital for almost any employer. We have seen that some of the strongest market growth has occurred close to major transport improvements. The pipeline of infrastructure either under way or proposed will continue to create opportunities across London’s submarkets.
London’s increasingly diverse employment base and move away from its heavy reliance on traditional sectors such as finance and banking means increasingly diverse occupier requirements. The requirements of businesses in London’s growing ‘knowledge economy’ can be very different to those in the financial or professional services sectors. This trend is likely to accelerate in the wake of Brexit.
Supply is responding to this, and the expansion and diversification of central London’s office market means occupiers have not only an increasing amount of choice in terms of where they locate, but also in the types of space they are now able to occupy. Such space is vital for the start-ups and small businesses that are the drivers of London’s future economic growth, particularly in those locations where smaller occupiers are priced out.
The problem is exacerbated as office stock is also being taken out of the market for alternative uses, and the introduction of MEES regulations from April 2018 will mean more secondary stock is removed.
With more change and uncertainty in the external environment, flexibility in occupational commitments is also increasingly important for larger corporates. Changes to lease accounting standards with the introduction of IFRS 16 in 2019, will produce further incentive to lease short-term flexible space.
Brexit and other structural changes will profoundly affect the amount and type of space that occupiers want, and their locational preferences, creating both risks and opportunities for the market. However, we believe the relentless growth in London’s employment base will continue.
In the next section we examine the characteristics and drivers of central London’s key submarkets, from those that are well established to those that are maturing or still evolving as mainstream markets.
21
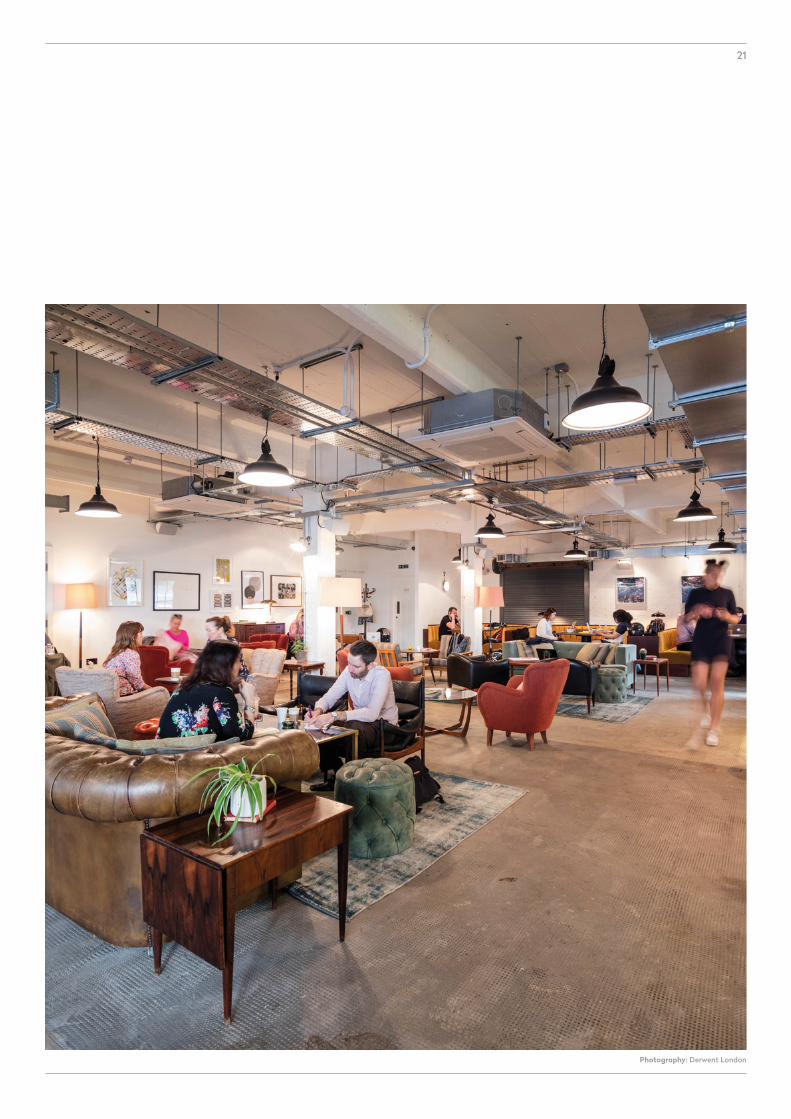
Photography: Derwent London
22
In this section – Tech Belt
– Knowledge Quarter
– Southbank
– East London
– City
– Midtown
– West End
– West London
CENTRAL LONDON’SSUBMARKETS
PART 4
23
Central London’s submarkets
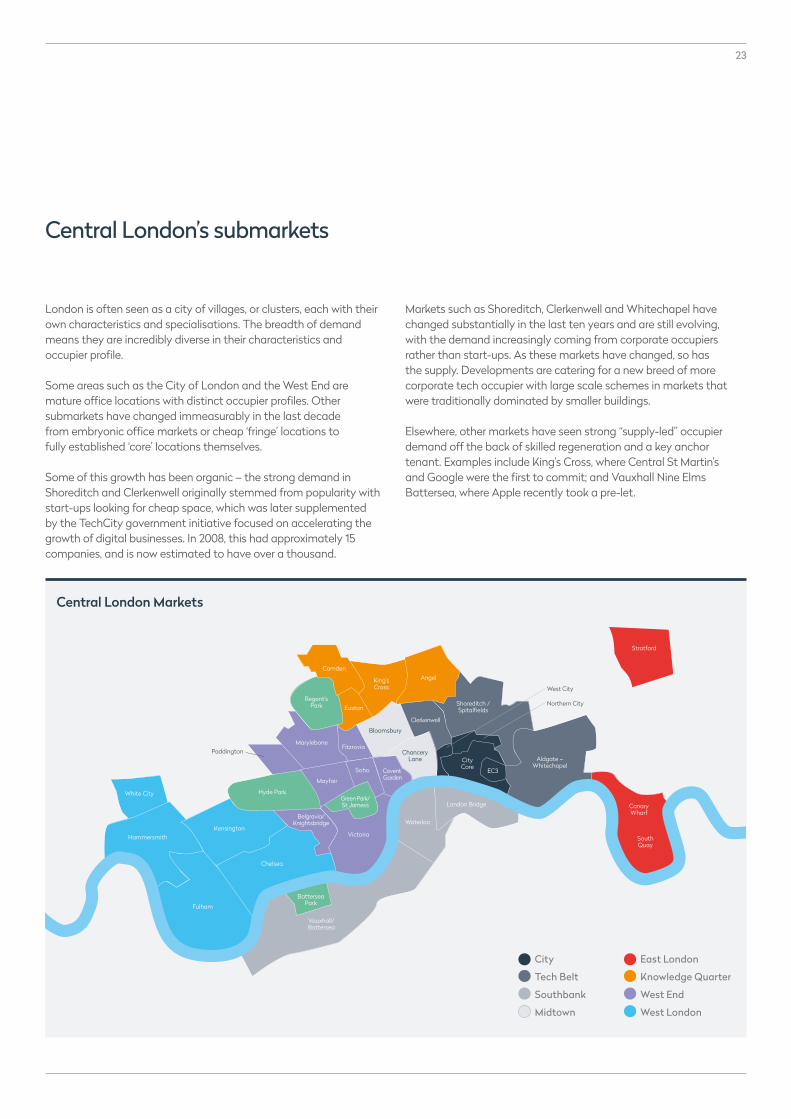
London is often seen as a city of villages, or clusters, each with their own characteristics and specialisations. The breadth of demand means they are incredibly diverse in their characteristics and occupier profile.
Some areas such as the City of London and the West End are mature office locations with distinct occupier profiles. Other submarkets have changed immeasurably in the last decade from embryonic office markets or cheap ‘fringe’ locations to fully established ‘core’ locations themselves.
Some of this growth has been organic – the strong demand in Shoreditch and Clerkenwell originally stemmed from popularity with start-ups looking for cheap space, which was later supplemented by the TechCity government initiative focused on accelerating the growth of digital businesses. In 2008, this had approximately 15 companies, and is now estimated to have over a thousand.
Markets such as Shoreditch, Clerkenwell and Whitechapel have changed substantially in the last ten years and are still evolving, with the demand increasingly coming from corporate occupiers rather than start-ups. As these markets have changed, so has the supply. Developments are catering for a new breed of more corporate tech occupier with large scale schemes in markets that were traditionally dominated by smaller buildings.
Elsewhere, other markets have seen strong “supply-led” occupier demand off the back of skilled regeneration and a key anchor tenant. Examples include King’s Cross, where Central St Martin’s and Google were the first to commit; and Vauxhall Nine Elms Battersea, where Apple recently took a pre-let.
Hammersmith
Fulham
Kensington
Chelsea
Hyde Park
Mayfair
Paddington
West City
Northern City
Marylebone
Regent’s Park Euston
Fitzrovia
Soho
Waterloo
London Bridge
City Core
Aldgate – Whitechapel
Canary Wharf
South Quay
Green Park/St James’s
Victoria
Belgravia/ Knightsbridge
Battersea Park
Vauxhall/ Battersea
Covent Garden
Bloomsbury
Clerkenwell
Chancery Lane
Shoreditch / Spitalfields
King’s Cross
EC3
White City
Stratford
AngelCamden
Central London Markets
City
Tech Belt
Southbank
Midtown
East London
Knowledge Quarter
West End
West London

24
Market profile
These markets have seen some of the greatest change in the last 20 years. During this time Shoreditch, Clerkenwell and Whitechapel have been seen as ‘trendy’ areas, with a large proportion of young professionals who prefer to work there as a lifestyle choice. This was not always the case. Traditionally Shoreditch and Clerkenwell were seen as cheap, secondary office locations, with Aldgate and Whitechapel either back office locations for banks or weak competition to the City of London.
During the economic downturn, the popularity of these submarkets was magnified as, at a time when financial and business services occupiers were downsizing, there was substantial growth in the TMT (technology, media and telecommunications) sector. TMT companies were much more likely to be looking for space in these markets which had relatively high levels of available and cheap office stock. This caused a situation where core markets were seeing double digit rental falls, but these ‘fringe’ markets were in fact growing.
Off the back of strong demand from start-ups and TechCity, larger tech companies have been increasingly attracted to the area. This has facilitated a change in the supply of office stock, with The Whitechapel Building, Principal Place as well as The White Collar Factory and The Bower on Old Street roundabout increasing the attractiveness to corporate occupiers, although this type of space is still lacking in Clerkenwell.
Occupier base
The demand for property in these markets comes from a very diverse occupier base, from start-ups to corporate occupiers. The success of Silicon Roundabout and TechCity has become self-perpetuating as more and more occupiers have become attracted to the area. There has been a shift towards a more corporate market although the area retains its mix of start-ups and SMEs. Google’s campus on Bonhill Street and Amazon at Principal Place mean that the area is now home to some of the world’s largest corporate tech occupiers.
The TechCity Investment Organisation was founded in 2010, built around the Silicon Roundabout tech cluster in Shoreditch. The organisation is focused on accelerating the growth of digital businesses through programmes such as Future Fifty, Digital Business Academy and Upscale which provides new businesses with workspace, technical and professional support and guidance to possible government funding available to them.
In turn, non-tech companies have all located to the area to support start-ups and the growing tech industry in the vicinity, with take-up of professional services firms coming to represent as much activity as TMT and creative companies. Clerkenwell is an established market for media, brand agencies and fashion houses and has been since the dotcom boom, although Skype have just left their offices in the area to move in with their parent company, Microsoft.
The boroughs which are home to these submarkets have the highest number of open workspace units, with Hackney having 93, Tower Hamlets, 51 and Islington, 35. WeWork, the co-working space provider, have five workspaces in the area, including the 60,000 sq ft The Bower, which was pre-let at the end of 2016. Similarly the Office Group has six locations.
Submarket Vacancy rate Q4 2016 Stock change 2007-2016
Aldgate – Whitechapel 4.0% 11%
Clerkenwell 6.0% 9%
Shoreditch 6.8% 10%
Tech BeltAldgate – Whitechapel – Clerkenwell – Shoreditch
Source: GVA

25
Connectivity and infrastructure
In markets with a large occupier base of technology companies, connectivity is obviously important. WiredScore which is endorsed by the Mayor of London, certifies buildings based on the “internet connectivity and infrastructure of commercial buildings”. It has awarded just one platinum certificate to a building in the area – White Collar Factory - with five more achieving Gold status. Whilst this certification is still in its early days, it does nevertheless highlight an issue for the area, with a large number of occupiers calling for improvements to its broadband.
In terms of transport, the area is already very well connected. This will improve further with the introduction of the Elizabeth Line stations in all these submarkets. The East London line has linked Shoreditch and Clerkenwell with less developed areas such as Hackney, Dalston and New Cross, which are now attracting some of the occupiers priced out of Shoreditch.
In this way, new transport infrastructure is acting as a creative corridor within London. Clerkenwell will see a large increase in capacity, with the advent of Crossrail in Farringdon being an addition to the recent Thameslink and Overground extensions.
Pricing
Since 2010, prime rents in all of the Tech Belt submarkets have increased by upwards of c.125%, with Shoreditch and Clerkenwell currently at £67.50 per sq ft, and Aldgate and Whitechapel at £57.50 per sq ft. To put this into perspective, net effective rents in Shoreditch and Clerkenwell are currently less than 1% cheaper than the City Core. With these submarkets seeing a big rise in business rates come April, they no longer represent a cheap option.
6%8%
8%
7%
4%
27%
27%
13%
Office take-up by sector
Source: GVA
Business Services
Consumer Services
Financial Services
Public Services
Manufacturing & Industry
Professional Services
TMT & Creative
Undisclosed
Submarket Rental growth 2012-2016
Prime rent (Q4 2016)
Aldgate – Whitechapel 77% £57.50
Clerkenwell 93% £67.50
Shoreditch 108% £67.50
Source: GVA
Photography: WeWork

26
Knowledge QuarterAngel – Camden – Euston – King’s Cross
Market profile
The northern fringe markets have become an important part of the central London office market during the last ten years, with each submarket seeing increased demand for space and strong rental growth.
The area immediately north of the Euston Road, in Euston and King’s Cross has seen substantial investment over the last decade with the development of Regent’s Place and more recently King’s Cross Central. These have provided a substantial step change in the quality and size of accommodation in the area, and the increase in demand has undoubtedly been supply-led.
Occupier base
The area along the Euston Road has been labelled the Knowledge Quarter, due to the concentration of academia, science and tech businesses based in the area. The arrival of Central St Martin’s early in the development of King’s Cross Central helped attract further occupiers. These included Google, who not only committed to building their own campus (which they are yet to start) but have in the meanwhile taken additional leases at King’s Cross Central.
UCL has a strong creative offering, notably through institutions such as the Slade School of Fine Art and the Bartlett School of the Built Environment. UCL’s Engineering facility has also entered into a new strategic partnership with BBC Research and Development to collaborate on Research and Development in the computing and digital spheres, and the new Alan Turing Institute, dedicated to the study of data science and big data, is located next to the British Library.
Submarket Vacancy rate Stock change 2007-2016
Angel 1.2% 6%
Camden 6.3% 7%
Euston 5.0% 25%
Kings Cross 3.1% 78%
1%
Office take-up by sector
4%
12%
79%
3% 1%
0 %
Source: GVA
Consumer Services
Financial Services
Public Services
Professional Services
TMT & Creative
Undisclosed
Source: GVA

27
The area is well stocked on new workspaces with multiple The Office Group and Impact Hub locations, as well as The Camden Collective which is run by the Business Improvement District for Camden Town and offers co-working spaces in the area.
The immediate vicinity of the Euston Road is a haven for science and medical institutions, providing a home for University College London Hospital (UCLH), the Wellcome Trust, the London BioScience Innovation Centre and the Royal College of General Practitioners as well as the Francis Crick Institute, which is a partnership between six prominent scientific institutions (UCL, Imperial College, King’s College, the Medical Research Council, the Wellcome Trust and Cancer Research UK).
Connectivity and infrastructure
The refurbishments of King’s Cross and St Pancras stations were the catalyst to wider improvements in the area, improving the connection between the transport and the surrounding area. Whilst already a well-connected transport hub, the introduction of High Speed 1 (HS1), Eurostar, Thameslink and major upgrades to the Victoria Line have greatly enhanced the range, frequency and speed of connections.
Looking forward, the advent of the second generation of High Speed line (HS2) should help join up London and the immediate vicinity around Euston to the rest of the country, increasing capacity, and potentially connecting with Crossrail 2 at Euston.
Pricing
This area has traditionally been associated with the availability of cheap, fringe space. However, Camden has seen prime rents almost double in the last five years, with King’s Cross seeing 74% growth in the same time. Affordability is clearly diminishing. As a market evolves, occupiers become priced out of what were once considered ‘cheap’ areas by central London standards, and there is a fear that what made the area a desirable place may now disappear.
Submarket Rental growth 2012-2016
Prime rent (Q4 2016)
Angel 22% £67.00
Camden 93% £55.00
Euston 50% £75.00
King's Cross 74% £82.50
Source: GVA
Photography: King’s Cross Central
28
Market profile
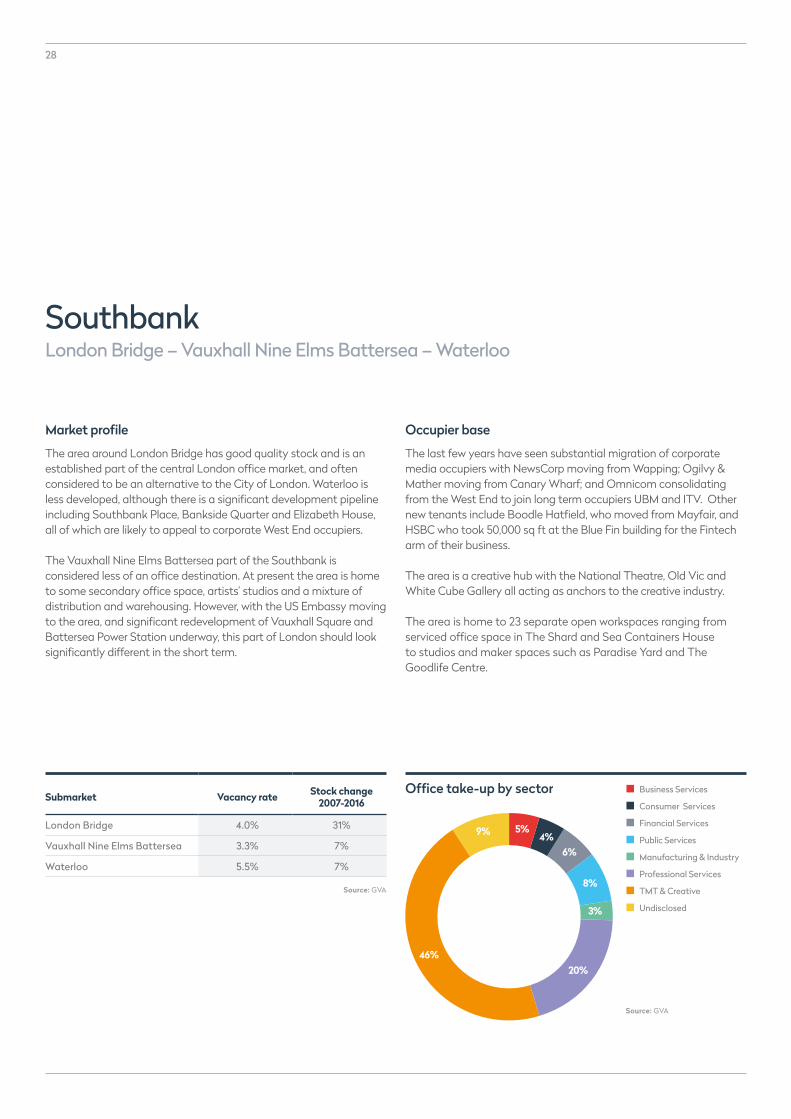
The area around London Bridge has good quality stock and is an established part of the central London office market, and often considered to be an alternative to the City of London. Waterloo is less developed, although there is a significant development pipeline including Southbank Place, Bankside Quarter and Elizabeth House, all of which are likely to appeal to corporate West End occupiers.
The Vauxhall Nine Elms Battersea part of the Southbank is considered less of an office destination. At present the area is home to some secondary office space, artists’ studios and a mixture of distribution and warehousing. However, with the US Embassy moving to the area, and significant redevelopment of Vauxhall Square and Battersea Power Station underway, this part of London should look significantly different in the short term.
Occupier base
The last few years have seen substantial migration of corporate media occupiers with NewsCorp moving from Wapping; Ogilvy & Mather moving from Canary Wharf; and Omnicom consolidating from the West End to join long term occupiers UBM and ITV. Other new tenants include Boodle Hatfield, who moved from Mayfair, and HSBC who took 50,000 sq ft at the Blue Fin building for the Fintech arm of their business.
The area is a creative hub with the National Theatre, Old Vic and White Cube Gallery all acting as anchors to the creative industry.
The area is home to 23 separate open workspaces ranging from serviced office space in The Shard and Sea Containers House to studios and maker spaces such as Paradise Yard and The Goodlife Centre.
Submarket Vacancy rate Stock change 2007-2016
London Bridge 4.0% 31%
Vauxhall Nine Elms Battersea 3.3% 7%
Waterloo 5.5% 7%
Office take-up by sector Business Services
Consumer Services
Financial Services
Public Services
Manufacturing & Industry
Professional Services
TMT & Creative
Undisclosed
Source: GVA
5%4%
6%
8%
3%
20%46%
9%
Source: GVA
SouthbankLondon Bridge – Vauxhall Nine Elms Battersea – Waterloo
29
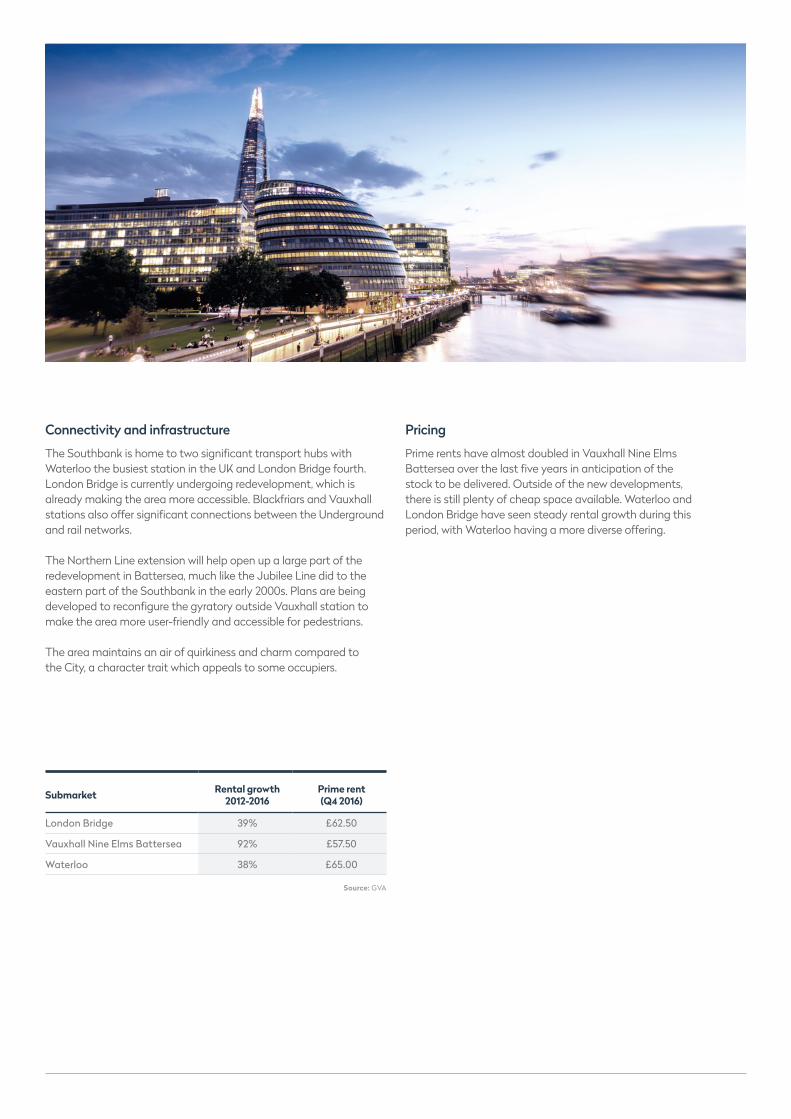
Pricing
Prime rents have almost doubled in Vauxhall Nine Elms Battersea over the last five years in anticipation of the stock to be delivered. Outside of the new developments, there is still plenty of cheap space available. Waterloo and London Bridge have seen steady rental growth during this period, with Waterloo having a more diverse offering.
Submarket Rental growth 2012-2016
Prime rent (Q4 2016)
London Bridge 39% £62.50
Vauxhall Nine Elms Battersea 92% £57.50
Waterloo 38% £65.00
Source: GVA
Connectivity and infrastructure
The Southbank is home to two significant transport hubs with Waterloo the busiest station in the UK and London Bridge fourth. London Bridge is currently undergoing redevelopment, which is already making the area more accessible. Blackfriars and Vauxhall stations also offer significant connections between the Underground and rail networks.
The Northern Line extension will help open up a large part of the redevelopment in Battersea, much like the Jubilee Line did to the eastern part of the Southbank in the early 2000s. Plans are being developed to reconfigure the gyratory outside Vauxhall station to make the area more user-friendly and accessible for pedestrians.
The area maintains an air of quirkiness and charm compared to the City, a character trait which appeals to some occupiers.

30
East LondonCanary Wharf – South Quay – Stratford
Market profile
Canary Wharf is an established central London office market, able to provide large floorplates at affordable rents, with South Quay discounted further. The area formerly known as Wood Wharf is currently undergoing development which will cater to creative occupiers. This is in contrast to the rest of Docklands which has traditionally been home to banks and financial services companies.
Stratford is now widely recognised as a part of the central London office market, although most of the office space is currently under construction. 2016 did however see the completion of the 900,000 sq ft Here East which has a mix of office, studio and innovation space catering to digital media and sports technology companies, with just a third still available.
Submarket Vacancy rate Stock change 2007-2016
Canary Wharf 2.5% 13%
South Quay 6.6% 1%
Stratford 1.6% 33%
Office take-up by sector Business Services
Consumer Services
Financial Services
Public Services
Manufacturing & Industry
Professional Services
TMT & Creative
Undisclosed
Source: GVA
10%
37%
15%
4%
7%
18%
7% 3%
Occupier base
Docklands, and Canary Wharf in particular, is an established financial services location, with a high provision of corporate office space. At the end of 2016, the Government Property Unit agreed a deal to relocate 6,000 staff from Whitehall to Canary Wharf. Outside the Wharf, there is a high provision of more affordable office space to the South, and workshops suitable for advanced manufacturing in the north. The Level 39 incubator space is primarily aimed at fintech start-ups. The new district at Canary Wharf will look to diversify the offer and cater more to tech and creative industries.
The FCA and Transport for London were amongst the first occupiers to take pre-lets at the International Quarter, with further development requiring a pre-let. BT Sport, Infinity, the Bartlett School of Architecture, UCL and Loughbrough University have all taken space at Here East.
Source: GVA
31
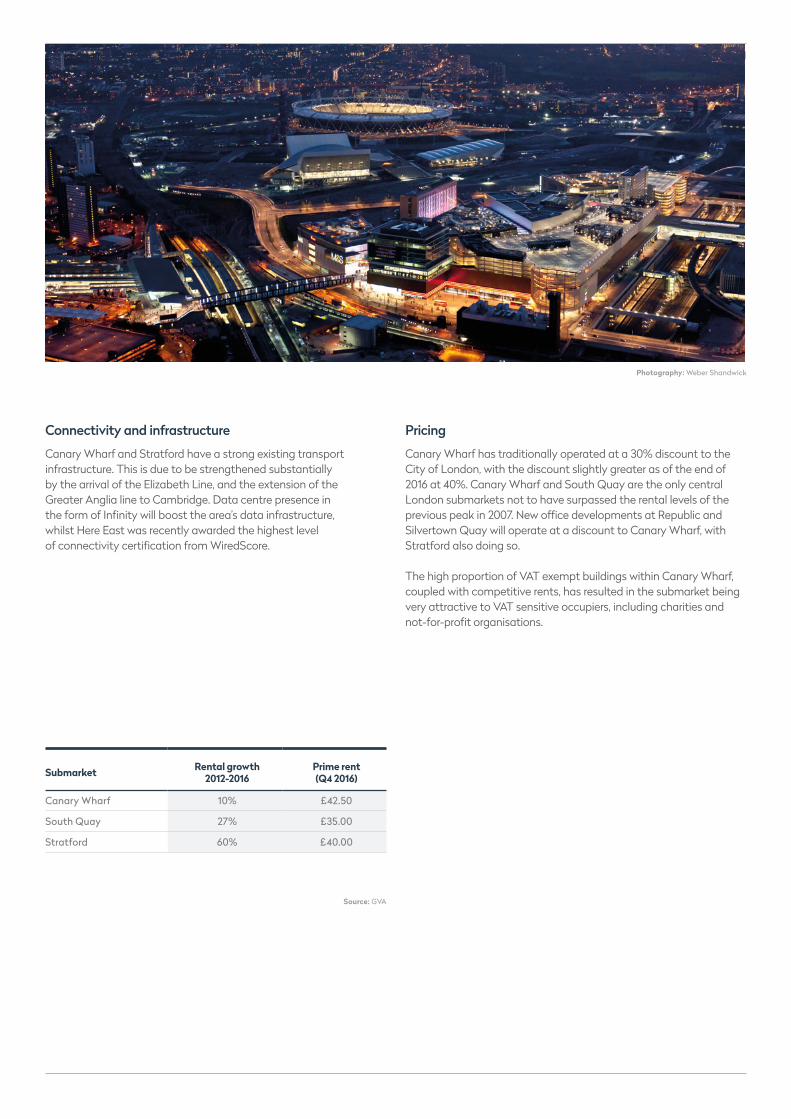
Connectivity and infrastructure
Canary Wharf and Stratford have a strong existing transport infrastructure. This is due to be strengthened substantially by the arrival of the Elizabeth Line, and the extension of the Greater Anglia line to Cambridge. Data centre presence in the form of Infinity will boost the area’s data infrastructure, whilst Here East was recently awarded the highest level of connectivity certification from WiredScore.
Pricing
Canary Wharf has traditionally operated at a 30% discount to the City of London, with the discount slightly greater as of the end of 2016 at 40%. Canary Wharf and South Quay are the only central London submarkets not to have surpassed the rental levels of the previous peak in 2007. New office developments at Republic and Silvertown Quay will operate at a discount to Canary Wharf, with Stratford also doing so.
The high proportion of VAT exempt buildings within Canary Wharf, coupled with competitive rents, has resulted in the submarket being very attractive to VAT sensitive occupiers, including charities and not-for-profit organisations.
Submarket Rental growth 2012-2016
Prime rent (Q4 2016)
Canary Wharf 10% £42.50
South Quay 27% £35.00
Stratford 60% £40.00
Source: GVA
Photography: Weber Shandwick

32
CityCity core – EC3 – North – West
Market profile
The City of London is the largest central London submarket and the home of financial and business services, although the economic downturn saw a diversification of its occupier base. Its office stock is dominated by high quality grade A space catering to the demands of some of the world’s largest companies. The last four years have seen relatively low development completions, coupled with high levels of pre-letting leading to low levels of availability.
The City is a wholly mature market, although some pockets are considered less ‘prime’ than others, particularly in the southern section of EC3. This is because of the quality of the stock and geography and is not necessarily reflected in pricing. EC3 is the traditional home of the insurance market, and is the area of the City most suited for the development of tall buildings.
The stock in the City core is built to the highest standards to meet requirements of international corporate institutions, with the market seeing significant development levels.
Occupier base
The City of London is the pre-eminent financial centre in Europe. Historically, the City has been reliant on banking and financial services, although this has become more diverse with an increase in demand from other sectors since the financial crisis. Having said that, 12 of the 20 largest deals since 2012 were by banking and financial services companies. In the same time period, financial services made up just under 40% of take-up, with professional services 19% and TMT 14%.
Traditionally the City core has been the domain of financial and professional services firms, although there are more and more examples of tech occupiers moving to the area, including Bloomberg, Worldpay and Monitise.
At present, the financial and legal sectors are in a period of consolidation, which is leading to an increase in tenant space coming onto the market.
Office take-up by sector Business Services
Consumer Services
Financial Services
Public Services
Manufacturing & Industry
Professional Services
TMT & Creative
Undisclosed
Source: GVA
9%4%
39%
19%
14%
11%
2%2%
Submarket Vacancy rate Stock change 2007-2016
City Core 5.2% 27%
EC3 11.6% 7%
Northern City 3.5% 10%
West City 1.5% 29%
Source: GVA
33
Connectivity and infrastructure
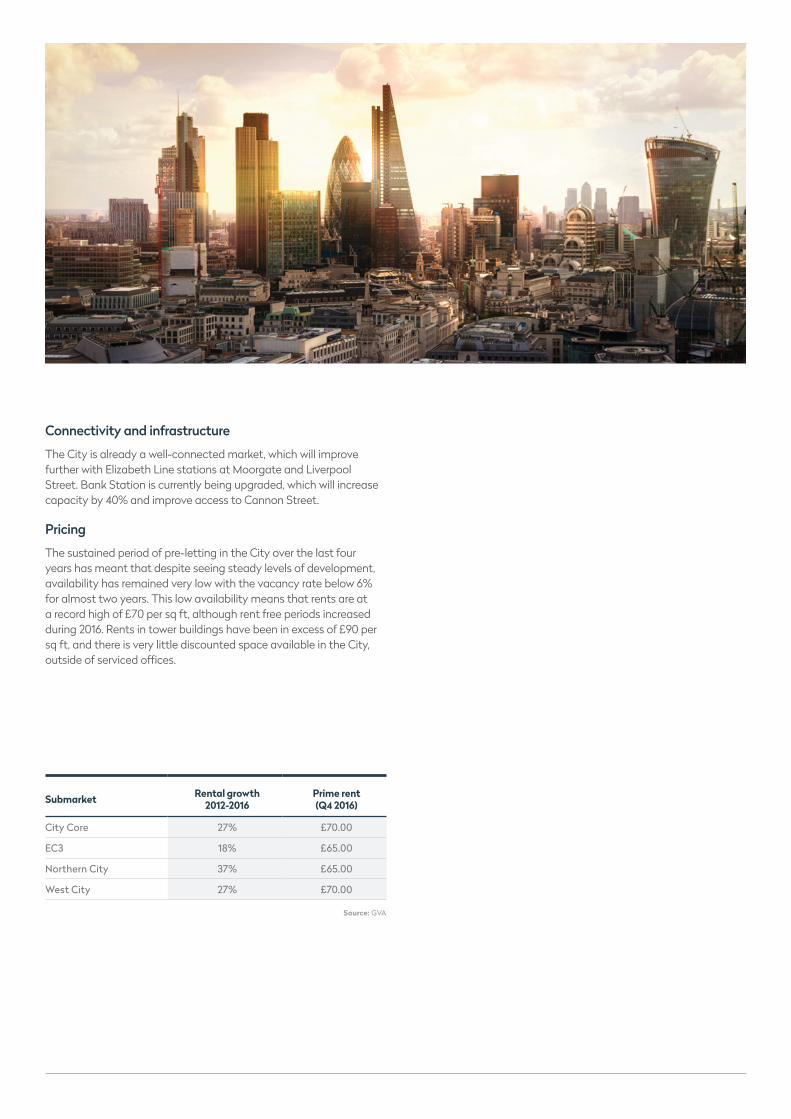
The City is already a well-connected market, which will improve further with Elizabeth Line stations at Moorgate and Liverpool Street. Bank Station is currently being upgraded, which will increase capacity by 40% and improve access to Cannon Street.
Pricing
The sustained period of pre-letting in the City over the last four years has meant that despite seeing steady levels of development, availability has remained very low with the vacancy rate below 6% for almost two years. This low availability means that rents are at a record high of £70 per sq ft, although rent free periods increased during 2016. Rents in tower buildings have been in excess of £90 per sq ft, and there is very little discounted space available in the City, outside of serviced offices.
Submarket Rental growth 2012-2016
Prime rent (Q4 2016)
City Core 27% £70.00
EC3 18% £65.00
Northern City 37% £65.00
West City 27% £70.00
Source: GVA

34
Office take-up by sector Business Services
Consumer Services
Financial Services
Public Services
Manufacturing & Industry
Professional Services
TMT & Creative
Undisclosed
MidtownBloomsbury – Holborn
Market profile
Midtown is a mix of modern and historic stock. Bloomsbury is a key education hub with a large supply of small office buildings, many of which are affiliated to higher education uses. The area has a symbiotic relationship with the Knowledge Quarter markets of Euston and King’s Cross.
Holborn has a long relationship with the legal sector, and is home to the Inns of Court and Royal Courts of Justice. The area east of Chancery Lane is home to a number of large Grade A buildings.
Occupier base
The area has changed from one that was synonymous with legal and professional sectors to a very diverse market, with activity in the last five years being equally split between professional services and the TMT and creative sectors.
As well as a large number of traditional legal occupiers, the market is home to Google at Central Saint Giles, Weber Shandwick at Waterhouse Square and Publicis at 40 Chancery Lane. Deloitte and Goldman Sachs have a large presence in the area, with the latter currently building their new headquarters in the vicinity of their existing building.
Educational instituations continue to play a large role in demand in the area with UCL, SOAS, Kings College, LSE and University of the Arts all key occupiers.
Submarket Vacancy rate Stock change 2007-2016
Bloomsbury 5.4% 0%
Holborn 2.6% 12%
Source: GVA
Source: GVA
5%9%
8%
11%
30%
8%
2%
27%
35
Connectivity and infrastructure
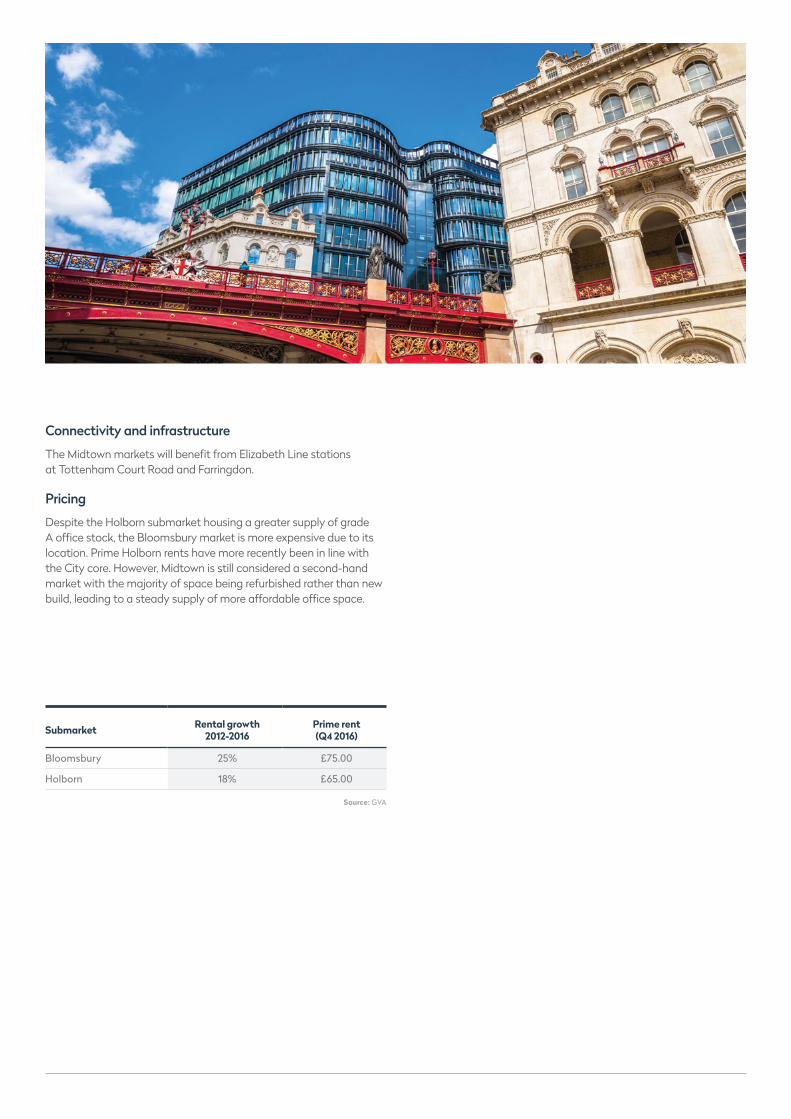
The Midtown markets will benefit from Elizabeth Line stations at Tottenham Court Road and Farringdon.
Pricing
Despite the Holborn submarket housing a greater supply of grade A office stock, the Bloomsbury market is more expensive due to its location. Prime Holborn rents have more recently been in line with the City core. However, Midtown is still considered a second-hand market with the majority of space being refurbished rather than new build, leading to a steady supply of more affordable office space.
Submarket Rental growth 2012-2016
Prime rent (Q4 2016)
Bloomsbury 25% £75.00
Holborn 18% £65.00
Source: GVA
36
West EndBelgravia-Knightsbridge – Covent Garden – Fitzrovia - Marylebone – Mayfair – Paddington – Soho – St James’s – Victoria
Submarket Vacancy rate Stock change 2007-2016
Belgravia – Knightsbridge 0.8% 0%
Covent Garden 5.6% 5%
Fitzrovia 4.7% 10%
Marylebone 3.1% 9%
Mayfair 5.0% 10%
Paddington 15.8% 36%
Soho 8%
St James’s 5.0% 12%
Victoria 2.6% 6%
Office take-up by sector Business Services
Consumer Services
Financial Services
Public Services
Manufacturing & Industry
Professional Services
TMT & Creative
Undisclosed
Source: GVA
8%
11%
19%
5%8%
15%
19%
17%
Source: GVA
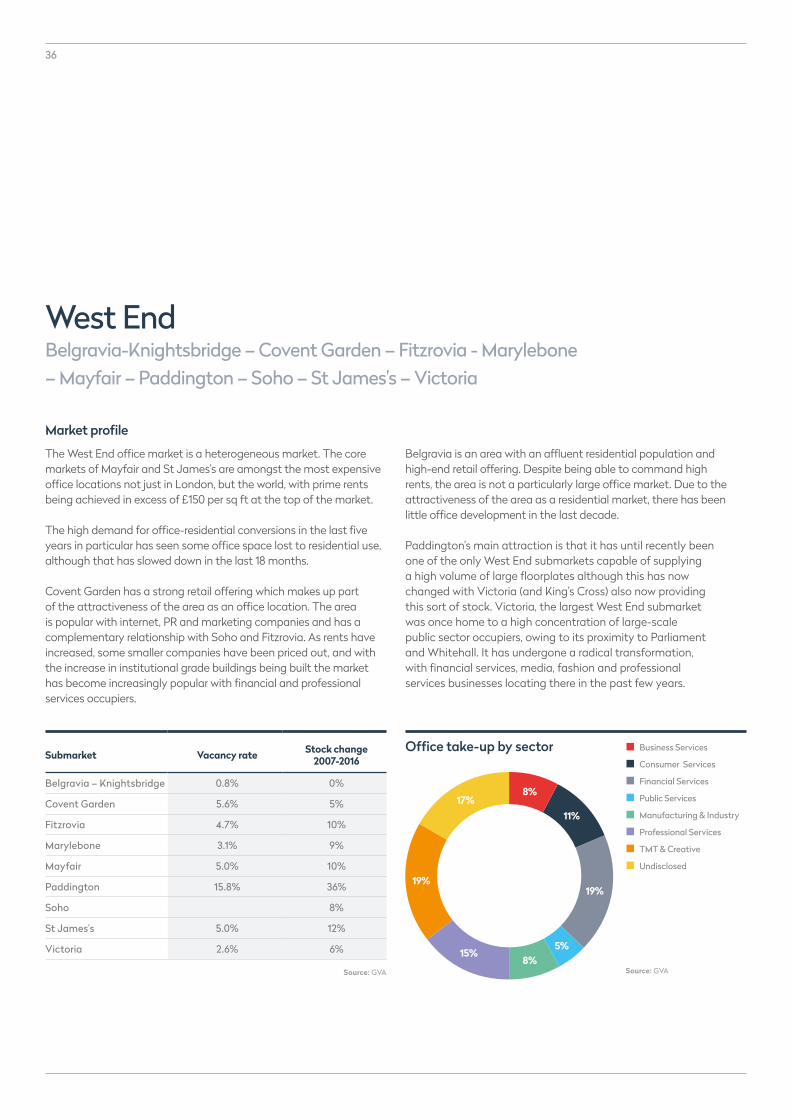
Market profile
The West End office market is a heterogeneous market. The core markets of Mayfair and St James’s are amongst the most expensive office locations not just in London, but the world, with prime rents being achieved in excess of £150 per sq ft at the top of the market.
The high demand for office-residential conversions in the last five years in particular has seen some office space lost to residential use, although that has slowed down in the last 18 months.
Covent Garden has a strong retail offering which makes up part of the attractiveness of the area as an office location. The area is popular with internet, PR and marketing companies and has a complementary relationship with Soho and Fitzrovia. As rents have increased, some smaller companies have been priced out, and with the increase in institutional grade buildings being built the market has become increasingly popular with financial and professional services occupiers.
Belgravia is an area with an affluent residential population and high-end retail offering. Despite being able to command high rents, the area is not a particularly large office market. Due to the attractiveness of the area as a residential market, there has been little office development in the last decade.
Paddington’s main attraction is that it has until recently been one of the only West End submarkets capable of supplying a high volume of large floorplates although this has now changed with Victoria (and King’s Cross) also now providing this sort of stock. Victoria, the largest West End submarket was once home to a high concentration of large-scale public sector occupiers, owing to its proximity to Parliament and Whitehall. It has undergone a radical transformation, with financial services, media, fashion and professional services businesses locating there in the past few years.
37
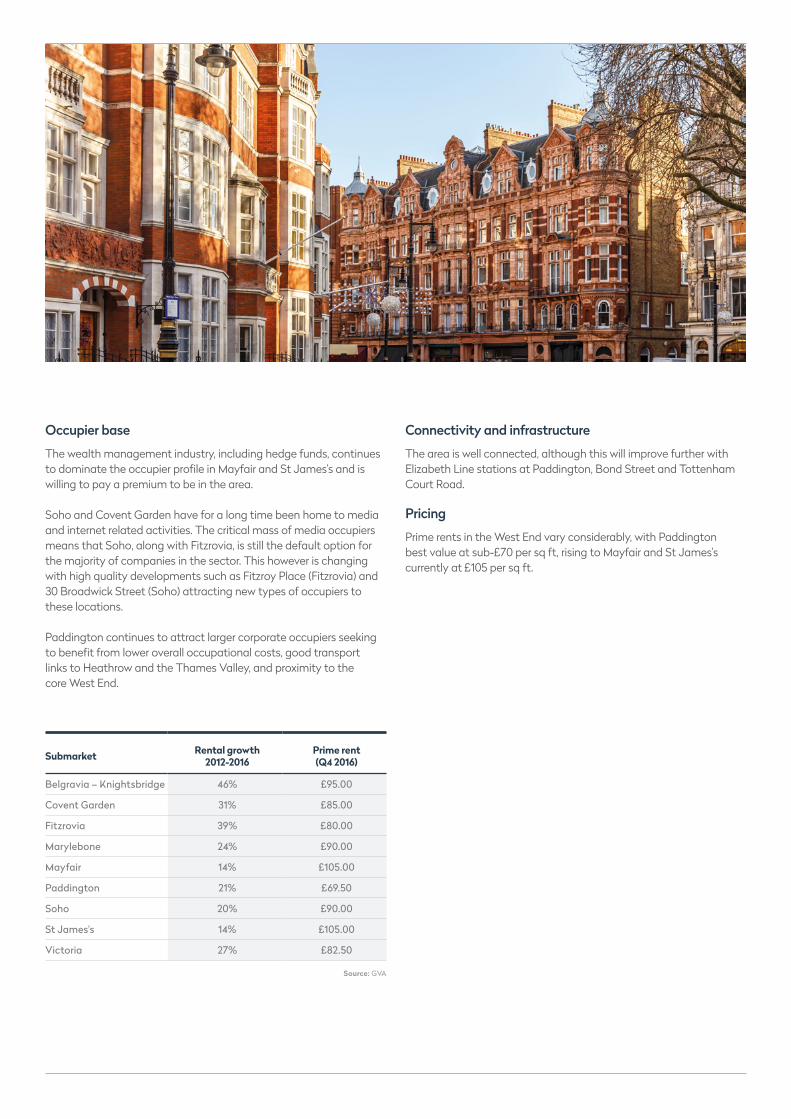
Connectivity and infrastructure
The area is well connected, although this will improve further with Elizabeth Line stations at Paddington, Bond Street and Tottenham Court Road.
Pricing
Prime rents in the West End vary considerably, with Paddington best value at sub-£70 per sq ft, rising to Mayfair and St James’s currently at £105 per sq ft.
Occupier base
The wealth management industry, including hedge funds, continues to dominate the occupier profile in Mayfair and St James’s and is willing to pay a premium to be in the area.
Soho and Covent Garden have for a long time been home to media and internet related activities. The critical mass of media occupiers means that Soho, along with Fitzrovia, is still the default option for the majority of companies in the sector. This however is changing with high quality developments such as Fitzroy Place (Fitzrovia) and 30 Broadwick Street (Soho) attracting new types of occupiers to these locations.
Paddington continues to attract larger corporate occupiers seeking to benefit from lower overall occupational costs, good transport links to Heathrow and the Thames Valley, and proximity to the core West End.
Submarket Rental growth 2012-2016
Prime rent (Q4 2016)
Belgravia – Knightsbridge 46% £95.00
Covent Garden 31% £85.00
Fitzrovia 39% £80.00
Marylebone 24% £90.00
Mayfair 14% £105.00
Paddington 21% £69.50
Soho 20% £90.00
St James's 14% £105.00
Victoria 27% £82.50
Source: GVA

38
West LondonChelsea – Fulham – Hammersmith – Kensington – White City
Market profile
West London is made up of distinct submarkets, few of which are primarily office locations. Clusters in these locations are dependent on key anchor tenants.
Despite having little available stock and new space, Kensington generally attracts occupiers seeking value out of the core West End markets. Hammersmith is a key out-of-town office location, with a large number of corporate occupiers who do not need to be in traditional core markets. Chelsea is a small office market with some high quality grade A space catering to wealth management firms who choose to locate in the area as a lifestyle choice.
The Mitsui Fudosan and Stanhope redevelopment of the old BBC White City sites aims to cater for the creative sector, while the Imperial Incubator provides specialist technical support for SMEs and new start-ups.
Traditionally, the area has been home to record labels and publishers, with Sony located on Kensington High Street. A fair proportion of Kensington’s office supply is made up of corporate office space whilst Westbourne Studios and Great Western Studios offer shared workspace for creative and media occupiers close to Portobello Road.
Submarket Vacancy rate Stock change 2007-2016
Chelsea 3.8% 4%
Fulham 1.7% 10%
Hammersmith 12.6% 3%
Kensington 0.6% 1%
White City 16.8% 20.4%
Source: GVA
Office take-up by sector
Source: GVA
Business Services
Consumer Services
Financial Services
Public Services
Manufacturing & Industry
Professional Services
TMT & Creative
Undisclosed
10%
17%
8%
9%27%
21%
6% 2%
39
Occupier base
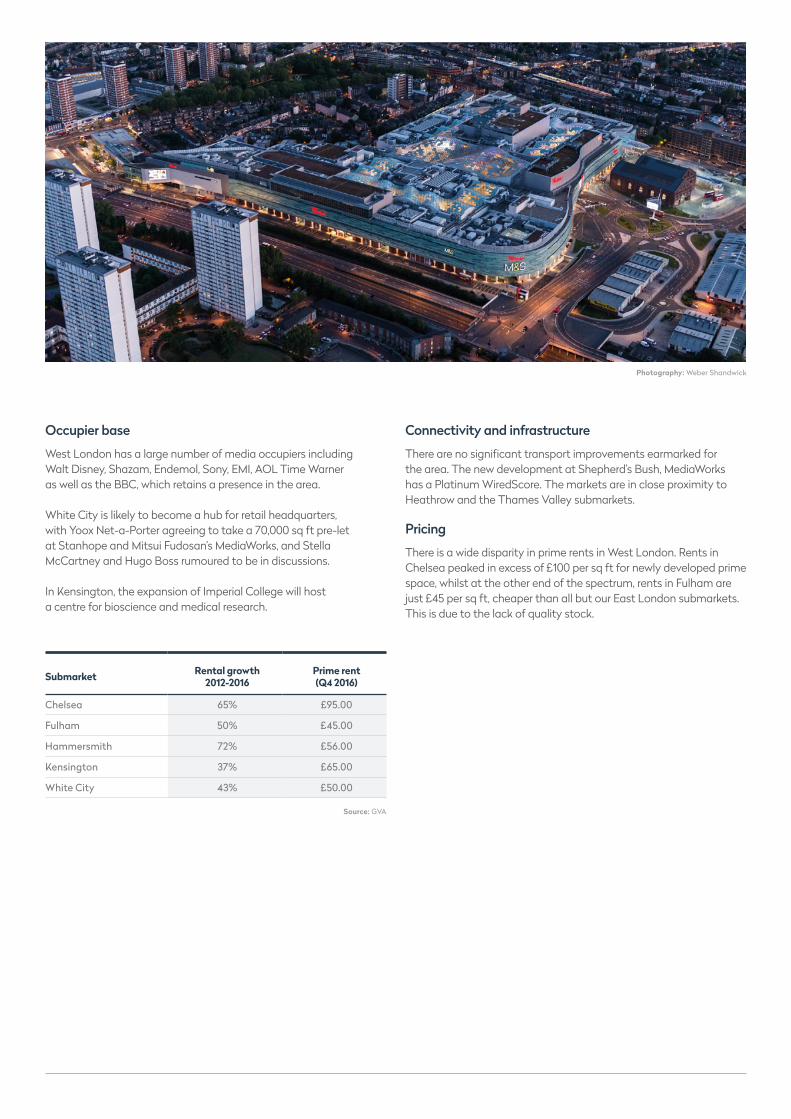
West London has a large number of media occupiers including Walt Disney, Shazam, Endemol, Sony, EMI, AOL Time Warner as well as the BBC, which retains a presence in the area.
White City is likely to become a hub for retail headquarters, with Yoox Net-a-Porter agreeing to take a 70,000 sq ft pre-let at Stanhope and Mitsui Fudosan’s MediaWorks, and Stella McCartney and Hugo Boss rumoured to be in discussions.
In Kensington, the expansion of Imperial College will host a centre for bioscience and medical research.
Connectivity and infrastructure
There are no significant transport improvements earmarked for the area. The new development at Shepherd’s Bush, MediaWorks has a Platinum WiredScore. The markets are in close proximity to Heathrow and the Thames Valley submarkets.
Pricing
There is a wide disparity in prime rents in West London. Rents in Chelsea peaked in excess of £100 per sq ft for newly developed prime space, whilst at the other end of the spectrum, rents in Fulham are just £45 per sq ft, cheaper than all but our East London submarkets. This is due to the lack of quality stock.
Submarket Rental growth 2012-2016
Prime rent (Q4 2016)
Chelsea 65% £95.00
Fulham 50% £45.00
Hammersmith 72% £56.00
Kensington 37% £65.00
White City 43% £50.00
Source: GVA
Photography: Weber Shandwick

Patrick O’Keeffe Head of London Agency and Investment Regional Senior Director – West End +44 (0)20 7911 2768 [email protected]
Ros Goode Regional Senior Director – London +44 (0)20 7911 2840 [email protected]
Daryl Perry Associate Research +44 (0)20 7911 2340 [email protected]
#evolvingcities
For further information please contact:
BirminghamBristolCardiffDublinEdinburghGlasgowLeedsLiverpoolLondonManchesterNewcastle
Our offices:
GVA 65 Gresham Street, London EC2V 7NQ
This report has been prepared by GVA for general information purposes only. Whilst GVA endeavours to ensure that the information in this report is correct it does not warrant completeness or accuracy. You should not rely on it without seeking professional advice. GVA assumes no responsibility for errors or omissions in this publication or other documents which are referenced by or linked to this report. To the maximum extent permitted by law and without limitation GVA excludes all representations, warranties and conditions relating to this report and the use of this report. All intellectual property rights are reserved and prior written permission is required from GVA to reproduce material contained in this report. GVA is the trading name of GVA Grimley Limited. ©GVA 2017.
11339


![Gdje smo i kuda ćemo u glasbi [Where we are and where are we going in music]](https://img.dokumen.tips/doc/110x75/63177b1be88f2a90c8012de9/gdje-smo-i-kuda-cemo-u-glasbi-where-we-are-and-where-are-we-going-in-music.jpg)


