Embed Size (px)
Citation preview

Page 1
LOCOMOTOR SENSORY ORGANIZATION TEST: A NOVEL PARADIGM FOR THE ASSESSMENT OF SENSORY CONTRIBUTIONS IN GAIT
Jung Hung Chien1,2, Diderik-Jan Anthony Eikema1, Mukul Mukherjee1, Nicholas
Stergiou1,2
1 Biomechanics Research Building
School of Health, Physical Education, and Recreation
University of Nebraska at Omaha
6160 University Dr.
Omaha, NE 68182
2 College of Public Health
Department of Environmental, Agricultural & Occupational Health
University of Nebraska Medical Center
984355 Nebraska Medical Center
Omaha, NE 68198
Abbreviated title: Locomotor Sensory Organization Test
Corresponding Author:
Nicholas Stergiou, PhD
Biomechanics Research Building, University of Nebraska at Omaha
6160 University Drive, Omaha, NE 68182
Phone: 402-554-3247
Fax: 402-554-3693
1234
5
6
7
8
9
10
11
12
13
14
15
16
17
18
19
20
21
22
23
24
25

Page 2
ABSTRACT
Feedback based balance control requires the integration of visual, proprioceptive and
vestibular input to detect the body’s movement within the environment. When the
accuracy of sensory signals is compromised, the system reorganizes the relative
contributions through a process of sensory recalibration, for upright postural stability to
be maintained. Whereas this process has been studied extensively in standing using the
Sensory Organization Test (SOT), less is known about these processes in more dynamic
tasks such as locomotion. In the present study, ten healthy young adults performed the six
conditions of the traditional SOT to quantify standing postural control when exposed to
sensory conflict. The same subjects performed these six conditions using a novel
experimental paradigm, the Locomotor SOT (LSOT), to study dynamic postural control
during walking under similar types of sensory conflict. To quantify postural control
during walking, the net Center of Pressure (netCOP) sway variability was used. This
corresponds to the performance index of the center of pressure (COP) trajectory, which is
used to quantify postural control during standing. Our results indicate that dynamic
balance control during locomotion in healthy individuals is affected by the systematic
manipulation of multisensory inputs. The sway variability patterns observed during
locomotion reflect similar balance performance with standing posture, indicating that
similar feedback processes may be involved. However, the contribution of visual input is
significantly increased during locomotion, compared to standing in similar sensory
conflict conditions. The increased visual gain in the LSOT conditions reflects the
importance of visual input for the control of locomotion. Since balance perturbations tend
to occur in dynamic tasks and in response to environmental constraints not present during
1
2
3
4
5
6
7
8
9
10
11
12
13
14
15
16
17
18
19
20
21
22
23

Page 3
the SOT, the LSOT may provide additional information for clinical evaluation on healthy
and deficient sensory processing.
Keywords: biomechanics, posture, sway variability, sensory organization test,
performance index, walking.
Abbreviations
LSOT – Locomotor Sensory Organization Test
SOT – Sensory Organization Test
netCOP – net Center of Pressure
PI – Performance Index
1
2
3
4
5
6
7
8
9
10

Page 4
Introduction
The maintenance of upright posture during standing and walking requires
integration of visual, somatosensory and vestibular inputs. Each of these inputs is
sensitive to particular characteristics of self-motion and motion within the environment
that uniquely contributes to the detection of postural sway. Upon sway detection, the
central nervous system initiates corrective postural adjustments by implementing the
appropriate muscular responses1. Inherent ambiguities in each of the modalities need to
be solved before sensory signals provide useful contributions. For example, the
somatosensory modality is unable to differentiate between movement of the support
surface and movement of the body. This ambiguity can be resolved through access to
visual information, which provides self-motion information independent of the support
surface. This solution process could be modeled following a Bayesian framework.
Sensory ambiguity leads to a broader probability curve of postural sway estimation and
uncertainty regarding necessary postural corrections when a single modality is involved.
When an additional sensory signal is available, the integrated signal leads to a more
precise estimation2-3 and subsequently more appropriate postural corrections. In
conditions of reduced sensory accuracy as a result of internal or external perturbations,
the system recalibrates sensory contributions, reciprocally lowering the gain of inaccurate
signals and increasing the gain of accurate signals1. Body sway and sway variability
increase when vision is absent, compared to standing with accurate visual input.
However, this increase is significantly lower than the degree of sway observed in
individuals with a reduced capacity for sensory reweighting4. Whereas the reported
1
2
3
4
5
6
7
8
9
10
11
12
13
14
15
16
17
18
19
20
21
22

Page 5
reweighting patterns have been observed during standing, similar sensory processes may
be involved in locomotion5.
In order to quantify sensory contributions and the adaptive mechanisms involved
in the control of posture during sensory conflict, the Sensory Organization Test (SOT)
has been used in patients with vestibular disorder6 - 8, concussion9, stroke10, and
Parkinson’s Disease11. Through the systematic manipulation of sensory input, the SOT
intends to perturb the system and induce adaptive sensory recalibration processes. It can
manipulate singly or in combination somatosensory and visual inputs to allow for the
assessment of a patient’s ability for maintaining balance11. It has been found that when
healthy adults stand on a firm surface with available visual input, sensory contributions
consisted of 70% somatosensory input, 20% vestibular input and 10% visual input12.
When somatosensory accuracy was reduced through support surface oscillations, sensory
recalibration changed the relative contributions to 70% vestibular information, 20%
visual information and 10% somatosensory information to maintain postural stability12.
Based on these results, the somatosensory and vestibular systems seem to be the
dominant sensory systems as compared to the visual system to achieve postural control
during standing12. Whereas this process has been studied extensively in standing, less is
known about whether similar strategies are also utilized to resolve sensory conflicts
during more dynamic situations of postural control such as walking.
Visual input during walking is uniquely capable of encoding task specific
information including travelled distances, navigation, planning walking trajectories and
perceiving environmental features13. When visual input was manipulated by prism
goggles in healthy young adults, subjects demonstrated a significant lateral deviation
1
2
3
4
5
6
7
8
9
10
11
12
13
14
15
16
17
18
19
20
21
22
23

Page 6
from their destination14. The somatosensory system also provides information about the
ground conditions during locomotion, such as the presence of slippery or icy surfaces.
Thies and colleagues (2005) indicated that individuals with peripheral neuropathy
increased step time and decreased step length when walking on an irregular surface as
compared to walking in a dim light condition15. These results suggest that the CNS might
have to recalibrate multisensory interactions in patients with inaccurate somatosensory
perception, by adjusting their gait patterns. Ishikawa and colleagues showed that patients
with unilateral vestibular disorders had an asymmetric walking pattern16 - 17. The
significantly shorter step length and longer swing time was observed on the side where
the vestibular system was affected. The same is observed using vestibular stimulation
during locomotion31. Adjusting step length and step time was suggested as a strategy to
maintain balance and prevent falling during locomotion18. Based on the above, it is
evident that a deficit in a sensory system can affect gait patterns and balance during
locomotion. However, a comprehensive study of how sensory information from all three
systems is integrated to achieve dynamic postural control during walking has not been
performed. It is possible that the reason for such a knowledge gap is the absence of an
experimental apparatus like the SOT for walking.
In the present study we developed and implemented an experimental apparatus,
consisting of an integrated instrumented multisensory virtual reality environment: the
Locomotor Sensory Organization Test (LSOT). This allowed for the assessment of
sensory contributions to the dynamic postural control during walking. We hypothesized
that dynamic postural control during walking would be affected by unimodal and
multimodal sensory perturbations, inducing sensory recalibration. In addition, we
1
2
3
4
5
6
7
8
9
10
11
12
13
14
15
16
17
18
19
20
21
22
23

Page 7
hypothesized that maintaining dynamic postural control during walking shares similar
feedback control mechanisms with maintaining postural control in standing, reflected in
similar postural sway behavior in the SOT and LSOT. Finally, we hypothesized that the
importance of vision in the locomotor task will significantly increase in postural
perturbations induced by visual conditions.
1
2
3
4
5

Page 8
Methods
Subjects
Ten healthy young adults (five males and five females; age 27.20±4.92 years,
height 171.30±7.01 cm and weight, 64.70±9.90 kg) participated in this study. Subjects
were free from any musculoskeletal impairments, had no history of significant lower
extremity injuries which may have affected their posture or gait and had no visual,
somatosensory or vestibular deficits. We excluded individuals without normal or
corrected to normal vision, scored above zero on the dizziness handicap inventory for a
vestibular deficit,30 and with any type of peripheral neuropathy that can affect
somatosensory function. Prior to the experiment, each subject signed an informed consent
approved by our University’s Medical Center Institutional Review Board.
Protocol
The experiment entailed exposing subjects to sensory perturbations in the SOT
and LSOT environments. The SOT was conducted in a quiet room using the Balance
Master System 8.4 (NeuroCom International Clackamas, OR, USA) (Figure 1). The
system contains a moveable visual surround and support surface that rotate in the
anterior-posterior (AP) plane. Two 22.9 x 45.7 cm force plates connected by a pin joint
are used to collect center of pressure data at 100 Hz. Foot placement is standardized
based on subjects’ height according to manufacturer guidelines. The SOT contains six
conditions to manipulate the combinations of visual, vestibular, and somatosensory
information used for postural control during standing. While standing in the Balance
1
2
3
4
5
6
7
8
9
10
11
12
13
14
15
16
17
18
19
20
21
22
23

Page 9
Master system, subjects wore a vest according to SOT procedures, attached to the safety
harness of the system.
The LSOT apparatus consisted of a virtual reality (VR) environment and an
instrumented treadmill containing two embedded force plates (Bertec Corp., Columbus,
OH, USA; Figure 2), integrated into a single system allowing for synchronized data
collection and stimulus presentation. A motion capture system (Optotak Certus; Northern
Digital Inc., Waterloo, Canada) was used to capture the three-dimensional marker
trajectories at a sampling rate of 100Hz. Active rigid body markers were placed on the
toe and heel of each leg. The unfiltered position data for the x, y, z coordinates were
exported using Optotrak Certus’ proprietary software. Data processing was performed
using custom Matlab code (Mathworks Inc., Natick, Massachusetts) for the calculation of
step length and step width. Ground reaction force data were acquired from the force
plates at 100 Hz. The Heel-Strike was considered to occur at the first frame in which the
vertical component of the ground reaction force exceeded a threshold level of 10N and
continuously exceeded this threshold for 40 ms. The Toe-Off was considered to occur at
the first frame in which the vertical component of the ground reaction force fell below the
10N threshold, sustained continuously for 40ms34-36. This 10N threshold was calculated as
three times the standard deviation of the vertical ground reaction force during the initial
100 ms (100 frames) of the trial34-36. A gait cycle was defined as the time elapsed between
two consecutive heel strikes of the ipsilateral leg.
The custom VR environment provided self-motion information through optic flow
manipulation and was written in Python using the WorldViz LLC graphics library (Santa
Barbara, CA, USA). The virtual environment was projected by three commercial
1
2
3
4
5
6
7
8
9
10
11
12
13
14
15
16
17
18
19
20
21
22
23

Page 10
projection systems (Optoma TX 774, Optoma Technology Inc., Milpitas, CA) on three
2.51 m x 1.72 m flat screens that were positioned 1.5 m away from the plane of motion.
The angle between side and middle screen was 120 deg. A moving virtual corridor was
projected onto the screen to generate the optic flow stimulus. Custom software, written in
Visual Basic (Microsoft Corp., Redmond, WA), was utilized to vary the treadmill speed
in real time. In order to manipulate vision, we used light intensity goggles (MSA Safety
Work, Pittsburgh, PA) which reduced the light intensity from 22 lux to 0.7 lux. The
LSOT contained six conditions similar to the SOT to manipulate the visual, vestibular,
and somatosensory information during walking (Figure 3). In order to increase safety
while on the treadmill, subjects also wore the same SOT vest, attached to a LiteGait
harness system (Mobility Research, AZ, USA).
Subjects were required to complete all SOT and LSOT conditions in a single
session. Subjects first completed the SOT conditions, followed by the LSOT conditions.
Experimenters explicitly instructed subjects to “try your best to keep your balance”
during the SOT and LSOT conditions. For the SOT, subjects were positioned standing
upright on the Balance Master. Each SOT condition followed a standard protocol of three
trials lasting 20 seconds each and the sequence of conditions given to subjects followed a
predetermined order (conditions 1 - 6). Between the SOT conditions, subjects received a
30 seconds rest period. For the LSOT, prior to the data collection each subject walked for
five minutes on the treadmill to determine their preferred walking speed (PWS). Subjects
stood on the sides of the treadmill without touching the belts. Subsequently, treadmill belt
velocity was incremented from 0 to 0.8 m/s. Then the subject were asked to step on
treadmill while holding the handrail. After the subject started walking on the treadmill,
1
2
3
4
5
6
7
8
9
10
11
12
13
14
15
16
17
18
19
20
21
22
23

Page 11
experimenters asked the subject to evaluate the speed as following: “Is this walking speed
comfortable like walking around the grocery store?” The treadmill velocity was increased
or decreased, following subject directions. Once a comfortable walking velocity was
attained, the subject walked continuously for 5 minutes. After the PWS was determined,
all subjects walked on the treadmill at their PWS for two minutes in each of the six
conditions of the LSOT and each LSOT condition was matched to its respective SOT
counterpart and sequence. The LSOT conditions were the following:
1) Normal walking condition: both the speed of the virtual corridor and the
treadmill speed were matched with PWS.
2) Reduced visual condition: no VR was presented, the treadmill speed matched
with PWS, and the subjects wore vision-reduced goggles.
3) Perturbed visual condition, achieved by manipulating the optic flow speed: the
speed of the virtual corridor was pseudo-randomly varied between 80% and 120%
(restricted randomization between 80% and 120% in steps of 1) of the selected PWS in
pseudo-randomly assigned time intervals within 1 to 10 seconds (restricted randomization
between 1 and 10 in steps of 1). Such a range was used in previous studies to manipulate
walking speed19-20. Moreover, we gave 1 to 10 seconds time intervals of perturbations to
reduce adaptation of walking in the perturbed environment. The treadmill speed matched
with PWS.
4) Perturbed somatosensory condition by manipulating the treadmill speed: the
speed of the virtual corridor matched with PWS, while the treadmill speed was varied
between 80% and 120% of the PWS in pseudo-randomly assigned time intervals within 1
to 10 seconds. Walking speed is highly associated with the sensitivity of somatosensory
1
2
3
4
5
6
7
8
9
10
11
12
13
14
15
16
17
18
19
20
21
22
23

Page 12
system31 and is very crucial during stance-to-swing transition33. Changing walking speeds
immediately affects the time of stance-to-swing transition. This is why fast walking is an
excellent selection for quantifying somatosensory impairment32 and why walking speed
has been used in the present study for our somatosensory perturbation31-33.
5) Perturbed visual and somatosensory condition by reducing vision and
manipulating treadmill speed: no VR was presented, the treadmill speed was varied
between 80% and 120% of PWS in pseudo-randomly assigned time interval within 1 to
10 seconds, and the subjects wore vision-reduced goggles.
6) Perturbed visual and somatosensory condition by manipulating optic flow and
treadmill speed: both the speed of the virtual corridor and the treadmill speed was varied
between 80% and 120% of the selected PWS in pseudo-randomly assigned time intervals
of 1 to 10 seconds duration. In this condition the velocity of the virtual corridor and
treadmill were synchronized with a unitary gain relationship.
Subjects were allowed to rest for one minute with eyes-closed between
conditions. Optic flow and treadmill speed were varied between 80 to 120%, as the
impact of different walking speeds on gait variability was conventionally investigated in
this range19-20. Indeed, the amount of gait variability has shown a negative linear
correlation with different walking speeds in this range in healthy young adults. However,
literature also indicated that over 120% of PWS, muscle activity had a significant jump in
comparison with the muscle activity at 120% of PWS21.
Data Analysis
1
2
3
4
5
6
7
8
9
10
11
12
13
14
15
16
17
18
19
20
21
22

Page 13
Postural performance was assessed using the Performance Index (PI). This metric
was used to determine the extent to which sway approached the body’s stability limits
during standing and walking4. The calculation method of the PI is conceptually similar to
the standard deviation. The PI is calculated by numerically integrating the rectified sway
signal (with the steady-state offset removed), and then scaling the result as a percentage
of the maximum sway possible during standing. A PI value approaching zero indicates
stable postural control. PI values that approach 100 indicate loss of balance. The PI
allowed us to compare postural performance and assess sensory contributions during
standing22. The PIs in both the AP and medial-lateral (ML) directions were calculated in
this study for the SOT.
PI=∑ ¿COP position∈each frame−originCOP position∨ ¿MaxCOP sway position−originCOP position
¿
(1)
For walking and the LSOT, the ground reaction force data were low-pass filtered
at 10Hz (with a 4th order Butterworth filter). The netCOP sway variability metric was
calculated using the filtered data. The netCOP is the point where the total sum of a
pressure field acts on a body during walking23. The netCOP measure allows for a direct
comparison of the COP measures between standing and locomotion. The netCOP
variable requires the identification of four specific netCOP points: right heel strike
(RHS), left heel strike (LHS), right toe-off (RTO), and left toe-off (LTO). These four
points were defined by using the data from the instrumented treadmill. The right leg heel
strike was defined as the largest positive value in the anterior-posterior direction and
largest positive value in the medial-lateral direction per gait cycle. The left leg heel strike
1
2
3
4
5
6
7
8
9
10
11
12
13
14
15
16
17
18
19
20
21
22
23

Page 14
was defined as the largest positive value in the anterior-posterior direction and largest
negative value in the medial-lateral direction per gait cycle. The right toe off was defined
as the largest negative value in the anterior-posterior direction and largest positive value
in the medial-lateral position per gait cycle. The left toe off was defined as the largest
negative value in the anterior-posterior direction and largest negative value in the medial-
lateral position per gait cycle (Figure 4). In order to estimate the postural sway during
walking, we calculated the netCOP area by calculating the two area triangles created.
One triangle consisted of the LHS, LTO, and intersection point between the two triangles.
The other consisted of the RHS, RTO, and intersection point. We then added these two
triangles to find the total area of netCOP for one gait cycle. The mean and the standard
deviation for each subject were calculated by averaging all 90 gait cycles. Then, the
netCOP sway variability was calculated as the coefficient of variation for each subject. In
the current study, 90 gait cycles were used to calculate the netCOP sway variability for
each subject. This was the lowest number of gait cycles performed by the slowest subject
within the two minutes of data collection. Thus all data were truncated to 90 gait cycles
per subject. The smaller the netCOP sway variability, the better the dynamic postural
control during walking. This approach in terms of interpretation, it is the same that is
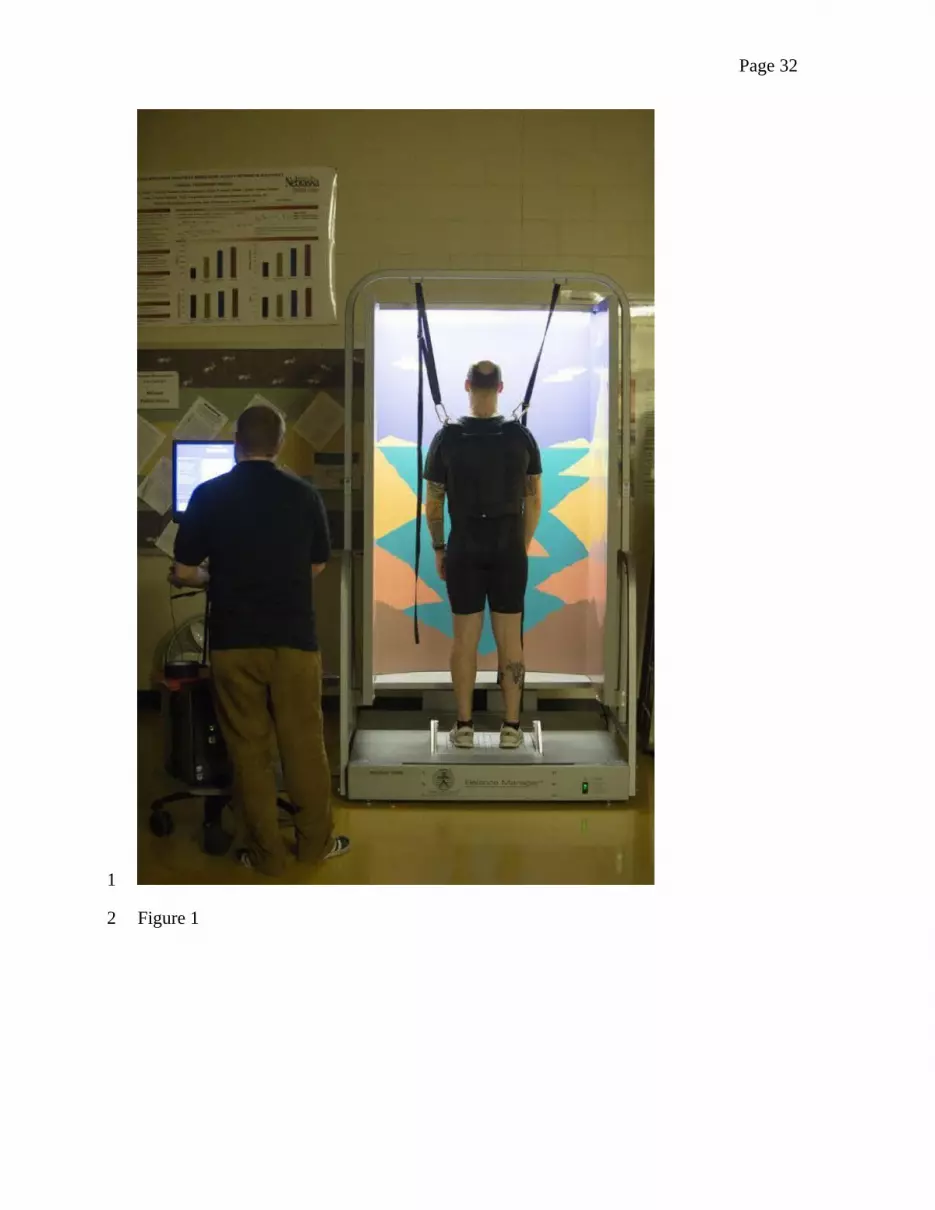
given to the SOT outcome measure. Figures 5 and 6 include trials of all SOT and LSOT
conditions to demonstrate how the variables of interest changed due to the perturbations
presented.
Step length and step width were determined based on the heel-strike and toe-off.
Step length was defined as the distance between heel strike and subsequent heel strike of
the contralateral foot. Step width was defined as the mediolateral distance between heel
1
2
3
4
5
6
7
8
9
10
11
12
13
14
15
16
17
18
19
20
21
22
23

Page 15
markers at successive heel strikes. Step length, and step width variability were defined as
the coefficient of variation of these spatial parameters to determine how spatial
parameters shifted during walking.
One-way repeated measures ANOVA’s were performed using SPSS 18.0 (IBM
Corporation, Somers, NY) to determine condition effects for the LSOT and SOT.
Specifically, the dependent measures were: a) the PI for the SOT in the anterior-posterior
(AP) direction, b) the PI for the SOT in the mediolateral (ML) direction, c) the spatial
parameters (step length, and step width) for the LSOT, d) the spatial parameters
variability (step length and step width variability), and e) the netCOP sway variability for
the LSOT (as derived from an area and not a length contains both the AP and ML
directions). Pairwise comparisons were performed to determine specific differences
between conditions using Bonferroni adjustments. The level of significance was set at
0.05.
1
2
3
4
5
6
7
8
9
10
11
12
13
14

Page 16
Results
Anterior-posterior PI in the SOT
The one-way repeated ANOVA revealed a significant condition effect (F = 55.38,
p < 0.001) (Table 1). The post-hoc pairwise comparisons revealed numerous differences
between conditions. The conditions 1, 2, and 3 were statistically similar, while the group
mean values increased significantly in conditions 4, 5 and 6. The largest group mean
value was present in condition 5 (eyes closed with sway-referenced surface), followed by
condition 6 (eyes open with sway-referenced surface and visual surroundings). However,
there was no significant difference between conditions 5 and 6 (p = 0.081).
Medial-lateral PI in the SOT
The one-way repeated ANOVA revealed a significant condition effect (F = 21.06,
p < 0.001) (Table 1). The pairwise comparisons revealed similar results with the AP
direction, however, this time the largest group mean value by a very small non-significant
margin was in the sixth condition. The group mean values were all smaller than the AP.
Spatial parameters in the LSOT
The one-way repeated ANOVA revealed a significant condition effect for step
length (F = 12.7, p < 0.001) and step width (F = 4.47, p = 0.002). The post-hoc analysis
showed that the step length was statistically longer in condition 1 than conditions 2, 5,
and 6 (Table 1). However for step width and due to the Bonferroni adjustment the post-
hoc pairwise comparisons did not show any statistically differences between conditions.
12
3
4
5
6
7
8
9
10
11
12
13
14
15
16
17
18
19
20
21
22
23
24

Page 17
Spatial parameters variability in the LSOT
The one-way repeated ANOVA showed a significant condition effect in step
length (F = 36.37, p < 0.001) and in step width (F = 10.52, p < 0.001). The post-hoc
pairwise comparisons showed that the step length variability was statistically smaller in
condition 1 than conditions 2, 4, 5, and 6 (Table 1). For step width variability, condition 1
was statistically smaller than condition 2, 3, 4, 5, and 6 (Table 1).
Sway variability in the LSOT
The one-way repeated ANOVA revealed a significant condition effect (F = 24.79,
p < 0.001) (Table 1). Subsequent pairwise comparisons revealed numerous significant
differences (Table 1). The group mean netCOP value for condition 1 was significantly
smaller than the other conditions. In addition, condition 5 (reduced visual information,
variable treadmill velocity) had the largest group mean value. Condition 6 (variable optic
flow and variable treadmill velocity) displayed the second largest group mean value. The
third largest value was for condition 2 (reduced visual information, treadmill speed
matched with PWS).
1
2
3
4
5
6
7
8
9
10
11
12
13
14
15
16
17

Page 18
Discussion
In the present study we investigated how individuals recalibrate sensory
contributions to locomotion in conditions of ambiguous sensory inputs. The LSOT, a
novel experimental paradigm, was developed to study sensory contributions to dynamic
postural control during walking. Our results supported our first hypotheses that walking
would be affected by unimodal and multimodal sensory perturbations, inducing sensory
recalibration. However, our results partially supported our second hypotheses that
maintaining dynamic postural control during walking shares similar feedback control
mechanisms with maintaining postural control in standing, as postural sway was similar
between the two tasks only when visual and somatosensory systems were perturbed
simultaneously. Finally, the result supported the hypothesis that vision will be the
dominant sensory system during walking.
Specifically, the significant differences found between conditions for the netCOP
values in the LSOT supported our first hypothesis (Table 1), indicating the LSOT can be
used to elicit systematic sensory recalibration processes. Importantly, our results almost
mirrored those found at the SOT, particularly in the AP direction (Table 1). This direction
is the dominant direction of sway movement during the SOT, since the perturbations are
presented in the AP direction (see Table 1). The PI values in the various perturbation
conditions conform to what is commonly reported in the literature4. The similarities
between the SOT and LSOT results suggest that similar feedback based perceptual
mechanisms could be involved. However, contrary to the SOT results, the LSOT also
resulted in significantly increased variability when vision was reduced, reflecting the
importance of visual input during locomotion.
1
2
3
4
5
6
7
8
9
10
11
12
13
14
15
16
17
18
19
20
21
22
23

Page 19
During standing, our findings showed that the combination of perturbed visual
and somatosensory inputs resulted in much larger reliance on the vestibular system
resulting in significantly increased levels of COP variability. This also appears to be the
case in walking. However, the effect of visual input on walking is more clearly
demonstrated when it is reduced (condition 2) while somatosensory input is not
perturbed. This condition produced the only practical difference between the SOT and the
LSOT and demonstrated a much larger effect in the LSOT. The LSOT conditions 2 and 5
provide a particularly interesting perspective on sensory contributions to locomotion. In
the control of upright posture, vision provides indispensable positional information and is
the only modality containing the functional organization to allow for this type of
contribution. Neither vestibular nor somatosensory input is sufficient to provide
positional information during locomotion. In conditions of reduced vision, subjects have
limited information of their location on the treadmill. This reduction in positional
information may have resulted in a positional drift towards the front or back edges of the
treadmill. Theoretically, if subjects walked on the treadmill and had positional drift
towards the front and back, the variability should be bigger in the sensory conflicted
conditions than the normal conditions. The results we provided in terms of step length
and width variability indicated that subjects indeed shift front and back and left and right,
in a greater extend in the sensory-conflicted conditions than in the normal walking
condition. The corrective motions employed when the limits of the treadmill are reached
increased the degree of variability of the netCOP since the netCOP area varies as a
function of the stride length on the treadmill. Such large excursions on the treadmill
remain unperceived by the vestibular sense, which lacks the sensitivity to detect this type
1
2
3
4
5
6
7
8
9
10
11
12
13
14
15
16
17
18
19
20
21
22
23

Page 20
of drift2. From a Bayesian perspective, uncertainty in dynamic postural control during
walking significantly increases, as vision capacity which is the primary source of
stabilizing sensory input, is reduced. Similar observations have been made in step
variability patterns in individuals afflicted with peripheral neuropathy under low light
environmental conditions24.
In persons with peripheral neuropathy, gait variability significantly increased on
irregular surfaces under the low lighting condition as compared to walking on a level
surface under regular lighting condition. The somatosensory perturbation of the irregular
support surface increased vestibular gain, which is less effective for the task of feedback
control of posture and gait variability. Similarly, in the current study the combined
perturbation conditions were implemented to investigate the vestibular control of
locomotion. Walking is a complicated behavior involving coordination of multiple
systems within the body and the sensory system provides reliable environmental
information to these systems25. As controlled by visual and vestibular perception, the
primary role of intersegmental postural coordination is the stabilization of the head in
space. This is why both visual and vestibular rotational stimuli lead to balance responses
in the roll plane, the magnitude of which decreases from proximal to distal segments.
Subsequently, during constant rotational stimuli the head consistently displays the largest
coupled angular deviation, followed by the torso and peripheral effectors26-27. We found
that netCOP variability significantly increased when walking with both the visual and
somatosensory input perturbed as compared to other sensory conflicted conditions. When
only the vestibular system was reliable, subjects increased the netCOP area sway
variability to maintain dynamic postural control.
1
2
3
4
5
6
7
8
9
10
11
12
13
14
15
16
17
18
19
20
21
22
23

Page 21
Do the mechanisms governing the control of both standing and walking share
commonalities in terms of maintaining balance? It has been argued that the control
mechanisms used to maintain balance during walking is quite different and complicated
from those used during standing because the center of gravity during walking is always
outside the base of support26. Further, O’Connor and Kuo (2009) stated that the
fundamental mechanism to control walking posture may be different from standing
posture28. They supported this statement with the observation that posture was more
sensitive to visual stimuli in the frontal plane than in the sagittal plane during walking.
For standing, the visual stimuli affected the postural control only in the sagittal plane and
not in the frontal plane. Our results were line with their study in terms of walking where
giving visual perturbation led to higher variability in the frontal plane than in the sagittal
plane. However, when multiple sensory systems are perturbed concurrently, the
mechanism to control walking and standing posture may be the same since spatial
variability increased in both the frontal and sagittal plane in our study. Moreover, the
overall netCOP sway variability significantly increased in these multiple sensory
conflicting conditions. Based on a Bayesian perspective,2-3 multiple sensory conflicting
conditions resulted in an increased uncertainty of the system to maintain postural control
regardless of the task; standing or walking. This is why our results partially supported our
second hypothesis that a degree of similarity of control mechanism exists between
maintaining dynamic postural control during walking and maintaining postural control in
standing.
Interestingly, when we compared conditions 1,2, 3 and 4 during walking, we
found no significant differences between conditions 2, 3, and 4, while all three of them
1
2
3
4
5
6
7
8
9
10
11
12
13
14
15
16
17
18
19
20
21
22
23

Page 22
were different than condition 1. This result may indicate that for walking both the visual
and the somatosensory system have significant contributions when perturbed singly.
However, this was not the case during standing where conditions 1, 2, and 3 were not
significantly different from each other, while all of them were significantly different from
condition 4. This result may indicate that for standing, visual information is not as
important as somatosensory information when manipulated singly. This is a very
interesting dichotomy between the two tasks that is revealed by the examination of the
non-significant results and this is why we have partially supported our second hypothesis.
Practically, our results point to the importance of visual information during walking as
the continuous assessment of our surroundings is fundamental to maintain postural
control. By factoring out vision during walking, we can suggest that the two tasks share
similar sensory contributions to postural control.
Our step width results were similar to those reported by Altman et al29, confirming
that a split belt treadmill could cause people to walk with wider steps. In the O’Connor
and Kuo study, the authors did not use a split belt treadmill and their dependent measure
was a modified step width parameter. This may affect direct comparison between our
results and theirs with respect to step width. Furthermore, in the O’Connor and Kuo’s
study, the dependent measures used were the discrete foot placement during walking and
the continuous COP trajectory during standing. The selection of these parameters could
be a limitation of their paper, when standing and walking are compared, as these
parameters are quite different in nature (discrete versus continuous). In our study, we
used in both standing and walking continuous measurements to quantify postural control.
To our knowledge this is also the first study that attempted to mimic the SOT paradigm in
1
2
3
4
5
6
7
8
9
10
11
12
13
14
15
16
17
18
19
20
21
22
23

Page 23
walking. In the current study, we found that increasing the amount of sway variability
seems to be a consistent strategy in standing and walking regarding the sensory
conflicting conditions. This was actually similar to O’Connor and Kuo’s work. We also
found that in conditions 5 and 6, the variability significantly increased in both walking
and standing. Thus, we believe that the control mechanisms of standing and walking
share a certain degree of similarity.
A possible limitation of the present study is the type of somatosensory
perturbation used for the LSOT; variable speeds. This is not identical to the tilting ground
perturbation used in the SOT. Thus, it can be argued that changing gait speed not only
alters somatosensory input, but also vestibular system input and the mechanical,
metabolic and general physiological demand placed on the subjects. However, variable
ground tilting during walking would have been a very difficult perturbation to be
achieved during walking and such technology is extremely expensive to have any type of
clinical applicability at present. Our designed perturbation, namely varying speeds, as we
explained in the methods does affect the somatosensory system based on the available
literature. On the other hand tilting the ground, as in the SOT somatosensory condition,
could possibly also affect the vestibular system by disturbing the torso dynamics resulting
in head movement37. Another possible limitation of the present study is that tactile
sensation is also available from the safety harness. We attempted to reduce this effect by
asking subjects not to hold onto the harness and by adjusting the harness to achieve
maximum possible comfort. The safety harness is also included in the standard clinical
SOT procedures and thus the utilization of such a harness in our experimental design did
improve external validity.
1
2
3
4
5
6
7
8
9
10
11
12
13
14
15
16
17
18
19
20
21
22
23

Page 24
In conclusion, the LSOT results demonstrated that a degree of similarity exists in
postural control mechanisms that are active during standing and walking in healthy
individuals. The primary difference between them appears to be the nature of the visual
contribution. Vision uniquely provides positional information during locomotion. In
healthy individuals, compensation by somatosensory mechanisms is more effective
during standing, as reflected in a relatively minor increase in COP variability. In
locomotion on the other hand, the visual perturbation significantly increased variability.
Thus this phenomenon of increased importance of unimodal visual over somatosensory
input during locomotion is the inverse of what is observed during standing. SOT has been
widely used to examine feedback based postural control during standing and these results
have been generalized to infer postural control during walking. However, the LSOT was
specifically designed to explore postural control mechanisms during walking and
revealed additional patterns of multisensory interactions, not reflected in performance on
the SOT. As falls tend to occur in dynamic tasks and in response to environmental
constraints not present during the SOT, the LSOT may provide additional information on
healthy and deficient sensory processing.
Acknowledgments
This study was supported by the NASA EPSCoR NNX11AM06A.
1
2
3
4
5
6
7
8
9
10
11
12
13
14
15
16
17
18
19
20

Page 25
References
1. Day, BL. and Cole J. Vestibular-evoked postural responses in the absence of somatosensory information. Brain 125(Pt 9): 2081-8, 2002.
2. Ernst, MO, Banks, MS. Humans integrate visual and haptic information in a statistically optimal fashion. Nature, 415(6870):429-33, 2002.
3. Fetsch, CR, Turner, AH, DeAngelis, GC, Angelaki, DE, Dynamic reweighting of visual and vestibular cues during self-motion perception. J Neurosci, 29(49):15601-12, 2009.
4. Black, F.O., Shupert C.L., Horak F.B., Nashner L.M. Abnormal postural control associated with peripheral vestibular disorders. Prog Brain Res 76:263-75, 1988.
5. Gruhn M., Zehl L., Buschges A. Straight walking and turning on a slippery surface. J Exp Biol. 212:194-209, 2009.
6. Rossi-Izquierdo M., Santos-Pérez S., Soto-Varela A. What is the most effective vestibular rehabilitation technique in patients with unilateral peripheral vestibular disorders? Eur Arch Otorhinolaryngol. 268(11): 1569-74, 2011.
7. Donaldson CJ, Hoffer ME, Balough BJ, Gottshall KR. Prognostic assessments of medical therapy and vestibular testing in post-traumatic migraine-associated dizziness patients. Otolaryngol Head Neck Surg. 143(6): 820-5, 2010.
8. Parietti-Winkler C, Gauchard GC, Simon C, Perrin PP. Pre-operative vestibular pattern and balance compensation after vestibular schwannoma surgery. Neuroscience. 72: 285-92, 2011.
9. Cavanaugh J.T., Guskiewicz K.M., Giuliani C., Marshall S., Mercer V., Stergiou N. Detecting altered postural control after cerebral concussion in athletes with normal postural stability. Br J Sports Med. 9(11): 805-11, 2005.
10. Smania N., Picelli A., Gandolfi M., Fiaschi A., Tinazzi M. Rehabilitation of sensorimotor integration deficits in balance impairment of patients with stroke hemiparesis: a before/after pilot study. Neurol Sci. 29(5): 313-9, 2008.
11. Nocera J., Horvat M., Ray C.T. Effects of home-based exercise on postural control and sensory organization in individuals with Parkinson disease. Parkinsonism Relat Disord. 15(10): 742-5, 2009.
12. Peterka RJ. Sensorimotor integration in human postural control. J Neurophysiol. 88(3): 1097-118, 2002.
13. Patla A.E, Tomescu S.S, Ishac M.G. What visual information is used for navigation around obstacles in a cluttered environment? Can J Physiol Pharmacol. 82(8-9): 682-92, 2004.
14. Alexander M.S., Flodin B.W., Marigold D.S. Prism adaptation and generalization during visually guided locomotor tasks. J Neurophysiol. 106(2): 860-71, 2011.
15. Thies S.B., Richardson J.K., Ashton-Miller J.A. Effects of surface irregularity and lighting on step variability during gait: a study in healthy young and older women. Gait Posture. 22(1): 26-31, 2005.
16. Ishikawa K., Edo M., Yokomizo M., Terada N., Okamoto Y., Togawa K. (1994). Analysis of gait in patients with peripheral vestibular disorders. ORL J Otorhinolaryngol Relat Spec. 56(6): 325-30.
1
23456789
10111213141516171819202122232425262728293031323334353637383940414243

Page 26
17. Ishikawa K., Edo M., Yokomizo M., Togawa K. Characteristics of human gait related variables in association with vestibular system disorders. Acta Otolaryngol Suppl. 520 Pt 1:199-201, 1995.
18. Patla A.E., Prentice S.D., Rietdyk S., Allard F., Martin C. What guides the selection of alternate foot placement during locomotion in humans? Exp Brain Res. 128(4): 441-50, 1999.
19. Jordan K., Challis J.H., Newell K.M. Walking speed influences on gait cycle variability. Gait Posture. 26(1): 128-34, 2007.
20. Jordan K., Newell K.M. The structure of variability in human walking and running is speed-dependent. Exerc Sport Sci Rev. 36(4): 200-4, 2008.
21. Chung, MJ, Wang, MJ. The change of gait parameters during walking at different percentage of preferred waling speed for healthy adults aged 20-60 years. Gait Posture. 31(1):131-5. 2010.
22. Black F.O, Shupert C.L, Peterka R.J, Nashner L.M. Effects of unilateral loss of vestibular function on the vestibule-ocular reflex and postural control. Ann Otol Rhinol Laryngol., 98(11): 884-889, 1989.
23. Mawase F., Haizler T., Bar-Haim S., and Karniel A. Kinetic adaptation during locomotion on a split-belt treadmill. J Neurophysiol. 109: 2216-2227, 2013.
24. Thies S.B., Richardson J.K., Demott T., Ashton-Miller J.A. Influence of an irregular surface and low light on the step variability of patients with peripheral neuropathy during level gait. Gait Posture. 22(1): 40-5, 2005.
25. Callisaya M. L., Blizzard L., McGinley J. L., Schmidt M. D., Srikanth V. K. Sensorimotor factors affecting gait variability in older people – a population-based study. J Gerontol A Biol Sci Med Sci. 65(4): 386-92, 2010.
26. Wardman D. L., Taylor J. L., Fitzpatrick R. C. Effect of galvanic vestibular stimulation on human posture and perception while standing. J Physiol. 551(Pt 3): 1033-42, 2003.
27. Berard J. R., Fung J., Lamontagne A. Evidence for the use of rotational optic flow cues for locomotor steering in healthy older adults. J Neurophysiol. 106(3): 1089-96, 2011.
28. O’ Conner S., Kuo A.D., Direction-Dependent control of balance during walking and standing. J Neurophysiol. 102: 1411-1419, 2009.
29. Altman A.R., Reisman D.S., Higginson J.S., Davis I.S. Kinematic comparison of split-belt and single-belt treadmill walking and the effects of accommodation. Gait and posture. 35: 287-291, 2012.
30. Jacobson G.P, Newman C. W. The development of the Dizziness Handicap Inventory. Arch Otolanryngol Head Surg. 116: 424-427, 1990.
31. Deshpande N, Metter E.J, Ferrucci L. Validity of clinically derived cumulative somatosensory impairment index. Arch Phys Med Rehabil. 91(2): 226-32. 2010.
32. Deshpande N, Ferrucci L, Metter J. Faulkner KA, Strotmeyer E, Satterfield S, Schwartz A, Simonsick E. Association of lower limb cutaneous sensitivity with gait speed in the elderly: the health ABC study. Am J Phys Med Rehabil. 87(11): 921-8, 2008.
33. Pearson KG. Proprioceptive regulation of locomotion. Current Opinion in Neurobiology. 5:786-791. 1995
123456789
101112131415161718192021222324252627282930313233343536373839404142434445

Page 27
34. Kiss RM. Comparison between kinematic and ground reaction force techniques for determining gait events during treadmill walking at different speeds. Med Eng Phys. 32(6): 662-7. 2010.
35. Zeni JA Jr, Richards JG, Higginson JS. Two simple methods for determining gait events during treadmill and overground walking using kinematic data. Gait Posture. 27(4): 710-4. 2008.
36. Mickelborough J, van der Linden ML, Richards J, Ennos AR. Validity and reliability of a kinematic protocol for determining foot contact events. Gait Posture. 11(1): 32-7. 2000.
37. Mergner T, Schweigart G, Fennell L, and Maurer. Posture control in vestibular-loss patients. Ann N Y acad Sci. 1164:206-15. 2009.
123456789
101112

Page 28
Tables, Figures and Captions
Table Captions
Table 1: Group means and standard deviations for all conditions for the 7 dependent
measures evaluated. Significant differences between conditions are indicated with
superscripts.
1
2
3
4
5
6

Page 29
Captions to Figures
Figure 1. The SMART balance Master (NeuroCom International Clackamas, OR, USA)
is used to perform the Sensory Organization Test (SOT). This test contains six
conditions: 1) eyes open with fixed surface and fixed visual surrounding; 2) eyes closed
with fixed surface; 3) eyes open with fixed surface and sway-referenced visual
surroundings; 4) eyes open with sway-referenced surface and fixed visual surroundings;
5) eyes closed with sway-referenced surface; 6) eye open with sway-referenced surface
and visual surroundings.
Figure 2. The components of Locomotor Sensory Organization Test (LSOT): virtual
reality and the instrumented treadmill.
Figure 3. The six conditions of Locomotor Sensory Organization Test (LSOT) that
mirrors those of the SOT: 1) normal walking condition 2) Reduced visual condition by
reducing vision capability condition 3) Perturbed visual condition by manipulating optic
flow speed condition 4) Perturbed somatosensory condition by manipulating treadmill
speed condition 5) Perturbed visual and somatosensory condition by reducing vision
capability and manipulating treadmill speed condition and 6) Perturbed visual and
somatosensory condition by manipulating optic flow and treadmill speed condition.
Figure 4. The netCOP sway area was composed by two-triangle areas that are
represented as the areas with dashed lines. Five points was used to generate these two-
triangle areas as following: intersection point, right heel-strike, right toe-off, left heel-
strike, left toe-off.
Figure 5. Representative trials from a single subject from the six SOT conditions -- the
COP sway in the six conditions for the SOT during standing.
1
2
3
4
5
6
7
8
9
10
11
12
13
14
15
16
17
18
19
20
21
22
23

Page 30
Figure 6. Representative trials from a single subject from the six LSOT conditions -- the
netCOP sway in the six conditions for the LSOT during walking.
1
2
3

Page 31
Table 1.
Conditions 1 2 3 4 5 6
PI in AP for SOT 7.26(1.41)$^& 9.18(2.94)$^& 9.36(2.72)$^& 17.56(5.01)*!#^& 38.10(12.72)*!#$ 28.64(10.59)*!#$
PI in ML for SOT 5.09(2.28)$^& 5.27(2.45)^& 5.44(2.37)^& 8.86(4.04)* 11.22(2.09)*!# 11.41(2.44)*!#
Step Length for LSOT (m) 0.58(0.05)!^& 0.49(0.07)*$ 0.53(0.07) 0.53(0.05)!^ 0.47(0.05)*^ 0.46(0.04)*
Step Width for LSOT (m) 0.19(0.07) 0.22(0.06) 0.24(0.03) 0.24(0.04) 0.28(0.06) 0.28(0.07)
Step Length Variability for
LSOT 2.96(0.87)!$^& 4.59(0.89)*#^& 2.23(0.48)!$^& 5.78(1.12)*# 7.92(2.02)*!# 6.36(0.69) *!#
Step width Variability for
LSOT 15.6(2.69) !#$^& 27.21(8.79)* 24.47(5.51)* 25.23(5.63)* 31.29(5.74)* 30.07(7.55)*
netCOP sway variability for
LSOT5.30(0.67)!#$^& 13.13(3.74)*^ 9.21(2.47)*^& 10.63(1.99)*^& 20.99(6.31)*!#$ 15.78(5.04)*#$
1. *: significant difference exhibited when compared to condition 1.2. !: significant difference exhibited when compared to condition 2.3. #: significant difference exhibited when compared to condition 3. 4. $: significant difference exhibited when compared to condition 4.5. ^: significant difference exhibited when compared to condition 5.6. &: significant difference exhibited when compared to condition 6.
1
234567
Page 32
Figure 1
1
2

Page 33
Figure 2
1
2

Page 34
Figure 3
1
2

Page 35
Figure 4
1
2
3
Page 36
Figure 5
1
2

Page 37
Figure 6
1
2
3