Embed Size (px)
Citation preview

Phil. Trans. R. Soc. A (2012) 370, 1376–1399doi:10.1098/rsta.2011.0257
Local structures of mesoporous bioactive glassesand their surface alterations in vitro:
inferences from solid-state nuclearmagnetic resonance
BY PHILIPS N. GUNAWIDJAJA1, RENNY MATHEW1, ANDY Y. H. LO1,ISABEL IZQUIERDO-BARBA2,3, ANA GARCÍA2,3, DANIEL ARCOS2,3,
MARíA VALLET-REGÍ2,3 AND MATTIAS EDÉN1,*1Physical Chemistry Division, Department of Materials and Environmental
Chemistry, Arrhenius Laboratory, Stockholm University,106 91 Stockholm, Sweden
2Departamento de Química Inorgánica y Bioinorgánica, Facultad de Farmacia,Universidad Complutense de Madrid, 28040 Madrid, Spain
3Networking Research Center on Bioengineering, Biomaterials andNanomedicine (CIBER-BBN), Madrid, Spain
We review the benefits of using 29Si and 1H magic angle spinning (MAS) nuclear magneticresonance (NMR) spectroscopy for probing the local structures of both bulk and surfaceportions of mesoporous bioactive glasses (MBGs) of the CaO–SiO2−(P2O5) system.These mesoporous materials exhibit an ordered pore arrangement, and are promisingcandidates for improved bone and tooth implants. We discuss experimental MAS NMRresults from three MBGs displaying different Ca, Si and P contents: the 29Si NMRspectra were recorded either directly by employing radio-frequency pulses to 29Si, orby magnetization transfers from neighbouring protons using cross polarization, therebyproviding quantitative information about the silicate speciation present in the pore walland at the MBG surface, respectively. The surface modifications were monitored for thethree MBGs during their immersion in a simulated body fluid (SBF) for intervals between30 min and one week. The results were formulated as a reaction sequence describing theinterconversions between the distinct silicate species. We generally observed a depletionof Ca2+ ions at the MBG surface, and a minor condensation of the silicate-surface networkover one week of SBF soaking.
Keywords: silicate-based biomaterial; biomineralization; magic angle spinning 29Si NMR;cross polarization; surface reactions
1. Introduction
Silica-based melt-prepared bioactive glasses (MPBGs) [1–4] are in clinical usefor repairing fractures and filling voids in bone and tooth. When subjected to
*Author for correspondence ([email protected]).
One contribution of 11 to a Theme Issue ‘Structure and biological activity of glasses and ceramics’.
This journal is © 2012 The Royal Society1376
Bioactive glasses probed by NMR 1377
OOO
OH
O
OH
||
||
OH
||
OH
O O
O O
O O O O O
+Na
OO
O
OO
OO
OOOO
O
Si Si Si Si Si
OOCa2+ Ca2+
SBFH+H+H+H+H+
O O
O O
O O O
O
O
O
O
O
2–HPO4
3–PO4
3–PO4
ACP layer HCA layer
OH
steps 1 and 2 step 3
step 5step 4
Ca2+ Ca2+ Ca2+
Si Si Si Si Si Si Si
Si Si Si SiSi
Si Si Si Si Si
Ca2+Ca2+
Ca2+ 2–CO3
–
O-H OH O H-
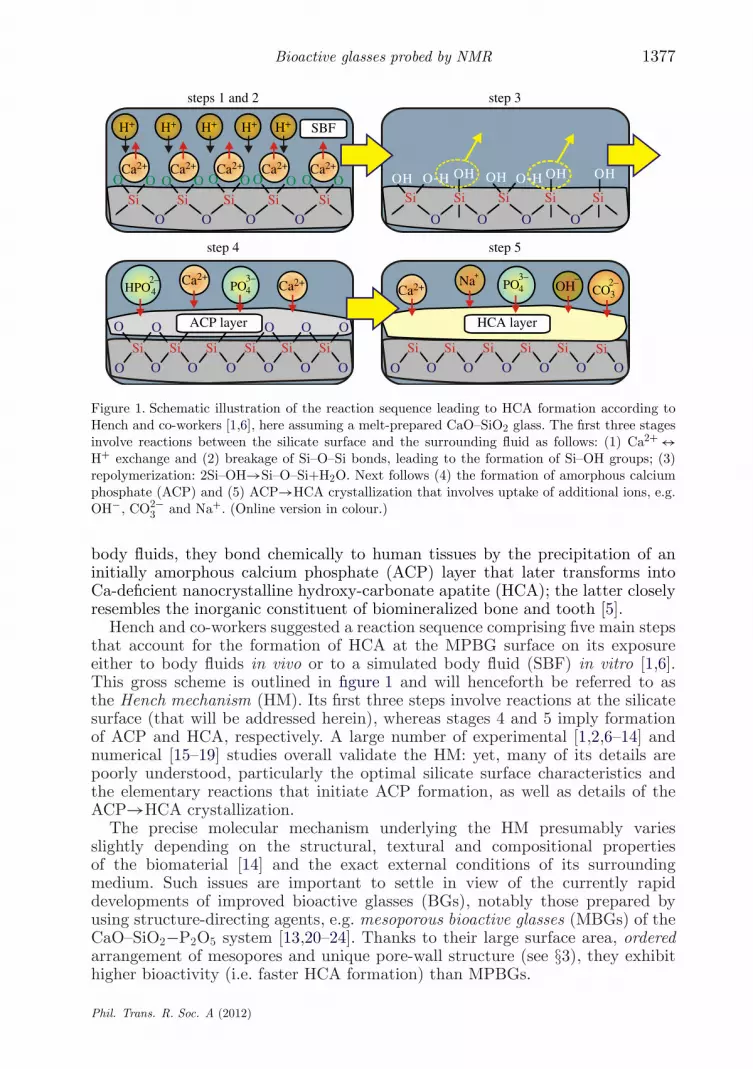
Figure 1. Schematic illustration of the reaction sequence leading to HCA formation according toHench and co-workers [1,6], here assuming a melt-prepared CaO–SiO2 glass. The first three stagesinvolve reactions between the silicate surface and the surrounding fluid as follows: (1) Ca2+ ↔H+ exchange and (2) breakage of Si–O–Si bonds, leading to the formation of Si–OH groups; (3)repolymerization: 2Si–OH→Si–O–Si+H2O. Next follows (4) the formation of amorphous calciumphosphate (ACP) and (5) ACP→HCA crystallization that involves uptake of additional ions, e.g.OH−, CO2−
3 and Na+. (Online version in colour.)
body fluids, they bond chemically to human tissues by the precipitation of aninitially amorphous calcium phosphate (ACP) layer that later transforms intoCa-deficient nanocrystalline hydroxy-carbonate apatite (HCA); the latter closelyresembles the inorganic constituent of biomineralized bone and tooth [5].
Hench and co-workers suggested a reaction sequence comprising five main stepsthat account for the formation of HCA at the MPBG surface on its exposureeither to body fluids in vivo or to a simulated body fluid (SBF) in vitro [1,6].This gross scheme is outlined in figure 1 and will henceforth be referred to asthe Hench mechanism (HM). Its first three steps involve reactions at the silicatesurface (that will be addressed herein), whereas stages 4 and 5 imply formationof ACP and HCA, respectively. A large number of experimental [1,2,6–14] andnumerical [15–19] studies overall validate the HM: yet, many of its details arepoorly understood, particularly the optimal silicate surface characteristics andthe elementary reactions that initiate ACP formation, as well as details of theACP→HCA crystallization.
The precise molecular mechanism underlying the HM presumably variesslightly depending on the structural, textural and compositional propertiesof the biomaterial [14] and the exact external conditions of its surroundingmedium. Such issues are important to settle in view of the currently rapiddevelopments of improved bioactive glasses (BGs), notably those prepared byusing structure-directing agents, e.g. mesoporous bioactive glasses (MBGs) of theCaO–SiO2−P2O5 system [13,20–24]. Thanks to their large surface area, orderedarrangement of mesopores and unique pore-wall structure (see §3), they exhibithigher bioactivity (i.e. faster HCA formation) than MPBGs.
Phil. Trans. R. Soc. A (2012)

1378 P. N. Gunawidjaja et al.
This contribution serves a dual purpose: on the one hand, it reviews theadvantages of using 29Si and 1H solid-state nuclear magnetic resonance (NMR)for probing both the bulk and surface of MBGs. We also discuss our recentlyproposed structural model of the MBG pore wall [23]. On the other hand, thisarticle presents new experimental data monitoring the surface reactions observedfrom MBGs comprising different Ca, Si and P contents; they are contrasted anddiscussed in relation to the three first steps of the HM.
This paper is organized as follows: §2 provides experimental details andintroduces the sample notation employed for our three series of SBF-exposedMBGs. Section 3 reviews general aspects of the MBG structure, and illustrateshow magic angle spinning (MAS) NMR may be exploited to investigate them.Section 4 presents and discusses the 29Si MAS NMR probing of the MBGstructures and their surface reactions occurring during one week of SBFimmersion, whereas §5 relates them to the HM. Section 6 accounts for the variousproton species observed at the MBG surface by 1H NMR, and §7 summarizes ourmain findings.
2. Material and methods
(a) Sample preparations
The MBG synthesis involved an evaporation-induced self-assembly process [25]at 40◦C, using the P123 triblock copolymer as the structure-directing agent,as described by López-Noriega et al. [22]. Each of the elements Si, P and Cawere incorporated using precursors of tetraethyl orthosilicate, triethyl phosphateand Ca(NO3)2 ·4H2O, respectively. The resulting homogeneous membranes wereheated at 700◦C for 6 h to remove organic species and nitrate ions. This procedurewas employed to prepare three MBG specimens of nominal molar compositions10CaO–90SiO2, 10CaO–85SiO2−5P2O5 and 37CaO–58SiO2−5P2O5, labelled‘S90’, ‘S85’ and ‘S58’, respectively, according to their mol% of SiO2.
Analysed cation compositions were determined by X-ray fluorescence(XRF) spectroscopy using a Philips PANalytical AXIOS spectrometer (PhilipsElectronics NV) with X-rays generated by the Rh Ka line at l = 0.614 Å.Overall, very good agreement resulted between the batched and the analysedcompositions, in which the largest relative deviations were observed forphosphorus (table 1).
(b) In vitro studies
An SBF solution was prepared according to Kokubo et al. [26] by dissolvingNaCl, KCl, NaHCO3, K2HPO4·3H2O, MgCl2·6H2O, CaCl2 and Na2SO4 indistilled water. It was buffered at pH = 7.45 by using tris(hydroxymethyl)–aminomethane/HCl and subsequently passed through 0.22 mm Millipore filters toavoid bacterial contamination. A 1.00 g sample of each pristine MBG (in the formof grains of variable sizes from a few micrometres to approx. 0.5 mm in diameter)was immersed in 50 ml of SBF under continuous orbital stirring (100 r.p.m.) forvariable intervals between 0.5 h and 7 days. The sealed polyethylene containers
Phil. Trans. R. Soc. A (2012)

Bioactive glasses probed by NMR 1379
Table 1. Nominal and analysed MBG compositions.
nominal analysed splitsample oxide equivalenta compositiona compositionb representationc
S90 10CaO–90SiO2 Ca0.111SiO2.11 Ca0.101SiO2.10 Ca0.101SiO2.10S85 10CaO–85SiO2−5P2O5 Ca0.118SiP0.118O2.41 Ca0.125SiP0.051O2.25 [Ca0.049SiO2.05]
−0.051[Ca3/2PO4]S58 37CaO–58SiO2−5P2O5 Ca0.638SiP0.172O3.07 Ca0.659SiP0.148O3.03 [Ca0.437SiO2.44]
−0.148[Ca3/2PO4]aNominal batched composition, expressed as molar oxide equivalents, or using a stoichiometricformula normalized to a unity Si coefficient.bCalculated from the XRF-analysed cation composition, with the oxygen coefficient obtainedthrough charge balance.cComposition according to equation (3.1).
were placed in an Ecotron HT incubator at 37◦C. Each sample was filtered,washed with water to quench the surface reactions and subsequently vacuumdried at 37◦C for several days.
The resulting SBF-soaked specimens are denoted as S90-tSBF, S85-tSBF andS58-tSBF, with the immersion period tSBF specified either in hours (h) or days (d).
(c) Solid-state nuclear magnetic resonance
The NMR experimentation was performed on finely ground powders ofthe S90, S85 and S58 derived samples, by filling 6 mm zirconia pencil rotorsand undergoing MAS at a rate of ur/2p = 8.0 kHz for all 29Si acquisitions.An Agilent/Varian/Chemagnetics Infinity-400 spectrometer was employed at amagnetic field of 9.4 T, giving Larmor frequencies of 79.5 MHz for 29Si and−400.1 MHz for 1H. All 29Si NMR data for S85 were previously presented inGunawidjaja et al. [14].
Single-pulse 29Si NMR experiments employed a nutation frequency ofuSi
nut/2p = 37 kHz, with the flip angle and relaxation delay as follows: 70◦ and720–1080 s, respectively, for all samples associated with S90 and S85; 60◦ and1800 s for those derived from S58. The relaxation delay was selected for eachsample based on a separate spin–lattice relaxation (T1) measurement. Typically,260–300 signal transients were co-added. 1H NMR spectra were recorded by Hahnspin–echoes [27] at ur/2p = 9.0 kHz using uH
nut/2p = 48 kHz (also employed for the1H 90◦ pulse in all cross polarization (CP) acquisitions), echo delay techo = 111 ms,5.0 s relaxation delay and approximately 1000 transients/acquisition.
Ramped [28] 1H→29Si CP was established at the modified Hartmann–Hahncondition uH
nut − uSinut = ur , giving nutation frequencies of 19 kHz and 27 kHz for
29Si and 1H, respectively. The number of accumulated transients was chosendepending on the Si content of the sample and varied as follows: 6000–16 000for the S90 and S85 series and 25 000–30 700 for that of S58. The contact interval(tCP) was 2.0 ms and the relaxation delay was 5.0 s throughout.
Phil. Trans. R. Soc. A (2012)

1380 P. N. Gunawidjaja et al.
We verified that application of high-power 1H decoupling did not affect the 29SiNMR peak widths perceptibly, and all experimentation was performed without1H decoupling. The processing involved 150 Hz Gaussian signal apodization. TheMAS rate of 8.0 kHz is sufficiently fast to concentrate >95% of the integrated 29SiNMR signal intensity into the centre-band; hence, all NMR spectra presentedbelow are zoomed around the centre-band region. Chemical shifts are quotedrelative to neat tetramethylsilane.
Each 29Si NMR spectrum was deconvoluted into its underlying Gaussian signalcomponents by employing an in-house iterative fitting computer program thatallows restrictions to be imposed for each peak position and full width at halfmaximum (FWHM) height. With all peak positions bound within (at least)±4 ppm and the FWHM restricted between 7 ppm and 13 ppm, each NMRspectrum was fitted several times (>10), using different initial conditions andshift boundaries. The resulting set of best-fit parameters was used to derive themean values and standard deviations of the respective parameters. They variedmarginally between the samples.
3. Mesoporous bioactive glasses and 29Si nuclear magnetic resonance:an overview
Here, we review structural features of the MBG pore wall over both atomic andnanometre length scales. Further, we briefly outline routine solid-state NMRexperimentation targeting 1H and 29Si [29–31], and illustrate how it may beexploited to probe the SiO4 speciations at both the pore-wall surface and itsinterior, as well as monitoring the surface modifications following SBF soaking ofthe MBG materials.
(a) Structural building blocks of mesoporous silica and silicate glasses
MBGs share structural features with both porous silica and traditional melt-prepared glasses of the CaO–SiO2−(P2O5) system, as discussed previously [14,23].Their textural properties, such as a large specific surface area, are similar to thoseof silica-based micro- and mesoporous materials. The pore walls of mesoporoussilica are built from a three-dimensional network of SiO4 units, interconnected byoxygen bridges at each corner of the tetrahedra. The structural building blocks ofsilicates are commonly described using the Qn notation [30,31], where n denotesthe number of bridging oxygen (BO) atoms at the SiO4 tetrahedron, leaving4–n positions occupied by non-bridging oxygen (NBO) ions. Hence, the pore-wallinterior of mesoporous silica is constructed predominantly by Q4 units.
It is well known that the surface of a mesoporous material is rich in silanols, i.e.lower connectivity SiO3(OH) and SiO2(OH)2 moieties involving terminal Si–OHgroups; they will be denoted by Q3
H and Q2H, respectively, to stress that protons
provide charge compensation of the NBOs [23]. Figure 2 provides a schematicpicture of the various Qn building blocks. Because of the distinct electronicconfigurations at their 29Si nuclei, these tetrahedral units are readily identified by29Si NMR, as they produce signals at chemical shifts separated by about 10 ppmin the spectrum [29–35]. In the case of our MBGs, we observe the Q4, Q3
H andQ2
H resonances around −110, −101 and −91 ppm, respectively.
Phil. Trans. R. Soc. A (2012)

Bioactive glasses probed by NMR 1381
~6 nm
O O
OH
O O
Si
Si Si Si Si Si Si
Si Si Si Si
O
OH
O
OH
O
O O
O O
O
O
O
O
O
O
O
O
O
O
Ca2+
O–
4Q
(a)
(b)
O2
QH 3QH 3QCa
2Q Ca
Ca2+
O–O– O–
Figure 2. (a) Structural model of the MBG pore wall [23], consisting of a primary CaO–SiO2phase (grey), with inclusions of nanometre-sized calcium orthophosphate (CaP) clusters (black).(b) Schematic picture of the interior and surface of the silica-based constituent. The pore-wallinterior is primarily built by interconnected Q4 silicate tetrahedra, whereas the surface incorporatessilanols comprising one (Q3
H) and two (Q2H) hydroxyl groups (cyan), as well as Ca2+-associated Q3
Caand Q2
Ca tetrahedral units. Marine blue and green oxygen atoms denote BO and NBO (encircled)species, respectively. (Online version in colour.)
MBGs also display structural characteristics of conventional melt-preparedglasses, as their amorphous pore walls constitute a silicate network, weaklymodified by Ca2+ ions. The latter break Si–O–Si bonds, leading to the formationof Qn
Ca species (n = 1, 2, 3), where each Ca2+ ion may (for instance) charge balanceeither the NBOs at one Q2
Ca tetrahedron (i.e. SiO2(O−)2) or two neighbouringQ3
Caunits (i.e. SiO3O−), as illustrated in figure 2. If spectral resolution permits,29Si NMR may identify such silicate units based on their distinct chemical shifts,which typically appear around −90 ppm (Q3
Ca), −83 ppm (Q2Ca) and −75 ppm
(Q1Ca) [30,31,36,37].Yet, if all six members of the set of silicate species {Q4,Q3
H,Q2H,Qn
Ca} aresimultaneously present in the structure, the 29Si NMR signal from each unitmay usually not be unambiguously resolved. This stems from the structurallydisordered nature of the pore walls, and the chemical shift of each 29SiO4tetrahedron also depends on a multitude of local structural parameters, such
Phil. Trans. R. Soc. A (2012)

1382 P. N. Gunawidjaja et al.
as Si–O distances and Si–O–Si bond angles, as well as the precise location of theCa2+ ions [30,31]. Since each such parameter of a given Qn species is associatedwith a distribution across the material, its net 29Si NMR response becomes verybroad, typically 7–12 ppm. Unfortunately, the signal separation between memberswithin each group of {Qn
Ca} and {QnH} units is of similar size to their peak widths.
Further, the Q2H and Q3
Ca species exhibit almost identical mean chemical shifts.
(b) Essential solid-state nuclear magnetic resonance experimentation
The quantification of the various Qn silicate populations is normally performedby ‘directly’ exciting the NMR signal from the sample by applying a radio-frequency (rf) pulse prior to its recording (often referred to as ‘single-pulse’ or‘Bloch-decay’ acquisition), followed by spectral deconvolution involving iterativefitting. 1H →29Si CP combined with MAS (CPMAS) is a widely employedNMR tool capable of providing selective information about the silicate surfacespeciation, stemming from an arrangement of the sole excitation of NMRresponses from 29Si nuclei in close proximity to nearby protons [29–35]. Suchselectivity follows naturally from the presence of large amounts of silanols andphysisorbed water molecules at the MBG surface, whereas the proton abundanceis very low in the pore-wall interior. By carefully selecting the so-called contactinterval (tCP)—during which rf fields are applied simultaneously to the 1H and29Si nuclei—one may gain some control of the depth over which the 29Si aredetected. Using short values of tCP < 0.5 ms restricts the probing of 29Si at the 1H-associated surface, whereas prolonged rf application (>10 ms) may affect 1H→29Simagnetization transfers beyond 0.5 nm. Provided that relatively short contactintervals (tCP ≤ 2 ms) are employed, CPMAS-acquired NMR spectra faithfullyquantify the various Qn
H and QnCa populations at the MBG surface, as illustrated
by Gunawidjaja et al. [14].We recently demonstrated the utility of 1H→29Si CPMAS for probing the S85
MBG surface and its alterations during prolonged SBF immersion [14,23]. Thesesurface reactions will be elucidated further herein, where we compare NMR resultsfrom three MBG series of variable Ca, Si and P contents.
(c) Constitution of phosphorus-bearing pore walls: calcium phosphate clusters
Phosphorus-bearing MBGs are reported to provide faster HCA formationthan their CaO–SiO2 and pure silica counterparts [21,24], in agreementwith general observations from studies of melt- and sol–gel-prepared BGs invitro [1,2,12,38,39]. The presence of phosphorus in CaO–SiO2−P2O5 MBGstriggers questions regarding its structural role in the pore wall, primarilyits relationship to Ca and Si. Although initial studies based on transmissionelectron microscopy coupled with energy-dispersive X-ray spectroscopy indicateda homogeneous element distribution over tens of nanometres [13,20–22], werecently clarified the role of P at the pore wall by employing complementarysolid-state NMR experiments [23]: phosphorus is present exclusively as a separatecalcium orthophosphate ‘phase’. We suggested that it forms nanometre-sizeddisordered clusters (denoted ‘CaP’), interrupting the dominating CaO–SiO2 pore-wall builder [23]: a schematic picture is given in figure 2. A main consequence ofthis ‘bi-phasic’ pore-wall model is the inherently high accessibility of the CaP
Phil. Trans. R. Soc. A (2012)

Bioactive glasses probed by NMR 1383
clusters to their surrounding medium, which naturally explains [14,23,24] thewell-documented substantial and rapid (minutes to hours) release of Ca2+ andPO3−
4 ions from MBGs into the SBF [13,14,20–22,40].Despite the major fraction of the CaP clusters dissolving within the first few
hours of MBG immersion, it is likely that some clusters remain intact at the porewall, where they may act as nucleation sites for further growth into an ACP layer[14,23,24]. Nevertheless, ultimate proof for the existence of the amorphous CaPclusters is yet to be established and further studies are required to clarify theirpotential role in the HCA formation.
(d) The CaO–SiO2 pore-wall component
Regardless of the existence of CaP clusters, the unambiguous sole presence oforthophosphate ions in these MBG structures [14,23,24] restricts the amount ofCa2+ ions available for modifying the silica-based pore-wall portion: as the PO3−
4ions consume a significant fraction of the Ca2+ modifiers for maintaining chargebalance, the extent of Q4 → Qn
Ca (n = 3, 2, 1) conversions reduces, i.e. the levelof silicate network depolymerization [14,23].
While the exact composition of the CaP pore-wall constituent is unknown, andsolid-state NMR confirms the presence of some apatite-like OH moieties [23,41],it is reasonable to assume a stoichiometric Ca3(PO4)2 composition. As we arefor the moment interested only in the effects of Ca2+ on the silicate networkand its associated Qn-speciation, the MBG compositions listed in table 1 ignorethe proton content at the surface, i.e. the presence of Qn
H tetrahedra. Generally,the net stoichiometric MBG formula, CaqSiPpO2+q+5p/2, may equivalently be castas [14,23,42,43]
[Caq−3p/2SiOm] − p[Ca3/2PO4], m = 2 + q − 3p/2. (3.1)
Equation (3.1) is a special case of the ‘split-network’ analysis discussed earlier[42,43], from which we may draw the following qualitative conclusions. (i) Itaccounts for the Ca2+ consumption by the orthophosphate ions, where theamount of Ca2+ ions associated with the silicate pore-wall component reducesfor increasing P content of the MBG. The entire Ca reservoir is located in thephosphate phase when q ≈ 3p/2. This argument remains qualitatively valid overthe entire range of conceivable molar ratios between Ca and P (approx. 1.0–1.7) in the calcium phosphate pore-wall portion. (ii) The average polymerizationdegree of the silicate network is (approximately) given by rSi = m = 2 + q − 3p/2,translating into the average number of BO atoms (n̄) from the set {Q4, Qn
Ca} ofsilicate tetrahedra being equal to [30,42–46]
n̄ = 2(4 − rSi) = 4 − 2q + 3p. (3.2)
Using equation (3.1), we may express the analysed stoichiometric formula foreach of the S58, S85 and S90 MBGs according to the ‘split representation’ givenin table 1. For these MBG compositions, we conclude the following. (A) Despitethe S90 and S85 specimens comprising nearly equal Ca contents (table 1), theabsence of P in the S90 MBG should effect a higher degree of silicate networkdepolymerization, i.e. a larger relative population of Qn
Ca (n ≤ 3) units than S85.(B) In the S85 structure, very few Ca2+ ions remain for creating significant
Phil. Trans. R. Soc. A (2012)

1384 P. N. Gunawidjaja et al.
amounts of QnCa units. (C) The markedly larger Ca content of the S58 composition
(while its molar fraction of P is only slightly higher than that of S85) predictsa significantly larger amount of Ca2+-associated SiO4 units when compared withthe other MBG samples.
In §4, predictions (A)–(C) will be verified experimentally by single pulse-acquired 29Si NMR spectra that quantitatively reflect the entire silicatespeciation, as well as by 1H→29Si CP that selectively probes the surface.
4. The silicate speciations of the S90, S85 and S58 mesoporous bioactive glasses
(a) Pristine mesoporous bioactive glasses
(i) Single-pulse nuclear magnetic resonance: quantitative pore-wall 29Si speciations
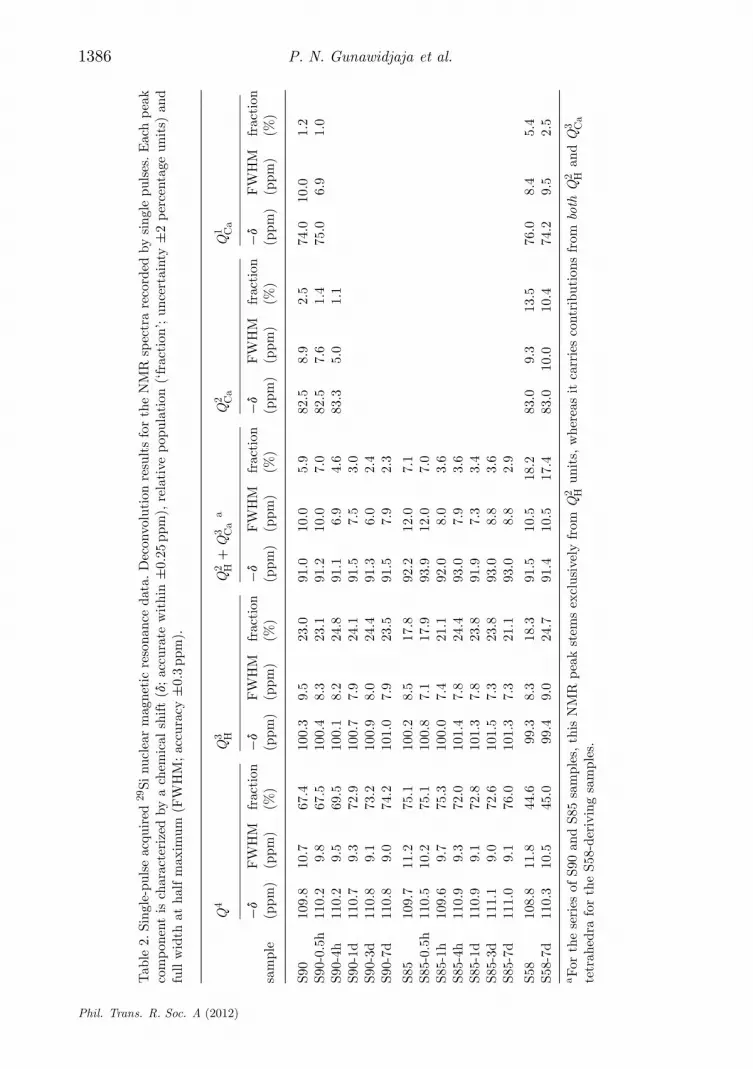
The directly excited 29Si NMR spectra from the S90 and S85 specimens aredisplayed in figure 3, together with deconvolutions into their underlying peakcomponents. Owing to the very long experimental times required to achievereasonable NMR spectral signal-to-noise ratios (S/N) from the S58 samples(stemming from a lower Si content, coupled with slower 29Si T1 relaxation),figure 4 only includes the two extreme members of this series, i.e. S58 andS58-7d. Best fit NMR parameters and fractional populations of the Q4, Qn
H andQn
Ca species are collected for all samples as shown in table 2. We initially focuson the results from each pristine MBG.
According to predictions (A)–(C) in §3d, the average silicate networkconnectivity should increase along the series S58 < S90 < S85. This is indeedwitnessed by the steadily decreased signal intensity in the higher ppm regionof the respective NMR spectra in figures 3 and 4. We note that suggestion (B)is confirmed by the absence of significant signal intensity in the spectral rangehigher than −85 ppm observed from the S85 MBG, which is consistent with verylow contributions from Ca2+-associated tetrahedra in its silicate network. TheS90 sample, on the other hand, reveals weak but significant NMR responses inthis spectral region, whereas they are substantial in those recorded from S58. Asexpected, the relative populations of Q4 tetrahedra decrease monotonically alongthe series S85 > S90 > S58, amounting to 75%, 67% and 45%, respectively (table2).
Interestingly, the relative amount of Q3H species remains at around 20%
at all three MBG surfaces. While the population of Si–OH groups displayssome dependency on the Ca content at the surface (through its accompanyingwater association), it is primarily reflected by the total surface area of thesample; the latter is very similar for the S90 and S85 MBGs, but lower for S58[22–24]. The Q2
H population is also similar at the S85 and S90 MBG surfaces, asexpected, whereas a two to three times larger NMR peak intensity is observedaround −92 ppm from the S58 sample. This reflects the presence of significantcontributions from Q3
Ca units in this MBG (consistent with its high Ca content),whose NMR signals overlap with those of the Q2
H tetrahedra (see §3a). This verifiesprediction (C).
The quantitative predictions from equation (3.2) were verified by calculatingthe NMR-derived average number of BO atoms (n̄) at the silicate tetrahedra ofeach MBG sample. We stress that equation (3.2) only accounts for the network
Phil. Trans. R. Soc. A (2012)

Bioactive glasses probed by NMR 1385
S85
29Si shift (ppm)
S90-0.5h
S90
S90-4h
S90-1d
S90-7d
S90-3d
S85
S85-0.5h
S85-4h
S85-1d
S85-3d
S85-7d
Q
–91 –110 ppm–101 –91 –110 ppm–101
–83
–76
1QCa
2QCa
2 3 4QH HQ Q2 3 4QH HQ
S90
single pulse
–70 –80 –90 –100 –110 –12029Si shift (ppm)
–70 –80 –90 –100 –110 –120
Figure 3. Directly excited 29Si MAS NMR spectra (black lines) from pristine S90 and S85 (toprow). All other spectra were recorded after SBF immersion from the as-indicated MBG samples.Deconvoluted peak components are plotted using grey lines; their assignments are displayed atthe top of each column. The curve beneath each spectrum represents the difference between theexperiment and best fit.
Phil. Trans. R. Soc. A (2012)
1386 P. N. Gunawidjaja et al.
Tab
le2.
Sing
le-p
ulse
acqu
ired
29Si
nucl
ear
mag
neti
cre
sona
nce
data
.Dec
onvo
luti
onre
sult
sfo
rth
eN
MR
spec
tra
reco
rded
bysi
ngle
puls
es.E
ach
peak
com
pone
ntis
char
acte
rize
dby
ach
emic
alsh
ift(d
;ac
cura
tew
ithi
n±0
.25
ppm
),re
lati
vepo
pula
tion
(‘fr
acti
on’;
unce
rtai
nty
±2pe
rcen
tage
unit
s)an
dfu
llw
idth
atha
lfm
axim
um(F
WH
M;ac
cura
cy±0
.3pp
m).
Q4
Q3 H
Q2 H
+Q
3 Ca
aQ
2 Ca
Q1 Ca
−dFW
HM
frac
tion
−dFW
HM
frac
tion
−dFW
HM
frac
tion
−dFW
HM
frac
tion
−dFW
HM
frac
tion
sam
ple
(ppm
)(p
pm)
(%)
(ppm
)(p
pm)
(%)
(ppm
)(p
pm)
(%)
(ppm
)(p
pm)
(%)
(ppm
)(p
pm)
(%)
S90
109.
810
.767
.410
0.3
9.5
23.0
91.0
10.0
5.9
82.5
8.9
2.5
74.0
10.0
1.2
S90-
0.5h
110.
29.
867
.510
0.4
8.3
23.1
91.2
10.0
7.0
82.5
7.6
1.4
75.0
6.9
1.0
S90-
4h11
0.2
9.5
69.5
100.
18.
224
.891
.16.
94.
683
.35.
01.
1S9
0-1d
110.
79.
372
.910
0.7
7.9
24.1
91.5
7.5
3.0
S90-
3d11
0.8
9.1
73.2
100.
98.
024
.491
.36.
02.
4S9
0-7d
110.
89.
074
.210
1.0
7.9
23.5
91.5
7.9
2.3
S85
109.
711
.275
.110
0.2
8.5
17.8
92.2
12.0
7.1
S85-
0.5h
110.
510
.275
.110
0.8
7.1
17.9
93.9
12.0
7.0
S85-
1h10
9.6
9.7
75.3
100.
07.
421
.192
.08.
03.
6S8
5-4h
110.
99.
372
.010
1.4
7.8
24.4
93.0
7.9
3.6
S85-
1d11
0.9
9.1
72.8
101.
37.
823
.891
.97.
33.
4S8
5-3d
111.
19.
072
.610
1.5
7.3
23.8
93.0
8.8
3.6
S85-
7d11
1.0
9.1
76.0
101.
37.
321
.193
.08.
82.
9
S58
108.
811
.844
.699
.38.
318
.391
.510
.518
.283
.09.
313
.576
.08.
45.
4S5
8-7d
110.
310
.545
.099
.49.
024
.791
.410
.517
.483
.010
.010
.474
.29.
52.
5
a For
the
seri
esof
S90
and
S85
sam
ples
,th
isN
MR
peak
stem
sex
clus
ivel
yfr
omQ
2 Hun
its,
whe
reas
itca
rrie
sco
ntri
buti
ons
from
both
Q2 H
and
Q3 Ca
tetr
ahed
rafo
rth
eS5
8-de
rivi
ngsa
mpl
es.
Phil. Trans. R. Soc. A (2012)

Bioactive glasses probed by NMR 1387
29Si shift (ppm)
4Q
–91 –110 pm–99–83–76
1QCa
2QCa
3QH
S58-7d
S58
single pulse(a)
(b)
3QCa
2Q
H+
451818
145
–70 –80 –90 –100 –110 –120
4525
1710
3
Figure 4. (a) Directly excited 29Si MAS NMR spectra from the pristine S58 sample and (b) afterits immersion in SBF for one week. The number at each peak component represents its relativepopulation (in per cent), and other labels are as in figure 3.
defragmentation stemming from Ca2+ modifiers: hence, the set of experimentalfractions {xn} of the Q4 and Qn
Ca tetrahedra listed in table 2 were renormalized toa unity sum. We assumed that all NMR signals around −92 ppm stem solely fromQ2
H units in the S90 and S85 samples, whereas the corresponding signal fraction(18%; table 2) is shared equally between Q2
H and Q3Ca species for the case of S58.
Then, the expression n̄ = Snnxn estimated the average number of BO atoms to4.00, 3.88 and 3.28 in the silicate networks of S85, S90 and S58, respectively. Thesevalues may be contrasted with the respective predictions of 3.90, 3.80 and 3.13from equation (3.2). The excellent agreement (within 5% throughout) is gratifyingwhen considering the uncertainties involved in the analysed sample compositions,the NMR-derived fractional populations, as well as the assumptions leading toequation (3.2).
(ii) 1H→29Si cross polarization: the mesoporous bioactive glass surface
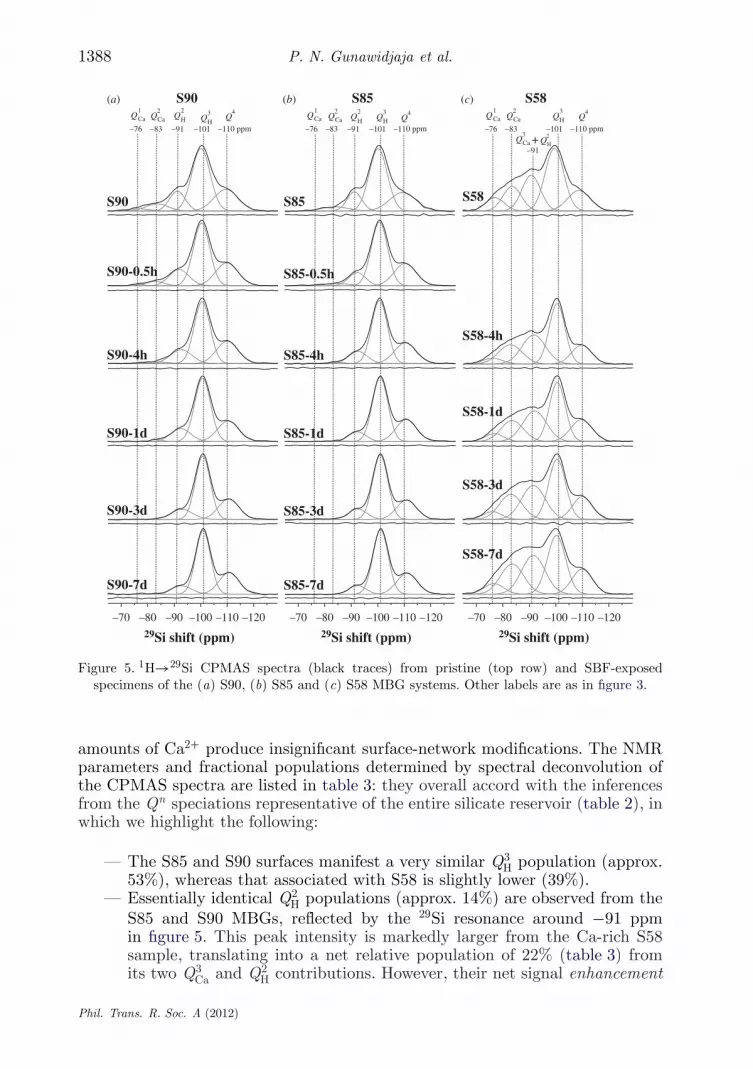
The surface specificity of the 1H→29Si CP acquisitions becomes very evidentwhen contrasting the NMR spectra depicted in figure 5 with those recordedby single pulses (figures 3 and 4). All the former reveal weak signals from Q4
tetrahedra and are dominated by the 29Si resonance from the Q3H silanol groups,
most notably for the spectra recorded from the S90 and S85 samples, where theQn
H groups constitute the majority of the surface silicate speciation and the minute
Phil. Trans. R. Soc. A (2012)
1388 P. N. Gunawidjaja et al.
S58-7d
S58-1d
S58-4h
S58
S58-3d
S85-0.5h
S85-4h
S85-1d
S85
S85-3d
S85-7d
–70 –80 –90 –100 –110 –120
S90-0.5h
S90
(a) (b) (c)
S90-4h
S90-1d
S90-3d
S90-7d
29Si shift (ppm)
–70 –80 –90 –100 –110 –120
29Si shift (ppm)
–70 –80 –90 –100 –110 –120
29Si shift (ppm)
+
4Q
–91 –110 ppm–101–83–76
1QCa
2QCa
3QH
S902
QH
4Q
1QCa
2QCa
3QH
2Q
H–91 –110 ppm–101–83–76 –83–76
1QCa
2QCa
3QCa
4Q
–110 ppm–101
–91
3QH
2QH
S85 S58
Figure 5. 1H→29Si CPMAS spectra (black traces) from pristine (top row) and SBF-exposedspecimens of the (a) S90, (b) S85 and (c) S58 MBG systems. Other labels are as in figure 3.
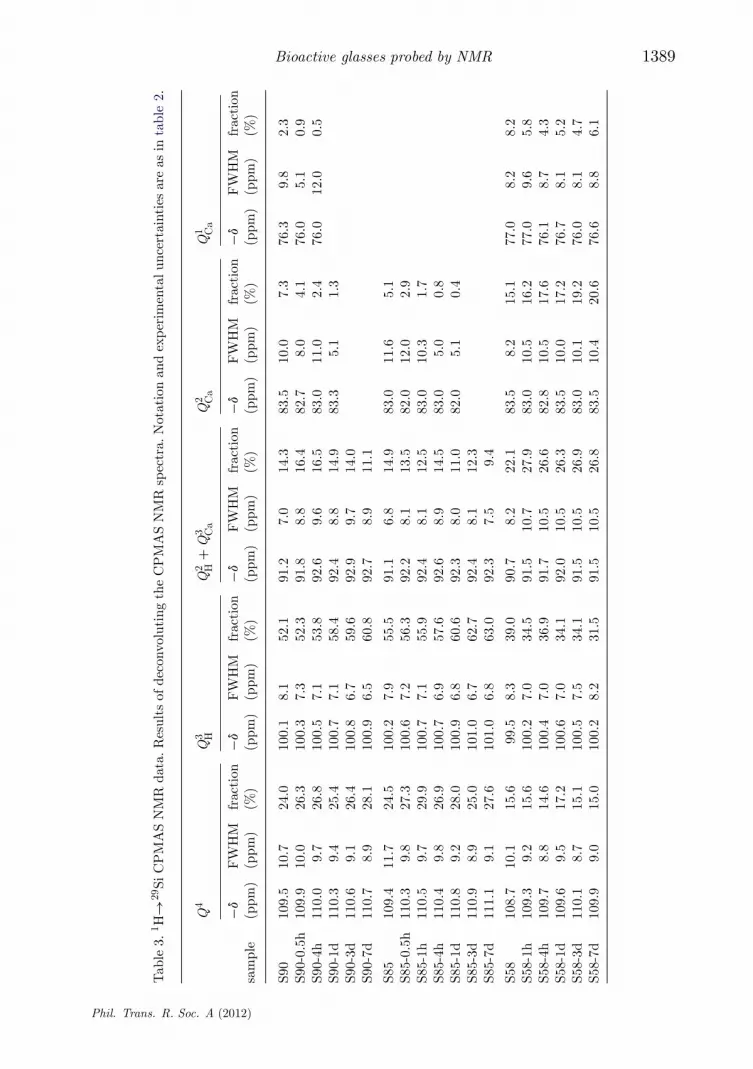
amounts of Ca2+ produce insignificant surface-network modifications. The NMRparameters and fractional populations determined by spectral deconvolution ofthe CPMAS spectra are listed in table 3: they overall accord with the inferencesfrom the Qn speciations representative of the entire silicate reservoir (table 2), inwhich we highlight the following:
— The S85 and S90 surfaces manifest a very similar Q3H population (approx.
53%), whereas that associated with S58 is slightly lower (39%).— Essentially identical Q2
H populations (approx. 14%) are observed from theS85 and S90 MBGs, reflected by the 29Si resonance around −91 ppmin figure 5. This peak intensity is markedly larger from the Ca-rich S58sample, translating into a net relative population of 22% (table 3) fromits two Q3
Ca and Q2H contributions. However, their net signal enhancement
Phil. Trans. R. Soc. A (2012)
Bioactive glasses probed by NMR 1389
Tab
le3.
1 H→
29Si
CP
MA
SN
MR
data
.Res
ults
ofde
conv
olut
ing
the
CP
MA
SN
MR
spec
tra.
Not
atio
nan
dex
peri
men
talu
ncer
tain
ties
are
asin
tabl
e2.
Q4
Q3 H
Q2 H
+Q
3 Ca
Q2 Ca
Q1 Ca
−dFW
HM
frac
tion
−dFW
HM
frac
tion
−dFW
HM
frac
tion
−dFW
HM
frac
tion
−dFW
HM
frac
tion
sam
ple
(ppm
)(p
pm)
(%)
(ppm
)(p
pm)
(%)
(ppm
)(p
pm)
(%)
(ppm
)(p
pm)
(%)
(ppm
)(p
pm)
(%)
S90
109.
510
.724
.010
0.1
8.1
52.1
91.2
7.0
14.3
83.5
10.0
7.3
76.3
9.8
2.3
S90-
0.5h
109.
910
.026
.310
0.3
7.3
52.3
91.8
8.8
16.4
82.7
8.0
4.1
76.0
5.1
0.9
S90-
4h11
0.0
9.7
26.8
100.
57.
153
.892
.69.
616
.583
.011
.02.
476
.012
.00.
5S9
0-1d
110.
39.
425
.410
0.7
7.1
58.4
92.4
8.8
14.9
83.3
5.1
1.3
S90-
3d11
0.6
9.1
26.4
100.
86.
759
.692
.99.
714
.0S9
0-7d
110.
78.
928
.110
0.9
6.5
60.8
92.7
8.9
11.1
S85
109.
411
.724
.510
0.2
7.9
55.5
91.1
6.8
14.9
83.0
11.6
5.1
S85-
0.5h
110.
39.
827
.310
0.6
7.2
56.3
92.2
8.1
13.5
82.0
12.0
2.9
S85-
1h11
0.5
9.7
29.9
100.
77.
155
.992
.48.
112
.583
.010
.31.
7S8
5-4h
110.
49.
826
.910
0.7
6.9
57.6
92.6
8.9
14.5
83.0
5.0
0.8
S85-
1d11
0.8
9.2
28.0
100.
96.
860
.692
.38.
011
.082
.05.
10.
4S8
5-3d
110.
98.
925
.010
1.0
6.7
62.7
92.4
8.1
12.3
S85-
7d11
1.1
9.1
27.6
101.
06.
863
.092
.37.
59.
4
S58
108.
710
.115
.699
.58.
339
.090
.78.
222
.183
.58.
215
.177
.08.
28.
2S5
8-1h
109.
39.
215
.610
0.2
7.0
34.5
91.5
10.7
27.9
83.0
10.5
16.2
77.0
9.6
5.8
S58-
4h10
9.7
8.8
14.6
100.
47.
036
.991
.710
.526
.682
.810
.517
.676
.18.
74.
3S5
8-1d
109.
69.
517
.210
0.6
7.0
34.1
92.0
10.5
26.3
83.5
10.0
17.2
76.7
8.1
5.2
S58-
3d11
0.1
8.7
15.1
100.
57.
534
.191
.510
.526
.983
.010
.119
.276
.08.
14.
7S5
8-7d
109.
99.
015
.010
0.2
8.2
31.5
91.5
10.5
26.8
83.5
10.4
20.6
76.6
8.8
6.1
Phil. Trans. R. Soc. A (2012)

1390 P. N. Gunawidjaja et al.
(compared with the cases of S90 and S85) is less pronounced in these CP-acquired NMR spectra than in their directly excited counterparts (table 2).This is attributed to the distinct experimental responses from the Q2
H andQ3
Ca species: despite the signal contribution from the Q2H tetrahedra being
emphasized in the 1H→29Si CP-acquired NMR spectrum from the Ca-richS58 sample, a significant fraction of its total Q3
Ca reservoir is present insidethe pore wall, whose 29Si NMR signal remains undetected by CP. Thecombination of these counteracting effects accounts for the almost equal(approx. 20%) relative peak areas observed in the NMR spectra recordedby using either CP or single pulses.
— As opposed to the case of S58, where a significant, but not predominant,portion of all Ca-associated Qn
Ca units is located at/near the pore-wallsurface, essentially all such units in the S90 and S85 structures constitutesurface species. This is evidenced by comparing the populations of theQ2
Ca and Q1Ca tetrahedra in tables 2 and 3: while their contributions
are insignificant/absent in the directly excited NMR spectra, they aremarkedly enhanced in those recorded by CP.
(b) Simulated body fluid-exposed samples
(i) Reactions at the S90 and S85 surfaces
We now turn to the 29Si NMR results from the series of SBF-soaked S90 andS85 samples (tables 2 and 3) and focus mainly on the CPMAS-derived silicatesurface speciations plotted in figure 6.
Both MBG series display the same trends during one week of SBF soaking.Three primary processes may be identified, as follows. (i) Dissolution of surface-associated Ca2+ions, according to
O O
O
O–
O–
O–
O–
Si Si
Ca2+
Ca2+(aq),
O
+ (4.1)
leads to a nearly complete removal of Q2Ca (and for S90 also Q1
Ca) tetrahedraover the first 4 h of SBF soaking, which emphasizes their preferential surfaceassociation. (ii) The S90 MBG surface reveals a slightly increased Q2
H populationemerging over the first 24 h. This is naturally attributed to the Ca2+ ↔ H+exchange, leading to the transformation of Q2
Ca tetrahedra into Q2H (i.e. geminal
silanol moieties),
O OO–
O–
Si Si
Ca2+
2H+ Ca2+(aq),
O O
OH
OH .Q 2Ca Q
2H
+ + (4.2)
Phil. Trans. R. Soc. A (2012)

Bioactive glasses probed by NMR 1391
18
22
26
30
34
50
54
58
62
66
2
6
10
14
18
16
20
24
28
32
4
8
12
16
20
2
6
10
14
18
2
6
10
14
18
1 10 102
18
22
26
30
34
26
30
34
38
42
2
6
10
14
18
50
54
58
62
66
0 1 10 1020 1 10 1020
S90(a) (b) (c) S58S85po
pula
tion
(%)
popu
latio
n (%
)
8
12
16
20
24
+
4Q
4Q
4Q
1 h 4 h 1 d 3 d 7 d0.5 h0 1 h 4 h 1 d 3 d 7 d0.5 h0 1 h 4 h 1 d 3 d 7 d0.5 h0
2Q
Ca
2Q
H2
QH
2Q
H
2Q
Ca
2Q
Ca
3Q
Ca
3Q
H
3Q
H
3Q
H
1Q
Ca
1Q
Ca
τSBF (h) τSBF (h) τSBF (h)
Figure 6. Plots of the as-indicated surface silicate speciations (obtained from the CPMAS NMRspectra of figure 5) against the SBF exposure interval (tSBF). The results correspond to thoseof the (a) S90, (b) S85 and (c) S58 MBGs. Note the use of a logarithmic time-scale (bottom)and that the vertical scale of all plots employs the same span of values, despite the limitingvalues varying.
(iii) However, the aggregate surface modification after one week of SBF exposureconstitutes a network repolymerization, verified by a steadily increased Q3
Hpopulation and a concurrent decrease in that of Q2
H, which is observed from bothMBG series over the full week of SBF immersion (figure 6). This observationmay be rationalized from Q3
H tetrahedra forming by the condensation of twoneighbouring Q2
H units [14], according to
O O O O OOH OH
OH
Si Si Si Si
O
OH OH OH
O O O
H2O, 2Q 3H
2Q 2H
. (4.3)
Both S85 and S90 MBG surfaces also hint at slightly increased Q4 populationsafter one week of SBF immersion. For the case S90, the elevated relative amountof Q4 tetrahedra is also supported by the NMR results obtained from single-pulseexcitation (table 2 and figure 3).
Phil. Trans. R. Soc. A (2012)

1392 P. N. Gunawidjaja et al.
In summary, the surface reactions (i)–(iii) imply a net sequence of conversionsaccording to Q2
Ca → Q2H → Q3
H, i.e.
2 O O–
O–
Si Si Si
Ca2+
2Ca2+(aq) 4OH–,3H2O
O
O O O
O
OH OH
O
2Q 2Ca 2Q
3H
, (4.4)
which amounts to a slight overall repolymerization of the silicate surface. Westress that equations (4.1)–(4.4) represent schematic reactions: all these processesare dynamic, mutually coupled and involve all distinct Q4, Qn
H and QnCa species.
Table 3 and figure 6 verify that, for both the S90 and S85 MBGs, the net decreaseof the Q2
Ca, Q1Ca and Q2
H populations matches well with the simultaneous increaseof the Q3
H species.We have focused on the MBG surface reactions during SBF treatment, as
inferred from the silicate speciations derived from 1H→29Si CPMAS NMR.However, the gross trends of (i) depleted Qn
Ca species, (ii) the slight decreasein the Q2
H populations, and (iii) the simultaneous increase in the Q3H silanols
may also be verified from the single-pulse NMR results plotted in figure 7: whilethe trends become less transparent owing to the dominating Q4 populationsthat obscure the changes in the contributions from surface-associated units,the quantitative SiO4 speciations presented in table 2 account for the netmodifications across the entire sample, thereby further supporting the inferencesmade from CPMAS NMR.
(ii) S58 surface reactions
The conclusions drawn from the NMR results of the Ca-rich S58 sampleconfirm some of the trends observed for the S90 and S85 series, but differ inseveral aspects: generally, this specimen behaves closer to MPBGs in terms ofnetwork defragmentation. Relative to the S58 sample prior to SBF treatment,the directly excited 29Si NMR spectrum from S58-7d (figure 4) manifests a lowersignal intensity in the chemical shift region higher than −90 ppm, which verifiesa net release of Ca2+ ions.
Focusing on the various silicate populations obtained by 1H→29Si CPMAS,listed in table 3 and plotted in figure 6, a decrease in the amount of Q1
Ca units isobserved for prolonged SBF-soaking intervals. However, contrary to the case ofthe S90 and S85 surfaces, there are no signs of a total surface depletion of Ca2+ions. Rather, the Q2
Ca population merely increases slightly from approximately15% to approximately 21%. Owing to the complexities arising from the six co-existing Q4, Q3
H, Q2H, Q3
Ca, Q2Ca and Q1
Ca structural units at this very complexMBG surface, the spectral deconvolutions and peak assignments become lesscertain. Further complications arise as, for instance, the Q1 species are herepragmatically attributed solely to Q1
Ca, but may involve simultaneous chargebalance from Ca2+ and protons, i.e. SiO(O−)2OH and/or SiO(O−)(OH)2 speciesassociated with one and 1/2 Ca2+ ion, respectively. Likewise, the NMR signalintensity around −83 ppm, thought to stem entirely from Q2
Ca units, may receivecontributions from SiO2(O−)OH moieties. Nevertheless, the NMR spectra from
Phil. Trans. R. Soc. A (2012)

Bioactive glasses probed by NMR 1393
2
6
10
14
18
14
18
22
26
30
2
6
10
14
18
1 10 102
66
70
74
78
82
0
popu
latio
n (%
)po
pula
tion
(%)
S90(a)
(b)
1 h 4 h 1 d 3 d 7 d0.5 h0
S851 h 4 h 1 d 3 d 7 d0.5 h0
2Q
Ca
2QH
2QH
3
4
QH
3QH
Q 4Q
1Q
Ca
τSBF (h)
1 10 1020
τSBF (h)
Figure 7. Silicate speciations quantitatively reflecting each entire sample, as obtained from thedirectly excited 29Si NMR spectra (displayed in figure 3) from (a) S90 and (b) S85 and plottedagainst the SBF-soaking interval.
all S58-tSBF samples reveal a substantial intensity in the shift region higherthan −90 ppm, strongly suggesting significant remains of surface-associatedCa2+ ions.
The net surface reactions occurring over one week of SBF exposure reflect anetwork depolymerization, where Q3
H silanols are replaced by lower connectivityQ2
H and Q2Ca units (and possibly also tetrahedra receiving charge balance by both
Ca2+ and H+), whereas the Q4, population stays essentially constant throughout.The Q3
H → Q2H conversions occurring during the first hour of SBF immersion
(figure 6) accord with the expectations of the second step of the HM (figure 1),which, incidentally, is not observed for the other MBGs. However, the Q3
H
Phil. Trans. R. Soc. A (2012)

1394 P. N. Gunawidjaja et al.
population steadily decreases over one week, whereas those of Q3Ca and Q2
H remainconstant after the first hour: hence, between 1 h and one week of S58 soaking,the net reactions involve transformation of Q3
H into Q2Ca or ‘mixed’ SiO2(O−)OH
tetrahedra.These results indicate a closer behaviour of the S58 MBG to that typically
observed for MPBGs in vitro; they may also stem from the high MBGconcentration in the SBF solution, leading to abnormal MBG surface reactionsand retarded HCA formation from this Ca-rich composition [40]. While S85evidenced HCA formation within 24 h of SBF soaking, neither powder XRD nor31P NMR revealed any traces of HCA from the present S58 sample [40].
5. Mesoporous bioactive glass surface reactions and the Hench mechanism
Overall, the surface reactions observed from the S90 and S85 MBGs accordwell with the predictions of the HM (figure 1). Equations (4.1) and (4.2) reflectthe initial step of Ca2+ ↔ H+ cation exchange. The subsequent silicate networkdefragmentation of the second HM stage is evident only from the S58 sample.Nevertheless, MBG surfaces already inherently comprise low-connectivity Qn
Htetrahedra (n = 2, 3), which markedly accelerate the surface reactions whencompared with the analogous processes associated with MPBGs [14]. The thirdHM step, involving network repolymerization at the surface, is witnessed by theincreased amounts of Q3
H (and to a minor degree Q4) units by condensation ofQ2
H tetrahedra (equation (4.3)). The aggregate effects of the first three HM stagesare summarized (schematically) as equation (4.4).
The HM was proposed to account for the formation of HCA from MPBGsthat comprise significantly larger amounts of network modifiers than the presentMBGs, thereby translating into open structures built primarily by Q2 units(and to a lesser extent Q3). Therefore, both the HM stages 2 and 3 naturallybecome more pronounced for such structures. For instance, 29Si MAS NMRunambiguously evidenced the formation of Q4 tetrahedra after prolonged SBFsoaking of MPBGs [11,47], which was readily detectable as the initial structuresdo not involve such building blocks. For MPBGs, the first three stages of the HMlead to the formation of a ‘silica-gel’ layer and accompanying increased surfacearea of the material, as observed/discussed intensively in the literature [6–11].While formally this feature also applies to the Ca-poor S90 and S85 MBGs,their surface alterations become less pronounced as the Ca2+ leaching is low.Indeed, the MBG surface is already ‘gel-like’, as it is rich in both silanols andphysisorbed water molecules. In the study of Gunawidjaja et al. [14], we proposedthat the MBG surface reactions generally accelerate, and may even partiallycircumvent, the three initial stages of the HM. This is one reason for the enhancedbioactivity observed from MBGs [13,14,20–24], although the CaP clusters alsoplay a significant role in the enhanced rate of HCA formation [14,23].
6. 1H nuclear magnetic resonance
1H NMR is useful for identifying the various proton environments present atthe MBG surface. Here, we merely briefly review the most important aspects ofthe 1H NMR spectra recorded from our present samples (figure 8), and refer to
Phil. Trans. R. Soc. A (2012)

Bioactive glasses probed by NMR 1395
1.85
2.1
1.85
S58
S58-7d
S85
S85-7dS90-7d
S90
1H shift (ppm)
*
*
**4.4
2.1
4.3
4.6
1.8
4.6
22 ppm
*
*
*
4.7
**
S58-7d
8 6 4 2 01H shift (ppm)
8 6 4 2 01H shift (ppm)
8 6 4 2 0
Figure 8. 1H MAS NMR spectra recorded by Hahn spin–echoes [27] from each MBG before (toprow) and after (bottom row) SBF exposure for one week. The signals around 4.5 ppm and 2 ppmstem from physisorbed water molecules and isolated silanols, respectively, whereas the sharp peaksmarked by asterisks (approx. 3.6 ppm and less than 1.3 ppm) derive from minor residues of organictemplating molecules. The inset spectrum is a horizontal expansion of that from S58-7d, whereresonances from strongly hydrogen-bonded silanols are indicated by the grey rectangle. Note thatthe NMR spectra are normalized to the same maximum amplitude and do not reflect absoluteintensities.
Leonova et al. [23] for a detailed account with further motivations for the peakassignments.
Disregarding the narrow NMR signals marked by asterisks in figure 8, whichoriginate from minor residual organic precursor/templating molecules, three maingroups of surface protons may be identified, as follows. (i) Those of physisorbedwater molecules and SiOH moieties resonating between 4 ppm and 5 ppm[32–35,48]. (ii) Protons of ‘isolated’ silanols not experiencing hydrogen bonding[32–35] that reveal two relatively sharp NMR peaks at 1.85 ppm and 2.1 ppm.While the former signal is usually more prominent, e.g. in the spectra from S90and S58 in figure 8, the latter is visible in those of S85 and S58-7d (also see [23]).(iii) Strongly hydrogen-bonded silanols that produce broad 1H resonances in thespectral region higher than 6 ppm [32,33,35,48]. This surface feature is prominentonly in the NMR spectra of the S58-derived samples, as indicated by the insetshown in figure 8. The significant calcium content of the S58 MBG makes itssurface hydrophilic, thereby leading to an enhanced water association [23]; thisis evidenced by the much stronger and broader NMR signal around 5 ppm (fromwater molecules) present in the spectrum from S58-7d relative to those derivedfrom S90 and S85 (figure 8).
The main distinction among these groups of O1H environments is theirextent of participation in hydrogen bonding (in turn dictated by the amount ofphysisorbed water molecules), which primarily determines the precise 1H NMRpeak position (around 4–5 ppm) originating from SiOH/H2O environments: thestronger the hydrogen bonding, the higher the chemical shift [31,48,49]. Thisis witnessed by the displacement of the NMR signal to higher shifts, which isconsistently observed after SBF treatment of each MBG sample (figure 8). Thepeak deshielding (and accompanying increased water content at the surface) isalso coincident with the disappearance of NMR signals from ‘isolated’ silanols:naturally, the latter exist only at ‘dry’ MBG surfaces [23].
Phil. Trans. R. Soc. A (2012)

1396 P. N. Gunawidjaja et al.
7. Summary
The key experimental tools of this work consisted of solid-state 29Si and 1HNMR [30,31], whose utilities were reviewed and illustrated for quantitativelymonitoring the silicate speciation of both the MBG pore-wall interior and itssurface for three MBG specimens of different Ca, Si and P contents. Excellentagreement was observed between the NMR-estimated average number of BOatoms per silicon tetrahedron, and that predicted by a split-network analysis[42,43]. We also discussed the various proton environments of silanols andsurface-adsorbed water molecules revealed by 1H NMR.
For each of the three MBG systems, we presented experimental resultsunveiling the silicate surface alterations following SBF exposure for intervalsbetween 30 min and one week. For two MBGs associated with low Ca contents,either phosphorus bearing (S85) or devoid of P (S90), 29Si CPMAS evidencedboth release of Ca2+ ions from the surface and an overall condensation of itssilicate network on prolonged SBF immersion, which suggested the followingschematic sequence of tetrahedral unit conversions: Q2
Ca → Q2H → Q3
H (equation(4.4)). The surface reactions observed herein were contrasted with those proposedin the context of traditional melt-prepared BGs by Hench [1,6] (figure 1). The S90and S85 MBGs displayed similar in vitro behaviour, whereas the Ca-richer S58specimen was observed to react more similarly to MPBGs. Yet, this feature of theS58 MBG composition is believed to partially originate from the relatively highMBG concentrations employed in our in vitro testing, which for the case of the Ca-rich S58 sample may lead to abnormal surface reactions [40]. Our future work willaim at elucidating this further by comparison with NMR results obtained fromconditions of lower MBG loading per SBF volume, as well as investigating thesimilarities and distinctions between the mechanisms leading to HCA formationin vitro from MBGs when compared with MPBGs.
The present contribution focused on examining the reactions involving thesilicate surface species of relevance for the three initial steps of the HM (figure 1).Here, 29Si CPMAS NMR is the most natural and informative probe, whereas 31Pand 1H NMR are the methods of choice to study the HCA formation itself (i.e.stages 4 and 5 of the HM); we refer to complementary studies [14,40,41] forresults that monitor the evolution of the biomimetic phosphate layer forming inSBF solutions.
This work was supported by the Swedish Research Council (contracts VR-NT 2009-7551 and 2010-4943), the Faculty of Natural Sciences at Stockholm University, CICYT Spain (project MAT 2008-00736) and the Comunidad Autónoma de Madrid (project S2009/MAT-1472). P.N.G. and A.Y.H.L.were supported by postdoctoral grants from the Carl Trygger Foundation and the Wenner-GrenFoundations, respectively.
References
1 Hench, L. L. 1991 Bioceramics: from concept to clinic. J. Am. Ceram. Soc. 74, 1487–1510.(doi:10.1111/j.1151-2916.1991.tb07132.x)
2 Vallet-Regí, M., Ragel, C. V. & Salinas, A. J. 2003 Glasses with medical applications. Eur. J.Inorg. Chem. 2003, 1029–1042. (doi:10.1002/ejic.200390134)
3 Hench, L. L. & Polak, J. M. 2002 Third-generation biomedical materials. Science 295,1014–1017. (doi:10.1126/science.1067404)
Phil. Trans. R. Soc. A (2012)

Bioactive glasses probed by NMR 1397
4 Rahaman, M. N., Day, D. E., Sonny Bal, B., Fu, Q., Jung, S. B., Bonewald, L. F. & Tomsia,A. P. 2011 Bioactive glass in tissue engineering. Acta Biomater. 7, 2355–2373. (doi:10.1016/j.actbio.2011.03.016)
5 Lowenstam, H. A. & Weiner, S. 1989 On biomineralization. New York, NY: Oxford UniversityPress.
6 Clark, A. E., Pantano, C. G. & Hench, L. L. 1976 Auger spectroscopic analysis of bioglasscorrosion films. J. Am. Ceram. Soc. 59, 37–39. (doi:10.1111/j.1151-2916.1976.tb09382.x)
7 Ogino, M. & Hench, L. L. 1980 Formation of calcium phosphate films on silicate glasses. J. Non-Cryst. Solids 38/39, 673–678. (doi:10.1016/0022-3093(80)90514-1)
8 Kim, C. Y., Clark, A. E. & Hench, L. L. 1989 Early stages of calcium-phosphate layer formationin bioglasses. J. Non-Cryst. Solids 113, 195–202. (doi:10.1016/0022-3093(89)90011-2)
9 Andersson, Ö. H. & Karlsson, K. H. 1991 On the bioactivity of silicate glass. J. Non-Cryst.Solids 129, 145–151. (doi:10.1016/0022-3093(91)90090-S)
10 Ohtsuki, C., Kokubo, T. & Yamamuro, T. 1992 Mechanism of apatite formation on CaO-SiO2-P2O5 glasses in a simulated body-fluid. J. Non-Cryst. Solids 143, 84–92. (doi:10.1016/s0022-3093(05)80556-3)
11 Hayakawa, S., Tsuru, K., Ohtsuki, C. & Osaka, A. 1999 Mechanism of apatite formation on asodium silicate glass in a simulated body fluid. J. Am. Ceram. Soc. 82, 2155–2160. (doi:10.1111/j.1151-2916.1999.tb02056.x)
12 Salinas, A. J., Martin, A. I. & Vallet-Regí, M. 2002 Bioactivity of three CaO-P2O5-SiO2 sol-gelglasses. J. Biomed. Mater. Res. A 61, 524–532. (doi:10.1002/jbm.10229)
13 Izquierdo-Barba, I., Arcos, D., Sakamoto, Y., Terasaki, O., Lopez-Noriega, A. & Vallet-Regi, M.2008 High-performance mesoporous bioceramics mimicking bone mineralization. Chem. Mater.20, 3191–3198. (doi:10.1021/cm800172x)
14 Gunawidjaja, P. N., Lo, A. Y. H., Izquierdo-Barba, I., García, A., Arcos, D., Stevensson, B.,Grins, J., Vallet-Regí, M. & Edén, M. 2010 Biomimetic apatite mineralization mechanisms ofmesoporous bioactive glasses as probed by multinuclear 31P, 29Si, 23Na and 13C solid-stateNMR. J. Phys. Chem. C 114, 19 345–19 356. (doi:10.1021/jp105408c)
15 Sahai, N. & Anseau, M. 2005 Cyclic silicate active site and stereochemical match for apatitenucleation on pseudowollastonite bioceramic-bone interfaces. Biomaterials 26, 5763–5770.(doi:10.1016/j.biomaterials.2005.02.037)
16 Pedone, A. 2009 Properties calculations of silica-based glasses by atomistic simulationstechniques: a review. J. Phys. Chem. C 113, 20 773–20 784. (doi:10.1021/jp9071263)
17 Tilocca, A. 2009 Structural models of bioactive glasses from molecular dynamics simulations.Proc. R. Soc. A 465, 1003–1027. (doi:10.1098/rspa.2008.0462)
18 Tilocca, A. & Cormack, A. N. 2010 Surface signatures of bioactivity: MD simulations of 45Sand 65S silicate glasses. Langmuir 26, 545–551. (doi:10.1021/la902548f)
19 Tilocca, A. & Cormack, A. N. 2011 The initial stages of bioglass dissolution: a Car-Parrinellomolecular-dynamics study of the glass-water interface. Proc. R. Soc. A 467, 2102–2111.(doi:10.1098/rspa.2010.0519)
20 Yan, X. X., Yu, C. Z., Zhou, X. F., Tang, J. W. & Zhao, D. Y. 2004 Highly ordered mesoporousbioactive glasses with superior in vitro bone-forming bioactivities. Angew. Chem. Int. Ed. 43,5980–5984. (doi:10.1002/anie.200460598)
21 Yan, X. X., Huang, X. H., Yu, C. Z., Deng, H. X., Wang, Y., Zhang, Z. D., Qiao, S. Z., Lu, G. Q.& Zhao, D. Y. 2006 The in vitro bioactivity of mesoporous bioactive glasses. Biomaterials 27,3396–3403. (doi:10.1016/j.biomaterials.2006.01.043)
22 López-Noriega, A., Arcos, D., Izquierdo-Barba, I., Sakamoto, Y., Terasaki, O. & Vallet-Regí,M. 2006 Ordered mesoporous bioactive glasses for bone tissue regeneration. Chem. Mater. 18,3137–3144. (doi:10.1021/cm060488o)
23 Leonova, E., Izquierdo-Barba, I., Arcos, D., Lopez-Noriega, A., Hedin, N., Vallet-Regí, M. &Edén, M. 2008 Multinuclear solid-state NMR studies of ordered mesoporous bioactive glasses.J. Phys. Chem. C 112, 5552–5562. (doi:10.1021/jp7107973)
24 García, A., Cicuéndez, M., Izquierdo-Barba, I., Arcos, D. & Vallet-Regí, M. 2009 Essentialrole of calcium phosphate heterogeneities in 2D-hexagonal and 3D-cubic SiO2-CaO-P2O5mesoporous bioactive glasses. Chem. Mater. 21, 5474–5484. (doi:10.1021/cm9022776)
Phil. Trans. R. Soc. A (2012)

1398 P. N. Gunawidjaja et al.
25 Brinker, C. J., Lu, Y. F., Sellinger, A. & Fan, H. Y. 1999 Evaporation-induced self-assembly:nanostructures made easy. Adv. Mater. 11, 579–585. (doi:10.1002/(SICI)1521-4095(199905))
26 Kokubo, T., Kushitani, H., Sakka, S., Kitsugi, T. & Yamamuro, T. 1990 Solutions able toreproduce in vivo surface-structure changes in bioactive glass-ceramic A-W3. J. Biomed. Mater.Res. 24, 721–734. (doi:10.1002/jbm.820240607)
27 Ernst, R. R., Bodenhausen, G. & Wokaun, A. 1987 Principles of nuclear magnetic resonancein one and two dimensions. Oxford, NY: Clarendon Press.
28 Metz, G., Wu, X. L. & Smith, S. O. 1994 Ramped-amplitude cross-polarization in magic-angle-spinning NMR. J. Magn. Reson. Ser. A 110, 219–227. (doi:10.1006/jmra.1994.1208)
29 Maciel, G. E. & Sindorf, D. W. 1980 Silicon-29 nuclear magnetic resonance study of the surfaceof silica-gel by cross polarization and magic-angle spinning. J. Am. Chem. Soc. 102, 7606–7607.(doi:10.1021/ja00545a056)
30 Engelhardt, G. & Michel, D. 1987 High-resolution solid-state NMR of silicates and zeolites.Chichester, UK: John Wiley.
31 MacKenzie, K. J. D. & Smith, M.E. 2002 Multinuclear solid-state NMR of inorganic materials.Amsterdam, The Netherlands: Pergamon Press.
32 Chuang, I. S., Kinney, D. R. & Maciel, G. E. 1993 Interior hydroxyls of the silica-gelsystem as studied by 29Si CP-MAS NMR spectroscopy. J. Am. Chem. Soc. 115, 8695–8705.(doi:10.1021/ja00072a024)
33 Liu, C. H. C. & Maciel, G. E. 1996 The fumed silica surface: A study by NMR. J. Am. Chem.Soc. 118, 5103–5119. (doi:10.1021/ja954120w)
34 Christiansen, S. C., Zhao, D. Y., Janicke, M. T., Landry, C. C., Stucky, G. D. & Chmelka, B. F.2001 Molecularly ordered inorganic frameworks in layered silicate surfactant mesophases. J. Am.Chem. Soc. 123, 4519–4529. (doi:10.1021/ja004310t)
35 Baccile, N., Laurent, G., Bonhomme, C., Innocenzi, P. & Babonneau, F. 2007 Solid-stateNMR characterization of the surfactant-silica interface in templated silicas: acidic versus basicconditions. Chem. Mater. 19, 1343–1354. (doi:10.1021/cm062545j)
36 Engelhardt, G., Nofz, M., Forkel, K., Wihsmann, F. G., Mägi, M., Samoson, A. & Lippmaa,E. 1985 Structural studies of calcium aluminosilicate glasses by high-resolution solid-state 29Siand 27Al magic angle spinning nuclear magnetic resonance. Phys. Chem. Glasses 26, 157–165.
37 Zhang, P., Grandinetti, P.J. & Stebbins, J.F. 1997 Anionic species determination in CaSiO3glass using two-dimensional 29Si NMR. J. Phys. Chem. B 101, 4004–4008. (doi:10.1021/jp9700342)
38 Lebecq, I., Désanglois, F., Leriche, A. & Follet-Houttemane, C. 2007 Compositional dependenceon the in vitro bioactivity of invert or conventional bioglasses in the Si-Ca-Na-P system.J. Biomed. Mater. Res. A 83, 156–168. (doi:10.1002/jbm.A.31228)
39 O’Donnell, M. D., Watts, S. J., Hill, R. G. & Law, R. V. 2009 The effect of phosphate content onthe bioactivity of soda-lime-phosphosilicate glasses. J. Mater. Sci. Mater. Med. 20, 1611–1618.(doi:10.1007/s10856-009-3732-2)
40 Gunawidjaja, P. N., Izquierdo-Barba, I., Mathew, R., Jansson, K., García, A., Grins, J., Arcos,D., Vallet-Regí, M. & Edén, M. Submitted. Quantifying apatite formation and cation leachingfrom mesoporous bioactive glasses in vitro: a SEM, solid-state NMR and powder XRD study.
41 Mathew, R., Gunawidjaja, P. N., Izquierdo-Barba, I., Jansson, K., García, A., Arcos, D.,Vallet-Regí, M. & Edén, M. 2011 Solid-state 31P and 1H NMR investigations of amorphousand crystalline calcium phosphates grown biomimetically from a mesoporous bioactive glass.J. Phys. Chem. C 115, 20 572–20 582. (doi:10.1021/jp206237n)
42 Edén, M. 2011 The split network analysis for exploring composition-structure correlations inmulti-component glasses. I. Rationalizing bioactivity-composition trends of bioglasses. J. Non-Cryst. Solids 357, 1595–1602. (doi:10.1016/j.jnoncrysol.2010.11.098)
43 Edén, M., Sundberg, P. & Stålhandske, C. 2011 The split network analysis for exploringcomposition-structure correlations in multi-component glasses. II. Multinuclear NMR studiesof alumino-borosilicates and glass-wool fibers. J. Non-Cryst. Solids 357, 1587–1594.(doi:10.1016/j.jnoncrysol.2010.11.101)
44 Stevels, J. M. 1960 Neue erkenntnisse uber die struktur des glases. Philips Techn. Rdsch9/10, 337–349.
Phil. Trans. R. Soc. A (2012)

Bioactive glasses probed by NMR 1399
45 Strnad, Z. 1992 Role of the glass phase in bioactive glass-ceramics. Biomaterials 13, 317–321.(doi:10.1016/0142-9612(92)90056-T)
46 Hill, R. 1996 An alternative view of the degradation of bioglass. J. Mater. Sci. Lett. 15,1122–1125. (doi:10.1007/bf00539955)
47 Dietrich, E., Oudadesse, H., Le Floch, M., Bureau, B. & Gloriant, T. 2009 In vitro chemicalreactivity of doped bioactive glasses: an original approach by solid-state NMR spectroscopy.Adv. Eng. Mater. 11, B98–B105. (doi:10.1002/adem.200800400)
48 Grünberg, B., Emmler, T., Gedat, E., Shenderovich, I., Findenegg, G. H., Limbach, H. H. &Buntkowsky, G. 2004 Hydrogen bonding of water confined in mesoporous silica MCM-41and SBA-15 studied by 1H solid-state NMR. Chem. Eur. J. 10, 5689–5696. (doi:10.1002/chem.200400351)
49 Yesinowski, J. P. & Eckert, H. 1987 Hydrogen environments in calcium phosphates: 1H MASNMR at high spinning speeds. J. Am. Chem. Soc. 109, 6274–6282. (doi:10.1021/ja00255a009)
Phil. Trans. R. Soc. A (2012)


