Embed Size (px)
Citation preview
Pergamon
Geochimica et Cosmochimica Acta, Vol. 68, No. 15, pp. 3157–3169, 2004Copyright © 2004 Elsevier Ltd
Printed in the USA. All rights reserved0016-7037/04 $30.00� .00
doi:10.1016/j.gca.2004.03.005
Lipid biomarkers and carbon-isotopes of modern travertine deposits (Yellowstone NationalPark, USA): Implications for biogeochemical dynamics in hot-spring systems
CHUANLUN L. ZHANG,1,* BRUCE W. FOUKE,2 GEORGE T. BONHEYO,2 AARON D. PEACOCK,3 DAVID C. WHITE,3 YONGSONGHUANG,4
and CHRISTOPHERS. ROMANEK1
1Savannah River Ecology Laboratory, University of Georgia, Drawer E, Aiken, SC 29802, USA2Department of Geology, University of Illinois, 245 Natural History Building, Urbana, IL 61801, USA
3Center for Biomarker Analysis, The University of Tennessee, Knoxville, TN 37932, USA4Department of Geological Sciences, Brown University, Providence, RI 02912, USA
Abstract—Lipid biomarkers and13C fractionation patterns were used to understand the dynamics of carboncycling during microbial metabolisms in different environments of travertine precipitation (called facies) atSpring AT-1 on Angel Terrace in the Mammoth Hot Springs complex of Yellowstone National Park, USA.Microbial mats that encrust travertine deposits were collected for analyses of lipid biomarkers and carbonisotopes along the continuous drainage outflow system of Spring AT-1. The spring water exhibits a continuoustemperature drop from 71°C in the vent at top to 24°C in the distal slope at bottom. Phospholipid fatty acids(PLFA) and glycolipid fatty acids (GLFA) exhibit distinctly different compositions in each of the facies,which are consistent with partitioning of the bacterial 16S rRNA gene sequences in the Spring AT-1 travertinefacies (Fouke et al., 2003).
The �13C composition of total biomass within the microbial mats decreases from�16.1‰ in the ventto �23.5‰ in the distal slope. However, lower values occur in the pond (�26.0‰) and the proximal slope(�28.0‰) between the vent and the distal slope. Isotopic compositions of PLFA and GLFA have variationssimilar to those of total biomass. The average�13C values of PLFA are�12.4� 5.2‰ (n� 10 individualfatty acids, same below) in the vent,�33.0� 3.1‰ (n� 11) in the pond,�33.7� 3.8‰ (n� 16) in theproximal slope, and�22.4� 3.4‰ (n� 10) in the distal slope; the average�13C values of GLFA are�19.6� 3.0‰ (n� 3) in the vent,�30.4� 4.7‰ (n� 8) in the pond,�36.9� 2.8‰ (n� 12) in the proximalslope, and�27.9� 3.1‰ (n� 13) in the distal slope. In particular, fatty acids in the vent are enriched in13Crelative to the total biomass, which is consistent with the notion that the biosynthetic pathways of the extantmicrobial community in the vent may be dominated byAquificales using the reversed tricarboxylic acid cycle.Fractionations between fatty acids and total biomass in the pond, the proximal slope and the distal slopesuggest the involvement of other biosynthetic pathways for CO2 fixation by extant microbial populations. Theresults indicate that lipid biomarkers provide valuable information on the changing diversity and activity ofmicrobial communities in different depositional environments. Carbon-isotope fractionations, on the otherhand, can provide insight into the operating biosynthetic pathways associated with different organisms in thechanging environment. This integrated approach may serve as a powerful tool for identifying functionalmetabolism within a community and identify shifts in microbial community structure in modern hot-springsystems. Copyright © 2004 Elsevier Ltd
Keywords: Phospholipid fatty acids, glycolipid fatty acids, lipid biomarkers, stable carbon isotopes,Aquificales, cyanobacteria, green sulfur bacteria, green non-sulfur bacteria, Angel Terrace, Mammoth Hot
Springs, Yellowstone National Parkthefor
ebe-lipidr nu-el--cies
,e,tion
ntal
ath-veral
theloseribu-
emo-CO,e
y-
ulfurtssed
INTRODUCTION
Lipid biomarkers provide quantitative information aboutstructure of extant microbial communities without the needculturing and isolation (White, 1988). Lipids are also one of thmost useful biochemical measures of in situ interactionstween microbial species and their environments becausecompositions can indicate temperature-, redox-, stress-, otritional conditions (Ray et al., 1971; Fork et al., 1979; Ringberg et al., 1989; Jahnke, 1992). Furthermore, bacteria commonly have ester-linked lipids and some bacterial specontain additional non-phytanyl ether lipids (Langworthy et al.1983; De Rosa et al., 1988; Huber et al., 1992). Archaea, on thother hand, have phytanyl ether lipids (Langworthy et al.1983). Thus, analysis of lipid structures permits identifica
* Author to whom correspondence should be addre
([email protected]).3157
of these two microbial domains in unknown environmesamples.
Different microorganisms have different biosynthetic pways. In particular, autotrophic microorganisms can use sepathways for CO2 fixation (Ratledge and Wilkinson, 1988). Avariety of phototrophs, which include cyanobacteria, useCalvin cycle, which requires the key enzymes of ribu1,5-bisphosphate carboxylase/oxygenase (RubisCO) andlokinase. Methanogens and several groups of known chlithoautotrophic bacteria use the acetyl-CoA pathway for2fixation (Fuchs, 1989; Vorholt et al., 1995). Other bacteriasuch asHydrogenobacter and Aquifex are known to use threversed tricarboxylic acid (rTCA) cycle for CO2 fixation(Fuchs, 1989; Beh et al., 1993). Another pathway is the 3-hdroxylpropionate (HP) cycle, which fixes HCO3
� rather thanCO2. This pathway has been observed in green non-sbacteria (Strauss and Fuchs, 1993) and Archaea (Menendez e
al., 1999). It is suggested that the latter three pathways require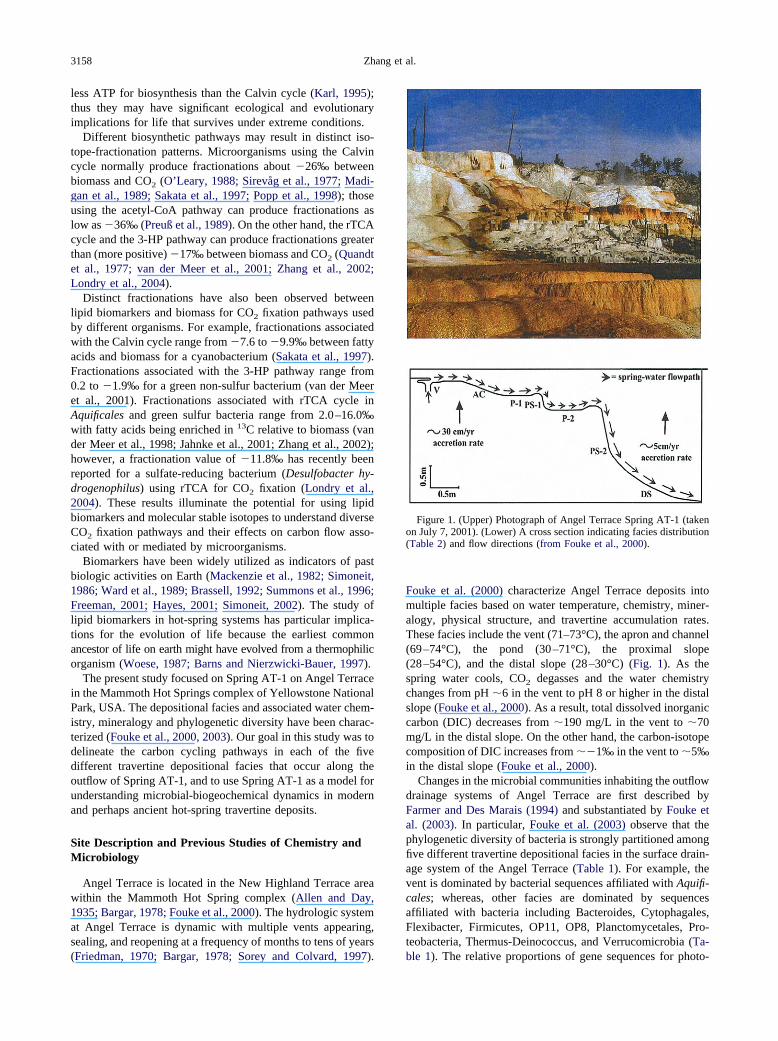
3158 Zhang et al.
less ATP for biosynthesis than the Calvin cycle (Karl, 1995);thus they may have significant ecological and evolutionaryimplications for life that survives under extreme conditions.
Different biosynthetic pathways may result in distinct iso-tope-fractionation patterns. Microorganisms using the Calvincycle normally produce fractionations about �26‰ betweenbiomass and CO2 (O’Leary, 1988; Sirevag et al., 1977; Madi-gan et al., 1989; Sakata et al., 1997; Popp et al., 1998); thoseusing the acetyl-CoA pathway can produce fractionations aslow as �36‰ (Preußet al., 1989). On the other hand, the rTCAcycle and the 3-HP pathway can produce fractionations greaterthan (more positive) �17‰ between biomass and CO2 (Quandtet al., 1977; van der Meer et al., 2001; Zhang et al., 2002;Londry et al., 2004).
Distinct fractionations have also been observed betweenlipid biomarkers and biomass for CO2 fixation pathways usedby different organisms. For example, fractionations associatedwith the Calvin cycle range from �7.6 to �9.9‰ between fattyacids and biomass for a cyanobacterium (Sakata et al., 1997).Fractionations associated with the 3-HP pathway range from0.2 to �1.9‰ for a green non-sulfur bacterium (van der Meeret al., 2001). Fractionations associated with rTCA cycle inAquificales and green sulfur bacteria range from 2.0–16.0‰with fatty acids being enriched in 13C relative to biomass (vander Meer et al., 1998; Jahnke et al., 2001; Zhang et al., 2002);however, a fractionation value of �11.8‰ has recently beenreported for a sulfate-reducing bacterium (Desulfobacter hy-drogenophilus) using rTCA for CO2 fixation (Londry et al.,2004). These results illuminate the potential for using lipidbiomarkers and molecular stable isotopes to understand diverseCO2 fixation pathways and their effects on carbon flow asso-ciated with or mediated by microorganisms.
Biomarkers have been widely utilized as indicators of pastbiologic activities on Earth (Mackenzie et al., 1982; Simoneit,1986; Ward et al., 1989; Brassell, 1992; Summons et al., 1996;Freeman, 2001; Hayes, 2001; Simoneit, 2002). The study oflipid biomarkers in hot-spring systems has particular implica-tions for the evolution of life because the earliest commonancestor of life on earth might have evolved from a thermophilicorganism (Woese, 1987; Barns and Nierzwicki-Bauer, 1997).
The present study focused on Spring AT-1 on Angel Terracein the Mammoth Hot Springs complex of Yellowstone NationalPark, USA. The depositional facies and associated water chem-istry, mineralogy and phylogenetic diversity have been charac-terized (Fouke et al., 2000, 2003). Our goal in this study was todelineate the carbon cycling pathways in each of the fivedifferent travertine depositional facies that occur along theoutflow of Spring AT-1, and to use Spring AT-1 as a model forunderstanding microbial-biogeochemical dynamics in modernand perhaps ancient hot-spring travertine deposits.
Site Description and Previous Studies of Chemistry andMicrobiology
Angel Terrace is located in the New Highland Terrace areawithin the Mammoth Hot Spring complex (Allen and Day,1935; Bargar, 1978; Fouke et al., 2000). The hydrologic systemat Angel Terrace is dynamic with multiple vents appearing,sealing, and reopening at a frequency of months to tens of years
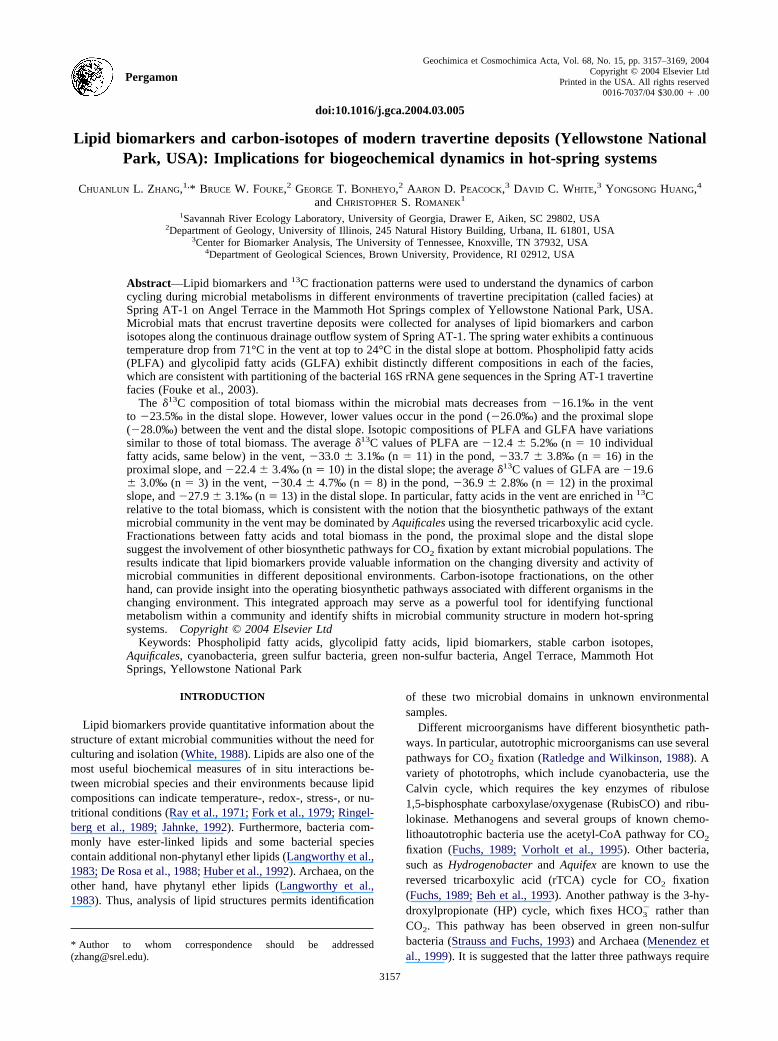
(Friedman, 1970; Bargar, 1978; Sorey and Colvard, 1997).Fouke et al. (2000) characterize Angel Terrace deposits intomultiple facies based on water temperature, chemistry, miner-alogy, physical structure, and travertine accumulation rates.These facies include the vent (71–73°C), the apron and channel(69–74°C), the pond (30–71°C), the proximal slope(28–54°C), and the distal slope (28–30°C) (Fig. 1). As thespring water cools, CO2 degasses and the water chemistrychanges from pH �6 in the vent to pH 8 or higher in the distalslope (Fouke et al., 2000). As a result, total dissolved inorganiccarbon (DIC) decreases from �190 mg/L in the vent to �70mg/L in the distal slope. On the other hand, the carbon-isotopecomposition of DIC increases from ��1‰ in the vent to �5‰in the distal slope (Fouke et al., 2000).
Changes in the microbial communities inhabiting the outflowdrainage systems of Angel Terrace are first described byFarmer and Des Marais (1994) and substantiated by Fouke etal. (2003). In particular, Fouke et al. (2003) observe that thephylogenetic diversity of bacteria is strongly partitioned amongfive different travertine depositional facies in the surface drain-age system of the Angel Terrace (Table 1). For example, thevent is dominated by bacterial sequences affiliated with Aquifi-cales; whereas, other facies are dominated by sequencesaffiliated with bacteria including Bacteroides, Cytophagales,Flexibacter, Firmicutes, OP11, OP8, Planctomycetales, Pro-teobacteria, Thermus-Deinococcus, and Verrucomicrobia (Ta-
Figure 1. (Upper) Photograph of Angel Terrace Spring AT-1 (takenon July 7, 2001). (Lower) A cross section indicating facies distribution(Table 2) and flow directions (from Fouke et al., 2000).
ble 1). The relative proportions of gene sequences for photo-
3159Carbon isotopes of bacterial biomarkers
autotrophs such as green sulfur bacteria, green non-sulfurbacteria, and cyanobacteria vary from facies to facies (Table 1).
Fouke et al. (2003) also observe that there is little downstream transport of bacterial cells at the Angel Terrace SpringAT-1. This indicates that the distribution of microorganismsmay be directly controlled by the physical and chemical con-ditions of each depositional facies. Results of this study supportthis hypothesis and indicate that Spring AT-1 would be anexcellent natural laboratory for studying biogeochemical dy-namics in the hot spring environments. Specifically, lipidbiomarkers and their molecular isotope compositions wouldallow us to delineate pathways for CO2 fixation within a matcommunity and the shifts in microbial community structurefrom facies to facies.
MATERIAL AND METHODS
3.1. Sample Collection
Microbial mats or fresh travertine accumulations (carbonate rocks inthe vent and the apron and channel) were collected at Angel Terrace
Table 1. Percentage of gene sequences for chemolithoautotrophs(Aquificales), photoautotrophs (green-sulfur bacteria, green non-sulfurbacteria, and cyanobacteria), and other bacterial species recovered fromsurface environments (facies) at Angel Terrace travertine in Yellow-stone (Fouke et al., 2003).
Division
Facies
Vent
Apronand
channel PondProximal
slopeDistalslope
Aquificales 91 25 7 15 5Green nonsulfur
bacteria3 4 1 16 ND
Green sulfur bacteria �1 4 1 9 3Cyanobacteria 1 ND 9 2 18Other bacteriaa 3 67 72 42 74
ND � not detected.a Other bacteria include BCF (Bacteroides, Cytophagales, and Flexi-
bacter), Firmicutes, OP11, OP8, Planctomycetales, Proteobacteria,Thermus-Deinococcus, and Verrucomicrobia in different proportions ineach facies, which are either heterotrophs or undetermined.
Table 2. Water chemistry and mi
Parameter Vent Apron & Channel
Temp. (°C)a 71.4 � 0.5 66.8 � 0.3pHa 6.3 � 0.1 6.7 � 0.1DIC (mg/L)b 192 111�13CDIC (‰)b �0.9 1.0�13CCO2-d (‰)c �5.4 �3.9�13CTB (‰) �16.1 � 4.2 NDd
Flow rateb High HighMineralogyb Aragonite AragoniteMat color Tan-gray travertine Pink-white
a Mean � 1 standard deviation for two or three replicate measuremb Data are from Fouke et al. (2000). DIC � dissolved inorganic carc Isotopic compositions of dissolved CO2 (�13CCO2-d) was calculated
� (1000 � �13CHCO3)/1000 � �13CHCO3 and �(CO2-HCO3) � 24.12 �T is absolute temperature (Mook et al., 1974).
d
Not determined.Spring AT-1 during daylight-hours in July 2001. The samples werecollected from the same spring reported by Fouke et al. (2003) but notfrom the exact locations. This is because the flow of the spring wateris dynamic and changes pathways frequently, which results in theformation of the same facies in different locations and times. Thetemperature in the same facies, however, is comparable between loca-tions, which makes this study relevant to that of Fouke et al. (2003).
In each facies, the mat material was physically peeled off andcollected into 50-mL sterile plastic tubes using forceps. Non-calcifiedmats grew very thin in the vent and in the apron and channel becauseof high rates of travertine precipitation. As a result, a piece of the freshcarbonate rock was cut using a knife and transferred into the plastictube using forceps. Two samples (A and B) were collected from eachof the five selected facies (Table 2). Water temperature and pH weremeasured at the time of collection using a combination probe. Sampleswere stored on ice in the field (�10 h) and frozen immediately on dryice at the end of the day. Samples were transported to the homeinstitution on dry ice and lyophilized before lipid extraction and car-bon-isotope determinations.
3.2. Lipid Extraction and Fatty Acid Identification
Freeze-dried materials were extracted following White et al. (1979)and (Zhang et al., 2002, 2003). The procedure employed a single-phaseorganic solvent system comprised of chloroform, methanol, and aque-ous 50-mM phosphate buffer (pH 7.4) in the ratio of 1:2:0.8 (v:v:v). Inthis study, samples were powdered and a portion of the material(0.34–1 g) was used for lipid extraction. After extraction overnight,chloroform and nano-pure water were added to the extractant in equalvolumes, which resulted in a two-phase system. The lower phasecontained the lipids, which were collected and fractionated on a silicicacid column into neutral lipids, polar lipids (phospholipids), and gly-colipids (Guckert et al., 1985). The phospholipids and glycolipids weretreated using a mild alkaline methanolysis to produce fatty acid methylesters (FAMEs), namely the phospholipids fatty acids (PLFA) andglycolipid fatty acids (GLFA).
An Agilent 6890 series gas-chromatograph (GC) interfaced to anAgilent 5973 mass selective detector was used for the identification ofFAMEs. The GC used a 60-m non-polar column (0.25-mm I.D.,0.25-�m film thickness) and the injector and detector were maintainedat 230°C and 300°C, respectively. The column-temperature was pro-grammed from 60°C for 1 min, ramping at 20°C/min to 150°C andholding for 4 min. This was followed by ramping at 7°C/min to 230°Cand holding for 2 min, and finally ramping at 10°C/min to 300°C andholding for 3 min. Mass-spectra were determined by electron impact at70 eV. Methyl Heneicosanoate was used as the internal standard. PLFAand GLFA were expressed as equivalent peaks against the internalstandard. Double-bond positions of monounsaturated FAME were de-termined by GC-mass-spectrometry (MS) analysis of the dimethyl
y of Angel Terrace Spring AT-1.
Facies
Pond-2 Proximal Slope-2 Distal Slope
50.9 � 0.6 46.8 � 0.5 24.3 � 0.07.5 � 0.0 8.1 � 0.0 8.4 � 0.0135 104 75
0.4 1.6 4.6�5.9 �5.1 �4.5
�26.3 �28.0 � 0.6 �23.5 � 0.0ow Moderate Lowragonite/Calcite Aragonite/Calcite Calcitehite/green Dark green/orange-brown Orange
13CHCO3 (� �13CDIC) using the equations of �13CCO2-d � �(CO2-HCO3)
, where � is the fractionation between dissolved CO2 and HCO3� and
neralog
LAW
ents.bon.from �
9866/T
3160 Zhang et al.
disulfide adducts (Nichols et al., 1986). Cis and trans isomers ofcompounds were identified by known standards. Figure 2 shows anexample of fatty-acid profiles for the vent facies.
3.3. Stable Carbon Isotopes
Carbon-isotope compositions of the FAMEs for PLFA and GLFAwere determined following Zhang et al. (2002) using a HP 6890gas-chromatograph connected to a Finnigan MAT Delta�-XL mass-spectrometer. Measurements were corrected for the methyl moietyaccording to Abrajano et al. (1994) using the following equation:
�13CFA � �Cn � 1 � �13CFAME � �13CMeOH�/Cn
where �13CFA is the �13C of the fatty acid, Cn is the number of carbonsin the fatty acid, �13CFAME is the �13C of the methylated fatty acid, and�13CMeOH is the �13C of the methanol used for the methylation reaction.
Carbon-isotope compositions of total biomass were determined us-ing bulk samples after dissolution of the associated carbonate in 1%EDTA. The residual material was then rinsed with distilled water anddried in an oven at 50°C overnight. The 13C/12C ratio of total biomasswas then determined on a Delta Plus isotope ratio mass spectrometerinterfaced with an Elemental Analyzer.
RESULTS
4.1. General Chemistry
Water temperature decreased from 71.4°C in the vent to24.3°C in the distal slope at the time of sampling. The pHincreased from 6.3 in the vent to 8.4 in the distal slope (Table2). These measurements are in the same range as previousrecordings (Fouke et al., 2000). Water samples were not pre-served properly and not analyzed for concentration and stablecarbon-isotopes of DIC. Previously however, the water hadbeen repeatedly collected and analyzed, and the results gaverelatively consistent DIC values for each facies (Fouke et al.,2000). We use these values as well as the reported �13C of DICas references for this study (Table 2). The isotopic compositionof dissolved CO2 is estimated to be in a narrow range of�3.9‰ to �5.9‰ across these facies (Table 2). The �13C
Figure 2. Gas chromatograph of phospholipid fatty acids from a ventsample collected from the Angel Terrace hot-spring complex in Yel-lowstone National Park (see Fig. 2 for description). Peak identificationsare: 1, i15:0; 2, a15:0; 3, i16:0; 4, 16:0; 5, i17:0; 6, a17:0; 7, 17:0; 8,i18:0; 9, 18:1w9c; 10, 18:1�7c; 11, 18:1�7t; 12, 18:0; 13, cy19:0; 14,20:1�9c; 15, 20:1�9t; 16, 20:0; 17, 21:0 (internal standard).
values of total biomass, however, show a much wider but
systematic variation along the temperature gradient, decreasingfrom �16.1‰ in the vent to �28.0‰ in the proximal slopefollowed by a slight increase to �23.5‰ in the distal slope(Table 2).
4.2. Lipid Profiles in Different Facies
4.2.1. Phospholipid fatty acids (PLFA)
PLFA in the vent facies are dominated by 20:1�9c and20:1�9t, which collectively make up about one third (32.1%,average of samples A and B; same reporting below) of the totalfatty acids (Table 3). The next most abundant fatty acid is 18:0(22.2%) followed by 18:1 with three isomers, 18:1�9c (8.2%),18:1�7c (7.6%), and 18:1�7t (1.7%). Collectively, these iso-mers make up �17.4% of total PLFA (Table 3). The universalfatty acid, 16:0, accounts for �10.0% of total PLFA. Lessabundant fatty acids include 20:0, cy19:0, and iso- or anteiso-15, �16 and �17 carbon chains, which are �5% each (Table 3).
The pond-2 and the proximal slope-2 (Fig. 1) have similarlipid profiles with 16:0 accounting for about half of total PLFAin both facies (Table 3). This is followed by 18:1�9c and18:1�7c, which collectively account for �15.5% of total PLFAin both facies. The most abundant fatty acid (20:1�9) in thevent nearly disappears in these facies and a15:0, i17:0, a17:0,and cy19:0 also decrease to below 1.0% (Table 3). On the otherhand, 16:1�7c and 18:2�6 appear in relatively high abundance(5.0–6.0%) with cy17:0 being a minor compound (1.5%) in thepond-2. In addition, the proximal slope-2 shows a sharpincrease in 14:0, which accounts for �2.7% of total PLFA(Table 3).
In the distal slope, 16:0 decreases to 30.0% of total PLFA butstill remains the most abundant. The compound 18:0 continuesto decrease to a value of 4.4%. On the other hand, 18:1�9cremains relatively unchanged (�14.0%) compared to its abun-dances in the pond-2 or the proximal slope-2, but 18:1�7cincreases to a greater proportion of �11.0%. Collectively,18:1�9c and 18:1�7c account for �25.0% of total PLFA in thedistal slope and are the most abundant in all four facies. Alsoincreased in the distal slope are i15:0 (�7.0%), a15:0 (�1.3%),16:1�7c (�6.8%), i17:0 (�1.3%), 18:3�3 (�5.4%), and 20:0–23:0 (1.0–2.2%) (Table 3). These changes may reflect shiftsin microbial community structure from facies to facies.
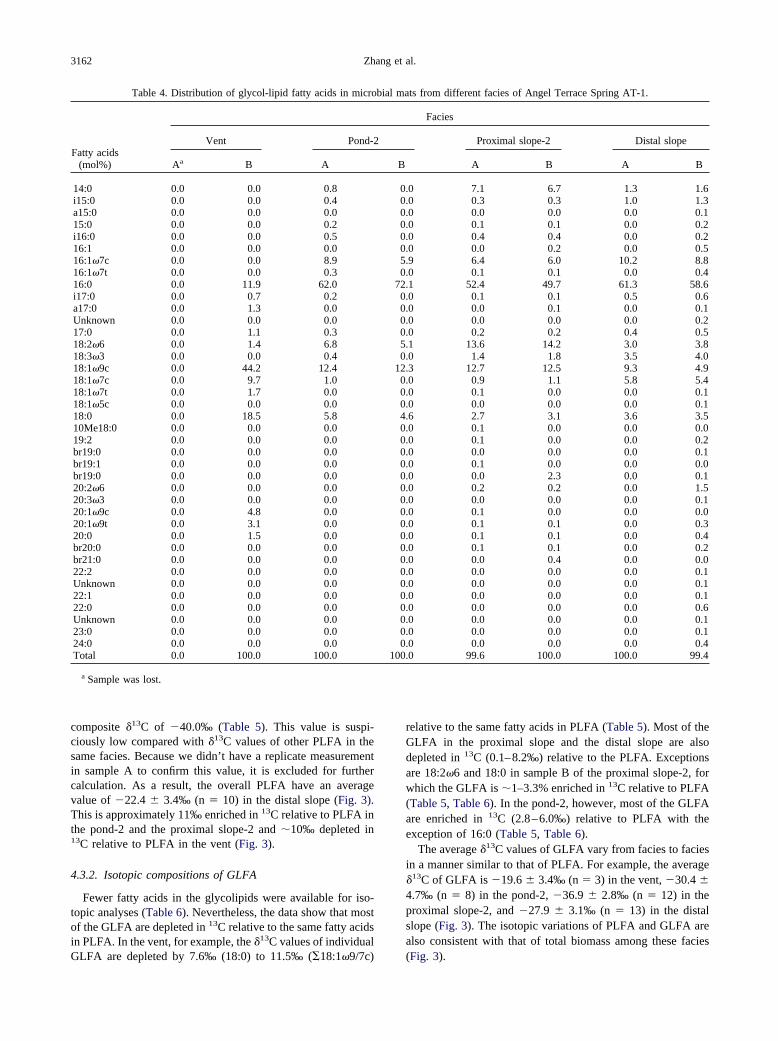
4.2.2. Glycolipid fatty acids (GLFA)
In all facies GLFA have major fatty acids that are also foundin PLFA (Table 4). However, the relative proportions of majorfatty acids in glycolipids may be different from those in thephospolipids. For example, GLFA in the vent have a signifi-cantly greater proportion of 18:1�9c (44.2%, sample B) andlower proportions of 20:1�9c (4.8%, sample B) and 20:1�9t(3.1%, sample B) than PLFA in the same facies (Table 4). Inthe pond-2 and the proximal slope-2, major GLFA such as16:1�7c, 16:0, 18:2�6, 18:1�9c and 18:0 have similar propor-tions as the PLFA (Table 4). In the distal slope, GLFA havegreater proportions of 16:1�7c (average 9.5% between samplesA and B, same below) and 16:0 (�60.0%) but lower propor-tions of i15:0 (1.2%), 18:2�6 (�3.4%), 18:1�9c (7.1%), and
18:1�7c (5.6%) than the PLFA (Table 4).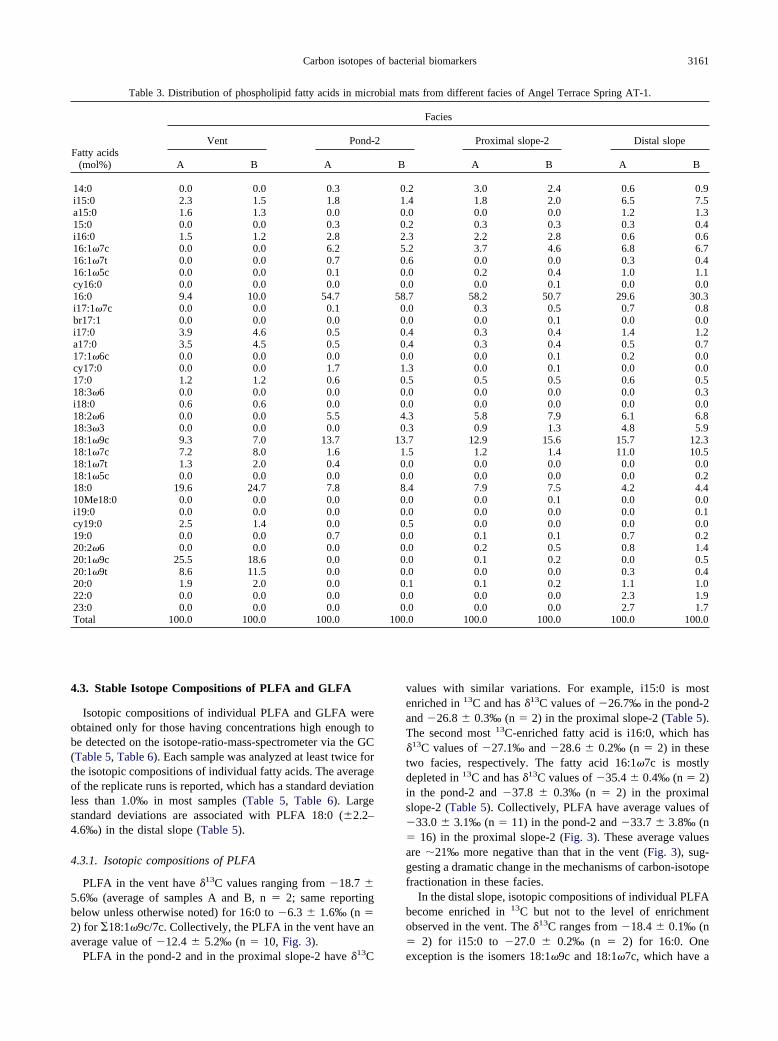
3161Carbon isotopes of bacterial biomarkers
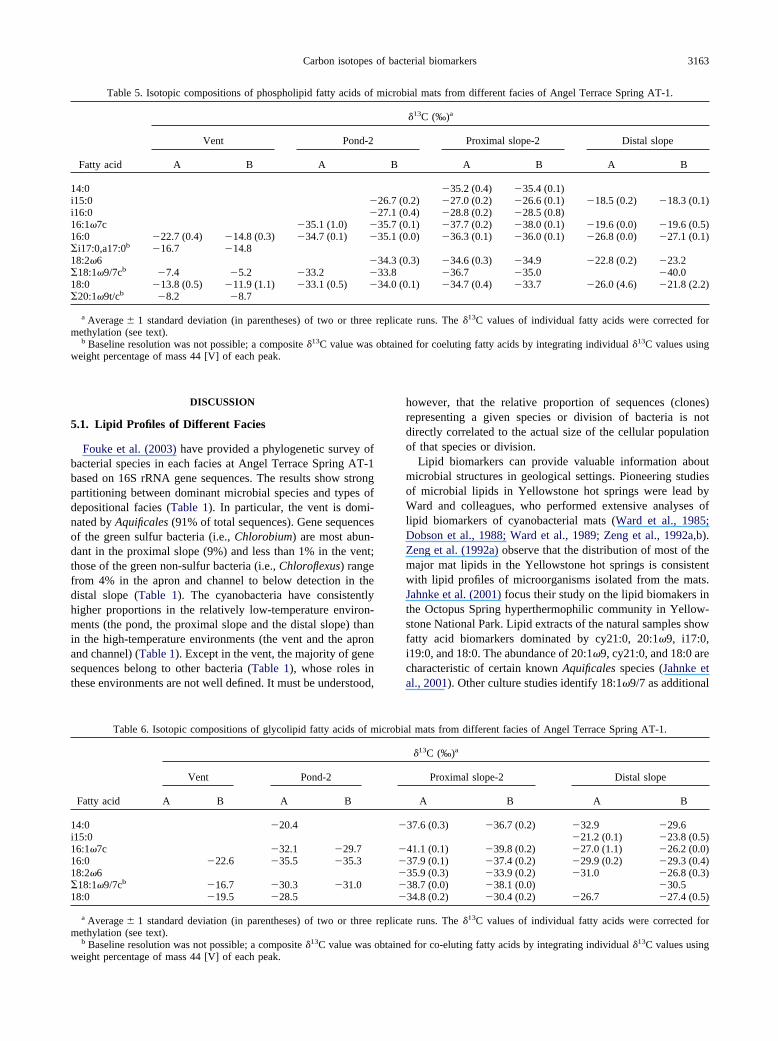
4.3. Stable Isotope Compositions of PLFA and GLFA
Isotopic compositions of individual PLFA and GLFA wereobtained only for those having concentrations high enough tobe detected on the isotope-ratio-mass-spectrometer via the GC(Table 5, Table 6). Each sample was analyzed at least twice forthe isotopic compositions of individual fatty acids. The averageof the replicate runs is reported, which has a standard deviationless than 1.0‰ in most samples (Table 5, Table 6). Largestandard deviations are associated with PLFA 18:0 (�2.2–4.6‰) in the distal slope (Table 5).
4.3.1. Isotopic compositions of PLFA
PLFA in the vent have �13C values ranging from �18.7 �5.6‰ (average of samples A and B, n � 2; same reportingbelow unless otherwise noted) for 16:0 to �6.3 � 1.6‰ (n �2) for �18:1�9c/7c. Collectively, the PLFA in the vent have anaverage value of �12.4 � 5.2‰ (n � 10, Fig. 3).
13
Table 3. Distribution of phospholipid fatty acids in micr
Fatty acids(mol%)
Vent Pond-
A B A
14:0 0.0 0.0 0.3i15:0 2.3 1.5 1.8a15:0 1.6 1.3 0.015:0 0.0 0.0 0.3i16:0 1.5 1.2 2.816:1�7c 0.0 0.0 6.216:1�7t 0.0 0.0 0.716:1�5c 0.0 0.0 0.1cy16:0 0.0 0.0 0.016:0 9.4 10.0 54.7i17:1�7c 0.0 0.0 0.1br17:1 0.0 0.0 0.0i17:0 3.9 4.6 0.5a17:0 3.5 4.5 0.517:1�6c 0.0 0.0 0.0cy17:0 0.0 0.0 1.717:0 1.2 1.2 0.618:3�6 0.0 0.0 0.0i18:0 0.6 0.6 0.018:2�6 0.0 0.0 5.518:3�3 0.0 0.0 0.018:1�9c 9.3 7.0 13.718:1�7c 7.2 8.0 1.618:1�7t 1.3 2.0 0.418:1�5c 0.0 0.0 0.018:0 19.6 24.7 7.810Me18:0 0.0 0.0 0.0i19:0 0.0 0.0 0.0cy19:0 2.5 1.4 0.019:0 0.0 0.0 0.720:2�6 0.0 0.0 0.020:1�9c 25.5 18.6 0.020:1�9t 8.6 11.5 0.020:0 1.9 2.0 0.022:0 0.0 0.0 0.023:0 0.0 0.0 0.0Total 100.0 100.0 100.0
PLFA in the pond-2 and in the proximal slope-2 have � C
values with similar variations. For example, i15:0 is mostenriched in 13C and has �13C values of �26.7‰ in the pond-2and �26.8 � 0.3‰ (n � 2) in the proximal slope-2 (Table 5).The second most 13C-enriched fatty acid is i16:0, which has�13C values of �27.1‰ and �28.6 � 0.2‰ (n � 2) in thesetwo facies, respectively. The fatty acid 16:1�7c is mostlydepleted in 13C and has �13C values of �35.4 � 0.4‰ (n � 2)in the pond-2 and �37.8 � 0.3‰ (n � 2) in the proximalslope-2 (Table 5). Collectively, PLFA have average values of�33.0 � 3.1‰ (n � 11) in the pond-2 and �33.7 � 3.8‰ (n� 16) in the proximal slope-2 (Fig. 3). These average valuesare �21‰ more negative than that in the vent (Fig. 3), sug-gesting a dramatic change in the mechanisms of carbon-isotopefractionation in these facies.
In the distal slope, isotopic compositions of individual PLFAbecome enriched in 13C but not to the level of enrichmentobserved in the vent. The �13C ranges from �18.4 � 0.1‰ (n� 2) for i15:0 to �27.0 � 0.2‰ (n � 2) for 16:0. One
ats from different facies of Angel Terrace Spring AT-1.
Facies
Proximal slope-2 Distal slope
A B A B
2 3.0 2.4 0.6 0.94 1.8 2.0 6.5 7.50 0.0 0.0 1.2 1.32 0.3 0.3 0.3 0.43 2.2 2.8 0.6 0.62 3.7 4.6 6.8 6.76 0.0 0.0 0.3 0.40 0.2 0.4 1.0 1.10 0.0 0.1 0.0 0.07 58.2 50.7 29.6 30.30 0.3 0.5 0.7 0.80 0.0 0.1 0.0 0.04 0.3 0.4 1.4 1.24 0.3 0.4 0.5 0.70 0.0 0.1 0.2 0.03 0.0 0.1 0.0 0.05 0.5 0.5 0.6 0.50 0.0 0.0 0.0 0.30 0.0 0.0 0.0 0.03 5.8 7.9 6.1 6.83 0.9 1.3 4.8 5.97 12.9 15.6 15.7 12.35 1.2 1.4 11.0 10.50 0.0 0.0 0.0 0.00 0.0 0.0 0.0 0.24 7.9 7.5 4.2 4.40 0.0 0.1 0.0 0.00 0.0 0.0 0.0 0.15 0.0 0.0 0.0 0.00 0.1 0.1 0.7 0.20 0.2 0.5 0.8 1.40 0.1 0.2 0.0 0.50 0.0 0.0 0.3 0.41 0.1 0.2 1.1 1.00 0.0 0.0 2.3 1.90 0.0 0.0 2.7 1.70 100.0 100.0 100.0 100.0
obial m
2
B
0.1.0.0.2.5.0.0.0.
58.0.0.0.0.0.1.0.0.0.4.0.
13.1.0.0.8.0.0.0.0.0.0.0.0.0.0.
100.
exception is the isomers 18:1�9c and 18:1�7c, which have a
3162 Zhang et al.
composite �13C of �40.0‰ (Table 5). This value is suspi-ciously low compared with �13C values of other PLFA in thesame facies. Because we didn’ t have a replicate measurementin sample A to confirm this value, it is excluded for furthercalculation. As a result, the overall PLFA have an averagevalue of �22.4 � 3.4‰ (n � 10) in the distal slope (Fig. 3).This is approximately 11‰ enriched in 13C relative to PLFA inthe pond-2 and the proximal slope-2 and �10‰ depleted in13C relative to PLFA in the vent (Fig. 3).
4.3.2. Isotopic compositions of GLFA
Fewer fatty acids in the glycolipids were available for iso-topic analyses (Table 6). Nevertheless, the data show that mostof the GLFA are depleted in 13C relative to the same fatty acidsin PLFA. In the vent, for example, the �13C values of individual
Table 4. Distribution of glycol-lipid fatty acids in micro
Fatty acids(mol%)
Vent Pond-2
Aa B A
14:0 0.0 0.0 0.8i15:0 0.0 0.0 0.4a15:0 0.0 0.0 0.015:0 0.0 0.0 0.2i16:0 0.0 0.0 0.516:1 0.0 0.0 0.016:1�7c 0.0 0.0 8.916:1�7t 0.0 0.0 0.316:0 0.0 11.9 62.0i17:0 0.0 0.7 0.2a17:0 0.0 1.3 0.0Unknown 0.0 0.0 0.017:0 0.0 1.1 0.318:2�6 0.0 1.4 6.818:3�3 0.0 0.0 0.418:1�9c 0.0 44.2 12.418:1�7c 0.0 9.7 1.018:1�7t 0.0 1.7 0.018:1�5c 0.0 0.0 0.018:0 0.0 18.5 5.810Me18:0 0.0 0.0 0.019:2 0.0 0.0 0.0br19:0 0.0 0.0 0.0br19:1 0.0 0.0 0.0br19:0 0.0 0.0 0.020:2�6 0.0 0.0 0.020:3�3 0.0 0.0 0.020:1�9c 0.0 4.8 0.020:1�9t 0.0 3.1 0.020:0 0.0 1.5 0.0br20:0 0.0 0.0 0.0br21:0 0.0 0.0 0.022:2 0.0 0.0 0.0Unknown 0.0 0.0 0.022:1 0.0 0.0 0.022:0 0.0 0.0 0.0Unknown 0.0 0.0 0.023:0 0.0 0.0 0.024:0 0.0 0.0 0.0Total 0.0 100.0 100.0
a Sample was lost.
GLFA are depleted by 7.6‰ (18:0) to 11.5‰ (�18:1�9/7c)
relative to the same fatty acids in PLFA (Table 5). Most of theGLFA in the proximal slope and the distal slope are alsodepleted in 13C (0.1–8.2‰) relative to the PLFA. Exceptionsare 18:2�6 and 18:0 in sample B of the proximal slope-2, forwhich the GLFA is �1–3.3% enriched in 13C relative to PLFA(Table 5, Table 6). In the pond-2, however, most of the GLFAare enriched in 13C (2.8–6.0‰) relative to PLFA with theexception of 16:0 (Table 5, Table 6).
The average �13C values of GLFA vary from facies to faciesin a manner similar to that of PLFA. For example, the average�13C of GLFA is �19.6 � 3.4‰ (n � 3) in the vent, �30.4 �4.7‰ (n � 8) in the pond-2, �36.9 � 2.8‰ (n � 12) in theproximal slope-2, and �27.9 � 3.1‰ (n � 13) in the distalslope (Fig. 3). The isotopic variations of PLFA and GLFA arealso consistent with that of total biomass among these facies
ts from different facies of Angel Terrace Spring AT-1.
Facies
Proximal slope-2 Distal slope
A B A B
0 7.1 6.7 1.3 1.60 0.3 0.3 1.0 1.30 0.0 0.0 0.0 0.10 0.1 0.1 0.0 0.20 0.4 0.4 0.0 0.20 0.0 0.2 0.0 0.59 6.4 6.0 10.2 8.80 0.1 0.1 0.0 0.41 52.4 49.7 61.3 58.60 0.1 0.1 0.5 0.60 0.0 0.1 0.0 0.10 0.0 0.0 0.0 0.20 0.2 0.2 0.4 0.51 13.6 14.2 3.0 3.80 1.4 1.8 3.5 4.03 12.7 12.5 9.3 4.90 0.9 1.1 5.8 5.40 0.1 0.0 0.0 0.10 0.0 0.0 0.0 0.16 2.7 3.1 3.6 3.50 0.1 0.0 0.0 0.00 0.1 0.0 0.0 0.20 0.0 0.0 0.0 0.10 0.1 0.0 0.0 0.00 0.0 2.3 0.0 0.10 0.2 0.2 0.0 1.50 0.0 0.0 0.0 0.10 0.1 0.0 0.0 0.00 0.1 0.1 0.0 0.30 0.1 0.1 0.0 0.40 0.1 0.1 0.0 0.20 0.0 0.4 0.0 0.00 0.0 0.0 0.0 0.10 0.0 0.0 0.0 0.10 0.0 0.0 0.0 0.10 0.0 0.0 0.0 0.60 0.0 0.0 0.0 0.10 0.0 0.0 0.0 0.10 0.0 0.0 0.0 0.40 99.6 100.0 100.0 99.4
bial ma
B
0.0.0.0.0.0.5.0.
72.0.0.0.0.5.0.
12.0.0.0.4.0.0.0.0.0.0.0.0.0.0.0.0.0.0.0.0.0.0.0.
100.
(Fig. 3).
3163Carbon isotopes of bacterial biomarkers
DISCUSSION
5.1. Lipid Profiles of Different Facies
Fouke et al. (2003) have provided a phylogenetic survey ofbacterial species in each facies at Angel Terrace Spring AT-1based on 16S rRNA gene sequences. The results show strongpartitioning between dominant microbial species and types ofdepositional facies (Table 1). In particular, the vent is domi-nated by Aquificales (91% of total sequences). Gene sequencesof the green sulfur bacteria (i.e., Chlorobium) are most abun-dant in the proximal slope (9%) and less than 1% in the vent;those of the green non-sulfur bacteria (i.e., Chloroflexus) rangefrom 4% in the apron and channel to below detection in thedistal slope (Table 1). The cyanobacteria have consistentlyhigher proportions in the relatively low-temperature environ-ments (the pond, the proximal slope and the distal slope) thanin the high-temperature environments (the vent and the apronand channel) (Table 1). Except in the vent, the majority of genesequences belong to other bacteria (Table 1), whose roles inthese environments are not well defined. It must be understood,
Table 5. Isotopic compositions of phospholipid fatty acids of
Fatty acid
Vent Pond-2
A B A
14:0i15:0 �i16:0 �16:1�7c �35.1 (1.0) �16:0 �22.7 (0.4) �14.8 (0.3) �34.7 (0.1) ��i17:0,a17:0b �16.7 �14.818:2�6 ��18:1�9/7cb �7.4 �5.2 �33.2 �18:0 �13.8 (0.5) �11.9 (1.1) �33.1 (0.5) ��20:1�9t/cb �8.2 �8.7
a Average � 1 standard deviation (in parentheses) of two or threemethylation (see text).
b Baseline resolution was not possible; a composite �13C value wasweight percentage of mass 44 [V] of each peak.
Table 6. Isotopic compositions of glycolipid fatty acids of m
Fatty acid
Vent Pond-2
A B A B
14:0 �20.4i15:016:1�7c �32.1 �29.716:0 �22.6 �35.5 �35.318:2�6�18:1�9/7cb �16.7 �30.3 �31.018:0 �19.5 �28.5
a Average � 1 standard deviation (in parentheses) of two or threemethylation (see text).
b Baseline resolution was not possible; a composite �13C value was
weight percentage of mass 44 [V] of each peak.however, that the relative proportion of sequences (clones)representing a given species or division of bacteria is notdirectly correlated to the actual size of the cellular populationof that species or division.
Lipid biomarkers can provide valuable information aboutmicrobial structures in geological settings. Pioneering studiesof microbial lipids in Yellowstone hot springs were lead byWard and colleagues, who performed extensive analyses oflipid biomarkers of cyanobacterial mats (Ward et al., 1985;Dobson et al., 1988; Ward et al., 1989; Zeng et al., 1992a,b).Zeng et al. (1992a) observe that the distribution of most of themajor mat lipids in the Yellowstone hot springs is consistentwith lipid profiles of microorganisms isolated from the mats.Jahnke et al. (2001) focus their study on the lipid biomakers inthe Octopus Spring hyperthermophilic community in Yellow-stone National Park. Lipid extracts of the natural samples showfatty acid biomarkers dominated by cy21:0, 20:1�9, i17:0,i19:0, and 18:0. The abundance of 20:1�9, cy21:0, and 18:0 arecharacteristic of certain known Aquificales species (Jahnke etal., 2001). Other culture studies identify 18:1�9/7 as additional
ial mats from different facies of Angel Terrace Spring AT-1.
�13C (‰)a
Proximal slope-2 Distal slope
A B A B
�35.2 (0.4) �35.4 (0.1).2) �27.0 (0.2) �26.6 (0.1) �18.5 (0.2) �18.3 (0.1).4) �28.8 (0.2) �28.5 (0.8).1) �37.7 (0.2) �38.0 (0.1) �19.6 (0.0) �19.6 (0.5).0) �36.3 (0.1) �36.0 (0.1) �26.8 (0.0) �27.1 (0.1)
.3) �34.6 (0.3) �34.9 �22.8 (0.2) �23.2�36.7 �35.0 �40.0
.1) �34.7 (0.4) �33.7 �26.0 (4.6) �21.8 (2.2)
e runs. The �13C values of individual fatty acids were corrected for
d for coeluting fatty acids by integrating individual �13C values using
l mats from different facies of Angel Terrace Spring AT-1.
�13C (‰)a
Proximal slope-2 Distal slope
A B A B
37.6 (0.3) �36.7 (0.2) �32.9 �29.6�21.2 (0.1) �23.8 (0.5)
41.1 (0.1) �39.8 (0.2) �27.0 (1.1) �26.2 (0.0)37.9 (0.1) �37.4 (0.2) �29.9 (0.2) �29.3 (0.4)35.9 (0.3) �33.9 (0.2) �31.0 �26.8 (0.3)38.7 (0.0) �38.1 (0.0) �30.534.8 (0.2) �30.4 (0.2) �26.7 �27.4 (0.5)
e runs. The �13C values of individual fatty acids were corrected for
for co-eluting fatty acids by integrating individual �13C values using
microb
B
26.7 (027.1 (035.7 (035.1 (0
34.3 (033.834.0 (0
replicat
obtaine
icrobia
�
�����
replicat
obtained
3164 Zhang et al.
major fatty acids instead of cy21:0 (Kawasumi et al., 1984;Nishihara et al., 1990; Stohr et al., 2001a; Zhang et al., 2002).
The above discussion provides a basis for understanding thebiogeochemical dynamics of lipids in different facies at SpringAT-1. For example, the dominance of 20:1�9, 18:0, and 18:1�9/7 in the vent (Table 3, Table 4) is consistent with thedistribution of the 16S rRNA gene sequences of Aquificales inthe vent (Fouke et al., 2003) and consistent with lipid profilesof known Aquificales species (Kawasumi et al., 1984; Huber etal., 1998; Jahnke et al., 2001; Stohr et al., 2001a; Gotz et al.,2002; Zhang et al., 2002). However, Aquificales in pure cul-tures do not produce iso- or anteiso- fatty acids (Jahnke et al.,2001; Zhang et al., 2002). Thus the presence of iso- or anteiso-15:0 to �17:0 in the vent are likely derived from other bacterialspecies. These may include Thermus aquaticus, Bacillusstearothermophilus and other mat-inhabiting heterotrophs,which are known to produce iso- and aneteiso- 15:0 to 17:0compounds as major fatty acids (Yao et al., 1970; Ray et al.,1971; Oshima and Miyagawa, 1974).
The similar lipid profiles between the pond-2 and the prox-imal slope-2 suggest that the relative proportions of extantmicrobial populations in these two facies may be similar. Thedramatic decrease in 20:1�9c/t in these facies suggests that therelative abundance of Aquificales is much lower than in thevent (Table 3, Table 4). On the other hand, 16:1�7c and 18:2�6in both PLFA and GLFA begin to appear in significant abun-dance accompanied by increasing 16:0 (Table 3, Table 4),which are consistent with their presence in cyanobacteria orgreen non-sulfur bacteria (Fork et al., 1979; Ward et al., 1989,Zheng et al., 1992a; Summons et al., 1996).
In the distal slope, the microbial community is also likelydominated by cyanobacteria and green non-sulfur bacteria asdemonstrated by high abundances of 16:1�7c and 18:2�6, and18:1�9c that are similar to those in the pond-2 and the proximal
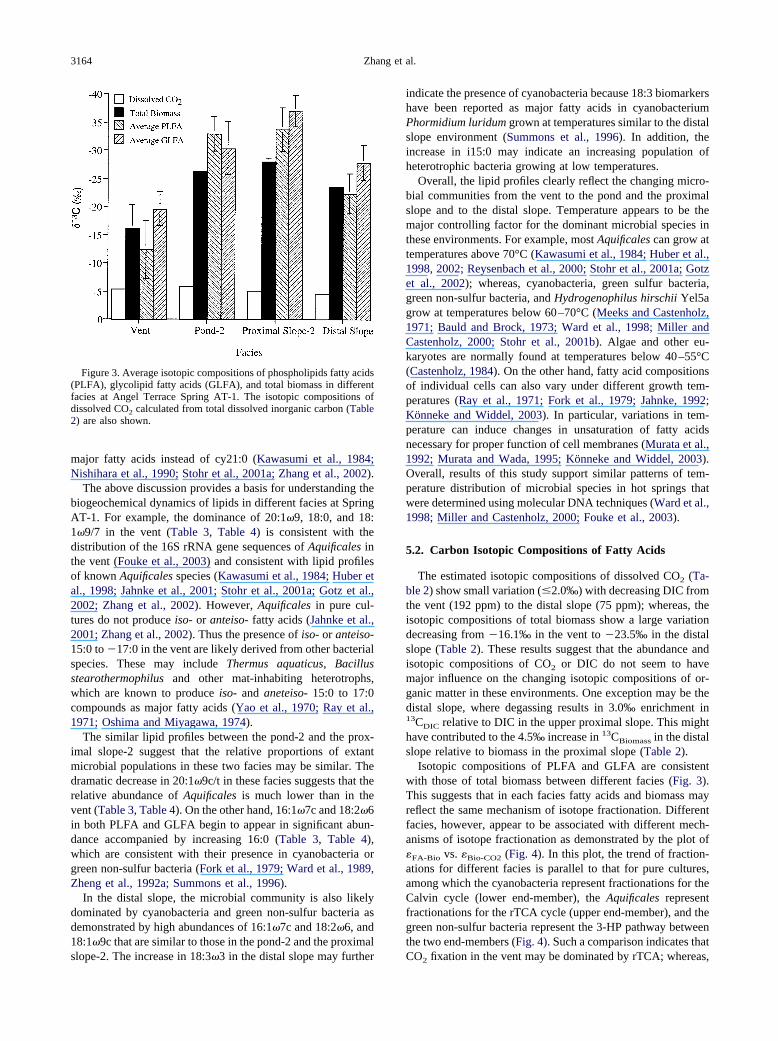
Figure 3. Average isotopic compositions of phospholipids fatty acids(PLFA), glycolipid fatty acids (GLFA), and total biomass in differentfacies at Angel Terrace Spring AT-1. The isotopic compositions ofdissolved CO2 calculated from total dissolved inorganic carbon (Table2) are also shown.
slope-2. The increase in 18:3�3 in the distal slope may further
indicate the presence of cyanobacteria because 18:3 biomarkershave been reported as major fatty acids in cyanobacteriumPhormidium luridum grown at temperatures similar to the distalslope environment (Summons et al., 1996). In addition, theincrease in i15:0 may indicate an increasing population ofheterotrophic bacteria growing at low temperatures.
Overall, the lipid profiles clearly reflect the changing micro-bial communities from the vent to the pond and the proximalslope and to the distal slope. Temperature appears to be themajor controlling factor for the dominant microbial species inthese environments. For example, most Aquificales can grow attemperatures above 70°C (Kawasumi et al., 1984; Huber et al.,1998, 2002; Reysenbach et al., 2000; Stohr et al., 2001a; Gotzet al., 2002); whereas, cyanobacteria, green sulfur bacteria,green non-sulfur bacteria, and Hydrogenophilus hirschii Yel5agrow at temperatures below 60–70°C (Meeks and Castenholz,1971; Bauld and Brock, 1973; Ward et al., 1998; Miller andCastenholz, 2000; Stohr et al., 2001b). Algae and other eu-karyotes are normally found at temperatures below 40–55°C(Castenholz, 1984). On the other hand, fatty acid compositionsof individual cells can also vary under different growth tem-peratures (Ray et al., 1971; Fork et al., 1979; Jahnke, 1992;Konneke and Widdel, 2003). In particular, variations in tem-perature can induce changes in unsaturation of fatty acidsnecessary for proper function of cell membranes (Murata et al.,1992; Murata and Wada, 1995; Konneke and Widdel, 2003).Overall, results of this study support similar patterns of tem-perature distribution of microbial species in hot springs thatwere determined using molecular DNA techniques (Ward et al.,1998; Miller and Castenholz, 2000; Fouke et al., 2003).
5.2. Carbon Isotopic Compositions of Fatty Acids
The estimated isotopic compositions of dissolved CO2 (Ta-ble 2) show small variation (2.0‰) with decreasing DIC fromthe vent (192 ppm) to the distal slope (75 ppm); whereas, theisotopic compositions of total biomass show a large variationdecreasing from �16.1‰ in the vent to �23.5‰ in the distalslope (Table 2). These results suggest that the abundance andisotopic compositions of CO2 or DIC do not seem to havemajor influence on the changing isotopic compositions of or-ganic matter in these environments. One exception may be thedistal slope, where degassing results in 3.0‰ enrichment in13CDIC relative to DIC in the upper proximal slope. This mighthave contributed to the 4.5‰ increase in 13CBiomass in the distalslope relative to biomass in the proximal slope (Table 2).
Isotopic compositions of PLFA and GLFA are consistentwith those of total biomass between different facies (Fig. 3).This suggests that in each facies fatty acids and biomass mayreflect the same mechanism of isotope fractionation. Differentfacies, however, appear to be associated with different mech-anisms of isotope fractionation as demonstrated by the plot of�FA-Bio vs. �Bio-CO2 (Fig. 4). In this plot, the trend of fraction-ations for different facies is parallel to that for pure cultures,among which the cyanobacteria represent fractionations for theCalvin cycle (lower end-member), the Aquificales representfractionations for the rTCA cycle (upper end-member), and thegreen non-sulfur bacteria represent the 3-HP pathway betweenthe two end-members (Fig. 4). Such a comparison indicates that
CO2 fixation in the vent may be dominated by rTCA; whereas,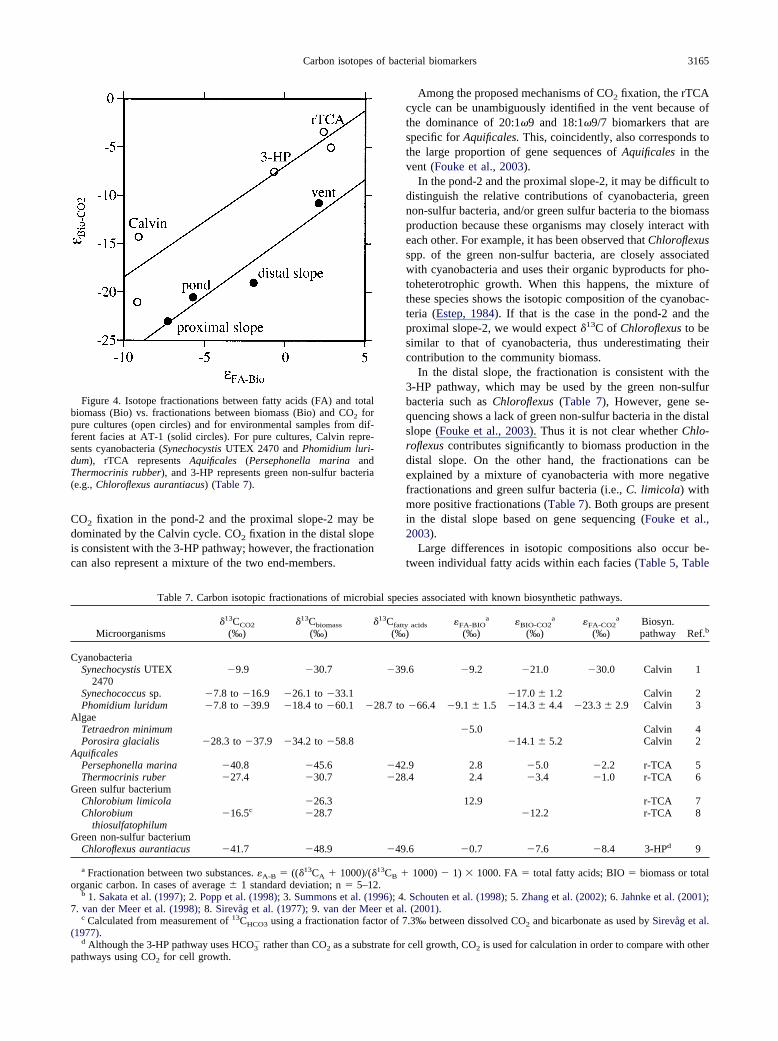
3165Carbon isotopes of bacterial biomarkers
CO2 fixation in the pond-2 and the proximal slope-2 may bedominated by the Calvin cycle. CO2 fixation in the distal slopeis consistent with the 3-HP pathway; however, the fractionationcan also represent a mixture of the two end-members.
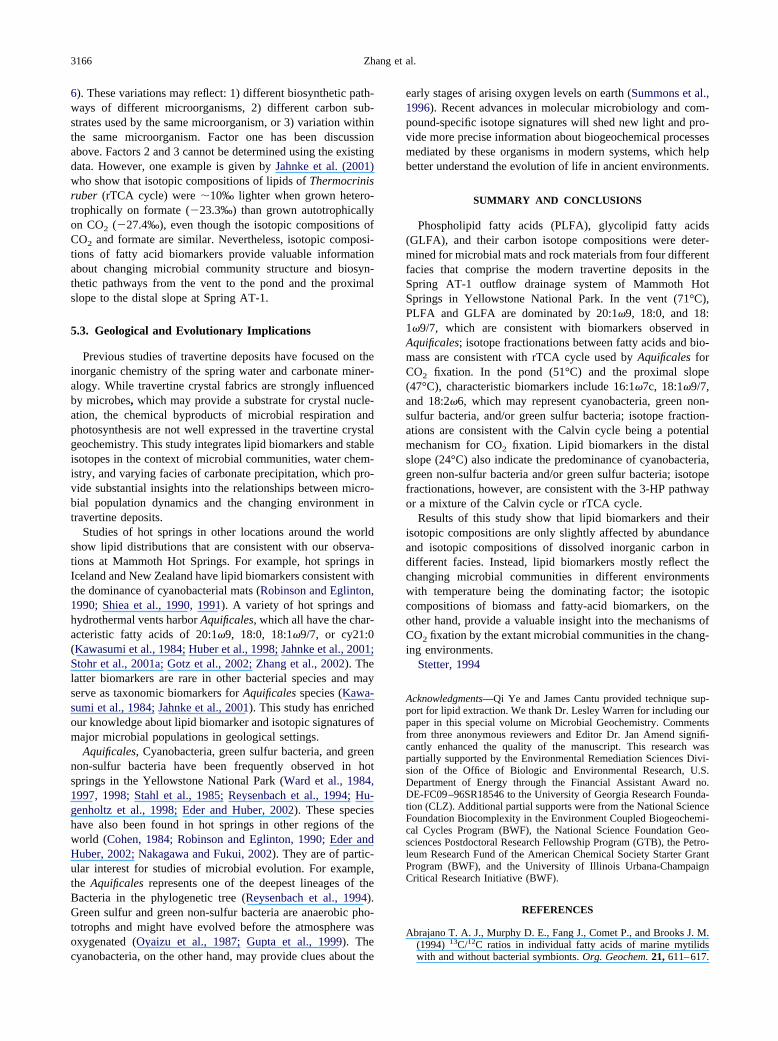
Figure 4. Isotope fractionations between fatty acids (FA) and totalbiomass (Bio) vs. fractionations between biomass (Bio) and CO2 forpure cultures (open circles) and for environmental samples from dif-ferent facies at AT-1 (solid circles). For pure cultures, Calvin repre-sents cyanobacteria (Synechocystis UTEX 2470 and Phomidium luri-dum), rTCA represents Aquificales (Persephonella marina andThermocrinis rubber), and 3-HP represents green non-sulfur bacteria(e.g., Chloroflexus aurantiacus) (Table 7).
Table 7. Carbon isotopic fractionations of microbi
Microorganisms�13CCO2
(‰)�13Cbiomass
(‰)�
CyanobacteriaSynechocystis UTEX
2470�9.9 �30.7
Synechococcus sp. �7.8 to �16.9 �26.1 to �33.1Phomidium luridum �7.8 to �39.9 �18.4 to �60.1 �
AlgaeTetraedron minimumPorosira glacialis �28.3 to �37.9 �34.2 to �58.8
AquificalesPersephonella marina �40.8 �45.6Thermocrinis ruber �27.4 �30.7
Green sulfur bacteriumChlorobium limicola �26.3Chlorobium
thiosulfatophilum�16.5c �28.7
Green non-sulfur bacteriumChloroflexus aurantiacus �41.7 �48.9
a Fractionation between two substances. �A-B � ((�13CA � 1000)/(�organic carbon. In cases of average � 1 standard deviation; n � 5–12
b 1. Sakata et al. (1997); 2. Popp et al. (1998); 3. Summons et al. (197. van der Meer et al. (1998); 8. Sirevag et al. (1977); 9. van der Mee
c Calculated from measurement of 13CHCO3 using a fractionation fac(1977).
d Although the 3-HP pathway uses HCO3� rather than CO2 as a subst
pathways using CO2 for cell growth.
Among the proposed mechanisms of CO2 fixation, the rTCAcycle can be unambiguously identified in the vent because ofthe dominance of 20:1�9 and 18:1�9/7 biomarkers that arespecific for Aquificales. This, coincidently, also corresponds tothe large proportion of gene sequences of Aquificales in thevent (Fouke et al., 2003).
In the pond-2 and the proximal slope-2, it may be difficult todistinguish the relative contributions of cyanobacteria, greennon-sulfur bacteria, and/or green sulfur bacteria to the biomassproduction because these organisms may closely interact witheach other. For example, it has been observed that Chloroflexusspp. of the green non-sulfur bacteria, are closely associatedwith cyanobacteria and uses their organic byproducts for pho-toheterotrophic growth. When this happens, the mixture ofthese species shows the isotopic composition of the cyanobac-teria (Estep, 1984). If that is the case in the pond-2 and theproximal slope-2, we would expect �13C of Chloroflexus to besimilar to that of cyanobacteria, thus underestimating theircontribution to the community biomass.
In the distal slope, the fractionation is consistent with the3-HP pathway, which may be used by the green non-sulfurbacteria such as Chloroflexus (Table 7), However, gene se-quencing shows a lack of green non-sulfur bacteria in the distalslope (Fouke et al., 2003). Thus it is not clear whether Chlo-roflexus contributes significantly to biomass production in thedistal slope. On the other hand, the fractionations can beexplained by a mixture of cyanobacteria with more negativefractionations and green sulfur bacteria (i.e., C. limicola) withmore positive fractionations (Table 7). Both groups are presentin the distal slope based on gene sequencing (Fouke et al.,2003).
Large differences in isotopic compositions also occur be-tween individual fatty acids within each facies (Table 5, Table
ies associated with known biosynthetic pathways.
acids �FA-BIOa
(‰)�BIO-CO2
a
(‰)�FA-CO2
a
(‰)Biosyn.pathway Ref.b
.6 �9.2 �21.0 �30.0 Calvin 1
�17.0 � 1.2 Calvin 2�66.4 �9.1 � 1.5 �14.3 � 4.4 �23.3 � 2.9 Calvin 3
�5.0 Calvin 4�14.1 � 5.2 Calvin 2
.9 2.8 �5.0 �2.2 r-TCA 5
.4 2.4 �3.4 �1.0 r-TCA 6
12.9 r-TCA 7�12.2 r-TCA 8
.6 �0.7 �7.6 �8.4 3-HPd 9
1000) � 1) � 1000. FA � total fatty acids; BIO � biomass or total
Schouten et al. (1998); 5. Zhang et al. (2002); 6. Jahnke et al. (2001);(2001).
.3‰ between dissolved CO2 and bicarbonate as used by Sirevag et al.
cell growth, CO2 is used for calculation in order to compare with other
al spec
13Cfatty
(‰)
�39
28.7 to
�42�28
�49
13CB �.96); 4.r et al.
tor of 7
rate for
3166 Zhang et al.
6). These variations may reflect: 1) different biosynthetic path-ways of different microorganisms, 2) different carbon sub-strates used by the same microorganism, or 3) variation withinthe same microorganism. Factor one has been discussionabove. Factors 2 and 3 cannot be determined using the existingdata. However, one example is given by Jahnke et al. (2001)who show that isotopic compositions of lipids of Thermocrinisruber (rTCA cycle) were �10‰ lighter when grown hetero-trophically on formate (�23.3‰) than grown autotrophicallyon CO2 (�27.4‰), even though the isotopic compositions ofCO2 and formate are similar. Nevertheless, isotopic composi-tions of fatty acid biomarkers provide valuable informationabout changing microbial community structure and biosyn-thetic pathways from the vent to the pond and the proximalslope to the distal slope at Spring AT-1.
5.3. Geological and Evolutionary Implications
Previous studies of travertine deposits have focused on theinorganic chemistry of the spring water and carbonate miner-alogy. While travertine crystal fabrics are strongly influencedby microbes, which may provide a substrate for crystal nucle-ation, the chemical byproducts of microbial respiration andphotosynthesis are not well expressed in the travertine crystalgeochemistry. This study integrates lipid biomarkers and stableisotopes in the context of microbial communities, water chem-istry, and varying facies of carbonate precipitation, which pro-vide substantial insights into the relationships between micro-bial population dynamics and the changing environment intravertine deposits.
Studies of hot springs in other locations around the worldshow lipid distributions that are consistent with our observa-tions at Mammoth Hot Springs. For example, hot springs inIceland and New Zealand have lipid biomarkers consistent withthe dominance of cyanobacterial mats (Robinson and Eglinton,1990; Shiea et al., 1990, 1991). A variety of hot springs andhydrothermal vents harbor Aquificales, which all have the char-acteristic fatty acids of 20:1�9, 18:0, 18:1�9/7, or cy21:0(Kawasumi et al., 1984; Huber et al., 1998; Jahnke et al., 2001;Stohr et al., 2001a; Gotz et al., 2002; Zhang et al., 2002). Thelatter biomarkers are rare in other bacterial species and mayserve as taxonomic biomarkers for Aquificales species (Kawa-sumi et al., 1984; Jahnke et al., 2001). This study has enrichedour knowledge about lipid biomarker and isotopic signatures ofmajor microbial populations in geological settings.
Aquificales, Cyanobacteria, green sulfur bacteria, and greennon-sulfur bacteria have been frequently observed in hotsprings in the Yellowstone National Park (Ward et al., 1984,1997, 1998; Stahl et al., 1985; Reysenbach et al., 1994; Hu-genholtz et al., 1998; Eder and Huber, 2002). These specieshave also been found in hot springs in other regions of theworld (Cohen, 1984; Robinson and Eglinton, 1990; Eder andHuber, 2002; Nakagawa and Fukui, 2002). They are of partic-ular interest for studies of microbial evolution. For example,the Aquificales represents one of the deepest lineages of theBacteria in the phylogenetic tree (Reysenbach et al., 1994).Green sulfur and green non-sulfur bacteria are anaerobic pho-totrophs and might have evolved before the atmosphere wasoxygenated (Oyaizu et al., 1987; Gupta et al., 1999). The
cyanobacteria, on the other hand, may provide clues about theearly stages of arising oxygen levels on earth (Summons et al.,1996). Recent advances in molecular microbiology and com-pound-specific isotope signatures will shed new light and pro-vide more precise information about biogeochemical processesmediated by these organisms in modern systems, which helpbetter understand the evolution of life in ancient environments.
SUMMARY AND CONCLUSIONS
Phospholipid fatty acids (PLFA), glycolipid fatty acids(GLFA), and their carbon isotope compositions were deter-mined for microbial mats and rock materials from four differentfacies that comprise the modern travertine deposits in theSpring AT-1 outflow drainage system of Mammoth HotSprings in Yellowstone National Park. In the vent (71°C),PLFA and GLFA are dominated by 20:1�9, 18:0, and 18:1�9/7, which are consistent with biomarkers observed inAquificales; isotope fractionations between fatty acids and bio-mass are consistent with rTCA cycle used by Aquificales forCO2 fixation. In the pond (51°C) and the proximal slope(47°C), characteristic biomarkers include 16:1�7c, 18:1�9/7,and 18:2�6, which may represent cyanobacteria, green non-sulfur bacteria, and/or green sulfur bacteria; isotope fraction-ations are consistent with the Calvin cycle being a potentialmechanism for CO2 fixation. Lipid biomarkers in the distalslope (24°C) also indicate the predominance of cyanobacteria,green non-sulfur bacteria and/or green sulfur bacteria; isotopefractionations, however, are consistent with the 3-HP pathwayor a mixture of the Calvin cycle or rTCA cycle.
Results of this study show that lipid biomarkers and theirisotopic compositions are only slightly affected by abundanceand isotopic compositions of dissolved inorganic carbon indifferent facies. Instead, lipid biomarkers mostly reflect thechanging microbial communities in different environmentswith temperature being the dominating factor; the isotopiccompositions of biomass and fatty-acid biomarkers, on theother hand, provide a valuable insight into the mechanisms ofCO2 fixation by the extant microbial communities in the chang-ing environments.
Stetter, 1994
Acknowledgments—Qi Ye and James Cantu provided technique sup-port for lipid extraction. We thank Dr. Lesley Warren for including ourpaper in this special volume on Microbial Geochemistry. Commentsfrom three anonymous reviewers and Editor Dr. Jan Amend signifi-cantly enhanced the quality of the manuscript. This research waspartially supported by the Environmental Remediation Sciences Divi-sion of the Office of Biologic and Environmental Research, U.S.Department of Energy through the Financial Assistant Award no.DE-FC09–96SR18546 to the University of Georgia Research Founda-tion (CLZ). Additional partial supports were from the National ScienceFoundation Biocomplexity in the Environment Coupled Biogeochemi-cal Cycles Program (BWF), the National Science Foundation Geo-sciences Postdoctoral Research Fellowship Program (GTB), the Petro-leum Research Fund of the American Chemical Society Starter GrantProgram (BWF), and the University of Illinois Urbana-ChampaignCritical Research Initiative (BWF).
REFERENCES
Abrajano T. A. J., Murphy D. E., Fang J., Comet P., and Brooks J. M.(1994) 13C/12C ratios in individual fatty acids of marine mytilids
with and without bacterial symbionts. Org. Geochem. 21, 611–617.
3167Carbon isotopes of bacterial biomarkers
Allen E. T. and Day A. L. (1935) Hot springs of the YellowstoneNational Park pp. 525. Carnegie Institution of Washington.
Bargar K. E. (1978) Geology and thermal history of Mammoth HotSprings, Yellowstone National Park, Wyoming. U. S. GeologicalSurvey Bulletin 1444, 1–54.
Barns S. M. and Nierzwick-Bauer S. (1997) Microbial diversity inmodern subsurface, ocean, surface environments. In Reviews inMineralogy, Vol. 35, pp. 35–79. Mineralogical Society of America.
Bauld J. and Brock T. D. (1973) Ecological studies of Chloroflexus, agliding photosynthetic bacterium. Arch. Mikrobiol. 92, 267–284.
Beh M., Strauss G., Huber R., Stetter K. O., and Fuchs G. (1993)Enzymes of the reductive citric acid cycle in the autotrophic eubac-terium Aquifex pyrophilus and in the archaebacterium Thermopro-teus neutrophilus. Arch. Microbiol. 160, 306–311.
Brassell S. C. (1992) Biomarkers in recent and ancient sediments: theimportance of the diagenetic continuum. In Organic matter—pro-ductivity, accumulation, and preservation in recent and ancientsediments (eds. J. K. Whelan and J. W. Farrington), pp. 339–367.Columbia University Press.
Castenholz R. W. (1984) Composition of hot spring microbial mats: Asummary. In Microbial Mats: Stromatolites (eds. Y. Cohen, R. W.Castenholz, and H. O. Halvorson), pp. 101–119. Alan R. Liss, Inc..
Cohen Y. (1984) The Solar. Lake cyanobacterial mats: strategies ofphotosynthetic life under sulfide. In Microbial Mats: Stromatolites(eds. Y. Cohen, R. W. Castenholz, and H. O. Halvorson), pp.133–148. Alan R. Liss, Inc..
De Rosa M., Gambacorta A., Huber R., Lanzotti V., Nicolaus B.,Stetter K. O. and Trincone A. (1988) Lipid structures in Thermotogamaritima. J. Chem. Soc. Chem. Commun. 1300–1301.
Dobson G., Ward D. M., Robinson N., and Eglinton G. (1988) Bio-geochemistry of hot spring environments: extractable lipids of acyanobacterial mat. Chem. Geol. 68, 155–179.
Eder W. and Huber R. (2002) New isolates and physiological proper-ties of the Aquificales and description of Thermocrinis albus sp nov.Extremophiles 6, 309–318.
Estep M. L. (1984) Carbon and hydrogen isotopic compositions ofalgae and bacteria from hydrothermal environments, YellowstoneNational Park. Geochim. Cosmochim. Acta 48, 591–599.
Farmer J. D. and Des Marais D. J. (1994) Biological versus inorganicprocesses in stromatolite morphogenesis: Observations from miner-alizing sedimentary systems. In Microbial Mats: Structure, Devel-opment, and Environmental Significance: NATO ASI Series in Eco-logical Sciences, Vol. G35 (eds. L. J. Stal and P. Caumette), pp.61–68. Springer-Verlag.
Fork D. C., Murata N., and Sato N. (1979) Effect of growth tempera-ture on the lipid and fatty acid composition and the dependence ontemperature of light-induced redox reactions of cytochrome f and oflight energy redistribution in the thermophlic blue-green alga Syn-echococcus lividus. Plant Physiol. 63, 524–530.
Fouke B. W., Farmer J. D., Des Marais D. J., Pratt L., Sturchio N. C.,Burns P. C. and Discipulo M. K. (2000) Depositional facies andaqueous-solid geochemistry of travertine-depositing hot springs (An-gel Terrace, Mammoth Hot Springs, Yellowstone National Park,U.S.A.). J. Sed. Res. 70, 565–585.
Fouke B. W., Bonheyo G. T., Sanzenbacher B., and Frias-Lopez J.(2003) Partitioning of bacterial communities between travertine dep-ositional facies at Mammoth Hot Springs, Yellowstone NationalPark, USA. Can. J. Earth. Sci. 40, 1531–1548.
Freeman K. H. (2001) Isotopic biogeochemistry of marine organiccarbon. In Stable Isotope Geochemistry, Vol. 43 (eds. J. W. Valleyand D. R. Cole), pp. 579–605. The Mineralogical Society of Amer-ica.
Friedman I. (1970) Some investigations of the deposition of travertinefrom hot springs: I. The isotope chemistry of a travertine-depositingspring. Geochim. Cosmochim. Acta 34, 1303–1315.
Fuchs G. (1989) Alternative pathways of autotrophic CO2 fixation. InAutotrophic Bacteria (eds. H. G. Schlegel and B. Bowien), pp.365–382. Science Tech Publishers.
Gotz D., Banta A., Beveridge T. J., Rushdi A. I., Simoneit B. R. T., andReysenbach A. (2002) Persephonella marina gen. nov., sp nov andPersephonella guaymasensis sp nov., two novel, thermophilic, hy-drogen-oxidizing microaerophiles from deep-sea hydrothermal
vents. Intl. J. Syst. Evol. Microbiol. 52, 1349–1359.Guckert J. B., Antworth C. B., Nichols P. D., and White D. C. (1985)Phospholipid ester-linked fatty acid profiles as reproducible assaysfor changes in prokaryotic community structure of estuarine sedi-ments. FEMS Microbiol. Ecol. 31, 147–158.
Gupta R. S., Mukhtar T., and Singh B. (1999) Evolutionary relation-ships among photosynthetic prokaryotes (Heliobacterium chlorum,Chloroflexus aurantiacus, cyanobacteria, Chlorobium tepidum andproteobacteria): implications regarding the origin of photosynthesis.Molecul. Microbiol. 32, 893–906.
Hayes J. M. (2001) Fractionation of carbon and hydrogen isotopes inbiosynthetic processes. In Stable Isotope Geochemistry, Vol. 43 (eds.J. W. Valley and D. R. Cole), pp. 225–277. The MineralogicalSociety of America.
Huber R., Wilharm T., Huber D., Trincone A., Burgraf S., Konig H.,Rachel R., Rochinger I., Fricke H., and Stetter K. O. (1992) Aquifexpyrophilus gen. nov. sp. nov., represents a novel group of marinehyperthermophilic hydrogen-oxidizing bacteria. System. Appl. Mi-crobiol. 15, 340–351.
Huber R., Eder W., Heldwein S., Wanner G., Huber H., Rachel R., andStetter K. O. (1998) Thermocrinis ruber gen. nov., sp. nov., apink-filament-forming hyperthermophilic bacterium isolated fromYellowstone National Park. Appl. Environ. Microbiol. 64, 3576–3583.
Huber H., Diller S., Horn C. and Rachel R. (2002) Thermovibrio rubergen. nov., sp nov., an extremely thermophilic, chemolithoautotro-phic, nitrate-reducing bacterium that forms a deep branch within thephylum. Aquificae. Intl. J. Syst. Evol. Microbiol. 52, 1859–1865.
Hugenholtz P., Pitulle C., Hershberger K. L., and Pace N. R. (1998)Novel division level bacterial diversity in a Yellowstone hot spring.J. Bacteriol. 180, 366–376.
Jahnke L. L. (1992) The effects of growth temperature on the methylsterol and phospholipid fatty-acid composition of Methylococcuscapsulatus (Bath). FEMS Microbiol. Lett. 93, 209–212.
Jahnke L. L., Eder W., Huber R., Hope J. M., Hinrichs K. U., HayesJ. M., Des Marais D. J., Cady S. L. and Summons R. E. (2001)Signature lipids and stable carbon isotope analyses of octopus springhyperthermophilic communities compared with those of Aquificalesrepresentatives. Appl. Environ. Microbiol. 67, 5179–5189.
Karl D. M. (1995) Ecology of free-living, hydrothermal vent microbialcommunities. In The Microbiology of Deep-Sea Hydrothermal Vents(ed. D. M. Karl), pp. 35–124. CRC Press.
Kawasumi T., Igarashi Y., Kodama T., and Minoda Y. (1984) Hydro-genobacter thermophilus gen. nov., sp. nov., an extremely thermo-philic, aerobic, hydrogen-oxidizing bacterium. Int. J. System. Bac-teriol. 34, 5–10.
Konneke M. and Widdel F. (2003) Effect of growth temperature oncelluar fatty acids in sulphate-reducing bacteria. Environ. Microbiol.5, 1064–1070.
Langworthy T. A., Holzer G., Zeikus J. G., and Tornabene T. G. (1983)Iso- and anteiso-branched glycerol diethers of the thermophilicanaerobes Thermodesulfotobacterium commune. System. Appl. Mi-crobiol. 4, 1–17.
Londry K. L., Jahnke L. L. and Des Marais D. J. (2004) Stable carbonisotope ratios of lipid biomarkers of sulfate-reducing bacteria. Appl.Environ. Microbiol. 70, 745–751.
Machenzie A. S., Brassell S. C., Eglinton G., and Maxwell J. R. (1982)Chemical fossils-the geological fate of steroids. Science 217, 491–504.
Madigan M. T., Takigiku R., Lee R. G., Gest H., and Hayes J. M.(1989) Carbon isotope fractionation by thermophilic phototrophicsulfur bacteria: Evidence for autotrophic growth in natural popula-tions. Appl. Environ. Microbiol. 55, 639–644.
Meeks J. C. and Castenholz R. W. (1971) Growth and photosynthesisin an extreme thermophile Synechococcus lividus (Cyanophyta).Arch. Mikrobiol. 78, 25–41.
Menendez C., Bauer Z., Huber H., Gadon N., Stetter K. O., and FuchsG. (1999) Presence of acetyl-coenzyme A (CoA) carboxylase andpropionyl-CoA carboxylase in autotrophic Crenarchaeota and indi-cation for operation of a 3-hydroxylpropionate cycle in autotrophiccarbon fixation. J. Bacteriol. 181, 1088–1098.
Miller S. R. and Castenholz R. W. (2000) Evolution of thermotolerancein hot spring cyanobacteria of the genus Synechococcus. Appl. En-
viron. Microbiol. 66, 4222–4229.
3168 Zhang et al.
Mook W. G., Brommerson J. C., and Staverman W. H. (1974) Carbonisotope fractionation between dissolved bicarbonate and gaseouscarbon dioxide. Earth Planet. Sci. Lett. 22, 169–176.
Murata N. and Wada H. (1995) Acyl-lipid desaturases and their im-portance in the tolerance and acclimatization to cold of cyanobacte-ria. Biochem. J. 308, 1–8.
Murata N., Wada H., and Gombos Z. (1992) Modes of fatty-aciddesaturation in cyanobacteria. Plant Cell Physiol. 33, 933–941.
Nakagawa T. and Hukui M. (2002) Phylogenetic characterization ofmicrobial mats and streamers from a Japanese alkaline hot springwith a thermal gradient. J. Gen. Appl. Microbiol. 48, 211–222.
Nichols P. D., Guckert J. B., and White D. C. (1986) Determination ofmonounsaturated fatty acid double-bond position and geometry formicrobial monocultures and complex microbial consortia by capil-lary GC/MS of their dimethyl disulfide adducts. J. Microbiol. Meth.5, 49–55.
Nishihara H., Igarashi Y., and Kodama T. (1990) A new isolate ofHydrogenobacter, an obligately chemolithoautotrophic, thermo-philic, halophilic and aerobic hydrogen-oxidizing bacterium fromseaside saline hot-spring. Arch. Microbiol. 153, 294–298.
O’Leary M. H. (1988) Carbon isotopes in photosynthesis. BioScience38, 328–329.
Oshima M. and Miyagawa A. (1974) Comparative studies on the fattyacid composition of moderately and extremely thermophilic bacteria.Lipids 9, 476–480.
Oyaizu H., Debrunner-Vossbrinck B., Mandelco L., Studier J. A., andWoese C. R. (1987) The green-sulfur bacteria: a deep branching inthe eubacterial line of decent. Syst. Appl. Microbiol. 9, 47–53.
Popp B. N., Dore J. E., Hanson K. L., Wakeham S. G., Laws E. A., andBidigare R. R. (1998) Effect of phytoplankton cell geometry oncarbon isotopic fractionation. Geochim. Cosmochim. Acta 62, 69–77.
Preuß A., Schauder R., and Fuchs G. (1989) Carbon isotope fraction-ation by autotrophic bacteria with three different CO2 fixation path-ways. J. Biosci. 44C, 397–402.
Quandt L., Gottschalk G., Ziegler H., and Stichler W. (1977) Isotopicdiscrimination by photosynthetic bacteria. FEMS Microbiol. Letts. 1,125–128.
Ratledge C. and Wilkinson S. G. (1988) Microbial Lipids, Vol. 1.Academic Press.
Ray P. H., White D. C., and Brock T. D. (1971) Effect of temperatureon the fatty acid composition of Thermus aquaticus. J. Bacteriol.106, 25–30.
Reysenbach A. L., Wickham G. S., and Pace N. R. (1994) Phylogeneticanalysis of the hyperthermophilic pink filament community in Oc-topus Spring, Yellowstone National Park. Appl. Environ. Microbiol.60, 2113–2119.
Reysenbach A. L., Ehringer M., and Hershberger K. (2000) Microbialdiversity at 83°C in Calcite Springs, Yellowstone National Park:Another environment where the Aquificales and “Korarchaeota”co-exist. Extremophiles 4, 61–67.
Ringelberg D. B., Davis J. D., Smith G. A., Pfiffner S. M., NicholsP. D., Nickels J. S., Henson J. M., Wilson J. T., Yates M., KampbellD. H., Read H. W., Stocksdale T. T., and White D. C. (1989)Validation of signature polarlipid fatty acid biomarkers for alkane-utilizing bacteria in soils and subsurface aquifer materials. FEMSMicrobiol. Ecol. 62, 39–50.
Robinson N. and Eglington G. (1990) Lipid chemistry of Icelandic hotspring microbial mats. Org. Geochem. 15, 291–298.
Sakata S., Hayes J. M., R. M. A., Evans R. A., Leckrone K. J. andTogasaki R. K. (1997) Carbon isotopic fractionation associated withlipid biosynthesis by a cyanobacterium: relevance for interpretationof biomarker records. Geochim. Cosmochim. Acta 61, 5379–5389.
Schouten S., Breteler W. C. M. K., Blokker P., Schogt N., RijpstraW. I. C., Grice K., Bass M. and Sinninghe Damste J. S. (1998)Biosynthetic effects on the stable carbon isotopic compositions ofalgal lipids: Implications for deciphering the carbon isotopic biomar-ker record. Geochim. Cosmochim. Acta 62, 1397–1406.
Shiea J., Brassell S. C., and Ward D. M. (1990) Mid-chain branchedmono- and dimethyl alkanes in hot spring cyanobacterial mats: adirect biogenic source for branched alkanes in ancient sediments?
Org. Geochem. 15, 223–231.Shiea J., Brassell S. C., and Ward D. M. (1991) Comparative analysisof extractable lipids in hot spring microbial mats and their compo-nent photosynthetic bacteria. Org. Geochem. 17, 309–319.
Simoneit B. R. T. (1986) Cyclic terpenoids of the geosphere. InBiological Markers in the Sedimentary Record (ed. R. B. Johns), pp.43–99. Elsevier Science Publishers.
Simoneit B. R. T. (2002) Molecular indicators (biomarkers) of past life.Anatomical Rec. 268. 186–195.
Sirevag R., Buchanan B. B., Berry J. A., and Troughton J. H. (1977)Mechanism of CO2 fixation in bacterial photosynthesis studied bythe carbon isotope fractionation technique. Arch. Microbiol. 112,35–38.
Sorey M. L. and Colvard E. M. (1997) Hydrologic investigations in theMammoth Corridor, Yellowstone National Park and vicinity, USA.Geothermics 26, 221–249.
Stahl D. A., Lane D. J., Olsen G. J., and Pace N. R. (1985) Charac-terization of a Yellowstone hot spring microbial community by 5SrRNA sequences. Appl. Environ. Microbiol. 49, 1379–1384.
Stohr R., Waberski A., Liesack W., Volker H., Wehmeyer U., andThomm M. (2001a) Hydrogenophilus hirschii sp nov., a novel ther-mophilic hydrogen-oxidizing beta-proteobacterium isolated fromYellowstone National Park. Intl. J. Syst. Evol. Microbiol. 51, 481–488.
Stohr R., Waberski A., Volker H., Tindall B. J. and Thomm M. (2001b)Hydrogenothermus marinus gen. nov., sp nov., a novel thermophilichydrogen-oxidizing bacterium, recognition of Calderobacterium hy-drogenophilum as a member of the genus Hydrogenobacter andproposal of the reclassification of Hydrogenobacter acidophilus asHydrogenobaculum acidophilum gen. nov., comb. nov., in the phy-lum ‘Hydrogenobacter/Aquifex’ . Intl. J. Syst. Evol. Microbiol. 51,1853–1862.
Strauss G. and Fuchs G. (1993) Enzymes of a novel autotrophic CO2
fixation pathway in the phototrophic bacterium Chloroflexus auran-tiacus, the 3-hydroxypropionate cycle. Eur. J. Biochem. 215, 633–643.
Summons R. E., Jahnke L. L., and Simoneit R. T. (1996) Lipidbiomarkers for bacterial ecosystems: Studies of cultured organisms,hydrothermal environments and ancient sediments. In Evolution ofHydrothermal Ecosystems on Earth (and Mars?) (eds. G. R. Bockand J. A. Goode), pp. 174–194. Wiley.
van der Meer M. T. J., Schouten S., and Sinninghe Damste J. S. (1998)The effect of the reversed tricarboxylic-acid cycle on the 13C con-tents of bacterial lipids. Org. Geochem. 28, 527–533.
van der Meer M. T. J., Schouten S., van Dongen B. E., RijpstraW. I. C., Fuchs G., Sinninghe Damste J. S., de Leeuw J. W., andWard D. M. (2001) Biosynthetic controls on the 13C contents oforganic components in the phototrophic bacterium Chloroflexus au-rantiacus. J. Biol. Chem. 14, 10971–10976.
Vorholt J., Kunow J., Stetter K. O., and Thauer R. K. (1995) Enzymesand coenzymes of the carbon monoxide dehydrogenase pathway forautotrophic CO2 fixation in Archaeoglobus lithotrophicus and thelack of carbon monoxide dehydrogenase in the heterotrophic. A.profundus Arch. Microbiol. 163, 112–118.
Ward D. M., Beck E., Revsbech N. P., Sandbeck K. A., and WinfreyM. R. (1984) Decomposition of hot spring microbial mats. In Mi-crobial Mats: Stromatolites (eds. Y. Cohen, R. W. Castenholz, andH. O. Halvorson), pp. 191–214. Alan R. Liss, Inc.
Ward D. M., Brassell S. C., and Eglinton G. (1985) Archaebacteriallipids in hot-spring microbial mats. Nature 318, 656–659.
Ward D. M., Shiea J., Zheng Y. B., Dobson G., Brassell S. C., andEglinton G. (1989) Lipid biochemical markers and the compositionof microbial mats. In Microbial Mats: Physiological Ecology ofBenthic Microbial Communities (eds. Y. Cohen and E. Rosenberg),pp. 439–454. Am. Soc. Microbiol.
Ward D. M., Santegoeds C. M., Nold S. C., Ramsing N. B., FerrisM. J., and Bateson M. M. (1997) Biodiversity within hot springmicrobial mat communities: Molecular monitoring of enrichmentcultures. Antonie Van Leeuwenhoek Int. J. Gen. Molecul. Microbiol.71, 143–150.
Ward D. M., Ferris M. J., Nold S. C., and Bateson M. M. (1998) A
3169Carbon isotopes of bacterial biomarkers
natural view of microbial biodiversity within hot spring cyanobac-terial mat communities. Microbiol. Molecul. Biol. Rev. 62, 1353–1370.
White D. C. (1988) Validation of quantitative analysis for microbialbiomass, community structure, and metabolic activity. Adv. Limnol.31, 1–18.
White D. C., Davis W. M., Nickels J. S., King J. D., and Bobbie R. J.(1979) Determination of the sedimentary microbial biomass by ex-tractible lipid phosphate. Oceologia 40, 51–62.
Woese C. R. (1987) Bacterial evolution. Microbiol. Rev. 51, 221–271.Yao M., Walker H. W., and Lillard D. A. (1970) Fatty acids from
vegetative cells and spores of Bacillus stearothermophilus. J. Bac-teriol. 102, 877–878.
Zeng Y. B., Ward D. M., Brassell S. C., and Eglinton G. (1992a)Biogeochemistry of hot spring environments. 2. Lipid compositions
of Yellowstone (Wyoming, USA) cyanobacterial and Chloroflexusmats. Chem. Geol. 3-4, 327–345.
Zeng Y. B., Ward D. M., Brassell S. C., and Eglinton G. (1992b)Biogeochemistry of hot spring environments. 3. Apolar and polarlipids in the biologically active layers of a cyanobacterial mat. Chem.Geol. 3-4, 347–360.
Zhang C. L., Ye Q., Reysenbach A.-L., Goetz D., Peacock A., WhiteD. C., Horita J., Cole D. R., Fang J., Pratt L., Fang J., and Huang Y.(2002) Carbon isotopic fractionations associated with thermophilicbacteria Thermotoga maritima and Persephonella marina. Environ.Microbiol. 4, 58–64.
Zhang C. L., Li Y., Ye Q., Fong J., Peacock A. D., Blunt E., Fang J.,Lovley D. R., and White D. C. (2003) Carbon isotope signatures offatty acids in Geobacter metallireducens and Shewanella Algae.Chem. Geol. 195, 17–28.


