Embed Size (px)
Citation preview

Jason Mann and Xutong Niu
Troy University
Archaeological Research Center
and
Surveying and Geomatics Sciences Program
Department of Mathematics and Geomatics
Troy, AL 36082
Project Report Statistical Development to Predict Archaeological Site Locations --- A Pilot Study
In fulfillment of NRCS Project No. 68-4101-15-0002

1
Table of Contents
PREFACE ...................................................................................................................................... 3
INTRODUCTION TO THE PILOT STUDY................................................................................. 5
DATA PREPARATION AND PRE_PROCESSING .................................................................... 7
LiDAR Data Processing .............................................................................................................. 7
Converting Point Cloud To Contours. ........................................................................................ 8
Visual Case Studies ................................................................................................................... 10
MACHINE LEARNING AND DISCOVERY ............................................................................. 10
Extracting Polygon Features From Contours ............................................................................ 10
Extracting Mound-Like Polygon From Polygon Features ........................................................ 11
Recognizing Potential Sites Based On Landform Analysis ...................................................... 12
FIELD INSPECTION and VERIFICATION ............................................................................... 13
Field Inspection ......................................................................................................................... 14
Knight Cattle Farm WRP ...................................................................................................... 15
Lyons WRP ........................................................................................................................... 18
Pate WRP .............................................................................................................................. 23
Thompson WRP .................................................................................................................... 27
Sadler WRP ........................................................................................................................... 42
Laboratory Methods and Curation ............................................................................................ 45
RESULTS ..................................................................................................................................... 46
Cost/Labor Analysis .................................................................................................................. 46
The Advantage of Using The Laser Method. ............................................................................ 46
False Predictions with The Laser Method ................................................................................. 48
Other Discoveries From This Study .......................................................................................... 52
Problems With Alabama State Archaeological Site File Data .............................................. 52
Problems With Standard 7.5 Topographic Maps. ................................................................. 52
Problems With Soil Data Maps............................................................................................. 52
Problems With Aerial Photography ...................................................................................... 52
Lidar Is An Improvement Just As A Stand-Alone Visual Product. ...................................... 52
RECOMMENDATIONS .............................................................................................................. 53
More Areas Need To Be Included In The LASER Dataset ...................................................... 53

2
Cost Analysis Shows The Need For Expansion ........................................................................ 53
More Study Will Improve The Process ..................................................................................... 53
Improvement Of The Soil Maps................................................................................................ 55
Improvement To The Alabama State Site File .......................................................................... 57
Future Direction ........................................................................................................................ 58
ACKNOWLEDGEMENTS .......................................................................................................... 59
REFERENCES ............................................................................................................................. 60
APPENDIX A. PREPROCESSED CONTOUR MAPS ............................................................... 61
APPENDIX B. EXTRACTED POTENTIAL SITE LOCATION MAPS ................................. 100
ADDENDUM. VISUAL CASE STUDIES ................................................................................ 203
Lyons Wrp Visual Case Study ................................................................................................ 203
The Survey And Results Of The Lyons Wrp Tract ............................................................ 203
Knight Wrp Case Study........................................................................................................... 207
The Survey And Results Of The Knight Wrp Tract ........................................................... 207
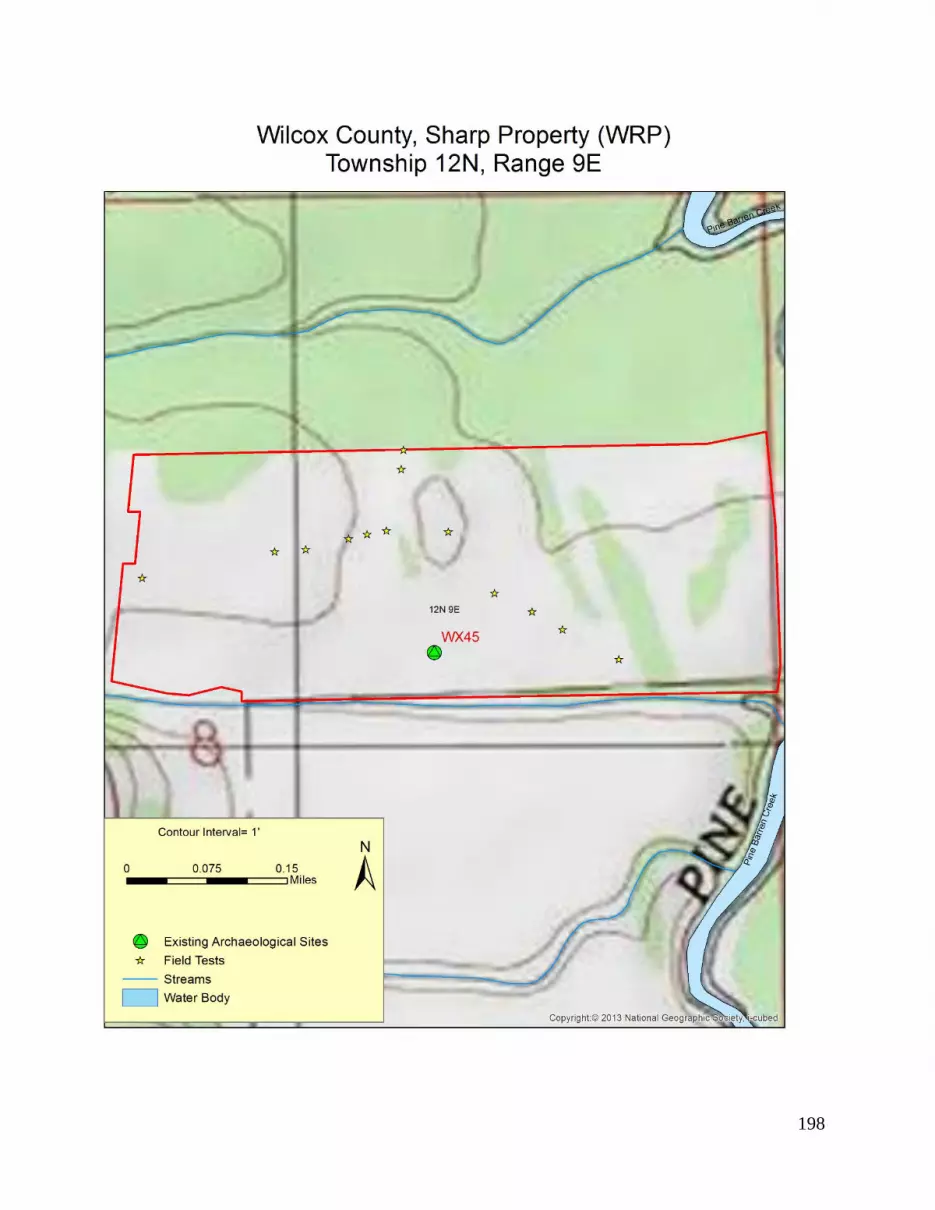
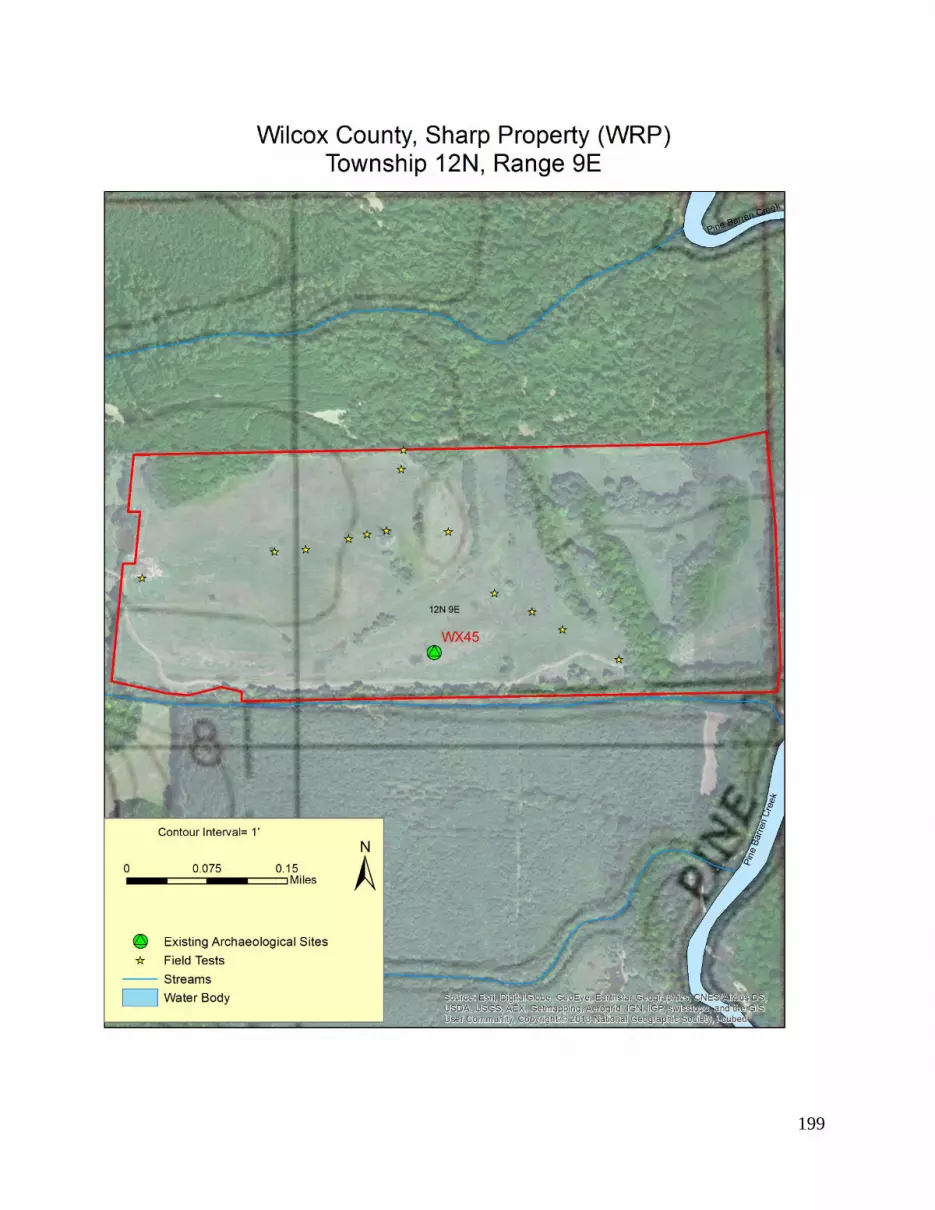
Sharp Wrp Case Study ............................................................................................................ 211
The Survey And Results Of The Sharp Wrp Tract ............................................................. 211

3
PREFACE
This project was developed out of the need to create an inventory of cultural resources
within NRCS WRP properties across Alabama. Beginning in 2011, Troy University
Archaeological Research Center (TUARC) was contracted to conduct high probability cultural
resource surveys of several WRP properties throughout Alabama. During the survey process
numerous archaeological sites were discovered. In some instances, sites that were discovered
defied what Jason Mann (director: TUARC) deemed as normal archaeological site locations or
situations. Some of the sites discovered were in-fact very impressive sites that by all sense of
conventional knowledge should not be in the locations they were discovered. For instance, in
Wilcox County, Alabama on the Knight WRP a very large potential multi-mound site was found
in an area that on common USGS topographic maps was denoted as relatively flat low wetlands.
It was however, this potential multi-mound site, 1Wx194 that led to the development of
this project. After the initial survey, because of the size, scale, and obvious importance, of
Wx194 some extensive reporting on the site was immediately needed. In most cases, a common
archaeological site can be simply described in text with a general base map showing its location,
but complex sites like Wx194 require more detailed work. In order to get a more detailed map of
the site Mann contacted the other Co-PI of this project (Dr. Xutong Niu) in the Department of
Mathematics and Geomatics at Troy University for assistance. Niu described how he could
generate a very nice topographic map of site 1Wx194 using newly acquired LiDAR data (See
Figure 1 below showing 1Wx194 multiple potential mounds).
Figure 1. 1Wx194 LiDAR Map showing 1 – foot contour lines, two potential large mounds.

4
After viewing this map, Mann asked Niu if a LiDAR map of the entire property could be
generated (See Figure 2 below showing Knight WRP LiDAR property map). Upon viewing the
large scale LiDAR map which showed 1-foot contour lines, Mann immediately felt that he had
missed some archaeological sites during the initial high-probability survey. The LiDAR map
showed a tremendous amount of terrain detail that traditional topographic and aerial photography
maps did not show. This led to further discussion between Mann and Niu about how LiDAR
could be utilized for the discovery of archaeological sites.
Figure 2. Section of Knight WRP LiDAR map showing 1-foot contour intervals and site 1Wx194.
5
Some basic research was conducted by both Mann and Niu about the application of
LiDAR and it was determined that LiDAR data could be used in a practical manner to find
archaeological sites. However, the methods used to extract the correct information from the
LiDAR data would require a good deal of testing and refinement. In order to justify the time
spent on a truly involved project both Mann and Niu would need funding to proceed further.
Such a project would not only involve development of the LiDAR processing method but also
require physical testing of properties for archaeological sites. This entire process would take a lot
of research time.
Because the initial project idea was developed from a NRCS WRP survey project Mann
and Niu drafted a research proposal and submitted it to the NRCS requesting funding. After
some discussion between NRCS representatives and Mann and Niu, an agreement was reached to
develop a Pilot Study to explore if LiDAR could be used in a practical way to find
archaeological sites. Two counties with abundant WRP properties that TUARC had previously
surveyed were selected as Pilot Study learning groups; those are Lowndes and Wilcox Counties,
Alabama. Both Lowndes and Wilcox counties have abundant WRP properties, they share similar
overall characteristics of being in the Black Belt and Southern Red Hills physiographic districts,
and most importantly the sample size of WRP properties would be sufficient to test the proposed
methods.
INTRODUCTION TO THE PILOT STUDY
Finding archaeological sites for the purposes of conservation and compliance within
Federal, State, and Local laws and regulations is a time consuming, labor intensive and costly
process. Previous to fieldwork, archaeologists examine elevations, landforms, soil types, and
proximity to water, current archaeological databases, historical records, and other environmental
factors to estimate the potential for archaeological sites to exist in any given area. After this
preparation, archaeologists physically inspect the land using survey techniques that vary from
conducting systematic testing to random shovel tests based on knowledge and experience, to
surface inspections.
Over the years archaeologists have developed high-probability techniques to reduce the
cost of time spent in the field surveying areas that produce negative results. High probability
survey techniques primarily involve the expertise and experience of the field archaeologist to
find sites. However, since previous experience does not guarantee that all of the archaeological
sites on a given tract of land will be discovered, systematic testing is usually required.
Systematic testing involves placing a shovel test every 30 meters on parallel transects within an
established grid pattern across the entire tract of land in question. (A single acre of land would
have nine shovel tests and a 40 acre tract would have at least 360 shovel tests.)
Fortunately, modern technology has enhanced an archaeologist’s ability to expedite
certain areas of the survey process. Electronic access to soil survey data (Web Soil Survey),
LiDAR, topographic maps, aerial photography, historic maps, archaeological site file data,

6
geophysical data, meteorological data, and even census data has led to improvements in the
archaeological survey process that focus on specific areas to be visually inspected or tested,
which will ultimately speed field survey time and reduce costs.
With this tremendous amount of easily gathered data it should be possible to synthesize
the data in a way to develop a statistically viable archaeological site predictive application.
In order to develop such an application a process is proposed that involves product
development and testing.
Expert knowledge plays an important role in the process. Topography, soil types, and
closeness to rivers or roads are common environmental factors considered in this process.
Traditionally, USGS Topographic Quadrangle maps are used by archeologists to interpret
various terrain patterns from contour lines and waterways. Based on experiences and knowledge
about the relationship between these environmental factors and archaeological sites, probable
locations are examined that will be tested for the presence of artifacts.
Unfortunately, USGS Topographical maps are not accurate enough to deliver fine scale
terrain variations. The original scale of 1:24,000, with contour intervals 3-6 m (10-20 feet), do
not always capture specific environmental features of interest in archaeology. Recently, however,
terrestrial LiDAR (Light Detection and Ranging) Technology has been widely used to collect
high-resolution (sub-meter) topographical data, which is essential for archaeologists to analyze
landscapes for archaeological sites.
LiDAR instruments and operational systems along with differential GPS (Global
Positioning System) and IMU (Inertial Measurement Units) have produced digital terrain models
(DTMs) in a format of dense ground point clouds (in general, 3-4 points/m2) with highly accurate
(<10cm) three-dimensional positions (X, Y, and Z). The point clouds can also be simultaneously
collected with high-resolution aerial photographs and multispectral radiometry. Integration of
these co-registered data provides users enhanced information for visual interpretation and scene
analysis.
Adapting LiDAR data to archaeology will necessitate manipulating the LiDAR data into
a form that can be examined and interpreted by archaeologists. With the assistance of GIS
(Geographic Information System) software, LiDAR points can be automatically triangulated into
TINs (Triangulated Irregular Networks) and interpolated into high-resolution DTMs and contour
lines. Based on the DTMs and contour lines, detailed local terrain features such as slopes and
aspects, ridges and valleys, flow directions and flow networks can be computed and visualized
using GIS tools. Further analyses will be needed to study spatial relationship among these
features which can describe special site structures for certain archaeological sites at different
temporal eras. This analysis process brings a lot of challenges as well as tools for site location
predictions for archaeologists.
Developing a method that could convert the experience and knowledge of archaeologists
into a proficient system that can aggregate these high-resolution terrain features and related
environmental data will be a challenge; however after running algorithms (to be developed), the
7
prediction of archaeological sites would be correlated with a statistical probability. Such a
system could greatly reduce workload and cost of negative results in archaeological research and
practice but also may reveal otherwise undetected features regarding site structures, landscapes,
and cultural links.
In this research, we proposed a four step framework for the development of an
application for automatic archaeological site discovery.
1. Data Preparation and Pre-processing
2. Machine Learning and Discovery
3. Field Inspection and Verification
4. Development of the Application Interface
DATA PREPARATION AND PRE_PROCESSING
Beginning with the first directive of this project, Data Preparation and Pre-Processing,
this aspect is essentially the easiest but most important facet of this project. This step processed
the LiDAR data into a format that can be utilized for the discovery of landforms which may
possess archaeological sites. This process is described below.
LIDAR DATA PROCESSING
LiDAR (Light Detection and Ranging) is an application of laser technology that collects
accurate elevation data from airborne platforms. High density measurement of ground elevations
from aircraft constitutes an indispensable, powerful, and highly economic way in various
geospatial applications (McGlone, 2004).
The LiDAR data used in this project was acquired by Tuck Mapping Solutions, Inc. and
completed between February 15, 2011 and March 25, 2011. This data acquisition was to assist
the Natural Resources Conservation Service (NRCS) make wetland determinations for its
Wetland Reserve Program (WRP) and assist NRCS engineers design structures necessary for
wetland restoration in association with that program. The nominal point spacing of the LiDAR
was 1 meter (Tuck Mapping Solutions, Inc., 2012).
The purpose of this project is to extract potential landforms from LiDAR and to identify
high probable archaeological sites from these landforms.
The first step is to determine what kinds of landforms could most likely contain
archaeological sites. Based on the previous experience of archaeologists working in the area,
several characteristics of archaeological sites were analyzed and discussed. These characteristics
include:
Elevations: most existing archaeological sites in the study area were located at a place
higher than the surrounding area in all directions and look like a raised feature or
mound. The top areas of the sites were relatively flat and occupied an area large
enough to reside. Surrounding the top area, elevations tend to drop in all directions.
8
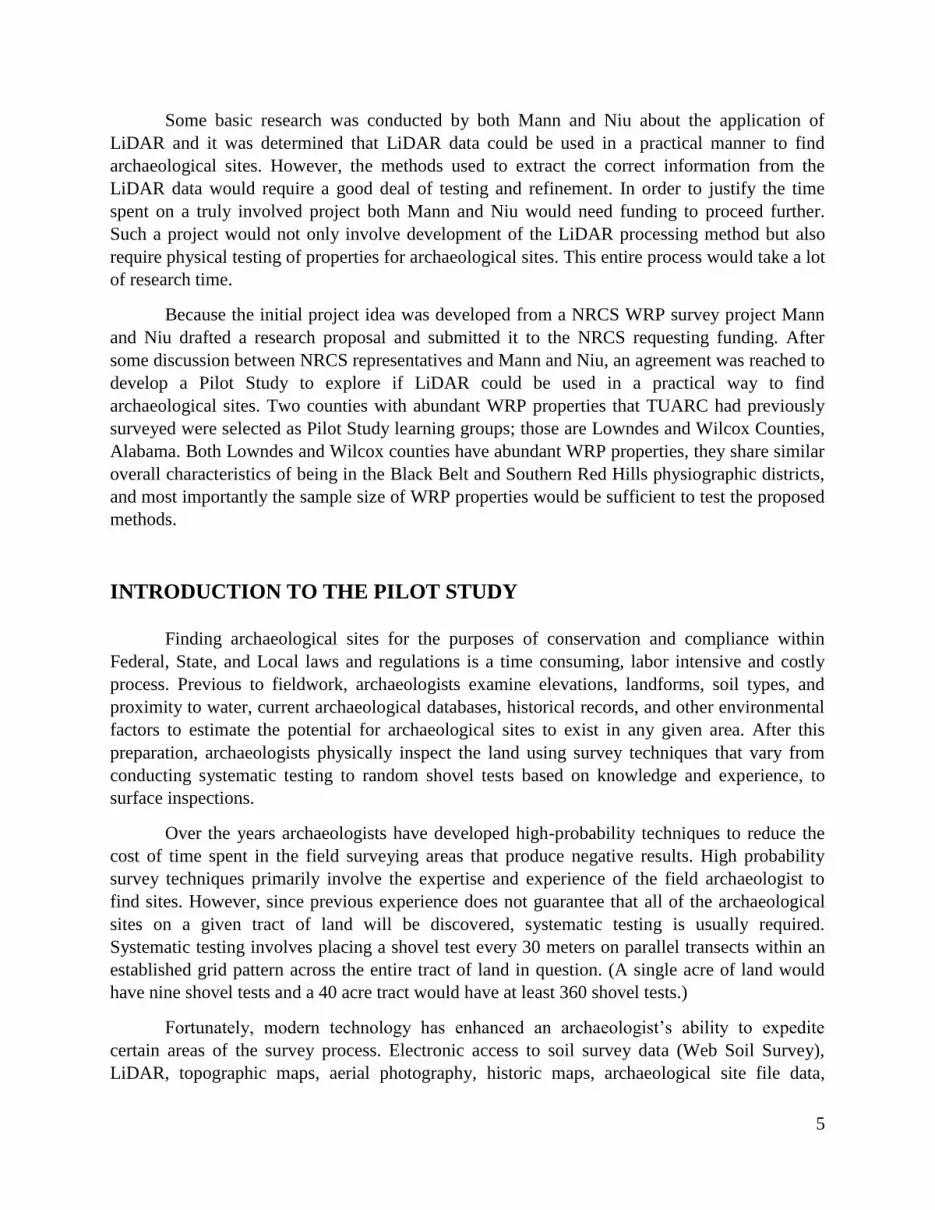
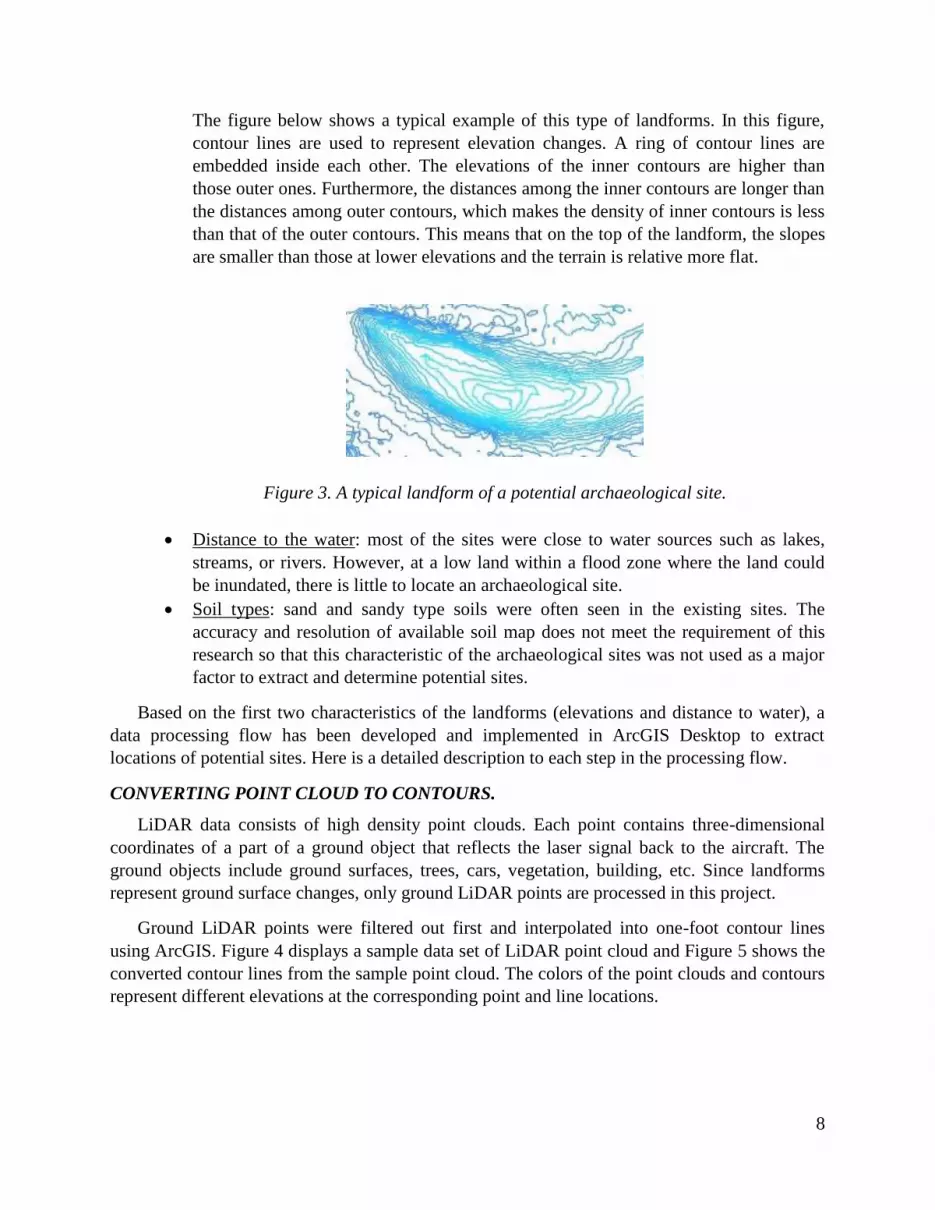
The figure below shows a typical example of this type of landforms. In this figure,
contour lines are used to represent elevation changes. A ring of contour lines are
embedded inside each other. The elevations of the inner contours are higher than
those outer ones. Furthermore, the distances among the inner contours are longer than
the distances among outer contours, which makes the density of inner contours is less
than that of the outer contours. This means that on the top of the landform, the slopes
are smaller than those at lower elevations and the terrain is relative more flat.
Figure 3. A typical landform of a potential archaeological site.
Distance to the water: most of the sites were close to water sources such as lakes,
streams, or rivers. However, at a low land within a flood zone where the land could
be inundated, there is little to locate an archaeological site.
Soil types: sand and sandy type soils were often seen in the existing sites. The
accuracy and resolution of available soil map does not meet the requirement of this
research so that this characteristic of the archaeological sites was not used as a major
factor to extract and determine potential sites.
Based on the first two characteristics of the landforms (elevations and distance to water), a
data processing flow has been developed and implemented in ArcGIS Desktop to extract
locations of potential sites. Here is a detailed description to each step in the processing flow.
CONVERTING POINT CLOUD TO CONTOURS.
LiDAR data consists of high density point clouds. Each point contains three-dimensional
coordinates of a part of a ground object that reflects the laser signal back to the aircraft. The
ground objects include ground surfaces, trees, cars, vegetation, building, etc. Since landforms
represent ground surface changes, only ground LiDAR points are processed in this project.
Ground LiDAR points were filtered out first and interpolated into one-foot contour lines
using ArcGIS. Figure 4 displays a sample data set of LiDAR point cloud and Figure 5 shows the
converted contour lines from the sample point cloud. The colors of the point clouds and contours
represent different elevations at the corresponding point and line locations.

9
Figure 4. A sample point cloud data.
Figure 5. Contour lines generated from the sample point cloud.
After all of the WRP properties in Lowndes and Wilcox were processed into LiDAR
based 1 foot contour maps (see maps in Appendix A), the next step in this study Machine
Learning and Discovery, could begin.

10
VISUAL CASE STUDIES
It should be noted here that after step 1 was completed, the archaeologist conducted three
visual case studies for some of the WRP properties mentioned in this report. The Visual Case
Studies are included as an addendum at the back of this report. The Visual Case Studies show
that just as a stand-alone product without enhanced automatic searching LiDAR based maps are
a valuable tool for the archaeologist and land manager.
MACHINE LEARNING AND DISCOVERY
During the process of this study a LiDAR based archaeological site extraction and
recognition (LASER) method was developed to detect terrain features that have a high
probability for containing cultural resources.
EXTRACTING POLYGON FEATURES FROM CONTOURS
Contours which form closed polygon were extracted in this step. It was assumed that a
mound top is higher than its surrounding terrain in all directions and closed polygons would form
boundaries of such kind of landforms.
Figure 6. Extracted polygons from contour lines.
Figure 6 shows the extracted closed polygons from contour lines. In Figure 7, these
extracted polygons overlaid on the original contour lines, where it can be seen that all the
mound-like landforms have been found and extracted.

11
Figure 7. Overlay of extracted polygons on the contour lines.
EXTRACTING MOUND-LIKE POLYGON FROM POLYGON FEATURES
Most of those polygon features in Figure 6 are embedded within other polygons. The
inner-most polygon in each group of embedded polygons has either the highest or lowest
elevation. Such a group of embedded polygons would represent a mound if the inner-most
polygon has the highest elevation in the group, or a ditch if the inner-most polygon has the
lowest elevation in the group. By comparing elevations of polygons among each group, center
polygons of the mound-like landforms are extracted in this step, as shown in Figure 8a. These
same polygons overlaid with the original contour lines as shown Figure 8b.
a. Extracted center polygon of mounds. b. Overlay of center polygon with contour
lines.
Figure 8. Extracted center polygons.

12
RECOGNIZING POTENTIAL SITES BASED ON LANDFORM ANALYSIS
After these top polygons of mound-like landforms are extracted, they cannot be claimed to be
locations of potential archaeological sites yet. Some of the top polygons are not flat enough as
the one shown in Figure 3. They need to be filtered from the extracted polygons. Such kind of
top polygons are determined based on two criteria.
The first one is that the area of the top polygon has to be larger than a certain size.
This can be done by using an area threshold.
The second one is that the slopes inside each top polygon should be smaller than
those of its surrounding terrain.
To implement this second criterion in ArcGIS, two buffers are generated for each
extracted top polygon (the orange oval in Figure 9). The size of the first buffer (the blue oval in
Figure 9) is 10 feet wide representing the immediate neighboring area of the land area, where
steeper slopes and lower elevations are expected. The second buffer (the green oval in Figure 9)
is 100 feet (approximately 30 meters) wide from the boundary of the top polygon representing
the larger surrounding area of the landform.
Figure 9. Illustration of Two Buffers of a Top Polygon
In this research, the averages and standard deviations of the elevations within the top
polygon, the first and the second buffers have been calculated and compared. The query
conditions used to extract potential site locations are:
a) The averaged elevation within the top polygon is higher than that of both buffers;
b) The averaged elevation within the first buffer is higher than that of the second
buffer;
c) The difference between the averaged elevation within the top polygon and that
within the second buffer are large enough, for example, greater than 1 foot.
d) The standard deviation of the elevations within the top polygon is smaller than
that of both buffers;
Those top polygons which satisfy all these conditions can be selected through an
attribute-based selection within ArcGIS.
10 ft
100 ft

13
After this done, locations of these polygons, such as distance to water sources, have to be
further analyzed to filter out some places which are too far away from water and impossible to be
considered as potential sites. The results of such analysis are shown in each final selection map
for each property.
All of the WRP properties were processed to find landforms which could possess
archaeological sites – see Appendix B.
FIELD INSPECTION AND VERIFICATION
The most time consuming and labor intensive aspect of this project involves the third
major step in this project – Field Inspection and Verification.
Because all of the WRP properties in Lowndes and Wilcox Counties had previously been
surveyed using traditional high probability survey methods it made good sense to see how the
LASER method compared against the original surveys.
Overall, the LASER method was in 94% agreement with finding the location of
previously discovered sites within the WRP properties (see Table 1). The two sites not detected
are sites smaller than 30 square meters and the search parameters for site detection are not set to
find landforms or features that small. Otherwise, objects like parked cars would be detected. The
table below shows the previously discovered sites that were detected with this method. In
Appendix B maps are provided with the location of all sites on the various WRP properties. The
two sites missed with this method are discussed in the results section of this report.
Table 1. Site Detection Results using the LASER method
Sites Previously
Discovered Site Name
Location
detected by
this method
Wx194 Knight YES
Wx195 Henderson1A YES
Wx196 Henderson1B YES
Wx197 Henderson2A YES
Wx198 Henderson2B YES
Wx142 Hollinger A YES
Wx143 Hollinger B YES
Wx145 SHARPE 2A YES
Wx146 SHARPE 2B YES
Wx147 SHARPE 2C YES
Wx148 Sharpe 2D YES
Wx162 SHARPE 2F YES

14
WX180 SHARPE 2E YES
WX189 Hollinger C YES
Wx201 Bullock A Yes
Wx202 Bullock B Yes
Wx203 Bullock C Yes
Wx204 Bullock D NO
Lo241 PATE C YES
Lo242 PATE D YES
Lo243 THOMPSON A YES
Lo244 THOMPSON B YES
Lo245 THOMPSON C YES
Lo253 PATE A YES
Lo254 PATE B YES
Lo255 Callen A YES
Lo246 Sadler A YES
Lo247 Sadler B YES
Lo248 Sadler C YES
Lo249 Sadler D YES
Lo250 Sadler E YES
Lo251 Sadler F YES
Lo252 Lyons A YES
No site number Small cemetery Henderson WRP NO
TOTALS 34 SITES .9411 YES
FIELD INSPECTION
Clearly, the LASER method developed here shows where previously discovered sites are
located, however the real test was to see if this method can find undiscovered sites. In order to
test this process, auto-detected landforms were selected for shovel testing. The process of
selecting the test locations was based primarily on time, weather, field conditions, and land
access availability. Some properties could not be tested due to co-ordination conflicts with
landowners, such as hunting seasons overlapping with PI’s schedules; weather related access to
properties such as heavy rains causing some landforms to become inaccessible, and other
practical concerns. However, eight landforms were tested and of the eight landforms tested seven
were positive for containing cultural resources.
The landforms that were detected by LASER method and were tested in the field are
located on the Knight Cattle Farm WRP in Wilcox County, Lyons WRP in Lowndes County,
Pate WRP in Lowndes County, Thompson WRP in Lowndes County, and Sadler WRP in
Lowndes County.
15
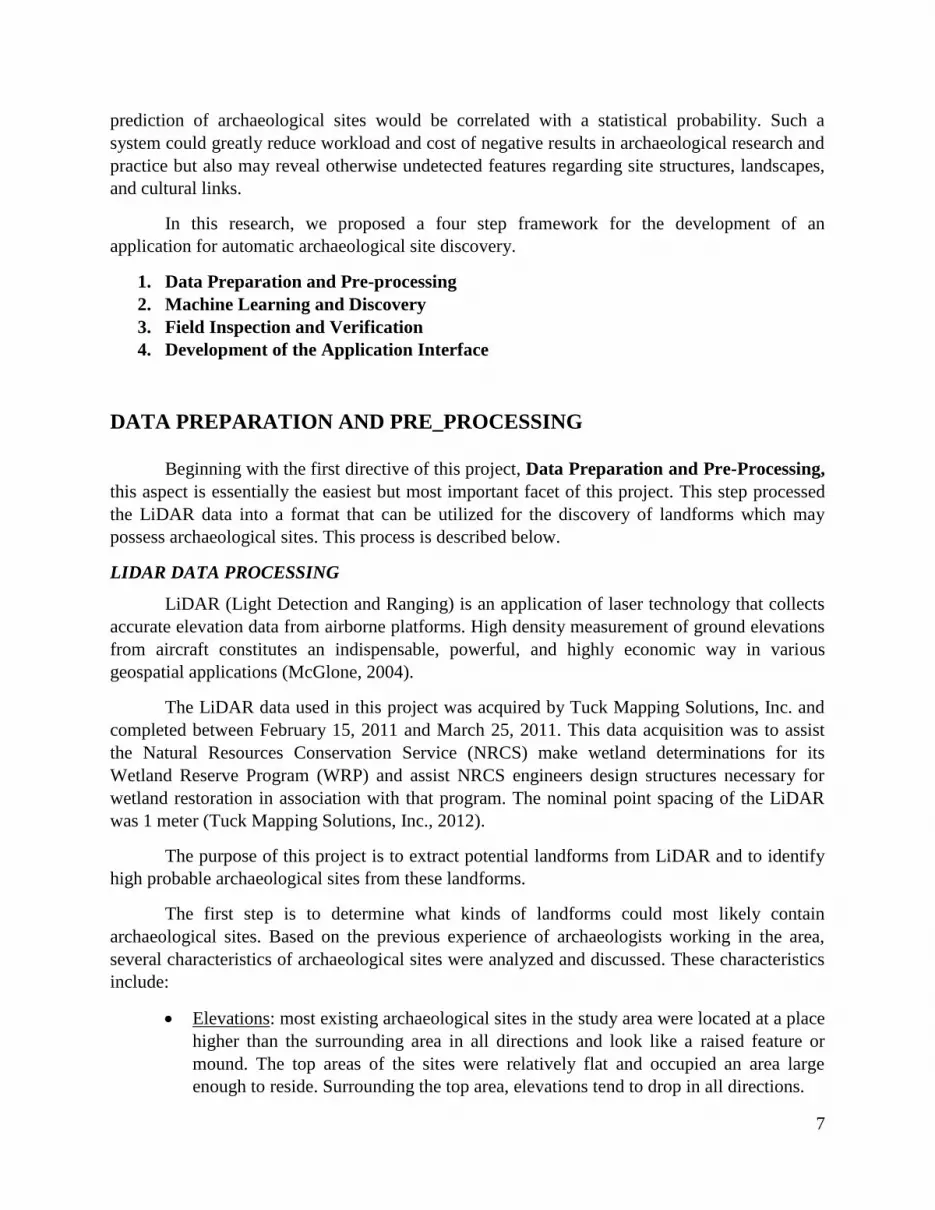
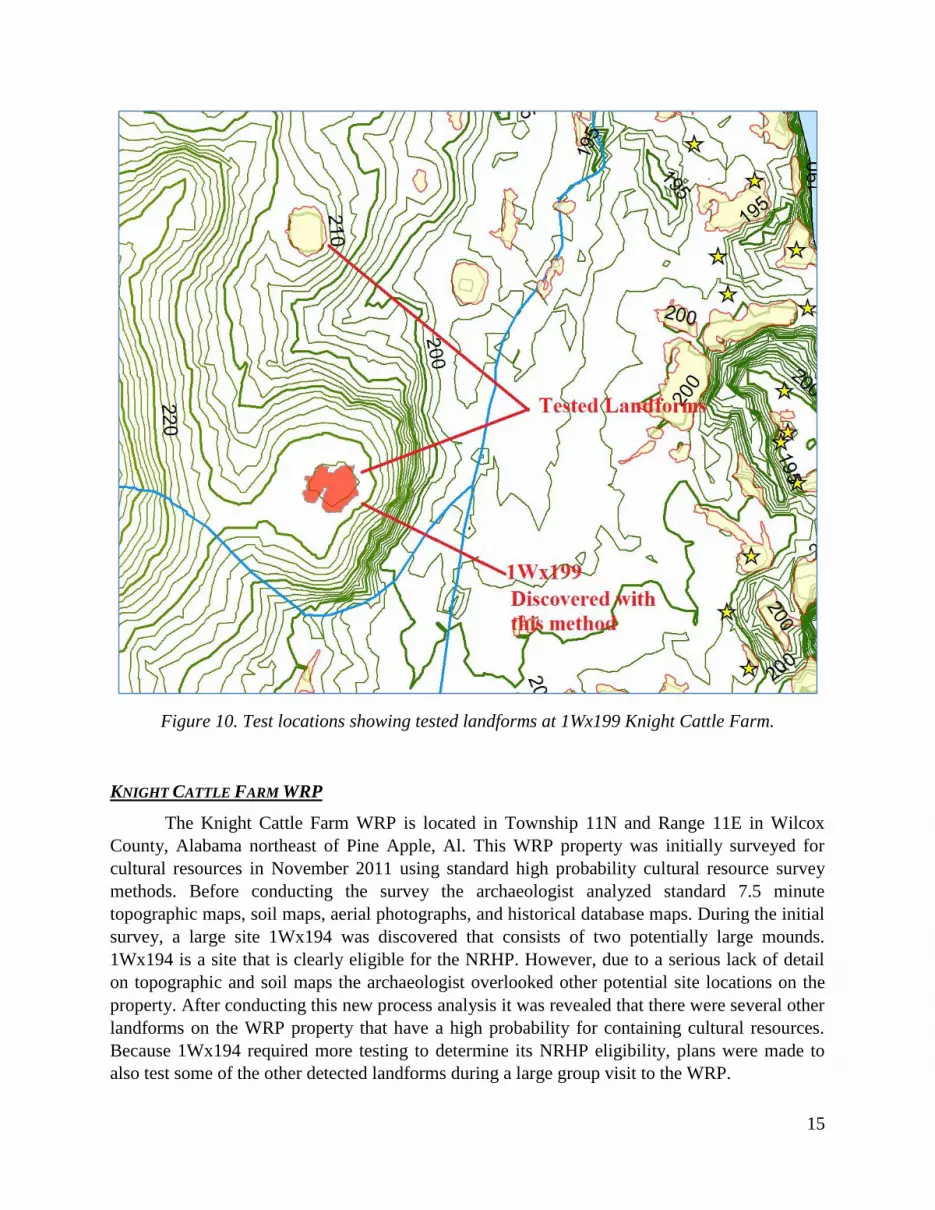
Figure 10. Test locations showing tested landforms at 1Wx199 Knight Cattle Farm.
KNIGHT CATTLE FARM WRP
The Knight Cattle Farm WRP is located in Township 11N and Range 11E in Wilcox
County, Alabama northeast of Pine Apple, Al. This WRP property was initially surveyed for
cultural resources in November 2011 using standard high probability cultural resource survey
methods. Before conducting the survey the archaeologist analyzed standard 7.5 minute
topographic maps, soil maps, aerial photographs, and historical database maps. During the initial
survey, a large site 1Wx194 was discovered that consists of two potentially large mounds.
1Wx194 is a site that is clearly eligible for the NRHP. However, due to a serious lack of detail
on topographic and soil maps the archaeologist overlooked other potential site locations on the
property. After conducting this new process analysis it was revealed that there were several other
landforms on the WRP property that have a high probability for containing cultural resources.
Because 1Wx194 required more testing to determine its NRHP eligibility, plans were made to
also test some of the other detected landforms during a large group visit to the WRP.

16
NOTE: (1Wx194 was tested by a large crew of Troy University students and NRCS
representatives on March 24, 2015 to determine if the site is a large mound, its cultural
affiliation, and for public outreach educational purposes. Please See YouTube video
https://www.youtube.com/watch?v=wp6fRNiLBiE )
On March 24, 2015, two landforms that were detected as having a high probability for
containing cultural resources were tested. See Figure 10.
Of the two landforms tested one contained cultural resources. The northern test location
was found to have wet clayey soils but the southern test location was sandy and well-drained.
Site 1Wx199, Tommy’s site, was discovered using the LASER method. The site was
found on a high relatively flat sandy knoll which could not be seen on USGS topographic or
other traditional map products. Shovel tests revealed artifacts to a depth of 80 cm and the
materials included fiber-tempered pottery, Tallahatta quartzite flakes, and coastal plain chert
flakes. Because of the presence of fiber-tempered pottery it is possible the site dates to at least
1000BC and Wx199 is potentially eligible for the NRHP. See Photo Figures 11, 12, and 13.
Figure 11. Shovel testing at 1Wx199 with Troy University students.

17
Figure 12. Image of Artifacts from 1Wx199.
18
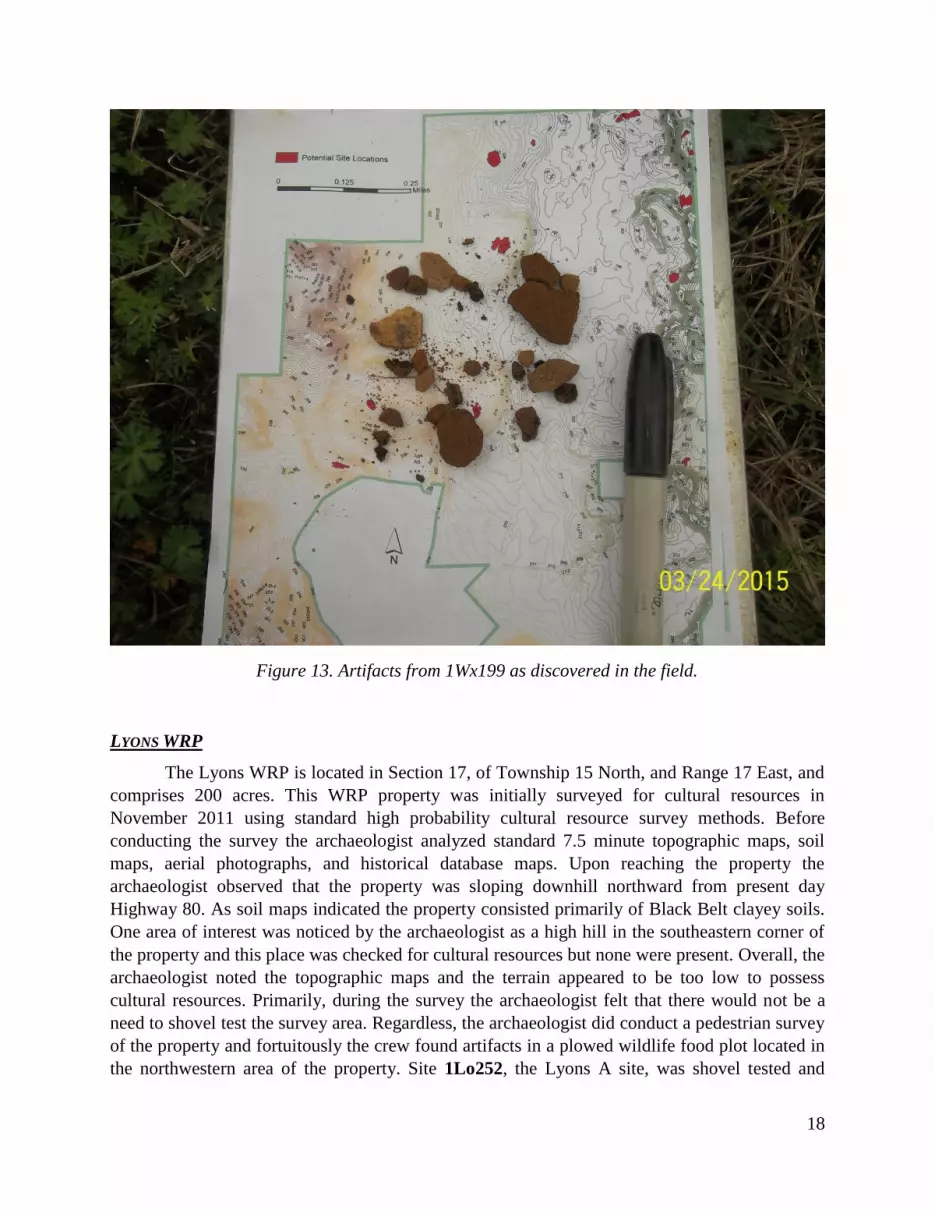
Figure 13. Artifacts from 1Wx199 as discovered in the field.
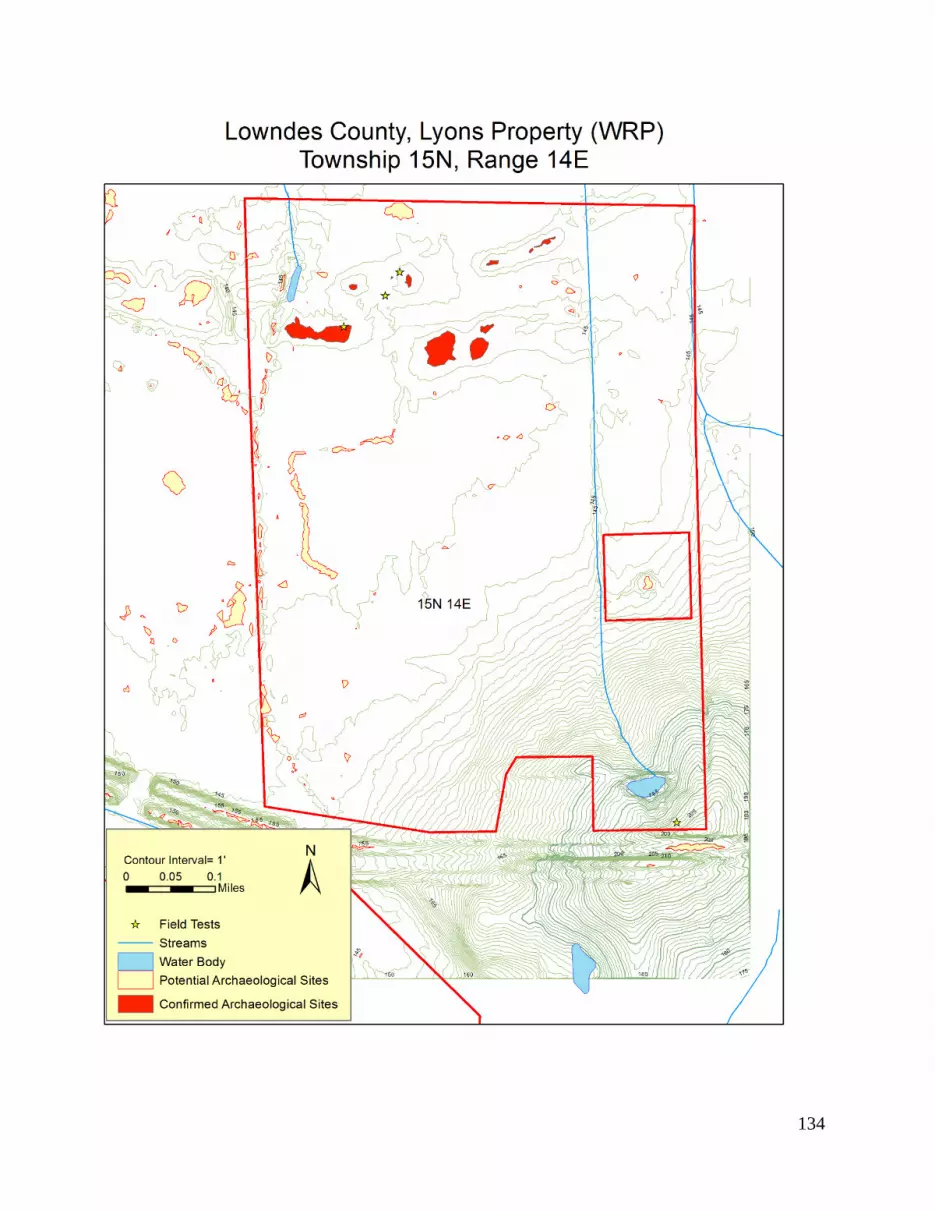
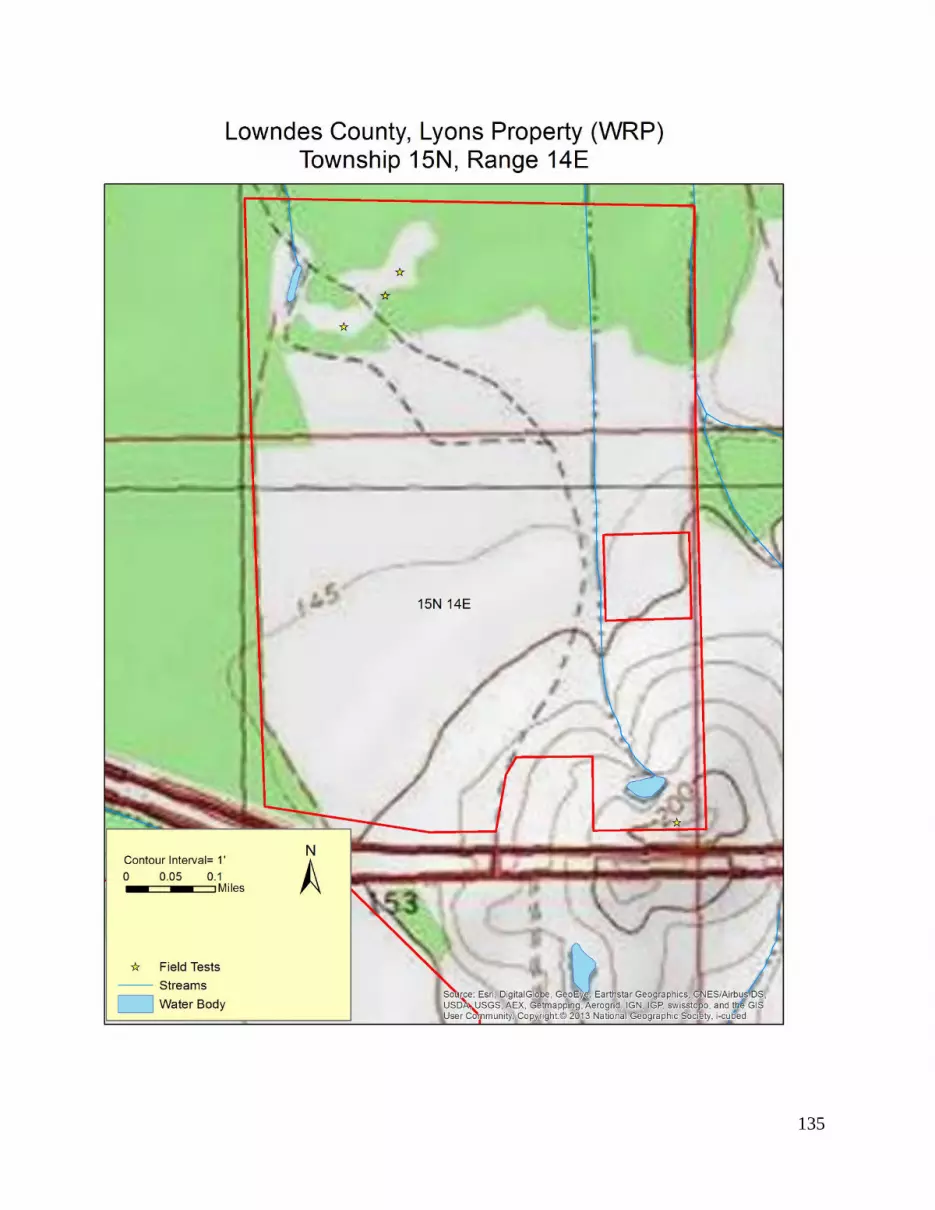
LYONS WRP
The Lyons WRP is located in Section 17, of Township 15 North, and Range 17 East, and
comprises 200 acres. This WRP property was initially surveyed for cultural resources in
November 2011 using standard high probability cultural resource survey methods. Before
conducting the survey the archaeologist analyzed standard 7.5 minute topographic maps, soil
maps, aerial photographs, and historical database maps. Upon reaching the property the
archaeologist observed that the property was sloping downhill northward from present day
Highway 80. As soil maps indicated the property consisted primarily of Black Belt clayey soils.
One area of interest was noticed by the archaeologist as a high hill in the southeastern corner of
the property and this place was checked for cultural resources but none were present. Overall, the
archaeologist noted the topographic maps and the terrain appeared to be too low to possess
cultural resources. Primarily, during the survey the archaeologist felt that there would not be a
need to shovel test the survey area. Regardless, the archaeologist did conduct a pedestrian survey
of the property and fortuitously the crew found artifacts in a plowed wildlife food plot located in
the northwestern area of the property. Site 1Lo252, the Lyons A site, was shovel tested and

19
surface collected. Overall, the site was revealed to be a large lithic scatter confined primarily to a
shallow plowzone. 1Lo252 confused the archaeologist because it is in a very low area adjacent to
a small unnamed tributary. However, Lo252 appears to be confined to a shallow eroded
plowzone it was not considered eligible for the National Register of Historic Places.
As this project developed one of the first observations the archaeologist noted on the
LiDAR generated map was that site 1Lo252 resides on a slightly elevated landform, only 1 foot
above the adjacent tributary. The landform that possesses the site does not appear on
topographic, soil, aerial, or other maps. However, the LiDAR maps do show the landform. The
LiDAR maps also show other landforms which share analogous characteristics to the landform
which 1Lo252 resides upon. After data processing and analysis these landforms were detected as
potentially possessing archaeological sites so plans were made to survey them with shovel tests.
During the field inspection for the LASER Method, two detected landforms were
surveyed with shovel testing. Both landforms were positive for cultural resources.
Figure 14. Location of detected landforms and sites discovered.

20
Figure 15. Shovel testing a detected location at Lyons WRP, site 1Lo261.
Site 1Lo260 was found within a densely forested area in the northern end of the property.
Shovel tests revealed that the site is primarily a lithic scatter consisting of coastal plain chert
flakes, quartz flakes, and fire cracked rock. Site 1Lo260 is confined primarily to a plowzone and
shovel tests did not reveal artifacts deeper than 30 cm. See Photo Figure 16 1Lo260 artifacts.
21
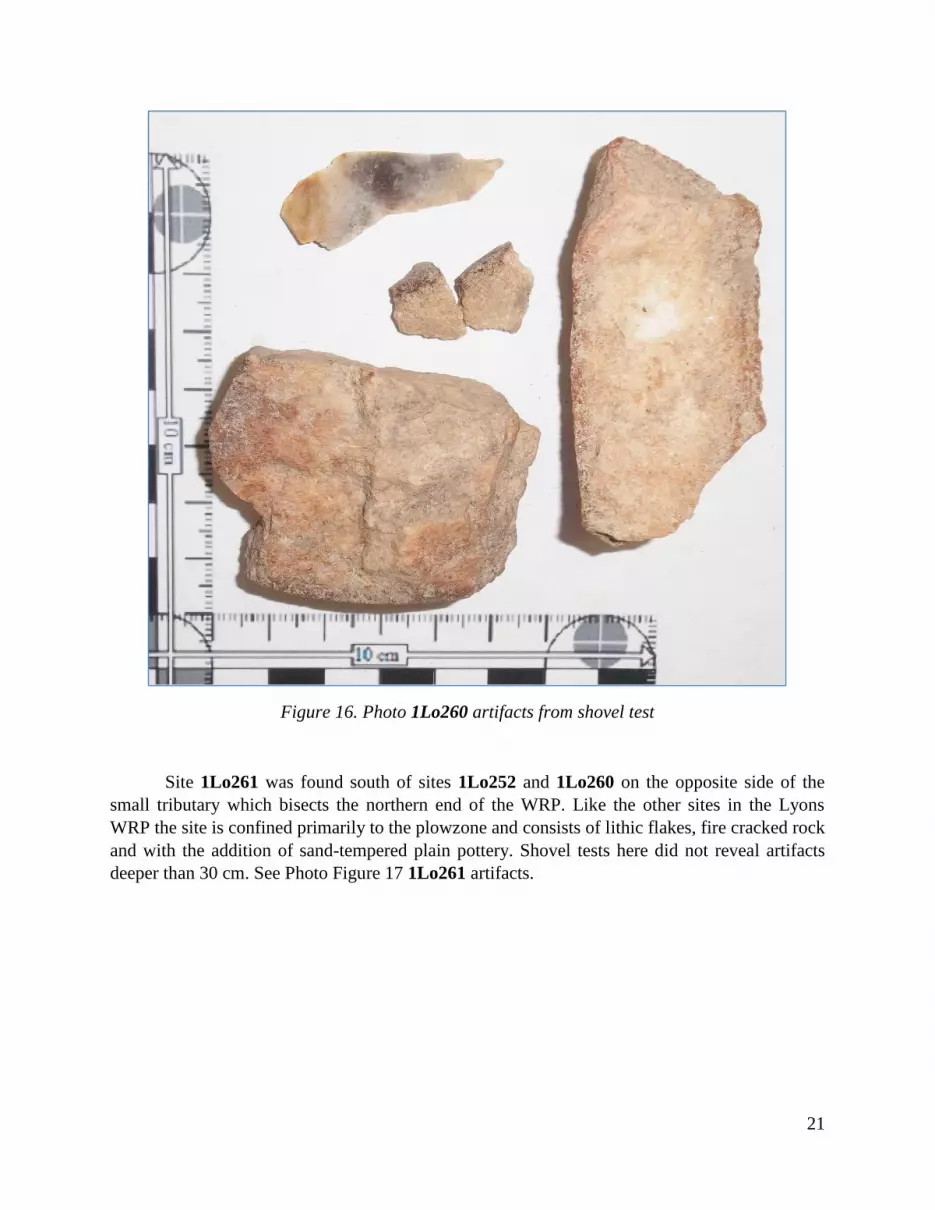
Figure 16. Photo 1Lo260 artifacts from shovel test
Site 1Lo261 was found south of sites 1Lo252 and 1Lo260 on the opposite side of the
small tributary which bisects the northern end of the WRP. Like the other sites in the Lyons
WRP the site is confined primarily to the plowzone and consists of lithic flakes, fire cracked rock
and with the addition of sand-tempered plain pottery. Shovel tests here did not reveal artifacts
deeper than 30 cm. See Photo Figure 17 1Lo261 artifacts.

22
Figure 17. Photo 1Lo261 lithics and pottery from shovel test.
Both Sites Lo260 and Lo261 could only have been discovered using one of two methods,
traditional grid based interval shovel testing and the method used in this study. During the initial
high probability survey, the archaeologist not only drove across but also walked across Lo261.
Even on foot the subtle and only slight elevation rise could not be seen. Furthermore, the 7.5
minute maps, aerial, and soil maps, gave no suggestion that the site was in an area which did not
flood regularly. Site Lo260 also, on the ground appeared to be in a densely forested swampy
area, the maps traditionally used for survey indicated that the area was too low to possess any
cultural resources. However, the LASER method showed that indeed the elevation difference of
just one foot in the Lyons WRP is enough difference for a landform to possess cultural resources.

23
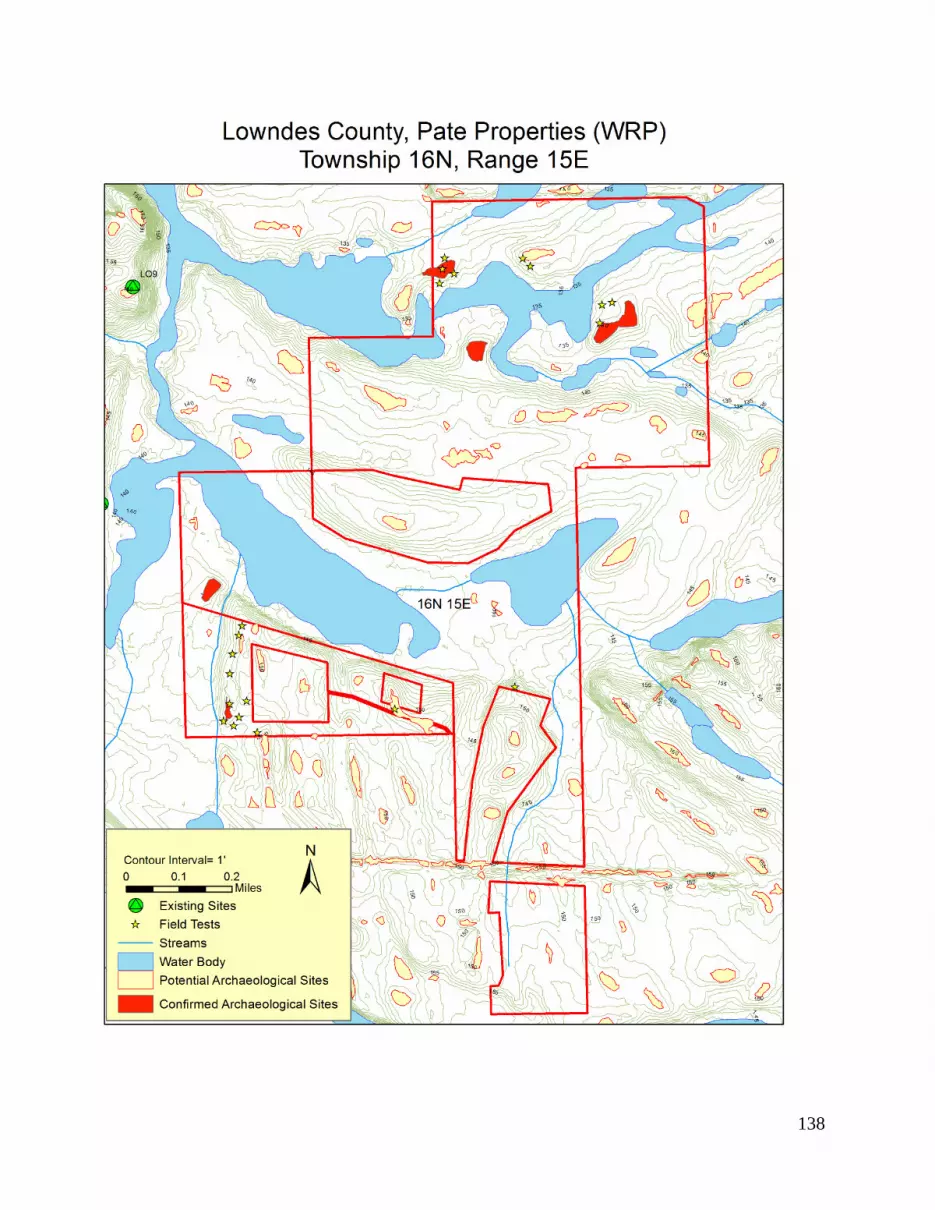
PATE WRP
The Pate WRP is located in Section 30, of Township 16 North, and Range 15 East, and
comprises 260 acres. This WRP property, though tested as one single property actually is titled
as three separate family owned tracts which were initially surveyed for cultural resources in
November 2011 using standard high probability cultural resource survey methods. Before
conducting the survey the archaeologist analyzed standard 7.5 minute topographic maps, soil
maps, aerial photographs, and historical database maps. Upon reaching the property the
archaeologist observed that the property consisted of gently sloping hills around swampy and
low wet areas and consisted primarily of Black Belt clayey soils which are heavily eroded from
agriculture. Overall, the archaeologist noted the topographic maps and the terrain appeared to be
too low to possess cultural resources. However, areas adjacent to and near water sources which
appeared to have enough elevation that do not flood regularly were checked with shovel tests.
With a crew of 6 technicians a total of 48 labor were spent surveying the Pate Family properties
using traditional high-probability survey techniques. As a result of the survey, four
archaeological sites were discovered on the property; 1Lo241, Lo242, Lo253, and Lo254. All of
the sites consist of lithic scatters which are confined to a shallow plowzone, with the exception
of site Lo253 which yielded a complete Benton point and is possibly intact to a depth of 70 cm.
Lo253, needs further investigation to determine if it is eligible for the National Register of
Historic Places, the other sites are not.
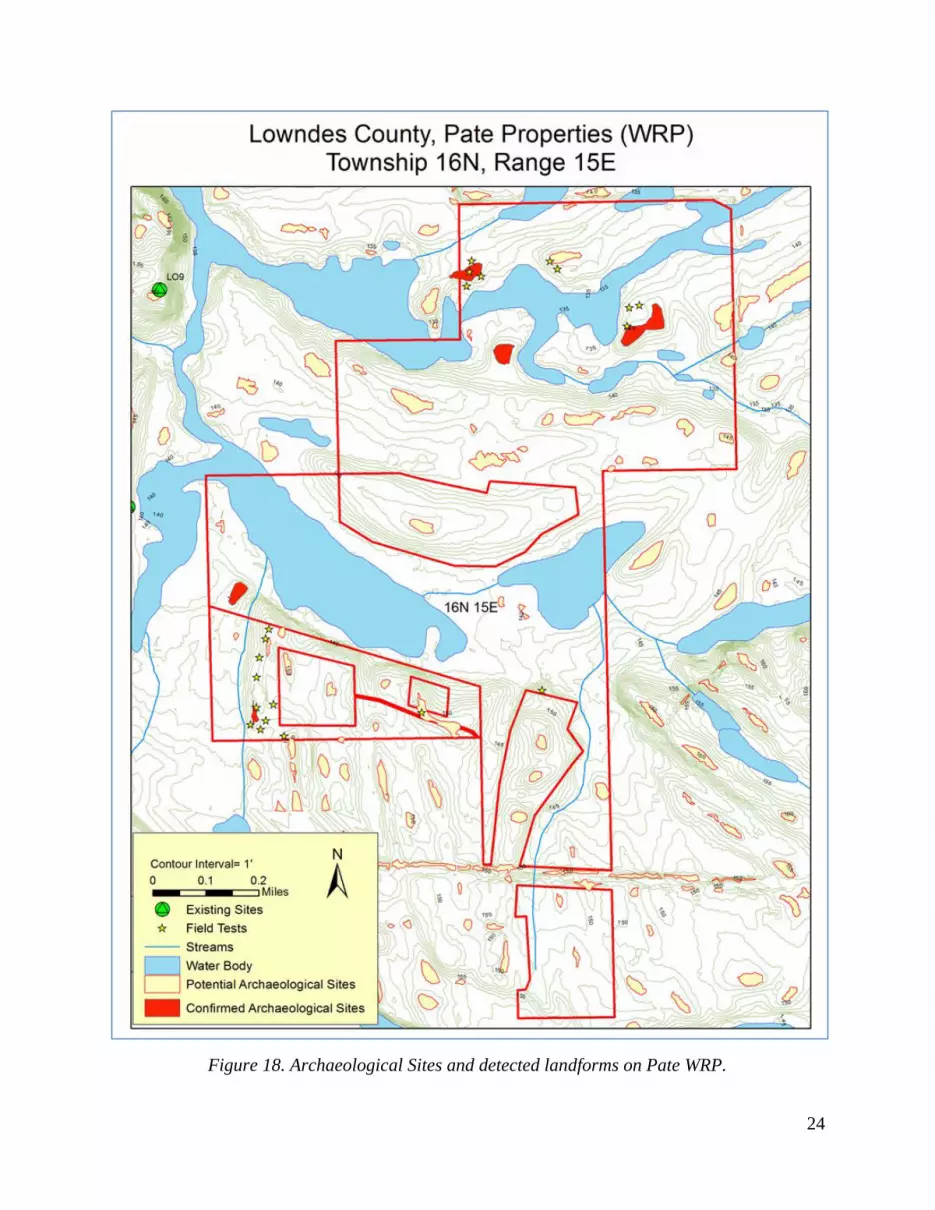
As this project developed one of the first observations the archaeologist noted on the
LiDAR generated map was that all the aforementioned sites reside on landforms which are
indicated as highly probable for cultural resources by the LASER method. The landforms that
possess the sites do not readily appear on topographic, soil, aerial, or other maps. However, the
LiDAR maps do show the landforms clearly. The LiDAR maps also show landforms which share
analogous characteristics to the landforms which contain the sites. After data processing and
analysis 14 landforms were detected as potentially possessing archaeological sites. During
analysis it was discovered that all of the landforms detected with the exception of one was
previously surveyed with shovel tests and surface inspections, so plans were made to shovel test
the unexplored landform. The detected landform was positive for cultural resources. See Figures
18, 19, and 20.
24
Figure 18. Archaeological Sites and detected landforms on Pate WRP.

25
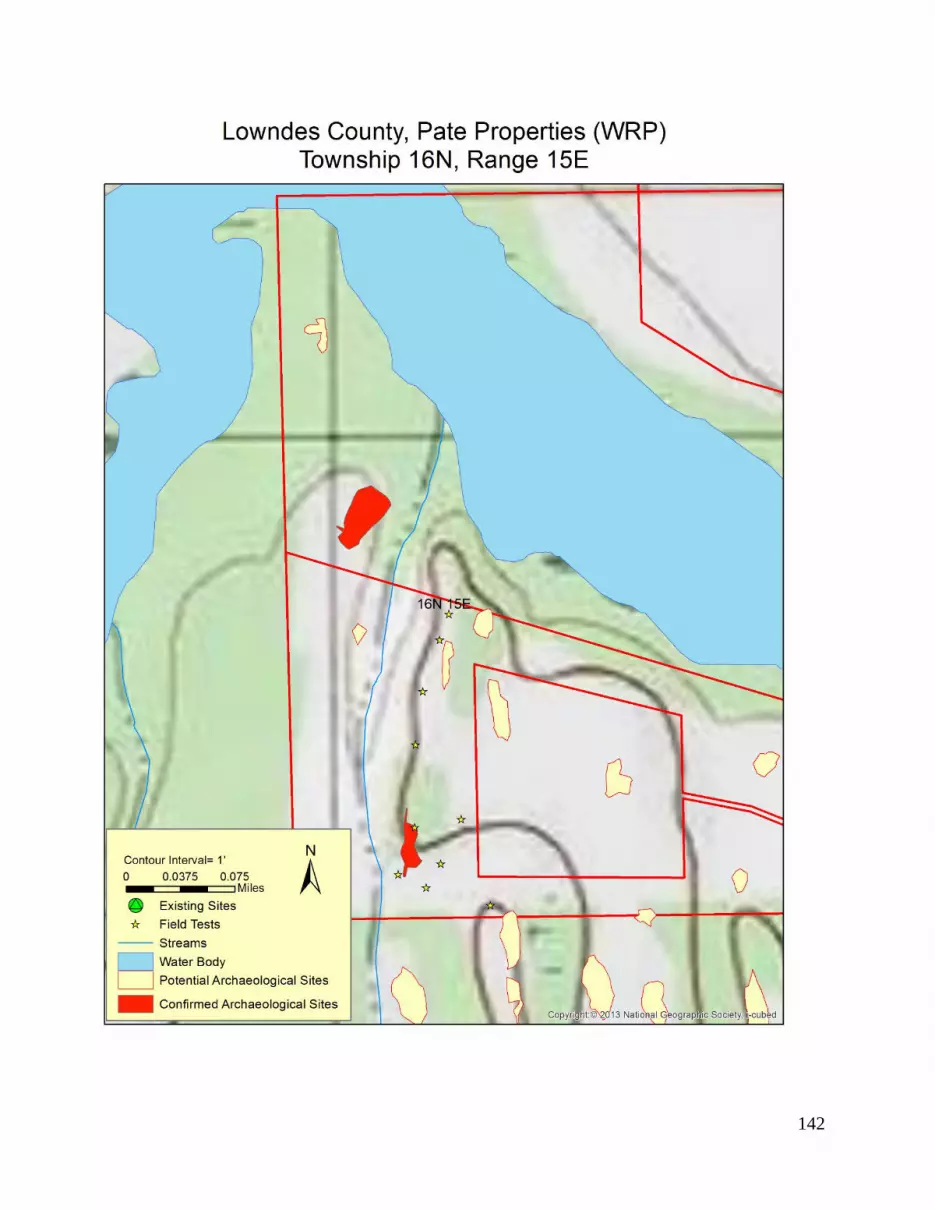
Figure 19. Site 1Lo257 on Pate WRP
26
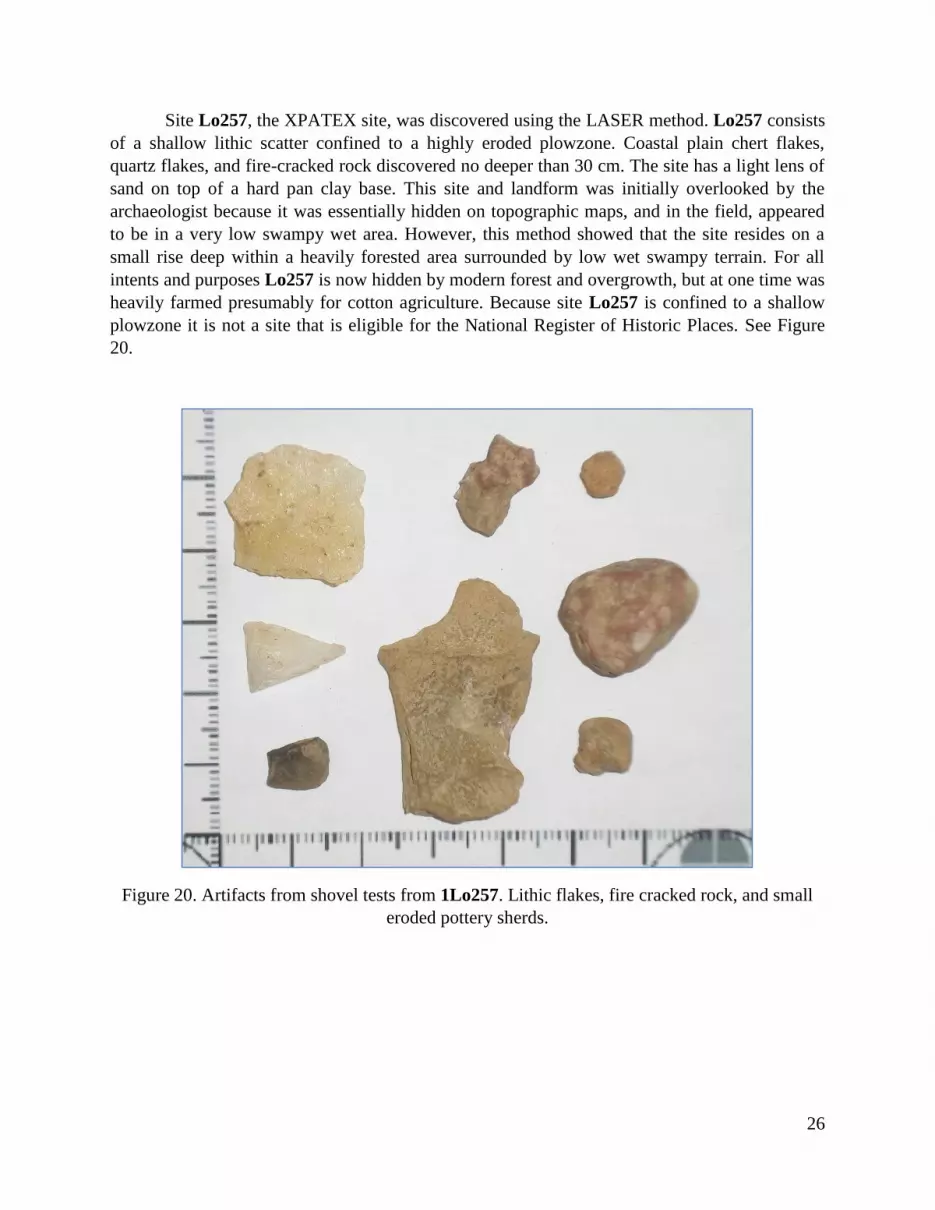
Site Lo257, the XPATEX site, was discovered using the LASER method. Lo257 consists
of a shallow lithic scatter confined to a highly eroded plowzone. Coastal plain chert flakes,
quartz flakes, and fire-cracked rock discovered no deeper than 30 cm. The site has a light lens of
sand on top of a hard pan clay base. This site and landform was initially overlooked by the
archaeologist because it was essentially hidden on topographic maps, and in the field, appeared
to be in a very low swampy wet area. However, this method showed that the site resides on a
small rise deep within a heavily forested area surrounded by low wet swampy terrain. For all
intents and purposes Lo257 is now hidden by modern forest and overgrowth, but at one time was
heavily farmed presumably for cotton agriculture. Because site Lo257 is confined to a shallow
plowzone it is not a site that is eligible for the National Register of Historic Places. See Figure
20.
Figure 20. Artifacts from shovel tests from 1Lo257. Lithic flakes, fire cracked rock, and small
eroded pottery sherds.

27
THOMPSON WRP
The Thompson WRP is located in Section 10, of Township 15 North, and Range 14 East,
and comprises 159 acres but it abuts the southern boundary of the Sadler WRP and for all intents
and purposes could be considered part of the same very large tract. This WRP property was
initially surveyed for cultural resources in November 2011 using standard high probability
cultural resource survey methods. Before conducting the survey the archaeologist analyzed
standard 7.5 minute topographic maps, soil maps, aerial photographs, and historical database
maps. Upon reaching the property the archaeologist observed that the property boundary
followed the contour of a high hill overlooking a very low swampy area. As soil maps indicated
the property consisted primarily of Black Belt clayey soils. The high hill along the boundary line
was the major area of interest to the archaeologist as it appeared enough non-sloping terrain was
available to possess intact archaeological sites. The low area of the property both visually on
foot and on the available maps appeared very low, and largely inundated with water and other
swamp-like wetland terrain. During the initial high-probability survey three archaeological sites
were discovered along the ridge-top upland boundary area of the property; sites Lo243, Lo244,
and Lo245. All three of these sites follow the standard of model where archaeological sites
should be, that being, highly elevated near water but in a spot that is well drained and does not
flood regularly. All three of these sites are just on the edge of the WRP boundary and are
bisected by the WRP boundary line. Despite suffering some damage from agricultural activity,
enough of these sites may be intact enough to be considered potentially eligible for the NRHP.
As this project developed one of the first observations the archaeologist noted on the
LiDAR generated map was that a landform was present deep within the Thompson WRP tract
that appeared to be a slightly elevated island-like feature in the middle of a low swampy area.
This feature as seen on the map below was noted as being “of-interest”. Another feature was also
noted along the northern boundary edge that may be partially within the WRP boundary that
could be a site location that is actually inside the WRP which should be checked.
During the LASER Method survey both of the aforementioned detected landforms were
indicated as potentially containing cultural resources. Plans were made to survey both hot-spots
with shovel tests and both landforms were positive for cultural resources.
Site Lo259, the JTHOMPSONJ site was indicated as being partially within the WRP
boundary so it was eligible to be shovel tested. A small sliver of about 5 to 15meters of the site is
actually in the boundary before reaching the edge of a steep slope and this small bit was shovel
tested. Artifacts included a quartzite pp/k distal end, coastal plain chert flakes, quartzite flakes,
fire-cracked rock, and brick scatter to a depth of about 70 cm. Because only a small portion of
the site was tested it is believed the site extends well out-side the WRP boundary into the
adjacent agriculture field. Lo259 was only tested because the precision of the LiDAR generated
maps showed that there was the possibility that a portion of the landform was actually within the
WRP boundary. Initially this site was not explored because it was believed that no portion of the
landform could be within the WRP boundary. See Figure 22 and 23 for Lo259 artifact photos.

28
Figure 21. Thompson WRP sites discovered during first survey and during this project’s survey.

29
Figure 22. Artifacts found at site Lo259: Fire Cracked Rock, Hammerstone cobbles, quartz
flakes, and PP/K distal end from shovel test.
Figure 23. Artifacts found at site Lo259: quartz PP/K distal end

30
Site Lo258, the XTHOMPSONX site, is without doubt the best example of how LiDAR
improves cultural resource survey methods just as a standalone product but also as a searchable
tool using the LASER method.
Prior to discovering Lo258, the landform on which it resides was visually spotted on the
first initial LiDAR generated map of the Thompson WRP. However, this landform was not
detected using traditional methods and it could not be seen on the foot. Aerial photographs,
traditional topographic maps, soil maps, and historical maps all indicated that the landform was a
very low, very swampy area that is inundated on a regular basis (See Figure 24). During the
initial survey of the Thompson WRP, the landform could not be seen as it was enshrouded in
heavy vegetation and the standing water also suggested that the landform was non-existent
because it was a very large swamp called Sawyer swamp and nothing more. In fact, the
topographic map has the label Sawyer Swamp directly on-top of the detected landform.
However, the LiDAR generated map and the high-probability detection method indicated that
there was a landform in the middle of the swamp which should be checked with shovel tests. Of
particular note, the density of canopy above the landform which contains Lo258 was particularly
dense and both PI’s were amazed at how well the LiDAR penetrated through the canopy to
reveal the landform. (See the panoramic fold out picture)
Figure 24. Thompson WRP maps- Aerial overlay and standard 7.5 minute topographic maps.

31
Figure 25. Site Lo258 – the XTHOMPSONX site on LiDAR overlay of standard topo map.

32
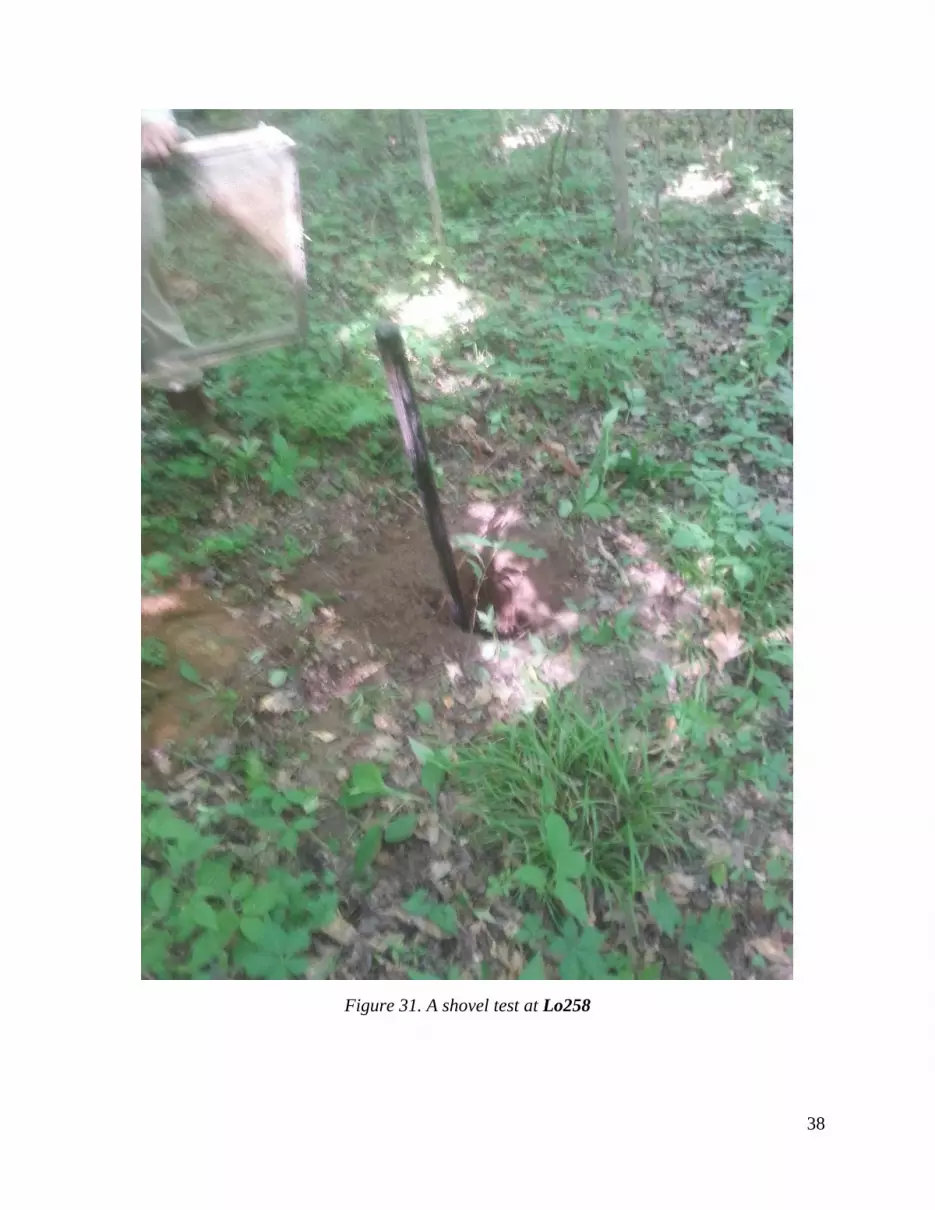
On May 21, 2015, we, the two principle investigators set out to check the detected
landform in Sawyer Swamp. Upon walking to the location, neither of us believed that there could
be anything worth checking in the swamp, the entire area was wet with standing water, mucky
soils, and thick vegetation. Just walking to the site was difficult. However, upon arriving at the
location coordinates both of us realized we were standing on a slightly elevated rise
approximately 1 to 1.5 feet higher than the surrounding swamp. Basically, we had found an
island in the swamp. It was also immediately clear that the island is an archaeological site.
Artifacts are present on the surface, in tree-tip-ups, and on exposed roots at the surface. Shovel
tests indicated that the site extends to an unknown depth because the water table was reached at
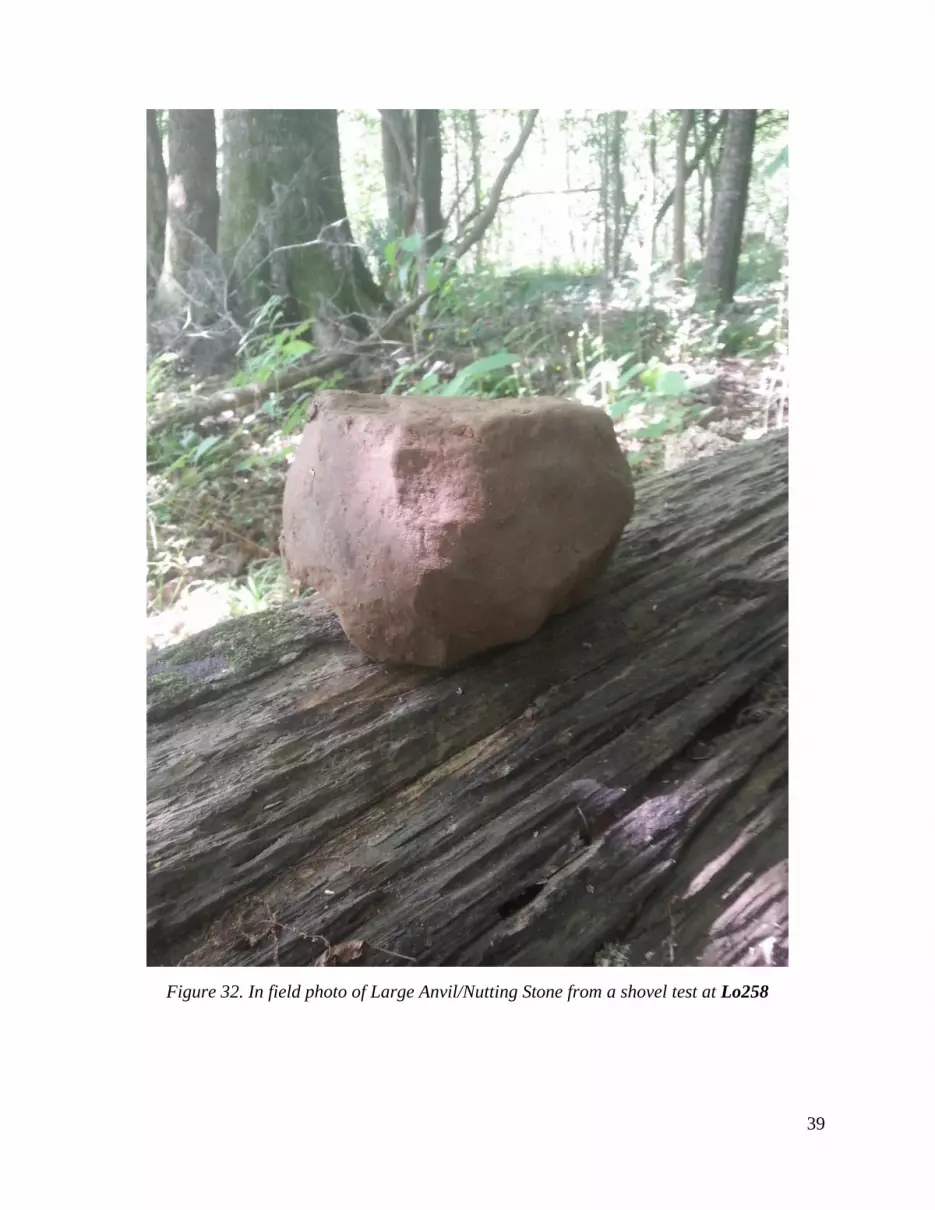
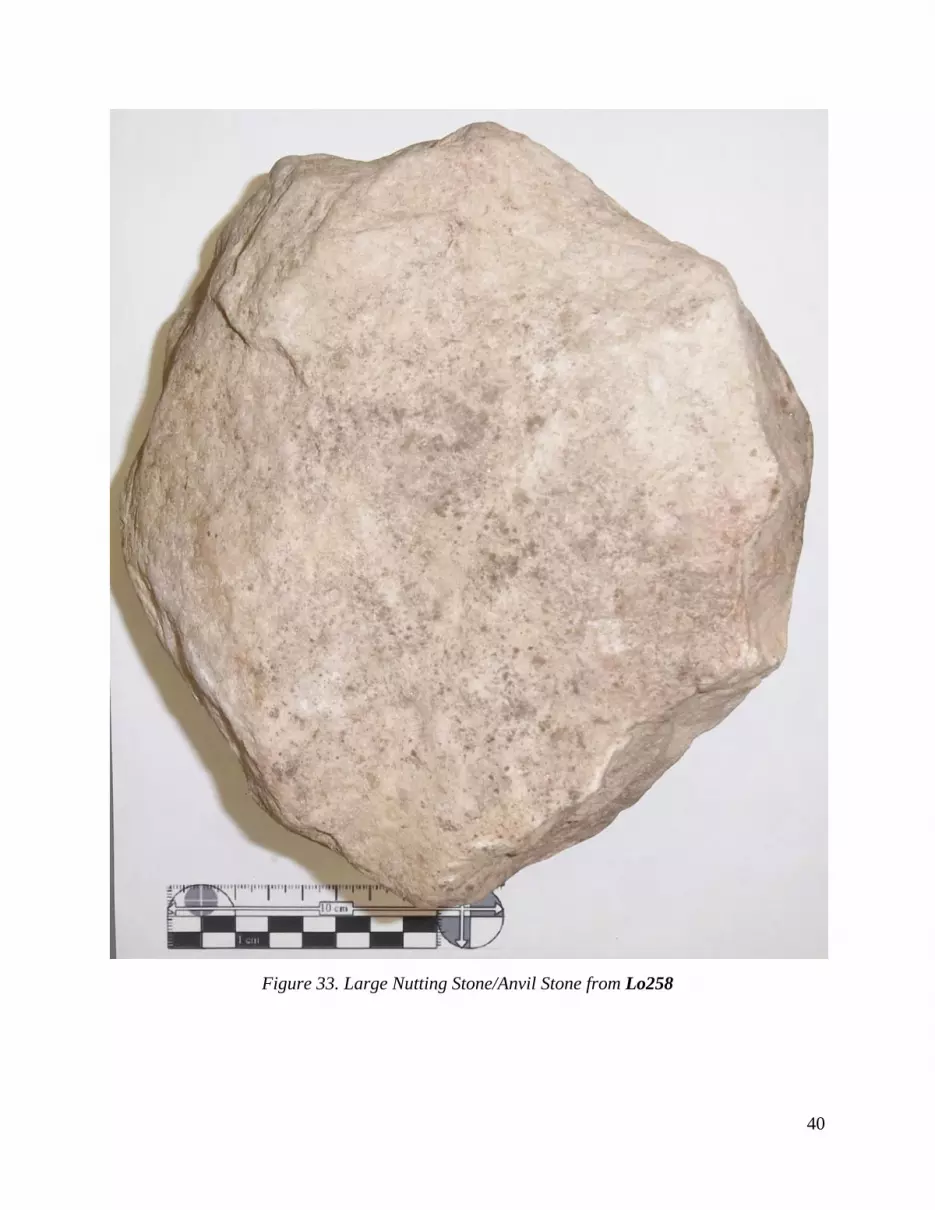
80 cm and artifacts were still being found. A large “Cantaloupe” size nutting/anvil stone was
discovered at 70 cm in one shovel test. The soil from the shovel tests is sandier and different
from the clayey black belt soils that retain the surrounding swampland waters. The artifacts
discovered are extensive which include coastal plain chert flakes, quartz flakes, fire cracked
rock, hammer stones, nutting stones, sand-tempered plain pottery, charcoal, and burned animal
bone fragments. Of particular importance, the archaeologist could not detect a visible plowzone
on the site. Perhaps because the site is surrounded by a low swamp it was never utilized for
agriculture. The swamp was likely timbered at one point, but timbering activities do not seem to
have damaged the site. It is presumed that during extremely heavy rain events that Lo258 may
flood but because of the heavy vegetation across the site very little erosion may occur during the
rare flooding events. Lo258 is clearly eligible for the National Register of Historic Places.
Lo258’s pristine and largely undisturbed nature makes the site a true rarity in the Eastern United
States. Also, because Lo258 is below and adjacent to several sites along the ridge top of the
Thompson WRP it seems likely that there will be a relationship between them. Perhaps such a
comparison of sites could show differences in land-use strategies between upland and lowland
areas and shed light upon previously poorly understood prehistoric land-use strategies. See
Photos of site Lo258 terrain, artifacts, and shovel tests below, in Figures 26 through 34.

33
Figure 26. Site 1Lo258, the XTHOMPSONX site aerial photo.

34
Figure 27. Lo258 Terrain

35
Figure 28. Lo258 Terrain

36
Figure 29. Lo258 Terrain and Co-Pi photographing artifacts on surface.

37
Figure 30. Artifacts on surface next to a tree tip-up at Lo258
38
Figure 31. A shovel test at Lo258
39
Figure 32. In field photo of Large Anvil/Nutting Stone from a shovel test at Lo258
40
Figure 33. Large Nutting Stone/Anvil Stone from Lo258

41
Figure 34. Sand Tempered Pottery, quartzite flakes, fire cracked rocks, coastal plain chert flakes
from Lo258 shovel test.
42
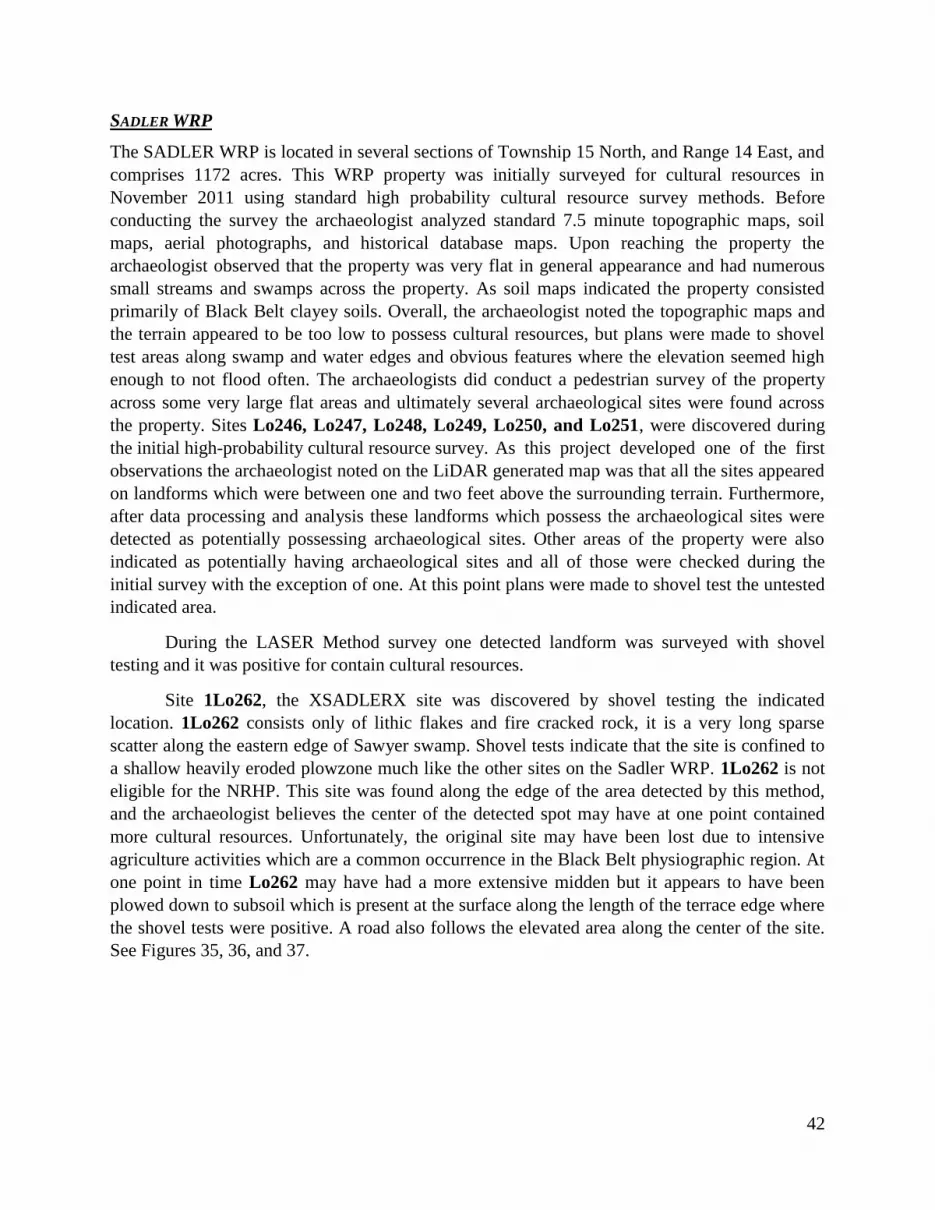
SADLER WRP
The SADLER WRP is located in several sections of Township 15 North, and Range 14 East, and
comprises 1172 acres. This WRP property was initially surveyed for cultural resources in
November 2011 using standard high probability cultural resource survey methods. Before
conducting the survey the archaeologist analyzed standard 7.5 minute topographic maps, soil
maps, aerial photographs, and historical database maps. Upon reaching the property the
archaeologist observed that the property was very flat in general appearance and had numerous
small streams and swamps across the property. As soil maps indicated the property consisted
primarily of Black Belt clayey soils. Overall, the archaeologist noted the topographic maps and
the terrain appeared to be too low to possess cultural resources, but plans were made to shovel
test areas along swamp and water edges and obvious features where the elevation seemed high
enough to not flood often. The archaeologists did conduct a pedestrian survey of the property
across some very large flat areas and ultimately several archaeological sites were found across
the property. Sites Lo246, Lo247, Lo248, Lo249, Lo250, and Lo251, were discovered during
the initial high-probability cultural resource survey. As this project developed one of the first
observations the archaeologist noted on the LiDAR generated map was that all the sites appeared
on landforms which were between one and two feet above the surrounding terrain. Furthermore,
after data processing and analysis these landforms which possess the archaeological sites were
detected as potentially possessing archaeological sites. Other areas of the property were also
indicated as potentially having archaeological sites and all of those were checked during the
initial survey with the exception of one. At this point plans were made to shovel test the untested
indicated area.
During the LASER Method survey one detected landform was surveyed with shovel
testing and it was positive for contain cultural resources.
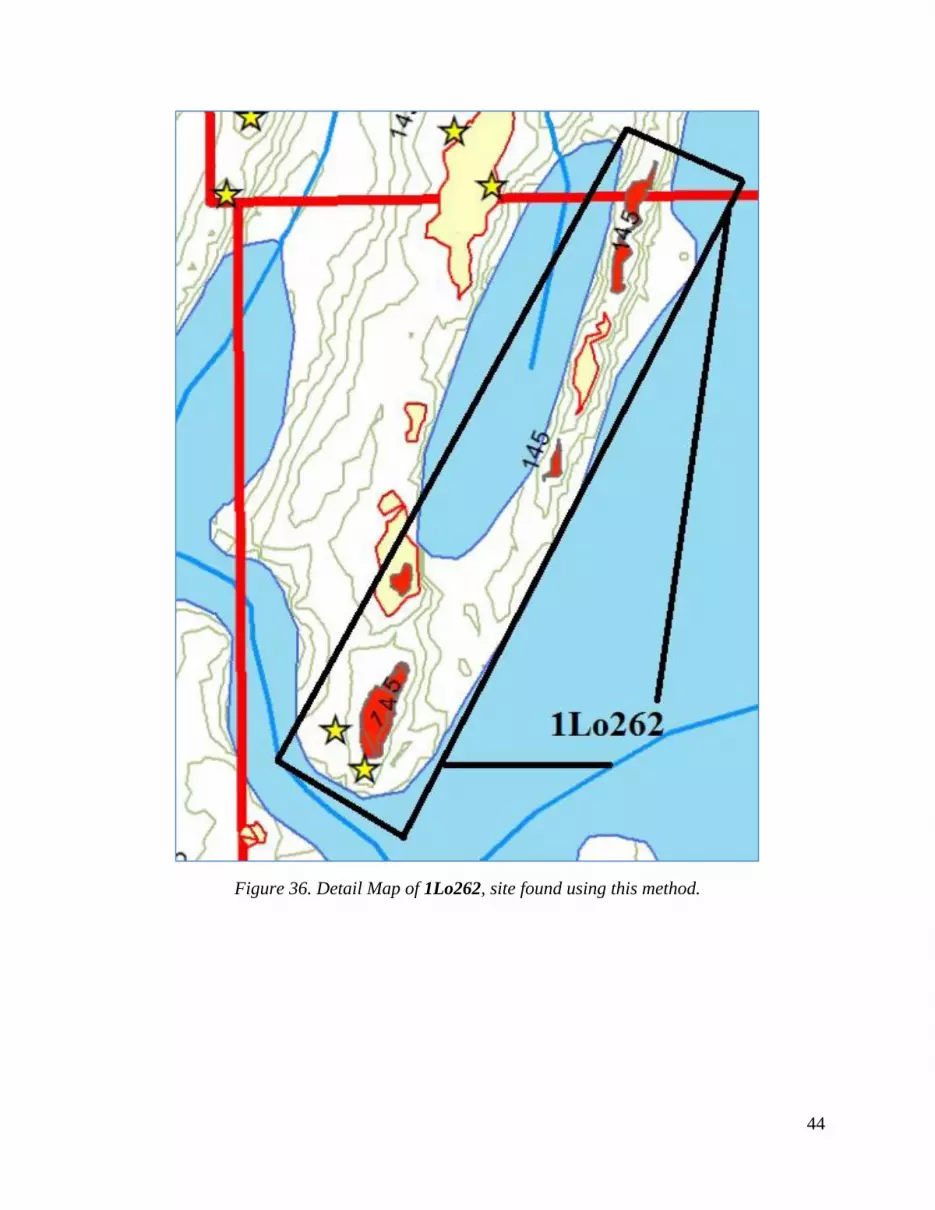
Site 1Lo262, the XSADLERX site was discovered by shovel testing the indicated
location. 1Lo262 consists only of lithic flakes and fire cracked rock, it is a very long sparse
scatter along the eastern edge of Sawyer swamp. Shovel tests indicate that the site is confined to
a shallow heavily eroded plowzone much like the other sites on the Sadler WRP. 1Lo262 is not
eligible for the NRHP. This site was found along the edge of the area detected by this method,
and the archaeologist believes the center of the detected spot may have at one point contained
more cultural resources. Unfortunately, the original site may have been lost due to intensive
agriculture activities which are a common occurrence in the Black Belt physiographic region. At
one point in time Lo262 may have had a more extensive midden but it appears to have been
plowed down to subsoil which is present at the surface along the length of the terrace edge where
the shovel tests were positive. A road also follows the elevated area along the center of the site.
See Figures 35, 36, and 37.

43
Figure 35. Archaeological Sites and detected landforms on Sadler WRP.
44
Figure 36. Detail Map of 1Lo262, site found using this method.

45
Figure 37. 1Lo262 Artifacts found in shovel tests, quartzite flakes and fire cracked rock
LABORATORY METHODS AND CURATION
Upon completion of field work, all artifacts recovered were taken to the Troy University
Archaeological Research Center for curation and analysis. Additional photographs of the
surveyed area can be provided upon request. Artifacts, field notes and photographs are stored at
the Troy University Archaeological Research Center in a stable and secure facility.

46
RESULTS
Many discoveries were made during the course of this Pilot Study.
COST/LABOR ANALYSIS
Traditionally, cultural resource surveys involve digging a shovel test every 30 meters at
grid junctures across an entire project area, sifting the soil, and noting the location of artifacts. It
is a labor intensive and time-consuming process. For instance, the Sadler WRP tract which
consists of 1172 acres, would, if intensively surveyed would require a minimum of four shovel
tests per acre resulting in 4,688 shovel tests. A crew of two archaeological technicians in the best
conditions can perform 10 shovel tests on average an hour. In total, conducting intensive interval
testing of the Sadler WRP would take two technicians 468.8 hours of labor, or 937.6 labor/hours
minimum, at 8 hours a day this method would ultimately result in 23.4 weeks of labor which
does not include reporting.
In order to mitigate the time involved for doing cultural resource surveys a strategy
deemed as high-probability testing was employed for surveying the WRP tracts of Alabama.
High-probability cultural resource surveys involve an archaeologist’s expert knowledge to
survey only the places within a project area where archaeological sites are likely to be. High
probability surveys are less time-labor intensive but there is also the possibility that an
archaeological site will be missed.
Most high-probability surveys involve the visual inspection of topographic maps, soil
data maps, and aerial photography, to locate the places in a project area where there is the
greatest probability for an archaeological site. Generally, those places with a good chance of
possessing cultural resources are well elevated areas near water that do not have more than 15
degrees of slope, (i.e. high, flat, and near-water). Those places are then checked with shovel
testing by the archaeologist. Furthermore, on the foot, during a high-probability survey, the
archaeologist has the discretion to check unusual or noticeable features on the landscape if they
suspect there may be a site present.
Overall, the high-probability cultural resource survey was successful in Lowndes and
Wilcox counties. Thirty four archaeological sites were found on various WRP tracts over 7560
acres in Lowndes and Wilcox Counties. Ten of the WRP properties possess archaeological sites.
However, of the ten WRP properties which possess sites, a total of 624 labor/hours were
consumed by a 6 person crew surveying the properties. Yet high-probability survey techniques
are very successful for saving time/labor. For instance, as discussed above, on the Sadler WRP
only 144 hours were consumed by high probability testing, whereas 938 hours would be required
doing interval grid testing under perfectly ideal conditions.
THE ADVANTAGE OF USING THE LASER METHOD.
During the course of this study it was discovered that not only does the LASER method
accurately find landforms which may possess archaeological sites it also saves a tremendous
amount of time/labor for the High Probability Cultural Resource Survey Method. The LASER

47
method shows which landforms actually need to be shovel tested and allows the archaeologist to
specifically pin-point those locations before leaving the office. It was discovered during testing
that for each site found using this method only one hour for a two person crew (2 labor hours)
was required to find an archaeological site in each WRP checked. Anecdotally, most of the time
spent was actually the time it took to walk to the location indicated by this method.
For instance, the LASER method on the Sadler WRP would have shown 18 spots to be
checked, which a two person crew could have accomplished in 36 total labor hours (2.25 actual
work days). Whereas, the traditional high probability method required 144 labor hours to check
17 spots and still miss a site. This method would have saved a tremendous amount of time/labor
costs. A smaller crew could also have been used which reduces overall risk, liability, and error.
Most importantly, seven sites were discovered using the LASER method which were
previously missed using the traditional method. One of the sites this method discovered
(1Lo258) is clearly NRHP eligible, and nearly every site previously discovered was also
indicated as a potential site location with this method.
Sites
Discussed
in this
study
Site Name
WRP
Property
Acreage
Labor
Hours per
Property
Average
Labor Hours
per site in
Traditional
Method
Labor
Hours per
Site with
the LASER
method
Wx194 Knight 410 72 72
Wx199 Tommys 410 2
Lo257 XPATEX 260 2
Lo258 XTHOMPSONX 159 2
Lo259 JTHOMPSONJ 159 2
Lo260 XLYONX 200 2
Lo261 JLYONJ 200 2
Lo262 XSADLERX 1172 2
Wx195 Henderson1A 633.5 120 24
Wx196 Henderson1B 633.5 120 24
Wx197 Henderson2A 633.5 120 24
Wx198 Henderson2B 633.5 120 24
Wx142 Hollinger A 267 48 16
Wx143 Hollinger B 267 48 16
Wx145 SHARPE 2A 626 96 16
Wx146 SHARPE 2B 626 96 16
Wx147 SHARPE 2C 626 96 16
Wx148 Sharpe 2D 626 96 16
Wx162 SHARPE 2F 626 96 16
WX180 SHARPE 2E 626 96 16

48
WX189 Hollinger C 267 48 16
Lo241 PATE C 260 48 12
Lo242 PATE D 260 48 12
Lo243 THOMPSON A 159 48 16
Lo244 THOMPSON B 159 48 16
Lo245 THOMPSON C 159 48 16
Lo253 PATE A 260 48 12
Lo254 PATE B 260 48 12
Lo255 Callen A 43.5 24 24
Lo246 Sadler A 1172 144 24
Lo247 Sadler B 1172 144 24
Lo248 Sadler C 1172 144 24
Lo249 Sadler D 1172 144 24
Lo250 Sadler E 1172 144 24
Lo251 Sadler F 1172 144 24
Lo252 Lyons A 200 24 24
no site
number
small cemetery
Henderson
633.5 120 24
Technicians Per Survey Team 6 person crew 2 person
crew
Labor hours spent finding archaeological
sites 19.4 average hours per site
2 hours per
site
TABLE 2. COST ANALYSIS
FALSE PREDICTIONS WITH THE LASER METHOD
The LASER method has been tested within Lowndes and Wilcox Counties in Alabama.
The results are very promising. However, due to the limited time duration of this pilot project,
the LASER method still has to be improved. Not every extracted polygon can be claimed to be
an actual site location. In fact, expert knowledge has to be applied carefully in the final result
selection. Locations of these potential sites have to been visually checked and physically verified
through field tests by archaeologists. Some current problems include:
False Prediction exists at locations along roads, dams, and, man-made features. Here are
some examples.
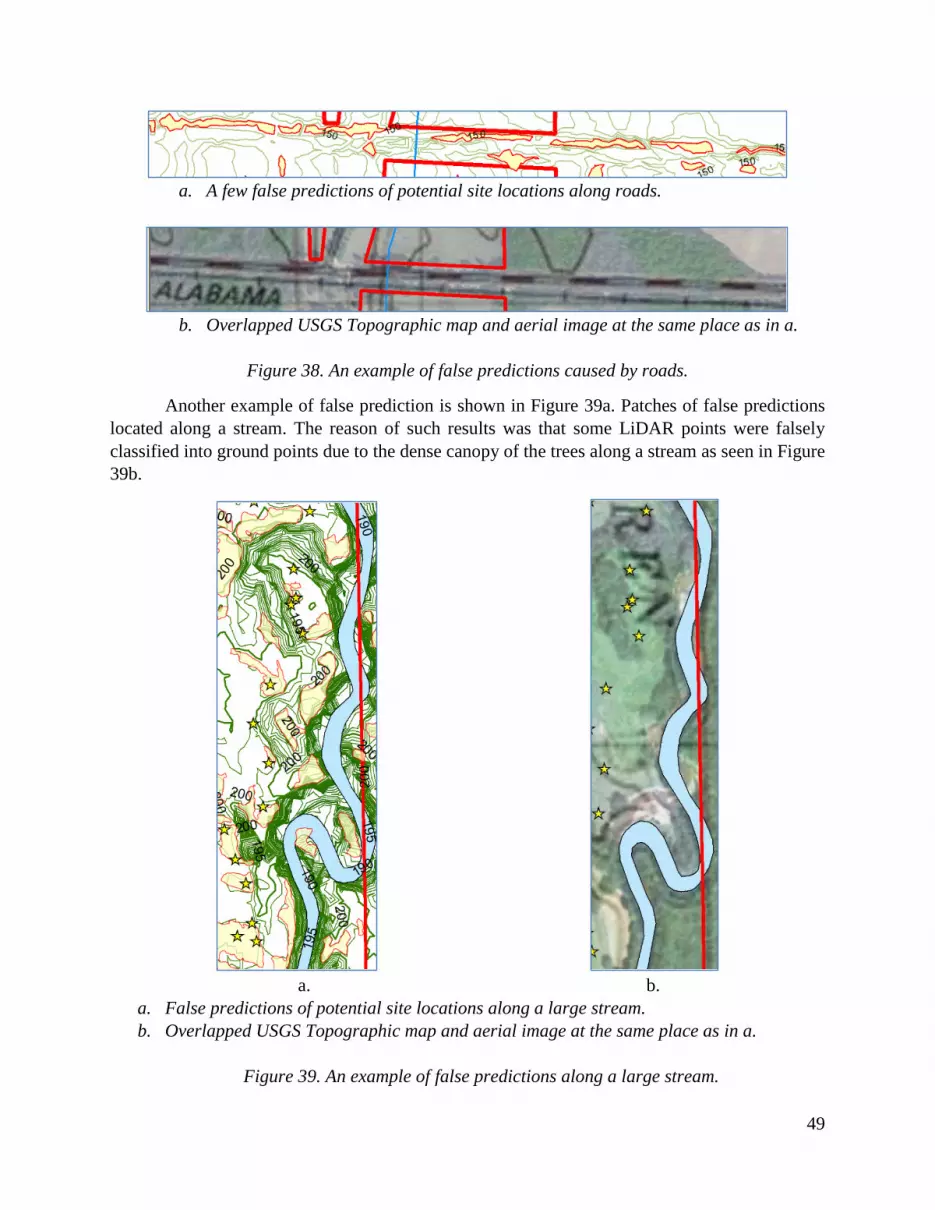
As seen in Figure 38a, a long stretch of raised road and rail road would add false
predictions to the results, where yellow polygons are extracted as potential site locations. Such
types of false alarms can be eliminated through visual comparison to the aerial images or
published USGS Topographic maps as shown in Figure 38b.
49
a. A few false predictions of potential site locations along roads.
b. Overlapped USGS Topographic map and aerial image at the same place as in a.
Figure 38. An example of false predictions caused by roads.
Another example of false prediction is shown in Figure 39a. Patches of false predictions
located along a stream. The reason of such results was that some LiDAR points were falsely
classified into ground points due to the dense canopy of the trees along a stream as seen in Figure
39b.
a. b.
a. False predictions of potential site locations along a large stream.
b. Overlapped USGS Topographic map and aerial image at the same place as in a.
Figure 39. An example of false predictions along a large stream.
50
a. b.
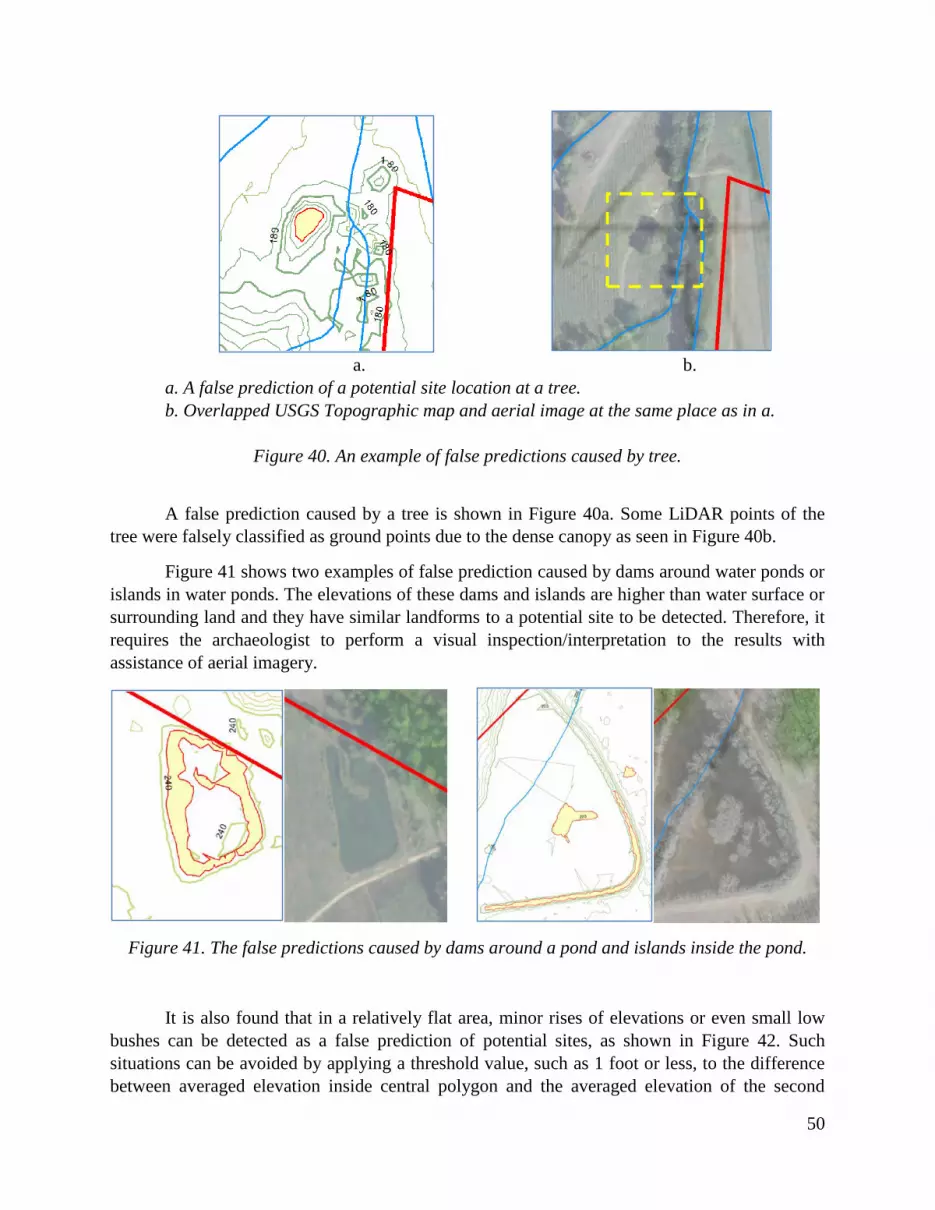
a. A false prediction of a potential site location at a tree.
b. Overlapped USGS Topographic map and aerial image at the same place as in a.
Figure 40. An example of false predictions caused by tree.
A false prediction caused by a tree is shown in Figure 40a. Some LiDAR points of the
tree were falsely classified as ground points due to the dense canopy as seen in Figure 40b.
Figure 41 shows two examples of false prediction caused by dams around water ponds or
islands in water ponds. The elevations of these dams and islands are higher than water surface or
surrounding land and they have similar landforms to a potential site to be detected. Therefore, it
requires the archaeologist to perform a visual inspection/interpretation to the results with
assistance of aerial imagery.
Figure 41. The false predictions caused by dams around a pond and islands inside the pond.
It is also found that in a relatively flat area, minor rises of elevations or even small low
bushes can be detected as a false prediction of potential sites, as shown in Figure 42. Such
situations can be avoided by applying a threshold value, such as 1 foot or less, to the difference
between averaged elevation inside central polygon and the averaged elevation of the second

51
buffer, which indicates the flatness of the whole area. Visual inspection/interpretation of aerial
imagery by the archaeologist also becomes necessary to remove these types of false predictions.
Figure 42. The false predictions caused by dams around a pond and islands inside the pond.
Some small sites located on slopes could not be detected using the LASER method. As
shown in Figure 43, a small archaeological site lWx204 was found at the highlighted location
but was not detected by the LASER method. Such a location is a relatively flat area located on a
slope. There is no closed contour line seen in the contour map. A new strategy has to be
developed in future research to detect such types of site locations.
Figure 43. An example of undetected sites.
An undetected
site location
1Wx204
52
OTHER DISCOVERIES FROM THIS STUDY
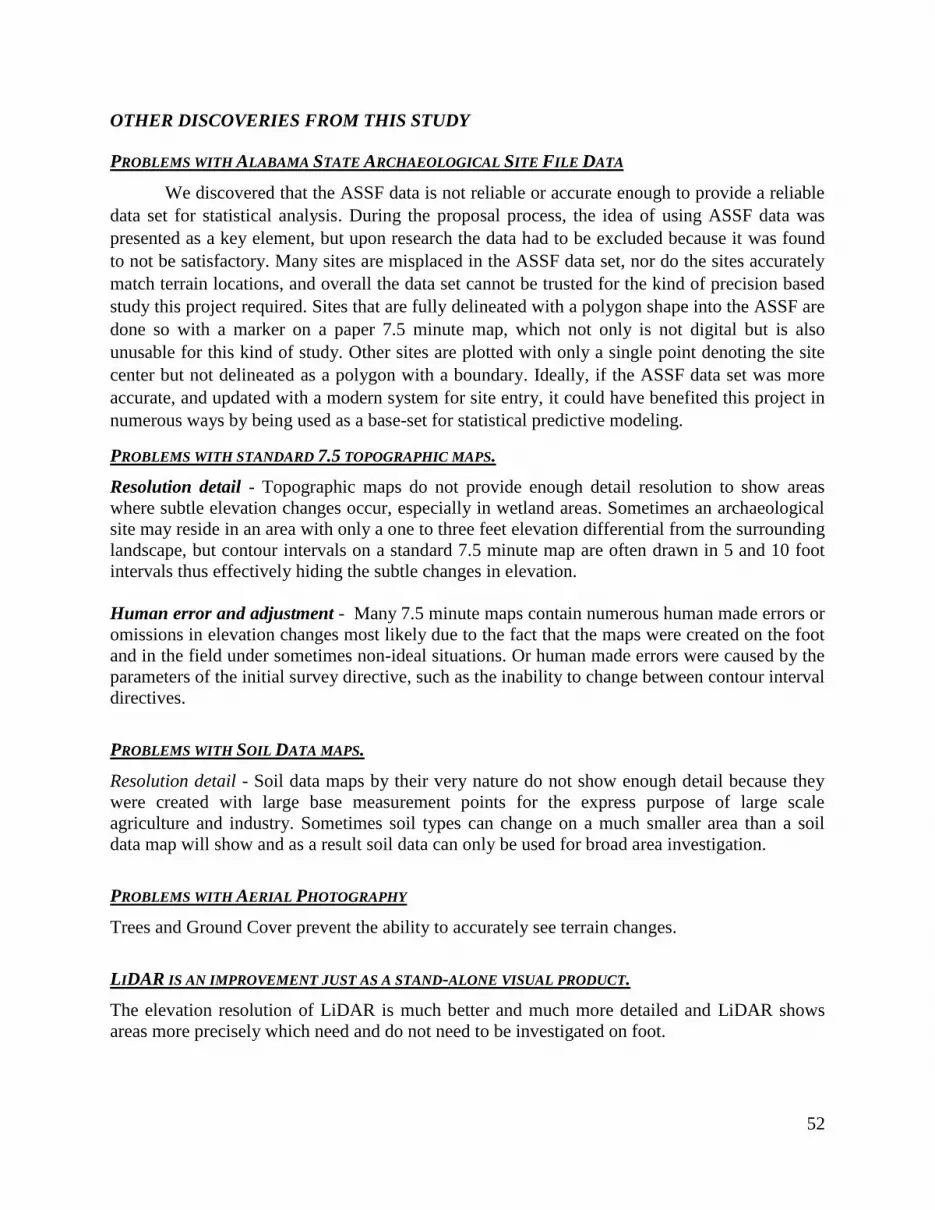
PROBLEMS WITH ALABAMA STATE ARCHAEOLOGICAL SITE FILE DATA
We discovered that the ASSF data is not reliable or accurate enough to provide a reliable
data set for statistical analysis. During the proposal process, the idea of using ASSF data was
presented as a key element, but upon research the data had to be excluded because it was found
to not be satisfactory. Many sites are misplaced in the ASSF data set, nor do the sites accurately
match terrain locations, and overall the data set cannot be trusted for the kind of precision based
study this project required. Sites that are fully delineated with a polygon shape into the ASSF are
done so with a marker on a paper 7.5 minute map, which not only is not digital but is also
unusable for this kind of study. Other sites are plotted with only a single point denoting the site
center but not delineated as a polygon with a boundary. Ideally, if the ASSF data set was more
accurate, and updated with a modern system for site entry, it could have benefited this project in
numerous ways by being used as a base-set for statistical predictive modeling.
PROBLEMS WITH STANDARD 7.5 TOPOGRAPHIC MAPS.
Resolution detail - Topographic maps do not provide enough detail resolution to show areas
where subtle elevation changes occur, especially in wetland areas. Sometimes an archaeological
site may reside in an area with only a one to three feet elevation differential from the surrounding
landscape, but contour intervals on a standard 7.5 minute map are often drawn in 5 and 10 foot
intervals thus effectively hiding the subtle changes in elevation.
Human error and adjustment - Many 7.5 minute maps contain numerous human made errors or
omissions in elevation changes most likely due to the fact that the maps were created on the foot
and in the field under sometimes non-ideal situations. Or human made errors were caused by the
parameters of the initial survey directive, such as the inability to change between contour interval
directives.
PROBLEMS WITH SOIL DATA MAPS.
Resolution detail - Soil data maps by their very nature do not show enough detail because they
were created with large base measurement points for the express purpose of large scale
agriculture and industry. Sometimes soil types can change on a much smaller area than a soil
data map will show and as a result soil data can only be used for broad area investigation.
PROBLEMS WITH AERIAL PHOTOGRAPHY
Trees and Ground Cover prevent the ability to accurately see terrain changes.
LIDAR IS AN IMPROVEMENT JUST AS A STAND-ALONE VISUAL PRODUCT.
The elevation resolution of LiDAR is much better and much more detailed and LiDAR shows
areas more precisely which need and do not need to be investigated on foot.

53
RECOMMENDATIONS
MORE AREAS NEED TO BE INCLUDED IN THE LASER DATASET
First and foremost, this Pilot Study has shown very positive results as well as the viability
of using the LASER method to find archaeological sites. However, this method still requires
more fine tuning. The methods used to find sites here are tuned to find sites specifically in WRP
properties from Lowndes and Wilcox Counties, Alabama. WRP properties, by their very
namesake are wetland areas; and Lowndes /Wilcox counties are found in very similar
physiographic regions with similar terrestrial morphology. It is highly likely that upland areas in
different physiographic regions will have different terrain variables for the prediction of
archaeological site locations. It also seems likely that wetland areas in different physiographic
regions will have different terrain variables that can be used to predict locations of
archaeological sites.
COST ANALYSIS SHOWS THE NEED FOR EXPANSION
From the cost analysis discussed above the LASER method shows a demonstrated cost
savings to the archaeological survey process. It saves considerable time, and labor hours. For this
reason alone the LASER method should be expanded and improved upon so as to become a
reliable cultural resource tool.
MORE STUDY WILL IMPROVE THE PROCESS
The LASER method, as it stands now, does show with considerable confidence
landforms which possess archaeological sites but there are false predictions which with more
study can be filtered out.
In simpler terms, less noise will mean less time wasted. For instance, in a typical
scenario, a land manager is provided a project area that requires a cultural resource survey before
other actions can occur with the property. At which point the land manager provides the Cultural
Resource Specialist (CRS) with a project area map and the CRS then conducts a full survey of
the property. It is a time consuming and costly process that often delays many important projects.
In our scenario, the project area would be scanned using the LASER method and a map
would be generated. The map would show specifically the areas that have a high-probability for
cultural resources. This map would then be submitted to the CRS as a directive guide for
surveying. Instead of a general map demanding that in some cases several hundred acres be
surveyed now only specific landforms would need to be surveyed. As the cost analysis shows the
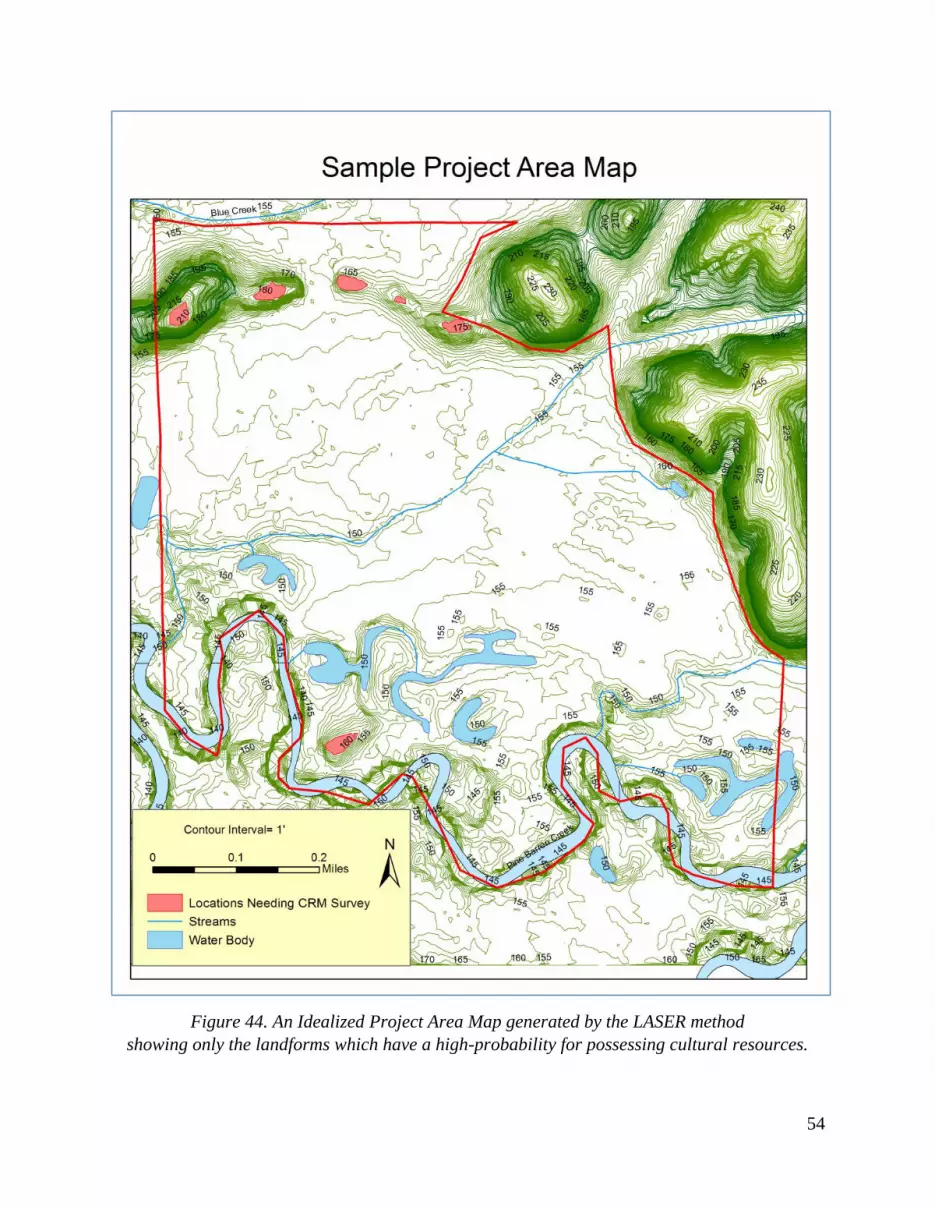
LASER method would be a significant time/labor/cost savings. Below is an idealized LASER
map showing only the landforms on a property which have a high-probability for possessing
cultural resources. Maps of this kind are the envisioned kind of map that this process would
ultimately generate for the Cultural Resource Specialist. See Figure 44.
54
Figure 44. An Idealized Project Area Map generated by the LASER method
showing only the landforms which have a high-probability for possessing cultural resources.

55
IMPROVEMENT OF THE SOIL MAPS
During the study, soil maps developed by NRCS were initially explored to assist site
detection. However, it has been found the current scale of the national soil maps do not match
the resolution of LiDAR data and its corresponding contour map. Figure 45 shows an overlaid
map of soil-maps and a LiDAR-based slope map at Knight Cattle Farm, WRP property at Wilcox
County. Based on the soil type descriptions in the map, some soil types (CoA, HoA, SnA) were
supposed to cover areas with 0-2 percent slopes. But seen from the map, the slopes within the
boundaries of such soil types are much higher than 2 percent slope. Some of the slopes are as
high as 25 to 35 percent slopes. Such apparent disagreement has stopped the researchers from
applying the current soil maps to this particular large-scale study. Through such a comparison,
however, it can be seen that there is possibility to improve soil mapping resolution scales by
using LiDAR-based digital surface model. Some of the principle methods used in this study for
detecting specific landforms can be applied to soil studies to potentially develop soil maps with a
resolution much higher than the current standard.

56
Figure 45. An overlaid map of soil-maps and a LiDAR-based slope map at Knight Cattle Farm,
WRP property at Wilcox County.

57
IMPROVEMENT TO THE ALABAMA STATE SITE FILE
As it stands now the (Alabama State Site File) ASSF is a seriously flawed data-set. Many
sites are not placed well-enough to be used in this study. Some sites are delineated as single-
point data while others are delineated shapes. However, because of the way sites are submitted to
the ASSF and the ASSF’s reliance on standard 7.5 minute topographic maps the precision,
resolution, and format, is not good enough for the parameters of this project.
However, the LASER method can be expanded to adjust and auto-correct some of the
errata in the ASSF. For instance, a site that is misplaced in the ASSF map could be auto
calculated to its true position. Point data, if accurately placed can be tied into LASER generated
landform maps to auto-delineate sites, i.e., convert point data to polygon data. If the ASSF is
corrected using this method then much more interesting, useful, and precise research projects can
be conducted. Figure 46 below shows an example of errata in the ASSF and how the LASER
method can be applied to correct site locations in the ASSF.
For instance, unique landforms may possess specific kinds of sites and searches can be
conducted accordingly. Perhaps Paleolithic sites are only found on hilltops with a specific shape.
By using the LASER method all of the specific kinds of hilltops in an area could be auto-located.
Figure 46: Map showing errata in the Alabama State Site File and how it can be auto-
corrected with the LASER method.

58
FUTURE DIRECTION
In this study, LiDAR data was the only high-resolution data source. Even though the
results are very promising, there are still plenty of areas to be improved. High resolution
aerial/satellite imagery can be analyzed to remove false predictions caused by man-made features
such as roads or dams. Other data sources can be tied into the basic system and be fully
developed. This Pilot Study has led to the discovery of seven archaeological sites, while other
LASER derived hot-spots were detected and not surveyed there may be more sites to be
discovered just in the results of this project.
Overall, this Pilot Study is found to be very successful and shows a new direction for the
discovery of cultural resources.
________________________ ________________________
Jason A. Mann Xutong Niu
Director, Associate Professor
Archaeological Research Center Department of Mathematics and Geomatics
Troy University Troy University
________________________ ________________________
Date Date

59
ACKNOWLEDGEMENTS
A number of individuals contributed to the success of this project and they should be
acknowledged accordingly. Teresa Paglione (NRCS) who as the primary NRCS representative
for this study essentially “made-it-happen”. Special thanks are extended to Joe Gardinski for
helping to acquire the LiDAR data that this project depended on. Director of the Troy University
Office of Sponsored Programs: Judy Fulmer, Associate Dean of the College of Arts and
Sciences: Dr. Bill Grantham, and the late Dean of the Troy University College of Arts and
Sciences: Dr. James “Jim” Rinehart whose support for this kind of research made it possible.
Two students need special recognition for their efforts, Geomatics student Rachel Watson who
assisted with the arduous task and labor of data entry and processing and, Archaeology student
Richard Bozeman who assisted with the plotting of archaeological sites. Special thanks are also
extended to the NRCS Field officers, Pete Wheeler in Lowndes County and John Lewis in
Wilcox County for helping with property access and getting gates open the nice way. And most
importantly the many students in the Geomatics and Archaeology programs at Troy University
should be thanked for learning along with their professors.
Archaeology and Geomatics students at site 1Wx194
60
REFERENCES
2015 Alabama State Archaeological Site File
2015 National Register of Historic Places
2015 Google Earth
2015 NRCS Web Soil Survey
2015 USDA-NRCS Geospatial Data Gateway
2004 Manual of Photogrammetry, Fifth Edition. Edited by McGlone. ASPRS Press. 1168 p.
2012 LiDAR Report. Lowndes, Wilcox and Marengo Counties, Alabama. By Tuck Mapping
Solutions, Inc.

61
APPENDIX A. PREPROCESSED CONTOUR MAPS
Generated from LiDAR Ground Points at WRP Properties in Lowndes and Wilcox Counties
62

63

64

65
66

67
68

69

70

71

72

73

74

75

76

77

78

79

80

81

82
83

84

85
86

87
88

89
90
91

92

93

94

95

96

97

98

99

100
APPENDIX B. EXTRACTED POTENTIAL SITE LOCATION MAPS
Generated from LiDAR Ground Points, along with USGS Topographic Maps, and Topographic
+ Aerial Imagery Maps at WRP Properties in Lowndes and Wilcox Counties

101

102

103
104
105

106

107

108

109

110
111

112
113
114
115

116

117

118

119

120

121
122

123
124
125

126

127

128

129

130

131

132
133
134
135

136

137
138

139

140

141
142

143

144

145

146

147

148

149

150

151

152

153

154

155

156

157
158

159

160

161

162
163

164
165

166

167

168
169

170

171

172
173

174

175
176
177
178

179

180

181

182

183
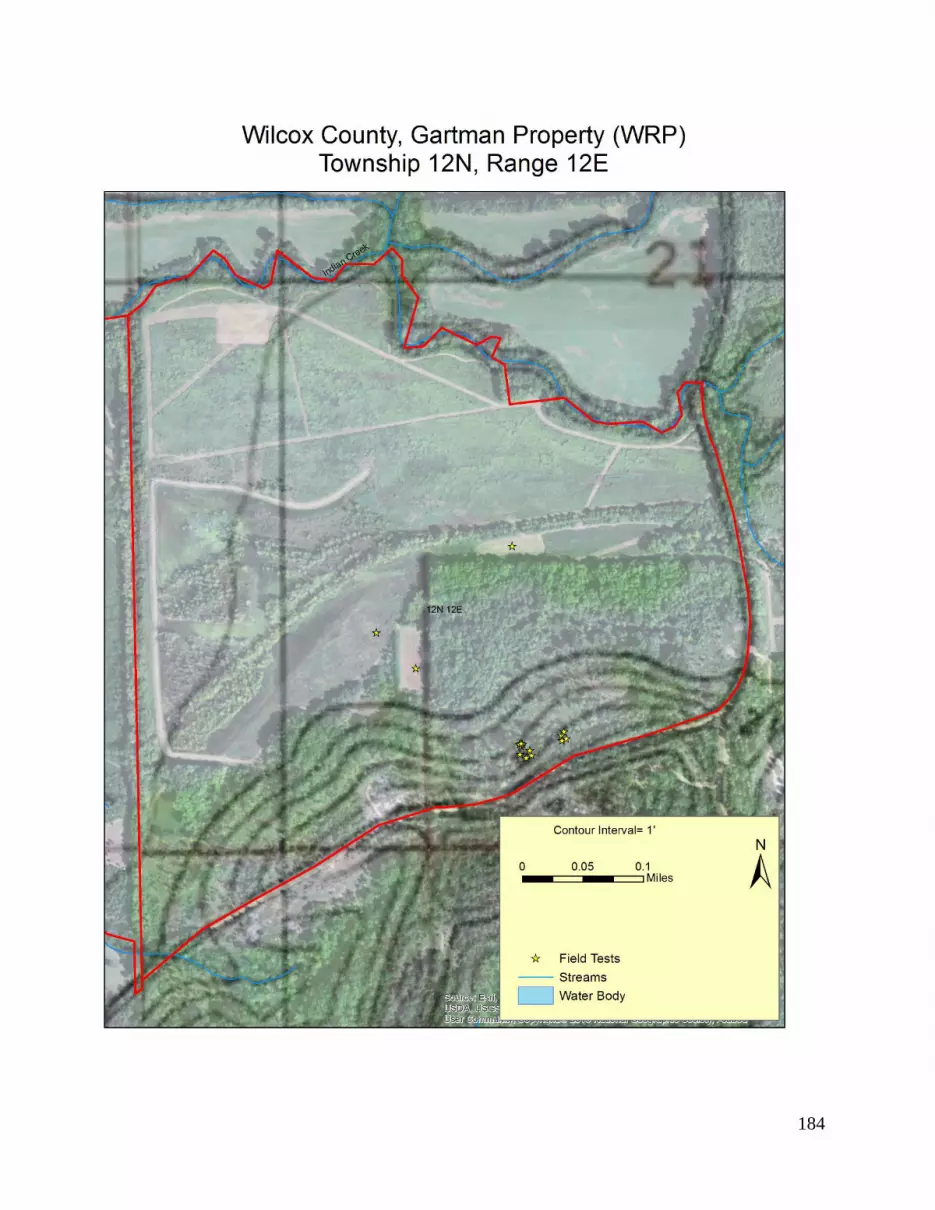
184

185

186
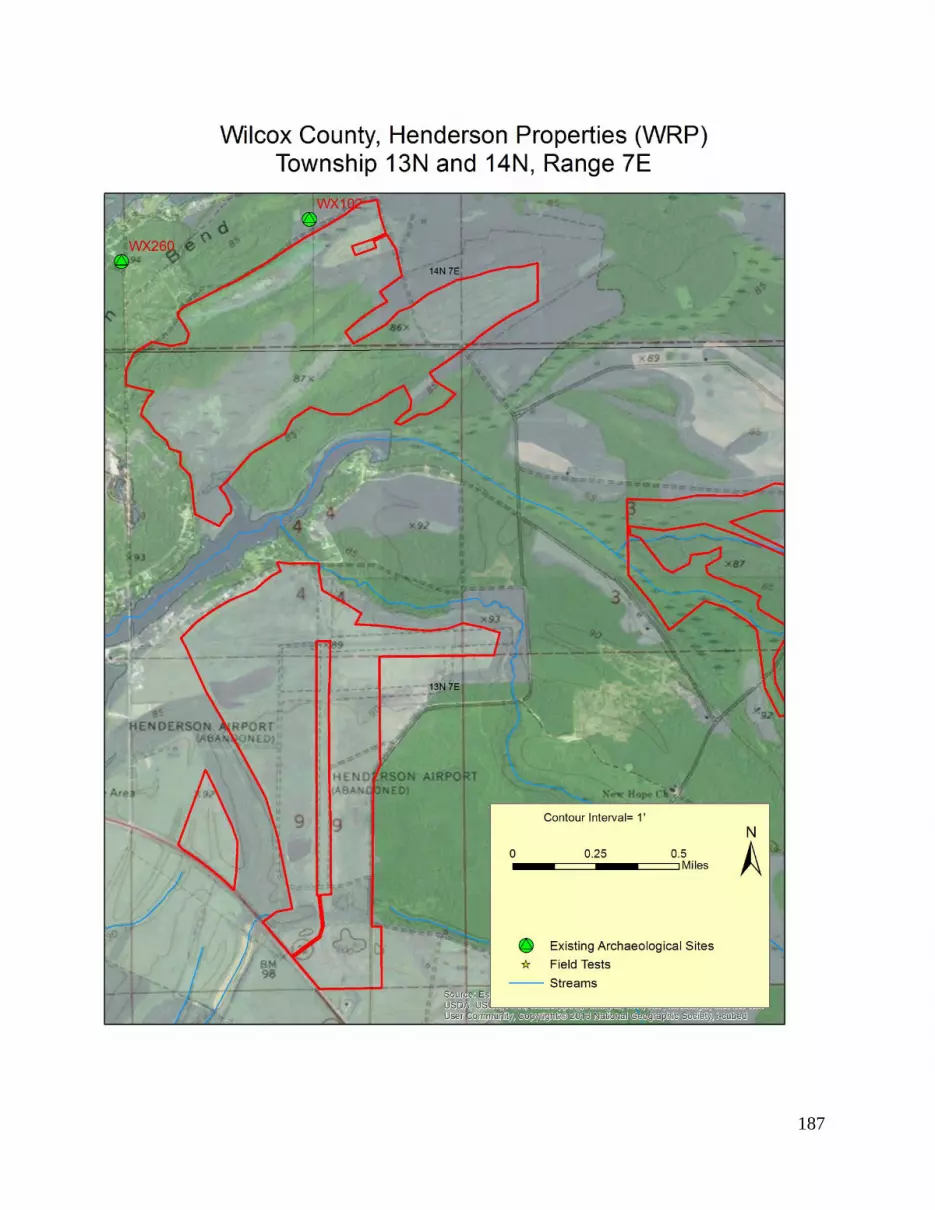
187

188

189

190

191
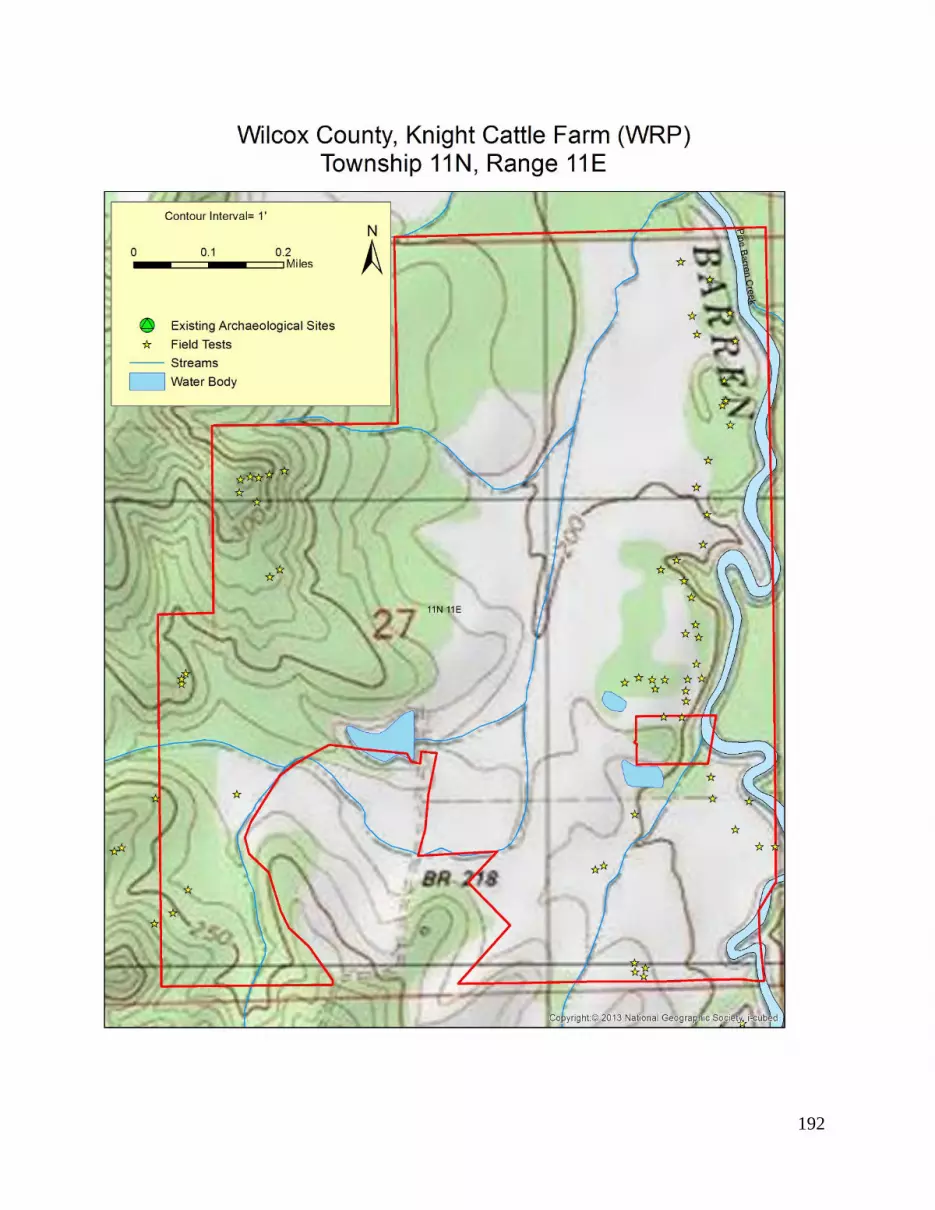
192

193

194

195

196
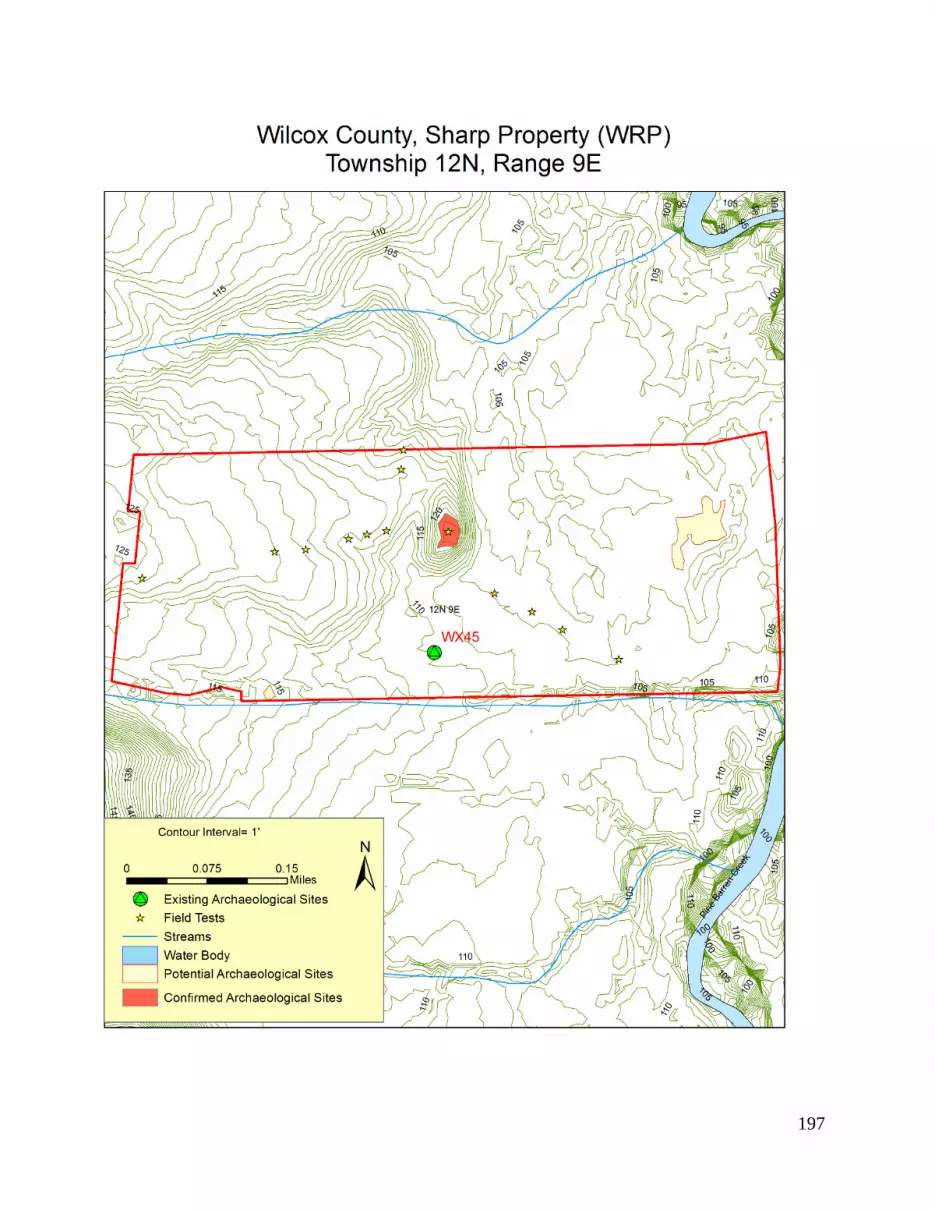
197
198
199

200

201

202

203
ADDENDUM. VISUAL CASE STUDIES
At the outset of this project selected WRP tracts in Lowndes and Wilcox counties were
reviewed to check for clarity of data and to compare LIDAR data to other base data. The WRP
tracts selected are properties that have been surveyed for cultural resources using high
probability cultural resource survey methods.
Traditionally, cultural resource surveys involve digging a shovel test every 30 meters at
grid junctures across an entire project area, sifting the soil, and noting the location of artifacts. It
is a labor intensive and time-consuming process. High-probability cultural resource surveys
involve an archaeologist’s expert knowledge to survey only the places within a project area
where archaeological sites are likely to be. High probability surveys are less time-labor intensive
but there is also the possibility that an archaeological site will be missed.
Most high-probability surveys involve the visual inspection of topographic maps, soil
data maps, and aerial photography, to locate the places in a project area where there is the
greatest probability for an archaeological site. Generally, those places with a good chance of
possessing cultural resources are well elevated areas near water that do not have more than 15
degrees of slope, (i.e. high, flat, and near-water). Those places are then checked with shovel
testing by the archaeologist. Furthermore, on the foot, during a high-probability survey, the
archaeologist has the discretion to check unusual or noticeable features on the landscape if they
suspect there may be a site present. This process of using high-probability cultural resource
surveys was used to survey the WRP tracts for cultural resources.
These WRP tracts below are simply case studies to show how LIDAR data could have
enhanced or streamlined the high-probability cultural resource survey methodology without any
automated computer detection.
LYONS WRP VISUAL CASE STUDY
Below are three map images of the Lyons WRP tract in Lowndes County, Alabama. The
first image is a standard 7.5 minute topographic map of the property with 10 and 5 foot contour
intervals showing elevation changes. The second image is a LIDAR generated map which shows
1 foot contour interval elevation changes. The detail difference between the two maps is obvious.
The LIDAR map shows a tremendous amount of area detail that the 7.5 minute map does not.
The third map shows the location of a discovered archaeological site and the locations with a
higher potential for archaeological site discovery.
THE SURVEY AND RESULTS OF THE LYONS WRP TRACT
During the initial cultural resource assessment of the Lyons tract one archaeological site
was found. This site was not found by pre-planning with a topographic map but was found by
accidental discovery on foot in a plowed wildlife food-plot. Because the standard topographic
map created the illusion that the area with the archaeological site was too low and likely in an
area that floods the archaeologist felt that there would not be a need to survey the area before
entering the field. However, upon entering the field on foot, the archaeologist did due diligence

204
regardless and conducted a pedestrian survey of the property upon which the crew found artifacts
on the surface of the plowed wildlife food plot.
After reviewing the now available LIDAR image of the Lyons tract, the archaeologist
now feels that some areas of the tract should have been shovel tested. Even on foot, these slight
elevation rises are not apparent due to ground cover from vegetation but they are in-fact there
and they may contain cultural resources especially given the proximity to the discovered
archaeological site.
Topographic Map of Lyons WRP

205
LIDAR generated map of Lyons WRP

206
LIDAR generated map of Lyons WRP with archaeological site and suspect areas revealed.
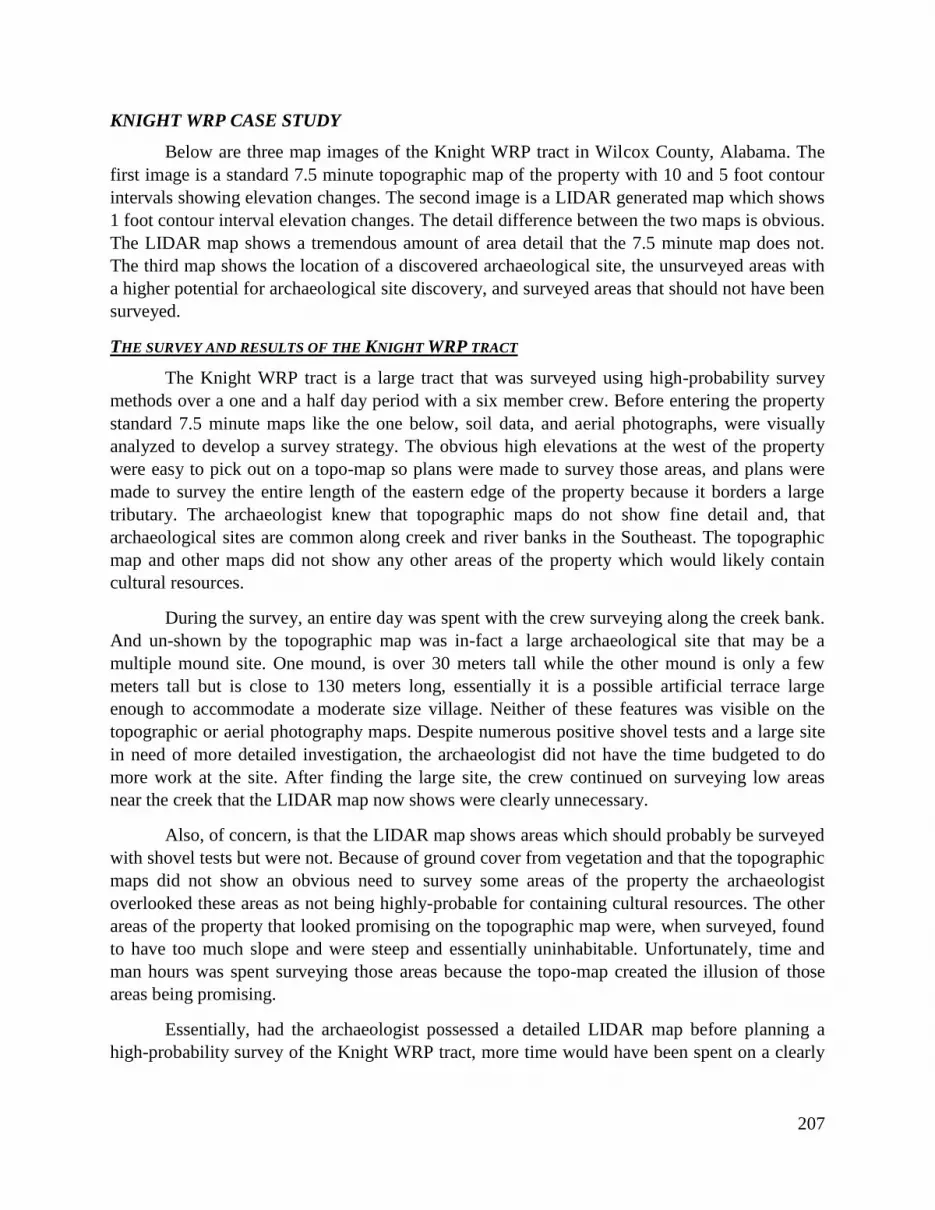
207
KNIGHT WRP CASE STUDY
Below are three map images of the Knight WRP tract in Wilcox County, Alabama. The
first image is a standard 7.5 minute topographic map of the property with 10 and 5 foot contour
intervals showing elevation changes. The second image is a LIDAR generated map which shows
1 foot contour interval elevation changes. The detail difference between the two maps is obvious.
The LIDAR map shows a tremendous amount of area detail that the 7.5 minute map does not.
The third map shows the location of a discovered archaeological site, the unsurveyed areas with
a higher potential for archaeological site discovery, and surveyed areas that should not have been
surveyed.
THE SURVEY AND RESULTS OF THE KNIGHT WRP TRACT
The Knight WRP tract is a large tract that was surveyed using high-probability survey
methods over a one and a half day period with a six member crew. Before entering the property
standard 7.5 minute maps like the one below, soil data, and aerial photographs, were visually
analyzed to develop a survey strategy. The obvious high elevations at the west of the property
were easy to pick out on a topo-map so plans were made to survey those areas, and plans were
made to survey the entire length of the eastern edge of the property because it borders a large
tributary. The archaeologist knew that topographic maps do not show fine detail and, that
archaeological sites are common along creek and river banks in the Southeast. The topographic
map and other maps did not show any other areas of the property which would likely contain
cultural resources.
During the survey, an entire day was spent with the crew surveying along the creek bank.
And un-shown by the topographic map was in-fact a large archaeological site that may be a
multiple mound site. One mound, is over 30 meters tall while the other mound is only a few
meters tall but is close to 130 meters long, essentially it is a possible artificial terrace large
enough to accommodate a moderate size village. Neither of these features was visible on the
topographic or aerial photography maps. Despite numerous positive shovel tests and a large site
in need of more detailed investigation, the archaeologist did not have the time budgeted to do
more work at the site. After finding the large site, the crew continued on surveying low areas
near the creek that the LIDAR map now shows were clearly unnecessary.
Also, of concern, is that the LIDAR map shows areas which should probably be surveyed
with shovel tests but were not. Because of ground cover from vegetation and that the topographic
maps did not show an obvious need to survey some areas of the property the archaeologist
overlooked these areas as not being highly-probable for containing cultural resources. The other
areas of the property that looked promising on the topographic map were, when surveyed, found
to have too much slope and were steep and essentially uninhabitable. Unfortunately, time and
man hours was spent surveying those areas because the topo-map created the illusion of those
areas being promising.
Essentially, had the archaeologist possessed a detailed LIDAR map before planning a
high-probability survey of the Knight WRP tract, more time would have been spent on a clearly

208
significant archaeological site, other archaeological sites may have been discovered, and time-
labor would not have been wasted in areas that were either too low or had too much slope.
Topographic map of Knight WRP
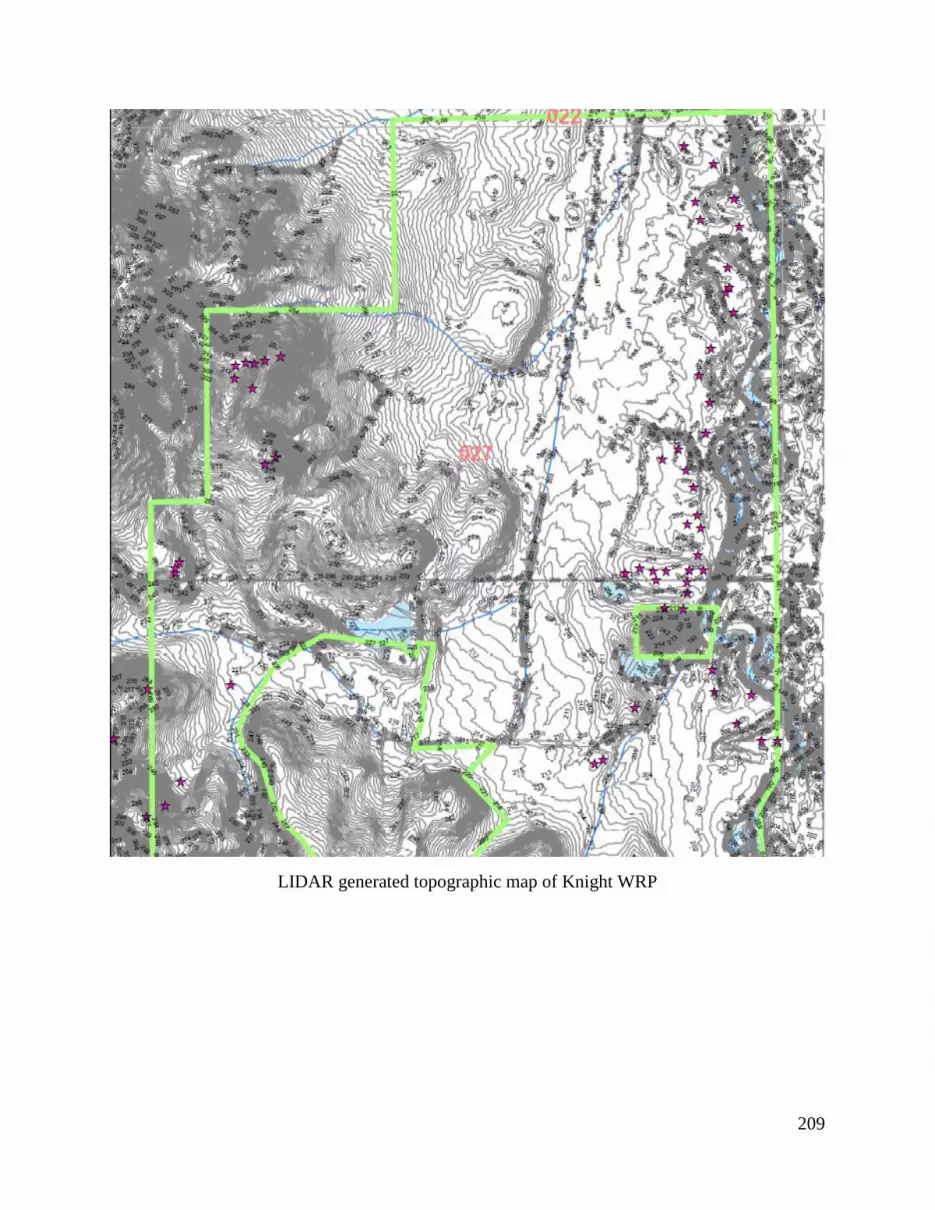
209
LIDAR generated topographic map of Knight WRP

210
LIDAR generated map of Knight WRP showing archaeological sites and other areas of concern

211
SHARP WRP CASE STUDY
Below are three map images of the Sharp WRP tract in Wilcox County, Alabama. The
first image is a standard 7.5 minute topographic map of the property with 10 and 5 foot contour
intervals showing elevation changes. The second image is a LIDAR generated map which shows
1 foot contour interval elevation changes. The detail difference between the two maps is obvious.
The LIDAR map shows a tremendous amount of area detail that the 7.5 minute map does not.
The third map shows the location of discovered archaeological sites, and areas that should not
have been surveyed.
THE SURVEY AND RESULTS OF THE SHARP WRP TRACT
The Sharp WRP tract is a large tract that was surveyed using high-probability survey
methods over a one and a half day period with a six member crew. Before entering the property
standard 7.5 minute maps like the one below, soil data, and aerial photographs, were analyzed to
develop a survey strategy. The northern edge of the property borders a large tributary known as
Pine Barren Creek and because topographic maps do not show much resolution between contour
lines the archaeologist decided to shovel test the entire length of the property along the creek. It
was also easy to see the extremely high elevated areas of the southwestern area of the property
on a topo map and the archaeologist planned to survey those areas.
During the survey, the creek bank area of the property was shovel tested in intervals. The
creek bank survey used a 6 person crew which took the better part of a day, approximately 24-30
total labor hours, and no sites were discovered. During the shovel testing it was clear the area
was too low, even though there were slight bumps in the walking terrain the bulk of the area
appeared to flood regularly. However, when the elevated region in the Southwestern corner of
the property was surveyed numerous sites, as the archaeologist suspected, were found. In
hindsight, a review of a LIDAR generated map would have clued the archaeologist that it would
have futile to survey along the low creek bank. The labor-hours spent along the low creek bank
could have been better spent at the elevated region where the sites were discovered.

212
Topographic Map of Sharp WRP
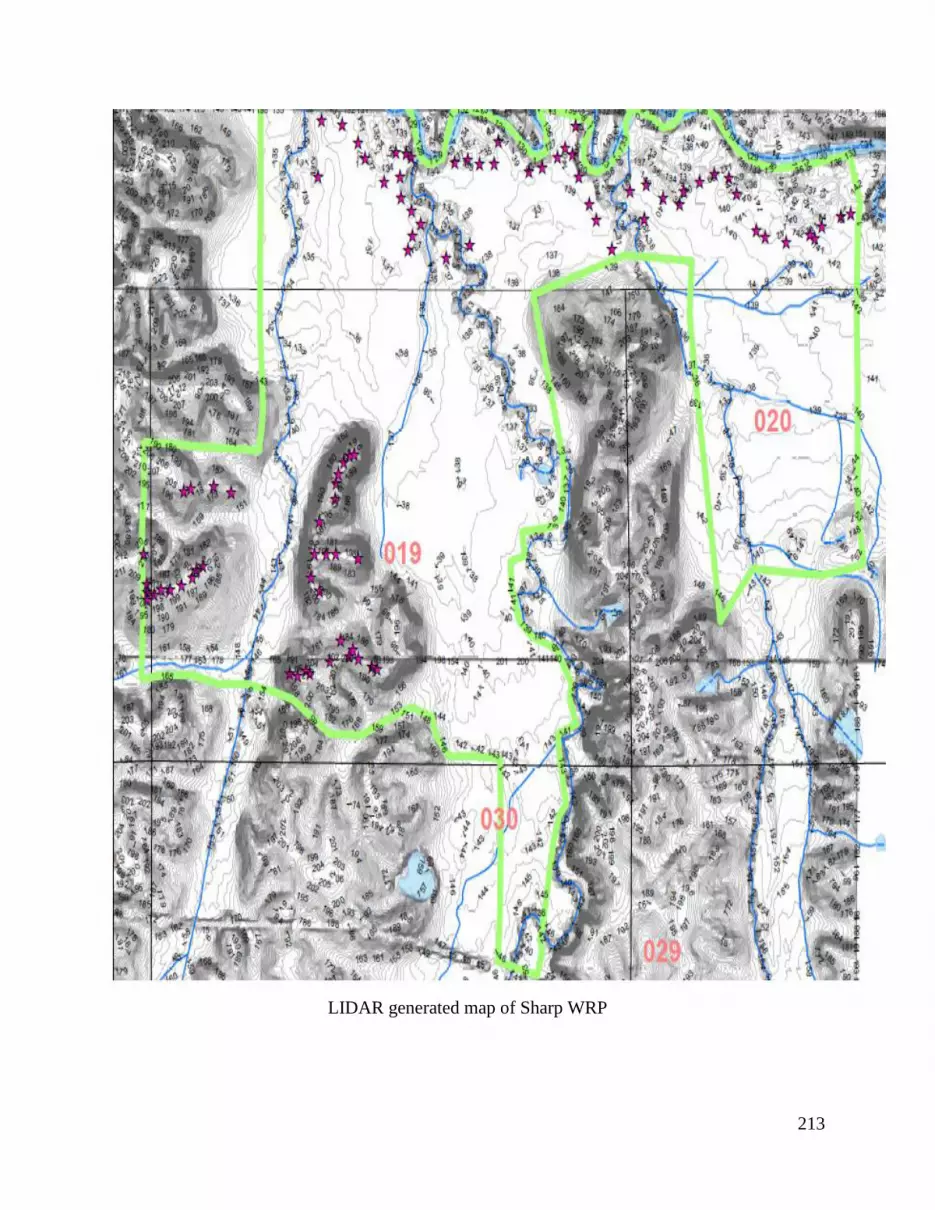
213
LIDAR generated map of Sharp WRP

214
LIDAR generated map of Sharp WRP showing archaeological sites and other areas of concern


