Embed Size (px)
Citation preview

International Journal of Economics and Finance; Vol. 5, No. 12; 2013
ISSN 1916-971X E-ISSN 1916-9728
Published by Canadian Center of Science and Education
1
Leverage Risk. The Weight of Borrowed Capital Distinguishes the
Solvency of Firms: An Empirical Analysis on a Sample of 4,500
Italian SMEs
Marco Muscettola1
1 Indipendent researcher, Bari, Italy
Correspondence: Marco Muscettola, via Generale Scattaglia, 30/B, 70010 Adelfia (Ba), Italy. E-mail:
Received: October 3, 2013 Accepted: October 18, 2013 Online Published: November 26, 2013
doi:10.5539/ijef.v5n12p URL: http://dx.doi.org/10.5539/ijef.v5n12p
Abstract
The analysis of the financial structure of firms is crucial in order to investigate their possibilities of profitable
progress or, on the other hand, their probability of default. In this perspective, the aim of this work, which is
supported by a large analysis sample, is to describe the structure of onerous debt in Italian SMEs and to decipher
the possible links between it and the probability of default. We therefore intend to answer two questions: can
insolvent firms be identified by analysing only the weight of financial debts? Is it possible to isolate a risk of
leverage among the dangers leading companies to bankruptcy?
Keywords: financial indebtedness, default risk estimation, model accuracy
1. Introduction
The analysis of the financial structure of firms is crucial in order to investigate their possibilities of economic
growth or, on the other hand, their probability of default. In this perspective, the aim of this work, which is
supported by a large analysis sample, is to describe the structure of onerous debt of Italian SMEs and to decipher
the possible links between it and the factors determining a firm’s probability of default. This study only focusses
on the interest payment burdens of non-financial corporations and on bank loans. Financial debt is defined here
as bank loans and all borrowed funds. Intercompany loans, debt securities, bonds and trade credit are out of the
leverage risk definition used in the present research.
With the aid of a large sample ensuring a wide representation of the universe of Italian SMEs, the present work
offers a considerable contribution to the existing literature by emphasising the importance of financial sources as
a durability variable of the same firms. In fact, this is the first paper which analyses onerous debt as the only
dependent variable of bankruptcy. Moreover, unlike classic rating models, the present work regards an extended
time horizon and, therefore, is more forward-looking. In this sense, the time frame is set at three years following
rating attribution and, consequently, the explanatory variables refer to a previous three-year period. In such a
phase of high tensions on the side of credit demand as the time period examined, this approach allows to cancel
out part of the macroeconomic influences on the inherent risk of the firms within the sample.
The empirical research supporting the analysis investigates the firms’ behaviour through the data examination of
Italian commercial, manufacturing and service firms with revenues between 5 and 50 million euro. Thus, the
final dataset lists the ordinary financial statements (not abbreviated) of 4,500 firms.
Using logistic regression, through the forward stepwise procedure, three rating scales will be created to estimate
the firms’ probability of default after three years. As previously mentioned, only five financial ratios calculated
on borrowed capital or their financial burdens will be included within the set of indicators selected as
explanatory variables.
As it will be shown, the analysis identifies significant connections between the structure of corporate debt and
the crises of firms: in fact, regression functions are able to recognise the sample with a correct classification rate
in spite of the fact that all profitability ratios, operating profit ratios, efficiency ratios and liquidity ratios are
being excluded, as well as the ratios related to asset structure, cash flow statement or non-bank capital structure.
First of all, it is interesting to understand that the use of bank borrowing by Italian SMEs is a basic component of
www.ccsenet.org/ijef International Journal of Economics and Finance Vol. 5, No. 12; 2013
2
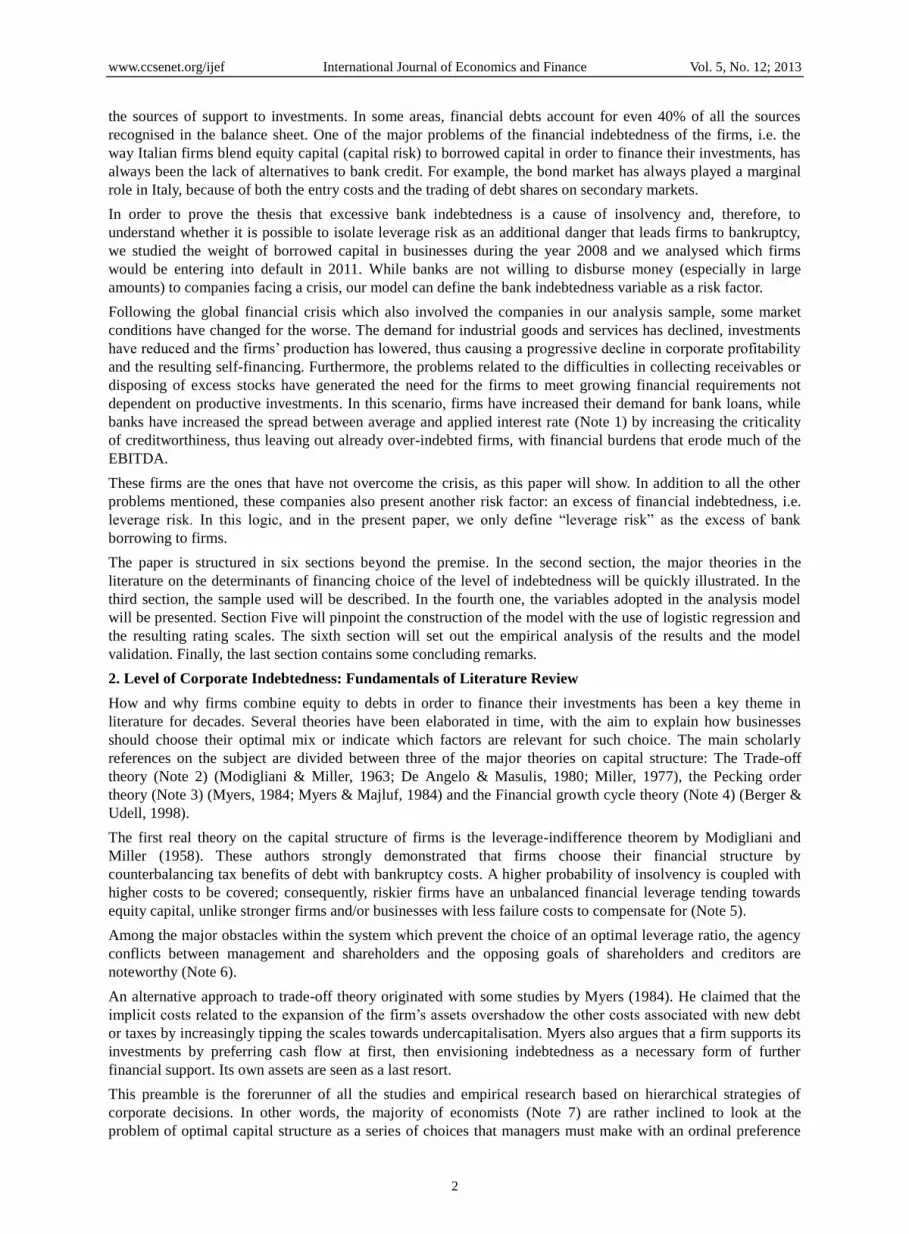
the sources of support to investments. In some areas, financial debts account for even 40% of all the sources
recognised in the balance sheet. One of the major problems of the financial indebtedness of the firms, i.e. the
way Italian firms blend equity capital (capital risk) to borrowed capital in order to finance their investments, has
always been the lack of alternatives to bank credit. For example, the bond market has always played a marginal
role in Italy, because of both the entry costs and the trading of debt shares on secondary markets.
In order to prove the thesis that excessive bank indebtedness is a cause of insolvency and, therefore, to
understand whether it is possible to isolate leverage risk as an additional danger that leads firms to bankruptcy,
we studied the weight of borrowed capital in businesses during the year 2008 and we analysed which firms
would be entering into default in 2011. While banks are not willing to disburse money (especially in large
amounts) to companies facing a crisis, our model can define the bank indebtedness variable as a risk factor.
Following the global financial crisis which also involved the companies in our analysis sample, some market
conditions have changed for the worse. The demand for industrial goods and services has declined, investments
have reduced and the firms’ production has lowered, thus causing a progressive decline in corporate profitability
and the resulting self-financing. Furthermore, the problems related to the difficulties in collecting receivables or
disposing of excess stocks have generated the need for the firms to meet growing financial requirements not
dependent on productive investments. In this scenario, firms have increased their demand for bank loans, while
banks have increased the spread between average and applied interest rate (Note 1) by increasing the criticality
of creditworthiness, thus leaving out already over-indebted firms, with financial burdens that erode much of the
EBITDA.
These firms are the ones that have not overcome the crisis, as this paper will show. In addition to all the other
problems mentioned, these companies also present another risk factor: an excess of financial indebtedness, i.e.
leverage risk. In this logic, and in the present paper, we only define “leverage risk” as the excess of bank
borrowing to firms.
The paper is structured in six sections beyond the premise. In the second section, the major theories in the
literature on the determinants of financing choice of the level of indebtedness will be quickly illustrated. In the
third section, the sample used will be described. In the fourth one, the variables adopted in the analysis model
will be presented. Section Five will pinpoint the construction of the model with the use of logistic regression and
the resulting rating scales. The sixth section will set out the empirical analysis of the results and the model
validation. Finally, the last section contains some concluding remarks.
2. Level of Corporate Indebtedness: Fundamentals of Literature Review
How and why firms combine equity to debts in order to finance their investments has been a key theme in
literature for decades. Several theories have been elaborated in time, with the aim to explain how businesses
should choose their optimal mix or indicate which factors are relevant for such choice. The main scholarly
references on the subject are divided between three of the major theories on capital structure: The Trade-off
theory (Note 2) (Modigliani & Miller, 1963; De Angelo & Masulis, 1980; Miller, 1977), the Pecking order
theory (Note 3) (Myers, 1984; Myers & Majluf, 1984) and the Financial growth cycle theory (Note 4) (Berger &
Udell, 1998).
The first real theory on the capital structure of firms is the leverage-indifference theorem by Modigliani and
Miller (1958). These authors strongly demonstrated that firms choose their financial structure by
counterbalancing tax benefits of debt with bankruptcy costs. A higher probability of insolvency is coupled with
higher costs to be covered; consequently, riskier firms have an unbalanced financial leverage tending towards
equity capital, unlike stronger firms and/or businesses with less failure costs to compensate for (Note 5).
Among the major obstacles within the system which prevent the choice of an optimal leverage ratio, the agency
conflicts between management and shareholders and the opposing goals of shareholders and creditors are
noteworthy (Note 6).
An alternative approach to trade-off theory originated with some studies by Myers (1984). He claimed that the
implicit costs related to the expansion of the firm’s assets overshadow the other costs associated with new debt
or taxes by increasingly tipping the scales towards undercapitalisation. Myers also argues that a firm supports its
investments by preferring cash flow at first, then envisioning indebtedness as a necessary form of further
financial support. Its own assets are seen as a last resort.
This preamble is the forerunner of all the studies and empirical research based on hierarchical strategies of
corporate decisions. In other words, the majority of economists (Note 7) are rather inclined to look at the
problem of optimal capital structure as a series of choices that managers must make with an ordinal preference

www.ccsenet.org/ijef International Journal of Economics and Finance Vol. 5, No. 12; 2013
3
which, at times, is unrelated to the costs and benefits resulting therefrom (Note 8).
In support of the thesis that the ownership structure of a firm can condition the composition of debt, a multitude
of statistical analyses have followed. One of the most acclaimed in-depth studies on the issue is the one by Fama
and French (2002). With the help of empirical evidence on a large sample of U.S. firms, these scholars partly
denied both trade-off and pecking order theories (Note 9).
Using a more traditional methodology may lead to mistakenly associate a firm’s probability of financial crisis to
the historical frequency of business failures occurred in similar companies. Following this line first suggested by
Taggart (1977) and later by Graham (2000), it is clear that crisis costs are undervalued. This is because the
historical default rate is much lower than the probability of crisis and, as a result, firms will be considered
insufficiently in debt.
What has just been stated is one of the main reasons for criticism of static models. Almeida and Philippon (2007)
point out that the benefit of a loan to a firm in crisis is much higher than in normal situations and, therefore, a
standard probability of default should not be used to define and quantify the risk of insolvency. A firm in
financial straits faces higher bankruptcy costs than the ones that can be estimated by using static and traditional
methods related to actual historical default trends.
Several features are still evident and commonly accepted in all previous empirical studies. In an analysis
conducted by various authors on a large sample of large American firms between 1974 and 2008, some
seemingly indisputable links with the capitalisation level of the firm can be deduced. First of all, some
parameters show a curvilinear trend (Kisgen, 2006). Indeed, the debt load increases in parallel with firm size and
profitability (Note 10) only up to a given point, then it decreases and levels off at lower average values in
relation to an even higher level of liabilities.
The contribution of Rauh and Sufi (2010) on a sample of American publicly traded companies is also very useful
in virtue of its the link with business profitability. The authors note that firms whose ratings are taken down a
notch due to financial (external or market-related) difficulties are able to adjust to their new rating class within a
few years by recovering similar structural compositions. In other words, after a worsening income, businesses
adjust their financial and capital structure to their new income conditions (Note 11).
Some studies investigating the reasons that lead companies to the choice of funding have also focussed on
corporate structural peculiarities regarding other typical non-financial stakeholders, such as the employees in
primis (Berk et al., 2010; Matsa, 2010), but also the suppliers and the customers (Kale & Shahrur, 2007). It has
been statistically noted that the capital structure is affected by them and can depend on the conflicting interests of
these very subjects in the company.
Titman and Wessels (1988) showed that failure costs also have an indirect relationship with the sales
performance, the amount of customers and the deferral of trade payments. Therefore, the firms that are more
likely to be put in financial disarray find it more difficult to obtain credit by suppliers (Banerjee et al., 2008) and
the monetary cycle is visibly and negatively influenced by this, with consequent imbalances towards bank
lending.
Although several acclaimed studies have been conducted in the search for a unifying parameter allowing to
identify financial leverage and to explain its dynamics, it is still difficult to reconcile the various arguments on
the matter, as Welch (2004) states. In line with the results achieved by MacKay and Phillips (2005), Lemmon et
al. (2008) summarise the scholars’ assumptions by stating that the changes in indebtedness levels are more usual
in a firm with respect to changes in industry averages, and they are more regular in a delimited market compared
to the changes in terms of typology of firm.
In summary, no unifying theory of indebtedness has been developed to date, because the complexity of the
matter (Marsh, 1982) has always led to a partial and systemic discussion. In fact, it is only recently that business
theories considering both risk analysis of financial debts and the consequences in terms of value creation have
been developed. Such analysis is defined as “contingent claim approach”.
Borrowed capital, therefore, can either create or destroy wealth. In addition to economic doctrines, some theories
of business economics have also been developed. These theories claim that the choice of indebtedness is not only
an important decision for a firm, but it also increases the possibility of supporting investments by producing
some prospects of profitability, if the returns of loans are higher than the financing costs. Moreover, such
prospects of profitability mean development and wealth.
Although the decision to choose debt over equity may engender some significant possibilities of benefit, it also
inevitably involves an increase in the financial risk of the specific firm, especially in certain bank-based areas

www.ccsenet.org/ijef International Journal of Economics and Finance Vol. 5, No. 12; 2013
4
(Foglia et al., 1998), since it makes the cost structure stiffer and increases the financial outlays. In turn, this
higher risk influences the basis on which the same external financiers judge the financial dynamics of firms (i.e.
their creditworthiness) and the borrower’s business.
“Relationship lending theories" (Rajan & Zingales, 2003) derive from these observations. Depending on the
economic specificities of the local context, there will either be a bank-based financial system (Continental
Europe) in which the close relationships between banks and companies predominate and creditors are better
protected, or a market-based financial system (England and USA) where firms choose access to bank credit
market only if the natural cash flow is no longer sufficient and there are no binding and lasting relationships
between firms and lending institutions. Depending on the relationship between firms and moneylenders, the
existing literature identifies two different types of financial support: arm’s length financing (Note 12) or
informed financing (Note 13).
In order to understand the dynamics of borrowed capital, therefore, it is appropriate to consider these theories as
well, which are of great significance to the authors, as they believe that a close and lasting relationship between
the bank and the firm further reduces asymmetric information and agency costs, thus increasing bank credit
availability (Morellec & Schrhoff, 2010).
3. Sample Presentation: Dataset
The firms analysed are small and medium-sized enterprises (SMEs) with revenues from 5 million to 50 million
euro, operating in Italy for at least 8 years. In order to equipoise the sample in the most balanced way, 4,500
firms were extracted from the bulk sample. Their characteristics are summarised in Table 1.
Table 1. Characteristics of the sample used in the research
Whole Sample Bad Firms Good Firms
Nr % Nr % Nr %
Manufactoring Firms 1,500 100.00 156 10.40 1,344 89.60
Commercial Firms 1,500 100.00 115 7.67 1,385 92.33
Service Firms 1,500 100.00 93 6.20 1,407 93.80
Northern Italy 2,629 100.00 158 6.01 2,471 93.99
Central Italy 1,091 100.00 110 10.08 981 89.92
Southern Italy 780 100.00 96 12.31 684 87.69
Whole Sample 4,500 100.00 364 8.09 4,136 91.91
The reference year for the analysis was 2008. All the firms which have not been insolvent at least until the year
2011 are considered “good firms”. On the other hand, firms that have become insolvent before the three years
following the year of analysis have been eliminated (Note 14). In this way the time frame has been set as three
consecutive years.
All the firms that have shown significant shareholdings in other companies or, on the other hand, have depended
on a parent company, as well as financial companies, farms, construction companies and all the companies that
have revealed (as can be found by reading the performance of their financial statements) some fluctuations in
sales revenues, in returns or in the main items of their balance sheet over the past four years have been excluded
from the analysis.
As for the meaning of “bad firm”, we refer to a standardised definition like the one formulated by the Basel
Committee (Note 15). Those firms that have been reported by the Central Credit Register of the Bank of Italy as
distressed and past-due, the firms that have initiated bankruptcy proceedings, and the firms that have a serious
negative act report (judicial or legal mortgage ...) will therefore be defined insolvent. In other words, a firm is
defined insolvent exclusively via objective sources.
The financial ratios, which formed the explanatory variables of our model, were determined by yearly statements
belonging to 4,500 unique firms from 2008 to 2010 (Note 16), as mentioned above.
Before we start describing the impact of borrowed capital on the probability of default, however, it is necessary
to highlight certain assumptions regarding the heterogeneity of the sample used. To be more specific, the level of

www.ccsenet.org/ijef International Journal of Economics and Finance Vol. 5, No. 12; 2013
5
indebtedness is also a consequence of the type of business conducted by the firms, as will be seen in the tables
below. It is sufficiently evident that a manufacturing firm generally needs a greater amount of investments and
infrastructure in order to be able to follow its mission (production), especially if compared to service firms. On
the other hand, a manufacturing firm will need more capital, thus using more financial funding to support its
heaviest production cycle. For these reasons, we decided to distinguish three sub-samples within the analysis
depending on the type of activity carried out primarily by the firm. The 4,500 firms are divided in 1,500
commercial firms, 1,500 service firms and 1,500 manufacturing firms.
By contrast, the following graph shows the incidence of financial debts on the balance sheet total (total assets)
for the group of good firms and for those that have become insolvent after three years, in view of the
geographical area in which the firm is operating and its macro sector.
The first observation concerns the impact of borrowings on firms in default after three years – an impact which
already has a much higher value than that of good firms. In some parts of Italy, firms becoming insolvent in 2011
have financial debts over 40% of their total corporate sources (liabilities and shareholders’ equity), in contrast
with a significantly lower Italian average for firms remaining healthy during all the years of our examination.
The second interesting observation is related to an uncertain trend and a separation which is not so clear-cut
between good and bad firms as regards Southern Italian companies. It is found that insolvent manufacturing
firms located in Southern Italy have a lower portion of borrowed capital than good firms, as if in these areas the
risk of default could be dependent on other factors than over-indebtedness or other causes that have generated a
more rapid deterioration in financial ratios.
Figure 1. Graph showing the incidence of financial debts on total of the liabilities and shareholders’ equity in
consideration of the firms’ status, geographical location and type of business
With regard to the capitalisation of the firms that will become insolvent, it is quite logical and generally accepted
that companies in distress or – even worse – which will become insolvent have a lower strength of
self-accumulation of income. After all, financial or economic losses do nothing but worsen financial relations by
affecting risk capital (equity) above all.
In this sense, regardless of the cause or consequence (Note 17), apart from some exceptions, it would appear that
firms facing default in 2011 were on average already more indebted back in 2008. A large percentage of bad
firms tended to use external finance (borrowed capital) in order to develop at a rate that was higher than the one
20%
22%
24%
26%
28%
30%
32%
34%
36%
38%
40%
42%
44%
46%
COMMERCIAL
GOOD FIRMS
MANUFACTURING
GOOD FIRMS
SERVICE GOOD
FIRMS
COMMERCIAL BAD
FIRMS
MANUFACTURING
BAD FIRMS
SERVICE BAD
FIRMS
NORTHERN ITALY CENTRAL ITALYSOUTHERN ITALY

www.ccsenet.org/ijef International Journal of Economics and Finance Vol. 5, No. 12; 2013
6
determined by their internal capitals alone. An essential aspect for evaluating debt sustainability is the debt
service burden of firms. It reproduces the combined burden of firms arising from their interest expenses and their
debt reimbursement obligations.
4. Explanatory Variables
The financial ratios used as independent variables in the model are only 5 quotients taken from the financial
statements from 2008 to 2010 (Note 18) identifying the weight of borrowed capital (Note 19). In order to obtain
a working model, empirically verifiable all time long and transferable (in time and space (Note 20)), it is
necessary to use clear and valid information sources and attainable data measurable in time (Gai, 2008).
The continuous variables are winsorized at the 1% and 99% levels to mitigate the influence of extreme values
(outliers) and the missing values are replaced by averages relating to percentile of reference by a predetermined
table (winsorization method).
The explanatory variables taken into account for the present study are the following five financial ratios:
1). Financial debts / Total assets (FDoA), i.e. the ratio between the total of the financial debts taken out by the
company, with short-term and long-term maturity, and the total assets recorded in the financial statements;
2). Interest expense / Total debts (IEoD), i.e. the ratio between financial interests (financial expenses) and total
debts of any type and with any deadline;
3). Interest expense / Financial debts (IEoFD), i.e. the ratio between interest expense and, this time, only
financial liabilities as they have been already defined;
4). Interest expense / Sales (IEoS), i.e. the ratio between interest expense and sales revenue;
5). Financial debts / Shareholder's equity (FDoE), i.e. the ratio between financial liabilities and total equity
entered in the accounts.
Although there is a strong correlation between the five variables adopted, as the table below shows, the small
number of the parameters used excludes any distorting phenomena, such as overfitting.
Table 2. Matrix of correlations between the selected independent variables
IEoD IEoFD IEoS FDoE
FDoA 0.561 0.627 0.535 0.458
IEoD 0.168 0.660 0.193
IEoFD 0.196 0.248
IEoS 0.190
FDoA= financial debts on total assets, IEoD= interest expense on total debts, IEoFD= interest expense on total financial debts, IEoS= interest
expense on total sales, FDoE= financial debts on Equity.
The following sets out the average data for the financial ratios used in the model by identifying the cluster
sample by place of business, prevailing sector and status (good or bad firms).
As claimed by much of the literature on the statistical significance of financial ratios (Muscettola & Pietrovito,
2012a), one of the indicators that – taken individually – is able to better discriminate the sample of good firms
from the ones that will become insolvent in 2011 is the ratio between the interest expense and sales (IEoS). In
fact, the difference between the averages of the two sub-samples is fairly evident also in the sample of SMEs
analysed.
All the other indicators show an equally fair ability to separate the two groups of firms, even three years before
insolvency.

www.ccsenet.org/ijef International Journal of Economics and Finance Vol. 5, No. 12; 2013
7
Table 3. Averages of financial data by sector, status and geographical location of business
FDoA IEoD IEoFD IEoS FDoE C
OM
ME
RC
IAL
FIR
MS
Whole Sample 27.98 2.50 14.00 1.25 3.80
Good
Firms
Northern Italy 28.33 2.39 14.04 1.18 3.82
Central Italy 28.13 2.59 13.83 1.29 3.79
Southern Italy 24.89 2.63 14.84 1.31 3.09
Bad
Firms
Northern Italy 40.26 3.62 8.65 2.32 7.44
Central Italy 36.80 2.91 9.91 2.00 9.49
Southern Italy 32.70 3.37 9.78 2.24 4.81
MA
NU
FA
CT
UR
ING
FIR
MS
Whole Sample 2.59 12.58 1.61 2.90 2.59
Good
Firms
Northern Italy 27.65 2.44 13.13 1.46 2.78
Central Italy 28.89 2.69 11.96 1.67 3.07
Southern Italy 30.03 3.07 10.90 2.08 2.43
Bad
Firms
Northern Italy 42.77 3.84 8.00 3.03 4.84
Central Italy 44.06 3.95 8.09 3.41 5.97
Southern Italy 29.05 3.27 9.74 3.26 2.38
SE
RV
ICE
FIR
MS
Whole Sample 26.56 2.28 15.97 1.85 3.90
Good
Firms
Northern Italy 26.36 2.13 16.33 1.69 3.90
Central Italy 25.34 2.33 16.13 1.93 3.61
Southern Italy 25.75 2.66 15.57 2.02 3.08
Bad
Firms
Northern Italy 38.47 3.28 9.18 3.55 8.25
Central Italy 37.67 3.27 10.94 3.73 6.34
Southern Italy 32.47 4.74 12.08 3.56 6.69
FDoA= financial debts on total assets, IEoD= interest expense on total debts, IEoFD= interest expense on total financial debts, IEoS= interest
expense on total sales, FDoE= financial debts on Equity.
In order to better examine the relative distances between the averages of the two samples, the analysis of
normalised averages described below is used.
Standard scores enable scores from different tests to be compared on a common scale (Note 21). For this matter
standard scores are used in our paper as a descriptive analysis aiming to compare the distributions of the
sub-samples of the present study. They also help to compare the level of performance at different times. As such,
each raw score may be given an equivalent “z-score”. A score that is exactly on the mean of good firms
corresponds to a z of 0.
The diagrammes below (Figure 2) clearly show how the standardised variables referred to bad firms are distant
from the averages of good firms.
The other important aspect the graph highlights is that, quite unexpectably, there is no visible deterioration of the
indicators as the year of default approaches, as it is usually the case with other types of financial indicators
(Muscettola & Pietrovito, 2012b). If we exclude the trend of the relationship between interest expense and sales
(especially with regard to samples of commercial and manufacturing firms), this can lead to the presumption that
these indicators can be excellent predictive factors even three years before the insolvency (Muscettola &
Naccarato, 2013), in contrast to other ratios which are good markers only for the year prior to the crisis, when it
probably is too late.

www.ccsenet.org/ijef International Journal of Economics and Finance Vol. 5, No. 12; 2013
8
Figure 2. Graph showing the trend of the averages standardised of the bad firms in consideration of the type of
business and the year prior to default
5. Analysis Model and Rating Scales
The technique of logistic regression used with the forward stepwise method allows us to build three regression
functions, one for each macro-sector, capable of distinguishing good firms from bad firms. The logit regression
is calculated by relying exclusively on the five ratios specified above (independent variables) and dividing the
analysis sample by type of activity carried out by the firms. After that, we will have three rating scales to be
associated with our test sample.
A logistic model is a binary choice model where the dependent variable may only assume two possible values. In
our case, pi is included in the range (0; 1) and represents the probability of default, which assumes the value “1”
if the i-th firm is insolvent in 2011 and the value “0” for good firms.
To assess the unknown, therefore, and to prove the hypothesis of this paper, we employ logistic regression with a
variable-reduction process known as “forward stepwise”. This is a renowned heuristic method with low
computational complexity. In this process, each of the five financial ratios is tried, one at a time, and 5
one-variable regression models are created (Note 22). The last step, instead, stands for detecting the best mixture
of explanatory variables, presupposing a cause-effect relationship between the identified “x” inputs.
Indicating pi as the probability that the i-th firm may join the group of the defaulting firms after three years, x1-5
as the set of the five financial statement variables, k as constant and β1-5 as the coefficients of the variables, it is
possible to write the function of the logistic model, in which the probability is a linear function of the indicators
and the model parameters (β1-5) are designed via the maximum likelihood estimation, in the following manner:
).....(5522115522111
1).....(
iii xxx
iii
i
exxxkfp
(1)
Table 4, 5 and 6 report the results of the stepwise logistic regression that counts the five explanatory variables
which fix the probability of default.
The tables expose the coefficients (β) of the factors with a significance level comprised between 1% and 5%
where “β” is the estimated coefficient of the logistic regression, “S.E.” denotes the standard error of the
estimated coefficients (Note 23), “wald” is the Wald chi-square test (Note 24), “sig.” specifies the p-value of the
-0,50
0,00
0,50
1,00
1,50
2,00FDoA -3Y
FDoA -2Y
FDoA -1Y
IEoD -3Y
IEoD -2Y
IEoD -1Y
IEoFD -3Y
IEoFD -2YIEoFD -1Y
IEoS -3Y
IEoS -2Y
IEoS -1Y
FDoE -3Y
FDoE -2Y
FDoE -1Y
COMMERCIAL BAD FIRMS
MANUFACTURING BAD FIRMS
SERVICE BAD FIRMS
GOOD FIRMS

www.ccsenet.org/ijef International Journal of Economics and Finance Vol. 5, No. 12; 2013
9
estimated coefficient (Note 25), “Exp(β)” is the change in the odds ratio associated with a 1 unit change in the
predictor variable.
Table 4. Stepwise logistic regression. Functions calculated on commercial firms in 2008
β E.S. Wald Sig. Exp(β) 95% CI for EXP(β )
Lower Upper
FDoA 0.0307 0.0053 33.7719 0.0000 1.0311 1.0205 1.0419
IEoD 0.1357 0.0667 4.1382 0.0419 1.1453 1.0050 1.3052
IEoS 0.2101 0.0520 16.3529 0.0001 1.2338 1.1144 1.3661
Constant -5.1200 0.2445 438.5563 0.0000 0.0060
FDoA= financial debts on total assets, IEoD= interest expense on total debts, IEoS= interest expense on total sales.
Table 5. Stepwise logistic regression. Functions calculated on manufacturing firms in 2008
β E.S. Wald Sig. Exp(β) 95% CI for EXP(β )
Lower Upper
IEoFD -0.0270 0.0126 4.5920 0.0321 0.9734 0.9497 0.9977
IEoS 0.2939 0.0491 35.8942 0.0000 1.3417 1.2187 1.4771
FDoE 0.0536 0.0112 22.8591 0.0000 1.0551 1.0321 1.0785
Constant -3.9711 0.2104 356.3794 0.0000 0.0189
IEoFD= interest expense on total financial debts, IEoS= interest expense on total sales, FDoE= financial debts on Equity.
Table 6. Stepwise logistic regression. Functions calculated on service firms in 2008
β E.S. Wald Sig. Exp(β) 95% CI for EXP(β )
Lower Upper
FDoA 0.0254 0.0067 14.6340 0.0001 1.0258 1.0125 1.0392
FDoE 0.0369 0.0155 5.6683 0.0173 1.0376 1.0065 1.0696
Constant -4.1187 0.2412 291.5145 0.0000 0.0163
FDoA= financial debts on total assets, FDoE= financial debts on Equity.
Each of the five indices contributed at least once to forming the regression function. The relationship between
interest expense and financial debts (IEoFD) is the only parameter that showed an opposite sign (negative
coefficient), thus demonstrating that as the variable increases, the factor value decreases and, presumably, the
probability of default of the firm decreases as well. This phenomenon stresses once again the statistical
significance in order to predict both insolvency and the burden of borrowed capital, which in this particular
index is placed in the denominator.
Equally noteworthy is the relevance in the functions of the variable formed by the ratio between interest expense
and sales (IEoS).
The construction of the rating scales occurs in connection with the type of sample used (Muscettola, 2010). In
that way there will be three rating scales considering the three logistic functions remarked.
Given the values for a set of predictors, we can foresee the probability that each observation may belong to a
class of ranking. Through a binary response, the logistic model determines the subdivision of the test sample into
ten equally numerous classes (Note 26). There is a 10% probability that each observation may belong to each of
the ten ordinal classes (Note 27). In order to shape the optimal cut-off between each class, we have been making
use of the technique of the median (Muscettola & Gallo, 2007): cut-off value for a two-class case is 0.5. This is
done by setting a cut-off value, so that observations with probabilities above the average of the individual decile
can be categorised as belonging to upper class, and moreover observations with probabilities below this average
www.ccsenet.org/ijef International Journal of Economics and Finance Vol. 5, No. 12; 2013
10
are classified as belonging to lower class (Note 28).
6. Results and Model Validation
Firms with high levels of financial indebtedness have denoted a greater vulnerability which, in changing (or
worsening, as in these years of financial crisis) market conditions, led them to a greater probability of
bankruptcy.
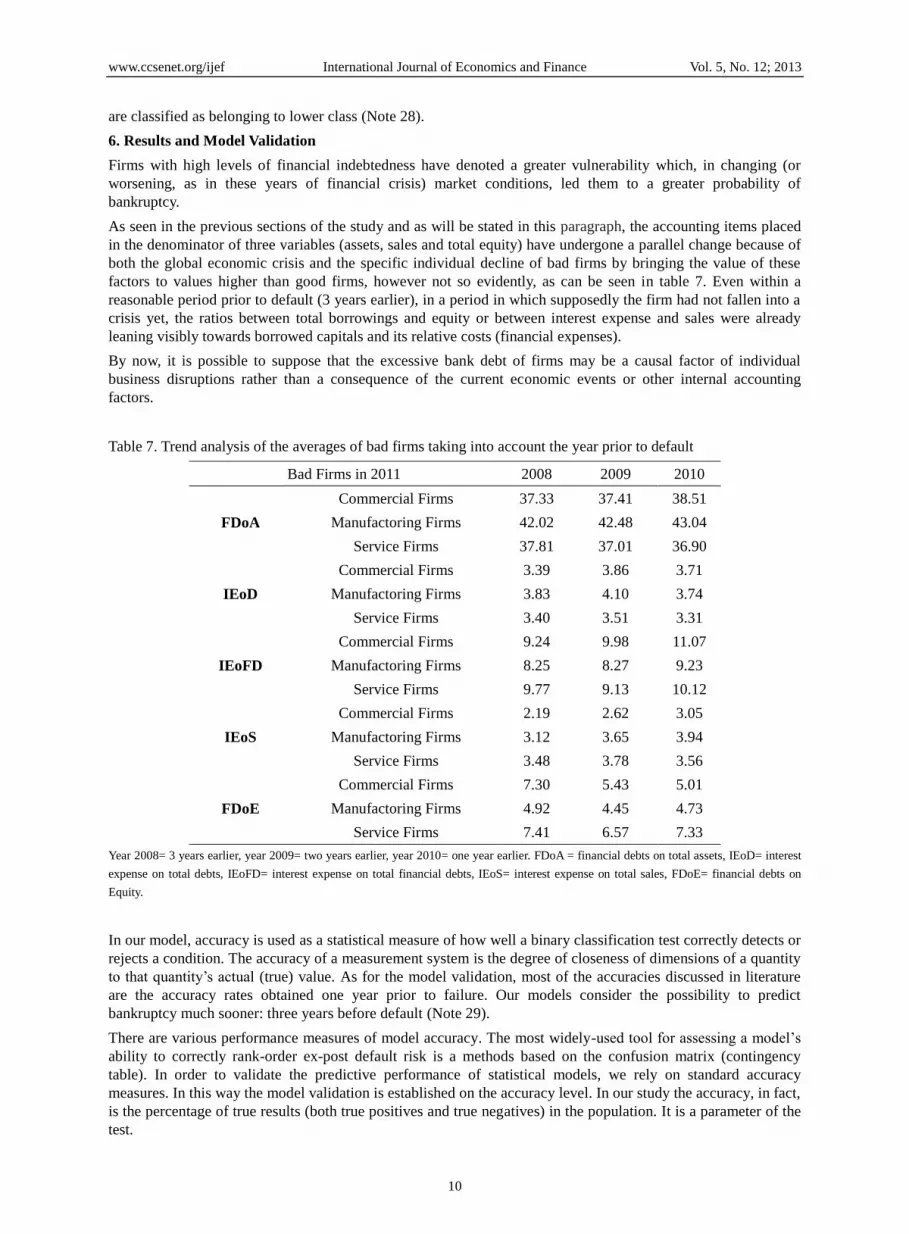
As seen in the previous sections of the study and as will be stated in this paragraph, the accounting items placed
in the denominator of three variables (assets, sales and total equity) have undergone a parallel change because of
both the global economic crisis and the specific individual decline of bad firms by bringing the value of these
factors to values higher than good firms, however not so evidently, as can be seen in table 7. Even within a
reasonable period prior to default (3 years earlier), in a period in which supposedly the firm had not fallen into a
crisis yet, the ratios between total borrowings and equity or between interest expense and sales were already
leaning visibly towards borrowed capitals and its relative costs (financial expenses).
By now, it is possible to suppose that the excessive bank debt of firms may be a causal factor of individual
business disruptions rather than a consequence of the current economic events or other internal accounting
factors.
Table 7. Trend analysis of the averages of bad firms taking into account the year prior to default
Bad Firms in 2011 2008 2009 2010
FDoA
Commercial Firms 37.33 37.41 38.51
Manufactoring Firms 42.02 42.48 43.04
Service Firms 37.81 37.01 36.90
IEoD
Commercial Firms 3.39 3.86 3.71
Manufactoring Firms 3.83 4.10 3.74
Service Firms 3.40 3.51 3.31
IEoFD
Commercial Firms 9.24 9.98 11.07
Manufactoring Firms 8.25 8.27 9.23
Service Firms 9.77 9.13 10.12
IEoS
Commercial Firms 2.19 2.62 3.05
Manufactoring Firms 3.12 3.65 3.94
Service Firms 3.48 3.78 3.56
FDoE
Commercial Firms 7.30 5.43 5.01
Manufactoring Firms 4.92 4.45 4.73
Service Firms 7.41 6.57 7.33
Year 2008= 3 years earlier, year 2009= two years earlier, year 2010= one year earlier. FDoA = financial debts on total assets, IEoD= interest
expense on total debts, IEoFD= interest expense on total financial debts, IEoS= interest expense on total sales, FDoE= financial debts on
Equity.
In our model, accuracy is used as a statistical measure of how well a binary classification test correctly detects or
rejects a condition. The accuracy of a measurement system is the degree of closeness of dimensions of a quantity
to that quantity’s actual (true) value. As for the model validation, most of the accuracies discussed in literature
are the accuracy rates obtained one year prior to failure. Our models consider the possibility to predict
bankruptcy much sooner: three years before default (Note 29).
There are various performance measures of model accuracy. The most widely-used tool for assessing a model’s
ability to correctly rank-order ex-post default risk is a methods based on the confusion matrix (contingency
table). In order to validate the predictive performance of statistical models, we rely on standard accuracy
measures. In this way the model validation is established on the accuracy level. In our study the accuracy, in fact,
is the percentage of true results (both true positives and true negatives) in the population. It is a parameter of the
test.

www.ccsenet.org/ijef International Journal of Economics and Finance Vol. 5, No. 12; 2013
11
(2)
The bankruptcy prediction literature continually refers also to Type I and Type II errors. Type I errors are the
misclassification of bankrupt firms as good firms (false positive). Vice versa, Type II errors are the
misclassification of good firms as bad firms (false negative) (Note 30).
As of the false positive (Type I Error) or the false negative (Type II Error), they relate to default/excellence cases
situated into the best/worst three classes of rating. After splitting the sample into classes of membership we take
a survey on the distribution of the cases default, in connection with the rating scale and the sample used.
Table 8 shows that the greatest number of accurate classifications concerns Northern Italian firms, followed by
those in Central Italy. However, more misclassifications occurred within the sample of Southern Italian firms,
especially in the service sector, although this phenomenon is mainly due to the scarcity of the sample analysed
(only 25 bad firms) (Note 31).
Table 8. Model validation. Model accuracy based on logistic regression models
Rating
Scales
Commercial Firms Manufactoring Firms Service Firms
North Centre South North Centre South North Centre South
1 0 1 1 0 0 1 0 0 0
2 0 0 0 0 1 1 0 1 2
3 1 2 4 1 0 2 1 1 1
4 2 0 1 0 1 2 3 2 2
5 3 2 1 4 2 3 3 2 2
6 3 5 2 5 4 6 5 1 3
7 5 5 2 8 4 6 4 2 5
8 4 4 9 7 7 6 8 5 4
9 11 8 6 8 11 4 7 5 4
10 16 13 4 37 16 10 12 6 2
Error Type I 26.76 27.23 34.57 29.99 30.22 46.53 29.12 27.40 51.47
Error Type II 31.11 37.50 36.67 25.71 26.09 51.22 37.21 36.00 60.00
Accuracy 73.13 72.38 65.33 70.13 70.02 52.91 70.49 72.20 47.60
With regard to manufacturing and commercial firms operating in Central and Northern Italy, the higher
frequency of insolvencies can always be identified within the worst class of rating. In the last decile of the total
population, in fact, more than 32% of bad firms are found. If we sum the last two rating classes, then, the above
percentage rises to 50% of bad firms on the total number of insolvent companies. If we exclude Southern Italy
firms, mixing our data with other aspects that are not purely commercial or financial (Muscettola & Modina,
2013), figures become even more significant (37% in the last class and 56% in the last two classes), with only 3
cases of insolvent firms ranked in the first two rating classes.
In conclusion, our model shows preciseness with an accuracy level of over 70% which confirms the statistical
implication of the variables engaged to properly predict the default (Ohlson, 1980; Barontini, 2000).
7. Conclusion
Banks generally play a crucial role in the economic development of every country. The capital structure decision,
on the other side, is decisive for any business organisation. The findings of this study reveal a significantly
positive relation between borrowed capital and the probability of default of firms. These results imply that an
increase in financial debt position is associated with a decrease in solvency (Note 32).
Although financial leverage provides the firms with more opportunities for productive investments, it increases
their probability of default more than proportionally, with all the imaginable negative consequences for business
management or the pricing of the borrowings, for example. The substantial level of debt of non-financial firms

www.ccsenet.org/ijef International Journal of Economics and Finance Vol. 5, No. 12; 2013
12
by historical canons entails that it remains an important source of vulnerability for the outlook of SMEs, in
particular with respect to risks associated with increased costs of debt financing or to variability of the market.
The firms that have not overcome the economic crisis, in fact, are those which already had a strong financial
indebtedness back in 2008 and, more importantly, which had an onerousness of debts that burdened the income
produced.
Taking a look back at the two research questions in the introduction of this study:
1) Can insolvent firms be identified by analysing their weight of financial debt only?
The analysis has demonstrated that a model for selecting firms which is built solely with financial indebtedness
of said firms actually works. The results exposed in the tables prove the model’s appreciable ability in the year
2008 to select firms which would become insolvent in 2011. The large number of accurate classifications is
indeed remarkable, even in spite of the fact that the analysis was carried out with three years in advance, in a
period prior to the global economic crisis and, most importantly, excluding all the ratios and variables which do
not strictly concern the financial debts of the firms.
2) Is it possible to identify a “leverage risk” among the dangers that can lead a firm to default?
The empirical evidence of our essay on a sample of 4,500 firms has demonstrated the logical (cause - effect) and
statistically significant relationship between the structure of onerous debts of firms and the series of corporate
failures. Due to a worsening macroeconomic trend, firms already too financially exposed to the banking system
could not access the external financing needed to further support their financial requirements, thus making their
internal financial equilibrium and their debt sustainability even more unstable. Leverage risk should be restricted,
defined and analysed according to this specific condition.
References
Almeida, H., & Philippon, T. (2007). The risk-adjusted cost of financial distress. J. Finance, 62, 2557-2586.
http://dx.doi.org/10.1111/j.1540-6261.2007.01286.x
Banerjee, S., Dasgupta, S., & Kim, Y. (2008). Buyer-supplier relationships and the stakeholder theory of capital
structure. J. Finance, 63, 2507–2552. http://dx.doi.org/10.1111/j.1540-6261.2008.01403.x
Barontini, R. (2000). La valutazione del rischio di credito. Il Mulino.
Berger, A. N., & Udell, G. F. (1998). The economics of small business finance: The roles of private equity and
debt markets in the financial growth cycle. Journal of Banking and Finance, 22, 613–673.
http://dx.doi.org/10.1016/S0378-4266(98)00038-7
Berk, J., Stanton, R., & Zechner, J. (2010). Human capital, bankruptcy, and capital structure. Journal of Finance,
65. http://dx.doi.org/10.1111/j.1540-6261.2010.01556.x
Chirinko, R., & Singha, A. (2000). Testing static tradeoff against pecking order models of capital structure: A
critical comment. J. Financ. Econ., 58, 417–425. http://dx.doi.org/10.1016/S0304-405X(00)00078-7
DeAngelo, H., & Masulis, R. W. (1980). Optimal capital structure under corporate and personal taxation. Journal
of Financ Econ., 8, 3–29. http://dx.doi.org/10.1016/0304-405X(80)90019-7
Fama, E., & French, K. (2002). Testing trade-off and pecking order predictions about dividends and debt. Rev.
Financ. Stud., 15, 1–33. http://dx.doi.org/10.1093/rfs/15.1.1
Ferri, G., & Bongini, P. (2005). Il sistema bancario meridionale: Crisi, ristrutturazione, politiche. Laterza
Editore.
Foglia, A., Laviola, S., Marullo, & Reedtz, P. (1998). Multiple banking relationships and the fragility of
corporate borrowers. Journal of Banking and Finance, 22, 1441–1456.
http://dx.doi.org/10.1016/S0378-4266(98)00058-2
Frank, M. Z., & Goyal, V. K. (2003). Testing the pecking order theory of capital structure. Journal of Financial
Economics, 67, 217–248. http://dx.doi.org/10.1016/S0304-405X(02)00252-0
Gai, L. (2008). Il rating delle PMI. Un approccio metodologico per banche, confidi e intermediari finanziari.
FrancoAngeli Editore.
Gibson, K, & Graham, J. (1996). The end of capitalism (As we knew it): A feminist critique of political economy.
Oxford UK and Cambridge USA: Blackwell Publishers.
Graham, J. R. (2000). How big are the tax benefits of debt? J. Finance, 55, 1901–1941.
http://dx.doi.org/10.1111/0022-1082.00277

www.ccsenet.org/ijef International Journal of Economics and Finance Vol. 5, No. 12; 2013
13
Hosmer, D. W., & Lemeshow, S. (2000). Applied logistic regression (2nd ed.). Wiley.
http://dx.doi.org/10.1002/0471722146
Kale, J., & Shahrur, H. (2007). Corporate capital structure and the characteristics of suppliers and customers. J.
Financ. Econ., 83, 321–365. http://dx.doi.org/10.1016/j.jfineco.2005.12.007
Kisgen, D. (2006). Credit ratings and capital structure. J. Finance, 61, 1035–1072.
http://dx.doi.org/10.1111/j.1540-6261.2006.00866.x
Leary, M., & Roberts, M. (2005). Do firms rebalance their capital structures? J. Finance, 60, 2575–2619.
http://dx.doi.org/10.1111/j.1540-6261.2005.00811.x
Leary, M., & Roberts, M. (2010). The pecking order, debt capacity, and information asymmetry. J. Financ. Econ.,
95, 332–355. http://dx.doi.org/10.1016/j.jfineco.2009.10.009
Lemmon, M. L., Roberts, M. R., & Zender, J. F. (2008). Back to the beginning: Persistence and the cross-section
of capital structure. Journal of Finance, 4, 1575–1608. http://dx.doi.org/10.1111/j.1540-6261.2008.01369.x
MacKay, P., & Phillips, G. M. (2003). How does industry affect firm financial structure? Working Paper,
University of Maryland.
Mackie-Mason, J. (1990). Do taxes affect corporate financing decisions? J. Finance, 44, 1471–1493.
http://dx.doi.org/10.1111/j.1540-6261.1990.tb03724.x
Marsh, P. (1982). The choice between equity and debt: An empirical study. J. Finance, 37, 121–144.
http://dx.doi.org/10.1111/j.1540-6261.1982.tb01099.x
Matsa, D. (2010). Capital structure as a strategic variable: Evidence from collective bargaining. J. Finance, 65,
1197–1232. http://dx.doi.org/10.1111/j.1540-6261.2010.01565.x
Miller, M. (1977). Debt and Taxes. Journal of Finance, 32, 261–275.
Modigliani, F., & Miller, M. (1958). The cost of capital, corporation finance and the theory of investment. The
American Economic Review, 48(3), 261–97.
Modigliani, F., & Miller, M. (1963). Corporate income taxes and the cost of capital: A correction. The American
Economic Review, 53(3), 433–443.
Morellec, E., & Schrhoff, N. (2010). Corporate investment and financing under asymmetric information. J.
Financ. Econ.
Muscettola, M. (2010). Analisi di bilancio ai fini dell’accesso al credito. FrancoAngeli Editore.
Muscettola, M., & Gallo, M. (2008). Analisi e gestione del rischio di credito. Il progetto Mayflower.
FrancoAngeli Editore.
Muscettola, M., & Modina, M. (2013). The quality of a regional rating. An empirical evidence on Italian SMEs.
Arethuse, 81–101.
Muscettola, M., & Naccarato, F. (2013). Probability of default and probability of excellence, an inverse model of
rating. One more tool to overcome the crisis: An empirical analysis. Business System Review, 2(2).
Muscettola, M., & Pietrovito, F. (2012 b). La rilevanza delle variabili finanziarie nel rating: I risultati di
un’analisi empirica sulle PMI italiane. In Rapporti di ricerca. Nr. 36. Sinergie Editore.
Muscettola, M., & Pietrovito, F. (2012a). Le caratteristiche delle imprese insolventi. Il Rating tra impresa, banca
e territorio. Sinergie Editore.
Myers, S. (1977). Determinants of corporate borrowing. J. Financ. Econ., 5, 147–175.
http://dx.doi.org/10.1016/0304-405X(77)90015-0
Myers, S. (2001). Capital structure. J. Econ. Perspectives, 15, 81–102. http://dx.doi.org/10.1257/jep.15.2.81
Myers, S. C., & Majluf, N. S. (1984). Corporate financing and investment decisions when firms have
information that investors do not have. Journal of Financial Economics, 13, 187–221.
http://dx.doi.org/10.1016/0304-405X(84)90023-0
Ohlson, J. A. (1980). Financial ratios and the probabilistic prediction of bankruptcy. Journal of Accounting
Research, 18, 109–131. http://dx.doi.org/10.2307/2490395
Rajan, R., & Zingales, L. (1995). What do we know about capital structure: Some evidence from international
data. J. Finance, 50, 1421–1460. http://dx.doi.org/10.1111/j.1540-6261.1995.tb05184.x

www.ccsenet.org/ijef International Journal of Economics and Finance Vol. 5, No. 12; 2013
14
Rauh, J., & Sufi, A. (2010). Capital structure and debt structure. Rev. Financ. Stud., 23, 4242–4280.
http://dx.doi.org/10.1093/rfs/hhq095
Taggart, R. A. (1977). A model of corporate financing decisions. J. Finance, 32, 1467–1484.
http://dx.doi.org/10.1111/j.1540-6261.1977.tb03348.x
Titman, S., & Wessels, R. (1988). The determinants of capital structure. J. Finance, 43, 1–19.
http://dx.doi.org/10.1111/j.1540-6261.1988.tb02585.x
Welch, I. (2004). Capital structure and stock returns. J. Polit. Econ,. 112, 106–131.
http://dx.doi.org/10.1086/379933
Notes
Note 1. As a confirmation of the necessity of a higher risk premium and the sensitivity of pricing to
creditworthiness.
Note 2. This theory states that firms look for an optimal capital structure for each type of business, based on the
quantification of the costs and the benefits of debt.
Note 3. The theory is based on the removal of the hypothesis of perfect information. Since corporate
management knows the true value of the asset, it considers financing one’s investments primarily through cash
flow and then through debt as a more cost-effective solution. The firms applying this theory see equity only as a
last resort.
Note 4. As their size and years of business increase, firms show an ever-growing tendency to rely on
differentiated funding arrangements. The interest in various financing channels is therefore closely related to the
age and the category of businesses. The traditional hierarchy, therefore, is to be amended not only in the light of
a firm’s size, but also of the degree of development of a productive project, to which different levels of
information opacity and financial need may correspond.
Note 5. The theory also applies to “traditional firms” that have a higher incidence of tangible fixed assets on
intangibles. They denote, by definition, a greater recoverability after default than more innovative businesses.
These firms consequently have lower bankruptcy costs and, therefore, can afford a higher leverage degree.
Note 6. Gibson and Graham (1996) show that the ratio between the financial leverage and the firm's market
value tends to be negative. In terms of opportunities, low-growth firms are more exposed to conflicts between
management and shareholders, while conflicts between management and creditors are more likely to occur in
high-growth companies. In other words, the increase of the value of the shares of a company should correspond
to a decrease in the power of management to contract new debts. On the other hand, in the light of the
aforementioned conflicts between the powers that be, Mackie and Mason (1990) describe those firms with great
profitability, and with a greater loss of added value caused by the payment of taxes, as firms with a prevalence of
administrative power over the strength of their shareholders. By inference, their debt load is consequently
heavier.
Note 7. However, empirical evidence derived from this method of analysis has shown several limitations in
explaining the hierarchy of corporate financing choices, especially if referring to the most recent analyses. Frank
and Goyal (2003), for instance, have raised several questions about the validity of the theory on a larger sample
than Myers’s.
Note 8. It is reasonable to think that in order to support their activities, firms resort to equity first, since it has no
immediate costs, and to debts later. As regards external capital, it is plausible that firms choose trade payables
first and financial debts and bond issue later, in a hierarchical order.
Note 9. Firstly, the authors proved that financial leverage tends to converge very slowly towards a fixed point
from which it deviates only provisionally. Secondly, they described the most profitable firms as the least
indebted ones as well, although they would have to compensate for higher returns with higher borrowing costs.
Other well-known studies which denied the validity of a ranking in funding choices applying to every situation
were performed by Chrinko and Singha (2000) and Leary and Roberts (2010).
Note 10. Among the most controversial points of the entire literature on optimal capital structure, however, there
is the understanding of the link (and the direction) between leverage and business profitability. Despite many
congenital deficiencies in several empirical studies, many authors have stressed the predominance of a negative
relation between the two quantities: as indebtedness decreases, profitability decreases. This inverse proportion,
however, is not consistent with the theory of debt as a tax benefit (Graham, 2000) to find a balance between the
choice of leverage and a strategy of costs and benefits in a market of indifference.

www.ccsenet.org/ijef International Journal of Economics and Finance Vol. 5, No. 12; 2013
15
Note 11. This could mean that capital structure is a direct consequence of business prospects.
Note 12. The bank acts mainly as an intermediary and intervenes to facilitate access to the market.
Note 13. The bank lends money and engages in a close, long-standing relationship with the firm mainly based
on information not available to the public (relationship-based systems).
Note 14. The analysis does not cover all the firms which got insolvent in 2008, in 2009 and in 2010, but only the
firms that became insolvent in 2011.
Note 15. This definition is narrower than the one generally applied in bank rating models, as these consider
default to be the onset of serious financial distress which borrowers cannot solve if unaided, and through which
the credit and loans granted may be lost. In our model, a firm was considered as default-grade during year 2011
if in that year the Central Credit Register reports the existence of credit overdue for more than three months.
Note 16. The yearly statements are provided by FourFinance Sas, which assembled, cleaned, regulated and
reclassified financial statements collected from multiple databases as, above all, Cerved Group Spa and Crif Spa.
As for the creation of the statistical model, the preliminary operations on the data, the choice of the outliers and
the creation of financial ratios, the reader ought to refer exclusively to the authors.
Note 17. It is not easy to say whether the excess of financial indebtedness may be the cause or the effect of a
poor corporate capitalization.
Note 18. The financial statements from 2008 to 2010 were provided by FourFinance SAS.
Note 19. Financial debt is defined here as bank loans and all borrowed funds not including inter-company loans,
debt securities, bonds and trade credits.
Note 20. To that aim, the distinction of the segments of the sample was simplified and the model was built with
a non-excessive series of variables linkable to a large and available data collection.
Note 21. A standard score is a consequential point that expresses how far a raw score is from some reference
point such as the mean in terms of standard deviation units. In other words, it is a measure of relative position
that is applicable when the data for the test are in the interval or ratio scale of measurement. Such modelling
technique allows us to compare the averages of financial ratios referred to the different area sectors in a unique
chart displaying an overview of the peculiarities of firms.
Note 22. The progression is repeated until no new variables make any significant contribution to the model. In
this way, the model allows a massive use of all the five financial variables starting from the financial ratios
which can demonstrate the most predictive strength.
Note 23. It indicates the standard deviation of the difference between the estimated values and true values.
Note 24. It tests the null hypothesis that the constant equals 0. This hypothesis is rejected when the p-value
(called “sig.”) is smaller than the critical p-value.
Note 25. P-value indicates, therefore, how likely (high values) or improbable (low values) is the possibility to
observe exactly the “x value” of the test statistic x under the null hypothesis. The p-value indicates the minimum
level of significance for which the null hypothesis is rejected.
Note 26. A rating on a scale of 1 to 10 where 1 is best, 10 is worst, and each number corresponds to an
increment of 10 percentage points.
Note 27. Ordinal classes are sessions that have a consequential order. There are several ways to extend the
binary-class case. In this paper we define the cumulative logistic method. Here, in fact, we look at cumulative
probabilities of class membership. For other methods see (Hosmer & Lemeshow, 2000).
Note 28. The motivation is to observe the class in which its probability of membership is highest. The overall
precision is designed for many values of the cut-off value, and the cut-off value that obtains maximum accuracy
is chosen.
Note 29. The effective accuracy of the model estimation increases as rapidly as the timeframe of the analysis is
shortened and it is also clear that the estimated coefficients of the logistic regression change markedly when the
time horizon is lengthened.
Note 30. It is generally agreed upon that Type I errors are more costly than Type II errors. That is calculated in
an expense twenty times higher than Type II errors.
Note 31. As for Southern Italian firms, in fact, there are more data to be considered. The demand of credit bank
exceeds supply, but banks are not willing to either loan more funds or raise the interest rate charged, as they are

www.ccsenet.org/ijef International Journal of Economics and Finance Vol. 5, No. 12; 2013
16
already maximizing profits with a situation of increased risk aversion. All this leads to a more selective credit
market (Ferri & Bongini, 2005) where the conditions of access to credit are more complex. We ultimately see
how firms with a higher cash flow level are – quite unjustifiably on the level of corporate demand – also the
most indebted with the banks which, on the other hand, prefer to employ their assets in firms with higher income
standing.
Note 32. The higher the incidence on assets of borrowing, the lower the profitability for a firm to have a
long-lasting life.
Copyrights
Copyright for this article is retained by the author(s), with first publication rights granted to the journal.
This is an open-access article distributed under the terms and conditions of the Creative Commons Attribution
license (http://creativecommons.org/licenses/by/3.0/).


