Embed Size (px)
Citation preview
Helen KellerINTERNATIONAL
The Higher Education/ucmdi\Network Ring Initiative!1 I
A collaborative programwith the Harvard School of Public Health (Harvard University, Boston, USA), SEAMEORegional Centre for Food and Nutrition (University of Indonesia,Jakarta, Indonesia), University of Mataram
(Mataram, Indonesia), University of Andalas (Padang, Indonesia), Helen Keller International-Indonesia (Jakarta,Indonesia) and the Summit Institute of Development (Mataram, Indonesia) with support from
the United States Agency for International Development-Indonesia
;
data-drivenlessonplans
IN NUTRITIONandPUBLIC HEALTHA HANDBOOK
Editors:Judhiastuty Februhartanty
Airin RoshitaHeida Khusun
Anuraj Shankar
summit SD1USAIDFROMTHE AMERICAN PEOPLE
AUTHORS OF THE LESSON PLANS(in alphabetical order)
Airin RoshitaSEAMEO RECFON Universitas Indonesia
11. Judhiastuty FebruhartantySEAMEO RECFON Universitas Indonesia
2. Anita ShankarJohns Hopkins University, BloombergSchool ofPublic Health, USA
3. Aria KekalihFaculty of Medicine, UniversitasIndonesia
12. Liana SuryaningsihFaculty of Agriculture, University ofMataram, Nusa Tenggara Barat, Indonesia
13. Lina RospitaSEAMEO RECFON Universitas Indonesia
4. Defriman DjafriFaculty of Public Health, AndalasUniversity, Padang, Indonesia
5. Deni ElnovrizaFaculty of Public Health, University ofAndalas, Padang, Indonesia
6. Dian N BasukiWorld Food Program Indonesia
Dwi GayatriFaculty of Public Health, UniversitasIndonesia
Helda KhusunSEAMEO RECFON Universitas Indonesia
14. Luh Ade Ari WiradnyaniSEAMEO RECFON Universitas Indonesia
15. Nur Indrawaty LipoetoFaculty of Public Health, AndalasUniversity, Padang, Indonesia
16. Rosvita RasyidFaculty of Public Health, AndalasUniversity, Padang, Indonesia
17, Surya HadiFaculty of Mathematics and NaturalSciences, University of Mataram, NusaTenggara Barat, Indonesia
18. Umi FahmidaSEAMEO RECFON Universitas Indonesia
9. HelmizarFaculty of Public Health, AndalasUniversity, Padang, Indonesia
10. Idral PurnakaryaFaculty of Public Health, AndalasUniversity, Padang, Indonesia
19. Vivi TrianaFaculty of Public Health, AndalasUniversity, Padang, Indonesia
VII
USAIDsummitKfiU»r
HENRI Data-driven lesson plans ) 17
Author;
Defrirnan Djafri (Faculty of Public Health, Andalas University, Padang, Indonesia)
Background
Confounding is a very important concept in epidemiology, because of its effect on distorting the association
between exposure and outcome. The confounding effect or effect modification (interaction) must be considered.vhen an extraneous variable affects the association between the exposure and the outcome of interest. Theconfounding effect can be controlled by planning the study well prior to data collection, or if the data is already
collected we can control for the confounding effect by performing adjusted analysis using stratified or regression
analysis.
Learning objectives
At the endof the lesson,the participantsare able to:1. understandthe concept of confoundingand interaction/effect modification2. describe the principieand methodsemployed incontrollingfor confoundingfactors3. identify a potential confounder4. assess the occurrence of confounders and effect modifiers by meansof statistical analysis
Jsage within the curriculum
~-iis lesson is part of the course "Analytical Epidemiology" for the Undergraduate Program in the Faculty of Public-ealth, Andalas University, given in semester VI. The data in this lesson is used by facilitators to support theectures and tasks. This lesson may also be offered in a postgraduate program where participants may be givenmore independent tasks such as performing analysis and interpretation using raw data from actual;jrveys/studies with some statistical application such as R, Epi Info, SPSS, STATA, etc, as well as presenting the-esuits in a plenary.
E gibility of participants
~->e participants are undergraduate students at Faculty of Public Health majoring in Epidemiology. Participantsmould have a basic knowledge in biostatistics and epidemiology as well as a basic skills in using a statisticaljftware.
4. ASSESSMENT OF CONFOUNDERS AND INTERACTIONS:AN ANALYSIS OF EPIDEMIOLOGICAL DATA
18 j HENRI Data-driven lesson plans
USAID
Materials and resources :: ; _rT
Presentation slides on "Confounding" and "Effect Modifier/interaction"An article about confoundingDataset for lecture on Confounding: Lung Cancer.xlsDataset for Task 2: CMD.xisR software/Epi Info 7 (open source software)Worksheet for Task 1(Appendix 4.1)Worksheet for Task 2 (Appendix 4.2)
Facilitators
The facilitators are the course coordinator(s).
Duration
This lesson is to be conducted for a total of 2 sessions, each 100 minutes.
Directions of class activities
1. In Session 1, facilitators complete the slide presentation on "Confounding". The dataset on LunjCancer.xls is usedas part of the lecture.
2. After the lecture,participantsare requiredto study an article about confounding by Sonis (1998).
3. Participants are given individual take home assignments on Task 1(Appendix 4.1) to compute and assesconfounding in a given case study.
4. InSession 2, facilitators complete the siide presentationon "Effect Modifier/Interaction".5. Participants are given individual take home assignments on Task 2 (appendix 4.2) based on the dataset
CHD.xis using R software or Epi Info 7.
Evaluation of the participants
The evaluation of the participants in this lesson will contribute tothe overall final grade. The followingcomponents are used:
• Individual tasks : 20%
• Midterm examination : 30%
• Final examination : 50%
All individualtake home assignmentsare submitted through e-mail with the output files.
i mssm
valuation of the lesson
raluation is done once at the end of the Semester. Students are requested to fill in a survey questionnaire to
i/aluate the overall course. The results of the survey will be shared with the course coordinators and teaching
>amfor improvement.
efereoces
1. Rosenberg D and Handler A. Analytic epidemiology and multivariable methods. New York: Springer-Verlakinc., 1998.
2. Rothman KJ, Greenland S, Lash TL. Modernepidemiology, 3rd. Lippincott Williams & Wilkins, 2008
3. Savitz DA. Interpretingepidemiologic evidence: Strategies for study design and analysis. Oxford University
Press,2003.4. Sonis J. A closer lookat confounding. Fam Med 1998;30:584-588.5. Twisk JWR. Applied longitudinaldata analysisforepidemiology. Cambridge University Press, 2003.
6. Vittinghoff E, Glidden D, McCulloch CE, Shiboski S. Multi-predictor methods in biostatistics. University ofCalifornia,2002.
HENRI Data-driven lesson plans | 19
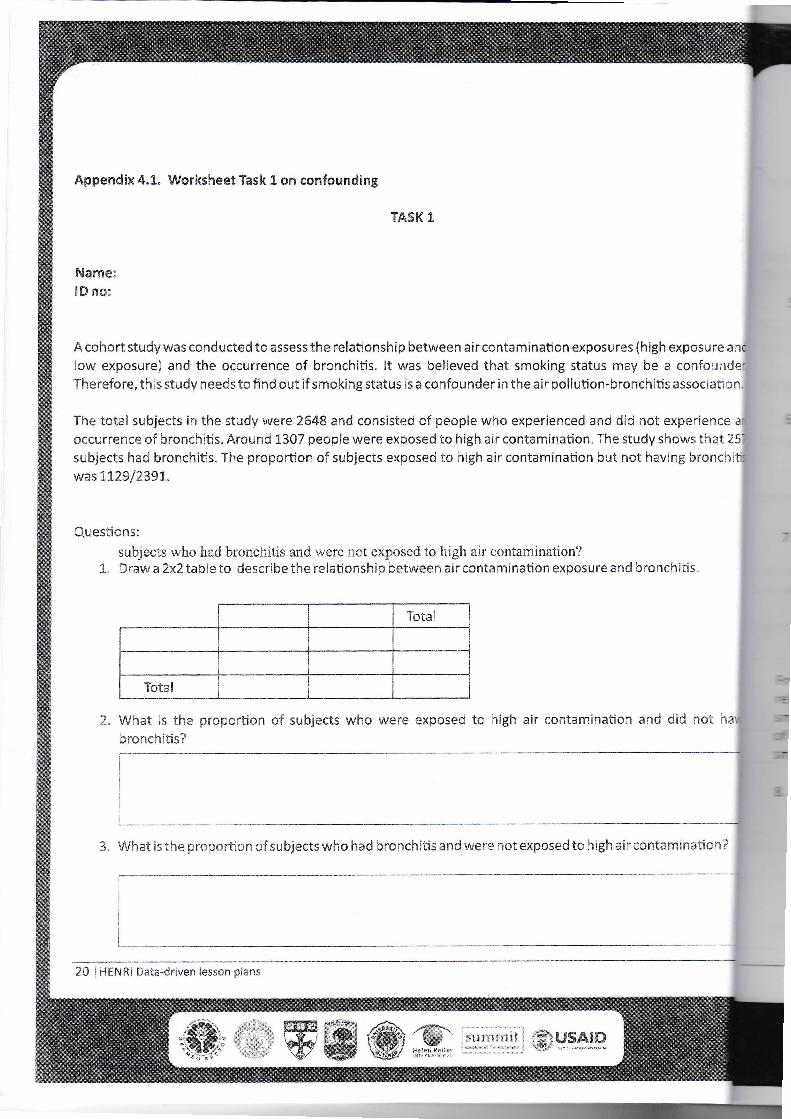
Appendix 4.1. Worksheet Task 1on confounding
TASK 1
NameIDno:
A cohort study was conducted to assess the relationship betweenair contamination exposures (high exposure anclow exposure) and the occurrence of bronchitis. It was believed that smoking status may be a confounder.Therefore, this study needsto find out if smokingstatus is a confounder inthe air pollution-bronchitisassociation.
The total subjects in the study were 2648 and consisted of people who experienced and did not experience anioccurrence of bronchitis. Around 1307 people were exposed to high air contamination.The study shows that 257subjects had bronchitis. The proportion of subjects exposed to high air contamination but not having bronchitiswas 1129/2391.
Questionssubjects who hadbronchitis and were not exposed to high air contamination?Draw a 2x2 table to describe the relationship betweenair contamination exposure and bronchitis
What is the proportion of subjects who were exposed to high air contamination and did not ha\Jbronchitis?
3. What is the proportionof subjects who hadbronchitisand were not exposed to highair contamination?
20 |HENRI Data-driven lesson plans
[summit j fSTiUSAJDK«n» ' W

4. Among subjects who did not have bronchitis, what is the proportion of them exposed to high air
contamination?
5. Amongst the subjects who were exposed to high air contamination, what is the ratio of those who had or
did not have bronchitis?
6. What is ratio of respondents who were exposed or not exposed to high air contamination who sufferedfrom bronchitis?
7. What is the correct measure for association/risk in this study? Based on the relationship between levels ofair contamination exposure and bronchitis, calculate the estimate of this association and interpret theresults.
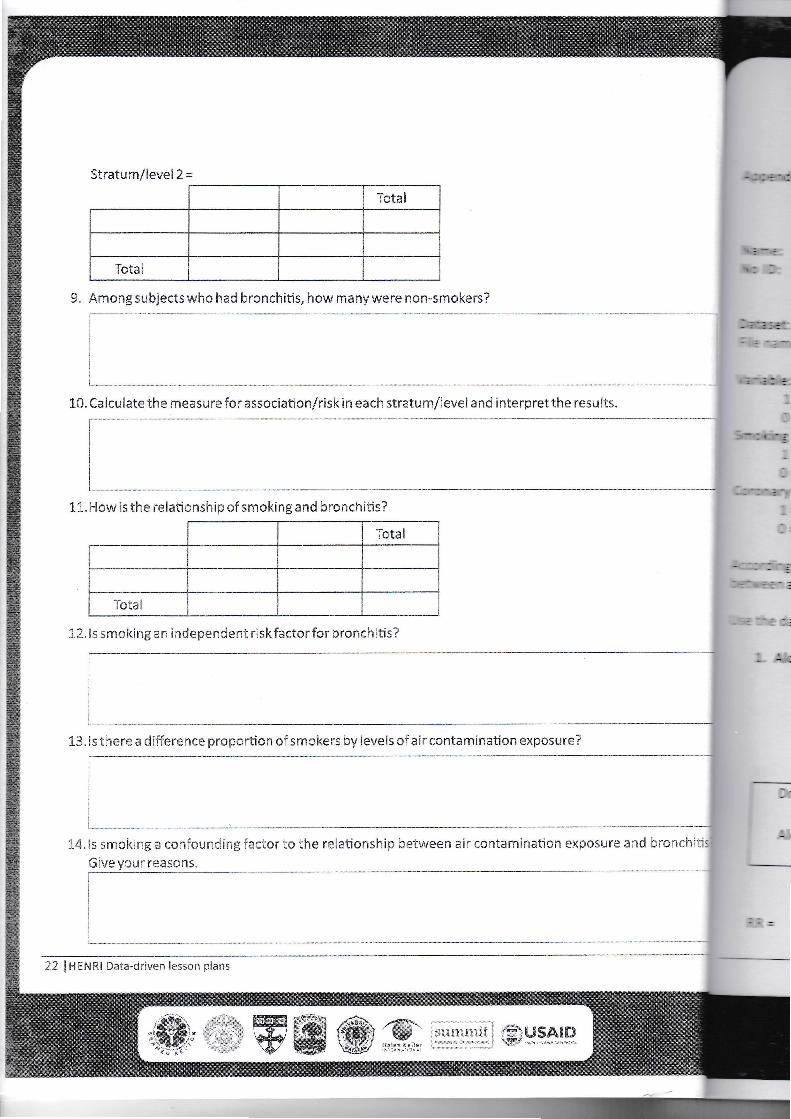
From the results above, stratification by smoking status was made to see whether or not it distorts therelationship between exposure of air contamination and bronchitis, it was found that the proportion ofsmokers was 1259/2648. Among subjects who had bronchitis in the smoker group, it was found that the ratioof subjects exposed and not exposed to high air contamination was 168/34. Meanwhile, among the non-smoker group, 259 subjects were exposedto high air contamination.
8. Create 2x2 table for each stratum/level based on the smokingstatus.
Stratum/level 1=? I
__Total
Total
summit USAIOHftlen Kft'Hssr
HENRI Data-driven lesson plans j 21
jg USAIDsummit
13.Isthere a difference proportionof smokers by levelsof air contamination exposure?
14.Is smoking a confounding factor to the relationship between air contamination exposure and bronchitis!Giveyour reasons. ___I
22 |HENRI Data-driven lesson plans
9. Among subjectswho had bronchitis, how manywere non-smokers?
10.Caicuiate the measurefor association/risk ineach stratum/level and interpret the results.
11.How is the relationshipo? smokingand bronchitis?
Total
|
Total 112.Issmokingan independent riskfactor for bronchitis?
Stratum/level 2 =
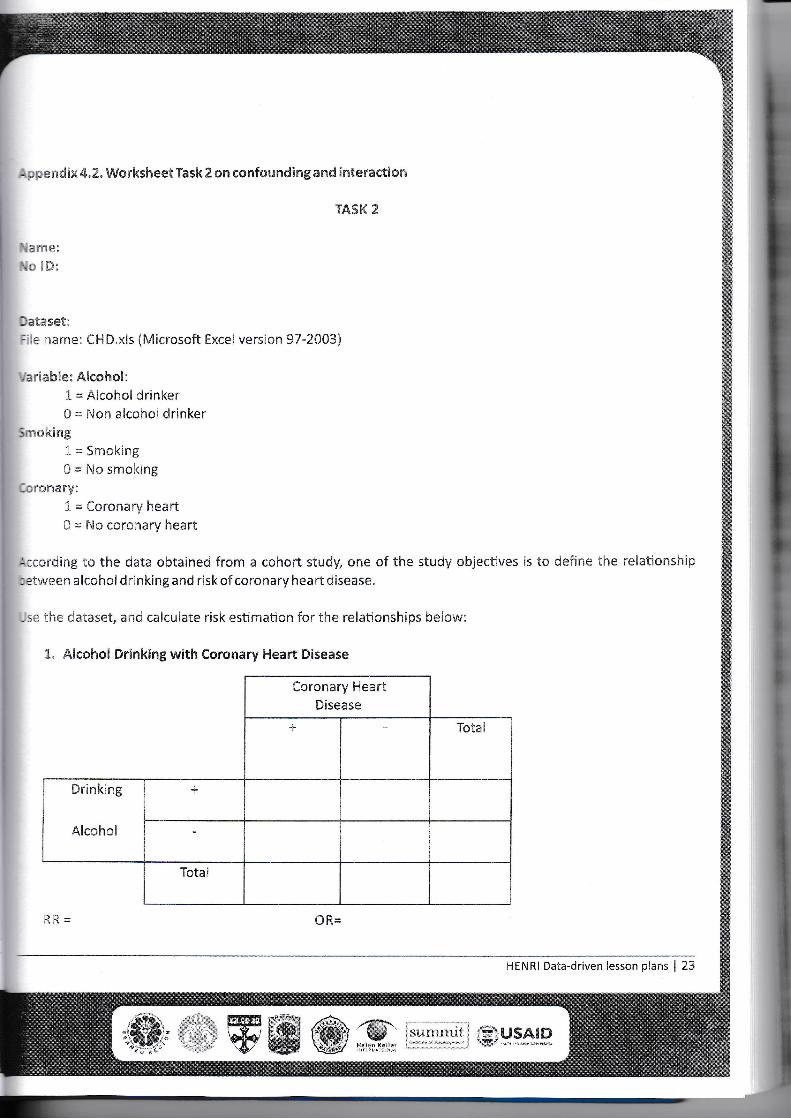
Appendix 4.2. Worksheet Task 2 on confoundingand interaction
TASK 2
Name:No ID:
Dataset::iie name: CHD.xls (Microsoft Excel version 97-2003}
Variable: Alcohol:1= Alcohol drinker0 = Non alcohol drinker
Smoking1= Smoking0 = No smoking
Coronary:
1= Coronary heart0 = No coronary heart
According to the data obtained from a cohort study, one of the study objectives is to define the relationship:etweenalcohol drinkingand risk of coronary heart disease,
Use the dataset, and calculate risk estimation for the relationships below:
1. Alcohol Drinkingwith Coronary Heart Disease
Coronary HeartDisease
+ Total
Drinking
Alcoholi
4- |
Total
RR OR=
HENRI Data-driven lesson plans | 23
jo UH (summit IIPUSAID

2. Alcohol Drinkingwith Coronary Heart Disease among Smokers (Smoking=l)
Coronary HeartDisease
Drinking
Alcohol
3. Alcohol Drinkingwith Coronary Heart Disease among Non-Smokers (Smoking=0)
Coronary HeartDisease
Drinking
Alcohol
24 j HENRI Data-driven lesson plans
USAIDsummitKe'lh
ÿÿÿÿI
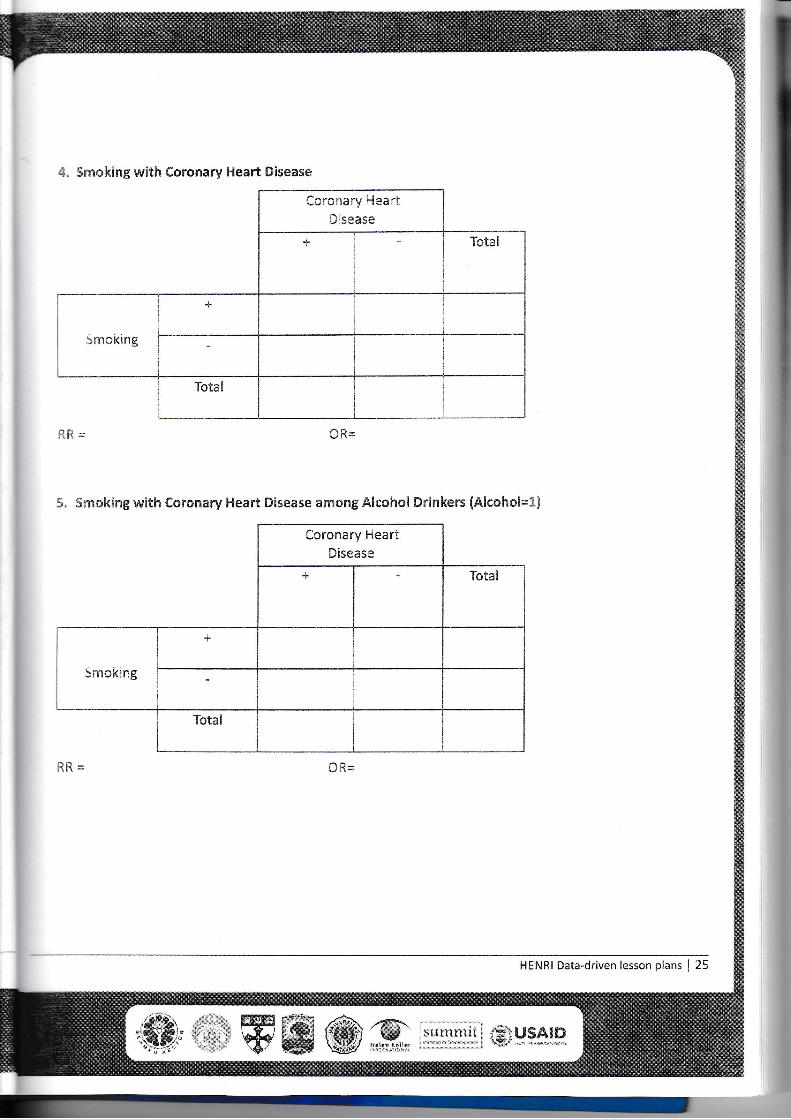
4. Smoking with Coronary Heart Disease
Coronary HeartDisease
+ Totai
C i,"smoking
1
+
-
Totai
RR 0R=
5. Smoking with Coronary Heart Disease among Aicohoi Drinkers (A!eohoi=lJ
Coronary HeartDisease
+ Total
bmoking
+
-
Total
RR 0R=
HENRI Data-driven lesson plans J 25
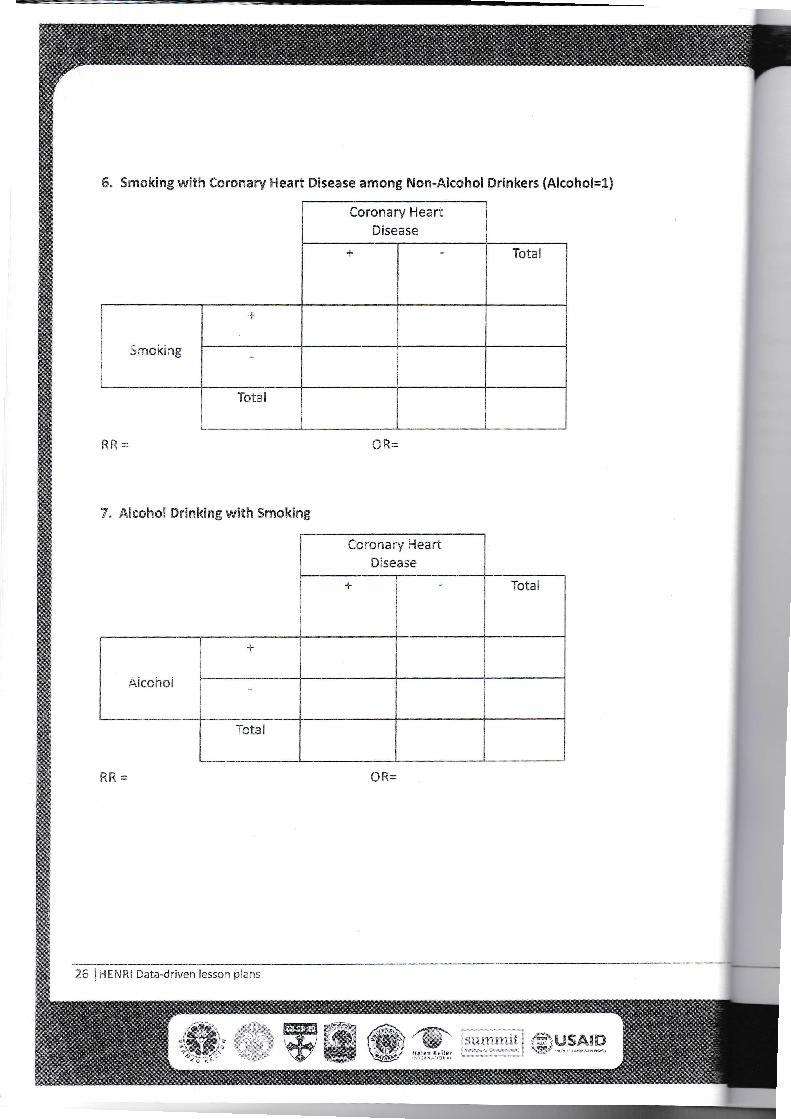
6. Smoking with Coronary Heart Disease among Non-Alcohol Drinkers (Alcohol=l)
Coronary HeartDisease
Smoking
7. Alcohol Drinkingwith Smoking
Coronary HeartDisease
Alcohol
26 j HENRI Data-driven lesson plans
summit USA1D Immi
1mm
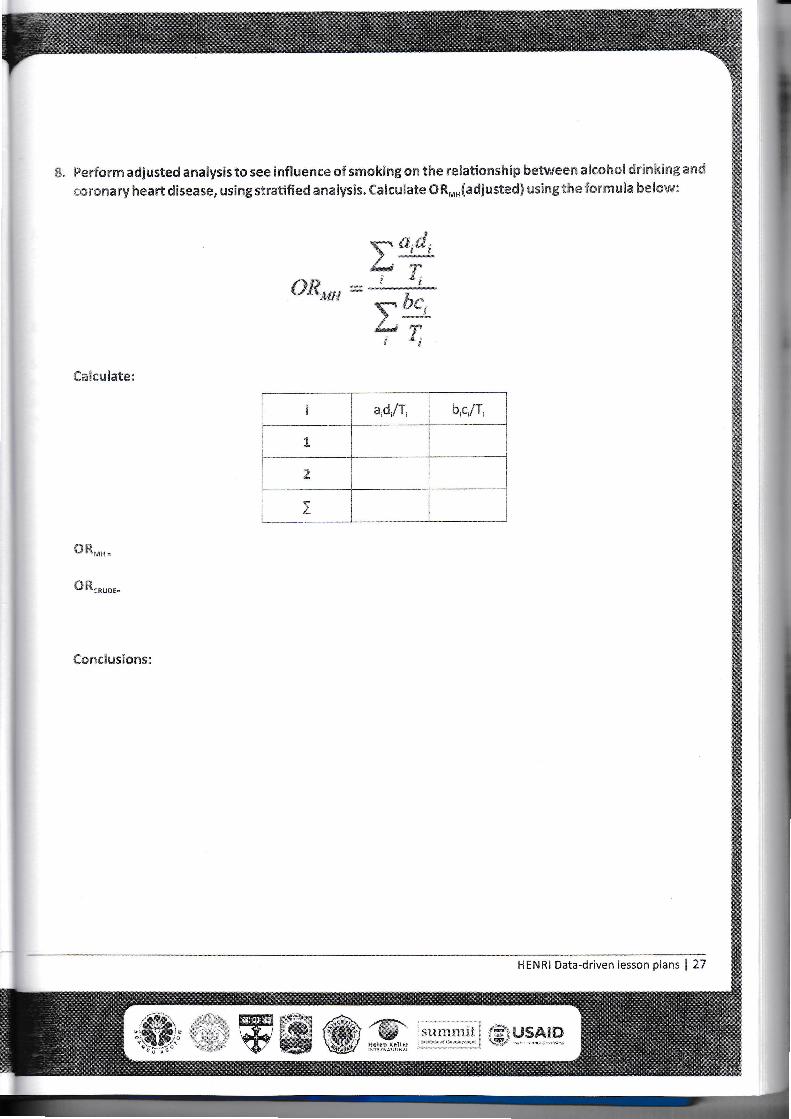
f8. Performadjusted analysis to see influenceof smokingon the relationshipbetweenalcoholdrinkingand
coronary heart disease, usingstratifiedanalysis. Calculate ORMH(adjustedj usingthe formula below:
Calculate:
OR..
OR,
Conclusions:
y a,d,immd *JjT*
or„ - • 'be(Ii *i
i aid/T, b.c/T,
1
2
I
v-sm"'
HENRI Data-driven lesson plans | 27
11suniraii
Helen K«n«r I.?..USAID

summit USAIDHelen KellerINTERNATIONAL
FROMTHE AMERICAN PEOPLE
SMS
The Higher Education Network Ring Initiative(HENRI)
ISBN 17fl-L02-].1414-7-4
9 786021 949474


