Embed Size (px)
Citation preview

This page intentionally left blank
RECOGNIZING THE BASICS
SECOND EDITION
William Herring, MD, FACRVice Chairman and Residency Program DirectorDepartment of RadiologyAlbert Einstein Medical CenterPhiladelphia, Pennsylvania
1600 John F. Kennedy Blvd.Ste 1800Philadelphia, PA 19103-2899
LEARNING RADIOLOGY 978-0-323-07444-5Copyright © 2012, 2007 by Mosby, Inc., an affiliate of Elsevier Inc.
No part of this publication may be reproduced or transmitted in any form or by any means, electronic or mechanical, including photocopying, recording, or any information storage and retrieval system, without permission in writing from the publisher. Details on how to seek permission, further information about the Publisher’s permissions, policies, and our arrangements with organizations such as the Copyright Clearance Center and the Copyright Licensing Agency, can be found at our website: www.elsevier.com/permissions.
This book and the individual contributions contained in it are protected under copyright by the Publisher (other than as may be noted herein).
Notices
Knowledge and best practice in this field are constantly changing. As new research and experience broaden our understanding, changes in research methods, professional practices, or medical treatment may become necessary.
Practitioners and researchers must always rely on their own experience and knowledge in evaluating and using any information, methods, compounds, or experiments described herein. In using such information or methods they should be mindful of their own safety and the safety of others, including parties for whom they have a professional responsibility.
With respect to any drug or pharmaceutical products identified, readers are advised to check the most current information provided (i) on procedures featured or (ii) by the manufacturer of each product to be administered, to verify the recommended dose or formula, the method and duration of administration, and contraindications. It is the responsibility of practitioners, relying on their own experience and knowledge of their patients, to make diagnoses, to determine dosages and the best treatment for each individual patient, and to take all appropriate safety precautions.
To the fullest extent of the law, neither the Publisher nor the authors, contributors, or editors, assume any liability for any injury and/or damage to persons or property as a matter of products liability, negligence or otherwise, or from any use or operation of any methods, products, instructions, or ideas contained in the material herein.
Library of Congress Cataloging-in-Publication DataHerring, William. Learning radiology : recognizing the basics / William Herring. — 2nd ed. p. ; cm. Includes bibliographical references and index. ISBN 978-0-323-07444-5 (pbk. : alk. paper) 1. Radiology, Medical—Study and teaching. I. Title. [DNLM: 1. Radiography—methods. 2. Diagnosis, Differential. WN 200] R899.H472 2012 616.07!572—dc22 2011006507
Acquisitions Editor: James MerrittDevelopmental Editor: Andrea VosburghPublishing Services Manager: Deborah VogelProject Manager: Brandilyn TidwellDesigner: Ellen ZanolleIllustrations Manager: Michael CarcelMarketing Manager: Jason Oberacker
Printed in the United States of America
Last digit is the print number: 9 8 7 6 5 4 3 2 1
Working together to grow libraries in developing countries
www.elsevier.com | www.bookaid.org | www.sabre.org

To my wife, Patricia,
and our family

This page intentionally left blank

vii
Contributor
Daniel J. Kowal, MDComputed Tomography Division DirectorRadiology Elective DirectorDepartment of RadiologySaint Vincent HospitalWorcester, MassachusettsChapter 20, Magnetic Resonance Imaging

This page intentionally left blank
ix
Preface to the First Edition
If you’re the kind of person, like I am, who reads the preface after you’ve read the book, I hope you enjoyed it. If you’re the kind of person who reads the preface before reading the book, then you’re in for a real treat.
Suppose for a moment that you wanted to know what kind of bird with a red beak just landed on your windowsill (don’t ask why). You could get a book on birds that listed all of them alphabetically from albatross to woodpecker and spend time looking at hundreds of bird pictures. Or you could get a book that lists birds by the colors of their beaks and thumb through a much shorter list to find that it was a cardinal.
This is a red-beak book. Where possible, groups of diseases are first described by the way they look rather than by what they’re called. Imaging diagnoses frequently, but not always, rest on a recognition of a reproducible visual picture of that abnormality. That is called the pattern recognition approach to identifying abnormalities, and the more experience you have and more proficient you become at looking at imaging studies, the more comfortable and confident you’ll be with that approach.
Before diagnostic images can help you decide what disease the patient may have, you must first be able to differentiate between what is normal and what is not. That isn’t as easy as it may sound. Recognizing the difference between normal and abnormal probably takes as much, if not more, practice than deciding what disease the person has.
In fact, it takes so much practice, some people—I believe they are called radiologists—have actually been known to spend their entire life doing it. You won’t be a radiologist after you’ve completed this book, but you should be able to rec-ognize abnormalities and interpret images better. By so doing, perhaps you can participate in the care of patients with more assurance and confidence.
In this text, you’ll spend time in each section learning how to recognize what is normal so that you can differentiate between such things as a skin fold and a pneumothorax or so that you can recognize whether that fuzzy white stuff at the lung bases is pneumonia or the patient simply hasn’t taken a deep breath.
Where pattern recognition doesn’t work, we’ll try when-ever possible to give you a logical approach to reaching a diagnosis based on simple yet effective decision trees. These will be little decision trees—saplings with only a few branches—so that they are relatively easy to remember.
By learning an approach, you’ll have a method you can apply to similar problems again and again. Have you ever heard the saying “Give a man a fish; you have fed him for today. Teach a man to fish, and you have fed him for a life-time”? Learning an imaging approach is like learning how to fish, except a lot less smelly. An approach will enable you to apply a rational solution to diagnostic imaging problems.
This text was written, in part, to make complementary use of the medium for which radiologic images are ideally suited: the computer screen. The web is ideal for accessing and dis-playing images, but many people do not want to read large volumes of text from their computer screens. So we’ve joined the text in the printed book with photos, quizzes, and tutori-als available online at StudentConsult.com in a series of web enhancements that accompany every chapter.
This text is not intended to be encyclopedic. There are many wonderful radiology reference texts available, some of which contain thousands of pages and weigh slightly less than a Volkswagen. This text is oriented more towards students, interns, and residents or residents-to-be.
Not every imaging modality is covered equally in this book, and some are not covered at all. This book emphasizes conventional radiography because that is the type of study most patients have first and because the same imaging prin-ciples that apply to recognizing the diagnosis on conventional radiographs can be applied to making the diagnosis on more complex modalities.
With a better appreciation and understanding of why images look the way they do, you’ll soon be recognizing abnormalities and making diagnoses that will impress your mentors and peers and astound your friends and relatives.
Let’s get started.
William Herring, MD
x
Preface to the Second Edition
This second edition of Learning Radiology: Recognizing the Basics includes numerous changes and additions. There are additional chapters, over a hundred new photos, reorganiza-tion of key material throughout the text, and an increased emphasis on the cross-sectional imaging modalities of com-puted tomography (CT), magnetic resonance imaging (MRI), and ultrasound.
Two entirely new chapters have been added to help you understand the basic principles and fundamental observa-tions of ultrasound and MRI. Trauma has moved to its own chapter, bringing together related material to provide cohesive coverage of this important subject. A new and helpful appen-dix has been added, which lists the most appropriate imaging study to order for each of a myriad of clinical scenarios. This information should prove indispensable on clinical rounds.
Many chapters have been reorganized. The chapter on Recognizing Adult Heart Disease has been restructured to include relevant material featuring CT and MRI. The chapters on Diseases of the Chest and Diseases of the GI and Urinary Tracts have been updated with increased emphasis on CT,
ultrasound, and MRI. The chapters on Recognizing Arthritis and Common Causes of Neck and Back Pain incorporate more MRI imaging. The chapter on Recognizing Bowel Obstruction and Ileus now includes additional CT imaging.
There are enhancements to the printed text again available to registered users on the StudentConsult.com website, including access to the full text and all of its photos. Also available on the website are 24 interactive modules to help you learn radiologic anatomy. An algorithm for diagnosing adult heart disease using conventional radiography is avail-able online. A new section on nuclear medicine has also been added to StudentConsult.com.
The first edition suggested that you’d soon be recognizing abnormalities and making diagnoses that would impress your mentors and peers and astonish your friends and relatives. With this edition, you hold the potential to be even more astounding.
Prepare to amaze.
William Herring, MD
xi
Acknowledgments
First, I am grateful to the many thousands of you whom I have never met but who found a website called Learning Radiology helpful, and made it so popular it played a role leading to the first edition of this book, which was so popular that it led to this second edition.
For their help and suggestions, I would like to thank my colleague Mindy Horrow, MD, who read and critiqued several chapters with her usual expert eye and fine mind, and Thomas Reilly, MD, one of our radiology residents, who made invalu-able suggestions about how the first edition could be changed. Daniel Kowal, MD, a radiologist who graduated from our program, did an absolutely wonderful job in simplifying the complexities of MRI for a great new chapter he wrote for this edition.
I want to thank Shuchi Rodgers, MD, Jenifer Slone, MD, Susan Summerton, MD, Mindy Horrow, MD, Morrie Kricun,
MD, Huyen Tran, MD, Joanne Lee, MD, Jeffrey Weinstein, MD, and Michael Chen, MD for supplying additional photos for this edition. Thanks to Ryan Smith, MD for reviewing the StudentConsult chapter on nuclear medicine.
I certainly want to recognize and again thank Jim Merritt and Andrea Vosburgh from Elsevier for their continued support and assistance.
I also want to acknowledge the hundreds of radiology resi-dents and medical students who, over the years, have pro-vided me with an audience of motivated learners without whom no teacher could teach.
Finally, I want to thank my wonderful wife, Pat, who has encouraged me throughout the project, and my family.

This page intentionally left blank

xiii
Contents
Chapter 1Recognizing Anything: An Introduction to Imaging Modalities 1
Let There Be Light . . . and Dark, and Shades of Gray 1Conventional Radiography (Plain Films) 1Computed Tomography (CT or CAT Scans) 1Ultrasound (US) 2Magnetic Resonance Imaging (MRI) 2Terminology 3The Best System Is the One That Works 6Conventions Used in This Book 7
Chapter 2Recognizing Normal Chest Anatomy and a Technically Adequate Chest Radiograph 8
The Normal Frontal Chest Radiograph 8The Lateral Chest Radiograph 8Five Key Areas on the Lateral Chest X-Ray 8Evaluating the Chest Radiograph for Technical Adequacy 12
Chapter 3Recognizing Airspace Versus Interstitial Lung Disease 18
Classifying Parenchymal Lung Disease 18Characteristics of Airspace Disease 18Some Causes of Airspace Disease 18Characteristics of Interstitial Lung Disease 20Some Causes of Interstitial Lung Disease 22
Chapter 4Recognizing the Causes of an Opacified Hemithorax 27
Atelectasis of the Entire Lung 27Massive Pleural Effusion 27Pneumonia of an Entire Lung 27Postpneumonectomy 28
Chapter 5Recognizing Atelectasis 32
What Is Atelectasis? 32Signs of Atelectasis 32Types of Atelectasis 32Patterns of Collapse in Lobar Atelectasis 37How Atelectasis Resolves 39
Chapter 6Recognizing a Pleural Effusion 40
Normal Anatomy and Physiology of the Pleural Space 40Causes of Pleural Effusions 40Types of Pleural Effusions 40Side Specificity of Pleural Effusions 40Recognizing the Different Appearances of Pleural Effusions 41Loculated Effusions 45
Chapter 7Recognizing Pneumonia 50
General Considerations 50General Characteristics of Pneumonia 50
Patterns of Pneumonia 50Aspiration 54Localizing Pneumonia 55How Pneumonia Resolves 57
Chapter 8Recognizing Pneumothorax, Pneumomediastinum, Pneumopericardium, and Subcutaneous Emphysema 59
Recognizing a Pneumothorax 59Recognizing the Pitfalls in Overdiagnosing a Pneumothorax 59Types of Pneumothoraces 61Causes of a Pneumothorax 62Other Ways to Diagnose a Pneumothorax 62Pulmonary Interstitial Emphysema 63Recognizing Pneumomediastinum 64Recognizing Pneumopericardium 65Recognizing Subcutaneous Emphysema 66
Chapter 9Recognizing Adult Heart Disease 68
Recognizing an Enlarged Cardiac Silhouette 68Pericardial Effusion 68Extracardiac Causes of Apparent Cardiac Enlargement 68Effect of Projection on Perception of Heart Size 68Identifying Cardiac Enlargement on an Anteroposterior Chest
Radiograph 68Recognizing Cardiomegaly on the Lateral Chest Radiograph 69Recognizing Cardiomegaly in Infants 70Normal Cardiac Contours 70Normal Pulmonary Vasculature 70General Principles of Cardiac Imaging 71Recognizing Common Cardiac Diseases 71
Chapter 10Recognizing the Correct Placement of Lines and Tubes: Critical Care Radiology 86
Endotracheal and Tracheostomy Tubes 86Intravascular Catheters 88Pulmonary Drainage Tubes (Chest Tubes, Thoracotomy Tubes) 91Cardiac Devices 93Gastrointestinal Tubes and Lines 95
Chapter 11Computed Tomography: Understanding the Basics and Recognizing Normal Anatomy 98
Introduction to CT 98Intravenous Contrast in CT Scanning 99Oral Contrast in CT Scanning 99Normal Chest CT Anatomy 100Cardiac CT 103Abdominal CT 105
Chapter 12Recognizing Diseases of the Chest 109
Mediastinal Masses 109Anterior Mediastinum 109Middle Mediastinum 112Posterior Mediastinum 113

xiv | Contents
Solitary Nodule/Mass in the Lung 113Bronchogenic Carcinoma 116Metastatic Neoplasms in the Lung 119Pulmonary Thromboembolic Disease 120Chronic Obstructive Pulmonary Disease 120Blebs and Bullae, Cysts and Cavities 122Bronchiectasis 123
Chapter 13Recognizing the Normal Abdomen: Conventional Radiographs 127
What to Look For 127Normal Bowel Gas Pattern 127Normal Fluid Levels 127Differentiating Large from Small Bowel 128Acute Abdominal Series: The Views and What They Show 129Calcifications 133Organomegaly 133
Chapter 14Recognizing Bowel Obstruction and Ileus 138
Abnormal Gas Patterns 138Laws of the Gut 138Functional Ileus, Localized: Sentinel Loops 138Functional Ileus, Generalized: Adynamic Ileus 139Mechanical Obstruction: Small Bowel Obstruction (SBO) 139Mechanical Obstruction: Large Bowel Obstruction (LBO) 144Volvulus of the Colon 146Intestinal Pseudo-obstruction (Ogilvie Syndrome) 146
Chapter 15Recognizing Extraluminal Air in the Abdomen 148
Signs of Free Intraperitoneal Air 148Causes of Free Air 149Signs of Extraperitoneal Air (Retroperitoneal Air) 150Causes of Extraperitoneal Air 150Signs of Air in the Bowel Wall 151Causes and Significance of Air in the Bowel Wall 153Signs of Air in the Biliary System 154Causes of Air in the Biliary System 154
Chapter 16Recognizing Abnormal Calcifications and Their Causes 156
Patterns of Calcification 156Rimlike Calcification 156Linear or Tracklike Calcification 156Lamellar or Laminar Calcification 156Cloudlike, Amorphous, or Popcorn Calcification 158Location of Calcification 159
Chapter 17Recognizing the Imaging Findings of Trauma 164
Chest Trauma 164Aortic Trauma 164Abdominal Trauma 167Pelvic Trauma 169
Chapter 18Recognizing Gastrointestinal, Hepatic, and Urinary Tract Abnormalities 172
Barium Studies of the Gastrointestinal Tract 172Esophagus 172Stomach and Duodenum 174Small and Large Bowel 176Pancreas 183Hepatobiliary Abnormalities 184Urinary Tract 189
Pelvis 190Urinary Bladder 190
Chapter 19Ultrasonography: Understanding the Principles and Recognizing Normal and Abnormal Findings 193
How it Works 193Doppler Ultrasonography 193Adverse Effects and Safety Issues 194Medical Uses of Ultrasonography 194Biliary System 194Urinary Tract 197Abdominal Aortic Aneurysms 198Female Pelvic Organs 198Appendicitis 203Pregnancy 203Vascular Ultrasound 206Deep Venous Thrombosis 207
Chapter 20Magnetic Resonance Imaging: Understanding the Principles and Recognizing the Basics 209DANIEL J. KOWAL
How MRI Works 209Hardware That Makes Up an MRI Scanner 209What Happens Once Scanning Begins 210Pulse Sequences 210How Can You Identify a T1-Weighted or T2-Weighted Image? 211MRI Contrast: General Considerations 213MRI Safety Issues 215Diagnostic Applications of MRI 217
Chapter 21Recognizing Abnormalities of Bone Density 218
Normal Bone Anatomy 218The Effect of Bone Physiology on Bone Anatomy 218Recognizing a Generalized Increase in Bone Density 219Recognizing a Focal Increase in Bone Density 221Recognizing a Generalized Decrease in Bone Density 223Recognizing a Focal Decrease in Bone Density 226Pathologic Fractures 229
Chapter 22Recognizing Fractures and Dislocations 232
Recognizing an Acute Fracture 232Recognizing Dislocations and Subluxations 232Describing Fractures 232Avulsion Fractures 237Salter-Harris Fractures: Epiphyseal Plate Fractures in Children 238Child Abuse 240Stress Fractures 241Common Fracture Eponyms 241Some Easily Missed Fractures or Dislocations 241Fracture Healing 244
Chapter 23Recognizing Joint Disease: An Approach to Arthritis 249
Anatomy of a Joint 249Classification of Arthritis 249Hypertrophic Arthritis 249Erosive Arthritis 255Infectious Arthritis 259
Chapter 24Recognizing Some Common Causes of Neck and Back Pain 261
Conventional Radiology, MRI, and CT 261The Normal Spine 261Back Pain 263Herniated Disks 264

Contents | xv
Degenerative Disk Disease 264Osteoarthritis of the Facet Joints 265Diffuse Idiopathic Skeletal Hyperostosis 266Compression Fractures of the Spine 266Spondylolisthesis and Spondylolysis 267Spinal Stenosis 267Malignancy Involving the Spine 268MRI in Metastatic Spine Disease 269Infections of the Spine: Diskitis and Osteomyelitis 271Spinal Trauma 271
Chapter 25Recognizing Some Common Causes of Intracranial Pathology 276
Normal Anatomy 276MRI and the Brain 276
Head Trauma 278Intracranial Hemorrhage 281Diffuse Axonal Injury 283Increased Intracranial Pressure 285Stroke 285Ruptured Aneurysms 288Hydrocephalus 289Cerebral Atrophy 293Brain Tumors 293Multiple Sclerosis 296Terminology 297
Appendix: Recognizing What to Order 299Bibliography 304Last Printed Page 318

This page intentionally left blank
1
Chapter 1
Recognizing Anything: An Introduction to Imaging Modalities
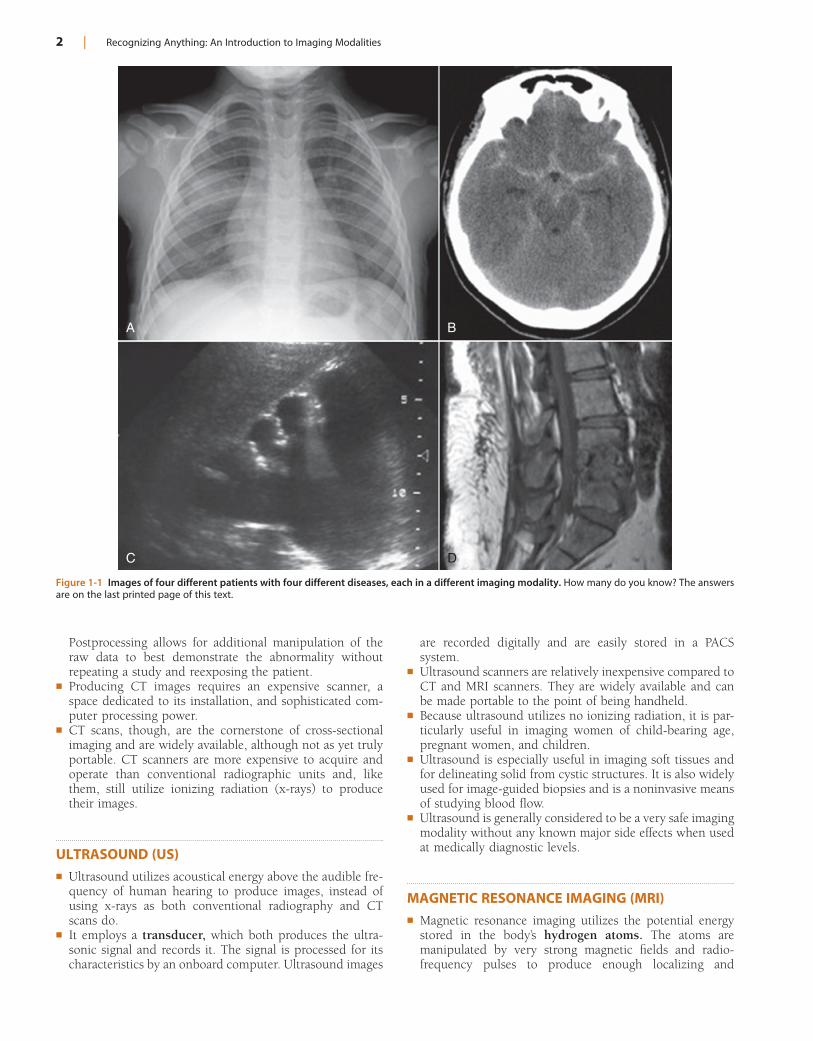
Up for a challenge? Look at these four images (Fig. 1-1). Each is diagnostic. How many can you recognize? “None” would be a good start. The answers are at the end of this book, both literally and figuratively. Literally, because the answers really are at the end of this book—on the last printed page, to be exact. Figuratively, because you will learn about each of these modalities, about these four diseases and many others, about how to approach imaging studies, and much more as you complete this text.
LET THERE BE LIGHT … AND DARK, AND SHADES OF GRAY! Once upon a time, not too long ago, radiographic images
lived on the medium of film. In some places, film is still used, but it is becoming much less common.
! Images were produced by a combination of x-rays and light striking a piece of photographic film, which in turn pro-duced a latent image that was subsequently processed in a darkroom filled with chemicals and then, literally, hung up to dry.• When an immediate reading was requested, the films
were interpreted while still dripping with chemicals, and the term wet reading for a “stat” interpretation was born.
• Films were viewed on lighted view boxes (almost always backward or upside-down if the film placement was being done as part of a movie or TV show).
! This workflow lasted for decades, but it had two major drawbacks:• It required lots of physical storage space for the growing
number of films.• The radiographic film itself could only be in one place
at one time, which was not necessarily where it might be needed to help in the care of the patient.
! And so digital radiography came to be, in which the pho-tographic film was replaced by a photosensitive cassette or plate that could be processed by an electronic reader so that the image could be stored digitally.• Countless images could be stored in the space of one
spinning hard disk on a computer server.• Even more importantly, the images could be viewed by
anyone with the right to do so, anywhere in the world, at any time.
! The studies were maintained on computer servers on which the images could be archived, communicated, and stored. This was and is called PACS, a Picture Archiving, Com-munications, and Storage system.
! Using PACS systems, all sorts of images can be stored and retrieved, including conventional radiographs (CR),
computed tomographic scans (CT), ultrasound images (US), and magnetic resonance imaging studies (MRI).
! Let’s look briefly at each of these modalities.
CONVENTIONAL RADIOGRAPHY (PLAIN FILMS)! Images produced through the use of ionizing radiation, i.e.,
x-rays, but without added contrast material like barium or iodine, are called conventional radiographs or, more often, “plain films.”
! These images are relatively inexpensive to produce, can be obtained almost anywhere using portable or mobile machines, and are still the most widely obtained imaging studies.
! They require a source to produce the x-rays (the “x-ray machine”), a method to record the image (a film, cassette, or plate) and a way to process the recorded image (either using chemicals or a digital reader).
! Common uses for conventional radiography include the ubiquitous chest x-ray, plain films of the abdomen, and virtually every initial image of the skeletal system to exclude fractures or arthritis.
! Ionizing radiation in large doses, substantially higher than any medical radiographic procedure, is known to produce cell mutations that can lead to many forms of cancer or anomalies. Public health data on lower levels of radiation vary as to their assessment of risk, but it is generally held that only medically necessary diagnostic examinations should be performed and that studies using x-rays should be avoided during potentially teratogenic times, such as pregnancy.
COMPUTED TOMOGRAPHY (CT OR CAT SCANS)! CT scanners, first introduced in the 1970s, brought a
quantum leap to medical imaging.! Using a gantry with a rotating x-ray beam and multiple
detectors in various arrays (which themselves are rotating continuously around the patient) along with sophisticated computer algorithms to process the data, a large number of two-dimensional, slicelike images could be formatted in multiple imaging planes.
! CT scans can also be “windowed” (see Chapter 11) in a way that optimizes the visibility of different types of pathology after they are obtained, a benefit called postpro-cessing that digital imaging, in general, markedly advanced.
2 | Recognizing Anything: An Introduction to Imaging Modalities
are recorded digitally and are easily stored in a PACS system.
! Ultrasound scanners are relatively inexpensive compared to CT and MRI scanners. They are widely available and can be made portable to the point of being handheld.
! Because ultrasound utilizes no ionizing radiation, it is par-ticularly useful in imaging women of child-bearing age, pregnant women, and children.
! Ultrasound is especially useful in imaging soft tissues and for delineating solid from cystic structures. It is also widely used for image-guided biopsies and is a noninvasive means of studying blood flow.
! Ultrasound is generally considered to be a very safe imaging modality without any known major side effects when used at medically diagnostic levels.
MAGNETIC RESONANCE IMAGING (MRI)! Magnetic resonance imaging utilizes the potential energy
stored in the body’s hydrogen atoms. The atoms are manipulated by very strong magnetic fields and radio-frequency pulses to produce enough localizing and
Postprocessing allows for additional manipulation of the raw data to best demonstrate the abnormality without repeating a study and reexposing the patient.
! Producing CT images requires an expensive scanner, a space dedicated to its installation, and sophisticated com-puter processing power.
! CT scans, though, are the cornerstone of cross-sectional imaging and are widely available, although not as yet truly portable. CT scanners are more expensive to acquire and operate than conventional radiographic units and, like them, still utilize ionizing radiation (x-rays) to produce their images.
ULTRASOUND (US)! Ultrasound utilizes acoustical energy above the audible fre-
quency of human hearing to produce images, instead of using x-rays as both conventional radiography and CT scans do.
! It employs a transducer, which both produces the ultra-sonic signal and records it. The signal is processed for its characteristics by an onboard computer. Ultrasound images
Figure 1-1 Images of four different patients with four different diseases, each in a different imaging modality. How many do you know? The answers are on the last printed page of this text.
A B
C D
Recognizing Anything: An Introduction to Imaging Modalities | 3
film. A new, unexposed piece of film will then be loaded into the cassette, and the cassette will be ready for the next exposure.
• If it is a digital cassette and contains no film, it will be processed through an electronic reader that will decipher the electronic image stored on the phosphor plate in the cassette and transmit that digital image to another system to store it. The electronic image in the cassette is then “erased” and the cassette is used again and again.
• Another, similar method of recording the image is on a digital plate connected directly to the processing com-puters without the need to ferry digital cassettes back and forth to an electronic reader. This is sometimes called direct digital radiography.
! Study or examination: used interchangeably, they refer to a collection of images that examine a particular part of the body or system, as in “double contrast study of the colon” (a series of images of the colon using air and barium and produced through the use of x-rays); or an “MRI exam-ination of the brain” (a collection of images of the brain using MRI to produce the images).
! Contrast material (contrast agent): usually a substance that is administered to a patient in order to make certain structures more easily visible (frequently referred to simply as contrast).• The most widely used examples of radiologic contrast
materials include liquid barium, which is administered orally for upper gastrointestinal (UGI) examinations and rectally for barium enema (BE) examinations, and iodine, which is administered intravenously for contrast-enhanced CT scans of the body.
• Contrast agents also are used for MRI (most often, some solutions of gadolinium injected intravenously for its paramagnetic properties) and for ultrasound (gas-filled microbubbles).
! Dye: the lay term for contrast. Although contrast is the better term, many patients, and some radiologists in explaining tests to patients, use the term dye. Don’t use the word dye unless you are talking to a patient explaining a test; use the term contrast or contrast agent. In fact, if you can use the words contrast and image in the same sen-tence, people will think you are a genius.
! Flat plate: an archaic, but still used, term meaning a con-ventional radiograph or plain film of the abdomen, almost always obtained with the patient lying supine. This term is left over from the pioneer days of radiology before film was used as the recording medium and the image was produced on a flat, glass plate.
! White and black: these are not radiologic terms, but almost every modality displays its images in white, black, and various shades of gray.• With conventional radiography, an object’s inherent
density will determine whether it appears white, black, or one of those shades of gray.
! “En face” and “in profile”: used primarily in conventional radiography and barium studies.• When you look at a lesion directly “head-on,” you are
seeing it en face. A lesion seen tangentially (from the side) is seen in profile.
• Only a sphere, which, by definition, is perfectly round in every dimension, will appear exactly the same shape
tissue-specific energy to allow highly sophisticated com-puter programs to generate 2- or 3-dimensional images (see Chapter 20).
! MRI scanners are not as widely available as CT scanners; they are expensive to acquire and require careful site con-struction to operate properly. In general, they also have a relatively high, ongoing operating cost.
! However, they utilize no ionizing radiation and produce much higher contrast between different types of soft tissues than can CT.
! MRI is widely used in neurologic imaging and is particu-larly sensitive in imaging soft tissues like muscles, tendons, and ligaments.
! Safety issues are associated with the extremely strong mag-netic fields of an MRI scanner, both for objects within the body (e.g., pacemakers) and for ferromagnetic projectiles in the MRI scanner environment (e.g., metal oxygen tanks). There are also known side effects from the radiofrequency waves such scanners produce, and possible adverse effects from some MRI contrast agents.
TERMINOLOGY! “Oh no,” you say, “must we have this section? Let me skip
to the good parts.” You can do that: just remember where this section is because you may have to refer to it later.
! Like politics, all terminology is local. Follow the terminol-ogy conventions used in your hospital or, alternatively, the person rendering your course grade, even if those conven-tions are different from what is described here.
Terminology Conventions Used in This Book
! Image: a good, all-around term that can be used to describe any type of rendering of a radiologic examination.• It works for all modalities; you may use it freely.• You could say you were looking at an “image of the
abdomen on a conventional radiograph,” or a “CT image of the abdomen,” or an “ultrasound image of the abdomen,” and so on. (Don’t use the term picture to refer to a radiologic image; image will make you sound much smarter.)
• When you view your images, remember you and the patient are always looking at each other face-to-face. This is the convention by which most images are viewed no matter what the position of the patient when the image was exposed.• The patient’s right side, whether it is on conventional
radiographs or a CT scan, is on your left side, and the patient’s left side should be on your right side.
! Cassette: a cassette is the flat device that looks like a huge iPad that holds either a piece of film or a special digital plate on which the latent image resides until it is processed in one of two ways, depending on whether the cassette contains film or a digital phosphor plate without film.• If the cassette contains film, the film will be removed
from the cassette in a darkroom (or by something called a daylight loader that simulates a darkroom) and sent through an automatic processor that contains a series of chemicals that will develop the image, make it visible to the human eye, and fix it permanently on the
4 | Recognizing Anything: An Introduction to Imaging Modalities
! Horizontal versus vertical x-ray beams: terms that describe the orientation of x-ray beams.• Horizontal and vertical beam orientation is an important
concept to understand because it will help you in inter-preting all kinds of conventional radiographic studies and in understanding their limitations. This may, in turn, prevent you from falling for a diagnostic pitfall.
• An x-ray beam is usually directed either horizontally between the tube and the cassette (as in an upright chest examination) or vertically between the tube and the cas-sette (as in a supine radiograph of the abdomen with the patient lying on the examining table).
• Horizontal x-ray beams are usually parallel to the floor of the examining room (unless the room was built by do-it-yourselfers on weekends).
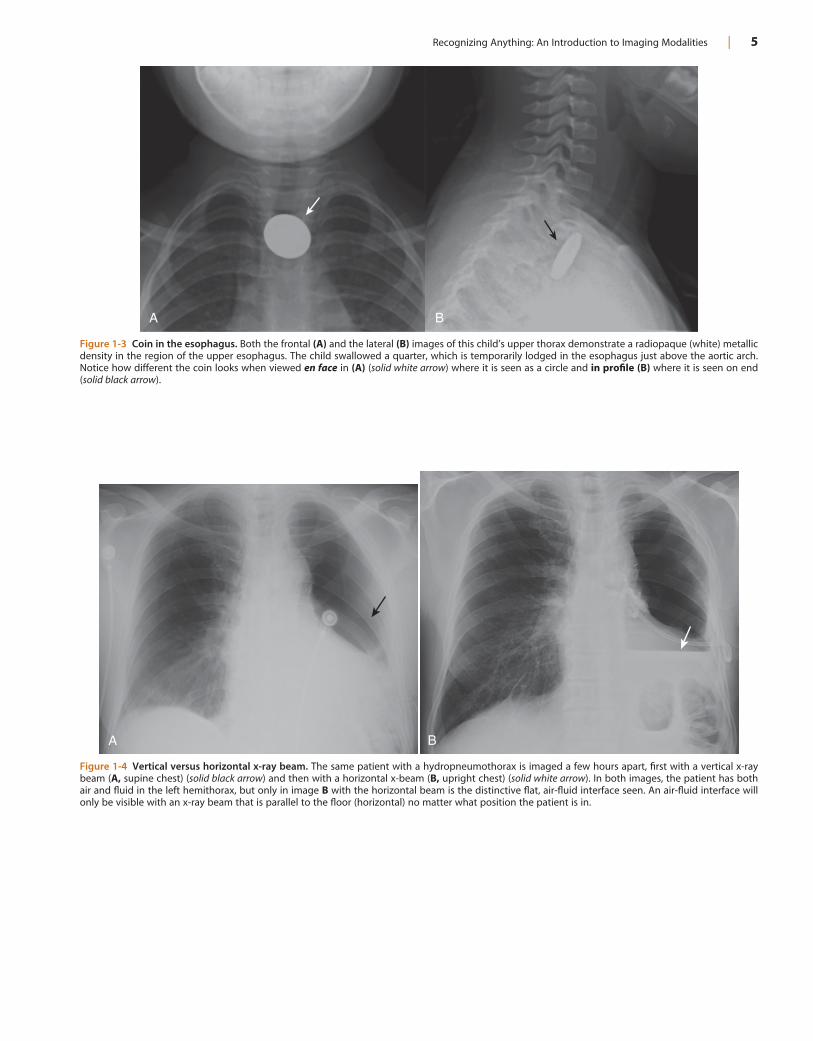
• In conventional radiography, an air-fluid or fat-fluid level will be visible only if the x-ray beam is horizontal, regardless of the position of the patient (Fig. 1-4).
• An air-fluid or fat-fluid level is an interface between two substances of different densities in which the lighter substance rises above and forms a straight-edge interface with the heavier substance below.
• You usually don’t have to specify whether you want the x-ray beam to be horizontal or vertical when ordering a study; by convention, certain studies are always done using one method or the other (Table 1-1). In general, any study with the terms erect, upright, cross-table, or decubitus is always done with a horizon-tal beam. You can see fluid levels (if present) with any of these types of studies.
The Five Basic Densities
! Conventional radiography is limited to demonstrating five basic densities, arranged here from least to most dense (Table 1-2):• Air, which appears the blackest on a radiograph.• Fat, which is a lighter shade of gray than air.• Soft tissue or fluid (because both soft tissue and fluid
appear the same on conventional radiographs, you can’t differentiate between heart muscle and the blood inside of the heart on a chest radiograph).
• Calcium (usually contained within bones).• Metal, which appears the whitest on a radiograph.
• Objects of metal density are not normally present in the body. Radiologic contrast media and prosthetic knees or hips are examples of metal densities arti-ficially placed in the body (Fig. 1-5).
! One of the major benefits of CT scanning is its ability to expand the gray scale, which enables us to differentiate many more than these five basic densities.
! Remember, the denser an object is, the more x-rays it absorbs, and the whiter it appears on radiographic images.
! The less dense an object is, the fewer x-rays it absorbs, and the blacker it will appear on radiographs.
! Unfortunately, the specific terms used to describe what appears as white on an image and what appears as black on an image change from one modality to another. Table 1-3 is a handy chart that describes the terms used for black and white using various modalities.
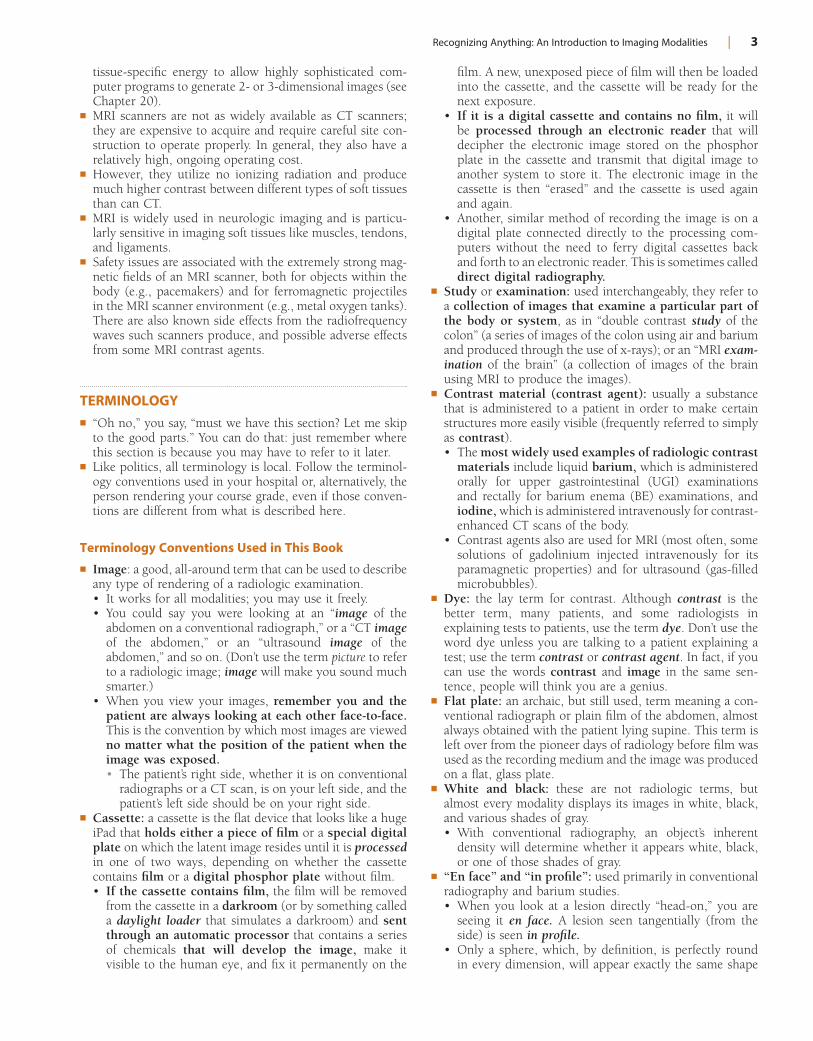
no matter in which plane it is viewed (e.g., a nodule in the lung) (Fig. 1-2).
• Naturally occurring structures, whether normal or abnormal, of any shape other than a sphere will appear slightly different in shape if viewed en face or in profile.
• This is not an easy concept to grasp because it involves making a mental reconstruction of a three-dimensional object from the two-dimensional projections conven-tional radiographs provide.
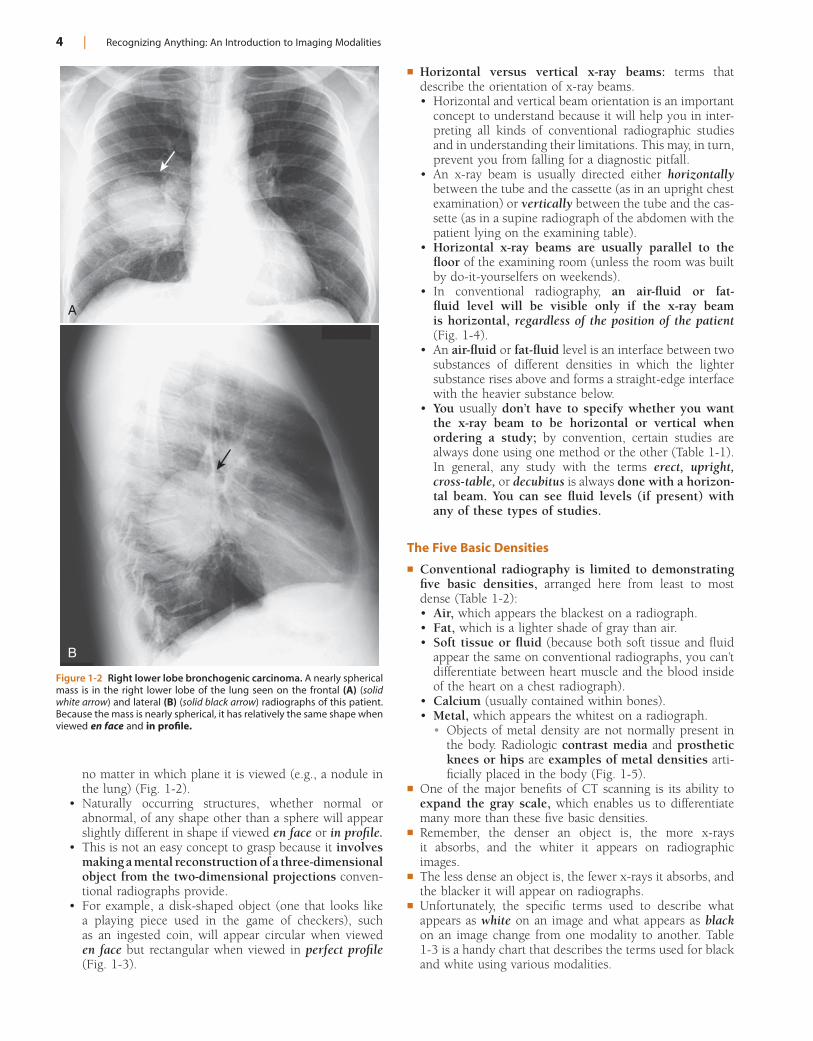
• For example, a disk-shaped object (one that looks like a playing piece used in the game of checkers), such as an ingested coin, will appear circular when viewed en face but rectangular when viewed in perfect profile (Fig. 1-3).
Figure 1-2 Right lower lobe bronchogenic carcinoma. A nearly spherical mass is in the right lower lobe of the lung seen on the frontal (A) (solid white arrow) and lateral (B) (solid black arrow) radiographs of this patient. Because the mass is nearly spherical, it has relatively the same shape when viewed en face and in profile.
A
B
Recognizing Anything: An Introduction to Imaging Modalities | 5
Figure 1-3 Coin in the esophagus. Both the frontal (A) and the lateral (B) images of this child’s upper thorax demonstrate a radiopaque (white) metallic density in the region of the upper esophagus. The child swallowed a quarter, which is temporarily lodged in the esophagus just above the aortic arch. Notice how different the coin looks when viewed en face in (A) (solid white arrow) where it is seen as a circle and in profile (B) where it is seen on end (solid black arrow).
A B
Figure 1-4 Vertical versus horizontal x-ray beam. The same patient with a hydropneumothorax is imaged a few hours apart, first with a vertical x-ray beam (A, supine chest) (solid black arrow) and then with a horizontal x-beam (B, upright chest) (solid white arrow). In both images, the patient has both air and fluid in the left hemithorax, but only in image B with the horizontal beam is the distinctive flat, air-fluid interface seen. An air-fluid interface will only be visible with an x-ray beam that is parallel to the floor (horizontal) no matter what position the patient is in.
A B
6 | Recognizing Anything: An Introduction to Imaging Modalities
TABLE 1-1 HORIZONTAL VERSUS VERTICAL X-RAY BEAM
Examples of Types of Studies
Orientation of Beam Implications
Upright view of the abdomen
Horizontal Air-fluid levels will be visible; free air will rise to undersurface of diaphragm
Left lateral decubitus view of the abdomen
Horizontal Air-fluid levels will be visible; free air will rise over liver
Supine abdomen Vertical Air-fluid levels will not be visible: free air will rise to undersurface of anterior abdominal wall and may not be visible until large amounts are present
Upright chest Horizontal Pneumothorax, if present, will usually be visible at apex of lung; air-fluid levels (e.g., in cavities) will be visible
Supine chest Vertical Pneumothorax may not be visible unless large; air-fluid levels will not be visible
Cross-table lateral examination of the knee
Horizontal Fat-fluid levels (lipohemarthrosis), if present, will be visible
Supine examination of the knee
Vertical Fat-fluid levels will not be visible
TABLE 1-2 FIVE BASIC DENSITIES SEEN ON CONVENTIONAL RADIOGRAPHY
Density Appearance
Air Absorbs the least x-ray and appears “blackest” on conventional radiographs
Fat Gray, somewhat darker (blacker) than soft tissue
Fluid or soft tissue Both fluid (e.g., blood) and soft tissue (e.g., muscle) have the same densities on conventional radiographs
Calcium The most dense, naturally occurring material (e.g., bones) absorbs most x-rays
Metal Usually absorbs all x-rays and appears the “whitest” (e.g., bullets, barium)
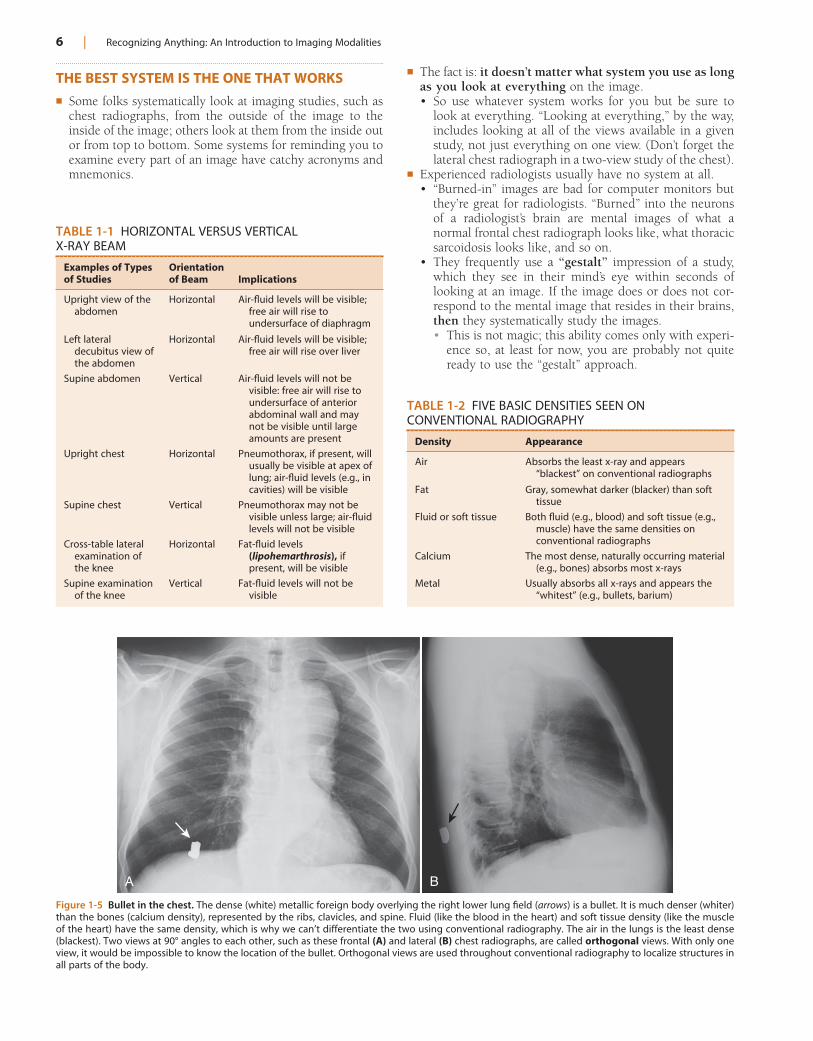
Figure 1-5 Bullet in the chest. The dense (white) metallic foreign body overlying the right lower lung field (arrows) is a bullet. It is much denser (whiter) than the bones (calcium density), represented by the ribs, clavicles, and spine. Fluid (like the blood in the heart) and soft tissue density (like the muscle of the heart) have the same density, which is why we can’t differentiate the two using conventional radiography. The air in the lungs is the least dense (blackest). Two views at 90° angles to each other, such as these frontal (A) and lateral (B) chest radiographs, are called orthogonal views. With only one view, it would be impossible to know the location of the bullet. Orthogonal views are used throughout conventional radiography to localize structures in all parts of the body.
A B
THE BEST SYSTEM IS THE ONE THAT WORKS! Some folks systematically look at imaging studies, such as
chest radiographs, from the outside of the image to the inside of the image; others look at them from the inside out or from top to bottom. Some systems for reminding you to examine every part of an image have catchy acronyms and mnemonics.
! The fact is: it doesn’t matter what system you use as long as you look at everything on the image.• So use whatever system works for you but be sure to
look at everything. “Looking at everything,” by the way, includes looking at all of the views available in a given study, not just everything on one view. (Don’t forget the lateral chest radiograph in a two-view study of the chest).
! Experienced radiologists usually have no system at all.• “Burned-in” images are bad for computer monitors but
they’re great for radiologists. “Burned” into the neurons of a radiologist’s brain are mental images of what a normal frontal chest radiograph looks like, what thoracic sarcoidosis looks like, and so on.
• They frequently use a “gestalt” impression of a study, which they see in their mind’s eye within seconds of looking at an image. If the image does or does not cor-respond to the mental image that resides in their brains, then they systematically study the images.• This is not magic; this ability comes only with experi-
ence so, at least for now, you are probably not quite ready to use the “gestalt” approach.
Recognizing Anything: An Introduction to Imaging Modalities | 7
! “Take-home” points at the end of chapters are signaled by this icon:
• You may use these points anywhere, not only your home.
WEBLINKRegistered users may obtain more information on Recognizing Anything: An Introduction to Imaging Modalities on StudentConsult.com.
! The most valuable system to use in interpreting images is the system in which you routinely increase your knowledge.• If you don’t know what you are looking for, you can stare
at an image for hours or days or, in the case of the lateral chest radiograph, you can ignore an image entirely, and the end result will be the same: you won’t see the findings.• There is an axiom in radiology: You only see what
you look for and you only look for what you know. So, if you don’t know what to look for, you will never recognize the finding no matter what system you use or how long you stare at the image.
! So, by reading this book, you will gain the knowledge that will allow you to recognize what it is you’re looking at—the best system of all.
CONVENTIONS USED IN THIS BOOK! Bold type is used liberally throughout this text to highlight
important points, and because this is a book filled with a large number of extraordinarily important points, you will see much bold type.
! Diagnostic pitfalls, potential false-positive or false-negative traps on the way to the correct interpretation of an image, are signaled by this icon:
! Important points that are so important that not even bold-face type does them justice are signaled by this icon:
! The Weblink symbol means additional instructional material is available on the StudentConsult.com website for registered users:
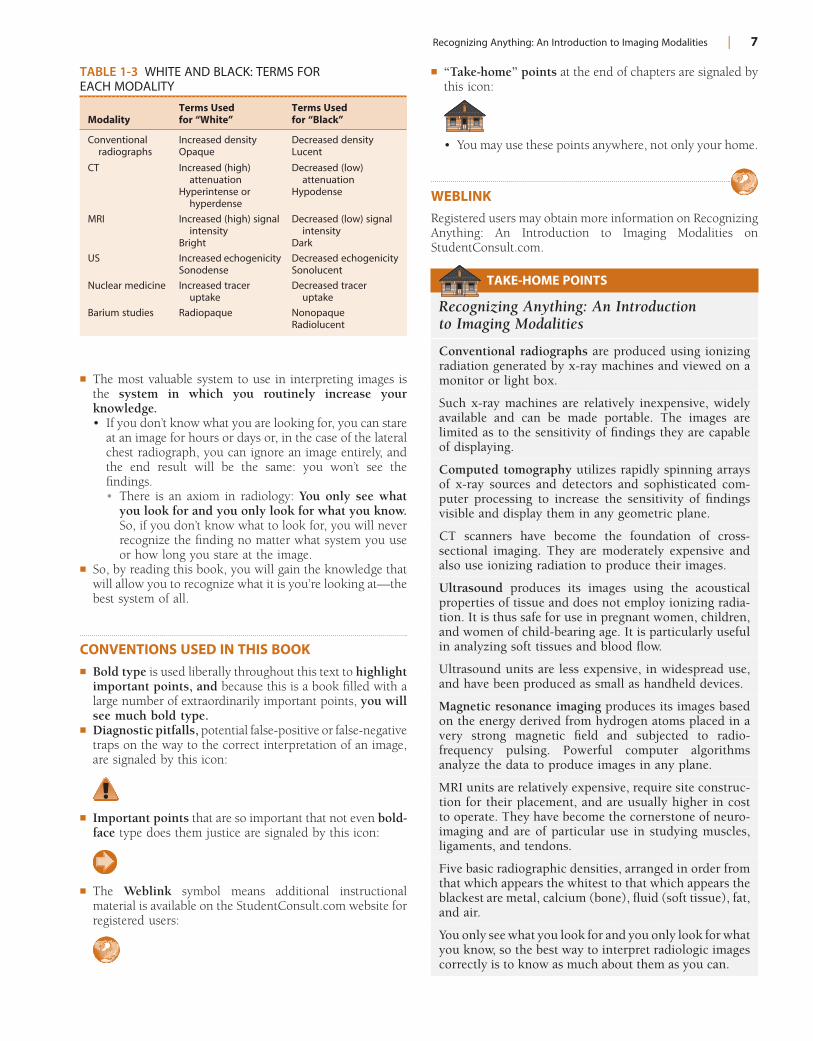
TABLE 1-3 WHITE AND BLACK: TERMS FOR EACH MODALITY
ModalityTerms Used for “White”
Terms Used for “Black”
Conventional radiographs
Increased density Decreased densityOpaque Lucent
CT Increased (high) attenuation
Decreased (low) attenuation
Hyperintense or hyperdense
Hypodense
MRI Increased (high) signal intensity
Decreased (low) signal intensity
Bright Dark
US Increased echogenicity Decreased echogenicitySonodense Sonolucent
Nuclear medicine Increased tracer uptake
Decreased tracer uptake
Barium studies Radiopaque NonopaqueRadiolucent
TAKE-HOME POINTS
Recognizing Anything: An Introduction to Imaging Modalities
Conventional radiographs are produced using ionizing radiation generated by x-ray machines and viewed on a monitor or light box.
Such x-ray machines are relatively inexpensive, widely available and can be made portable. The images are limited as to the sensitivity of findings they are capable of displaying.
Computed tomography utilizes rapidly spinning arrays of x-ray sources and detectors and sophisticated com-puter processing to increase the sensitivity of findings visible and display them in any geometric plane.
CT scanners have become the foundation of cross-sectional imaging. They are moderately expensive and also use ionizing radiation to produce their images.
Ultrasound produces its images using the acoustical properties of tissue and does not employ ionizing radia-tion. It is thus safe for use in pregnant women, children, and women of child-bearing age. It is particularly useful in analyzing soft tissues and blood flow.
Ultrasound units are less expensive, in widespread use, and have been produced as small as handheld devices.
Magnetic resonance imaging produces its images based on the energy derived from hydrogen atoms placed in a very strong magnetic field and subjected to radio-frequency pulsing. Powerful computer algorithms analyze the data to produce images in any plane.
MRI units are relatively expensive, require site construc-tion for their placement, and are usually higher in cost to operate. They have become the cornerstone of neuro-imaging and are of particular use in studying muscles, ligaments, and tendons.
Five basic radiographic densities, arranged in order from that which appears the whitest to that which appears the blackest are metal, calcium (bone), fluid (soft tissue), fat, and air.
You only see what you look for and you only look for what you know, so the best way to interpret radiologic images correctly is to know as much about them as you can.
8
Chapter 2
Recognizing Normal Chest Anatomy and a Technically Adequate Chest Radiograph
! In order to become more comfortable interpreting chest radiographs, you first need to be able to recognize funda-mental, normal anatomy so you can differentiate it from what is abnormal.
! Second, you have to be able to quickly determine if a study is technically adequate so that you don’t mistake technical deficiencies for abnormalities.
! Third, if you decide a finding is abnormal, you need to have some strategy for deciding what the abnormal-ity is.
! First (and second) things first: This chapter will familiar-ize you with normal chest radiographic anatomy and enable you to evaluate the technical adequacy of a radiograph by helping you become more familiar with the diagnostic pit-falls certain technical artifacts can introduce.
THE NORMAL FRONTAL CHEST RADIOGRAPH! Figure 2-1 displays some of the normal anatomic features
visible on the frontal chest radiograph.! Vessels and bronchi: normal lung markings
• Virtually all of the “white lines” you see in the lungs on a chest radiograph are blood vessels. Blood vessels characteristically branch and taper gradually from the hila centrally to the peripheral margins of the lung. You cannot accurately differentiate between pulmonary arter-ies and pulmonary veins on a conventional radiograph.
• Bronchi are mostly invisible on a normal chest radio-graph because they are normally very thin-walled, they contain air, and they are surrounded by air.
! Pleura: normal anatomy• The pleura is composed of two layers, the outer pari-
etal and inner visceral, with the pleural space between them. The visceral pleura is adherent to the lung and enfolds to form the major and minor fissures.
• Normally several milliliters of fluid, but no air, are in the pleural space.
• Neither the parietal pleura nor the visceral pleura is normally visible on a conventional chest radiograph, except on occasion where the two layers of visceral pleura enfold to form the fissures. Even then, they are usually no thicker than a line drawn with the point of a sharpened pencil.
THE LATERAL CHEST RADIOGRAPH! As part of the standard two-view chest examination, patients
usually have an upright, frontal chest radiograph and an upright, left lateral view of the chest.
! A left lateral chest x-ray (the patient’s left side is against the film) is of great diagnostic value but is sometimes ignored by beginners because of their lack of familiarity with the findings visible in that projection.
! Figure 2-2 displays some of the normal anatomic features visible on the lateral chest radiograph.
! Why look at the lateral chest?• It can help you determine the location of disease you
already identified as being present on the frontal image.• It can confirm the presence of disease you may be
unsure of on the basis of the frontal image alone, such as a mass or pneumonia.
• It can demonstrate disease not visible on the frontal image (Fig. 2-3).
FIVE KEY AREAS ON THE LATERAL CHEST X-RAY (FIG. 2-2 AND TABLE 2-1)! The retrosternal clear space! The hilar region! The fissures! The thoracic spine! The diaphragm and posterior costophrenic sulci
The Retrosternal Clear Space
! Normally, a relatively lucent crescent is present just behind the sternum and anterior to the shadow of the ascending aorta.• Look for this clear space to “fill-in” with soft tissue
density when an anterior mediastinal mass is present (Fig. 2-4).
Pitfall: Be careful not to mistake the soft tissue of the patient’s superimposed arms for “filling-in” of the clear
space. Although patients are asked to hold their arms over their head for a lateral chest exposure, many are too weak to raise their arms.
• Solution: You should be able to identify the patient’s arm by spotting the humerus (Fig. 2-5).
The Hilar Region
! The hila may be difficult to assess on the frontal view, especially if both hila are slightly enlarged, since compari-son with the opposite normal side is impossible.
! The lateral view may help. Most of the hilar densities are made up of the pulmonary arteries. Normally, no discrete mass is visible in the hila on the lateral view.
Recognizing Normal Chest Anatomy and a Technically Adequate Chest Radiograph | 9
• Thickening of the fissure by fluid is almost always associated with other signs of fluid in the chest such as Kerley B lines and pleural effusions (see Chapter 6).
• Thickening of the fissure by fibrosis is the more likely cause if there are no other signs of fluid in the chest.
The Thoracic Spine
! Normally, the thoracic vertebral bodies are roughly rect-angular in shape, and each vertebral body’s endplate par-allels the endplate of the vertebral body above and below it.
! Each intervertebral disk space becomes slightly taller than or remains the same as the one above it throughout the thoracic spine.
! Degeneration of the disk can lead to narrowing of the disk space and the development of small, bony spurs (osteo-phytes) at the margins of the vertebral bodies.
! When there is a compression fracture, most often from osteoporosis, the vertebral body loses height. Compression
! When there is a hilar mass, such as might occur with enlargement of hilar lymph nodes, the hilum (or hila) will cast a distinct, lobulated masslike shadow on the lateral radiograph (Fig. 2-6).
The Fissures
! On the lateral film, both the major (oblique) and minor (horizontal) fissures may be visible as a fine, white line (about as thick as a line made with the point of a sharpened pencil).• The major fissures course obliquely, roughly from the
level of the 5th thoracic vertebra to a point on the diaphragmatic surface of the pleura a few centimeters behind the sternum.
• The minor fissure lies at the level of the 4th anterior rib (on the right side only) and is horizontally oriented (see Figs. 2-1 and 2-2).
• Both the major and minor fissures may be visible on the lateral view, but because of the oblique plane of the major fissure, only the minor fissure is usually visible on the frontal view.
! The fissures demarcate the upper and lower lobes on the left and the upper, middle, and lower lobes on the right.
! When a fissure contains fluid or develops fibrosis from a chronic process, it will become thickened (Fig. 2-7).
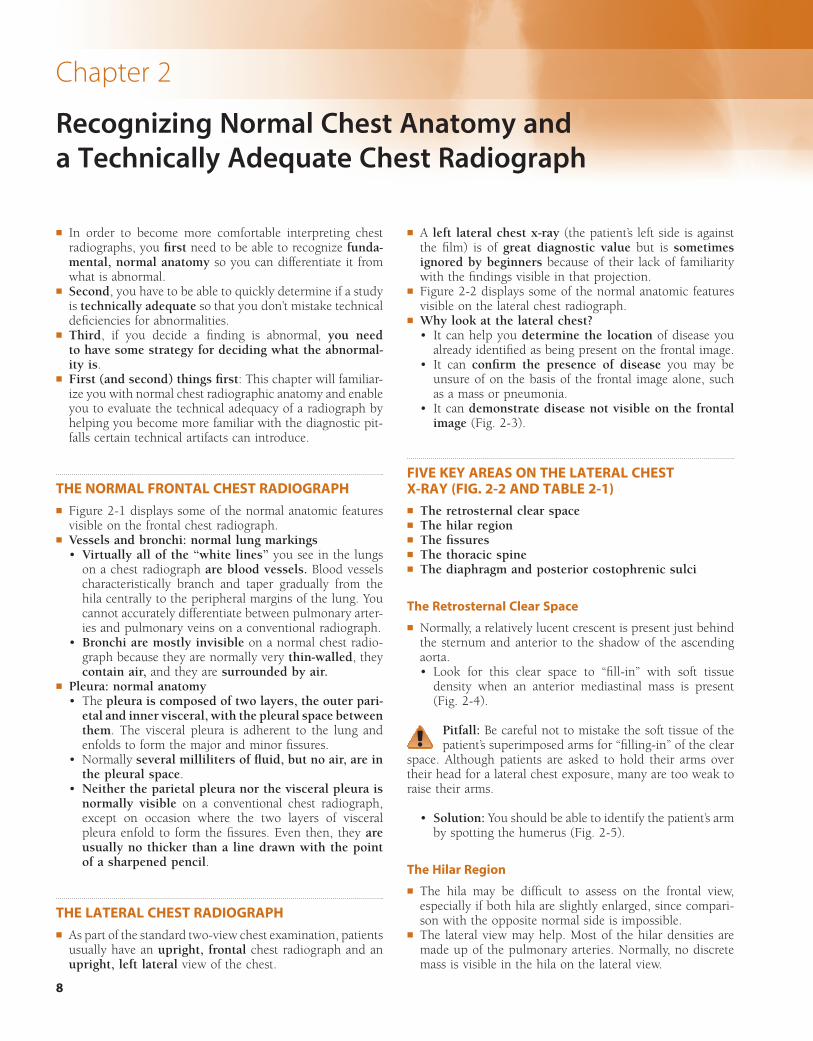
Figure 2-1 Well-exposed frontal view of a normal chest. Notice how the spine is just visible through the heart shadow. Both the right and left lateral costophrenic angles are sharply and acutely angled. The white line demar-cates the approximate level of the minor or horizontal fissure, which is usually visible on the frontal view because it is seen en face. There is no minor fissure on the left side. The white circle contains lung markings that are blood vessels. Note that the left hilum is normally slightly higher than the right. The white “3” lies on the posterior 3rd rib while the black “3” lies on the anterior 3rd rib.
Coracoid process-scapula
Trachea3
Head of clavicle
Medial border-scapula
Left hilum-Left pulmonary
arteryRight hilum-Right pulmonary
artery
Pulmonary bloodvessels
Right breastshadow
Costophrenicangle
Righthemidiaphragm
Cardiophrenicangle
Rightatrium
Descendingaorta
Leftventricle
Mainpulmonary
artery
Ascendingaorta-
superiorvena cava
Aorticknob
Cardiophrenicangle Left
hemidiaphragmCostophrenic
angle
3
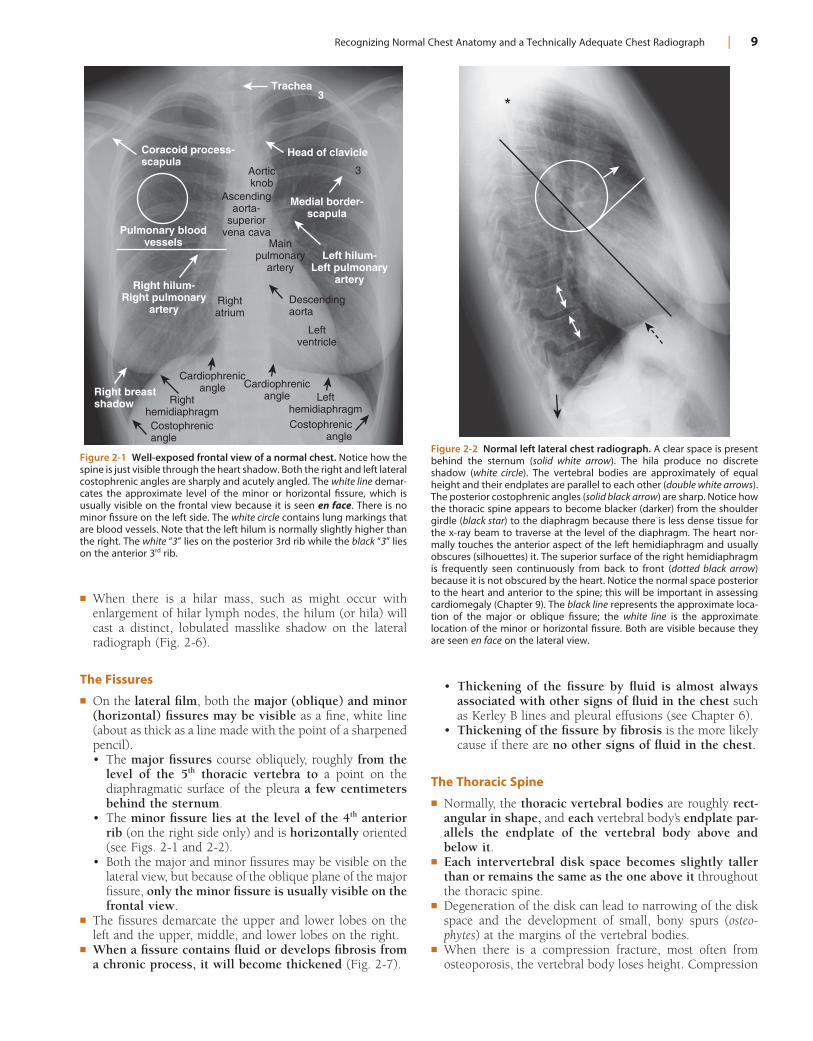
Figure 2-2 Normal left lateral chest radiograph. A clear space is present behind the sternum (solid white arrow). The hila produce no discrete shadow (white circle). The vertebral bodies are approximately of equal height and their endplates are parallel to each other (double white arrows). The posterior costophrenic angles (solid black arrow) are sharp. Notice how the thoracic spine appears to become blacker (darker) from the shoulder girdle (black star) to the diaphragm because there is less dense tissue for the x-ray beam to traverse at the level of the diaphragm. The heart nor-mally touches the anterior aspect of the left hemidiaphragm and usually obscures (silhouettes) it. The superior surface of the right hemidiaphragm is frequently seen continuously from back to front (dotted black arrow) because it is not obscured by the heart. Notice the normal space posterior to the heart and anterior to the spine; this will be important in assessing cardiomegaly (Chapter 9). The black line represents the approximate loca-tion of the major or oblique fissure; the white line is the approximate location of the minor or horizontal fissure. Both are visible because they are seen en face on the lateral view.
*
10 | Recognizing Normal Chest Anatomy and a Technically Adequate Chest Radiograph
diaphragm from side-to-side on conventional radiographs because of the position of the heart in the center of the chest.• Therefore, we refer to the right half of the diaphragm
as the right hemidiaphragm and the left half of the diaphragm as the left hemidiaphragm.
! How to tell the right from the left hemidiaphragm on the lateral radiograph:• The right hemidiaphragm is usually visible for its
entire length from front to back. Normally, the right hemidiaphragm is slightly higher than the left, a rela-tionship that tends to hold true on the lateral radiograph as well as on the frontal.
• The left hemidiaphragm is seen sharply posteriorly but is silhouetted by the muscle of the heart anteriorly (i.e., its edge disappears anteriorly) (see Fig. 2-2).
• Air in the stomach or splenic flexure of the colon appears immediately below the left hemidiaphragm. The liver lies below the right hemidiaphragm, and bowel gas is usually not seen between the liver and the right hemidiaphragm.
! The posterior costophrenic angles (posterior costo-phrenic sulci)• Each hemidiaphragm produces a rounded dome that
indents the central portion of the base of each lung, like the bottom of a wine bottle.• This produces a depression, or sulcus, that surrounds
the periphery of each lung and represents the lowest point of the pleural space when the patient is upright.
fractures very commonly first involve depression of the superior endplate of the vertebral body (Fig. 2-8).
! Don’t forget to look at the thoracic spine when studying the lateral chest radiograph for valuable clues about systemic disorders (see Chapter 24).
The Diaphragm and Posterior Costophrenic Sulci
! Because the diaphragm is composed of soft tissue (muscle) and the abdomen below it contains soft tissue structures like the liver and spleen, only the upper border of the diaphragm, abutting the air-filled lung, is usually visible on conventional radiographs.
! Even though we have one diaphragm that separates the thorax from the abdomen, we usually do not see the entire
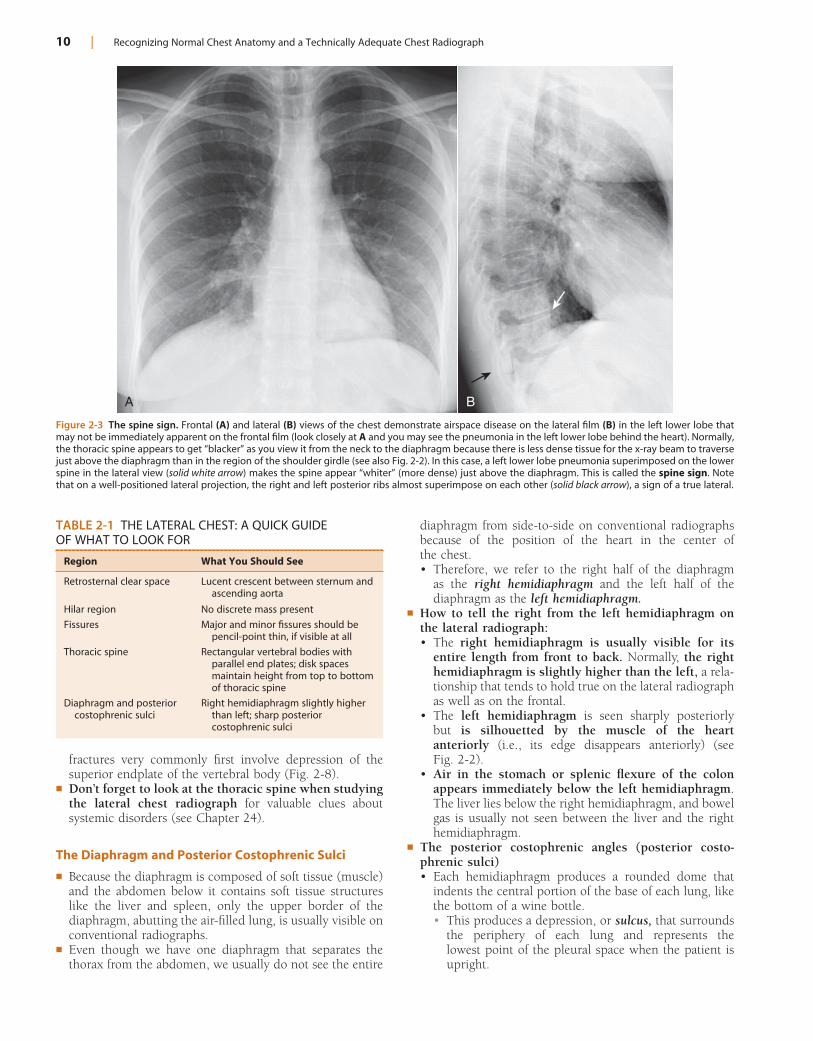
Figure 2-3 The spine sign. Frontal (A) and lateral (B) views of the chest demonstrate airspace disease on the lateral film (B) in the left lower lobe that may not be immediately apparent on the frontal film (look closely at A and you may see the pneumonia in the left lower lobe behind the heart). Normally, the thoracic spine appears to get “blacker” as you view it from the neck to the diaphragm because there is less dense tissue for the x-ray beam to traverse just above the diaphragm than in the region of the shoulder girdle (see also Fig. 2-2). In this case, a left lower lobe pneumonia superimposed on the lower spine in the lateral view (solid white arrow) makes the spine appear “whiter” (more dense) just above the diaphragm. This is called the spine sign. Note that on a well-positioned lateral projection, the right and left posterior ribs almost superimpose on each other (solid black arrow), a sign of a true lateral.
A B
TABLE 2-1 THE LATERAL CHEST: A QUICK GUIDE OF WHAT TO LOOK FOR
Region What You Should See
Retrosternal clear space Lucent crescent between sternum and ascending aorta
Hilar region No discrete mass present
Fissures Major and minor fissures should be pencil-point thin, if visible at all
Thoracic spine Rectangular vertebral bodies with parallel end plates; disk spaces maintain height from top to bottom of thoracic spine
Diaphragm and posterior costophrenic sulci
Right hemidiaphragm slightly higher than left; sharp posterior costophrenic sulci
Recognizing Normal Chest Anatomy and a Technically Adequate Chest Radiograph | 11
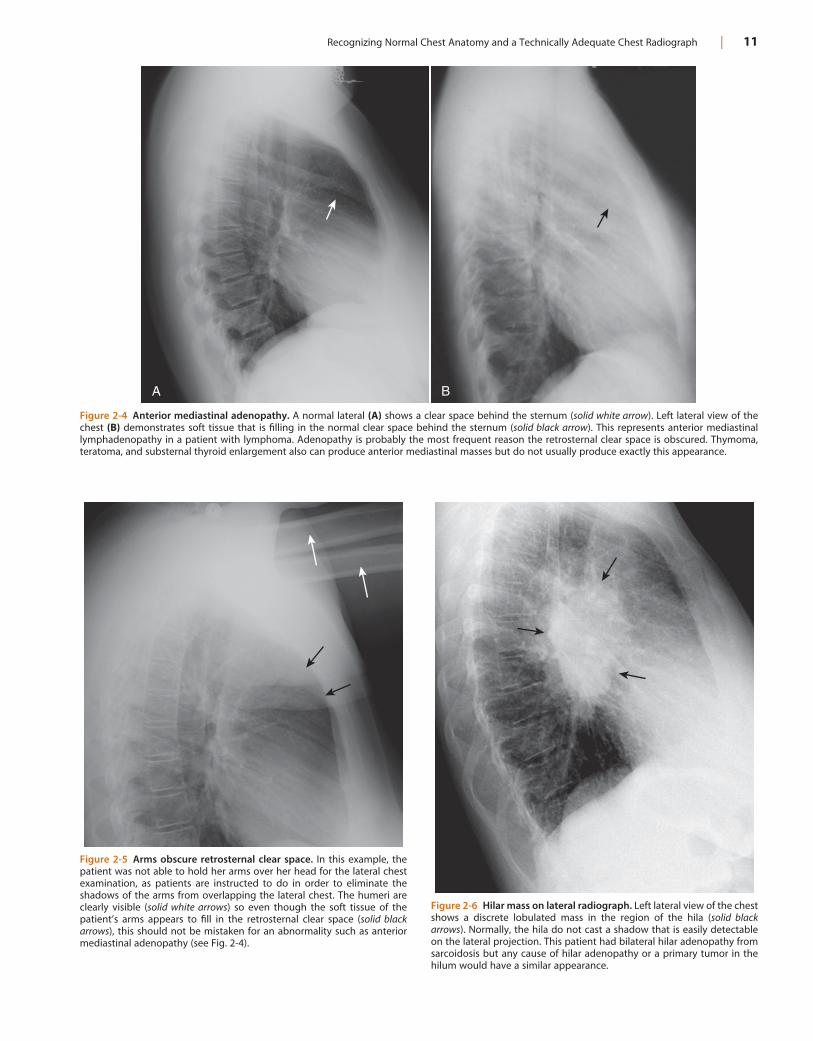
Figure 2-4 Anterior mediastinal adenopathy. A normal lateral (A) shows a clear space behind the sternum (solid white arrow). Left lateral view of the chest (B) demonstrates soft tissue that is filling in the normal clear space behind the sternum (solid black arrow). This represents anterior mediastinal lymphadenopathy in a patient with lymphoma. Adenopathy is probably the most frequent reason the retrosternal clear space is obscured. Thymoma, teratoma, and substernal thyroid enlargement also can produce anterior mediastinal masses but do not usually produce exactly this appearance.
A B
Figure 2-5 Arms obscure retrosternal clear space. In this example, the patient was not able to hold her arms over her head for the lateral chest examination, as patients are instructed to do in order to eliminate the shadows of the arms from overlapping the lateral chest. The humeri are clearly visible (solid white arrows) so even though the soft tissue of the patient’s arms appears to fill in the retrosternal clear space (solid black arrows), this should not be mistaken for an abnormality such as anterior mediastinal adenopathy (see Fig. 2-4).
Figure 2-6 Hilar mass on lateral radiograph. Left lateral view of the chest shows a discrete lobulated mass in the region of the hila (solid black arrows). Normally, the hila do not cast a shadow that is easily detectable on the lateral projection. This patient had bilateral hilar adenopathy from sarcoidosis but any cause of hilar adenopathy or a primary tumor in the hilum would have a similar appearance.
12 | Recognizing Normal Chest Anatomy and a Technically Adequate Chest Radiograph
• On a frontal chest radiograph, this sulcus is most easily viewed in profile at the outer edge of the lung as the lateral costophrenic sulcus (also called the lateral costophrenic angle) and on the lateral radiograph as the posterior costophrenic sulcus (also known as the poste-rior costophrenic angle) (see Figs. 2-1 and 2-2).
• Normally, all of the costophrenic sulci are sharply outlined and acutely angled.
• Pleural effusions accumulate in the deep recesses of the costophrenic sulci, filling in their acute angles with the patient upright. This is called blunting of the costo-phrenic angles (see Chapter 6).
• It takes only about 75 cc of fluid (or less) to blunt the posterior costophrenic angle on the lateral film, while it takes about 250-300 cc to blunt the lateral costo-phrenic angles on the frontal film (Fig. 2-9).
EVALUATING THE CHEST RADIOGRAPH FOR TECHNICAL ADEQUACY! Evaluating five technical factors will help you determine
if a chest radiograph is adequate for interpretation or whether certain artifacts may have been introduced that can lead you astray (Table 2-2):• Penetration• Inspiration• Rotation• Magnification• Angulation
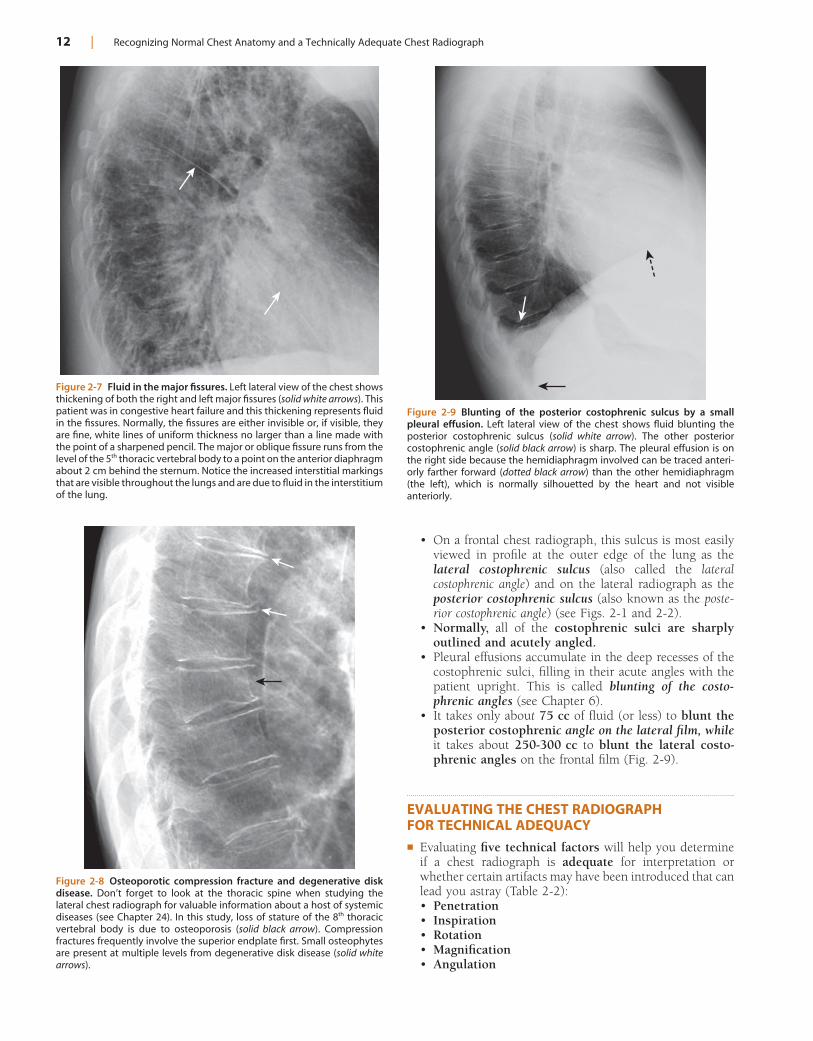
Figure 2-7 Fluid in the major fissures. Left lateral view of the chest shows thickening of both the right and left major fissures (solid white arrows). This patient was in congestive heart failure and this thickening represents fluid in the fissures. Normally, the fissures are either invisible or, if visible, they are fine, white lines of uniform thickness no larger than a line made with the point of a sharpened pencil. The major or oblique fissure runs from the level of the 5th thoracic vertebral body to a point on the anterior diaphragm about 2 cm behind the sternum. Notice the increased interstitial markings that are visible throughout the lungs and are due to fluid in the interstitium of the lung.
Figure 2-8 Osteoporotic compression fracture and degenerative disk disease. Don’t forget to look at the thoracic spine when studying the lateral chest radiograph for valuable information about a host of systemic diseases (see Chapter 24). In this study, loss of stature of the 8th thoracic vertebral body is due to osteoporosis (solid black arrow). Compression fractures frequently involve the superior endplate first. Small osteophytes are present at multiple levels from degenerative disk disease (solid white arrows).
Figure 2-9 Blunting of the posterior costophrenic sulcus by a small pleural effusion. Left lateral view of the chest shows fluid blunting the posterior costophrenic sulcus (solid white arrow). The other posterior costophrenic angle (solid black arrow) is sharp. The pleural effusion is on the right side because the hemidiaphragm involved can be traced anteri-orly farther forward (dotted black arrow) than the other hemidiaphragm (the left), which is normally silhouetted by the heart and not visible anteriorly.
Recognizing Normal Chest Anatomy and a Technically Adequate Chest Radiograph | 13
TABLE 2-2 WHAT DEFINES A TECHNICALLY ADEQUATE CHEST RADIOGRAPH?
Factor What You Should See
Penetration The spine should be visible through the heart
Inspiration At least eight to nine posterior ribs should be visible
Rotation Spinous process should fall equidistant between the medial ends of the clavicles
Magnification AP films (mostly portable chest x-rays) will magnify the heart slightly
Angulation Clavicle normally has an “S” shape and superimposes on the 3rd or 4th rib
• Second, the pulmonary markings, which are mostly the blood vessels in the lung, may appear more prominent than they really are. You may mistakenly think the patient is in congestive heart failure or has pulmonary fibrosis.• Solutions: Look for other radiologic signs of conges-
tive heart failure (see Chapter 9). Look at the lateral chest film to confirm the presence of increased mark-ings, airspace disease, or effusion at the left base that you suspected from the frontal radiograph.
Pitfall of overpenetration
• If the study is overpenetrated (too dark), the lung mark-ings may seem decreased or absent (Fig. 2-11). You could mistakenly think the patient has emphysema or a pneumothorax or, if the degree of overpenetration is marked, it could render findings like a pulmonary nodule almost invisible.• Solutions: Look for other radiographic signs of
emphysema (see Chapter 12) or pneumothorax (see Chapter 8). Ask the radiologist if the film should be repeated.
Inspiration
! A full inspiration ensures a reproducible radiograph from one time to the next and eliminates artifacts that may be confused for or obscure disease.• The degree of inspiration can be assessed by counting
the number of posterior ribs visible above the dia-phragm on the frontal chest radiograph.
Penetration
! Unless x-rays adequately pass through the body part being studied, you may not visualize everything necessary on the image produced.• To determine if a frontal chest radiograph is adequately
penetrated, you should be able to see the thoracic spine through the heart shadow (see Fig. 2-1).
Pitfalls of underpenetration (inadequate penetra-tion): You can tell a frontal chest radiograph is under-
penetrated (too light) if you are not able to see the spine through the heart (Fig. 2-10). Underpenetration can intro-duce at least two errors into your interpretation.
• First, the left hemidiaphragm may not be visible on the frontal film because the left lung base may appear opaque. This technical artifact could either mimic or hide true disease in the left lower lung field (e.g., left lower lobe pneumonia or left pleural effusion) (see Fig. 2-10).• Solution: Look at the lateral chest radiograph to
confirm the presence of disease at the left base (see “The Lateral Chest Radiograph” in this chapter).
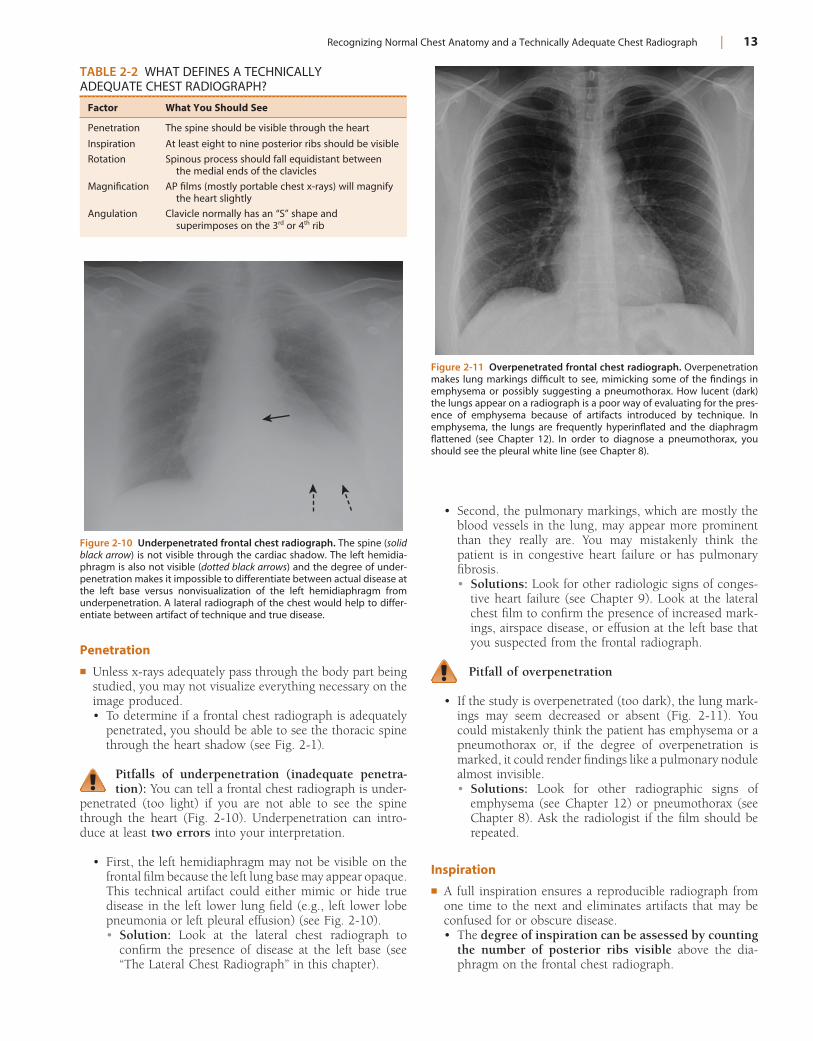
Figure 2-10 Underpenetrated frontal chest radiograph. The spine (solid black arrow) is not visible through the cardiac shadow. The left hemidia-phragm is also not visible (dotted black arrows) and the degree of under-penetration makes it impossible to differentiate between actual disease at the left base versus nonvisualization of the left hemidiaphragm from underpenetration. A lateral radiograph of the chest would help to differ-entiate between artifact of technique and true disease.
Figure 2-11 Overpenetrated frontal chest radiograph. Overpenetration makes lung markings difficult to see, mimicking some of the findings in emphysema or possibly suggesting a pneumothorax. How lucent (dark) the lungs appear on a radiograph is a poor way of evaluating for the pres-ence of emphysema because of artifacts introduced by technique. In emphysema, the lungs are frequently hyperinflated and the diaphragm flattened (see Chapter 12). In order to diagnose a pneumothorax, you should see the pleural white line (see Chapter 8).
14 | Recognizing Normal Chest Anatomy and a Technically Adequate Chest Radiograph
Rotation
! Significant rotation (the patient turns the body to one side or the other) may alter the expected contours of the heart and great vessels, the hila, and hemidiaphragms.
! The easiest way to assess whether the patient is rotated toward the left or right is by studying the position of the medial ends of each clavicle relative to the spinous process of the thoracic vertebral body between the clavicles (Fig. 2-14).• The medial ends of the clavicles are anterior
structures.• The spinous process is a posterior structure.• If the spinous process appears to lie equidistant from
the medial ends of each clavicle on the frontal chest radiograph, there is no rotation (Fig. 2-15A).
• If the spinous process appears closer to the medial end of the left clavicle, the patient is rotated toward his own right side (Fig. 2-15B).
• If the spinous process appears closer to the medial end of the right clavicle, the patient is rotated toward his own left side (Fig. 2-15C).
• These relationships hold true regardless of whether the patient was facing the x-ray tube or the cassette at the time of exposure.
Pitfalls of excessive rotation
• Even minor degrees of rotation can distort the normal anatomic appearance of the heart and great vessels, the hila, and hemidiaphragms.
• Marked rotation can introduce errors in interpreta-tion: The hilum may appear larger on the side rotated farther away from the imaging cassette because objects farther from the imaging cassette tend to be more magni-fied than objects closer to the cassette.
• Solutions: Look at the hilum on the lateral chest view to see if that view confirms hilar enlargement (see “The Hilar Region” in this chapter). Compare the current
• To help in differentiating the anterior from the poste-rior ribs, consult Box 2-1.
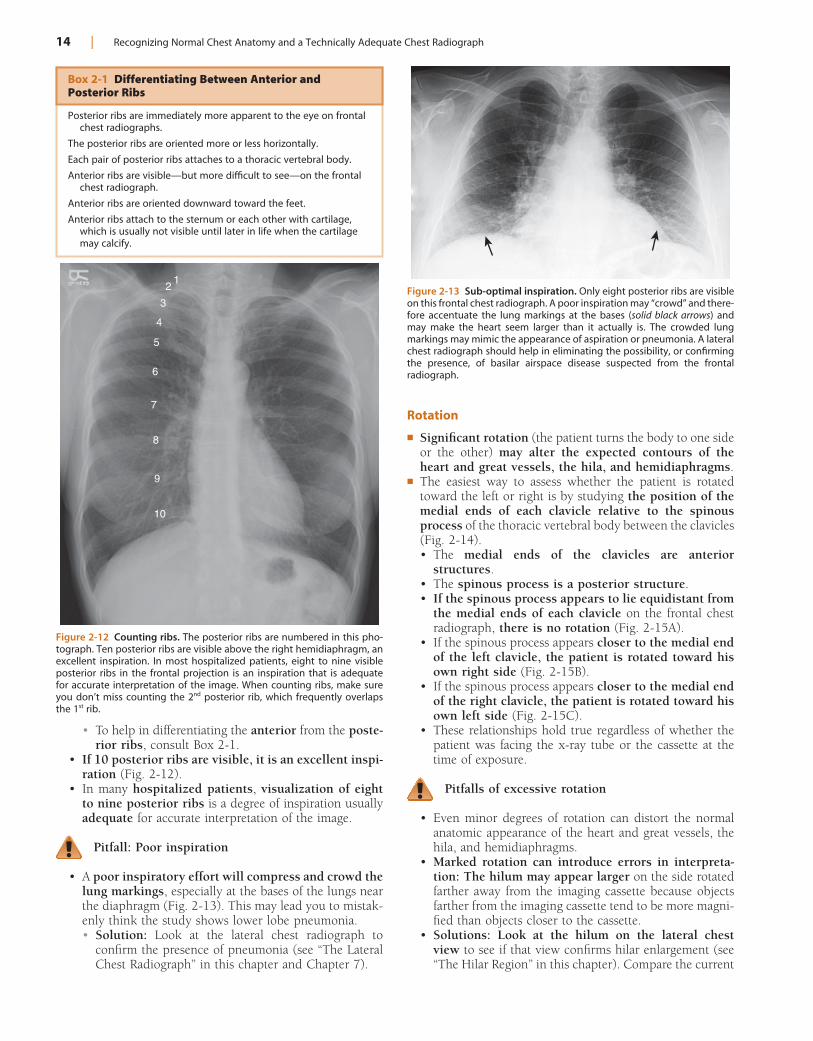
• If 10 posterior ribs are visible, it is an excellent inspi-ration (Fig. 2-12).
• In many hospitalized patients, visualization of eight to nine posterior ribs is a degree of inspiration usually adequate for accurate interpretation of the image.
Pitfall: Poor inspiration
• A poor inspiratory effort will compress and crowd the lung markings, especially at the bases of the lungs near the diaphragm (Fig. 2-13). This may lead you to mistak-enly think the study shows lower lobe pneumonia.• Solution: Look at the lateral chest radiograph to
confirm the presence of pneumonia (see “The Lateral Chest Radiograph” in this chapter and Chapter 7).
Figure 2-12 Counting ribs. The posterior ribs are numbered in this pho-tograph. Ten posterior ribs are visible above the right hemidiaphragm, an excellent inspiration. In most hospitalized patients, eight to nine visible posterior ribs in the frontal projection is an inspiration that is adequate for accurate interpretation of the image. When counting ribs, make sure you don’t miss counting the 2nd posterior rib, which frequently overlaps the 1st rib.
12
3
4
5
6
7
8
9
10
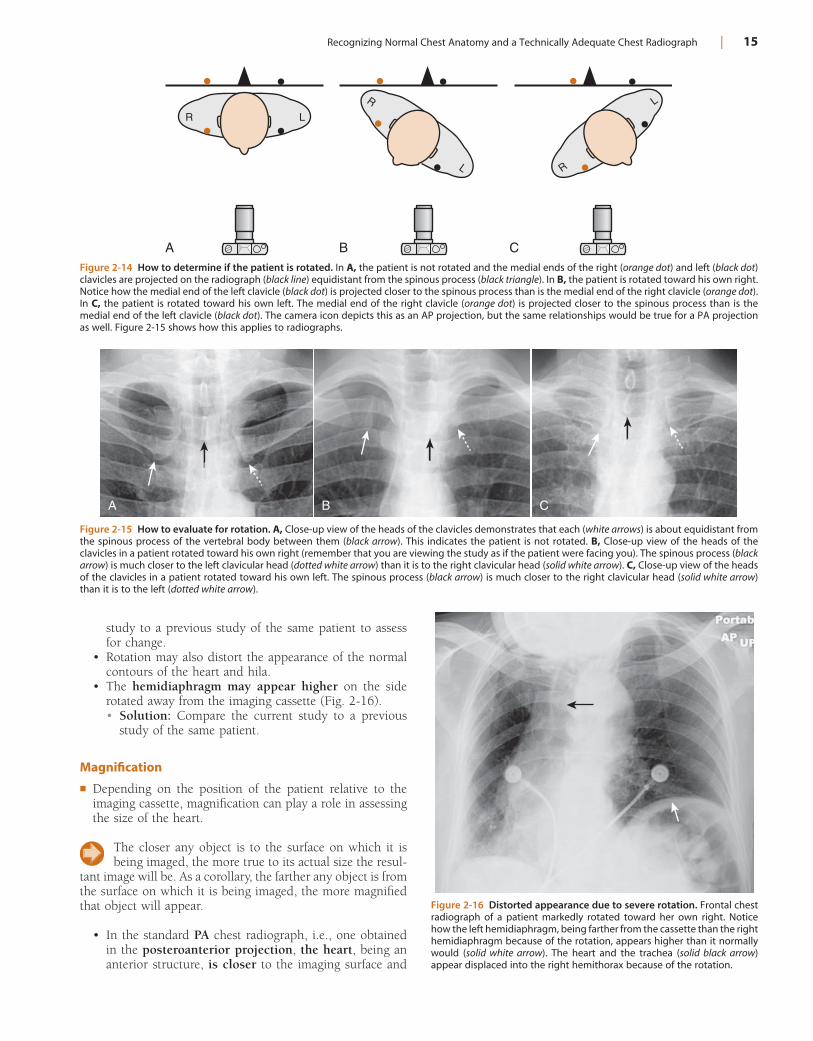
Figure 2-13 Sub-optimal inspiration. Only eight posterior ribs are visible on this frontal chest radiograph. A poor inspiration may “crowd” and there-fore accentuate the lung markings at the bases (solid black arrows) and may make the heart seem larger than it actually is. The crowded lung markings may mimic the appearance of aspiration or pneumonia. A lateral chest radiograph should help in eliminating the possibility, or confirming the presence, of basilar airspace disease suspected from the frontal radiograph.
Box 2-1 Differentiating Between Anterior and Posterior Ribs
Posterior ribs are immediately more apparent to the eye on frontal chest radiographs.
The posterior ribs are oriented more or less horizontally.
Each pair of posterior ribs attaches to a thoracic vertebral body.
Anterior ribs are visible—but more difficult to see—on the frontal chest radiograph.
Anterior ribs are oriented downward toward the feet.
Anterior ribs attach to the sternum or each other with cartilage, which is usually not visible until later in life when the cartilage may calcify.
Recognizing Normal Chest Anatomy and a Technically Adequate Chest Radiograph | 15
study to a previous study of the same patient to assess for change.
• Rotation may also distort the appearance of the normal contours of the heart and hila.
• The hemidiaphragm may appear higher on the side rotated away from the imaging cassette (Fig. 2-16).• Solution: Compare the current study to a previous
study of the same patient.
Magnification
! Depending on the position of the patient relative to the imaging cassette, magnification can play a role in assessing the size of the heart.
The closer any object is to the surface on which it is being imaged, the more true to its actual size the resul-
tant image will be. As a corollary, the farther any object is from the surface on which it is being imaged, the more magnified that object will appear.
• In the standard PA chest radiograph, i.e., one obtained in the posteroanterior projection, the heart, being an anterior structure, is closer to the imaging surface and
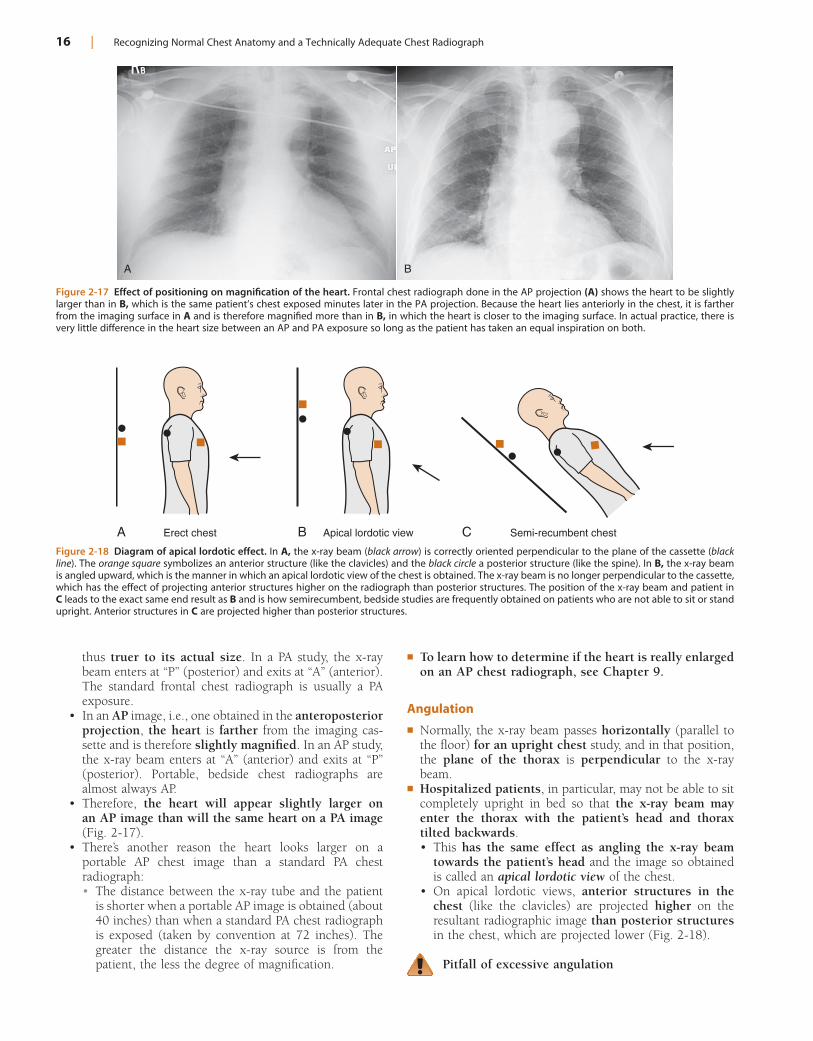
Figure 2-14 How to determine if the patient is rotated. In A, the patient is not rotated and the medial ends of the right (orange dot) and left (black dot) clavicles are projected on the radiograph (black line) equidistant from the spinous process (black triangle). In B, the patient is rotated toward his own right. Notice how the medial end of the left clavicle (black dot) is projected closer to the spinous process than is the medial end of the right clavicle (orange dot). In C, the patient is rotated toward his own left. The medial end of the right clavicle (orange dot) is projected closer to the spinous process than is the medial end of the left clavicle (black dot). The camera icon depicts this as an AP projection, but the same relationships would be true for a PA projection as well. Figure 2-15 shows how this applies to radiographs.
A B C
R L
R
LR
L
Figure 2-15 How to evaluate for rotation. A, Close-up view of the heads of the clavicles demonstrates that each (white arrows) is about equidistant from the spinous process of the vertebral body between them (black arrow). This indicates the patient is not rotated. B, Close-up view of the heads of the clavicles in a patient rotated toward his own right (remember that you are viewing the study as if the patient were facing you). The spinous process (black arrow) is much closer to the left clavicular head (dotted white arrow) than it is to the right clavicular head (solid white arrow). C, Close-up view of the heads of the clavicles in a patient rotated toward his own left. The spinous process (black arrow) is much closer to the right clavicular head (solid white arrow) than it is to the left (dotted white arrow).
A B C
Figure 2-16 Distorted appearance due to severe rotation. Frontal chest radiograph of a patient markedly rotated toward her own right. Notice how the left hemidiaphragm, being farther from the cassette than the right hemidiaphragm because of the rotation, appears higher than it normally would (solid white arrow). The heart and the trachea (solid black arrow) appear displaced into the right hemithorax because of the rotation.
16 | Recognizing Normal Chest Anatomy and a Technically Adequate Chest Radiograph
! To learn how to determine if the heart is really enlarged on an AP chest radiograph, see Chapter 9.
Angulation
! Normally, the x-ray beam passes horizontally (parallel to the floor) for an upright chest study, and in that position, the plane of the thorax is perpendicular to the x-ray beam.
! Hospitalized patients, in particular, may not be able to sit completely upright in bed so that the x-ray beam may enter the thorax with the patient’s head and thorax tilted backwards.• This has the same effect as angling the x-ray beam
towards the patient’s head and the image so obtained is called an apical lordotic view of the chest.
• On apical lordotic views, anterior structures in the chest (like the clavicles) are projected higher on the resultant radiographic image than posterior structures in the chest, which are projected lower (Fig. 2-18).
Pitfall of excessive angulation
thus truer to its actual size. In a PA study, the x-ray beam enters at “P” (posterior) and exits at “A” (anterior). The standard frontal chest radiograph is usually a PA exposure.
• In an AP image, i.e., one obtained in the anteroposterior projection, the heart is farther from the imaging cas-sette and is therefore slightly magnified. In an AP study, the x-ray beam enters at “A” (anterior) and exits at “P” (posterior). Portable, bedside chest radiographs are almost always AP.
• Therefore, the heart will appear slightly larger on an AP image than will the same heart on a PA image (Fig. 2-17).
• There’s another reason the heart looks larger on a portable AP chest image than a standard PA chest radiograph:• The distance between the x-ray tube and the patient
is shorter when a portable AP image is obtained (about 40 inches) than when a standard PA chest radiograph is exposed (taken by convention at 72 inches). The greater the distance the x-ray source is from the patient, the less the degree of magnification.
Figure 2-17 Effect of positioning on magnification of the heart. Frontal chest radiograph done in the AP projection (A) shows the heart to be slightly larger than in B, which is the same patient’s chest exposed minutes later in the PA projection. Because the heart lies anteriorly in the chest, it is farther from the imaging surface in A and is therefore magnified more than in B, in which the heart is closer to the imaging surface. In actual practice, there is very little difference in the heart size between an AP and PA exposure so long as the patient has taken an equal inspiration on both.
A B
Figure 2-18 Diagram of apical lordotic effect. In A, the x-ray beam (black arrow) is correctly oriented perpendicular to the plane of the cassette (black line). The orange square symbolizes an anterior structure (like the clavicles) and the black circle a posterior structure (like the spine). In B, the x-ray beam is angled upward, which is the manner in which an apical lordotic view of the chest is obtained. The x-ray beam is no longer perpendicular to the cassette, which has the effect of projecting anterior structures higher on the radiograph than posterior structures. The position of the x-ray beam and patient in C leads to the exact same end result as B and is how semirecumbent, bedside studies are frequently obtained on patients who are not able to sit or stand upright. Anterior structures in C are projected higher than posterior structures.
A Erect chest Apical lordotic view Semi-recumbent chestB C
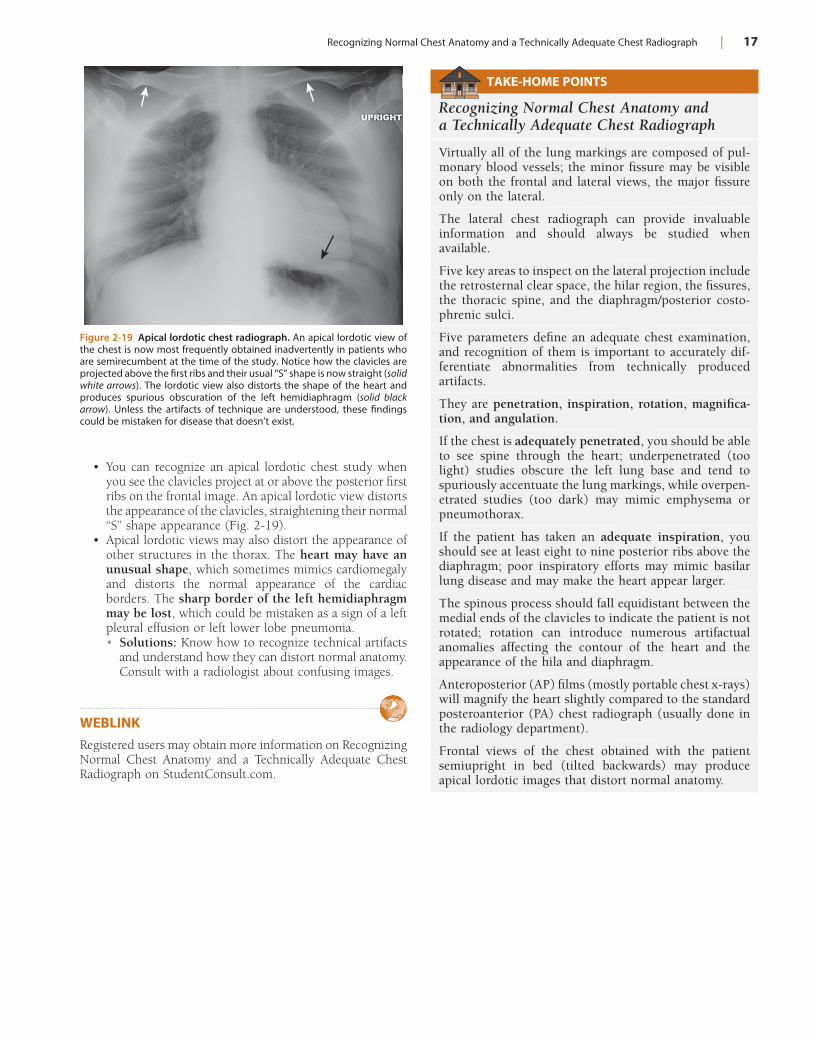
Recognizing Normal Chest Anatomy and a Technically Adequate Chest Radiograph | 17
• You can recognize an apical lordotic chest study when you see the clavicles project at or above the posterior first ribs on the frontal image. An apical lordotic view distorts the appearance of the clavicles, straightening their normal “S” shape appearance (Fig. 2-19).
• Apical lordotic views may also distort the appearance of other structures in the thorax. The heart may have an unusual shape, which sometimes mimics cardiomegaly and distorts the normal appearance of the cardiac borders. The sharp border of the left hemidiaphragm may be lost, which could be mistaken as a sign of a left pleural effusion or left lower lobe pneumonia.• Solutions: Know how to recognize technical artifacts
and understand how they can distort normal anatomy. Consult with a radiologist about confusing images.
WEBLINKRegistered users may obtain more information on Recognizing Normal Chest Anatomy and a Technically Adequate Chest Radiograph on StudentConsult.com.
Figure 2-19 Apical lordotic chest radiograph. An apical lordotic view of the chest is now most frequently obtained inadvertently in patients who are semirecumbent at the time of the study. Notice how the clavicles are projected above the first ribs and their usual “S” shape is now straight (solid white arrows). The lordotic view also distorts the shape of the heart and produces spurious obscuration of the left hemidiaphragm (solid black arrow). Unless the artifacts of technique are understood, these findings could be mistaken for disease that doesn’t exist.
TAKE-HOME POINTS
Recognizing Normal Chest Anatomy and a Technically Adequate Chest Radiograph
Virtually all of the lung markings are composed of pul-monary blood vessels; the minor fissure may be visible on both the frontal and lateral views, the major fissure only on the lateral.
The lateral chest radiograph can provide invaluable information and should always be studied when available.
Five key areas to inspect on the lateral projection include the retrosternal clear space, the hilar region, the fissures, the thoracic spine, and the diaphragm/posterior costo-phrenic sulci.
Five parameters define an adequate chest examination, and recognition of them is important to accurately dif-ferentiate abnormalities from technically produced artifacts.
They are penetration, inspiration, rotation, magnifica-tion, and angulation.
If the chest is adequately penetrated, you should be able to see spine through the heart; underpenetrated (too light) studies obscure the left lung base and tend to spuriously accentuate the lung markings, while overpen-etrated studies (too dark) may mimic emphysema or pneumothorax.
If the patient has taken an adequate inspiration, you should see at least eight to nine posterior ribs above the diaphragm; poor inspiratory efforts may mimic basilar lung disease and may make the heart appear larger.
The spinous process should fall equidistant between the medial ends of the clavicles to indicate the patient is not rotated; rotation can introduce numerous artifactual anomalies affecting the contour of the heart and the appearance of the hila and diaphragm.
Anteroposterior (AP) films (mostly portable chest x-rays) will magnify the heart slightly compared to the standard posteroanterior (PA) chest radiograph (usually done in the radiology department).
Frontal views of the chest obtained with the patient semiupright in bed (tilted backwards) may produce apical lordotic images that distort normal anatomy.
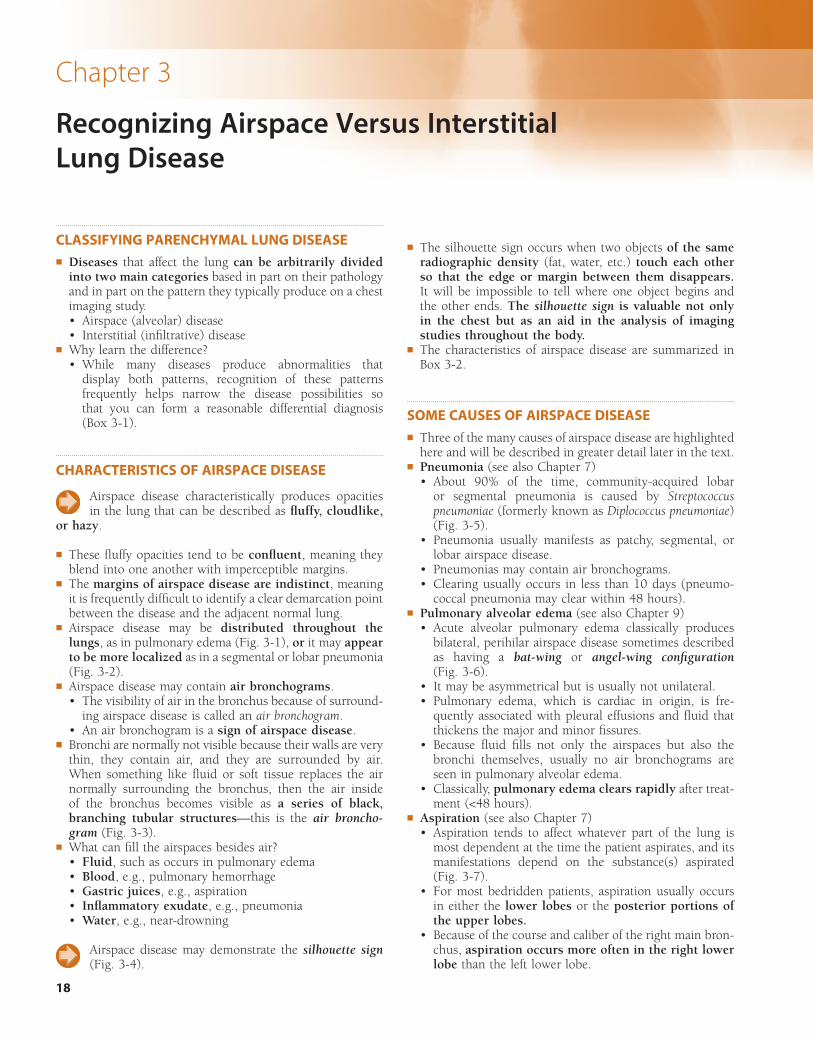
18
Chapter 3
Recognizing Airspace Versus Interstitial Lung Disease
CLASSIFYING PARENCHYMAL LUNG DISEASE! Diseases that affect the lung can be arbitrarily divided
into two main categories based in part on their pathology and in part on the pattern they typically produce on a chest imaging study.• Airspace (alveolar) disease• Interstitial (infiltrative) disease
! Why learn the difference?• While many diseases produce abnormalities that
display both patterns, recognition of these patterns frequently helps narrow the disease possibilities so that you can form a reasonable differential diagnosis (Box 3-1).
CHARACTERISTICS OF AIRSPACE DISEASE
Airspace disease characteristically produces opacities in the lung that can be described as fluffy, cloudlike,
or hazy.
! These fluffy opacities tend to be confluent, meaning they blend into one another with imperceptible margins.
! The margins of airspace disease are indistinct, meaning it is frequently difficult to identify a clear demarcation point between the disease and the adjacent normal lung.
! Airspace disease may be distributed throughout the lungs, as in pulmonary edema (Fig. 3-1), or it may appear to be more localized as in a segmental or lobar pneumonia (Fig. 3-2).
! Airspace disease may contain air bronchograms.• The visibility of air in the bronchus because of surround-
ing airspace disease is called an air bronchogram.• An air bronchogram is a sign of airspace disease.
! Bronchi are normally not visible because their walls are very thin, they contain air, and they are surrounded by air. When something like fluid or soft tissue replaces the air normally surrounding the bronchus, then the air inside of the bronchus becomes visible as a series of black, branching tubular structures—this is the air broncho-gram (Fig. 3-3).
! What can fill the airspaces besides air?• Fluid, such as occurs in pulmonary edema• Blood, e.g., pulmonary hemorrhage• Gastric juices, e.g., aspiration• Inflammatory exudate, e.g., pneumonia• Water, e.g., near-drowning
Airspace disease may demonstrate the silhouette sign (Fig. 3-4).
! The silhouette sign occurs when two objects of the same radiographic density (fat, water, etc.) touch each other so that the edge or margin between them disappears. It will be impossible to tell where one object begins and the other ends. The silhouette sign is valuable not only in the chest but as an aid in the analysis of imaging studies throughout the body.
! The characteristics of airspace disease are summarized in Box 3-2.
SOME CAUSES OF AIRSPACE DISEASE! Three of the many causes of airspace disease are highlighted
here and will be described in greater detail later in the text.! Pneumonia (see also Chapter 7)
• About 90% of the time, community-acquired lobar or segmental pneumonia is caused by Streptococcus pneumoniae (formerly known as Diplococcus pneumoniae) (Fig. 3-5).
• Pneumonia usually manifests as patchy, segmental, or lobar airspace disease.
• Pneumonias may contain air bronchograms.• Clearing usually occurs in less than 10 days (pneumo-
coccal pneumonia may clear within 48 hours).! Pulmonary alveolar edema (see also Chapter 9)
• Acute alveolar pulmonary edema classically produces bilateral, perihilar airspace disease sometimes described as having a bat-wing or angel-wing configuration (Fig. 3-6).
• It may be asymmetrical but is usually not unilateral.• Pulmonary edema, which is cardiac in origin, is fre-
quently associated with pleural effusions and fluid that thickens the major and minor fissures.
• Because fluid fills not only the airspaces but also the bronchi themselves, usually no air bronchograms are seen in pulmonary alveolar edema.
• Classically, pulmonary edema clears rapidly after treat-ment (<48 hours).
! Aspiration (see also Chapter 7)• Aspiration tends to affect whatever part of the lung is
most dependent at the time the patient aspirates, and its manifestations depend on the substance(s) aspirated (Fig. 3-7).
• For most bedridden patients, aspiration usually occurs in either the lower lobes or the posterior portions of the upper lobes.
• Because of the course and caliber of the right main bron-chus, aspiration occurs more often in the right lower lobe than the left lower lobe.
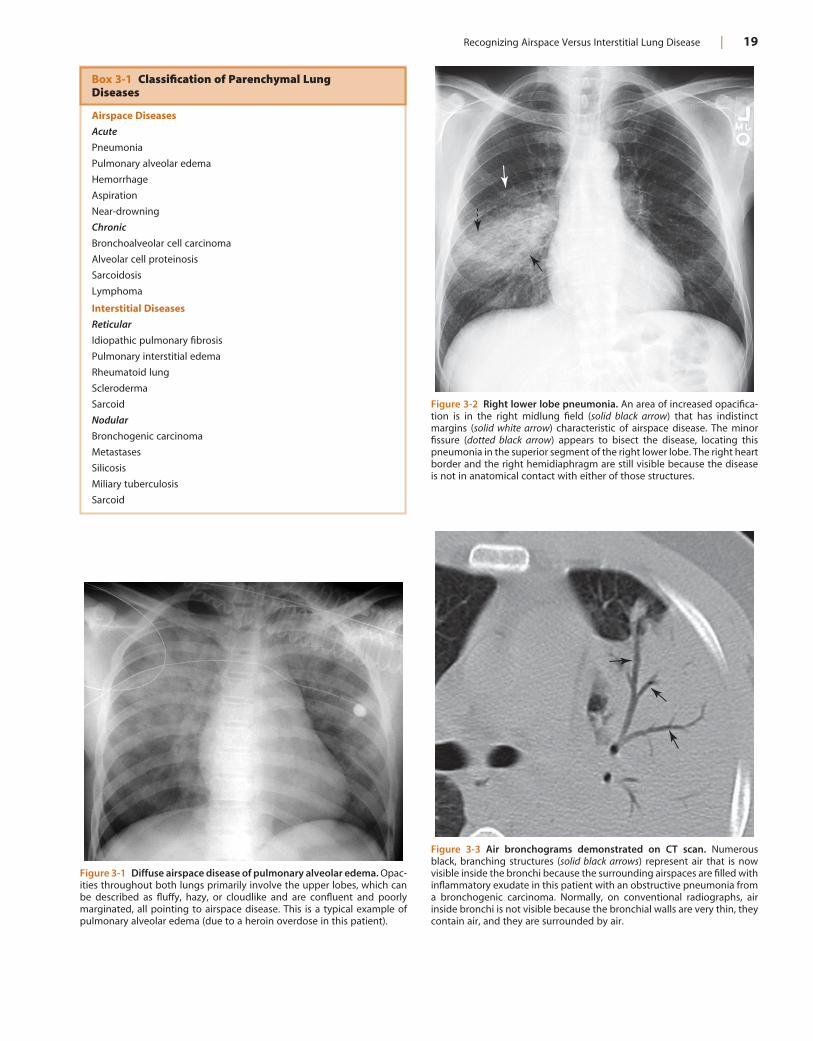
Recognizing Airspace Versus Interstitial Lung Disease | 19
Figure 3-1 Diffuse airspace disease of pulmonary alveolar edema. Opac-ities throughout both lungs primarily involve the upper lobes, which can be described as fluffy, hazy, or cloudlike and are confluent and poorly marginated, all pointing to airspace disease. This is a typical example of pulmonary alveolar edema (due to a heroin overdose in this patient).
Figure 3-2 Right lower lobe pneumonia. An area of increased opacifica-tion is in the right midlung field (solid black arrow) that has indistinct margins (solid white arrow) characteristic of airspace disease. The minor fissure (dotted black arrow) appears to bisect the disease, locating this pneumonia in the superior segment of the right lower lobe. The right heart border and the right hemidiaphragm are still visible because the disease is not in anatomical contact with either of those structures.
Figure 3-3 Air bronchograms demonstrated on CT scan. Numerous black, branching structures (solid black arrows) represent air that is now visible inside the bronchi because the surrounding airspaces are filled with inflammatory exudate in this patient with an obstructive pneumonia from a bronchogenic carcinoma. Normally, on conventional radiographs, air inside bronchi is not visible because the bronchial walls are very thin, they contain air, and they are surrounded by air.
Box 3-1 Classification of Parenchymal Lung Diseases
Airspace Diseases
Acute
Pneumonia
Pulmonary alveolar edema
Hemorrhage
Aspiration
Near-drowning
Chronic
Bronchoalveolar cell carcinoma
Alveolar cell proteinosis
Sarcoidosis
Lymphoma
Interstitial Diseases
Reticular
Idiopathic pulmonary fibrosis
Pulmonary interstitial edema
Rheumatoid lung
Scleroderma
Sarcoid
Nodular
Bronchogenic carcinoma
Metastases
Silicosis
Miliary tuberculosis
Sarcoid
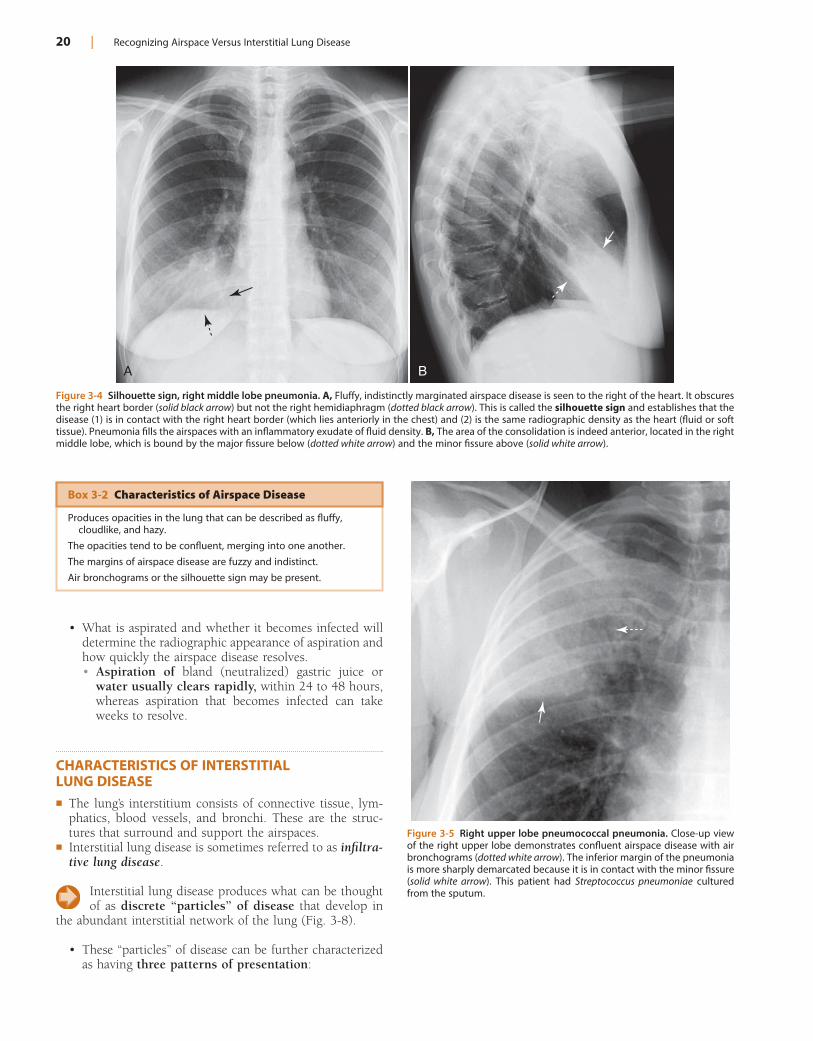
20 | Recognizing Airspace Versus Interstitial Lung Disease
Figure 3-4 Silhouette sign, right middle lobe pneumonia. A, Fluffy, indistinctly marginated airspace disease is seen to the right of the heart. It obscures the right heart border (solid black arrow) but not the right hemidiaphragm (dotted black arrow). This is called the silhouette sign and establishes that the disease (1) is in contact with the right heart border (which lies anteriorly in the chest) and (2) is the same radiographic density as the heart (fluid or soft tissue). Pneumonia fills the airspaces with an inflammatory exudate of fluid density. B, The area of the consolidation is indeed anterior, located in the right middle lobe, which is bound by the major fissure below (dotted white arrow) and the minor fissure above (solid white arrow).
A B
Figure 3-5 Right upper lobe pneumococcal pneumonia. Close-up view of the right upper lobe demonstrates confluent airspace disease with air bronchograms (dotted white arrow). The inferior margin of the pneumonia is more sharply demarcated because it is in contact with the minor fissure (solid white arrow). This patient had Streptococcus pneumoniae cultured from the sputum.
Box 3-2 Characteristics of Airspace Disease
Produces opacities in the lung that can be described as fluffy, cloudlike, and hazy.
The opacities tend to be confluent, merging into one another.
The margins of airspace disease are fuzzy and indistinct.
Air bronchograms or the silhouette sign may be present.
• What is aspirated and whether it becomes infected will determine the radiographic appearance of aspiration and how quickly the airspace disease resolves.• Aspiration of bland (neutralized) gastric juice or
water usually clears rapidly, within 24 to 48 hours, whereas aspiration that becomes infected can take weeks to resolve.
CHARACTERISTICS OF INTERSTITIAL LUNG DISEASE! The lung’s interstitium consists of connective tissue, lym-
phatics, blood vessels, and bronchi. These are the struc-tures that surround and support the airspaces.
! Interstitial lung disease is sometimes referred to as infiltra-tive lung disease.
Interstitial lung disease produces what can be thought of as discrete “particles” of disease that develop in
the abundant interstitial network of the lung (Fig. 3-8).
• These “particles” of disease can be further characterized as having three patterns of presentation:
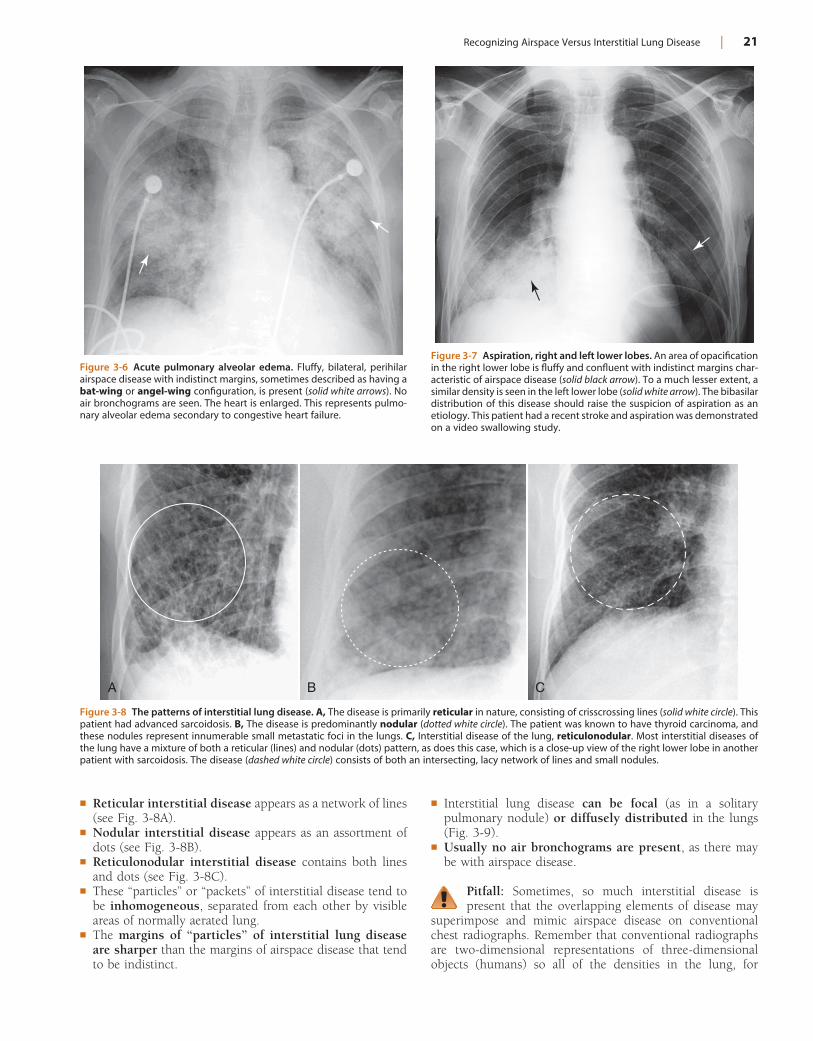
Recognizing Airspace Versus Interstitial Lung Disease | 21
Figure 3-6 Acute pulmonary alveolar edema. Fluffy, bilateral, perihilar airspace disease with indistinct margins, sometimes described as having a bat-wing or angel-wing configuration, is present (solid white arrows). No air bronchograms are seen. The heart is enlarged. This represents pulmo-nary alveolar edema secondary to congestive heart failure.
Figure 3-7 Aspiration, right and left lower lobes. An area of opacification in the right lower lobe is fluffy and confluent with indistinct margins char-acteristic of airspace disease (solid black arrow). To a much lesser extent, a similar density is seen in the left lower lobe (solid white arrow). The bibasilar distribution of this disease should raise the suspicion of aspiration as an etiology. This patient had a recent stroke and aspiration was demonstrated on a video swallowing study.
Figure 3-8 The patterns of interstitial lung disease. A, The disease is primarily reticular in nature, consisting of crisscrossing lines (solid white circle). This patient had advanced sarcoidosis. B, The disease is predominantly nodular (dotted white circle). The patient was known to have thyroid carcinoma, and these nodules represent innumerable small metastatic foci in the lungs. C, Interstitial disease of the lung, reticulonodular. Most interstitial diseases of the lung have a mixture of both a reticular (lines) and nodular (dots) pattern, as does this case, which is a close-up view of the right lower lobe in another patient with sarcoidosis. The disease (dashed white circle) consists of both an intersecting, lacy network of lines and small nodules.
A B C
! Reticular interstitial disease appears as a network of lines (see Fig. 3-8A).
! Nodular interstitial disease appears as an assortment of dots (see Fig. 3-8B).
! Reticulonodular interstitial disease contains both lines and dots (see Fig. 3-8C).
! These “particles” or “packets” of interstitial disease tend to be inhomogeneous, separated from each other by visible areas of normally aerated lung.
! The margins of “particles” of interstitial lung disease are sharper than the margins of airspace disease that tend to be indistinct.
! Interstitial lung disease can be focal (as in a solitary pulmonary nodule) or diffusely distributed in the lungs (Fig. 3-9).
! Usually no air bronchograms are present, as there may be with airspace disease.
Pitfall: Sometimes, so much interstitial disease is present that the overlapping elements of disease may
superimpose and mimic airspace disease on con ventional chest radiographs. Remember that conventional radiographs are two-dimensional representations of three-dimensional objects (humans) so all of the densities in the lung, for
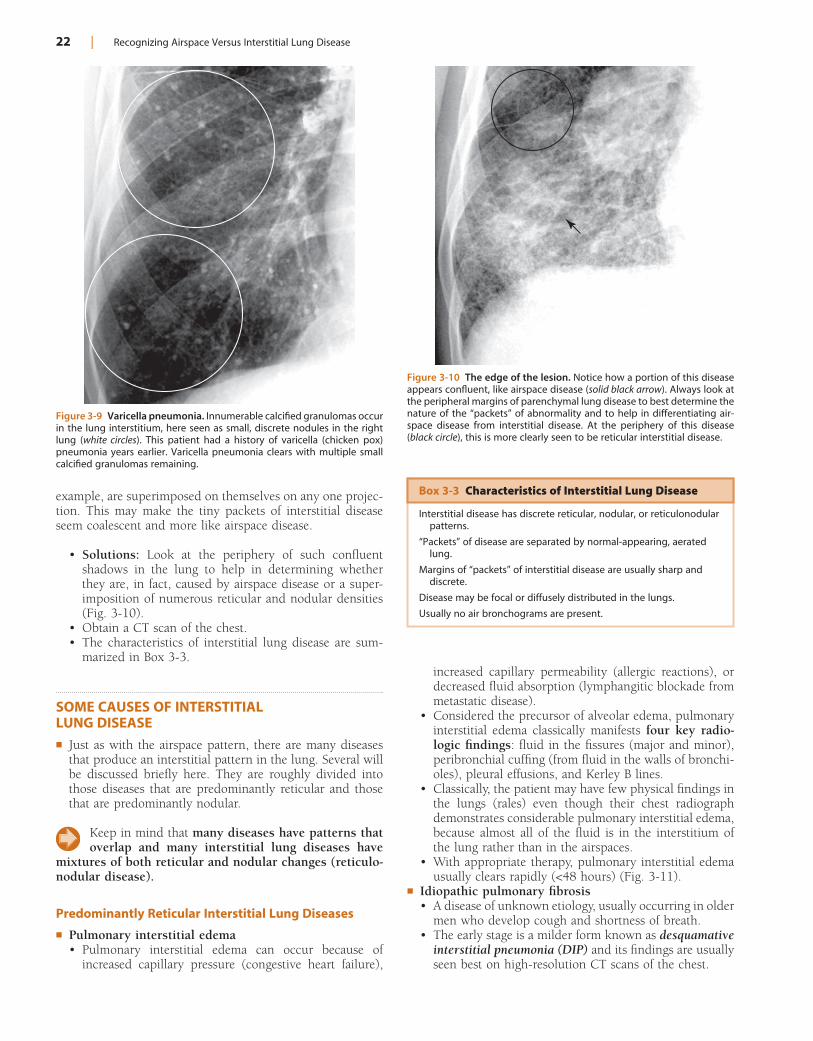
22 | Recognizing Airspace Versus Interstitial Lung Disease
example, are superimposed on themselves on any one projec-tion. This may make the tiny packets of interstitial disease seem coalescent and more like airspace disease.
• Solutions: Look at the periphery of such confluent shadows in the lung to help in determining whether they are, in fact, caused by airspace disease or a super-imposition of numerous reticular and nodular densities (Fig. 3-10).
• Obtain a CT scan of the chest.• The characteristics of interstitial lung disease are sum-
marized in Box 3-3.
SOME CAUSES OF INTERSTITIAL LUNG DISEASE! Just as with the airspace pattern, there are many diseases
that produce an interstitial pattern in the lung. Several will be discussed briefly here. They are roughly divided into those diseases that are predominantly reticular and those that are predominantly nodular.
Keep in mind that many diseases have patterns that overlap and many interstitial lung diseases have
mixtures of both reticular and nodular changes (reticulo-nodular disease).
Predominantly Reticular Interstitial Lung Diseases
! Pulmonary interstitial edema• Pulmonary interstitial edema can occur because of
increased capillary pressure (congestive heart failure),
Figure 3-9 Varicella pneumonia. Innumerable calcified granulomas occur in the lung interstitium, here seen as small, discrete nodules in the right lung (white circles). This patient had a history of varicella (chicken pox) pneumonia years earlier. Varicella pneumonia clears with multiple small calcified granulomas remaining.
Figure 3-10 The edge of the lesion. Notice how a portion of this disease appears confluent, like airspace disease (solid black arrow). Always look at the peripheral margins of parenchymal lung disease to best determine the nature of the “packets” of abnormality and to help in differentiating air-space disease from interstitial disease. At the periphery of this disease (black circle), this is more clearly seen to be reticular interstitial disease.
Box 3-3 Characteristics of Interstitial Lung Disease
Interstitial disease has discrete reticular, nodular, or reticulonodular patterns.
“Packets” of disease are separated by normal-appearing, aerated lung.
Margins of “packets” of interstitial disease are usually sharp and discrete.
Disease may be focal or diffusely distributed in the lungs.
Usually no air bronchograms are present.
increased capillary permeability (allergic reactions), or decreased fluid absorption (lymphangitic blockade from metastatic disease).
• Considered the precursor of alveolar edema, pulmonary interstitial edema classically manifests four key radio-logic findings: fluid in the fissures (major and minor), peribronchial cuffing (from fluid in the walls of bronchi-oles), pleural effusions, and Kerley B lines.
• Classically, the patient may have few physical findings in the lungs (rales) even though their chest radiograph demonstrates considerable pulmonary interstitial edema, because almost all of the fluid is in the interstitium of the lung rather than in the airspaces.
• With appropriate therapy, pulmonary interstitial edema usually clears rapidly (<48 hours) (Fig. 3-11).
! Idiopathic pulmonary fibrosis• A disease of unknown etiology, usually occurring in older
men who develop cough and shortness of breath.• The early stage is a milder form known as desquamative
interstitial pneumonia (DIP) and its findings are usually seen best on high-resolution CT scans of the chest.
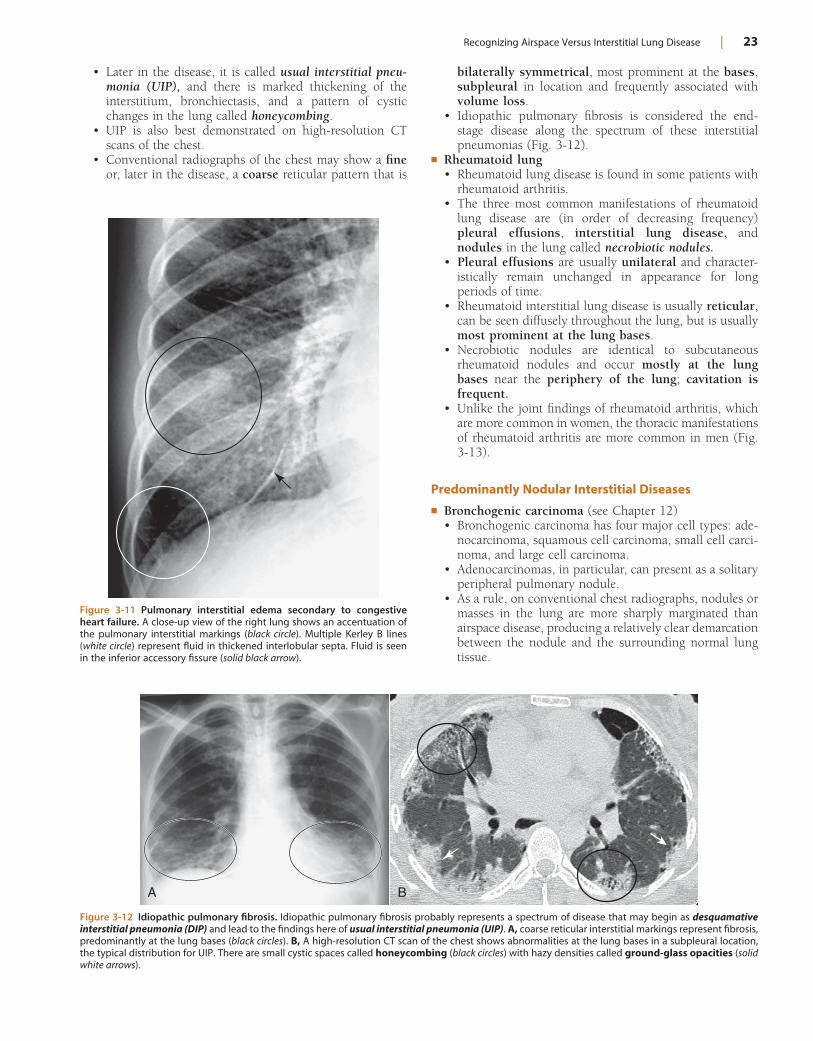
Recognizing Airspace Versus Interstitial Lung Disease | 23
Figure 3-11 Pulmonary interstitial edema secondary to congestive heart failure. A close-up view of the right lung shows an accentuation of the pulmonary interstitial markings (black circle). Multiple Kerley B lines (white circle) represent fluid in thickened interlobular septa. Fluid is seen in the inferior accessory fissure (solid black arrow).
Figure 3-12 Idiopathic pulmonary fibrosis. Idiopathic pulmonary fibrosis probably represents a spectrum of disease that may begin as desquamative interstitial pneumonia (DIP) and lead to the findings here of usual interstitial pneumonia (UIP). A, coarse reticular interstitial markings represent fibrosis, predominantly at the lung bases (black circles). B, A high-resolution CT scan of the chest shows abnormalities at the lung bases in a subpleural location, the typical distribution for UIP. There are small cystic spaces called honeycombing (black circles) with hazy densities called ground-glass opacities (solid white arrows).
A B
• Later in the disease, it is called usual interstitial pneu-monia (UIP), and there is marked thickening of the interstitium, bronchiectasis, and a pattern of cystic changes in the lung called honeycombing.
• UIP is also best demonstrated on high-resolution CT scans of the chest.
• Conventional radiographs of the chest may show a fine or, later in the disease, a coarse reticular pattern that is
bilaterally symmetrical, most prominent at the bases, subpleural in location and frequently associated with volume loss.
• Idiopathic pulmonary fibrosis is considered the end-stage disease along the spectrum of these interstitial pneumonias (Fig. 3-12).
! Rheumatoid lung• Rheumatoid lung disease is found in some patients with
rheumatoid arthritis.• The three most common manifestations of rheumatoid
lung disease are (in order of decreasing frequency) pleural effusions, interstitial lung disease, and nodules in the lung called necrobiotic nodules.
• Pleural effusions are usually unilateral and character-istically remain unchanged in appearance for long periods of time.
• Rheumatoid interstitial lung disease is usually reticular, can be seen diffusely throughout the lung, but is usually most prominent at the lung bases.
• Necrobiotic nodules are identical to subcutaneous rheumatoid nodules and occur mostly at the lung bases near the periphery of the lung; cavitation is frequent.
• Unlike the joint findings of rheumatoid arthritis, which are more common in women, the thoracic manifestations of rheumatoid arthritis are more common in men (Fig. 3-13).
Predominantly Nodular Interstitial Diseases
! Bronchogenic carcinoma (see Chapter 12)• Bronchogenic carcinoma has four major cell types: ade-
nocarcinoma, squamous cell carcinoma, small cell carci-noma, and large cell carcinoma.
• Adenocarcinomas, in particular, can present as a solitary peripheral pulmonary nodule.
• As a rule, on conventional chest radiographs, nodules or masses in the lung are more sharply marginated than airspace disease, producing a relatively clear demarcation between the nodule and the surrounding normal lung tissue.
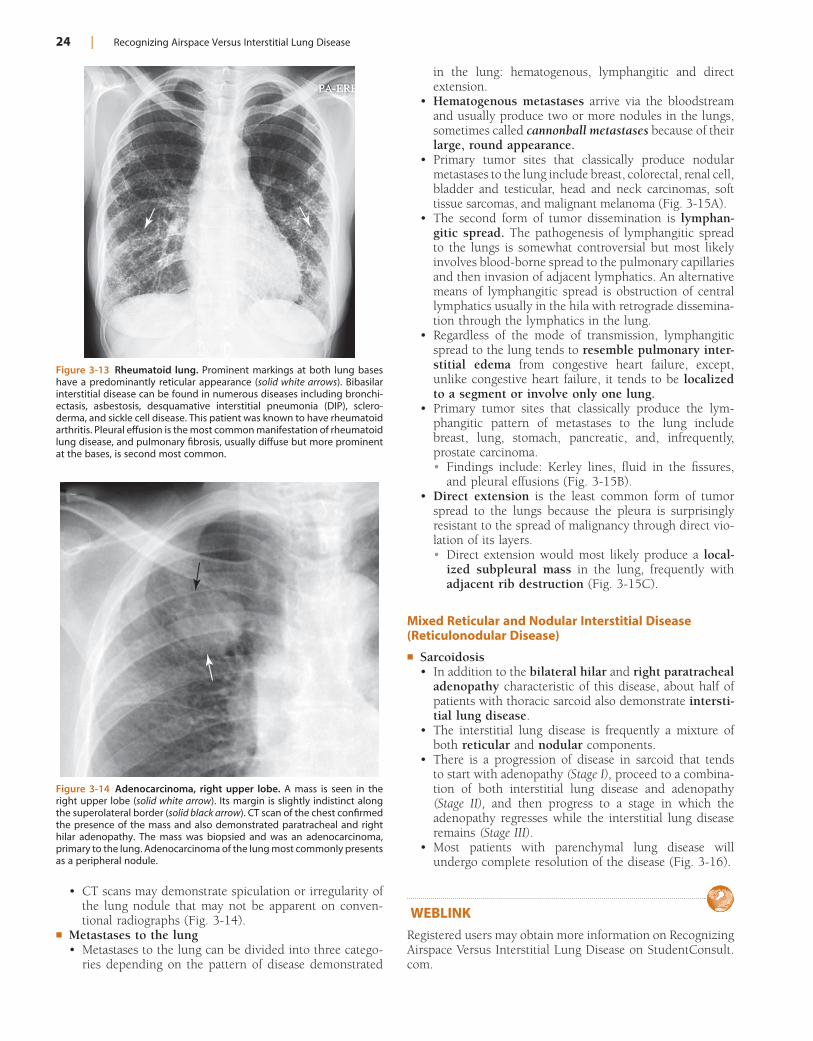
24 | Recognizing Airspace Versus Interstitial Lung Disease
in the lung: hematogenous, lymphangitic and direct extension.
• Hematogenous metastases arrive via the bloodstream and usually produce two or more nodules in the lungs, sometimes called cannonball metastases because of their large, round appearance.
• Primary tumor sites that classically produce nodular metastases to the lung include breast, colorectal, renal cell, bladder and testicular, head and neck carcinomas, soft tissue sarcomas, and malignant melanoma (Fig. 3-15A).
• The second form of tumor dissemination is lymphan-gitic spread. The pathogenesis of lymphangitic spread to the lungs is somewhat controversial but most likely involves blood-borne spread to the pulmonary capillaries and then invasion of adjacent lymphatics. An alternative means of lymphangitic spread is obstruction of central lymphatics usually in the hila with retrograde dissemina-tion through the lymphatics in the lung.
• Regardless of the mode of transmission, lymphangitic spread to the lung tends to resemble pulmonary inter-stitial edema from congestive heart failure, except, unlike congestive heart failure, it tends to be localized to a segment or involve only one lung.
• Primary tumor sites that classically produce the lym-phangitic pattern of metastases to the lung include breast, lung, stomach, pancreatic, and, infrequently, prostate carcinoma.• Findings include: Kerley lines, fluid in the fissures,
and pleural effusions (Fig. 3-15B).• Direct extension is the least common form of tumor
spread to the lungs because the pleura is surprisingly resistant to the spread of malignancy through direct vio-lation of its layers.• Direct extension would most likely produce a local-
ized subpleural mass in the lung, frequently with adjacent rib destruction (Fig. 3-15C).
Mixed Reticular and Nodular Interstitial Disease (Reticulonodular Disease)
! Sarcoidosis• In addition to the bilateral hilar and right paratracheal
adenopathy characteristic of this disease, about half of patients with thoracic sarcoid also demonstrate intersti-tial lung disease.
• The interstitial lung disease is frequently a mixture of both reticular and nodular components.
• There is a progression of disease in sarcoid that tends to start with adenopathy (Stage I), proceed to a combina-tion of both interstitial lung disease and adenopathy (Stage II), and then progress to a stage in which the adenopathy regresses while the interstitial lung disease remains (Stage III).
• Most patients with parenchymal lung disease will undergo complete resolution of the disease (Fig. 3-16).
WEBLINKRegistered users may obtain more information on Recognizing Airspace Versus Interstitial Lung Disease on StudentConsult.com.
• CT scans may demonstrate spiculation or irregularity of the lung nodule that may not be apparent on conven-tional radiographs (Fig. 3-14).
! Metastases to the lung• Metastases to the lung can be divided into three catego-
ries depending on the pattern of disease demonstrated
Figure 3-13 Rheumatoid lung. Prominent markings at both lung bases have a predominantly reticular appearance (solid white arrows). Bibasilar interstitial disease can be found in numerous diseases including bronchi-ectasis, asbestosis, desquamative interstitial pneumonia (DIP), sclero-derma, and sickle cell disease. This patient was known to have rheumatoid arthritis. Pleural effusion is the most common manifestation of rheumatoid lung disease, and pulmonary fibrosis, usually diffuse but more prominent at the bases, is second most common.
Figure 3-14 Adenocarcinoma, right upper lobe. A mass is seen in the right upper lobe (solid white arrow). Its margin is slightly indistinct along the superolateral border (solid black arrow). CT scan of the chest confirmed the presence of the mass and also demonstrated paratracheal and right hilar adenopathy. The mass was biopsied and was an adenocarcinoma, primary to the lung. Adenocarcinoma of the lung most commonly presents as a peripheral nodule.

Recognizing Airspace Versus Interstitial Lung Disease | 25
Figure 3-16 Sarcoidosis. A frontal radiograph of the chest reveals bilateral hilar (solid black arrows) and right paratracheal adenopathy (dotted black arrow), a classical distribution for the adenopathy in sarcoidosis. In addition, the patient has diffuse, bilateral interstitial lung disease (black circle) that is reticulonodular in nature. In some patients with this stage of disease, the adenopathy regresses while the interstitial disease remains. In the overwhelm-ing majority of patients with sarcoid, the disease completely resolves.
C
A B
Figure 3-15 Metastases to the lung, CT scans. A, Multiple discrete nodules of varying size are present throughout both lungs (solid white arrows). The diagnosis of exclusion, whenever multiple nodules are found in the lungs, is metastatic disease. In this case, the metastases were from colon carcinoma. B, The interstitial markings in the right lung are prominent (solid white arrow), there are septal lines (dotted black arrow) and lymphadenopathy (solid black arrows) from lymphangitic spread of a bronchogenic carcinoma. C, In this case, the lung cancer has grown through the chest wall (solid white arrow) and invaded it by direct extension. The pleura usually serves as a strong barrier to the direct spread of tumor.
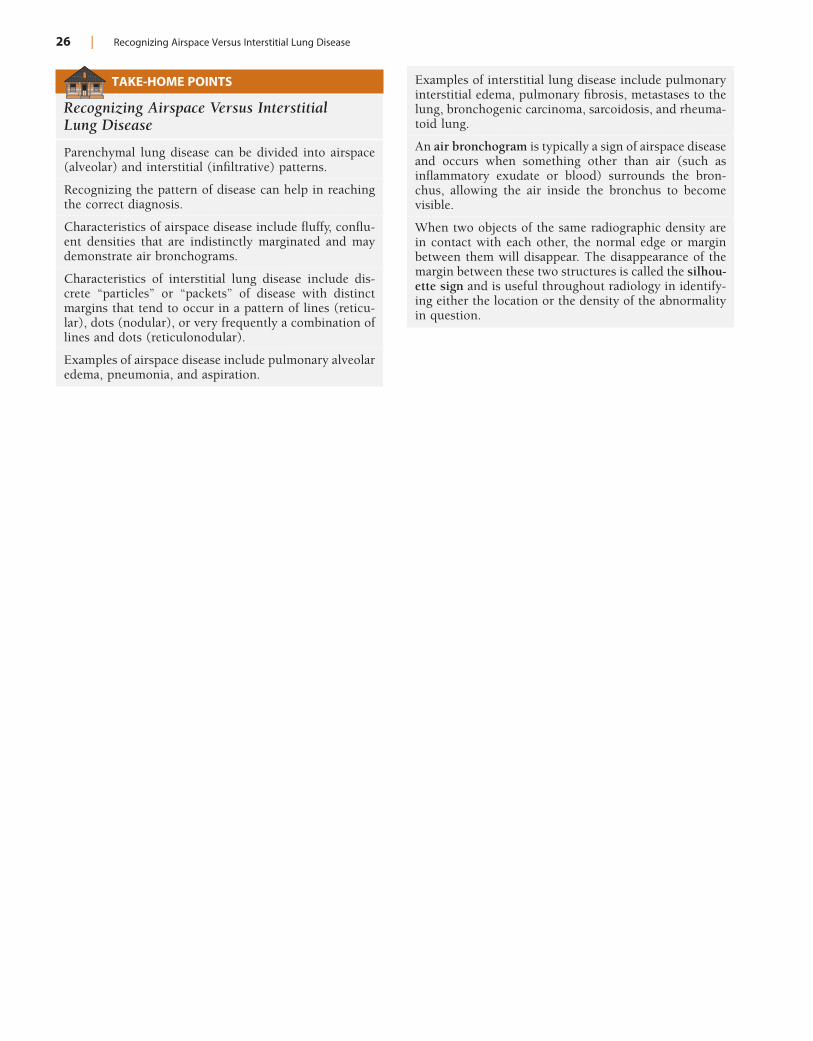
26 | Recognizing Airspace Versus Interstitial Lung Disease
TAKE-HOME POINTS
Recognizing Airspace Versus Interstitial Lung Disease
Parenchymal lung disease can be divided into airspace (alveolar) and interstitial (infiltrative) patterns.
Recognizing the pattern of disease can help in reaching the correct diagnosis.
Characteristics of airspace disease include fluffy, conflu-ent densities that are indistinctly marginated and may demonstrate air bronchograms.
Characteristics of interstitial lung disease include dis-crete “particles” or “packets” of disease with distinct margins that tend to occur in a pattern of lines (reticu-lar), dots (nodular), or very frequently a combination of lines and dots (reticulonodular).
Examples of airspace disease include pulmonary alveolar edema, pneumonia, and aspiration.
Examples of interstitial lung disease include pulmonary interstitial edema, pulmonary fibrosis, metastases to the lung, bronchogenic carcinoma, sarcoidosis, and rheuma-toid lung.
An air bronchogram is typically a sign of airspace disease and occurs when something other than air (such as inflammatory exudate or blood) surrounds the bron-chus, allowing the air inside the bronchus to become visible.
When two objects of the same radiographic density are in contact with each other, the normal edge or margin between them will disappear. The disappearance of the margin between these two structures is called the silhou-ette sign and is useful throughout radiology in identify-ing either the location or the density of the abnormality in question.
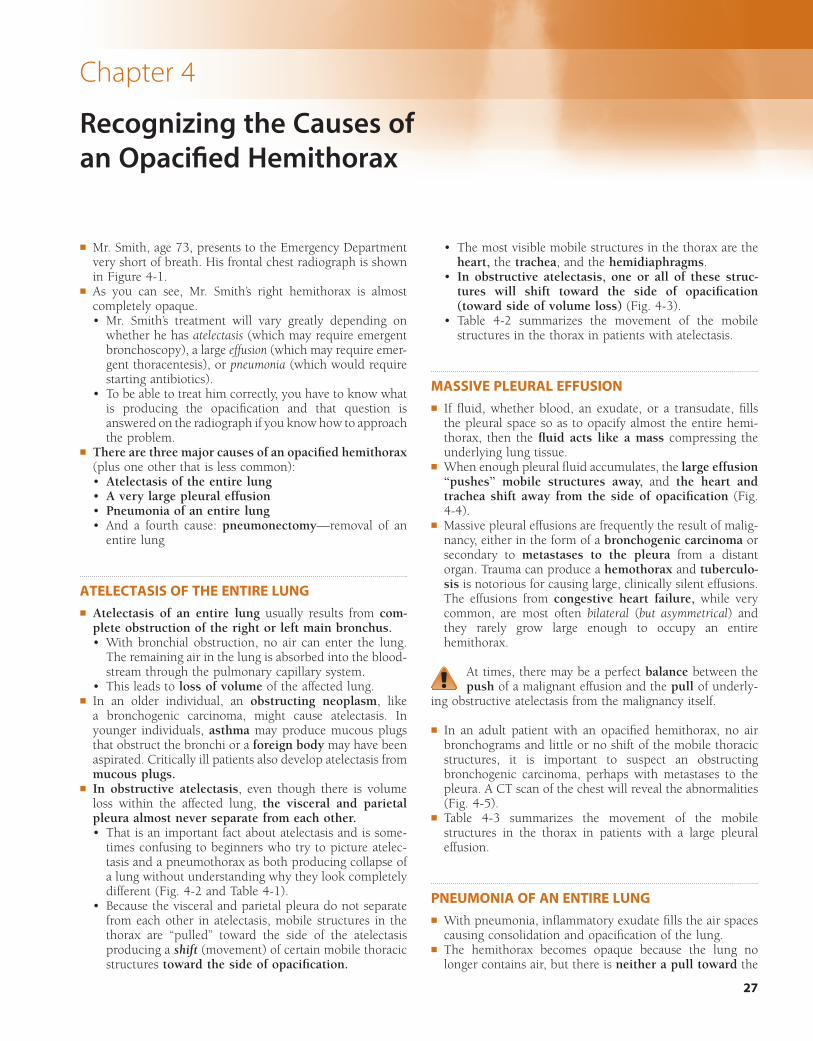
27
Chapter 4
Recognizing the Causes of an Opacified Hemithorax
! Mr. Smith, age 73, presents to the Emergency Department very short of breath. His frontal chest radiograph is shown in Figure 4-1.
! As you can see, Mr. Smith’s right hemithorax is almost completely opaque.• Mr. Smith’s treatment will vary greatly depending on
whether he has atelectasis (which may require emergent bronchoscopy), a large effusion (which may require emer-gent thoracentesis), or pneumonia (which would require starting antibiotics).
• To be able to treat him correctly, you have to know what is producing the opacification and that question is answered on the radiograph if you know how to approach the problem.
! There are three major causes of an opacified hemithorax (plus one other that is less common):• Atelectasis of the entire lung• A very large pleural effusion• Pneumonia of an entire lung• And a fourth cause: pneumonectomy—removal of an
entire lung
ATELECTASIS OF THE ENTIRE LUNG! Atelectasis of an entire lung usually results from com-
plete obstruction of the right or left main bronchus.• With bronchial obstruction, no air can enter the lung.
The remaining air in the lung is absorbed into the blood-stream through the pulmonary capillary system.
• This leads to loss of volume of the affected lung.! In an older individual, an obstructing neoplasm, like
a bronchogenic carcinoma, might cause atelectasis. In younger individuals, asthma may produce mucous plugs that obstruct the bronchi or a foreign body may have been aspirated. Critically ill patients also develop atelectasis from mucous plugs.
! In obstructive atelectasis, even though there is volume loss within the affected lung, the visceral and parietal pleura almost never separate from each other.• That is an important fact about atelectasis and is some-
times confusing to beginners who try to picture atelec-tasis and a pneumothorax as both producing collapse of a lung without understanding why they look completely different (Fig. 4-2 and Table 4-1).
• Because the visceral and parietal pleura do not separate from each other in atelectasis, mobile structures in the thorax are “pulled” toward the side of the atelectasis producing a shift (movement) of certain mobile thoracic structures toward the side of opacification.
• The most visible mobile structures in the thorax are the heart, the trachea, and the hemidiaphragms.
• In obstructive atelectasis, one or all of these struc-tures will shift toward the side of opacification (toward side of volume loss) (Fig. 4-3).
• Table 4-2 summarizes the movement of the mobile structures in the thorax in patients with atelectasis.
MASSIVE PLEURAL EFFUSION! If fluid, whether blood, an exudate, or a transudate, fills
the pleural space so as to opacify almost the entire hemi-thorax, then the fluid acts like a mass compressing the underlying lung tissue.
! When enough pleural fluid accumulates, the large effusion “pushes” mobile structures away, and the heart and trachea shift away from the side of opacification (Fig. 4-4).
! Massive pleural effusions are frequently the result of malig-nancy, either in the form of a bronchogenic carcinoma or secondary to metastases to the pleura from a distant organ. Trauma can produce a hemothorax and tuberculo-sis is notorious for causing large, clinically silent effusions. The effusions from congestive heart failure, while very common, are most often bilateral (but asymmetrical) and they rarely grow large enough to occupy an entire hemithorax.
At times, there may be a perfect balance between the push of a malignant effusion and the pull of underly-
ing obstructive atelectasis from the malignancy itself.
! In an adult patient with an opacified hemithorax, no air bronchograms and little or no shift of the mobile thoracic structures, it is important to suspect an obstructing bronchogenic carcinoma, perhaps with metastases to the pleura. A CT scan of the chest will reveal the abnormalities (Fig. 4-5).
! Table 4-3 summarizes the movement of the mobile structures in the thorax in patients with a large pleural effusion.
PNEUMONIA OF AN ENTIRE LUNG! With pneumonia, inflammatory exudate fills the air spaces
causing consolidation and opacification of the lung.! The hemithorax becomes opaque because the lung no
longer contains air, but there is neither a pull toward the
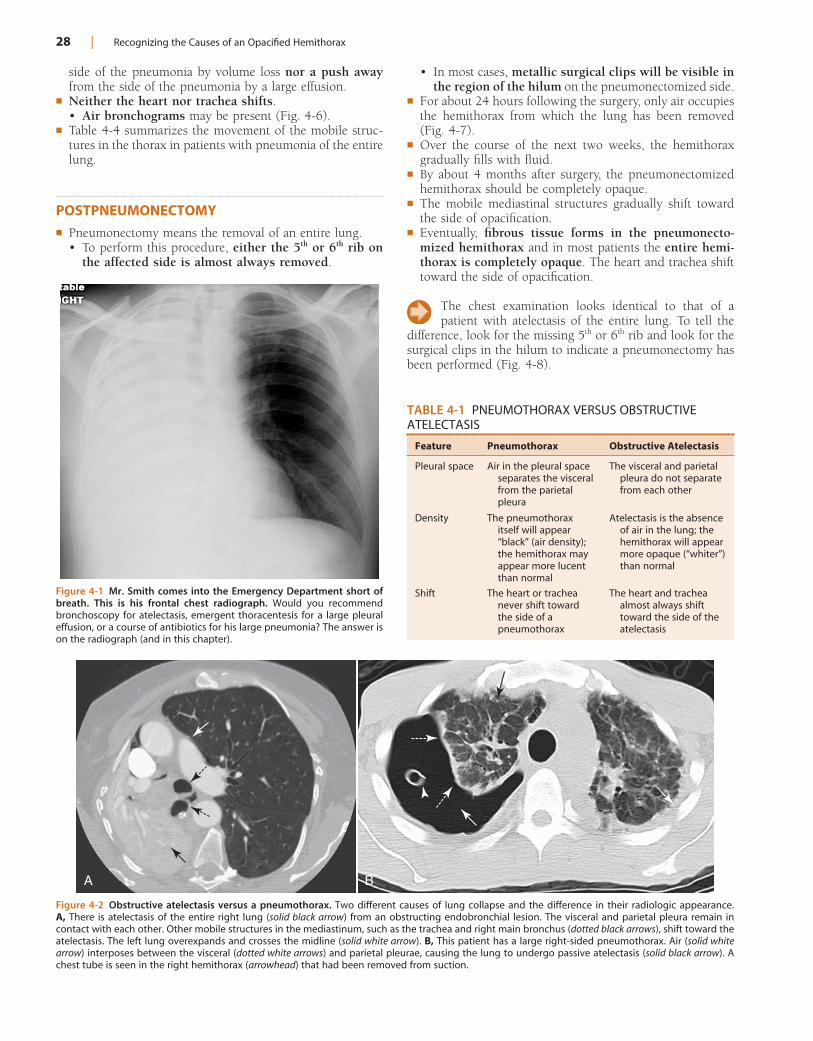
28 | Recognizing the Causes of an Opacified Hemithorax
Figure 4-1 Mr. Smith comes into the Emergency Department short of breath. This is his frontal chest radiograph. Would you recommend bronchoscopy for atelectasis, emergent thoracentesis for a large pleural effusion, or a course of antibiotics for his large pneumonia? The answer is on the radiograph (and in this chapter).
Figure 4-2 Obstructive atelectasis versus a pneumothorax. Two different causes of lung collapse and the difference in their radiologic appearance. A, There is atelectasis of the entire right lung (solid black arrow) from an obstructing endobronchial lesion. The visceral and parietal pleura remain in contact with each other. Other mobile structures in the mediastinum, such as the trachea and right main bronchus (dotted black arrows), shift toward the atelectasis. The left lung overexpands and crosses the midline (solid white arrow). B, This patient has a large right-sided pneumothorax. Air (solid white arrow) interposes between the visceral (dotted white arrows) and parietal pleurae, causing the lung to undergo passive atelectasis (solid black arrow). A chest tube is seen in the right hemithorax (arrowhead) that had been removed from suction.
A B
TABLE 4-1 PNEUMOTHORAX VERSUS OBSTRUCTIVE ATELECTASIS
Feature Pneumothorax Obstructive Atelectasis
Pleural space Air in the pleural space separates the visceral from the parietal pleura
The visceral and parietal pleura do not separate from each other
Density The pneumothorax itself will appear “black” (air density); the hemithorax may appear more lucent than normal
Atelectasis is the absence of air in the lung; the hemithorax will appear more opaque (“whiter”) than normal
Shift The heart or trachea never shift toward the side of a pneumothorax
The heart and trachea almost always shift toward the side of the atelectasis
side of the pneumonia by volume loss nor a push away from the side of the pneumonia by a large effusion.
! Neither the heart nor trachea shifts.• Air bronchograms may be present (Fig. 4-6).
! Table 4-4 summarizes the movement of the mobile struc-tures in the thorax in patients with pneumonia of the entire lung.
POSTPNEUMONECTOMY! Pneumonectomy means the removal of an entire lung.
• To perform this procedure, either the 5th or 6th rib on the affected side is almost always removed.
• In most cases, metallic surgical clips will be visible in the region of the hilum on the pneumonectomized side.
! For about 24 hours following the surgery, only air occupies the hemithorax from which the lung has been removed (Fig. 4-7).
! Over the course of the next two weeks, the hemithorax gradually fills with fluid.
! By about 4 months after surgery, the pneumonectomized hemithorax should be completely opaque.
! The mobile mediastinal structures gradually shift toward the side of opacification.
! Eventually, fibrous tissue forms in the pneumonecto-mized hemithorax and in most patients the entire hemi-thorax is completely opaque. The heart and trachea shift toward the side of opacification.
The chest examination looks identical to that of a patient with atelectasis of the entire lung. To tell the
difference, look for the missing 5th or 6th rib and look for the surgical clips in the hilum to indicate a pneumonectomy has been performed (Fig. 4-8).
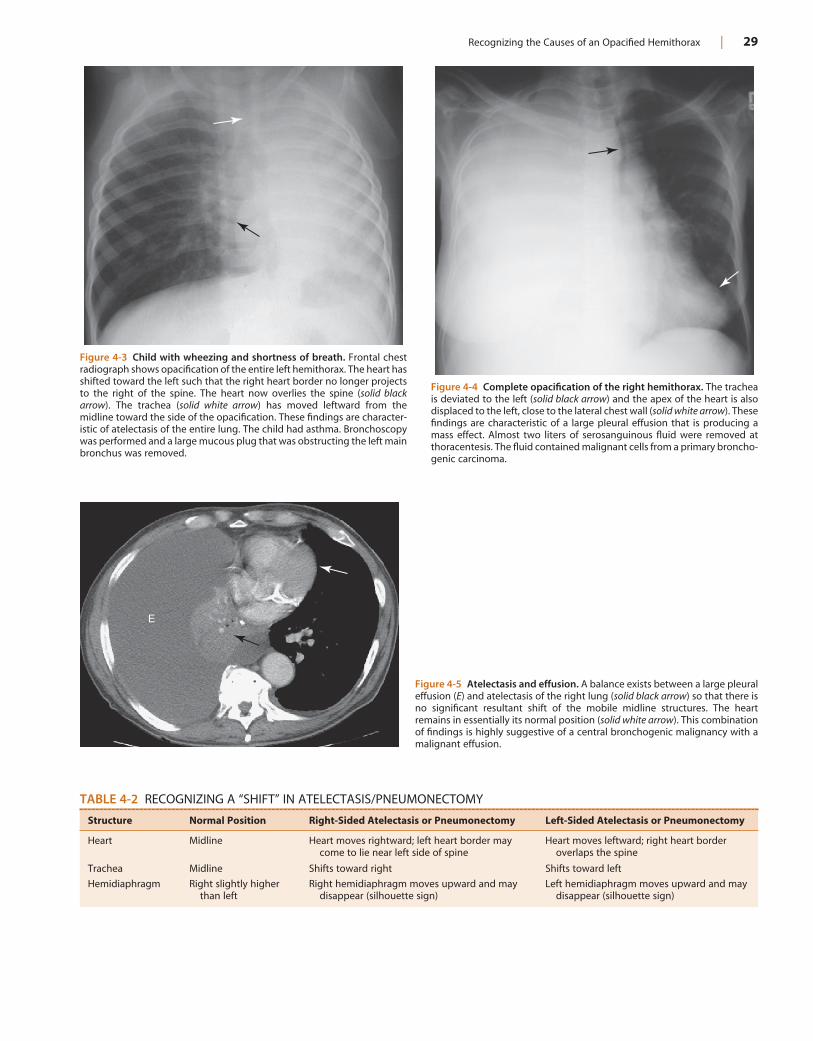
Recognizing the Causes of an Opacified Hemithorax | 29
Figure 4-3 Child with wheezing and shortness of breath. Frontal chest radiograph shows opacification of the entire left hemithorax. The heart has shifted toward the left such that the right heart border no longer projects to the right of the spine. The heart now overlies the spine (solid black arrow). The trachea (solid white arrow) has moved leftward from the midline toward the side of the opacification. These findings are character-istic of atelectasis of the entire lung. The child had asthma. Bronchoscopy was performed and a large mucous plug that was obstructing the left main bronchus was removed.
TABLE 4-2 RECOGNIZING A “SHIFT” IN ATELECTASIS/PNEUMONECTOMY
Structure Normal Position Right-Sided Atelectasis or Pneumonectomy Left-Sided Atelectasis or Pneumonectomy
Heart Midline Heart moves rightward; left heart border may come to lie near left side of spine
Heart moves leftward; right heart border overlaps the spine
Trachea Midline Shifts toward right Shifts toward left
Hemidiaphragm Right slightly higher than left
Right hemidiaphragm moves upward and may disappear (silhouette sign)
Left hemidiaphragm moves upward and may disappear (silhouette sign)
Figure 4-4 Complete opacification of the right hemithorax. The trachea is deviated to the left (solid black arrow) and the apex of the heart is also displaced to the left, close to the lateral chest wall (solid white arrow). These findings are characteristic of a large pleural effusion that is producing a mass effect. Almost two liters of serosanguinous fluid were removed at thoracentesis. The fluid contained malignant cells from a primary broncho-genic carcinoma.
Figure 4-5 Atelectasis and effusion. A balance exists between a large pleural effusion (E) and atelectasis of the right lung (solid black arrow) so that there is no significant resultant shift of the mobile midline structures. The heart remains in essentially its normal position (solid white arrow). This combination of findings is highly suggestive of a central bronchogenic malignancy with a malignant effusion.
E
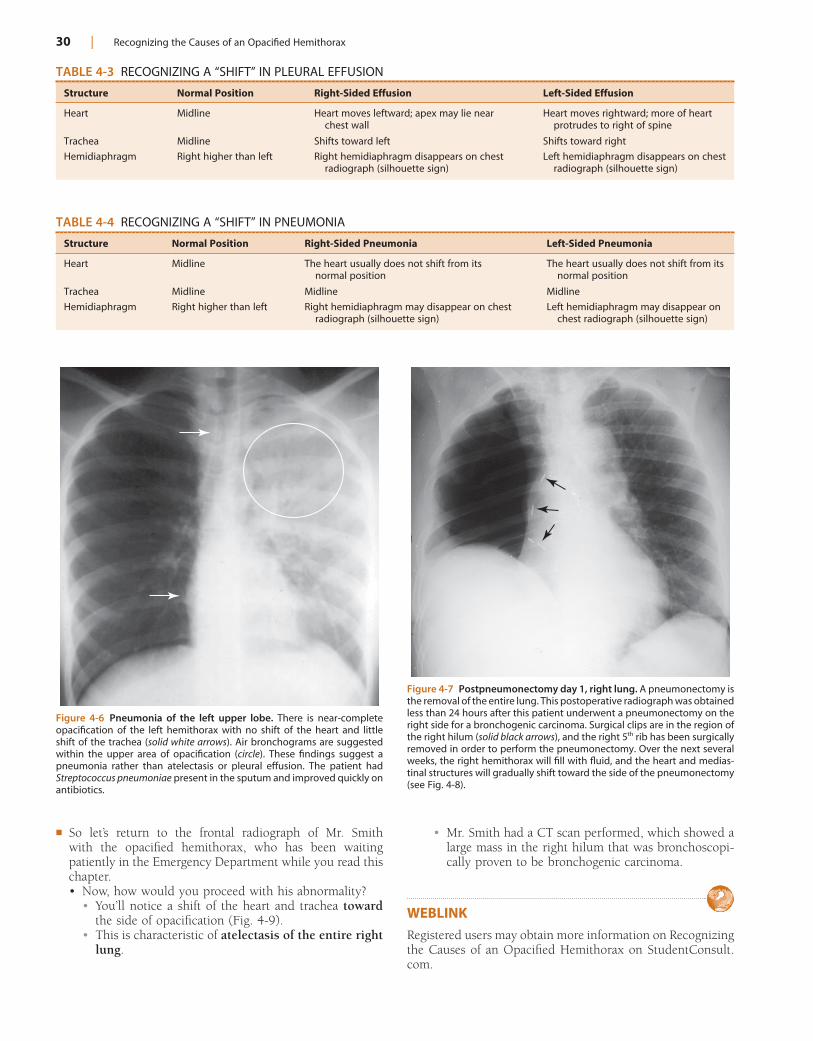
30 | Recognizing the Causes of an Opacified Hemithorax
Figure 4-6 Pneumonia of the left upper lobe. There is near-complete opacification of the left hemithorax with no shift of the heart and little shift of the trachea (solid white arrows). Air bronchograms are suggested within the upper area of opacification (circle). These findings suggest a pneumonia rather than atelectasis or pleural effusion. The patient had Streptococcus pneumoniae present in the sputum and improved quickly on antibiotics.
TABLE 4-4 RECOGNIZING A “SHIFT” IN PNEUMONIA
Structure Normal Position Right-Sided Pneumonia Left-Sided Pneumonia
Heart Midline The heart usually does not shift from its normal position
The heart usually does not shift from its normal position
Trachea Midline Midline Midline
Hemidiaphragm Right higher than left Right hemidiaphragm may disappear on chest radiograph (silhouette sign)
Left hemidiaphragm may disappear on chest radiograph (silhouette sign)
Figure 4-7 Postpneumonectomy day 1, right lung. A pneumonectomy is the removal of the entire lung. This postoperative radiograph was obtained less than 24 hours after this patient underwent a pneumonectomy on the right side for a bronchogenic carcinoma. Surgical clips are in the region of the right hilum (solid black arrows), and the right 5th rib has been surgically removed in order to perform the pneumonectomy. Over the next several weeks, the right hemithorax will fill with fluid, and the heart and medias-tinal structures will gradually shift toward the side of the pneumonectomy (see Fig. 4-8).
TABLE 4-3 RECOGNIZING A “SHIFT” IN PLEURAL EFFUSION
Structure Normal Position Right-Sided Effusion Left-Sided Effusion
Heart Midline Heart moves leftward; apex may lie near chest wall
Heart moves rightward; more of heart protrudes to right of spine
Trachea Midline Shifts toward left Shifts toward right
Hemidiaphragm Right higher than left Right hemidiaphragm disappears on chest radiograph (silhouette sign)
Left hemidiaphragm disappears on chest radiograph (silhouette sign)
! So let’s return to the frontal radiograph of Mr. Smith with the opacified hemithorax, who has been waiting patiently in the Emergency Department while you read this chapter.• Now, how would you proceed with his abnormality?
• You’ll notice a shift of the heart and trachea toward the side of opacification (Fig. 4-9).
• This is characteristic of atelectasis of the entire right lung.
• Mr. Smith had a CT scan performed, which showed a large mass in the right hilum that was bronchoscopi-cally proven to be bronchogenic carcinoma.
WEBLINKRegistered users may obtain more information on Recognizing the Causes of an Opacified Hemithorax on StudentConsult.com.
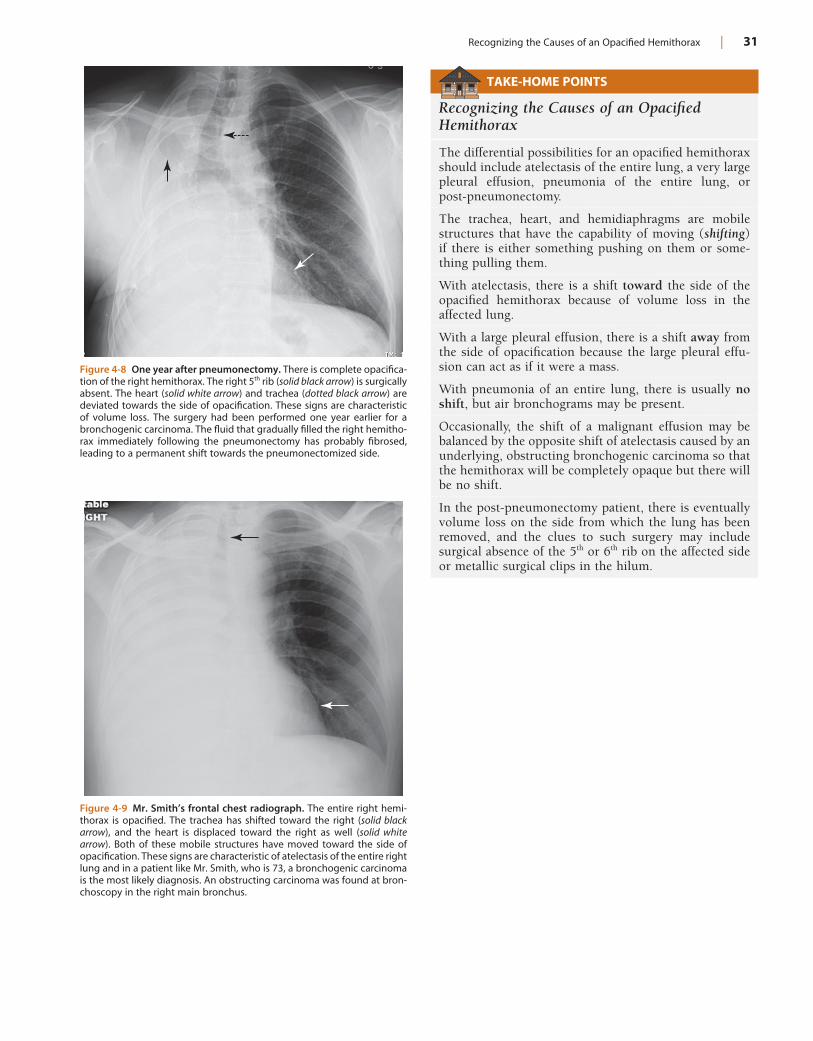
Recognizing the Causes of an Opacified Hemithorax | 31
Figure 4-8 One year after pneumonectomy. There is complete opacifica-tion of the right hemithorax. The right 5th rib (solid black arrow) is surgically absent. The heart (solid white arrow) and trachea (dotted black arrow) are deviated towards the side of opacification. These signs are characteristic of volume loss. The surgery had been performed one year earlier for a bronchogenic carcinoma. The fluid that gradually filled the right hemitho-rax immediately following the pneumonectomy has probably fibrosed, leading to a permanent shift towards the pneumonectomized side.
Figure 4-9 Mr. Smith’s frontal chest radiograph. The entire right hemi-thorax is opacified. The trachea has shifted toward the right (solid black arrow), and the heart is displaced toward the right as well (solid white arrow). Both of these mobile structures have moved toward the side of opacification. These signs are characteristic of atelectasis of the entire right lung and in a patient like Mr. Smith, who is 73, a bronchogenic carcinoma is the most likely diagnosis. An obstructing carcinoma was found at bron-choscopy in the right main bronchus.
TAKE-HOME POINTS
Recognizing the Causes of an Opacified Hemithorax
The differential possibilities for an opacified hemithorax should include atelectasis of the entire lung, a very large pleural effusion, pneumonia of the entire lung, or post-pneumonectomy.
The trachea, heart, and hemidiaphragms are mobile structures that have the capability of moving (shifting) if there is either something pushing on them or some-thing pulling them.
With atelectasis, there is a shift toward the side of the opacified hemithorax because of volume loss in the affected lung.
With a large pleural effusion, there is a shift away from the side of opacification because the large pleural effu-sion can act as if it were a mass.
With pneumonia of an entire lung, there is usually no shift, but air bronchograms may be present.
Occasionally, the shift of a malignant effusion may be balanced by the opposite shift of atelectasis caused by an underlying, obstructing bronchogenic carcinoma so that the hemithorax will be completely opaque but there will be no shift.
In the post-pneumonectomy patient, there is eventually volume loss on the side from which the lung has been removed, and the clues to such surgery may include surgical absence of the 5th or 6th rib on the affected side or metallic surgical clips in the hilum.
32
Chapter 5
Recognizing Atelectasis
WHAT IS ATELECTASIS?! Common to all forms of atelectasis is a loss of volume in
some or all of the lung, usually leading to increased density of the lung involved.• The lung normally appears “black” on a chest radiograph
because it contains air. When something of fluid or soft tissue density is substituted for that air or when the air in the lung is resorbed (as it can be in atelectasis), that part of the lung becomes whiter (more dense or more opaque).
! Unless mentioned otherwise, statements in this chapter that refer to “atelectasis” are referring to obstructive atelectasis. This might be a good time to review the chart from Chapter 4 (see Table 4-1) highlighting the markedly different appearances of the thorax in a large pneumothorax and atelectasis of the entire lung (see Fig. 4-2).
SIGNS OF ATELECTASIS! Displacement (shift) of the interlobar fissures (major
and minor) toward the area of atelectasis.! Increase in the density of the affected lung (Fig. 5-1).! Displacement (shift) of the mobile structures of the
thorax.• The mobile structures are those capable of movement
due to changes in lung volume.• Trachea
• Normally midline in location and centered on the spinous processes of the vertebral bodies (also midline structures) on a nonrotated, frontal chest x-ray. A slight rightward deviation of the trachea is always present at the site of the left-sided aortic knob.
• With atelectasis, especially of the upper lobes, the trachea may shift toward the side of the volume loss (Fig. 5-2).
• Heart• At least 1 cm of the right heart border normally
projects to the right of the spine on a nonrotated, frontal radiograph.
• With atelectasis, especially of the lower lobes, the heart may shift to one side or the other." When the heart shifts toward the left, the right
heart border will overlap the spine (Fig. 5-3)." When the heart shifts toward the right, the left
heart border will approach the midline (Fig. 5-4).• Hemidiaphragm
" The right hemidiaphragm is almost always higher than the left by about half the interspace
distance between two adjacent ribs. In about 10% of normal people, the left hemidiaphragm is higher than the right.
" In the presence of atelectasis, especially of the lower lobes, the hemidiaphragm on the affected side will usually be displaced upward (Fig. 5-5).
! Overinflation of the unaffected ipsilateral lobes or the contralateral lung.• The greater the volume loss and the more chronic its
presence, the more the lung on the side opposite the atelectasis or the unaffected lobe(s) in the ipsilateral lung will attempt to overinflate to compensate for the volume loss.
• This may be noticeable on the lateral projection by an increase in the size of the retrosternal clear space and on the frontal projection by extension of the overin-flated contralateral lung across the midline (Fig. 5-6).
! The signs of atelectasis are summarized in Box 5-1.
TYPES OF ATELECTASIS! Subsegmental atelectasis (also called discoid atelectasis
or platelike atelectasis) (Fig. 5-7)• Subsegmental atelectasis produces linear densities of
varying thickness usually parallel to the diaphragm, most commonly at the lung bases.• It does not produce a sufficient amount of volume loss
to cause a shift of the mobile thoracic structures.• It occurs mostly in patients who are “splinting,” i.e.,
not taking a deep breath, such as postoperative patients or patients with pleuritic chest pain.
• Subsegmental atelectasis is not due to bronchial obstruction.• It is most likely related to deactivation of surfactant,
which leads to collapse of airspaces in a nonsegmental or nonlobar distribution.
• On a single study, without prior examinations for com-parison, subsegmental atelectasis and chronic, linear scarring can look identical. Subsegmental atelectasis typically disappears within a matter of days with resumption of normal deep breathing whereas scarring remains.
! Compressive atelectasis• Loss of volume due to passive compression of the lung
can be caused by:• A poor inspiratory effort in which passive atelectasis
of the lung is seen at the bases (Fig. 5-8).• A large pleural effusion, large pneumothorax, or
a space-occupying lesion (such as a large mass in the lung).
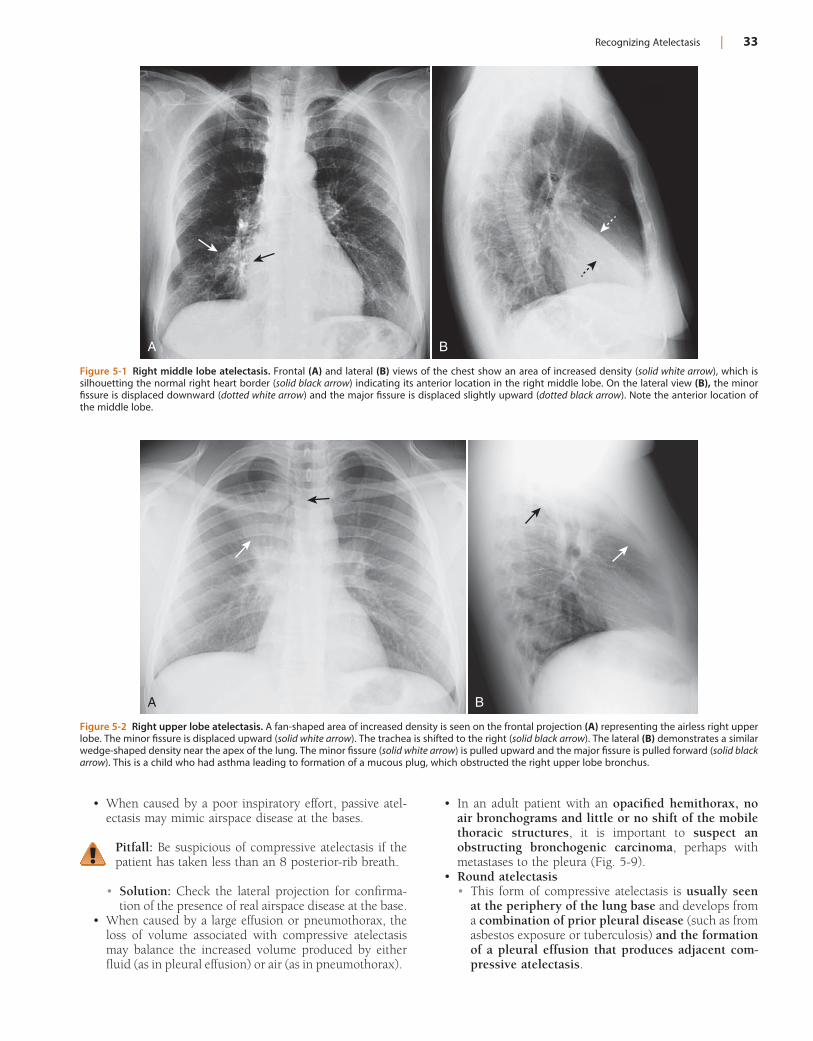
Recognizing Atelectasis | 33
• In an adult patient with an opacified hemithorax, no air bronchograms and little or no shift of the mobile thoracic structures, it is important to suspect an obstructing bronchogenic carcinoma, perhaps with metastases to the pleura (Fig. 5-9).
• Round atelectasis• This form of compressive atelectasis is usually seen
at the periphery of the lung base and develops from a combination of prior pleural disease (such as from asbestos exposure or tuberculosis) and the formation of a pleural effusion that produces adjacent com-pressive atelectasis.
• When caused by a poor inspiratory effort, passive atel-ectasis may mimic airspace disease at the bases.
Pitfall: Be suspicious of compressive atelectasis if the patient has taken less than an 8 posterior-rib breath.
• Solution: Check the lateral projection for confirma-tion of the presence of real airspace disease at the base.
• When caused by a large effusion or pneumothorax, the loss of volume associated with compressive atelectasis may balance the increased volume produced by either fluid (as in pleural effusion) or air (as in pneumothorax).
Figure 5-1 Right middle lobe atelectasis. Frontal (A) and lateral (B) views of the chest show an area of increased density (solid white arrow), which is silhouetting the normal right heart border (solid black arrow) indicating its anterior location in the right middle lobe. On the lateral view (B), the minor fissure is displaced downward (dotted white arrow) and the major fissure is displaced slightly upward (dotted black arrow). Note the anterior location of the middle lobe.
A B
Figure 5-2 Right upper lobe atelectasis. A fan-shaped area of increased density is seen on the frontal projection (A) representing the airless right upper lobe. The minor fissure is displaced upward (solid white arrow). The trachea is shifted to the right (solid black arrow). The lateral (B) demonstrates a similar wedge-shaped density near the apex of the lung. The minor fissure (solid white arrow) is pulled upward and the major fissure is pulled forward (solid black arrow). This is a child who had asthma leading to formation of a mucous plug, which obstructed the right upper lobe bronchus.
A B
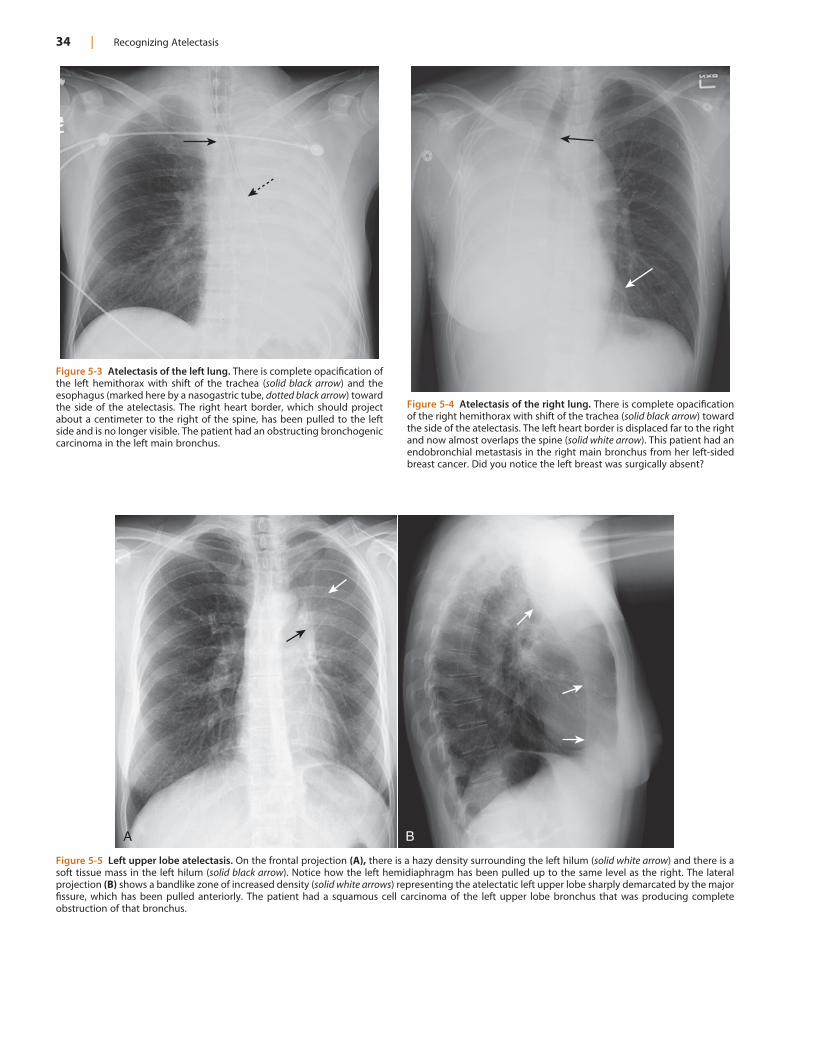
34 | Recognizing Atelectasis
Figure 5-3 Atelectasis of the left lung. There is complete opacification of the left hemithorax with shift of the trachea (solid black arrow) and the esophagus (marked here by a nasogastric tube, dotted black arrow) toward the side of the atelectasis. The right heart border, which should project about a centimeter to the right of the spine, has been pulled to the left side and is no longer visible. The patient had an obstructing bronchogenic carcinoma in the left main bronchus.
Figure 5-4 Atelectasis of the right lung. There is complete opacification of the right hemithorax with shift of the trachea (solid black arrow) toward the side of the atelectasis. The left heart border is displaced far to the right and now almost overlaps the spine (solid white arrow). This patient had an endobronchial metastasis in the right main bronchus from her left-sided breast cancer. Did you notice the left breast was surgically absent?
Figure 5-5 Left upper lobe atelectasis. On the frontal projection (A), there is a hazy density surrounding the left hilum (solid white arrow) and there is a soft tissue mass in the left hilum (solid black arrow). Notice how the left hemidiaphragm has been pulled up to the same level as the right. The lateral projection (B) shows a bandlike zone of increased density (solid white arrows) representing the atelectatic left upper lobe sharply demarcated by the major fissure, which has been pulled anteriorly. The patient had a squamous cell carcinoma of the left upper lobe bronchus that was producing complete obstruction of that bronchus.
A B
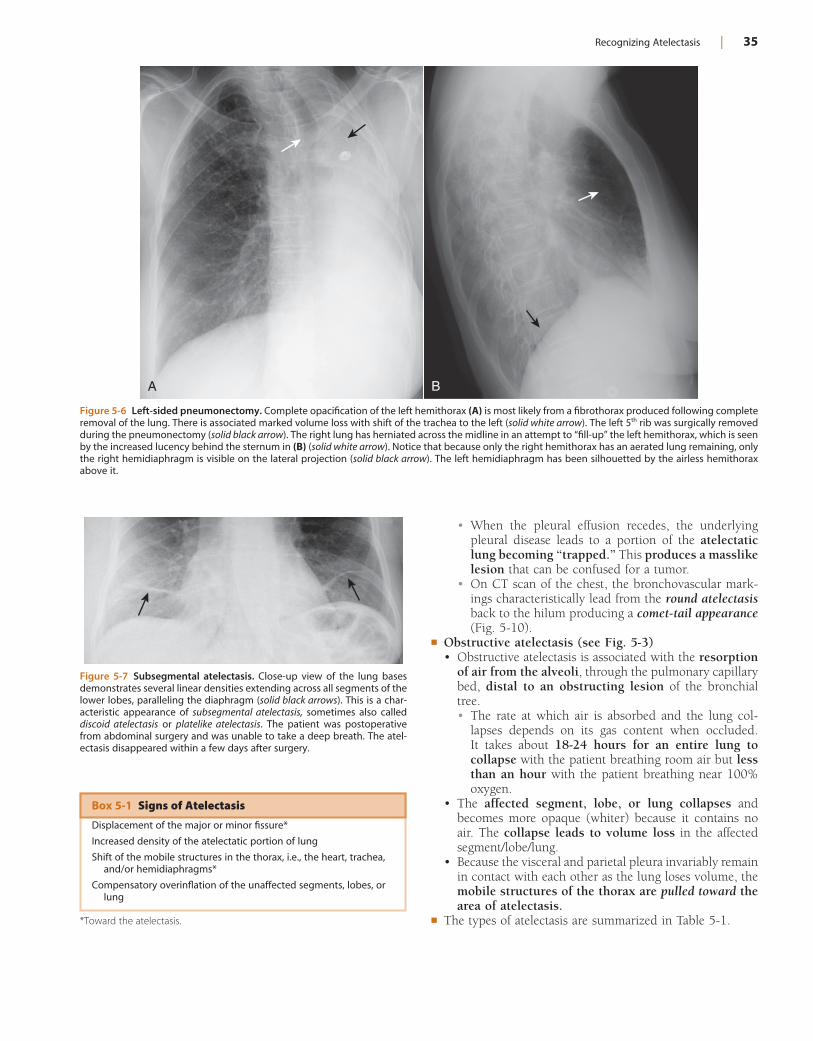
Recognizing Atelectasis | 35
• When the pleural effusion recedes, the underlying pleural disease leads to a portion of the atelectatic lung becoming “trapped.” This produces a masslike lesion that can be confused for a tumor.
• On CT scan of the chest, the bronchovascular mark-ings characteristically lead from the round atelectasis back to the hilum producing a comet-tail appearance (Fig. 5-10).
! Obstructive atelectasis (see Fig. 5-3)• Obstructive atelectasis is associated with the resorption
of air from the alveoli, through the pulmonary capillary bed, distal to an obstructing lesion of the bronchial tree.• The rate at which air is absorbed and the lung col-
lapses depends on its gas content when occluded. It takes about 18-24 hours for an entire lung to collapse with the patient breathing room air but less than an hour with the patient breathing near 100% oxygen.
• The affected segment, lobe, or lung collapses and becomes more opaque (whiter) because it contains no air. The collapse leads to volume loss in the affected segment/lobe/lung.
• Because the visceral and parietal pleura invariably remain in contact with each other as the lung loses volume, the mobile structures of the thorax are pulled toward the area of atelectasis.
! The types of atelectasis are summarized in Table 5-1.
Figure 5-6 Left-sided pneumonectomy. Complete opacification of the left hemithorax (A) is most likely from a fibrothorax produced following complete removal of the lung. There is associated marked volume loss with shift of the trachea to the left (solid white arrow). The left 5th rib was surgically removed during the pneumonectomy (solid black arrow). The right lung has herniated across the midline in an attempt to “fill-up” the left hemithorax, which is seen by the increased lucency behind the sternum in (B) (solid white arrow). Notice that because only the right hemithorax has an aerated lung remaining, only the right hemidiaphragm is visible on the lateral projection (solid black arrow). The left hemidiaphragm has been silhouetted by the airless hemithorax above it.
A B
Figure 5-7 Subsegmental atelectasis. Close-up view of the lung bases demonstrates several linear densities extending across all segments of the lower lobes, paralleling the diaphragm (solid black arrows). This is a char-acteristic appearance of subsegmental atelectasis, sometimes also called discoid atelectasis or platelike atelectasis. The patient was postoperative from abdominal surgery and was unable to take a deep breath. The atel-ectasis disappeared within a few days after surgery.
*Toward the atelectasis.
Box 5-1 Signs of Atelectasis
Displacement of the major or minor fissure*
Increased density of the atelectatic portion of lung
Shift of the mobile structures in the thorax, i.e., the heart, trachea, and/or hemidiaphragms*
Compensatory overinflation of the unaffected segments, lobes, or lung
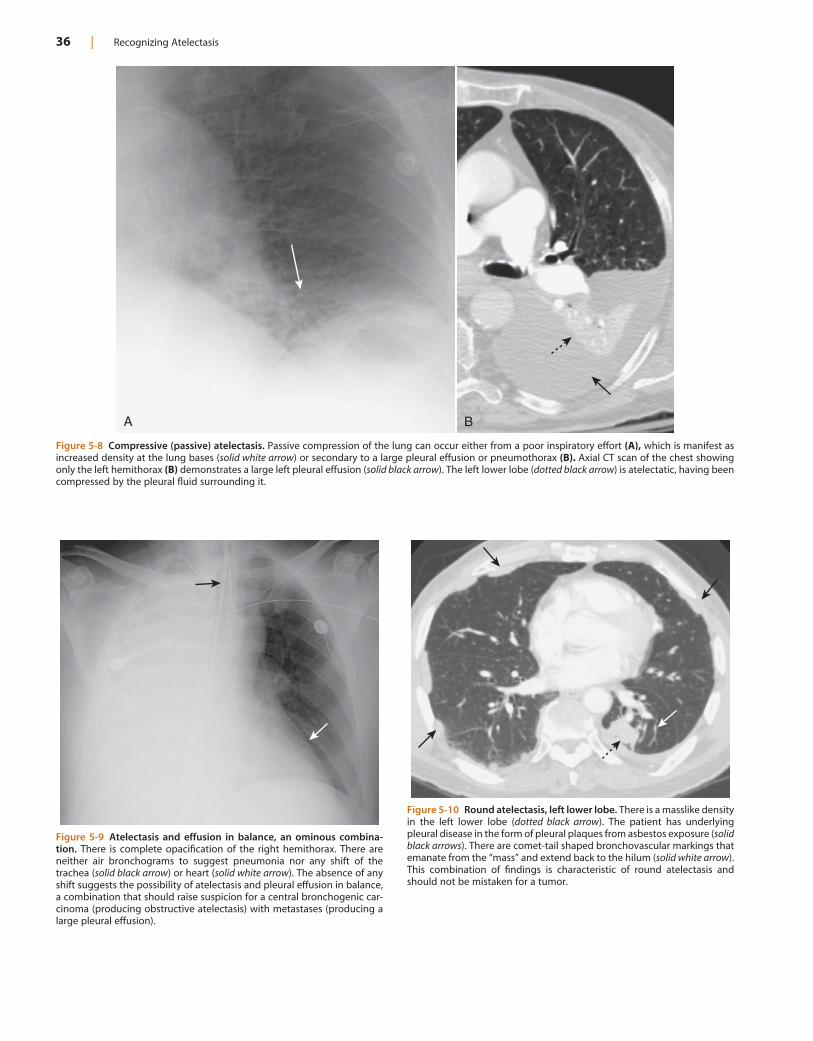
36 | Recognizing Atelectasis
Figure 5-8 Compressive (passive) atelectasis. Passive compression of the lung can occur either from a poor inspiratory effort (A), which is manifest as increased density at the lung bases (solid white arrow) or secondary to a large pleural effusion or pneumothorax (B). Axial CT scan of the chest showing only the left hemithorax (B) demonstrates a large left pleural effusion (solid black arrow). The left lower lobe (dotted black arrow) is atelectatic, having been compressed by the pleural fluid surrounding it.
BA
Figure 5-9 Atelectasis and effusion in balance, an ominous combina-tion. There is complete opacification of the right hemithorax. There are neither air bronchograms to suggest pneumonia nor any shift of the trachea (solid black arrow) or heart (solid white arrow). The absence of any shift suggests the possibility of atelectasis and pleural effusion in balance, a combination that should raise suspicion for a central bronchogenic car-cinoma (producing obstructive atelectasis) with metastases (producing a large pleural effusion).
Figure 5-10 Round atelectasis, left lower lobe. There is a masslike density in the left lower lobe (dotted black arrow). The patient has underlying pleural disease in the form of pleural plaques from asbestos exposure (solid black arrows). There are comet-tail shaped bronchovascular markings that emanate from the “mass” and extend back to the hilum (solid white arrow). This combination of findings is characteristic of round atelectasis and should not be mistaken for a tumor.
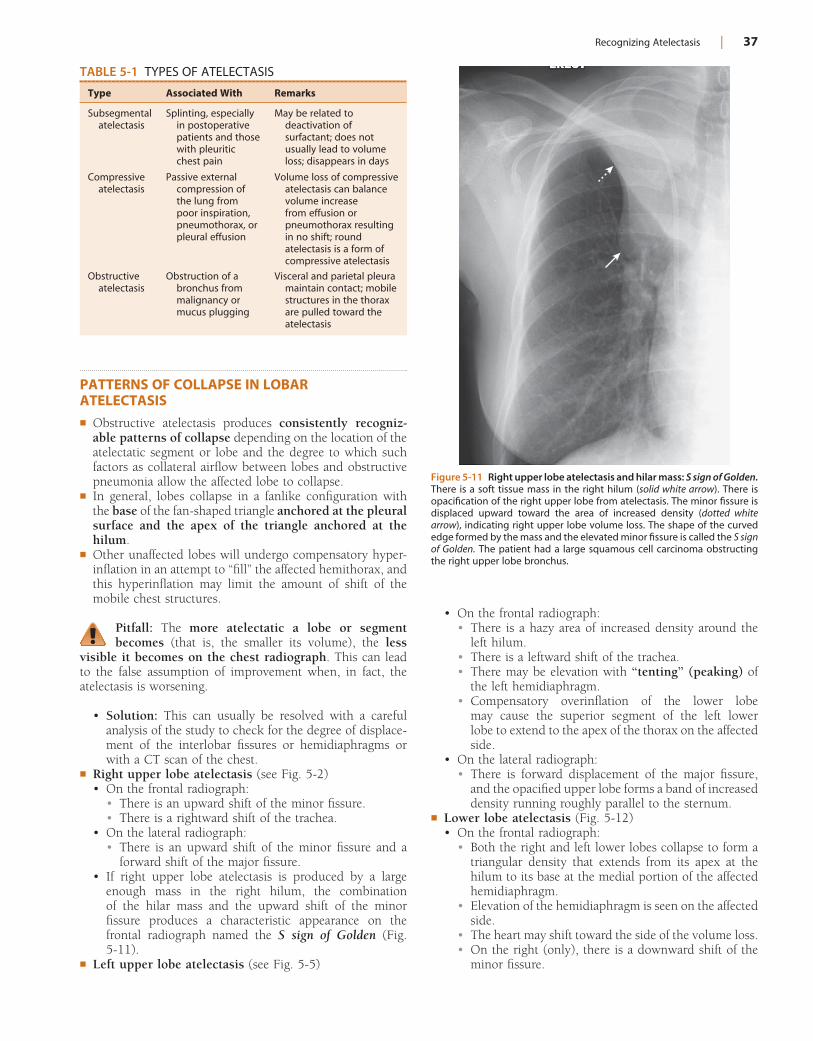
Recognizing Atelectasis | 37
PATTERNS OF COLLAPSE IN LOBAR ATELECTASIS! Obstructive atelectasis produces consistently recogniz-
able patterns of collapse depending on the location of the atelectatic segment or lobe and the degree to which such factors as collateral airflow between lobes and obstructive pneumonia allow the affected lobe to collapse.
! In general, lobes collapse in a fanlike configuration with the base of the fan-shaped triangle anchored at the pleural surface and the apex of the triangle anchored at the hilum.
! Other unaffected lobes will undergo compensatory hyper-inflation in an attempt to “fill” the affected hemithorax, and this hyperinflation may limit the amount of shift of the mobile chest structures.
Pitfall: The more atelectatic a lobe or segment becomes (that is, the smaller its volume), the less
visible it becomes on the chest radiograph. This can lead to the false assumption of improvement when, in fact, the atelectasis is worsening.
• Solution: This can usually be resolved with a careful analysis of the study to check for the degree of displace-ment of the interlobar fissures or hemidiaphragms or with a CT scan of the chest.
! Right upper lobe atelectasis (see Fig. 5-2)• On the frontal radiograph:
• There is an upward shift of the minor fissure.• There is a rightward shift of the trachea.
• On the lateral radiograph:• There is an upward shift of the minor fissure and a
forward shift of the major fissure.• If right upper lobe atelectasis is produced by a large
enough mass in the right hilum, the combination of the hilar mass and the upward shift of the minor fissure produces a characteristic appearance on the frontal radiograph named the S sign of Golden (Fig. 5-11).
! Left upper lobe atelectasis (see Fig. 5-5)
TABLE 5-1 TYPES OF ATELECTASIS
Type Associated With Remarks
Subsegmental atelectasis
Splinting, especially in postoperative patients and those with pleuritic chest pain
May be related to deactivation of surfactant; does not usually lead to volume loss; disappears in days
Compressive atelectasis
Passive external compression of the lung from poor inspiration, pneumothorax, or pleural effusion
Volume loss of compressive atelectasis can balance volume increase from effusion or pneumothorax resulting in no shift; round atelectasis is a form of compressive atelectasis
Obstructive atelectasis
Obstruction of a bronchus from malignancy or mucus plugging
Visceral and parietal pleura maintain contact; mobile structures in the thorax are pulled toward the atelectasis
Figure 5-11 Right upper lobe atelectasis and hilar mass: S sign of Golden. There is a soft tissue mass in the right hilum (solid white arrow). There is opacification of the right upper lobe from atelectasis. The minor fissure is displaced upward toward the area of increased density (dotted white arrow), indicating right upper lobe volume loss. The shape of the curved edge formed by the mass and the elevated minor fissure is called the S sign of Golden. The patient had a large squamous cell carcinoma obstructing the right upper lobe bronchus.
• On the frontal radiograph:• There is a hazy area of increased density around the
left hilum.• There is a leftward shift of the trachea.• There may be elevation with “tenting” (peaking) of
the left hemidiaphragm.• Compensatory overinflation of the lower lobe
may cause the superior segment of the left lower lobe to extend to the apex of the thorax on the affected side.
• On the lateral radiograph:• There is forward displacement of the major fissure,
and the opacified upper lobe forms a band of increased density running roughly parallel to the sternum.
! Lower lobe atelectasis (Fig. 5-12)• On the frontal radiograph:
• Both the right and left lower lobes collapse to form a triangular density that extends from its apex at the hilum to its base at the medial portion of the affected hemidiaphragm.
• Elevation of the hemidiaphragm is seen on the affected side.
• The heart may shift toward the side of the volume loss.• On the right (only), there is a downward shift of the
minor fissure.
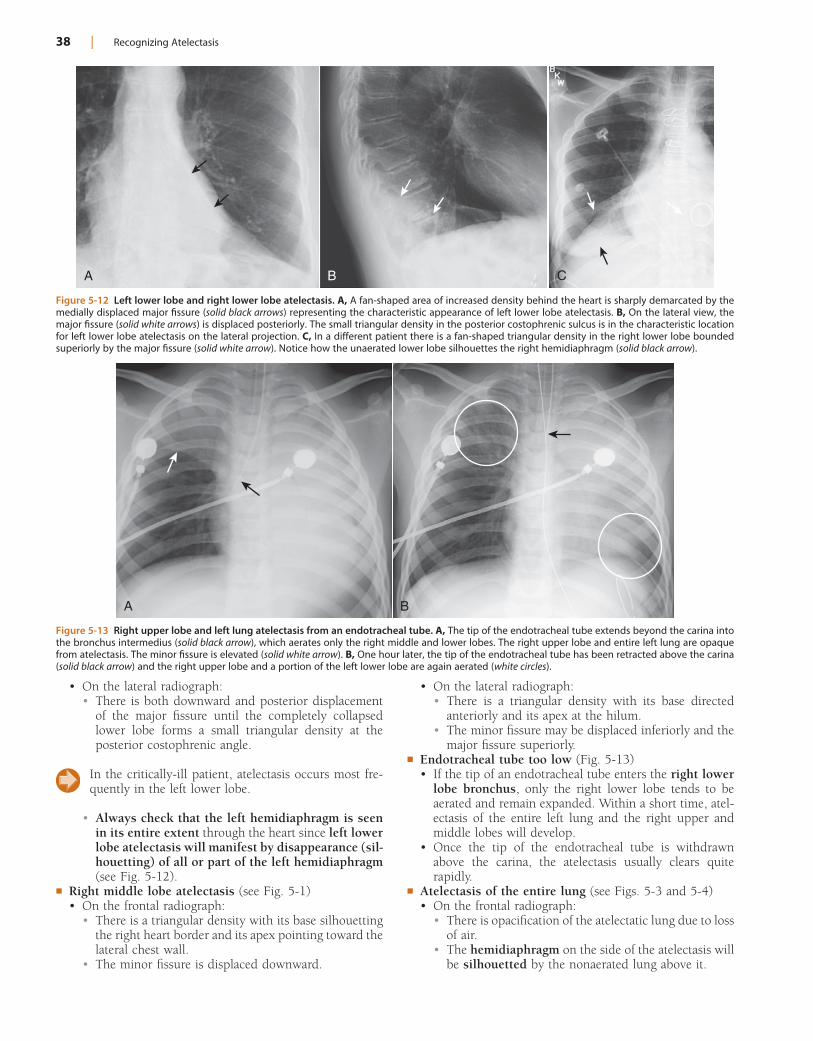
38 | Recognizing Atelectasis
• On the lateral radiograph:• There is a triangular density with its base directed
anteriorly and its apex at the hilum.• The minor fissure may be displaced inferiorly and the
major fissure superiorly.! Endotracheal tube too low (Fig. 5-13)
• If the tip of an endotracheal tube enters the right lower lobe bronchus, only the right lower lobe tends to be aerated and remain expanded. Within a short time, atel-ectasis of the entire left lung and the right upper and middle lobes will develop.
• Once the tip of the endotracheal tube is withdrawn above the carina, the atelectasis usually clears quite rapidly.
! Atelectasis of the entire lung (see Figs. 5-3 and 5-4)• On the frontal radiograph:
• There is opacification of the atelectatic lung due to loss of air.
• The hemidiaphragm on the side of the atelectasis will be silhouetted by the nonaerated lung above it.
• On the lateral radiograph:• There is both downward and posterior displacement
of the major fissure until the completely collapsed lower lobe forms a small triangular density at the posterior costophrenic angle.
In the critically-ill patient, atelectasis occurs most fre-quently in the left lower lobe.
• Always check that the left hemidiaphragm is seen in its entire extent through the heart since left lower lobe atelectasis will manifest by disappearance (sil-houetting) of all or part of the left hemidiaphragm (see Fig. 5-12).
! Right middle lobe atelectasis (see Fig. 5-1)• On the frontal radiograph:
• There is a triangular density with its base silhouetting the right heart border and its apex pointing toward the lateral chest wall.
• The minor fissure is displaced downward.
Figure 5-12 Left lower lobe and right lower lobe atelectasis. A, A fan-shaped area of increased density behind the heart is sharply demarcated by the medially displaced major fissure (solid black arrows) representing the characteristic appearance of left lower lobe atelectasis. B, On the lateral view, the major fissure (solid white arrows) is displaced posteriorly. The small triangular density in the posterior costophrenic sulcus is in the characteristic location for left lower lobe atelectasis on the lateral projection. C, In a different patient there is a fan-shaped triangular density in the right lower lobe bounded superiorly by the major fissure (solid white arrow). Notice how the unaerated lower lobe silhouettes the right hemidiaphragm (solid black arrow).
A B C
Figure 5-13 Right upper lobe and left lung atelectasis from an endotracheal tube. A, The tip of the endotracheal tube extends beyond the carina into the bronchus intermedius (solid black arrow), which aerates only the right middle and lower lobes. The right upper lobe and entire left lung are opaque from atelectasis. The minor fissure is elevated (solid white arrow). B, One hour later, the tip of the endotracheal tube has been retracted above the carina (solid black arrow) and the right upper lobe and a portion of the left lower lobe are again aerated (white circles).
A B
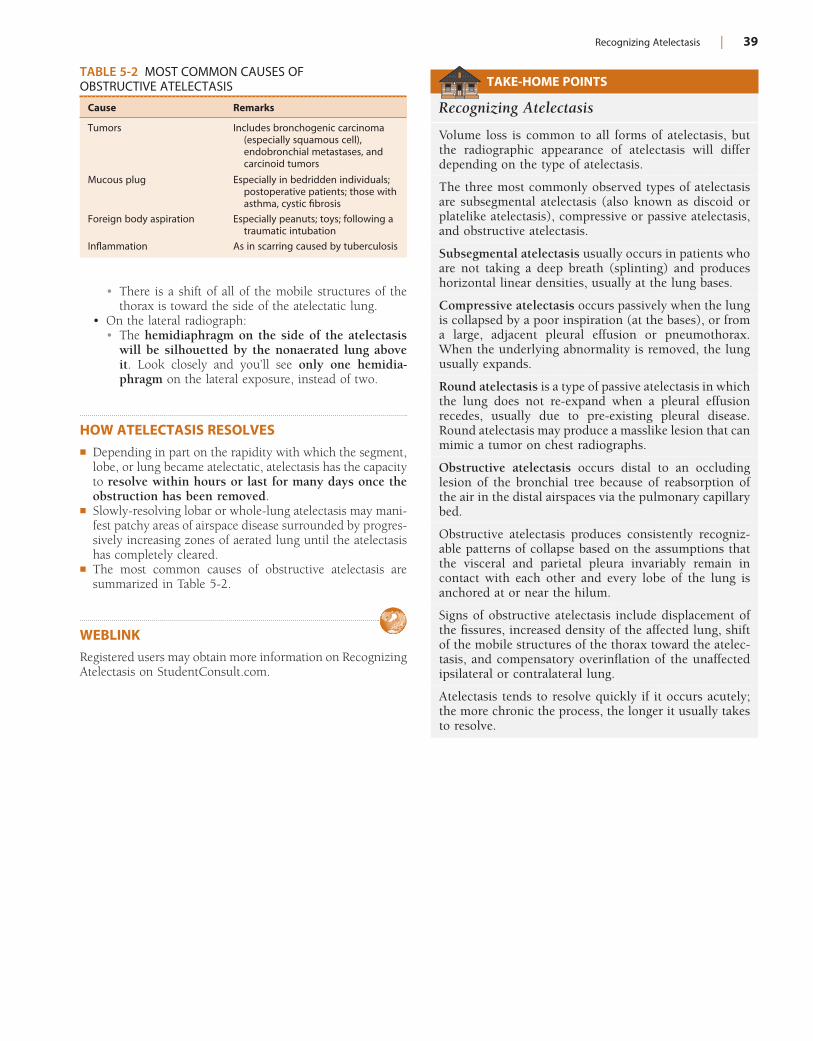
Recognizing Atelectasis | 39
• There is a shift of all of the mobile structures of the thorax is toward the side of the atelectatic lung.
• On the lateral radiograph:• The hemidiaphragm on the side of the atelectasis
will be silhouetted by the nonaerated lung above it. Look closely and you’ll see only one hemidia-phragm on the lateral exposure, instead of two.
HOW ATELECTASIS RESOLVES! Depending in part on the rapidity with which the segment,
lobe, or lung became atelectatic, atelectasis has the capacity to resolve within hours or last for many days once the obstruction has been removed.
! Slowly-resolving lobar or whole-lung atelectasis may mani-fest patchy areas of airspace disease surrounded by progres-sively increasing zones of aerated lung until the atelectasis has completely cleared.
! The most common causes of obstructive atelectasis are summarized in Table 5-2.
WEBLINKRegistered users may obtain more information on Recognizing Atelectasis on StudentConsult.com.
TABLE 5-2 MOST COMMON CAUSES OF OBSTRUCTIVE ATELECTASIS
Cause Remarks
Tumors Includes bronchogenic carcinoma (especially squamous cell), endobronchial metastases, and carcinoid tumors
Mucous plug Especially in bedridden individuals; postoperative patients; those with asthma, cystic fibrosis
Foreign body aspiration Especially peanuts; toys; following a traumatic intubation
Inflammation As in scarring caused by tuberculosis
TAKE-HOME POINTS
Recognizing Atelectasis
Volume loss is common to all forms of atelectasis, but the radiographic appearance of atelectasis will differ depending on the type of atelectasis.
The three most commonly observed types of atelectasis are subsegmental atelectasis (also known as discoid or platelike atelectasis), compressive or passive atelectasis, and obstructive atelectasis.
Subsegmental atelectasis usually occurs in patients who are not taking a deep breath (splinting) and produces horizontal linear densities, usually at the lung bases.
Compressive atelectasis occurs passively when the lung is collapsed by a poor inspiration (at the bases), or from a large, adjacent pleural effusion or pneumothorax. When the underlying abnormality is removed, the lung usually expands.
Round atelectasis is a type of passive atelectasis in which the lung does not re-expand when a pleural effusion recedes, usually due to pre-existing pleural disease. Round atelectasis may produce a masslike lesion that can mimic a tumor on chest radiographs.
Obstructive atelectasis occurs distal to an occluding lesion of the bronchial tree because of reabsorption of the air in the distal airspaces via the pulmonary capillary bed.
Obstructive atelectasis produces consistently recogniz-able patterns of collapse based on the assumptions that the visceral and parietal pleura invariably remain in contact with each other and every lobe of the lung is anchored at or near the hilum.
Signs of obstructive atelectasis include displacement of the fissures, increased density of the affected lung, shift of the mobile structures of the thorax toward the atelec-tasis, and compensatory overinflation of the unaffected ipsilateral or contralateral lung.
Atelectasis tends to resolve quickly if it occurs acutely; the more chronic the process, the longer it usually takes to resolve.
40
Chapter 6
Recognizing a Pleural Effusion
NORMAL ANATOMY AND PHYSIOLOGY OF THE PLEURAL SPACE! Normal anatomy
• The parietal pleura lines the inside of the thoracic cage and the visceral pleura adheres to the surface of the lung parenchyma, including its interface with the medias-tinum and diaphragm (see Chapter 2, The Normal Frontal Chest Radiograph). The enfolds of the visceral pleura form the interlobar fissures—the major (oblique) and minor (horizontal) on the right, only the major on the left. The space between the visceral and parietal pleura, i.e., the pleural space, is a potential space normally containing only about 2-5 mL of pleural fluid.
! Normal physiology• Normally, several hundred milliliters of pleural fluid are
produced and reabsorbed each day. Fluid is produced primarily at the parietal pleura from the pulmonary capillary bed and is resorbed at the visceral pleura and by lymphatic drainage through the parietal pleura.
CAUSES OF PLEURAL EFFUSIONS! Fluid accumulates in the pleural space when the rate at
which the fluid forms exceeds the rate by which it is cleared.• The rate of formation may be increased by:
• Increasing hydrostatic pressure, as in left heart failure.• Decreasing colloid osmotic pressure, as in
hypoproteinemia.• Increasing capillary permeability, as can occur in
toxic disruption of the capillary membrane in pneu-monia or hypersensitivity reactions.
• The rate of resorption can decrease by:• Decreased absorption of fluid by lymphatics, either
from lymphangitic blockade by tumor or from increased venous pressure, which decreases the rate of fluid transport via the thoracic duct.
• Decreased pressure in the pleural space, as in atel-ectasis of the lung due to bronchial obstruction.
! Pleural effusions can also form when there is transport of peritoneal fluid from the abdominal cavity through the diaphragm or via lymphatics from a subdiaphragmatic process (Table 6-1).
TYPES OF PLEURAL EFFUSIONS! Pleural effusions are divided into exudates or transu-
dates, depending on their protein content and their lactate dehydrogenase (LDH) concentrations.
! Transudates tend to form when there is increased capil-lary hydrostatic pressure or decreased osmotic pres-sure, such as occurs in:• Congestive heart failure, primarily left heart failure,
which is the most common cause of a transudative pleural effusion
• Hypoalbuminemia• Cirrhosis• Nephrotic syndrome
! Exudates• Most common cause of an exudative pleural effusion
is malignancy.• Empyema—an exudate containing pus• Hemothorax—has a fluid hematocrit >50% blood
hematocrit• Chylothorax—contains increased triglycerides or
cholesterol
SIDE SPECIFICITY OF PLEURAL EFFUSIONS! Certain diseases tend to produce pleural effusions on one
side or the other, or bilaterally.! Diseases that usually produce bilateral effusions:
• Congestive heart failure• Usually about the same amount of fluid in each
hemithorax.• If markedly different amounts are in each hemithorax,
suspect a parapneumonic effusion or malignancy on the side with the greater volume of fluid.
• Lupus erythematosus—usually bilateral, but when uni-lateral, the effusions are usually left-sided.
! Diseases that can produce effusions on either side (but are usually unilateral):• Tuberculosis and other exudative effusions associated
with infectious agents, including viruses• Pulmonary thromboembolic disease• Trauma
! Diseases that usually produce left-sided effusions:• Pancreatitis• Distal thoracic duct obstruction• Dressler syndrome (Box 6-1, Fig. 6-1)
! Diseases that usually produce right-sided effusions:• Abdominal disease related to the liver or ovaries—
some ovarian tumors can be associated with a right pleural effusion and ascites (Meigs syndrome)
• Rheumatoid arthritis—the effusion can remain unchanged for years
• Proximal thoracic duct obstruction
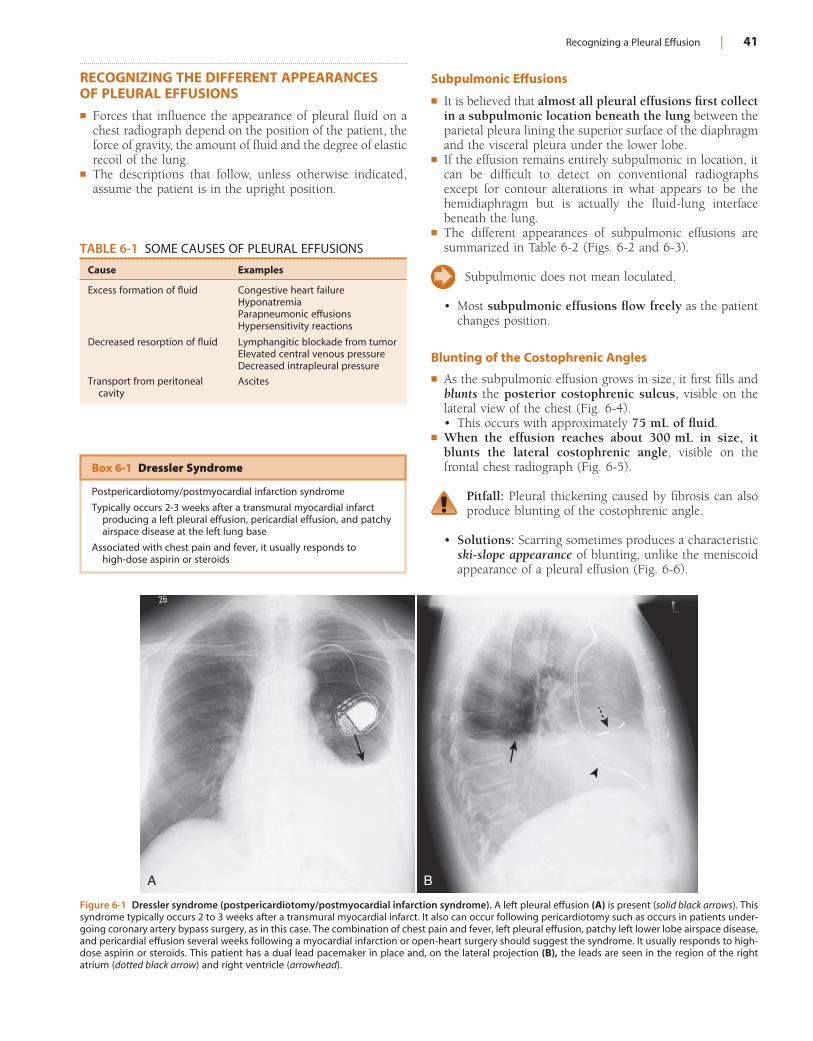
Recognizing a Pleural Effusion | 41
TABLE 6-1 SOME CAUSES OF PLEURAL EFFUSIONS
Cause Examples
Excess formation of fluid Congestive heart failureHyponatremiaParapneumonic effusionsHypersensitivity reactions
Decreased resorption of fluid Lymphangitic blockade from tumorElevated central venous pressureDecreased intrapleural pressure
Transport from peritoneal cavity
Ascites
Figure 6-1 Dressler syndrome (postpericardiotomy/postmyocardial infarction syndrome). A left pleural effusion (A) is present (solid black arrows). This syndrome typically occurs 2 to 3 weeks after a transmural myocardial infarct. It also can occur following pericardiotomy such as occurs in patients under-going coronary artery bypass surgery, as in this case. The combination of chest pain and fever, left pleural effusion, patchy left lower lobe airspace disease, and pericardial effusion several weeks following a myocardial infarction or open-heart surgery should suggest the syndrome. It usually responds to high-dose aspirin or steroids. This patient has a dual lead pacemaker in place and, on the lateral projection (B), the leads are seen in the region of the right atrium (dotted black arrow) and right ventricle (arrowhead).
A B
Box 6-1 Dressler Syndrome
Postpericardiotomy/postmyocardial infarction syndrome
Typically occurs 2-3 weeks after a transmural myocardial infarct producing a left pleural effusion, pericardial effusion, and patchy airspace disease at the left lung base
Associated with chest pain and fever, it usually responds to high-dose aspirin or steroids
RECOGNIZING THE DIFFERENT APPEARANCES OF PLEURAL EFFUSIONS! Forces that influence the appearance of pleural fluid on a
chest radiograph depend on the position of the patient, the force of gravity, the amount of fluid and the degree of elastic recoil of the lung.
! The descriptions that follow, unless otherwise indicated, assume the patient is in the upright position.
Subpulmonic Effusions
! It is believed that almost all pleural effusions first collect in a subpulmonic location beneath the lung between the parietal pleura lining the superior surface of the diaphragm and the visceral pleura under the lower lobe.
! If the effusion remains entirely subpulmonic in location, it can be difficult to detect on conventional radiographs except for contour alterations in what appears to be the hemidiaphragm but is actually the fluid-lung interface beneath the lung.
! The different appearances of subpulmonic effusions are summarized in Table 6-2 (Figs. 6-2 and 6-3).
Subpulmonic does not mean loculated.
• Most subpulmonic effusions flow freely as the patient changes position.
Blunting of the Costophrenic Angles
! As the subpulmonic effusion grows in size, it first fills and blunts the posterior costophrenic sulcus, visible on the lateral view of the chest (Fig. 6-4).• This occurs with approximately 75 mL of fluid.
! When the effusion reaches about 300 mL in size, it blunts the lateral costophrenic angle, visible on the frontal chest radiograph (Fig. 6-5).
Pitfall: Pleural thickening caused by fibrosis can also produce blunting of the costophrenic angle.
• Solutions: Scarring sometimes produces a characteristic ski-slope appearance of blunting, unlike the meniscoid appearance of a pleural effusion (Fig. 6-6).
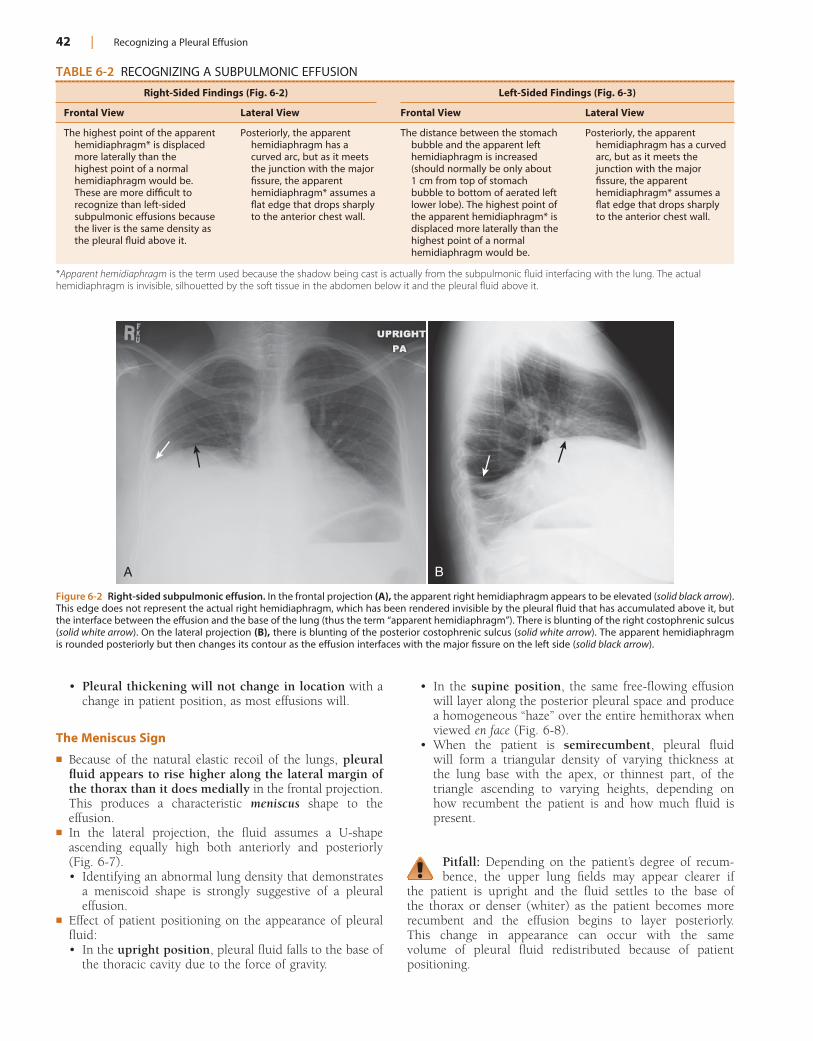
42 | Recognizing a Pleural Effusion
• Pleural thickening will not change in location with a change in patient position, as most effusions will.
The Meniscus Sign
! Because of the natural elastic recoil of the lungs, pleural fluid appears to rise higher along the lateral margin of the thorax than it does medially in the frontal projection. This produces a characteristic meniscus shape to the effusion.
! In the lateral projection, the fluid assumes a U-shape ascending equally high both anteriorly and posteriorly (Fig. 6-7).• Identifying an abnormal lung density that demonstrates
a meniscoid shape is strongly suggestive of a pleural effusion.
! Effect of patient positioning on the appearance of pleural fluid:• In the upright position, pleural fluid falls to the base of
the thoracic cavity due to the force of gravity.
TABLE 6-2 RECOGNIZING A SUBPULMONIC EFFUSION
Right-Sided Findings (Fig. 6-2) Left-Sided Findings (Fig. 6-3)
Frontal View Lateral View Frontal View Lateral View
The highest point of the apparent hemidiaphragm* is displaced more laterally than the highest point of a normal hemidiaphragm would be. These are more difficult to recognize than left-sided subpulmonic effusions because the liver is the same density as the pleural fluid above it.
Posteriorly, the apparent hemidiaphragm has a curved arc, but as it meets the junction with the major fissure, the apparent hemidiaphragm* assumes a flat edge that drops sharply to the anterior chest wall.
The distance between the stomach bubble and the apparent left hemidiaphragm is increased (should normally be only about 1 cm from top of stomach bubble to bottom of aerated left lower lobe). The highest point of the apparent hemidiaphragm* is displaced more laterally than the highest point of a normal hemidiaphragm would be.
Posteriorly, the apparent hemidiaphragm has a curved arc, but as it meets the junction with the major fissure, the apparent hemidiaphragm* assumes a flat edge that drops sharply to the anterior chest wall.
*Apparent hemidiaphragm is the term used because the shadow being cast is actually from the subpulmonic fluid interfacing with the lung. The actual hemidiaphragm is invisible, silhouetted by the soft tissue in the abdomen below it and the pleural fluid above it.
Figure 6-2 Right-sided subpulmonic effusion. In the frontal projection (A), the apparent right hemidiaphragm appears to be elevated (solid black arrow). This edge does not represent the actual right hemidiaphragm, which has been rendered invisible by the pleural fluid that has accumulated above it, but the interface between the effusion and the base of the lung (thus the term “apparent hemidiaphragm”). There is blunting of the right costophrenic sulcus (solid white arrow). On the lateral projection (B), there is blunting of the posterior costophrenic sulcus (solid white arrow). The apparent hemidiaphragm is rounded posteriorly but then changes its contour as the effusion interfaces with the major fissure on the left side (solid black arrow).
A B
• In the supine position, the same free-flowing effusion will layer along the posterior pleural space and produce a homogeneous “haze” over the entire hemithorax when viewed en face (Fig. 6-8).
• When the patient is semirecumbent, pleural fluid will form a triangular density of varying thickness at the lung base with the apex, or thinnest part, of the triangle ascending to varying heights, depending on how recumbent the patient is and how much fluid is present.
Pitfall: Depending on the patient’s degree of recum-bence, the upper lung fields may appear clearer if
the patient is upright and the fluid settles to the base of the thorax or denser (whiter) as the patient becomes more recumbent and the effusion begins to layer posteriorly. This change in appearance can occur with the same volume of pleural fluid redistributed because of patient positioning.
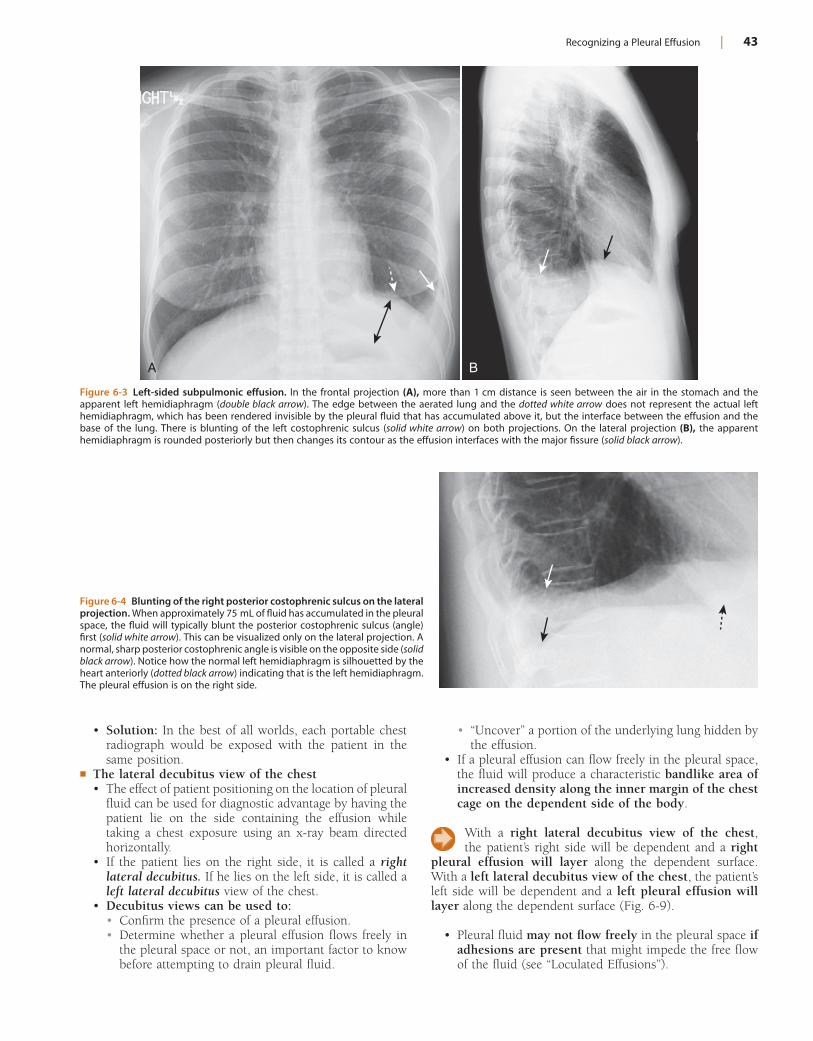
Recognizing a Pleural Effusion | 43
Figure 6-3 Left-sided subpulmonic effusion. In the frontal projection (A), more than 1 cm distance is seen between the air in the stomach and the apparent left hemidiaphragm (double black arrow). The edge between the aerated lung and the dotted white arrow does not represent the actual left hemidiaphragm, which has been rendered invisible by the pleural fluid that has accumulated above it, but the interface between the effusion and the base of the lung. There is blunting of the left costophrenic sulcus (solid white arrow) on both projections. On the lateral projection (B), the apparent hemidiaphragm is rounded posteriorly but then changes its contour as the effusion interfaces with the major fissure (solid black arrow).
A B
Figure 6-4 Blunting of the right posterior costophrenic sulcus on the lateral projection. When approximately 75 mL of fluid has accumulated in the pleural space, the fluid will typically blunt the posterior costophrenic sulcus (angle) first (solid white arrow). This can be visualized only on the lateral projection. A normal, sharp posterior costophrenic angle is visible on the opposite side (solid black arrow). Notice how the normal left hemidiaphragm is silhouetted by the heart anteriorly (dotted black arrow) indicating that is the left hemidiaphragm. The pleural effusion is on the right side.
• Solution: In the best of all worlds, each portable chest radiograph would be exposed with the patient in the same position.
! The lateral decubitus view of the chest• The effect of patient positioning on the location of pleural
fluid can be used for diagnostic advantage by having the patient lie on the side containing the effusion while taking a chest exposure using an x-ray beam directed horizontally.
• If the patient lies on the right side, it is called a right lateral decubitus. If he lies on the left side, it is called a left lateral decubitus view of the chest.
• Decubitus views can be used to:• Confirm the presence of a pleural effusion.• Determine whether a pleural effusion flows freely in
the pleural space or not, an important factor to know before attempting to drain pleural fluid.
• “Uncover” a portion of the underlying lung hidden by the effusion.
• If a pleural effusion can flow freely in the pleural space, the fluid will produce a characteristic bandlike area of increased density along the inner margin of the chest cage on the dependent side of the body.
With a right lateral decubitus view of the chest, the patient’s right side will be dependent and a right
pleural effusion will layer along the dependent surface. With a left lateral decubitus view of the chest, the patient’s left side will be dependent and a left pleural effusion will layer along the dependent surface (Fig. 6-9).
• Pleural fluid may not flow freely in the pleural space if adhesions are present that might impede the free flow of the fluid (see “Loculated Effusions”).
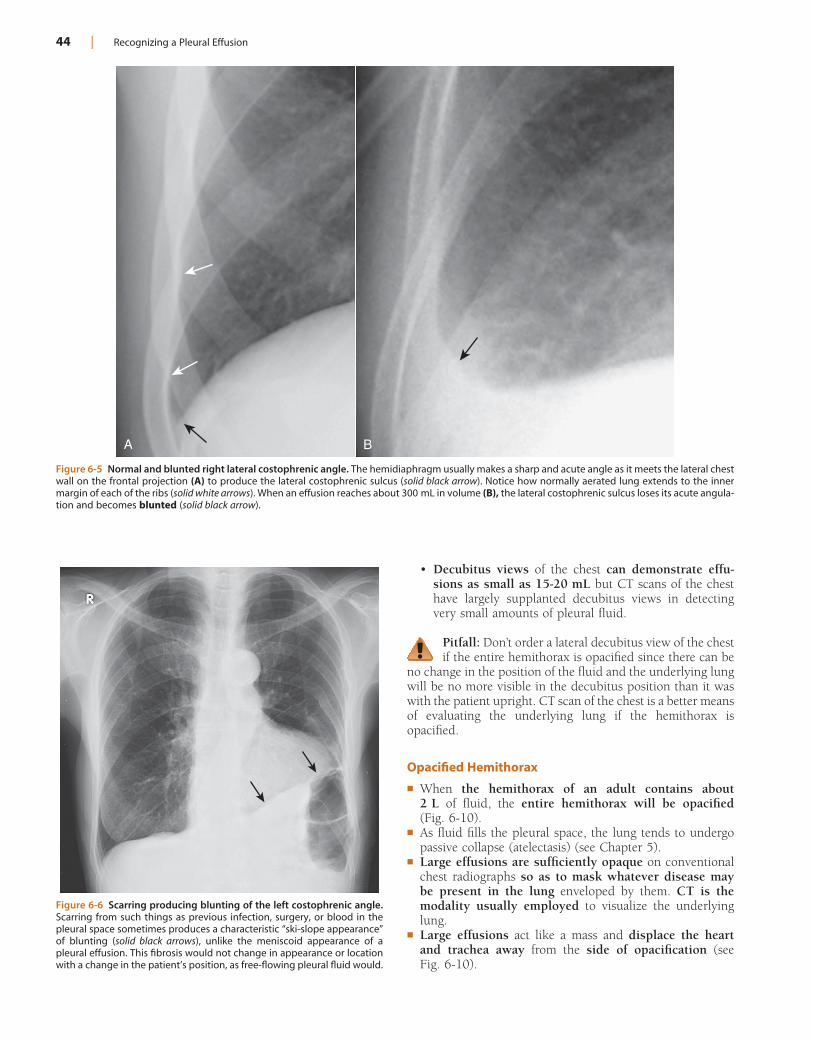
44 | Recognizing a Pleural Effusion
• Decubitus views of the chest can demonstrate effu-sions as small as 15-20 mL but CT scans of the chest have largely supplanted decubitus views in detecting very small amounts of pleural fluid.
Pitfall: Don’t order a lateral decubitus view of the chest if the entire hemithorax is opacified since there can be
no change in the position of the fluid and the underlying lung will be no more visible in the decubitus position than it was with the patient upright. CT scan of the chest is a better means of evaluating the underlying lung if the hemithorax is opacified.
Opacified Hemithorax
! When the hemithorax of an adult contains about 2 L of fluid, the entire hemithorax will be opacified (Fig. 6-10).
! As fluid fills the pleural space, the lung tends to undergo passive collapse (atelectasis) (see Chapter 5).
! Large effusions are sufficiently opaque on conventional chest radiographs so as to mask whatever disease may be present in the lung enveloped by them. CT is the modality usually employed to visualize the underlying lung.
! Large effusions act like a mass and displace the heart and trachea away from the side of opacification (see Fig. 6-10).
Figure 6-5 Normal and blunted right lateral costophrenic angle. The hemidiaphragm usually makes a sharp and acute angle as it meets the lateral chest wall on the frontal projection (A) to produce the lateral costophrenic sulcus (solid black arrow). Notice how normally aerated lung extends to the inner margin of each of the ribs (solid white arrows). When an effusion reaches about 300 mL in volume (B), the lateral costophrenic sulcus loses its acute angula-tion and becomes blunted (solid black arrow).
A B
Figure 6-6 Scarring producing blunting of the left costophrenic angle. Scarring from such things as previous infection, surgery, or blood in the pleural space sometimes produces a characteristic “ski-slope appearance” of blunting (solid black arrows), unlike the meniscoid appearance of a pleural effusion. This fibrosis would not change in appearance or location with a change in the patient’s position, as free-flowing pleural fluid would.
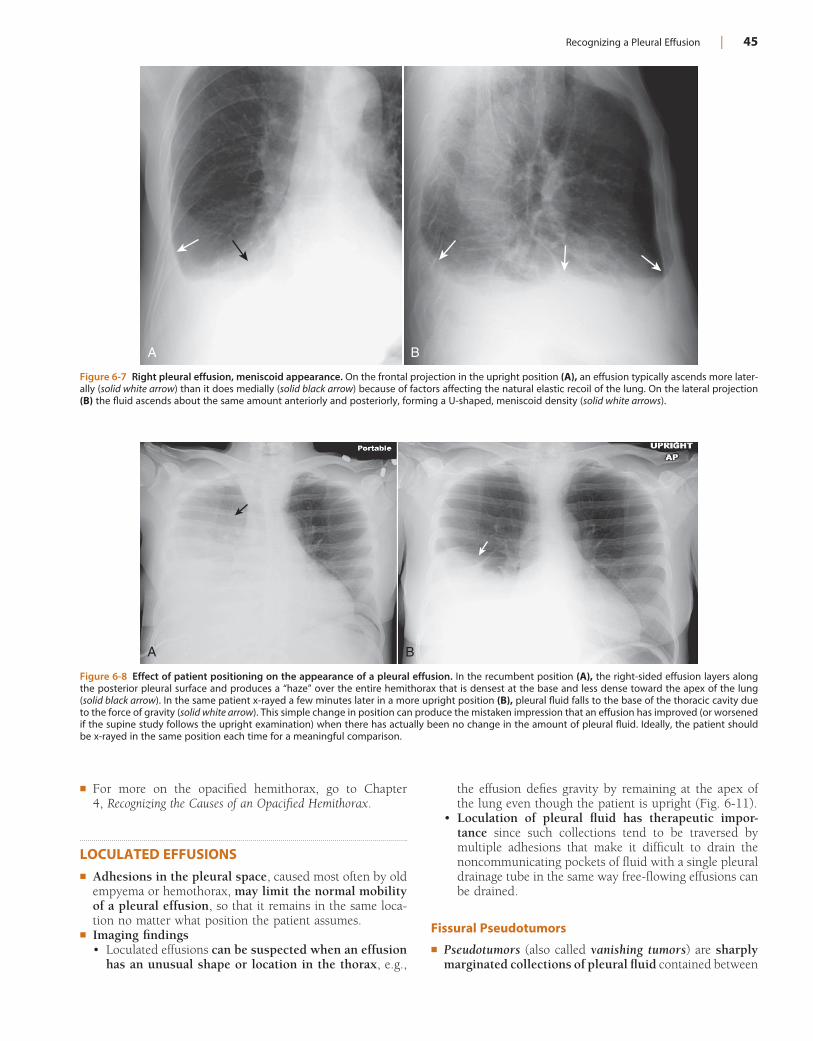
Recognizing a Pleural Effusion | 45
Figure 6-7 Right pleural effusion, meniscoid appearance. On the frontal projection in the upright position (A), an effusion typically ascends more later-ally (solid white arrow) than it does medially (solid black arrow) because of factors affecting the natural elastic recoil of the lung. On the lateral projection (B) the fluid ascends about the same amount anteriorly and posteriorly, forming a U-shaped, meniscoid density (solid white arrows).
A B
Figure 6-8 Effect of patient positioning on the appearance of a pleural effusion. In the recumbent position (A), the right-sided effusion layers along the posterior pleural surface and produces a “haze” over the entire hemithorax that is densest at the base and less dense toward the apex of the lung (solid black arrow). In the same patient x-rayed a few minutes later in a more upright position (B), pleural fluid falls to the base of the thoracic cavity due to the force of gravity (solid white arrow). This simple change in position can produce the mistaken impression that an effusion has improved (or worsened if the supine study follows the upright examination) when there has actually been no change in the amount of pleural fluid. Ideally, the patient should be x-rayed in the same position each time for a meaningful comparison.
A B
! For more on the opacified hemithorax, go to Chapter 4, Recognizing the Causes of an Opacified Hemithorax.
LOCULATED EFFUSIONS! Adhesions in the pleural space, caused most often by old
empyema or hemothorax, may limit the normal mobility of a pleural effusion, so that it remains in the same loca-tion no matter what position the patient assumes.
! Imaging findings• Loculated effusions can be suspected when an effusion
has an unusual shape or location in the thorax, e.g.,
the effusion defies gravity by remaining at the apex of the lung even though the patient is upright (Fig. 6-11).
• Loculation of pleural fluid has therapeutic impor-tance since such collections tend to be traversed by multiple adhesions that make it difficult to drain the noncommunicating pockets of fluid with a single pleural drainage tube in the same way free-flowing effusions can be drained.
Fissural Pseudotumors
! Pseudotumors (also called vanishing tumors) are sharply marginated collections of pleural fluid contained between
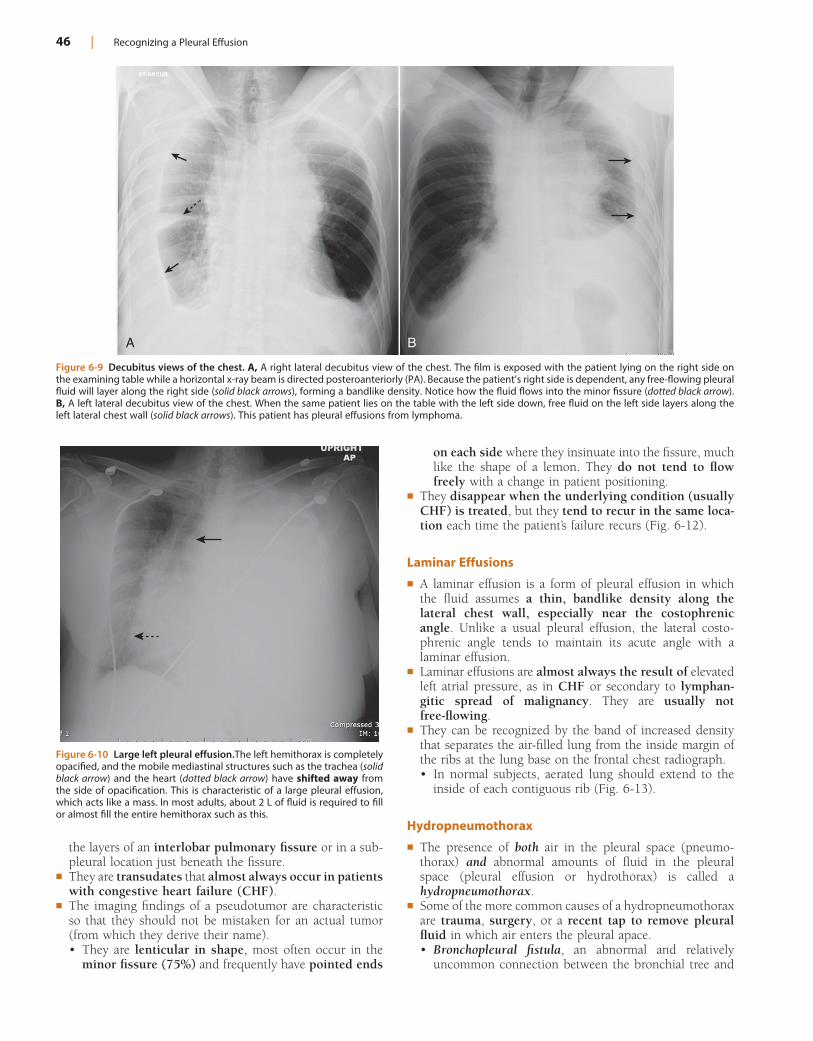
46 | Recognizing a Pleural Effusion
on each side where they insinuate into the fissure, much like the shape of a lemon. They do not tend to flow freely with a change in patient positioning.
! They disappear when the underlying condition (usually CHF) is treated, but they tend to recur in the same loca-tion each time the patient’s failure recurs (Fig. 6-12).
Laminar Effusions
! A laminar effusion is a form of pleural effusion in which the fluid assumes a thin, bandlike density along the lateral chest wall, especially near the costophrenic angle. Unlike a usual pleural effusion, the lateral costo-phrenic angle tends to maintain its acute angle with a laminar effusion.
! Laminar effusions are almost always the result of elevated left atrial pressure, as in CHF or secondary to lymphan-gitic spread of malignancy. They are usually not free-flowing.
! They can be recognized by the band of increased density that separates the air-filled lung from the inside margin of the ribs at the lung base on the frontal chest radiograph.• In normal subjects, aerated lung should extend to the
inside of each contiguous rib (Fig. 6-13).
Hydropneumothorax
! The presence of both air in the pleural space (pneumo-thorax) and abnormal amounts of fluid in the pleural space (pleural effusion or hydrothorax) is called a hydropneumothorax.
! Some of the more common causes of a hydropneumothorax are trauma, surgery, or a recent tap to remove pleural fluid in which air enters the pleural apace.• Bronchopleural fistula, an abnormal and relatively
uncommon connection between the bronchial tree and
the layers of an interlobar pulmonary fissure or in a sub-pleural location just beneath the fissure.
! They are transudates that almost always occur in patients with congestive heart failure (CHF).
! The imaging findings of a pseudotumor are characteristic so that they should not be mistaken for an actual tumor (from which they derive their name).• They are lenticular in shape, most often occur in the
minor fissure (75%) and frequently have pointed ends
Figure 6-9 Decubitus views of the chest. A, A right lateral decubitus view of the chest. The film is exposed with the patient lying on the right side on the examining table while a horizontal x-ray beam is directed posteroanteriorly (PA). Because the patient’s right side is dependent, any free-flowing pleural fluid will layer along the right side (solid black arrows), forming a bandlike density. Notice how the fluid flows into the minor fissure (dotted black arrow). B, A left lateral decubitus view of the chest. When the same patient lies on the table with the left side down, free fluid on the left side layers along the left lateral chest wall (solid black arrows). This patient has pleural effusions from lymphoma.
A B
Figure 6-10 Large left pleural effusion.The left hemithorax is completely opacified, and the mobile mediastinal structures such as the trachea (solid black arrow) and the heart (dotted black arrow) have shifted away from the side of opacification. This is characteristic of a large pleural effusion, which acts like a mass. In most adults, about 2 L of fluid is required to fill or almost fill the entire hemithorax such as this.
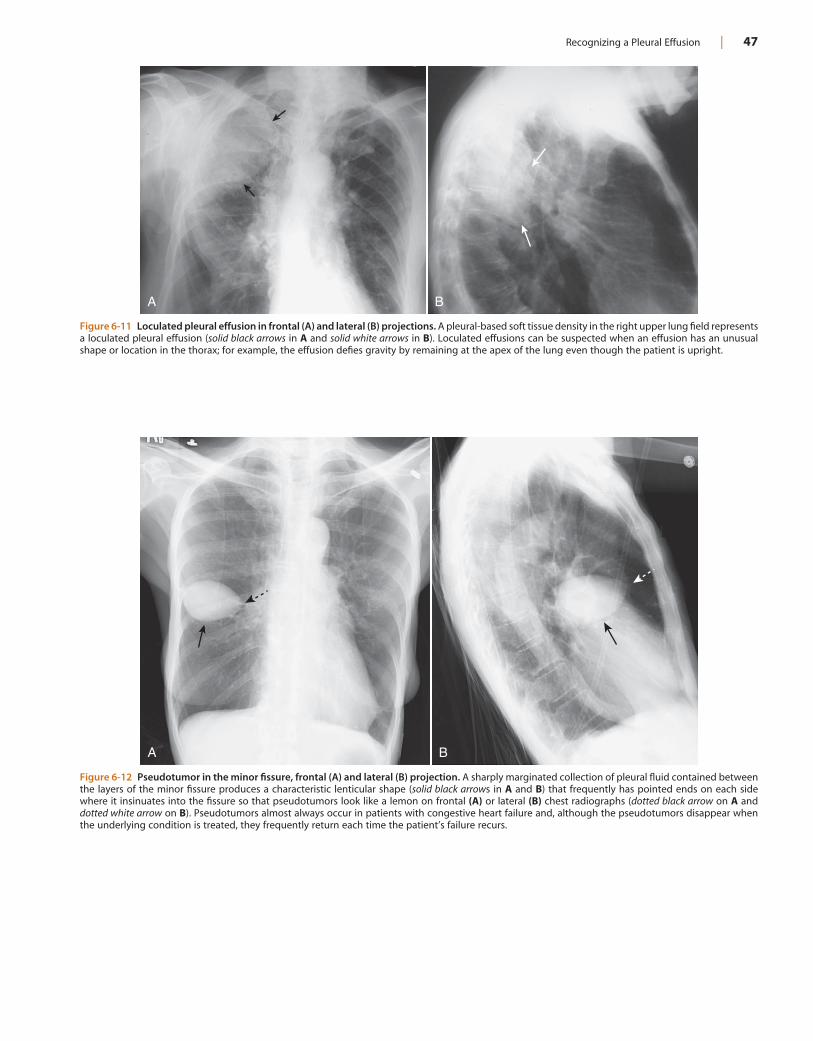
Recognizing a Pleural Effusion | 47
Figure 6-11 Loculated pleural effusion in frontal (A) and lateral (B) projections. A pleural-based soft tissue density in the right upper lung field represents a loculated pleural effusion (solid black arrows in A and solid white arrows in B). Loculated effusions can be suspected when an effusion has an unusual shape or location in the thorax; for example, the effusion defies gravity by remaining at the apex of the lung even though the patient is upright.
A B
Figure 6-12 Pseudotumor in the minor fissure, frontal (A) and lateral (B) projection. A sharply marginated collection of pleural fluid contained between the layers of the minor fissure produces a characteristic lenticular shape (solid black arrows in A and B) that frequently has pointed ends on each side where it insinuates into the fissure so that pseudotumors look like a lemon on frontal (A) or lateral (B) chest radiographs (dotted black arrow on A and dotted white arrow on B). Pseudotumors almost always occur in patients with congestive heart failure and, although the pseudotumors disappear when the underlying condition is treated, they frequently return each time the patient’s failure recurs.
A B
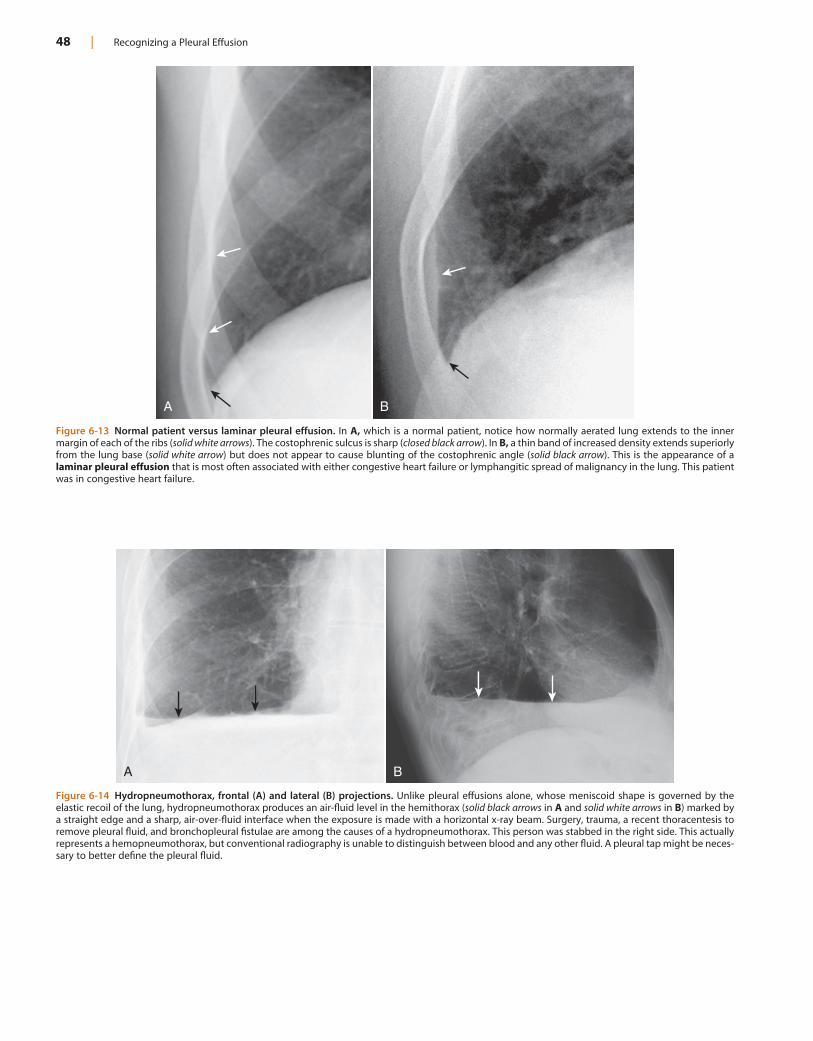
48 | Recognizing a Pleural Effusion
Figure 6-13 Normal patient versus laminar pleural effusion. In A, which is a normal patient, notice how normally aerated lung extends to the inner margin of each of the ribs (solid white arrows). The costophrenic sulcus is sharp (closed black arrow). In B, a thin band of increased density extends superiorly from the lung base (solid white arrow) but does not appear to cause blunting of the costophrenic angle (solid black arrow). This is the appearance of a laminar pleural effusion that is most often associated with either congestive heart failure or lymphangitic spread of malignancy in the lung. This patient was in congestive heart failure.
A B
Figure 6-14 Hydropneumothorax, frontal (A) and lateral (B) projections. Unlike pleural effusions alone, whose meniscoid shape is governed by the elastic recoil of the lung, hydropneumothorax produces an air-fluid level in the hemithorax (solid black arrows in A and solid white arrows in B) marked by a straight edge and a sharp, air-over-fluid interface when the exposure is made with a horizontal x-ray beam. Surgery, trauma, a recent thoracentesis to remove pleural fluid, and bronchopleural fistulae are among the causes of a hydropneumothorax. This person was stabbed in the right side. This actually represents a hemopneumothorax, but conventional radiography is unable to distinguish between blood and any other fluid. A pleural tap might be neces-sary to better define the pleural fluid.
A B
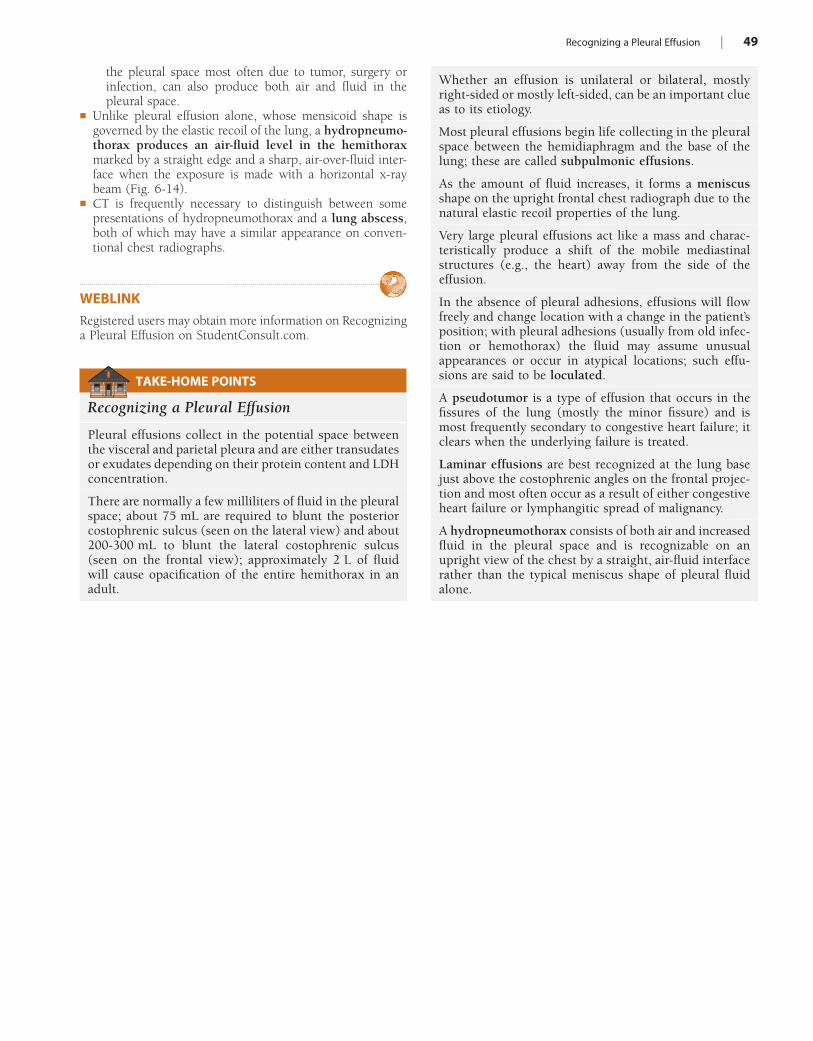
Recognizing a Pleural Effusion | 49
TAKE-HOME POINTS
Recognizing a Pleural Effusion
Pleural effusions collect in the potential space between the visceral and parietal pleura and are either transudates or exudates depending on their protein content and LDH concentration.
There are normally a few milliliters of fluid in the pleural space; about 75 mL are required to blunt the posterior costophrenic sulcus (seen on the lateral view) and about 200-300 mL to blunt the lateral costophrenic sulcus (seen on the frontal view); approximately 2 L of fluid will cause opacification of the entire hemithorax in an adult.
the pleural space most often due to tumor, surgery or infection, can also produce both air and fluid in the pleural space.
! Unlike pleural effusion alone, whose mensicoid shape is governed by the elastic recoil of the lung, a hydropneumo-thorax produces an air-fluid level in the hemithorax marked by a straight edge and a sharp, air-over-fluid inter-face when the exposure is made with a horizontal x-ray beam (Fig. 6-14).
! CT is frequently necessary to distinguish between some presentations of hydropneumothorax and a lung abscess, both of which may have a similar appearance on conven-tional chest radiographs.
WEBLINKRegistered users may obtain more information on Recognizing a Pleural Effusion on StudentConsult.com.
Whether an effusion is unilateral or bilateral, mostly right-sided or mostly left-sided, can be an important clue as to its etiology.
Most pleural effusions begin life collecting in the pleural space between the hemidiaphragm and the base of the lung; these are called subpulmonic effusions.
As the amount of fluid increases, it forms a meniscus shape on the upright frontal chest radiograph due to the natural elastic recoil properties of the lung.
Very large pleural effusions act like a mass and charac-teristically produce a shift of the mobile mediastinal structures (e.g., the heart) away from the side of the effusion.
In the absence of pleural adhesions, effusions will flow freely and change location with a change in the patient’s position; with pleural adhesions (usually from old infec-tion or hemothorax) the fluid may assume unusual appearances or occur in atypical locations; such effu-sions are said to be loculated.
A pseudotumor is a type of effusion that occurs in the fissures of the lung (mostly the minor fissure) and is most frequently secondary to congestive heart failure; it clears when the underlying failure is treated.
Laminar effusions are best recognized at the lung base just above the costophrenic angles on the frontal projec-tion and most often occur as a result of either congestive heart failure or lymphangitic spread of malignancy.
A hydropneumothorax consists of both air and increased fluid in the pleural space and is recognizable on an upright view of the chest by a straight, air-fluid interface rather than the typical meniscus shape of pleural fluid alone.
50
Chapter 7
Recognizing Pneumonia
GENERAL CONSIDERATIONS! Pneumonia can be defined as consolidation of lung pro-
duced by inflammatory exudate, usually as a result of an infectious agent.
! Most pneumonias produce airspace disease, either lobar or segmental.
! Other pneumonias demonstrate interstitial disease, and others produce findings in both the airspaces and the interstitium.
! Most microorganisms that produce pneumonia are spread to the lungs via the tracheobronchial tree, either through inhalation or aspiration of the organisms.
! In some instances, microorganisms are spread via the bloodstream and in even fewer cases, by direct extension.
! Because many different microorganisms can produce similar imaging findings in the lungs, it is difficult to identify with certainty the causative organism from the radio-graphic presentation alone.• However, certain patterns of disease are very sugges-
tive of a particular causative organism (Table 7-1).• Some use the term “infiltrate” synonymously with pneu-
monia, although many diseases, from amyloid to pulmo-nary fibrosis, can infiltrate the lung
GENERAL CHARACTERISTICS OF PNEUMONIA
• Because pneumonia fills the involved airspaces or inter-stitial tissues with some form of fluid or inflammatory exudate, pneumonias appear denser (whiter) than the surrounding, normally aerated lung.
• Pneumonia may contain air bronchograms if the bronchi themselves are not filled with inflammatory exudate or fluid (see Fig. 3-3).
• Air bronchograms are much more likely to be visible when the pneumonia involves the central portion of the lung near the hilum. Near the periphery of the lung, the bronchi are usually too small to be visible (Fig. 7-1).
• Remember that anything of fluid or soft tissue density that replaces the normal gas in the airspaces may also produce this sign, so an air bronchogram is not specific for pneumonia (see Chapter 3, Recognizing Airspace versus Interstitial Lung Disease).
! Pneumonia that involves the airspaces appears fluffy and its margins are indistinct.• Where pneumonia abuts a pleural surface, such as an
interlobar fissure or the chest wall, it will be sharply marginated.
! Interstitial pneumonia, on the other hand, may produce prominence of the interstitial markings in the affected part
of the lung or may spread to adjacent airways and resemble airspace disease.
! Except for the presence of air bronchograms, airspace pneumonia is usually homogeneous in density (Fig. 7-2).
! In some types of pneumonia (i.e., bronchopneumonia), the bronchi, as well as the airspaces, contain inflammatory exudate. This can lead to atelectasis associated with the pneumonia.• Box 7-1 summarizes the keys to recognizing
pneumonia.
PATTERNS OF PNEUMONIA! Pneumonias may be distributed in the lung in several pat-
terns described as lobar, segmental, interstitial, round, and cavitary (Table 7-2).
! Remember, these are terms that simply describe the distri-bution of the disease in the lungs; they aren’t diagnostic of pneumonia because many other diseases can produce the same patterns of disease distribution in the lung.
Lobar Pneumonia
! The prototypical lobar pneumonia is pneumococcal pneumonia caused by Streptococcus pneumoniae (Fig. 7-3).
! Although we are calling it lobar pneumonia, the patient may present before the disease involves the entire lobe. In its most classic form, the disease fills most or all of a lobe of the lung.
! Because lobes are bound by interlobar fissures, one or more of the margins of a lobar pneumonia may be sharply marginated.
! Where the disease is not bound by a fissure, it will have an indistinct and irregular margin.
! Lobar pneumonias almost always produce a silhouette sign where they come in contact with the heart, aorta, or dia-phragm, and they almost always contain air bronchograms if they involve the central portions of the lung.
Segmental Pneumonia (Bronchopneumonia)
! The prototypical bronchopneumonia is caused by Staphylococcus aureus. Many gram-negative bacteria, such as Pseudomonas aeruginosa, can produce the same picture.
! Brochopneumonias are spread centrifugally via the tracheo-bronchial tree to many foci in the lung at the same time. Therefore they frequently involve several segments of the lung simultaneously.
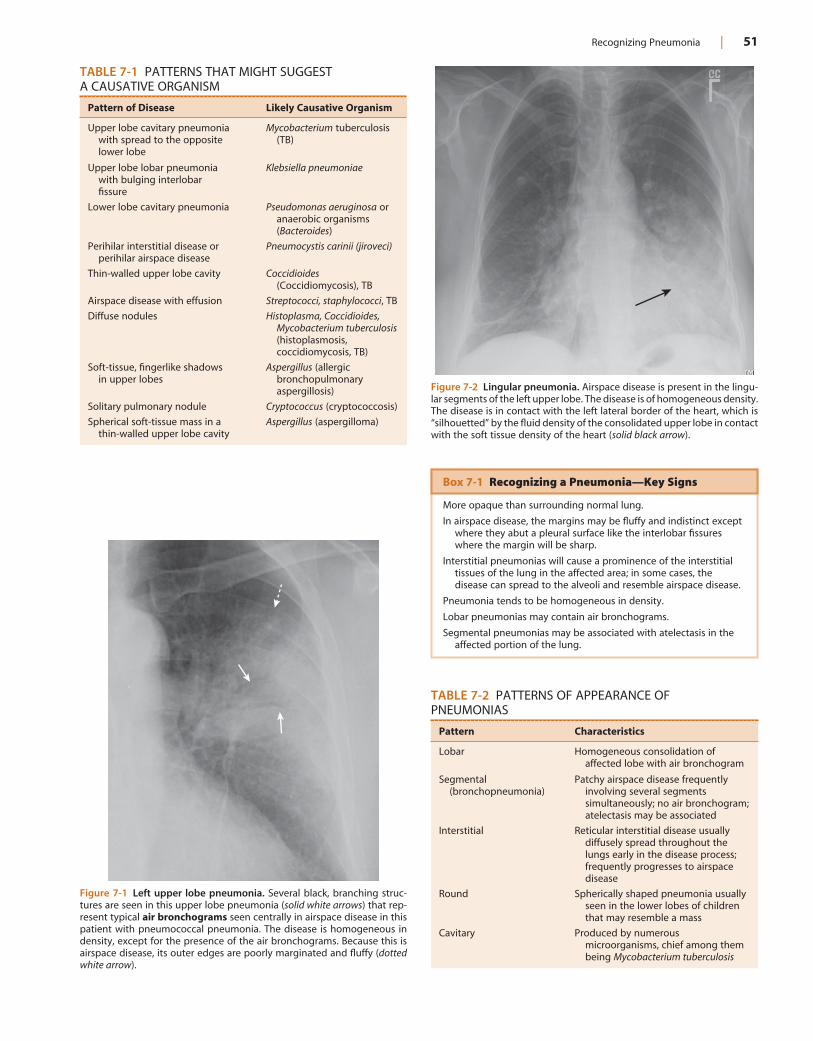
Recognizing Pneumonia | 51
TABLE 7-1 PATTERNS THAT MIGHT SUGGEST A CAUSATIVE ORGANISM
Pattern of Disease Likely Causative Organism
Upper lobe cavitary pneumonia with spread to the opposite lower lobe
Mycobacterium tuberculosis (TB)
Upper lobe lobar pneumonia with bulging interlobar fissure
Klebsiella pneumoniae
Lower lobe cavitary pneumonia Pseudomonas aeruginosa or anaerobic organisms (Bacteroides)
Perihilar interstitial disease or perihilar airspace disease
Pneumocystis carinii (jiroveci)
Thin-walled upper lobe cavity Coccidioides (Coccidiomycosis), TB
Airspace disease with effusion Streptococci, staphylococci, TB
Diffuse nodules Histoplasma, Coccidioides, Mycobacterium tuberculosis (histoplasmosis, coccidiomycosis, TB)
Soft-tissue, fingerlike shadows in upper lobes
Aspergillus (allergic bronchopulmonary aspergillosis)
Solitary pulmonary nodule Cryptococcus (cryptococcosis)
Spherical soft-tissue mass in a thin-walled upper lobe cavity
Aspergillus (aspergilloma)
Figure 7-1 Left upper lobe pneumonia. Several black, branching struc-tures are seen in this upper lobe pneumonia (solid white arrows) that rep-resent typical air bronchograms seen centrally in airspace disease in this patient with pneumococcal pneumonia. The disease is homogeneous in density, except for the presence of the air bronchograms. Because this is airspace disease, its outer edges are poorly marginated and fluffy (dotted white arrow).
Figure 7-2 Lingular pneumonia. Airspace disease is present in the lingu-lar segments of the left upper lobe. The disease is of homogeneous density. The disease is in contact with the left lateral border of the heart, which is “silhouetted” by the fluid density of the consolidated upper lobe in contact with the soft tissue density of the heart (solid black arrow).
TABLE 7-2 PATTERNS OF APPEARANCE OF PNEUMONIAS
Pattern Characteristics
Lobar Homogeneous consolidation of affected lobe with air bronchogram
Segmental (bronchopneumonia)
Patchy airspace disease frequently involving several segments simultaneously; no air bronchogram; atelectasis may be associated
Interstitial Reticular interstitial disease usually diffusely spread throughout the lungs early in the disease process; frequently progresses to airspace disease
Round Spherically shaped pneumonia usually seen in the lower lobes of children that may resemble a mass
Cavitary Produced by numerous microorganisms, chief among them being Mycobacterium tuberculosis
Box 7-1 Recognizing a Pneumonia—Key Signs
More opaque than surrounding normal lung.
In airspace disease, the margins may be fluffy and indistinct except where they abut a pleural surface like the interlobar fissures where the margin will be sharp.
Interstitial pneumonias will cause a prominence of the interstitial tissues of the lung in the affected area; in some cases, the disease can spread to the alveoli and resemble airspace disease.
Pneumonia tends to be homogeneous in density.
Lobar pneumonias may contain air bronchograms.
Segmental pneumonias may be associated with atelectasis in the affected portion of the lung.
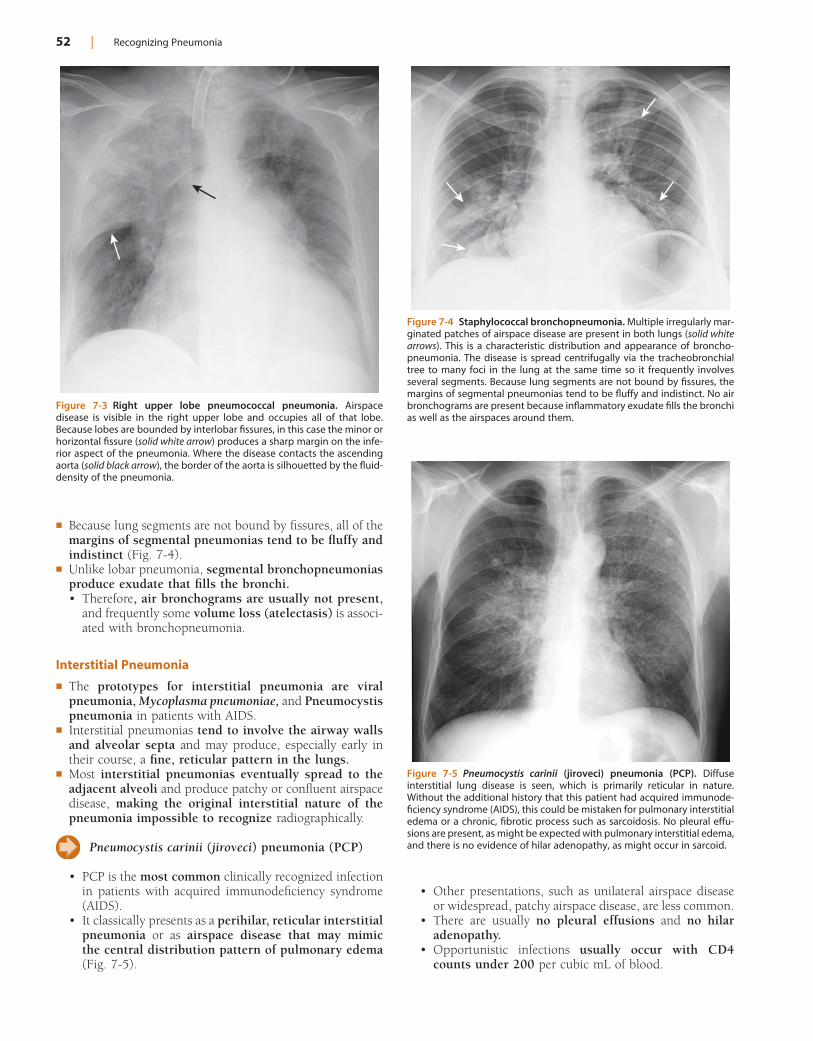
52 | Recognizing Pneumonia
! Because lung segments are not bound by fissures, all of the margins of segmental pneumonias tend to be fluffy and indistinct (Fig. 7-4).
! Unlike lobar pneumonia, segmental bronchopneumonias produce exudate that fills the bronchi.• Therefore, air bronchograms are usually not present,
and frequently some volume loss (atelectasis) is associ-ated with bronchopneumonia.
Interstitial Pneumonia
! The prototypes for interstitial pneumonia are viral pneumonia, Mycoplasma pneumoniae, and Pneumocystis pneumonia in patients with AIDS.
! Interstitial pneumonias tend to involve the airway walls and alveolar septa and may produce, especially early in their course, a fine, reticular pattern in the lungs.
! Most interstitial pneumonias eventually spread to the adjacent alveoli and produce patchy or confluent airspace disease, making the original interstitial nature of the pneumonia impossible to recognize radiographically.
Pneumocystis carinii (jiroveci) pneumonia (PCP)
• PCP is the most common clinically recognized infection in patients with acquired immunodeficiency syndrome (AIDS).
• It classically presents as a perihilar, reticular interstitial pneumonia or as airspace disease that may mimic the central distribution pattern of pulmonary edema (Fig. 7-5).
Figure 7-3 Right upper lobe pneumococcal pneumonia. Airspace disease is visible in the right upper lobe and occupies all of that lobe. Because lobes are bounded by interlobar fissures, in this case the minor or horizontal fissure (solid white arrow) produces a sharp margin on the infe-rior aspect of the pneumonia. Where the disease contacts the ascending aorta (solid black arrow), the border of the aorta is silhouetted by the fluid-density of the pneumonia.
Figure 7-4 Staphylococcal bronchopneumonia. Multiple irregularly mar-ginated patches of airspace disease are present in both lungs (solid white arrows). This is a characteristic distribution and appearance of broncho-pneumonia. The disease is spread centrifugally via the tracheobronchial tree to many foci in the lung at the same time so it frequently involves several segments. Because lung segments are not bound by fissures, the margins of segmental pneumonias tend to be fluffy and indistinct. No air bronchograms are present because inflammatory exudate fills the bronchi as well as the airspaces around them.
Figure 7-5 Pneumocystis carinii (jiroveci) pneumonia (PCP). Diffuse interstitial lung disease is seen, which is primarily reticular in nature. Without the additional history that this patient had acquired immunode-ficiency syndrome (AIDS), this could be mistaken for pulmonary interstitial edema or a chronic, fibrotic process such as sarcoidosis. No pleural effu-sions are present, as might be expected with pulmonary interstitial edema, and there is no evidence of hilar adenopathy, as might occur in sarcoid.
• Other presentations, such as unilateral airspace disease or widespread, patchy airspace disease, are less common.
• There are usually no pleural effusions and no hilar adenopathy.
• Opportunistic infections usually occur with CD4 counts under 200 per cubic mL of blood.
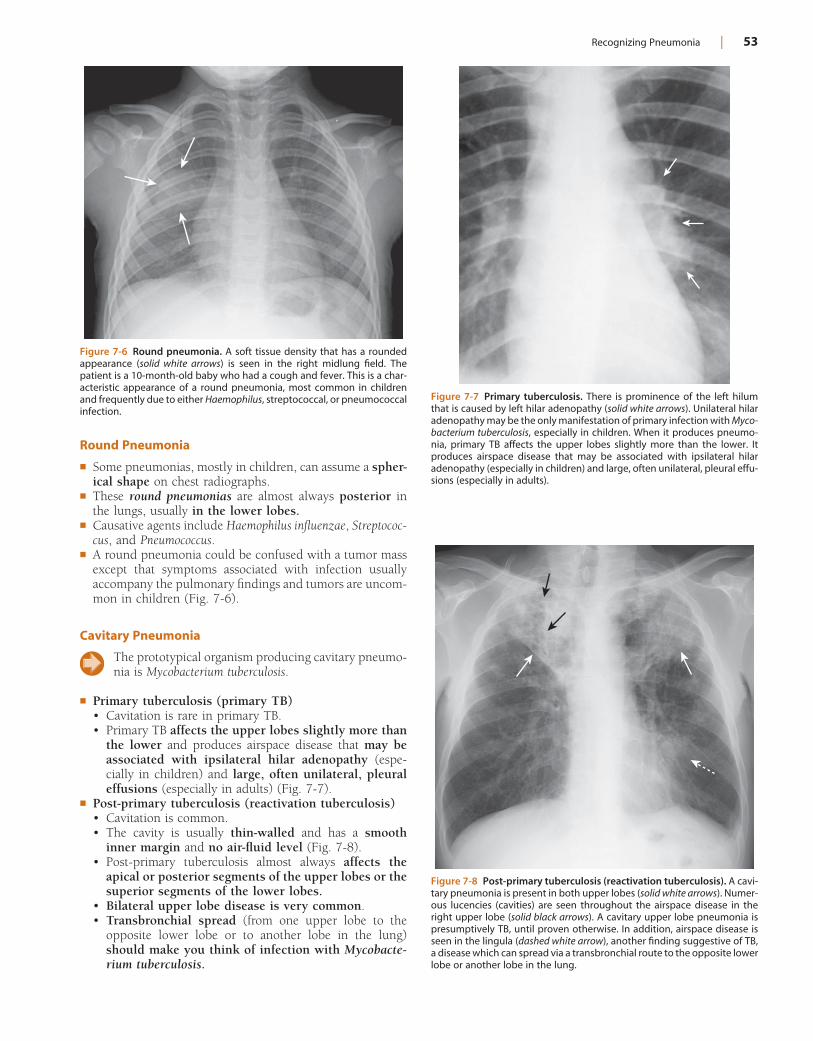
Recognizing Pneumonia | 53
Round Pneumonia
! Some pneumonias, mostly in children, can assume a spher-ical shape on chest radiographs.
! These round pneumonias are almost always posterior in the lungs, usually in the lower lobes.
! Causative agents include Haemophilus influenzae, Streptococ-cus, and Pneumococcus.
! A round pneumonia could be confused with a tumor mass except that symptoms associated with infection usually accompany the pulmonary findings and tumors are uncom-mon in children (Fig. 7-6).
Cavitary Pneumonia
The prototypical organism producing cavitary pneumo-nia is Mycobacterium tuberculosis.
! Primary tuberculosis (primary TB)• Cavitation is rare in primary TB.• Primary TB affects the upper lobes slightly more than
the lower and produces airspace disease that may be associated with ipsilateral hilar adenopathy (espe-cially in children) and large, often unilateral, pleural effusions (especially in adults) (Fig. 7-7).
! Post-primary tuberculosis (reactivation tuberculosis)• Cavitation is common.• The cavity is usually thin-walled and has a smooth
inner margin and no air-fluid level (Fig. 7-8).• Post-primary tuberculosis almost always affects the
apical or posterior segments of the upper lobes or the superior segments of the lower lobes.
• Bilateral upper lobe disease is very common.• Transbronchial spread (from one upper lobe to the
opposite lower lobe or to another lobe in the lung) should make you think of infection with Mycobacte-rium tuberculosis.
Figure 7-6 Round pneumonia. A soft tissue density that has a rounded appearance (solid white arrows) is seen in the right midlung field. The patient is a 10-month-old baby who had a cough and fever. This is a char-acteristic appearance of a round pneumonia, most common in children and frequently due to either Haemophilus, streptococcal, or pneumococcal infection.
Figure 7-7 Primary tuberculosis. There is prominence of the left hilum that is caused by left hilar adenopathy (solid white arrows). Unilateral hilar adenopathy may be the only manifestation of primary infection with Myco-bacterium tuberculosis, especially in children. When it produces pneumo-nia, primary TB affects the upper lobes slightly more than the lower. It produces airspace disease that may be associated with ipsilateral hilar adenopathy (especially in children) and large, often unilateral, pleural effu-sions (especially in adults).
Figure 7-8 Post-primary tuberculosis (reactivation tuberculosis). A cavi-tary pneumonia is present in both upper lobes (solid white arrows). Numer-ous lucencies (cavities) are seen throughout the airspace disease in the right upper lobe (solid black arrows). A cavitary upper lobe pneumonia is presumptively TB, until proven otherwise. In addition, airspace disease is seen in the lingula (dashed white arrow), another finding suggestive of TB, a disease which can spread via a transbronchial route to the opposite lower lobe or another lobe in the lung.
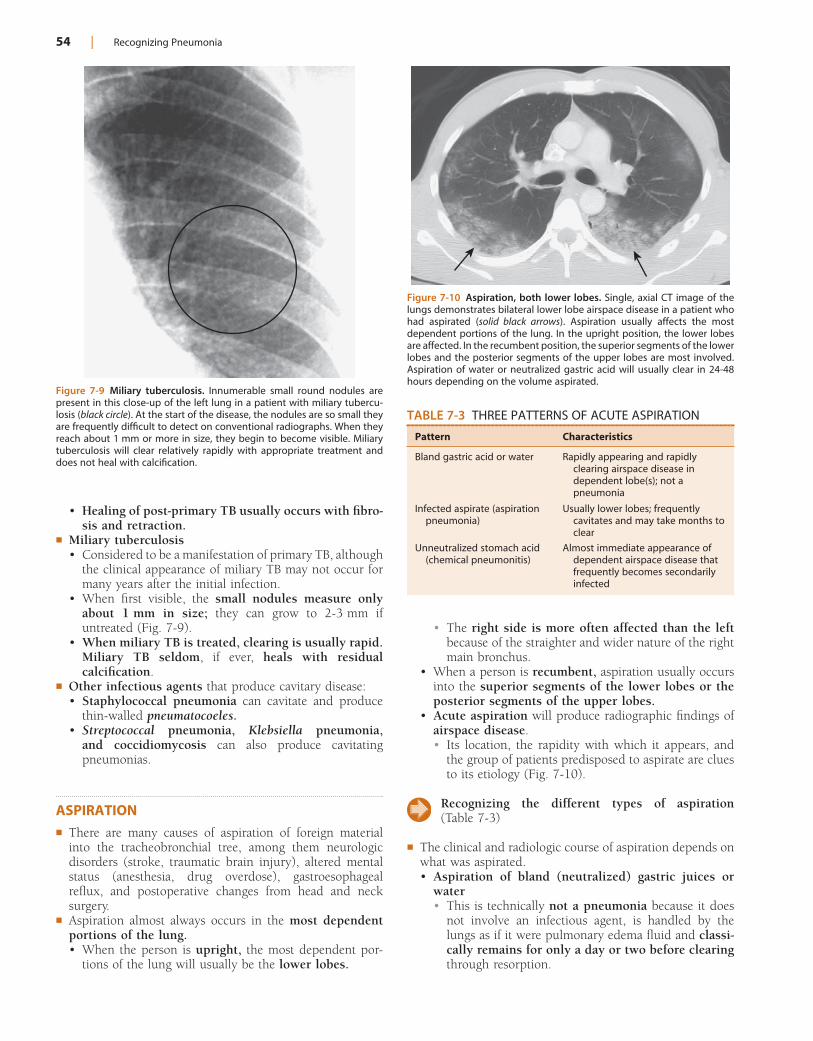
54 | Recognizing Pneumonia
• The right side is more often affected than the left because of the straighter and wider nature of the right main bronchus.
• When a person is recumbent, aspiration usually occurs into the superior segments of the lower lobes or the posterior segments of the upper lobes.
• Acute aspiration will produce radiographic findings of airspace disease.• Its location, the rapidity with which it appears, and
the group of patients predisposed to aspirate are clues to its etiology (Fig. 7-10).
Recognizing the different types of aspiration (Table 7-3)
! The clinical and radiologic course of aspiration depends on what was aspirated.• Aspiration of bland (neutralized) gastric juices or
water• This is technically not a pneumonia because it does
not involve an infectious agent, is handled by the lungs as if it were pulmonary edema fluid and classi-cally remains for only a day or two before clearing through resorption.
• Healing of post-primary TB usually occurs with fibro-sis and retraction.
! Miliary tuberculosis• Considered to be a manifestation of primary TB, although
the clinical appearance of miliary TB may not occur for many years after the initial infection.
• When first visible, the small nodules measure only about 1 mm in size; they can grow to 2-3 mm if untreated (Fig. 7-9).
• When miliary TB is treated, clearing is usually rapid. Miliary TB seldom, if ever, heals with residual calcification.
! Other infectious agents that produce cavitary disease:• Staphylococcal pneumonia can cavitate and produce
thin-walled pneumatocoeles.• Streptococcal pneumonia, Klebsiella pneumonia,
and coccidiomycosis can also produce cavitating pneumonias.
ASPIRATION! There are many causes of aspiration of foreign material
into the tracheobronchial tree, among them neurologic disorders (stroke, traumatic brain injury), altered mental status (anesthesia, drug overdose), gastroesophageal reflux, and postoperative changes from head and neck surgery.
! Aspiration almost always occurs in the most dependent portions of the lung.• When the person is upright, the most dependent por-
tions of the lung will usually be the lower lobes.
Figure 7-9 Miliary tuberculosis. Innumerable small round nodules are present in this close-up of the left lung in a patient with miliary tubercu-losis (black circle). At the start of the disease, the nodules are so small they are frequently difficult to detect on conventional radiographs. When they reach about 1 mm or more in size, they begin to become visible. Miliary tuberculosis will clear relatively rapidly with appropriate treatment and does not heal with calcification.
Figure 7-10 Aspiration, both lower lobes. Single, axial CT image of the lungs demonstrates bilateral lower lobe airspace disease in a patient who had aspirated (solid black arrows). Aspiration usually affects the most dependent portions of the lung. In the upright position, the lower lobes are affected. In the recumbent position, the superior segments of the lower lobes and the posterior segments of the upper lobes are most involved. Aspiration of water or neutralized gastric acid will usually clear in 24-48 hours depending on the volume aspirated.
TABLE 7-3 THREE PATTERNS OF ACUTE ASPIRATION
Pattern Characteristics
Bland gastric acid or water Rapidly appearing and rapidly clearing airspace disease in dependent lobe(s); not a pneumonia
Infected aspirate (aspiration pneumonia)
Usually lower lobes; frequently cavitates and may take months to clear
Unneutralized stomach acid (chemical pneumonitis)
Almost immediate appearance of dependent airspace disease that frequently becomes secondarily infected
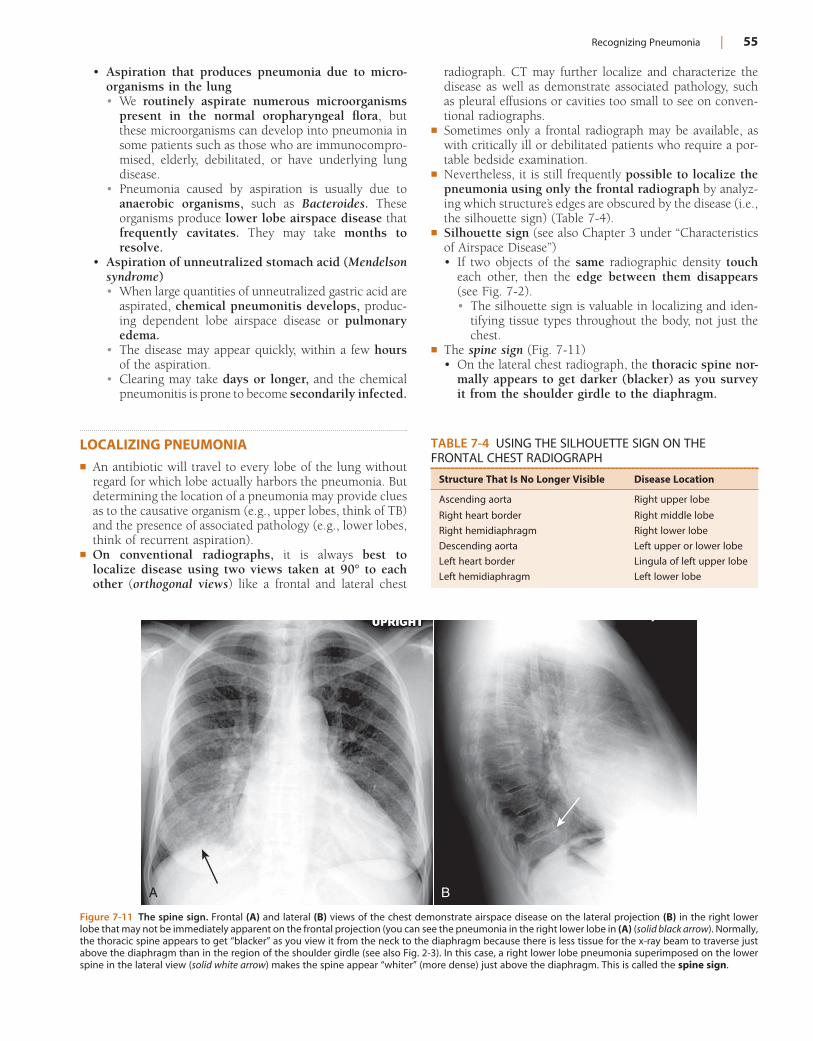
Recognizing Pneumonia | 55
TABLE 7-4 USING THE SILHOUETTE SIGN ON THE FRONTAL CHEST RADIOGRAPH
Structure That Is No Longer Visible Disease Location
Ascending aorta Right upper lobe
Right heart border Right middle lobe
Right hemidiaphragm Right lower lobe
Descending aorta Left upper or lower lobe
Left heart border Lingula of left upper lobe
Left hemidiaphragm Left lower lobe
Figure 7-11 The spine sign. Frontal (A) and lateral (B) views of the chest demonstrate airspace disease on the lateral projection (B) in the right lower lobe that may not be immediately apparent on the frontal projection (you can see the pneumonia in the right lower lobe in (A) (solid black arrow). Normally, the thoracic spine appears to get “blacker” as you view it from the neck to the diaphragm because there is less tissue for the x-ray beam to traverse just above the diaphragm than in the region of the shoulder girdle (see also Fig. 2-3). In this case, a right lower lobe pneumonia superimposed on the lower spine in the lateral view (solid white arrow) makes the spine appear “whiter” (more dense) just above the diaphragm. This is called the spine sign.
A B
• Aspiration that produces pneumonia due to micro-organisms in the lung• We routinely aspirate numerous microorganisms
present in the normal oropharyngeal flora, but these microorganisms can develop into pneumonia in some patients such as those who are immunocompro-mised, elderly, debilitated, or have underlying lung disease.
• Pneumonia caused by aspiration is usually due to anaerobic organisms, such as Bacteroides. These organisms produce lower lobe airspace disease that frequently cavitates. They may take months to resolve.
• Aspiration of unneutralized stomach acid (Mendelson syndrome)• When large quantities of unneutralized gastric acid are
aspirated, chemical pneumonitis develops, produc-ing dependent lobe airspace disease or pulmonary edema.
• The disease may appear quickly, within a few hours of the aspiration.
• Clearing may take days or longer, and the chemical pneumonitis is prone to become secondarily infected.
LOCALIZING PNEUMONIA! An antibiotic will travel to every lobe of the lung without
regard for which lobe actually harbors the pneumonia. But determining the location of a pneumonia may provide clues as to the causative organism (e.g., upper lobes, think of TB) and the presence of associated pathology (e.g., lower lobes, think of recurrent aspiration).
! On conventional radiographs, it is always best to localize disease using two views taken at 90° to each other (orthogonal views) like a frontal and lateral chest
radiograph. CT may further localize and characterize the disease as well as demonstrate associated pathology, such as pleural effusions or cavities too small to see on conven-tional radiographs.
! Sometimes only a frontal radiograph may be available, as with critically ill or debilitated patients who require a por-table bedside examination.
! Nevertheless, it is still frequently possible to localize the pneumonia using only the frontal radiograph by analyz-ing which structure’s edges are obscured by the disease (i.e., the silhouette sign) (Table 7-4).
! Silhouette sign (see also Chapter 3 under “Characteristics of Airspace Disease”)• If two objects of the same radiographic density touch
each other, then the edge between them disappears (see Fig. 7-2).• The silhouette sign is valuable in localizing and iden-
tifying tissue types throughout the body, not just the chest.
! The spine sign (Fig. 7-11)• On the lateral chest radiograph, the thoracic spine nor-
mally appears to get darker (blacker) as you survey it from the shoulder girdle to the diaphragm.
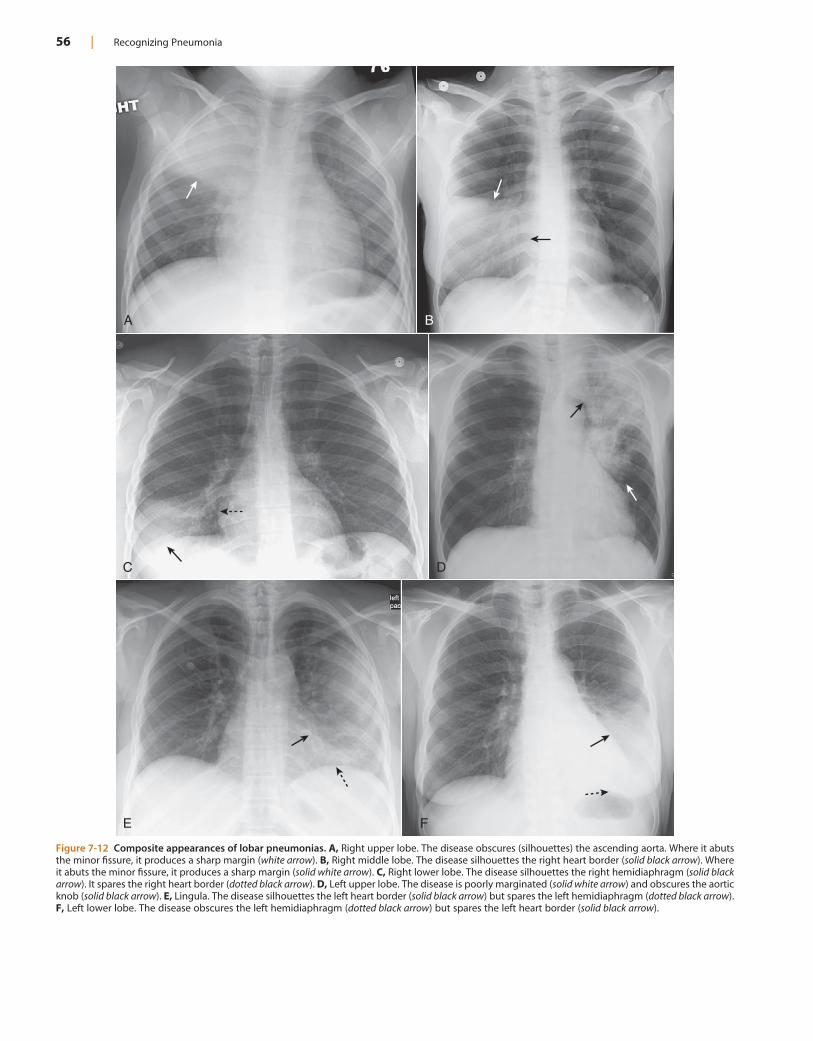
56 | Recognizing Pneumonia
Figure 7-12 Composite appearances of lobar pneumonias. A, Right upper lobe. The disease obscures (silhouettes) the ascending aorta. Where it abuts the minor fissure, it produces a sharp margin (white arrow). B, Right middle lobe. The disease silhouettes the right heart border (solid black arrow). Where it abuts the minor fissure, it produces a sharp margin (solid white arrow). C, Right lower lobe. The disease silhouettes the right hemidiaphragm (solid black arrow). It spares the right heart border (dotted black arrow). D, Left upper lobe. The disease is poorly marginated (solid white arrow) and obscures the aortic knob (solid black arrow). E, Lingula. The disease silhouettes the left heart border (solid black arrow) but spares the left hemidiaphragm (dotted black arrow). F, Left lower lobe. The disease obscures the left hemidiaphragm (dotted black arrow) but spares the left heart border (solid black arrow).
A
C D
B
E F
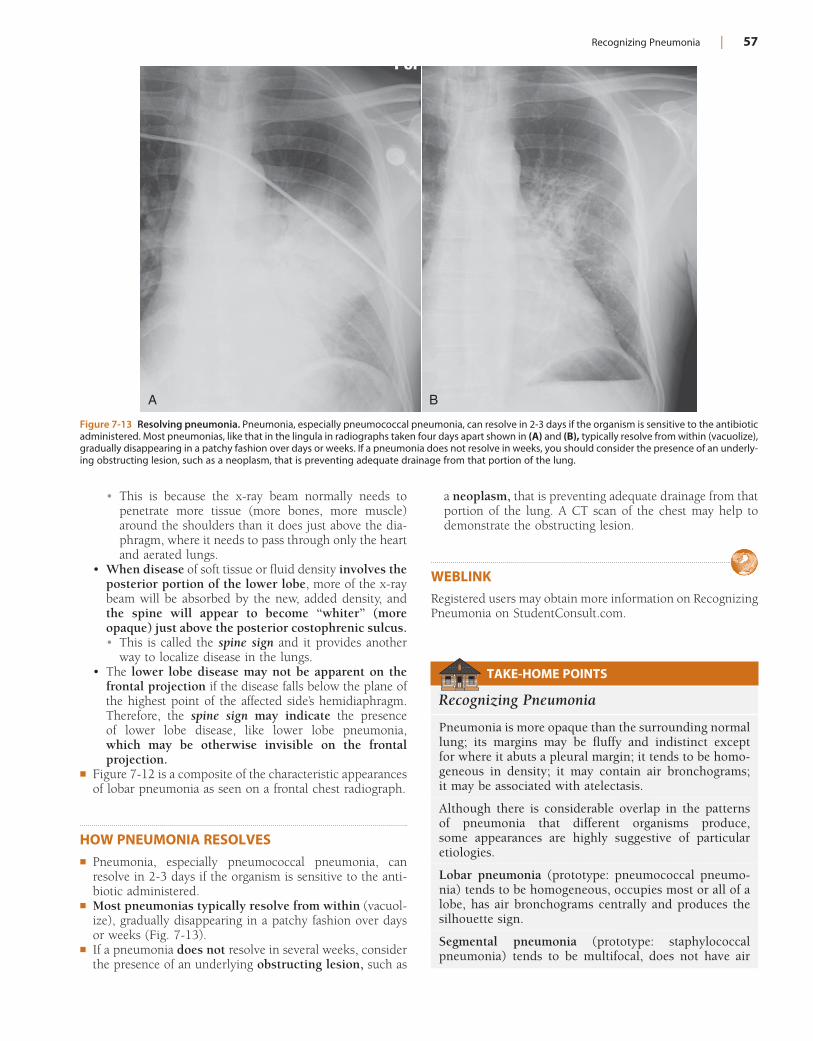
Recognizing Pneumonia | 57
a neoplasm, that is preventing adequate drainage from that portion of the lung. A CT scan of the chest may help to demonstrate the obstructing lesion.
WEBLINKRegistered users may obtain more information on Recognizing Pneumonia on StudentConsult.com.
• This is because the x-ray beam normally needs to penetrate more tissue (more bones, more muscle) around the shoulders than it does just above the dia-phragm, where it needs to pass through only the heart and aerated lungs.
• When disease of soft tissue or fluid density involves the posterior portion of the lower lobe, more of the x-ray beam will be absorbed by the new, added density, and the spine will appear to become “whiter” (more opaque) just above the posterior costophrenic sulcus.• This is called the spine sign and it provides another
way to localize disease in the lungs.• The lower lobe disease may not be apparent on the
frontal projection if the disease falls below the plane of the highest point of the affected side’s hemidiaphragm. Therefore, the spine sign may indicate the presence of lower lobe disease, like lower lobe pneumonia, which may be otherwise invisible on the frontal projection.
! Figure 7-12 is a composite of the characteristic appearances of lobar pneumonia as seen on a frontal chest radiograph.
HOW PNEUMONIA RESOLVES! Pneumonia, especially pneumococcal pneumonia, can
resolve in 2-3 days if the organism is sensitive to the anti-biotic administered.
! Most pneumonias typically resolve from within (vacuol-ize), gradually disappearing in a patchy fashion over days or weeks (Fig. 7-13).
! If a pneumonia does not resolve in several weeks, consider the presence of an underlying obstructing lesion, such as
Figure 7-13 Resolving pneumonia. Pneumonia, especially pneumococcal pneumonia, can resolve in 2-3 days if the organism is sensitive to the antibiotic administered. Most pneumonias, like that in the lingula in radiographs taken four days apart shown in (A) and (B), typically resolve from within (vacuolize), gradually disappearing in a patchy fashion over days or weeks. If a pneumonia does not resolve in weeks, you should consider the presence of an underly-ing obstructing lesion, such as a neoplasm, that is preventing adequate drainage from that portion of the lung.
A B
TAKE-HOME POINTS
Recognizing Pneumonia
Pneumonia is more opaque than the surrounding normal lung; its margins may be fluffy and indistinct except for where it abuts a pleural margin; it tends to be homo-geneous in density; it may contain air bronchograms; it may be associated with atelectasis.
Although there is considerable overlap in the patterns of pneumonia that different organisms produce, some appearances are highly suggestive of particular etiologies.
Lobar pneumonia (prototype: pneumococcal pneumo-nia) tends to be homogeneous, occupies most or all of a lobe, has air bronchograms centrally and produces the silhouette sign.
Segmental pneumonia (prototype: staphylococcal pneumonia) tends to be multifocal, does not have air
58 | Recognizing Pneumonia
bronchograms, and can be associated with volume loss because the bronchi are also filled with inflammatory exudate.
Interstitial pneumonia (prototype: viral pneumonia or PCP) tends to involve the airway walls and alveolar septa and may produce, especially early in the course, a fine, reticular pattern in the lungs; later in the course, it produces airspace disease.
Round pneumonia (prototype: haemophilus) usually occurs in children in the lower lobes posteriorly and can resemble a mass, the clue being that masses in children are uncommon.
Cavitary pneumonia (prototype: tuberculosis) has lucent cavities produced by lung necrosis as its hallmark; post-primary tuberculosis usually involves the upper lobes;
it can spread via a transbronchial route that can infect the opposite lower lobe or another lobe in the same lung.
Aspiration occurs in the most dependent portion of the lung at the time of the aspiration, usually the lower lobes or the posterior segments of the upper lobes; aspiration can be bland and clear quickly, can be infected and take months to clear, or may be from a chemical pneumonitis which can take weeks to clear.
Pneumonia can be localized by using the silhouette sign and the spine sign as aids.
Pneumonias frequently resolve by “breaking up” so that they contain patchy areas of newly aerated lung within the confines of the previous pneumonia (vacuolization).
59
Chapter 8
Recognizing Pneumothorax, Pneumomediastinum, Pneumopericardium, and Subcutaneous Emphysema
RECOGNIZING A PNEUMOTHORAX! A pneumothorax occurs when air enters the pleural
space.• When this occurs, the negative pressure normally present
in the pleural space rises higher than the intralveolar pressure and the lung collapses.
• The parietal pleura remains in contact with the inner surface of the chest wall, but the visceral pleura retracts toward the hilum with the collapsing lung.• The visceral pleura becomes visible as a thin, white
line outlined by air on both sides, marking the outer border of the lung and indicating the presence of the pneumothorax. The visible visceral pleura is called the visceral pleural white line or simply the visceral pleural line.
You must be able to identify the visceral pleural line (Fig. 8-1) to make the definitive diagnosis of a
pneumothorax!
! Even as the lung collapses, it tends to maintain its usual lunglike shape so that the curvature of the visceral pleural line parallels the curvature of the chest wall; that is, the visceral pleural line is convex outward toward the chest wall (Fig. 8-2).• Most other linear densities that mimic a pneumothorax
do not demonstrate this spatial relationship with the chest wall.
! There is usually, but not always, an absence of lung mark-ings peripheral to the visceral pleural line.
Pitfall: Pleural adhesions may keep part, but not all, of the visceral pleura adherent to the parietal pleura,
even in the presence of a pneumothorax (Fig. 8-3).
• On conventional radiographs, it may be possible to visu-alize lung markings in front or in back of the pneumo-thorax and to overlook the presence of a pneumothorax because lung markings appear to extend to the chest wall.
• Absence of lung markings alone is not sufficient for the diagnosis of pneumothorax nor is the pres-ence of lung markings distal to the visceral pleural line sufficient to eliminate the possibility of a pneumothorax.
! The presence of an air-fluid interface in the pleural space is, by definition, an indication that a pneumothorax is present (see Fig. 6-14).
• For more about recognizing a hydropneumothorax, see Chapter 6, Recognizing a Pleural Effusion.
! In the supine position, air in a relatively large pneumotho-rax may collect anteriorly and inferiorly in the thorax and manifest itself by displacing the costophrenic sulcus inferiorly while, at the same time, producing increased lucency of that costophrenic sulcus.• This is called the deep sulcus sign and it is presumptive
evidence for the presence of a pneumothorax on a supine chest radiograph (Fig. 8-4).
! The key signs for recognizing a pneumothorax are sum-marized in Box 8-1
RECOGNIZING THE PITFALLS IN OVERDIAGNOSING A PNEUMOTHORAX! Several pitfalls can lead to the mistaken diagnosis of a
pneumothorax.
Pitfall 1: Absence of lung markings mistaken for a pneumothorax.
• The simple absence of lung markings is not sufficient to warrant the diagnosis of a pneumothorax as other dis-eases produce such a finding.
• These diseases include:• Bullous disease of the lung (Fig. 8-5)• Large cysts in the lung• Pulmonary embolism, which can lead to a lack of
perfusion and hence a decrease in the number of vessels visible in a particular part of the lung (Wester-mark sign of oligemia).
• In none of these diseases would the treatment ordinarily include the insertion of a chest tube. In fact, insertion of a chest tube into a bulla might actually produce an intractable pneumothorax.• Solution: Look at the contour of the structure you
believe is the visceral pleural line. Unlike the margin of a bulla, the visceral pleural line will be convex outward toward the chest wall and will parallel the curve of the chest wall (Fig. 8-6).
Pitfall 2: Mistaking a skin fold for a pneumothorax.
60 | Recognizing Pneumothorax, Pneumomediastinum, Pneumopericardium, and Subcutaneous Emphysema
Figure 8-1 Visceral pleural line in a pneumothorax. You must see the visceral pleural line to make the definitive diagnosis of a pneumothorax (solid white arrows). The visceral and parietal pleurae are normally not visible, both normally lying adjacent to the lateral chest wall. When air enters the pleural space, the visceral pleura retracts toward the hilum along with the collapsing lung and becomes visible as a very thin, white line with air outlining it on either side. Notice how the contour of the pneumothorax parallels the curvature of the adjacent chest wall.
Figure 8-2 Pneumothorax seen on CT. As the lung collapses, it tends to maintain its usual shape so that the curve of the visceral pleural line (solid white arrows) parallels the curve of the chest wall (dotted white arrows). This is important in differentiating a pneumothorax from artifacts or other dis-eases that can mimic a pneumothorax. As it collapses, the lung on the side of the pneumothorax also tends to remain lucent until the lung loses almost all of its normal volume, at which point it appears opaque. This patient also has subcutaneous emphysema—air in the soft tissues—of the left lateral chest wall (white stars). The patient had suffered a stab wound.
*
*
Figure 8-3 Pneumothorax with pleural adhesions. Lung markings may be visible on a conventional radiograph of the chest, distal to the visceral pleural line if pleural adhesions are present. In (A), a pneumothorax (solid white arrows) is prevented from collapsing the lung by pleural adhesions (solid black arrows). On a CT scan (B), the pleural adhesions (solid black arrows) are seen tethering the lung (solid white arrows) to the parietal pleura. Adhesions most frequently result from prior infection or blood in the pleural space.
A B
• When the patient lies directly on the radiographic cas-sette (as for a portable supine radiograph), a fold of the patient’s skin may become trapped between the patient’s back and the surface of the cassette.
• This can produce an edge in the expected position of the visceral pleural line which may, in fact, parallel the
chest wall just as you would expect the visceral pleural line in a pneumothorax (Fig. 8-7).• Solution: Unlike the thin, white line of the visceral
pleura, skin folds produce a relatively thick, white band of density.
Pitfall 3: Mistaking the medial border of the scapula for a pneumothorax.
• Ordinarily, the patient is positioned for an upright frontal chest radiograph in such a way that the scapulae are
Recognizing Pneumothorax, Pneumomediastinum, Pneumopericardium, and Subcutaneous Emphysema | 61
Figure 8-4 Deep sulcus sign. In the supine position, air in a relatively large pneumothorax may collect anteriorly and inferiorly in the thorax and mani-fest itself by displacing the costophrenic sulcus inferiorly while, at the same time, producing increased lucency of that sulcus (solid black arrow). This is called the deep sulcus sign and is an indication of a pneumothorax on a supine radiograph. Notice how much lower the left costophrenic sulcus appears than the right sulcus (solid white arrow).
Figure 8-5 Bullous disease, right upper lobe. A thin, white line is visible on this close-up of the right upper lobe (solid white arrows) and no lung markings are seen peripheral to it. Unlike the visceral pleural line of a pneumothorax, this white line is convex away from the chest wall and does not parallel the curve of the chest wall. This is the classical appearance of a bulla in a patient with emphysema. It is important to differentiate between a pneumothorax and a bulla because inadvertently placing a chest tube into a bulla will almost always produce a pneumothorax which may be difficult to re-expand. The walls of several bullae are visible in this patient (dotted white arrows). On rare occasions, the bullae can grow so large as to render the hemithorax seemingly devoid of visible lung tissue (vanishing lung syndrome).
Box 8-1 Recognizing a Pneumothorax—Signs to Look For
Visualization of the visceral pleural line—a must for the diagnosis
Convex curve of the visceral pleural line paralleling the contour of the chest wall
Absence of lung markings distal to the visceral pleural line (most times)
The deep sulcus sign of an inferiorly displaced costophrenic angle seen on a supine chest
The presence of an air-fluid interface in the pleural space
Figure 8-6 Bullous disease on right; pneumothorax on left. This axial section from a chest CT demonstrates the different appearances of bullous disease, seen on the right with its border convex away from the chest wall (dotted white arrow), and a pneumothorax seen here on the left with its border convex toward and paralleling the chest wall (solid white arrow). This patient also has subcutaneous emphysema on the left (solid black arrow).
retracted lateral to the outer margin of the rib cage, thus preventing the medial borders of the scapulae from over-lapping the lung fields.
• With supine radiographs, the medial borders of the scapulae may superimpose on the upper lobes and mimic the visceral pleural line of a pneumothorax (Fig. 8-8).• Solution: Before you diagnose a pneumothorax
because you think you see the visceral pleural line, make sure you can trace the outlines of the scapula on the side in question and identify its medial border as being separate from the suspected pneumothorax.
TYPES OF PNEUMOTHORACES! Pneumothoraces can be categorized as primary, i.e., occur-
ring in what appears to have been normal lung (spontane-ous pneumothorax being an example), or secondary, i.e., those that occur in diseased lung (as in emphysema).
! They have also been classified based on the presence or absence of a “shift” of the mobile mediastinal structures, like the heart and trachea.
• Simple pneumothorax: the mediastinal structures usually do not shift (Fig. 8-9).
• Tension pneumothorax: the mediastinal structures often shift away from the side of the pneumothorax associated with cardiopulmonary compromise (Fig. 8-10).
62 | Recognizing Pneumothorax, Pneumomediastinum, Pneumopericardium, and Subcutaneous Emphysema
• Progressive loss of air into the pleural space through a one-way, check-valve mechanism may cause a shift of the heart and mediastinal structures away from the side of the pneumothorax. The air may be entering through a rent in the parietal pleura, visceral pleura, or from the tracheobronchial tree.
• The continuously increasing intrathoracic pressure may lead to cardiopulmonary compromise by impairing venous return to the heart.
• Besides a shift of the mobile mediastinal structures away from the side of the pneumothorax, there may be inversion of the hemidiaphragm (especially on the left side) and flattening of the heart contour on the side under tension.
! Tension pneumothoraces are associated with a shift of the mediastinal structures away from the side of the pneu-mothorax; simple pneumothoraces are not associated with any shift. The heart or mediastinal structures never shift toward the side of a pneumothorax.
! The question “How large is the pneumothorax?” is common but the actual issue is “Does this patient require a chest tube to drain the pneumothorax?” Box 8-2 sum-marizes the answer.
CAUSES OF A PNEUMOTHORAX! Spontaneous
• Spontaneous pneumothoraces are common and often develop from rupture of an apical, subpleural bleb or bulla. They characteristically occur in tall, thin males between 20 and 40 years of age.
Figure 8-7 Skin fold mimicking a pneumothorax. When patients lie directly on the radiographic cassette as they might for a portable, supine radiograph, a fold of the patient’s skin may become trapped between the patient’s back and the surface of the cassette. This can produce an edge (dotted white arrow) in the expected position of a pneumothorax, and that edge may parallel the chest wall just as you would expect a pneumothorax to do (A). Unlike the thin, white line of the visceral pleura in a different patient with a pneumothorax (solid white arrow—in B), skin folds produce relatively thick, white bands of density. A skin fold is an edge; the visceral pleura produces a line.
A B
! Traumatic• The most common cause of a pneumothorax, either
accidental or iatrogenic• Through the chest wall, e.g., stab wound• Internal, e.g., rupture of a bronchus from a motor
vehicle collision• Iatrogenic, e.g., following transbronchial biopsy
! Diseases that decrease lung compliance• Chronic fibrotic diseases, e.g., eosinophilic granuloma
! Diseases that stiffen the lung, e.g., hyaline membrane disease in infants
! Rupture of an alveolus or bronchiole, e.g., asthma
OTHER WAYS TO DIAGNOSE A PNEUMOTHORAX! CT of the chest
• CT of the chest has essentially replaced expiratory and decubitus views of the chest if there is a strong clinical suspicion of a pneumothorax that is not demonstrated on conventional radiographs (Fig. 8-11).
• CT is able to detect extremely small amounts of air in the pleural space.
! Expiratory chest x-rays• Based on the theory that the volume of air in the lung
will normally decrease on expiration, but the size of a pneumothorax will not, small pneumothoraces not visible on an inspiratory radiograph may become visible on a radiograph exposed in full expiration. Routine expiratory views are no longer recommended for the detection of pneumothoraces.
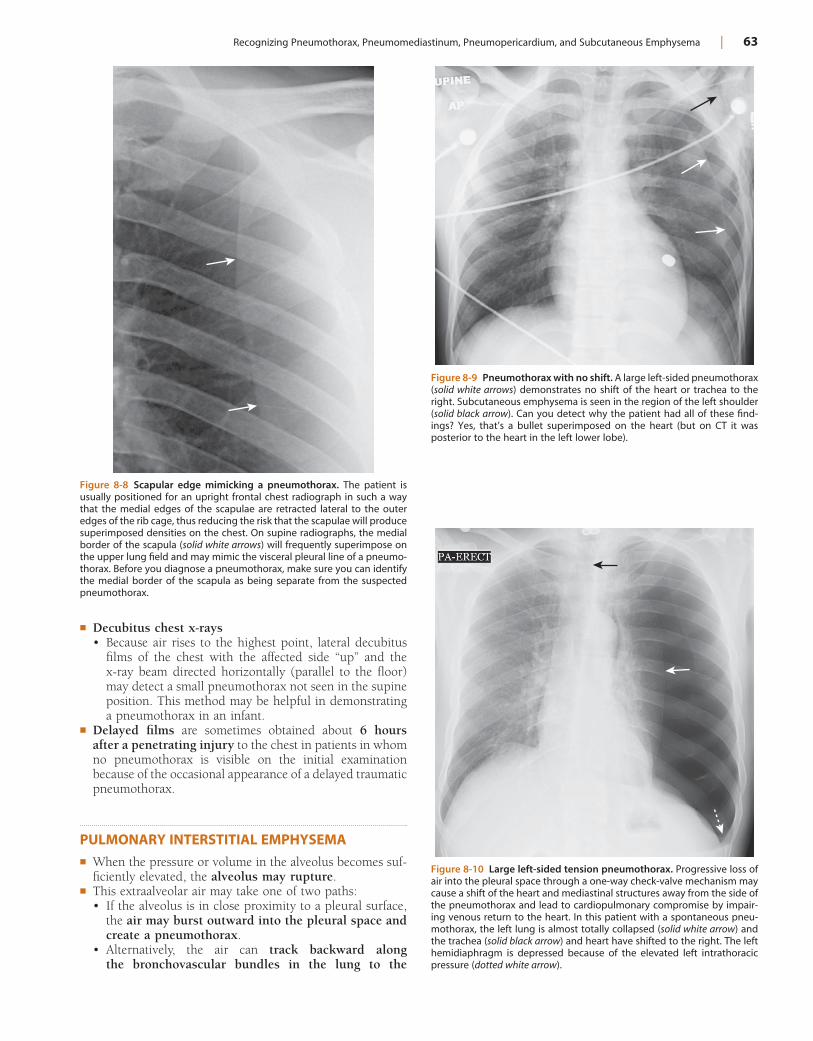
Recognizing Pneumothorax, Pneumomediastinum, Pneumopericardium, and Subcutaneous Emphysema | 63
Figure 8-8 Scapular edge mimicking a pneumothorax. The patient is usually positioned for an upright frontal chest radiograph in such a way that the medial edges of the scapulae are retracted lateral to the outer edges of the rib cage, thus reducing the risk that the scapulae will produce superimposed densities on the chest. On supine radiographs, the medial border of the scapula (solid white arrows) will frequently superimpose on the upper lung field and may mimic the visceral pleural line of a pneumo-thorax. Before you diagnose a pneumothorax, make sure you can identify the medial border of the scapula as being separate from the suspected pneumothorax.
Figure 8-9 Pneumothorax with no shift. A large left-sided pneumothorax (solid white arrows) demonstrates no shift of the heart or trachea to the right. Subcutaneous emphysema is seen in the region of the left shoulder (solid black arrow). Can you detect why the patient had all of these find-ings? Yes, that’s a bullet superimposed on the heart (but on CT it was posterior to the heart in the left lower lobe).
Figure 8-10 Large left-sided tension pneumothorax. Progressive loss of air into the pleural space through a one-way check-valve mechanism may cause a shift of the heart and mediastinal structures away from the side of the pneumothorax and lead to cardiopulmonary compromise by impair-ing venous return to the heart. In this patient with a spontaneous pneu-mothorax, the left lung is almost totally collapsed (solid white arrow) and the trachea (solid black arrow) and heart have shifted to the right. The left hemidiaphragm is depressed because of the elevated left intrathoracic pressure (dotted white arrow).
! Decubitus chest x-rays• Because air rises to the highest point, lateral decubitus
films of the chest with the affected side “up” and the x-ray beam directed horizontally (parallel to the floor) may detect a small pneumothorax not seen in the supine position. This method may be helpful in demonstrating a pneumothorax in an infant.
! Delayed films are sometimes obtained about 6 hours after a penetrating injury to the chest in patients in whom no pneumothorax is visible on the initial examination because of the occasional appearance of a delayed traumatic pneumothorax.
PULMONARY INTERSTITIAL EMPHYSEMA! When the pressure or volume in the alveolus becomes suf-
ficiently elevated, the alveolus may rupture.! This extraalveolar air may take one of two paths:
• If the alveolus is in close proximity to a pleural surface, the air may burst outward into the pleural space and create a pneumothorax.
• Alternatively, the air can track backward along the bronchovascular bundles in the lung to the
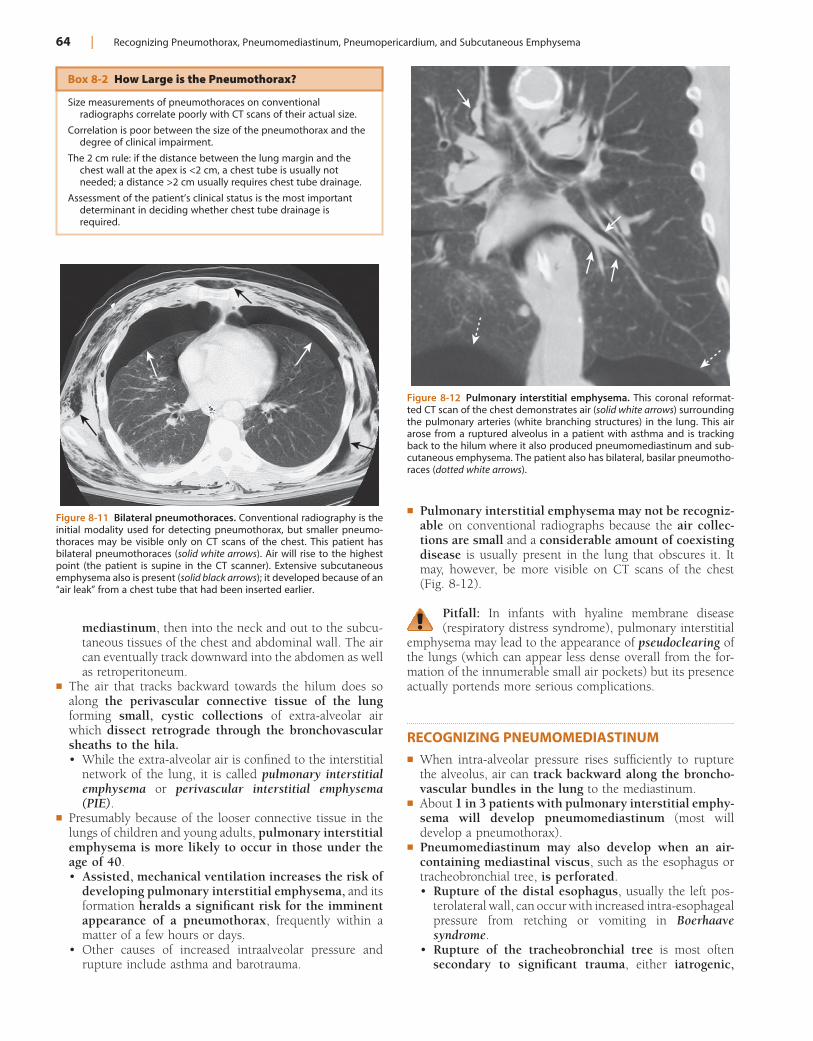
64 | Recognizing Pneumothorax, Pneumomediastinum, Pneumopericardium, and Subcutaneous Emphysema
! Pulmonary interstitial emphysema may not be recogniz-able on conventional radiographs because the air collec-tions are small and a considerable amount of coexisting disease is usually present in the lung that obscures it. It may, however, be more visible on CT scans of the chest (Fig. 8-12).
Pitfall: In infants with hyaline membrane disease (respiratory distress syndrome), pulmonary interstitial
emphysema may lead to the appearance of pseudoclearing of the lungs (which can appear less dense overall from the for-mation of the innumerable small air pockets) but its presence actually portends more serious complications.
RECOGNIZING PNEUMOMEDIASTINUM! When intra-alveolar pressure rises sufficiently to rupture
the alveolus, air can track backward along the broncho-vascular bundles in the lung to the mediastinum.
! About 1 in 3 patients with pulmonary interstitial emphy-sema will develop pneumomediastinum (most will develop a pneumothorax).
! Pneumomediastinum may also develop when an air-containing mediastinal viscus, such as the esophagus or tracheobronchial tree, is perforated.• Rupture of the distal esophagus, usually the left pos-
terolateral wall, can occur with increased intra-esophageal pressure from retching or vomiting in Boerhaave syndrome.
• Rupture of the tracheobronchial tree is most often secondary to significant trauma, either iatrogenic,
mediastinum, then into the neck and out to the subcu-taneous tissues of the chest and abdominal wall. The air can eventually track downward into the abdomen as well as retroperitoneum.
! The air that tracks backward towards the hilum does so along the perivascular connective tissue of the lung forming small, cystic collections of extra-alveolar air which dissect retrograde through the bronchovascular sheaths to the hila.• While the extra-alveolar air is confined to the interstitial
network of the lung, it is called pulmonary interstitial emphysema or perivascular interstitial emphysema (PIE).
! Presumably because of the looser connective tissue in the lungs of children and young adults, pulmonary interstitial emphysema is more likely to occur in those under the age of 40.• Assisted, mechanical ventilation increases the risk of
developing pulmonary interstitial emphysema, and its formation heralds a significant risk for the imminent appearance of a pneumothorax, frequently within a matter of a few hours or days.
• Other causes of increased intraalveolar pressure and rupture include asthma and barotrauma.
Figure 8-11 Bilateral pneumothoraces. Conventional radiography is the initial modality used for detecting pneumothorax, but smaller pneumo-thoraces may be visible only on CT scans of the chest. This patient has bilateral pneumothoraces (solid white arrows). Air will rise to the highest point (the patient is supine in the CT scanner). Extensive subcutaneous emphysema also is present (solid black arrows); it developed because of an “air leak” from a chest tube that had been inserted earlier.
Figure 8-12 Pulmonary interstitial emphysema. This coronal reformat-ted CT scan of the chest demonstrates air (solid white arrows) surrounding the pulmonary arteries (white branching structures) in the lung. This air arose from a ruptured alveolus in a patient with asthma and is tracking back to the hilum where it also produced pneumomediastinum and sub-cutaneous emphysema. The patient also has bilateral, basilar pneumotho-races (dotted white arrows).
Box 8-2 How Large is the Pneumothorax?
Size measurements of pneumothoraces on conventional radiographs correlate poorly with CT scans of their actual size.
Correlation is poor between the size of the pneumothorax and the degree of clinical impairment.
The 2 cm rule: if the distance between the lung margin and the chest wall at the apex is <2 cm, a chest tube is usually not needed; a distance >2 cm usually requires chest tube drainage.
Assessment of the patient’s clinical status is the most important determinant in deciding whether chest tube drainage is required.
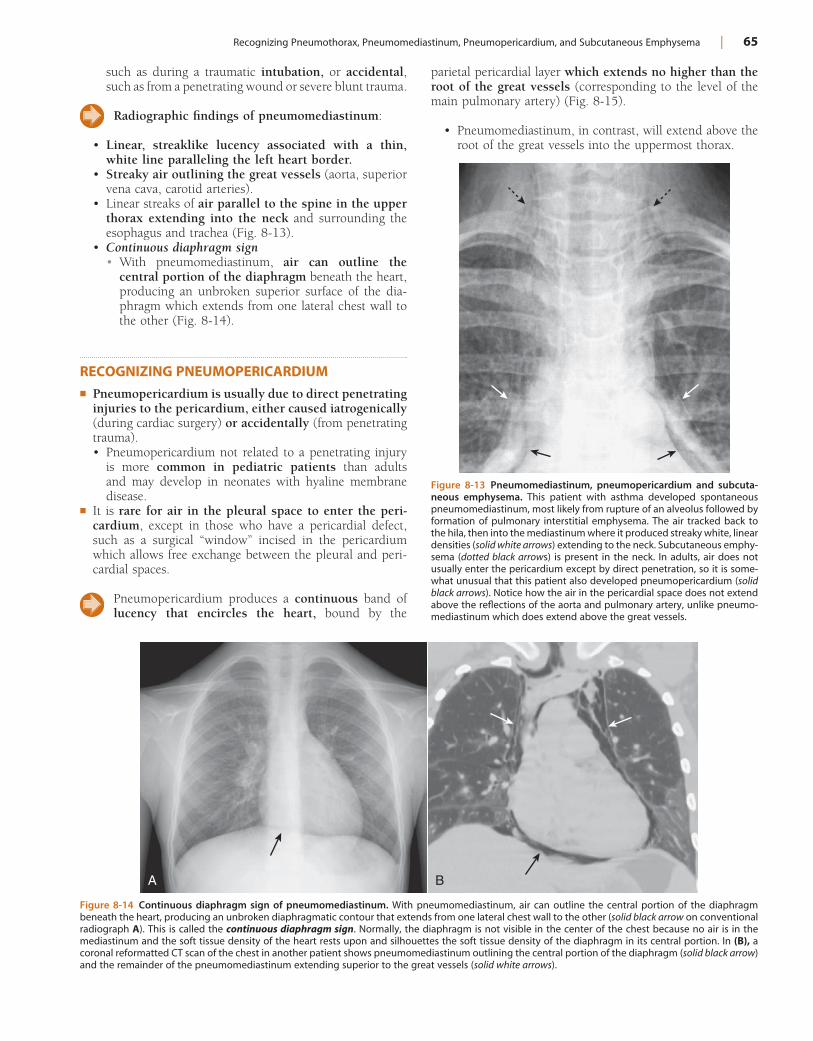
Recognizing Pneumothorax, Pneumomediastinum, Pneumopericardium, and Subcutaneous Emphysema | 65
Figure 8-13 Pneumomediastinum, pneumopericardium and subcuta-neous emphysema. This patient with asthma developed spontaneous pneumomediastinum, most likely from rupture of an alveolus followed by formation of pulmonary interstitial emphysema. The air tracked back to the hila, then into the mediastinum where it produced streaky white, linear densities (solid white arrows) extending to the neck. Subcutaneous emphy-sema (dotted black arrows) is present in the neck. In adults, air does not usually enter the pericardium except by direct penetration, so it is some-what unusual that this patient also developed pneumopericardium (solid black arrows). Notice how the air in the pericardial space does not extend above the reflections of the aorta and pulmonary artery, unlike pneumo-mediastinum which does extend above the great vessels.
Figure 8-14 Continuous diaphragm sign of pneumomediastinum. With pneumomediastinum, air can outline the central portion of the diaphragm beneath the heart, producing an unbroken diaphragmatic contour that extends from one lateral chest wall to the other (solid black arrow on conventional radiograph A). This is called the continuous diaphragm sign. Normally, the diaphragm is not visible in the center of the chest because no air is in the mediastinum and the soft tissue density of the heart rests upon and silhouettes the soft tissue density of the diaphragm in its central portion. In (B), a coronal reformatted CT scan of the chest in another patient shows pneumomediastinum outlining the central portion of the diaphragm (solid black arrow) and the remainder of the pneumomediastinum extending superior to the great vessels (solid white arrows).
A B
such as during a traumatic intubation, or accidental, such as from a penetrating wound or severe blunt trauma.
Radiographic findings of pneumomediastinum:
• Linear, streaklike lucency associated with a thin, white line paralleling the left heart border.
• Streaky air outlining the great vessels (aorta, superior vena cava, carotid arteries).
• Linear streaks of air parallel to the spine in the upper thorax extending into the neck and surrounding the esophagus and trachea (Fig. 8-13).
• Continuous diaphragm sign• With pneumomediastinum, air can outline the
central portion of the diaphragm beneath the heart, producing an unbroken superior surface of the dia-phragm which extends from one lateral chest wall to the other (Fig. 8-14).
RECOGNIZING PNEUMOPERICARDIUM! Pneumopericardium is usually due to direct penetrating
injuries to the pericardium, either caused iatrogenically (during cardiac surgery) or accidentally (from penetrating trauma).• Pneumopericardium not related to a penetrating injury
is more common in pediatric patients than adults and may develop in neonates with hyaline membrane disease.
! It is rare for air in the pleural space to enter the peri-cardium, except in those who have a pericardial defect, such as a surgical “window” incised in the pericardium which allows free exchange between the pleural and peri-cardial spaces.
Pneumopericardium produces a continuous band of lucency that encircles the heart, bound by the
parietal pericardial layer which extends no higher than the root of the great vessels (corresponding to the level of the main pulmonary artery) (Fig. 8-15).
• Pneumomediastinum, in contrast, will extend above the root of the great vessels into the uppermost thorax.
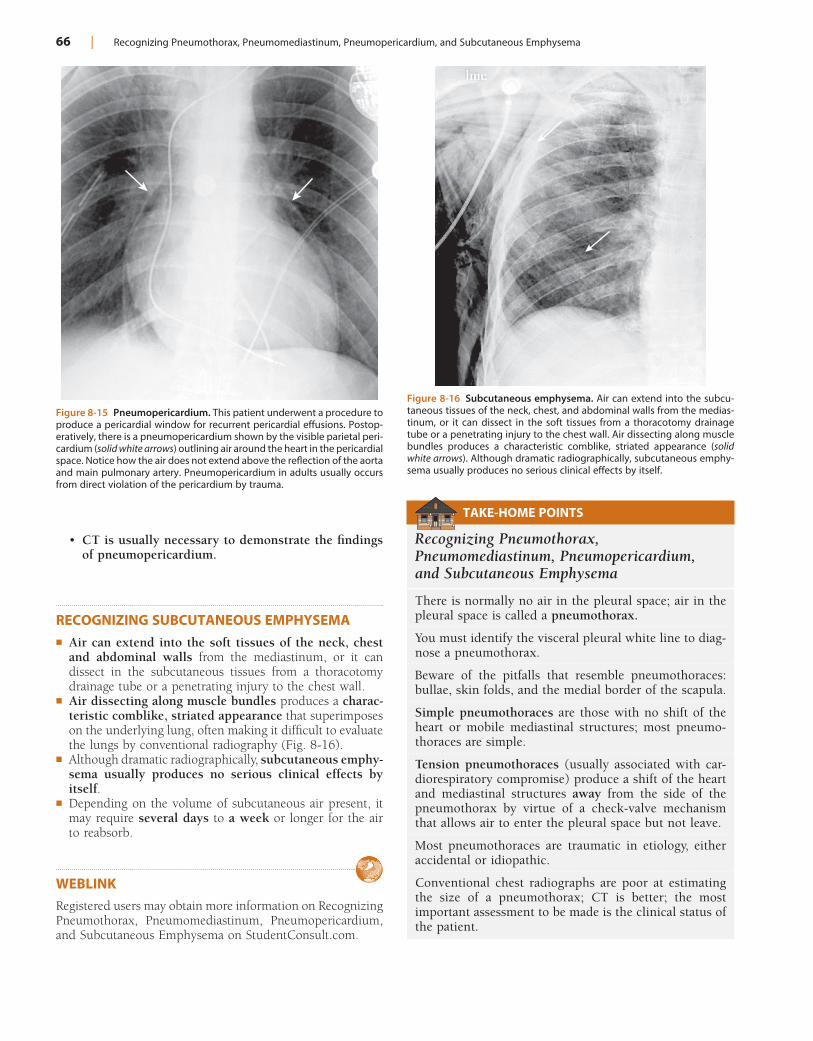
66 | Recognizing Pneumothorax, Pneumomediastinum, Pneumopericardium, and Subcutaneous Emphysema
• CT is usually necessary to demonstrate the findings of pneumopericardium.
RECOGNIZING SUBCUTANEOUS EMPHYSEMA! Air can extend into the soft tissues of the neck, chest
and abdominal walls from the mediastinum, or it can dissect in the subcutaneous tissues from a thoracotomy drainage tube or a penetrating injury to the chest wall.
! Air dissecting along muscle bundles produces a charac-teristic comblike, striated appearance that superimposes on the underlying lung, often making it difficult to evaluate the lungs by conventional radiography (Fig. 8-16).
! Although dramatic radiographically, subcutaneous emphy-sema usually produces no serious clinical effects by itself.
! Depending on the volume of subcutaneous air present, it may require several days to a week or longer for the air to reabsorb.
WEBLINKRegistered users may obtain more information on Recognizing Pneumothorax, Pneu momediastinum, Pneumopericardium, and Subcutaneous Emphysema on StudentConsult.com.
Figure 8-15 Pneumopericardium. This patient underwent a procedure to produce a pericardial window for recurrent pericardial effusions. Postop-eratively, there is a pneumopericardium shown by the visible parietal peri-cardium (solid white arrows) outlining air around the heart in the pericardial space. Notice how the air does not extend above the reflection of the aorta and main pulmonary artery. Pneumopericardium in adults usually occurs from direct violation of the pericardium by trauma.
Figure 8-16 Subcutaneous emphysema. Air can extend into the subcu-taneous tissues of the neck, chest, and abdominal walls from the medias-tinum, or it can dissect in the soft tissues from a thoracotomy drainage tube or a penetrating injury to the chest wall. Air dissecting along muscle bundles produces a characteristic comblike, striated appearance (solid white arrows). Although dramatic radiographically, subcutaneous emphy-sema usually produces no serious clinical effects by itself.
TAKE-HOME POINTS
Recognizing Pneumothorax, Pneumomediastinum, Pneumopericardium, and Subcutaneous Emphysema
There is normally no air in the pleural space; air in the pleural space is called a pneumothorax.
You must identify the visceral pleural white line to diag-nose a pneumothorax.
Beware of the pitfalls that resemble pneumothoraces: bullae, skin folds, and the medial border of the scapula.
Simple pneumothoraces are those with no shift of the heart or mobile mediastinal structures; most pneumo-thoraces are simple.
Tension pneumothoraces (usually associated with car-diorespiratory compromise) produce a shift of the heart and mediastinal structures away from the side of the pneumothorax by virtue of a check-valve mechanism that allows air to enter the pleural space but not leave.
Most pneumothoraces are traumatic in etiology, either accidental or idiopathic.
Conventional chest radiographs are poor at estimating the size of a pneumothorax; CT is better; the most important assessment to be made is the clinical status of the patient.
Recognizing Pneumothorax, Pneumomediastinum, Pneumopericardium, and Subcutaneous Emphysema | 67
Besides the conventional upright chest radiograph, other ways to diagnose a pneumothorax include: expiratory exposures, decubitus views, and delayed images. CT remains the most sensitive test for detecting small pneumothoraces.
Spontaneous pneumothoraces most often occur as a result of rupture of a small apical, sub-pleural bleb; they most often occur in younger men.
Pulmonary interstitial emphysema results from an increase in the intralveolar pressure that leads to rupture of an alveolus and dissection of air back towards the hila along the bronchovascular bundles; it is frequently dif-ficult to visualize.
Pneumomediastinum can occur when air tracks back to the mediastinum from a ruptured alveolus or from
perforation of an air-containing viscus such as the esoph-agus or trachea; it can produce the continuous diaphragm sign on a frontal chest radiograph.
Pneumopericardium usually is due to direct penetration of the pericardium rather than dissection of air from a pneumomediastinum; it can be difficult to differentiate from a pneumomediastinum. A key is that pneumoperi-cardium does not extend above the roots of the great vessels, whereas pneumomediastinum does.
Air dissecting into the neck and chest wall can produce subcutaneous emphysema, which, because of its super-imposition on the lungs, can make evaluation of the underlying lung more difficult. By itself, it is usually of no clinical significance and usually clears in a few days, depending on its volume.
68
Chapter 9
Recognizing Adult Heart Disease
We’ll begin with an assessment of heart size, then describe the normal and abnormal contours of the heart on the frontal radiograph, and finally illustrate some imaging findings in common cardiac diseases.
RECOGNIZING AN ENLARGED CARDIAC SILHOUETTE! The cardiac silhouette can appear enlarged for three main
reasons:• The heart is enlarged (cardiomegaly).• A pericardial effusion mimics the appearance of cardio-
megaly on conventional radiographs.• An extracardiac factor produces apparent cardiac
enlargement.
You can estimate the size of the cardiac silhouette on the frontal chest radiograph using the cardiothoracic
ratio, which is a measurement of the widest transverse diameter of the heart compared to the widest internal diameter of the rib cage (from inside of rib to inside of rib at the level of the diaphragm) (Fig. 9-1).
! In most normal adults at full inspiration, the cardiothoracic ratio is less than 50%. That is, the size of the heart is usually less than half of the internal diameter of the thoracic rib cage.
PERICARDIAL EFFUSION! Normally, there are 15-50 mL of fluid in the pericardial
space between the parietal and visceral pericardial layers.
! Abnormal accumulations of fluid begin in the dependent portions of the pericardial space, which, in the supine position, is posterior to the left ventricle (Fig. 9-2A).
! As the pericardial effusion increases in size, it tends to accumulate more along the right heart border until it fills the pericardial space and encircles the heart (Fig. 9-2B).
! CT scans can demonstrate small pericardial effusions, although pericardial ultrasonography is usually the imaging study of first choice. Conventional radiographs are poor at defining a pericardial effusion.
! Some of the causes of pericardial effusions are outlined in Box 9-1.
EXTRACARDIAC CAUSES OF APPARENT CARDIAC ENLARGEMENT
Although the cardiothoracic ratio provides a handy way of assessing heart size, it does have its pitfalls.
! Sometimes, there is an extracardiac cause of apparent cardiac enlargement that may cause the cardiothoracic ratio to appear greater than 50%, while the heart itself may actually be normal in size.
! The extracardiac causes of apparent cardiomegaly are out-lined in Table 9-1. Magnification of the heart produced by projection, usually on a supine, portable chest examination, is the most common cause of apparent cardiomegaly.
EFFECT OF PROJECTION ON PERCEPTION OF HEART SIZE! Because the heart resides anteriorly in the chest, on a
posteroanterior (PA) chest radiograph (the standard frontal chest study in which the x-ray beam enters posteri-orly and exits anteriorly where the imaging cassette is posi-tioned), the heart appears truer to its actual size because it is nearer the imaging surface.
! On an anteroposterior (AP) chest radiograph (the usual bedside, portable chest radiograph in which the x-ray beam enters anteriorly and exits posteriorly where the cassette is positioned), the heart is slightly magnified because it is farther from the imaging surface.
! Therefore, the heart will appear slightly larger on an AP chest radiograph like a portable chest radiograph than will the same heart on a PA chest radiograph (see Fig. 2-17).
IDENTIFYING CARDIAC ENLARGEMENT ON AN ANTEROPOSTERIOR CHEST RADIOGRAPH! So is it possible to estimate the size of the heart on a por-
table chest radiograph? Glad you asked, because the answer is “yes.”
! If the left heart border is touching the left lateral chest wall, the heart is enlarged.
! If the left heart border is very close to the left chest wall, the heart is probably enlarged.
! If the heart is borderline enlarged on a portable AP radiograph, it is probably normal in size (Table 9-2).
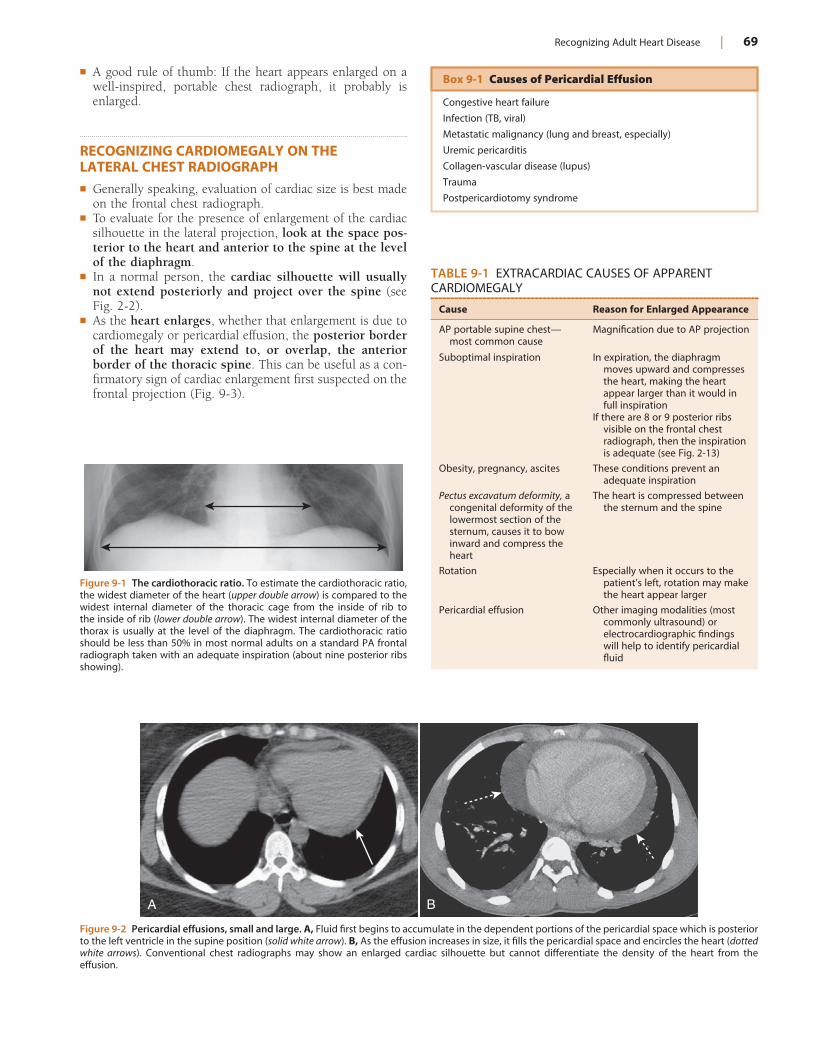
Recognizing Adult Heart Disease | 69
Figure 9-1 The cardiothoracic ratio. To estimate the cardiothoracic ratio, the widest diameter of the heart (upper double arrow) is compared to the widest internal diameter of the thoracic cage from the inside of rib to the inside of rib (lower double arrow). The widest internal diameter of the thorax is usually at the level of the diaphragm. The cardiothoracic ratio should be less than 50% in most normal adults on a standard PA frontal radiograph taken with an adequate inspiration (about nine posterior ribs showing).
Figure 9-2 Pericardial effusions, small and large. A, Fluid first begins to accumulate in the dependent portions of the pericardial space which is posterior to the left ventricle in the supine position (solid white arrow). B, As the effusion increases in size, it fills the pericardial space and encircles the heart (dotted white arrows). Conventional chest radiographs may show an enlarged cardiac silhouette but cannot differentiate the density of the heart from the effusion.
A B
TABLE 9-1 EXTRACARDIAC CAUSES OF APPARENT CARDIOMEGALY
Cause Reason for Enlarged Appearance
AP portable supine chest—most common cause
Magnification due to AP projection
Suboptimal inspiration In expiration, the diaphragm moves upward and compresses the heart, making the heart appear larger than it would in full inspiration
If there are 8 or 9 posterior ribs visible on the frontal chest radiograph, then the inspiration is adequate (see Fig. 2-13)
Obesity, pregnancy, ascites These conditions prevent an adequate inspiration
Pectus excavatum deformity, a congenital deformity of the lowermost section of the sternum, causes it to bow inward and compress the heart
The heart is compressed between the sternum and the spine
Rotation Especially when it occurs to the patient’s left, rotation may make the heart appear larger
Pericardial effusion Other imaging modalities (most commonly ultrasound) or electrocardiographic findings will help to identify pericardial fluid
Box 9-1 Causes of Pericardial Effusion
Congestive heart failure
Infection (TB, viral)
Metastatic malignancy (lung and breast, especially)
Uremic pericarditis
Collagen-vascular disease (lupus)
Trauma
Postpericardiotomy syndrome
! A good rule of thumb: If the heart appears enlarged on a well-inspired, portable chest radiograph, it probably is enlarged.
RECOGNIZING CARDIOMEGALY ON THE LATERAL CHEST RADIOGRAPH! Generally speaking, evaluation of cardiac size is best made
on the frontal chest radiograph.! To evaluate for the presence of enlargement of the cardiac
silhouette in the lateral projection, look at the space pos-terior to the heart and anterior to the spine at the level of the diaphragm.
! In a normal person, the cardiac silhouette will usually not extend posteriorly and project over the spine (see Fig. 2-2).
! As the heart enlarges, whether that enlargement is due to cardiomegaly or pericardial effusion, the posterior border of the heart may extend to, or overlap, the anterior border of the thoracic spine. This can be useful as a con-firmatory sign of cardiac enlargement first suspected on the frontal projection (Fig. 9-3).
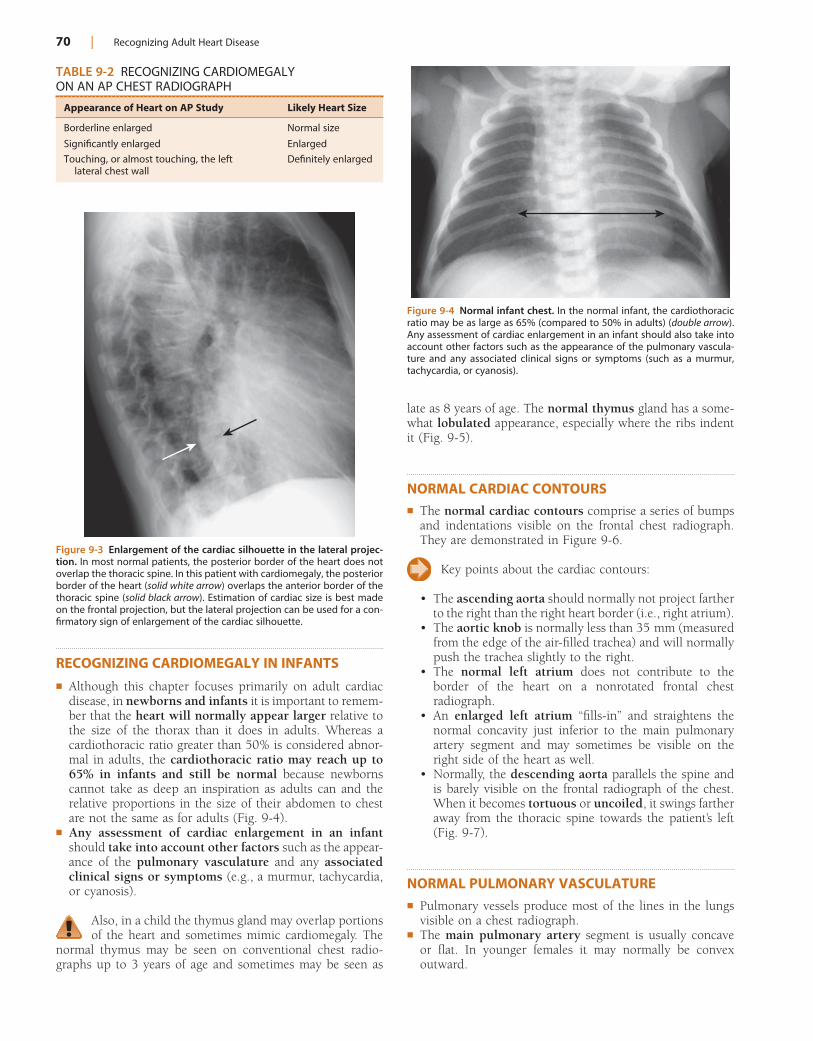
70 | Recognizing Adult Heart Disease
TABLE 9-2 RECOGNIZING CARDIOMEGALY ON AN AP CHEST RADIOGRAPH
Appearance of Heart on AP Study Likely Heart Size
Borderline enlarged Normal size
Significantly enlarged Enlarged
Touching, or almost touching, the left lateral chest wall
Definitely enlarged
Figure 9-3 Enlargement of the cardiac silhouette in the lateral projec-tion. In most normal patients, the posterior border of the heart does not overlap the thoracic spine. In this patient with cardiomegaly, the posterior border of the heart (solid white arrow) overlaps the anterior border of the thoracic spine (solid black arrow). Estimation of cardiac size is best made on the frontal projection, but the lateral projection can be used for a con-firmatory sign of enlargement of the cardiac silhouette.
Figure 9-4 Normal infant chest. In the normal infant, the cardiothoracic ratio may be as large as 65% (compared to 50% in adults) (double arrow). Any assessment of cardiac enlargement in an infant should also take into account other factors such as the appearance of the pulmonary vascula-ture and any associated clinical signs or symptoms (such as a murmur, tachycardia, or cyanosis).
RECOGNIZING CARDIOMEGALY IN INFANTS! Although this chapter focuses primarily on adult cardiac
disease, in newborns and infants it is important to remem-ber that the heart will normally appear larger relative to the size of the thorax than it does in adults. Whereas a cardiothoracic ratio greater than 50% is considered abnor-mal in adults, the cardiothoracic ratio may reach up to 65% in infants and still be normal because newborns cannot take as deep an inspiration as adults can and the relative proportions in the size of their abdomen to chest are not the same as for adults (Fig. 9-4).
! Any assessment of cardiac enlargement in an infant should take into account other factors such as the appear-ance of the pulmonary vasculature and any associated clinical signs or symptoms (e.g., a murmur, tachycardia, or cyanosis).
Also, in a child the thymus gland may overlap portions of the heart and sometimes mimic cardiomegaly. The
normal thymus may be seen on conventional chest radio-graphs up to 3 years of age and sometimes may be seen as
late as 8 years of age. The normal thymus gland has a some-what lobulated appearance, especially where the ribs indent it (Fig. 9-5).
NORMAL CARDIAC CONTOURS! The normal cardiac contours comprise a series of bumps
and indentations visible on the frontal chest radiograph. They are demonstrated in Figure 9-6.
Key points about the cardiac contours:
• The ascending aorta should normally not project farther to the right than the right heart border (i.e., right atrium).
• The aortic knob is normally less than 35 mm (measured from the edge of the air-filled trachea) and will normally push the trachea slightly to the right.
• The normal left atrium does not contribute to the border of the heart on a nonrotated frontal chest radiograph.
• An enlarged left atrium “fills-in” and straightens the normal concavity just inferior to the main pulmonary artery segment and may sometimes be visible on the right side of the heart as well.
• Normally, the descending aorta parallels the spine and is barely visible on the frontal radiograph of the chest. When it becomes tortuous or uncoiled, it swings farther away from the thoracic spine towards the patient’s left (Fig. 9-7).
NORMAL PULMONARY VASCULATURE! Pulmonary vessels produce most of the lines in the lungs
visible on a chest radiograph.! The main pulmonary artery segment is usually concave
or flat. In younger females it may normally be convex outward.
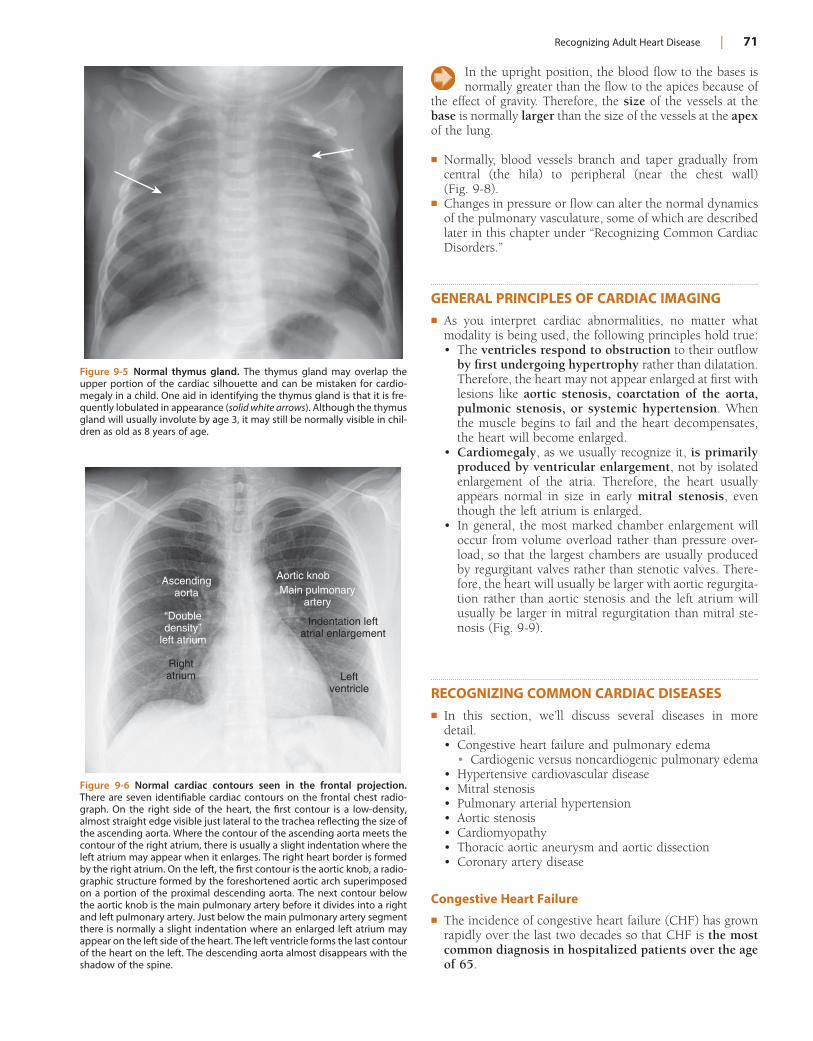
Recognizing Adult Heart Disease | 71
Figure 9-5 Normal thymus gland. The thymus gland may overlap the upper portion of the cardiac silhouette and can be mistaken for cardio-megaly in a child. One aid in identifying the thymus gland is that it is fre-quently lobulated in appearance (solid white arrows). Although the thymus gland will usually involute by age 3, it may still be normally visible in chil-dren as old as 8 years of age.
Figure 9-6 Normal cardiac contours seen in the frontal projection. There are seven identifiable cardiac contours on the frontal chest radio-graph. On the right side of the heart, the first contour is a low-density, almost straight edge visible just lateral to the trachea reflecting the size of the ascending aorta. Where the contour of the ascending aorta meets the contour of the right atrium, there is usually a slight indentation where the left atrium may appear when it enlarges. The right heart border is formed by the right atrium. On the left, the first contour is the aortic knob, a radio-graphic structure formed by the foreshortened aortic arch superimposed on a portion of the proximal descending aorta. The next contour below the aortic knob is the main pulmonary artery before it divides into a right and left pulmonary artery. Just below the main pulmonary artery segment there is normally a slight indentation where an enlarged left atrium may appear on the left side of the heart. The left ventricle forms the last contour of the heart on the left. The descending aorta almost disappears with the shadow of the spine.
Ascendingaorta
“Doubledensity”
left atrium
Aortic knobMain pulmonary
artery
Indentation leftatrial enlargement
Leftventricle
Rightatrium
In the upright position, the blood flow to the bases is normally greater than the flow to the apices because of
the effect of gravity. Therefore, the size of the vessels at the base is normally larger than the size of the vessels at the apex of the lung.
! Normally, blood vessels branch and taper gradually from central (the hila) to peripheral (near the chest wall) (Fig. 9-8).
! Changes in pressure or flow can alter the normal dynamics of the pulmonary vasculature, some of which are described later in this chapter under “Recognizing Common Cardiac Disorders.”
GENERAL PRINCIPLES OF CARDIAC IMAGING! As you interpret cardiac abnormalities, no matter what
modality is being used, the following principles hold true:• The ventricles respond to obstruction to their outflow
by first undergoing hypertrophy rather than dilatation. Therefore, the heart may not appear enlarged at first with lesions like aortic stenosis, coarctation of the aorta, pulmonic stenosis, or systemic hypertension. When the muscle begins to fail and the heart decompensates, the heart will become enlarged.
• Cardiomegaly, as we usually recognize it, is primarily produced by ventricular enlargement, not by isolated enlargement of the atria. Therefore, the heart usually appears normal in size in early mitral stenosis, even though the left atrium is enlarged.
• In general, the most marked chamber enlargement will occur from volume overload rather than pressure over-load, so that the largest chambers are usually produced by regurgitant valves rather than stenotic valves. There-fore, the heart will usually be larger with aortic regurgita-tion rather than aortic stenosis and the left atrium will usually be larger in mitral regurgitation than mitral ste-nosis (Fig. 9-9).
RECOGNIZING COMMON CARDIAC DISEASES! In this section, we’ll discuss several diseases in more
detail.• Congestive heart failure and pulmonary edema
• Cardiogenic versus noncardiogenic pulmonary edema• Hypertensive cardiovascular disease• Mitral stenosis• Pulmonary arterial hypertension• Aortic stenosis• Cardiomyopathy• Thoracic aortic aneurysm and aortic dissection• Coronary artery disease
Congestive Heart Failure
! The incidence of congestive heart failure (CHF) has grown rapidly over the last two decades so that CHF is the most common diagnosis in hospitalized patients over the age of 65.
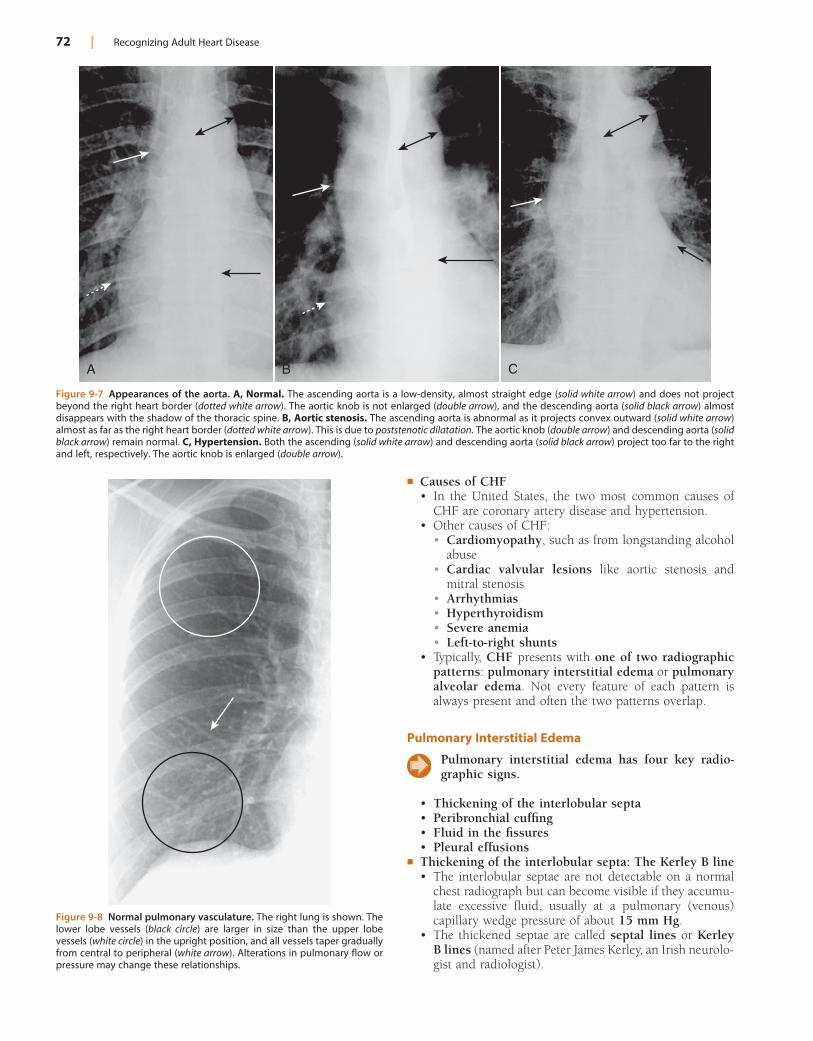
72 | Recognizing Adult Heart Disease
Figure 9-8 Normal pulmonary vasculature. The right lung is shown. The lower lobe vessels (black circle) are larger in size than the upper lobe vessels (white circle) in the upright position, and all vessels taper gradually from central to peripheral (white arrow). Alterations in pulmonary flow or pressure may change these relationships.
Figure 9-7 Appearances of the aorta. A, Normal. The ascending aorta is a low-density, almost straight edge (solid white arrow) and does not project beyond the right heart border (dotted white arrow). The aortic knob is not enlarged (double arrow), and the descending aorta (solid black arrow) almost disappears with the shadow of the thoracic spine. B, Aortic stenosis. The ascending aorta is abnormal as it projects convex outward (solid white arrow) almost as far as the right heart border (dotted white arrow). This is due to poststenotic dilatation. The aortic knob (double arrow) and descending aorta (solid black arrow) remain normal. C, Hypertension. Both the ascending (solid white arrow) and descending aorta (solid black arrow) project too far to the right and left, respectively. The aortic knob is enlarged (double arrow).
A B C
! Causes of CHF• In the United States, the two most common causes of
CHF are coronary artery disease and hypertension.• Other causes of CHF:
• Cardiomyopathy, such as from longstanding alcohol abuse
• Cardiac valvular lesions like aortic stenosis and mitral stenosis
• Arrhythmias• Hyperthyroidism• Severe anemia• Left-to-right shunts
• Typically, CHF presents with one of two radiographic patterns: pulmonary interstitial edema or pulmonary alveolar edema. Not every feature of each pattern is always present and often the two patterns overlap.
Pulmonary Interstitial Edema
Pulmonary interstitial edema has four key radio-graphic signs.
• Thickening of the interlobular septa• Peribronchial cuffing• Fluid in the fissures• Pleural effusions
! Thickening of the interlobular septa: The Kerley B line• The interlobular septae are not detectable on a normal
chest radiograph but can become visible if they accumu-late excessive fluid, usually at a pulmonary (venous) capillary wedge pressure of about 15 mm Hg.
• The thickened septae are called septal lines or Kerley B lines (named after Peter James Kerley, an Irish neurolo-gist and radiologist).
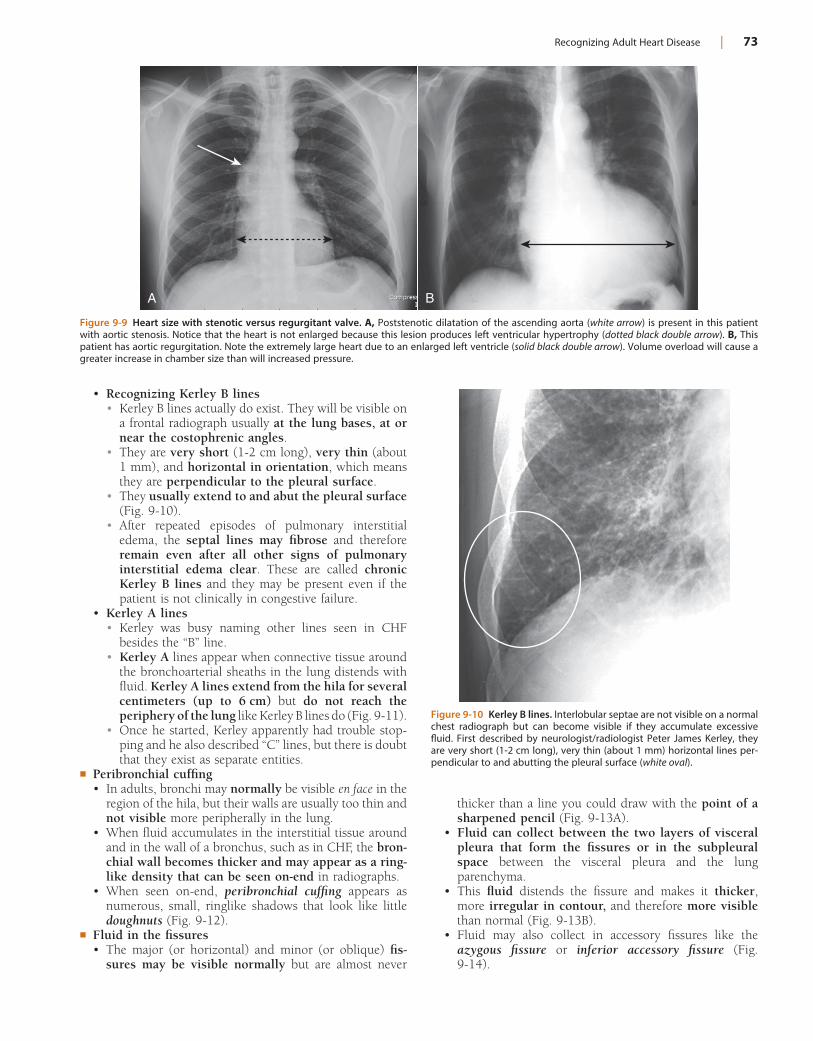
Recognizing Adult Heart Disease | 73
Figure 9-9 Heart size with stenotic versus regurgitant valve. A, Poststenotic dilatation of the ascending aorta (white arrow) is present in this patient with aortic stenosis. Notice that the heart is not enlarged because this lesion produces left ventricular hypertrophy (dotted black double arrow). B, This patient has aortic regurgitation. Note the extremely large heart due to an enlarged left ventricle (solid black double arrow). Volume overload will cause a greater increase in chamber size than will increased pressure.
A B
• Recognizing Kerley B lines• Kerley B lines actually do exist. They will be visible on
a frontal radiograph usually at the lung bases, at or near the costophrenic angles.
• They are very short (1-2 cm long), very thin (about 1 mm), and horizontal in orientation, which means they are perpendicular to the pleural surface.
• They usually extend to and abut the pleural surface (Fig. 9-10).
• After repeated episodes of pulmonary interstitial edema, the septal lines may fibrose and therefore remain even after all other signs of pulmonary interstitial edema clear. These are called chronic Kerley B lines and they may be present even if the patient is not clinically in congestive failure.
• Kerley A lines• Kerley was busy naming other lines seen in CHF
besides the “B” line.• Kerley A lines appear when connective tissue around
the bronchoarterial sheaths in the lung distends with fluid. Kerley A lines extend from the hila for several centimeters (up to 6 cm) but do not reach the periphery of the lung like Kerley B lines do (Fig. 9-11).
• Once he started, Kerley apparently had trouble stop-ping and he also described “C” lines, but there is doubt that they exist as separate entities.
! Peribronchial cuffing• In adults, bronchi may normally be visible en face in the
region of the hila, but their walls are usually too thin and not visible more peripherally in the lung.
• When fluid accumulates in the interstitial tissue around and in the wall of a bronchus, such as in CHF, the bron-chial wall becomes thicker and may appear as a ring-like density that can be seen on-end in radiographs.
• When seen on-end, peribronchial cuffing appears as numerous, small, ringlike shadows that look like little doughnuts (Fig. 9-12).
! Fluid in the fissures• The major (or horizontal) and minor (or oblique) fis-
sures may be visible normally but are almost never
Figure 9-10 Kerley B lines. Interlobular septae are not visible on a normal chest radiograph but can become visible if they accumulate excessive fluid. First described by neurologist/radiologist Peter James Kerley, they are very short (1-2 cm long), very thin (about 1 mm) horizontal lines per-pendicular to and abutting the pleural surface (white oval).
thicker than a line you could draw with the point of a sharpened pencil (Fig. 9-13A).
• Fluid can collect between the two layers of visceral pleura that form the fissures or in the subpleural space between the visceral pleura and the lung parenchyma.
• This fluid distends the fissure and makes it thicker, more irregular in contour, and therefore more visible than normal (Fig. 9-13B).
• Fluid may also collect in accessory fissures like the azygous fissure or inferior accessory fissure (Fig. 9-14).
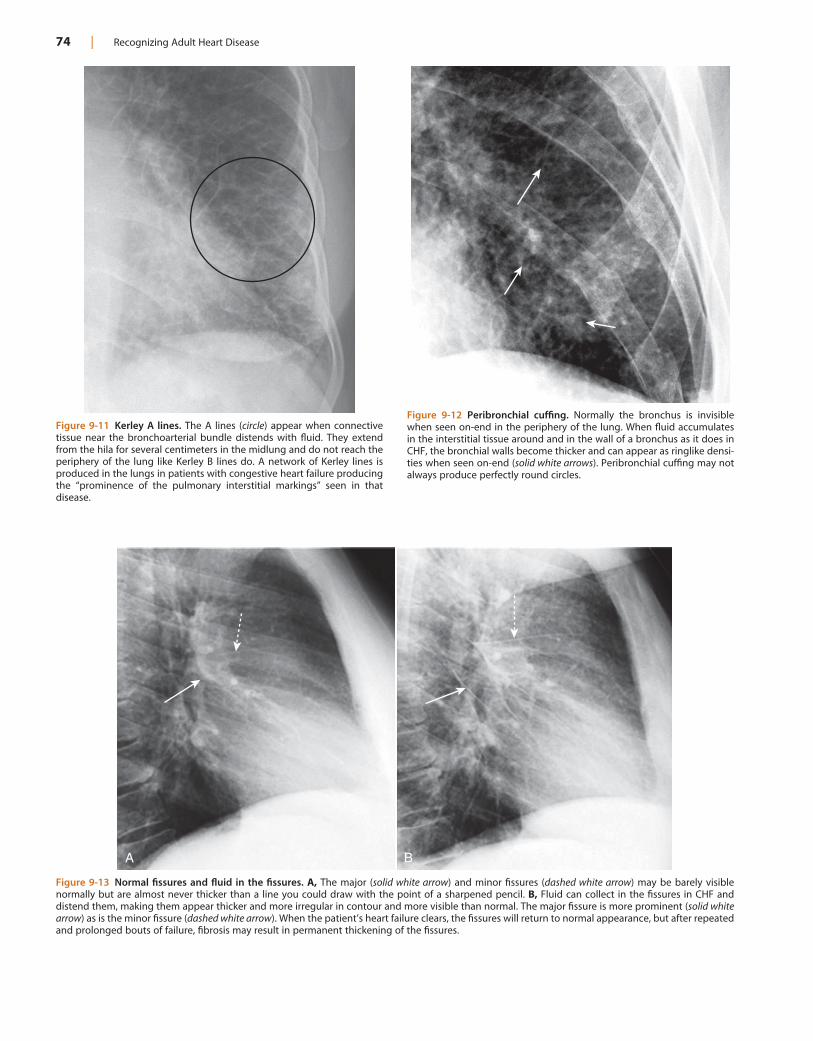
74 | Recognizing Adult Heart Disease
Figure 9-11 Kerley A lines. The A lines (circle) appear when connective tissue near the bronchoarterial bundle distends with fluid. They extend from the hila for several centimeters in the midlung and do not reach the periphery of the lung like Kerley B lines do. A network of Kerley lines is produced in the lungs in patients with congestive heart failure producing the “prominence of the pulmonary interstitial markings” seen in that disease.
Figure 9-12 Peribronchial cuffing. Normally the bronchus is invisible when seen on-end in the periphery of the lung. When fluid accumulates in the interstitial tissue around and in the wall of a bronchus as it does in CHF, the bronchial walls become thicker and can appear as ringlike densi-ties when seen on-end (solid white arrows). Peribronchial cuffing may not always produce perfectly round circles.
Figure 9-13 Normal fissures and fluid in the fissures. A, The major (solid white arrow) and minor fissures (dashed white arrow) may be barely visible normally but are almost never thicker than a line you could draw with the point of a sharpened pencil. B, Fluid can collect in the fissures in CHF and distend them, making them appear thicker and more irregular in contour and more visible than normal. The major fissure is more prominent (solid white arrow) as is the minor fissure (dashed white arrow). When the patient’s heart failure clears, the fissures will return to normal appearance, but after repeated and prolonged bouts of failure, fibrosis may result in permanent thickening of the fissures.
A B
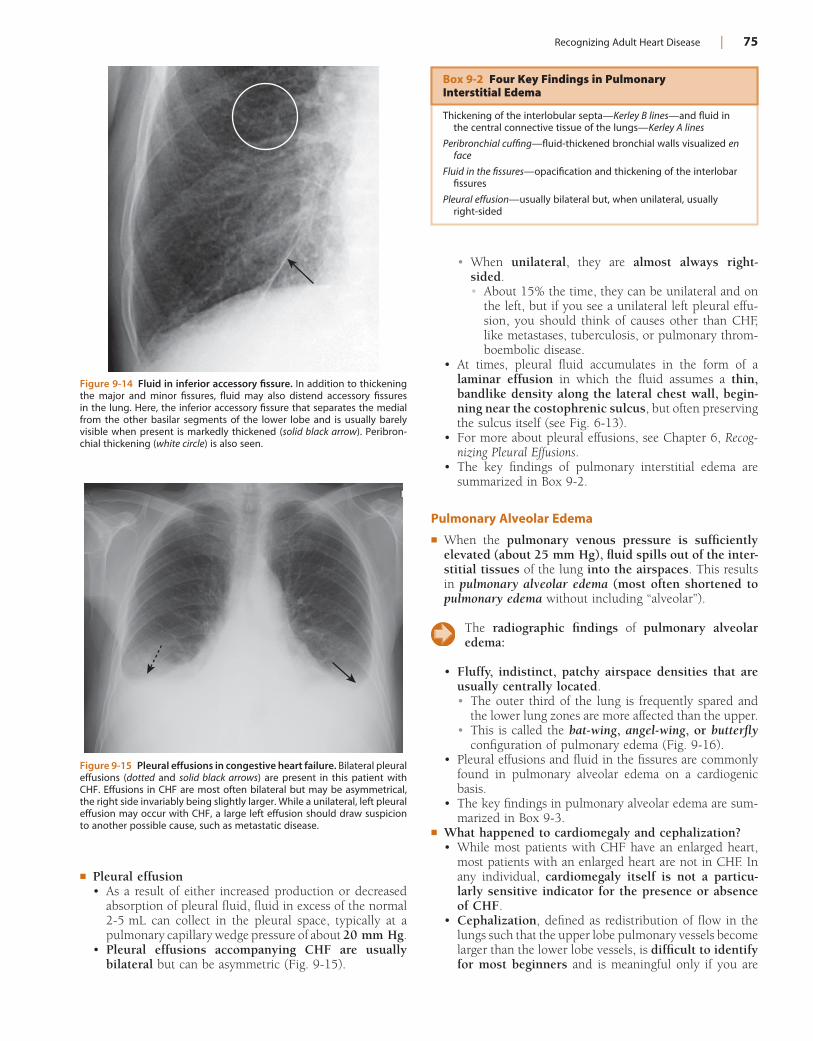
Recognizing Adult Heart Disease | 75
• When unilateral, they are almost always right-sided.• About 15% the time, they can be unilateral and on
the left, but if you see a unilateral left pleural effu-sion, you should think of causes other than CHF, like metastases, tuberculosis, or pulmonary throm-boembolic disease.
• At times, pleural fluid accumulates in the form of a laminar effusion in which the fluid assumes a thin, bandlike density along the lateral chest wall, begin-ning near the costophrenic sulcus, but often preserving the sulcus itself (see Fig. 6-13).
• For more about pleural effusions, see Chapter 6, Recog-nizing Pleural Effusions.
• The key findings of pulmonary interstitial edema are summarized in Box 9-2.
Pulmonary Alveolar Edema
! When the pulmonary venous pressure is sufficiently elevated (about 25 mm Hg), fluid spills out of the inter-stitial tissues of the lung into the airspaces. This results in pulmonary alveolar edema (most often shortened to pulmonary edema without including “alveolar”).
The radiographic findings of pulmonary alveolar edema:
• Fluffy, indistinct, patchy airspace densities that are usually centrally located.• The outer third of the lung is frequently spared and
the lower lung zones are more affected than the upper.• This is called the bat-wing, angel-wing, or butterfly
configuration of pulmonary edema (Fig. 9-16).• Pleural effusions and fluid in the fissures are commonly
found in pulmonary alveolar edema on a cardiogenic basis.
• The key findings in pulmonary alveolar edema are sum-marized in Box 9-3.
! What happened to cardiomegaly and cephalization?• While most patients with CHF have an enlarged heart,
most patients with an enlarged heart are not in CHF. In any individual, cardiomegaly itself is not a particu-larly sensitive indicator for the presence or absence of CHF.
• Cephalization, defined as redistribution of flow in the lungs such that the upper lobe pulmonary vessels become larger than the lower lobe vessels, is difficult to identify for most beginners and is meaningful only if you are
Figure 9-14 Fluid in inferior accessory fissure. In addition to thickening the major and minor fissures, fluid may also distend accessory fissures in the lung. Here, the inferior accessory fissure that separates the medial from the other basilar segments of the lower lobe and is usually barely visible when present is markedly thickened (solid black arrow). Peribron-chial thickening (white circle) is also seen.
Figure 9-15 Pleural effusions in congestive heart failure. Bilateral pleural effusions (dotted and solid black arrows) are present in this patient with CHF. Effusions in CHF are most often bilateral but may be asymmetrical, the right side invariably being slightly larger. While a unilateral, left pleural effusion may occur with CHF, a large left effusion should draw suspicion to another possible cause, such as metastatic disease.
! Pleural effusion• As a result of either increased production or decreased
absorption of pleural fluid, fluid in excess of the normal 2-5 mL can collect in the pleural space, typically at a pulmonary capillary wedge pressure of about 20 mm Hg.
• Pleural effusions accompanying CHF are usually bilateral but can be asymmetric (Fig. 9-15).
Box 9-2 Four Key Findings in Pulmonary Interstitial Edema
Thickening of the interlobular septa—Kerley B lines—and fluid in the central connective tissue of the lungs—Kerley A lines
Peribronchial cuffing—fluid-thickened bronchial walls visualized en face
Fluid in the fissures—opacification and thickening of the interlobar fissures
Pleural effusion—usually bilateral but, when unilateral, usually right-sided
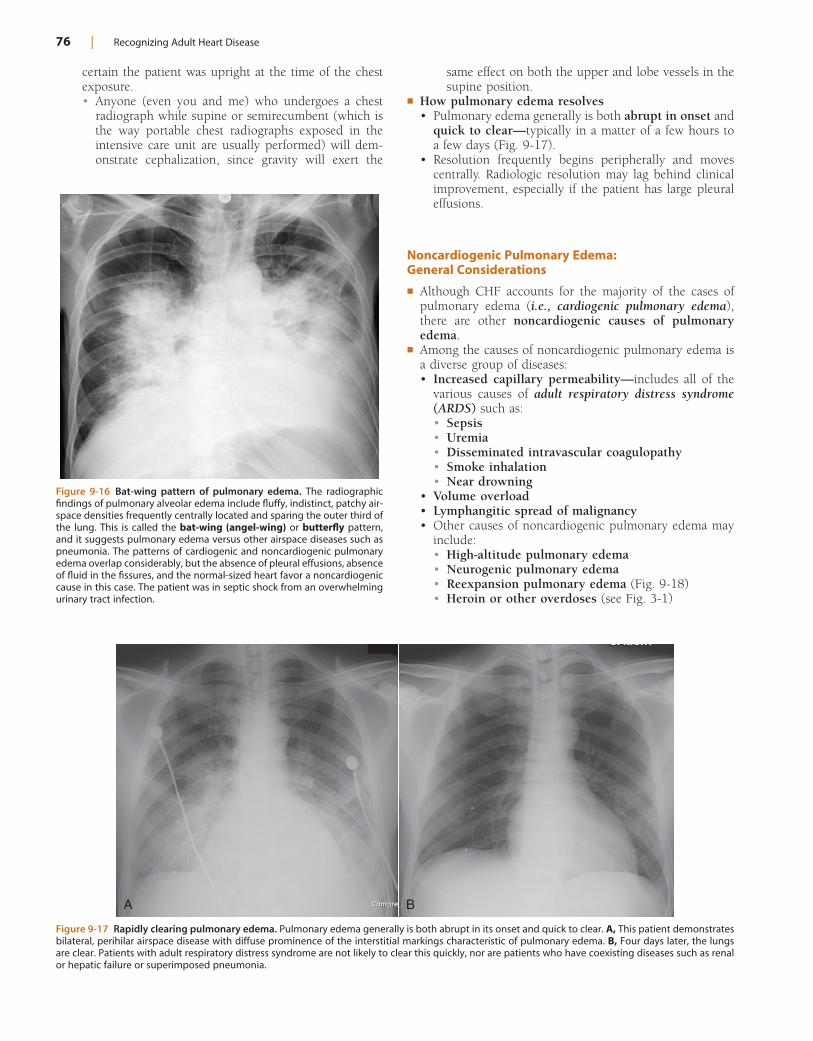
76 | Recognizing Adult Heart Disease
Figure 9-16 Bat-wing pattern of pulmonary edema. The radiographic findings of pulmonary alveolar edema include fluffy, indistinct, patchy air-space densities frequently centrally located and sparing the outer third of the lung. This is called the bat-wing (angel-wing) or butterfly pattern, and it suggests pulmonary edema versus other airspace diseases such as pneumonia. The patterns of cardiogenic and noncardiogenic pulmonary edema overlap considerably, but the absence of pleural effusions, absence of fluid in the fissures, and the normal-sized heart favor a noncardiogenic cause in this case. The patient was in septic shock from an overwhelming urinary tract infection.
Figure 9-17 Rapidly clearing pulmonary edema. Pulmonary edema generally is both abrupt in its onset and quick to clear. A, This patient demonstrates bilateral, perihilar airspace disease with diffuse prominence of the interstitial markings characteristic of pulmonary edema. B, Four days later, the lungs are clear. Patients with adult respiratory distress syndrome are not likely to clear this quickly, nor are patients who have coexisting diseases such as renal or hepatic failure or superimposed pneumonia.
A B
certain the patient was upright at the time of the chest exposure.• Anyone (even you and me) who undergoes a chest
radiograph while supine or semirecumbent (which is the way portable chest radiographs exposed in the intensive care unit are usually performed) will dem-onstrate cephalization, since gravity will exert the
same effect on both the upper and lobe vessels in the supine position.
! How pulmonary edema resolves• Pulmonary edema generally is both abrupt in onset and
quick to clear—typically in a matter of a few hours to a few days (Fig. 9-17).
• Resolution frequently begins peripherally and moves centrally. Radiologic resolution may lag behind clinical improvement, especially if the patient has large pleural effusions.
Noncardiogenic Pulmonary Edema: General Considerations
! Although CHF accounts for the majority of the cases of pulmonary edema (i.e., cardiogenic pulmonary edema), there are other noncardiogenic causes of pulmonary edema.
! Among the causes of noncardiogenic pulmonary edema is a diverse group of diseases:• Increased capillary permeability—includes all of the
various causes of adult respiratory distress syndrome (ARDS) such as:• Sepsis• Uremia• Disseminated intravascular coagulopathy• Smoke inhalation• Near drowning
• Volume overload• Lymphangitic spread of malignancy• Other causes of noncardiogenic pulmonary edema may
include:• High-altitude pulmonary edema• Neurogenic pulmonary edema• Reexpansion pulmonary edema (Fig. 9-18)• Heroin or other overdoses (see Fig. 3-1)
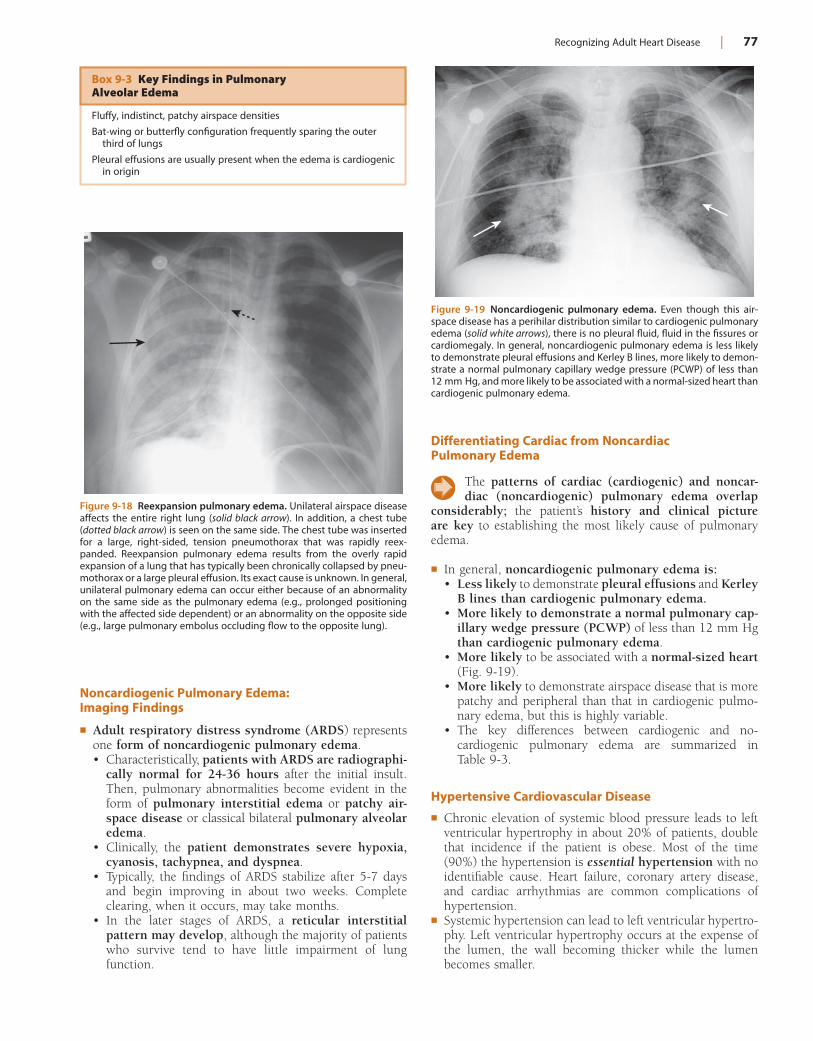
Recognizing Adult Heart Disease | 77
Box 9-3 Key Findings in Pulmonary Alveolar Edema
Fluffy, indistinct, patchy airspace densities
Bat-wing or butterfly configuration frequently sparing the outer third of lungs
Pleural effusions are usually present when the edema is cardiogenic in origin
Differentiating Cardiac from Noncardiac Pulmonary Edema
The patterns of cardiac (cardiogenic) and noncar-diac (noncardiogenic) pulmonary edema overlap
considerably; the patient’s history and clinical picture are key to establishing the most likely cause of pulmonary edema.
! In general, noncardiogenic pulmonary edema is:• Less likely to demonstrate pleural effusions and Kerley
B lines than cardiogenic pulmonary edema.• More likely to demonstrate a normal pulmonary cap-
illary wedge pressure (PCWP) of less than 12 mm Hg than cardiogenic pulmonary edema.
• More likely to be associated with a normal-sized heart (Fig. 9-19).
• More likely to demonstrate airspace disease that is more patchy and peripheral than that in cardiogenic pulmo-nary edema, but this is highly variable.
• The key differences between cardiogenic and no- cardiogenic pulmonary edema are summarized in Table 9-3.
Hypertensive Cardiovascular Disease
! Chronic elevation of systemic blood pressure leads to left ventricular hypertrophy in about 20% of patients, double that incidence if the patient is obese. Most of the time (90%) the hypertension is essential hypertension with no identifiable cause. Heart failure, coronary artery disease, and cardiac arrhythmias are common complications of hypertension.
! Systemic hypertension can lead to left ventricular hypertro-phy. Left ventricular hypertrophy occurs at the expense of the lumen, the wall becoming thicker while the lumen becomes smaller.
Noncardiogenic Pulmonary Edema: Imaging Findings
! Adult respiratory distress syndrome (ARDS) represents one form of noncardiogenic pulmonary edema.• Characteristically, patients with ARDS are radiographi-
cally normal for 24-36 hours after the initial insult. Then, pulmonary abnormalities become evident in the form of pulmonary interstitial edema or patchy air-space disease or classical bilateral pulmonary alveolar edema.
• Clinically, the patient demonstrates severe hypoxia, cyanosis, tachypnea, and dyspnea.
• Typically, the findings of ARDS stabilize after 5-7 days and begin improving in about two weeks. Complete clearing, when it occurs, may take months.
• In the later stages of ARDS, a reticular interstitial pattern may develop, although the majority of patients who survive tend to have little impairment of lung function.
Figure 9-18 Reexpansion pulmonary edema. Unilateral airspace disease affects the entire right lung (solid black arrow). In addition, a chest tube (dotted black arrow) is seen on the same side. The chest tube was inserted for a large, right-sided, tension pneumothorax that was rapidly reex-panded. Reexpansion pulmonary edema results from the overly rapid expansion of a lung that has typically been chronically collapsed by pneu-mothorax or a large pleural effusion. Its exact cause is unknown. In general, unilateral pulmonary edema can occur either because of an abnormality on the same side as the pulmonary edema (e.g., prolonged positioning with the affected side dependent) or an abnormality on the opposite side (e.g., large pulmonary embolus occluding flow to the opposite lung).
Figure 9-19 Noncardiogenic pulmonary edema. Even though this air-space disease has a perihilar distribution similar to cardiogenic pulmonary edema (solid white arrows), there is no pleural fluid, fluid in the fissures or cardiomegaly. In general, noncardiogenic pulmonary edema is less likely to demonstrate pleural effusions and Kerley B lines, more likely to demon-strate a normal pulmonary capillary wedge pressure (PCWP) of less than 12 mm Hg, and more likely to be associated with a normal-sized heart than cardiogenic pulmonary edema.
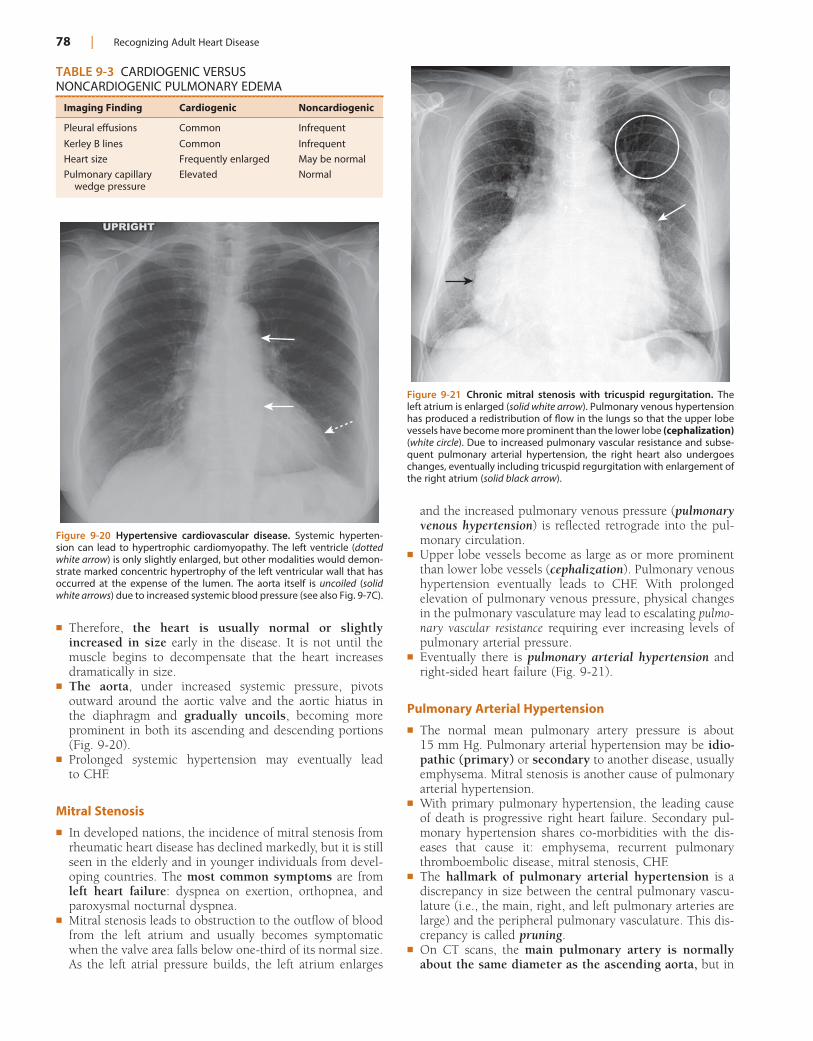
78 | Recognizing Adult Heart Disease
and the increased pulmonary venous pressure (pulmonary venous hypertension) is reflected retrograde into the pul-monary circulation.
! Upper lobe vessels become as large as or more prominent than lower lobe vessels (cephalization). Pulmonary venous hypertension eventually leads to CHF. With prolonged elevation of pulmonary venous pressure, physical changes in the pulmonary vasculature may lead to escalating pulmo-nary vascular resistance requiring ever increasing levels of pulmonary arterial pressure.
! Eventually there is pulmonary arterial hypertension and right-sided heart failure (Fig. 9-21).
Pulmonary Arterial Hypertension
! The normal mean pulmonary artery pressure is about 15 mm Hg. Pulmonary arterial hypertension may be idio-pathic (primary) or secondary to another disease, usually emphysema. Mitral stenosis is another cause of pulmonary arterial hypertension.
! With primary pulmonary hypertension, the leading cause of death is progressive right heart failure. Secondary pul-monary hypertension shares co-morbidities with the dis-eases that cause it: emphysema, recurrent pulmonary thromboembolic disease, mitral stenosis, CHF.
! The hallmark of pulmonary arterial hypertension is a discrepancy in size between the central pulmonary vascu-lature (i.e., the main, right, and left pulmonary arteries are large) and the peripheral pulmonary vasculature. This dis-crepancy is called pruning.
! On CT scans, the main pulmonary artery is normally about the same diameter as the ascending aorta, but in
! Therefore, the heart is usually normal or slightly increased in size early in the disease. It is not until the muscle begins to decompensate that the heart increases dramatically in size.
! The aorta, under increased systemic pressure, pivots outward around the aortic valve and the aortic hiatus in the diaphragm and gradually uncoils, becoming more prominent in both its ascending and descending portions (Fig. 9-20).
! Prolonged systemic hypertension may eventually lead to CHF.
Mitral Stenosis
! In developed nations, the incidence of mitral stenosis from rheumatic heart disease has declined markedly, but it is still seen in the elderly and in younger individuals from devel-oping countries. The most common symptoms are from left heart failure: dyspnea on exertion, orthopnea, and paroxysmal nocturnal dyspnea.
! Mitral stenosis leads to obstruction to the outflow of blood from the left atrium and usually becomes symptomatic when the valve area falls below one-third of its normal size. As the left atrial pressure builds, the left atrium enlarges
TABLE 9-3 CARDIOGENIC VERSUS NONCARDIOGENIC PULMONARY EDEMA
Imaging Finding Cardiogenic Noncardiogenic
Pleural effusions Common Infrequent
Kerley B lines Common Infrequent
Heart size Frequently enlarged May be normal
Pulmonary capillary wedge pressure
Elevated Normal
Figure 9-20 Hypertensive cardiovascular disease. Systemic hyperten-sion can lead to hypertrophic cardiomyopathy. The left ventricle (dotted white arrow) is only slightly enlarged, but other modalities would demon-strate marked concentric hypertrophy of the left ventricular wall that has occurred at the expense of the lumen. The aorta itself is uncoiled (solid white arrows) due to increased systemic blood pressure (see also Fig. 9-7C).
Figure 9-21 Chronic mitral stenosis with tricuspid regurgitation. The left atrium is enlarged (solid white arrow). Pulmonary venous hypertension has produced a redistribution of flow in the lungs so that the upper lobe vessels have become more prominent than the lower lobe (cephalization) (white circle). Due to increased pulmonary vascular resistance and subse-quent pulmonary arterial hypertension, the right heart also undergoes changes, eventually including tricuspid regurgitation with enlargement of the right atrium (solid black arrow).
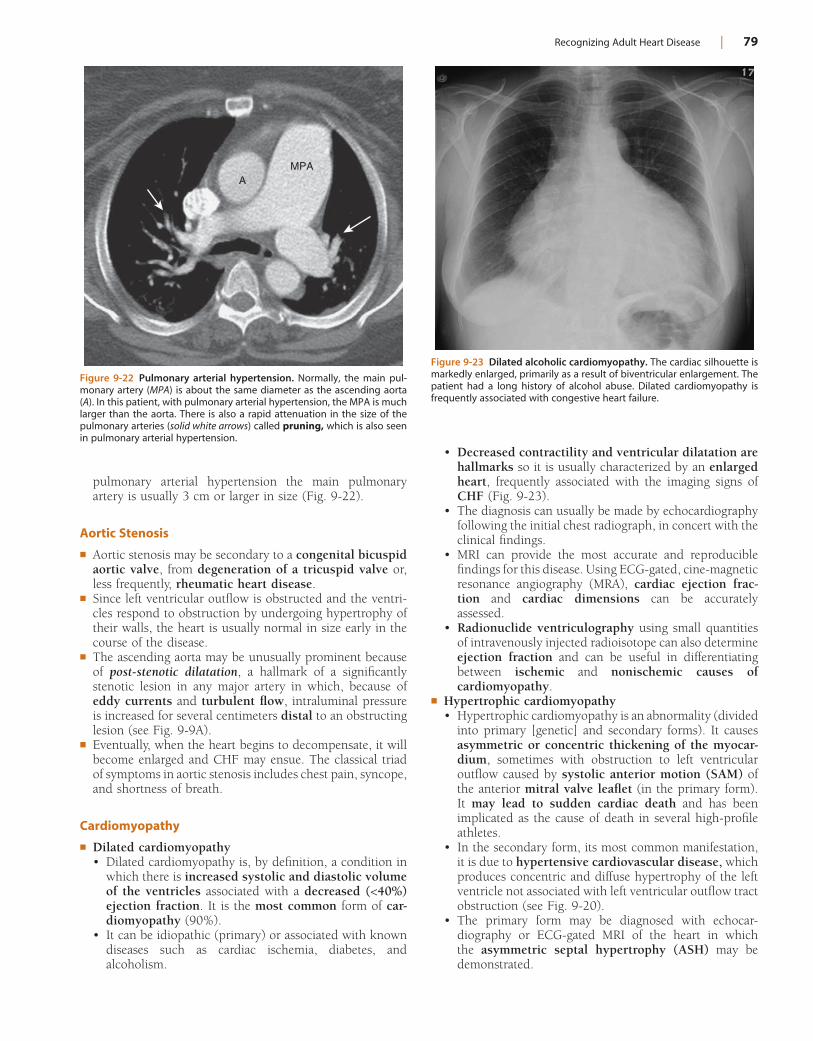
Recognizing Adult Heart Disease | 79
• Decreased contractility and ventricular dilatation are hallmarks so it is usually characterized by an enlarged heart, frequently associated with the imaging signs of CHF (Fig. 9-23).
• The diagnosis can usually be made by echocardiography following the initial chest radiograph, in concert with the clinical findings.
• MRI can provide the most accurate and reproducible findings for this disease. Using ECG-gated, cine-magnetic resonance angiography (MRA), cardiac ejection frac-tion and cardiac dimensions can be accurately assessed.
• Radionuclide ventriculography using small quantities of intravenously injected radioisotope can also determine ejection fraction and can be useful in differentiating between ischemic and nonischemic causes of cardiomyopathy.
! Hypertrophic cardiomyopathy• Hypertrophic cardiomyopathy is an abnormality (divided
into primary [genetic] and secondary forms). It causes asymmetric or concentric thickening of the myocar-dium, sometimes with obstruction to left ventricular outflow caused by systolic anterior motion (SAM) of the anterior mitral valve leaflet (in the primary form). It may lead to sudden cardiac death and has been implicated as the cause of death in several high-profile athletes.
• In the secondary form, its most common manifestation, it is due to hypertensive cardiovascular disease, which produces concentric and diffuse hypertrophy of the left ventricle not associated with left ventricular outflow tract obstruction (see Fig. 9-20).
• The primary form may be diagnosed with echocar-diography or ECG-gated MRI of the heart in which the asymmetric septal hypertrophy (ASH) may be demonstrated.
pulmonary arterial hypertension the main pulmonary artery is usually 3 cm or larger in size (Fig. 9-22).
Aortic Stenosis
! Aortic stenosis may be secondary to a congenital bicuspid aortic valve, from degeneration of a tricuspid valve or, less frequently, rheumatic heart disease.
! Since left ventricular outflow is obstructed and the ventri-cles respond to obstruction by undergoing hypertrophy of their walls, the heart is usually normal in size early in the course of the disease.
! The ascending aorta may be unusually prominent because of post-stenotic dilatation, a hallmark of a significantly stenotic lesion in any major artery in which, because of eddy currents and turbulent flow, intraluminal pressure is increased for several centimeters distal to an obstructing lesion (see Fig. 9-9A).
! Eventually, when the heart begins to decompensate, it will become enlarged and CHF may ensue. The classical triad of symptoms in aortic stenosis includes chest pain, syncope, and shortness of breath.
Cardiomyopathy
! Dilated cardiomyopathy• Dilated cardiomyopathy is, by definition, a condition in
which there is increased systolic and diastolic volume of the ventricles associated with a decreased (<40%) ejection fraction. It is the most common form of car-diomyopathy (90%).
• It can be idiopathic (primary) or associated with known diseases such as cardiac ischemia, diabetes, and alcoholism.
Figure 9-22 Pulmonary arterial hypertension. Normally, the main pul-monary artery (MPA) is about the same diameter as the ascending aorta (A). In this patient, with pulmonary arterial hypertension, the MPA is much larger than the aorta. There is also a rapid attenuation in the size of the pulmonary arteries (solid white arrows) called pruning, which is also seen in pulmonary arterial hypertension.
AMPA
Figure 9-23 Dilated alcoholic cardiomyopathy. The cardiac silhouette is markedly enlarged, primarily as a result of biventricular enlargement. The patient had a long history of alcohol abuse. Dilated cardiomyopathy is frequently associated with congestive heart failure.
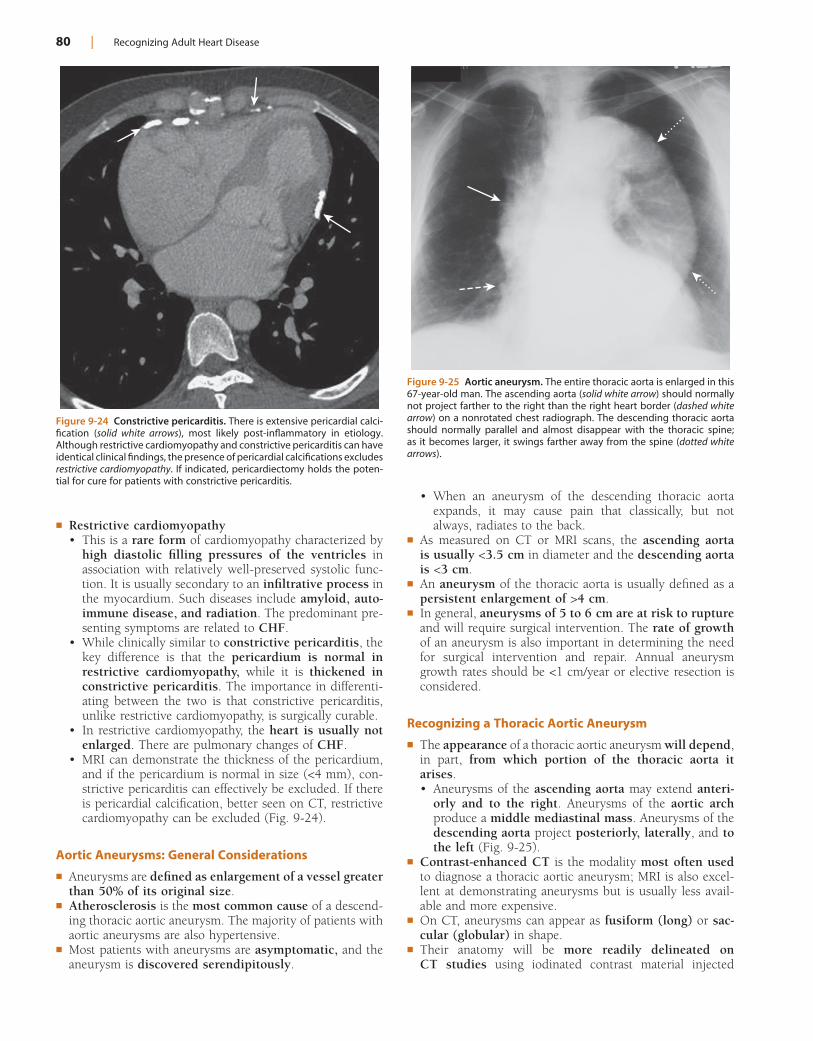
80 | Recognizing Adult Heart Disease
• When an aneurysm of the descending thoracic aorta expands, it may cause pain that classically, but not always, radiates to the back.
! As measured on CT or MRI scans, the ascending aorta is usually <3.5 cm in diameter and the descending aorta is <3 cm.
! An aneurysm of the thoracic aorta is usually defined as a persistent enlargement of >4 cm.
! In general, aneurysms of 5 to 6 cm are at risk to rupture and will require surgical intervention. The rate of growth of an aneurysm is also important in determining the need for surgical intervention and repair. Annual aneurysm growth rates should be <1 cm/year or elective resection is considered.
Recognizing a Thoracic Aortic Aneurysm
! The appearance of a thoracic aortic aneurysm will depend, in part, from which portion of the thoracic aorta it arises.• Aneurysms of the ascending aorta may extend anteri-
orly and to the right. Aneurysms of the aortic arch produce a middle mediastinal mass. Aneurysms of the descending aorta project posteriorly, laterally, and to the left (Fig. 9-25).
! Contrast-enhanced CT is the modality most often used to diagnose a thoracic aortic aneurysm; MRI is also excel-lent at demonstrating aneurysms but is usually less avail-able and more expensive.
! On CT, aneurysms can appear as fusiform (long) or sac-cular (globular) in shape.
! Their anatomy will be more readily delineated on CT studies using iodinated contrast material injected
! Restrictive cardiomyopathy• This is a rare form of cardiomyopathy characterized by
high diastolic filling pressures of the ventricles in association with relatively well-preserved systolic func-tion. It is usually secondary to an infiltrative process in the myocardium. Such diseases include amyloid, auto-immune disease, and radiation. The predominant pre-senting symptoms are related to CHF.
• While clinically similar to constrictive pericarditis, the key difference is that the pericardium is normal in restrictive cardiomyopathy, while it is thickened in constrictive pericarditis. The importance in differenti-ating between the two is that constrictive pericarditis, unlike restrictive cardiomyopathy, is surgically curable.
• In restrictive cardiomyopathy, the heart is usually not enlarged. There are pulmonary changes of CHF.
• MRI can demonstrate the thickness of the pericardium, and if the pericardium is normal in size (<4 mm), con-strictive pericarditis can effectively be excluded. If there is pericardial calcification, better seen on CT, restrictive cardiomyopathy can be excluded (Fig. 9-24).
Aortic Aneurysms: General Considerations
! Aneurysms are defined as enlargement of a vessel greater than 50% of its original size.
! Atherosclerosis is the most common cause of a descend-ing thoracic aortic aneurysm. The majority of patients with aortic aneurysms are also hypertensive.
! Most patients with aneurysms are asymptomatic, and the aneurysm is discovered serendipitously.
Figure 9-24 Constrictive pericarditis. There is extensive pericardial calci-fication (solid white arrows), most likely post-inflammatory in etiology. Although restrictive cardiomyopathy and constrictive pericarditis can have identical clinical findings, the presence of pericardial calcifications excludes restrictive cardiomyopathy. If indicated, pericardiectomy holds the poten-tial for cure for patients with constrictive pericarditis.
Figure 9-25 Aortic aneurysm. The entire thoracic aorta is enlarged in this 67-year-old man. The ascending aorta (solid white arrow) should normally not project farther to the right than the right heart border (dashed white arrow) on a nonrotated chest radiograph. The descending thoracic aorta should normally parallel and almost disappear with the thoracic spine; as it becomes larger, it swings farther away from the spine (dotted white arrows).
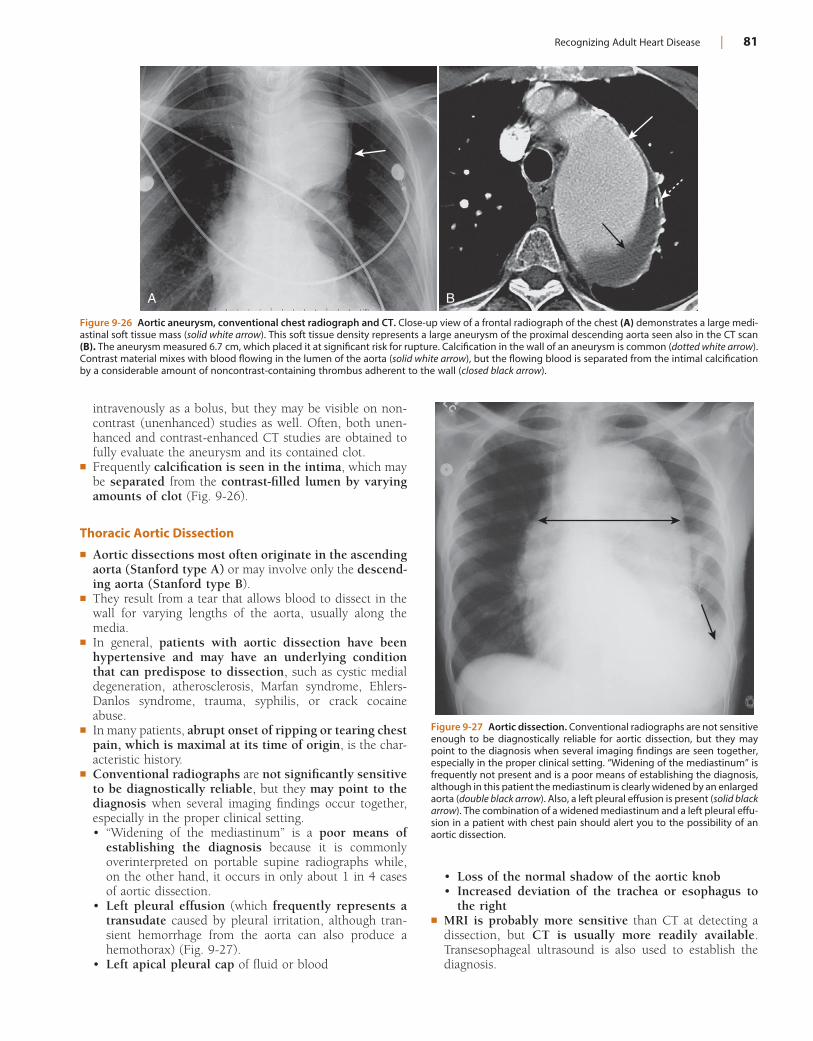
Recognizing Adult Heart Disease | 81
Figure 9-26 Aortic aneurysm, conventional chest radiograph and CT. Close-up view of a frontal radiograph of the chest (A) demonstrates a large medi-astinal soft tissue mass (solid white arrow). This soft tissue density represents a large aneurysm of the proximal descending aorta seen also in the CT scan (B). The aneurysm measured 6.7 cm, which placed it at significant risk for rupture. Calcification in the wall of an aneurysm is common (dotted white arrow). Contrast material mixes with blood flowing in the lumen of the aorta (solid white arrow), but the flowing blood is separated from the intimal calcification by a considerable amount of noncontrast-containing thrombus adherent to the wall (closed black arrow).
A B
intravenously as a bolus, but they may be visible on non-contrast (unenhanced) studies as well. Often, both unen-hanced and contrast-enhanced CT studies are obtained to fully evaluate the aneurysm and its contained clot.
! Frequently calcification is seen in the intima, which may be separated from the contrast-filled lumen by varying amounts of clot (Fig. 9-26).
Thoracic Aortic Dissection
! Aortic dissections most often originate in the ascending aorta (Stanford type A) or may involve only the descend-ing aorta (Stanford type B).
! They result from a tear that allows blood to dissect in the wall for varying lengths of the aorta, usually along the media.
! In general, patients with aortic dissection have been hypertensive and may have an underlying condition that can predispose to dissection, such as cystic medial degeneration, atherosclerosis, Marfan syndrome, Ehlers-Danlos syndrome, trauma, syphilis, or crack cocaine abuse.
! In many patients, abrupt onset of ripping or tearing chest pain, which is maximal at its time of origin, is the char-acteristic history.
! Conventional radiographs are not significantly sensitive to be diagnostically reliable, but they may point to the diagnosis when several imaging findings occur together, especially in the proper clinical setting.• “Widening of the mediastinum” is a poor means of
establishing the diagnosis because it is commonly overinterpreted on portable supine radiographs while, on the other hand, it occurs in only about 1 in 4 cases of aortic dissection.
• Left pleural effusion (which frequently represents a transudate caused by pleural irritation, although tran-sient hemorrhage from the aorta can also produce a hemothorax) (Fig. 9-27).
• Left apical pleural cap of fluid or blood
Figure 9-27 Aortic dissection. Conventional radiographs are not sensitive enough to be diagnostically reliable for aortic dissection, but they may point to the diagnosis when several imaging findings are seen together, especially in the proper clinical setting. “Widening of the mediastinum” is frequently not present and is a poor means of establishing the diagnosis, although in this patient the mediastinum is clearly widened by an enlarged aorta (double black arrow). Also, a left pleural effusion is present (solid black arrow). The combination of a widened mediastinum and a left pleural effu-sion in a patient with chest pain should alert you to the possibility of an aortic dissection.
• Loss of the normal shadow of the aortic knob• Increased deviation of the trachea or esophagus to
the right! MRI is probably more sensitive than CT at detecting a
dissection, but CT is usually more readily available. Transesophageal ultrasound is also used to establish the diagnosis.
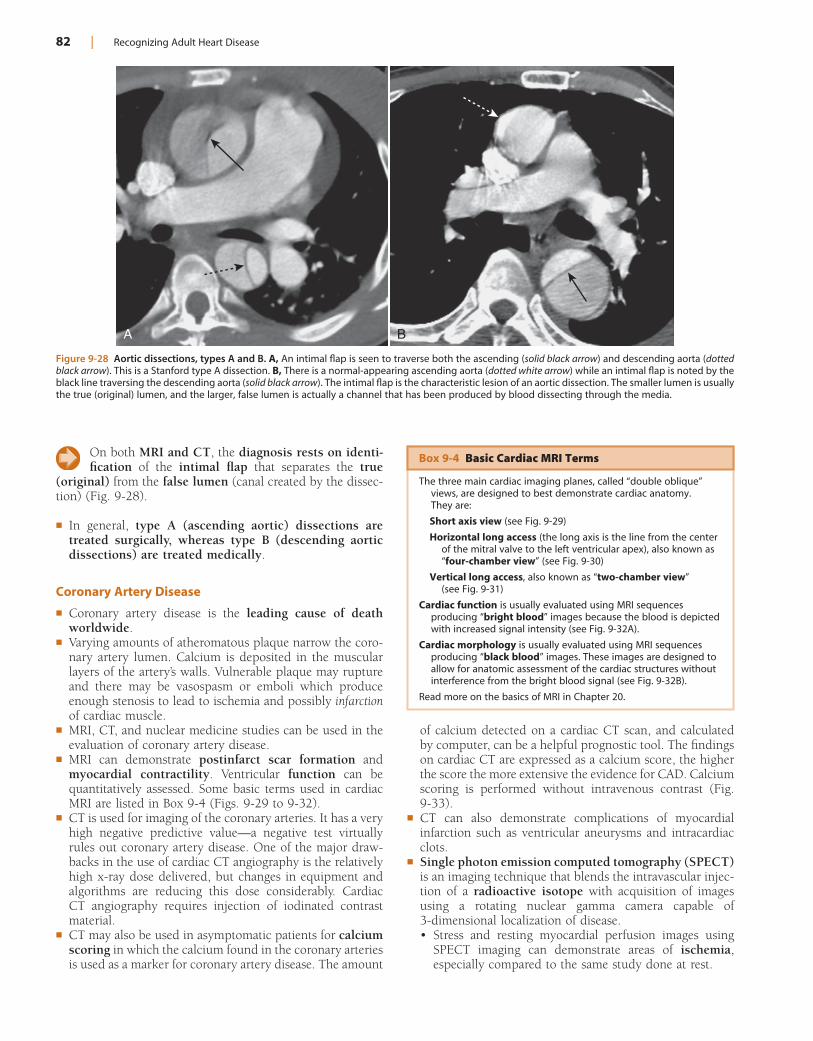
82 | Recognizing Adult Heart Disease
On both MRI and CT, the diagnosis rests on identi-fication of the intimal flap that separates the true
(original) from the false lumen (canal created by the dissec-tion) (Fig. 9-28).
! In general, type A (ascending aortic) dissections are treated surgically, whereas type B (descending aortic dissections) are treated medically.
Coronary Artery Disease
! Coronary artery disease is the leading cause of death worldwide.
! Varying amounts of atheromatous plaque narrow the coro-nary artery lumen. Calcium is deposited in the muscular layers of the artery’s walls. Vulnerable plaque may rupture and there may be vasospasm or emboli which produce enough stenosis to lead to ischemia and possibly infarction of cardiac muscle.
! MRI, CT, and nuclear medicine studies can be used in the evaluation of coronary artery disease.
! MRI can demonstrate postinfarct scar formation and myocardial contractility. Ventricular function can be quantitatively assessed. Some basic terms used in cardiac MRI are listed in Box 9-4 (Figs. 9-29 to 9-32).
! CT is used for imaging of the coronary arteries. It has a very high negative predictive value—a negative test virtually rules out coronary artery disease. One of the major draw-backs in the use of cardiac CT angiography is the relatively high x-ray dose delivered, but changes in equipment and algorithms are reducing this dose considerably. Cardiac CT angiography requires injection of iodinated contrast material.
! CT may also be used in asymptomatic patients for calcium scoring in which the calcium found in the coronary arteries is used as a marker for coronary artery disease. The amount
Figure 9-28 Aortic dissections, types A and B. A, An intimal flap is seen to traverse both the ascending (solid black arrow) and descending aorta (dotted black arrow). This is a Stanford type A dissection. B, There is a normal-appearing ascending aorta (dotted white arrow) while an intimal flap is noted by the black line traversing the descending aorta (solid black arrow). The intimal flap is the characteristic lesion of an aortic dissection. The smaller lumen is usually the true (original) lumen, and the larger, false lumen is actually a channel that has been produced by blood dissecting through the media.
A B
Box 9-4 Basic Cardiac MRI Terms
The three main cardiac imaging planes, called “double oblique” views, are designed to best demonstrate cardiac anatomy. They are:
Short axis view (see Fig. 9-29)
Horizontal long access (the long axis is the line from the center of the mitral valve to the left ventricular apex), also known as “four-chamber view” (see Fig. 9-30)
Vertical long access, also known as “two-chamber view” (see Fig. 9-31)
Cardiac function is usually evaluated using MRI sequences producing “bright blood” images because the blood is depicted with increased signal intensity (see Fig. 9-32A).
Cardiac morphology is usually evaluated using MRI sequences producing “black blood” images. These images are designed to allow for anatomic assessment of the cardiac structures without interference from the bright blood signal (see Fig. 9-32B).
Read more on the basics of MRI in Chapter 20.
of calcium detected on a cardiac CT scan, and calculated by computer, can be a helpful prognostic tool. The findings on cardiac CT are expressed as a calcium score, the higher the score the more extensive the evidence for CAD. Calcium scoring is performed without intravenous contrast (Fig. 9-33).
! CT can also demonstrate complications of myocardial infarction such as ventricular aneurysms and intracardiac clots.
! Single photon emission computed tomography (SPECT) is an imaging technique that blends the intravascular injec-tion of a radioactive isotope with acquisition of images using a rotating nuclear gamma camera capable of 3-dimensional localization of disease.• Stress and resting myocardial perfusion images using
SPECT imaging can demonstrate areas of ischemia, especially compared to the same study done at rest.
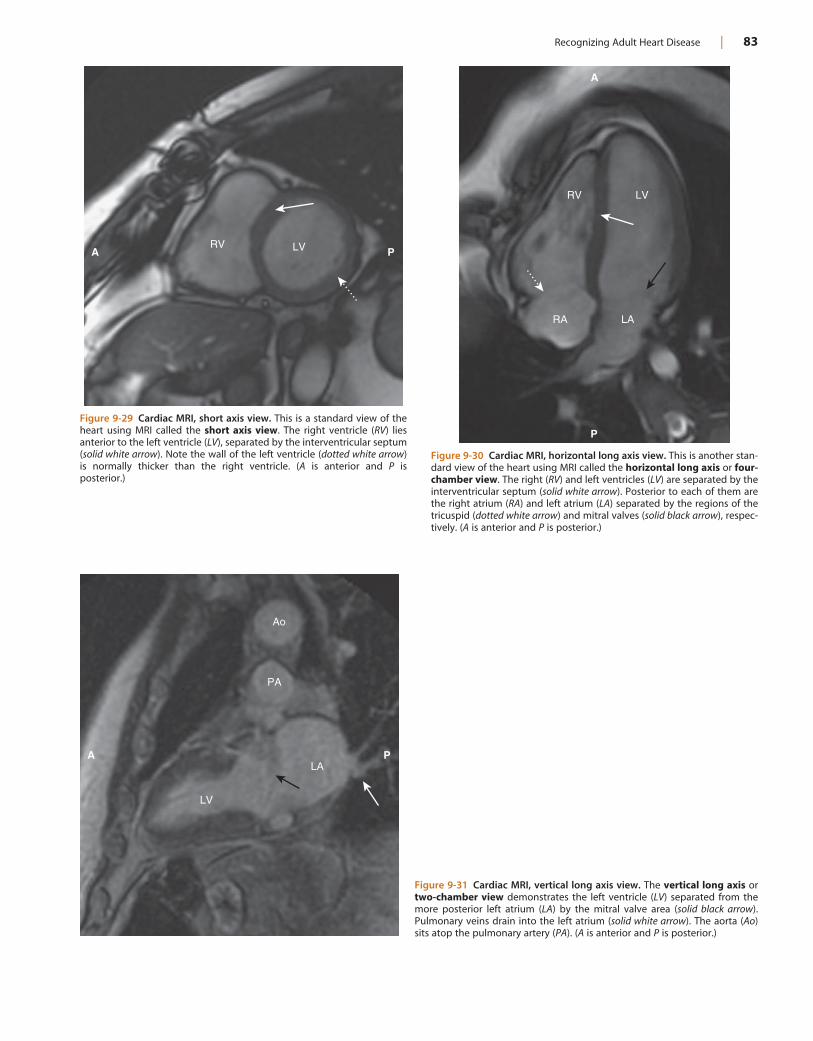
Recognizing Adult Heart Disease | 83
Figure 9-29 Cardiac MRI, short axis view. This is a standard view of the heart using MRI called the short axis view. The right ventricle (RV) lies anterior to the left ventricle (LV), separated by the interventricular septum (solid white arrow). Note the wall of the left ventricle (dotted white arrow) is normally thicker than the right ventricle. (A is anterior and P is posterior.)
RV LV PA
Figure 9-30 Cardiac MRI, horizontal long axis view. This is another stan-dard view of the heart using MRI called the horizontal long axis or four-chamber view. The right (RV) and left ventricles (LV) are separated by the interventricular septum (solid white arrow). Posterior to each of them are the right atrium (RA) and left atrium (LA) separated by the regions of the tricuspid (dotted white arrow) and mitral valves (solid black arrow), respec-tively. (A is anterior and P is posterior.)
RA LA
RV LV
P
A
Figure 9-31 Cardiac MRI, vertical long axis view. The vertical long axis or two-chamber view demonstrates the left ventricle (LV) separated from the more posterior left atrium (LA) by the mitral valve area (solid black arrow). Pulmonary veins drain into the left atrium (solid white arrow). The aorta (Ao) sits atop the pulmonary artery (PA). (A is anterior and P is posterior.)
PA
LA
Ao
LV
PA
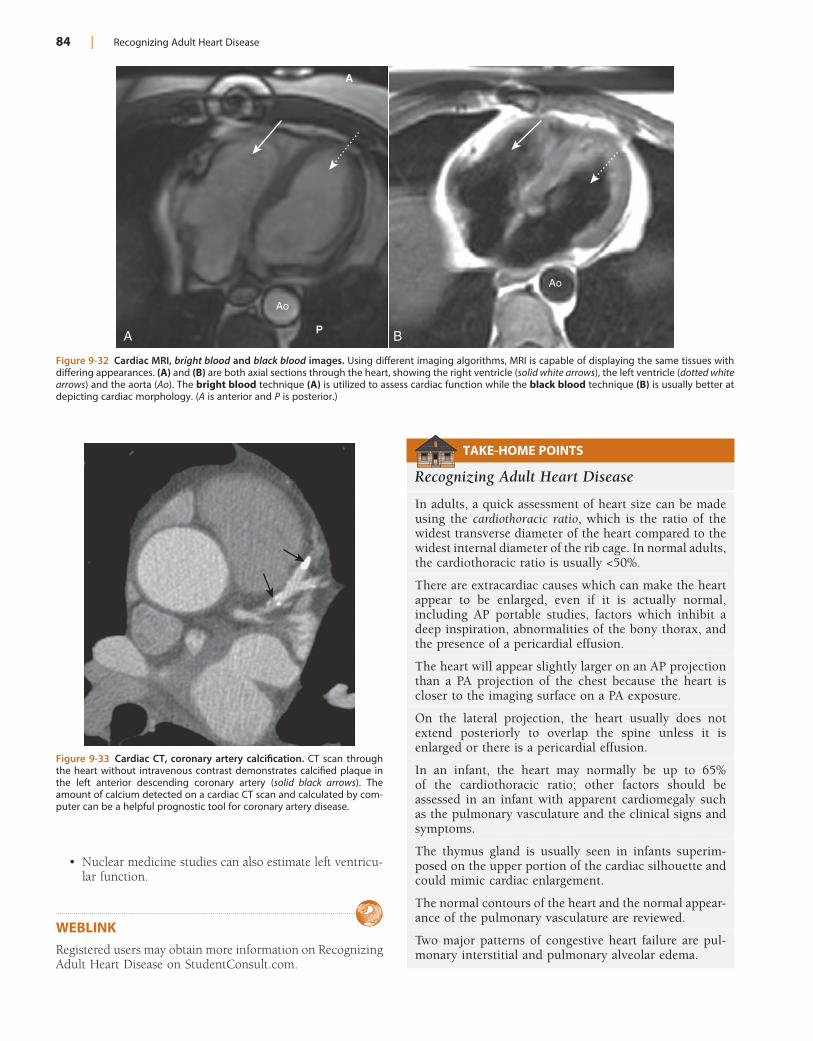
84 | Recognizing Adult Heart Disease
Figure 9-32 Cardiac MRI, bright blood and black blood images. Using different imaging algorithms, MRI is capable of displaying the same tissues with differing appearances. (A) and (B) are both axial sections through the heart, showing the right ventricle (solid white arrows), the left ventricle (dotted white arrows) and the aorta (Ao). The bright blood technique (A) is utilized to assess cardiac function while the black blood technique (B) is usually better at depicting cardiac morphology. (A is anterior and P is posterior.)
Ao
Ao
P
A
A B
• Nuclear medicine studies can also estimate left ventricu-lar function.
WEBLINKRegistered users may obtain more information on Recognizing Adult Heart Disease on StudentConsult.com.
Figure 9-33 Cardiac CT, coronary artery calcification. CT scan through the heart without intravenous contrast demonstrates calcified plaque in the left anterior descending coronary artery (solid black arrows). The amount of calcium detected on a cardiac CT scan and calculated by com-puter can be a helpful prognostic tool for coronary artery disease.
TAKE-HOME POINTS
Recognizing Adult Heart Disease
In adults, a quick assessment of heart size can be made using the cardiothoracic ratio, which is the ratio of the widest transverse diameter of the heart compared to the widest internal diameter of the rib cage. In normal adults, the cardiothoracic ratio is usually <50%.
There are extracardiac causes which can make the heart appear to be enlarged, even if it is actually normal, including AP portable studies, factors which inhibit a deep inspiration, abnormalities of the bony thorax, and the presence of a pericardial effusion.
The heart will appear slightly larger on an AP projection than a PA projection of the chest because the heart is closer to the imaging surface on a PA exposure.
On the lateral projection, the heart usually does not extend posteriorly to overlap the spine unless it is enlarged or there is a pericardial effusion.
In an infant, the heart may normally be up to 65% of the cardiothoracic ratio; other factors should be assessed in an infant with apparent cardiomegaly such as the pulmonary vasculature and the clinical signs and symptoms.
The thymus gland is usually seen in infants superim-posed on the upper portion of the cardiac silhouette and could mimic cardiac enlargement.
The normal contours of the heart and the normal appear-ance of the pulmonary vasculature are reviewed.
Two major patterns of congestive heart failure are pul-monary interstitial and pulmonary alveolar edema.
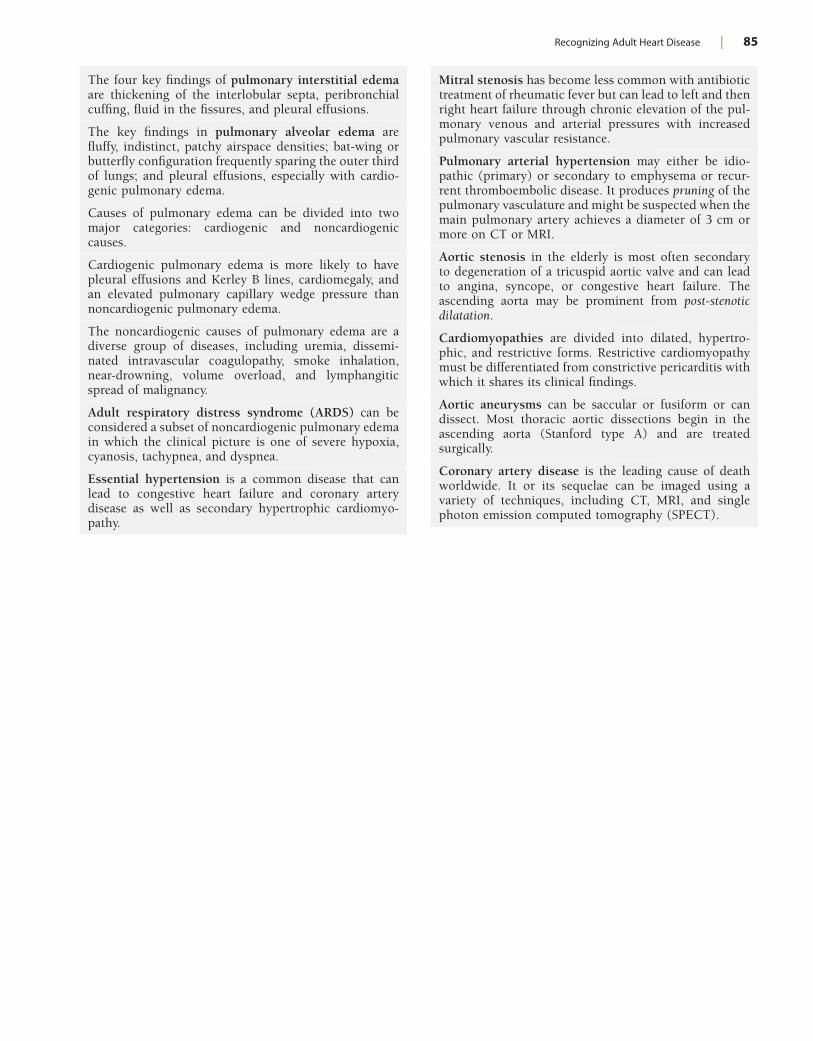
Recognizing Adult Heart Disease | 85
The four key findings of pulmonary interstitial edema are thickening of the interlobular septa, peribronchial cuffing, fluid in the fissures, and pleural effusions.
The key findings in pulmonary alveolar edema are fluffy, indistinct, patchy airspace densities; bat-wing or butterfly configuration frequently sparing the outer third of lungs; and pleural effusions, especially with cardio-genic pulmonary edema.
Causes of pulmonary edema can be divided into two major categories: cardiogenic and noncardiogenic causes.
Cardiogenic pulmonary edema is more likely to have pleural effusions and Kerley B lines, cardiomegaly, and an elevated pulmonary capillary wedge pressure than noncardiogenic pulmonary edema.
The noncardiogenic causes of pulmonary edema are a diverse group of diseases, including uremia, dissemi-nated intravascular coagulopathy, smoke inhalation, near-drowning, volume overload, and lymphangitic spread of malignancy.
Adult respiratory distress syndrome (ARDS) can be considered a subset of noncardiogenic pulmonary edema in which the clinical picture is one of severe hypoxia, cyanosis, tachypnea, and dyspnea.
Essential hypertension is a common disease that can lead to congestive heart failure and coronary artery disease as well as secondary hypertrophic cardiomyo-pathy.
Mitral stenosis has become less common with antibiotic treatment of rheumatic fever but can lead to left and then right heart failure through chronic elevation of the pul-monary venous and arterial pressures with increased pulmonary vascular resistance.
Pulmonary arterial hypertension may either be idio-pathic (primary) or secondary to emphysema or recur-rent thromboembolic disease. It produces pruning of the pulmonary vasculature and might be suspected when the main pulmonary artery achieves a diameter of 3 cm or more on CT or MRI.
Aortic stenosis in the elderly is most often secondary to degeneration of a tricuspid aortic valve and can lead to angina, syncope, or congestive heart failure. The ascending aorta may be prominent from post-stenotic dilatation.
Cardiomyopathies are divided into dilated, hypertro-phic, and restrictive forms. Restrictive cardiomyopathy must be differentiated from constrictive pericarditis with which it shares its clinical findings.
Aortic aneurysms can be saccular or fusiform or can dissect. Most thoracic aortic dissections begin in the ascending aorta (Stanford type A) and are treated surgically.
Coronary artery disease is the leading cause of death worldwide. It or its sequelae can be imaged using a variety of techniques, including CT, MRI, and single photon emission computed tomography (SPECT).
86
Chapter 10
Recognizing the Correct Placement of Lines and Tubes: Critical Care Radiology
! Patients in the critical or intensive care units (ICU) are monitored on a frequent basis with portable chest radiog-raphy both to check on the position of their multiple assis-tive devices and to assess their cardiopulmonary status.• Diseases commonly seen in critically ill patients are dis-
cussed in other chapters (Table 10-1).! In this chapter, you’ll get practical advice for evaluating the
successful (or not so successful) insertion and ultimate position of multiple tubes, lines, catheters, and other sup-portive apparatus used in the ICU.
! Most times, a conventional radiograph is obtained after the insertion or attempted insertion of one of these devices to check on its position and to rule out any unintended complications.
! Therefore, for each tube or device, you’ll learn:• Why they are used.• Where they belong when properly placed.• Where such devices can be malpositioned and what
complications may occur from the device.
ENDOTRACHEAL AND TRACHEOSTOMY TUBESEndotracheal Tubes (ETT)
! Why they are used• Assist ventilation• Isolate the trachea to permit control of the airway• Prevent gastric distension• Provide a direct route for suctioning• Administer medications
! Correct placement of an ETT (Box 10-1)• Endotracheal tubes are usually wide-bore tubes (about
1 cm) with a radioopaque marker stripe and no side holes. The tip is frequently diagonally shaped.
• With the patient’s head in the neutral position (i.e., bottom of mandible is at the level of C5-C6), the tip of ETT should be 3-5 cm from the carina.• This is roughly half the distance between the medial
ends of clavicles and the carina (Fig. 10-1).• Ideally the diameter of the ETT should be one half
to two thirds the width of the trachea.• An inflated cuff (balloon), if present, may fill—
but shouldn’t distend—the lumen of the trachea (Fig. 10-2).
How to find the carina on a frontal chest radiograph
• Follow the right or left main bronchus backward until it meets the opposite main bronchus. The carina projects over the T5, T6, or T7 vertebral bodies in 95% of people.
• Movement of tip with flexion and extension• Neck flexion may cause 2 cm of descent of the tube
tip. This is why the tip should be 3-5 cm from the carina.
• Neck extension from neutral may cause 2 cm of ascent of the tip.
! Incorrect placement and complications of an ETT• Most common malposition: because of the shallower
angle and wider diameter of the right main bronchus or bronchus intermedius, the tip of the ETT will tend to slide into the right-sided bronchial tree preferentially to the left.• This can lead to atelectasis (especially of the non-
aerated right upper lobe and left lung) (see Fig. 5-13).
• Intubation of the right main bronchus could also lead to a right-sided tension pneumothorax.
• Inadvertent esophageal intubation will produce a grossly dilated stomach.
• The tip of the tube should not be positioned in the larynx or pharynx—the tip should be at least 3 cm distal to level of vocal cords; otherwise, the tube can damage the vocal cords or lead to aspiration (Fig. 10-3).
Tracheostomy Tubes
! Why they are used• In patients with airway obstruction at or above level of
larynx• In respiratory failure requiring long-term intubation
(>21 days)• For airway obstruction during sleep apnea• When paralysis of the muscles affects swallowing or
respiration! Correct placement of a tracheostomy tube (Box 10-2)
• The tip should be about halfway between the stoma in which the tracheostomy tube was inserted and the carina. This is usually around the level of T3 (Fig. 10-4).
• Unlike an ETT, the placement of the tip of a tracheos-tomy tube is not affected by flexion and extension of the head.
• The width of the tracheostomy tube should be about two thirds the width of trachea.
! Incorrect placement and complications of a tracheos-tomy tube• Immediately after insertion, look for signs of inadver-
tent perforation of the trachea, such as:• Pneumomediastinum• Pneumothorax• Subcutaneous emphysema
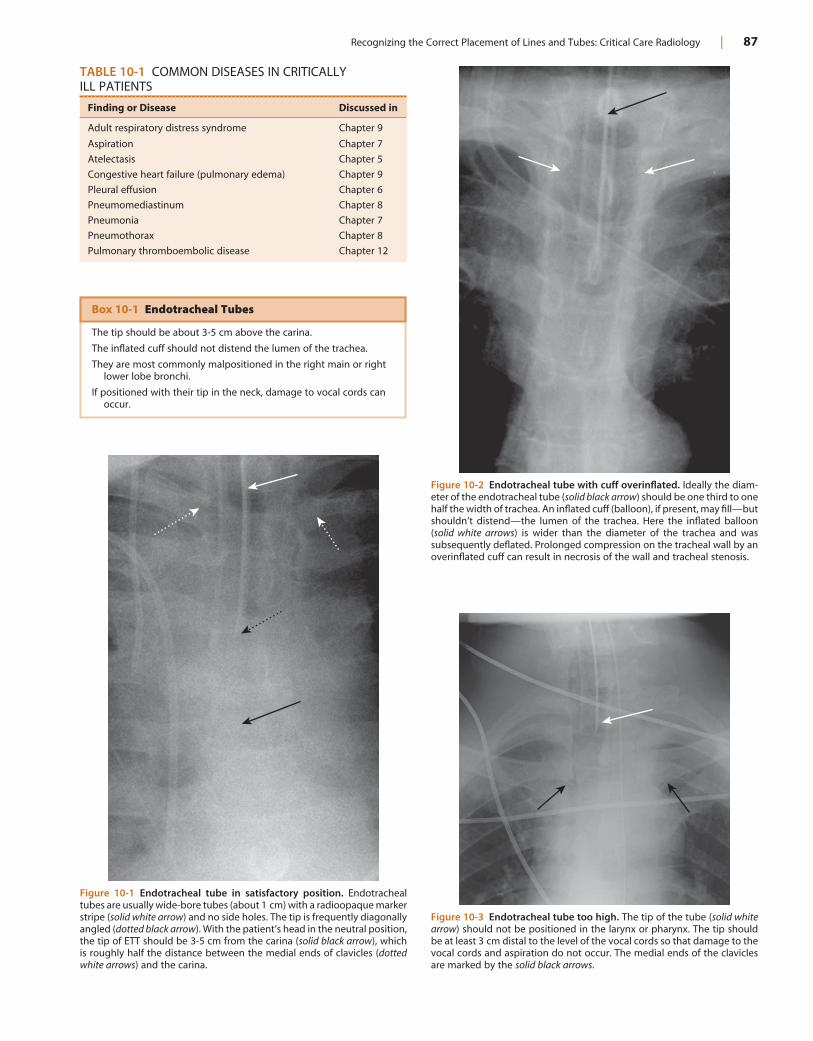
Recognizing the Correct Placement of Lines and Tubes: Critical Care Radiology | 87
TABLE 10-1 COMMON DISEASES IN CRITICALLY ILL PATIENTS
Finding or Disease Discussed in
Adult respiratory distress syndrome Chapter 9
Aspiration Chapter 7
Atelectasis Chapter 5
Congestive heart failure (pulmonary edema) Chapter 9
Pleural effusion Chapter 6
Pneumomediastinum Chapter 8
Pneumonia Chapter 7
Pneumothorax Chapter 8
Pulmonary thromboembolic disease Chapter 12
Figure 10-1 Endotracheal tube in satisfactory position. Endotracheal tubes are usually wide-bore tubes (about 1 cm) with a radioopaque marker stripe (solid white arrow) and no side holes. The tip is frequently diagonally angled (dotted black arrow). With the patient’s head in the neutral position, the tip of ETT should be 3-5 cm from the carina (solid black arrow), which is roughly half the distance between the medial ends of clavicles (dotted white arrows) and the carina.
Figure 10-2 Endotracheal tube with cuff overinflated. Ideally the diam-eter of the endotracheal tube (solid black arrow) should be one third to one half the width of trachea. An inflated cuff (balloon), if present, may fill—but shouldn’t distend—the lumen of the trachea. Here the inflated balloon (solid white arrows) is wider than the diameter of the trachea and was subsequently deflated. Prolonged compression on the tracheal wall by an overinflated cuff can result in necrosis of the wall and tracheal stenosis.
Figure 10-3 Endotracheal tube too high. The tip of the tube (solid white arrow) should not be positioned in the larynx or pharynx. The tip should be at least 3 cm distal to the level of the vocal cords so that damage to the vocal cords and aspiration do not occur. The medial ends of the clavicles are marked by the solid black arrows.
Box 10-1 Endotracheal Tubes
The tip should be about 3-5 cm above the carina.
The inflated cuff should not distend the lumen of the trachea.
They are most commonly malpositioned in the right main or right lower lobe bronchi.
If positioned with their tip in the neck, damage to vocal cords can occur.
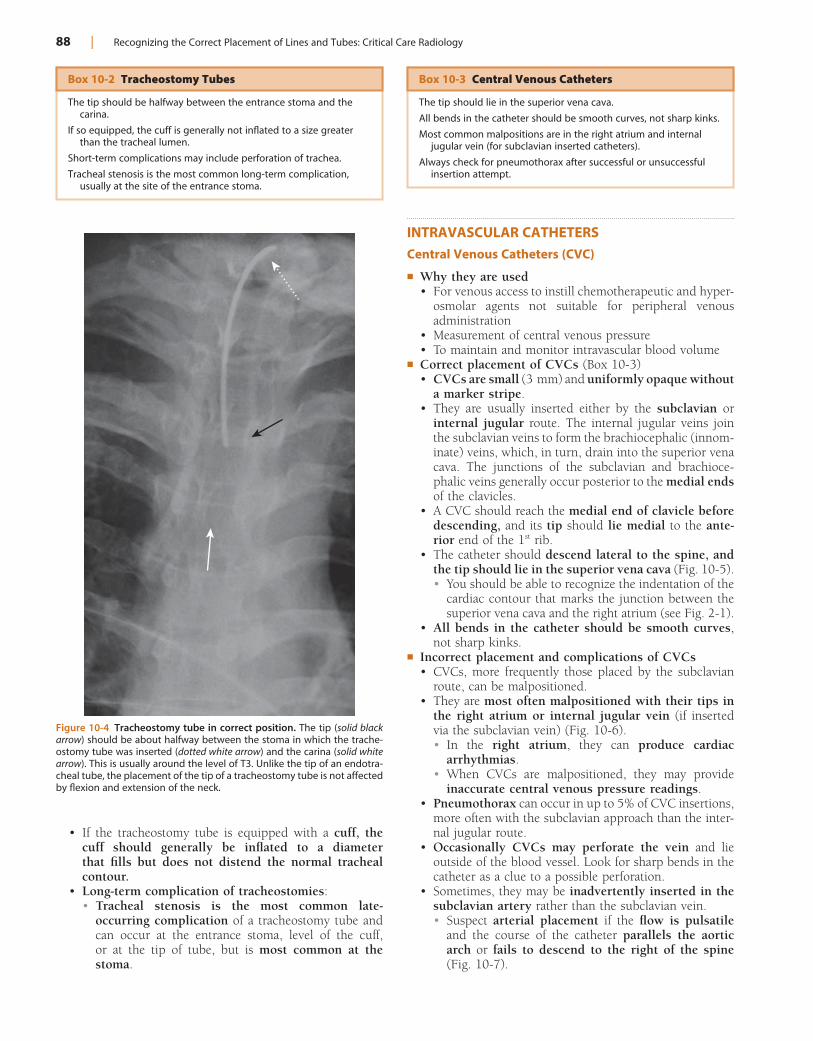
88 | Recognizing the Correct Placement of Lines and Tubes: Critical Care Radiology
Figure 10-4 Tracheostomy tube in correct position. The tip (solid black arrow) should be about halfway between the stoma in which the trache-ostomy tube was inserted (dotted white arrow) and the carina (solid white arrow). This is usually around the level of T3. Unlike the tip of an endotra-cheal tube, the placement of the tip of a tracheostomy tube is not affected by flexion and extension of the neck.
Box 10-3 Central Venous Catheters
The tip should lie in the superior vena cava.
All bends in the catheter should be smooth curves, not sharp kinks.
Most common malpositions are in the right atrium and internal jugular vein (for subclavian inserted catheters).
Always check for pneumothorax after successful or unsuccessful insertion attempt.
Box 10-2 Tracheostomy Tubes
The tip should be halfway between the entrance stoma and the carina.
If so equipped, the cuff is generally not inflated to a size greater than the tracheal lumen.
Short-term complications may include perforation of trachea.
Tracheal stenosis is the most common long-term complication, usually at the site of the entrance stoma.
• If the tracheostomy tube is equipped with a cuff, the cuff should generally be inflated to a diameter that fills but does not distend the normal tracheal contour.
• Long-term complication of tracheostomies:• Tracheal stenosis is the most common late-
occurring complication of a tracheostomy tube and can occur at the entrance stoma, level of the cuff, or at the tip of tube, but is most common at the stoma.
INTRAVASCULAR CATHETERSCentral Venous Catheters (CVC)
! Why they are used• For venous access to instill chemotherapeutic and hyper-
osmolar agents not suitable for peripheral venous administration
• Measurement of central venous pressure• To maintain and monitor intravascular blood volume
! Correct placement of CVCs (Box 10-3)• CVCs are small (3 mm) and uniformly opaque without
a marker stripe.• They are usually inserted either by the subclavian or
internal jugular route. The internal jugular veins join the subclavian veins to form the brachiocephalic (innom-inate) veins, which, in turn, drain into the superior vena cava. The junctions of the subclavian and brachioce-phalic veins generally occur posterior to the medial ends of the clavicles.
• A CVC should reach the medial end of clavicle before descending, and its tip should lie medial to the ante-rior end of the 1st rib.
• The catheter should descend lateral to the spine, and the tip should lie in the superior vena cava (Fig. 10-5).• You should be able to recognize the indentation of the
cardiac contour that marks the junction between the superior vena cava and the right atrium (see Fig. 2-1).
• All bends in the catheter should be smooth curves, not sharp kinks.
! Incorrect placement and complications of CVCs• CVCs, more frequently those placed by the subclavian
route, can be malpositioned.• They are most often malpositioned with their tips in
the right atrium or internal jugular vein (if inserted via the subclavian vein) (Fig. 10-6).• In the right atrium, they can produce cardiac
arrhythmias.• When CVCs are malpositioned, they may provide
inaccurate central venous pressure readings.• Pneumothorax can occur in up to 5% of CVC insertions,
more often with the subclavian approach than the inter-nal jugular route.
• Occasionally CVCs may perforate the vein and lie outside of the blood vessel. Look for sharp bends in the catheter as a clue to a possible perforation.
• Sometimes, they may be inadvertently inserted in the subclavian artery rather than the subclavian vein.• Suspect arterial placement if the flow is pulsatile
and the course of the catheter parallels the aortic arch or fails to descend to the right of the spine (Fig. 10-7).
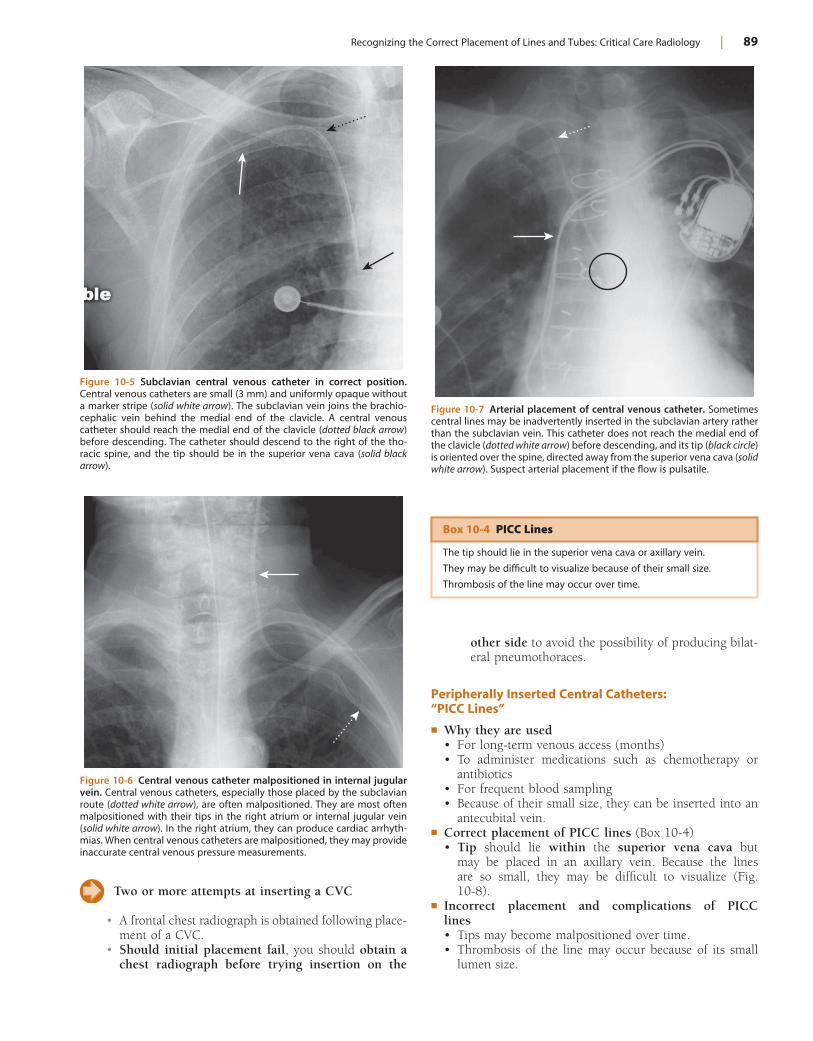
Recognizing the Correct Placement of Lines and Tubes: Critical Care Radiology | 89
Figure 10-5 Subclavian central venous catheter in correct position. Central venous catheters are small (3 mm) and uniformly opaque without a marker stripe (solid white arrow). The subclavian vein joins the brachio-cephalic vein behind the medial end of the clavicle. A central venous catheter should reach the medial end of the clavicle (dotted black arrow) before descending. The catheter should descend to the right of the tho-racic spine, and the tip should be in the superior vena cava (solid black arrow).
Figure 10-6 Central venous catheter malpositioned in internal jugular vein. Central venous catheters, especially those placed by the subclavian route (dotted white arrow), are often malpositioned. They are most often malpositioned with their tips in the right atrium or internal jugular vein (solid white arrow). In the right atrium, they can produce cardiac arrhyth-mias. When central venous catheters are malpositioned, they may provide inaccurate central venous pressure measurements.
Figure 10-7 Arterial placement of central venous catheter. Sometimes central lines may be inadvertently inserted in the subclavian artery rather than the subclavian vein. This catheter does not reach the medial end of the clavicle (dotted white arrow) before descending, and its tip (black circle) is oriented over the spine, directed away from the superior vena cava (solid white arrow). Suspect arterial placement if the flow is pulsatile.
Two or more attempts at inserting a CVC
• A frontal chest radiograph is obtained following place-ment of a CVC.
• Should initial placement fail, you should obtain a chest radiograph before trying insertion on the
other side to avoid the possibility of producing bilat-eral pneumothoraces.
Peripherally Inserted Central Catheters: “PICC Lines”
! Why they are used• For long-term venous access (months)• To administer medications such as chemotherapy or
antibiotics• For frequent blood sampling• Because of their small size, they can be inserted into an
antecubital vein.! Correct placement of PICC lines (Box 10-4)
• Tip should lie within the superior vena cava but may be placed in an axillary vein. Because the lines are so small, they may be difficult to visualize (Fig. 10-8).
! Incorrect placement and complications of PICC lines• Tips may become malpositioned over time.• Thrombosis of the line may occur because of its small
lumen size.
Box 10-4 PICC Lines
The tip should lie in the superior vena cava or axillary vein.
They may be difficult to visualize because of their small size.
Thrombosis of the line may occur over time.
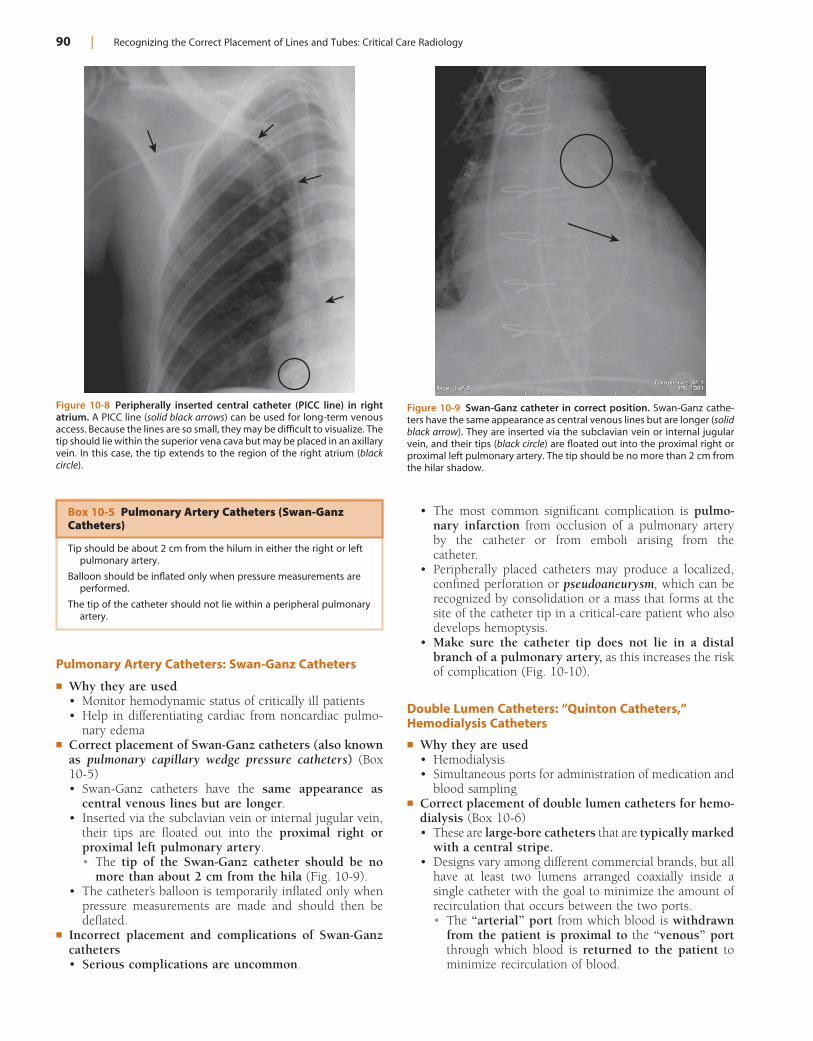
90 | Recognizing the Correct Placement of Lines and Tubes: Critical Care Radiology
• The most common significant complication is pulmo-nary infarction from occlusion of a pulmonary artery by the catheter or from emboli arising from the catheter.
• Peripherally placed catheters may produce a localized, confined perforation or pseudoaneurysm, which can be recognized by consolidation or a mass that forms at the site of the catheter tip in a critical-care patient who also develops hemoptysis.
• Make sure the catheter tip does not lie in a distal branch of a pulmonary artery, as this increases the risk of complication (Fig. 10-10).
Double Lumen Catheters: “Quinton Catheters,” Hemodialysis Catheters
! Why they are used• Hemodialysis• Simultaneous ports for administration of medication and
blood sampling! Correct placement of double lumen catheters for hemo-
dialysis (Box 10-6)• These are large-bore catheters that are typically marked
with a central stripe.• Designs vary among different commercial brands, but all
have at least two lumens arranged coaxially inside a single catheter with the goal to minimize the amount of recirculation that occurs between the two ports.• The “arterial” port from which blood is withdrawn
from the patient is proximal to the “venous” port through which blood is returned to the patient to minimize recirculation of blood.
Figure 10-8 Peripherally inserted central catheter (PICC line) in right atrium. A PICC line (solid black arrows) can be used for long-term venous access. Because the lines are so small, they may be difficult to visualize. The tip should lie within the superior vena cava but may be placed in an axillary vein. In this case, the tip extends to the region of the right atrium (black circle).
Figure 10-9 Swan-Ganz catheter in correct position. Swan-Ganz cathe-ters have the same appearance as central venous lines but are longer (solid black arrow). They are inserted via the subclavian vein or internal jugular vein, and their tips (black circle) are floated out into the proximal right or proximal left pulmonary artery. The tip should be no more than 2 cm from the hilar shadow.
Box 10-5 Pulmonary Artery Catheters (Swan-Ganz Catheters)
Tip should be about 2 cm from the hilum in either the right or left pulmonary artery.
Balloon should be inflated only when pressure measurements are performed.
The tip of the catheter should not lie within a peripheral pulmonary artery.
Pulmonary Artery Catheters: Swan-Ganz Catheters
! Why they are used• Monitor hemodynamic status of critically ill patients• Help in differentiating cardiac from noncardiac pulmo-
nary edema! Correct placement of Swan-Ganz catheters (also known
as pulmonary capillary wedge pressure catheters) (Box 10-5)• Swan-Ganz catheters have the same appearance as
central venous lines but are longer.• Inserted via the subclavian vein or internal jugular vein,
their tips are floated out into the proximal right or proximal left pulmonary artery.• The tip of the Swan-Ganz catheter should be no
more than about 2 cm from the hila (Fig. 10-9).• The catheter’s balloon is temporarily inflated only when
pressure measurements are made and should then be deflated.
! Incorrect placement and complications of Swan-Ganz catheters• Serious complications are uncommon.
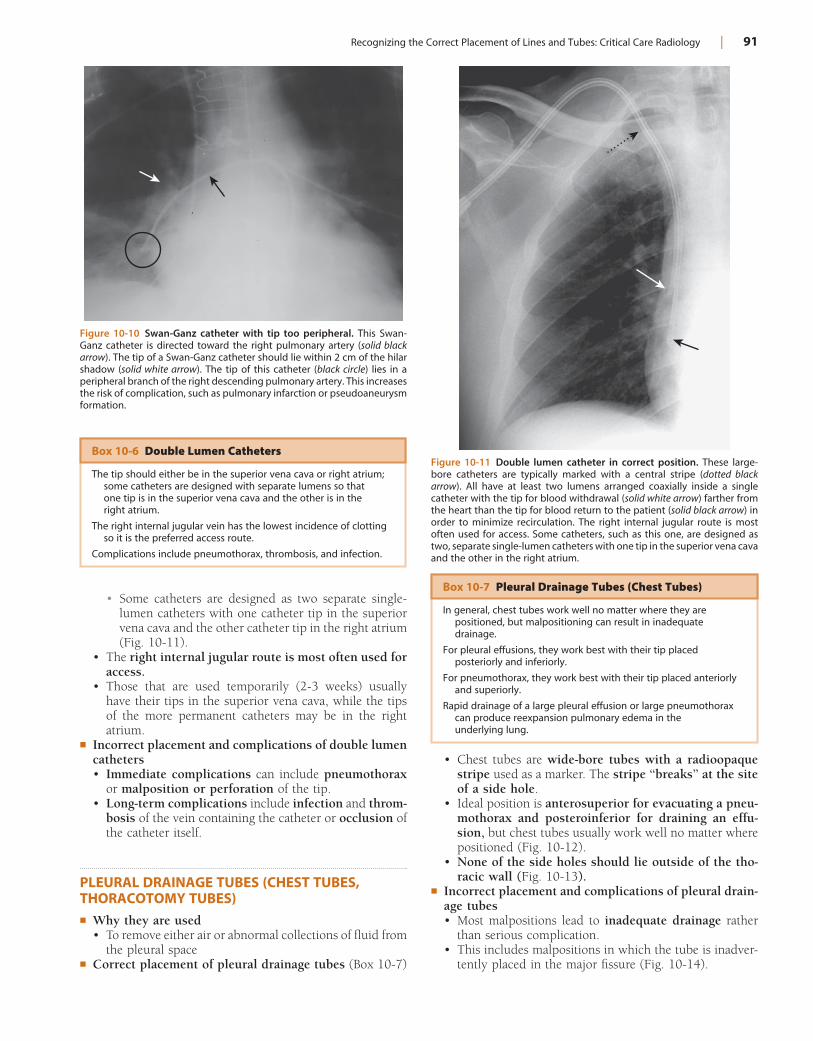
Recognizing the Correct Placement of Lines and Tubes: Critical Care Radiology | 91
• Chest tubes are wide-bore tubes with a radioopaque stripe used as a marker. The stripe “breaks” at the site of a side hole.
• Ideal position is anterosuperior for evacuating a pneu-mothorax and posteroinferior for draining an effu-sion, but chest tubes usually work well no matter where positioned (Fig. 10-12).
• None of the side holes should lie outside of the tho-racic wall (Fig. 10-13).
! Incorrect placement and complications of pleural drain-age tubes• Most malpositions lead to inadequate drainage rather
than serious complication.• This includes malpositions in which the tube is inadver-
tently placed in the major fissure (Fig. 10-14).
• Some catheters are designed as two separate single-lumen catheters with one catheter tip in the superior vena cava and the other catheter tip in the right atrium (Fig. 10-11).
• The right internal jugular route is most often used for access.
• Those that are used temporarily (2-3 weeks) usually have their tips in the superior vena cava, while the tips of the more permanent catheters may be in the right atrium.
! Incorrect placement and complications of double lumen catheters• Immediate complications can include pneumothorax
or malposition or perforation of the tip.• Long-term complications include infection and throm-
bosis of the vein containing the catheter or occlusion of the catheter itself.
PLEURAL DRAINAGE TUBES (CHEST TUBES, THORACOTOMY TUBES)! Why they are used
• To remove either air or abnormal collections of fluid from the pleural space
! Correct placement of pleural drainage tubes (Box 10-7)
Figure 10-10 Swan-Ganz catheter with tip too peripheral. This Swan-Ganz catheter is directed toward the right pulmonary artery (solid black arrow). The tip of a Swan-Ganz catheter should lie within 2 cm of the hilar shadow (solid white arrow). The tip of this catheter (black circle) lies in a peripheral branch of the right descending pulmonary artery. This increases the risk of complication, such as pulmonary infarction or pseudoaneurysm formation.
Box 10-6 Double Lumen Catheters
The tip should either be in the superior vena cava or right atrium; some catheters are designed with separate lumens so that one tip is in the superior vena cava and the other is in the right atrium.
The right internal jugular vein has the lowest incidence of clotting so it is the preferred access route.
Complications include pneumothorax, thrombosis, and infection.
Figure 10-11 Double lumen catheter in correct position. These large-bore catheters are typically marked with a central stripe (dotted black arrow). All have at least two lumens arranged coaxially inside a single catheter with the tip for blood withdrawal (solid white arrow) farther from the heart than the tip for blood return to the patient (solid black arrow) in order to minimize recirculation. The right internal jugular route is most often used for access. Some catheters, such as this one, are designed as two, separate single-lumen catheters with one tip in the superior vena cava and the other in the right atrium.
Box 10-7 Pleural Drainage Tubes (Chest Tubes)
In general, chest tubes work well no matter where they are positioned, but malpositioning can result in inadequate drainage.
For pleural effusions, they work best with their tip placed posteriorly and inferiorly.
For pneumothorax, they work best with their tip placed anteriorly and superiorly.
Rapid drainage of a large pleural effusion or large pneumothorax can produce reexpansion pulmonary edema in the underlying lung.
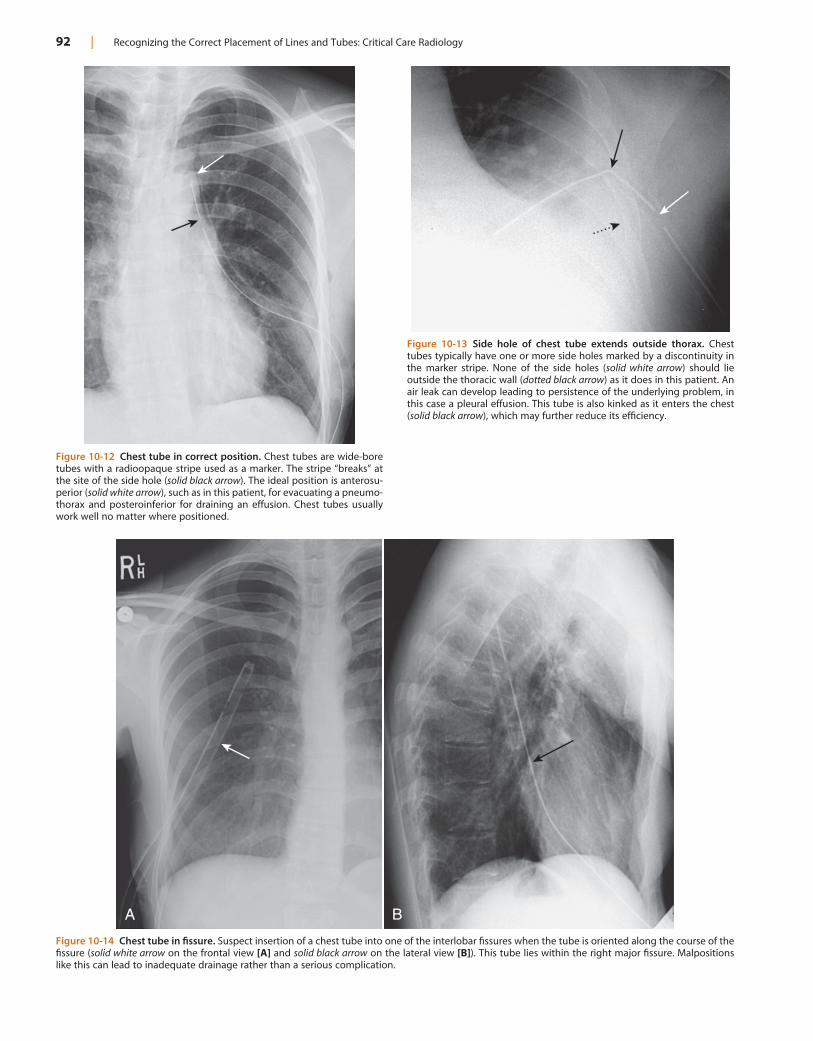
92 | Recognizing the Correct Placement of Lines and Tubes: Critical Care Radiology
Figure 10-12 Chest tube in correct position. Chest tubes are wide-bore tubes with a radioopaque stripe used as a marker. The stripe “breaks” at the site of the side hole (solid black arrow). The ideal position is anterosu-perior (solid white arrow), such as in this patient, for evacuating a pneumo-thorax and posteroinferior for draining an effusion. Chest tubes usually work well no matter where positioned.
Figure 10-13 Side hole of chest tube extends outside thorax. Chest tubes typically have one or more side holes marked by a discontinuity in the marker stripe. None of the side holes (solid white arrow) should lie outside the thoracic wall (dotted black arrow) as it does in this patient. An air leak can develop leading to persistence of the underlying problem, in this case a pleural effusion. This tube is also kinked as it enters the chest (solid black arrow), which may further reduce its efficiency.
Figure 10-14 Chest tube in fissure. Suspect insertion of a chest tube into one of the interlobar fissures when the tube is oriented along the course of the fissure (solid white arrow on the frontal view [A] and solid black arrow on the lateral view [B]). This tube lies within the right major fissure. Malpositions like this can lead to inadequate drainage rather than a serious complication.
A B

Recognizing the Correct Placement of Lines and Tubes: Critical Care Radiology | 93
Box 10-8 Pacemakers
The generator is usually placed in the left anterior chest wall with at least one lead in the right ventricular apex.
Remember that the right ventricle projects to the left of the spine on the frontal view and anteriorly on the lateral view of the chest.
Complications are infrequent but include fractures in the lead wires and pneumothorax.
Ectopically placed leads may result in failure of the pacemaker to function properly.
Figure 10-15 Dual-lead pacemaker in correct position. Pacemakers consist of a pulse generator (solid white arrow) usually implanted in the left chest wall and one or more electrode leads usually inserted into the subclavian vein. This patient has a dual-lead pacemaker. One of the leads is in the apex of the right ventricle (solid black arrow in [A] and [B]) while the other lead is in the right atrium (dotted black arrow in [A] and [B]). Notice that the right ventricular lead (solid black arrows) projects to the left of the midline (A) and anteriorly (B), and the right atrial lead typically curls upward.
A B
• If the side hole extends outside of the chest wall, this can lead to an air leak causing both inadequate drainage and subcutaneous emphysema.
• Serious complications are uncommon:• Bleeding secondary to laceration of intercostal
artery• Laceration of liver or spleen on insertion• Rapid reexpansion of a collapsed lung, caused
either by a large pneumothorax or a large pleural effu-sion, may lead to unilateral reexpansion pulmonary edema (see Fig. 9-18).
CARDIAC DEVICESPacemakers
! Why they are used• Used for cardiac conduction abnormalities• Certain conditions refractory to medical treatment (e.g.,
congestive heart failure)! Correct placement of cardiac pacemakers (Box 10-8)
• All pacemakers consist of a pulse generator usually implanted subcutaneously in the left anterior chest wall and at least one lead (electrode) inserted percutane-ously most often into the subclavian vein.
• The tip of one lead is almost always located in the apex of the right ventricle.
Remember that in the frontal projection, the apex of the right ventricle lies to the left of the spine and on the
lateral film the apex of the right ventricle is located anteriorly (Fig. 10-15).
• Some pacemakers have two leads (usually their tips are in the right atrium and right ventricle) while others may have three leads (with their tips usually in the right atrium, right ventricle, and coronary sinus).
• All leads should have gentle curves. The electrodes should have no sharp kinks.
! Incorrect placement and complications of cardiac pacemakers• Pneumothoraces are infrequent complications of either
pacemaker or AICD insertion.• Fracture of the leads may occur at any of three places:
the pacer itself, the tip of the lead, or the site of venous access. Breaks in the lead can be recognized by discon-tinuity in the wire lead itself (Fig. 10-16).
• Leads can perforate the heart producing cardiac tam-ponade. Look for sharp bends in leads secondary to perforation of a blood vessel.
• Leads may retract from normal contact with the ven-tricular wall because the patient twists or twiddles the pacemaker generator under the skin, unknowingly winding the leads around the pacer causing retraction of
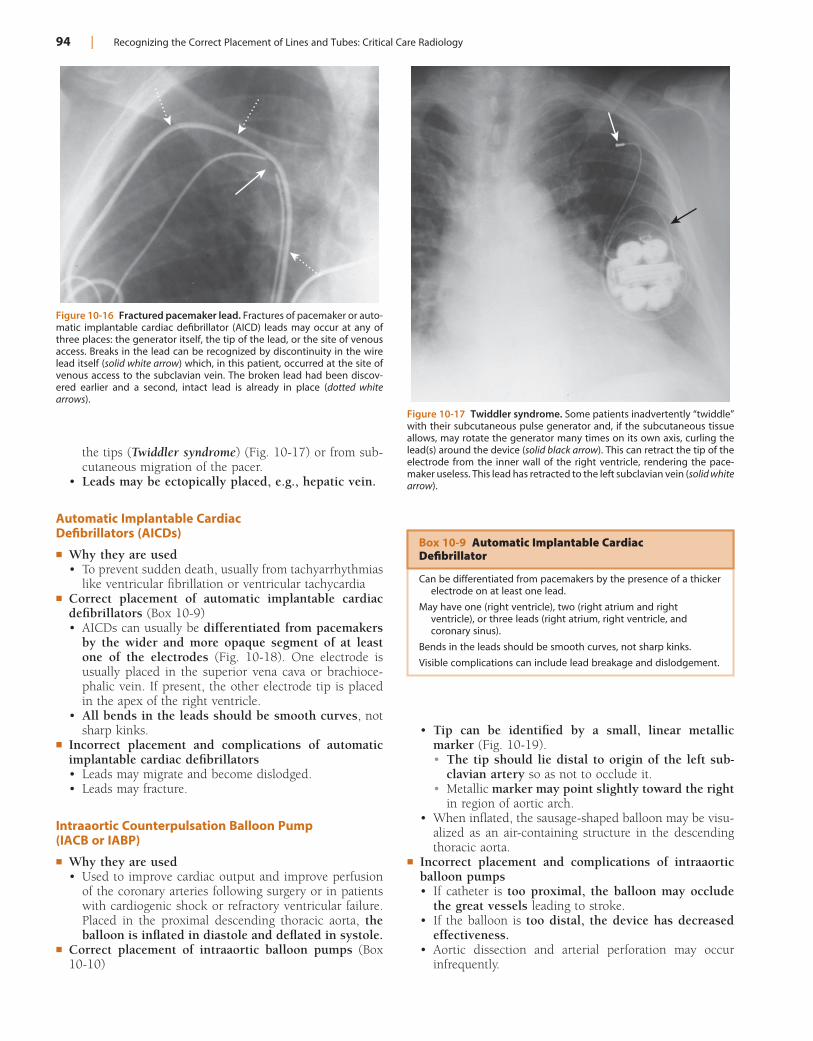
94 | Recognizing the Correct Placement of Lines and Tubes: Critical Care Radiology
Figure 10-16 Fractured pacemaker lead. Fractures of pacemaker or auto-matic implantable cardiac defibrillator (AICD) leads may occur at any of three places: the generator itself, the tip of the lead, or the site of venous access. Breaks in the lead can be recognized by discontinuity in the wire lead itself (solid white arrow) which, in this patient, occurred at the site of venous access to the subclavian vein. The broken lead had been discov-ered earlier and a second, intact lead is already in place (dotted white arrows).
Figure 10-17 Twiddler syndrome. Some patients inadvertently “twiddle” with their subcutaneous pulse generator and, if the subcutaneous tissue allows, may rotate the generator many times on its own axis, curling the lead(s) around the device (solid black arrow). This can retract the tip of the electrode from the inner wall of the right ventricle, rendering the pace-maker useless. This lead has retracted to the left subclavian vein (solid white arrow).
Box 10-9 Automatic Implantable Cardiac Defibrillator
Can be differentiated from pacemakers by the presence of a thicker electrode on at least one lead.
May have one (right ventricle), two (right atrium and right ventricle), or three leads (right atrium, right ventricle, and coronary sinus).
Bends in the leads should be smooth curves, not sharp kinks.
Visible complications can include lead breakage and dislodgement.
the tips (Twiddler syndrome) (Fig. 10-17) or from sub-cutaneous migration of the pacer.
• Leads may be ectopically placed, e.g., hepatic vein.
Automatic Implantable Cardiac Defibrillators (AICDs)
! Why they are used• To prevent sudden death, usually from tachyarrhythmias
like ventricular fibrillation or ventricular tachycardia! Correct placement of automatic implantable cardiac
defibrillators (Box 10-9)• AICDs can usually be differentiated from pacemakers
by the wider and more opaque segment of at least one of the electrodes (Fig. 10-18). One electrode is usually placed in the superior vena cava or brachioce-phalic vein. If present, the other electrode tip is placed in the apex of the right ventricle.
• All bends in the leads should be smooth curves, not sharp kinks.
! Incorrect placement and complications of automatic implantable cardiac defibrillators• Leads may migrate and become dislodged.• Leads may fracture.
Intraaortic Counterpulsation Balloon Pump (IACB or IABP)
! Why they are used• Used to improve cardiac output and improve perfusion
of the coronary arteries following surgery or in patients with cardiogenic shock or refractory ventricular failure. Placed in the proximal descending thoracic aorta, the balloon is inflated in diastole and deflated in systole.
! Correct placement of intraaortic balloon pumps (Box 10-10)
• Tip can be identified by a small, linear metallic marker (Fig. 10-19).• The tip should lie distal to origin of the left sub-
clavian artery so as not to occlude it.• Metallic marker may point slightly toward the right
in region of aortic arch.• When inflated, the sausage-shaped balloon may be visu-
alized as an air-containing structure in the descending thoracic aorta.
! Incorrect placement and complications of intraaortic balloon pumps• If catheter is too proximal, the balloon may occlude
the great vessels leading to stroke.• If the balloon is too distal, the device has decreased
effectiveness.• Aortic dissection and arterial perforation may occur
infrequently.
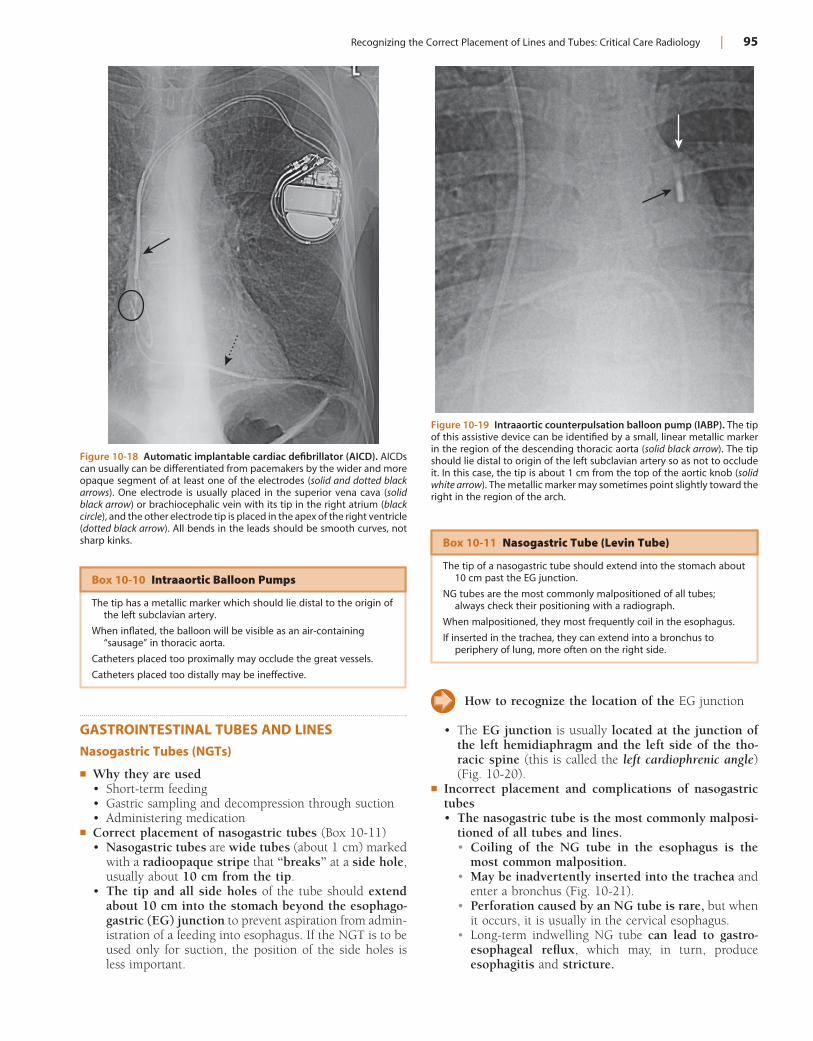
Recognizing the Correct Placement of Lines and Tubes: Critical Care Radiology | 95
How to recognize the location of the EG junction
• The EG junction is usually located at the junction of the left hemidiaphragm and the left side of the tho-racic spine (this is called the left cardiophrenic angle) (Fig. 10-20).
! Incorrect placement and complications of nasogastric tubes• The nasogastric tube is the most commonly malposi-
tioned of all tubes and lines.• Coiling of the NG tube in the esophagus is the
most common malposition.• May be inadvertently inserted into the trachea and
enter a bronchus (Fig. 10-21).• Perforation caused by an NG tube is rare, but when
it occurs, it is usually in the cervical esophagus.• Long-term indwelling NG tube can lead to gastro-
esophageal reflux, which may, in turn, produce esophagitis and stricture.
GASTROINTESTINAL TUBES AND LINESNasogastric Tubes (NGTs)
! Why they are used• Short-term feeding• Gastric sampling and decompression through suction• Administering medication
! Correct placement of nasogastric tubes (Box 10-11)• Nasogastric tubes are wide tubes (about 1 cm) marked
with a radioopaque stripe that “breaks” at a side hole, usually about 10 cm from the tip.
• The tip and all side holes of the tube should extend about 10 cm into the stomach beyond the esophago-gastric (EG) junction to prevent aspiration from admin-istration of a feeding into esophagus. If the NGT is to be used only for suction, the position of the side holes is less important.
Figure 10-18 Automatic implantable cardiac defibrillator (AICD). AICDs can usually can be differentiated from pacemakers by the wider and more opaque segment of at least one of the electrodes (solid and dotted black arrows). One electrode is usually placed in the superior vena cava (solid black arrow) or brachiocephalic vein with its tip in the right atrium (black circle), and the other electrode tip is placed in the apex of the right ventricle (dotted black arrow). All bends in the leads should be smooth curves, not sharp kinks.
Box 10-10 Intraaortic Balloon Pumps
The tip has a metallic marker which should lie distal to the origin of the left subclavian artery.
When inflated, the balloon will be visible as an air-containing “sausage” in thoracic aorta.
Catheters placed too proximally may occlude the great vessels.
Catheters placed too distally may be ineffective.
Figure 10-19 Intraaortic counterpulsation balloon pump (IABP). The tip of this assistive device can be identified by a small, linear metallic marker in the region of the descending thoracic aorta (solid black arrow). The tip should lie distal to origin of the left subclavian artery so as not to occlude it. In this case, the tip is about 1 cm from the top of the aortic knob (solid white arrow). The metallic marker may sometimes point slightly toward the right in the region of the arch.
Box 10-11 Nasogastric Tube (Levin Tube)
The tip of a nasogastric tube should extend into the stomach about 10 cm past the EG junction.
NG tubes are the most commonly malpositioned of all tubes; always check their positioning with a radiograph.
When malpositioned, they most frequently coil in the esophagus.
If inserted in the trachea, they can extend into a bronchus to periphery of lung, more often on the right side.
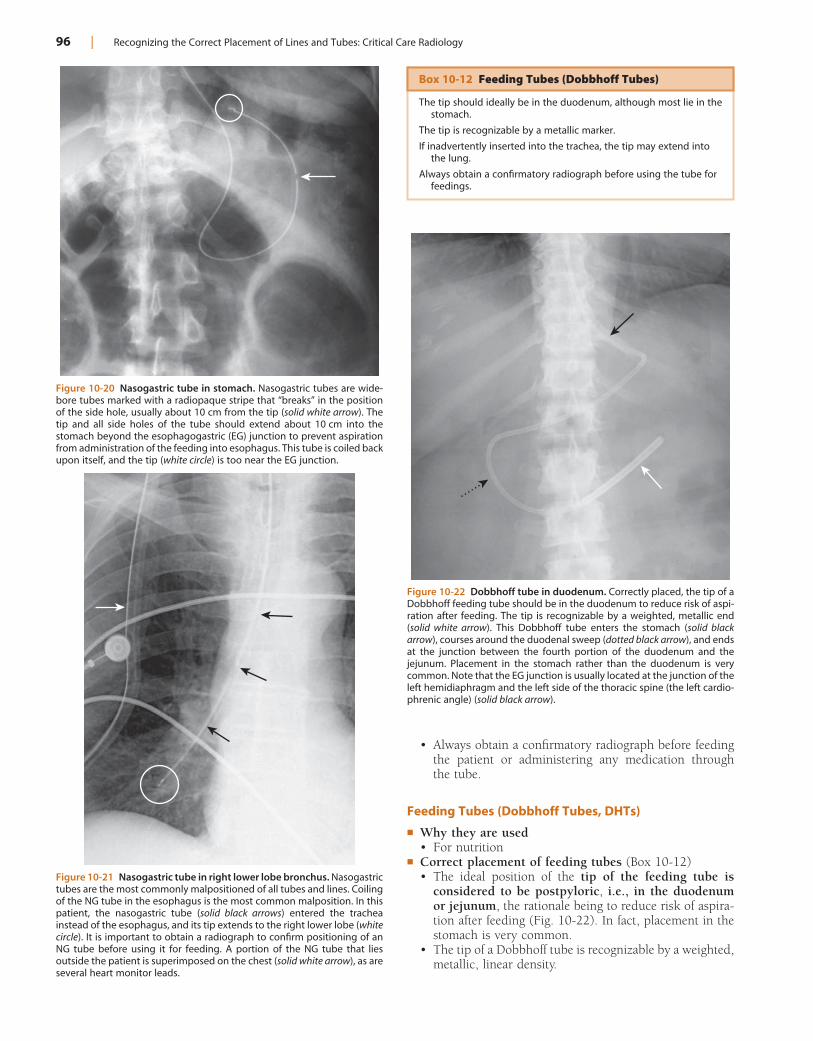
96 | Recognizing the Correct Placement of Lines and Tubes: Critical Care Radiology
Figure 10-20 Nasogastric tube in stomach. Nasogastric tubes are wide-bore tubes marked with a radiopaque stripe that “breaks” in the position of the side hole, usually about 10 cm from the tip (solid white arrow). The tip and all side holes of the tube should extend about 10 cm into the stomach beyond the esophagogastric (EG) junction to prevent aspiration from administration of the feeding into esophagus. This tube is coiled back upon itself, and the tip (white circle) is too near the EG junction.
Figure 10-21 Nasogastric tube in right lower lobe bronchus. Nasogastric tubes are the most commonly malpositioned of all tubes and lines. Coiling of the NG tube in the esophagus is the most common malposition. In this patient, the nasogastric tube (solid black arrows) entered the trachea instead of the esophagus, and its tip extends to the right lower lobe (white circle). It is important to obtain a radiograph to confirm positioning of an NG tube before using it for feeding. A portion of the NG tube that lies outside the patient is superimposed on the chest (solid white arrow), as are several heart monitor leads.
Figure 10-22 Dobbhoff tube in duodenum. Correctly placed, the tip of a Dobbhoff feeding tube should be in the duodenum to reduce risk of aspi-ration after feeding. The tip is recognizable by a weighted, metallic end (solid white arrow). This Dobbhoff tube enters the stomach (solid black arrow), courses around the duodenal sweep (dotted black arrow), and ends at the junction between the fourth portion of the duodenum and the jejunum. Placement in the stomach rather than the duodenum is very common. Note that the EG junction is usually located at the junction of the left hemidiaphragm and the left side of the thoracic spine (the left cardio-phrenic angle) (solid black arrow).
Box 10-12 Feeding Tubes (Dobbhoff Tubes)
The tip should ideally be in the duodenum, although most lie in the stomach.
The tip is recognizable by a metallic marker.
If inadvertently inserted into the trachea, the tip may extend into the lung.
Always obtain a confirmatory radiograph before using the tube for feedings.
• Always obtain a confirmatory radiograph before feeding the patient or administering any medication through the tube.
Feeding Tubes (Dobbhoff Tubes, DHTs)
! Why they are used• For nutrition
! Correct placement of feeding tubes (Box 10-12)• The ideal position of the tip of the feeding tube is
considered to be postpyloric, i.e., in the duodenum or jejunum, the rationale being to reduce risk of aspira-tion after feeding (Fig. 10-22). In fact, placement in the stomach is very common.
• The tip of a Dobbhoff tube is recognizable by a weighted, metallic, linear density.
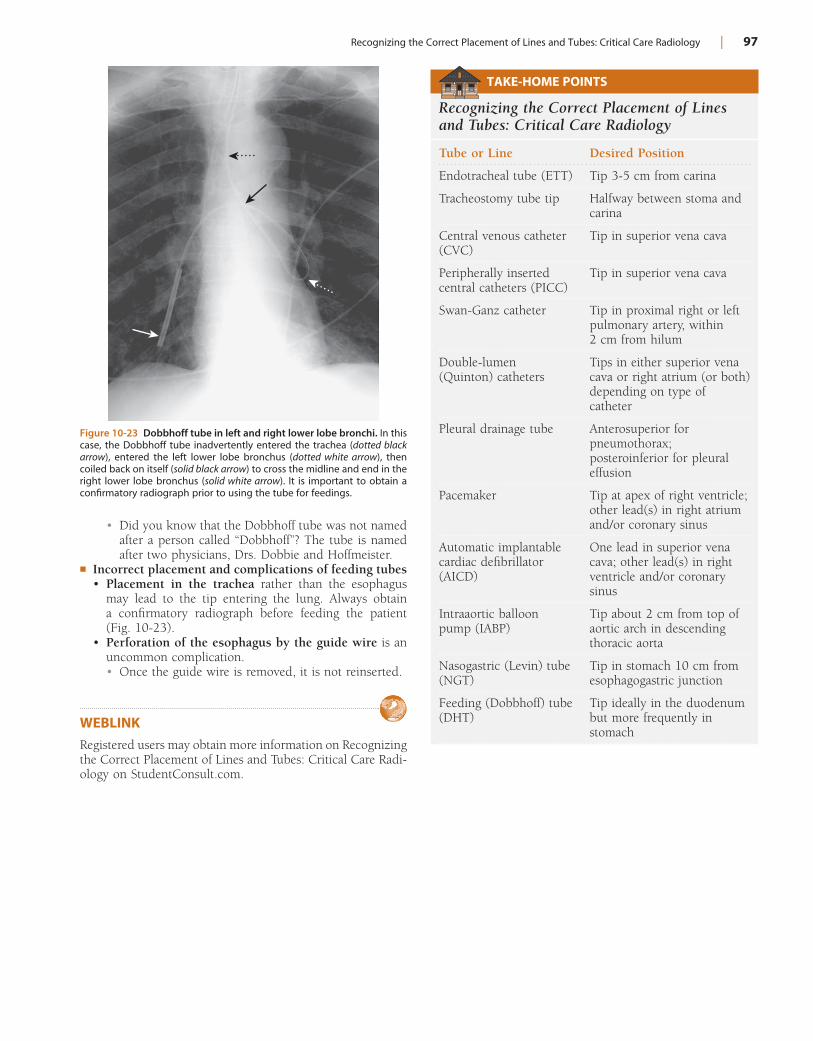
Recognizing the Correct Placement of Lines and Tubes: Critical Care Radiology | 97
• Did you know that the Dobbhoff tube was not named after a person called “Dobbhoff”? The tube is named after two physicians, Drs. Dobbie and Hoffmeister.
! Incorrect placement and complications of feeding tubes• Placement in the trachea rather than the esophagus
may lead to the tip entering the lung. Always obtain a confirmatory radiograph before feeding the patient (Fig. 10-23).
• Perforation of the esophagus by the guide wire is an uncommon complication.• Once the guide wire is removed, it is not reinserted.
WEBLINKRegistered users may obtain more information on Recognizing the Correct Placement of Lines and Tubes: Critical Care Radi-ology on StudentConsult.com.
Figure 10-23 Dobbhoff tube in left and right lower lobe bronchi. In this case, the Dobbhoff tube inadvertently entered the trachea (dotted black arrow), entered the left lower lobe bronchus (dotted white arrow), then coiled back on itself (solid black arrow) to cross the midline and end in the right lower lobe bronchus (solid white arrow). It is important to obtain a confirmatory radiograph prior to using the tube for feedings.
TAKE-HOME POINTS
Recognizing the Correct Placement of Lines and Tubes: Critical Care Radiology
Tube or Line Desired Position
Endotracheal tube (ETT) Tip 3-5 cm from carina
Tracheostomy tube tip Halfway between stoma and carina
Central venous catheter (CVC)
Tip in superior vena cava
Peripherally inserted central catheters (PICC)
Tip in superior vena cava
Swan-Ganz catheter Tip in proximal right or left pulmonary artery, within 2 cm from hilum
Double-lumen (Quinton) catheters
Tips in either superior vena cava or right atrium (or both) depending on type of catheter
Pleural drainage tube Anterosuperior for pneumothorax; posteroinferior for pleural effusion
Pacemaker Tip at apex of right ventricle; other lead(s) in right atrium and/or coronary sinus
Automatic implantable cardiac defibrillator (AICD)
One lead in superior vena cava; other lead(s) in right ventricle and/or coronary sinus
Intraaortic balloon pump (IABP)
Tip about 2 cm from top of aortic arch in descending thoracic aorta
Nasogastric (Levin) tube (NGT)
Tip in stomach 10 cm from esophagogastric junction
Feeding (Dobbhoff) tube (DHT)
Tip ideally in the duodenum but more frequently in stomach
98
Chapter 11
Computed Tomography: Understanding the Basics and Recognizing Normal Anatomy
INTRODUCTION TO CT! A computed tomographic (CT) image is composed of a
matrix of thousands of tiny squares called pixels, each of which is computer-assigned a CT number from !1000 to +1000 measured in something called Hounsfield units (HU), after Sir Godfrey Hounsfield, the man credited with developing the first CT scanner (for which he won the Nobel prize in Medicine in 1979 along with Allan Cormack).• A tomogram is a slice through the body measured in
millimeters that allows for the accurate localization of objects in that section, unlike conventional radiographs that superimpose all of the structures within a given field of view.
• A CT scanner uses x-rays transmitted to multiple detectors connected to a computer, which processes the data though various algorithms to produce images of diagnostic quality.
! The CT number will vary according to the density of the tissue scanned and is a measure of how much of the x-ray beam is absorbed by the tissues at each point in the scan. By convention, air is assigned a Hounsfield number of !1000 HU and bone is about 400 to 600 HU (fat is !40 to !100, water is 0, and soft tissue 20 to 100).
! CT images are displayed or viewed using a range of Houn-sfield numbers preselected to best demonstrate the tissues being studied (for example, from !100 to +300) and any-thing within that range of CT numbers is displayed over the levels of density in the available gray scale.
! This range of densities is called the window or window-width setting, and the number within that range that is arbitrarily chosen to be the center of the gray scale is called the center or the window level.
Denser substances that absorb more x-rays have high CT numbers, are said to demonstrate increased atten-
uation, and are displayed as whiter densities on CT scans.
• On conventional radiographs, these substances (like metal and calcium) would also appear whiter and be said to have increased density or be more opaque.
! Less dense substances that absorb fewer x-rays have low CT numbers, are said to demonstrate decreased atten-uation, and are displayed as blacker densities on CT scans.• On conventional radiographs, these substances (like
air and fat) would also appear as blacker densities and be said to have decreased density (or increased lucency).
! High-resolution computed tomography (HRCT), or thin-slice CT, is now a potential part of every chest CT, making
these studies particularly useful for the imaging and char-acterization of diffuse parenchymal lung diseases.
! Spiral CT (helical CT) uses a continuously rotating x-ray source and detector array combined with constant table movement to permit data acquisition through the chest or abdomen so quickly it can be done while the patient holds a single breath.• This results in an extremely rapid acquisition of data
that has no “gaps” between slices, which, in turn, allows for seamless reconstruction (also called reformatting) of those images in almost any plane. As importantly, the resolution of the reconstructions is equivalent to the clarity of the original scan with most modern scanners.
• Traditionally, CT images were viewed mostly in the axial plane. With volumetric data acquisition and seamless reconstruction, CT scans now provide diagnostically useful images in the coronal and sagittal planes as well as three-dimensional reconstructions that can be viewed at any angle.
Multislice CT (also called multidetector CT) makes use of multiple rows of detectors that allow for images
to be reconstructed in a range of slice thicknesses after the scan is completed without reimaging the patient.
• Because of increasingly sophisticated arrays of detectors and acquisition of as many as 256 slices simultaneously, multislice CT scanners permit very fast imaging (head to toe in less than 30 seconds) that has allowed for development of new applications for CT, such as virtual colonoscopy (see Chapter 18) and virtual bron-choscopy, cardiac calcium scoring, and CT coronary angiography (see Chapter 9).
• Such examinations can contain a thousand or more images so that the older convention of filming each image for study on a view box is impractical and such examinations are almost always viewed on computer workstations.
! So, you might ask, why not scan everyone at the thinnest possible slice thickness from head to toe?• The reason is that doing so might expose a patient to an
unnecessarily high dose of radiation. The radiation dose delivered by CT studies is dependent on many factors, including the type of equipment, the energy of the x-rays used to produce the images, and the size of the patient. The economic and personal costs of evaluat-ing unexpected and often inconsequential findings may also outweigh any potential benefit from whole-body screening.
• Dose-reducing measures are being employed, including the use of optimized CT settings, reduction in the x-ray
Computed Tomography: Understanding the Basics and Recognizing Normal Anatomy | 99
use has diminished as the quality of CT images has improved. Oral contrast is usually not employed in chest CT scanning unless there is a question concerning the esophagus.
! Orally administered contrast, frequently given in tempo-rally divided doses to allow earlier contrast to reach the colon while later contrast opacifies the stomach, is utilized for most abdominal CT scans except those performed for trauma, the stone search study, and studies specifically directed towards evaluating vascular structures like the aorta.
! One of two different types of oral contrast may be used. The most widely used is a dilute solution of barium sulfate, the same contrast agent employed in upper gastrointestinal studies and barium enemas. If there is concern for bowel perforation and the possibility that contrast may exit from the lumen of the bowel, an iodine-based, water-soluble contrast is sometimes used (Gastrografin). Contrast may also be introduced rectally to opacify the colon more quickly than it would take for orally administered contrast to reach the large bowel or through a Foley catheter to quickly opacify the urinary bladder.
! You will probably not be required to make the decision of when or if to use contrast because the radiologist will usually tailor the examination to best answer the clini-cal question being asked, so it is always important to provide as much clinical information as possible when requesting a study.
! Table 11-1 summarizes when intravenous and oral con-trasts are utilized for particular problems.
energy used, limiting the number of repeat scans, and assuring—through appropriate consultation—that the benefits derived from obtaining the study outweigh any potential risks of the radiation exposure.
INTRAVENOUS CONTRAST IN CT SCANNING! CT scans can be performed with or without the intra-
venous administration of iodinated contrast material but, in general, they yield more diagnostic information that is more easily recognizable when intravenous con-trast can be used.• All radiographic contrast agents, in general, are admin-
istered to increase the differences in density between two tissues. CT scans done with intravenous contrast are called contrast-enhanced or simply enhanced. Most of the time, the radiologist will choose the scanning parameters to optimize the CT study for the patient’s clinical issues. For example, different rates of contrast administration and timing of the scan will allow diagnos-tic enhancement of hepatic vessels versus the liver parenchyma.
• While it might sound like a wonderful idea to give everyone contrast for all CT studies, keep in mind that iodinated contrast can have adverse effects and produce serious reactions in susceptible individuals (Box 11-1).
ORAL CONTRAST IN CT SCANNING! For abdominal and pelvic CT imaging, oral contrast
may also be administered to define the bowel, although its
TABLE 11-1 CT SCANS: WHEN CONTRAST IS USED
IV Contrast Used IV Contrast Usually Not Used
Chest
CT-pulmonary angiogram (CT-PA) for pulmonary embolism
Evaluation of the mediastinum or hila for mass or adenopathy
Detect aortic aneurysm or dissection
Evaluate blunt or penetrating trauma
Characterize pleural disease (metastases, empyema)
CT densitometry of pulmonary masses
Evaluate the coronary arteries
Evaluation of diffuse infiltrative lung diseases using HRCT
Confirmation of the presence of a nodule suspected from conventional radiographs
Detect pneumothorax/pneumomediastinum
Calcium scoring for the coronary arteries
Known allergies to contrast or renal failure
Abdomen and Pelvis
Evaluate for the presence of and/or to characterize a mass and to stage or follow up malignancies
TraumaAbdominal pain (e.g.,
appendicitis)Detect aortic aneurysm or
dissection
Virtual colonoscopySearch for a ureteral calculus
When Oral Contrast Is Used
Most cases of nontraumatic abdominal painInflammatory bowel diseaseAbdominal or pelvic abscessLocate the site of bowel perforation, including fistulae
Box 11-1 Contrast Reactions and Renal Failure
Intravenous contrast materials available today are nonionic, low-osmolar solutions containing a high concentration of iodine that circulate through the bloodstream, opacify those tissues and organs with high blood flow, are absorbed by x-ray (and therefore appear “whiter” on images), and are finally excreted in the urine by the kidneys.
In some patients (e.g., those with diabetes, dehydration, multiple myeloma) who have compromised renal function evidenced by creatinine > 1.5, iodinated contrast can produce a nephrotoxic effect resulting in acute tubular necrosis. Though usually reversible, in a small number of patients with underlying renal insufficiency, renal dysfunction may permanently worsen. This effect is dose related.
Iodinated contrast agents can sometimes produce mild side effects, including a feeling of warmth, nausea, vomiting, local irritation at the site of injection, itching, and hives; these side effects usually require no treatment. Occasional idiosyncratic, allergic-like reactions include itching, hives, and laryngeal irritation.
Asthmatics and those with a history of severe allergies or prior reactions to IV contrast have a higher likelihood of contrast reactions (but still very low overall) and may benefit from steroids, benadryl, and cimetidine administered prior and/or after injection. Prior shellfish allergy bears absolutely NO relationship to iodinated contrast reactions.
In about 0.01 to 0.04% of all patients, severe and idiosyncratic reactions to contrast can occur that can produce intense bronchospasm, laryngeal edema, circulatory collapse, and very rarely death (1 in 200,000 to 300,000).
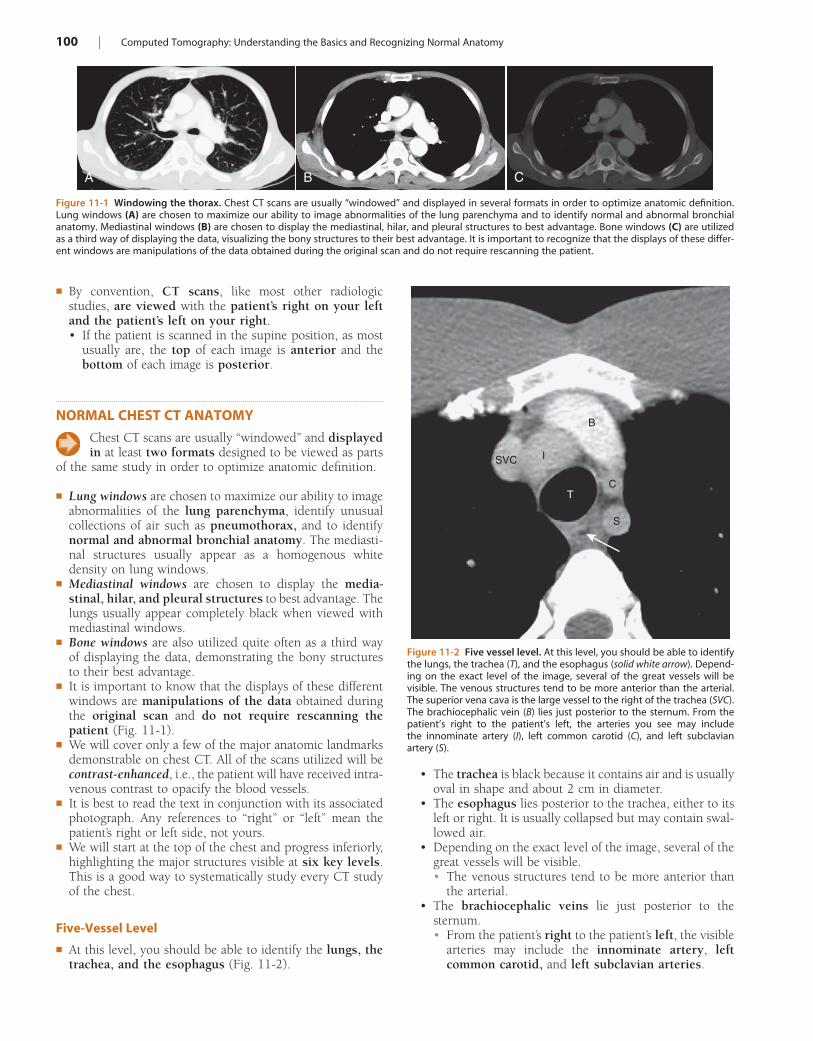
100 | Computed Tomography: Understanding the Basics and Recognizing Normal Anatomy
• The trachea is black because it contains air and is usually oval in shape and about 2 cm in diameter.
• The esophagus lies posterior to the trachea, either to its left or right. It is usually collapsed but may contain swal-lowed air.
• Depending on the exact level of the image, several of the great vessels will be visible.• The venous structures tend to be more anterior than
the arterial.• The brachiocephalic veins lie just posterior to the
sternum.• From the patient’s right to the patient’s left, the visible
arteries may include the innominate artery, left common carotid, and left subclavian arteries.
! By convention, CT scans, like most other radiologic studies, are viewed with the patient’s right on your left and the patient’s left on your right.• If the patient is scanned in the supine position, as most
usually are, the top of each image is anterior and the bottom of each image is posterior.
NORMAL CHEST CT ANATOMY
Chest CT scans are usually “windowed” and displayed in at least two formats designed to be viewed as parts
of the same study in order to optimize anatomic definition.
! Lung windows are chosen to maximize our ability to image abnormalities of the lung parenchyma, identify unusual collections of air such as pneumothorax, and to identify normal and abnormal bronchial anatomy. The mediasti-nal structures usually appear as a homo genous white density on lung windows.
! Mediastinal windows are chosen to display the media-stinal, hilar, and pleural structures to best advantage. The lungs usually appear completely black when viewed with mediastinal windows.
! Bone windows are also utilized quite often as a third way of displaying the data, demonstrating the bony structures to their best advantage.
! It is important to know that the displays of these different windows are manipulations of the data obtained during the original scan and do not require rescanning the patient (Fig. 11-1).
! We will cover only a few of the major anatomic landmarks demonstrable on chest CT. All of the scans utilized will be contrast-enhanced, i.e., the patient will have received intra-venous contrast to opacify the blood vessels.
! It is best to read the text in conjunction with its associated photograph. Any references to “right” or “left” mean the patient’s right or left side, not yours.
! We will start at the top of the chest and progress inferiorly, highlighting the major structures visible at six key levels. This is a good way to systematically study every CT study of the chest.
Five-Vessel Level
! At this level, you should be able to identify the lungs, the trachea, and the esophagus (Fig. 11-2).
Figure 11-1 Windowing the thorax. Chest CT scans are usually “windowed” and displayed in several formats in order to optimize anatomic definition. Lung windows (A) are chosen to maximize our ability to image abnormalities of the lung parenchyma and to identify normal and abnormal bronchial anatomy. Mediastinal windows (B) are chosen to display the mediastinal, hilar, and pleural structures to best advantage. Bone windows (C) are utilized as a third way of displaying the data, visualizing the bony structures to their best advantage. It is important to recognize that the displays of these differ-ent windows are manipulations of the data obtained during the original scan and do not require rescanning the patient.
A B C
Figure 11-2 Five vessel level. At this level, you should be able to identify the lungs, the trachea (T), and the esophagus (solid white arrow). Depend-ing on the exact level of the image, several of the great vessels will be visible. The venous structures tend to be more anterior than the arterial. The superior vena cava is the large vessel to the right of the trachea (SVC). The brachiocephalic vein (B) lies just posterior to the sternum. From the patient’s right to the patient’s left, the arteries you see may include the innominate artery (I), left common carotid (C), and left subclavian artery (S).
B
SVC I
C
S
T
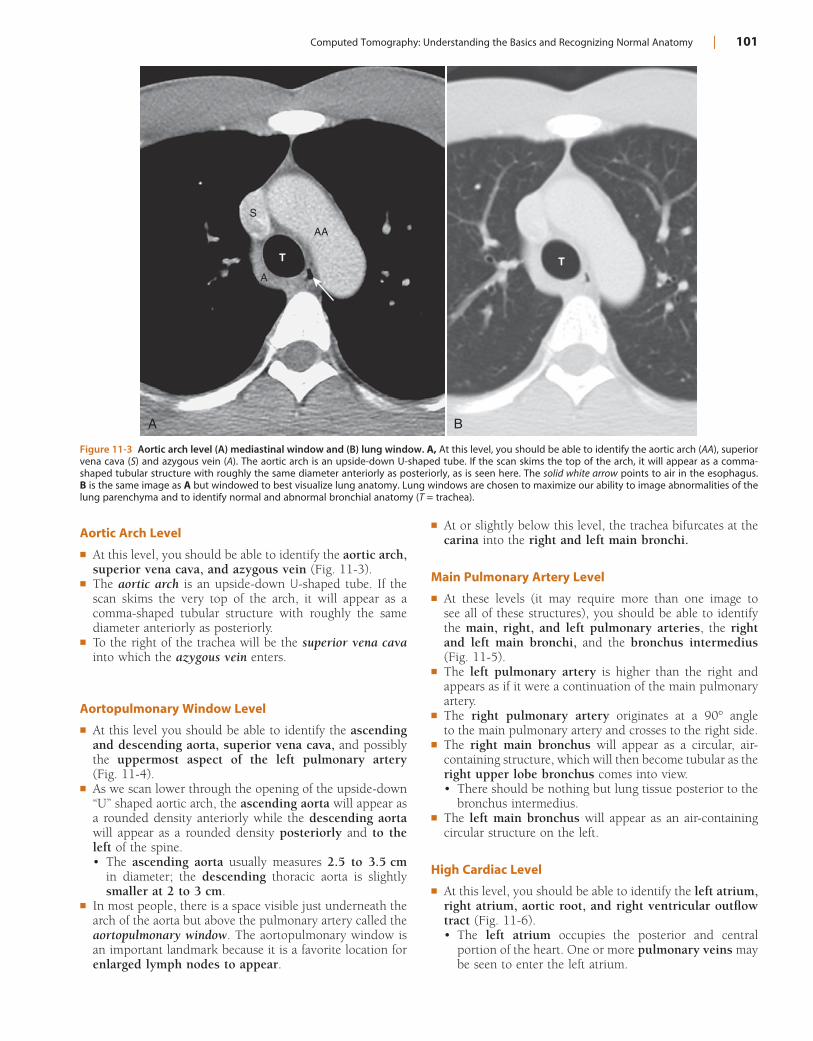
Computed Tomography: Understanding the Basics and Recognizing Normal Anatomy | 101
Aortic Arch Level
! At this level, you should be able to identify the aortic arch, superior vena cava, and azygous vein (Fig. 11-3).
! The aortic arch is an upside-down U-shaped tube. If the scan skims the very top of the arch, it will appear as a comma-shaped tubular structure with roughly the same diameter anteriorly as posteriorly.
! To the right of the trachea will be the superior vena cava into which the azygous vein enters.
Aortopulmonary Window Level
! At this level you should be able to identify the ascending and descending aorta, superior vena cava, and possibly the uppermost aspect of the left pulmonary artery (Fig. 11-4).
! As we scan lower through the opening of the upside-down “U” shaped aortic arch, the ascending aorta will appear as a rounded density anteriorly while the descending aorta will appear as a rounded density posteriorly and to the left of the spine.• The ascending aorta usually measures 2.5 to 3.5 cm
in diameter; the descending thoracic aorta is slightly smaller at 2 to 3 cm.
! In most people, there is a space visible just underneath the arch of the aorta but above the pulmonary artery called the aortopulmonary window. The aortopulmonary window is an important landmark because it is a favorite location for enlarged lymph nodes to appear.
Figure 11-3 Aortic arch level (A) mediastinal window and (B) lung window. A, At this level, you should be able to identify the aortic arch (AA), superior vena cava (S) and azygous vein (A). The aortic arch is an upside-down U-shaped tube. If the scan skims the top of the arch, it will appear as a comma-shaped tubular structure with roughly the same diameter anteriorly as posteriorly, as is seen here. The solid white arrow points to air in the esophagus. B is the same image as A but windowed to best visualize lung anatomy. Lung windows are chosen to maximize our ability to image abnormalities of the lung parenchyma and to identify normal and abnormal bronchial anatomy (T = trachea).
A B
AA
A
T
S
T
! At or slightly below this level, the trachea bifurcates at the carina into the right and left main bronchi.
Main Pulmonary Artery Level
! At these levels (it may require more than one image to see all of these structures), you should be able to identify the main, right, and left pulmonary arteries, the right and left main bronchi, and the bronchus intermedius (Fig. 11-5).
! The left pulmonary artery is higher than the right and appears as if it were a continuation of the main pulmonary artery.
! The right pulmonary artery originates at a 90° angle to the main pulmonary artery and crosses to the right side.
! The right main bronchus will appear as a circular, air-containing structure, which will then become tubular as the right upper lobe bronchus comes into view.• There should be nothing but lung tissue posterior to the
bronchus intermedius.! The left main bronchus will appear as an air-containing
circular structure on the left.
High Cardiac Level
! At this level, you should be able to identify the left atrium, right atrium, aortic root, and right ventricular outflow tract (Fig. 11-6).• The left atrium occupies the posterior and central
portion of the heart. One or more pulmonary veins may be seen to enter the left atrium.
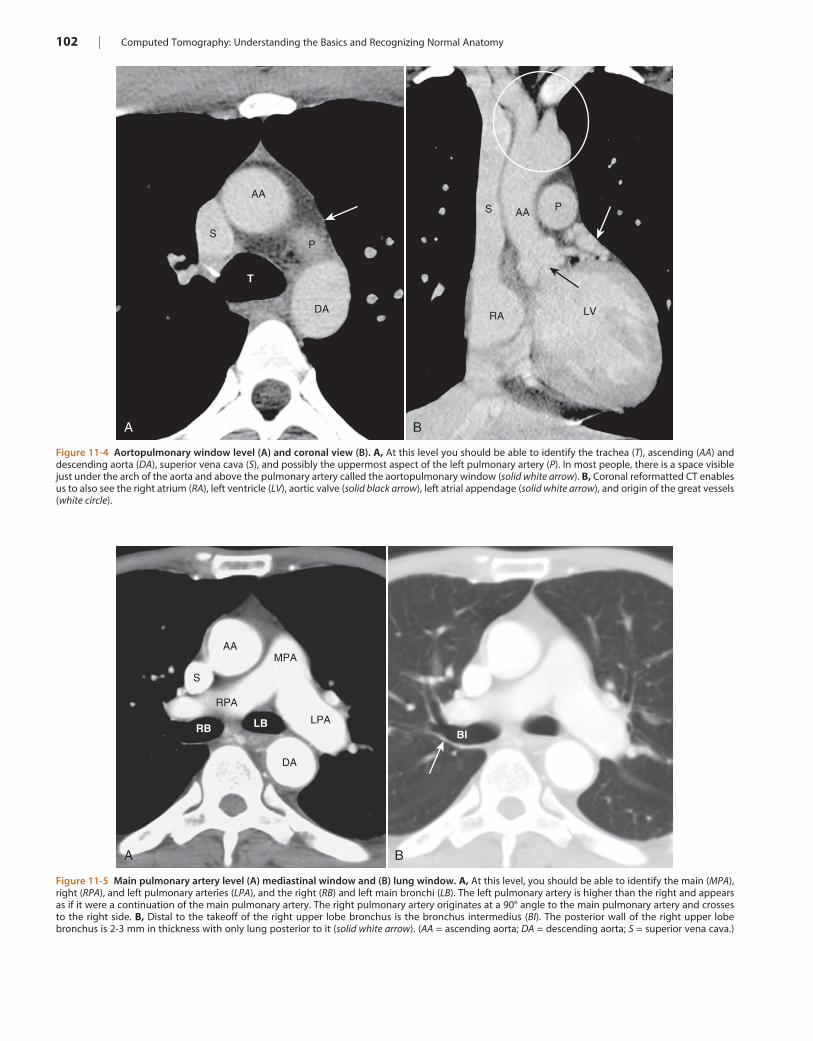
102 | Computed Tomography: Understanding the Basics and Recognizing Normal Anatomy
Figure 11-4 Aortopulmonary window level (A) and coronal view (B). A, At this level you should be able to identify the trachea (T), ascending (AA) and descending aorta (DA), superior vena cava (S), and possibly the uppermost aspect of the left pulmonary artery (P). In most people, there is a space visible just under the arch of the aorta and above the pulmonary artery called the aortopulmonary window (solid white arrow). B, Coronal reformatted CT enables us to also see the right atrium (RA), left ventricle (LV), aortic valve (solid black arrow), left atrial appendage (solid white arrow), and origin of the great vessels (white circle).
A B
T
DA
P
AA
S
AA PS
RA LV
Figure 11-5 Main pulmonary artery level (A) mediastinal window and (B) lung window. A, At this level, you should be able to identify the main (MPA), right (RPA), and left pulmonary arteries (LPA), and the right (RB) and left main bronchi (LB). The left pulmonary artery is higher than the right and appears as if it were a continuation of the main pulmonary artery. The right pulmonary artery originates at a 90° angle to the main pulmonary artery and crosses to the right side. B, Distal to the takeoff of the right upper lobe bronchus is the bronchus intermedius (BI). The posterior wall of the right upper lobe bronchus is 2-3 mm in thickness with only lung posterior to it (solid white arrow). (AA = ascending aorta; DA = descending aorta; S = superior vena cava.)
A B
BI
DA
LPA
MPA
RPA
AA
S
LBRB
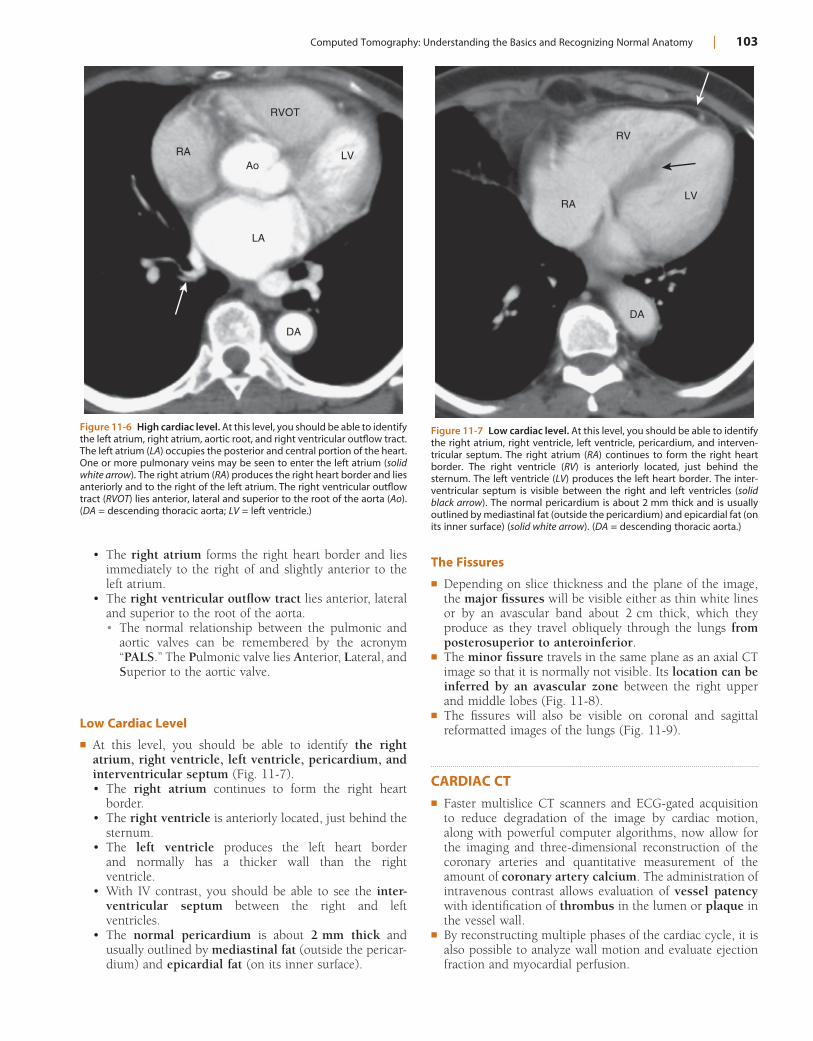
Computed Tomography: Understanding the Basics and Recognizing Normal Anatomy | 103
The Fissures
! Depending on slice thickness and the plane of the image, the major fissures will be visible either as thin white lines or by an avascular band about 2 cm thick, which they produce as they travel obliquely through the lungs from posterosuperior to anteroinferior.
! The minor fissure travels in the same plane as an axial CT image so that it is normally not visible. Its location can be inferred by an avascular zone between the right upper and middle lobes (Fig. 11-8).
! The fissures will also be visible on coronal and sagittal reformatted images of the lungs (Fig. 11-9).
CARDIAC CT! Faster multislice CT scanners and ECG-gated acquisition
to reduce degradation of the image by cardiac motion, along with powerful computer algorithms, now allow for the imaging and three-dimensional reconstruction of the coronary arteries and quantitative measurement of the amount of coronary artery calcium. The administration of intravenous contrast allows evaluation of vessel patency with identification of thrombus in the lumen or plaque in the vessel wall.
! By reconstructing multiple phases of the cardiac cycle, it is also possible to analyze wall motion and evaluate ejection fraction and myocardial perfusion.
• The right atrium forms the right heart border and lies immediately to the right of and slightly anterior to the left atrium.
• The right ventricular outflow tract lies anterior, lateral and superior to the root of the aorta.• The normal relationship between the pulmonic and
aortic valves can be remembered by the acronym “PALS.” The Pulmonic valve lies Anterior, Lateral, and Superior to the aortic valve.
Low Cardiac Level
! At this level, you should be able to identify the right atrium, right ventricle, left ventricle, pericardium, and interventricular septum (Fig. 11-7).• The right atrium continues to form the right heart
border.• The right ventricle is anteriorly located, just behind the
sternum.• The left ventricle produces the left heart border
and normally has a thicker wall than the right ventricle.
• With IV contrast, you should be able to see the inter-ventricular septum between the right and left ventricles.
• The normal pericardium is about 2 mm thick and usually outlined by mediastinal fat (outside the pericar-dium) and epicardial fat (on its inner surface).
Figure 11-6 High cardiac level. At this level, you should be able to identify the left atrium, right atrium, aortic root, and right ventricular outflow tract. The left atrium (LA) occupies the posterior and central portion of the heart. One or more pulmonary veins may be seen to enter the left atrium (solid white arrow). The right atrium (RA) produces the right heart border and lies anteriorly and to the right of the left atrium. The right ventricular outflow tract (RVOT) lies anterior, lateral and superior to the root of the aorta (Ao). (DA = descending thoracic aorta; LV = left ventricle.)
LA
DA
RA LVAo
RVOT
Figure 11-7 Low cardiac level. At this level, you should be able to identify the right atrium, right ventricle, left ventricle, pericardium, and interven-tricular septum. The right atrium (RA) continues to form the right heart border. The right ventricle (RV) is anteriorly located, just behind the sternum. The left ventricle (LV) produces the left heart border. The inter-ventricular septum is visible between the right and left ventricles (solid black arrow). The normal pericardium is about 2 mm thick and is usually outlined by mediastinal fat (outside the pericardium) and epicardial fat (on its inner surface) (solid white arrow). (DA = descending thoracic aorta.)
DA
RALV
RV
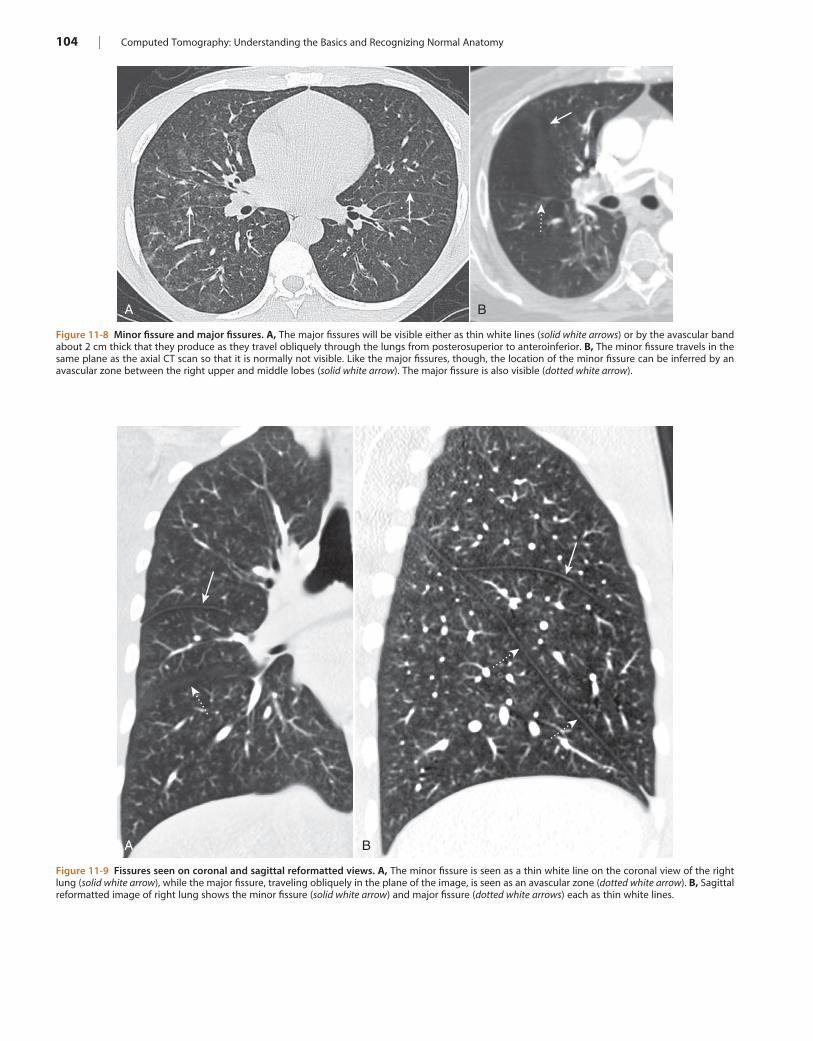
104 | Computed Tomography: Understanding the Basics and Recognizing Normal Anatomy
Figure 11-8 Minor fissure and major fissures. A, The major fissures will be visible either as thin white lines (solid white arrows) or by the avascular band about 2 cm thick that they produce as they travel obliquely through the lungs from posterosuperior to anteroinferior. B, The minor fissure travels in the same plane as the axial CT scan so that it is normally not visible. Like the major fissures, though, the location of the minor fissure can be inferred by an avascular zone between the right upper and middle lobes (solid white arrow). The major fissure is also visible (dotted white arrow).
A B
Figure 11-9 Fissures seen on coronal and sagittal reformatted views. A, The minor fissure is seen as a thin white line on the coronal view of the right lung (solid white arrow), while the major fissure, traveling obliquely in the plane of the image, is seen as an avascular zone (dotted white arrow). B, Sagittal reformatted image of right lung shows the minor fissure (solid white arrow) and major fissure (dotted white arrows) each as thin white lines.
A B
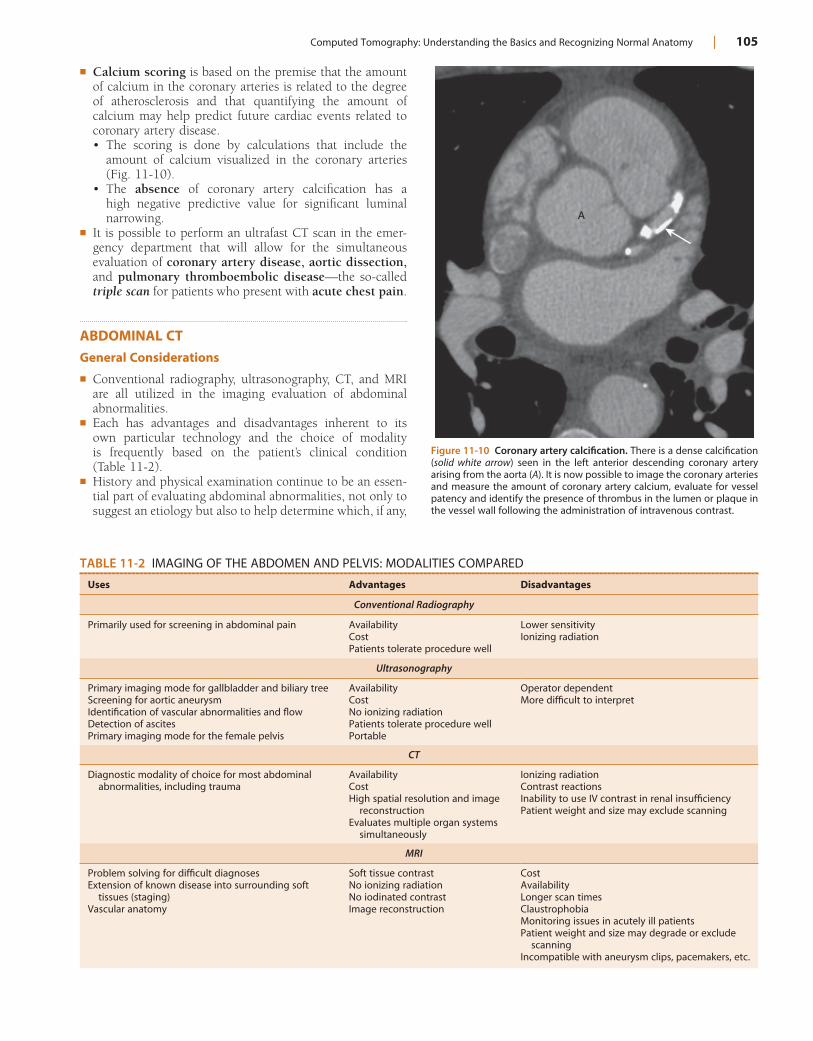
Computed Tomography: Understanding the Basics and Recognizing Normal Anatomy | 105
! Calcium scoring is based on the premise that the amount of calcium in the coronary arteries is related to the degree of atherosclerosis and that quantifying the amount of calcium may help predict future cardiac events related to coronary artery disease.• The scoring is done by calculations that include the
amount of calcium visualized in the coronary arteries (Fig. 11-10).
• The absence of coronary artery calcification has a high negative predictive value for significant luminal narrowing.
! It is possible to perform an ultrafast CT scan in the emer-gency department that will allow for the simultaneous evaluation of coronary artery disease, aortic dissection, and pulmonary thromboembolic disease—the so-called triple scan for patients who present with acute chest pain.
ABDOMINAL CTGeneral Considerations
! Conventional radiography, ultrasonography, CT, and MRI are all utilized in the imaging evaluation of abdominal abnormalities.
! Each has advantages and disadvantages inherent to its own particular technology and the choice of modality is frequently based on the patient’s clinical condition (Table 11-2).
! History and physical examination continue to be an essen-tial part of evaluating abdominal abnormalities, not only to suggest an etiology but also to help determine which, if any,
Figure 11-10 Coronary artery calcification. There is a dense calcification (solid white arrow) seen in the left anterior descending coronary artery arising from the aorta (A). It is now possible to image the coronary arteries and measure the amount of coronary artery calcium, evaluate for vessel patency and identify the presence of thrombus in the lumen or plaque in the vessel wall following the administration of intravenous contrast.
A
TABLE 11-2 IMAGING OF THE ABDOMEN AND PELVIS: MODALITIES COMPARED
Uses Advantages Disadvantages
Conventional Radiography
Primarily used for screening in abdominal pain AvailabilityCostPatients tolerate procedure well
Lower sensitivityIonizing radiation
Ultrasonography
Primary imaging mode for gallbladder and biliary treeScreening for aortic aneurysmIdentification of vascular abnormalities and flowDetection of ascitesPrimary imaging mode for the female pelvis
AvailabilityCostNo ionizing radiationPatients tolerate procedure wellPortable
Operator dependentMore difficult to interpret
CT
Diagnostic modality of choice for most abdominal abnormalities, including trauma
AvailabilityCostHigh spatial resolution and image
reconstructionEvaluates multiple organ systems
simultaneously
Ionizing radiationContrast reactionsInability to use IV contrast in renal insufficiencyPatient weight and size may exclude scanning
MRI
Problem solving for difficult diagnosesExtension of known disease into surrounding soft
tissues (staging)Vascular anatomy
Soft tissue contrastNo ionizing radiationNo iodinated contrastImage reconstruction
CostAvailabilityLonger scan timesClaustrophobiaMonitoring issues in acutely ill patientsPatient weight and size may degrade or exclude
scanningIncompatible with aneurysm clips, pacemakers, etc.
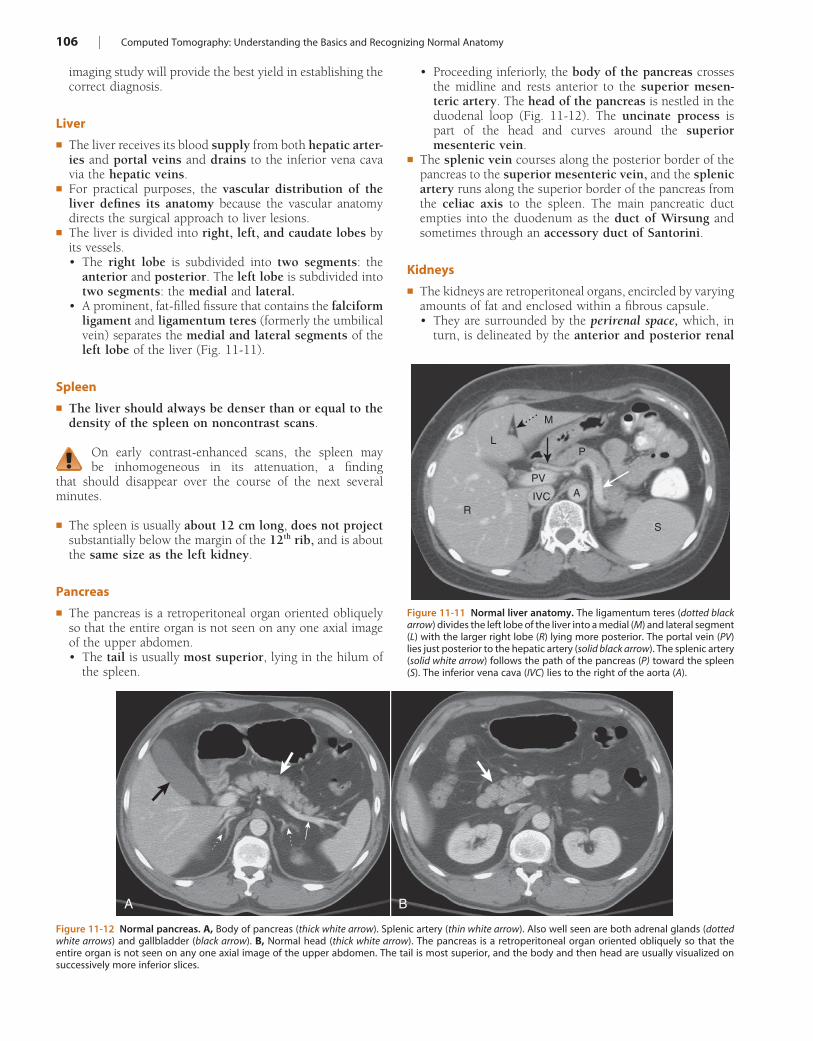
106 | Computed Tomography: Understanding the Basics and Recognizing Normal Anatomy
Figure 11-11 Normal liver anatomy. The ligamentum teres (dotted black arrow) divides the left lobe of the liver into a medial (M) and lateral segment (L) with the larger right lobe (R) lying more posterior. The portal vein (PV) lies just posterior to the hepatic artery (solid black arrow). The splenic artery (solid white arrow) follows the path of the pancreas (P) toward the spleen (S). The inferior vena cava (IVC) lies to the right of the aorta (A).
A
P
S
IVC
PV
R
L
M
Figure 11-12 Normal pancreas. A, Body of pancreas (thick white arrow). Splenic artery (thin white arrow). Also well seen are both adrenal glands (dotted white arrows) and gallbladder (black arrow). B, Normal head (thick white arrow). The pancreas is a retroperitoneal organ oriented obliquely so that the entire organ is not seen on any one axial image of the upper abdomen. The tail is most superior, and the body and then head are usually visualized on successively more inferior slices.
A B
imaging study will provide the best yield in establishing the correct diagnosis.
Liver
! The liver receives its blood supply from both hepatic arter-ies and portal veins and drains to the inferior vena cava via the hepatic veins.
! For practical purposes, the vascular distribution of the liver defines its anatomy because the vascular anatomy directs the surgical approach to liver lesions.
! The liver is divided into right, left, and caudate lobes by its vessels.• The right lobe is subdivided into two segments: the
anterior and posterior. The left lobe is subdivided into two segments: the medial and lateral.
• A prominent, fat-filled fissure that contains the falciform ligament and ligamentum teres (formerly the umbilical vein) separates the medial and lateral segments of the left lobe of the liver (Fig. 11-11).
Spleen
! The liver should always be denser than or equal to the density of the spleen on noncontrast scans.
On early contrast-enhanced scans, the spleen may be inhomogeneous in its attenuation, a finding
that should disappear over the course of the next several minutes.
! The spleen is usually about 12 cm long, does not project substantially below the margin of the 12th rib, and is about the same size as the left kidney.
Pancreas
! The pancreas is a retroperitoneal organ oriented obliquely so that the entire organ is not seen on any one axial image of the upper abdomen.• The tail is usually most superior, lying in the hilum of
the spleen.
• Proceeding inferiorly, the body of the pancreas crosses the midline and rests anterior to the superior mesen-teric artery. The head of the pancreas is nestled in the duodenal loop (Fig. 11-12). The uncinate process is part of the head and curves around the superior mesenteric vein.
! The splenic vein courses along the posterior border of the pancreas to the superior mesenteric vein, and the splenic artery runs along the superior border of the pancreas from the celiac axis to the spleen. The main pancreatic duct empties into the duodenum as the duct of Wirsung and sometimes through an accessory duct of Santorini.
Kidneys
! The kidneys are retroperitoneal organs, encircled by varying amounts of fat and enclosed within a fibrous capsule.• They are surrounded by the perirenal space, which, in
turn, is delineated by the anterior and posterior renal
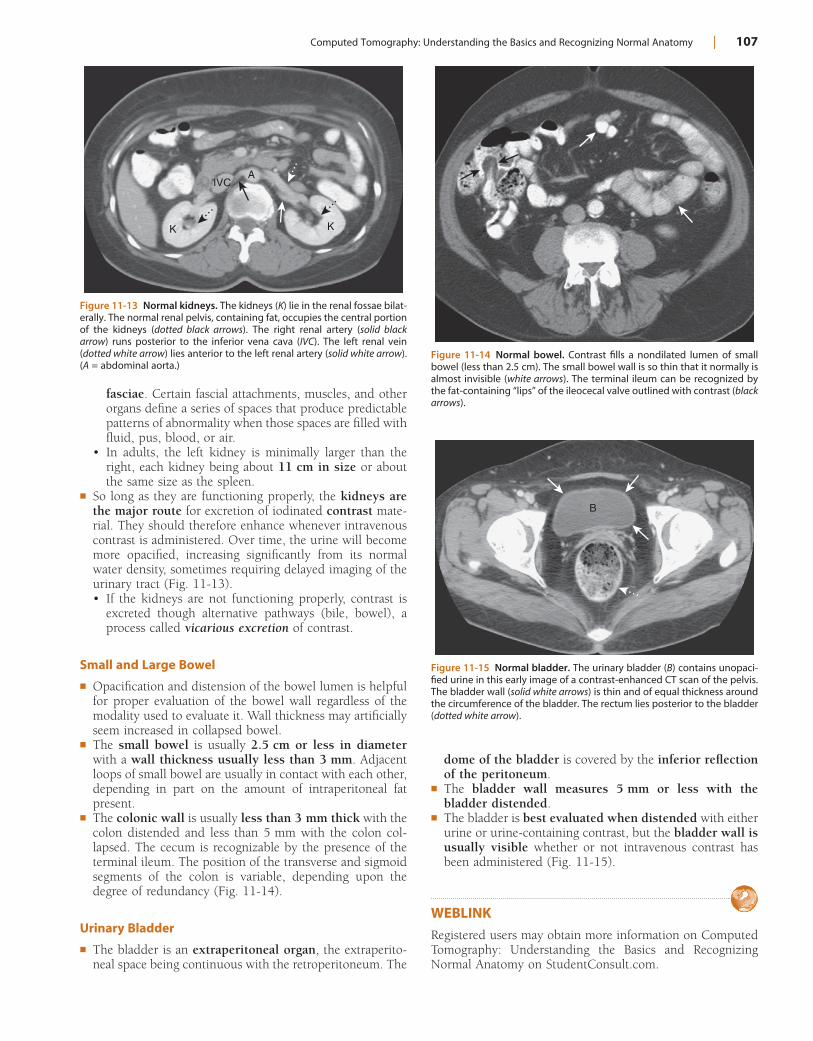
Computed Tomography: Understanding the Basics and Recognizing Normal Anatomy | 107
Figure 11-13 Normal kidneys. The kidneys (K) lie in the renal fossae bilat-erally. The normal renal pelvis, containing fat, occupies the central portion of the kidneys (dotted black arrows). The right renal artery (solid black arrow) runs posterior to the inferior vena cava (IVC). The left renal vein (dotted white arrow) lies anterior to the left renal artery (solid white arrow). (A = abdominal aorta.)
AIVC
KK
Figure 11-14 Normal bowel. Contrast fills a nondilated lumen of small bowel (less than 2.5 cm). The small bowel wall is so thin that it normally is almost invisible (white arrows). The terminal ileum can be recognized by the fat-containing “lips” of the ileocecal valve outlined with contrast (black arrows).
Figure 11-15 Normal bladder. The urinary bladder (B) contains unopaci-fied urine in this early image of a contrast-enhanced CT scan of the pelvis. The bladder wall (solid white arrows) is thin and of equal thickness around the circumference of the bladder. The rectum lies posterior to the bladder (dotted white arrow).
B
fasciae. Certain fascial attachments, muscles, and other organs define a series of spaces that produce predictable patterns of abnormality when those spaces are filled with fluid, pus, blood, or air.
• In adults, the left kidney is minimally larger than the right, each kidney being about 11 cm in size or about the same size as the spleen.
! So long as they are functioning properly, the kidneys are the major route for excretion of iodinated contrast mate-rial. They should therefore enhance whenever intravenous contrast is administered. Over time, the urine will become more opacified, increasing significantly from its normal water density, sometimes requiring delayed imaging of the urinary tract (Fig. 11-13).• If the kidneys are not functioning properly, contrast is
excreted though alternative pathways (bile, bowel), a process called vicarious excretion of contrast.
Small and Large Bowel
! Opacification and distension of the bowel lumen is helpful for proper evaluation of the bowel wall regardless of the modality used to evaluate it. Wall thickness may artificially seem increased in collapsed bowel.
! The small bowel is usually 2.5 cm or less in diameter with a wall thickness usually less than 3 mm. Adjacent loops of small bowel are usually in contact with each other, depending in part on the amount of intraperitoneal fat present.
! The colonic wall is usually less than 3 mm thick with the colon distended and less than 5 mm with the colon col-lapsed. The cecum is recognizable by the presence of the terminal ileum. The position of the transverse and sigmoid segments of the colon is variable, depending upon the degree of redundancy (Fig. 11-14).
Urinary Bladder
! The bladder is an extraperitoneal organ, the extraperito-neal space being continuous with the retroperitoneum. The
dome of the bladder is covered by the inferior reflection of the peritoneum.
! The bladder wall measures 5 mm or less with the bladder distended.
! The bladder is best evaluated when distended with either urine or urine-containing contrast, but the bladder wall is usually visible whether or not intravenous contrast has been administered (Fig. 11-15).
WEBLINKRegistered users may obtain more information on Computed Tomography: Understanding the Basics and Recognizing Normal Anatomy on StudentConsult.com.
108 | Computed Tomography: Understanding the Basics and Recognizing Normal Anatomy
TAKE-HOME POINTS
Computed Tomography: Understanding the Basics and Recognizing Normal Anatomy
CT scanners produce a computer-generated representa-tion of human anatomy based on measurements of the density of the tissue scanned, which is determined by the amount the x-ray beam is absorbed or transmitted by the tissues at each point in the scan.
Spiral CT scanners use a continuously rotating x-ray detector combined with constant table movement to permit rapid and “gapless” data acquisition that can be obtained in a single breath-hold by the patient. This allows for diagnostically useful images in the coronal and sagittal planes and 3D reconstructions that can be viewed at any angle.
CT scans can be performed with or without intravenous contrast and displayed in any number of windows that allow the original data acquired to be viewed with optimum density settings for the lungs, mediastinum, or bone without the need for rescanning the patient.
Iodinated contrast agents may produce occasional side effects such as warmth, nausea, and vomiting and rare idiosyncratic, allergic-like reactions leading to anaphy-laxis and death.
Oral and/or rectal contrast may be used to define the bowel and help in differentiating the bowel from adja-cent lymph nodes or pathologic, fluid-containing lesions.
There are a number of clinical settings in which either iodinated or oral contrast (or both) improve the diagnos-tic accuracy of CT scanning. The radiologist usually tailors imaging studies based on the clinical problem.
Normal anatomy of the major structures is described at six levels in the chest from top to bottom: five-vessel view, aortic arch, aortopulmonary window, main pulmo-nary artery, upper cardiac, and lower cardiac levels.
The normal anatomy of the liver, spleen, pancreas, kidneys, bowel, and bladder is described.
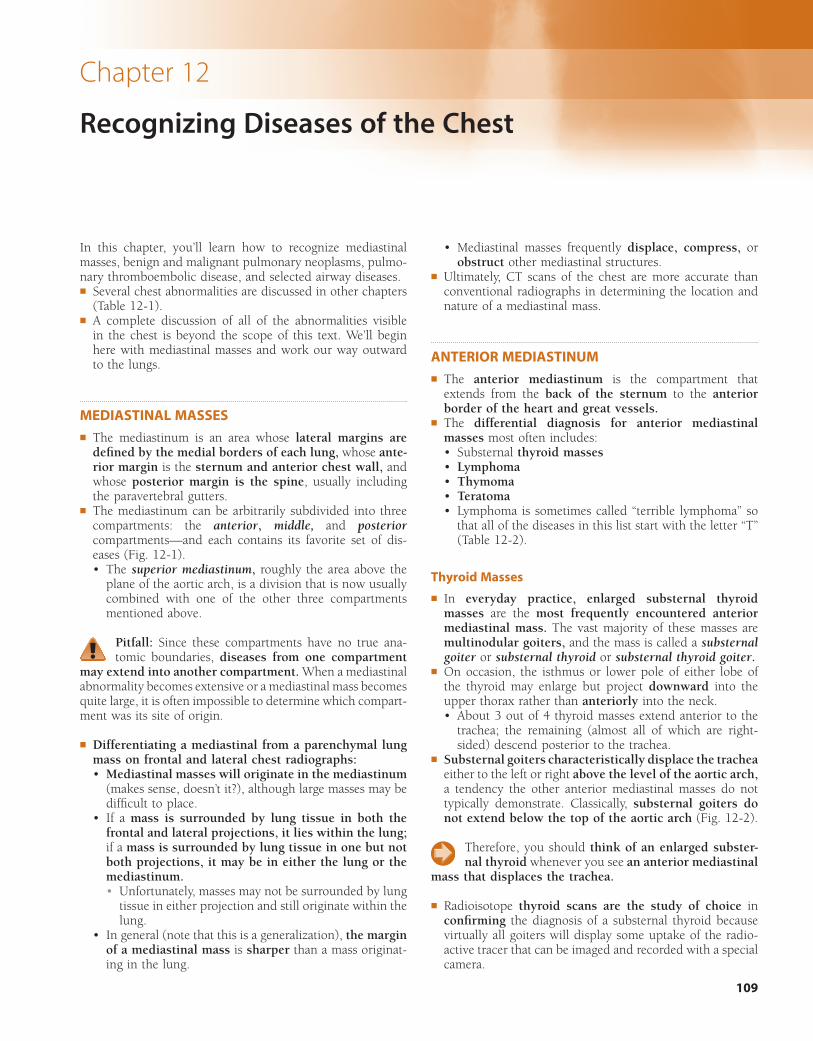
109
Chapter 12
Recognizing Diseases of the Chest
In this chapter, you’ll learn how to recognize mediastinal masses, benign and malignant pulmonary neoplasms, pulmo-nary thromboembolic disease, and selected airway diseases.! Several chest abnormalities are discussed in other chapters
(Table 12-1).! A complete discussion of all of the abnormalities visible
in the chest is beyond the scope of this text. We’ll begin here with mediastinal masses and work our way outward to the lungs.
MEDIASTINAL MASSES! The mediastinum is an area whose lateral margins are
defined by the medial borders of each lung, whose ante-rior margin is the sternum and anterior chest wall, and whose posterior margin is the spine, usually including the paravertebral gutters.
! The mediastinum can be arbitrarily subdivided into three compartments: the anterior, middle, and posterior compartments—and each contains its favorite set of dis-eases (Fig. 12-1).• The superior mediastinum, roughly the area above the
plane of the aortic arch, is a division that is now usually combined with one of the other three compartments mentioned above.
Pitfall: Since these compartments have no true ana-tomic boundaries, diseases from one compartment
may extend into another compartment. When a mediastinal abnormality becomes extensive or a mediastinal mass becomes quite large, it is often impossible to determine which compart-ment was its site of origin.
! Differentiating a mediastinal from a parenchymal lung mass on frontal and lateral chest radiographs:• Mediastinal masses will originate in the mediastinum
(makes sense, doesn’t it?), although large masses may be difficult to place.
• If a mass is surrounded by lung tissue in both the frontal and lateral projections, it lies within the lung; if a mass is surrounded by lung tissue in one but not both projections, it may be in either the lung or the mediastinum.• Unfortunately, masses may not be surrounded by lung
tissue in either projection and still originate within the lung.
• In general (note that this is a generalization), the margin of a mediastinal mass is sharper than a mass originat-ing in the lung.
• Mediastinal masses frequently displace, compress, or obstruct other mediastinal structures.
! Ultimately, CT scans of the chest are more accurate than conventional radiographs in determining the location and nature of a mediastinal mass.
ANTERIOR MEDIASTINUM! The anterior mediastinum is the compartment that
extends from the back of the sternum to the anterior border of the heart and great vessels.
! The differential diagnosis for anterior mediastinal masses most often includes:• Substernal thyroid masses• Lymphoma• Thymoma• Teratoma• Lymphoma is sometimes called “terrible lymphoma” so
that all of the diseases in this list start with the letter “T” (Table 12-2).
Thyroid Masses
! In everyday practice, enlarged substernal thyroid masses are the most frequently encountered anterior mediastinal mass. The vast majority of these masses are multinodular goiters, and the mass is called a substernal goiter or substernal thyroid or substernal thyroid goiter.
! On occasion, the isthmus or lower pole of either lobe of the thyroid may enlarge but project downward into the upper thorax rather than anteriorly into the neck.• About 3 out of 4 thyroid masses extend anterior to the
trachea; the remaining (almost all of which are right-sided) descend posterior to the trachea.
! Substernal goiters characteristically displace the trachea either to the left or right above the level of the aortic arch, a tendency the other anterior mediastinal masses do not typically demonstrate. Classically, substernal goiters do not extend below the top of the aortic arch (Fig. 12-2).
Therefore, you should think of an enlarged subster-nal thyroid whenever you see an anterior mediastinal
mass that displaces the trachea.
! Radioisotope thyroid scans are the study of choice in confirming the diagnosis of a substernal thyroid because virtually all goiters will display some uptake of the radio-active tracer that can be imaged and recorded with a special camera.
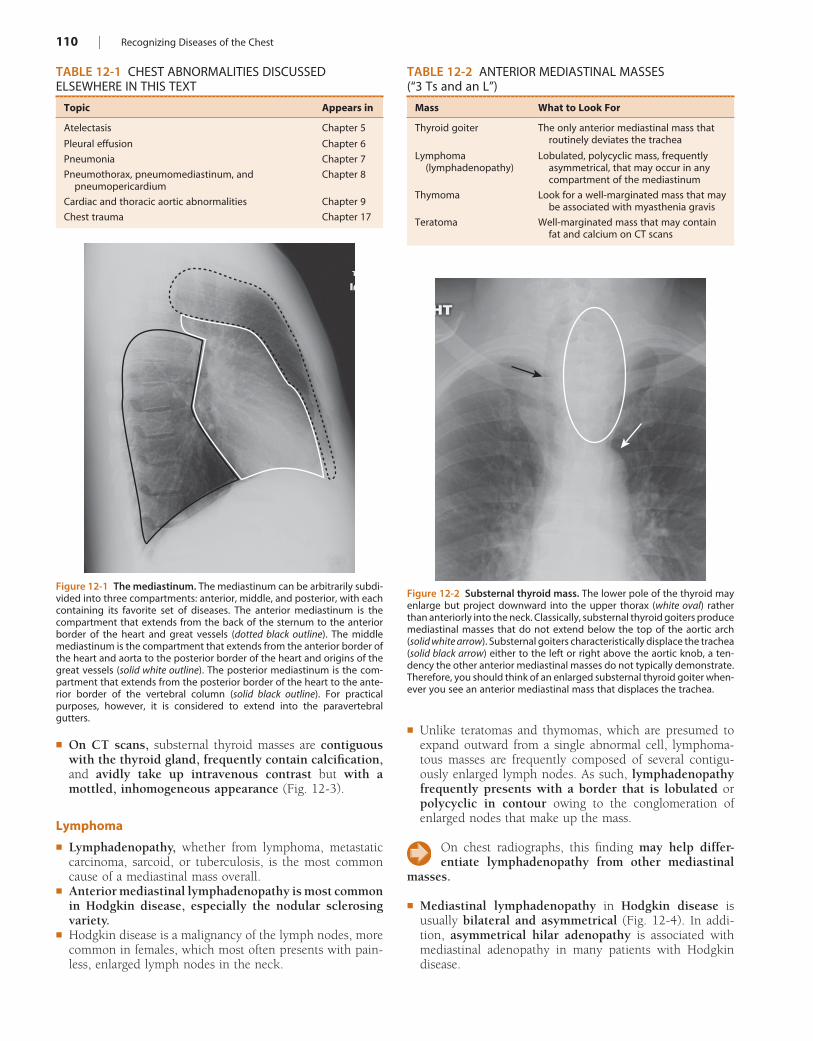
110 | Recognizing Diseases of the Chest
! Unlike teratomas and thymomas, which are presumed to expand outward from a single abnormal cell, lymphoma-tous masses are frequently composed of several contigu-ously enlarged lymph nodes. As such, lymphadenopathy frequently presents with a border that is lobulated or polycyclic in contour owing to the conglomeration of enlarged nodes that make up the mass.
On chest radiographs, this finding may help differ-entiate lymphadenopathy from other mediastinal
masses.
! Mediastinal lymphadenopathy in Hodgkin disease is usually bilateral and asymmetrical (Fig. 12-4). In addi-tion, asymmetrical hilar adenopathy is associated with mediastinal adenopathy in many patients with Hodgkin disease.
! On CT scans, substernal thyroid masses are contiguous with the thyroid gland, frequently contain calcification, and avidly take up intravenous contrast but with a mottled, inhomogeneous appearance (Fig. 12-3).
Lymphoma
! Lymphadenopathy, whether from lymphoma, metastatic carcinoma, sarcoid, or tuberculosis, is the most common cause of a mediastinal mass overall.
! Anterior mediastinal lymphadenopathy is most common in Hodgkin disease, especially the nodular sclerosing variety.
! Hodgkin disease is a malignancy of the lymph nodes, more common in females, which most often presents with pain-less, enlarged lymph nodes in the neck.
TABLE 12-1 CHEST ABNORMALITIES DISCUSSED ELSEWHERE IN THIS TEXT
Topic Appears in
Atelectasis Chapter 5
Pleural effusion Chapter 6
Pneumonia Chapter 7
Pneumothorax, pneumomediastinum, and pneumopericardium
Chapter 8
Cardiac and thoracic aortic abnormalities Chapter 9
Chest trauma Chapter 17
Figure 12-1 The mediastinum. The mediastinum can be arbitrarily subdi-vided into three compartments: anterior, middle, and posterior, with each containing its favorite set of diseases. The anterior mediastinum is the compartment that extends from the back of the sternum to the anterior border of the heart and great vessels (dotted black outline). The middle mediastinum is the compartment that extends from the anterior border of the heart and aorta to the posterior border of the heart and origins of the great vessels (solid white outline). The posterior mediastinum is the com-partment that extends from the posterior border of the heart to the ante-rior border of the vertebral column (solid black outline). For practical purposes, however, it is considered to extend into the paravertebral gutters.
TABLE 12-2 ANTERIOR MEDIASTINAL MASSES (“3 Ts and an L”)
Mass What to Look For
Thyroid goiter The only anterior mediastinal mass that routinely deviates the trachea
Lymphoma (lymphadenopathy)
Lobulated, polycyclic mass, frequently asymmetrical, that may occur in any compartment of the mediastinum
Thymoma Look for a well-marginated mass that may be associated with myasthenia gravis
Teratoma Well-marginated mass that may contain fat and calcium on CT scans
Figure 12-2 Substernal thyroid mass. The lower pole of the thyroid may enlarge but project downward into the upper thorax (white oval) rather than anteriorly into the neck. Classically, substernal thyroid goiters produce mediastinal masses that do not extend below the top of the aortic arch (solid white arrow). Substernal goiters characteristically displace the trachea (solid black arrow) either to the left or right above the aortic knob, a ten-dency the other anterior mediastinal masses do not typically demonstrate. Therefore, you should think of an enlarged substernal thyroid goiter when-ever you see an anterior mediastinal mass that displaces the trachea.
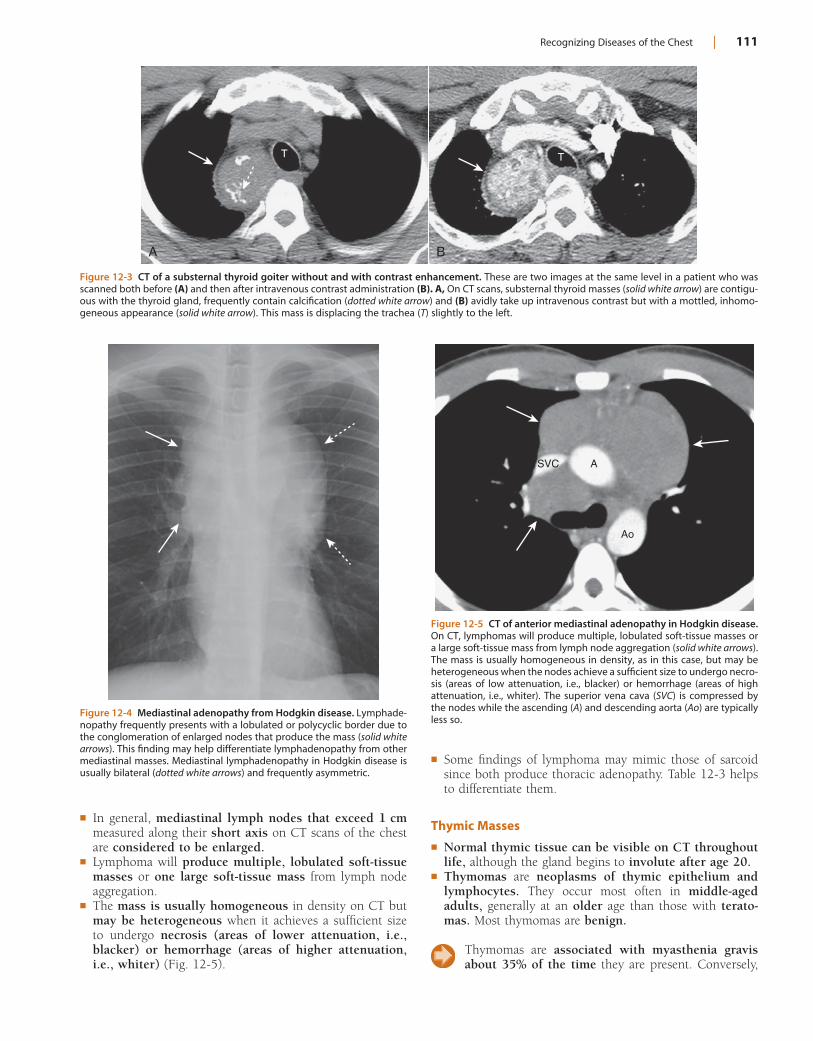
Recognizing Diseases of the Chest | 111
! In general, mediastinal lymph nodes that exceed 1 cm measured along their short axis on CT scans of the chest are considered to be enlarged.
! Lymphoma will produce multiple, lobulated soft-tissue masses or one large soft-tissue mass from lymph node aggregation.
! The mass is usually homogeneous in density on CT but may be heterogeneous when it achieves a sufficient size to undergo necrosis (areas of lower attenuation, i.e., blacker) or hemorrhage (areas of higher attenuation, i.e., whiter) (Fig. 12-5).
Figure 12-3 CT of a substernal thyroid goiter without and with contrast enhancement. These are two images at the same level in a patient who was scanned both before (A) and then after intravenous contrast administration (B). A, On CT scans, substernal thyroid masses (solid white arrow) are contigu-ous with the thyroid gland, frequently contain calcification (dotted white arrow) and (B) avidly take up intravenous contrast but with a mottled, inhomo-geneous appearance (solid white arrow). This mass is displacing the trachea (T) slightly to the left.
A B
T T
Figure 12-4 Mediastinal adenopathy from Hodgkin disease. Lymphade-nopathy frequently presents with a lobulated or polycyclic border due to the conglomeration of enlarged nodes that produce the mass (solid white arrows). This finding may help differentiate lymphadenopathy from other mediastinal masses. Mediastinal lymphadenopathy in Hodgkin disease is usually bilateral (dotted white arrows) and frequently asymmetric.
Figure 12-5 CT of anterior mediastinal adenopathy in Hodgkin disease. On CT, lymphomas will produce multiple, lobulated soft-tissue masses or a large soft-tissue mass from lymph node aggregation (solid white arrows). The mass is usually homogeneous in density, as in this case, but may be heterogeneous when the nodes achieve a sufficient size to undergo necro-sis (areas of low attenuation, i.e., blacker) or hemorrhage (areas of high attenuation, i.e., whiter). The superior vena cava (SVC) is compressed by the nodes while the ascending (A) and descending aorta (Ao) are typically less so.
SVC A
Ao
! Some findings of lymphoma may mimic those of sarcoid since both produce thoracic adenopathy. Table 12-3 helps to differentiate them.
Thymic Masses
! Normal thymic tissue can be visible on CT throughout life, although the gland begins to involute after age 20.
! Thymomas are neoplasms of thymic epithelium and lymphocytes. They occur most often in middle-aged adults, generally at an older age than those with terato-mas. Most thymomas are benign.
Thymomas are associated with myasthenia gravis about 35% of the time they are present. Conversely,
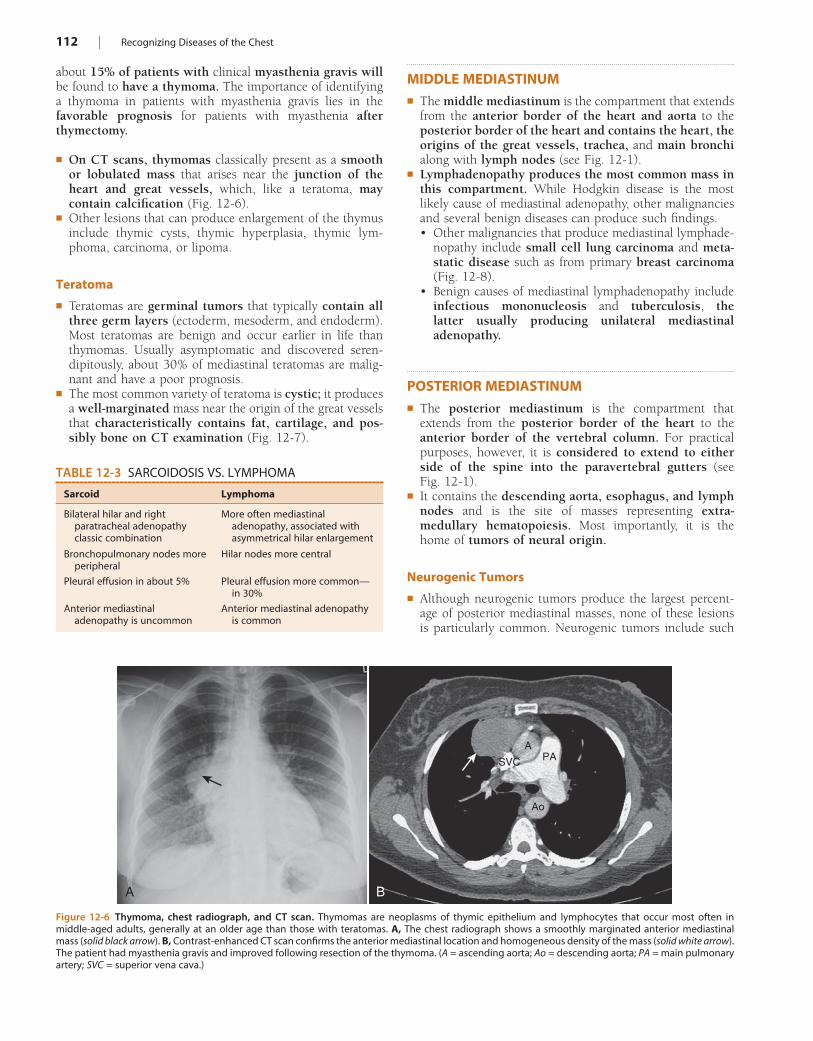
112 | Recognizing Diseases of the Chest
Figure 12-6 Thymoma, chest radiograph, and CT scan. Thymomas are neoplasms of thymic epithelium and lymphocytes that occur most often in middle-aged adults, generally at an older age than those with teratomas. A, The chest radiograph shows a smoothly marginated anterior mediastinal mass (solid black arrow). B, Contrast-enhanced CT scan confirms the anterior mediastinal location and homogeneous density of the mass (solid white arrow). The patient had myasthenia gravis and improved following resection of the thymoma. (A = ascending aorta; Ao = descending aorta; PA = main pulmonary artery; SVC = superior vena cava.)
A B
APA
Ao
SVC
TABLE 12-3 SARCOIDOSIS VS. LYMPHOMA
Sarcoid Lymphoma
Bilateral hilar and right paratracheal adenopathy classic combination
More often mediastinal adenopathy, associated with asymmetrical hilar enlargement
Bronchopulmonary nodes more peripheral
Hilar nodes more central
Pleural effusion in about 5% Pleural effusion more common—in 30%
Anterior mediastinal adenopathy is uncommon
Anterior mediastinal adenopathy is common
about 15% of patients with clinical myasthenia gravis will be found to have a thymoma. The importance of identifying a thymoma in patients with myasthenia gravis lies in the favorable prognosis for patients with myasthenia after thymectomy.
! On CT scans, thymomas classically present as a smooth or lobulated mass that arises near the junction of the heart and great vessels, which, like a teratoma, may contain calcification (Fig. 12-6).
! Other lesions that can produce enlargement of the thymus include thymic cysts, thymic hyperplasia, thymic lym-phoma, carcinoma, or lipoma.
Teratoma
! Teratomas are germinal tumors that typically contain all three germ layers (ectoderm, mesoderm, and endoderm). Most teratomas are benign and occur earlier in life than thymomas. Usually asymptomatic and discovered seren-dipitously, about 30% of mediastinal teratomas are malig-nant and have a poor prognosis.
! The most common variety of teratoma is cystic; it produces a well-marginated mass near the origin of the great vessels that characteristically contains fat, cartilage, and pos-sibly bone on CT examination (Fig. 12-7).
MIDDLE MEDIASTINUM! The middle mediastinum is the compartment that extends
from the anterior border of the heart and aorta to the posterior border of the heart and contains the heart, the origins of the great vessels, trachea, and main bronchi along with lymph nodes (see Fig. 12-1).
! Lymphadenopathy produces the most common mass in this compartment. While Hodgkin disease is the most likely cause of mediastinal adenopathy, other malignancies and several benign diseases can produce such findings.• Other malignancies that produce mediastinal lymphade-
nopathy include small cell lung carcinoma and meta-static disease such as from primary breast carcinoma (Fig. 12-8).
• Benign causes of mediastinal lymphadenopathy include infectious mononucleosis and tuberculosis, the latter usually producing unilateral mediastinal adenopathy.
POSTERIOR MEDIASTINUM! The posterior mediastinum is the compartment that
extends from the posterior border of the heart to the anterior border of the vertebral column. For practical purposes, however, it is considered to extend to either side of the spine into the paravertebral gutters (see Fig. 12-1).
! It contains the descending aorta, esophagus, and lymph nodes and is the site of masses representing extra-medullary hematopoiesis. Most importantly, it is the home of tumors of neural origin.
Neurogenic Tumors
! Although neurogenic tumors produce the largest percent-age of posterior mediastinal masses, none of these lesions is particularly common. Neurogenic tumors include such
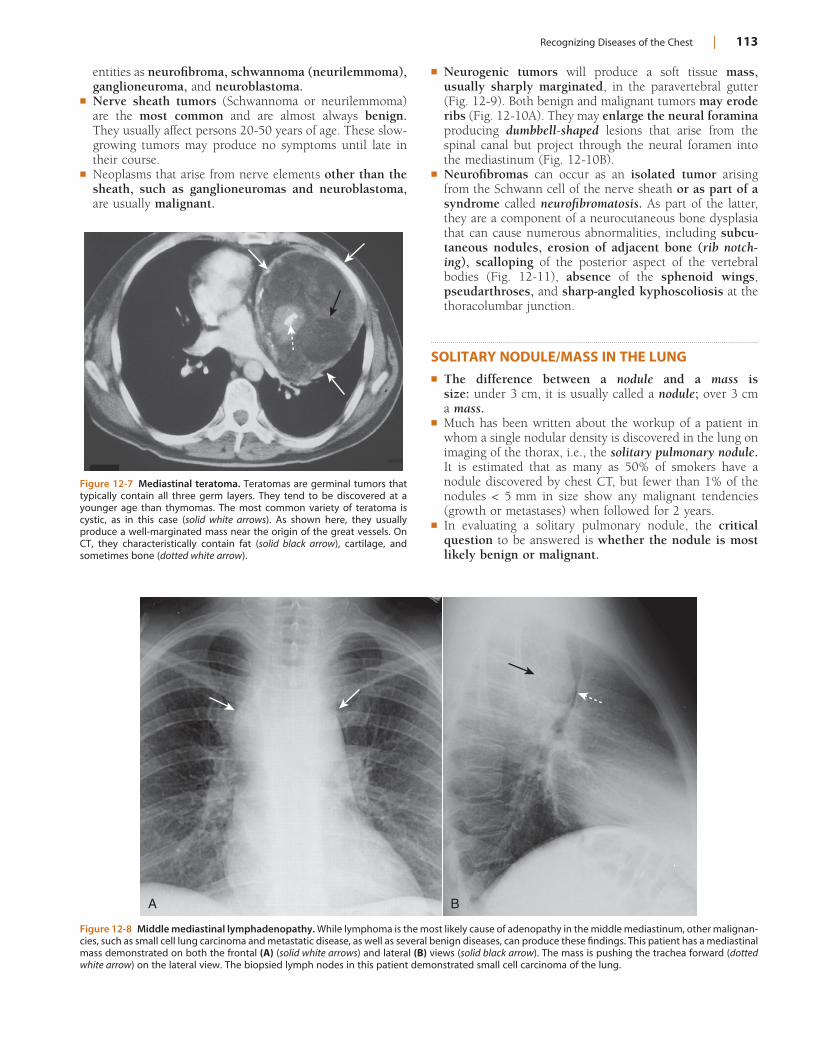
Recognizing Diseases of the Chest | 113
Figure 12-7 Mediastinal teratoma. Teratomas are germinal tumors that typically contain all three germ layers. They tend to be discovered at a younger age than thymomas. The most common variety of teratoma is cystic, as in this case (solid white arrows). As shown here, they usually produce a well-marginated mass near the origin of the great vessels. On CT, they characteristically contain fat (solid black arrow), cartilage, and sometimes bone (dotted white arrow).
Figure 12-8 Middle mediastinal lymphadenopathy. While lymphoma is the most likely cause of adenopathy in the middle mediastinum, other malignan-cies, such as small cell lung carcinoma and metastatic disease, as well as several benign diseases, can produce these findings. This patient has a mediastinal mass demonstrated on both the frontal (A) (solid white arrows) and lateral (B) views (solid black arrow). The mass is pushing the trachea forward (dotted white arrow) on the lateral view. The biopsied lymph nodes in this patient demonstrated small cell carcinoma of the lung.
A B
entities as neurofibroma, schwannoma (neurilemmoma), ganglioneuroma, and neuroblastoma.
! Nerve sheath tumors (Schwannoma or neurilemmoma) are the most common and are almost always benign. They usually affect persons 20-50 years of age. These slow-growing tumors may produce no symptoms until late in their course.
! Neoplasms that arise from nerve elements other than the sheath, such as ganglioneuromas and neuroblastoma, are usually malignant.
! Neurogenic tumors will produce a soft tissue mass, usually sharply marginated, in the paravertebral gutter (Fig. 12-9). Both benign and malignant tumors may erode ribs (Fig. 12-10A). They may enlarge the neural foramina producing dumbbell-shaped lesions that arise from the spinal canal but project through the neural foramen into the mediastinum (Fig. 12-10B).
! Neurofibromas can occur as an isolated tumor arising from the Schwann cell of the nerve sheath or as part of a syndrome called neurofibromatosis. As part of the latter, they are a component of a neurocutaneous bone dysplasia that can cause numerous abnormalities, including subcu-taneous nodules, erosion of adjacent bone (rib notch-ing), scalloping of the posterior aspect of the vertebral bodies (Fig. 12-11), absence of the sphenoid wings, pseudarthroses, and sharp-angled kyphoscoliosis at the thoracolumbar junction.
SOLITARY NODULE/MASS IN THE LUNG! The difference between a nodule and a mass is
size: under 3 cm, it is usually called a nodule; over 3 cm a mass.
! Much has been written about the workup of a patient in whom a single nodular density is discovered in the lung on imaging of the thorax, i.e., the solitary pulmonary nodule. It is estimated that as many as 50% of smokers have a nodule discovered by chest CT, but fewer than 1% of the nodules < 5 mm in size show any malignant tendencies (growth or metastases) when followed for 2 years.
! In evaluating a solitary pulmonary nodule, the critical question to be answered is whether the nodule is most likely benign or malignant.
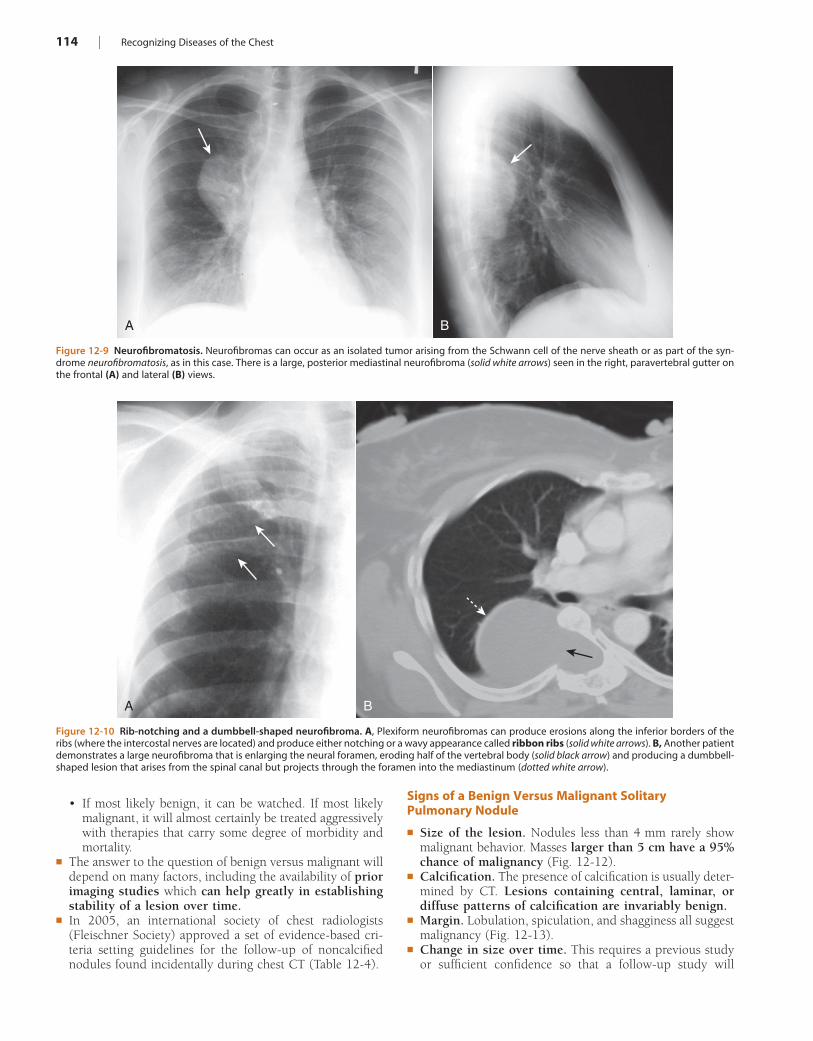
114 | Recognizing Diseases of the Chest
Figure 12-9 Neurofibromatosis. Neurofibromas can occur as an isolated tumor arising from the Schwann cell of the nerve sheath or as part of the syn-drome neurofibromatosis, as in this case. There is a large, posterior mediastinal neurofibroma (solid white arrows) seen in the right, paravertebral gutter on the frontal (A) and lateral (B) views.
A B
Figure 12-10 Rib-notching and a dumbbell-shaped neurofibroma. A, Plexiform neurofibromas can produce erosions along the inferior borders of the ribs (where the intercostal nerves are located) and produce either notching or a wavy appearance called ribbon ribs (solid white arrows). B, Another patient demonstrates a large neurofibroma that is enlarging the neural foramen, eroding half of the vertebral body (solid black arrow) and producing a dumbbell-shaped lesion that arises from the spinal canal but projects through the foramen into the mediastinum (dotted white arrow).
A B
• If most likely benign, it can be watched. If most likely malignant, it will almost certainly be treated aggressively with therapies that carry some degree of morbidity and mortality.
! The answer to the question of benign versus malignant will depend on many factors, including the availability of prior imaging studies which can help greatly in establishing stability of a lesion over time.
! In 2005, an international society of chest radiologists (Fleischner Society) approved a set of evidence-based cri-teria setting guidelines for the follow-up of noncalcified nodules found incidentally during chest CT (Table 12-4).
Signs of a Benign Versus Malignant Solitary Pulmonary Nodule
! Size of the lesion. Nodules less than 4 mm rarely show malignant behavior. Masses larger than 5 cm have a 95% chance of malignancy (Fig. 12-12).
! Calcification. The presence of calcification is usually deter-mined by CT. Lesions containing central, laminar, or diffuse patterns of calcification are invariably benign.
! Margin. Lobulation, spiculation, and shagginess all suggest malignancy (Fig. 12-13).
! Change in size over time. This requires a previous study or sufficient confidence so that a follow-up study will
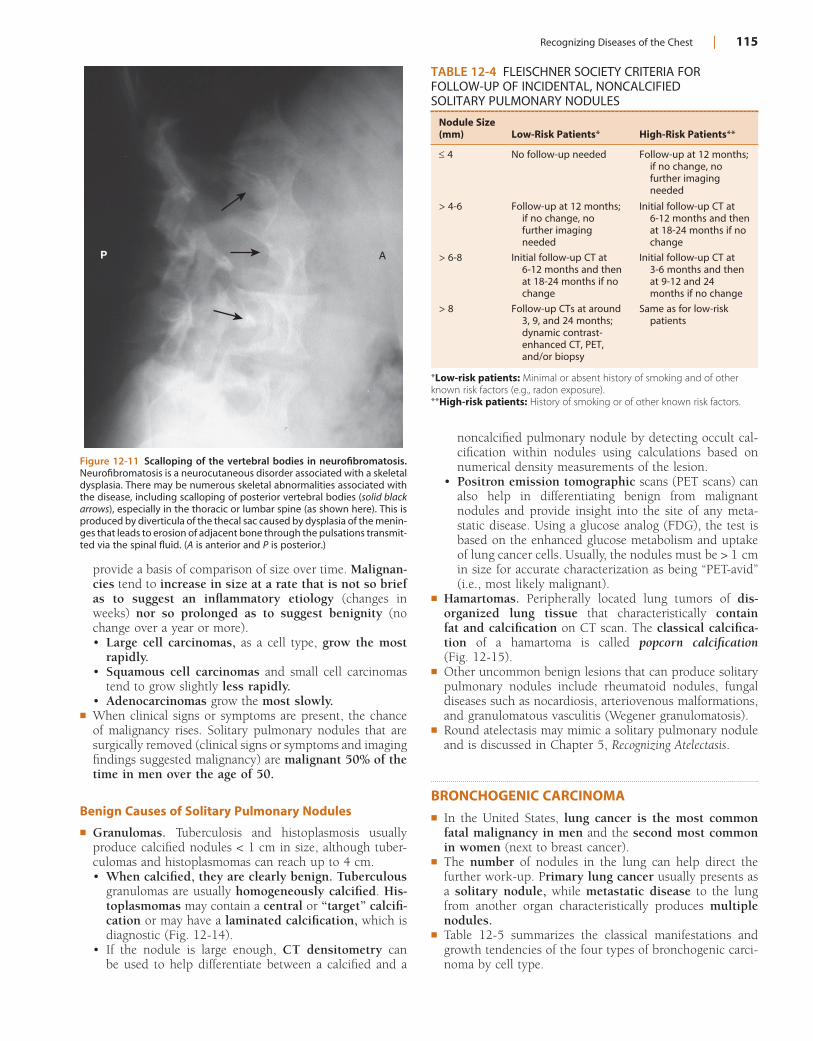
Recognizing Diseases of the Chest | 115
Figure 12-11 Scalloping of the vertebral bodies in neurofibromatosis. Neurofibromatosis is a neurocutaneous disorder associated with a skeletal dysplasia. There may be numerous skeletal abnormalities associated with the disease, including scalloping of posterior vertebral bodies (solid black arrows), especially in the thoracic or lumbar spine (as shown here). This is produced by diverticula of the thecal sac caused by dysplasia of the menin-ges that leads to erosion of adjacent bone through the pulsations transmit-ted via the spinal fluid. (A is anterior and P is posterior.)
P A
TABLE 12-4 FLEISCHNER SOCIETY CRITERIA FOR FOLLOW-UP OF INCIDENTAL, NONCALCIFIED SOLITARY PULMONARY NODULES
Nodule Size (mm) Low-Risk Patients* High-Risk Patients**
4 No follow-up needed Follow-up at 12 months; if no change, no further imaging needed
> 4-6 Follow-up at 12 months; if no change, no further imaging needed
Initial follow-up CT at 6-12 months and then at 18-24 months if no change
> 6-8 Initial follow-up CT at 6-12 months and then at 18-24 months if no change
Initial follow-up CT at 3-6 months and then at 9-12 and 24 months if no change
> 8 Follow-up CTs at around 3, 9, and 24 months; dynamic contrast-enhanced CT, PET, and/or biopsy
Same as for low-risk patients
*Low-risk patients: Minimal or absent history of smoking and of other known risk factors (e.g., radon exposure).**High-risk patients: History of smoking or of other known risk factors.
provide a basis of comparison of size over time. Malignan-cies tend to increase in size at a rate that is not so brief as to suggest an inflammatory etiology (changes in weeks) nor so prolonged as to suggest benignity (no change over a year or more).• Large cell carcinomas, as a cell type, grow the most
rapidly.• Squamous cell carcinomas and small cell carcinomas
tend to grow slightly less rapidly.• Adenocarcinomas grow the most slowly.
! When clinical signs or symptoms are present, the chance of malignancy rises. Solitary pulmonary nodules that are surgically removed (clinical signs or symptoms and imaging findings suggested malignancy) are malignant 50% of the time in men over the age of 50.
Benign Causes of Solitary Pulmonary Nodules
! Granulomas. Tuberculosis and histoplasmosis usually produce calcified nodules < 1 cm in size, although tuber-culomas and histoplasmomas can reach up to 4 cm.• When calcified, they are clearly benign. Tuberculous
granulomas are usually homogeneously calcified. His-toplasmomas may contain a central or “target” calcifi-cation or may have a laminated calcification, which is diagnostic (Fig. 12-14).
• If the nodule is large enough, CT densitometry can be used to help differentiate between a calcified and a
noncalcified pulmonary nodule by detecting occult cal-cification within nodules using calculations based on numerical density measurements of the lesion.
• Positron emission tomographic scans (PET scans) can also help in differentiating benign from malignant nodules and provide insight into the site of any meta-static disease. Using a glucose analog (FDG), the test is based on the enhanced glucose metabolism and uptake of lung cancer cells. Usually, the nodules must be > 1 cm in size for accurate characterization as being “PET-avid” (i.e., most likely malignant).
! Hamartomas. Peripherally located lung tumors of dis-organized lung tissue that characteristically contain fat and calcification on CT scan. The classical calcifica-tion of a hamartoma is called popcorn calcification (Fig. 12-15).
! Other uncommon benign lesions that can produce solitary pulmonary nodules include rheumatoid nodules, fungal diseases such as nocardiosis, arteriovenous malformations, and granulomatous vasculitis (Wegener granulomatosis).
! Round atelectasis may mimic a solitary pulmonary nodule and is discussed in Chapter 5, Recognizing Atelectasis.
BRONCHOGENIC CARCINOMA! In the United States, lung cancer is the most common
fatal malignancy in men and the second most common in women (next to breast cancer).
! The number of nodules in the lung can help direct the further work-up. Primary lung cancer usually presents as a solitary nodule, while metastatic disease to the lung from another organ characteristically produces multiple nodules.
! Table 12-5 summarizes the classical manifestations and growth tendencies of the four types of bronchogenic carci-noma by cell type.
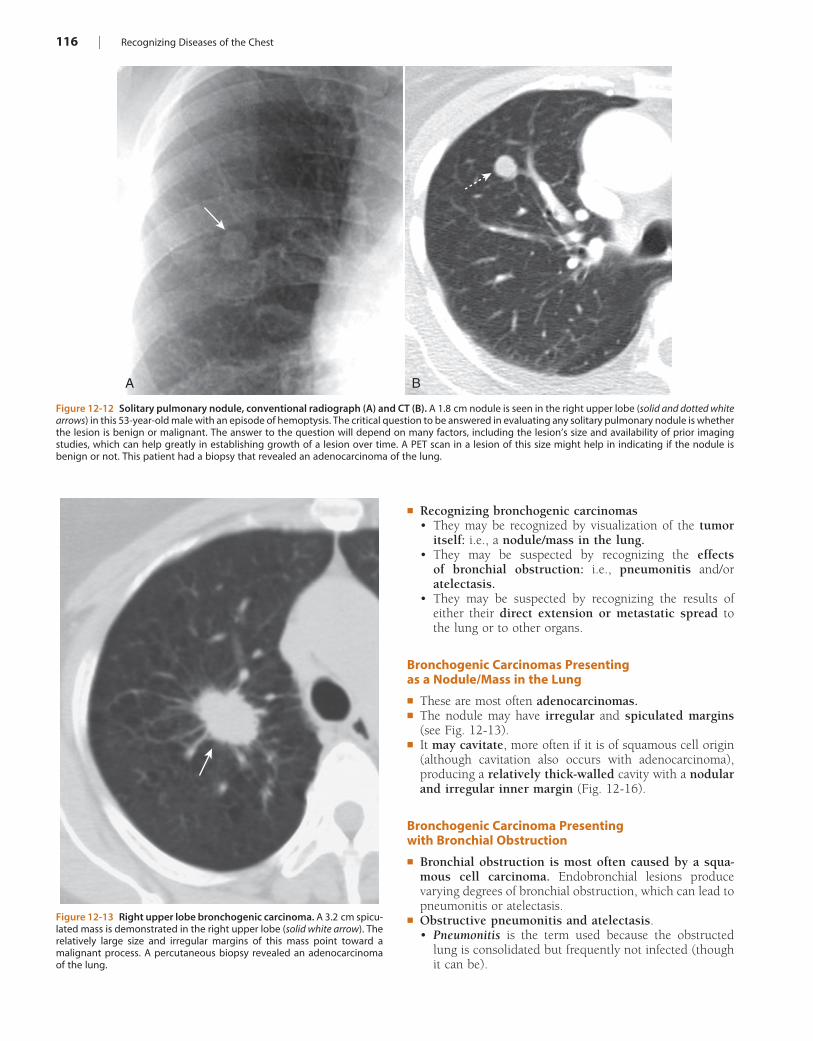
116 | Recognizing Diseases of the Chest
Figure 12-13 Right upper lobe bronchogenic carcinoma. A 3.2 cm spicu-lated mass is demonstrated in the right upper lobe (solid white arrow). The relatively large size and irregular margins of this mass point toward a malignant process. A percutaneous biopsy revealed an adenocarcinoma of the lung.
Figure 12-12 Solitary pulmonary nodule, conventional radiograph (A) and CT (B). A 1.8 cm nodule is seen in the right upper lobe (solid and dotted white arrows) in this 53-year-old male with an episode of hemoptysis. The critical question to be answered in evaluating any solitary pulmonary nodule is whether the lesion is benign or malignant. The answer to the question will depend on many factors, including the lesion’s size and availability of prior imaging studies, which can help greatly in establishing growth of a lesion over time. A PET scan in a lesion of this size might help in indicating if the nodule is benign or not. This patient had a biopsy that revealed an adenocarcinoma of the lung.
A B
! Recognizing bronchogenic carcinomas• They may be recognized by visualization of the tumor
itself: i.e., a nodule/mass in the lung.• They may be suspected by recognizing the effects
of bronchial obstruction: i.e., pneumonitis and/or atelectasis.
• They may be suspected by recognizing the results of either their direct extension or metastatic spread to the lung or to other organs.
Bronchogenic Carcinomas Presenting as a Nodule/Mass in the Lung
! These are most often adenocarcinomas.! The nodule may have irregular and spiculated margins
(see Fig. 12-13).! It may cavitate, more often if it is of squamous cell origin
(although cavitation also occurs with adenocarcinoma), producing a relatively thick-walled cavity with a nodular and irregular inner margin (Fig. 12-16).
Bronchogenic Carcinoma Presenting with Bronchial Obstruction
! Bronchial obstruction is most often caused by a squa-mous cell carcinoma. Endobronchial lesions produce varying degrees of bronchial obstruction, which can lead to pneumonitis or atelectasis.
! Obstructive pneumonitis and atelectasis.• Pneumonitis is the term used because the obstructed
lung is consolidated but frequently not infected (though it can be).
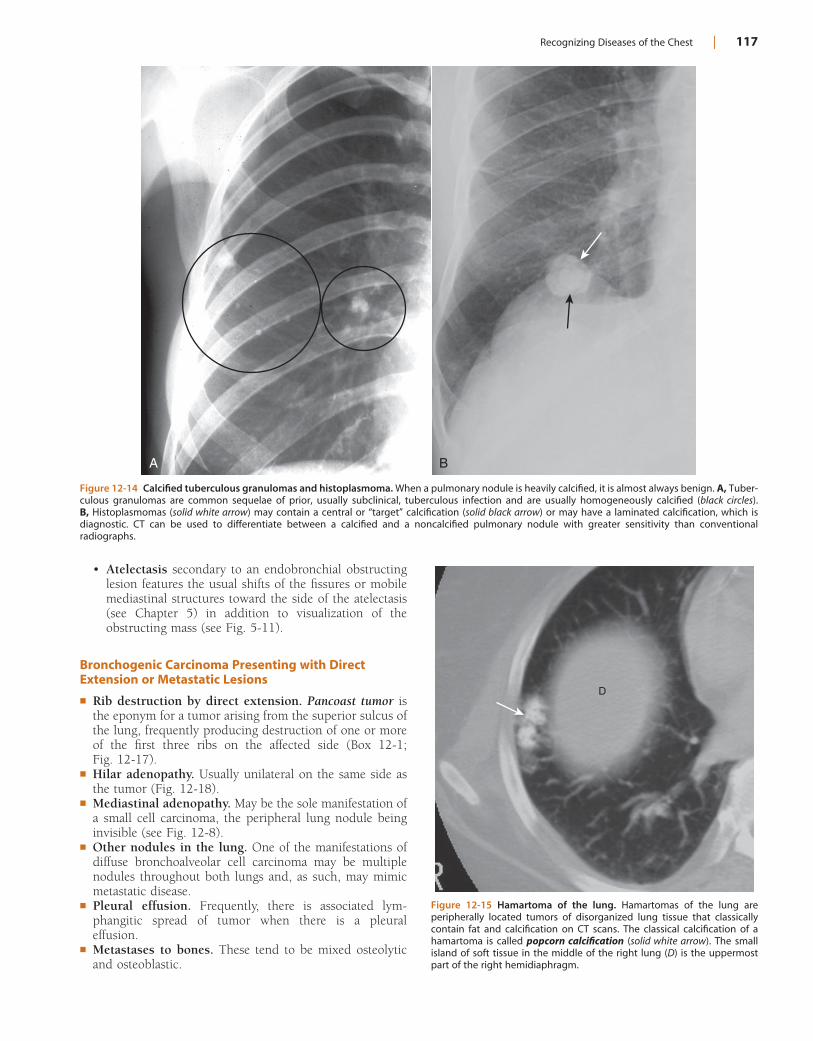
Recognizing Diseases of the Chest | 117
• Atelectasis secondary to an endobronchial obstructing lesion features the usual shifts of the fissures or mobile mediastinal structures toward the side of the atelectasis (see Chapter 5) in addition to visualization of the obstructing mass (see Fig. 5-11).
Bronchogenic Carcinoma Presenting with Direct Extension or Metastatic Lesions
! Rib destruction by direct extension. Pancoast tumor is the eponym for a tumor arising from the superior sulcus of the lung, frequently producing destruction of one or more of the first three ribs on the affected side (Box 12-1; Fig. 12-17).
! Hilar adenopathy. Usually unilateral on the same side as the tumor (Fig. 12-18).
! Mediastinal adenopathy. May be the sole manifestation of a small cell carcinoma, the peripheral lung nodule being invisible (see Fig. 12-8).
! Other nodules in the lung. One of the manifestations of diffuse bronchoalveolar cell carcinoma may be multiple nodules throughout both lungs and, as such, may mimic metastatic disease.
! Pleural effusion. Frequently, there is associated lym-phangitic spread of tumor when there is a pleural effusion.
! Metastases to bones. These tend to be mixed osteolytic and osteoblastic.
Figure 12-14 Calcified tuberculous granulomas and histoplasmoma. When a pulmonary nodule is heavily calcified, it is almost always benign. A, Tuber-culous granulomas are common sequelae of prior, usually subclinical, tuberculous infection and are usually homogeneously calcified (black circles). B, Histoplasmomas (solid white arrow) may contain a central or “target” calcification (solid black arrow) or may have a laminated calcification, which is diagnostic. CT can be used to differentiate between a calcified and a noncalcified pulmonary nodule with greater sensitivity than conventional radiographs.
A B
Figure 12-15 Hamartoma of the lung. Hamartomas of the lung are peripherally located tumors of disorganized lung tissue that classically contain fat and calcification on CT scans. The classical calcification of a hamartoma is called popcorn calcification (solid white arrow). The small island of soft tissue in the middle of the right lung (D) is the uppermost part of the right hemidiaphragm.
D
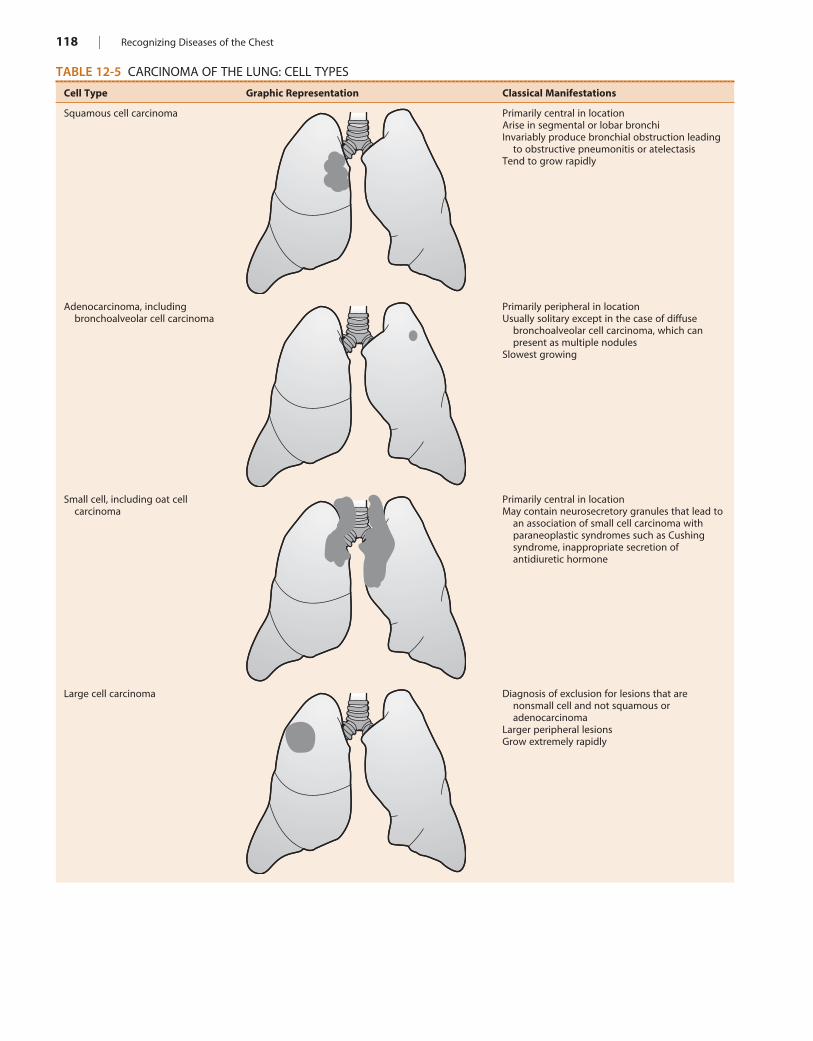
118 | Recognizing Diseases of the Chest
TABLE 12-5 CARCINOMA OF THE LUNG: CELL TYPES
Cell Type Graphic Representation Classical Manifestations
Squamous cell carcinoma Primarily central in locationArise in segmental or lobar bronchiInvariably produce bronchial obstruction leading
to obstructive pneumonitis or atelectasisTend to grow rapidly
Adenocarcinoma, including bronchoalveolar cell carcinoma
Primarily peripheral in locationUsually solitary except in the case of diffuse
bronchoalveolar cell carcinoma, which can present as multiple nodules
Slowest growing
Small cell, including oat cell carcinoma
Primarily central in locationMay contain neurosecretory granules that lead to
an association of small cell carcinoma with paraneoplastic syndromes such as Cushing syndrome, inappropriate secretion of antidiuretic hormone
Large cell carcinoma Diagnosis of exclusion for lesions that are nonsmall cell and not squamous or adenocarcinoma
Larger peripheral lesionsGrow extremely rapidly
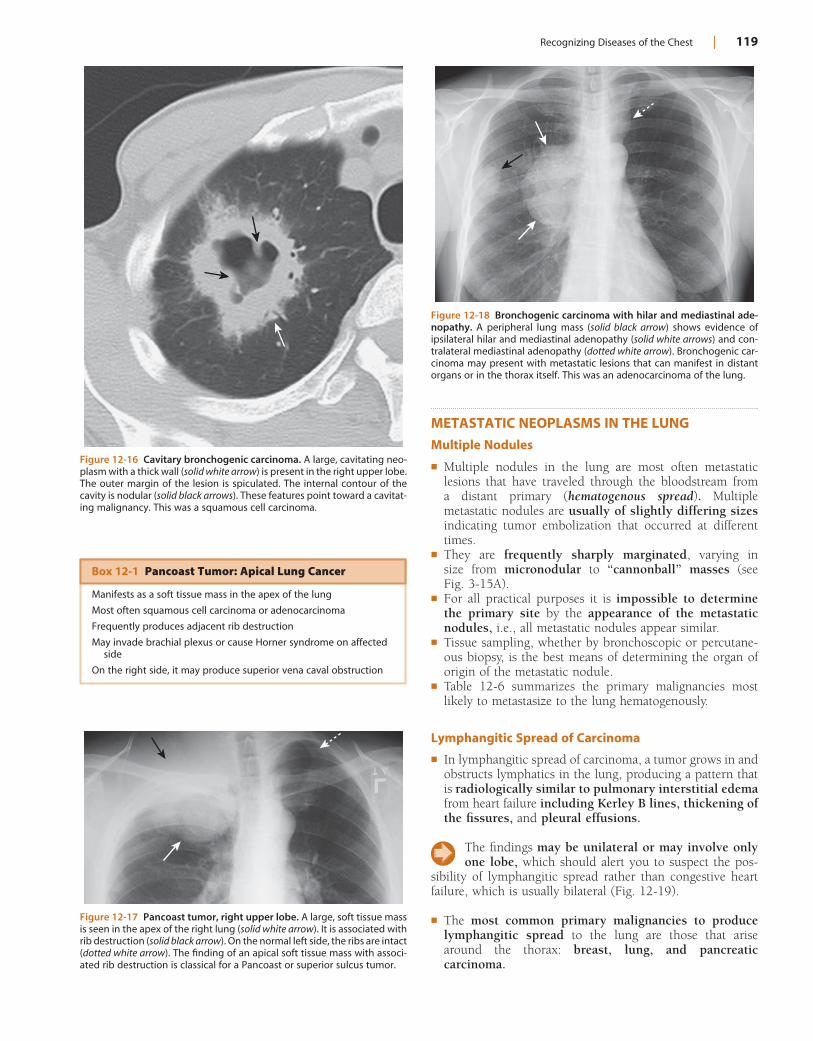
Recognizing Diseases of the Chest | 119
Figure 12-16 Cavitary bronchogenic carcinoma. A large, cavitating neo-plasm with a thick wall (solid white arrow) is present in the right upper lobe. The outer margin of the lesion is spiculated. The internal contour of the cavity is nodular (solid black arrows). These features point toward a cavitat-ing malignancy. This was a squamous cell carcinoma.
Figure 12-17 Pancoast tumor, right upper lobe. A large, soft tissue mass is seen in the apex of the right lung (solid white arrow). It is associated with rib destruction (solid black arrow). On the normal left side, the ribs are intact (dotted white arrow). The finding of an apical soft tissue mass with associ-ated rib destruction is classical for a Pancoast or superior sulcus tumor.
Box 12-1 Pancoast Tumor: Apical Lung Cancer
Manifests as a soft tissue mass in the apex of the lung
Most often squamous cell carcinoma or adenocarcinoma
Frequently produces adjacent rib destruction
May invade brachial plexus or cause Horner syndrome on affected side
On the right side, it may produce superior vena caval obstruction
Figure 12-18 Bronchogenic carcinoma with hilar and mediastinal ade-nopathy. A peripheral lung mass (solid black arrow) shows evidence of ipsilateral hilar and mediastinal adenopathy (solid white arrows) and con-tralateral mediastinal adenopathy (dotted white arrow). Bronchogenic car-cinoma may present with metastatic lesions that can manifest in distant organs or in the thorax itself. This was an adenocarcinoma of the lung.
METASTATIC NEOPLASMS IN THE LUNGMultiple Nodules
! Multiple nodules in the lung are most often metastatic lesions that have traveled through the bloodstream from a distant primary (hematogenous spread). Multiple metastatic nodules are usually of slightly differing sizes indicating tumor embolization that occurred at different times.
! They are frequently sharply marginated, varying in size from micronodular to “cannonball” masses (see Fig. 3-15A).
! For all practical purposes it is impossible to determine the primary site by the appearance of the metastatic nodules, i.e., all metastatic nodules appear similar.
! Tissue sampling, whether by bronchoscopic or percutane-ous biopsy, is the best means of determining the organ of origin of the metastatic nodule.
! Table 12-6 summarizes the primary malignancies most likely to metastasize to the lung hematogenously.
Lymphangitic Spread of Carcinoma
! In lymphangitic spread of carcinoma, a tumor grows in and obstructs lymphatics in the lung, producing a pattern that is radiologically similar to pulmonary interstitial edema from heart failure including Kerley B lines, thickening of the fissures, and pleural effusions.
The findings may be unilateral or may involve only one lobe, which should alert you to suspect the pos-
sibility of lymphangitic spread rather than congestive heart failure, which is usually bilateral (Fig. 12-19).
! The most common primary malignancies to produce lymphangitic spread to the lung are those that arise around the thorax: breast, lung, and pancreatic carcinoma.
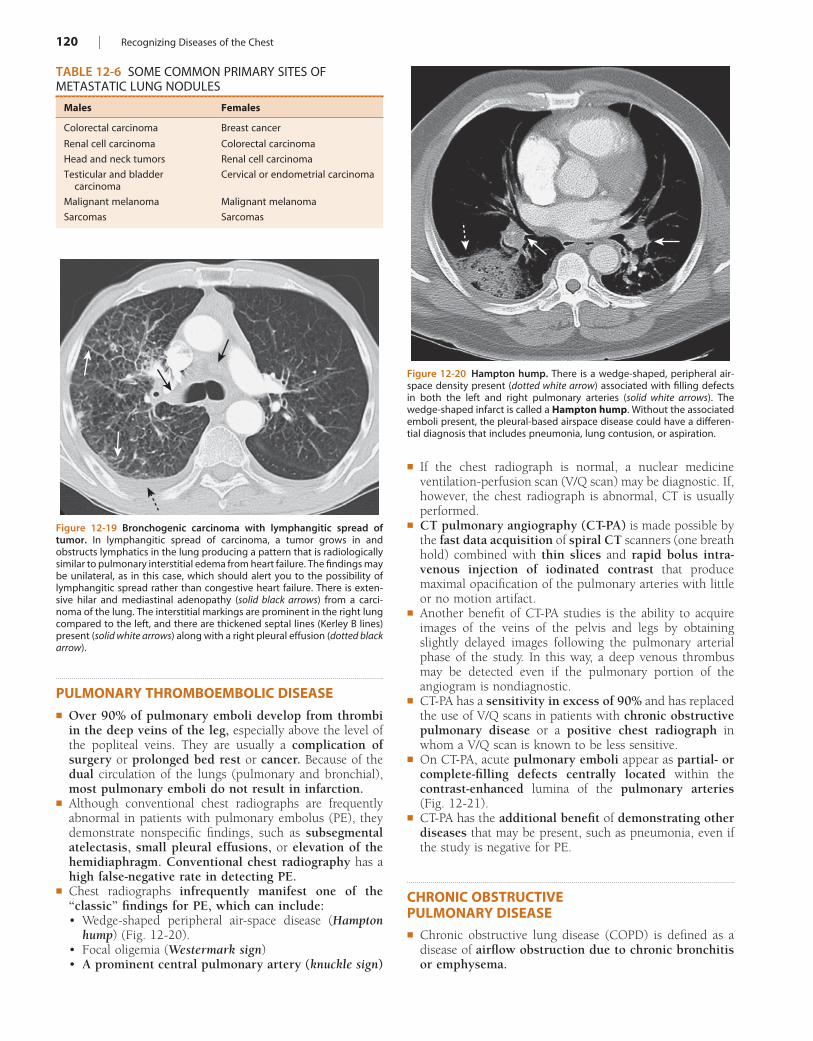
120 | Recognizing Diseases of the Chest
! If the chest radiograph is normal, a nuclear medicine ventilation-perfusion scan (V/Q scan) may be diagnostic. If, however, the chest radiograph is abnormal, CT is usually performed.
! CT pulmonary angiography (CT-PA) is made possible by the fast data acquisition of spiral CT scanners (one breath hold) combined with thin slices and rapid bolus intra-venous injection of iodinated contrast that produce maximal opacification of the pulmonary arteries with little or no motion artifact.
! Another benefit of CT-PA studies is the ability to acquire images of the veins of the pelvis and legs by obtaining slightly delayed images following the pulmonary arterial phase of the study. In this way, a deep venous thrombus may be detected even if the pulmonary portion of the angiogram is nondiagnostic.
! CT-PA has a sensitivity in excess of 90% and has replaced the use of V/Q scans in patients with chronic obstructive pulmonary disease or a positive chest radiograph in whom a V/Q scan is known to be less sensitive.
! On CT-PA, acute pulmonary emboli appear as partial- or complete-filling defects centrally located within the contrast-enhanced lumina of the pulmonary arteries (Fig. 12-21).
! CT-PA has the additional benefit of demonstrating other diseases that may be present, such as pneumonia, even if the study is negative for PE.
CHRONIC OBSTRUCTIVE PULMONARY DISEASE! Chronic obstructive lung disease (COPD) is defined as a
disease of airflow obstruction due to chronic bronchitis or emphysema.
TABLE 12-6 SOME COMMON PRIMARY SITES OF METASTATIC LUNG NODULES
Males Females
Colorectal carcinoma Breast cancer
Renal cell carcinoma Colorectal carcinoma
Head and neck tumors Renal cell carcinoma
Testicular and bladder carcinoma
Cervical or endometrial carcinoma
Malignant melanoma Malignant melanoma
Sarcomas Sarcomas
Figure 12-19 Bronchogenic carcinoma with lymphangitic spread of tumor. In lymphangitic spread of carcinoma, a tumor grows in and obstructs lymphatics in the lung producing a pattern that is radiologically similar to pulmonary interstitial edema from heart failure. The findings may be unilateral, as in this case, which should alert you to the possibility of lymphangitic spread rather than congestive heart failure. There is exten-sive hilar and mediastinal adenopathy (solid black arrows) from a carci-noma of the lung. The interstitial markings are prominent in the right lung compared to the left, and there are thickened septal lines (Kerley B lines) present (solid white arrows) along with a right pleural effusion (dotted black arrow).
Figure 12-20 Hampton hump. There is a wedge-shaped, peripheral air-space density present (dotted white arrow) associated with filling defects in both the left and right pulmonary arteries (solid white arrows). The wedge-shaped infarct is called a Hampton hump. Without the associated emboli present, the pleural-based airspace disease could have a differen-tial diagnosis that includes pneumonia, lung contusion, or aspiration.
PULMONARY THROMBOEMBOLIC DISEASE! Over 90% of pulmonary emboli develop from thrombi
in the deep veins of the leg, especially above the level of the popliteal veins. They are usually a complication of surgery or prolonged bed rest or cancer. Because of the dual circulation of the lungs (pulmonary and bronchial), most pulmonary emboli do not result in infarction.
! Although conventional chest radiographs are frequently abnormal in patients with pulmonary embolus (PE), they demonstrate nonspecific findings, such as subsegmental atelectasis, small pleural effusions, or elevation of the hemidiaphragm. Conventional chest radiography has a high false-negative rate in detecting PE.
! Chest radiographs infrequently manifest one of the “classic” findings for PE, which can include:• Wedge-shaped peripheral air-space disease (Hampton
hump) (Fig. 12-20).• Focal oligemia (Westermark sign)• A prominent central pulmonary artery (knuckle sign)
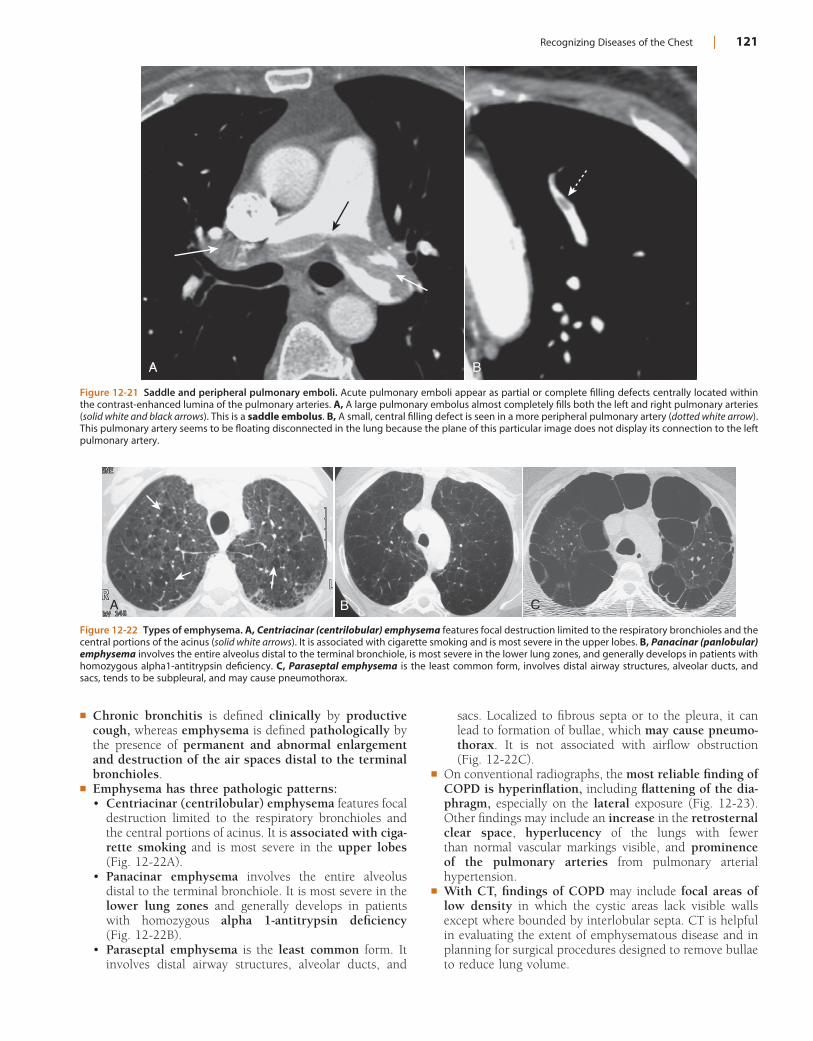
Recognizing Diseases of the Chest | 121
sacs. Localized to fibrous septa or to the pleura, it can lead to formation of bullae, which may cause pneumo-thorax. It is not associated with airflow obstruction (Fig. 12-22C).
! On conventional radiographs, the most reliable finding of COPD is hyperinflation, including flattening of the dia-phragm, especially on the lateral exposure (Fig. 12-23). Other findings may include an increase in the retrosternal clear space, hyperlucency of the lungs with fewer than normal vascular markings visible, and prominence of the pulmonary arteries from pulmonary arterial hypertension.
! With CT, findings of COPD may include focal areas of low density in which the cystic areas lack visible walls except where bounded by interlobular septa. CT is helpful in evaluating the extent of emphysematous disease and in planning for surgical procedures designed to remove bullae to reduce lung volume.
! Chronic bronchitis is defined clinically by productive cough, whereas emphysema is defined pathologically by the presence of permanent and abnormal enlargement and destruction of the air spaces distal to the terminal bronchioles.
! Emphysema has three pathologic patterns:• Centriacinar (centrilobular) emphysema features focal
destruction limited to the respiratory bronchioles and the central portions of acinus. It is associated with ciga-rette smoking and is most severe in the upper lobes (Fig. 12-22A).
• Panacinar emphysema involves the entire alveolus distal to the terminal bronchiole. It is most severe in the lower lung zones and generally develops in patients with homozygous alpha 1-antitrypsin deficiency (Fig. 12-22B).
• Paraseptal emphysema is the least common form. It involves distal airway structures, alveolar ducts, and
Figure 12-21 Saddle and peripheral pulmonary emboli. Acute pulmonary emboli appear as partial or complete filling defects centrally located within the contrast-enhanced lumina of the pulmonary arteries. A, A large pulmonary embolus almost completely fills both the left and right pulmonary arteries (solid white and black arrows). This is a saddle embolus. B, A small, central filling defect is seen in a more peripheral pulmonary artery (dotted white arrow). This pulmonary artery seems to be floating disconnected in the lung because the plane of this particular image does not display its connection to the left pulmonary artery.
A B
Figure 12-22 Types of emphysema. A, Centriacinar (centrilobular) emphysema features focal destruction limited to the respiratory bronchioles and the central portions of the acinus (solid white arrows). It is associated with cigarette smoking and is most severe in the upper lobes. B, Panacinar (panlobular) emphysema involves the entire alveolus distal to the terminal bronchiole, is most severe in the lower lung zones, and generally develops in patients with homozygous alpha1-antitrypsin deficiency. C, Paraseptal emphysema is the least common form, involves distal airway structures, alveolar ducts, and sacs, tends to be subpleural, and may cause pneumothorax.
A B C
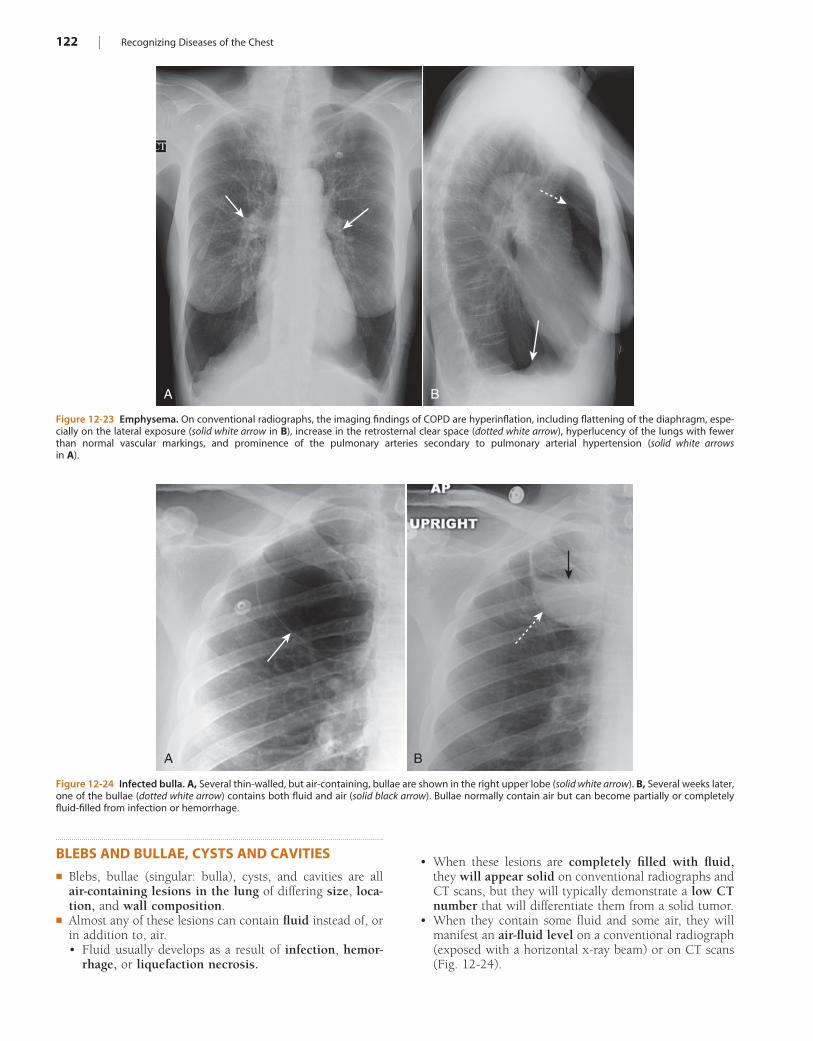
122 | Recognizing Diseases of the Chest
Figure 12-23 Emphysema. On conventional radiographs, the imaging findings of COPD are hyperinflation, including flattening of the diaphragm, espe-cially on the lateral exposure (solid white arrow in B), increase in the retrosternal clear space (dotted white arrow), hyperlucency of the lungs with fewer than normal vascular markings, and prominence of the pulmonary arteries secondary to pulmonary arterial hypertension (solid white arrows in A).
A B
Figure 12-24 Infected bulla. A, Several thin-walled, but air-containing, bullae are shown in the right upper lobe (solid white arrow). B, Several weeks later, one of the bullae (dotted white arrow) contains both fluid and air (solid black arrow). Bullae normally contain air but can become partially or completely fluid-filled from infection or hemorrhage.
A B
BLEBS AND BULLAE, CYSTS AND CAVITIES! Blebs, bullae (singular: bulla), cysts, and cavities are all
air-containing lesions in the lung of differing size, loca-tion, and wall composition.
! Almost any of these lesions can contain fluid instead of, or in addition to, air.• Fluid usually develops as a result of infection, hemor-
rhage, or liquefaction necrosis.
• When these lesions are completely filled with fluid, they will appear solid on conventional radiographs and CT scans, but they will typically demonstrate a low CT number that will differentiate them from a solid tumor.
• When they contain some fluid and some air, they will manifest an air-fluid level on a conventional radiograph (exposed with a horizontal x-ray beam) or on CT scans (Fig. 12-24).
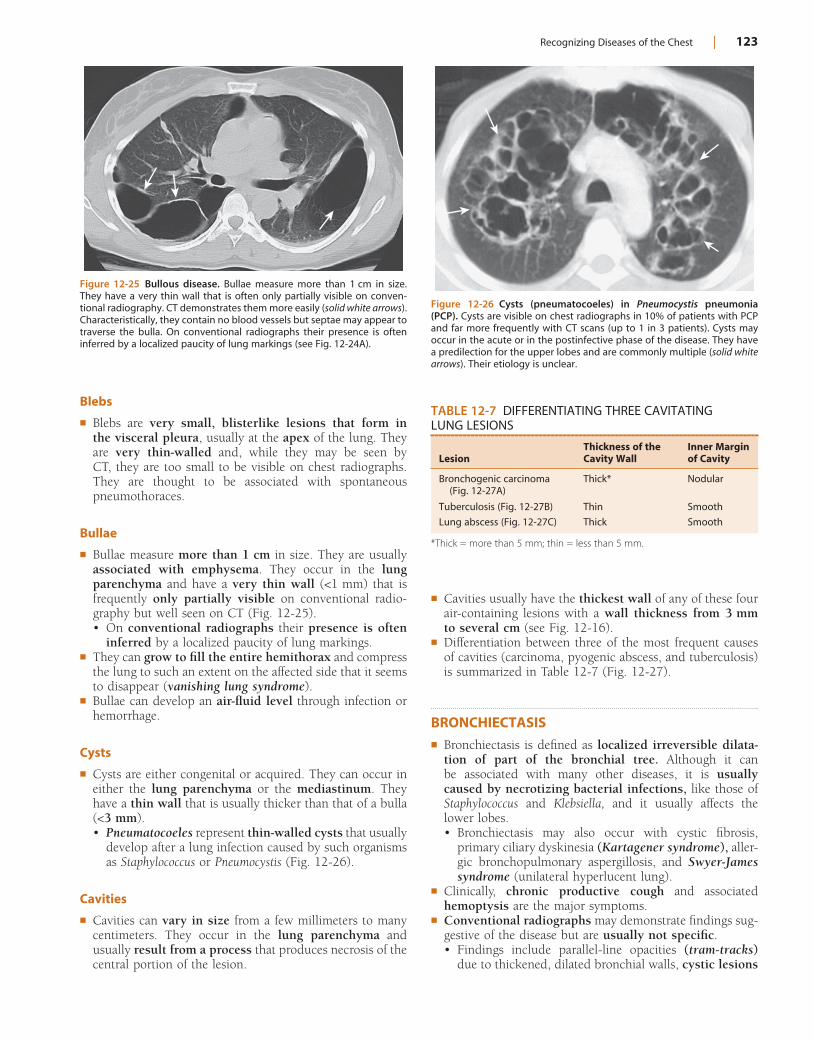
Recognizing Diseases of the Chest | 123
Figure 12-25 Bullous disease. Bullae measure more than 1 cm in size. They have a very thin wall that is often only partially visible on conven-tional radiography. CT demonstrates them more easily (solid white arrows). Characteristically, they contain no blood vessels but septae may appear to traverse the bulla. On conventional radiographs their presence is often inferred by a localized paucity of lung markings (see Fig. 12-24A).
Figure 12-26 Cysts (pneumatocoeles) in Pneumocystis pneumonia (PCP). Cysts are visible on chest radiographs in 10% of patients with PCP and far more frequently with CT scans (up to 1 in 3 patients). Cysts may occur in the acute or in the postinfective phase of the disease. They have a predilection for the upper lobes and are commonly multiple (solid white arrows). Their etiology is unclear.
Blebs
! Blebs are very small, blisterlike lesions that form in the visceral pleura, usually at the apex of the lung. They are very thin-walled and, while they may be seen by CT, they are too small to be visible on chest radiographs. They are thought to be associated with spontaneous pneumothoraces.
Bullae
! Bullae measure more than 1 cm in size. They are usually associated with emphysema. They occur in the lung parenchyma and have a very thin wall (<1 mm) that is frequently only partially visible on conventional radio-graphy but well seen on CT (Fig. 12-25).• On conventional radiographs their presence is often
inferred by a localized paucity of lung markings.! They can grow to fill the entire hemithorax and compress
the lung to such an extent on the affected side that it seems to disappear (vanishing lung syndrome).
! Bullae can develop an air-fluid level through infection or hemorrhage.
Cysts
! Cysts are either congenital or acquired. They can occur in either the lung parenchyma or the mediastinum. They have a thin wall that is usually thicker than that of a bulla (<3 mm).• Pneumatocoeles represent thin-walled cysts that usually
develop after a lung infection caused by such organisms as Staphylococcus or Pneumocystis (Fig. 12-26).
Cavities
! Cavities can vary in size from a few millimeters to many centimeters. They occur in the lung parenchyma and usually result from a process that produces necrosis of the central portion of the lesion.
TABLE 12-7 DIFFERENTIATING THREE CAVITATING LUNG LESIONS
LesionThickness of the Cavity Wall
Inner Margin of Cavity
Bronchogenic carcinoma (Fig. 12-27A)
Thick* Nodular
Tuberculosis (Fig. 12-27B) Thin Smooth
Lung abscess (Fig. 12-27C) Thick Smooth
*Thick = more than 5 mm; thin = less than 5 mm.
! Cavities usually have the thickest wall of any of these four air-containing lesions with a wall thickness from 3 mm to several cm (see Fig. 12-16).
! Differentiation between three of the most frequent causes of cavities (carcinoma, pyogenic abscess, and tuberculosis) is summarized in Table 12-7 (Fig. 12-27).
BRONCHIECTASIS! Bronchiectasis is defined as localized irreversible dilata-
tion of part of the bronchial tree. Although it can be associated with many other diseases, it is usually caused by necrotizing bacterial infections, like those of Staphylococcus and Klebsiella, and it usually affects the lower lobes.• Bronchiectasis may also occur with cystic fibrosis,
primary ciliary dyskinesia (Kartagener syndrome), aller-gic bronchopulmonary aspergillosis, and Swyer-James syndrome (unilateral hyperlucent lung).
! Clinically, chronic productive cough and associated hemoptysis are the major symptoms.
! Conventional radiographs may demonstrate findings sug-gestive of the disease but are usually not specific.• Findings include parallel-line opacities (tram-tracks)
due to thickened, dilated bronchial walls, cystic lesions
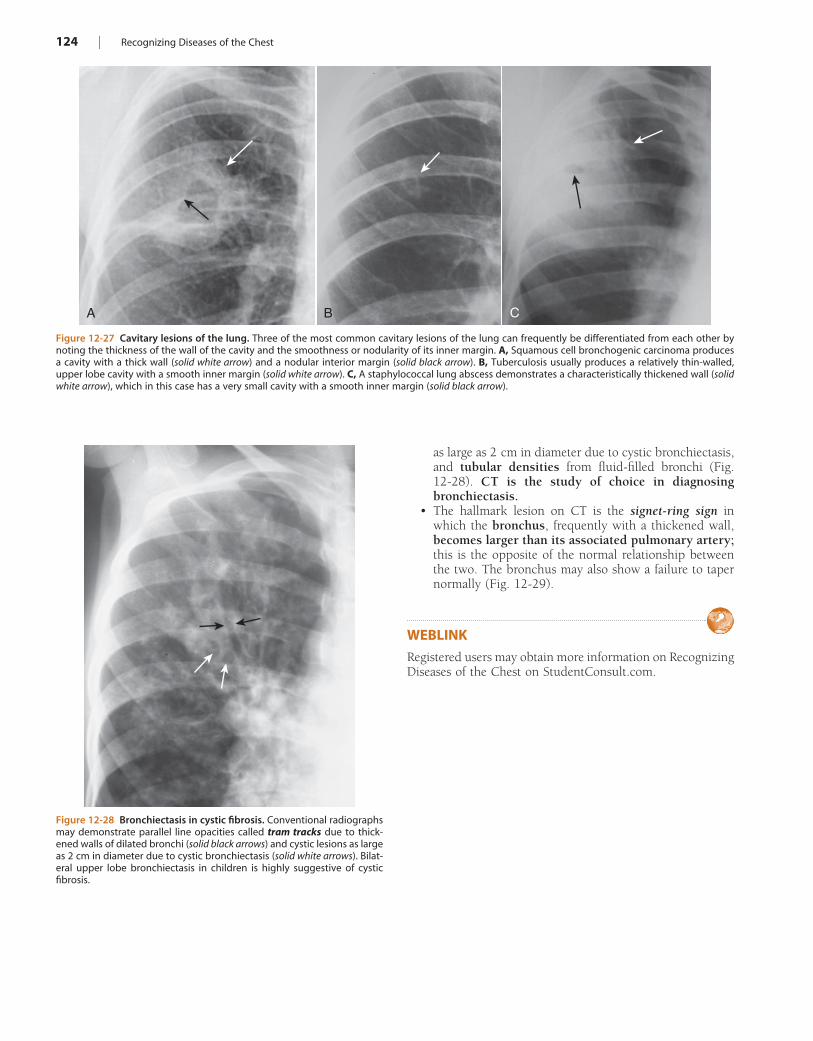
124 | Recognizing Diseases of the Chest
Figure 12-27 Cavitary lesions of the lung. Three of the most common cavitary lesions of the lung can frequently be differentiated from each other by noting the thickness of the wall of the cavity and the smoothness or nodularity of its inner margin. A, Squamous cell bronchogenic carcinoma produces a cavity with a thick wall (solid white arrow) and a nodular interior margin (solid black arrow). B, Tuberculosis usually produces a relatively thin-walled, upper lobe cavity with a smooth inner margin (solid white arrow). C, A staphylococcal lung abscess demonstrates a characteristically thickened wall (solid white arrow), which in this case has a very small cavity with a smooth inner margin (solid black arrow).
A B C
as large as 2 cm in diameter due to cystic bronchiectasis, and tubular densities from fluid-filled bronchi (Fig. 12-28). CT is the study of choice in diagnosing bronchiectasis.
• The hallmark lesion on CT is the signet-ring sign in which the bronchus, frequently with a thickened wall, becomes larger than its associated pulmonary artery; this is the opposite of the normal relationship between the two. The bronchus may also show a failure to taper normally (Fig. 12-29).
WEBLINKRegistered users may obtain more information on Recognizing Diseases of the Chest on StudentConsult.com.
Figure 12-28 Bronchiectasis in cystic fibrosis. Conventional radiographs may demonstrate parallel line opacities called tram tracks due to thick-ened walls of dilated bronchi (solid black arrows) and cystic lesions as large as 2 cm in diameter due to cystic bronchiectasis (solid white arrows). Bilat-eral upper lobe bronchiectasis in children is highly suggestive of cystic fibrosis.
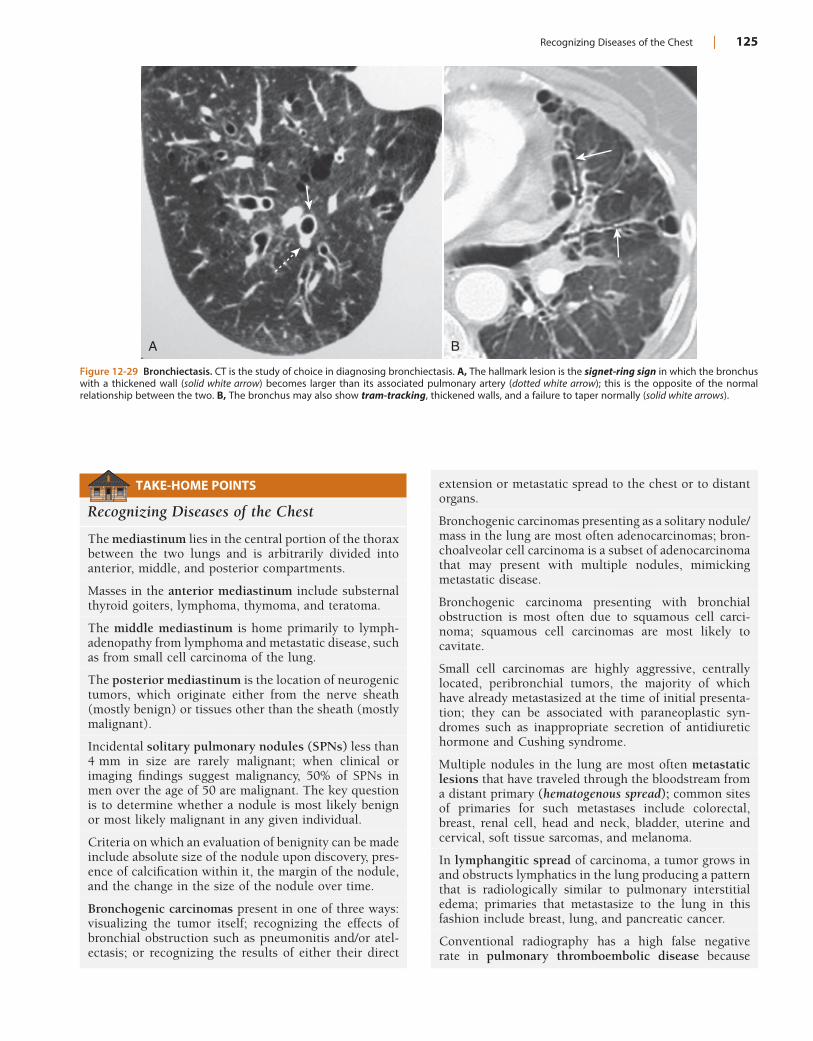
Recognizing Diseases of the Chest | 125
Figure 12-29 Bronchiectasis. CT is the study of choice in diagnosing bronchiectasis. A, The hallmark lesion is the signet-ring sign in which the bronchus with a thickened wall (solid white arrow) becomes larger than its associated pulmonary artery (dotted white arrow); this is the opposite of the normal relationship between the two. B, The bronchus may also show tram-tracking, thickened walls, and a failure to taper normally (solid white arrows).
A B
TAKE-HOME POINTS
Recognizing Diseases of the Chest
The mediastinum lies in the central portion of the thorax between the two lungs and is arbitrarily divided into anterior, middle, and posterior compartments.
Masses in the anterior mediastinum include substernal thyroid goiters, lymphoma, thymoma, and teratoma.
The middle mediastinum is home primarily to lymph-adenopathy from lymphoma and metastatic disease, such as from small cell carcinoma of the lung.
The posterior mediastinum is the location of neurogenic tumors, which originate either from the nerve sheath (mostly benign) or tissues other than the sheath (mostly malignant).
Incidental solitary pulmonary nodules (SPNs) less than 4 mm in size are rarely malignant; when clinical or imaging findings suggest malignancy, 50% of SPNs in men over the age of 50 are malignant. The key question is to determine whether a nodule is most likely benign or most likely malignant in any given individual.
Criteria on which an evaluation of benignity can be made include absolute size of the nodule upon discovery, pres-ence of calcification within it, the margin of the nodule, and the change in the size of the nodule over time.
Bronchogenic carcinomas present in one of three ways: visualizing the tumor itself; recognizing the effects of bronchial obstruction such as pneumonitis and/or atel-ectasis; or recognizing the results of either their direct
extension or metastatic spread to the chest or to distant organs.
Bronchogenic carcinomas presenting as a solitary nodule/mass in the lung are most often adenocarcinomas; bron-choalveolar cell carcinoma is a subset of adenocarcinoma that may present with multiple nodules, mimicking metastatic disease.
Bronchogenic carcinoma presenting with bronchial obstruction is most often due to squamous cell carci-noma; squamous cell carcinomas are most likely to cavitate.
Small cell carcinomas are highly aggressive, centrally located, peribronchial tumors, the majority of which have already metastasized at the time of initial presenta-tion; they can be associated with paraneoplastic syn-dromes such as inappropriate secretion of antidiuretic hormone and Cushing syndrome.
Multiple nodules in the lung are most often metastatic lesions that have traveled through the bloodstream from a distant primary (hematogenous spread); common sites of primaries for such metastases include colorectal, breast, renal cell, head and neck, bladder, uterine and cervical, soft tissue sarcomas, and melanoma.
In lymphangitic spread of carcinoma, a tumor grows in and obstructs lymphatics in the lung producing a pattern that is radiologically similar to pulmonary interstitial edema; primaries that metastasize to the lung in this fashion include breast, lung, and pancreatic cancer.
Conventional radiography has a high false negative rate in pulmonary thromboembolic disease because

126 | Recognizing Diseases of the Chest
demonstration of “classic” findings such as Hampton hump, Westermark sign, and the knuckle sign is infrequent.
CT-pulmonary angiography (CT-PA) is now widely used for the diagnosis of pulmonary embolism producing images of the pulmonary arteries with little or no motion artifact.
Chronic obstructive pulmonary disease (COPD) con-sists of emphysema and chronic bronchitis; of the two, chronic bronchitis is a clinical diagnosis while
emphysema is defined pathologically and has findings that can be seen on both conventional radiographs and CT scans.
Blebs, bullae, cysts, and cavities are all air-containing lesions in the lung that differ in size, location, and wall composition; bullae, cysts, and cavities are seen on CT and may also be seen on conventional radiographs.
Although bronchiectasis may be seen on conventional radiographs, CT is the study of choice demonstrating tram-tracks, cystic lesions, or tubular densities.
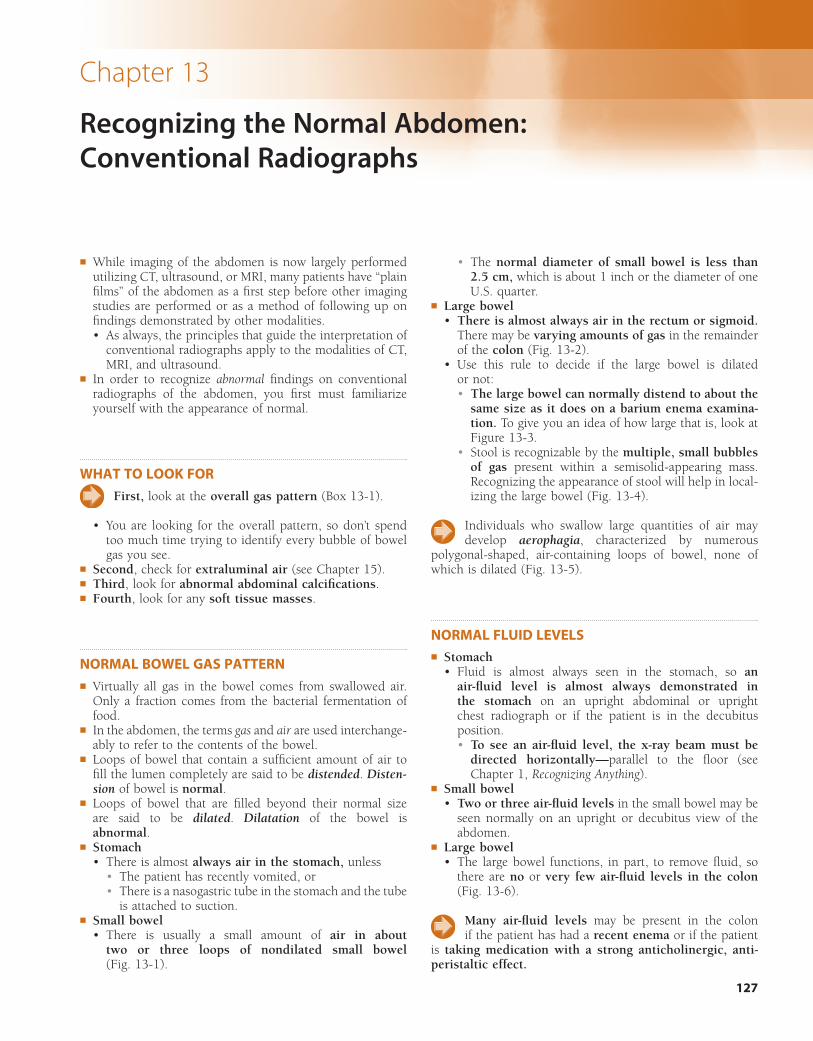
127
Chapter 13
Recognizing the Normal Abdomen: Conventional Radiographs
! While imaging of the abdomen is now largely performed utilizing CT, ultrasound, or MRI, many patients have “plain films” of the abdomen as a first step before other imaging studies are performed or as a method of following up on findings demonstrated by other modalities.• As always, the principles that guide the interpretation of
conventional radiographs apply to the modalities of CT, MRI, and ultrasound.
! In order to recognize abnormal findings on conventional radiographs of the abdomen, you first must familiarize yourself with the appearance of normal.
WHAT TO LOOK FOR
First, look at the overall gas pattern (Box 13-1).
• You are looking for the overall pattern, so don’t spend too much time trying to identify every bubble of bowel gas you see.
! Second, check for extraluminal air (see Chapter 15).! Third, look for abnormal abdominal calcifications.! Fourth, look for any soft tissue masses.
NORMAL BOWEL GAS PATTERN! Virtually all gas in the bowel comes from swallowed air.
Only a fraction comes from the bacterial fermentation of food.
! In the abdomen, the terms gas and air are used interchange-ably to refer to the contents of the bowel.
! Loops of bowel that contain a sufficient amount of air to fill the lumen completely are said to be distended. Disten-sion of bowel is normal.
! Loops of bowel that are filled beyond their normal size are said to be dilated. Dilatation of the bowel is abnormal.
! Stomach• There is almost always air in the stomach, unless
• The patient has recently vomited, or• There is a nasogastric tube in the stomach and the tube
is attached to suction.! Small bowel
• There is usually a small amount of air in about two or three loops of nondilated small bowel (Fig. 13-1).
• The normal diameter of small bowel is less than 2.5 cm, which is about 1 inch or the diameter of one U.S. quarter.
! Large bowel• There is almost always air in the rectum or sigmoid.
There may be varying amounts of gas in the remainder of the colon (Fig. 13-2).
• Use this rule to decide if the large bowel is dilated or not:• The large bowel can normally distend to about the
same size as it does on a barium enema examina-tion. To give you an idea of how large that is, look at Figure 13-3.
• Stool is recognizable by the multiple, small bubbles of gas present within a semisolid-appearing mass. Recognizing the appearance of stool will help in local-izing the large bowel (Fig. 13-4).
Individuals who swallow large quantities of air may develop aerophagia, characterized by numerous
polygonal-shaped, air-containing loops of bowel, none of which is dilated (Fig. 13-5).
NORMAL FLUID LEVELS! Stomach
• Fluid is almost always seen in the stomach, so an air-fluid level is almost always demonstrated in the stomach on an upright abdominal or upright chest radiograph or if the patient is in the decubitus position.• To see an air-fluid level, the x-ray beam must be
directed horizontally—parallel to the floor (see Chapter 1, Recognizing Anything).
! Small bowel• Two or three air-fluid levels in the small bowel may be
seen normally on an upright or decubitus view of the abdomen.
! Large bowel• The large bowel functions, in part, to remove fluid, so
there are no or very few air-fluid levels in the colon (Fig. 13-6).
Many air-fluid levels may be present in the colon if the patient has had a recent enema or if the patient
is taking medication with a strong anticholinergic, anti-peristaltic effect.
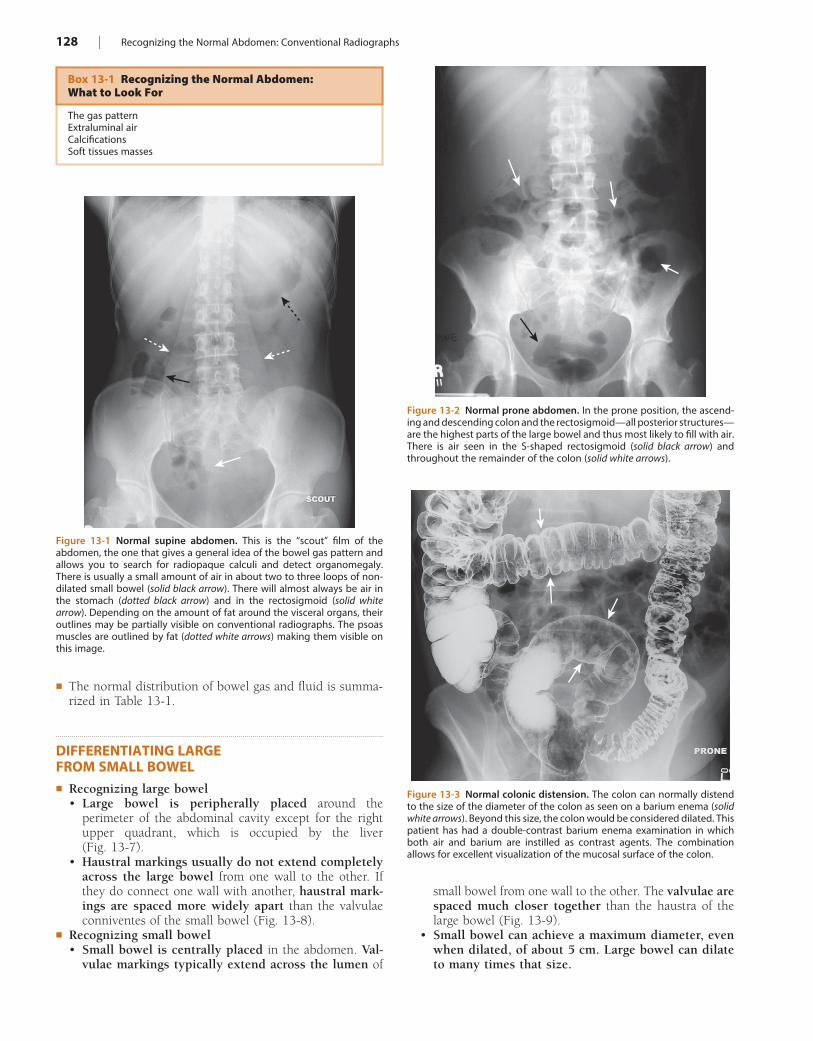
128 | Recognizing the Normal Abdomen: Conventional Radiographs
small bowel from one wall to the other. The valvulae are spaced much closer together than the haustra of the large bowel (Fig. 13-9).
• Small bowel can achieve a maximum diameter, even when dilated, of about 5 cm. Large bowel can dilate to many times that size.
! The normal distribution of bowel gas and fluid is summa-rized in Table 13-1.
DIFFERENTIATING LARGE FROM SMALL BOWEL! Recognizing large bowel
• Large bowel is peripherally placed around the perimeter of the abdominal cavity except for the right upper quadrant, which is occupied by the liver (Fig. 13-7).
• Haustral markings usually do not extend completely across the large bowel from one wall to the other. If they do connect one wall with another, haustral mark-ings are spaced more widely apart than the valvulae conniventes of the small bowel (Fig. 13-8).
! Recognizing small bowel• Small bowel is centrally placed in the abdomen. Val-
vulae markings typically extend across the lumen of
Figure 13-1 Normal supine abdomen. This is the “scout” film of the abdomen, the one that gives a general idea of the bowel gas pattern and allows you to search for radiopaque calculi and detect organomegaly. There is usually a small amount of air in about two to three loops of non-dilated small bowel (solid black arrow). There will almost always be air in the stomach (dotted black arrow) and in the rectosigmoid (solid white arrow). Depending on the amount of fat around the visceral organs, their outlines may be partially visible on conventional radiographs. The psoas muscles are outlined by fat (dotted white arrows) making them visible on this image.
Figure 13-2 Normal prone abdomen. In the prone position, the ascend-ing and descending colon and the rectosigmoid—all posterior structures—are the highest parts of the large bowel and thus most likely to fill with air. There is air seen in the S-shaped rectosigmoid (solid black arrow) and throughout the remainder of the colon (solid white arrows).
Figure 13-3 Normal colonic distension. The colon can normally distend to the size of the diameter of the colon as seen on a barium enema (solid white arrows). Beyond this size, the colon would be considered dilated. This patient has had a double-contrast barium enema examination in which both air and barium are instilled as contrast agents. The combination allows for excellent visualization of the mucosal surface of the colon.
Box 13-1 Recognizing the Normal Abdomen: What to Look For
The gas patternExtraluminal airCalcificationsSoft tissues masses
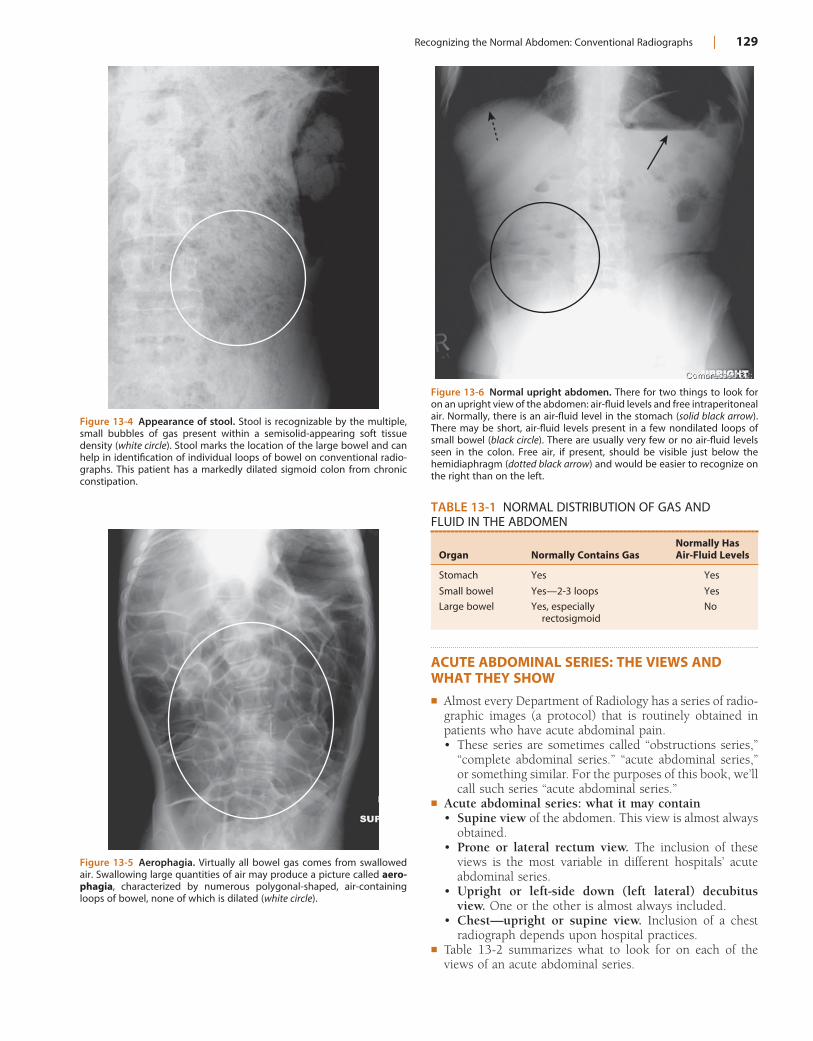
Recognizing the Normal Abdomen: Conventional Radiographs | 129
ACUTE ABDOMINAL SERIES: THE VIEWS AND WHAT THEY SHOW! Almost every Department of Radiology has a series of radio-
graphic images (a protocol) that is routinely obtained in patients who have acute abdominal pain.• These series are sometimes called “obstructions series,”
“complete abdominal series.” “acute abdominal series,” or something similar. For the purposes of this book, we’ll call such series “acute abdominal series.”
! Acute abdominal series: what it may contain• Supine view of the abdomen. This view is almost always
obtained.• Prone or lateral rectum view. The inclusion of these
views is the most variable in different hospitals’ acute abdominal series.
• Upright or left-side down (left lateral) decubitus view. One or the other is almost always included.
• Chest—upright or supine view. Inclusion of a chest radiograph depends upon hospital practices.
! Table 13-2 summarizes what to look for on each of the views of an acute abdominal series.
Figure 13-4 Appearance of stool. Stool is recognizable by the multiple, small bubbles of gas present within a semisolid-appearing soft tissue density (white circle). Stool marks the location of the large bowel and can help in identification of individual loops of bowel on conventional radio-graphs. This patient has a markedly dilated sigmoid colon from chronic constipation.
Figure 13-5 Aerophagia. Virtually all bowel gas comes from swallowed air. Swallowing large quantities of air may produce a picture called aero-phagia, characterized by numerous polygonal-shaped, air-containing loops of bowel, none of which is dilated (white circle).
Figure 13-6 Normal upright abdomen. There for two things to look for on an upright view of the abdomen: air-fluid levels and free intraperitoneal air. Normally, there is an air-fluid level in the stomach (solid black arrow). There may be short, air-fluid levels present in a few nondilated loops of small bowel (black circle). There are usually very few or no air-fluid levels seen in the colon. Free air, if present, should be visible just below the hemidiaphragm (dotted black arrow) and would be easier to recognize on the right than on the left.
TABLE 13-1 NORMAL DISTRIBUTION OF GAS AND FLUID IN THE ABDOMEN
Organ Normally Contains GasNormally Has Air-Fluid Levels
Stomach Yes Yes
Small bowel Yes—2-3 loops Yes
Large bowel Yes, especially rectosigmoid
No
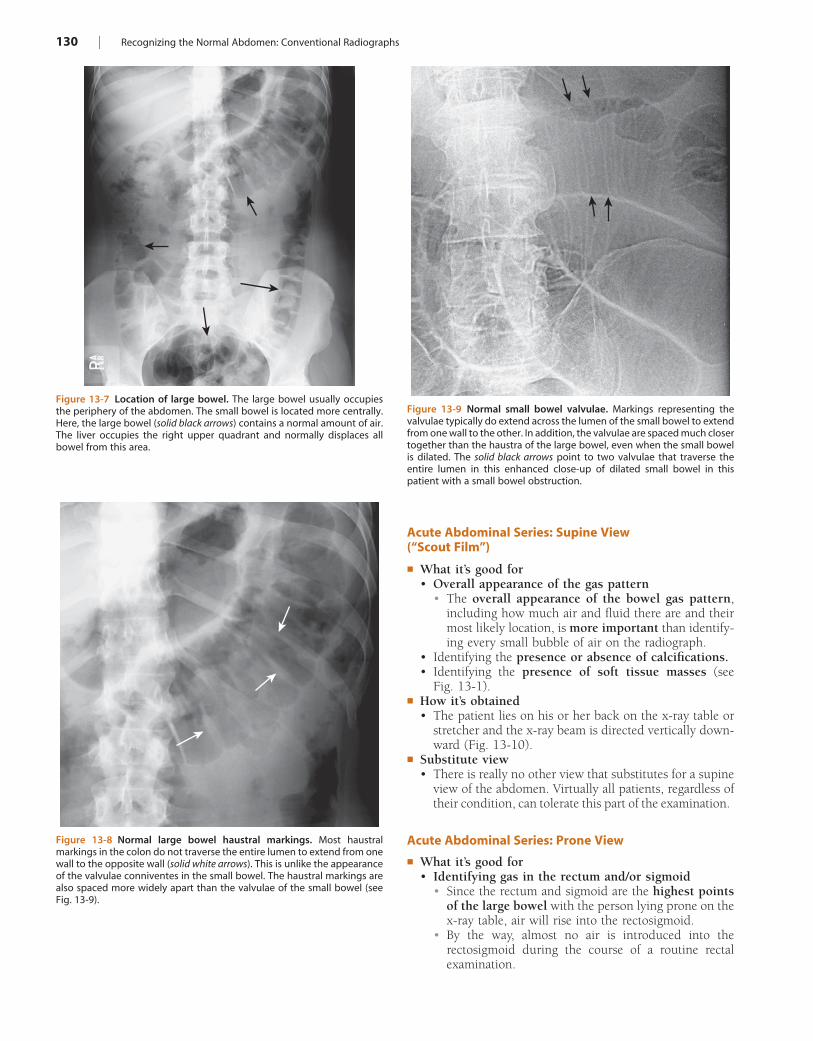
130 | Recognizing the Normal Abdomen: Conventional Radiographs
Figure 13-7 Location of large bowel. The large bowel usually occupies the periphery of the abdomen. The small bowel is located more centrally. Here, the large bowel (solid black arrows) contains a normal amount of air. The liver occupies the right upper quadrant and normally displaces all bowel from this area.
Figure 13-8 Normal large bowel haustral markings. Most haustral markings in the colon do not traverse the entire lumen to extend from one wall to the opposite wall (solid white arrows). This is unlike the appearance of the valvulae conniventes in the small bowel. The haustral markings are also spaced more widely apart than the valvulae of the small bowel (see Fig. 13-9).
Figure 13-9 Normal small bowel valvulae. Markings representing the valvulae typically do extend across the lumen of the small bowel to extend from one wall to the other. In addition, the valvulae are spaced much closer together than the haustra of the large bowel, even when the small bowel is dilated. The solid black arrows point to two valvulae that traverse the entire lumen in this enhanced close-up of dilated small bowel in this patient with a small bowel obstruction.
Acute Abdominal Series: Supine View (“Scout Film”)
! What it’s good for• Overall appearance of the gas pattern
• The overall appearance of the bowel gas pattern, including how much air and fluid there are and their most likely location, is more important than identify-ing every small bubble of air on the radiograph.
• Identifying the presence or absence of calcifications.• Identifying the presence of soft tissue masses (see
Fig. 13-1).! How it’s obtained
• The patient lies on his or her back on the x-ray table or stretcher and the x-ray beam is directed vertically down-ward (Fig. 13-10).
! Substitute view• There is really no other view that substitutes for a supine
view of the abdomen. Virtually all patients, regardless of their condition, can tolerate this part of the examination.
Acute Abdominal Series: Prone View
! What it’s good for• Identifying gas in the rectum and/or sigmoid
• Since the rectum and sigmoid are the highest points of the large bowel with the person lying prone on the x-ray table, air will rise into the rectosigmoid.
• By the way, almost no air is introduced into the rectosigmoid during the course of a routine rectal examination.
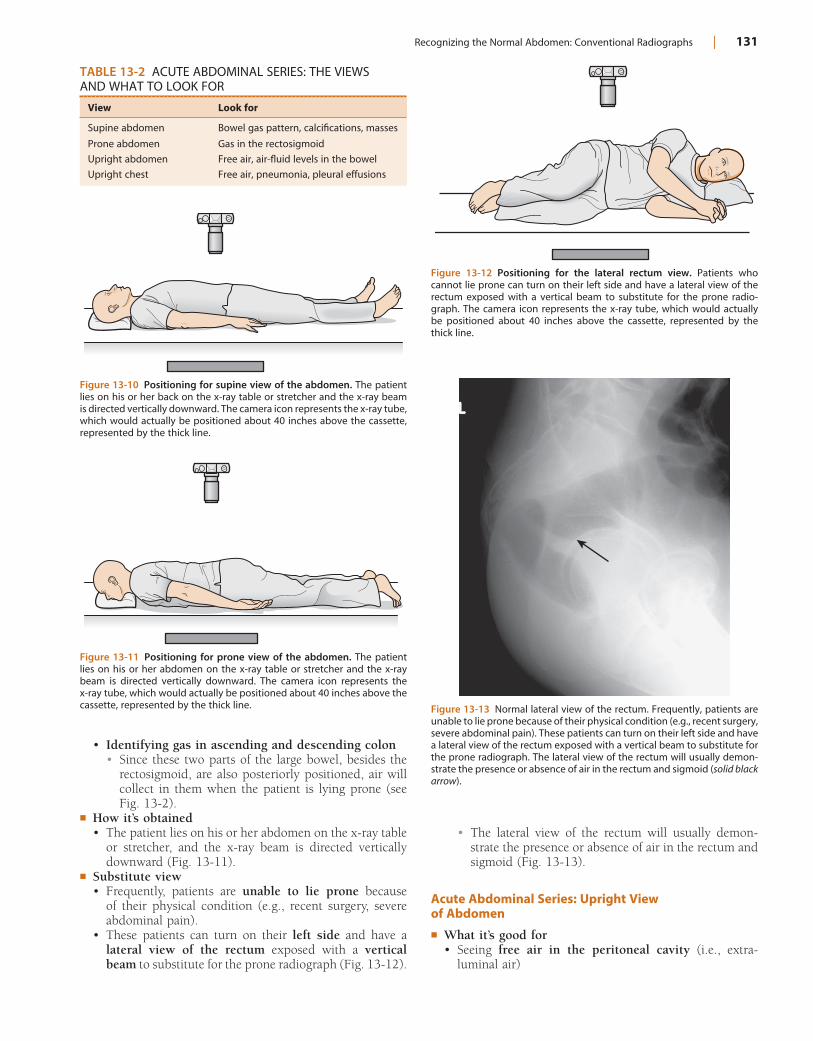
Recognizing the Normal Abdomen: Conventional Radiographs | 131
TABLE 13-2 ACUTE ABDOMINAL SERIES: THE VIEWS AND WHAT TO LOOK FOR
View Look for
Supine abdomen Bowel gas pattern, calcifications, masses
Prone abdomen Gas in the rectosigmoid
Upright abdomen Free air, air-fluid levels in the bowel
Upright chest Free air, pneumonia, pleural effusions
Figure 13-10 Positioning for supine view of the abdomen. The patient lies on his or her back on the x-ray table or stretcher and the x-ray beam is directed vertically downward. The camera icon represents the x-ray tube, which would actually be positioned about 40 inches above the cassette, represented by the thick line.
Figure 13-11 Positioning for prone view of the abdomen. The patient lies on his or her abdomen on the x-ray table or stretcher and the x-ray beam is directed vertically downward. The camera icon represents the x-ray tube, which would actually be positioned about 40 inches above the cassette, represented by the thick line.
• Identifying gas in ascending and descending colon• Since these two parts of the large bowel, besides the
rectosigmoid, are also posteriorly positioned, air will collect in them when the patient is lying prone (see Fig. 13-2).
! How it’s obtained• The patient lies on his or her abdomen on the x-ray table
or stretcher, and the x-ray beam is directed vertically downward (Fig. 13-11).
! Substitute view• Frequently, patients are unable to lie prone because
of their physical condition (e.g., recent surgery, severe abdominal pain).
• These patients can turn on their left side and have a lateral view of the rectum exposed with a vertical beam to substitute for the prone radiograph (Fig. 13-12).
Figure 13-12 Positioning for the lateral rectum view. Patients who cannot lie prone can turn on their left side and have a lateral view of the rectum exposed with a vertical beam to substitute for the prone radio-graph. The camera icon represents the x-ray tube, which would actually be positioned about 40 inches above the cassette, represented by the thick line.
• The lateral view of the rectum will usually demon-strate the presence or absence of air in the rectum and sigmoid (Fig. 13-13).
Acute Abdominal Series: Upright View of Abdomen
! What it’s good for• Seeing free air in the peritoneal cavity (i.e., extra-
luminal air)
Figure 13-13 Normal lateral view of the rectum. Frequently, patients are unable to lie prone because of their physical condition (e.g., recent surgery, severe abdominal pain). These patients can turn on their left side and have a lateral view of the rectum exposed with a vertical beam to substitute for the prone radiograph. The lateral view of the rectum will usually demon-strate the presence or absence of air in the rectum and sigmoid (solid black arrow).
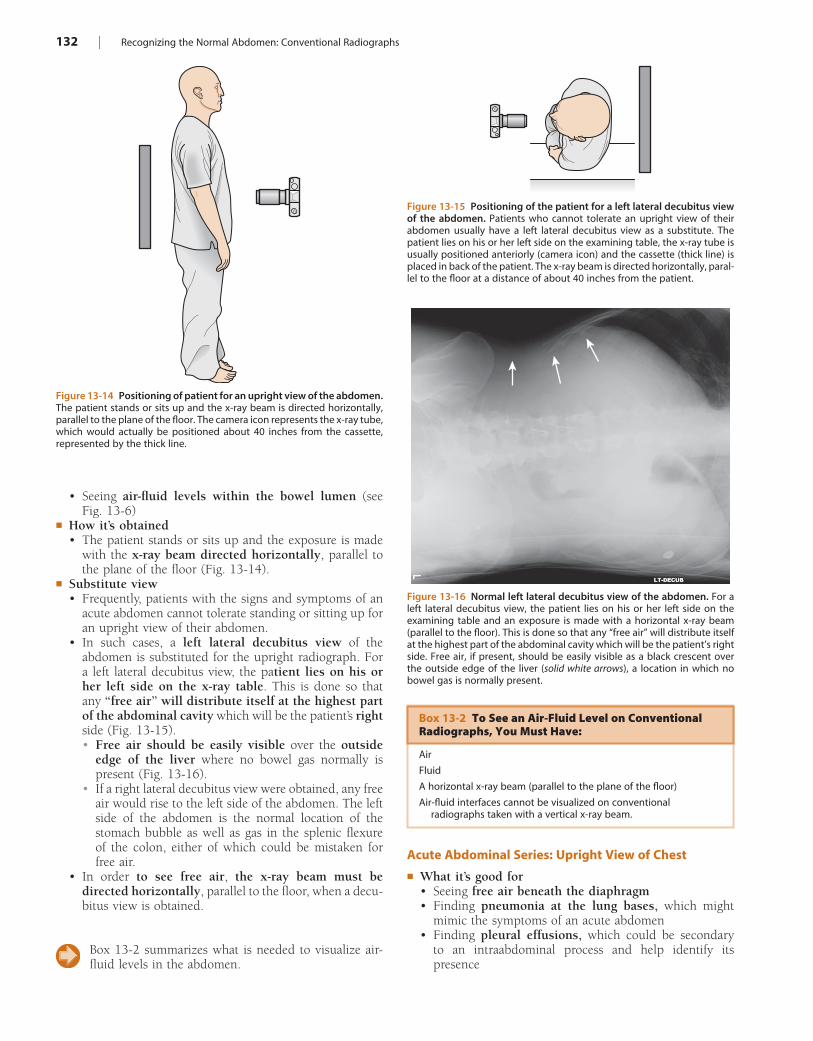
132 | Recognizing the Normal Abdomen: Conventional Radiographs
• Seeing air-fluid levels within the bowel lumen (see Fig. 13-6)
! How it’s obtained• The patient stands or sits up and the exposure is made
with the x-ray beam directed horizontally, parallel to the plane of the floor (Fig. 13-14).
! Substitute view• Frequently, patients with the signs and symptoms of an
acute abdomen cannot tolerate standing or sitting up for an upright view of their abdomen.
• In such cases, a left lateral decubitus view of the abdomen is substituted for the upright radiograph. For a left lateral decubitus view, the patient lies on his or her left side on the x-ray table. This is done so that any “free air” will distribute itself at the highest part of the abdominal cavity which will be the patient’s right side (Fig. 13-15).• Free air should be easily visible over the outside
edge of the liver where no bowel gas normally is present (Fig. 13-16).
• If a right lateral decubitus view were obtained, any free air would rise to the left side of the abdomen. The left side of the abdomen is the normal location of the stomach bubble as well as gas in the splenic flexure of the colon, either of which could be mistaken for free air.
• In order to see free air, the x-ray beam must be directed horizontally, parallel to the floor, when a decu-bitus view is obtained.
Box 13-2 summarizes what is needed to visualize air-fluid levels in the abdomen.
Figure 13-14 Positioning of patient for an upright view of the abdomen. The patient stands or sits up and the x-ray beam is directed horizontally, parallel to the plane of the floor. The camera icon represents the x-ray tube, which would actually be positioned about 40 inches from the cassette, represented by the thick line.
Acute Abdominal Series: Upright View of Chest
! What it’s good for• Seeing free air beneath the diaphragm• Finding pneumonia at the lung bases, which might
mimic the symptoms of an acute abdomen• Finding pleural effusions, which could be secondary
to an intraabdominal process and help identify its presence
Figure 13-15 Positioning of the patient for a left lateral decubitus view of the abdomen. Patients who cannot tolerate an upright view of their abdomen usually have a left lateral decubitus view as a substitute. The patient lies on his or her left side on the examining table, the x-ray tube is usually positioned anteriorly (camera icon) and the cassette (thick line) is placed in back of the patient. The x-ray beam is directed horizontally, paral-lel to the floor at a distance of about 40 inches from the patient.
Figure 13-16 Normal left lateral decubitus view of the abdomen. For a left lateral decubitus view, the patient lies on his or her left side on the examining table and an exposure is made with a horizontal x-ray beam (parallel to the floor). This is done so that any “free air” will distribute itself at the highest part of the abdominal cavity which will be the patient’s right side. Free air, if present, should be easily visible as a black crescent over the outside edge of the liver (solid white arrows), a location in which no bowel gas is normally present.
Box 13-2 To See an Air-Fluid Level on Conventional Radiographs, You Must Have:
Air
Fluid
A horizontal x-ray beam (parallel to the plane of the floor)
Air-fluid interfaces cannot be visualized on conventional radiographs taken with a vertical x-ray beam.
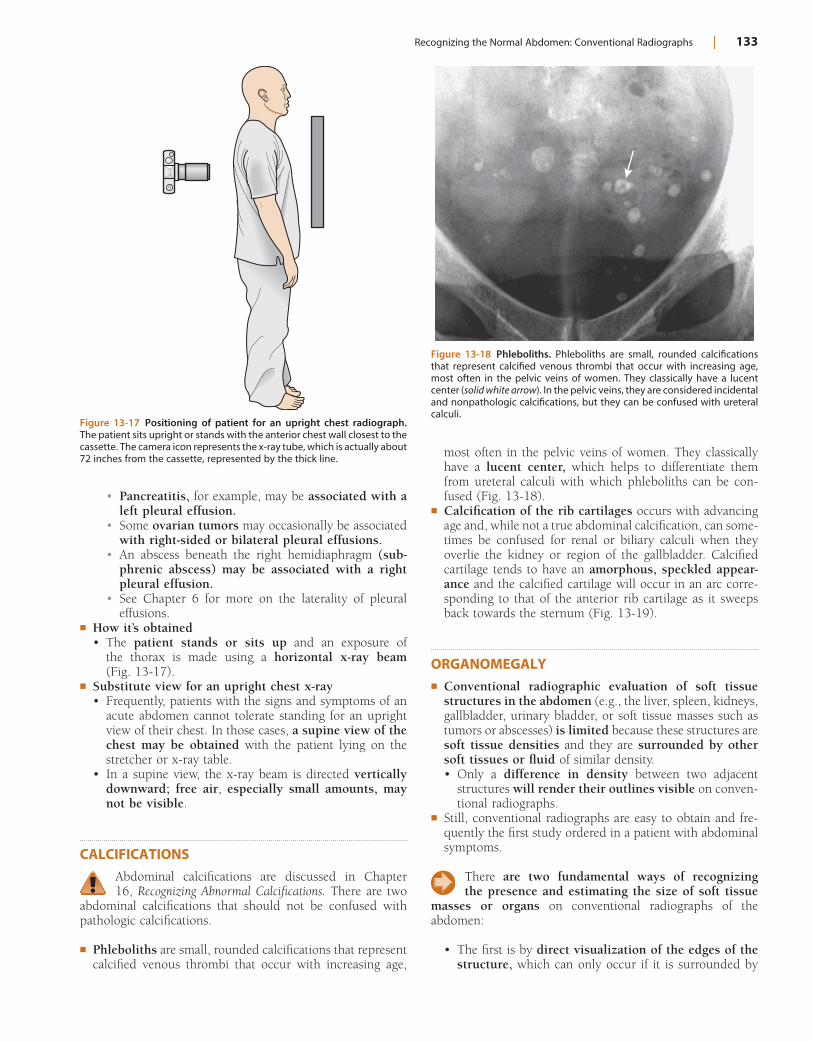
Recognizing the Normal Abdomen: Conventional Radiographs | 133
most often in the pelvic veins of women. They classically have a lucent center, which helps to differentiate them from ureteral calculi with which phleboliths can be con-fused (Fig. 13-18).
! Calcification of the rib cartilages occurs with advancing age and, while not a true abdominal calcification, can some-times be confused for renal or biliary calculi when they overlie the kidney or region of the gallbladder. Calcified cartilage tends to have an amorphous, speckled appear-ance and the calcified cartilage will occur in an arc corre-sponding to that of the anterior rib cartilage as it sweeps back towards the sternum (Fig. 13-19).
ORGANOMEGALY! Conventional radiographic evaluation of soft tissue
structures in the abdomen (e.g., the liver, spleen, kidneys, gallbladder, urinary bladder, or soft tissue masses such as tumors or abscesses) is limited because these structures are soft tissue densities and they are surrounded by other soft tissues or fluid of similar density.• Only a difference in density between two adjacent
structures will render their outlines visible on conven-tional radiographs.
! Still, conventional radiographs are easy to obtain and fre-quently the first study ordered in a patient with abdominal symptoms.
There are two fundamental ways of recognizing the presence and estimating the size of soft tissue
masses or organs on conventional radiographs of the abdomen:
• The first is by direct visualization of the edges of the structure, which can only occur if it is surrounded by
• Pancreatitis, for example, may be associated with a left pleural effusion.
• Some ovarian tumors may occasionally be associated with right-sided or bilateral pleural effusions.
• An abscess beneath the right hemidiaphragm (sub-phrenic abscess) may be associated with a right pleural effusion.
• See Chapter 6 for more on the laterality of pleural effusions.
! How it’s obtained• The patient stands or sits up and an exposure of
the thorax is made using a horizontal x-ray beam (Fig. 13-17).
! Substitute view for an upright chest x-ray• Frequently, patients with the signs and symptoms of an
acute abdomen cannot tolerate standing for an upright view of their chest. In those cases, a supine view of the chest may be obtained with the patient lying on the stretcher or x-ray table.
• In a supine view, the x-ray beam is directed vertically downward; free air, especially small amounts, may not be visible.
CALCIFICATIONS
Abdominal calcifications are discussed in Chapter 16, Recognizing Abnormal Calcifications. There are two
abdominal calcifications that should not be confused with pathologic calcifications.
! Phleboliths are small, rounded calcifications that represent calcified venous thrombi that occur with increasing age,
Figure 13-17 Positioning of patient for an upright chest radiograph. The patient sits upright or stands with the anterior chest wall closest to the cassette. The camera icon represents the x-ray tube, which is actually about 72 inches from the cassette, represented by the thick line.
Figure 13-18 Phleboliths. Phleboliths are small, rounded calcifications that represent calcified venous thrombi that occur with increasing age, most often in the pelvic veins of women. They classically have a lucent center (solid white arrow). In the pelvic veins, they are considered incidental and nonpathologic calcifications, but they can be confused with ureteral calculi.
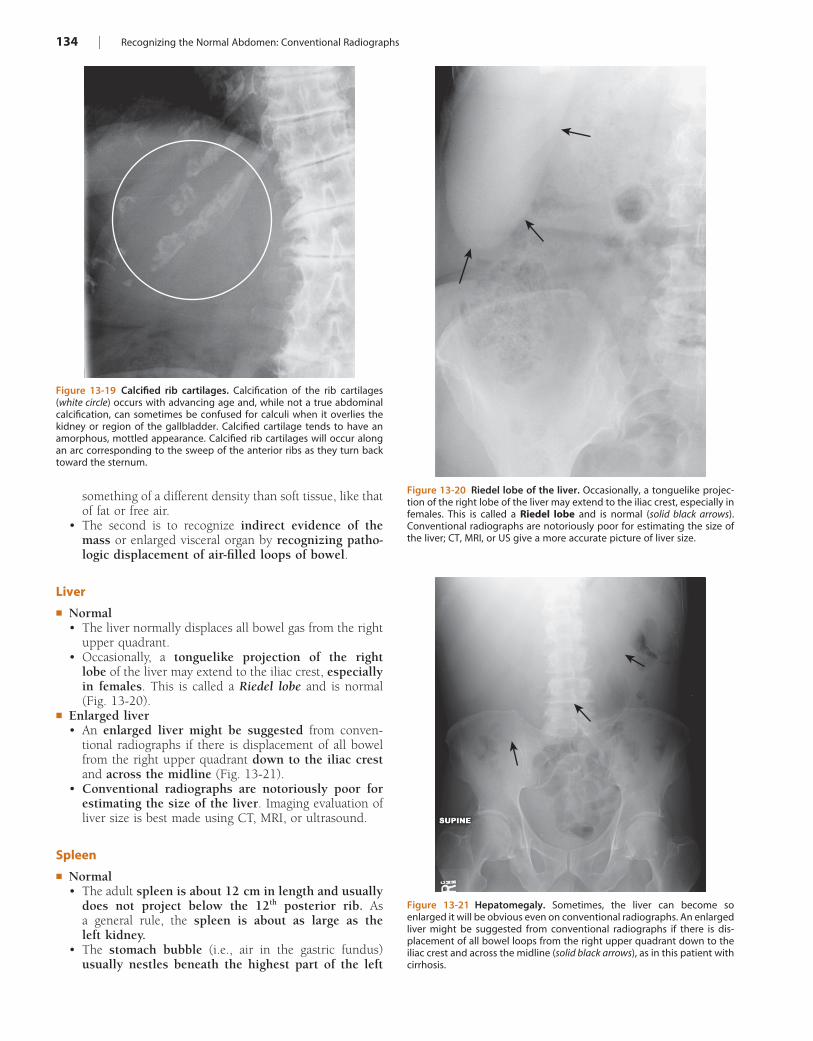
134 | Recognizing the Normal Abdomen: Conventional Radiographs
something of a different density than soft tissue, like that of fat or free air.
• The second is to recognize indirect evidence of the mass or enlarged visceral organ by recognizing patho-logic displacement of air-filled loops of bowel.
Liver
! Normal• The liver normally displaces all bowel gas from the right
upper quadrant.• Occasionally, a tonguelike projection of the right
lobe of the liver may extend to the iliac crest, especially in females. This is called a Riedel lobe and is normal (Fig. 13-20).
! Enlarged liver• An enlarged liver might be suggested from conven-
tional radiographs if there is displacement of all bowel from the right upper quadrant down to the iliac crest and across the midline (Fig. 13-21).
• Conventional radiographs are notoriously poor for estimating the size of the liver. Imaging evaluation of liver size is best made using CT, MRI, or ultrasound.
Spleen
! Normal• The adult spleen is about 12 cm in length and usually
does not project below the 12th posterior rib. As a general rule, the spleen is about as large as the left kidney.
• The stomach bubble (i.e., air in the gastric fundus) usually nestles beneath the highest part of the left
Figure 13-19 Calcified rib cartilages. Calcification of the rib cartilages (white circle) occurs with advancing age and, while not a true abdominal calcification, can sometimes be confused for calculi when it overlies the kidney or region of the gallbladder. Calcified cartilage tends to have an amorphous, mottled appearance. Calcified rib cartilages will occur along an arc corresponding to the sweep of the anterior ribs as they turn back toward the sternum.
Figure 13-20 Riedel lobe of the liver. Occasionally, a tonguelike projec-tion of the right lobe of the liver may extend to the iliac crest, especially in females. This is called a Riedel lobe and is normal (solid black arrows). Conventional radiographs are notoriously poor for estimating the size of the liver; CT, MRI, or US give a more accurate picture of liver size.
Figure 13-21 Hepatomegaly. Sometimes, the liver can become so enlarged it will be obvious even on conventional radiographs. An enlarged liver might be suggested from conventional radiographs if there is dis-placement of all bowel loops from the right upper quadrant down to the iliac crest and across the midline (solid black arrows), as in this patient with cirrhosis.
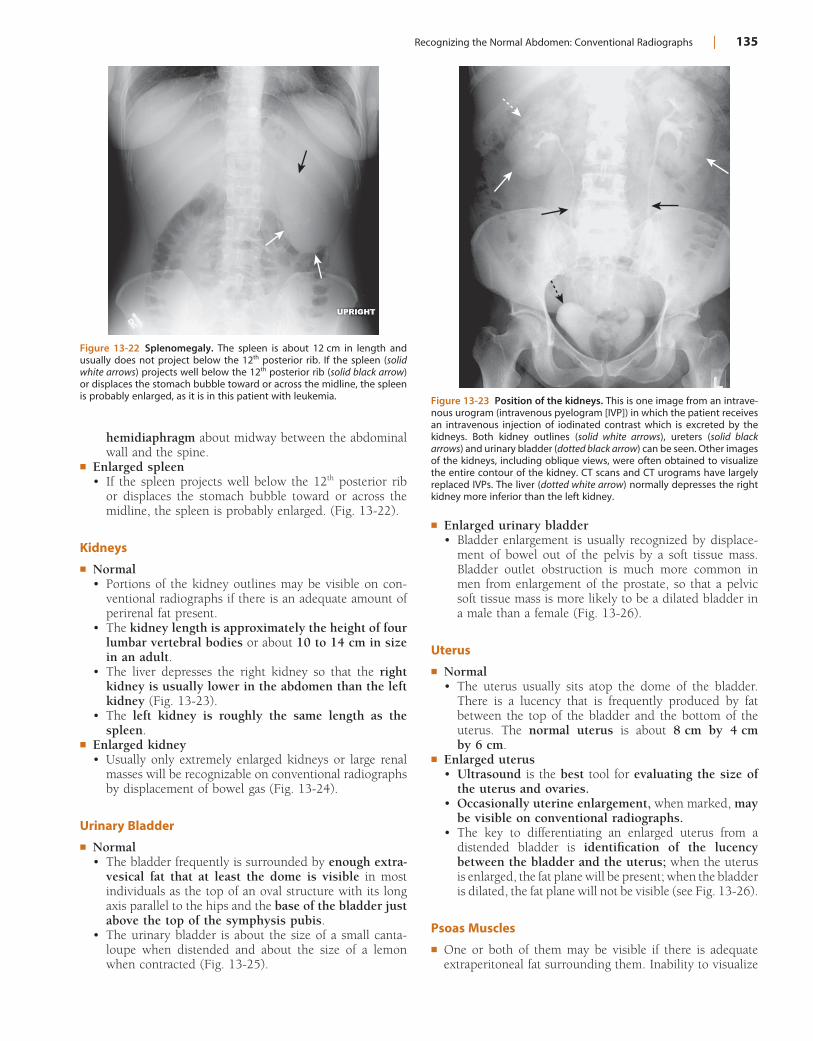
Recognizing the Normal Abdomen: Conventional Radiographs | 135
hemidiaphragm about midway between the abdominal wall and the spine.
! Enlarged spleen• If the spleen projects well below the 12th posterior rib
or displaces the stomach bubble toward or across the midline, the spleen is probably enlarged. (Fig. 13-22).
Kidneys
! Normal• Portions of the kidney outlines may be visible on con-
ventional radiographs if there is an adequate amount of perirenal fat present.
• The kidney length is approximately the height of four lumbar vertebral bodies or about 10 to 14 cm in size in an adult.
• The liver depresses the right kidney so that the right kidney is usually lower in the abdomen than the left kidney (Fig. 13-23).
• The left kidney is roughly the same length as the spleen.
! Enlarged kidney• Usually only extremely enlarged kidneys or large renal
masses will be recognizable on conventional radiographs by displacement of bowel gas (Fig. 13-24).
Urinary Bladder
! Normal• The bladder frequently is surrounded by enough extra-
vesical fat that at least the dome is visible in most individuals as the top of an oval structure with its long axis parallel to the hips and the base of the bladder just above the top of the symphysis pubis.
• The urinary bladder is about the size of a small canta-loupe when distended and about the size of a lemon when contracted (Fig. 13-25).
Figure 13-22 Splenomegaly. The spleen is about 12 cm in length and usually does not project below the 12th posterior rib. If the spleen (solid white arrows) projects well below the 12th posterior rib (solid black arrow) or displaces the stomach bubble toward or across the midline, the spleen is probably enlarged, as it is in this patient with leukemia. Figure 13-23 Position of the kidneys. This is one image from an intrave-
nous urogram (intravenous pyelogram [IVP]) in which the patient receives an intravenous injection of iodinated contrast which is excreted by the kidneys. Both kidney outlines (solid white arrows), ureters (solid black arrows) and urinary bladder (dotted black arrow) can be seen. Other images of the kidneys, including oblique views, were often obtained to visualize the entire contour of the kidney. CT scans and CT urograms have largely replaced IVPs. The liver (dotted white arrow) normally depresses the right kidney more inferior than the left kidney.
! Enlarged urinary bladder• Bladder enlargement is usually recognized by displace-
ment of bowel out of the pelvis by a soft tissue mass. Bladder outlet obstruction is much more common in men from enlargement of the prostate, so that a pelvic soft tissue mass is more likely to be a dilated bladder in a male than a female (Fig. 13-26).
Uterus
! Normal• The uterus usually sits atop the dome of the bladder.
There is a lucency that is frequently produced by fat between the top of the bladder and the bottom of the uterus. The normal uterus is about 8 cm by 4 cm by 6 cm.
! Enlarged uterus• Ultrasound is the best tool for evaluating the size of
the uterus and ovaries.• Occasionally uterine enlargement, when marked, may
be visible on conventional radiographs.• The key to differentiating an enlarged uterus from a
distended bladder is identification of the lucency between the bladder and the uterus; when the uterus is enlarged, the fat plane will be present; when the bladder is dilated, the fat plane will not be visible (see Fig. 13-26).
Psoas Muscles
! One or both of them may be visible if there is adequate extraperitoneal fat surrounding them. Inability to visualize
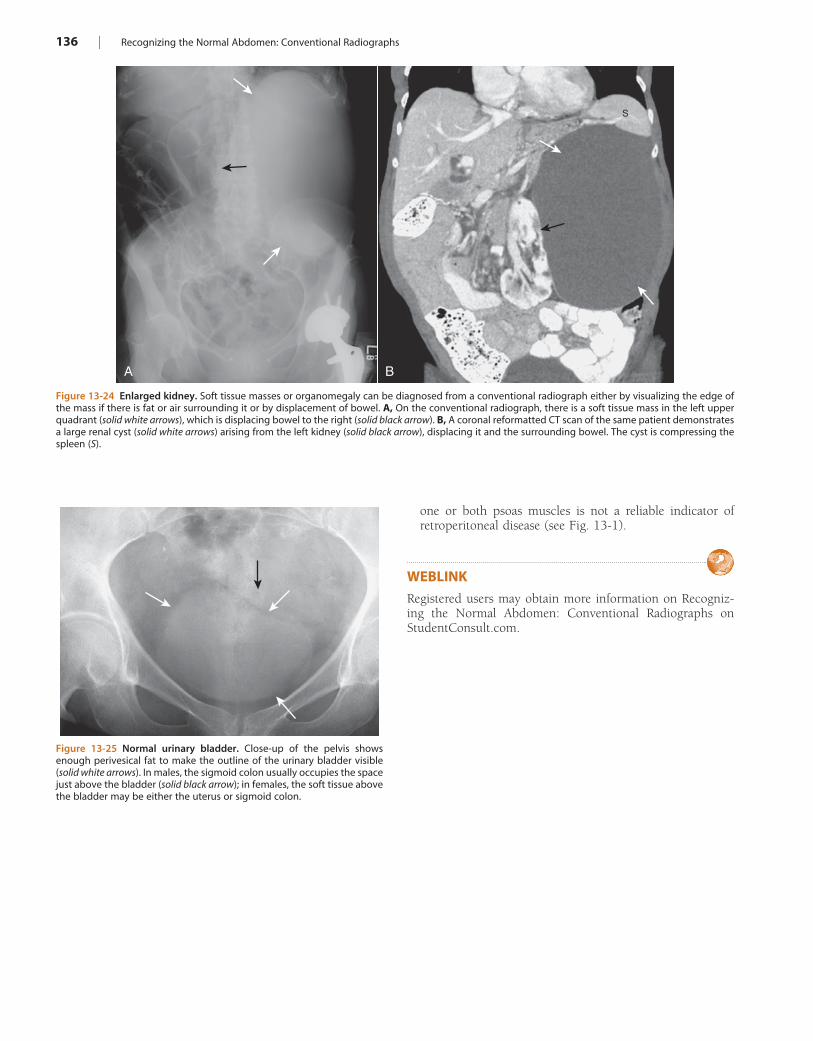
136 | Recognizing the Normal Abdomen: Conventional Radiographs
one or both psoas muscles is not a reliable indicator of retroperitoneal disease (see Fig. 13-1).
WEBLINKRegistered users may obtain more information on Recogniz-ing the Normal Abdomen: Conventional Radiographs on StudentConsult.com.
Figure 13-24 Enlarged kidney. Soft tissue masses or organomegaly can be diagnosed from a conventional radiograph either by visualizing the edge of the mass if there is fat or air surrounding it or by displacement of bowel. A, On the conventional radiograph, there is a soft tissue mass in the left upper quadrant (solid white arrows), which is displacing bowel to the right (solid black arrow). B, A coronal reformatted CT scan of the same patient demonstrates a large renal cyst (solid white arrows) arising from the left kidney (solid black arrow), displacing it and the surrounding bowel. The cyst is compressing the spleen (S).
S
A B
Figure 13-25 Normal urinary bladder. Close-up of the pelvis shows enough perivesical fat to make the outline of the urinary bladder visible (solid white arrows). In males, the sigmoid colon usually occupies the space just above the bladder (solid black arrow); in females, the soft tissue above the bladder may be either the uterus or sigmoid colon.
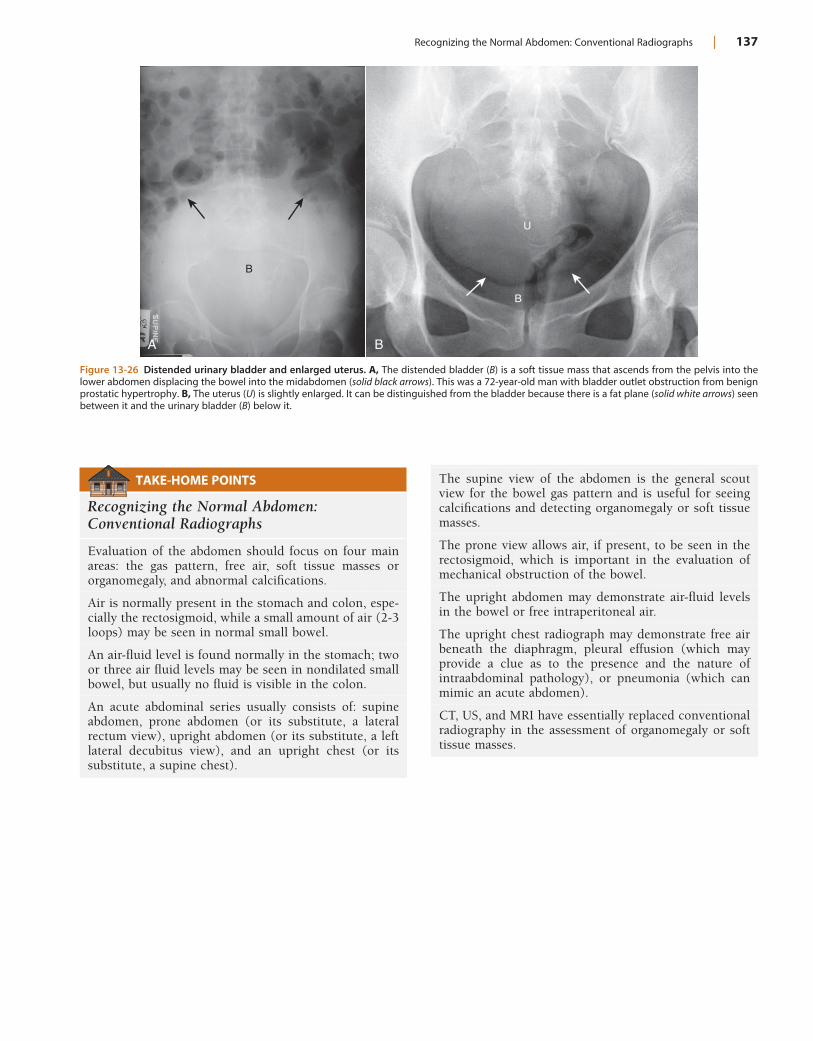
Recognizing the Normal Abdomen: Conventional Radiographs | 137
Figure 13-26 Distended urinary bladder and enlarged uterus. A, The distended bladder (B) is a soft tissue mass that ascends from the pelvis into the lower abdomen displacing the bowel into the midabdomen (solid black arrows). This was a 72-year-old man with bladder outlet obstruction from benign prostatic hypertrophy. B, The uterus (U) is slightly enlarged. It can be distinguished from the bladder because there is a fat plane (solid white arrows) seen between it and the urinary bladder (B) below it.
B
B
U
A B
TAKE-HOME POINTS
Recognizing the Normal Abdomen: Conventional Radiographs
Evaluation of the abdomen should focus on four main areas: the gas pattern, free air, soft tissue masses or organomegaly, and abnormal calcifications.
Air is normally present in the stomach and colon, espe-cially the rectosigmoid, while a small amount of air (2-3 loops) may be seen in normal small bowel.
An air-fluid level is found normally in the stomach; two or three air fluid levels may be seen in nondilated small bowel, but usually no fluid is visible in the colon.
An acute abdominal series usually consists of: supine abdomen, prone abdomen (or its substitute, a lateral rectum view), upright abdomen (or its substitute, a left lateral decubitus view), and an upright chest (or its substitute, a supine chest).
The supine view of the abdomen is the general scout view for the bowel gas pattern and is useful for seeing calcifications and detecting organomegaly or soft tissue masses.
The prone view allows air, if present, to be seen in the rectosigmoid, which is important in the evaluation of mechanical obstruction of the bowel.
The upright abdomen may demonstrate air-fluid levels in the bowel or free intraperitoneal air.
The upright chest radiograph may demonstrate free air beneath the diaphragm, pleural effusion (which may provide a clue as to the presence and the nature of intraabdominal pathology), or pneumonia (which can mimic an acute abdomen).
CT, US, and MRI have essentially replaced conventional radiography in the assessment of organomegaly or soft tissue masses.
138
Chapter 14
Recognizing Bowel Obstruction and Ileus
! In Chapter 13, we discussed how to recognize the normal intestinal gas pattern.
! In this chapter, you’ll learn how to recognize and categorize the four most common abnormal bowel gas patterns and their causes. These abnormal bowel gas patterns will appear the same whether imaged initially by conventional radio-graphy or by CT scanning. CT is superior in revealing the location, degree, and cause of an obstruction and in dem-onstrating any signs of reduced bowel viability.
! Abnormalities of bowel function are suspected by the history and clinical findings.
! The key questions in assessing the bowel gas pattern on imaging studies are:• Is air present in the rectum or sigmoid?• Are there dilated loops of small bowel?• Are there dilated loops of large bowel?
ABNORMAL GAS PATTERNS! Abnormal intestinal gas patterns can be divided into two
main categories, each of which can be subdivided into two subcategories (Box 14-1).
! Functional ileus is one main category in which it is pre-sumed that one or more loops of bowel lose their ability to propagate the peristaltic waves of the bowel, usually due to some local irritation or inflammation, and hence cause a functional type of “obstruction” proximal to the affected loop(s).
! There are two kinds of functional ileus.• Localized ileus (also called sentinel loops) affects only
one or two loops of (usually small) bowel.• Generalized adynamic ileus affects all loops of large
and small bowel and frequently the stomach.! Mechanical obstruction is the other main category of
abnormal bowel gas pattern. With mechanical obstruction, a physical, organic, obstructing lesion prevents the passage of intestinal content past the point of either the small or large bowel blockage.
! There are two kinds of mechanical obstruction.• Small bowel obstruction (frequently abbreviated SBO)• Large bowel obstruction (frequently abbreviated LBO)
LAWS OF THE GUT! The bowel reacts to a mechanical obstruction in more or
less predictable ways.! Loops proximal to the obstruction soon become dilated
with air and/or fluid.
• This can occur within a few hours of a complete small bowel obstruction.
! Peristalsis will continue (except in the loops of bowel involved in a functional ileus) in an attempt to propel intestinal contents through the bowel.
! Loops distal to an obstruction will eventually become decompressed or airless, as their contents are evacuated.
! In a mechanical obstruction, the loop(s) that will become the most dilated will either be the loop of bowel with the largest resting diameter before the onset of the obstruc-tion (e.g., the cecum in the large bowel), or the loop(s) of bowel just proximal to the obstruction.
! Most patients with a mechanical obstruction will present with some form of abdominal pain, abdominal disten-sion, and constipation.• Patients may present with vomiting early in the course
of a proximal small bowel obstruction and later in the course of the illness with a distal small bowel obstruction.
! Prolonged obstruction with persistently elevated intra-luminal pressures can lead to vascular compromise, necro-sis and perforation in the affected loop of bowel.
! Let’s look at each of the four abnormal bowel gas patterns in detail (Table 14-1). For each of the four abnormalities, we’ll look at their pathophysiology, causes, key imaging features, and diagnostic pitfalls.
FUNCTIONAL ILEUS, LOCALIZED: SENTINEL LOOPS! Pathophysiology
• Focal irritation of a loop or loops of bowel occurs most often from inflammation of an adjacent visceral organ, e.g., pancreatitis may affect bowel loops in the left upper quadrant, diverticulitis in the left lower quadrant.• The loop(s) affected are almost always loops of small
bowel and, because they herald the presence of underlying pathology, they are called sentinel loops.
• The irritation causes these loops to lose their normal function and become aperistaltic, which in turn leads to dilatation of these loops.
• Because a functional ileus does not produce the degree of obstruction that a mechanical obstruction does, some gas continues to pass through the defunctionalized bowel past the point of the localized ileus.
• Air usually reaches and is visible in the rectum or sigmoid.
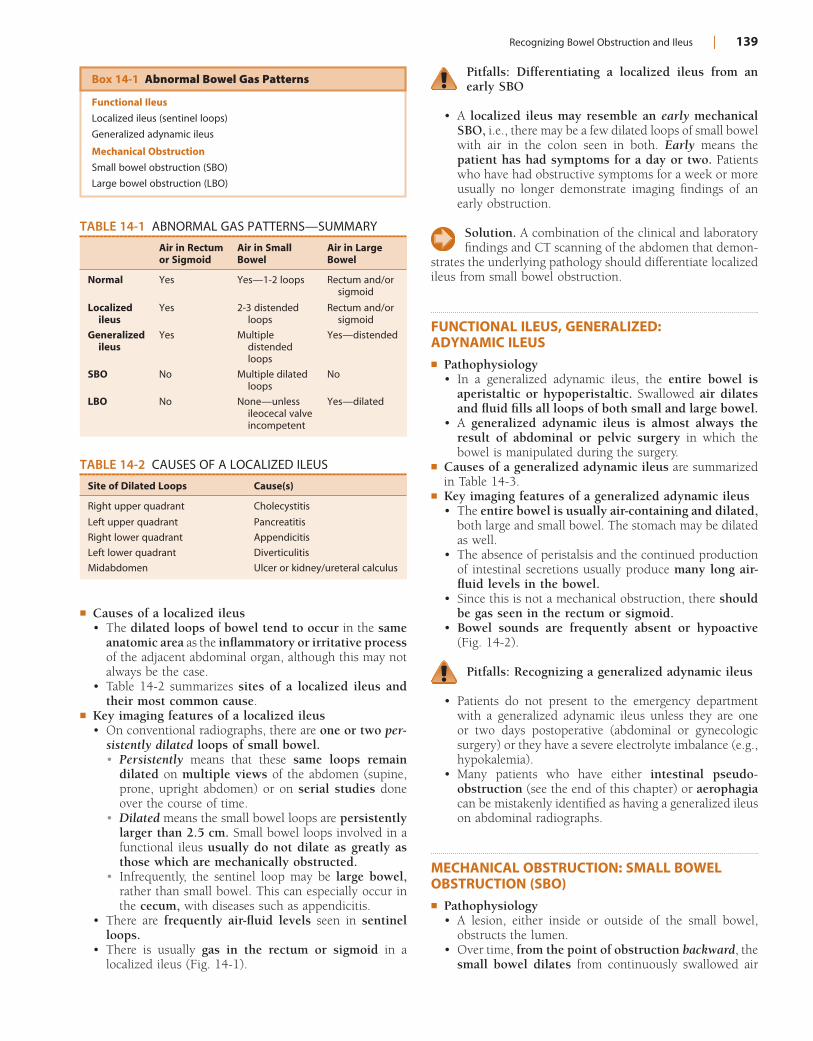
Recognizing Bowel Obstruction and Ileus | 139
Pitfalls: Differentiating a localized ileus from an early SBO
• A localized ileus may resemble an early mechanical SBO, i.e., there may be a few dilated loops of small bowel with air in the colon seen in both. Early means the patient has had symptoms for a day or two. Patients who have had obstructive symptoms for a week or more usually no longer demonstrate imaging findings of an early obstruction.
Solution. A combination of the clinical and laboratory findings and CT scanning of the abdomen that demon-
strates the underlying pathology should differentiate localized ileus from small bowel obstruction.
FUNCTIONAL ILEUS, GENERALIZED: ADYNAMIC ILEUS! Pathophysiology
• In a generalized adynamic ileus, the entire bowel is aperistaltic or hypoperistaltic. Swallowed air dilates and fluid fills all loops of both small and large bowel.
• A generalized adynamic ileus is almost always the result of abdominal or pelvic surgery in which the bowel is manipulated during the surgery.
! Causes of a generalized adynamic ileus are summarized in Table 14-3.
! Key imaging features of a generalized adynamic ileus• The entire bowel is usually air-containing and dilated,
both large and small bowel. The stomach may be dilated as well.
• The absence of peristalsis and the continued production of intestinal secretions usually produce many long air-fluid levels in the bowel.
• Since this is not a mechanical obstruction, there should be gas seen in the rectum or sigmoid.
• Bowel sounds are frequently absent or hypoactive (Fig. 14-2).
Pitfalls: Recognizing a generalized adynamic ileus
• Patients do not present to the emergency department with a generalized adynamic ileus unless they are one or two days postoperative (abdominal or gynecologic surgery) or they have a severe electrolyte imbalance (e.g., hypokalemia).
• Many patients who have either intestinal pseudo-obstruction (see the end of this chapter) or aerophagia can be mistakenly identified as having a generalized ileus on abdominal radiographs.
MECHANICAL OBSTRUCTION: SMALL BOWEL OBSTRUCTION (SBO)! Pathophysiology
• A lesion, either inside or outside of the small bowel, obstructs the lumen.
• Over time, from the point of obstruction backward, the small bowel dilates from continuously swallowed air
! Causes of a localized ileus• The dilated loops of bowel tend to occur in the same
anatomic area as the inflammatory or irritative process of the adjacent abdominal organ, although this may not always be the case.
• Table 14-2 summarizes sites of a localized ileus and their most common cause.
! Key imaging features of a localized ileus• On conventional radiographs, there are one or two per-
sistently dilated loops of small bowel.• Persistently means that these same loops remain
dilated on multiple views of the abdomen (supine, prone, upright abdomen) or on serial studies done over the course of time.
• Dilated means the small bowel loops are persistently larger than 2.5 cm. Small bowel loops involved in a functional ileus usually do not dilate as greatly as those which are mechanically obstructed.
• Infrequently, the sentinel loop may be large bowel, rather than small bowel. This can especially occur in the cecum, with diseases such as appendicitis.
• There are frequently air-fluid levels seen in sentinel loops.
• There is usually gas in the rectum or sigmoid in a localized ileus (Fig. 14-1).
TABLE 14-1 ABNORMAL GAS PATTERNS—SUMMARY
Air in Rectum or Sigmoid
Air in Small Bowel
Air in Large Bowel
Normal Yes Yes—1-2 loops Rectum and/or sigmoid
Localized ileus
Yes 2-3 distended loops
Rectum and/or sigmoid
Generalized ileus
Yes Multiple distended loops
Yes—distended
SBO No Multiple dilated loops
No
LBO No None—unless ileocecal valve incompetent
Yes—dilated
TABLE 14-2 CAUSES OF A LOCALIZED ILEUS
Site of Dilated Loops Cause(s)
Right upper quadrant Cholecystitis
Left upper quadrant Pancreatitis
Right lower quadrant Appendicitis
Left lower quadrant Diverticulitis
Midabdomen Ulcer or kidney/ureteral calculus
Box 14-1 Abnormal Bowel Gas Patterns
Functional Ileus
Localized ileus (sentinel loops)
Generalized adynamic ileus
Mechanical Obstruction
Small bowel obstruction (SBO)
Large bowel obstruction (LBO)
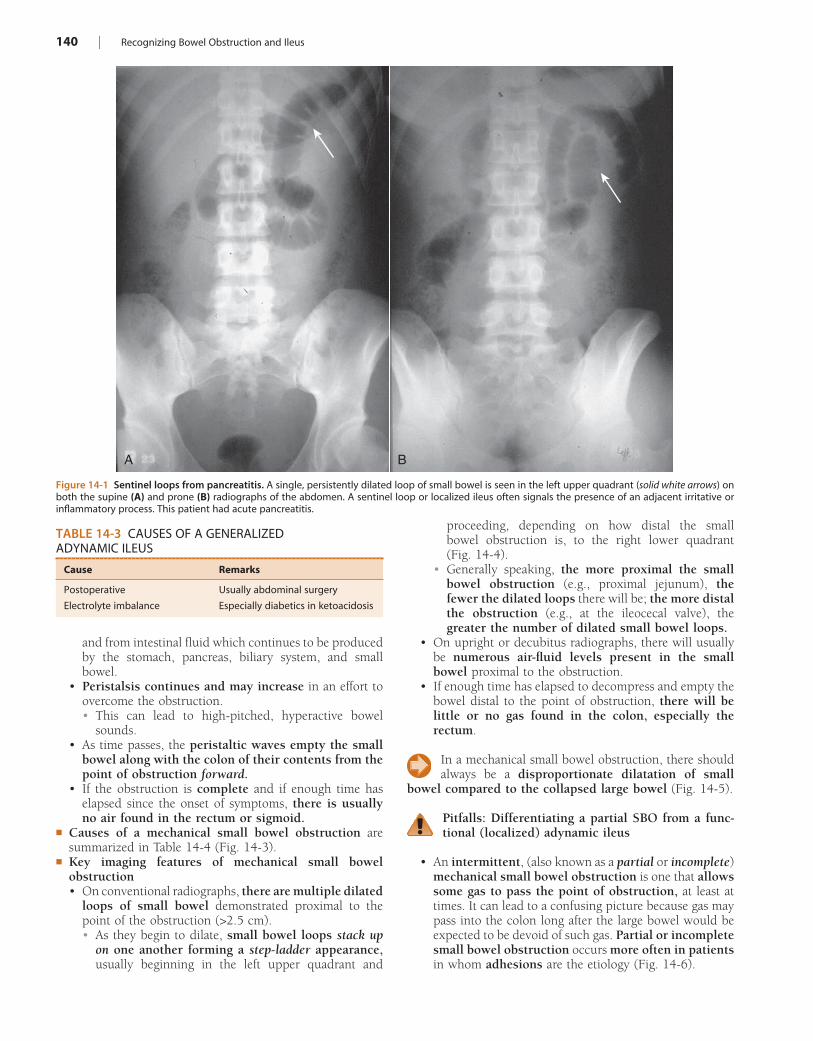
140 | Recognizing Bowel Obstruction and Ileus
proceeding, depending on how distal the small bowel obstruction is, to the right lower quadrant (Fig. 14-4).
• Generally speaking, the more proximal the small bowel obstruction (e.g., proximal jejunum), the fewer the dilated loops there will be; the more distal the obstruction (e.g., at the ileocecal valve), the greater the number of dilated small bowel loops.
• On upright or decubitus radiographs, there will usually be numerous air-fluid levels present in the small bowel proximal to the obstruction.
• If enough time has elapsed to decompress and empty the bowel distal to the point of obstruction, there will be little or no gas found in the colon, especially the rectum.
In a mechanical small bowel obstruction, there should always be a disproportionate dilatation of small
bowel compared to the collapsed large bowel (Fig. 14-5).
Pitfalls: Differentiating a partial SBO from a func-tional (localized) adynamic ileus
• An intermittent, (also known as a partial or incomplete) mechanical small bowel obstruction is one that allows some gas to pass the point of obstruction, at least at times. It can lead to a confusing picture because gas may pass into the colon long after the large bowel would be expected to be devoid of such gas. Partial or incomplete small bowel obstruction occurs more often in patients in whom adhesions are the etiology (Fig. 14-6).
and from intestinal fluid which continues to be produced by the stomach, pancreas, biliary system, and small bowel.
• Peristalsis continues and may increase in an effort to overcome the obstruction.• This can lead to high-pitched, hyperactive bowel
sounds.• As time passes, the peristaltic waves empty the small
bowel along with the colon of their contents from the point of obstruction forward.
• If the obstruction is complete and if enough time has elapsed since the onset of symptoms, there is usually no air found in the rectum or sigmoid.
! Causes of a mechanical small bowel obstruction are summarized in Table 14-4 (Fig. 14-3).
! Key imaging features of mechanical small bowel obstruction• On conventional radiographs, there are multiple dilated
loops of small bowel demonstrated proximal to the point of the obstruction (>2.5 cm).• As they begin to dilate, small bowel loops stack up
on one another forming a step-ladder appearance, usually beginning in the left upper quadrant and
Figure 14-1 Sentinel loops from pancreatitis. A single, persistently dilated loop of small bowel is seen in the left upper quadrant (solid white arrows) on both the supine (A) and prone (B) radiographs of the abdomen. A sentinel loop or localized ileus often signals the presence of an adjacent irritative or inflammatory process. This patient had acute pancreatitis.
A B
TABLE 14-3 CAUSES OF A GENERALIZED ADYNAMIC ILEUS
Cause Remarks
Postoperative Usually abdominal surgery
Electrolyte imbalance Especially diabetics in ketoacidosis
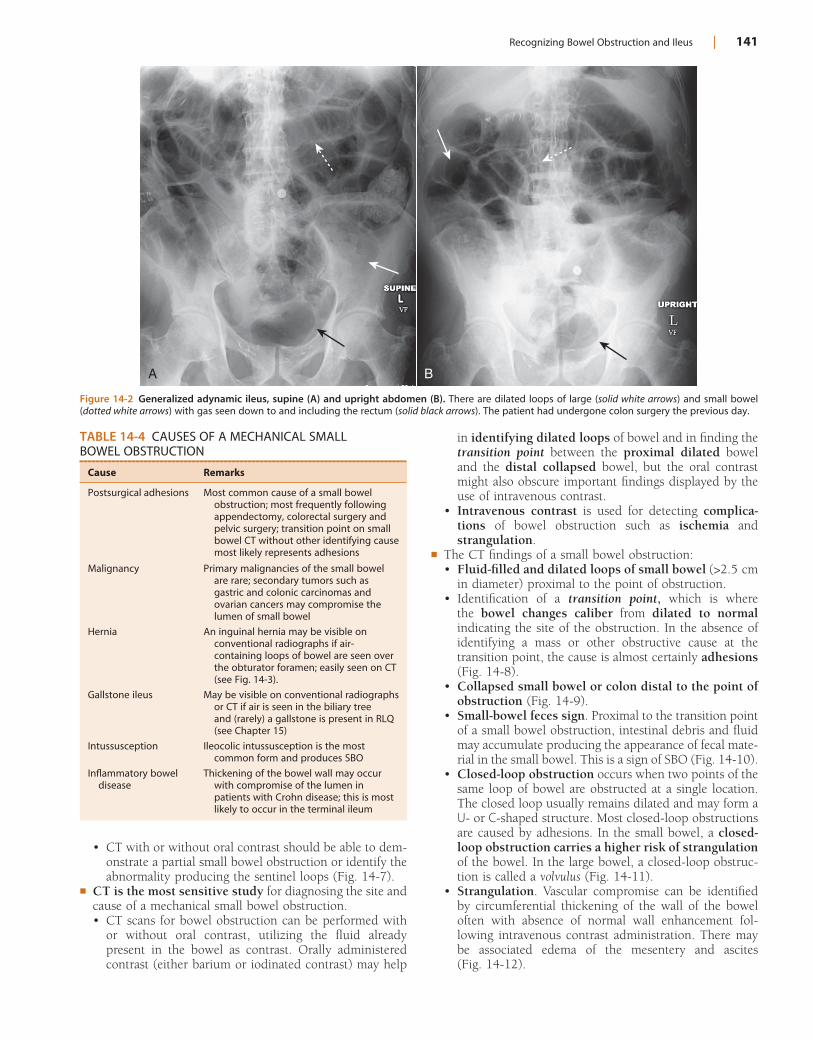
Recognizing Bowel Obstruction and Ileus | 141
in identifying dilated loops of bowel and in finding the transition point between the proximal dilated bowel and the distal collapsed bowel, but the oral contrast might also obscure important findings displayed by the use of intravenous contrast.
• Intravenous contrast is used for detecting complica-tions of bowel obstruction such as ischemia and strangulation.
! The CT findings of a small bowel obstruction:• Fluid-filled and dilated loops of small bowel (>2.5 cm
in diameter) proximal to the point of obstruction.• Identification of a transition point, which is where
the bowel changes caliber from dilated to normal indicating the site of the obstruction. In the absence of identifying a mass or other obstructive cause at the transition point, the cause is almost certainly adhesions (Fig. 14-8).
• Collapsed small bowel or colon distal to the point of obstruction (Fig. 14-9).
• Small-bowel feces sign. Proximal to the transition point of a small bowel obstruction, intestinal debris and fluid may accumulate producing the appearance of fecal mate-rial in the small bowel. This is a sign of SBO (Fig. 14-10).
• Closed-loop obstruction occurs when two points of the same loop of bowel are obstructed at a single location. The closed loop usually remains dilated and may form a U- or C-shaped structure. Most closed-loop obstructions are caused by adhesions. In the small bowel, a closed-loop obstruction carries a higher risk of strangulation of the bowel. In the large bowel, a closed-loop obstruc-tion is called a volvulus (Fig. 14-11).
• Strangulation. Vascular compromise can be identified by circumferential thickening of the wall of the bowel often with absence of normal wall enhancement fol-lowing intravenous contrast administration. There may be associated edema of the mesentery and ascites (Fig. 14-12).
Figure 14-2 Generalized adynamic ileus, supine (A) and upright abdomen (B). There are dilated loops of large (solid white arrows) and small bowel (dotted white arrows) with gas seen down to and including the rectum (solid black arrows). The patient had undergone colon surgery the previous day.
A B
TABLE 14-4 CAUSES OF A MECHANICAL SMALL BOWEL OBSTRUCTION
Cause Remarks
Postsurgical adhesions Most common cause of a small bowel obstruction; most frequently following appendectomy, colorectal surgery and pelvic surgery; transition point on small bowel CT without other identifying cause most likely represents adhesions
Malignancy Primary malignancies of the small bowel are rare; secondary tumors such as gastric and colonic carcinomas and ovarian cancers may compromise the lumen of small bowel
Hernia An inguinal hernia may be visible on conventional radiographs if air-containing loops of bowel are seen over the obturator foramen; easily seen on CT (see Fig. 14-3).
Gallstone ileus May be visible on conventional radiographs or CT if air is seen in the biliary tree and (rarely) a gallstone is present in RLQ (see Chapter 15)
Intussusception Ileocolic intussusception is the most common form and produces SBO
Inflammatory bowel disease
Thickening of the bowel wall may occur with compromise of the lumen in patients with Crohn disease; this is most likely to occur in the terminal ileum
• CT with or without oral contrast should be able to dem-onstrate a partial small bowel obstruction or identify the abnormality producing the sentinel loops (Fig. 14-7).
! CT is the most sensitive study for diagnosing the site and cause of a mechanical small bowel obstruction.• CT scans for bowel obstruction can be performed with
or without oral contrast, utilizing the fluid already present in the bowel as contrast. Orally administered contrast (either barium or iodinated contrast) may help
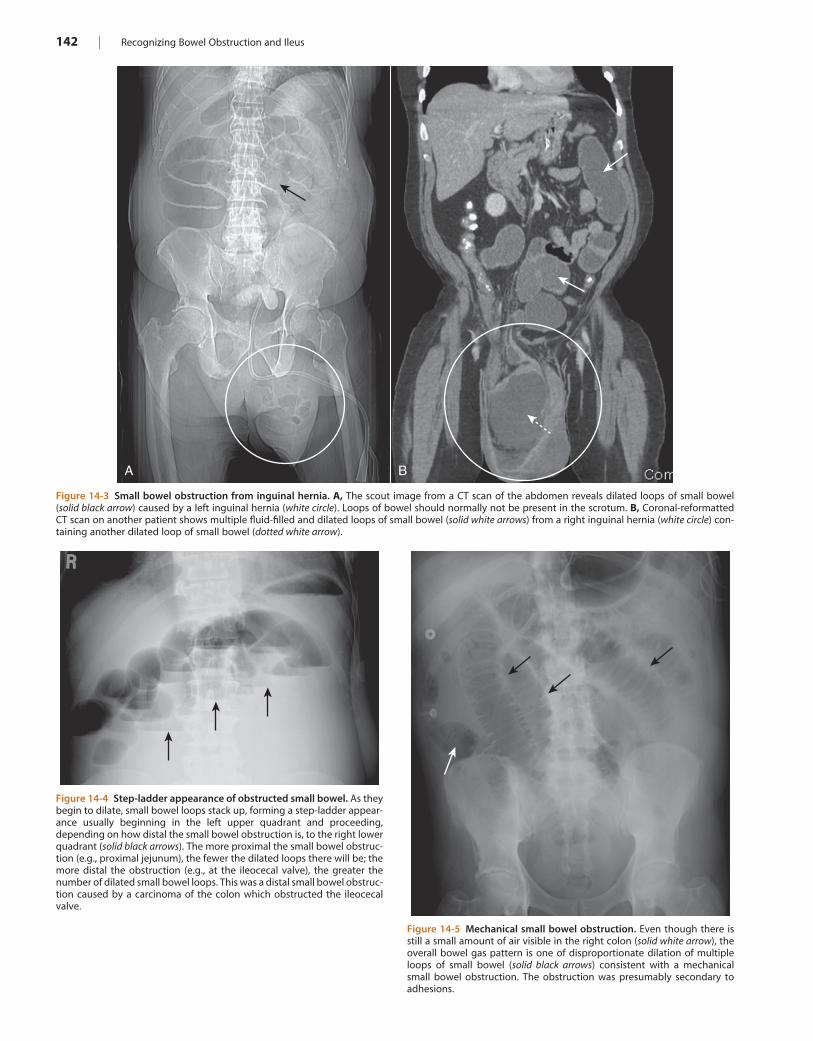
142 | Recognizing Bowel Obstruction and Ileus
Figure 14-3 Small bowel obstruction from inguinal hernia. A, The scout image from a CT scan of the abdomen reveals dilated loops of small bowel (solid black arrow) caused by a left inguinal hernia (white circle). Loops of bowel should normally not be present in the scrotum. B, Coronal-reformatted CT scan on another patient shows multiple fluid-filled and dilated loops of small bowel (solid white arrows) from a right inguinal hernia (white circle) con-taining another dilated loop of small bowel (dotted white arrow).
A B
Figure 14-4 Step-ladder appearance of obstructed small bowel. As they begin to dilate, small bowel loops stack up, forming a step-ladder appear-ance usually beginning in the left upper quadrant and proceeding, depending on how distal the small bowel obstruction is, to the right lower quadrant (solid black arrows). The more proximal the small bowel obstruc-tion (e.g., proximal jejunum), the fewer the dilated loops there will be; the more distal the obstruction (e.g., at the ileocecal valve), the greater the number of dilated small bowel loops. This was a distal small bowel obstruc-tion caused by a carcinoma of the colon which obstructed the ileocecal valve.
Figure 14-5 Mechanical small bowel obstruction. Even though there is still a small amount of air visible in the right colon (solid white arrow), the overall bowel gas pattern is one of disproportionate dilation of multiple loops of small bowel (solid black arrows) consistent with a mechanical small bowel obstruction. The obstruction was presumably secondary to adhesions.
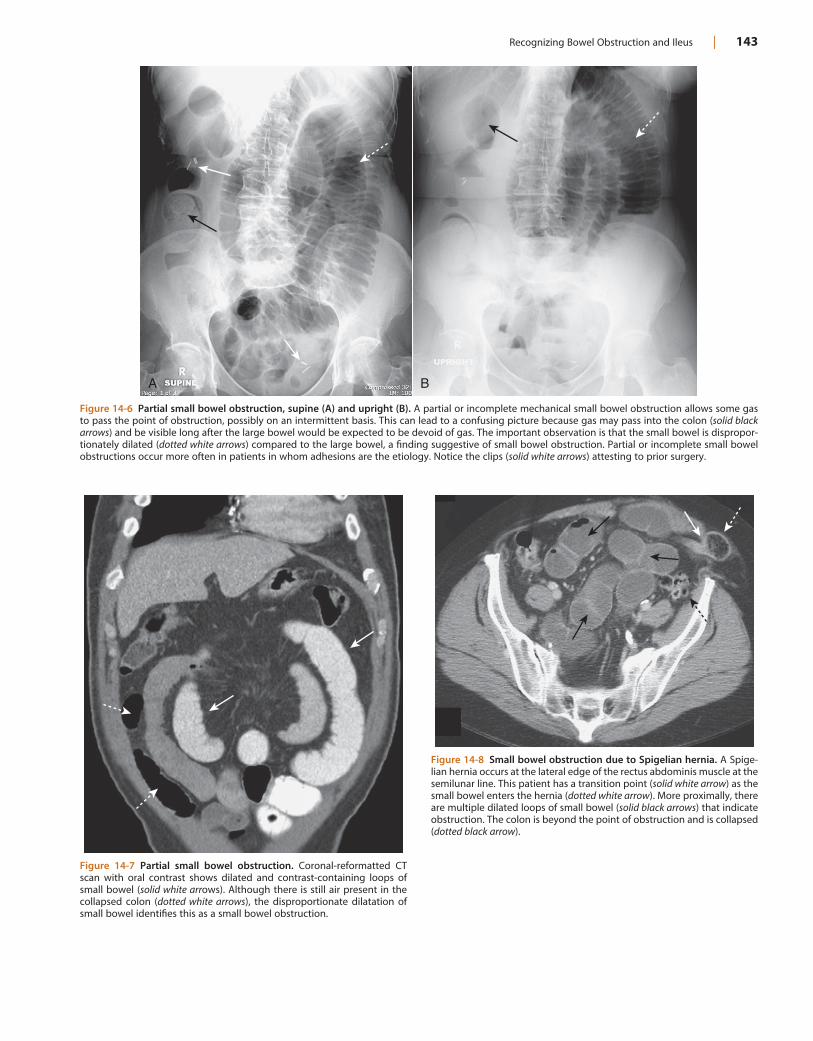
Recognizing Bowel Obstruction and Ileus | 143
Figure 14-6 Partial small bowel obstruction, supine (A) and upright (B). A partial or incomplete mechanical small bowel obstruction allows some gas to pass the point of obstruction, possibly on an intermittent basis. This can lead to a confusing picture because gas may pass into the colon (solid black arrows) and be visible long after the large bowel would be expected to be devoid of gas. The important observation is that the small bowel is dispropor-tionately dilated (dotted white arrows) compared to the large bowel, a finding suggestive of small bowel obstruction. Partial or incomplete small bowel obstructions occur more often in patients in whom adhesions are the etiology. Notice the clips (solid white arrows) attesting to prior surgery.
A B
Figure 14-7 Partial small bowel obstruction. Coronal-reformatted CT scan with oral contrast shows dilated and contrast-containing loops of small bowel (solid white arrows). Although there is still air present in the collapsed colon (dotted white arrows), the disproportionate dilatation of small bowel identifies this as a small bowel obstruction.
Figure 14-8 Small bowel obstruction due to Spigelian hernia. A Spige-lian hernia occurs at the lateral edge of the rectus abdominis muscle at the semilunar line. This patient has a transition point (solid white arrow) as the small bowel enters the hernia (dotted white arrow). More proximally, there are multiple dilated loops of small bowel (solid black arrows) that indicate obstruction. The colon is beyond the point of obstruction and is collapsed (dotted black arrow).
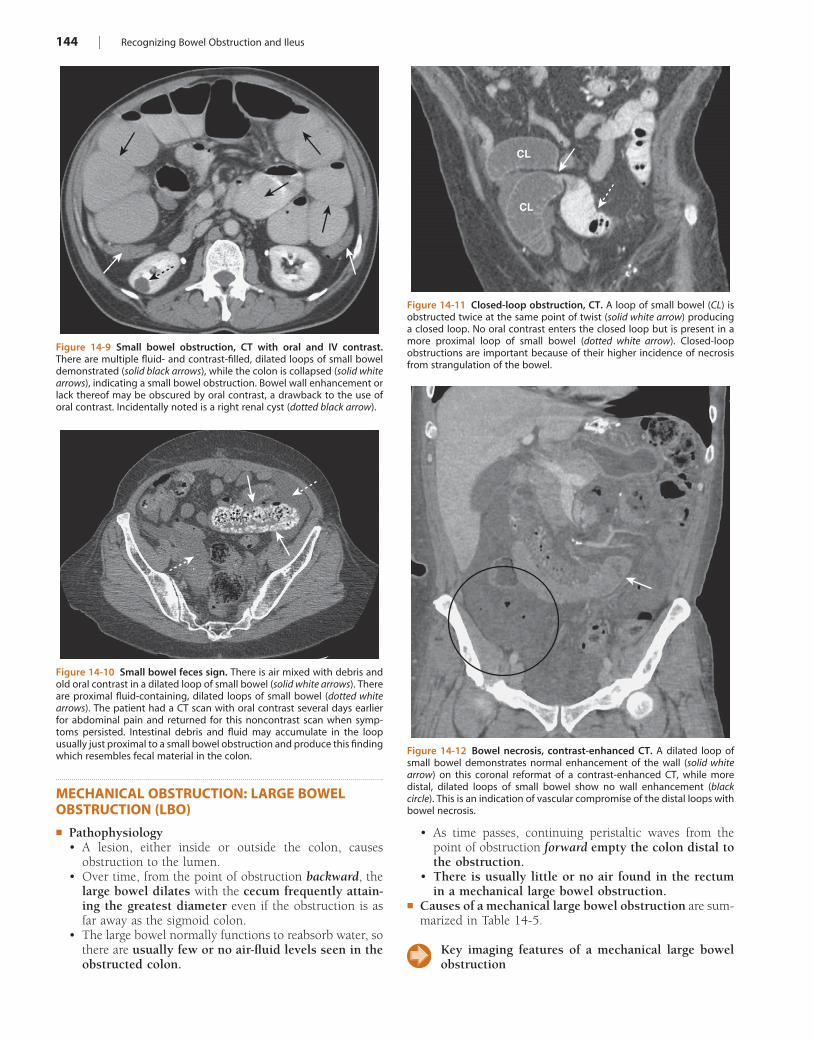
144 | Recognizing Bowel Obstruction and Ileus
MECHANICAL OBSTRUCTION: LARGE BOWEL OBSTRUCTION (LBO)! Pathophysiology
• A lesion, either inside or outside the colon, causes obstruction to the lumen.
• Over time, from the point of obstruction backward, the large bowel dilates with the cecum frequently attain-ing the greatest diameter even if the obstruction is as far away as the sigmoid colon.
• The large bowel normally functions to reabsorb water, so there are usually few or no air-fluid levels seen in the obstructed colon.
Figure 14-9 Small bowel obstruction, CT with oral and IV contrast. There are multiple fluid- and contrast-filled, dilated loops of small bowel demonstrated (solid black arrows), while the colon is collapsed (solid white arrows), indicating a small bowel obstruction. Bowel wall enhancement or lack thereof may be obscured by oral contrast, a drawback to the use of oral contrast. Incidentally noted is a right renal cyst (dotted black arrow).
Figure 14-10 Small bowel feces sign. There is air mixed with debris and old oral contrast in a dilated loop of small bowel (solid white arrows). There are proximal fluid-containing, dilated loops of small bowel (dotted white arrows). The patient had a CT scan with oral contrast several days earlier for abdominal pain and returned for this noncontrast scan when symp-toms persisted. Intestinal debris and fluid may accumulate in the loop usually just proximal to a small bowel obstruction and produce this finding which resembles fecal material in the colon.
Figure 14-11 Closed-loop obstruction, CT. A loop of small bowel (CL) is obstructed twice at the same point of twist (solid white arrow) producing a closed loop. No oral contrast enters the closed loop but is present in a more proximal loop of small bowel (dotted white arrow). Closed-loop obstructions are important because of their higher incidence of necrosis from strangulation of the bowel.
CL
CL
Figure 14-12 Bowel necrosis, contrast-enhanced CT. A dilated loop of small bowel demonstrates normal enhancement of the wall (solid white arrow) on this coronal reformat of a contrast-enhanced CT, while more distal, dilated loops of small bowel show no wall enhancement (black circle). This is an indication of vascular compromise of the distal loops with bowel necrosis.
• As time passes, continuing peristaltic waves from the point of obstruction forward empty the colon distal to the obstruction.
• There is usually little or no air found in the rectum in a mechanical large bowel obstruction.
! Causes of a mechanical large bowel obstruction are sum-marized in Table 14-5.
Key imaging features of a mechanical large bowel obstruction
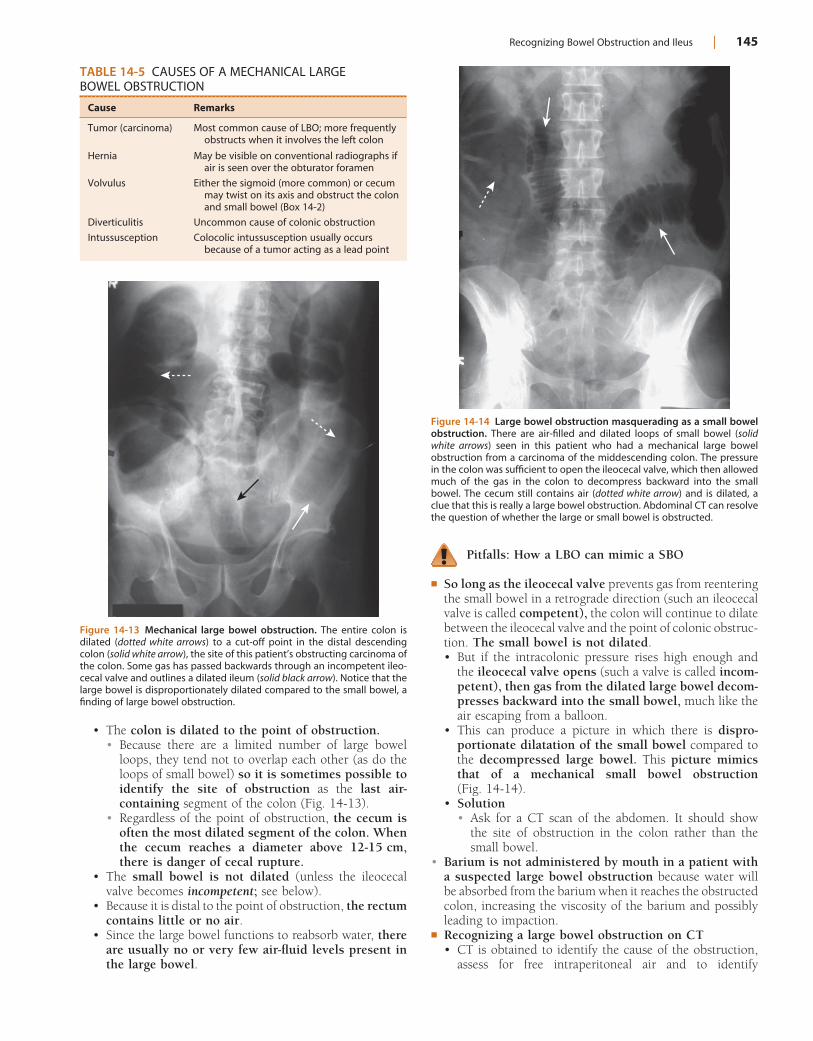
Recognizing Bowel Obstruction and Ileus | 145
Pitfalls: How a LBO can mimic a SBO
! So long as the ileocecal valve prevents gas from reentering the small bowel in a retrograde direction (such an ileocecal valve is called competent), the colon will continue to dilate between the ileocecal valve and the point of colonic obstruc-tion. The small bowel is not dilated.• But if the intracolonic pressure rises high enough and
the ileocecal valve opens (such a valve is called incom-petent), then gas from the dilated large bowel decom-presses backward into the small bowel, much like the air escaping from a balloon.
• This can produce a picture in which there is dispro-portionate dilatation of the small bowel compared to the decompressed large bowel. This picture mimics that of a mechanical small bowel obstruction (Fig. 14-14).
• Solution• Ask for a CT scan of the abdomen. It should show
the site of obstruction in the colon rather than the small bowel.
• Barium is not administered by mouth in a patient with a suspected large bowel obstruction because water will be absorbed from the barium when it reaches the obstructed colon, increasing the viscosity of the barium and possibly leading to impaction.
! Recognizing a large bowel obstruction on CT• CT is obtained to identify the cause of the obstruction,
assess for free intraperitoneal air and to identify
TABLE 14-5 CAUSES OF A MECHANICAL LARGE BOWEL OBSTRUCTION
Cause Remarks
Tumor (carcinoma) Most common cause of LBO; more frequently obstructs when it involves the left colon
Hernia May be visible on conventional radiographs if air is seen over the obturator foramen
Volvulus Either the sigmoid (more common) or cecum may twist on its axis and obstruct the colon and small bowel (Box 14-2)
Diverticulitis Uncommon cause of colonic obstruction
Intussusception Colocolic intussusception usually occurs because of a tumor acting as a lead point
Figure 14-13 Mechanical large bowel obstruction. The entire colon is dilated (dotted white arrows) to a cut-off point in the distal descending colon (solid white arrow), the site of this patient’s obstructing carcinoma of the colon. Some gas has passed backwards through an incompetent ileo-cecal valve and outlines a dilated ileum (solid black arrow). Notice that the large bowel is disproportionately dilated compared to the small bowel, a finding of large bowel obstruction.
• The colon is dilated to the point of obstruction.• Because there are a limited number of large bowel
loops, they tend not to overlap each other (as do the loops of small bowel) so it is sometimes possible to identify the site of obstruction as the last air-containing segment of the colon (Fig. 14-13).
• Regardless of the point of obstruction, the cecum is often the most dilated segment of the colon. When the cecum reaches a diameter above 12-15 cm, there is danger of cecal rupture.
• The small bowel is not dilated (unless the ileocecal valve becomes incompetent; see below).
• Because it is distal to the point of obstruction, the rectum contains little or no air.
• Since the large bowel functions to reabsorb water, there are usually no or very few air-fluid levels present in the large bowel.
Figure 14-14 Large bowel obstruction masquerading as a small bowel obstruction. There are air-filled and dilated loops of small bowel (solid white arrows) seen in this patient who had a mechanical large bowel obstruction from a carcinoma of the middescending colon. The pressure in the colon was sufficient to open the ileocecal valve, which then allowed much of the gas in the colon to decompress backward into the small bowel. The cecum still contains air (dotted white arrow) and is dilated, a clue that this is really a large bowel obstruction. Abdominal CT can resolve the question of whether the large or small bowel is obstructed.
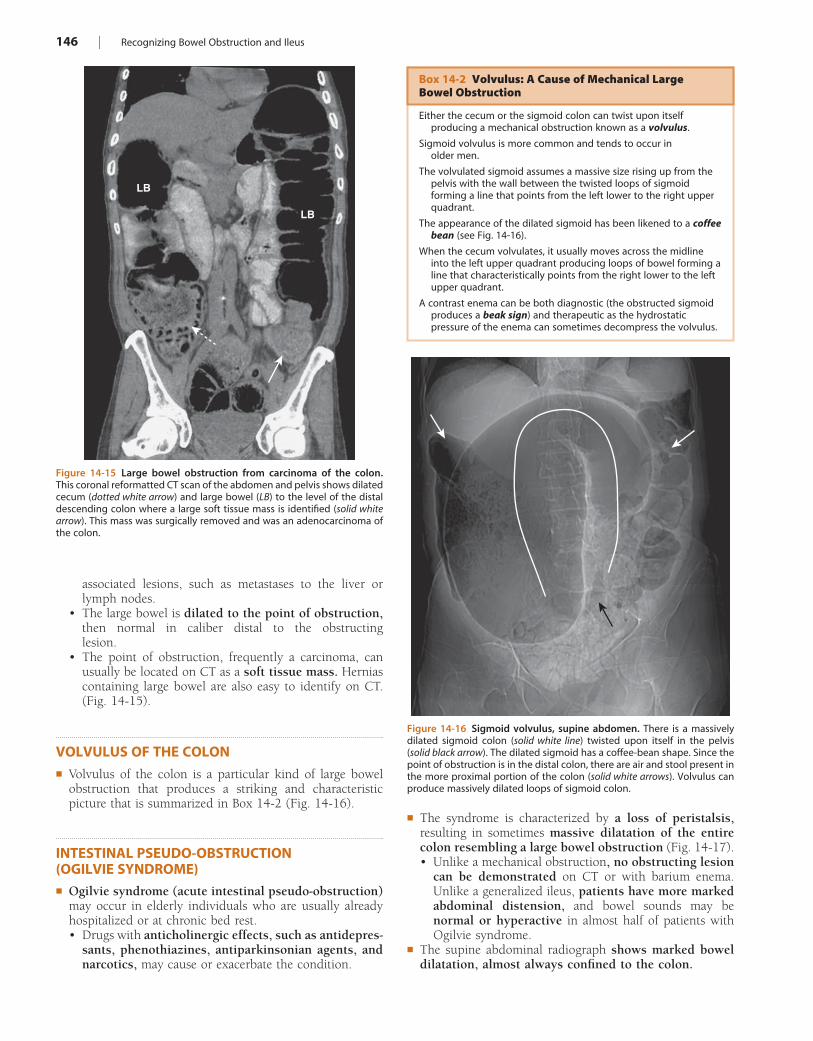
146 | Recognizing Bowel Obstruction and Ileus
associated lesions, such as metastases to the liver or lymph nodes.
• The large bowel is dilated to the point of obstruction, then normal in caliber distal to the obstructing lesion.
• The point of obstruction, frequently a carcinoma, can usually be located on CT as a soft tissue mass. Hernias containing large bowel are also easy to identify on CT. (Fig. 14-15).
VOLVULUS OF THE COLON! Volvulus of the colon is a particular kind of large bowel
obstruction that produces a striking and characteristic picture that is summarized in Box 14-2 (Fig. 14-16).
INTESTINAL PSEUDO-OBSTRUCTION (OGILVIE SYNDROME)! Ogilvie syndrome (acute intestinal pseudo-obstruction)
may occur in elderly individuals who are usually already hospitalized or at chronic bed rest.• Drugs with anticholinergic effects, such as antidepres-
sants, phenothiazines, antiparkinsonian agents, and narcotics, may cause or exacerbate the condition.
Figure 14-15 Large bowel obstruction from carcinoma of the colon. This coronal reformatted CT scan of the abdomen and pelvis shows dilated cecum (dotted white arrow) and large bowel (LB) to the level of the distal descending colon where a large soft tissue mass is identified (solid white arrow). This mass was surgically removed and was an adenocarcinoma of the colon.
LB
LB
Box 14-2 Volvulus: A Cause of Mechanical Large Bowel Obstruction
Either the cecum or the sigmoid colon can twist upon itself producing a mechanical obstruction known as a volvulus.
Sigmoid volvulus is more common and tends to occur in older men.
The volvulated sigmoid assumes a massive size rising up from the pelvis with the wall between the twisted loops of sigmoid forming a line that points from the left lower to the right upper quadrant.
The appearance of the dilated sigmoid has been likened to a coffee bean (see Fig. 14-16).
When the cecum volvulates, it usually moves across the midline into the left upper quadrant producing loops of bowel forming a line that characteristically points from the right lower to the left upper quadrant.
A contrast enema can be both diagnostic (the obstructed sigmoid produces a beak sign) and therapeutic as the hydrostatic pressure of the enema can sometimes decompress the volvulus.
Figure 14-16 Sigmoid volvulus, supine abdomen. There is a massively dilated sigmoid colon (solid white line) twisted upon itself in the pelvis (solid black arrow). The dilated sigmoid has a coffee-bean shape. Since the point of obstruction is in the distal colon, there are air and stool present in the more proximal portion of the colon (solid white arrows). Volvulus can produce massively dilated loops of sigmoid colon.
! The syndrome is characterized by a loss of peristalsis, resulting in sometimes massive dilatation of the entire colon resembling a large bowel obstruction (Fig. 14-17).• Unlike a mechanical obstruction, no obstructing lesion
can be demonstrated on CT or with barium enema. Unlike a generalized ileus, patients have more marked abdominal distension, and bowel sounds may be normal or hyperactive in almost half of patients with Ogilvie syndrome.
! The supine abdominal radiograph shows marked bowel dilatation, almost always confined to the colon.
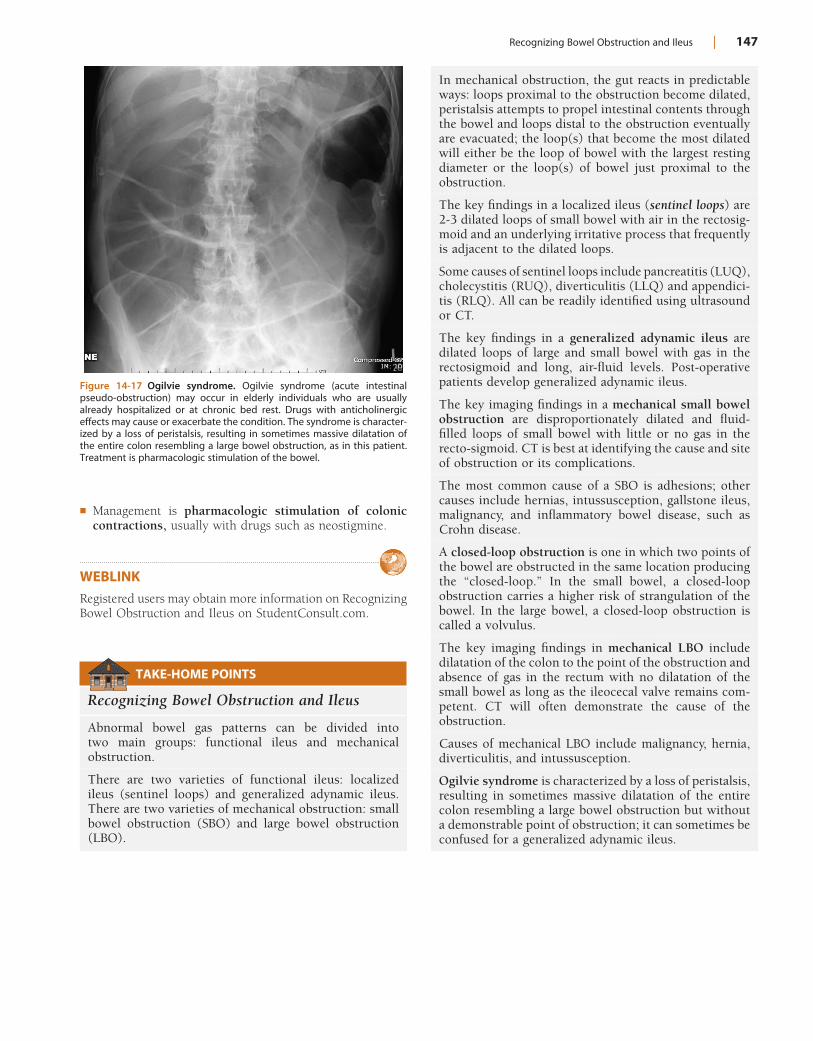
Recognizing Bowel Obstruction and Ileus | 147
! Management is pharmacologic stimulation of colonic contractions, usually with drugs such as neostigmine.
WEBLINKRegistered users may obtain more information on Recognizing Bowel Obstruction and Ileus on StudentConsult.com.
Figure 14-17 Ogilvie syndrome. Ogilvie syndrome (acute intestinal pseudo-obstruction) may occur in elderly individuals who are usually already hospitalized or at chronic bed rest. Drugs with anticholinergic effects may cause or exacerbate the condition. The syndrome is character-ized by a loss of peristalsis, resulting in sometimes massive dilatation of the entire colon resembling a large bowel obstruction, as in this patient. Treatment is pharmacologic stimulation of the bowel.
TAKE-HOME POINTS
Recognizing Bowel Obstruction and Ileus
Abnormal bowel gas patterns can be divided into two main groups: functional ileus and mechanical obstruction.
There are two varieties of functional ileus: localized ileus (sentinel loops) and generalized adynamic ileus. There are two varieties of mechanical obstruction: small bowel obstruction (SBO) and large bowel obstruction (LBO).
In mechanical obstruction, the gut reacts in predictable ways: loops proximal to the obstruction become dilated, peristalsis attempts to propel intestinal contents through the bowel and loops distal to the obstruction eventually are evacuated; the loop(s) that become the most dilated will either be the loop of bowel with the largest resting diameter or the loop(s) of bowel just proximal to the obstruction.
The key findings in a localized ileus (sentinel loops) are 2-3 dilated loops of small bowel with air in the rectosig-moid and an underlying irritative process that frequently is adjacent to the dilated loops.
Some causes of sentinel loops include pancreatitis (LUQ), cholecystitis (RUQ), diverticulitis (LLQ) and appendici-tis (RLQ). All can be readily identified using ultrasound or CT.
The key findings in a generalized adynamic ileus are dilated loops of large and small bowel with gas in the rectosigmoid and long, air-fluid levels. Post-operative patients develop generalized adynamic ileus.
The key imaging findings in a mechanical small bowel obstruction are disproportionately dilated and fluid-filled loops of small bowel with little or no gas in the recto-sigmoid. CT is best at identifying the cause and site of obstruction or its complications.
The most common cause of a SBO is adhesions; other causes include hernias, intussusception, gallstone ileus, malignancy, and inflammatory bowel disease, such as Crohn disease.
A closed-loop obstruction is one in which two points of the bowel are obstructed in the same location producing the “closed-loop.” In the small bowel, a closed-loop obstruction carries a higher risk of strangulation of the bowel. In the large bowel, a closed-loop obstruction is called a volvulus.
The key imaging findings in mechanical LBO include dilatation of the colon to the point of the obstruction and absence of gas in the rectum with no dilatation of the small bowel as long as the ileocecal valve remains com-petent. CT will often demonstrate the cause of the obstruction.
Causes of mechanical LBO include malignancy, hernia, diverticulitis, and intussusception.
Ogilvie syndrome is characterized by a loss of peristalsis, resulting in sometimes massive dilatation of the entire colon resembling a large bowel obstruction but without a demonstrable point of obstruction; it can sometimes be confused for a generalized adynamic ileus.
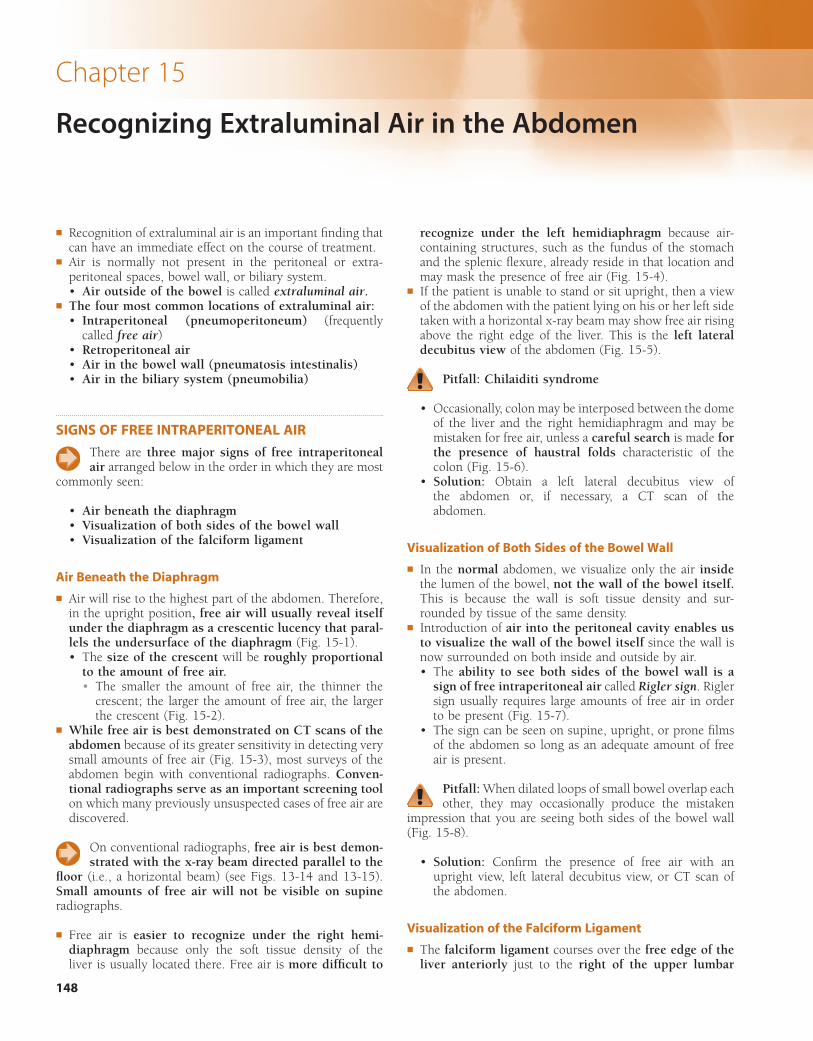
148
Chapter 15
Recognizing Extraluminal Air in the Abdomen
! Recognition of extraluminal air is an important finding that can have an immediate effect on the course of treatment.
! Air is normally not present in the peritoneal or extra-peritoneal spaces, bowel wall, or biliary system.• Air outside of the bowel is called extraluminal air.
! The four most common locations of extraluminal air:• Intraperitoneal (pneumoperitoneum) (frequently
called free air)• Retroperitoneal air• Air in the bowel wall (pneumatosis intestinalis)• Air in the biliary system (pneumobilia)
SIGNS OF FREE INTRAPERITONEAL AIR
There are three major signs of free intraperitoneal air arranged below in the order in which they are most
commonly seen:
• Air beneath the diaphragm• Visualization of both sides of the bowel wall• Visualization of the falciform ligament
Air Beneath the Diaphragm
! Air will rise to the highest part of the abdomen. Therefore, in the upright position, free air will usually reveal itself under the diaphragm as a crescentic lucency that paral-lels the undersurface of the diaphragm (Fig. 15-1).• The size of the crescent will be roughly proportional
to the amount of free air.• The smaller the amount of free air, the thinner the
crescent; the larger the amount of free air, the larger the crescent (Fig. 15-2).
! While free air is best demonstrated on CT scans of the abdomen because of its greater sensitivity in detecting very small amounts of free air (Fig. 15-3), most surveys of the abdomen begin with conventional radiographs. Conven-tional radiographs serve as an important screening tool on which many previously unsuspected cases of free air are discovered.
On conventional radiographs, free air is best demon-strated with the x-ray beam directed parallel to the
floor (i.e., a horizontal beam) (see Figs. 13-14 and 13-15). Small amounts of free air will not be visible on supine radiographs.
! Free air is easier to recognize under the right hemi-diaphragm because only the soft tissue density of the liver is usually located there. Free air is more difficult to
recognize under the left hemidiaphragm because air-containing structures, such as the fundus of the stomach and the splenic flexure, already reside in that location and may mask the presence of free air (Fig. 15-4).
! If the patient is unable to stand or sit upright, then a view of the abdomen with the patient lying on his or her left side taken with a horizontal x-ray beam may show free air rising above the right edge of the liver. This is the left lateral decubitus view of the abdomen (Fig. 15-5).
Pitfall: Chilaiditi syndrome
• Occasionally, colon may be interposed between the dome of the liver and the right hemidiaphragm and may be mistaken for free air, unless a careful search is made for the presence of haustral folds characteristic of the colon (Fig. 15-6).
• Solution: Obtain a left lateral decubitus view of the abdomen or, if necessary, a CT scan of the abdomen.
Visualization of Both Sides of the Bowel Wall
! In the normal abdomen, we visualize only the air inside the lumen of the bowel, not the wall of the bowel itself. This is because the wall is soft tissue density and sur-rounded by tissue of the same density.
! Introduction of air into the peritoneal cavity enables us to visualize the wall of the bowel itself since the wall is now surrounded on both inside and outside by air.• The ability to see both sides of the bowel wall is a
sign of free intraperitoneal air called Rigler sign. Rigler sign usually requires large amounts of free air in order to be present (Fig. 15-7).
• The sign can be seen on supine, upright, or prone films of the abdomen so long as an adequate amount of free air is present.
Pitfall: When dilated loops of small bowel overlap each other, they may occasionally produce the mistaken
impression that you are seeing both sides of the bowel wall (Fig. 15-8).
• Solution: Confirm the presence of free air with an upright view, left lateral decubitus view, or CT scan of the abdomen.
Visualization of the Falciform Ligament
! The falciform ligament courses over the free edge of the liver anteriorly just to the right of the upper lumbar
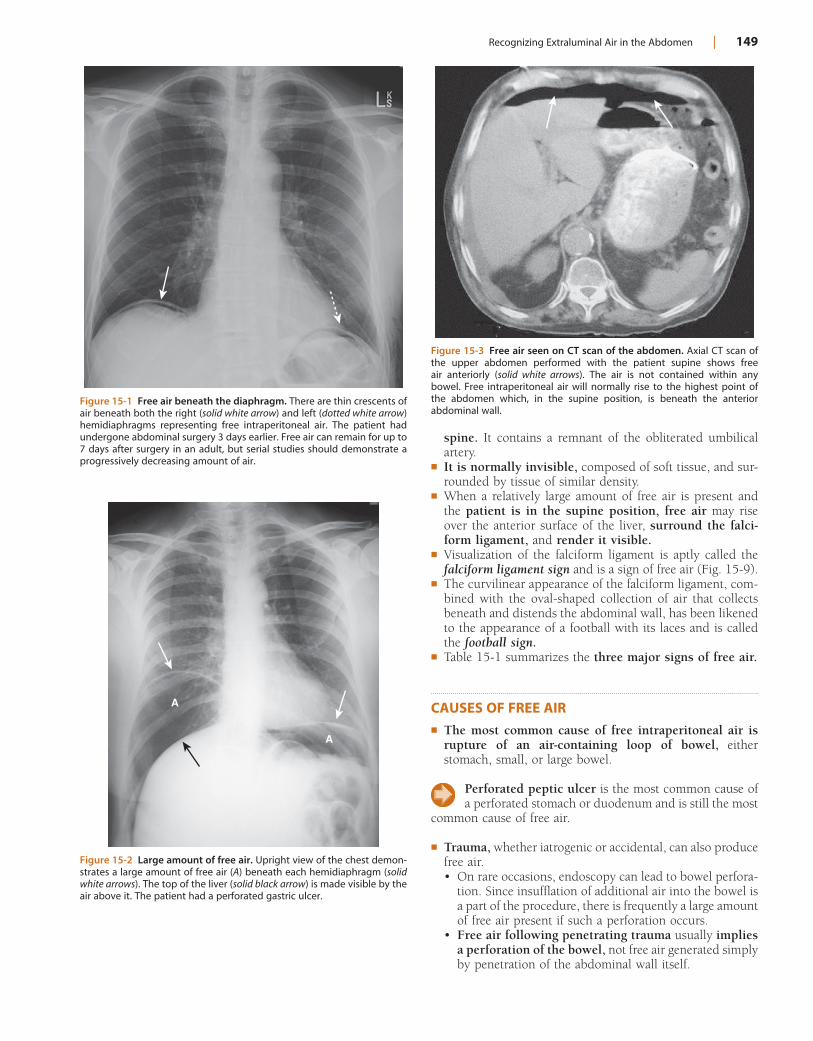
Recognizing Extraluminal Air in the Abdomen | 149
spine. It contains a remnant of the obliterated umbilical artery.
! It is normally invisible, composed of soft tissue, and sur-rounded by tissue of similar density.
! When a relatively large amount of free air is present and the patient is in the supine position, free air may rise over the anterior surface of the liver, surround the falci-form ligament, and render it visible.
! Visualization of the falciform ligament is aptly called the falciform ligament sign and is a sign of free air (Fig. 15-9).
! The curvilinear appearance of the falciform ligament, com-bined with the oval-shaped collection of air that collects beneath and distends the abdominal wall, has been likened to the appearance of a football with its laces and is called the football sign.
! Table 15-1 summarizes the three major signs of free air.
CAUSES OF FREE AIR! The most common cause of free intraperitoneal air is
rupture of an air-containing loop of bowel, either stomach, small, or large bowel.
Perforated peptic ulcer is the most common cause of a perforated stomach or duodenum and is still the most
common cause of free air.
! Trauma, whether iatrogenic or accidental, can also produce free air.• On rare occasions, endoscopy can lead to bowel perfora-
tion. Since insufflation of additional air into the bowel is a part of the procedure, there is frequently a large amount of free air present if such a perforation occurs.
• Free air following penetrating trauma usually implies a perforation of the bowel, not free air generated simply by penetration of the abdominal wall itself.
Figure 15-1 Free air beneath the diaphragm. There are thin crescents of air beneath both the right (solid white arrow) and left (dotted white arrow) hemidiaphragms representing free intraperitoneal air. The patient had undergone abdominal surgery 3 days earlier. Free air can remain for up to 7 days after surgery in an adult, but serial studies should demonstrate a progressively decreasing amount of air.
Figure 15-2 Large amount of free air. Upright view of the chest demon-strates a large amount of free air (A) beneath each hemidiaphragm (solid white arrows). The top of the liver (solid black arrow) is made visible by the air above it. The patient had a perforated gastric ulcer.
A
A
Figure 15-3 Free air seen on CT scan of the abdomen. Axial CT scan of the upper abdomen performed with the patient supine shows free air anteriorly (solid white arrows). The air is not contained within any bowel. Free intraperitoneal air will normally rise to the highest point of the abdomen which, in the supine position, is beneath the anterior abdominal wall.
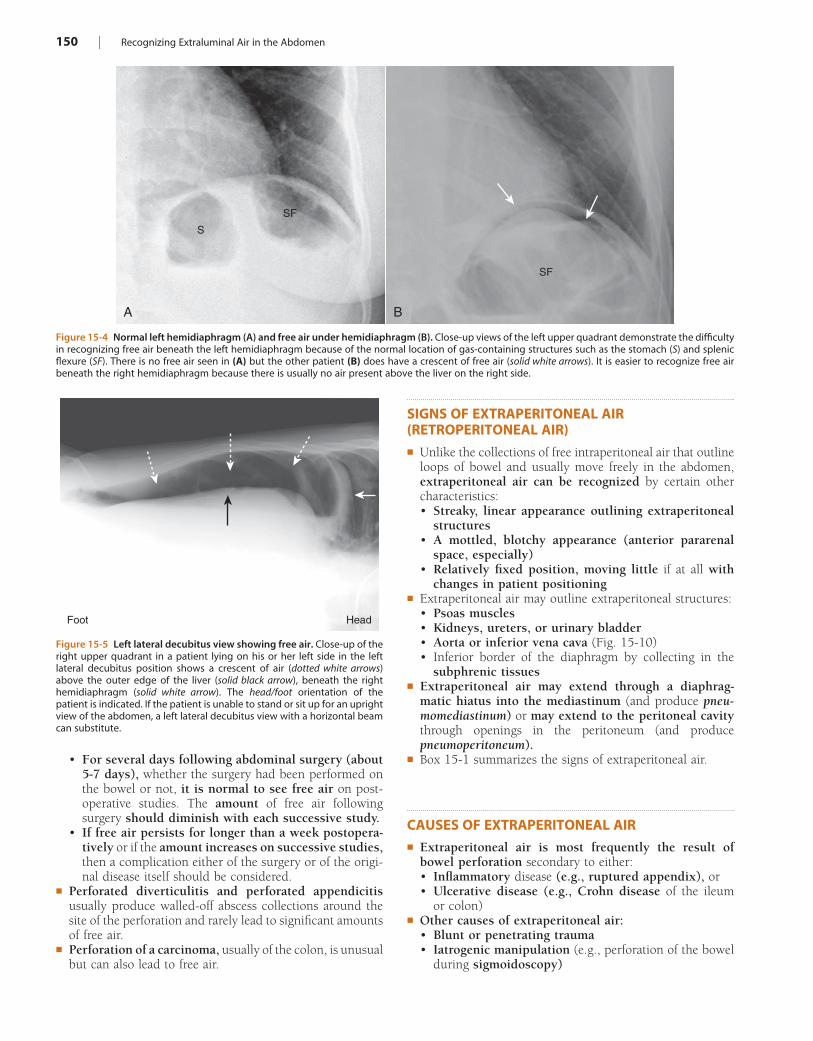
150 | Recognizing Extraluminal Air in the Abdomen
SIGNS OF EXTRAPERITONEAL AIR (RETROPERITONEAL AIR)! Unlike the collections of free intraperitoneal air that outline
loops of bowel and usually move freely in the abdomen, extraperitoneal air can be recognized by certain other characteristics:• Streaky, linear appearance outlining extraperitoneal
structures• A mottled, blotchy appearance (anterior pararenal
space, especially)• Relatively fixed position, moving little if at all with
changes in patient positioning! Extraperitoneal air may outline extraperitoneal structures:
• Psoas muscles• Kidneys, ureters, or urinary bladder• Aorta or inferior vena cava (Fig. 15-10)• Inferior border of the diaphragm by collecting in the
subphrenic tissues! Extraperitoneal air may extend through a diaphrag-
matic hiatus into the mediastinum (and produce pneu-momediastinum) or may extend to the peritoneal cavity through openings in the peritoneum (and produce pneumoperitoneum).
! Box 15-1 summarizes the signs of extraperitoneal air.
CAUSES OF EXTRAPERITONEAL AIR! Extraperitoneal air is most frequently the result of
bowel perforation secondary to either:• Inflammatory disease (e.g., ruptured appendix), or• Ulcerative disease (e.g., Crohn disease of the ileum
or colon)! Other causes of extraperitoneal air:
• Blunt or penetrating trauma• Iatrogenic manipulation (e.g., perforation of the bowel
during sigmoidoscopy)
• For several days following abdominal surgery (about 5-7 days), whether the surgery had been performed on the bowel or not, it is normal to see free air on post-operative studies. The amount of free air following surgery should diminish with each successive study.
• If free air persists for longer than a week postopera-tively or if the amount increases on successive studies, then a complication either of the surgery or of the origi-nal disease itself should be considered.
! Perforated diverticulitis and perforated appendicitis usually produce walled-off abscess collections around the site of the perforation and rarely lead to significant amounts of free air.
! Perforation of a carcinoma, usually of the colon, is unusual but can also lead to free air.
Figure 15-4 Normal left hemidiaphragm (A) and free air under hemidiaphragm (B). Close-up views of the left upper quadrant demonstrate the difficulty in recognizing free air beneath the left hemidiaphragm because of the normal location of gas-containing structures such as the stomach (S) and splenic flexure (SF). There is no free air seen in (A) but the other patient (B) does have a crescent of free air (solid white arrows). It is easier to recognize free air beneath the right hemidiaphragm because there is usually no air present above the liver on the right side.
A B
S
SF
SF
Figure 15-5 Left lateral decubitus view showing free air. Close-up of the right upper quadrant in a patient lying on his or her left side in the left lateral decubitus position shows a crescent of air (dotted white arrows) above the outer edge of the liver (solid black arrow), beneath the right hemidiaphragm (solid white arrow). The head/foot orientation of the patient is indicated. If the patient is unable to stand or sit up for an upright view of the abdomen, a left lateral decubitus view with a horizontal beam can substitute.
Foot Head
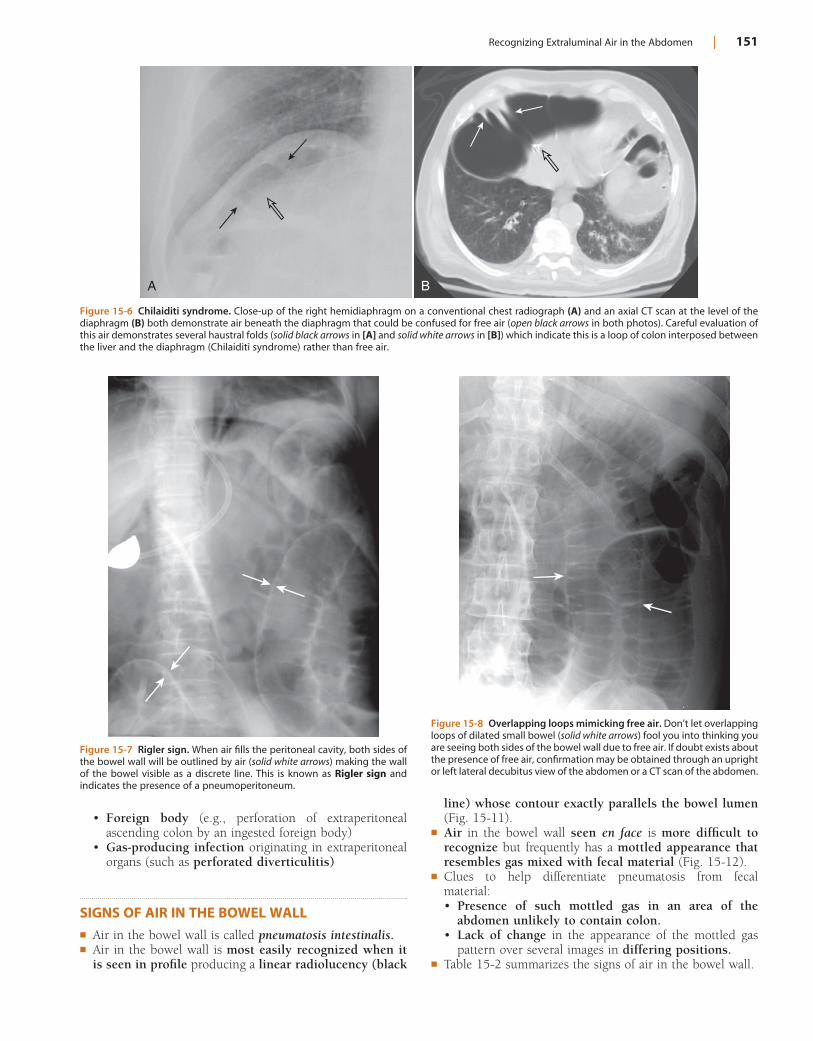
Recognizing Extraluminal Air in the Abdomen | 151
line) whose contour exactly parallels the bowel lumen (Fig. 15-11).
! Air in the bowel wall seen en face is more difficult to recognize but frequently has a mottled appearance that resembles gas mixed with fecal material (Fig. 15-12).
! Clues to help differentiate pneumatosis from fecal material:• Presence of such mottled gas in an area of the
abdomen unlikely to contain colon.• Lack of change in the appearance of the mottled gas
pattern over several images in differing positions.! Table 15-2 summarizes the signs of air in the bowel wall.
• Foreign body (e.g., perforation of extraperitoneal ascending colon by an ingested foreign body)
• Gas-producing infection originating in extraperitoneal organs (such as perforated diverticulitis)
SIGNS OF AIR IN THE BOWEL WALL! Air in the bowel wall is called pneumatosis intestinalis.! Air in the bowel wall is most easily recognized when it
is seen in profile producing a linear radiolucency (black
Figure 15-6 Chilaiditi syndrome. Close-up of the right hemidiaphragm on a conventional chest radiograph (A) and an axial CT scan at the level of the diaphragm (B) both demonstrate air beneath the diaphragm that could be confused for free air (open black arrows in both photos). Careful evaluation of this air demonstrates several haustral folds (solid black arrows in [A] and solid white arrows in [B]) which indicate this is a loop of colon interposed between the liver and the diaphragm (Chilaiditi syndrome) rather than free air.
A B
Figure 15-7 Rigler sign. When air fills the peritoneal cavity, both sides of the bowel wall will be outlined by air (solid white arrows) making the wall of the bowel visible as a discrete line. This is known as Rigler sign and indicates the presence of a pneumoperitoneum.
Figure 15-8 Overlapping loops mimicking free air. Don’t let overlapping loops of dilated small bowel (solid white arrows) fool you into thinking you are seeing both sides of the bowel wall due to free air. If doubt exists about the presence of free air, confirmation may be obtained through an upright or left lateral decubitus view of the abdomen or a CT scan of the abdomen.
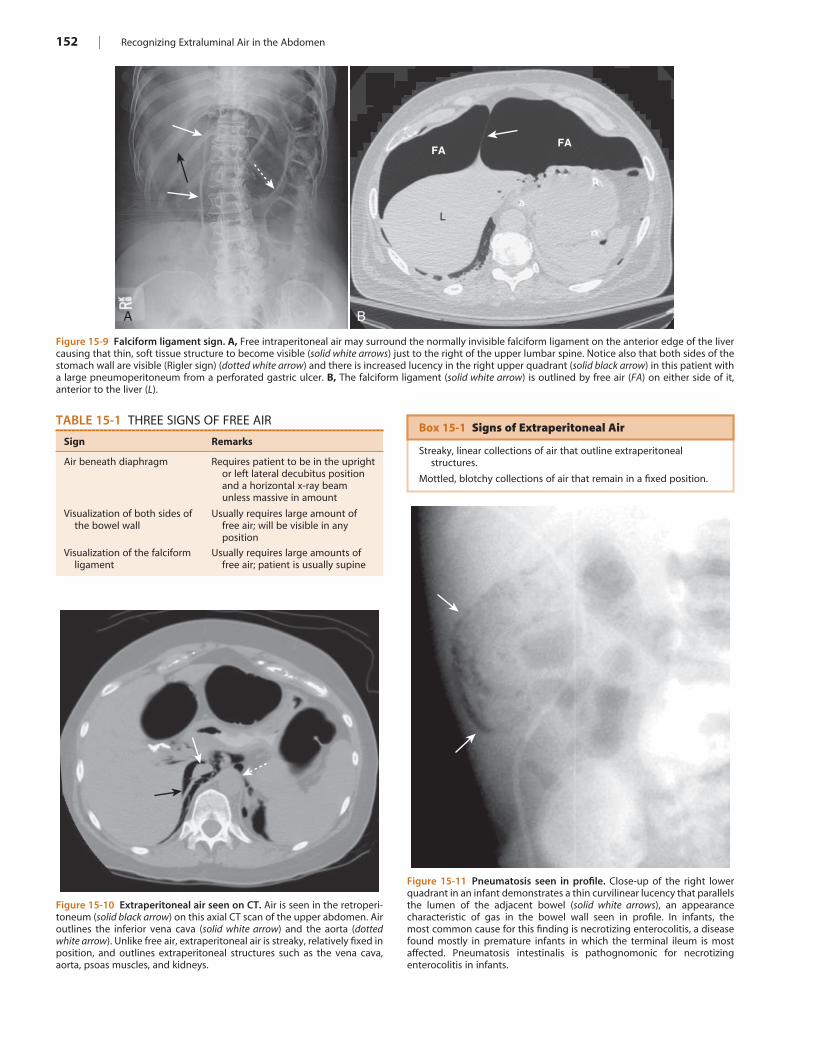
152 | Recognizing Extraluminal Air in the Abdomen
Figure 15-9 Falciform ligament sign. A, Free intraperitoneal air may surround the normally invisible falciform ligament on the anterior edge of the liver causing that thin, soft tissue structure to become visible (solid white arrows) just to the right of the upper lumbar spine. Notice also that both sides of the stomach wall are visible (Rigler sign) (dotted white arrow) and there is increased lucency in the right upper quadrant (solid black arrow) in this patient with a large pneumoperitoneum from a perforated gastric ulcer. B, The falciform ligament (solid white arrow) is outlined by free air (FA) on either side of it, anterior to the liver (L).
A B
L
FAFA
TABLE 15-1 THREE SIGNS OF FREE AIR
Sign Remarks
Air beneath diaphragm Requires patient to be in the upright or left lateral decubitus position and a horizontal x-ray beam unless massive in amount
Visualization of both sides of the bowel wall
Usually requires large amount of free air; will be visible in any position
Visualization of the falciform ligament
Usually requires large amounts of free air; patient is usually supine
Figure 15-10 Extraperitoneal air seen on CT. Air is seen in the retroperi-toneum (solid black arrow) on this axial CT scan of the upper abdomen. Air outlines the inferior vena cava (solid white arrow) and the aorta (dotted white arrow). Unlike free air, extraperitoneal air is streaky, relatively fixed in position, and outlines extraperitoneal structures such as the vena cava, aorta, psoas muscles, and kidneys.
Figure 15-11 Pneumatosis seen in profile. Close-up of the right lower quadrant in an infant demonstrates a thin curvilinear lucency that parallels the lumen of the adjacent bowel (solid white arrows), an appearance characteristic of gas in the bowel wall seen in profile. In infants, the most common cause for this finding is necrotizing enterocolitis, a disease found mostly in premature infants in which the terminal ileum is most affected. Pneumatosis intestinalis is pathognomonic for necrotizing enterocolitis in infants.
Box 15-1 Signs of Extraperitoneal Air
Streaky, linear collections of air that outline extraperitoneal structures.
Mottled, blotchy collections of air that remain in a fixed position.
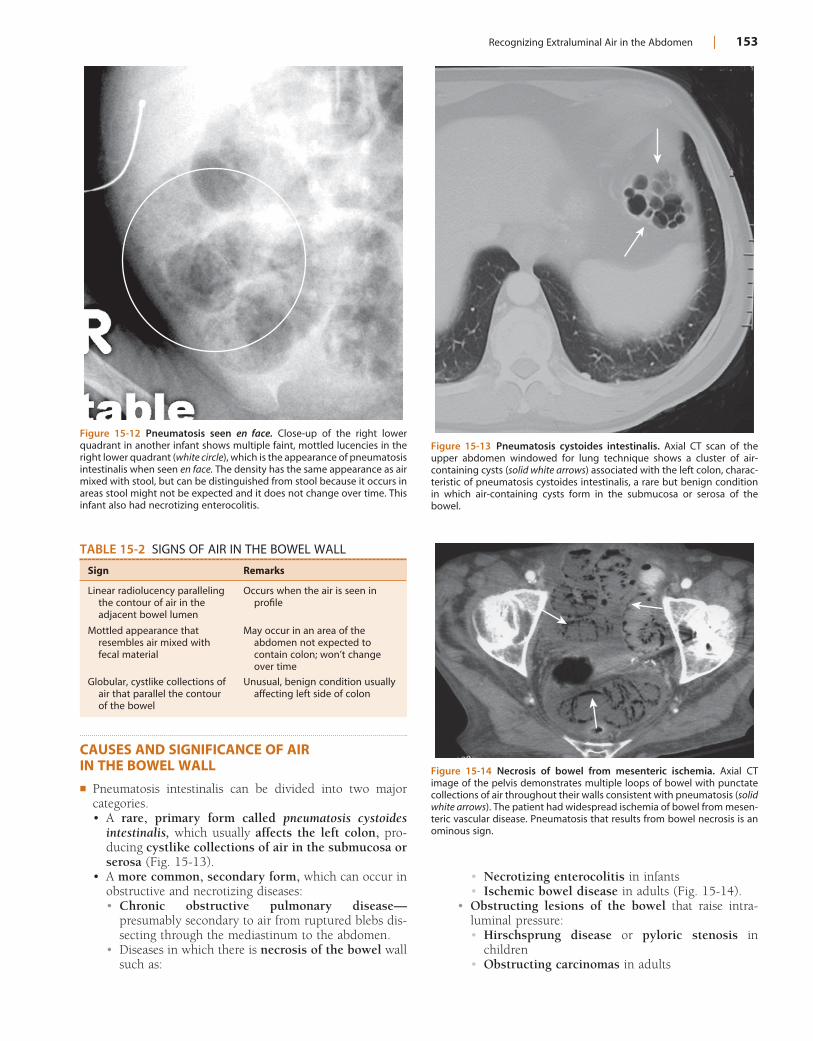
Recognizing Extraluminal Air in the Abdomen | 153
• Necrotizing enterocolitis in infants• Ischemic bowel disease in adults (Fig. 15-14).
• Obstructing lesions of the bowel that raise intra-luminal pressure:• Hirschsprung disease or pyloric stenosis in
children• Obstructing carcinomas in adults
CAUSES AND SIGNIFICANCE OF AIR IN THE BOWEL WALL! Pneumatosis intestinalis can be divided into two major
categories.• A rare, primary form called pneumatosis cystoides
intestinalis, which usually affects the left colon, pro-ducing cystlike collections of air in the submucosa or serosa (Fig. 15-13).
• A more common, secondary form, which can occur in obstructive and necrotizing diseases:• Chronic obstructive pulmonary disease—
presumably secondary to air from ruptured blebs dis-secting through the mediastinum to the abdomen.
• Diseases in which there is necrosis of the bowel wall such as:
Figure 15-12 Pneumatosis seen en face. Close-up of the right lower quadrant in another infant shows multiple faint, mottled lucencies in the right lower quadrant (white circle), which is the appearance of pneumatosis intestinalis when seen en face. The density has the same appearance as air mixed with stool, but can be distinguished from stool because it occurs in areas stool might not be expected and it does not change over time. This infant also had necrotizing enterocolitis.
TABLE 15-2 SIGNS OF AIR IN THE BOWEL WALL
Sign Remarks
Linear radiolucency paralleling the contour of air in the adjacent bowel lumen
Occurs when the air is seen in profile
Mottled appearance that resembles air mixed with fecal material
May occur in an area of the abdomen not expected to contain colon; won’t change over time
Globular, cystlike collections of air that parallel the contour of the bowel
Unusual, benign condition usually affecting left side of colon
Figure 15-13 Pneumatosis cystoides intestinalis. Axial CT scan of the upper abdomen windowed for lung technique shows a cluster of air-containing cysts (solid white arrows) associated with the left colon, charac-teristic of pneumatosis cystoides intestinalis, a rare but benign condition in which air-containing cysts form in the submucosa or serosa of the bowel.
Figure 15-14 Necrosis of bowel from mesenteric ischemia. Axial CT image of the pelvis demonstrates multiple loops of bowel with punctate collections of air throughout their walls consistent with pneumatosis (solid white arrows). The patient had widespread ischemia of bowel from mesen-teric vascular disease. Pneumatosis that results from bowel necrosis is an ominous sign.
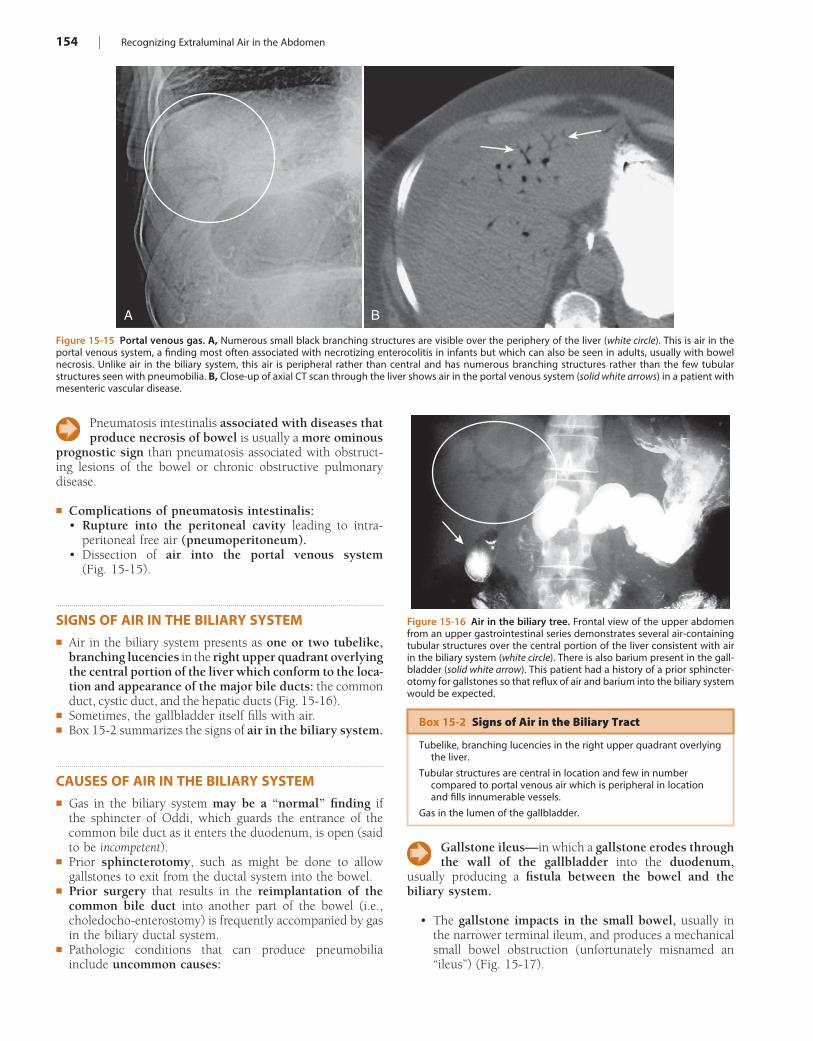
154 | Recognizing Extraluminal Air in the Abdomen
Pneumatosis intestinalis associated with diseases that produce necrosis of bowel is usually a more ominous
prognostic sign than pneumatosis associated with obstruct-ing lesions of the bowel or chronic obstructive pulmonary disease.
! Complications of pneumatosis intestinalis:• Rupture into the peritoneal cavity leading to intra-
peritoneal free air (pneumoperitoneum).• Dissection of air into the portal venous system
(Fig. 15-15).
SIGNS OF AIR IN THE BILIARY SYSTEM! Air in the biliary system presents as one or two tubelike,
branching lucencies in the right upper quadrant overlying the central portion of the liver which conform to the loca-tion and appearance of the major bile ducts: the common duct, cystic duct, and the hepatic ducts (Fig. 15-16).
! Sometimes, the gallbladder itself fills with air.! Box 15-2 summarizes the signs of air in the biliary system.
CAUSES OF AIR IN THE BILIARY SYSTEM! Gas in the biliary system may be a “normal” finding if
the sphincter of Oddi, which guards the entrance of the common bile duct as it enters the duodenum, is open (said to be incompetent).
! Prior sphincterotomy, such as might be done to allow gallstones to exit from the ductal system into the bowel.
! Prior surgery that results in the reimplantation of the common bile duct into another part of the bowel (i.e., choledocho-enterostomy) is frequently accompanied by gas in the biliary ductal system.
! Pathologic conditions that can produce pneumobilia include uncommon causes:
Figure 15-15 Portal venous gas. A, Numerous small black branching structures are visible over the periphery of the liver (white circle). This is air in the portal venous system, a finding most often associated with necrotizing enterocolitis in infants but which can also be seen in adults, usually with bowel necrosis. Unlike air in the biliary system, this air is peripheral rather than central and has numerous branching structures rather than the few tubular structures seen with pneumobilia. B, Close-up of axial CT scan through the liver shows air in the portal venous system (solid white arrows) in a patient with mesenteric vascular disease.
A B
Figure 15-16 Air in the biliary tree. Frontal view of the upper abdomen from an upper gastrointestinal series demonstrates several air-containing tubular structures over the central portion of the liver consistent with air in the biliary system (white circle). There is also barium present in the gall-bladder (solid white arrow). This patient had a history of a prior sphincter-otomy for gallstones so that reflux of air and barium into the biliary system would be expected.
Box 15-2 Signs of Air in the Biliary Tract
Tubelike, branching lucencies in the right upper quadrant overlying the liver.
Tubular structures are central in location and few in number compared to portal venous air which is peripheral in location and fills innumerable vessels.
Gas in the lumen of the gallbladder.
Gallstone ileus—in which a gallstone erodes through the wall of the gallbladder into the duodenum,
usually producing a fistula between the bowel and the biliary system.
• The gallstone impacts in the small bowel, usually in the narrower terminal ileum, and produces a mechanical small bowel obstruction (unfortunately misnamed an “ileus”) (Fig. 15-17).
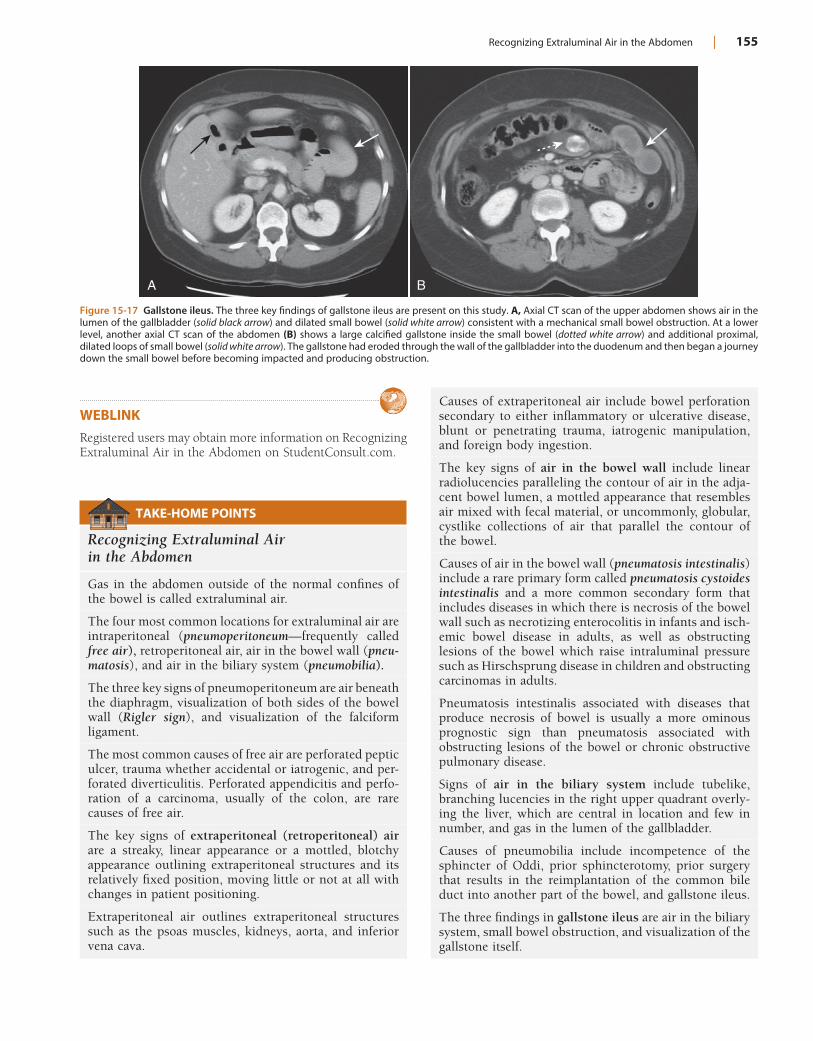
Recognizing Extraluminal Air in the Abdomen | 155
WEBLINK
Registered users may obtain more information on Recognizing Extraluminal Air in the Abdomen on StudentConsult.com.
Figure 15-17 Gallstone ileus. The three key findings of gallstone ileus are present on this study. A, Axial CT scan of the upper abdomen shows air in the lumen of the gallbladder (solid black arrow) and dilated small bowel (solid white arrow) consistent with a mechanical small bowel obstruction. At a lower level, another axial CT scan of the abdomen (B) shows a large calcified gallstone inside the small bowel (dotted white arrow) and additional proximal, dilated loops of small bowel (solid white arrow). The gallstone had eroded through the wall of the gallbladder into the duodenum and then began a journey down the small bowel before becoming impacted and producing obstruction.
A B
TAKE-HOME POINTS
Recognizing Extraluminal Air in the Abdomen
Gas in the abdomen outside of the normal confines of the bowel is called extraluminal air.
The four most common locations for extraluminal air are intraperitoneal (pneumoperitoneum—frequently called free air), retroperitoneal air, air in the bowel wall (pneu-matosis), and air in the biliary system (pneumobilia).
The three key signs of pneumoperitoneum are air beneath the diaphragm, visualization of both sides of the bowel wall (Rigler sign), and visualization of the falciform ligament.
The most common causes of free air are perforated peptic ulcer, trauma whether accidental or iatrogenic, and per-forated diverticulitis. Perforated appendicitis and perfo-ration of a carcinoma, usually of the colon, are rare causes of free air.
The key signs of extraperitoneal (retroperitoneal) air are a streaky, linear appearance or a mottled, blotchy appearance outlining extraperitoneal structures and its relatively fixed position, moving little or not at all with changes in patient positioning.
Extraperitoneal air outlines extraperitoneal structures such as the psoas muscles, kidneys, aorta, and inferior vena cava.
Causes of extraperitoneal air include bowel perforation secondary to either inflammatory or ulcerative disease, blunt or penetrating trauma, iatrogenic manipulation, and foreign body ingestion.
The key signs of air in the bowel wall include linear radiolucencies paralleling the contour of air in the adja-cent bowel lumen, a mottled appearance that resembles air mixed with fecal material, or uncommonly, globular, cystlike collections of air that parallel the contour of the bowel.
Causes of air in the bowel wall (pneumatosis intestinalis) include a rare primary form called pneumatosis cystoides intestinalis and a more common secondary form that includes diseases in which there is necrosis of the bowel wall such as necrotizing enterocolitis in infants and isch-emic bowel disease in adults, as well as obstructing lesions of the bowel which raise intraluminal pressure such as Hirschsprung disease in children and obstructing carcinomas in adults.
Pneumatosis intestinalis associated with diseases that produce necrosis of bowel is usually a more ominous prognostic sign than pneumatosis associated with obstructing lesions of the bowel or chronic obstructive pulmonary disease.
Signs of air in the biliary system include tubelike, branching lucencies in the right upper quadrant overly-ing the liver, which are central in location and few in number, and gas in the lumen of the gallbladder.
Causes of pneumobilia include incompetence of the sphincter of Oddi, prior sphincterotomy, prior surgery that results in the reimplantation of the common bile duct into another part of the bowel, and gallstone ileus.
The three findings in gallstone ileus are air in the biliary system, small bowel obstruction, and visualization of the gallstone itself.
156
Chapter 16
Recognizing Abnormal Calcifications and Their Causes
! Soft tissue calcifications lend themselves to an intuitive approach that ties together a diverse group of diseases. While this chapter focuses primarily on abdominal calcifi-cations, the same principles and approach apply to dystro-phic calcifications found anywhere in the body.
! Dystrophic calcification is soft tissue calcification that occurs in tissue that is already abnormal. (Metastatic cal-cification, by contrast, is calcification in otherwise normal soft tissues due to disturbances in calcium/phosphorus metabolism.)
! On conventional radiographs, the nature of most calcifica-tions can be determined by examining their pattern of calcification and their anatomic location.
! The same principles hold true for CT evaluation of calcifica-tions except that the anatomic location is usually easier to determine on CT.
PATTERNS OF CALCIFICATION! Calcifications tend to occur in one of four distinct
patterns, depending on the type of structure that has calcified:• Rimlike• Linear or tracklike• Lamellar (or laminar)• Cloudlike, amorphous, or popcorn
RIMLIKE CALCIFICATION! Rimlike calcification implies calcification that has
occurred in the wall of a hollow viscus.! Examples of structures that manifest rimlike
calcifications:• Cysts—calcification in any one of these is relatively
uncommon.• Renal cysts• Splenic cysts• Extraabdominal sites
• Mediastinal cysts, such as pericardial and bron-chial cysts (Fig. 16-1).
• Popliteal cysts (Baker cysts)• Aneurysms
• Aortic aneurysm. CT and US are used to identify and characterize abdominal aortic aneurysms. On conven-tional radiographs, such aneurysms are most easily recognized on a lateral radiograph of the lumbar spine. The abdominal aorta should normally measure <3 cm in diameter (Fig. 16-2).
• Splenic artery or renal artery aneurysms—usually secondary to atherosclerosis.
• Extraabdominal sites• Femoral artery aneurysms• Cerebral aneurysms
• Saccular organs, such as the gallbladder or urinary bladder• Porcelain gallbladder—an uncommon entity (named
after the gross appearance of the gallbladder, which resembles porcelain) that occurs with chronic inflam-mation of and stasis in the gallbladder and is associ-ated with gallstones and an increased incidence of carcinoma of the gallbladder (Fig. 16-3).
• Urinary bladder—calcification of the wall is an uncommon occurrence in diseases such as schistoso-miasis, bladder cancer, and tuberculosis.
! Table 16-1 highlights key facts about rimlike calcifications.
LINEAR OR TRACKLIKE CALCIFICATION! Linear or tracklike calcifications imply calcification
that has occurred in the walls of tubular structures (Fig. 16-4).
! Examples include calcifications in the walls of:• Arteries
• Common in atherosclerosis and seen anywhere in the body.
• Walls of veins do not calcify. In veins, long, linear thrombi or small, focal thrombi (the latter called phleboliths) may calcify (see Fig. 13-18).
• Tubular structures• Fallopian tubes and vas deferens—seen more often
in diabetics (Fig. 16-5).• Ureter—uncommon finding seen in schistosomiasis
and even more rarely in tuberculosis.! Table 16-2 highlights key facts about linear or tracklike
calcifications
LAMELLAR OR LAMINAR CALCIFICATION! Lamellar (or laminar) calcifications imply calcification
that forms around a nidus inside a hollow lumen (Fig. 16-6).• A “hollow lumen” refers to a structure such as the gall-
bladder or urinary bladder.• Calcification in concentric layers begins with a central
nidus around which alternating layers of calcified and
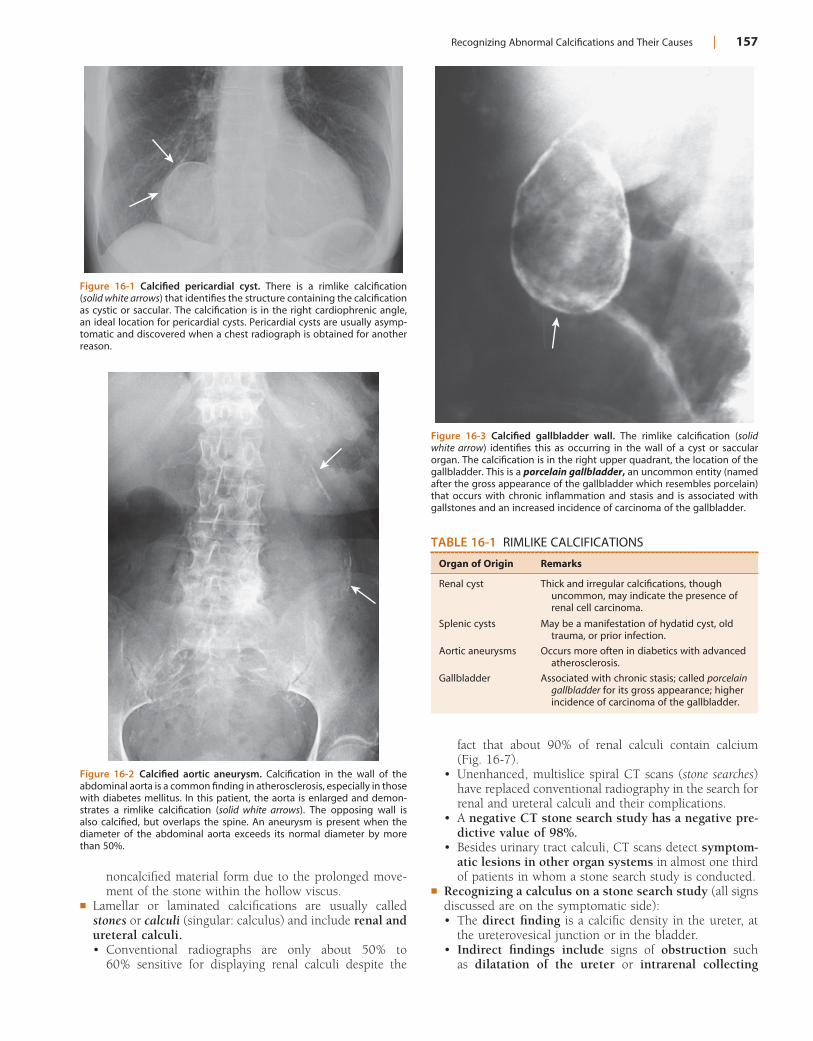
Recognizing Abnormal Calcifications and Their Causes | 157
fact that about 90% of renal calculi contain calcium (Fig. 16-7).
• Unenhanced, multislice spiral CT scans (stone searches) have replaced conventional radiography in the search for renal and ureteral calculi and their complications.
• A negative CT stone search study has a negative pre-dictive value of 98%.
• Besides urinary tract calculi, CT scans detect symptom-atic lesions in other organ systems in almost one third of patients in whom a stone search study is conducted.
! Recognizing a calculus on a stone search study (all signs discussed are on the symptomatic side):• The direct finding is a calcific density in the ureter, at
the ureterovesical junction or in the bladder.• Indirect findings include signs of obstruction such
as dilatation of the ureter or intrarenal collecting
noncalcified material form due to the prolonged move-ment of the stone within the hollow viscus.
! Lamellar or laminated calcifications are usually called stones or calculi (singular: calculus) and include renal and ureteral calculi.• Conventional radiographs are only about 50% to
60% sensitive for displaying renal calculi despite the
Figure 16-1 Calcified pericardial cyst. There is a rimlike calcification (solid white arrows) that identifies the structure containing the calcification as cystic or saccular. The calcification is in the right cardiophrenic angle, an ideal location for pericardial cysts. Pericardial cysts are usually asymp-tomatic and discovered when a chest radiograph is obtained for another reason.
Figure 16-2 Calcified aortic aneurysm. Calcification in the wall of the abdominal aorta is a common finding in atherosclerosis, especially in those with diabetes mellitus. In this patient, the aorta is enlarged and demon-strates a rimlike calcification (solid white arrows). The opposing wall is also calcified, but overlaps the spine. An aneurysm is present when the diameter of the abdominal aorta exceeds its normal diameter by more than 50%.
Figure 16-3 Calcified gallbladder wall. The rimlike calcification (solid white arrow) identifies this as occurring in the wall of a cyst or saccular organ. The calcification is in the right upper quadrant, the location of the gallbladder. This is a porcelain gallbladder, an uncommon entity (named after the gross appearance of the gallbladder which resembles porcelain) that occurs with chronic inflammation and stasis and is associated with gallstones and an increased incidence of carcinoma of the gallbladder.
TABLE 16-1 RIMLIKE CALCIFICATIONS
Organ of Origin Remarks
Renal cyst Thick and irregular calcifications, though uncommon, may indicate the presence of renal cell carcinoma.
Splenic cysts May be a manifestation of hydatid cyst, old trauma, or prior infection.
Aortic aneurysms Occurs more often in diabetics with advanced atherosclerosis.
Gallbladder Associated with chronic stasis; called porcelain gallbladder for its gross appearance; higher incidence of carcinoma of the gallbladder.
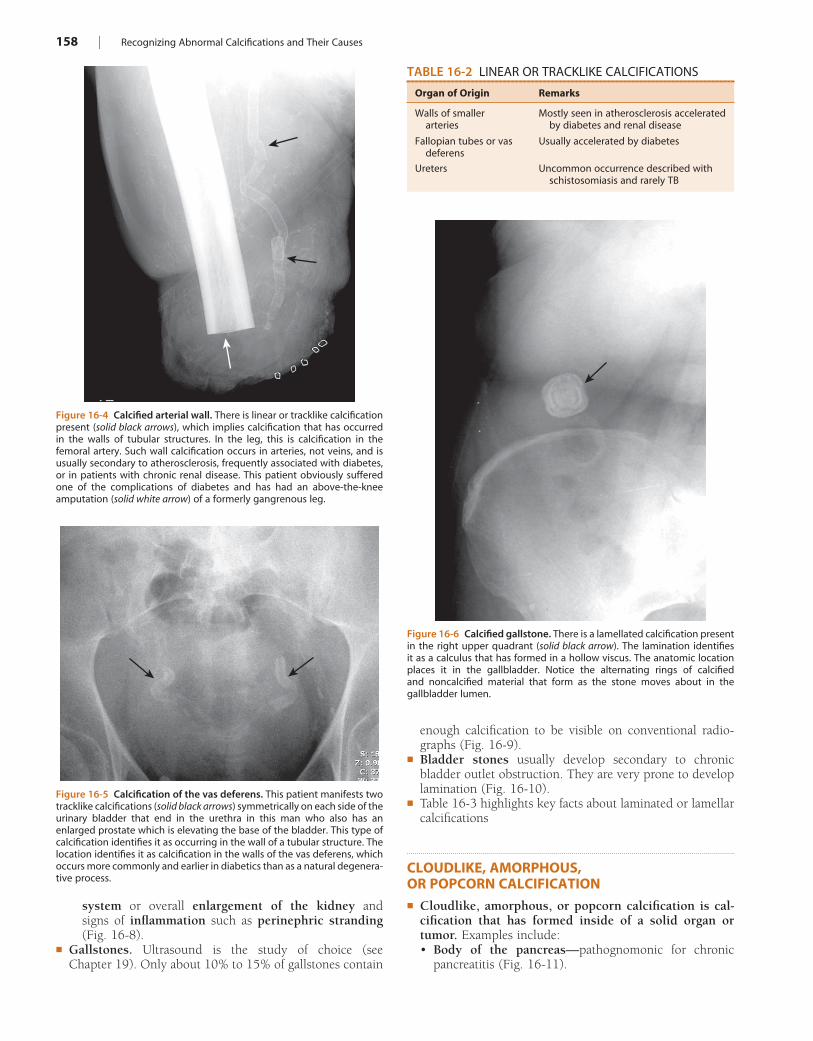
158 | Recognizing Abnormal Calcifications and Their Causes
enough calcification to be visible on conventional radio-graphs (Fig. 16-9).
! Bladder stones usually develop secondary to chronic bladder outlet obstruction. They are very prone to develop lamination (Fig. 16-10).
! Table 16-3 highlights key facts about laminated or lamellar calcifications
CLOUDLIKE, AMORPHOUS, OR POPCORN CALCIFICATION! Cloudlike, amorphous, or popcorn calcification is cal-
cification that has formed inside of a solid organ or tumor. Examples include:• Body of the pancreas—pathognomonic for chronic
pancreatitis (Fig. 16-11).
Figure 16-4 Calcified arterial wall. There is linear or tracklike calcification present (solid black arrows), which implies calcification that has occurred in the walls of tubular structures. In the leg, this is calcification in the femoral artery. Such wall calcification occurs in arteries, not veins, and is usually secondary to atherosclerosis, frequently associated with diabetes, or in patients with chronic renal disease. This patient obviously suffered one of the complications of diabetes and has had an above-the-knee amputation (solid white arrow) of a formerly gangrenous leg.
Figure 16-5 Calcification of the vas deferens. This patient manifests two tracklike calcifications (solid black arrows) symmetrically on each side of the urinary bladder that end in the urethra in this man who also has an enlarged prostate which is elevating the base of the bladder. This type of calcification identifies it as occurring in the wall of a tubular structure. The location identifies it as calcification in the walls of the vas deferens, which occurs more commonly and earlier in diabetics than as a natural degenera-tive process.
TABLE 16-2 LINEAR OR TRACKLIKE CALCIFICATIONS
Organ of Origin Remarks
Walls of smaller arteries
Mostly seen in atherosclerosis accelerated by diabetes and renal disease
Fallopian tubes or vas deferens
Usually accelerated by diabetes
Ureters Uncommon occurrence described with schistosomiasis and rarely TB
Figure 16-6 Calcified gallstone. There is a lamellated calcification present in the right upper quadrant (solid black arrow). The lamination identifies it as a calculus that has formed in a hollow viscus. The anatomic location places it in the gallbladder. Notice the alternating rings of calcified and noncalcified material that form as the stone moves about in the gallbladder lumen.
system or overall enlargement of the kidney and signs of inflammation such as perinephric stranding (Fig. 16-8).
! Gallstones. Ultrasound is the study of choice (see Chapter 19). Only about 10% to 15% of gallstones contain
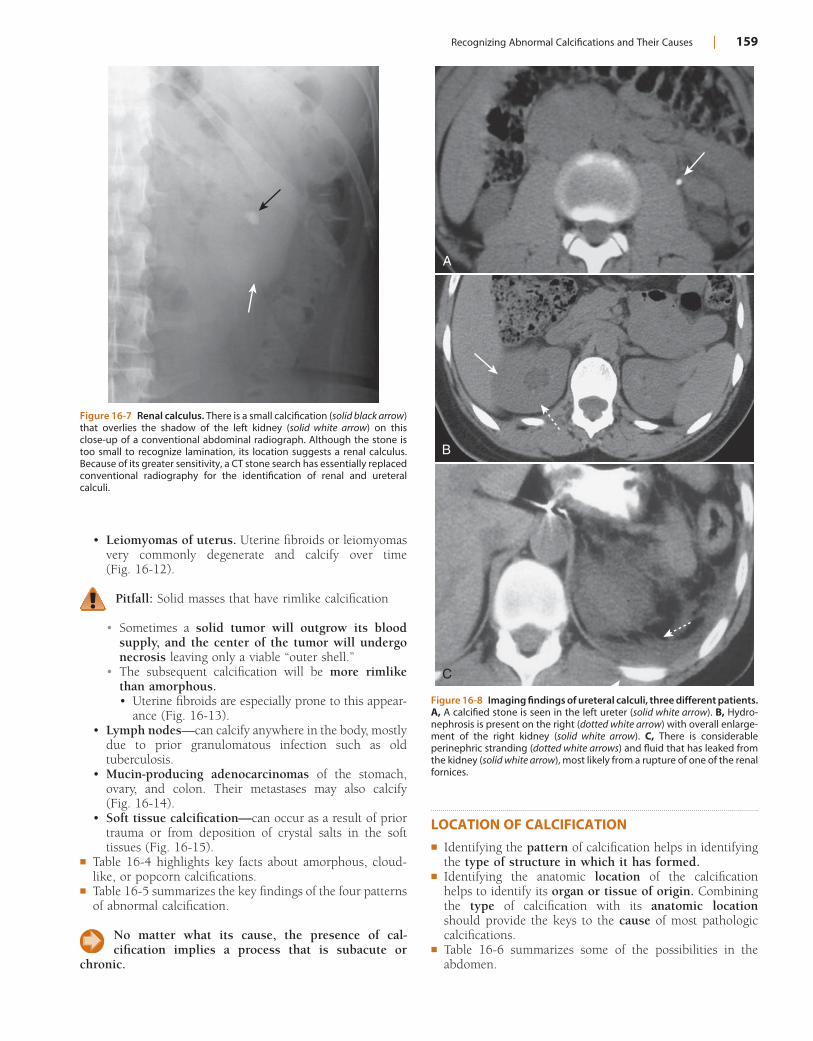
Recognizing Abnormal Calcifications and Their Causes | 159
LOCATION OF CALCIFICATION! Identifying the pattern of calcification helps in identifying
the type of structure in which it has formed.! Identifying the anatomic location of the calcification
helps to identify its organ or tissue of origin. Combining the type of calcification with its anatomic location should provide the keys to the cause of most pathologic calcifications.
! Table 16-6 summarizes some of the possibilities in the abdomen.
• Leiomyomas of uterus. Uterine fibroids or leiomyomas very commonly degenerate and calcify over time (Fig. 16-12).
Pitfall: Solid masses that have rimlike calcification
• Sometimes a solid tumor will outgrow its blood supply, and the center of the tumor will undergo necrosis leaving only a viable “outer shell.”
• The subsequent calcification will be more rimlike than amorphous.• Uterine fibroids are especially prone to this appear-
ance (Fig. 16-13).• Lymph nodes—can calcify anywhere in the body, mostly
due to prior granulomatous infection such as old tuberculosis.
• Mucin-producing adenocarcinomas of the stomach, ovary, and colon. Their metastases may also calcify (Fig. 16-14).
• Soft tissue calcification—can occur as a result of prior trauma or from deposition of crystal salts in the soft tissues (Fig. 16-15).
! Table 16-4 highlights key facts about amorphous, cloud-like, or popcorn calcifications.
! Table 16-5 summarizes the key findings of the four patterns of abnormal calcification.
No matter what its cause, the presence of cal-cification implies a process that is subacute or
chronic.
Figure 16-7 Renal calculus. There is a small calcification (solid black arrow) that overlies the shadow of the left kidney (solid white arrow) on this close-up of a conventional abdominal radiograph. Although the stone is too small to recognize lamination, its location suggests a renal calculus. Because of its greater sensitivity, a CT stone search has essentially replaced conventional radiography for the identification of renal and ureteral calculi.
Figure 16-8 Imaging findings of ureteral calculi, three different patients. A, A calcified stone is seen in the left ureter (solid white arrow). B, Hydro-nephrosis is present on the right (dotted white arrow) with overall enlarge-ment of the right kidney (solid white arrow). C, There is considerable perinephric stranding (dotted white arrows) and fluid that has leaked from the kidney (solid white arrow), most likely from a rupture of one of the renal fornices.
A
B
C
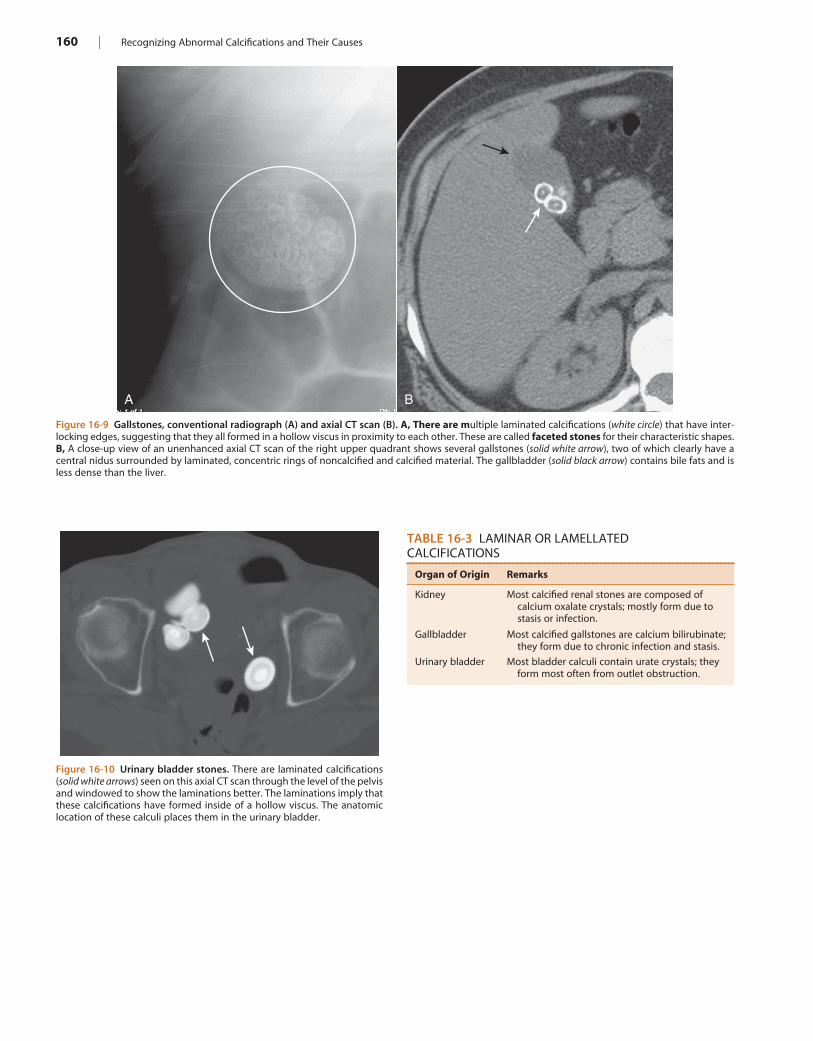
160 | Recognizing Abnormal Calcifications and Their Causes
Figure 16-9 Gallstones, conventional radiograph (A) and axial CT scan (B). A, There are multiple laminated calcifications (white circle) that have inter-locking edges, suggesting that they all formed in a hollow viscus in proximity to each other. These are called faceted stones for their characteristic shapes. B, A close-up view of an unenhanced axial CT scan of the right upper quadrant shows several gallstones (solid white arrow), two of which clearly have a central nidus surrounded by laminated, concentric rings of noncalcified and calcified material. The gallbladder (solid black arrow) contains bile fats and is less dense than the liver.
A B
Figure 16-10 Urinary bladder stones. There are laminated calcifications (solid white arrows) seen on this axial CT scan through the level of the pelvis and windowed to show the laminations better. The laminations imply that these calcifications have formed inside of a hollow viscus. The anatomic location of these calculi places them in the urinary bladder.
TABLE 16-3 LAMINAR OR LAMELLATED CALCIFICATIONS
Organ of Origin Remarks
Kidney Most calcified renal stones are composed of calcium oxalate crystals; mostly form due to stasis or infection.
Gallbladder Most calcified gallstones are calcium bilirubinate; they form due to chronic infection and stasis.
Urinary bladder Most bladder calculi contain urate crystals; they form most often from outlet obstruction.
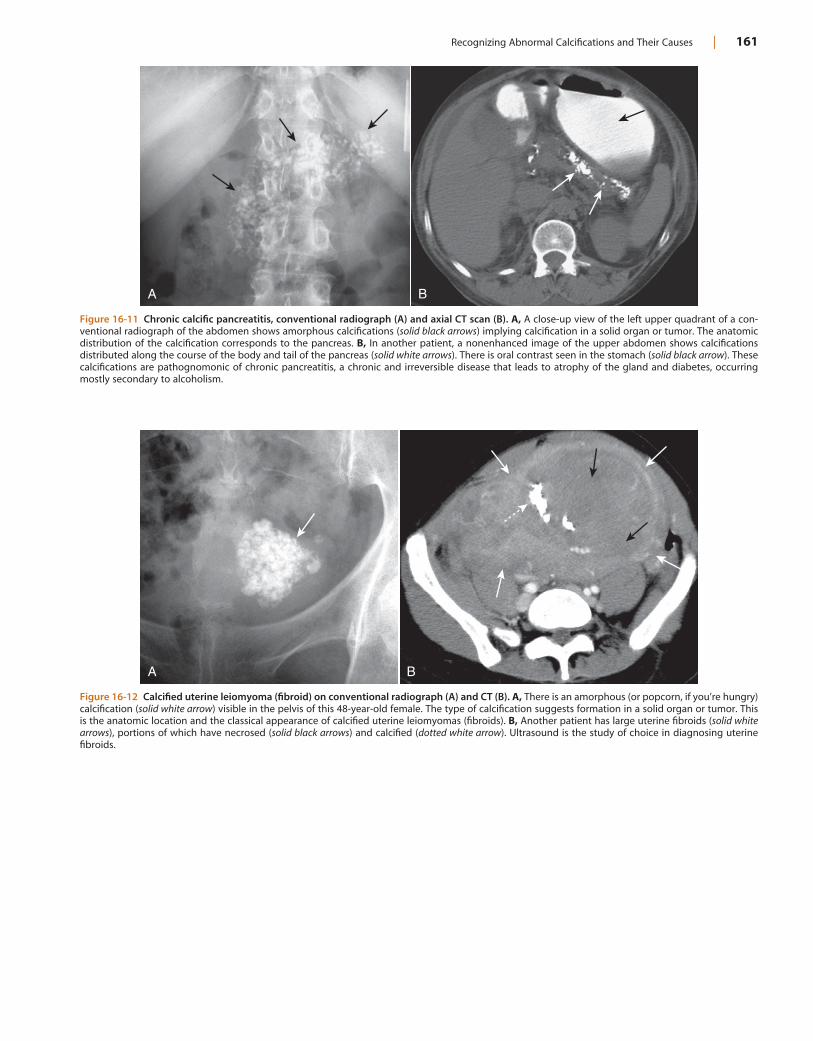
Recognizing Abnormal Calcifications and Their Causes | 161
Figure 16-11 Chronic calcific pancreatitis, conventional radiograph (A) and axial CT scan (B). A, A close-up view of the left upper quadrant of a con-ventional radiograph of the abdomen shows amorphous calcifications (solid black arrows) implying calcification in a solid organ or tumor. The anatomic distribution of the calcification corresponds to the pancreas. B, In another patient, a nonenhanced image of the upper abdomen shows calcifications distributed along the course of the body and tail of the pancreas (solid white arrows). There is oral contrast seen in the stomach (solid black arrow). These calcifications are pathognomonic of chronic pancreatitis, a chronic and irreversible disease that leads to atrophy of the gland and diabetes, occurring mostly secondary to alcoholism.
A B
Figure 16-12 Calcified uterine leiomyoma (fibroid) on conventional radiograph (A) and CT (B). A, There is an amorphous (or popcorn, if you’re hungry) calcification (solid white arrow) visible in the pelvis of this 48-year-old female. The type of calcification suggests formation in a solid organ or tumor. This is the anatomic location and the classical appearance of calcified uterine leiomyomas (fibroids). B, Another patient has large uterine fibroids (solid white arrows), portions of which have necrosed (solid black arrows) and calcified (dotted white arrow). Ultrasound is the study of choice in diagnosing uterine fibroids.
A B
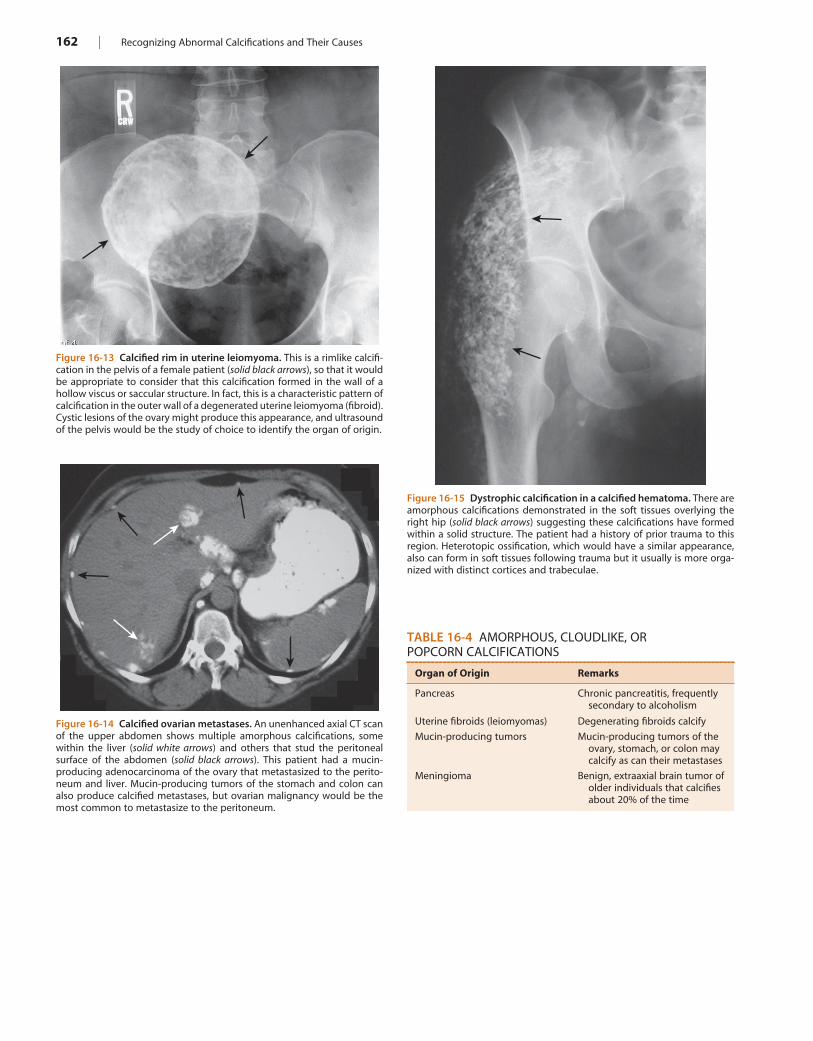
162 | Recognizing Abnormal Calcifications and Their Causes
Figure 16-13 Calcified rim in uterine leiomyoma. This is a rimlike calcifi-cation in the pelvis of a female patient (solid black arrows), so that it would be appropriate to consider that this calcification formed in the wall of a hollow viscus or saccular structure. In fact, this is a characteristic pattern of calcification in the outer wall of a degenerated uterine leiomyoma (fibroid). Cystic lesions of the ovary might produce this appearance, and ultrasound of the pelvis would be the study of choice to identify the organ of origin.
Figure 16-14 Calcified ovarian metastases. An unenhanced axial CT scan of the upper abdomen shows multiple amorphous calcifications, some within the liver (solid white arrows) and others that stud the peritoneal surface of the abdomen (solid black arrows). This patient had a mucin-producing adenocarcinoma of the ovary that metastasized to the perito-neum and liver. Mucin-producing tumors of the stomach and colon can also produce calcified metastases, but ovarian malignancy would be the most common to metastasize to the peritoneum.
Figure 16-15 Dystrophic calcification in a calcified hematoma. There are amorphous calcifications demonstrated in the soft tissues overlying the right hip (solid black arrows) suggesting these calcifications have formed within a solid structure. The patient had a history of prior trauma to this region. Heterotopic ossification, which would have a similar appearance, also can form in soft tissues following trauma but it usually is more orga-nized with distinct cortices and trabeculae.
TABLE 16-4 AMORPHOUS, CLOUDLIKE, OR POPCORN CALCIFICATIONS
Organ of Origin Remarks
Pancreas Chronic pancreatitis, frequently secondary to alcoholism
Uterine fibroids (leiomyomas) Degenerating fibroids calcify
Mucin-producing tumors Mucin-producing tumors of the ovary, stomach, or colon may calcify as can their metastases
Meningioma Benign, extraaxial brain tumor of older individuals that calcifies about 20% of the time
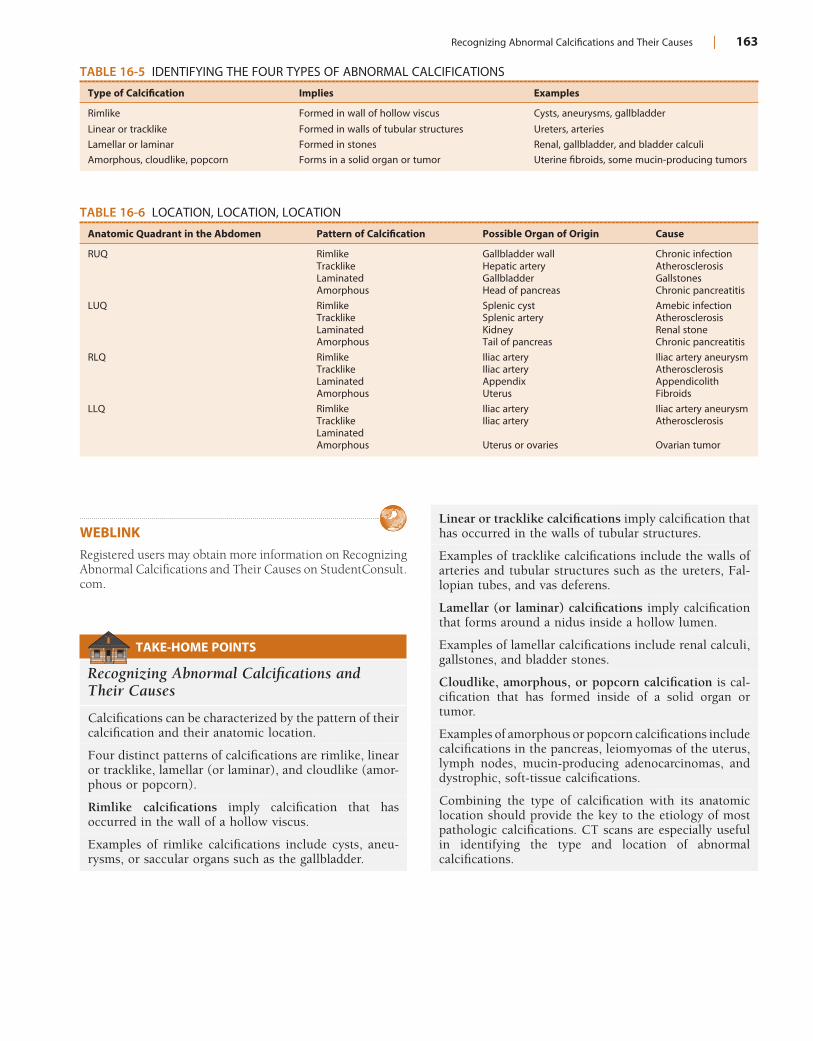
Recognizing Abnormal Calcifications and Their Causes | 163
TABLE 16-5 IDENTIFYING THE FOUR TYPES OF ABNORMAL CALCIFICATIONS
Type of Calcification Implies Examples
Rimlike Formed in wall of hollow viscus Cysts, aneurysms, gallbladder
Linear or tracklike Formed in walls of tubular structures Ureters, arteries
Lamellar or laminar Formed in stones Renal, gallbladder, and bladder calculi
Amorphous, cloudlike, popcorn Forms in a solid organ or tumor Uterine fibroids, some mucin-producing tumors
TABLE 16-6 LOCATION, LOCATION, LOCATION
Anatomic Quadrant in the Abdomen Pattern of Calcification Possible Organ of Origin Cause
RUQ Rimlike Gallbladder wall Chronic infectionTracklike Hepatic artery AtherosclerosisLaminated Gallbladder GallstonesAmorphous Head of pancreas Chronic pancreatitis
LUQ Rimlike Splenic cyst Amebic infectionTracklike Splenic artery AtherosclerosisLaminated Kidney Renal stoneAmorphous Tail of pancreas Chronic pancreatitis
RLQ Rimlike Iliac artery Iliac artery aneurysmTracklike Iliac artery AtherosclerosisLaminated Appendix AppendicolithAmorphous Uterus Fibroids
LLQ Rimlike Iliac artery Iliac artery aneurysmTracklike Iliac artery AtherosclerosisLaminatedAmorphous Uterus or ovaries Ovarian tumor
TAKE-HOME POINTS
Recognizing Abnormal Calcifications and Their Causes
Calcifications can be characterized by the pattern of their calcification and their anatomic location.
Four distinct patterns of calcifications are rimlike, linear or tracklike, lamellar (or laminar), and cloudlike (amor-phous or popcorn).
Rimlike calcifications imply calcification that has occurred in the wall of a hollow viscus.
Examples of rimlike calcifications include cysts, aneu-rysms, or saccular organs such as the gallbladder.
WEBLINK
Registered users may obtain more information on Recognizing Abnormal Calcifications and Their Causes on StudentConsult.com.
Linear or tracklike calcifications imply calcification that has occurred in the walls of tubular structures.
Examples of tracklike calcifications include the walls of arteries and tubular structures such as the ureters, Fal-lopian tubes, and vas deferens.
Lamellar (or laminar) calcifications imply calcification that forms around a nidus inside a hollow lumen.
Examples of lamellar calcifications include renal calculi, gallstones, and bladder stones.
Cloudlike, amorphous, or popcorn calcification is cal-cification that has formed inside of a solid organ or tumor.
Examples of amorphous or popcorn calcifications include calcifications in the pancreas, leiomyomas of the uterus, lymph nodes, mucin-producing adenocarcinomas, and dystrophic, soft-tissue calcifications.
Combining the type of calcification with its anatomic location should provide the key to the etiology of most pathologic calcifications. CT scans are especially useful in identifying the type and location of abnormal calcifications.
164
Chapter 17
Recognizing the Imaging Findings of Trauma
! Trauma is the leading cause of death, hospitalization, and disability in Americans from the age of 1 year through age 45. The major imaging findings of most organ system’s trauma will be discussed as a group in this chapter. Table 17-1 summarizes some of the traumatic injuries that are discussed in other chapters.
! Trauma-related injuries are divided into the two major mechanisms which produce them.• Blunt trauma is usually the result of motor vehicle
accidents and is the more common of the two.• Penetrating trauma is usually the result of accidental or
criminal stabbings and gunshot wounds.
CHEST TRAUMA! Chest injuries in trauma patients are very common and are
responsible for one out of four trauma-related deaths. The overwhelming majority of chest trauma is the result of motor vehicle accidents.
Rib Fractures
! The severity of underlying visceral injury is usually more important than the rib fractures themselves, but their pre-sence might provide clues to unsuspected pathology.
! Fractures of the first three ribs are relatively uncommon and, if they occur following blunt trauma, indicate a suf-ficient amount of force to produce other internal injuries (Fig. 17-1).
! Fractures of ribs 4-9 are common and important if they are displaced (pneumothorax) or if there are two fractures in each of three or more contiguous ribs (flail chest).• Flail chest is almost always accompanied by a pulmo-
nary contusion (see below). Because of the severity of the injuries with which it is usually associated, a flail chest has a significant mortality (Fig. 17-2).
! Fractures of ribs 10-12 may indicate the presence of under-lying trauma to the liver (right side) or the spleen (left side), especially if they are displaced.
! In cases of minor trauma, it is not unusual for rib frac-tures to be undetectable on the initial examination but to become visible in several weeks after callus begins to form.
Pulmonary Contusions
! Pulmonary contusions are the most frequent complications of blunt chest trauma. They represent hemorrhage into the lung, usually at the point of impact.
! Recognizing a pulmonary contusion• The history of trauma is of paramount importance as
contusions present as airspace disease that is indistin-guishable from other airspace diseases like pneumonia or aspiration.
• Contusions tend to be peripherally placed and frequently occur at the point of maximum impact. Air broncho-grams are usually not present because blood fills the bronchi as well as the airspaces (Fig. 17-3).
! Classically, they appear within 6 hours after the trauma and, because blood in the airspaces tends to be reabsorbed quickly, disappear within 72 hours, frequently sooner.
! Airspace disease that lingers more than 72 hours should raise suspicions of another process such as aspiration pneumonia or a pulmonary laceration.
Pulmonary Lacerations (Hematoma or Traumatic Pneumatocele)
! Pulmonary hematomas result from a laceration of the lung parenchyma and, as such, may accompany more severe blunt trauma or penetrating chest trauma.
! A pulmonary laceration is also called a traumatic pneuma-tocele or hematoma.
! They are sometimes masked by the airspace disease from a surrounding pulmonary contusion, at least for the first few days until the contusion resolves.
! Recognizing a pulmonary laceration• Their appearance will depend on whether they contain
blood and, if so, how much blood fills the laceration.• If they are completely filled with blood, they will
appear as a solid, ovoid mass.• If they are partially filled with blood and partially
filled with air, they may contain a visible air-fluid level or demonstrate a crescent sign as the blood begins to form a clot and pull away from the wall of the laceration.
• If they are completely filled with air, they will appear as an air-containing, cystlike structure in the lung (Fig. 17-4).
! Unlike pulmonary contusions that clear rapidly, pulmo-nary lacerations, especially if they are blood filled, may take weeks or months to completely clear.
AORTIC TRAUMA! Trauma to the aorta is most frequently the result of decele-
ration injuries in motor vehicle accidents. Although the survival rates are improving, most patients with rupture
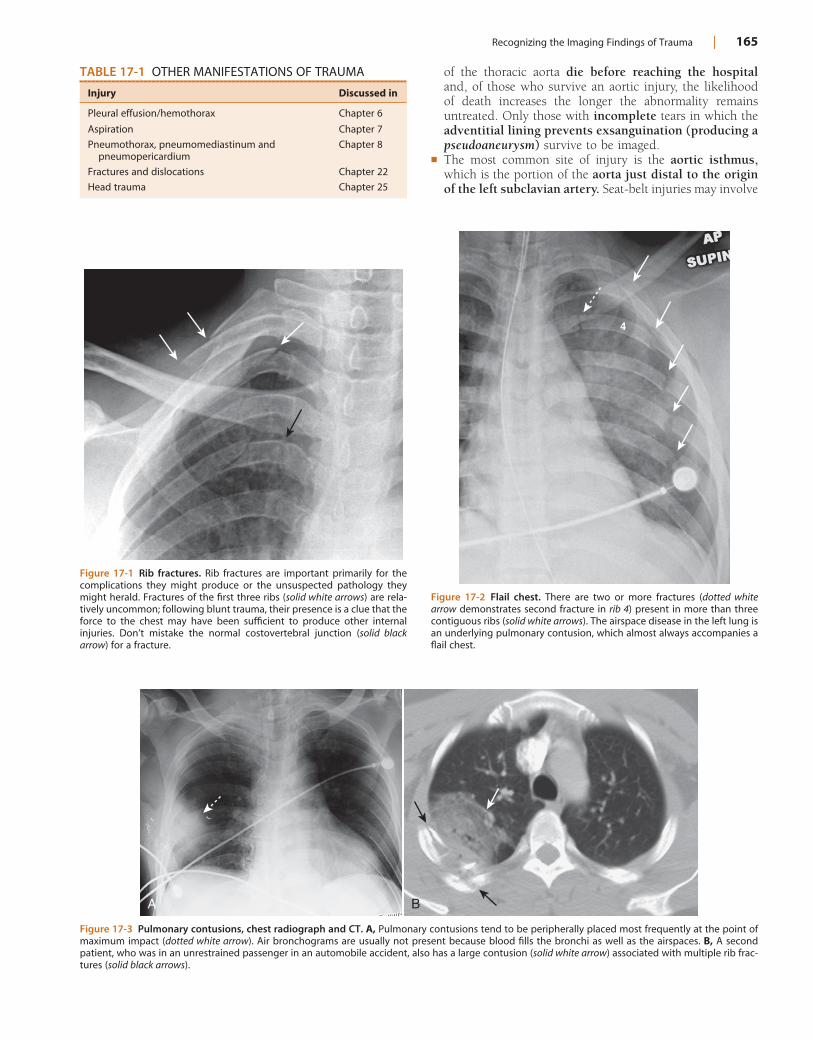
Recognizing the Imaging Findings of Trauma | 165
TABLE 17-1 OTHER MANIFESTATIONS OF TRAUMA
Injury Discussed in
Pleural effusion/hemothorax Chapter 6
Aspiration Chapter 7
Pneumothorax, pneumomediastinum and pneumopericardium
Chapter 8
Fractures and dislocations Chapter 22
Head trauma Chapter 25
Figure 17-1 Rib fractures. Rib fractures are important primarily for the complications they might produce or the unsuspected pathology they might herald. Fractures of the first three ribs (solid white arrows) are rela-tively uncommon; following blunt trauma, their presence is a clue that the force to the chest may have been sufficient to produce other internal injuries. Don’t mistake the normal costovertebral junction (solid black arrow) for a fracture.
Figure 17-2 Flail chest. There are two or more fractures (dotted white arrow demonstrates second fracture in rib 4) present in more than three contiguous ribs (solid white arrows). The airspace disease in the left lung is an underlying pulmonary contusion, which almost always accompanies a flail chest.
4
Figure 17-3 Pulmonary contusions, chest radiograph and CT. A, Pulmonary contusions tend to be peripherally placed most frequently at the point of maximum impact (dotted white arrow). Air bronchograms are usually not present because blood fills the bronchi as well as the airspaces. B, A second patient, who was in an unrestrained passenger in an automobile accident, also has a large contusion (solid white arrow) associated with multiple rib frac-tures (solid black arrows).
A B
of the thoracic aorta die before reaching the hospital and, of those who survive an aortic injury, the likelihood of death increases the longer the abnormality remains untreated. Only those with incomplete tears in which the adventitial lining prevents exsanguination (producing a pseudoaneurysm) survive to be imaged.
! The most common site of injury is the aortic isthmus, which is the portion of the aorta just distal to the origin of the left subclavian artery. Seat-belt injuries may involve
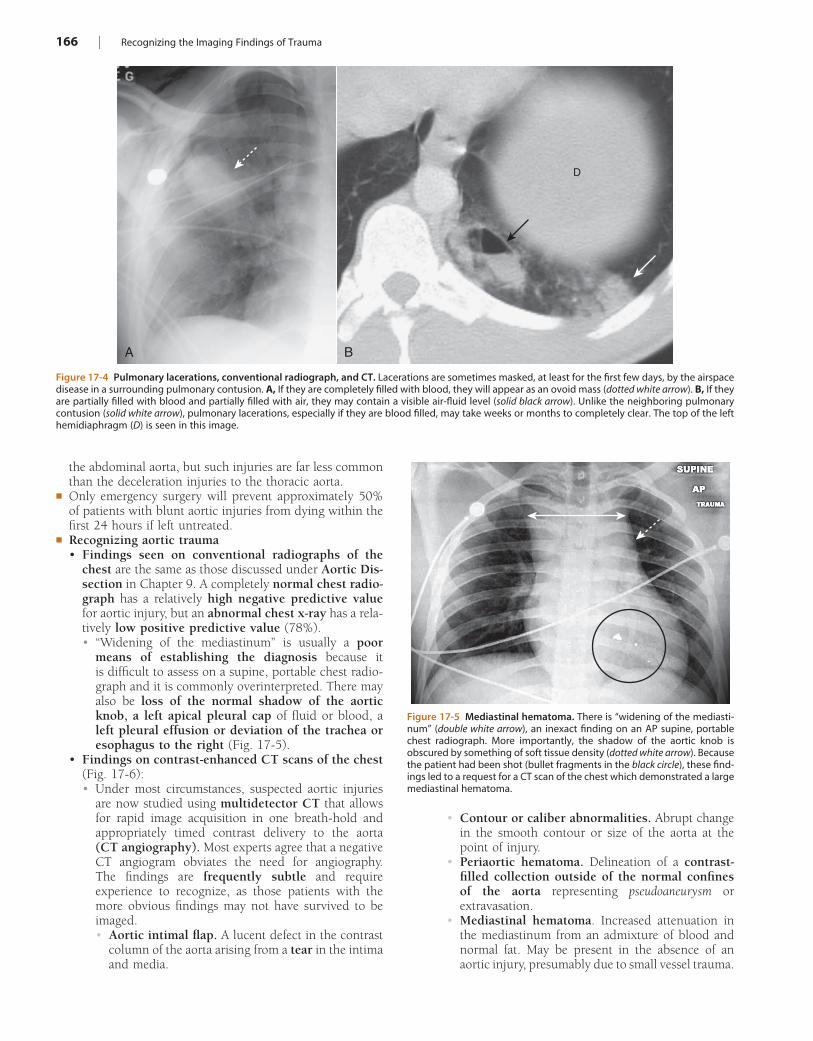
166 | Recognizing the Imaging Findings of Trauma
the abdominal aorta, but such injuries are far less common than the deceleration injuries to the thoracic aorta.
! Only emergency surgery will prevent approximately 50% of patients with blunt aortic injuries from dying within the first 24 hours if left untreated.
! Recognizing aortic trauma• Findings seen on conventional radiographs of the
chest are the same as those discussed under Aortic Dis-section in Chapter 9. A completely normal chest radio-graph has a relatively high negative predictive value for aortic injury, but an abnormal chest x-ray has a rela-tively low positive predictive value (78%).• “Widening of the mediastinum” is usually a poor
means of establishing the diagnosis because it is difficult to assess on a supine, portable chest radio-graph and it is commonly overinterpreted. There may also be loss of the normal shadow of the aortic knob, a left apical pleural cap of fluid or blood, a left pleural effusion or deviation of the trachea or esophagus to the right (Fig. 17-5).
• Findings on contrast-enhanced CT scans of the chest (Fig. 17-6):• Under most circumstances, suspected aortic injuries
are now studied using multidetector CT that allows for rapid image acquisition in one breath-hold and appropriately timed contrast delivery to the aorta (CT angiography). Most experts agree that a negative CT angiogram obviates the need for angiography. The findings are frequently subtle and require experience to recognize, as those patients with the more obvious findings may not have survived to be imaged.• Aortic intimal flap. A lucent defect in the contrast
column of the aorta arising from a tear in the intima and media.
Figure 17-4 Pulmonary lacerations, conventional radiograph, and CT. Lacerations are sometimes masked, at least for the first few days, by the airspace disease in a surrounding pulmonary contusion. A, If they are completely filled with blood, they will appear as an ovoid mass (dotted white arrow). B, If they are partially filled with blood and partially filled with air, they may contain a visible air-fluid level (solid black arrow). Unlike the neighboring pulmonary contusion (solid white arrow), pulmonary lacerations, especially if they are blood filled, may take weeks or months to completely clear. The top of the left hemidiaphragm (D) is seen in this image.
A B
D
Figure 17-5 Mediastinal hematoma. There is “widening of the mediasti-num” (double white arrow), an inexact finding on an AP supine, portable chest radiograph. More importantly, the shadow of the aortic knob is obscured by something of soft tissue density (dotted white arrow). Because the patient had been shot (bullet fragments in the black circle), these find-ings led to a request for a CT scan of the chest which demonstrated a large mediastinal hematoma.
• Contour or caliber abnormalities. Abrupt change in the smooth contour or size of the aorta at the point of injury.
• Periaortic hematoma. Delineation of a contrast-filled collection outside of the normal confines of the aorta representing pseudoaneurysm or extravasation.
• Mediastinal hematoma. Increased attenuation in the mediastinum from an admixture of blood and normal fat. May be present in the absence of an aortic injury, presumably due to small vessel trauma.
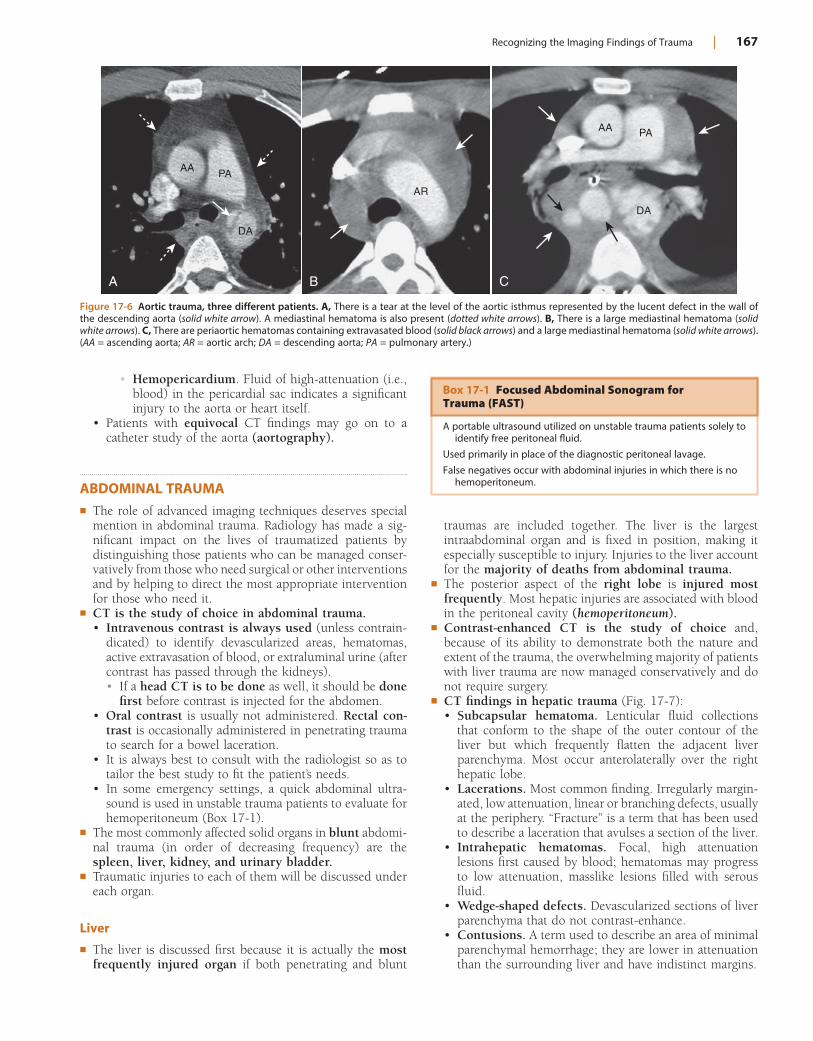
Recognizing the Imaging Findings of Trauma | 167
• Hemopericardium. Fluid of high-attenuation (i.e., blood) in the pericardial sac indicates a significant injury to the aorta or heart itself.
• Patients with equivocal CT findings may go on to a catheter study of the aorta (aortography).
ABDOMINAL TRAUMA! The role of advanced imaging techniques deserves special
mention in abdominal trauma. Radiology has made a sig-nificant impact on the lives of traumatized patients by distinguishing those patients who can be managed conser-vatively from those who need surgical or other inter ventions and by helping to direct the most appropriate intervention for those who need it.
! CT is the study of choice in abdominal trauma.• Intravenous contrast is always used (unless contrain-
dicated) to identify devascularized areas, hematomas, active extravasation of blood, or extraluminal urine (after contrast has passed through the kidneys).• If a head CT is to be done as well, it should be done
first before contrast is injected for the abdomen.• Oral contrast is usually not administered. Rectal con-
trast is occasionally administered in penetrating trauma to search for a bowel laceration.
• It is always best to consult with the radiologist so as to tailor the best study to fit the patient’s needs.
• In some emergency settings, a quick abdominal ultra-sound is used in unstable trauma patients to evaluate for hemoperitoneum (Box 17-1).
! The most commonly affected solid organs in blunt abdomi-nal trauma (in order of decreasing frequency) are the spleen, liver, kidney, and urinary bladder.
! Traumatic injuries to each of them will be discussed under each organ.
Liver
! The liver is discussed first because it is actually the most frequently injured organ if both penetrating and blunt
Figure 17-6 Aortic trauma, three different patients. A, There is a tear at the level of the aortic isthmus represented by the lucent defect in the wall of the descending aorta (solid white arrow). A mediastinal hematoma is also present (dotted white arrows). B, There is a large mediastinal hematoma (solid white arrows). C, There are periaortic hematomas containing extravasated blood (solid black arrows) and a large mediastinal hematoma (solid white arrows). (AA = ascending aorta; AR = aortic arch; DA = descending aorta; PA = pulmonary artery.)
A B
AA PA
DA
AR
AA PA
DA
C
Box 17-1 Focused Abdominal Sonogram for Trauma (FAST)
A portable ultrasound utilized on unstable trauma patients solely to identify free peritoneal fluid.
Used primarily in place of the diagnostic peritoneal lavage.
False negatives occur with abdominal injuries in which there is no hemoperitoneum.
traumas are included together. The liver is the largest intraabdominal organ and is fixed in position, making it especially susceptible to injury. Injuries to the liver account for the majority of deaths from abdominal trauma.
! The posterior aspect of the right lobe is injured most frequently. Most hepatic injuries are associated with blood in the peritoneal cavity (hemoperitoneum).
! Contrast-enhanced CT is the study of choice and, because of its ability to demonstrate both the nature and extent of the trauma, the overwhelming majority of patients with liver trauma are now managed conservatively and do not require surgery.
! CT findings in hepatic trauma (Fig. 17-7):• Subcapsular hematoma. Lenticular fluid collections
that conform to the shape of the outer contour of the liver but which frequently flatten the adjacent liver parenchyma. Most occur anterolaterally over the right hepatic lobe.
• Lacerations. Most common finding. Irregularly margin-ated, low attenuation, linear or branching defects, usually at the periphery. “Fracture” is a term that has been used to describe a laceration that avulses a section of the liver.
• Intrahepatic hematomas. Focal, high attenuation lesions first caused by blood; hematomas may progress to low attenuation, masslike lesions filled with serous fluid.
• Wedge-shaped defects. Devascularized sections of liver parenchyma that do not contrast-enhance.
• Contusions. A term used to describe an area of minimal parenchymal hemorrhage; they are lower in attenuation than the surrounding liver and have indistinct margins.
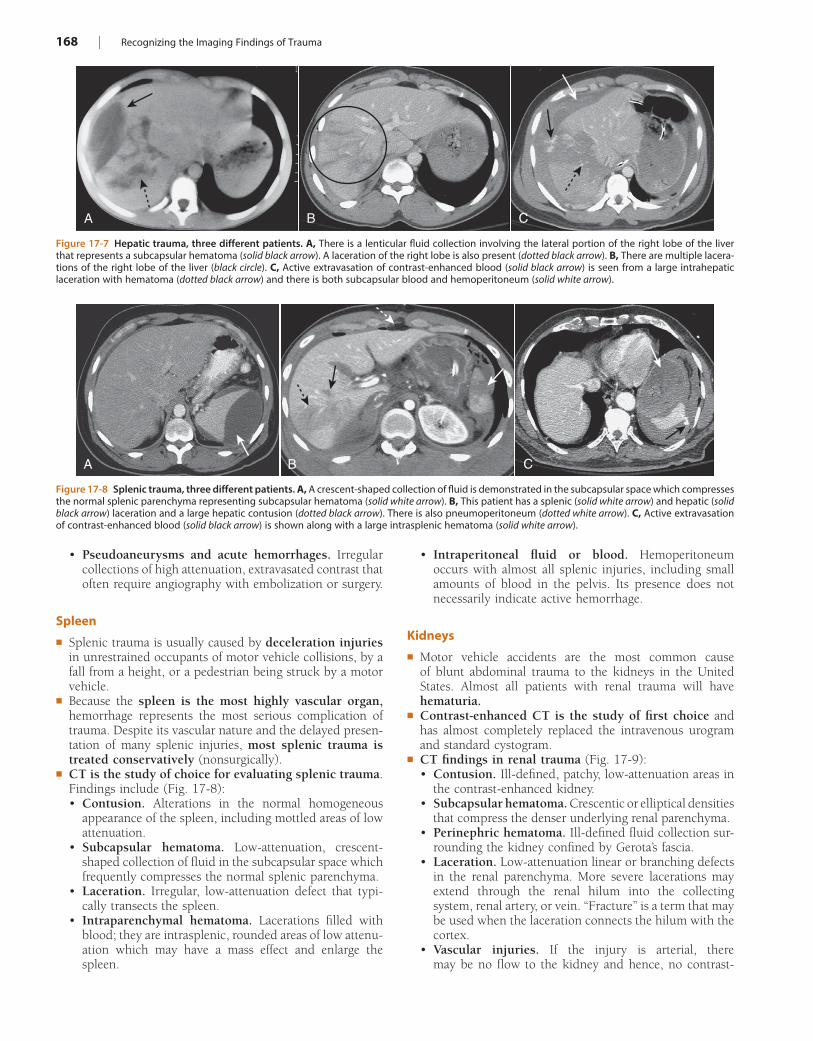
168 | Recognizing the Imaging Findings of Trauma
• Intraperitoneal fluid or blood. Hemoperitoneum occurs with almost all splenic injuries, including small amounts of blood in the pelvis. Its presence does not necessarily indicate active hemorrhage.
Kidneys
! Motor vehicle accidents are the most common cause of blunt abdominal trauma to the kidneys in the United States. Almost all patients with renal trauma will have hematuria.
! Contrast-enhanced CT is the study of first choice and has almost completely replaced the intravenous urogram and standard cystogram.
! CT findings in renal trauma (Fig. 17-9):• Contusion. Ill-defined, patchy, low-attenuation areas in
the contrast-enhanced kidney.• Subcapsular hematoma. Crescentic or elliptical densities
that compress the denser underlying renal parenchyma.• Perinephric hematoma. Ill-defined fluid collection sur-
rounding the kidney confined by Gerota’s fascia.• Laceration. Low-attenuation linear or branching defects
in the renal parenchyma. More severe lacerations may extend through the renal hilum into the collecting system, renal artery, or vein. “Fracture” is a term that may be used when the laceration connects the hilum with the cortex.
• Vascular injuries. If the injury is arterial, there may be no flow to the kidney and hence, no contrast-
• Pseudoaneurysms and acute hemorrhages. Irregular collections of high attenuation, extravasated contrast that often require angiography with embolization or surgery.
Spleen
! Splenic trauma is usually caused by deceleration injuries in unrestrained occupants of motor vehicle collisions, by a fall from a height, or a pedestrian being struck by a motor vehicle.
! Because the spleen is the most highly vascular organ, hemorrhage represents the most serious complication of trauma. Despite its vascular nature and the delayed presen-tation of many splenic injuries, most splenic trauma is treated conservatively (nonsurgically).
! CT is the study of choice for evaluating splenic trauma. Findings include (Fig. 17-8):• Contusion. Alterations in the normal homogeneous
appearance of the spleen, including mottled areas of low attenuation.
• Subcapsular hematoma. Low-attenuation, crescent-shaped collection of fluid in the subcapsular space which frequently compresses the normal splenic parenchyma.
• Laceration. Irregular, low-attenuation defect that typi-cally transects the spleen.
• Intraparenchymal hematoma. Lacerations filled with blood; they are intrasplenic, rounded areas of low attenu-ation which may have a mass effect and enlarge the spleen.
Figure 17-7 Hepatic trauma, three different patients. A, There is a lenticular fluid collection involving the lateral portion of the right lobe of the liver that represents a subcapsular hematoma (solid black arrow). A laceration of the right lobe is also present (dotted black arrow). B, There are multiple lacera-tions of the right lobe of the liver (black circle). C, Active extravasation of contrast-enhanced blood (solid black arrow) is seen from a large intrahepatic laceration with hematoma (dotted black arrow) and there is both subcapsular blood and hemoperitoneum (solid white arrow).
A B C
Figure 17-8 Splenic trauma, three different patients. A, A crescent-shaped collection of fluid is demonstrated in the subcapsular space which compresses the normal splenic parenchyma representing subcapsular hematoma (solid white arrow). B, This patient has a splenic (solid white arrow) and hepatic (solid black arrow) laceration and a large hepatic contusion (dotted black arrow). There is also pneumoperitoneum (dotted white arrow). C, Active extravasation of contrast-enhanced blood (solid black arrow) is shown along with a large intrasplenic hematoma (solid white arrow).
A B C
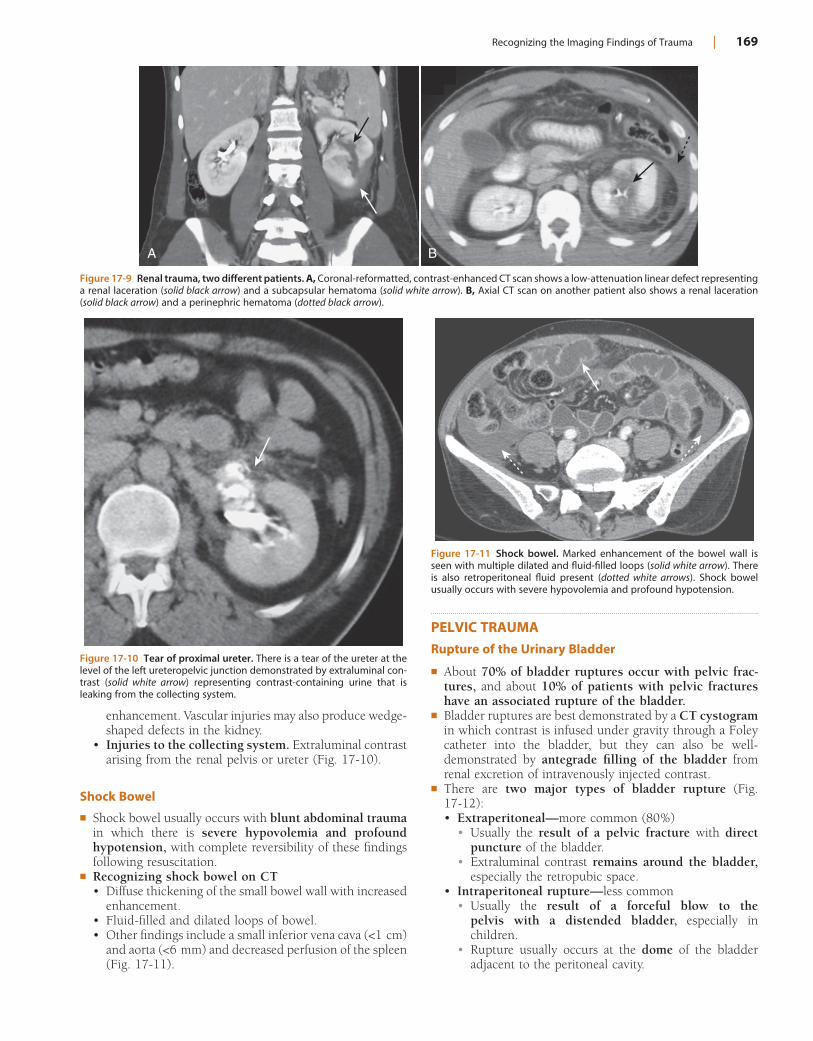
Recognizing the Imaging Findings of Trauma | 169
Figure 17-9 Renal trauma, two different patients. A, Coronal-reformatted, contrast-enhanced CT scan shows a low-attenuation linear defect representing a renal laceration (solid black arrow) and a subcapsular hematoma (solid white arrow). B, Axial CT scan on another patient also shows a renal laceration (solid black arrow) and a perinephric hematoma (dotted black arrow).
A B
enhancement. Vascular injuries may also produce wedge-shaped defects in the kidney.
• Injuries to the collecting system. Extraluminal contrast arising from the renal pelvis or ureter (Fig. 17-10).
Shock Bowel
! Shock bowel usually occurs with blunt abdominal trauma in which there is severe hypovolemia and profound hypotension, with complete reversibility of these findings following resuscitation.
! Recognizing shock bowel on CT• Diffuse thickening of the small bowel wall with increased
enhancement.• Fluid-filled and dilated loops of bowel.• Other findings include a small inferior vena cava (<1 cm)
and aorta (<6 mm) and decreased perfusion of the spleen (Fig. 17-11).
Figure 17-10 Tear of proximal ureter. There is a tear of the ureter at the level of the left ureteropelvic junction demonstrated by extraluminal con-trast (solid white arrow) representing contrast-containing urine that is leaking from the collecting system.
Figure 17-11 Shock bowel. Marked enhancement of the bowel wall is seen with multiple dilated and fluid-filled loops (solid white arrow). There is also retroperitoneal fluid present (dotted white arrows). Shock bowel usually occurs with severe hypovolemia and profound hypotension.
PELVIC TRAUMARupture of the Urinary Bladder
! About 70% of bladder ruptures occur with pelvic frac-tures, and about 10% of patients with pelvic fractures have an associated rupture of the bladder.
! Bladder ruptures are best demonstrated by a CT cystogram in which contrast is infused under gravity through a Foley catheter into the bladder, but they can also be well-demonstrated by antegrade filling of the bladder from renal excretion of intravenously injected contrast.
! There are two major types of bladder rupture (Fig. 17-12):• Extraperitoneal—more common (80%)
• Usually the result of a pelvic fracture with direct puncture of the bladder.
• Extraluminal contrast remains around the bladder, especially the retropubic space.
• Intraperitoneal rupture—less common• Usually the result of a forceful blow to the
pelvis with a distended bladder, especially in children.
• Rupture usually occurs at the dome of the bladder adjacent to the peritoneal cavity.
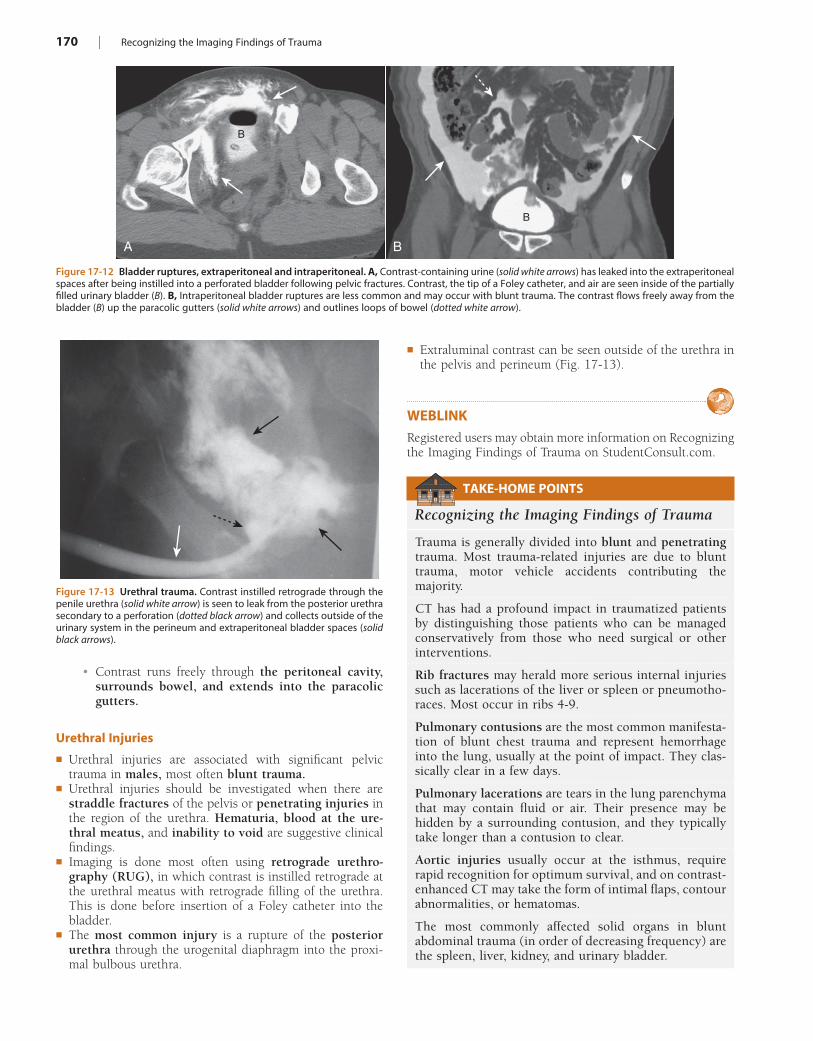
170 | Recognizing the Imaging Findings of Trauma
• Contrast runs freely through the peritoneal cavity, surrounds bowel, and extends into the paracolic gutters.
Urethral Injuries
! Urethral injuries are associated with significant pelvic trauma in males, most often blunt trauma.
! Urethral injuries should be investigated when there are straddle fractures of the pelvis or penetrating injuries in the region of the urethra. Hematuria, blood at the ure-thral meatus, and inability to void are suggestive clinical findings.
! Imaging is done most often using retrograde urethro-graphy (RUG), in which contrast is instilled retrograde at the urethral meatus with retrograde filling of the urethra. This is done before insertion of a Foley catheter into the bladder.
! The most common injury is a rupture of the posterior urethra through the urogenital diaphragm into the proxi-mal bulbous urethra.
Figure 17-12 Bladder ruptures, extraperitoneal and intraperitoneal. A, Contrast-containing urine (solid white arrows) has leaked into the extraperitoneal spaces after being instilled into a perforated bladder following pelvic fractures. Contrast, the tip of a Foley catheter, and air are seen inside of the partially filled urinary bladder (B). B, Intraperitoneal bladder ruptures are less common and may occur with blunt trauma. The contrast flows freely away from the bladder (B) up the paracolic gutters (solid white arrows) and outlines loops of bowel (dotted white arrow).
A B
B
B
Figure 17-13 Urethral trauma. Contrast instilled retrograde through the penile urethra (solid white arrow) is seen to leak from the posterior urethra secondary to a perforation (dotted black arrow) and collects outside of the urinary system in the perineum and extraperitoneal bladder spaces (solid black arrows).
! Extraluminal contrast can be seen outside of the urethra in the pelvis and perineum (Fig. 17-13).
WEBLINKRegistered users may obtain more information on Recognizing the Imaging Findings of Trauma on StudentConsult.com.
TAKE-HOME POINTS
Recognizing the Imaging Findings of Trauma
Trauma is generally divided into blunt and penetrating trauma. Most trauma-related injuries are due to blunt trauma, motor vehicle accidents contributing the majority.
CT has had a profound impact in traumatized patients by distinguishing those patients who can be managed conservatively from those who need surgical or other interventions.
Rib fractures may herald more serious internal injuries such as lacerations of the liver or spleen or pneumotho-races. Most occur in ribs 4-9.
Pulmonary contusions are the most common manifesta-tion of blunt chest trauma and represent hemorrhage into the lung, usually at the point of impact. They clas-sically clear in a few days.
Pulmonary lacerations are tears in the lung parenchyma that may contain fluid or air. Their presence may be hidden by a surrounding contusion, and they typically take longer than a contusion to clear.
Aortic injuries usually occur at the isthmus, require rapid recognition for optimum survival, and on contrast-enhanced CT may take the form of intimal flaps, contour abnormalities, or hematomas.
The most commonly affected solid organs in blunt abdominal trauma (in order of decreasing frequency) are the spleen, liver, kidney, and urinary bladder.
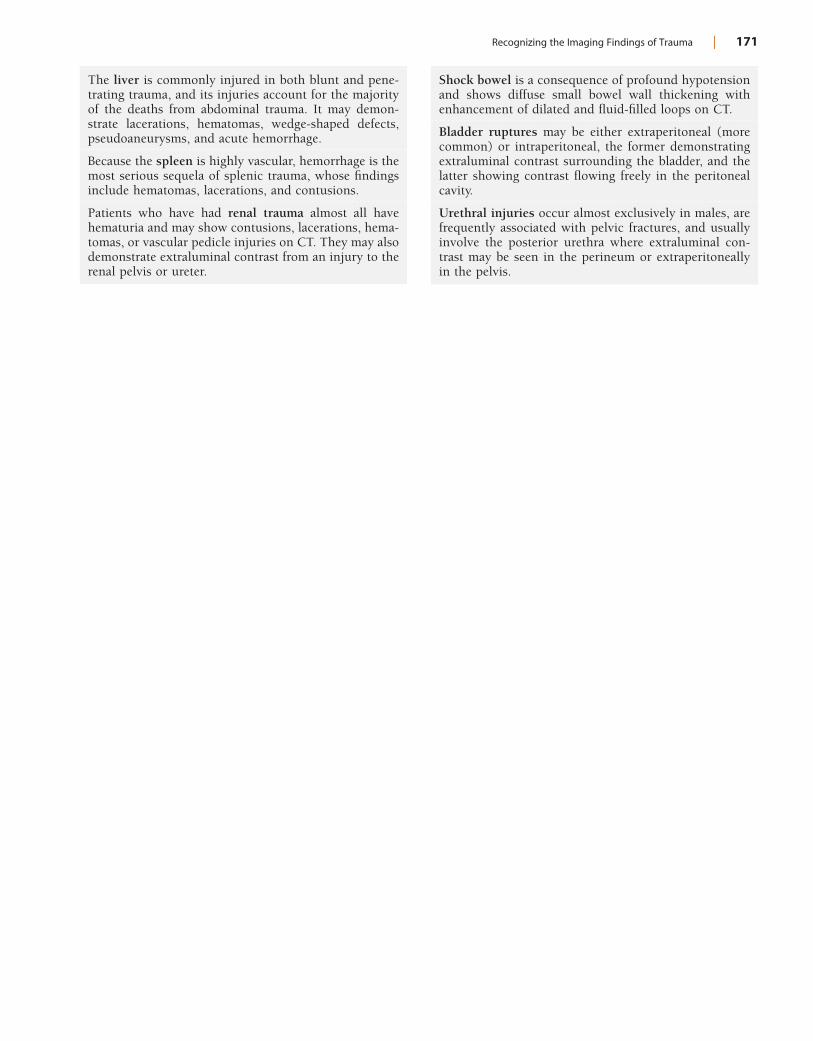
Recognizing the Imaging Findings of Trauma | 171
The liver is commonly injured in both blunt and pene-trating trauma, and its injuries account for the majority of the deaths from abdominal trauma. It may demon-strate lacerations, hematomas, wedge-shaped defects, pseudoaneurysms, and acute hemorrhage.
Because the spleen is highly vascular, hemorrhage is the most serious sequela of splenic trauma, whose findings include hematomas, lacerations, and contusions.
Patients who have had renal trauma almost all have hematuria and may show contusions, lacerations, hema-tomas, or vascular pedicle injuries on CT. They may also demonstrate extraluminal contrast from an injury to the renal pelvis or ureter.
Shock bowel is a consequence of profound hypotension and shows diffuse small bowel wall thickening with enhancement of dilated and fluid-filled loops on CT.
Bladder ruptures may be either extraperitoneal (more common) or intraperitoneal, the former demonstrating extraluminal contrast surrounding the bladder, and the latter showing contrast flowing freely in the peritoneal cavity.
Urethral injuries occur almost exclusively in males, are frequently associated with pelvic fractures, and usually involve the posterior urethra where extraluminal con-trast may be seen in the perineum or extraperitoneally in the pelvis.
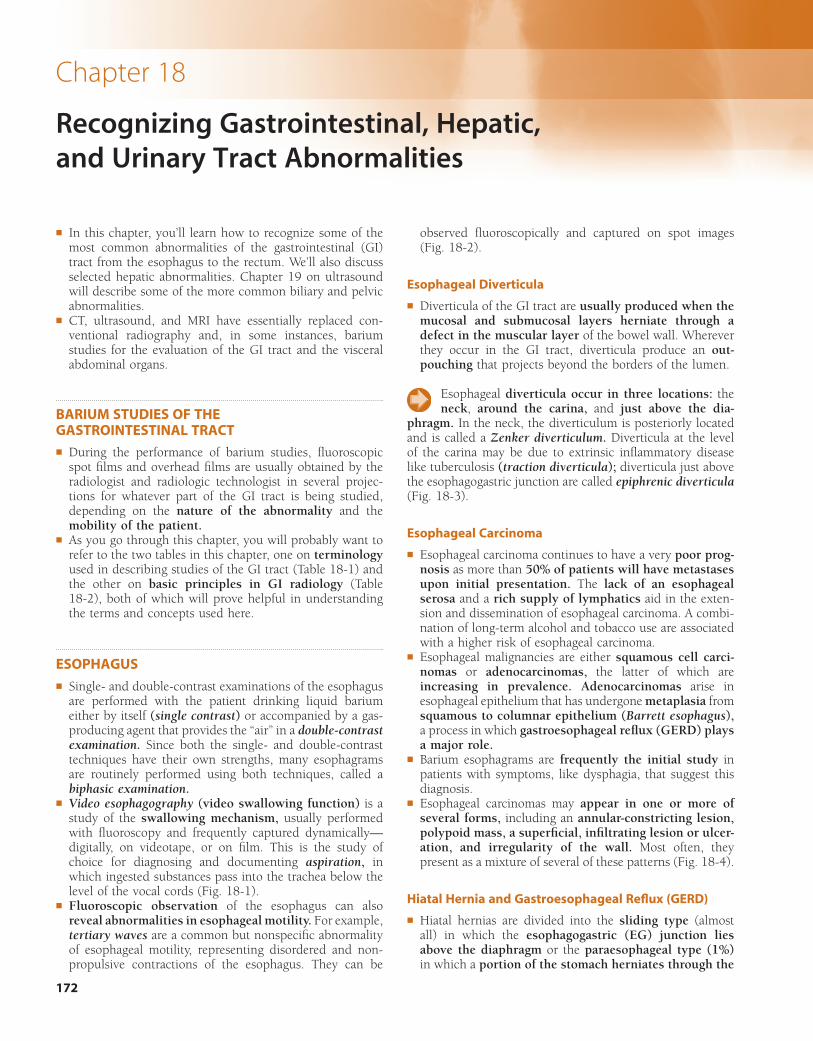
172
Chapter 18
Recognizing Gastrointestinal, Hepatic, and Urinary Tract Abnormalities
! In this chapter, you’ll learn how to recognize some of the most common abnormalities of the gastrointestinal (GI) tract from the esophagus to the rectum. We’ll also discuss selected hepatic abnormalities. Chapter 19 on ultrasound will describe some of the more common biliary and pelvic abnormalities.
! CT, ultrasound, and MRI have essentially replaced con-ventional radiography and, in some instances, barium studies for the evaluation of the GI tract and the visceral abdominal organs.
BARIUM STUDIES OF THE GASTROINTESTINAL TRACT! During the performance of barium studies, fluoroscopic
spot films and overhead films are usually obtained by the radiologist and radiologic technologist in several projec-tions for whatever part of the GI tract is being studied, depending on the nature of the abnormality and the mobility of the patient.
! As you go through this chapter, you will probably want to refer to the two tables in this chapter, one on terminology used in describing studies of the GI tract (Table 18-1) and the other on basic principles in GI radiology (Table 18-2), both of which will prove helpful in understanding the terms and concepts used here.
ESOPHAGUS! Single- and double-contrast examinations of the esophagus
are performed with the patient drinking liquid barium either by itself (single contrast) or accompanied by a gas-producing agent that provides the “air” in a double-contrast examination. Since both the single- and double-contrast techniques have their own strengths, many esophagrams are routinely performed using both techniques, called a biphasic examination.
! Video esophagography (video swallowing function) is a study of the swallowing mechanism, usually performed with fluoroscopy and frequently captured dynamically—digitally, on videotape, or on film. This is the study of choice for diagnosing and documenting aspiration, in which ingested substances pass into the trachea below the level of the vocal cords (Fig. 18-1).
! Fluoroscopic observation of the esophagus can also reveal abnormalities in esophageal motility. For example, tertiary waves are a common but nonspecific abnormality of esophageal motility, representing disordered and non-propulsive contractions of the esophagus. They can be
observed fluoroscopically and captured on spot images (Fig. 18-2).
Esophageal Diverticula
! Diverticula of the GI tract are usually produced when the mucosal and submucosal layers herniate through a defect in the muscular layer of the bowel wall. Wherever they occur in the GI tract, diverticula produce an out-pouching that projects beyond the borders of the lumen.
Esophageal diverticula occur in three locations: the neck, around the carina, and just above the dia-
phragm. In the neck, the diverticulum is posteriorly located and is called a Zenker diverticulum. Diverticula at the level of the carina may be due to extrinsic inflammatory disease like tuberculosis (traction diverticula); diverticula just above the esophagogastric junction are called epiphrenic diverticula (Fig. 18-3).
Esophageal Carcinoma
! Esophageal carcinoma continues to have a very poor prog-nosis as more than 50% of patients will have metastases upon initial presentation. The lack of an esophageal serosa and a rich supply of lymphatics aid in the exten-sion and dissemination of esophageal carcinoma. A combi-nation of long-term alcohol and tobacco use are associated with a higher risk of esophageal carcinoma.
! Esophageal malignancies are either squamous cell carci-nomas or adenocarcinomas, the latter of which are increasing in prevalence. Adenocarcinomas arise in esophageal epithelium that has undergone metaplasia from squamous to columnar epithelium (Barrett esophagus), a process in which gastroesophageal reflux (GERD) plays a major role.
! Barium esophagrams are frequently the initial study in patients with symptoms, like dysphagia, that suggest this diagnosis.
! Esophageal carcinomas may appear in one or more of several forms, including an annular-constricting lesion, polypoid mass, a superficial, infiltrating lesion or ulcer-ation, and irregularity of the wall. Most often, they present as a mixture of several of these patterns (Fig. 18-4).
Hiatal Hernia and Gastroesophageal Reflux (GERD)
! Hiatal hernias are divided into the sliding type (almost all) in which the esophagogastric (EG) junction lies above the diaphragm or the paraesophageal type (1%) in which a portion of the stomach herniates through the
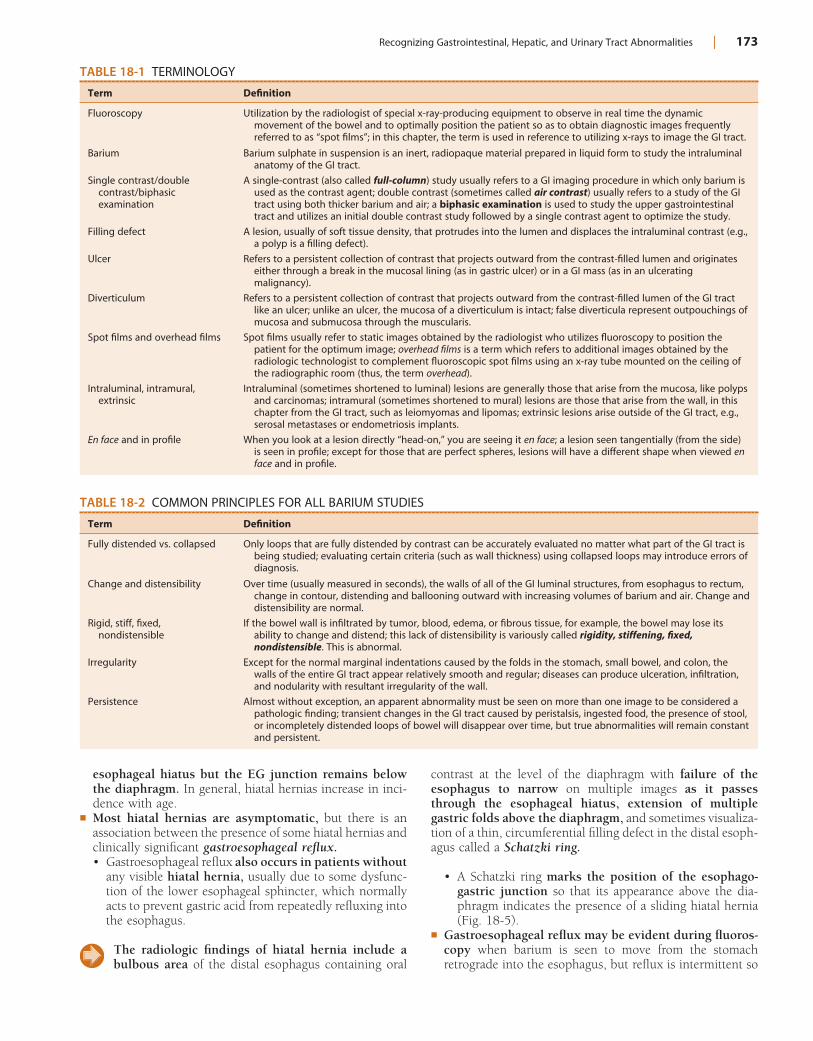
Recognizing Gastrointestinal, Hepatic, and Urinary Tract Abnormalities | 173
TABLE 18-1 TERMINOLOGY
Term Definition
Fluoroscopy Utilization by the radiologist of special x-ray-producing equipment to observe in real time the dynamic movement of the bowel and to optimally position the patient so as to obtain diagnostic images frequently referred to as “spot films”; in this chapter, the term is used in reference to utilizing x-rays to image the GI tract.
Barium Barium sulphate in suspension is an inert, radiopaque material prepared in liquid form to study the intraluminal anatomy of the GI tract.
Single contrast/double contrast/biphasic examination
A single-contrast (also called full-column) study usually refers to a GI imaging procedure in which only barium is used as the contrast agent; double contrast (sometimes called air contrast) usually refers to a study of the GI tract using both thicker barium and air; a biphasic examination is used to study the upper gastrointestinal tract and utilizes an initial double contrast study followed by a single contrast agent to optimize the study.
Filling defect A lesion, usually of soft tissue density, that protrudes into the lumen and displaces the intraluminal contrast (e.g., a polyp is a filling defect).
Ulcer Refers to a persistent collection of contrast that projects outward from the contrast-filled lumen and originates either through a break in the mucosal lining (as in gastric ulcer) or in a GI mass (as in an ulcerating malignancy).
Diverticulum Refers to a persistent collection of contrast that projects outward from the contrast-filled lumen of the GI tract like an ulcer; unlike an ulcer, the mucosa of a diverticulum is intact; false diverticula represent outpouchings of mucosa and submucosa through the muscularis.
Spot films and overhead films Spot films usually refer to static images obtained by the radiologist who utilizes fluoroscopy to position the patient for the optimum image; overhead films is a term which refers to additional images obtained by the radiologic technologist to complement fluoroscopic spot films using an x-ray tube mounted on the ceiling of the radiographic room (thus, the term overhead).
Intraluminal, intramural, extrinsic
Intraluminal (sometimes shortened to luminal) lesions are generally those that arise from the mucosa, like polyps and carcinomas; intramural (sometimes shortened to mural) lesions are those that arise from the wall, in this chapter from the GI tract, such as leiomyomas and lipomas; extrinsic lesions arise outside of the GI tract, e.g., serosal metastases or endometriosis implants.
En face and in profile When you look at a lesion directly “head-on,” you are seeing it en face; a lesion seen tangentially (from the side) is seen in profile; except for those that are perfect spheres, lesions will have a different shape when viewed en face and in profile.
TABLE 18-2 COMMON PRINCIPLES FOR ALL BARIUM STUDIES
Term Definition
Fully distended vs. collapsed Only loops that are fully distended by contrast can be accurately evaluated no matter what part of the GI tract is being studied; evaluating certain criteria (such as wall thickness) using collapsed loops may introduce errors of diagnosis.
Change and distensibility Over time (usually measured in seconds), the walls of all of the GI luminal structures, from esophagus to rectum, change in contour, distending and ballooning outward with increasing volumes of barium and air. Change and distensibility are normal.
Rigid, stiff, fixed, nondistensible
If the bowel wall is infiltrated by tumor, blood, edema, or fibrous tissue, for example, the bowel may lose its ability to change and distend; this lack of distensibility is variously called rigidity, stiffening, fixed, nondistensible. This is abnormal.
Irregularity Except for the normal marginal indentations caused by the folds in the stomach, small bowel, and colon, the walls of the entire GI tract appear relatively smooth and regular; diseases can produce ulceration, infiltration, and nodularity with resultant irregularity of the wall.
Persistence Almost without exception, an apparent abnormality must be seen on more than one image to be considered a pathologic finding; transient changes in the GI tract caused by peristalsis, ingested food, the presence of stool, or incompletely distended loops of bowel will disappear over time, but true abnormalities will remain constant and persistent.
esophageal hiatus but the EG junction remains below the diaphragm. In general, hiatal hernias increase in inci-dence with age.
! Most hiatal hernias are asymptomatic, but there is an association between the presence of some hiatal hernias and clinically significant gastroesophageal reflux.• Gastroesophageal reflux also occurs in patients without
any visible hiatal hernia, usually due to some dysfunc-tion of the lower esophageal sphincter, which normally acts to prevent gastric acid from repeatedly refluxing into the esophagus.
The radiologic findings of hiatal hernia include a bulbous area of the distal esophagus containing oral
contrast at the level of the diaphragm with failure of the esophagus to narrow on multiple images as it passes through the esophageal hiatus, extension of multiple gastric folds above the diaphragm, and sometimes visualiza-tion of a thin, circumferential filling defect in the distal esoph-agus called a Schatzki ring.
• A Schatzki ring marks the position of the esophago-gastric junction so that its appearance above the dia-phragm indicates the presence of a sliding hiatal hernia (Fig. 18-5).
! Gastroesophageal reflux may be evident during fluoros-copy when barium is seen to move from the stomach retrograde into the esophagus, but reflux is intermittent so
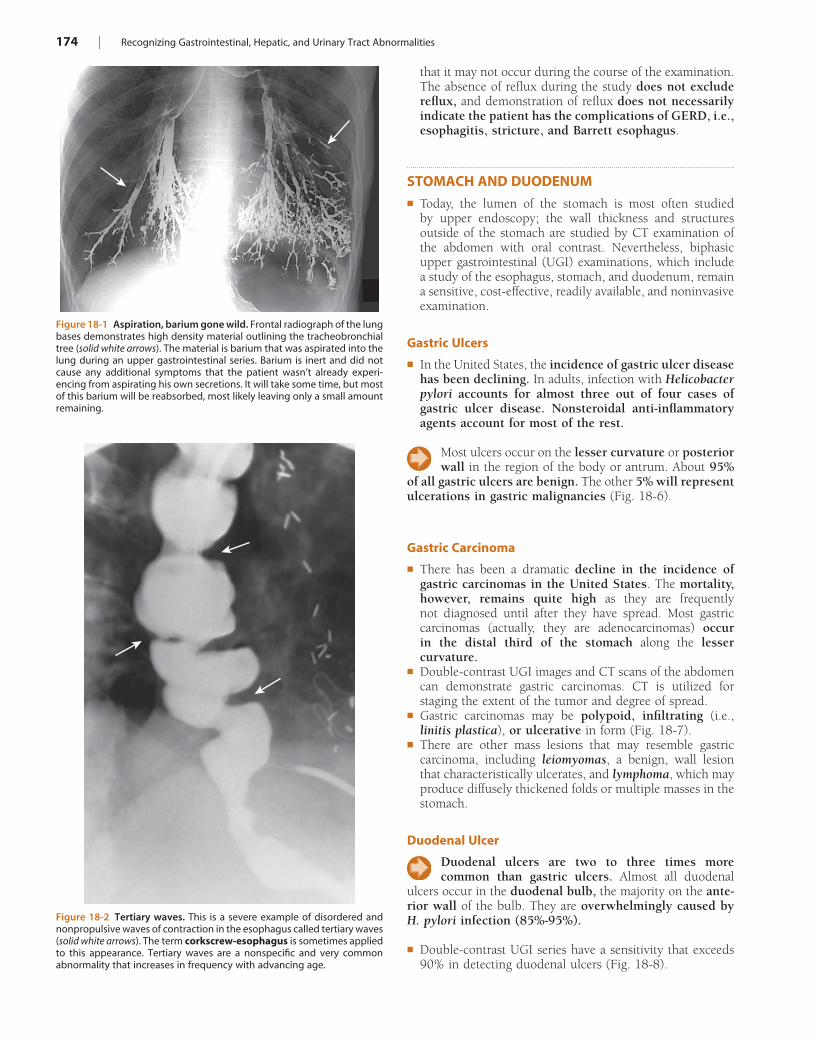
174 | Recognizing Gastrointestinal, Hepatic, and Urinary Tract Abnormalities
Figure 18-1 Aspiration, barium gone wild. Frontal radiograph of the lung bases demonstrates high density material outlining the tracheobronchial tree (solid white arrows). The material is barium that was aspirated into the lung during an upper gastrointestinal series. Barium is inert and did not cause any additional symptoms that the patient wasn’t already experi-encing from aspirating his own secretions. It will take some time, but most of this barium will be reabsorbed, most likely leaving only a small amount remaining.
Figure 18-2 Tertiary waves. This is a severe example of disordered and nonpropulsive waves of contraction in the esophagus called tertiary waves (solid white arrows). The term corkscrew-esophagus is sometimes applied to this appearance. Tertiary waves are a nonspecific and very common abnormality that increases in frequency with advancing age.
that it may not occur during the course of the examination. The absence of reflux during the study does not exclude reflux, and demonstration of reflux does not necessarily indicate the patient has the complications of GERD, i.e., esophagitis, stricture, and Barrett esophagus.
STOMACH AND DUODENUM! Today, the lumen of the stomach is most often studied
by upper endoscopy; the wall thickness and structures outside of the stomach are studied by CT examination of the abdomen with oral contrast. Nevertheless, biphasic upper gastrointestinal (UGI) examinations, which include a study of the esophagus, stomach, and duodenum, remain a sensitive, cost-effective, readily available, and noninvasive examination.
Gastric Ulcers
! In the United States, the incidence of gastric ulcer disease has been declining. In adults, infection with Helicobacter pylori accounts for almost three out of four cases of gastric ulcer disease. Nonsteroidal anti-inflammatory agents account for most of the rest.
Most ulcers occur on the lesser curvature or posterior wall in the region of the body or antrum. About 95%
of all gastric ulcers are benign. The other 5% will represent ulcerations in gastric malignancies (Fig. 18-6).
Gastric Carcinoma
! There has been a dramatic decline in the incidence of gastric carcinomas in the United States. The mortality, however, remains quite high as they are frequently not diagnosed until after they have spread. Most gastric carcinomas (actually, they are adenocarcinomas) occur in the distal third of the stomach along the lesser curvature.
! Double-contrast UGI images and CT scans of the abdomen can demonstrate gastric carcinomas. CT is utilized for staging the extent of the tumor and degree of spread.
! Gastric carcinomas may be polypoid, infiltrating (i.e., linitis plastica), or ulcerative in form (Fig. 18-7).
! There are other mass lesions that may resemble gastric carcinoma, including leiomyomas, a benign, wall lesion that characteristically ulcerates, and lymphoma, which may produce diffusely thickened folds or multiple masses in the stomach.
Duodenal Ulcer
Duodenal ulcers are two to three times more common than gastric ulcers. Almost all duodenal
ulcers occur in the duodenal bulb, the majority on the ante-rior wall of the bulb. They are overwhelmingly caused by H. pylori infection (85%-95%).
! Double-contrast UGI series have a sensitivity that exceeds 90% in detecting duodenal ulcers (Fig. 18-8).
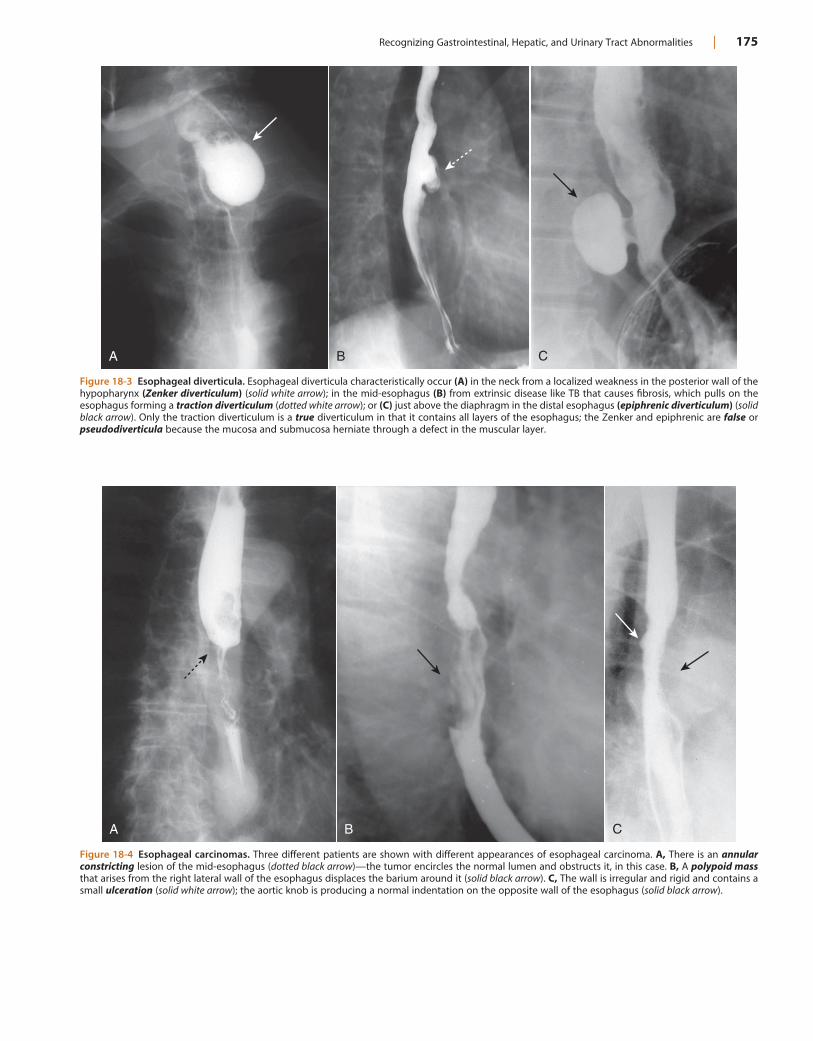
Recognizing Gastrointestinal, Hepatic, and Urinary Tract Abnormalities | 175
Figure 18-3 Esophageal diverticula. Esophageal diverticula characteristically occur (A) in the neck from a localized weakness in the posterior wall of the hypopharynx (Zenker diverticulum) (solid white arrow); in the mid-esophagus (B) from extrinsic disease like TB that causes fibrosis, which pulls on the esophagus forming a traction diverticulum (dotted white arrow); or (C) just above the diaphragm in the distal esophagus (epiphrenic diverticulum) (solid black arrow). Only the traction diverticulum is a true diverticulum in that it contains all layers of the esophagus; the Zenker and epiphrenic are false or pseudodiverticula because the mucosa and submucosa herniate through a defect in the muscular layer.
A B C
Figure 18-4 Esophageal carcinomas. Three different patients are shown with different appearances of esophageal carcinoma. A, There is an annular constricting lesion of the mid-esophagus (dotted black arrow)—the tumor encircles the normal lumen and obstructs it, in this case. B, A polypoid mass that arises from the right lateral wall of the esophagus displaces the barium around it (solid black arrow). C, The wall is irregular and rigid and contains a small ulceration (solid white arrow); the aortic knob is producing a normal indentation on the opposite wall of the esophagus (solid black arrow).
A B C
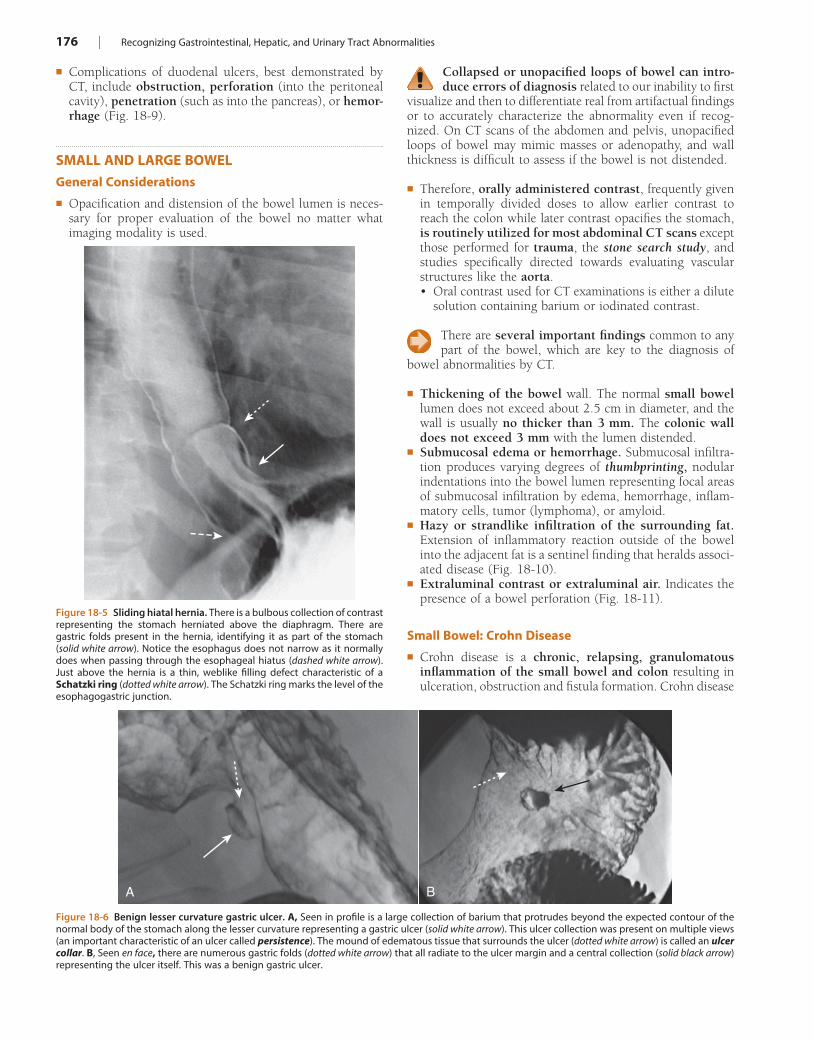
176 | Recognizing Gastrointestinal, Hepatic, and Urinary Tract Abnormalities
Figure 18-5 Sliding hiatal hernia. There is a bulbous collection of contrast representing the stomach herniated above the diaphragm. There are gastric folds present in the hernia, identifying it as part of the stomach (solid white arrow). Notice the esophagus does not narrow as it normally does when passing through the esophageal hiatus (dashed white arrow). Just above the hernia is a thin, weblike filling defect characteristic of a Schatzki ring (dotted white arrow). The Schatzki ring marks the level of the esophagogastric junction.
Figure 18-6 Benign lesser curvature gastric ulcer. A, Seen in profile is a large collection of barium that protrudes beyond the expected contour of the normal body of the stomach along the lesser curvature representing a gastric ulcer (solid white arrow). This ulcer collection was present on multiple views (an important characteristic of an ulcer called persistence). The mound of edematous tissue that surrounds the ulcer (dotted white arrow) is called an ulcer collar. B, Seen en face, there are numerous gastric folds (dotted white arrow) that all radiate to the ulcer margin and a central collection (solid black arrow) representing the ulcer itself. This was a benign gastric ulcer.
A B
! Complications of duodenal ulcers, best demonstrated by CT, include obstruction, perforation (into the peritoneal cavity), penetration (such as into the pancreas), or hemor-rhage (Fig. 18-9).
SMALL AND LARGE BOWELGeneral Considerations
! Opacification and distension of the bowel lumen is neces-sary for proper evaluation of the bowel no matter what imaging modality is used.
Collapsed or unopacified loops of bowel can intro-duce errors of diagnosis related to our inability to first
visualize and then to differentiate real from artifactual findings or to accurately characterize the abnormality even if recog-nized. On CT scans of the abdomen and pelvis, unopacified loops of bowel may mimic masses or adenopathy, and wall thickness is difficult to assess if the bowel is not distended.
! Therefore, orally administered contrast, frequently given in temporally divided doses to allow earlier contrast to reach the colon while later contrast opacifies the stomach, is routinely utilized for most abdominal CT scans except those performed for trauma, the stone search study, and studies specifically directed towards evaluating vascular structures like the aorta.• Oral contrast used for CT examinations is either a dilute
solution containing barium or iodinated contrast.
There are several important findings common to any part of the bowel, which are key to the diagnosis of
bowel abnormalities by CT.
! Thickening of the bowel wall. The normal small bowel lumen does not exceed about 2.5 cm in diameter, and the wall is usually no thicker than 3 mm. The colonic wall does not exceed 3 mm with the lumen distended.
! Submucosal edema or hemorrhage. Submucosal infiltra-tion produces varying degrees of thumbprinting, nodular indentations into the bowel lumen representing focal areas of submucosal infiltration by edema, hemorrhage, inflam-matory cells, tumor (lymphoma), or amyloid.
! Hazy or strandlike infiltration of the surrounding fat. Extension of inflammatory reaction outside of the bowel into the adjacent fat is a sentinel finding that heralds associ-ated disease (Fig. 18-10).
! Extraluminal contrast or extraluminal air. Indicates the presence of a bowel perforation (Fig. 18-11).
Small Bowel: Crohn Disease
! Crohn disease is a chronic, relapsing, granulomatous inflammation of the small bowel and colon resulting in ulceration, obstruction and fistula formation. Crohn disease
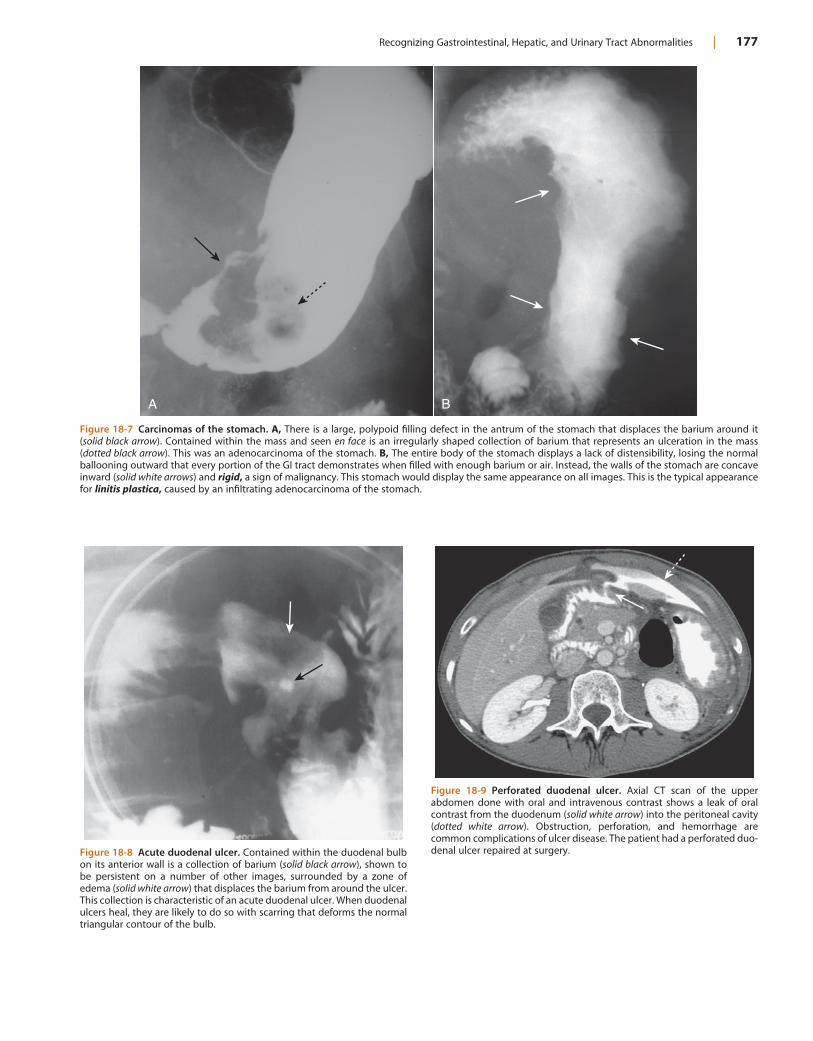
Recognizing Gastrointestinal, Hepatic, and Urinary Tract Abnormalities | 177
Figure 18-7 Carcinomas of the stomach. A, There is a large, polypoid filling defect in the antrum of the stomach that displaces the barium around it (solid black arrow). Contained within the mass and seen en face is an irregularly shaped collection of barium that represents an ulceration in the mass (dotted black arrow). This was an adenocarcinoma of the stomach. B, The entire body of the stomach displays a lack of distensibility, losing the normal ballooning outward that every portion of the GI tract demonstrates when filled with enough barium or air. Instead, the walls of the stomach are concave inward (solid white arrows) and rigid, a sign of malignancy. This stomach would display the same appearance on all images. This is the typical appearance for linitis plastica, caused by an infiltrating adenocarcinoma of the stomach.
A B
Figure 18-8 Acute duodenal ulcer. Contained within the duodenal bulb on its anterior wall is a collection of barium (solid black arrow), shown to be persistent on a number of other images, surrounded by a zone of edema (solid white arrow) that displaces the barium from around the ulcer. This collection is characteristic of an acute duodenal ulcer. When duodenal ulcers heal, they are likely to do so with scarring that deforms the normal triangular contour of the bulb.
Figure 18-9 Perforated duodenal ulcer. Axial CT scan of the upper abdomen done with oral and intravenous contrast shows a leak of oral contrast from the duodenum (solid white arrow) into the peritoneal cavity (dotted white arrow). Obstruction, perforation, and hemorrhage are common complications of ulcer disease. The patient had a perforated duo-denal ulcer repaired at surgery.
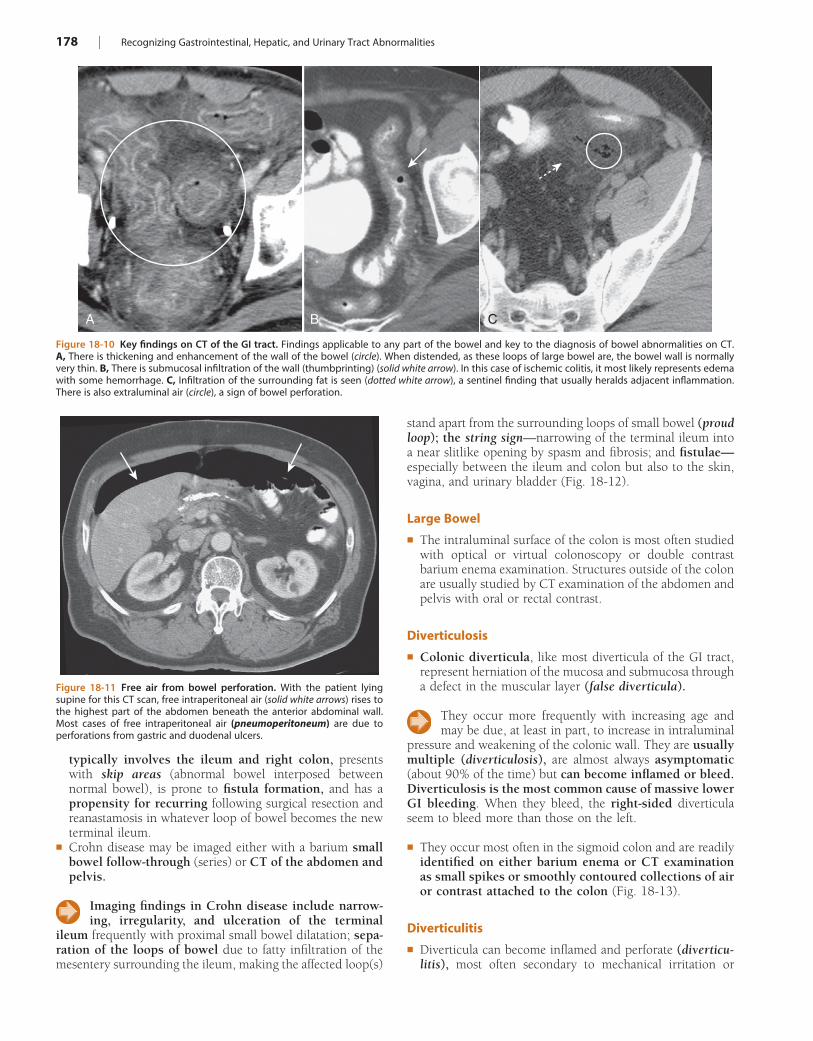
178 | Recognizing Gastrointestinal, Hepatic, and Urinary Tract Abnormalities
stand apart from the surrounding loops of small bowel (proud loop); the string sign—narrowing of the terminal ileum into a near slitlike opening by spasm and fibrosis; and fistulae—especially between the ileum and colon but also to the skin, vagina, and urinary bladder (Fig. 18-12).
Large Bowel
! The intraluminal surface of the colon is most often studied with optical or virtual colonoscopy or double contrast barium enema examination. Structures outside of the colon are usually studied by CT examination of the abdomen and pelvis with oral or rectal contrast.
Diverticulosis
! Colonic diverticula, like most diverticula of the GI tract, represent herniation of the mucosa and submucosa through a defect in the muscular layer (false diverticula).
They occur more frequently with increasing age and may be due, at least in part, to increase in intraluminal
pressure and weakening of the colonic wall. They are usually multiple (diverticulosis), are almost always asymptomatic (about 90% of the time) but can become inflamed or bleed. Diverticulosis is the most common cause of massive lower GI bleeding. When they bleed, the right-sided diverticula seem to bleed more than those on the left.
! They occur most often in the sigmoid colon and are readily identified on either barium enema or CT examination as small spikes or smoothly contoured collections of air or contrast attached to the colon (Fig. 18-13).
Diverticulitis
! Diverticula can become inflamed and perforate (diverticu-litis), most often secondary to mechanical irritation or
typically involves the ileum and right colon, presents with skip areas (abnormal bowel interposed between normal bowel), is prone to fistula formation, and has a propensity for recurring following surgical resection and reanastamosis in whatever loop of bowel becomes the new terminal ileum.
! Crohn disease may be imaged either with a barium small bowel follow-through (series) or CT of the abdomen and pelvis.
Imaging findings in Crohn disease include narrow-ing, irregularity, and ulceration of the terminal
ileum frequently with proximal small bowel dilatation; sepa-ration of the loops of bowel due to fatty infiltration of the mesentery surrounding the ileum, making the affected loop(s)
Figure 18-10 Key findings on CT of the GI tract. Findings applicable to any part of the bowel and key to the diagnosis of bowel abnormalities on CT. A, There is thickening and enhancement of the wall of the bowel (circle). When distended, as these loops of large bowel are, the bowel wall is normally very thin. B, There is submucosal infiltration of the wall (thumbprinting) (solid white arrow). In this case of ischemic colitis, it most likely represents edema with some hemorrhage. C, Infiltration of the surrounding fat is seen (dotted white arrow), a sentinel finding that usually heralds adjacent inflammation. There is also extraluminal air (circle), a sign of bowel perforation.
A B C
Figure 18-11 Free air from bowel perforation. With the patient lying supine for this CT scan, free intraperitoneal air (solid white arrows) rises to the highest part of the abdomen beneath the anterior abdominal wall. Most cases of free intraperitoneal air (pneumoperitoneum) are due to perforations from gastric and duodenal ulcers.
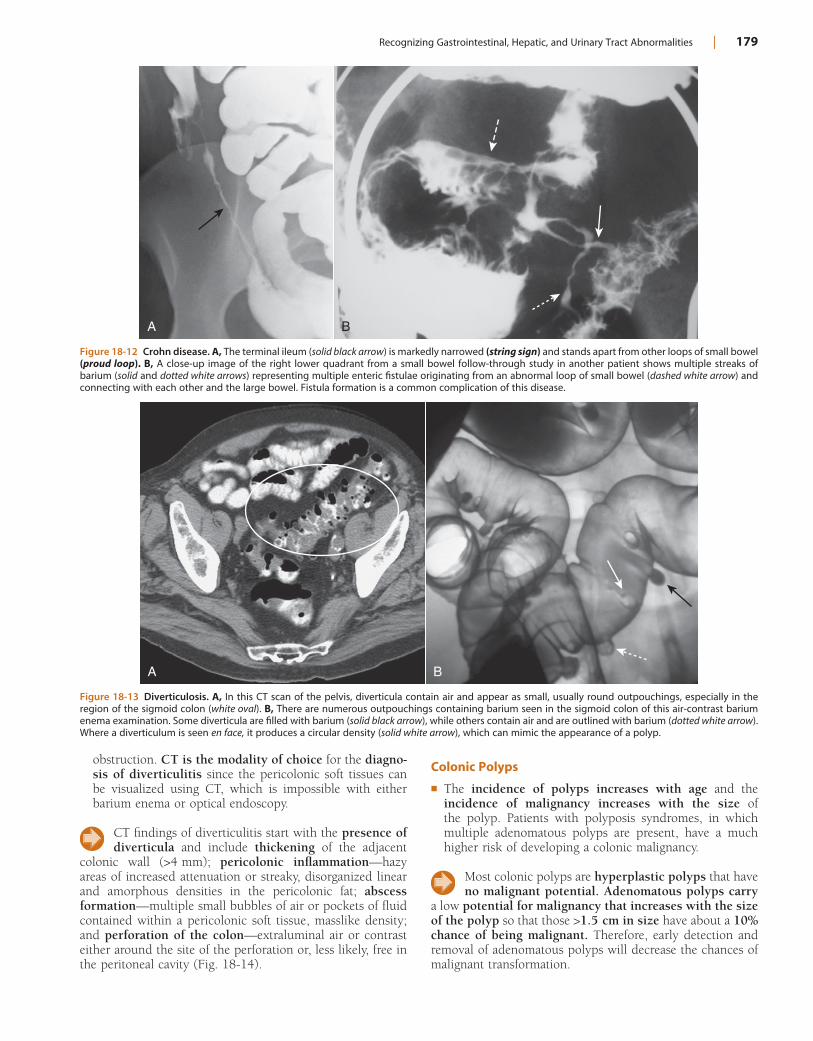
Recognizing Gastrointestinal, Hepatic, and Urinary Tract Abnormalities | 179
Colonic Polyps
! The incidence of polyps increases with age and the incidence of malignancy increases with the size of the polyp. Patients with polyposis syndromes, in which multiple adenomatous polyps are present, have a much higher risk of developing a colonic malignancy.
Most colonic polyps are hyperplastic polyps that have no malignant potential. Adenomatous polyps carry
a low potential for malignancy that increases with the size of the polyp so that those >1.5 cm in size have about a 10% chance of being malignant. Therefore, early detection and removal of adenomatous polyps will decrease the chances of malignant transformation.
obstruction. CT is the modality of choice for the diagno-sis of diverticulitis since the pericolonic soft tissues can be visualized using CT, which is impossible with either barium enema or optical endoscopy.
CT findings of diverticulitis start with the presence of diverticula and include thickening of the adjacent
colonic wall (>4 mm); pericolonic inflammation—hazy areas of increased attenuation or streaky, disorganized linear and amorphous densities in the pericolonic fat; abscess formation—multiple small bubbles of air or pockets of fluid contained within a pericolonic soft tissue, masslike density; and perforation of the colon—extraluminal air or contrast either around the site of the perforation or, less likely, free in the peritoneal cavity (Fig. 18-14).
Figure 18-12 Crohn disease. A, The terminal ileum (solid black arrow) is markedly narrowed (string sign) and stands apart from other loops of small bowel (proud loop). B, A close-up image of the right lower quadrant from a small bowel follow-through study in another patient shows multiple streaks of barium (solid and dotted white arrows) representing multiple enteric fistulae originating from an abnormal loop of small bowel (dashed white arrow) and connecting with each other and the large bowel. Fistula formation is a common complication of this disease.
A B
Figure 18-13 Diverticulosis. A, In this CT scan of the pelvis, diverticula contain air and appear as small, usually round outpouchings, especially in the region of the sigmoid colon (white oval). B, There are numerous outpouchings containing barium seen in the sigmoid colon of this air-contrast barium enema examination. Some diverticula are filled with barium (solid black arrow), while others contain air and are outlined with barium (dotted white arrow). Where a diverticulum is seen en face, it produces a circular density (solid white arrow), which can mimic the appearance of a polyp.
A B
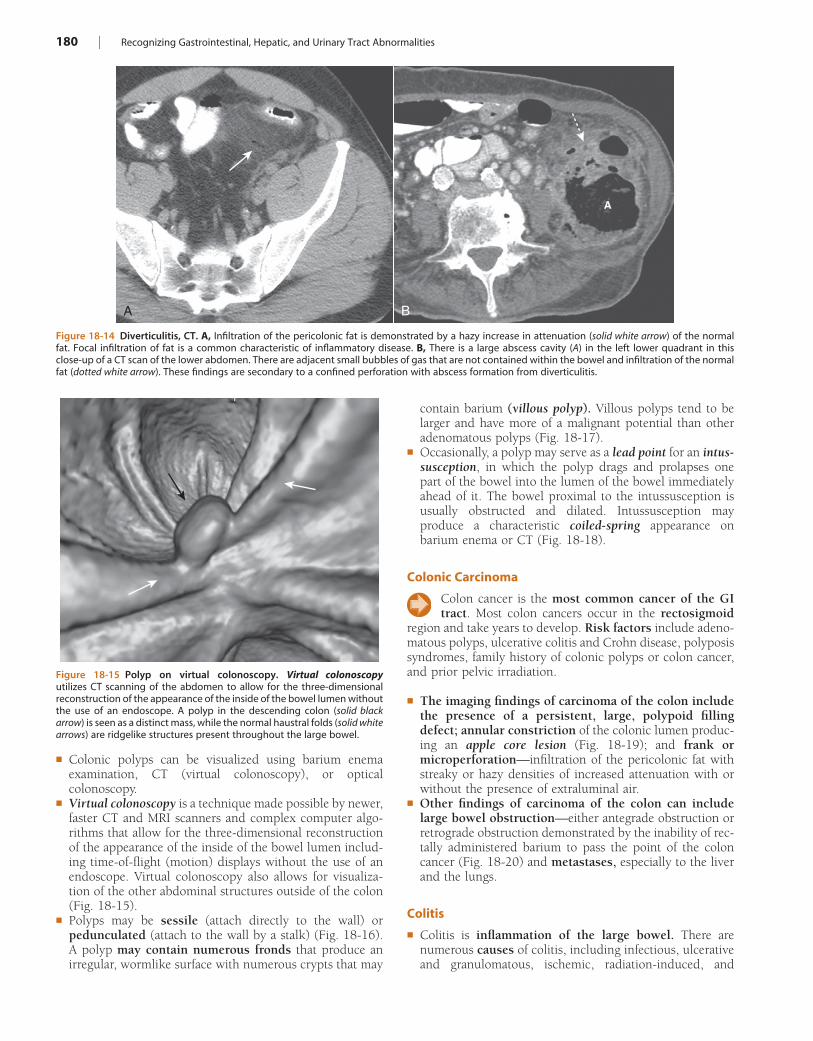
180 | Recognizing Gastrointestinal, Hepatic, and Urinary Tract Abnormalities
contain barium (villous polyp). Villous polyps tend to be larger and have more of a malignant potential than other adenomatous polyps (Fig. 18-17).
! Occasionally, a polyp may serve as a lead point for an intus-susception, in which the polyp drags and prolapses one part of the bowel into the lumen of the bowel immediately ahead of it. The bowel proximal to the intussusception is usually obstructed and dilated. Intussusception may produce a characteristic coiled-spring appearance on barium enema or CT (Fig. 18-18).
Colonic Carcinoma
Colon cancer is the most common cancer of the GI tract. Most colon cancers occur in the rectosigmoid
region and take years to develop. Risk factors include adeno-matous polyps, ulcerative colitis and Crohn disease, polyposis syndromes, family history of colonic polyps or colon cancer, and prior pelvic irradiation.
! The imaging findings of carcinoma of the colon include the presence of a persistent, large, polypoid filling defect; annular constriction of the colonic lumen produc-ing an apple core lesion (Fig. 18-19); and frank or microperforation—infiltration of the pericolonic fat with streaky or hazy densities of increased attenuation with or without the presence of extraluminal air.
! Other findings of carcinoma of the colon can include large bowel obstruction—either antegrade obstruction or retrograde obstruction demonstrated by the inability of rec-tally administered barium to pass the point of the colon cancer (Fig. 18-20) and metastases, especially to the liver and the lungs.
Colitis
! Colitis is inflammation of the large bowel. There are numerous causes of colitis, including infectious, ulcerative and granulomatous, ischemic, radiation-induced, and
! Colonic polyps can be visualized using barium enema examination, CT (virtual colonoscopy), or optical colonoscopy.
! Virtual colonoscopy is a technique made possible by newer, faster CT and MRI scanners and complex computer algo-rithms that allow for the three-dimensional reconstruction of the appearance of the inside of the bowel lumen includ-ing time-of-flight (motion) displays without the use of an endoscope. Virtual colonoscopy also allows for visualiza-tion of the other abdominal structures outside of the colon (Fig. 18-15).
! Polyps may be sessile (attach directly to the wall) or pedunculated (attach to the wall by a stalk) (Fig. 18-16). A polyp may contain numerous fronds that produce an irregular, wormlike surface with numerous crypts that may
Figure 18-14 Diverticulitis, CT. A, Infiltration of the pericolonic fat is demonstrated by a hazy increase in attenuation (solid white arrow) of the normal fat. Focal infiltration of fat is a common characteristic of inflammatory disease. B, There is a large abscess cavity (A) in the left lower quadrant in this close-up of a CT scan of the lower abdomen. There are adjacent small bubbles of gas that are not contained within the bowel and infiltration of the normal fat (dotted white arrow). These findings are secondary to a confined perforation with abscess formation from diverticulitis.
A B
A
Figure 18-15 Polyp on virtual colonoscopy. Virtual colonoscopy utilizes CT scanning of the abdomen to allow for the three-dimensional reconstruction of the appearance of the inside of the bowel lumen without the use of an endoscope. A polyp in the descending colon (solid black arrow) is seen as a distinct mass, while the normal haustral folds (solid white arrows) are ridgelike structures present throughout the large bowel.
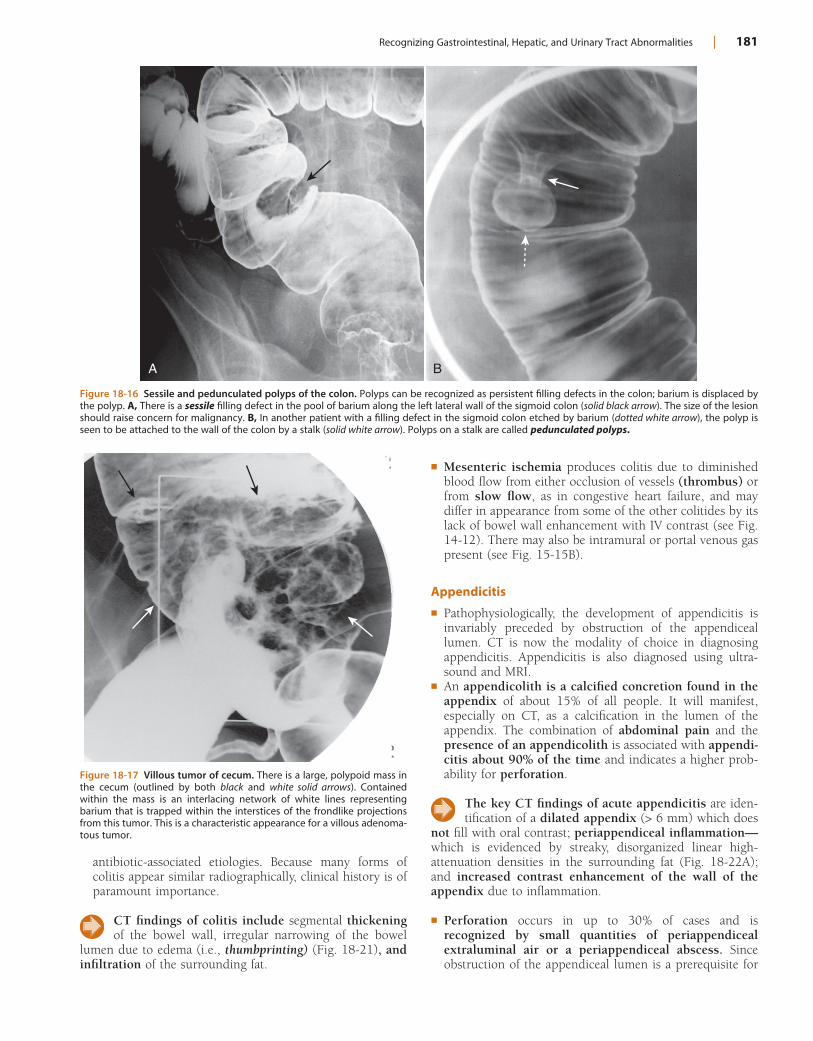
Recognizing Gastrointestinal, Hepatic, and Urinary Tract Abnormalities | 181
! Mesenteric ischemia produces colitis due to diminished blood flow from either occlusion of vessels (thrombus) or from slow flow, as in congestive heart failure, and may differ in appearance from some of the other colitides by its lack of bowel wall enhancement with IV contrast (see Fig. 14-12). There may also be intramural or portal venous gas present (see Fig. 15-15B).
Appendicitis
! Pathophysiologically, the development of appendicitis is invariably preceded by obstruction of the appendiceal lumen. CT is now the modality of choice in diagnosing appendicitis. Appendicitis is also diagnosed using ultra-sound and MRI.
! An appendicolith is a calcified concretion found in the appendix of about 15% of all people. It will manifest, especially on CT, as a calcification in the lumen of the appendix. The combination of abdominal pain and the presence of an appendicolith is associated with appendi-citis about 90% of the time and indicates a higher prob-ability for perforation.
The key CT findings of acute appendicitis are iden-tification of a dilated appendix (> 6 mm) which does
not fill with oral contrast; periappendiceal inflammation—which is evidenced by streaky, disorganized linear high-attenuation densities in the surrounding fat (Fig. 18-22A); and increased contrast enhancement of the wall of the appendix due to inflammation.
! Perforation occurs in up to 30% of cases and is recognized by small quantities of periappendiceal extraluminal air or a periappendiceal abscess. Since obstruction of the appendiceal lumen is a prerequisite for
antibiotic-associated etiologies. Because many forms of colitis appear similar radiographically, clinical history is of paramount importance.
CT findings of colitis include segmental thickening of the bowel wall, irregular narrowing of the bowel
lumen due to edema (i.e., thumbprinting) (Fig. 18-21), and infiltration of the surrounding fat.
Figure 18-16 Sessile and pedunculated polyps of the colon. Polyps can be recognized as persistent filling defects in the colon; barium is displaced by the polyp. A, There is a sessile filling defect in the pool of barium along the left lateral wall of the sigmoid colon (solid black arrow). The size of the lesion should raise concern for malignancy. B, In another patient with a filling defect in the sigmoid colon etched by barium (dotted white arrow), the polyp is seen to be attached to the wall of the colon by a stalk (solid white arrow). Polyps on a stalk are called pedunculated polyps.
A B
Figure 18-17 Villous tumor of cecum. There is a large, polypoid mass in the cecum (outlined by both black and white solid arrows). Contained within the mass is an interlacing network of white lines representing barium that is trapped within the interstices of the frondlike projections from this tumor. This is a characteristic appearance for a villous adenoma-tous tumor.
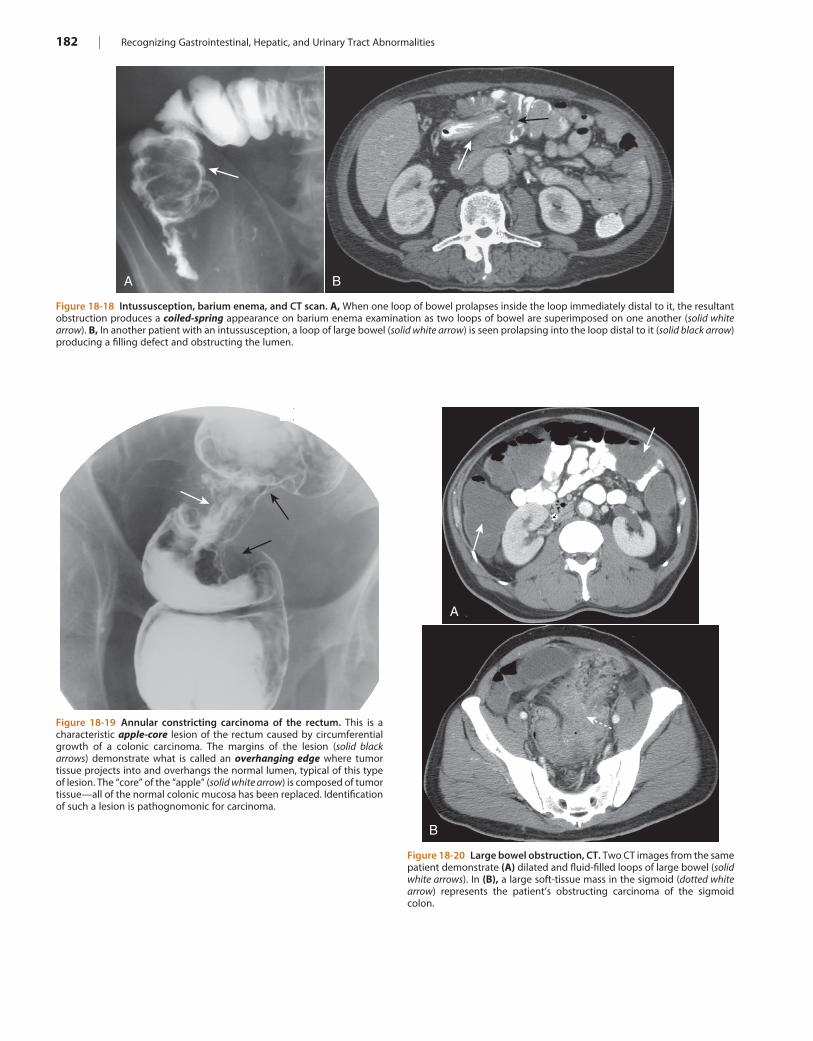
182 | Recognizing Gastrointestinal, Hepatic, and Urinary Tract Abnormalities
Figure 18-18 Intussusception, barium enema, and CT scan. A, When one loop of bowel prolapses inside the loop immediately distal to it, the resultant obstruction produces a coiled-spring appearance on barium enema examination as two loops of bowel are superimposed on one another (solid white arrow). B, In another patient with an intussusception, a loop of large bowel (solid white arrow) is seen prolapsing into the loop distal to it (solid black arrow) producing a filling defect and obstructing the lumen.
A B
Figure 18-19 Annular constricting carcinoma of the rectum. This is a characteristic apple-core lesion of the rectum caused by circumferential growth of a colonic carcinoma. The margins of the lesion (solid black arrows) demonstrate what is called an overhanging edge where tumor tissue projects into and overhangs the normal lumen, typical of this type of lesion. The “core” of the “apple” (solid white arrow) is composed of tumor tissue—all of the normal colonic mucosa has been replaced. Identification of such a lesion is pathognomonic for carcinoma.
Figure 18-20 Large bowel obstruction, CT. Two CT images from the same patient demonstrate (A) dilated and fluid-filled loops of large bowel (solid white arrows). In (B), a large soft-tissue mass in the sigmoid (dotted white arrow) represents the patient’s obstructing carcinoma of the sigmoid colon.
A
B
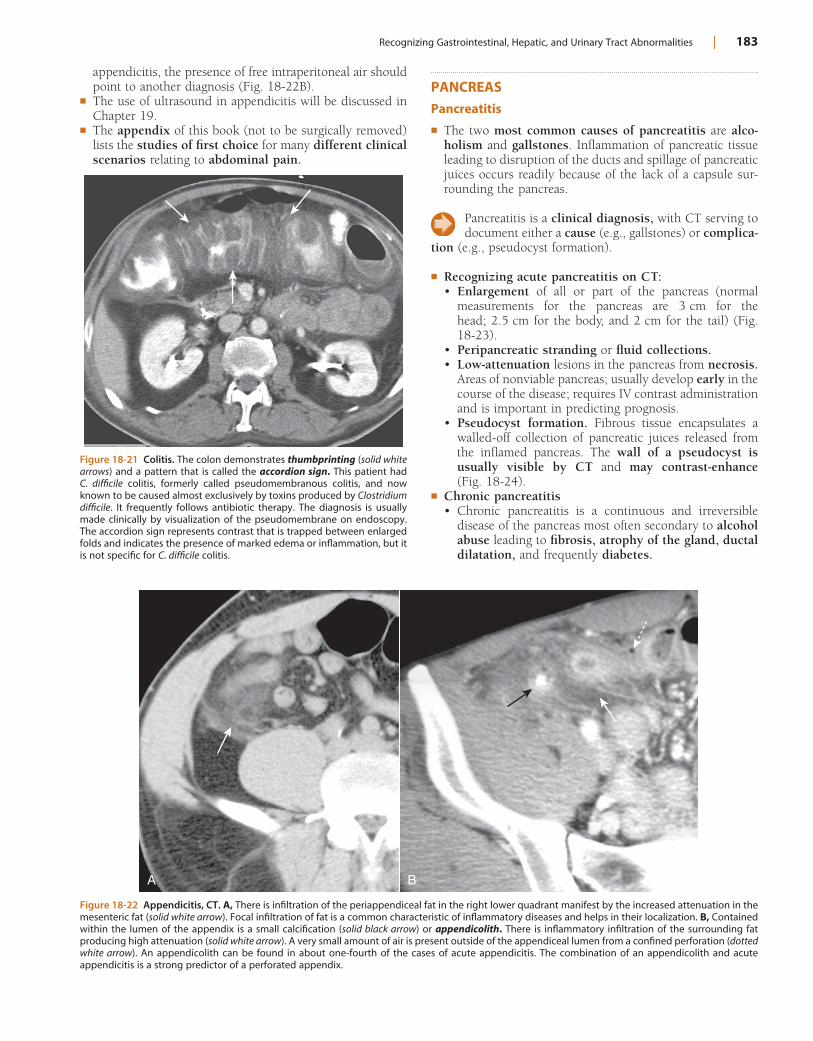
Recognizing Gastrointestinal, Hepatic, and Urinary Tract Abnormalities | 183
Figure 18-21 Colitis. The colon demonstrates thumbprinting (solid white arrows) and a pattern that is called the accordion sign. This patient had C. difficile colitis, formerly called pseudomembranous colitis, and now known to be caused almost exclusively by toxins produced by Clostridium difficile. It frequently follows antibiotic therapy. The diagnosis is usually made clinically by visualization of the pseudomembrane on endoscopy. The accordion sign represents contrast that is trapped between enlarged folds and indicates the presence of marked edema or inflammation, but it is not specific for C. difficile colitis.
Figure 18-22 Appendicitis, CT. A, There is infiltration of the periappendiceal fat in the right lower quadrant manifest by the increased attenuation in the mesenteric fat (solid white arrow). Focal infiltration of fat is a common characteristic of inflammatory diseases and helps in their localization. B, Contained within the lumen of the appendix is a small calcification (solid black arrow) or appendicolith. There is inflammatory infiltration of the surrounding fat producing high attenuation (solid white arrow). A very small amount of air is present outside of the appendiceal lumen from a confined perforation (dotted white arrow). An appendicolith can be found in about one-fourth of the cases of acute appendicitis. The combination of an appendicolith and acute appendicitis is a strong predictor of a perforated appendix.
A B
appendicitis, the presence of free intraperitoneal air should point to another diagnosis (Fig. 18-22B).
! The use of ultrasound in appendicitis will be discussed in Chapter 19.
! The appendix of this book (not to be surgically removed) lists the studies of first choice for many different clinical scenarios relating to abdominal pain.
PANCREASPancreatitis
! The two most common causes of pancreatitis are alco-holism and gallstones. Inflammation of pancreatic tissue leading to disruption of the ducts and spillage of pancreatic juices occurs readily because of the lack of a capsule sur-rounding the pancreas.
Pancreatitis is a clinical diagnosis, with CT serving to document either a cause (e.g., gallstones) or complica-
tion (e.g., pseudocyst formation).
! Recognizing acute pancreatitis on CT:• Enlargement of all or part of the pancreas (normal
measurements for the pancreas are 3 cm for the head; 2.5 cm for the body, and 2 cm for the tail) (Fig. 18-23).
• Peripancreatic stranding or fluid collections.• Low-attenuation lesions in the pancreas from necrosis.
Areas of nonviable pancreas; usually develop early in the course of the disease; requires IV contrast administration and is important in predicting prognosis.
• Pseudocyst formation. Fibrous tissue encapsulates a walled-off collection of pancreatic juices released from the inflamed pancreas. The wall of a pseudocyst is usually visible by CT and may contrast-enhance (Fig. 18-24).
! Chronic pancreatitis• Chronic pancreatitis is a continuous and irreversible
disease of the pancreas most often secondary to alcohol abuse leading to fibrosis, atrophy of the gland, ductal dilatation, and frequently diabetes.
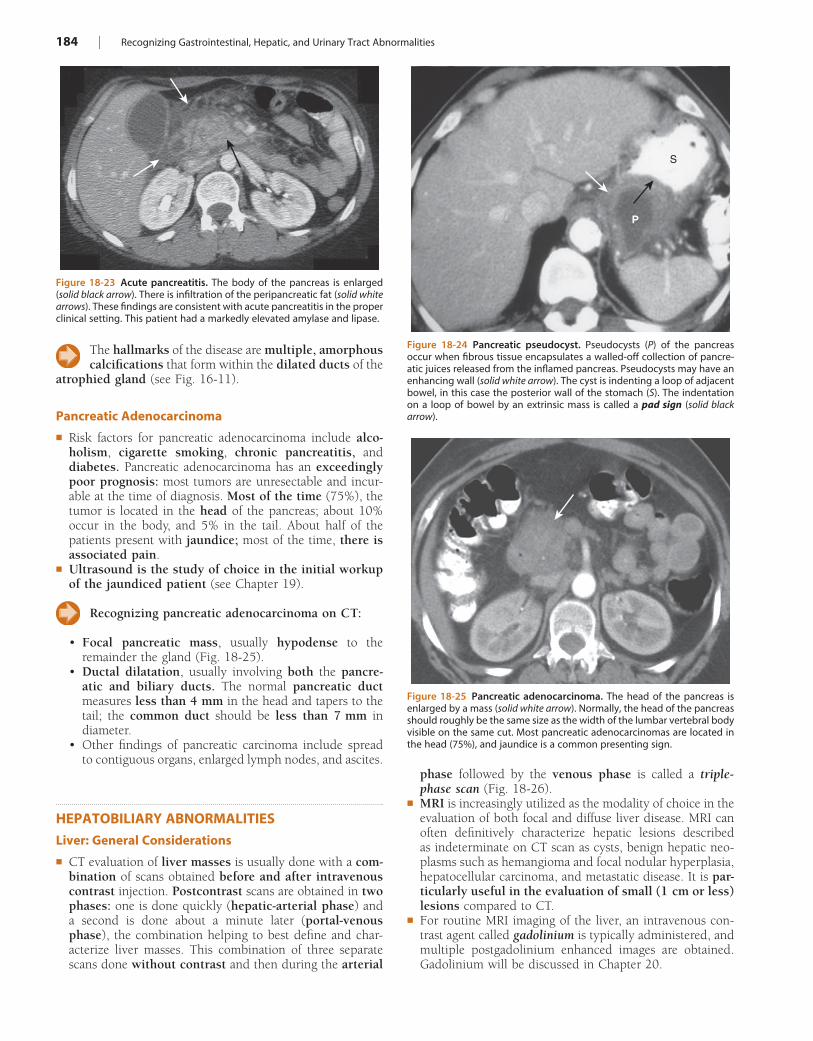
184 | Recognizing Gastrointestinal, Hepatic, and Urinary Tract Abnormalities
The hallmarks of the disease are multiple, amorphous calcifications that form within the dilated ducts of the
atrophied gland (see Fig. 16-11).
Pancreatic Adenocarcinoma
! Risk factors for pancreatic adenocarcinoma include alco-holism, cigarette smoking, chronic pancreatitis, and diabetes. Pancreatic adenocarcinoma has an exceedingly poor prognosis: most tumors are unresectable and incur-able at the time of diagnosis. Most of the time (75%), the tumor is located in the head of the pancreas; about 10% occur in the body, and 5% in the tail. About half of the patients present with jaundice; most of the time, there is associated pain.
! Ultrasound is the study of choice in the initial workup of the jaundiced patient (see Chapter 19).
Recognizing pancreatic adenocarcinoma on CT:
• Focal pancreatic mass, usually hypodense to the remainder the gland (Fig. 18-25).
• Ductal dilatation, usually involving both the pancre-atic and biliary ducts. The normal pancreatic duct measures less than 4 mm in the head and tapers to the tail; the common duct should be less than 7 mm in diameter.
• Other findings of pancreatic carcinoma include spread to contiguous organs, enlarged lymph nodes, and ascites.
HEPATOBILIARY ABNORMALITIESLiver: General Considerations
! CT evaluation of liver masses is usually done with a com-bination of scans obtained before and after intravenous contrast injection. Postcontrast scans are obtained in two phases: one is done quickly (hepatic-arterial phase) and a second is done about a minute later (portal-venous phase), the combination helping to best define and char-acterize liver masses. This combination of three separate scans done without contrast and then during the arterial
Figure 18-23 Acute pancreatitis. The body of the pancreas is enlarged (solid black arrow). There is infiltration of the peripancreatic fat (solid white arrows). These findings are consistent with acute pancreatitis in the proper clinical setting. This patient had a markedly elevated amylase and lipase.
Figure 18-24 Pancreatic pseudocyst. Pseudocysts (P) of the pancreas occur when fibrous tissue encapsulates a walled-off collection of pancre-atic juices released from the inflamed pancreas. Pseudocysts may have an enhancing wall (solid white arrow). The cyst is indenting a loop of adjacent bowel, in this case the posterior wall of the stomach (S). The indentation on a loop of bowel by an extrinsic mass is called a pad sign (solid black arrow).
S
P
Figure 18-25 Pancreatic adenocarcinoma. The head of the pancreas is enlarged by a mass (solid white arrow). Normally, the head of the pancreas should roughly be the same size as the width of the lumbar vertebral body visible on the same cut. Most pancreatic adenocarcinomas are located in the head (75%), and jaundice is a common presenting sign.
phase followed by the venous phase is called a triple-phase scan (Fig. 18-26).
! MRI is increasingly utilized as the modality of choice in the evaluation of both focal and diffuse liver disease. MRI can often definitively characterize hepatic lesions described as indeterminate on CT scan as cysts, benign hepatic neo-plasms such as hemangioma and focal nodular hyperplasia, hepatocellular carcinoma, and metastatic disease. It is par-ticularly useful in the evaluation of small (1 cm or less) lesions compared to CT.
! For routine MRI imaging of the liver, an intravenous con-trast agent called gadolinium is typically administered, and multiple postgadolinium enhanced images are obtained. Gadolinium will be discussed in Chapter 20.
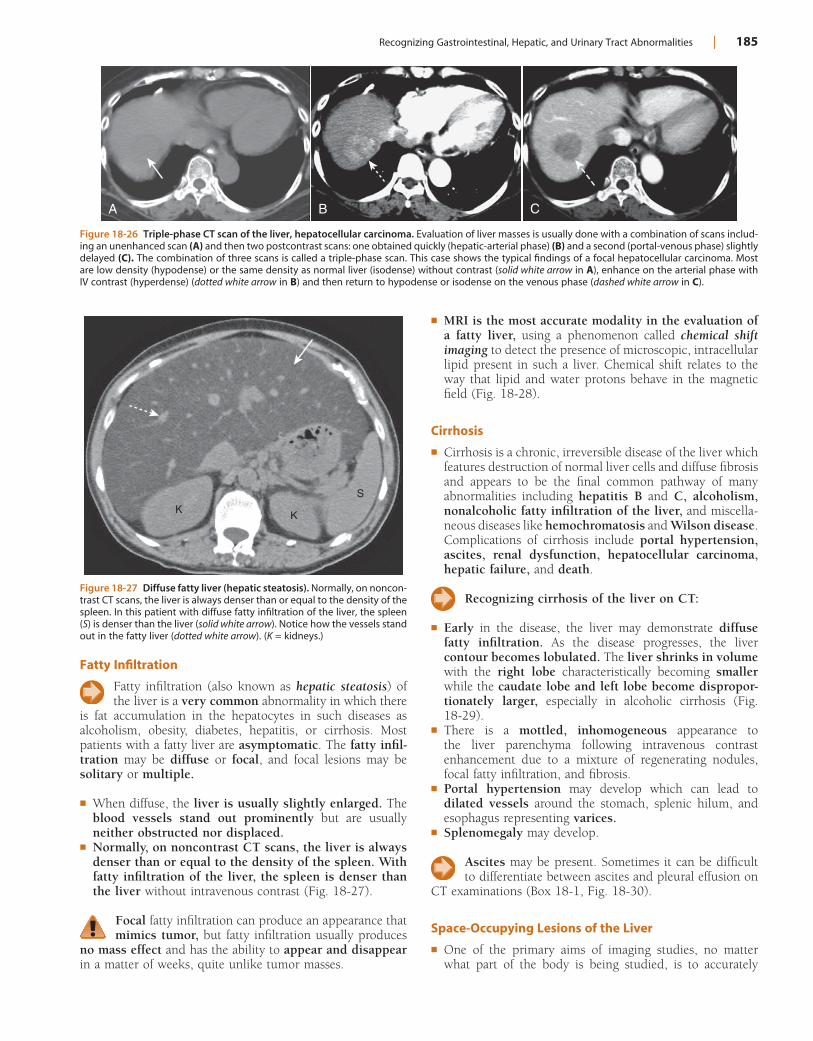
Recognizing Gastrointestinal, Hepatic, and Urinary Tract Abnormalities | 185
Figure 18-26 Triple-phase CT scan of the liver, hepatocellular carcinoma. Evaluation of liver masses is usually done with a combination of scans includ-ing an unenhanced scan (A) and then two postcontrast scans: one obtained quickly (hepatic-arterial phase) (B) and a second (portal-venous phase) slightly delayed (C). The combination of three scans is called a triple-phase scan. This case shows the typical findings of a focal hepatocellular carcinoma. Most are low density (hypodense) or the same density as normal liver (isodense) without contrast (solid white arrow in A), enhance on the arterial phase with IV contrast (hyperdense) (dotted white arrow in B) and then return to hypodense or isodense on the venous phase (dashed white arrow in C).
A B C
Figure 18-27 Diffuse fatty liver (hepatic steatosis). Normally, on noncon-trast CT scans, the liver is always denser than or equal to the density of the spleen. In this patient with diffuse fatty infiltration of the liver, the spleen (S) is denser than the liver (solid white arrow). Notice how the vessels stand out in the fatty liver (dotted white arrow). (K = kidneys.)
K K
S
Fatty Infiltration
Fatty infiltration (also known as hepatic steatosis) of the liver is a very common abnormality in which there
is fat accumulation in the hepatocytes in such diseases as alcoholism, obesity, diabetes, hepatitis, or cirrhosis. Most patients with a fatty liver are asymptomatic. The fatty infil-tration may be diffuse or focal, and focal lesions may be solitary or multiple.
! When diffuse, the liver is usually slightly enlarged. The blood vessels stand out prominently but are usually neither obstructed nor displaced.
! Normally, on noncontrast CT scans, the liver is always denser than or equal to the density of the spleen. With fatty infiltration of the liver, the spleen is denser than the liver without intravenous contrast (Fig. 18-27).
Focal fatty infiltration can produce an appearance that mimics tumor, but fatty infiltration usually produces
no mass effect and has the ability to appear and disappear in a matter of weeks, quite unlike tumor masses.
! MRI is the most accurate modality in the evaluation of a fatty liver, using a phenomenon called chemical shift imaging to detect the presence of microscopic, intracellular lipid present in such a liver. Chemical shift relates to the way that lipid and water protons behave in the magnetic field (Fig. 18-28).
Cirrhosis
! Cirrhosis is a chronic, irreversible disease of the liver which features destruction of normal liver cells and diffuse fibrosis and appears to be the final common pathway of many abnormalities including hepatitis B and C, alcoholism, nonalcoholic fatty infiltration of the liver, and miscella-neous diseases like hemochromatosis and Wilson disease. Complications of cirrhosis include portal hypertension, ascites, renal dysfunction, hepatocellular carcinoma, hepatic failure, and death.
Recognizing cirrhosis of the liver on CT:
! Early in the disease, the liver may demonstrate diffuse fatty infiltration. As the disease progresses, the liver contour becomes lobulated. The liver shrinks in volume with the right lobe characteristically becoming smaller while the caudate lobe and left lobe become dispropor-tionately larger, especially in alcoholic cirrhosis (Fig. 18-29).
! There is a mottled, inhomogeneous appearance to the liver parenchyma following intravenous contrast enhancement due to a mixture of regenerating nodules, focal fatty infiltration, and fibrosis.
! Portal hypertension may develop which can lead to dilated vessels around the stomach, splenic hilum, and esophagus representing varices.
! Splenomegaly may develop.
Ascites may be present. Sometimes it can be difficult to differentiate between ascites and pleural effusion on
CT examinations (Box 18-1, Fig. 18-30).
Space-Occupying Lesions of the Liver
! One of the primary aims of imaging studies, no matter what part of the body is being studied, is to accurately
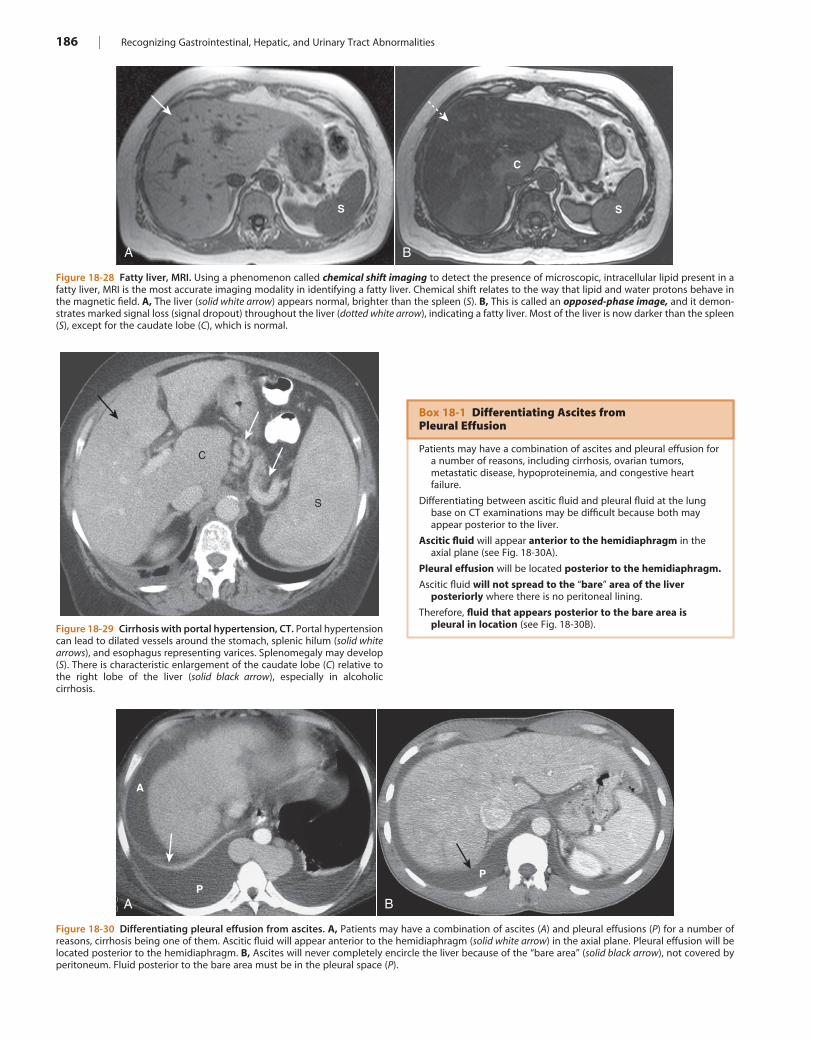
186 | Recognizing Gastrointestinal, Hepatic, and Urinary Tract Abnormalities
Figure 18-28 Fatty liver, MRI. Using a phenomenon called chemical shift imaging to detect the presence of microscopic, intracellular lipid present in a fatty liver, MRI is the most accurate imaging modality in identifying a fatty liver. Chemical shift relates to the way that lipid and water protons behave in the magnetic field. A, The liver (solid white arrow) appears normal, brighter than the spleen (S). B, This is called an opposed-phase image, and it demon-strates marked signal loss (signal dropout) throughout the liver (dotted white arrow), indicating a fatty liver. Most of the liver is now darker than the spleen (S), except for the caudate lobe (C), which is normal.
A B
C
SS
Figure 18-29 Cirrhosis with portal hypertension, CT. Portal hypertension can lead to dilated vessels around the stomach, splenic hilum (solid white arrows), and esophagus representing varices. Splenomegaly may develop (S). There is characteristic enlargement of the caudate lobe (C) relative to the right lobe of the liver (solid black arrow), especially in alcoholic cirrhosis.
C
S
Box 18-1 Differentiating Ascites from Pleural Effusion
Patients may have a combination of ascites and pleural effusion for a number of reasons, including cirrhosis, ovarian tumors, metastatic disease, hypoproteinemia, and congestive heart failure.
Differentiating between ascitic fluid and pleural fluid at the lung base on CT examinations may be difficult because both may appear posterior to the liver.
Ascitic fluid will appear anterior to the hemidiaphragm in the axial plane (see Fig. 18-30A).
Pleural effusion will be located posterior to the hemidiaphragm.
Ascitic fluid will not spread to the “bare” area of the liver posteriorly where there is no peritoneal lining.
Therefore, fluid that appears posterior to the bare area is pleural in location (see Fig. 18-30B).
Figure 18-30 Differentiating pleural effusion from ascites. A, Patients may have a combination of ascites (A) and pleural effusions (P) for a number of reasons, cirrhosis being one of them. Ascitic fluid will appear anterior to the hemidiaphragm (solid white arrow) in the axial plane. Pleural effusion will be located posterior to the hemidiaphragm. B, Ascites will never completely encircle the liver because of the “bare area” (solid black arrow), not covered by peritoneum. Fluid posterior to the bare area must be in the pleural space (P).
A B
PP
A
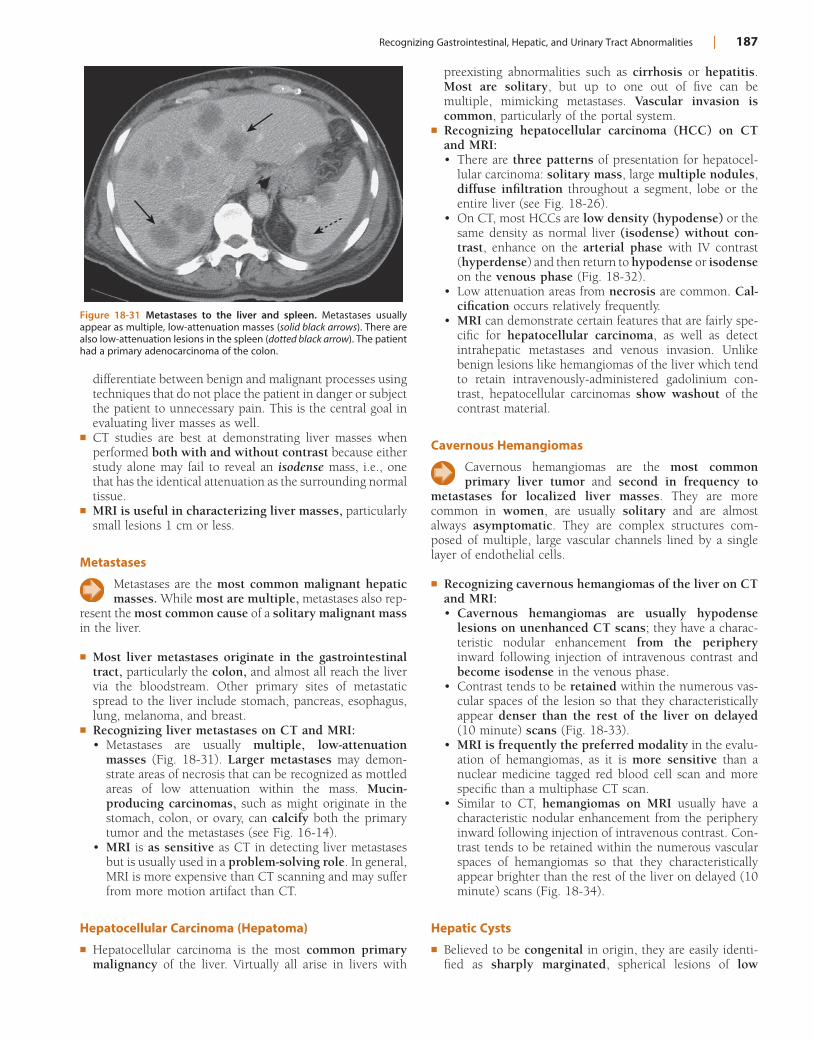
Recognizing Gastrointestinal, Hepatic, and Urinary Tract Abnormalities | 187
Figure 18-31 Metastases to the liver and spleen. Metastases usually appear as multiple, low-attenuation masses (solid black arrows). There are also low-attenuation lesions in the spleen (dotted black arrow). The patient had a primary adenocarcinoma of the colon.
preexisting abnormalities such as cirrhosis or hepatitis. Most are solitary, but up to one out of five can be multiple, mimicking metastases. Vascular invasion is common, particularly of the portal system.
! Recognizing hepatocellular carcinoma (HCC) on CT and MRI:• There are three patterns of presentation for hepatocel-
lular carcinoma: solitary mass, large multiple nodules, diffuse infiltration throughout a segment, lobe or the entire liver (see Fig. 18-26).
• On CT, most HCCs are low density (hypodense) or the same density as normal liver (isodense) without con-trast, enhance on the arterial phase with IV contrast (hyperdense) and then return to hypodense or isodense on the venous phase (Fig. 18-32).
• Low attenuation areas from necrosis are common. Cal-cification occurs relatively frequently.
• MRI can demonstrate certain features that are fairly spe-cific for hepatocellular carcinoma, as well as detect intrahepatic metastases and venous invasion. Unlike benign lesions like hemangiomas of the liver which tend to retain intravenously-administered gadolinium con-trast, hepatocellular carcinomas show washout of the contrast material.
Cavernous Hemangiomas
Cavernous hemangiomas are the most common primary liver tumor and second in frequency to
metastases for localized liver masses. They are more common in women, are usually solitary and are almost always asymptomatic. They are complex structures com-posed of multiple, large vascular channels lined by a single layer of endothelial cells.
! Recognizing cavernous hemangiomas of the liver on CT and MRI:• Cavernous hemangiomas are usually hypodense
lesions on unenhanced CT scans; they have a charac-teristic nodular enhancement from the periphery inward following injection of intravenous contrast and become isodense in the venous phase.
• Contrast tends to be retained within the numerous vas-cular spaces of the lesion so that they characteristically appear denser than the rest of the liver on delayed (10 minute) scans (Fig. 18-33).
• MRI is frequently the preferred modality in the evalu-ation of hemangiomas, as it is more sensitive than a nuclear medicine tagged red blood cell scan and more specific than a multiphase CT scan.
• Similar to CT, hemangiomas on MRI usually have a characteristic nodular enhancement from the periphery inward following injection of intravenous contrast. Con-trast tends to be retained within the numerous vascular spaces of hemangiomas so that they characteristically appear brighter than the rest of the liver on delayed (10 minute) scans (Fig. 18-34).
Hepatic Cysts
! Believed to be congenital in origin, they are easily identi-fied as sharply marginated, spherical lesions of low
differentiate between benign and malignant processes using techniques that do not place the patient in danger or subject the patient to unnecessary pain. This is the central goal in evaluating liver masses as well.
! CT studies are best at demonstrating liver masses when performed both with and without contrast because either study alone may fail to reveal an isodense mass, i.e., one that has the identical attenuation as the surrounding normal tissue.
! MRI is useful in characterizing liver masses, particularly small lesions 1 cm or less.
Metastases
Metastases are the most common malignant hepatic masses. While most are multiple, metastases also rep-
resent the most common cause of a solitary malignant mass in the liver.
! Most liver metastases originate in the gastrointestinal tract, particularly the colon, and almost all reach the liver via the bloodstream. Other primary sites of metastatic spread to the liver include stomach, pancreas, esophagus, lung, melanoma, and breast.
! Recognizing liver metastases on CT and MRI:• Metastases are usually multiple, low-attenuation
masses (Fig. 18-31). Larger metastases may demon-strate areas of necrosis that can be recognized as mottled areas of low attenuation within the mass. Mucin-producing carcinomas, such as might originate in the stomach, colon, or ovary, can calcify both the primary tumor and the metastases (see Fig. 16-14).
• MRI is as sensitive as CT in detecting liver metastases but is usually used in a problem-solving role. In general, MRI is more expensive than CT scanning and may suffer from more motion artifact than CT.
Hepatocellular Carcinoma (Hepatoma)
! Hepatocellular carcinoma is the most common primary malignancy of the liver. Virtually all arise in livers with
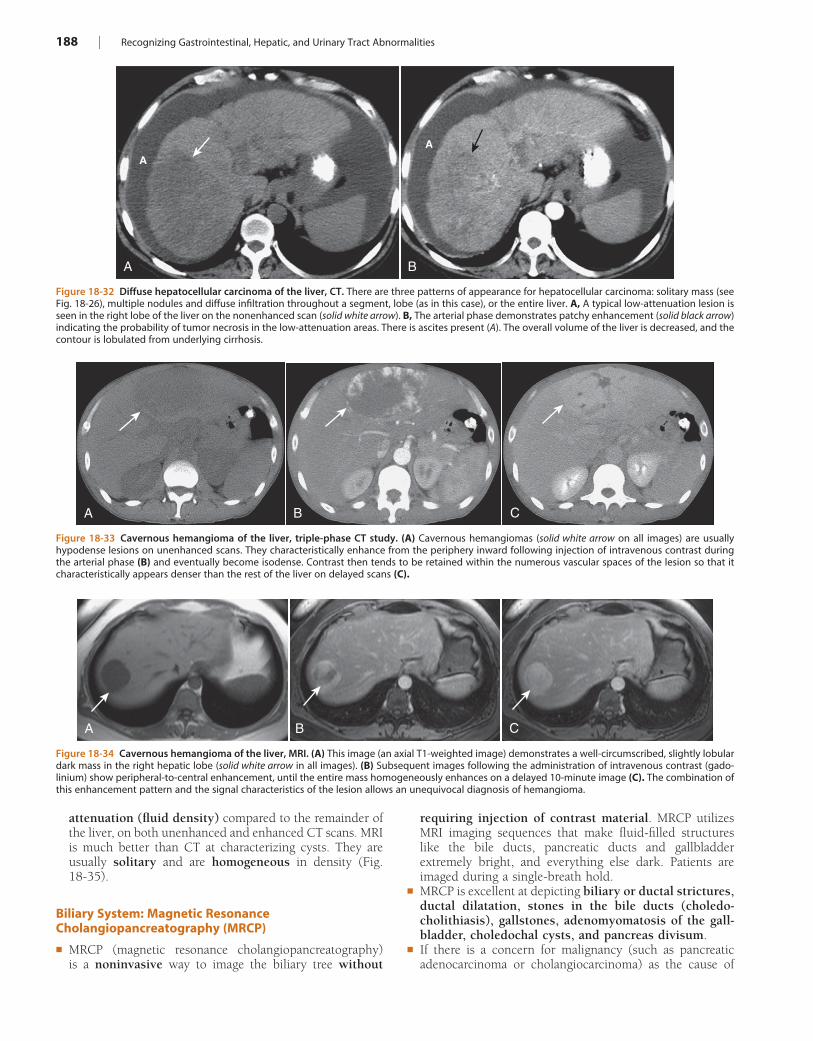
188 | Recognizing Gastrointestinal, Hepatic, and Urinary Tract Abnormalities
Figure 18-33 Cavernous hemangioma of the liver, triple-phase CT study. (A) Cavernous hemangiomas (solid white arrow on all images) are usually hypodense lesions on unenhanced scans. They characteristically enhance from the periphery inward following injection of intravenous contrast during the arterial phase (B) and eventually become isodense. Contrast then tends to be retained within the numerous vascular spaces of the lesion so that it characteristically appears denser than the rest of the liver on delayed scans (C).
A B C
Figure 18-34 Cavernous hemangioma of the liver, MRI. (A) This image (an axial T1-weighted image) demonstrates a well-circumscribed, slightly lobular dark mass in the right hepatic lobe (solid white arrow in all images). (B) Subsequent images following the administration of intravenous contrast (gado-linium) show peripheral-to-central enhancement, until the entire mass homogeneously enhances on a delayed 10-minute image (C). The combination of this enhancement pattern and the signal characteristics of the lesion allows an unequivocal diagnosis of hemangioma.
A B C
Figure 18-32 Diffuse hepatocellular carcinoma of the liver, CT. There are three patterns of appearance for hepatocellular carcinoma: solitary mass (see Fig. 18-26), multiple nodules and diffuse infiltration throughout a segment, lobe (as in this case), or the entire liver. A, A typical low-attenuation lesion is seen in the right lobe of the liver on the nonenhanced scan (solid white arrow). B, The arterial phase demonstrates patchy enhancement (solid black arrow) indicating the probability of tumor necrosis in the low-attenuation areas. There is ascites present (A). The overall volume of the liver is decreased, and the contour is lobulated from underlying cirrhosis.
A
AA
B
attenuation (fluid density) compared to the remainder of the liver, on both unenhanced and enhanced CT scans. MRI is much better than CT at characterizing cysts. They are usually solitary and are homogeneous in density (Fig. 18-35).
Biliary System: Magnetic Resonance Cholangiopancreatography (MRCP)
! MRCP (magnetic resonance cholangiopancreatography) is a noninvasive way to image the biliary tree without
requiring injection of contrast material. MRCP utilizes MRI imaging sequences that make fluid-filled structures like the bile ducts, pancreatic ducts and gallbladder extremely bright, and everything else dark. Patients are imaged during a single-breath hold.
! MRCP is excellent at depicting biliary or ductal strictures, ductal dilatation, stones in the bile ducts (choledo-cholithiasis), gallstones, adenomyomatosis of the gall-bladder, choledochal cysts, and pancreas divisum.
! If there is a concern for malignancy (such as pancreatic adenocarcinoma or cholangiocarcinoma) as the cause of
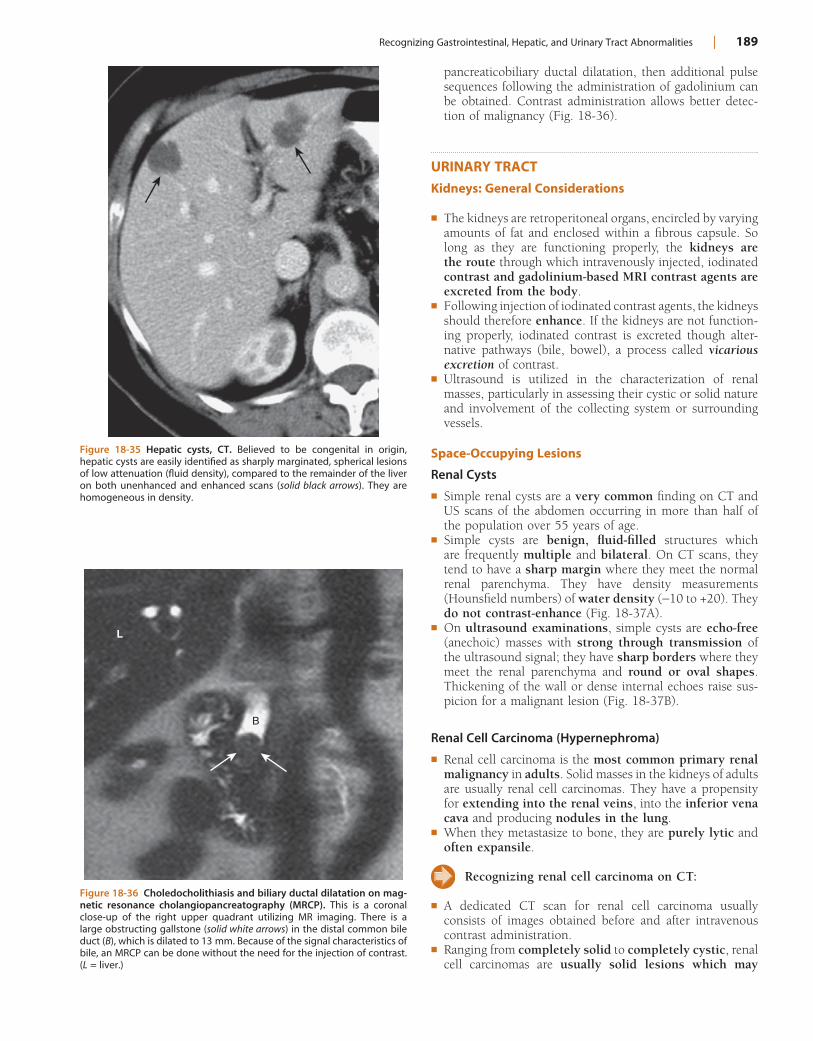
Recognizing Gastrointestinal, Hepatic, and Urinary Tract Abnormalities | 189
pancreaticobiliary ductal dilatation, then additional pulse sequences following the administration of gadolinium can be obtained. Contrast administration allows better detec-tion of malignancy (Fig. 18-36).
URINARY TRACTKidneys: General Considerations
! The kidneys are retroperitoneal organs, encircled by varying amounts of fat and enclosed within a fibrous capsule. So long as they are functioning properly, the kidneys are the route through which intravenously injected, iodinated contrast and gadolinium-based MRI contrast agents are excreted from the body.
! Following injection of iodinated contrast agents, the kidneys should therefore enhance. If the kidneys are not function-ing properly, iodinated contrast is excreted though alter-native pathways (bile, bowel), a process called vicarious excretion of contrast.
! Ultrasound is utilized in the characterization of renal masses, particularly in assessing their cystic or solid nature and involvement of the collecting system or surrounding vessels.
Space-Occupying Lesions
Renal Cysts
! Simple renal cysts are a very common finding on CT and US scans of the abdomen occurring in more than half of the population over 55 years of age.
! Simple cysts are benign, fluid-filled structures which are frequently multiple and bilateral. On CT scans, they tend to have a sharp margin where they meet the normal renal parenchyma. They have density measurements (Hounsfield numbers) of water density ("10 to +20). They do not contrast-enhance (Fig. 18-37A).
! On ultrasound examinations, simple cysts are echo-free (anechoic) masses with strong through trans mission of the ultrasound signal; they have sharp borders where they meet the renal parenchyma and round or oval shapes. Thickening of the wall or dense internal echoes raise sus-picion for a malignant lesion (Fig. 18-37B).
Renal Cell Carcinoma (Hypernephroma)
! Renal cell carcinoma is the most common primary renal malignancy in adults. Solid masses in the kidneys of adults are usually renal cell carcinomas. They have a propensity for extending into the renal veins, into the inferior vena cava and producing nodules in the lung.
! When they metastasize to bone, they are purely lytic and often expansile.
Recognizing renal cell carcinoma on CT:
! A dedicated CT scan for renal cell carcinoma usually consists of images obtained before and after intravenous contrast administration.
! Ranging from completely solid to completely cystic, renal cell carcinomas are usually solid lesions which may
Figure 18-35 Hepatic cysts, CT. Believed to be congenital in origin, hepatic cysts are easily identified as sharply marginated, spherical lesions of low attenuation (fluid density), compared to the remainder of the liver on both unenhanced and enhanced scans (solid black arrows). They are homogeneous in density.
Figure 18-36 Choledocholithiasis and biliary ductal dilatation on mag-netic resonance cholangiopancreatography (MRCP). This is a coronal close-up of the right upper quadrant utilizing MR imaging. There is a large obstructing gallstone (solid white arrows) in the distal common bile duct (B), which is dilated to 13 mm. Because of the signal characteristics of bile, an MRCP can be done without the need for the injection of contrast. (L = liver.)
B
L
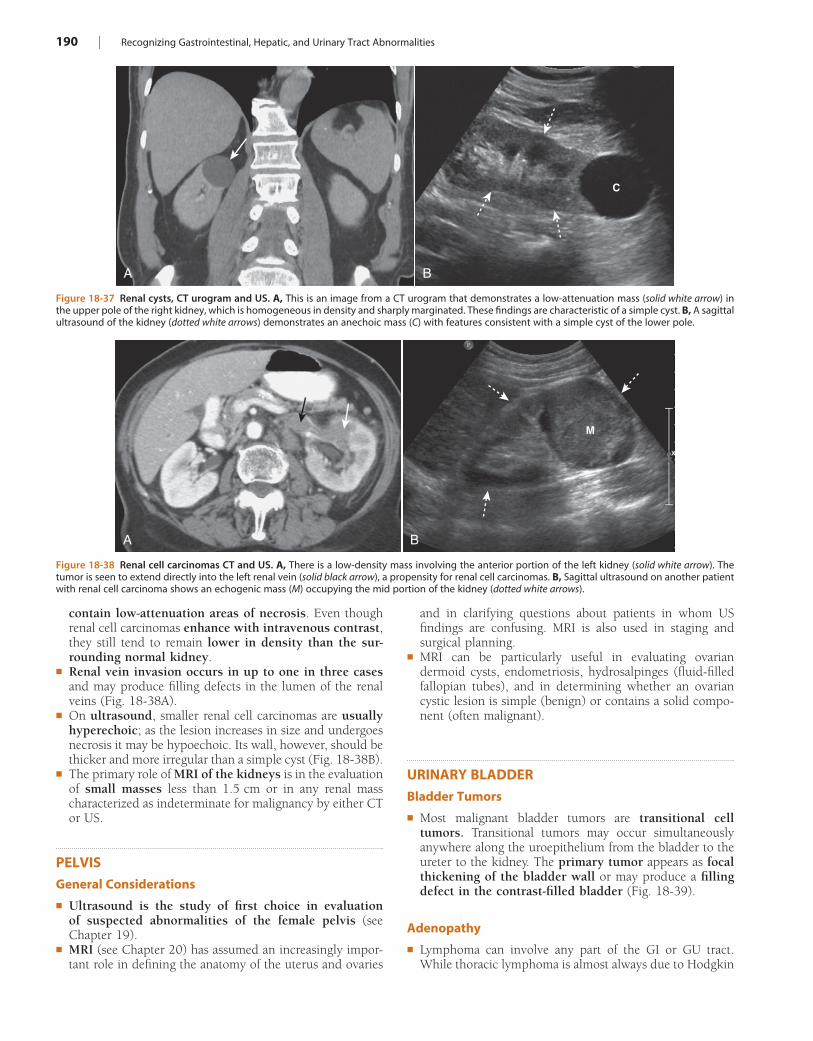
190 | Recognizing Gastrointestinal, Hepatic, and Urinary Tract Abnormalities
and in clarifying questions about patients in whom US findings are confusing. MRI is also used in staging and surgical planning.
! MRI can be particularly useful in evaluating ovarian dermoid cysts, endometriosis, hydrosalpinges (fluid-filled fallopian tubes), and in determining whether an ovarian cystic lesion is simple (benign) or contains a solid compo-nent (often malignant).
URINARY BLADDERBladder Tumors
! Most malignant bladder tumors are transitional cell tumors. Transitional tumors may occur simultaneously anywhere along the uroepithelium from the bladder to the ureter to the kidney. The primary tumor appears as focal thickening of the bladder wall or may produce a filling defect in the contrast-filled bladder (Fig. 18-39).
Adenopathy
! Lymphoma can involve any part of the GI or GU tract. While thoracic lymphoma is almost always due to Hodgkin
contain low-attenuation areas of necrosis. Even though renal cell carcinomas enhance with intravenous contrast, they still tend to remain lower in density than the sur-rounding normal kidney.
! Renal vein invasion occurs in up to one in three cases and may produce filling defects in the lumen of the renal veins (Fig. 18-38A).
! On ultrasound, smaller renal cell carcinomas are usually hyperechoic; as the lesion increases in size and undergoes necrosis it may be hypoechoic. Its wall, however, should be thicker and more irregular than a simple cyst (Fig. 18-38B).
! The primary role of MRI of the kidneys is in the evaluation of small masses less than 1.5 cm or in any renal mass characterized as indeterminate for malignancy by either CT or US.
PELVISGeneral Considerations
! Ultrasound is the study of first choice in evaluation of suspected abnormalities of the female pelvis (see Chapter 19).
! MRI (see Chapter 20) has assumed an increasingly impor-tant role in defining the anatomy of the uterus and ovaries
Figure 18-37 Renal cysts, CT urogram and US. A, This is an image from a CT urogram that demonstrates a low-attenuation mass (solid white arrow) in the upper pole of the right kidney, which is homogeneous in density and sharply marginated. These findings are characteristic of a simple cyst. B, A sagittal ultrasound of the kidney (dotted white arrows) demonstrates an anechoic mass (C) with features consistent with a simple cyst of the lower pole.
A B
C
Figure 18-38 Renal cell carcinomas CT and US. A, There is a low-density mass involving the anterior portion of the left kidney (solid white arrow). The tumor is seen to extend directly into the left renal vein (solid black arrow), a propensity for renal cell carcinomas. B, Sagittal ultrasound on another patient with renal cell carcinoma shows an echogenic mass (M) occupying the mid portion of the kidney (dotted white arrows).
A B
M
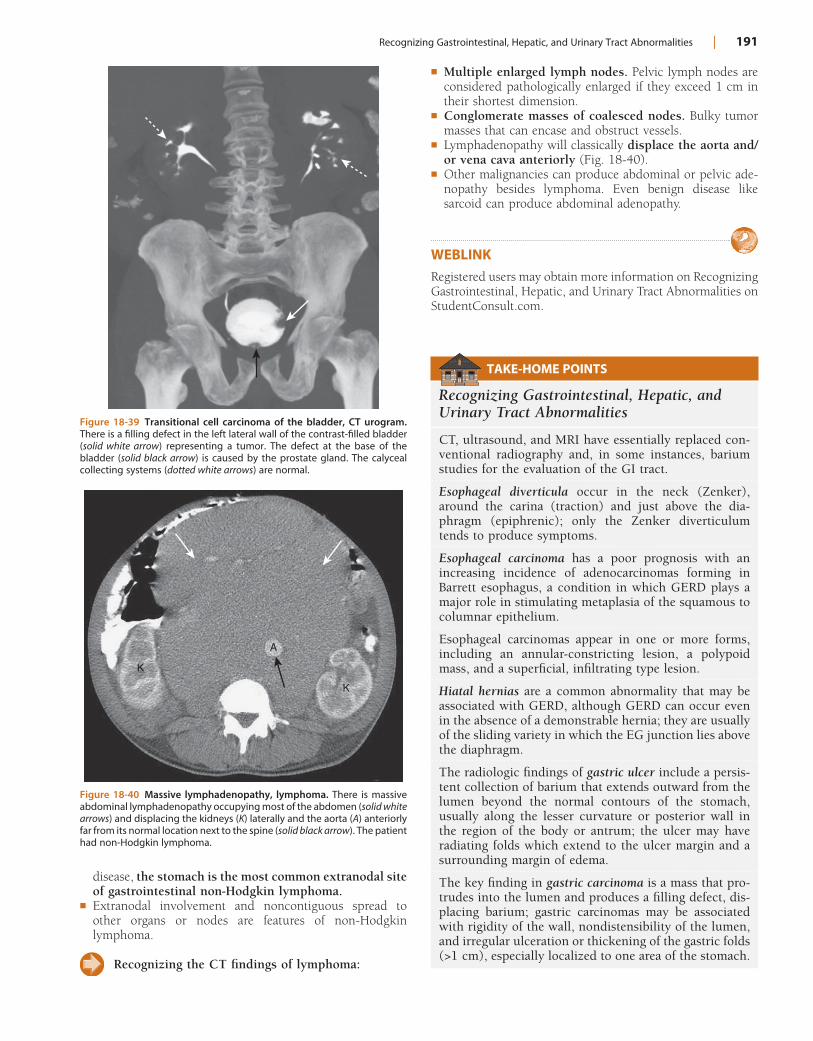
Recognizing Gastrointestinal, Hepatic, and Urinary Tract Abnormalities | 191
! Multiple enlarged lymph nodes. Pelvic lymph nodes are considered pathologically enlarged if they exceed 1 cm in their shortest dimension.
! Conglomerate masses of coalesced nodes. Bulky tumor masses that can encase and obstruct vessels.
! Lymphadenopathy will classically displace the aorta and/or vena cava anteriorly (Fig. 18-40).
! Other malignancies can produce abdominal or pelvic ade-nopathy besides lymphoma. Even benign disease like sarcoid can produce abdominal adenopathy.
WEBLINKRegistered users may obtain more information on Recognizing Gastrointestinal, Hepatic, and Urinary Tract Abnormalities on StudentConsult.com.
disease, the stomach is the most common extranodal site of gastrointestinal non-Hodgkin lymphoma.
! Extranodal involvement and noncontiguous spread to other organs or nodes are features of non-Hodgkin lymphoma.
Recognizing the CT findings of lymphoma:
Figure 18-39 Transitional cell carcinoma of the bladder, CT urogram. There is a filling defect in the left lateral wall of the contrast-filled bladder (solid white arrow) representing a tumor. The defect at the base of the bladder (solid black arrow) is caused by the prostate gland. The calyceal collecting systems (dotted white arrows) are normal.
Figure 18-40 Massive lymphadenopathy, lymphoma. There is massive abdominal lymphadenopathy occupying most of the abdomen (solid white arrows) and displacing the kidneys (K) laterally and the aorta (A) anteriorly far from its normal location next to the spine (solid black arrow). The patient had non-Hodgkin lymphoma.
A
K
K
TAKE-HOME POINTS
Recognizing Gastrointestinal, Hepatic, and Urinary Tract Abnormalities
CT, ultrasound, and MRI have essentially replaced con-ventional radiography and, in some instances, barium studies for the evaluation of the GI tract.
Esophageal diverticula occur in the neck (Zenker), around the carina (traction) and just above the dia-phragm (epiphrenic); only the Zenker diverticulum tends to produce symptoms.
Esophageal carcinoma has a poor prognosis with an increasing incidence of adenocarcinomas forming in Barrett esophagus, a condition in which GERD plays a major role in stimulating metaplasia of the squamous to columnar epithelium.
Esophageal carcinomas appear in one or more forms, including an annular-constricting lesion, a polypoid mass, and a superficial, infiltrating type lesion.
Hiatal hernias are a common abnormality that may be associated with GERD, although GERD can occur even in the absence of a demonstrable hernia; they are usually of the sliding variety in which the EG junction lies above the diaphragm.
The radiologic findings of gastric ulcer include a persis-tent collection of barium that extends outward from the lumen beyond the normal contours of the stomach, usually along the lesser curvature or posterior wall in the region of the body or antrum; the ulcer may have radiating folds which extend to the ulcer margin and a surrounding margin of edema.
The key finding in gastric carcinoma is a mass that pro-trudes into the lumen and produces a filling defect, dis-placing barium; gastric carcinomas may be associated with rigidity of the wall, nondistensibility of the lumen, and irregular ulceration or thickening of the gastric folds (>1 cm), especially localized to one area of the stomach.
192 | Recognizing Gastrointestinal, Hepatic, and Urinary Tract Abnormalities
The radiologic findings of duodenal ulcers include a per-sistent collection of contrast, more often seen en face with surrounding spasm and edema. Healing of duodenal ulcers produces scarring and deformity of the bulb.
Any imaging evaluation of the bowel should ideally be carried out with the bowel distended with air or contrast because collapsed and unopacified loops of bowel can introduce artifactual errors of diagnosis.
Key abnormal findings of bowel disease on CT are thick-ening of the bowel wall, submucosal edema or hemor-rhage, hazy infiltration of fat, and extraluminal air or contrast.
Crohn disease is a chronic, relapsing, granulomatous inflammation of the small bowel and colon, usually involv-ing the terminal ileum, resulting in ulceration, obstruc-tion, and fistula formation; it may have skip areas, is prone to fistula formation, and has a propensity for recurring fol-lowing surgical removal of an involved segment.
Colonic diverticulosis increases in incidence with increas-ing age, most often involves the sigmoid colon, and is almost always asymptomatic, although it can lead to diverticulitis or massive GI bleeding, especially from right-sided diverticula.
CT is the study of choice for imaging diverticulitis; the findings include pericolonic inflammation, thickening of the adjacent colonic wall (>4 mm), abscess formation and confined perforation of the colon.
Most colonic polyps are hyperplastic and have no malignant potential; adenomatous polyps carry a malig-nant potential that is related, in part, to their size. Colonic polyps can be visualized using barium enema examination, CT (virtual colonoscopy), or optical colonoscopy.
Imaging signs of colonic polyps include a persistent filling defect in the colon with or without a stalk; some larger, villous adenomatous polyps have a higher malig-nant potential and may contain barium within the inter-stices of their fronds.
The imaging findings of colonic carcinoma are a persis-tent, large, polypoid or annular constricting filling defect of the colon which may have frank or micro-perforation or large bowel obstruction and metastases, especially to the liver and the lungs.
Colitis of any etiology can cause thickening of the bowel wall, narrowing of the lumen, and infiltration of the sur-rounding fat.
CT is the study of choice in diagnosing appendicitis. Findings include a dilated appendix (>6 mm) that does not fill with oral contrast, periappendiceal inflammation, increased enhancement of the wall of the appendix with intravenous contrast, and sometimes identification of an appendicolith (fecolith).
The two most common causes of pancreatitis are gallstones and alcoholism; pancreatitis is a clinical diagnosis, with CT serving to document a cause or a
complication of the disease; CT findings include enlarge-ment of the pancreas, peripancreatic stranding, pancre-atic necrosis, and pseudocyst formation.
Pancreatic adenocarcinoma has a very unfavorable prog-nosis, occurs most often in the pancreatic head, and usually manifests as a focal hypodense mass, which may be associated with dilatation of the pancreatic and/or biliary ducts.
Fatty infiltration of the liver is very common and can produce focal or diffuse areas of decreased attenuation that characteristically do not displace or obstruct the hepatic vessels; the liver appears less dense than the spleen.
In its later stages, cirrhosis produces a small liver (espe-cially the right lobe) with a lobulated contour, inhomo-geneous appearance of the parenchyma, prominent left and caudate lobes, splenomegaly, varices, and ascites.
Evaluation of liver masses is frequently done utilizing a triple-phase scan that includes a precontrast scan and two postcontrast scans, one in the hepatic-arterial phase and then another in the portal venous phase.
Metastases are the most common malignant hepatic masses; metastases mostly originate in the GI tract and appear as multiple, low-density masses that may necrose as they become larger.
Hepatocellular carcinoma is the most common primary hepatic malignancy; these lesions are usually solitary and typically enhance with IV contrast on CT.
Cavernous hemangiomas are usually solitary, more common in females, and typically produce no symptoms; they have a characteristic centripetal pattern of enhance-ment and frequently retain contrast longer than the remainder of the liver.
MRCP (magnetic resonance cholangiopancreatography) is a noninvasive way to image the biliary tree without requiring injection of contrast material; it can be used to demonstrate biliary strictures, gallstones, and congenital anomalies.
Renal cysts are a very common finding, are frequently multiple and bilateral, do not enhance, and typically have sharp margins where they meet the normal renal parenchyma. On US, simple cysts are well-defined anechoic masses.
Renal cell carcinoma is the most common primary renal malignancy and shows a propensity for extension into the renal vein and for metastasizing to lung and bone; on CT, it is usually a solid mass that enhances with IV contrast but remains less dense than the normal kidney. On US, renal cell carcinomas are frequently echogenic masses.
Ultrasound is the imaging study of first choice in evaluat-ing the female pelvis.
Abdominal and pelvic adenopathy may be caused by lymphoma, other malignancies, or benign diseases like sarcoid; multiple enlarged nodes or conglomerate masses of nodes may be seen on CT.
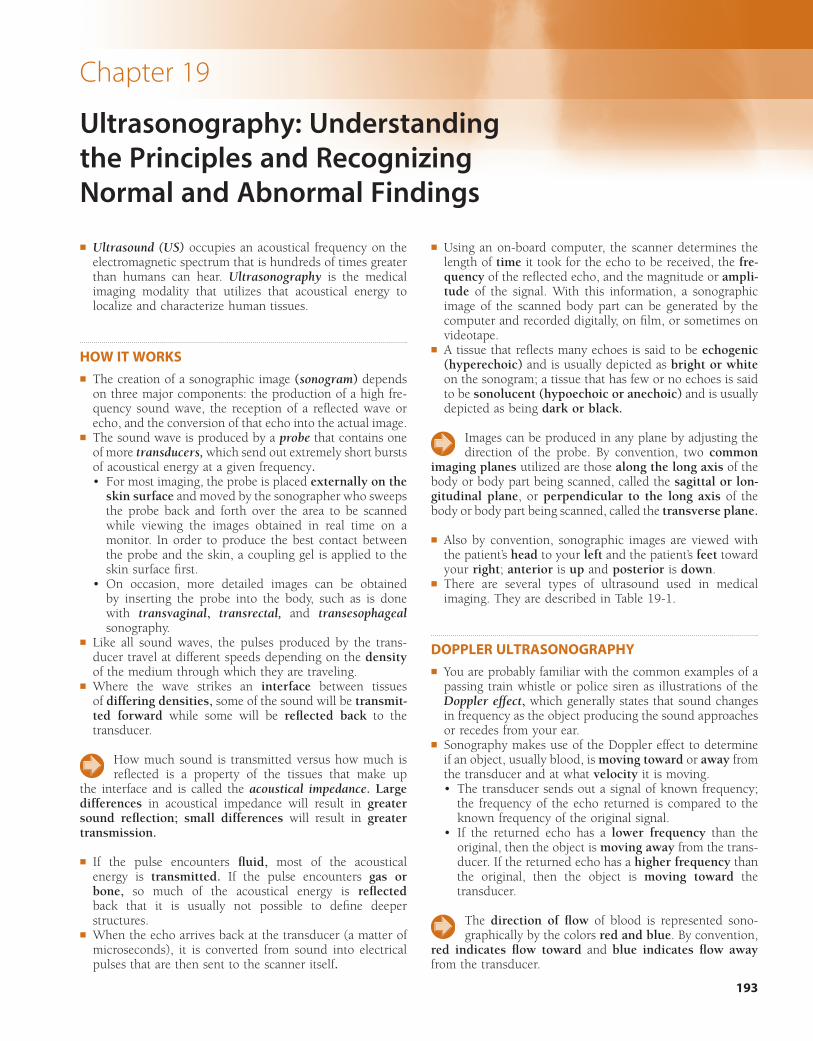
193
Chapter 19
Ultrasonography: Understanding the Principles and Recognizing Normal and Abnormal Findings
! Ultrasound (US) occupies an acoustical frequency on the electromagnetic spectrum that is hundreds of times greater than humans can hear. Ultrasonography is the medical imaging modality that utilizes that acoustical energy to localize and characterize human tissues.
HOW IT WORKS! The creation of a sonographic image (sonogram) depends
on three major components: the production of a high fre-quency sound wave, the reception of a reflected wave or echo, and the conversion of that echo into the actual image.
! The sound wave is produced by a probe that contains one of more transducers, which send out extremely short bursts of acoustical energy at a given frequency.• For most imaging, the probe is placed externally on the
skin surface and moved by the sonographer who sweeps the probe back and forth over the area to be scanned while viewing the images obtained in real time on a monitor. In order to produce the best contact between the probe and the skin, a coupling gel is applied to the skin surface first.
• On occasion, more detailed images can be obtained by inserting the probe into the body, such as is done with transvaginal, transrectal, and transesophageal sonography.
! Like all sound waves, the pulses produced by the trans-ducer travel at different speeds depending on the density of the medium through which they are traveling.
! Where the wave strikes an interface between tissues of differing densities, some of the sound will be transmit-ted forward while some will be reflected back to the transducer.
How much sound is transmitted versus how much is reflected is a property of the tissues that make up
the interface and is called the acoustical impedance. Large differences in acoustical impedance will result in greater sound reflection; small differences will result in greater transmission.
! If the pulse encounters fluid, most of the acoustical energy is transmitted. If the pulse encounters gas or bone, so much of the acoustical energy is reflected back that it is usually not possible to define deeper structures.
! When the echo arrives back at the transducer (a matter of microseconds), it is converted from sound into electrical pulses that are then sent to the scanner itself.
! Using an on-board computer, the scanner determines the length of time it took for the echo to be received, the fre-quency of the reflected echo, and the magnitude or ampli-tude of the signal. With this information, a sonographic image of the scanned body part can be generated by the computer and recorded digitally, on film, or sometimes on videotape.
! A tissue that reflects many echoes is said to be echogenic (hyperechoic) and is usually depicted as bright or white on the sonogram; a tissue that has few or no echoes is said to be sonolucent (hypoechoic or anechoic) and is usually depicted as being dark or black.
Images can be produced in any plane by adjusting the direction of the probe. By convention, two common
imaging planes utilized are those along the long axis of the body or body part being scanned, called the sagittal or lon-gitudinal plane, or perpendicular to the long axis of the body or body part being scanned, called the transverse plane.
! Also by convention, sonographic images are viewed with the patient’s head to your left and the patient’s feet toward your right; anterior is up and posterior is down.
! There are several types of ultrasound used in medical imaging. They are described in Table 19-1.
DOPPLER ULTRASONOGRAPHY! You are probably familiar with the common examples of a
passing train whistle or police siren as illustrations of the Doppler effect, which generally states that sound changes in frequency as the object producing the sound approaches or recedes from your ear.
! Sonography makes use of the Doppler effect to determine if an object, usually blood, is moving toward or away from the transducer and at what velocity it is moving.• The transducer sends out a signal of known frequency;
the frequency of the echo returned is compared to the known frequency of the original signal.
• If the returned echo has a lower frequency than the original, then the object is moving away from the trans-ducer. If the returned echo has a higher frequency than the original, then the object is moving toward the transducer.
The direction of flow of blood is represented sono-graphically by the colors red and blue. By convention,
red indicates flow toward and blue indicates flow away from the transducer.
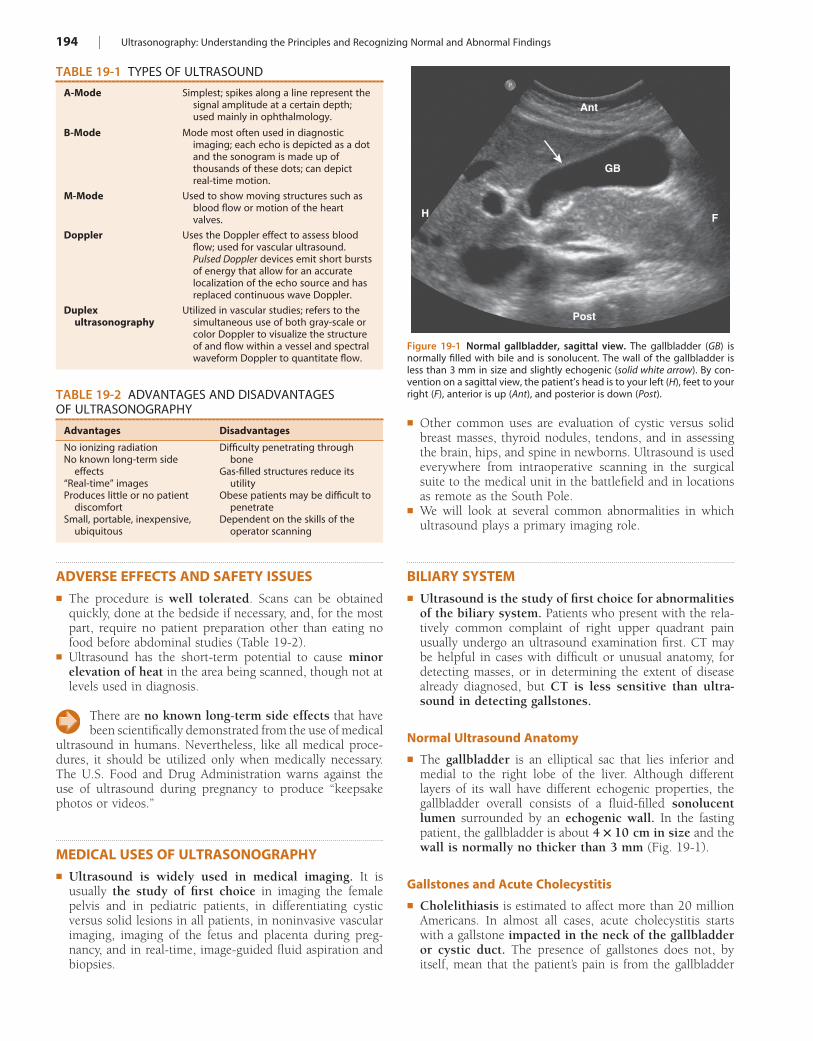
194 | Ultrasonography: Understanding the Principles and Recognizing Normal and Abnormal Findings
! Other common uses are evaluation of cystic versus solid breast masses, thyroid nodules, tendons, and in assessing the brain, hips, and spine in newborns. Ultrasound is used everywhere from intraoperative scanning in the surgical suite to the medical unit in the battlefield and in locations as remote as the South Pole.
! We will look at several common abnormalities in which ultrasound plays a primary imaging role.
BILIARY SYSTEM! Ultrasound is the study of first choice for abnormalities
of the biliary system. Patients who present with the rela-tively common complaint of right upper quadrant pain usually undergo an ultrasound examination first. CT may be helpful in cases with difficult or unusual anatomy, for detecting masses, or in determining the extent of disease already diagnosed, but CT is less sensitive than ultra-sound in detecting gallstones.
Normal Ultrasound Anatomy
! The gallbladder is an elliptical sac that lies inferior and medial to the right lobe of the liver. Although different layers of its wall have different echogenic properties, the gallbladder overall consists of a fluid-filled sonolucent lumen surrounded by an echogenic wall. In the fasting patient, the gallbladder is about 4 ! 10 cm in size and the wall is normally no thicker than 3 mm (Fig. 19-1).
Gallstones and Acute Cholecystitis
! Cholelithiasis is estimated to affect more than 20 million Americans. In almost all cases, acute cholecystitis starts with a gallstone impacted in the neck of the gallbladder or cystic duct. The presence of gallstones does not, by itself, mean that the patient’s pain is from the gallbladder
TABLE 19-1 TYPES OF ULTRASOUND
A-Mode Simplest; spikes along a line represent the signal amplitude at a certain depth; used mainly in ophthalmology.
B-Mode Mode most often used in diagnostic imaging; each echo is depicted as a dot and the sonogram is made up of thousands of these dots; can depict real-time motion.
M-Mode Used to show moving structures such as blood flow or motion of the heart valves.
Doppler Uses the Doppler effect to assess blood flow; used for vascular ultrasound. Pulsed Doppler devices emit short bursts of energy that allow for an accurate localization of the echo source and has replaced continuous wave Doppler.
Duplex ultrasonography
Utilized in vascular studies; refers to the simultaneous use of both gray-scale or color Doppler to visualize the structure of and flow within a vessel and spectral waveform Doppler to quantitate flow.
TABLE 19-2 ADVANTAGES AND DISADVANTAGES OF ULTRASONOGRAPHY
Advantages Disadvantages
No ionizing radiationNo known long-term side
effects“Real-time” imagesProduces little or no patient
discomfortSmall, portable, inexpensive,
ubiquitous
Difficulty penetrating through bone
Gas-filled structures reduce its utility
Obese patients may be difficult to penetrate
Dependent on the skills of the operator scanning
Figure 19-1 Normal gallbladder, sagittal view. The gallbladder (GB) is normally filled with bile and is sonolucent. The wall of the gallbladder is less than 3 mm in size and slightly echogenic (solid white arrow). By con-vention on a sagittal view, the patient’s head is to your left (H), feet to your right (F), anterior is up (Ant), and posterior is down (Post).
H F
Post
GB
Ant
ADVERSE EFFECTS AND SAFETY ISSUES! The procedure is well tolerated. Scans can be obtained
quickly, done at the bedside if necessary, and, for the most part, require no patient preparation other than eating no food before abdominal studies (Table 19-2).
! Ultrasound has the short-term potential to cause minor elevation of heat in the area being scanned, though not at levels used in diagnosis.
There are no known long-term side effects that have been scientifically demonstrated from the use of medical
ultrasound in humans. Nevertheless, like all medical proce-dures, it should be utilized only when medically necessary. The U.S. Food and Drug Administration warns against the use of ultrasound during pregnancy to produce “keepsake photos or videos.”
MEDICAL USES OF ULTRASONOGRAPHY! Ultrasound is widely used in medical imaging. It is
usually the study of first choice in imaging the female pelvis and in pediatric patients, in differentiating cystic versus solid lesions in all patients, in noninvasive vascular imaging, imaging of the fetus and placenta during preg-nancy, and in real-time, image-guided fluid aspiration and biopsies.
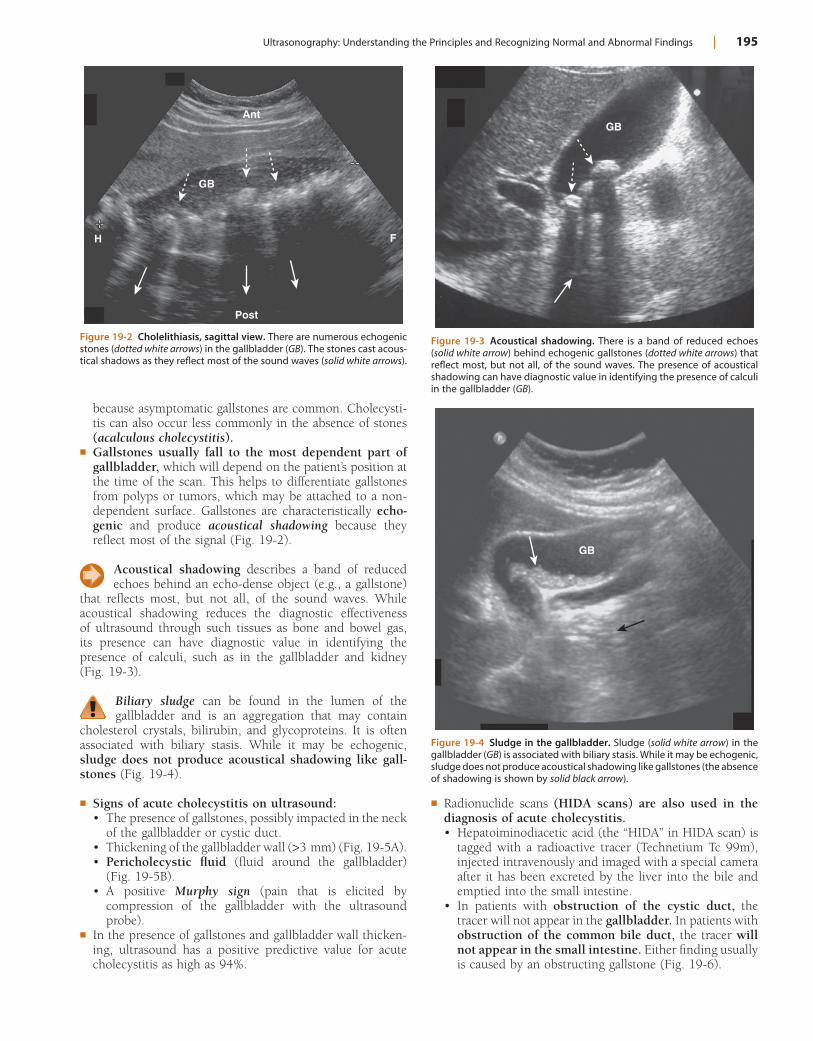
Ultrasonography: Understanding the Principles and Recognizing Normal and Abnormal Findings | 195
! Radionuclide scans (HIDA scans) are also used in the diagnosis of acute cholecystitis.• Hepatoiminodiacetic acid (the “HIDA” in HIDA scan) is
tagged with a radioactive tracer (Technetium Tc 99m), injected intravenously and imaged with a special camera after it has been excreted by the liver into the bile and emptied into the small intestine.
• In patients with obstruction of the cystic duct, the tracer will not appear in the gallbladder. In patients with obstruction of the common bile duct, the tracer will not appear in the small intestine. Either finding usually is caused by an obstructing gallstone (Fig. 19-6).
because asymptomatic gallstones are common. Cholecysti-tis can also occur less commonly in the absence of stones (acalculous cholecystitis).
! Gallstones usually fall to the most dependent part of gallbladder, which will depend on the patient’s position at the time of the scan. This helps to differentiate gallstones from polyps or tumors, which may be attached to a non-dependent surface. Gallstones are characteristically echo-genic and produce acoustical shadowing because they reflect most of the signal (Fig. 19-2).
Acoustical shadowing describes a band of reduced echoes behind an echo-dense object (e.g., a gallstone)
that reflects most, but not all, of the sound waves. While acoustical shadowing reduces the diagnostic effectiveness of ultrasound through such tissues as bone and bowel gas, its presence can have diagnostic value in identifying the presence of calculi, such as in the gallbladder and kidney (Fig. 19-3).
Biliary sludge can be found in the lumen of the gallbladder and is an aggregation that may contain
cholesterol crystals, bilirubin, and glycoproteins. It is often associated with biliary stasis. While it may be echogenic, sludge does not produce acoustical shadowing like gall-stones (Fig. 19-4).
! Signs of acute cholecystitis on ultrasound:• The presence of gallstones, possibly impacted in the neck
of the gallbladder or cystic duct.• Thickening of the gallbladder wall (>3 mm) (Fig. 19-5A).• Pericholecystic fluid (fluid around the gallbladder)
(Fig. 19-5B).• A positive Murphy sign (pain that is elicited by
compression of the gallbladder with the ultrasound probe).
! In the presence of gallstones and gallbladder wall thicken-ing, ultrasound has a positive predictive value for acute cholecystitis as high as 94%.
Figure 19-2 Cholelithiasis, sagittal view. There are numerous echogenic stones (dotted white arrows) in the gallbladder (GB). The stones cast acous-tical shadows as they reflect most of the sound waves (solid white arrows).
H F
Post
GB
Ant
Figure 19-3 Acoustical shadowing. There is a band of reduced echoes (solid white arrow) behind echogenic gallstones (dotted white arrows) that reflect most, but not all, of the sound waves. The presence of acoustical shadowing can have diagnostic value in identifying the presence of calculi in the gallbladder (GB).
GB
Figure 19-4 Sludge in the gallbladder. Sludge (solid white arrow) in the gallbladder (GB) is associated with biliary stasis. While it may be echogenic, sludge does not produce acoustical shadowing like gallstones (the absence of shadowing is shown by solid black arrow).
GB
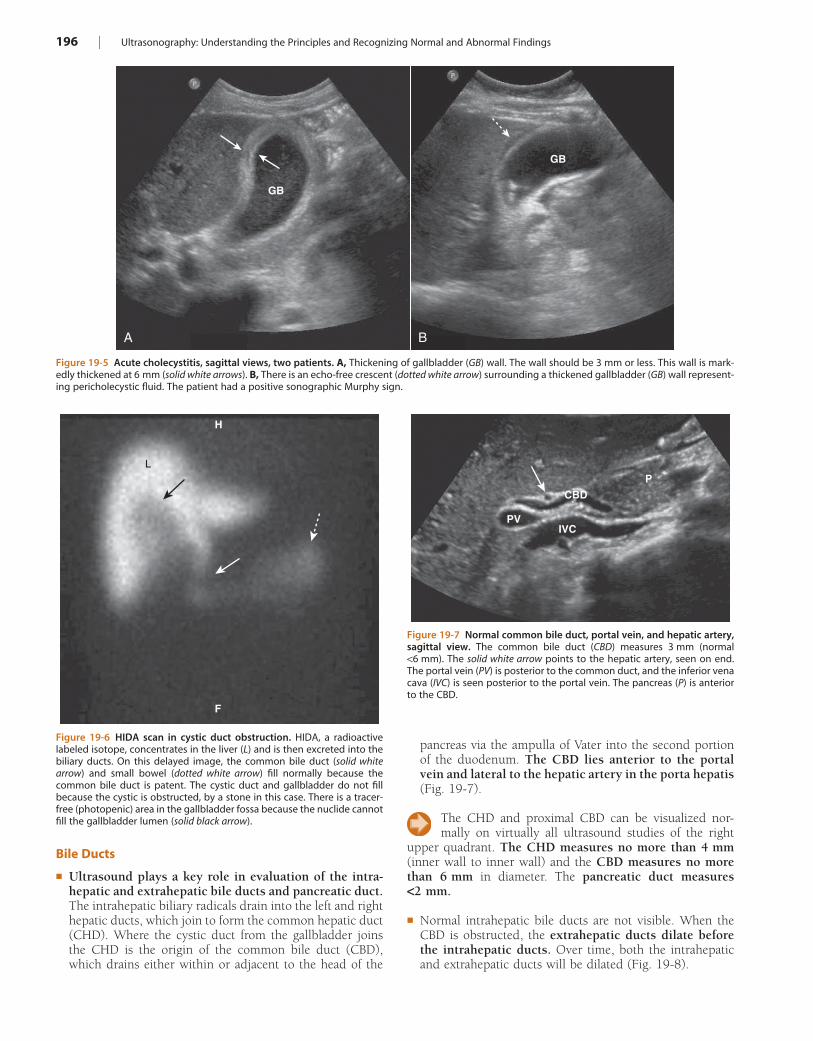
196 | Ultrasonography: Understanding the Principles and Recognizing Normal and Abnormal Findings
pancreas via the ampulla of Vater into the second portion of the duodenum. The CBD lies anterior to the portal vein and lateral to the hepatic artery in the porta hepatis (Fig. 19-7).
The CHD and proximal CBD can be visualized nor-mally on virtually all ultrasound studies of the right
upper quadrant. The CHD measures no more than 4 mm (inner wall to inner wall) and the CBD measures no more than 6 mm in diameter. The pancreatic duct measures <2 mm.
! Normal intrahepatic bile ducts are not visible. When the CBD is obstructed, the extrahepatic ducts dilate before the intrahepatic ducts. Over time, both the intrahepatic and extrahepatic ducts will be dilated (Fig. 19-8).
Bile Ducts
! Ultrasound plays a key role in evaluation of the intra-hepatic and extrahepatic bile ducts and pancreatic duct. The intrahepatic biliary radicals drain into the left and right hepatic ducts, which join to form the common hepatic duct (CHD). Where the cystic duct from the gallbladder joins the CHD is the origin of the common bile duct (CBD), which drains either within or adjacent to the head of the
Figure 19-5 Acute cholecystitis, sagittal views, two patients. A, Thickening of gallbladder (GB) wall. The wall should be 3 mm or less. This wall is mark-edly thickened at 6 mm (solid white arrows). B, There is an echo-free crescent (dotted white arrow) surrounding a thickened gallbladder (GB) wall represent-ing pericholecystic fluid. The patient had a positive sonographic Murphy sign.
A B
GB
GB
Figure 19-6 HIDA scan in cystic duct obstruction. HIDA, a radioactive labeled isotope, concentrates in the liver (L) and is then excreted into the biliary ducts. On this delayed image, the common bile duct (solid white arrow) and small bowel (dotted white arrow) fill normally because the common bile duct is patent. The cystic duct and gallbladder do not fill because the cystic is obstructed, by a stone in this case. There is a tracer-free (photopenic) area in the gallbladder fossa because the nuclide cannot fill the gallbladder lumen (solid black arrow).
H
F
L
Figure 19-7 Normal common bile duct, portal vein, and hepatic artery, sagittal view. The common bile duct (CBD) measures 3 mm (normal <6 mm). The solid white arrow points to the hepatic artery, seen on end. The portal vein (PV) is posterior to the common duct, and the inferior vena cava (IVC) is seen posterior to the portal vein. The pancreas (P) is anterior to the CBD.
PVIVC
CBDP
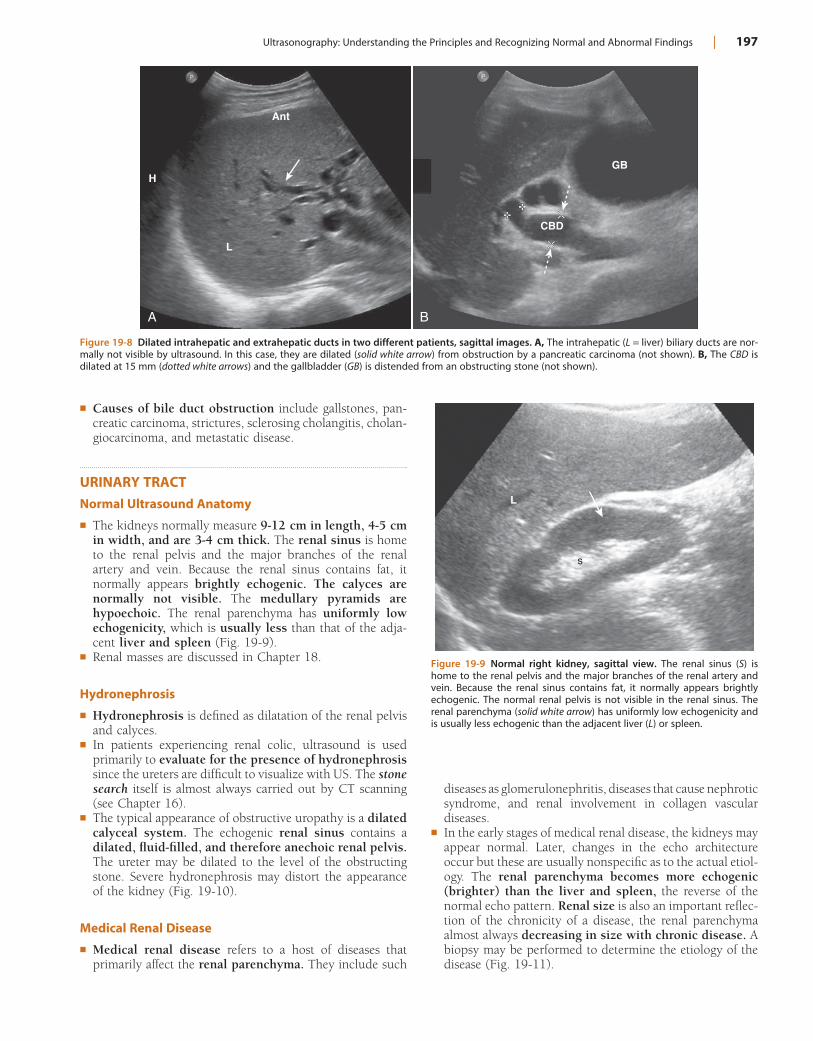
Ultrasonography: Understanding the Principles and Recognizing Normal and Abnormal Findings | 197
diseases as glomerulonephritis, diseases that cause nephrotic syndrome, and renal involvement in collagen vascular diseases.
! In the early stages of medical renal disease, the kidneys may appear normal. Later, changes in the echo architecture occur but these are usually nonspecific as to the actual etiol-ogy. The renal parenchyma becomes more echogenic (brighter) than the liver and spleen, the reverse of the normal echo pattern. Renal size is also an important reflec-tion of the chronicity of a disease, the renal parenchyma almost always decreasing in size with chronic disease. A biopsy may be performed to determine the etiology of the disease (Fig. 19-11).
! Causes of bile duct obstruction include gallstones, pan-creatic carcinoma, strictures, sclerosing cholangitis, cholan-giocarcinoma, and metastatic disease.
URINARY TRACTNormal Ultrasound Anatomy
! The kidneys normally measure 9-12 cm in length, 4-5 cm in width, and are 3-4 cm thick. The renal sinus is home to the renal pelvis and the major branches of the renal artery and vein. Because the renal sinus contains fat, it normally appears brightly echogenic. The calyces are normally not visible. The medullary pyramids are hypoechoic. The renal parenchyma has uniformly low echogenicity, which is usually less than that of the adja-cent liver and spleen (Fig. 19-9).
! Renal masses are discussed in Chapter 18.
Hydronephrosis
! Hydronephrosis is defined as dilatation of the renal pelvis and calyces.
! In patients experiencing renal colic, ultrasound is used primarily to evaluate for the presence of hydronephrosis since the ureters are difficult to visualize with US. The stone search itself is almost always carried out by CT scanning (see Chapter 16).
! The typical appearance of obstructive uropathy is a dilated calyceal system. The echogenic renal sinus contains a dilated, fluid-filled, and therefore anechoic renal pelvis. The ureter may be dilated to the level of the obstructing stone. Severe hydronephrosis may distort the appearance of the kidney (Fig. 19-10).
Medical Renal Disease
! Medical renal disease refers to a host of diseases that primarily affect the renal parenchyma. They include such
Figure 19-8 Dilated intrahepatic and extrahepatic ducts in two different patients, sagittal images. A, The intrahepatic (L = liver) biliary ducts are nor-mally not visible by ultrasound. In this case, they are dilated (solid white arrow) from obstruction by a pancreatic carcinoma (not shown). B, The CBD is dilated at 15 mm (dotted white arrows) and the gallbladder (GB) is distended from an obstructing stone (not shown).
A B
H
Ant
L
CBD
GB
Figure 19-9 Normal right kidney, sagittal view. The renal sinus (S) is home to the renal pelvis and the major branches of the renal artery and vein. Because the renal sinus contains fat, it normally appears brightly echogenic. The normal renal pelvis is not visible in the renal sinus. The renal parenchyma (solid white arrow) has uniformly low echogenicity and is usually less echogenic than the adjacent liver (L) or spleen.
L
s
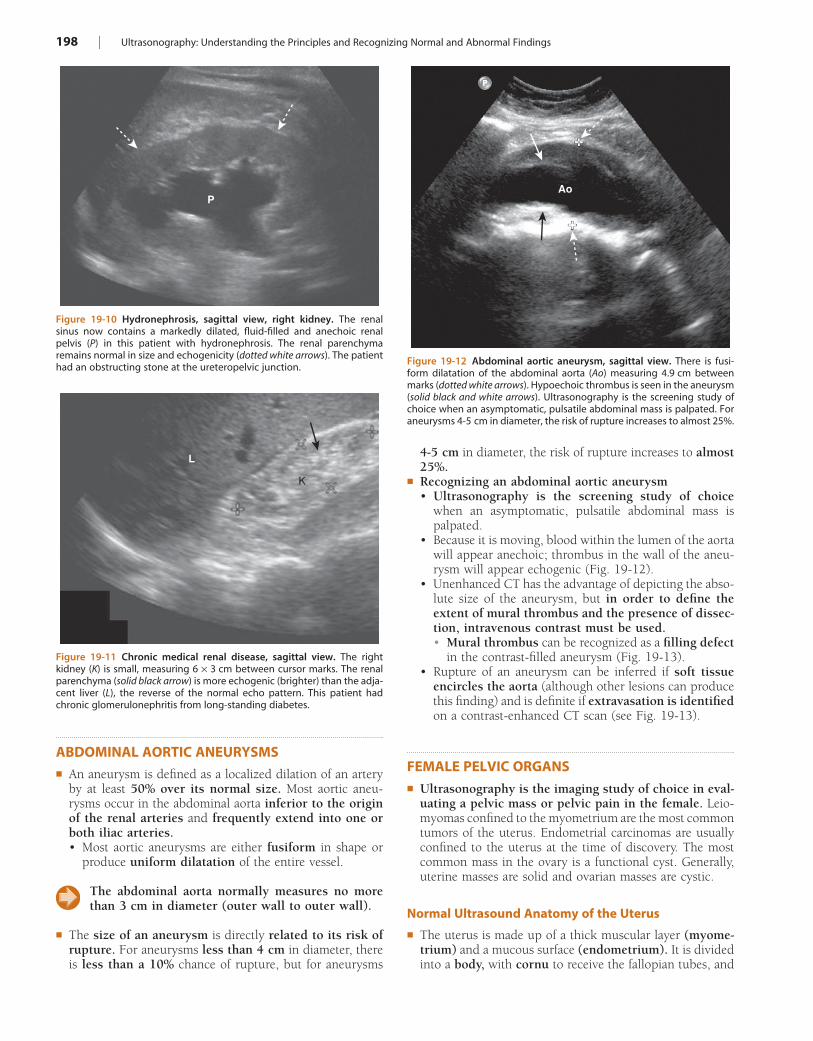
198 | Ultrasonography: Understanding the Principles and Recognizing Normal and Abnormal Findings
4-5 cm in diameter, the risk of rupture increases to almost 25%.
! Recognizing an abdominal aortic aneurysm• Ultrasonography is the screening study of choice
when an asymptomatic, pulsatile abdominal mass is palpated.
• Because it is moving, blood within the lumen of the aorta will appear anechoic; thrombus in the wall of the aneu-rysm will appear echogenic (Fig. 19-12).
• Unenhanced CT has the advantage of depicting the abso-lute size of the aneurysm, but in order to define the extent of mural thrombus and the presence of dissec-tion, intravenous contrast must be used.• Mural thrombus can be recognized as a filling defect
in the contrast-filled aneurysm (Fig. 19-13).• Rupture of an aneurysm can be inferred if soft tissue
encircles the aorta (although other lesions can produce this finding) and is definite if extravasation is identified on a contrast-enhanced CT scan (see Fig. 19-13).
FEMALE PELVIC ORGANS! Ultrasonography is the imaging study of choice in eval-
uating a pelvic mass or pelvic pain in the female. Leio-myomas confined to the myometrium are the most common tumors of the uterus. Endometrial carcinomas are usually confined to the uterus at the time of discovery. The most common mass in the ovary is a functional cyst. Generally, uterine masses are solid and ovarian masses are cystic.
Normal Ultrasound Anatomy of the Uterus
! The uterus is made up of a thick muscular layer (myome-trium) and a mucous surface (endometrium). It is divided into a body, with cornu to receive the fallopian tubes, and
ABDOMINAL AORTIC ANEURYSMS! An aneurysm is defined as a localized dilation of an artery
by at least 50% over its normal size. Most aortic aneu-rysms occur in the abdominal aorta inferior to the origin of the renal arteries and frequently extend into one or both iliac arteries.• Most aortic aneurysms are either fusiform in shape or
produce uniform dilatation of the entire vessel.
The abdominal aorta normally measures no more than 3 cm in diameter (outer wall to outer wall).
! The size of an aneurysm is directly related to its risk of rupture. For aneurysms less than 4 cm in diameter, there is less than a 10% chance of rupture, but for aneurysms
Figure 19-11 Chronic medical renal disease, sagittal view. The right kidney (K) is small, measuring 6 # 3 cm between cursor marks. The renal parenchyma (solid black arrow) is more echogenic (brighter) than the adja-cent liver (L), the reverse of the normal echo pattern. This patient had chronic glomerulonephritis from long-standing diabetes.
L
K
Figure 19-12 Abdominal aortic aneurysm, sagittal view. There is fusi-form dilatation of the abdominal aorta (Ao) measuring 4.9 cm between marks (dotted white arrows). Hypoechoic thrombus is seen in the aneurysm (solid black and white arrows). Ultrasonography is the screening study of choice when an asymptomatic, pulsatile abdominal mass is palpated. For aneurysms 4-5 cm in diameter, the risk of rupture increases to almost 25%.
Ao
Figure 19-10 Hydronephrosis, sagittal view, right kidney. The renal sinus now contains a markedly dilated, fluid-filled and anechoic renal pelvis (P) in this patient with hydronephrosis. The renal parenchyma remains normal in size and echogenicity (dotted white arrows). The patient had an obstructing stone at the ureteropelvic junction.
P
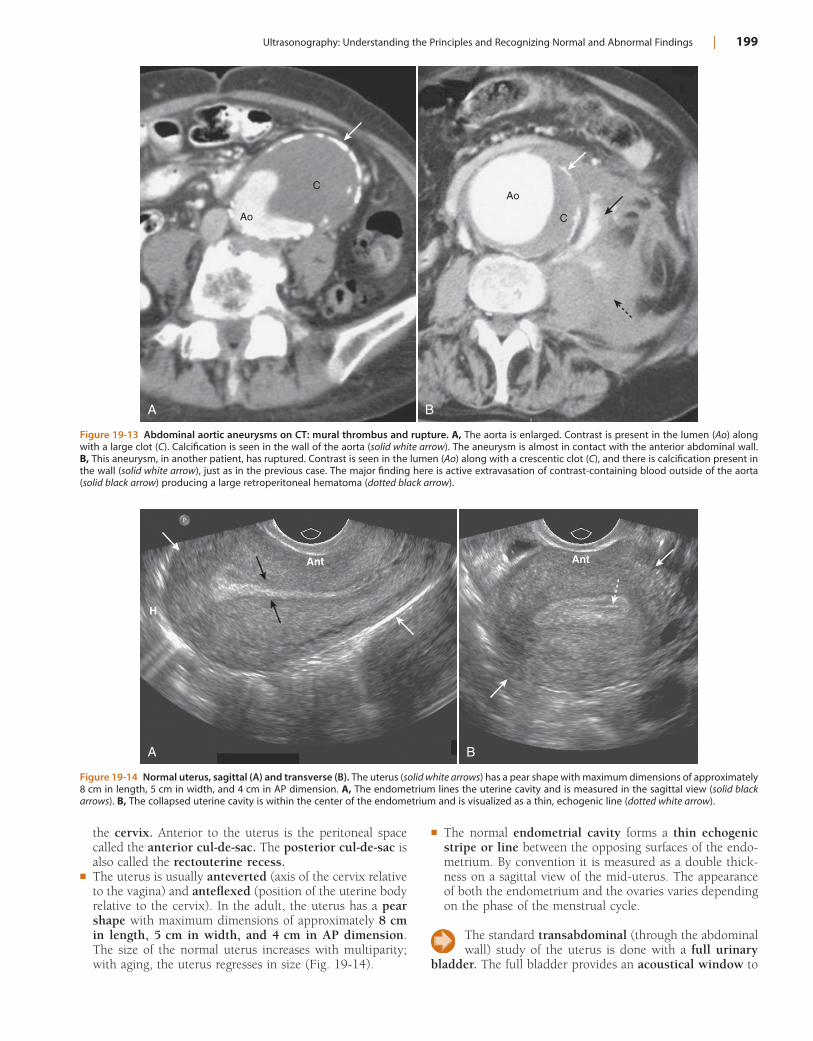
Ultrasonography: Understanding the Principles and Recognizing Normal and Abnormal Findings | 199
! The normal endometrial cavity forms a thin echogenic stripe or line between the opposing surfaces of the endo-metrium. By convention it is measured as a double thick-ness on a sagittal view of the mid-uterus. The appearance of both the endometrium and the ovaries varies depending on the phase of the menstrual cycle.
The standard transabdominal (through the abdominal wall) study of the uterus is done with a full urinary
bladder. The full bladder provides an acoustical window to
the cervix. Anterior to the uterus is the peritoneal space called the anterior cul-de-sac. The posterior cul-de-sac is also called the rectouterine recess.
! The uterus is usually anteverted (axis of the cervix relative to the vagina) and anteflexed (position of the uterine body relative to the cervix). In the adult, the uterus has a pear shape with maximum dimensions of approximately 8 cm in length, 5 cm in width, and 4 cm in AP dimension. The size of the normal uterus increases with multiparity; with aging, the uterus regresses in size (Fig. 19-14).
Figure 19-13 Abdominal aortic aneurysms on CT: mural thrombus and rupture. A, The aorta is enlarged. Contrast is present in the lumen (Ao) along with a large clot (C). Calcification is seen in the wall of the aorta (solid white arrow). The aneurysm is almost in contact with the anterior abdominal wall. B, This aneurysm, in another patient, has ruptured. Contrast is seen in the lumen (Ao) along with a crescentic clot (C), and there is calcification present in the wall (solid white arrow), just as in the previous case. The major finding here is active extravasation of contrast-containing blood outside of the aorta (solid black arrow) producing a large retroperitoneal hematoma (dotted black arrow).
A B
Ao
AoC
C
Figure 19-14 Normal uterus, sagittal (A) and transverse (B). The uterus (solid white arrows) has a pear shape with maximum dimensions of approximately 8 cm in length, 5 cm in width, and 4 cm in AP dimension. A, The endometrium lines the uterine cavity and is measured in the sagittal view (solid black arrows). B, The collapsed uterine cavity is within the center of the endometrium and is visualized as a thin, echogenic line (dotted white arrow).
A B
Ant Ant
H
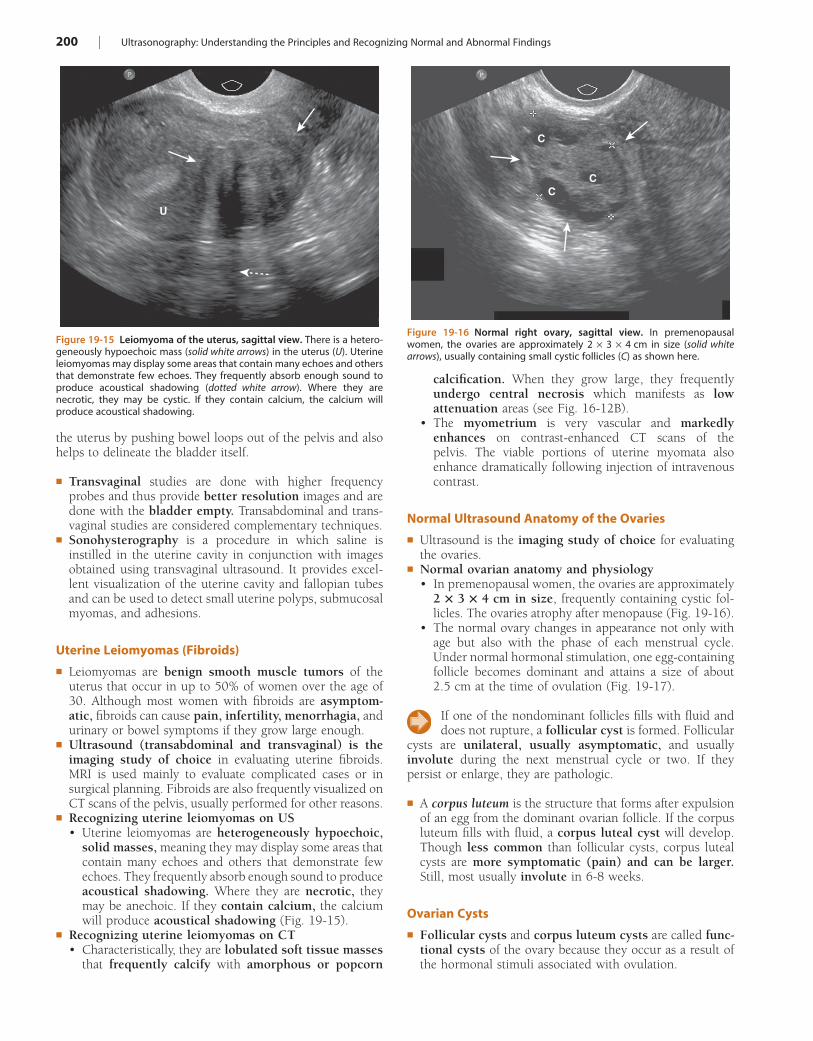
200 | Ultrasonography: Understanding the Principles and Recognizing Normal and Abnormal Findings
calcification. When they grow large, they frequently undergo central necrosis which manifests as low attenuation areas (see Fig. 16-12B).
• The myometrium is very vascular and markedly enhances on contrast-enhanced CT scans of the pelvis. The viable portions of uterine myomata also enhance dramatically following injection of intravenous contrast.
Normal Ultrasound Anatomy of the Ovaries
! Ultrasound is the imaging study of choice for evaluating the ovaries.
! Normal ovarian anatomy and physiology• In premenopausal women, the ovaries are approximately
2 ! 3 ! 4 cm in size, frequently containing cystic fol-licles. The ovaries atrophy after menopause (Fig. 19-16).
• The normal ovary changes in appearance not only with age but also with the phase of each menstrual cycle. Under normal hormonal stimulation, one egg-containing follicle becomes dominant and attains a size of about 2.5 cm at the time of ovulation (Fig. 19-17).
If one of the nondominant follicles fills with fluid and does not rupture, a follicular cyst is formed. Follicular
cysts are unilateral, usually asymptomatic, and usually involute during the next menstrual cycle or two. If they persist or enlarge, they are pathologic.
! A corpus luteum is the structure that forms after expulsion of an egg from the dominant ovarian follicle. If the corpus luteum fills with fluid, a corpus luteal cyst will develop. Though less common than follicular cysts, corpus luteal cysts are more symptomatic (pain) and can be larger. Still, most usually involute in 6-8 weeks.
Ovarian Cysts
! Follicular cysts and corpus luteum cysts are called func-tional cysts of the ovary because they occur as a result of the hormonal stimuli associated with ovulation.
the uterus by pushing bowel loops out of the pelvis and also helps to delineate the bladder itself.
! Transvaginal studies are done with higher frequency probes and thus provide better resolution images and are done with the bladder empty. Transabdominal and trans-vaginal studies are considered complementary techniques.
! Sonohysterography is a procedure in which saline is instilled in the uterine cavity in conjunction with images obtained using transvaginal ultrasound. It provides excel-lent visualization of the uterine cavity and fallopian tubes and can be used to detect small uterine polyps, submucosal myomas, and adhesions.
Uterine Leiomyomas (Fibroids)
! Leiomyomas are benign smooth muscle tumors of the uterus that occur in up to 50% of women over the age of 30. Although most women with fibroids are asymptom-atic, fibroids can cause pain, infertility, menorrhagia, and urinary or bowel symptoms if they grow large enough.
! Ultrasound (transabdominal and transvaginal) is the imaging study of choice in evaluating uterine fibroids. MRI is used mainly to evaluate complicated cases or in surgical planning. Fibroids are also frequently visualized on CT scans of the pelvis, usually performed for other reasons.
! Recognizing uterine leiomyomas on US• Uterine leiomyomas are heterogeneously hypoechoic,
solid masses, meaning they may display some areas that contain many echoes and others that demonstrate few echoes. They frequently absorb enough sound to produce acoustical shadowing. Where they are necrotic, they may be anechoic. If they contain calcium, the calcium will produce acoustical shadowing (Fig. 19-15).
! Recognizing uterine leiomyomas on CT• Characteristically, they are lobulated soft tissue masses
that frequently calcify with amorphous or popcorn
Figure 19-15 Leiomyoma of the uterus, sagittal view. There is a hetero-geneously hypoechoic mass (solid white arrows) in the uterus (U). Uterine leiomyomas may display some areas that contain many echoes and others that demonstrate few echoes. They frequently absorb enough sound to produce acoustical shadowing (dotted white arrow). Where they are necrotic, they may be cystic. If they contain calcium, the calcium will produce acoustical shadowing.
U
Figure 19-16 Normal right ovary, sagittal view. In premenopausal women, the ovaries are approximately 2 # 3 # 4 cm in size (solid white arrows), usually containing small cystic follicles (C) as shown here.
C
C
C
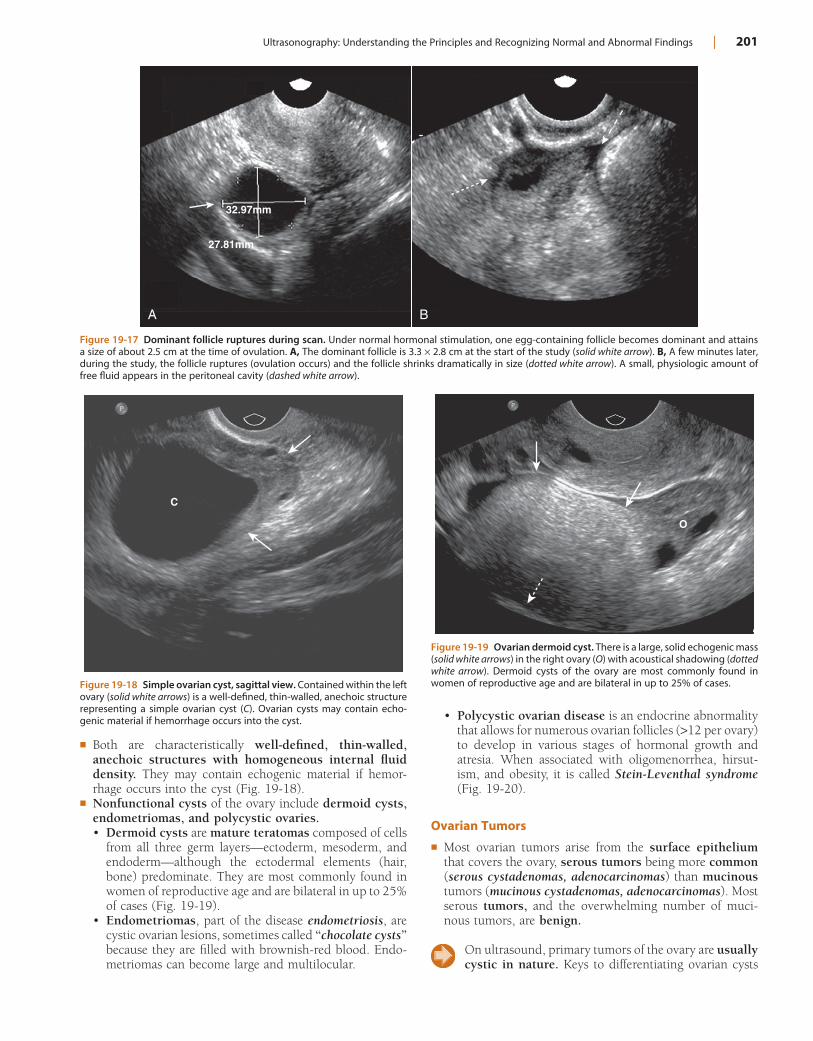
Ultrasonography: Understanding the Principles and Recognizing Normal and Abnormal Findings | 201
• Polycystic ovarian disease is an endocrine abnormality that allows for numerous ovarian follicles (>12 per ovary) to develop in various stages of hormonal growth and atresia. When associated with oligomenorrhea, hirsut-ism, and obesity, it is called Stein-Leventhal syndrome (Fig. 19-20).
Ovarian Tumors
! Most ovarian tumors arise from the surface epithelium that covers the ovary, serous tumors being more common (serous cystadenomas, adenocarcinomas) than mucinous tumors (mucinous cystadenomas, adenocarcinomas). Most serous tumors, and the overwhelming number of muci-nous tumors, are benign.
On ultrasound, primary tumors of the ovary are usually cystic in nature. Keys to differentiating ovarian cysts
! Both are characteristically well-defined, thin-walled, anechoic structures with homogeneous internal fluid density. They may contain echogenic material if hemor-rhage occurs into the cyst (Fig. 19-18).
! Nonfunctional cysts of the ovary include dermoid cysts, endometriomas, and polycystic ovaries.• Dermoid cysts are mature teratomas composed of cells
from all three germ layers—ectoderm, mesoderm, and endoderm—although the ectodermal elements (hair, bone) predominate. They are most commonly found in women of reproductive age and are bilateral in up to 25% of cases (Fig. 19-19).
• Endometriomas, part of the disease endometriosis, are cystic ovarian lesions, sometimes called “chocolate cysts” because they are filled with brownish-red blood. Endo-metriomas can become large and multilocular.
Figure 19-17 Dominant follicle ruptures during scan. Under normal hormonal stimulation, one egg-containing follicle becomes dominant and attains a size of about 2.5 cm at the time of ovulation. A, The dominant follicle is 3.3 # 2.8 cm at the start of the study (solid white arrow). B, A few minutes later, during the study, the follicle ruptures (ovulation occurs) and the follicle shrinks dramatically in size (dotted white arrow). A small, physiologic amount of free fluid appears in the peritoneal cavity (dashed white arrow).
A
27.81mm
32.97mm
B
Figure 19-18 Simple ovarian cyst, sagittal view. Contained within the left ovary (solid white arrows) is a well-defined, thin-walled, anechoic structure representing a simple ovarian cyst (C). Ovarian cysts may contain echo-genic material if hemorrhage occurs into the cyst.
C
Figure 19-19 Ovarian dermoid cyst. There is a large, solid echogenic mass (solid white arrows) in the right ovary (O) with acoustical shadowing (dotted white arrow). Dermoid cysts of the ovary are most commonly found in women of reproductive age and are bilateral in up to 25% of cases.
O
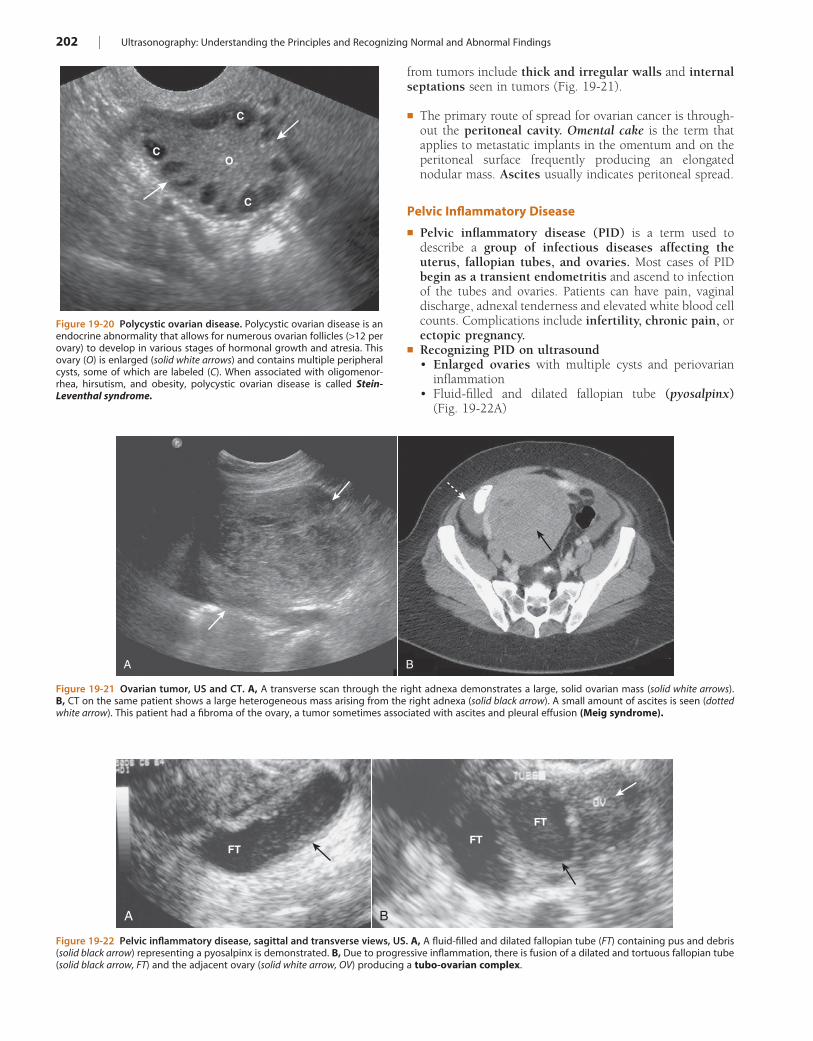
202 | Ultrasonography: Understanding the Principles and Recognizing Normal and Abnormal Findings
Figure 19-20 Polycystic ovarian disease. Polycystic ovarian disease is an endocrine abnormality that allows for numerous ovarian follicles (>12 per ovary) to develop in various stages of hormonal growth and atresia. This ovary (O) is enlarged (solid white arrows) and contains multiple peripheral cysts, some of which are labeled (C). When associated with oligomenor-rhea, hirsutism, and obesity, polycystic ovarian disease is called Stein-Leventhal syndrome.
C
C
C
O
Figure 19-21 Ovarian tumor, US and CT. A, A transverse scan through the right adnexa demonstrates a large, solid ovarian mass (solid white arrows). B, CT on the same patient shows a large heterogeneous mass arising from the right adnexa (solid black arrow). A small amount of ascites is seen (dotted white arrow). This patient had a fibroma of the ovary, a tumor sometimes associated with ascites and pleural effusion (Meig syndrome).
A B
Figure 19-22 Pelvic inflammatory disease, sagittal and transverse views, US. A, A fluid-filled and dilated fallopian tube (FT) containing pus and debris (solid black arrow) representing a pyosalpinx is demonstrated. B, Due to progressive inflammation, there is fusion of a dilated and tortuous fallopian tube (solid black arrow, FT) and the adjacent ovary (solid white arrow, OV) producing a tubo-ovarian complex.
A
FTFT
FT
B
from tumors include thick and irregular walls and internal septations seen in tumors (Fig. 19-21).
! The primary route of spread for ovarian cancer is through-out the peritoneal cavity. Omental cake is the term that applies to metastatic implants in the omentum and on the peritoneal surface frequently producing an elongated nodular mass. Ascites usually indicates peritoneal spread.
Pelvic Inflammatory Disease
! Pelvic inflammatory disease (PID) is a term used to describe a group of infectious diseases affecting the uterus, fallopian tubes, and ovaries. Most cases of PID begin as a transient endometritis and ascend to infection of the tubes and ovaries. Patients can have pain, vaginal discharge, adnexal tenderness and elevated white blood cell counts. Complications include infertility, chronic pain, or ectopic pregnancy.
! Recognizing PID on ultrasound• Enlarged ovaries with multiple cysts and periovarian
inflammation• Fluid-filled and dilated fallopian tube (pyosalpinx)
(Fig. 19-22A)
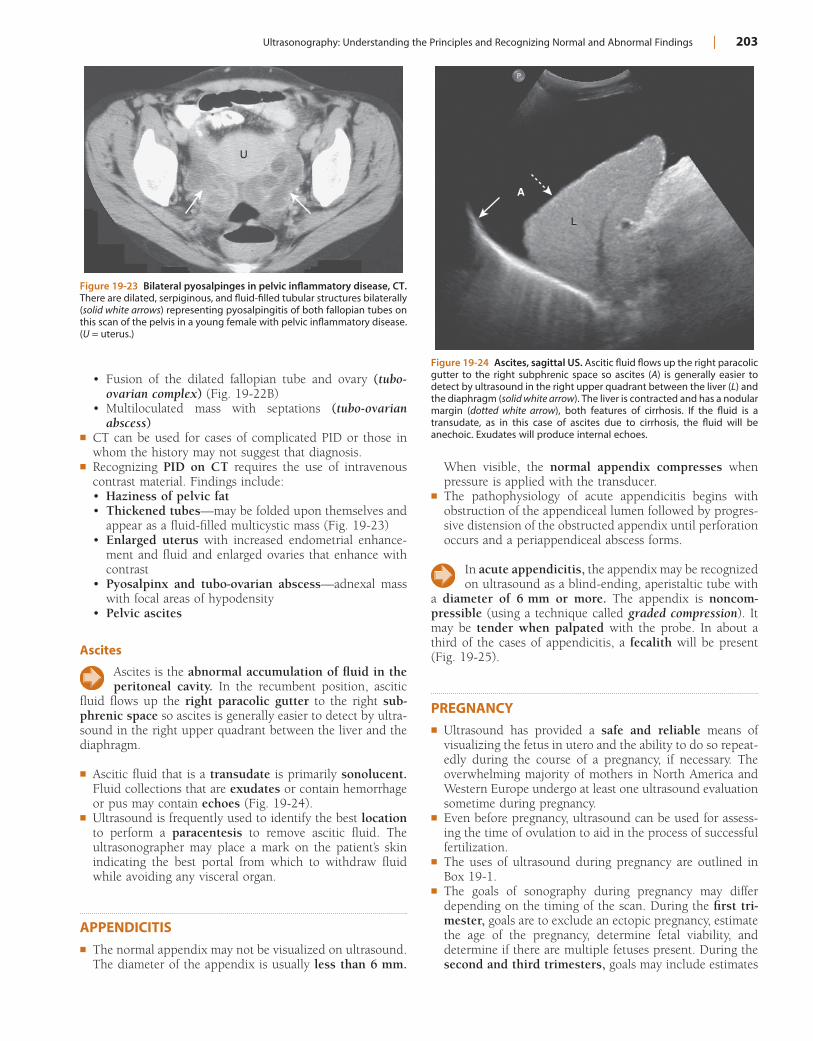
Ultrasonography: Understanding the Principles and Recognizing Normal and Abnormal Findings | 203
When visible, the normal appendix compresses when pressure is applied with the transducer.
! The pathophysiology of acute appendicitis begins with obstruction of the appendiceal lumen followed by progres-sive distension of the obstructed appendix until perforation occurs and a periappendiceal abscess forms.
In acute appendicitis, the appendix may be recognized on ultrasound as a blind-ending, aperistaltic tube with
a diameter of 6 mm or more. The appendix is noncom-pressible (using a technique called graded compression). It may be tender when palpated with the probe. In about a third of the cases of appendicitis, a fecalith will be present (Fig. 19-25).
PREGNANCY! Ultrasound has provided a safe and reliable means of
visualizing the fetus in utero and the ability to do so repeat-edly during the course of a pregnancy, if necessary. The overwhelming majority of mothers in North America and Western Europe undergo at least one ultrasound evaluation sometime during pregnancy.
! Even before pregnancy, ultrasound can be used for assess-ing the time of ovulation to aid in the process of successful fertilization.
! The uses of ultrasound during pregnancy are outlined in Box 19-1.
! The goals of sonography during pregnancy may differ depending on the timing of the scan. During the first tri-mester, goals are to exclude an ectopic pregnancy, estimate the age of the pregnancy, determine fetal viability, and determine if there are multiple fetuses present. During the second and third trimesters, goals may include estimates
Figure 19-23 Bilateral pyosalpinges in pelvic inflammatory disease, CT. There are dilated, serpiginous, and fluid-filled tubular structures bilaterally (solid white arrows) representing pyosalpingitis of both fallopian tubes on this scan of the pelvis in a young female with pelvic inflammatory disease. (U = uterus.)
U
Figure 19-24 Ascites, sagittal US. Ascitic fluid flows up the right paracolic gutter to the right subphrenic space so ascites (A) is generally easier to detect by ultrasound in the right upper quadrant between the liver (L) and the diaphragm (solid white arrow). The liver is contracted and has a nodular margin (dotted white arrow), both features of cirrhosis. If the fluid is a transudate, as in this case of ascites due to cirrhosis, the fluid will be anechoic. Exudates will produce internal echoes.
L
A
• Fusion of the dilated fallopian tube and ovary (tubo-ovarian complex) (Fig. 19-22B)
• Multiloculated mass with septations (tubo-ovarian abscess)
! CT can be used for cases of complicated PID or those in whom the history may not suggest that diagnosis.
! Recognizing PID on CT requires the use of intravenous contrast material. Findings include:• Haziness of pelvic fat• Thickened tubes—may be folded upon themselves and
appear as a fluid-filled multicystic mass (Fig. 19-23)• Enlarged uterus with increased endometrial enhance-
ment and fluid and enlarged ovaries that enhance with contrast
• Pyosalpinx and tubo-ovarian abscess—adnexal mass with focal areas of hypodensity
• Pelvic ascites
Ascites
Ascites is the abnormal accumulation of fluid in the peritoneal cavity. In the recumbent position, ascitic
fluid flows up the right paracolic gutter to the right sub-phrenic space so ascites is generally easier to detect by ultra-sound in the right upper quadrant between the liver and the diaphragm.
! Ascitic fluid that is a transudate is primarily sonolucent. Fluid collections that are exudates or contain hemorrhage or pus may contain echoes (Fig. 19-24).
! Ultrasound is frequently used to identify the best location to perform a paracentesis to remove ascitic fluid. The ultrasonographer may place a mark on the patient’s skin indicating the best portal from which to withdraw fluid while avoiding any visceral organ.
APPENDICITIS! The normal appendix may not be visualized on ultrasound.
The diameter of the appendix is usually less than 6 mm.
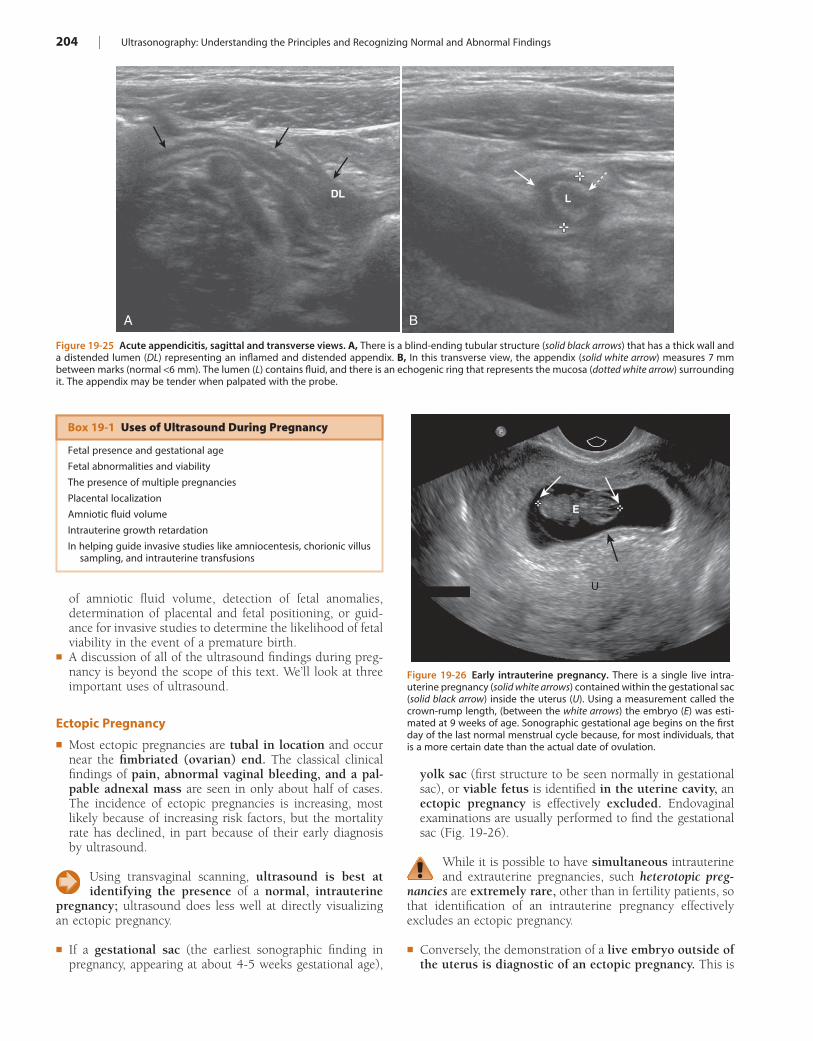
204 | Ultrasonography: Understanding the Principles and Recognizing Normal and Abnormal Findings
yolk sac (first structure to be seen normally in gestational sac), or viable fetus is identified in the uterine cavity, an ectopic pregnancy is effectively excluded. Endovaginal examinations are usually performed to find the gestational sac (Fig. 19-26).
While it is possible to have simultaneous intrauterine and extrauterine pregnancies, such heterotopic preg-
nancies are extremely rare, other than in fertility patients, so that identification of an intrauterine pregnancy effectively excludes an ectopic pregnancy.
! Conversely, the demonstration of a live embryo outside of the uterus is diagnostic of an ectopic pregnancy. This is
of amniotic fluid volume, detection of fetal anomalies, determination of placental and fetal positioning, or guid-ance for invasive studies to determine the likelihood of fetal viability in the event of a premature birth.
! A discussion of all of the ultrasound findings during preg-nancy is beyond the scope of this text. We’ll look at three important uses of ultrasound.
Ectopic Pregnancy
! Most ectopic pregnancies are tubal in location and occur near the fimbriated (ovarian) end. The classical clinical findings of pain, abnormal vaginal bleeding, and a pal-pable adnexal mass are seen in only about half of cases. The incidence of ectopic pregnancies is increasing, most likely because of increasing risk factors, but the mortality rate has declined, in part because of their early diagnosis by ultrasound.
Using transvaginal scanning, ultrasound is best at identifying the presence of a normal, intrauterine
pregnancy; ultrasound does less well at directly visualizing an ectopic pregnancy.
! If a gestational sac (the earliest sonographic finding in pregnancy, appearing at about 4-5 weeks gestational age),
Figure 19-25 Acute appendicitis, sagittal and transverse views. A, There is a blind-ending tubular structure (solid black arrows) that has a thick wall and a distended lumen (DL) representing an inflamed and distended appendix. B, In this transverse view, the appendix (solid white arrow) measures 7 mm between marks (normal <6 mm). The lumen (L) contains fluid, and there is an echogenic ring that represents the mucosa (dotted white arrow) surrounding it. The appendix may be tender when palpated with the probe.
A
DL L
B
Figure 19-26 Early intrauterine pregnancy. There is a single live intra-uterine pregnancy (solid white arrows) contained within the gestational sac (solid black arrow) inside the uterus (U). Using a measurement called the crown-rump length, (between the white arrows) the embryo (E) was esti-mated at 9 weeks of age. Sonographic gestational age begins on the first day of the last normal menstrual cycle because, for most individuals, that is a more certain date than the actual date of ovulation.
E
U
Box 19-1 Uses of Ultrasound During Pregnancy
Fetal presence and gestational age
Fetal abnormalities and viability
The presence of multiple pregnancies
Placental localization
Amniotic fluid volume
Intrauterine growth retardation
In helping guide invasive studies like amniocentesis, chorionic villus sampling, and intrauterine transfusions
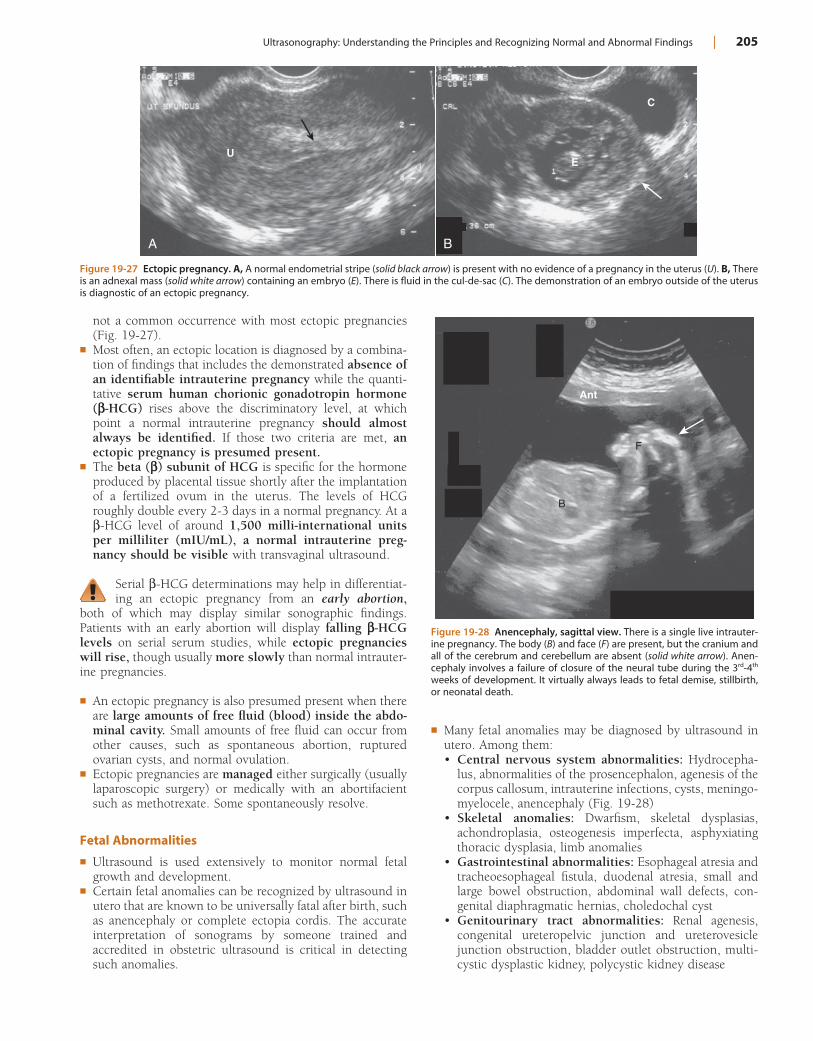
Ultrasonography: Understanding the Principles and Recognizing Normal and Abnormal Findings | 205
not a common occurrence with most ectopic pregnancies (Fig. 19-27).
! Most often, an ectopic location is diagnosed by a combina-tion of findings that includes the demonstrated absence of an identifiable intrauterine pregnancy while the quanti-tative serum human chorionic gonadotropin hormone ("-HCG) rises above the discriminatory level, at which point a normal intrauterine pregnancy should almost always be identified. If those two criteria are met, an ectopic pregnancy is presumed present.
! The beta (") subunit of HCG is specific for the hormone produced by placental tissue shortly after the implantation of a fertilized ovum in the uterus. The levels of HCG roughly double every 2-3 days in a normal pregnancy. At a $-HCG level of around 1,500 milli-international units per milliliter (mIU/mL), a normal intrauterine preg-nancy should be visible with transvaginal ultrasound.
Serial $-HCG determinations may help in differentiat-ing an ectopic pregnancy from an early abortion,
both of which may display similar sonographic findings. Patients with an early abortion will display falling "-HCG levels on serial serum studies, while ectopic pregnancies will rise, though usually more slowly than normal intrauter-ine pregnancies.
! An ectopic pregnancy is also presumed present when there are large amounts of free fluid (blood) inside the abdo-minal cavity. Small amounts of free fluid can occur from other causes, such as spontaneous abortion, ruptured ovarian cysts, and normal ovulation.
! Ectopic pregnancies are managed either surgically (usually laparoscopic surgery) or medically with an abortifacient such as methotrexate. Some spontaneously resolve.
Fetal Abnormalities
! Ultrasound is used extensively to monitor normal fetal growth and development.
! Certain fetal anomalies can be recognized by ultrasound in utero that are known to be universally fatal after birth, such as anencephaly or complete ectopia cordis. The accurate interpretation of sonograms by someone trained and accredited in obstetric ultrasound is critical in detecting such anomalies.
Figure 19-27 Ectopic pregnancy. A, A normal endometrial stripe (solid black arrow) is present with no evidence of a pregnancy in the uterus (U). B, There is an adnexal mass (solid white arrow) containing an embryo (E). There is fluid in the cul-de-sac (C). The demonstration of an embryo outside of the uterus is diagnostic of an ectopic pregnancy.
A
UE
C
B
! Many fetal anomalies may be diagnosed by ultrasound in utero. Among them:• Central nervous system abnormalities: Hydrocepha-
lus, abnormalities of the prosencephalon, agenesis of the corpus callosum, intrauterine infections, cysts, meningo-myelocele, anencephaly (Fig. 19-28)
• Skeletal anomalies: Dwarfism, skeletal dysplasias, achondroplasia, osteogenesis imperfecta, asphyxiating thoracic dysplasia, limb anomalies
• Gastrointestinal abnormalities: Esophageal atresia and tracheoesophageal fistula, duodenal atresia, small and large bowel obstruction, abdominal wall defects, con-genital diaphragmatic hernias, choledochal cyst
• Genitourinary tract abnormalities: Renal agenesis, congenital ureteropelvic junction and ureterovesicle junction obstruction, bladder outlet obstruction, multi-cystic dysplastic kidney, polycystic kidney disease
Figure 19-28 Anencephaly, sagittal view. There is a single live intrauter-ine pregnancy. The body (B) and face (F) are present, but the cranium and all of the cerebrum and cerebellum are absent (solid white arrow). Anen-cephaly involves a failure of closure of the neural tube during the 3rd-4th weeks of development. It virtually always leads to fetal demise, stillbirth, or neonatal death.
Ant
B
F
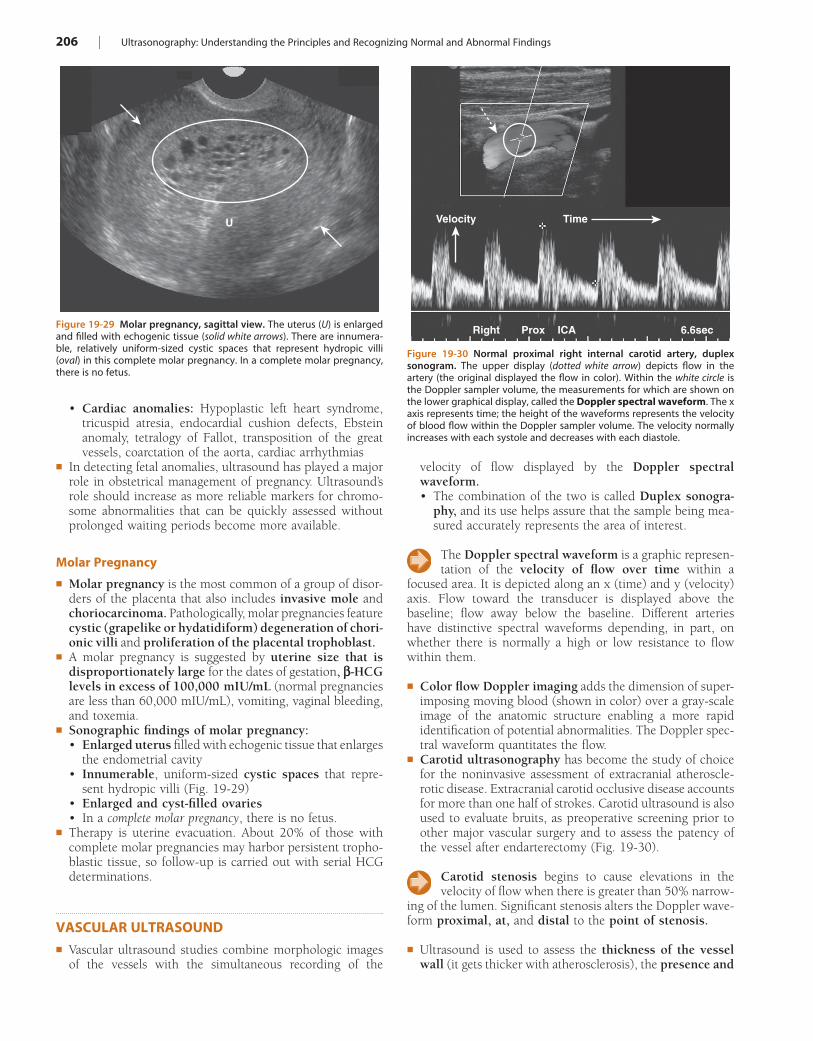
206 | Ultrasonography: Understanding the Principles and Recognizing Normal and Abnormal Findings
velocity of flow displayed by the Doppler spectral waveform.• The combination of the two is called Duplex sonogra-
phy, and its use helps assure that the sample being mea-sured accurately represents the area of interest.
The Doppler spectral waveform is a graphic represen-tation of the velocity of flow over time within a
focused area. It is depicted along an x (time) and y (velocity) axis. Flow toward the transducer is displayed above the baseline; flow away below the baseline. Different arteries have distinctive spectral waveforms depending, in part, on whether there is normally a high or low resistance to flow within them.
! Color flow Doppler imaging adds the dimension of super-imposing moving blood (shown in color) over a gray-scale image of the anatomic structure enabling a more rapid identification of potential abnormalities. The Doppler spec-tral waveform quantitates the flow.
! Carotid ultrasonography has become the study of choice for the noninvasive assessment of extracranial atheroscle-rotic disease. Extracranial carotid occlusive disease accounts for more than one half of strokes. Carotid ultrasound is also used to evaluate bruits, as preoperative screening prior to other major vascular surgery and to assess the patency of the vessel after endarterectomy (Fig. 19-30).
Carotid stenosis begins to cause elevations in the velocity of flow when there is greater than 50% narrow-
ing of the lumen. Significant stenosis alters the Doppler wave-form proximal, at, and distal to the point of stenosis.
! Ultrasound is used to assess the thickness of the vessel wall (it gets thicker with atherosclerosis), the presence and
• Cardiac anomalies: Hypoplastic left heart syndrome, tricuspid atresia, endocardial cushion defects, Ebstein anomaly, tetralogy of Fallot, transposition of the great vessels, coarctation of the aorta, cardiac arrhythmias
! In detecting fetal anomalies, ultrasound has played a major role in obstetrical management of pregnancy. Ultrasound’s role should increase as more reliable markers for chromo-some abnormalities that can be quickly assessed without prolonged waiting periods become more available.
Molar Pregnancy
! Molar pregnancy is the most common of a group of disor-ders of the placenta that also includes invasive mole and choriocarcinoma. Pathologically, molar pregnancies feature cystic (grapelike or hydatidiform) degeneration of chori-onic villi and proliferation of the placental trophoblast.
! A molar pregnancy is suggested by uterine size that is disproportionately large for the dates of gestation, "-HCG levels in excess of 100,000 mIU/mL (normal pregnancies are less than 60,000 mIU/mL), vomiting, vaginal bleeding, and toxemia.
! Sonographic findings of molar pregnancy:• Enlarged uterus filled with echogenic tissue that enlarges
the endometrial cavity• Innumerable, uniform-sized cystic spaces that repre-
sent hydropic villi (Fig. 19-29)• Enlarged and cyst-filled ovaries• In a complete molar pregnancy, there is no fetus.
! Therapy is uterine evacuation. About 20% of those with complete molar pregnancies may harbor persistent tropho-blastic tissue, so follow-up is carried out with serial HCG determinations.
VASCULAR ULTRASOUND! Vascular ultrasound studies combine morphologic images
of the vessels with the simultaneous recording of the
Figure 19-29 Molar pregnancy, sagittal view. The uterus (U) is enlarged and filled with echogenic tissue (solid white arrows). There are innumera-ble, relatively uniform-sized cystic spaces that represent hydropic villi (oval) in this complete molar pregnancy. In a complete molar pregnancy, there is no fetus.
U
Figure 19-30 Normal proximal right internal carotid artery, duplex sonogram. The upper display (dotted white arrow) depicts flow in the artery (the original displayed the flow in color). Within the white circle is the Doppler sampler volume, the measurements for which are shown on the lower graphical display, called the Doppler spectral waveform. The x axis represents time; the height of the waveforms represents the velocity of blood flow within the Doppler sampler volume. The velocity normally increases with each systole and decreases with each diastole.
Velocity
Right Prox ICA 6.6sec
Time
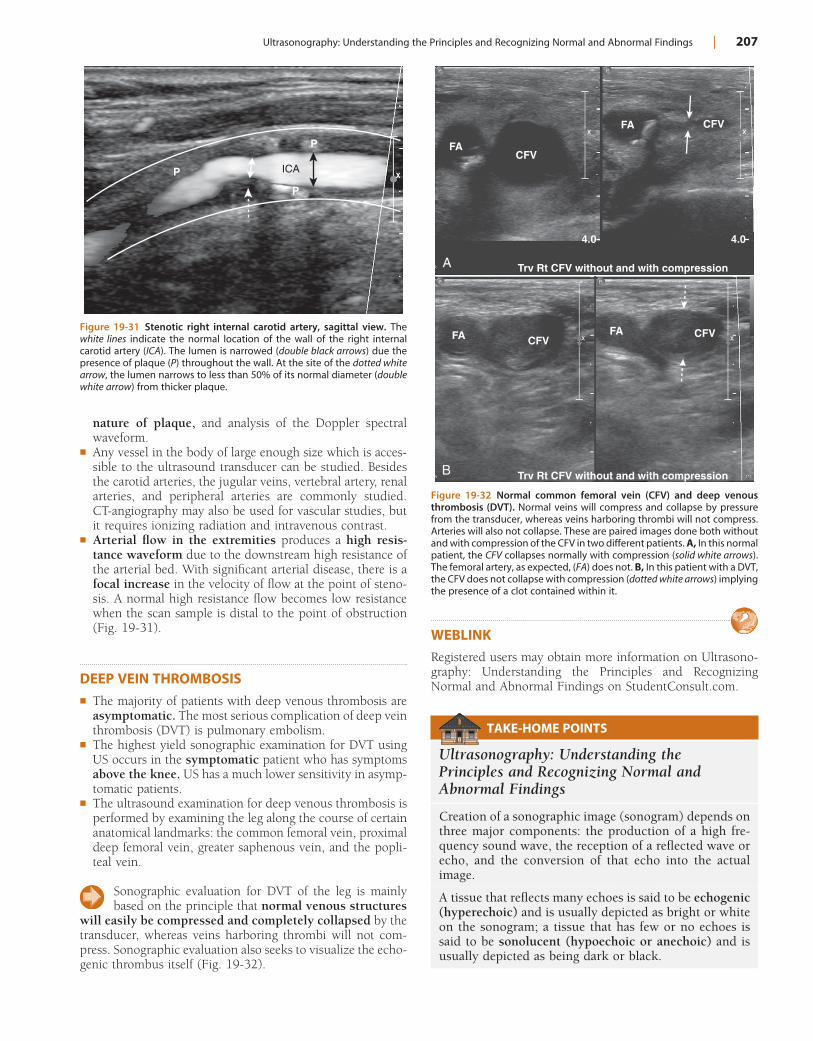
Ultrasonography: Understanding the Principles and Recognizing Normal and Abnormal Findings | 207
WEBLINKRegistered users may obtain more information on Ultrasono-graphy: Understanding the Principles and Recognizing Normal and Abnormal Findings on StudentConsult.com.
nature of plaque, and analysis of the Doppler spectral waveform.
! Any vessel in the body of large enough size which is acces-sible to the ultrasound transducer can be studied. Besides the carotid arteries, the jugular veins, vertebral artery, renal arteries, and peripheral arteries are commonly studied. CT-angiography may also be used for vascular studies, but it requires ionizing radiation and intravenous contrast.
! Arterial flow in the extremities produces a high resis-tance waveform due to the downstream high resistance of the arterial bed. With significant arterial disease, there is a focal increase in the velocity of flow at the point of steno-sis. A normal high resistance flow becomes low resistance when the scan sample is distal to the point of obstruction (Fig. 19-31).
DEEP VEIN THROMBOSIS! The majority of patients with deep venous thrombosis are
asymptomatic. The most serious complication of deep vein thrombosis (DVT) is pulmonary embolism.
! The highest yield sonographic examination for DVT using US occurs in the symptomatic patient who has symptoms above the knee. US has a much lower sensitivity in asymp-tomatic patients.
! The ultrasound examination for deep venous thrombosis is performed by examining the leg along the course of certain anatomical landmarks: the common femoral vein, proximal deep femoral vein, greater saphenous vein, and the popli-teal vein.
Sonographic evaluation for DVT of the leg is mainly based on the principle that normal venous structures
will easily be compressed and completely collapsed by the transducer, whereas veins harboring thrombi will not com-press. Sonographic evaluation also seeks to visualize the echo-genic thrombus itself (Fig. 19-32).
Figure 19-31 Stenotic right internal carotid artery, sagittal view. The white lines indicate the normal location of the wall of the right internal carotid artery (ICA). The lumen is narrowed (double black arrows) due the presence of plaque (P) throughout the wall. At the site of the dotted white arrow, the lumen narrows to less than 50% of its normal diameter (double white arrow) from thicker plaque.
P
P
P
ICA
Figure 19-32 Normal common femoral vein (CFV) and deep venous thrombosis (DVT). Normal veins will compress and collapse by pressure from the transducer, whereas veins harboring thrombi will not compress. Arteries will also not collapse. These are paired images done both without and with compression of the CFV in two different patients. A, In this normal patient, the CFV collapses normally with compression (solid white arrows). The femoral artery, as expected, (FA) does not. B, In this patient with a DVT, the CFV does not collapse with compression (dotted white arrows) implying the presence of a clot contained within it.
A
FACFV
4.0 4.0
FA FACFV
Trv Rt CFV without and with compression
Trv Rt CFV without and with compression
CFV
CFVFA
B
TAKE-HOME POINTS
Ultrasonography: Understanding the Principles and Recognizing Normal and Abnormal Findings
Creation of a sonographic image (sonogram) depends on three major components: the production of a high fre-quency sound wave, the reception of a reflected wave or echo, and the conversion of that echo into the actual image.
A tissue that reflects many echoes is said to be echogenic (hyperechoic) and is usually depicted as bright or white on the sonogram; a tissue that has few or no echoes is said to be sonolucent (hypoechoic or anechoic) and is usually depicted as being dark or black.
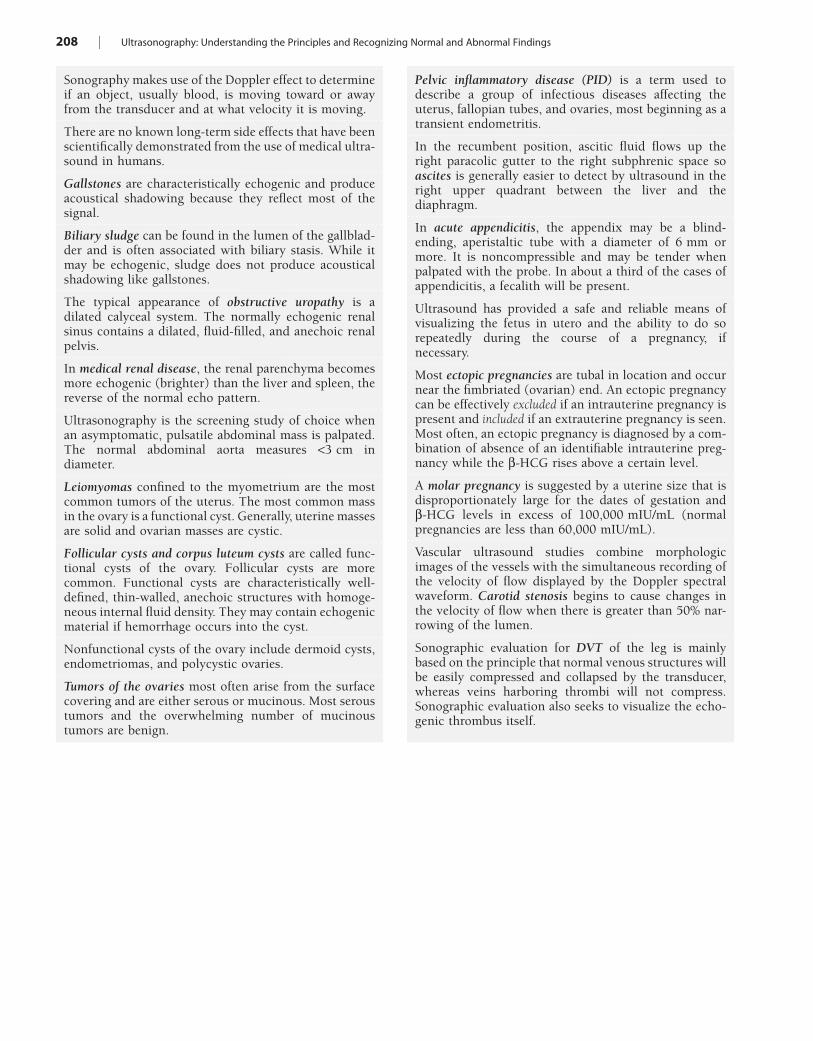
208 | Ultrasonography: Understanding the Principles and Recognizing Normal and Abnormal Findings
Sonography makes use of the Doppler effect to determine if an object, usually blood, is moving toward or away from the transducer and at what velocity it is moving.
There are no known long-term side effects that have been scientifically demonstrated from the use of medical ultra-sound in humans.
Gallstones are characteristically echogenic and produce acoustical shadowing because they reflect most of the signal.
Biliary sludge can be found in the lumen of the gallblad-der and is often associated with biliary stasis. While it may be echogenic, sludge does not produce acoustical shadowing like gallstones.
The typical appearance of obstructive uropathy is a dilated calyceal system. The normally echogenic renal sinus contains a dilated, fluid-filled, and anechoic renal pelvis.
In medical renal disease, the renal parenchyma becomes more echogenic (brighter) than the liver and spleen, the reverse of the normal echo pattern.
Ultrasonography is the screening study of choice when an asymptomatic, pulsatile abdominal mass is palpated. The normal abdominal aorta measures <3 cm in diameter.
Leiomyomas confined to the myometrium are the most common tumors of the uterus. The most common mass in the ovary is a functional cyst. Generally, uterine masses are solid and ovarian masses are cystic.
Follicular cysts and corpus luteum cysts are called func-tional cysts of the ovary. Follicular cysts are more common. Functional cysts are characteristically well-defined, thin-walled, anechoic structures with homoge-neous internal fluid density. They may contain echogenic material if hemorrhage occurs into the cyst.
Nonfunctional cysts of the ovary include dermoid cysts, endometriomas, and polycystic ovaries.
Tumors of the ovaries most often arise from the surface covering and are either serous or mucinous. Most serous tumors and the overwhelming number of mucinous tumors are benign.
Pelvic inflammatory disease (PID) is a term used to describe a group of infectious diseases affecting the uterus, fallopian tubes, and ovaries, most beginning as a transient endometritis.
In the recumbent position, ascitic fluid flows up the right paracolic gutter to the right subphrenic space so ascites is generally easier to detect by ultrasound in the right upper quadrant between the liver and the diaphragm.
In acute appendicitis, the appendix may be a blind-ending, aperistaltic tube with a diameter of 6 mm or more. It is noncompressible and may be tender when palpated with the probe. In about a third of the cases of appendicitis, a fecalith will be present.
Ultrasound has provided a safe and reliable means of visualizing the fetus in utero and the ability to do so repeatedly during the course of a pregnancy, if necessary.
Most ectopic pregnancies are tubal in location and occur near the fimbriated (ovarian) end. An ectopic pregnancy can be effectively excluded if an intrauterine pregnancy is present and included if an extrauterine pregnancy is seen. Most often, an ectopic pregnancy is diagnosed by a com-bination of absence of an identifiable intrauterine preg-nancy while the $-HCG rises above a certain level.
A molar pregnancy is suggested by a uterine size that is disproportionately large for the dates of gestation and $-HCG levels in excess of 100,000 mIU/mL (normal pregnancies are less than 60,000 mIU/mL).
Vascular ultrasound studies combine morphologic images of the vessels with the simultaneous recording of the velocity of flow displayed by the Doppler spectral waveform. Carotid stenosis begins to cause changes in the velocity of flow when there is greater than 50% nar-rowing of the lumen.
Sonographic evaluation for DVT of the leg is mainly based on the principle that normal venous structures will be easily compressed and collapsed by the transducer, whereas veins harboring thrombi will not compress. Sonographic evaluation also seeks to visualize the echo-genic thrombus itself.
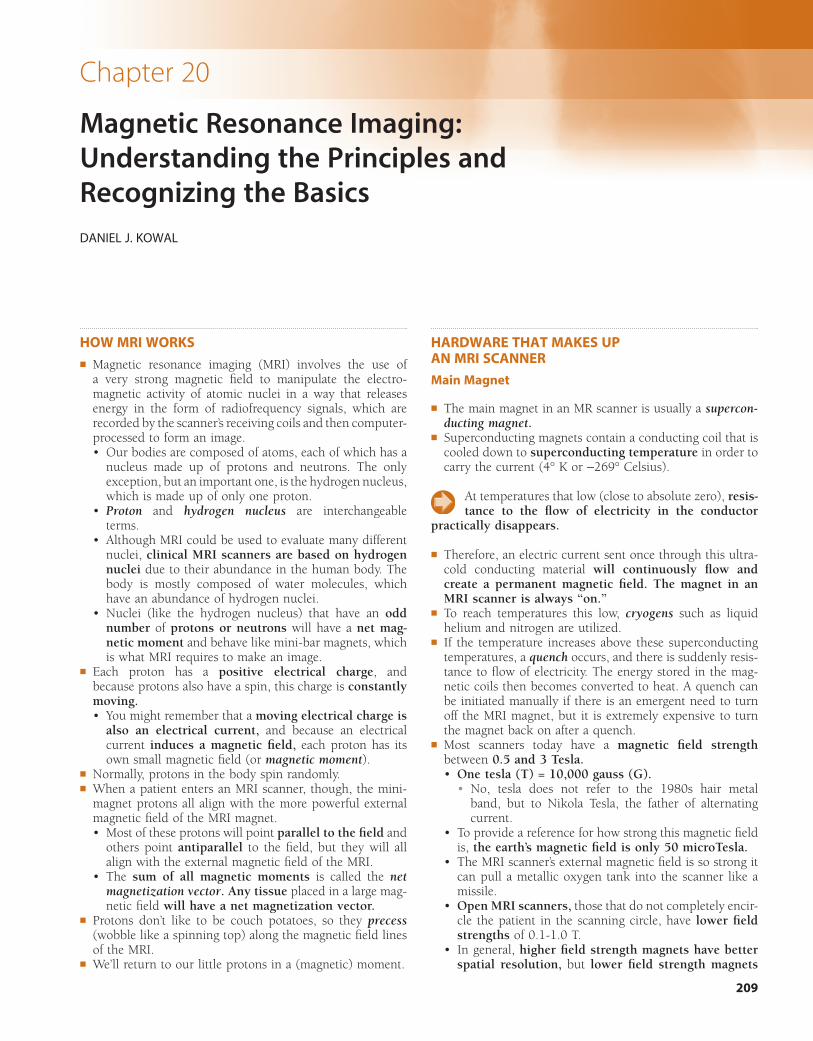
209
Chapter 20
Magnetic Resonance Imaging: Understanding the Principles and Recognizing the BasicsDANIEL J. KOWAL
HOW MRI WORKS! Magnetic resonance imaging (MRI) involves the use of
a very strong magnetic field to manipulate the electro-magnetic activity of atomic nuclei in a way that releases energy in the form of radiofrequency signals, which are recorded by the scanner’s receiving coils and then computer-processed to form an image.• Our bodies are composed of atoms, each of which has a
nucleus made up of protons and neutrons. The only exception, but an important one, is the hydrogen nucleus, which is made up of only one proton.
• Proton and hydrogen nucleus are interchangeable terms.
• Although MRI could be used to evaluate many different nuclei, clinical MRI scanners are based on hydrogen nuclei due to their abundance in the human body. The body is mostly composed of water molecules, which have an abundance of hydrogen nuclei.
• Nuclei (like the hydrogen nucleus) that have an odd number of protons or neutrons will have a net mag-netic moment and behave like mini-bar magnets, which is what MRI requires to make an image.
! Each proton has a positive electrical charge, and because protons also have a spin, this charge is constantly moving.• You might remember that a moving electrical charge is
also an electrical current, and because an electrical current induces a magnetic field, each proton has its own small magnetic field (or magnetic moment).
! Normally, protons in the body spin randomly.! When a patient enters an MRI scanner, though, the mini-
magnet protons all align with the more powerful external magnetic field of the MRI magnet.• Most of these protons will point parallel to the field and
others point antiparallel to the field, but they will all align with the external magnetic field of the MRI.
• The sum of all magnetic moments is called the net magnetization vector. Any tissue placed in a large mag-netic field will have a net magnetization vector.
! Protons don’t like to be couch potatoes, so they precess (wobble like a spinning top) along the magnetic field lines of the MRI.
! We’ll return to our little protons in a (magnetic) moment.
HARDWARE THAT MAKES UP AN MRI SCANNERMain Magnet
! The main magnet in an MR scanner is usually a supercon-ducting magnet.
! Superconducting magnets contain a conducting coil that is cooled down to superconducting temperature in order to carry the current (4° K or "269° Celsius).
At temperatures that low (close to absolute zero), resis-tance to the flow of electricity in the conductor
practically disappears.
! Therefore, an electric current sent once through this ultra-cold conducting material will continuously flow and create a permanent magnetic field. The magnet in an MRI scanner is always “on.”
! To reach temperatures this low, cryogens such as liquid helium and nitrogen are utilized.
! If the temperature increases above these superconducting temperatures, a quench occurs, and there is suddenly resis-tance to flow of electricity. The energy stored in the mag-netic coils then becomes converted to heat. A quench can be initiated manually if there is an emergent need to turn off the MRI magnet, but it is extremely expensive to turn the magnet back on after a quench.
! Most scanners today have a magnetic field strength between 0.5 and 3 Tesla.• One tesla (T) = 10,000 gauss (G).
• No, tesla does not refer to the 1980s hair metal band, but to Nikola Tesla, the father of alternating current.
• To provide a reference for how strong this magnetic field is, the earth’s magnetic field is only 50 microTesla.
• The MRI scanner’s external magnetic field is so strong it can pull a metallic oxygen tank into the scanner like a missile.
• Open MRI scanners, those that do not completely encir-cle the patient in the scanning circle, have lower field strengths of 0.1-1.0 T.
• In general, higher field strength magnets have better spatial resolution, but lower field strength magnets
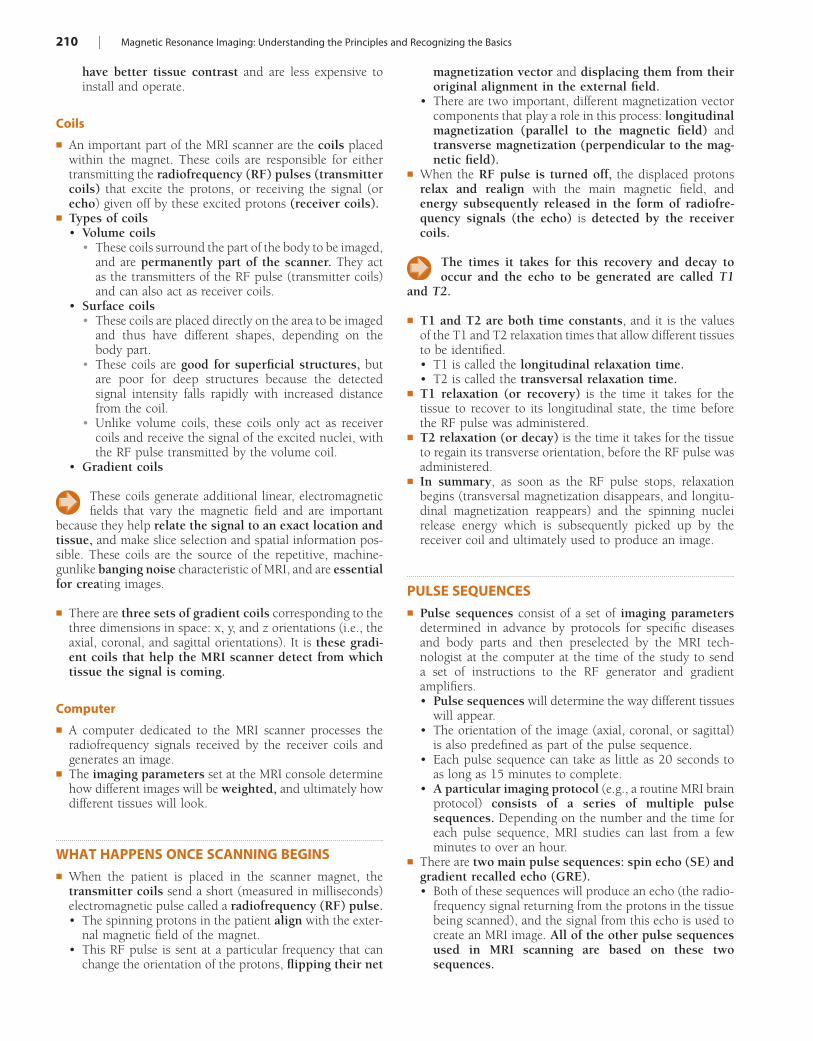
210 | Magnetic Resonance Imaging: Understanding the Principles and Recognizing the Basics
magnetization vector and displacing them from their original alignment in the external field.
• There are two important, different magnetization vector components that play a role in this process: longitudinal magnetization (parallel to the magnetic field) and transverse magnetization (perpendicular to the mag-netic field).
! When the RF pulse is turned off, the displaced protons relax and realign with the main magnetic field, and energy subsequently released in the form of radiofre-quency signals (the echo) is detected by the receiver coils.
The times it takes for this recovery and decay to occur and the echo to be generated are called T1
and T2.
! T1 and T2 are both time constants, and it is the values of the T1 and T2 relaxation times that allow different tissues to be identified.• T1 is called the longitudinal relaxation time.• T2 is called the transversal relaxation time.
! T1 relaxation (or recovery) is the time it takes for the tissue to recover to its longitudinal state, the time before the RF pulse was administered.
! T2 relaxation (or decay) is the time it takes for the tissue to regain its transverse orientation, before the RF pulse was administered.
! In summary, as soon as the RF pulse stops, relaxation begins (transversal magnetization disappears, and longitu-dinal magnetization reappears) and the spinning nuclei release energy which is subsequently picked up by the receiver coil and ultimately used to produce an image.
PULSE SEQUENCES! Pulse sequences consist of a set of imaging parameters
determined in advance by protocols for specific diseases and body parts and then preselected by the MRI tech-nologist at the computer at the time of the study to send a set of instructions to the RF generator and gradient amplifiers.• Pulse sequences will determine the way different tissues
will appear.• The orientation of the image (axial, coronal, or sagittal)
is also predefined as part of the pulse sequence.• Each pulse sequence can take as little as 20 seconds to
as long as 15 minutes to complete.• A particular imaging protocol (e.g., a routine MRI brain
protocol) consists of a series of multiple pulse sequences. Depending on the number and the time for each pulse sequence, MRI studies can last from a few minutes to over an hour.
! There are two main pulse sequences: spin echo (SE) and gradient recalled echo (GRE).• Both of these sequences will produce an echo (the radio-
frequency signal returning from the protons in the tissue being scanned), and the signal from this echo is used to create an MRI image. All of the other pulse sequences used in MRI scanning are based on these two sequences.
have better tissue contrast and are less expensive to install and operate.
Coils
! An important part of the MRI scanner are the coils placed within the magnet. These coils are responsible for either transmitting the radiofrequency (RF) pulses (transmitter coils) that excite the protons, or receiving the signal (or echo) given off by these excited protons (receiver coils).
! Types of coils• Volume coils
• These coils surround the part of the body to be imaged, and are permanently part of the scanner. They act as the transmitters of the RF pulse (transmitter coils) and can also act as receiver coils.
• Surface coils• These coils are placed directly on the area to be imaged
and thus have different shapes, depending on the body part.
• These coils are good for superficial structures, but are poor for deep structures because the detected signal intensity falls rapidly with increased distance from the coil.
• Unlike volume coils, these coils only act as receiver coils and receive the signal of the excited nuclei, with the RF pulse transmitted by the volume coil.
• Gradient coils
These coils generate additional linear, electromagnetic fields that vary the magnetic field and are important
because they help relate the signal to an exact location and tissue, and make slice selection and spatial information pos-sible. These coils are the source of the repetitive, machine-gunlike banging noise characteristic of MRI, and are essential for creating images.
! There are three sets of gradient coils corresponding to the three dimensions in space: x, y, and z orientations (i.e., the axial, coronal, and sagittal orientations). It is these gradi-ent coils that help the MRI scanner detect from which tissue the signal is coming.
Computer
! A computer dedicated to the MRI scanner processes the radiofrequency signals received by the receiver coils and generates an image.
! The imaging parameters set at the MRI console determine how different images will be weighted, and ultimately how different tissues will look.
WHAT HAPPENS ONCE SCANNING BEGINS! When the patient is placed in the scanner magnet, the
transmitter coils send a short (measured in milliseconds) electromagnetic pulse called a radiofrequency (RF) pulse.• The spinning protons in the patient align with the exter-
nal magnetic field of the magnet.• This RF pulse is sent at a particular frequency that can
change the orientation of the protons, flipping their net
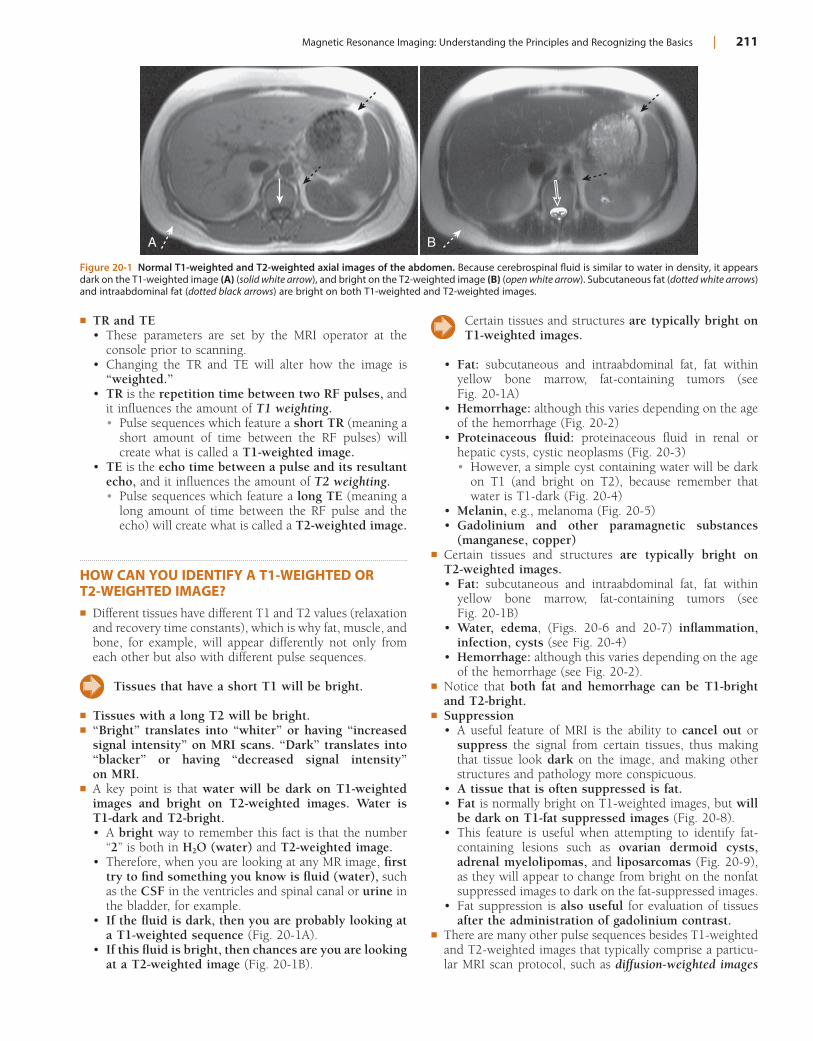
Magnetic Resonance Imaging: Understanding the Principles and Recognizing the Basics | 211
Certain tissues and structures are typically bright on T1-weighted images.
• Fat: subcutaneous and intraabdominal fat, fat within yellow bone marrow, fat-containing tumors (see Fig. 20-1A)
• Hemorrhage: although this varies depending on the age of the hemorrhage (Fig. 20-2)
• Proteinaceous fluid: proteinaceous fluid in renal or hepatic cysts, cystic neoplasms (Fig. 20-3)• However, a simple cyst containing water will be dark
on T1 (and bright on T2), because remember that water is T1-dark (Fig. 20-4)
• Melanin, e.g., melanoma (Fig. 20-5)• Gadolinium and other paramagnetic substances
(manganese, copper)! Certain tissues and structures are typically bright on
T2-weighted images.• Fat: subcutaneous and intraabdominal fat, fat within
yellow bone marrow, fat-containing tumors (see Fig. 20-1B)
• Water, edema, (Figs. 20-6 and 20-7) inflammation, infection, cysts (see Fig. 20-4)
• Hemorrhage: although this varies depending on the age of the hemorrhage (see Fig. 20-2).
! Notice that both fat and hemorrhage can be T1-bright and T2-bright.
! Suppression• A useful feature of MRI is the ability to cancel out or
suppress the signal from certain tissues, thus making that tissue look dark on the image, and making other structures and pathology more conspicuous.
• A tissue that is often suppressed is fat.• Fat is normally bright on T1-weighted images, but will
be dark on T1-fat suppressed images (Fig. 20-8).• This feature is useful when attempting to identify fat-
containing lesions such as ovarian dermoid cysts, adrenal myelolipomas, and liposarcomas (Fig. 20-9), as they will appear to change from bright on the nonfat suppressed images to dark on the fat-suppressed images.
• Fat suppression is also useful for evaluation of tissues after the administration of gadolinium contrast.
! There are many other pulse sequences besides T1-weighted and T2-weighted images that typically comprise a particu-lar MRI scan protocol, such as diffusion-weighted images
! TR and TE• These parameters are set by the MRI operator at the
console prior to scanning.• Changing the TR and TE will alter how the image is
“weighted.”• TR is the repetition time between two RF pulses, and
it influences the amount of T1 weighting.• Pulse sequences which feature a short TR (meaning a
short amount of time between the RF pulses) will create what is called a T1-weighted image.
• TE is the echo time between a pulse and its resultant echo, and it influences the amount of T2 weighting.• Pulse sequences which feature a long TE (meaning a
long amount of time between the RF pulse and the echo) will create what is called a T2-weighted image.
HOW CAN YOU IDENTIFY A T1-WEIGHTED OR T2-WEIGHTED IMAGE?! Different tissues have different T1 and T2 values (relaxation
and recovery time constants), which is why fat, muscle, and bone, for example, will appear differently not only from each other but also with different pulse sequences.
Tissues that have a short T1 will be bright.
! Tissues with a long T2 will be bright.! “Bright” translates into “whiter” or having “increased
signal intensity” on MRI scans. “Dark” translates into “blacker” or having “decreased signal intensity” on MRI.
! A key point is that water will be dark on T1-weighted images and bright on T2-weighted images. Water is T1-dark and T2-bright.• A bright way to remember this fact is that the number
“2” is both in H2O (water) and T2-weighted image.• Therefore, when you are looking at any MR image, first
try to find something you know is fluid (water), such as the CSF in the ventricles and spinal canal or urine in the bladder, for example.
• If the fluid is dark, then you are probably looking at a T1-weighted sequence (Fig. 20-1A).
• If this fluid is bright, then chances are you are looking at a T2-weighted image (Fig. 20-1B).
Figure 20-1 Normal T1-weighted and T2-weighted axial images of the abdomen. Because cerebrospinal fluid is similar to water in density, it appears dark on the T1-weighted image (A) (solid white arrow), and bright on the T2-weighted image (B) (open white arrow). Subcutaneous fat (dotted white arrows) and intraabdominal fat (dotted black arrows) are bright on both T1-weighted and T2-weighted images.
A B
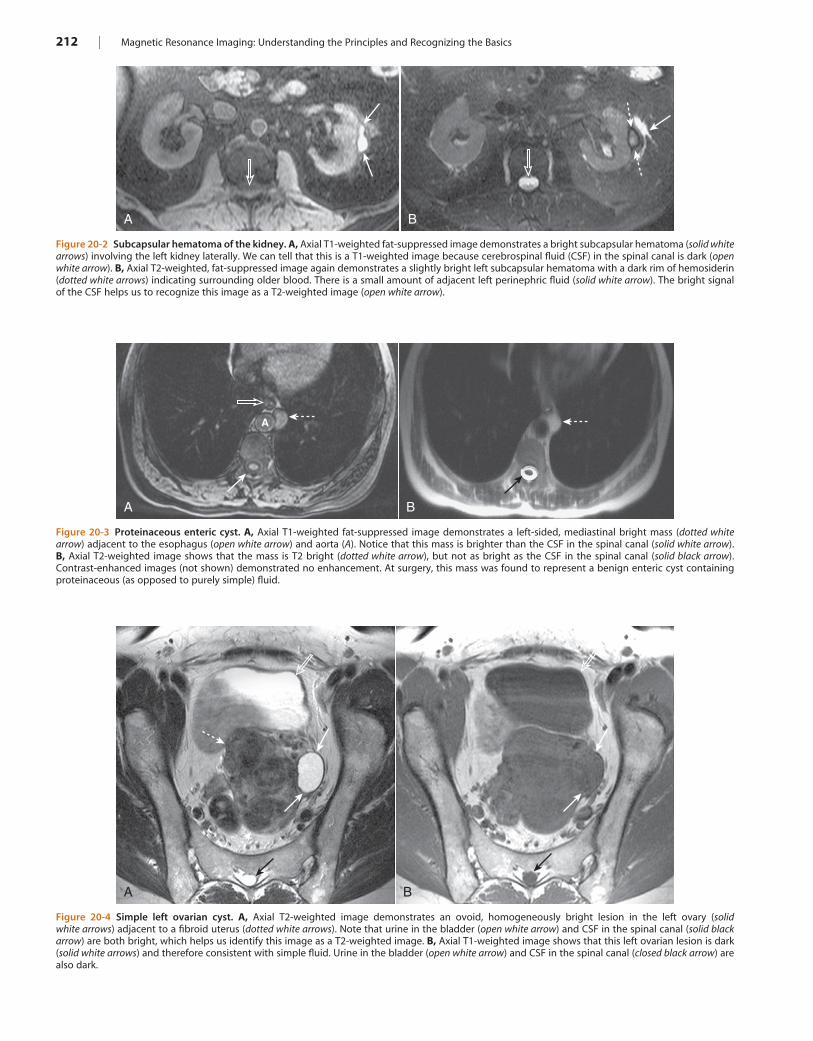
212 | Magnetic Resonance Imaging: Understanding the Principles and Recognizing the Basics
Figure 20-4 Simple left ovarian cyst. A, Axial T2-weighted image demonstrates an ovoid, homogeneously bright lesion in the left ovary (solid white arrows) adjacent to a fibroid uterus (dotted white arrows). Note that urine in the bladder (open white arrow) and CSF in the spinal canal (solid black arrow) are both bright, which helps us identify this image as a T2-weighted image. B, Axial T1-weighted image shows that this left ovarian lesion is dark (solid white arrows) and therefore consistent with simple fluid. Urine in the bladder (open white arrow) and CSF in the spinal canal (closed black arrow) are also dark.
A B
Figure 20-3 Proteinaceous enteric cyst. A, Axial T1-weighted fat-suppressed image demonstrates a left-sided, mediastinal bright mass (dotted white arrow) adjacent to the esophagus (open white arrow) and aorta (A). Notice that this mass is brighter than the CSF in the spinal canal (solid white arrow). B, Axial T2-weighted image shows that the mass is T2 bright (dotted white arrow), but not as bright as the CSF in the spinal canal (solid black arrow). Contrast-enhanced images (not shown) demonstrated no enhancement. At surgery, this mass was found to represent a benign enteric cyst containing proteinaceous (as opposed to purely simple) fluid.
A B
A
Figure 20-2 Subcapsular hematoma of the kidney. A, Axial T1-weighted fat-suppressed image demonstrates a bright subcapsular hematoma (solid white arrows) involving the left kidney laterally. We can tell that this is a T1-weighted image because cerebrospinal fluid (CSF) in the spinal canal is dark (open white arrow). B, Axial T2-weighted, fat-suppressed image again demonstrates a slightly bright left subcapsular hematoma with a dark rim of hemosiderin (dotted white arrows) indicating surrounding older blood. There is a small amount of adjacent left perinephric fluid (solid white arrow). The bright signal of the CSF helps us to recognize this image as a T2-weighted image (open white arrow).
A B
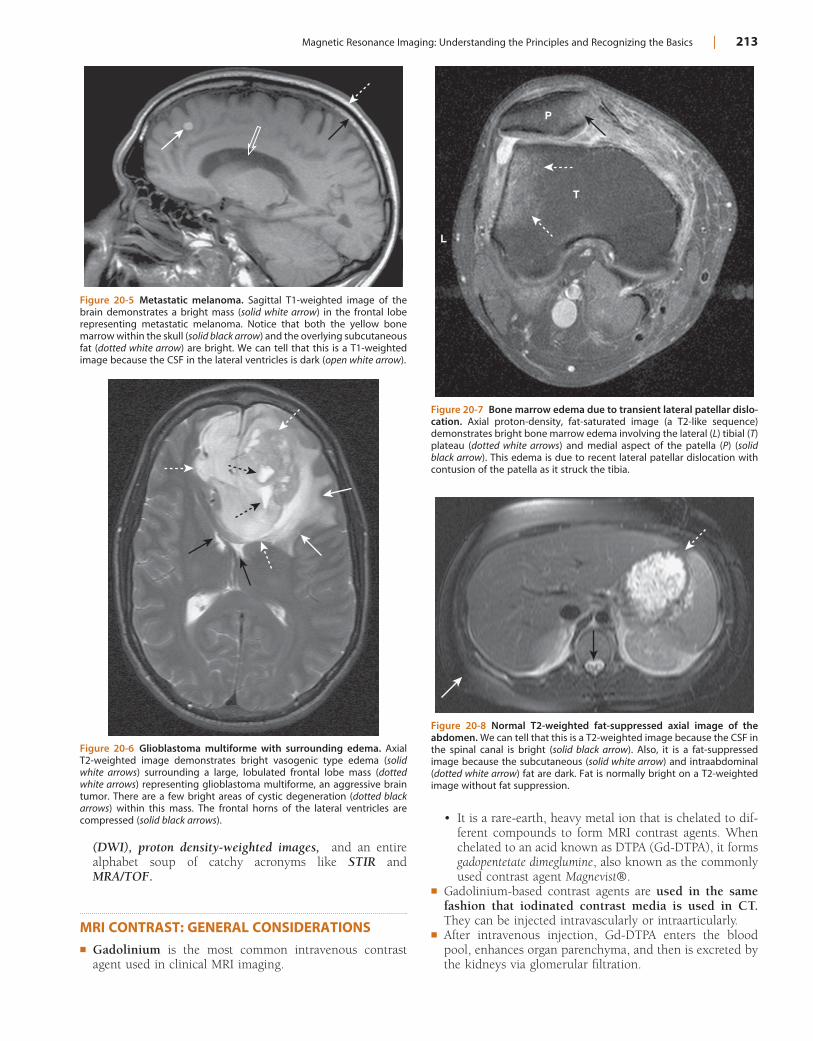
Magnetic Resonance Imaging: Understanding the Principles and Recognizing the Basics | 213
Figure 20-5 Metastatic melanoma. Sagittal T1-weighted image of the brain demonstrates a bright mass (solid white arrow) in the frontal lobe representing metastatic melanoma. Notice that both the yellow bone marrow within the skull (solid black arrow) and the overlying subcutaneous fat (dotted white arrow) are bright. We can tell that this is a T1-weighted image because the CSF in the lateral ventricles is dark (open white arrow).
Figure 20-6 Glioblastoma multiforme with surrounding edema. Axial T2-weighted image demonstrates bright vasogenic type edema (solid white arrows) surrounding a large, lobulated frontal lobe mass (dotted white arrows) representing glioblastoma multiforme, an aggressive brain tumor. There are a few bright areas of cystic degeneration (dotted black arrows) within this mass. The frontal horns of the lateral ventricles are compressed (solid black arrows).
Figure 20-7 Bone marrow edema due to transient lateral patellar dislo-cation. Axial proton-density, fat-saturated image (a T2-like sequence) demonstrates bright bone marrow edema involving the lateral (L) tibial (T) plateau (dotted white arrows) and medial aspect of the patella (P) (solid black arrow). This edema is due to recent lateral patellar dislocation with contusion of the patella as it struck the tibia.
L
P
T
Figure 20-8 Normal T2-weighted fat-suppressed axial image of the abdomen. We can tell that this is a T2-weighted image because the CSF in the spinal canal is bright (solid black arrow). Also, it is a fat-suppressed image because the subcutaneous (solid white arrow) and intraabdominal (dotted white arrow) fat are dark. Fat is normally bright on a T2-weighted image without fat suppression.
(DWI), proton density-weighted images, and an entire alphabet soup of catchy acronyms like STIR andMRA/TOF.
MRI CONTRAST: GENERAL CONSIDERATIONS! Gadolinium is the most common intravenous contrast
agent used in clinical MRI imaging.
• It is a rare-earth, heavy metal ion that is chelated to dif-ferent compounds to form MRI contrast agents. When chelated to an acid known as DTPA (Gd-DTPA), it forms gadopentetate dimeglumine, also known as the commonly used contrast agent Magnevist®.
! Gadolinium-based contrast agents are used in the same fashion that iodinated contrast media is used in CT. They can be injected intravascularly or intraarticularly.
! After intravenous injection, Gd-DTPA enters the blood pool, enhances organ parenchyma, and then is excreted by the kidneys via glomerular filtration.
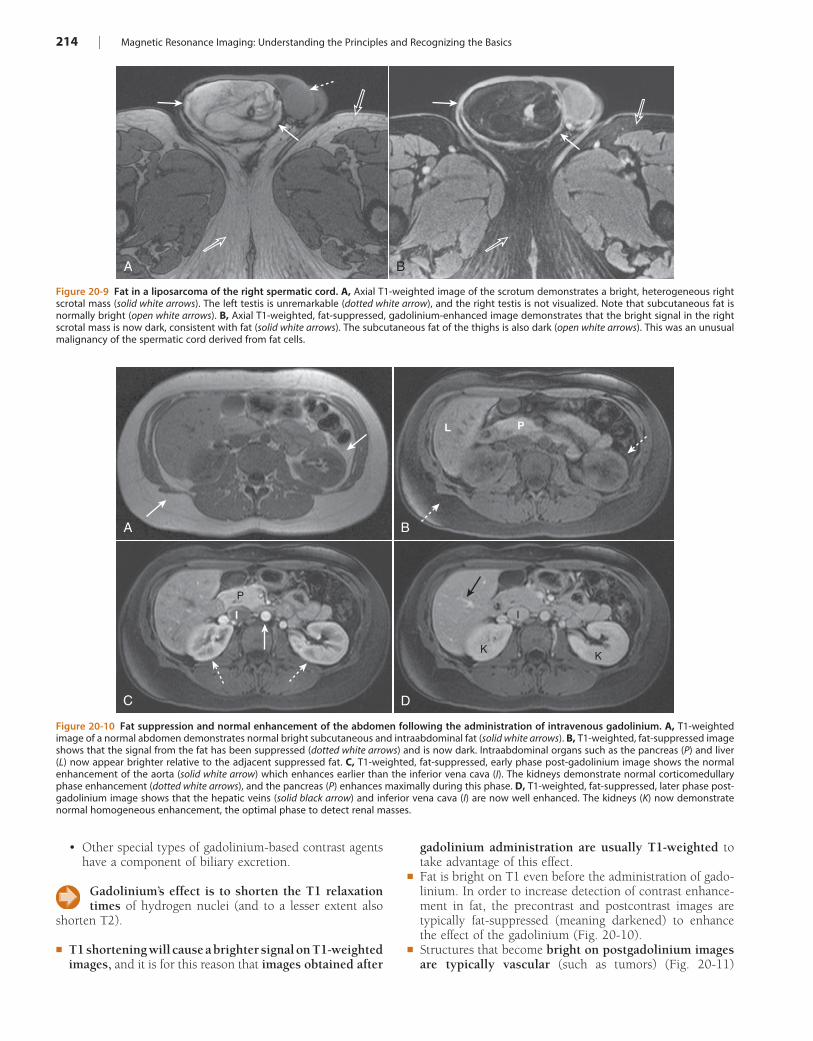
214 | Magnetic Resonance Imaging: Understanding the Principles and Recognizing the Basics
• Other special types of gadolinium-based contrast agents have a component of biliary excretion.
Gadolinium’s effect is to shorten the T1 relaxation times of hydrogen nuclei (and to a lesser extent also
shorten T2).
! T1 shortening will cause a brighter signal on T1-weighted images, and it is for this reason that images obtained after
Figure 20-9 Fat in a liposarcoma of the right spermatic cord. A, Axial T1-weighted image of the scrotum demonstrates a bright, heterogeneous right scrotal mass (solid white arrows). The left testis is unremarkable (dotted white arrow), and the right testis is not visualized. Note that subcutaneous fat is normally bright (open white arrows). B, Axial T1-weighted, fat-suppressed, gadolinium-enhanced image demonstrates that the bright signal in the right scrotal mass is now dark, consistent with fat (solid white arrows). The subcutaneous fat of the thighs is also dark (open white arrows). This was an unusual malignancy of the spermatic cord derived from fat cells.
A B
Figure 20-10 Fat suppression and normal enhancement of the abdomen following the administration of intravenous gadolinium. A, T1-weighted image of a normal abdomen demonstrates normal bright subcutaneous and intraabdominal fat (solid white arrows). B, T1-weighted, fat-suppressed image shows that the signal from the fat has been suppressed (dotted white arrows) and is now dark. Intraabdominal organs such as the pancreas (P) and liver (L) now appear brighter relative to the adjacent suppressed fat. C, T1-weighted, fat-suppressed, early phase post-gadolinium image shows the normal enhancement of the aorta (solid white arrow) which enhances earlier than the inferior vena cava (I). The kidneys demonstrate normal corticomedullary phase enhancement (dotted white arrows), and the pancreas (P) enhances maximally during this phase. D, T1-weighted, fat-suppressed, later phase post-gadolinium image shows that the hepatic veins (solid black arrow) and inferior vena cava (I) are now well enhanced. The kidneys (K) now demonstrate normal homogeneous enhancement, the optimal phase to detect renal masses.
A B
C D
L P
I
P
KK
I
gadolinium administration are usually T1-weighted to take advantage of this effect.
! Fat is bright on T1 even before the administration of gado-linium. In order to increase detection of contrast enhance-ment in fat, the precontrast and postcontrast images are typically fat-suppressed (meaning darkened) to enhance the effect of the gadolinium (Fig. 20-10).
! Structures that become bright on postgadolinium images are typically vascular (such as tumors) (Fig. 20-11)
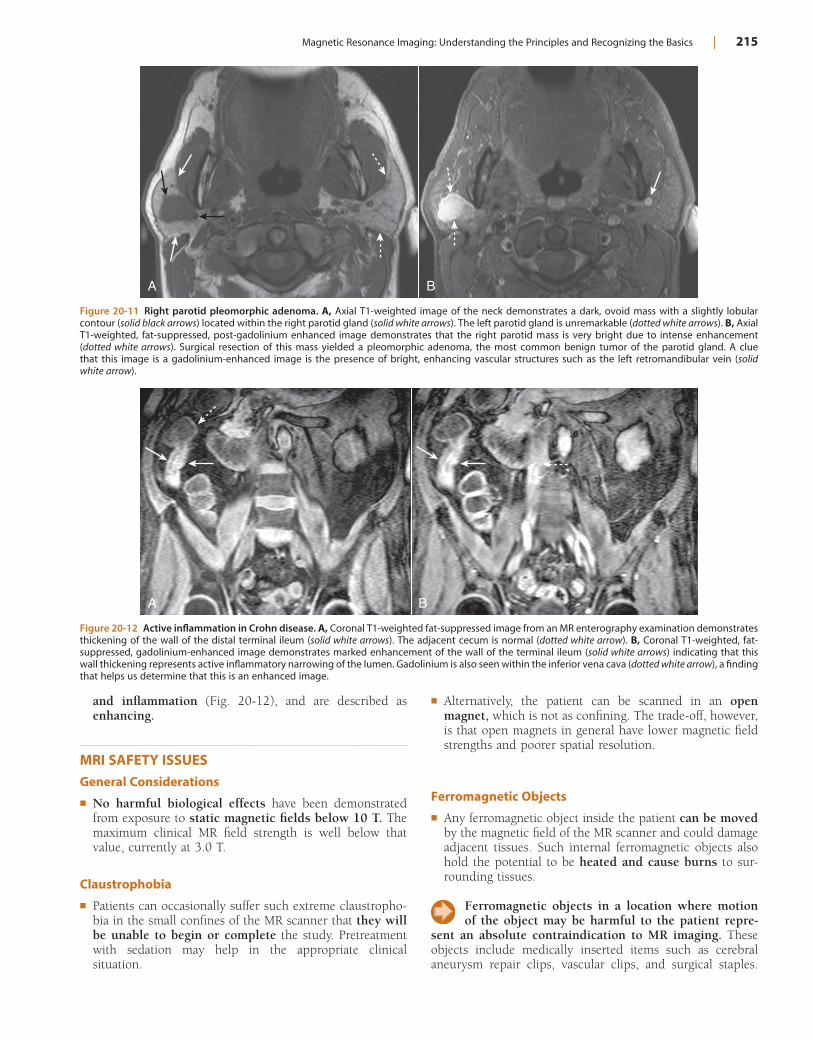
Magnetic Resonance Imaging: Understanding the Principles and Recognizing the Basics | 215
! Alternatively, the patient can be scanned in an open magnet, which is not as confining. The trade-off, however, is that open magnets in general have lower magnetic field strengths and poorer spatial resolution.
Ferromagnetic Objects
! Any ferromagnetic object inside the patient can be moved by the magnetic field of the MR scanner and could damage adjacent tissues. Such internal ferromagnetic objects also hold the potential to be heated and cause burns to sur-rounding tissues.
Ferromagnetic objects in a location where motion of the object may be harmful to the patient repre-
sent an absolute contraindication to MR imaging. These objects include medically inserted items such as cerebral aneurysm repair clips, vascular clips, and surgical staples.
and inflammation (Fig. 20-12), and are described as enhancing.
MRI SAFETY ISSUESGeneral Considerations
! No harmful biological effects have been demonstrated from exposure to static magnetic fields below 10 T. The maximum clinical MR field strength is well below that value, currently at 3.0 T.
Claustrophobia
! Patients can occasionally suffer such extreme claustropho-bia in the small confines of the MR scanner that they will be unable to begin or complete the study. Pretreatment with sedation may help in the appropriate clinical situation.
Figure 20-11 Right parotid pleomorphic adenoma. A, Axial T1-weighted image of the neck demonstrates a dark, ovoid mass with a slightly lobular contour (solid black arrows) located within the right parotid gland (solid white arrows). The left parotid gland is unremarkable (dotted white arrows). B, Axial T1-weighted, fat-suppressed, post-gadolinium enhanced image demonstrates that the right parotid mass is very bright due to intense enhancement (dotted white arrows). Surgical resection of this mass yielded a pleomorphic adenoma, the most common benign tumor of the parotid gland. A clue that this image is a gadolinium-enhanced image is the presence of bright, enhancing vascular structures such as the left retromandibular vein (solid white arrow).
A B
Figure 20-12 Active inflammation in Crohn disease. A, Coronal T1-weighted fat-suppressed image from an MR enterography examination demonstrates thickening of the wall of the distal terminal ileum (solid white arrows). The adjacent cecum is normal (dotted white arrow). B, Coronal T1-weighted, fat-suppressed, gadolinium-enhanced image demonstrates marked enhancement of the wall of the terminal ileum (solid white arrows) indicating that this wall thickening represents active inflammatory narrowing of the lumen. Gadolinium is also seen within the inferior vena cava (dotted white arrow), a finding that helps us determine that this is an enhanced image.
A B
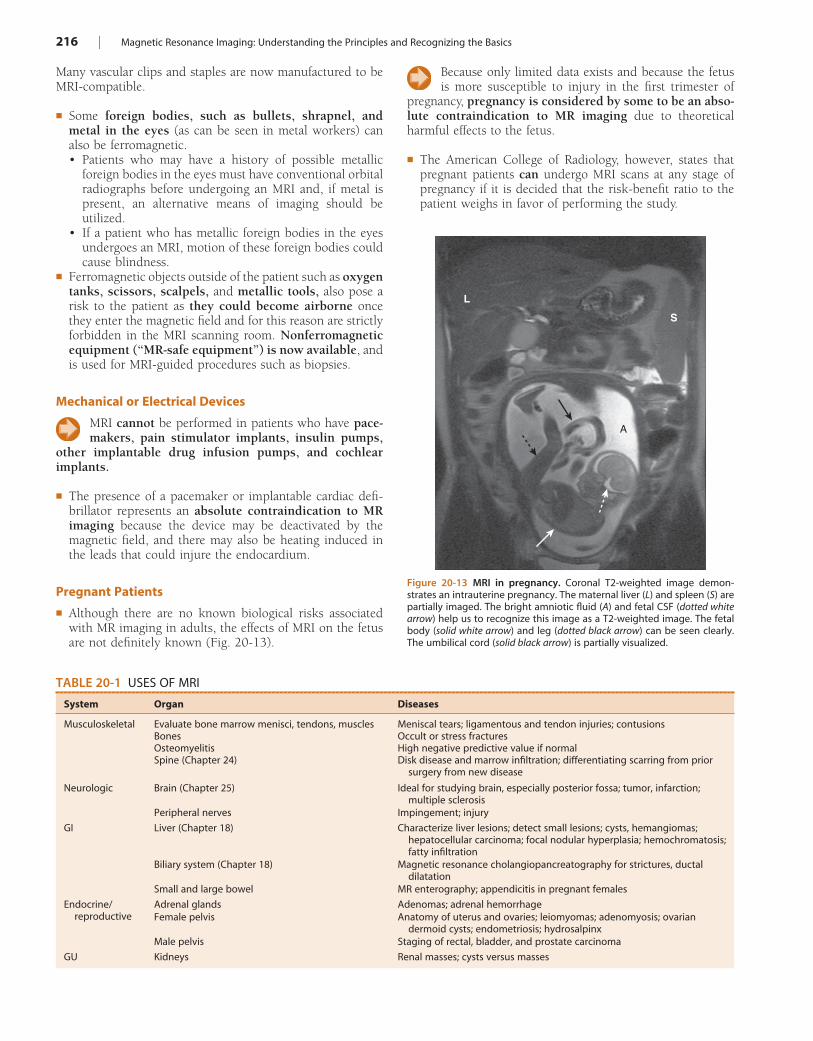
216 | Magnetic Resonance Imaging: Understanding the Principles and Recognizing the Basics
Because only limited data exists and because the fetus is more susceptible to injury in the first trimester of
pregnancy, pregnancy is considered by some to be an abso-lute contraindication to MR imaging due to theoretical harmful effects to the fetus.
! The American College of Radiology, however, states that pregnant patients can undergo MRI scans at any stage of pregnancy if it is decided that the risk-benefit ratio to the patient weighs in favor of performing the study.
Figure 20-13 MRI in pregnancy. Coronal T2-weighted image demon-strates an intrauterine pregnancy. The maternal liver (L) and spleen (S) are partially imaged. The bright amniotic fluid (A) and fetal CSF (dotted white arrow) help us to recognize this image as a T2-weighted image. The fetal body (solid white arrow) and leg (dotted black arrow) can be seen clearly. The umbilical cord (solid black arrow) is partially visualized.
A
L
S
TABLE 20-1 USES OF MRI
System Organ Diseases
Musculoskeletal Evaluate bone marrow menisci, tendons, muscles Meniscal tears; ligamentous and tendon injuries; contusionsBones Occult or stress fracturesOsteomyelitis High negative predictive value if normalSpine (Chapter 24) Disk disease and marrow infiltration; differentiating scarring from prior
surgery from new disease
Neurologic Brain (Chapter 25) Ideal for studying brain, especially posterior fossa; tumor, infarction; multiple sclerosis
Peripheral nerves Impingement; injury
GI Liver (Chapter 18) Characterize liver lesions; detect small lesions; cysts, hemangiomas; hepatocellular carcinoma; focal nodular hyperplasia; hemochromatosis; fatty infiltration
Biliary system (Chapter 18) Magnetic resonance cholangiopancreatography for strictures, ductal dilatation
Small and large bowel MR enterography; appendicitis in pregnant females
Endocrine/reproductive
Adrenal glands Adenomas; adrenal hemorrhageFemale pelvis Anatomy of uterus and ovaries; leiomyomas; adenomyosis; ovarian
dermoid cysts; endometriosis; hydrosalpinxMale pelvis Staging of rectal, bladder, and prostate carcinoma
GU Kidneys Renal masses; cysts versus masses
Many vascular clips and staples are now manufactured to be MRI-compatible.
! Some foreign bodies, such as bullets, shrapnel, and metal in the eyes (as can be seen in metal workers) can also be ferromagnetic.• Patients who may have a history of possible metallic
foreign bodies in the eyes must have conventional orbital radiographs before undergoing an MRI and, if metal is present, an alternative means of imaging should be utilized.
• If a patient who has metallic foreign bodies in the eyes undergoes an MRI, motion of these foreign bodies could cause blindness.
! Ferromagnetic objects outside of the patient such as oxygen tanks, scissors, scalpels, and metallic tools, also pose a risk to the patient as they could become airborne once they enter the magnetic field and for this reason are strictly forbidden in the MRI scanning room. Nonferromagnetic equipment (“MR-safe equipment”) is now available, and is used for MRI-guided procedures such as biopsies.
Mechanical or Electrical Devices
MRI cannot be performed in patients who have pace-makers, pain stimulator implants, insulin pumps,
other implantable drug infusion pumps, and cochlear implants.
! The presence of a pacemaker or implantable cardiac defi-brillator represents an absolute contraindication to MR imaging because the device may be deactivated by the magnetic field, and there may also be heating induced in the leads that could injure the endocardium.
Pregnant Patients
! Although there are no known biological risks associated with MR imaging in adults, the effects of MRI on the fetus are not definitely known (Fig. 20-13).
Magnetic Resonance Imaging: Understanding the Principles and Recognizing the Basics | 217
! MRI should probably not be performed electively in early term pregnancy due to this unknown risk to the fetus.
! Gadolinium is not recommended in pregnant patients, as gadolinium crosses the placenta, is subsequently excreted by the fetal kidneys, and has unknown effects on the fetus.
Nephrogenic Systemic Fibrosis
! In patients with renal insufficiency, gadolinium-based contrast agents have been associated with a rare, painful, debilitating, and sometimes fatal disease called nephro-genic systemic fibrosis (NSF).
! NSF produces fibrosis of skin, eyes, joints, and internal organs resembling scleroderma.
! Patients with preexisting renal dysfunction, especially those on dialysis, are at the greatest risk.• Caution is exercised when administering gadolinium
to patients who have moderate renal disease (estimated glomerular filtration rate [eGFR] between 30-60 mL/min/1.73m2). Gadolinium is typically avoided in patients with severe renal disease (eGFR < 30).
! There is currently no evidence to suggest that patients with normal renal function are at risk of developing NSF, and contrast-enhanced MRI imaging remains extremely safe in the vast majority of patients.
DIAGNOSTIC APPLICATIONS OF MRI! Some of the many clinical uses of MRI are outlined in Table
20-1. The chapters in which some of the diseases are dis-cussed in greater detail are indicated.
WEBLINKRegistered users may obtain more information on Magnetic Resonance Imaging: Understanding the Principles and Recog-nizing the Basics on StudentConsult.com.
TAKE-HOME POINTS
MRI: Understanding the Principles and Recognizing the Basics
MRI uses a very strong magnetic field to influence the electromagnetic activity of hydrogen nuclei, also called protons.
Protons each have a charge and possess a spin. The con-stant movement of protons generates a small magnetic field causing the proton to behave like a mini-magnet. When the protons are placed in the much more powerful magnetic field of the MRI scanner, they all align with this external magnetic field.
A radiofrequency (RF) pulse, transmitted by a transmit-ter coil, displaces the protons from their original align-ment with the external magnetic field of the scanner.
When the RF pulse is turned off, the displaced protons relax and realign with the main magnetic field,
producing a radiofrequency signal (the echo) as they do so. Receiver coils receive this signal (or echo) given off by the excited protons. A computer reconstructs the information from the echo to generate an image.
The main magnet in an MRI scanner is usually a super-conducting magnet that is cooled to extremely low tem-peratures in order to carry the electrical current.
There are three major types of coils within the MRI scanner: volume, surface, and gradient coils.
Pulse sequences consist of a set of imaging parameters that determine the way a particular tissue will appear. The two main pulse sequences that all MRI pulse sequences are based on are called spin echo (SE) and gradient recalled echo (GRE).
T1 and T2 are both time constants. T1 is called the lon-gitudinal relaxation time, and T2 is called the transversal relaxation time.
TR is the repetition time between two RF pulses. A short TR creates a T1-weighted image.
TE is the echo time between a pulse and its resultant echo. A long TE creates a T2-weighted image.
On T1-weighted images, fat, hemorrhage, proteinaceous fluid, melanin, and gadolinium are typically bright (white).
On T2-weighted images, fat, water, edema, inflamma-tion, infection, cysts, and hemorrhage are typically bright.
In summary, fat is T1-bright and T2-bright. Water is T1-dark and T2-bright.
Suppression is a feature of MRI that will cancel out or eliminate signal from certain tissues and is most often used for fat. Although normally T1-bright, fat will be dark on T1-weighted fat suppressed images. Fat suppres-sion is particularly useful for tissue characterization after administration of gadolinium.
Gadolinium is the most common intravenous contrast agent used in clinical MR imaging, and its effect is to shorten the T1 relaxation time of hydrogen nuclei yield-ing a brighter signal. Vascular structures such as tumors and areas of inflammation enhance after gadolinium administration and become more conspicuous.
Ferromagnetic objects must be kept outside of the MRI scanning room as they could become airborne when exposed to the magnetic field. Patients who may have metallic foreign bodies in their eyes must first have con-ventional orbital radiographs to see if metal is present.
In pregnancy, MRI is preferred in the second and third trimester, and gadolinium is contraindicated.
Nephrogenic systemic fibrosis is a debilitating fibrotic disease that can occur in patients with renal insufficiency who receive intravenous gadolinium-based contrast agents. Therefore, gadolinium is typically avoided in patients with severe renal disease.
218
Chapter 21
Recognizing Abnormalities of Bone Density
NORMAL BONE ANATOMYConventional Radiography
! On conventional radiographs, bones consist of a dense cortex of compact bone, which completely envelopes a less dense medullary cavity containing cancellous bone arranged as trabeculae, separated primarily by blood vessels, hematopoietic cells, and fat. The proportions of cortical versus trabecular bone vary in different skeletal sites and even at different locations in the same bone, i.e., the cortex is naturally thicker in some places than in others.
! When viewed in tangent on conventional radiographs, the cortex produces a smooth white shell of varying thickness that appears as a dense white band along the outer margins of the bone.
! The medullary cavity on conventional radiographs appears as a core of less dense, grayish material inside the cortical shell, interlaced with a fine network of bony trabecular markings. The corticomedullary junction is the edge between the inner margin of the cortex and the medullary cavity (Fig. 21-1).
! It is important to remember that the cortex completely surrounds the entire bone but on conventional radio-graphs is best seen where it is viewed in profile, i.e., where the x-ray beam passes tangentially to the bone.
! Almost all examinations of bone start with conventional radiographs obtained with at least two views exposed at a 90° angle to each other (called orthogonal views) so as to localize abnormalities better and to visualize as much of the circumference of the bone as possible.• Still, conventional radiographs cannot visualize the
entire circumference of a tubular bone and they are not particularly sensitive for demonstrating muscu-loskeletal soft tissue abnormalities other than soft tissue swelling.
CT and MRI
! CT and MRI are able to demonstrate the entire circumfer-ence and internal matrix of bone, including, especially with MRI, surrounding soft tissues not visible on conventional radiographs. This is accomplished by computer-aided reformatting and a superior ability to display more subtle differences in tissue densities (Fig. 21-2).
! In addition to bony trabeculae, the marrow cavity contains red and yellow bone marrow. The red marrow produces the precursors of blood cells. Yellow marrow contains fat. The composition of marrow is different for different bones of the body and changes during life to become less
hematopoietically active with age so that, around age 30, most of the appendicular skeleton contains only yellow marrow while most of the red marrow resides in the axial skeleton. Unlike conventional radiography, MRI is an excellent means of studying the components of marrow, a fact that makes MRI so useful in the study of marrow pathology.
! Whereas the cortex is the part of the bone most easily visualized on conventional radiographs, cortical bone has a very low signal intensity on conventional MRI sequences.
THE EFFECT OF BONE PHYSIOLOGY ON BONE ANATOMY! Bones reflect the general metabolic status of the individual.
Their composition requires a protein-containing, collag-enous matrix (osteoid) upon which bone mineral, prin-cipally calcium phosphate, is transformed into cartilage and bone.
! Bones are continuously undergoing remodeling processes that include resorption of old or diseased bone by osteo-clasts and formation of new bone by osteoblasts. While osteoblasts are responsible for bone matrix production, osteoclasts resorb both the matrix and mineral.
! Both osteoclastic and osteoblastic activity depend on the presence of a viable blood supply to bring those cells to the bone
! Bones also respond to mechanical forces—for example, the contractions of muscles and tendons, the process of bearing weight, constant use, or prolonged disuse—that help to form or maintain the shape as well as the content of each bone.
! In this chapter, we arbitrarily divide abnormalities of bone density into two major categories based primarily on their appearance on conventional radiographs—those that produce a pattern of either increased or decreased bone density and then subdivide those two patterns by extent of disease: focal versus diffuse (or generalized) changes (Table 21-1).
! If MRI were used as the basis for categorization, bone (marrow) disorders could be divided into four other categories:• Reconversion refers to the reversal of the normal con-
version of marrow cells so that red marrow repopulates bone from which it had been replaced by yellow marrow. Chronic anemias such as sickle cell disease are examples of this category.
• Marrow replacement such as by metastatic cells, mul-tiple myeloma, or leukemia.
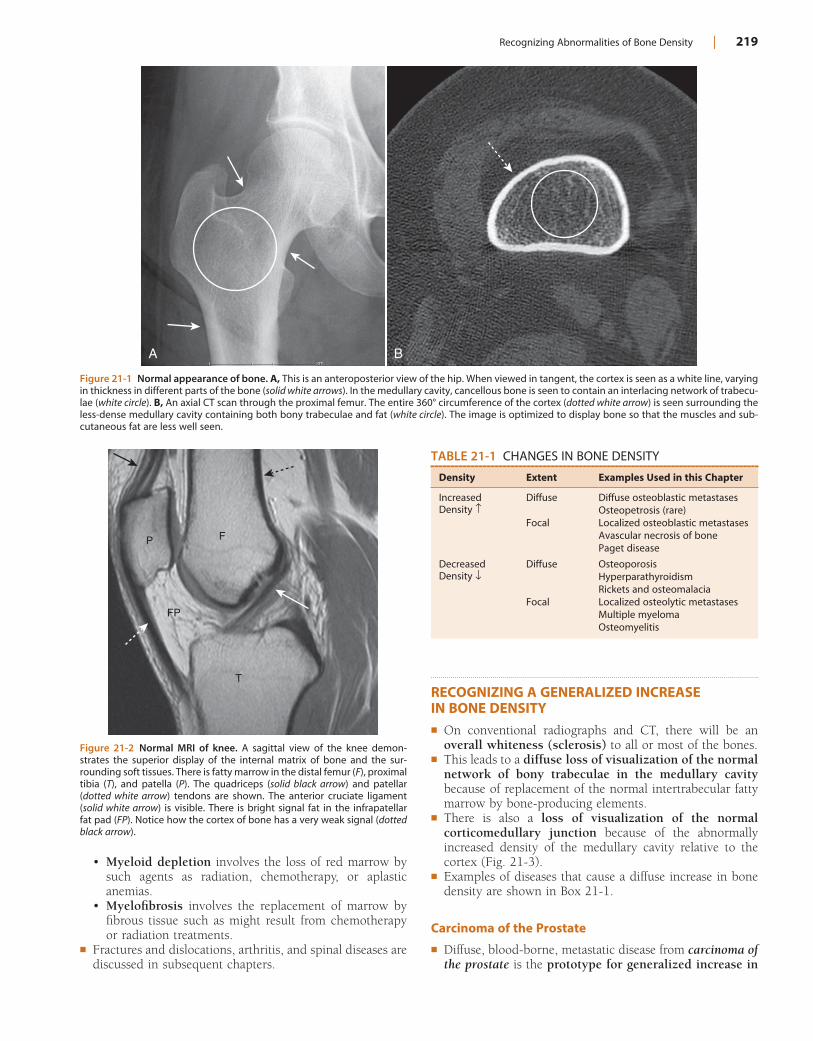
Recognizing Abnormalities of Bone Density | 219
RECOGNIZING A GENERALIZED INCREASE IN BONE DENSITY! On conventional radiographs and CT, there will be an
overall whiteness (sclerosis) to all or most of the bones.! This leads to a diffuse loss of visualization of the normal
network of bony trabeculae in the medullary cavity because of replacement of the normal intertrabecular fatty marrow by bone-producing elements.
! There is also a loss of visualization of the normal corticomedullary junction because of the abnormally increased density of the medullary cavity relative to the cortex (Fig. 21-3).
! Examples of diseases that cause a diffuse increase in bone density are shown in Box 21-1.
Carcinoma of the Prostate
! Diffuse, blood-borne, metastatic disease from carcinoma of the prostate is the prototype for generalized increase in
• Myeloid depletion involves the loss of red marrow by such agents as radiation, chemotherapy, or aplastic anemias.
• Myelofibrosis involves the replacement of marrow by fibrous tissue such as might result from chemotherapy or radiation treatments.
! Fractures and dislocations, arthritis, and spinal diseases are discussed in subsequent chapters.
Figure 21-1 Normal appearance of bone. A, This is an anteroposterior view of the hip. When viewed in tangent, the cortex is seen as a white line, varying in thickness in different parts of the bone (solid white arrows). In the medullary cavity, cancellous bone is seen to contain an interlacing network of trabecu-lae (white circle). B, An axial CT scan through the proximal femur. The entire 360° circumference of the cortex (dotted white arrow) is seen surrounding the less-dense medullary cavity containing both bony trabeculae and fat (white circle). The image is optimized to display bone so that the muscles and sub-cutaneous fat are less well seen.
A B
Figure 21-2 Normal MRI of knee. A sagittal view of the knee demon-strates the superior display of the internal matrix of bone and the sur-rounding soft tissues. There is fatty marrow in the distal femur (F), proximal tibia (T), and patella (P). The quadriceps (solid black arrow) and patellar (dotted white arrow) tendons are shown. The anterior cruciate ligament (solid white arrow) is visible. There is bright signal fat in the infrapatellar fat pad (FP). Notice how the cortex of bone has a very weak signal (dotted black arrow).
P F
FP
T
TABLE 21-1 CHANGES IN BONE DENSITY
Density Extent Examples Used in this Chapter
IncreasedDensity %
Diffuse Diffuse osteoblastic metastasesOsteopetrosis (rare)
Focal Localized osteoblastic metastasesAvascular necrosis of bonePaget disease
DecreasedDensity &
Diffuse OsteoporosisHyperparathyroidismRickets and osteomalacia
Focal Localized osteolytic metastasesMultiple myelomaOsteomyelitis
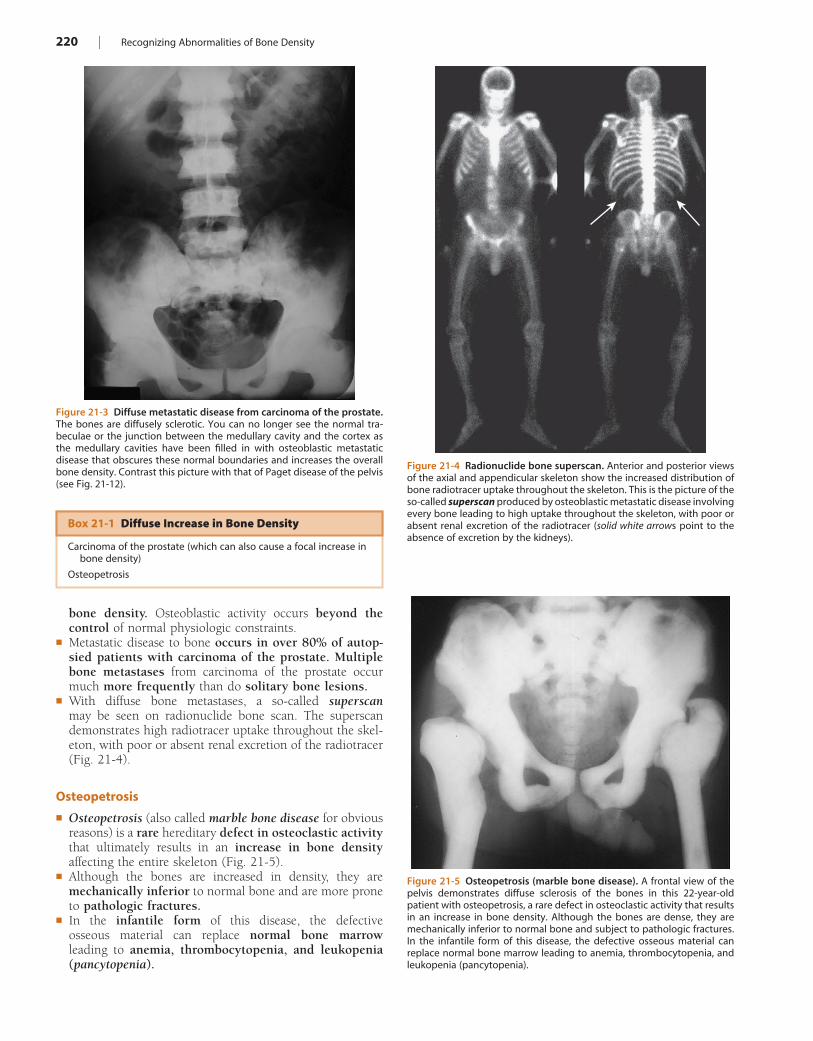
220 | Recognizing Abnormalities of Bone Density
bone density. Osteoblastic activity occurs beyond the control of normal physiologic constraints.
! Metastatic disease to bone occurs in over 80% of autop-sied patients with carcinoma of the prostate. Multiple bone metastases from carcinoma of the prostate occur much more frequently than do solitary bone lesions.
! With diffuse bone metastases, a so-called superscan may be seen on radionuclide bone scan. The superscan demonstrates high radiotracer uptake throughout the skel-eton, with poor or absent renal excretion of the radiotracer (Fig. 21-4).
Osteopetrosis
! Osteopetrosis (also called marble bone disease for obvious reasons) is a rare hereditary defect in osteoclastic activity that ultimately results in an increase in bone density affecting the entire skeleton (Fig. 21-5).
! Although the bones are increased in density, they are mechanically inferior to normal bone and are more prone to pathologic fractures.
! In the infantile form of this disease, the defective osseous material can replace normal bone marrow leading to anemia, thrombocytopenia, and leukopenia (pancytopenia).
Figure 21-3 Diffuse metastatic disease from carcinoma of the prostate. The bones are diffusely sclerotic. You can no longer see the normal tra-beculae or the junction between the medullary cavity and the cortex as the medullary cavities have been filled in with osteoblastic metastatic disease that obscures these normal boundaries and increases the overall bone density. Contrast this picture with that of Paget disease of the pelvis (see Fig. 21-12).
Figure 21-4 Radionuclide bone superscan. Anterior and posterior views of the axial and appendicular skeleton show the increased distribution of bone radiotracer uptake throughout the skeleton. This is the picture of the so-called superscan produced by osteoblastic metastatic disease involving every bone leading to high uptake throughout the skeleton, with poor or absent renal excretion of the radiotracer (solid white arrows point to the absence of excretion by the kidneys).
Figure 21-5 Osteopetrosis (marble bone disease). A frontal view of the pelvis demonstrates diffuse sclerosis of the bones in this 22-year-old patient with osteopetrosis, a rare defect in osteoclastic activity that results in an increase in bone density. Although the bones are dense, they are mechanically inferior to normal bone and subject to pathologic fractures. In the infantile form of this disease, the defective osseous material can replace normal bone marrow leading to anemia, thrombocytopenia, and leukopenia (pancytopenia).
Box 21-1 Diffuse Increase in Bone Density
Carcinoma of the prostate (which can also cause a focal increase in bone density)
Osteopetrosis
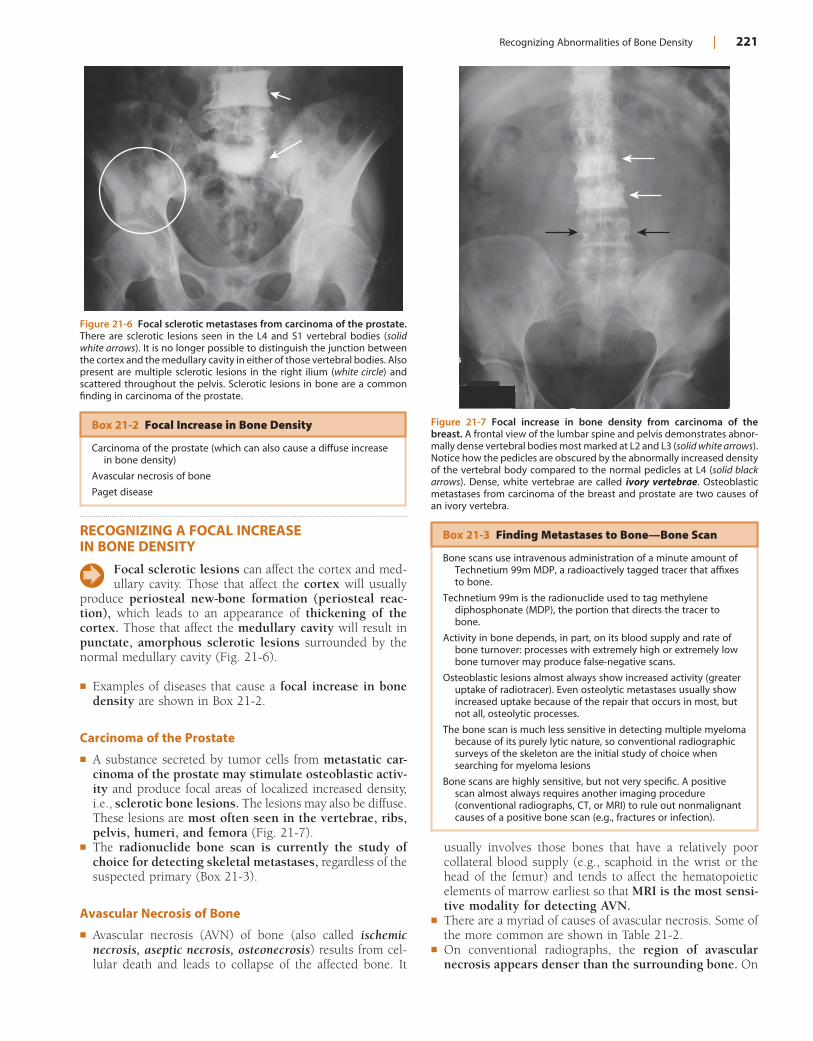
Recognizing Abnormalities of Bone Density | 221
Figure 21-6 Focal sclerotic metastases from carcinoma of the prostate. There are sclerotic lesions seen in the L4 and S1 vertebral bodies (solid white arrows). It is no longer possible to distinguish the junction between the cortex and the medullary cavity in either of those vertebral bodies. Also present are multiple sclerotic lesions in the right ilium (white circle) and scattered throughout the pelvis. Sclerotic lesions in bone are a common finding in carcinoma of the prostate.
Figure 21-7 Focal increase in bone density from carcinoma of the breast. A frontal view of the lumbar spine and pelvis demonstrates abnor-mally dense vertebral bodies most marked at L2 and L3 (solid white arrows). Notice how the pedicles are obscured by the abnormally increased density of the vertebral body compared to the normal pedicles at L4 (solid black arrows). Dense, white vertebrae are called ivory vertebrae. Osteoblastic metastases from carcinoma of the breast and prostate are two causes of an ivory vertebra.
Box 21-3 Finding Metastases to Bone—Bone Scan
Bone scans use intravenous administration of a minute amount of Technetium 99m MDP, a radioactively tagged tracer that affixes to bone.
Technetium 99m is the radionuclide used to tag methylene diphosphonate (MDP), the portion that directs the tracer to bone.
Activity in bone depends, in part, on its blood supply and rate of bone turnover: processes with extremely high or extremely low bone turnover may produce false-negative scans.
Osteoblastic lesions almost always show increased activity (greater uptake of radiotracer). Even osteolytic metastases usually show increased uptake because of the repair that occurs in most, but not all, osteolytic processes.
The bone scan is much less sensitive in detecting multiple myeloma because of its purely lytic nature, so conventional radiographic surveys of the skeleton are the initial study of choice when searching for myeloma lesions
Bone scans are highly sensitive, but not very specific. A positive scan almost always requires another imaging procedure (conventional radiographs, CT, or MRI) to rule out nonmalignant causes of a positive bone scan (e.g., fractures or infection).
Box 21-2 Focal Increase in Bone Density
Carcinoma of the prostate (which can also cause a diffuse increase in bone density)
Avascular necrosis of bone
Paget disease
RECOGNIZING A FOCAL INCREASE IN BONE DENSITY
Focal sclerotic lesions can affect the cortex and med-ullary cavity. Those that affect the cortex will usually
produce periosteal new-bone formation (periosteal reac-tion), which leads to an appearance of thickening of the cortex. Those that affect the medullary cavity will result in punctate, amorphous sclerotic lesions surrounded by the normal medullary cavity (Fig. 21-6).
! Examples of diseases that cause a focal increase in bone density are shown in Box 21-2.
Carcinoma of the Prostate
! A substance secreted by tumor cells from metastatic car-cinoma of the prostate may stimulate osteoblastic activ-ity and produce focal areas of localized increased density, i.e., sclerotic bone lesions. The lesions may also be diffuse. These lesions are most often seen in the vertebrae, ribs, pelvis, humeri, and femora (Fig. 21-7).
! The radionuclide bone scan is currently the study of choice for detecting skeletal metastases, regardless of the suspected primary (Box 21-3).
Avascular Necrosis of Bone
! Avascular necrosis (AVN) of bone (also called ischemic necrosis, aseptic necrosis, osteonecrosis) results from cel-lular death and leads to collapse of the affected bone. It
usually involves those bones that have a relatively poor collateral blood supply (e.g., scaphoid in the wrist or the head of the femur) and tends to affect the hematopoietic elements of marrow earliest so that MRI is the most sensi-tive modality for detecting AVN.
! There are a myriad of causes of avascular necrosis. Some of the more common are shown in Table 21-2.
! On conventional radiographs, the region of avascular necrosis appears denser than the surrounding bone. On
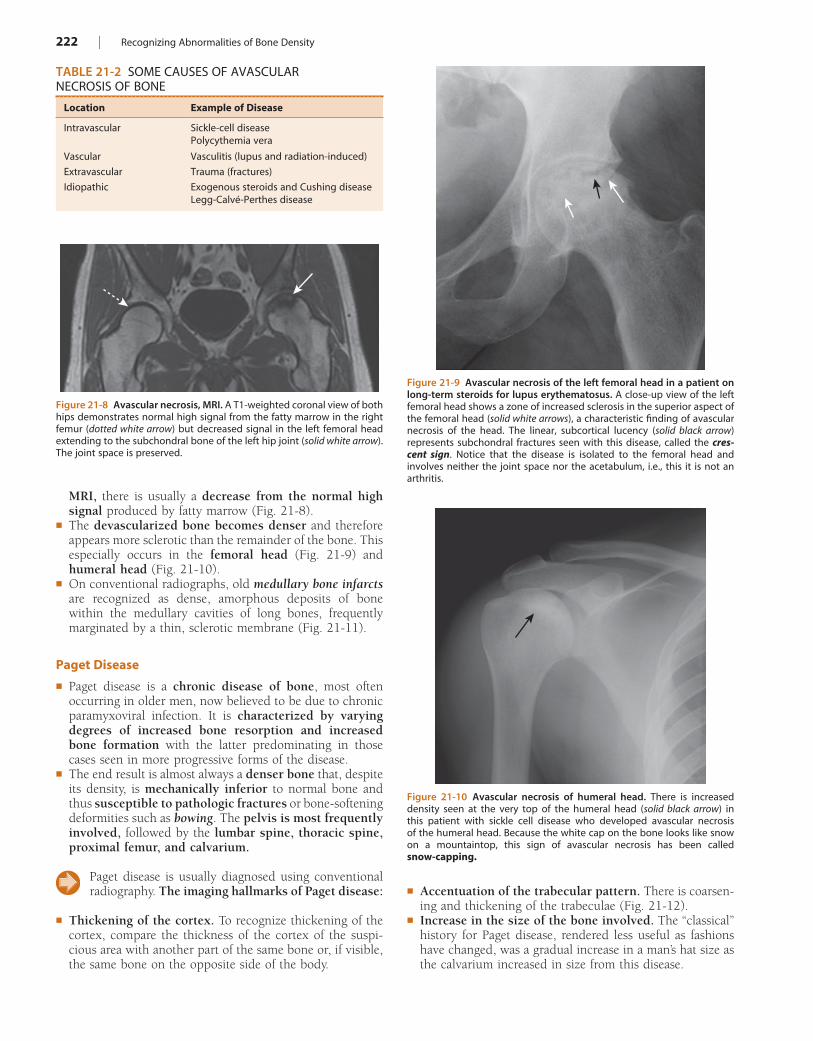
222 | Recognizing Abnormalities of Bone Density
TABLE 21-2 SOME CAUSES OF AVASCULAR NECROSIS OF BONE
Location Example of Disease
Intravascular Sickle-cell diseasePolycythemia vera
Vascular Vasculitis (lupus and radiation-induced)
Extravascular Trauma (fractures)
Idiopathic Exogenous steroids and Cushing diseaseLegg-Calvé-Perthes disease
Figure 21-8 Avascular necrosis, MRI. A T1-weighted coronal view of both hips demonstrates normal high signal from the fatty marrow in the right femur (dotted white arrow) but decreased signal in the left femoral head extending to the subchondral bone of the left hip joint (solid white arrow). The joint space is preserved.
Figure 21-9 Avascular necrosis of the left femoral head in a patient on long-term steroids for lupus erythematosus. A close-up view of the left femoral head shows a zone of increased sclerosis in the superior aspect of the femoral head (solid white arrows), a characteristic finding of avascular necrosis of the head. The linear, subcortical lucency (solid black arrow) represents subchondral fractures seen with this disease, called the cres-cent sign. Notice that the disease is isolated to the femoral head and involves neither the joint space nor the acetabulum, i.e., this it is not an arthritis.
Figure 21-10 Avascular necrosis of humeral head. There is increased density seen at the very top of the humeral head (solid black arrow) in this patient with sickle cell disease who developed avascular necrosis of the humeral head. Because the white cap on the bone looks like snow on a mountaintop, this sign of avascular necrosis has been called snow-capping.
MRI, there is usually a decrease from the normal high signal produced by fatty marrow (Fig. 21-8).
! The devascularized bone becomes denser and therefore appears more sclerotic than the remainder of the bone. This especially occurs in the femoral head (Fig. 21-9) and humeral head (Fig. 21-10).
! On conventional radiographs, old medullary bone infarcts are recognized as dense, amorphous deposits of bone within the medullary cavities of long bones, frequently marginated by a thin, sclerotic membrane (Fig. 21-11).
Paget Disease
! Paget disease is a chronic disease of bone, most often occurring in older men, now believed to be due to chronic paramyxoviral infection. It is characterized by varying degrees of increased bone resorption and increased bone formation with the latter predominating in those cases seen in more progressive forms of the disease.
! The end result is almost always a denser bone that, despite its density, is mechanically inferior to normal bone and thus susceptible to pathologic fractures or bone-softening deformities such as bowing. The pelvis is most frequently involved, followed by the lumbar spine, thoracic spine, proximal femur, and calvarium.
Paget disease is usually diagnosed using conventional radiography. The imaging hallmarks of Paget disease:
! Thickening of the cortex. To recognize thickening of the cortex, compare the thickness of the cortex of the suspi-cious area with another part of the same bone or, if visible, the same bone on the opposite side of the body.
! Accentuation of the trabecular pattern. There is coarsen-ing and thickening of the trabeculae (Fig. 21-12).
! Increase in the size of the bone involved. The “classical” history for Paget disease, rendered less useful as fashions have changed, was a gradual increase in a man’s hat size as the calvarium increased in size from this disease.
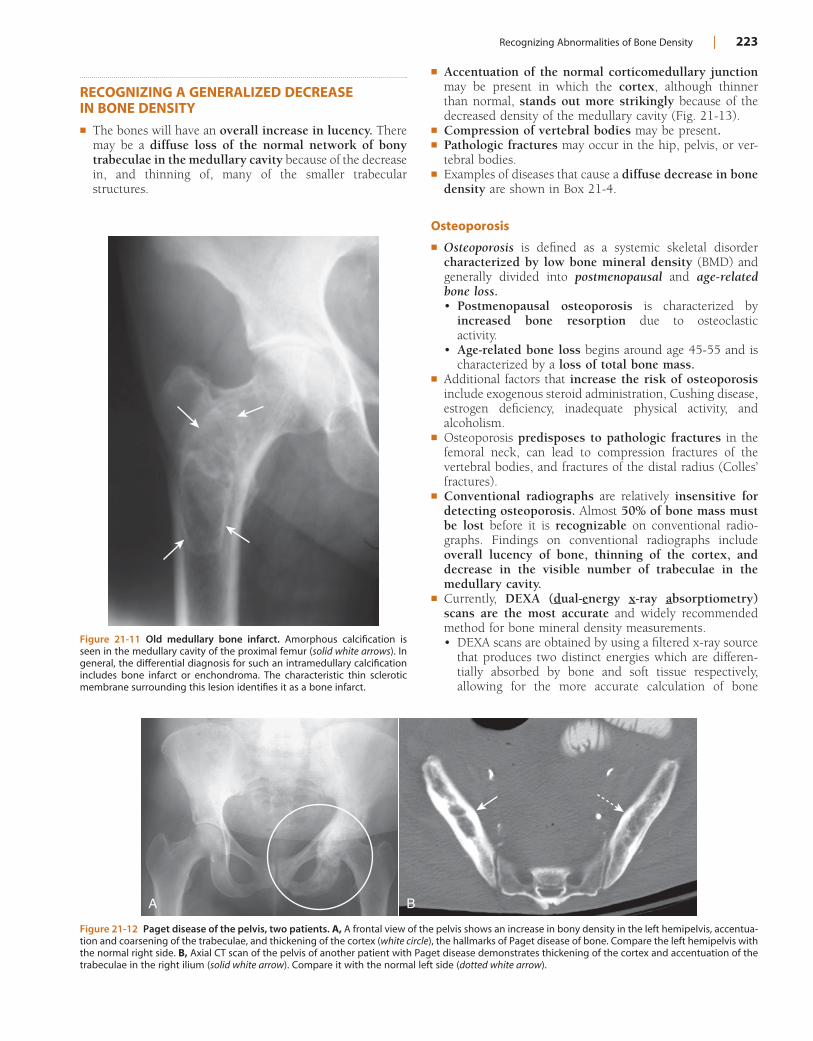
Recognizing Abnormalities of Bone Density | 223
Figure 21-11 Old medullary bone infarct. Amorphous calcification is seen in the medullary cavity of the proximal femur (solid white arrows). In general, the differential diagnosis for such an intramedullary calcification includes bone infarct or enchondroma. The characteristic thin sclerotic membrane surrounding this lesion identifies it as a bone infarct.
Figure 21-12 Paget disease of the pelvis, two patients. A, A frontal view of the pelvis shows an increase in bony density in the left hemipelvis, accentua-tion and coarsening of the trabeculae, and thickening of the cortex (white circle), the hallmarks of Paget disease of bone. Compare the left hemipelvis with the normal right side. B, Axial CT scan of the pelvis of another patient with Paget disease demonstrates thickening of the cortex and accentuation of the trabeculae in the right ilium (solid white arrow). Compare it with the normal left side (dotted white arrow).
A B
RECOGNIZING A GENERALIZED DECREASE IN BONE DENSITY! The bones will have an overall increase in lucency. There
may be a diffuse loss of the normal network of bony trabeculae in the medullary cavity because of the decrease in, and thinning of, many of the smaller trabecular structures.
! Accentuation of the normal corticomedullary junction may be present in which the cortex, although thinner than normal, stands out more strikingly because of the decreased density of the medullary cavity (Fig. 21-13).
! Compression of vertebral bodies may be present.! Pathologic fractures may occur in the hip, pelvis, or ver-
tebral bodies.! Examples of diseases that cause a diffuse decrease in bone
density are shown in Box 21-4.
Osteoporosis
! Osteoporosis is defined as a systemic skeletal disorder characterized by low bone mineral density (BMD) and generally divided into postmenopausal and age-related bone loss.• Postmenopausal osteoporosis is characterized by
increased bone resorption due to osteoclastic activity.
• Age-related bone loss begins around age 45-55 and is characterized by a loss of total bone mass.
! Additional factors that increase the risk of osteoporosis include exogenous steroid administration, Cushing disease, estrogen deficiency, inadequate physical activity, and alcoholism.
! Osteoporosis predisposes to pathologic fractures in the femoral neck, can lead to compression fractures of the vertebral bodies, and fractures of the distal radius (Colles’ fractures).
! Conventional radiographs are relatively insensitive for detecting osteoporosis. Almost 50% of bone mass must be lost before it is recognizable on conventional radio-graphs. Findings on conventional radiographs include overall lucency of bone, thinning of the cortex, and decrease in the visible number of trabeculae in the medullary cavity.
! Currently, DEXA (dual-energy x-ray absorptiometry) scans are the most accurate and widely recommended method for bone mineral density measurements.• DEXA scans are obtained by using a filtered x-ray source
that produces two distinct energies which are differen-tially absorbed by bone and soft tissue respectively, allowing for the more accurate calculation of bone
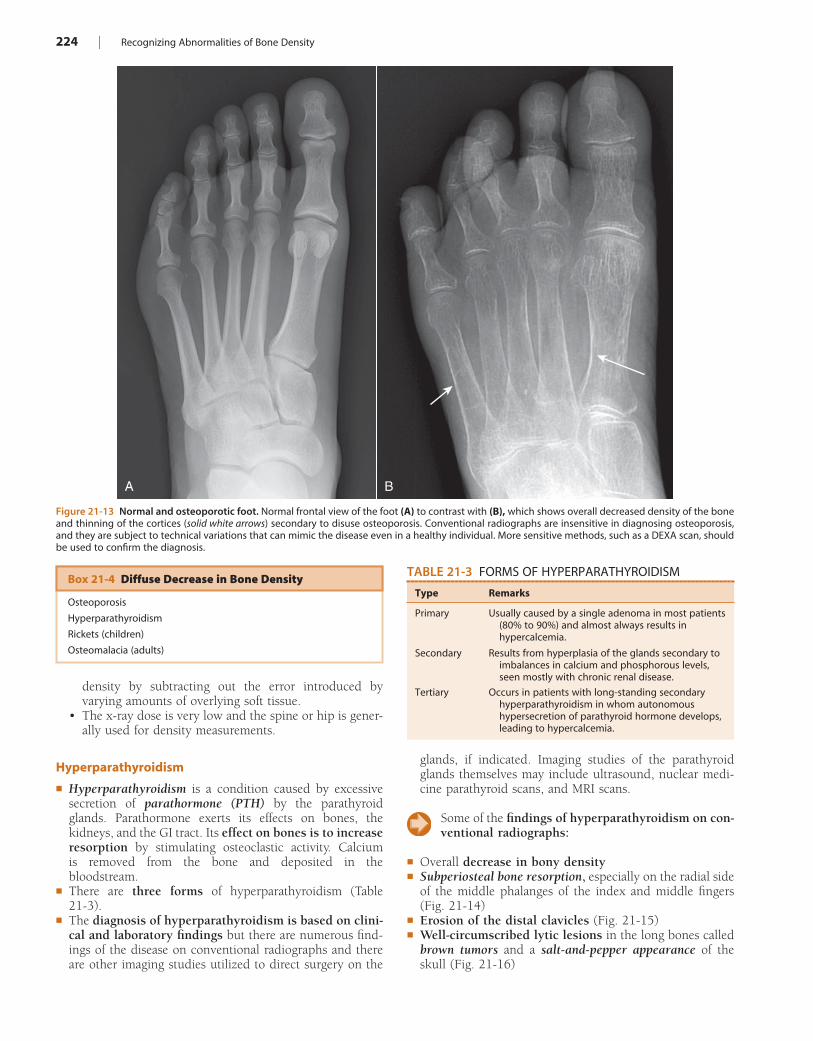
224 | Recognizing Abnormalities of Bone Density
Figure 21-13 Normal and osteoporotic foot. Normal frontal view of the foot (A) to contrast with (B), which shows overall decreased density of the bone and thinning of the cortices (solid white arrows) secondary to disuse osteoporosis. Conventional radiographs are insensitive in diagnosing osteoporosis, and they are subject to technical variations that can mimic the disease even in a healthy individual. More sensitive methods, such as a DEXA scan, should be used to confirm the diagnosis.
A B
TABLE 21-3 FORMS OF HYPERPARATHYROIDISM
Type Remarks
Primary Usually caused by a single adenoma in most patients (80% to 90%) and almost always results in hypercalcemia.
Secondary Results from hyperplasia of the glands secondary to imbalances in calcium and phosphorous levels, seen mostly with chronic renal disease.
Tertiary Occurs in patients with long-standing secondary hyperparathyroidism in whom autonomous hypersecretion of parathyroid hormone develops, leading to hypercalcemia.
Box 21-4 Diffuse Decrease in Bone Density
Osteoporosis
Hyperparathyroidism
Rickets (children)
Osteomalacia (adults)
density by subtracting out the error introduced by varying amounts of overlying soft tissue.
• The x-ray dose is very low and the spine or hip is gener-ally used for density measurements.
Hyperparathyroidism
! Hyperparathyroidism is a condition caused by excessive secretion of parathormone (PTH) by the parathyroid glands. Parathormone exerts its effects on bones, the kidneys, and the GI tract. Its effect on bones is to increase resorption by stimulating osteoclastic activity. Calcium is removed from the bone and deposited in the bloodstream.
! There are three forms of hyperparathyroidism (Table 21-3).
! The diagnosis of hyperparathyroidism is based on clini-cal and laboratory findings but there are numerous find-ings of the disease on conventional radiographs and there are other imaging studies utilized to direct surgery on the
glands, if indicated. Imaging studies of the parathyroid glands themselves may include ultrasound, nuclear medi-cine parathyroid scans, and MRI scans.
Some of the findings of hyperparathyroidism on con-ventional radiographs:
! Overall decrease in bony density! Subperiosteal bone resorption, especially on the radial side
of the middle phalanges of the index and middle fingers (Fig. 21-14)
! Erosion of the distal clavicles (Fig. 21-15)! Well-circumscribed lytic lesions in the long bones called
brown tumors and a salt-and-pepper appearance of the skull (Fig. 21-16)
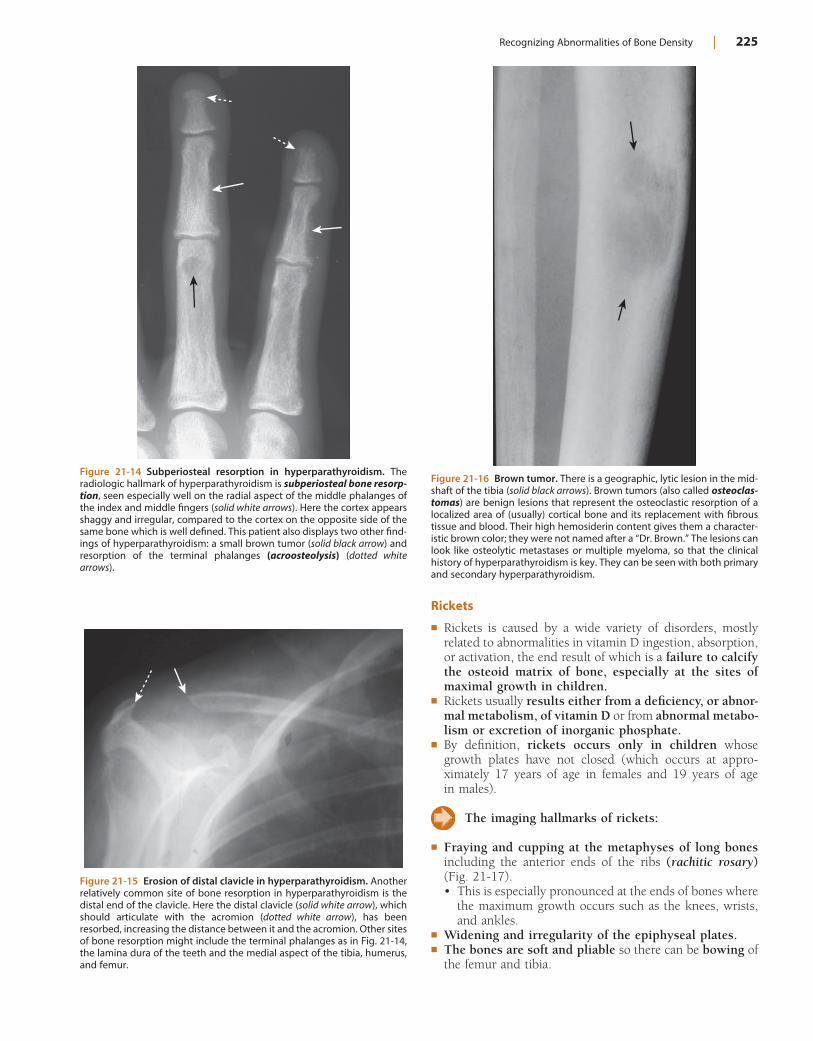
Recognizing Abnormalities of Bone Density | 225
Rickets
! Rickets is caused by a wide variety of disorders, mostly related to abnormalities in vitamin D ingestion, absorption, or activation, the end result of which is a failure to calcify the osteoid matrix of bone, especially at the sites of maximal growth in children.
! Rickets usually results either from a deficiency, or abnor-mal metabolism, of vitamin D or from abnormal metabo-lism or excretion of inorganic phosphate.
! By definition, rickets occurs only in children whose growth plates have not closed (which occurs at appro-ximately 17 years of age in females and 19 years of age in males).
The imaging hallmarks of rickets:
! Fraying and cupping at the metaphyses of long bones including the anterior ends of the ribs (rachitic rosary) (Fig. 21-17).• This is especially pronounced at the ends of bones where
the maximum growth occurs such as the knees, wrists, and ankles.
! Widening and irregularity of the epiphyseal plates.! The bones are soft and pliable so there can be bowing of
the femur and tibia.
Figure 21-14 Subperiosteal resorption in hyperparathyroidism. The radiologic hallmark of hyperparathyroidism is subperiosteal bone resorp-tion, seen especially well on the radial aspect of the middle phalanges of the index and middle fingers (solid white arrows). Here the cortex appears shaggy and irregular, compared to the cortex on the opposite side of the same bone which is well defined. This patient also displays two other find-ings of hyperparathyroidism: a small brown tumor (solid black arrow) and resorption of the terminal phalanges (acroosteolysis) (dotted white arrows).
Figure 21-15 Erosion of distal clavicle in hyperparathyroidism. Another relatively common site of bone resorption in hyperparathyroidism is the distal end of the clavicle. Here the distal clavicle (solid white arrow), which should articulate with the acromion (dotted white arrow), has been resorbed, increasing the distance between it and the acromion. Other sites of bone resorption might include the terminal phalanges as in Fig. 21-14, the lamina dura of the teeth and the medial aspect of the tibia, humerus, and femur.
Figure 21-16 Brown tumor. There is a geographic, lytic lesion in the mid-shaft of the tibia (solid black arrows). Brown tumors (also called osteoclas-tomas) are benign lesions that represent the osteoclastic resorption of a localized area of (usually) cortical bone and its replacement with fibrous tissue and blood. Their high hemosiderin content gives them a character-istic brown color; they were not named after a “Dr. Brown.” The lesions can look like osteolytic metastases or multiple myeloma, so that the clinical history of hyperparathyroidism is key. They can be seen with both primary and secondary hyperparathyroidism.
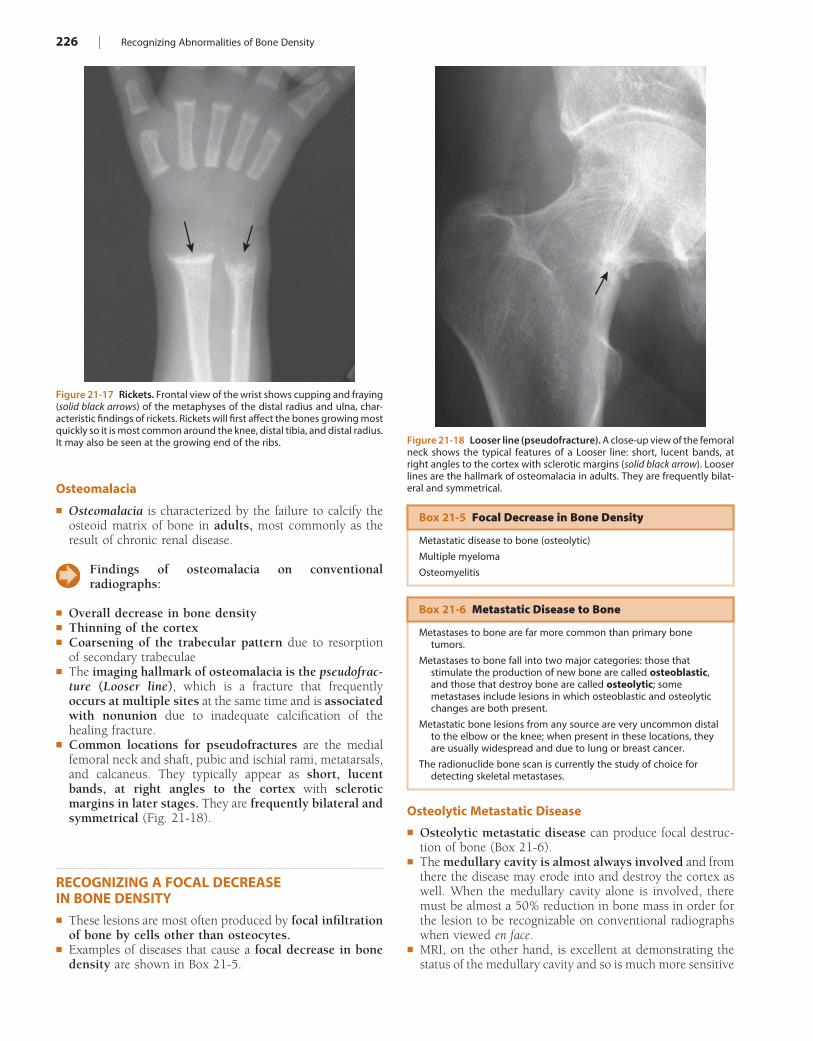
226 | Recognizing Abnormalities of Bone Density
Osteomalacia
! Osteomalacia is characterized by the failure to calcify the osteoid matrix of bone in adults, most commonly as the result of chronic renal disease.
Findings of osteomalacia on conventional radiographs:
! Overall decrease in bone density! Thinning of the cortex! Coarsening of the trabecular pattern due to resorption
of secondary trabeculae! The imaging hallmark of osteomalacia is the pseudofrac-
ture (Looser line), which is a fracture that frequently occurs at multiple sites at the same time and is associated with nonunion due to inadequate calcification of the healing fracture.
! Common locations for pseudofractures are the medial femoral neck and shaft, pubic and ischial rami, metatarsals, and calcaneus. They typically appear as short, lucent bands, at right angles to the cortex with sclerotic margins in later stages. They are frequently bilateral and symmetrical (Fig. 21-18).
RECOGNIZING A FOCAL DECREASE IN BONE DENSITY! These lesions are most often produced by focal infiltration
of bone by cells other than osteocytes.! Examples of diseases that cause a focal decrease in bone
density are shown in Box 21-5.
Figure 21-17 Rickets. Frontal view of the wrist shows cupping and fraying (solid black arrows) of the metaphyses of the distal radius and ulna, char-acteristic findings of rickets. Rickets will first affect the bones growing most quickly so it is most common around the knee, distal tibia, and distal radius. It may also be seen at the growing end of the ribs. Figure 21-18 Looser line (pseudofracture). A close-up view of the femoral
neck shows the typical features of a Looser line: short, lucent bands, at right angles to the cortex with sclerotic margins (solid black arrow). Looser lines are the hallmark of osteomalacia in adults. They are frequently bilat-eral and symmetrical.
Box 21-6 Metastatic Disease to Bone
Metastases to bone are far more common than primary bone tumors.
Metastases to bone fall into two major categories: those that stimulate the production of new bone are called osteoblastic, and those that destroy bone are called osteolytic; some metastases include lesions in which osteoblastic and osteolytic changes are both present.
Metastatic bone lesions from any source are very uncommon distal to the elbow or the knee; when present in these locations, they are usually widespread and due to lung or breast cancer.
The radionuclide bone scan is currently the study of choice for detecting skeletal metastases.
Box 21-5 Focal Decrease in Bone Density
Metastatic disease to bone (osteolytic)
Multiple myeloma
Osteomyelitis
Osteolytic Metastatic Disease
! Osteolytic metastatic disease can produce focal destruc-tion of bone (Box 21-6).
! The medullary cavity is almost always involved and from there the disease may erode into and destroy the cortex as well. When the medullary cavity alone is involved, there must be almost a 50% reduction in bone mass in order for the lesion to be recognizable on conventional radiographs when viewed en face.
! MRI, on the other hand, is excellent at demonstrating the status of the medullary cavity and so is much more sensitive
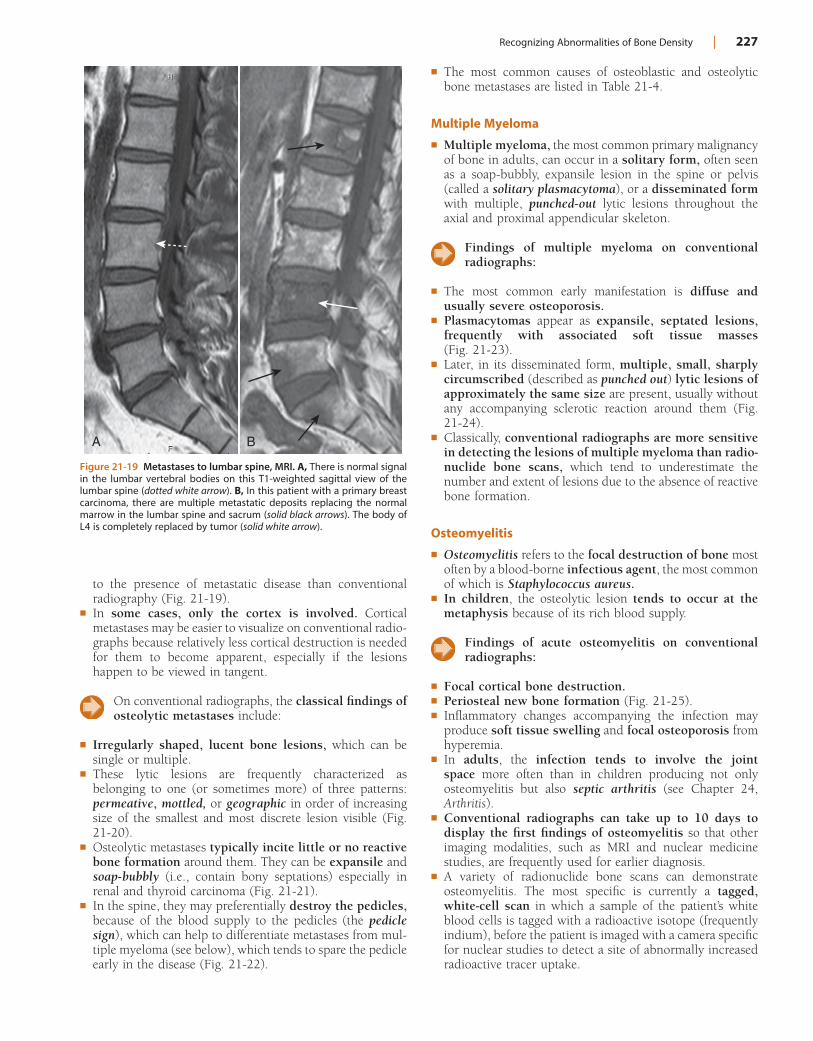
Recognizing Abnormalities of Bone Density | 227
! The most common causes of osteoblastic and osteolytic bone metastases are listed in Table 21-4.
Multiple Myeloma
! Multiple myeloma, the most common primary malignancy of bone in adults, can occur in a solitary form, often seen as a soap-bubbly, expansile lesion in the spine or pelvis (called a solitary plasmacytoma), or a disseminated form with multiple, punched-out lytic lesions throughout the axial and proximal appendicular skeleton.
Findings of multiple myeloma on conventional radiographs:
! The most common early manifestation is diffuse and usually severe osteoporosis.
! Plasmacytomas appear as expansile, septated lesions, frequently with associated soft tissue masses (Fig. 21-23).
! Later, in its disseminated form, multiple, small, sharply circumscribed (described as punched out) lytic lesions of approximately the same size are present, usually without any accompanying sclerotic reaction around them (Fig. 21-24).
! Classically, conventional radiographs are more sensitive in detecting the lesions of multiple myeloma than radio-nuclide bone scans, which tend to underestimate the number and extent of lesions due to the absence of reactive bone formation.
Osteomyelitis
! Osteomyelitis refers to the focal destruction of bone most often by a blood-borne infectious agent, the most common of which is Staphylococcus aureus.
! In children, the osteolytic lesion tends to occur at the metaphysis because of its rich blood supply.
Findings of acute osteomyelitis on conventional radiographs:
! Focal cortical bone destruction.! Periosteal new bone formation (Fig. 21-25).! Inflammatory changes accompanying the infection may
produce soft tissue swelling and focal osteoporosis from hyperemia.
! In adults, the infection tends to involve the joint space more often than in children producing not only osteomyelitis but also septic arthritis (see Chapter 24, Arthritis).
! Conventional radiographs can take up to 10 days to display the first findings of osteomyelitis so that other imaging modalities, such as MRI and nuclear medicine studies, are frequently used for earlier diagnosis.
! A variety of radionuclide bone scans can demonstrate osteomyelitis. The most specific is currently a tagged, white-cell scan in which a sample of the patient’s white blood cells is tagged with a radioactive isotope (frequently indium), before the patient is imaged with a camera specific for nuclear studies to detect a site of abnormally increased radioactive tracer uptake.
Figure 21-19 Metastases to lumbar spine, MRI. A, There is normal signal in the lumbar vertebral bodies on this T1-weighted sagittal view of the lumbar spine (dotted white arrow). B, In this patient with a primary breast carcinoma, there are multiple metastatic deposits replacing the normal marrow in the lumbar spine and sacrum (solid black arrows). The body of L4 is completely replaced by tumor (solid white arrow).
BA
to the presence of metastatic disease than conventional radiography (Fig. 21-19).
! In some cases, only the cortex is involved. Cortical metastases may be easier to visualize on conventional radio-graphs because relatively less cortical destruction is needed for them to become apparent, especially if the lesions happen to be viewed in tangent.
On conventional radiographs, the classical findings of osteolytic metastases include:
! Irregularly shaped, lucent bone lesions, which can be single or multiple.
! These lytic lesions are frequently characterized as belonging to one (or sometimes more) of three patterns: permeative, mottled, or geographic in order of increasing size of the smallest and most discrete lesion visible (Fig. 21-20).
! Osteolytic metastases typically incite little or no reactive bone formation around them. They can be expansile and soap-bubbly (i.e., contain bony septations) especially in renal and thyroid carcinoma (Fig. 21-21).
! In the spine, they may preferentially destroy the pedicles, because of the blood supply to the pedicles (the pedicle sign), which can help to differentiate metastases from mul-tiple myeloma (see below), which tends to spare the pedicle early in the disease (Fig. 21-22).
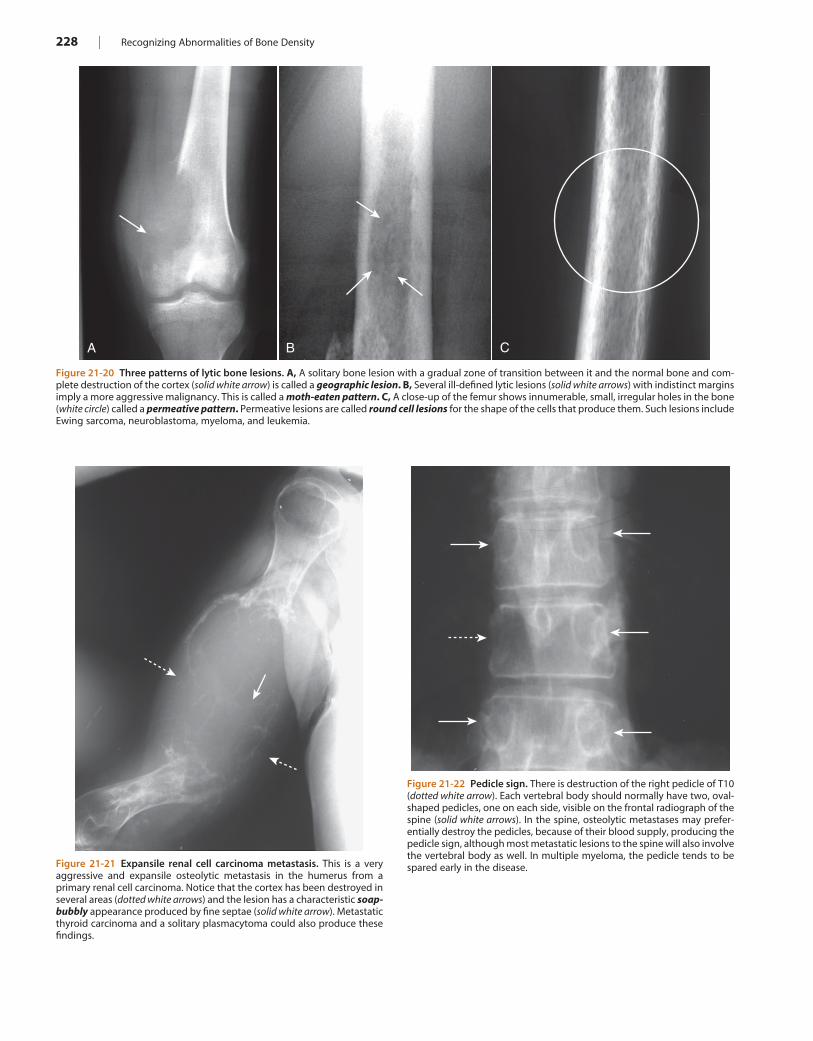
228 | Recognizing Abnormalities of Bone Density
Figure 21-20 Three patterns of lytic bone lesions. A, A solitary bone lesion with a gradual zone of transition between it and the normal bone and com-plete destruction of the cortex (solid white arrow) is called a geographic lesion. B, Several ill-defined lytic lesions (solid white arrows) with indistinct margins imply a more aggressive malignancy. This is called a moth-eaten pattern. C, A close-up of the femur shows innumerable, small, irregular holes in the bone (white circle) called a permeative pattern. Permeative lesions are called round cell lesions for the shape of the cells that produce them. Such lesions include Ewing sarcoma, neuroblastoma, myeloma, and leukemia.
B CA
Figure 21-21 Expansile renal cell carcinoma metastasis. This is a very aggressive and expansile osteolytic metastasis in the humerus from a primary renal cell carcinoma. Notice that the cortex has been destroyed in several areas (dotted white arrows) and the lesion has a characteristic soap-bubbly appearance produced by fine septae (solid white arrow). Metastatic thyroid carcinoma and a solitary plasmacytoma could also produce these findings.
Figure 21-22 Pedicle sign. There is destruction of the right pedicle of T10 (dotted white arrow). Each vertebral body should normally have two, oval-shaped pedicles, one on each side, visible on the frontal radiograph of the spine (solid white arrows). In the spine, osteolytic metastases may prefer-entially destroy the pedicles, because of their blood supply, producing the pedicle sign, although most metastatic lesions to the spine will also involve the vertebral body as well. In multiple myeloma, the pedicle tends to be spared early in the disease.
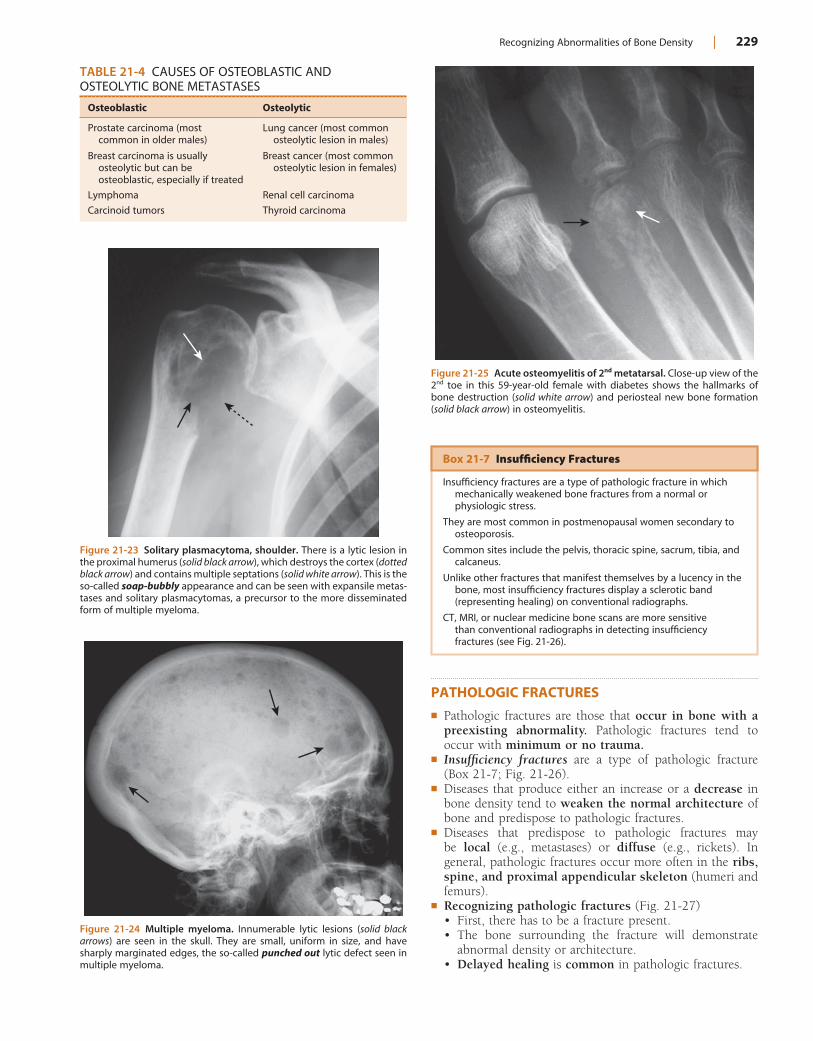
Recognizing Abnormalities of Bone Density | 229
PATHOLOGIC FRACTURES! Pathologic fractures are those that occur in bone with a
preexisting abnormality. Pathologic fractures tend to occur with minimum or no trauma.
! Insufficiency fractures are a type of pathologic fracture (Box 21-7; Fig. 21-26).
! Diseases that produce either an increase or a decrease in bone density tend to weaken the normal architecture of bone and predispose to pathologic fractures.
! Diseases that predispose to pathologic fractures may be local (e.g., metastases) or diffuse (e.g., rickets). In general, pathologic fractures occur more often in the ribs, spine, and proximal appendicular skeleton (humeri and femurs).
! Recognizing pathologic fractures (Fig. 21-27)• First, there has to be a fracture present.• The bone surrounding the fracture will demonstrate
abnormal density or architecture.• Delayed healing is common in pathologic fractures.
TABLE 21-4 CAUSES OF OSTEOBLASTIC AND OSTEOLYTIC BONE METASTASES
Osteoblastic Osteolytic
Prostate carcinoma (most common in older males)
Lung cancer (most common osteolytic lesion in males)
Breast carcinoma is usually osteolytic but can be osteoblastic, especially if treated
Breast cancer (most common osteolytic lesion in females)
Lymphoma Renal cell carcinoma
Carcinoid tumors Thyroid carcinoma
Figure 21-23 Solitary plasmacytoma, shoulder. There is a lytic lesion in the proximal humerus (solid black arrow), which destroys the cortex (dotted black arrow) and contains multiple septations (solid white arrow). This is the so-called soap-bubbly appearance and can be seen with expansile metas-tases and solitary plasmacytomas, a precursor to the more disseminated form of multiple myeloma.
Figure 21-24 Multiple myeloma. Innumerable lytic lesions (solid black arrows) are seen in the skull. They are small, uniform in size, and have sharply marginated edges, the so-called punched out lytic defect seen in multiple myeloma.
Figure 21-25 Acute osteomyelitis of 2nd metatarsal. Close-up view of the 2nd toe in this 59-year-old female with diabetes shows the hallmarks of bone destruction (solid white arrow) and periosteal new bone formation (solid black arrow) in osteomyelitis.
Box 21-7 Insufficiency Fractures
Insufficiency fractures are a type of pathologic fracture in which mechanically weakened bone fractures from a normal or physiologic stress.
They are most common in postmenopausal women secondary to osteoporosis.
Common sites include the pelvis, thoracic spine, sacrum, tibia, and calcaneus.
Unlike other fractures that manifest themselves by a lucency in the bone, most insufficiency fractures display a sclerotic band (representing healing) on conventional radiographs.
CT, MRI, or nuclear medicine bone scans are more sensitive than conventional radiographs in detecting insufficiency fractures (see Fig. 21-26).
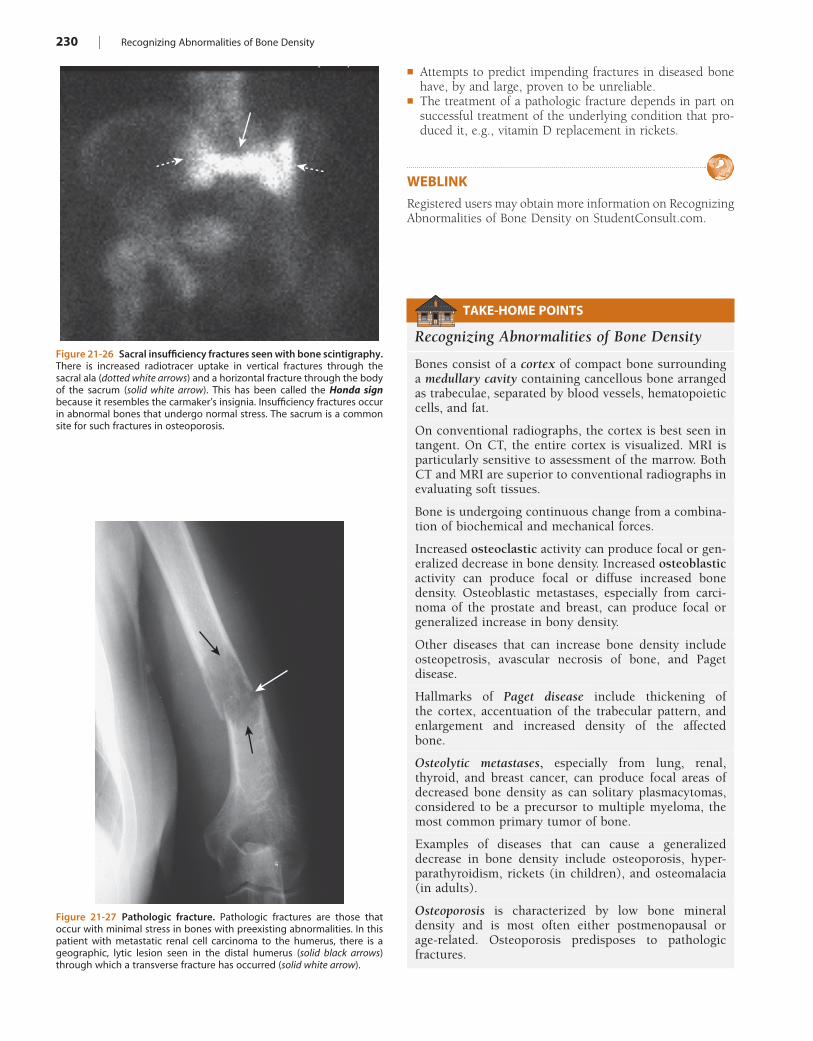
230 | Recognizing Abnormalities of Bone Density
! Attempts to predict impending fractures in diseased bone have, by and large, proven to be unreliable.
! The treatment of a pathologic fracture depends in part on successful treatment of the underlying condition that pro-duced it, e.g., vitamin D replacement in rickets.
WEBLINKRegistered users may obtain more information on Recognizing Abnormalities of Bone Density on StudentConsult.com.
Figure 21-26 Sacral insufficiency fractures seen with bone scintigraphy. There is increased radiotracer uptake in vertical fractures through the sacral ala (dotted white arrows) and a horizontal fracture through the body of the sacrum (solid white arrow). This has been called the Honda sign because it resembles the carmaker’s insignia. Insufficiency fractures occur in abnormal bones that undergo normal stress. The sacrum is a common site for such fractures in osteoporosis.
Figure 21-27 Pathologic fracture. Pathologic fractures are those that occur with minimal stress in bones with preexisting abnormalities. In this patient with metastatic renal cell carcinoma to the humerus, there is a geographic, lytic lesion seen in the distal humerus (solid black arrows) through which a transverse fracture has occurred (solid white arrow).
TAKE-HOME POINTS
Recognizing Abnormalities of Bone Density
Bones consist of a cortex of compact bone surrounding a medullary cavity containing cancellous bone arranged as trabeculae, separated by blood vessels, hematopoietic cells, and fat.
On conventional radiographs, the cortex is best seen in tangent. On CT, the entire cortex is visualized. MRI is particularly sensitive to assessment of the marrow. Both CT and MRI are superior to conventional radiographs in evaluating soft tissues.
Bone is undergoing continuous change from a combina-tion of biochemical and mechanical forces.
Increased osteoclastic activity can produce focal or gen-eralized decrease in bone density. Increased osteoblastic activity can produce focal or diffuse increased bone density. Osteoblastic metastases, especially from carci-noma of the prostate and breast, can produce focal or generalized increase in bony density.
Other diseases that can increase bone density include osteopetrosis, avascular necrosis of bone, and Paget disease.
Hallmarks of Paget disease include thickening of the cortex, accentuation of the trabecular pattern, and enlargement and increased density of the affected bone.
Osteolytic metastases, especially from lung, renal, thyroid, and breast cancer, can produce focal areas of decreased bone density as can solitary plasmacytomas, considered to be a precursor to multiple myeloma, the most common primary tumor of bone.
Examples of diseases that can cause a generalized decrease in bone density include osteoporosis, hyper-parathyroidism, rickets (in children), and osteomalacia (in adults).
Osteoporosis is characterized by low bone mineral density and is most often either postmenopausal or age-related. Osteoporosis predisposes to pathologic fractures.

Recognizing Abnormalities of Bone Density | 231
Pathologic fractures are those that occur with minimal or no trauma in bones that had a preexisting abnormality.
Examples of diseases that can cause a focal decrease in bone density include metastases, multiple myeloma, and osteomyelitis.
The radionuclide bone scan is the modality of choice in screening for skeletal metastases. MRI is used primarily
to solve specific questions related to a lesion’s composi-tion and extent.
There must be almost a 50% reduction in the mass of bone in order for a difference in density to be perceived on conventional radiographs; MRI is much more sensitive to the presence of medullary metastatic disease.
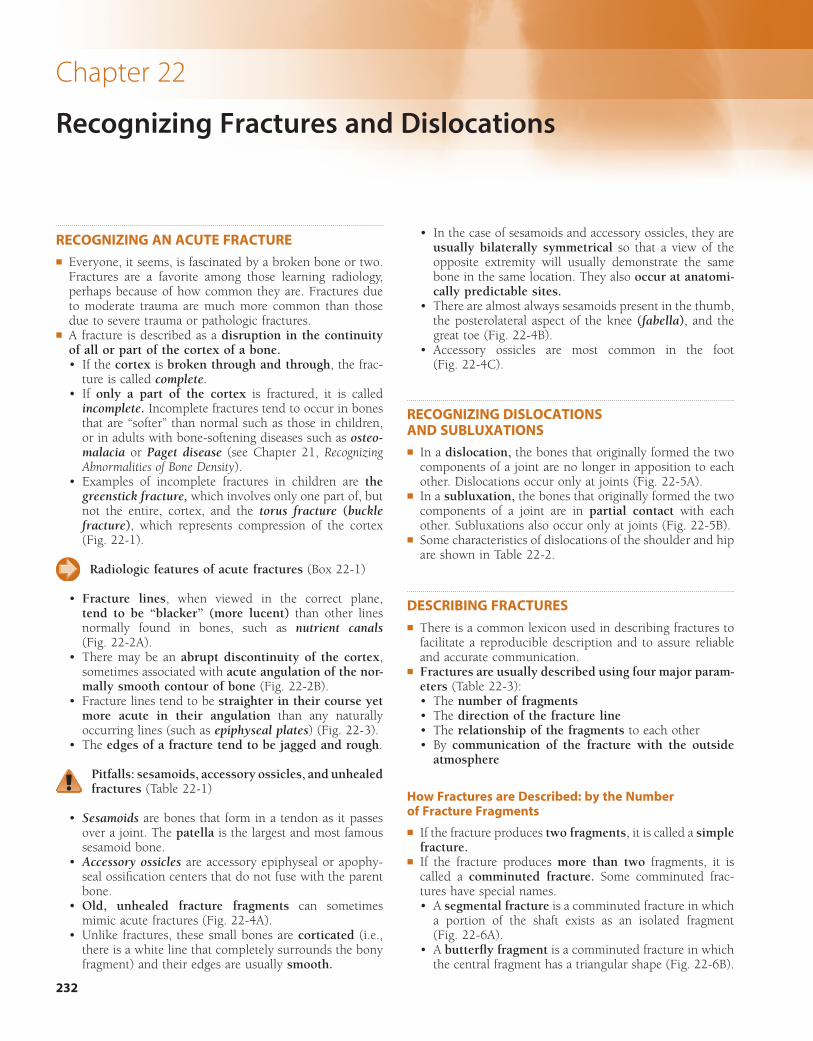
232
Chapter 22
Recognizing Fractures and Dislocations
RECOGNIZING AN ACUTE FRACTURE! Everyone, it seems, is fascinated by a broken bone or two.
Fractures are a favorite among those learning radiology, perhaps because of how common they are. Fractures due to moderate trauma are much more common than those due to severe trauma or pathologic fractures.
! A fracture is described as a disruption in the continuity of all or part of the cortex of a bone.• If the cortex is broken through and through, the frac-
ture is called complete.• If only a part of the cortex is fractured, it is called
incomplete. Incomplete fractures tend to occur in bones that are “softer” than normal such as those in children, or in adults with bone-softening diseases such as osteo-malacia or Paget disease (see Chapter 21, Recognizing Abnormalities of Bone Density).
• Examples of incomplete fractures in children are the greenstick fracture, which involves only one part of, but not the entire, cortex, and the torus fracture (buckle fracture), which represents compression of the cortex (Fig. 22-1).
Radiologic features of acute fractures (Box 22-1)
• Fracture lines, when viewed in the correct plane, tend to be “blacker” (more lucent) than other lines normally found in bones, such as nutrient canals (Fig. 22-2A).
• There may be an abrupt discontinuity of the cortex, sometimes associated with acute angulation of the nor-mally smooth contour of bone (Fig. 22-2B).
• Fracture lines tend to be straighter in their course yet more acute in their angulation than any naturally occurring lines (such as epiphyseal plates) (Fig. 22-3).
• The edges of a fracture tend to be jagged and rough.
Pitfalls: sesamoids, accessory ossicles, and unhealed fractures (Table 22-1)
• Sesamoids are bones that form in a tendon as it passes over a joint. The patella is the largest and most famous sesamoid bone.
• Accessory ossicles are accessory epiphyseal or apophy-seal ossification centers that do not fuse with the parent bone.
• Old, unhealed fracture fragments can sometimes mimic acute fractures (Fig. 22-4A).
• Unlike fractures, these small bones are corticated (i.e., there is a white line that completely surrounds the bony fragment) and their edges are usually smooth.
• In the case of sesamoids and accessory ossicles, they are usually bilaterally symmetrical so that a view of the opposite extremity will usually demonstrate the same bone in the same location. They also occur at anatomi-cally predictable sites.
• There are almost always sesamoids present in the thumb, the posterolateral aspect of the knee (fabella), and the great toe (Fig. 22-4B).
• Accessory ossicles are most common in the foot (Fig. 22-4C).
RECOGNIZING DISLOCATIONS AND SUBLUXATIONS! In a dislocation, the bones that originally formed the two
components of a joint are no longer in apposition to each other. Dislocations occur only at joints (Fig. 22-5A).
! In a subluxation, the bones that originally formed the two components of a joint are in partial contact with each other. Subluxations also occur only at joints (Fig. 22-5B).
! Some characteristics of dislocations of the shoulder and hip are shown in Table 22-2.
DESCRIBING FRACTURES! There is a common lexicon used in describing fractures to
facilitate a reproducible description and to assure reliable and accurate communication.
! Fractures are usually described using four major param-eters (Table 22-3):• The number of fragments• The direction of the fracture line• The relationship of the fragments to each other• By communication of the fracture with the outside
atmosphere
How Fractures are Described: by the Number of Fracture Fragments
! If the fracture produces two fragments, it is called a simple fracture.
! If the fracture produces more than two fragments, it is called a comminuted fracture. Some comminuted frac-tures have special names.• A segmental fracture is a comminuted fracture in which
a portion of the shaft exists as an isolated fragment (Fig. 22-6A).
• A butterfly fragment is a comminuted fracture in which the central fragment has a triangular shape (Fig. 22-6B).
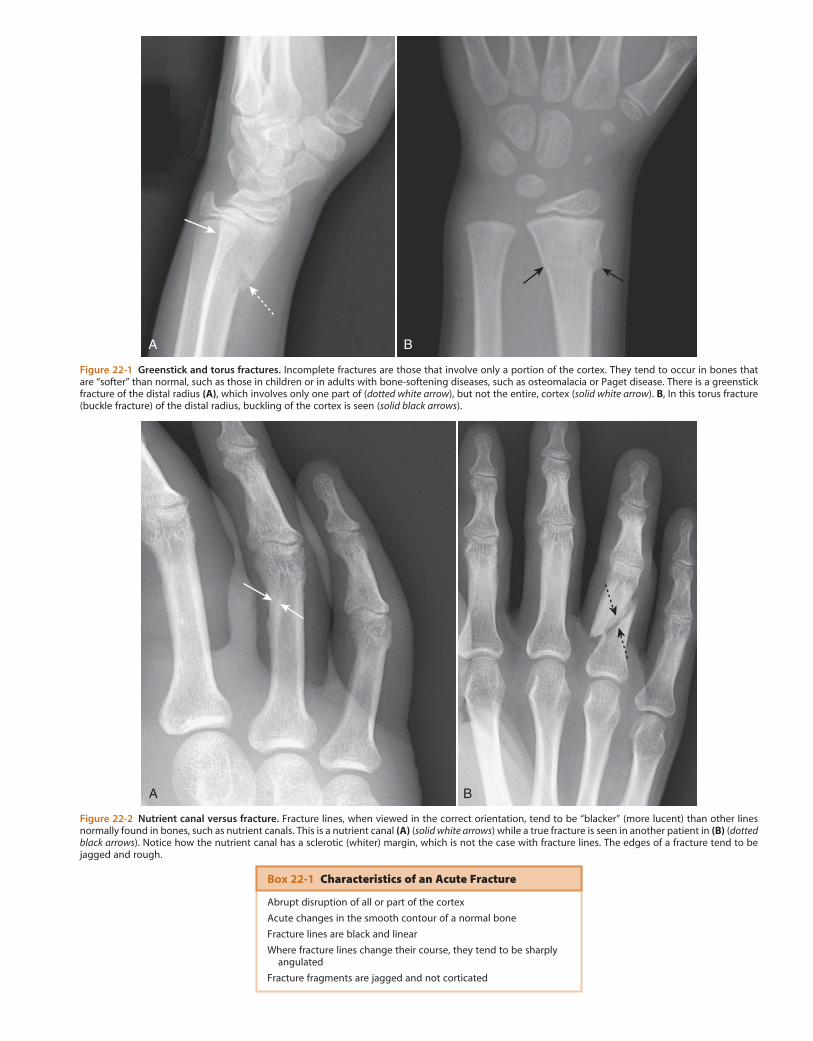
Figure 22-1 Greenstick and torus fractures. Incomplete fractures are those that involve only a portion of the cortex. They tend to occur in bones that are “softer” than normal, such as those in children or in adults with bone-softening diseases, such as osteomalacia or Paget disease. There is a greenstick fracture of the distal radius (A), which involves only one part of (dotted white arrow), but not the entire, cortex (solid white arrow). B, In this torus fracture (buckle fracture) of the distal radius, buckling of the cortex is seen (solid black arrows).
A B
Box 22-1 Characteristics of an Acute Fracture
Abrupt disruption of all or part of the cortex
Acute changes in the smooth contour of a normal bone
Fracture lines are black and linear
Where fracture lines change their course, they tend to be sharply angulated
Fracture fragments are jagged and not corticated
Figure 22-2 Nutrient canal versus fracture. Fracture lines, when viewed in the correct orientation, tend to be “blacker” (more lucent) than other lines normally found in bones, such as nutrient canals. This is a nutrient canal (A) (solid white arrows) while a true fracture is seen in another patient in (B) (dotted black arrows). Notice how the nutrient canal has a sclerotic (whiter) margin, which is not the case with fracture lines. The edges of a fracture tend to be jagged and rough.
A B
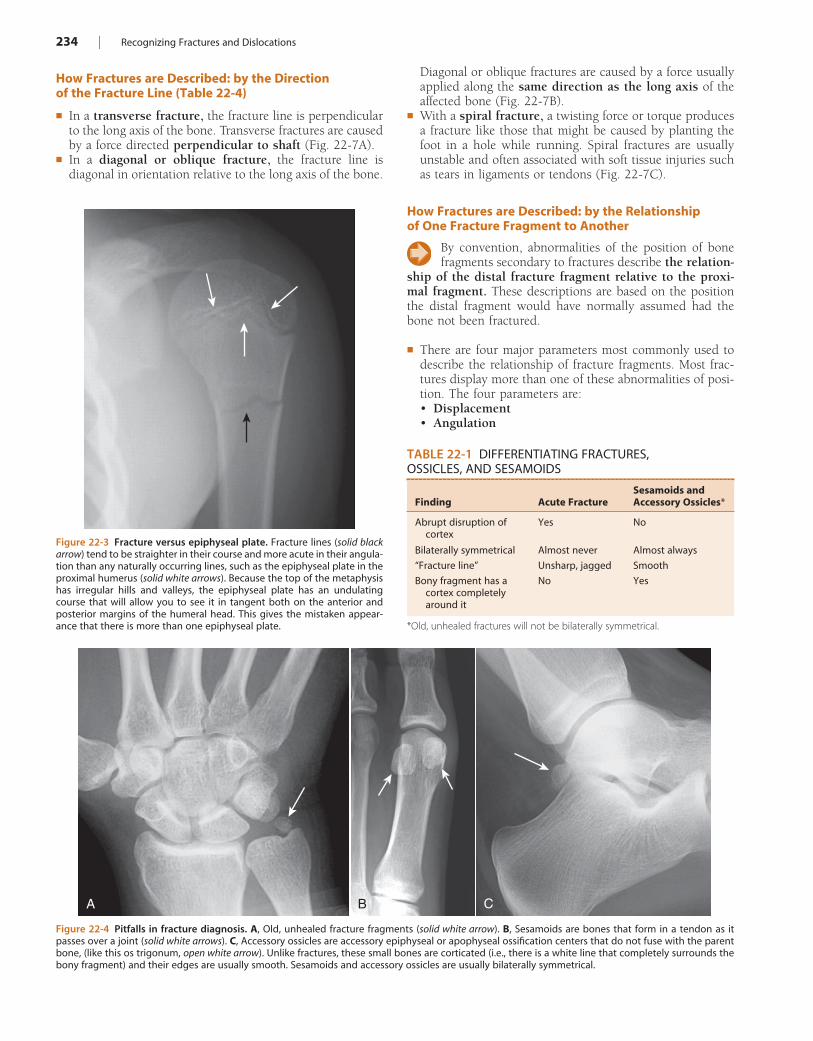
234 | Recognizing Fractures and Dislocations
Figure 22-3 Fracture versus epiphyseal plate. Fracture lines (solid black arrow) tend to be straighter in their course and more acute in their angula-tion than any naturally occurring lines, such as the epiphyseal plate in the proximal humerus (solid white arrows). Because the top of the metaphysis has irregular hills and valleys, the epiphyseal plate has an undulating course that will allow you to see it in tangent both on the anterior and posterior margins of the humeral head. This gives the mistaken appear-ance that there is more than one epiphyseal plate.
TABLE 22-1 DIFFERENTIATING FRACTURES, OSSICLES, AND SESAMOIDS
Finding Acute FractureSesamoids and Accessory Ossicles*
Abrupt disruption of cortex
Yes No
Bilaterally symmetrical Almost never Almost always
“Fracture line” Unsharp, jagged Smooth
Bony fragment has a cortex completely around it
No Yes
*Old, unhealed fractures will not be bilaterally symmetrical.
Figure 22-4 Pitfalls in fracture diagnosis. A, Old, unhealed fracture fragments (solid white arrow). B, Sesamoids are bones that form in a tendon as it passes over a joint (solid white arrows). C, Accessory ossicles are accessory epiphyseal or apophyseal ossification centers that do not fuse with the parent bone, (like this os trigonum, open white arrow). Unlike fractures, these small bones are corticated (i.e., there is a white line that completely surrounds the bony fragment) and their edges are usually smooth. Sesamoids and accessory ossicles are usually bilaterally symmetrical.
A B C
How Fractures are Described: by the Direction of the Fracture Line (Table 22-4)
! In a transverse fracture, the fracture line is perpendicular to the long axis of the bone. Transverse fractures are caused by a force directed perpendicular to shaft (Fig. 22-7A).
! In a diagonal or oblique fracture, the fracture line is diagonal in orientation relative to the long axis of the bone.
Diagonal or oblique fractures are caused by a force usually applied along the same direction as the long axis of the affected bone (Fig. 22-7B).
! With a spiral fracture, a twisting force or torque produces a fracture like those that might be caused by planting the foot in a hole while running. Spiral fractures are usually unstable and often associated with soft tissue injuries such as tears in ligaments or tendons (Fig. 22-7C).
How Fractures are Described: by the Relationship of One Fracture Fragment to Another
By convention, abnormalities of the position of bone fragments secondary to fractures describe the relation-
ship of the distal fracture fragment relative to the proxi-mal fragment. These descriptions are based on the position the distal fragment would have normally assumed had the bone not been fractured.
! There are four major parameters most commonly used to describe the relationship of fracture fragments. Most frac-tures display more than one of these abnormalities of posi-tion. The four parameters are:• Displacement• Angulation
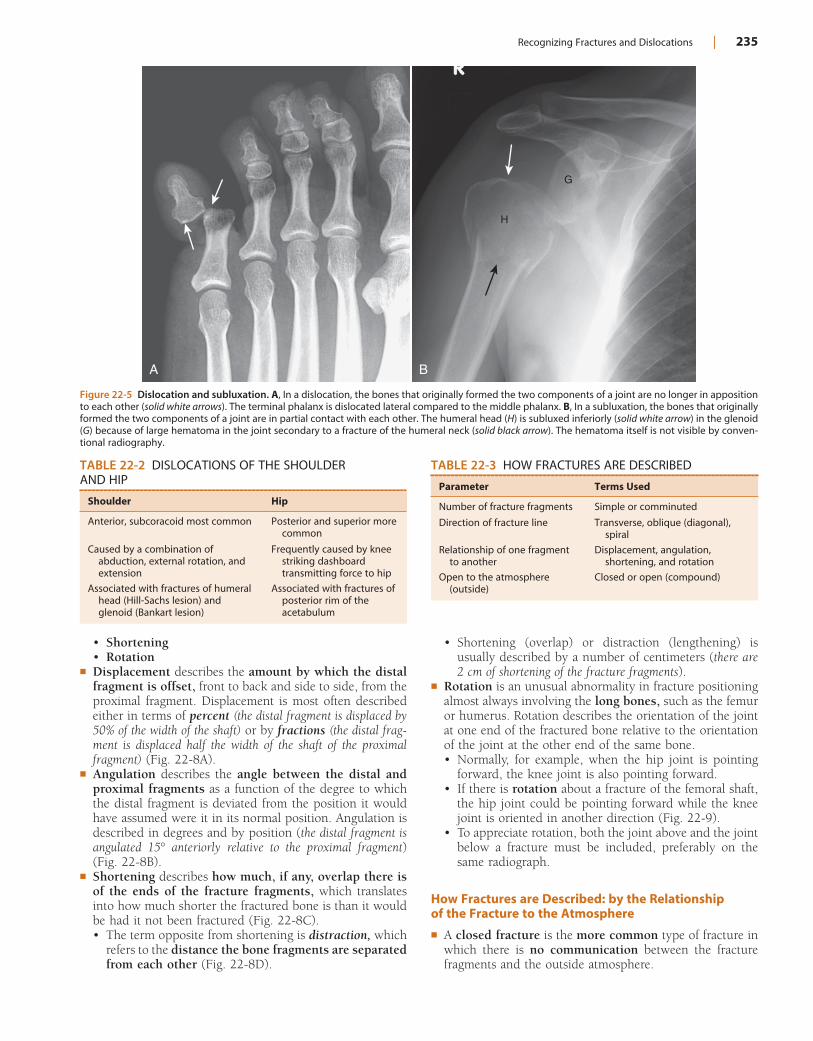
Recognizing Fractures and Dislocations | 235
Figure 22-5 Dislocation and subluxation. A, In a dislocation, the bones that originally formed the two components of a joint are no longer in apposition to each other (solid white arrows). The terminal phalanx is dislocated lateral compared to the middle phalanx. B, In a subluxation, the bones that originally formed the two components of a joint are in partial contact with each other. The humeral head (H) is subluxed inferiorly (solid white arrow) in the glenoid (G) because of large hematoma in the joint secondary to a fracture of the humeral neck (solid black arrow). The hematoma itself is not visible by conven-tional radiography.
A B
H
G
TABLE 22-2 DISLOCATIONS OF THE SHOULDER AND HIP
Shoulder Hip
Anterior, subcoracoid most common Posterior and superior more common
Caused by a combination of abduction, external rotation, and extension
Frequently caused by knee striking dashboard transmitting force to hip
Associated with fractures of humeral head (Hill-Sachs lesion) and glenoid (Bankart lesion)
Associated with fractures of posterior rim of the acetabulum
TABLE 22-3 HOW FRACTURES ARE DESCRIBED
Parameter Terms Used
Number of fracture fragments Simple or comminuted
Direction of fracture line Transverse, oblique (diagonal), spiral
Relationship of one fragment to another
Displacement, angulation, shortening, and rotation
Open to the atmosphere (outside)
Closed or open (compound)
• Shortening• Rotation
! Displacement describes the amount by which the distal fragment is offset, front to back and side to side, from the proximal fragment. Displacement is most often described either in terms of percent (the distal fragment is displaced by 50% of the width of the shaft) or by fractions (the distal frag-ment is displaced half the width of the shaft of the proximal fragment) (Fig. 22-8A).
! Angulation describes the angle between the distal and proximal fragments as a function of the degree to which the distal fragment is deviated from the position it would have assumed were it in its normal position. Angulation is described in degrees and by position (the distal fragment is angulated 15° anteriorly relative to the proximal fragment) (Fig. 22-8B).
! Shortening describes how much, if any, overlap there is of the ends of the fracture fragments, which translates into how much shorter the fractured bone is than it would be had it not been fractured (Fig. 22-8C).• The term opposite from shortening is distraction, which
refers to the distance the bone fragments are separated from each other (Fig. 22-8D).
• Shortening (overlap) or distraction (lengthening) is usually described by a number of centimeters (there are 2 cm of shortening of the fracture fragments).
! Rotation is an unusual abnormality in fracture positioning almost always involving the long bones, such as the femur or humerus. Rotation describes the orientation of the joint at one end of the fractured bone relative to the orientation of the joint at the other end of the same bone.• Normally, for example, when the hip joint is pointing
forward, the knee joint is also pointing forward.• If there is rotation about a fracture of the femoral shaft,
the hip joint could be pointing forward while the knee joint is oriented in another direction (Fig. 22-9).
• To appreciate rotation, both the joint above and the joint below a fracture must be included, preferably on the same radiograph.
How Fractures are Described: by the Relationship of the Fracture to the Atmosphere
! A closed fracture is the more common type of fracture in which there is no communication between the fracture fragments and the outside atmosphere.
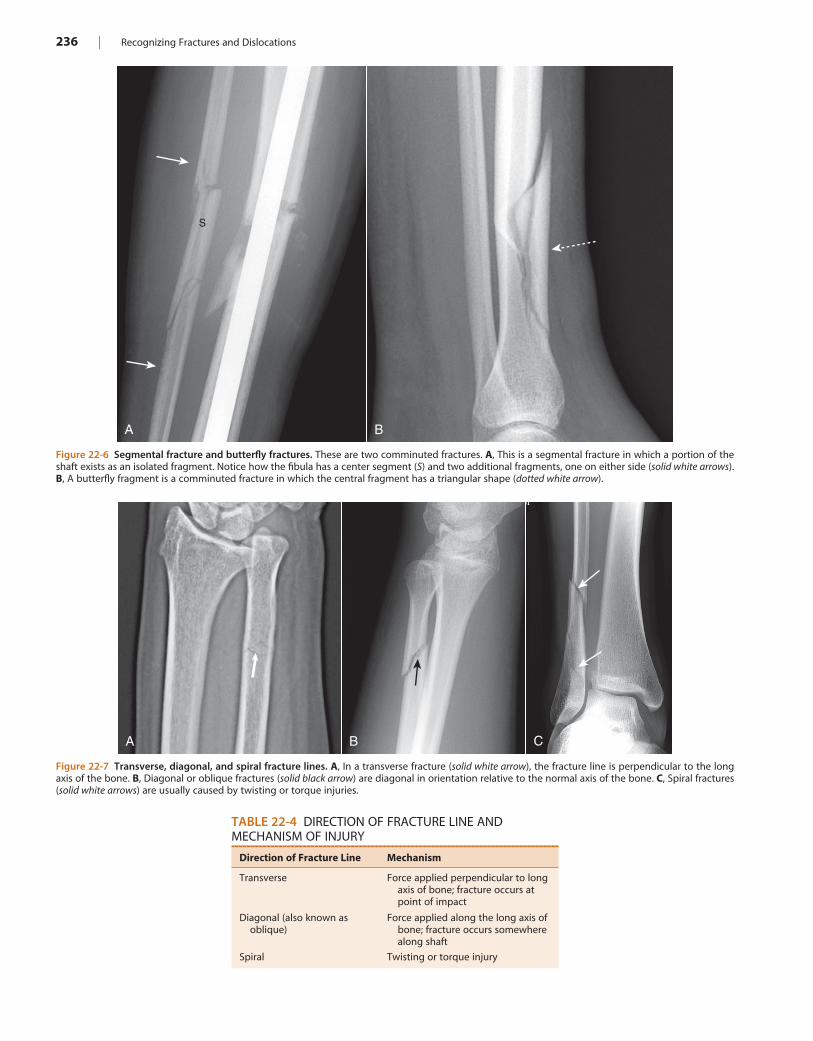
236 | Recognizing Fractures and Dislocations
Figure 22-6 Segmental fracture and butterfly fractures. These are two comminuted fractures. A, This is a segmental fracture in which a portion of the shaft exists as an isolated fragment. Notice how the fibula has a center segment (S) and two additional fragments, one on either side (solid white arrows). B, A butterfly fragment is a comminuted fracture in which the central fragment has a triangular shape (dotted white arrow).
A B
S
Figure 22-7 Transverse, diagonal, and spiral fracture lines. A, In a transverse fracture (solid white arrow), the fracture line is perpendicular to the long axis of the bone. B, Diagonal or oblique fractures (solid black arrow) are diagonal in orientation relative to the normal axis of the bone. C, Spiral fractures (solid white arrows) are usually caused by twisting or torque injuries.
A B C
TABLE 22-4 DIRECTION OF FRACTURE LINE AND MECHANISM OF INJURY
Direction of Fracture Line Mechanism
Transverse Force applied perpendicular to long axis of bone; fracture occurs at point of impact
Diagonal (also known as oblique)
Force applied along the long axis of bone; fracture occurs somewhere along shaft
Spiral Twisting or torque injury
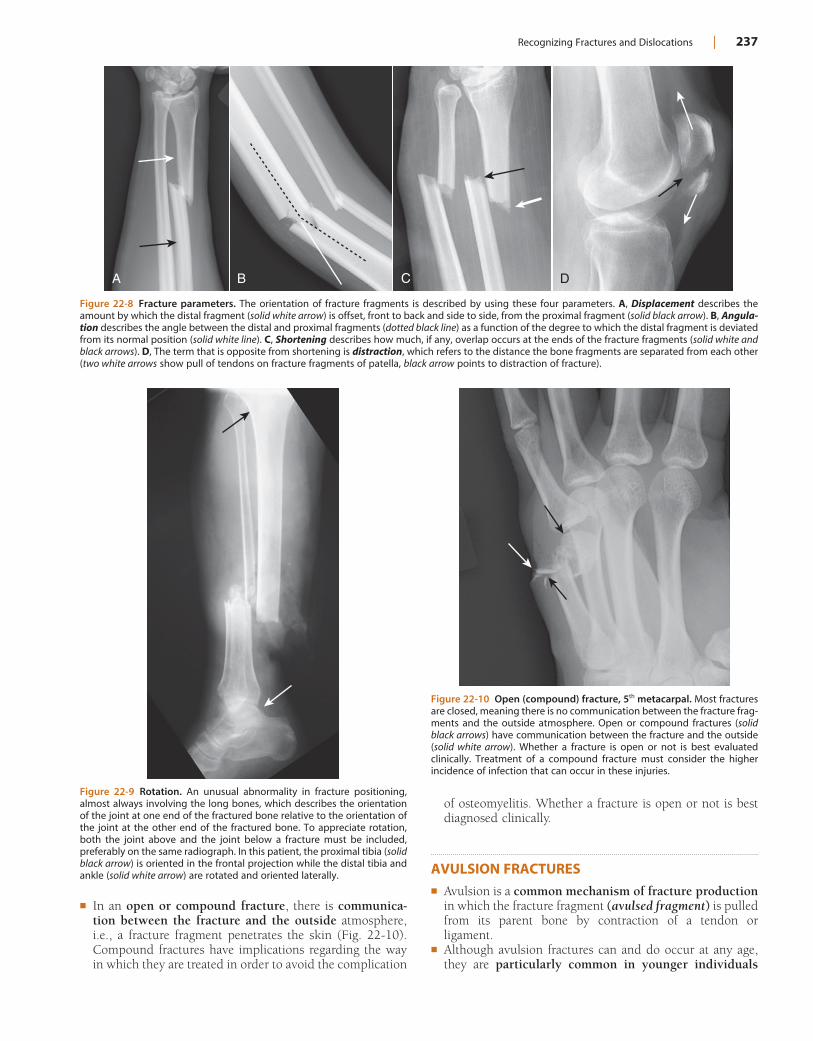
Recognizing Fractures and Dislocations | 237
of osteomyelitis. Whether a fracture is open or not is best diagnosed clinically.
AVULSION FRACTURES! Avulsion is a common mechanism of fracture production
in which the fracture fragment (avulsed fragment) is pulled from its parent bone by contraction of a tendon or ligament.
! Although avulsion fractures can and do occur at any age, they are particularly common in younger individuals
Figure 22-8 Fracture parameters. The orientation of fracture fragments is described by using these four parameters. A, Displacement describes the amount by which the distal fragment (solid white arrow) is offset, front to back and side to side, from the proximal fragment (solid black arrow). B, Angula-tion describes the angle between the distal and proximal fragments (dotted black line) as a function of the degree to which the distal fragment is deviated from its normal position (solid white line). C, Shortening describes how much, if any, overlap occurs at the ends of the fracture fragments (solid white and black arrows). D, The term that is opposite from shortening is distraction, which refers to the distance the bone fragments are separated from each other (two white arrows show pull of tendons on fracture fragments of patella, black arrow points to distraction of fracture).
A B DC
Figure 22-9 Rotation. An unusual abnormality in fracture positioning, almost always involving the long bones, which describes the orientation of the joint at one end of the fractured bone relative to the orientation of the joint at the other end of the fractured bone. To appreciate rotation, both the joint above and the joint below a fracture must be included, preferably on the same radiograph. In this patient, the proximal tibia (solid black arrow) is oriented in the frontal projection while the distal tibia and ankle (solid white arrow) are rotated and oriented laterally.
Figure 22-10 Open (compound) fracture, 5th metacarpal. Most fractures are closed, meaning there is no communication between the fracture frag-ments and the outside atmosphere. Open or compound fractures (solid black arrows) have communication between the fracture and the outside (solid white arrow). Whether a fracture is open or not is best evaluated clinically. Treatment of a compound fracture must consider the higher incidence of infection that can occur in these injuries.
! In an open or compound fracture, there is communica-tion between the fracture and the outside atmosphere, i.e., a fracture fragment penetrates the skin (Fig. 22-10). Compound fractures have implications regarding the way in which they are treated in order to avoid the complication
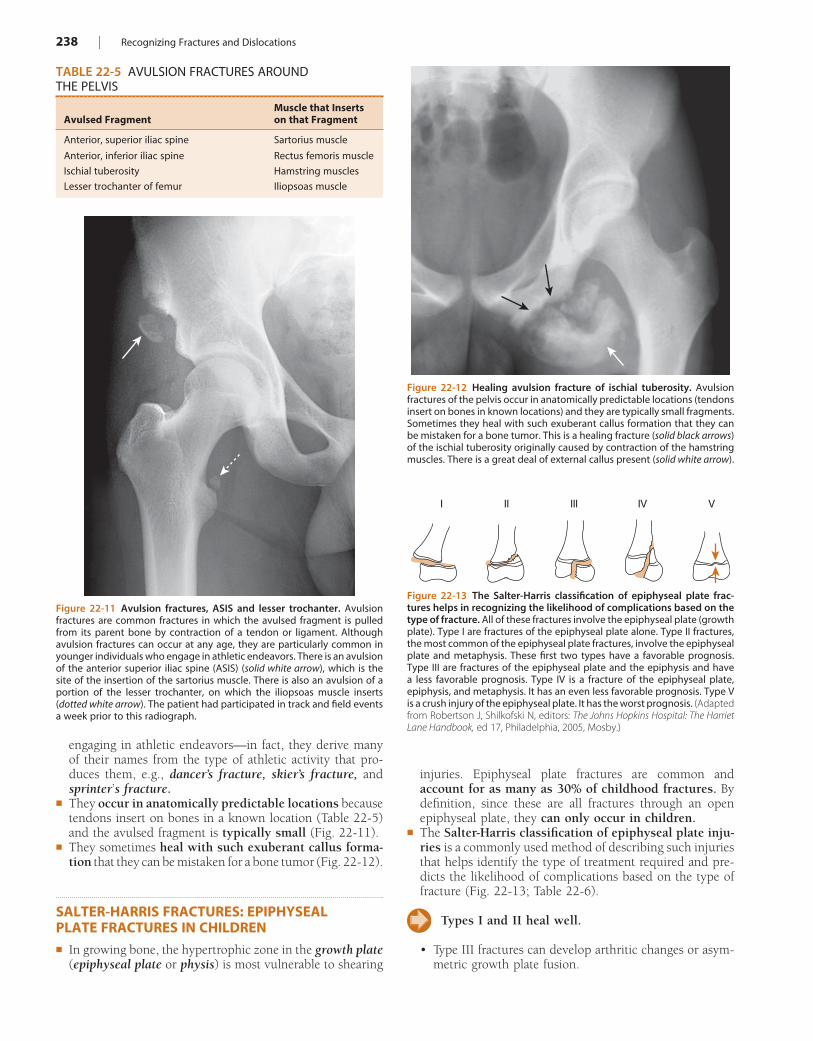
238 | Recognizing Fractures and Dislocations
injuries. Epiphyseal plate fractures are common and account for as many as 30% of childhood fractures. By definition, since these are all fractures through an open epiphyseal plate, they can only occur in children.
! The Salter-Harris classification of epiphyseal plate inju-ries is a commonly used method of describing such injuries that helps identify the type of treatment required and pre-dicts the likelihood of complications based on the type of fracture (Fig. 22-13; Table 22-6).
Types I and II heal well.
• Type III fractures can develop arthritic changes or asym-metric growth plate fusion.
engaging in athletic endeavors—in fact, they derive many of their names from the type of athletic activity that pro-duces them, e.g., dancer’s fracture, skier’s fracture, and sprinter’s fracture.
! They occur in anatomically predictable locations because tendons insert on bones in a known location (Table 22-5) and the avulsed fragment is typically small (Fig. 22-11).
! They sometimes heal with such exuberant callus forma-tion that they can be mistaken for a bone tumor (Fig. 22-12).
SALTER-HARRIS FRACTURES: EPIPHYSEAL PLATE FRACTURES IN CHILDREN! In growing bone, the hypertrophic zone in the growth plate
(epiphyseal plate or physis) is most vulnerable to shearing
TABLE 22-5 AVULSION FRACTURES AROUND THE PELVIS
Avulsed FragmentMuscle that Inserts on that Fragment
Anterior, superior iliac spine Sartorius muscle
Anterior, inferior iliac spine Rectus femoris muscle
Ischial tuberosity Hamstring muscles
Lesser trochanter of femur Iliopsoas muscle
Figure 22-11 Avulsion fractures, ASIS and lesser trochanter. Avulsion fractures are common fractures in which the avulsed fragment is pulled from its parent bone by contraction of a tendon or ligament. Although avulsion fractures can occur at any age, they are particularly common in younger individuals who engage in athletic endeavors. There is an avulsion of the anterior superior iliac spine (ASIS) (solid white arrow), which is the site of the insertion of the sartorius muscle. There is also an avulsion of a portion of the lesser trochanter, on which the iliopsoas muscle inserts (dotted white arrow). The patient had participated in track and field events a week prior to this radiograph.
Figure 22-12 Healing avulsion fracture of ischial tuberosity. Avulsion fractures of the pelvis occur in anatomically predictable locations (tendons insert on bones in known locations) and they are typically small fragments. Sometimes they heal with such exuberant callus formation that they can be mistaken for a bone tumor. This is a healing fracture (solid black arrows) of the ischial tuberosity originally caused by contraction of the hamstring muscles. There is a great deal of external callus present (solid white arrow).
Figure 22-13 The Salter-Harris classification of epiphyseal plate frac-tures helps in recognizing the likelihood of complications based on the type of fracture. All of these fractures involve the epiphyseal plate (growth plate). Type I are fractures of the epiphyseal plate alone. Type II fractures, the most common of the epiphyseal plate fractures, involve the epiphyseal plate and metaphysis. These first two types have a favorable prognosis. Type III are fractures of the epiphyseal plate and the epiphysis and have a less favorable prognosis. Type IV is a fracture of the epiphyseal plate, epiphysis, and metaphysis. It has an even less favorable prognosis. Type V is a crush injury of the epiphyseal plate. It has the worst prognosis. (Adapted from Robertson J, Shilkofski N, editors: The Johns Hopkins Hospital: The Harriet Lane Handbook, ed 17, Philadelphia, 2005, Mosby.)
I II III IV V
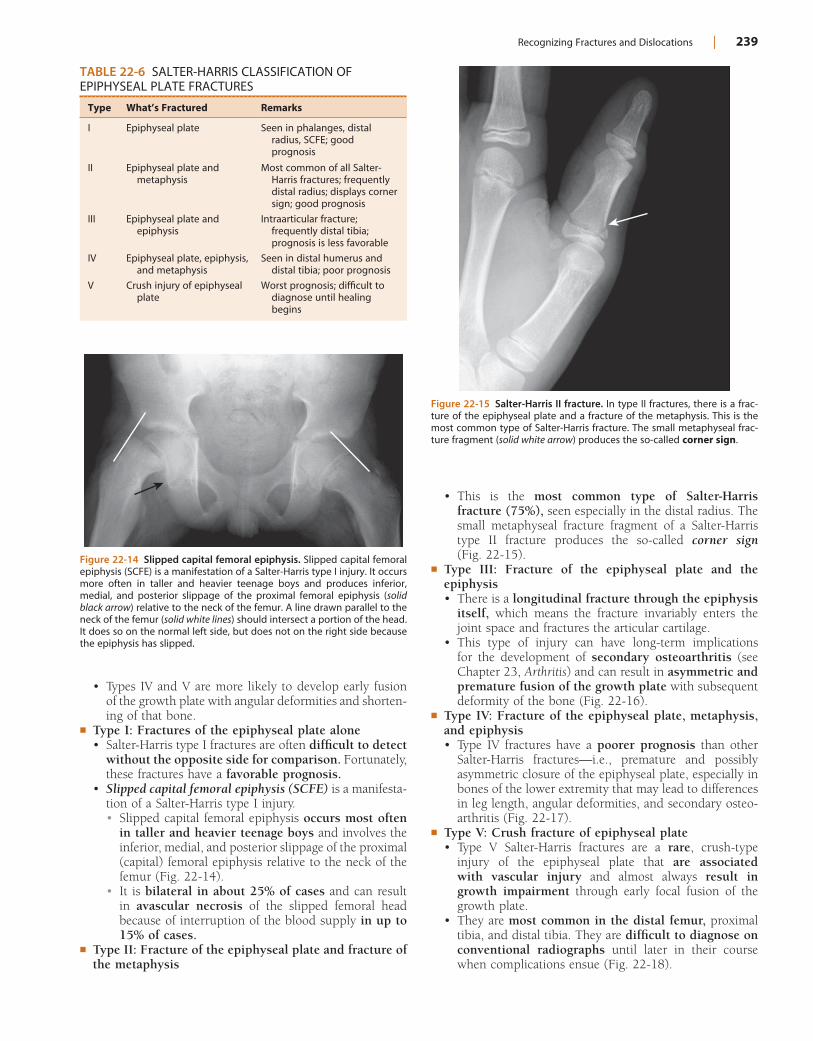
Recognizing Fractures and Dislocations | 239
• Types IV and V are more likely to develop early fusion of the growth plate with angular deformities and shorten-ing of that bone.
! Type I: Fractures of the epiphyseal plate alone• Salter-Harris type I fractures are often difficult to detect
without the opposite side for comparison. Fortunately, these fractures have a favorable prognosis.
• Slipped capital femoral epiphysis (SCFE) is a manifesta-tion of a Salter-Harris type I injury.• Slipped capital femoral epiphysis occurs most often
in taller and heavier teenage boys and involves the inferior, medial, and posterior slippage of the proximal (capital) femoral epiphysis relative to the neck of the femur (Fig. 22-14).
• It is bilateral in about 25% of cases and can result in avascular necrosis of the slipped femoral head because of interruption of the blood supply in up to 15% of cases.
! Type II: Fracture of the epiphyseal plate and fracture of the metaphysis
TABLE 22-6 SALTER-HARRIS CLASSIFICATION OF EPIPHYSEAL PLATE FRACTURES
Type What’s Fractured Remarks
I Epiphyseal plate Seen in phalanges, distal radius, SCFE; good prognosis
II Epiphyseal plate and metaphysis
Most common of all Salter-Harris fractures; frequently distal radius; displays corner sign; good prognosis
III Epiphyseal plate and epiphysis
Intraarticular fracture; frequently distal tibia; prognosis is less favorable
IV Epiphyseal plate, epiphysis, and metaphysis
Seen in distal humerus and distal tibia; poor prognosis
V Crush injury of epiphyseal plate
Worst prognosis; difficult to diagnose until healing begins
Figure 22-14 Slipped capital femoral epiphysis. Slipped capital femoral epiphysis (SCFE) is a manifestation of a Salter-Harris type I injury. It occurs more often in taller and heavier teenage boys and produces inferior, medial, and posterior slippage of the proximal femoral epiphysis (solid black arrow) relative to the neck of the femur. A line drawn parallel to the neck of the femur (solid white lines) should intersect a portion of the head. It does so on the normal left side, but does not on the right side because the epiphysis has slipped.
Figure 22-15 Salter-Harris II fracture. In type II fractures, there is a frac-ture of the epiphyseal plate and a fracture of the metaphysis. This is the most common type of Salter-Harris fracture. The small metaphyseal frac-ture fragment (solid white arrow) produces the so-called corner sign.
• This is the most common type of Salter-Harris fracture (75%), seen especially in the distal radius. The small metaphyseal fracture fragment of a Salter-Harris type II fracture produces the so-called corner sign (Fig. 22-15).
! Type III: Fracture of the epiphyseal plate and the epiphysis• There is a longitudinal fracture through the epiphysis
itself, which means the fracture invariably enters the joint space and fractures the articular cartilage.
• This type of injury can have long-term implications for the development of secondary osteoarthritis (see Chapter 23, Arthritis) and can result in asymmetric and premature fusion of the growth plate with subsequent deformity of the bone (Fig. 22-16).
! Type IV: Fracture of the epiphyseal plate, metaphysis, and epiphysis• Type IV fractures have a poorer prognosis than other
Salter-Harris fractures—i.e., premature and possibly asymmetric closure of the epiphyseal plate, especially in bones of the lower extremity that may lead to differences in leg length, angular deformities, and secondary osteo-arthritis (Fig. 22-17).
! Type V: Crush fracture of epiphyseal plate• Type V Salter-Harris fractures are a rare, crush-type
injury of the epiphyseal plate that are associated with vascular injury and almost always result in growth impairment through early focal fusion of the growth plate.
• They are most common in the distal femur, proximal tibia, and distal tibia. They are difficult to diagnose on conventional radiographs until later in their course when complications ensue (Fig. 22-18).
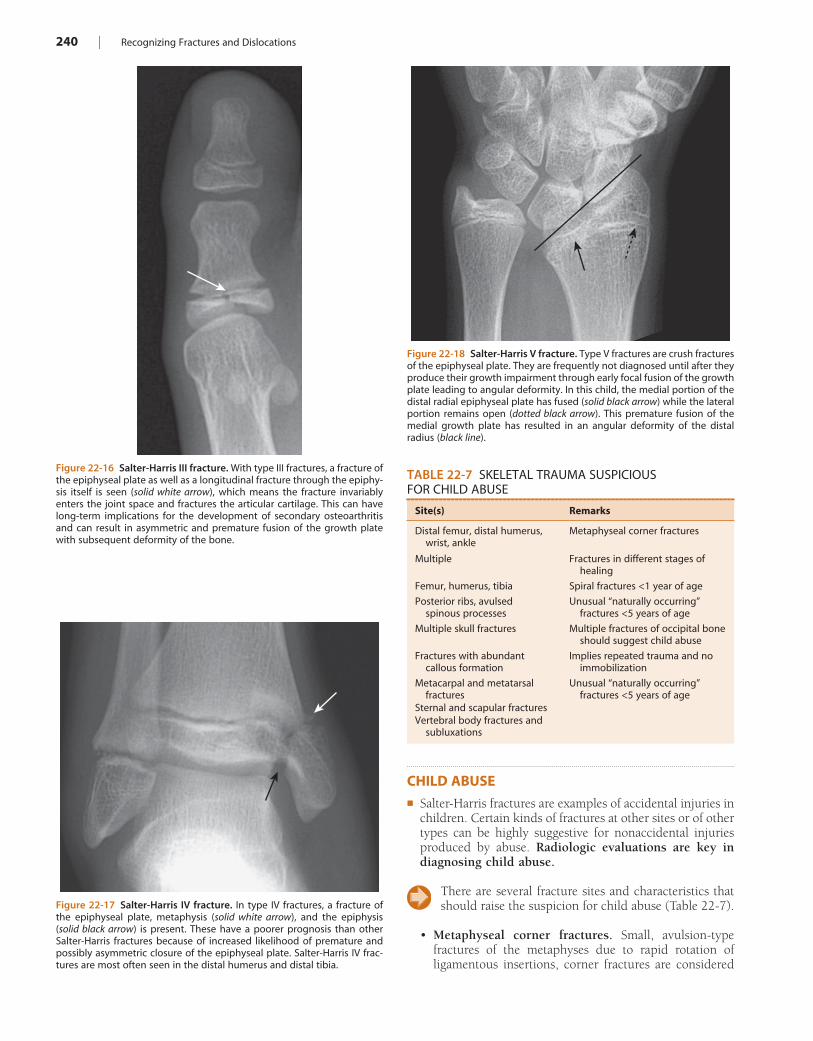
240 | Recognizing Fractures and Dislocations
Figure 22-17 Salter-Harris IV fracture. In type IV fractures, a fracture of the epiphyseal plate, metaphysis (solid white arrow), and the epiphysis (solid black arrow) is present. These have a poorer prognosis than other Salter-Harris fractures because of increased likelihood of premature and possibly asymmetric closure of the epiphyseal plate. Salter-Harris IV frac-tures are most often seen in the distal humerus and distal tibia.
Figure 22-18 Salter-Harris V fracture. Type V fractures are crush fractures of the epiphyseal plate. They are frequently not diagnosed until after they produce their growth impairment through early focal fusion of the growth plate leading to angular deformity. In this child, the medial portion of the distal radial epiphyseal plate has fused (solid black arrow) while the lateral portion remains open (dotted black arrow). This premature fusion of the medial growth plate has resulted in an angular deformity of the distal radius (black line).
TABLE 22-7 SKELETAL TRAUMA SUSPICIOUS FOR CHILD ABUSE
Site(s) Remarks
Distal femur, distal humerus, wrist, ankle
Metaphyseal corner fractures
Multiple Fractures in different stages of healing
Femur, humerus, tibia Spiral fractures <1 year of age
Posterior ribs, avulsed spinous processes
Unusual “naturally occurring” fractures <5 years of age
Multiple skull fractures Multiple fractures of occipital bone should suggest child abuse
Fractures with abundant callous formation
Implies repeated trauma and no immobilization
Metacarpal and metatarsal fractures
Unusual “naturally occurring” fractures <5 years of age
Sternal and scapular fracturesVertebral body fractures and
subluxations
Figure 22-16 Salter-Harris III fracture. With type III fractures, a fracture of the epiphyseal plate as well as a longitudinal fracture through the epiphy-sis itself is seen (solid white arrow), which means the fracture invariably enters the joint space and fractures the articular cartilage. This can have long-term implications for the development of secondary osteoarthritis and can result in asymmetric and premature fusion of the growth plate with subsequent deformity of the bone.
CHILD ABUSE! Salter-Harris fractures are examples of accidental injuries in
children. Certain kinds of fractures at other sites or of other types can be highly suggestive for nonaccidental injuries produced by abuse. Radiologic evaluations are key in diagnosing child abuse.
There are several fracture sites and characteristics that should raise the suspicion for child abuse (Table 22-7).
• Metaphyseal corner fractures. Small, avulsion-type fractures of the metaphyses due to rapid rotation of ligamentous insertions, corner fractures are considered
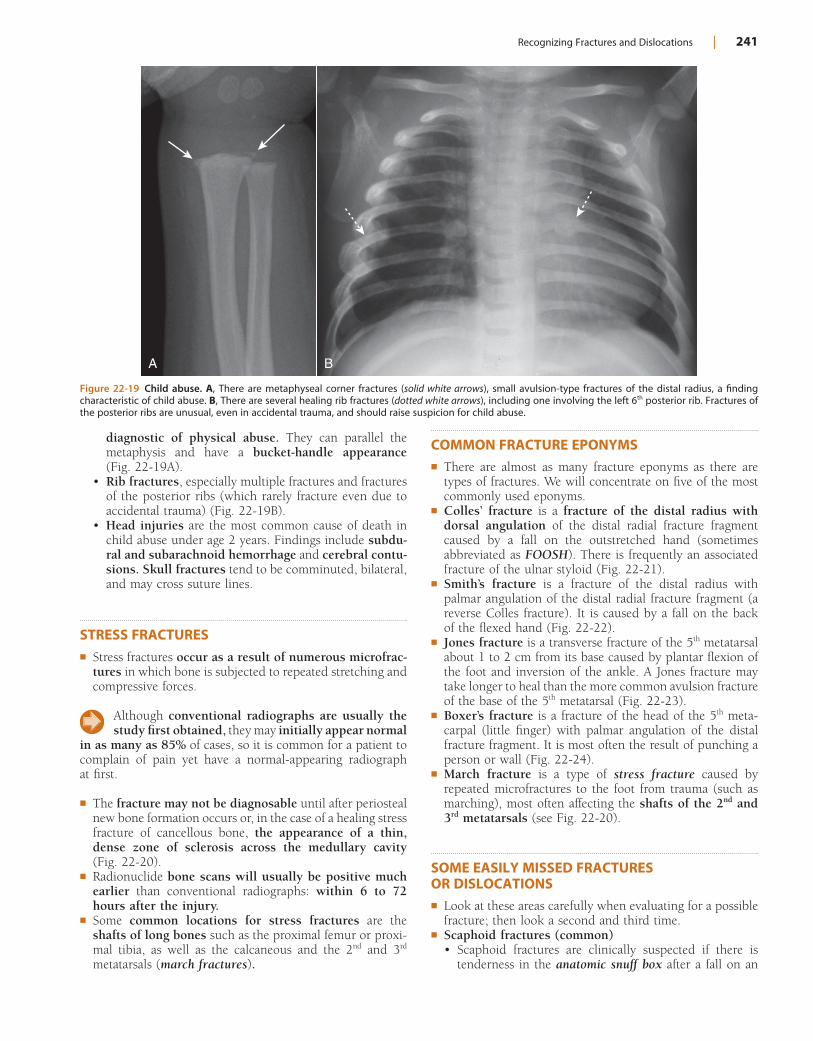
Recognizing Fractures and Dislocations | 241
Figure 22-19 Child abuse. A, There are metaphyseal corner fractures (solid white arrows), small avulsion-type fractures of the distal radius, a finding characteristic of child abuse. B, There are several healing rib fractures (dotted white arrows), including one involving the left 6th posterior rib. Fractures of the posterior ribs are unusual, even in accidental trauma, and should raise suspicion for child abuse.
A B
diagnostic of physical abuse. They can parallel the metaphysis and have a bucket-handle appearance (Fig. 22-19A).
• Rib fractures, especially multiple fractures and fractures of the posterior ribs (which rarely fracture even due to accidental trauma) (Fig. 22-19B).
• Head injuries are the most common cause of death in child abuse under age 2 years. Findings include subdu-ral and subarachnoid hemorrhage and cerebral contu-sions. Skull fractures tend to be comminuted, bilateral, and may cross suture lines.
STRESS FRACTURES! Stress fractures occur as a result of numerous microfrac-
tures in which bone is subjected to repeated stretching and compressive forces.
Although conventional radiographs are usually the study first obtained, they may initially appear normal
in as many as 85% of cases, so it is common for a patient to complain of pain yet have a normal-appearing radiograph at first.
! The fracture may not be diagnosable until after periosteal new bone formation occurs or, in the case of a healing stress fracture of cancellous bone, the appearance of a thin, dense zone of sclerosis across the medullary cavity (Fig. 22-20).
! Radionuclide bone scans will usually be positive much earlier than conventional radiographs: within 6 to 72 hours after the injury.
! Some common locations for stress fractures are the shafts of long bones such as the proximal femur or proxi-mal tibia, as well as the calcaneous and the 2nd and 3rd metatarsals (march fractures).
COMMON FRACTURE EPONYMS! There are almost as many fracture eponyms as there are
types of fractures. We will concentrate on five of the most commonly used eponyms.
! Colles’ fracture is a fracture of the distal radius with dorsal angulation of the distal radial fracture fragment caused by a fall on the outstretched hand (sometimes abbreviated as FOOSH). There is frequently an associated fracture of the ulnar styloid (Fig. 22-21).
! Smith’s fracture is a fracture of the distal radius with palmar angulation of the distal radial fracture fragment (a reverse Colles fracture). It is caused by a fall on the back of the flexed hand (Fig. 22-22).
! Jones fracture is a transverse fracture of the 5th metatarsal about 1 to 2 cm from its base caused by plantar flexion of the foot and inversion of the ankle. A Jones fracture may take longer to heal than the more common avulsion fracture of the base of the 5th metatarsal (Fig. 22-23).
! Boxer’s fracture is a fracture of the head of the 5th meta-carpal (little finger) with palmar angulation of the distal fracture fragment. It is most often the result of punching a person or wall (Fig. 22-24).
! March fracture is a type of stress fracture caused by repeated microfractures to the foot from trauma (such as marching), most often affecting the shafts of the 2nd and 3rd metatarsals (see Fig. 22-20).
SOME EASILY MISSED FRACTURES OR DISLOCATIONS! Look at these areas carefully when evaluating for a possible
fracture; then look a second and third time.! Scaphoid fractures (common)
• Scaphoid fractures are clinically suspected if there is tenderness in the anatomic snuff box after a fall on an
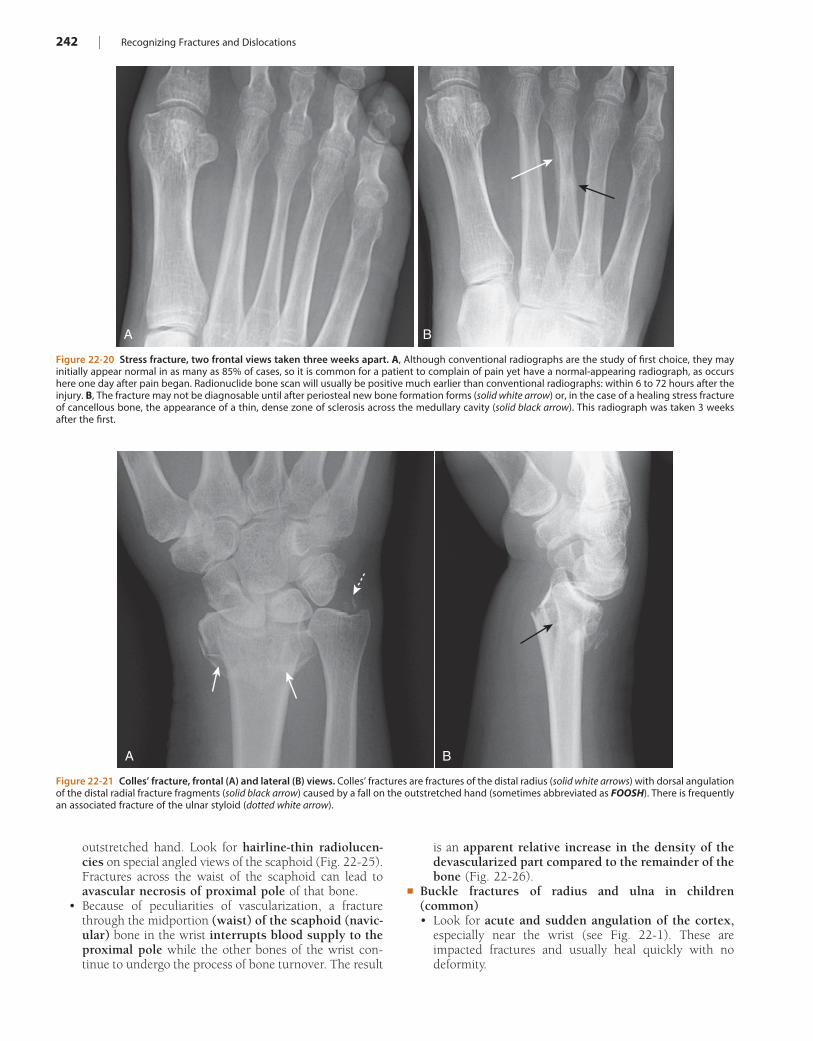
242 | Recognizing Fractures and Dislocations
Figure 22-20 Stress fracture, two frontal views taken three weeks apart. A, Although conventional radiographs are the study of first choice, they may initially appear normal in as many as 85% of cases, so it is common for a patient to complain of pain yet have a normal-appearing radiograph, as occurs here one day after pain began. Radionuclide bone scan will usually be positive much earlier than conventional radiographs: within 6 to 72 hours after the injury. B, The fracture may not be diagnosable until after periosteal new bone formation forms (solid white arrow) or, in the case of a healing stress fracture of cancellous bone, the appearance of a thin, dense zone of sclerosis across the medullary cavity (solid black arrow). This radiograph was taken 3 weeks after the first.
A B
Figure 22-21 Colles’ fracture, frontal (A) and lateral (B) views. Colles’ fractures are fractures of the distal radius (solid white arrows) with dorsal angulation of the distal radial fracture fragments (solid black arrow) caused by a fall on the outstretched hand (sometimes abbreviated as FOOSH). There is frequently an associated fracture of the ulnar styloid (dotted white arrow).
A B
outstretched hand. Look for hairline-thin radiolucen-cies on special angled views of the scaphoid (Fig. 22-25). Fractures across the waist of the scaphoid can lead to avascular necrosis of proximal pole of that bone.
• Because of peculiarities of vascularization, a fracture through the midportion (waist) of the scaphoid (navic-ular) bone in the wrist interrupts blood supply to the proximal pole while the other bones of the wrist con-tinue to undergo the process of bone turnover. The result
is an apparent relative increase in the density of the devascularized part compared to the remainder of the bone (Fig. 22-26).
! Buckle fractures of radius and ulna in children (common)• Look for acute and sudden angulation of the cortex,
especially near the wrist (see Fig. 22-1). These are impacted fractures and usually heal quickly with no deformity.
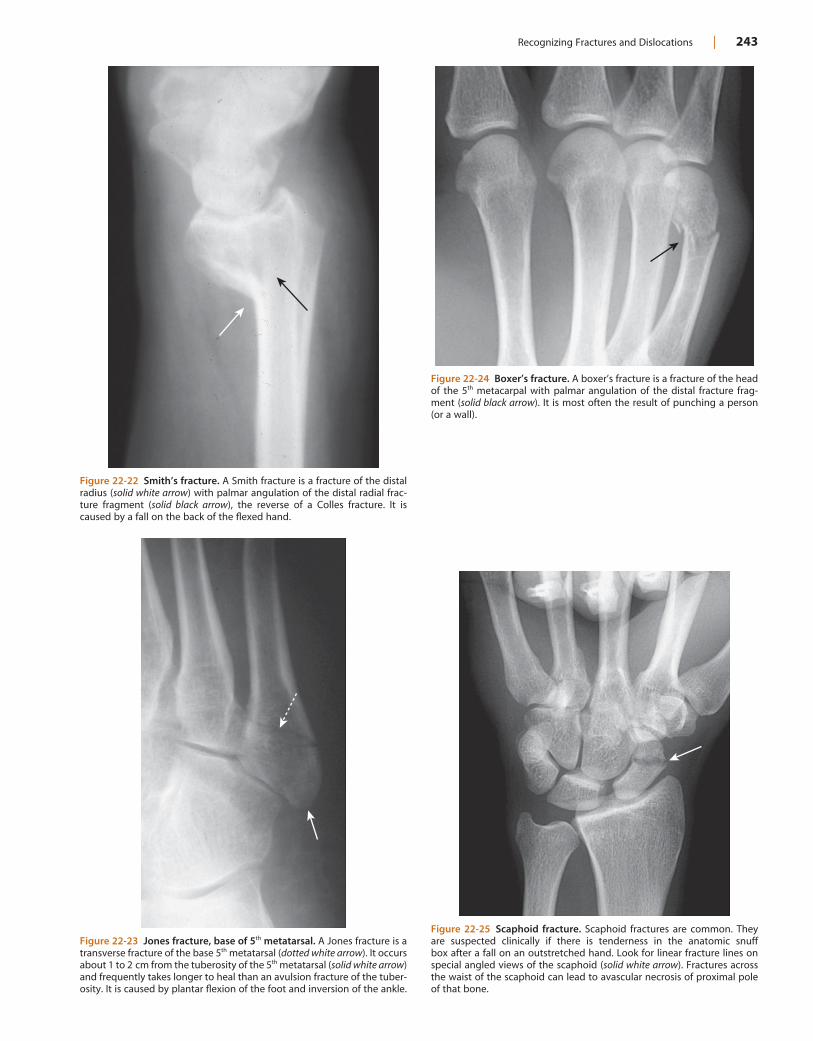
Recognizing Fractures and Dislocations | 243
Figure 22-22 Smith’s fracture. A Smith fracture is a fracture of the distal radius (solid white arrow) with palmar angulation of the distal radial frac-ture fragment (solid black arrow), the reverse of a Colles fracture. It is caused by a fall on the back of the flexed hand.
Figure 22-23 Jones fracture, base of 5th metatarsal. A Jones fracture is a transverse fracture of the base 5th metatarsal (dotted white arrow). It occurs about 1 to 2 cm from the tuberosity of the 5th metatarsal (solid white arrow) and frequently takes longer to heal than an avulsion fracture of the tuber-osity. It is caused by plantar flexion of the foot and inversion of the ankle.
Figure 22-24 Boxer’s fracture. A boxer’s fracture is a fracture of the head of the 5th metacarpal with palmar angulation of the distal fracture frag-ment (solid black arrow). It is most often the result of punching a person (or a wall).
Figure 22-25 Scaphoid fracture. Scaphoid fractures are common. They are suspected clinically if there is tenderness in the anatomic snuff box after a fall on an outstretched hand. Look for linear fracture lines on special angled views of the scaphoid (solid white arrow). Fractures across the waist of the scaphoid can lead to avascular necrosis of proximal pole of that bone.
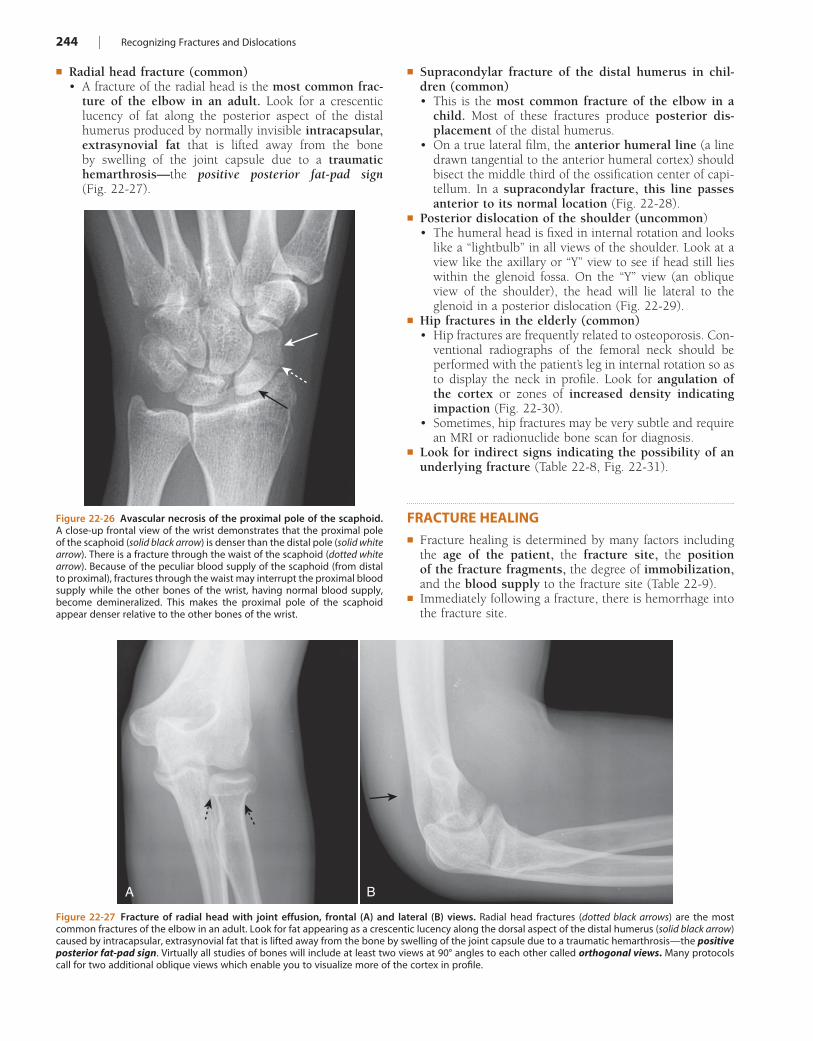
244 | Recognizing Fractures and Dislocations
Figure 22-26 Avascular necrosis of the proximal pole of the scaphoid. A close-up frontal view of the wrist demonstrates that the proximal pole of the scaphoid (solid black arrow) is denser than the distal pole (solid white arrow). There is a fracture through the waist of the scaphoid (dotted white arrow). Because of the peculiar blood supply of the scaphoid (from distal to proximal), fractures through the waist may interrupt the proximal blood supply while the other bones of the wrist, having normal blood supply, become demineralized. This makes the proximal pole of the scaphoid appear denser relative to the other bones of the wrist.
Figure 22-27 Fracture of radial head with joint effusion, frontal (A) and lateral (B) views. Radial head fractures (dotted black arrows) are the most common fractures of the elbow in an adult. Look for fat appearing as a crescentic lucency along the dorsal aspect of the distal humerus (solid black arrow) caused by intracapsular, extrasynovial fat that is lifted away from the bone by swelling of the joint capsule due to a traumatic hemarthrosis—the positive posterior fat-pad sign. Virtually all studies of bones will include at least two views at 90° angles to each other called orthogonal views. Many protocols call for two additional oblique views which enable you to visualize more of the cortex in profile.
A B
! Radial head fracture (common)• A fracture of the radial head is the most common frac-
ture of the elbow in an adult. Look for a crescentic lucency of fat along the posterior aspect of the distal humerus produced by normally invisible intracapsular, extrasynovial fat that is lifted away from the bone by swelling of the joint capsule due to a traumatic hemarthrosis—the positive posterior fat-pad sign (Fig. 22-27).
! Supracondylar fracture of the distal humerus in chil-dren (common)• This is the most common fracture of the elbow in a
child. Most of these fractures produce posterior dis-placement of the distal humerus.
• On a true lateral film, the anterior humeral line (a line drawn tangential to the anterior humeral cortex) should bisect the middle third of the ossification center of capi-tellum. In a supracondylar fracture, this line passes anterior to its normal location (Fig. 22-28).
! Posterior dislocation of the shoulder (uncommon)• The humeral head is fixed in internal rotation and looks
like a “lightbulb” in all views of the shoulder. Look at a view like the axillary or “Y” view to see if head still lies within the glenoid fossa. On the “Y” view (an oblique view of the shoulder), the head will lie lateral to the glenoid in a posterior dislocation (Fig. 22-29).
! Hip fractures in the elderly (common)• Hip fractures are frequently related to osteoporosis. Con-
ventional radiographs of the femoral neck should be performed with the patient’s leg in internal rotation so as to display the neck in profile. Look for angulation of the cortex or zones of increased density indicating impaction (Fig. 22-30).
• Sometimes, hip fractures may be very subtle and require an MRI or radionuclide bone scan for diagnosis.
! Look for indirect signs indicating the possibility of an underlying fracture (Table 22-8, Fig. 22-31).
FRACTURE HEALING! Fracture healing is determined by many factors including
the age of the patient, the fracture site, the position of the fracture fragments, the degree of immobilization, and the blood supply to the fracture site (Table 22-9).
! Immediately following a fracture, there is hemorrhage into the fracture site.
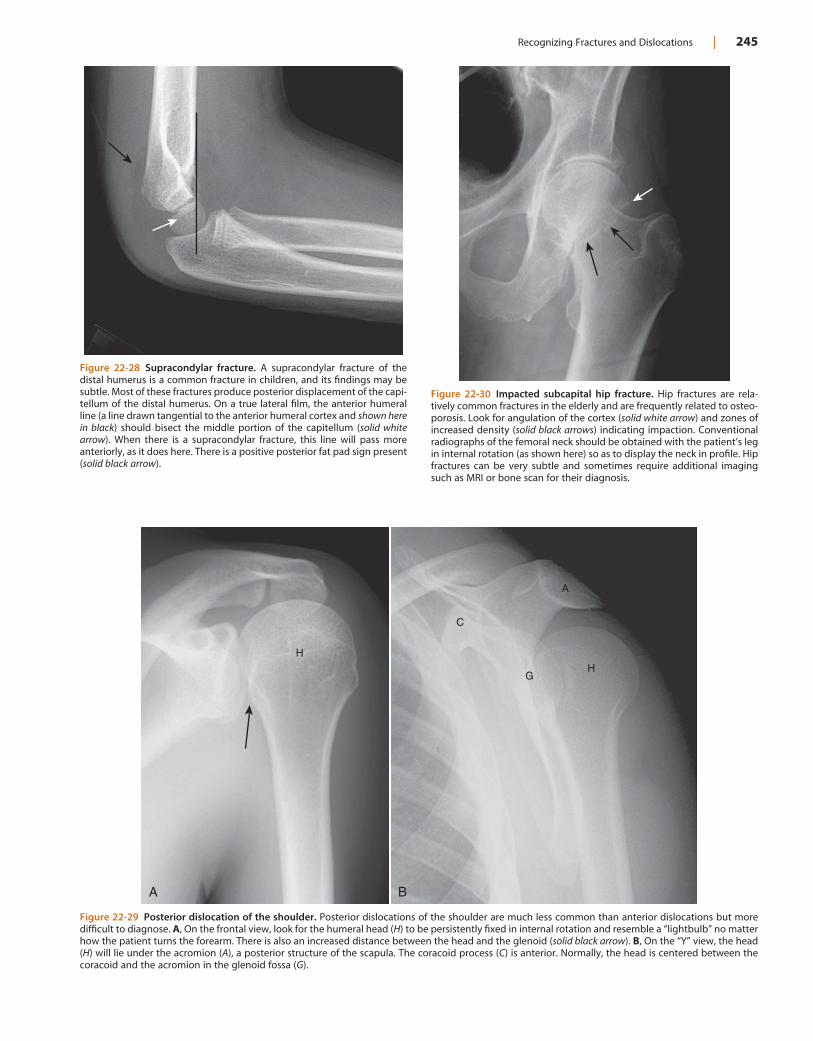
Recognizing Fractures and Dislocations | 245
Figure 22-28 Supracondylar fracture. A supracondylar fracture of the distal humerus is a common fracture in children, and its findings may be subtle. Most of these fractures produce posterior displacement of the capi-tellum of the distal humerus. On a true lateral film, the anterior humeral line (a line drawn tangential to the anterior humeral cortex and shown here in black) should bisect the middle portion of the capitellum (solid white arrow). When there is a supracondylar fracture, this line will pass more anteriorly, as it does here. There is a positive posterior fat pad sign present (solid black arrow).
Figure 22-29 Posterior dislocation of the shoulder. Posterior dislocations of the shoulder are much less common than anterior dislocations but more difficult to diagnose. A, On the frontal view, look for the humeral head (H) to be persistently fixed in internal rotation and resemble a “lightbulb” no matter how the patient turns the forearm. There is also an increased distance between the head and the glenoid (solid black arrow). B, On the “Y” view, the head (H) will lie under the acromion (A), a posterior structure of the scapula. The coracoid process (C) is anterior. Normally, the head is centered between the coracoid and the acromion in the glenoid fossa (G).
A B
HH
G
C
A
Figure 22-30 Impacted subcapital hip fracture. Hip fractures are rela-tively common fractures in the elderly and are frequently related to osteo-porosis. Look for angulation of the cortex (solid white arrow) and zones of increased density (solid black arrows) indicating impaction. Conventional radiographs of the femoral neck should be obtained with the patient’s leg in internal rotation (as shown here) so as to display the neck in profile. Hip fractures can be very subtle and sometimes require additional imaging such as MRI or bone scan for their diagnosis.
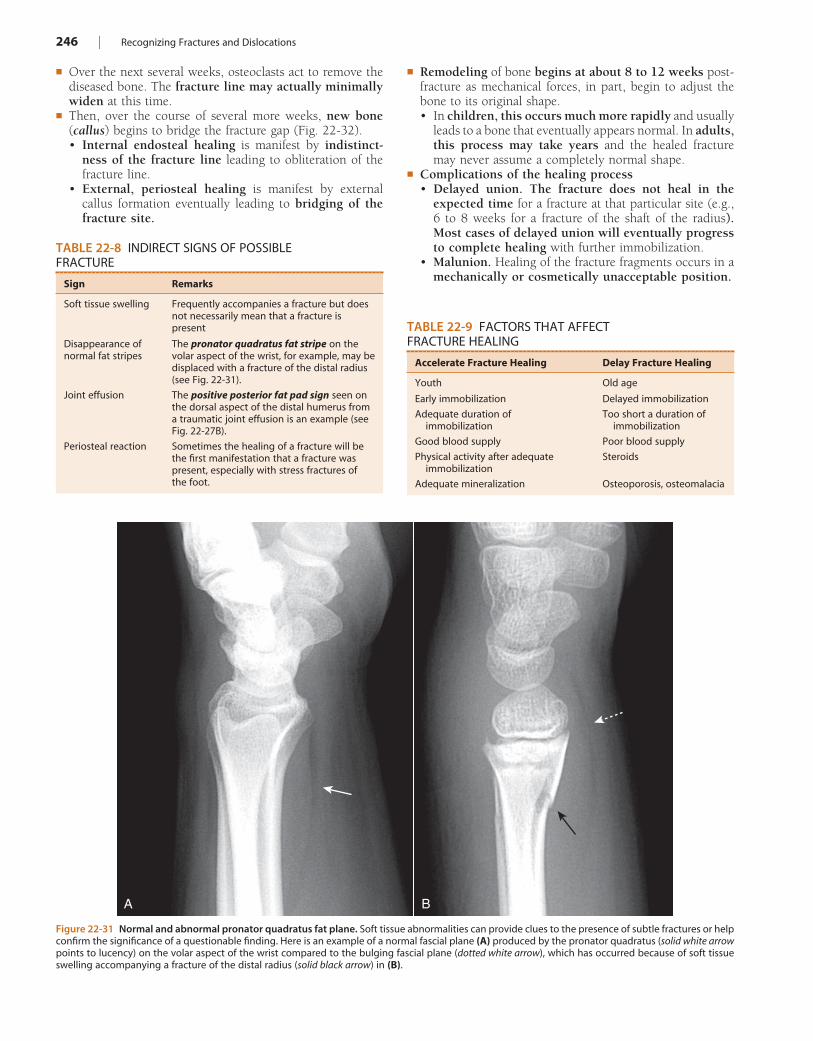
246 | Recognizing Fractures and Dislocations
TABLE 22-8 INDIRECT SIGNS OF POSSIBLE FRACTURE
Sign Remarks
Soft tissue swelling Frequently accompanies a fracture but does not necessarily mean that a fracture is present
Disappearance of normal fat stripes
The pronator quadratus fat stripe on the volar aspect of the wrist, for example, may be displaced with a fracture of the distal radius (see Fig. 22-31).
Joint effusion The positive posterior fat pad sign seen on the dorsal aspect of the distal humerus from a traumatic joint effusion is an example (see Fig. 22-27B).
Periosteal reaction Sometimes the healing of a fracture will be the first manifestation that a fracture was present, especially with stress fractures of the foot.
Figure 22-31 Normal and abnormal pronator quadratus fat plane. Soft tissue abnormalities can provide clues to the presence of subtle fractures or help confirm the significance of a questionable finding. Here is an example of a normal fascial plane (A) produced by the pronator quadratus (solid white arrow points to lucency) on the volar aspect of the wrist compared to the bulging fascial plane (dotted white arrow), which has occurred because of soft tissue swelling accompanying a fracture of the distal radius (solid black arrow) in (B).
A B
TABLE 22-9 FACTORS THAT AFFECT FRACTURE HEALING
Accelerate Fracture Healing Delay Fracture Healing
Youth Old age
Early immobilization Delayed immobilization
Adequate duration of immobilization
Too short a duration of immobilization
Good blood supply Poor blood supply
Physical activity after adequate immobilization
Steroids
Adequate mineralization Osteoporosis, osteomalacia
! Over the next several weeks, osteoclasts act to remove the diseased bone. The fracture line may actually minimally widen at this time.
! Then, over the course of several more weeks, new bone (callus) begins to bridge the fracture gap (Fig. 22-32).• Internal endosteal healing is manifest by indistinct-
ness of the fracture line leading to obliteration of the fracture line.
• External, periosteal healing is manifest by external callus formation eventually leading to bridging of the fracture site.
! Remodeling of bone begins at about 8 to 12 weeks post-fracture as mechanical forces, in part, begin to adjust the bone to its original shape.• In children, this occurs much more rapidly and usually
leads to a bone that eventually appears normal. In adults, this process may take years and the healed fracture may never assume a completely normal shape.
! Complications of the healing process• Delayed union. The fracture does not heal in the
expected time for a fracture at that particular site (e.g., 6 to 8 weeks for a fracture of the shaft of the radius). Most cases of delayed union will eventually progress to complete healing with further immobilization.
• Malunion. Healing of the fracture fragments occurs in a mechanically or cosmetically unacceptable position.
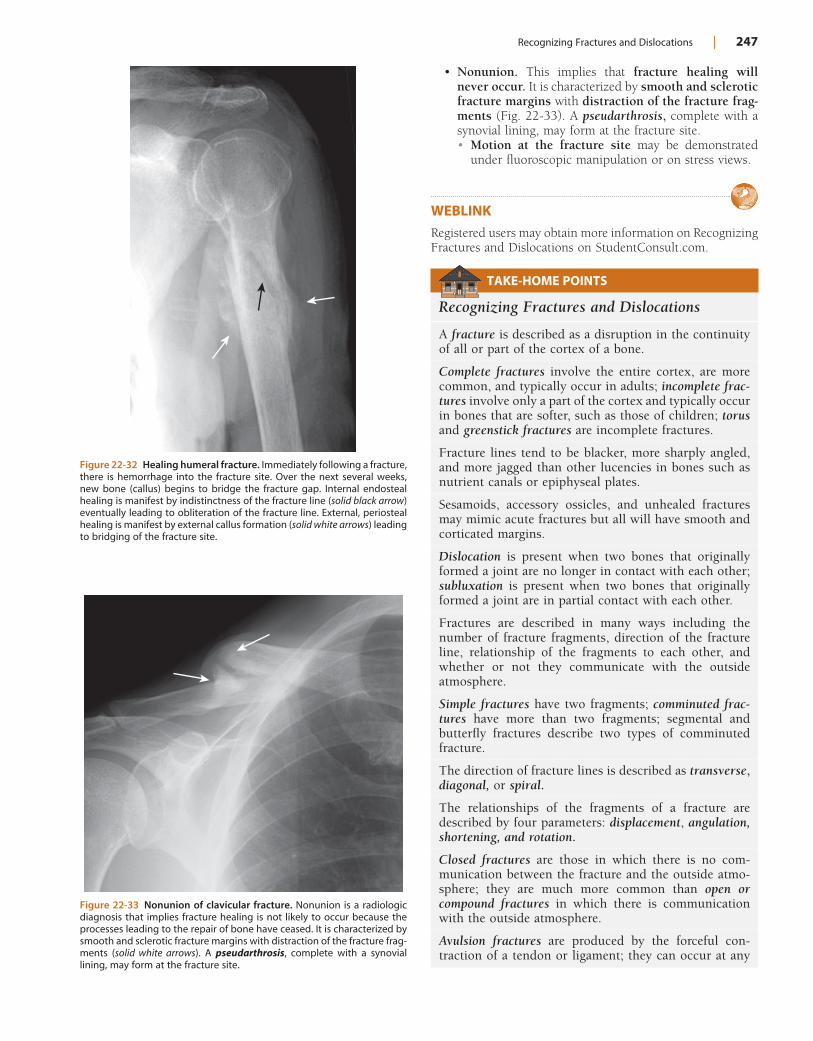
Recognizing Fractures and Dislocations | 247
Figure 22-32 Healing humeral fracture. Immediately following a fracture, there is hemorrhage into the fracture site. Over the next several weeks, new bone (callus) begins to bridge the fracture gap. Internal endosteal healing is manifest by indistinctness of the fracture line (solid black arrow) eventually leading to obliteration of the fracture line. External, periosteal healing is manifest by external callus formation (solid white arrows) leading to bridging of the fracture site.
Figure 22-33 Nonunion of clavicular fracture. Nonunion is a radiologic diagnosis that implies fracture healing is not likely to occur because the processes leading to the repair of bone have ceased. It is characterized by smooth and sclerotic fracture margins with distraction of the fracture frag-ments (solid white arrows). A pseudarthrosis, complete with a synovial lining, may form at the fracture site.
• Nonunion. This implies that fracture healing will never occur. It is characterized by smooth and sclerotic fracture margins with distraction of the fracture frag-ments (Fig. 22-33). A pseudarthrosis, complete with a synovial lining, may form at the fracture site.• Motion at the fracture site may be demonstrated
under fluoroscopic manipulation or on stress views.
WEBLINKRegistered users may obtain more information on Recognizing Fractures and Dislocations on StudentConsult.com.
TAKE-HOME POINTS
Recognizing Fractures and Dislocations
A fracture is described as a disruption in the continuity of all or part of the cortex of a bone.
Complete fractures involve the entire cortex, are more common, and typically occur in adults; incomplete frac-tures involve only a part of the cortex and typically occur in bones that are softer, such as those of children; torus and greenstick fractures are incomplete fractures.
Fracture lines tend to be blacker, more sharply angled, and more jagged than other lucencies in bones such as nutrient canals or epiphyseal plates.
Sesamoids, accessory ossicles, and unhealed fractures may mimic acute fractures but all will have smooth and corticated margins.
Dislocation is present when two bones that originally formed a joint are no longer in contact with each other; subluxation is present when two bones that originally formed a joint are in partial contact with each other.
Fractures are described in many ways including the number of fracture fragments, direction of the fracture line, relationship of the fragments to each other, and whether or not they communicate with the outside atmosphere.
Simple fractures have two fragments; comminuted frac-tures have more than two fragments; segmental and butterfly fractures describe two types of comminuted fracture.
The direction of fracture lines is described as transverse, diagonal, or spiral.
The relationships of the fragments of a fracture are described by four parameters: displacement, angulation, shortening, and rotation.
Closed fractures are those in which there is no com-munication between the fracture and the outside atmo-sphere; they are much more common than open or compound fractures in which there is communication with the outside atmosphere.
Avulsion fractures are produced by the forceful con-traction of a tendon or ligament; they can occur at any
248 | Recognizing Fractures and Dislocations
age but are particularly common in younger, athletic individuals.
The Salter-Harris classification categorizes fractures through the epiphyseal plate that are graded by severity and prognosis, the more severe having an increased risk of resulting in angular deformities or shortening of the affected bone.
Child abuse should be suspected when there are multiple fractures in various stages of healing, metaphyseal corner fractures, rib fractures, and skull fractures, especially if multiple.
Stress fractures, such as march fractures in the metatar-sals, occur as a result of numerous microfractures and frequently are not visible on conventional radiographs taken when the pain first begins; after some time, bony callus formation or a dense zone of sclerosis becomes visible.
Some common named fractures are Colles’ fracture (of the radius), Smith’s fracture (of the radius), Jones frac-ture (of the base of the 5th metatarsal), boxer’s fracture (of the head of the 5th metacarpal), and march fracture (in the foot).
Some fractures are more difficult to detect than others; the easily missed fractures (and how common they are) include scaphoid fractures (common), buckle fractures of the radius and ulna (common), radial head fractures (common), supracondylar fractures (common), poste-rior dislocations of the shoulder (uncommon), and hip fractures (common).
Soft tissue swelling, the disappearance of normal fat stripes and fascial planes, joint effusions, and periosteal reaction are indirect signs that should alert you to the possibility of an underlying fracture.
Fractures heal with a combination of endosteal callus, recognized by a progressive indistinctness of the fracture line, and external callus that bridges the fracture site; many factors affect fracture healing, including the age of the patient, the degree of mobility of the fracture, and its blood supply.
Delayed union refers to a fracture that is taking longer to heal than is usually required for that site; malunion means the fracture is healing but in a mechanically or cosmetically unacceptable way; nonunion is a radiologic diagnosis that implies there is little if any likelihood the fracture will heal.

249
Chapter 23
Recognizing Joint Disease: An Approach to Arthritis
! Imaging studies play a key role in the diagnosis and man-agement of arthritis and are the method by which many arthritides are first diagnosed. Other arthritides are initially diagnosed on clinical and laboratory grounds and imaging is used to document the severity, extent, and course of the disease (Table 23-1).
! Conventional radiographs demonstrate osseous abnormali-ties but provide only indirect and usually delayed evidence of abnormalities involving the soft tissues, such as the syno-vial lining of the joint, the articular cartilage, muscles, liga-ments, and tendons surrounding the joint. MRI is used to demonstrate those soft tissue abnormalities.
ANATOMY OF A JOINT! Figure 23-1 contains a diagram of a typical synovial joint
and compares the structures visualized on conventional radiographs and MRI.
! The articular cortex is the thin, white line as seen on con-ventional radiographs that lies within the joint capsule and is usually capped by hyaline cartilage, called the articular cartilage. The bone immediately beneath the articular cortex is called subchondral bone.
! Lining the joint capsule is the synovial membrane contain-ing synovial fluid. The synovial membrane is frequently the earliest structure involved by an arthritis.
! Conventional radiographs will demonstrate abnormalities of the articular cortex and the subchondral bone and will provide late, indirect evidence of the integrity of the articu-lar cartilage.
! On conventional radiographs, the synovial membrane, synovial fluid, and the articular cartilage are usually not directly visible. All, however, are visible using MRI.
! While MRI is more sensitive in directly visualizing the soft tissues in and around a joint, conventional radiographs remain the study of first choice in evaluating for the pres-ence of an arthritis.
CLASSIFICATION OF ARTHRITIS! First, let’s define what an arthritis is and then we’ll outline
a classification of arthritides. An arthritis is a disease that affects a joint and usually the bones on either side of the joint, almost always accompanied by joint space narrow-ing (Fig. 23-2).
! We will divide arthritides into three main categories: (Table 23-2)
• Hypertrophic arthritis is characterized, in general, by bone formation at the site of the involved joint(s). The bone formation may occur within the confines of the parent bone (subchondral sclerosis) or protrude from the parent bone (osteophyte) (Fig. 23-3A).
• Erosive arthritis indicates underlying inflammation and is characterized by tiny, marginal, irregularly shaped lytic lesions in or around the joint surfaces called erosions (Fig. 23-3B).
• Infectious arthritis is characterized by joint swelling, osteopenia, and destruction of long, contiguous seg-ments of the articular cortex (Fig. 23-3C).
! Within each of these three main categories, we’ll look at a few of the more common types of arthritis that also have characteristic imaging findings.
HYPERTROPHIC ARTHRITIS! Hypertrophic arthritis is characterized by bone forma-
tion, either within the confines of preexisting bone (sub-chondral sclerosis) or by bony protrusions extending from the normal bone (osteophytes).
! Hypertrophic arthritides include:• Osteoarthritis (degenerative arthritis, degenerative
joint disease), which is further divided into:• Primary osteoarthritis• Secondary osteoarthritis
• Erosive osteoarthritis• Charcot arthropathy (neuropathic joint)• Calcium pyrophosphate deposition disease (CPPD)
Primary Osteoarthritis (Also Known as Primary Degenerative Arthritis, Degenerative Joint Disease)
! This is the most common form of arthritis, estimated to affect over 20 million Americans. It results from intrinsic degeneration of the articular cartilage, mostly from the mechanical stress of excessive wear and tear in weight-bearing joints.
! It mostly involves the hips, knees, and hands and increases in prevalence with increasing age.
The imaging findings in osteoarthritis:
! Marginal osteophyte formation. A hallmark of hypertrophic arthritis, osseous transformation of cartilagi-nous excrescences and metaplasia of synovial lining cells
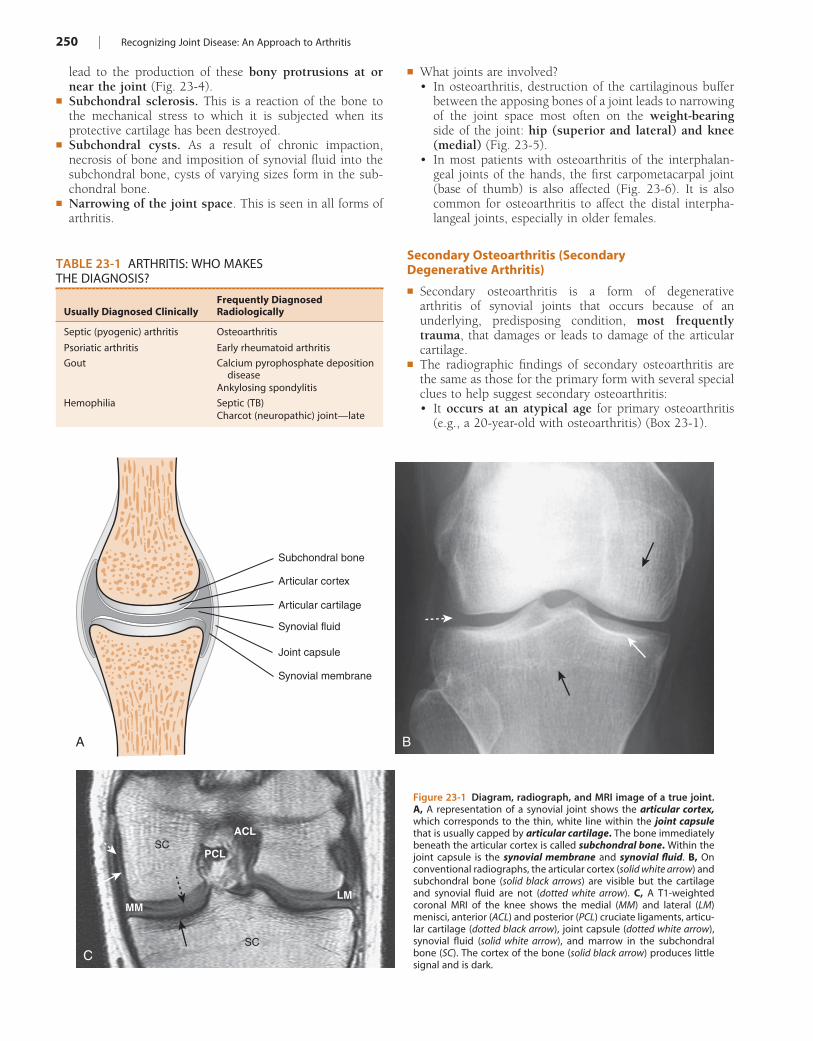
250 | Recognizing Joint Disease: An Approach to Arthritis
TABLE 23-1 ARTHRITIS: WHO MAKES THE DIAGNOSIS?
Usually Diagnosed ClinicallyFrequently Diagnosed Radiologically
Septic (pyogenic) arthritis Osteoarthritis
Psoriatic arthritis Early rheumatoid arthritis
Gout Calcium pyrophosphate deposition disease
Ankylosing spondylitis
Hemophilia Septic (TB)Charcot (neuropathic) joint—late
Subchondral bone
Articular cartilage
Articular cortex
Synovial membrane
Joint capsule
PCL
ACL
LM
SC
Synovial fluid
A
C
B
SC
MM
lead to the production of these bony protrusions at or near the joint (Fig. 23-4).
! Subchondral sclerosis. This is a reaction of the bone to the mechanical stress to which it is subjected when its protective cartilage has been destroyed.
! Subchondral cysts. As a result of chronic impaction, necrosis of bone and imposition of synovial fluid into the subchondral bone, cysts of varying sizes form in the sub-chondral bone.
! Narrowing of the joint space. This is seen in all forms of arthritis.
! What joints are involved?• In osteoarthritis, destruction of the cartilaginous buffer
between the apposing bones of a joint leads to narrowing of the joint space most often on the weight-bearing side of the joint: hip (superior and lateral) and knee (medial) (Fig. 23-5).
• In most patients with osteoarthritis of the interphalan-geal joints of the hands, the first carpometacarpal joint (base of thumb) is also affected (Fig. 23-6). It is also common for osteoarthritis to affect the distal interpha-langeal joints, especially in older females.
Secondary Osteoarthritis (Secondary Degenerative Arthritis)
! Secondary osteoarthritis is a form of degenerative arthritis of synovial joints that occurs because of an underlying, predisposing condition, most frequently trauma, that damages or leads to damage of the articular cartilage.
! The radiographic findings of secondary osteoarthritis are the same as those for the primary form with several special clues to help suggest secondary osteoarthritis:• It occurs at an atypical age for primary osteoarthritis
(e.g., a 20-year-old with osteoarthritis) (Box 23-1).
Figure 23-1 Diagram, radiograph, and MRI image of a true joint. A, A representation of a synovial joint shows the articular cortex, which corresponds to the thin, white line within the joint capsule that is usually capped by articular cartilage. The bone immediately beneath the articular cortex is called subchondral bone. Within the joint capsule is the synovial membrane and synovial fluid. B, On conventional radiographs, the articular cortex (solid white arrow) and subchondral bone (solid black arrows) are visible but the cartilage and synovial fluid are not (dotted white arrow). C, A T1-weighted coronal MRI of the knee shows the medial (MM) and lateral (LM) menisci, anterior (ACL) and posterior (PCL) cruciate ligaments, articu-lar cartilage (dotted black arrow), joint capsule (dotted white arrow), synovial fluid (solid white arrow), and marrow in the subchondral bone (SC). The cortex of the bone (solid black arrow) produces little signal and is dark.
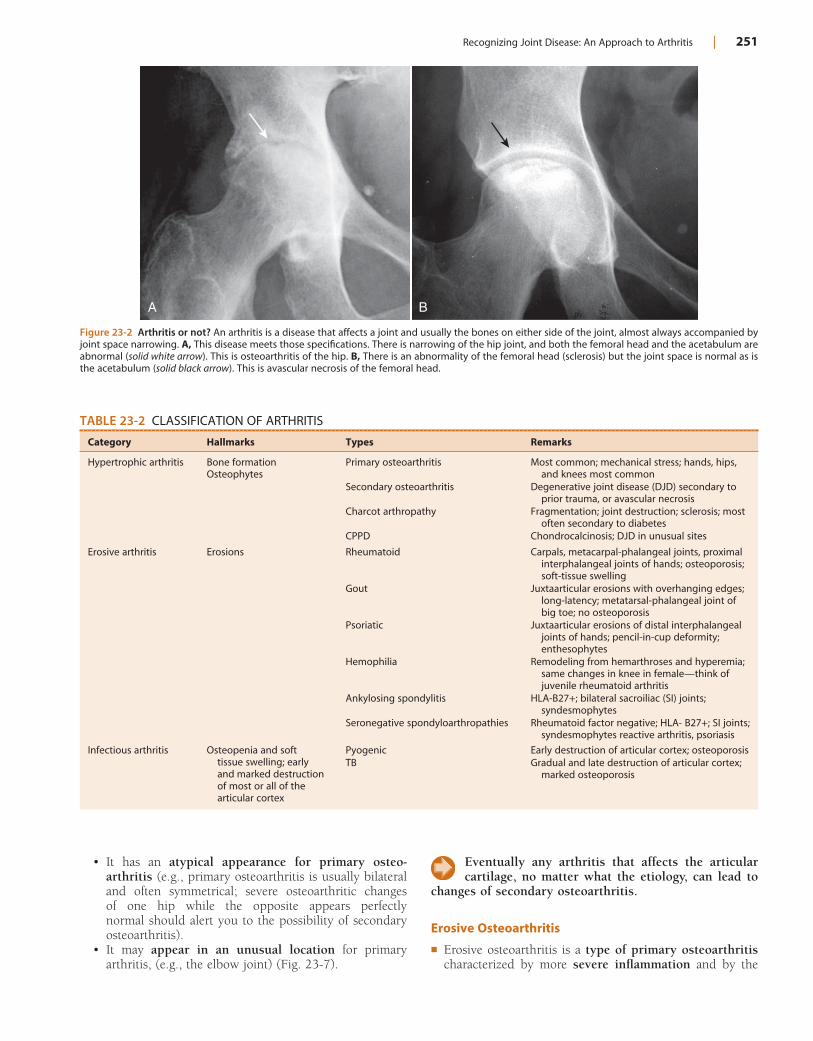
Recognizing Joint Disease: An Approach to Arthritis | 251
Figure 23-2 Arthritis or not? An arthritis is a disease that affects a joint and usually the bones on either side of the joint, almost always accompanied by joint space narrowing. A, This disease meets those specifications. There is narrowing of the hip joint, and both the femoral head and the acetabulum are abnormal (solid white arrow). This is osteoarthritis of the hip. B, There is an abnormality of the femoral head (sclerosis) but the joint space is normal as is the acetabulum (solid black arrow). This is avascular necrosis of the femoral head.
A B
TABLE 23-2 CLASSIFICATION OF ARTHRITIS
Category Hallmarks Types Remarks
Hypertrophic arthritis Bone formationOsteophytes
Primary osteoarthritis Most common; mechanical stress; hands, hips, and knees most common
Secondary osteoarthritis Degenerative joint disease (DJD) secondary to prior trauma, or avascular necrosis
Charcot arthropathy Fragmentation; joint destruction; sclerosis; most often secondary to diabetes
CPPD Chondrocalcinosis; DJD in unusual sites
Erosive arthritis Erosions Rheumatoid Carpals, metacarpal-phalangeal joints, proximal interphalangeal joints of hands; osteoporosis; soft-tissue swelling
Gout Juxtaarticular erosions with overhanging edges; long-latency; metatarsal-phalangeal joint of big toe; no osteoporosis
Psoriatic Juxtaarticular erosions of distal interphalangeal joints of hands; pencil-in-cup deformity; enthesophytes
Hemophilia Remodeling from hemarthroses and hyperemia; same changes in knee in female—think of juvenile rheumatoid arthritis
Ankylosing spondylitis HLA-B27+; bilateral sacroiliac (SI) joints; syndesmophytes
Seronegative spondyloarthropathies Rheumatoid factor negative; HLA- B27+; SI joints; syndesmophytes reactive arthritis, psoriasis
Infectious arthritis Osteopenia and soft tissue swelling; early and marked destruction of most or all of the articular cortex
Pyogenic Early destruction of articular cortex; osteoporosisTB Gradual and late destruction of articular cortex;
marked osteoporosis
• It has an atypical appearance for primary osteo-arthritis (e.g., primary osteoarthritis is usually bilateral and often symmetrical; severe osteoarthritic changes of one hip while the opposite appears perfectly normal should alert you to the possibility of secondary osteoarthritis).
• It may appear in an unusual location for primary arthritis, (e.g., the elbow joint) (Fig. 23-7).
Eventually any arthritis that affects the articular cartilage, no matter what the etiology, can lead to
changes of secondary osteoarthritis.
Erosive Osteoarthritis
! Erosive osteoarthritis is a type of primary osteoarthritis characterized by more severe inflammation and by the
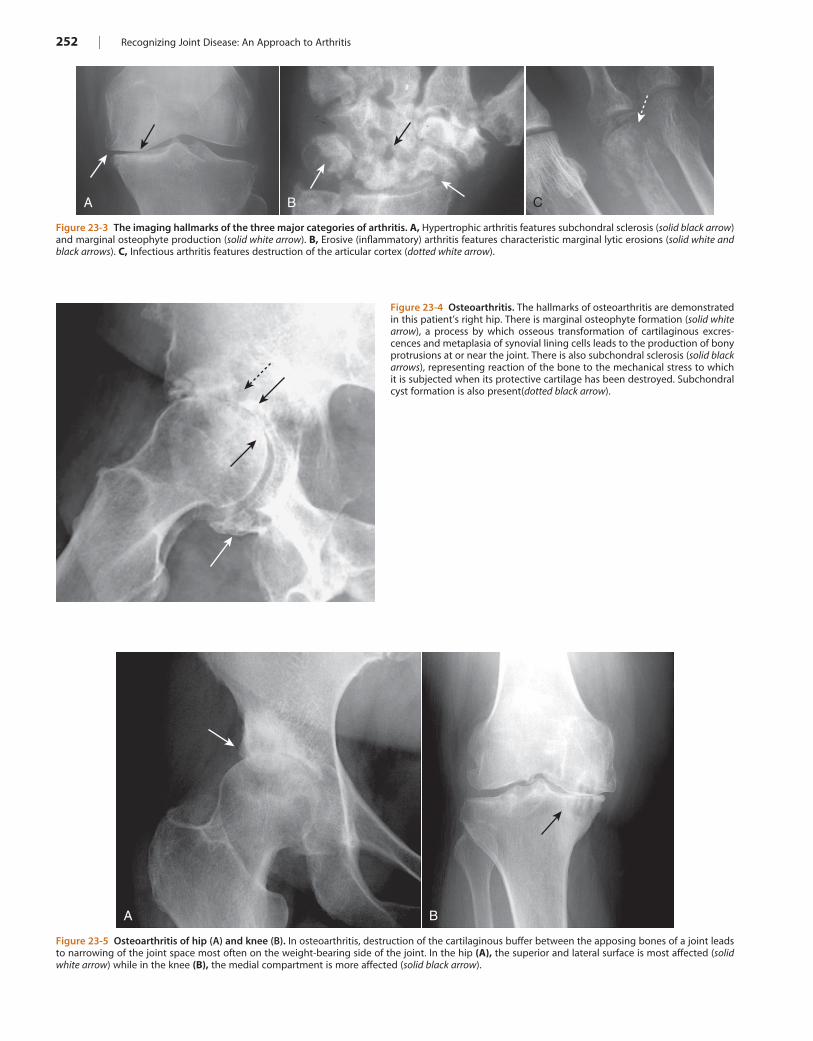
252 | Recognizing Joint Disease: An Approach to Arthritis
Figure 23-3 The imaging hallmarks of the three major categories of arthritis. A, Hypertrophic arthritis features subchondral sclerosis (solid black arrow) and marginal osteophyte production (solid white arrow). B, Erosive (inflammatory) arthritis features characteristic marginal lytic erosions (solid white and black arrows). C, Infectious arthritis features destruction of the articular cortex (dotted white arrow).
A B C
Figure 23-4 Osteoarthritis. The hallmarks of osteoarthritis are demonstrated in this patient’s right hip. There is marginal osteophyte formation (solid white arrow), a process by which osseous transformation of cartilaginous excres-cences and metaplasia of synovial lining cells leads to the production of bony protrusions at or near the joint. There is also subchondral sclerosis (solid black arrows), representing reaction of the bone to the mechanical stress to which it is subjected when its protective cartilage has been destroyed. Subchondral cyst formation is also present(dotted black arrow).
Figure 23-5 Osteoarthritis of hip (A) and knee (B). In osteoarthritis, destruction of the cartilaginous buffer between the apposing bones of a joint leads to narrowing of the joint space most often on the weight-bearing side of the joint. In the hip (A), the superior and lateral surface is most affected (solid white arrow) while in the knee (B), the medial compartment is more affected (solid black arrow).
A B
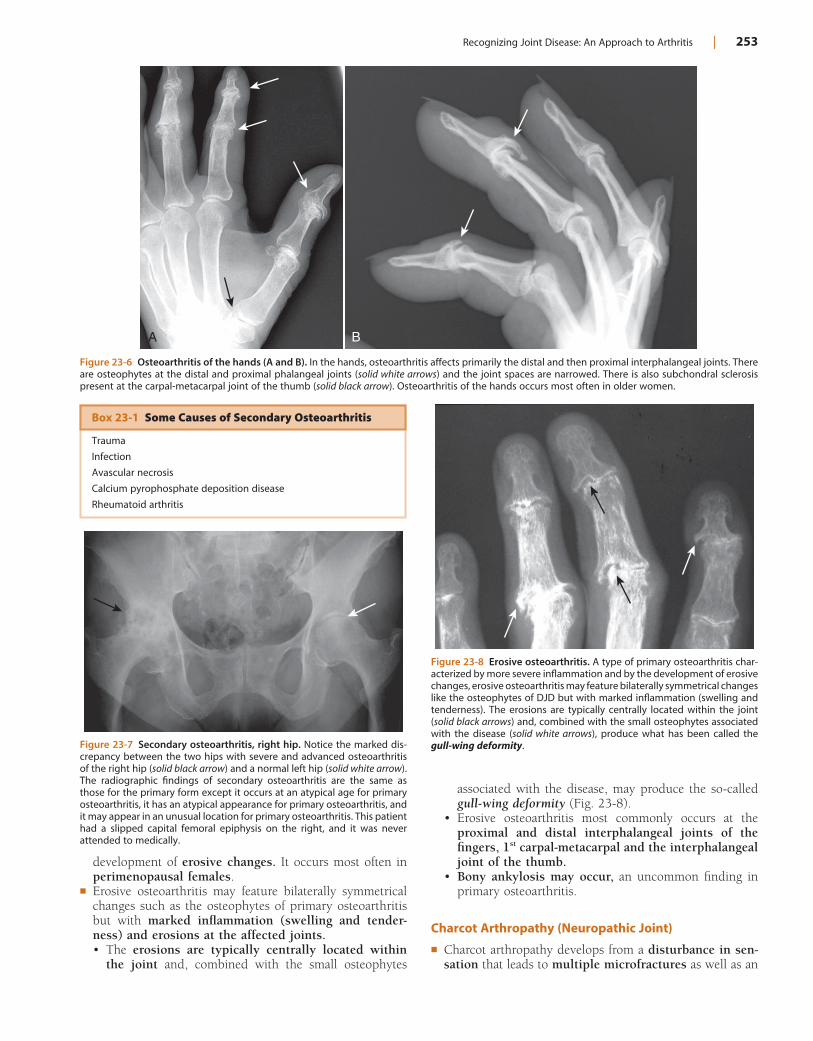
Recognizing Joint Disease: An Approach to Arthritis | 253
associated with the disease, may produce the so-called gull-wing deformity (Fig. 23-8).
• Erosive osteoarthritis most commonly occurs at the proximal and distal interphalangeal joints of the fingers, 1st carpal-metacarpal and the interphalangeal joint of the thumb.
• Bony ankylosis may occur, an uncommon finding in primary osteoarthritis.
Charcot Arthropathy (Neuropathic Joint)
! Charcot arthropathy develops from a disturbance in sen-sation that leads to multiple microfractures as well as an
Figure 23-6 Osteoarthritis of the hands (A and B). In the hands, osteoarthritis affects primarily the distal and then proximal interphalangeal joints. There are osteophytes at the distal and proximal phalangeal joints (solid white arrows) and the joint spaces are narrowed. There is also subchondral sclerosis present at the carpal-metacarpal joint of the thumb (solid black arrow). Osteoarthritis of the hands occurs most often in older women.
A B
Box 23-1 Some Causes of Secondary Osteoarthritis
Trauma
Infection
Avascular necrosis
Calcium pyrophosphate deposition disease
Rheumatoid arthritis
Figure 23-7 Secondary osteoarthritis, right hip. Notice the marked dis-crepancy between the two hips with severe and advanced osteoarthritis of the right hip (solid black arrow) and a normal left hip (solid white arrow). The radiographic findings of secondary osteoarthritis are the same as those for the primary form except it occurs at an atypical age for primary osteoarthritis, it has an atypical appearance for primary osteoarthritis, and it may appear in an unusual location for primary osteoarthritis. This patient had a slipped capital femoral epiphysis on the right, and it was never attended to medically.
development of erosive changes. It occurs most often in perimenopausal females.
! Erosive osteoarthritis may feature bilaterally symmetrical changes such as the osteophytes of primary osteoarthritis but with marked inflammation (swelling and tender-ness) and erosions at the affected joints.• The erosions are typically centrally located within
the joint and, combined with the small osteophytes
Figure 23-8 Erosive osteoarthritis. A type of primary osteoarthritis char-acterized by more severe inflammation and by the development of erosive changes, erosive osteoarthritis may feature bilaterally symmetrical changes like the osteophytes of DJD but with marked inflammation (swelling and tenderness). The erosions are typically centrally located within the joint (solid black arrows) and, combined with the small osteophytes associated with the disease (solid white arrows), produce what has been called the gull-wing deformity.
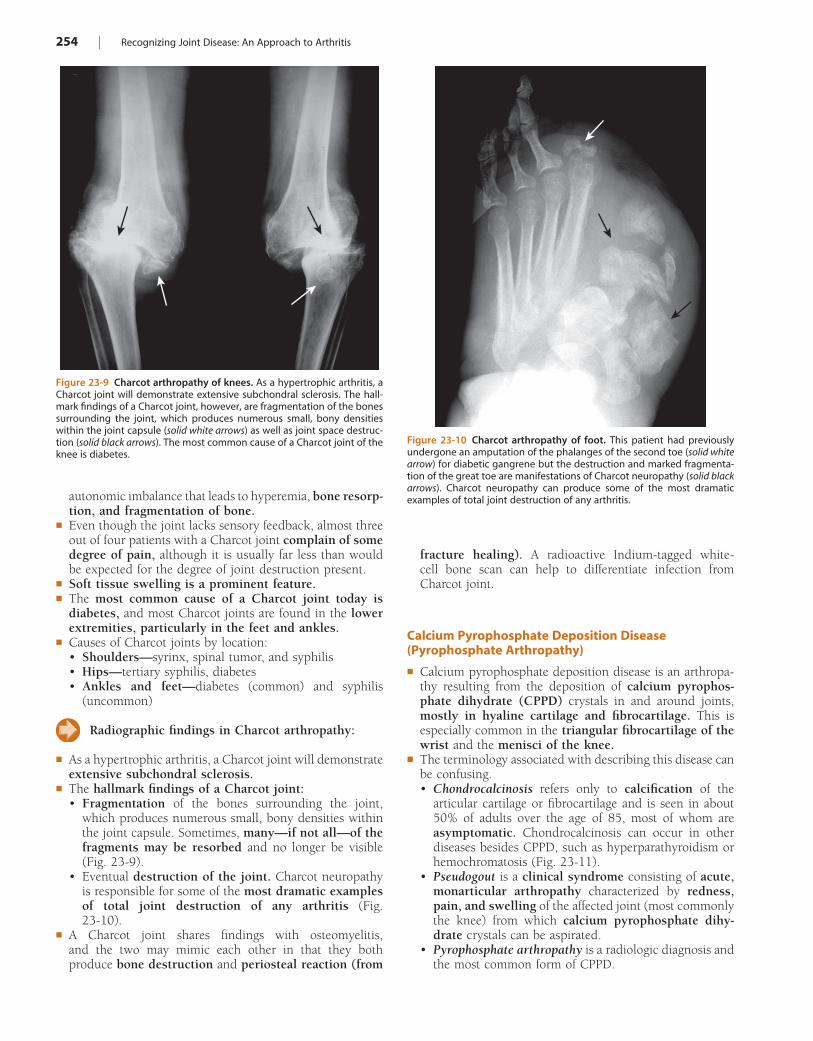
254 | Recognizing Joint Disease: An Approach to Arthritis
autonomic imbalance that leads to hyperemia, bone resorp-tion, and fragmentation of bone.
! Even though the joint lacks sensory feedback, almost three out of four patients with a Charcot joint complain of some degree of pain, although it is usually far less than would be expected for the degree of joint destruction present.
! Soft tissue swelling is a prominent feature.! The most common cause of a Charcot joint today is
diabetes, and most Charcot joints are found in the lower extremities, particularly in the feet and ankles.
! Causes of Charcot joints by location:• Shoulders—syrinx, spinal tumor, and syphilis• Hips—tertiary syphilis, diabetes• Ankles and feet—diabetes (common) and syphilis
(uncommon)
Radiographic findings in Charcot arthropathy:
! As a hypertrophic arthritis, a Charcot joint will demonstrate extensive subchondral sclerosis.
! The hallmark findings of a Charcot joint:• Fragmentation of the bones surrounding the joint,
which produces numerous small, bony densities within the joint capsule. Sometimes, many—if not all—of the fragments may be resorbed and no longer be visible (Fig. 23-9).
• Eventual destruction of the joint. Charcot neuropathy is responsible for some of the most dramatic examples of total joint destruction of any arthritis (Fig. 23-10).
! A Charcot joint shares findings with osteomyelitis, and the two may mimic each other in that they both produce bone destruction and periosteal reaction (from
Figure 23-9 Charcot arthropathy of knees. As a hypertrophic arthritis, a Charcot joint will demonstrate extensive subchondral sclerosis. The hall-mark findings of a Charcot joint, however, are fragmentation of the bones surrounding the joint, which produces numerous small, bony densities within the joint capsule (solid white arrows) as well as joint space destruc-tion (solid black arrows). The most common cause of a Charcot joint of the knee is diabetes.
Figure 23-10 Charcot arthropathy of foot. This patient had previously undergone an amputation of the phalanges of the second toe (solid white arrow) for diabetic gangrene but the destruction and marked fragmenta-tion of the great toe are manifestations of Charcot neuropathy (solid black arrows). Charcot neuropathy can produce some of the most dramatic examples of total joint destruction of any arthritis.
fracture healing). A radioactive Indium-tagged white-cell bone scan can help to differentiate infection from Charcot joint.
Calcium Pyrophosphate Deposition Disease (Pyrophosphate Arthropathy)
! Calcium pyrophosphate deposition disease is an arthropa-thy resulting from the deposition of calcium pyrophos-phate dihydrate (CPPD) crystals in and around joints, mostly in hyaline cartilage and fibrocartilage. This is especially common in the triangular fibrocartilage of the wrist and the menisci of the knee.
! The terminology associated with describing this disease can be confusing.• Chondrocalcinosis refers only to calcification of the
articular cartilage or fibrocartilage and is seen in about 50% of adults over the age of 85, most of whom are asymptomatic. Chondrocalcinosis can occur in other diseases besides CPPD, such as hyperparathyroidism or hemochromatosis (Fig. 23-11).
• Pseudogout is a clinical syndrome consisting of acute, monarticular arthropathy characterized by redness, pain, and swelling of the affected joint (most commonly the knee) from which calcium pyrophosphate dihy-drate crystals can be aspirated.
• Pyrophosphate arthropathy is a radiologic diagnosis and the most common form of CPPD.
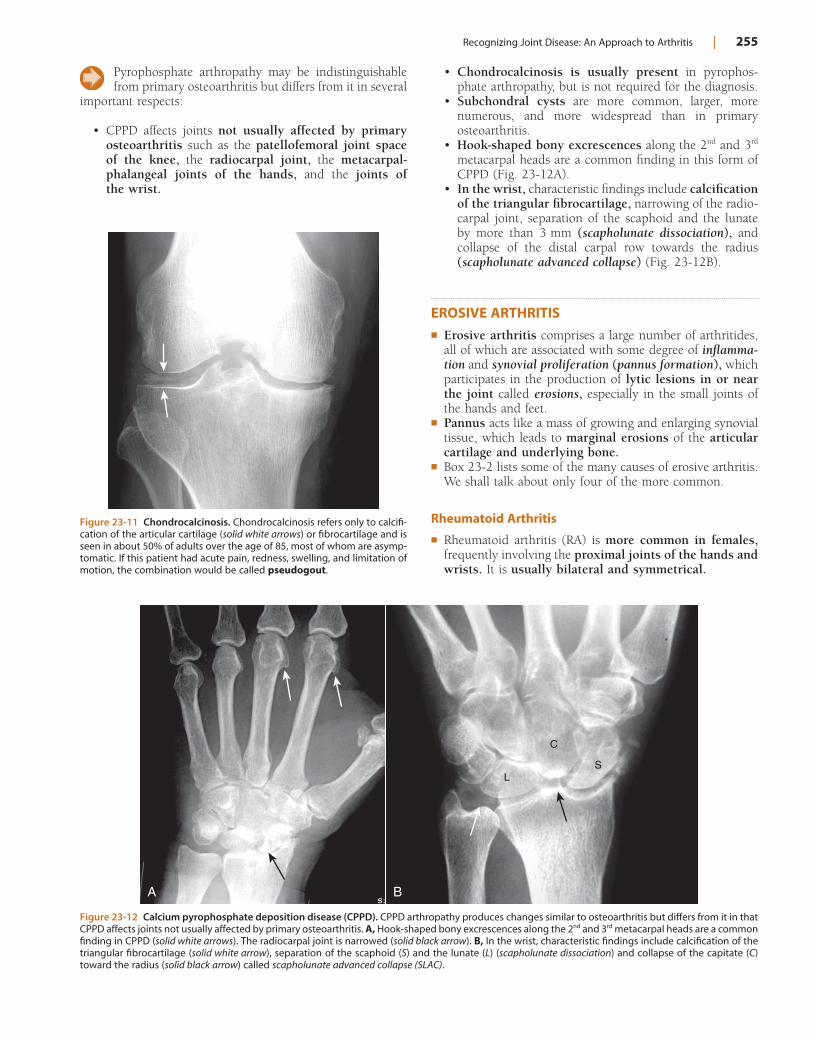
Recognizing Joint Disease: An Approach to Arthritis | 255
Figure 23-11 Chondrocalcinosis. Chondrocalcinosis refers only to calcifi-cation of the articular cartilage (solid white arrows) or fibrocartilage and is seen in about 50% of adults over the age of 85, most of whom are asymp-tomatic. If this patient had acute pain, redness, swelling, and limitation of motion, the combination would be called pseudogout.
Figure 23-12 Calcium pyrophosphate deposition disease (CPPD). CPPD arthropathy produces changes similar to osteoarthritis but differs from it in that CPPD affects joints not usually affected by primary osteoarthritis. A, Hook-shaped bony excrescences along the 2nd and 3rd metacarpal heads are a common finding in CPPD (solid white arrows). The radiocarpal joint is narrowed (solid black arrow). B, In the wrist, characteristic findings include calcification of the triangular fibrocartilage (solid white arrow), separation of the scaphoid (S) and the lunate (L) (scapholunate dissociation) and collapse of the capitate (C) toward the radius (solid black arrow) called scapholunate advanced collapse (SLAC).
A B
L
C
S
Pyrophosphate arthropathy may be indistinguishable from primary osteoarthritis but differs from it in several
important respects:
• CPPD affects joints not usually affected by primary osteoarthritis such as the patellofemoral joint space of the knee, the radiocarpal joint, the metacarpal-phalangeal joints of the hands, and the joints of the wrist.
• Chondrocalcinosis is usually present in pyrophos-phate arthropathy, but is not required for the diagnosis.
• Subchondral cysts are more common, larger, more numerous, and more widespread than in primary osteoarthritis.
• Hook-shaped bony excrescences along the 2nd and 3rd metacarpal heads are a common finding in this form of CPPD (Fig. 23-12A).
• In the wrist, characteristic findings include calcification of the triangular fibrocartilage, narrowing of the radio-carpal joint, separation of the scaphoid and the lunate by more than 3 mm (scapholunate dissociation), and collapse of the distal carpal row towards the radius (scapholunate advanced collapse) (Fig. 23-12B).
EROSIVE ARTHRITIS! Erosive arthritis comprises a large number of arthritides,
all of which are associated with some degree of inflamma-tion and synovial proliferation (pannus formation), which participates in the production of lytic lesions in or near the joint called erosions, especially in the small joints of the hands and feet.
! Pannus acts like a mass of growing and enlarging synovial tissue, which leads to marginal erosions of the articular cartilage and underlying bone.
! Box 23-2 lists some of the many causes of erosive arthritis. We shall talk about only four of the more common.
Rheumatoid Arthritis
! Rheumatoid arthritis (RA) is more common in females, frequently involving the proximal joints of the hands and wrists. It is usually bilateral and symmetrical.
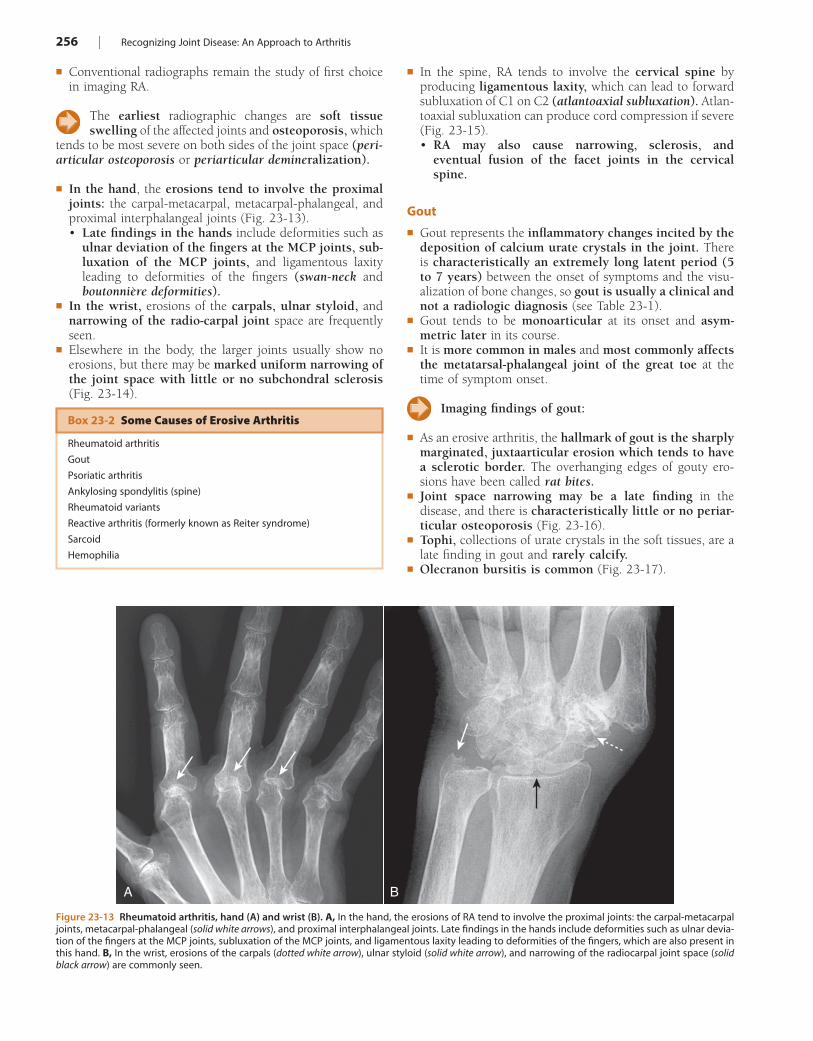
256 | Recognizing Joint Disease: An Approach to Arthritis
Figure 23-13 Rheumatoid arthritis, hand (A) and wrist (B). A, In the hand, the erosions of RA tend to involve the proximal joints: the carpal-metacarpal joints, metacarpal-phalangeal (solid white arrows), and proximal interphalangeal joints. Late findings in the hands include deformities such as ulnar devia-tion of the fingers at the MCP joints, subluxation of the MCP joints, and ligamentous laxity leading to deformities of the fingers, which are also present in this hand. B, In the wrist, erosions of the carpals (dotted white arrow), ulnar styloid (solid white arrow), and narrowing of the radiocarpal joint space (solid black arrow) are commonly seen.
A B
Box 23-2 Some Causes of Erosive Arthritis
Rheumatoid arthritis
Gout
Psoriatic arthritis
Ankylosing spondylitis (spine)
Rheumatoid variants
Reactive arthritis (formerly known as Reiter syndrome)
Sarcoid
Hemophilia
! Conventional radiographs remain the study of first choice in imaging RA.
The earliest radiographic changes are soft tissue swelling of the affected joints and osteoporosis, which
tends to be most severe on both sides of the joint space (peri-articular osteoporosis or periarticular demineralization).
! In the hand, the erosions tend to involve the proximal joints: the carpal-metacarpal, metacarpal-phalangeal, and proximal interphalangeal joints (Fig. 23-13).• Late findings in the hands include deformities such as
ulnar deviation of the fingers at the MCP joints, sub-luxation of the MCP joints, and ligamentous laxity leading to deformities of the fingers (swan-neck and boutonnière deformities).
! In the wrist, erosions of the carpals, ulnar styloid, and narrowing of the radio-carpal joint space are frequently seen.
! Elsewhere in the body, the larger joints usually show no erosions, but there may be marked uniform narrowing of the joint space with little or no subchondral sclerosis (Fig. 23-14).
! In the spine, RA tends to involve the cervical spine by producing ligamentous laxity, which can lead to forward subluxation of C1 on C2 (atlantoaxial subluxation). Atlan-toaxial subluxation can produce cord compression if severe (Fig. 23-15).• RA may also cause narrowing, sclerosis, and
eventual fusion of the facet joints in the cervical spine.
Gout
! Gout represents the inflammatory changes incited by the deposition of calcium urate crystals in the joint. There is characteristically an extremely long latent period (5 to 7 years) between the onset of symptoms and the visu-alization of bone changes, so gout is usually a clinical and not a radiologic diagnosis (see Table 23-1).
! Gout tends to be monoarticular at its onset and asym-metric later in its course.
! It is more common in males and most commonly affects the metatarsal-phalangeal joint of the great toe at the time of symptom onset.
Imaging findings of gout:
! As an erosive arthritis, the hallmark of gout is the sharply marginated, juxtaarticular erosion which tends to have a sclerotic border. The overhanging edges of gouty ero-sions have been called rat bites.
! Joint space narrowing may be a late finding in the disease, and there is characteristically little or no periar-ticular osteoporosis (Fig. 23-16).
! Tophi, collections of urate crystals in the soft tissues, are a late finding in gout and rarely calcify.
! Olecranon bursitis is common (Fig. 23-17).
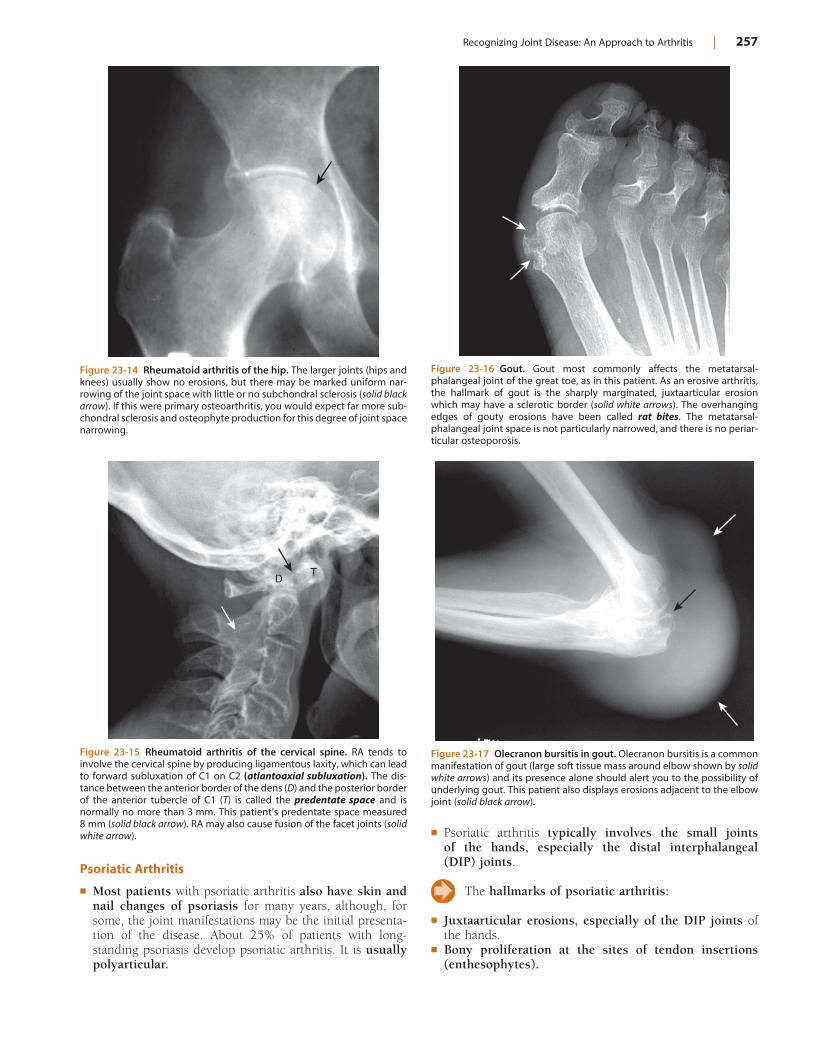
Recognizing Joint Disease: An Approach to Arthritis | 257
! Psoriatic arthritis typically involves the small joints of the hands, especially the distal interphalangeal (DIP) joints.
The hallmarks of psoriatic arthritis:
! Juxtaarticular erosions, especially of the DIP joints of the hands.
! Bony proliferation at the sites of tendon insertions (enthesophytes).
Psoriatic Arthritis
! Most patients with psoriatic arthritis also have skin and nail changes of psoriasis for many years, although, for some, the joint manifestations may be the initial presenta-tion of the disease. About 25% of patients with long-standing psoriasis develop psoriatic arthritis. It is usually polyarticular.
Figure 23-14 Rheumatoid arthritis of the hip. The larger joints (hips and knees) usually show no erosions, but there may be marked uniform nar-rowing of the joint space with little or no subchondral sclerosis (solid black arrow). If this were primary osteoarthritis, you would expect far more sub-chondral sclerosis and osteophyte production for this degree of joint space narrowing.
Figure 23-15 Rheumatoid arthritis of the cervical spine. RA tends to involve the cervical spine by producing ligamentous laxity, which can lead to forward subluxation of C1 on C2 (atlantoaxial subluxation). The dis-tance between the anterior border of the dens (D) and the posterior border of the anterior tubercle of C1 (T) is called the predentate space and is normally no more than 3 mm. This patient’s predentate space measured 8 mm (solid black arrow). RA may also cause fusion of the facet joints (solid white arrow).
DT
Figure 23-16 Gout. Gout most commonly affects the metatarsal-phalangeal joint of the great toe, as in this patient. As an erosive arthritis, the hallmark of gout is the sharply marginated, juxtaarticular erosion which may have a sclerotic border (solid white arrows). The overhanging edges of gouty erosions have been called rat bites. The metatarsal-phalangeal joint space is not particularly narrowed, and there is no periar-ticular osteoporosis.
Figure 23-17 Olecranon bursitis in gout. Olecranon bursitis is a common manifestation of gout (large soft tissue mass around elbow shown by solid white arrows) and its presence alone should alert you to the possibility of underlying gout. This patient also displays erosions adjacent to the elbow joint (solid black arrow).
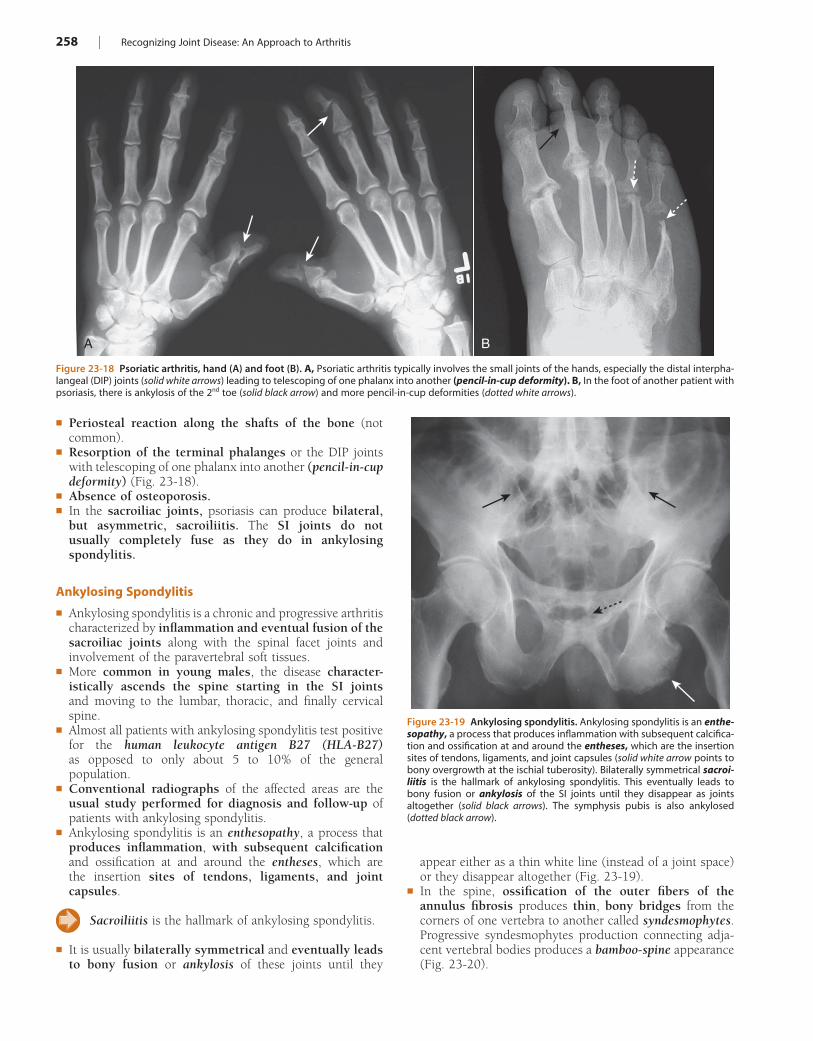
258 | Recognizing Joint Disease: An Approach to Arthritis
appear either as a thin white line (instead of a joint space) or they disappear altogether (Fig. 23-19).
! In the spine, ossification of the outer fibers of the annulus fibrosis produces thin, bony bridges from the corners of one vertebra to another called syndesmophytes. Progressive syndesmophytes production connecting adja-cent vertebral bodies produces a bamboo-spine appearance (Fig. 23-20).
! Periosteal reaction along the shafts of the bone (not common).
! Resorption of the terminal phalanges or the DIP joints with telescoping of one phalanx into another (pencil-in-cup deformity) (Fig. 23-18).
! Absence of osteoporosis.! In the sacroiliac joints, psoriasis can produce bilateral,
but asymmetric, sacroiliitis. The SI joints do not usually completely fuse as they do in ankylosing spondylitis.
Ankylosing Spondylitis
! Ankylosing spondylitis is a chronic and progressive arthritis characterized by inflammation and eventual fusion of the sacroiliac joints along with the spinal facet joints and involvement of the paravertebral soft tissues.
! More common in young males, the disease character-istically ascends the spine starting in the SI joints and moving to the lumbar, thoracic, and finally cervical spine.
! Almost all patients with ankylosing spondylitis test positive for the human leukocyte antigen B27 (HLA-B27) as opposed to only about 5 to 10% of the general population.
! Conventional radiographs of the affected areas are the usual study performed for diagnosis and follow-up of patients with ankylosing spondylitis.
! Ankylosing spondylitis is an enthesopathy, a process that produces inflammation, with subsequent calcification and ossification at and around the entheses, which are the insertion sites of tendons, ligaments, and joint capsules.
Sacroiliitis is the hallmark of ankylosing spondylitis.
! It is usually bilaterally symmetrical and eventually leads to bony fusion or ankylosis of these joints until they
Figure 23-18 Psoriatic arthritis, hand (A) and foot (B). A, Psoriatic arthritis typically involves the small joints of the hands, especially the distal interpha-langeal (DIP) joints (solid white arrows) leading to telescoping of one phalanx into another (pencil-in-cup deformity). B, In the foot of another patient with psoriasis, there is ankylosis of the 2nd toe (solid black arrow) and more pencil-in-cup deformities (dotted white arrows).
A B
Figure 23-19 Ankylosing spondylitis. Ankylosing spondylitis is an enthe-sopathy, a process that produces inflammation with subsequent calcifica-tion and ossification at and around the entheses, which are the insertion sites of tendons, ligaments, and joint capsules (solid white arrow points to bony overgrowth at the ischial tuberosity). Bilaterally symmetrical sacroi-liitis is the hallmark of ankylosing spondylitis. This eventually leads to bony fusion or ankylosis of the SI joints until they disappear as joints altogether (solid black arrows). The symphysis pubis is also ankylosed (dotted black arrow).
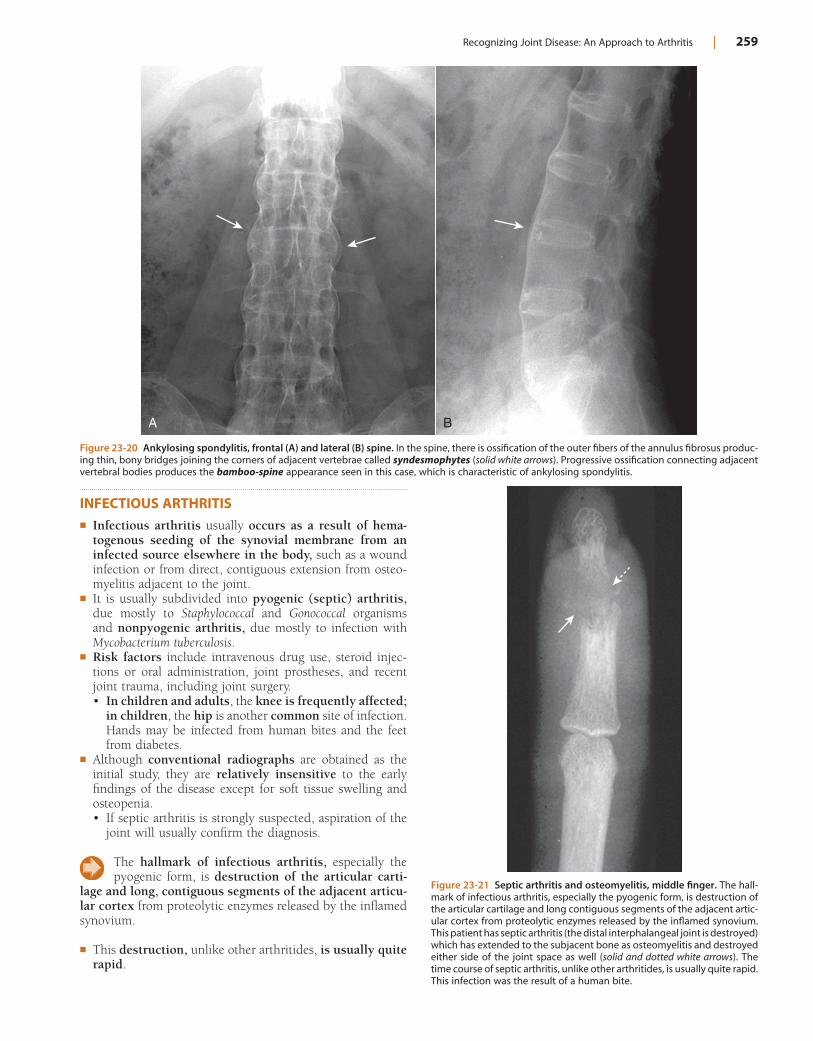
Recognizing Joint Disease: An Approach to Arthritis | 259
INFECTIOUS ARTHRITIS! Infectious arthritis usually occurs as a result of hema-
togenous seeding of the synovial membrane from an infected source elsewhere in the body, such as a wound infection or from direct, contiguous extension from osteo-myelitis adjacent to the joint.
! It is usually subdivided into pyogenic (septic) arthritis, due mostly to Staphylococcal and Gonococcal organisms and nonpyogenic arthritis, due mostly to infection with Mycobacterium tuberculosis.
! Risk factors include intravenous drug use, steroid injec-tions or oral administration, joint prostheses, and recent joint trauma, including joint surgery.• In children and adults, the knee is frequently affected;
in children, the hip is another common site of infection. Hands may be infected from human bites and the feet from diabetes.
! Although conventional radiographs are obtained as the initial study, they are relatively insensitive to the early findings of the disease except for soft tissue swelling and osteopenia.• If septic arthritis is strongly suspected, aspiration of the
joint will usually confirm the diagnosis.
The hallmark of infectious arthritis, especially the pyogenic form, is destruction of the articular carti-
lage and long, contiguous segments of the adjacent articu-lar cortex from proteolytic enzymes released by the inflamed synovium.
! This destruction, unlike other arthritides, is usually quite rapid.
Figure 23-20 Ankylosing spondylitis, frontal (A) and lateral (B) spine. In the spine, there is ossification of the outer fibers of the annulus fibrosus produc-ing thin, bony bridges joining the corners of adjacent vertebrae called syndesmophytes (solid white arrows). Progressive ossification connecting adjacent vertebral bodies produces the bamboo-spine appearance seen in this case, which is characteristic of ankylosing spondylitis.
A B
Figure 23-21 Septic arthritis and osteomyelitis, middle finger. The hall-mark of infectious arthritis, especially the pyogenic form, is destruction of the articular cartilage and long contiguous segments of the adjacent artic-ular cortex from proteolytic enzymes released by the inflamed synovium. This patient has septic arthritis (the distal interphalangeal joint is destroyed) which has extended to the subjacent bone as osteomyelitis and destroyed either side of the joint space as well (solid and dotted white arrows). The time course of septic arthritis, unlike other arthritides, is usually quite rapid. This infection was the result of a human bite.
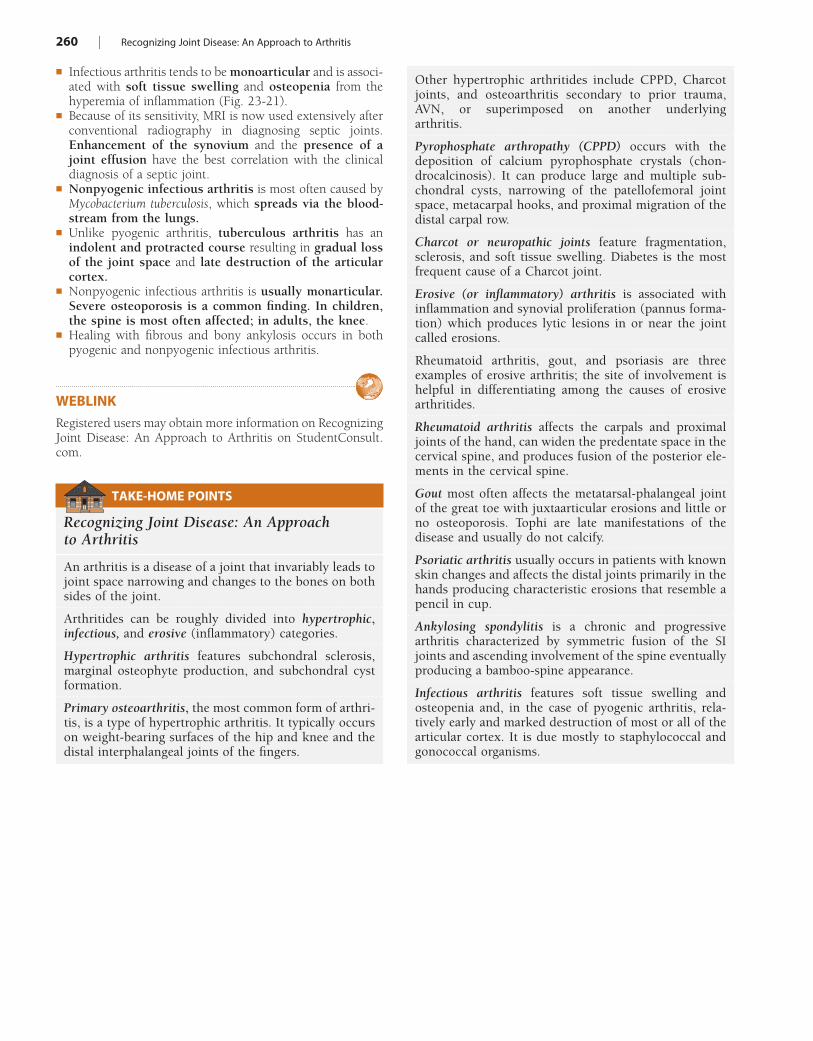
260 | Recognizing Joint Disease: An Approach to Arthritis
! Infectious arthritis tends to be monoarticular and is associ-ated with soft tissue swelling and osteopenia from the hyperemia of inflammation (Fig. 23-21).
! Because of its sensitivity, MRI is now used extensively after conventional radiography in diagnosing septic joints. Enhancement of the synovium and the presence of a joint effusion have the best correlation with the clinical diagnosis of a septic joint.
! Nonpyogenic infectious arthritis is most often caused by Mycobacterium tuberculosis, which spreads via the blood-stream from the lungs.
! Unlike pyogenic arthritis, tuberculous arthritis has an indolent and protracted course resulting in gradual loss of the joint space and late destruction of the articular cortex.
! Nonpyogenic infectious arthritis is usually monarticular. Severe osteoporosis is a common finding. In children, the spine is most often affected; in adults, the knee.
! Healing with fibrous and bony ankylosis occurs in both pyogenic and nonpyogenic infectious arthritis.
WEBLINKRegistered users may obtain more information on Recognizing Joint Disease: An Approach to Arthritis on StudentConsult.com.
TAKE-HOME POINTS
Recognizing Joint Disease: An Approach to Arthritis
An arthritis is a disease of a joint that invariably leads to joint space narrowing and changes to the bones on both sides of the joint.
Arthritides can be roughly divided into hypertrophic, infectious, and erosive (inflammatory) categories.
Hypertrophic arthritis features subchondral sclerosis, marginal osteophyte production, and subchondral cyst formation.
Primary osteoarthritis, the most common form of arthri-tis, is a type of hypertrophic arthritis. It typically occurs on weight-bearing surfaces of the hip and knee and the distal interphalangeal joints of the fingers.
Other hypertrophic arthritides include CPPD, Charcot joints, and osteoarthritis secondary to prior trauma, AVN, or superimposed on another underlying arthritis.
Pyrophosphate arthropathy (CPPD) occurs with the deposition of calcium pyrophosphate crystals (chon-drocalcinosis). It can produce large and multiple sub-chondral cysts, narrowing of the patellofemoral joint space, metacarpal hooks, and proximal migration of the distal carpal row.
Charcot or neuropathic joints feature fragmentation, sclerosis, and soft tissue swelling. Diabetes is the most frequent cause of a Charcot joint.
Erosive (or inflammatory) arthritis is associated with inflammation and synovial proliferation (pannus forma-tion) which produces lytic lesions in or near the joint called erosions.
Rheumatoid arthritis, gout, and psoriasis are three examples of erosive arthritis; the site of involvement is helpful in differentiating among the causes of erosive arthritides.
Rheumatoid arthritis affects the carpals and proximal joints of the hand, can widen the predentate space in the cervical spine, and produces fusion of the posterior ele-ments in the cervical spine.
Gout most often affects the metatarsal-phalangeal joint of the great toe with juxtaarticular erosions and little or no osteoporosis. Tophi are late manifestations of the disease and usually do not calcify.
Psoriatic arthritis usually occurs in patients with known skin changes and affects the distal joints primarily in the hands producing characteristic erosions that resemble a pencil in cup.
Ankylosing spondylitis is a chronic and progressive arthritis characterized by symmetric fusion of the SI joints and ascending involvement of the spine eventually producing a bamboo-spine appearance.
Infectious arthritis features soft tissue swelling and osteopenia and, in the case of pyogenic arthritis, rela-tively early and marked destruction of most or all of the articular cortex. It is due mostly to staphylococcal and gonococcal organisms.
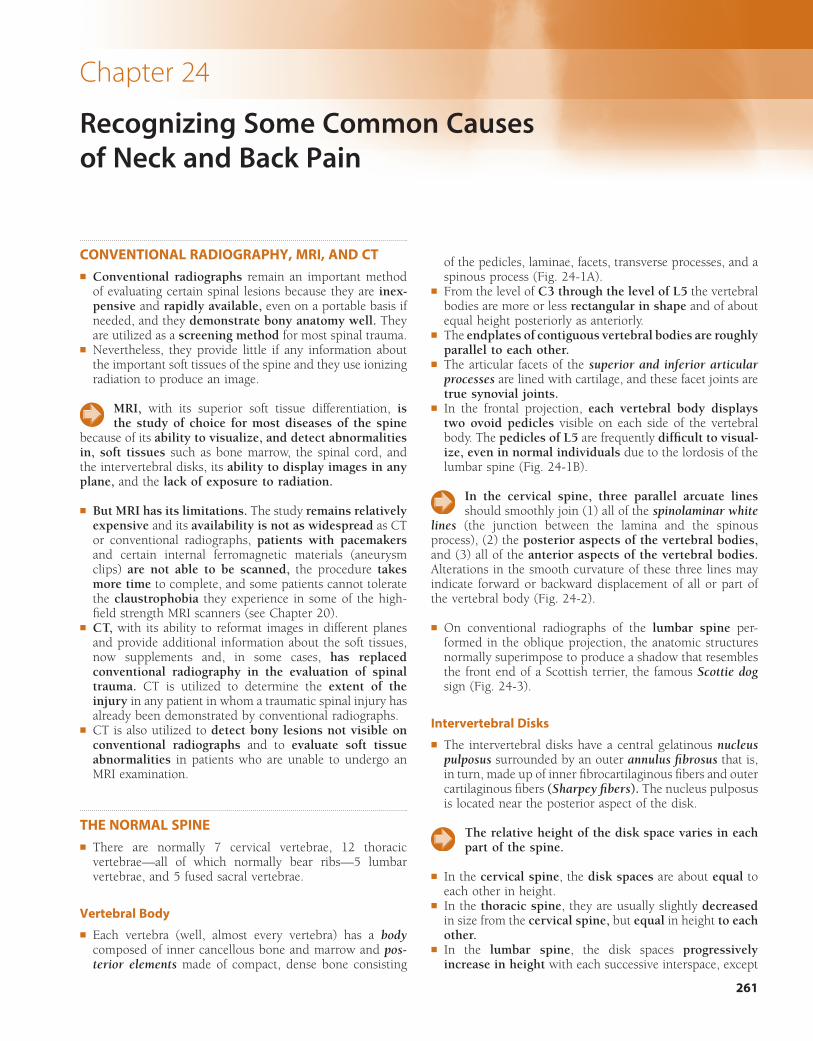
261
Chapter 24
Recognizing Some Common Causes of Neck and Back Pain
CONVENTIONAL RADIOGRAPHY, MRI, AND CT! Conventional radiographs remain an important method
of evaluating certain spinal lesions because they are inex-pensive and rapidly available, even on a portable basis if needed, and they demonstrate bony anatomy well. They are utilized as a screening method for most spinal trauma.
! Nevertheless, they provide little if any information about the important soft tissues of the spine and they use ionizing radiation to produce an image.
MRI, with its superior soft tissue differentiation, is the study of choice for most diseases of the spine
because of its ability to visualize, and detect abnormalities in, soft tissues such as bone marrow, the spinal cord, and the intervertebral disks, its ability to display images in any plane, and the lack of exposure to radiation.
! But MRI has its limitations. The study remains relatively expensive and its availability is not as widespread as CT or conventional radiographs, patients with pacemakers and certain internal ferromagnetic materials (aneurysm clips) are not able to be scanned, the procedure takes more time to complete, and some patients cannot tolerate the claustrophobia they experience in some of the high-field strength MRI scanners (see Chapter 20).
! CT, with its ability to reformat images in different planes and provide additional information about the soft tissues, now supplements and, in some cases, has replaced conventional radiography in the evaluation of spinal trauma. CT is utilized to determine the extent of the injury in any patient in whom a traumatic spinal injury has already been demonstrated by conventional radiographs.
! CT is also utilized to detect bony lesions not visible on conventional radiographs and to evaluate soft tissue abnormalities in patients who are unable to undergo an MRI examination.
THE NORMAL SPINE! There are normally 7 cervical vertebrae, 12 thoracic
vertebrae—all of which normally bear ribs—5 lumbar vertebrae, and 5 fused sacral vertebrae.
Vertebral Body
! Each vertebra (well, almost every vertebra) has a body composed of inner cancellous bone and marrow and pos-terior elements made of compact, dense bone consisting
of the pedicles, laminae, facets, transverse processes, and a spinous process (Fig. 24-1A).
! From the level of C3 through the level of L5 the vertebral bodies are more or less rectangular in shape and of about equal height posteriorly as anteriorly.
! The endplates of contiguous vertebral bodies are roughly parallel to each other.
! The articular facets of the superior and inferior articular processes are lined with cartilage, and these facet joints are true synovial joints.
! In the frontal projection, each vertebral body displays two ovoid pedicles visible on each side of the vertebral body. The pedicles of L5 are frequently difficult to visual-ize, even in normal individuals due to the lordosis of the lumbar spine (Fig. 24-1B).
In the cervical spine, three parallel arcuate lines should smoothly join (1) all of the spinolaminar white
lines (the junction between the lamina and the spinous process), (2) the posterior aspects of the vertebral bodies, and (3) all of the anterior aspects of the vertebral bodies. Alterations in the smooth curvature of these three lines may indicate forward or backward displacement of all or part of the vertebral body (Fig. 24-2).
! On conventional radiographs of the lumbar spine per-formed in the oblique projection, the anatomic structures normally superimpose to produce a shadow that resembles the front end of a Scottish terrier, the famous Scottie dog sign (Fig. 24-3).
Intervertebral Disks
! The intervertebral disks have a central gelatinous nucleus pulposus surrounded by an outer annulus fibrosus that is, in turn, made up of inner fibrocartilaginous fibers and outer cartilaginous fibers (Sharpey fibers). The nucleus pulposus is located near the posterior aspect of the disk.
The relative height of the disk space varies in each part of the spine.
! In the cervical spine, the disk spaces are about equal to each other in height.
! In the thoracic spine, they are usually slightly decreased in size from the cervical spine, but equal in height to each other.
! In the lumbar spine, the disk spaces progressively increase in height with each successive interspace, except
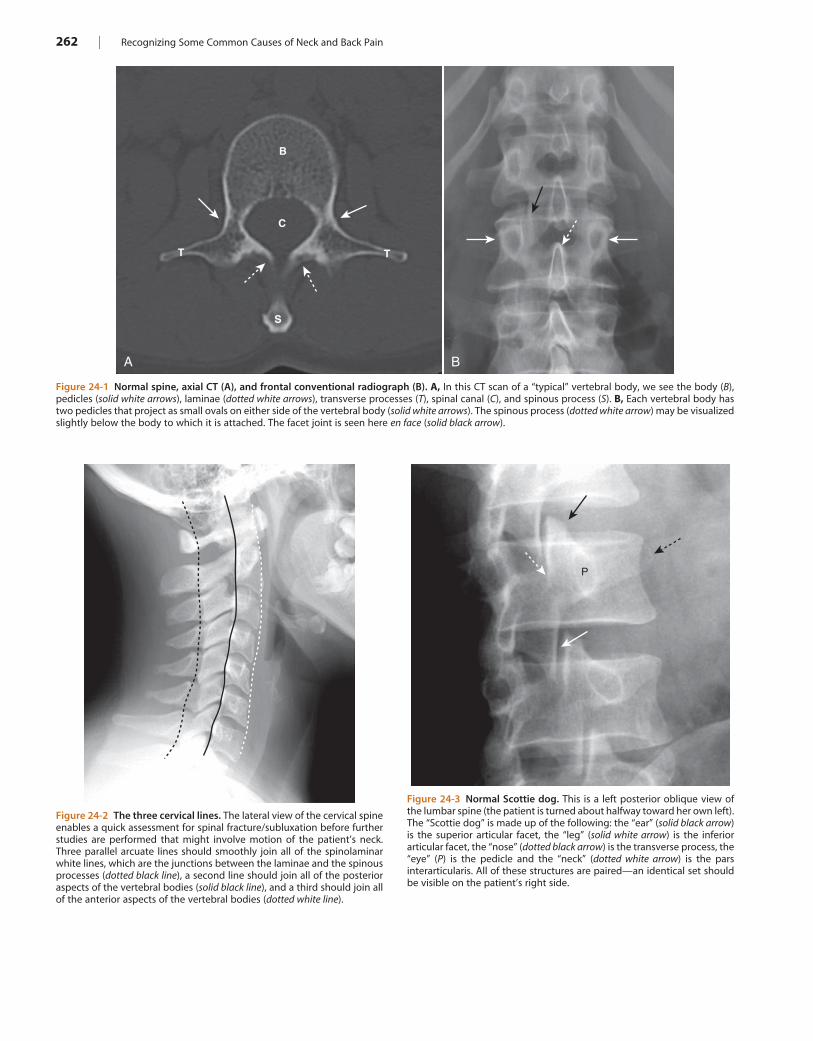
262 | Recognizing Some Common Causes of Neck and Back Pain
Figure 24-1 Normal spine, axial CT (A), and frontal conventional radiograph (B). A, In this CT scan of a “typical” vertebral body, we see the body (B), pedicles (solid white arrows), laminae (dotted white arrows), transverse processes (T), spinal canal (C), and spinous process (S). B, Each vertebral body has two pedicles that project as small ovals on either side of the vertebral body (solid white arrows). The spinous process (dotted white arrow) may be visualized slightly below the body to which it is attached. The facet joint is seen here en face (solid black arrow).
A
C
B
T T
S
B
Figure 24-2 The three cervical lines. The lateral view of the cervical spine enables a quick assessment for spinal fracture/subluxation before further studies are performed that might involve motion of the patient’s neck. Three parallel arcuate lines should smoothly join all of the spinolaminar white lines, which are the junctions between the laminae and the spinous processes (dotted black line), a second line should join all of the posterior aspects of the vertebral bodies (solid black line), and a third should join all of the anterior aspects of the vertebral bodies (dotted white line).
Figure 24-3 Normal Scottie dog. This is a left posterior oblique view of the lumbar spine (the patient is turned about halfway toward her own left). The “Scottie dog” is made up of the following: the “ear” (solid black arrow) is the superior articular facet, the “leg” (solid white arrow) is the inferior articular facet, the “nose” (dotted black arrow) is the transverse process, the “eye” (P) is the pedicle and the “neck” (dotted white arrow) is the pars interarticularis. All of these structures are paired—an identical set should be visible on the patient’s right side.
P
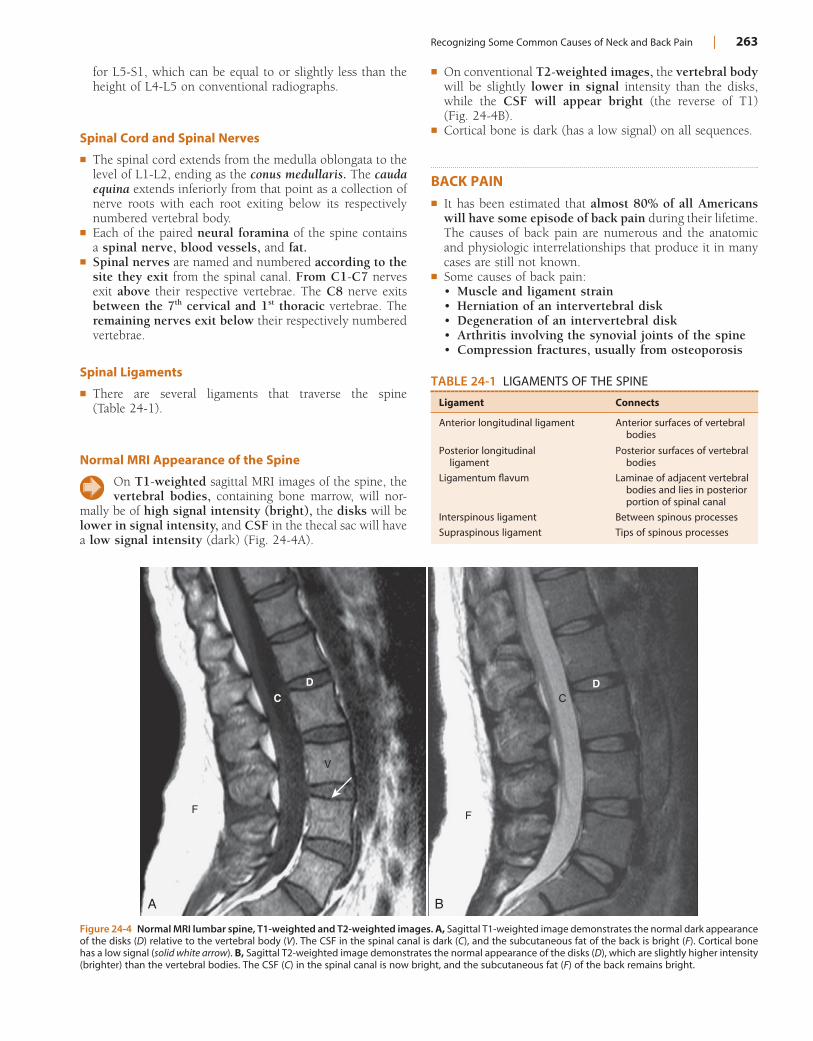
Recognizing Some Common Causes of Neck and Back Pain | 263
TABLE 24-1 LIGAMENTS OF THE SPINE
Ligament Connects
Anterior longitudinal ligament Anterior surfaces of vertebral bodies
Posterior longitudinal ligament
Posterior surfaces of vertebral bodies
Ligamentum flavum Laminae of adjacent vertebral bodies and lies in posterior portion of spinal canal
Interspinous ligament Between spinous processes
Supraspinous ligament Tips of spinous processes
Figure 24-4 Normal MRI lumbar spine, T1-weighted and T2-weighted images. A, Sagittal T1-weighted image demonstrates the normal dark appearance of the disks (D) relative to the vertebral body (V). The CSF in the spinal canal is dark (C), and the subcutaneous fat of the back is bright (F). Cortical bone has a low signal (solid white arrow). B, Sagittal T2-weighted image demonstrates the normal appearance of the disks (D), which are slightly higher intensity (brighter) than the vertebral bodies. The CSF (C) in the spinal canal is now bright, and the subcutaneous fat (F) of the back remains bright.
A B
V
F F
CD D
C
for L5-S1, which can be equal to or slightly less than the height of L4-L5 on conventional radiographs.
Spinal Cord and Spinal Nerves
! The spinal cord extends from the medulla oblongata to the level of L1-L2, ending as the conus medullaris. The cauda equina extends inferiorly from that point as a collection of nerve roots with each root exiting below its respectively numbered vertebral body.
! Each of the paired neural foramina of the spine contains a spinal nerve, blood vessels, and fat.
! Spinal nerves are named and numbered according to the site they exit from the spinal canal. From C1-C7 nerves exit above their respective vertebrae. The C8 nerve exits between the 7th cervical and 1st thoracic vertebrae. The remaining nerves exit below their respectively numbered vertebrae.
Spinal Ligaments
! There are several ligaments that traverse the spine (Table 24-1).
Normal MRI Appearance of the Spine
On T1-weighted sagittal MRI images of the spine, the vertebral bodies, containing bone marrow, will nor-
mally be of high signal intensity (bright), the disks will be lower in signal intensity, and CSF in the thecal sac will have a low signal intensity (dark) (Fig. 24-4A).
! On conventional T2-weighted images, the vertebral body will be slightly lower in signal intensity than the disks, while the CSF will appear bright (the reverse of T1) (Fig. 24-4B).
! Cortical bone is dark (has a low signal) on all sequences.
BACK PAIN! It has been estimated that almost 80% of all Americans
will have some episode of back pain during their lifetime. The causes of back pain are numerous and the anatomic and physiologic interrelationships that produce it in many cases are still not known.
! Some causes of back pain:• Muscle and ligament strain• Herniation of an intervertebral disk• Degeneration of an intervertebral disk• Arthritis involving the synovial joints of the spine• Compression fractures, usually from osteoporosis
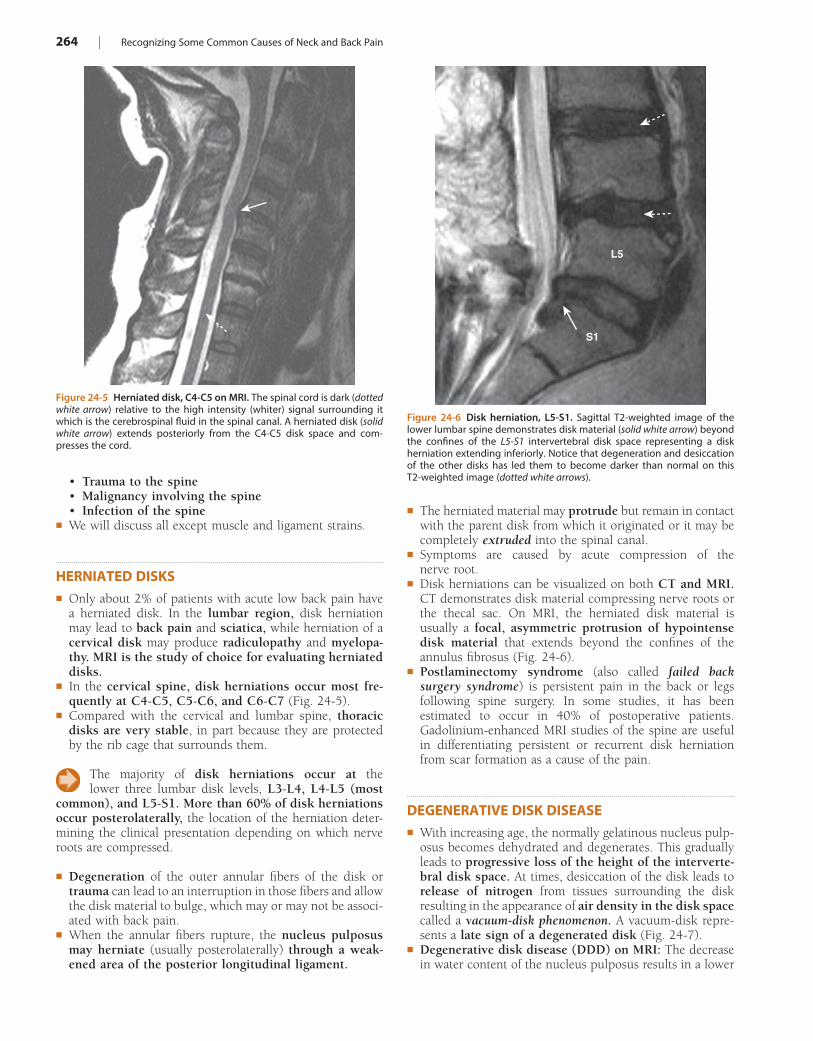
264 | Recognizing Some Common Causes of Neck and Back Pain
• Trauma to the spine• Malignancy involving the spine• Infection of the spine
! We will discuss all except muscle and ligament strains.
HERNIATED DISKS! Only about 2% of patients with acute low back pain have
a herniated disk. In the lumbar region, disk herniation may lead to back pain and sciatica, while herniation of a cervical disk may produce radiculopathy and myelopa-thy. MRI is the study of choice for evaluating herniated disks.
! In the cervical spine, disk herniations occur most fre-quently at C4-C5, C5-C6, and C6-C7 (Fig. 24-5).
! Compared with the cervical and lumbar spine, thoracic disks are very stable, in part because they are protected by the rib cage that surrounds them.
The majority of disk herniations occur at the lower three lumbar disk levels, L3-L4, L4-L5 (most
common), and L5-S1. More than 60% of disk herniations occur posterolaterally, the location of the herniation deter-mining the clinical presentation depending on which nerve roots are compressed.
! Degeneration of the outer annular fibers of the disk or trauma can lead to an interruption in those fibers and allow the disk material to bulge, which may or may not be associ-ated with back pain.
! When the annular fibers rupture, the nucleus pulposus may herniate (usually posterolaterally) through a weak-ened area of the posterior longitudinal ligament.
Figure 24-5 Herniated disk, C4-C5 on MRI. The spinal cord is dark (dotted white arrow) relative to the high intensity (whiter) signal surrounding it which is the cerebrospinal fluid in the spinal canal. A herniated disk (solid white arrow) extends posteriorly from the C4-C5 disk space and com-presses the cord.
Figure 24-6 Disk herniation, L5-S1. Sagittal T2-weighted image of the lower lumbar spine demonstrates disk material (solid white arrow) beyond the confines of the L5-S1 intervertebral disk space representing a disk herniation extending inferiorly. Notice that degeneration and desiccation of the other disks has led them to become darker than normal on this T2-weighted image (dotted white arrows).
L5
S1
! The herniated material may protrude but remain in contact with the parent disk from which it originated or it may be completely extruded into the spinal canal.
! Symptoms are caused by acute compression of the nerve root.
! Disk herniations can be visualized on both CT and MRI. CT demonstrates disk material compressing nerve roots or the thecal sac. On MRI, the herniated disk material is usually a focal, asymmetric protrusion of hypointense disk material that extends beyond the confines of the annulus fibrosus (Fig. 24-6).
! Postlaminectomy syndrome (also called failed back surgery syndrome) is persistent pain in the back or legs following spine surgery. In some studies, it has been estimated to occur in 40% of postoperative patients. Gadolinium-enhanced MRI studies of the spine are useful in differentiating persistent or recurrent disk herniation from scar formation as a cause of the pain.
DEGENERATIVE DISK DISEASE! With increasing age, the normally gelatinous nucleus pulp-
osus becomes dehydrated and degenerates. This gradually leads to progressive loss of the height of the interverte-bral disk space. At times, desiccation of the disk leads to release of nitrogen from tissues surrounding the disk resulting in the appearance of air density in the disk space called a vacuum-disk phenomenon. A vacuum-disk repre-sents a late sign of a degenerated disk (Fig. 24-7).
! Degenerative disk disease (DDD) on MRI: The decrease in water content of the nucleus pulposus results in a lower
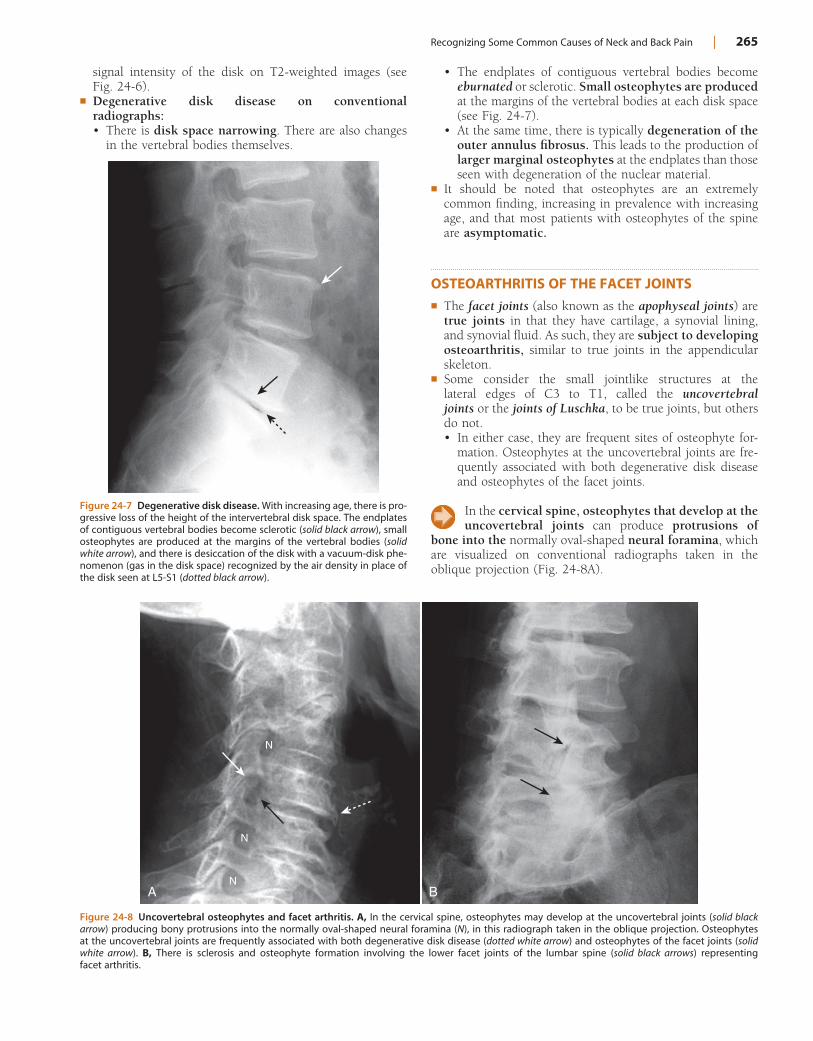
Recognizing Some Common Causes of Neck and Back Pain | 265
Figure 24-7 Degenerative disk disease. With increasing age, there is pro-gressive loss of the height of the intervertebral disk space. The endplates of contiguous vertebral bodies become sclerotic (solid black arrow), small osteophytes are produced at the margins of the vertebral bodies (solid white arrow), and there is desiccation of the disk with a vacuum-disk phe-nomenon (gas in the disk space) recognized by the air density in place of the disk seen at L5-S1 (dotted black arrow).
Figure 24-8 Uncovertebral osteophytes and facet arthritis. A, In the cervical spine, osteophytes may develop at the uncovertebral joints (solid black arrow) producing bony protrusions into the normally oval-shaped neural foramina (N), in this radiograph taken in the oblique projection. Osteophytes at the uncovertebral joints are frequently associated with both degenerative disk disease (dotted white arrow) and osteophytes of the facet joints (solid white arrow). B, There is sclerosis and osteophyte formation involving the lower facet joints of the lumbar spine (solid black arrows) representing facet arthritis.
A
N
N
NB
signal intensity of the disk on T2-weighted images (see Fig. 24-6).
! Degenerative disk disease on conventional radiographs:• There is disk space narrowing. There are also changes
in the vertebral bodies themselves.
• The endplates of contiguous vertebral bodies become eburnated or sclerotic. Small osteophytes are produced at the margins of the vertebral bodies at each disk space (see Fig. 24-7).
• At the same time, there is typically degeneration of the outer annulus fibrosus. This leads to the production of larger marginal osteophytes at the endplates than those seen with degeneration of the nuclear material.
! It should be noted that osteophytes are an extremely common finding, increasing in prevalence with increasing age, and that most patients with osteophytes of the spine are asymptomatic.
OSTEOARTHRITIS OF THE FACET JOINTS! The facet joints (also known as the apophyseal joints) are
true joints in that they have cartilage, a synovial lining, and synovial fluid. As such, they are subject to developing osteoarthritis, similar to true joints in the appendicular skeleton.
! Some consider the small jointlike structures at the lateral edges of C3 to T1, called the uncovertebral joints or the joints of Luschka, to be true joints, but others do not.• In either case, they are frequent sites of osteophyte for-
mation. Osteophytes at the uncovertebral joints are fre-quently associated with both degenerative disk disease and osteophytes of the facet joints.
In the cervical spine, osteophytes that develop at the uncovertebral joints can produce protrusions of
bone into the normally oval-shaped neural foramina, which are visualized on conventional radiographs taken in the oblique projection (Fig. 24-8A).
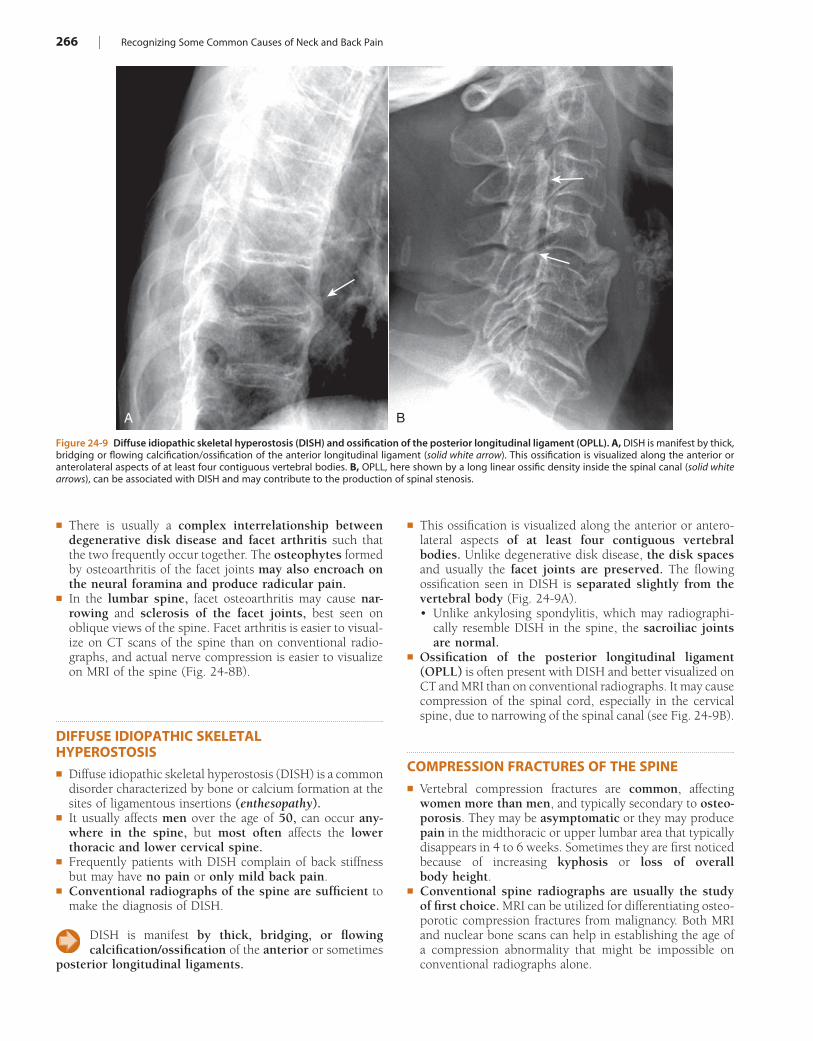
266 | Recognizing Some Common Causes of Neck and Back Pain
! This ossification is visualized along the anterior or antero-lateral aspects of at least four contiguous vertebral bodies. Unlike degenerative disk disease, the disk spaces and usually the facet joints are preserved. The flowing ossification seen in DISH is separated slightly from the vertebral body (Fig. 24-9A).• Unlike ankylosing spondylitis, which may radiographi-
cally resemble DISH in the spine, the sacroiliac joints are normal.
! Ossification of the posterior longitudinal ligament (OPLL) is often present with DISH and better visualized on CT and MRI than on conventional radiographs. It may cause compression of the spinal cord, especially in the cervical spine, due to narrowing of the spinal canal (see Fig. 24-9B).
COMPRESSION FRACTURES OF THE SPINE! Vertebral compression fractures are common, affecting
women more than men, and typically secondary to osteo-porosis. They may be asymptomatic or they may produce pain in the midthoracic or upper lumbar area that typically disappears in 4 to 6 weeks. Sometimes they are first noticed because of increasing kyphosis or loss of overall body height.
! Conventional spine radiographs are usually the study of first choice. MRI can be utilized for differentiating osteo-porotic compression fractures from malignancy. Both MRI and nuclear bone scans can help in establishing the age of a compression abnormality that might be impossible on conventional radiographs alone.
! There is usually a complex interrelationship between degenerative disk disease and facet arthritis such that the two frequently occur together. The osteophytes formed by osteoarthritis of the facet joints may also encroach on the neural foramina and produce radicular pain.
! In the lumbar spine, facet osteoarthritis may cause nar-rowing and sclerosis of the facet joints, best seen on oblique views of the spine. Facet arthritis is easier to visual-ize on CT scans of the spine than on conventional radio-graphs, and actual nerve compression is easier to visualize on MRI of the spine (Fig. 24-8B).
DIFFUSE IDIOPATHIC SKELETAL HYPEROSTOSIS! Diffuse idiopathic skeletal hyperostosis (DISH) is a common
disorder characterized by bone or calcium formation at the sites of ligamentous insertions (enthesopathy).
! It usually affects men over the age of 50, can occur any-where in the spine, but most often affects the lower thoracic and lower cervical spine.
! Frequently patients with DISH complain of back stiffness but may have no pain or only mild back pain.
! Conventional radiographs of the spine are sufficient to make the diagnosis of DISH.
DISH is manifest by thick, bridging, or flowing calcification/ossification of the anterior or sometimes
posterior longitudinal ligaments.
Figure 24-9 Diffuse idiopathic skeletal hyperostosis (DISH) and ossification of the posterior longitudinal ligament (OPLL). A, DISH is manifest by thick, bridging or flowing calcification/ossification of the anterior longitudinal ligament (solid white arrow). This ossification is visualized along the anterior or anterolateral aspects of at least four contiguous vertebral bodies. B, OPLL, here shown by a long linear ossific density inside the spinal canal (solid white arrows), can be associated with DISH and may contribute to the production of spinal stenosis.
A B
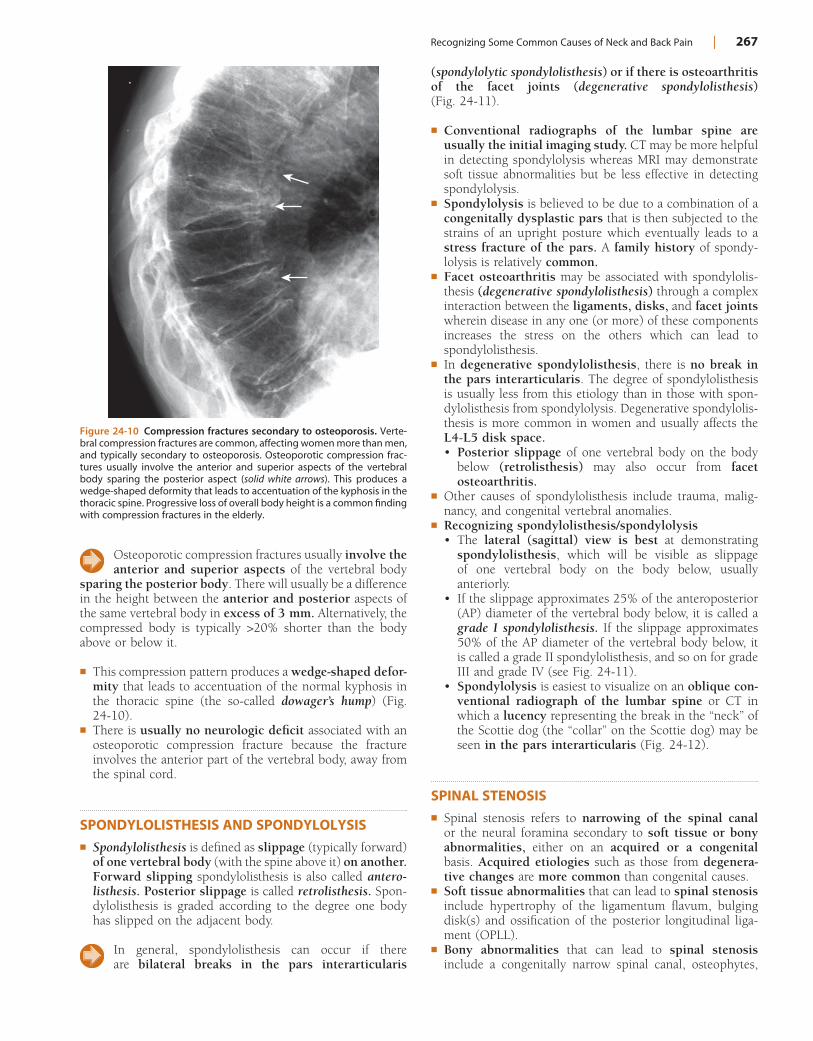
Recognizing Some Common Causes of Neck and Back Pain | 267
(spondylolytic spondylolisthesis) or if there is osteoarthritis of the facet joints (degenerative spondylolisthesis) (Fig. 24-11).
! Conventional radiographs of the lumbar spine are usually the initial imaging study. CT may be more helpful in detecting spondylolysis whereas MRI may demonstrate soft tissue abnormalities but be less effective in detecting spondylolysis.
! Spondylolysis is believed to be due to a combination of a congenitally dysplastic pars that is then subjected to the strains of an upright posture which eventually leads to a stress fracture of the pars. A family history of spondy-lolysis is relatively common.
! Facet osteoarthritis may be associated with spondylolis-thesis (degenerative spondylolisthesis) through a complex interaction between the ligaments, disks, and facet joints wherein disease in any one (or more) of these components increases the stress on the others which can lead to spondylolisthesis.
! In degenerative spondylolisthesis, there is no break in the pars interarticularis. The degree of spondylolisthesis is usually less from this etiology than in those with spon-dylolisthesis from spondylolysis. Degenerative spondylolis-thesis is more common in women and usually affects the L4-L5 disk space.• Posterior slippage of one vertebral body on the body
below (retrolisthesis) may also occur from facet osteoarthritis.
! Other causes of spondylolisthesis include trauma, malig-nancy, and congenital vertebral anomalies.
! Recognizing spondylolisthesis/spondylolysis• The lateral (sagittal) view is best at demonstrating
spondylolisthesis, which will be visible as slippage of one vertebral body on the body below, usually anteriorly.
• If the slippage approximates 25% of the anteroposterior (AP) diameter of the vertebral body below, it is called a grade I spondylolisthesis. If the slippage approximates 50% of the AP diameter of the vertebral body below, it is called a grade II spondylolisthesis, and so on for grade III and grade IV (see Fig. 24-11).
• Spondylolysis is easiest to visualize on an oblique con-ventional radiograph of the lumbar spine or CT in which a lucency representing the break in the “neck” of the Scottie dog (the “collar” on the Scottie dog) may be seen in the pars interarticularis (Fig. 24-12).
SPINAL STENOSIS! Spinal stenosis refers to narrowing of the spinal canal
or the neural foramina secondary to soft tissue or bony abnormalities, either on an acquired or a congenital basis. Acquired etiologies such as those from degenera-tive changes are more common than congenital causes.
! Soft tissue abnormalities that can lead to spinal stenosis include hypertrophy of the ligamentum flavum, bulging disk(s) and ossification of the posterior longitudinal liga-ment (OPLL).
! Bony abnormalities that can lead to spinal stenosis include a congenitally narrow spinal canal, osteophytes,
Figure 24-10 Compression fractures secondary to osteoporosis. Verte-bral compression fractures are common, affecting women more than men, and typically secondary to osteoporosis. Osteoporotic compression frac-tures usually involve the anterior and superior aspects of the vertebral body sparing the posterior aspect (solid white arrows). This produces a wedge-shaped deformity that leads to accentuation of the kyphosis in the thoracic spine. Progressive loss of overall body height is a common finding with compression fractures in the elderly.
Osteoporotic compression fractures usually involve the anterior and superior aspects of the vertebral body
sparing the posterior body. There will usually be a difference in the height between the anterior and posterior aspects of the same vertebral body in excess of 3 mm. Alternatively, the compressed body is typically >20% shorter than the body above or below it.
! This compression pattern produces a wedge-shaped defor-mity that leads to accentuation of the normal kyphosis in the thoracic spine (the so-called dowager’s hump) (Fig. 24-10).
! There is usually no neurologic deficit associated with an osteoporotic compression fracture because the fracture involves the anterior part of the vertebral body, away from the spinal cord.
SPONDYLOLISTHESIS AND SPONDYLOLYSIS! Spondylolisthesis is defined as slippage (typically forward)
of one vertebral body (with the spine above it) on another. Forward slipping spondylolisthesis is also called antero-listhesis. Posterior slippage is called retrolisthesis. Spon-dylolisthesis is graded according to the degree one body has slipped on the adjacent body.
In general, spondylolisthesis can occur if there are bilateral breaks in the pars interarticularis
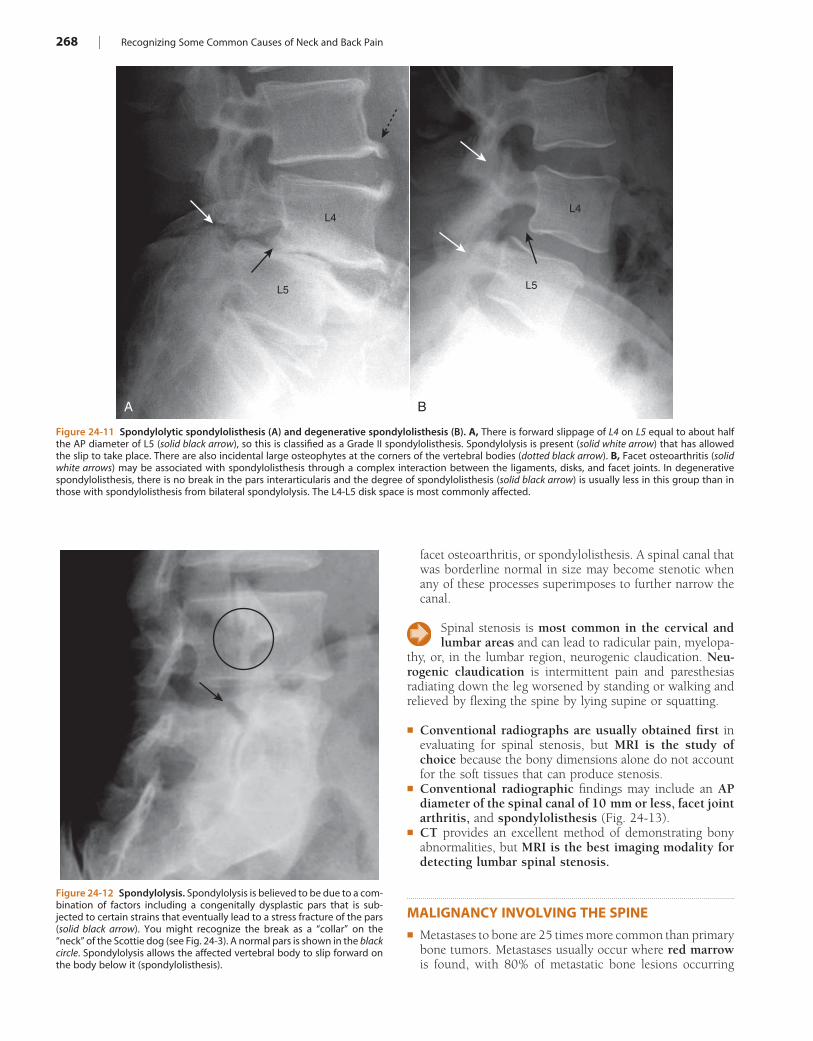
268 | Recognizing Some Common Causes of Neck and Back Pain
Figure 24-12 Spondylolysis. Spondylolysis is believed to be due to a com-bination of factors including a congenitally dysplastic pars that is sub-jected to certain strains that eventually lead to a stress fracture of the pars (solid black arrow). You might recognize the break as a “collar” on the “neck” of the Scottie dog (see Fig. 24-3). A normal pars is shown in the black circle. Spondylolysis allows the affected vertebral body to slip forward on the body below it (spondylolisthesis).
Figure 24-11 Spondylolytic spondylolisthesis (A) and degenerative spondylolisthesis (B). A, There is forward slippage of L4 on L5 equal to about half the AP diameter of L5 (solid black arrow), so this is classified as a Grade II spondylolisthesis. Spondylolysis is present (solid white arrow) that has allowed the slip to take place. There are also incidental large osteophytes at the corners of the vertebral bodies (dotted black arrow). B, Facet osteoarthritis (solid white arrows) may be associated with spondylolisthesis through a complex interaction between the ligaments, disks, and facet joints. In degenerative spondylolisthesis, there is no break in the pars interarticularis and the degree of spondylolisthesis (solid black arrow) is usually less in this group than in those with spondylolisthesis from bilateral spondylolysis. The L4-L5 disk space is most commonly affected.
A
L5 L5
L4L4
B
facet osteoarthritis, or spondylolisthesis. A spinal canal that was borderline normal in size may become stenotic when any of these processes superimposes to further narrow the canal.
Spinal stenosis is most common in the cervical and lumbar areas and can lead to radicular pain, myelopa-
thy, or, in the lumbar region, neurogenic claudication. Neu-rogenic claudication is intermittent pain and paresthesias radiating down the leg worsened by standing or walking and relieved by flexing the spine by lying supine or squatting.
! Conventional radiographs are usually obtained first in evaluating for spinal stenosis, but MRI is the study of choice because the bony dimensions alone do not account for the soft tissues that can produce stenosis.
! Conventional radiographic findings may include an AP diameter of the spinal canal of 10 mm or less, facet joint arthritis, and spondylolisthesis (Fig. 24-13).
! CT provides an excellent method of demonstrating bony abnormalities, but MRI is the best imaging modality for detecting lumbar spinal stenosis.
MALIGNANCY INVOLVING THE SPINE! Metastases to bone are 25 times more common than primary
bone tumors. Metastases usually occur where red marrow is found, with 80% of metastatic bone lesions occurring
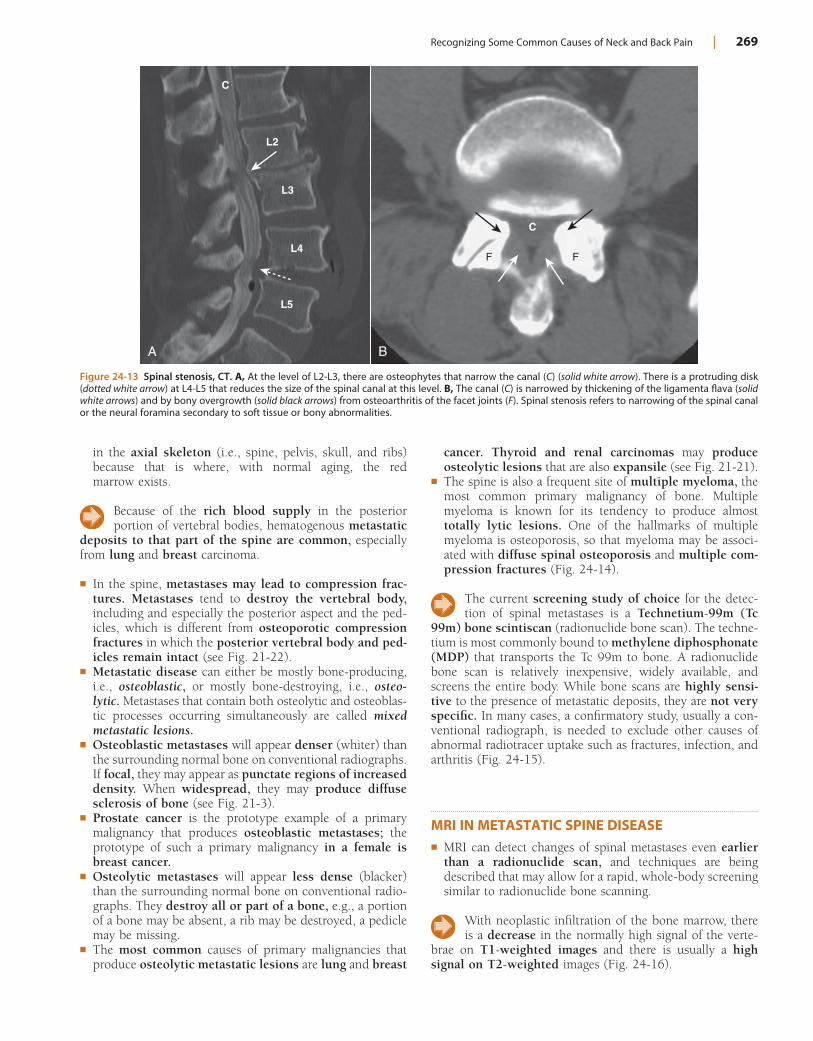
Recognizing Some Common Causes of Neck and Back Pain | 269
Figure 24-13 Spinal stenosis, CT. A, At the level of L2-L3, there are osteophytes that narrow the canal (C) (solid white arrow). There is a protruding disk (dotted white arrow) at L4-L5 that reduces the size of the spinal canal at this level. B, The canal (C) is narrowed by thickening of the ligamenta flava (solid white arrows) and by bony overgrowth (solid black arrows) from osteoarthritis of the facet joints (F). Spinal stenosis refers to narrowing of the spinal canal or the neural foramina secondary to soft tissue or bony abnormalities.
A
C
C
L2
L3
L4F F
L5
B
in the axial skeleton (i.e., spine, pelvis, skull, and ribs) because that is where, with normal aging, the red marrow exists.
Because of the rich blood supply in the posterior portion of vertebral bodies, hematogenous metastatic
deposits to that part of the spine are common, especially from lung and breast carcinoma.
! In the spine, metastases may lead to compression frac-tures. Metastases tend to destroy the vertebral body, including and especially the posterior aspect and the ped-icles, which is different from osteoporotic compression fractures in which the posterior vertebral body and ped-icles remain intact (see Fig. 21-22).
! Metastatic disease can either be mostly bone-producing, i.e., osteoblastic, or mostly bone-destroying, i.e., osteo-lytic. Metastases that contain both osteolytic and osteoblas-tic processes occurring simultaneously are called mixed metastatic lesions.
! Osteoblastic metastases will appear denser (whiter) than the surrounding normal bone on conventional radiographs. If focal, they may appear as punctate regions of increased density. When widespread, they may produce diffuse sclerosis of bone (see Fig. 21-3).
! Prostate cancer is the prototype example of a primary malignancy that produces osteoblastic metastases; the prototype of such a primary malignancy in a female is breast cancer.
! Osteolytic metastases will appear less dense (blacker) than the surrounding normal bone on conventional radio-graphs. They destroy all or part of a bone, e.g., a portion of a bone may be absent, a rib may be destroyed, a pedicle may be missing.
! The most common causes of primary malignancies that produce osteolytic metastatic lesions are lung and breast
cancer. Thyroid and renal carcinomas may produce osteolytic lesions that are also expansile (see Fig. 21-21).
! The spine is also a frequent site of multiple myeloma, the most common primary malignancy of bone. Multiple myeloma is known for its tendency to produce almost totally lytic lesions. One of the hallmarks of multiple myeloma is osteoporosis, so that myeloma may be associ-ated with diffuse spinal osteoporosis and multiple com-pression fractures (Fig. 24-14).
The current screening study of choice for the detec-tion of spinal metastases is a Technetium-99m (Tc
99m) bone scintiscan (radionuclide bone scan). The techne-tium is most commonly bound to methylene diphosphonate (MDP) that transports the Tc 99m to bone. A radionuclide bone scan is relatively inexpensive, widely available, and screens the entire body. While bone scans are highly sensi-tive to the presence of metastatic deposits, they are not very specific. In many cases, a confirmatory study, usually a con-ventional radiograph, is needed to exclude other causes of abnormal radiotracer uptake such as fractures, infection, and arthritis (Fig. 24-15).
MRI IN METASTATIC SPINE DISEASE! MRI can detect changes of spinal metastases even earlier
than a radionuclide scan, and techniques are being described that may allow for a rapid, whole-body screening similar to radionuclide bone scanning.
With neoplastic infiltration of the bone marrow, there is a decrease in the normally high signal of the verte-
brae on T1-weighted images and there is usually a high signal on T2-weighted images (Fig. 24-16).
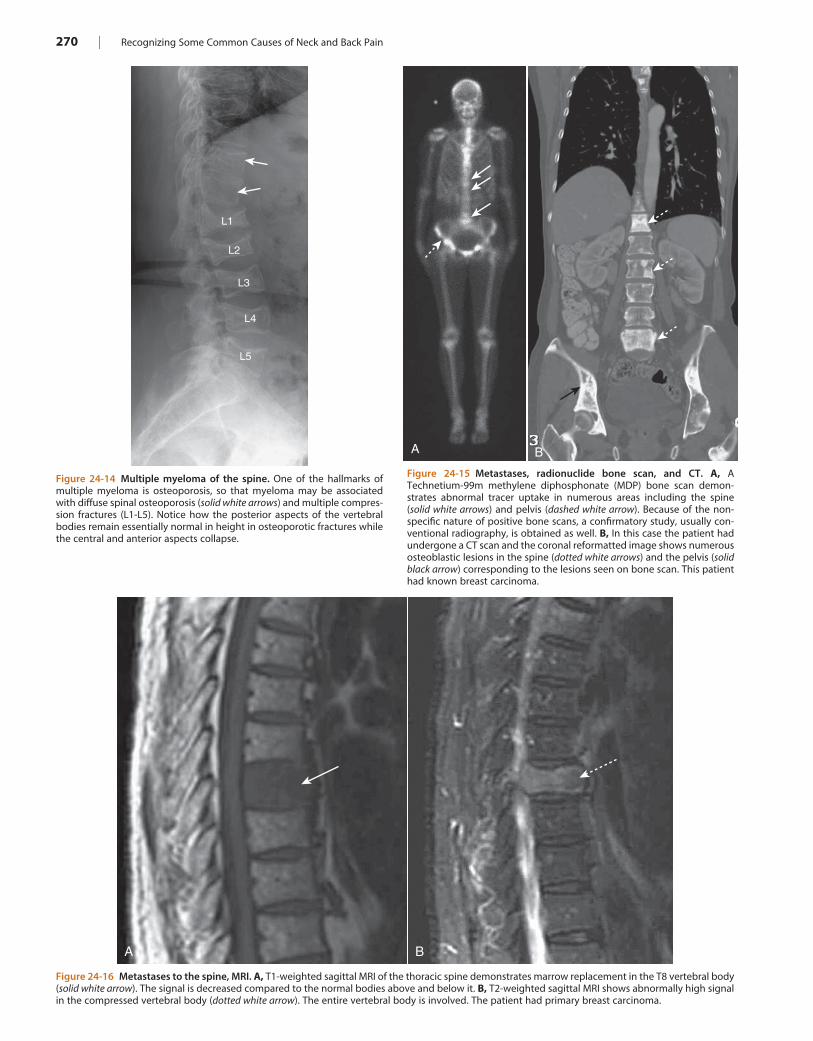
270 | Recognizing Some Common Causes of Neck and Back Pain
Figure 24-15 Metastases, radionuclide bone scan, and CT. A, A Technetium-99m methylene diphosphonate (MDP) bone scan demon-strates abnormal tracer uptake in numerous areas including the spine (solid white arrows) and pelvis (dashed white arrow). Because of the non-specific nature of positive bone scans, a confirmatory study, usually con-ventional radiography, is obtained as well. B, In this case the patient had undergone a CT scan and the coronal reformatted image shows numerous osteoblastic lesions in the spine (dotted white arrows) and the pelvis (solid black arrow) corresponding to the lesions seen on bone scan. This patient had known breast carcinoma.
A B
Figure 24-16 Metastases to the spine, MRI. A, T1-weighted sagittal MRI of the thoracic spine demonstrates marrow replacement in the T8 vertebral body (solid white arrow). The signal is decreased compared to the normal bodies above and below it. B, T2-weighted sagittal MRI shows abnormally high signal in the compressed vertebral body (dotted white arrow). The entire vertebral body is involved. The patient had primary breast carcinoma.
A B
Figure 24-14 Multiple myeloma of the spine. One of the hallmarks of multiple myeloma is osteoporosis, so that myeloma may be associated with diffuse spinal osteoporosis (solid white arrows) and multiple compres-sion fractures (L1-L5). Notice how the posterior aspects of the vertebral bodies remain essentially normal in height in osteoporotic fractures while the central and anterior aspects collapse.
L1
L2
L3
L4
L5
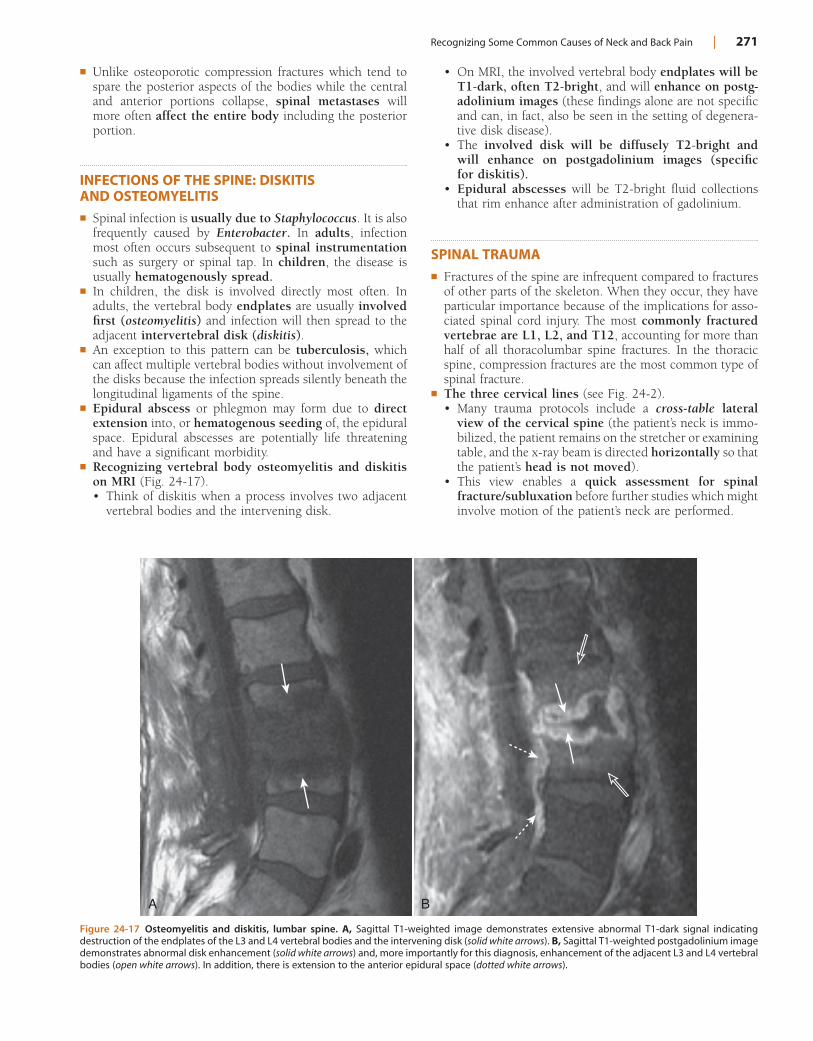
Recognizing Some Common Causes of Neck and Back Pain | 271
! Unlike osteoporotic compression fractures which tend to spare the posterior aspects of the bodies while the central and anterior portions collapse, spinal metastases will more often affect the entire body including the posterior portion.
INFECTIONS OF THE SPINE: DISKITIS AND OSTEOMYELITIS! Spinal infection is usually due to Staphylococcus. It is also
frequently caused by Enterobacter. In adults, infection most often occurs subsequent to spinal instrumentation such as surgery or spinal tap. In children, the disease is usually hematogenously spread.
! In children, the disk is involved directly most often. In adults, the vertebral body endplates are usually involved first (osteomyelitis) and infection will then spread to the adjacent intervertebral disk (diskitis).
! An exception to this pattern can be tuberculosis, which can affect multiple vertebral bodies without involvement of the disks because the infection spreads silently beneath the longitudinal ligaments of the spine.
! Epidural abscess or phlegmon may form due to direct extension into, or hematogenous seeding of, the epidural space. Epidural abscesses are potentially life threatening and have a significant morbidity.
! Recognizing vertebral body osteomyelitis and diskitis on MRI (Fig. 24-17).• Think of diskitis when a process involves two adjacent
vertebral bodies and the intervening disk.
Figure 24-17 Osteomyelitis and diskitis, lumbar spine. A, Sagittal T1-weighted image demonstrates extensive abnormal T1-dark signal indicating destruction of the endplates of the L3 and L4 vertebral bodies and the intervening disk (solid white arrows). B, Sagittal T1-weighted postgadolinium image demonstrates abnormal disk enhancement (solid white arrows) and, more importantly for this diagnosis, enhancement of the adjacent L3 and L4 vertebral bodies (open white arrows). In addition, there is extension to the anterior epidural space (dotted white arrows).
A B
• On MRI, the involved vertebral body endplates will be T1-dark, often T2-bright, and will enhance on postg-adolinium images (these findings alone are not specific and can, in fact, also be seen in the setting of degenera-tive disk disease).
• The involved disk will be diffusely T2-bright and will enhance on postgadolinium images (specific for diskitis).
• Epidural abscesses will be T2-bright fluid collections that rim enhance after administration of gadolinium.
SPINAL TRAUMA! Fractures of the spine are infrequent compared to fractures
of other parts of the skeleton. When they occur, they have particular importance because of the implications for asso-ciated spinal cord injury. The most commonly fractured vertebrae are L1, L2, and T12, accounting for more than half of all thoracolumbar spine fractures. In the thoracic spine, compression fractures are the most common type of spinal fracture.
! The three cervical lines (see Fig. 24-2).• Many trauma protocols include a cross-table lateral
view of the cervical spine (the patient’s neck is immo-bilized, the patient remains on the stretcher or examining table, and the x-ray beam is directed horizontally so that the patient’s head is not moved).
• This view enables a quick assessment for spinal fracture/subluxation before further studies which might involve motion of the patient’s neck are performed.
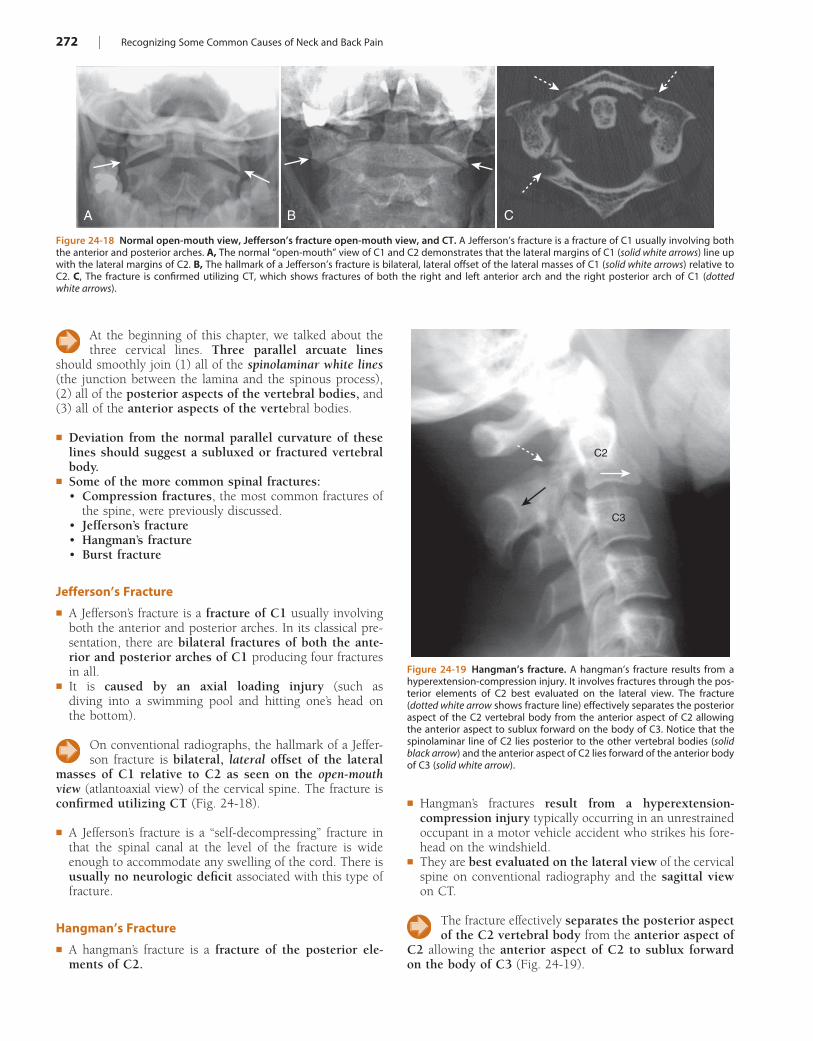
272 | Recognizing Some Common Causes of Neck and Back Pain
! Hangman’s fractures result from a hyperextension-compression injury typically occurring in an unrestrained occupant in a motor vehicle accident who strikes his fore-head on the windshield.
! They are best evaluated on the lateral view of the cervical spine on conventional radiography and the sagittal view on CT.
The fracture effectively separates the posterior aspect of the C2 vertebral body from the anterior aspect of
C2 allowing the anterior aspect of C2 to sublux forward on the body of C3 (Fig. 24-19).
At the beginning of this chapter, we talked about the three cervical lines. Three parallel arcuate lines
should smoothly join (1) all of the spinolaminar white lines (the junction between the lamina and the spinous process), (2) all of the posterior aspects of the vertebral bodies, and (3) all of the anterior aspects of the vertebral bodies.
! Deviation from the normal parallel curvature of these lines should suggest a subluxed or fractured vertebral body.
! Some of the more common spinal fractures:• Compression fractures, the most common fractures of
the spine, were previously discussed.• Jefferson’s fracture• Hangman’s fracture• Burst fracture
Jefferson’s Fracture
! A Jefferson’s fracture is a fracture of C1 usually involving both the anterior and posterior arches. In its classical pre-sentation, there are bilateral fractures of both the ante-rior and posterior arches of C1 producing four fractures in all.
! It is caused by an axial loading injury (such as diving into a swimming pool and hitting one’s head on the bottom).
On conventional radiographs, the hallmark of a Jeffer-son fracture is bilateral, lateral offset of the lateral
masses of C1 relative to C2 as seen on the open-mouth view (atlantoaxial view) of the cervical spine. The fracture is confirmed utilizing CT (Fig. 24-18).
! A Jefferson’s fracture is a “self-decompressing” fracture in that the spinal canal at the level of the fracture is wide enough to accommodate any swelling of the cord. There is usually no neurologic deficit associated with this type of fracture.
Hangman’s Fracture
! A hangman’s fracture is a fracture of the posterior ele-ments of C2.
Figure 24-18 Normal open-mouth view, Jefferson’s fracture open-mouth view, and CT. A Jefferson’s fracture is a fracture of C1 usually involving both the anterior and posterior arches. A, The normal “open-mouth” view of C1 and C2 demonstrates that the lateral margins of C1 (solid white arrows) line up with the lateral margins of C2. B, The hallmark of a Jefferson’s fracture is bilateral, lateral offset of the lateral masses of C1 (solid white arrows) relative to C2. C, The fracture is confirmed utilizing CT, which shows fractures of both the right and left anterior arch and the right posterior arch of C1 (dotted white arrows).
A B C
Figure 24-19 Hangman’s fracture. A hangman’s fracture results from a hyperextension-compression injury. It involves fractures through the pos-terior elements of C2 best evaluated on the lateral view. The fracture (dotted white arrow shows fracture line) effectively separates the posterior aspect of the C2 vertebral body from the anterior aspect of C2 allowing the anterior aspect to sublux forward on the body of C3. Notice that the spinolaminar line of C2 lies posterior to the other vertebral bodies (solid black arrow) and the anterior aspect of C2 lies forward of the anterior body of C3 (solid white arrow).
C2
C3
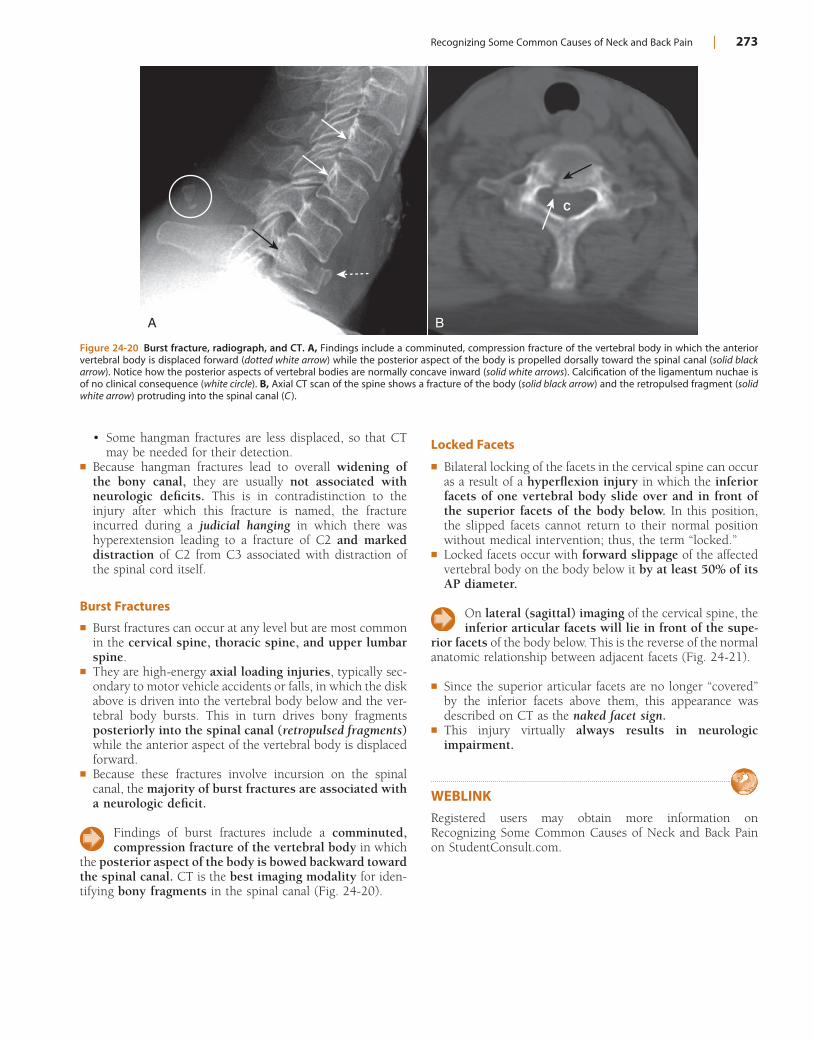
Recognizing Some Common Causes of Neck and Back Pain | 273
Locked Facets
! Bilateral locking of the facets in the cervical spine can occur as a result of a hyperflexion injury in which the inferior facets of one vertebral body slide over and in front of the superior facets of the body below. In this position, the slipped facets cannot return to their normal position without medical intervention; thus, the term “locked.”
! Locked facets occur with forward slippage of the affected vertebral body on the body below it by at least 50% of its AP diameter.
On lateral (sagittal) imaging of the cervical spine, the inferior articular facets will lie in front of the supe-
rior facets of the body below. This is the reverse of the normal anatomic relationship between adjacent facets (Fig. 24-21).
! Since the superior articular facets are no longer “covered” by the inferior facets above them, this appearance was described on CT as the naked facet sign.
! This injury virtually always results in neurologic impairment.
WEBLINKRegistered users may obtain more information on Recognizing Some Common Causes of Neck and Back Pain on StudentConsult.com.
• Some hangman fractures are less displaced, so that CT may be needed for their detection.
! Because hangman fractures lead to overall widening of the bony canal, they are usually not associated with neurologic deficits. This is in contradistinction to the injury after which this fracture is named, the fracture incurred during a judicial hanging in which there was hyperextension leading to a fracture of C2 and marked distraction of C2 from C3 associated with distraction of the spinal cord itself.
Burst Fractures
! Burst fractures can occur at any level but are most common in the cervical spine, thoracic spine, and upper lumbar spine.
! They are high-energy axial loading injuries, typically sec-ondary to motor vehicle accidents or falls, in which the disk above is driven into the vertebral body below and the ver-tebral body bursts. This in turn drives bony fragments posteriorly into the spinal canal (retropulsed fragments) while the anterior aspect of the vertebral body is displaced forward.
! Because these fractures involve incursion on the spinal canal, the majority of burst fractures are associated with a neurologic deficit.
Findings of burst fractures include a comminuted, compression fracture of the vertebral body in which
the posterior aspect of the body is bowed backward toward the spinal canal. CT is the best imaging modality for iden-tifying bony fragments in the spinal canal (Fig. 24-20).
Figure 24-20 Burst fracture, radiograph, and CT. A, Findings include a comminuted, compression fracture of the vertebral body in which the anterior vertebral body is displaced forward (dotted white arrow) while the posterior aspect of the body is propelled dorsally toward the spinal canal (solid black arrow). Notice how the posterior aspects of vertebral bodies are normally concave inward (solid white arrows). Calcification of the ligamentum nuchae is of no clinical consequence (white circle). B, Axial CT scan of the spine shows a fracture of the body (solid black arrow) and the retropulsed fragment (solid white arrow) protruding into the spinal canal (C ).
A
C
B
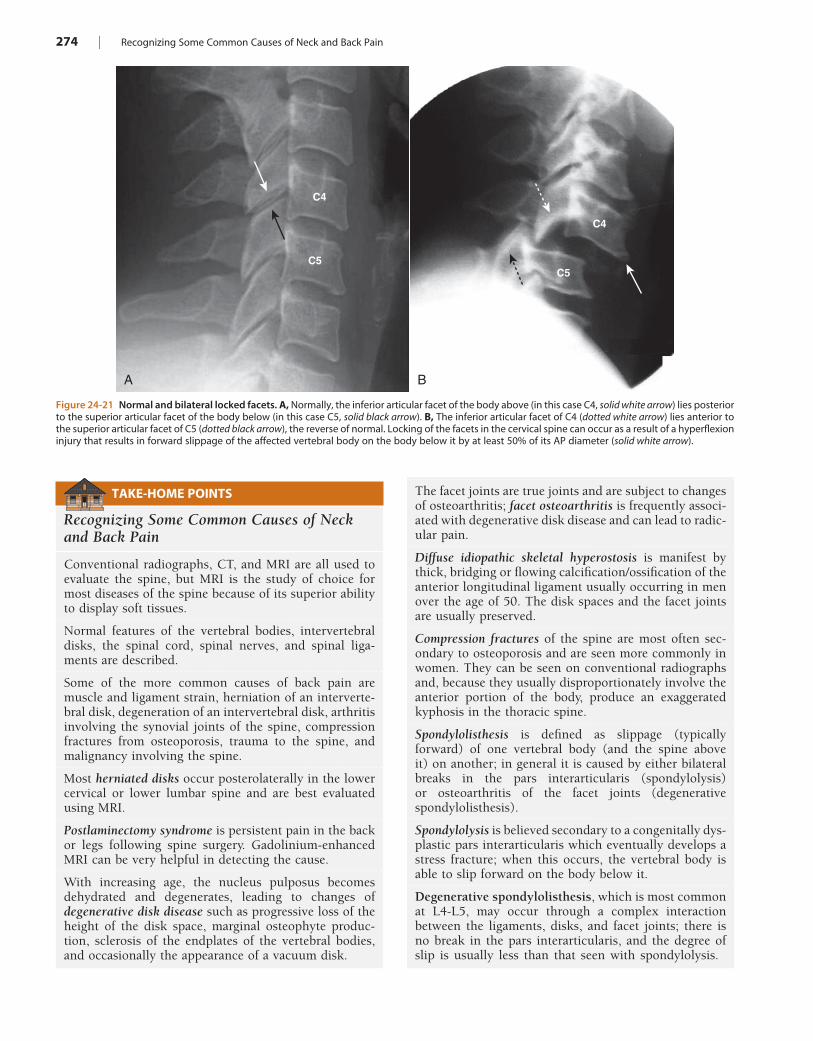
274 | Recognizing Some Common Causes of Neck and Back Pain
TAKE-HOME POINTS
Recognizing Some Common Causes of Neck and Back Pain
Conventional radiographs, CT, and MRI are all used to evaluate the spine, but MRI is the study of choice for most diseases of the spine because of its superior ability to display soft tissues.
Normal features of the vertebral bodies, intervertebral disks, the spinal cord, spinal nerves, and spinal liga-ments are described.
Some of the more common causes of back pain are muscle and ligament strain, herniation of an interverte-bral disk, degeneration of an intervertebral disk, arthritis involving the synovial joints of the spine, compression fractures from osteoporosis, trauma to the spine, and malignancy involving the spine.
Most herniated disks occur posterolaterally in the lower cervical or lower lumbar spine and are best evaluated using MRI.
Postlaminectomy syndrome is persistent pain in the back or legs following spine surgery. Gadolinium-enhanced MRI can be very helpful in detecting the cause.
With increasing age, the nucleus pulposus becomes dehydrated and degenerates, leading to changes of degenerative disk disease such as progressive loss of the height of the disk space, marginal osteophyte produc-tion, sclerosis of the endplates of the vertebral bodies, and occasionally the appearance of a vacuum disk.
The facet joints are true joints and are subject to changes of osteoarthritis; facet osteoarthritis is frequently associ-ated with degenerative disk disease and can lead to radic-ular pain.
Diffuse idiopathic skeletal hyperostosis is manifest by thick, bridging or flowing calcification/ossification of the anterior longitudinal ligament usually occurring in men over the age of 50. The disk spaces and the facet joints are usually preserved.
Compression fractures of the spine are most often sec-ondary to osteoporosis and are seen more commonly in women. They can be seen on conventional radiographs and, because they usually disproportionately involve the anterior portion of the body, produce an exaggerated kyphosis in the thoracic spine.
Spondylolisthesis is defined as slippage (typically forward) of one vertebral body (and the spine above it) on another; in general it is caused by either bilateral breaks in the pars interarticularis (spondylolysis) or osteoarthritis of the facet joints (degenerative spondylolisthesis).
Spondylolysis is believed secondary to a congenitally dys-plastic pars interarticularis which eventually develops a stress fracture; when this occurs, the vertebral body is able to slip forward on the body below it.
Degenerative spondylolisthesis, which is most common at L4-L5, may occur through a complex interaction between the ligaments, disks, and facet joints; there is no break in the pars interarticularis, and the degree of slip is usually less than that seen with spondylolysis.
Figure 24-21 Normal and bilateral locked facets. A, Normally, the inferior articular facet of the body above (in this case C4, solid white arrow) lies posterior to the superior articular facet of the body below (in this case C5, solid black arrow). B, The inferior articular facet of C4 (dotted white arrow) lies anterior to the superior articular facet of C5 (dotted black arrow), the reverse of normal. Locking of the facets in the cervical spine can occur as a result of a hyperflexion injury that results in forward slippage of the affected vertebral body on the body below it by at least 50% of its AP diameter (solid white arrow).
A
C4
C4
C5C5
B
Recognizing Some Common Causes of Neck and Back Pain | 275
Spinal stenosis is a narrowing of the spinal canal or the neural foramina secondary to soft tissue or bony abnor-malities, either on an acquired or, less commonly, con-genital basis; it occurs most frequently in the cervical and lumbar regions.
Metastatic lesions to the spine are common, especially to the blood-rich posterior aspect of the vertebral body including the pedicles; lung (mixed), breast (mixed), and prostate (osteoblastic) metastases are the most common.
Multiple myeloma also frequently involves the spine either with severe osteoporosis, which can produce compression fractures, or lytic destruction of the verte-bral body.
Infection of the spine usually starts in the vertebral body endplates in adults and then involves the adjacent disk. Think of diskitis when a process involves two adjacent vertebral bodies and the intervening disk.
Three parallel arcuate lines should smoothly connect important landmarks on the lateral cervical spine view and allow for a quick assessment for fracture or subluxation before the patient is moved for further studies.
The findings in a Jefferson fracture, hangman fracture, burst fracture, and locked facets are discussed; the first two are self-decompressing injuries that are usually not associated with neurologic deficit while the latter two are frequently associated with neurologic impairment.
276
Chapter 25
Recognizing Some Common Causes of Intracranial Pathology
! Advances in neuroimaging have had a remarkable impact on the diagnosis and treatment of neurologic diseases ranging from earlier detection and treatment of stroke to a more timely diagnosis of dementia, from the rapid detec-tion and treatment of cerebral aneurysms to the ability to diagnose multiple sclerosis after a single attack.
! Both CT and MRI are utilized for studying the brain and spinal cord, but MRI is the study of first choice for most clinical scenarios (Table 25-1). Conventional radio-graphy has no significant role in imaging intracranial abnormalities.
NORMAL ANATOMY! The normal anatomy of the brain is somewhat easier to
understand with CT than MRI (Fig. 25-1).! In the posterior fossa, the 4th ventricle appears as an
inverted U-shaped structure. Like all cerebrospinal fluid (CSF) containing structures, it normally appears black. Superior to the 4th ventricle are the cerebellar hemi-spheres, inferiorly lie the pons and medulla oblongata. The tentorium cerebelli separates the infratentorial com-ponents of the posterior fossa (medulla, pons, cerebellum, and 4th ventricle) from the supratentorial compartment.
! The interpeduncular cistern lies in the midbrain and separates the paired cerebral peduncles (which emerge from the superior surface of the pons). The suprasellar cistern is anterior to the interpeduncular cistern and usually has a five-point or six-point starlike appearance.
! The sylvian fissures are bilaterally symmetrical and contain CSF. They separate the temporal from the frontal and pari-etal lobes.
! The lentiform nucleus is composed of the putamen (later-ally) and globus pallidus (medially). The 3rd ventricle is slitlike and midline. At the posterior aspect of the 3rd ven-tricle is the pineal gland. Farther posterior is the quadri-geminal plate cistern.
! The corpus callosum connects the right and left cerebral hemispheres and forms the roof of the lateral ventricle. The anterior end is called the genu and the posterior end is called the splenium.
! The basal ganglia are represented by the subthalamic nucleus, substantia nigra, globus pallidus, putamen, and caudate nucleus. The putamen and caudate nucleus are called the striatum.
! The frontal horns of the lateral ventricles hug the head of the caudate nucleus. The two frontal horns are sepa-rated by the midline septum pellucidum. The temporal horns, which are normally very small, are more inferior
and contained in the temporal lobes. The posterior horns of the lateral ventricle (occipital horns) lie in the occipital lobes. The most superior portion of the ventricular system is formed by the bodies of the lateral ventricles.
! The falx cerebri lies in the interhemispheric fissure, which separates the two cerebral hemispheres, and is frequently calcified in adults.
! The surface or cortex of the brain is made up of gray matter convolutions, which in turn are composed of sulci (grooves) and gyri (elevations). The medullary white matter lies below the cortex.
On an unenhanced CT scan of the brain, anything that appears “white” will generally either be bone (calcium)
density or blood in the absence of a metallic foreign body (Table 25-2).
! Calcifications that may be seen on CT of the brain which are nonpathologic:• Pineal gland (Fig. 25-2A)• Basal ganglia (see Fig. 25-2A)• Choroid plexus (see Fig. 25-1F)• Falx and tentorium (Fig. 25-2B)
! Normal structures that can enhance after administration of iodinated intravenous contrast:• Venous sinuses• Choroid plexus• Pituitary gland and stalk
! Metallic densities in the head can cause artifacts on CT scans. Dental fillings, aneurysm clips, and bullets can all cause streak artifacts.
MRI AND THE BRAIN
In general, MRI is the study of choice for detecting and staging intracranial and spinal cord abnormalities.
It is usually more sensitive than CT because of its superior contrast and soft tissue resolution. It is, however, less sen-sitive than CT in detecting calcification in lesions and corti-cal bone, which appear as signal voids with MR. It cannot be used in patients with pacemakers.
! MRI is more difficult to interpret because the same struc-ture or abnormality will appear differently depending on the pulse sequence, the scan parameters, and the fact that MRI is more variable in its depiction of differences which occur over the time course of some abnormalities (e.g., hemorrhage) than is CT.
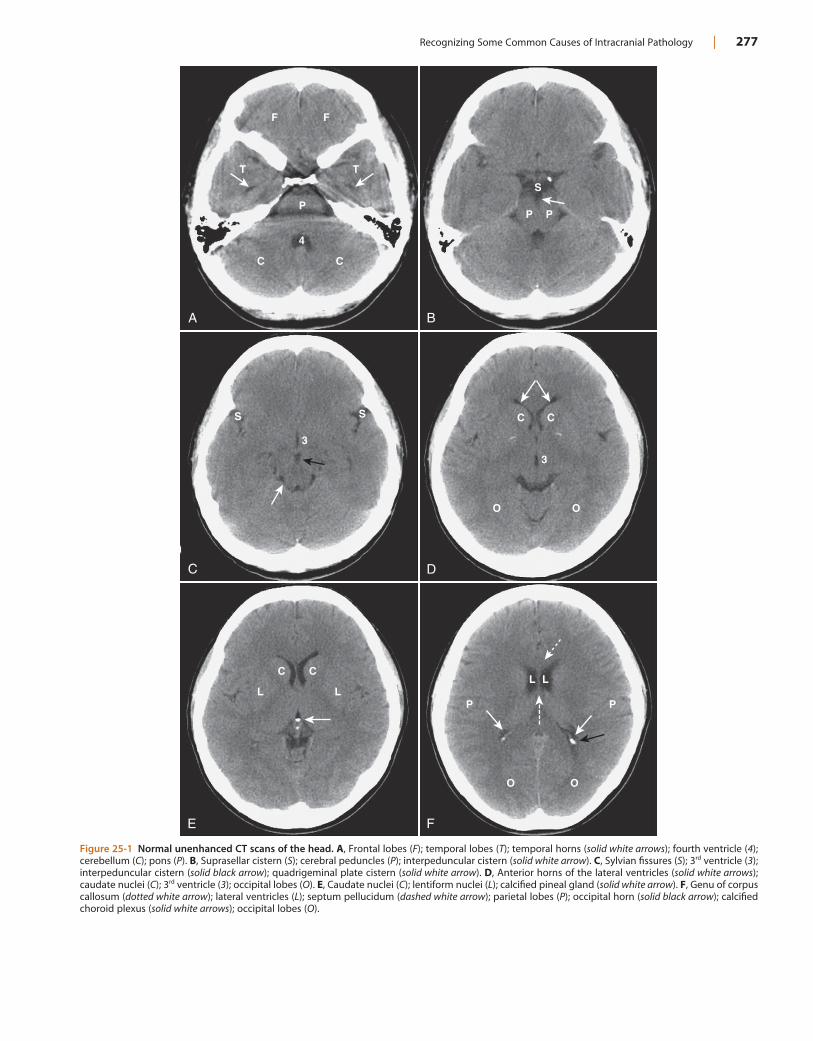
Recognizing Some Common Causes of Intracranial Pathology | 277
Figure 25-1 Normal unenhanced CT scans of the head. A, Frontal lobes (F); temporal lobes (T); temporal horns (solid white arrows); fourth ventricle (4); cerebellum (C); pons (P). B, Suprasellar cistern (S); cerebral peduncles (P); interpeduncular cistern (solid white arrow). C, Sylvian fissures (S); 3rd ventricle (3); interpeduncular cistern (solid black arrow); quadrigeminal plate cistern (solid white arrow). D, Anterior horns of the lateral ventricles (solid white arrows); caudate nuclei (C); 3rd ventricle (3); occipital lobes (O). E, Caudate nuclei (C); lentiform nuclei (L); calcified pineal gland (solid white arrow). F, Genu of corpus callosum (dotted white arrow); lateral ventricles (L); septum pellucidum (dashed white arrow); parietal lobes (P); occipital horn (solid black arrow); calcified choroid plexus (solid white arrows); occipital lobes (O).
A B
F F
T T
P
4
C C
S
P P
C C
3
O O
C C
L LL L
P P
O O
S
3
S
D
E F
C
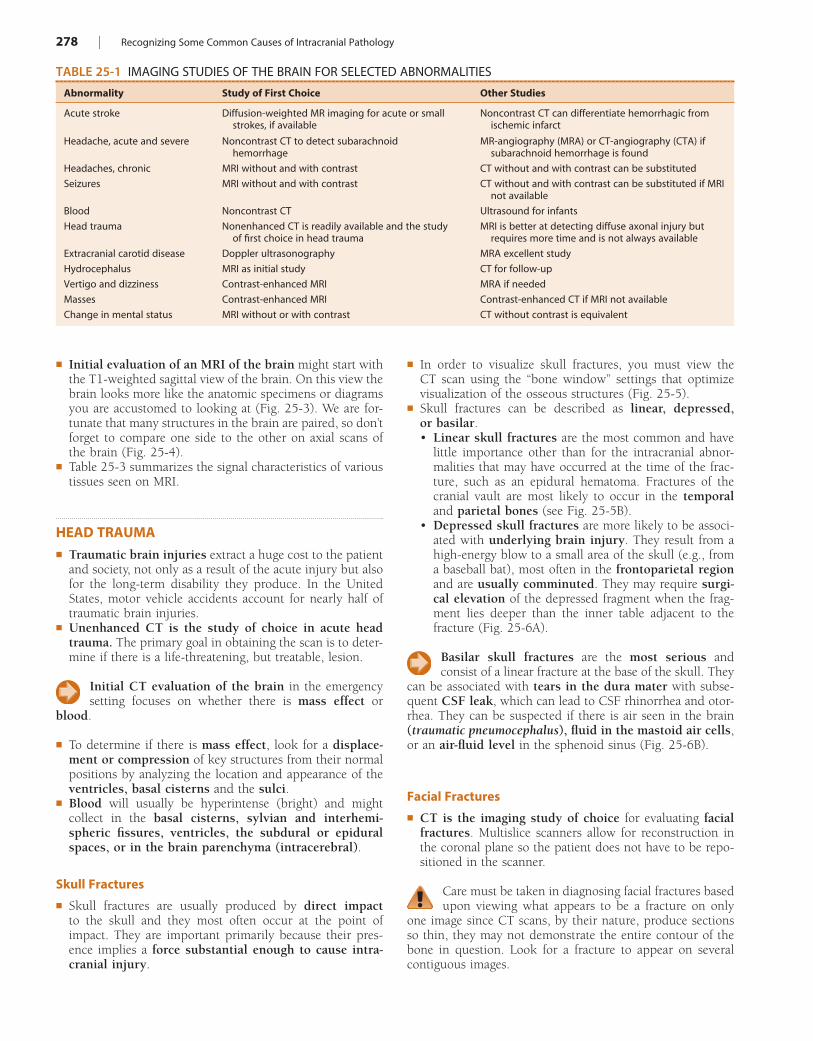
278 | Recognizing Some Common Causes of Intracranial Pathology
! In order to visualize skull fractures, you must view the CT scan using the “bone window” settings that optimize visualization of the osseous structures (Fig. 25-5).
! Skull fractures can be described as linear, depressed, or basilar.• Linear skull fractures are the most common and have
little importance other than for the intracranial abnor-malities that may have occurred at the time of the frac-ture, such as an epidural hematoma. Fractures of the cranial vault are most likely to occur in the temporal and parietal bones (see Fig. 25-5B).
• Depressed skull fractures are more likely to be associ-ated with underlying brain injury. They result from a high-energy blow to a small area of the skull (e.g., from a baseball bat), most often in the frontoparietal region and are usually comminuted. They may require surgi-cal elevation of the depressed fragment when the frag-ment lies deeper than the inner table adjacent to the fracture (Fig. 25-6A).
Basilar skull fractures are the most serious and consist of a linear fracture at the base of the skull. They
can be associated with tears in the dura mater with subse-quent CSF leak, which can lead to CSF rhinorrhea and otor-rhea. They can be suspected if there is air seen in the brain (traumatic pneumocephalus), fluid in the mastoid air cells, or an air-fluid level in the sphenoid sinus (Fig. 25-6B).
Facial Fractures
! CT is the imaging study of choice for evaluating facial fractures. Multislice scanners allow for reconstruction in the coronal plane so the patient does not have to be repo-sitioned in the scanner.
Care must be taken in diagnosing facial fractures based upon viewing what appears to be a fracture on only
one image since CT scans, by their nature, produce sections so thin, they may not demonstrate the entire contour of the bone in question. Look for a fracture to appear on several contiguous images.
! Initial evaluation of an MRI of the brain might start with the T1-weighted sagittal view of the brain. On this view the brain looks more like the anatomic specimens or diagrams you are accustomed to looking at (Fig. 25-3). We are for-tunate that many structures in the brain are paired, so don’t forget to compare one side to the other on axial scans of the brain (Fig. 25-4).
! Table 25-3 summarizes the signal characteristics of various tissues seen on MRI.
HEAD TRAUMA! Traumatic brain injuries extract a huge cost to the patient
and society, not only as a result of the acute injury but also for the long-term disability they produce. In the United States, motor vehicle accidents account for nearly half of traumatic brain injuries.
! Unenhanced CT is the study of choice in acute head trauma. The primary goal in obtaining the scan is to deter-mine if there is a life-threatening, but treatable, lesion.
Initial CT evaluation of the brain in the emergency setting focuses on whether there is mass effect or
blood.
! To determine if there is mass effect, look for a displace-ment or compression of key structures from their normal positions by analyzing the location and appearance of the ventricles, basal cisterns and the sulci.
! Blood will usually be hyperintense (bright) and might collect in the basal cisterns, sylvian and interhemi-spheric fissures, ventricles, the subdural or epidural spaces, or in the brain parenchyma (intracerebral).
Skull Fractures
! Skull fractures are usually produced by direct impact to the skull and they most often occur at the point of impact. They are important primarily because their pres-ence implies a force substantial enough to cause intra-cranial injury.
TABLE 25-1 IMAGING STUDIES OF THE BRAIN FOR SELECTED ABNORMALITIES
Abnormality Study of First Choice Other Studies
Acute stroke Diffusion-weighted MR imaging for acute or small strokes, if available
Noncontrast CT can differentiate hemorrhagic from ischemic infarct
Headache, acute and severe Noncontrast CT to detect subarachnoid hemorrhage
MR-angiography (MRA) or CT-angiography (CTA) if subarachnoid hemorrhage is found
Headaches, chronic MRI without and with contrast CT without and with contrast can be substituted
Seizures MRI without and with contrast CT without and with contrast can be substituted if MRI not available
Blood Noncontrast CT Ultrasound for infants
Head trauma Nonenhanced CT is readily available and the study of first choice in head trauma
MRI is better at detecting diffuse axonal injury but requires more time and is not always available
Extracranial carotid disease Doppler ultrasonography MRA excellent study
Hydrocephalus MRI as initial study CT for follow-up
Vertigo and dizziness Contrast-enhanced MRI MRA if needed
Masses Contrast-enhanced MRI Contrast-enhanced CT if MRI not available
Change in mental status MRI without or with contrast CT without contrast is equivalent
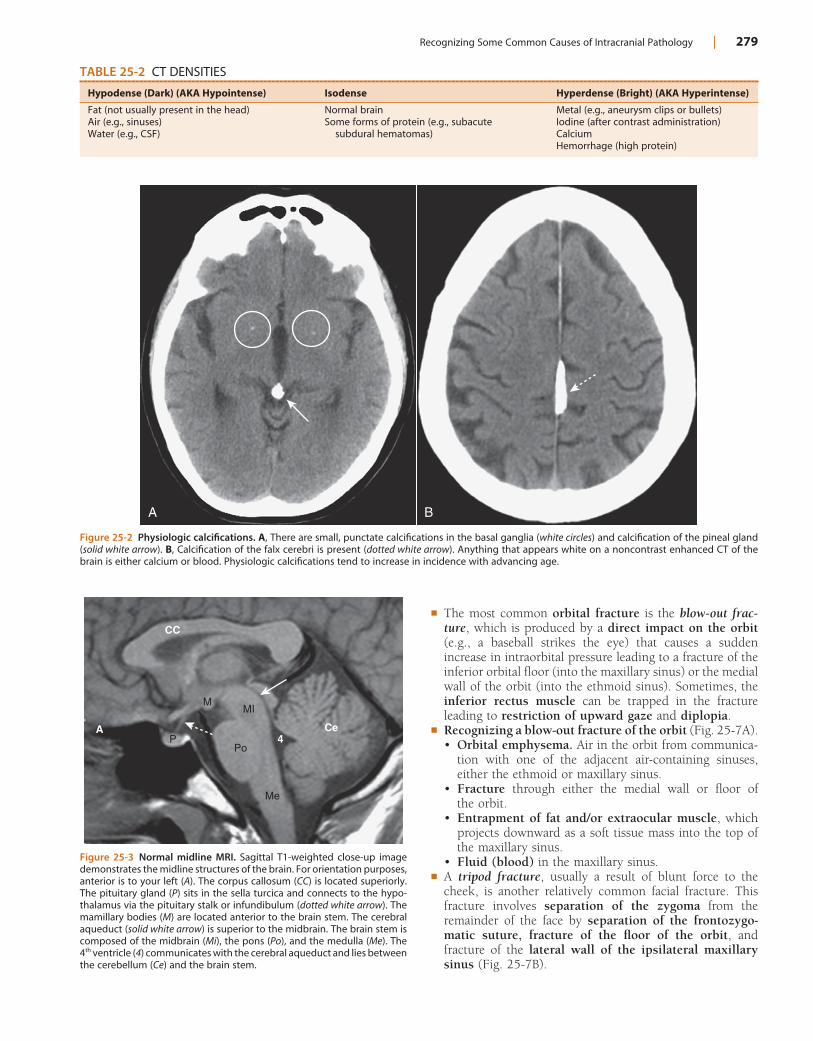
Recognizing Some Common Causes of Intracranial Pathology | 279
TABLE 25-2 CT DENSITIES
Hypodense (Dark) (AKA Hypointense) Isodense Hyperdense (Bright) (AKA Hyperintense)
Fat (not usually present in the head)Air (e.g., sinuses)Water (e.g., CSF)
Normal brainSome forms of protein (e.g., subacute
subdural hematomas)
Metal (e.g., aneurysm clips or bullets)Iodine (after contrast administration)CalciumHemorrhage (high protein)
Figure 25-2 Physiologic calcifications. A, There are small, punctate calcifications in the basal ganglia (white circles) and calcification of the pineal gland (solid white arrow). B, Calcification of the falx cerebri is present (dotted white arrow). Anything that appears white on a noncontrast enhanced CT of the brain is either calcium or blood. Physiologic calcifications tend to increase in incidence with advancing age.
A B
Figure 25-3 Normal midline MRI. Sagittal T1-weighted close-up image demonstrates the midline structures of the brain. For orientation purposes, anterior is to your left (A). The corpus callosum (CC) is located superiorly. The pituitary gland (P) sits in the sella turcica and connects to the hypo-thalamus via the pituitary stalk or infundibulum (dotted white arrow). The mamillary bodies (M) are located anterior to the brain stem. The cerebral aqueduct (solid white arrow) is superior to the midbrain. The brain stem is composed of the midbrain (Mi), the pons (Po), and the medulla (Me). The 4th ventricle (4) communicates with the cerebral aqueduct and lies between the cerebellum (Ce) and the brain stem.
MMI
Po
Me
P
CC
A Ce4
! The most common orbital fracture is the blow-out frac-ture, which is produced by a direct impact on the orbit (e.g., a baseball strikes the eye) that causes a sudden increase in intraorbital pressure leading to a fracture of the inferior orbital floor (into the maxillary sinus) or the medial wall of the orbit (into the ethmoid sinus). Sometimes, the inferior rectus muscle can be trapped in the fracture leading to restriction of upward gaze and diplopia.
! Recognizing a blow-out fracture of the orbit (Fig. 25-7A).• Orbital emphysema. Air in the orbit from communica-
tion with one of the adjacent air-containing sinuses, either the ethmoid or maxillary sinus.
• Fracture through either the medial wall or floor of the orbit.
• Entrapment of fat and/or extraocular muscle, which projects downward as a soft tissue mass into the top of the maxillary sinus.
• Fluid (blood) in the maxillary sinus.! A tripod fracture, usually a result of blunt force to the
cheek, is another relatively common facial fracture. This fracture involves separation of the zygoma from the remainder of the face by separation of the frontozygo-matic suture, fracture of the floor of the orbit, and fracture of the lateral wall of the ipsilateral maxillary sinus (Fig. 25-7B).
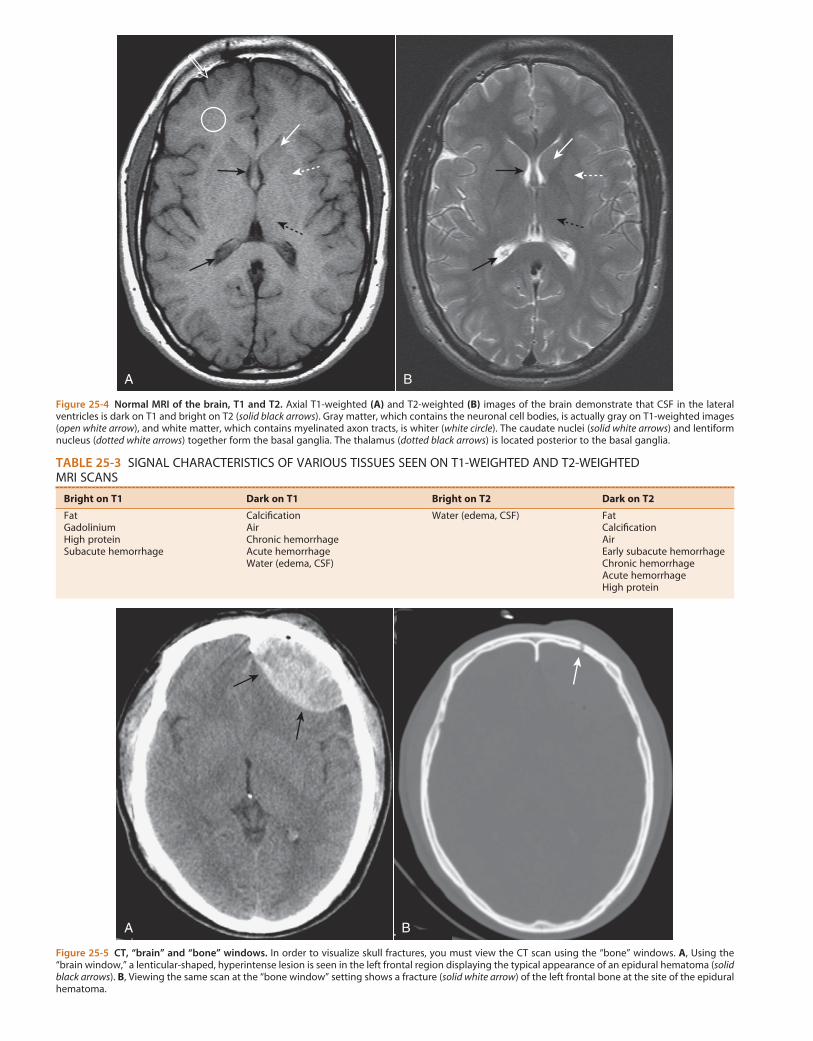
Figure 25-4 Normal MRI of the brain, T1 and T2. Axial T1-weighted (A) and T2-weighted (B) images of the brain demonstrate that CSF in the lateral ventricles is dark on T1 and bright on T2 (solid black arrows). Gray matter, which contains the neuronal cell bodies, is actually gray on T1-weighted images (open white arrow), and white matter, which contains myelinated axon tracts, is whiter (white circle). The caudate nuclei (solid white arrows) and lentiform nucleus (dotted white arrows) together form the basal ganglia. The thalamus (dotted black arrows) is located posterior to the basal ganglia.
A B
TABLE 25-3 SIGNAL CHARACTERISTICS OF VARIOUS TISSUES SEEN ON T1-WEIGHTED AND T2-WEIGHTED MRI SCANS
Bright on T1 Dark on T1 Bright on T2 Dark on T2
FatGadoliniumHigh proteinSubacute hemorrhage
CalcificationAirChronic hemorrhageAcute hemorrhageWater (edema, CSF)
Water (edema, CSF) FatCalcificationAirEarly subacute hemorrhageChronic hemorrhageAcute hemorrhageHigh protein
Figure 25-5 CT, “brain” and “bone” windows. In order to visualize skull fractures, you must view the CT scan using the “bone” windows. A, Using the “brain window,” a lenticular-shaped, hyperintense lesion is seen in the left frontal region displaying the typical appearance of an epidural hematoma (solid black arrows). B, Viewing the same scan at the “bone window” setting shows a fracture (solid white arrow) of the left frontal bone at the site of the epidural hematoma.
A B
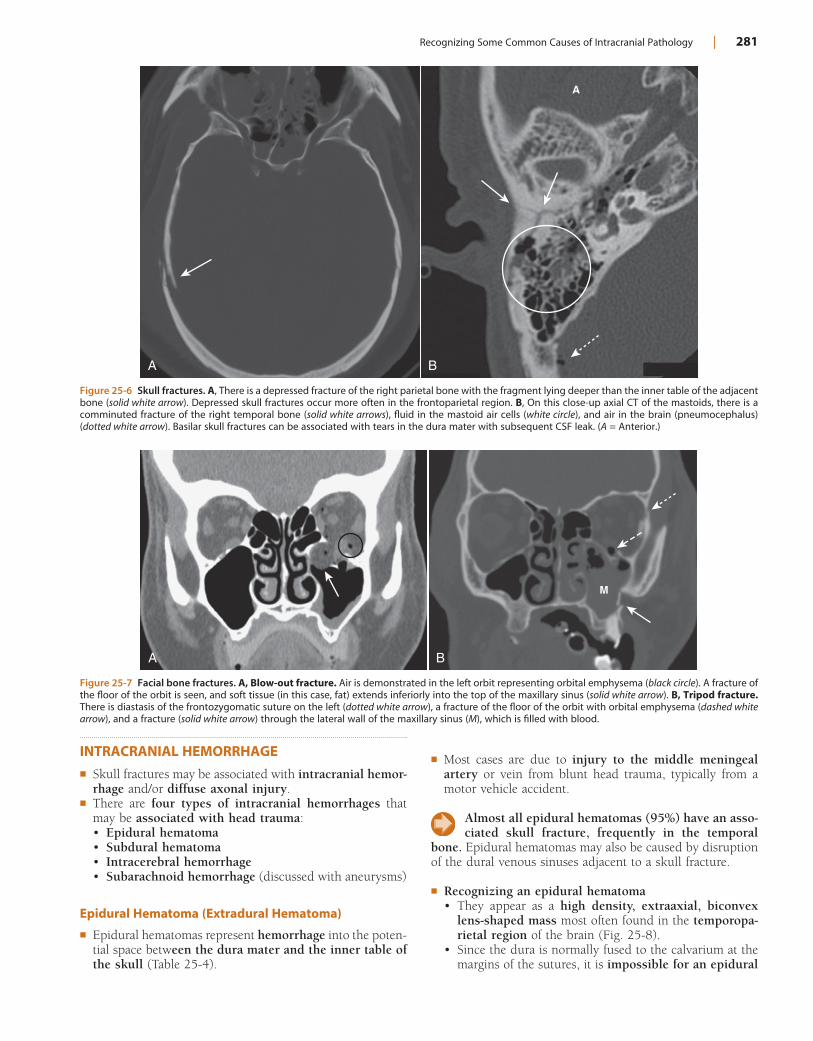
Recognizing Some Common Causes of Intracranial Pathology | 281
Figure 25-6 Skull fractures. A, There is a depressed fracture of the right parietal bone with the fragment lying deeper than the inner table of the adjacent bone (solid white arrow). Depressed skull fractures occur more often in the frontoparietal region. B, On this close-up axial CT of the mastoids, there is a comminuted fracture of the right temporal bone (solid white arrows), fluid in the mastoid air cells (white circle), and air in the brain (pneumocephalus) (dotted white arrow). Basilar skull fractures can be associated with tears in the dura mater with subsequent CSF leak. (A = Anterior.)
A
A
B
Figure 25-7 Facial bone fractures. A, Blow-out fracture. Air is demonstrated in the left orbit representing orbital emphysema (black circle). A fracture of the floor of the orbit is seen, and soft tissue (in this case, fat) extends inferiorly into the top of the maxillary sinus (solid white arrow). B, Tripod fracture. There is diastasis of the frontozygomatic suture on the left (dotted white arrow), a fracture of the floor of the orbit with orbital emphysema (dashed white arrow), and a fracture (solid white arrow) through the lateral wall of the maxillary sinus (M), which is filled with blood.
A B
M
INTRACRANIAL HEMORRHAGE! Skull fractures may be associated with intracranial hemor-
rhage and/or diffuse axonal injury.! There are four types of intracranial hemorrhages that
may be associated with head trauma:• Epidural hematoma• Subdural hematoma• Intracerebral hemorrhage• Subarachnoid hemorrhage (discussed with aneurysms)
Epidural Hematoma (Extradural Hematoma)
! Epidural hematomas represent hemorrhage into the poten-tial space between the dura mater and the inner table of the skull (Table 25-4).
! Most cases are due to injury to the middle meningeal artery or vein from blunt head trauma, typically from a motor vehicle accident.
Almost all epidural hematomas (95%) have an asso-ciated skull fracture, frequently in the temporal
bone. Epidural hematomas may also be caused by disruption of the dural venous sinuses adjacent to a skull fracture.
! Recognizing an epidural hematoma• They appear as a high density, extraaxial, biconvex
lens-shaped mass most often found in the temporopa-rietal region of the brain (Fig. 25-8).
• Since the dura is normally fused to the calvarium at the margins of the sutures, it is impossible for an epidural
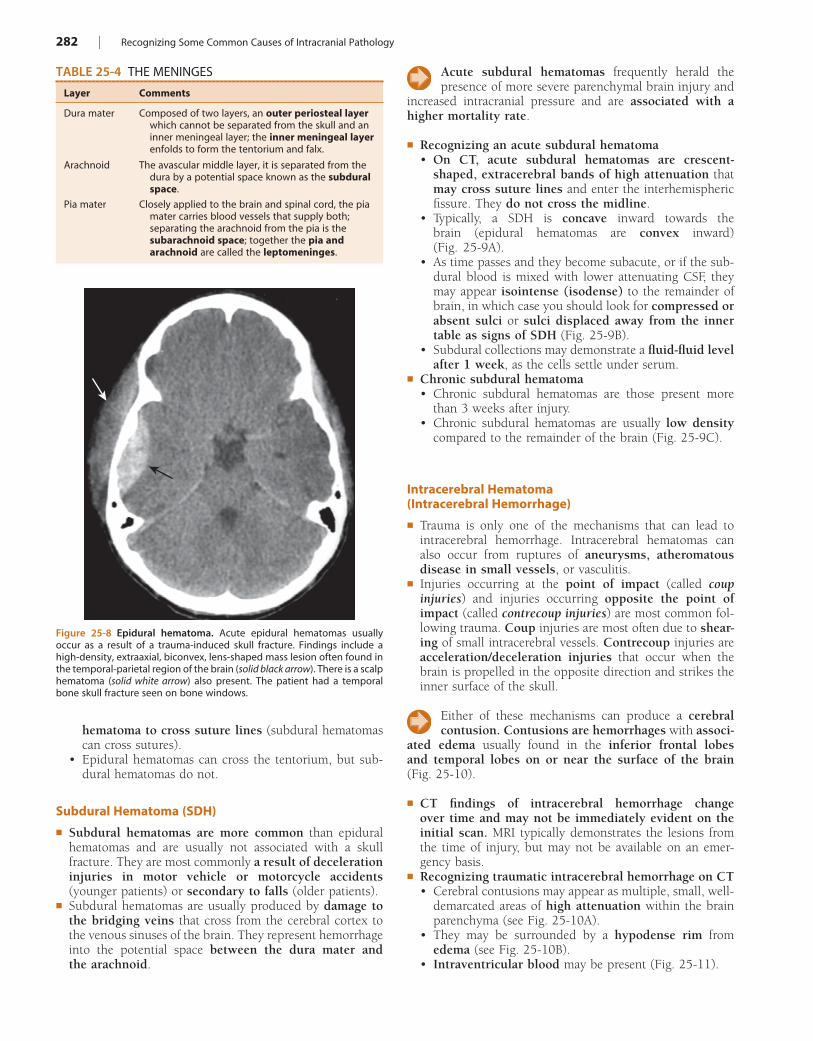
282 | Recognizing Some Common Causes of Intracranial Pathology
Acute subdural hematomas frequently herald the presence of more severe parenchymal brain injury and
increased intracranial pressure and are associated with a higher mortality rate.
! Recognizing an acute subdural hematoma• On CT, acute subdural hematomas are crescent-
shaped, extracerebral bands of high attenuation that may cross suture lines and enter the interhemispheric fissure. They do not cross the midline.
• Typically, a SDH is concave inward towards the brain (epidural hematomas are convex inward) (Fig. 25-9A).
• As time passes and they become subacute, or if the sub-dural blood is mixed with lower attenuating CSF, they may appear isointense (isodense) to the remainder of brain, in which case you should look for compressed or absent sulci or sulci displaced away from the inner table as signs of SDH (Fig. 25-9B).
• Subdural collections may demonstrate a fluid-fluid level after 1 week, as the cells settle under serum.
! Chronic subdural hematoma• Chronic subdural hematomas are those present more
than 3 weeks after injury.• Chronic subdural hematomas are usually low density
compared to the remainder of the brain (Fig. 25-9C).
Intracerebral Hematoma (Intracerebral Hemorrhage)
! Trauma is only one of the mechanisms that can lead to intracerebral hemorrhage. Intracerebral hematomas can also occur from ruptures of aneurysms, atheromatous disease in small vessels, or vasculitis.
! Injuries occurring at the point of impact (called coup injuries) and injuries occurring opposite the point of impact (called contrecoup injuries) are most common fol-lowing trauma. Coup injuries are most often due to shear-ing of small intracerebral vessels. Contrecoup injuries are acceleration/deceleration injuries that occur when the brain is propelled in the opposite direction and strikes the inner surface of the skull.
Either of these mechanisms can produce a cerebral contusion. Contusions are hemorrhages with associ-
ated edema usually found in the inferior frontal lobes and temporal lobes on or near the surface of the brain (Fig. 25-10).
! CT findings of intracerebral hemorrhage change over time and may not be immediately evident on the initial scan. MRI typically demonstrates the lesions from the time of injury, but may not be available on an emer-gency basis.
! Recognizing traumatic intracerebral hemorrhage on CT• Cerebral contusions may appear as multiple, small, well-
demarcated areas of high attenuation within the brain parenchyma (see Fig. 25-10A).
• They may be surrounded by a hypodense rim from edema (see Fig. 25-10B).
• Intraventricular blood may be present (Fig. 25-11).
hematoma to cross suture lines (subdural hematomas can cross sutures).
• Epidural hematomas can cross the tentorium, but sub-dural hematomas do not.
Subdural Hematoma (SDH)
! Subdural hematomas are more common than epidural hematomas and are usually not associated with a skull fracture. They are most commonly a result of deceleration injuries in motor vehicle or motorcycle accidents (younger patients) or secondary to falls (older patients).
! Subdural hematomas are usually produced by damage to the bridging veins that cross from the cerebral cortex to the venous sinuses of the brain. They represent hemorrhage into the potential space between the dura mater and the arachnoid.
TABLE 25-4 THE MENINGES
Layer Comments
Dura mater Composed of two layers, an outer periosteal layer which cannot be separated from the skull and an inner meningeal layer; the inner meningeal layer enfolds to form the tentorium and falx.
Arachnoid The avascular middle layer, it is separated from the dura by a potential space known as the subdural space.
Pia mater Closely applied to the brain and spinal cord, the pia mater carries blood vessels that supply both; separating the arachnoid from the pia is the subarachnoid space; together the pia and arachnoid are called the leptomeninges.
Figure 25-8 Epidural hematoma. Acute epidural hematomas usually occur as a result of a trauma-induced skull fracture. Findings include a high-density, extraaxial, biconvex, lens-shaped mass lesion often found in the temporal-parietal region of the brain (solid black arrow). There is a scalp hematoma (solid white arrow) also present. The patient had a temporal bone skull fracture seen on bone windows.
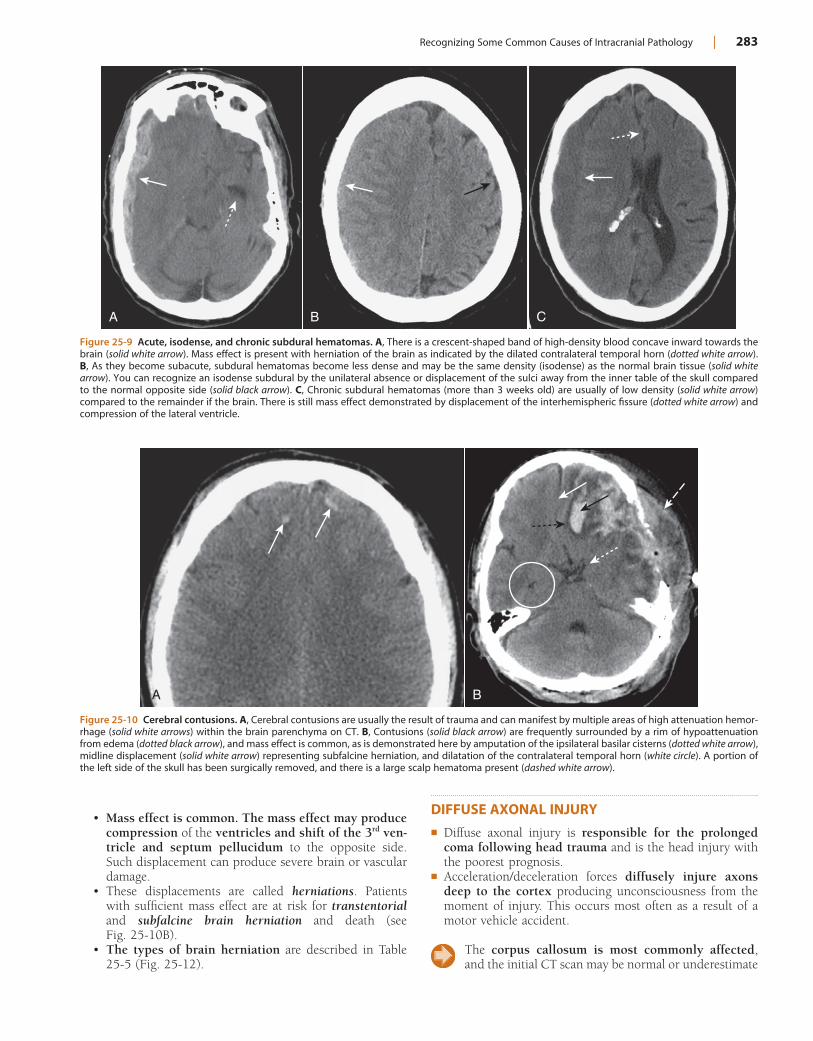
Recognizing Some Common Causes of Intracranial Pathology | 283
DIFFUSE AXONAL INJURY! Diffuse axonal injury is responsible for the prolonged
coma following head trauma and is the head injury with the poorest prognosis.
! Acceleration/deceleration forces diffusely injure axons deep to the cortex producing unconsciousness from the moment of injury. This occurs most often as a result of a motor vehicle accident.
The corpus callosum is most commonly affected, and the initial CT scan may be normal or underestimate
• Mass effect is common. The mass effect may produce compression of the ventricles and shift of the 3rd ven-tricle and septum pellucidum to the opposite side. Such displacement can produce severe brain or vascular damage.
• These displacements are called herniations. Patients with sufficient mass effect are at risk for transtentorial and subfalcine brain herniation and death (see Fig. 25-10B).
• The types of brain herniation are described in Table 25-5 (Fig. 25-12).
Figure 25-9 Acute, isodense, and chronic subdural hematomas. A, There is a crescent-shaped band of high-density blood concave inward towards the brain (solid white arrow). Mass effect is present with herniation of the brain as indicated by the dilated contralateral temporal horn (dotted white arrow). B, As they become subacute, subdural hematomas become less dense and may be the same density (isodense) as the normal brain tissue (solid white arrow). You can recognize an isodense subdural by the unilateral absence or displacement of the sulci away from the inner table of the skull compared to the normal opposite side (solid black arrow). C, Chronic subdural hematomas (more than 3 weeks old) are usually of low density (solid white arrow) compared to the remainder if the brain. There is still mass effect demonstrated by displacement of the interhemispheric fissure (dotted white arrow) and compression of the lateral ventricle.
A B C
Figure 25-10 Cerebral contusions. A, Cerebral contusions are usually the result of trauma and can manifest by multiple areas of high attenuation hemor-rhage (solid white arrows) within the brain parenchyma on CT. B, Contusions (solid black arrow) are frequently surrounded by a rim of hypoattenuation from edema (dotted black arrow), and mass effect is common, as is demonstrated here by amputation of the ipsilateral basilar cisterns (dotted white arrow), midline displacement (solid white arrow) representing subfalcine herniation, and dilatation of the contralateral temporal horn (white circle). A portion of the left side of the skull has been surgically removed, and there is a large scalp hematoma present (dashed white arrow).
A B
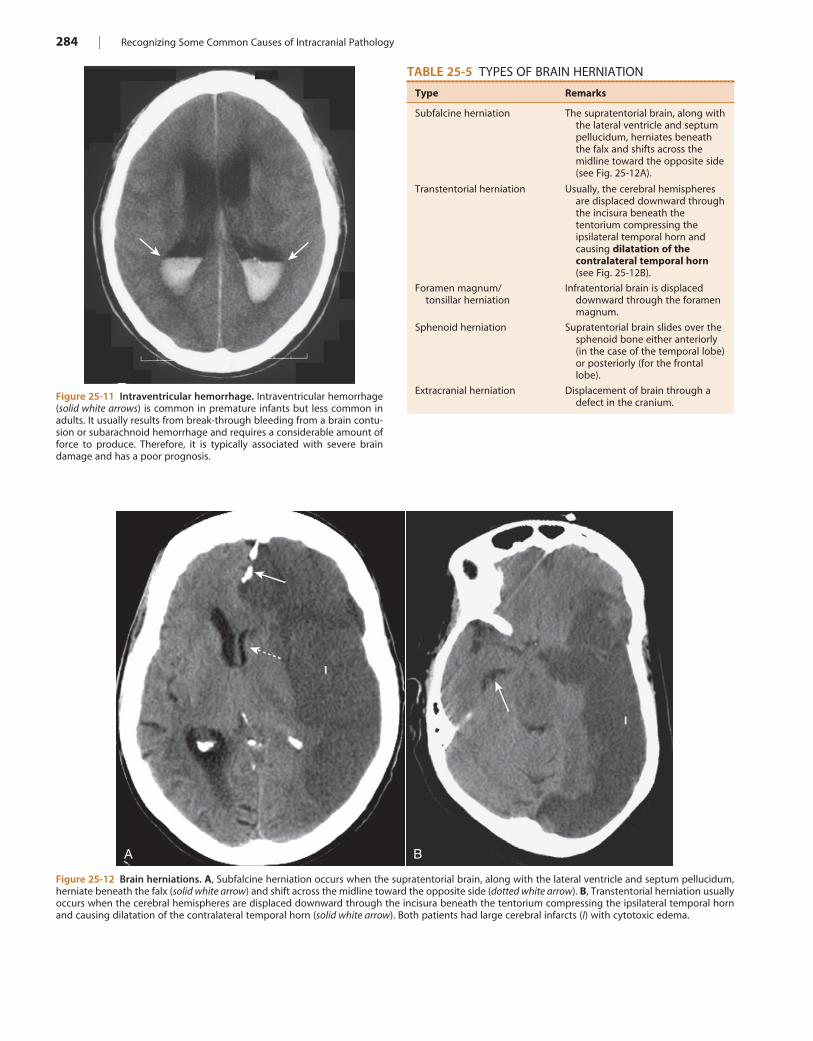
284 | Recognizing Some Common Causes of Intracranial Pathology
Figure 25-11 Intraventricular hemorrhage. Intraventricular hemorrhage (solid white arrows) is common in premature infants but less common in adults. It usually results from break-through bleeding from a brain contu-sion or subarachnoid hemorrhage and requires a considerable amount of force to produce. Therefore, it is typically associated with severe brain damage and has a poor prognosis.
TABLE 25-5 TYPES OF BRAIN HERNIATION
Type Remarks
Subfalcine herniation The supratentorial brain, along with the lateral ventricle and septum pellucidum, herniates beneath the falx and shifts across the midline toward the opposite side (see Fig. 25-12A).
Transtentorial herniation Usually, the cerebral hemispheres are displaced downward through the incisura beneath the tentorium compressing the ipsilateral temporal horn and causing dilatation of the contralateral temporal horn (see Fig. 25-12B).
Foramen magnum/tonsillar herniation
Infratentorial brain is displaced downward through the foramen magnum.
Sphenoid herniation Supratentorial brain slides over the sphenoid bone either anteriorly (in the case of the temporal lobe) or posteriorly (for the frontal lobe).
Extracranial herniation Displacement of brain through a defect in the cranium.
Figure 25-12 Brain herniations. A, Subfalcine herniation occurs when the supratentorial brain, along with the lateral ventricle and septum pellucidum, herniate beneath the falx (solid white arrow) and shift across the midline toward the opposite side (dotted white arrow). B, Transtentorial herniation usually occurs when the cerebral hemispheres are displaced downward through the incisura beneath the tentorium compressing the ipsilateral temporal horn and causing dilatation of the contralateral temporal horn (solid white arrow). Both patients had large cerebral infarcts (I) with cytotoxic edema.
A B
I
I
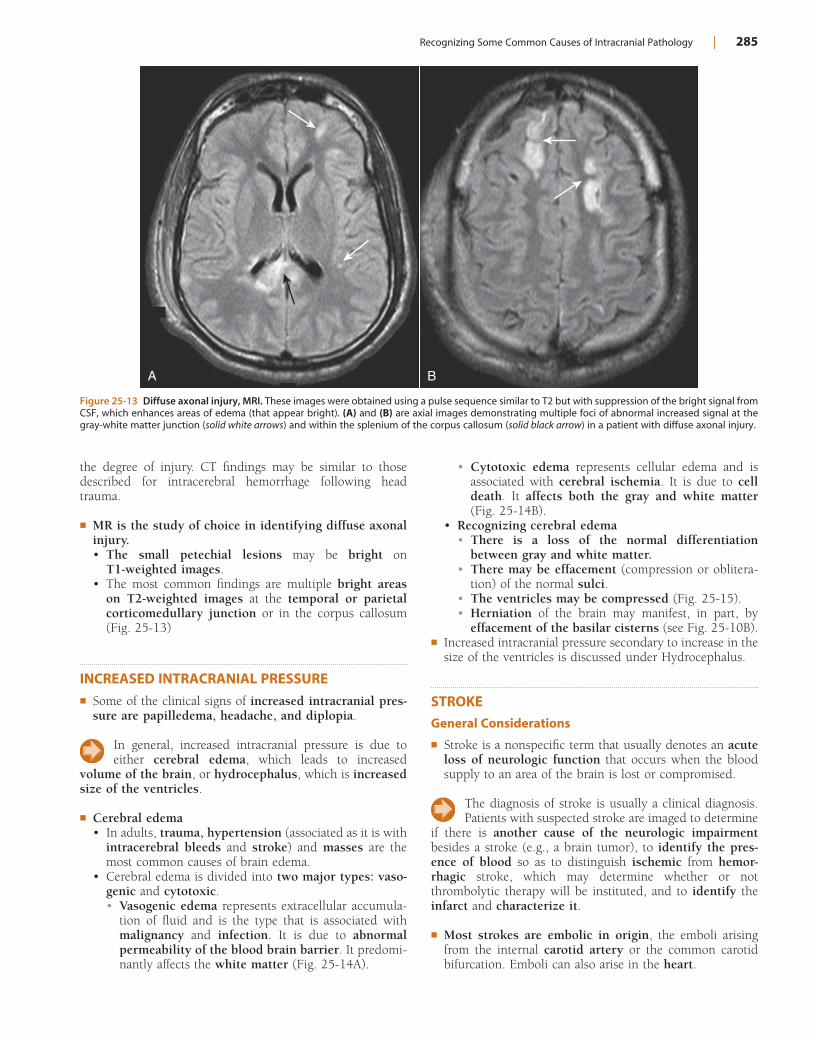
Recognizing Some Common Causes of Intracranial Pathology | 285
• Cytotoxic edema represents cellular edema and is associated with cerebral ischemia. It is due to cell death. It affects both the gray and white matter (Fig. 25-14B).
• Recognizing cerebral edema• There is a loss of the normal differentiation
between gray and white matter.• There may be effacement (compression or oblitera-
tion) of the normal sulci.• The ventricles may be compressed (Fig. 25-15).• Herniation of the brain may manifest, in part, by
effacement of the basilar cisterns (see Fig. 25-10B).! Increased intracranial pressure secondary to increase in the
size of the ventricles is discussed under Hydrocephalus.
STROKEGeneral Considerations
! Stroke is a nonspecific term that usually denotes an acute loss of neurologic function that occurs when the blood supply to an area of the brain is lost or compromised.
The diagnosis of stroke is usually a clinical diagnosis. Patients with suspected stroke are imaged to determine
if there is another cause of the neurologic impairment besides a stroke (e.g., a brain tumor), to identify the pres-ence of blood so as to distinguish ischemic from hemor-rhagic stroke, which may determine whether or not thrombolytic therapy will be instituted, and to identify the infarct and characterize it.
! Most strokes are embolic in origin, the emboli arising from the internal carotid artery or the common carotid bifurcation. Emboli can also arise in the heart.
the degree of injury. CT findings may be similar to those described for intracerebral hemorrhage following head trauma.
! MR is the study of choice in identifying diffuse axonal injury.• The small petechial lesions may be bright on
T1-weighted images.• The most common findings are multiple bright areas
on T2-weighted images at the temporal or parietal corticomedullary junction or in the corpus callosum (Fig. 25-13)
INCREASED INTRACRANIAL PRESSURE! Some of the clinical signs of increased intracranial pres-
sure are papilledema, headache, and diplopia.
In general, increased intracranial pressure is due to either cerebral edema, which leads to increased
volume of the brain, or hydrocephalus, which is increased size of the ventricles.
! Cerebral edema• In adults, trauma, hypertension (associated as it is with
intracerebral bleeds and stroke) and masses are the most common causes of brain edema.
• Cerebral edema is divided into two major types: vaso-genic and cytotoxic.• Vasogenic edema represents extracellular accumula-
tion of fluid and is the type that is associated with malignancy and infection. It is due to abnormal permeability of the blood brain barrier. It predomi-nantly affects the white matter (Fig. 25-14A).
Figure 25-13 Diffuse axonal injury, MRI. These images were obtained using a pulse sequence similar to T2 but with suppression of the bright signal from CSF, which enhances areas of edema (that appear bright). (A) and (B) are axial images demonstrating multiple foci of abnormal increased signal at the gray-white matter junction (solid white arrows) and within the splenium of the corpus callosum (solid black arrow) in a patient with diffuse axonal injury.
A B
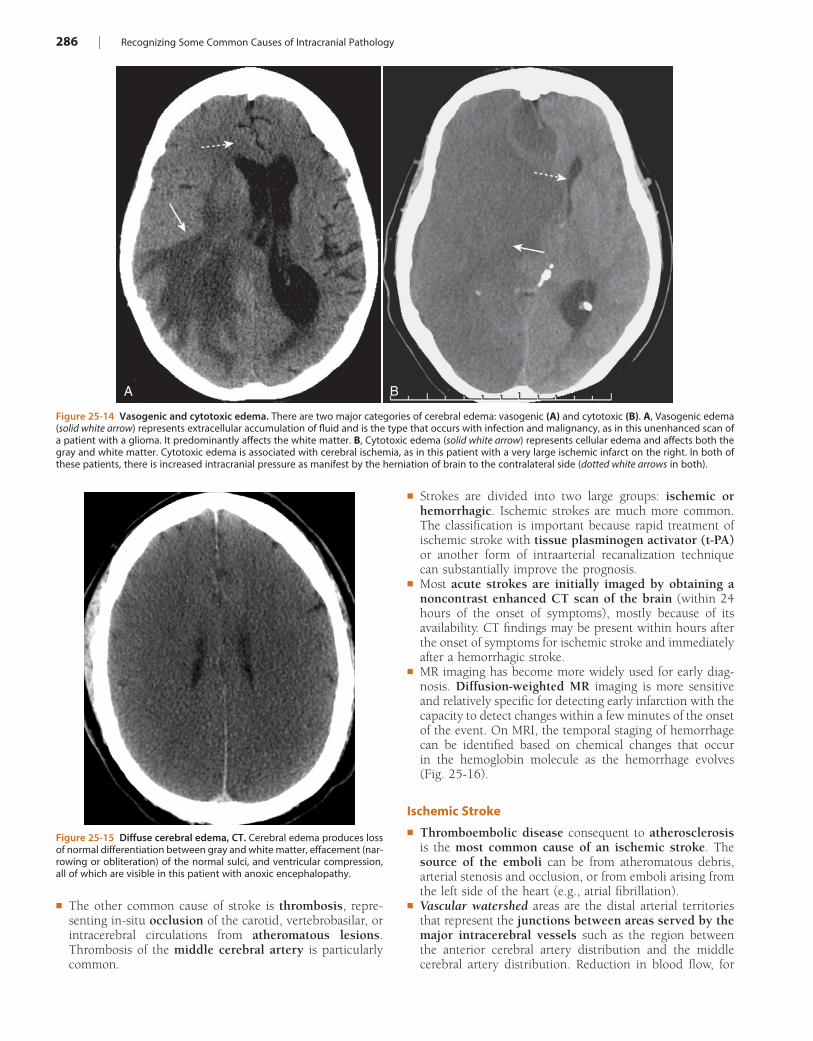
286 | Recognizing Some Common Causes of Intracranial Pathology
! Strokes are divided into two large groups: ischemic or hemorrhagic. Ischemic strokes are much more common. The classification is important because rapid treatment of ischemic stroke with tissue plasminogen activator (t-PA) or another form of intraarterial recanalization technique can substantially improve the prognosis.
! Most acute strokes are initially imaged by obtaining a noncontrast enhanced CT scan of the brain (within 24 hours of the onset of symptoms), mostly because of its availability. CT findings may be present within hours after the onset of symptoms for ischemic stroke and immediately after a hemorrhagic stroke.
! MR imaging has become more widely used for early diag-nosis. Diffusion-weighted MR imaging is more sensitive and relatively specific for detecting early infarction with the capacity to detect changes within a few minutes of the onset of the event. On MRI, the temporal staging of hemorrhage can be identified based on chemical changes that occur in the hemoglobin molecule as the hemorrhage evolves (Fig. 25-16).
Ischemic Stroke
! Thromboembolic disease consequent to atherosclerosis is the most common cause of an ischemic stroke. The source of the emboli can be from atheromatous debris, arterial stenosis and occlusion, or from emboli arising from the left side of the heart (e.g., atrial fibrillation).
! Vascular watershed areas are the distal arterial territories that represent the junctions between areas served by the major intracerebral vessels such as the region between the anterior cerebral artery distribution and the middle cerebral artery distribution. Reduction in blood flow, for
Figure 25-14 Vasogenic and cytotoxic edema. There are two major categories of cerebral edema: vasogenic (A) and cytotoxic (B). A, Vasogenic edema (solid white arrow) represents extracellular accumulation of fluid and is the type that occurs with infection and malignancy, as in this unenhanced scan of a patient with a glioma. It predominantly affects the white matter. B, Cytotoxic edema (solid white arrow) represents cellular edema and affects both the gray and white matter. Cytotoxic edema is associated with cerebral ischemia, as in this patient with a very large ischemic infarct on the right. In both of these patients, there is increased intracranial pressure as manifest by the herniation of brain to the contralateral side (dotted white arrows in both).
A B
Figure 25-15 Diffuse cerebral edema, CT. Cerebral edema produces loss of normal differentiation between gray and white matter, effacement (nar-rowing or obliteration) of the normal sulci, and ventricular compression, all of which are visible in this patient with anoxic encephalopathy.
! The other common cause of stroke is thrombosis, repre-senting in-situ occlusion of the carotid, vertebrobasilar, or intracerebral circulations from atheromatous lesions. Thrombosis of the middle cerebral artery is particularly common.
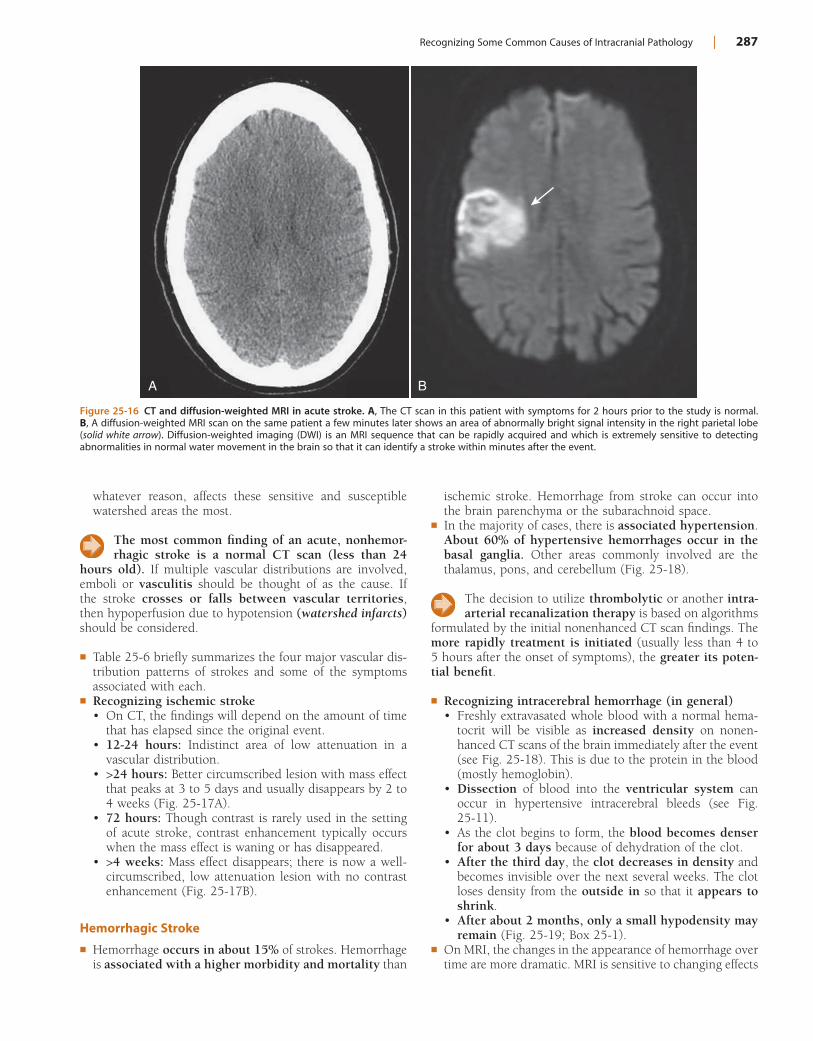
Recognizing Some Common Causes of Intracranial Pathology | 287
ischemic stroke. Hemorrhage from stroke can occur into the brain parenchyma or the subarachnoid space.
! In the majority of cases, there is associated hypertension. About 60% of hypertensive hemorrhages occur in the basal ganglia. Other areas commonly involved are the thalamus, pons, and cerebellum (Fig. 25-18).
The decision to utilize thrombolytic or another intra-arterial recanalization therapy is based on algorithms
formulated by the initial nonenhanced CT scan findings. The more rapidly treatment is initiated (usually less than 4 to 5 hours after the onset of symptoms), the greater its poten-tial benefit.
! Recognizing intracerebral hemorrhage (in general)• Freshly extravasated whole blood with a normal hema-
tocrit will be visible as increased density on nonen-hanced CT scans of the brain immediately after the event (see Fig. 25-18). This is due to the protein in the blood (mostly hemoglobin).
• Dissection of blood into the ventricular system can occur in hypertensive intracerebral bleeds (see Fig. 25-11).
• As the clot begins to form, the blood becomes denser for about 3 days because of dehydration of the clot.
• After the third day, the clot decreases in density and becomes invisible over the next several weeks. The clot loses density from the outside in so that it appears to shrink.
• After about 2 months, only a small hypodensity may remain (Fig. 25-19; Box 25-1).
! On MRI, the changes in the appearance of hemorrhage over time are more dramatic. MRI is sensitive to changing effects
whatever reason, affects these sensitive and susceptible watershed areas the most.
The most common finding of an acute, nonhemor-rhagic stroke is a normal CT scan (less than 24
hours old). If multiple vascular distributions are involved, emboli or vasculitis should be thought of as the cause. If the stroke crosses or falls between vascular territories, then hypoperfusion due to hypotension (watershed infarcts) should be considered.
! Table 25-6 briefly summarizes the four major vascular dis-tribution patterns of strokes and some of the symptoms associated with each.
! Recognizing ischemic stroke• On CT, the findings will depend on the amount of time
that has elapsed since the original event.• 12-24 hours: Indistinct area of low attenuation in a
vascular distribution.• >24 hours: Better circumscribed lesion with mass effect
that peaks at 3 to 5 days and usually disappears by 2 to 4 weeks (Fig. 25-17A).
• 72 hours: Though contrast is rarely used in the setting of acute stroke, contrast enhancement typically occurs when the mass effect is waning or has disappeared.
• >4 weeks: Mass effect disappears; there is now a well-circumscribed, low attenuation lesion with no contrast enhancement (Fig. 25-17B).
Hemorrhagic Stroke
! Hemorrhage occurs in about 15% of strokes. Hemorrhage is associated with a higher morbidity and mortality than
Figure 25-16 CT and diffusion-weighted MRI in acute stroke. A, The CT scan in this patient with symptoms for 2 hours prior to the study is normal. B, A diffusion-weighted MRI scan on the same patient a few minutes later shows an area of abnormally bright signal intensity in the right parietal lobe (solid white arrow). Diffusion-weighted imaging (DWI) is an MRI sequence that can be rapidly acquired and which is extremely sensitive to detecting abnormalities in normal water movement in the brain so that it can identify a stroke within minutes after the event.
A B
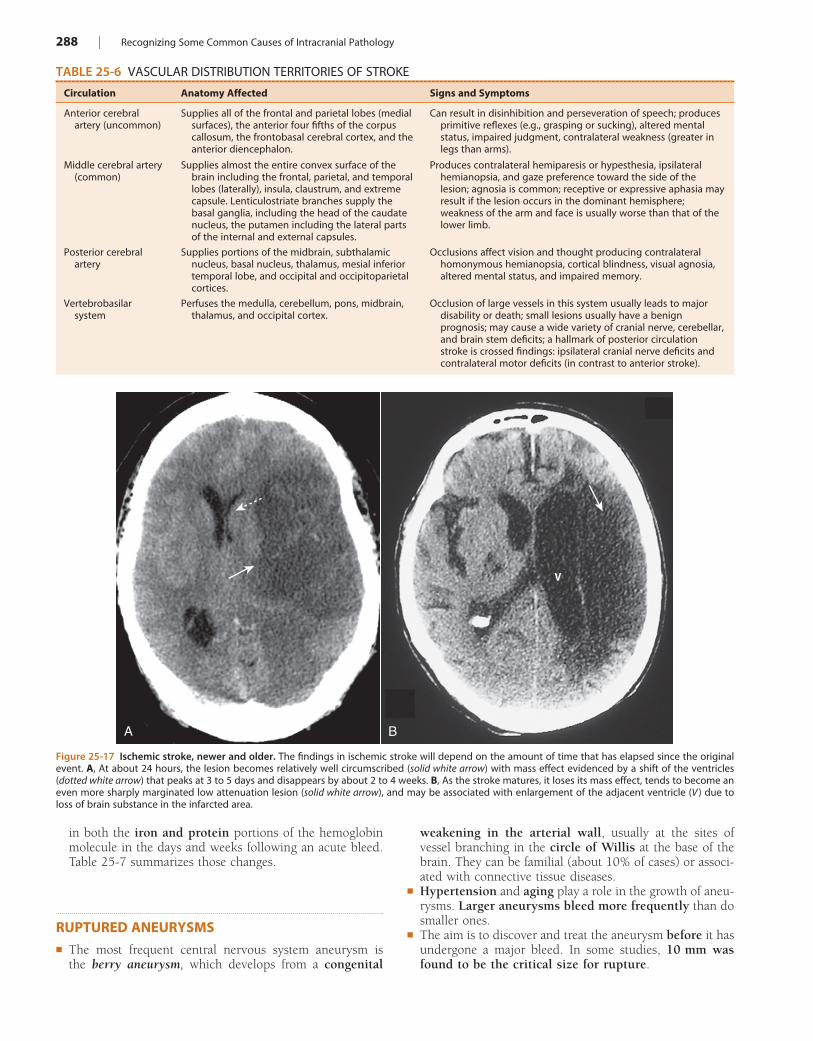
288 | Recognizing Some Common Causes of Intracranial Pathology
TABLE 25-6 VASCULAR DISTRIBUTION TERRITORIES OF STROKE
Circulation Anatomy Affected Signs and Symptoms
Anterior cerebral artery (uncommon)
Supplies all of the frontal and parietal lobes (medial surfaces), the anterior four fifths of the corpus callosum, the frontobasal cerebral cortex, and the anterior diencephalon.
Can result in disinhibition and perseveration of speech; produces primitive reflexes (e.g., grasping or sucking), altered mental status, impaired judgment, contralateral weakness (greater in legs than arms).
Middle cerebral artery (common)
Supplies almost the entire convex surface of the brain including the frontal, parietal, and temporal lobes (laterally), insula, claustrum, and extreme capsule. Lenticulostriate branches supply the basal ganglia, including the head of the caudate nucleus, the putamen including the lateral parts of the internal and external capsules.
Produces contralateral hemiparesis or hypesthesia, ipsilateral hemianopsia, and gaze preference toward the side of the lesion; agnosia is common; receptive or expressive aphasia may result if the lesion occurs in the dominant hemisphere; weakness of the arm and face is usually worse than that of the lower limb.
Posterior cerebral artery
Supplies portions of the midbrain, subthalamic nucleus, basal nucleus, thalamus, mesial inferior temporal lobe, and occipital and occipitoparietal cortices.
Occlusions affect vision and thought producing contralateral homonymous hemianopsia, cortical blindness, visual agnosia, altered mental status, and impaired memory.
Vertebrobasilar system
Perfuses the medulla, cerebellum, pons, midbrain, thalamus, and occipital cortex.
Occlusion of large vessels in this system usually leads to major disability or death; small lesions usually have a benign prognosis; may cause a wide variety of cranial nerve, cerebellar, and brain stem deficits; a hallmark of posterior circulation stroke is crossed findings: ipsilateral cranial nerve deficits and contralateral motor deficits (in contrast to anterior stroke).
Figure 25-17 Ischemic stroke, newer and older. The findings in ischemic stroke will depend on the amount of time that has elapsed since the original event. A, At about 24 hours, the lesion becomes relatively well circumscribed (solid white arrow) with mass effect evidenced by a shift of the ventricles (dotted white arrow) that peaks at 3 to 5 days and disappears by about 2 to 4 weeks. B, As the stroke matures, it loses its mass effect, tends to become an even more sharply marginated low attenuation lesion (solid white arrow), and may be associated with enlargement of the adjacent ventricle (V ) due to loss of brain substance in the infarcted area.
A B
V
in both the iron and protein portions of the hemoglobin molecule in the days and weeks following an acute bleed. Table 25-7 summarizes those changes.
RUPTURED ANEURYSMS! The most frequent central nervous system aneurysm is
the berry aneurysm, which develops from a congenital
weakening in the arterial wall, usually at the sites of vessel branching in the circle of Willis at the base of the brain. They can be familial (about 10% of cases) or associ-ated with connective tissue diseases.
! Hypertension and aging play a role in the growth of aneu-rysms. Larger aneurysms bleed more frequently than do smaller ones.
! The aim is to discover and treat the aneurysm before it has undergone a major bleed. In some studies, 10 mm was found to be the critical size for rupture.
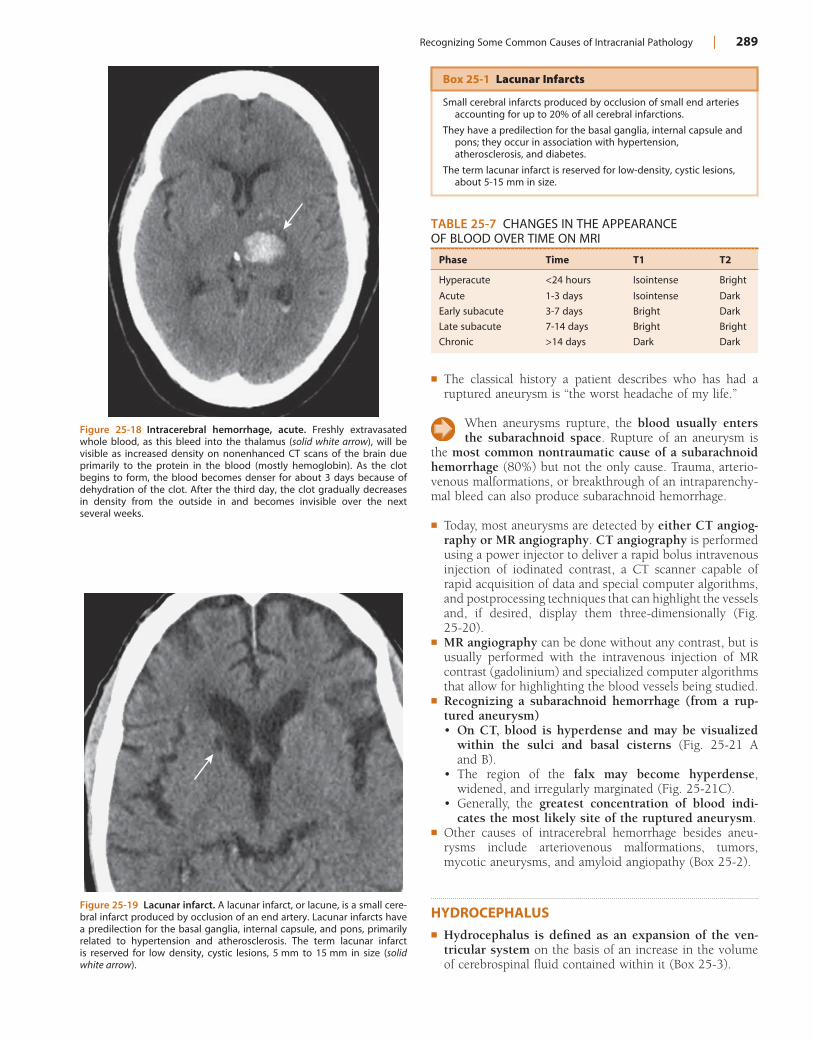
Recognizing Some Common Causes of Intracranial Pathology | 289
Figure 25-18 Intracerebral hemorrhage, acute. Freshly extravasated whole blood, as this bleed into the thalamus (solid white arrow), will be visible as increased density on nonenhanced CT scans of the brain due primarily to the protein in the blood (mostly hemoglobin). As the clot begins to form, the blood becomes denser for about 3 days because of dehydration of the clot. After the third day, the clot gradually decreases in density from the outside in and becomes invisible over the next several weeks.
Figure 25-19 Lacunar infarct. A lacunar infarct, or lacune, is a small cere-bral infarct produced by occlusion of an end artery. Lacunar infarcts have a predilection for the basal ganglia, internal capsule, and pons, primarily related to hypertension and atherosclerosis. The term lacunar infarct is reserved for low density, cystic lesions, 5 mm to 15 mm in size (solid white arrow).
Box 25-1 Lacunar Infarcts
Small cerebral infarcts produced by occlusion of small end arteries accounting for up to 20% of all cerebral infarctions.
They have a predilection for the basal ganglia, internal capsule and pons; they occur in association with hypertension, atherosclerosis, and diabetes.
The term lacunar infarct is reserved for low-density, cystic lesions, about 5-15 mm in size.
TABLE 25-7 CHANGES IN THE APPEARANCE OF BLOOD OVER TIME ON MRI
Phase Time T1 T2
Hyperacute <24 hours Isointense Bright
Acute 1-3 days Isointense Dark
Early subacute 3-7 days Bright Dark
Late subacute 7-14 days Bright Bright
Chronic >14 days Dark Dark
! The classical history a patient describes who has had a ruptured aneurysm is “the worst headache of my life.”
When aneurysms rupture, the blood usually enters the subarachnoid space. Rupture of an aneurysm is
the most common nontraumatic cause of a subarachnoid hemorrhage (80%) but not the only cause. Trauma, arterio-venous malformations, or breakthrough of an intraparenchy-mal bleed can also produce subarachnoid hemorrhage.
! Today, most aneurysms are detected by either CT angiog-raphy or MR angiography. CT angiography is performed using a power injector to deliver a rapid bolus intravenous injection of iodinated contrast, a CT scanner capable of rapid acquisition of data and special computer algorithms, and postprocessing techniques that can highlight the vessels and, if desired, display them three-dimensionally (Fig. 25-20).
! MR angiography can be done without any contrast, but is usually performed with the intravenous injection of MR contrast (gadolinium) and specialized computer algorithms that allow for highlighting the blood vessels being studied.
! Recognizing a subarachnoid hemorrhage (from a rup-tured aneurysm)• On CT, blood is hyperdense and may be visualized
within the sulci and basal cisterns (Fig. 25-21 A and B).
• The region of the falx may become hyperdense, widened, and irregularly marginated (Fig. 25-21C).
• Generally, the greatest concentration of blood indi-cates the most likely site of the ruptured aneurysm.
! Other causes of intracerebral hemorrhage besides aneu-rysms include arteriovenous malformations, tumors, mycotic aneurysms, and amyloid angiopathy (Box 25-2).
HYDROCEPHALUS! Hydrocephalus is defined as an expansion of the ven-
tricular system on the basis of an increase in the volume of cerebrospinal fluid contained within it (Box 25-3).
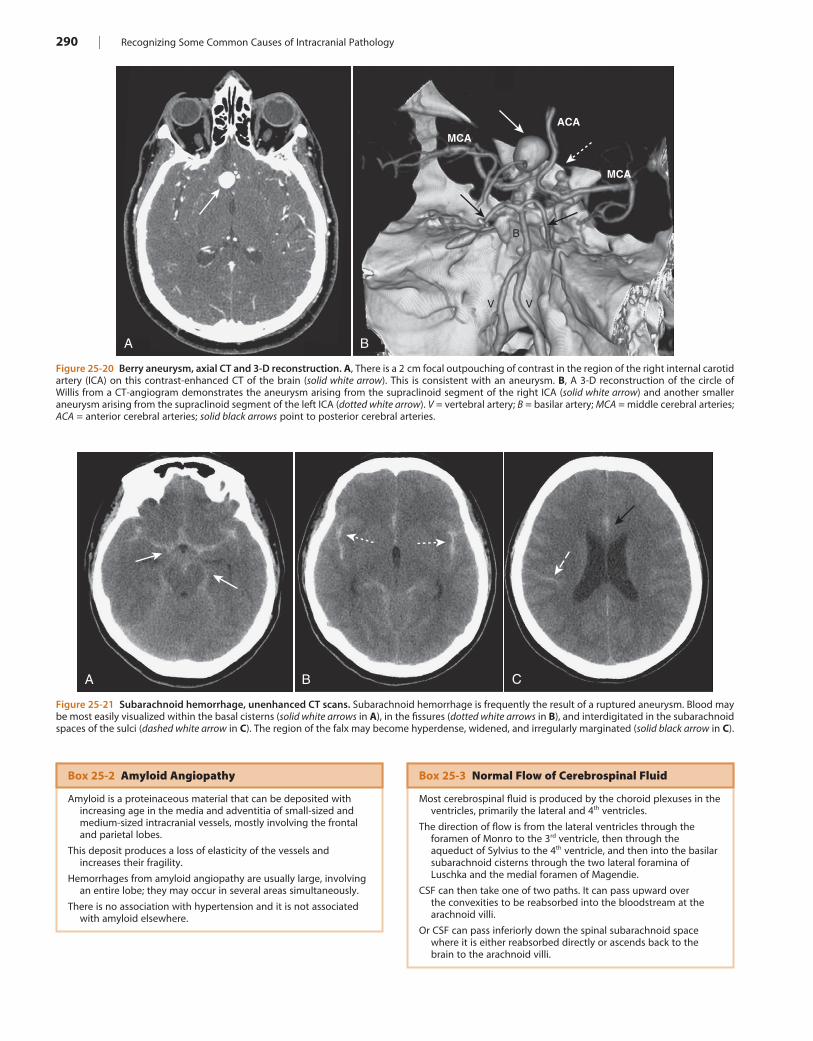
290 | Recognizing Some Common Causes of Intracranial Pathology
Figure 25-20 Berry aneurysm, axial CT and 3-D reconstruction. A, There is a 2 cm focal outpouching of contrast in the region of the right internal carotid artery (ICA) on this contrast-enhanced CT of the brain (solid white arrow). This is consistent with an aneurysm. B, A 3-D reconstruction of the circle of Willis from a CT-angiogram demonstrates the aneurysm arising from the supraclinoid segment of the right ICA (solid white arrow) and another smaller aneurysm arising from the supraclinoid segment of the left ICA (dotted white arrow). V = vertebral artery; B = basilar artery; MCA = middle cerebral arteries; ACA = anterior cerebral arteries; solid black arrows point to posterior cerebral arteries.
A B
B
V V
MCAACA
MCA
Figure 25-21 Subarachnoid hemorrhage, unenhanced CT scans. Subarachnoid hemorrhage is frequently the result of a ruptured aneurysm. Blood may be most easily visualized within the basal cisterns (solid white arrows in A), in the fissures (dotted white arrows in B), and interdigitated in the subarachnoid spaces of the sulci (dashed white arrow in C). The region of the falx may become hyperdense, widened, and irregularly marginated (solid black arrow in C).
A B C
Box 25-3 Normal Flow of Cerebrospinal Fluid
Most cerebrospinal fluid is produced by the choroid plexuses in the ventricles, primarily the lateral and 4th ventricles.
The direction of flow is from the lateral ventricles through the foramen of Monro to the 3rd ventricle, then through the aqueduct of Sylvius to the 4th ventricle, and then into the basilar subarachnoid cisterns through the two lateral foramina of Luschka and the medial foramen of Magendie.
CSF can then take one of two paths. It can pass upward over the convexities to be reabsorbed into the bloodstream at the arachnoid villi.
Or CSF can pass inferiorly down the spinal subarachnoid space where it is either reabsorbed directly or ascends back to the brain to the arachnoid villi.
Box 25-2 Amyloid Angiopathy
Amyloid is a proteinaceous material that can be deposited with increasing age in the media and adventitia of small-sized and medium-sized intracranial vessels, mostly involving the frontal and parietal lobes.
This deposit produces a loss of elasticity of the vessels and increases their fragility.
Hemorrhages from amyloid angiopathy are usually large, involving an entire lobe; they may occur in several areas simultaneously.
There is no association with hypertension and it is not associated with amyloid elsewhere.
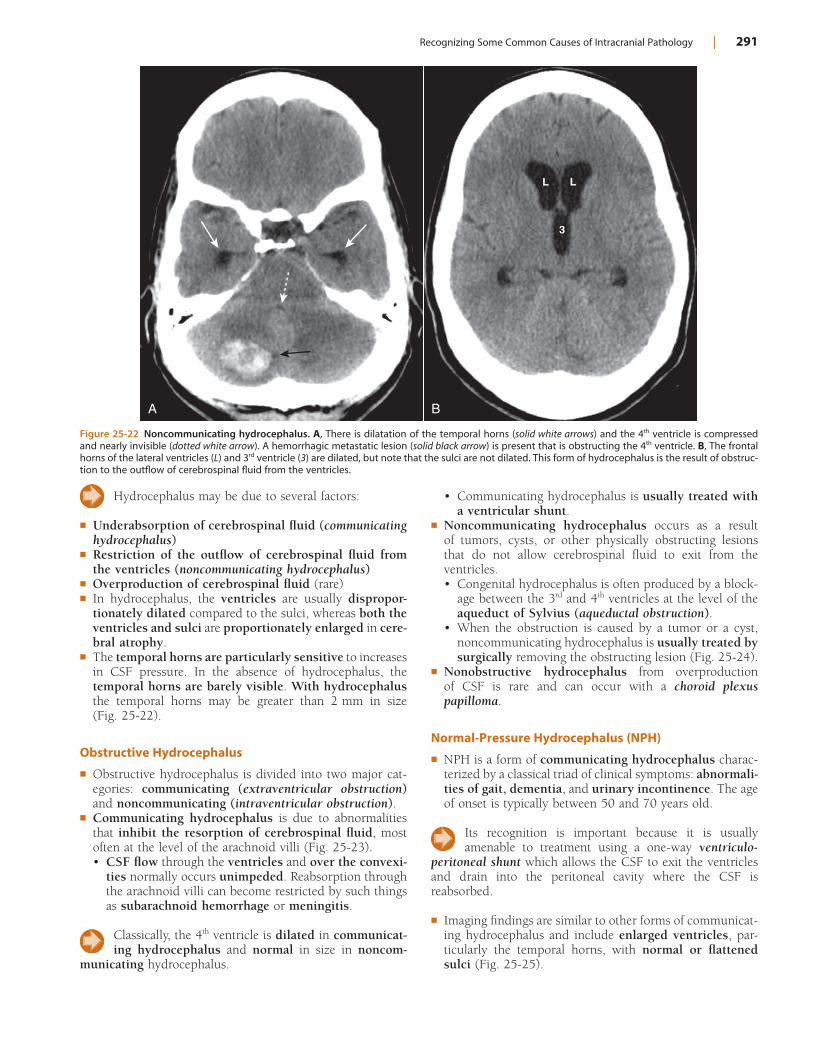
Recognizing Some Common Causes of Intracranial Pathology | 291
• Communicating hydrocephalus is usually treated with a ventricular shunt.
! Noncommunicating hydrocephalus occurs as a result of tumors, cysts, or other physically obstructing lesions that do not allow cerebrospinal fluid to exit from the ventricles.• Congenital hydrocephalus is often produced by a block-
age between the 3rd and 4th ventricles at the level of the aqueduct of Sylvius (aqueductal obstruction).
• When the obstruction is caused by a tumor or a cyst, noncommunicating hydrocephalus is usually treated by surgically removing the obstructing lesion (Fig. 25-24).
! Nonobstructive hydrocephalus from overproduction of CSF is rare and can occur with a choroid plexus papilloma.
Normal-Pressure Hydrocephalus (NPH)
! NPH is a form of communicating hydrocephalus charac-terized by a classical triad of clinical symptoms: abnormali-ties of gait, dementia, and urinary incontinence. The age of onset is typically between 50 and 70 years old.
Its recognition is important because it is usually amenable to treatment using a one-way ventriculo-
peritoneal shunt which allows the CSF to exit the ventricles and drain into the peritoneal cavity where the CSF is reabsorbed.
! Imaging findings are similar to other forms of communicat-ing hydrocephalus and include enlarged ventricles, par-ticularly the temporal horns, with normal or flattened sulci (Fig. 25-25).
Hydrocephalus may be due to several factors:
! Underabsorption of cerebrospinal fluid (communicating hydrocephalus)
! Restriction of the outflow of cerebrospinal fluid from the ventricles (noncommunicating hydrocephalus)
! Overproduction of cerebrospinal fluid (rare)! In hydrocephalus, the ventricles are usually dispropor-
tionately dilated compared to the sulci, whereas both the ventricles and sulci are proportionately enlarged in cere-bral atrophy.
! The temporal horns are particularly sensitive to increases in CSF pressure. In the absence of hydrocephalus, the temporal horns are barely visible. With hydrocephalus the temporal horns may be greater than 2 mm in size (Fig. 25-22).
Obstructive Hydrocephalus
! Obstructive hydrocephalus is divided into two major cat-egories: communicating (extraventricular obstruction) and noncommunicating (intraventricular obstruction).
! Communicating hydrocephalus is due to abnormalities that inhibit the resorption of cerebrospinal fluid, most often at the level of the arachnoid villi (Fig. 25-23).• CSF flow through the ventricles and over the convexi-
ties normally occurs unimpeded. Reabsorption through the arachnoid villi can become restricted by such things as subarachnoid hemorrhage or meningitis.
Classically, the 4th ventricle is dilated in communicat-ing hydrocephalus and normal in size in noncom-
municating hydrocephalus.
Figure 25-22 Noncommunicating hydrocephalus. A, There is dilatation of the temporal horns (solid white arrows) and the 4th ventricle is compressed and nearly invisible (dotted white arrow). A hemorrhagic metastatic lesion (solid black arrow) is present that is obstructing the 4th ventricle. B, The frontal horns of the lateral ventricles (L) and 3rd ventricle (3) are dilated, but note that the sulci are not dilated. This form of hydrocephalus is the result of obstruc-tion to the outflow of cerebrospinal fluid from the ventricles.
A
L L
3
B
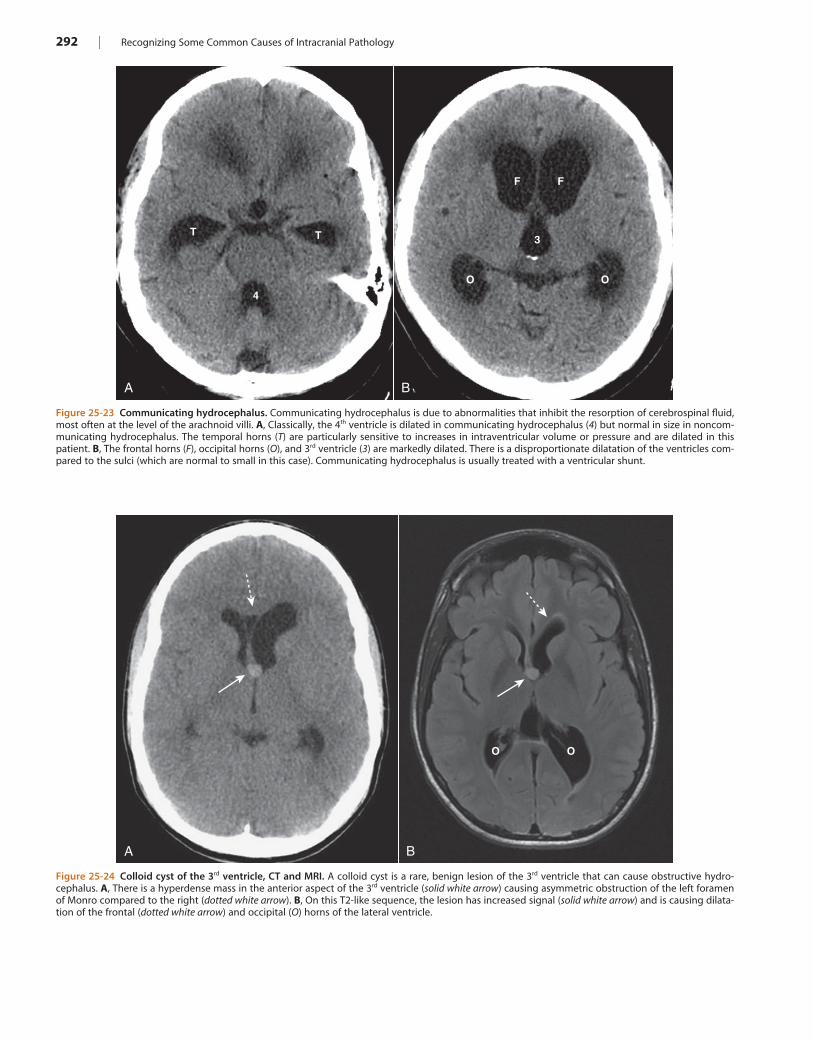
292 | Recognizing Some Common Causes of Intracranial Pathology
Figure 25-23 Communicating hydrocephalus. Communicating hydrocephalus is due to abnormalities that inhibit the resorption of cerebrospinal fluid, most often at the level of the arachnoid villi. A, Classically, the 4th ventricle is dilated in communicating hydrocephalus (4) but normal in size in noncom-municating hydrocephalus. The temporal horns (T) are particularly sensitive to increases in intraventricular volume or pressure and are dilated in this patient. B, The frontal horns (F), occipital horns (O), and 3rd ventricle (3) are markedly dilated. There is a disproportionate dilatation of the ventricles com-pared to the sulci (which are normal to small in this case). Communicating hydrocephalus is usually treated with a ventricular shunt.
A B
F F
3
O O
T T
4
Figure 25-24 Colloid cyst of the 3rd ventricle, CT and MRI. A colloid cyst is a rare, benign lesion of the 3rd ventricle that can cause obstructive hydro-cephalus. A, There is a hyperdense mass in the anterior aspect of the 3rd ventricle (solid white arrow) causing asymmetric obstruction of the left foramen of Monro compared to the right (dotted white arrow). B, On this T2-like sequence, the lesion has increased signal (solid white arrow) and is causing dilata-tion of the frontal (dotted white arrow) and occipital (O) horns of the lateral ventricle.
A B
O O
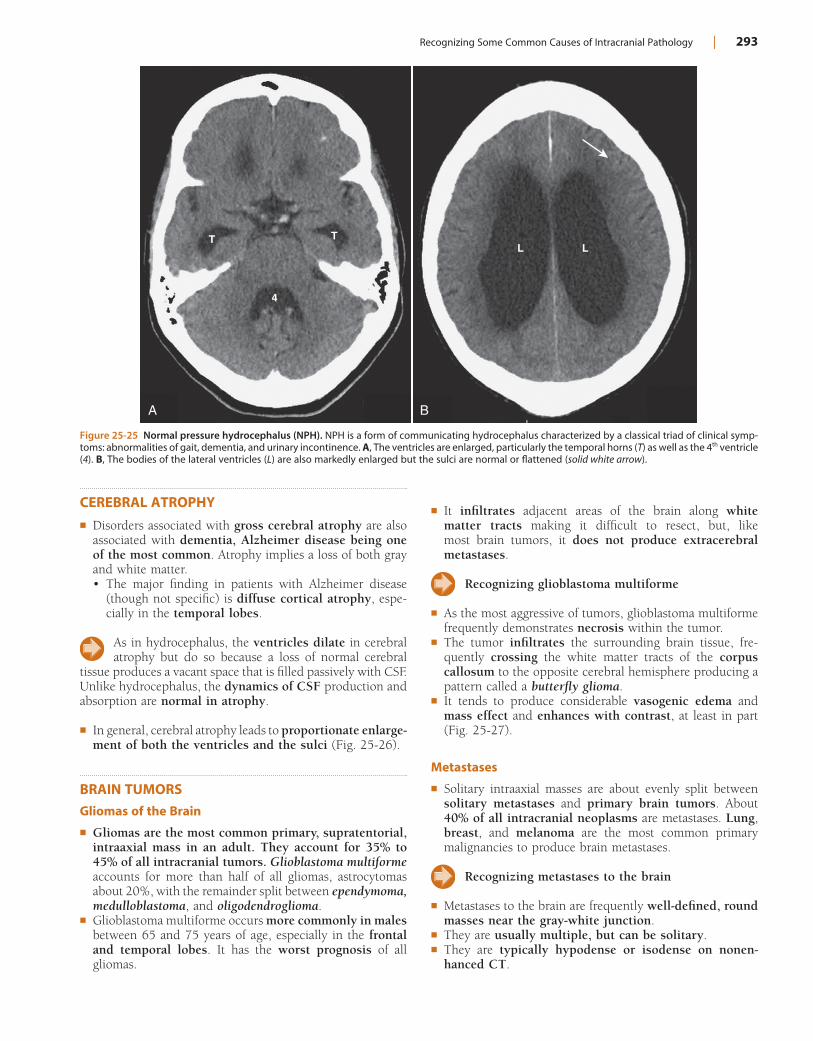
Recognizing Some Common Causes of Intracranial Pathology | 293
Figure 25-25 Normal pressure hydrocephalus (NPH). NPH is a form of communicating hydrocephalus characterized by a classical triad of clinical symp-toms: abnormalities of gait, dementia, and urinary incontinence. A, The ventricles are enlarged, particularly the temporal horns (T) as well as the 4th ventricle (4). B, The bodies of the lateral ventricles (L) are also markedly enlarged but the sulci are normal or flattened (solid white arrow).
A B
L LTT
4
CEREBRAL ATROPHY! Disorders associated with gross cerebral atrophy are also
associated with dementia, Alzheimer disease being one of the most common. Atrophy implies a loss of both gray and white matter.• The major finding in patients with Alzheimer disease
(though not specific) is diffuse cortical atrophy, espe-cially in the temporal lobes.
As in hydrocephalus, the ventricles dilate in cerebral atrophy but do so because a loss of normal cerebral
tissue produces a vacant space that is filled passively with CSF. Unlike hydrocephalus, the dynamics of CSF production and absorption are normal in atrophy.
! In general, cerebral atrophy leads to proportionate enlarge-ment of both the ventricles and the sulci (Fig. 25-26).
BRAIN TUMORSGliomas of the Brain
! Gliomas are the most common primary, supratentorial, intraaxial mass in an adult. They account for 35% to 45% of all intracranial tumors. Glioblastoma multiforme accounts for more than half of all gliomas, astrocytomas about 20%, with the remainder split between ependymoma, medulloblastoma, and oligodendroglioma.
! Glioblastoma multiforme occurs more commonly in males between 65 and 75 years of age, especially in the frontal and temporal lobes. It has the worst prognosis of all gliomas.
! It infiltrates adjacent areas of the brain along white matter tracts making it difficult to resect, but, like most brain tumors, it does not produce extracerebral metastases.
Recognizing glioblastoma multiforme
! As the most aggressive of tumors, glioblastoma multiforme frequently demonstrates necrosis within the tumor.
! The tumor infiltrates the surrounding brain tissue, fre-quently crossing the white matter tracts of the corpus callosum to the opposite cerebral hemisphere producing a pattern called a butterfly glioma.
! It tends to produce considerable vasogenic edema and mass effect and enhances with contrast, at least in part (Fig. 25-27).
Metastases
! Solitary intraaxial masses are about evenly split between solitary metastases and primary brain tumors. About 40% of all intracranial neoplasms are metastases. Lung, breast, and melanoma are the most common primary malignancies to produce brain metastases.
Recognizing metastases to the brain
! Metastases to the brain are frequently well-defined, round masses near the gray-white junction.
! They are usually multiple, but can be solitary.! They are typically hypodense or isodense on nonen-
hanced CT.
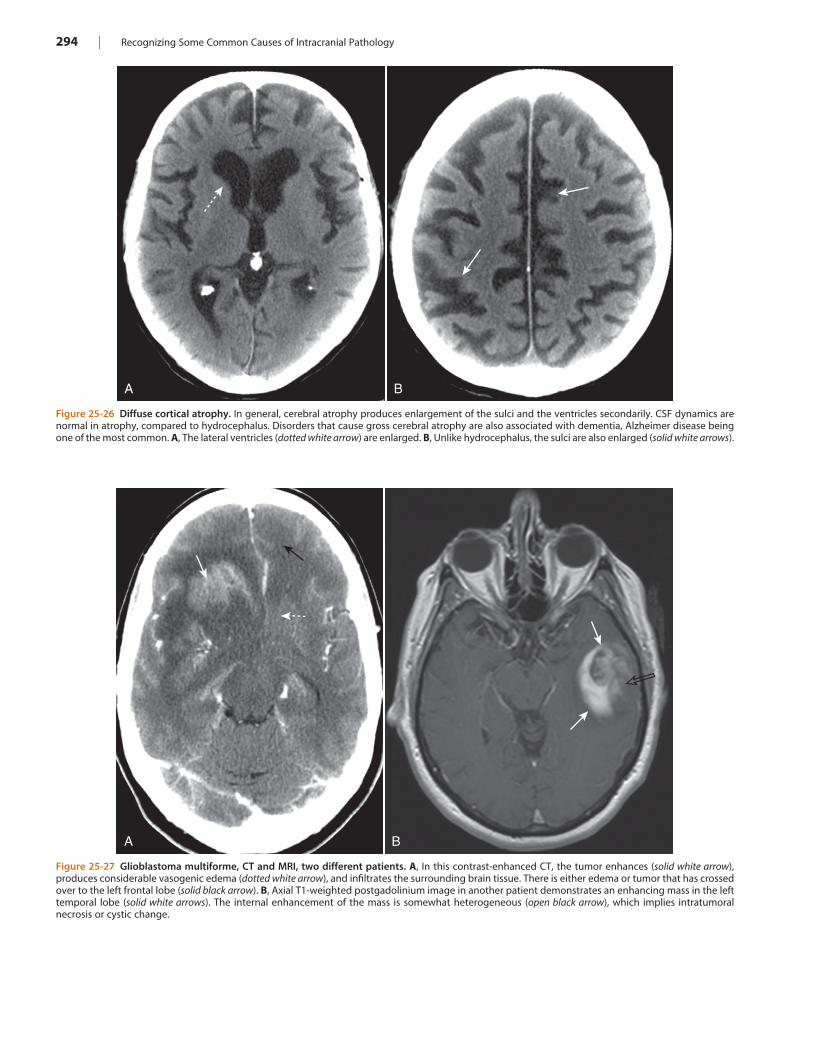
294 | Recognizing Some Common Causes of Intracranial Pathology
Figure 25-26 Diffuse cortical atrophy. In general, cerebral atrophy produces enlargement of the sulci and the ventricles secondarily. CSF dynamics are normal in atrophy, compared to hydrocephalus. Disorders that cause gross cerebral atrophy are also associated with dementia, Alzheimer disease being one of the most common. A, The lateral ventricles (dotted white arrow) are enlarged. B, Unlike hydrocephalus, the sulci are also enlarged (solid white arrows).
A B
Figure 25-27 Glioblastoma multiforme, CT and MRI, two different patients. A, In this contrast-enhanced CT, the tumor enhances (solid white arrow), produces considerable vasogenic edema (dotted white arrow), and infiltrates the surrounding brain tissue. There is either edema or tumor that has crossed over to the left frontal lobe (solid black arrow). B, Axial T1-weighted postgadolinium image in another patient demonstrates an enhancing mass in the left temporal lobe (solid white arrows). The internal enhancement of the mass is somewhat heterogeneous (open black arrow), which implies intratumoral necrosis or cystic change.
A B
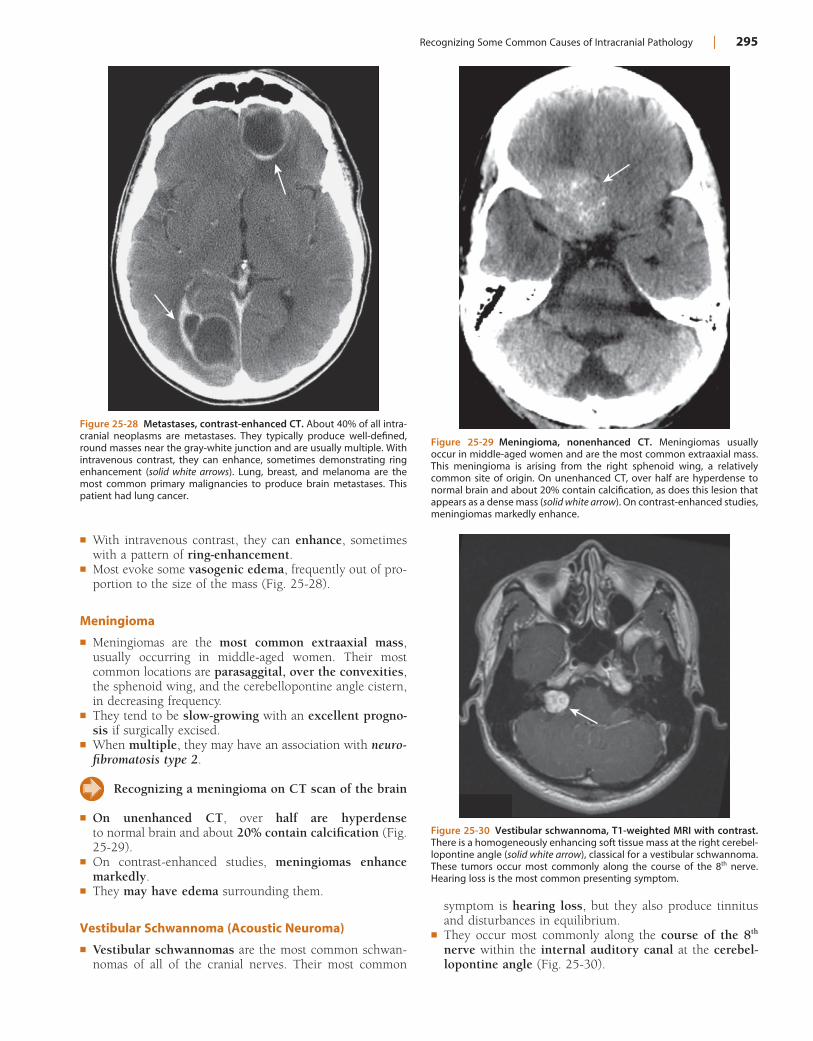
Recognizing Some Common Causes of Intracranial Pathology | 295
! With intravenous contrast, they can enhance, sometimes with a pattern of ring-enhancement.
! Most evoke some vasogenic edema, frequently out of pro-portion to the size of the mass (Fig. 25-28).
Meningioma
! Meningiomas are the most common extraaxial mass, usually occurring in middle-aged women. Their most common locations are parasaggital, over the convexities, the sphenoid wing, and the cerebellopontine angle cistern, in decreasing frequency.
! They tend to be slow-growing with an excellent progno-sis if surgically excised.
! When multiple, they may have an association with neuro-fibromatosis type 2.
Recognizing a meningioma on CT scan of the brain
! On unenhanced CT, over half are hyperdense to normal brain and about 20% contain calcification (Fig. 25-29).
! On contrast-enhanced studies, meningiomas enhance markedly.
! They may have edema surrounding them.
Vestibular Schwannoma (Acoustic Neuroma)
! Vestibular schwannomas are the most common schwan-nomas of all of the cranial nerves. Their most common
Figure 25-28 Metastases, contrast-enhanced CT. About 40% of all intra-cranial neoplasms are metastases. They typically produce well-defined, round masses near the gray-white junction and are usually multiple. With intravenous contrast, they can enhance, sometimes demonstrating ring enhancement (solid white arrows). Lung, breast, and melanoma are the most common primary malignancies to produce brain metastases. This patient had lung cancer.
Figure 25-29 Meningioma, nonenhanced CT. Meningiomas usually occur in middle-aged women and are the most common extraaxial mass. This meningioma is arising from the right sphenoid wing, a relatively common site of origin. On unenhanced CT, over half are hyperdense to normal brain and about 20% contain calcification, as does this lesion that appears as a dense mass (solid white arrow). On contrast-enhanced studies, meningiomas markedly enhance.
Figure 25-30 Vestibular schwannoma, T1-weighted MRI with contrast. There is a homogeneously enhancing soft tissue mass at the right cerebel-lopontine angle (solid white arrow), classical for a vestibular schwannoma. These tumors occur most commonly along the course of the 8th nerve. Hearing loss is the most common presenting symptom.
symptom is hearing loss, but they also produce tinnitus and disturbances in equilibrium.
! They occur most commonly along the course of the 8th nerve within the internal auditory canal at the cerebel-lopontine angle (Fig. 25-30).
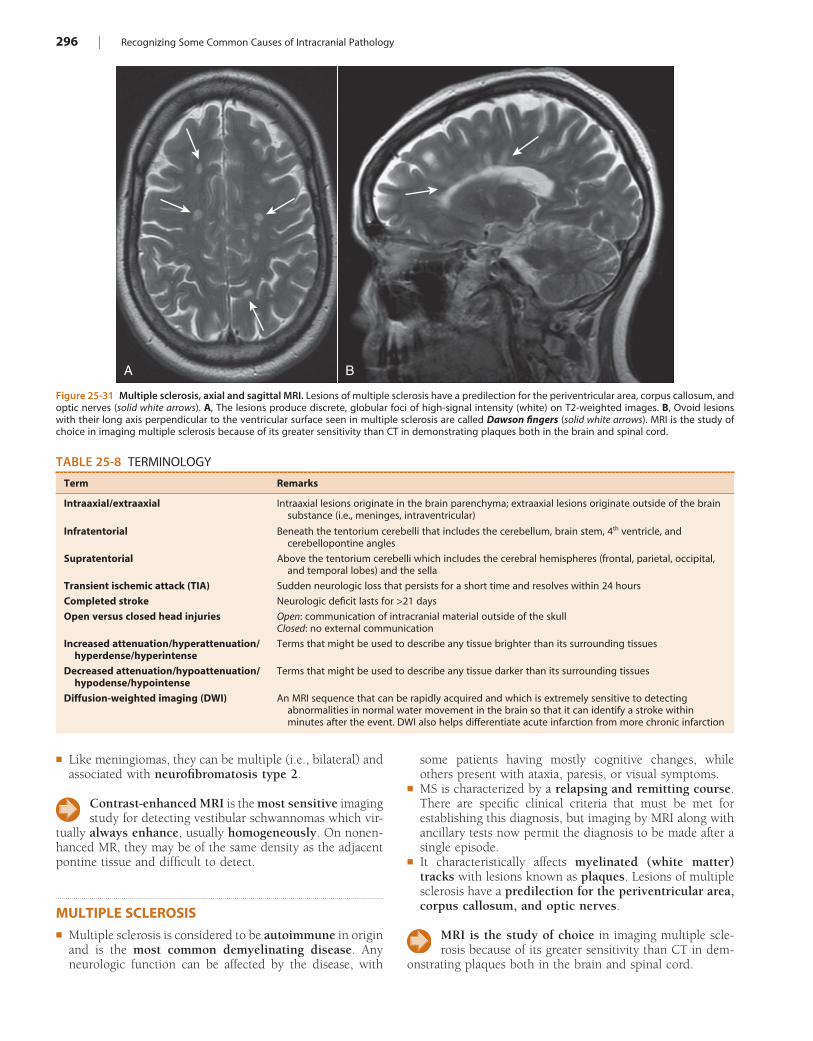
296 | Recognizing Some Common Causes of Intracranial Pathology
Figure 25-31 Multiple sclerosis, axial and sagittal MRI. Lesions of multiple sclerosis have a predilection for the periventricular area, corpus callosum, and optic nerves (solid white arrows). A, The lesions produce discrete, globular foci of high-signal intensity (white) on T2-weighted images. B, Ovoid lesions with their long axis perpendicular to the ventricular surface seen in multiple sclerosis are called Dawson fingers (solid white arrows). MRI is the study of choice in imaging multiple sclerosis because of its greater sensitivity than CT in demonstrating plaques both in the brain and spinal cord.
A B
TABLE 25-8 TERMINOLOGY
Term Remarks
Intraaxial/extraaxial Intraaxial lesions originate in the brain parenchyma; extraaxial lesions originate outside of the brain substance (i.e., meninges, intraventricular)
Infratentorial Beneath the tentorium cerebelli that includes the cerebellum, brain stem, 4th ventricle, and cerebellopontine angles
Supratentorial Above the tentorium cerebelli which includes the cerebral hemispheres (frontal, parietal, occipital, and temporal lobes) and the sella
Transient ischemic attack (TIA) Sudden neurologic loss that persists for a short time and resolves within 24 hours
Completed stroke Neurologic deficit lasts for >21 days
Open versus closed head injuries Open: communication of intracranial material outside of the skullClosed: no external communication
Increased attenuation/hyperattenuation/ hyperdense/hyperintense
Terms that might be used to describe any tissue brighter than its surrounding tissues
Decreased attenuation/hypoattenuation/ hypodense/hypointense
Terms that might be used to describe any tissue darker than its surrounding tissues
Diffusion-weighted imaging (DWI) An MRI sequence that can be rapidly acquired and which is extremely sensitive to detecting abnormalities in normal water movement in the brain so that it can identify a stroke within minutes after the event. DWI also helps differentiate acute infarction from more chronic infarction
! Like meningiomas, they can be multiple (i.e., bilateral) and associated with neurofibromatosis type 2.
Contrast-enhanced MRI is the most sensitive imaging study for detecting vestibular schwannomas which vir-
tually always enhance, usually homogeneously. On nonen-hanced MR, they may be of the same density as the adjacent pontine tissue and difficult to detect.
MULTIPLE SCLEROSIS! Multiple sclerosis is considered to be autoimmune in origin
and is the most common demyelinating disease. Any neurologic function can be affected by the disease, with
some patients having mostly cognitive changes, while others present with ataxia, paresis, or visual symptoms.
! MS is characterized by a relapsing and remitting course. There are specific clinical criteria that must be met for establishing this diagnosis, but imaging by MRI along with ancillary tests now permit the diagnosis to be made after a single episode.
! It characteristically affects myelinated (white matter) tracks with lesions known as plaques. Lesions of multiple sclerosis have a predilection for the periventricular area, corpus callosum, and optic nerves.
MRI is the study of choice in imaging multiple scle-rosis because of its greater sensitivity than CT in dem-
onstrating plaques both in the brain and spinal cord.
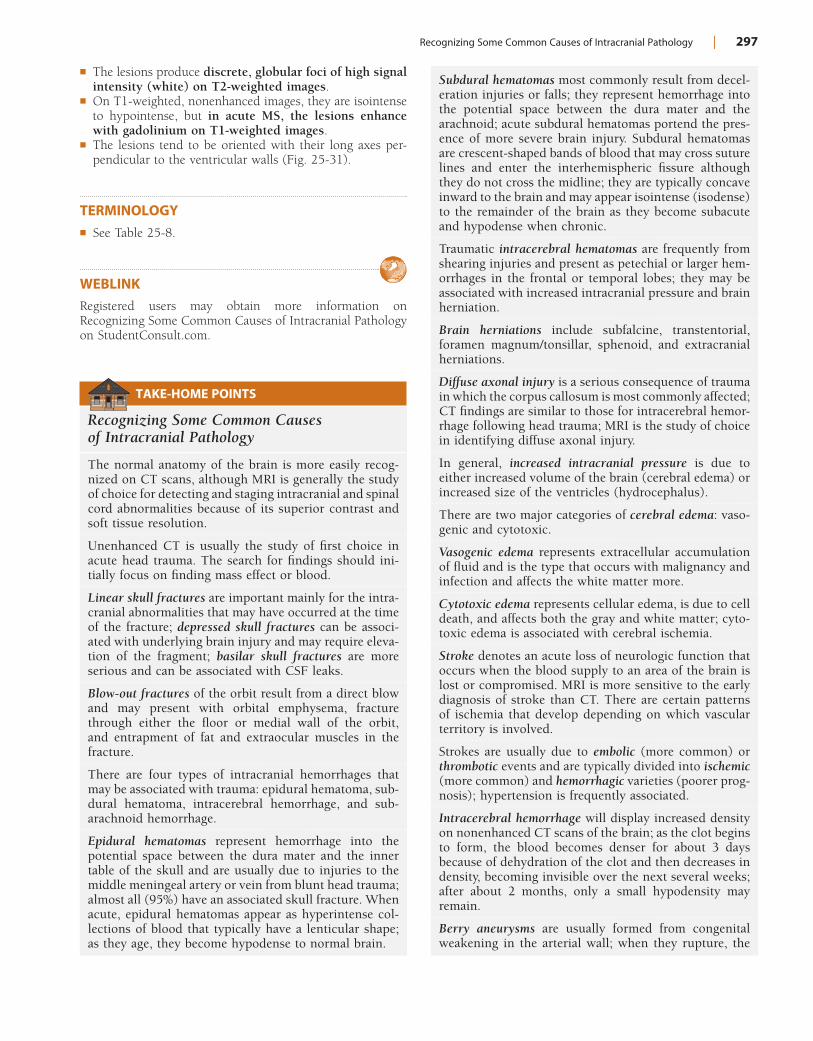
Recognizing Some Common Causes of Intracranial Pathology | 297
TAKE-HOME POINTS
Recognizing Some Common Causes of Intracranial Pathology
The normal anatomy of the brain is more easily recog-nized on CT scans, although MRI is generally the study of choice for detecting and staging intracranial and spinal cord abnormalities because of its superior contrast and soft tissue resolution.
Unenhanced CT is usually the study of first choice in acute head trauma. The search for findings should ini-tially focus on finding mass effect or blood.
Linear skull fractures are important mainly for the intra-cranial abnormalities that may have occurred at the time of the fracture; depressed skull fractures can be associ-ated with underlying brain injury and may require eleva-tion of the fragment; basilar skull fractures are more serious and can be associated with CSF leaks.
Blow-out fractures of the orbit result from a direct blow and may present with orbital emphysema, fracture through either the floor or medial wall of the orbit, and entrapment of fat and extraocular muscles in the fracture.
There are four types of intracranial hemorrhages that may be associated with trauma: epidural hematoma, sub-dural hematoma, intracerebral hemorrhage, and sub-arachnoid hemorrhage.
Epidural hematomas represent hemorrhage into the potential space between the dura mater and the inner table of the skull and are usually due to injuries to the middle meningeal artery or vein from blunt head trauma; almost all (95%) have an associated skull fracture. When acute, epidural hematomas appear as hyperintense col-lections of blood that typically have a lenticular shape; as they age, they become hypodense to normal brain.
! The lesions produce discrete, globular foci of high signal intensity (white) on T2-weighted images.
! On T1-weighted, nonenhanced images, they are isointense to hypointense, but in acute MS, the lesions enhance with gadolinium on T1-weighted images.
! The lesions tend to be oriented with their long axes per-pendicular to the ventricular walls (Fig. 25-31).
TERMINOLOGY! See Table 25-8.
WEBLINKRegistered users may obtain more information on Recognizing Some Common Causes of Intracranial Pathology on StudentConsult.com.
Subdural hematomas most commonly result from decel-eration injuries or falls; they represent hemorrhage into the potential space between the dura mater and the arachnoid; acute subdural hematomas portend the pres-ence of more severe brain injury. Subdural hematomas are crescent-shaped bands of blood that may cross suture lines and enter the interhemispheric fissure although they do not cross the midline; they are typically concave inward to the brain and may appear isointense (isodense) to the remainder of the brain as they become subacute and hypodense when chronic.
Traumatic intracerebral hematomas are frequently from shearing injuries and present as petechial or larger hem-orrhages in the frontal or temporal lobes; they may be associated with increased intracranial pressure and brain herniation.
Brain herniations include subfalcine, transtentorial, foramen magnum/tonsillar, sphenoid, and extracranial herniations.
Diffuse axonal injury is a serious consequence of trauma in which the corpus callosum is most commonly affected; CT findings are similar to those for intracerebral hemor-rhage following head trauma; MRI is the study of choice in identifying diffuse axonal injury.
In general, increased intracranial pressure is due to either increased volume of the brain (cerebral edema) or increased size of the ventricles (hydrocephalus).
There are two major categories of cerebral edema: vaso-genic and cytotoxic.
Vasogenic edema represents extracellular accumulation of fluid and is the type that occurs with malignancy and infection and affects the white matter more.
Cytotoxic edema represents cellular edema, is due to cell death, and affects both the gray and white matter; cyto-toxic edema is associated with cerebral ischemia.
Stroke denotes an acute loss of neurologic function that occurs when the blood supply to an area of the brain is lost or compromised. MRI is more sensitive to the early diagnosis of stroke than CT. There are certain patterns of ischemia that develop depending on which vascular territory is involved.
Strokes are usually due to embolic (more common) or thrombotic events and are typically divided into ischemic (more common) and hemorrhagic varieties (poorer prog-nosis); hypertension is frequently associated.
Intracerebral hemorrhage will display increased density on nonenhanced CT scans of the brain; as the clot begins to form, the blood becomes denser for about 3 days because of dehydration of the clot and then decreases in density, becoming invisible over the next several weeks; after about 2 months, only a small hypodensity may remain.
Berry aneurysms are usually formed from congenital weakening in the arterial wall; when they rupture, the
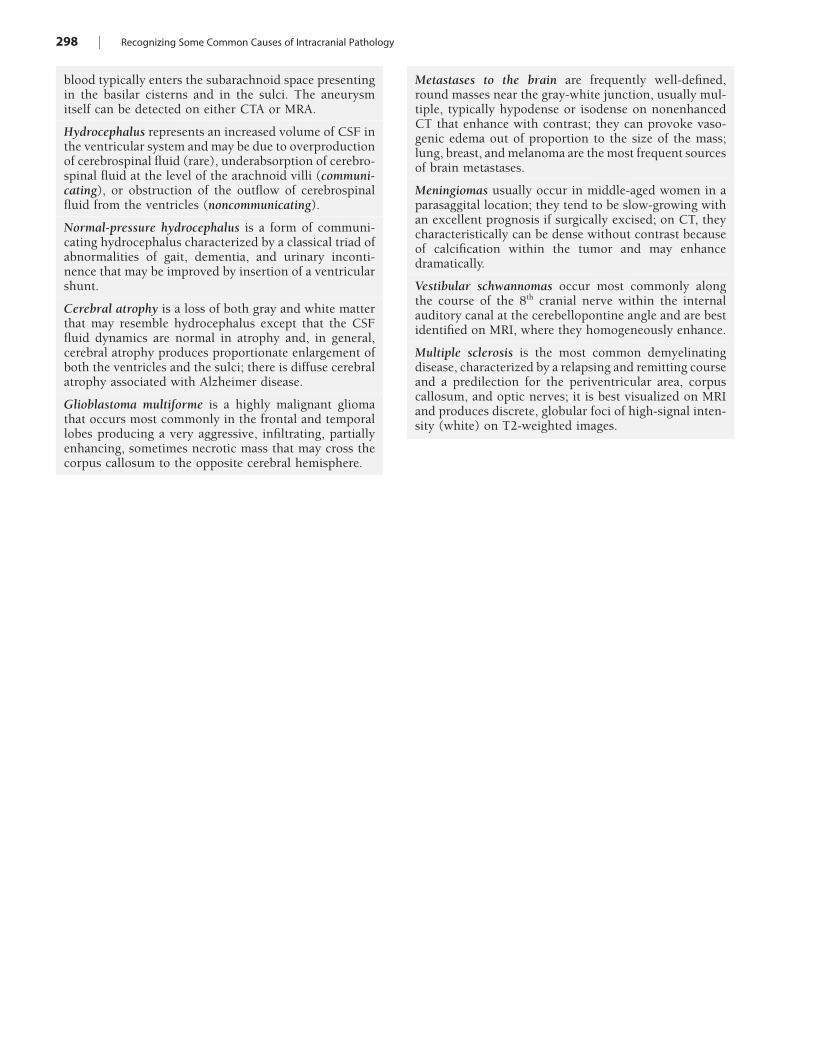
298 | Recognizing Some Common Causes of Intracranial Pathology
blood typically enters the subarachnoid space presenting in the basilar cisterns and in the sulci. The aneurysm itself can be detected on either CTA or MRA.
Hydrocephalus represents an increased volume of CSF in the ventricular system and may be due to overproduction of cerebrospinal fluid (rare), underabsorption of cerebro-spinal fluid at the level of the arachnoid villi (communi-cating), or obstruction of the outflow of cerebrospinal fluid from the ventricles (noncommunicating).
Normal-pressure hydrocephalus is a form of communi-cating hydrocephalus characterized by a classical triad of abnormalities of gait, dementia, and urinary inconti-nence that may be improved by insertion of a ventricular shunt.
Cerebral atrophy is a loss of both gray and white matter that may resemble hydrocephalus except that the CSF fluid dynamics are normal in atrophy and, in general, cerebral atrophy produces proportionate enlargement of both the ventricles and the sulci; there is diffuse cerebral atrophy associated with Alzheimer disease.
Glioblastoma multiforme is a highly malignant glioma that occurs most commonly in the frontal and temporal lobes producing a very aggressive, infiltrating, partially enhancing, sometimes necrotic mass that may cross the corpus callosum to the opposite cerebral hemisphere.
Metastases to the brain are frequently well-defined, round masses near the gray-white junction, usually mul-tiple, typically hypodense or isodense on nonenhanced CT that enhance with contrast; they can provoke vaso-genic edema out of proportion to the size of the mass; lung, breast, and melanoma are the most frequent sources of brain metastases.
Meningiomas usually occur in middle-aged women in a parasaggital location; they tend to be slow-growing with an excellent prognosis if surgically excised; on CT, they characteristically can be dense without contrast because of calcification within the tumor and may enhance dramatically.
Vestibular schwannomas occur most commonly along the course of the 8th cranial nerve within the internal auditory canal at the cerebellopontine angle and are best identified on MRI, where they homogeneously enhance.
Multiple sclerosis is the most common demyelinating disease, characterized by a relapsing and remitting course and a predilection for the periventricular area, corpus callosum, and optic nerves; it is best visualized on MRI and produces discrete, globular foci of high-signal inten-sity (white) on T2-weighted images.
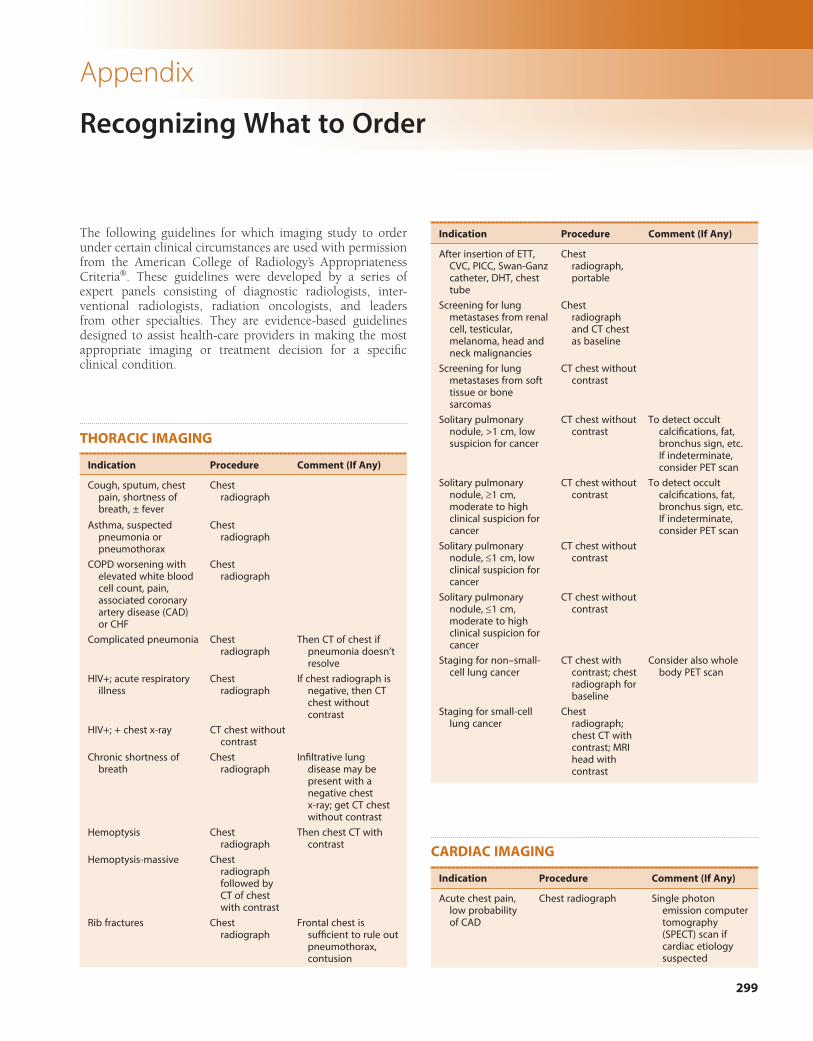
299
Appendix
Recognizing What to Order
The following guidelines for which imaging study to order under certain clinical circumstances are used with permission from the American College of Radiology’s Appropriateness Criteria®. These guidelines were developed by a series of expert panels consisting of diagnostic radiologists, inter-ventional radiologists, radiation oncologists, and leaders from other specialties. They are evidence-based guidelines designed to assist health-care providers in making the most appropriate imaging or treatment decision for a specific clinical condition.
THORACIC IMAGING
Indication Procedure Comment (If Any)
Cough, sputum, chest pain, shortness of breath, ± fever
Chest radiograph
Asthma, suspected pneumonia or pneumothorax
Chest radiograph
COPD worsening with elevated white blood cell count, pain, associated coronary artery disease (CAD) or CHF
Chest radiograph
Complicated pneumonia Chest radiograph
Then CT of chest if pneumonia doesn’t resolve
HIV+; acute respiratory illness
Chest radiograph
If chest radiograph is negative, then CT chest without contrast
HIV+; + chest x-ray CT chest without contrast
Chronic shortness of breath
Chest radiograph
Infiltrative lung disease may be present with a negative chest x-ray; get CT chest without contrast
Hemoptysis Chest radiograph
Then chest CT with contrast
Hemoptysis-massive Chest radiograph followed by CT of chest with contrast
Rib fractures Chest radiograph
Frontal chest is sufficient to rule out pneumothorax, contusion
Indication Procedure Comment (If Any)
After insertion of ETT, CVC, PICC, Swan-Ganz catheter, DHT, chest tube
Chest radiograph, portable
Screening for lung metastases from renal cell, testicular, melanoma, head and neck malignancies
Chest radiograph and CT chest as baseline
Screening for lung metastases from soft tissue or bone sarcomas
CT chest without contrast
Solitary pulmonary nodule, >1 cm, low suspicion for cancer
CT chest without contrast
To detect occult calcifications, fat, bronchus sign, etc. If indeterminate, consider PET scan
Solitary pulmonary nodule, 1 cm, moderate to high clinical suspicion for cancer
CT chest without contrast
To detect occult calcifications, fat, bronchus sign, etc. If indeterminate, consider PET scan
Solitary pulmonary nodule, 1 cm, low clinical suspicion for cancer
CT chest without contrast
Solitary pulmonary nodule, 1 cm, moderate to high clinical suspicion for cancer
CT chest without contrast
Staging for non–small-cell lung cancer
CT chest with contrast; chest radiograph for baseline
Consider also whole body PET scan
Staging for small-cell lung cancer
Chest radiograph; chest CT with contrast; MRI head with contrast
CARDIAC IMAGING
Indication Procedure Comment (If Any)
Acute chest pain, low probability of CAD
Chest radiograph Single photon emission computer tomography (SPECT) scan if cardiac etiology suspected
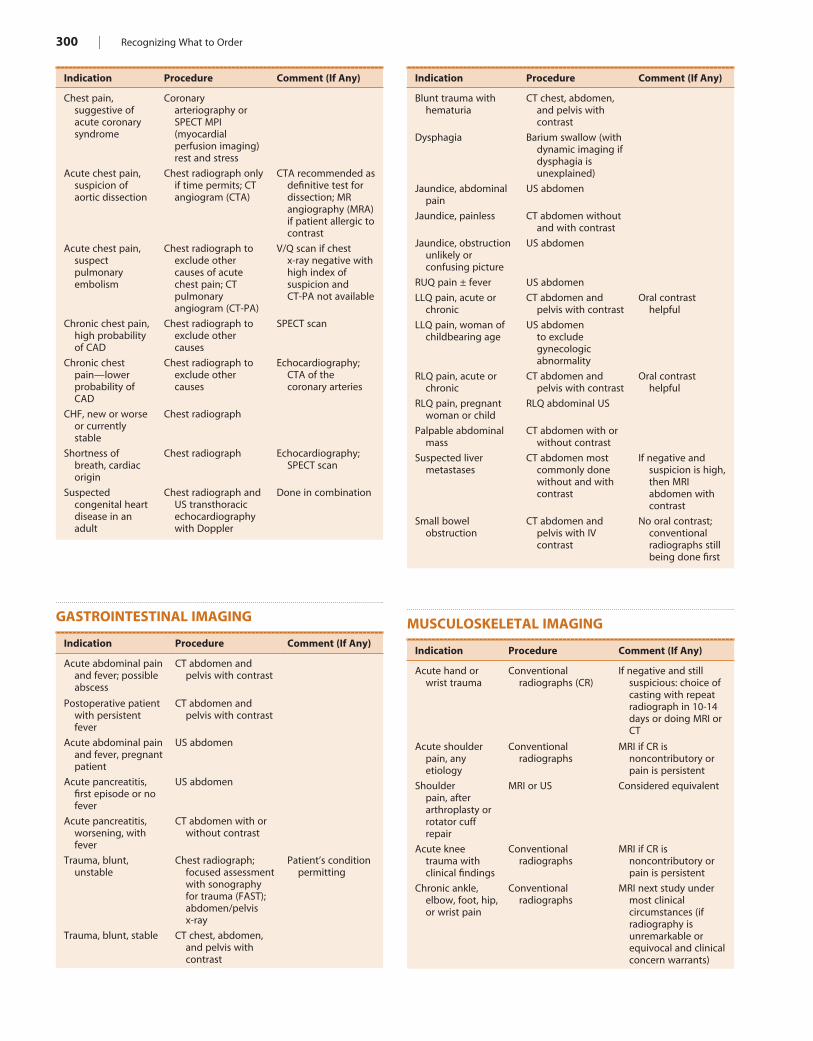
300 | Recognizing What to Order
Indication Procedure Comment (If Any)
Chest pain, suggestive of acute coronary syndrome
Coronary arteriography or SPECT MPI (myocardial perfusion imaging) rest and stress
Acute chest pain, suspicion of aortic dissection
Chest radiograph only if time permits; CT angiogram (CTA)
CTA recommended as definitive test for dissection; MR angiography (MRA) if patient allergic to contrast
Acute chest pain, suspect pulmonary embolism
Chest radiograph to exclude other causes of acute chest pain; CT pulmonary angiogram (CT-PA)
V/Q scan if chest x-ray negative with high index of suspicion and CT-PA not available
Chronic chest pain, high probability of CAD
Chest radiograph to exclude other causes
SPECT scan
Chronic chest pain—lower probability of CAD
Chest radiograph to exclude other causes
Echocardiography; CTA of the coronary arteries
CHF, new or worse or currently stable
Chest radiograph
Shortness of breath, cardiac origin
Chest radiograph Echocardiography; SPECT scan
Suspected congenital heart disease in an adult
Chest radiograph and US transthoracic echocardiography with Doppler
Done in combination
GASTROINTESTINAL IMAGING
Indication Procedure Comment (If Any)
Acute abdominal pain and fever; possible abscess
CT abdomen and pelvis with contrast
Postoperative patient with persistent fever
CT abdomen and pelvis with contrast
Acute abdominal pain and fever, pregnant patient
US abdomen
Acute pancreatitis, first episode or no fever
US abdomen
Acute pancreatitis, worsening, with fever
CT abdomen with or without contrast
Trauma, blunt, unstable
Chest radiograph; focused assessment with sonography for trauma (FAST); abdomen/pelvis x-ray
Patient’s condition permitting
Trauma, blunt, stable CT chest, abdomen, and pelvis with contrast
Indication Procedure Comment (If Any)
Blunt trauma with hematuria
CT chest, abdomen, and pelvis with contrast
Dysphagia Barium swallow (with dynamic imaging if dysphagia is unexplained)
Jaundice, abdominal pain
US abdomen
Jaundice, painless CT abdomen without and with contrast
Jaundice, obstruction unlikely or confusing picture
US abdomen
RUQ pain ± fever US abdomen
LLQ pain, acute or chronic
CT abdomen and pelvis with contrast
Oral contrast helpful
LLQ pain, woman of childbearing age
US abdomen to exclude gynecologic abnormality
RLQ pain, acute or chronic
CT abdomen and pelvis with contrast
Oral contrast helpful
RLQ pain, pregnant woman or child
RLQ abdominal US
Palpable abdominal mass
CT abdomen with or without contrast
Suspected liver metastases
CT abdomen most commonly done without and with contrast
If negative and suspicion is high, then MRI abdomen with contrast
Small bowel obstruction
CT abdomen and pelvis with IV contrast
No oral contrast; conventional radiographs still being done first
MUSCULOSKELETAL IMAGING
Indication Procedure Comment (If Any)
Acute hand or wrist trauma
Conventional radiographs (CR)
If negative and still suspicious: choice of casting with repeat radiograph in 10-14 days or doing MRI or CT
Acute shoulder pain, any etiology
Conventional radiographs
MRI if CR is noncontributory or pain is persistent
Shoulder pain, after arthroplasty or rotator cuff repair
MRI or US Considered equivalent
Acute knee trauma with clinical findings
Conventional radiographs
MRI if CR is noncontributory or pain is persistent
Chronic ankle, elbow, foot, hip, or wrist pain
Conventional radiographs
MRI next study under most clinical circumstances (if radiography is unremarkable or equivocal and clinical concern warrants)
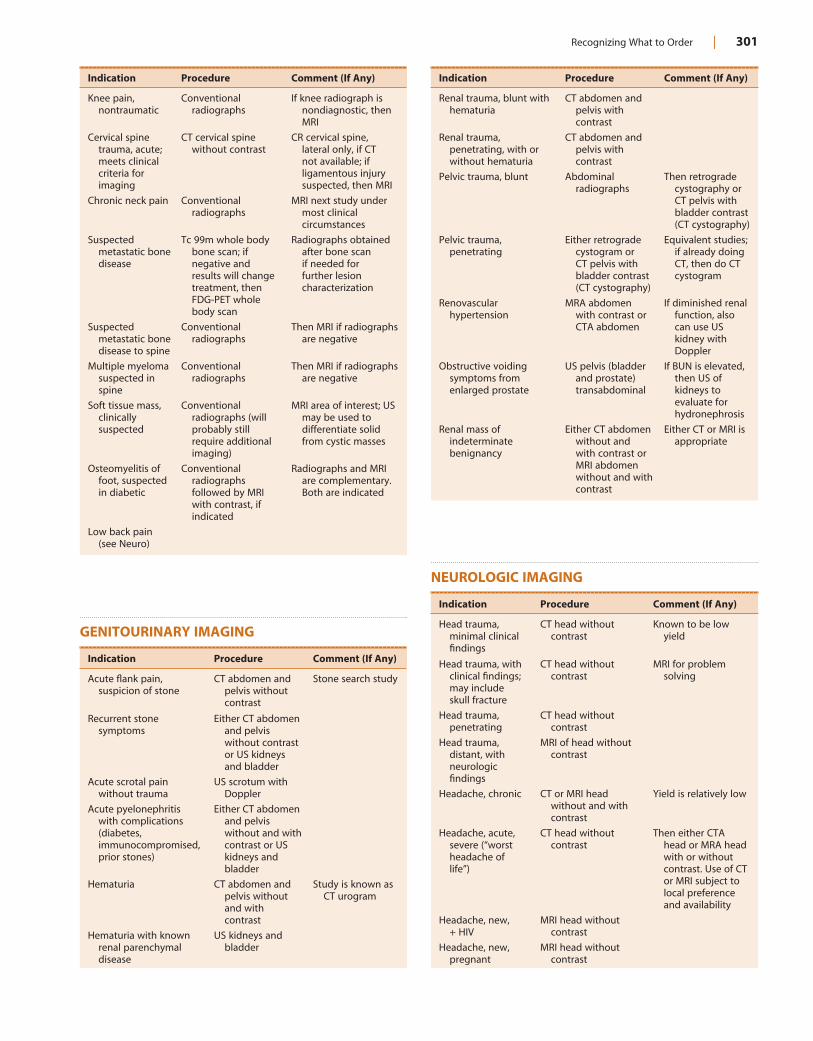
Recognizing What to Order | 301
Indication Procedure Comment (If Any)
Knee pain, nontraumatic
Conventional radiographs
If knee radiograph is nondiagnostic, then MRI
Cervical spine trauma, acute; meets clinical criteria for imaging
CT cervical spine without contrast
CR cervical spine, lateral only, if CT not available; if ligamentous injury suspected, then MRI
Chronic neck pain Conventional radiographs
MRI next study under most clinical circumstances
Suspected metastatic bone disease
Tc 99m whole body bone scan; if negative and results will change treatment, then FDG-PET whole body scan
Radiographs obtained after bone scan if needed for further lesion characterization
Suspected metastatic bone disease to spine
Conventional radiographs
Then MRI if radiographs are negative
Multiple myeloma suspected in spine
Conventional radiographs
Then MRI if radiographs are negative
Soft tissue mass, clinically suspected
Conventional radiographs (will probably still require additional imaging)
MRI area of interest; US may be used to differentiate solid from cystic masses
Osteomyelitis of foot, suspected in diabetic
Conventional radiographs followed by MRI with contrast, if indicated
Radiographs and MRI are complementary. Both are indicated
Low back pain (see Neuro)
GENITOURINARY IMAGING
Indication Procedure Comment (If Any)
Acute flank pain, suspicion of stone
CT abdomen and pelvis without contrast
Stone search study
Recurrent stone symptoms
Either CT abdomen and pelvis without contrast or US kidneys and bladder
Acute scrotal pain without trauma
US scrotum with Doppler
Acute pyelonephritis with complications (diabetes, immunocompromised, prior stones)
Either CT abdomen and pelvis without and with contrast or US kidneys and bladder
Hematuria CT abdomen and pelvis without and with contrast
Study is known as CT urogram
Hematuria with known renal parenchymal disease
US kidneys and bladder
Indication Procedure Comment (If Any)
Renal trauma, blunt with hematuria
CT abdomen and pelvis with contrast
Renal trauma, penetrating, with or without hematuria
CT abdomen and pelvis with contrast
Pelvic trauma, blunt Abdominal radiographs
Then retrograde cystography or CT pelvis with bladder contrast (CT cystography)
Pelvic trauma, penetrating
Either retrograde cystogram or CT pelvis with bladder contrast (CT cystography)
Equivalent studies; if already doing CT, then do CT cystogram
Renovascular hypertension
MRA abdomen with contrast or CTA abdomen
If diminished renal function, also can use US kidney with Doppler
Obstructive voiding symptoms from enlarged prostate
US pelvis (bladder and prostate) transabdominal
If BUN is elevated, then US of kidneys to evaluate for hydronephrosis
Renal mass of indeterminate benignancy
Either CT abdomen without and with contrast or MRI abdomen without and with contrast
Either CT or MRI is appropriate
NEUROLOGIC IMAGING
Indication Procedure Comment (If Any)
Head trauma, minimal clinical findings
CT head without contrast
Known to be low yield
Head trauma, with clinical findings; may include skull fracture
CT head without contrast
MRI for problem solving
Head trauma, penetrating
CT head without contrast
Head trauma, distant, with neurologic findings
MRI of head without contrast
Headache, chronic CT or MRI head without and with contrast
Yield is relatively low
Headache, acute, severe (“worst headache of life”)
CT head without contrast
Then either CTA head or MRA head with or without contrast. Use of CT or MRI subject to local preference and availability
Headache, new, + HIV
MRI head without contrast
Headache, new, pregnant
MRI head without contrast
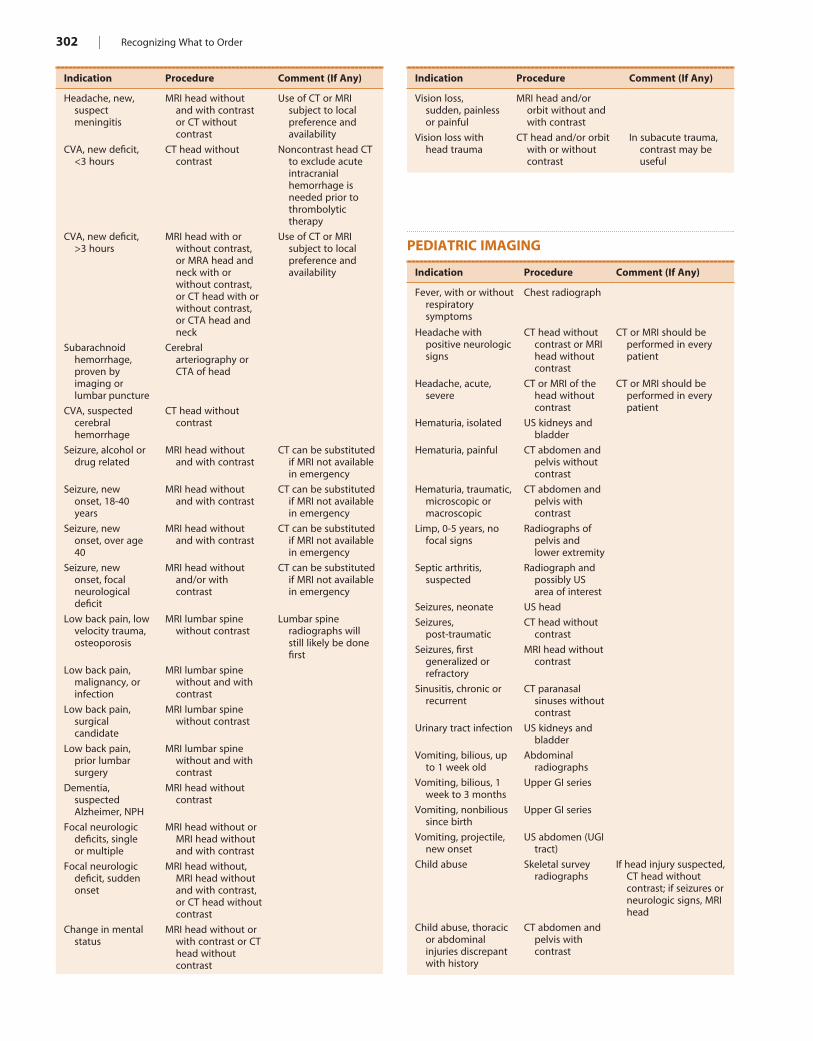
302 | Recognizing What to Order
Indication Procedure Comment (If Any)
Headache, new, suspect meningitis
MRI head without and with contrast or CT without contrast
Use of CT or MRI subject to local preference and availability
CVA, new deficit, <3 hours
CT head without contrast
Noncontrast head CT to exclude acute intracranial hemorrhage is needed prior to thrombolytic therapy
CVA, new deficit, >3 hours
MRI head with or without contrast, or MRA head and neck with or without contrast, or CT head with or without contrast, or CTA head and neck
Use of CT or MRI subject to local preference and availability
Subarachnoid hemorrhage, proven by imaging or lumbar puncture
Cerebral arteriography or CTA of head
CVA, suspected cerebral hemorrhage
CT head without contrast
Seizure, alcohol or drug related
MRI head without and with contrast
CT can be substituted if MRI not available in emergency
Seizure, new onset, 18-40 years
MRI head without and with contrast
CT can be substituted if MRI not available in emergency
Seizure, new onset, over age 40
MRI head without and with contrast
CT can be substituted if MRI not available in emergency
Seizure, new onset, focal neurological deficit
MRI head without and/or with contrast
CT can be substituted if MRI not available in emergency
Low back pain, low velocity trauma, osteoporosis
MRI lumbar spine without contrast
Lumbar spine radiographs will still likely be done first
Low back pain, malignancy, or infection
MRI lumbar spine without and with contrast
Low back pain, surgical candidate
MRI lumbar spine without contrast
Low back pain, prior lumbar surgery
MRI lumbar spine without and with contrast
Dementia, suspected Alzheimer, NPH
MRI head without contrast
Focal neurologic deficits, single or multiple
MRI head without or MRI head without and with contrast
Focal neurologic deficit, sudden onset
MRI head without, MRI head without and with contrast, or CT head without contrast
Change in mental status
MRI head without or with contrast or CT head without contrast
Indication Procedure Comment (If Any)
Vision loss, sudden, painless or painful
MRI head and/or orbit without and with contrast
Vision loss with head trauma
CT head and/or orbit with or without contrast
In subacute trauma, contrast may be useful
PEDIATRIC IMAGING
Indication Procedure Comment (If Any)
Fever, with or without respiratory symptoms
Chest radiograph
Headache with positive neurologic signs
CT head without contrast or MRI head without contrast
CT or MRI should be performed in every patient
Headache, acute, severe
CT or MRI of the head without contrast
CT or MRI should be performed in every patient
Hematuria, isolated US kidneys and bladder
Hematuria, painful CT abdomen and pelvis without contrast
Hematuria, traumatic, microscopic or macroscopic
CT abdomen and pelvis with contrast
Limp, 0-5 years, no focal signs
Radiographs of pelvis and lower extremity
Septic arthritis, suspected
Radiograph and possibly US area of interest
Seizures, neonate US head
Seizures, post-traumatic
CT head without contrast
Seizures, first generalized or refractory
MRI head without contrast
Sinusitis, chronic or recurrent
CT paranasal sinuses without contrast
Urinary tract infection US kidneys and bladder
Vomiting, bilious, up to 1 week old
Abdominal radiographs
Vomiting, bilious, 1 week to 3 months
Upper GI series
Vomiting, nonbilious since birth
Upper GI series
Vomiting, projectile, new onset
US abdomen (UGI tract)
Child abuse Skeletal survey radiographs
If head injury suspected, CT head without contrast; if seizures or neurologic signs, MRI head
Child abuse, thoracic or abdominal injuries discrepant with history
CT abdomen and pelvis with contrast
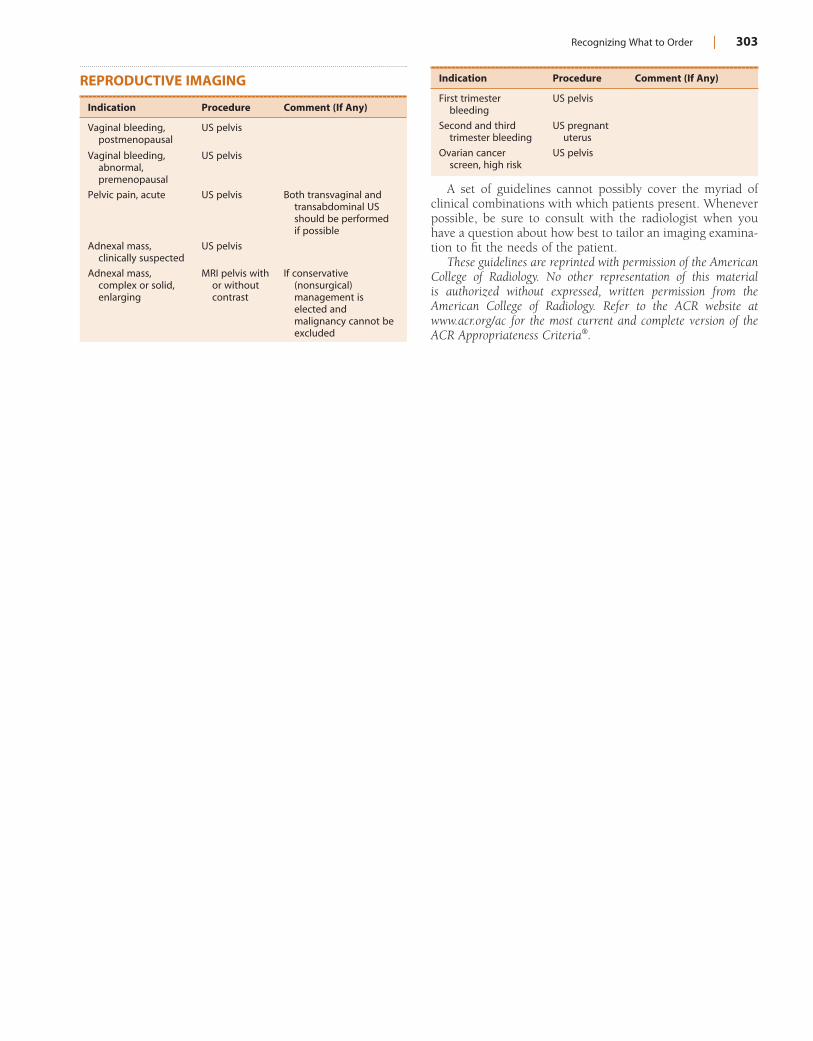
Recognizing What to Order | 303
REPRODUCTIVE IMAGING
Indication Procedure Comment (If Any)
Vaginal bleeding, postmenopausal
US pelvis
Vaginal bleeding, abnormal, premenopausal
US pelvis
Pelvic pain, acute US pelvis Both transvaginal and transabdominal US should be performed if possible
Adnexal mass, clinically suspected
US pelvis
Adnexal mass, complex or solid, enlarging
MRI pelvis with or without contrast
If conservative (nonsurgical) management is elected and malignancy cannot be excluded
Indication Procedure Comment (If Any)
First trimester bleeding
US pelvis
Second and third trimester bleeding
US pregnant uterus
Ovarian cancer screen, high risk
US pelvis
A set of guidelines cannot possibly cover the myriad of clinical combinations with which patients present. Whenever possible, be sure to consult with the radiologist when you have a question about how best to tailor an imaging examina-tion to fit the needs of the patient.
These guidelines are reprinted with permission of the American College of Radiology. No other representation of this material is authorized without expressed, written permission from the American College of Radiology. Refer to the ACR website at www.acr.org/ac for the most current and complete version of the ACR Appropriateness Criteria®.

304
Bibliography
TEXTSArnold W, DeLegge M, Schwaitzberg S: Enteral Access: The Foundation of
Feeding, 2002, Kendall Hunt.Blickman H: Pediatric Radiology: The Requisites, ed 2, St. Louis, 1998, Mosby.Fraser RS, Pare P, Fraser RG, Pare PD: Synopsis of Diseases of the Chest, ed 2,
Philadelphia, 1994, W.B. Saunders.Goodman LR: Principles of Chest Roentgenology, ed 3, Philadelphia, 2007,
Saunders.Greenspan A: Orthopedic Radiology: A Practical Approach, ed 3, Philadelphia,
2000, Lippincott Williams and Wilkins.Grossman RL, Yousem DM: Neuroradiology: The Requisites, St. Louis, 1994,
Mosby.Guyton AC, Hall J: Textbook of Medical Physiology, ed 11, Philadelphia, 2005,
W.B. Saunders.Harris JH, Harris WH: The Radiology of Emergency Medicine, ed 4, Philadel-
phia, 2000, Lippincott Williams and Wilkins.Juhl JH, Crummy AB: Essentials of Radiologic Imaging, ed 6, Philadelphia,
1993, Lippincott.Love M: An Introduction to Diagnostic Ultrasound, Springfield, Il, 1980, Charles
C. Thomas.Manaster BJ, Disler DG, May DA: Musculoskeletal Imaging: The Requisites,
ed 2, St. Louis, 2002, Mosby.McLoud TC: Thoracic Radiology: The Requisites, St. Louis, 1998, Mosby.Meyers MA: Dynamic Radiology of the Abdomen: Normal and Pathological
Anatomy, ed 2, New York, 1982, Springer-Verlag.Resnick D, Niwayama G: Diagnosis of Bone and Joint Disorders, ed 2, Philadel-
phia, 1981, W.B. Saunders.Resnick D: Diagnosis of Bone and Joint Disorders, ed 4, Philadelphia, 2002,
W.B. Saunders.Rumack C, Wilson S, Charboneau JW: Diagnostic Ultrasound, ed 2, St. Louis,
1998, Mosby.Schultz RJ: The Language of Fractures, Huntington, NY, 1972, Robert E.
Krieger.Webb WR, Brant WE, Helms CA: Fundamentals of Body CT, Philadelphia,
1991, W.B. Saunders.Weissleder R, Wittenberg J, Harisinghani MG: Primer of Diagnostic Imaging,
ed 3, St. Louis, 2003, Mosby.
JOURNAL ARTICLESAberle DR, Wiener-Kronish JP, Webb WR, Matthay MA: Hydrostatic versus
increased permeability pulmonary edema: diagnosis based on radiographic data in critically ill patients, Radiology 168:73-79, 1988.
Amjadi K, Alvarez GG, Vanderhelst E, Velkeniers B, Lam M, Noppen M: The prevalence of blebs or bullae among young healthy adults: a thoracoscopic investigation, Chest 132(4):1140-1145, 2007.
Bates D, Ruggieri P: Imaging modalities for evaluation of the spine, Radiol Clin North Am 29(4):675-690, 1991.
Boudiaf M, Soyer P, Terem C, Pelage J, Maissiat E, Rymer R: CT evaluation of small bowel obstruction, RadioGraphics 21:613-624, 2001.
Burney K, Burchard F, Papouchado M, Wilde P: Cardiac pacing systems and implantable cardiac defibrillators (ICDs): a radiological perspective of equipment, anatomy and complications, Clin Radiol 59(8):699-708, 2004.
Cohen SM, Kurtz AB: Biliary sonography, Radiol Clin North Am 29(6):1171-1198, 1991.
Dalinka MK, Reginato AJ, Golden DA: Calcium deposition disease, Semin Roentgenol 17(1):39-47, 1982.
Dyer DS, Moore EE, Mestek MF, Bernstein SM, Iklé DN, Durham JD, Heinig MJ, Russ PD, Symonds DL, Kumpe DA, Roe EJ, Honigman B,
McIntyre RC, EJ: Can chest CT be used to exclude aortic injury? Radiology 213:195-202, 1999.
Edeiken J: Radiologic approach to arthritis, Semin Roentgenol 17(1):8-15, 1982.
Ellis K, Austin J, Jaretzki A: Radiologic detection of thymoma in patients with myasthenia gravis, AJR 151:873-881, 1988.
Garcia MJ: Could cardiac CT revolutionize the practice of cardiology? Cleve Clin J Med 72(2):88-89, 2005.
Gaskill MF, Lukin R, Wiot JG: Lumbar disc disease and stenosis, Radiol Clin North Am 29(4):753-764, 1991.
Haus BM, Stark P, Shofer SL, Kuschner WG: Massive pulmonary pseudotu-mor, Chest 124(2):758-760, 2003.
Hendrix RW, Rogers LF: Diagnostic imaging of fracture complications, Radiol Clin North Am 27(5):1023-1033, 1989.
Henry M, Arnold T, Harvey J: British Thoracic Society guidelines for the management of spontaneous pneumothorax, Thorax 58(suppl 2):39-52, 2003.
Henschke CI, Yankelevitz DF, Wand A, Davis SD, Shiau M: Accuracy and efficacy of chest radiography in the intensive care unit, Radiol Clin North Am 34(1):21-31, 1996.
Horrow MM: Ultrasound of the extrahepatic bile duct: issues of size, Ultra-sound Quarterly 26(2):67-74, 2010.
Indrajit IK, Shreeram MN, D’Souza JD: Multislice CT: a quantum leap in whole body imaging, Indian J Radiol Imaging 14(2):209-216, 2004.
Ingram MD, Watson SG, Skippage PL, Patel U: Urethral injuries after pelvic trauma: evaluation with urethrography, RadioGraphics 28:1631-1643, 2008.
Johnson JL: Pleural effusions in cardiovascular disease, Postgrad Med 107(4):95-101, 2000.
Kundel HL, Wright DJ: The influence of prior knowledge on visual search strategies during the viewing of chest radiographs, Radiology 93:315-320, 1969.
Lingawi SS: The naked facet sign, Radiology 219:366-367, 2001.MacMahon H, Austin JHM, Gamsu G, Herold CJ, Jett JR, Naidich DP,
Patz EF, Swensen SJ: Guidelines for management of small pulmonary nodules detected on CT scans: a statement from the Fleischner Society, Radiology 237:395-400, 2005.
Old JL, Calvert M: Vertebral compression fractures in the elderly, Am Fam Physician 69(1):111-116, 2004.
Pathria MN, Petersilge CA: Spinal trauma, Radiol Clin North Am 29(4):847-865, 1991.
Riddervold HO: Easily missed fractures, Radiol Clin North Am 30(2):475-494, 1992.
Shifrin RY, Choplin RH: Aspiration in patients in critical care units, Radiol Clin North Am 34(1):83-96, 1996.
Steenburg SD, Ravenel JG: Acute traumatic thoracic aortic injuries: experi-ence with 64-MDCT, AJR 191:1564-1569, 2008.
Thomas EL, Lansdown EL: Visual search patterns of radiologists in training, Radiology 81:288–292, 1963.
Tie MLH: Basic head CT for intensivists, Crit Care Resusc 3(1):35-44, 2001.
Tocino I, Westcott JL: Barotrauma, Radiol Clin North Am 34(1):59-81, 1996.
Yu S, Haughton VM, Rosenbaum AE: Magnetic resonance imaging and anatomy of the spine, Radiol Clin North Am 29(4):691-710, 1991.
Yuh WT, Quets JP, Lee HJ, Simonson TM, Michalson LS, Nguyen PT, Sato Y, Mayr NA, Berbaum KS: Anatomic distribution of metastases in the verte-bral body and modes of hematogenous spread, Spine 21(19):2243-2250, 1996.
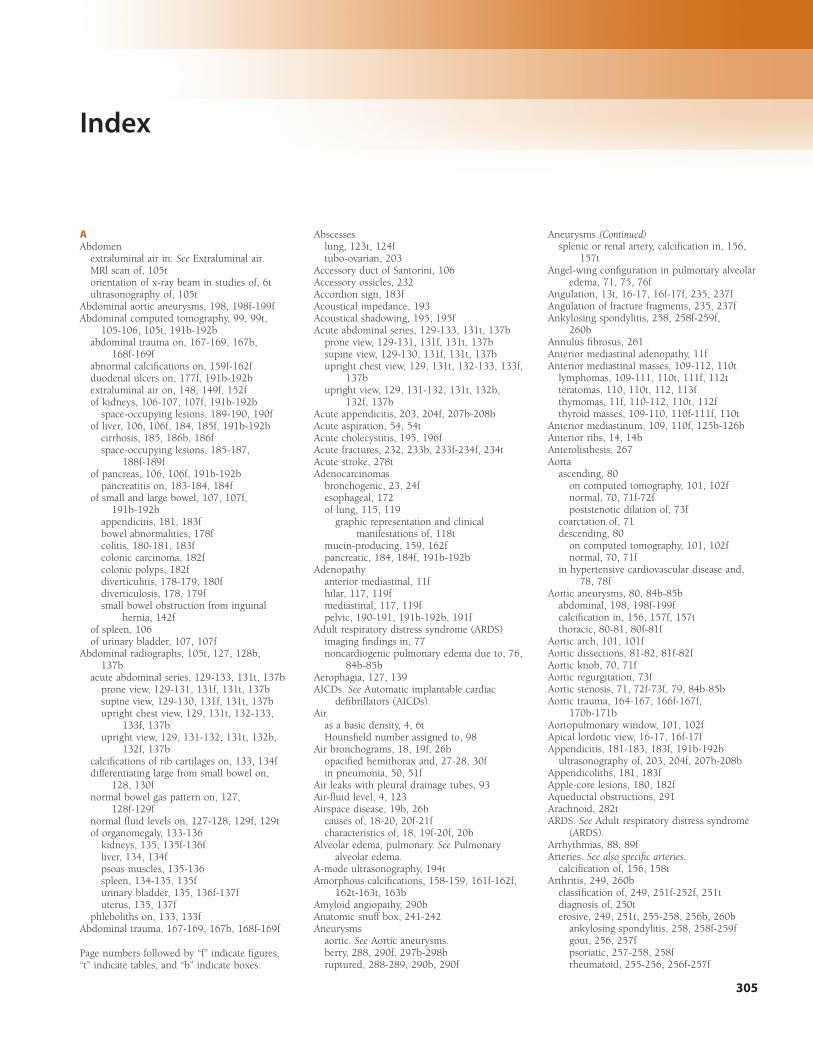
305
Index
AAbdomen
extraluminal air in. See Extraluminal air.MRl scan of, 105torientation of x-ray beam in studies of, 6tultrasonography of, 105t
Abdominal aortic aneurysms, 198, 198f-199fAbdominal computed tomography, 99, 99t,
105-106, 105t, 191b-192babdominal trauma on, 167-169, 167b,
168f-169fabnormal calcifications on, 159f-162fduodenal ulcers on, 177f, 191b-192bextraluminal air on, 148, 149f, 152fof kidneys, 106-107, 107f, 191b-192b
space-occupying lesions, 189-190, 190fof liver, 106, 106f, 184, 185f, 191b-192b
cirrhosis, 185, 186b, 186fspace-occupying lesions, 185-187,
188f-189fof pancreas, 106, 106f, 191b-192b
pancreatitis on, 183-184, 184fof small and large bowel, 107, 107f,
191b-192bappendicitis, 181, 183fbowel abnormalities, 178fcolitis, 180-181, 183fcolonic carcinoma, 182fcolonic polyps, 182fdiverticulitis, 178-179, 180fdiverticulosis, 178, 179fsmall bowel obstruction from inguinal
hernia, 142fof spleen, 106of urinary bladder, 107, 107f
Abdominal radiographs, 105t, 127, 128b, 137b
acute abdominal series, 129-133, 131t, 137bprone view, 129-131, 131f, 131t, 137bsupine view, 129-130, 131f, 131t, 137bupright chest view, 129, 131t, 132-133,
133f, 137bupright view, 129, 131-132, 131t, 132b,
132f, 137bcalcifications of rib cartilages on, 133, 134fdifferentiating large from small bowel on,
128, 130fnormal bowel gas pattern on, 127,
128f-129fnormal fluid levels on, 127-128, 129f, 129tof organomegaly, 133-136
kidneys, 135, 135f-136fliver, 134, 134fpsoas muscles, 135-136spleen, 134-135, 135furinary bladder, 135, 136f-137futerus, 135, 137f
phleboliths on, 133, 133fAbdominal trauma, 167-169, 167b, 168f-169f
Abscesseslung, 123t, 124ftubo-ovarian, 203
Accessory duct of Santorini, 106Accessory ossicles, 232Accordion sign, 183fAcoustical impedance, 193Acoustical shadowing, 195, 195fAcute abdominal series, 129-133, 131t, 137b
prone view, 129-131, 131f, 131t, 137bsupine view, 129-130, 131f, 131t, 137bupright chest view, 129, 131t, 132-133, 133f,
137bupright view, 129, 131-132, 131t, 132b,
132f, 137bAcute appendicitis, 203, 204f, 207b-208bAcute aspiration, 54, 54tAcute cholecystitis, 195, 196fAcute fractures, 232, 233b, 233f-234f, 234tAcute stroke, 278tAdenocarcinomas
bronchogenic, 23, 24fesophageal, 172of lung, 115, 119
graphic representation and clinical manifestations of, 118t
mucin-producing, 159, 162fpancreatic, 184, 184f, 191b-192b
Adenopathyanterior mediastinal, 11fhilar, 117, 119fmediastinal, 117, 119fpelvic, 190-191, 191b-192b, 191f
Adult respiratory distress syndrome (ARDS)imaging findings in, 77noncardiogenic pulmonary edema due to, 76,
84b-85bAerophagia, 127, 139AICDs. See Automatic implantable cardiac
defibrillators (AICDs).Air
as a basic density, 4, 6tHounsfield number assigned to, 98
Air bronchograms, 18, 19f, 26bopacified hemithorax and, 27-28, 30fin pneumonia, 50, 51f
Air leaks with pleural drainage tubes, 93Air-fluid level, 4, 123Airspace disease, 19b, 26b
causes of, 18-20, 20f-21fcharacteristics of, 18, 19f-20f, 20b
Alveolar edema, pulmonary. See Pulmonary alveolar edema.
A-mode ultrasonography, 194tAmorphous calcifications, 158-159, 161f-162f,
162t-163t, 163bAmyloid angiopathy, 290bAnatomic snuff box, 241-242Aneurysms
aortic. See Aortic aneurysms.berry, 288, 290f, 297b-298bruptured, 288-289, 290b, 290f
Page numbers followed by “f” indicate figures, “t” indicate tables, and “b” indicate boxes.
splenic or renal artery, calcification in, 156, 157t
Angel-wing configuration in pulmonary alveolar edema, 71, 75, 76f
Angulation, 13t, 16-17, 16f-17f, 235, 237fAngulation of fracture fragments, 235, 237fAnkylosing spondylitis, 258, 258f-259f,
260bAnnulus fibrosus, 261Anterior mediastinal adenopathy, 11fAnterior mediastinal masses, 109-112, 110t
lymphomas, 109-111, 110t, 111f, 112tteratomas, 110, 110t, 112, 113fthymomas, 11f, 110-112, 110t, 112fthyroid masses, 109-110, 110f-111f, 110t
Anterior mediastinum, 109, 110f, 125b-126bAnterior ribs, 14, 14bAnterolisthesis, 267Aorta
ascending, 80on computed tomography, 101, 102fnormal, 70, 71f-72fpoststenotic dilation of, 73f
coarctation of, 71descending, 80
on computed tomography, 101, 102fnormal, 70, 71f
in hypertensive cardiovascular disease and, 78, 78f
Aortic aneurysms, 80, 84b-85babdominal, 198, 198f-199fcalcification in, 156, 157f, 157tthoracic, 80-81, 80f-81f
Aortic arch, 101, 101fAortic dissections, 81-82, 81f-82fAortic knob, 70, 71fAortic regurgitation, 73fAortic stenosis, 71, 72f-73f, 79, 84b-85bAortic trauma, 164-167, 166f-167f,
170b-171bAortopulmonary window, 101, 102fApical lordotic view, 16-17, 16f-17fAppendicitis, 181-183, 183f, 191b-192b
ultrasonography of, 203, 204f, 207b-208bAppendicoliths, 181, 183fApple-core lesions, 180, 182fAqueductal obstructions, 291Arachnoid, 282tARDS. See Adult respiratory distress syndrome
(ARDS).Arrhythmias, 88, 89fArteries. See also specific arteries.
calcification of, 156, 158tArthritis, 249, 260b
classification of, 249, 251f-252f, 251tdiagnosis of, 250terosive, 249, 251t, 255-258, 256b, 260b
ankylosing spondylitis, 258, 258f-259fgout, 256, 257fpsoriatic, 257-258, 258frheumatoid, 255-256, 256f-257f
Aneurysms (Continued)
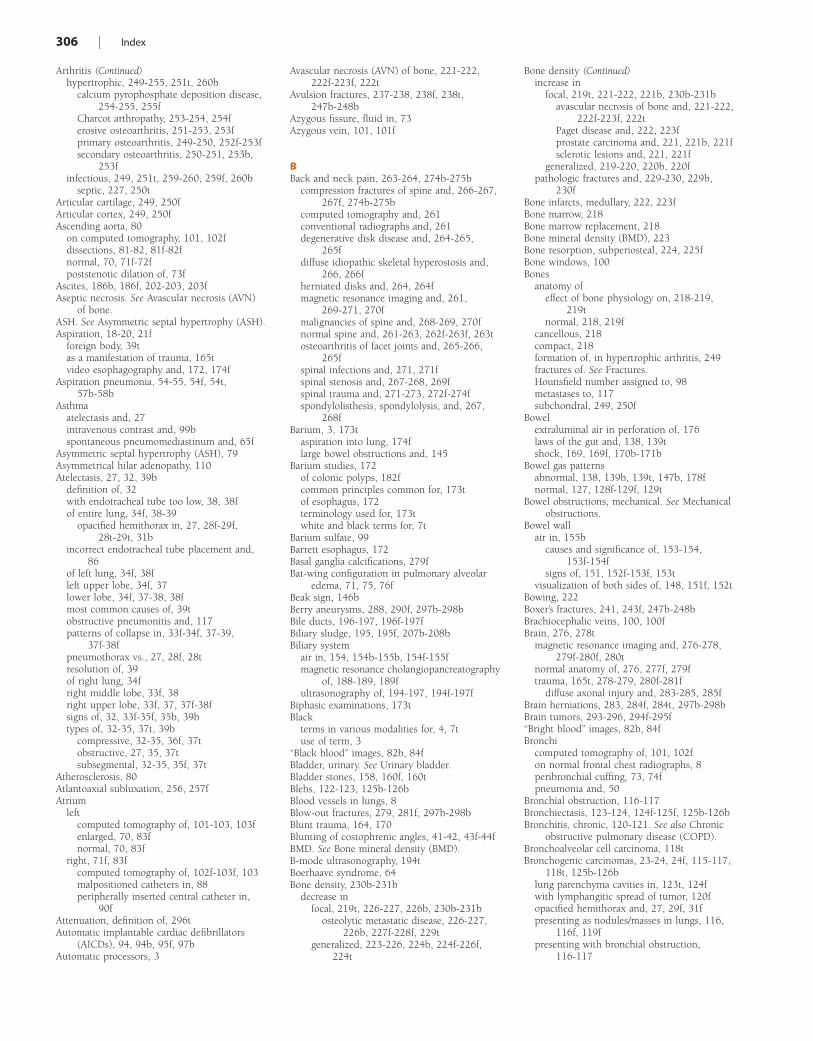
306 | Index
hypertrophic, 249-255, 251t, 260bcalcium pyrophosphate deposition disease,
254-255, 255fCharcot arthropathy, 253-254, 254ferosive osteoarthritis, 251-253, 253fprimary osteoarthritis, 249-250, 252f-253fsecondary osteoarthritis, 250-251, 253b,
253finfectious, 249, 251t, 259-260, 259f, 260b
septic, 227, 250tArticular cartilage, 249, 250fArticular cortex, 249, 250fAscending aorta, 80
on computed tomography, 101, 102fdissections, 81-82, 81f-82fnormal, 70, 71f-72fpoststenotic dilation of, 73f
Ascites, 186b, 186f, 202-203, 203fAseptic necrosis. See Avascular necrosis (AVN)
of bone.ASH. See Asymmetric septal hypertrophy (ASH).Aspiration, 18-20, 21f
foreign body, 39tas a manifestation of trauma, 165tvideo esophagography and, 172, 174f
Aspiration pneumonia, 54-55, 54f, 54t, 57b-58b
Asthmaatelectasis and, 27intravenous contrast and, 99bspontaneous pneumomediastinum and, 65f
Asymmetric septal hypertrophy (ASH), 79Asymmetrical hilar adenopathy, 110Atelectasis, 27, 32, 39b
definition of, 32with endotracheal tube too low, 38, 38fof entire lung, 34f, 38-39
opacified hemithorax in, 27, 28f-29f, 28t-29t, 31b
incorrect endotracheal tube placement and, 86
of left lung, 34f, 38fleft upper lobe, 34f, 37lower lobe, 34f, 37-38, 38fmost common causes of, 39tobstructive pneumonitis and, 117patterns of collapse in, 33f-34f, 37-39,
37f-38fpneumothorax vs., 27, 28f, 28tresolution of, 39of right lung, 34fright middle lobe, 33f, 38right upper lobe, 33f, 37, 37f-38fsigns of, 32, 33f-35f, 35b, 39btypes of, 32-35, 37t, 39b
compressive, 32-35, 36f, 37tobstructive, 27, 35, 37tsubsegmental, 32-35, 35f, 37t
Atherosclerosis, 80Atlantoaxial subluxation, 256, 257fAtrium
leftcomputed tomography of, 101-103, 103fenlarged, 70, 83fnormal, 70, 83f
right, 71f, 83fcomputed tomography of, 102f-103f, 103malpositioned catheters in, 88peripherally inserted central catheter in,
90fAttenuation, definition of, 296tAutomatic implantable cardiac defibrillators
(AICDs), 94, 94b, 95f, 97bAutomatic processors, 3
Avascular necrosis (AVN) of bone, 221-222, 222f-223f, 222t
Avulsion fractures, 237-238, 238f, 238t, 247b-248b
Azygous fissure, fluid in, 73Azygous vein, 101, 101f
BBack and neck pain, 263-264, 274b-275b
compression fractures of spine and, 266-267, 267f, 274b-275b
computed tomography and, 261conventional radiographs and, 261degenerative disk disease and, 264-265,
265fdiffuse idiopathic skeletal hyperostosis and,
266, 266fherniated disks and, 264, 264fmagnetic resonance imaging and, 261,
269-271, 270fmalignancies of spine and, 268-269, 270fnormal spine and, 261-263, 262f-263f, 263tosteoarthritis of facet joints and, 265-266,
265fspinal infections and, 271, 271fspinal stenosis and, 267-268, 269fspinal trauma and, 271-273, 272f-274fspondylolisthesis, spondylolysis, and, 267,
268fBarium, 3, 173t
aspiration into lung, 174flarge bowel obstructions and, 145
Barium studies, 172of colonic polyps, 182fcommon principles common for, 173tof esophagus, 172terminology used for, 173twhite and black terms for, 7t
Barium sulfate, 99Barrett esophagus, 172Basal ganglia calcifications, 279fBat-wing configuration in pulmonary alveolar
edema, 71, 75, 76fBeak sign, 146bBerry aneurysms, 288, 290f, 297b-298bBile ducts, 196-197, 196f-197fBiliary sludge, 195, 195f, 207b-208bBiliary system
air in, 154, 154b-155b, 154f-155fmagnetic resonance cholangiopancreatography
of, 188-189, 189fultrasonography of, 194-197, 194f-197f
Biphasic examinations, 173tBlack
terms in various modalities for, 4, 7tuse of term, 3
“Black blood” images, 82b, 84fBladder, urinary. See Urinary bladder.Bladder stones, 158, 160f, 160tBlebs, 122-123, 125b-126bBlood vessels in lungs, 8Blow-out fractures, 279, 281f, 297b-298bBlunt trauma, 164, 170Blunting of costophrenic angles, 41-42, 43f-44fBMD. See Bone mineral density (BMD).B-mode ultrasonography, 194tBoerhaave syndrome, 64Bone density, 230b-231b
decrease infocal, 219t, 226-227, 226b, 230b-231b
osteolytic metastatic disease, 226-227, 226b, 227f-228f, 229t
generalized, 223-226, 224b, 224f-226f, 224t
increase infocal, 219t, 221-222, 221b, 230b-231b
avascular necrosis of bone and, 221-222, 222f-223f, 222t
Paget disease and, 222, 223fprostate carcinoma and, 221, 221b, 221fsclerotic lesions and, 221, 221f
generalized, 219-220, 220b, 220fpathologic fractures and, 229-230, 229b,
230fBone infarcts, medullary, 222, 223fBone marrow, 218Bone marrow replacement, 218Bone mineral density (BMD), 223Bone resorption, subperiosteal, 224, 225fBone windows, 100Bones
anatomy ofeffect of bone physiology on, 218-219,
219tnormal, 218, 219f
cancellous, 218compact, 218formation of, in hypertrophic arthritis, 249fractures of. See Fractures.Hounsfield number assigned to, 98metastases to, 117subchondral, 249, 250f
Bowelextraluminal air in perforation of, 176laws of the gut and, 138, 139tshock, 169, 169f, 170b-171b
Bowel gas patternsabnormal, 138, 139b, 139t, 147b, 178fnormal, 127, 128f-129f, 129t
Bowel obstructions, mechanical. See Mechanical obstructions.
Bowel wallair in, 155b
causes and significance of, 153-154, 153f-154f
signs of, 151, 152f-153f, 153tvisualization of both sides of, 148, 151f, 152t
Bowing, 222Boxer’s fractures, 241, 243f, 247b-248bBrachiocephalic veins, 100, 100fBrain, 276, 278t
magnetic resonance imaging and, 276-278, 279f-280f, 280t
normal anatomy of, 276, 277f, 279ftrauma, 165t, 278-279, 280f-281f
diffuse axonal injury and, 283-285, 285fBrain herniations, 283, 284f, 284t, 297b-298bBrain tumors, 293-296, 294f-295f“Bright blood” images, 82b, 84fBronchi
computed tomography of, 101, 102fon normal frontal chest radiographs, 8peribronchial cuffing, 73, 74fpneumonia and, 50
Bronchial obstruction, 116-117Bronchiectasis, 123-124, 124f-125f, 125b-126bBronchitis, chronic, 120-121. See also Chronic
obstructive pulmonary disease (COPD).Bronchoalveolar cell carcinoma, 118tBronchogenic carcinomas, 23-24, 24f, 115-117,
118t, 125b-126blung parenchyma cavities in, 123t, 124fwith lymphangitic spread of tumor, 120fopacified hemithorax and, 27, 29f, 31fpresenting as nodules/masses in lungs, 116,
116f, 119fpresenting with bronchial obstruction,
116-117
Arthritis (Continued) Bone density (Continued)
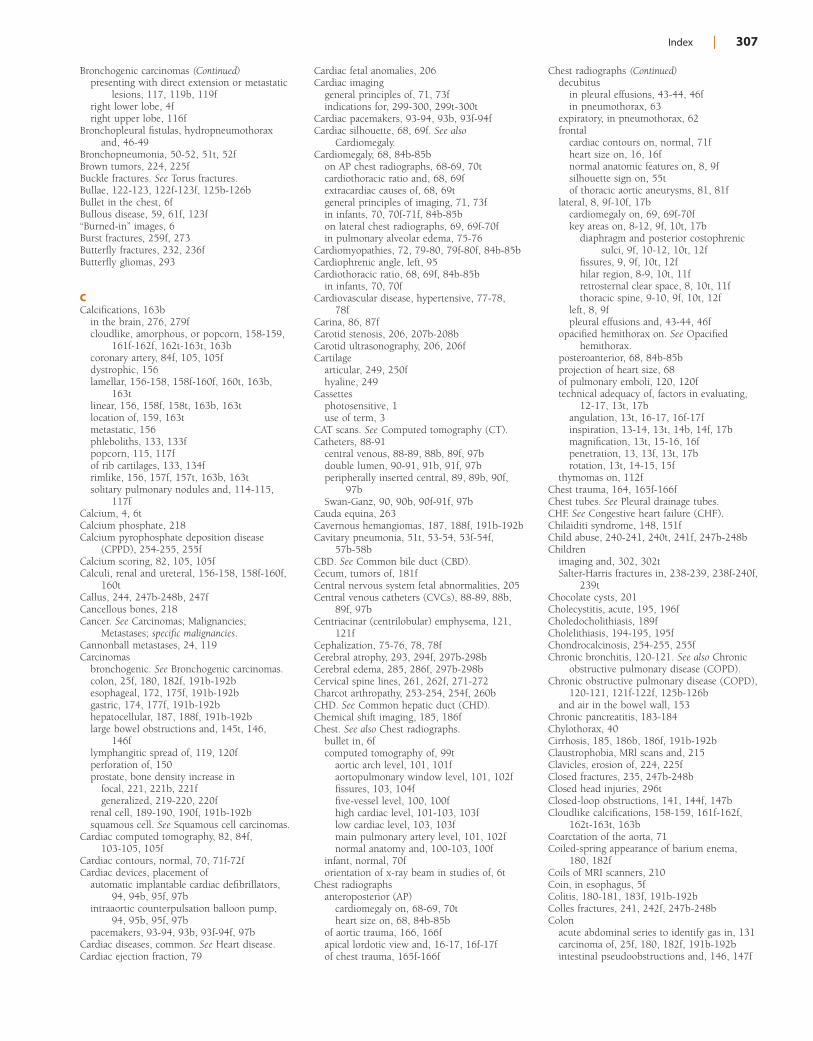
Index | 307
presenting with direct extension or metastatic lesions, 117, 119b, 119f
right lower lobe, 4fright upper lobe, 116f
Bronchopleural fistulas, hydropneumothorax and, 46-49
Bronchopneumonia, 50-52, 51t, 52fBrown tumors, 224, 225fBuckle fractures. See Torus fractures.Bullae, 122-123, 122f-123f, 125b-126bBullet in the chest, 6fBullous disease, 59, 61f, 123f“Burned-in” images, 6Burst fractures, 259f, 273Butterfly fractures, 232, 236fButterfly gliomas, 293
CCalcifications, 163b
in the brain, 276, 279fcloudlike, amorphous, or popcorn, 158-159,
161f-162f, 162t-163t, 163bcoronary artery, 84f, 105, 105fdystrophic, 156lamellar, 156-158, 158f-160f, 160t, 163b,
163tlinear, 156, 158f, 158t, 163b, 163tlocation of, 159, 163tmetastatic, 156phleboliths, 133, 133fpopcorn, 115, 117fof rib cartilages, 133, 134frimlike, 156, 157f, 157t, 163b, 163tsolitary pulmonary nodules and, 114-115,
117fCalcium, 4, 6tCalcium phosphate, 218Calcium pyrophosphate deposition disease
(CPPD), 254-255, 255fCalcium scoring, 82, 105, 105fCalculi, renal and ureteral, 156-158, 158f-160f,
160tCallus, 244, 247b-248b, 247fCancellous bones, 218Cancer. See Carcinomas; Malignancies;
Metastases; specific malignancies.Cannonball metastases, 24, 119Carcinomas
bronchogenic. See Bronchogenic carcinomas.colon, 25f, 180, 182f, 191b-192besophageal, 172, 175f, 191b-192bgastric, 174, 177f, 191b-192bhepatocellular, 187, 188f, 191b-192blarge bowel obstructions and, 145t, 146,
146flymphangitic spread of, 119, 120fperforation of, 150prostate, bone density increase in
focal, 221, 221b, 221fgeneralized, 219-220, 220f
renal cell, 189-190, 190f, 191b-192bsquamous cell. See Squamous cell carcinomas.
Cardiac computed tomography, 82, 84f, 103-105, 105f
Cardiac contours, normal, 70, 71f-72fCardiac devices, placement of
automatic implantable cardiac defibrillators, 94, 94b, 95f, 97b
intraaortic counterpulsation balloon pump, 94, 95b, 95f, 97b
pacemakers, 93-94, 93b, 93f-94f, 97bCardiac diseases, common. See Heart disease.Cardiac ejection fraction, 79
Cardiac fetal anomalies, 206Cardiac imaging
general principles of, 71, 73findications for, 299-300, 299t-300t
Cardiac pacemakers, 93-94, 93b, 93f-94fCardiac silhouette, 68, 69f. See also
Cardiomegaly.Cardiomegaly, 68, 84b-85b
on AP chest radiographs, 68-69, 70tcardiothoracic ratio and, 68, 69fextracardiac causes of, 68, 69tgeneral principles of imaging, 71, 73fin infants, 70, 70f-71f, 84b-85bon lateral chest radiographs, 69, 69f-70fin pulmonary alveolar edema, 75-76
Cardiomyopathies, 72, 79-80, 79f-80f, 84b-85bCardiophrenic angle, left, 95Cardiothoracic ratio, 68, 69f, 84b-85b
in infants, 70, 70fCardiovascular disease, hypertensive, 77-78,
78fCarina, 86, 87fCarotid stenosis, 206, 207b-208bCarotid ultrasonography, 206, 206fCartilage
articular, 249, 250fhyaline, 249
Cassettesphotosensitive, 1use of term, 3
CAT scans. See Computed tomography (CT).Catheters, 88-91
central venous, 88-89, 88b, 89f, 97bdouble lumen, 90-91, 91b, 91f, 97bperipherally inserted central, 89, 89b, 90f,
97bSwan-Ganz, 90, 90b, 90f-91f, 97b
Cauda equina, 263Cavernous hemangiomas, 187, 188f, 191b-192bCavitary pneumonia, 51t, 53-54, 53f-54f,
57b-58bCBD. See Common bile duct (CBD).Cecum, tumors of, 181fCentral nervous system fetal abnormalities, 205Central venous catheters (CVCs), 88-89, 88b,
89f, 97bCentriacinar (centrilobular) emphysema, 121,
121fCephalization, 75-76, 78, 78fCerebral atrophy, 293, 294f, 297b-298bCerebral edema, 285, 286f, 297b-298bCervical spine lines, 261, 262f, 271-272Charcot arthropathy, 253-254, 254f, 260bCHD. See Common hepatic duct (CHD).Chemical shift imaging, 185, 186fChest. See also Chest radiographs.
bullet in, 6fcomputed tomography of, 99t
aortic arch level, 101, 101faortopulmonary window level, 101, 102ffissures, 103, 104ffive-vessel level, 100, 100fhigh cardiac level, 101-103, 103flow cardiac level, 103, 103fmain pulmonary artery level, 101, 102fnormal anatomy and, 100-103, 100f
infant, normal, 70forientation of x-ray beam in studies of, 6t
Chest radiographsanteroposterior (AP)
cardiomegaly on, 68-69, 70theart size on, 68, 84b-85b
of aortic trauma, 166, 166fapical lordotic view and, 16-17, 16f-17fof chest trauma, 165f-166f
decubitusin pleural effusions, 43-44, 46fin pneumothorax, 63
expiratory, in pneumothorax, 62frontal
cardiac contours on, normal, 71fheart size on, 16, 16fnormal anatomic features on, 8, 9fsilhouette sign on, 55tof thoracic aortic aneurysms, 81, 81f
lateral, 8, 9f-10f, 17bcardiomegaly on, 69, 69f-70fkey areas on, 8-12, 9f, 10t, 17b
diaphragm and posterior costophrenic sulci, 9f, 10-12, 10t, 12f
fissures, 9, 9f, 10t, 12fhilar region, 8-9, 10t, 11fretrosternal clear space, 8, 10t, 11fthoracic spine, 9-10, 9f, 10t, 12f
left, 8, 9fpleural effusions and, 43-44, 46f
opacified hemithorax on. See Opacified hemithorax.
posteroanterior, 68, 84b-85bprojection of heart size, 68of pulmonary emboli, 120, 120ftechnical adequacy of, factors in evaluating,
12-17, 13t, 17bangulation, 13t, 16-17, 16f-17finspiration, 13-14, 13t, 14b, 14f, 17bmagnification, 13t, 15-16, 16fpenetration, 13, 13f, 13t, 17brotation, 13t, 14-15, 15f
thymomas on, 112fChest trauma, 164, 165f-166fChest tubes. See Pleural drainage tubes.CHF. See Congestive heart failure (CHF).Chilaiditi syndrome, 148, 151fChild abuse, 240-241, 240t, 241f, 247b-248bChildren
imaging and, 302, 302tSalter-Harris fractures in, 238-239, 238f-240f,
239tChocolate cysts, 201Cholecystitis, acute, 195, 196fCholedocholithiasis, 189fCholelithiasis, 194-195, 195fChondrocalcinosis, 254-255, 255fChronic bronchitis, 120-121. See also Chronic
obstructive pulmonary disease (COPD).Chronic obstructive pulmonary disease (COPD),
120-121, 121f-122f, 125b-126band air in the bowel wall, 153
Chronic pancreatitis, 183-184Chylothorax, 40Cirrhosis, 185, 186b, 186f, 191b-192bClaustrophobia, MRl scans and, 215Clavicles, erosion of, 224, 225fClosed fractures, 235, 247b-248bClosed head injuries, 296tClosed-loop obstructions, 141, 144f, 147bCloudlike calcifications, 158-159, 161f-162f,
162t-163t, 163bCoarctation of the aorta, 71Coiled-spring appearance of barium enema,
180, 182fCoils of MRI scanners, 210Coin, in esophagus, 5fColitis, 180-181, 183f, 191b-192bColles fractures, 241, 242f, 247b-248bColon
acute abdominal series to identify gas in, 131carcinoma of, 25f, 180, 182f, 191b-192bintestinal pseudoobstructions and, 146, 147f
Bronchogenic carcinomas (Continued) Chest radiographs (Continued)
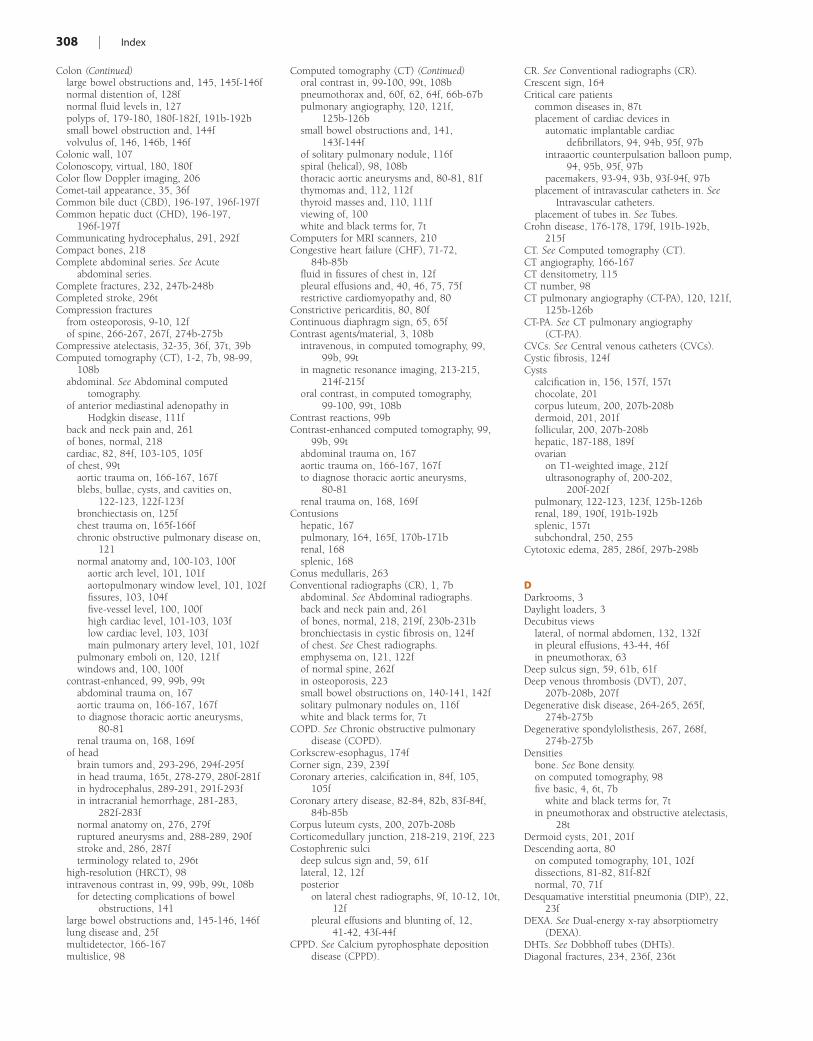
308 | Index
large bowel obstructions and, 145, 145f-146fnormal distention of, 128fnormal fluid levels in, 127polyps of, 179-180, 180f-182f, 191b-192bsmall bowel obstruction and, 144fvolvulus of, 146, 146b, 146f
Colonic wall, 107Colonoscopy, virtual, 180, 180fColor flow Doppler imaging, 206Comet-tail appearance, 35, 36fCommon bile duct (CBD), 196-197, 196f-197fCommon hepatic duct (CHD), 196-197,
196f-197fCommunicating hydrocephalus, 291, 292fCompact bones, 218Complete abdominal series. See Acute
abdominal series.Complete fractures, 232, 247b-248bCompleted stroke, 296tCompression fractures
from osteoporosis, 9-10, 12fof spine, 266-267, 267f, 274b-275b
Compressive atelectasis, 32-35, 36f, 37t, 39bComputed tomography (CT), 1-2, 7b, 98-99,
108babdominal. See Abdominal computed
tomography.of anterior mediastinal adenopathy in
Hodgkin disease, 111fback and neck pain and, 261of bones, normal, 218cardiac, 82, 84f, 103-105, 105fof chest, 99t
aortic trauma on, 166-167, 167fblebs, bullae, cysts, and cavities on,
122-123, 122f-123fbronchiectasis on, 125fchest trauma on, 165f-166fchronic obstructive pulmonary disease on,
121normal anatomy and, 100-103, 100f
aortic arch level, 101, 101faortopulmonary window level, 101, 102ffissures, 103, 104ffive-vessel level, 100, 100fhigh cardiac level, 101-103, 103flow cardiac level, 103, 103fmain pulmonary artery level, 101, 102f
pulmonary emboli on, 120, 121fwindows and, 100, 100f
contrast-enhanced, 99, 99b, 99tabdominal trauma on, 167aortic trauma on, 166-167, 167fto diagnose thoracic aortic aneurysms,
80-81renal trauma on, 168, 169f
of headbrain tumors and, 293-296, 294f-295fin head trauma, 165t, 278-279, 280f-281fin hydrocephalus, 289-291, 291f-293fin intracranial hemorrhage, 281-283,
282f-283fnormal anatomy on, 276, 279fruptured aneurysms and, 288-289, 290fstroke and, 286, 287fterminology related to, 296t
high-resolution (HRCT), 98intravenous contrast in, 99, 99b, 99t, 108b
for detecting complications of bowel obstructions, 141
large bowel obstructions and, 145-146, 146flung disease and, 25fmultidetector, 166-167multislice, 98
oral contrast in, 99-100, 99t, 108bpneumothorax and, 60f, 62, 64f, 66b-67bpulmonary angiography, 120, 121f,
125b-126bsmall bowel obstructions and, 141,
143f-144fof solitary pulmonary nodule, 116fspiral (helical), 98, 108bthoracic aortic aneurysms and, 80-81, 81fthymomas and, 112, 112fthyroid masses and, 110, 111fviewing of, 100white and black terms for, 7t
Computers for MRI scanners, 210Congestive heart failure (CHF), 71-72,
84b-85bfluid in fissures of chest in, 12fpleural effusions and, 40, 46, 75, 75frestrictive cardiomyopathy and, 80
Constrictive pericarditis, 80, 80fContinuous diaphragm sign, 65, 65fContrast agents/material, 3, 108b
intravenous, in computed tomography, 99, 99b, 99t
in magnetic resonance imaging, 213-215, 214f-215f
oral contrast, in computed tomography, 99-100, 99t, 108b
Contrast reactions, 99bContrast-enhanced computed tomography, 99,
99b, 99tabdominal trauma on, 167aortic trauma on, 166-167, 167fto diagnose thoracic aortic aneurysms,
80-81renal trauma on, 168, 169f
Contusionshepatic, 167pulmonary, 164, 165f, 170b-171brenal, 168splenic, 168
Conus medullaris, 263Conventional radiographs (CR), 1, 7b
abdominal. See Abdominal radiographs.back and neck pain and, 261of bones, normal, 218, 219f, 230b-231bbronchiectasis in cystic fibrosis on, 124fof chest. See Chest radiographs.emphysema on, 121, 122fof normal spine, 262fin osteoporosis, 223small bowel obstructions on, 140-141, 142fsolitary pulmonary nodules on, 116fwhite and black terms for, 7t
COPD. See Chronic obstructive pulmonary disease (COPD).
Corkscrew-esophagus, 174fCorner sign, 239, 239fCoronary arteries, calcification in, 84f, 105,
105fCoronary artery disease, 82-84, 82b, 83f-84f,
84b-85bCorpus luteum cysts, 200, 207b-208bCorticomedullary junction, 218-219, 219f, 223Costophrenic sulci
deep sulcus sign and, 59, 61flateral, 12, 12fposterior
on lateral chest radiographs, 9f, 10-12, 10t, 12f
pleural effusions and blunting of, 12, 41-42, 43f-44f
CPPD. See Calcium pyrophosphate deposition disease (CPPD).
CR. See Conventional radiographs (CR).Crescent sign, 164Critical care patients
common diseases in, 87tplacement of cardiac devices in
automatic implantable cardiac defibrillators, 94, 94b, 95f, 97b
intraaortic counterpulsation balloon pump, 94, 95b, 95f, 97b
pacemakers, 93-94, 93b, 93f-94f, 97bplacement of intravascular catheters in. See
Intravascular catheters.placement of tubes in. See Tubes.
Crohn disease, 176-178, 179f, 191b-192b, 215f
CT. See Computed tomography (CT).CT angiography, 166-167CT densitometry, 115CT number, 98CT pulmonary angiography (CT-PA), 120, 121f,
125b-126bCT-PA. See CT pulmonary angiography
(CT-PA).CVCs. See Central venous catheters (CVCs).Cystic fibrosis, 124fCysts
calcification in, 156, 157f, 157tchocolate, 201corpus luteum, 200, 207b-208bdermoid, 201, 201ffollicular, 200, 207b-208bhepatic, 187-188, 189fovarian
on T1-weighted image, 212fultrasonography of, 200-202,
200f-202fpulmonary, 122-123, 123f, 125b-126brenal, 189, 190f, 191b-192bsplenic, 157tsubchondral, 250, 255
Cytotoxic edema, 285, 286f, 297b-298b
DDarkrooms, 3Daylight loaders, 3Decubitus views
lateral, of normal abdomen, 132, 132fin pleural effusions, 43-44, 46fin pneumothorax, 63
Deep sulcus sign, 59, 61b, 61fDeep venous thrombosis (DVT), 207,
207b-208b, 207fDegenerative disk disease, 264-265, 265f,
274b-275bDegenerative spondylolisthesis, 267, 268f,
274b-275bDensities
bone. See Bone density.on computed tomography, 98five basic, 4, 6t, 7b
white and black terms for, 7tin pneumothorax and obstructive atelectasis,
28tDermoid cysts, 201, 201fDescending aorta, 80
on computed tomography, 101, 102fdissections, 81-82, 81f-82fnormal, 70, 71f
Desquamative interstitial pneumonia (DIP), 22, 23f
DEXA. See Dual-energy x-ray absorptiometry (DEXA).
DHTs. See Dobbhoff tubes (DHTs).Diagonal fractures, 234, 236f, 236t
Colon (Continued) Computed tomography (CT) (Continued)
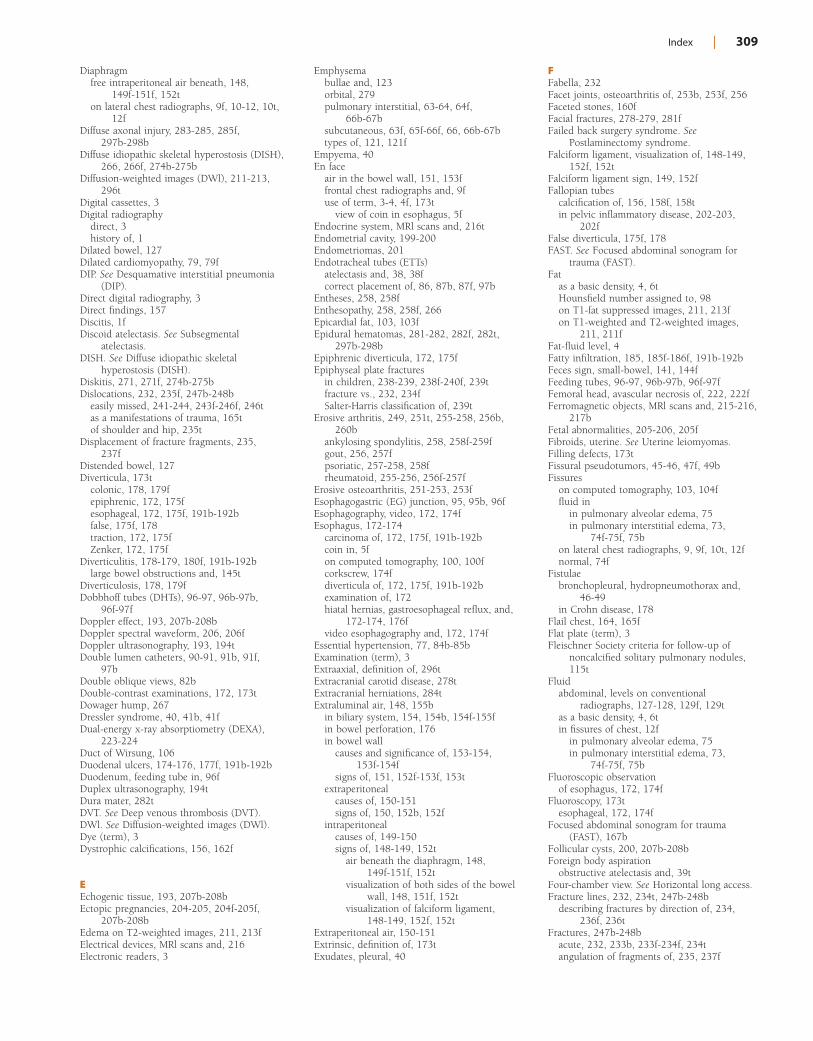
Index | 309
Diaphragmfree intraperitoneal air beneath, 148,
149f-151f, 152ton lateral chest radiographs, 9f, 10-12, 10t,
12fDiffuse axonal injury, 283-285, 285f,
297b-298bDiffuse idiopathic skeletal hyperostosis (DISH),
266, 266f, 274b-275bDiffusion-weighted images (DWl), 211-213,
296tDigital cassettes, 3Digital radiography
direct, 3history of, 1
Dilated bowel, 127Dilated cardiomyopathy, 79, 79fDIP. See Desquamative interstitial pneumonia
(DIP).Direct digital radiography, 3Direct findings, 157Discitis, 1fDiscoid atelectasis. See Subsegmental
atelectasis.DISH. See Diffuse idiopathic skeletal
hyperostosis (DISH).Diskitis, 271, 271f, 274b-275bDislocations, 232, 235f, 247b-248b
easily missed, 241-244, 243f-246f, 246tas a manifestations of trauma, 165tof shoulder and hip, 235t
Displacement of fracture fragments, 235, 237f
Distended bowel, 127Diverticula, 173t
colonic, 178, 179fepiphrenic, 172, 175fesophageal, 172, 175f, 191b-192bfalse, 175f, 178traction, 172, 175fZenker, 172, 175f
Diverticulitis, 178-179, 180f, 191b-192blarge bowel obstructions and, 145t
Diverticulosis, 178, 179fDobbhoff tubes (DHTs), 96-97, 96b-97b,
96f-97fDoppler effect, 193, 207b-208bDoppler spectral waveform, 206, 206fDoppler ultrasonography, 193, 194tDouble lumen catheters, 90-91, 91b, 91f,
97bDouble oblique views, 82bDouble-contrast examinations, 172, 173tDowager hump, 267Dressler syndrome, 40, 41b, 41fDual-energy x-ray absorptiometry (DEXA),
223-224Duct of Wirsung, 106Duodenal ulcers, 174-176, 177f, 191b-192bDuodenum, feeding tube in, 96fDuplex ultrasonography, 194tDura mater, 282tDVT. See Deep venous thrombosis (DVT).DWl. See Diffusion-weighted images (DWl).Dye (term), 3Dystrophic calcifications, 156, 162f
EEchogenic tissue, 193, 207b-208bEctopic pregnancies, 204-205, 204f-205f,
207b-208bEdema on T2-weighted images, 211, 213fElectrical devices, MRl scans and, 216Electronic readers, 3
Emphysemabullae and, 123orbital, 279pulmonary interstitial, 63-64, 64f,
66b-67bsubcutaneous, 63f, 65f-66f, 66, 66b-67btypes of, 121, 121f
Empyema, 40En face
air in the bowel wall, 151, 153ffrontal chest radiographs and, 9fuse of term, 3-4, 4f, 173t
view of coin in esophagus, 5fEndocrine system, MRl scans and, 216tEndometrial cavity, 199-200Endometriomas, 201Endotracheal tubes (ETTs)
atelectasis and, 38, 38fcorrect placement of, 86, 87b, 87f, 97b
Entheses, 258, 258fEnthesopathy, 258, 258f, 266Epicardial fat, 103, 103fEpidural hematomas, 281-282, 282f, 282t,
297b-298bEpiphrenic diverticula, 172, 175fEpiphyseal plate fractures
in children, 238-239, 238f-240f, 239tfracture vs., 232, 234fSalter-Harris classification of, 239t
Erosive arthritis, 249, 251t, 255-258, 256b, 260b
ankylosing spondylitis, 258, 258f-259fgout, 256, 257fpsoriatic, 257-258, 258frheumatoid, 255-256, 256f-257f
Erosive osteoarthritis, 251-253, 253fEsophagogastric (EG) junction, 95, 95b, 96fEsophagography, video, 172, 174fEsophagus, 172-174
carcinoma of, 172, 175f, 191b-192bcoin in, 5fon computed tomography, 100, 100fcorkscrew, 174fdiverticula of, 172, 175f, 191b-192bexamination of, 172hiatal hernias, gastroesophageal reflux, and,
172-174, 176fvideo esophagography and, 172, 174f
Essential hypertension, 77, 84b-85bExamination (term), 3Extraaxial, definition of, 296tExtracranial carotid disease, 278tExtracranial herniations, 284tExtraluminal air, 148, 155b
in biliary system, 154, 154b, 154f-155fin bowel perforation, 176in bowel wall
causes and significance of, 153-154, 153f-154f
signs of, 151, 152f-153f, 153textraperitoneal
causes of, 150-151signs of, 150, 152b, 152f
intraperitonealcauses of, 149-150signs of, 148-149, 152t
air beneath the diaphragm, 148, 149f-151f, 152t
visualization of both sides of the bowel wall, 148, 151f, 152t
visualization of falciform ligament, 148-149, 152f, 152t
Extraperitoneal air, 150-151Extrinsic, definition of, 173tExudates, pleural, 40
FFabella, 232Facet joints, osteoarthritis of, 253b, 253f, 256Faceted stones, 160fFacial fractures, 278-279, 281fFailed back surgery syndrome. See
Postlaminectomy syndrome.Falciform ligament, visualization of, 148-149,
152f, 152tFalciform ligament sign, 149, 152fFallopian tubes
calcification of, 156, 158f, 158tin pelvic inflammatory disease, 202-203,
202fFalse diverticula, 175f, 178FAST. See Focused abdominal sonogram for
trauma (FAST).Fat
as a basic density, 4, 6tHounsfield number assigned to, 98on T1-fat suppressed images, 211, 213fon T1-weighted and T2-weighted images,
211, 211fFat-fluid level, 4Fatty infiltration, 185, 185f-186f, 191b-192bFeces sign, small-bowel, 141, 144fFeeding tubes, 96-97, 96b-97b, 96f-97fFemoral head, avascular necrosis of, 222, 222fFerromagnetic objects, MRl scans and, 215-216,
217bFetal abnormalities, 205-206, 205fFibroids, uterine. See Uterine leiomyomas.Filling defects, 173tFissural pseudotumors, 45-46, 47f, 49bFissures
on computed tomography, 103, 104ffluid in
in pulmonary alveolar edema, 75in pulmonary interstitial edema, 73,
74f-75f, 75bon lateral chest radiographs, 9, 9f, 10t, 12fnormal, 74f
Fistulaebronchopleural, hydropneumothorax and,
46-49in Crohn disease, 178
Flail chest, 164, 165fFlat plate (term), 3Fleischner Society criteria for follow-up of
noncalcified solitary pulmonary nodules, 115t
Fluidabdominal, levels on conventional
radiographs, 127-128, 129f, 129tas a basic density, 4, 6tin fissures of chest, 12f
in pulmonary alveolar edema, 75in pulmonary interstitial edema, 73,
74f-75f, 75bFluoroscopic observation
of esophagus, 172, 174fFluoroscopy, 173t
esophageal, 172, 174fFocused abdominal sonogram for trauma
(FAST), 167bFollicular cysts, 200, 207b-208bForeign body aspiration
obstructive atelectasis and, 39tFour-chamber view. See Horizontal long access.Fracture lines, 232, 234t, 247b-248b
describing fractures by direction of, 234, 236f, 236t
Fractures, 247b-248bacute, 232, 233b, 233f-234f, 234tangulation of fragments of, 235, 237f
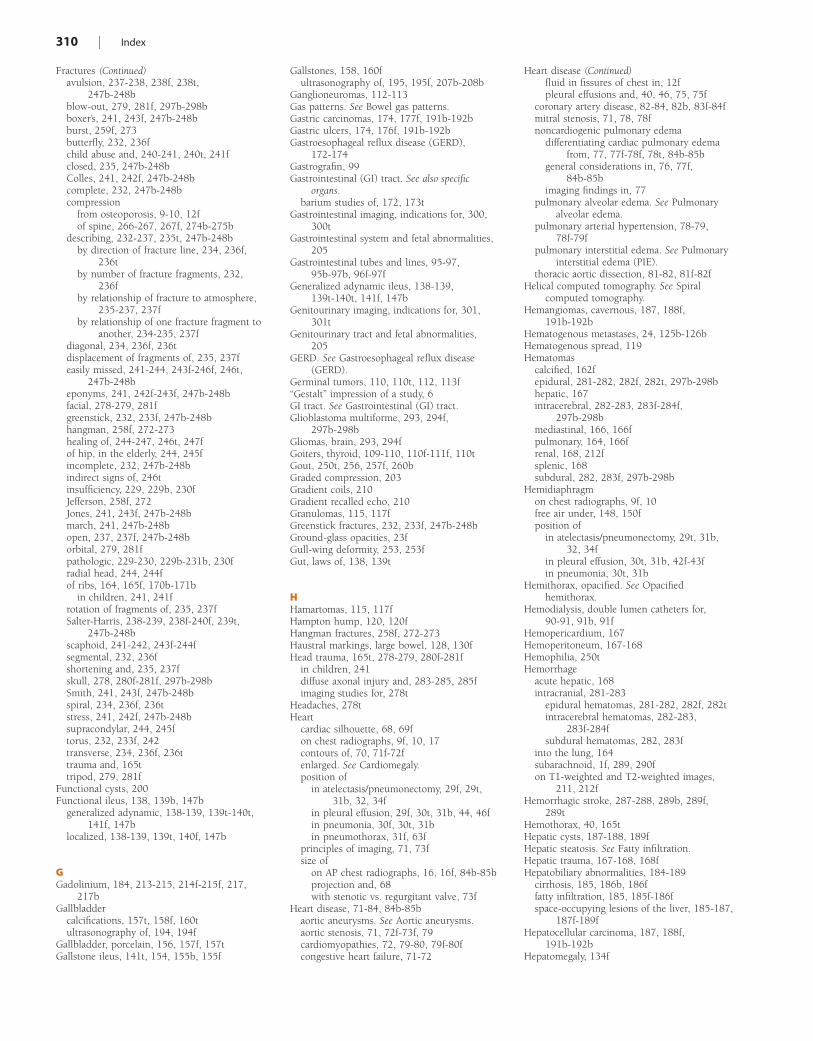
310 | Index
avulsion, 237-238, 238f, 238t, 247b-248b
blow-out, 279, 281f, 297b-298bboxer’s, 241, 243f, 247b-248bburst, 259f, 273butterfly, 232, 236fchild abuse and, 240-241, 240t, 241fclosed, 235, 247b-248bColles, 241, 242f, 247b-248bcomplete, 232, 247b-248bcompression
from osteoporosis, 9-10, 12fof spine, 266-267, 267f, 274b-275b
describing, 232-237, 235t, 247b-248bby direction of fracture line, 234, 236f,
236tby number of fracture fragments, 232,
236fby relationship of fracture to atmosphere,
235-237, 237fby relationship of one fracture fragment to
another, 234-235, 237fdiagonal, 234, 236f, 236tdisplacement of fragments of, 235, 237feasily missed, 241-244, 243f-246f, 246t,
247b-248beponyms, 241, 242f-243f, 247b-248bfacial, 278-279, 281fgreenstick, 232, 233f, 247b-248bhangman, 258f, 272-273healing of, 244-247, 246t, 247fof hip, in the elderly, 244, 245fincomplete, 232, 247b-248bindirect signs of, 246tinsufficiency, 229, 229b, 230fJefferson, 258f, 272Jones, 241, 243f, 247b-248bmarch, 241, 247b-248bopen, 237, 237f, 247b-248borbital, 279, 281fpathologic, 229-230, 229b-231b, 230fradial head, 244, 244fof ribs, 164, 165f, 170b-171b
in children, 241, 241frotation of fragments of, 235, 237fSalter-Harris, 238-239, 238f-240f, 239t,
247b-248bscaphoid, 241-242, 243f-244fsegmental, 232, 236fshortening and, 235, 237fskull, 278, 280f-281f, 297b-298bSmith, 241, 243f, 247b-248bspiral, 234, 236f, 236tstress, 241, 242f, 247b-248bsupracondylar, 244, 245ftorus, 232, 233f, 242transverse, 234, 236f, 236ttrauma and, 165ttripod, 279, 281f
Functional cysts, 200Functional ileus, 138, 139b, 147b
generalized adynamic, 138-139, 139t-140t, 141f, 147b
localized, 138-139, 139t, 140f, 147b
GGadolinium, 184, 213-215, 214f-215f, 217,
217bGallbladder
calcifications, 157t, 158f, 160tultrasonography of, 194, 194f
Gallbladder, porcelain, 156, 157f, 157tGallstone ileus, 141t, 154, 155b, 155f
Gallstones, 158, 160fultrasonography of, 195, 195f, 207b-208b
Ganglioneuromas, 112-113Gas patterns. See Bowel gas patterns.Gastric carcinomas, 174, 177f, 191b-192bGastric ulcers, 174, 176f, 191b-192bGastroesophageal reflux disease (GERD),
172-174Gastrografin, 99Gastrointestinal (GI) tract. See also specific
organs.barium studies of, 172, 173t
Gastrointestinal imaging, indications for, 300, 300t
Gastrointestinal system and fetal abnormalities, 205
Gastrointestinal tubes and lines, 95-97, 95b-97b, 96f-97f
Generalized adynamic ileus, 138-139, 139t-140t, 141f, 147b
Genitourinary imaging, indications for, 301, 301t
Genitourinary tract and fetal abnormalities, 205
GERD. See Gastroesophageal reflux disease (GERD).
Germinal tumors, 110, 110t, 112, 113f“Gestalt” impression of a study, 6GI tract. See Gastrointestinal (GI) tract.Glioblastoma multiforme, 293, 294f,
297b-298bGliomas, brain, 293, 294fGoiters, thyroid, 109-110, 110f-111f, 110tGout, 250t, 256, 257f, 260bGraded compression, 203Gradient coils, 210Gradient recalled echo, 210Granulomas, 115, 117fGreenstick fractures, 232, 233f, 247b-248bGround-glass opacities, 23fGull-wing deformity, 253, 253fGut, laws of, 138, 139t
HHamartomas, 115, 117fHampton hump, 120, 120fHangman fractures, 258f, 272-273Haustral markings, large bowel, 128, 130fHead trauma, 165t, 278-279, 280f-281f
in children, 241diffuse axonal injury and, 283-285, 285fimaging studies for, 278t
Headaches, 278tHeart
cardiac silhouette, 68, 69fon chest radiographs, 9f, 10, 17contours of, 70, 71f-72fenlarged. See Cardiomegaly.position of
in atelectasis/pneumonectomy, 29f, 29t, 31b, 32, 34f
in pleural effusion, 29f, 30t, 31b, 44, 46fin pneumonia, 30f, 30t, 31bin pneumothorax, 31f, 63f
principles of imaging, 71, 73fsize of
on AP chest radiographs, 16, 16f, 84b-85bprojection and, 68with stenotic vs. regurgitant valve, 73f
Heart disease, 71-84, 84b-85baortic aneurysms. See Aortic aneurysms.aortic stenosis, 71, 72f-73f, 79cardiomyopathies, 72, 79-80, 79f-80fcongestive heart failure, 71-72
fluid in fissures of chest in, 12fpleural effusions and, 40, 46, 75, 75f
coronary artery disease, 82-84, 82b, 83f-84fmitral stenosis, 71, 78, 78fnoncardiogenic pulmonary edema
differentiating cardiac pulmonary edema from, 77, 77f-78f, 78t, 84b-85b
general considerations in, 76, 77f, 84b-85b
imaging findings in, 77pulmonary alveolar edema. See Pulmonary
alveolar edema.pulmonary arterial hypertension, 78-79,
78f-79fpulmonary interstitial edema. See Pulmonary
interstitial edema (PIE).thoracic aortic dissection, 81-82, 81f-82f
Helical computed tomography. See Spiral computed tomography.
Hemangiomas, cavernous, 187, 188f, 191b-192b
Hematogenous metastases, 24, 125b-126bHematogenous spread, 119Hematomas
calcified, 162fepidural, 281-282, 282f, 282t, 297b-298bhepatic, 167intracerebral, 282-283, 283f-284f,
297b-298bmediastinal, 166, 166fpulmonary, 164, 166frenal, 168, 212fsplenic, 168subdural, 282, 283f, 297b-298b
Hemidiaphragmon chest radiographs, 9f, 10free air under, 148, 150fposition of
in atelectasis/pneumonectomy, 29t, 31b, 32, 34f
in pleural effusion, 30t, 31b, 42f-43fin pneumonia, 30t, 31b
Hemithorax, opacified. See Opacified hemithorax.
Hemodialysis, double lumen catheters for, 90-91, 91b, 91f
Hemopericardium, 167Hemoperitoneum, 167-168Hemophilia, 250tHemorrhage
acute hepatic, 168intracranial, 281-283
epidural hematomas, 281-282, 282f, 282tintracerebral hematomas, 282-283,
283f-284fsubdural hematomas, 282, 283f
into the lung, 164subarachnoid, 1f, 289, 290fon T1-weighted and T2-weighted images,
211, 212fHemorrhagic stroke, 287-288, 289b, 289f,
289tHemothorax, 40, 165tHepatic cysts, 187-188, 189fHepatic steatosis. See Fatty infiltration.Hepatic trauma, 167-168, 168fHepatobiliary abnormalities, 184-189
cirrhosis, 185, 186b, 186ffatty infiltration, 185, 185f-186fspace-occupying lesions of the liver, 185-187,
187f-189fHepatocellular carcinoma, 187, 188f,
191b-192bHepatomegaly, 134f
Fractures (Continued) Heart disease (Continued)
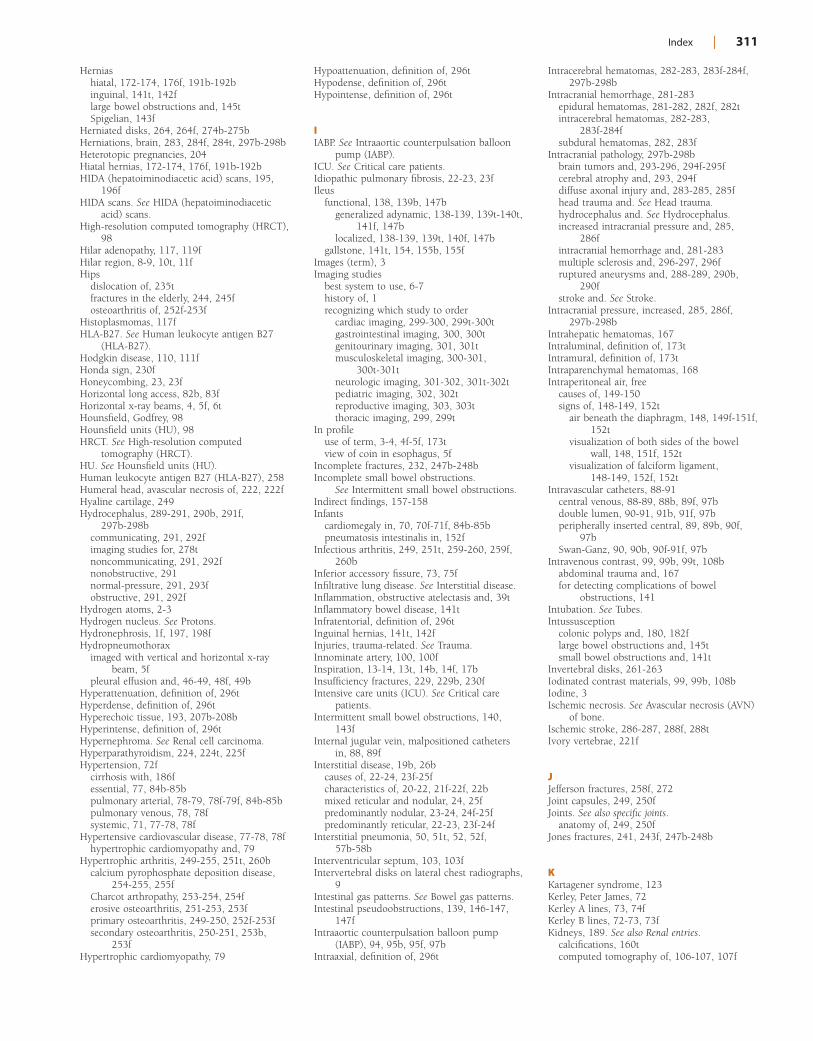
Index | 311
Herniashiatal, 172-174, 176f, 191b-192binguinal, 141t, 142flarge bowel obstructions and, 145tSpigelian, 143f
Herniated disks, 264, 264f, 274b-275bHerniations, brain, 283, 284f, 284t, 297b-298bHeterotopic pregnancies, 204Hiatal hernias, 172-174, 176f, 191b-192bHIDA (hepatoiminodiacetic acid) scans, 195,
196fHIDA scans. See HIDA (hepatoiminodiacetic
acid) scans.High-resolution computed tomography (HRCT),
98Hilar adenopathy, 117, 119fHilar region, 8-9, 10t, 11fHips
dislocation of, 235tfractures in the elderly, 244, 245fosteoarthritis of, 252f-253f
Histoplasmomas, 117fHLA-B27. See Human leukocyte antigen B27
(HLA-B27).Hodgkin disease, 110, 111fHonda sign, 230fHoneycombing, 23, 23fHorizontal long access, 82b, 83fHorizontal x-ray beams, 4, 5f, 6tHounsfield, Godfrey, 98Hounsfield units (HU), 98HRCT. See High-resolution computed
tomography (HRCT).HU. See Hounsfield units (HU).Human leukocyte antigen B27 (HLA-B27), 258Humeral head, avascular necrosis of, 222, 222fHyaline cartilage, 249Hydrocephalus, 289-291, 290b, 291f,
297b-298bcommunicating, 291, 292fimaging studies for, 278tnoncommunicating, 291, 292fnonobstructive, 291normal-pressure, 291, 293fobstructive, 291, 292f
Hydrogen atoms, 2-3Hydrogen nucleus. See Protons.Hydronephrosis, 1f, 197, 198fHydropneumothorax
imaged with vertical and horizontal x-ray beam, 5f
pleural effusion and, 46-49, 48f, 49bHyperattenuation, definition of, 296tHyperdense, definition of, 296tHyperechoic tissue, 193, 207b-208bHyperintense, definition of, 296tHypernephroma. See Renal cell carcinoma.Hyperparathyroidism, 224, 224t, 225fHypertension, 72f
cirrhosis with, 186fessential, 77, 84b-85bpulmonary arterial, 78-79, 78f-79f, 84b-85bpulmonary venous, 78, 78fsystemic, 71, 77-78, 78f
Hypertensive cardiovascular disease, 77-78, 78fhypertrophic cardiomyopathy and, 79
Hypertrophic arthritis, 249-255, 251t, 260bcalcium pyrophosphate deposition disease,
254-255, 255fCharcot arthropathy, 253-254, 254ferosive osteoarthritis, 251-253, 253fprimary osteoarthritis, 249-250, 252f-253fsecondary osteoarthritis, 250-251, 253b,
253fHypertrophic cardiomyopathy, 79
Hypoattenuation, definition of, 296tHypodense, definition of, 296tHypointense, definition of, 296t
IIABP. See Intraaortic counterpulsation balloon
pump (IABP).ICU. See Critical care patients.Idiopathic pulmonary fibrosis, 22-23, 23fIleus
functional, 138, 139b, 147bgeneralized adynamic, 138-139, 139t-140t,
141f, 147blocalized, 138-139, 139t, 140f, 147b
gallstone, 141t, 154, 155b, 155fImages (term), 3Imaging studies
best system to use, 6-7history of, 1recognizing which study to order
cardiac imaging, 299-300, 299t-300tgastrointestinal imaging, 300, 300tgenitourinary imaging, 301, 301tmusculoskeletal imaging, 300-301,
300t-301tneurologic imaging, 301-302, 301t-302tpediatric imaging, 302, 302treproductive imaging, 303, 303tthoracic imaging, 299, 299t
In profileuse of term, 3-4, 4f-5f, 173tview of coin in esophagus, 5f
Incomplete fractures, 232, 247b-248bIncomplete small bowel obstructions.
See Intermittent small bowel obstructions.Indirect findings, 157-158Infants
cardiomegaly in, 70, 70f-71f, 84b-85bpneumatosis intestinalis in, 152f
Infectious arthritis, 249, 251t, 259-260, 259f, 260b
Inferior accessory fissure, 73, 75fInfiltrative lung disease. See Interstitial disease.Inflammation, obstructive atelectasis and, 39tInflammatory bowel disease, 141tInfratentorial, definition of, 296tInguinal hernias, 141t, 142fInjuries, trauma-related. See Trauma.Innominate artery, 100, 100fInspiration, 13-14, 13t, 14b, 14f, 17bInsufficiency fractures, 229, 229b, 230fIntensive care units (ICU). See Critical care
patients.Intermittent small bowel obstructions, 140,
143fInternal jugular vein, malpositioned catheters
in, 88, 89fInterstitial disease, 19b, 26b
causes of, 22-24, 23f-25fcharacteristics of, 20-22, 21f-22f, 22bmixed reticular and nodular, 24, 25fpredominantly nodular, 23-24, 24f-25fpredominantly reticular, 22-23, 23f-24f
Interstitial pneumonia, 50, 51t, 52, 52f, 57b-58b
Interventricular septum, 103, 103fIntervertebral disks on lateral chest radiographs,
9Intestinal gas patterns. See Bowel gas patterns.Intestinal pseudoobstructions, 139, 146-147,
147fIntraaortic counterpulsation balloon pump
(IABP), 94, 95b, 95f, 97bIntraaxial, definition of, 296t
Intracerebral hematomas, 282-283, 283f-284f, 297b-298b
Intracranial hemorrhage, 281-283epidural hematomas, 281-282, 282f, 282tintracerebral hematomas, 282-283,
283f-284fsubdural hematomas, 282, 283f
Intracranial pathology, 297b-298bbrain tumors and, 293-296, 294f-295fcerebral atrophy and, 293, 294fdiffuse axonal injury and, 283-285, 285fhead trauma and. See Head trauma.hydrocephalus and. See Hydrocephalus.increased intracranial pressure and, 285,
286fintracranial hemorrhage and, 281-283multiple sclerosis and, 296-297, 296fruptured aneurysms and, 288-289, 290b,
290fstroke and. See Stroke.
Intracranial pressure, increased, 285, 286f, 297b-298b
Intrahepatic hematomas, 167Intraluminal, definition of, 173tIntramural, definition of, 173tIntraparenchymal hematomas, 168Intraperitoneal air, free
causes of, 149-150signs of, 148-149, 152t
air beneath the diaphragm, 148, 149f-151f, 152t
visualization of both sides of the bowel wall, 148, 151f, 152t
visualization of falciform ligament, 148-149, 152f, 152t
Intravascular catheters, 88-91central venous, 88-89, 88b, 89f, 97bdouble lumen, 90-91, 91b, 91f, 97bperipherally inserted central, 89, 89b, 90f,
97bSwan-Ganz, 90, 90b, 90f-91f, 97b
Intravenous contrast, 99, 99b, 99t, 108babdominal trauma and, 167for detecting complications of bowel
obstructions, 141Intubation. See Tubes.Intussusception
colonic polyps and, 180, 182flarge bowel obstructions and, 145tsmall bowel obstructions and, 141t
Invertebral disks, 261-263Iodinated contrast materials, 99, 99b, 108bIodine, 3Ischemic necrosis. See Avascular necrosis (AVN)
of bone.Ischemic stroke, 286-287, 288f, 288tIvory vertebrae, 221f
JJefferson fractures, 258f, 272Joint capsules, 249, 250fJoints. See also specific joints.
anatomy of, 249, 250fJones fractures, 241, 243f, 247b-248b
KKartagener syndrome, 123Kerley, Peter James, 72Kerley A lines, 73, 74fKerley B lines, 72-73, 73fKidneys, 189. See also Renal entries.
calcifications, 160tcomputed tomography of, 106-107, 107f
312 | Index
on conventional radiographsenlarged, 135, 136fnormal, 135, 135f
magnetic resonance imaging of, 190, 212fspace-occupying lesions of, 189-190, 190ftrauma to, 168-169, 169f, 170b-171bultrasonography of, 197, 197f-198f
KneesCharcot arthropathy of, 254fnormal MRI of, 219forientation of x-ray beam in studies of, 6tosteoarthritis of, 252f
Knuckle sign, 120
LLacerations
hepatic, 167pulmonary, 164, 166f, 170b-171brenal, 168, 169fsplenic, 168
Lactate dehydrogenase (LDH) concentrations, 40
Lacunar infarcts, 289b, 289fLamellar calcifications, 156-158, 158f-160f,
160t, 163b, 163tLaminar effusions, 46, 48f, 49b, 75Large bowel, 176
abnormal gas pattern in, 139tappendicitis and, 181-183, 183fcolitis and, 180-181, 183fcolonic carcinoma, 25f, 180, 182fcolonic polyps and, 179-180, 180f-182fcomputed tomography of, 107differentiating small bowel form, 128, 130fdiverticulitis and, 178-179, 180fdiverticulosis and, 178, 179fnormal fluid levels in, 127, 129f, 129tnormal gas pattern in, 127, 128f-129f, 129t
Large bowel obstructions (LBOs), 138, 139t, 144-146, 147b
causes of, 144-145, 145f, 145tcomputed tomography and, 145-146, 146fvolvulus of the colon, 146, 146b, 146f
Large cell carcinomasgraphic representation and clinical
manifestations of, 118tgrowth of, 115
Lateral costophrenic sulci, 12, 12fLateral rectum view, 127, 131, 131fLBOs. See Large bowel obstructions (LBOs).Leads, pacemaker, 93-94, 93f-94fLeft atrium
computed tomography of, 101-103, 103fenlarged, 70, 83fnormal, 70, 83f
Left lateral decubitus viewof abdomen, 132, 132fof free air, 148, 150f
Left upper lobe atelectasis, 34f, 37Left ventricle
cardiac MRI of, 83f-84fcomputed tomography of, 102f-103f, 103
Leiomyomasgastric, 174uterine
calcification of, 159, 161f-162f, 162tultrasonography of, 200, 200f,
207b-208bLevin tubes, 95bLigaments of spine, 263, 263tLigamentum teres, 106, 106fLinear calcifications, 156, 158f, 158t, 163b,
163t
Lingular pneumonia, 51fLinitis plastica, 174, 177fLiposarcomas, 211, 214fLiver
cirrhosis, 185, 186b, 186f, 191b-192bcomputed tomography of, 106, 106f, 184,
185fon conventional radiographs
enlarged, 134, 134fnormal, 134, 134f
fatty infiltration of, 185, 185f-186f, 191b-192b
magnetic resonance imaging of, 184space-occupying lesions of, 185-187,
187f-189ftrauma to, 167-168, 168f, 170b-171b
Lobar pneumonias, 18, 50, 51t, 56f, 57b-58bright lower, 19f
Localized ileus, 138-139, 139t, 140f, 147bLocalizing pneumonia, 55-57, 55f-56f, 55tLocked facets, 273, 274fLoculated effusions, 45-49, 47f-48f, 49bLooser lines of osteomalacia, 226, 226fLower lobe atelectasis, 34f, 37-38, 38fLucency, increased, 98Lung abscesses, 123t, 124fLung cancer. See Bronchogenic carcinomas.Lung disease. See also specific disorders.
airspace, 19b, 26bcauses of, 18-20, 20f-21fcharacteristics of, 18, 19f-20f, 20b
chronic obstructive pulmonary disease, 120-121, 121f-122f, 125b-126b
classification of, 18, 19binterstitial, 19b, 26b
causes of, 22-24, 23f-25fcharacteristics of, 20-22, 21f-22f, 22bmixed reticular and nodular, 24, 25fpredominantly nodular, 23-24, 24f-25fpredominantly reticular, 22-23, 23f-24f
Lung markingsabsence of, pneumothorax and, 59-61, 61fpoor inspiratory effort and, 14, 14f
Lung masses, parenchymal, 109Lung windows, 102fLungs
atelectasis of. See Atelectasis.blebs, bullae, cysts, and cavities of, 122-123,
122f-124f, 123t, 125b-126bcarcinoma of. See Bronchogenic carcinomas.on computed tomography, 100fmetastases to, 24, 25f, 119, 120f, 120t,
125b-126bon normal frontal chest radiographs, 8pseudoclearing of, 64solitary nodules/masses in, 113-115, 115t,
125b-126bbenign causes of, 115, 117fprimary lung cancer and, 115signs of benign vs. malignant, 114-115,
116fLupus erythematosus
avascular necrosis of bone and, 222fpleural effusions and, 40
Lymph nodes, calcification of, 159Lymphadenopathy, mediastinal
anterior, 11f, 110-111, 110t, 111f, 112tmiddle, 112, 113f
Lymphangitic spread, 24, 119, 120f, 125b-126b
Lymphomasanterior mediastinal, 109-111, 110t, 111f,
112tgastric, 174pleural effusions from, 46f
MMagnetic field strength, 209-210Magnetic resonance cholangiopancreatography
(MRCP), 188-189, 189f, 191b-192bMagnetic resonance imaging (MRl), 1-3, 7b,
209-210, 217babdominal, 105tback and neck pain and, 261of bones, 218-219, 219f
avascular necrosis of bone, 221-222, 222fcardiac, 82, 82b, 83f-84fcontrast, 213-215, 214f-215fdiffusion-weighted, 286, 287fhardware for, 209-210of head, 276-278, 279f-280f, 280t
diffuse axonal injury, 285, 285fidentifying a T1-weighted or T2-weighted
image, 211-213, 211f-214fof kidneys, 190of liver, 184
fatty infiltration of, 185, 186fspace-occupying lesions of, 187, 188f
of pelvis, 190pregnant patients and, 216-217, 216f, 217bpulse sequences and, 210-211safety issues, 215-217, 216fof spine
in metastatic spine disease, 269-271, 270f
normal, 263, 263fuses of, 216twhite and black terms for, 7t
Magnification, chest radiographs and, 13t, 15-16, 16f
Main magnet of MRI scanner, 209-210Malignancies. See also Metastases; specific
malignancies..small bowel obstructions from, 141tsolitary pulmonary nodules, 114-115, 116fspinal, 268-269, 270f
Marble bone disease. See Osteopetrosis.March fractures, 241, 247b-248bMarrow replacement, 218Masses
mediastinal. See Mediastinal masses.parenchymal lung, 109solitary pulmonary, 113-115, 115t,
125b-126bbenign causes of, 115, 117fbronchogenic carcinoma presenting as,
116, 116f, 119fprimary lung cancer and, 115signs of benign vs. malignant, 114-115,
116fthyroid, 109-110, 110f-111f, 110t
Mechanical devices, MRl scans and, 216Mechanical obstructions, 138, 147b
large bowel obstructions, 138, 139t, 144-146, 147b
causes of, 144-145, 145f, 145tcomputed tomography and, 145-146,
146fvolvulus of the colon, 146, 146b, 146f
laws of the gut and, 138, 139tsmall bowel obstructions, 138-141, 139t,
147bcauses of, 140, 141t, 142fcomputed tomography and, 141,
143f-144fdifferentiating localized ileus from, 139intermittent, 140, 143flarge bowel obstructions masquerading as,
145, 145fon radiographs, 140-141, 142f
Mediastinal fat, 103, 103f
Kidneys (Continued)
Index | 313
Mediastinal masses, 109, 125b-126banterior, 109-112, 110t
lymphomas, 109-111, 110t, 111f, 112tteratomas, 110, 110t, 112, 113fthymomas, 11f, 110-112, 110t, 112fthyroid masses, 109-110, 110f-111f,
110tdifferentiating parenchymal lung masses from
on chest radiographs, 109middle, 112, 113fposterior, 109, 110f, 112-113, 114f-115f
Mediastinal windows, 100, 102fMediastinum, 109, 110f, 125b-126b
anterior, 109, 110fmasses. See Mediastinal masses.middle, 109, 110f, 112posterior, 109, 110f, 112-113, 114f-115fsuperior, 109
Medical renal disease, 197, 198f, 207b-208bMedullary bone infarcts, 222, 223fMedullary cavity, 218, 226, 230b-231bMeigs syndrome, 40Melanomas, 213fMendelson syndrome, 55Meninges, 282tMeningiomas, 295, 295f, 297b-298bMeniscus sign, pleuraI effusions and, 42-44,
45f-46f, 49bMetal densities
appearance of, 6t, 98examples of, 4in the head, 276
Metastasesto bone, 220-221, 220f, 221bbrain, 293-295, 295f, 297b-298bbronchogenic carcinoma and, 117, 119b,
119fcannonball, 24hematogenous, 24hepatic, 187, 187f, 191b-192bto lung, 24, 25f, 119, 120f, 120t
multiple nodules and, 115, 125b-126bmelanoma, 213fmiddle mediastinal lymphadenopathy and,
112, 113fosteolytic, 226-227, 226b, 227f-228f, 229t,
230b-231b, 269ovarian, calcified, 162fspinal, 269, 270f, 274b-275b
MRI in, 269-271, 270fMiddle mediastinum, 109, 110f, 112, 113f,
125b-126bMiliary tuberculosis, 54, 54fMitral stenosis, 71, 78, 78f, 84b-85bMixed metastatic lesions, 269Mixed reticular and nodular interstitial disease,
24, 25fM-mode ultrasonography, 194tMolar pregnancies, 206, 207b-208bMR angiography, 289, 290fMRCP. See Magnetic resonance
cholangiopancreatography (MRCP).MRI. See Magnetic resonance imaging (MRl).Mucin-producing adenocarcinomas, 159, 162fMucous plug, 39tMultidetector CT, 166-167Multinodular goiters. See Thyroid masses.Multiple myeloma, 227, 229f
of spine, 269, 270f, 274b-275bMultiple nodules in the lungs, 119, 120t,
125b-126bMultiple sclerosis, 296-297, 296f, 297b-298bMultislice computed tomography, 98Mural thrombus, 198, 199fMurphy sign, 195
Musculoskeletal imaging, indications for, 300-301, 300t-301t
Musculoskeletal system, MRl scans and, 216tMyasthenia gravis, 111-112Mycobacterium tuberculosis, 53-54, 53f-54fMyelofibrosis, 219Myeloid depletion, 219
NNasogastric tubes (NGTs), 95-96, 95b, 96f,
97bNeck pain. See Back and neck pain.Necrobiotic nodules, 23Neoplasms. See also Carcinomas; Malignancies;
Tumors.lung, metastatic, 119, 120f, 120tobstructing
atelectasis and, 27pneumonia and, 57
Nephrogenic systemic fibrosis (NSF), 217, 217bNerve sheath tumors, 113Nerves, spinal, 263Net magnetization vector, 209Neurilemmomas. See Schwannomas.Neuroblastomas, 112-113Neurofibromas, 112-113, 114fNeurofibromatosis, 113, 114f-115f, 279, 295,
295fNeurogenic tumors, 112-113, 114f-115fNeurologic imaging, indications for, 301-302,
301t-302tNeurologic system, MRl scans and, 216tNeuropathic joints. See Charcot arthropathy.NGTs. See Nasogastric tubes (NGTs).Nodular interstitial lung disease, 21, 21fNodules, pulmonary
bronchogenic carcinoma presenting as, 116, 116f, 119f
multiple metastatic, 119, 120t, 125b-126bsolitary, 113-115, 115t, 125b-126b
benign causes of, 115, 117fprimary lung cancer and, 115signs of benign vs. malignant, 114-115,
116fNoncardiogenic pulmonary edema
differentiating cardiac pulmonary edema from, 77, 77f-78f, 78t, 84b-85b
general considerations in, 76, 77f, 84b-85bimaging findings in, 77
Noncommunicating hydrocephalus, 291, 292fNonfunctional cysts, 201, 201f-202fNonobstructive hydrocephalus, 291Normal-pressure hydrocephalus (NPH), 291,
293f, 297b-298bNPH. See Normal-pressure hydrocephalus
(NPH).NSF. See Nephrogenic systemic fibrosis (NSF).Nuclear medicine, white and black terms for, 7tNucleus pulposus, 261Nutrient canals, 232, 234t
OOat cell carcinoma, 118tObstructing neoplasms, 27Obstructions, mechanical. See Mechanical
obstructions.Obstructions series. See Acute abdominal series.Obstructive atelectasis, 27, 35, 37t, 39b
left upper lobe, 34f, 37lower lobe, 34f, 37-38, 38fmost common causes of, 39tpatterns of collapse in, 33f-34f, 37-39,
37f-38f
right middle lobe, 33f, 38right upper lobe, 33f, 37, 37f-38f
Obstructive hydrocephalus, 291, 292fObstructive pneumonitis, 116-117Ogilvie syndrome, 139, 146-147, 147b, 147fOlecranon bursitis, 256, 257fOmental cake, 202Opacified hemithorax, 27, 28f, 31b
atelectasis and, 27, 28f-29f, 28t-29tof left lung, 34f
pleural effusions and, 27, 29f, 30t, 31b, 44-45, 46f
pneumonia and, 27-28, 30f, 30tpostpneumonectomy, 27-30, 30f-31f, 31b,
35fOpen fractures, 237, 237f, 247b-248bOpposed-phase images, 186fOral contrast, 99-100, 99t, 108b
in trauma, 176Orbital fractures, 279, 281fOrganomegaly, 133-136
kidneys, 135, 135f-136fliver, 134, 134fpsoas muscles, 135-136spleen, 134-135, 135furinary bladder, 135, 136f-137futerus, 135, 137f
Orthogonal views, 6fOssicles, 234tOsteoarthritis
erosive, 251-253, 253fof facet joints, 253f, 256primary, 249-250, 252f-253fsecondary osteoarthritis, 250-251, 253b,
253fOsteoblastic bone metastases, 229tOsteoblasts, 218Osteoclasts, 218Osteoid, 218Osteolytic metastatic disease, 226-227, 226b,
227f-228f, 229t, 230b-231b, 269Osteomalacia, 226, 226f, 232Osteomyelitis, 227, 229f, 259f
of the spine, 1f, 271, 271fOsteonecrosis. See Avascular necrosis (AVN) of
bone.Osteopetrosis, 220, 220fOsteophytes, 9, 249Osteoporosis, 223-224, 230b-231b
age-related, 223compression fractures from, 9-10, 12f,
254fpostmenopausal, 223
Ovarian cystson T1-weighted image, 212fultrasonography and, 200-201, 201f-202f
Ovarian metastases, calcified, 162fOvarian tumors, 201-202, 202f, 207b-208bOvaries, 200, 200f-201fOverhead films, gastrointestinal, 173tOverpenetrated frontal chest radiographs, 13,
13f
PPacemakers, 93-94, 93b, 93f-94f, 97bPACS. See Picture archiving, communications,
and storage system (PACs).Pad sign, 184fPaget disease, 222, 223f, 230b-231bPain, back and neck. See Back and neck pain.PALS acronym, 103Panacinar emphysema, 121, 121fPancoast tumors, 117, 119b, 119f
Obstructive atelectasis (Continued)
314 | Index
Pancreascalcification of, 158, 161f, 162tcomputed tomography of, 106, 106f
Pancreatic adenocarcinomas, 184, 184f, 191b-192b
Pancreatitis, 183-184, 184f, 191b-192bPancytopenia, 220Paraseptal emphysema, 121, 121fParathormone, 224Parenchymal lung masses, 109Parietal pleura, 8, 40
in pneumothorax, 59, 60fPartial small bowel obstructions. See
Intermittent small bowel obstructions.Passive atelectasis, 32-35, 36fPathologic fractures, 229-230, 229b-231b,
230fPatient positioning. See Positioning.PCP. See Pneumocystis carinii (jiroveci) pneumonia
(PCP).Pediatric imaging, indications for, 302, 302tPedicle sign, 227, 228fPedicles, 261, 262fPedunculated polyps, 180, 181fPelvic computed tomography, 99, 99tPelvic inflammatory disease (PID), 202-203,
202f-203f, 207b-208bPelvic trauma, 169-170, 170fPelvic ultrasonography, female, 105t, 190,
198-203, 207b-208bascites and, 203, 203fnormal uterus anatomy, 198-200, 199fovarian cysts and tumors and, 200-202,
200f-202fpelvic inflammatory disease and, 202-203,
202futerine leiomyomas and, 200, 200f
Pelvisavulsion fractures around the, 238tmagnetic resonance imaging of, 190Paget disease of, 222, 223f
Penetrating trauma, 164Penetration of chest radiographs, 13, 13f, 13t,
17bPerfect profile, 4Peribronchial cuffing, 73, 74f, 75bPericardial cysts, 157fPericardial effusions, 68, 69b, 69f, 69tPericardium, 103, 103fPerinephric hematomas, 168Periosteal reaction, 246tPeripherally inserted central catheters (PICC
lines), 89, 89b, 90f, 97bPerirenal space, 106-107PET scans. See Positron emission tomographic
(PET) scans.Phleboliths, 133, 133fPhotosensitive cassettes/plates, 1Pia mater, 282tPICC lines. See Peripherally inserted central
catheters (PICC lines).Picture archiving, communications, and storage
system (PACs), 1-2PID. See Pelvic inflammatory disease (PID).Pineal gland calcifications, 279fPixels, 98Plain films. See Conventional radiographs
(CR).Plasmacytomas, solitary, 227, 229fPlatelike atelectasis. See Subsegmental
atelectasis.Plates, photosensitive, 1Pleura, 8Pleural drainage tubes, 91-93, 91b, 92f,
97b
Pleural effusions, 49bascites vs., 186b, 186fbronchogenic carcinoma and, 117causes of, 40, 41tdifferent appearances of, recognizing, 41-45
blunting of costophrenic angles and, 12, 41-42, 43f-44f
meniscus sign, 42-44, 45f-46fopacified hemithorax and, 27, 29f, 30t,
31b, 44-45, 46fsubpulmonic effusions, 41, 42f-43f, 42t,
49bfissural pseudotumors and, 45-46, 47f, 49bhydropneumothorax and, 46-49, 48f, 49blaminar, 46, 48f, 49bloculated, 45-49, 47f-48f, 49bas a manifestations of trauma, 165tin pulmonary alveolar edema, 75in pulmonary interstitial edema, 75, 75b,
75frheumatoid lung disease and, 23side specificity of, 40, 41b, 41ftypes of, 40
Pleural spaceadhesions in, 45normal anatomy and physiology of, 40in pneumothorax and atelectasis, 28t
Pneumatocoeles, 54, 123, 123ftraumatic, 164, 166f
Pneumatosis cystoides intestinalis, 153, 153f, 155b
Pneumatosis intestinalis, 151, 155bcomplications of, 154, 154fen face, 153fin infants, 152f
Pneumococcal pneumonia, right upper lobe, 18, 20f, 50, 52f, 57
Pneumocystis carinii (jiroveci) pneumonia (PCP), 52, 52f
Pneumomediastinum, 64-65, 65f, 66b-67b, 150
as a manifestations of trauma, 165tPneumonectomy
left-sided, 35fopacified hemithorax following, 27-30,
30f-31f, 31bPneumonia, 50, 57b-58b
airspace, 18, 20f, 50, 51faspiration, 54-55, 54f, 54t, 57b-58bcharacteristics of, 50, 51b, 51fdefinition of, 50desquamative, 22, 23flingular, 51flocalizing, 55-57, 55f-56f, 55topacified hemithorax in, 27-28, 30f, 30t, 31bpatterns of appearance of, 50-54, 51t,
57b-58bcavitary, 51t, 53-54, 53f-54f, 57b-58binterstitial, 50, 51t, 52, 52flobar, 18, 50, 51t, 56f, 57b-58b
right lower, 19fround, 1f, 51t, 53, 53f, 57b-58bsegmental, 50-52, 51t, 52f, 57b-58b
patterns suggesting causative organisms for, 51t
pneumococcal, right upper lobe, 20fresolution of, 57, 57fsilhouette sign in, 20f, 50, 51f, 55, 55t,
57b-58busual interstitial, 23, 23fvaricella, 22f
Pneumonitis, obstructive, 116-117Pneumopericardium, 65-66, 65f-66f, 66b-67b
as a manifestations of trauma, 165tPneumoperitoneum, 150, 155b, 178f
Pneumothorax, 59, 60f-61f, 61b, 66b-67batelectasis vs., 27, 28f, 28tcardiac pacemaker placement and, 93catheter insertions and
central venous catheters, 88double lumen catheters, 91
causes of, 62computed tomography in, 60f, 62, 64f,
66b-67blung windows and
decubitus chest x-rays in, 63delayed films in, 63expiratory x-rays in, 62as a manifestations of trauma, 165toverdiagnosis of, 59-61, 61f-63fprimary, 61simple, 61, 63f, 66b-67bsize of, 62, 64btension, 61-62, 63f, 66b-67b
incorrect endotracheal tube placement and, 86
types of, 61-62, 63f, 64bPolycystic ovarian disease, 201, 202fPolyps, colonic, 179-180, 180f-182f,
191b-192bPopcorn calcifications, 158-159, 161f-162f,
162t-163t, 163bPorcelain gallbladder, 156, 157f, 157tPortal veins, 106, 106fPortal venous gas, 154, 154fPositioning
for acute abdominal serieslateral rectum view, 131, 131fleft lateral decubitus view, 132, 132fprone view, 131, 131fsupine view, 130, 131fupright abdomen view, 132, 132fupright chest view, 133, 133f
endotracheal tubes and, 86, 87b, 87fpleural effusions and, 42-44, 45f
Positron emission tomographic (PET) scans, 115Posterior costophrenic sulci
on lateral chest radiographs, 9f, 10-12, 10t, 12f
pleural effusions and blunting of, 12, 41-42, 43f-44f
Posterior mediastinum, 109, 110f, 112-113, 114f-115f, 125b-126b
Posterior ribs, 14, 14b, 14fPostlaminectomy syndrome, 264, 274b-275bPostpericardiotomy/postmyocardial infarction
syndrome. See Dressler syndrome.Postpneumonectomy, 27-30, 30f-31f, 31bPost-primary tuberculosis, 53-54, 53fPostprocessing, 1-2Post-stenotic dilatation, 79Postsurgical adhesions, 141tPrecess, 209Predominantly nodular interstitial disease,
23-24, 24f-25fPredominantly reticular interstitial disease,
22-23, 23f-24fPregnancy
MRl scans during, 216-217, 216f, 217bultrasonography during, 203-206, 204b,
207b-208bectopic pregnancies and, 204-205,
204f-205ffetal abnormalities and, 205-206, 205fmolar pregnancies and, 206
Primary osteoarthritis, 249-250, 252f-253f, 260b
Primary pneumothorax, 61Primary tuberculosis, 53, 53fProbes, 193
Index | 315
Pronator quadratus fat plane, 246fProne abdomen view, 129-131, 131f, 131t,
137bProstate carcinoma, bone density increase in
focal, 221, 221b, 221fgeneralized, 219-220, 220f
Proteinaceous fluid, 211, 212fProtons, 209, 217bProud loops, 178, 179fPruning, 78, 79fPseudarthrosis, 247, 247fPseudoaneurysms
aortic, 164-165hepatic, 168Swan-Ganz catheters and, 90
Pseudoclearing of the lungs, 64Pseudocysts, pancreatic, 183, 184fPseudofractures in osteomalacia, 226, 226fPseudogout, 254, 255fPseudomonas aeruginosa, 50Pseudotumors, fissural, 45-46, 47f, 49bPsoas muscles, 135-136Psoriatic arthritis, 250t, 257-258, 258f, 260bPulmonary alveolar edema, 18, 75-76, 84b-85b
adult respiratory distress syndrome and, 77bat-wing configuration in, 21f, 71, 75, 76fdiffuse airspace disease of, 18, 19fkey findings in, 77bresolution of, 76, 76f
Pulmonary arterial hypertension, 78-79, 78f-79f, 84b-85b
Pulmonary artery, main, 70-71, 71fon computed tomography, 78-79, 101, 102f
in pulmonary arterial hypertension, 78-79, 83f
Pulmonary artery catheters, 90, 90b, 90f-91fPulmonary capillary wedge pressure catheters.
See Swan-Ganz catheters.Pulmonary cavities, 122-123, 123t, 124f,
125b-126bPulmonary contusions, 164, 165f, 170b-171bPulmonary edema
alveolar. See Pulmonary alveolar edema.noncardiogenic
differentiating cardiac pulmonary edema from, 77, 77f-78f, 78t, 84b-85b
general considerations in, 76, 77f, 84b-85b
imaging findings in, 77reexpansion, 76, 77f, 93
Pulmonary embolism, 59, 120, 120f-121f, 125b-126b
Pulmonary fibrosis, idiopathic, 22-23, 23fPulmonary infarction, Swan-Ganz catheters and,
90Pulmonary interstitial edema (PIE), 22-23,
72-75, 84b-85badult respiratory distress syndrome and, 77fluid in fissures in, 73, 74f-75f, 75bKerley A lines and, 73, 74fKerley B lines and, 72-73, 73fperibronchial cuffing and, 73, 74f, 75bpleural effusions and, 75, 75b, 75fsecondary to congestive heart failure, 23f
Pulmonary interstitial emphysema, 63-64, 64f, 66b-67b
Pulmonary lacerations, 164, 166f, 170b-171bPulmonary nodules/masses
multiple, 119, 120tsolitary, 113-115, 115t, 125b-126b
benign causes of, 115, 117fprimary lung cancer and, 115signs of benign vs. malignant, 114-115,
116fPulmonary stenosis, 71
Pulmonary thromboembolic disease, 120, 120f-121f, 125b-126b
Pulmonary vascular resistance, 78Pulmonary vasculature, 70-71, 72f, 84b-85bPulmonary venous hypertension, 78, 78fPulse sequences, 210-211, 217bPunched-out lytic lesions, 227, 229fPyrophosphate arthropathy, 254, 260b
QQuinton catheters. See Double lumen catheters.
RRachitic rosary, 225, 226fRadial head fractures, 244, 244fRadiofrequency (RF) pulses, 210, 217bRadiographs. See Chest radiographs;
Conventional radiographs (CR).Radiography, digital, 1Radionuclide bone scans, 221, 221bRadionuclide bone superscans, 220, 220fRadionuclide ventriculography, 79Reactivation tuberculosis. See Post-primary
tuberculosis.Reconversion, 218Rectal contrast in abdominal trauma, 167Rectum
abnormal gas pattern in, 138-139, 139tconstricting carcinoma of, 182flateral view of, 127, 131, 131f
Red bone marrow, 218Reexpansion pulmonary edema, 76, 77f, 93Reformatting in spiral CT, 98Renal calculi, 159fRenal cell carcinoma, 189-190, 190f,
191b-192bRenal cysts, 189, 190f, 191b-192bRenal failure, contrast reactions and, 99bRenal parenchyma, 197, 198fRenal trauma, 168-169, 169f, 170b-171bReproductive imaging, indications for, 303,
303tRestrictive cardiomyopathy, 80, 80fReticular interstitial lung disease, 21-23, 21f,
23f-24fReticulonodular interstitial lung disease, 21,
21fRetrograde urethrography (RUG), 170Retrolisthesis, 267Retrosternal clear space, 8, 10t, 11fRF pulses. See Radiofrequency (RF) pulses.Rheumatic heart disease, 79Rheumatoid arthritis, 40, 255-256, 256f-257f,
260bRheumatoid lung disease, 23, 24fRib cartilages, 133, 134fRibs
anterior and posterior, differentiating between, 14, 14b
fractures of, 164, 165f, 170b-171bin children, 241, 241f
Rickets, 225, 226fRiedel lobe of the liver, 134, 134fRight atrium, 71f, 83f
computed tomography of, 102f-103f, 103malpositioned catheters in, 88peripherally inserted central catheter in, 90f
Right middle lobe atelectasis, 33f, 38Right upper lobe atelectasis, 33f, 37, 37f-38fRight ventricle
cardiac MRI of, 83fcomputed tomography of, 103, 103f
Right ventricular outflow tract, 103, 103f
Rigler sign, 148, 151f-152f, 155bRimlike calcifications, 156, 157f, 157t, 163b,
163tRotation
chest radiographs and, 13t, 14-15, 15ffractures and, 235, 237f
Round atelectasis, 33-35, 36f, 39bRound pneumonia, 1f, 51t, 53, 53f, 57b-58bRUG. See Retrograde urethrography (RUG).Ruptured aneurysms, 288-289, 290b, 290f
SS sign of Golden, 37, 37fSacroiliitis, 258Saddle emboli, 121fSalter-Harris fractures, 238-239, 238f-240f,
239t, 247b-248bSarcoidosis, 24, 25f, 112tSBOs. See Small bowel obstructions (SBOs).Scaphoid fractures, 241-242, 243f-244fScapula, medial border of, 60-61, 63fScarring, 44fSCFE. See Slipped capital femoral epiphysis
(SCFE).Schatzki ring, 173, 176fSchwannomas, 112-113, 295-296, 295fSclerotic lesions, focal, 221, 221fScottie dog sign, 261, 262fScout film. See Supine abdomen view.Secondary osteoarthritis, 250-251, 253b, 253fSegmental fractures, 232, 236fSegmental pneumonia, 50-52, 51t, 52f,
57b-58bSeizures, 278tSemirecumbent position, pleural effusions and,
42Sentinel loops, 138-139, 139t, 140f, 147bSeptal lines. See Kerley B lines.Septic arthritis, 227, 250t, 259, 259fSesamoids, 232, 234t, 247b-248bSessile polyps, 180, 181fSharpey fibers, 261Shock bowel, 169, 169f, 170b-171bShort axis view, cardiac MRI, 82b, 83fShortening and fracture fragments, 235, 237fShoulder dislocations, 235t
posterior, 244, 245fSigmoid, abnormal gas pattern in, 138-139,
139tSigmoid volvulus, 146b, 146fSignet-ring sign, 124, 125fSilhouette, cardiac, 68, 69f. See also
Cardiomegaly.Silhouette sign, 18
in pneumonia, 20f, 50, 51f, 55, 55t, 57b-58b
Simple pneumothorax, 61, 63f, 66b-67bSingle photon emission computed tomography
(SPECT), 82-84Single-contrast examinations, 172, 173tSkeletal fetal abnormalities, 205Skin folds, pneumothorax and, 60, 62fSki-slope appearance of blunting, 41, 44fSkull fractures, 278, 280f-281f, 297b-298bSlipped capital femoral epiphysis (SCFE), 239,
239fSmall bowel, 176
abnormal gas pattern in, 139tcomputed tomography and, 107, 107fCrohn disease and, 176-178, 179fdifferentiating large bowel form, 128,
130fnormal fluid levels in, 127, 129tnormal gas pattern in, 127, 128f, 129t
316 | Index
Small bowel obstructions (SBOs), 138-141, 139t, 147b
causes of, 140, 141t, 142fcomputed tomography of, 141, 143f-144fdifferentiating localized ileus from, 139intermittent, 140, 143flarge bowel obstructions masquerading as,
145, 145fradiographs of, 140-141, 142f
Small cell lung carcinoma, 125b-126bgraphic representation and clinical
manifestations of, 118tmiddle mediastinal lymphadenopathy and,
112, 113fSmall-bowel feces sign, 141, 144fSmith fractures, 241, 243f, 247b-248bSoft tissue
as a basic density, 4, 6tHounsfield number assigned to, 98
Soft tissue masseslarge bowel obstructions and, 146, 146fneurogenic tumors and, 113, 114f
Solitary plasmacytomas, 227, 229fSolitary pulmonary nodules/masses, 113-115,
115t, 125b-126bbenign causes of, 115, 117fprimary lung cancer and, 115signs of benign vs. malignant, 114-115, 116f
Sonograms. See Ultrasonography.Sonohysterography, 200Sonolucent tissue, 193, 207b-208bSpace-occupying lesions
hepatic, 185-187, 187f-189frenal, 189-190, 190f
SPECT. See Single photon emission computed tomography (SPECT).
Sphenoid herniations, 284tSpigelian hernias, 143fSpin echo, 210Spinal cord, 263Spinal ligaments, 263, 263tSpinal nerves, 263Spinal stenosis, 267-268, 269f, 274b-275bSpinal trauma, 271-273, 272f-274fSpine. See also Back and neck pain.
infections of, 271, 271fligaments of, 263tmalignancy involving, 268-269, 270fnormal, 261-263, 262f-263f
Spine sign, 10fin pneumonia, 55-57, 55f
Spinolaminar white lines, 271-272Spinous process, 14, 17bSpiral computed tomography, 98, 108bSpiral fractures, 234, 236f, 236tSpleen
computed tomography of, 106, 106fon conventional radiographs
enlarged, 135, 135fnormal, 134-135
Splenic artery, 106, 106fSplenic cysts, 157tSplenic trauma, 168, 168f, 170b-171bSplenomegaly, 135fSpondylolisthesis, 267, 268f, 274b-275bSpondylolysis, 267, 268f, 274b-275bSpot films, 173tSquamous cell carcinomas
bronchial obstruction and, 116esophageal, 172graphic representation and clinical
manifestations of, 118tof the left upper lobe bronchus, 34fof solitary pulmonary nodule, 115
Staphylococcal pneumonia, 54
Staphylococcus aureus, 50Stein-Leventhal syndrome, 201, 202fStep-ladder appearance of small bowel
obstructions, 140, 142fStomach
abnormalities, 174-176, 176f-177fnormal fluid levels in, 127, 129tnormal gas pattern in, 127, 129t
Stone search study, 99, 157, 176, 197Stones, 156-158, 158f-160f, 160tStool, appearance on conventional radiographs,
129fStrangulation, 141, 144fStreak artifacts, 276Streptococcus pneumoniae, 50, 52fStress fractures, 241, 242f, 247b-248bString sign, 178, 179fStroke, 285-286, 287f, 297b-298b
completed, 296themorrhagic, 287-288, 289b, 289f, 289tischemic, 286-287, 288f, 288t
Study (term), 3Subarachnoid hemorrhage, 1f, 289, 290fSubcapsular hematomas
hepatic, 167renal, 168, 169f, 212fsplenic, 168
Subchondral bone, 249, 250fSubchondral cysts, 250, 255Subchondral sclerosis, 249Subclavian arteries
left, 100, 100fmalpositioned catheters in, 88-89, 89f
Subcutaneous emphysema, 63f, 65f-66f, 66, 66b-67b
Subdural hematomas, 282, 283f, 297b-298bSubfalcine herniations, 284tSubluxations, 232, 235f, 247b-248b, 257fSubperiosteal bone resorption, 224, 225fSubpulmonic effusions, 41, 42f-43f, 42t, 49bSubsegmental atelectasis, 32-35, 35f, 37t,
39bSubsternal thyroid goiters. See Thyroid masses.Sulci
lateral costophrenic, 12, 12fposterior costophrenic, 9f, 10-12, 10t, 12f
pleural effusions and blunting of, 12, 41-42, 43f-44f
Superconducting magnets, 209-210Superior mediastinum, 109Superior vena cava, 101, 101f-102fSuperscans, 220, 220fSupine abdomen view, 129-130, 131f, 131t,
137bSupine chest view, 133Supine position, pleural effusions and, 42, 45fSupracondylar fractures, 244, 245fSupratentorial, definition of, 296tSurface coils, 210Swallowing mechanism, video esophagography
and, 172, 174fSwan-Ganz catheters, 90, 90b, 90f-91f, 97bSwyer-James syndrome, 123Syndesmophytes, 258, 259fSynovial fluid, 249, 250fSynovial membrane, 249, 250fSystemic hypertension, 71, 77-78, 78f
TT1, 210, 217bT2, 210, 217bTE, 211, 217bTension pneumothorax, 61-62, 63f, 66b-67bTeratomas, 11f, 110, 110t, 112, 113f
Terminology, 3-4for densities, 4, 6t-7t
Tertiary waves, 172, 174fThoracic aortic aneurysms, 80-81, 80f-81fThoracic aortic dissection, 81-82, 81f-82fThoracic imaging, indications for, 299, 299tThoracic spine, 9-10, 9f, 10t, 12fThoracotomy tubes. See Pleural drainage tubes.Thromboembolic disease, 286Thumbprinting, 176, 183fThymomas, 11f, 110-112, 110t, 112fThymus gland in infants, 70, 71f, 84b-85bThyroid masses, 109-110, 110f-111f, 110tTomograms, 98Tonsillar herniations, 284tTorus fractures, 232, 233f, 242TR, 211, 217bTrachea
on computed tomography, 100, 100fposition of
in atelectasis/pneumonectomy, 29t, 31b, 32, 33f-34f
in pleural effusion, 29f, 30t, 31b, 44, 46fin pneumonia, 30f, 30t, 31bin pneumothorax, 31f, 63f
thyroid masses and, 109, 110fTracheostomy tubes, 86-88, 88b, 88f, 97bTraction diverticula, 172, 175fTram-tracks, 123-124, 124f-125fTransducers, 2, 193Transient ischemic attack (TlA), 296tTransitional cell carcinoma, 191fTransmitter coils, 210Transtentorial herniations, 284tTransudates, pleural, 40Transvaginal studies, 200Transverse fractures, 234, 236f, 236tTrauma, 164, 170b-171b
abdominal, 167-169, 167b, 168f-169faortic, 164-167, 166f-167fchest, 164, 165f-166ffree air following, 149-150head, 165t, 278-279, 280f-281f
diffuse axonal injury and, 283-285, 285fmanifestations of, 165tpelvic, 169-170, 170frenal, 168-169, 169fshock bowel, 169, 169fspinal, 271-273, 272f-274f
Traumatic brain injuries, 278Tricuspid regurgitation, 78fTriple-phase scans, 184, 185f, 191b-192bTripod fractures, 279, 281fTuberculosis
lung parenchyma cavities in, 123t, 124fmiliary, 54, 54fpleural effusions and, 40post-primary, 53-54, 53fprimary, 53, 53fsolitary pulmonary nodules and, 115, 117f
Tubesendotracheal
atelectasis and, 38, 38fcorrect placement of, 86, 87b, 87f, 97b
feeding tubes, 96-97, 96b-97b, 96f-97fnasogastric tubes, 95-96, 95b, 96f, 97bpleural drainage tubes, 91-93, 91b, 92f, 97btracheostomy, 86-88, 88b, 88f, 97b
Tubo-ovarian abscesses, 203Tubo-ovarian complex, 202f, 203Tumors. See also specific tumors.
brain, 293-296, 294f-295fbrown, 224, 225fof cecum, 181fgerminal, 110, 110t, 112, 113f
Index | 317
vascular, 206-207, 206f-207f, 207b-208bwhite and black terms for, 7t
Underpenetrated frontal chest radiographs, 13, 13f
Upright abdomen view, 129, 131-132, 131t, 132b, 132f, 137b
Upright chest view, 129, 131t, 132-133, 133f, 137b
Upright position, pleural effusions and, 42Ureters
calcification of, 156-158, 158t, 159fproximal, tear of, 169f
Urethral trauma, 170, 170b-171b, 170fUrinary bladder
adenopathy, 190-191, 191fcalcification of, 156, 160tcomputed tomography of, 107, 107fon conventional radiographs
enlarged, 135, 137fnormal, 135, 136f
rupture of, 169-170, 170b-171b, 170ftumors, 190, 191f
Urinary bladder stones, 158, 160f, 160tUrinary tract. See also Kidneys; Renal entries.
ultrasonography of, 197, 197f-198fUsual interstitial pneumonia (UIP), 23, 23fUterine leiomyomas
calcification of, 159, 161f-162f, 162tultrasonography of, 200, 200f, 207b-208b
Uteruson conventional radiographs
enlarged, 135, 137fnormal, 135
ultrasonography of, 198-200, 199f
VVacuum-disk phenomenon, 264Vanishing lung syndrome, 61f, 123Vanishing tumors. See Pseudotumors, fissural.Varicella pneumonia, 22fVas deferens, calcification of, 156, 158f, 158tVascular injuries, renal, 168-169Vascular ultrasonography, 206-207, 206f-207f,
207b-208bVascular watershed, 286-287Vasogenic edema, 285, 286f, 293, 294f,
297b-298bVentricles of heart
cardiac MRI of, 82b, 83f-84fgeneral principles of imaging, 71
leftcardiac MRI of, 83f-84fcomputed tomography of, 102f-103f,
103right
cardiac MRI of, 83fcomputed tomography of, 103, 103f
Vertical long access, 82b, 83fVertical x-ray beams, 4, 5f, 6tVestibular schwannomas, 295-296, 295f,
297b-298bVicarious excretion of contrast, 107, 189Video esophagography, 172, 174fVillous polyps, 180, 181fVirtual colonoscopy, 180, 180fVisceral pleura, 8, 40
blebs in, 123in pneumothorax, 59, 61fin pulmonary interstitial edema, 73
Visceral pleural line, 59, 60f, 61b, 62fVolvulus, 141, 144f, 145t
of the colon, 146, 146b, 146f
WWater
Hounsfield number assigned to, 98on T2-weighted images, 211, 213f
Water-soluble contrast, 99Westermark sign
of oligemia, 59pulmonary embolism, 120
Wet readings, 1White
terms in various modalities for, 4, 7tuse of term, 3
Window level, 98Window-width setting for computed
tomography, 98
XX-rays, horizontal vs. vertical beams, 4, 5f, 6t
YYellow bone marrow, 218
ZZenker diverticulum, 172, 175f
large bowel obstructions and, 145tobstructive atelectasis and, 39tovarian, 201-202, 202f, 207b-208bpancoast, 117, 119b, 119fposterior mediastinal, 112-113, 114f-115furinary bladder, 190, 191f
T1-weighted images, 211, 217bgadolinium and, 214, 214f-215fidentifying, 211-213, 211f-214f
T2-weighted images, 211, 217bidentifying, 211-213, 211f-214f
Twiddler syndrome, 93-94, 94fTwo-chamber view. See Vertical long access.
UUIP. See Usual interstitial pneumonia (UIP).Ulcer collar, 176fUlcers, 173t
duodenal, 174-176, 177f, 191b-192besophageal, 175fgastric, 174, 176f, 191b-192b
Ultrasonography, 1-2, 7b, 193, 194t, 207b-208babdominal, 99tabdominal aortic aneurysms and, 198,
198f-199fadverse effects and safety issues, 194, 194tappendicitis and, 203, 204fbiliary system and, 194-197, 194f-197f,
207b-208bcarotid, 206, 206fdeep venous thrombosis and, 207,
207b-208b, 207fDoppler, 193, 194tfemale pelvic, 105t, 190, 198-203,
207b-208bascites and, 203, 203fnormal uterus anatomy in, 198-200, 199fovarian cysts and tumors and, 200-202,
200f-202fpelvic inflammatory disease and, 202-203,
202futerine leiomyomas and, 200, 200f
medical uses of, 194during pregnancy, 203-206, 204b,
207b-208bectopic pregnancies and, 204-205,
204f-205ffetal abnormalities and, 205-206, 205fmolar pregnancies and, 206
of urinary tract, 197, 197f-198f, 207b-208b
Tumors (Continued) Ultrasonography (Continued) Ventricles of heart (Continued)
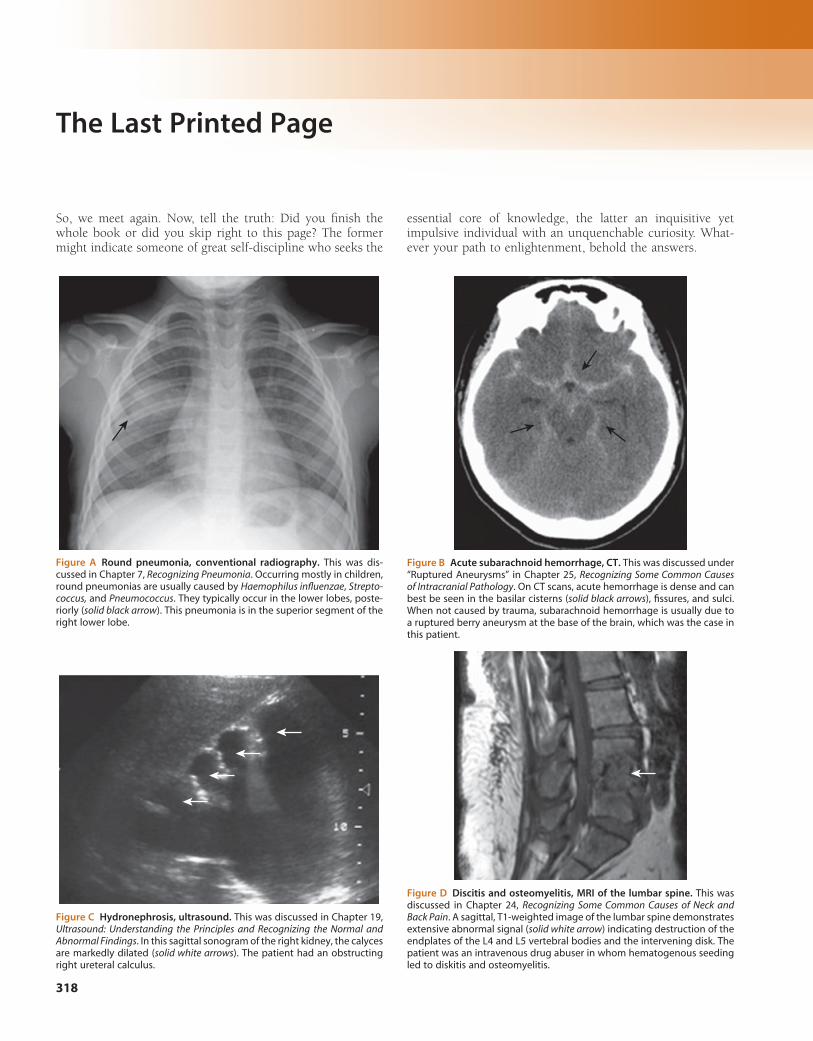
318
The Last Printed Page
So, we meet again. Now, tell the truth: Did you finish the whole book or did you skip right to this page? The former might indicate someone of great self-discipline who seeks the
Figure A Round pneumonia, conventional radiography. This was dis-cussed in Chapter 7, Recognizing Pneumonia. Occurring mostly in children, round pneumonias are usually caused by Haemophilus influenzae, Strepto-coccus, and Pneumococcus. They typically occur in the lower lobes, poste-riorly (solid black arrow). This pneumonia is in the superior segment of the right lower lobe.
Figure B Acute subarachnoid hemorrhage, CT. This was discussed under “Ruptured Aneurysms” in Chapter 25, Recognizing Some Common Causes of Intracranial Pathology. On CT scans, acute hemorrhage is dense and can best be seen in the basilar cisterns (solid black arrows), fissures, and sulci. When not caused by trauma, subarachnoid hemorrhage is usually due to a ruptured berry aneurysm at the base of the brain, which was the case in this patient.
Figure C Hydronephrosis, ultrasound. This was discussed in Chapter 19, Ultrasound: Understanding the Principles and Recognizing the Normal and Abnormal Findings. In this sagittal sonogram of the right kidney, the calyces are markedly dilated (solid white arrows). The patient had an obstructing right ureteral calculus.
Figure D Discitis and osteomyelitis, MRI of the lumbar spine. This was discussed in Chapter 24, Recognizing Some Common Causes of Neck and Back Pain. A sagittal, T1-weighted image of the lumbar spine demonstrates extensive abnormal signal (solid white arrow) indicating destruction of the endplates of the L4 and L5 vertebral bodies and the intervening disk. The patient was an intravenous drug abuser in whom hematogenous seeding led to diskitis and osteomyelitis.
essential core of knowledge, the latter an inquisitive yet impulsive individual with an unquenchable curiosity. What-ever your path to enlightenment, behold the answers.


