Embed Size (px)
Citation preview

Lc
Ra
b
a
AA
KLLOSS
1
htctpcad
f(
h0
Journal of Operations Management 32 (2014) 414–428
Contents lists available at ScienceDirect
Journal of Operations Management
jo ur nal ho me pa ge: www.elsev ier .com/ locate / jom
ean manufacturing and firm performance: The incrementalontribution of lean management accounting practices
osemary R. Fullertona,∗, Frances A. Kennedyb,1, Sally K. Widenerb
Jon M. Huntsman School of Business, Utah State University, Logan, UT 84322-3540, USAClemson University, Clemson, SC 29634-1303, USA
r t i c l e i n f o
rticle history:vailable online 11 September 2014
eywords:ean manufacturingean accountingperations and financial performanceurvey analysistructural equation modeling
a b s t r a c t
Manufacturing firms operating in rapidly changing and highly competitive markets have embraced thecontinuous process improvement mindset. They have worked to improve quality, flexibility, and cus-tomer response time using the principles of Lean thinking. To reach its potential, lean must be adoptedas a holistic business strategy, rather than an activity isolated in operations. The lean enterprise calls forthe integration of lean practices across operations and other business functions. As a critical componentfor achieving financial control, management accounting practices (MAP) need to be adjusted to meet thedemands and objectives of lean organizations. Our aim is to help both researchers and practitioners bet-ter understand how lean MAP can support operations personnel with their internal decision making, andoperations executives and business leaders in their objective of increasing lean operations performanceas part of a holistic lean enterprise strategy. We use survey data from 244 U.S. manufacturing firms toconstruct a structural equation model. We document that the extent of lean manufacturing implementa-tion is associated with the use of lean MAP, and further that the lean MAP are related in a systematic way:simplified and strategically aligned MAP positively influences the use of value stream costing, which inturn positively influences the use of visual performance measures. We also find that the extent of leanmanufacturing practices is directly related to operations performance. More importantly, lean manu-facturing practices also indirectly affect operations performance through lean MAP. These findings are
consistent with the notion that lean thinking is a holistic business strategy. In order to derive the greatestimpact on performance, our results indicate that operations management cannot operate in a vacuum.Instead, operations and accounting personnel must partner with each other to ensure that lean MAP arestrategically integrated into the lean culture. In sum, lean MAP provide essential financial control thatintegrates with and supports operations to achieve desired benefits.. Introduction
Manufacturing firms operating in the rapidly changing andighly competitive market of the past two decades have embracedhe principles of Lean thinking. In doing so, they reorganize intoells and value streams to improve the quality, flexibility, and cus-omer response time of their manufacturing processes. Decisionsreviously made by managers are instead made by those teams
lose to the work processes. The organization is transformed fromtraditional structure characterized as top-down with project-riven improvement led by middle managers into one where
∗ Corresponding author. Tel.: +1 435 881 8739; fax: +1 435 797 1475.E-mail addresses: [email protected] (R.R. Fullerton),
[email protected] (F.A. Kennedy), [email protected]. Widener).
1 Tel.: +1 864 656 4712.
ttp://dx.doi.org/10.1016/j.jom.2014.09.002272-6963/© 2014 Elsevier B.V. All rights reserved.
© 2014 Elsevier B.V. All rights reserved.
continuous improvement is conducted throughout the company bylocally empowered teams. This change in manufacturing strategyis associated with increased operational efficiency and effective-ness, which positively impacts firm performance (e.g., Fullerton andWempe, 2009; Hofer et al., 2012; Kaynak, 2003; Yang et al., 2011).
The Shingo Prize, which awards world-class companies fortheir adherence to lean principles, evaluates companies that haveachieved a “cultural transformation through the integration of
principles of operational excellence across the enterprise and itsvalue stream to create a complete, systemic view, leading to con-sistent results” (Shingo Prize, 2010, 5).2 It supports lean as an2 The Shingo Prize is an annual award that recognizes operational excellence. Itis based on the lean management approach and model taught by Dr. Shigeo Shingo,and is awarded to companies per their effectiveness in transforming their orga-nizations through the application of specific lean principles, systems, and tools.Those principles, systems, and tools are carefully outlined in a set of guidelines,

ration
ice(tatpamtAMaoi
vpliswcipv
psmmwwmipifiliea
pettTaihCtbtsstli
wr
R.R. Fullerton et al. / Journal of Ope
ntegrated, complex management system that spans the entireompany (Ahlstrom and Karlsson, 1996), where all people at all lev-ls have to be involved and committed to continuous improvementFurlan et al., 2011). As a holistic business strategy, lean thinking,hus, encompasses a change in mindset that extends beyond oper-tions. In particular, management accountants should be part ofhe lean transformation team since they are charged with sup-lying operations personnel and executives accurate, appropriate,nd timely internal information. As a critical support function, leananagement accounting practices (MAP) provide the financial con-
rol essential for internal decision making in lean organizations.n empirical question that has not been clarified is the role leanAP have in a lean manufacturing environment and whether oper-
tions management need to be concerned with the implementationf lean accounting practices. The purpose of this study is to shednsights on these issues.
In this study, we use three components to represent lean MAP:alue stream costing (VSC), simplified and strategic MAP, and visualerformance measures. We develop hypotheses predicting that
ean manufacturing positively influences lean MAP, and that theres a systematic structure among the lean MAP. We also hypothe-ize that the lean MAP positively influence operations performance,hich in turn, positively influences financial performance. We
ontrol for the direct effect of the extent of lean manufacturingmplementation on operations performance in order to sort out theerformance effects due to the lean manufacturing implementationersus the lean MAP.
We examine our hypotheses using a structural equation modelopulated with survey data from 244 U.S. manufacturing firms. Noturprising, we find that the extent of lean manufacturing imple-entation is positively related to lean MAP and operations perfor-ance. We further find that lean MAP are related in a systematicay: simplified, strategic MAP positively influences the use of VSC,hich in turn, positively influences the use of visual performanceeasures. In addition, the use of visual performance measures pos-
tively influences operations performance, and in turn, financialerformance. Thus, simplified, strategic MAP and VSC indirectly
nfluence operations performance (and subsequently, financial per-ormance) through the use of visual performance measures. Whats new and interesting is that after accounting for the effect ofean manufacturing on operations performance, lean MAP also pos-tively influence operations performance. Moreover, some of theffects of lean manufacturing practices on operations performancere translated through lean MAP.
Our findings expand lean understanding for researchers andractitioners in two key ways. First, we provide some of the initialmpirical evidence of the relationships among lean MAP, opera-ions performance, and financial performance. Thus, we respondo calls by Ahlstrom and Karlsson (1996) and van der Merwe andhomson (2007) to provide empirical research that investigates ifnd how lean MAP integrate with operations. Second, and mostmportantly, we contribute by providing a more complete look atow a holistic lean strategy can enhance firm performance (seeamacho-Minano et al., 2013). Our results support prior evidencehat firms can increase their operations and financial performancey implementing lean manufacturing. Further, our results suggesthat firms can leverage their returns from a lean manufacturingtrategy by also implementing lean MAP. This implication is con-istent with researchers and practitioners who have argued that
raditional MAP motivate behaviors detrimental to the success ofean because of their focus on cost reduction rather than processmprovement and customer value, and, thus, need to be updated tohich experienced Shingo examiners use to determine the selection of Shingo Prizeecipients. The website for the Shingo Prize is www.shingoprize.org.
s Management 32 (2014) 414–428 415
reflect the strategic objectives inherent to lean manufacturing (e.g.,Ahlstrom and Karlsson, 1996; Chiarini, 2012; Johnson and Kaplan,1987; Li et al., 2012; Maskell et al., 2012; Ruiz-de-Arbulo-Lopezet al., 2013). We show that strategically integrating both lean man-ufacturing and lean MAP provides a greater return to the firm (inthe form of increased operations and financial performance) thandoes the implementation of only a lean manufacturing strategy,consistent with the notion that lean is a holistic business strategy(e.g., Camacho-Minano et al., 2013). This finding suggests that oper-ations management should not implement a lean strategy solely onthe manufacturing floor. Rather operations managers need to part-ner with accounting personnel to ensure that lean MAP such asvalue stream costing (VSC) and visual performance measures areimplemented in support of the lean manufacturing processes. Thiswill result in more positive effects on operations performance, andin turn, financial performance.
The remainder of this paper is organized as follows. Section 2develops the hypotheses and discusses the related literature. Sec-tion 3 outlines the research study, and Section 4 discusses theresults. Finally, Section 5 provides a summary of the study, limi-tations, and suggestions for future research.
2. Literature support and hypotheses development
Lean thinking is arguably the most important strategy forachieving world-class performance. Womack et al. (1991) firstcoined the term “Lean production” in their seminal book, TheMachine that Changed the World. However, the origin of lean think-ing is generally attributed to Toyota, whose production system wasoriginally referred to as just-in-time (JIT), but is now commonlycalled the Toyota Production System (TPS). Lean thinking empha-sizes excellence through the elimination of waste and a focus oncontinuous improvement. Referring to JIT/TPS, Schonberger, 1987,5) called lean “the most important productivity enhancing man-agement innovation since the turn of the century.” Prior empiricalresearch has often linked lean manufacturing to operational (e.g.,Cua et al., 2001; Hallgren and Olhager, 2009; Narasimhan et al.,2006; Shah and Ward, 2003) and financial (e.g., Fullerton et al.,2003; Fullerton and Wempe, 2009; Hofer et al., 2012; Kaynak, 2003;Kinney and Wempe, 2002; Yang et al., 2011) performance.
2.1. Literature support
Lean is most well-known as a manufacturing system, but manyargue that to be successful it has to be applied much more broadly asa complete business system (Grasso, 2005; Kennedy and Widener,2008; McVay et al., 2013; Solomon and Fullerton, 2007; Womackand Jones, 1996). The essence of lean thinking is that all businessprocesses and functions integrate into a unified, coherent systemwith the purpose of using lean principles and tools to providebetter value to customers through continuous improvement andelimination of waste (Grasso, 2005; Shingo Prize, 2010). Since allbusiness processes are interrelated, some argue that lean manufac-turing cannot operate in isolation to realize its potential (Maskelland Kennedy, 2007).
Empirical research has taken steps in examining the holisticstrategy. In their longitudinal study of core operations and humanresource management practices in British manufacturing firms, deMenezes et al. (2010) find that firms with integrated advancedmanufacturing practices consistently outperform others. More-over, a 2006 Aberdeen study (Aberdeen Group, 2006) reported that
there was a large performance gap between those manufacturingfirms that had applied lean practices solely on the shop floor, asopposed to those that had developed a lean culture throughoutthe organization. In their case study, Benders and Slomp (2009)
4 ration
ebtlMwp(traai
ubcmaCse2ocsdOoit(
tpfwcdatfl(tiMatti
smtec(doctrefec
tion is to examine whether lean initiatives can be successful byfocusing efforts solely on the shop floor, or whether operationsmanagement must work with accounting in order to extract greaterbenefit from their lean manufacturing strategy, consistent with the
3 Fullerton et al. (2013) examine two additional accounting and control prac-tices. Inventory tracking is a traditional accounting practice, as opposed to a lean
16 R.R. Fullerton et al. / Journal of Ope
xplain lean manufacturing as a long, arduous process that cane both problematic and beneficial depending on differing con-extual factors. However, in their review of empirical studies onean implementations and their effects on performance, Comacho-
inano et al. (2013) conclude that evidence examining how andhether contextual factors impact the relationship between leanractices and financial performance is inconclusive. Further, Sila2007) found no performance difference among subgroups dis-inguishing five contextual factors – TQM implementation, ISOegistration, country of origin, company size, and scope of oper-tions. In extending this literature stream, we examine lean MAP,n important component of a successful lean transformation thats often overlooked.
This study uses a contingency framework, which has often beensed in the literature to examine the effectiveness of MAP in varioususiness environments. Contingency-based research assumes thatertain types of MAP are more suited to certain strategies and thatanagers will adapt their organizations accordingly to achieve fit
nd enhance performance (Chenhall, 2003; Gong and Tse, 2009).ontingency theory also assumes that there is no one best way totructure a firm; rather, firms must adapt their structure to fit theirnvironmental contingencies (Chenhall, 2003; Gerdin and Greve,004, 2008). It is important for firms to find the right combinationf contingencies, since lack of alignment will lead to dysfunctionalonsequences (Fry and Smith, 1987). Many argue that MAP are aignificant element of a firm’s organizational structure and must beesigned to fit the context in which they operate (Chenhall, 2003;tley, 1980). Different types of MAP are associated with differentrganization strategies, and the methods for managing workflown a JIT/TQM environment, for example, are best aligned with MAPhat have been adapted to fit advanced manufacturing strategiesGerdin, 2005).
For a lean thinking firm to achieve strategic fit, we thus arguehat accounting as an integral aspect of any business must be aart of its lean transformation. Traditional MAP were developedor a different landscape – one where continuous product flowas not critical and labor was a significant portion of product
osts. Management accounting information has supported this tra-itional environment with information extracted on the shop floor,nd then calculated and reported under parameters separate fromhe shop floor. In contrast, many contend that the informationow and physical flow in lean operations need to be intertwinedHuntzinger, 2007, 6). In fact, several contend that most lean ini-iatives will fail if the traditional management accounting systems left unchanged (e.g., Ahlstrom and Karlsson, 1996; Li et al., 2012;
eade et al., 2006). For example, traditional accounting reportsre not timely, they are too complex for most operations personnelo understand, they encourage meeting standards rather than cus-omer demands, and they fail to provide information about processmprovements achieved through lean.
In this study, we examine three lean MAP. First, supporting thetrategic objectives of lean MAP, simplified and strategically alignedanagement accounting practices represents accounting practices
hat mirror the lean manufacturing concepts of waste elimination,fficiency, and simplicity. Second, managing value streams is criti-al to successful lean enterprises, which makes value stream costingVSC) an important component of lean MAP (Li et al., 2012; Ruiz-e-Arbulo-Lopez et al., 2013). VSC recognizes the new structuref the manufacturing organization and records and tracks actualosts for each individual value stream. This simplifies the repor-ing system by significantly reducing the number of transactionsecorded and reported. Accounting reports are simpler to prepare,
asier for shop-floor decision makers to understand, and more use-ul for decision making (Fullerton et al., 2013; Li et al., 2012; Maskellt al., 2012). Third, lean MAP are concerned about communicatinglear and timely information through visual performance measuress Management 32 (2014) 414–428
that provide key operational and financial metrics linked to themanufacturing strategy of continuous improvement, quality first-time through, and low-levels of inventory (Fullerton et al., 2013;Kennedy and Maskell, 2006). The measures are provided in a visu-ally simple way, rendering the information useful for all employees.Since lean relies on worker involvement, the workers must be ableto clearly see and understand the information they use to makeand evaluate process improvements (Ruiz-de-Arbulo-Lopez et al.,2013).
Extant research has provided empirical evidence that imple-mentation of lean manufacturing is positively related to the useof lean MAP (Fullerton et al., 2013; Kennedy and Widener, 2008).Kennedy and Widener (2008) found that the firm in their casestudy changed its MAP to be better aligned with its lean man-ufacturing initiative. Operations managers were able to betterunderstand how to manage their inventory levels and maxi-mize their capacity to exploit additional business opportunities.Fullerton et al. (2013) empirically demonstrated that the extentof a lean manufacturing implementation was related to a packageof five MAP.3 They concluded that lean firms relied more onlean MAP, including simplified, strategic MAP, visual performancemeasurement, empowerment of employees, and VSC; and reliedless on traditional inventory tracking. Neither of these studies,though, shed insight on how the lean manufacturing strategy andrelated MAP influence performance. While the potential benefitsfrom implementing lean accounting in lean environments havebeen noted in two recent IMA statements and practitioner liter-ature (Cunningham and Fiume, 2003; Kennedy and Brewer, 2005;Kennedy and Maskell, 2006), there is limited empirical evidencerelated specifically to lean MAP and their effect on operations andfinancial performance. A few studies, though, have examined therelationships among financial performance, the expanded use ofnonfinancial performance measures, and advanced manufacturingpractices such as lean, just-in-time (JIT), and total quality man-agement (TQM) (Baines and Langfield-Smith, 2003; Callen et al.,2000, 2005; Durden et al., 1999; Fullerton and Wempe, 2009;Kaynak, 2003; Perera et al., 1997). For example, Perera et al.(1997) found that changes to MAP had no effect on firms adopt-ing advanced manufacturing technologies. Similarly, Callen et al.(2000) found that the use of nonfinancial performance indicatorsdid not affect the performance of either JIT or non-JIT firms. Onthe other hand, Kaynak (2003) finds that practices such as thereporting, monitoring, and use of quality data ultimately posi-tively impact financial and market performance. Further, Bainesand Langfield-Smith (2003) and Fullerton and Wempe (2009) findthat adapting MAP to better align with advanced manufacturingpractices ultimately positively affects organizational performance.
In sum, the literature reveals two important insights. First, theevidence is mixed on how more non-traditional MAP, such as theuse of non-financial and quality indicators as compared to the moretraditional financial accounting measures, impacts the relation-ships among manufacturing strategies, operational performance,and firm performance. Second, there is no direct evidence on howthe use of specific lean MAP affects performance. Thus, our inten-
accounting practice. Empowerment is a control technique that results from theinformation provided by the lean accounting practices. We do not examine eitherinventory tracking or empowerment in this study as we are interested in the threeprimary lean MAP touted for tracking and providing accounting information in alean environment.

R.R. Fullerton et al. / Journal of Operations Management 32 (2014) 414–428 417
he con
Se
ontil(io
tMMop
2
ta
otsagCrpmrflsiu
ltwp
Fig. 1. Theoretical model. Note: The dotted line represents t
hingo Prize premise (2010) that lean thinking represents deeplymbedded principles throughout the business processes.
In conclusion, we hope to shed insights on whether and howperations managers and accounting personnel will need to coordi-ate work activities. We hope to fill this gap in the literature streamhrough a more rigorous examination that: (1) uses data from firmsnterested in lean manufacturing; (2) controls for the extent of theean manufacturing implementation on operations performance;3) examines the relations between the extent of lean manufactur-ng implementation and usage of lean MAP; and (4) examines bothperations and financial performance.
In the next section, we first develop our expectations about howhe extent of lean manufacturing implementation is related to lean
AP4 (H1a–H1c). We then develop the relations among the leanAP (H2a–H2b). Finally, we theorize how lean MAP will impact
perations performance (H3a–H3b), and in turn, affect financialerformance (H4).
.2. Hypotheses development
We begin our hypothesis discussion by developing the rela-ions between the extent of lean manufacturing implementationnd lean MAP. Our theoretical model is illustrated in Fig. 1.
Lean thinking creates major changes in an organization’s wayf doing business. Consistency in operating practices suggests thathe same efforts made to eliminate waste and inefficiencies on thehop floor should be extended to accounting practices. This wouldllow the accounting system to be more supportive and strate-ically aligned with operational objectives (Maskell et al., 2012).unningham and Fiume (2003) also stress that the accountant’sesponsibility is to provide accounting information to operationsersonnel that is simple, timely, and easy to understand – infor-ation that supports the company’s strategy and motivates the
ight behaviors. That is, the information should support the smooth
ow of quality product with minimal waste. In their in-depth casetudy, Kennedy and Widener (2008) found that lean manufactur-ng initiatives influenced the use of lean accounting practices (i.e.,se of streamlined transaction processing, use of actual costs, and4 We do not claim that these hypotheses (i.e., H1a–H1c) make a contribution to theiterature since they are replications of Fullerton et al. (2013). However, we includehem as part of our theoretical development because we are interested in exploringhether some of the effects of a lean manufacturing implementation on operationserformance are transmitted through the lean MAP.
trol path. The solid lines represent the hypothesized paths.
use of kanbans). Thus, consistent with the findings of Fullertonet al. (2013) and the discussion above, we propose the followinghypothesis:
H1a. The implementation of a lean manufacturing strategy is pos-itively related to the use of simplified and strategically aligned MAP.
A lean manufacturing firm organized into value streams needsMAP designed specifically for a lean organization (Brosnahan,2008). In lean manufacturing, operations are refocused from a taskor product to a value stream. Operations personnel seek the rel-evant information contained in VSC to manage bottlenecks andcapacity so as to maintain smooth production flow. VSC also pro-vides capacity information which allows value stream managers tobetter understand the costs relevant to expansion and productiondecisions such as whether to take on special orders or in-sourcerather than out-source. In accordance with this discussion and theempirical evidence provided by Fullerton et al. (2013), we hypoth-esize the following:
H1b. The implementation of a lean manufacturing strategy is pos-itively related to the use of VSC.
In a lean manufacturing environment, employees working incells need information with which to facilitate their work activi-ties (Cunningham and Fiume, 2003; McGovern and Andrews, 1998;Zayko and Hancock, 1998). Traditional financial measures providehigh-level information on outcomes that are not detailed or simpleenough to be relevant to shop-floor workers. Instead, operationalinformation that communicates real-time results in a visual wayprovides the simple, relevant information shop-floor workers canuse to help ensure that the objectives of a lean manufacturing strat-egy are met (Cardinaels, 2008; Galsworth, 1997; Maskell et al.,2012). In accordance with this discussion and with the empiricalevidence provided by Kennedy and Widener (2008) and Fullertonet al. (2013) we hypothesize the following:
H1c. The implementation of a lean manufacturing strategy ispositively related to the use of visual performance measurementinformation.
We are also interested in how lean MAP are related to oneanother. First, we hypothesize that simplified, strategic MAP is
positively related to VSC. Second, we hypothesize that VSC is posi-tively related to the use of visual performance measures.Fullerton et al. (2013) provide evidence that the objectivesof lean manufacturing are more likely to be achieved when

4 ration
soctaooawsMstwt
afovdatmFtwgbrdsicit
opplsaMl
Hr
amaftdisdp
muVpfa
18 R.R. Fullerton et al. / Journal of Ope
implified, strategic MAP are adopted. As the extent of emphasisn lean manufacturing increases and lean thinking infuses theulture, it becomes easier and more compelling for managemento encourage accounting and other support functions to begindopting lean tools that simplify and streamline processes in theirwn areas. As accountants recognize the value of simplifying theirwn accounting practices to support strategic lean initiatives, theyre more likely to directly interact with operations personnel. Thisill improve communication and help accountants better under-
tand how to satisfy management’s information needs and designAP that are aligned with strategic objectives. Empirical evidence
upports this argument, as (Cadez and Guilding, 2008, 840) findhat as non-accounting personnel build stronger relationshipsith accountants, the accountants become “more active players in
he strategic management process.”A key strategic information need for lean manufacturers is the
ggregation of costs by value stream. Accountants are essentialor designing the internal reporting system that supports the newrganizational structure and facilitates decision making within thealue stream. VSC has a fundamentally different purpose from tra-itional MAP that center on allocating costs to products (Kennedynd Maskell, 2006); instead, VSC charges all direct product costso the “value stream” and attempts to capture actual costs with
inimal allocations (Kennedy and Widener, 2008; Solomon andullerton, 2007). VSC is a more straightforward accounting sys-em that conveys the continuous improvement and reduction ofaste principles embodied in lean thinking – supporting a strate-
ically “fit” application. Li et al. (2012) conclude that a VSC approachridges the information gap between operations and financialeporting. Ruiz-de-Arbulo-Lopez et al. (2013) use a case study toemonstrate how VSC is better able to model the processes on thehop floor, give relevant cost information, and simplify the account-ng process in comparison to traditional costing and activity-basedosting. However, in her case study of a small manufacturing firm ints first year of lean implementation, Chiarini (2012) suggests cau-ion in adopting VSC for small companies in the early stages of lean.
In sum, we argue that accountants who have followed the leadf their company’s lean transition by simplifying their accountingrocesses become more involved as strategic business partners andarticipants in continuous improvement initiatives. They are more
ikely to understand the necessity for changing their MAP to betterupport lean principles. Thus, as the lean culture begins to maturend more emphasis is placed on simplified and strategically alignedAP, we expect that VSC will emerge to support the objectives of
ean. This leads to the following hypothesis:
2a. Simplified and strategically aligned MAP are positivelyelated to the use of VSC.
To support lean manufacturing objectives, all employees needccessible, timely, and relevant information in an easy-to-use for-at (see Johnson, 1992). Performance measurement information
bout the value stream is critical, not only for management, but alsoor shop-floor workers, who need to assess in real time how wellhe processes are working (e.g., on-time delivery, first-pass yield,ay-by-the-hour) so that they can immediately respond to chang-
ng customer needs (Ruiz-de-Arbulo-Lopez et al., 2013). The valuetream performance measurement information is often updatedaily to inform employees, signal a need, and control productionrocesses (Galsworth, 1997).
Visually presenting the operational performance measure-ent information is an effective way to facilitate quick and easy
nderstanding by non-accountants. Li et al. (2012, 36) infers that
SC is the “best [accounting system] alternative for lean com-anies because it simplifies management and provides visibilityor managing continuous improvement.” In their study on visu-lizing multi-dimensional information, Dull and Tegarden (1999)s Management 32 (2014) 414–428
concluded that the form of information affects the accuracy ofpredictions using that information. Cardinaels (2008) providesempirical support on the use of visual information and concludedthat graphical cost accounting data are better than tabulated num-bers at informing users with limited accounting knowledge. In theircase study, Kennedy and Widener (2008) found that VSC perfor-mance metrics are normally provided on a daily or weekly basis,made available to all operations team members, and often dis-played on metric boards. Using visual data, lean production workerscan readily identify problems and practice better communication(Kennedy and Widener, 2008).
In sum, once a firm begins to rely more on VSC, it is likely thatoperational and cost metrics reporting on the value stream activi-ties will increase in relevance and visibility. We expect to find thatas the extent of VSC increases, visual performance measures willbe more available. This leads to our next hypothesis:
H2b. The use of VSC is positively related to the use of visual per-formance measures.
We next turn our attention to how both VSC and the use of visualperformance measures will result in a desired outcome – increasedoperations performance. We begin with VSC.
Relative to accounting practices focused on the use of standardcosting and allocations, VSC is a simpler accounting process thataccounts for all direct product costs incurred in the individual valuestreams. The use of VSC eliminates most allocations and many ofthe transaction costs associated with tracking labor (Apreuteseiand Arvinte, 2010; Kennedy and Brewer, 2005). Unlike traditionalaccounting, VSC focuses on minimizing inventory rather than pro-ducing to capacity (Yu-Lee, 2011). Thus, there are two primaryreasons that manufacturing results are enhanced from the use ofVSC. First, due to the simpler nature of VSC, the financial reportsand accounting information are easier for production managers tounderstand, which facilitates decision making (McVay et al., 2013).Better decision making leads to reduced costs, increased qualityand efficiency, and more likely achievement of aligned businessstrategies. Second, firms that manage and report by value streamsconcentrate on increasing the flow of the product through thevalue stream, rather than building product regardless of demandand optimizing individual department performance (Kennedy andMaskell, 2006). This makes all members of the value streamaccountable for their value stream’s performance related to quality,cycle times, and on-time deliveries (Maskell et al., 2012). VSC is alean accounting technique that encourages continuous improve-ment in lean environments because it more accurately reflectsoperational improvements (Ruiz-de-Arbulo-Lopez et al., 2013). Insum, since VSC is easier to understand and provides a focus morestrategically aligned with lean principles, we expect operationsperformance to improve. This leads to the next hypothesis.
H3a. The use of VSC is positively related to increased operationsperformance.
In addition to the positive effects from VSC, we argue that the useof visual performance measurement information will also enhanceoperations performance. Organizational behavior literature hassuggested that appropriate feedback facilitates goal attainment(Erez, 1977; Ilgen et al., 1979; Locke and Lathan, 1990, 2002;Neubert, 1998) by motivating workers to adjust their strategiesand the level and direction of their efforts, which can positivelyaffect performance (Earley et al., 1990; Ilgen et al., 1979; Locke andLathan, 1990, 2002). Flynn et al. (1994) found that visual charts andinformation controls containing performance metrics had a strong
association with quality performance. Lean manufacturing pro-cesses require efficient distribution of information. This includesimprovement-oriented performance measures and visual controltechniques. “Visual performance measurement boards and posted
ration
copacdTsgaefli
Ht
cafwtiSctfietssRmKqmwt
Hf
3
3
icsfigpsqssctect
cre
mance measures from the Shingo Prize Guidelines, the 14 principlesdescribed in the Toyota Way (Liker, 2004, 38–39), and the casestudy of Kennedy and Widener (2008). The eight-item visual per-formance measures scale (VLPM) includes making the information
5 Although it would be helpful to have multiple responses from the same plant,
R.R. Fullerton et al. / Journal of Ope
ontinuous improvement projects provide control and motivatengoing analysis of problems leading to waste reduction, improvedroductivity, and faster, better service to the customers” (Kennedynd Maskell, 2006, 14–15). Lean manufacturing utilizes simple,lear, visual communication tools to motivate higher worker pro-uctivity. In their case study of three aerospace firms, Parry andurner (2006) conclude that visual management systems can makeignificant contributions to the achievement of each firm’s businessoals. A well-accepted idiom is “what gets measured gets man-ged.” If the measures are visible on the shop floor, readily available,asy to understand, and related to lean objectives of quality andow, then operations performance is likely to show substantial
mprovement. This leads to our next hypothesis:
3b. The use of visual performance measures is positively relatedo operations performance.
In our final hypothesis, we broaden our focus to firm finan-ial performance. Improving operations performance leads to costnd waste reduction, which should positively affect financial per-ormance (Gustafsson and Johnson, 2002; Sila, 2007). Reducingaste in scrap and rework and improving productivity lowers
he cost structure of a firm (Mackelprang and Nair, 2010) andncreases return on assets (Fullerton et al., 2003; Yang et al., 2011).hetty (1987) found that as reputations for quality are established,ompanies can build market share and demand higher prices forheir products. Improving cycle times has been tied to increasednancial performance in several studies (Gunasekaran, 2002; Kimt al., 2002; Omachonu and Ross, 1994; Rogers et al., 1982). Con-rary to the results in most studies, Inman et al. (2011), in theirtudy of JIT and agile manufacturing, did not find a direct relation-hip between operational performance and financial performance.ather, the impact of operational performance on financial perfor-ance was mediated through marketing performance. However,
aynak (2003) found in her examination of TQM practices thatuality performance had a robust relationship with financial andarket performance. Overall, we posit that operations performanceill be directly related to financial performance, and hypothesize
he following:
4. Operations performance is positively related to financial per-ormance.
. Methodology
.1. Survey design and sample
We designed a detailed survey instrument to collect specificnformation about the manufacturing operations, organizationalulture, top management leadership, performance measurementystem and broader management accounting control system,nancial and operational performance changes, and general demo-raphics used by managers of U.S. manufacturing firms. Only aortion of the 125 survey questions are applicable to the relation-hips examined in this research project. The majority of the surveyuestions are either categorical or interval semantic differentialcales (see Appendix A for a description of the questions used in thistudy). We conducted a pretest by soliciting feedback from severalolleagues, as well as four operations managers working in firmshat were in the process of implementing lean. We asked them tovaluate the survey instrument for readability, completeness, andlarity. We made appropriate changes to the survey in response toheir feedback.
Because of the limited number of firms that have actuallyhanged their MAP in support of lean initiatives, collecting dataelated to lean accounting is particularly difficult. However, inter-st in designing more relevant MAP is becoming more widespread,
s Management 32 (2014) 414–428 419
which encouraged the formation in 2005 of the first annual LeanAccounting Summit (LAS), a conference venue focused on variousaspects of accounting for lean operations. The Summit attendeeswere invited to leave their contact information on the LAS websitefor future professional exchanges. The researchers were given per-mission to contact attendees that participated in the 2005–2008annual LASs. A total of 1389 names appeared on the contact lists.However, over one-third of the names were either duplications ofpeople who attended more than one Summit or attendees fromthe same plant, which we eliminated from the sample.5 We alsoeliminated potential contacts due to the following reasons: (1)they were employees of non-manufacturing entities; (2) they wereemployees of international firms (which is outside the scope); or(3) the contact information was incorrect. After adjusting for allof the above reasons, the remaining sample size was 476. We con-tacted respondents a maximum of four times (three were by e-mailand the last contact was by mail) and asked them to complete adetailed, 15 min on-line survey reflecting operations at their facil-ity. We received 265 responses from U.S. managers. Six responseswere largely incomplete and eliminated from the testing, leaving arelevant sample response rate of 54 percent (the high response ratewas deemed to be primarily due to a personal phone contact withthe potential respondent prior to initially e-mailing the survey). Fif-teen responses were received from duplicate plants. The answersfrom those duplications were averaged together, which resulted ina testable sample of 244. The large majority of the respondents hadaccounting and finance backgrounds, with titles of controller, CFO,and VP of finance. The distribution of the respondents and othersample characteristics are shown in Table 1.
We investigated non-response bias by comparing early respon-dents to late respondents, based on return date. We classified earlyresponders (n = 134) as those that responded following the firstcontact and late responders (n = 110) as those that answered on thefollowing three contacts. We found no statistically significant dif-ferences between early and late respondents for any of the variablesincluded in our research model. We also compared the groups onsales and again found no significant differences. Overall, the resultssupport the absence of significant non-response bias.
3.2. Survey constructs
The study has six primary constructs (extent of lean manufactur-ing, simplified and strategically aligned MAP, visual performancemeasures, VSC, operations performance, and financial perfor-mance). While we drew on general concepts from previous studies,the majority of the constructs were purpose developed. We usedthe Shingo Prize 2006 guidelines to develop the scales for leanmanufacturing and visual performance measurement information.The nine elements representing lean manufacturing (LMFG) –standardization, manufacturing cells, reduced setup times, kanbansystem, one-piece flow, reduced lot sizes, reduced buffer invento-ries, 5S, and Kaizen – are representative of lean in the Shingo PrizeGuidelines and several related studies (e.g., Fullerton andMcWatters, 2002; Fullerton et al., 2003; Sakakibara et al., 1993;Shah and Ward, 2003; White et al., 1999). We adapted visual perfor-
it was not considered practical, and even detrimental to obtaining responses. Infact, when this occurred accidentally, some complaints were received from contactssaying that either they or a colleague had responded previously. Attendees fromthe same firm were contacted as long as they represented different manufacturingplants.

420 R.R. Fullerton et al. / Journal of Operations Management 32 (2014) 414–428
Table 1Sample characteristics.
Sample characteristic Number of responses Classifications Totals Percent Mean
Respondentpositions
239 Controller 73 30.5 N/AFinance/Accounting Mgr 37 15.5V/P/Director Finance 31 13.0CFO 29 12.1V/P/Director Operations 18 7.5Cost Accountant 18 7.5Operations Manager 12 5.0Lean Specialist 10 4.2President/COO/Plant Mgr 6 2.5Miscellaneous 5 2.1
Gender 239 Male (0) 134 56.1 0.44Female (1) 105 43.9
Unionized 231 Non-unionized (0) 116 50.2 0.85Partially unionized (1) 33 14.3Fully unionized (2) 82 35.5
Respondent’s yearsof experience withfirm
236 0–3 years 72 30.5 7.8years4–6 years 57 24.2
7–10 years 49 20.822–45 years 58 24.6
Respondent’s yearsof managementexperience
237 0–9 years 55 23.2 15.96years10–15 years 77 32.5
16–20 years 45 19.021–48 years 60 25.3
Firm employees 146 5–175 37 25.3 4956180–300 36 24.7310–750 37 25.3784–160,000 36 24.7
Firm sales 164 $100–$36,000,000 40 24.4 $499800–$,000–,000–
vomWcFl
t(stoceip
3
iwfrgfmspudt
criteria. Bergkvist and Rossiter (2007) demonstrate how somesingle-item concrete measures can be superior to multi-item meas-ures. We contend that our measure of VSC is unambiguous, singular,
$38,000,0$120,000$800,000
isual, readily available, and aligned with strategic goals. We devel-ped the measures for a simplified, strategic MAP (SMAP) from theanagement accounting practices described in the Kennedy andidener (2008) lean accounting case study. These are also con-
eptually supported by Maskell et al. (2012) and Cunningham andiume (2003). The four-item measure captures the use of stream-ined MAP designed to provide relevant strategic information.
We adapted our operations performance construct (OPRF) fromhe operational performance measures used in Shah and Ward2003) and a related literature review. The six-item scale con-ists of self-assessed improvements of scrap and rework, setupimes, queue times, machine downtime, lot sizes, and cycle timever a three-year period. We adapted our financial performanceonstruct (FPRF) from Kaynak’s TQM study (2003) and a related lit-rature review. The four items include self assessments of changesn net sales, ROA, profitability, and market share over a three-yeareriod.
.2.1. Exploratory factor analysisIn order to develop a parsimonious representation for the var-
ous constructs in the survey, some of which are new constructs,e conducted an initial principal-components-based exploratory
actor analysis for each set of questions that we planned ex ante toepresent a separate construct. We eliminated items that loadedreater than 0.40 on more than one construct or that loaded onto aactor that did not make logical sense. After all of the survey instru-
ent constructs were defined, we performed another factor analy-
is to verify the initial exploratory results. Using the principal com-onents method, the same five constructs emerged with eigenval-es greater than 1.0, accounting for 59% of the total variance in theata. These factors were in general alignment with a priori expec-ations. The VARIMAX rotation resulted in the following factors:M116,000,000 42 25.6$650,000,000 41 25.0$100,000,000,000 41 25.0
LMFG: The extent to which the facility has implemented various Leanmanufacturing tools such as cells, a Kanban system, one-pieceflow, 5S, and Kaizen.
VLPM: The availability and visibility of strategically alignedperformance measures on the shop floor.
SMAP: The efforts made in the accounting system to simplify andalign it with strategic initiatives.
OPRF: The changes in operations performance over three years.FPRF: The changes in financial performance over three years.
These factors along with VSC represent the variables used inthe testing of the research model. The results of the factor analysisare shown in Appendix B.6 VSC is a single five-point seman-tic differential scaled question that asked respondents to assessthe extent to which they used VSC from 1 “not at all” to 5 a“great deal.” While most variables used in SEM are latent vari-ables, it is also acceptable to use observed variables (Kline, 2005,p. 12). An observed variable captures the construct when it is suf-ficiently narrow or unambiguous to the respondents (Sackett andLawson, 1990; Wanous et al., 1997). Rossiter (2002) argues thata single-item measure is sufficient if the construct is singular andconcrete in the minds of the raters, and Drolet and Morrison (2001)recommend the use of single-item measures that meet Rossiter’s
6 Note that the positive anchor of the 5-point Likert scaled survey questions forLMFG, OPRF, and FPRF is “5,” and for VLPM and SMAP, the positive anchor is “1.” Tomake the interpretation of the results more intuitive, we subtracted the responsesto the questions representing VLPM and SMAP from 6 so the higher the value of eachconstruct, the greater is VLPM and SMAP.

ration
atslc
sf(pl
ubeaamlsrsddtlrmct1trt
3
fapmmdoteauAwAatcwBJm
mzrtc
1951); they all exceed the acceptable standard of 0.70 for estab-lished constructs (Nunnally, 1978; Nunnally and Bernstein, 1994).In addition, we looked at the composite reliabilities, which unlike
R.R. Fullerton et al. / Journal of Ope
nd concrete in the minds of our responders.7 It is a costing sys-em that is directly related to the operational activities of a valuetream. Even though not all of our respondents have implementedean MAP, they were all attendees of the LASs, where VSC wasonsistently discussed and clarified.
The factor solutions for the defined constructs support the con-truct validity of the survey instrument. Multiple-question loadingsor each factor in excess of 0.50 demonstrate convergent validitysee Bagozzi and Yi, 1988). In addition, discriminant validity is sup-orted, with none of the questions in the factor analyses having
oadings in excess of 0.40 on more than one factor.To provide additional assurance on the suitability of our meas-
res, we undertake a rigorous examination of common methodias utilizing both procedural and statistical remedies (Podsakofft al., 2003). Although respondents were aware that they werenswering questions about lean accounting, lean manufacturing,nd performance, they were unlikely to guess our specific researchodel. If the research question is unknown, respondents have
ess ability to manipulate their answers in an attempt to meetome presumed expectations of the relationships. We used variousesponse formats (e.g., not at all to a great deal; strongly agree totrongly disagree; significant increase to significant decrease) andid not group questions by construct. We protected the respon-ents’ anonymity and carefully pre-tested the survey to ensurehat we avoided ambiguity, while using simple, easy-to-understandanguage. To assess the extent of common method bias that mayemain after implementation of procedural remedies, we ran a Har-an’s one-factor test on the survey questions that form the primary
onstructs in our model. If the majority of variance is explained byhe first factor, then there is significant bias (Podsakoff and Organ,986). In this analysis, only 17.3% of the variance is explained byhe first factor, and the balance of the variance is explained by theemaining variables (13.7%, 10.2%, 8.8%, 8.6%). Overall, we concludehat the potential for common method bias is low.
.2.2. Confirmatory factor analysisWe evaluated the measurement model with a confirmatory
actor analysis (CFA) (Gerbing and Anderson, 1988). Schumackernd Lomax (1996, 72) recommend a two-step modeling approach,roposed by James et al. (1982), that first evaluates the measure-ent model to assure its fit and then examines the full model. Theeasurement model provides an assessment of convergent and
iscriminant validity, while the full model provides an assessmentf predictive validity. Jöreskog and Sörbom (1993, 113) indicatehat the measurement model must be tested independently tonsure that the chosen indicators for a construct are appropri-te. The maximum likelihood (ML) approach in AMOS 18 wassed to test the measurement model and full structural model.mong the 244 responses, most measures have a full response,ith no more than five responses missing for any single measure.MOS does not evaluate missing data, but provides a theoreticalpproach to random missing data that is “efficient and consis-ent, and asymptotically unbiased” (Byrne, 2001, 292). Whereovariances were suggested by AMOS and justified theoretically,
e included them between error terms of the same construct (seeaines and Langfield-Smith, 2003; Fullerton and Wempe, 2009;aworski and Young, 1992; Shields et al., 2000). All of the structuralodels are over-identified and recursive.
7 For additional reassurance that our results are not affected by using a single-itemeasure, we run the following sensitivity analysis. We relaxed the assumption of
ero error variance and included the parameter for the error variance as (1-averageeliability) × (actual item variance). In doing so, our results were almost identical tohe original model and the qualitative inferences were unchanged, giving us moreomfort in the use of the single-item measure.
s Management 32 (2014) 414–428 421
We evaluated the measurement model using a number of fitindices, including: X2 and the ratio of X2 to degrees of freedom;Root Mean Square Error of Approximation (RMSEA); standard-ized root mean square residual (SRMR); Bentler–Bonett normedfit index (NFI) (Bentler and Bonett, 1980); incremental fit index(IFI) (Bollen, 1989); Tucker–Lewis Index (TLI) (Tucker and Lewis,1973); Comparative Fit Index (CFI) (Bentler, 1990), and AkaikeInformation Criterion (AIC) (Akaike, 1987). While there are nominimal established guidelines for what constitutes an acceptablefit (Schermelleh-Engel et al., 2003), there are several suggestedparameters in published reference and academic works for whatrepresents acceptable and good fit. Small p-values for the X2 indi-cate that the hypothesized structure is not confirmed by the sampledata (Hughes et al., 1986). However, Jöreskog and Sörbom (1989)note that this statistic should be interpreted with caution, and thatother measures of fit should be considered, such as the ratio of X2
to degrees of freedom, which should be less than 2.0. RMSEA isone of the most informative criteria in assessing model fit (Byrne,2001), with a built-in correction for model complexity (Kline, 2005,137). A RMSEA value of less than 0.08 is reasonable, although manyview a value of 0.05 or less as indicating a good fit (Browne andCudeck, 1993; Byrne, 2001; Kline, 2005). An SRMR less than 0.05(Schermelleh-Engel et al., 2003) to 0.10 (Kline, 2005) is consideredfavorable. The other ratios (NFI, TLI, CFI, and IFI) are evaluated fortheir closeness to 1.0, with values over 0.90 (Bentler, 1992, Byrne,2001; Kline, 2005) or over 0.95 (for the CFI; Hu and Bentler, 1998;Schermelleh-Engel et al., 2003) representing good fit. In addition,we used the AIC, which compares the hypothesized sample modelto a hypothetical random sample (saturated) model, to measuremodel parsimony (Kline, 2005, 142). The AIC of the hypothesizedmodel should be less than that of the saturated model, since themodel with the smallest AIC is the one most likely to replicate(Byrne, 2001; Hu and Bentler, 1995; Kline, 2005). The measurementmodel has good fit indices, with the exception of NFI, as shown inTable 2. However, NFI often underestimates fit in small samples(Byrne, 2001; Kline, 2005), whereas TLI, CFI, and IFI are preferredfit indices for small sample sizes (Shah and Goldstein, 2006). Thus,we feel the overall model fit for our sample is reasonable.
Discriminant validity assesses the extent to which the individ-ual constructs are discrete (Bagozzi et al., 1991). Crocker and Algina(1986) indicate that discriminant validity is shown when the cor-relations of individual factors do not exceed the alpha (reliability)coefficients. Another measure of discriminant validity is to comparethe square root of the average variance extracted (AVE) to the corre-lations between constructs (Braunscheidel and Suresh, 2009; Chin,1998; Fornell and Larcker, 1981). The square root of AVE is indi-cated on the diagonal of Table 3 and is greater than the constructcorrelations.8 Table 3 shows that all of the correlation coefficientsare less than the alpha coefficients. The alpha coefficients are usedto test for the internal consistency of the constructs (Cronbach,
8 We also compared the AVE to the inter-construct correlations produced in theAMOS confirmatory factor analysis. We find that all of the correlations are lessthan the square root of the AVE as recommended by Fornell and Larcker (1981)with one exception, the correlation between LMFG and OPRF (0.73). Even thoughSchumacker and Lomax (1996) recommend the Pearson correlation for testing SEMmodels (which is less than the square root of the AVE), we turned to Kenny (2012) –http://davidakenny.net/cm/mfactor.htm to gain further assurance about our model.He suggests that discriminant validity among latent factors in SEM is poor if thecorrelations �.85. Although all of our correlation coefficients <0.85, we performan additional recommended test that restricts the correlation between LMFG andOPRF to 1 in the CFA. We find that model fit is worse (e.g., SRMR increases from .05to .15, and ILI, CFI, and CFI drop to barely over 0.90). We, thus, conclude that ourdiscriminant validity is acceptable overall (Kenny, 2012).

422 R.R. Fullerton et al. / Journal of Operations Management 32 (2014) 414–428
Table 2Results from confirmatory factor analysis summary data for individual constructindicators.
Construct indicators Standardizedcoefficients (loadings)
t-Values (all significantto p < 0.000)
Lean manufacturing practicesLMFG1 0.654 –a
LMFG2 0.741 9.978LMFG3 0.705 9.573LMFG4 0.681 8.498LMFG5 0.720 9.719LMFG6 0.791 10.425LMFG7 0.684 9.259LMFG8 0.642 8.813LMFG9 0.709 9.541
Visual performance measuresVLPM1 0.525 –a
VLPM2 0.606 6.911VLPM3 0.652 7.839VLPM4 0.680 7.302VLPM5 0.695 7.457VLPM6 0.725 7.568VLPM7 0.712 7.572VLPM8 0.656 7.215
Simplified and strategic management accounting practicesSMAP1 0.636 –a
SMAP2 0.511 8.080SMAP3 0.880 9.922SMAP4 0.792 9.711
Operations performanceOFPR1 0.613 –a
OFPR2 0.631 7.914OFPR3 0.776 9.123OFPR4 0.551 7.126OFPR5 0.712 8.631OFPR6 0.551 7.126
Financial performanceFPRF 0.652 –a
FPRF 0.727 9.463FPRF 0.906 9.566FPRF 0.588 9.582
Notes: n = 244.Measurement models are estimated using maximum likelihood.See Appendix for definition of individual indicators from survey data.Model fit indices: Chi-square, 630.072; degrees of freedom, 440; p, 0.000; Chi-squarerA
Cc0IIetiMVamfea
4
4
(
119 227 132 115 136
125
17
112 129108
0
50
100
150
200
250
300
LA LM JIT TQM TPM
# o
f Res
pond
ents
Lean P ractic es
Adoptions of Lean Practice s
Non-Adop ters
Adopters
operations performance. This relation is well-established in extantliterature (e.g., Hallgren and Olhager, 2009; Narasimhan et al.,2006; Shah and Ward, 2003, 2007) and accordingly, we find that
atio, 1.432; NFI, 0.833; IFI, 0.943; TLI, 0.934; CFI, 0.942; RMSEA, 0.042; SRMR, 0.052;IC, 870.072 (saturated model, 1120.00).a Indicates a parameter that was fixed at 1.0.
ronbach’s alpha do not assume equally weighted measures. Theomposite reliabilities are also above the acceptable standard of.70 (Chin, 1998; Fornell and Larcker, 1981), as shown in Table 3.n Table 3, we also see many significant correlations as expected.ndeed all of the constructs are significantly correlated with thexception of the relations between VLPM and VSC with FPRF. Due tohe voluminous number of factors that impact FPRF, it is not surpris-ng that a univariate effect for these two constructs is not revealed.
oreover, this is consistent with our hypotheses that VLPM andSC affect FPRF through OPRF. Given the many significant univari-te correlations, we assessed multivariate multicollinearity in theeasurement model by examining tolerance and variance inflation
actors. None of the variance inflation factors exceed 2.0 and the tol-rance statistics are all under 1.0, indicating multicollinearity is not
concern.
. Research results
.1. Descriptive statistics
We asked the survey respondents to indicate whether or not“yes or no”) they had formally implemented lean accounting at
Fig. 2. Description of sample. LA, lean accounting; LM, lean manufacturing; JIT, just-in-time; TQM, total quality management; TPM, total productive maintenance.
their facility. The results show that 119 of the 244 plants have someform of lean accounting in place, and all 119 of those plants indi-cated that they have formally implemented lean manufacturing.9
Fig. 2 depicts the distributions for the implementations of lean prac-tices (lean manufacturing, lean accounting, JIT, TQM, and TPM) forall respondent firms.
Table 4 presents descriptive statistics for the test modelvariables for the full sample, the plants indicating they hadadopted lean accounting, and the plants that had not adoptedlean accounting. The mean ratios for the lean accounting plantsversus the non-lean accounting plants are all in the directionsexpected. Interestingly, the ANOVAs show that the means for allof the variables are significantly different for those plants thathave adopted lean accounting versus those that have not, exceptfor operations performance. While it is higher for lean-accountingplants, it is not significantly so.
4.2. Fitness of the structural equation model
Before the path coefficients can be assessed, the fitness of thestructural model must be evaluated. As shown in Table 5, thegoodness-of-fit statistics generally indicate a good fit to the data.Although the X2 is significant, the X2 ratio is less than two, indi-cating an acceptable fit (Kline, 2005). Each one of the remainingmodel fit indices shown in Table 5 (NFI, IFI, TLI, and CFI) exceeds theacceptable fit level of 0.90, with the exception of NFI, which oftenunderestimates fit in small samples (Kline, 2005). The RMSEA doesnot exceed the acceptable fit measure of 0.08 (Browne and Cudeck,1993), nor does the SRMR exceed 0.10 (Kline, 2005). The probabilityvalue that the model is a close fit is convincing at 0.950. Jöreskogand Sörbom (1996) suggest that the p-value for this test should be>0.50. Further, parsimony is demonstrated by an AIC that is lowerthan that for the saturated model.
4.3. Hypothesized findings
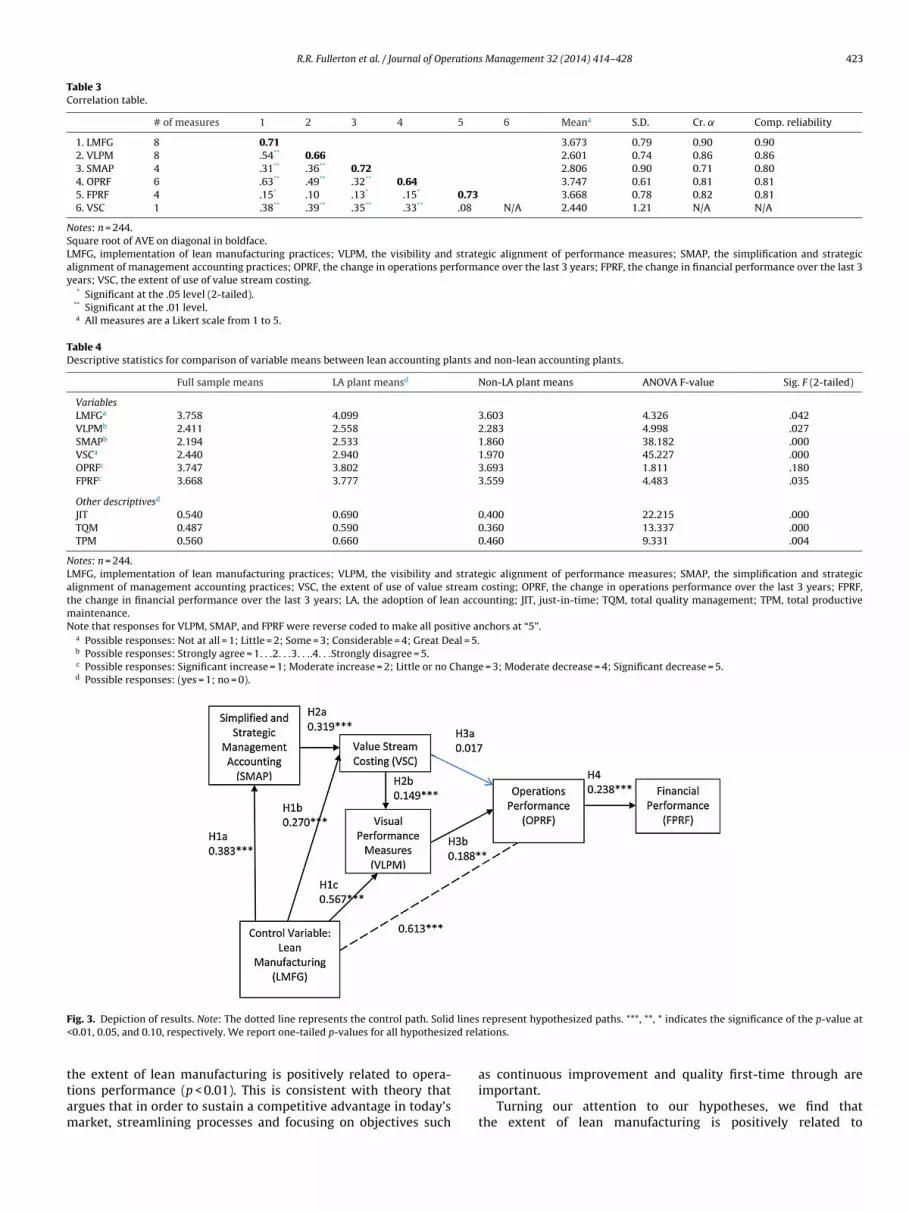
Table 5 and Fig. 3 show the results of the structural model. Weare interested in the incremental effects of lean MAP on opera-tions performance. Moreover, we are interested in whether leanmanufacturing affects operations performance through lean MAP.Thus, we control for the direct effect of lean manufacturing on
9 Note that this sample does not approximate a representation of the percentageof lean accounting adopters in the general population, since the sample was takenfrom attendees at Lean Accounting Summits, where the interest in lean accountingand percentage of adoption would be much higher.
R.R. Fullerton et al. / Journal of Operations Management 32 (2014) 414–428 423
Table 3Correlation table.
# of measures 1 2 3 4 5 6 Meana S.D. Cr. ̨ Comp. reliability
1. LMFG 8 0.71 3.673 0.79 0.90 0.902. VLPM 8 .54** 0.66 2.601 0.74 0.86 0.863. SMAP 4 .31** .36** 0.72 2.806 0.90 0.71 0.804. OPRF 6 .63** .49** .32** 0.64 3.747 0.61 0.81 0.815. FPRF 4 .15* .10 .13* .15* 0.73 3.668 0.78 0.82 0.816. VSC 1 .38** .39** .35** .33** .08 N/A 2.440 1.21 N/A N/A
Notes: n = 244.Square root of AVE on diagonal in boldface.LMFG, implementation of lean manufacturing practices; VLPM, the visibility and strategic alignment of performance measures; SMAP, the simplification and strategicalignment of management accounting practices; OPRF, the change in operations performance over the last 3 years; FPRF, the change in financial performance over the last 3years; VSC, the extent of use of value stream costing.
* Significant at the .05 level (2-tailed).** Significant at the .01 level.a All measures are a Likert scale from 1 to 5.
Table 4Descriptive statistics for comparison of variable means between lean accounting plants and non-lean accounting plants.
Full sample means LA plant meansd Non-LA plant means ANOVA F-value Sig. F (2-tailed)
VariablesLMFGa 3.758 4.099 3.603 4.326 .042VLPMb 2.411 2.558 2.283 4.998 .027SMAPb 2.194 2.533 1.860 38.182 .000VSCa 2.440 2.940 1.970 45.227 .000OPRFc 3.747 3.802 3.693 1.811 .180FPRFc 3.668 3.777 3.559 4.483 .035
Other descriptivesd
JIT 0.540 0.690 0.400 22.215 .000TQM 0.487 0.590 0.360 13.337 .000TPM 0.560 0.660 0.460 9.331 .004
Notes: n = 244.LMFG, implementation of lean manufacturing practices; VLPM, the visibility and strategic alignment of performance measures; SMAP, the simplification and strategicalignment of management accounting practices; VSC, the extent of use of value stream costing; OPRF, the change in operations performance over the last 3 years; FPRF,the change in financial performance over the last 3 years; LA, the adoption of lean accounting; JIT, just-in-time; TQM, total quality management; TPM, total productivemaintenance.Note that responses for VLPM, SMAP, and FPRF were reverse coded to make all positive anchors at “5”.
a Possible responses: Not at all = 1; Little = 2; Some = 3; Considerable = 4; Great Deal = 5.b Possible responses: Strongly agree = 1. . .2. . .3. . ..4. . .Strongly disagree = 5.c Possible responses: Significant increase = 1; Moderate increase = 2; Little or no Change = 3; Moderate decrease = 4; Significant decrease = 5.d Possible responses: (yes = 1; no = 0).
F lines< ed rela
ttam
ig. 3. Depiction of results. Note: The dotted line represents the control path. Solid0.01, 0.05, and 0.10, respectively. We report one-tailed p-values for all hypothesiz
he extent of lean manufacturing is positively related to opera-ions performance (p < 0.01). This is consistent with theory thatrgues that in order to sustain a competitive advantage in today’sarket, streamlining processes and focusing on objectives such
represent hypothesized paths. ***, **, * indicates the significance of the p-value attions.
as continuous improvement and quality first-time through areimportant.
Turning our attention to our hypotheses, we find thatthe extent of lean manufacturing is positively related to

424 R.R. Fullerton et al. / Journal of Operation
Table 5Structural equation model results.
Relationships Hypothesis Standardized coefficient t-Values
LMFG → SMAP H1a 0.383 4.729***LMFG → VSC H1b 0.270 3.881***LMFG → VLPM H1c 0.567 5.690***SMAP → VSC H2a 0.319 4.379***VSC → VLPM H2b 0.149 2.323***VSC → OPRF H3a 0.017 0.287VLPM → OPRF H3b 0.188 2.234**OPRF → FPRF H3 0.238 3.028***
Control pathLMFG → OPRF 0.613 5.783***
Notes: n = 244.Measurement models are estimated using maximum likelihood.***, **, * indicates the significance of the p-value at <0.01, 0.05, and 0.10, respectively.We report one-tailed p-values (for all hypothesized relations).Model fit indices: Chi-square, 645.203; degrees of freedom, 446; p, 0.000; Chi-squareratio, 1.447; NFI, 0.829; IFI, 0.940; TLI, 0.932; CFI, 0.939; RMSEA, 0.043; SRMR, .056;AIC, 873.203 (saturated model, 1120.00).LMFG, implementation of lean manufacturing practices; VLPM, the visibility andstrategic alignment of performance measures; SMAP, the simplification and strate-gpt
sVmomfits
aMslsattmpiif
mnobrpmpfpltqtiombp
tasked with making manufacturing decisions are provided withmore concise, simpler, and relevant information that leads to anincremental increase in operations performance. In sum, lean MAP
Table 6Trimmed model: standardized direct, indirect, and total effects.
Relationships variable Direct effects Indirect effects Total effects
LMFG → SMAP 0.384*** 0.384***LMFG → VSC 0.271*** 0.122*** 0.393***LMFG → VLPM 0.567*** 0.059*** 0.626***SMAP → VSC 0.318** 0.318***LMFG → OPRF 0.617*** 0.121** 0.737***SMAP → VLPM 0.048*** 0.048***SMAP → OPRF 0.009** 0.009**SMAP → FPRF 0.002*** 0.002***VSC → VLPM 0.149*** 0.149***VSC → OPRF 0.029** 0.029**VSC → FPRF 0.007*** 0.007***VLPM → OPRF 0.192** 0.192**VLPM → FPRF 0.046** 0.046**OPRF → FPRF 0.238*** 0.238***
Notes: n = 244.These are the standardized direct, indirect, and total effects from a structural equa-tion model that trims the insignificant path from VSC to operations performance.***, **, * p-values <0.01, 0.05, and 0.10, respectively. We report one-tailed p-values.LMFG, Implementation of lean manufacturing practices; VLPM, The visibility and
ic alignment of management accounting practices; OPRF, the change in operationserformance over the last 3 years; FPRF, the change in financial performance overhe last 3 years; VSC, the extent of use of value stream costing.
implified and strategically aligned MAP (coef. = 0.383, p < 0.01),SC (coef. = 0.270, p < 0.01), and the use of visual performanceeasures (coef. = 0.537, p < 0.01). These results provide evidence
n H1a, H1b, and H1c. They show that the extent of leananufacturing positively influences the use of lean MAP. Thus,
rms that are implementing lean manufacturing are realizing thathey correspondingly need to adapt their management accountingystem to be aligned with and supportive of their operations.
We next turn our attention to our hypothesized relationsmong the set of lean MAP. H2a predicts that simplified, strategicAP are positively associated with VSC, and we find a positive,
ignificant relation (coef. = 0.319, p < 0.01). Firms that have appliedean thinking to their accounting functions by simplifying andtrategically aligning their MAP are more likely to see the valuend need for VSC and provide direct product cost information forhe value streams, supporting better decision making. H2b predictshat VSC is positively associated with the use of visual performance
easures, and we find a positive, significant relation (coef. = 0.149, < 0.01). As firms embrace VSC, they also see the need and benefitn providing more visual performance measures that support theirnternal accounting system and provide information that is easyor the operations personnel to use and comprehend.
Interestingly, there is no indication that operations perfor-ance increases because firms rely more on VSC; thus, H3a is
ot supported. Since VSC is more focused on a financial reportingf value stream product costs, there may not be a direct linkageetween the use of VSC and operations performance, which iselated to non-financial outputs. H3b predicts that the use of visualerformance measures is positively related to operations perfor-ance, and we find a positive, significant relation (coef. = 0.188,
< 0.05). The results indicate that as firms use more visual per-ormance measures, they have also increased their operationserformance over the past three years in terms of quality issues,
ot sizes, and cycle times. Operations personnel are able to usehese visual measures to identify and respond to problems moreuickly than information that is hidden in computers and compiledoo late to be relevant. The results also indicate that while thenformation contained in VSC is not by itself associated with
perations performance, translating it into visual performanceeasurement information that enables operations employees toe more efficient and/or effective results in enhanced operationserformance. Finally, H4 predicts that operations performance
s Management 32 (2014) 414–428
is positively associated with financial performance. We find apositive, significant relation (coef. = 0.238, p < 0.01). As expected,the results demonstrate that when flexibility is increased throughthe elimination of production wastes and improvements in qualityinitiatives, financial performance improves.
4.4. Direct and indirect findings
To provide additional insights into the effects that lean MAPhave on operations and financial performance, we run a trimmedstructural equation model that removes the insignificant pathhypothesized in H3a, providing more parsimony and clearerinsight. The direct, indirect, and total effects of the trimmed modelare shown in Table 6. The results demonstrate that lean MAP haveboth direct and indirect effects on operations and financial perfor-mance. The use of visual performance measures has a direct effecton operations performance (p < 0.05), while simplified, strategicMAP (p < 0.05) and VSC (p < 0.05) have indirect effects. Moreover,simplified, strategic MAP (p < 0.01), VSC (p < 0.01), and the use ofvisual performance measures (p < 0.05) indirectly influence finan-cial performance. Although we do not find a direct effect of VSC onoperations performance (see Table 5), Table 6 shows that VSC isimportant in translating the effects of simplified, strategic MAP toboth operations and financial performance. Thus, it is likely that VSCdoes not directly influence operations performance, because theVSC information must be translated through the use of visual per-formance measures before the benefits of operations performancecan be realized.
An important implication of Table 6 is that lean manufactur-ing has both direct and indirect effects on operations performance.By examining an integrated model that includes the manufac-turing strategy as well as the management accounting supportfunction, we are able to see how lean manufacturing affects oper-ations performance. That is, as manufacturing operations focus oncontinuous improvement and quality first-time through, there is adirect improvement in operations performance. Further, it appearsthat when accounting personnel get on board with lean and imple-ment lean MAP, operations managers and shop-floor employees
strategic alignment of performance measures; SMAP, The simplification and strate-gic alignment of management accounting practices; OPRF, The change in operationsperformance over the last 3 years; FPRF, The change in financial performance overthe last 3 years: VSC, The extent of use of value stream costing.

ration
psi
4
tsMiwot(opii
4
eeelmcartwtimmtafitmboomoslMoaotaai
5
toab(
R.R. Fullerton et al. / Journal of Ope
rovide financial control tailored to the lean environment, thus,upporting operations managers and shop-floor workers in theirnternal decision making, which leads to enhanced performance.
.5. Robustness tests
Chiarini (2012) described VSC as an ineffective accounting sys-em for the small company she examined that was in the earlytage of lean implementation. In their literature review, Camacho-inano et al. (2013) found that contextual factors of size, years of
mplementation, and sector in lean companies had mixed resultsith financial performance. In order to evaluate the robustness of
ur results, we run a series of models that control for size (sales),op management support, unionization, management experiencein years), years of lean manufacturing implementation, and yearsf VSC implementation. We implement these controls by modelingaths between each of the control variables and the six constructs
n our model. In untabulated results, we find that our statisticalnferences remain similar across the various tests.
.6. Implications of the results
The results of this study are important because they providevidence that performance is enhanced with a holistic lean strat-gy comprised of both lean manufacturing and lean MAP. It is notnough for operations management to implement a well-executedean manufacturing strategy. Instead, operations management
ust work with accountants to ensure that the underlying financialontrol data are aligned with lean manufacturing initiatives. Man-gement accountants should be encouraged to act more as coaches,ather than enforcers – providing more strategic analysis thanransaction analysis. Anecdotal evidence from many discussionsith operations managers indicates the critical need for accoun-
ants to become more involved in lean transitions. When account-ng personnel implement lean MAP that are aligned with lean
anufacturing initiatives, our results show that operations perfor-ance is enhanced. Further, the structural model provides evidence
hat supporting lean implementations with the appropriate man-gement accounting and control systems will lead to increasednancial performance beyond that which is derived from opera-ions. Lean MAP play an integral part in the success of a lean imple-
entation, as they provide the information to motivate appropriateehaviors. That is, lean MAP provide financial control that spursperations managers to reduce inventory, make more efficient usef capacity, and strive for continuous improvement. Yet, the role ofanagement accounting in lean implementations has often been
verlooked, especially by researchers. The evidence in this studyuggests that firms deriving the greatest benefit from using a higherevel of lean manufacturing practices are those also adopting lean
AP – simplifying and aligning their MAP, reporting their leanperations through VSC, and using a more visual performance man-gement system. These integrated lean strategies lead to improvedperations and financial performance. Empirical studies such ashis will hopefully initiate more interaction between operationsnd accounting functions. As operations managers encourage man-gement accountants to take a more pro-active role with leannitiatives, firms should see an increase in their performance.
. Conclusion
Lean pundits have suggested that in order to achieve its poten-ial, lean must be a holistic business strategy engrained in all aspects
f the organization. They argue that support systems, such asccounting, human resources, and information technology, shoulde both participating in and providing support for lean initiativesCunningham and Fiume, 2003; McVay et al., 2013; Solomon ands Management 32 (2014) 414–428 425
Fullerton, 2007). It is particularly important to strategically alignmanagement accounting, since it provides the financial control nec-essary to support and facilitate effective performance-enhancingdecision making. Traditional MAP focus on minimizing averageproduct cost; thus, it is often argued that they lead operations man-agers to make decisions that are inconsistent with lean objectives.In contrast, the financial control provided by lean MAP is simplerand easier to understand. Lean MAP facilitate operations managersto make decisions that reduce inventory and better utilize capacity,shift their focus to maximizing customer value and the efficiencyof the value stream, and motivate them to strive for continuousimprovement. Thus, it is important to understand how and if leanMAP can better support and be integrated with operations. Thisresearch provides some of the first empirical evidence on theseissues – how lean manufacturing and lean MAP working togethercan affect operations performance by having more relevant, visual,and actionable information.
Lean manufacturing has a significant relationship with opera-tions performance as does lean MAP. Visual performance measuresare directly related to operations performance, which in turn isdirectly related to financial performance. Further, simplified andstrategically aligned MAP and VSC are indirectly related to oper-ations and financial performance. The lean MAP work togetheras a package, and in doing so, both VSC and the use of visualperformance measures act as performance mediators. VSC doesnot have a direct effect on operations performance, but it acts tomediate simplified, strategic MAP that enhance the use of visualperformance measures, and visual performance measures mediatesimplified, strategic MAP and VSC that ultimately enhance finan-cial performance. Importantly, lean manufacturing also indirectlyaffects operations performance through lean MAP.
These results have important implications for operations man-agers and executives involved in developing and implementinglean strategies. A high-level implication is that lean thinking isindeed a comprehensive business strategy that not only involvesoperations, but also depends on lean managerial accounting prac-tices for providing information in a timely fashion that motivatesappropriate lean behaviors. Thus, a practical implication is thatoperations personnel cannot operate in isolation. They mustdevelop good communications and a strong working relationshipwith management accountants in order to achieve their expectedgains in efficiency and performance from lean initiatives. Throughfocusing on continuous improvement, reorganizing into cells, pro-ducing per customer demand, and ensuring quality first-timethrough, operations personnel may think they are getting the mostbenefit they can from implementing a lean strategy. But that is notthe complete story. Some of the potential gains in operations per-formance will be foregone unless operations personnel join forceswith their accountants to encourage them to lean their accountingprocesses, better communicate relevant information that facili-tates sound decision making, and change their reporting systemto better support lean initiatives. If accountants are excluded frombeing a fundamental part of the continuous improvement team,they can become barriers to change that they do not understandor have a vested interest in (Cunningham and Fiume, 2003, 3).Since our results indicate that lean manufacturing affects opera-tions performance through lean MAP, there is also a practical, albeitself-interested, implication. Operations personnel that are incen-tivized on the basis of operations performance may realize greaterincentive compensation when they partner with accounting per-sonnel and encourage the implementation of lean MAP.
5.1. Limitations of the research
This study does not use a random sample, which reduces thegeneralizability and applicability of the findings. It is very difficult

4 ration
tiItaacqiVaw
5
cisotbItertsioatt
A
JcPCa
Au
26 R.R. Fullerton et al. / Journal of Ope
o find a sizable sampling of firms that have adopted lean MAP, sot was expedient to use a single venue for selecting respondents.t is assumed that all of the respondents were interested in leanhinking, and particularly lean accounting by their attendance at
Lean Accounting Summit. As in all survey research, a necessaryssumption in data collection is that the respondents had suffi-ient knowledge to answer the items, and that they answered theuestions conscientiously and truthfully. Another potential issue
s the single measure of VSC. While it does measure gradients ofSC adoption, it would be helpful to identify specific practices thatre used in relationship to VSC. Further, the performance measuresere self-reported, which may introduce bias in the measures.
.2. Future research
This study examines various aspects of the environment andharacteristics that may encourage manufacturing firms to be will-ng to take the rather dramatic steps to change their accountingystems in support of other change initiatives occurring through-ut their operations. In-depth case studies are needed to identifyhese characteristics more specifically. Long-term analyses woulde helpful to evaluate the sustainable success of changes in MAP.
nterdisciplinary research involving both accounting and opera-ions researchers could be a fruitful partnership to provide furthervidence and deeper insights on the complementary benefits thatesult from an integrated accounting and operations strategy. Fur-her, survey studies that have a larger cross-sectional randomample may provide a clearer understanding of the results foundn this study. Regardless of the research methods, it is evident thatperations personnel need to join forces with their managementccountants and enlist them in providing internal informationhat is timely, relevant, and valuable to the decision makers ofoday.
cknowledgements
We appreciate the insightful feedback received from twoOM reviewers and the editor. We also acknowledge the helpfulomments from participants at the 2013 EIASM Conference onerformance Measurement in Barcelona, Spain, the 2012 EIASMonference in Helsinki, Finland, and the 2012 AAA Western Region-ls in Vancouver, WA.
ppendix A. Survey questions that support the variablessed in this research
Lean manufacturing practices (LMFG)a
To what extent has your facility implemented the following:• Standardization• Manufacturing cells• Reduced setup times• Kanban system• One-piece flow• Reduced lot sizes• Reduced buffer inventories• 5S• Kaizen (continuous improvement)
Visual performance measures (VLPM)b
Indicate your agreement to the following statements related toyour management accounting system:
• Many performance measures are collected on the shop floor.• Performance metrics are aligned with operational goals• Visual boards are used to share information.• Information on quality performance is readily available.
• Charts showing defect rates are posted on the shop floor.• We have created a visual mode of organization• Information on productivity is readily available.• Quality data are displayed at work stations.s Management 32 (2014) 414–428
Simplified management accounting practices (SMAP)b
Indicate your agreement to the following statements related toyour management accounting system:
• Our accounting system has been simplified in the past 3years.• Our accounting closing process has been streamlined.• Our management accounting system supports our strategicinitiatives.• Our accounting information system facilitates strategicdecision making.
Operations performance (OPRF)c
Indicate how your facility’s operations have changed over thelast three years:
• Scrap and rework• Machine setup times• Queue times and move times• Machine downtime• Lot sizes• Cycle time
Financial Performance (FPRF)c
Indicate how your facility’s operations have changed over thelast three years:
• Net sales• Return on assets• Overall firm profitability• Market share
Value Stream Costing (VSC)a
Indicate the extent to which your facility uses value streamcosting.
a Possible responses: Not at all = 1; Little = 2; Some = 3; Considerable = 4; GreatDeal = 5.
b Possible responses: Strongly agree = 1. . .2. . .3. . ..4. . .Strongly disagree = 5.c Possible responses: Significant increase = 1; Moderate increase = 2; Little or no
Change = 3; Moderate decrease = 4; Significant decrease = 5.
Appendix B. Exploratory factor analysis: factor loadings forexplanatory variables
Factor 1 Factor 2 Factor 3 Factor 4 Factor 5LMFG VLPM OPRF SMAP FPRF
LMFG-standardization 0.599LMFG-cells 0.710LMFG-reduced setup 0.633LMFG-Kanban 0.739LMFG-one-piece flow 0.724LMFG-reduced lot size 0.760LMFG-reduced inventory 0.601LMFG-5S 0.728LMFG-Kaizen 0.716VLPM-collect shop floor 0.631VLPM-aligned measures 0.638VLPM-visual boards 0.616VLPM-quality info 0.753VLPM-defect charts 0.759VLPM-visual organization 0.560VLPM-productivity info 0.717VLPM-data work stations 0.683OPRF-scrap & rework 0.625OPRF-setup times 0.602OPFR-queue times 0.707OPRF-machine downtime 0.639OPRF-lot sizes 0.677OPRF-cycle time 0.555SMAP-MAS simplified 0.769SMAP-close streamlined 0.705SMAP-support strategies 0.794SMAP-decision making 0.764FPRF-net sales 0.816FPRF-ROA 0.765FPRF-profitability 0.848
FPRF-market share 0.789Notes: n = 244.All loadings in excess of 0.40 are shown.Kaiser–Meyer–Olkin measure of sampling adequacy is good (0.87) and the Bartletttest of Sphericity is highly significant (p = 0.000).

ration
R
A
A
AA
B
B
B
B
B
B
B
B
BB
BB
B
C
C
C
C
C
C
C
C
C
C
C
C
d
D
D
D
E
E
F
F
R.R. Fullerton et al. / Journal of Ope
eferences
berdeen Group, 2006. The Lean Benchmark Report: Closing the Reality Gap(March)., pp. 1–45.
hlstrom, P., Karlsson, C., 1996. Change processes towards lean production: the roleof the management accounting system. Int. J. Oper. Prod. Manage. 16 (11), 42–56.
kaike, H., 1987. Factor analysis and AIC. Psychometrika 52, 317–332.preutesei, M., Arvinte, R., 2010. Financial models and tools for managing lean
manufacturing. J. Econ. Eng. 4, 4–7.agozzi, R.P., Yi, Y., 1988. On the evaluation of structural equation models. J. Acad.
Market. Sci. 16 (1), 74–94.agozzi, R.P., Yi, Y., Phillips, L.W., 1991. Assessing construct validity in organizational
research. Adm. Sci. Q. 36 (3), 421–458.aines, A., Langfield-Smith, K., 2003. Antecedents to management accounting
change: a structural equation approach. Account. Organ. Soc. 28 (7/8), 675–698.enders, J., Slomp, J., 2009. Struggling with solutions: a case study of using organi-
zation concepts. Int. J. Prod. Res. 47 (18), 5237–5243.entler, P.M., 1990. Comparative fit indexes in structural models. Psychol. Bull. 107,
238–246.entler, P.M., 1992. On the fit of models to covariances and methodology to the
Bulletin. Psychol. Bull. 112, 400–404.entler, P.M., Bonett, D.G., 1980. Significant tests and goodness of fit in the analysis
of covariance structures. Psychol. Bull. 88, 588–606.ergkvist, L., Rossiter, J.R., 2007. The predictive validity of multiple-item versus
single-item measures of the same constructs. J. Marketing Res. 44 (May),175–184.
ollen, K.A., 1989. Structural Equations with Latent Variables. Wiley, New York, NY.raunscheidel, M.J., Suresh, N.C., 2009. The organizational antecedents of a firm’s
supply chain agility for risk mitigation and response. J. Oper. Manage. 27 (2),119–140.
rosnahan, J., 2008. Unleash the power of lean accounting. J. Account. (July), 60–66.rowne, M.W., Cudeck, R., 1993. Alternative ways of assessing model fit. In: Bollen,
K.A., Long, J.S. (Eds.), Testing Structural Equation Models. Sage, Newbury Park,CA, pp. 136–162.
yrne, B.M., 2001. Structural Equation Modeling with Amos: Basic Concepts, Appli-cations, and Programming. Erlbaum, Mahwah, NJ.
adez, S., Guilding, C., 2008. An exploratory investigation of an integrated contin-gency model of strategic management accounting. Account. Organ. Soc. 33 (7/8),836–863.
allen, J.L., Fader, C., Krinsky, I., 2000. Just-in-time: a cross-sectional plant analysis.Int. J. Prod. Econ. 63 (3), 277–301.
allen, J.L., Morel, M., Fader, C., 2005. Productivity measurement and the relationshipbetween plant performance and JIT intensity. Contemp. Account. Res. 22 (2),271–309.
ardinaels, E., 2008. The interplay between cost accounting knowledge and presen-tation formats in cost-based decision-making. Account. Organ. Soc. 33, 582–602.
henhall, R., 2003. Management control systems design within its organizationalcontext: findings from contingency-based research and directions for the future.Account. Organ. Soc. 28 (2/3), 127–168.
hiarini, A., 2012. Lean production: mistakes and limitations of accounting systemsinside the SME sector. J. Manuf. Technol. 23 (5), 681–700.
hin, W.W., 1998. Partial least squares approach to structural equation modeling.In: Marcoulides, I.G.A. (Ed.), Modern Methods for Business Research. LawrenceErlbaum Associates, Mahwah, NJ, pp. 295–336.
amacho-Minano, M., Moyano-Fuentes, J., Sacristan-Diaz, M., 2013. What can welearn from the evolution of research on lean management assessment? Int. J.Prod. Res. 51 (4), 1098–1116.
rocker, L., Algina, J., 1986. Introduction to Classical and Modern Test Theory. Har-court, Brace, and Jovanovich, Fort Worth, TX.
ronbach, L.J., 1951. Coefficient alpha and the internal structure of tests. Psychome-trika 16 (3), 297–334.
ua, K.O., McKone, K.E., Schroeder, R.G., 2001. Relationships between implementa-tion of TQM, JIT, and TPM and manufacturing performance. J. Oper. Manage. 19(6), 675–694.
unningham, J.E., Fiume, O.J., 2003. Real Numbers: Management Accounting in aLean Organization. Managing Times Press, Durham, NC.
e Menezes, L.M., Wood, S., Gelade, G., 2010. The integration of human resource andoperation management practices and its link with performance: a longitudinallatent class study. J. Oper. Manage. 28, 455–471.
rolet, A.L., Morrison, D.G., 2001. Do we really need multiple-item measures inservice research? J. Service Res. 3 (February), 196–204.
ull, R.B., Tegarden, D.P., 1999. A comparison of three visual representations of com-plex multidimensional accounting information. J. Inform. Syst. 13 (2), 117–131.
urden, C.H., Hassel, L.G., Upton, D.R., 1999. Cost accounting and performance mea-surement in a just-in-time production environment. Asia Pacific J. Manage. 16(1), 111–125.
arley, P.C., Northcraft, G.G., Lee, C., Lituchy, T.R., 1990. Impact of process and out-come feedback on the relation of goal setting to task performance. Acad. Manage.J. 33 (1), 87–105.
rez, M., 1977. Feedback: a necessary condition for the goal setting-performancerelationship, Journal of. Appl. Psychol. 62 (5), 624–627.
lynn, B.B., Schroeder, R.G., Sakakibara, S., 1994. A framework for quality manage-ment research and an associated measurement instrument. J. Oper. Manage. 11(4), 339–367.
ornell, C., Larcker, D.F., 1981. Evaluating structural equation models with unobser-vable variables and measurement error. J. Marketing Res. 43 (February), 39–50.
s Management 32 (2014) 414–428 427
Fry, L.W., Smith, D.A., 1987. Congruence, contingency, and theory building. Acad.Manage. Rev. 12 (1), 117–132.
Fullerton, R.R., McWatters, C.S., 2002. The role of performance measures and incen-tive systems in relation to the degree of JIT implementation. Account. Organ.Soc. 27, 711–735.
Fullerton, R.R., McWatters, C.S., Fawson, C., 2003. An examination of the rela-tionships between JIT and financial performance. J. Oper. Manage. 21,383–404.
Fullerton, R.R., Wempe, W.F., 2009. Lean manufacturing, non-financial performancemeasures, and financial performance. Int. J. Prod. Manage. 29 (3), 214–240.
Fullerton, R.R., Kennedy, F., Widener, S.K., 2013. Management accounting practicesand control in a lean manufacturing environment. Account. Organ. Soc. 38 (1),50–71.
Furlan, A., Vinelli, A., Pont, G., 2011. Complementarity and lean manufacturing bun-dles: an empirical analysis. Int. J. Oper. Prod. Manage. 31 (8), 835–850.
Galsworth, G.D., 1997. Visual Systems: Harnessing the Power of the Visual Work-place. AMACOM, New York.
Gerbing, D.W., Anderson, J.C., 1988. An updated paradigm for scale developmentincorporating unidimensionality and its assessment. J. Marketing Res. 25 (2),186–192.
Gerdin, J., 2005. Management accounting system design in manufacturing depart-ments: an empirical investigation using a multiple contingencies approach.Account. Organ. Soc. 30, 99–126.
Gerdin, J., Greve, J., 2004. Forms of contingency fit in management accountingresearch – a critical review. Account. Organ. Soc. 29, 303–326.
Gerdin, J., Greve, J., 2008. The appropriateness of statistical methods for testing con-tingency hypotheses in management accounting research. Account. Organ. Soc.33, 995–1009.
Gong, M.A., Tse, M.S.C., 2009. Pick, mix or match? A discussion of theories for man-agement accounting research. J. Account. Bus. Manage. 16 (2), 54–66.
Grasso, L.P., 2005. Are ABC and RCA accounting systems compatible with lean man-agement? Manage. Account. Q. 7 (1), 12–27.
Gunasekaran, A., 2002. Benchmarking in logistics. Benchmarking 9 (4), 324.Gustafsson, A., Johnson, M.D., 2002. Measuring and managing the
satisfaction—loyalty–performance links at Volvo. J. Target. Measur. Anal.Market. 10 (3), 249–259.
Hallgren, M., Olhager, J., 2009. Lean and agile manufacturing: external and inter-nal drivers and performance outcomes. Int. J. Oper. Prod. Manage. 29 (10),976–999.
Hofer, C., Eroglu, C., Hofer, A.R., 2012. The effect of lean production on financialperformance: the mediating role of inventory leanness. Int. J. Prod. Econ. 138,242–253.
Hu, L.T., Bentler, P.M., 1995. Evaluating model fit. In: Hoyle, R.H. (Ed.), StructuralEquation Modeling: Concepts, Issues, and Applications. Sage, Thousand Oaks,CA, pp. 79–99.
Hu, L.T., Bentler, P.M., 1998. Fit indices in covariance structure analysis: sensitivityto underparameterized model misspecification. Psychol. Methods 8, 424–453.
Hughes, M.A., Price, L.R., Marrs, D.W., 1986. Linking theory construction and theorytesting: models with multiple indicators of latent variables. Acad. Manage. Rev.11 (1), 128–144.
Huntzinger, J.R., 2007. Lean Cost Management. J. Ross Publishing, Fort Lauderdale,FL.
Ilgen, D.R., Fisher, C.D., Taylor, M.T., 1979. Consequences of individual feedback onbehavior in organizations. J. Appl. Psychol. 64, 349–371.
Inman, R.A., Sale, R.S., Green Jr., K.W., Whitten, D., 2011. Agile manufacturing: rela-tion to JIT, operational performance and firm performance. J. Oper. Manage. 29,343–355.
James, L.F., Mulaik, S.A., Brett, J.M., 1982. Causal Analysis: Assumptions, Models andData. Sage, Beverly Hills, CA.
Jaworski, B.J., Young, S.M., 1992. Dysfunctional behavior and management con-trol: an empirical study of marketing managers. Account. Organ. Soc. 17 (1),17–35.
Johnson, H.T., 1992. Relevance Regained: From Top-down Control to Bottom-upEmpowerment. The Free Press, NY.
Johnson, H.T., Kaplan, R.S., 1987. Relevance Lost: The Rise and Fall of ManagementAccounting. Harvard Business School Press, Boston.
Jöreskog, K.G., Sörbom, D., 1989. LISREL 7 User’s Reference Guide. Scientific Software,Chicago, IL.
Jöreskog, K.G., Sörbom, D., 1993. LISREL 8: Structural equation modeling with theSIMPLIS command language. Lawrence Erlbaum Associates, Hillsdale, NJ.
Jöreskog, K.G., Sörbom, D., 1996. Structural equation modeling. In: Workshop pre-sented for the NORC Social Science Research Professional Development TrainingSessions, Chicago, IL.
Kaynak, H., 2003. The relationship between total quality management practices andtheir effects on firm performance. J. Oper. Manage. 21 (4), 1–31.
Kennedy, F.A., Brewer, P.C., 2005. Lean accounting: what’s it all about? Strat. Financ.,27–34.
Kennedy, F.A., Maskell, B., 2006. Accounting for the lean enterprise: changes to theaccounting paradigm. In: Statement of Management Accounting. Institute ofManagement Accountants, pp. 1–32.
Kennedy, F.A., Widener, S.K., 2008. A control framework: insights from evidence on
lean accounting. Manage. Account. Res., 301–303.Kenny, D.A., 2012. Multiple latent variable models: confirmatory factor analysis.http://davidakenny.net/cm/mfactor.htm
Kinney, M.R., Wempe, W.F., 2002. Further evidence on the extent and origins of JIT’sprofitability effects. Account. Rev. 77 (1), 203–225.

4 ration
K
K
L
LL
L
M
M
M
M
M
M
N
N
NN
O
O
P
P
P
P
R
R
Yu-Lee, R., 2011. Proper lean accounting: eliminating waste isn’t enough; you have
28 R.R. Fullerton et al. / Journal of Ope
im, S., Yea, S., Kim, G., 2002. Shift scheduling for steppers in the semiconductorwafer fabrication process. IIE Trans. 34 (2), 167–178.
line, R.B., 2005. Principles and Practice of Structural Equation Modeling, second ed.Guildford Press, New York, NY.
i, X., Sawhney, R., Arendt, E.J., Ramasamy, K., 2012. A comparative analysis of man-agement accounting systems’ impact on lean implementation. Int. J. Technol.Manage. 57 (1/2/3), 33–48.
iker, J.K., 2004. The Toyota Way. McGraw Hill, New York, NY.ocke, E., Lathan, G., 1990. A Theory of Goal Setting and Task Performance. Prentice-
Hall, Englewood Cliffs, NJ.ocke, E., Lathan, G., 2002. Building a practically useful theory of goal setting and
task motivation: a 35-year odyssey. Am. Psychol. 57 (9), 705–717.ackelprang, A.W., Nair, A.L., 2010. Relationships between just-in-time manu-
facturing practices and performance: a meta-analytic investigation. J. Oper.Manage. 28, 283–302.
askell, B.H., Kennedy, F.A., 2007. Why do we need lean accounting and how doesit work? J. Corp. Account. Financ. (March/April), 59–73.
askell, B.H., Baggaley, B., Grasso, L., 2012. Practical Lean Accounting, second ed.CRC Press, Boca Raton, FL.
cGovern, M.F., Andrews, B.J., 1998. Operational excellence: a manufacturing meta-morphosis at western geophysical exploration products. In: Liker, J.K. (Ed.),Becoming Lean: Inside Stories of U.S. manufacturers Productivity Press, Portland,OR, pp. 388–406.
cVay, G., Kennedy, F.A., Fullerton, R.R., 2013. Accounting in the Lean Enterprise:Providing Simple, Practical, and Decision-Relevant Information. ProductivityPress, New York.
eade, D., Kumar, S., Houshyar, A., 2006. Financial analysis of a theoretical lean man-ufacturing implementation using hybrid simulation modeling. J. Manuf. Syst. 25(2), 137–152.
arasimhan, R., Swink, M., Kim, S.W., 2006. Disentangling leanness and agility: anempirical investigation. J. Oper. Manage. 24, 440–457.
eubert, M.J., 1998. The value of feedback and goal setting over goal setting alongand potential moderators of this effect: a meta-analysis. Hum. Perform. 11 (4),321–335.
unnally, J., 1978. Psychometric Theory, second ed. McGraw-Hill, New York, NY.unnally, J., Bernstein, I., 1994. Psychometric Theory, third ed. McGraw-Hill, New
York, NY.machonu, V.K., Ross, J.E., 1994. Principles of Total Quality. St Lucie Press, Delray
Beach, FL.tley, D.T., 1980. The contingency theory of management accounting: achievements
and prognosis. Account. Organ. Soc. 5, 413–428.arry, G.C., Turner, C.E., 2006. Application of lean visual process management tools.
J. Manage. 12 (4), 531–544.erera, S., Harrison, G., Poole, M., 1997. Customer-focused manufacturing strat-
egy and the use of operations-based non-financial performance measures: aresearch note. Account. Organ. Soc. 22 (6), 557–572.
odsakoff, P.M., Organ, D.W., 1986. Self-reports in organizational research: problemsand prospects. J. Manage. 12 (Winter (4)), 531–544.
odsakoff, P.M., MacKenzie, S.B., Lee, J., Podsakoff, N.P., 2003. Common methodbiases in behavioral research: a critical review of the literature and recom-mended remedies. Journal of. Appl. Psychol. 88, 879–903.
ogers, J.C., Uhr, E.B., Houch, E.C., 1982. An RSM investigation of the profit potentialof customer service variables in physical distribution. J. Acad. Market. Sci. 10 (1),189–207.
ossiter, J.R., 2002. The C-OAR-SE procedure for scale development in marketing.Int. J. Res. Market. 19 (December), 209–219.
s Management 32 (2014) 414–428
Ruiz-de-Arbulo-Lopez, P., Fortuny-Santos, J., Cuatrecasas-Arbos, L., 2013. Lean man-ufacturing: costing the value stream. Indust. Manage. Data Syst. 113 (5),647–668.
Sackett, P.R., Lawson Jr., J.R., 1990. Research strategies and tactics in industrial andorganizational psychology. In: Dunnette, M.D., Hough, L.M. (Eds.), Handbook ofIndustrial and Organizational Psychology, vol. 1, second ed. Consulting Psychol-ogists Press, Palo Alto, CA, pp. 419–489.
Sakakibara, S., Flynn, B.B., Schroeder, R.G., 1993. A framework and measurementinstrument for just-in-time manufacturing. Prod. Oper. Manage. 2 (3), 177–194.
Schermelleh-Engel, K., Moosbrugger, H., Muller, H., 2003. Evaluating the fit of struc-tural equation models: tests of significance and descriptive goodness-of-fitmeasures. Meth. Psychol. Res. Online 8 (2), 23–74.
Schonberger, R.J., 1987. World Class Manufacturing Casebook: Implementing JIT andTQC. The Free Press, New York.
Schumacker, R.E., Lomax, R.G., 1996. A Beginner’s Guide to Structural EquationEffects in Structural Equation Modeling. Erlbaum, Mahwah, NJ.
Shah, R., Goldstein, S.M., 2006. Use of structural equation modeling in operationsmanagement research: looking back and forward. J. Oper. Manage. 24 (2),148–169.
Shah, R., Ward, P.T., 2003. Lean manufacturing: context, practice bundles, and per-formance. J. Oper. Manage. 21, 129–149.
Shah, R., Ward, P.T., 2007. Defining and developing measures of lean production. J.Oper. Manage. 25, 785–805.
Shetty, Y.K., 1987. Product quality and competitive strategy. Bus. Horiz. 30 (3), 46–53.Shields, M., Deng, F.J., Kato, Y., 2000. The design and effects of control systems: test
of direct- and indirect-effects models. Account. Organ. Soc. 25 (2), 185–202.Shingo Prize for Operational Excellence, 2010. Model & Application Guidelines. Ver-
sion 4. Utah State University, pp. 1–40.Sila, I., 2007. Examining the effects of contextual factor on TQM and performance
through the lens of organizational theories: an empirical study. J. Oper. Manage.25, 83–109.
Solomon, J., Fullerton, R., 2007. Accounting for World Class Operations: A PracticalGuide for Management Accounting Change in Support of Lean Manufacturing.WCM Associates, Fort Wayne, IN.
Tucker, L.R., Lewis, C., 1973. A reliability coefficient for maximum likelihood factoranalysis. Psychometrika 38, 1–10.
van der Merwe, A., Thomson, J., 2007. The lowdown on lean accounting. Strat. Financ.,26–33 (February).
Wanous, J.P., Reichers, A.E., Hudy, M.J., 1997. Overall job satisfaction: how good aresingle-item measures? J. Appl. Psychol. 82 (2), 247–252.
White, R.E., Pearson, J.N., Wilson, J.R., 1999. JIT manufacturing: a survey ofimplementations in small and large US manufacturers. Manage. Sci. 45 (1),1–15.
Womack, J.P., Jones, D.T., 1996. Lean Thinking: Banish Waste and Create Wealth inyour Corporation. Simon and Schuster, New York.
Womack, J.P., Jones, D.T., Roos, D., 1991. The Machine that Changed the World: TheStory of Lean Production. HarperCollins Publishers, New York.
Yang, M.G., Hong, P., Modi, S.B., 2011. Impact of lean manufacturing and envi-ronmental management on business performance: an empirical study ofmanufacturing firms. Int. J. Prod. Econ. 129, 251–261.
to reduce inputs to save money. Indust. Eng. 43 (10), 39–43.Zayko, M., Hancock, W.M., 1998. Implementing lean manufacturing at Gelman
Sciences. Inc. In: Liker, J.K. (Ed.), Becoming Lean: Inside Stories of U.S. Manu-facturers. Productivity Press, Portland, OR, pp. 246–301.