Embed Size (px)
Citation preview
Leading the Transformation.
5 October 2021, CACIB 6th Auto Credit Day
Volkswagen Aktiengesellschaft / Volkswagen Financial Services
The following presentations as well as remarks/comments and explanations in this context contain forward-looking statements on the business
development of the Volkswagen Group. These statements are based on assumptions relating to the development of the economic, political and
legal environment in individual countries, economic regions and markets, and in particular for the automotive industry, which we have made on the
basis of the information available to us and which we consider to be realistic at the time of going to press. The estimates given entail a degree of
risk, and actual developments may differ from those forecast. Any changes in significant parameters relating to our key sales markets, or any
significant shifts in exchange rates or commodities relevant to the Volkswagen Group or deviations in the actual effects of the Covid-19 pandemic
from the scenario presented will have a corresponding effect on the development of our business. In addition, there may be departures from our
expected business development if the assessments of the factors influencing value enhancement and of risks and opportunities presented develop
in a way other than we are currently expecting, or if additional risks and opportunities or other factors emerge that affect the development of our
business.
We do not update forward-looking statements retrospectively. Such statements are valid on the date of publication and can be superseded.
This information does not constitute an offer to exchange or sell or an offer to exchange or buy any securities.
Disclaimer
2
Leading the Transformation.
Deliveries to Customers
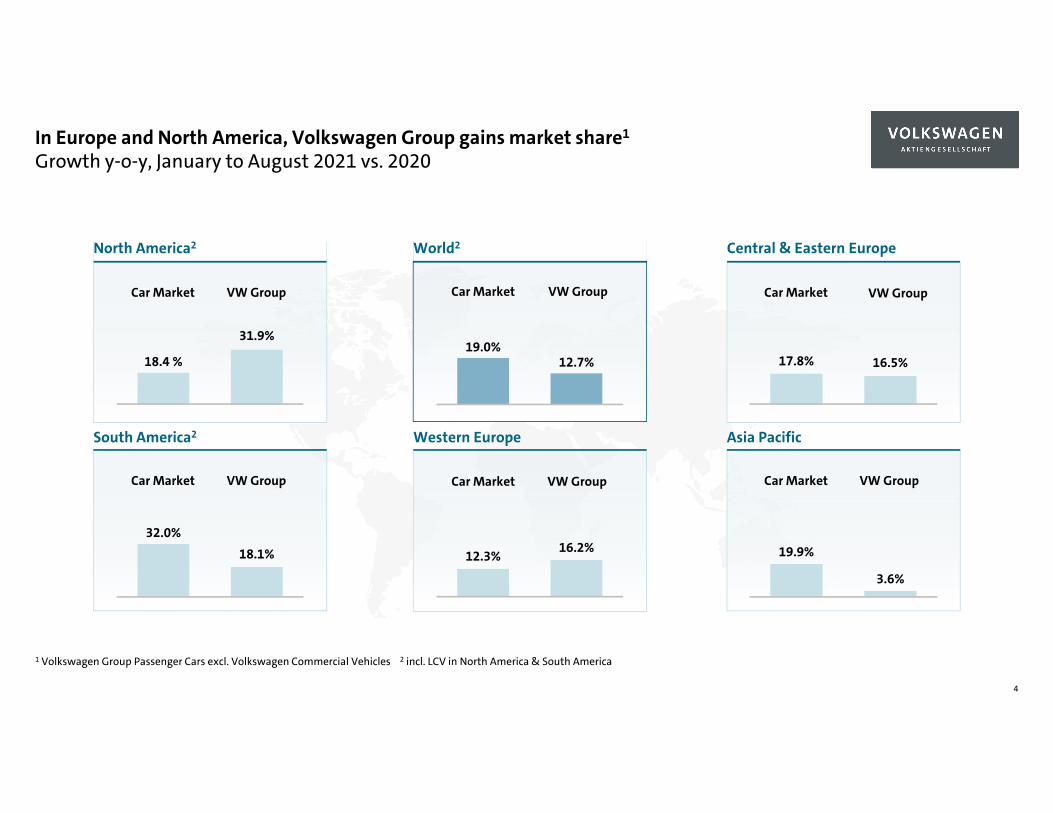
In Europe and North America, Volkswagen Group gains market share1
Growth y-o-y, January to August 2021 vs. 2020
4
Car Market VW Group
Car Market VW Group
Car Market VW Group
Car Market VW GroupCar Market VW Group
Car Market VW Group
18.4 %
31.9%
17.8% 16.5%
19.9%
3.6%
32.0%
18.1%
19.0%12.7%
12.3%16.2%
North America2 World2 Central & Eastern Europe
South America2 Western Europe Asia Pacific
1 Volkswagen Group Passenger Cars excl. Volkswagen Commercial Vehicles 2 incl. LCV in North America & South America
Leading the Transformation.
Key Financials
Das Bild kann nicht angezeigt werden.
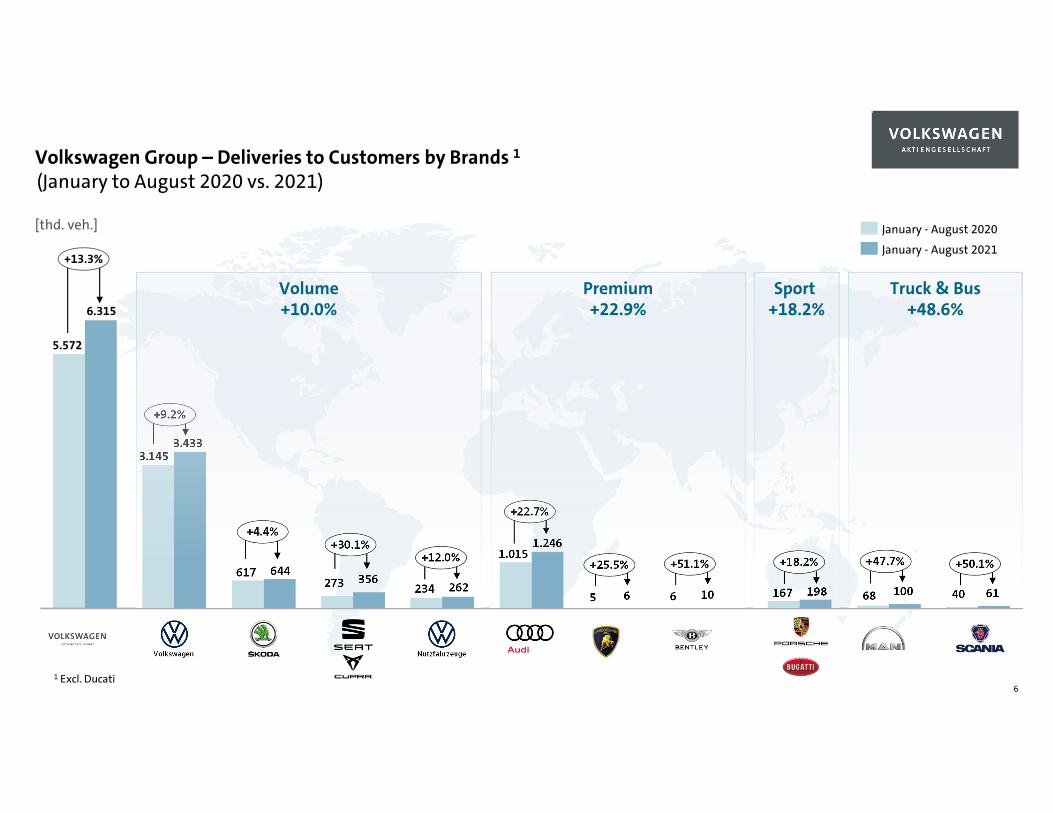
Volkswagen Group – Deliveries to Customers by Brands 1
6
5.572
6.315
+13.3%
January - August 2020
January - August 2021
1 Excl. Ducati
[thd. veh.]
NutzfahrzeugeVolkswagen
(January to August 2020 vs. 2021)
3.1453.433
617 644
+4.4%
273 356
+30.1%
234 262
+12.0% 1.0151.246
+22.7%
6 10
+51.1%
167 198
+18.2%
68 100
+47.7%
40 61
+50.1%
+9.2%
5 6
+25.5%
Truck & Bus+48.6%
Sport+18.2%
Premium+22.9%
Volume+10.0%
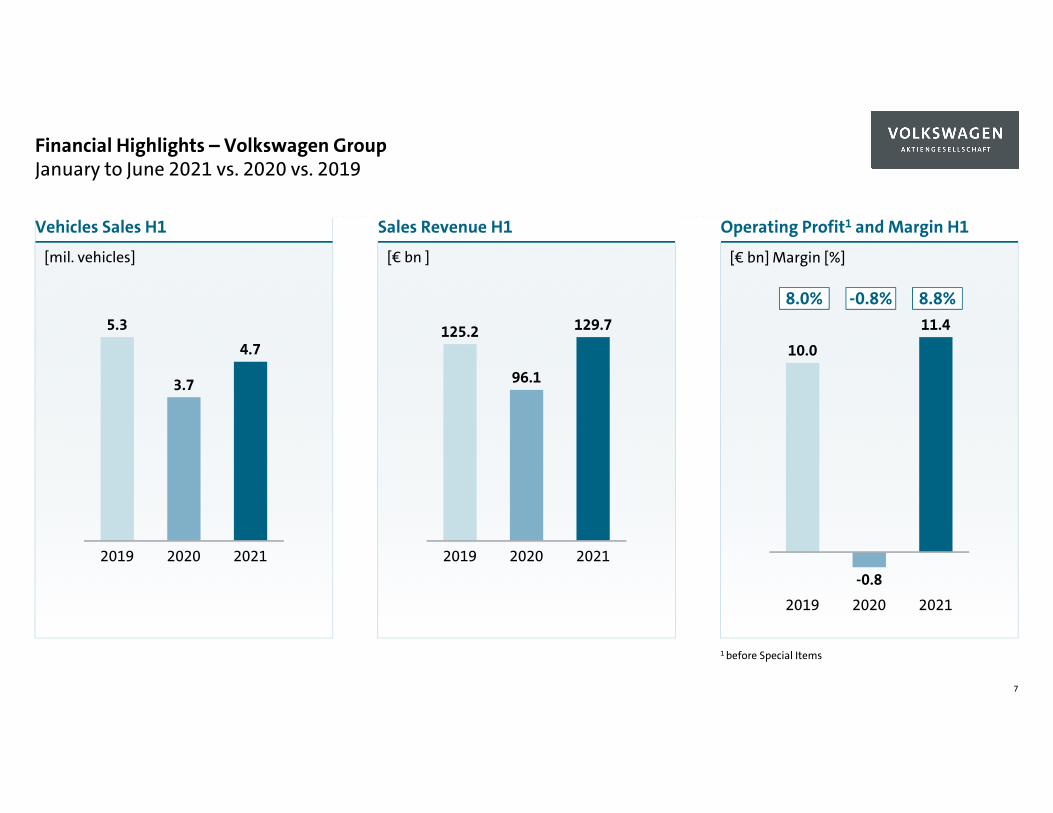
Financial Highlights – Volkswagen GroupJanuary to June 2021 vs. 2020 vs. 2019
7
[mil. vehicles]
Vehicles Sales H1
[€ bn ]
Sales Revenue H1
[€ bn] Margin [%]
Operating Profit1 and Margin H1
2019 2020
11.4
2021
-0.8
10.0
20202019 2021
125.2
96.1
129.7
2021
3.7
2019 2020
5.34.7
-0.8% 8.8%8.0%
1 before Special Items
Das Bild kann nicht angezeigt werden.
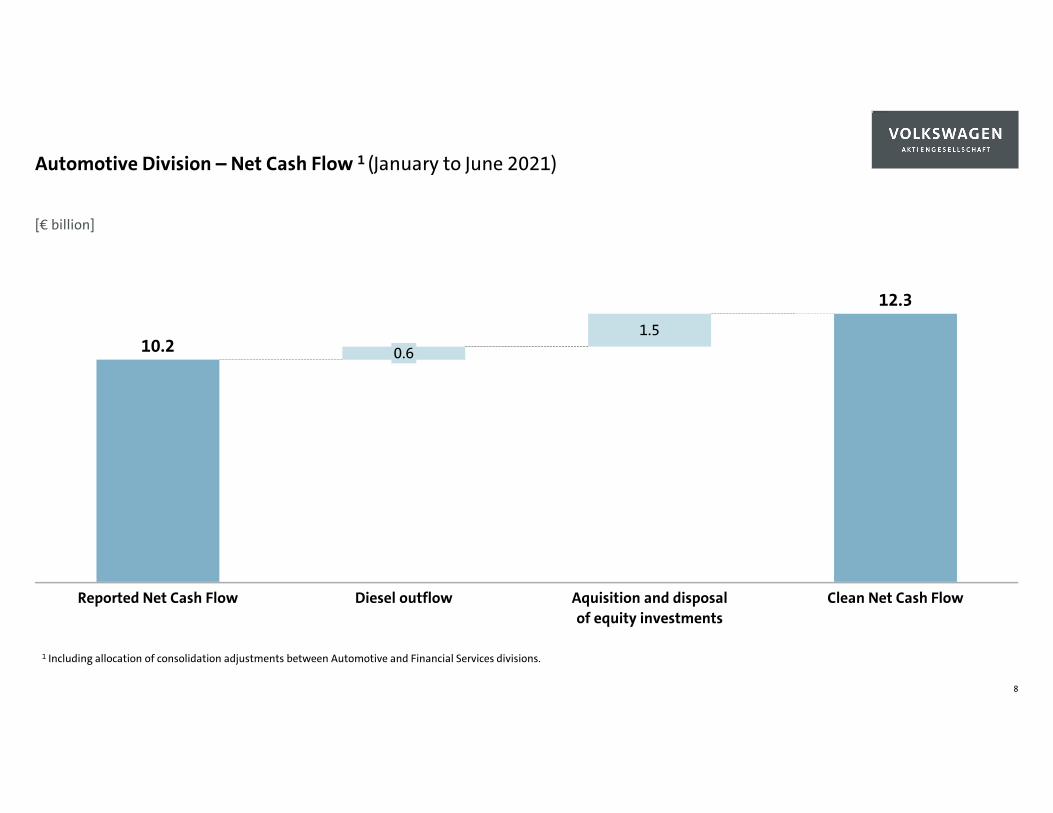
0.6
Reported Net Cash Flow Diesel outflow
1.5
Aquisition and disposalof equity investments
Clean Net Cash Flow
10.2
12.3
Automotive Division – Net Cash Flow 1 (January to June 2021)
8
1 Including allocation of consolidation adjustments between Automotive and Financial Services divisions.
[€ billion]
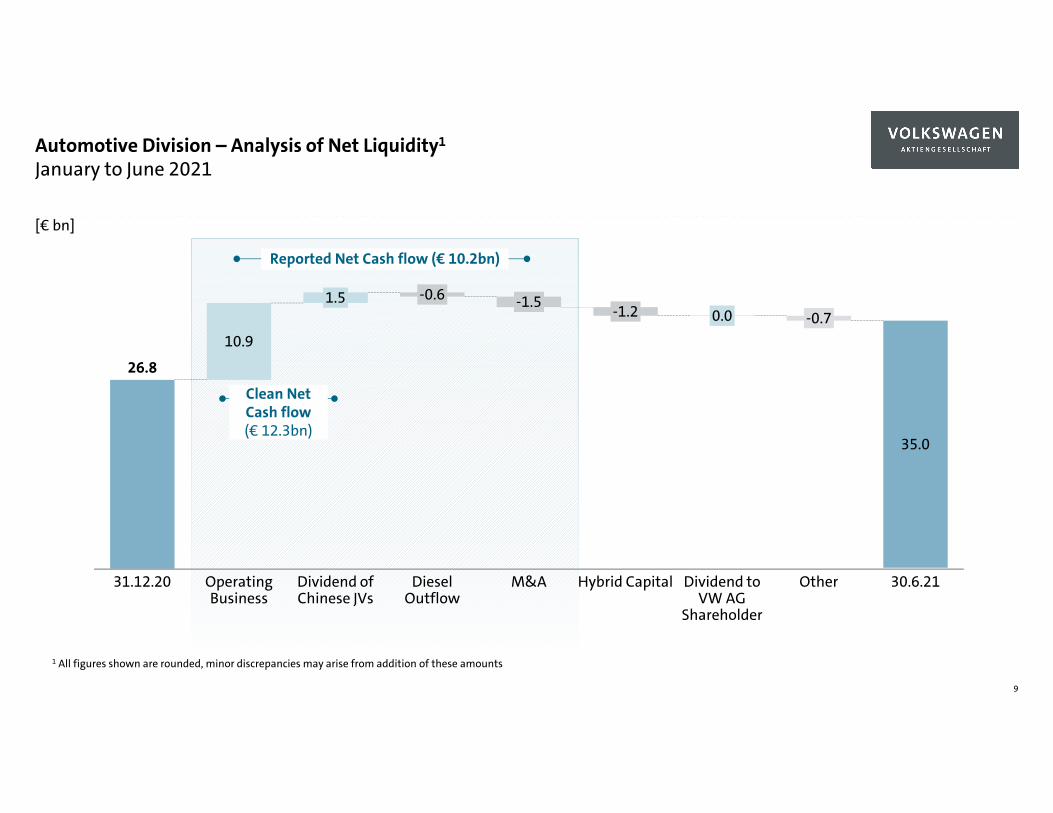
DieselOutflow
31.12.20 Dividend of Chinese JVs
10.9
-1.5
OtherOperatingBusiness
1.5 -0.6
M&A
-1.2
Hybrid Capital
0.0
Dividend toVW AG
Shareholder
-0.7
35.0
30.6.21
26.8
Automotive Division – Analysis of Net Liquidity1
January to June 2021
9
[€ bn]
1 All figures shown are rounded, minor discrepancies may arise from addition of these amounts
Reported Net Cash flow (€ 10.2bn)
Clean Net Cash flow(€ 12.3bn)
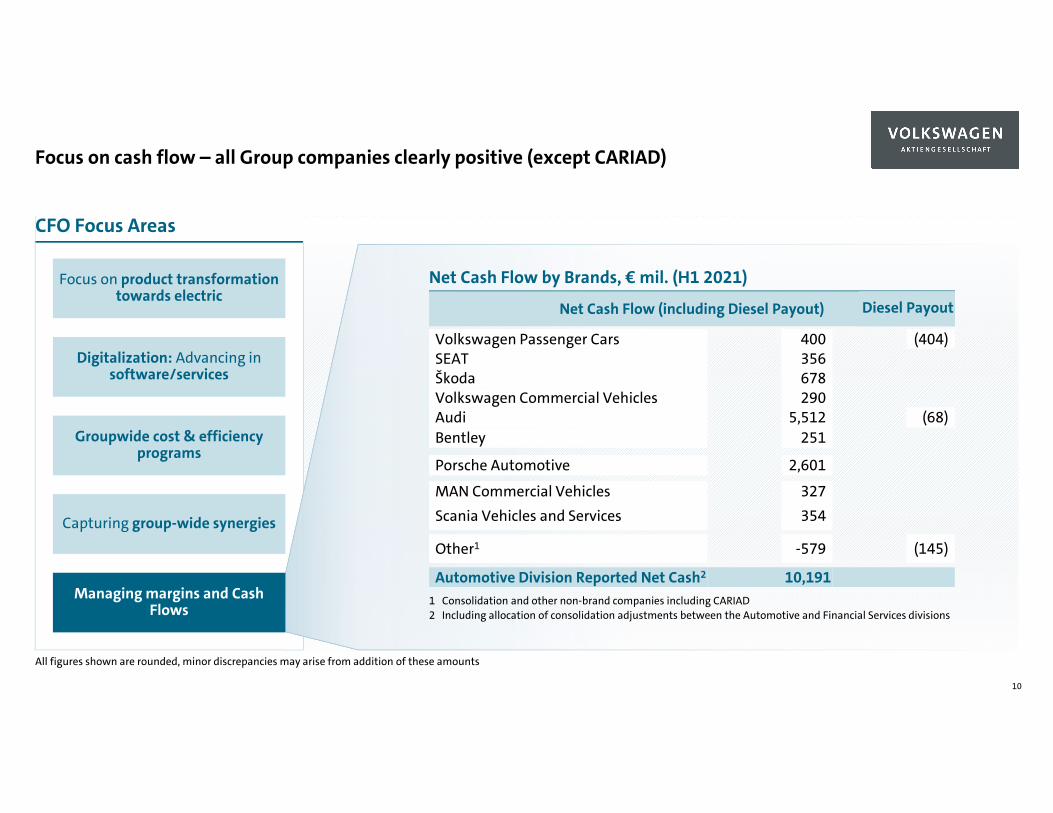
Focus on cash flow – all Group companies clearly positive (except CARIAD)
10
CFO Focus Areas
Managing margins and Cash Flows
Digitalization: Advancing in software/services
Groupwide cost & efficiency programs
Capturing group-wide synergies
Focus on product transformation towards electric
All figures shown are rounded, minor discrepancies may arise from addition of these amounts
Net Cash Flow by Brands, € mil. (H1 2021)
Net Cash Flow (including Diesel Payout)
Volkswagen Passenger CarsSEATŠkodaVolkswagen Commercial VehiclesAudiBentley
Porsche Automotive
Scania Vehicles and ServicesMAN Commercial Vehicles
400356678290
5,512251
2,601
327354
Automotive Division Reported Net Cash2 10,191
Other1 -579
1 Consolidation and other non-brand companies including CARIAD2 Including allocation of consolidation adjustments between the Automotive and Financial Services divisions
Diesel Payout
(404)
(68)
(145)
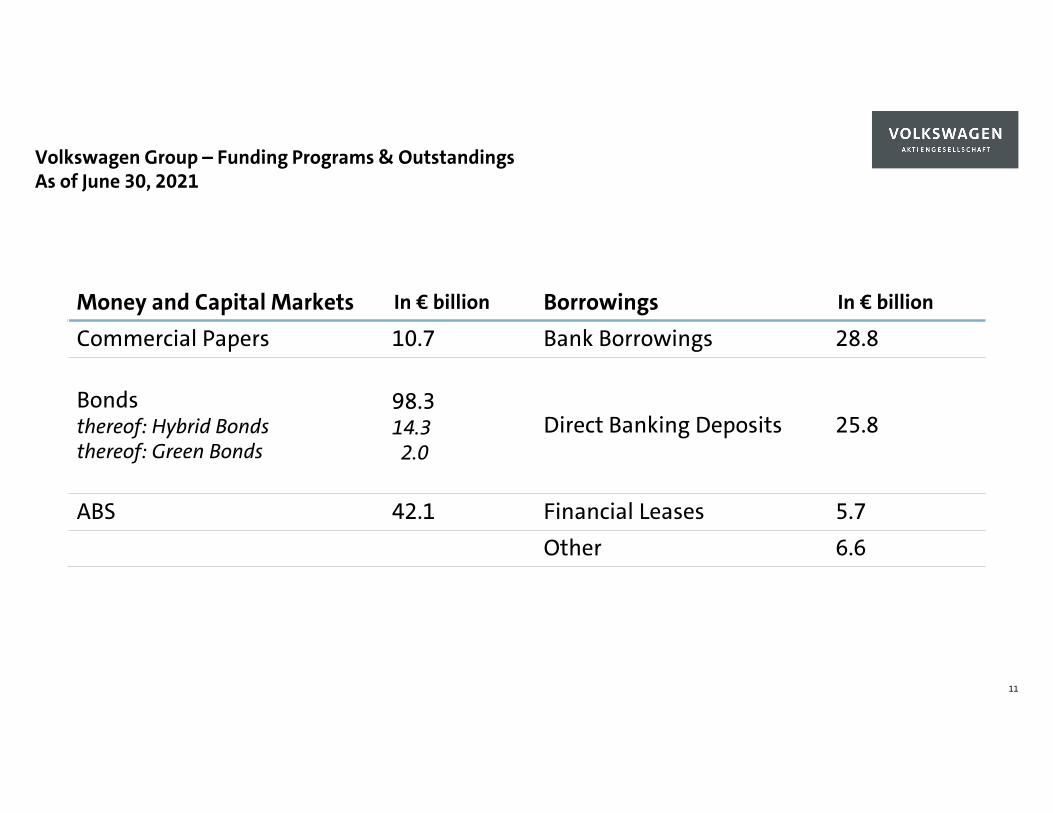
As of June 30, 2021Volkswagen Group – Funding Programs & Outstandings
11
Money and Capital Markets In € billion Borrowings In € billion
Commercial Papers 10.7 Bank Borrowings 28.8
Bondsthereof: Hybrid Bondsthereof: Green Bonds
98.314.32.0
Direct Banking Deposits 25.8
ABS 42.1 Financial Leases 5.7Other 6.6
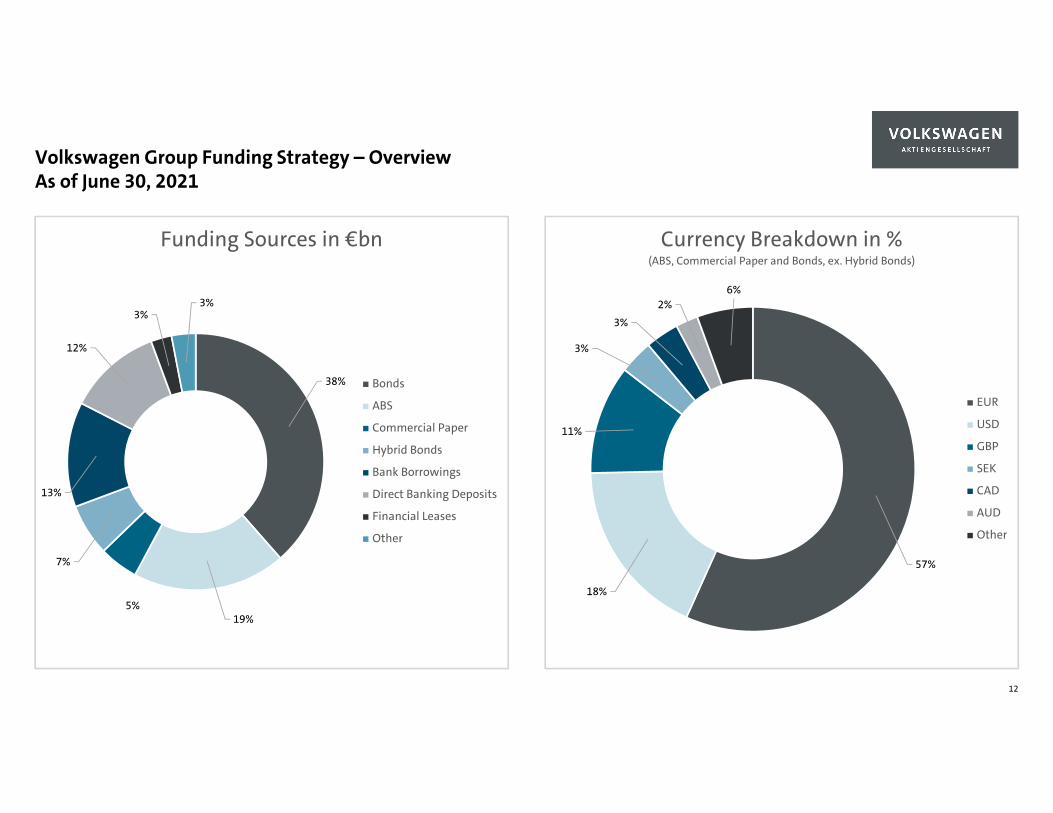
38%
19%5%
7%
13%
12%
3%3%
Funding Sources in €bn
Bonds
ABS
Commercial Paper
Hybrid Bonds
Bank Borrowings
Direct Banking Deposits
Financial Leases
Other
57%
18%
11%
3%
3%
2%6%
Currency Breakdown in %(ABS, Commercial Paper and Bonds, ex. Hybrid Bonds)
EUR
USD
GBP
SEK
CAD
AUD
Other
Volkswagen Group Funding Strategy – OverviewAs of June 30, 2021
12
0
10.000
20.000
30.000
40.000
50.000
60.000
70.000
80.000
90.000
100.000
110.000
0
2.000
4.000
6.000
8.000
10.000
12.000
14.000
16.000
18.000
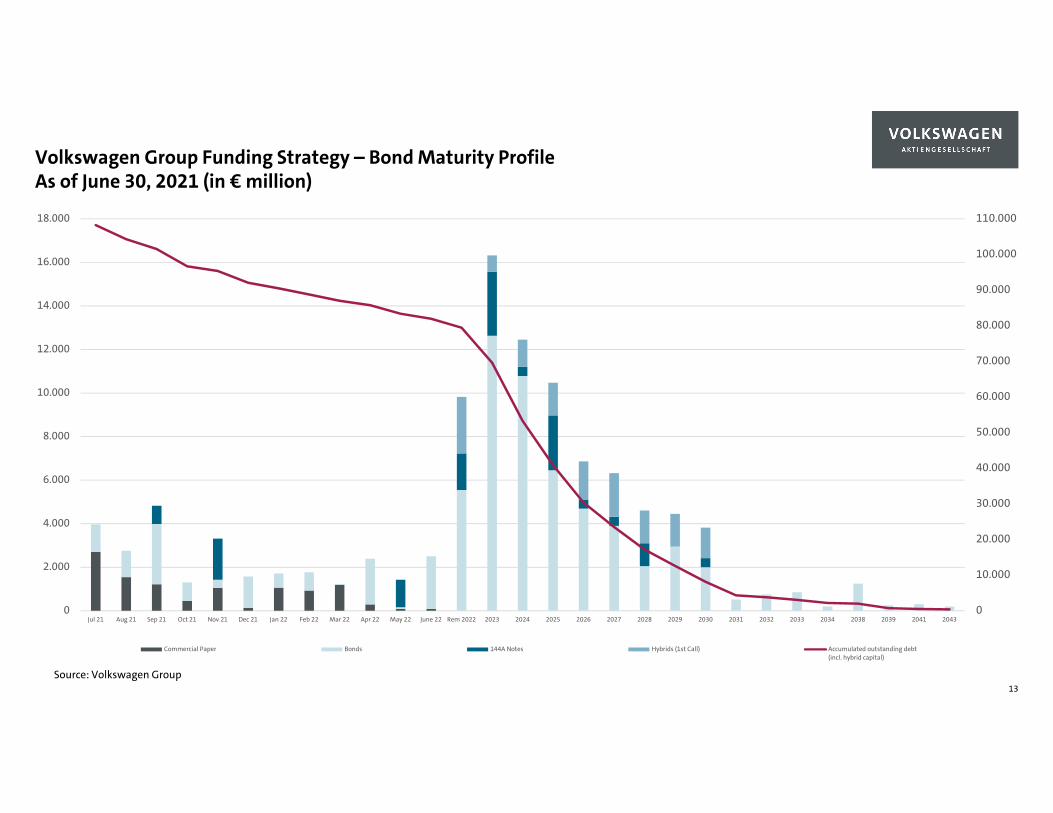
Jul 21 Aug 21 Sep 21 Oct 21 Nov 21 Dec 21 Jan 22 Feb 22 Mar 22 Apr 22 May 22 June 22 Rem 2022 2023 2024 2025 2026 2027 2028 2029 2030 2031 2032 2033 2034 2038 2039 2041 2043
Commercial Paper Bonds 144A Notes Hybrids (1st Call) Accumulated outstanding debt(incl. hybrid capital)
As of June 30, 2021 (in € million) Volkswagen Group Funding Strategy – Bond Maturity Profile
13Source: Volkswagen Group
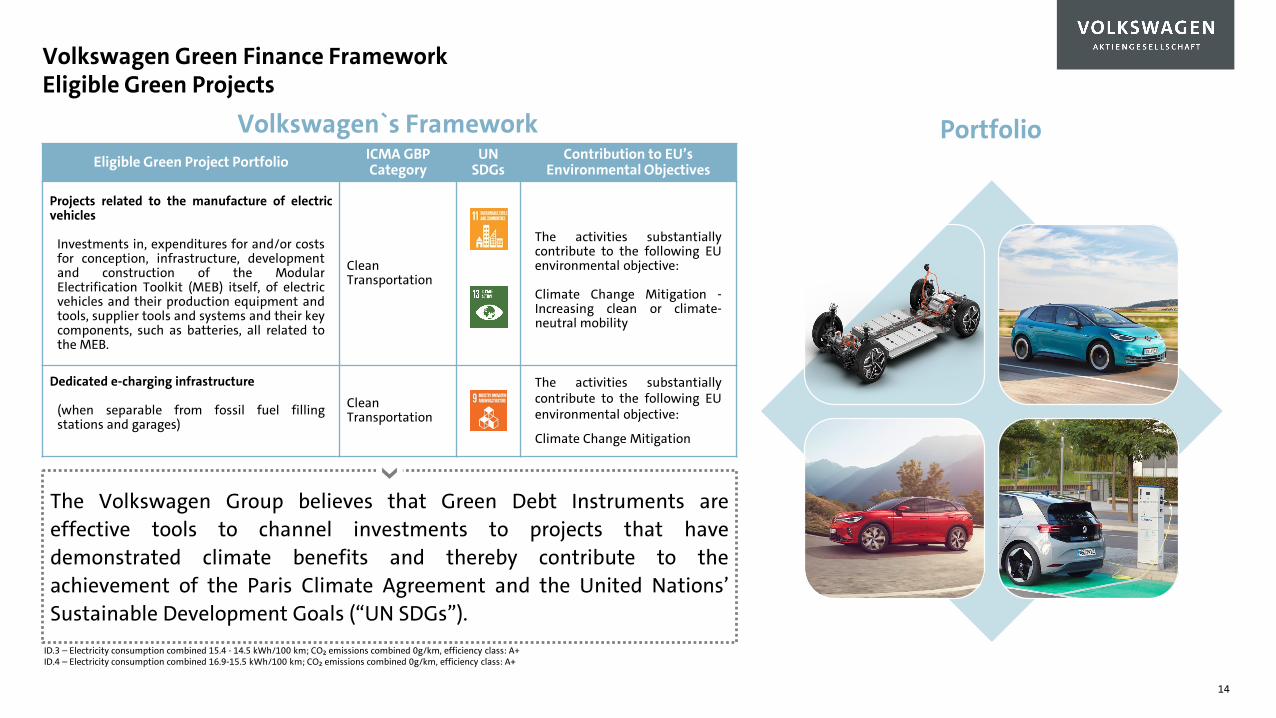
PortfolioEligible Green Project Portfolio ICMA GBP
CategoryUN
SDGsContribution to EU’s
Environmental Objectives
Projects related to the manufacture of electricvehicles
Investments in, expenditures for and/or costsfor conception, infrastructure, developmentand construction of the ModularElectrification Toolkit (MEB) itself, of electricvehicles and their production equipment andtools, supplier tools and systems and their keycomponents, such as batteries, all related tothe MEB.
CleanTransportation
The activities substantiallycontribute to the following EUenvironmental objective:
Climate Change Mitigation -Increasing clean or climate-neutral mobility
Dedicated e-charging infrastructure
(when separable from fossil fuel fillingstations and garages)
CleanTransportation
The activities substantiallycontribute to the following EUenvironmental objective:
Climate Change Mitigation
The Volkswagen Group believes that Green Debt Instruments areeffective tools to channel investments to projects that havedemonstrated climate benefits and thereby contribute to theachievement of the Paris Climate Agreement and the United Nations’Sustainable Development Goals (“UN SDGs”).
Volkswagen`s Framework
Volkswagen Green Finance FrameworkEligible Green Projects
ID.3 – Electricity consumption combined 15.4 - 14.5 kWh/100 km; CO₂ emissions combined 0g/km, efficiency class: A+ID.4 – Electricity consumption combined 16.9-15.5 kWh/100 km; CO₂ emissions combined 0g/km, efficiency class: A+
14
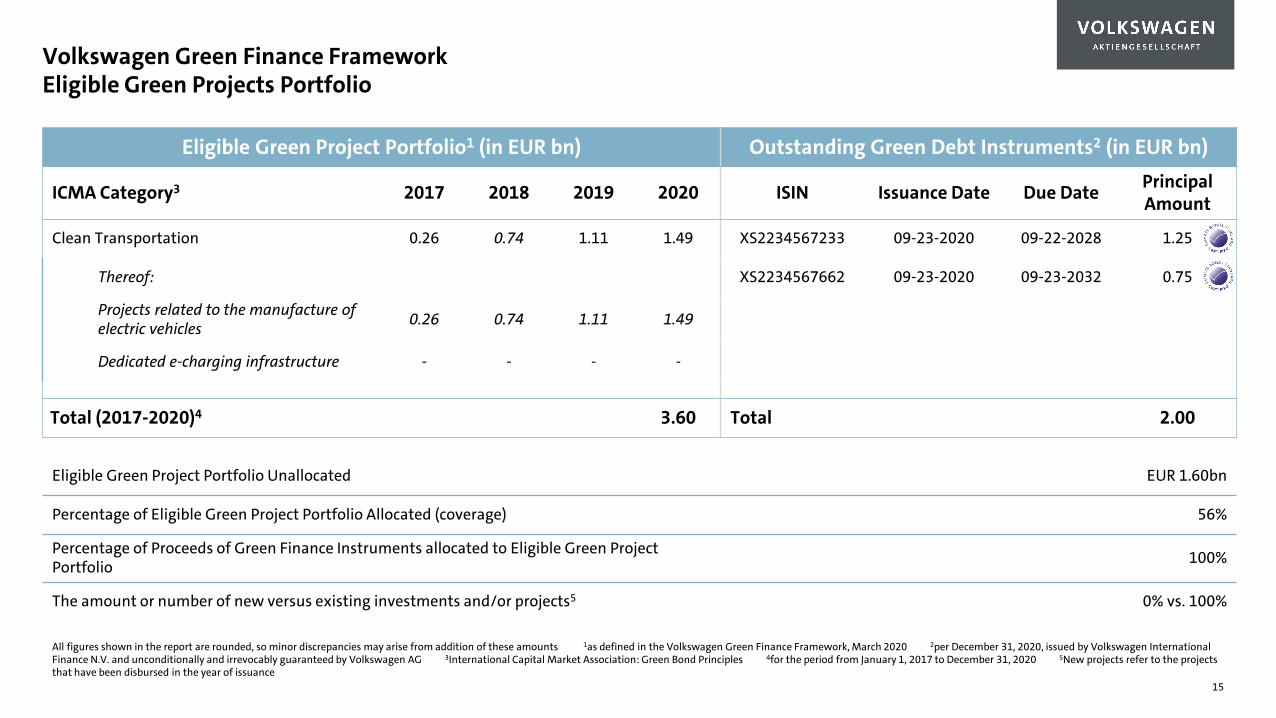
Eligible Green Project Portfolio1 (in EUR bn) Outstanding Green Debt Instruments2 (in EUR bn)
ICMA Category3 2017 2018 2019 2020 ISIN Issuance Date Due Date PrincipalAmount
Clean Transportation 0.26 0.74 1.11 1.49 XS2234567233 09-23-2020 09-22-2028 1.25
Thereof: XS2234567662 09-23-2020 09-23-2032 0.75
Projects related to the manufacture of electric vehicles 0.26 0.74 1.11 1.49
Dedicated e-charging infrastructure - - - -
Total (2017-2020)4 3.60 Total 2.00
Eligible Green Project Portfolio Unallocated EUR 1.60bn
Percentage of Eligible Green Project Portfolio Allocated (coverage) 56%
Percentage of Proceeds of Green Finance Instruments allocated to Eligible Green Project Portfolio 100%
The amount or number of new versus existing investments and/or projects5 0% vs. 100%
All figures shown in the report are rounded, so minor discrepancies may arise from addition of these amounts 1as defined in the Volkswagen Green Finance Framework, March 2020 2per December 31, 2020, issued by Volkswagen International Finance N.V. and unconditionally and irrevocably guaranteed by Volkswagen AG 3International Capital Market Association: Green Bond Principles 4for the period from January 1, 2017 to December 31, 2020 5New projects refer to the projects that have been disbursed in the year of issuance
Volkswagen Green Finance FrameworkEligible Green Projects Portfolio
15
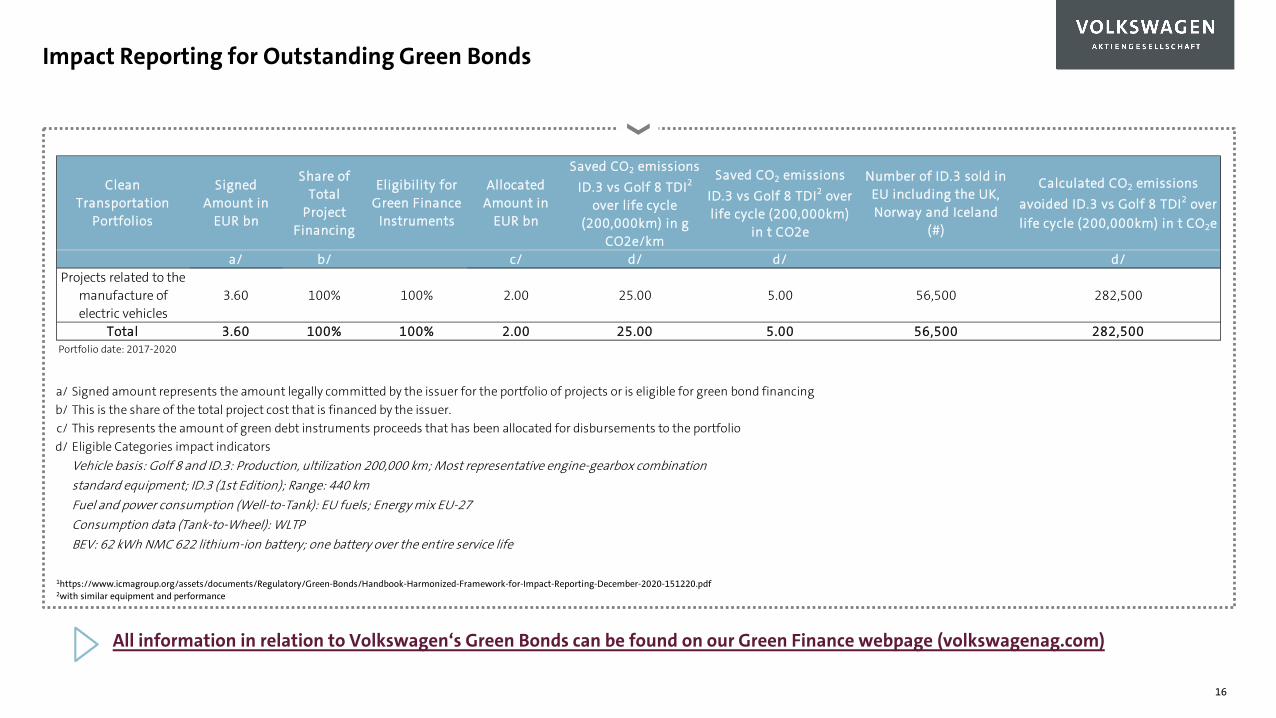
Impact Reporting for Outstanding Green Bonds
1https://www.icmagroup.org/assets/documents/Regulatory/Green-Bonds/Handbook-Harmonized-Framework-for-Impact-Reporting-December-2020-151220.pdf 2with similar equipment and performance
a/ Signed amount represents the amount legally committed by the issuer for the portfolio of projects or is eligible for green bond financingb/ This is the share of the total project cost that is financed by the issuer. c/ This represents the amount of green debt instruments proceeds that has been allocated for disbursements to the portfoliod/ Eligible Categories impact indicators
Vehicle basis: Golf 8 and ID.3: Production, ultilization 200,000 km; Most representative engine-gearbox combination standard equipment; ID.3 (1st Edition); Range: 440 kmFuel and power consumption (Well-to-Tank): EU fuels; Energy mix EU-27Consumption data (Tank-to-Wheel): WLTPBEV: 62 kWh NMC 622 lithium-ion battery; one battery over the entire service life
Clean Transportation
Portfolios
Signed Amount in
EUR bn
Share of Total
Project Financing
Eligibility for Green Finance
Instruments
Allocated Amount in
EUR bn
Saved CO2 emissions ID.3 vs Golf 8 TDI2
over life cycle (200,000km) in g
CO2e/km
Saved CO2 emissions ID.3 vs Golf 8 TDI2 over life cycle (200,000km)
in t CO2e
Number of ID.3 sold in EU including the UK, Norway and Iceland
(#)
Calculated CO2 emissions avoided ID.3 vs Golf 8 TDI2 over life cycle (200,000km) in t CO2e
a/ b/ c/ d/ d/ d/Projects related to the
manufacture of electric vehicles
3.60 100% 100% 2.00 25.00 5.00 56,500 282,500
Total 3.60 100% 100% 2.00 25.00 5.00 56,500 282,500Portfolio date: 2017-2020
All information in relation to Volkswagen‘s Green Bonds can be found on our Green Finance webpage (volkswagenag.com)
16
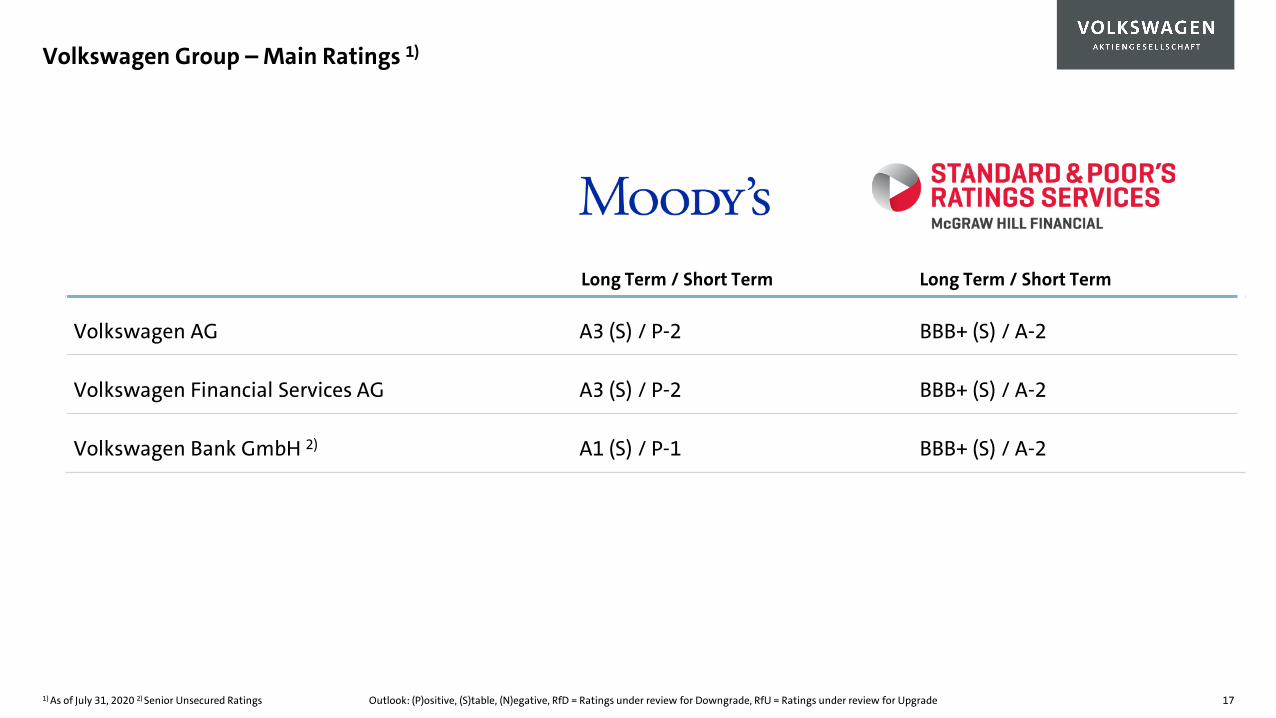
Volkswagen Group – Main Ratings 1)
17
Long Term / Short Term Long Term / Short Term
Volkswagen AG A3 (S) / P-2 BBB+ (S) / A-2
Volkswagen Financial Services AG A3 (S) / P-2 BBB+ (S) / A-2
Volkswagen Bank GmbH 2) A1 (S) / P-1 BBB+ (S) / A-2
1) As of July 31, 2020 2) Senior Unsecured Ratings Outlook: (P)ositive, (S)table, (N)egative, RfD = Ratings under review for Downgrade, RfU = Ratings under review for Upgrade
Leading the Transformation.
Outlook & Operative Excellence
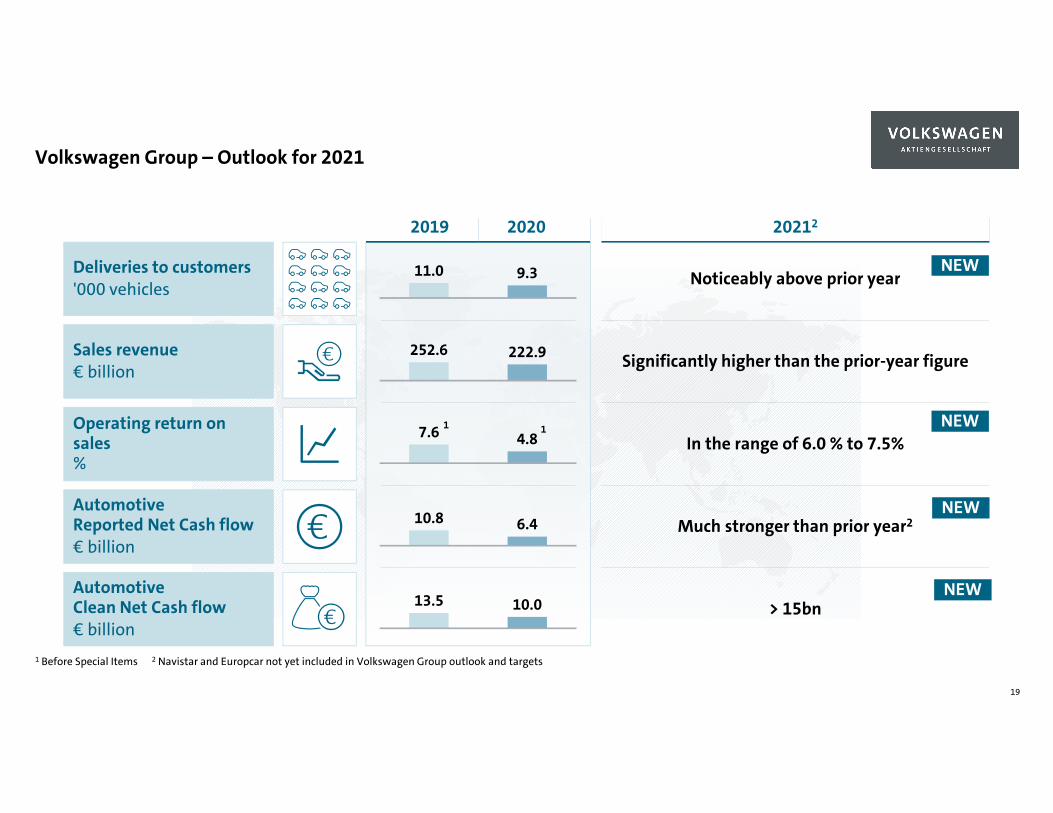
Volkswagen Group – Outlook for 2021
19
> 15bn
1 Before Special Items 2 Navistar and Europcar not yet included in Volkswagen Group outlook and targets
2019
9.311.0
252.6 222.9
Noticeably above prior year
Significantly higher than the prior-year figure
7.6 4.8 In the range of 6.0 % to 7.5%1
10.8 6.4 Much stronger than prior year2
13.5 10.0
1
Deliveries to customers'000 vehicles
Sales revenue € billion
Operating return on sales %
AutomotiveReported Net Cash flow€ billion
AutomotiveClean Net Cash flow€ billion
2020 20212
NEW
NEW
NEW
NEW
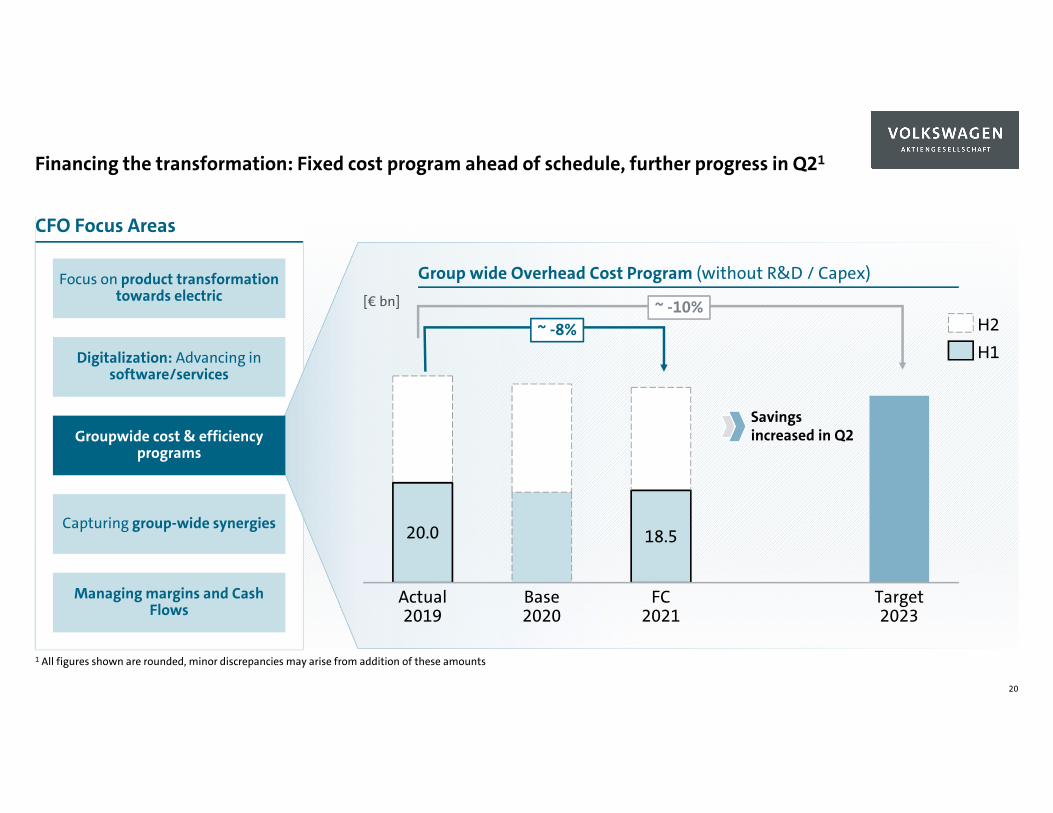
Financing the transformation: Fixed cost program ahead of schedule, further progress in Q21
20
CFO Focus Areas
Managing margins and Cash Flows
Digitalization: Advancing in software/services
Groupwide cost & efficiency programs
Capturing group-wide synergies
Focus on product transformation towards electric
1 All figures shown are rounded, minor discrepancies may arise from addition of these amounts
Group wide Overhead Cost Program (without R&D / Capex)
Savings increased in Q2
[€ bn] ~ -10%~ -8% H2
H1
18.520.0
Actual2019
Base2020
FC2021
Target2023
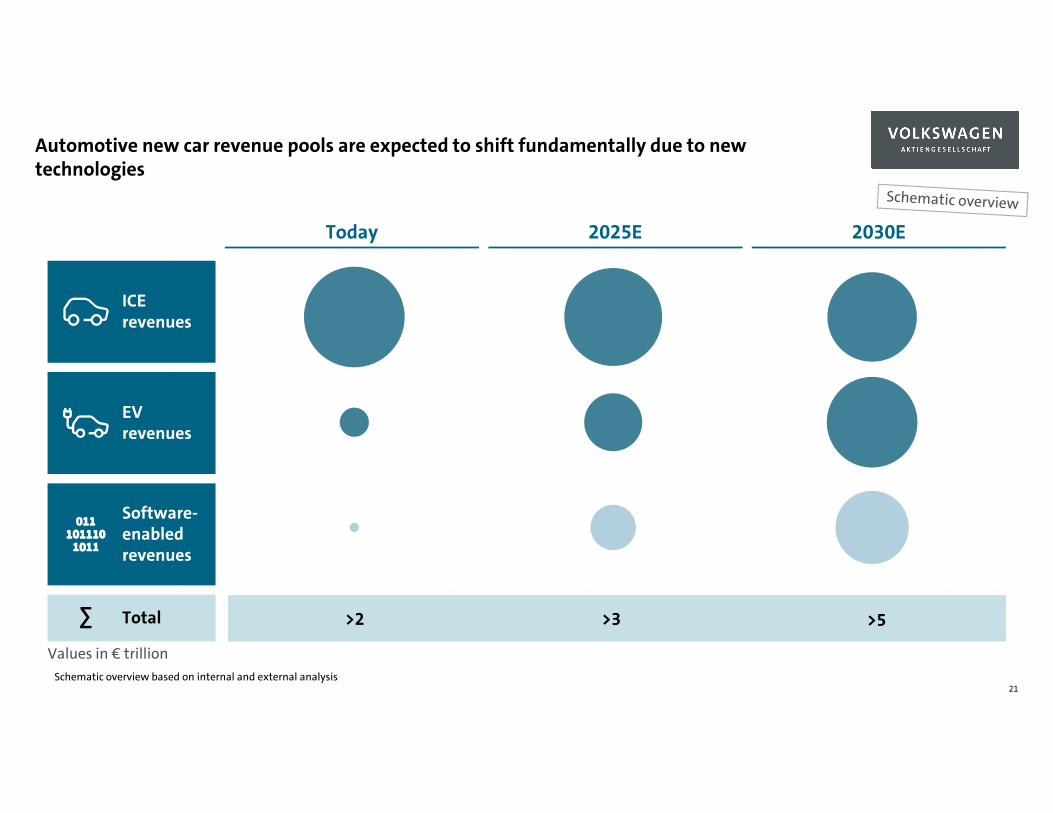
Automotive new car revenue pools are expected to shift fundamentally due to new technologies
Schematic overview based on internal and external analysis21
ICE revenues
EV revenues
Software-enabledrevenues
Total∑ >3>2 >5
Values in € trillion
Today 2030E2025E
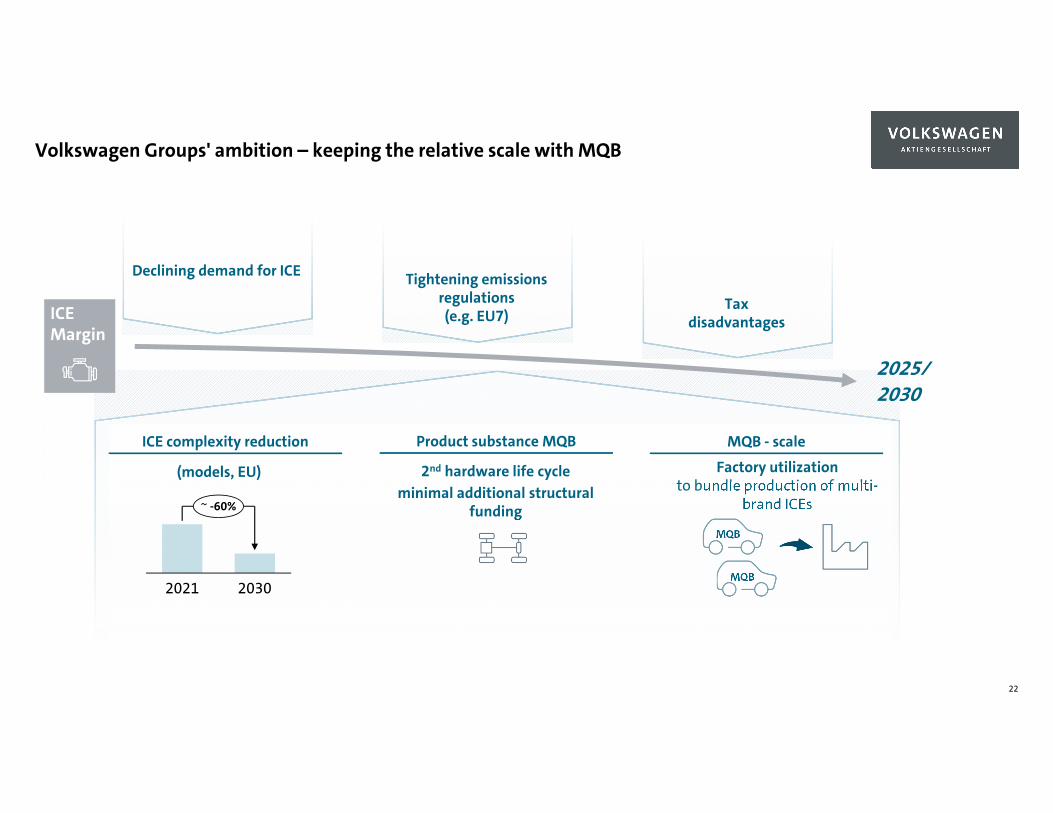
Volkswagen Groups' ambition – keeping the relative scale with MQB
22
Declining demand for ICE Tightening emissions regulations(e.g. EU7)
Taxdisadvantages
20302021
~ -60%
(models, EU)
ICE Margin
ICE complexity reduction
2025/2030
Product substance MQB
2nd hardware life cycle minimal additional structural
funding
Factory utilization to bundle production of multi-
brand ICEs
MQB
MQB - scale
MQB
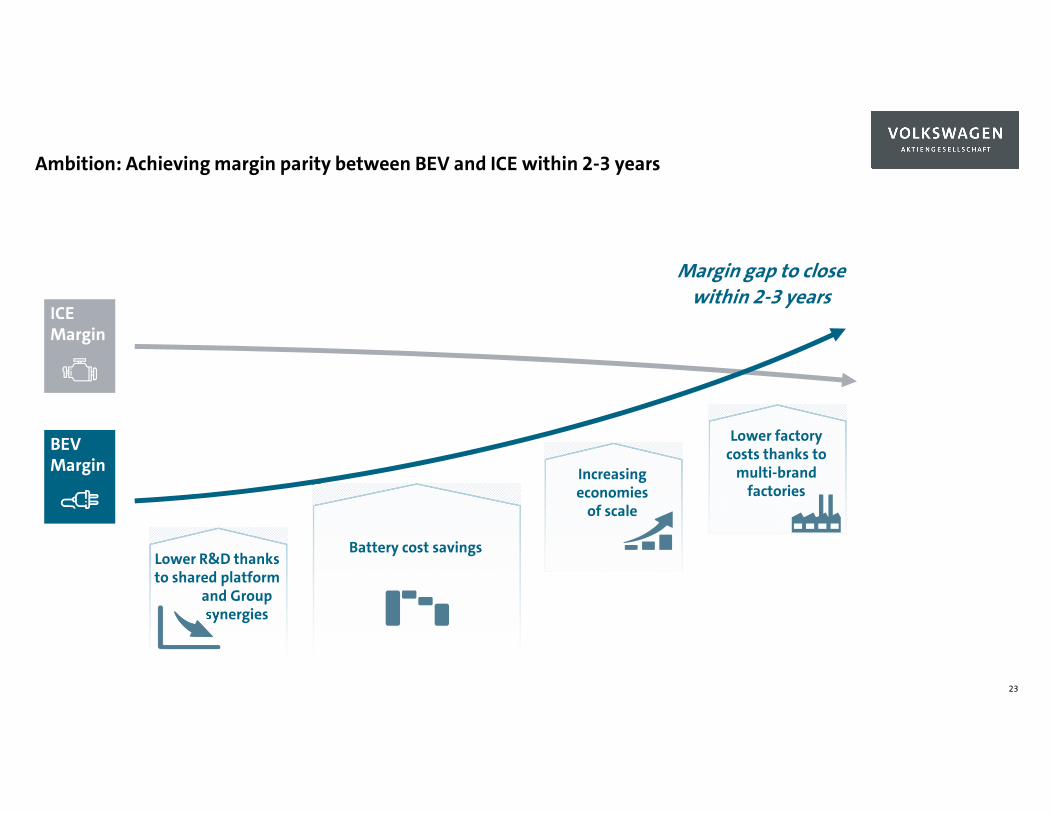
Ambition: Achieving margin parity between BEV and ICE within 2-3 years
23
Lower R&D thanks to shared platform
and Group synergies
ICE Margin
BEV Margin
Battery cost savings
Increasing economies
of scale
Lower factory costs thanks to
multi-brand factories
Margin gap to closewithin 2-3 years
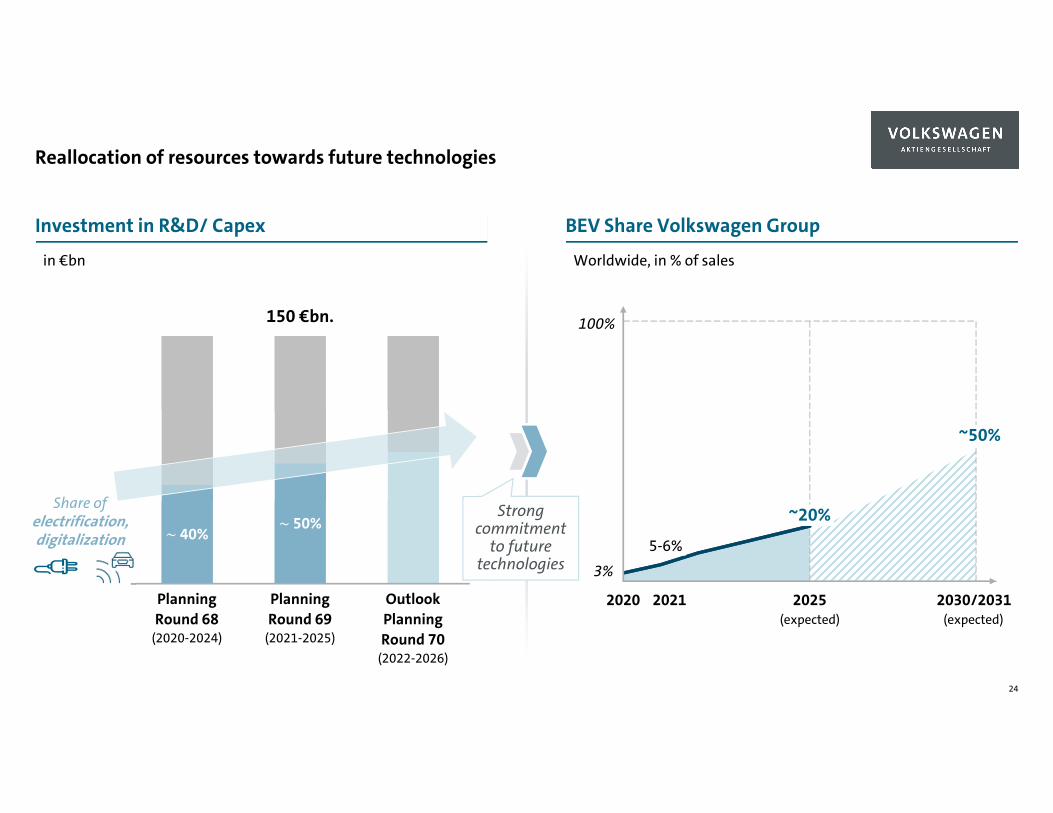
Reallocation of resources towards future technologies
24
Worldwide, in % of salesin €bn
Investment in R&D/ Capex BEV Share Volkswagen Group
~ 40%
PlanningRound 68
(2020-2024)
~ 50%
Outlook Planning Round 70
(2022-2026)
PlanningRound 69
(2021-2025)
100%
(expected) (expected)2030/2031
Share of electrification, digitalization
202520212020
3%
5-6%
~20%
150 €bn.
Strong commitment
to future technologies
~50%
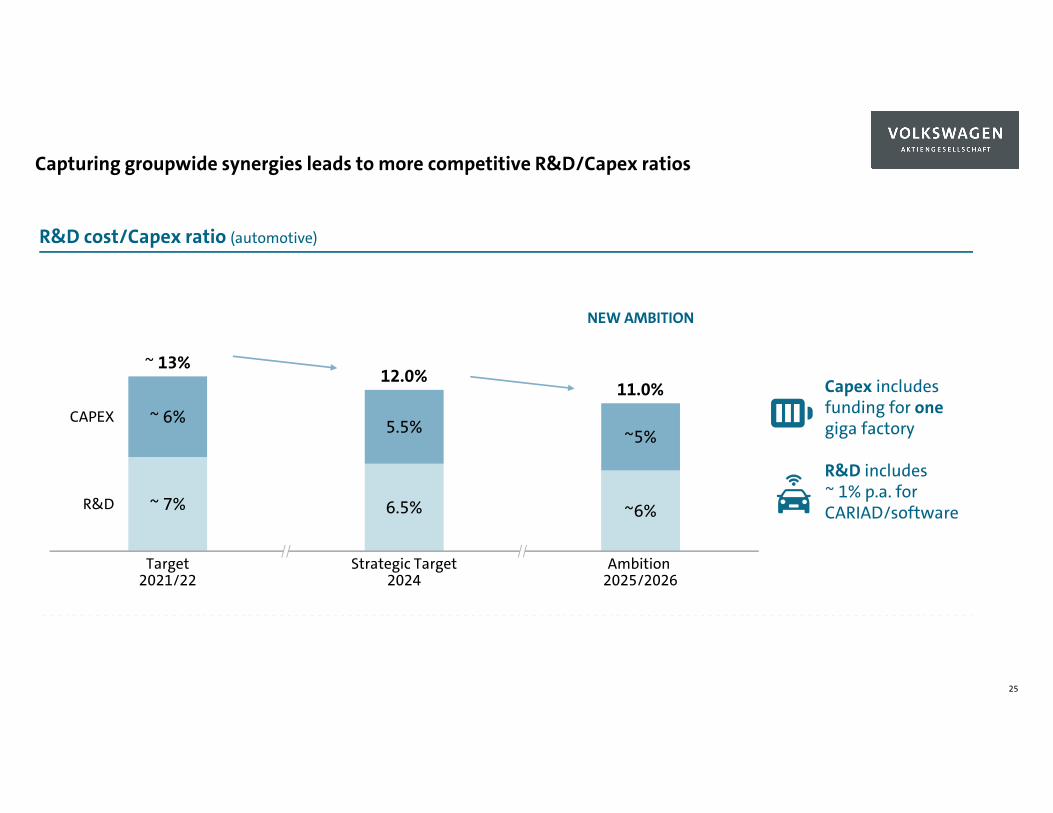
Capturing groupwide synergies leads to more competitive R&D/Capex ratios
25
Ambition 2025/2026
6.5%
~ 6%
Strategic Target2024
~ 7%
Target2021/22
5.5% ~5%
~6%
CAPEX
R&D
~ 13%12.0%
11.0%
R&D cost/Capex ratio (automotive)
Capex includes funding for onegiga factory
R&D includes ~ 1% p.a. for CARIAD/software
NEW AMBITION
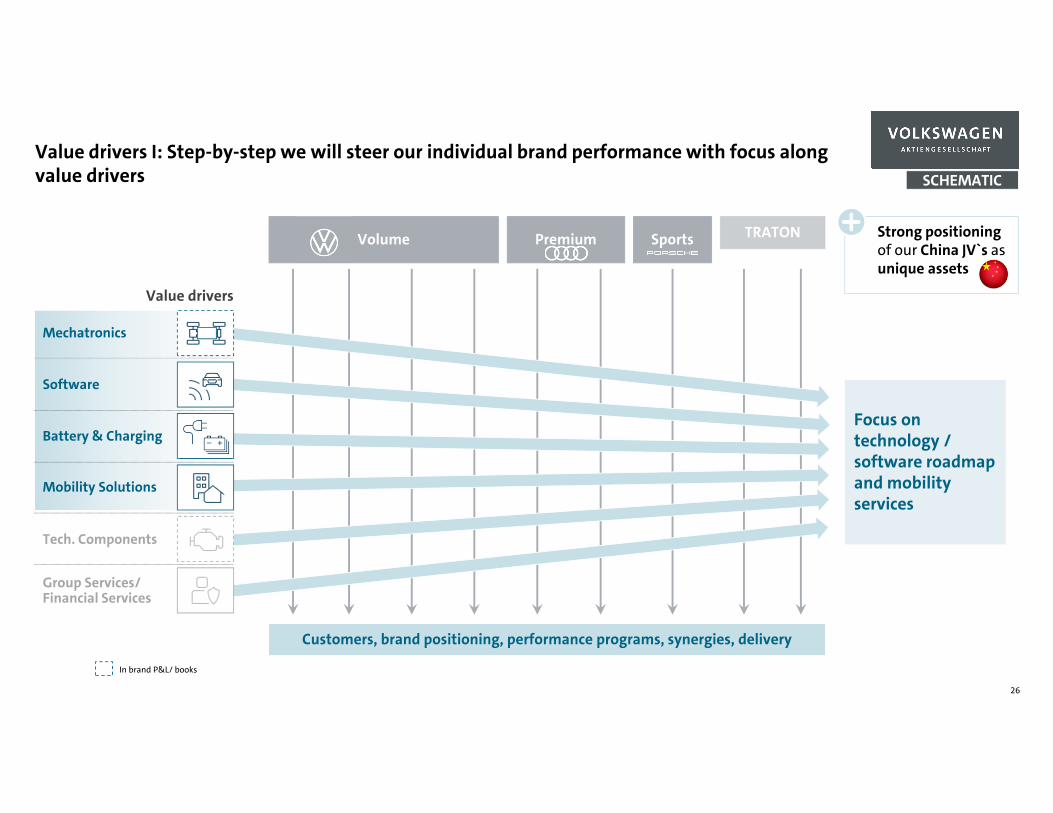
Value drivers I: Step-by-step we will steer our individual brand performance with focus along value drivers
26
SCHEMATIC
In brand P&L/ books
Customers, brand positioning, performance programs, synergies, delivery
Strong positioning of our China JV`s as unique assets
Tech. Components
Mobility Solutions
Software
Mechatronics
Value drivers
Battery & Charging
Group Services/ Financial Services
Volume Premium Sports TRATON
Focus on technology / software roadmap and mobility services
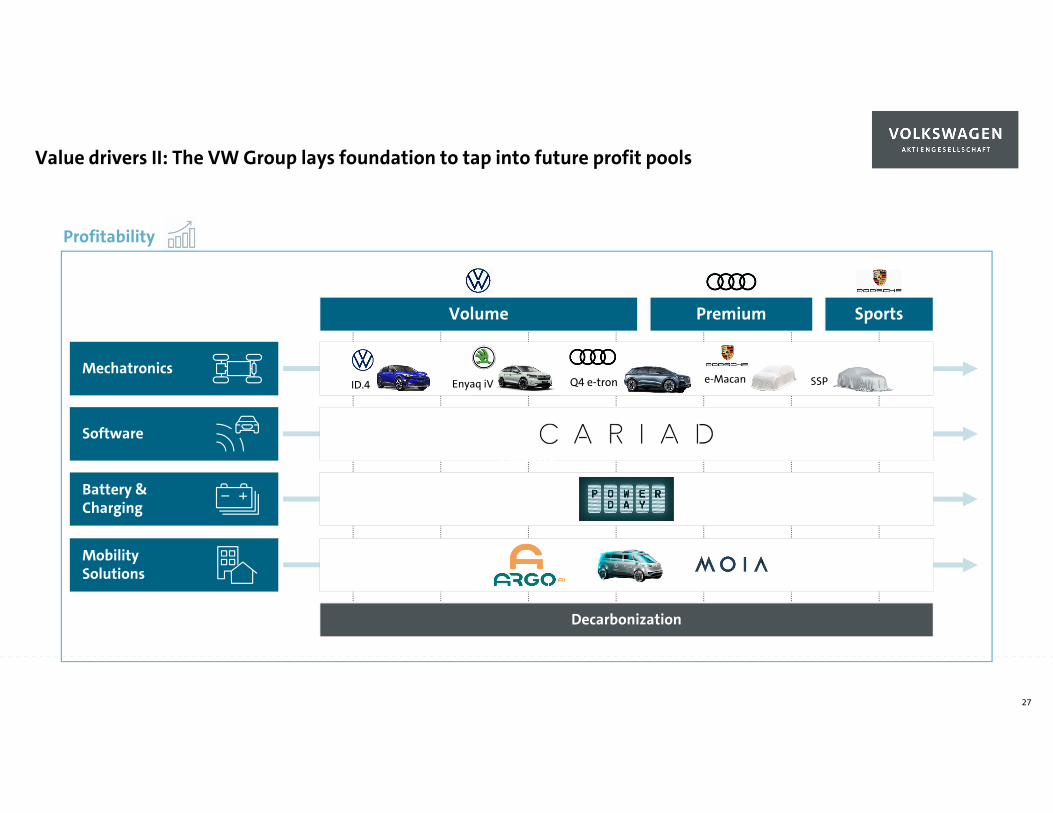
Value drivers II: The VW Group lays foundation to tap into future profit pools
Profitability
Mechatronics
Software
Battery &Charging
MobilitySolutions
Volume Premium Sports
Decarbonization
ID.4 Enyaq iV Q4 e-tron e-Macan SSP
Volume
27
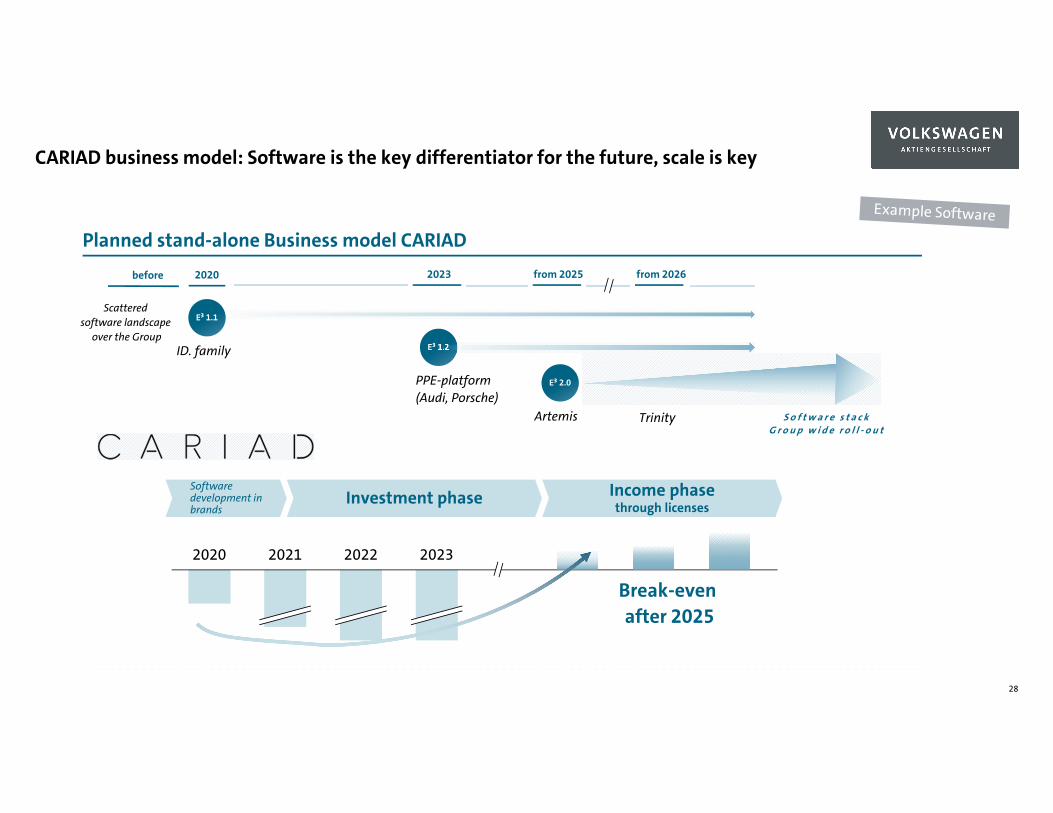
CARIAD business model: Software is the key differentiator for the future, scale is key
28
Planned stand-alone Business model CARIAD
20212020 2022 2023
Income phasethrough licenses Investment phase
Software development in brands
Break-even after 2025
E³ 1.1
E³ 1.2
2020
S o f t w a r e s t a c kG r o u p w i d e r o l l - o u t
from 2026
Scattered software landscape
over the Group
before
E³ 2.0
from 2025 2023
ID. family
PPE-platform(Audi, Porsche)
Artemis Trinity
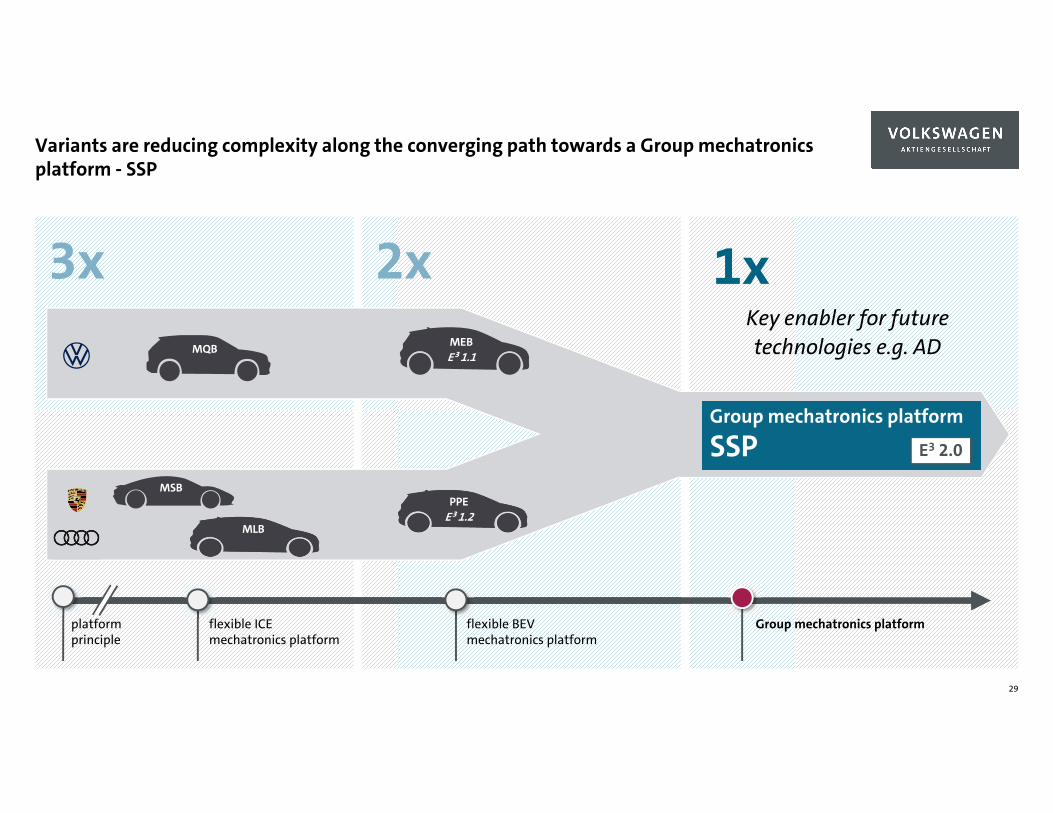
Variants are reducing complexity along the converging path towards a Group mechatronics platform - SSP
29
flexible ICE mechatronics platform
MQB
platform principle
MSB
MLB
3xMEB
E³ 1.1
flexible BEVmechatronics platform
Group mechatronics platform
2xKey enabler for future technologies e.g. AD
PPEE³ 1.2
1x
Group mechatronics platform
SSP E3 2.0
Leading the Transformation.
Strategy – Shaping e-mobility
31
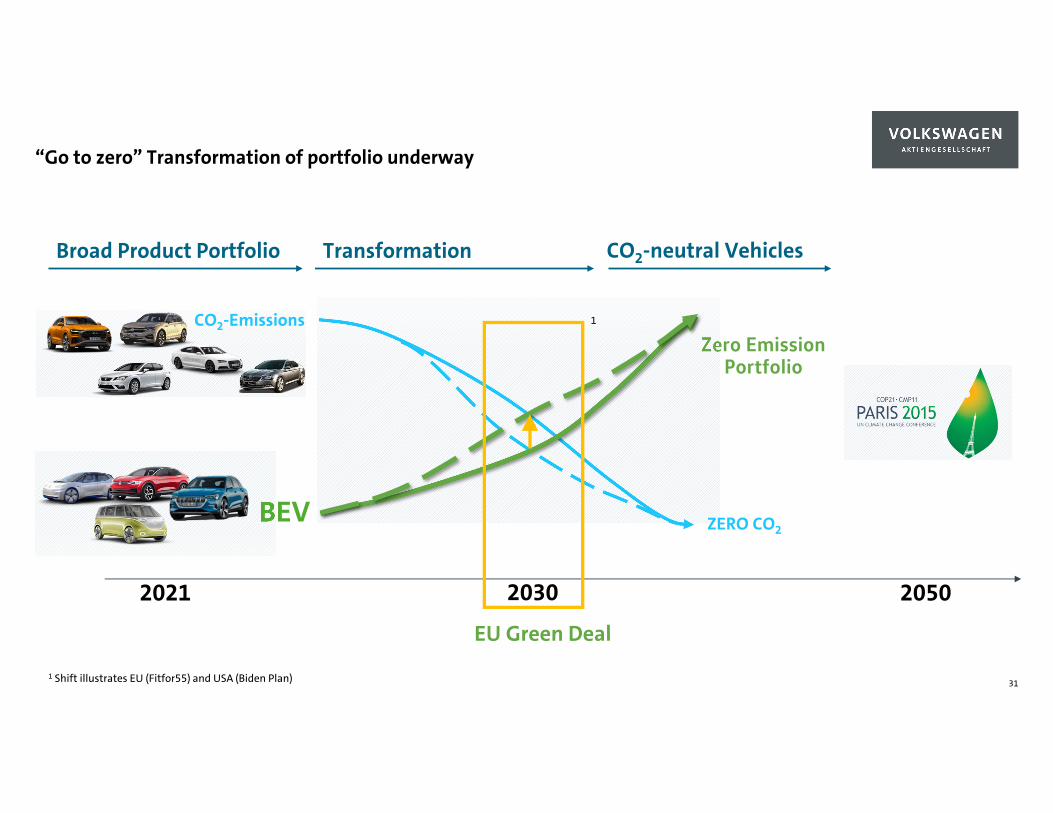
“Go to zero” Transformation of portfolio underway
2050
TransformationBroad Product Portfolio
2021
BEV
CO2-EmissionsZero Emission
Portfolio
2030
CO2-neutral Vehicles
EU Green Deal
ZERO CO2
1 Shift illustrates EU (Fitfor55) and USA (Biden Plan)
1
Das Bild kann nicht angezeigt werden.
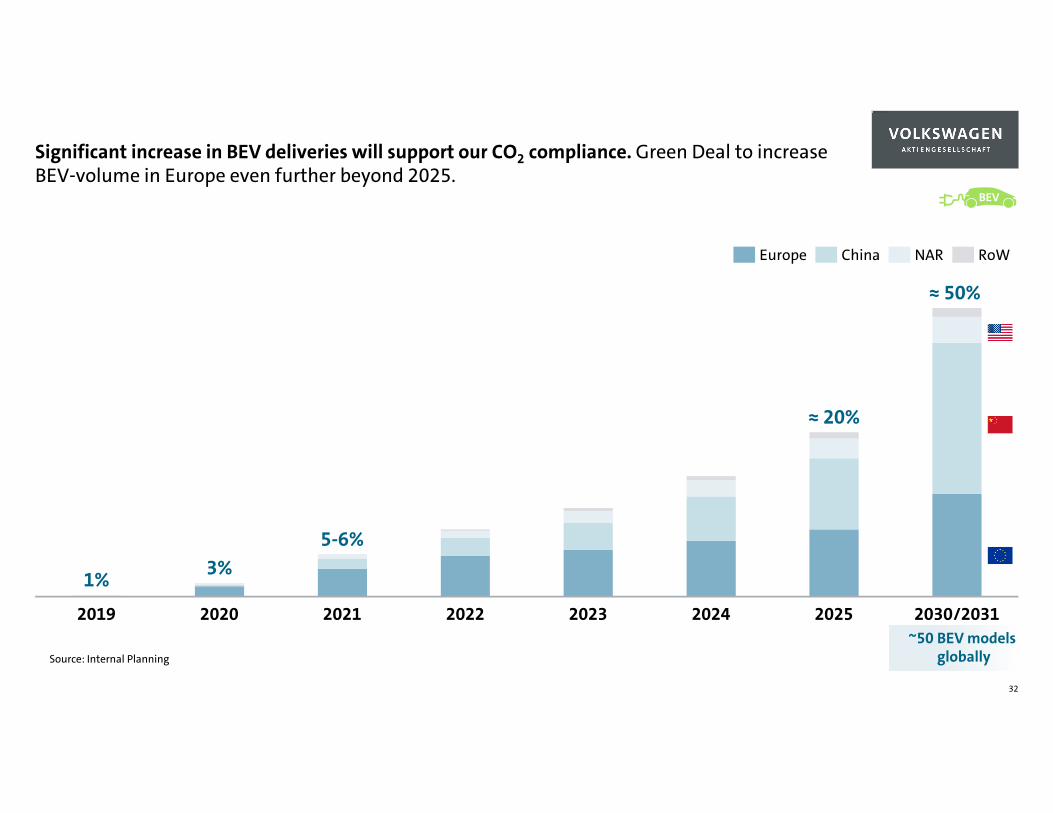
Significant increase in BEV deliveries will support our CO2 compliance. Green Deal to increase BEV-volume in Europe even further beyond 2025.
32
Source: Internal Planning
BEV
2022 20252019 2020 2021 20242023 2030/2031
5-6%
1% 3%
≈ 20%
≈ 50%
Europe RoWChina NAR
~50 BEV models globally
Das Bild kann nicht angezeigt werden.
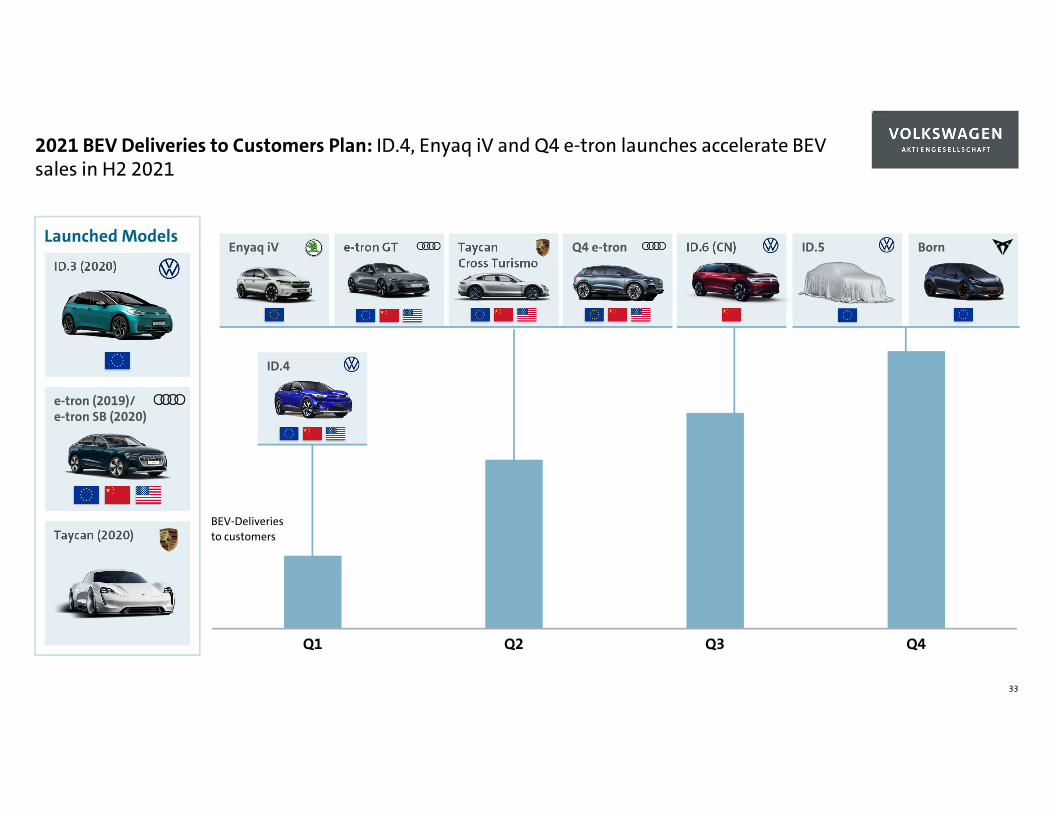
2021 BEV Deliveries to Customers Plan: ID.4, Enyaq iV and Q4 e-tron launches accelerate BEV sales in H2 2021
33
Launched Models
Taycan (2020)
ID.3 (2020)
e-tron (2019)/e-tron SB (2020)
ID.4
e-tron GT TaycanCross Turismo
Enyaq iV Q4 e-tron ID.6 (CN) Born
Q1 Q2 Q3 Q4
ID.5
BEV-Deliveriesto customers
Das Bild kann nicht angezeigt werden.
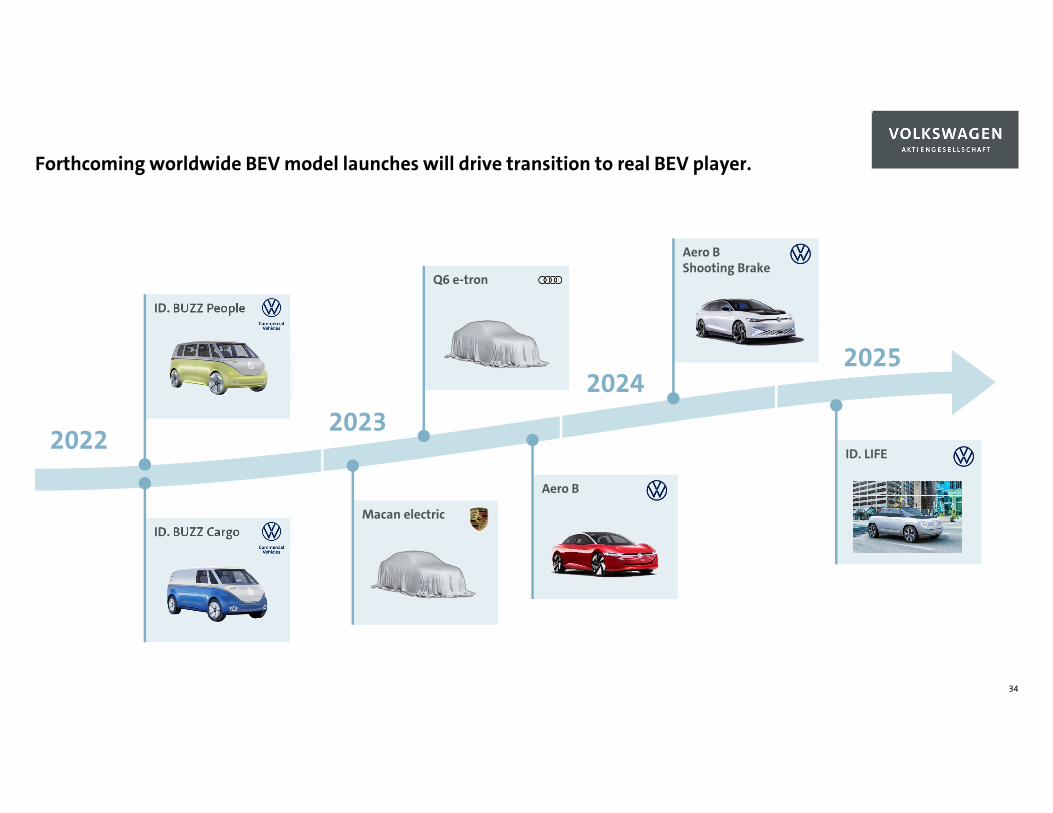
Forthcoming worldwide BEV model launches will drive transition to real BEV player.
34
20222023
ID. BUZZ People
ID. BUZZ Cargo
Q6 e-tron
Aero B Shooting Brake
Macan electric
Aero B
ID. LIFE
20252024
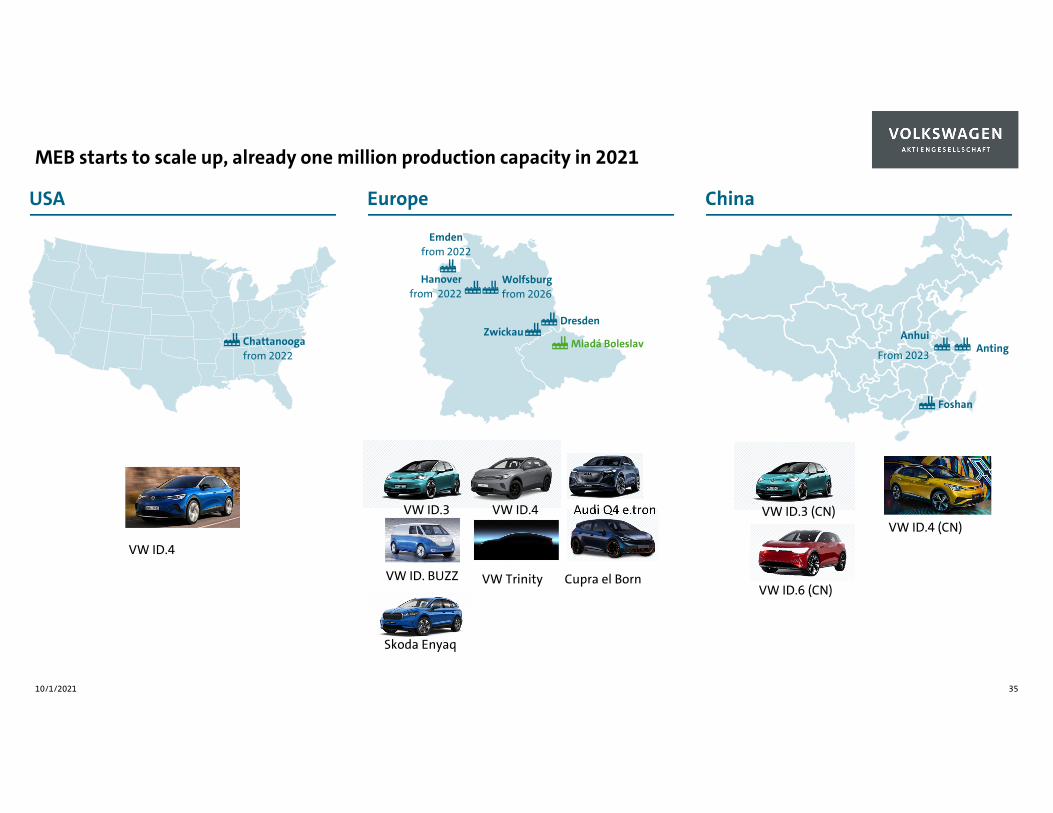
MEB starts to scale up, already one million production capacity in 2021
10/1/2021 35
USA
ID.4 Audi Q4 e.tron
Europe China
Chattanoogafrom 2022
AntingAnhui
From 2023
Foshan
Mladá Boleslav
DresdenZwickau
Emdenfrom 2022
Wolfsburgfrom 2026
Hanoverfrom 2022
VW ID.4VW ID.3
Skoda Enyaq
VW ID.4
VW ID. BUZZ VW Trinity Cupra el BornVW ID.6 (CN)
VW ID.4 (CN)VW ID.3 (CN)
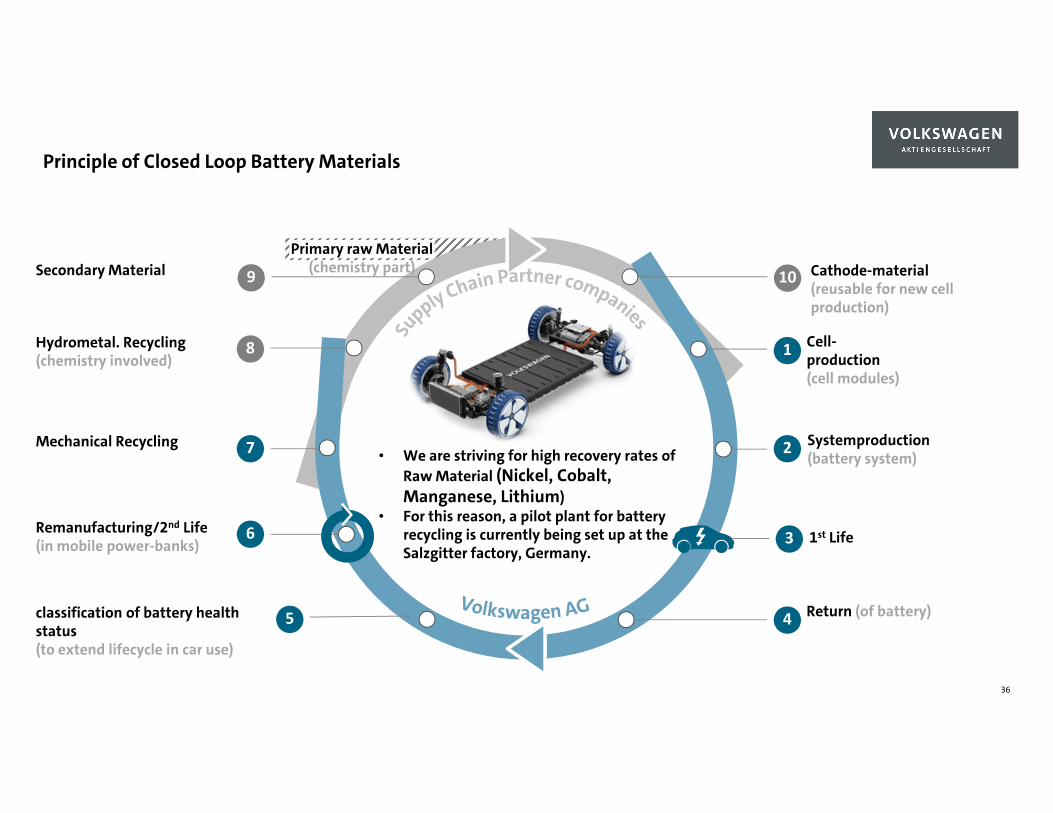
Cathode-material (reusable for new cell production)
Cell-production (cell modules)
Systemproduction (battery system)
1st Life
classification of battery health status (to extend lifecycle in car use)
Remanufacturing/2nd Life (in mobile power-banks)
Mechanical Recycling
Hydrometal. Recycling (chemistry involved)
Secondary Material 10
1
2
3
45
6
7
8
9
Return (of battery)
Primary raw Material (chemistry part)
• We are striving for high recovery rates ofRaw Material (Nickel, Cobalt,Manganese, Lithium)
• For this reason, a pilot plant for batteryrecycling is currently being set up at theSalzgitter factory, Germany.
Principle of Closed Loop Battery Materials
36
37
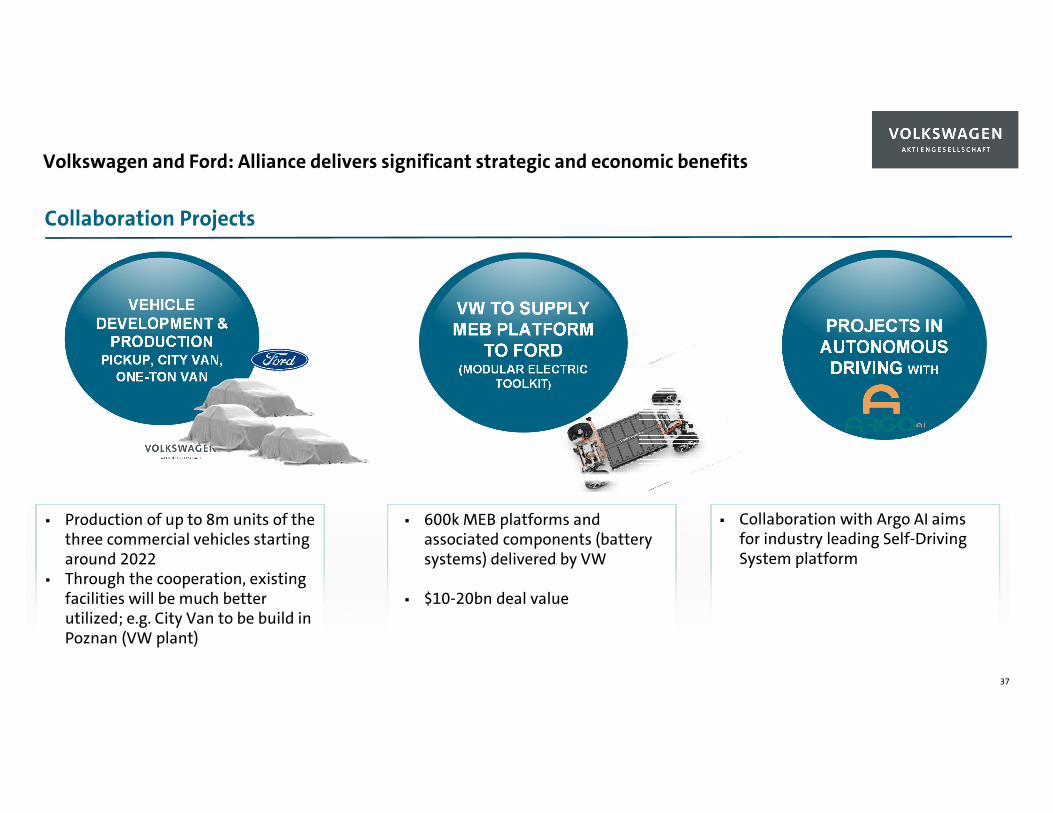
Volkswagen and Ford: Alliance delivers significant strategic and economic benefits
VEHICLEDEVELOPMENT &
PRODUCTIONPICKUP, CITY VAN,
ONE-TON VAN
VW TO SUPPLY MEB PLATFORM
TO FORD(MODULAR ELECTRIC
TOOLKIT)
PROJECTS IN AUTONOMOUS
DRIVING WITH
Production of up to 8m units of thethree commercial vehicles startingaround 2022
Through the cooperation, existingfacilities will be much betterutilized; e.g. City Van to be build inPoznan (VW plant)
600k MEB platforms andassociated components (batterysystems) delivered by VW
$10-20bn deal value
Collaboration with Argo AI aimsfor industry leading Self-DrivingSystem platform
Collaboration Projects
Leading the Transformation.
Strategy – Software-enabled car company
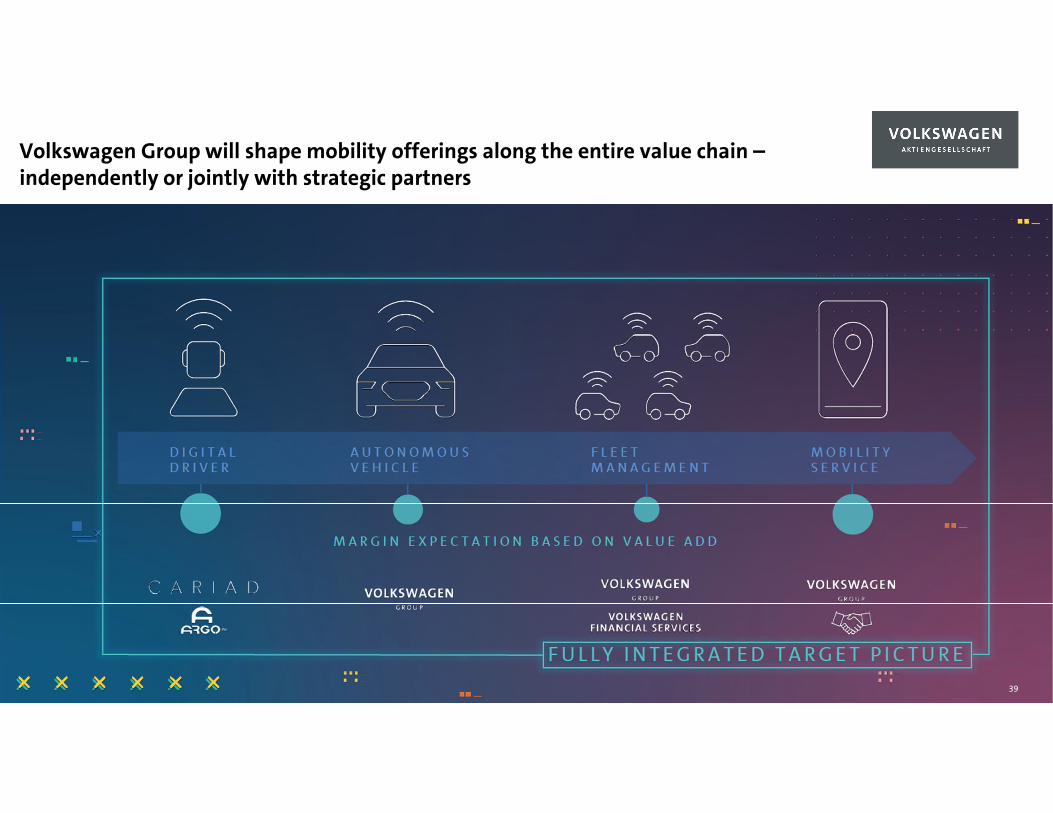
Volkswagen Group will shape mobility offerings along the entire value chain –independently or jointly with strategic partners
39
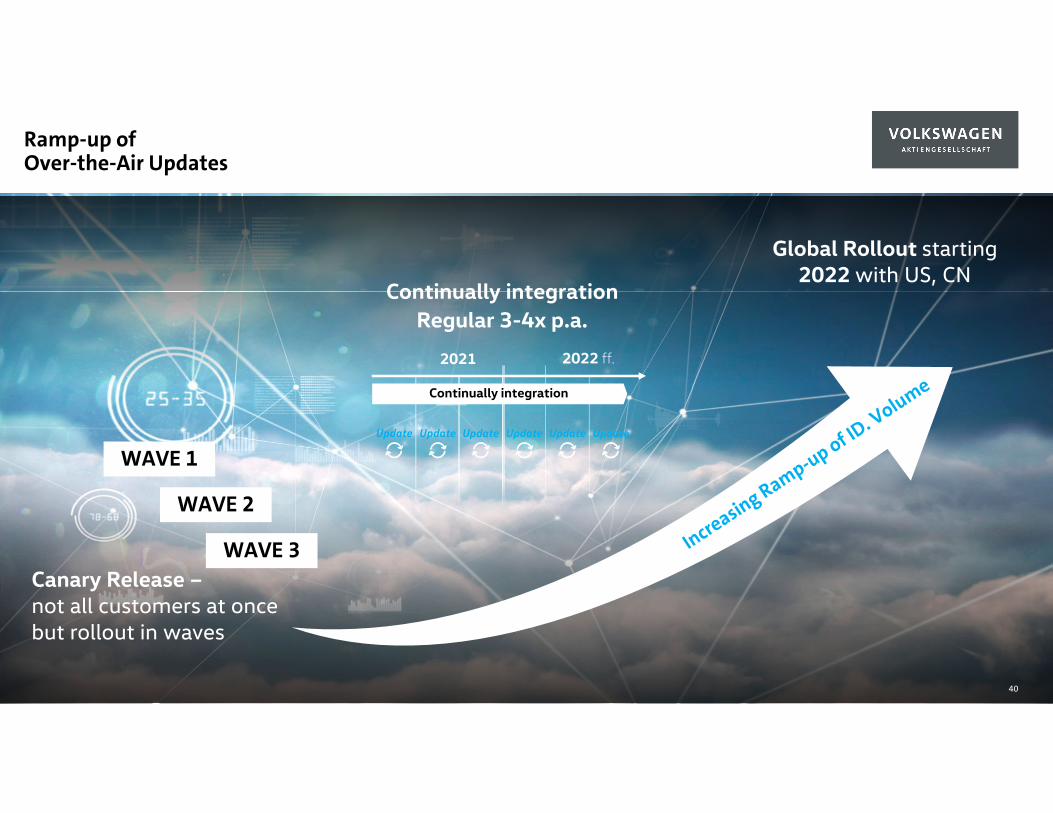
Ramp-up ofOver-the-Air Updates
2021
Continually integration
Update Update Update Update Update Update
2022 ff.
Canary Release –not all customers at once but rollout in waves
WAVE 1
WAVE 2
WAVE 3
Continually integrationRegular 3-4x p.a.
Global Rollout starting 2022 with US, CN
40
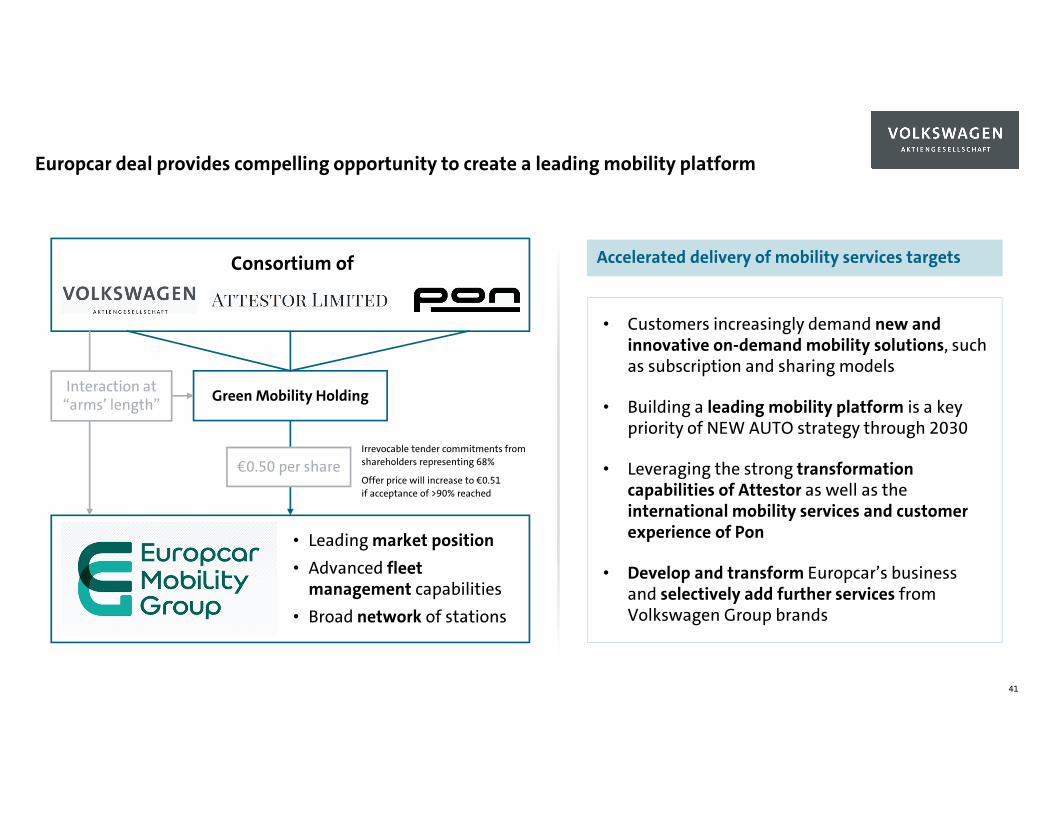
Europcar deal provides compelling opportunity to create a leading mobility platform
41
Consortium of
Green Mobility HoldingInteraction at “arms’ length”
€0.50 per share
• Leading market position• Advanced fleet
management capabilities• Broad network of stations
Irrevocable tender commitments from shareholders representing 68%
Offer price will increase to €0.51if acceptance of >90% reached
• Customers increasingly demand new andinnovative on-demand mobility solutions, suchas subscription and sharing models
• Building a leading mobility platform is a keypriority of NEW AUTO strategy through 2030
• Leveraging the strong transformationcapabilities of Attestor as well as theinternational mobility services and customerexperience of Pon
• Develop and transform Europcar’s businessand selectively add further services fromVolkswagen Group brands
Accelerated delivery of mobility services targets
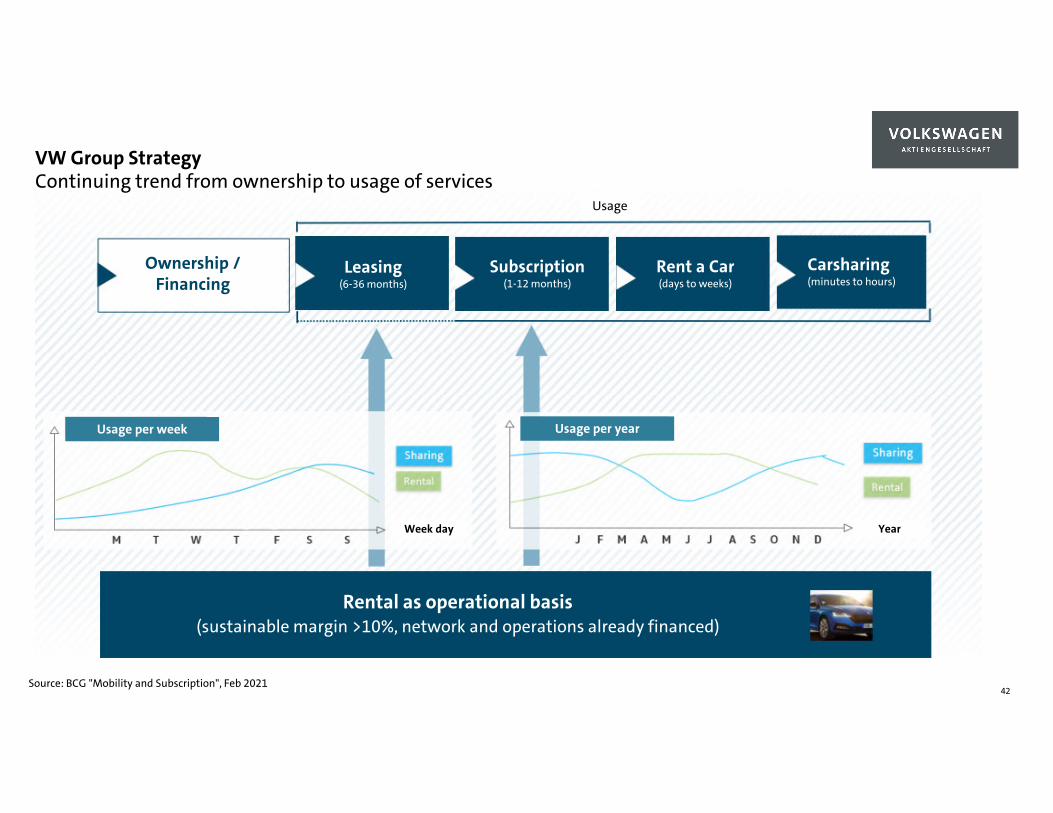
Mobility unit
Rental as operational basis(sustainable margin >10%, network and operations already financed)
Ownership /Financing
Leasing(6-36 months)
Subscription(1-12 months)
Rent a Car(days to weeks)
Carsharing(minutes to hours)
Usage
42Source: BCG "Mobility and Subscription", Feb 2021
Continuing trend from ownership to usage of servicesVW Group Strategy
Usage per week Usage per year
Week day Year
Group Divisions
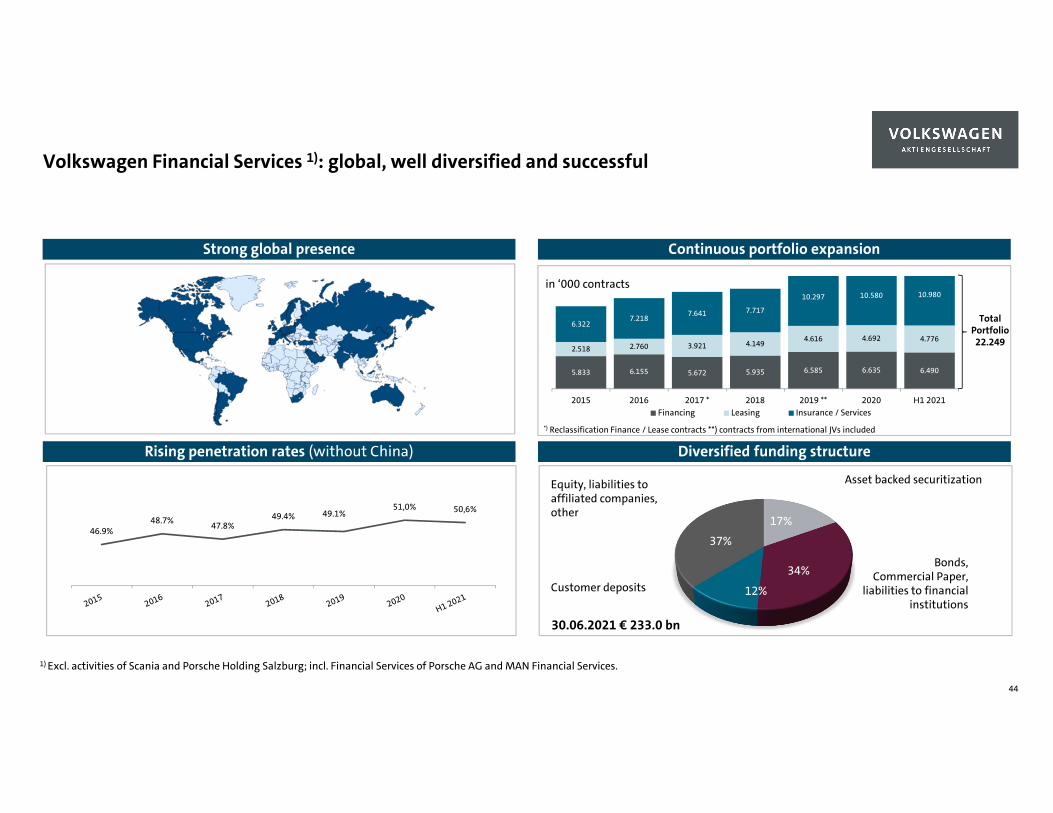
17%
34%
12%
37%
*) Reclassification Finance / Lease contracts **) contracts from international JVs included
5.833 6.155 5.672 5.935 6.585 6.635 6.490
2.518 2.760 3.921 4.149 4.616 4.692 4.776
6.3227.218 7.641 7.717
10.297 10.580 10.980
2015 2016 2017 * 2018 2019 ** 2020 H1 2021Financing Leasing Insurance / Services
Continuous portfolio expansionStrong global presence
Total Portfolio22.249
in ‘000 contracts
Rising penetration rates (without China) Diversified funding structure
Customer deposits
Equity, liabilities to affiliated companies, other
Bonds,Commercial Paper,
liabilities to financialinstitutions
Asset backed securitization
30.06.2021 € 233.0 bn
46.9%48.7% 47.8%
49.4% 49.1%51,0% 50,6%
Volkswagen Financial Services 1): global, well diversified and successful
1) Excl. activities of Scania and Porsche Holding Salzburg; incl. Financial Services of Porsche AG and MAN Financial Services.
44
0
250
500
2012 2013 2014 2015 2016 2017 2018 2019 2020ytd Aug 2021
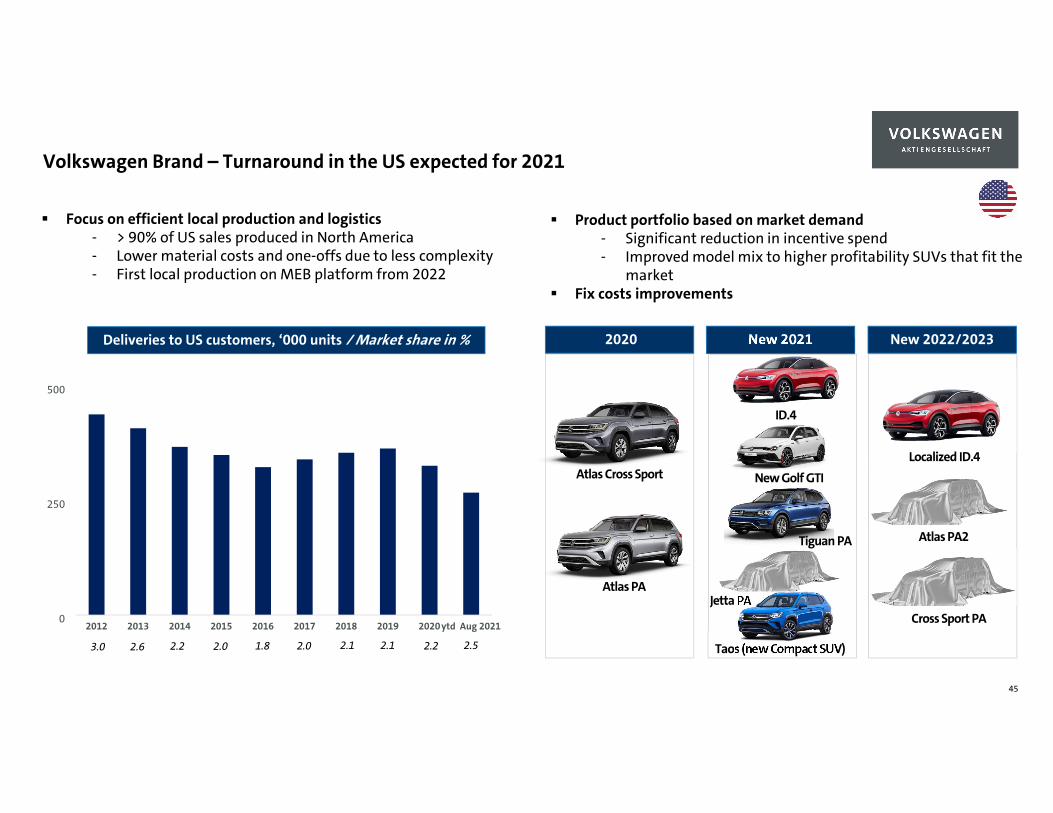
New 2021
Taos (new Compact SUV)
Product portfolio based on market demand- Significant reduction in incentive spend- Improved model mix to higher profitability SUVs that fit the
market Fix costs improvements
Focus on efficient local production and logistics- > 90% of US sales produced in North America- Lower material costs and one-offs due to less complexity- First local production on MEB platform from 2022
Volkswagen Brand – Turnaround in the US expected for 2021
New 2022/2023
Atlas PA
Localized ID.4Atlas Cross Sport
ID.4
Tiguan PA
New Golf GTI
Jetta PA
Atlas PA2
Cross Sport PA
Deliveries to US customers, ‘000 units / Market share in % 2020
1.82.6 2.12.2 2.0 2.13.0 2.52.0 2.2
45
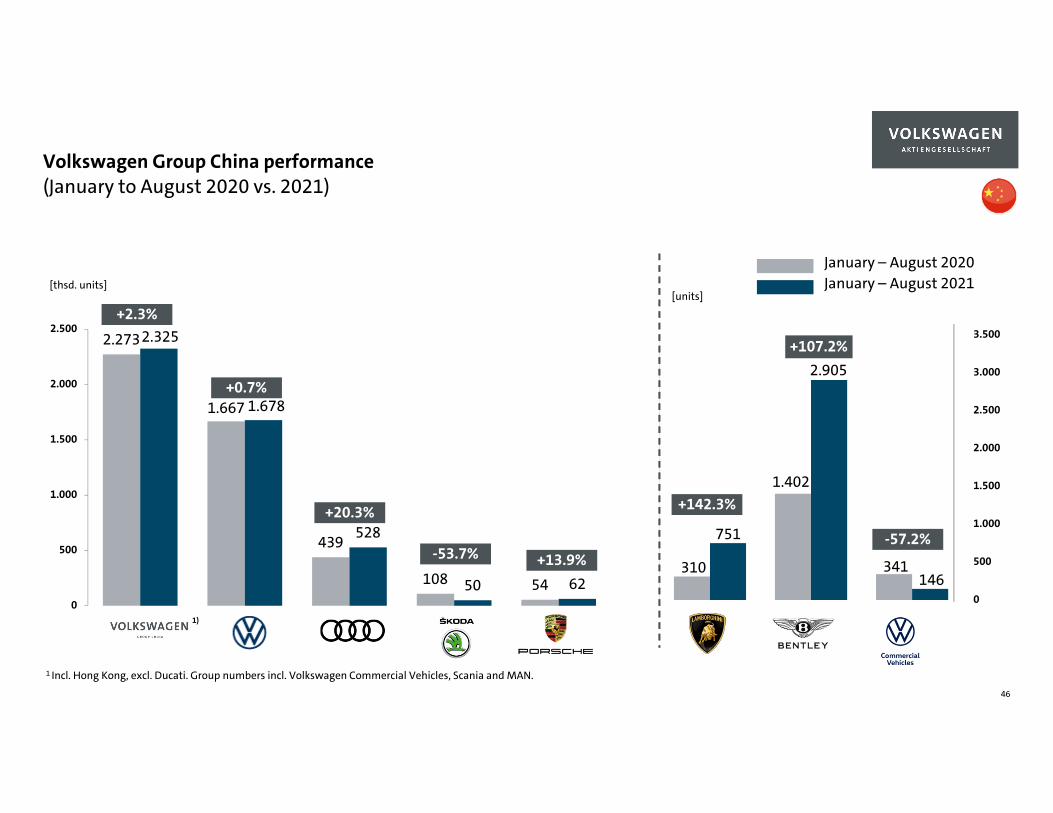
310
1.402
341
751
2.905
1460
500
1.000
1.500
2.000
2.500
3.000
3.5002.273
1.667
439
108 54
2.325
1.678
528
50 620
500
1.000
1.500
2.000
2.500
1)
+0.7%
+20.3%
-53.7% +13.9%
January – August 2020January – August 2021
+142.3%
+107.2%
-57.2%
+2.3%
[thsd. units][units]
Volkswagen Group China performance
1 Incl. Hong Kong, excl. Ducati. Group numbers incl. Volkswagen Commercial Vehicles, Scania and MAN.
(January to August 2020 vs. 2021)
46
Das Bild kann nicht angezeigt werden.
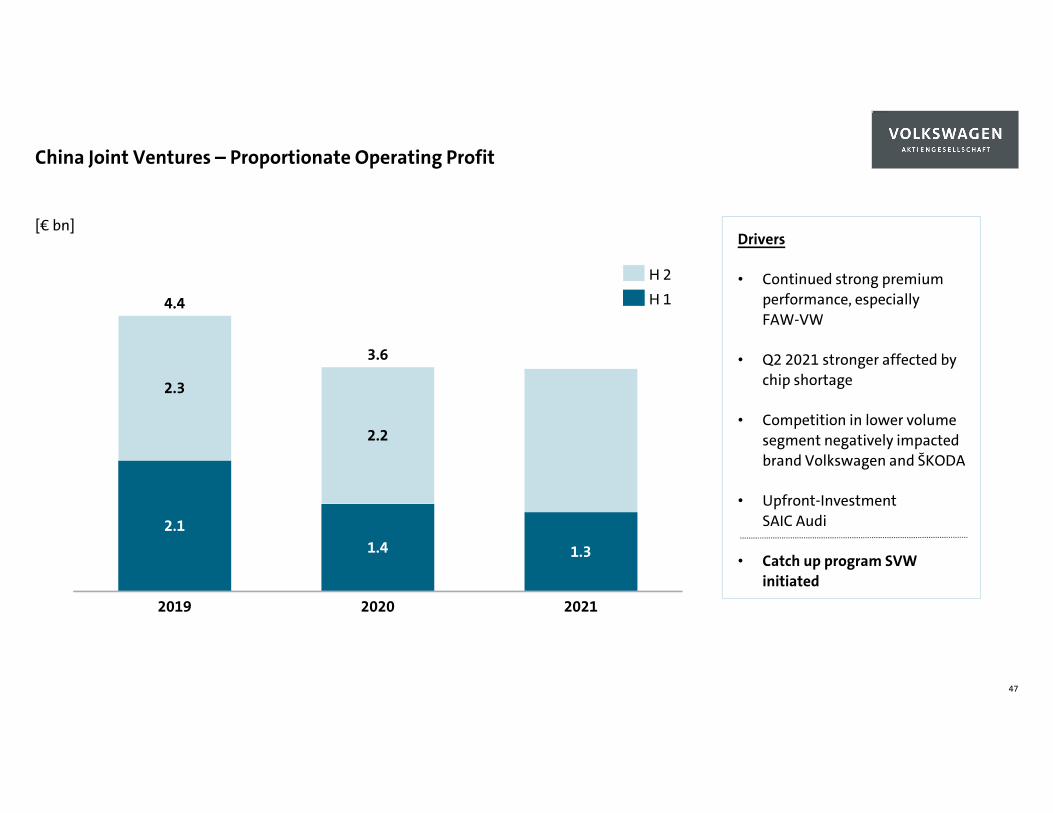
China Joint Ventures – Proportionate Operating Profit
47
2.2
1.3
2.3
2.1
2019
1.4
2020 2021
4.4
3.6
[€ bn]Drivers
• Continued strong premiumperformance, especiallyFAW-VW
• Q2 2021 stronger affected bychip shortage
• Competition in lower volumesegment negatively impactedbrand Volkswagen and ŠKODA
• Upfront-InvestmentSAIC Audi
• Catch up program SVWinitiated
H 2H 1
Das Bild kann nicht angezeigt werden.
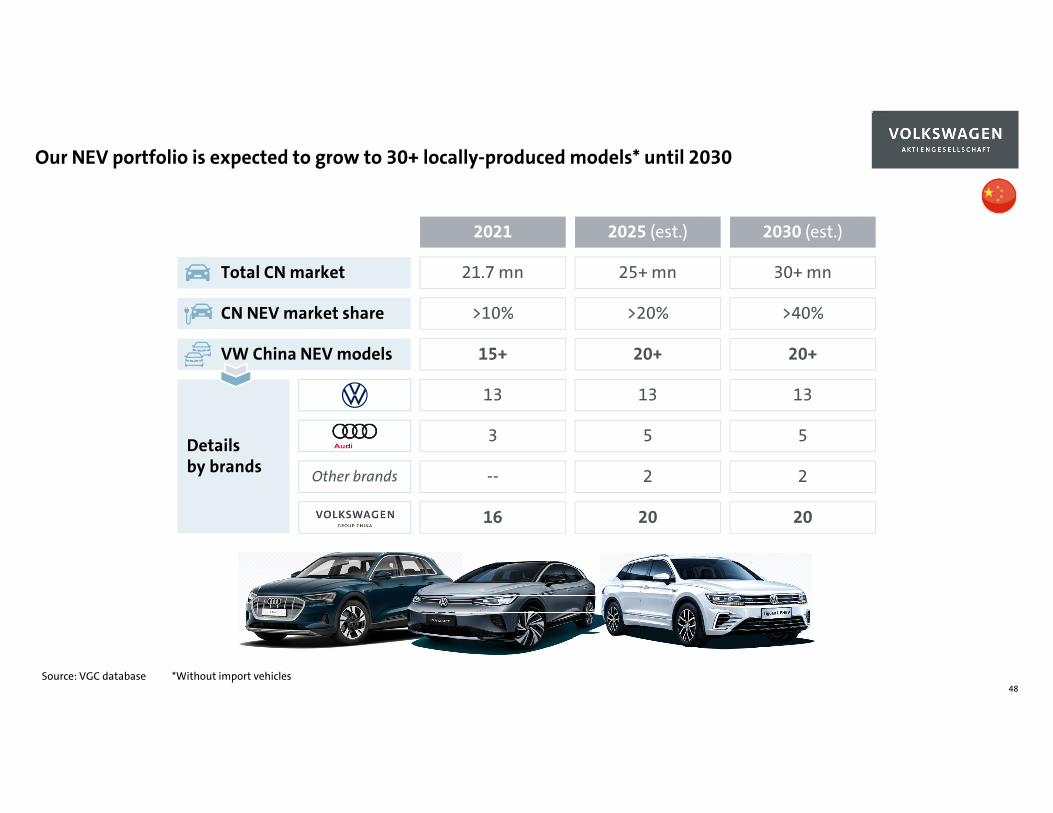
Our NEV portfolio is expected to grow to 30+ locally-produced models* until 2030
48Source: VGC database *Without import vehicles
Total CN market
CN NEV market share
VW China NEV models
Details by brands Other brands
2021
16
21.7 mn
>10%
15+
13
3
--
2030 (est.)
20
30+ mn
>40%
20+
13
5
2
2025 (est.)
20
25+ mn
>20%
20+
13
5
2
Das Bild kann nicht angezeigt werden.
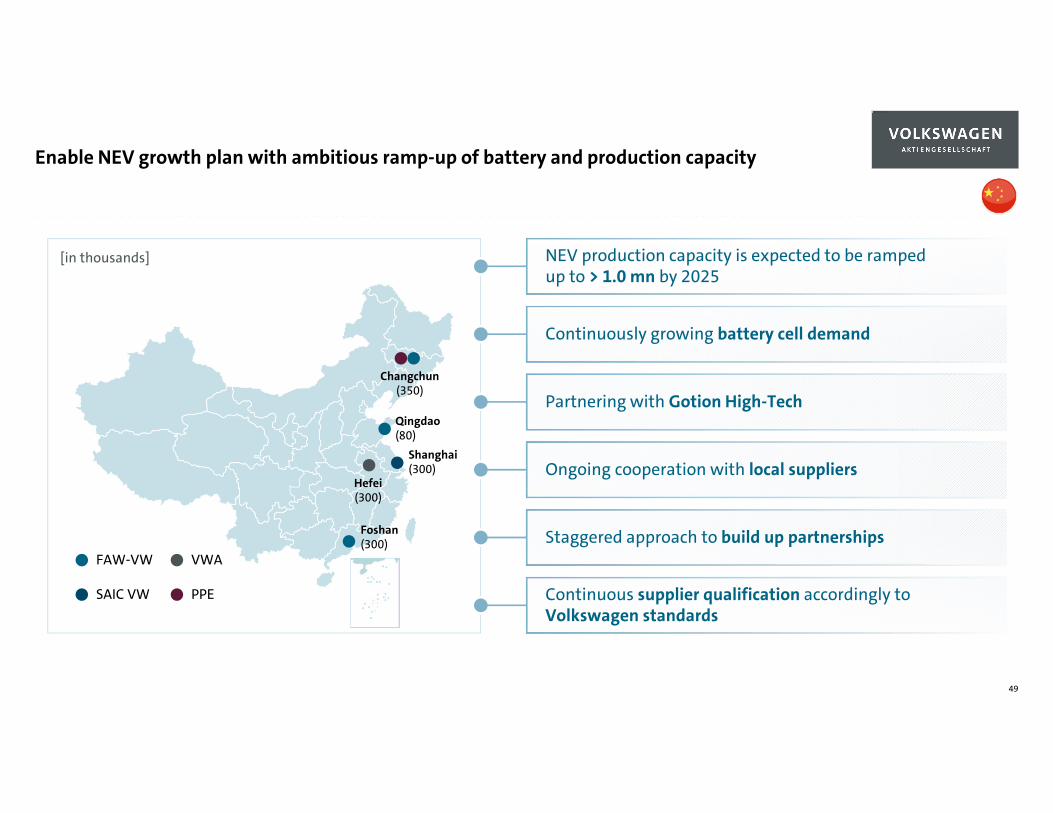
Enable NEV growth plan with ambitious ramp-up of battery and production capacity
49
Continuous supplier qualification accordingly to Volkswagen standards
NEV production capacity is expected to be ramped up to > 1.0 mn by 2025
Continuously growing battery cell demand
Partnering with Gotion High-Tech
Ongoing cooperation with local suppliers
Staggered approach to build up partnerships
[in thousands]
FAW-VW
SAIC VW
VWA
PPE
Changchun (350)
Hefei (300)
Shanghai (300)
Qingdao (80)
Foshan (300)

Leading the Transformation.
Integrity & Compliance
Das Bild kann nicht angezeigt werden.
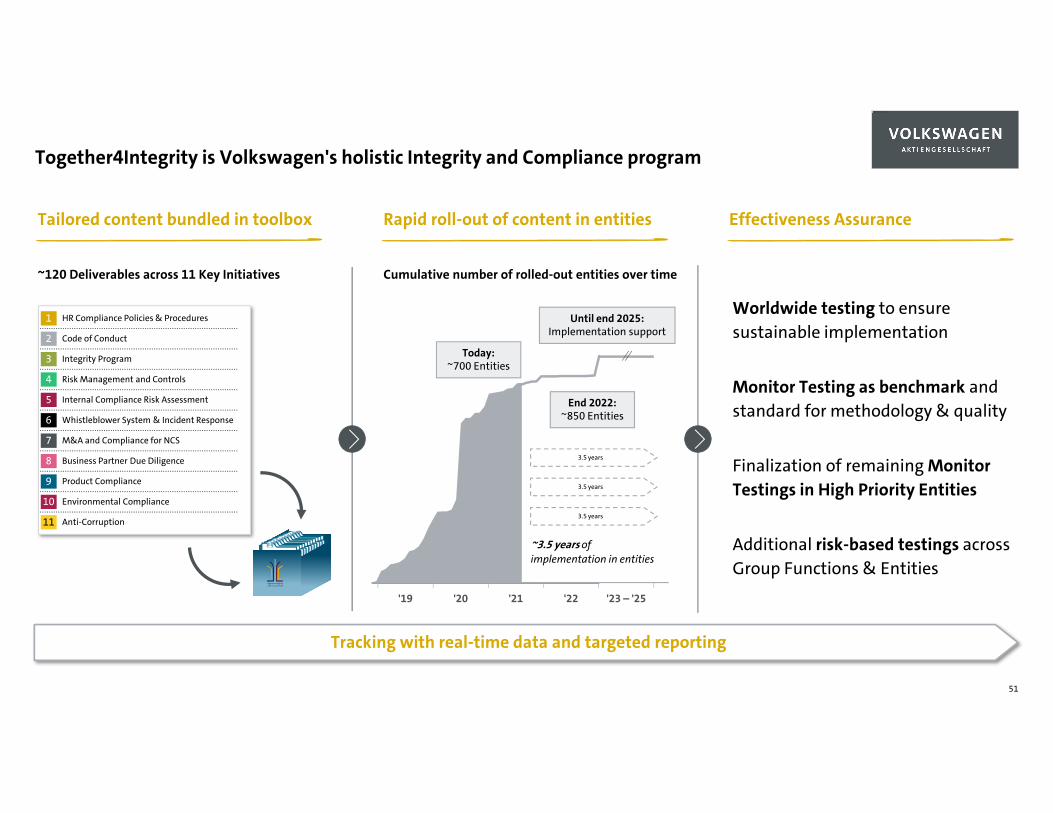
Together4Integrity is Volkswagen's holistic Integrity and Compliance program
51
Tailored content bundled in toolbox
Today:~700 Entities
'19 '22
End 2022:~850 Entities
'20 '21 '23 – '25
Until end 2025:Implementation support
Rapid roll-out of content in entities Effectiveness Assurance
Tracking with real-time data and targeted reporting
2 Code of Conduct
3 Integrity Program
4 Risk Management and Controls
5 Internal Compliance Risk Assessment
6 Whistleblower System & Incident Response
7 M&A and Compliance for NCS
8 Business Partner Due Diligence
9 Product Compliance
10 Environmental Compliance
11 Anti-Corruption
1 HR Compliance Policies & Procedures
10
10181114111
Worldwide testing to ensure sustainable implementation
Monitor Testing as benchmark and standard for methodology & quality
Finalization of remaining Monitor Testings in High Priority Entities
Additional risk-based testings across Group Functions & Entities
~120 Deliverables across 11 Key Initiatives Cumulative number of rolled-out entities over time
3.5 years
3.5 years
~3.5 years of implementation in entities
3.5 years

Appendix
53
Helen Beckermann (Wolfsburg Office) Head of Group Investor Relations E-Mail: [email protected] Telephone: +49 5361 9 49015
Monika Kowalski (Wolfsburg Office) Investor Relations ManagerEquityE-Mail: [email protected]: +49 5361 9 31106
Ulrich Hauswaldt (Wolfsburg Office) Investor Relations ManagerEquity, Debt & ESGE-Mail: [email protected]: +49 5361 9 42224
Andreas Buchta (Wolfsburg Office) Investor Relations ManagerEquity & Key Contact North AmericaE-Mail: [email protected]: + 49 5361 9 40765
Andreas Kowalczyk (Wolfsburg Office) Investor Relations ManagerEquityE-Mail: [email protected]: +49 5361 9 23183
Alexander Hunger (Wolfsburg Office) Investor Relations ManagerEquity & ESGE-Mail: [email protected] Telephone: +49 5361 9 47420
Investor Relations Team
The official website of Volkswagen Group Investor Relations. Company topics, brandchannels, innovation and informations.
We are pleased to answer your inquiries regarding Volkswagen shares and other capital market related questions.
Björn-Michael Piesch (Wolfsburg Office) Investor Relations ManagerEquity & Key Contact VW BrandE-Mail: [email protected]: +49 5361 9 196310
Lai Wang (Beijing Office) Investor Relations ManagerEquity & Key Contact China/Asia-PacificE-Mail: [email protected]: +86 151 0151 0625
Leading the Transformation.
Appendix
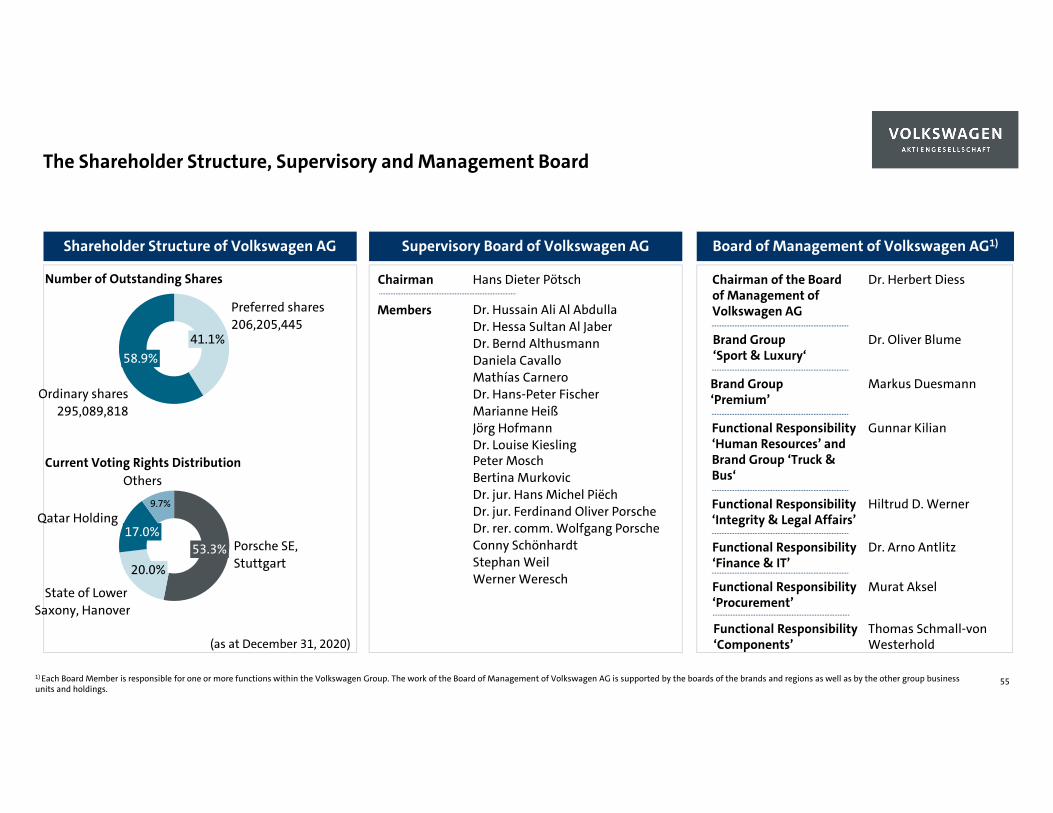
Shareholder Structure of Volkswagen AG Supervisory Board of Volkswagen AG Board of Management of Volkswagen AG1)
Dr. Hussain Ali Al AbdullaDr. Hessa Sultan Al JaberDr. Bernd AlthusmannDaniela CavalloMathías CarneroDr. Hans-Peter Fischer Marianne HeißJörg HofmannDr. Louise KieslingPeter MoschBertina MurkovicDr. jur. Hans Michel PiëchDr. jur. Ferdinand Oliver PorscheDr. rer. comm. Wolfgang PorscheConny SchönhardtStephan WeilWerner Weresch
Chairman of the Board of Management of Volkswagen AG
Brand Group ‘Sport & Luxury‘
Functional Responsibility ‘Human Resources’ and Brand Group ‘Truck & Bus‘
Brand Group ‘Premium’
Functional Responsibility ‘Integrity & Legal Affairs’
Functional Responsibility ‘Finance & IT’
Dr. Herbert Diess
Dr. Oliver Blume
Gunnar Kilian
Markus Duesmann
Hiltrud D. Werner
Dr. Arno Antlitz
(as at December 31, 2020)
41.1%
Preferred shares206,205,445
58.9%
Ordinary shares295,089,818
53.3% Porsche SE, Stuttgart20.0%
Qatar Holding17.0%
State of Lower Saxony, Hanover
Others
9.7%
Number of Outstanding Shares
Current Voting Rights Distribution
Hans Dieter PötschChairman
Members
55
The Shareholder Structure, Supervisory and Management Board
1) Each Board Member is responsible for one or more functions within the Volkswagen Group. The work of the Board of Management of Volkswagen AG is supported by the boards of the brands and regions as well as by the other group businessunits and holdings.
Functional Responsibility ‘Procurement’
Murat Aksel
Functional Responsibility ‘Components’
Thomas Schmall-von Westerhold
56
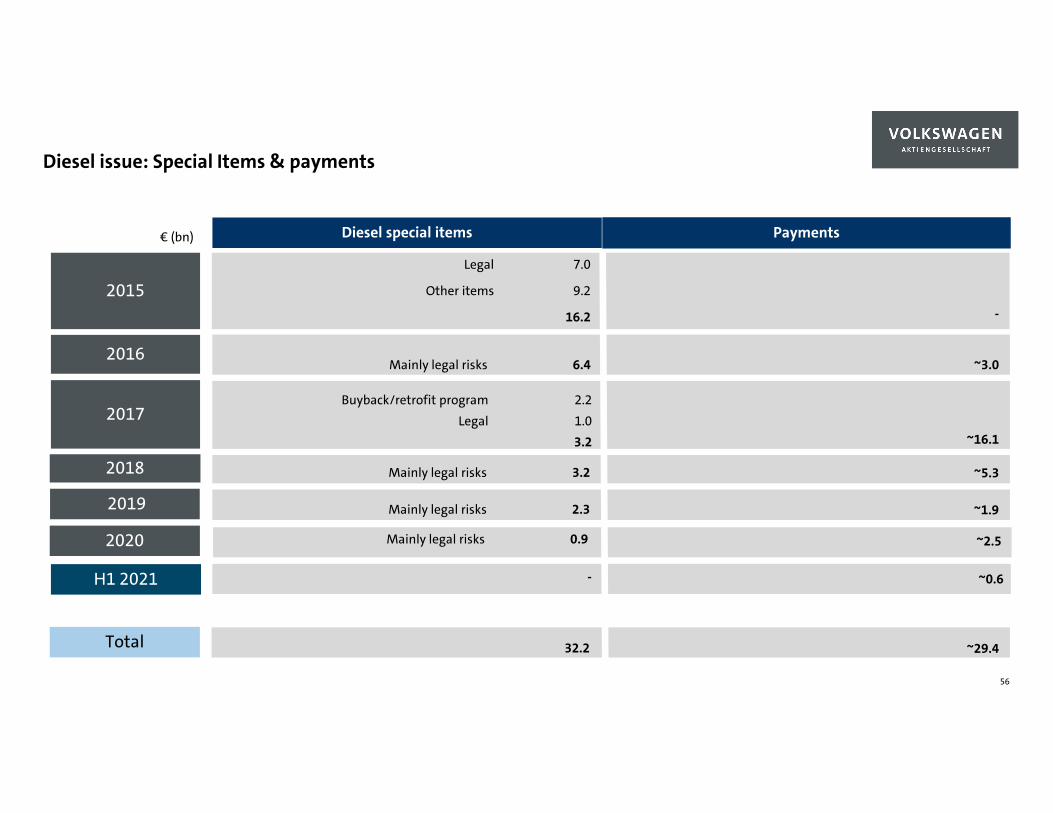
Buyback/retrofit program 2.2Legal 1.0
3.2
Legal 7.0
Other items 9.2
16.2
Mainly legal risks 6.4
Mainly legal risks 3.2 ~5.3
~16.1
~3.0
-
2017
2015
2016
2018
2019
Diesel special items Payments€ (bn)
H1 2021
32.2 ~29.4Total
~1.9
Diesel issue: Special Items & payments
Mainly legal risks 2.3
2020 Mainly legal risks 0.9
~3.0
~0.6
~2.5
-
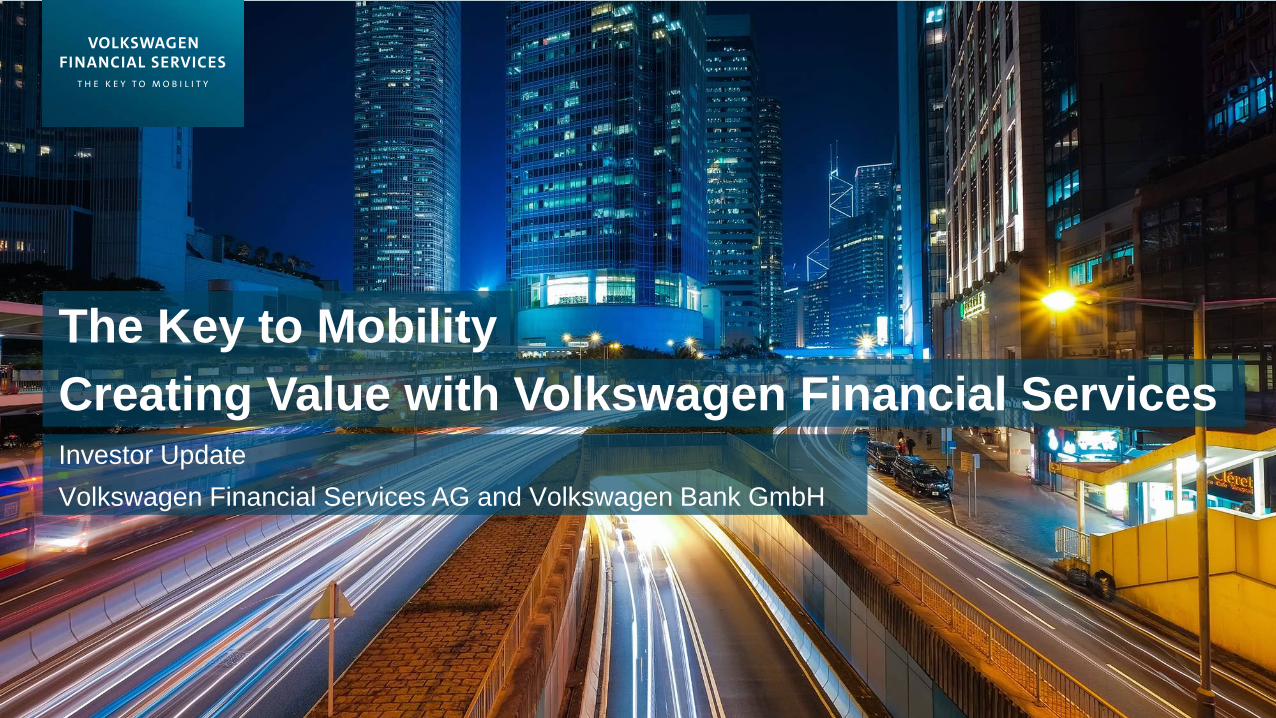
Creating Value with Volkswagen Financial ServicesThe Key to Mobility
Investor UpdateVolkswagen Financial Services AG and Volkswagen Bank GmbH
3
4
1
Agenda
Overview Volkswagen Financial Services
Risk Management
Funding
Strategy and Initiatives
58
2
OverviewVolkswagen Financial Services
60
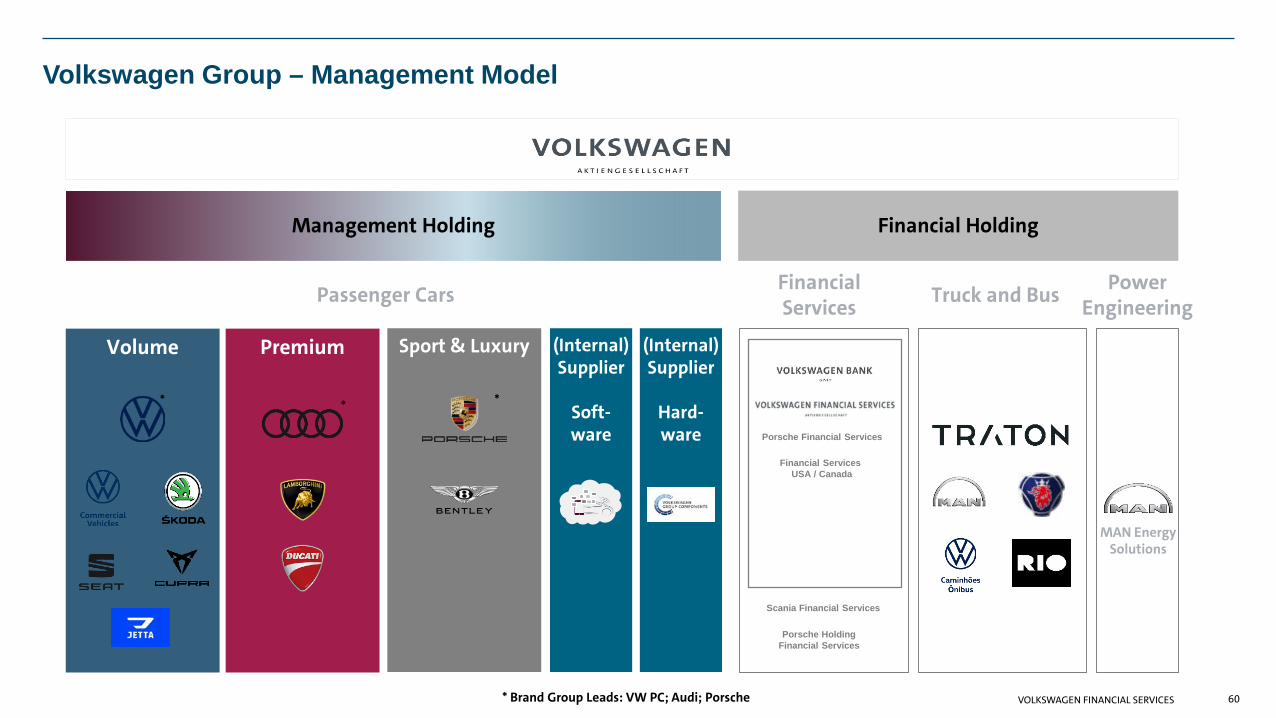
Volkswagen Group – Management Model
Passenger Cars
Management Holding Financial Holding
Truck and Bus
MAN EnergySolutions
Financial Services
* Brand Group Leads: VW PC; Audi; Porsche
Volume
*
Premium
*
Sport & Luxury
*
(Internal) Supplier
Hard-ware
(Internal) Supplier
Soft-ware
Power Engineering
Porsche Financial Services
Financial Services USA / Canada
Scania Financial Services
Porsche Holding Financial Services
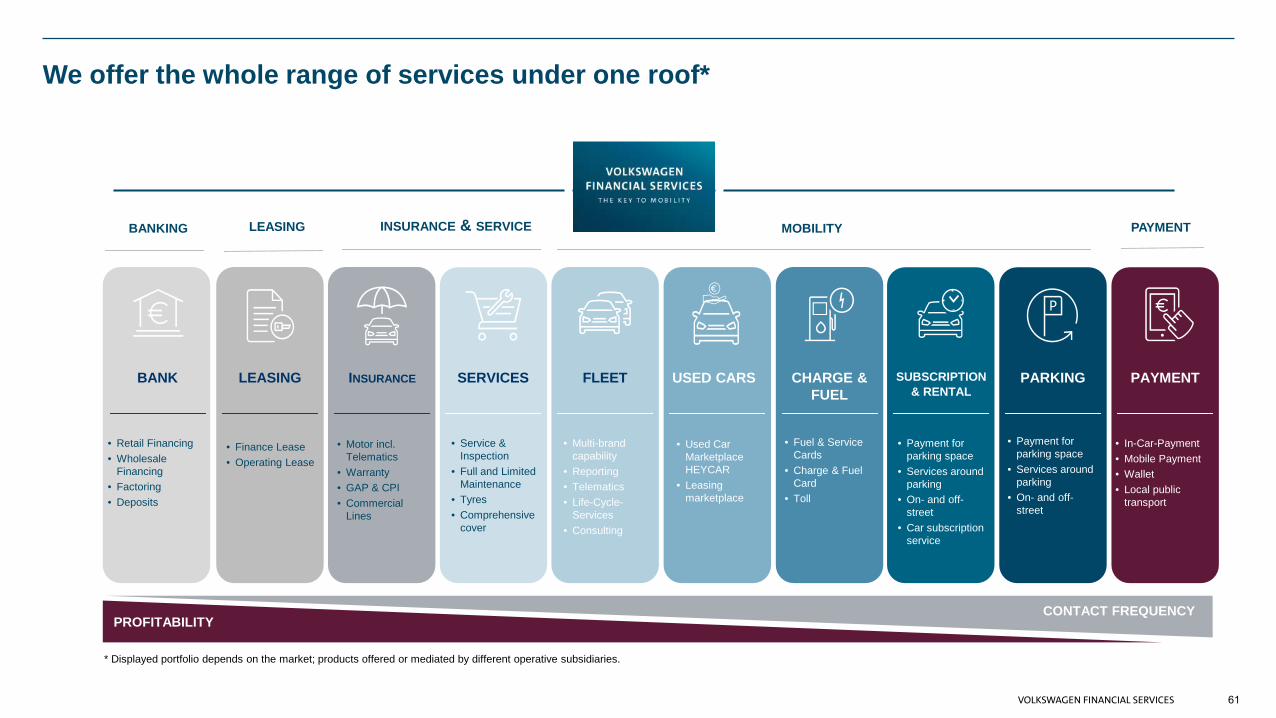
We offer the whole range of services under one roof*
* Displayed portfolio depends on the market; products offered or mediated by different operative subsidiaries.
MOBILITYBANKING LEASING INSURANCE & SERVICE PAYMENT
PROFITABILITYCONTACT FREQUENCY
61
BANK LEASING INSURANCE SERVICES FLEET CHARGE & FUEL
SUBSCRIPTION& RENTAL
PARKING PAYMENTUSED CARS
• Service &Inspection
• Full and LimitedMaintenance
• Tyres• Comprehensive
cover
• Motor incl.Telematics
• Warranty• GAP & CPI• Commercial
Lines
• Multi-brandcapability
• Reporting• Telematics• Life-Cycle-
Services• Consulting
• Payment forparking space
• Services aroundparking
• On- and off-street
• Car subscriptionservice
• Finance Lease• Operating Lease
• Retail Financing• Wholesale
Financing• Factoring• Deposits
• Fuel & ServiceCards
• Charge & FuelCard
• Toll
• In-Car-Payment• Mobile Payment• Wallet• Local public
transport
• Used CarMarketplaceHEYCAR
• Leasingmarketplace
• Payment forparking space
• Services aroundparking
• On- and off-street
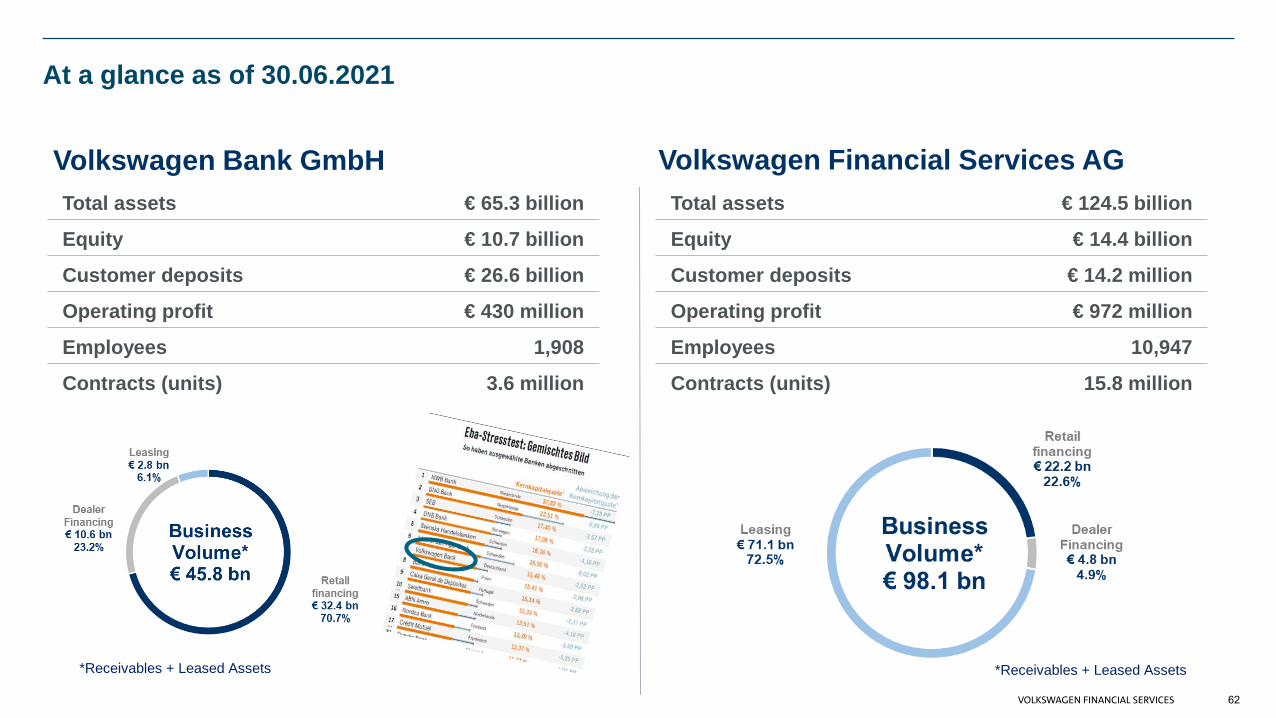
At a glance as of 30.06.2021
Total assets € 124.5 billion
Equity € 14.4 billion
Customer deposits € 14.2 million
Operating profit € 972 million
Employees 10,947
Contracts (units) 15.8 million
Total assets € 65.3 billion
Equity € 10.7 billion
Customer deposits € 26.6 billion
Operating profit € 430 million
Employees 1,908
Contracts (units) 3.6 million
Volkswagen Financial Services AGVolkswagen Bank GmbH
*Receivables + Leased Assets
62
*Receivables + Leased Assets
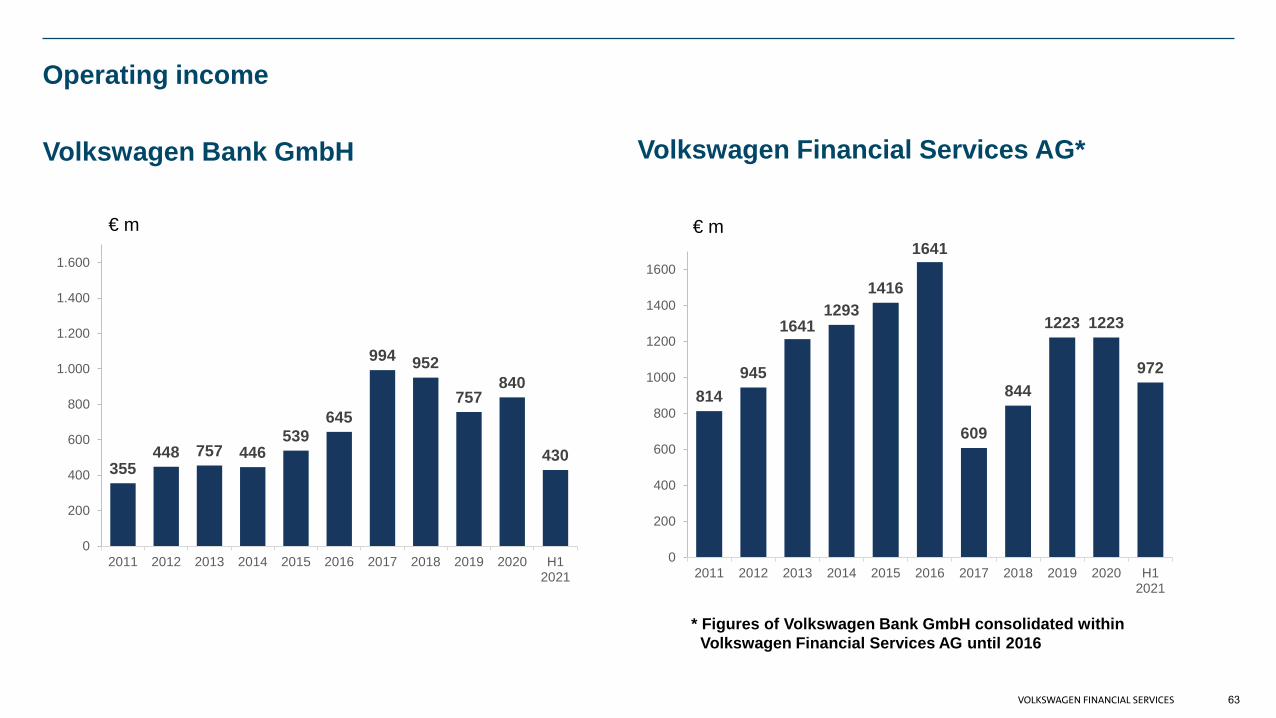
Operating income
€ m
Volkswagen Financial Services AG*Volkswagen Bank GmbH
€ m
* Figures of Volkswagen Bank GmbH consolidated withinVolkswagen Financial Services AG until 2016
814945
16411293
1416
1641
609
844
1223 1223
972
0
200
400
600
800
1000
1200
1400
1600
2011 2012 2013 2014 2015 2016 2017 2018 2019 2020 H12021
355448 757 446
539645
994 952
757840
430
0
200
400
600
800
1.000
1.200
1.400
1.600
2011 2012 2013 2014 2015 2016 2017 2018 2019 2020 H12021
63

Kapiteltrennfolie zweite ZeileRisk Management
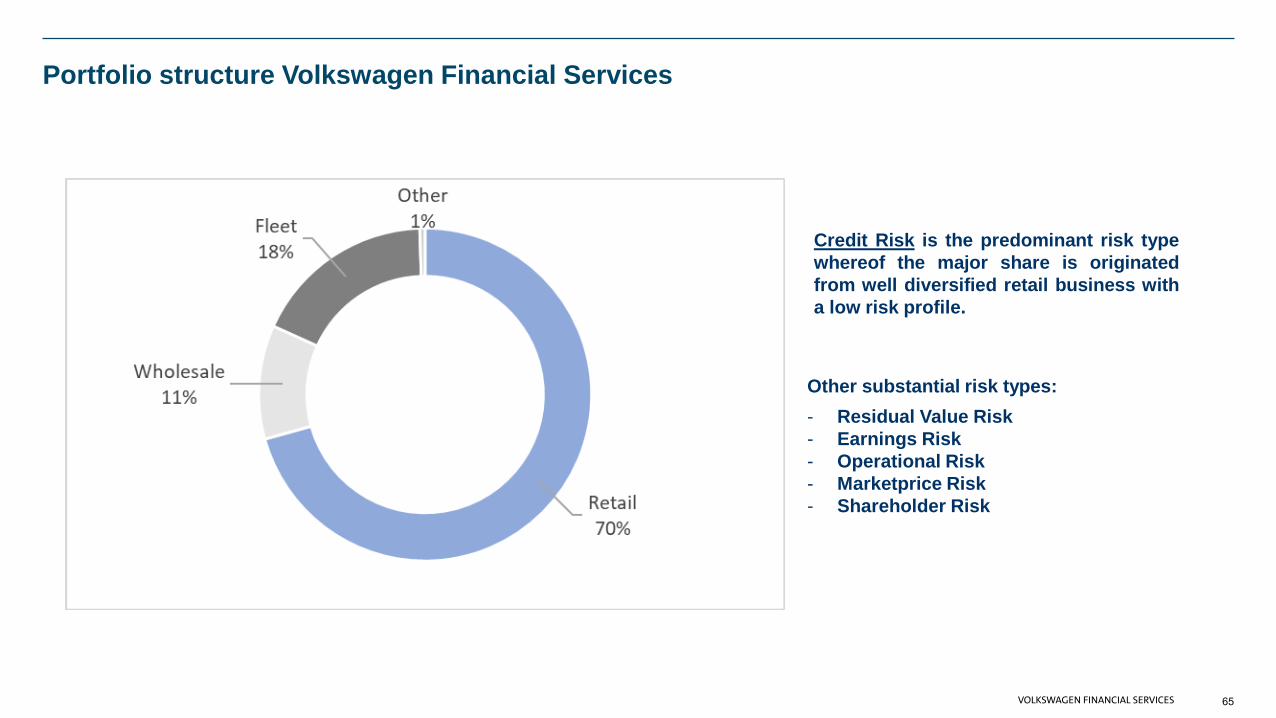
Portfolio structure Volkswagen Financial Services
65
Other substantial risk types:- Residual Value Risk- Earnings Risk- Operational Risk- Marketprice Risk- Shareholder Risk
Credit Risk is the predominant risk typewhereof the major share is originatedfrom well diversified retail business witha low risk profile.
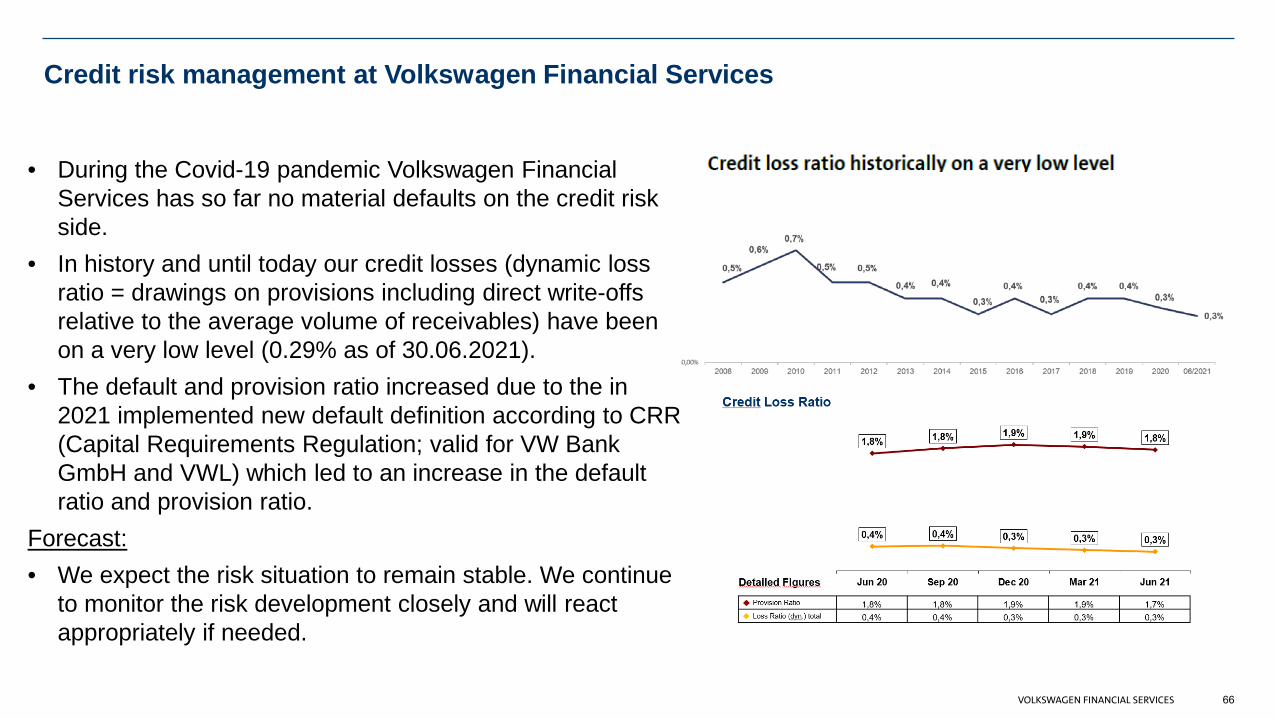
Credit risk management at Volkswagen Financial Services
• During the Covid-19 pandemic Volkswagen FinancialServices has so far no material defaults on the credit riskside.
• In history and until today our credit losses (dynamic lossratio = drawings on provisions including direct write-offsrelative to the average volume of receivables) have beenon a very low level (0.29% as of 30.06.2021).
• The default and provision ratio increased due to the in2021 implemented new default definition according to CRR(Capital Requirements Regulation; valid for VW BankGmbH and VWL) which led to an increase in the defaultratio and provision ratio.
Forecast: • We expect the risk situation to remain stable. We continue
to monitor the risk development closely and will reactappropriately if needed.
66
Residual value risk management at Volkswagen Financial Services
• The current positive trend in the development of used car prices is related to anincreased demand in the used car market, driven by the current shortage of newcar deliveries due to the chip shortage and the trend to a second vehicle byprivate customers. Due to these effects we assume this trend to be a short termeffect only.
• Priority of Volkswagen Financial Services is to support the sales of theVolkswagen group brands and to keep the residual values stable by offeringattractive financial service products e.g. the used car platform Heycar.
• We are monitoring the development of residual values very closely.
• Provisioning is done conservatively. All residual value risks completely coveredby risk provisions and equity.
67
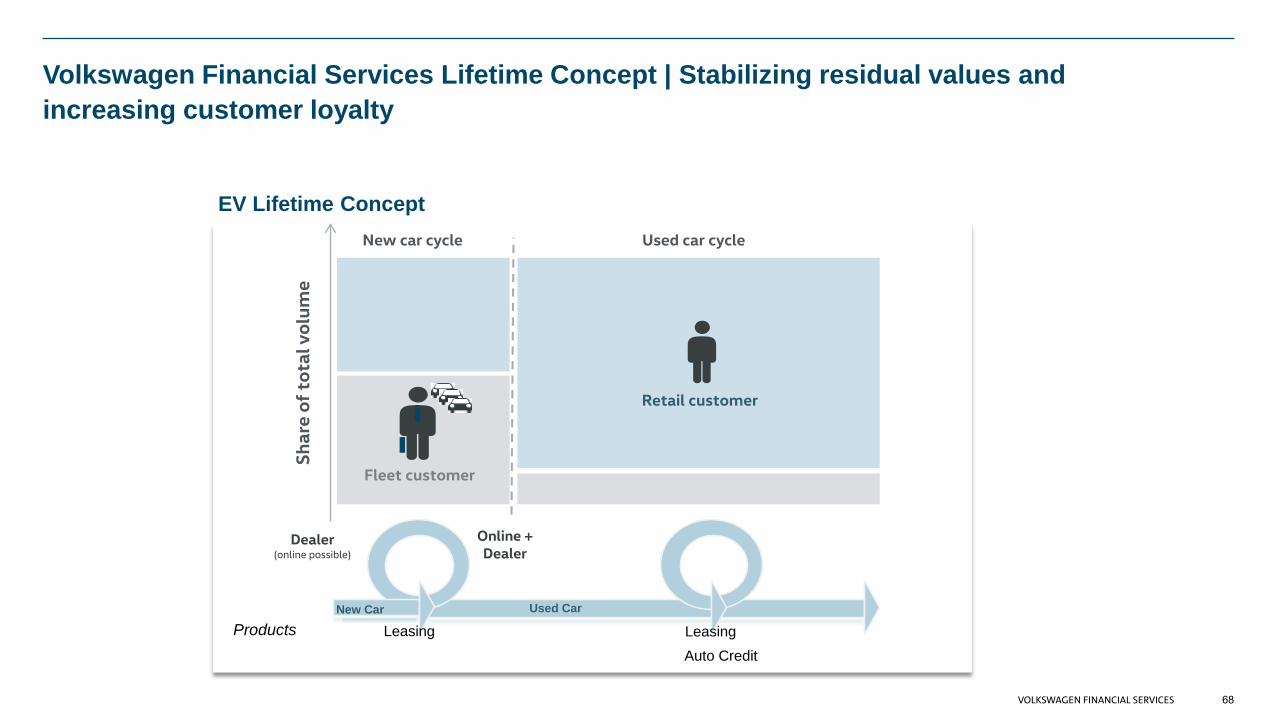
Volkswagen Financial Services Lifetime Concept | Stabilizing residual values and increasing customer loyalty
EV Lifetime ConceptNew car cycle Used car cycle
Shar
e of
tota
l vol
ume
Fleet customer
Dealer(online possible)
Online + Dealer
Used CarNew Car
Leasing Leasing Auto Credit
Products
Retail customer
68
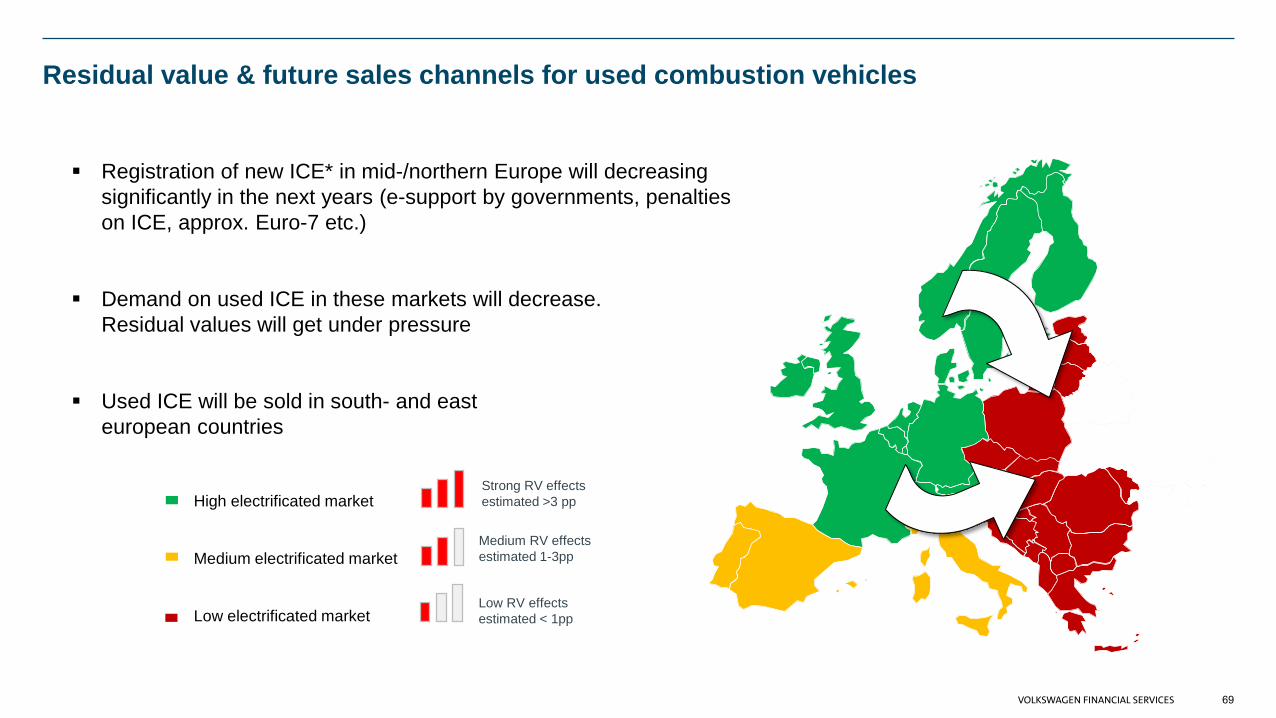
Residual value & future sales channels for used combustion vehicles
69
High electrificated market
Medium electrificated market
Low electrificated market
Strong RV effects estimated >3 pp
Medium RV effects estimated 1-3pp
Low RV effects estimated < 1pp
Registration of new ICE* in mid-/northern Europe will decreasingsignificantly in the next years (e-support by governments, penaltieson ICE, approx. Euro-7 etc.)
Demand on used ICE in these markets will decrease.Residual values will get under pressure
Used ICE will be sold in south- and easteuropean countries

Funding
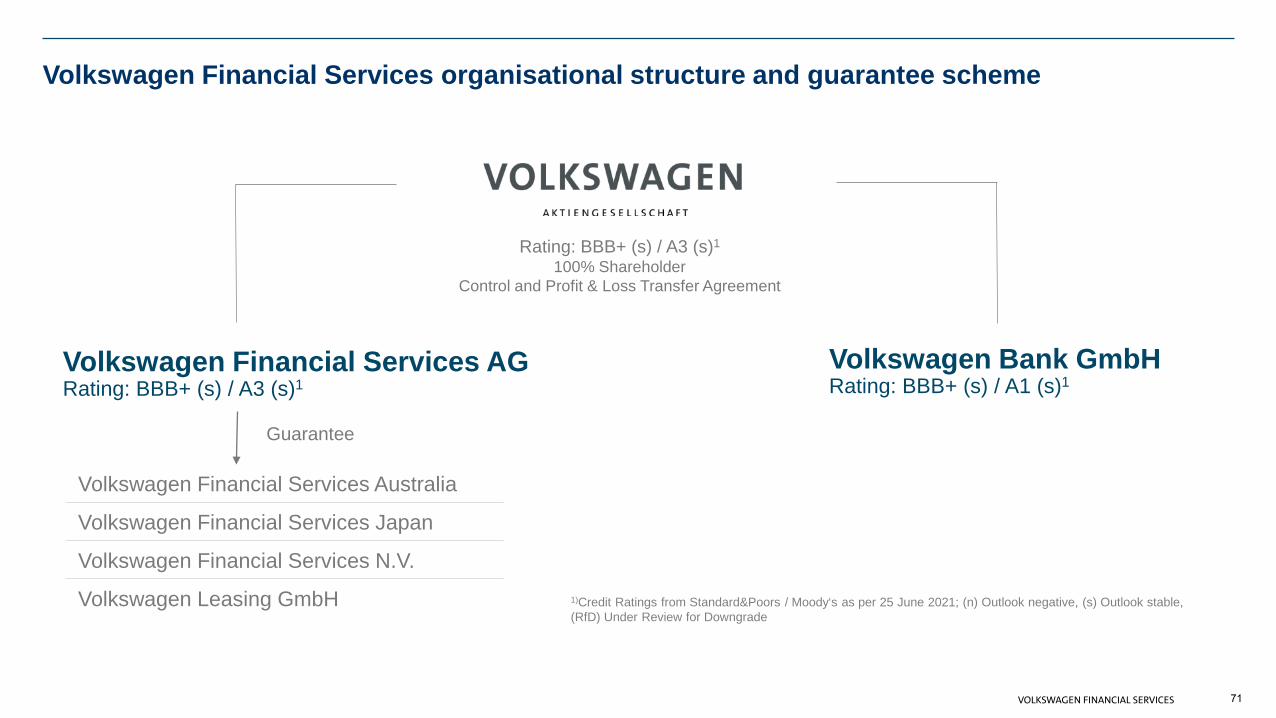
Volkswagen Financial Services organisational structure and guarantee scheme
Guarantee
1)Credit Ratings from Standard&Poors / Moody‘s as per 25 June 2021; (n) Outlook negative, (s) Outlook stable, (RfD) Under Review for Downgrade
Volkswagen Financial Services AGRating: BBB+ (s) / A3 (s)1
Volkswagen Bank GmbHRating: BBB+ (s) / A1 (s)1
Rating: BBB+ (s) / A3 (s)1
100% ShareholderControl and Profit & Loss Transfer Agreement
Volkswagen Financial Services Australia
Volkswagen Financial Services Japan
Volkswagen Financial Services N.V.
Volkswagen Leasing GmbH
71
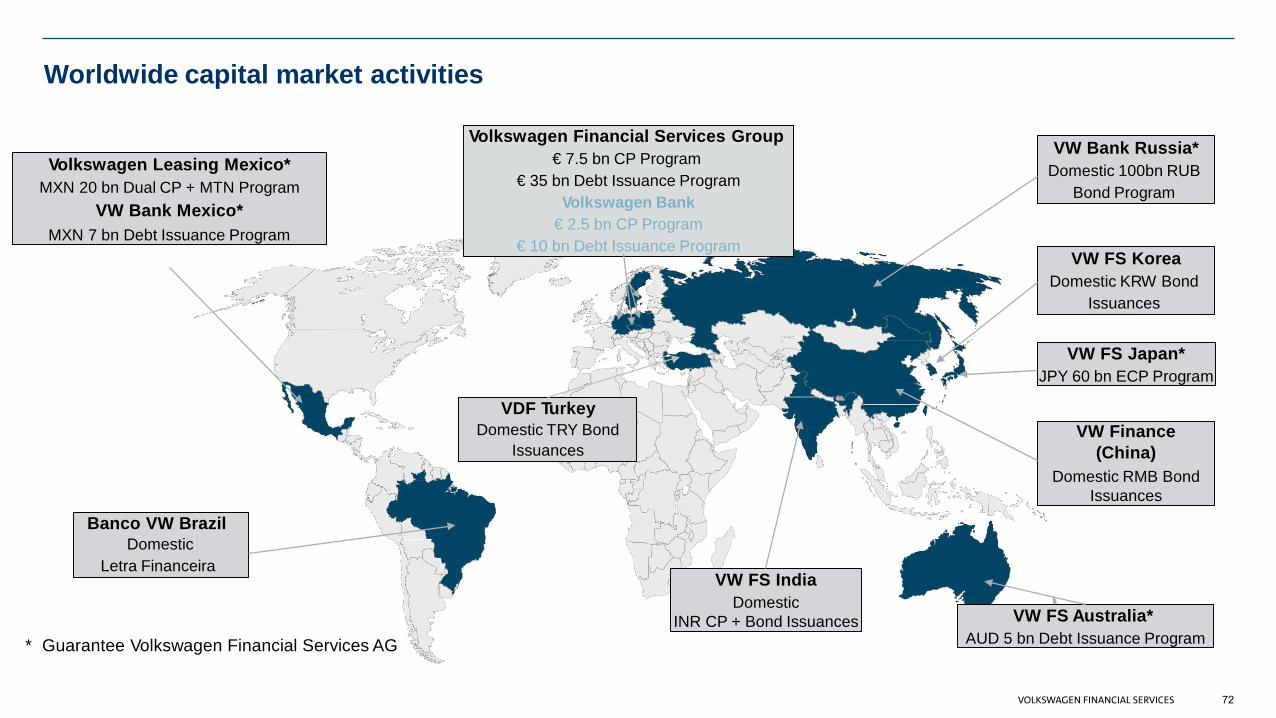
Worldwide capital market activities
VW FS Australia*AUD 5 bn Debt Issuance Program
Volkswagen Leasing Mexico*MXN 20 bn Dual CP + MTN Program
VW Bank Mexico*MXN 7 bn Debt Issuance Program
Banco VW BrazilDomestic
Letra FinanceiraVW FS India
DomesticINR CP + Bond Issuances
Volkswagen Financial Services Group€ 7.5 bn CP Program
€ 35 bn Debt Issuance ProgramVolkswagen Bank
€ 2.5 bn CP Program€ 10 bn Debt Issuance Program
VW Bank Russia*Domestic 100bn RUB
Bond Program
VW FS KoreaDomestic KRW Bond
Issuances
VW FS Japan*JPY 60 bn ECP Program
VW Finance(China)
Domestic RMB Bond Issuances
VDF TurkeyDomestic TRY Bond
Issuances
* Guarantee Volkswagen Financial Services AG
72
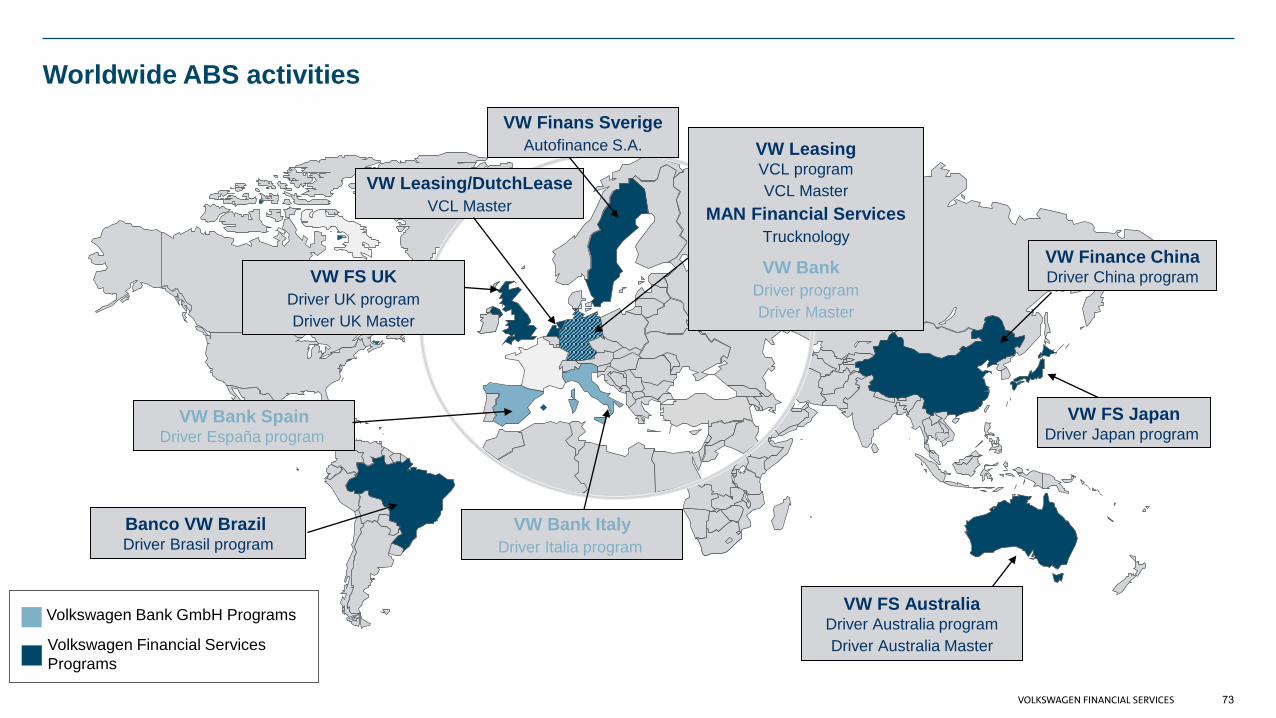
Worldwide ABS activities
VW Leasing/DutchLeaseVCL Master
VW Bank SpainDriver España program
Banco VW Brazil Driver Brasil program
VW FS AustraliaDriver Australia programDriver Australia Master
VW FS JapanDriver Japan program
VW Finance ChinaDriver China program
VW LeasingVCL programVCL Master
MAN Financial ServicesTrucknology
VW Bank Driver programDriver Master
VW FS UKDriver UK programDriver UK Master
VW Bank ItalyDriver Italia program
Volkswagen Bank GmbH Programs
Volkswagen Financial ServicesPrograms
VW Finans SverigeAutofinance S.A.
73
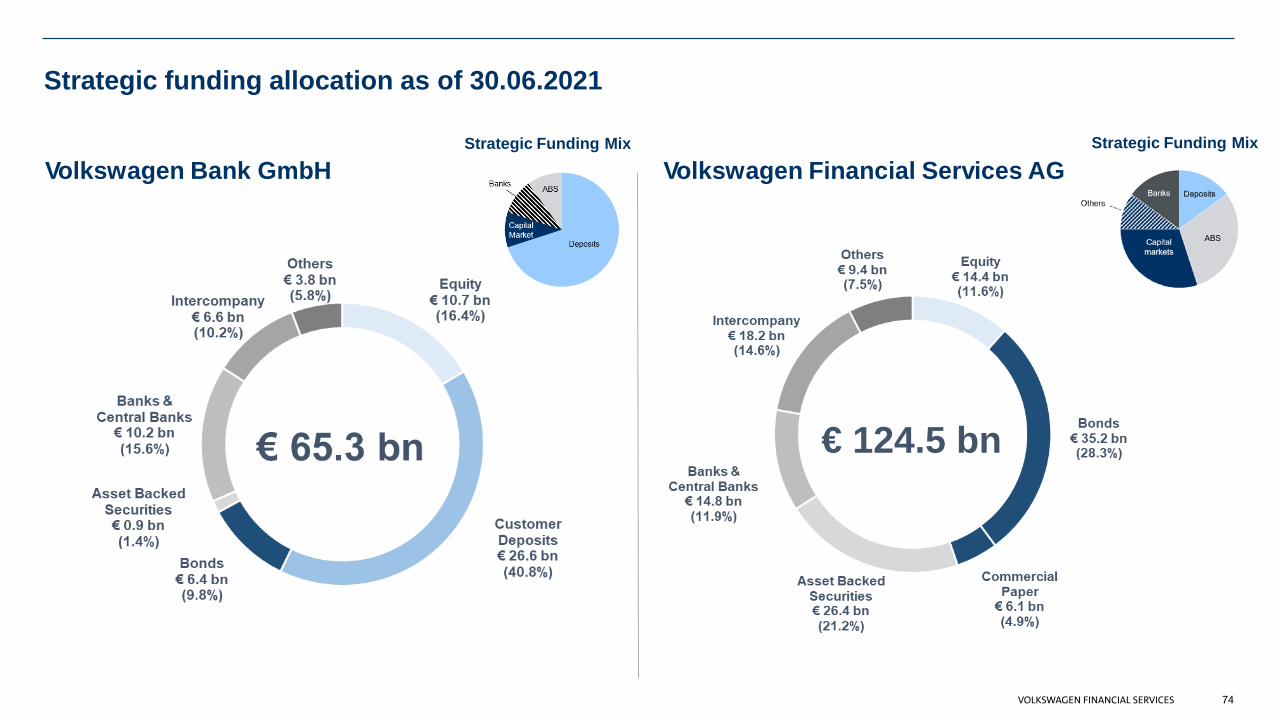
Strategic funding allocation as of 30.06.2021
Strategic Funding Mix
Volkswagen Bank GmbH Volkswagen Financial Services AGStrategic Funding Mix
74
€ 124.5 bn

Strategy and Initiatives
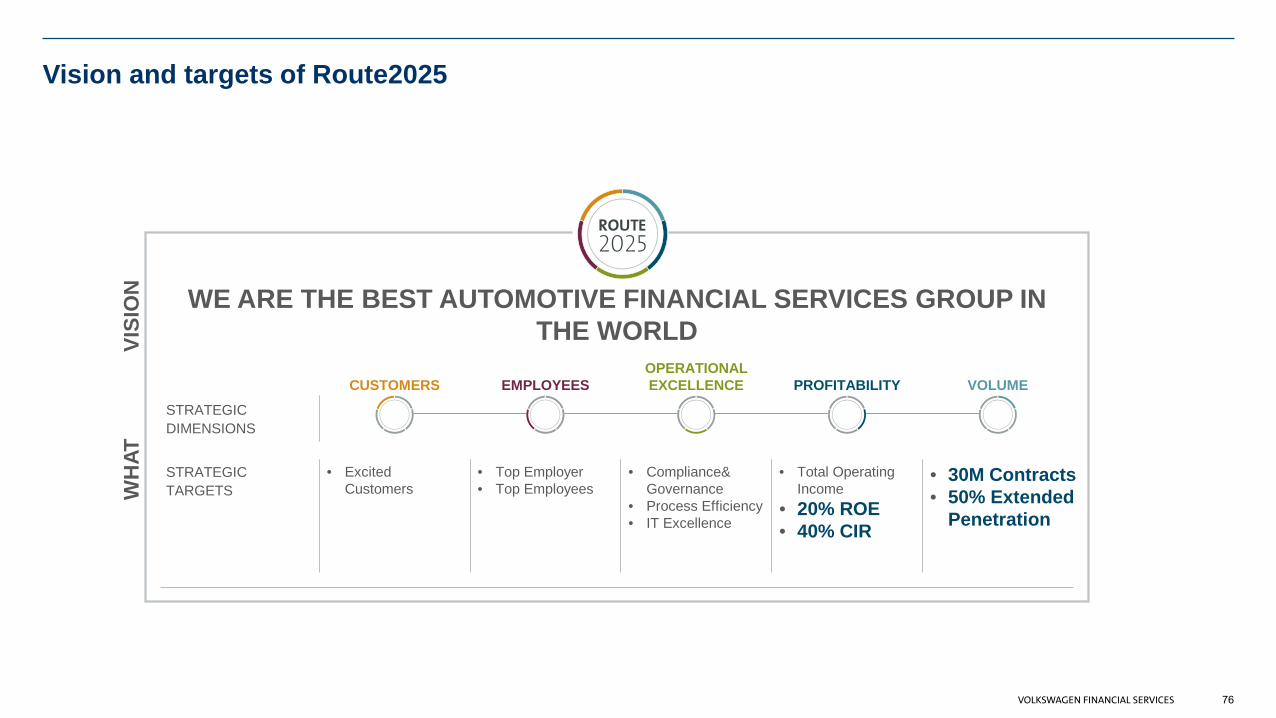
WE ARE THE BEST AUTOMOTIVE FINANCIAL SERVICES GROUP IN THE WORLD
CUSTOMERSOPERATIONALEXCELLENCE VOLUMEPROFITABILITYEMPLOYEES
STRATEGIC DIMENSIONS
STRATEGICTARGETS
• ExcitedCustomers
• Top Employer• Top Employees
• Compliance&Governance
• Process Efficiency• IT Excellence
• Total OperatingIncome
• 20% ROE• 40% CIR
• 30M Contracts• 50% Extended
Penetration
VISI
ON
WH
AT
Vision and targets of Route2025
76
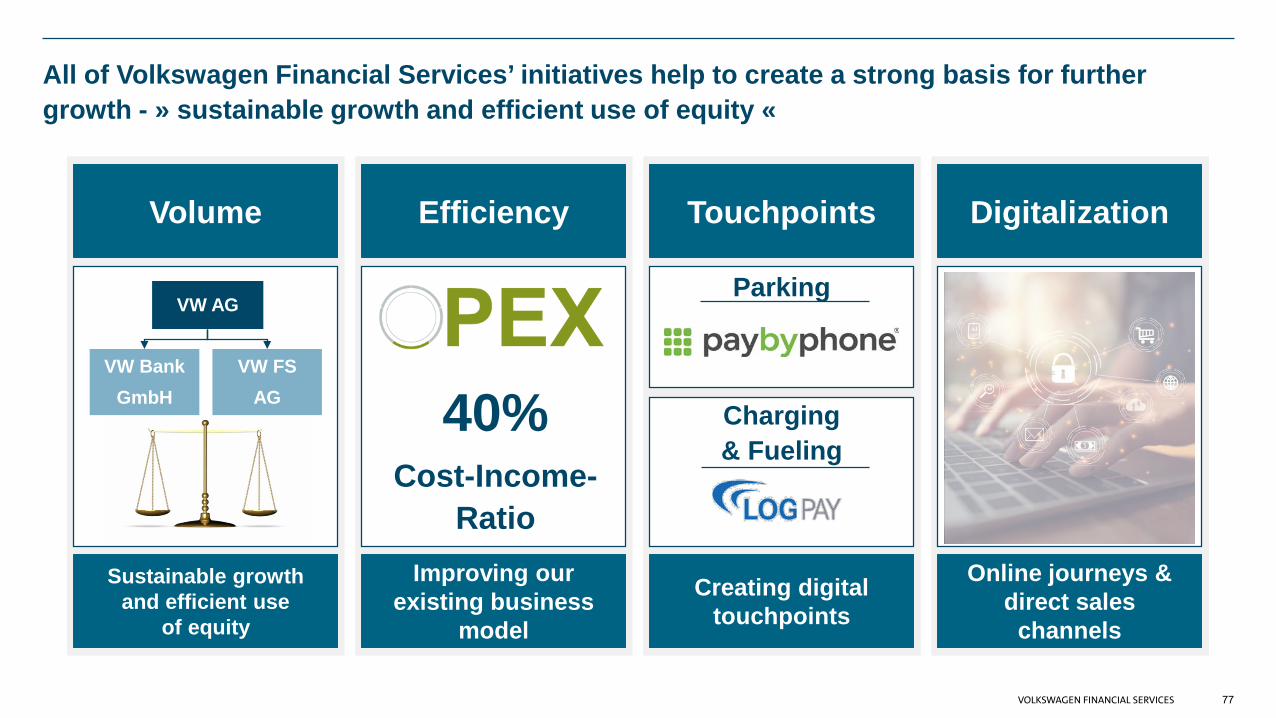
All of Volkswagen Financial Services’ initiatives help to create a strong basis for further growth - » sustainable growth and efficient use of equity «
Sustainable growth and efficient use
of equity
Volume Efficiency Touchpoints Digitalization
Improving our existing business
model
Creating digitaltouchpoints
Online journeys & direct sales
channels
Parking
Charging & Fueling
VW BankGmbH
VW FS AG
VW AG
77
40% Cost-Income-
Ratio
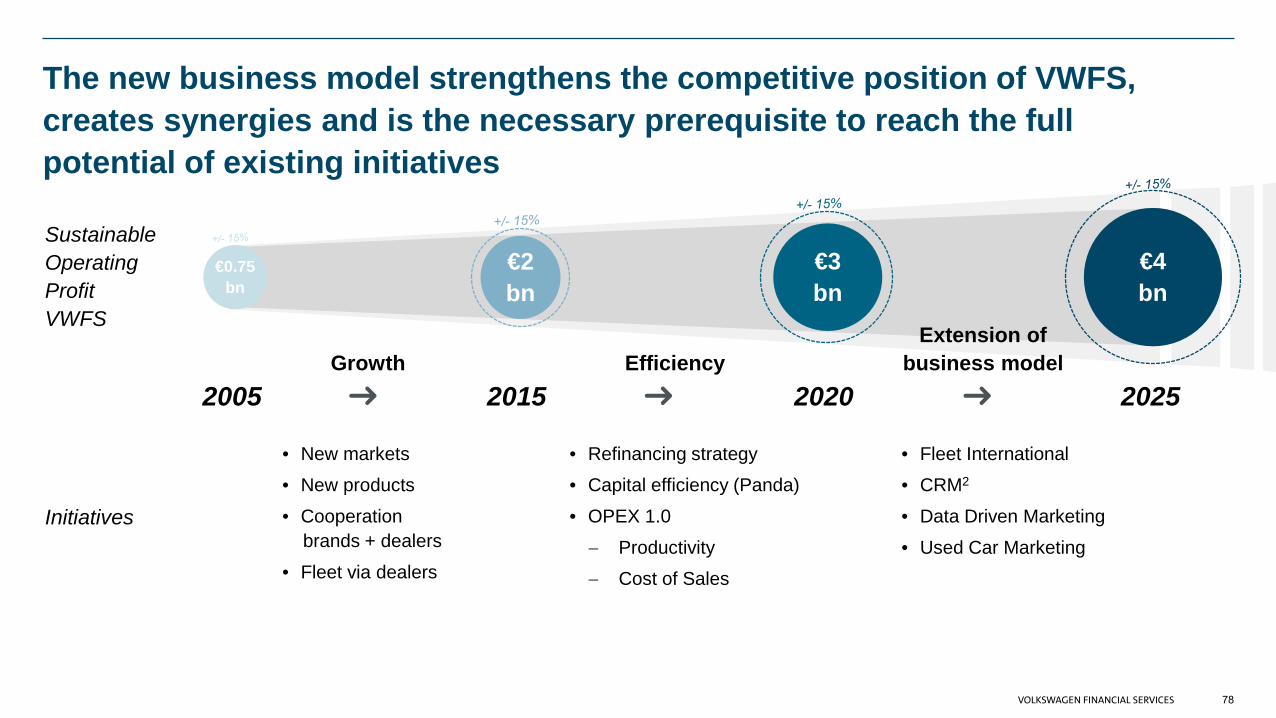
The new business model strengthens the competitive position of VWFS, creates synergies and is the necessary prerequisite to reach the fullpotential of existing initiatives
€0.75bn
€2bn
2005 2015 2020
• New markets• New products• Cooperation
brands + dealers• Fleet via dealers
• Refinancing strategy• Capital efficiency (Panda)• OPEX 1.0− Productivity− Cost of Sales
• Fleet International• CRM2
• Data Driven Marketing• Used Car Marketing
GrowthExtension of
business model
€3bn
Efficiency
Initiatives
SustainableOperating ProfitVWFS
78
2025
€4bn
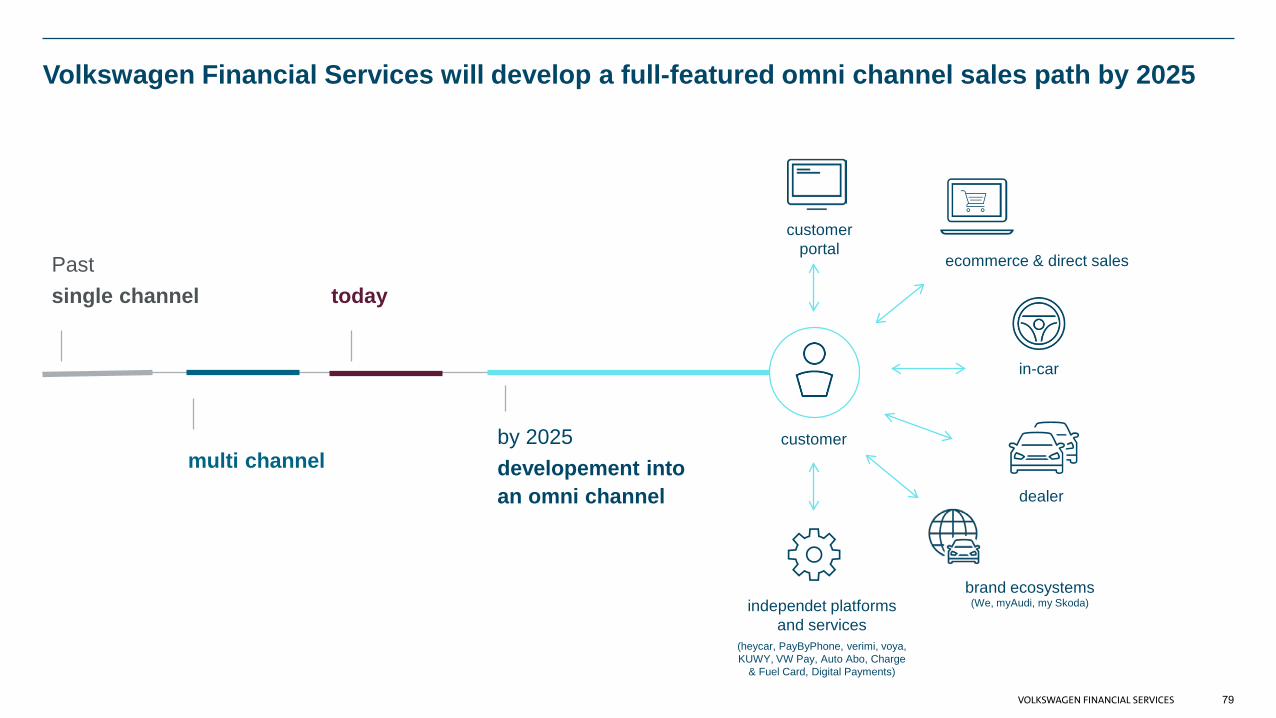
Volkswagen Financial Services will develop a full-featured omni channel sales path by 2025
Pastsingle channel
multi channelby 2025developement intoan omni channel
customer
customer portal
in-car
independet platformsand services
brand ecosystems
dealer
today
(heycar, PayByPhone, verimi, voya, KUWY, VW Pay, Auto Abo, Charge
& Fuel Card, Digital Payments)
ecommerce & direct sales
(We, myAudi, my Skoda)
79
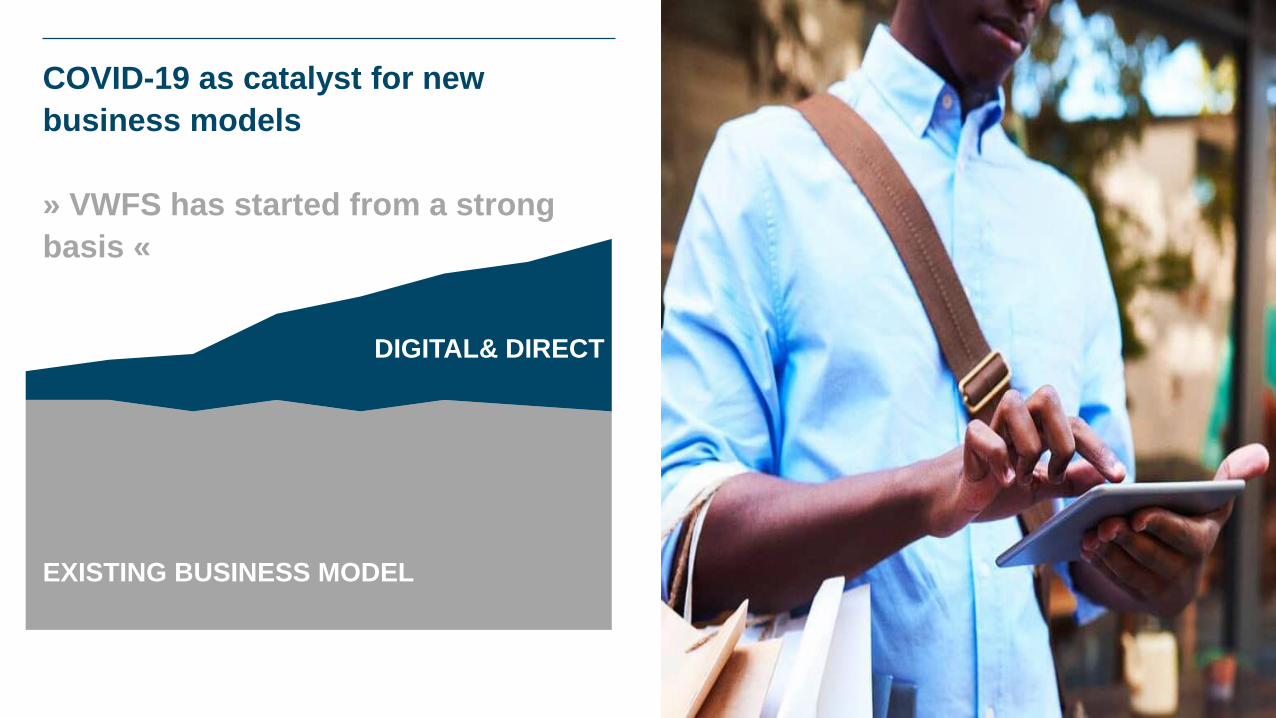
EXISTING BUSINESS MODEL
DIGITAL& DIRECT
COVID-19 as catalyst for new business models
» VWFS has started from a strong basis «
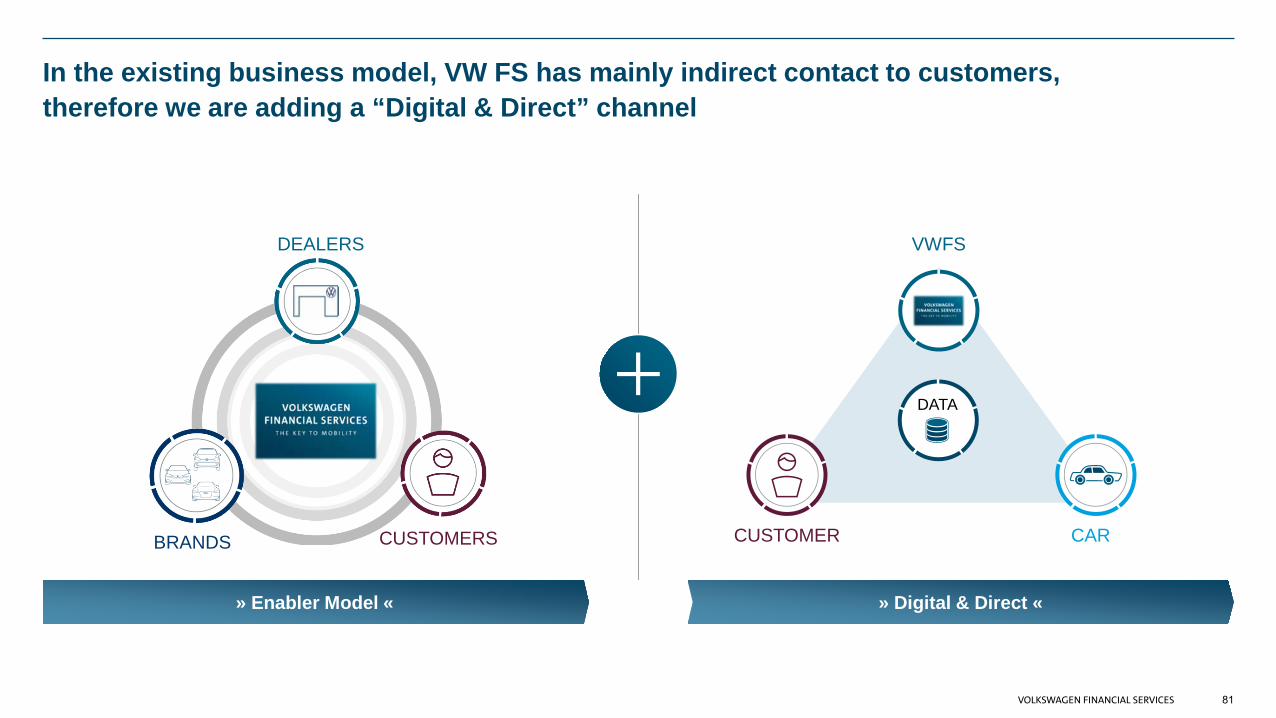
In the existing business model, VW FS has mainly indirect contact to customers,therefore we are adding a “Digital & Direct” channel
» Enabler Model « » Digital & Direct «
CUSTOMER CAR
DATA
VWFS
81
DEALERS
CUSTOMERSBRANDS
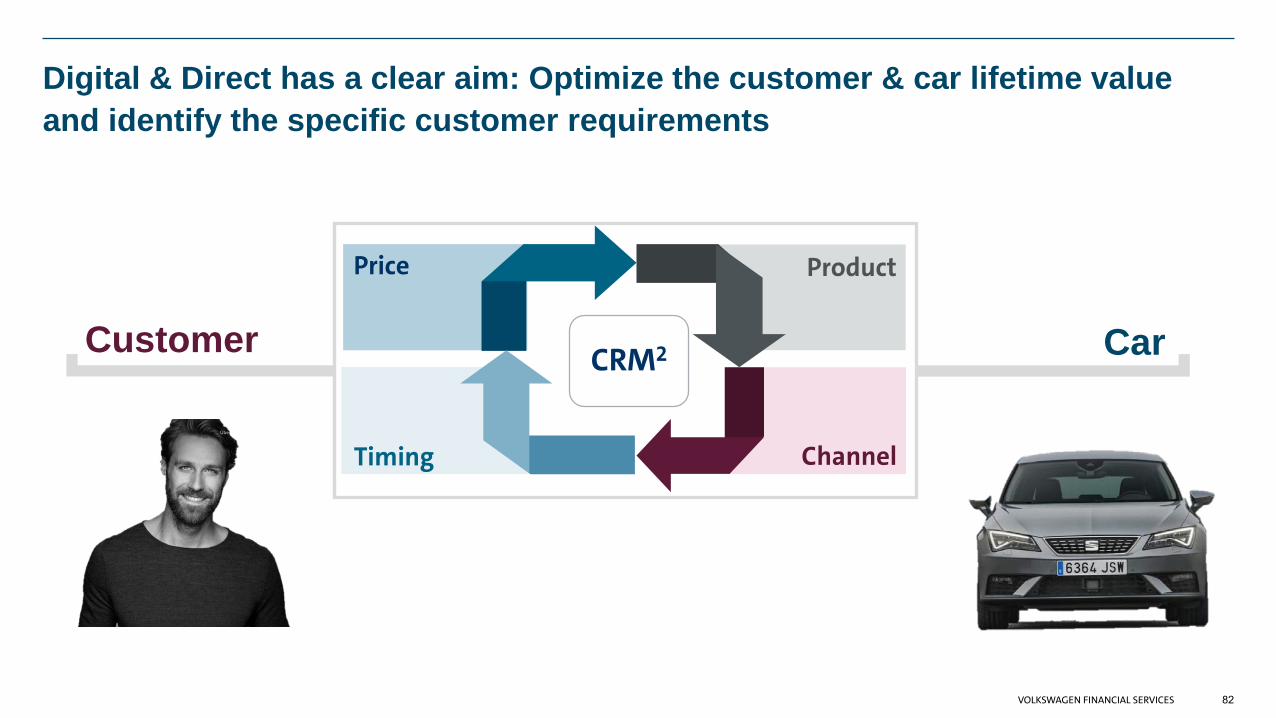
Digital & Direct has a clear aim: Optimize the customer & car lifetime value and identify the specific customer requirements
82
Customer Car
Price Product
Timing Channel
CRM2
Questions?
83
Vielen Dank!Volkswagen Bank GmbHTreasury - Investor Relations Gifhorner Str. 5738112 Braunschweig