Embed Size (px)
Citation preview
Walden UniversityScholarWorks
Walden Dissertations and Doctoral Studies Walden Dissertations and Doctoral StudiesCollection
2018
Leaders' Endorsement of Idiosyncratic WorkplaceFun, Organizational Playfulness Climate, AndOrganizational CreativityKrasimir KaramfilovWalden University
Follow this and additional works at: https://scholarworks.waldenu.edu/dissertations
Part of the Business Administration, Management, and Operations Commons, and theManagement Sciences and Quantitative Methods Commons
This Dissertation is brought to you for free and open access by the Walden Dissertations and Doctoral Studies Collection at ScholarWorks. It has beenaccepted for inclusion in Walden Dissertations and Doctoral Studies by an authorized administrator of ScholarWorks. For more information, pleasecontact [email protected].
Walden University
College of Management and Technology
This is to certify that the doctoral dissertation by
Krasimir Karamfilov
has been found to be complete and satisfactory in all respects, and that any and all revisions required by the review committee have been made.
Review Committee Dr. David Banner, Committee Chairperson, Management Faculty
Dr. Steven Tippins, Committee Member, Management Faculty Dr. Jean Gordon, University Reviewer, Management Faculty
Chief Academic Officer Eric Riedel, Ph.D.
Walden University 2018
Abstract
Leaders’ Endorsement of Idiosyncratic Workplace Fun, Organizational Playfulness
Climate, And Organizational Creativity
by
Krasimir Karamfilov
MFA, American Film Institute Conservatory, 2003
BA/MA, National Academy for Theater and Film Arts, Bulgaria, 1994
Dissertation Submitted in Partial Fulfillment
of the Requirements for the Degree of
Doctor of Philosophy
Ph.D. in Management
Walden University
November 2018
Abstract
Emotionally disconnected employees, about 70% in the U.S., do not experience positive
affect at work, are disengaged, and not creative. The purpose of this quantitative quasi-
experimental study was to investigate the effects of leaders’ endorsement of idiosyncratic
workplace fun (independent variable) and organizational playfulness climate
(independent variable) on organizational creativity (dependent variable). Complexity-
based theoretical perspectives on organizational creativity framed this quantitative study.
Data were collected via three survey instruments at two data points from 7 project teams,
divided into two experimental groups, at 6 companies in northwestern United States.
One group received an intervention for 1 month. Pearson’s correlation analysis showed
no significant relationships between leaders’ endorsement of idiosyncratic workplace fun
and organizational playfulness climate with organizational creativity. Repeated measures
analysis of variance revealed that the 2 experimental groups did not differ significantly in
terms of their creativity when team leaders endorsed idiosyncratic workplace fun and
when project teams worked in an organizational playfulness climate. Bivariate regression
analysis and multiple regression analysis showed that leaders’ endorsement of
idiosyncratic workplace fun and organizational playfulness climate did not predict
organizational creativity, neither individually nor collectively. Although the study’s
findings cannot be used to affect social change, the examination of the relationships
between leaders’ endorsement of idiosyncratic workplace fun, organizational playfulness
climate, and organizational creativity in the future might yield important insights about
the mechanisms facilitating the emergence of organizational creativity at companies.
Leaders’ Endorsement of Idiosyncratic Workplace Fun, Organizational Playfulness
Climate, And Organizational Creativity
by
Krasimir Karamfilov
MFA, American Film Institute Conservatory, 2003
BA/MA, National Academy for Theater and Film Arts, Bulgaria, 1994
Dissertation Submitted in Partial Fulfillment
of the Requirements for the Degree of
Doctor of Philosophy
Ph.D. in Management
Walden University
November 2018
Dedication
To my mom, Marinka Karamfilova (1950-2018).
To my daughter Zoe, the love of my life.
To my parents, Marinka and Petyu, who did not get a chance to go to college, but
gave me everything, so that I can get that chance.
To all playful, creative, and funny people in the world.
Acknowledgments
This dissertation could not have been completed without the support of a few key
people. I thank my dissertation chair, Dr. David Banner, who provided me with
invaluable insights and guidance during the dissertation process. I could not have had a
more spirited captain in the treacherous waters of dissertation writing and research.
I thank my methodological expert, Dr. Steven Tippins, and my University
Research Reviewer, Dr. Jean Gordon, for their feedback on the dissertation.
Cheers go out to my professors at Walden University, whose instruction paved the
way for the successful completion of my doctoral studies.
My peers in the doctoral program provided invaluable support and encouragement
during the writing of the dissertation, for which I thank them.
The doctoral journey has been extremely challenging, with many ups and downs
along the way. I thank my life partner, Michelle, and my daughter, Zoe, for believing in
my abilities even when I lost faith in myself.
The moral and material help I received from my parents played a crucial role in
the completion of the doctoral degree. Their constant support and encouragement
sustained me during the doctoral program. I thank them from the bottom of my heart.
i
Table of Contents
List of Tables .......................................................................................................................v
List of Figures .................................................................................................................... vi
Chapter 1: Introduction to the Study ....................................................................................1
Background of the Study ...............................................................................................3
Problem Statement .........................................................................................................6
Purpose of the Study ......................................................................................................7
Research Questions and Hypotheses .............................................................................8
Theoretical and Conceptual Framework ........................................................................9
Theoretical Foundation ........................................................................................... 9
Conceptual Framework ......................................................................................... 13
Nature of the Study ......................................................................................................15
Definitions....................................................................................................................17
Assumptions .................................................................................................................17
Scope and Delimitations ..............................................................................................19
Limitations ...................................................................................................................20
Significance of the Study .............................................................................................21
Significance to Theory .......................................................................................... 21
Significance to Practice......................................................................................... 22
Significance to Social Change .............................................................................. 22
Summary and Transition ..............................................................................................23
Chapter 2: Literature Review .............................................................................................25
ii
Literature Search Strategy............................................................................................26
Theoretical Foundation ................................................................................................27
Literature Review.........................................................................................................30
The Nature of Work .............................................................................................. 30
Workplace Fun ...................................................................................................... 33
Idiosyncratic Workplace Fun ................................................................................ 47
Organizational Playfulness Climate ...................................................................... 50
Organizational Climate ......................................................................................... 51
Organizational Play ............................................................................................... 63
Defining Organizational Playfulness Climate ...................................................... 72
Organizational Creativity ...................................................................................... 73
Summary and Conclusions ..........................................................................................87
Chapter 3: Research Method ..............................................................................................90
Research Design and Rationale ...................................................................................90
Methodology ................................................................................................................92
Population ............................................................................................................. 92
Sampling and Sampling Procedures ..................................................................... 92
Procedures for Recruitment, Participation, and Data Collection (Primary
Data) .......................................................................................................... 96
Intervention ........................................................................................................... 99
Instrumentation of Constructs ............................................................................. 100
Operationalization of Variables .......................................................................... 106
iii
Data Analysis Plan .....................................................................................................107
Data Screening and Cleaning .............................................................................. 107
Descriptive Analysis ........................................................................................... 108
Group Equivalence Analysis............................................................................... 108
Research Questions and Hypotheses .................................................................. 108
Analysis Plans for Hypotheses............................................................................ 109
Threats to Validity .....................................................................................................110
External Validity ................................................................................................. 110
Internal Validity .................................................................................................. 111
Construct Validity ............................................................................................... 112
Ethical Procedures .............................................................................................. 113
Summary ....................................................................................................................115
Chapter 4: Results ............................................................................................................117
Data Collection ..........................................................................................................117
Intervention Fidelity...................................................................................................119
Study Results .............................................................................................................119
Summary ....................................................................................................................136
Chapter 5: Discussion, Conclusions, and Recommendations ..........................................138
Interpretation of Findings ..........................................................................................138
Limitations of the Study.............................................................................................144
Recommendations ......................................................................................................146
Implications................................................................................................................149
iv
Conclusions ................................................................................................................152
References ........................................................................................................................154
Appendix A: Leaders’ Endorsement of Idiosyncratic Workplace Fun Scale ..................188
Appendix B: Organizational Playfulness Climate Questionnaire ....................................189
Appendix C: Team Creativity Scale ................................................................................192
v
List of Tables
Table 1. Summary of Exploratory Factor Analysis for the Leaders’ Endorsement of
Idiosyncratic Workplace Fun Scale ........................................................................ 120
Table 2. Interrater agreement and interclass correlations ............................................... 121
Table 3. Descriptive Statistics......................................................................................... 123
Table 4. Linear Regression Coefficients for Group A (LEIWF) .................................... 129
Table 5. Linear Regression Coefficients for Group B (LEIWF) .................................... 130
Table 6. Linear Regression Coefficients for Group A (OPC) ........................................ 131
Table 7. Linear Regression Coefficients for Group B (OPC) ......................................... 131
Table 8. Model Summary ............................................................................................... 133
Table 9. ANOVA ............................................................................................................ 133
Table 10. Multiple Regression Coefficients ................................................................... 135
Table 11. Moderation Coefficients ................................................................................. 136
vi
List of Figures
Figure 1. Research model ....................................................................................................9
Figure 2. Contingency theory and its derivatives ..............................................................14
Figure 3. Organizational creativity components ................................................................74
Figure 4. Nonequivalent control-group design ..................................................................91
1Chapter 1: Introduction to the Study
On August 26, 2012, a group of lifeguards at the El Monte Aquatic Center in El
Monte, California, posted a video of themselves dancing to “Gangnam Style,” a hit song
by South Korean pop star PSY, on YouTube. Ten days later, the lifeguards were fired for
filming the video during their lunch breaks (NBCUniversal, 2014). After 15,654
supporters signed a petition on Change.org to rehire the lifeguards, all fired lifeguards
were reinstated (Change.org, 2014).
The lifeguards in this story were fired for being creative and having fun on the
job. Their actions violated a policy that stated that no employee could use the pools for
private use (NBCUniversal, 2014). The work policies at the El Monte Aquatic Center
reflected the perspective that work could not involve fun, play, or creativity.
Incidents like this one occur because work is considered a good thing in
contemporary societies, while fun and play are considered bad (Comm, 2018). In
organizational settings, having fun at work is often seen as ineffective and unproductive
behavior (Plester & Hutchison, 2016). Such a view is the result of the incongruence
between employees’ needs and organizational needs (Argyris, 1974). Whereas most
employees seek meaning and self-actualization at work (Maslow, 2000), most
corporations seek profits, growth, and increased market share (Korten, 2015).
Meaning and self-actualization emerge when employees do work that develops
their human potential (Robinson & Aronica, 2009). The three activities that develop
human potential the most are having fun, playing, and being creative (Bateson, 2014;
Henricks, 2014; Sicart, 2014). None of these three activities played a role in the history
2of management over the last 100 years (Witzel, 2016). Although this omission
is somewhat remedied today at companies in the technology sector (Bock, 2015),
workplace fun, organizational play, and creativity are not evident at every organization.
This is a problem, as humanity faces societal and environmental problems that demand
creative solutions beyond our current human capabilities (West, 2018).
Despite the absence of workplace fun, organizational play, and creativity from the
management cannon, several early management theorists noted their importance at work.
DeMan (1929) claimed that human beings possessed a natural inclination to seek joy in
work, while Follett (1924) wrote that having a creative experience through the integration
of two or more interests is “seminal for our future thinking” (p. 4). To arrive at joy and
creativity, however, employees must experience enjoyment, fulfillment, and job
satisfaction, all states based on the satisfaction of needs (Maslow, 2000). The needs to
have fun, play, and be creative are as fundamental to people as basic needs for food and
shelter and emotional needs for love and affection (Bateson, 2014).
In this dissertation, I developed a quantitative study in order to investigate the
effects of leaders’ endorsement of idiosyncratic workplace fun (LEIWF) and
organizational playfulness climate (OPC) on organizational creativity. The study
findings revealed the extent to which idiosyncratic workplace fun and organizational play
impacted organizational creativity and showed whether their influence was as significant
as some researchers and practitioners (Sicart, 2014; Tews, Michel, Xu, & Drost, 2015)
claimed it to be.
3The chapter begins with a summary of the extant research related to each
examined variable, followed by a description of the knowledge gap in the literature on
organizational creativity that the study addressed. Next, I present the research problem
and the purpose of the study. I posit three research questions and advance six
hypotheses. I build the theoretical foundation of the study on the integration of the
systems theory of creativity (Csikszentmihalyi, 1996), complexity-based theory of
organizational creativity (Stacey, 1996), and organizational creativity theory (Woodman,
Sawyer, & Griffin, 1996) within the conceptual framework of the general contingency
theory of management (Luthans & Stewart, 1977). I also explain the nature of the study
and state key definitions; discuss assumptions, delimitations, and limitations; and clarify
the significance of the study. The chapter concludes with a brief summary of its key
points.
Background of the Study
Creativity is the current buzz word in the business world. Everything, from office
designs to leadership practices and organizational narratives, is geared toward enhancing
employee, team, and organizational creativity (Catmull, 2014; Sheridan, 2015).
Anecdotal accounts of the effect of organizational factors on organizational creativity are
continuously published in publications such as Inc., Fast Company, and Fortune.
Two organizational influences that dominate the anecdotal evidence of enhanced
organizational creativity are workplace fun and organizational climate. Stories about the
fun employees have at companies such as Google, Nike, Facebook, and Apple, among
many others, are legendary. Employees play foosball and board games, work out in the
4company gym, have massages, eat as much as they want for free, and enjoy time
with their children at company-funded daycare spaces (Bock, 2015; Morgan, 2014).
Despite all the anecdotal evidence, there is a dearth of empirical evidence that
supports the claim that workplace fun and an organizational climate rooted in playfulness
and leisure contribute to organizational creativity. The purpose of this study was to
provide empirical evidence in support of or against this claim. Without empirical
research on how and when workplace fun and organizational climates influence
organizational creativity, their benefits and usefulness in business organizations remains
a myth.
Recent research on workplace fun shows that workplace fun falls into three types:
managed fun, organic fun, and task fun (Plester, Cooper-Thomas, & Winquist, 2015).
The existence of a fourth type of workplace fun, idiosyncratic workplace fun, is proposed
in this study. In contrast to organic fun, which Plester et al. (2015) defined as fun that
occurs spontaneously at work, idiosyncratic workplace fun encompasses the fun activities
that employees enjoy doing after work. These are the activities that employees already
know are fun for them.
Four streams of workplace fun research dominate the scholarly literature: studies
on the effect of workplace fun on employees (e.g., Becker & Tews, 2016; Chan & Mak,
2016; Plester & Hutchison, 2016), studies on the impact of workplace fun on
organizational outcomes (e.g., Fluegge-Wolf, 2014; Han, Kim, & Jeong, 2016; Tews,
Michel, & Allen, 2014), studies on the influence of humor on team and organizational
outcomes (e.g., Lehmann-Willenbrock & Allen, 2014; Lussier, Grégoire, & Vachon,
52017; Tremblay & Gibson, 2016), and studies related to the effect of workplace
fun on different generational cohorts (e.g., Lamm & Meeks, 2009; Tews, Michel, &
Bartlett, 2012; Tews, Michel, & Drost, 2015).
Out of the more than 50 studies on workplace fun conducted since the turn of the
21st century, only one study (Fluegge-Wolf, 2014) showed that workplace fun influenced
creative performance. The current study fills a research gap pertaining to a possible
relationship between leaders’ endorsement of idiosyncratic workplace fun and
organizational creativity. The gap widens when the influence of organizational
playfulness climate on organizational creativity is considered.
Recent research on organizational climate has been plagued by disagreements in
defining the dimensions that collectively constitute the organizational climate construct
(Denison, 1996). This has forced organizational researchers to resort to studying the
effects of a general organizational climate on both employee outcomes (e.g., Shanker,
2014; Shih, Lie, Klein, & Jiang, 2014; Viitala, Tanskanen, & Santti, 2015) and
organizational outcomes (e.g., Khan, Qureshi, Rasli, & Ahmad, 2015; Shahin, Naftchali,
& Pool, 2014).
The current study is the first U.S.-based study that provides empirical evidence on
the relationship between organizational playfulness climate and organizational creativity.
Although the effects of creative climates and climates for innovation on organizational
outcomes have been studied in the past (Ingram, 2016; Mafabi et al., 2015; Ren & Zhang,
2015), there is no scientific evidence on the impact of an organizational playfulness
climate on organizational creativity. This omission might be partly due to the integrative
6nature of the organizational playfulness climate construct, which encompasses
dimensions of both organizational climate and organizational play.
Based on the effects of various factors on organizational creativity, six research
streams can be identified in recent scholarship on organizational creativity: leadership
factors (e.g., Khattak, Batool, & Haider, 2017; Wu & Cormican, 2016), team factors
(e.g., Rodríguez-Sánchez, Devloo, Rico, Salanova, & Anseel, 2017; Hu, Erdogan, Jiang,
Bauer, & Liu, 2018; Zhu, Gardner, & Chen, 2016), communication factors (e.g., Boies,
Fiset, & Gill, 2015; Jia, Shaw, Tsui, & Park, 2014), psychological factors (e.g., Homan,
Buengeler, Eckhoff, van Ginkel, & Voelpel, 2015; Kim, Choi, & Park, 2012), control
factors (e.g., Chiang & Hung, 2014; Rosso, 2014), and miscellaneous factors (e.g.,
Guistiniano, Lombardi, & Cavaliere, 2016; Olszak, Bartus, & Lorek, 2018).
Despite its current preeminence in organizational research, organizational
creativity needs further exploration, as it is a multifaceted construct that forms intricate
relationships with many organizational components (Blomberg, 2014). This study was
relevant and necessary because its findings filled numerous gaps in the literature on
organizational creativity, workplace fun, and organizational climate. The inherent
complexity of idiosyncratic workplace fun, organizational playfulness climate, and
organizational creativity portended the existence of unexplored relationships that
advanced organizational and management scholarship.
Problem Statement
According to a Gallup report on the state of the American workplace between
2010 and 2012, 70% of American employees are “emotionally disconnected from their
7workplaces and less likely to be productive” (Gallup Inc., 2013, p. 6). This
detachment might reflect the combined dissatisfaction of employees with both the work
and the work settings. Low job satisfaction and lack of positive affect at work prevent
employees from flourishing at work (Lin, Yu, & Yi, 2014; Walumbwa, Muchiri, Misati,
Wu, & Meiliani, 2018). Given that detached and unhappy employees are not creative
employees (Patkin, 2014; Donaldson, Dollwet, & Rao, 2015), the long-term survival and
success of business enterprises is threatened (Mafabi, Munene, & Ahiauzu, 2015).
The general research problem was that work needs to be reformed, so that
organizations become cherished places, full of thriving employees, who do work that is
fun, meaningful, and creative (Xu, Zhao, Li, & Lin, 2017). The specific research
problem was that the relationship between leaders’ endorsement of idiosyncratic
workplace fun, organizational playfulness climate, and organizational creativity is
unclear (Caniels, De Stobbeleir, & De Clippeleer, 2014) and might play a critical role in
this reformation.
Purpose of the Study
The purpose of this quantitative quasi-experimental study was to test the theory of
organizational creativity that related contextual factors, such as leaders’ endorsement of
idiosyncratic workplace fun and organizational playfulness climate, to organizational
creativity, controlling for age, race, and gender in project teams at companies in
northwestern United States. The study is significant to society because it advocates for
societal health through full human development, expression, and creativity in the
workplace.
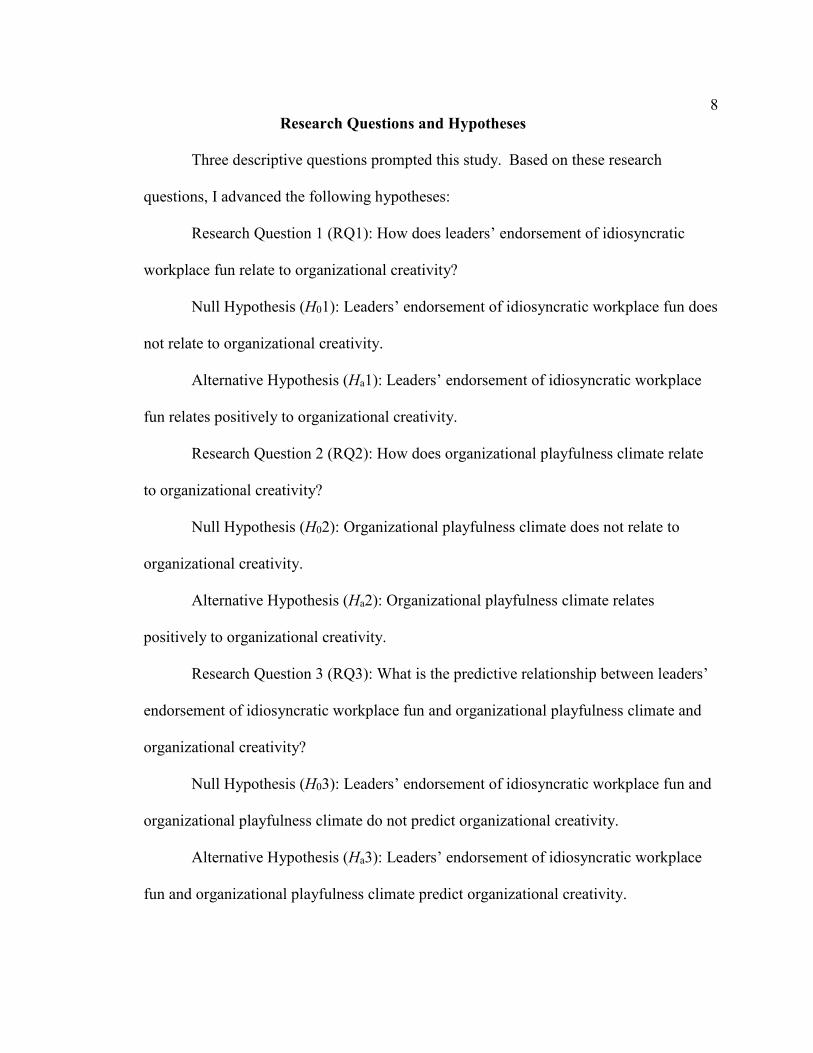
8Research Questions and Hypotheses
Three descriptive questions prompted this study. Based on these research
questions, I advanced the following hypotheses:
Research Question 1 (RQ1): How does leaders’ endorsement of idiosyncratic
workplace fun relate to organizational creativity?
Null Hypothesis (H01): Leaders’ endorsement of idiosyncratic workplace fun does
not relate to organizational creativity.
Alternative Hypothesis (Ha1): Leaders’ endorsement of idiosyncratic workplace
fun relates positively to organizational creativity.
Research Question 2 (RQ2): How does organizational playfulness climate relate
to organizational creativity?
Null Hypothesis (H02): Organizational playfulness climate does not relate to
organizational creativity.
Alternative Hypothesis (Ha2): Organizational playfulness climate relates
positively to organizational creativity.
Research Question 3 (RQ3): What is the predictive relationship between leaders’
endorsement of idiosyncratic workplace fun and organizational playfulness climate and
organizational creativity?
Null Hypothesis (H03): Leaders’ endorsement of idiosyncratic workplace fun and
organizational playfulness climate do not predict organizational creativity.
Alternative Hypothesis (Ha3): Leaders’ endorsement of idiosyncratic workplace
fun and organizational playfulness climate predict organizational creativity.
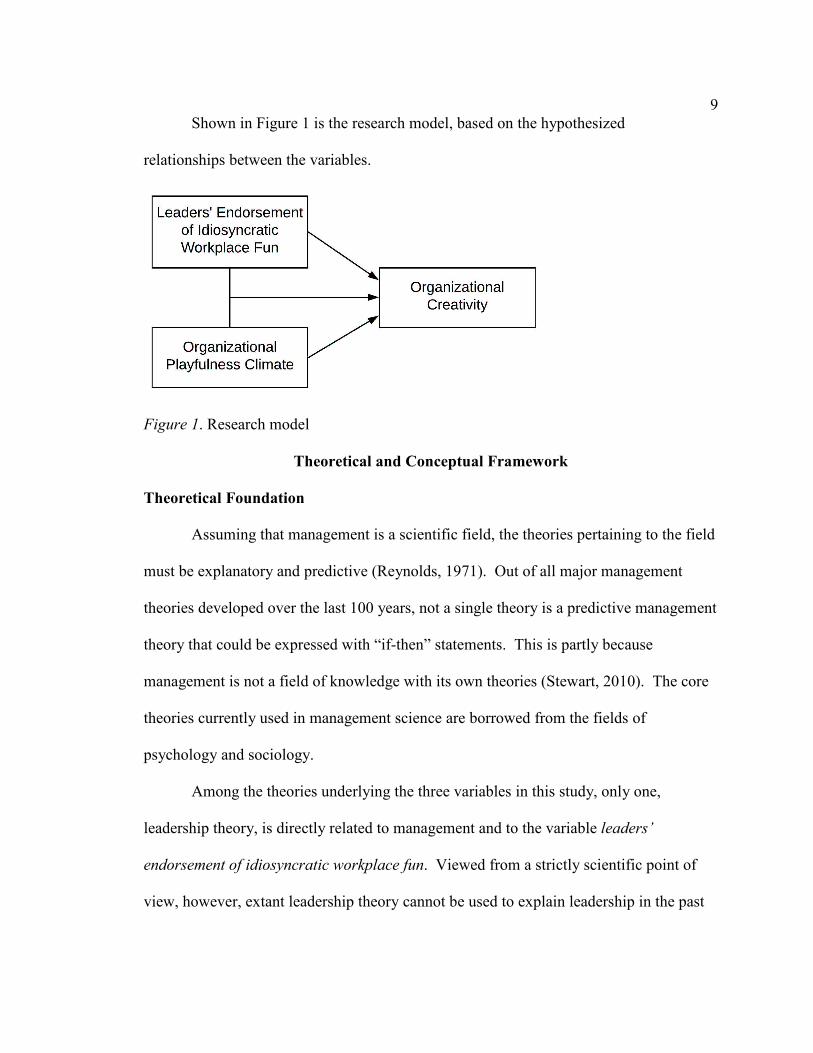
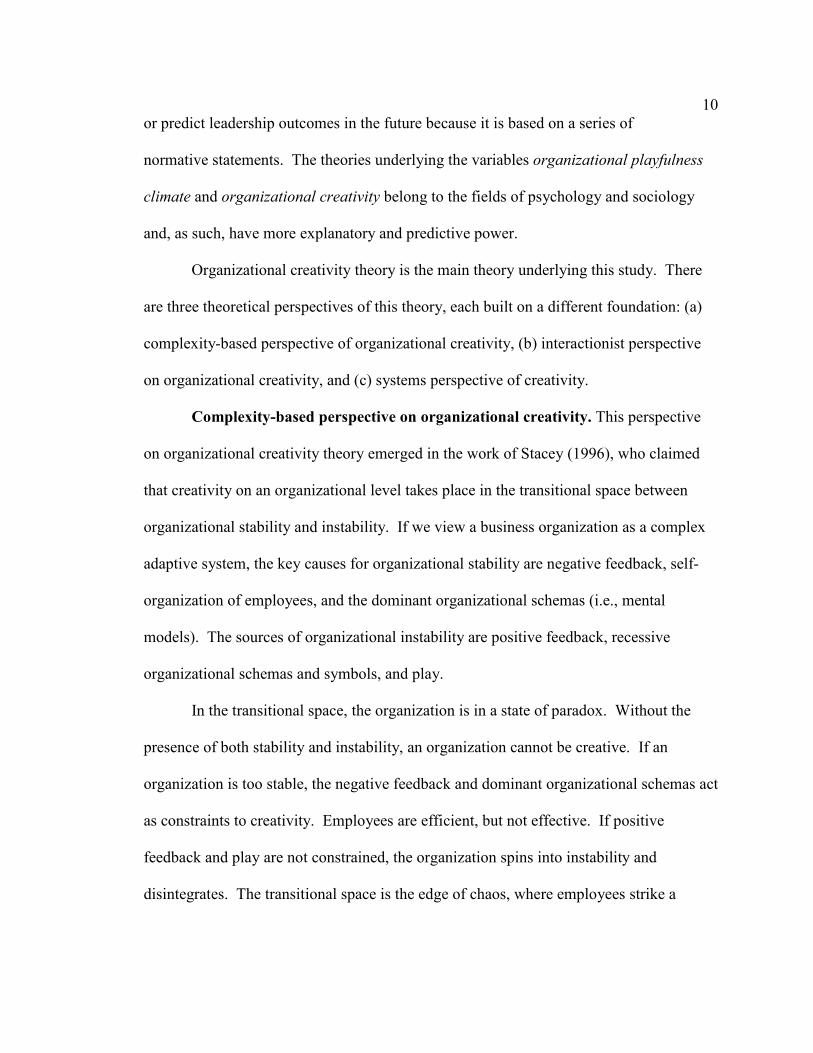
9Shown in Figure 1 is the research model, based on the hypothesized
relationships between the variables.
Figure 1. Research model
Theoretical and Conceptual Framework
Theoretical Foundation
Assuming that management is a scientific field, the theories pertaining to the field
must be explanatory and predictive (Reynolds, 1971). Out of all major management
theories developed over the last 100 years, not a single theory is a predictive management
theory that could be expressed with “if-then” statements. This is partly because
management is not a field of knowledge with its own theories (Stewart, 2010). The core
theories currently used in management science are borrowed from the fields of
psychology and sociology.
Among the theories underlying the three variables in this study, only one,
leadership theory, is directly related to management and to the variable leaders’
endorsement of idiosyncratic workplace fun. Viewed from a strictly scientific point of
view, however, extant leadership theory cannot be used to explain leadership in the past
10or predict leadership outcomes in the future because it is based on a series of
normative statements. The theories underlying the variables organizational playfulness
climate and organizational creativity belong to the fields of psychology and sociology
and, as such, have more explanatory and predictive power.
Organizational creativity theory is the main theory underlying this study. There
are three theoretical perspectives of this theory, each built on a different foundation: (a)
complexity-based perspective of organizational creativity, (b) interactionist perspective
on organizational creativity, and (c) systems perspective of creativity.
Complexity-based perspective on organizational creativity. This perspective
on organizational creativity theory emerged in the work of Stacey (1996), who claimed
that creativity on an organizational level takes place in the transitional space between
organizational stability and instability. If we view a business organization as a complex
adaptive system, the key causes for organizational stability are negative feedback, self-
organization of employees, and the dominant organizational schemas (i.e., mental
models). The sources of organizational instability are positive feedback, recessive
organizational schemas and symbols, and play.
In the transitional space, the organization is in a state of paradox. Without the
presence of both stability and instability, an organization cannot be creative. If an
organization is too stable, the negative feedback and dominant organizational schemas act
as constraints to creativity. Employees are efficient, but not effective. If positive
feedback and play are not constrained, the organization spins into instability and
disintegrates. The transitional space is the edge of chaos, where employees strike a
11balance between efficiency and effectiveness. Five control parameters could
push an organization from stability to the edge of chaos, where creativity takes place: (a)
rate of information flow, (b) degree of diversity, (c) richness of connectivity, (d) level of
contained anxiety, and (e) degree of power differentials.
Stacey’s (1996) perspective on organizational creativity theory is relevant to this
study because the two independent variables in the study are part of the recessive shadow
system in business organizations. Leaders’ endorsement of idiosyncratic workplace fun
and an organizational playfulness climate push an organization towards instability and
oppose the legitimate, stable ways of organizational behavior. According to this
complexity-based perspective on organizational creativity theory, leaders’ endorsement
of idiosyncratic workplace fun and organizational playfulness climate will positively
influence organizational creativity.
Interactionist perspective on organizational creativity. Woodman, Griffin, and
Sawyer (1993) advanced this organizational creativity perspective, emphasizing the
importance of social and contextual influences on individual, group, and organizational
creativity. From this perspective, creative behavior across all organizational levels
emerges from the interaction of individual and group characteristics with contextual
factors both within and across levels of analysis. Specifically, organizational creativity is
perceived as a function of group creativity and contextual components, such as
organizational climate and culture, resource constraints, and rewards systems, among
others.
12At the core of this perspective is the recognition that organizational
creativity is the product of complex individual, group, and organizational dynamics that
take place in a complex social system. Feedback loops on individual and group levels, as
well as reciprocal influences between situations and employee behavior, underscore the
dynamics on each level of social organization. The interactionist perspective on
organizational creativity is relevant to this study, as leaders’ endorsement of idiosyncratic
workplace fun is a social influence on organizational creativity on individual level, while
organizational playfulness climate is a contextual influence on organizational creativity
on group level. Due to the cross-level organizational dynamics present at most business
organizations, it was expected that both variables would influence organizational
creativity.
Systems perspective on creativity. Csikszentmihalyi (1996) wrote that
creativity can occur only when three parts of a system—domain, field, and individual
person—interrelate. Whereas the domain is the knowledge area within which creativity
takes place, the field constitutes the experts in the field, who validate the novelty and
usefulness of an idea, product, process, or service created by an individual or a group of
individuals. If the field does not recognize a phenomenon as novel, useful, and worthy
for inclusion in its respective domain, it cannot be claimed that creativity has taken place.
From this perspective, organizational creativity depends on the recognition of
products, services, and processes as novel and useful by the industry peers of a company.
The industry peers constitute the field that determines the organizational creativity of an
enterprise. No novelty can exist without the peer-to-peer feedback within an industry.
13This creative validation by a field of experts can also be applied within a
company where research and development teams, for example, can validate the novelty
of products both within a team (i.e., individual level) and across teams (i.e., group level).
Stacey’s (1996) and Woodman et al.’s (1993) perspectives on organizational
creativity pertain to the independent variables in this study and their possible effect on the
dependent variable. Csikszentmihalyi’s (1996) systems perspective of creativity relates
solely to the dependent variable. Because this study did not involve the interrelated
feedback between industry peers or teams within a company, the systems perspective of
creativity did not apply to this research.
Conceptual Framework
The conceptual framework that underlies this study is the general contingency
theory of management (GCT), advanced by Luthans and Stewart (1977). Although not a
theory in the strict sense of the word (Longenecker & Pringle, 1978), GCT is termed a
theory because it aims to explain how primary, secondary, and tertiary organizational
variables interact and affect organizational performance. GCT is based on a contingency
theory of institutional design, which postulates that organizational performance is the
result of a match between an organization’s external and internal contexts, or
environments (Schoonhoven, 1981; Van de Ven, Ganco, & Hinings, 2013). The theory
can be applied to various organizational and institutional elements, such as design,
structure, strategy, management, and leadership.
Luthans and Stewart (1977) applied contingency theory to management and
advanced the general contingency theory of management with the ultimate goal of
14uncovering functional relationships between managerial, environmental, and
performance variables. In contrast to situational leadership models, where the focus is on
leader and follower behaviors (Hersey & Blanchard, 1977; Peretomode, 2012), the
contingency approach to management accounts for environmental influences that interact
with organizational resources and leadership factors to impact organizational
performance (Luthans & Stewart, 1977).
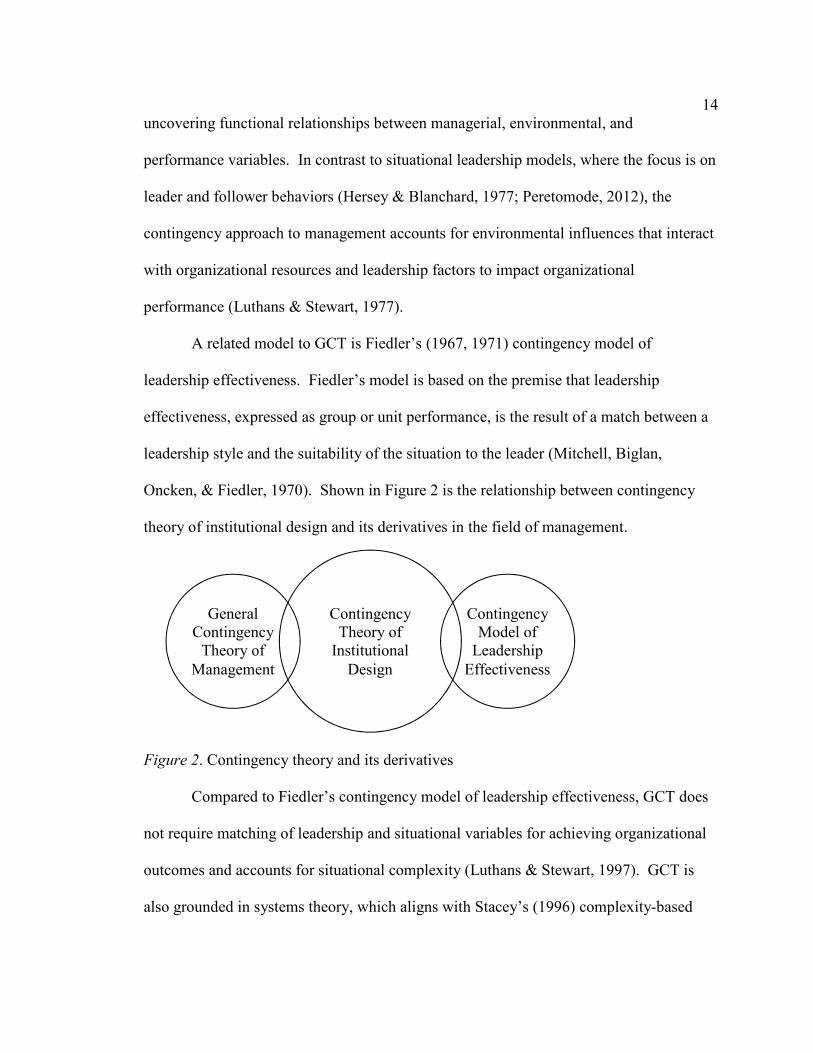
A related model to GCT is Fiedler’s (1967, 1971) contingency model of
leadership effectiveness. Fiedler’s model is based on the premise that leadership
effectiveness, expressed as group or unit performance, is the result of a match between a
leadership style and the suitability of the situation to the leader (Mitchell, Biglan,
Oncken, & Fiedler, 1970). Shown in Figure 2 is the relationship between contingency
theory of institutional design and its derivatives in the field of management.
Figure 2. Contingency theory and its derivatives
Compared to Fiedler’s contingency model of leadership effectiveness, GCT does
not require matching of leadership and situational variables for achieving organizational
outcomes and accounts for situational complexity (Luthans & Stewart, 1997). GCT is
also grounded in systems theory, which aligns with Stacey’s (1996) complexity-based
Contingency Theory of
Institutional Design
Contingency Model of
Leadership Effectiveness
General Contingency
Theory of Management
15theory of organizational creativity. While Fiedler’s leadership model is a
maximizing model, where for every X1 there is a matching X2 at which Y is maximized,
GCT is a multiplicative framework, where both X1 and X2 must be present for best
organizational results (Y = X1X2) (Schoonhoven, 1981).
Within the conceptual framework of the general contingency theory of
management, leaders’ endorsement of idiosyncratic workplace fun represented a primary
leadership variable. Organizational playfulness climate represented a secondary
organizational variable. Organizational creativity represented a tertiary performance
variable. The current study’s results revealed the degree to which organizational
creativity (OC) was a function of leaders’ endorsement of idiosyncratic workplace fun
(LEIWF) and organizational playfulness climate (OPC), or OC = f(LEIWF x OPC).
Nature of the Study
The nature of the study was quantitative and quasi-experimental. The
philosophical worldview that underlies quantitative research is post-positivism (Hoy &
Adams, 2015). This worldview is based on the belief that our reality is deterministic and
governed by cause and effect (Hoy & Adams, 2015). Such a worldview is reductionist in
that it requires phenomena and ideas to be reduced or divided into small units suitable for
examination (Wrench, Thomas-Maddox, Richmond, & McCroskey, 2015). In doing so,
researchers can objectively observe and measure phenomena (Leavy, 2017). The purpose
of quantitative research is to discover, test, verify, and refine theories and laws that
govern reality (Hoy & Adams, 2015). This quantitative study aligned with the post-
16positivist paradigm, as I measured three phenomena, examined their
relationships, and tested theories related to them.
In the study, I selected a quasi-experimental design, using intact project teams at
companies located in northwestern United States. The sampling frame consisted of
member companies of the Seattle Metropolitan Chamber of Commerce and the Portland
Business Alliance in the states of Washington and Oregon, respectively. I intended to
examine the relationships between the variables longitudinally, as most studies on
workplace fun and organizational creativity have been cross-sectional. In contrast to the
cross-sectional approach, a longitudinal approach has more power in detecting causality
between the variables (Caruana, Roman, Hernández-Sánchez, & Solli, 2015). The three
study variables included leaders’ endorsement of idiosyncratic workplace fun
(independent variable), organizational playfulness climate (independent variable), and
organizational creativity (dependent variable).
I analyzed the collected data with SPSS 21 software package. I used repeated
measures analysis of variance (ANOVA) to test whether the project teams in the two
quasi-experimental groups differed significantly in terms of their creative output. I
calculated Pearson correlation coefficients to establish the direction and magnitude of the
relationship between the examined phenomena. I used bivariate regression analysis and
hierarchical multiple regression analysis to test whether leaders’ endorsement of
idiosyncratic workplace fun and organizational playfulness climate predicted
organizational creativity, both individually and collectively.
17The study was feasible, because validated quantitative instruments
measured each variable independently. Due to limited company access and limited
resources, the desired sample size of 66 project teams was not achieved. I conducted the
study with a small sample size of randomly selected project teams.
Definitions
This quasi-experimental quantitative study had three variables, two independent
and one dependent. The two independent variables were leaders’ endorsement of
idiosyncratic workplace fun and organizational playfulness climate. The dependent
variable was organizational creativity. Each variable is defined as follows:
Leaders’ endorsement of idiosyncratic workplace fun: leaders’ support of
workplace fun chosen by employees and exercised at their discretion (Tews et al., 2015).
Organizational playfulness climate: employees’ shared perceptions of and
meaning attached to organizational interactions, activities, practices, and procedures
rooted in playfulness (Yu et al., 2003).
Organizational creativity: the generation of novel and useful products, processes,
and services in organizational settings by organizational teams (Woodman et al., 1993).
Assumptions
Several assumptions underlay the study. The main assumption was that
management is a scientific field. Although the history of management thought is over a
100 years old (Witzel, 2016), a close examination of management theory and the seminal
works that built it reveal that the field of management is founded on highly questionable
premises (Stewart, 2010).
18A key assumption specific to this study was that all business
organizations are inherently creative. It was further assumed that leaders’ endorsement
of idiosyncratic workplace fun and organizational playfulness climate would influence
the creativity of project teams at companies over and above the influence of other factors,
such as individual characteristics, contextual cues, leadership style, organizational
culture, and team composition. It was also assumed that the positive influence of leaders’
endorsement of idiosyncratic workplace fun and organizational playfulness climate on
team creativity constituted the existence of organizational creativity.
A related assumption was that members of project teams would find idiosyncratic
workplace fun and organizational playfulness climate appropriate and conducive to
creativity. Different people have different creative processes, as they are motivated by
different stimuli, have different educational backgrounds, adopt different perspectives in
approaching creative tasks, and have different skillsets (Leski, 2016). Given that the
research involved project teams, it was assumed that the effects of LEIWF and OPC
would propagate across organizational levels.
It was further assumed that the measuring instruments in the study were adequate
in measuring the examined phenomena. For example, the Organizational Playfulness
Climate Questionnaire (OPCQ) was developed in Taiwan and written in Chinese, which
raised questions about the validity and reliability of the measure’s English translation. It
was assumed that the English version of the OPCQ survey would be as valid and reliable
as its original version.
19Scope and Delimitations
The proposed study had four delimitations: (a) research problem, (b) research site
location, (c) sample population, and (d) research design. The focus of prior studies on the
effects of contextual factors on organizational creativity has been on employee creativity
(Joo, Yang, & McLean, 2014; Ritter & Ferguson, 2017). In contrast, I chose not to
equate general employee creativity with organizational creativity, thus adopting an
atypical approach to the research problem. Employees could be individually creative, but
their creativity may not aggregate and lead to the production of novel and useful products
or processes that reflect the accomplishment of an organizational goal. Organizational
goals that build the competitive advantage of a company are made possible only by the
combined talent and skills of many employees (Catmull, 2014).
The lack of adequate resources to sample project teams from across the United
States necessitated the use of research sites proximal to my place of residence. The
research sites were located in urban centers in the northwestern United States already
known as hubs of creativity. Whereas researchers in several extant studies used
university students to investigate group creativity (Carmeli, Dutton, & Hardin, 2015;
Han, Han, & Brass, 2014; Homan et al., 2015), I elected to use project teams, engaged in
the solving of actual workplace problems.
Although the use of project teams across industries widened the generalizability
of the study’s findings, the small geographic area from which the population was drawn
prevented the generalizability of the study’s results to project teams located in other
geographical areas. The two-wave quasi-experimental design used in the study also
20differed from the typical approach in testing leadership and organizational
climate effects on employee and organizational creativity, as most past studies with a
similar focus favored a cross-sectional design (Khattak et al., 2017; Yoon, Kim, & Song,
2016; Yoshida, Sendjaya, Hirst, & Cooper, 2014).
Limitations
The study had a few design and methodological limitations. First, the study did
not have adequate financial resources and time. This imposed the use of a quantitative
methodology for the study, decreased the probability of gaining access to many
companies, and necessitated a short intervention period. This limitation was addressed
by applying for research grants and using credit card debt to finance the study.
Second, the chosen quasi-experimental design prevented control over intrinsic
factors, such as history and testing, which lowered the internal validity of the study (Hoy
& Adams, 2015). Third, the study’s population included project teams only in the
northwestern United States, which limited the generalizability of the findings to U.S.-
based project teams. In addition, the sample was chosen from an incomplete sampling
frame, comprised of member companies of the Seattle Metropolitan Chamber of
Commerce and the Portland Business Alliance. These limitations could have been
addressed by adding additional variables to the study, widening the population, and
expanding the sampling frame. However, such changes could have been made only when
ample resources were available, which was not the case in this study.
The study’s internal threats to validity included both extrinsic and intrinsic
factors. The main extrinsic factor was selection effects, as the project teams in the
21sample were diverse and engaged in different projects. The intrinsic factors
included history, maturation, and testing. These threats to internal validity were
addressed by allowing a longer time period between the administration of the pretest and
posttest and selecting project teams with similar number of team members (Wrench et al.,
2015).
The external threats to validity pertained to the non-representativeness of the
sample, due to the selection of project teams in one country and two states, and reactive
arrangements in the different contexts in which the project teams operated. The reactive
arrangements could not be minimized by selecting project teams in only one industry
(Hoy & Adams, 2015). Choosing project teams from several industries, however,
minimized the setting-treatment interaction effects. Thus, the study triangulated on
occupation and settings, as the project teams included in the sample represented both
different companies and different industries.
Significance of the Study
Significance to Theory
The study contributed to three management domains: organizational theory,
organizational behavior, and human resources management. Specifically, the study
contributed new knowledge to three theoretical streams: leadership, organizational
climate, and organizational creativity. The study is important to scholars of workplace
fun, organizational climate, and organizational creativity, as its purpose was to provide
empirical evidence on the relationships between concepts from three areas of
organizational life that have been rarely, if ever, examined together.
22Significance to Practice
To the extent that the study was conducted in companies where the creative power
of project teams was used, the study’s findings are important to team leaders and team
members at companies that depend on teams of any kind, such as project development
teams, cross-functional teams, virtual teams, and research and development teams, among
others. To fully understand the study’s significance, a company can be imagined
operating without workplace fun, playfulness, and organizational creativity. Without
organizational creativity, a company cannot produce novel and useful products,
processes, and services (Brandt & Eagleman, 2017). This diminishes the company’s
competitiveness and survivability (De Bono, 2015) and prevents employees from
learning and developing their potential (Tews & Noe, 2017; Tews, Michel, & Noe, 2017).
Leaders’ efforts to promote organizational creativity affirm employees’ rights to
learn and express themselves in new and creative ways at work. Without being joyful,
playful, and celebratory at work, employees earn their pay without expressing their full
humanity. As such, work becomes a means to an end. Leaders’ endorsement of
idiosyncratic workplace fun and play supports employees’ right to rejoice and be fully
human in the workplace (Cable, 2018).
Significance to Social Change
In today’s global business environment, in which companies compete for market
share and profits at the expense of humanity’s well-being and the earth’s health (Korten,
2015), leaders’ endorsement of idiosyncratic workplace fun, playful organizational
climate, and organizational creativity may seem inconsequential. Laughter, joy,
23engagement, and creativity define positivity and, as such, are essential to
people and the social systems they create. A society abundant of fun, play, and creativity
is a healthy society (Reckwitz, 2017). The discovery of positive relationships between
leaders’ endorsement of idiosyncratic workplace fun, organizational playfulness climate,
and organizational creativity contributes to positive social change, because it shows that
both employees and organizations can thrive when workplace fun and playfulness are
core elements of organizational life.
Summary and Transition
People and organizations are creative entities. In today’s technologically
advanced human society, business organizations deliver the creative breakthroughs that
advance human civilization. Although there is ample anecdotal evidence on the positive
influence of workplace fun and playfulness at business organizations, the reality is that
more than half of the employees at business organizations are emotionally disconnected
from their work (Gallup Inc., 2013) and do not experience positive affect and job
satisfaction (Lin et al., 2014). As a result, employees cannot flourish at work and be
creative, which threatens the long-term success and survival of companies (Mafabi et al.,
2015). This study filled a gap in the extant research by providing empirical evidence on
the effect of contextual organizational factors on organizational creativity.
Organizational creativity theory, as explicated by Woodman et al. (1993) and
Stacey (1996), provided the theoretical foundation for this study. The two independent
variables, leaders’ endorsement of idiosyncratic workplace fun and organizational
playfulness climate, are both driving forces in the shadow system within organizations
24and contextual components that influence individual, team, and organizational
creativity. The study was also situated within the conceptual framework of general
contingency theory of management (Luthans & Stewart, 1977).
Based on the theoretical foundation and conceptual framework, the study was
conducted as a quasi-experimental quantitative study, using project teams at business
organizations. Six hypotheses were tested and three research questions were answered to
explain the effect of leaders’ endorsement of idiosyncratic workplace fun and
organizational playfulness climate on organizational creativity.
The small scale and limited generalizability of the study notwithstanding, the
study is significant to theory, practice, and social change. In Chapter 2, I provide a
comprehensive literature review of the research streams that underlie each variable in the
study, discuss additional theories that play a role in the examined relationships, explain in
detail the research gaps this study fills, and show how the study extends knowledge in the
field of management.
25Chapter 2: Literature Review
Most work environments are devoid of human emotions (Gopinath, 2011). While
it is easily understandable why negative emotions, such as anger and hatred, are
undesired at work, it is baffling why positive emotions, such as joy and excitement, are
rarely witnessed in office spaces. The lack of positive affect at work might be caused by
the Puritan work ethic embedded in business organizations (Costea, Crump, & Holm,
2007; Kavanagh, 2011). At the receiving end of this work ethic are the employees, who
work without fully expressing their voice or positive emotions. This has a triple negative
effect on employees: they perceive their work as boring (Harju, Hakanen, & Schaufeli,
2014); they disengage from work (Anitha, 2014); and they stop being creative (Rego,
Sousa, Marques, & Cuhna, 2014).
In this study, I investigated the impact of two organizational factors rooted in
positive affect, leaders’ endorsement of idiosyncratic workplace fun and organizational
playfulness climate, on organizational creativity. This chapter begins with a review of
the literature search strategy used for each variable in the study. Next, I present the
theoretical foundation of the study, followed by an explanation of the nature of work,
which lays the foundation for the literature review. Then I synthesize and critically
examine research on workplace fun, organizational playfulness climate, and
organizational creativity. The chapter concludes with a summary of the major themes in
the literature and a description of the gaps in the literature that this study filled.
26Literature Search Strategy
For dependent variable organizational creativity, I conducted a search for peer-
reviewed articles in Academic Search Complete, Business Source Complete, ProQuest
Central, PsycARTICLES, ScienceDirect, Emerald Management, SAGE Premier, and
ABI/INFORM Complete databases. The search criteria included articles with
organizational creativity, employee creativity, group creativity, creativity in groups, and
team creativity in the title for the period between 2014 and 2018. The search for seminal
literature on creativity, team creativity, and organizational creativity began with an
exploration of the applications of creativity in business. Using the snowball technique, I
discovered seminal works on creativity pertaining to constrained creativity (e.g., Stokes,
2006), creativity in context (e.g., Amabile, 1996), creative confidence (e.g., Kelley &
Kelley, 2013), creative action in organizations (e.g., Ford & Gioia, 1995), and general
creativity (e.g., Csikszentmihalyi, 1996).
For independent variable leaders’ endorsement of idiosyncratic workplace fun, the
same databases and time period were used in finding peer-reviewed articles with fun,
workplace fun, fun at work, workplace humor, and organizational humor in the title.
Resources found through the snowball approach included three recent books on
workplace fun (Cable, 2018; Comm, 2018; Johnson, 2017). The same search procedures
and databases were used for finding peer-reviewed articles related to the second
independent variable, organizational playfulness climate. Keywords included
organizational play, organizational playfulness, play at work, playfulness climate, and
27organizational climate. Seminal works referenced in this study include books
by Huizinga (2014), Piaget (1962), and Papert and Harel (1991).
Theoretical Foundation
Creativity is a complex phenomenon. It can emerge from one person, or from
many people; it can be fostered by some environments and not by others; it can flourish
with and without constraints. In spite of this complexity, creativity theory, like any other
social science theory, has limits. According to Baer (2012), a key limit is that creativity
is domain-specific. Transfer of creativity skills across domains is difficult. Motivation
and expertise are also domain-specific. Being creative in one domain does not mean
creativity across domains. Creativity training in a domain improves creativity only in
that domain.
There may be, however, metatheories of creativity, such as intrinsic motivation
and divergent thinking (Baer, 2012). Torrance (1965) was the first to propose divergent
thinking as a key cognitive process for creativity. Amabile’s (1996) componential theory
of creativity included task motivation, based on intrinsic motivation, as one of the three
components of creative performance (domain-relevant skills and creativity-relevant skills
being the other two). Sternberg and Lubart’s (1991) investment theory of creativity
added four other creativity-spurring factors (i.e., intellectual skills, domain knowledge,
personality, and environment) to thinking style and motivation. All these creativity
theories pertain to individual creativity.
When individuals assemble in groups to be creative, individual creativity becomes
only a building component to team and organizational creativity. To account for the
28escalation of creativity to the group and organizational levels of analysis,
Stacey (1996) examined organizational creativity through the prism of complexity theory.
In the complexity-based theory of organizational creativity, companies are creative only
when they occupy a space defined by both stability and instability (Stacey, 1996). An
enterprise in which negative feedback and top-down organizational schemas dominate is
bound to be more stable than a company in which positive feedback, play, bottom-up
organizational schemas, and recessive organizational symbols are the norm.
Based on this conceptualization of organizational creativity, business
organizations are most creative at the edge of chaos, where both stability and instability
are present. Although paradoxical, this is the space where organizational efficiency and
effectiveness are in balance. This is also a fragile space, in which the rate of information
flow, degree of diversity, richness of connectivity, level of contained anxiety, and degree
of power differentials can push an organization to stability or instability (Stacey, 1996).
This theoretical perspective is relevant to the current study because both leaders’
endorsement of idiosyncratic workplace fun and organizational playfulness climate
belong to the recessive organizational schema without which organizational creativity
cannot emerge. The three research questions in the current study relate to the
complexity-based theory of organizational creativity as they aim to reveal whether
leaders’ support of autonomous fun at work and an organizational climate rooted in
playfulness influence, ether individually or jointly, organizational creativity. The
questions also aim to examine empirically anecdotal claims about the existence of such
relationships. Recent studies that have applied Stacey’s (1996) complexity-based theory
29of organizational creativity include a study on the influence of complex
adaptive systems theory on firm product innovativeness (Akgun, Keskin, & Byrne,
2014), a study on the application of complexity science perspective on new business
development (Tsai, 2014), and a study on strategy transformation through strategic
innovation capability (Kodama & Shibata, 2013), among others.
A second theoretical perspective on organizational creativity that is relevant to
this study is the interactionist theory of organizational creativity, proposed by Woodman
et al. (1993). While Stacey (1996) adopted a macro-perspective in explaining
organizational creativity through nonlinear systems dynamics, Woodman et al. (1993)
focused solely on the micro-components, such as resource constraints and rewards
systems, that feed into and amplify organizational complexity. In Woodman et al.’s
conceptualization of organizational creativity, complexity is seen as the result of
interactions between individual and group characteristics and contextual factors present
within and across levels of analysis.
A key tenet of this theoretical perspective is that organizations are complex social
systems, in which feedback between organizational levels and influences between
employees and situations define the organizational dynamics. In relation to leadership,
Woodman et al. (1993) contended that high-level creative results could be obtained only
through democratic leadership. The word democratic implies leadership that encourages
individual liberties and freedoms, one of which is the freedom to have volitional fun.
The interactionist perspective of organizational creativity is pertinent to the
current study as it directly relates to the two independent variables. Leaders’
30endorsement of idiosyncratic workplace fun is a social influence on individual
level that reflects democratic leadership. Organizational playfulness climate is a
contextual influence on the group level. The research questions that I posited in this
study emerged from the understanding of the cross-level organizational dynamics present
in most companies. This is why the expectation of both independent variables to
influence organizational creativity is embedded in the questions. Prior studies rooted in
Woodman et al.’s (1993) interactionist theory of organizational creativity include a study
on the impact of leadership on small business innovativeness (Dunne, Aaron, McDowell,
Urban, & Geho, 2016), a study on the effect of conflict on team creativity (Langfred &
Moye, 2014), and a study on the influence of diversified knowledge and R&D team
centrality on radical creativity (Tang & Ye, 2015), among others.
A study grounded in organizational creativity theory lies outside of the leadership
and management cannon that dominated management research over the last 100 years
(Witzel, 2016). This necessitates a brief examination of the nature of work, as the
variables in the current study imply the existence of workplace dynamics that oppose, if
not contradict, long-standing organizational norms and standards. The research gap this
study fills is clearly revealed when we answer three work-related questions: (a) why do
people work? (b) how do people work? and (c) how do people work best?
Literature Review
The Nature of Work
In 1956, during an interview for The Paris Review (Stein, 1956), writer William
Faulkner (1897-1962) said:
31One of the saddest things is that the only thing a man can do for eight
hours a day, day after day, is work. You can’t eat eight hours a day nor drink for
eight hours a day nor make love for eight hours—all you can do for eight hours is
work. Which is the reason why man makes himself and everybody else so
miserable and unhappy (p. 19).
According to Cable (2018), people work to satisfy psychological, emotional, and
personal needs. The satisfaction of these needs gives meaning to people’s lives, but only
when the work performed is a calling, not just a means to an end. Such a
conceptualization of work is rooted in hedonistic philosophy, underscored by the belief
that people are governed by both pleasure and pain (Sayers, 2005).
Marx (1887) noted that the hedonistic perspective of work alienated the worker
from the work and engendered feelings of discontent, dissatisfaction, unhappiness, and
meaninglessness. Once alienated, the worker feels that work is forced on and external to
her. It logically follows that at the other end of the alienation-closeness continuum is
work that is enjoyable, engaging, creative, and fulfilling. Such work would be an end in
itself, resulting in employees’ human development at work and self-actualization through
work (Maslow, 2000; Sayers, 2005).
The steady rise in employees’ dissatisfaction at work over the last 25 years (i.e.,
from 34% in 1991 to 70% in 2012) suggests that (a) jobs are too small for people’s
capabilities, and (b) the use of the corporation as a legal entity through which people do
work needs to change (Gallup, Inc., 2013; Winkler, 2018). These two issues are
32connected, as changes in the way corporations operate could expand jobs to
accommodate more human capabilities.
The corporation is a political, legal, and economic entity, vested with limited
liability and governed by its executives and shareholders (Winkler, 2018). With
employees playing a secondary, sometimes tertiary, role in the modern corporation, and
with finance being the master instead of the servant (Korten, 2015), notions of job
satisfaction, human development, job autonomy, and employee creativity seem outright
preposterous. Instead of enjoying work, employees are driven to work. In a study of 346
managers at 311 U.S. organizations, Graves, Ruderman, Ohlott, and Weber (2012)
discovered that being driven to work related negatively to self-esteem and did not relate
to performance, while enjoyment at work related positively to managerial performance
and career satisfaction, but related negatively to psychological strain.
The divergent aims of the corporation and its employees create friction in the
employee-organization relationship (OER) that can be allayed only when the corporation
stops seeking a solely transactional relationship with its employees and embraces
relational strategies that give meaning to employees’ work experience (Fitzsimmons &
Stamper, 2014). Drawing on social exchange theory (Cropanzano & Mitchell, 2005), the
OER is most optimal when it is reciprocal, with both sides having a common
understanding of the relationship, and the exchanged resources are valued by each
recipient (Coyle-Shapiro & Shore, 2007).
The following comprehensive review of the literature on workplace fun,
organizational playfulness climate, and organizational creativity shows that, when
33implemented and realized, these organizational variables turn work into an end
in itself. The hypothesized relationships stem from the belief that the “employee-
organization relationship should be related to pressing organizational issues, such as
creativity” (Coyle-Shapiro & Shore, 2007, p. 176), and from the premise that being
creative is the highest level of human development (Sayers, 2005).
Workplace Fun
Fun at work sounds good to some people and strange to others. It could be fun to
talk to a coworker in a hallway about tennis. It could be fun to look at a body of water
out an office window. It could also be fun to sing, or read phone texts from friends
during a conference call. Although such activities may seem unproductive and non-
essential for the operation of a company, they serve several purposes.
One purpose is employee relaxation or taking a break from the stress of work.
Another purpose is meditation, or focusing of one’s attention. A third purpose is playing
with friends, or deepening workplace relationships through communication, interaction,
and exchange of ideas. When promoted, such non-essential activities at work become
organizational resources (Demerouti, Bakker, Nachreiner, & Schaufeli, 2001; Wernerfelt,
1984).
Workplace fun is one of those seemingly non-essential employee activities turned
a resource. Research conducted over the past 15 years confirms this claim. Karl,
Peluchette, Hall, and Harland (2005) surveyed employees at 18 companies across sectors
(i.e., five public, seven private, and six nonprofit) and found that they viewed workplace
fun as important, desirable, appropriate, and leading to positive consequences. In a
34related study including 572 human resource managers, Ford, Mc Laughlin, and
Newstrom (2003) reported that most managers believed in promoting workplace fun,
because it offered benefits to both employees and the organization. One those benefits is
that workplace fun dispels boredom, which, according to Harju et al. (2014), often leads
to negative health- and work-related outcomes, such as poor overall health, higher stress,
high turnover intentions, and low workability, among others.
Another important benefit of workplace fun is that it alleviates the burden
imposed on employees by work (Bolton & Houlihan, 2009). When employees have fun
at work, they change cognitive frames and focus on non-work-related activities that lead
to mental and physical relaxation. Glasser (1994) claimed that fun at work is the highest
employee need. In contrast to Maslow’s (2000) hierarchy of needs, in which the highest
human need is self-actualization, Glasser looked at human needs in organizational
settings from a control theory perspective. Given that most work aspects are controlled
by management or policies instituted by management, the locus of control at work is not
with the employee, but with the management. In having fun at work, employees regain
control of their work experience.
In addition to employees’ hierarchy of needs proposed by Glasser (1994),
Baptiste’s (2009) exploration of the well-being of 12 public sector managers in England
showed that some employee needs must be satisfied before workplace fun can occur. For
example, factors that defined well-being for those managers included work-life balance,
stress management, management support, and a sense of purpose. The managers
35revealed that if issues such as stress, anxiety, anger, pessimism, and
unhappiness are not addressed at work, workplace fun cannot be enacted.
When workplace fun is adopted by organizations, employees go to work knowing
that a portion of their workday will be enjoyable and that time will pass faster. Sucala,
Stefan, Szentagotai-Tatar, and David (2010) tested this hypothesis by examining the
relationship between expectancies and the perception of time progression. Study
participants in the “enjoyment expectancies” group rated a task as more enjoyable and
less boring than participants in the “boredom expectancies” group. Time passed more
quickly for the “enjoyment expectancies” group than for the “boredom expectancies”
group. Based on these findings, it follows that employees evaluate time as passing more
quickly if they expect to have enjoyable tasks at work and more slowly if they expect to
have boring tasks.
Although both researchers and working professionals agree on the general
benefits of workplace fun, studies in which fun at work is used as a unitary construct do
not reveal its complexity. In two qualitative studies at four companies (Study 1) and
eight companies (Study 2), Plester et al. (2015) revealed the existence of three categories
of workplace fun (i.e., managed fun, organic fun, and task fun), with each category
having its own distinctive features. Managed fun was fun created by management and
imposed on employees. Although appreciated by employees, managed fun had a
coercive element, which created negative emotions in employees and provoked cynicism.
Organic fun emerged spontaneously and was the most common type of workplace fun.
36Task fun, whereby employees have fun while doing specific work tasks, was
considered most important by study participants.
McDowell (2004) was the first to propose four workplace fun dimensions (i.e.,
socializing, celebrating, personal freedoms, and global fun) whose impact on various
workplace outcomes has been investigated in several studies (Becker & Tews, 2016;
Fluegge-Woolf, 2014; Tews et al., 2014; Tews et al., 2015). In a study of 195 servers at a
national restaurant chain, Tews, Michel, and Stafford (2013) examined the impact of two
workplace fun dimensions, fun activities and manager support of fun, on employee
turnover and performance. Findings indicated that fun activities did not relate to
turnover, but related positively to performance. Manager support for fun related
negatively to turnover, but did not relate to performance. Further, the impact of fun
activities on turnover and performance was not stronger when there were greater levels of
manager support for fun. Across ages, fun activities were a stronger predictor of
performance for older than younger employees, while manager support for fun was a
stronger predictor of turnover among younger employees than among older employees.
Becker and Tews (2016) extended Tews et al.’s (2013) findings by investigating
the impact of workplace fun on experienced fun, work engagement, constituent
attachment, and turnover. Results showed that fun activities related positively to
employee engagement and constituent attachment. Out of the three facets of workplace
fun used in the study (i.e., fun activities, socializing with coworkers, and manager support
for fun), only celebrations, a fun activity, had a negative relationship with turnover.
Socializing with coworkers was not significantly related to turnover. Manager support
37for fun related positively to turnover for employees over 30, but not for
employees under 30.
Although some of Tews et al.’s (2013) results align with Becker and Tews’s
(2016) results, other findings, such as the effect of manager support of fun on turnover,
contradict Becker’s findings. These contradictions might be occurring because the
organizational contexts in the two studies were different (i.e., hotels vs. restaurants) and
the studies used different samples (i.e., hotel workers vs. restaurant servers). This
highlights the importance of contextual factors in determining the outcomes of workplace
fun.
In a follow-up study that tested the relationship between workplace fun and
employee turnover, Tews et al. (2014) added constituent attachment as an independent
variable, in addition to fun activities, coworker socialization, and manager support of fun.
Using a sample of 296 servers at a casual dining restaurant chain, the researchers found
that fun activities did not relate to turnover, while coworker socialization and manager
support for fun related negatively to turnover. Coworker socialization had a stronger
relationship with constituent attachment and turnover than did fun activities, while fun
activities had a slightly stronger relationship with constituent attachment than manager
support for fun. These results indicate that the relational aspects of workplace fun have
the strongest influence on organizational outcomes.
An argument can be made that the results in the studies by Tews and colleagues
stem from the specific organizational context in the hospitality industry, which facilitates
the salient outcomes of workplace fun. Research in the healthcare industry by Karl and
38colleagues (Karl & Peluchette, 2006; Karl, Harland, Peluchette, & Rodie, 2010)
counters such an argument. In an experimental study on the impact of workplace fun on
perceptions of service quality at a hospital, Karl et al. (2010) found that workplace fun
did not significantly influence patients’ responsiveness, assurance, intent to return, intent
to refer, and intent to complain. Level of fun had a positive effect on intent to complain
for patients waiting a short time and a negative effect on intent to complain for patients
waiting a long time. In an earlier study with a sample of 142 healthcare workers, Karl
and Peluchette (2006) reported that the greater the degree of experienced emotional labor,
the greater the emotional exhaustion of healthcare workers. The negative impact of
emotional exhaustion on job satisfaction was significantly weaker for those employees
who experienced greater levels of workplace fun than it was for employees who
experienced low levels of workplace fun.
Recent research on workplace fun has also revealed the influence of workplace
fun on employees. Chan and Mak (2016) surveyed 240 employees at a retail firm in
Hong Kong and reported that workplace fun related positively to employees’ job
satisfaction and trust-in-management, with the positive relationship between workplace
fun and trust-in-management being stronger when employees experienced high level of
fun at work. In India, Patel and Desai (2013) discovered a significant positive
relationship between workplace fun and employee morale and performance, as well as a
positive influence of workplace fun on employee and organizational reputation,
organizational culture, employee enthusiasm, and employee productivity.
39Fluegge-Woolf (2014) found similar relationships between fun at work
and job performance in a study of 245 working university students. Whereas fun at work
positively impacted both task and creative performance, albeit through indirect effects, it
also related positively to positive affect, work engagement, and organizational citizenship
behaviors. These findings indicate that workplace fun provides an array of work-related
individual benefits and has cross-cultural validity as an organizational construct.
On a team level, using a sample of 271 hotel employees across the United States,
Han et al. (2016) discovered that workplace fun activities facilitated both emergent states
and promoted positive team processes, which enhanced team performance. Specifically,
workplace fun activities related positively to experienced workplace fun and
interpersonal trust. Experienced workplace fun moderated the positive relationship
between workplace fun activities and interpersonal trust and related positively to group
cohesion. Experienced workplace fun and interpersonal trust mediated the relationship
between workplace fun activities and group cohesion. While interpersonal trust mediated
the negative impact of workplace fun activities on task conflict and relationship conflict,
group cohesion mediated the relationship between experienced workplace fun and
interpersonal citizenship behavior. In turn, group cohesion and interpersonal citizenship
behavior related positively to team performance.
The positive influence of workplace fun on employees and work teams indicates
its significance as a job resource. This might be the reason why companies that promote
workplace fun tend to attract more job applicants than companies that do not promote
workplace fun. Tews et al. (2012) tested the effect of fun on applicant attraction and
40reported that workplace fun had a positive impact on applicant attraction, as
well as a stronger positive impact on applicant attraction than compensation and
advancement opportunities. Fun coworker interactions had a stronger positive impact on
applicant attraction than did formal fun activities across perceived fun, perceived person-
organization fit, and offer acceptance intentions.
Despite its positive role in organizational life, workplace fun is not equally
perceived by all employees. Lamm and Meeks (2009) investigated the effect of
workplace fun on three generations—Baby Boomers (born between 1941 and 1960),
Generation X (born between 1961 and 1980), and Millennials (born after 1980)—and
found that generational cohorts had different attitudes toward workplace fun.
Specifically, the associations between workplace fun and job satisfaction, and workplace
fun and task performance, were stronger for Millennials than for Generation Xers.
Although the relationship between workplace fun and organizational citizenship behavior
was more positive for Generation Xers than Millennials, Baby Boomers had higher job
satisfaction than Generation Xers due to workplace fun.
The importance of workplace fun for Millennials was tested in a recent study by
Tews et al. (2015), who used a sample of 234 full-time working Millennials. Findings
showed that 49% of the variance in job embeddedness was explained by workplace fun.
Coworker socializing and fun job responsibilities were positively and significantly related
to Millennials’ embeddedness, while fun activities and manager support for fun were
non-significant to embeddedness. The three best predictors of embeddedness were fun
job responsibilities (38.5%), perceived career opportunities (16.5%), and tenure (10.2%).
41In addition to the difference in perception of workplace fun across
generations, individuals also have different dispositions toward workplace fun. Hart and
Albarracin (2009) showed that people’s level of achievement motivation impacted the
goals they pursued. Over the course of four experimental studies, individuals with
chronically high-achievement motivation prioritized achievement over fun, while people
with low-achievement motivation prioritized fun over achievement. The two groups
performed differently depending on the framing of a task and the presence of
achievement primes. These findings reveal the role of employees’ motivation in
perceiving workplace fun. Whereas some employees may see fun at work as a distraction
that negatively affects their performance, other employees may view workplace fun as a
performance booster.
To further examine types of fun, individual attitudes toward fun, and their relation
to personality and biological factors, McManus and Furnham (2010) conducted a mixed-
method study with 1,100 participants. The types of fun that emerged included sociability,
contentment, achievement, sensual, and ecstatic. Fun also meant different things to
different people. To some participants fun was akin to risk-taking, while to others fun
was being around fun people, or having money, or being spontaneous. In general,
extraverts had more fun than introverts. The descriptors of fun with the highest
percentage of agreement among the participants were happy (71.8%), laughing (62.2%),
entertained (51.6%), stress-free (47.9%), excited (47.7%), energetic (47.6%), relaxed
(46.6%), joyful (44.0%), joking (43.8%), playful (43.2%), and talking (40.3%).
42These results show that fun is a complex concept encompassing
affective and motivational dimensions. Based on their personality characteristics,
individuals see fun in different ways and in different types of activities. A construct that
unifies most descriptors of fun is humor.
According to Westwood and Johnson (2013), there are two approaches in
addressing humor in organizations: functionalist approach (i.e., humor as a managerial
tool towards a goal) and a non-functionalist approach. In the functionalist approach,
humor is perceived as serving a purpose and objectives. In the non-functionalist
approach, humor is perceived as resistance to and subversion of the status quo. In
addition, prior research has discovered four humor types (i.e., affiliative, self-enhancing,
self-defeating, aggressive) and tree humor clusters (i.e., humor endorsers, humor deniers,
self-enhancers) (Evans & Steptoe-Warren, 2015). In alignment with the non-functionalist
perspective, Kenny and Euchler (2012) observed the role humor played in organizational
settings during a qualitative study at an advertising agency, where they found two
contradictory approaches to humor: (a) humor as a tool to subvert forms of dominance
and challenge the status quo, and (b) humor as a tool for both questioning and asserting
control at work.
In a recent field study, Watson and Drew (2017) complemented the findings by
Euchler (2012) by showing that humor could serve as a means to accomplish strategic
ends that could be otherwise damaging or unacceptable to members of a group. Using a
sample of six university officials and four local Scottish authorities during three official
meetings on the subject of long-term professional learning of teachers, the researchers
43found that different group members used humor for different purposes. In the
first meeting, a local official used humor to assert her influence on the workgroup. In the
second meeting, a university official used humor to assume authority by making a turn in
the conversation, which established her leadership position in relation to the group chair.
In the third meeting, a university official used humor to show power covertly during a
tense discussion between university officials and local authorities. These observations
reveal the benefits of using humor within a play frame to settle matters of leadership,
decision-making, and power in nonthreatening and amusing ways.
Recent research points to important individual and group benefits of workplace
humor. Mesmer-Magnus et al. (2012) conducted a meta-analysis of positive humor in the
workplace and discovered that employee humor related positively to health, coping
effectiveness, work performance, workgroup cohesion, but related negatively to burnout,
stress, and work withdrawal. Supervisor humor related positively to workgroup
cohesion, subordinate perceptions of supervisor performance, subordinate job
satisfaction, subordinate work performance, and subordinate satisfaction with supervisor,
and related negatively to subordinate work withdrawal. This evidence implies that
workplace fun and humor should be cultivated by both leaders and employees.
Expanding the level of analysis to the team, Lehmann-Willenbrock and Allen
(2014) examined the relationship between humor patterns in team interactions and team
performance, using a sample of 54 German teams at two industrial organizations. Results
showed that humor patterns related positively to team performance, with job security
climate moderating the relationship between humor patterns and team performance, such
44that the relationship was stronger when job security climate was low. Humor
patterns triggered new ideas (i.e., creativity), and it was humor patterns, not humor alone,
that related to team performance. These findings highlight the importance of humor in
organizational contexts.
Workplace humor is especially important in the service industries. In examining
the role of humor usage on creativity, trust, and performance in business-to-business
relationships, Lussier et al. (2017) reported that salesperson humor did not have a direct
effect on salesperson objective performance in a sample of 149 salesperson-customer
dyads across four industries in Canada. Humor usage had a direct positive effect on
salesperson creativity and customer trust, with salesperson creativity and customer trust
mediating the relationship between salesperson humor usage and objective performance.
An interesting finding in this study was that salesperson creativity served as a more
proximal variable to salesperson objective performance than humor usage.
The recent empirical research on organizational humor confirms Westwood and
Johnson’s (2013) view that humor is pervasive in organizations and central in human
interactions. Despite mounting positive evidence in support of implementing workplace
fun and humor in organizational settings, a few critical questions remain unanswered: Is
workplace humor and fun boundless? What are the negative effects of workplace fun? If
there are negative effects of workplace fun, what are the underlying dynamics of these
effects?
Plester (2013) answered these questions in an ethnographic study at a small IT
firm in New Zealand. Findings from 13 interviews showed that when humor had no
45boundaries, its darker side appeared. Humor distracted from business
processes, led to the damage of property, and hurt people, both physically (from a
practical joke) and emotionally. Humor was also used to control employees’ behavior.
Employees who didn’t join in the festivities felt that their position in the company was
threatened.
In an earlier ethnographic study at four companies, Plester (2009) discovered that
organizational formality influenced workplace fun boundaries. The more formal the
organization, the less fun was experienced by employees, and the more defined the
boundaries of workplace fun. Boundaries were determined by both employees and
external factors (i.e., industry, society), which indicated that workplace fun was a
bounded social activity.
In another ethnographic study, Medeiros and Alcapadipani (2016) interviewed 13
current and past employees at fast-food and call-center companies in Brazil in order to
examine whether misbehavior and humor served as forms of resistance and subversion.
Thematic analysis of the interviews showed that when employees felt wronged, they
engaged in overt or covert misbehaviors that served as revenge toward the wrongdoer and
resulted in laughter among coworkers. Employees used humor as a revolt against feeling
undervalued and to resist a sense of alienation caused by the type of work they did. In
this type of misbehavior, humor resulted from dissatisfaction of personal needs. In other
situations, humor expressed dissatisfaction with company policies, management, or
customers. Employees felt helpless and needed to retain some control. In those cases,
pranks and humorous behaviors became a form of subversion against the status quo.
46These findings counter the functionalist, positive perspective of organizational
humor and support the complex, non-functionalist perspective of humor as a form of
resistance and subversion.
More recently, Tremblay and Gibson (2016) found that different styles of humor
act as boundary conditions in the relationship between transactional leadership behaviors
and perceived supervisor support within a sample of 284 employees at nine small
companies in Canada. Employees perceived high contingent reward leaders as less
supportive when they used constructive humor and more supportive when they used less
constructive humor. Conversely, employees perceived weak contingent reward leaders as
more supportive when they used constructive humor. Employees perceived high
contingent reward leaders as less supportive when they used self-defeating humor and
more supportive when they used less self-defeating humor. Employees perceived high
contingent reward leaders as more supportive when they exhibited aggressive humor and
weak contingent reward leaders as less supportive when they used aggressive humor (i.e.,
undermining effect). Aggressive humor exacerbated the negative effect of laissez-faire
leadership behaviors on perceived supervisor support, such that employees perceived
high laissez-faire leaders as least supportive when they used aggressive humor. The use
of constructive humor had no effect on the relationship between laissez-faire leadership
behaviors and perceived supervisor support.
While Tremblay and Gibson (2016) focused on the negative impact of leaders’
humor usage, Söderlund and Oikarinen (2018) examined the effect of employee humor in
the hospitality industry on customer satisfaction in two experimental studies. Employee
47joke-telling in face-to-face encounters with customers reduced the customers’
perceptions of the relevance of what the employee said and attenuated customer
satisfaction. Perceived relevance and customer affect mediated the negative relationship
between joke-telling and customer satisfaction. These findings imply that humor is not
superior to non-humor across workplace situations. Who uses humor (i.e., manager vs.
employee) is important in understanding the various organizational outcomes stemming
from humor usage.
Based on the presented empirical evidence, a clear gap in the study of workplace
fun has emerged. Despite its demonstrated benefits at work, workplace fun is not always
fun for all employees and remains a management tool used to manipulate the
organizational climate, stifle employees’ self-expression and true identities, and keep the
locus of control with management. As such, the current procedures used by managers to
implement fun at work do not yield optimal organizational results. The recent research
on workplace fun explains why workplace fun should be implemented in organizations,
but not how.
Idiosyncratic Workplace Fun
A solution that might resolve the negative effects of workplace fun and enhance
its positive effects is idiosyncratic workplace fun (IWF). Idiosyncratic workplace fun is
volitional workplace fun that is specific to an employee. It is rooted in the notion that “it
is the very person who knows best what is fun to himself/herself” (Han et al., 2016, p.
1408). As such, IWF is an intrinsically motivated type of workplace fun. Because IWF
is chosen by employees and exercised at their discretion, the coercive element of
48management-imposed fun is removed and the locus of control is transferred to
employees. This allows employees to engage in fun activities that reflect their true
identities and bring them joy, amusement, and laughter at work.
Idiosyncratic workplace fun is related to, yet distinct from, independent play,
which is play at work that is performed individually by employees (Patelczyc, Capezio,
Wang, Restubog, & Aquino, 2018). For an activity to be considered play, it has to meet
the criteria of amusement, immersion (i.e., flow), and interactivity (Van Vleet & Feeney,
2015). Idiosyncratic workplace fun could be enjoyable and immersive, but not
interactive. Engaging other employees in workplace fun initiates social dynamics and
leads to social play (Patelczyc et al., 2018).
Recent research on autonomy in the workplace provides initial support to the
possible benefits of IWF. Autonomy at work decreases employees’ end-of-work fatigue
(Trougakos, Hideg, Cheng, & Beal, 2014), buffers the relationship between work-life-
conflict and turnover intentions, job satisfaction, and organizational commitment
(Brauchli, Bauer, & Hammig, 2014), and relates positively to employees’ psychological
empowerment (Liu, Zhang, Wang, & Lee, 2011). Legault and Inzlicht (2013) found that
autonomous motivation related positively to performance and related negatively to
performance errors.
Job autonomy is also positively associated with employee creativity (Joo et al.,
2014) and moderates the relationship between the quality of leader-member exchange
(LMX) and creative work involvement, such that the relationship is stronger for
employees with greater job autonomy (Volmer, Spurk, & Niessen, 2012). A meta-
49analysis by Fischer and Boer (2011) on the effects of wealth and autonomy on
the well-being of citizens in 63 countries revealed that there was no linear relationship
between wealth and well-being, while individualism, rooted in autonomy, was the best
predictor of well-being. This evidence confirms the primary significance of autonomy in
self-regulation, highlights the importance of satisfying individuals’ need for autonomy,
and validates self-determination theory (SDT).
Deci and Ryan (2000) postulated that the need for autonomy, along with the needs
for competence and relatedness, is an innate and universal psychological need, essential
for psychological growth and well-being. Autonomy underlies all types of motivation on
the motivational continuum, from amotivation to intrinsic motivation (Ryan & Deci,
2000). If autonomy is thwarted, individuals experience alienation and ill-being, and
develop self-defeating behaviors that further perpetuate the dissatisfaction of the need for
autonomy (Deci & Ryan, 2000, 2008). When autonomy is endorsed, individuals
experience greater energy and vitality, as well as increased motivation and psychological
well-being (Deci & Ryan, 2008).
Given that organizational leaders play a primary role in supporting or thwarting
any type of workplace fun, their endorsement of idiosyncratic workplace fun might
facilitate numerous positive organizational outcomes, including organizational creativity.
According to leader-member exchange (LMX) theory, leaders can affect employees in
positive ways only when the relationship between leaders and employees is of high
quality (Omilion-Hodges & Baker, 2017). Recent studies have shown that the quality of
the leader-member exchange associated positively with both employee creativity (Joo et
50al., 2014) and teams’ creative work involvement (Kahrobaei & Mortazavi,
2017). Of the seven types of leadership (i.e., transformational, transactional, ideological,
servant, authentic, ethical, and spiritual) only transformational and servant leaders
provide individualized consideration of their subordinates’ needs (Anderson & Sun,
2017).
Leaders’ endorsement of idiosyncratic workplace fun is not an isolated
organizational phenomenon, as it exists alongside other organizational constructs. One of
the most critical organizational constructs is organizational climate, simply defined as the
sum of formal and informal ways of operating and doing business by an organization
(Thumin & Thumin, 2011). In this study, I examine the impact of organizational climate
rooted in playfulness, or organizational playfulness climate, on organizational creativity.
Organizational Playfulness Climate
Recent research on organizational playfulness climate is virtually nonexistent.
Although Yu et al. (2003) developed an organizational playfulness climate questionnaire
15 years ago, no empirical studies since then have validated the instrument outside of
Taiwan. This is rather strange, as companies with organizational playfulness climate,
such as technology companies, advertising agencies, and toy producers, proliferate
around the globe. This study was the first U.S.-based study in which organizational
playfulness climate was investigated.
Organizational playfulness climate includes two components: organizational
climate and organizational play. Both constructs are multidimensional and interrelated,
as organizational climate subsumes organizational play. Due to the lack of studies on
51organizational playfulness climate, recent research on organizational climate
and organizational play has been discussed separately and then integrated into a cohesive
construct for the purposes of this study.
Organizational Climate
Although research on organizational climate has been ongoing for over four
decades, there are still gaps and inconsistencies in the literature that require investigation.
A key reason for these gaps is the confusion among scholars and practitioners about the
difference between organizational climate and organizational culture (Denison, 1996).
Organizational climate is operationalized as employees’ shared perceptions of the
organizational social context, manifested in organizational behaviors, practices, policies,
and procedures (Schneider, Ehrhart, & Macey, 2013). In contrast, organizational culture
is defined as a set of time-tested assumptions shared by the members of a group and
passed along to new group members that emerged as the group solved external problems
of adaptation and internal problems of integration (Schein, 2010).
Due to the all-inclusive nature of the organizational context, researchers have not
been able to agree on the structural composition of the organizational climate construct.
This is reflected in two recently designed measures of organizational climate: the Survey
of Organizational Characteristics (SOC) by Thumin and Thumin (2011) and the
Organizational Climate Scale (OCS) by Pena-Suarez, Munoz, Campillo-Alvarez,
Fonseca-Pedrero, and Garcia-Cueto (2013). Although the empirical studies on which
these two instruments are based are different in terms of sample size, sample industry,
and sample site, both measures encompass multiple dimensions and over 50 survey items.
52Only one organizational climate dimension, rewards, is included in both the
SOC and the OCS. The little overlap between macro-level organizational climate
instruments have prompted researchers to focus on strategic and domain-specific
climates, such as creative climate and support climate, as well as on industry-specific
climates.
Based on the assumption that job satisfaction is a close proxy of the
organizational climate at companies, two other recent investigations of the organizational
climate construct demonstrated the complexity in measuring organizational climate at
companies. Coda, da Silva, and Custodio (2015) used a sample of 518 employees at
various companies in Sao Paulo, Brazil, to design and validate an Organizational Climate
Measuring Tool (OCMT) that could be used in organizations across industries. After the
researchers obtained 100 assertive statements from a review of the organizational climate
literature, a panel of six experts grouped the statements into 15 organizational climate
dimensions, which, upon validation, formed five multiple dimensions: motivation,
leadership, management philosophy, nature of work, and people management. The final
OCMT consisted of 15 dimensions, composed of 84 indicators (i.e., assertive statements).
Focusing specifically on the banking industry, Tortorella, Escobar, and Rodrigues
(2015) developed a general satisfaction index (GSI) that improved upon prior GSIs by
using matrices and vectors from linear algebra instead of the arithmetic mean of
employees’ satisfaction percentage rate. The resulting GSI encompassed nine
dimensions and 27 questions. The dimensions included communication, company’s
image, training, leadership, professional growth, empowerment, motivation, recognition,
53and salary. While two of these dimensions, leadership and motivation, match
two of the multiple dimensions in the OCMT by Coda et al. (2015), six of the remaining
seven dimensions in the GSI match six of the 15 individual dimensions in the OCMT.
The match of organizational climate dimensions between these two organizational
climate instruments, however, could be attributed to cultural similarities of the
populations used in the construction of the instruments, as both investigations took place
in Brazil.
Despite the difficulty in solidifying the organizational climate dimensions, recent
studies show that researchers continue to examine the influence of a general
organizational climate on organizational outcomes. In a study on the impact of
organizational climate and team cohesiveness on employee commitment at public and
private banks in India, Basu (2016) used a sample of 360 bankers and an organizational
climate instrument with ten dimensions (i.e., appraisal and recognition, functional
coordination, effective discipline and policy, participative decision making, professional
growth, professional interaction, role clarity, customer orientation, supportive leadership
style, security and stability). Findings showed that organizational climate and team
cohesiveness did not relate significantly to employee commitment. Overall, the impact of
organizational climate on employee commitment did not differ between public and
private banks. The organizational climate between the private and public banks differed
only in terms of participative decision making, with employees in private banks
participating in decision making significantly more often than employees in public banks.
54 The relationship between organizational climate and job satisfaction is
critical in organizational settings, as it determines how employees behave at work. In
examining the effect of customer aggression and organizational climate of support on IT
professionals’ reaction to customer aggression and job satisfaction, Shih et al. (2014)
found that organizational climate of support positively impacted job satisfaction among
118 employees at IT companies in Taiwan. A higher organizational climate of support
also had a moderating effect on, or encouraged, a deep acting strategy when facing
customer aggression, but did not discourage a face acting strategy when receiving
customer aggression. This evidence shows the key role played by organizational climate
of support in industries with high emotional labor.
The organizational context impacts an array of other employee outcomes, in
addition to employees’ job satisfaction. Shanker (2014) examined the effect of
organizational climate on employees’ intention to stay with an organization, using a
cross-sectional study design and a sample of 615 participants at service organizations in
western India. An interesting aspect of this study was the inclusion of subscales of three
strategic organizational climates—relationship-oriented organizational climate, goal-
setting and work independence organizational climate, and power-oriented organizational
climate—in the survey. Results showed that both relationship-oriented organizational
climate and goal-setting and work independence oriented organizational climate
positively correlated to intention to stay, while power-oriented organizational climate
negatively correlated with intention to stay. These findings indicate the critical role of
organizational climate in predicting employee turnover.
55In examining the relationship between organizational climate and
turnover intentions, Hung, Lee, and Lee (2018) extended Shanker’s (2014) findings. The
researchers demonstrated that organizational climate related positively to organizational
commitment and negatively to turnover intentions, with organizational commitment fully
mediating the relationship between organizational climate and turnover intentions. Using
a sample of 771employees at a large insurance company in Taiwan, Hung and colleagues
found that while organizational commitment mediated the negative relationship between
organizational climate and turnover intensions, salary satisfaction moderated the path
from organizational commitment to turnover intentions, such that higher salary
satisfaction increased organizational commitment and decreased turnover intentions even
when work pressure was high.
Employee health is another individual outcome affected by organizational
climate. In examining the relationship between organizational climate, employee
bullying, and employee health among 400 employees at 20 universities in Pakistan,
Qureshi, Rasli, and Zaman (2014) found that organizational climate related negatively to
workplace bullying, while its influence on employee health was positive. Workplace
bullying mediated the relationship between organizational climate and employee health,
as expressed by disturbed sleep, depression, and anxiety. In South Africa, Mafini (2016)
revealed that four organizational climate components (i.e., manager-employee
relationships, working conditions, remuneration, and work allocation) predicted
employee well-being in a sample of 164 employees at seven service companies. The four
organizational climate components accounted for 44% of the variance explained in
56employee well-being. These studies show the importance of a constructive and
employee-centered organizational climate in mitigating social and psychosocial
workplace issues.
In terms of broader organizational outcomes, Shahin, Naftchali, and Pool (2014)
discovered that perceived organizational climate at medium-sized companies in
Mazandaran, Iran, related positively to organizational citizenship behavior and company
performance, especially in terms of the financial criteria, customers’ criteria, and growth
and learning criteria of performance. These results show that organizational climate
significantly influences organizational outcomes on every organizational level. The
richness of the organizational level outcomes affected by organizational climate is
evidenced in a study by Sharma and Gupta (2012), who conducted a mixed-method study
at 32 randomly selected IT companies on the impact of organizational climate and
demographics on project specific risks in the Indian software industry. Results showed
that the organizational climate dimensions (i.e., role clarity, high standards of work tasks,
effective supervision, and intrinsic fulfilment) significantly influenced the project specific
risks (i.e., SRS variability risk, team composition risk, control process risk, dependability
risk) in software projects.
An interesting aspect of the organizational climate construct is that some of its
dimensions directly affect organizational outcomes, while other dimensions have an
indirect effect, no effect, or both direct and indirect effects. Two recent studies
exemplified these situations. Fainshmidt and Frazier (2017) studied the effect of an
organizational climate for trust on the dynamic capabilities and competitive advantage of
57209 companies across industries in Israel and reported that climate for trust had
both a positive indirect effect on competitive advantage through the dynamic capabilities
of sensing, seizing, and reconfiguring, as well as a positive direct effect. In a study in
Turkey with a sample of 178 employees in the food, information, and restaurant
industries, Kaya and Baskaya (2016) found that the overall organizational climate and its
six dimensions did not relate significantly to employee individual performance, while an
ethical climate related positively to employee individual performance.
The studies by Shanker (2014) and Kaya and Baskaya (2016) highlight the
importance of studying the impact of concurrent organizational climates on employee and
organizational outcomes. Using a sample of 740 employees at two hospitals in Turkey,
Naldoken & Tengilimoglu (2017) investigated the effects of organizational climate in
terms of social interaction on knowledge management. Organizational climate,
comprised of warm climate, supportive climate, and innovative climate, related positively
and significantly to social interaction, comprised of trust, communication, and
coordination. The three climates related positively and significantly to the collecting and
sharing knowledge dimension of knowledge management, while only innovative climate
related significantly to the dimension storing and using knowledge. In the presence of
social interaction, the effect of organizational climate on knowledge management became
negative, suggesting that social interaction did not mediate, but determined the
relationship between organizational climate and knowledge management.
The integration of domain-specific climates also played a key role in a study by
Törner, Pousette, Larsman, and Hemlin (2017), who used a sample of 885 employees in
58137 workgroups at two construction firms and two mining companies in
Sweden to test whether a second-order climate of perceived organizational support could
help companies cope with paradoxical demands. Perceived organizational support (POS)
climate significantly predicted team production effectiveness, team innovation, safety
compliance, accident involvement, and ill-health symptoms, but did not predict sick
leave. A POS climate explained the variation in the measured outcomes as well as a non-
restricted second-order, general organizational climate. These findings suggest that there
are overarching, second-order climates that transcend domain-specific climates and
predict a wide array of organizational outcomes. This implies an overlap of
organizational climate aspects within domain-specific climates.
When two or more organizational climates are present at an organization, each
climate has its own unique pathways in influencing organizational outcomes. Lee and
Idris (2017) demonstrated this in a study that examined the difference between
psychosocial safety climate and team climate in influencing job engagement and job
performance within a sample of 412 employees at 44 companies across industries in
Malaysia. Findings revealed that psychosocial safety climate related positively to role
clarity and performance feedback, with role clarity and performance feedback mediating
the relationship between psychosocial safety climate and job engagement. Team climate
did not relate to role clarity and performance feedback, yet still related positively to job
engagement. Although both psychosocial safety climate and team climate related
positively to job performance through job engagement, the climates differed on how they
influenced those outcomes.
59Collectively, these studies show not only that organizational climate is a
complex, multidimensional construct, but that there is interactive complexity, created by
the impact of individual organizational climate dimensions on organizational outcomes
and by the interaction of multiple domain-specific climates. In recent years, two
organizational outcomes, creativity and innovation, have become highly researched, due
to their vital role in the success and survivability of companies. The following studies
illustrate the depth and breadth of the recent research on innovative and creative climates
and behaviors.
Yu, Yu, and Yu (2013) conducted a study on the effect of knowledge sharing and
organizational climate on innovative behavior and found that knowledge sharing and
organizational innovative climate significantly affected the innovative behavior of 403
participants at 33 financial and insurance companies in Taiwan. This finding is
important, because if organizational innovative climate affects innovative behavior at
financial companies, which are highly regulated, it can be assumed that this effect may be
valid in less regulated organizational contexts. A few recent studies confirm this
supposition.
In investigating the effect of job stressors and organizational innovation climate
on employees’ innovative behavior, Ren and Zhang (2015) reported that challenge
stressors associated positively with idea generation, while hindrance stressors related
negatively to idea generation in a sample of 282 employees in R&D teams at various
organizations in China. Hindrance stressors also moderated the relationship between
organizational innovation climate and innovative behavior, such that the relationship was
60weaker when hindrance stressors were high. Innovative climate related more
strongly to idea implementation than to idea generation. These results indicate that
organizational innovative climate is a contextual variable that influences innovative
behaviors along the entire innovation cycle.
The interaction between organizational climates noted earlier is also observed in
the literature on innovative and creative climates and behaviors. When Kang, Matusik,
Kim, and Phillips (2016) looked at the interactive effects of multiple organizational
climates on employee innovative behavior in 39 entrepreneurial firms in the Unites
States, they found that passion for inventing mediated the relationship between
organizational innovative climate and employee innovative behavior. Proactive climate
moderated the relationship between innovative climate and passion for inventing, such
that the relationship was stronger when proactive climate was high rather than low. Risk-
taking climate moderated the relationship between passion for inventing and innovative
behavior, such that the relationship was stronger when risk-taking climate was high rather
than low. The indirect relationship between organizational innovative climate and
innovative behavior via passion for inventing was strongest when both proactive climate
and risk-taking climate were high. A takeaway from this study is that several
organizational climates can interact to influence employee innovative behavior and that
the order of that interaction is of critical importance.
More recently, Hirst, van Knippenberg, Zhou, Zhu, and Tsai (2018) conducted a
cross-level study on the impact of exploitation and exploration climates’ influence on
performance and creativity among 70 engineering teams (317 employees) across
61industries in Australia, Taiwan, and China. Team exploitation climate had a
linear positive relationship with performance for individuals with lower performance self-
efficacy and a curvilinear relationship with performance for individuals with higher
performance self-efficacy, such that the positive relationship had diminishing returns for
higher levels of team exploitation climate. Team exploration climate had a linear positive
relationship with creativity for individuals with lower self-efficacy and a curvilinear
relationship with creativity for individuals with higher self-efficacy, such that the positive
relationship had diminishing returns for higher levels of team exploration climate. These
findings indicate that although supportive team climates and individual self-efficacy
might encourage employees to be more creative and perform better, there is a saturation
point beyond which the support and encouragement does not translate into better
outcomes.
In another integrative study, Zhu et al. (2018) studied the relationships between
two work team climates (i.e., collaborative climate and competitive climate), individual
motivation, and creativity among 54 R&D teams (238 employees) at a large tech
company in Taiwan. Intra-team competitive climate related positively to team members’
extrinsic motivation, but did not relate to team members’ intrinsic motivation. Intra-team
collaborative climate related positively to individual intrinsic motivation and had a direct
and significant effect on individual creativity, after controlling for intrinsic and extrinsic
motivation. Intra-team competitive climate did not relate to individual creativity. The
indirect positive relationship between collaborative climate and creativity through
intrinsic motivation was stronger when extrinsic motivation was low than when it was
62high. These results imply that collaboration climate facilitates enjoyment,
engagement, and workplace fun, which promote creativity, while competitive climate
does not lead to such team dynamics.
In terms of survivability, Mafabi et al. (2015) examined the impact of creative
climate and innovation on organizational resilience in a sample of 235 managers at 51
parastatal organizations in Uganda. Findings showed that creative climate related
positively to both innovation and organizational resilience, while innovation related
positively to organizational resilience and partially mediated the relationship between
creative climate and organizational resilience. These results suggest that variations in
creative climate could cause variations in innovation, which could lead to changes in
organizational resilience.
Despite the positive relationship between organizational climates and creative and
innovative behaviors, the relationship is not observed in all companies across industries.
In a study on the impact of abusive supervision and abusive supervisory climate on
salesperson creativity and sales team effectiveness among 421 employees in 102 sales
teams at a chain of pharmacies in China, Jiang and Gu (2016) found that abusive
supervisory climate related negatively to both team creativity (via average salesperson
creativity) and to sales team performance (via sales team creativity). Psychological
safety mediated the relationship between abusive supervision and salesperson creativity.
These findings suggest that the dominant organizational climate must promote physical
and psychological safety for employees to be creative at work.
63In some instances, however, firms have non-detrimental organizational
climates, yet creative outcomes do not materialize. Bjorkdahl and Borjesson (2011)
investigated the impact of organizational climate on capabilities for innovation among
462 employees at nine forest-based Nordic manufacturing firms and found that most
firms scored low on the creative climate dimensions of freedom, playfulness, liveliness,
and risk-taking. In terms of capabilities for innovation, half of the firms lacked systems
for collecting and handling ideas, and most firms scored low on the implementation
dimension. None of the firms were good at rethinking current business models. These
results show that some firms have limited capabilities for innovation, and point to the fact
that a creative climate is a necessary but not sufficient condition for being innovative.
What is also needed, perhaps, is a little bit of playfulness.
Organizational Play
The second component of organizational playfulness climate is organizational
play. Although the concept of play is well-known by every individual, research on
organizational play and playfulness has been lacking the rigor, breadth, and depth
evidenced in research on play in the area of child development. The paucity of
organizational play research is understandable, as business management and play are two
seemingly opposing constructs. Similarly to fun at work, play at work has been
perceived for decades as an unnecessary distraction that has no bearing on organizational
outcomes (Costea et al., 2007).
The work of Piaget (1962) and Papert and Harel (1991) established play as a
foundational human behavior, without which optimal human development was
64impossible. According to Piaget, children not only observe reality and build
knowledge incrementally, but they form knowledge structures based on their
observations and experience, most of them emerging from play. Piaget’s knowledge
theory is known as constructivism. Papert and Harel extended Piaget’s theory by
proposing a constructivist approach to learning, which involved playing with materials
and tools, and gaining new knowledge through the act of making something. In this way,
children build their knowledge of the world from both observation and hands-on
experience, with the two processes reinforcing each other. Papert and Harel’s
constructivist theory aligned with the eighteenth century notion of man as Homo faber, or
Man the Maker.
In proposing the theories of constructivism and constructionism, Piaget (1962)
and Papert and Harel (1991) acknowledged the significance of play not only in human
development, but also in the larger society. This argument was not new, as the
importance of play in culture had been expressed in the 1940s by Huizinga (2014), who
renamed the human race Homo ludens, or Man the Player. In his seminal text, Huizinga
examined the role of play in modern civilization, as well as the linkages of play to art,
philosophy, and knowing. One notable omission in Huizinga’s book is the link between
work and play. In the 1940s, work in organizational settings was the domain of Homo
sapiens, or The Wise Man.
The view of work as superior to play persisted until Csikszentmihalyi and Bennett
(1971) proposed an exploratory model of play, in which they looked at play from the
perspective of the player. Viewing games as a key expression of play, Csikszentmihalyi
65and Bennett highlighted the use of stimuli in games of all kinds (i.e., games of
chance, games of strategy, and games of skill). For example, as a player’s skills increase
in a game of skill, new stimuli have to be introduced. The absence of new stimuli would
invite boredom and collapse the state of play. In the presence of new stimuli, the player
strives to master them, thus increasing skill level and prompting the introduction of new
stimuli. This is how human potential is developed. In the confines of a work
environment, individuals cannot develop their human potential, because, by going to
work, individuals transition from a playing field with boundless stimuli to one with
limited stimuli.
Csikszentmihalyi and Bennett’s (1971) exploratory model of play received
support from March (1979), coauthor of the management classic Organizations (1958)
and co-creator of the term bounded rationality (along with Herbert Simon), who wrote
that business organizations needed a balance of play and rationality, so that new
organizational purposes are explored. According to March, without a theory of
foolishness, which included the use of impulse, intuition, playfulness, fun, and faith,
organizations relied on ideology of choice rooted in consistency and rationality, and
ignored the fluidity and ambiguity of human objectives. By acknowledging the need to
accept playfulness in social organizations, March revealed the need for research on
organizational playfulness and fun at work.
Dandridge (1986) advanced the first conceptual framework for integrating work
and play through ceremony. In this framework, ceremony encompasses organizational
play, as well as other ritualized and preplanned events, such as celebrations, coffee
66breaks, and ice cream socials. Ceremony creates a separate reality in
organizations, where play can exist without being functional in the typical work-related
sense. Although interesting, Dandridge’s perspective mirrored the concept of managed
fun, which recent research by Plester et al. (2015) deemed ineffective.
Four theoretical perspectives underlie current understanding of organizational
play: stimulus-seeking perspective of play, flow perspective of play, cathartic nature of
play, and social and cognitive perspectives of play (Petelczyc et al., 2018). The variety
of theoretical approaches to organizational play has stimulated three approaches to
studying play in organizations: play as an activity, play as a trait, and play as an
organizational feature (Petelczyc et al., 2018). Empirical research on organizational play
began in earnest in the 1990s.
The work of Tegano (1990) with 50 teachers at a childcare center showed that
both playfulness and tolerance of ambiguity significantly related to employee creativity, a
highly desired organizational outcome. In terms of employee performance, Webster and
Martocchio (1993) found that employees who received job software training as “play”
showed higher motivation to learn and performed better in a test that accessed software
knowledge. In a related experimental study, Glynn (1994) reported that individuals given
play task cues prior to doing a job remained means-oriented, which led to increased
performance quality and performance evaluation, while individuals given work task cues
remained ends-oriented, which lowered their performance quality and performance
evaluation.
67These early empirical studies on adult play and playfulness revealed the
promise of organizational play for enhancing employee performance, learning, and
creativity. Although organizational play must have happened at companies during the
dot.com years in the late 1990s, no published empirical studies evidenced that trend. An
advance in showing the power of organizational play occurred in the early 2000s, when
Pinault (2004), with the help of his colleagues at the Imagination Lab Foundation in
Switzerland, developed The Play Zone, an interactive environment using radio frequency
identification tags (RFIDs) and customer relationship management (CRM), designed to
deliver optimal customer experience. The Play Zone originated from LEGO® SERIOUS
PLAYTM, a creative process using play with LEGO bricks for modeling complex
relationships between organizations and consumers.
Despite its usefulness, the LEGO® SERIOUS PLAYTM is an exclusionary
process, as it is primarily used by business executives, who may or may not be playful
individuals. The process does not involve all employees at an organization and
represents a small part of the larger concept of organizational play. While Pinault (2004)
found benefits of play from the perspective of engaging with external stimuli, he did not
acknowledge the playfulness inherent in every employee and the possible organizational
outcomes that could emerge from it.
Research shows that playfulness at work leads to a host of employee benefits.
Yu, Wu, Chen, and Lin (2007) found that the playfulness trait and organizational
playfulness climate related positively to job satisfaction, employee creativity (expressed
as innovative behavior), and job productivity. Supportive leadership also related
68positively to innovative behavior. By framing work as play and expressing
their playfulness, employees turn workplaces into play spaces, where they can be
relational, generative, safe, and highly creative (Comm, 2018).
An example of such a play space is the Danish design firm Ryland Inc., where
Sorensen and Spoelstra (2012) conducted a qualitative study on the role of play at work.
Data from employee interviews and company documents revealed that play takes place at
work in three ways: play as a serious continuation of work, play as a critical intervention
into work, and play as a usurpation of work. A critical insight from this study is that play
can usurp work, while work cannot usurp play. This makes possible the emergence of
organizational playfulness climate.
Given that playfulness, or a person’s predisposition to make an environment or
situation more entertaining and enjoyable, is consistent across gender, age, cultures, and
time (Gordon, 2014), the effects of playfulness climate, as well as the significance of
playfulness, can be observed across contexts. In high schools, Chang, Hsu, and Chen
(2013) reported a positive relationship between playfulness climate in the class and
student creativity. In relationships, data collected from 327 adults in Germany, Austria,
and Switzerland showed that individuals in an intimate relationship felt more playful than
single individuals, with playful individuals preferring playful partners (Proyer & Wagner,
2015). Among elderly adults (i.e., 65 years or older), the negative effects of playfulness,
such as horsing around and being disruptive, disappear, and playfulness regulation across
contexts becomes the norm (Yarnal & Qian, 2011).
69Similarly to the playfulness dimensions of children (i.e., physically
spontaneous, socially spontaneous, cognitively spontaneous, humorous, and joyful),
playful adults are gregarious, uninhibited, comedic, and dynamic (Gordon, 2014). In
examining 627 young adults at two Midwestern universities, Barnett (2012) found that
the personality (degree of extraversion), affect (positive or negative), and motivation
(intrinsic or extrinsic) of adults explained 67.64% of male total playfulness and 93.09%
of female total playfulness. A salient outcome of being a playful, extroverted, and open
to experience individual is creativity, as adults who think of themselves as playful also
think that they are creative (Bateson & Nettle, 2014).
Whereas the expression of employees’ playfulness trait is rarely encouraged in
work settings, playfulness can also emerge as a state of mind provoked by contextual
cues. In a quasi-experimental study at eleven companies across industries, West, Hoff,
and Carlsson (2016) showed that play cues (i.e., playful props, childish sweets)
influenced positively the creative climate, playfulness, and productivity of 13 work
meetings in an intervention group of 123 employees. None of these effects occurred in
the five meetings held by 41 employees in the control group.
Despite these empirical findings, adult boredom is more evident in organizational
settings than adult playfulness (Butler, Olaison, Sliwa, Sorenson, & Spoelstra, 2011).
Tokarri (2015) conducted a descriptive meta-synthesis of 12 studies on organizational
play between 2002 and 2013 and reported that researchers have been investigating three
research strands: play as fun, pros and cons of organizational play, and management of
play. The meta-synthesis revealed that organizational play is rooted in employee
70authenticity and a sense of belongingness, which are not supported at work.
Study participants viewed work as “play gone wrong” (Tokarri, 2015, p. 99), a
constrained and institutionalized form of play. A shortcoming of this meta-synthesis is
that most of the reviewed studies related to workplace fun, not organizational play.
Based on the reviewed research on playfulness and organizational play, there
seems to be a disagreement in the literature about the nature of organizational play. At
one end of the spectrum is the definition of play as an autotelic activity that does not lead
to the achievement of a goal (telos) (Csikszentmihalyi & Bennett, 1971). As such, play is
intrinsically motivated and without rules (Del Mar, 2015). At the other end of the
spectrum is the concept of serious play, defined as a deliberate, intrinsically motivated
activity meant to facilitate the achievement of an extrinsically motivated organizational
goal (Statler, Heracleous, & Jacobs, 2011). In this conceptualization, play is tamed for
organizational purposes.
The issue with serious play is the assumption that employees can hold two
cognitive frames, one for work and one for play, at the same time. Holding in mind two
diametrically opposing intentions, and acting on both, cannot happen. One intention has
to take over the other. Statler et al.’s (2011) main argument is that workplace play can fit
into the old managerial ethos and be viewed as a paradox of intentionality. There cannot
be a paradox of intentionality because, in play, individuals lack analytic or exogenous
viewpoint on their behavior (i.e., self-consciousness) (Csikszentmihalyi & Bennett,
1971). If the self is forgotten in play, paradox of intentionality is impossible. The
71conceptualization of serious play can be valid only if play is viewed as
subordinate activity to work, which, according to Sorensen and Spoelstra (2012) can
never happen.
Aware of the confusion surrounding organizational play, Spraggon and Bodolica
(2013) proposed a solution by introducing the concept of social ludic activities (SLAa).
In contrast to serious play, SLAs are practice-based, spontaneous, employee-initiated, and
endogenously organized. While serious play is controlled, manager-driven, and
artificially triggered, SLAs are defined as practices aimed at coping with organizational
factors and work tasks. SLAs cannot be understood by rationality, but by the logic of
practice, and may or may not result in productivity. If learning and developing expertise
are the main goals of work (Örtenblad, 2018; Starbuck, 2017), organizational play must
remain irrational, and the decisions that emerge from play must remain non-rational.
This autotelic view of organizational play is consonant with Stec’s (2011)
argument that expertise cannot be captured in rule-based expert systems, as improved
performance and being creative require taking responsibility rather than taking
responsibility away from employees with foolproof rules. As a rule-based domain, work
does not allow the emergence of diverse aims and values, which only play can generate
(Del Mar, 2015). When we play to win, or be productive, at work, we disregard the fact
that play, as a concept, predates the concept of work (Del Mar, 2015). It is one of the
reasons why, as Sorensen and Spoelstra (2012) demonstrated, play can take over work,
but work cannot take over play.
72Defining Organizational Playfulness Climate
The integration of the concept of organizational climate and the concept of
organizational play results in the formation of a new multifaceted concept: organizational
playfulness climate (OPC). Similar to any other type of organizational climate, an OPC
is rooted in individual interactions that give rise to systems of shared actions and
reactions that become embedded in the organization (Schneider et al., 2013). The key
difference between OPC and other organizational climates is that the individual
interactions are founded on the notion of playfulness. The playfulness can be a trait that
employees express at work, or emerge as a state of mind prompted by organizational
context.
In designing the Organizational Playfulness Climate Questionnaire, Yu et al.
(2003) discovered eight factors that contributed to the emergence of an OPC: (1) close
cooperation and collaboration, (2) supportive managers and relaxed interactions, (3)
shared leisure time, (4) informality and humor, (5) inflexibility, criticism, and
competitiveness, (6) individual leisure and free time, (7) relaxation-conducive work
environment, and (8) independent work and casual dress code. It is noteworthy that the
OPC factors include autonomous behaviors, playfulness behaviors, and organizational
structures that are considered antecedents of individual and organizational creativity
(Bateson, 2014; Caniels et al., 2014) and workplace fun (Plester et al., 2015). In the
following section, I examine the organizational creativity construct and its hypothesized
relationship to idiosyncratic workplace fun and organizational playfulness climate.
73Organizational Creativity
Creativity is popular. A search in the book department of Amazon.com turned up
13,207 books directly related to creativity. Individuals and companies alike want to be
creative. This is ironic because individuals are wired to create (Kaufman & Gregoire,
2016). The Bible begins with the words, “In the beginning God created the heavens and
the earth.” The writers of the Bible did not use the verb made, or the phrase put together,
but the word create. Throughout time, people have created magnificent works of art,
buildings, tools, machines, services, and processes (Csikszentmihalyi, 1996). The
creative legacy people leave when they die is the proof that a human civilization existed
on earth.
Individuals were the dominant creators in society up until the beginning of the
Industrial Revolution. Today, the dominant creators are business organizations (Kelley
& Kelley, 2013). Although companies are social systems populated by individuals, the
inherent creativity of people does not translate into organizational creativity. The
structural complexity of organizations prohibits a creative employee from influencing
organizational creativity, unless the employee is a company leader known as a lone
genius (Coget, Shani, & Solari, 2014).
If creativity is defined as the creation of novel and useful products, services, and
processes within a social system (Runco & Jaeger, 2012; Woodman et al., 1993), then
employee creativity is necessary, but not sufficient to produce organizational creativity.
When employees form teams, the individual creativity of many employees is integrated
and organizational creativity emerges. Organizational creativity is a function of team
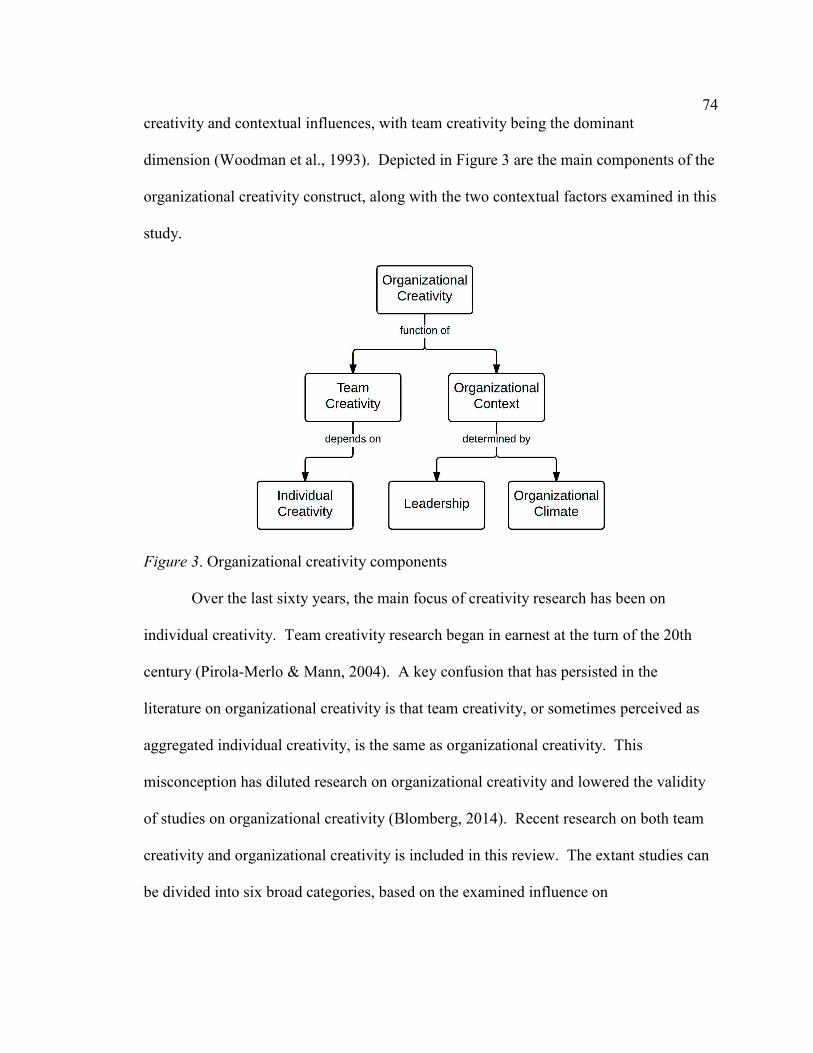
74creativity and contextual influences, with team creativity being the dominant
dimension (Woodman et al., 1993). Depicted in Figure 3 are the main components of the
organizational creativity construct, along with the two contextual factors examined in this
study.
Figure 3. Organizational creativity components
Over the last sixty years, the main focus of creativity research has been on
individual creativity. Team creativity research began in earnest at the turn of the 20th
century (Pirola-Merlo & Mann, 2004). A key confusion that has persisted in the
literature on organizational creativity is that team creativity, or sometimes perceived as
aggregated individual creativity, is the same as organizational creativity. This
misconception has diluted research on organizational creativity and lowered the validity
of studies on organizational creativity (Blomberg, 2014). Recent research on both team
creativity and organizational creativity is included in this review. The extant studies can
be divided into six broad categories, based on the examined influence on
75organizational/team creativity: leadership influences, team dynamics,
communication-related factors, internal psychological characteristics, controls and
constraints, and summative studies.
Leadership influences. In a study at 47 companies across industries in South
Korea (about 1500 employees), Yoon, Kim, and Song (2016) examined the influence of
top management team (TMT) characteristics on organizational creativity. The size of the
TMT and the average age of the TMT related negatively to organizational creativity,
while functional diversity in the TMT related positively to organizational creativity. The
findings suggest that smaller, younger, and functionally diverse TMT teams should be
employed at companies that rely on organizational creativity.
In an investigation with a different leadership focus, Wu and Cormican (2016)
studied the effect of shared leadership on team creativity in 22 chemical and mechanical
engineering design teams (158 employees) in Ireland. Density in a shared leadership
network related positively to team creativity, while centralization in a shared leadership
network related negatively to team creativity. Efficiency in a shared leadership network
was not related to team creativity, while there was an inverted U-shaped relationship
between strength and team creativity in shared leadership networks (i.e., as strength
increases, team creativity increases up to a peak, then decreases).
Although transactional leadership is rarely recommended as an antecedent of
organizational creativity, Hussain, Abbas, Lei, Haider, and Akram (2017) conducted a
study with 300 employees at a telecom company in Pakistan and found that both
transactional leadership and knowledge sharing behavior related positively to
76organizational creativity, with knowledge sharing mediating the relationship
between transactional leadership and organizational creativity. In contrast, Khattak et al.
(2017) also conducted a study in Pakistan, this time with 350 employees in the banking
sector, and reported that both transformational leadership and transactional leadership
significantly related to employees’ creativity, with transactional leadership having a
negative effect on employees’ creativity.
While empirical studies have shown that transformational leadership relates
positively to employees’ creativity, the pathways of the influence across organizational
levels are not clearly understood. Dong, Bartol, Zhang, and Li (2017) set out to discover
how dual-focused transformational leadership impacted individual and team creativity
within a sample of 171 employees in 43 R&D teams at eight companies in China.
Results showed that individual skill development mediated the relationship between
individual-focused transformational leadership and individual creativity. Team
knowledge sharing mediated the relationship between team-focused transformational
leadership and team creativity. Team knowledge sharing also moderated the mediated
relationship between individual-focused transformational leadership and individual
creativity via skill development, such that the relationship was stronger when there were
lower rather than higher levels of knowledge sharing. These findings suggest that
fostering individual and team creativity requires different and varied behaviors from
transformational leaders.
In addition to transformational, transactional, and shared leadership, Xu et al.
(2017) found that authentic leadership related positively to employee creativity in a
77sample of 428 employees in 63 teams across industries in Taiwan. Leader-
member exchange (LMX) and employee thriving at work sequentially mediated the
positive relationship between authentic leadership and individual creativity.
Psychological safety climate and employee thriving at work sequentially mediated the
relationship between authentic leadership and employee creativity. Authentic leadership
also moderated the indirect relationship between LMX and individual creativity, such that
the relationship was stronger when authentic leadership was high rather than low. These
findings demonstrate that authentic leadership uses different cross-level pathways to
affect employee creativity.
Although these studies reveal the strong influence of leadership styles and
components on team and organizational creativity, recent research shows a complex web
of concepts that interact with the leadership factors and contribute to the emergence of
organizational creativity. The influence of leaders on organizational outcomes is not an
isolated phenomenon, but a complex, interactive process.
The findings in a study by Park, Shin, Lee, and No (2015) support this argument.
The researchers examined the interactive effects of human resource management (HRM)
practices and CEO’s learning orientation on organizational creativity and found that the
employee evaluation system and the CEO’s learning goal orientation had a positive
interaction effect on organizational creativity. In contrast, a monetary reward system and
the CEO’s learning goal orientation did not have a significant interaction effect on
organizational creativity. These results suggest that the alignment of HRM formal
practices with informal CEO practices, such as learning orientation, positively influences
78organizational creativity, while distributing monetary rewards for performance
when emphasizing risk-taking and long-term perspective sends contradictory signals to
employees.
Another key factor that influences team creativity is leader-member exchange
(LMX) differentiation, or the degree to which the relationship quality between leaders
and members varies across dyads. Using a time-lagged research design with 358
employees from 98 teams at a Chinese conglomerate, Zhao (2015) reported that
relationship conflict mediated the relationship between LMX differentiation and team
creativity (after controlling for the mean LMX within the team). High team member
exchange alleviated the damages done by LMX differentiation on team processes and
outcomes (e.g., team creativity). These findings show the importance of positive team
dynamics in countering the ill effects of negative leadership factors on team creativity. It
is important to note here that recent research on organizational creativity is conducted
predominantly in countries in Asia, such as China, South Korea, and Taiwan, and
findings often vary from country to country.
In contrast to the positive results relating transformational leadership to team
creativity in a study conducted by Khattak et al. (2017) in Pakistan, Shin and Eom (2014)
discovered that team leaders’ transformational leadership at 11 South Korean companies
did not relate to team creative performance. Team creative efficacy and risk-taking
norms related positively to team creative performance, with team proactivity mediating
the relationship between team creative efficacy and team creative performance and the
relationship between risk-taking norms and creative team performance. These results
79indicate that team characteristics and dynamics could be equally, if not more,
significant to team creativity than leadership influences. A few recent studies confirm
this line of reasoning.
Team dynamics. In a study with a time-lagged design (3 data points), using a
sample of 354 employees from 72 teams at 11 information and technology companies in
China, Hu et al. (2018) found that team information sharing and team psychological
safety related positively to team creativity. Team power distance value moderated the
indirect relationship between leader humility and team creativity, such that the positive
indirect relationship became stronger when team power distance value was low than
when team power distance value was high. These results show that team variables often
act as mediators and moderators of the relationship between leadership and team creative
outcomes.
In another time-lagged study (4 data points) at a U.S. university, Langfred and
Moye (2014) used a sample of 31 four-person teams of MBA students to test the effect of
two types of team conflict on two team creative processes and a team creative outcome.
Relationship conflict related negatively and significantly to information exchange and
team creative problem solving, but not to the team creative outcome. Information
exchange and team creative problem solving did not mediate the negative and significant
relationship between task conflict and team creative outcome. This implies that the
different types of intra-team conflict use different pathways to affect team creative
processes and team creative outcomes.
80 A recent study by Rodriguez-Sanchez, Devloo, Rico, Salanova, and
Anseel (2017) provided empirical evidence of the relationships between team cohesion,
team task engagement, and team creative performance across creativity tasks. Using a
three-lagged design over three weeks with a sample of 605 participants (i.e., students,
full-time employees, unemployed workers) in 118 teams, the researchers reported that
team cohesion related positively to both perceived team performance and output
creativity, with team task engagement mediating the relationship between team cohesion
and team creative performance. In the cyclical relationship team cohesion-team creative
performance-team cohesion, only perceived task performance related significantly to
subsequent team cohesion, while output creativity did not facilitate the emergence of
team cohesion. These findings show that both team cohesion and team task engagement
play a vital role in helping teams become continuously creative.
Not all team dynamics, however, promote team and organizational creativity.
Tang and Ye (2015) conducted a study on the influence of diversified knowledge and
R&D team centrality on radical creativity among 207 employees in 32 R&D teams at
seven research institutes in China and found that R&D teams’ betweenness centrality of
knowledge networks moderated the relationship between diversified knowledge from
insiders and outsiders of the team and radical creativity, such that high betweenness
centrality decreased the positive impact of diversified knowledge on team radical
creativity. That is, diversified knowledge was better exchanged within a team when its
betweenness centrality was low. This helped teams to absorb knowledge better, which
led to increased team radical creativity. Collectively, the results from the studies
81involving team dynamics show that team and organizational creativity are
multilevel phenomena that include bottom-up interactions across organizational levels.
Communication factors. In addition to leadership influences and team
characteristics and dynamics, the studies by Dong et al. (2017) and Hu et al. (2018) point
to a third key factor that affects team and organizational creativity: communication,
expressed as information exchange, knowledge sharing, or knowledge management. In
studying the effects of knowledge management and self-organization on organizational
creativity, Uslu and Cubuk (2015) reported that corporate innovativeness and
organizational communication mediated the relationship of knowledge management and
self-organization with organizational creativity in a sample of 227 employees across
industries in Turkey. In that context, organizational communication and corporate
innovativeness determined organizational creativity the most.
In a related study, Jia et al. (2014) surveyed 229 work teams at 55 high-tech
companies in China and found that team members’ work-related communication density
related positively to team creativity. Task complexity moderated the relationship
between communication density and team creativity such that the relationship was
stronger when task complexity was high. The strength of the relationship between
employee-organization relationships and team creativity depended on task complexity
such that the relationship was stronger when task complexity was high.
The power of within-team communication to facilitate team creativity emerged in
an experimental study by Boies, Fiset, and Gill (2015), who assigned 137 students in 44
two-to-four person teams to three leadership conditions (inspirational motivation,
82intellectual stimulation, and control) and investigated the impact of leadership
dimensions on task performance and creativity. Teams assigned to the inspirational
motivation (IM) condition committed less task performance errors than teams assigned to
the intellectual stimulation condition (IS), which had less task performance errors than
teams assigned to the control condition. Teams assigned to the IS condition had a greater
creative performance than teams assigned to the IM condition, which had greater creative
performance than teams assigned to the control condition. Communication and trust
sequentially mediated the relationship between leadership and task performance and
between inspirational motivation and the novelty component of creativity. IS and IM
directly impacted the novelty component of creativity. Communication also mediated the
relationship between IS and the usefulness component of creativity, but not between IM
and usefulness. These findings suggest that within-team communication is crucial in
facilitating team trust and in translating the influence of leaders into better task and
creative performance.
While team communication can be an antecedent to team creativity, Carmeli,
Dutton, and Hardin (2015) found that respectful engagement (RE) acted as an antecedent
to relational information processing (RIP), which, in turn, affected creativity among
employees and teams. Carmeli and colleagues conducted four quantitative studies with
diverse samples and designs (604 participants in total) and discovered that respectful
engagement related positively to relational information processing, with RIP being
positively associated with employees’ creative behavior and team creativity. Relational
information processing mediated the relationships between respectful engagement and
83employees’ creative behaviors, as well as the relationship between respectful
engagement and team creativity. In addition to perceiving creativity as the result of
resources exchange, the findings in this study suggest that individual and team creativity
are also cultivated by the quality of employees’ interactions and the way they process
information at work together, in a conversation.
Leadership factors, team dynamics, and team communication are critical in
promoting team and organizational creativity. These influences, however, emerge from
psychological processes within the team that lay the foundation for the creative process.
These psychological factors operate on both individual and team levels.
Psychological factors. In examining intuitiveness and creativity in groups, Kim
et al. (2012) used a sample of 306 employees from 50 teams at two South Korean
manufacturing companies and showed that intuitive cognitive style related positively to
individual creativity, while systematic cognitive style did not relate to individual
creativity. Intuitive cognitive style related positively to creativity when group task
conflict was high, but not when it was low, while systematic cognitive style related
positively to creativity when group relationship conflict was high, but not when it was
low. The findings by Kim et al. relate to the concept of serious play discussed in the
section on organizational playfulness climate.
These results suggest that intuitive thinkers need heterogeneous information and
exhibit a promotion focus, while systematic thinkers need strict rules and exhibit
prevention focus. This is another reason why teams that intend to use serious play as a
tactic for promoting creativity would most likely fail. Evaluating and adjusting the
84cognitive style composition of a team is a complex, time-consuming process
that runs counter to the open-ended goal of generating creative outcomes.
An internal team element that also plays an increasingly important role in
organizations is the diversity beliefs of teams. Using 48 teams within an experimental
study design with a dual contingency model, Homan et al. (2015) discovered that for
teams with less positive diversity beliefs, there was a positive relationship between
attending diversity training and team creativity, but only to the extent that the teams were
high on nationality diversity. Providing diversity training to teams that had low
nationality diversity and low positive diversity beliefs resulted in reduced creativity.
These results suggest that nationality diversity in organizations is a necessary, but not
sufficient, condition for engendering team creativity.
Psychological factors facilitate team creativity on both individual and team levels.
Gonçalves and Brandao (2017) investigated the influence of team leaders’ humility on
team creativity with a sample of 73 teams (341 employees) at 40 companies across
industries in Portugal. On team level, psychological safety predicted team creativity. On
individual level, leaders’ humility predicted team creativity, with psychological safety
and psychological capital mediating their relationship. Taken collectively, these findings
indicate that psychological factors could both promote and constrain team and
organizational creativity. As the fifth research stream in the literature on organizational
creativity shows, organizational controls and constraints significantly impact creativity.
Team controls and constraints. In an exemplary longitudinal study involving
279 participants in 84 product development teams at electronics manufacturing firms in
85Taiwan, Chiang and Hung (2014) showed that new product development team
members’ aggregate creativity related positively to new product innovativeness.
Restrictive control worked in conjunction with team members’ aggregate creativity to
influence the innovativeness of team outcomes in teams composed of highly creative
members rather than in teams with less creative members. Promotive control worked in
conjunction with team members’ aggregate creativity to influence the innovativeness of
team outcomes in teams with lower levels of team aggregate creativity rather than in
teams with higher aggregate creativity.
In terms of constraints to team creativity, Rosso (2014) conducted a qualitative
study, using a purposive sample of four R&D teams at a Fortune 500 company, and
discovered that teams routinely encountered two main types of constraints: process
constraints (i.e., time, equipment, human resources, and money) and product constraints
(i.e., product requirements, customer and market needs, business needs, and intellectual
property). Process constraints limited approaches to the work, while product constraints
limited the possible outcomes. On a deeper level, Rosso found that the constraints
impacted team creativity in a positive or negative way depending on two types of team
dynamics: enabling dynamics and disabling dynamics. When teams had enabling
dynamics, they collaborated, communicated, were flexible and empowered, and exhibited
playfulness and humor. In the presence of enabling dynamics, process and product
constraints were perceived as opportunities. Playfulness was a big component of teams
with enabling dynamics. Teams with disabling dynamics struggled with collaboration,
communication, and all other organizational climate factors.
86The results of these studies indicate that team controls and constraints
can either enable or disable team and organizational creativity. This perspective aligns
with recent research by Saetre and Brun (2012), who found that the management of
innovation rested on the balance of creativity and constraint. Stokes (2006) offered a
similar perspective, theorizing that creative breakthroughs often happen when constraints
are in place. These results also suggest that leaders must be cognizant of the creative
abilities of each employee in order to optimize the creative capabilities of project
development teams.
Multiple factors. The last research stream in the literature on organizational
creativity includes summative studies, in which a large number of variables are
examined. Guistiniano et al. (2016) used a sample of 362 employees at five subsidiaries
of manufacturing multi-national corporations in Italy to investigate how knowledge
collecting fostered organizational creativity. Results showed that knowledge collecting,
top management support, and information and communication technology (ICT) had a
positive effect on organizational creativity. ICT moderated the relationship between
knowledge collecting and organizational creativity, such that when knowledge collecting
was low, high use of ICT was beneficial for organizational creativity. When knowledge
collecting was high, the high use of ICT was detrimental to organizational creativity.
Organizational creativity was highest when both top management support and knowledge
collecting were also high.
In an earlier study, Chamakiotis, Dekoninck, and Panteli (2013) conducted an
exploratory case study with six virtual teams (49 participants in total) at the European
87Global Project Realization (EGPR) to investigate factors that influenced
creativity in virtual design teams. The analysis of interview data revealed that
communication skills, relevant knowledge, task engagement, centered and shared
leadership, and asynchronous computer-mediated communication influenced team
creativity. Team heterogeneity and high synchronicity both promoted and inhibited team
creativity, while geographical dispersion only inhibited team creativity.
The summative studies on team and organizational creativity show the complexity
of the creative process. Factors on every level of the organizational environment
influence team and organizational creativity. Due to the high level of interaction between
the factors and each employee’s perception of these factors, their impact can never be
completely predictable (Runco & Jaeger, 2012).
Summary and Conclusions
The extant literature on leadership, workplace fun, organizational climate,
organizational play, and organizational creativity reveals the multifaceted nature of the
examined variables. In addition to managed fun, organic fun, and task fun (Plester et al.,
2015), the existence of a fourth type of workplace fun, idiosyncratic workplace fun, is
proposed in this study. This new aspect of workplace fun is consistent with Becker and
Tews’s (2016) view that “fun activities likely need to be voluntary versus mandatory,
intrinsically enjoyable” (p. 293) and self-determination theory (Deci & Ryan, 2008).
Although similar to the concept of manager support for fun (Tews et al., 2017), leaders’
endorsement of idiosyncratic workplace fun is a more specific concept, aligned with
employees’ preferences for fun. The hypothesized effect of leaders’ endorsement of
88idiosyncratic workplace fun on organizational creativity fills a gap in the
literature related to the unknown relationship between these two variables.
A second gap the current study filled pertains to the hypothesized relationship
between organizational playfulness climate and organizational creativity. Research on
organizational climate has not been conclusive about the dimensions that constitute the
organizational climate construct (Schneider et al., 2013), which has forced researchers to
examine the impact strategic and domain-specific organizational climates have on
organizational outcomes (Lee & Idris, 2017; Shih et al., 2014). Studies that have tested
the influence of a generic organizational climate on organizational and employee
outcomes have low validity, due to the inconsistent way of measuring organizational
climate (Sharma & Gupta, 2012). A strategic and integrative climate whose influence on
organizational creativity has not been investigated in the literature is organizational
playfulness climate. This study was the first research study to test that relationship.
Prior research on organizational creativity confirms Baer’s (2012) argument that
there is no unified theory of creativity. The six research streams in the literature on
organizational creativity presented herein confirm Woodman et al.’s (1993) interactionist
theory of organizational creativity, and show that both leadership and group influences,
combined with contextual influences, play a key role in facilitating organizational
creativity. In consideration of the complexity of the examined variables, qualitative
approaches to studying the effects of organizational factors on organizational creativity
might be more appropriate than quantitative approaches. In attempt to increase the
validity of studies on workplace fun, organizational climate, and organizational
89creativity, a quasi-experimental quantitative design was chosen to test the
relationships between the variables. A detailed justification of the selected research
methodology is presented in Chapter 3.
90Chapter 3: Research Method
The purpose of this quantitative quasi-experimental study was to test the theory of
organizational creativity that relates contextual factors, such as leaders’ endorsement of
idiosyncratic workplace fun and organizational playfulness climate, to organizational
creativity, controlling for age, race, and gender in project teams at companies in
northwestern United States. The study is significant to society because it promotes
societal health through full human development, expression, and creativity in the
workplace. This chapter begins with an explanation of the research design used in the
study and the rationale for selecting that design. I then present the study’s methodology,
including sampling strategy, sampling size, and sampling procedures. Next, I discuss and
justify the utility of the survey instruments used in the study. I also describe the data
analysis plan, the threats to the study’s validity, and the ethical concerns and procedures
related to various aspects of the study. The chapter concludes with a summary of the
study’s design and methodology.
Research Design and Rationale
The relationships between three variables were examined in this study. The two
independent variables were leaders’ endorsement of idiosyncratic workplace fun and
organizational playfulness climate. The dependent variable was organizational creativity.
I selected a quasi-experimental quantitative research design to test the relationships
between the variables.
The population for the study included intact project teams at business
organizations. The aggregation of cases into project teams prevented random assignment
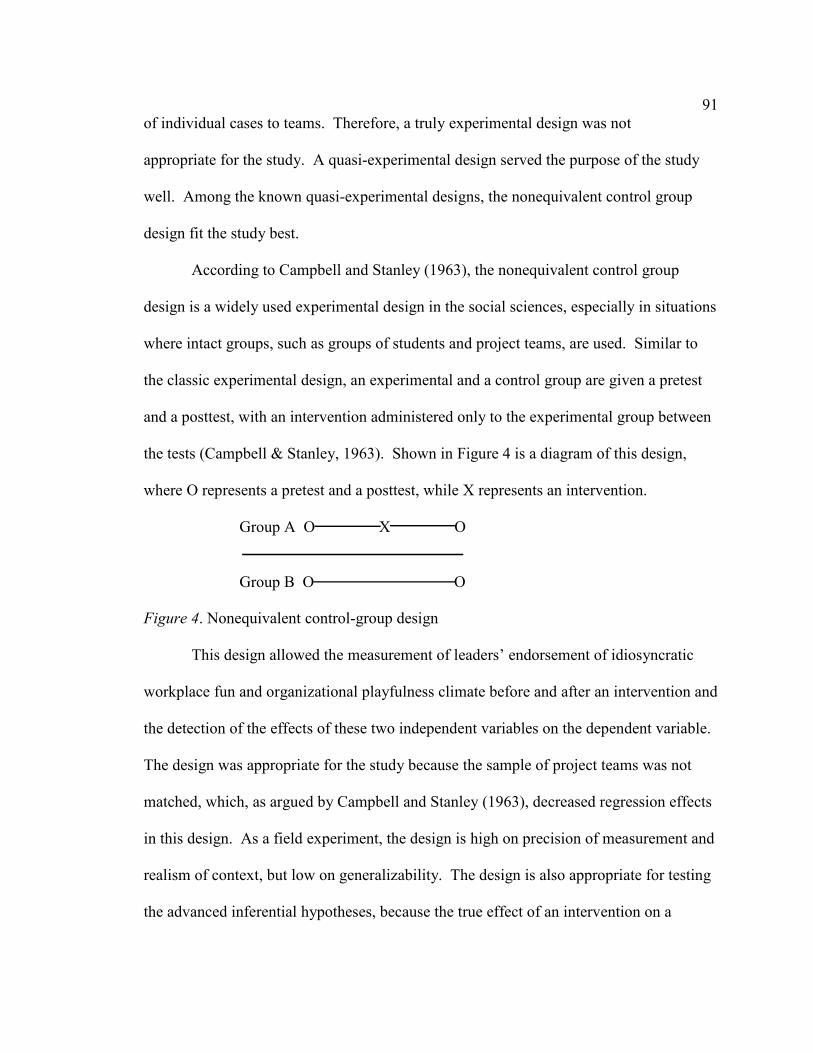
91of individual cases to teams. Therefore, a truly experimental design was not
appropriate for the study. A quasi-experimental design served the purpose of the study
well. Among the known quasi-experimental designs, the nonequivalent control group
design fit the study best.
According to Campbell and Stanley (1963), the nonequivalent control group
design is a widely used experimental design in the social sciences, especially in situations
where intact groups, such as groups of students and project teams, are used. Similar to
the classic experimental design, an experimental and a control group are given a pretest
and a posttest, with an intervention administered only to the experimental group between
the tests (Campbell & Stanley, 1963). Shown in Figure 4 is a diagram of this design,
where O represents a pretest and a posttest, while X represents an intervention.
Group A O X O
Group B O O
Figure 4. Nonequivalent control-group design
This design allowed the measurement of leaders’ endorsement of idiosyncratic
workplace fun and organizational playfulness climate before and after an intervention and
the detection of the effects of these two independent variables on the dependent variable.
The design was appropriate for the study because the sample of project teams was not
matched, which, as argued by Campbell and Stanley (1963), decreased regression effects
in this design. As a field experiment, the design is high on precision of measurement and
realism of context, but low on generalizability. The design is also appropriate for testing
the advanced inferential hypotheses, because the true effect of an intervention on a
92dependent variable can be determined only when a control group is compared
to an experimental group (Hoy & Adams, 2015). Additionally, the nonequivalent control
group design has strong internal validity, controlling for the effects of history,
maturation, testing, instrumentation, selection, and mortality (Campbell & Stanley,
1963). The design’s external validity may be limited to the study participants, due to the
interaction of selection and intervention, but this design has less reactive arrangements
(e.g., awareness of being in an experiment) than a classic experimental design (Campbell
& Stanley, 1963).
Methodology
Population
Leaders and employees at companies from various industries constituted the
population for this study. Given that organizational creativity is a group outcome (Ford
& Gioia, 1995; Woodman et al., 1993), employees who contribute to the production of
creative organizational outcomes do not work in isolation, but belong to project teams
(Rosso, 2014). Therefore, the unit of analysis was the group (i.e., a project team). Due to
limited time and resources, the project team population included only teams operating in
northwestern United States (i.e., Oregon and Washington states). The pre-hoc sample
size was 66 project teams.
Sampling and Sampling Procedures
Sampling strategy. The sampling strategy that I used in the study was a mix of
cluster sampling and simple random sampling. According to Etikan and Bala (2017), this
is a mixed sampling strategy. The sampling process began with identifying space-based
93clusters (i.e., cities) and organization-based clusters in the states of Oregon and
Washington. This was necessary because project teams are typically clustered in
companies headquartered in or around big cities and metropolitan areas. For example,
creative companies proliferate in and around Seattle, Washington, and Portland, Oregon.
Because there are no statewide sampling frames of project teams operating in
each of the two states, the two organizational clusters where the research was conducted
included Seattle and Portland. The large number of companies in each city provided
organizational variety and more possibilities for access to project teams, which justified
the selection of the two cities. A sampling frame of companies, members of the Seattle’s
Metropolitan Chamber of Commerce and the Portland Business Alliance, served as a
pool of companies from which the project teams were drawn.
Project team leaders at the companies to which an invitation to participate in the
study was sent determined the participation of project teams in the study. The companies
were given a choice to participate in the study with a team or teams. When the
companies decided to participate in the study, they indicated whether their team or teams
would be part of the experimental group or the control group. As a result, I did not
determine the randomized assignment of project teams to the two groups, the companies
did. Once a company agreed to participate in the study, I obtained a list of the
participating project teams and their size from the company.
Initially, my goal was for project teams to meet two criteria in order to be
included in the study: (a) be in the initial or intermediate stage of the project development
cycle, and (b) have a distinct goal, resulting in the design, realization, or production of a
94novel and useful product, service, or process. Project teams working on
projects in later stages of development were to be excluded from the study, as there was
less time to estimate the effect of leaders’ endorsement of idiosyncratic workplace fun
and organizational playfulness climate on organizational creativity. These conditions
were not met, as the limited sample size necessitated the use of all teams that chose to
participate in the study regardless of their developmental stage and goal.
Appropriateness of sampling strategy. Out of the four major types of
probability sampling designs (i.e., simple random sampling, stratified sampling,
systematic sampling, and cluster sampling), two probability sampling designs were used
in the sampling strategy. The combination of simple random sampling and cluster
sampling was appropriate for the study, because, according to Daniel (2012), it ensured
sampling precision, representativeness, and low cost. Further, it accounted for the
composition and distribution of project teams in the population.
Systematic sampling and stratified sampling were the sampling designs that were
not used in the study. In systematic sampling, only the first sample participant is
randomly selected, while all subsequent participants are selected based on a systematic
interval (Etikan & Bala, 2017). Because the selection of the first participant determines
the selection of all other participants, the principle of independence was not met, making
this sampling design a non-probability sampling design (Daniel, 2012). As such,
systematic sampling introduces selection bias in a study and representativeness is not
achieved (Etikan & Bala, 2017). The absence of a sampling frame of project teams and
95the need for representativeness of project teams from different industries
rendered systematic sampling inappropriate for this study.
Stratified sampling was inappropriate for this study because the population of
companies in the sampling frame must be first separated into mutually exclusive,
homogeneous strata, and then participants from each stratum must be selected via simple
random sampling (Etikan & Bala, 2017). This sampling strategy is exclusionary and its
use in this study would have underscored the assumption that only certain kind of
companies produced creative organizational outcomes. Such an assumption clashed with
my key assumption in this study that all companies are creative companies. Stratified
sampling is also more complicated, expensive, and time-consuming than simple random
sampling (Daniel, 2012). These features made stratified sampling inappropriate for this
study.
Sample size. The initial sample size estimate was 66 project teams, divided into
two experimental groups of 33 project teams each (i.e., Group A and Group B). The
sampling size could be obtained in one of three ways: (a) contacted companies provided
enough project teams for the two experimental groups, (b) contacted companies provided
a portion of the project teams in the study and the researcher found the rest of the needed
project teams purposively, or (c) contacted companies refused to provide project teams to
the study and the researcher selected the project teams purposively. I computed the pre-
hoc sample size with G*Power 3.1 for an analysis of variance (ANOVA), omnibus, one-
way. The pre-hoc sample size was based on effect size f = .40, α = .05, and 80% power.
The post-hoc sampling size was seven project teams. The contacted companies provided
96a portion of the project teams in the study and I found the rest of the needed
project teams purposively.
Procedures for Recruitment, Participation, and Data Collection (Primary Data)
Based on G*Power calculations, the pre-hoc sample size was 66 project teams.
The initial sampling frame included member companies of the Metropolitan Chamber of
Commerce in Seattle, Washington, and the Portland Business Alliance in Portland,
Oregon. While the leadership at the Metropolitan Chamber of Commerce in Seattle
provided a list of its member companies without contact information, the leadership at the
Portland Business Alliance refused to provide a contact list, stating that their member
companies were listed on its website.
To collect the contact information of the companies in the sampling frame, I hired
five freelancers to find the contact information of the companies on the Seattle’s list and
to compile a list in Excel of the companies in Portland. The combined list included 2,979
companies in Portland and Seattle. I sent a letter to all 2,979 companies, inviting them to
contribute project teams to the study. I enclosed a letter of cooperation with a self-
addressed stamped envelope. After a month, I had received four signed letters of
cooperation (response rate of 0.13%).
Due to the low response rate from the mailing campaign, I started recruiting
project teams purposively via personal contacts. I was able to secure three teams at two
companies. I found these teams through the Portland chapter of the Project Management
Institute. I attended one of the chapter's monthly meetings and talked about the study to
over 100 project managers. I handed out letters of cooperation at the meeting.
97In addition, I hired Qualtrics, an Internet-based survey provider to help
with the recruitment of participants for the study. I had two phone meetings with an
account manager at Qualtrics. The manager assured me that Qualtrics could help me
recruit the needed number of project teams for the study. Because I needed signed letters
of cooperation, I transformed the letter of cooperation into a survey. Qualtrics sent out
the letter to 619 project managers and leaders at various companies.
When the data came back, they were useless. Most of the respondents were not
project managers or leaders at companies. In reality, Qualtrics did not have a database of
contacts, but used a third party's database. Qualtrics did not have control over who
received the letter. I sent a confirmation email to all 619 respondents in order to find out
which ones were legitimate and which ones were not. I found 11 legitimate responses.
Combined with the teams from the mailing campaign, the sample size consisted of 39
teams at 17 companies.
After the Institutional Review Board (IRB) at Walden University granted full
approval to the study (IRB approval #10-06-17-0331081), copies of an informed consent
form (ICF) were distributed to all members of participating teams via email. Individuals
were asked to review and agree to the ICF, which provided information about the study.
The ICF was needed because the study disrupted the workflow of participating project
teams. No project teams were excluded from the study because the declining members in
a project team were a majority.
The signing of an ICF by a participant signified that he or she was a competent
adult, who chose to participate in the study voluntarily, had adequate information about
98the study, and comprehended the study’s aims and procedures. Study
participants were assured that their privacy would be kept through the protection of any
and all sensitive information that was revealed in the settings where observations were
made. The participants were further assured that their anonymity would be guaranteed
and that the information they provided in questionnaires, meetings, and interviews would
be kept confidential.
To minimize common method variance, data were collected from multiple
sources in two waves (Podsakoff, MacKenzie, Lee, & Podsakoff, 2003). Only employees
reported their attitudes toward leaders’ endorsement of idiosyncratic workplace fun at the
two data collection points. Both employees and their leaders reported their perceptions of
organizational playfulness climate at the two data collection points. Only team leaders
reported the change in organizational creativity at the second collection point. The first
wave of data collection measured the presence of leaders’ endorsement of idiosyncratic
workplace fun, organizational playfulness climate, and organizational creativity prior to
the intervention. A month later, the second wave of data collection measured
organizational creativity and the existence of leaders’ endorsement of idiosyncratic
workplace fun and organizational playfulness climate during the intervention month.
The data collection process involved the use of survey and Internet-based
methods. The use of these data collection methods was appropriate for the study because
(a) the measurement instruments used to measure the independent and dependent
variables were survey questionnaires, (b) Internet-based survey service providers, such as
Qualtrics, facilitate the data collection process with least error and maximum security and
99speed, and (c) the study had limited resources. Each project team member
received an email with links to the surveys at the beginning of the study and at the end of
the study, a month later. These two occasions corresponded to the pretest and the
posttest, respectively. Using the Qualtrics platform, taking the surveys at each data point
took up to 30 minutes. Upon the completion of the posttest, each team member and
leader were thanked for participating in the study. The collected data, aggregated by
Qualtrics, was imported into SPSS 21 for data analysis. After data analysis was
complete, study participants were debriefed and handouts of the study’s findings were
disseminated to them via email.
Intervention
An intervention in this study was administered to Group A. After the pretest,
team leaders in Group A began endorsing idiosyncratic workplace fun and playfulness in
their respective teams for a month, as well as modeling idiosyncratic workplace fun and
playfulness themselves. Guided by this researcher, project team leaders encouraged team
members to interact in playful, improvisational, and humorous ways while doing their
work with verbal cues, such as “Please don’t forget to have fun at work today,” “Let’s
have fun today,” “Remember to play and do things you like to do for fun,” “Take the
time to have some fun today,” “Let’s play,” and “It’s important to do fun activities you
enjoy while at work.” No intervention was administered to Group B, which was a control
group. In order to ensure that all participants in Group A did the intervention for a
month, I contacted the team leaders in Group A two weeks after the beginning of the
100intervention and encouraged them to continue with the intervention for two
more weeks. Group A consisted of three project teams. Group B consisted of four
project teams.
Instrumentation of Constructs
To the extent that the number of variables determined the number of measuring
instruments in a research study, three instruments were used to independently measure
the variables. The variable organizational creativity, however, could be validly measured
with a single instrument, as no instrument could account for all contextual factors that
could impact organizational creativity (Blomberg, 2014). Based on Woodman et al.’s
(1993) conceptualization of organizational creativity, the measurement of organizational
creativity required at least two instruments in order to account for group creativity and for
a portion of contextual influences.
In this study, leaders’ endorsement of idiosyncratic workplace fun and
organizational playfulness climate represented contextual influences on organizational
creativity. Therefore, the inclusion of a measure of team creativity had a dual purpose:
(a) to satisfy the theoretical condition pertaining to team creativity for measuring
organizational creativity, and (b) to serve as a proxy for a measure of organizational
creativity in relation to contextual influences. A search in the literature revealed that
there were appropriate instruments to measure the examined variables.
Although there was no extant instrument that specifically measured leaders’
endorsement of idiosyncratic workplace fun, a modified version of the Fun Climate
Measure (FCM) designed by McDowell (2004) could be used to measure this variable
101(Appendix A). This instrument measured one contextual influence on the
dependent variable organizational creativity. The Organizational Playfulness Climate
Questionnaire, developed by Yu et al. (2003), measured the independent variable
organizational playfulness climate (Appendix B). This instrument measured a second
contextual influence on the dependent variable organizational creativity. To improve
scale reliability, only factors with Cronbach’s alpha greater than .70 were used in this
study. The Team Creativity Scale (TCS), developed by Jiang and Zhang (2014),
measured the dominant dimension of the organizational creativity construct (Appendix
C). All instruments used Likert scales to measure the observed variable.
An instrument that has been used extensively in research on fun at work over the
past 13 years is the Fun Climate Measure (FCM) by McDowell (2004). Developed
during a doctoral study, the FCM has been validated as a reliable instrument in numerous
recent studies (Fluegge-Wolf, 2014; Tews et al., 2014; Tews et al., 2015). A modified
version of the FCM was appropriate for measuring leaders’ endorsement of idiosyncratic
workplace fun for two reasons. First, the items included in the scale encompass four
domains, in which idiosyncratic workplace fun can take place: socializing with
coworkers, work celebrations, personal freedoms, global fun. Second, the instrument
captures a holistic perception of workplace fun, revealing it as a complex,
multidimensional construct. Such a conceptualization of workplace fun is consonant with
the complexity-based theoretical foundation of this study. Permission to use the FCM in
the current study was obtained on November 4, 2016.
102McDowell (2004) used focus groups of working adults (60 adults in
total) to define fun at work as a construct and generate 40 initial items for the scale. Fifty
graduate students in an industrial organizational psychology program evaluated the 40
items for content validity. Eighteen survey items had 60% agreement among the
evaluators. McDowell added two more items related to the construct validity of the
instrument. The pretesting of the measure included 182 professionals across various
industries. Analysis showed strong internal consistency of the scale (Cronbach α = .90).
Exploratory factor analysis with Varimax rotation determined a four-factor
structure of the scale. Cronbach alphas for each factor are as follows: .835 (socializing
with coworkers), .781 (work celebrations), .701 (personal freedoms), and .792 (global
fun). Scale optimization added another four items to the scale for a total of 24 items (i.e.,
four factors of six items).
Confirmatory factor analysis (CFA) showed strong discriminant validity of the
FCM in relation to a Fun Person Scale (FPS). The two scales correlated only at r = .23,
accounting for less than 5% of the explained variance. Convergent validity was assessed
by correlating the FCM with a measure of job satisfaction (i.e., Job Descriptive Index
(JDI)) and a measure of affectivity (i.e., Positive Affect and Negative Affect Scale
(PANAS)). The correlation between the FCM and JDI was r = .83, while the correlation
between the FCM and PANAS was r = .60 for the positive affect subscale and r = -.54
for the negative affect subscale. These coefficients suggest strong discriminant and
convergent validity of the Fun Climate Measure.
103In order to test the validity and dimensionality of the modified Fun
Climate Measure, now named Leaders’ Endorsement of Idiosyncratic Workplace Fun
Scale, exploratory factor analysis was performed prior to distributing the instrument to
study participants. The Internet survey provider SurveyMonkey provided the data for the
exploratory factor analysis. According to Field (2013), a sample of over 200 participants
is adequate for factor analysis. SurveyMonkey randomly distributed the Leaders’
Endorsement of Idiosyncratic Workplace Fun Scale to full-time employees in the United
States across industries. For a fee, SurveyMonkey guaranteed that over 200 participants
would respond to the survey. The final sample size included 210 participants. To assess
whether the items in the scale fit together, the internal consistency reliability of the scale
was calculated and it was optimal (Cronbach’s α = .84).
The Organizational Playfulness Climate Questionnaire (OPCQ) by Yu et al.
(2003) was appropriate for this study because it incorporated findings from seminal
works on organizational climate and creativity, such as Amabile’s (1996) nine
environmental factors that stimulate creativity and innovation, Isaksen, Lauer, and
Ekvall’s (1999) Situational Outlook Questionnaire (SOQ), Glynn and Webster’s (1992)
Adult Playfulness Scale, and case studies (Kelley, 2001). The complex nature of
organizational playfulness climate is evidenced in the eight factors that comprise the
OPCQ. The multidimensionality of the OPCQ aligns with the complexity-based theory
of creativity used in this study. Permission to use the OPCQ in this study was obtained
on June 24, 2016.
104Yu et al. (2003) used two focus groups, one of 18 researchers and
another one of 30 academics and high-tech professionals, to generate the 45 items in the
OPCQ. A pilot study with 755 professionals in various industries tested the validity of
the instrument and its eight-factor structure. Factor analysis on the pretest data, using
orthogonal rotation, showed that all eight factors had eigenvalue greater than 1,
explaining 63.81% of the variance in organizational playfulness climate. Internal
consistency reliability of the OPCQ is .91, with six out of the eight factors having
Cronbach’s alpha greater than .70.
The discriminant validity of the OPCQ was tested by diving 27% of the
participants in the pilot into four groups, each one having either a low or high score for
“fun” and “creativity.” A comparison between the high fun and low fun groups revealed
significant differences (t = 2.964-6.712, p < .01) between the two groups in each factor of
the OPCQ. A comparison between the high creativity and low creativity groups also
revealed significant differences (t = 2.682-4.596, p < .01) between the groups in each
factor of the OPCQ. These tests suggested that people with high fun and high creativity
personality were more aware of an organizational playfulness climate than people with
low fun and low creativity personalities.
The Team Creativity Scale (TCS) by Jiang and Zhang (2014) that measured the
group creativity dimension of organizational creativity was appropriate to this study for
two reasons. First, the researchers used a complex systems theory perspective to design
the instrument that aligns with Stacey’s (1996) complexity-based theory of organizational
creativity that underlies the current study. Second, team creativity is measured as a
105holistic construct that encompasses three dimensions: creative thinking,
creative action, and creative outcome. These two properties of the instrument distinguish
it from the one-dimensional instruments used to measure organizational creativity in prior
studies (Janssen, 2000; Zhou & George, 2001). Permission to use the TCS in this study
was obtained on June 24, 2016.
In developing the TCS, the researchers used 183 participants working in teams at
two companies, a creative enterprise and a high-tech company. To diminish common
error variance, different groups reported on each TCS dimension (i.e., team members on
creative thinking, team leaders on creative action, and managers on creative outcome).
The internal consistency reliability of each of the three subscales is .843 for creative
thinking, .719 for creative action, and .755 for creative outcome. Average item-to-item
correlations in each subscale range between .459 and .642.
Exploratory factor analysis using Varimax rotation revealed adequate loadings on
each of the three TCS dimensions, with creative thinking, creative action, and creative
action explaining 26.31%, 21.18%, and 23.65% of the variance, respectively. The
loading coefficients among all factors range between .673 and .89, indicating good
convergent validity. The standardized loadings of measurement items, ranging between
.546 and .816, show further support for the good convergent validity of the TCS. The
average variances extracted (AVE) test assessed the divergent validity of the three
constructs, with the square root AVE ranging between .678 and .801, indicating good
divergent validity.
106Jiang and Zhang (2014) examined the predictive validity of the TCS
by testing the correlations between team creativity and team trust, two constructs that
have shown a positive relationship in previous studies. The standardized path coefficient
between the three factors of the TCS and team trust were positive (.62 for creative
thinking, .76 for creative action, and .92 for creative outcome) and significant at the .01
level, suggesting good predictive validity of the TCS.
Operationalization of Variables
Leaders endorse idiosyncratic workplace fun when employees feel that their
leaders or supervisors encourage each employee to engage in volitional and autonomous
workplace fun that may or may not involve socializing with coworkers, work
celebrations, personal freedoms, and general fun activities. Leaders’ endorsement of
idiosyncratic workplace fun was measured with a modified version of the Fun Climate
Measure (FCM), which included seven items, each measured with a five-point Likert
scale ranging from 1 (strongly disagree) to 5 (strongly agree). A high overall score
represents high leaders’ endorsement of idiosyncratic workplace fun. An example item is
“My supervisor encourages me to have fun at work.”
Organizational playfulness climate (OPC) is present at an organization when
employees attest that the organizational environment encompasses close cooperation and
collaboration, supportive managers and relaxed interactions, shared leisure time,
informality and humor, individual leisure and free time, relaxation-conducive work
environment, independent work and casual dress code, and lack of inflexibility, criticism,
and competitiveness. The OPC was measured with the Organizational Playfulness
107Climate Questionnaire (OPCQ), which consisted of 40 items, each measured
with a five-point Likert scale ranging from 1 (completely not true) to 5 (completely true).
A high overall score represents a high organizational playfulness climate. An example
item is “Playing or engaging in the leisure activities with my colleagues inspires me with
new ideas for work.”
Organizational creativity is evident when leaders agree that employees in project
teams engage in creative thinking that leads to creative actions which result in creative
outcomes. Organizational creativity was measured with the Team Creativity Scale,
which includes nine items, each measured with a five-point Likert scale ranging from 1
(strongly disagree) to 5 (strongly agree). A high overall score represents high
organizational creativity. An example item is “The team can realize a creative outcome
fluently.”
Data Analysis Plan
The data analysis stage of the study included (a) data screening and cleaning, (b)
descriptive analysis, (c) description of an analysis to ensure that groups were equivalent
at the outset of the study, and (d) analysis plans for each hypothesis.
Data Screening and Cleaning
Upon transferring the data from the Qualtrics platform to SPSS 21, the scores for
each variable were checked for outliers. There were no extreme scores in the data as the
three variables were measured with Likert scales ranging from 1 to 5. The variables were
checked for normality by running histograms on each variable. The distribution of
responses for the three variables was normal. This was followed by checking for missing
108data by running frequencies for each variable. Missing data at the second data
point for the variables leaders’ endorsement of idiosyncratic fun and organizational
playfulness climate were replaced by the series mean for that variable.
Descriptive Analysis
Since the three variables in the study were measured on the interval level, the
descriptive analysis procedures included (a) organization of the data for each variable
into a frequency distribution, (b) displaying the data in tables, (c) describing the
distribution mean, or the average, for each variable, and (d) describing the variability of
the distributions (Frankfort-Nachmias & Leon-Guerrero, 2009).
Group Equivalence Analysis
Probabilistic group equivalence was ensured at the outset of the study by
randomly assigning the project teams in the sample to each of the two experimental
groups. Initially, since the optimal project team size is seven people (Guimera, Uzzi,
Spiro, & Amaral, 2005), only project teams with more than four but less than seven
members were to be selected prior to their assignment to Group A and Group B. Due to
the low response rate from the 2,979 companies to the call to participate in the study,
project teams with three members were included in the study.
Research Questions and Hypotheses
The research questions that were answered in this study pertained to the
relationship and significance, both individually and jointly, of leaders’ endorsement of
idiosyncratic workplace fun and organizational playfulness climate to organizational
creativity. Based on these research questions, it was hypothesized that both leaders’
109endorsement of idiosyncratic workplace fun and organizational playfulness
climate would be related positively to organizational creativity. It was further
hypothesized that project teams supervised by leaders who endorsed idiosyncratic
workplace fun would be more creative than project teams supervised by leaders who did
not endorse idiosyncratic workplace fun. Project teams working in an organizational
playfulness climate would be more creative than project teams working in an
organizational climate not rooted in playfulness. Both individually and collectively,
leaders’ endorsement of idiosyncratic workplace fun and organizational playfulness
climate would predict organizational creativity.
Analysis Plans for Hypotheses
Three statistical tests were performed to examine the relationship between the
variables in the study. Hypotheses H01, Ha1, H02, and Ha2 were tested by estimating
Pearson correlation coefficients, which indicated the direction and magnitude of the
relationships between the two independent variables and the dependent variable. The
value of the R statistic has been reported. Hypotheses H03, Ha3, H04, and Ha4 were tested
with repeated-measures analysis of variance (ANOVA), which indicated whether the
project teams in the two quasi-experimental groups differed significantly in terms of their
creative output before and after the intervention. The value of the F ratio and its p value
have been reported.
Bivariate regression analysis tested Hypotheses H05, Ha5, H06, and Ha6, which
examined the individual predictive power of LEIWF and OPC on organizational
creativity. Unstandardized beta coefficients (i.e., β values), p values, and confidence
110intervals have been reported. Hierarchical multiple regression analysis tested
Hypotheses H07 and Ha7, indicating whether LEIWF and OPC collectively predicted
organizational creativity. The control variables were entered in Step 1, while the
independent and dependent variables were entered in Step 2 in the regression. Pearson
correlation coefficients, the F ratio, unstandardized beta coefficients, p values, and
confidence intervals have been reported. Statistical significance was confirmed with p
values lower than .05. Confidence intervals including zero indicated nonsignificant
results.
Threats to Validity
External Validity
The external threats to validity in this study stem from wrong inferences, made by
the investigator from the collected and analyzed data, which pertain to other people,
settings, and times, and their interaction (Hoy & Adams, 2015). The threat emerging
from the interaction of participant selection and intervention was addressed by avoiding
result-based claims about teams that are not small project teams at for-profit business
organizations. The threat from the interaction of setting and intervention was reduced by
relating the research findings only to project teams in companies located in and around
big urban centers in the United States. The threat stemming from the interaction of
history and treatment was mitigated by not generalizing the results to project teams that
operated in the past, or project teams that will operate in the future.
111Internal Validity
Experimental and quasi-experimental research studies are exposed to nine threats
to internal validity (Clair, Cook, & Hallberg, 2014). The first threat, ambiguous temporal
precedence, concerns the cause-effect relationship between the variables in time. Using
an experimental group (Group A) and a control group (Group B) minimized this threat, as
the nonequivalent control-group design showed which variables occurred first. If the
repeated measures analysis of variance (ANOVA) did not show any difference between
the two groups in terms of organizational creativity, then only correlations could be
established between the independent and dependent variables. The treat of selection,
where sampling and assignment procedures can result in systematic differences between
the experimental and control conditions, was mitigated by randomly assigning project
teams to Group A and Group B, thus increasing the probability of equal distribution of
sample characteristics among the groups. The threat of history, or the influence of
external events on the participants, was minimized by having the project teams located in
the same geographical location and experiencing the same external events.
The treat of maturation, or the occurrence of natural changes in the participants
during the course of a study, was minimal, as the study lasted only a month. The treat of
attrition, whereby participants drop out of the study, did not apply to this study, as the
sample was very small and no teams dropped out during the study. Diffusion of treatment
was minimized as a treat, as the project teams in groups A and B were based in separate
companies, with no communication between the teams. One company contributed two
project teams to the study, with one team in Group A and one team in Group B. The treat
112of testing was diminished by having the pretest and posttest administered a
month apart. The threats of regression artifacts and instrumentation was negligible,
because participating project teams were not selected based on extreme scores and the
survey instruments did not change during the study.
Construct Validity
There were two threats to construct validity in this study. The first one pertained
to the instrument used to measure leaders’ endorsement of idiosyncratic workplace fun.
The instrument used in the study was a modified version of Fun Climate Measure (FCM)
designed by McDowell (2004) that contains 24 items. Out of these 24 items, seven items
related directly to the construct leaders’ endorsement of idiosyncratic workplace fun.
These seven items were modified by changing their referent (Chan, 1998) in order to
express precisely the examined construct. The modification of the items notwithstanding,
McDowell (2004) developed the items in the Fun Climate Measure based on a robust
theoretical framework underlying the fun at work construct. To address this threat,
exploratory factor analysis (EFA) was performed to assess the factor loadings and
internal consistency reliability of the modified scale.
The second threat to construct validity in the study stemmed from the definition
used to operationalize the independent variable organizational playfulness climate.
Although Yu et al. (2003) based the Organizational Playfulness Climate Questionnaire on
a sound theoretical foundation, they did not provide an operational definition of the
construct. The definition of organizational playfulness climate used in this study
emerged from synthesizing the findings of Yu et al.’s (2003) study with the findings in
113other studies on organizational climate and playfulness (Chang et al., 2013;
Pena-Suarez et al., 2013).
Ethical Procedures
Upon deciding to participate in the study with one or more project teams,
representatives at participating companies signed a letter of cooperation, which provided
the participants with an overview of the study. The random assignment of participants to
two experimental groups precluded the use of prearranged agreements to access
participants. Ethical concerns related to the recruitment process were minimal, as project
teams were recruited via formal communication channels and with the assistance of the
Seattle Metropolitan Chamber of Commerce and the Portland Business Alliance. There
were no ethical concerns with the purposive recruitment of project teams through the
Portland chapter of the Project Management Institute (PMI), as permission to contact
PMI members was granted by PMI-Portland officials prior to the recruitment and the
participation of PMI members in the study was voluntary.
An ethical concern related to data collection was the refusal of selected companies
and project teams via Qualtrics to participate in the study. The refusal of companies to
participate in the study could not be addressed by randomly selecting other companies
from the sampling frame, or other teams at the companies, and inquiring about
participation in the study. The lack of financial resources for recruiting more companies
via Qualtrics precluded the use of these approaches. Upon the collection of all letters of
cooperation from the participating companies, the IRB at Walden University approved
the study for data collection (IRB approval #10-06-17-0331081).
114Ethical concerns related to the intervention included the disruption of
work of non-participating coworkers working at participating companies, as well as
damaging and highly disruptive idiosyncratic workplace fun behaviors by the
participants. These concerns were addressed in the informed consent form by asking the
team leaders in Group A to remove from the study participants who exhibited such
damaging and disruptive behaviors. No study participants were removed during the
intervention.
Treatment of data. All collected data were anonymous and confidential. No
identification data or computer server numbers were tracked or collected. There were no
ethical issues pertaining to the sensitivity of the information, as personal attitudes and
characteristics, such as religious preferences, sexual practices, and intelligence, among
others, were not included or measured in the study. The office settings in which the study
took place raised some ethical concerns, as the intervention might have interrupted the
normal workflow of participating project teams. Team leaders in the experimental group
(Group A) were instructed to cancel the intervention and remove participants from the
study if the participants exhibited idiosyncratic workplace fun or playful behavior that
was harmful to other employees or damaging to the work environment.
The surveys were administered via Qualtrics, a secure online survey provider.
After participants completed the survey, they were be asked to delete the notification
email about the survey, thus minimizing the chance of non-participants accessing the
survey and proving false information. The data were initially stored on Qualtrics servers
and then transferred to a personal computer for analysis in SPSS. A copy of all collected
115data was also stored on a password-protected drive online. Only I, the
investigator, had access to the data. The data will be destroyed five years after the study
has been deemed complete by Walden University.
To avoid ethical issues during the interpretation of the data, the language used in
the discussion of results is devoid of bias against participants because of sexual
orientation, gender, age, disability, race, or ethnicity. No data has been falsified,
suppressed, or invented to meet preconceived research needs. After the completion of the
study, research findings were shared with all participating project teams.
Summary
Despite the complexity of organizational creativity and the need for a holistic
examination of the relationships between the proposed variables, the research design
chosen for this study is reductionist. This was necessitated because (a) there was a
history of prior research that had approached workplace fun, organizational climate, and
organizational creativity quantitatively, and (b) lack of resources prevented the
implementation of qualitative or mixed method research designs. The complexity of the
organizational creativity construct was captured in the theoretical foundation underlying
the study, as well as in the instruments used to measure the independent and dependent
variables.
The effects of leaders’ endorsement of idiosyncratic workplace fun and
organizational playfulness climate on organizational creativity were investigated within a
quasi-experimental quantitative research design. The sampling frame consisted of
member companies of the Seattle Metropolitan Chamber of Commerce and the Portland
116Business Alliance in the states of Washington and Oregon, respectively, in
northwestern United States. The sample size was seven project teams, divided into an
experimental group (Group A) and a control group (Group B). The leaders in Group A
introduced an intervention, which consisted of encouraging employees to engage in
idiosyncratic workplace fun and to interact with fellow employees in playful and
humorous ways. No intervention was administered to the participants in Group B. The
intervention lasted for a month, with data being collected from both experimental groups
before and after the intervention.
The relationships between the variables was measured with validated instruments
that have been successfully used in prior research studies to measure workplace fun,
organizational playfulness climate, and organizational creativity. A modified version of
the Fun Climate Measure by McDowell (2004) measured leaders’ endorsement of
idiosyncratic workplace fun. The Organizational Playfulness Climate Questionnaire by
Yu et al. (2003) measured organizational playfulness climate. The Team Creativity Scale
by Jiang and Zhang (2014) measured organizational creativity. All instruments have
strong construct, convergent, predictive, and discriminant validities.
The study’s results are presented in Chapter 4. Using statistical analyses, I tested
six hypotheses through correlational analysis, repeated measures analysis of variance
(ANOVA), bivariate regression analysis, and multiple regression analysis. These
analyses provided answers to the three research questions that prompted this research
investigation.
117Chapter 4: Results
The purpose of this quasi-experimental quantitative study was to uncover the
effects leaders’ endorsement of idiosyncratic workplace fun and organizational
playfulness climate had on organizational creativity within a sample of intact project
teams at various business organizations. The questions that guided the research
investigation pertained to the magnitude and predictive nature of the relationships
LEIWF and OPC had with organizational creativity. Based on the literature review of
prior research, I advanced six hypotheses, anticipating positive relationships between
LEIWF and organizational creativity and between OPC and organizational creativity. I
also hypothesized that the two independent variables would predict organizational
creativity, both individually and collectively.
This chapter begins with a description of the timeframe for data collection,
including actual recruitment and response rates. I briefly review the discrepancies in data
collection from the initial plan presented in Chapter 3 and report baseline descriptive and
demographic characteristics of the sample. Next, I describe the representativeness of the
sample of the population of interest and provide an explanation of the fidelity of the
administered intervention. I then report the study results, organized by research
hypotheses. The chapter concludes with a summary of the answers to the three research
questions.
Data Collection
Data collection began on March 19, 2018, and concluded on May 13, 2018, with
the intervention running between March 19, 2018, and April 22, 2018. The final
118recruited sample included 32 employees in seven project teams at six
companies. The number of participating teams was substantially lower than the 66 teams
needed to have an adequately powered study. While 2,979 companies received an
official invitation to participate in the study, only four companies accepted the invitation
and returned a signed letter of cooperation. The use of purposive sampling resulted in the
recruitment of three project teams at two additional companies for a total of six
companies.
Four teams comprised Group A (4.25 members on average per team) and three
teams comprised Group B (five members on average per team). Twenty-eight employees
took the pretest (87.5% response rate), while 25 employees took the posttest (78.1%
response rate). The average age of the participants was around 52 years (M = 3.71, SD =
1.36). The sampled population constituted of 50% male and 50% female participants (M
= 1.50, SD = 0.51), 89.3% of them Caucasian and 10.7% African-American (M = 1.11,
SD = 0.32). The average tenure of the employees was around 14 years (M = 2.82, SD =
1.61), with 82.1% working for a creative company and 17.9% working for a non-creative
company (M = 1.18, SD = 0.39).
Before the start of data collection, the leaders of the participating teams provided
the emails of their team members so that the surveys could be sent to each team member.
Out of the 17 companies that signed the letter of cooperation, nine companies recruited
via Qualtrics dropped out by not responding to the request to provide their team
members’ emails. The sample size consisted of 8 teams (37 employees in total) at 7
companies. After the teams received the pretest surveys, one team in Group B did not
119respond to the surveys and was excluded from the study. Seven teams at six
companies provided data at the two data points.
The sample was representative of the population of interest as the companies
included in the sample included a technology company, a manufacturing company, a
financial services company, an architectural firm, a business consultancy, and a travel
company. The six companies represent 0.2% of the sampling frame of 2,979 companies
invited to participate in the study. This low representativeness limits the external validity
of the findings to these populations and their specific context and geographical location.
Intervention Fidelity
The intervention in this study ran for 1 month. The project team leaders who
endorsed idiosyncratic workplace fun received three emails related to the intervention.
The first email invited them to begin the intervention and provided them with guidance
on how to endorse idiosyncratic workplace fun. Two weeks later, a second email
reminded them to continue the intervention for two more weeks and encouraged their
efforts. At the 1-month mark, a third email instructed them to end the intervention. The
project team leaders did not report any challenges or adverse events with the
implementation of the intervention.
Study Results
To assess the reliability of the Leaders’ Endorsement of Idiosyncratic Workplace
Fun Scale, I performed exploratory factor analysis, using a sample of 210 randomly
assigned employees across industries via the Internet survey provider SurveyMonkey. A
principal axis factor analysis was conducted on the seven items with orthogonal rotation
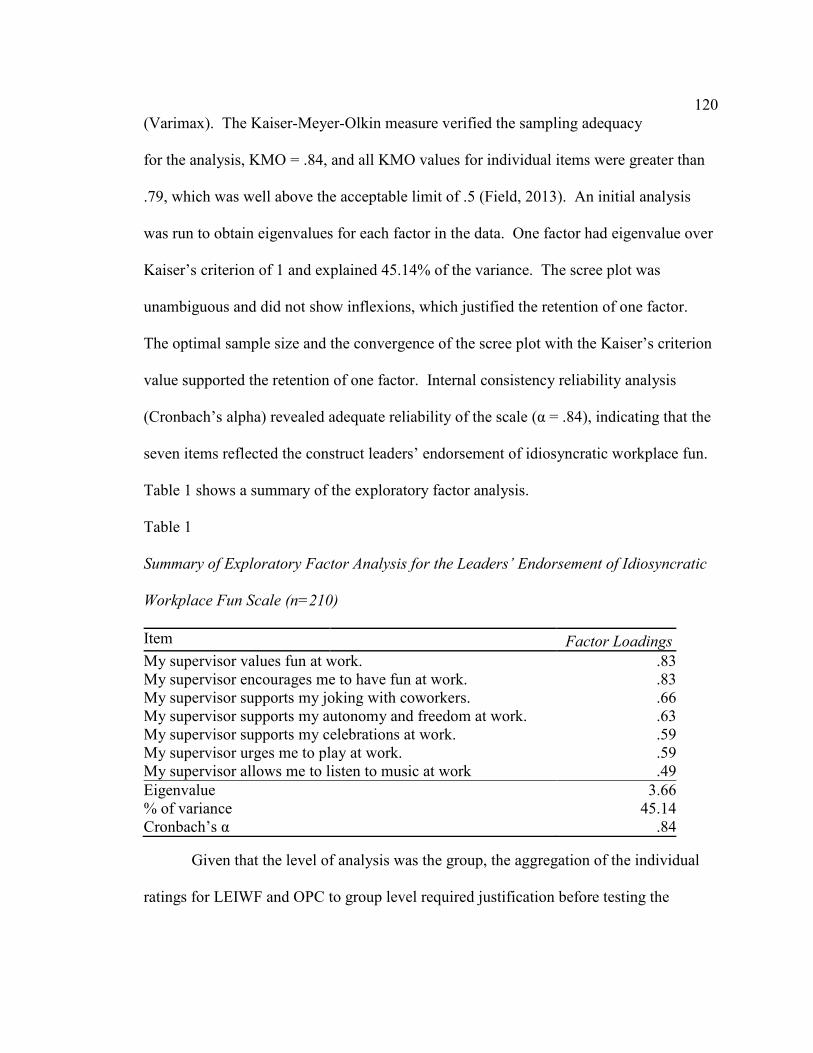
120(Varimax). The Kaiser-Meyer-Olkin measure verified the sampling adequacy
for the analysis, KMO = .84, and all KMO values for individual items were greater than
.79, which was well above the acceptable limit of .5 (Field, 2013). An initial analysis
was run to obtain eigenvalues for each factor in the data. One factor had eigenvalue over
Kaiser’s criterion of 1 and explained 45.14% of the variance. The scree plot was
unambiguous and did not show inflexions, which justified the retention of one factor.
The optimal sample size and the convergence of the scree plot with the Kaiser’s criterion
value supported the retention of one factor. Internal consistency reliability analysis
(Cronbach’s alpha) revealed adequate reliability of the scale (α = .84), indicating that the
seven items reflected the construct leaders’ endorsement of idiosyncratic workplace fun.
Table 1 shows a summary of the exploratory factor analysis.
Table 1
Summary of Exploratory Factor Analysis for the Leaders’ Endorsement of Idiosyncratic
Workplace Fun Scale (n=210)
Item Factor Loadings
My supervisor values fun at work. .83My supervisor encourages me to have fun at work. .83My supervisor supports my joking with coworkers. .66My supervisor supports my autonomy and freedom at work. .63My supervisor supports my celebrations at work. .59My supervisor urges me to play at work. .59My supervisor allows me to listen to music at work .49Eigenvalue 3.66% of variance 45.14Cronbach’s α .84
Given that the level of analysis was the group, the aggregation of the individual
ratings for LEIWF and OPC to group level required justification before testing the
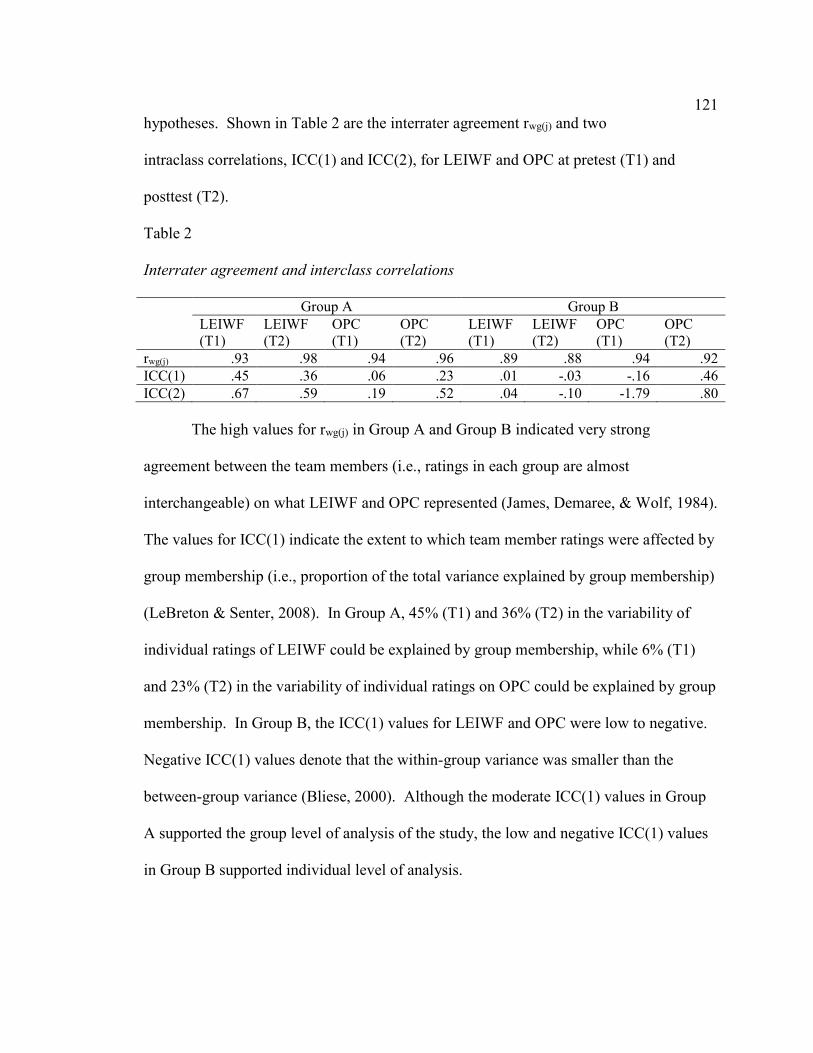
121hypotheses. Shown in Table 2 are the interrater agreement rwg(j) and two
intraclass correlations, ICC(1) and ICC(2), for LEIWF and OPC at pretest (T1) and
posttest (T2).
Table 2
Interrater agreement and interclass correlations
Group A Group B LEIWF
(T1) LEIWF (T2)
OPC (T1)
OPC (T2)
LEIWF (T1)
LEIWF (T2)
OPC (T1)
OPC (T2)
rwg(j) .93 .98 .94 .96 .89 .88 .94 .92 ICC(1) .45 .36 .06 .23 .01 -.03 -.16 .46 ICC(2) .67 .59 .19 .52 .04 -.10 -1.79 .80
The high values for rwg(j) in Group A and Group B indicated very strong
agreement between the team members (i.e., ratings in each group are almost
interchangeable) on what LEIWF and OPC represented (James, Demaree, & Wolf, 1984).
The values for ICC(1) indicate the extent to which team member ratings were affected by
group membership (i.e., proportion of the total variance explained by group membership)
(LeBreton & Senter, 2008). In Group A, 45% (T1) and 36% (T2) in the variability of
individual ratings of LEIWF could be explained by group membership, while 6% (T1)
and 23% (T2) in the variability of individual ratings on OPC could be explained by group
membership. In Group B, the ICC(1) values for LEIWF and OPC were low to negative.
Negative ICC(1) values denote that the within-group variance was smaller than the
between-group variance (Bliese, 2000). Although the moderate ICC(1) values in Group
A supported the group level of analysis of the study, the low and negative ICC(1) values
in Group B supported individual level of analysis.
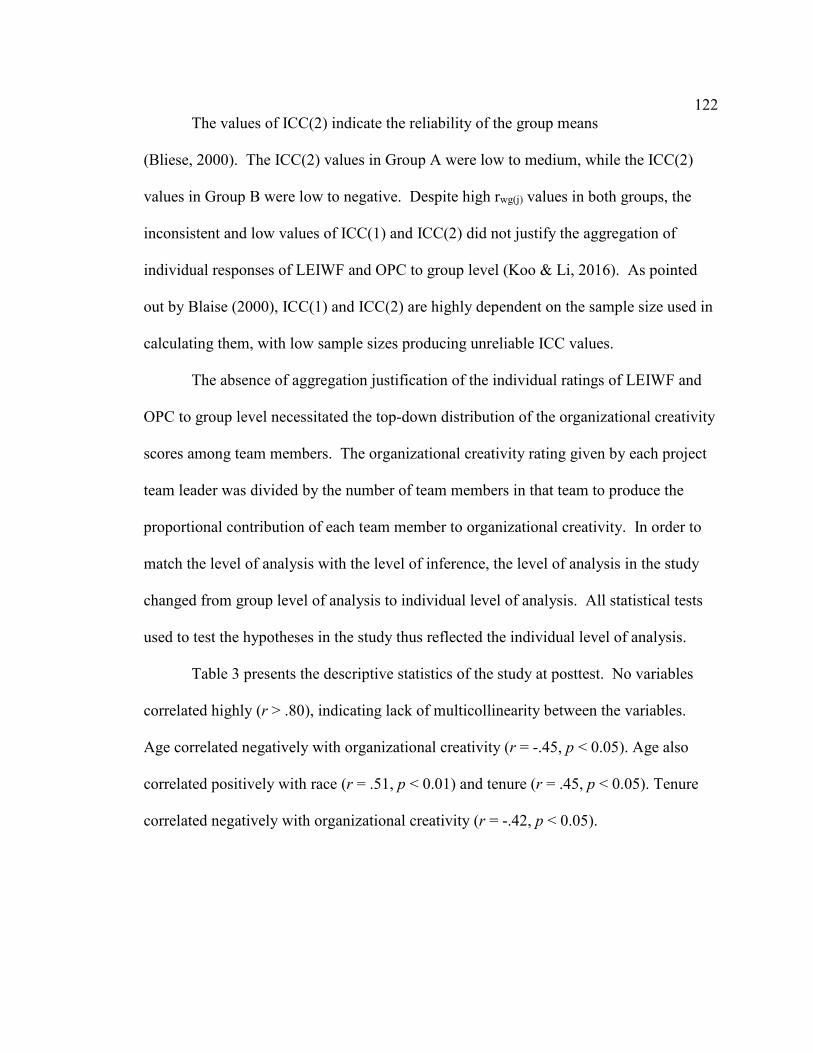
122The values of ICC(2) indicate the reliability of the group means
(Bliese, 2000). The ICC(2) values in Group A were low to medium, while the ICC(2)
values in Group B were low to negative. Despite high rwg(j) values in both groups, the
inconsistent and low values of ICC(1) and ICC(2) did not justify the aggregation of
individual responses of LEIWF and OPC to group level (Koo & Li, 2016). As pointed
out by Blaise (2000), ICC(1) and ICC(2) are highly dependent on the sample size used in
calculating them, with low sample sizes producing unreliable ICC values.
The absence of aggregation justification of the individual ratings of LEIWF and
OPC to group level necessitated the top-down distribution of the organizational creativity
scores among team members. The organizational creativity rating given by each project
team leader was divided by the number of team members in that team to produce the
proportional contribution of each team member to organizational creativity. In order to
match the level of analysis with the level of inference, the level of analysis in the study
changed from group level of analysis to individual level of analysis. All statistical tests
used to test the hypotheses in the study thus reflected the individual level of analysis.
Table 3 presents the descriptive statistics of the study at posttest. No variables
correlated highly (r > .80), indicating lack of multicollinearity between the variables.
Age correlated negatively with organizational creativity (r = -.45, p < 0.05). Age also
correlated positively with race (r = .51, p < 0.01) and tenure (r = .45, p < 0.05). Tenure
correlated negatively with organizational creativity (r = -.42, p < 0.05).
123Table 3
Descriptive Statistics
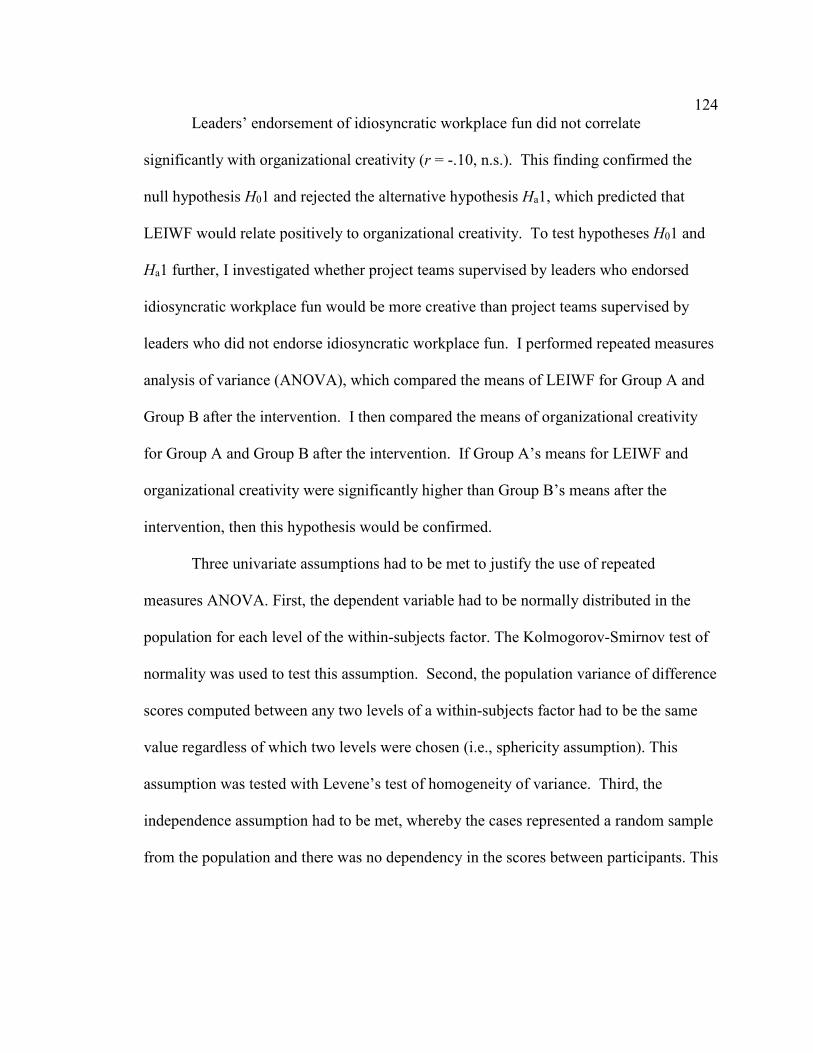
124Leaders’ endorsement of idiosyncratic workplace fun did not correlate
significantly with organizational creativity (r = -.10, n.s.). This finding confirmed the
null hypothesis H01 and rejected the alternative hypothesis Ha1, which predicted that
LEIWF would relate positively to organizational creativity. To test hypotheses H01 and
Ha1 further, I investigated whether project teams supervised by leaders who endorsed
idiosyncratic workplace fun would be more creative than project teams supervised by
leaders who did not endorse idiosyncratic workplace fun. I performed repeated measures
analysis of variance (ANOVA), which compared the means of LEIWF for Group A and
Group B after the intervention. I then compared the means of organizational creativity
for Group A and Group B after the intervention. If Group A’s means for LEIWF and
organizational creativity were significantly higher than Group B’s means after the
intervention, then this hypothesis would be confirmed.
Three univariate assumptions had to be met to justify the use of repeated
measures ANOVA. First, the dependent variable had to be normally distributed in the
population for each level of the within-subjects factor. The Kolmogorov-Smirnov test of
normality was used to test this assumption. Second, the population variance of difference
scores computed between any two levels of a within-subjects factor had to be the same
value regardless of which two levels were chosen (i.e., sphericity assumption). This
assumption was tested with Levene’s test of homogeneity of variance. Third, the
independence assumption had to be met, whereby the cases represented a random sample
from the population and there was no dependency in the scores between participants. This
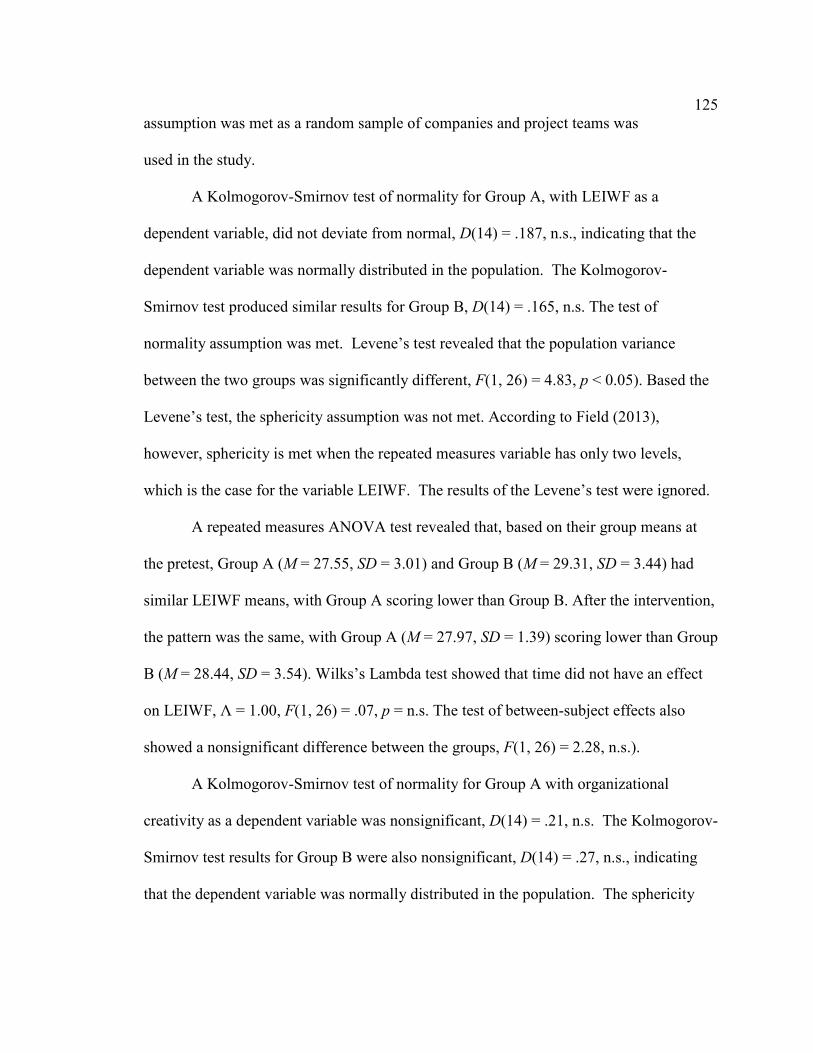
125assumption was met as a random sample of companies and project teams was
used in the study.
A Kolmogorov-Smirnov test of normality for Group A, with LEIWF as a
dependent variable, did not deviate from normal, D(14) = .187, n.s., indicating that the
dependent variable was normally distributed in the population. The Kolmogorov-
Smirnov test produced similar results for Group B, D(14) = .165, n.s. The test of
normality assumption was met. Levene’s test revealed that the population variance
between the two groups was significantly different, F(1, 26) = 4.83, p < 0.05). Based the
Levene’s test, the sphericity assumption was not met. According to Field (2013),
however, sphericity is met when the repeated measures variable has only two levels,
which is the case for the variable LEIWF. The results of the Levene’s test were ignored.
A repeated measures ANOVA test revealed that, based on their group means at
the pretest, Group A (M = 27.55, SD = 3.01) and Group B (M = 29.31, SD = 3.44) had
similar LEIWF means, with Group A scoring lower than Group B. After the intervention,
the pattern was the same, with Group A (M = 27.97, SD = 1.39) scoring lower than Group
B (M = 28.44, SD = 3.54). Wilks’s Lambda test showed that time did not have an effect
on LEIWF, Ʌ = 1.00, F(1, 26) = .07, p = n.s. The test of between-subject effects also
showed a nonsignificant difference between the groups, F(1, 26) = 2.28, n.s.).
A Kolmogorov-Smirnov test of normality for Group A with organizational
creativity as a dependent variable was nonsignificant, D(14) = .21, n.s. The Kolmogorov-
Smirnov test results for Group B were also nonsignificant, D(14) = .27, n.s., indicating
that the dependent variable was normally distributed in the population. The sphericity
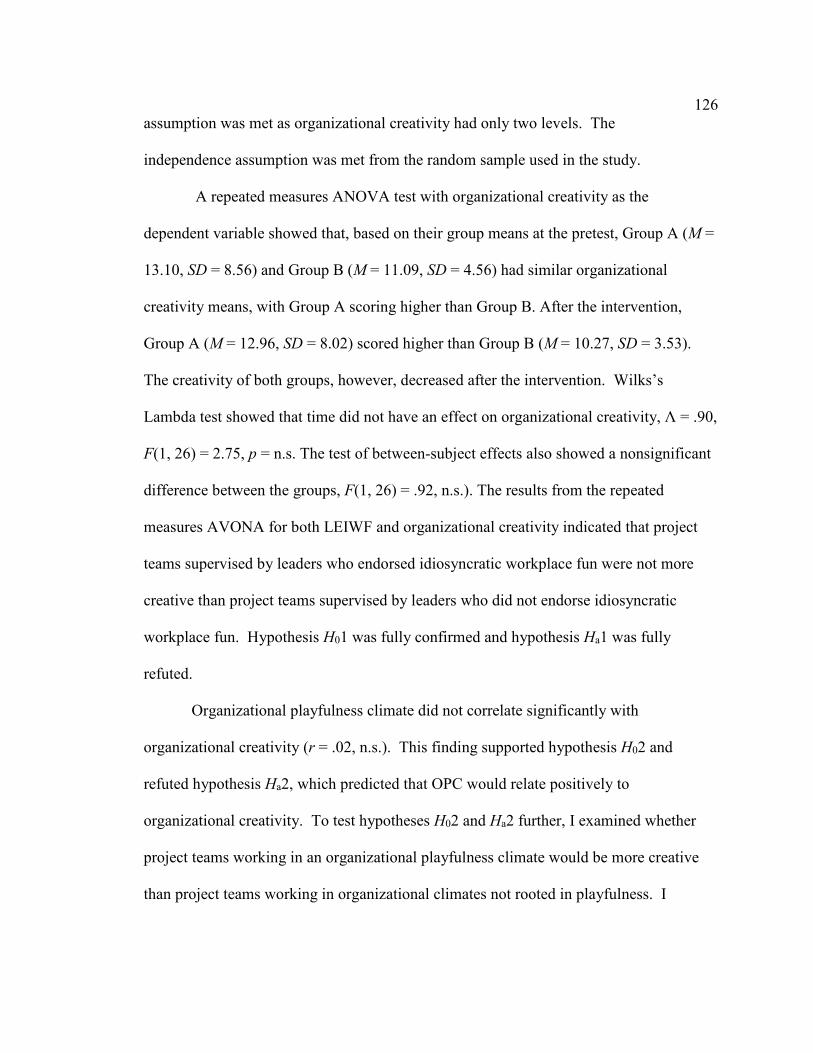
126assumption was met as organizational creativity had only two levels. The
independence assumption was met from the random sample used in the study.
A repeated measures ANOVA test with organizational creativity as the
dependent variable showed that, based on their group means at the pretest, Group A (M =
13.10, SD = 8.56) and Group B (M = 11.09, SD = 4.56) had similar organizational
creativity means, with Group A scoring higher than Group B. After the intervention,
Group A (M = 12.96, SD = 8.02) scored higher than Group B (M = 10.27, SD = 3.53).
The creativity of both groups, however, decreased after the intervention. Wilks’s
Lambda test showed that time did not have an effect on organizational creativity, Ʌ = .90,
F(1, 26) = 2.75, p = n.s. The test of between-subject effects also showed a nonsignificant
difference between the groups, F(1, 26) = .92, n.s.). The results from the repeated
measures AVONA for both LEIWF and organizational creativity indicated that project
teams supervised by leaders who endorsed idiosyncratic workplace fun were not more
creative than project teams supervised by leaders who did not endorse idiosyncratic
workplace fun. Hypothesis H01 was fully confirmed and hypothesis Ha1 was fully
refuted.
Organizational playfulness climate did not correlate significantly with
organizational creativity (r = .02, n.s.). This finding supported hypothesis H02 and
refuted hypothesis Ha2, which predicted that OPC would relate positively to
organizational creativity. To test hypotheses H02 and Ha2 further, I examined whether
project teams working in an organizational playfulness climate would be more creative
than project teams working in organizational climates not rooted in playfulness. I
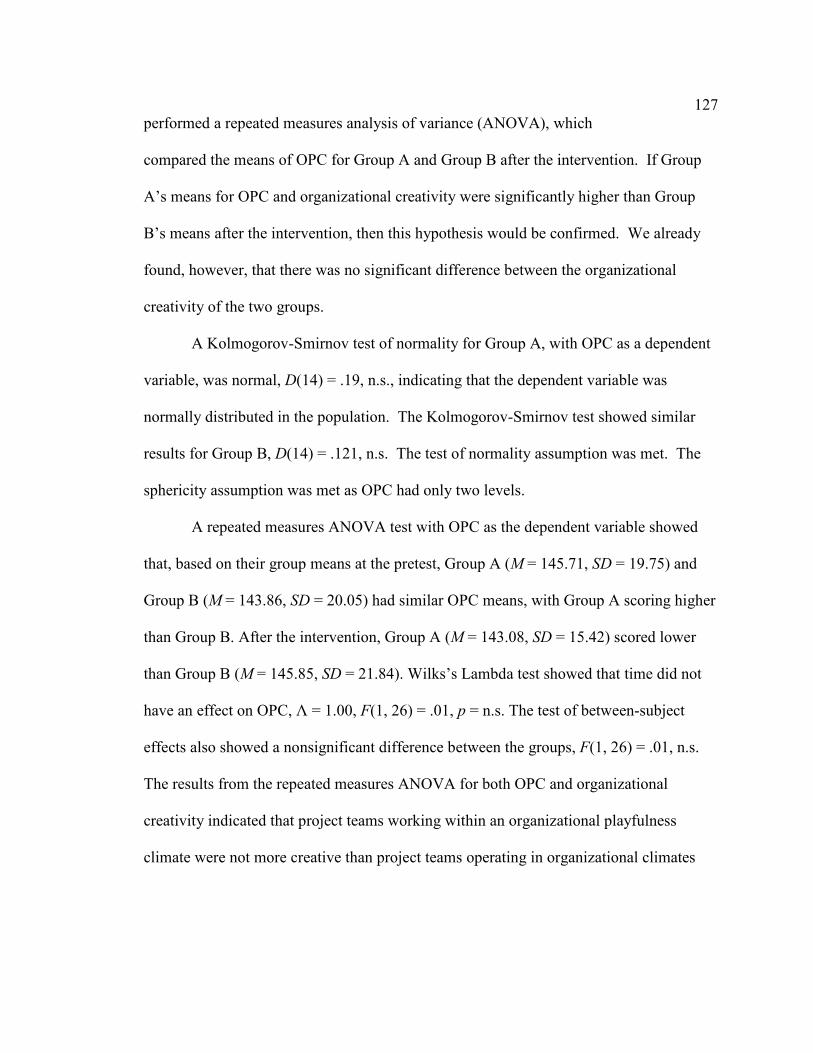
127performed a repeated measures analysis of variance (ANOVA), which
compared the means of OPC for Group A and Group B after the intervention. If Group
A’s means for OPC and organizational creativity were significantly higher than Group
B’s means after the intervention, then this hypothesis would be confirmed. We already
found, however, that there was no significant difference between the organizational
creativity of the two groups.
A Kolmogorov-Smirnov test of normality for Group A, with OPC as a dependent
variable, was normal, D(14) = .19, n.s., indicating that the dependent variable was
normally distributed in the population. The Kolmogorov-Smirnov test showed similar
results for Group B, D(14) = .121, n.s. The test of normality assumption was met. The
sphericity assumption was met as OPC had only two levels.
A repeated measures ANOVA test with OPC as the dependent variable showed
that, based on their group means at the pretest, Group A (M = 145.71, SD = 19.75) and
Group B (M = 143.86, SD = 20.05) had similar OPC means, with Group A scoring higher
than Group B. After the intervention, Group A (M = 143.08, SD = 15.42) scored lower
than Group B (M = 145.85, SD = 21.84). Wilks’s Lambda test showed that time did not
have an effect on OPC, Ʌ = 1.00, F(1, 26) = .01, p = n.s. The test of between-subject
effects also showed a nonsignificant difference between the groups, F(1, 26) = .01, n.s.
The results from the repeated measures ANOVA for both OPC and organizational
creativity indicated that project teams working within an organizational playfulness
climate were not more creative than project teams operating in organizational climates
128not rooted in playfulness. Hypothesis H02 was fully supported and hypothesis
Ha2 was fully rejected.
Hypothesis Ha3 stated that leaders’ endorsement of idiosyncratic workplace fun
and organizational playfulness climate predicted organizational creativity. To test
whether LEIWF and OPC predicted organizational creativity individually, I performed a
bivariate linear regression analysis for Group A and Group B after the intervention. To
test whether LEIWF and OPC predicted organizational creativity collectively, I
performed a multiple regression analysis for Group A and Group B after the intervention.
In the bivariate regression analysis, I used a fixed-effects model, as the study was
quasi-experimental (Green & Salkind, 2014). The regression equation is Y = BslopeX +
Bconstant, where Y is the dependent variable, X is the independent variable, Bslope is a slope
weight for the independent variable, and Bconstant is an additive constant. Three
assumptions had to be considered for the fixed-effects model. First, the dependent
variable had to be normally distributed in the population for each level of the independent
variable. This assumption was met for LEIWF during the repeated measures ANOVA
analysis. Second, the population variances of the dependent variable had to be the same
for all levels of the independent variable. Third, the cases had to represent a random
sample from the population, with independent scores from one case to another.
Based on the coefficients in Table 4, the linear regression equation for predicting
organizational creativity in Group A is:
organizational creativity(Group A) = .729LEIWF + 12.389
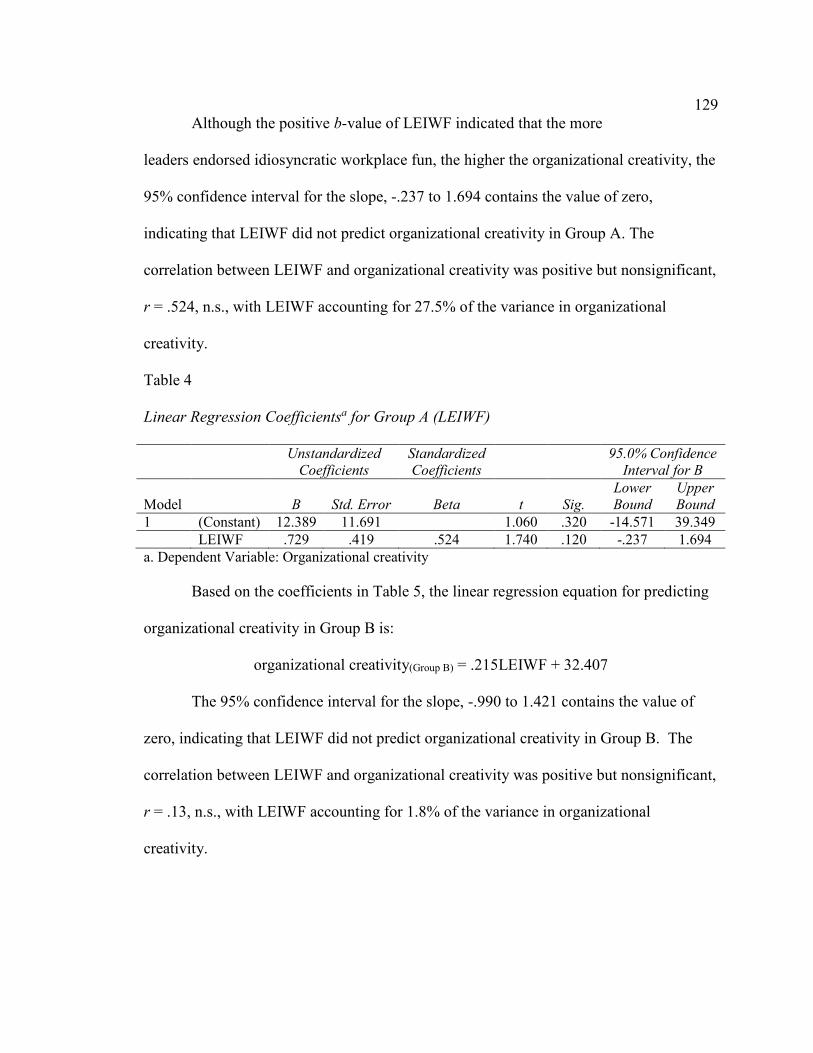
129 Although the positive b-value of LEIWF indicated that the more
leaders endorsed idiosyncratic workplace fun, the higher the organizational creativity, the
95% confidence interval for the slope, -.237 to 1.694 contains the value of zero,
indicating that LEIWF did not predict organizational creativity in Group A. The
correlation between LEIWF and organizational creativity was positive but nonsignificant,
r = .524, n.s., with LEIWF accounting for 27.5% of the variance in organizational
creativity.
Table 4
Linear Regression Coefficientsa for Group A (LEIWF)
Unstandardized
Coefficients
Standardized
Coefficients
95.0% Confidence
Interval for B
Model
B
Std. Error
Beta
t
Sig.
Lower
Bound
Upper
Bound
1 (Constant) 12.389 11.691 1.060 .320 -14.571 39.349 LEIWF .729 .419 .524 1.740 .120 -.237 1.694 a. Dependent Variable: Organizational creativity
Based on the coefficients in Table 5, the linear regression equation for predicting
organizational creativity in Group B is:
organizational creativity(Group B) = .215LEIWF + 32.407
The 95% confidence interval for the slope, -.990 to 1.421 contains the value of
zero, indicating that LEIWF did not predict organizational creativity in Group B. The
correlation between LEIWF and organizational creativity was positive but nonsignificant,
r = .13, n.s., with LEIWF accounting for 1.8% of the variance in organizational
creativity.
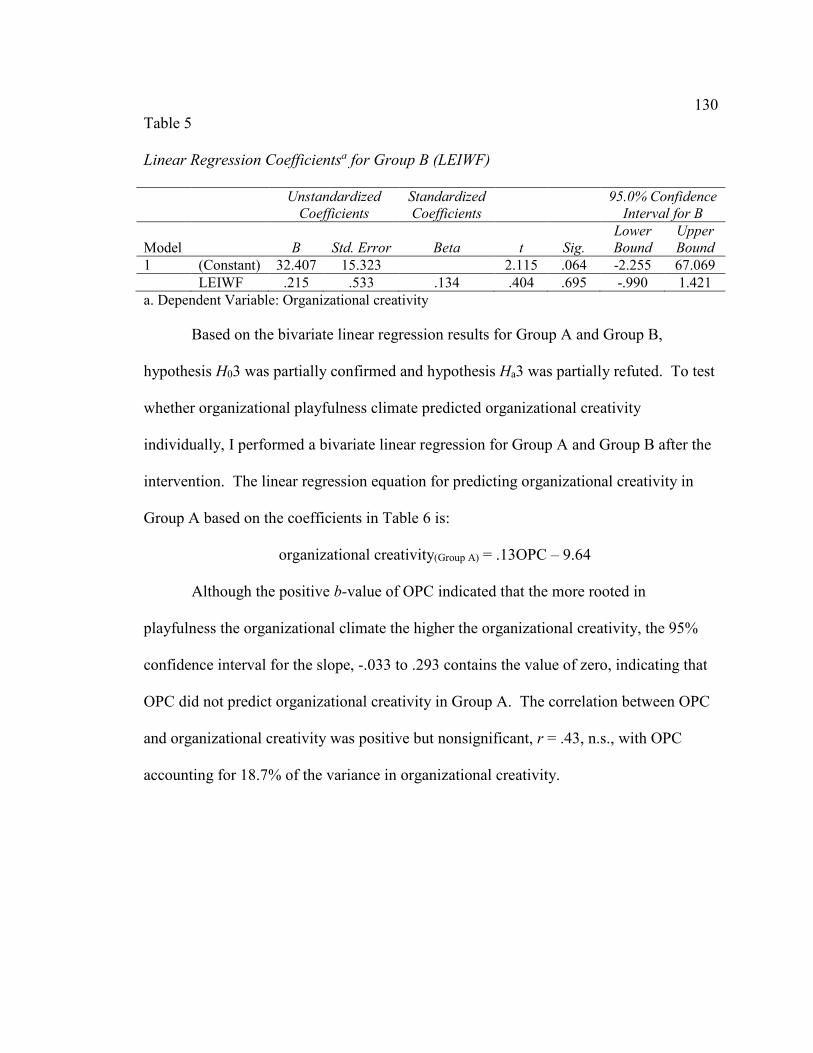
130Table 5
Linear Regression Coefficientsa for Group B (LEIWF)
Unstandardized
Coefficients
Standardized
Coefficients
95.0% Confidence
Interval for B
Model
B
Std. Error
Beta
t
Sig.
Lower
Bound
Upper
Bound
1 (Constant) 32.407 15.323 2.115 .064 -2.255 67.069 LEIWF .215 .533 .134 .404 .695 -.990 1.421 a. Dependent Variable: Organizational creativity
Based on the bivariate linear regression results for Group A and Group B,
hypothesis H03 was partially confirmed and hypothesis Ha3 was partially refuted. To test
whether organizational playfulness climate predicted organizational creativity
individually, I performed a bivariate linear regression for Group A and Group B after the
intervention. The linear regression equation for predicting organizational creativity in
Group A based on the coefficients in Table 6 is:
organizational creativity(Group A) = .13OPC – 9.64
Although the positive b-value of OPC indicated that the more rooted in
playfulness the organizational climate the higher the organizational creativity, the 95%
confidence interval for the slope, -.033 to .293 contains the value of zero, indicating that
OPC did not predict organizational creativity in Group A. The correlation between OPC
and organizational creativity was positive but nonsignificant, r = .43, n.s., with OPC
accounting for 18.7% of the variance in organizational creativity.
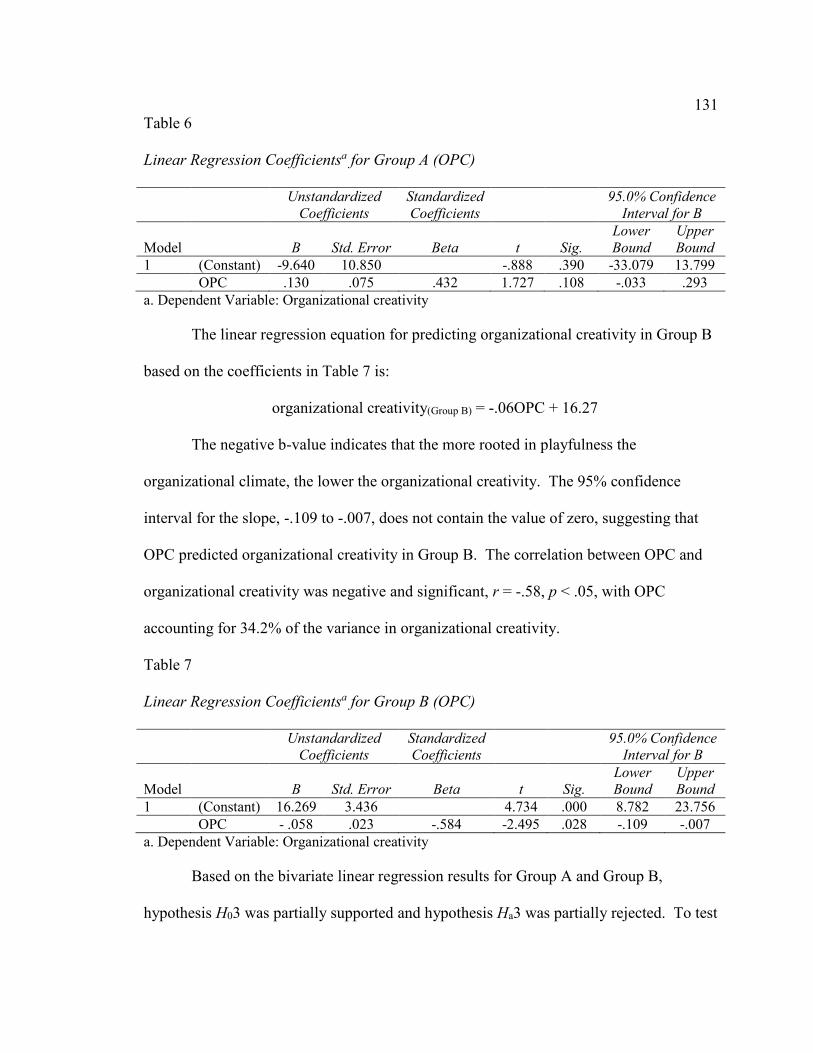
131Table 6
Linear Regression Coefficientsa for Group A (OPC)
Unstandardized
Coefficients
Standardized
Coefficients
95.0% Confidence
Interval for B
Model
B
Std. Error
Beta
t
Sig.
Lower
Bound
Upper
Bound
1 (Constant) -9.640 10.850 -.888 .390 -33.079 13.799 OPC .130 .075 .432 1.727 .108 -.033 .293 a. Dependent Variable: Organizational creativity
The linear regression equation for predicting organizational creativity in Group B
based on the coefficients in Table 7 is:
organizational creativity(Group B) = -.06OPC + 16.27
The negative b-value indicates that the more rooted in playfulness the
organizational climate, the lower the organizational creativity. The 95% confidence
interval for the slope, -.109 to -.007, does not contain the value of zero, suggesting that
OPC predicted organizational creativity in Group B. The correlation between OPC and
organizational creativity was negative and significant, r = -.58, p < .05, with OPC
accounting for 34.2% of the variance in organizational creativity.
Table 7
Linear Regression Coefficientsa for Group B (OPC)
Unstandardized
Coefficients
Standardized
Coefficients
95.0% Confidence
Interval for B
Model
B
Std. Error
Beta
t
Sig.
Lower
Bound
Upper
Bound
1 (Constant) 16.269 3.436 4.734 .000 8.782 23.756 OPC - .058 .023 -.584 -2.495 .028 -.109 -.007 a. Dependent Variable: Organizational creativity
Based on the bivariate linear regression results for Group A and Group B,
hypothesis H03 was partially supported and hypothesis Ha3 was partially rejected. To test
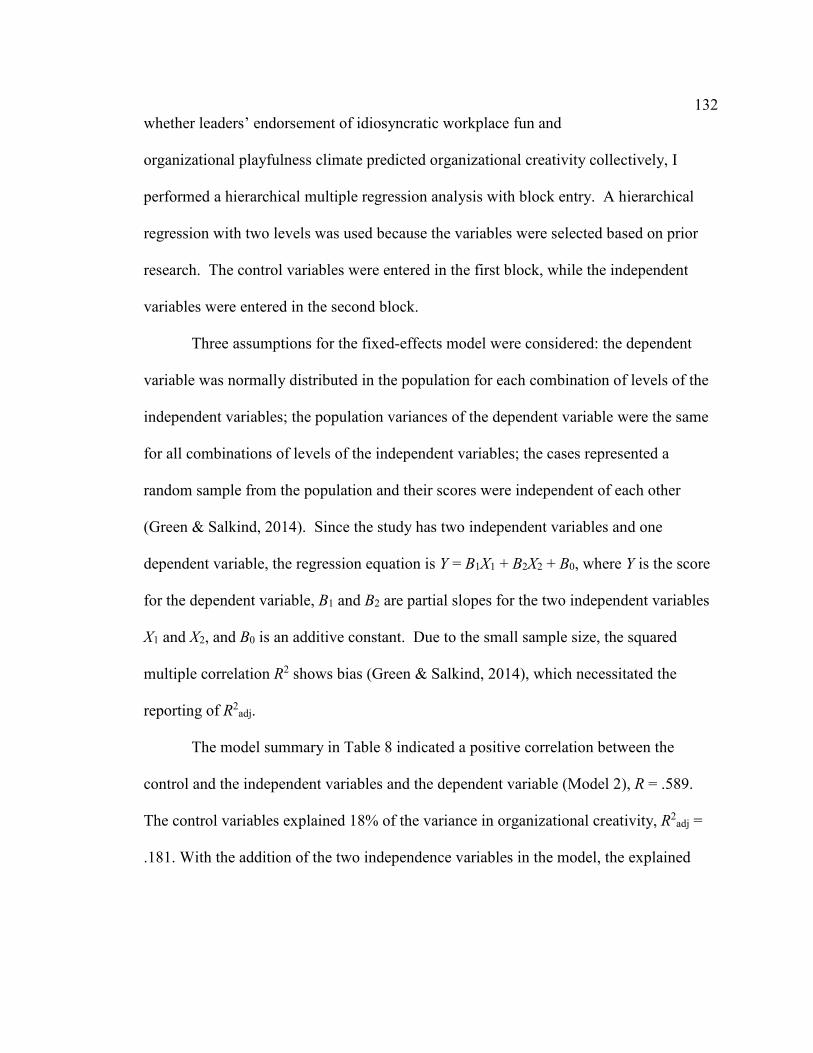
132whether leaders’ endorsement of idiosyncratic workplace fun and
organizational playfulness climate predicted organizational creativity collectively, I
performed a hierarchical multiple regression analysis with block entry. A hierarchical
regression with two levels was used because the variables were selected based on prior
research. The control variables were entered in the first block, while the independent
variables were entered in the second block.
Three assumptions for the fixed-effects model were considered: the dependent
variable was normally distributed in the population for each combination of levels of the
independent variables; the population variances of the dependent variable were the same
for all combinations of levels of the independent variables; the cases represented a
random sample from the population and their scores were independent of each other
(Green & Salkind, 2014). Since the study has two independent variables and one
dependent variable, the regression equation is Y = B1X1 + B2X2 + B0, where Y is the score
for the dependent variable, B1 and B2 are partial slopes for the two independent variables
X1 and X2, and B0 is an additive constant. Due to the small sample size, the squared
multiple correlation R2 shows bias (Green & Salkind, 2014), which necessitated the
reporting of R2adj.
The model summary in Table 8 indicated a positive correlation between the
control and the independent variables and the dependent variable (Model 2), R = .589.
The control variables explained 18% of the variance in organizational creativity, R2adj =
.181. With the addition of the two independence variables in the model, the explained
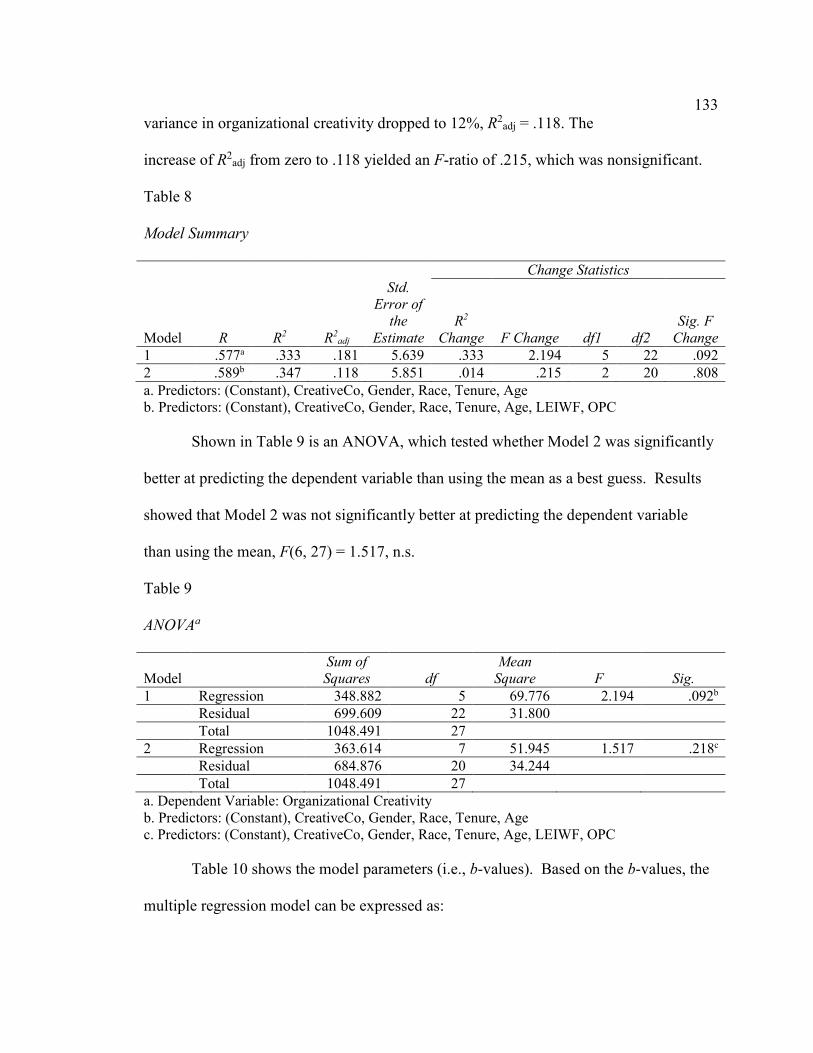
133variance in organizational creativity dropped to 12%, R2
adj = .118. The
increase of R2adj from zero to .118 yielded an F-ratio of .215, which was nonsignificant.
Table 8
Model Summary
Change Statistics
Model
R
R2
R2adj
Std.
Error of
the
Estimate
R2
Change
F Change
df1
df2
Sig. F
Change
1 .577a .333 .181 5.639 .333 2.194 5 22 .092 2 .589b .347 .118 5.851 .014 .215 2 20 .808 a. Predictors: (Constant), CreativeCo, Gender, Race, Tenure, Age b. Predictors: (Constant), CreativeCo, Gender, Race, Tenure, Age, LEIWF, OPC
Shown in Table 9 is an ANOVA, which tested whether Model 2 was significantly
better at predicting the dependent variable than using the mean as a best guess. Results
showed that Model 2 was not significantly better at predicting the dependent variable
than using the mean, F(6, 27) = 1.517, n.s.
Table 9
ANOVAa
Model
Sum of
Squares
df
Mean
Square
F
Sig.
1 Regression 348.882 5 69.776 2.194 .092b Residual 699.609 22 31.800 Total 1048.491 27 2 Regression 363.614 7 51.945 1.517 .218c Residual 684.876 20 34.244 Total 1048.491 27 a. Dependent Variable: Organizational Creativity b. Predictors: (Constant), CreativeCo, Gender, Race, Tenure, Age c. Predictors: (Constant), CreativeCo, Gender, Race, Tenure, Age, LEIWF, OPC
Table 10 shows the model parameters (i.e., b-values). Based on the b-values, the
multiple regression model can be expressed as:
134organizational creativity = -2.388age – 3.092gender + 5.568race - .558tenure
+ .661creativeco -.043LEIWF + .045OPC + 14.760
The negative b-value of LEIWF indicates that the more leaders endorse
idiosyncratic workplace fun, the lower the organizational creativity, but the result is not
statistically significant. The positive b-value of OPC indicates that the more rooted in
playfulness the organizational climate, the higher the organizational creativity, but the
result is not statistically significant. The values of the standardized β coefficient suggest
that LEIWF is the least important predictor of organizational creativity (β = -.018), while
OPC is the third least important predictor of organizational creativity (β = .133). These
findings suggest that, collectively, LEIWF and OPC, do not predict organizational
creativity. Hypothesis H03 was fully confirmed, while hypothesis Ha3 was fully rejected.
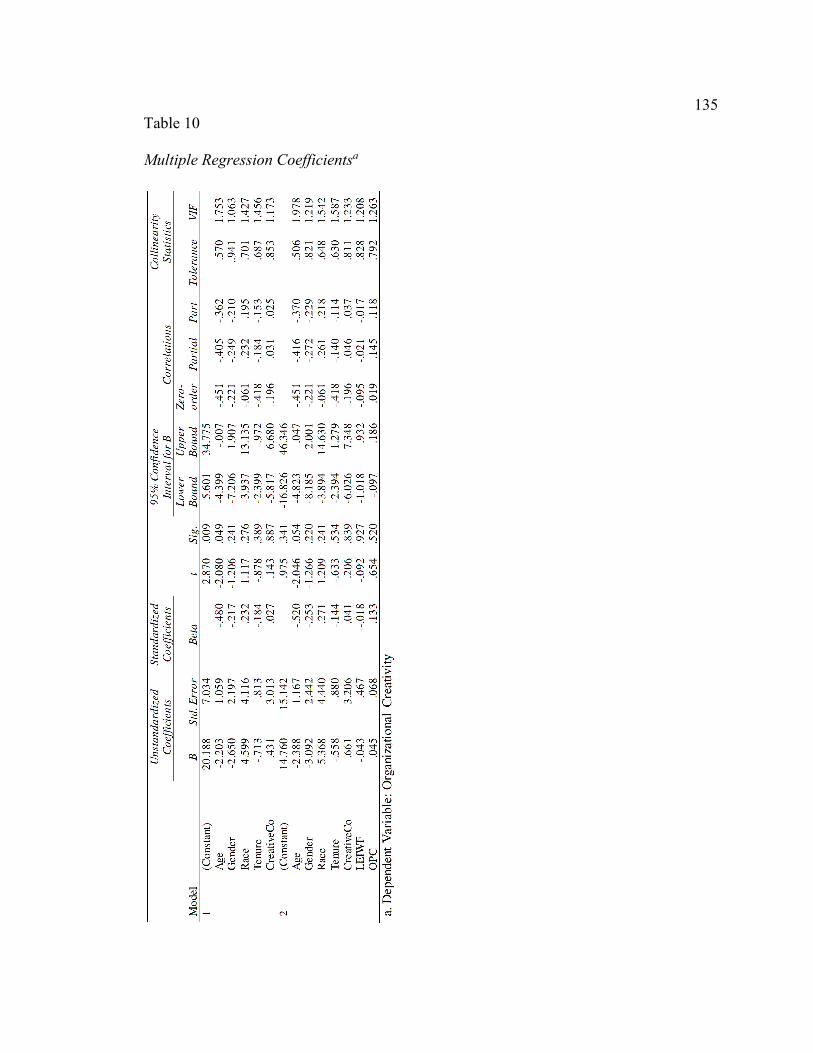
135Table 10
Multiple Regression Coefficientsa
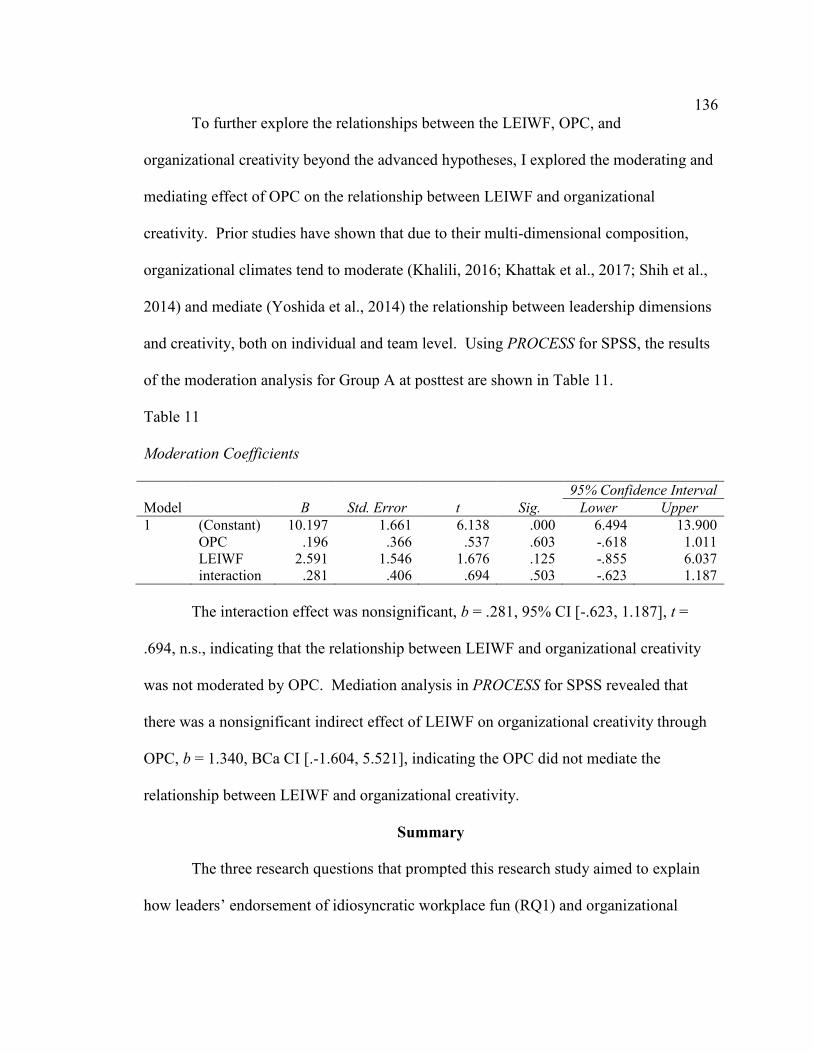
136To further explore the relationships between the LEIWF, OPC, and
organizational creativity beyond the advanced hypotheses, I explored the moderating and
mediating effect of OPC on the relationship between LEIWF and organizational
creativity. Prior studies have shown that due to their multi-dimensional composition,
organizational climates tend to moderate (Khalili, 2016; Khattak et al., 2017; Shih et al.,
2014) and mediate (Yoshida et al., 2014) the relationship between leadership dimensions
and creativity, both on individual and team level. Using PROCESS for SPSS, the results
of the moderation analysis for Group A at posttest are shown in Table 11.
Table 11
Moderation Coefficients
95% Confidence Interval
Model B Std. Error t Sig. Lower Upper
1 (Constant) 10.197 1.661 6.138 .000 6.494 13.900 OPC .196 .366 .537 .603 -.618 1.011 LEIWF 2.591 1.546 1.676 .125 -.855 6.037 interaction .281 .406 .694 .503 -.623 1.187
The interaction effect was nonsignificant, b = .281, 95% CI [-.623, 1.187], t =
.694, n.s., indicating that the relationship between LEIWF and organizational creativity
was not moderated by OPC. Mediation analysis in PROCESS for SPSS revealed that
there was a nonsignificant indirect effect of LEIWF on organizational creativity through
OPC, b = 1.340, BCa CI [.-1.604, 5.521], indicating the OPC did not mediate the
relationship between LEIWF and organizational creativity.
Summary
The three research questions that prompted this research study aimed to explain
how leaders’ endorsement of idiosyncratic workplace fun (RQ1) and organizational
137playfulness climate (RQ2) related to organizational creativity, and whether
LEIWF and OPC predicted organizational creativity, both individually and collectively
(RQ3). Based on the study’s findings, LEIWF and OPC did not relate significantly to
organizational creativity. Project teams with leaders who endorsed idiosyncratic
workplace fun were not more creative than project teams with leaders who did not
endorse idiosyncratic workplace fun. Project teams working in organizational climates
rooted in playfulness were not more creative than project teams working in organizational
climates not rooted in playfulness. LEIWF and OPC did not predict organizational
creativity individually and collectively. Beyond the research questions, OPC neither
moderated nor mediated the relationship between LEIWF and organizational creativity.
These findings contradicted recent studies that explored the relationships between
supportive leadership behaviors, organizational climates, and team and organizational
creativity. The next chapter contains interpretations of the current study’s findings
relative to the findings of prior studies, as well as the theoretical foundation and
conceptual framework of the study. I also discuss limitations of the study, give
recommendations for improving the study should it be replicated in the future, articulate
theoretical and methodological implications, and draw conclusions.
138Chapter 5: Discussion, Conclusions, and Recommendations
In this study, I aimed to provide empirical support to the anecdotal evidence of
the positive influence of workplace fun and organizational playfulness climate on
organizational creativity. The quantitative quasi-experimental nature of the study met the
requirements for rigor and objectivity needed in the investigation of the relationships
between the variables. The presence of gaps in recent research on workplace fun,
organizational playfulness climate, and organizational creativity spurred this
investigation. While the concept of idiosyncratic workplace fun had never been studied,
organizational playfulness climate had never been related to organizational creativity.
The study’s findings suggested that leaders’ endorsement of idiosyncratic
workplace fun and organizational playfulness climate did not relate significantly to
organizational creativity. Project teams with leaders who endorsed idiosyncratic
workplace fun and operated within a climate steeped in playfulness were not more
creative than project teams that lacked these two contextual influences. The findings
indicated that LEIWF and OPC did not predict organizational creativity.
Interpretation of Findings
Management scholars conducting research on workplace fun agree on the positive
influence of workplace fun on a host of organizational outcomes. Job satisfaction (Chan
& Mak, 2016), employee engagement (Becker & Tews, 2016), turnover (Tews et al.,
2013), team performance (Lehmann-Willenbrock & Allen, 2014), and employees’
performance (Fluegge-Wolf, 2014) are some of the organizational outcomes positively
impacted by the presence of workplace fun at business organizations. Based on this
139evidence, it was expected that leaders’ endorsement of idiosyncratic
workplace fun would be related positively to organizational creativity.
Prior research on leadership styles and dimensions and their relationship with
employee creativity (Henker, Sonnentag, & Unger, 2015), team creativity (Bai, Lin, &
Li, 2016), and organizational creativity (Yoon et al., 2016) also suggested that leaders’
support of workplace fun would positively impact organizational creativity. The
autonomous nature of idiosyncratic workplace fun aligned with self-determination theory
(Deci & Ryan, 2008) and was expected to intrinsically motivate team members, elevate
their energy level, increase their positive affect, and lead to creative behaviors.
Woodman et al.’s (1993) interactionist theory of organizational creativity suggested that
the interaction of leaders with their teams through leaders’ endorsement of idiosyncratic
workplace fun and the interaction of employees’ workplace attitudes while having fun
with their work would positively influence organizational creativity.
The results of this study diverged from these theoretical propositions and
empirical findings. Leaders’ endorsement of idiosyncratic workplace fun correlated
negatively, but not significantly, to organizational creativity. Compared to the control
group (Group B), the project teams in Group A, led by leaders who endorsed
idiosyncratic workplace fun, did not significantly differ in their creativity. In fact, the
creativity of both groups decreased after the intervention. The endorsement of
idiosyncratic workplace fun by team leaders did not individually predict organizational
creativity.
140A possible explanation of these divergent findings is that team
members did not trust their leaders when they endorsed idiosyncratic workplace fun. As
Chan and Mak (2016) showed, the positive relationship between workplace fun and trust-
in-management was stronger when employees experienced high level of fun at work.
This suggests that workplace fun has to exist to some degree at organizations in order for
employees’ trust of management to get stronger with high levels of workplace fun.
If the participating project teams in this study did not experience workplace fun
prior to this study, then when team leaders started endorsing idiosyncratic workplace fun,
the team members might have perceived the endorsement as a pretext for some other goal
sought by management. This explanation is supported by Plester et al. (2015), who found
that when workplace fun and management mixed, employees experienced negative
emotions. Prior research has shown that positive affect, not negative affect, mediates the
relationship between leadership and creativity (Rego, Sousa, Marques, & Cuhna, 2014).
At the other end of the workplace fun spectrum, it is possible that, due to the
small size of the project teams and the high average employee tenure (i.e., 14 years), the
team members in Group A and Group B experienced high levels of psychological safety
and already enacted idiosyncratic workplace fun behaviors at work. Spraggon and
Bodolica (2017) theorized that the greater the corporate climate for psychological safety,
the higher the likelihood of employees to engage in social ludic activities (SLAs).
Because SLAs involve interactions with other employees, there might have been a
misunderstanding among team members about the nature of idiosyncratic workplace fun
and how it differed from other playful and workplace fun activities.
141 The second independent variable, organizational playfulness climate,
correlated positively to organizational creativity, but the correlation was not statistically
significant. Although the teams in Group A operated in an organizational climate
grounded in playfulness as their leaders endorsed idiosyncratic workplace fun, these
teams were not more creative than the teams in Group B that operated within the status
quo organizational climate of their company. Counter to expectations, the teams in
Group A experienced weaker OPC than the teams in Group B after the intervention. The
presence of OPC at companies did not individually predict organizational creativity.
These findings stand in contrast to the perception of 82.1% of the team members
in the sample who indicated at pretest that they worked for a creative company. If that
was the case, the team members should have already experienced some form of play at
work, as organizational play is an integral part of most creative companies (Kelley &
Kelley, 2013). Teams at creative companies have enabling dynamics and are often
flexible and empowered and exhibit playfulness and humor (Rosso, 2014). According to
Bateson and Nettle (2014), people who think of themselves as playful also think that they
are creative. Although individuals can be playful without being creative, they can rarely
be creative without being playful (Henricks, 2015).
The results of this study deviate from the findings by Yu et al. (2007), who found
that organizational playfulness climate related positively to creativity (expressed as
innovative behavior). Given that the study by Yu et al. is the only prior study that
examined the relationship between OPC and creativity in organizational settings, there is
not enough empirical research to draw meaningful comparisons between this study’s
142findings and prior research. The dearth of prior research on OPC was a key
reason for including OPC as an independent variable in this study. It should be noted that
while Yu et al. examined the impact of OPC on an individual-level variable, the focus in
this study was on the influence of OPC on an organizational-level variable (i.e.,
organizational creativity). Prior studies on the effect of domain-specific climates on
innovative and creative organizational outcomes have indicated that the influence of
domain-specific climates, such as OPC, is often indirect and needs to be translated via
mediating or moderating variables (Hirst et al., 2018; Kang et al., 2016; Zhu et al., 2018).
Another possible explanation of why OPC was not significantly related to
organizational creativity is that, conceptually, having idiosyncratic workplace fun is
different than being playful at work. Engaging in idiosyncratic workplace fun could
include activities, such as reading a book or standing on one’s head, that might not be
considered playful by employees and not contribute to an organizational playfulness
climate. According to play theory, playfulness is a defining feature of play and is
expressed as a positive mood state, which may not be easily detectable in observable
behavior (Bateson, 2014).
Playfulness is also related to extraversion and is comprised of four playfulness
dimensions in adults: gregarious, uninhibited, comedic, and dynamic (Barnett, 2012). If
most team members in Group A did not embody these characteristics, their behaviors
would not contribute to the establishment of an organizational playfulness climate and
lead to increased organizational creativity. It is entirely possible that leaders’
endorsement of idiosyncratic workplace fun did not contribute to the formation or
143enhancement of an organizational playfulness climate, but instead contributed
to other existing climates at the participating companies.
The divergence of this study’s findings from previous research and theory can be
attributed to many factors. The duration of the intervention period might not have been
long enough for the teams in Group A to engage in playful behaviors as a result of team
leaders’ endorsement of idiosyncratic workplace fun. It takes time for the ethos of play
to override the ethos of management (Costea et al., 2007), especially because individual
and organizational actions are justified in terms of means and ends, while playfulness and
fun are viewed as antithetical to that model (March, 1979). Most people require priming
by mechanical signals or cues, so that they shift into play consciousness
(Csikszentmihalyi & Bennett, 1971).
Taken together, LEIWF and OPC did not predict organizational creativity. Along
with working at a creative company, the two independent variables were among the three
least important predictors of organizational creativity, compared to control variables age,
gender, race, and tenure. As suggested by the complexity-based theory of organizational
creativity, business companies are complex adaptive systems, oscillating between
stability and instability (Stacey, 1996). Both LEIWF and OPC represent sources of
organizational instability and push the organization toward the edge of chaos where
creativity happens. Collectively present at the participating companies in this study,
LEIWF and OPC most likely clashed with the dominant organizational schemas at each
company and evoked negative feedback.
144Recent research by Caniels et al. (2014) demonstrated this inherent
organizational complexity by discovering that different types of antecedents were
required in each of the three phases of the creative process: idea generation, idea
promotion, and idea implementation. These phases are consonant with the three
components of team creativity (i.e., creative thinking, creative action, and team creative
outcome) proposed by Jiang and Zhang (2014). The joint presence of LEIWF and OPC
within the project teams in Group A might have been spread among the three phases,
such that the influence of LEIWF and OPC on organizational creativity as a unitary
construct was diluted and not strong enough to make a significant impact.
Viewed through the perspective of the general contingency theory of management
(Luthans & Stewart, 1977), the study’s findings suggest that organizational creativity is
not a function of leaders’ endorsement of idiosyncratic workplace fun and organizational
playfulness climate. The equation OC = f(LEIWF x OPC) is not valid. The primary
leadership variable LEIWF and the secondary environmental variable OPC do not
interact and influence the tertiary performance variable organizational creativity. The
misalignment between the study’s findings and the study’s underlying theoretical
foundation and conceptual framework raises questions about the limitations of the study.
Limitations of the Study
The current study had several strengths. The longitudinal quasi-experimental
design used in the study aimed at discovering not only correlations between the variables,
but also the causal links between LEIWF, OPC, and organizational creativity. The
multilevel nature of the study (i.e., individual-level and team-level variables impacting
145organizational-level outcome) aligned with the conceptual complexity of the
variables and the reported multilevel influence of similar constructs on organizational
outcomes. The study introduced idiosyncratic workplace fun as a new type of workplace
fun and was the first study to test the influence on LEIWF on organizational creativity.
The study was also the first U.S. study to test the effect of organizational playfulness
climate on organizational creativity.
Despite these strengths, the nonsignificant findings in the study stemmed from
several limitations. I did not have adequate financial resources and time to conduct the
study as initially planned. The small sample size, the short intervention duration, the
inclusion of project teams with less than four members, the use of purposive sampling,
and the use of a quantitative research methodology and design reflect this resource-based
limitation.
While the pre-hoc sample size of 66 teams was estimated for 80% power and
effect size .40, a sample size of seven project teams resulted in a severely underpowered
study and effect size close to zero. Such outcomes are consonant with statistical theory
on the deteriorating effect of small sample sizes on statistical power (Anderson, Kelley,
& Maxwell, 2017; Fraley & Vazire, 2014; Greenland et al., 2016). The small sample size
led to biased values of the intraclass correlation coefficients ICC(1) and ICC(2) in both
experimental groups. The small sample size necessitated a top-down distribution of
organizational creativity scores instead of bottom-up aggregation of individual scores as
the study’s initial level of analysis was the group.
146The instrument that I used to measure LEIWF presented another
limitation in the study. Although the Leaders’ Endorsement of Idiosyncratic Workplace
Fun Scale is based on the highly validated Fun Climate Measure by McDowell (2004), its
trustworthiness is questionable. Despite adequate factor loadings of the seven scale items
and acceptable Cronbach’s alpha, the scale needs further validation for construct and
discriminant validity. A related limitation was the use of a team creativity instrument
that did not account for environmental influences to measure organizational creativity. In
terms of the intervention procedures, the absence of a manipulation check to verify
whether leaders actually endorsed idiosyncratic workplace fun limits the validity of the
obtained data.
The generalizability of the study across industries and organizational contexts is
limited by the participation in the study of companies located only in Portland, Oregon,
and Seattle, Washington, most of which were perceived as creative companies by their
employees. The skewed mix of creative versus noncreative companies did not represent
the diversity of companies in the marketplace. Northwestern United States is culturally
different than other parts of the country and the rest of the world, which limits the
relevance of the study’s findings to companies in other geographical areas.
Recommendations
The complexity of organizational creativity as a concept necessitates the use of a
research methodology and design that can account for that complexity when examining
relationships between organizational creativity and other concepts. The use of a quasi-
experimental design and quantitative methodology in this study did not allow for a
147comprehensive examination of the relationships between the variables. Future
studies investigating the relationships between LEIWF, OPC, and organizational
creativity should employ a mixed method research methodology, whereby both
qualitative and quantitative research designs are used concurrently to answer the research
questions (Morse, 2018).
As research designs accounting for conceptual complexity require more time to
complete, future studies investigating the relationships between LEIWF, OPC, and
organizational creativity should be conducted with sufficient human and financial
resources. Well-funded future studies should first validate the LEIWF Scale and develop
an organizational creativity instrument that accounts for the complexity of the
organizational creativity concept prior to replicating the current study. The instruments
used to measure organizational creativity in recent studies have been limited, as they have
included three survey items (Guistiniano et al., 2016; Park et al., 2014) and six survey
items (Hussain et al., 2017).
Sufficient resources will allow future studies a wider access to project teams at
companies across industries and geographical areas. Access to project teams at
companies presented the biggest challenge in this study. Several Chambers of Commerce
contacted during the recruitment period refused to provide the contact information of
their company members unless they got paid for supplying the information. The ample
resources of future quantitative or mixed method studies on organizational creativity will
allow them to widen the sampling frame, increase the sample size, improve statistical
power, and result in statistically significant findings.
148 Qualitatively, researchers can examine in interviews and focus groups
the three levels of creativity at companies (i.e., individual, group, and organizational) and
how they converge to produce a holistic picture of organizational creativity at
organizations. Individual, group, and organizational dimensions not captured by
quantitative instruments can be brought to light in interviews and added to the model
used to understand the relationships between LEIWF, OPC, and organizational creativity.
For example, the interaction of organizational play and organizational climate is difficult
to measure comprehensively with quantitative instruments due to the multidimensionality
of the constructs, but could be uncovered in a phenomenological study.
On an individual level, the adoption of idiosyncratic workplace fun depends on
each employee’s degree of individual playfulness (Bateson, 2014). This, in turn, informs
employees’ comfort in and perception of the organizational climate facilitated by the
adoption or rejection of idiosyncratic workplace fun. Future research should aim to
capture such consequential nuances.
Experimental and quasi-experimental studies probing the relationships between
LEIWF, OPC, and organizational creativity in the future should extend the intervention
period, so that project teams have more time to adopt idiosyncratic workplace fun and
settle into the organizational playfulness climate that might emerge as a result.
Intervention periods longer than a month will allow project teams to discover the
conditions under which idiosyncratic workplace fun is appropriate at work and how it fits
within the operational model of the company. Future longitudinal studies with large
149samples could uncover causal links between LEIWF, OPC, and organizational
creativity and the boundary conditions under which the relationships work.
The usefulness of these recommendations depends to a large degree on the
relevance of the relationships between LEIWF, OPC, and organizational creativity across
cultural contexts. The fact that employees at some companies and industries in Taiwan
(Yu et al., 2007), United States (Bock, 2015), and Denmark (Sorensen & Spoelstra, 2012)
can play, have fun at work, and be creative does not mean that employees in other
countries enjoy such workplace benefits and work in such environments. Future studies
should explore where leaders can endorse idiosyncratic workplace fun, where playfulness
at work is appropriate, and where the mix of idiosyncratic workplace fun, organizational
playfulness climate, and organizational creativity is most beneficial.
Implications
The nonsignificant results in this study preclude any implications to positive
social change stemming directly from the findings. The study must be replicated with a
larger sample size and significant findings must be obtained before any implications for
positive social change are drawn. As a small sample size increases the likelihood of a
Type II error (Greenland et al., 2016) the study’s results should be viewed only as
indicators of possible relationships between LEIWF, OPC, and organizational creativity.
For example, the nonsignificant but high b values of leaders’ endorsement of
idiosyncratic workplace fun in Group A and Group B in the bivariate regression test
suggest that LEIWF might be a strong predictor organizational creativity under different
conditions. The weak and negative b values of organizational playfulness climate in both
150groups in the bivariate regression test suggest that OPC might be a weak or
negative predictor of organizational creativity.
The confirmation of these suggestive results across companies, industries, and
geographical areas could mean that idiosyncratic workplace fun might be a valid type of
workplace fun that is valued by project team leaders and members as it leads to higher
organizational creativity. The multi-level influence of LEIWF could make it a desired
organizational component at companies, on which society depends for the solving of its
most pressing problems. The presence of an organizational climate rooted in playfulness
and leisure could indicate to project team leaders and members that the conditions are
right for organizational creativity. It is possible that individual employees could accrue
the benefits of play and relaxation at work while the benefits of OPC for teams and the
organization remain either minimal or negative. When OPC is prioritized at companies,
however, play and playfulness could become vital for employees and begin to influence
employees’ lives outside of work. This could lead to a positive cultural shift in our
society, as outdated notions of the nature of work and our relationship to it are replaced
by new work-life models that integrate work seamlessly into people’s lives through play,
positive effect, imagination, and constant creativity.
The methodological implications of the study’s findings relate to the research
methodology and designs used in management studies to examine the relationships
between complex phenomena. This study is an example of a robustly designed but
underpowered management study, grounded in a less than ideal methodology. When too
many parameters in a management study are compromised, the study’s findings reflect
151these shortcomings. This study’s procedures and results highlight the fragility
management studies and the importance of using rigorous research designs and
methodology in investigating complex relationships in management science.
The theoretical implications of the results, as they relate to leadership theory,
workplace fun theory, and organizational creativity theory, are insignificant. It can be
proposed, however, that LEIWF might be a type of leaders’ support distinct from the
individualized support provided by transformational leaders and the support employees
receive from various organizational components, such as information system design
(Olszak et al., 2018) and workplace relationships (Colbert, Bono, & Purvanova, 2016).
The confirmation of idiosyncratic workplace fun as a fourth type of workplace fun would
extend the current understanding of how employees could have fun at work and add an
important dimension to the concept of workplace fun.
While both LEIWF and OPC push companies to the edge of chaos, OPC might be
too destabilizing for organizations. This suggests the existence of a continuum of
destabilizing organizational influences, some of which might not contribute to or
adversely affect organizational creativity. Such knowledge would enhance organizational
play theory and the complexity-based theory of organizational creativity.
The implications for practice stemming from the study’s findings pertain to the
enactment of idiosyncratic workplace fun by employees and the emergence of
organizational playfulness climate and organizational creativity at organizations. These
processes depend to a large degree on leaders’ modeling idiosyncratic workplace fun and
playfulness, so that team members can identify with such behaviors, feel safe in
152incorporating idiosyncratic workplace fun in their daily routine, and express
their playfulness at work. Recent research by Qu, Janssen, and Shi (2015) found that
follower relational identification with the leader mediated the positive relationship
between transformational leadership and follower creativity.
LEIWF and OPC might have significant effects on organizational creativity if
employees understood that idiosyncratic fun and being playful at work were allowed
from the first day of their employment at a company. Such an understanding would most
likely engender an organizational climate grounded in playfulness and spur creativity
across organizational levels. When team leaders and team members express themselves
freely at work through fun and play, their emotional needs would be met and the
likelihood of their giving their very best to the organization would increase.
Conclusions
Questions about the purpose of life have intrigued people for centuries. Since the
Industrial Revolution, questions about the purpose of companies have captivated business
leaders and managers. While Samuelson and Nordhaus (2009) asserted that the purpose
of companies and individuals was to maximize either profits or utility, Csikszentmihalyi
(1996) stated that the main purpose of life was to create. Kaufman and Gregoire (2016)
confirmed Csikszentmihalyi’s perspective by showing that the human brain was wired to
create. Eagleman and Brandt (2017) further theorized that Homo sapiens became the
runaway species because of their ability to create.
This study originated from anecdotal evidence about the positive effect of
workplace fun and organizational playfulness climate on organizational creativity. To
153test this thesis, I designed a quasi-experimental quantitative study and
investigated the effects of leaders’ endorsement of idiosyncratic workplace fun and
organizational playfulness climate on organizational creativity. The study took place at
companies in the northwestern United States with a sample of 7 intact project teams.
Due to the small sample size, low statistical power, and possible Type II errors,
the study produced nonsignificant results. The findings contradicted extant leadership
research, organizational climate research, creativity research, and workplace fun research
that reported positive and significant relationships between workplace fun, domain-
specific climates, and organizational creativity. The limitations of the study
notwithstanding, the findings suggest that adequately powered replication studies might
demonstrate that companies could thrive creatively when leaders support followers’ need
satisfaction and their pursuit of better work environments through fun and play.
Employees’ need for full emotional expression at work has become a necessity
and should not be negated by leaders and organizational structures (Van Kleef, van den
Berg, & Heerdink, 2015). The link between play and creativity is undeniable (Silverman,
2016). By adopting a fun-based or play-based operational model, business organizations
could change the work lives of their employees, reinvent themselves through creativity,
and transform human society for the better.
154References
Akgun, A. E., Keskin, H., & Byrne, J. C. (2014). Complex adaptive systems theory and
firm product innovativeness. Journal of Engineering and Technology
Management, 31(1), 21-42. doi:10.1016/j.jengtecman.2013.09.003.
Amabile, T. M. (1996). Creativity in context. Boulder, CO: Westview Press, Inc.
Anderson, M. H., & Sun, P. Y. T. (2017). Revewing leadership styles: Overlap and the
need for a new 'full-range' theory. International Journal of Management Reviews,
19(1), 76-96. doi:10.1111/ijmr.12082.
Anderson, S. F., Kelley, K., & Maxwell, S. E. (2017). Sample-size planning for more
accurate statistical power: A method adjusting sample effect sizes for publication
bias and uncertainty. Psychological Science, 28(11), 1547-1562.
doi:10.1177/0956797617723724.
Anitha, J. (2014). Determinants of employee engagement and their impact on employee
performance. International Journal of Productivity and Performance
Management, 63(3), 308-323. doi:10.1108/IJPPM-01-2013-0008.
Argyris, C. (1974). Personality vs. organization. Organizational Dynamics, 3(2), 2-17.
doi:10.1016/0090-2616(74)90006-0.
Baer, J. (2012). Domain specificity and the limits of creativity theory. Journal of
Creative Behavior, 46(1), 16-29. doi:10.1002/jocb.002.
Bai, Y., Lin, L., & Li, P. P. (2016). How to enable employee creativity in a team context:
A cross-level mediating process of transformational leadership. Journal of
Business Research, 69(9), 3240-3250. doi:10.1016/j.jbusres.2016.02.025.
155Baptiste, N. R. (2009). Fun and well-being: Insights from senior managers in a
local authority. Employee Relations, 31(6), 600-612.
doi:10.1108/01425450910991758.
Barnett, L. A. (2012). Playful people: Fun is in the mind of the beholder. Imagination,
Cognition and Personality, 31(3), 169-197. doi:10.2190/IC.31.3.c.
Basu, R. (2016). Implication of organisational climate and team effectiveness on
employee commitment - a study on Indian banks. ASBM Journal of Management,
9(1), 1-16. Retrieved from http://www.asbm.ac.in/asbmpublication.
Bateson, P. (2014). Play, playfulness, creativity and innovation. Animal Behavior and
Cognition, 1(2), 99-112. doi:10.12966/abc.05.02.2014.
Bateson, P., & Nettle, D. (2014). Playfulness, ideas, and creativity: A survey. Creativity
Research Journal, 26(2), 219-222. doi:10.1080/10400419.2014.901091.
Becker, F. W., & Tews, M. J. (2016). Fun activities at work: Do they matter to hospitality
employees? Journal of Human Resources in Hospitality & Tourism, 15(3), 279-
296. doi:10.1080/15332845.2016.1147938.
Bjorkdahl, J., & Borjesson, S. (2011). Organizational climate and capabilities for
innovation: A study of nine forest-based Nordic manufacturing firms.
Scandinavian Journal of Forest Research, 26, 488-500.
doi:10.1080/02827581.2011.585997.
Bliese, P. D. (2000). Within-group agreement, nonindependence, and reliability:
implications for data aggregation and analysis. In K. J. Klein & S. W. J.
Kozlowski (Eds.), Multilevel theory, research, and methods in organizations:
156Foundations, extensions, and new directions (pp. 349-381). San
Francisco, CA: Jossey-Bass.
Blomberg, A. (2014). Organizational creativity diluted: A critical appraisal of discursive
practices in academic research. Journal of Organizational Change Management,
27(6), 935-954. doi:10.1108/JOCM-12-2013-0252.
Bock, L. (2015). Work rules!: Insights from inside Google that will transform how you
live and lead. New York, NY: Twelve.
Boies, K., Fiset, J., & Gill, H. (2015). Communication and trust are key: Unlocking the
relationship between leadership and team performance and creativity. The
Leadership Quarterly, 26(6), 1080-1094. doi:10.1016/j.leaqua.2015.07.007.
Bolton, S. C., & Houlihan, M. (2009). Are we having fun yet? A consideration of
workplace fun and engagement. Employee Relations, 31(6), 556-568.
doi:10.1108/01425450910991721.
Brandt, A., & Eagleman, D. (2017). The runaway species. Edinburgh, U.K.: Canongate
Ltd.
Brauchli, R., Bauer, G. F., & Hammig, O. (2014). Job autonomy buffers the impact of
work-life conflict on organizational outcomes: A large-scale cross-sectional study
among employees in Switzerland. Swiss Journal of Psychology, 73(2), 77-86.
doi:10.1024/1421-0185/a000126.
Butler, N., Olaison, L., Sliwa, M., Sorensen, B. M., & Spoelstra, S. (2011). Work, play
and boredom. Ephemera: Theory & Politics in Organization, 11(4), 329-335.
Retrieved from http://www.ephemerajournal.org/.
157Cable, D. M. (2018). Alive at work: The neuroscience of helping your people
love what they do. Cambridge, MA: Harvard Business Review Press.
Campbell, D. T., & Stanley, J. C. (1963). Experimental and quasi-experimental designs
for research. Chicago, IL: Rand McNally.
Caniels, M. C. J., De Stobbeleir, K., & De Clippeleer, I. (2014). The antecedents of
creativity revisited: A process perspective. Creativity & Innovation Management,
23(2), 96-110. doi:10.1111/caim.12051.
Carmeli, A., Dutton, J. E., & Hardin, A. E. (2015). Respect as an engine for new ideas:
Linking respectful engagement, relational information processing and creativity
among employees and teams. Human Relations, 68(6), 1021-1047.
doi:10.1177/0018726714550256.
Caruana, E. J., Roman, M., Hernández-Sánchez, J., & Solli, P. (2015). Longitudinal
studies. Journal of Thoracic Disease, 7(11), E537–E540. doi:10.3978/j.issn.2072-
1439.2015.10.63.
Catmull, E. (2014). Creativity, Inc.: Overcoming the unseen forces that stand in the way
of true inspiration. New York, NY: Random House.
Chamakiotis, P., Dekoninck, E. A., & Panteli, N. (2013). Factors influencing creativity in
virtual design teams: An interplay between technology, teams and individuals.
Creativity & Innovation Management, 22(3), 265-279. doi:10.1111/caim.12039.
Chan, D. (1998). Functional relations among constructs in the same content domain at
different levels of analysis: A topology of composition models. Journal of
Applied Psychology, 83(2), 234-246. doi:10.1037/0021-9010.83.2.234.
158Chan, S. C. H., & Mak, W. (2016). Have you experienced fun in the
workplace? An empirical study of workplace fun, trust-in-management and job
satisfaction. Journal of Chinese Human Resource Management, 7(1), 27-38.
doi:10.1108/JCHRM-03-2016-0002.
Chang, C. P., Hsu, C. T., & Chen, I. J. (2013). The relationship between the playfulness
climate in the classroom and student creativity. Quality & Quantity, 47(3), 1493-
1510. doi:10.1007/s11135-011-9603-1.
Change.org. (2014). Rehire!. Retrieved from http://www.change.org/p/bring-back-the-14-
el-monte-lifeguards-rehire.
Chiang, Y., & Hung, K. (2014). Team control mode, workers' creativity, and new product
innovativeness. R&D Management, 44(2), 124-136. doi:10.1111/radm.12044.
Clair, T. S., Cook, T. D., & Hallberg, K. (2014). Examining the internal validity and
statistical precision of the comparative interupted time series design by
comparison with a randomized experiment. American Journal of Evaluation,
35(3), 311-327. doi:10.1177/1098214014527337.
Coda, R., da Silva, D., & Custodio, I. (2015). Multidimensional configurations of the
organizational climate construct. International Journal of Human Resource
Management, 26(14), 1827-1847. doi:10.1080/09585192.2014.962561.
Coget, J., Shani, A. B., & Solari, L. (2014). The lone genius, or leaders who tyrannize
their creative teams: An alternative to the "mothering" model of leadership and
creativity. Organizational Dynamics, 43(2), 105-113.
doi:10.1016/j.orgdyn.2014.03.004.
159Colbert, A. E., Bono, J. E., & Purvanova, R. K. (2016). Flourishing via
workplace relationships: Moving beyond instrumental support. Academy of
Management Journal, 59(4), 1199-1223. doi:10.5465/amj.2014.0506.
Comm, J. (2018). The fun formula: How curiosity, risk-taking, and serendipity can
revolutionize how you work. Nashville, TN: Thomas Nelson.
Costea, B., Crump, N., & Holm, J. (2007). The spectre of Dionysus: Play, work, and
managerialism. Society and Business Review, 2(2), 153-165.
doi:10.1108/17465680710757376.
Coyle-Shapiro, J. A., & Shore, L. M. (2007). The employee-organization relationship:
Where do we go from here? Human Resource Management Review, 17(2), 166-
179. doi:10.1016/j.hrmr.2007.03.008.
Cropanzano, R., & Mitchell, M. S. (2005). Social exchange theory: An interdisciplinary
review. Journal of Management, 31(6), 874-900.
doi:10.1177/0149206305279602.
Csikszentmihalyi, M. (1996). Creativity. New York, NY: HarperPerennial.
Csikszentmihalyi, M., & Bennett, S. (1971). An exploratory model of play. American
Anthropologist, 73(1), 45-58. doi:10.1525/aa.1971.73.1.02a00040.
Dandridge, T. C. (1986). Ceremony as an integration of work and play. Organization
Studies, 7(2), 159-170. doi:10.1177/017084068600700205.
Daniel, J. (2012). Sampling essentials. Thousand Oaks, CA: Sage Publications, Inc.
De Bono, E. (2015). Serious creativity: How to be creative under pressure and turn ideas
into action. London, United Kingdom: Random House UK.
160De Man, H. (1929). Joy in work. New York, NY: Holt.
Deci, E. L., & Ryan, R. M. (2000). The "what" and "why" of goal pursuits: Human needs
and the self-determination of behavior. Psychological Inquiry, 11(4), 227-268.
doi:10.1207/s15327965pli1104_01.
Deci, E. L., & Ryan, R. M. (2008). Self-determination theory: A macrotheory of human
motivation, development, and health. Canadian Psychology, 49(3), 182-185.
doi:10.1037/a0012801.
Del Mar, M. (2015). Must we play to win? A reply to Morgan. Philosophy of the Social
Sciences, 45(2), 266-272. doi:10.1177/0048393114543988.
Demerouti, E., Bakker, A. B., Nachreiner, F., & Schaufeli, W. B. (2001). The job
demands-resources model of burnout. Journal of Applied Psychology, 86(3), 499-
512. doi:10.1037//0021-9010.86.3.499.
Denison, D. R. (1996). What is the difference between organizational culture and
organizational climate? A native's point of view on a decade of pradigm wars.
Academy of Management Review, 21(3), 619-654.
doi:10.5465/amr.1996.9702100310.
Donaldson, S. I., Dollwet, M., & Rao, M. A. (2015). Happiness, excellence, and optimal
human functioning revisited: Examining the peer-reviewed literature linked to
positive psychology. Journal of Positive Psychology, 10(3), 185-195.
doi:10.1080/17439760.2014.943801.
Dong, Y., Bartol, K. M., Zhang, Z., & Li, C. (2017). Enhancing employee creativity via
individual skill development and team knowledge sharing: Influences of dual-
161focused transformational leadership. Journal of Organizational
Behavior, 38(3), 439-458. doi:10.1002/job.2134.
Dunne, T. C., Aaron, J. R., McDowell, W. C., Urban, D. J., & Geho, P. R. (2016). The
impact of leadership on small business innovativeness. Journal of Business
Research, 69(11), 4876-4881. doi:10.1016/j.jbusres.2016.04.046.
Evans, T. R., & Steptoe-Warren, G. (2015). Humor style clusters: Exploring managerial
humor. International Journal of Business Communication, online, 1-12.
doi:10.1177/2329488415612478.
Fainshmidt, S., & Frazier, M. L. (2017). What facilitates dynamic capabilities? The role
of organizational climate for trust. Long Range Planning, 50(5), 550-566.
doi:10.1016/j.lrp.2016.05.005.
Fiedler, F. (1967). A theory of leadership effectiveness. New York, NY: McGraw-Hill.
Fiedler, F. E. (1971). Validation and extension of the contingency model of leadership
effectiveness: A review of empirical findings. Psychological Bulletin, 76(2), 128-
148. doi:10.1037/h0031454.
Field, A. (2013). Discovering statistics using IBM SPSS statistics (4th ed.). London,
United Kingdom: SAGE Publications Ltd.
Fischer, R., & Boer, D. (2011). What is more important for national well-being: Money
or autonomy? A meta-analysis of well-being, burnout, and anxiety across 63
societies. Journal of Personality and Social Psychology, 101(1), 164-184.
doi:10.1037/a0023663.
162Fitzsimmons, S. R., & Stamper, C. L. (2014). How societal culture influences
friction in the employee-organization relationship. Human Resource Management
Review, 24(1), 80-94. doi:10.1016/j.hrmr.2013.07.001.
Fluegge-Woolf, E. R. (2014). Fun at work and job performance. Management Research
Review, 37(8), 682-705. doi:10.1108/MRR-11-2012-0252.
Follett, M. P. (1924). Creative experience. London, UK: Longmans, Green.
Ford, C. M., & Gioia, D. A. (1995). Creative action in organizations: Ivory tower visions
and real world voices. Thousand Oaks, CA: Sage Publications, Inc.
Ford, R. C., McLaughlin, F. S., & Newstrom, J. W. (2003). Questions and answers about
fun at work. People & Strategy, 26(4), 18-33. Retrieved from
http://www.hrps.org/?page=PeopleStrategy.
Fraley, R. C., & Vazire, S. (2014). The n-pact factor: Evaluating the quality of
empirical journals with respect to sample size and statistical power. PLoS ONE,
9(10), e109019. doi:10.1371/journal.pone.0109019.
Frankfort-Nachmias, C., & Leon-Guerrero, A. (2009). Social statistics for a diverse
society (5th ed.). Thousand Oaks, CA: Pine Forge Press.
Gallup, Inc. (2013). State of the American workplace. Retrieved from
http://www.gallup.com/strategicconsulting/163007/state-american-
workplace.aspx.
George, J. M., & Zhou, J. (2007). Dual tuning in a supportive context: Joint contributions
of positive mood, negative mood, and supervisory behaviors to employee
163creativity. Academy of Management Journal, 50(3), 605-622.
doi:10.5465/amj.2007.25525934.
Glasser, W. (1994). The control theory manager. New York, NY: HarperBusiness.
Glynn, M. A. (1994). Effects of work task cues and play task cues on information
processing, judgment, and motivation. Journal of Applied Psychology, 79(1), 34-
45. doi:10.1037//0021-9010.79.1.34.
Glynn, M. A., & Webster, J. (1992). The adult playfulness scale: An initial assessment.
Psychological Reports, 71(1), 83-103. doi:10.2466/pr0.1992.71.1.83.
Gonçalves, L., & Brandao, F. (2017). The relation between leader's humility and team
creativity: The moderating effect of psychological safety and psychological
capital. International Journal of Organizational Analysis, 25(4), 687-702.
doi:10.1108/IJOA-06-2016-1036.
Gopinath, R. (2011). Employees' emotions in workplace. Research Journal of Business
Management, 5(1), 1-15. doi:10.3923/rjbm.2011.1.15.
Gordon, G. (2014). Well played: The origins and future of playfulness. American Journal
of Play, 6(2), 234-266. Retrieved from http://www.journalofplay.org.
Graves, L. M., Ruderman, M. N., Ohlott, P. J., & Weber, T. J. (2012). Driven to work
and enjoyment of work: Effects on managers' outcomes. Journal of Management,
38(5), 1655-1680. doi:10.1177/0149206310363612.
Greenland, S., Senn, S. J., Rothman, K. J., Carlin, J. B., Poole, C., Goodman, S. N., et al.
(2016). Statistical tests, p values, confidence intervals, and power: A guide to
164misinterpretations. European Journal of Epidemiology, 31(4), 337-
350. doi:10.1007/s10654-016-0149-3.
Guimera, R., Uzzi, B., Spiro, J., & Amaral, L. A. N. (2005). Team assembly mechanisms
determine collaboration network structure and team performance. Science,
308(5722), 697-702. doi:10.1126/science.1106340.
Guistiniano, L., Lombardi, S., & Cavaliere, V. (2016). How knowledge collecting fosters
organizational creativity. Management Decision, 54(6), 1464-1496.
doi:10.1108/MD-04-2015-0111.
Han, J., Han, J., & Brass, D. J. (2014). Human capital diversity in the creation of social
capital for team creativity. Journal of Organizational Behavior, 35(1), 54-71.
doi:10.1002/job.1853.
Han, H., Kim, W., & Jeong, C. (2016). Workplace fun for better team performance:
Focus on frontline hotel employees. International Journal of Contemporary
Hospitality Management, 28(7), 1391-1416. doi:10.1108/IJCHM-11-2014-0555.
Harju, L., Hakanen, J. J., & Schaufeli, W. B. (2014). Job boredom and its correlates in 87
Finnish organizations. Journal of Occupational and Environmental Medicine,
56(9), 911-918. doi:10.1097/JOM.0000000000000248
Hart, W., & Albarracin, D. (2009). The effects of chronic achievement motivation and
achievement primes on the activation of achievement and fun goals. Journal of
Personality and Social Psychology, 97(6), 1129-1141. doi:10.1037/a0017146.
165Henricks, T. S. (2014). Play as self-realization: Toward a general theory of
play. American Journal of Play, 6(2), 190-213. Retrieved from
http://www.journalofplay.org.
Hersey, P., & Blanchard, K. (1977). Management of organizational behavior, utilizing
human resources (3rd ed.). Englewood Cliffs, NJ: Prentice Hall.
Hirst, G., van Knippenberg, D., Zhou, Q., Zhu, C. J., & Tsai, P. C. (2018). Exploitation
and exploration climates' influence on performance and creativity: Diminishing
returns as function of self-efficacy. Journal of Management, 44(3), 870-891.
doi:10.1177/0149206315596814.
Homan, A. C., Buengeler, C., Eckhoff, R. A., van Ginkel, W. P., & Voelpel, S. C. (2015).
The interplay of diversity training and diversity beliefs on team creativity in
nationality diverse teams. Journal of Applied Psychology, 100(5), 1456-1468.
doi:10.1037/apl0000013.
Hoy, W. K., & Adams, C. M. (2015). Quantitative research in education: A primer.
Thousand Oaks, CA: SAGE Publications, Inc.
Hu, J., Erdogan, B., Kaifeng, J., Bauer, T. N., & Liu, S. (2018). Leader humility and team
creativity: The role of team information sharing, psychological safety, and power
distance. Journal of Applied Psychology, 103(3), 313-323.
doi:10.1037/ap10000277.
Huizinga, J. (2014). Homo ludens: A study of the play-element in culture. Eastford, CT:
Martino Fine Books.
166Hung, L., Lee, Y., & Lee, D. (2018). The moderating effects of salary
satisfaction and working pressure on the organizational climate, organizational
commitment to turnover intention. International Journal of Business and Society,
19(1), 103-116. Retrieved from http://www.ijbs.unimas.my/.
Ingram, T. (2016). Relationship between talent management and organizational
performance: The role of climate for creativity. Entrepreneurial Business and
Economics Review, 4(3), 195-205. doi:10.15678/EBER.2016.040315.
Isaksen, S. G., Lauer, K. J., & Ekvall, G. (1999). Situational outlook questionnaire: A
measure of the climate for creativity and change. Psychological Reports, 85(2),
665-674. doi:10.2466/pr0.1999.85.2.665.
James, L. R., Demaree, R. G., & Wolf, G. (1984). Estimating within-group interrater
reliability with and without response bias. Journal of Applied Psychology, 69(1),
85-98. doi:10.1037//0021-9010.69.1.85.
Janssen, O. (2000). Job demands, perceptions of effort-reward fairness and innovative
work behavior. Journal of Occupational and Organizational Psychology, 73(3),
287-302. doi:10.1348/096317900167038.
Jia, L., Shaw, J. D., Tsui, A. S., & Park, T. (2014). A social-structural perspective on
employee-organization relationships and team creativity. Academy of
Management Journal, 57(3), 869-891. doi:10.5465/amj.2011.0147.
Jiang, W., & Gu, Q. (2016). How abusive supervision and abusive supervisory climate
influence salesperson creativity and sales team effectiveness in China.
Management Decision, 54(2), 455-475. doi:10.1108/MD-07-2015-0302.
167Jiang, H., & Zhang, Q. (2014). Development and validation of team creativity
measures: A complex systems perspective. Creativity and Innovation
Management, 23(3), 264-275. doi:10.1111/caim.12078.
Johnson, S. (2017). Wonderland: How play made the modern world. New York, NY:
Riverhead Books.
Joo, B.-K., Yang, B., & McLean, G. N. (2014). Employee creativity: The effects of
perceived learning culture, leader-member exchange quality, job autonomy, and
proactivity. Human Resource Development International, 17(3), 297-317.
doi:10.1080/13678868.2014.896126.
Kahrobaei, S., & Mortazavi, S. (2017). How leader–member exchange can uplift team’s
energy to increase creative work involvement. Team Performance Management,
22(2), 75-91. doi:10.1108/TPM-06-2015-0029.
Kang, J. H., Matusik, J. G., Kim, T., & Phillips, J. M. (2016). Interactive effects of
multiple organizational climates on employee innovative behavior in
entrepreneurial firms: A cross-level investigation. Journal of Business Venturing,
31(6), 628-642. doi:10.1016/j.jbusvent.2016.08.002.
Karl, K., & Peluchette, J. (2006). How does workplace fun impact employee perceptions
of customer service quality? Journal of Leadership & Organizational Studies,
13(2), 2-13. doi:10.1177/10717919070130020201.
Karl, K. A., Harland, L. K., Peluchette, J. V., & Rodie, A. R. (2010). Perceptions of
service quality: What's fun got to do with it? Health Marketing Quarterly, 27(2),
155-172. doi:10.1080/07359681003745097.
168Karl, K., Peluchette, J., Hall, L., & Harland, L. (2005). Attitudes toward
workplace fun: A three sector comparison. Journal of Leadership &
Organizational Studies, 12(2), 1-17. doi:10.1177/107179190501200201.
Kaufman, S. B., & Gregoire, C. (2016). Wired to create: Unraveling the mysteries of the
creative mind. New York, NY: TarcherPerigee.
Kavanagh, D. (2011). Work and play in management studies: A Kleinian analysis.
Ephemera: Theory & Politics in Organization, 11(4), 336-356. Retrieved from
http://www.ephemerajournal.org/.
Kaya, G., & Baskaya, R. (2016). The roles of organizational and ethical climate on
individual performance of employees. Business Management Dynamics, 5(8), 27-
38. Retrieved from http://www.bmdynamics.com.
Kelley, T. (2001). The art of innovation: Lessons in creativity from IDEO, America's
leading design firm. New York, NY: Crown Business.
Kelley, D., & Kelley, T. (2013). Creative confidence. New York, NY: Crown Business.
Kenny, K., & Euchler, G. (2012). 'Some good clean fun': Humour, control and subversion
in an advertising agency. Gender, Work & Organization, 19(3), 306-323.
doi:10.1111/j.1468-0432.2012.00594.x.
Khan, N. U., Qureshi, M. I., Rasli, A. M., & Ahmad, A. (2015). The impact of multiple
organizational climates on performance of public sector organizations: Evidences
from Pakistan. International Journal of Economics and Financial Issues,
5(Special Issue), 276-282. Retrieved from http://www.ecojournals.com.
169Khattak, S. R., Batool, S., & Haider, M. (2017). Relationship of leadership
styles and employee creativity: A mediating role of creative self-efficacy and
moderating role of organizational climate. Pakistan Journal of Commerce &
Social Sciences, 11(2), 698-719. Retrieved from http://www.jespk.net/.
Kim, M. J., Choi, J. N., & Park, O. S. (2012). Intuitiveness and creativity in groups:
Cross-level interactions between group conflict and individual cognitive styles.
Social Behavior & Personality, 40(9), 1419-1434.
doi:10.2224/sbp.2012.40.9.1419.
Kodama, M., & Shibata, T. (2013). Strategy transformation through strategic innovation
capability – a case study of Fanuc. R&D Management, 44(1), 75-103.
doi:10.1111/radm.12041.
Koo, T. K., & Li, M. Y. (2016). A guideline of selecting and reporting intraclass
correlation coefficients for reliability research. Journal of Chiropractic Medicine,
15(2), 155-163. doi:10.1016/j.jcm.2016.02.012.
Korten, D. C. (2015). When corporations rule the world (3rd ed.). San Francisco, CA:
Berrett-Koehler Publishers.
Lamm, E., & Meeks, M. D. (2009). Workplace fun: The moderating effects of
generational differences. Employee Relations, 31(6), 613-631.
doi:10.1108/01425450910991767.
Lang, J. C., & Lee, C. H. (2010). Workplace humor and organizational creativity.
International Journal of Human Resource Management, 21(1), 46-60.
doi:10.1080/09585190903466855.
170Langfred, C. W., & Moye, N. (2014). Does conflict help or hinder creativity
in teams? An examination of conflict's effects on creative processes and creative
outcomes. International Journal of Business and Management, 9(6), 30-42.
Retrieved from http://www.ccsenet.org/journal/index.php/ijbm.
Leavy, P. (2017). Research design: Quantitative, qualitative, mixed methods, arts-based,
and community-based participatory research approaches. New York, NY: The
Guilford Press.
LeBreton, J. M., & Senter, J. L. (2008). Answers to 20 questions about interrater
reliability and intrarater agreement. Organizational Research Methods, 11(4),
815-852. doi:0.1177/1094428106296642.
Lee, M. C. C., & Idris, M. A. (2017). Psychosocial safety climate versus team climate.
Personnel Review, 46(5), 988-1003. doi:10.1108/PR-01-2016-0003.
Legault, L., & Inzlicht, M. (2013). Self-determination, self-regulation, and the brain:
Autonomy improves performance by enhancing neuroaffective responsiveness to
self-regulation failure. Journal of Personality and Social Psychology, 105(1),
123-138. doi:10.1037/a0030426.
Lehmann-Willenbrock, N., & Allen, J. A. (2014). How fun are your meetings:
Investigating the relationship between humor patterns in team interactions and
team performance. Journal of Applied Psychology, 99(6), 1278-1287.
doi:10.1037/a0038083.
Leski, K. (2016). The storm of creativity. Cambridge, MA: The MIT Press.
171Lin, Y., Yu, C., & Yi, C. (2014). The effects of positive affect, person-job fit,
and well-being on job performance. Social Behavior & Personality, 42(9), 1537-
1547. doi:10.2224/sbp.2014.42.9.1537.
Liu, D., Zhang, S., Wang, L., & Lee, T. W. (2011). The effects of autonomy and
empowerment on employee turnover: Test of a multilevel model in teams.
Journal of Applied Psychology, 96(6), 1305-1316. doi:10.1037/a0024518.
Longenecker, J. G., & Pringle, C. D. (1978). The illusion of contingency theory as a
general theory. Academy of Management Review, 3(3), 679-683.
doi:10.5465/amr.1978.4305970.
Lussier, B., Grégoire, Y., & Vachon, M. (2017). The role of humor usage on creativity,
trust and performance in business relationships: An analysis of the salesperson-
customer dyad. Industrial Marketing Management, 65, 168-181.
doi:10.1016/j.indmarman.2017.03.012.
Luthans, F., & Stewart, T. I. (1977). A general contingency theory of management.
Academy of Management Review, 2(2), 181-195. doi:10.5465/amr.1977.4409038.
Lutz Allen, S., Smith, J. E., & Da Silva, N. (2013). Leadership style in relation to
organizational change and organizational creativity: Perceptions from nonprofit
organizational members. Nonprofit Management & Leadership, 24(1), 23-42.
doi:10.1002/nml.21078.
Mafabi, S., Munene, J. C., & Ahiauzu, A. (2015). Creative climate and organisational
resilience: The mediating role of innovation. International Journal of
Organizational Analysis, 23(4), 564-587. doi:10.1108/IJOA-07-2012-0596.
172Mafini, C. (2016). The contribution of organisational climate to employee
well-being Journal of Applied Business Research, 32(4), 1157-1168. Retrieved
from https://clutejournals.com/index.php/JABR.
March, J. G. (1979). The technology of foolishness. In J. G. March (Ed.), Decisions and
organizations. Cambridge, MA: Basil Blackwell.
Marx, K. (1887). Capital. Moscow, Russia: Progress Publishers.
Maslow, A. H. (2000). The Maslow business reader. New York, NY: John Wiley &
Sons, Inc.
McDowell, T. (2004). Fun at work: Scale development, confirmatory factor analysis, and
links to organizational outcomes (Doctoral dissertation). Retrieved from ProQuest
Dissertations and Theses database. (UMI no. 3155834).
McManus, I. C., & Furnham, A. (2010). "Fun, fun, fun": Types of fun, attitudes to fun,
and their relation to personality and biographical factors. Psychology, 1(3), 159-
168. doi:10.4236/psych.2010.13021.
Medeiros, C. R., & Alcapadipani, R. (2016). In the corporate backstage, the taste of
revenge: Misbehaviour and humor as form of resistance and subversion. Revista
de Administracao, 51(2), 123-136. doi:10.5700/rausp1229
Mesmer-Magnus, J., Glew, D. J., & Viswesvaran, C. (2012). A meta-analysis of positive
humor in the workplace. Journal of Managerial Psychology, 27(2), 155-190.
doi:10.1108/02683941211199554.
Meyer, P. (2010). From workplace to playspace: Innovating, learning, and changing
through dynamic engagement. San Francisco, CA: Jossey-Bass.
173Mitchell, T. R., Biglan, A., Oncken, G. R., & Fiedler, F. E. (1970). The
contingency model: Criticism and suggestions. Academy of Management Journal,
13(3), 253-267. doi:10.2307/254963.
Morgan, J. (2014). The future of work: Attract new talent, build better leaders, and create
a competitive organization. Hoboken, NJ: Wiley.
Naldoken, U., & Tengilimoglu, D. (2017). A field study on determining the effects of
organizational climate in terms of social interaction on knowledge management at
health organizations. Journal of Economics and Management, 29(3), 75-101.
doi:10.22367/jem.2017.29.05.
NBCUniversal. (2014). El Monte lifeguards fired after making video spoof at pool.
Retrieved from http://www.nbclosangeles.com/news/local/El-Monte-Lifeguards-
Fired-After-Making-Video-Spoof-at-Pool-168839546.html
Olszak, C. M., Bartus, T., & Lorek, P. (2018). A comprehensive framework of
information system design to provide organizational creativity support.
Information & Management, 55(1), 94-108. doi:10.1016/j.im.2017.04.004.
Omilion-Hodges, L. M., & Baker, C. R. (2017). Communicating leader-member
relationship quality. International Journal of Business Communication, 54(2),
115-145. doi:10.1177/2329488416687052.
Örtenblad, A. (2018). What does “learning organization” mean? The Learning
Organization, 25(3), 150-158. doi:10.1108/TLO-02-2018-0016.
Papert, S., & Harel, I. (1991). Constructionism. New York, NY: Ablex Publishing
Corporation.
174Park, J., Shin, S., Lee, S., & No, S. (2015). Human resource management
practices and organizational creativity: The role of chief executive officer's
learning goal orientation. Social Behavior & Personality, 43(6), 899-908.
doi:10.2224/sbp.2015.43.6.899.
Patel, B., & Desai, T. (2013). Effect of workplace fun on employee morale and
performance. International Journal of Scientific Research, 2(5), 323-326.
doi:10.15373/22778179.
Patkin, T. (2014). Eight simple cures for employee disengagement. Contract
Management, 54(3), 14-17. Retrieved from
http://www.ncmahq.org/NewsPublications/CMMCurrentIssue.cfm?navItemNumb
er=9969.
Pena-Suarez, E., Muniz, J., Campillo-Alvarez, A., Fonseca-Pedrero, E., & Garcia-Cueto,
E. (2013). Assessing organizational climate: Psychometric properties of the
CLIOR scale. Psicothema, 25(1), 137-144. doi:10.7334/psicothema2012.260.
Peretomode, O. (2012). Situational and contingency theories of leadership: Are they the
same? IOSR Journal of Business and Management, 4(3), 13-17. Retrieved from
http://www.iosrjournals.org.
Petelczyc, C. A., Capezio, A., Wang, L., Restubog, S. L. D., & Aquino, K. (2018). Play
at work: An integrative review and agenda for future research. Journal of
Management, 44(1), 161-190. doi:10.1177/0149206317731519.
Piaget, J. (1962). Play, dreams and imitation in childhood. New York, NY: W. W.
Norton & Company.
175Pinault, L. (2004). The play zone. New York, NY: HarperCollins.
Pirola-Merlo, A., & Mann, L. (2004). The relationship between individual creativity and
team creativity: Aggregating across people and time. Journal of Organizational
Behavior, 25(2), 235-257. doi:10.1002/job.240.
Plester, B. (2009). Crossing the line: Boundaries of workplace humour and fun. Employee
Relations, 31(6), 584-599. doi:10.1108/01425450910991749.
Plester, B. (2013, 4-6 December). When is a joke not a joke? The dark side of
organizational humour. Paper presented at the Australia and New Zealand
Academy of Management Conference, Hobart, Australia.
Plester, B., & Hutchison, A. (2016). Fun times: The relationship between fun and
workplace engagement. Employee Relations, 38(3), 332-350. doi:10.1108/ER-03-
2014-0027.
Plester, B., Cooper-Thomas, H., & Winquist, J. (2015). The fun paradox. Employee
Relations, 37(3), 380-398. doi:10.1108/ER-04-2013-0037.
Podsakoff, P. M., MacKenzie, S. B., Lee, J.-Y., & Podsakoff, N. P. (2003). Common
method biases in behavioral research: A critical review of the literature and
recommended remedies. Journal of Applied Psychology, 88(5), 879-903.
doi:10.1037/0021-9010.88.5.879.
Proyer, R. T., & Wagner, L. (2015). Playfulness in adult revisited: The signal theory in
German speakers. American Journal of Play, 7(2), 201-227. Retrieved from
http://www.journalofplay.org.
176Qu, R., Janssen, O., & Shi, K. (2015). Transformational leadership and
follower creativity: The mediating role of follower relational identification and
the moderating role of leader creativity expectation. The Leadership Quarterly,
26(2), 286-299. doi:10.1016/j.leaqua.2014.12.004.
Qureshi, M. I., Rasli, A. M., & Zaman, K. (2014). A new trilogy to understand the
relationship among organizational climate, workplace bullying and employee
health. Arab Economics and Business Journal, 9, 133-146.
doi:10.1016/j.aebj.2014.05.009.
Reckwitz, A. (2017). The invention of creativity: Modern society and the culture of the
new. Cambridge, UK: Polity.
Rees, C., Alfes, K., & Gatenby, M. (2013). Employee voice and engagement:
Connections and consequences. International Journal of Human Resource
Management, 24(14), 2780-2798. doi:10.1080/09585192.2013.763843.
Rego, A., Sousa, F., Marques, C., & Cuhna, M. P. (2014). Hope and positive affect
mediating the authentic leadership and creativity relationship. Journal of Business
Research, 67(2), 200-212. doi:10.1016/j.jbusres.2012.10.003.
Ren, F., & Zhang, J. (2015). Job stressors, organizational innovation climate, and
employees' innovative behavior. Creativity Research Journal, 27(1), 16-23.
doi:10.1080/10400419.2015.992659.
Reynolds, P. D. (1971). A primer in theory construction. Needham Heights, MA: Allyn
and Bacon.
177Ritter, S. M., & Ferguson, S. (2017). Happy creativity: Listening to happy
music facilitates divergent thinking. PLoS ONE, 12(9), e0182210.
doi:10.137/journal.pone.0182210.
Robinson, K., & Aronica, L. (2009). The element. New York, NY: Penguin Books.
Rodríguez-Sánchez, A. M., Devloo, T., Rico, R., Salanova, M., & Anseel, F. (2017).
What makes creative teams tick? Cohesion, engagement, and performance across
creativity tasks: A three-wave study. Group & Organization Management, 42(4),
521-547. doi:10.1177/1059601116636476.
Rosso, B. D. (2014). Creativity and constraints: Exploring the role of constraints in the
creative process of research and development teams. Organization Studies, 35(4),
551-585. doi:10.1177/0170840613517600
Runco, M. A., & Jaeger, G. J. (2012). The standard definition of creativity. Creativity
Research Journal, 24(1), 92-96. doi:10.1080/10400419.2012.650092.
Ryan, R. M., & Deci, E. L. (2000). Self-determination theory and the facilitation of
intrinsic motivation, social development, and well-being. American Psychologist,
55(1), 68-78. doi:10.1037/0003-066x.55.1.68.
Saetre, A. S., & Brun, E. (2012). Strategic management of innovation: Managing
exploration-exploitation by balancing creativity and constraint. International
Journal of Innovation & Technology Management, 9(4), 1-24.
doi:10.1142/S0219877012500253.
Samuelson, P. A., & Nordhaus, W. D. (2009). Economics (19th ed.). New York, NY:
McGraw-Hill Education.
178Sayers, S. (2005). Why work? Marx and human nature. Science & Society,
69(4), 606-616. doi:10.1521/siso.2005.69.4.606.
Schein, E. H. (2010). Organizational culture and leadership. San Francisco, CA: Jossey-
Bass.
Schneider, B., Ehrhart, M. G., & Macey, W. H. (2013). Organizational climate and
culture. Annual Review of Psychology, 64(1), 361-388. doi:10.1146/annurev-
psych-113011-143809.
Schoonhoven, C. B. (1981). Problems with contingency theory: Testing assumptions
hidden within the language of contingency "theory". Administrative Science
Quarterly, 26(3), 349-377. doi:10.2307/2392512.
Shahin, A., Naftchali, J. S., & Pool, J. K. (2014). Developing a model for the influence of
perceived organizational climate on organizational citizenship behaviour and
organizational performance based on balanced score card. International Journal
of Productivity and Performance Management, 63(3), 290-307.
doi:10.1108/IJPPM-03-2013-0044.
Shanker, M. (2014). A study on organizational climate in relation to employees' intention
to stay. Journal of Psychosocial Research, 9(2), 389-397. Retrieved from
https://www.questia.com/library/p439850/journal-of-psychosocial-research.
Sharma, A., & Gupta, A. (2012). Impact of organisational climate and demographics on
project specific risks in context to Indian software industry. International Journal
of Project Management, 30, 176-187. doi:10.1016/j.ijproman.2011.05.003.
179Sheridan, R. (2015). Joy, Inc.: How we build a workplace people love. New
York, NY: Portfolio.
Shih, S., Lie, T., Klein, G., & Jiang, J. J. (2014). Information technology customer
aggression: The importance of an organizational climate of support. Information
& Management, 51, 670-678. doi:10.1016/j.im.2014.06.001.
Shin, Y., & Eom, C. (2014). Team proactivity as a linking mechanism between team
creative efficacy, transformational leadership, and risk-taking norms and team
creative performance. Journal of Creative Behavior, 48(2), 89-114.
doi:10.1002/jocb.42.
Sicart, M. (2014). Play matters. Cambridge, MA: The MIT Press.
Silverman, I. W. (2016). In defense of the play-creativity hypothesis. Creativity Research
Journal, 28(2), 136-143. doi:10.1080/10400419.2016.1162560.
Soderlund, M., & Oikarinen, E. (2018). Joking with customers in the service encounter
has a negative impact on customer satisfaction: Replication and extension.
Journal of Retailing and Consumer Services, 42, 55-64.
doi:/10.1016/j.jretconser.2018.01.013.
Sorensen, B. M., & Spoelstra, S. (2012). Play at work: Continuation, intervention and
usurpation. Organization, 19(1), 81-97. doi:10.1177/1350508411407369.
Spraggon, M., & Bodolica, V. (2014). Social ludic activities: A polymorphous form of
organizational play. Journal of Managerial Psychology, 29(5), 524-540.
doi:10.1108/JMP-01-2012-0009.
180Spraggon, M., & Bodolica, V. (2017). Collective tacit knowledge generation
through play. Management Decision, 55(1), 119-135. doi:10.1108/MD-05-2015-
0173.
Stacey, R. D. (1996). Compexity and creativity in organizations. San Francisco, CA:
Bettett-Koehler Publishers.
Starbuck, W. H. (2017). Organizational learning and unlearning. The Learning
Organization, 24(1), 30-38. doi:10.1108/TLO-11-2016-0073.
Statler, M., Heracleous, L., & Jacobs, C. D. (2011). Serious play as a practice of paradox.
Journal of Applied Behavioral Science, 47(2), 236-256.
doi:10.1177/0021886311398453.
Stec, D. (2011). Performance logics: Notions of self and our attitudes towards organizing
play. Academy of Management Annual Meeting Proceedings, 1-6.
doi:10.5465/AMBPP.2011.65869125.
Stein, J. (1956). William Faulkner, the art of fiction no. 12. The Paris Review,
Spring(12), 1-27. Retrieved from
https://www.theparisreview.org/interviews/4954/william-faulkner-the-art-of-
fiction-no-12-william-faulkner.
Sternberg, R. J., & Lubart, T. I. (1991). An investment theory of creativity and its
development. Human Development, 34(1), 1-31. doi:10.1159/000277029.
Stewart, M. (2010). The management myth: Debunking modern business philosophy.
New York, NY: W. W. Norton & Company.
181Stokes, P. D. (2006). Creativity from constraints: The psychology of
breakthrough. New York, NY: Springer Publishing Company, Inc.
Sucala, M. L., Stefan, S., Szentagotai-Tatar, A., & David, D. (2010). Time flies when you
expect to have fun: An experimental investigation of the relationship between
expectancies and the perception of time progression. Cognition, Brain, Behavior:
An Interdisciplinary Journal, 14(3), 231-241. Retrieved from
http://www.cbbjournal.ro/.
Tang, C., & Ye, L. (2015). Diversified knowledge, R&D team centrality, and radical
creativity. Creativity and Innovation Management, 24(1), 123-135.
doi:10.1111/caim.12110.
Tegano, D. W. (1990). Relationship of tolerance of ambiguity and playfulness to
creativity. Psychological Reports, 66(3), 1047-1056. doi:10.2466/pr0.66.3.1047-
1056.
Tews, M. J., & Noe, R. A. (2017). Does training have to be fun? A review and conceptual
model of the role of fun in workplace training. Human Resource Management
Review(Published online November 11, 2017). doi:10.1016/j.hrmr.2017.11.003.
Tews, M. J., Michel, J. W., & Allen, D. G. (2014). Fun and friends: The impact of
workplace fun and constituent attachment on turnover in a hospitality context.
Human Relations, 67(8), 923-946. doi:10.1177/0018726713508143.
Tews, M. J., Michel, J. W., & Bartlett, A. (2012). The fundamental role of workplace fun
in applicant attraction. Journal of Leadership & Organizational Studies, 19(1),
105-114. doi:10.1177/1548051811431828.
182Tews, M. J., Michel, J. W., & Stafford, K. (2013). Does fun pay? The impact
of workplace fun on employee turnover and performance. Cornell Hospitality
Quarterly, 54(4), 370-382. doi:10.1177/1938965513505355.
Tews, M. J., Michel, J., Xu, S., & Drost, A. J. (2015). Workplace fun matters... but what
else? Employee Relations, 37(2), 248-267. doi:10.1108/ER-10-2013-0152.
Tews, M. J., Michel, J. W., & Noe, R. A. (2017). Does fun promote learning? The
relationship between fun in the workplace and informal learning. Journal of
Vocational Behavior, 98, 46-55. doi:10.1016/j.jvb.2016.09.006.
Thumin, F. J., & Thumin, L. J. (2011). The measurement and interpretation of
organizational climate. The Journal of Psychology, 145(2), 93-109.
doi:10.1080/00223980.2010.538754.
Tokkari, V. (2015). Organizational play: Within and beyond managing. Qualitative
Research in Organizations and Management, 10(2), 86-104. doi:10.1108/QROM-
11-2013-1181.
Törner, M., Pousette, A., Larsman, P., & Hemlin, S. (2017). Coping with paradoxical
demands through an organizational climate of perceived support: An empirical
study among workers in construction and mining. Journal of Applied Behavioral
Science, 53(1), 117-141. doi:10.1177/0021886316671577.
Torrance, E. P. (1965). Rewarding creative behavior. Englewood Cliffs, NJ: Personnel.
Tortorella, G. L., Escobar, L., & Rodrigues, C. (2015). Organizational climate research:
A proposed approach focused on banking institutions. Business Process
Management Journal, 21(6), 1377-1390. doi:10.1108/BPMJ-02-2015-0011.
183Tremblay, M., & Gibson, M. (2016). The role of humor in the relationship
between transactional leadership behavior, perceived supervisor support, and
citizenship behavior. Journal of Leadership & Organizational Studies, 23(1), 39-
54. doi:10.1177/1548051815613018.
Trigo, A. (2013). Mechanisms of learning and innovation performance: The relevance of
knowledge sharing and creativity for non-technological innovation. International
Journal of Innovation & Technology Management, 10(6), 1-27.
doi:10.1142/S0219877013400282.
Trougakos, J. P., Hideg, I., Cheng, B. H., & Beal, D. J. (2014). Lunch breaks unpacked:
The role of autonomy as a moderator of recovery during lunch. Academy of
Management Journal, 57(2), 405-421. doi:10.5465/amj.2011.1072.
Tsai, W. (2014). Application of complexity science perspective on new business
development: A case study of VISA organization. Journal of International
Management Studies, 9(2), 152-163. Retrieved from
http://www.jimsjournal.org/pi.html.
Van de Ven, A. H., Ganco, M., & Hinings, C. R. (2013). Returning to the frontier of
contingency theory of organizational and institutional designs. Academy of
Management Annals, 7(1), 393-400. doi:10.1080/19416520.2013.774981.
Van Kleef, G. A., van den Berg, H., & Heerdink, M. W. (2015). The persuasive power of
emotions: Effects of emotional expressions on attitude formation and change.
Journal of Applied Psychology, 100(4), 1124-1142. doi:10.1037/apl0000003.
184Van Vleet, M., & Feeney, B. C. (2015). Young at heart: A perspective for
advancing research on play in adulthood. Perspectives on Psychological Science,
10(5), 639-645. doi:10.1177/1745691615596789.
Viitala, R., Tanskanen, J., & Santti, R. (2015). The connection between organizational
climate and well-being at work. International Journal of Organizational Analysis,
23(4), 606-620. doi:10.1108/IJOA-10-2013-0716.
Volmer, J., Spurk, D., & Niessen, C. (2012). Leader-member exchange (LMX), job
autonomy, and creative work environment. The Leadership Quarterly, 23(3), 456-
465. doi:10.1016/j.leaqua.2011.10.005.
Walumbwa, F. O., Muchiri, M. K., Misati, E., Wu, C., & Meiliani, M. (2018). Inspired to
perform: A multilevel investigation of antecedents and consequences of thriving
at work. Journal of Organizational Behavior, 39(3), 249-261.
doi:10.1002/job.2216.
Watson, C., & Drew, V. (2017). Humour and laughter in meetings: Influence, decision-
making and the emergence of leadership. Discourse & Communication, 11(3),
314-329. doi:10.1177/1750481317699432.
Webster, J., & Marrocchio, J. J. (1993). Turning work into play: Implications for
microcomputer software training. Journal of Management, 19(1), 127-146.
doi:10.1016/0149-2063(93)90049-s.
Wernerfelt, B. (1984). A resource-based view of the firm. Strategic Management
Journal, 5(2), 171-180. doi:10.1002/smj.4250050207.
185West, D. M. (2018). The future of work: Robots, AI, and automation.
Washington, DC: Brookings Institution Press.
West, S. E., Hoff, E., & Carlsson, I. (2016). Play and productivity: Enhancing the
creative climate at workplace meetings with play cues. American Journal of Play,
9(1), 71-86. Retrieved from http://www.journalofplay.org.
Westwood, R. I., & Johnson, A. (2013). Humor in organizations: From function to
resistance. Humor: International Journal of Humor Research, 26(2), 219-247.
doi:10.1515/humor-2013-0024.
Winkler, A. (2018). We the corporations: How American businesses won their civil
rights. New York, NY: Liveright.
Witzel, M. (2016). A history of management thought. London, UK: Routledge.
Woodman, R. W., Sawyer, J. E., & Griffin, R. W. (1993). Toward a theory of
organizational creativity. Academy of Management Review, 18(2), 293-321.
doi:10.5465/amr.1993.3997517.
Wrench, J. S., Thomas-Maddox, C., Richmond, V. P., & McCroskey, J. C. (2015).
Quantitative research methods for communication. Oxford, UK: Oxford
University Press.
Wu, Q., & Cormican, K. (2016). Shared leadership and team creativity: A social network
analysis in engineering design teams. Journal of Technology Management &
Innovation, 11(2), 2-12. Retrieved from http://jotmi.org.
186Xu, B., Zhao, S., Li, C., & Lin, C. (2017). Authentic leadership and employee
creativity: Testing the multilevel mediation model. Leadership & Organization
Development Journal, 38(3), 482-498. doi:10.1108/LODJ-09-2015-0194.
Yoon, W., Kim, S. J., & Song, J. (2016). Top management team characteristics and
organizational creativity. Review of Managerial Science, 10(4), 757-779.
doi:10.1007/s11846-015-0175-7.
Yoshida, D. T., Sendjaya, S., Hirst, G., & Cooper, B. (2014). Does servant leadership
foster creativity and innovation? A multi-level mediation study of identification
and prototypicality. Journal of Business Research, 67(7), 1395-1404.
doi:10.1016/j.jbusres.2013.08.013.
Yu, C., Yu, T.-F., & Yu, C.-C. (2013). Knowledge sharing, organizational climate, and
innovative behavior: A cross-level analysis of effects. Social Behavior and
Personality, 41(1), 143-156. doi:10.2224/sbp.2013.41.1.143.
Yu, P., Wu, J. J., Chen, I. H., & Lin, Y. T. (2007). Is playfulness a benefit to work?
Empirical evidence of professionals in Taiwan. International Journal of
Technology Management, 39(3), 412-429. doi:10.1504/IJTM.2007.013503.
Yu, P., Wu, J. J., Lin, W. W., & Yang, C. H. (2003). The development of adult
playfulness scale and organizational playfulness climate questionnaire.
Psychological Testing, 50(1), 73-110.
Zhao, H. (2015). Leader-member exchange differentiation and team creativity.
Leadership & Organization Development Journal, 36(7), 798-815.
doi:10.1108/LODJ-12-2013-0172.
187Zhou, J., & George, J. M. (2001). When job dissatisfaction leads to creativity:
Encouraging the expression of voice. Academy of Management Journal, 44(4),
682-696. doi:10.2307/3069410.
Zhu, Y., Gardner, D. G., & Chen, H. (2016). Relationships between work team climate,
individual motivation, and creativity. Journal of Management.
doi:10.1177/0149206316638161.
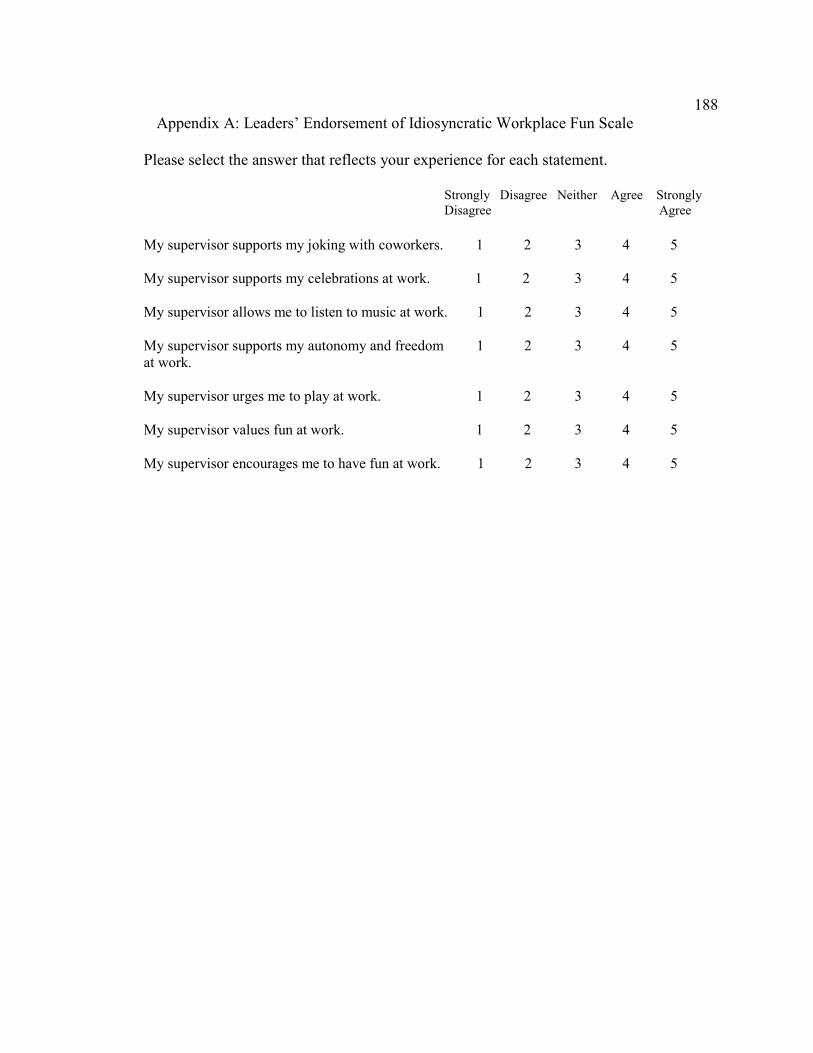
188Appendix A: Leaders’ Endorsement of Idiosyncratic Workplace Fun Scale
Please select the answer that reflects your experience for each statement.
Strongly Disagree Neither Agree Strongly Disagree Agree
My supervisor supports my joking with coworkers. 1 2 3 4 5 My supervisor supports my celebrations at work. 1 2 3 4 5 My supervisor allows me to listen to music at work. 1 2 3 4 5 My supervisor supports my autonomy and freedom 1 2 3 4 5 at work. My supervisor urges me to play at work. 1 2 3 4 5 My supervisor values fun at work. 1 2 3 4 5 My supervisor encourages me to have fun at work. 1 2 3 4 5
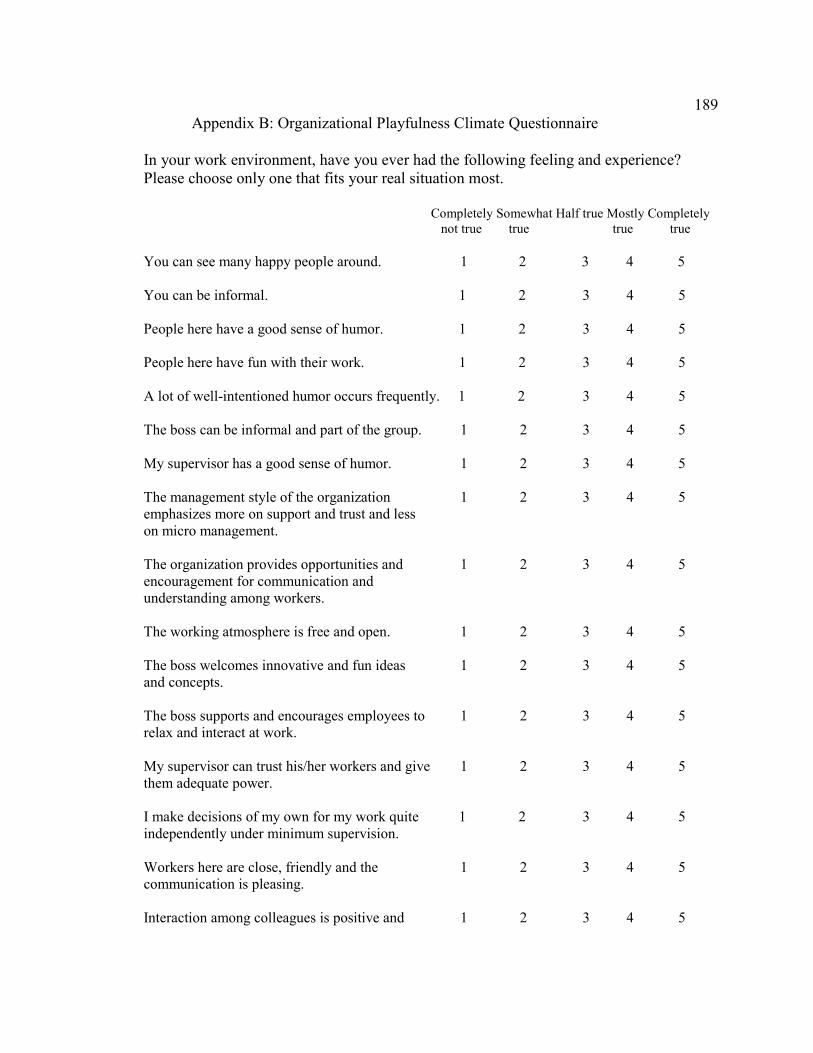
189Appendix B: Organizational Playfulness Climate Questionnaire
In your work environment, have you ever had the following feeling and experience? Please choose only one that fits your real situation most.
Completely Somewhat Half true Mostly Completely not true true true true
You can see many happy people around. 1 2 3 4 5
You can be informal. 1 2 3 4 5 People here have a good sense of humor. 1 2 3 4 5 People here have fun with their work. 1 2 3 4 5 A lot of well-intentioned humor occurs frequently. 1 2 3 4 5 The boss can be informal and part of the group. 1 2 3 4 5 My supervisor has a good sense of humor. 1 2 3 4 5 The management style of the organization 1 2 3 4 5 emphasizes more on support and trust and less on micro management. The organization provides opportunities and 1 2 3 4 5 encouragement for communication and understanding among workers. The working atmosphere is free and open. 1 2 3 4 5 The boss welcomes innovative and fun ideas 1 2 3 4 5 and concepts. The boss supports and encourages employees to 1 2 3 4 5 relax and interact at work. My supervisor can trust his/her workers and give 1 2 3 4 5 them adequate power. I make decisions of my own for my work quite 1 2 3 4 5 independently under minimum supervision. Workers here are close, friendly and the 1 2 3 4 5 communication is pleasing. Interaction among colleagues is positive and 1 2 3 4 5
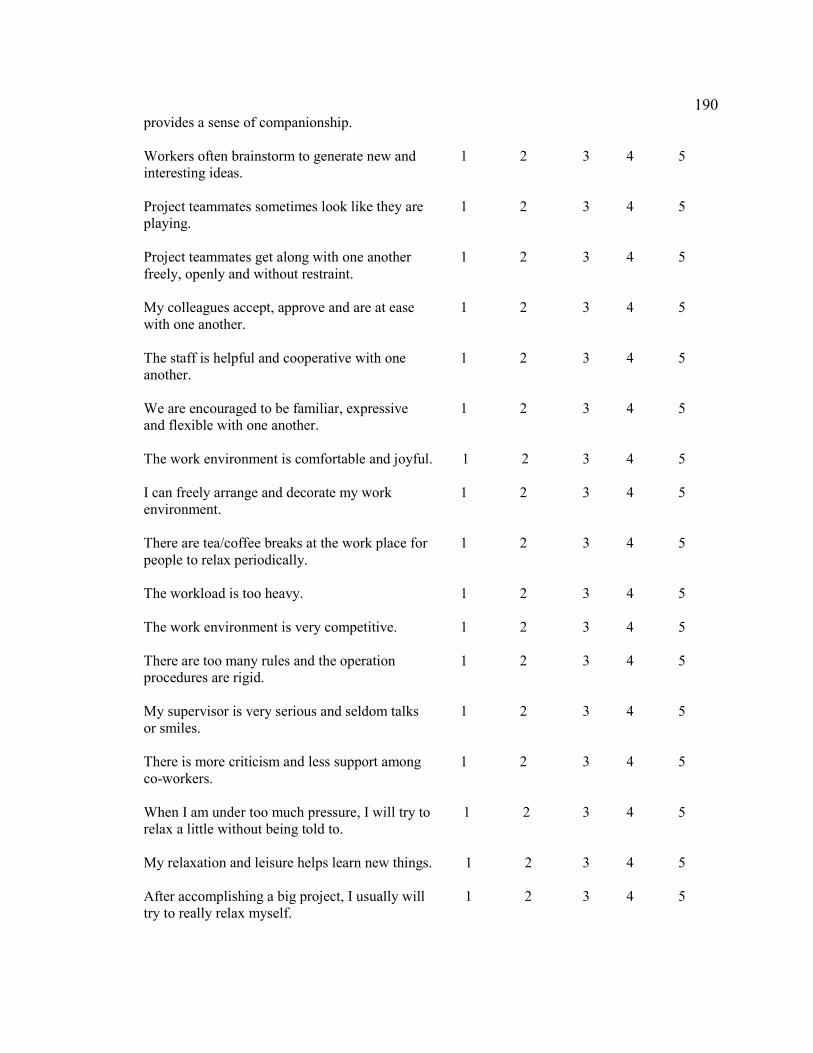
190provides a sense of companionship. Workers often brainstorm to generate new and 1 2 3 4 5 interesting ideas. Project teammates sometimes look like they are 1 2 3 4 5 playing. Project teammates get along with one another 1 2 3 4 5 freely, openly and without restraint. My colleagues accept, approve and are at ease 1 2 3 4 5 with one another. The staff is helpful and cooperative with one 1 2 3 4 5 another. We are encouraged to be familiar, expressive 1 2 3 4 5 and flexible with one another. The work environment is comfortable and joyful. 1 2 3 4 5 I can freely arrange and decorate my work 1 2 3 4 5 environment. There are tea/coffee breaks at the work place for 1 2 3 4 5 people to relax periodically. The workload is too heavy. 1 2 3 4 5 The work environment is very competitive. 1 2 3 4 5 There are too many rules and the operation 1 2 3 4 5 procedures are rigid. My supervisor is very serious and seldom talks 1 2 3 4 5 or smiles. There is more criticism and less support among 1 2 3 4 5 co-workers. When I am under too much pressure, I will try to 1 2 3 4 5 relax a little without being told to. My relaxation and leisure helps learn new things. 1 2 3 4 5 After accomplishing a big project, I usually will 1 2 3 4 5 try to really relax myself.
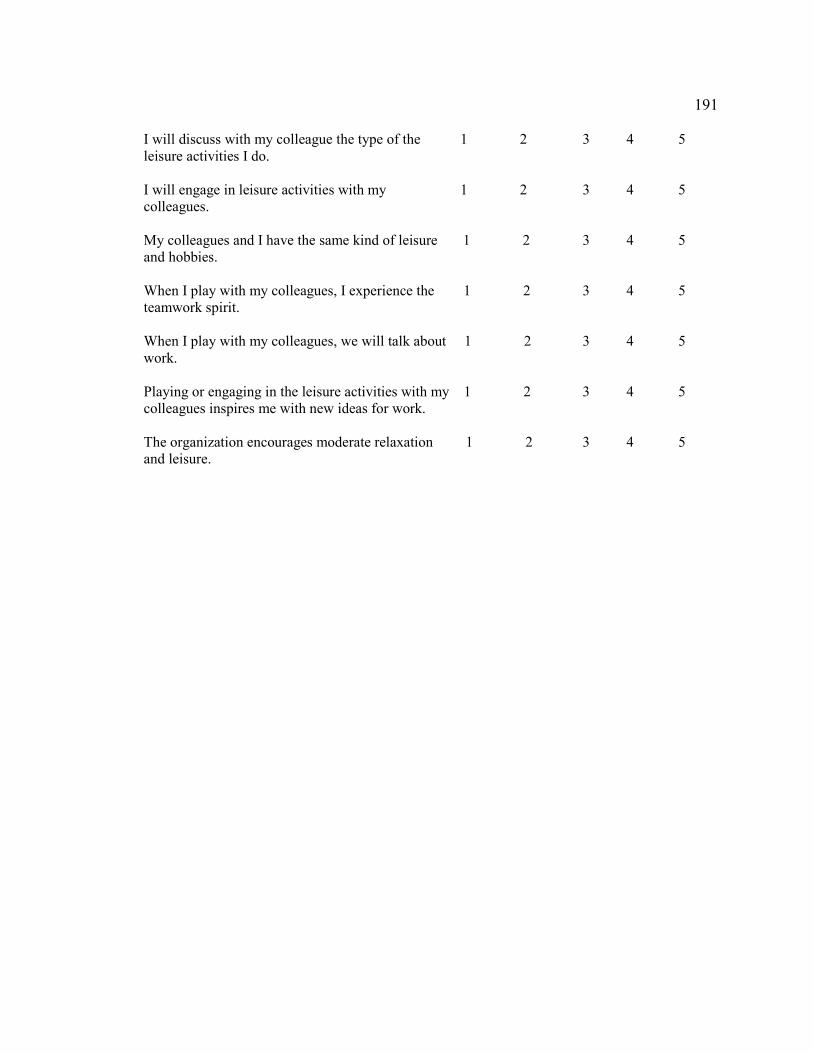
191 I will discuss with my colleague the type of the 1 2 3 4 5 leisure activities I do. I will engage in leisure activities with my 1 2 3 4 5 colleagues. My colleagues and I have the same kind of leisure 1 2 3 4 5 and hobbies. When I play with my colleagues, I experience the 1 2 3 4 5 teamwork spirit. When I play with my colleagues, we will talk about 1 2 3 4 5 work. Playing or engaging in the leisure activities with my 1 2 3 4 5 colleagues inspires me with new ideas for work. The organization encourages moderate relaxation 1 2 3 4 5 and leisure.
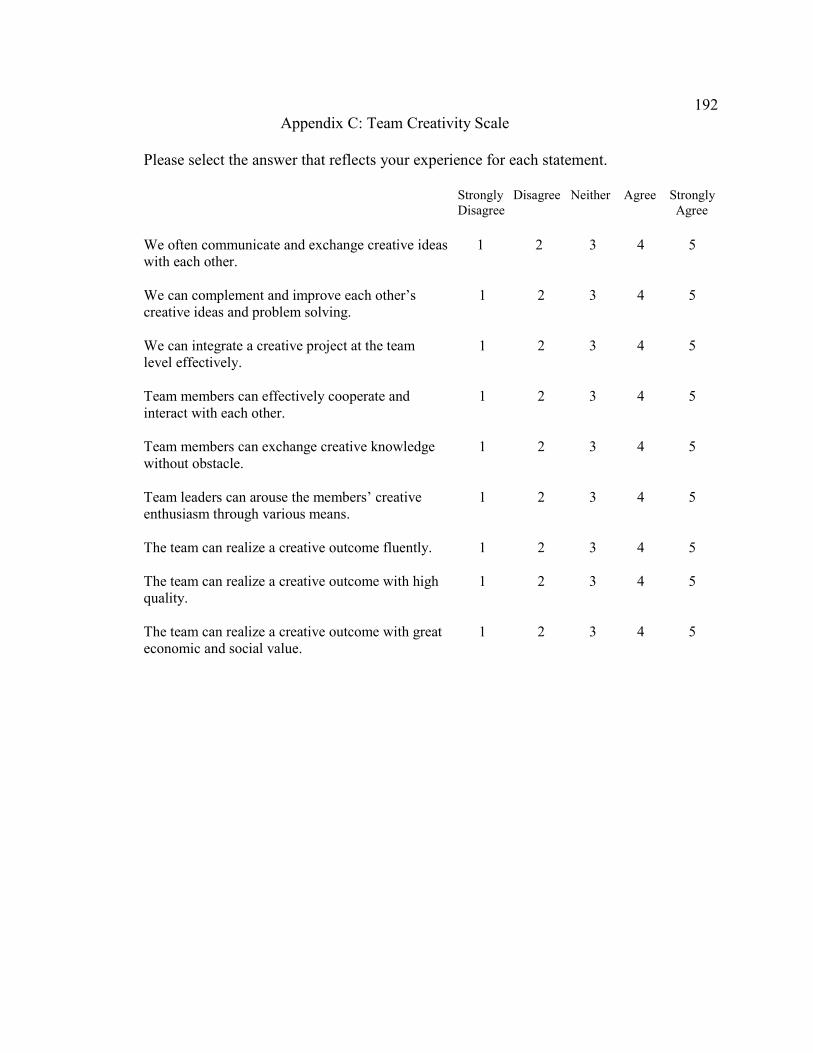
192Appendix C: Team Creativity Scale
Please select the answer that reflects your experience for each statement.
Strongly Disagree Neither Agree Strongly Disagree Agree
We often communicate and exchange creative ideas 1 2 3 4 5 with each other. We can complement and improve each other’s 1 2 3 4 5 creative ideas and problem solving. We can integrate a creative project at the team 1 2 3 4 5 level effectively. Team members can effectively cooperate and 1 2 3 4 5 interact with each other. Team members can exchange creative knowledge 1 2 3 4 5 without obstacle. Team leaders can arouse the members’ creative 1 2 3 4 5 enthusiasm through various means. The team can realize a creative outcome fluently. 1 2 3 4 5 The team can realize a creative outcome with high 1 2 3 4 5 quality. The team can realize a creative outcome with great 1 2 3 4 5 economic and social value.


