Embed Size (px)
Citation preview

J Physiol 583.1 (2007) pp 81–97 81
Store-operated Ca2+ entry during intracellular Ca2+ releasein mammalian skeletal muscle
Bradley S. Launikonis1,2 and Eduardo Rıos1
1Section of Cellular Signalling, Department of Molecular Biophysics and Physiology, Rush University Medical Center, 1750 W. Harrison Street, Chicago,
IL 60612, USA2School of Biomedical Sciences, University of Queensland, Brisbane, Queensland, 4072, Australia
Store-operated Ca2+ entry (SOCE) is activated following the depletion of internal Ca2+ stores in
virtually all eukaryotic cells. Shifted excitation and emission ratioing of fluorescence (SEER) was
used to image mag-indo-1 trapped in the tubular (t) system of mechanically skinned rat skeletal
muscle fibres to measure SOCE during intracellular Ca2+ release. Cytosolic Ca2+ transients
were simultaneously imaged using the fluorescence of rhod-2. Spatially and temporally resolved
images of t system [Ca2+] ([Ca2+]t-sys) allowed estimation of Ca2+ entry flux from the rate
of decay of [Ca2+]t-sys. Ca2+ release was induced pharmacologically to activate SOCE without
voltage-dependent contributions to Ca2+ flux. Inward Ca2+ flux was monotonically dependent
on the [Ca2+] gradient, and strongly dependent on the transmembrane potential. The activation
of SOCE was controlled locally. It could occur without full Ca2+ store depletion and in less than
a second after initiation of store depletion. These results indicate that the molecular agonists
of SOCE must be evenly distributed throughout the junctional membranes and can activate
rapidly. Termination of SOCE required a net increase in [Ca2+]SR. Activation and termination
of SOCE are also demonstrated, for the first time, during a single event of Ca2+ release. At the
physiological [Ca2+]t-sys, near 2 mM (relative to t system volume), SOCE flux relative to accessible
cytoplasmic volume was at least 18.6 μM s−1, consistent with times of SR refilling of 1–2 min
measured in intact muscle fibres.
(Received 19 April 2007; accepted after revision 11 June 2007; first published online 14 June 2007)
Corresponding author B. S. Launikonis: School of Biomedical Sciences, The University of Queensland, Brisbane, Qld,
4072, Australia. Email: [email protected]
Store-operated Ca2+ entry (SOCE) is a regulated flowof external Ca2+ into cells to refill depleted inter-nal stores (Parekh & Putney, 2005), which occurs inboth non-excitable and excitable cells. Given the diverserange of cells for which SOCE is functional it wouldbe reasonable to expect quite different adaptations ofthis mechanism, tailored around the specific functionand structure of the individual cell. For example, thehighly specialized skeletal muscle cell regulates changes incytoplasmic [Ca2+] ([Ca2+]c) of two orders of magnitudewithin milliseconds (Rome, 2006) in the process knownas excitation–contraction (EC) coupling (Melzer et al.1995). Consistent with varying functional needs, ECcoupling displays different molecular structures andkinetics even among skeletal muscle cells of differenttaxa (Di Biase & Franzini-Armstrong, 2005). Changes in[Ca2+]c in non-excitable cells are slower and occur overmuch longer periods (Parekh & Putney, 2005). Skeletal
This paper has online supplemental material.
muscle and non-excitable cells may well have evolvedSOCE with different features, adequate for differentdemands. For instance, it is reasonable to expect thatCa2+ entry in response to store depletion will activatemore quickly in skeletal muscle cells than in non-excitablecells.
The structure of the interface of the cell with its exteriorshould also affect the SOCE mechanisms. Most non-excitable cells are small and compact. In these the endo-plasmic reticulum (ER) commands the plasmalemmalstore-operated Ca2+ (SOC) channel to open upon storedepletion, which may require aggregation of receptorsor ER translocation (Wu et al. 2006; Luik et al. 2006;Lewis, 2007). In contrast, skeletal muscle cells are large andelongated. In these cells, the surface membrane consistsof a sarcolemma and the tubular (t) system, a networkof narrow tubules that invaginate into the cell at regularintervals (Veratti, 1961; Eisenberg, 1983). The large areaand close apposition of this membrane system with theCa2+ store (the sarcoplasmic reticulum, or SR) make the tsystem a chief candidate locus for SOCE.
C© 2007 The Authors. Journal compilation C© 2007 The Physiological Society DOI: 10.1113/jphysiol.2007.135046

82 B. S. Launikonis and E. Rıos J Physiol 583.1
SOCE was indeed shown to be functional at the level ofthe t system in studies with mechanically skinned skeletalmuscle fibres (Launikonis et al. 2003). These preparations,which have the sarcolemma mechanically removed causingthe t system to reseal, maintain the normal physiologicalfunction (including an action potential-induced Ca2+
release from SR at a normal rate; Posterino & Lamb,2003; Launikonis et al. 2006). In addition to identifyingthe t system membrane as the locus of Ca2+ entry,the studies with mechanically skinned fibres exhibited asingular advantage: the resealing of t tubules after skinningresults in formation of a finite pool of extracellularCa2+.
A method of imaging Ca2+ in the t system of skinnedfibres was developed in the Stephenson laboratory morethan a decade ago (Stephenson & Lamb, 1993; Lamb et al.1995). Following the identification of SOCE in skeletalmuscle (Kurebayashi & Ogawa, 2001), this method wasmodified to study SOCE by trapping the low affinityCa2+-sensitive dye, fluo-5N, in the t system (Launikoniset al. 2003). This study showed that the resealed t systemcould be depleted of Ca2+ in less than 30 s followingapplication of caffeine and that depletion failed when theskinned fibres were exposed to high intracellular [Ca2+],a treatment that disrupts the functional coupling betweenSR and t system (Lamb et al. 1995). These experiments thusconfirmed the presence of the store-operated pathway inthe t system membrane and validated its assessment fromchanges in Ca2+-dependent fluorescence in the resealed tsystem (Launikonis et al. 2003).
Brotto and colleagues also used a non-ratiometric dyetrapped in the t system of skinned fibres in attempts tomeasure SOCE during SR Ca2+ release. In contrast to theresults of Launikonis et al. (2003), they reported a t systemfluorescence signal that declined only slowly over a periodof more than 10 min upon caffeine application (Zhao et al.2005, 2006; Hirata et al. 2006).
To improve quantification of the decay of [Ca2+] inthe t system ([Ca2+]t-sys) as a measure of SOCE duringintracellular Ca2+ release, we used a novel technique toimage [Ca2+] inside the t system, shifted excitation andemission ratioing of fluorescence, or SEER (Launikoniset al. 2005). SEER improved the quantification becauseit is ratiometric and has greater sensitivity than previousmethods. Additionally, it could be used simultaneouslywith the cytoplasmic Ca2+ indicator rhod-2.
This combination of techniques in skinned fibresallowed for: (i) control of the composition of thet system lumen and cytoplasmic environment; (ii)recording of [Ca2+] simultaneously in t system and cyto-plasm; and (iii) reliably estimating the [Ca2+]SR load byextrapolation from similar experiments where [Ca2+]SR
is measured (experiments communicated here and byFryer & Stephenson, 1996; Herrmann-Frank et al. 1999;Launikonis et al. 2005, 2006).
Voltage-dependent currents were avoided by directlyactivating the Ca2+ release channel/ryanodine receptor(RyR) of the SR by pharmacological means – rather thanby depolarization of the plasma membrane – in solutionsthat maintain a constant membrane potential (Lamb &Stephenson, 1994). Furthermore, [Ca2+]c was bufferedwith EGTA and BAPTA to restrict the uptake of cyto-plasmic Ca2+ by the t system. The decay in [Ca2+]t-sys
during Ca2+ release observed this way was found to belargely due to SOCE. The measurable rate of changeof [Ca2+]t-sys thus provides a direct quantification ofstore-dependent Ca2+ influx simultaneously with intra-cellular Ca2+ release.
Methods
All experimental methods were approved by theInstitutional Animal Care and Use Committee at RushUniversity. Sprague–Dawley rats (250–300 g) were killedby CO2 asphyxiation and the extensor digitorum longus(EDL) muscles were rapidly excised. Muscles were thenplaced in a Petri dish under paraffin oil above a layer ofSylgard.
The method of trapping fluorescent dye in the sealed tsystem has been described (Lamb et al. 1995; Launikoniset al. 2003; Launikonis & Stephenson, 2004). Briefly, smallbundles of fibres were isolated and exposed to a ‘dyesolution’ while still intact. Individual fibres were thenisolated and mechanically skinned. Skinned fibres weretransferred to a custom built experimental chamber witha coverslip bottom, where they were bathed in an ‘internalsolution’.
Solutions
The dye-containing solution applied before skinning ofrat fibres contained (mm): NaCl, 145; KCl, 3; CaCl2, 2.5;MgCl2, 2; mag-indo-1 salt, 10; and Hepes 10 (pH adjustedto 7.4 with NaOH). The standard internal solutions areshown in Table 1. High [K+] solutions kept the sealed tsystem polarized and high [Na+] depolarized it (Lamb& Stephenson, 1994). Reference solutions were used toload SR and t system with Ca2+ and to preequilibratethe preparations to appropriate buffering and membranepotential conditions before Ca2+ release. Solutions withcaffeine and low Mg2+ solution were designed to induceSR Ca2+ release (Launikonis & Stephenson, 2000; Lambet al. 2001).
Confocal imaging
Imaging was done as described in Launikonis et al. (2005).Briefly, the experimental chamber was placed above thewater immersion objective (40×, NA 1.2) of the confocal
C© 2007 The Authors. Journal compilation C© 2007 The Physiological Society

J Physiol 583.1 SOCE during Ca2+ release in muscle 83
Table 1. Composition of internal solutions
Solution K+ Na+ Ca2+ Mg2+ EGTA BAPTA Caffeine
Reference–0 Ca2+ 100 30 0 0.65 1 0 0Reference–100 Ca2+ 100 30 0.0001 0.65 1 0 0Reference–800 Ca2+ 100 30 0.0008 0.65 1 0 0Reference–0 Ca2+–BAPTA 100 30 0 0.65 0 5 0Reference–Na–0 Ca2+ 0 130 0 0.65 1 0 0Reference–Na–800 Ca2+ 0 130 0.0008 0.65 1 0 0Low Mg2+ 100 30 0 0.01 1 0 0Caffeine 100 30 0 0.01 1 0 30Low Mg2+–BAPTA 100 30 0 0.01 0 5 0Caffeine–BAPTA 100 30 0 0.01 0 5 30Caffeine–depol 0 130 0 0.01 1 0 30
All concentrations are in mM. Additionally, solutions contained (mM): glutamate, 100; creatine phosphate, 10;ATP, 5; Hepes, 10; rhod-2, 0.1. Mg2+ was added as MgCl2 and Ca2+ was added as CaCl2. Note that ‘Mg2+’ and‘Ca2+’ refer to concentrations of free divalents in solution and that total concentrations of Mg and Ca addedwere much higher. Osmolality was adjusted to 290 ± 10 mosmol kg−1 with sucrose and pH was set to 7.1 withKOH or NaOH. BTS (SIGMA-Aldrich Co, St Louis, MO, USA; n-benzyl-p-toluene sulphonamide; 50 μM) wasadded to all solutions to suppress contraction (Cheung et al. 2002). 2-Aminoethyl diphenyl borate (2-APB;0.1 mM; Sigma-Aldrich) was added to solutions as required from a 100 mM stock in DMSO.
laser scanning system (TCS SP2, Leica Microsystems,Exton, PA, USA). Simultaneous acquisition of threeimages (F1, F2 and F3) was achieved by line-interleavingof three excitation wavelengths (351, 364 and 543 nm)while collecting emitted light in three emission ranges(390–440 nm, 465–535 nm, and 562–666 nm).
Calibration of [Ca2+]t-sys
SEER of mag-indo can be used to image [Ca2+] insidecellular organelles, as previously demonstrated in SR(Launikonis et al. 2005). Equation (1) (Grynkiewicz et al.1985), with parameters defined in Launikonis et al. (2005),was assumed to describe the relationship between R and[Ca2+]t-sys:
[Ca2+](x, y) =γ KD[R(x, y)−Rmin]/[Rmax−R(x, y)]
(1)
To determine the [Ca2+] inside the t system, dye-loadedpreparations were bathed in calibration solutions, whichwere a standard potassium glutamate internal saline with0.65 mm Mg2+, 5 μm A23187 (Sigma Aldrich) and 5 μm
ionomycin. [Ca2+]c (0–1 mm) was buffered by 15 mm
EGTA or nitrilotriacetate in the appropriate range.[Ca2+]c higher than 1 mm in the bathing solution
appeared to cause loss of dye from the preparation,a problem also found in calibrations of mag-indo-1(fluorscent dye from molecular probes) inside the SR(Launikonis et al. 2005). To circumvent this problemRmax was determined in conditions that promoted heavyloading of Ca2+ into the t system, namely an internalsolution with 800 nm Ca2+ and all K+ replaced with Na+
to depolarize the t system. Rmax was thus determined tobe 4.82 ± 0.04 in three fibres. This value was close to
the one found by a similar approach in calibrations ofmag-indo-1 inside SR in frog muscle fibres (Launikoniset al. 2005). While it is not certain that the concentrationreached inside the organelle under these conditions issufficient to saturate the dye, a nearly identical value ofRmax, 4.98 ± 0.05 (n = 3), was found by the same methodfor indo-1, a dye that is nearly identical optically, but has aroughly 100 times greater affinity for Ca2+. Fitting eqn(1) to all R versus [Ca2+] data, with Rmax set to 4.82,yielded the following values for the other parameters:γ K D = 0.615 mm and Rmin = 0.45. This prediction of Rmin
was later confirmed experimentally. When applying therelease-inducing low Mg2+–BAPTA to freshly skinnedpreparations, R in the t system could not fall below0.45 when inducing store-operated Ca2+ depletion (threefibres), confirming this as the Rmin value.
[Ca2+] in two compartments during release
Simultaneous SEER and rhod-2 images provided spatiallyand temporally resolved measures of [Ca2+]t-sys and[Ca2+]c during Ca2+ release. Ca2+ was released underconditions leading to known total SR calcium, [Ca2+]SR
and cytoplasmic transients (Fryer & Stephenson, 1996;Launikonis & Stephenson, 2000; Launikonis et al. 2005,2006). Thus, even though we only imaged cytoplasmicand t system [Ca2+] during release, we could estimate thatwithin the SR with some confidence.
SOCE was quantified during Ca2+ release induced byfive different solutions (detailed in Table 1). The first was‘low Mg2+’, containing 10 μm Mg2+, and 1 mm EGTA fornominally 0 [Ca2+]. This solution elicited Ca2+ releasethat was brief and ceased during imaging, leading toimmediate reuptake by the SR (Launikonis et al. 2006).
C© 2007 The Authors. Journal compilation C© 2007 The Physiological Society

84 B. S. Launikonis and E. Rıos J Physiol 583.1
Thus, this condition allowed for measurement of trans-membrane Ca2+ movements during a complete sequenceof SR depletion (which was partial) and recovery. Asecond condition ‘low Mg2+–BAPTA’, suppressed thecytosolic Ca2+ transient. Two other conditions added30 mm caffeine to the respective low Mg2+ solutions. Thisenhanced release of SR Ca2+ and kept the RyR in a highlyactive state, preventing any net reuptake of Ca2+ into theSR. In another series of experiments Na+ replaced all K+
in the solution ‘caffeine–depol’, to depolarize the sealed tsystem. This was in contrast to all the K+-based solutions,which were designed to keep the t system polarized (Lamb& Stephenson, 1994).
It should be noted that in the mammal, Ca2+ releasevia direct activation of the RyR is faster in the presence ofBAPTA than EGTA. We understand this as a consequenceof rapid Ca2+ chelation by BAPTA, which suppressesCa2+-dependent inactivation and has no inhibitory effects,in agreement with the reported absence of Ca2+-inducedCa2+ release in mammalian muscles (Shirokova et al. 1996,1998; Launikonis & Stephenson, 2000), presumably due tolack of the RyR3 isoform (Zhou et al. 2004; Pouvreau et al.2007).
Reference solutions with either 100 or 800 nm Ca2+ andReference–Na–800 Ca2+ (Table 1) were used to load Ca2+
into the t system and SR. There is no precedent studysetting conditions for loading Ca2+ to appropriate levelsin t system and SR of skinned fibres. So approaches whichallowed appropriate levels in [Ca2+]t-sys for experiments tobe reached while loading SR close to endogeneous levelswere developed. In many cases preparations were left inthe order of 5–15 min in Reference–100 Ca2+. We expectthis loading protocol to cause Ca2+ in SR to plateau notmuch beyond endogeneous levels (Launikonis et al. 2005).In some experiments 800 nm Ca2+ was used to load Ca2+
for periods not more than 30 s to avoid overload of SRand reduce the time required to load Ca2+ into the tsystem. During the course of experiments it was foundthat Reference–Na–800 Ca2+ loaded the t system at a fasterrate than Reference–800 Ca2+. This probably reflects thegreater capacity of t system Ca2+-ATPase to translocateCa2+ in the absence of an electrical gradient. Therefore,Reference–Na–800 Ca2+ was the preferred Ca2+ loadingsolution. In most cases we expect SR was loaded with Ca2+
at or slightly above its endogeneous level but not ‘heavily’loaded (i.e. close to full; Launikonis & Stephenson, 2000).This is also evident from the moderate time courses ofthe cytoplasmic Ca2+ transients in the presence of 1 mm
EGTA (Figs 4, 7 and 8). However, the final [Ca2+]SR is notprecisely known.
Analysis of changes in [Ca2+]t-sys
As the sealed t system is a closed, finite compartment,any change in [Ca2+]t-sys must be due to Ca2+ flux across
the membrane (Almers et al. 1981; Friedrich et al. 2001)or changes in the volume of the compartment. In thefollowing we neglect the changes in volume (see below;Launikonis & Stephenson, 2004), and assume that JCa,the net Ca2+ flux across the t system membrane, isproportional to the rate of change, d[Ca2+]t-sys/dt .
When expressed relative to the volume of the t system,the total calcium concentration of the organelle is probablyin the tens of millimolar range (Hidalgo et al. 1986;Owen et al. 1997), with most calcium presumably boundto low-affinity sites on membrane proteins. Thereforethe net rate of change of total calcium concentrationdue to entry to the cytosol, d[calcium]c/dt , should beequal to Ad[Ca2+]t-sys/dt , where A is the product of thefractional volume of the t system within the intact fibre(t-sysvol = 0.014; Launikonis & Stephenson, 2002a) and afactor representing the ratio between bound and free Ca2+
in the t system (β), which is expected to be roughly constantbut will remain unknown.
We should point out that in the text we refer to Ca2+
current across the sealed t system inferred from net loss of[Ca2+]t-sys as ‘Ca2+ influx’ or ‘Ca2+ entry’, for consistencywith terms describing Ca2+ movements in intact musclefibres.
SEER imaging of Ca2+ inside the t system
Figure 1 shows confocal xy images of mag-indo-1 in the tsystem of a mechanically skinned rat EDL fibre. The fibrehad been bathed in a physiological solution containingmag-indo-1 while still intact and then mechanicallyskinned to trap the dye in the t system, as previouslydescribed (Lamb et al. 1995; Launikonis et al. 2003;Launikonis & Stephenson, 2004). Figure 1A and B areimages F1 and F2, respectively, of a fibre bathedin low Mg2+. The images show two t tubules persarcomere and infrequent longitudinal connections, whichwere originally described by Veratti (1961). Note thatlongitudinal structures appear across the long gap betweenthe t tubules, crossing the M line, and run in series.
The ratio (R) of F1 and F2 is shown in Fig. 1C, onlyin ‘well-stained’ regions, defined as those in the upperquartile of the distribution of the dye (calculated asdescribed by Launikonis et al. 2005). Raw ratioing of F1
and F2 (not shown) does not exhibit a clear arrangementof two t tubules per sarcomere. The dye-based restrictionof the image clearly recovers the double t tubular structure.Results presented below (Figs 4, 5, 6, 7 and 8) will showthat R computed this way monitors t system [Ca2+]([Ca2+]t-sys).
Furthermore, we can calculate the concentration ofmag-indo-1 in the t system, [mag-indo-1]t-sys, in thisimage (Launikonis et al. 2005). In Fig. 1, [mag-indo-1]t-sys
is 12.2 μm. This is much less than the 10 mm mag-indo-1
C© 2007 The Authors. Journal compilation C© 2007 The Physiological Society

J Physiol 583.1 SOCE during Ca2+ release in muscle 85
present in the dye solution applied to the intact fibre,probably due to a combination of factors, includingdilution of mag-indo-1 in the normal extracellular fluidsurrounding the intact fibre, some ‘squeezing-out’ of thedye that entered the intact t system during the skinningprocess, and slow extrusion from the t system by aniontransporters (Launikonis & Stephenson, 2002b, 2004).[mag-indo-1]t-sys was always in the low micromolar range,and therefore no major Ca2+ buffering effects should beexpected from the monitoring dye.
Analysis of confocal images
All imaging in this study was performed in xy mode, inmost cases at 0.2324 μm pixel distance and 1.25 ms lineinterval. xy scanning lent itself to a method of imageanalysis illustrated in Fig. 2. The scanning line, definingthe variable x, was transversal to the fibre axis. xy imagingprovided information in two dimensions of space and in atemporal dimension as well, along the y axis. The temporalevolution of [Ca2+]t-sys and [Ca2+]c could be derived byaveraging, respectively, R(xy) or F3(xy) over x within theborders of the preparation, to obtain a function (R(y) orF3(y)) of y that mapped proportionally to elapsed time.The correspondence factor between t and y, 16.1 ms perμm, is determined by the group scanning speed (3.75 msper line in each of 3 images, and pixel distance). For theapproach to be valid, the fibre must be homogeneous alongthe y axis, which usually can be decided by inspection ofthe xy image at rest. Uniformity is considered reasonablewhen changes of R(y) in the resting fibre are minorrelative to the magnitude and rate of the dynamic changesR(y(t)) = G(t) of interest during stimulated release. Forinstance, in the case of Fig. 2 the sarcomeric structureimposes an oscillatory pattern of period ca 2 μm or32.2 ms and amplitude ∼20% peak-to-peak. Other minor
A B C
10 μm
Figure 1. SEER imaging of mag-indo-1 inside the sealed t system of a rat skinned fibreA, image of fluorescence F1 (acquired as defined in Methods); B, image F2; C, R = F1/F2, spatially restricted to thetwo upper quartiles of the dye distribution (Launikonis et al. 2005). Fibre was bathed in low Mg2+. Image-averagedR was 1.82, corresponding to a [Ca2+]t-sys of 0.28 mM. Average dye concentration in the well-stained region was12.2 μM. (ID: 101805c #11.)
irregularities add to the variance of R(y). This degree ofuniformity is sufficient if the goal is to reveal greater,faster or longer-lasting components in G(t). The eventsillustrated in Figs 4, 5, 6, 7 and 8 clearly satisfy this criterion.Figure 2 illustrates a degree of homogeneity that is suitable.
In experiments represented in Figs 4, 5, 6, 7 and 8R refers to the ratio of F1/F2 of mag-indo-1 in thet system and the normalization of cytoplasmic rhod-2fluorescence is represented as F3/F3,0. The reference (F0)for normalization of rhod-2 fluorescence was F3(y) withinthe borders of the preparation under resting conditionsimmediately prior to exposure of the preparation torelease-inducing solution. The F0 value may not representthe minimum F3 value in the F3 image (fluorescence can belower in the surrounding bathing solution) in Figs 4, 5, 6,7 and 8. In Fig. 3, a different combination of dyes was used.R refers to the ratio F1/F2 of indo-5F in the cytoplasm andF3/F3,0 represents normalized value of fluo-3 fluorescencein the t system to that under resting conditions.
Volume changes in the sealed t systemduring Ca2+ release
In this work store-dependent Ca2+ flux is assessed fromthe net change in [Ca2+]t-sys following Ca2+ release. Anychange in volume of the t system due to water flux duringCa2+ release will confound our derivation of Ca2+ entry.Although the volume of the sealed t system of rat skeletalmuscle varies little during osmotic stress (Launikonis &Stephenson, 2004), it was important to check whether thiswas the case during Ca2+ release. For this purpose fluo-3was trapped in the t system of rat skeletal muscle. Becausefluorescence of fluo-3 is at saturation values, its changesonly reflect the evolution of ionic strength, and can be usedto derive change in volume (Launikonis & Stephenson,2004).
C© 2007 The Authors. Journal compilation C© 2007 The Physiological Society

86 B. S. Launikonis and E. Rıos J Physiol 583.1
0 20 40 60 80 100
R in
t s
yste
m
1.0
1.5
2.0
2.5
3.0
0.0 0.5 1.0 1.5
0.5
1.0
1.5
2.0
2.5
3.0
y, μm
time, s
A
B
y and time
x
sequential line acquisition direction
C
scan
nin
g l
ine
50 μm &
800 ms
50 μm
F3/F
3,0
Figure 2. Image acquisition and analysisA, F3 image. B, simultaneously acquired R in t system. The scanning line was transversal to the fibre axis, x, witheach line (512 total) sequentially acquired along the longitudinal axis of the fibre, y. C, spatially averaged values ofF3 and R from within the borders of the preparation, as indicated by the double arrows of corresponding colour.Note that y maps proportionally to time. (ID: 072805f s025 z007.)
The t system and SR were initially loaded with Ca2+
in a reference solution containing 800 nm Ca2+. Thepreparation was then exposed to a low Mg2+ solutioncontaining 100 μm indo-5F, which induced Ca2+ release
0 10 20 30 40 50
0.0
0.1
0.2
0.3
0.4
0.5
0.2
0.4
0.6
0.8
1.0
1.2
low Mg2+
time, s
F3/F
3,0
in t
sys
tem
Rin
cyto
pla
sm
Figure 3. Ca2+ release is not associated with a change involume of the sealed t systemImage-averaged fluorescence of cytoplasmic indo-5F (blue) and offluo-3 trapped in t system (red), versus time. At between 3 and 6 s(light blue bar), the bathing solution was changed from reference tothe release-inducing low Mg2+. Fluorescence of fluo-3 in the t system,which presumably corresponds to a fully Ca2+-saturated level, decaysthroughout at a steady low rate. (ID: 012306a s008.)
and allowed us to image the Ca2+ transient. As shown inFig. 3, after an artifact caused by the change in solutionthe fluo-3 fluorescence decreased at a constant rate, bothduring and after Ca2+ release. This steady decrease is dueto bleaching and slow loss of dye from the sealed t system(Launikonis & Stephenson, 2002b, 2004). This result wasobtained on all three fibres examined. The result indicatesthat there were no significant changes in volume of the tsystem specifically associated with Ca2+ release.
Quenching of fluorescence by caffeine
Caffeine at concentrations greater than 10 mm can quenchfluorescence signals of Ca2+ sensitive dyes, inducing a shiftin the Rmin and Rmax that has been demonstrated withindo dyes (Muschol et al. 1999; McKemy et al. 2000). Toquantify the effect in these preparations, Rmax and Rmin
were determined in the presence of 30 mm caffeine.Rmin was determined by allowing [Ca2+]t-sys to
decrease in the presence of caffeine–BAPTA solution.The average thus found in three freshly skinnedpreparations, 0.73 ± 0.05 (n = 3), is significantly largerthan the value (0.45) determined in the same way usinglow Mg2+–BAPTA as stimulus for Ca2+ release.
Rmax was determined as the maximum reached earlywhen exposing the preparations to 30 mm caffeine and
C© 2007 The Authors. Journal compilation C© 2007 The Physiological Society

J Physiol 583.1 SOCE during Ca2+ release in muscle 87
5 mm BAPTA. This solution causes a rapid release ofSR Ca2+ (Launikonis & Stephenson, 2000) which isaccumulated rapidly by the t system (data not shown).The maximum R was 5.5 ± 0.07 in three preparations.
Results
This section includes images of the evolution of [Ca2+]within the t system during SR Ca2+ depletion, quantifiedto derive Ca2+ flux, with simultaneously recorded imagesof [Ca2+]c at both the normal resting membrane potentialand in the chronically depolarized cell. [Ca2+]t-sys ismeasured by SEER and calibrated in situ. Two types ofstimuli were used, leading to Ca2+ release of differentduration and extent in conjunction with two cytosolicbuffers, to exert different degrees of control of [Ca2+]c.
SOCE during store depletion and recovery
Simultaneously acquired cytoplasmic rhod-2 and t systemSEER images are shown in Fig. 4. A summary in Fig. 4Cof the temporal evolution of [Ca2+]t-sys and [Ca2+]c
was derived by averaging over x within the borders ofthe preparation, to obtain a function of y that mappedproportionally to elapsed time (see Methods and Fig. 2).
Changing the internal solution from reference with100 nm Ca2+ and 0.65 mm Mg2+ to low Mg2+ (a nominallyCa2+-free solution with 1 mm EGTA and 10 μm Mg2+)caused the release of SR Ca2+. The drop in internal solution[Ca2+] is shown by the reduction in F3 fluorescenceintensity around the preparation. The spatial progressionof Ca2+ release (probably timed by diffusion of Mg2+ awayfrom the fibre) results in a V-shaped Ca2+ transient inimage A at 6 s and in narrowing of the area of low [Ca2+]surrounding the fibre, as released Ca2+ diffuses into thisarea. Note that the membrane potential was held at itsresting value across the t system throughout the durationof this experiment (Lamb & Stephenson, 1994).
During the initial rise of the Ca2+ transient, [Ca2+]t-sys
increased (image B at 6 s). Plasma membrane Ca2+-ATPaseand Na+–Ca2+ exchanger have both been shown tocolocalize with the dihydropyridine receptor at thejunctional membrane domain of the t system (Sacchettoet al. 1996), making translocation of Ca2+ by these proteinsthe most likely explanation for the increase in [Ca2+]t-sys
(Hidalgo et al. 1986, 1991; Donoso et al. 1995). Later, priorto the peak of the Ca2+ transient (B at 6 s; see also graphin Fig. 4C), there was a sharp reversal of the directionof change in [Ca2+]t-sys, i.e. in the sign of net t systemflux, which became negative. Later, at about 10 s, there wasanother reversal in flux, indicating net Ca2+ entry to the tsystem. This pattern of Ca2+ movements in the presenceof low Mg2+ was observed in five fibres.
Using mag-indo-1 in the SR, we previously showed thatthe SR starts to take up Ca2+ and recover from depletion atthe time of RyR closure (Fig. 4 in Launikonis et al. 2006).Therefore the concomitant inversion in sign of the rate ofchange in [Ca2+]t-sys (which as explained in Methods weinterpret as change of net flux) observed here between 11and 13 s is consistent with reduction of a store-operatedinward component of this flux below the level of apresumably small efflux, and validates measurement of[Ca2+]t-sys as a monitor of SOCE.
Attempts were made to block SOCE with the commonlyused agent 2-APB. It was found that low Mg2+ was nolonger able to elicit Ca2+ release from SR when in thepresence of 0.1 mm 2-APB. This result was observed inthree preparations. There was no effect of the additionof 0.1% DMSO (2-APB vehicle) to low Mg2+ solutionalone on Ca2+ release. Therefore these experiments wereabandoned. It is known that 2-APB interacts with anumber of proteins, including the inositol trisphosphatereceptor (Parekh & Putney, 2005), and therefore an inter-action with RyR1 would not be surprising.
SOCE with suppressed changes in [Ca2+]c
In the above experiment, the signal from cytosolic rhod-2demonstrates a significant increase in [Ca2+]c duringrelease in the presence of 1 mm EGTA (Fig. 4). Anexploration of the effects of [Ca2+]c was called for becauseits increase could directly affect SOCE (Hoth & Penner,1993; Zweifach & Lewis, 1995) and should promote Ca2+
uptake by the t system, thus complicating the evaluationof SOCE through net flux. To evaluate these points, weperformed similar release experiments as those above,with the addition of 5 mm BAPTA to the release-inducingsolution.
R and rhod-2 images are shown in Fig. 5A and B fora fibre exposed to low Mg2+–BAPTA. Immediately priorto this exposure, the preparation was passed throughreference with 800 nm Ca2+ to increase [Ca2+]t-sys and thenequilibrated to a reference solution with BAPTA and noadded calcium. R and F3 averaged over x are plotted versus yor time in Fig. 5C. [Ca2+]t-sys was uniform throughout thefibre prior to release (see online supplemental material).A small cytosolic Ca2+ transient, of magnitude 0.1F0,was induced by the stimulus in the presence of BAPTA.Probably because the transient was small, the decay in[Ca2+]t-sys started without any preceding uptake of Ca2+.This result was obtained on the two fibres tested in thismanner. Note also that a V-shaped spatiotemporal patternof Ca2+ release from the SR, similar to that in Fig. 4, shouldhave occurred as Mg2+ diffused away from the preparation.This is not reported by the cytoplasmic rhod-2 due to thepresence of BAPTA (Fig. 5).
C© 2007 The Authors. Journal compilation C© 2007 The Physiological Society

88 B. S. Launikonis and E. Rıos J Physiol 583.1
The inset of Fig. 5C plots the evolution of R restrictedto the central or peripheral regions of the preparation, forthe first 1.9 s after immersion in low Mg2+–BAPTA. Decayis faster in the periphery, starting in less than 1 s followingintroduction of low Mg2+–BAPTA, which suggests thatSOCE is rapidly activated and determined by depletion atthe local level.
0 2 6 8 10 12 14
1
2
2
3
4
1 s 6 s 8 s
11 s 13 s 16 s 18 s
A
B
3 s
0.2
0.3
0.5
1.0
1.5
2.5
[Ca
2+] t
-sys,
mM
C low Mg2+
F3/F
3,0
time, s
Rin
t s
ys
tem
50 μm
A
B
Figure 4. SOCE during Ca2+ release and removalA, selected images of fluorescence F3 of cytosolic rhod-2 and B, ratio R of fluorescence images F1 and F2 ofmag-indo-1 in the t system, simultaneously acquired while applying the release-inducing low Mg2+ solution. C,spatially averaged values of F3 (normalized by resting value F3,0, red) and R (blue) versus elapsed time (which mapsto the abscissa of x–y scans as described in Methods). The interval of solution change is indicated by the blackbracket in image B at 3 s, and by the light blue bar in C, where fluorescence and ratio plots were omitted duringsolution change. (ID: 072005b s013.)
Similar experiments were carried out usingcaffeine–BAPTA, following the same protocol as inFig. 5. A decay of [Ca2+]t-sys without recovery, startingwithin 1–3 s of immersion in caffeine–BAPTA wasobserved in four preparations. An example is shown inFig. 6. Note that 15 s in reference solution with BAPTAand 0 Ca did not cause activation of SOCE. Also, there was
C© 2007 The Authors. Journal compilation C© 2007 The Physiological Society

J Physiol 583.1 SOCE during Ca2+ release in muscle 89
a small increase in [Ca2+]t-sys preceding the increase inF3. This suggests that the t system devices for Ca2+ uptakerespond to a local rise in [Ca2+] in the microdomain ofthe ‘couplon’ (Stern et al. 1997) before the global [Ca2+]increase is reflected in changes in F3.
In Fig. 6 the effect of caffeine quenching of mag-indo-1fluorescence from the t system can be observed as an abruptupward shift in R at the point of caffeine introduction tothe bathing solution (Fig. 6B and C). The shift constitutesa change in dye properties, which required a differentcalibration in the presence of caffeine (McKemy et al.2000). In Fig. 6D the average [Ca2+]t-sys in x has beenplotted against y or time. The continuity of [Ca2+]t-sys ismaintained, indicating that parameters used to determine
0 1 2 3 4
1.0
1.5
2.0
1
2
3
4
0.0 0.5 1.0 1.5
1
2
3
4
0.1
0.5
1.0
2.0
3.0
A
B
Rin
t s
ys
tem
[Ca
2+] t
-sys,
mM
F3/F
3,0
time, s
R
time, s
edge
middle
C low Mg2+-BAPTA
50 μm
Figure 5. SOCE with suppressed change in [Ca2+]c
A, F3 and B, R in t system, acquired while changing from a solution with 5 mM BAPTA, 0 Ca and 0.65 mM Mg2+to release-inducing low Mg2+–BAPTA. C, spatially averaged F3/F3,0 ( red) and R (blue) versus elapsed time, whichdirectly correspond to time and y axis in A and B. Inset, average R in central 40 μm (‘middle’) and 30 μm slicestarting at the lower edge (‘edge’) of the fibre image. Note the periodic pattern of [Ca2+]t-sys in C, which resultsfrom the regular placement of t-tubules along the fibre. Other details as in Fig. 4. (ID: 072805f s012.)
[Ca2+]t-sys from R in either the presence or the absence ofcaffeine were adequate (see Methods).
Following activation of SOCE, [Ca2+]t-sys did notsignificantly recover in caffeine–BAPTA (Fig. 6). Thistime course is consistent with the lack of recovery of[Ca2+]SR during continued caffeine exposure (Launikonis& Stephenson, 2000), again indicating that the inwardflux of Ca2+ under the conditions described is largelystore-operated. Thus, only an exit flux from the tsystem is observed in low Mg2+–BAPTA (Fig. 5) andin caffeine–BAPTA (Fig. 6) if SR is not heavily loadedwith Ca2+. In conclusion, SOCE depletes the sealed tsystem of Ca2+ in a few seconds when [Ca2+]c is keptlow.
C© 2007 The Authors. Journal compilation C© 2007 The Physiological Society

90 B. S. Launikonis and E. Rıos J Physiol 583.1
SOCE and membrane potential
To examine the effect of t system membrane potential onthe store-operated Ca2+ flux, preparations were exposedto K+- or Na+-based caffeine solutions in the presenceof 1 mm EGTA. An internal solution with only Na+
will chronically depolarize the t system and a K+-basedinternal solution with some Na+ will activate the tsystem Na+-pump and allow the normal [K+] and [Na+]gradients to be reestablished across the t system, resultingin a close to normal resting potential (Lamb & Stephenson,1990, 1994). To assure and ascertain Ca2+ store depletionunder both conditions of membrane potential, 30 mm
caffeine and 1 mm EGTA were used in the solution.Indeed, caffeine facilitates SR Ca2+ release under a widerange of conditions and prevents net Ca2+ uptake bythe SR (Herrmann-Frank et al. 1999), while 1 mm EGTA
0 2 4 6 8 10 12 14
1
2
3
0
1
2
0 2 4 6 8 10 12 14
2
3
4
5
caffeine-BAPTA caffeine-BAPTA
A
B
C D
1 s 3 s 6 s 8 s 11 s
Rin
t s
ys
tem
[Ca
2+] t
-sys,
mM
time, s time, s
50 μm
F3/F
3,0
Figure 6. Ca2+ movements following Ca2+ release in caffeine–BAPTA with moderately Ca2+-loaded SRA, F3 and B, R in t system, acquired while changing from a solution with 5 mM BAPTA, 0 Ca and 0.65 mM Mg2+to releasing-inducing caffeine–BAPTA. C, spatially averaged F3/F3,0 ( red) and R (blue) versus elapsed time, whichdirectly correspond to time and y axis in A and B. D, spatially averaged F3/F3,0 (red) and [Ca2+]t-sys (green) derivedfrom R in C. Note the abrupt shift in R at the point of introduction of caffeine in the bathing solution. The calibrationof R in terms of [Ca2+]t-sys was done using two sets of measured parameters: one for the period without caffeine(before end of blue bar marking solution change), and the other for the period with caffeine (starting at the endof blue bar). Other details as in Fig. 4. (ID: 072805e s017.)
buffers released Ca2+ while not hindering the observationof the cytoplasmic Ca2+ transient, thus providing anunambiguous indicator of Ca2+ release, which can in turnbe used to assess depletion.
The evolution of [Ca2+]t-sys upon caffeine stimulationin a K+-based glutamate solution is illustrated in Fig. 7.Prior to caffeine, the fibre was loaded in reference with800 nm Ca2+ (not shown), then immersed in reference with0 Ca2+ (image A at 4 s). Release initiation is revealed bythe increase in F3 intensity and the diffusion of Ca2+ awayfrom the preparation. Note that there is no abrupt shift inR following caffeine introduction to the bathing solution.The reason for this, which is in contrast to that of caffeinein the presence of 5 mm BAPTA (Fig. 6), is not known.However, the shift in R was consistent in all fibres exposedto caffeine–BAPTA. No fibres exposed to caffeine–EGTA
C© 2007 The Authors. Journal compilation C© 2007 The Physiological Society
J Physiol 583.1 SOCE during Ca2+ release in muscle 91
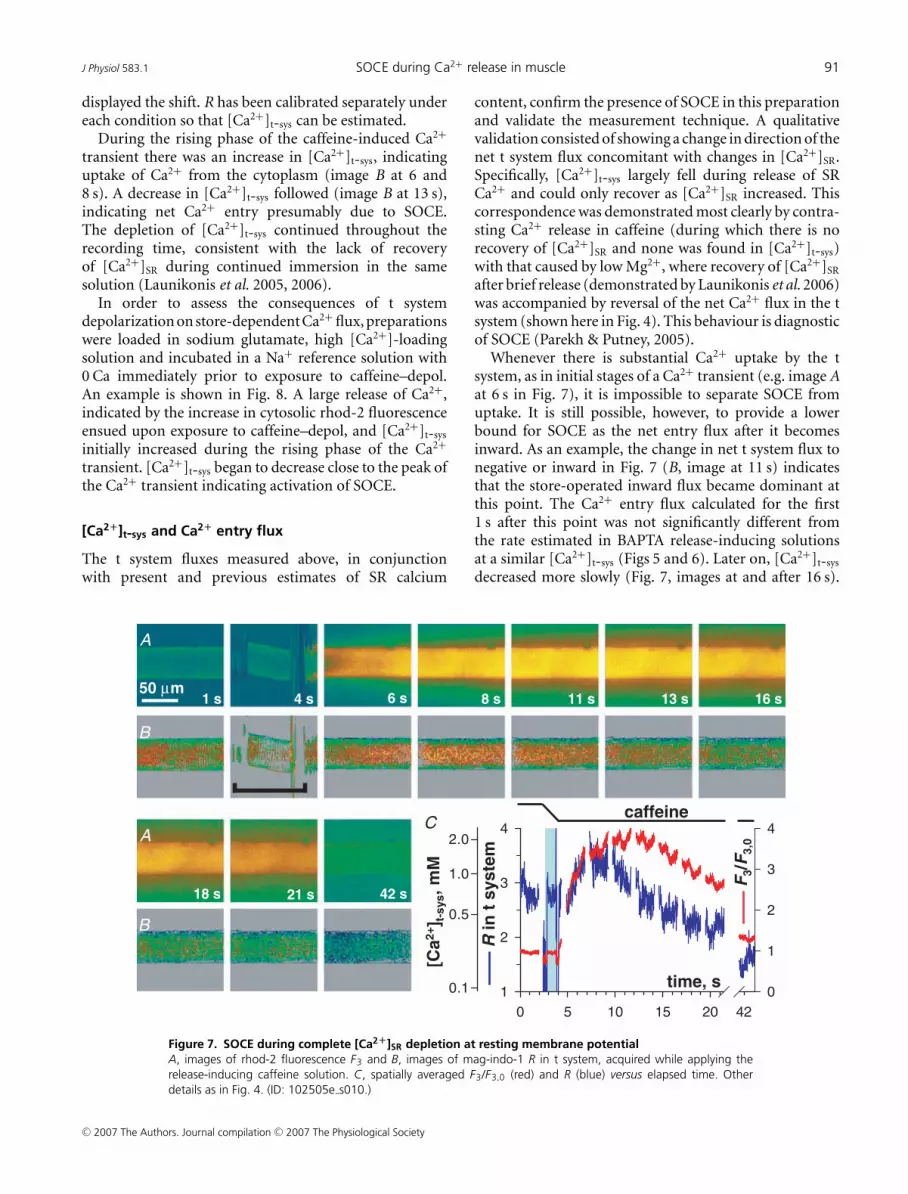
displayed the shift. R has been calibrated separately undereach condition so that [Ca2+]t-sys can be estimated.
During the rising phase of the caffeine-induced Ca2+
transient there was an increase in [Ca2+]t-sys, indicatinguptake of Ca2+ from the cytoplasm (image B at 6 and8 s). A decrease in [Ca2+]t-sys followed (image B at 13 s),indicating net Ca2+ entry presumably due to SOCE.The depletion of [Ca2+]t-sys continued throughout therecording time, consistent with the lack of recoveryof [Ca2+]SR during continued immersion in the samesolution (Launikonis et al. 2005, 2006).
In order to assess the consequences of t systemdepolarization on store-dependent Ca2+ flux, preparationswere loaded in sodium glutamate, high [Ca2+]-loadingsolution and incubated in a Na+ reference solution with0 Ca immediately prior to exposure to caffeine–depol.An example is shown in Fig. 8. A large release of Ca2+,indicated by the increase in cytosolic rhod-2 fluorescenceensued upon exposure to caffeine–depol, and [Ca2+]t-sys
initially increased during the rising phase of the Ca2+
transient. [Ca2+]t-sys began to decrease close to the peak ofthe Ca2+ transient indicating activation of SOCE.
[Ca2+]t-sys and Ca2+ entry flux
The t system fluxes measured above, in conjunctionwith present and previous estimates of SR calcium
0 5 10 15 20
1
2
3
4
0
1
2
3
4
42
time, s
F3/F
3,0
Rin
t s
ys
tem
caffeine
0.1
0.5
1.0
2.0
[Ca
2+] t
-sys,
mM
A
B
1 s 4 s 6 s 8 s 11 s 13 s 16 s
18 s 21 s 42 s
C
50 μm
A
B
Figure 7. SOCE during complete [Ca2+]SR depletion at resting membrane potentialA, images of rhod-2 fluorescence F3 and B, images of mag-indo-1 R in t system, acquired while applying therelease-inducing caffeine solution. C, spatially averaged F3/F3,0 (red) and R (blue) versus elapsed time. Otherdetails as in Fig. 4. (ID: 102505e s010.)
content, confirm the presence of SOCE in this preparationand validate the measurement technique. A qualitativevalidation consisted of showing a change in direction of thenet t system flux concomitant with changes in [Ca2+]SR.Specifically, [Ca2+]t-sys largely fell during release of SRCa2+ and could only recover as [Ca2+]SR increased. Thiscorrespondence was demonstrated most clearly by contra-sting Ca2+ release in caffeine (during which there is norecovery of [Ca2+]SR and none was found in [Ca2+]t-sys)with that caused by low Mg2+, where recovery of [Ca2+]SR
after brief release (demonstrated by Launikonis et al. 2006)was accompanied by reversal of the net Ca2+ flux in the tsystem (shown here in Fig. 4). This behaviour is diagnosticof SOCE (Parekh & Putney, 2005).
Whenever there is substantial Ca2+ uptake by the tsystem, as in initial stages of a Ca2+ transient (e.g. image Aat 6 s in Fig. 7), it is impossible to separate SOCE fromuptake. It is still possible, however, to provide a lowerbound for SOCE as the net entry flux after it becomesinward. As an example, the change in net t system flux tonegative or inward in Fig. 7 (B, image at 11 s) indicatesthat the store-operated inward flux became dominant atthis point. The Ca2+ entry flux calculated for the first1 s after this point was not significantly different fromthe rate estimated in BAPTA release-inducing solutionsat a similar [Ca2+]t-sys (Figs 5 and 6). Later on, [Ca2+]t-sys
decreased more slowly (Fig. 7, images at and after 16 s).
C© 2007 The Authors. Journal compilation C© 2007 The Physiological Society

92 B. S. Launikonis and E. Rıos J Physiol 583.1
0 5 10 15 20
1
2
3
4
0
1
2
3
4
5
6
7
0.1
0.5
1.0
2.0
F3/F
3,0
Rin
t s
ys
tem
[Ca
2+] t
-sys,
mM
caffeine-depol
42
time, s
4 s 6 s 8 s 11 s 13 s 16 s
18 s 21 s 42 s
1 s50 μm
A
A
B
B
C
Figure 8. SOCE during complete [Ca2+]SR depletion with a depolarized t systemA, F3 and B, R in t system, acquired while applying the release-inducing solution caffeine–depol after transferfrom Reference–Na–0 Ca2+, which depolarized the t system. C, spatially averaged F3/F3,0 (red) and R (blue) versuselapsed time. Other details as in Fig. 4. (ID: 092705e s007.)
The lower rate of decay in the EGTA-buffered solutionmay be due to (i) Ca2+ uptake from the cytoplasm, whichwould delay the depletion of [Ca2+]t-sys as the driving forcefor SOCE declined, or (ii) graded deactivation of SOCE as
0 1 2 30
1
2
3
4
5
low Mg2+
low Mg2+-Bapta
caffeine-Bapta
caffeine
caffeine-depol
0
25
50
75
[Ca2+
]t-sys, mM
-d[C
a2
+] t
-sy
s/d
t, m
M s
-1
*d[C
a] c
ell/d
t, μ
βM
s-1
Figure 9. Magnitude of SOCE at different [Ca2+]t-sys and tsystem membrane potentialSymbols plot rate of change of [Ca2+]t-sys versus initial value of[Ca2+]t-sys. Right ordinate axis represents rate of change in terms oftotal cytosolic Ca2+ concentration. β is the ratio between total andfree t system [calcium]. Colours represent different stimuli as indicated,with filled symbols plotting data obtained with a polarized t systemand open symbols a depolarized one. Broken lines plot best linear fitspassing through the origin or exponential fits. Best fit parameters:slopes of linear regressions were 0.97 ± 0.02 and 0.21 ± 0.01 s−1;and rate constants for exponentials: 0.90 ± 0.05 and 0.92 ± 0.07 s−1,for polarized and depolarized cells, respectively. n = 16 fibres.
Ca2+ cycled through the SR (Collet & Ma, 2004). It couldalso be due to a combination of (i) and (ii).
The rate of SOCE can now be determined within thisframework and used to establish the influence of [Ca2+]t-sys
on store-operated flux. This was done by plotting therate of decrease of [Ca2+]t-sys versus [Ca2+]t-sys at theinitiation of the event. A summary of results obtained withvarious release-inducing solutions is in Fig. 9. The curvesrepresent best fits with linear or exponential functions.Intriguingly, the exponentials gave better fits at bothmembrane potentials. This analysis of collected data clearlydemonstrates the following features: the rate of Ca2+
flux was significantly greater in normally polarized cellscompared to that in depolarized cells. The store-operatedCa2+ flux calculated from each release-inducing solution(a minimum estimate, as it assumes equality of net andunidirectional flux) appeared to define a single-valuedfunction of [Ca2+]t-sys, which is both an indication ofa simple mechanism (i.e. not dependent on additional,uncontrolled variables) and an indirect validation of themethod of calculating this flux. The apparent nonlinearityof the dependence suggests that [Ca2+]t-sys could havegating (Hofer, 2005), in addition to flux-driving effects,or reflect quantification errors.
The axis on the right side is proportionally calibratedin terms of accessible cytoplasmic volume, assuming afractional t system volume of 1.4% (Eisenberg, 1983;Dulhunty, 1984; Launikonis & Stephenson, 2002a). Itis worth noting that the fractional volume of the
C© 2007 The Authors. Journal compilation C© 2007 The Physiological Society

J Physiol 583.1 SOCE during Ca2+ release in muscle 93
t-system (t-sysvol) of intact fibres has been estimatedfrom electron and confocal microscopy, with differingresults. The upper estimate for t-sysvol from electronmicroscopy in mammalian fast-twitch muscle is 0.7%(Dulhunty, 1984), whereas confocal microscopy estimates1.4% (Launikonis & Stephenson, 2002a). As fibres mustbe fixed in hypertonic solution for electron microscopyimaging, a correction for shrinkage of the preparationwas made from measurements of total fibre volumechanges in hypertonic solution, with the assumption thatthe fibre and t-system volumes shrink proportionally(Eisenberg, 1983). This assumption was found to beincorrect (Launikonis & Stephenson, 2004). Accordingly,fluorescent dyes equilibrated in the t-system of intact,living muscle cells report significantly larger volumes thanthose estimated from electron microscopy (Endo, 1966;Soeller & Cannell, 1999; Launikonis & Stephenson, 2002a).
The flux rates will scale up after taking into accountCa2+ buffering within the t system wall (see Methods).This buffering power (β = [total calcium]t-sys/[Ca2+]t-sys)has not been determined under the present experimentalconditions. Under somewhat comparable conditions, withSOCE activated upon depletion of SR Ca2+ by 30 mm
caffeine, assays of total calcium in the t system put β inthe range 1–20 (Donoso et al. 1995; Owen et al. 1997; M.Barnes and D. G. Stephenson, unpublished observations).
Discussion
SOCE during Ca2+ release in skinned fibres
By combining confocal measurements of free [Ca2+]within the t system and simultaneous recordings of cyto-plasmic Ca2+ we were able to measure for the first timethe t system SOCE flux during Ca2+ release from the SR inskeletal muscle.
In this study we build on previous work where itwas shown that Ca2+-dependent t system fluorescenceis an indicator of SOCE in skinned skeletal musclefibres (Launikonis et al. 2003). Depletion of SR Ca2+ byapplication of caffeine caused t system Ca2+ to deplete,showing activation of SOCE. By disrupting the couplingbetween the t system and SR membranes (Lamb et al. 1995)the signal to open the SOC channel upon store depletionis severed (Launikonis et al. 2003). Because uncouplinginterrupts signalling between membranes but does notaffect membrane protein function, it is a more precisemethod of identifying SOCE than the use of a non-specificpharmacological agent, like 2-APB.
It was indeed found that 2-APB interacts with RyR1 inour skinned fibre experiments. This interaction has notbeen reported in intact fibres. In intact fibre studies theapproach is usually to deplete SR Ca2+ in the absenceof extracellular Ca2+ and 2-APB, and then introduceextracellular Ca2+ (or the Ca2+ surrogate Mn2+) to evoke
SOCE and 2-APB to block it. An interaction of 2-APBand RyR1 would go unnoticed in such an experiment.Alternatively, the diffusional access of 2-APB to the triadcould be restricted in intact compared to skinned fibres,consequently preventing 2-APB access to RyR1, togetherwith its interfering with Ca2+ release.
The current results show [Ca2+]t-sys changes duringCa2+ release. Most notably, low Mg2+-induced Ca2+
release resulted in an increase in [Ca2+]t-sys, then an abruptdrop, followed by a recovery as Ca2+ release ended (Fig. 4).This sequence occurred in the order of seconds. Thesechanges in [Ca2+]t-sys can only be due to the net flux of Ca2+
across the t system membrane. Therefore, these changes in[Ca2+]t-sys indicate Ca2+ uptake into the t system duringCa2+ release from SR, SOCE activation in less than 1 sfollowing initiation of Ca2+ release and SOCE terminationas the SR refills with Ca2+ at the decline of the Ca2+ releasetransient (as demonstrated by Launikonis et al. 2006) toallow net reuptake of Ca2+ by the t system. This firstdemonstration of activation and termination of SOCEduring a single Ca2+ release event in muscle shows thatactivation of SOCE is rapid under these circumstances.
Ca2+ uptake by the t system
A striking observation of this study was that the t systemcould take up Ca2+ during Ca2+ release from SR at arapid rate (up to 1 mm s−1 relative to t system volume;Fig. 4). This therefore represents a possible means of Ca2+
depletion in the cell during Ca2+ release. It would bedifficult, however, to extrapolate from these observationsto a physiological situation, to for instance estimate Ca2+
loss during a train of action potentials that cause fatigue.On the one hand, the present conditions may overestimatethe rate of Ca2+ loss, as t system Ca2+ uptake was observedduring a very large release of Ca2+ following directactivation of the SR RyR (Figs 4–8). On the other hand, thepresent measurements amount to a lower limit of Ca2+ lossduring a comparable Ca2+ transient, as intact fibres wouldallow diffusional efflux from tubules to extracellular space,which would reduce the t system concentration buildupand enhance Ca2+ efflux into the t system.
Properties of SOCE in muscle
This study demonstrates three features of SOCE: (i) itdoes not require complete depletion of the SR, (ii) itsactivation and rate are approximately independent of themagnitude of the cytoplasmic Ca2+ transient, and (iii) itis activated by local SR depletion. (i) follows from the factthat SOCE was activated prior to the peak of the Ca2+
transients (Figs 4–8), indicating that Ca2+ was still presentin the SR at the time of activation. This observation,plus the similarity of fluxes with different degrees of
C© 2007 The Authors. Journal compilation C© 2007 The Physiological Society

94 B. S. Launikonis and E. Rıos J Physiol 583.1
cytosolic buffering, constitutes evidence that [Ca2+]c isnot a direct determinant or mediator of SOCE in muscle.The local character of activation of SOCE was shown by thespatially inhomogeneous decrease in [Ca2+]t-sys associatedwith a non-uniform release of Ca2+ from SR across the fibre(Figs 4–6).
Importantly, activation of SOCE was observed tooccur locally in less than 1 s following the introductionof release-inducing solutions containing 5 mm BAPTA.Furthermore, activation of SOCE occurred throughout thewhole t system, consistent with the spatiotemporal patternof SR Ca2+ depletion, which was dependent on the rate ofMg2+ diffusion away from the preparation (Figs 4–6). Bycomparison with recent studies of SOCE activation in thesmall, non-excitable Jurkat cell (Wu et al. 2006; Luik et al.2006), we can further elucidate the mechanism of SOCEactivation in skeletal muscle. Following Ca2+ depletionof ER in Jurkat cells there is accumulation of the intra-store Ca2+ sensor STIM1 (stromal interacting molecule1) at junctional regions of the ER. The subsequent SOCchannel activation takes place only at specific sites onthe surface membrane (Luik et al. 2006). This processrequired one-third of junctional ER to relocate to theplasma membrane in an overall process taking 6–10 s toreach 20% maximal activation (Wu et al. 2006). Thereforethe time required to reach maximal SOCE activation inmammalian skeletal muscle (Fig. 5) was more than anorder of magnitude shorter than that required to reach20% maximal activation in Jurkat cells.
The contrasting properties of skeletal muscle, wherejunctional SR is structurally static and activation ofSOCE is faster and spatially unrestricted in the t system,suggest that the elementary molecular machinery forSOCE in skeletal muscle is already uniformly distributedand present in the junctional membranes prior to storedepletion. A direct physical interaction between therelevant molecules is plausible given that this cell alreadyhas the well-defined contacts between the t system and SRthat drive EC coupling (Franzini-Armstrong et al. 1999;Paolini et al. 2004). This model is also consistent with thefunctional disruption of SOCE caused in skeletal muscleby high intracellular [Ca2+] treatment, which severs theprotein–protein interactions between the SR and t systemat the triad (Launikonis et al. 2003).
In contrast to studies of non-excitable cells (Hoth& Penner, 1993; Zweifach & Lewis, 1995), we foundtermination of SOCE to be independent of cytoplasmicCa2+ conditions but fully regulated from the SR. This isconsistent with the observation (Kurebayashi & Ogawa,2001) of a prolonged rise of [Ca2+]c due to SOCE,reaching micromolar levels without inactivation, in anintact skeletal muscle cell in the presence of a SRCa2+-pump inhibitor. The difference with the inactivationproperties described in non-excitable cells may reflectdifferent store-operated currents (ICRAC and ISOC; Parekh
& Putney, 2005; Lewis, 2007). In skeletal muscle, anICRAC with Ca2+ inactivation properties similar to thosedescribed in non-excitable cells is yet to be reported.The differences seem teleologically justified. In workingmuscle, where [Ca2+]c can reach tens of micromolar(Baylor & Hollingworth, 2003), entry flux should be able toproceed independently of the increase in [Ca2+]c in orderto maintain a required level of [Ca2+]SR.
Ca2+ entry flux rate
This study provides the first determination of Ca2+ entryflux rates during Ca2+ release in skeletal muscle cells.Ca2+ entry flux during Ca2+ release was found to bedependent on the driving force provided by [Ca2+]t-sys
and the membrane potential (Fig. 9), even though thedependence was not linear as simple permeation theorywould predict. In any case, the physiological conditionsin skeletal muscle of 2 mm [Ca2+]t-sys and a membranepotential of around −90 mV will strongly favour inwardCa2+ flux to the cell when SOC channels are activated inskeletal muscle.
From the results summarized in Fig. 9, the SOCE flux inthe resting cell at 2 mm [Ca2+]t-sys (relative to t-systemvolume) can be estimated at 18.6 μm s−1 (in terms ofthe accessible cytoplasmic volume) times the bufferingpower of the t system, a factor in the range 1–20 (seeMethods; Hidalgo et al. 1986; Owen et al. 1997). This canbe compared with estimates from studies on intact cells,according to which it takes 1–2 min to refill the depletedSR following reintroduction of 2 mm extracellular Ca2+
(Kurebayashi & Ogawa, 2001; Collet & Ma, 2004). Therate of SOCE measured here at physiological [Ca2+]t-sys
predicts that 1.12–2.24 mm calcium will enter the cell in1–2 min, which should be sufficient to refill the SR ofmammalian fibres (1.01 mm total calcium concentration;Fryer & Stephenson, 1996) even if graded deactivation ofSOCE slowed the influx rate as the SR refilled (Collet &Ma, 2004).
These observations and calculations confirm thepresence of SOCE and show that its flux across thet system can fully account for the SR refilling timesin intact cells (Kurebayashi & Ogawa, 2001). Recently,though, the existence of SOCE in skeletal muscle fibreshas been brought into question by Allard et al. (2006). Thisgroup used a combination of voltage- and patch-clampingtechniques to monitor electrical activity across the surfacemembrane during Ca2+ release from SR. In this workthe major part of the cell was electrically insulated withsilicone grease allowing accurate control of voltage in theexposed area (a 100 μm segment of a ∼30 μm diametercell). In contrast to the results of others (Vandebroucket al. 2002), no unitary channel activity was recordedacross a patch of the exposed sarcolemma during depletingCa2+ release. The result was interpreted as evidence
C© 2007 The Authors. Journal compilation C© 2007 The Physiological Society

J Physiol 583.1 SOCE during Ca2+ release in muscle 95
for either the absence of SOCE across this membrane,or for it consisting of unitary currents of undetectablesize.
Moreover, the macroscopic current recorded by Allardet al. (2006) under voltage-clamp upon repolarizationfrom long Ca2+-depleting pulses did not change in asignificant way, suggesting that there was no SOCE acrossthe t system either, and similarly minor changes incurrent were observed after other treatments that causedcell-wide depletion. These apparently negative results arenot inconsistent with the presence of an electrogenicSOCE with the magnitude reported here. Indeed, the Ca2+
current density associated with a flux of 1 mm per minute,about 3.2 A l−1, would result in a macroscopic current of∼0.3 nA in the cell segments used by Allard et al. (2006).Changes of that magnitude could have passed unnoticed,given the evident presence of other electrophysiologicalchanges upon various treatments (e.g. their Fig. 1). Infact, after 5 min of application of cyclopiazonic acid, whichcaused a substantial loss of SR calcium, the incrementalcurrent in response to a −100 mV pulse increased by∼0.2 A F−1, or 0.2 nA in a 1000 pF cell (Fig. 5 of Allardet al. 2006). In this framework it is possible to concludethat SOCE is controlled at the triads and not across thesarcolemma in skeletal muscle. However, the experimentsof Allard et al. do not fully disprove the presence ofSOCE across the sarcolemma, leaving this controversyunresolved.
Other studies of SOCE in skinned fibres (Zhao et al.2005, 2006; Hirata et al. 2006) suggest a much slowerentry flux than observed here, with the t system takingup to 12 min to deplete of Ca2+ upon store depletion.In sharp contrast, all entry fluxes reported in our studyended in seconds, by deactivation of SOCE or t systemdepletion.
Several technical differences may account for thediscrepancies: in the studies referred to above, all cells wereprobed for their SOCE response in a K+-based internalsolution with no Na+, thus rendering the t system Na+
pump inactive and depolarizing the t system. This featurealone does not account for the difference, however, becausethe depolarized cells of our study still depleted calcium inthe t system in less than 1 min following store depletion(Fig. 8). In the previous studies attempts to deplete SRCa2+ were done with caffeine in the presence of ∼1 mm
[Mg2+]c and submillimolar [ATP], without an indicatorof SR Ca2+ release. Caffeine is a poor activator of RyR1 inadult skeletal muscle at 1 mm [Mg2+]c (Lamb et al. 2001)and at low [ATP] (Owen et al. 1996; Laver et al. 2001;Dutka & Lamb, 2004). Therefore store depletion, whichwas not demonstrated under the conditions used, mayhave been limited, and most significantly, in the previousstudies fibres were skinned in a solution with 0.5 mm totalcalcium and 0.5 mm rhod-5N (Zhao et al. 2005; Hirata et al.2006), which exposed skinned fibres to micromolar levels
of Ca2+. In addition, skinned fibres were further exposedto micromolar levels of Ca2+ for several minutes in order toload the t system and SR (Zhao et al. 2005). The exposureof the intracellular environment to micromolar Ca2+ for afew minutes irreversibly disrupts the coupling between thet system and SR membranes (Lamb et al. 1995; Launikoniset al. 2003; Verburg et al. 2005).
Preliminary results from another laboratory employingskinned fibres to study SOCE in mammalian musclehave also appeared (Duke & Steele, 2006). They reportthat fluorescence of t system-trapped fluo-5N of ratfibres is lost in less than 1 min following waves of Ca2+
release induced in an internal solution with halothaneand low Mg2+. This rate of SOCE is consistent withthat presented here and with the levels previouslyshown in amphibian skeletal muscle (Launikonis et al.2003).
[Ca2+]SR and activation of SOCE in skeletal muscle
Problems finding a protocol suitable to load Ca2+ intothe t system while achieving an endogeneous level ofCa2+ in SR (Fryer & Stephenson, 1996) meant that Ca2+
probably exceeded normal levels in some fibres. Giventhe fact that SOCE was clearly active prior to completedepletion of Ca2+ in SR (Figs 4–8), the question remainsopen whether SOCE has a relative or absolute threshold inskeletal muscle. That is, can SOCE start following release ofa certain amount of Ca2+ from SR regardless of the initiallevel or does a certain level of Ca2+ depletion in SR haveto be reached for activation?
In summary, we have shown that store-dependent Ca2+
influx across the t system can be measured during Ca2+
release in rat skeletal muscle. SOCE flux determined thisway was much higher than in earlier estimates, at valuesconsistent with the rapid refilling of the cellular storesdemonstrated in intact cells. SOCE flux was also foundto be strongly dependent on the membrane potentialand Ca2+ gradient. From our observations of SOCE inthese experiments we present a model of SOCE in skeletalmuscle where the elementary molecular units of SOCE areevenly distributed throughout the t system and are locallycontrolled, activated rapidly following Ca2+ release andinfluenced little by changes in cytosolic [Ca2+] within thephysiological range but fully regulated from within theSR.
References
Allard B, Couchoux H, Pouvreau S & Jacquemond V (2006).Sarcoplasmic reticulum Ca2+ release and depletion fail toaffect sarcolemmal ion channel activity in mouse skeletalmuscle. J Physiol 575, 68–81.
Almers W, Fink RHA & Palade PT (1981). Calcium depletionin frog muscle tubules: the decline of calcium current undermaintained depolarization. J Physiol 312, 177–207.
C© 2007 The Authors. Journal compilation C© 2007 The Physiological Society

96 B. S. Launikonis and E. Rıos J Physiol 583.1
Baylor SM & Hollingworth S (2003). Sarcoplasmic reticulumcalcium release compared in slow-twitch and fast-twitchfibres of mouse muscle. J Physiol 551, 125–138.
Cheung A, Dantzig JA, Hollingworth S, Baylor SM, GoldmanYE, Mitchison TJ & Straight AF (2002). A small-moleculeinhibitor of skeletal muscle myosin II. Nat Cell Biol 4, 83–88.
Collet C & Ma J (2004). Calcium-dependent facilitation andgraded deactivation of store-operated calcium entry in fetalskeletal muscle. Biophys J 87, 268–275.
Di Biase V & Franzini-Armstrong C (2005). Evolution ofskeletal type e-c coupling: a novel means of controllingcalcium delivery. J Cell Biol 171, 695–704.
Donoso P, Prieto H & Hidalgo C (1995). Luminal calciumregulates calcium release in triads isolated from frog andrabbit skeletal muscle. Biophys J 68, 507–515.
Duke AM & Steele D (2006). Store-operated Ca2+ entryfollowing halothane-induced Ca2+ waves in mechanicallyskinned rat muscle fibres. Proc Physiol Soc 3, 140P.
Dulhunty AF (1984). Heterogeneity of t-tubule geometry invertebrate skeletal muscle fibres. J Muscle Res Cell Mot 5,333–347.
Dutka TL & Lamb GD (2004). Effect of low cytoplasmic [ATP]on excitation-contraction coupling in fast-twitch musclefibres of the rat. J Physiol 560, 451–468.
Eisenberg BR (1983). Quantitative ultrastructure ofmammalian skeletal muscle. In Handbook of Physiology,section 10, Skeletal Muscle, ed. Peachey LD, pp. 73–112.American Physiological Society, Bethesda, MD, USA.
Endo M (1966). Entry of fluorescent dyes into the sarcotubularsystem of the frog muscle. J Physiol 185, 224–238.
Franzini-Armstrong CA, Protasi F & Ramesh V (1999). Shape,size, and distribution of Ca2+ release units and couplons inskeletal and cardiac muscle. Biophys J 77, 1528–1539.
Friedrich O, Ehmer T, Uttenweiler D, Vogel M, Barry PH &Fink RHA (2001). Numerical analysis of Ca2+ depletion inthe transverse tubular system of mammalian muscle.Biophys J 80, 2046–2055.
Fryer MW & Stephenson DG (1996). Total and sarcoplasmicreticulum calcium contents of skinned fibres from ratskeletal muscle. J Physiol 493, 357–380.
Grynkiewicz G, Poenie M & Tsien RY (1985). A new generationof Ca2+ indicators with greatly improved fluorescenceproperties. J Biol Chem 260, 3440–3450.
Herrmann-Frank A, Luttgau H-C & Stephenson DG (1999).Caffeine and excitation-contraction coupling in skeletalmuscle: a stimulating story. J Muscle Res Cell Motil 20,223–237.
Hidalgo C, Cifuentes F & Donoso P (1991). Sodium-calciumexchange in transverse tubule vesicles isolated fromamphibian skeletal muscle. Ann NY Acad Sci 639, 483–497.
Hidalgo C, Gonzalez ME & Garcıa AM (1986). Calciumtransport in transverse tubules isolated from rabbit skeletalmuscle. Biochim Biophys Acta 854, 279–286.
Hirata Y, Brotto M, Weisleder N, Chu Y, Lin P, Zhao X,Thornton A, Komazaki S, Takeshima H, Ma J & Pan Z(2006). Uncoupling store-operated Ca2+ entry and alteredCa2+ release from sarcoplasmic reticulum through silencingof junctophilin genes. Biophys J 90, 4418–4427.
Hofer AM (2005). Another dimension to calcium signaling: alook at extracellular calcium. J Cell Sci 118, 855–862.
Hoth M & Penner R (1993). Calcium release-activated calciumcurrent in rat mast cells. J Physiol 465, 737–749.
Kurebayashi N & Ogawa Y (2001). Depletion of Ca2+ in thesarcoplasmic reticulum stimulates Ca2+ entry into mouseskeletal muscle fibres. J Physiol 533, 185–199.
Lamb GD, Cellini MA & Stephenson DG (2001). DifferentCa2+ releasing action of caffeine and depolarization inskeletal muscle fibres of the rat. J Physiol 531, 715–728.
Lamb GD, Junankar PR & Stephenson DG (1995). Raisedintracellular [Ca2+] abolishes excitation–contractioncoupling in skeletal muscle fibres of rat and toad. J Physiol489, 349–362.
Lamb GD & Stephenson DG (1990). Calcium release in skinnedmuscle fibres of the toad by transverse tubule depolarizationor by direct stimulation. J Physiol 423, 495–517.
Lamb GD & Stephenson DG (1994). Effects of intracellular pHand [Mg2+] on excitation–contraction coupling in skeletalmuscle fibres of the rat. J Physiol 478, 331–339.
Launikonis BS, Barnes M & Stephenson DG (2003).Identification of the coupling between skeletal musclestore-operated calcium entry and the inositol trisphosphatereceptor. Proc Natl Acad Sci U S A 100, 2941–2944.
Launikonis BS & Stephenson DG (2000). Effects of Mg2+ onCa2+ release from sarcoplasmic reticulum of skeletal musclefibres from yabby (crustacean) and rat. J Physiol 526,299–312.
Launikonis BS & Stephenson DG (2002a). Tubular systemvolume changes in twitch fibres from toad and rat skeletalmuscle assessed by confocal microscopy. J Physiol 538,607–618.
Launikonis BS & Stephenson DG (2002b). Properties of thevertebrate skeletal muscle tubular system as a sealedcompartment. Cell Biol Int 26, 921–929.
Launikonis BS & Stephenson DG (2004). Osmotic properties ofthe sealed tubular system of toad and rat skeletal muscle.J Gen Physiol 123, 231–247.
Launikonis BS, Zhou J, Royer L, Shannon TR, Brum G & Rıos E(2005). Confocal imaging of [Ca2+] in cellular organelles bySEER, shifted excitation and emission ratioing. J Physiol 567,523–543.
Launikonis BS, Zhou J, Royer L, Shannon TR, Brum G & Rıos E(2006). Depletion ‘skraps’ and dynamic buffering inside thecellular Ca2+ store. Proc Natl Acad Sci U S A 103, 2982–2987.
Laver DR, Lenz GKE & Lamb GD (2001). Regulation of thecalcium release channel from rabbit skeletal muscle by thenucleotides ATP, AMP, IMP and adenosine. J Physiol 537,763–778.
Lewis RS (2007). The molecular choreography of astore-operated calcium channel. Nature 446, 284–287.
Luik RM, Wu MW, Buchanan J & Lewis RS (2006). Theelementary unit of store-operated Ca2+ entry: localactivation of CRAC channels by STIM1 at ER-plasmamembrane junctions. J Cell Biol 174, 815–825.
McKemy DD, Welch W, Airey JA & Sutko JL (2000).Concentrations of caffeine greater than 20 mM increase theindo-1 fluorescence ratio in a Ca2+-independent manner.Cell Calcium 27, 117–124.
Melzer W, Herrmann-Frank A & Luttgau HC (1995). The roleof Ca2+ ions in excitation-contraction coupling of skeletalmuscle fibres. Biochim Biophys Acta 1241, 59–116.
C© 2007 The Authors. Journal compilation C© 2007 The Physiological Society

J Physiol 583.1 SOCE during Ca2+ release in muscle 97
Muschol M, Dasgupta BR & Salzberg BM (1999). Caffeineinteraction with fluorescent calcium indicator dyes. Biophys J77, 577–586.
Owen VJ, Lamb GD & Stephenson DG (1996). Effect of low[ATP] on depolarization-induced Ca2+ release in skeletalmuscle of the toad. J Physiol 493, 309–315.
Owen VJ, Lamb GD, Stephenson DG & Fryer MW (1997).Relationship between depolarization-induced forceresponses and Ca2+ content in skeletal muscle fibres of ratand toad. J Physiol 498, 571–586.
Paolini C, Fessenden JD, Pessah IN & Franzini-Armstrong C(2004). Evidence for conformational coupling between twocalcium channels. Proc Natl Acad Sci U S A 101,12748–12752.
Parekh AB & Putney JW Jr (2005). Store-operated calciumchannels. Physiol Rev 85, 757–810.
Posterino GS & Lamb GD (2003). Effect of sarcoplasmicreticulum Ca2+ content on action potential-induced Ca2+release in rat skeletal muscle fibres. J Physiol 524, 239–258.
Pouvreau S, Royer L, Yi J, Brum G, Meissner G, Rıos E & ZhouJ (2007). Ca2+ sparks operated by membrane depolarizationrequire isoform 3 ryanodine receptor channels in skeletalmuscle. Proc Natl Acad Sci U S A 104, 5235–5240.
Rome LC (2006). Design and function of superfast muscles:new insights into physiology of skeletal muscle. Annu RevPhysiol 68, 193–221.
Sacchetto R, Margreth A, Pelosi M & Carafoli E (1996).Colocalization of the dihydropyridine receptor, theplasma-membrane calcium ATPase isoform 1 and thesodium/calcium exchanger to the junctional-membranedomain of transverse tubules of rabbit skeletal muscle.Eur J Biochem 237, 483–488.
Shirokova N, Garcıa J, Pizarro G & Rıos E (1996). Ca2+ releasefrom the sarcoplasmic reticulum compared in amphibianand mammalian skeletal muscle. J Gen Physiol 107, 1–18.
Shirokova N, Garcıa J & Rıos E (1998). Local calcium release inmammalian skeletal muscle. J Physiol 512, 377–384.
Soeller C & Cannell MB (1999). Examination of the transversetubular system in living cardiac rat myocytes by 2-photonmicroscopy and digital image-processing techniques. CircRes 84, 266–275.
Stephenson DG & Lamb GD (1993). Visualisation of thetransverse tubular system in isolated intact and inmechanically skinned muscle fibres of the cane toad byconfocal laser scanning microscopy. J Physiol 459, 15P.
Stern MD, Pizarro G & Rıos E (1997). Local control model ofexcitation-contraction coupling in skeletal muscle. J GenPhysiol 110, 415–440.
Vandebrouck C, Martin D, Colson-Van Schoor M, Debaix H &Gailly P (2002). Involvement of TRPC in the abnormalcalcium influx observed in dystrophic (mdx) mouse skeletalmuscle. J Cell Biol 158, 1089–1096.
Veratti E (1961). Investigations on the fine structure of striatedmuscle fiber. J Biophys Biochem Cytol 10, 1–59.
Verburg E, Murphy RM, Stephenson DG & Lamb GD (2005).Disruption of excitation–contraction coupling and titin byendogenous Ca2+-activated proteases in toad muscle fibres.J Physiol 564, 775–790.
Wu MW, Buchanan J, Luik RM & Lewis RS (2006). Ca2+ storedepletion causes STIM1 to accumulate in ER regions closelyassociated with the plasma membrane. J Cell Biol 174,803–813.
Zhao X, Weisleder N, Han X, Pan Z, Parness J, Brotto M & Ma J(2006). Azumolene inhibits a component of store-operatedcalcium entry coupled to the skeletal muscle ryanodinereceptor. J Biol Chem 281, 33477–33486.
Zhao X, Yoshita M, Brotto L, Takeshima H, Weisleder N, HirataY, Nosek TM, Ma J & Brotto M (2005). Enhanced resistanceto fatigue and altered calcium handling properties ofsarcalumenin knockout mice. Physiol Genomics 23, 72–78.
Zhou J, Launikonis BS, Rıos E & Brum G (2004). Regulation ofCa2+ sparks by Ca2+ and Mg2+ in mammalian andamphibian muscle. An RyR isoform-specific role inexcitation–contraction coupling? J Gen Physiol 124, 409–428.
Zweifach A & Lewis RS (1995). Rapid inactivation ofdepletion-activated calcium current (ICRAC) due to localcalcium feedback. J Gen Physiol 105, 209–226.
Acknowledgements
We thank D.G. Stephenson (La Trobe University) for comments
on the manuscript. B.S.L. was a C. J. Martin Fellow of the National
Health and Medical Research Council (Australia). This work was
supported by grants from National Institute of Arthritis and
Musculoskeletal and Skin Diseases/National Institute of Health
to E. Rıos.
Supplemental material
Online supplemental material for this paper can be accessed at:
http://jp.physoc.org/cgi/content/full/jphysiol.2007.135046/DC1
and
http://www.blackwell-synergy.com/doi/suppl/10.1113/jphysiol.
2007.135046
C© 2007 The Authors. Journal compilation C© 2007 The Physiological Society


