Embed Size (px)
Citation preview
2008 INTERNATIONAL CONFERENCE ON PROGNOSTICS AND HEALTH MANAGEMENT
Abstract— Aerospace-electronic systems usually face a very
harsh environment, requiring them to survive the high strain rates, e.g. during launch and re-entry and thermal environments including extreme low and high temperatures. Traditional health monitoring methodologies have relied on reactive methods of failure detection often providing little or no insight into the remaining useful life of the system. In this paper, a mathematical approach for interrogation of system state under cyclic thermo-mechanical stresses has been developed for 6-different leadfree solder alloy systems. Data has been collected for leading indicators of failure for alloy systems including, Sn3Ag0.5Cu, Sn3Ag0.7Cu, Sn1Ag0.5Cu, Sn0.3Ag0.5Cu0.1Bi, Sn0.2Ag0.5Cu0.1Bi0.1Ni, 96.5Sn3.5Ag second-level interconnects under the application of cyclic thermo-mechanical loads. Methodology presented resides in the pre-failure space of the system in which no macro-indicators such as cracks or delamination exist. Systems subjected to thermo-mechanical damage have been interrogated for system state and the computed damage state correlated with known imposed damage. The approach involves the use of condition monitoring devices which can be interrogated for damage proxies at finite time-intervals. Interrogation techniques are based on derivation of damage proxies, and system prior damage based non-linear least-squares methods including the Levenberg-Marquardt Algorithm. The system’s residual life is computed based on residual-life computation algorithms.
Index Terms—Prognostics, health monitoring, solder joint reliability, leading indicators of failure.
Manuscript received May 23, 2008. The research presented in this paper
has been supported by NASA-IVHM Program Grant NNA08BA21C from the National Aeronautics and Space Administration.
Pradeep Lall, Vikrant More, Rahul Vaidya, Jeff Suhling are with Auburn University, Department of Mechanical Engineering and Center for Advanced Vehicle Electronics, Auburn, Alabama 36849, USA. (Pradeep Lall is corresponding author, phone: 334-844-3434; fax: 334-844-3307; e-mail: [email protected],edu).
Chandan Bhat was a MS Candidate, and Graduate Research Assistant advised by Professor Lall at Auburn University, Auburn, Alabama, 36849. He is now with Cree Research, Inc. Durham, North Carolina 27703 USA.
Madhura Hande was a MS Candidate, and Graduate Research Assistant advised by Professor Lall at Auburn University, Auburn, Alabama, 36849. She is now with Intel Corporation, Chandler, Arizona, USA.
Ranjit Pandher is with Cookson Electronics, Jersey City, NJ 07304, USA. Kai Goebel is with the NASA Ames Research Center, Moffett Field,
California 94035.
I. INTRODUCTION vionics systems require ultra-high reliability to fulfill critical roles in autonomous aircraft control and navigation, flight path prediction and tracking, and self-
separation. Complex electrical power systems (EPS) which broadly comprise of energy generation, energy storage, power distribution, and power management, have a major impact on the operational availability, and reliability of avionic systems. Technology trends in evolution of avionics systems point towards more electric aircraft and the prevalent use of power semiconductor devices in future aircraft and space platforms. Advanced health management techniques for electrical power systems and avionic systems are required to meet the safety, reliability, maintainability, and supportability requirements of aeronautics and space systems. Current health management techniques in EPS and Avionic Systems provide very-limited or no-visibility into health of power electronics, and packaging to predict impending failures. [McCann 2005, Marko 1996, Schauz 1996, Shiroishi 1997].
Maintenance has evolved over the years from corrective maintenance to performing time-based preventive maintenance. Future improvements in reduction of system downtime require emphasis on early detection of degradation mechanisms. Incentive for development of prognostics and health management methodologies has been provided by need for reduction in operation and maintenance process costs [Jarell 2002]. New advances in sensor technology and failure analysis have catalyzed a broadening of application scope for prognostication systems to include large electromechanical systems such as aircraft, helicopters, ships, power plants, and many industrial operations. Current prognostic health management (PHM) application areas include, fatigue crack damage in mechanical structures such as those in aircraft [Munns 2000], surface ships [Baldwin 2002], civil infrastructure [Chang 2003], railway structures [Barke 2005] and power plants [Jarrell 2002].
Previously, the PHM of mechanical structures has been done by dynamic analysis based on natural frequencies, mode shapes, damping factors, and static analysis based on deformation or changes in structure orientation due to load or unexpected damage, using innovative signal processing, new sensors, and control theory [Kok 2005]. In case of
Latent Damage Assessment and Prognostication of Residual Life in Airborne Lead-free
Electronics Under Thermo-Mechanical Loads
Pradeep Lall, Senior Member IEEE, Chandan Bhat, Madhura Hande, Vikrant More, Rahul Vaidya, Ranjit Pandher, Jeff Suhling, Kai Goebel
A
mechanical systems, like propulsion systems, compressors, gears, damage progresses mainly due to wear under prolonged usage, imbalance condition in one of the rotating elements, misalignment of the shafts of the rotating components which leads to changes in the vibration signature of the equipment. Comparison of vibration signals from the defective equipment and sound equipment, enables detection of performance degradation [Dyne 1992]. The concept of prognostication of aircraft hydraulic system using signature analysis of measurable condition parameters such as port timing, internal leakage has been demonstrated by [Smeulers 2002]. Wayside detection involving fault identification using interrogating sensors placed along the sides of railway tracks has been used in the railway industry for gathering information about vehicle performance. Information on the vehicle condition and performance over an extended period of time is recorded in an online database, which is interrogated for critical performance parameters to provide information on condition of in-service railway vehicles [Barke 2005]. A model-based method has been used for the on-line identification of cracks in a rotor of aircraft engines which start and stop quite frequently and run at high speeds [Sekhar 2003]. Detection of surface corrosion has been used to reduce the maintenance required, and trigger preventive repair for increased aircraft availability and significantly reduced cost of ownership. Fluorescent fiber optic sensors that detect aluminum coating from the early stages of the corrosion process have been used for providing early warning of corrosion in susceptible areas of an aging aircraft [Maalej 2004]. Crack modeling approach in beam has been used to demonstrate the structural health management (HM) using low frequency vibration; simple models of crack flexibility based on beam elements are adequate [Friswell 2002]. Optical fiber based sensor system has been used on concrete structure to evaluate its performance for health monitoring [Fernando 2003]. Monitoring bridge performance has been done to answer questions on the performance of existing bridges, refine techniques needed to evaluate different bridge components, and develop approaches that can be used to provide a continuous picture of a bridge's structural integrity using structural health monitoring [DeWolf 2002]. These techniques help in detection of damage of bridges or building to avoid the economic and social effect of aging and deterioration [Chang 2003]. In other applications, signal feature analysis is used to detect abnormalities related to impending failure indication by an inference system using an historical database [Hess 2001, 2002].
In electronics assemblies, the built-in-self test (BIST) circuit involving error detection and correction circuits are used to give electronic assemblies the ability to test and diagnose themselves with minimal interaction from external test equipment [Chandramouli 1996, Drees 2004, Hassan 1992, Williams 1983, Zorian 1994]. The results obtained from BIST functions can generate diagnostic information which in turn provides additional confidence in the measurement result and confirms the device availability. BIST helps in minimizing the interaction with external automated test equipment (ATE) as well as provides the advantage of a more robust “at-speed” test of the circuitry, however, the
current form of BIST gives little insight about the system level reliability or the remaining useful life of the system. Several studies conducted [Allen 2003, Drees 2004, Gao 2002, Rosenthal 1990] have shown that BIST can be prone to false alarms and can result in unnecessary costly replacement, re-qualification, delayed shipping, and loss of system availability. Fuses and Canaries may be mounted on a part to provide advance warning of failure due to specific wear out failure mechanism. Advanced warning is used to provide a maintenance-window for correction action, after an initial failure or malfunction, to prevent additional or secondary failures [Mishra 2002, Anderson 2004]. However, past efforts have provided limited insight into methods for estimation of remaining useful life.
Lall, et. al. [2004b, 2005, 2006a,b, 2007a,b] have previously developed leading indicators of failure. Proxies like the phase growth rate of solder interconnects have been experimentally identified as leading indicators to failure. In this paper, the PHM approach presented is different from state-of-art diagnostics and resides in the pre-failure-space of the electronic-system, in which no macro-indicators such as cracks or delamination exist. The presented PHM methodologies enable the estimation of prior damage in deployed electronics by interrogation of the system state. This methodology eliminates the need to capture the prior stress history and helps in accurate prediction of remaining useful life. In this paper a mathematical approach has been presented to calculate the prior damage in electronics subjected to cyclic and isothermal thermo-mechanical loads. Mathematical relationships have been developed for computation of residual life. This health monitoring framework will facilitate quick assessment of system state and potential for failure of critical electronic systems.
II. TEST VEHICLE In the present study, seven lead free solder compositions including, SAC405, SAC105, SAC305, SAC0307, Sn0.3Ag0.7Cu0.1Bi, Sn0.2Ag0.7Cu0.1Bi0.1Ni, Sn3.5Ag on identical ball-grid arrays with FR4-06 laminates have been studied under thermo-mechanical loads. Table 1 shows package parameters for the test vehicles used in this study. Components analyzed include tape-array and chip-array ball grid arrays with I/O counts in the range of 100 to 144, and body size of 10 mm. Phase growth and intermetallic compound (IMC) data has been gathered and analyzed using image processing. The boards contain six trace layers to simulate the thermal mass of a true production board, though all functional traces were run on the topmost layer. All pads on the board were non-solder mask defined (NSMD) and had an immersion silver finish. The SAC105, SAC305, SAC0307, Sn0.3Ag0.7Cu0.1Bi, Sn0.2Ag0.7Cu0.1Bi0.1Ni, Sn3.5Ag components were assembled to the electroless nickel gold finish printed circuit board and subjected to -55ºC to 125ºC Cycle, 2.5 hour per cycle. The SAC405 components were assembled to ImAg finish printed circuit boards and subjected to -40ºC to 125ºC Cycle, 30 minute dwell, and 30 minute ramps.
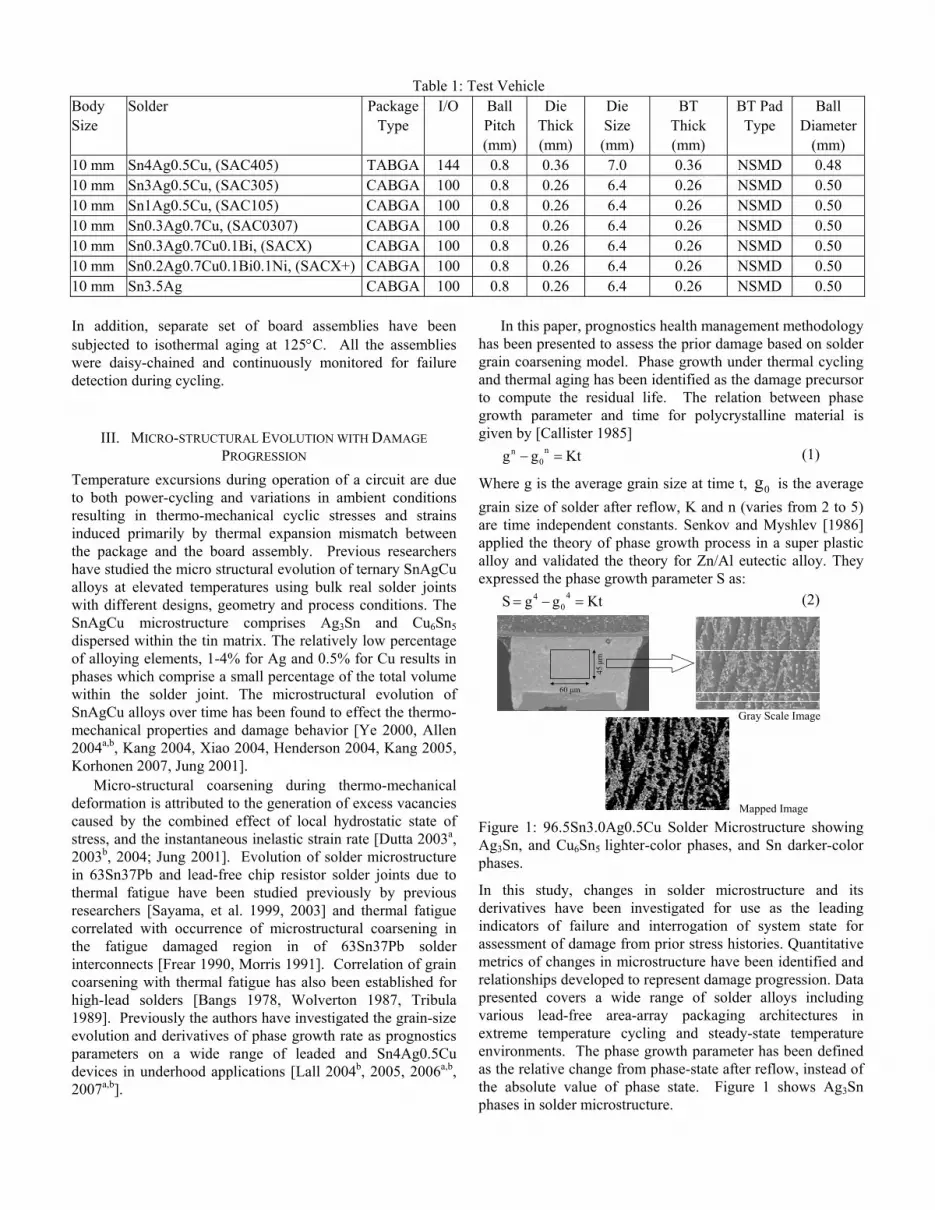
Table 1: Test Vehicle Body Size
Solder PackageType
I/O Ball Pitch (mm)
Die Thick (mm)
Die Size (mm)
BT Thick (mm)
BT Pad Type
Ball Diameter
(mm) 10 mm Sn4Ag0.5Cu, (SAC405) TABGA 144 0.8 0.36 7.0 0.36 NSMD 0.48 10 mm Sn3Ag0.5Cu, (SAC305) CABGA 100 0.8 0.26 6.4 0.26 NSMD 0.50 10 mm Sn1Ag0.5Cu, (SAC105) CABGA 100 0.8 0.26 6.4 0.26 NSMD 0.50 10 mm Sn0.3Ag0.7Cu, (SAC0307) CABGA 100 0.8 0.26 6.4 0.26 NSMD 0.50 10 mm Sn0.3Ag0.7Cu0.1Bi, (SACX) CABGA 100 0.8 0.26 6.4 0.26 NSMD 0.50 10 mm Sn0.2Ag0.7Cu0.1Bi0.1Ni, (SACX+) CABGA 100 0.8 0.26 6.4 0.26 NSMD 0.50 10 mm Sn3.5Ag CABGA 100 0.8 0.26 6.4 0.26 NSMD 0.50 In addition, separate set of board assemblies have been subjected to isothermal aging at 125°C. All the assemblies were daisy-chained and continuously monitored for failure detection during cycling.
III. MICRO-STRUCTURAL EVOLUTION WITH DAMAGE PROGRESSION
Temperature excursions during operation of a circuit are due to both power-cycling and variations in ambient conditions resulting in thermo-mechanical cyclic stresses and strains induced primarily by thermal expansion mismatch between the package and the board assembly. Previous researchers have studied the micro structural evolution of ternary SnAgCu alloys at elevated temperatures using bulk real solder joints with different designs, geometry and process conditions. The SnAgCu microstructure comprises Ag3Sn and Cu6Sn5 dispersed within the tin matrix. The relatively low percentage of alloying elements, 1-4% for Ag and 0.5% for Cu results in phases which comprise a small percentage of the total volume within the solder joint. The microstructural evolution of SnAgCu alloys over time has been found to effect the thermo-mechanical properties and damage behavior [Ye 2000, Allen 2004a,b, Kang 2004, Xiao 2004, Henderson 2004, Kang 2005, Korhonen 2007, Jung 2001].
Micro-structural coarsening during thermo-mechanical deformation is attributed to the generation of excess vacancies caused by the combined effect of local hydrostatic state of stress, and the instantaneous inelastic strain rate [Dutta 2003a, 2003b, 2004; Jung 2001]. Evolution of solder microstructure in 63Sn37Pb and lead-free chip resistor solder joints due to thermal fatigue have been studied previously by previous researchers [Sayama, et al. 1999, 2003] and thermal fatigue correlated with occurrence of microstructural coarsening in the fatigue damaged region in of 63Sn37Pb solder interconnects [Frear 1990, Morris 1991]. Correlation of grain coarsening with thermal fatigue has also been established for high-lead solders [Bangs 1978, Wolverton 1987, Tribula 1989]. Previously the authors have investigated the grain-size evolution and derivatives of phase growth rate as prognostics parameters on a wide range of leaded and Sn4Ag0.5Cu devices in underhood applications [Lall 2004b, 2005, 2006a,b, 2007a,b].
In this paper, prognostics health management methodology has been presented to assess the prior damage based on solder grain coarsening model. Phase growth under thermal cycling and thermal aging has been identified as the damage precursor to compute the residual life. The relation between phase growth parameter and time for polycrystalline material is given by [Callister 1985]
Ktgg n0
n =− (1)
Where g is the average grain size at time t, 0g is the average grain size of solder after reflow, K and n (varies from 2 to 5) are time independent constants. Senkov and Myshlev [1986] applied the theory of phase growth process in a super plastic alloy and validated the theory for Zn/Al eutectic alloy. They expressed the phase growth parameter S as:
KtggS 40
4 =−= (2)
60 μm
45 μ
m
Gray Scale Image
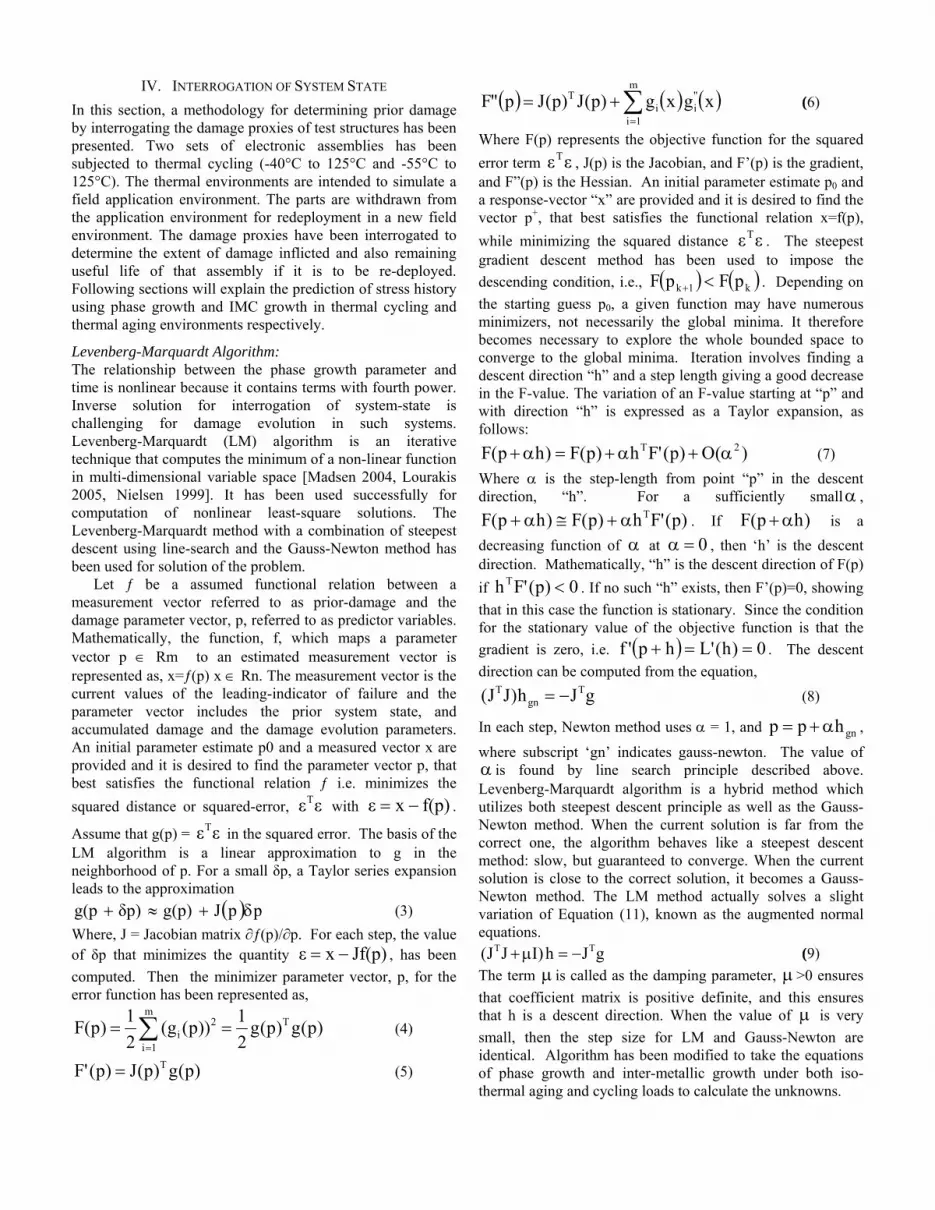
Mapped Image Figure 1: 96.5Sn3.0Ag0.5Cu Solder Microstructure showing Ag3Sn, and Cu6Sn5 lighter-color phases, and Sn darker-color phases.
In this study, changes in solder microstructure and its derivatives have been investigated for use as the leading indicators of failure and interrogation of system state for assessment of damage from prior stress histories. Quantitative metrics of changes in microstructure have been identified and relationships developed to represent damage progression. Data presented covers a wide range of solder alloys including various lead-free area-array packaging architectures in extreme temperature cycling and steady-state temperature environments. The phase growth parameter has been defined as the relative change from phase-state after reflow, instead of the absolute value of phase state. Figure 1 shows Ag3Sn phases in solder microstructure.
IV. INTERROGATION OF SYSTEM STATE In this section, a methodology for determining prior damage by interrogating the damage proxies of test structures has been presented. Two sets of electronic assemblies has been subjected to thermal cycling (-40°C to 125°C and -55°C to 125°C). The thermal environments are intended to simulate a field application environment. The parts are withdrawn from the application environment for redeployment in a new field environment. The damage proxies have been interrogated to determine the extent of damage inflicted and also remaining useful life of that assembly if it is to be re-deployed. Following sections will explain the prediction of stress history using phase growth and IMC growth in thermal cycling and thermal aging environments respectively.
Levenberg-Marquardt Algorithm: The relationship between the phase growth parameter and time is nonlinear because it contains terms with fourth power. Inverse solution for interrogation of system-state is challenging for damage evolution in such systems. Levenberg-Marquardt (LM) algorithm is an iterative technique that computes the minimum of a non-linear function in multi-dimensional variable space [Madsen 2004, Lourakis 2005, Nielsen 1999]. It has been used successfully for computation of nonlinear least-square solutions. The Levenberg-Marquardt method with a combination of steepest descent using line-search and the Gauss-Newton method has been used for solution of the problem.
Let ƒ be a assumed functional relation between a measurement vector referred to as prior-damage and the damage parameter vector, p, referred to as predictor variables. Mathematically, the function, f, which maps a parameter vector p ∈ Rm to an estimated measurement vector is represented as, x=ƒ(p) x ∈ Rn. The measurement vector is the current values of the leading-indicator of failure and the parameter vector includes the prior system state, and accumulated damage and the damage evolution parameters. An initial parameter estimate p0 and a measured vector x are provided and it is desired to find the parameter vector p, that best satisfies the functional relation ƒ i.e. minimizes the squared distance or squared-error, εεT with f(p)xε −= .
Assume that g(p) = εεT in the squared error. The basis of the LM algorithm is a linear approximation to g in the neighborhood of p. For a small δp, a Taylor series expansion leads to the approximation
( ) ppJg(p)δp)g(p δ+≈+ (3) Where, J = Jacobian matrix ∂ƒ(p)/∂p. For each step, the value of δp that minimizes the quantity Jf(p)xε −= , has been computed. Then the minimizer parameter vector, p, for the error function has been represented as,
)p(g)p(g21))p(g(
21)p(F T
m
1i
2i == ∑
=
(4)
)p(g)p(J)p('F T= (5)
( ) ( ) ( )∑=
+=m
1i
"ii
T xgxg)p(J)p(Jp"F (6)
Where F(p) represents the objective function for the squared error term εεT , J(p) is the Jacobian, and F’(p) is the gradient, and F”(p) is the Hessian. An initial parameter estimate p0 and a response-vector “x” are provided and it is desired to find the vector p+, that best satisfies the functional relation x=f(p), while minimizing the squared distance εεT . The steepest gradient descent method has been used to impose the descending condition, i.e., ( ) ( )k1k pFpF <+ . Depending on the starting guess p0, a given function may have numerous minimizers, not necessarily the global minima. It therefore becomes necessary to explore the whole bounded space to converge to the global minima. Iteration involves finding a descent direction “h” and a step length giving a good decrease in the F-value. The variation of an F-value starting at “p” and with direction “h” is expressed as a Taylor expansion, as follows:
)(O)p('Fh)p(F)hp(F 2T α+α+=α+ (7) Where α is the step-length from point “p” in the descent direction, “h”. For a sufficiently small α ,
)p('Fh)p(F)hp(F Tα+≅α+ . If )hp(F α+ is a decreasing function of α at 0=α , then ‘h’ is the descent direction. Mathematically, “h” is the descent direction of F(p) if 0)p('FhT < . If no such “h” exists, then F’(p)=0, showing that in this case the function is stationary. Since the condition for the stationary value of the objective function is that the gradient is zero, i.e. ( ) 0)h('Lhp'f ==+ . The descent direction can be computed from the equation,
gJh)JJ( Tgn
T −= (8)
In each step, Newton method uses α = 1, and gnhpp α+= ,
where subscript ‘gn’ indicates gauss-newton. The value of α is found by line search principle described above. Levenberg-Marquardt algorithm is a hybrid method which utilizes both steepest descent principle as well as the Gauss-Newton method. When the current solution is far from the correct one, the algorithm behaves like a steepest descent method: slow, but guaranteed to converge. When the current solution is close to the correct solution, it becomes a Gauss-Newton method. The LM method actually solves a slight variation of Equation (11), known as the augmented normal equations.
gJh)IJJ( TT −=μ+ (9) The term μ is called as the damping parameter, μ >0 ensures that coefficient matrix is positive definite, and this ensures that h is a descent direction. When the value of μ is very small, then the step size for LM and Gauss-Newton are identical. Algorithm has been modified to take the equations of phase growth and inter-metallic growth under both iso-thermal aging and cycling loads to calculate the unknowns.
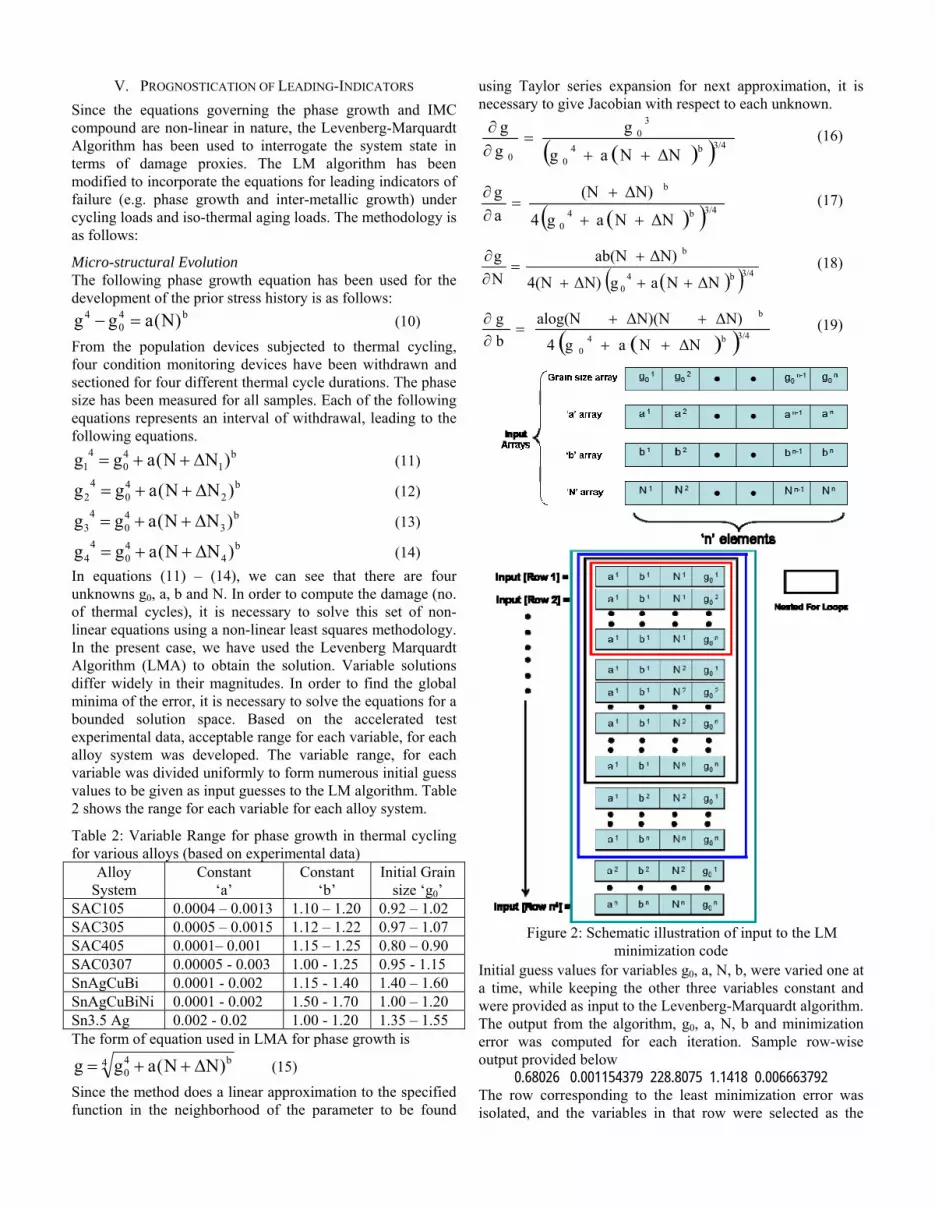
V. PROGNOSTICATION OF LEADING-INDICATORS Since the equations governing the phase growth and IMC compound are non-linear in nature, the Levenberg-Marquardt Algorithm has been used to interrogate the system state in terms of damage proxies. The LM algorithm has been modified to incorporate the equations for leading indicators of failure (e.g. phase growth and inter-metallic growth) under cycling loads and iso-thermal aging loads. The methodology is as follows:
Micro-structural Evolution The following phase growth equation has been used for the development of the prior stress history is as follows:
b40
4 )N(agg =− (10)
From the population devices subjected to thermal cycling, four condition monitoring devices have been withdrawn and sectioned for four different thermal cycle durations. The phase size has been measured for all samples. Each of the following equations represents an interval of withdrawal, leading to the following equations.
b1
40
41 )NN(agg Δ++= (11)
b2
40
42 )NN(agg Δ++= (12)
b3
40
43 )NN(agg Δ++= (13)
b4
40
44 )NN(agg Δ++= (14)
In equations (11) – (14), we can see that there are four unknowns g0, a, b and N. In order to compute the damage (no. of thermal cycles), it is necessary to solve this set of non-linear equations using a non-linear least squares methodology. In the present case, we have used the Levenberg Marquardt Algorithm (LMA) to obtain the solution. Variable solutions differ widely in their magnitudes. In order to find the global minima of the error, it is necessary to solve the equations for a bounded solution space. Based on the accelerated test experimental data, acceptable range for each variable, for each alloy system was developed. The variable range, for each variable was divided uniformly to form numerous initial guess values to be given as input guesses to the LM algorithm. Table 2 shows the range for each variable for each alloy system.
Table 2: Variable Range for phase growth in thermal cycling for various alloys (based on experimental data)
Alloy System
Constant ‘a’
Constant ‘b’
Initial Grain size ‘g0’
SAC105 0.0004 – 0.0013 1.10 – 1.20 0.92 – 1.02 SAC305 0.0005 – 0.0015 1.12 – 1.22 0.97 – 1.07 SAC405 0.0001– 0.001 1.15 – 1.25 0.80 – 0.90 SAC0307 0.00005 - 0.003 1.00 - 1.25 0.95 - 1.15 SnAgCuBi 0.0001 - 0.002 1.15 - 1.40 1.40 – 1.60 SnAgCuBiNi 0.0001 - 0.002 1.50 - 1.70 1.00 – 1.20 Sn3.5 Ag 0.002 - 0.02 1.00 - 1.20 1.35 – 1.55 The form of equation used in LMA for phase growth is
4 b40 )NN(agg Δ++= (15)
Since the method does a linear approximation to the specified function in the neighborhood of the parameter to be found
using Taylor series expansion for next approximation, it is necessary to give Jacobian with respect to each unknown.
( )( )3/4b40
30
0 ΔNNag
ggg
++=
∂∂ (16)
( )( )3/4b40
b
ΔNNag4
ΔN)(Nag
++
+=
∂∂ (17)
( )( )3/4b40
b
ΔNNagΔN)4(N
ΔN)ab(NNg
+++
+=
∂∂ (18)
( )( )3/4b40
b
ΔNNag4
ΔN)ΔN)(Nalog(Nbg
++
++=
∂∂ (19)
Figure 2: Schematic illustration of input to the LM
minimization code Initial guess values for variables g0, a, N, b, were varied one at a time, while keeping the other three variables constant and were provided as input to the Levenberg-Marquardt algorithm. The output from the algorithm, g0, a, N, b and minimization error was computed for each iteration. Sample row-wise output provided below
0.68026 0.001154379 228.8075 1.1418 0.006663792 The row corresponding to the least minimization error was isolated, and the variables in that row were selected as the
final values for g0, a, N, b. Schematic illustration of the operation is shown in Figure 2.
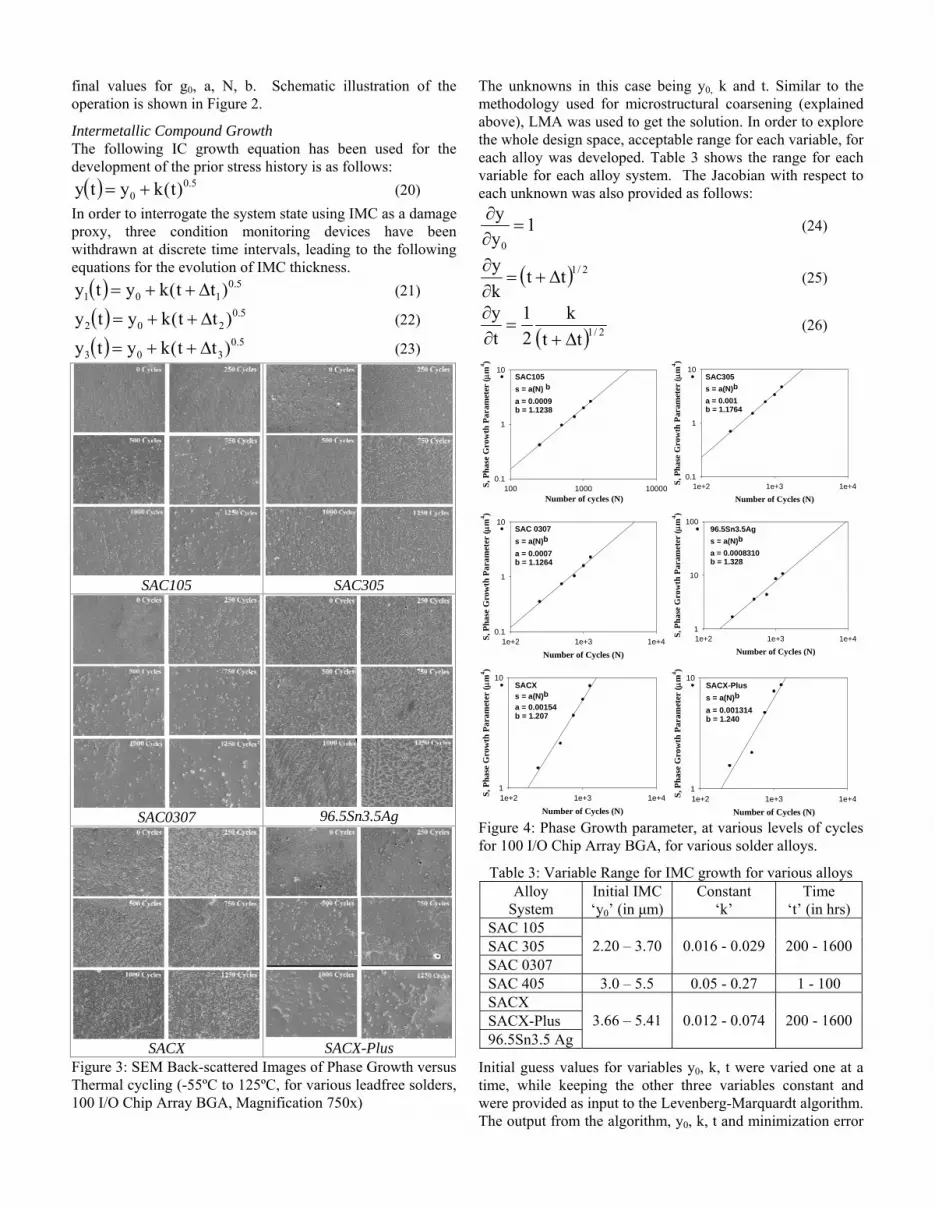
Intermetallic Compound Growth The following IC growth equation has been used for the development of the prior stress history is as follows:
( ) 5.00 )t(kyty += (20)
In order to interrogate the system state using IMC as a damage proxy, three condition monitoring devices have been withdrawn at discrete time intervals, leading to the following equations for the evolution of IMC thickness.
( ) 5.0101 )tt(kyty Δ++= (21)
( ) 5.0202 )tt(kyty Δ++= (22)
( ) 5.0303 )tt(kyty Δ++= (23)
SAC105 SAC305
SAC0307 96.5Sn3.5Ag
SACX SACX-Plus
Figure 3: SEM Back-scattered Images of Phase Growth versus Thermal cycling (-55ºC to 125ºC, for various leadfree solders, 100 I/O Chip Array BGA, Magnification 750x)
The unknowns in this case being y0, k and t. Similar to the methodology used for microstructural coarsening (explained above), LMA was used to get the solution. In order to explore the whole design space, acceptable range for each variable, for each alloy was developed. Table 3 shows the range for each variable for each alloy system. The Jacobian with respect to each unknown was also provided as follows:
1yy
0
=∂∂
(24)
( ) 2/1ttky
Δ+=∂∂
(25)
( ) 2/1ttk
21
ty
Δ+=
∂∂
(26)
Number of cycles (N)100 1000 10000S,
Pha
se G
row
th P
aram
eter
(μm
4 )0.1
1
10SAC105s = a(N) b
a = 0.0009b = 1.1238
Number of Cycles (N)1e+2 1e+3 1e+4S,
Pha
se G
row
th P
aram
eter
(μm
4 )
0.1
1
10SAC305s = a(N)b
a = 0.001b = 1.1764
Number of Cycles (N)1e+2 1e+3 1e+4S,
Pha
se G
row
th P
aram
eter
(μm
4 )
0.1
1
10SAC 0307s = a(N)b
a = 0.0007b = 1.1264
Number of Cycles (N)1e+2 1e+3 1e+4S,
Pha
se G
row
th P
aram
eter
(μm
4 )
1
10
10096.5Sn3.5Ags = a(N)b
a = 0.0008310b = 1.328
Number of Cycles (N)1e+2 1e+3 1e+4S,
Pha
se G
row
th P
aram
eter
(μm
4 )
1
10SACXs = a(N)ba = 0.00154b = 1.207
Number of Cycles (N)1e+2 1e+3 1e+4S,
Pha
se G
row
th P
aram
eter
(μm
4 )
1
10SACX-Pluss = a(N)b
a = 0.001314b = 1.240
Figure 4: Phase Growth parameter, at various levels of cycles for 100 I/O Chip Array BGA, for various solder alloys.
Table 3: Variable Range for IMC growth for various alloys Alloy
System Initial IMC ‘y0’ (in μm)
Constant ‘k’
Time ‘t’ (in hrs)
SAC 105 SAC 305 SAC 0307
2.20 – 3.70 0.016 - 0.029 200 - 1600
SAC 405 3.0 – 5.5 0.05 - 0.27 1 - 100 SACX SACX-Plus 96.5Sn3.5 Ag
3.66 – 5.41 0.012 - 0.074 200 - 1600
Initial guess values for variables y0, k, t were varied one at a time, while keeping the other three variables constant and were provided as input to the Levenberg-Marquardt algorithm. The output from the algorithm, y0, k, t and minimization error
was computed for each iteration. The row corresponding to the least minimization error was isolated, and the variables in that row were selected as the final values for y0, k, t.
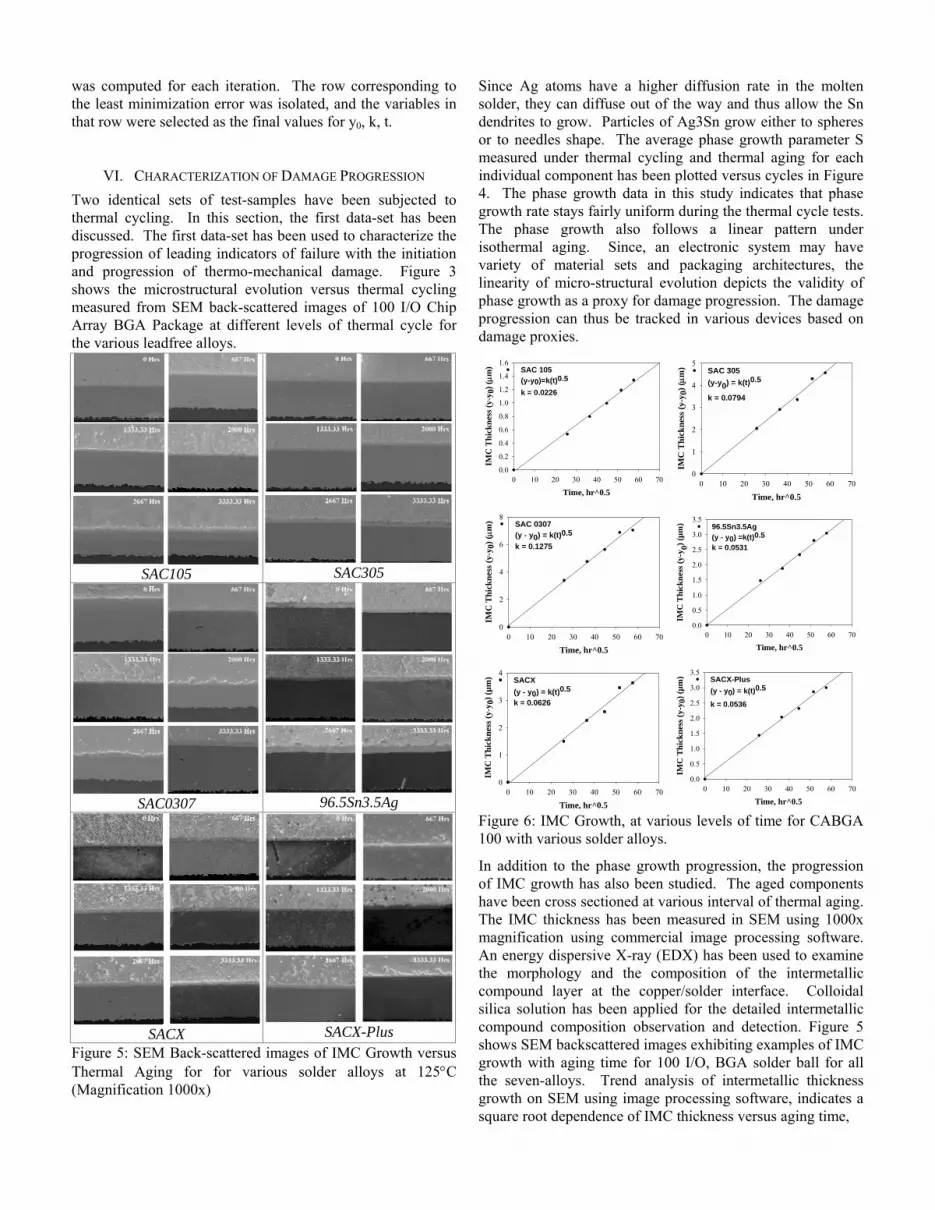
VI. CHARACTERIZATION OF DAMAGE PROGRESSION Two identical sets of test-samples have been subjected to thermal cycling. In this section, the first data-set has been discussed. The first data-set has been used to characterize the progression of leading indicators of failure with the initiation and progression of thermo-mechanical damage. Figure 3 shows the microstructural evolution versus thermal cycling measured from SEM back-scattered images of 100 I/O Chip Array BGA Package at different levels of thermal cycle for the various leadfree alloys.
SAC105 SAC305
SAC0307 96.5Sn3.5Ag
SACX
SACX-Plus Figure 5: SEM Back-scattered images of IMC Growth versus Thermal Aging for for various solder alloys at 125°C (Magnification 1000x)
Since Ag atoms have a higher diffusion rate in the molten solder, they can diffuse out of the way and thus allow the Sn dendrites to grow. Particles of Ag3Sn grow either to spheres or to needles shape. The average phase growth parameter S measured under thermal cycling and thermal aging for each individual component has been plotted versus cycles in Figure 4. The phase growth data in this study indicates that phase growth rate stays fairly uniform during the thermal cycle tests. The phase growth also follows a linear pattern under isothermal aging. Since, an electronic system may have variety of material sets and packaging architectures, the linearity of micro-structural evolution depicts the validity of phase growth as a proxy for damage progression. The damage progression can thus be tracked in various devices based on damage proxies.
Time, hr^0.50 10 20 30 40 50 60 70
IMC
Thi
ckne
ss (y
-y0)
(μm
)
0.0
0.2
0.4
0.6
0.8
1.0
1.2
1.4
1.6SAC 105(y-y0)=k(t)0.5
k = 0.0226
Time, hr^0.50 10 20 30 40 50 60 70
IMC
Thi
ckne
ss (y
-y0)
(μm
)
0
1
2
3
4
5SAC 305(y-y0) = k(t)0.5
k = 0.0794
Time, hr^0.50 10 20 30 40 50 60 70
IMC
Thi
ckne
ss (y
-y0)
(μm
)
0
2
4
6
8SAC 0307(y - y0) = k(t)0.5k = 0.1275
Time, hr^0.50 10 20 30 40 50 60 70
IMC
Thi
ckne
ss (y
-y0) (
µm)
0.0
0.5
1.0
1.5
2.0
2.5
3.0
3.596.5Sn3.5Ag(y - y0) =k(t)0.5k = 0.0531
Time, hr^0.50 10 20 30 40 50 60 70
IMC
Thi
ckne
ss (y
-y0)
(µm
)
0
1
2
3
4SACX(y - y0) = k(t)0.5
k = 0.0626
Time, hr^0.50 10 20 30 40 50 60 70
IMC
Thi
ckne
ss (y
-y0)
(µm
)
0.0
0.5
1.0
1.5
2.0
2.5
3.0
3.5SACX-Plus(y - y0) = k(t)0.5
k = 0.0536
Figure 6: IMC Growth, at various levels of time for CABGA 100 with various solder alloys.
In addition to the phase growth progression, the progression of IMC growth has also been studied. The aged components have been cross sectioned at various interval of thermal aging. The IMC thickness has been measured in SEM using 1000x magnification using commercial image processing software. An energy dispersive X-ray (EDX) has been used to examine the morphology and the composition of the intermetallic compound layer at the copper/solder interface. Colloidal silica solution has been applied for the detailed intermetallic compound composition observation and detection. Figure 5 shows SEM backscattered images exhibiting examples of IMC growth with aging time for 100 I/O, BGA solder ball for all the seven-alloys. Trend analysis of intermetallic thickness growth on SEM using image processing software, indicates a square root dependence of IMC thickness versus aging time,
n0 ktyy += (27)
Where y(t) is IMC growth thickness during aging, 0y is the
initial thickness of intermetallic compounds, k is the coefficient standing for the square root of the diffusivity at aging temperature, and t is test time. The exponent value, n = ½ has been used in the above equation, which reveals a diffusion-controlled mechanism during aging. The average IMC growth measured at each level of test time has been plotted versus time (Figure 6).
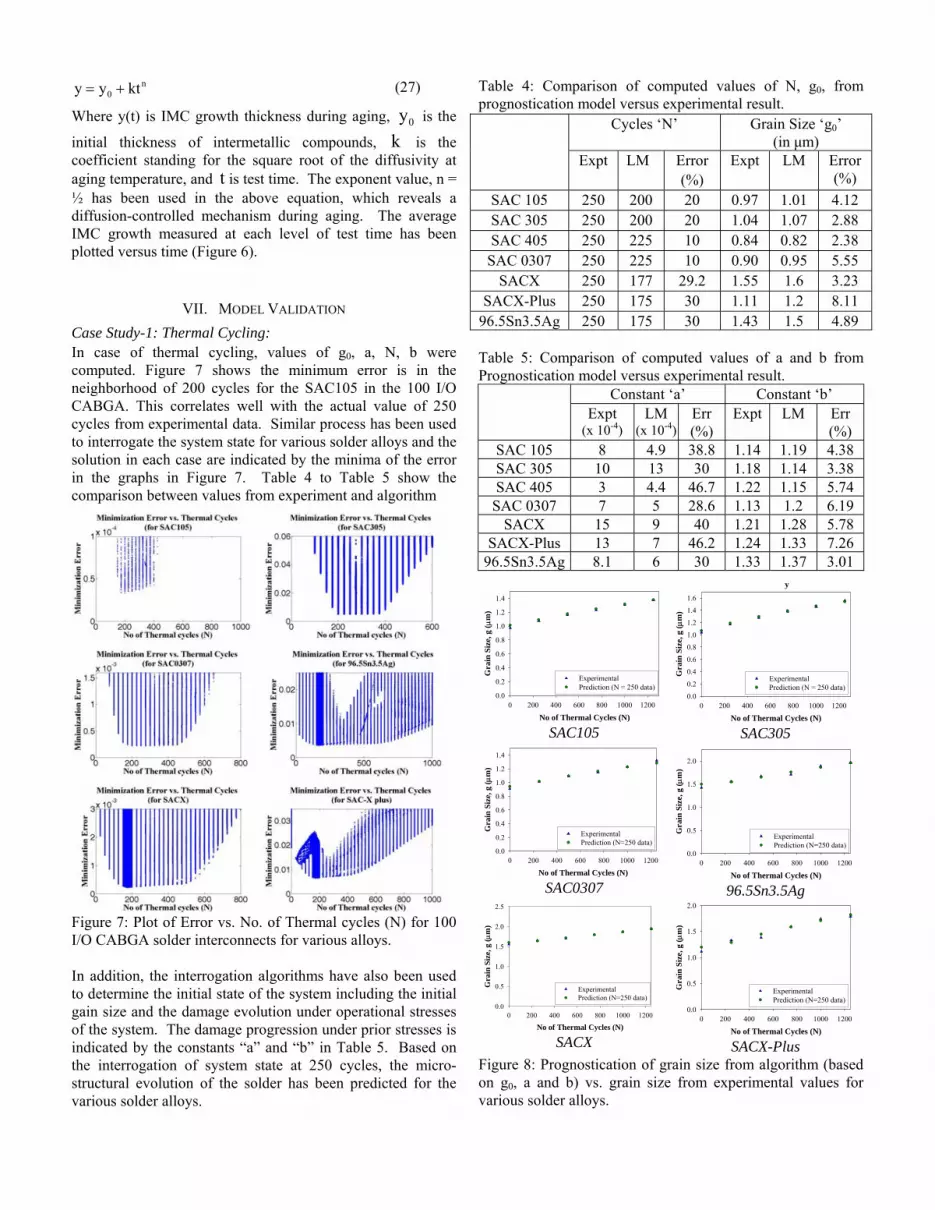
VII. MODEL VALIDATION Case Study-1: Thermal Cycling: In case of thermal cycling, values of g0, a, N, b were computed. Figure 7 shows the minimum error is in the neighborhood of 200 cycles for the SAC105 in the 100 I/O CABGA. This correlates well with the actual value of 250 cycles from experimental data. Similar process has been used to interrogate the system state for various solder alloys and the solution in each case are indicated by the minima of the error in the graphs in Figure 7. Table 4 to Table 5 show the comparison between values from experiment and algorithm
Figure 7: Plot of Error vs. No. of Thermal cycles (N) for 100 I/O CABGA solder interconnects for various alloys. In addition, the interrogation algorithms have also been used to determine the initial state of the system including the initial gain size and the damage evolution under operational stresses of the system. The damage progression under prior stresses is indicated by the constants “a” and “b” in Table 5. Based on the interrogation of system state at 250 cycles, the micro-structural evolution of the solder has been predicted for the various solder alloys.
Table 4: Comparison of computed values of N, g0, from prognostication model versus experimental result.
Cycles ‘N’ Grain Size ‘g0’ (in μm)
Expt LM Error (%)
Expt LM Error (%)
SAC 105 250 200 20 0.97 1.01 4.12 SAC 305 250 200 20 1.04 1.07 2.88 SAC 405 250 225 10 0.84 0.82 2.38
SAC 0307 250 225 10 0.90 0.95 5.55 SACX 250 177 29.2 1.55 1.6 3.23
SACX-Plus 250 175 30 1.11 1.2 8.11 96.5Sn3.5Ag 250 175 30 1.43 1.5 4.89 Table 5: Comparison of computed values of a and b from Prognostication model versus experimental result.
Constant ‘a’ Constant ‘b’ Expt
(x 10-4) LM
(x 10-4) Err (%)
Expt LM Err (%)
SAC 105 8 4.9 38.8 1.14 1.19 4.38 SAC 305 10 13 30 1.18 1.14 3.38 SAC 405 3 4.4 46.7 1.22 1.15 5.74
SAC 0307 7 5 28.6 1.13 1.2 6.19 SACX 15 9 40 1.21 1.28 5.78
SACX-Plus 13 7 46.2 1.24 1.33 7.26 96.5Sn3.5Ag 8.1 6 30 1.33 1.37 3.01
No of Thermal Cycles (N)0 200 400 600 800 1000 1200
Gra
in S
ize,
g (μ
m)
0.0
0.2
0.4
0.6
0.8
1.0
1.2
1.4
ExperimentalPrediction (N = 250 data)
SAC105
y
No of Thermal Cycles (N)0 200 400 600 800 1000 1200
Gra
in S
ize,
g (μ
m)
0.0
0.2
0.4
0.6
0.81.0
1.2
1.4
1.6
ExperimentalPrediction (N = 250 data)
SAC305
No of Thermal Cycles (N)0 200 400 600 800 1000 1200
Gra
in S
ize,
g (μ
m)
0.0
0.2
0.4
0.6
0.8
1.0
1.2
1.4
ExperimentalPrediction (N=250 data)
SAC0307
No of Thermal Cycles (N)0 200 400 600 800 1000 1200
Gra
in S
ize,
g (μ
m)
0.0
0.5
1.0
1.5
2.0
ExperimentalPrediction (N=250 data)
96.5Sn3.5Ag
No of Thermal Cycles (N)0 200 400 600 800 1000 1200
Gra
in S
ize,
g (μ
m)
0.0
0.5
1.0
1.5
2.0
2.5
ExperimentalPrediction (N=250 data)
SACX
No of Thermal Cycles (N)0 200 400 600 800 1000 1200
Gra
in S
ize,
g (μ
m)
0.0
0.5
1.0
1.5
2.0
ExperimentalPrediction (N=250 data)
SACX-Plus Figure 8: Prognostication of grain size from algorithm (based on g0, a and b) vs. grain size from experimental values for various solder alloys.

Figure 8 shows the comparison between the predicted versus the experimental values of phase size. The experimental data and model show good correlation. The micro-structural evolution of solder has been previously correlated with the damage progression under the intended use environment. The models can thus interrogate prior damage and predict the damage progression under cyclic thermo-mechanical stresses.
Case-2: Isothermal Aging: In case of thermal aging, values of y0, k, t have been computed. Figure 9 shows that the error is minimum in the neighborhood of 621 hrs for SAC105 in the 100 I/O CABGA. This correlates well with the actual value of 667 hrs from experimental data. Similar process has been used to interrogate the system state for various solder alloys and the solution in each case are indicated by the minima of the error in the graphs in Figure 9. The values of interrogated prior life have been tabulated in Table 6. System damage state from interrogation algorithms show good correlation with the experimentally measurements of prior damage. The correlation holds true for various leadfree alloys.
Figure 9: Global Minima for IMC based History Calculation for 100 I/O CABGA, for various Solder Alloys. Based on the interrogation of system state at 667 hours, the micro-structural evolution of the solder-pad intermetallic has been predicted for the various solder alloys. Figure 10 shows the comparison between the predicted versus the experimental values of intermetallic thickness. The experimental data and model show good correlation. The micro-structural evolution of the IMC has been previously correlated with the damage progression under the intended use environment. The models can this interrogate prior damage and predict the damage progression under steady-state thermo-mechanical stresses.
Time (hours)0 500 1000 1500 2000 2500 3000 3500
IMC
Thi
ckne
ss ( μ
m)
0
1
2
3
4
5
ExperimentalAlgorithm
SAC105
Time (hours)0 500 1000 1500 2000 2500 3000 3500
IMC
Thi
ckne
ss ( μ
m)
0
2
4
6
8
ExperimentalAlgorithm
SAC305
Time (hours)0 500 1000 1500 2000 2500 3000 3500
IMC
Thi
ckne
ss (μ
m)
0
2
4
6
8
10
12
ExperimentalAlgorithm
SAC0307
Time in Hrs0 500 1000 1500 2000 2500 3000 3500
IMC
Thi
ckne
ss (µ
m)
0
2
4
6
8
10
12
ExperimentAlgorithm
96.5Sn3.5Ag
Time in (Hrs)0 500 1000 1500 2000 2500 3000 3500
IMC
Thi
ckne
ss (µ
m)
0
2
4
6
8
10
12
ExperimentAlgorithm
SACX
Time in Hrs0 500 1000 1500 2000 2500 3000 3500
IMC
Thi
ckne
ss (µ
m)
2
4
6
8
10
12
Experimental Algorithm
SACX-Plus Figure 10: Prognostication of IMC Thickness from algorithm (based on y0 and k) and IMC from experimental values vs time for various alloys. Table 6: Comparison of computed values of t, y0 from prognostication model and experimental result
Aging Time ‘t’ (hrs) IMC Size ‘y0’(μm) Expt LM Error
(%) Expt LM Error
(%) SAC 105 667 621 6.89 2.89 2.83 2.07 SAC 305 667 625 6.29 2.68 3.04 13.43 SAC 405 22 28 27.27 3.4 3.31 2.65 SAC0307 667 690 3.45 3.45 3.68 6.66
SACX 667 830 24.44 3.93 3.63 7.63 SACX-Plus 667 829 24.28 3.91 3.91 0
96.5Sn3.5Ag 667 915 37.18 6.12 6.1 0.33
VIII. IMPLEMENTATION OF PHM TECHNIQUE The PHM technique presented in the paper may be implemented using condition monitoring devices, which can be cross-sectioned to interrogate the system state and determine the failure progression of the assembly. Consider an electronic assembly which has been deployed in the field application. The assembly needs to be redeployed in the same environment.
The condition monitoring devices in the system will then, be withdrawn at periodic intervals in the deployed environment. The condition monitoring devices will be cross-sectioned and their grain size data will be extracted. This data
will be analyzed using Levenberg’s-Marquardt Algorithm and methodologies discussed earlier, to find out the initial grain size (g0) and the prior time of deployment (N, or t) for which the component has been deployed. The rate of change of phase growth parameter, (dS/dN), will be computed using the computed values of damage proxies or leading indicators-of-failure. The rate of change of phase growth parameter (dS/dN) can be correlated to time-to-1%-failure [Lall 2004, 2005, 2006]. Residual Life (RL) can be calculated using the equation, NNRL 1% −= .
IX. SUMMARY AND CONCLUSIONS A methodology has been presented to calculate the prior damage in electronics subjected to cyclic and isothermal thermo-mechanical loads. The time duration for which the component has been deployed and initial grain size is been estimated using Levenberg-Marquardt Algorithm with Trust Regions. Methodology has been demonstrated using various leading-indicators of failure including, phase growth and intermetallic thickness. The presented approach uses non-linear least-squares based method of estimating prior stress history, and residual life, by interrogating system-state prior to redeployment. The prior stress histories have been calculated for both cyclic thermo-mechanical loads and isothermal loads. Computed results have been correlated with the experimental data for various aging times and thermal cycles for several packaging architectures. Model predictions of interrogated prior system damage correlate well with experimental data. The correlations indicate that the leading indicators based PHM technique can be used to interrogate the system state and thus estimate the Residual-Life of a component. The presented approach of computing residual life can be implemented prior to appearance of any macro-indicators of damage like crack. Methodology presented using condition monitoring components to find out the residual life is promising because these components experience the same environment as actual component.
NOMENCLATURE a Cyclic Phase Growth Coefficient b Cyclic Phase-Growth Exponent ƒ Function Relationship g Grain Size, μm
0g Initial Grain Size, μm
g(p) εεT , the squared error h Descent Direction hgn Descent Direction for Gauss-Newton Method HM Health Management IMC Intermetallic Compound J Jacobian, ∂ƒ(p)/∂p k Intermetallic Growth Coefficient N Number of Thermal Cycles, (dimensionless) p Predictor Variable PHM Prognostic Health Management
RL Remaining Useful-Life S Phase Size, 4
04 gg − , μm4
t Time (hours) y Intermetallic Thickness (μm) y0 Initial Intermetallic Thickness (μm) Greek symbols α multiplier for descent direction ΔN Prognostication Neighborhood in cycles (cycles) Δt Prognostication Neighborhood in time (hours) μ damping parameter δp perturbation of predictor variable ε Error, Jf(p)x −
REFERENCES [1] Allen, D., Probabilities Associated with a Built-in-Test System, Focus
on False Alarms, Proceedings of AUTOTESTCON, IEEE Systems Readiness Technology Conference, pp. 643-645, September 22-25, 2003.
[2] Allen, S., L., Notis, Mr., R., Chromik, R., R., Vinci, R., P., Lewis, D., J., Schaefer, R., Microstructural Evolution in Lead-free Solder Alloys: Part II. Directionally solidified Sn–Ag–Cu, Sn–Cu, Sn–Ag, Journal of Materials Research, Vol. 19, No. 5, pp. 1425, May 2004b.
[3] Allen, S., L., Notis, Mr., R., Chromik, R., R., Vinci, R., P., Microstructural Evolution in Lead-free Solder Alloys: Part I. Cast Sn–Ag–Cu eutectic, Journal of Materials Research, Vol. 19, No. 5, pp. 1417–1424, May 2004a.
[4] Anderson, N., and Wilcoxon, R., Framework for Prognostics of Electronic Systems, Proceedings of International Military and Aerospace Avionics COTS Conference, Seattle, WA, Aug 3-5, 2004.
[5] Baldwin, C., J. Kiddy, T. Salter, P. Chen, and J. Niemczuk, Fiber Optic Structural Health Monitoring System: Rough Sea Trials Testing of the RV Triton, MTS/IEEE Oceans 2002, Volume 3, pp. 1807-1814, October 2002.
[6] Bangs, E. R., and Beal, R. E., Wel. J. Res. Supp., 54, p. 377, 1978. [7] Barke, D., Chiu, W., K., Structural Health Monitoring in the Railway
Industry: A Review, Structural Health Monitoring, Vol. 4, No. 1, pp. 81-93, 2005.
[8] Bodensohn, A., Haueis, M., Mäckel, R., Pulvermüller, M., Schreiber, T., System Monitoring for Lifetime Prediction in Automotive Industry, Advanced Microsystems for Automotive Applications, pp. 149 – 158 , 2005.
[9] Bond, L., J., Predictive Engineering for Aging Infrastructure, SPIE 3588, pp 2-13, 1999.
[10] Callister, Jr., W., Materials Science and Engineering: An Introduction, Wiley, New York, 1985.
[11] Chandramouli, R., Pateras, S., Testing Systems on a Chip, IEEE Spectrum, Vol. 33, No. 11, pp. 42-47, Nov. 1996.
[12] Chang, P., C., Flatau, A., and Liu, S.,C., Review Paper: Health Monitoring of Civil Infrastructure, Structural Health Monitoring, Vol.2, No.3, pp. 257-267, 2003.
[13] DeWolf, J., Robert T., Lauzon, G., Culmo, M., P., Monitoring Bridge Performance, Structural Health Monitoring, Vol. 1, No. 2, pp. 129-138, 2002.
[14] Drees, R., and Young, N., Role of BIT in Support System Maintenance and Availability, IEEE A&E Systems Magazine, pp. 3-7, August 2004.
[15] Dutta, I., A Constitutive Model for Creep of Lead-Free Solders Undergoing Strain-Enhanced Microstructural Coarsening: A First Report, Journal of Electronic Materials, Vol 32, No. 4, pp. 201-207, 2003a.
[16] Dutta, I., Impression Creep Testing and Microstructurally Adaptive Creep Modeling of Lead Free Solder Interconnects, TRC, October 25-27, 2004.
[17] Dutta, I., Park, C., and Choi, S., Creep and Microstructural Evolution in Lead-Free Microelectronic Solder Joints, Proceedings of InterPACK
’03, Paper Number IPACK2003-35209, pp.1-6, Maui, HI, July 6-11, 2003b.
[18] Dyne, S., Collins, P., Tunbridge, D., Satellite Mechanical Health Monitoring, IEEE Colloquium on Advanced Vibration Measurements, Techniques and Instrumentation for the Early Prediction of Failure, London, UK , pp. 4/1- 4/8, May 8, 1992.
[19] Fernando, G., F., Hameed, A., Winter, D., Tetlow, J., Leng, R., Barnes, G., Mays, Kister, G., Structural Integrity Monitoring of Concrete Structures via Optical Fiber Sensors: Sensor Protection Systems, Structural Health Monitoring 2003 2: 123-135.
[20] Frear, D. R., Microstructural Evolution During Thermomechanical Fatigue of 62Sn-36Pb-2Ag, and 60Sn-40Pb Solder Joints, IEEE Transactions on Components Hybrids and Manufacturing Technology, Vol 13. No 4, pp. 718-726, December 1990.
[21] Friswell, M., I., Penny, J., E., T., Crack Modeling for Structural Health Monitoring, Structural Health Monitoring, Vol. 1, No. 2, pp. 139-148 2002.
[22] Gao, R. X., Suryavanshi, A., BIT for Intelligent System Design and Condition Monitoring, IEEE Transactions on Instrumentation and Measurement, Vol. 51, Issue: 5, pp. 1061-1067, October 2002.
[23] Greitzer, F., L., Kangas, L., J., Terrones, K., M., Maynard, M., A., Wilson, B., W., Pawlowski, r., A., Sisk, R., D., Brown, N., B., Gas Turbine Engine Health Monitoring and Prognostics, International Society of Logistics (SOLE) Symposium, Las Vegas, Nevada, August 30 – September 2, 1999.
[24] Hassan, A., Agarwal, V. K., Nadeau-Dostie, B., Rajski, J., BIST of PCB Interconnects Using Boundary- Scan Architecture, IEEE Transactions on Computer-Aided Design, Vol. 11, No. 10, pp. 1278-1288, October 1992.
[25] Hauser R, Hayes, D, Parsonnet V, et al., Feasibility and Initial Results Of An Internet-Based Pacemaker and ICD Pulse Generator And Lead Registry. Pacing and Clinical Electrophysiology, Vol. 24, pp. 82-87, 2001.
[26] Henderson, D., W., King, E. K., Korhonen T., M., Korhonen M., A., Lehman L., P., Cotts E., J., Kang, S., K., Lauro, P., Shih, D., Y., Goldsmith, C., Puttlitz, K., J., The Microstructure of Sn in near eutectic Sn–Ag–Cu alloy Solder Joints and its role in Thermomechanical Fatigue, Journal of Materials Research, Vol. 19, No. 6, pp. 1608–1612, June 2004.
[27] Hess, A., Prognostics, from the need to reality-from the Fleet users and PHM System Designer / Developers Perspectives, Joint Strike Fighter Program Office, Arlington VA, USA, IEEE Aerospace Conference Proceedings, vol. 6, pp. 2791-2797, 2002.
[28] Hess, A., The Joint Strike Fighter (JSF) Prognostics and Health Management, JSF Program Office, National Defense Industrial Association, 4th Annual Systems Engineering Conference, 22-25 October 2001
[29] Jarrell, D., Sisk, D., Bond, L., Prognostics and Condition Based Maintenance (CBM) A Scientific Crystal Ball, Pacific Northwest National Laboratory, Richland, WA, International Congress on Advanced Nuclear Power Plants (ICAPP), paper #194 June 2002.
[30] Jung, K., Conrad, H., Microstructure Coarsening During Static Annealing of 60Sn40Pb Solder Joints: I Stereology, Journal of Electronic Materials, Oct 2001.
[31] Kang, S., K., Lauro, P., Shih, D., Y., Henderson, D., W., Gosselin, T., Bartelo, J., Cain, S., R., Goldsmith, C., Puttlitz, K., J., Hwang, T., K., Evaluation of Thermal Fatigue and Failure Mechanisms of Sn–Ag–Cu Solder Joints with Reduced Ag Contents, 2004 Electronic Components and Technology Conference, pp. 661 – 667, 2004.
[32] Kang, S., K., Lauro, P., Shih, D., Y., Henderson, D., W., Puttlitz, K., J., Microstructure and Mechanical Properties of Lead-free Solders and Solder Joints used in Microelectronic Applications, IBM Journal of Research and Development, Vol. 49, No. 4/5, pp. 607 – 619, July / September 2005.
[33] Kok, R., Furlong, C., Development and Characterization of MEMS Inertial System for Health Monitoring of Structures, Experimental Techniques, Vol. 29, No. 6, pp. 46-53, November-December 2005.
[34] Korhonen T., M., Lehman L., P., Korhonen M., A., Henderson, D., W., Isothermal Fatigue Behavior of the Near-Eutectic Sn–Ag–Cu Allo between -25ºC and 125ºC , Journal of Electronic Materials, Vol. 36, No. 2, pp. 173 – 178, 2007.
[35] Lall, P., Hande, M., Bhat, C., Islam, M., Suhling, J.C., Lee, J., Prognostics Health Monitoring (PHM) for Prior-Damage Assessment in Electronics Equipment under Thermo-Mechanical Loads, Electronic
Components and Technology Conference, Reno, Nevada, pp. 1097-1111, 2007a.
[36] Lall, P., Hande, M., Bhat, C., Islam, M., Suhling, J.C., Lee, J., Feature Extraction and Damage-Precursors for Prognostication of Lead-Free Electronics, Microelectronics Reliability Journal, Volume 47, pp. 1907–1920, December 2007b.
[37] Lall, P., Hande, M., Bhat, C., Islam, M., Suhling, J.C., Lee, J., Feature Extraction and Damage-Precursors for Prognostication of Lead-Free Electronics, Electronic Components and Technology Conference, San Diego, California, pp. 718-727, 2006a.
[38] Lall, P., Islam, N., Rahim, K., Suhling, J. C., Prognostics and Health management of Electronic Packaging, IEEE Transactions on Components and Packaging Technologies, Vol. 29, No. 3, pp. 666-677, September 2006b.
[39] Lall, P., Islam, N., Suhling, J., Prognostication and Health Monitoring of Leaded and Lead Free Electronic and MEMS Packages in Harsh Environments, Proceedings of the 55th IEEE Electronic Components and Technology Conference, Orlando, FL, pp. 1305-1313, June 1-3, 2005.
[40] Lall, P., Islam, M. N. , Singh, N., Suhling, J.C., Darveaux, R., Model for BGA and CSP Reliability in Automotive Underhood Applications, IEEE Transactions on Components and Packaging Technologies, Vol. 27, No. 3, pp. 585-593, September 2004a.
[41] Lall, P., Islam, N., Rahim, K., Suhling, J., Gale, S., Leading Indicators-of-Failure for Prognosis of Electronic and MEMS Packaging, Proceedings of the 54th IEEE Electronic Components and Technology Conference, Las Vegas, Nevada, pp. 1570-1578, June 1 - 4, 2004b.
[42] Lourakis, M., I., A., A brief Description of the Levenberg-Marquardt algorithm implemented by Levmar, Foundation of Research & Technology – Hellas (Forth), Greece, pp. 1- 6, Feb 11, 2005.
[43] Maalej, M., S. F. U. Ahmed, K. S. C. Kuang, P. Paramasivam Fiber Optic Sensing for Monitoring Corrosion-Induced Damage, Structural Health Monitoring, Vol. 3, No. 2, pp. 165-176, 2004.
[44] Madsen, K., Nielsen, H., B., Tingleff, O., Methods for Non-Linear Least Squares Problems, Technical University of Denmark, Lecture notes, available at http://www.imm.dtu.dk/courses/02611/nllsq.pdf, 2nd Edition, pp. 1-30, 2004.
[45] Marko, K.A., J.V. James, T.M. Feldkamp, C.V. Puskorius, J.A. Feldkamp, and D. Roller, Applications of Neural Networks to the Construction of "Virtual" Sensors and Model-Based Diagnostics, Proceedings of ISATA 29th International Symposium on Automotive Technology and Automation, pp.133-138, June 3-6, 1996.
[46] McCann, R. S., L. Spirkovska, Human Factors of Integrated Systems Health Management on Next-Generation Spacecraft, First International Forum on Integrated System Health Engineering and Management in Aerospace, Napa, CA, pp. 1-18, November 7-10, 2005.
[47] Mishra, S., and Pecht, M., In-situ Sensors for Product Reliability Monitoring, Proceedings of SPIE, Vol. 4755, pp. 10-19, 2002.
[48] Morris, Jr., J. W., Tribula, D., Summers, T. S. E., and Grivas D., The role of Microstructure in Thermal Fatigue of Pb/Sn Solder Joints, in Solder Joint Reliability, edited by J. H. Lau, Von Nostrand Reinhold, New York, pp. 225- 265, 1991.
[49] Munns, T. E., R. M. Kent, Structural Health Monitoring: Degradation Mechanism and System Requirements, Digital Avionics Systems Conferences, pp. 6C2/1-6C2/8, Vol. 2, 2000.
[50] Nielsen, H., B, Damping Parameter in Marquardt’s Method, Technical Report, IMM-REP-1999-05, Technical University of Denmark, Available at http://www.imm.dtu.dk/˜hbn, pp. 1-16, 1999.
[51] Rosenthal, D., and Wadell, B., Predicting and Eliminating Built-in Test False Alarms, IEEE Transactions on Reliability, Vol. 39, No 4, pp. 500-505, October 1990.
[52] Sayama, T., Takayanagi, T. and Mori, T., Analysis of Grain Growth Process in Sn/Pb Eutectic Solder Joint, EEP-Vol. 26-1, Advances in Electronic Packaging-1999, Volume 1, ASME, 1999.
[53] Sayama, T., Takayanagi, T., Nagai, Y., Mori, T., and Yu, Q., Evaluation of Microstructural Evolution and Thermal Fatigue Crack Initiation in Sn-Ag-Cu Solder Joints, ASME InterPACK, Paper Number IPACK2003-35096, pp.1-8, 2003.
[54] Schauz, J. R., Wavelet Neural Networks for EEG Modeling and Classification, PhD Thesis, Georgia Institute of Technology, 1996.
[55] Sekhar, A., S., Identification of a Crack in a Rotor System using a Model-based Wavelet Approach, Structural Health Monitoring, Vol. 2, No. 4, pp. 293-308, 2003.
[56] Senkov, O. N., and Myshlev, M. M., Acta Metallurgica, 34, pp. 97-106, 1986.
[57] Shiroishi, J., Y. Li, S. Liang, T. Kurfess, and S. Danyluk, Bearing Condition Diagnostics via Vibration and Acoustic Emission Measurements, Mechanical Systems and Signal Processing, Vol.11, No.5, pp.693-705, Sept. 1997.
[58] Smeulers, J., P., M., Zeelen, R., Bos, A., PROMIS - A Generic PHM Methodology Applied to Aircraft Subsystems, IEEE Aerospace Conference Proceedings, Vol. 6, pp. 3153 – 3159, 2002.
[59] Tribula, D.G., Grivas, D., Frear, D., and Morris, J., Journal of Electronic Packaging, 111, pp. 83-89, 1989.
[60] Williams, T. W., Parker, K. P., Design for Testability-A Survey, Proceedings of the IEEE, January 1983.
[61] Wolverton, A., Brazing and Soldering, 13, pp. 33, 1987. [62] Xiao, Q., Bailer, H., J., Armstrong, W., D., Aging Effects on
Microstructure and Tensile Property of Sn3.9Ag0.6cu Solder Alloy, Transactions of the ASME, Vol. 126, pp. 208 – 212, June 2004.
[63] Ye, L., L., Lai, Z., Liu, J., Tholen, A., Microstructural Coarsening of Lead Free Solder Joints during Thermal Cycling, 2000 Electronic Components and Technology Conference, pp. 134 – 137, 2000.
[64] Zorian, Y., A Structured Testability Approach for Multi Chip Boards Based on BIST and Boundary Scan, IEEE Transactions on Components, Packaging, and Manufacturing Technology-Part B, Vol. 17, No. 3, pp. 283-290, August 1994.
Pradeep Lall (M’92) received the B.E. degree in mechanical engineering from the Delhi College of Engineering, University of Delhi, Delhi, India, in 1988, the M.S. and Ph.D. degrees in mechanical engineering from the University of Maryland, College Park, in 1989 and 1993, respectively, and the M.B.A. degree from Kellogg School of Management, Northwestern University, Evanston, IL, in 2002.
Dr. Lall is a Fellow of the ASME. He has ten years of industry experience. He was previously
with Motorola’s Wireless Technology Center. He is currently a Thomas Walter Professor with the Department of Mechanical Engineering and Associate Director of the NSF Center for Advanced Vehicle Electronics, Auburn University, Auburn, AL. He has published extensively in the area of electronic packaging with emphasis on modeling and predictive techniques. He has authored and coauthored several book chapters and is an Associate Editor for the ASME Journal of Electronic Packaging. He is lead author of Influence of Temperature on Microelectronic and System Reliability (Boca Raton, FL: CRC, 1997). He holds three U.S. patents.
Dr. Lall received the Samuel Ginn College of Engineering Senior Faculty Research Award in 2007, three Motorola Outstanding Innovation awards, five Motorola Engineering Awards, four Publication Awards, and nine Best Paper Awards. He is a Six-Sigma Black-Belt in Statistics, an Associate Editor for the IEEE TRANSACTIONS ON ELECTRONICS PACKAGING MANUFACTURING, and a Member of Beta Gamma Sigma. He is a Senior Member of the IEEE and a Fellow of the ASME. .


