Embed Size (px)
Citation preview
ORIGINAL ARTICLE
Laser nitriding of tool steel: thermal stress analysis
Bekir Sami Yilbas & A. F. M. Arif & C. Karatas &
S. Akhtar & B. J. Abdul Aleem
Received: 27 March 2009 /Accepted: 23 November 2009 /Published online: 18 December 2009# Springer-Verlag London Limited 2009
Abstract Lasers can be considered as one of the effectivetools to nitride the metallic surfaces. This is because of theprecision of operation and the fast processing time. In thepresent study, laser gas-assisted nitriding of tool steel (H13)is carried out. Temperature and stress fields are predictedusing the finite element method. The metallurgical changesin the laser irradiated region are examined using scanningelectron microscope (SEM) and X-ray diffraction. Thefracture toughness of the surface is determined using theindentation tests. It is found that von Mises stress attainshigh values in the laser-heated regions. The residual stresspredicted is tensile, and it is in the order of 450 MPa. SEMmicrographs reveal that surface is free from cracks, andfeathery-like compact structures are formed in the vicinityof the surface. The fracture toughness of the surface reducesafter the laser treatment process because of the formation ofbrittle structure in the surface region.
Keywords Laser . Nitriding . Tool steel . Temperature .
Stress
1 Introduction
Surface modification through synthesis of nitrides in thesurface region of metallic alloys provides superior tribo-logical properties. There exist many conventional nitridingtechniques which include reactive magnetron sputtering,
plasma nitriding, ion implantation, salt bath nitriding, etc.However, laser gas-assisted nitriding offers significantadvantage over the conventional nitriding process due tothe precision of operation, short processing duration, andlocal processing without changing the bulk properties of thesubstrate material underneath of the nitrided region. Nitrid-ing of steel surfaces using a laser source is possible throughgenerating the nitride species in the irradiated region usinghigh-pressure nitrogen as the assisting gas. The lasernitriding provides hard surfaces, which resist wear, erosion,and corrosion. However, laser-nitriding process is involvedwith high-temperature heating and high cooling rates. This,in turn, results in high levels of thermal stresses in the heatedregion. Moreover, the residual stress in the heated regionremains high after the completion of the heating process.This limits the application of the nitridng surfaces. Conse-quently, investigation into thermal stresses and residualstress levels in the laser-nitrided regions becomes essential.
Considerable research studies were carried out to ex-amine laser gas-assisted nitriding process. The influence oflaser parameters on the nitriding of low carbon steel wasexamined by Copola et al. [1]. They indicated that differentnitrided species formed in the nitrided layer, which wasdependent upon the nitriding conditions. Laser gas-assistednitriding of iron was studied by Sun et al. [2]. Theyprovided the concentration and phase formation of ironnitrides due to different laser power intensities and laserscanning speeds. Measurement of residual stress in ε-phaseion nitride layers was carried out by Watkins et al. [3]. Theyshowed that the residual stress was tensile and varied withinthe surface region. Thermal solubility of laser producediron nitrides was examined by Han et al. [4]. They indicatedthat stainless steel was more stable than iron even atelevated temperatures (973 K); in which case, no oxideswere formed in the nitrided layer. Nitride formation duringlaser melting of steel was examined by Vedani et al. [5].They showed that a significant reduction in surface defects
B. S. Yilbas (*) :A. F. M. Arif : S. Akhtar :B. J. A. AleemME Department, KFUPM,Dhahran, Saudi Arabiae-mail: [email protected]
C. KaratasEngineering Faculty, Hacettepe Universitesi,Ankara, Turkey
Int J Adv Manuf Technol (2010) 49:1009–1018DOI 10.1007/s00170-009-2467-z

could be achieved by laser preheating of the nitridedsamples. Laser reactive plasma nitriding and coatingformations were investigated by Schaaf et al. [6]. Theyindicated that gas–plasma surface reactions led to a fastdiffusion of the gas species into the material; subsequently,the desired coating formation became possible upon properselection of the treatment parameters. Interstitial ordering ofnitrogen and carbon in laser-nitrided and laser-carburizedaustenitic stainless steel was investigated by Binczcycka etal. [7]. They indicated that a weak attractive interaction ofnitrogen interstitials was present. Reactive surface process-ing of iron and steel by a laser beam in nitrogen ambientwas studied by Carpene et al. [8]. They indicated that foriron, steel, and aluminum, the maximum nitrogen incorpo-ration took place in the nanosecond stage while excellentnitriding efficiency was noted in the whole-time domain forthe titanium substrate. Laser-induced plume dynamicsduring excimer laser nitriding of iron were examined byHan et al. [9]. They showed that the one-dimensional lasersupported combustion wave model described reasonablythe laser–plasma dynamics in nitriding process. The energydependence on microstructure of nitrides deposited by dualion beam sputtering was investigated by Hubler et al. [10].They indicated that iron nitride grain size dropped when theapplied energy was increased, which modified the corrosionresistance of the nitrided surface. The laser alloying andnitriding of steel surface was investigated by Chudina [10].He determined the residual stress distribution and wearresistance of the nitrided surfaces. Chudina et al. [11] inves-tigated the laser nitriding and alloying of steel surfaces.They indicated that the laser alloyed surface providedimproved hardness and wear resistance. Surface alloying ofsteel by a laser beam in nitrogen ambient was studied byMudali et al. [12]. They indicated that laser gas-assistednitriding provided superior properties of the surface. Lasertreatment of steel surface in a liquid nitrogen environmentwas examined by Jendrzejewski et al. [13]. They showedthat the local nitrogen enrichment of the laser-treatedregions depended on the laser-processing conditions.
In light of the previous studies [14, 15], the micro-structural changes and residual stress development in thelaser gas-assisted nitrided region are examined. Theindentation tests are carried out to determine the fracturetoughness of the resulting surface.
2 Heat transfer and nitrogen diffusion analyses
The transient diffusion equation based on the Fourier heatingmodel can be written in the Cartesian coordinates as:
rDE
Dt¼ r krTð Þð ÞþSo ð1Þ
where E is the energy gain of the substrate material, and Sois the source term and
So ¼ Iod 1� rf� �
e �x2þy2
a2
� �
Io is laser peak intensity, δ is the absorption depth, rf is thesurface reflectivity (which is taken as 62% [16]), a is theGaussian parameter, x and y are the axes (Fig. 1), ρ isthe density, Cp is the specific heat capacity, and k is thethermal conductivity. It should be noted that the laser beamaxis in along the x-axis (Fig. 1).
In the case of a moving heat source along the x-axis withconstant velocity U, energy gain by the substrate materialyields:
rDE
Dt¼ r
@E
@t�rU
@E
@xð2Þ
or
rDE
Dt¼ r
@ CpT� �@t
�rU@ CpT� �@x
ð3Þ
Combining Eqs. 1 and 3 yields:
r@ CpT� �@t
¼ r krTð Þð Þ þ rU@ CpT� �@x
þSo ð4Þ
At the free surfaces of the nitrided specimen (Fig. 1), theconvective boundary is assumed, except at the irradiatedsurface at which convective and radiative boundarycondition is considered. Therefore, the correspondingboundary condition is:
@T
@x¼ h
kTs � Tambð Þ: @T
@y¼ h
kTs � Tambð Þ þ "s
kT4s � T 4
amb
� �:
@T
@z¼ h
kTs � Tambð Þ
where h is the heat transfer coefficient due to naturalconvection, and Ts and Tamb are the surface and ambienttemperatures, respectively, ε is the emissivity (ε=0.9 isconsidered), σ is the Stefan–Boltzmann constant (σ=5.67×10⁻⁸W/m2K). At far away boundary (at edges of thesolution domain) constant temperature boundary is assumed(T=293 K), i.e.,
x ¼ 1; y ¼ 1; z ¼ 1 ! T¼ 20oC
Initially (prior to laser treatment), the substrate materialis assumed to be at constant ambient temperature, i.e., T=Tamb, which is considered as constant (Tamb=293 K).
Equation 4 is solved numerically with the appropriateboundary conditions to predict the temperature field.
1010 Int J Adv Manuf Technol (2010) 49:1009–1018

3 Modeling of thermal stresses
To analyze the phase change problem, a nonlinear transientthermal analysis is performed employing enthalpy method.To account for latent heat evolution during phase change,the enthalpy of the material as a function of temperature isincorporated in the energy equation. The material propertiesgiven in Table 1 is used in the simulations. For structuralresponse, the finite element formulation, which is based onthe principle of virtual work, is used. The mathematicalarrangements of the finite element formulation are similarto those given in [17]. Moreover, the coupling between thethermal and structural fields has been accomplished bydirect coupling (matrix coupling); 3-D coupled-field solidelement (SOLID5) has been used for the present work. Theelement has eight nodes with up to six degrees of freedomat each node.
The thermal and structural properties used in the currentsimulations are given in the Table 1. It should be noted thatthe conditions for the current simulations match the actualexperiments carried out in the present study.
4 Experimental
The CO2 laser (LC-ALPHAIII) delivering nominal outputpower of 2 kW at pulse mode with different frequencies is
used to irradiate the workpiece surface. Although the laserused delivered the repetitive pulses depending on the dutycycle, the high frequency (Table 2) mode was selected toresult in a c.w. mode operation. The spatial distribution ofthe laser output at the workpiece surface was Guassian(TEM00 mode) with the nominal power of 110 W. Thenominal focal length of the focusing lens is 127 mm. Thelens is low absorption ZnSe standard lens. The laser beamdiameter is 19 mm prior to focusing. The lens defocusedthe laser beam to obtain the spot diameter of 0.8 mm at the
Laser Treated Region
z
x
y
Laser Irradiated Spot
Laser Beamx = 0y = 0z = 0
U
Tool Steel
Nitrogen
2 mm
19 mm
35 mm
0.04 mm
X-Axis Y-Axis Z-AxisPOINTS (mm) (mm) (mm)
A1 15 10.1 0A2 20 10.1 0A3 15 9.5 0A4 17.5 9.5 0A5 20 9.5 0A6 15 8.9 0A7 20 8.9 0
A1 A2
A3 A4 A5
A7 A8
x
y
Laser Beam Scanning Direction
Schematic view of laser nitriding process and geometric dimensions
Laser tracks and locations at x,y-plane and dimensions
Fig. 1 A schematic view oflaser-nitriding process and laserscanning tracks and dimensionsin x,y-plane
Table 1 Mechanical and thermal properties of steel used in thesimulations [18]
Modulus of elasticity 215 GPa at 300°K
176 GPa at 772°K
165 GPa at 866°K
Poisson’s ratio 0.3
Coefficient of thermalexpansion
11.0 µm/m-°C @ @temperature20.0–95 °C
11.5 µm/m-°C @ @temperature20.0–205 °C
12.6 µm/m-°C @ @Temperature20.0–540 °C
Thermal conductivity 26.8 W/m.oC at 300°K
31.0 W/m.oC at 673°K
33.4 W/m.oC at 977°K
Int J Adv Manuf Technol (2010) 49:1009–1018 1011

irradiated surface. Nitrogen-assisting gas emerging fromthe conical nozzle and co-axially with the laser beam isused. The nitriding conditions are given in Table 2. Theworkpiece accommodated is tool steel (H13) at 2 mm inthicknesses. The surface of the workpiece is ground toobtain the average surface roughness of 3 µm prior tonitriding process. This is due to that the surface roughnessof 3 µm did not result the considerable surface reflectionduring the laser irradiation. However, lowering thesurface roughness through fine surface polishing resultedin substantial reflection of the laser beam while dam-aging the focusing lens. Therefore, the surface roughnessof the workpieces was kept almost the same duringexperiments.
Material characterization of the laser-nitrided surfaces iscarried out using SEM, X-ray diffraction (XRD), and X-rayphotoelectron spectroscopy. Jeol 6460 electron microscopyis used for SEM examinations, and Broker D8 Advancedhaving MoKα radiation is used for XRD analysis.
Microphotonics digital microhardness tester (MP-100TC) was used to obtain fracture toughness of the nitridelayer. The load used during the measurements was kept as20 N. The standard test method for Vickers indentationhardness of advanced ceramics (ASTM C1327-99) wasadopted. The measurements were repeated three times ateach location.
5 Determination of young modulus and fracturetoughness by indentation tests
The elastic response of the surface when subjected toindentation tests needs to be examined through which theYoung’s modulus can be determined. After consideringFig. 2, the Young’s modules can be formulated as [19]:
E* ¼ 9
16
� �0:5
P:h�1:5:R�0:5 ð5Þ
where P is the applied load, h is the elastic penetration ofthe indenter, and R is the indenter radius. The true modulusof elasticity can be determined using the indenter properties[20], i.e.:
E ¼ 1� u2
1
E*� 1�ui2ð Þ
Ei
ð6Þ
where Ei and νi are the Young’s modulus and Poisson’sratio of indenter, respectively. In the calculations, Ei=1,141 GPa and νi=0.07 (diamond indenter) [21] and ν=0.25 are taken.The fracture toughness of the surface ismeasured using the indenter test data for microhardness(Vickers) and crack inhibiting. In this case, microhardnessin HV and the crack length generated due to indentation at
Table 2 Laser assisted nitriding conditions
Feed rate (m/s) Power (W) Frequency (Hz) Nozzlegap (mm)
Nozzlediameter (mm)
Focussetting (mm)
N2 Pressure (kPa)
0.08 110 1500 1.5 1.5 127 600
A schematic view of indentation and relevant dimensions.
Geometric configuration of indentation mark and crack length
Indentation mark and crack
C
Crack Length
Indention Mark
Load
Surface Profile After Load Removal
Surface Profile Under Load Removal
Free Surface
h
Crack
Fig. 2 Indentation mark and geometric configurations
1012 Int J Adv Manuf Technol (2010) 49:1009–1018

the surface are measured. The fracture toughness (K) iscalculated using the equation given below [22]:
K ¼ 0:016E
H
� �0:5
:P:C�1:5 ð7Þ
where E is the elastic modulus, which is determined fromEq. 6, H is the hardness (Vickers), P is the applied load onindenter, C is the crack length, R is the indenter radius, andh is the indentation depth as shown in Fig. 2. The data usedfor the calculations are given in Table 3. Moreover, in orderto visualize the cracks formed around the indentation mark,top surface of coating is grinded slightly; i.e., the surfaceroughness was reduced almost from 7 to 1 µm after thegrinding.
6 Results and discussions
Laser gas-assisted nitriding of H13 tool steel is considered.Temperature and stress fields are predicted using the finiteelement method. Experiments are carried out to examinethe microstuctural changes in the laser-irradiated region andfracture toughness of the treated surface.
Figure 3 shows temporal variation of temperaturecalculated at three locations on the surface. The laser beamlocations change with time, which are indicated as A3, A4,and A5 in Fig. 1. Temperature rises and decays sharply onsurface depending over the location of the laser beam at thesurface. It should be noted that during laser heating,
temperature increases beyond the melting temperature atthe surface due to high energy flux. In this case, thesuperheating of the liquid phase occurs in this region,provided that the depth of the superheated liquid is veryshallow. In addition, nitride species formed in the surfacevicinity may alter the melting temperature of the surface.However, this effect is neglected in the simulations.Moreover, the rates of temperature rise and decay aroundits maximum are higher than that corresponding to sometimes before and after the laser beam scanning the samelocation. The high rates of rise and fall of temperaturereveal that the high rate of heating occurs because of thepresence of the laser beam and the convection as well asconduction heat losses from the initially heated spotenhance the cooling rate. However, the cooling rate reducesat some time after laser beam passing the specific location.This is attributed to the temperature gradient, which reducesas temperature in the irradiated region becomes low.Consequently, energy transfer from the heated section tothe solid bulk reduces due to the low temperature gradient.
Table 3 Data obtained after indentation tests and used to determinethe elastic modulus and fracture toughness of the laser nitrided surface
H (HV) P (N) C (μm) R (μm) h (μm)
As received 350 (5.49 GPa) 20 15 60 5
Laser nitrided 1100 (10.8 GPa) 20 20 60 4.5
0.0E+00
3.0E+08
6.0E+08
9.0E+08
1.2E+09
1.2 1.4 1.6 1.8 2.0 2.2
TIME (s)
vON
MIS
ES
ST
RE
SS
(P
a)
x = 15 mm : y = 9.5 mm : z = 0 mmx = 17.5 mm : y = 9.5 mm : z = 0 mmx = 20 mm : y = 9.5 mm : z = 0 mm
Fig. 4 Temporal variation of von Mises stress at different locations onthe surface
0
1000
2000
3000
4000
1.2 1.4 1.6 1.8 2.0 2.2
TIME (s)
TE
MP
ER
AT
UR
E (
K)
x = 15 mm : y = 9.5 mm : z = 0 mmx = 17.5 mm : y = 9.5 mm : z = 0 mmx = 20 mm : y = 9.5 mm : z = 0 mm
A3 A4 A5
Fig. 3 Temporal distribution of temperature at different locations onthe surface. The laser beam location is at A3, A4, A5
0
1000
2000
3000
4000
0.0E+00 5.0E-03 1.0E-02 1.5E-02 2.0E-02 2.5E-02
DISTANCE ALONG X-AXIS (m)
TE
MP
ER
AT
UR
E (
K)
y = 9.5 mm : z = 0 mm : t = 0.625 s : Laser is at A2
y = 9.5 mm : z = 0 mm : t = 1.875 s : Laser is at A5
Fig. 5 Temperature distribution along the x-axis for the laser beam attwo locations
Int J Adv Manuf Technol (2010) 49:1009–1018 1013

Figure 4 shows temporal variation of von Mises stresscalculated at locations similar to those shown in Fig. 3. vonMises reduces when temperature reaches its peak valuebecause of the elastic modulus, which reduces withincreasing temperature, i.e., von Mises stress increasesonce temperature reduces, despite the fact that temperaturegradient becomes less with progressing time. This is truefor the location x=15 mm/y=9.5 mm/z=−0.04 mm. Con-sequently, temperature gradient results in high thermalstrains in the surface region, which in turn causes increasedstress levels in this region. In the case of location x=20 mm/y=9.5 mm/z=−0.04 mm, initially, von Mises attainshigh values as time progresses; it reduces because of the
attainment of high temperature in this region, i.e., whenlaser heating spot reaches this region, temperature increasesand von Mises stress reduces. The attainment of high stresslevels in the initial period is associated with the conductionheating when the laser is at point A3 and A4. This causestemperature increase beyond 1,000 K at the location x=20 mm/y=9.5 mm/z=−0.04 mm. The temperature gradientin this region results in the development of the high stresslevels in this region during the initial heating period.
Figure 5 shows temperature distribution calculated alongthe x-axis at the surface; y-axis location is y=9.5 mm(location A5) for two heating periods while Fig. 6 showscontour plot of temperature profiles calculated at two
x
y
x
y
Time = 0.625 s
Time = 1.875 s
Fig. 6 Contour plot of temper-ature distribution at the surfacefor two heating periods
1014 Int J Adv Manuf Technol (2010) 49:1009–1018
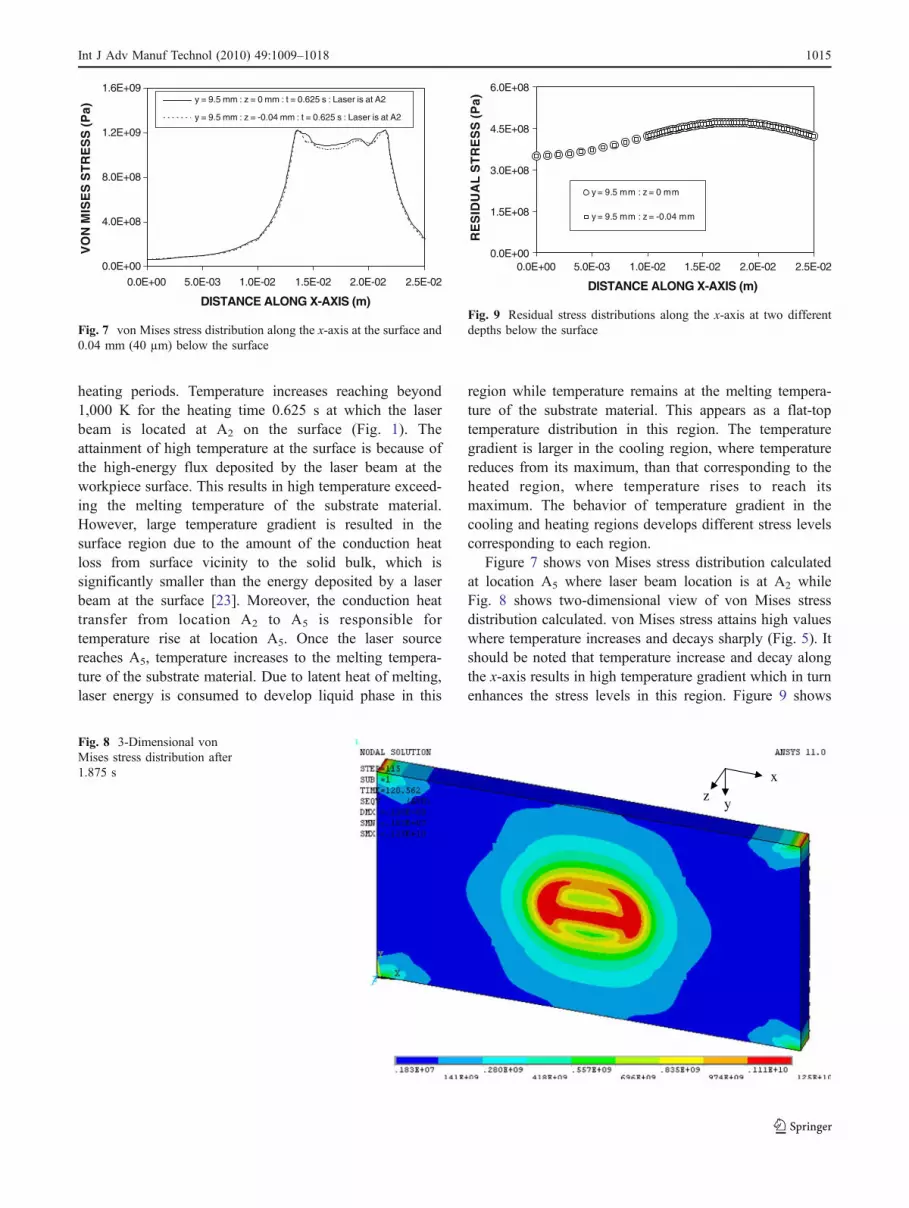
heating periods. Temperature increases reaching beyond1,000 K for the heating time 0.625 s at which the laserbeam is located at A2 on the surface (Fig. 1). Theattainment of high temperature at the surface is because ofthe high-energy flux deposited by the laser beam at theworkpiece surface. This results in high temperature exceed-ing the melting temperature of the substrate material.However, large temperature gradient is resulted in thesurface region due to the amount of the conduction heatloss from surface vicinity to the solid bulk, which issignificantly smaller than the energy deposited by a laserbeam at the surface [23]. Moreover, the conduction heattransfer from location A2 to A5 is responsible fortemperature rise at location A5. Once the laser sourcereaches A5, temperature increases to the melting tempera-ture of the substrate material. Due to latent heat of melting,laser energy is consumed to develop liquid phase in this
region while temperature remains at the melting tempera-ture of the substrate material. This appears as a flat-toptemperature distribution in this region. The temperaturegradient is larger in the cooling region, where temperaturereduces from its maximum, than that corresponding to theheated region, where temperature rises to reach itsmaximum. The behavior of temperature gradient in thecooling and heating regions develops different stress levelscorresponding to each region.
Figure 7 shows von Mises stress distribution calculatedat location A5 where laser beam location is at A2 whileFig. 8 shows two-dimensional view of von Mises stressdistribution calculated. von Mises stress attains high valueswhere temperature increases and decays sharply (Fig. 5). Itshould be noted that temperature increase and decay alongthe x-axis results in high temperature gradient which in turnenhances the stress levels in this region. Figure 9 shows
0.0E+00
1.5E+08
3.0E+08
4.5E+08
6.0E+08
0.0E+00 5.0E-03 1.0E-02 1.5E-02 2.0E-02 2.5E-02
DISTANCE ALONG X-AXIS (m)
RE
SID
UA
L S
TR
ES
S (
Pa)
y = 9.5 mm : z = 0 mm
y = 9.5 mm : z = -0.04 mm
Fig. 9 Residual stress distributions along the x-axis at two differentdepths below the surface
0.0E+00
4.0E+08
8.0E+08
1.2E+09
1.6E+09
0.0E+00 5.0E-03 1.0E-02 1.5E-02 2.0E-02 2.5E-02
DISTANCE ALONG X-AXIS (m)
VO
N M
ISE
S S
TR
ES
S (
Pa)
y = 9.5 mm : z = 0 mm : t = 0.625 s : Laser is at A2
y = 9.5 mm : z = -0.04 mm : t = 0.625 s : Laser is at A2
Fig. 7 von Mises stress distribution along the x-axis at the surface and0.04 mm (40 µm) below the surface
x
yz
Fig. 8 3-Dimensional vonMises stress distribution after1.875 s
Int J Adv Manuf Technol (2010) 49:1009–1018 1015
residual stress distribution along the x-axis at the surfaceand at the depth z=−0.04 mm below the surface. Theresidual stress within the depth of 0.04 mm (−0.04≤z≤0 mm) below the surface remains almost the same. This isbecause of the temperature distribution within 0.04 mmdepth, provided that at 0.04 mm depth (z=−0.04 mm),temperature attains less than that corresponding to surface(z=0 mm). The maximum value of the residual stress is inthe order of 450 MPa, which is less than the elastic limit ofthe substrate material; consequently, no crack is expected toform in the laser-irradiated region.
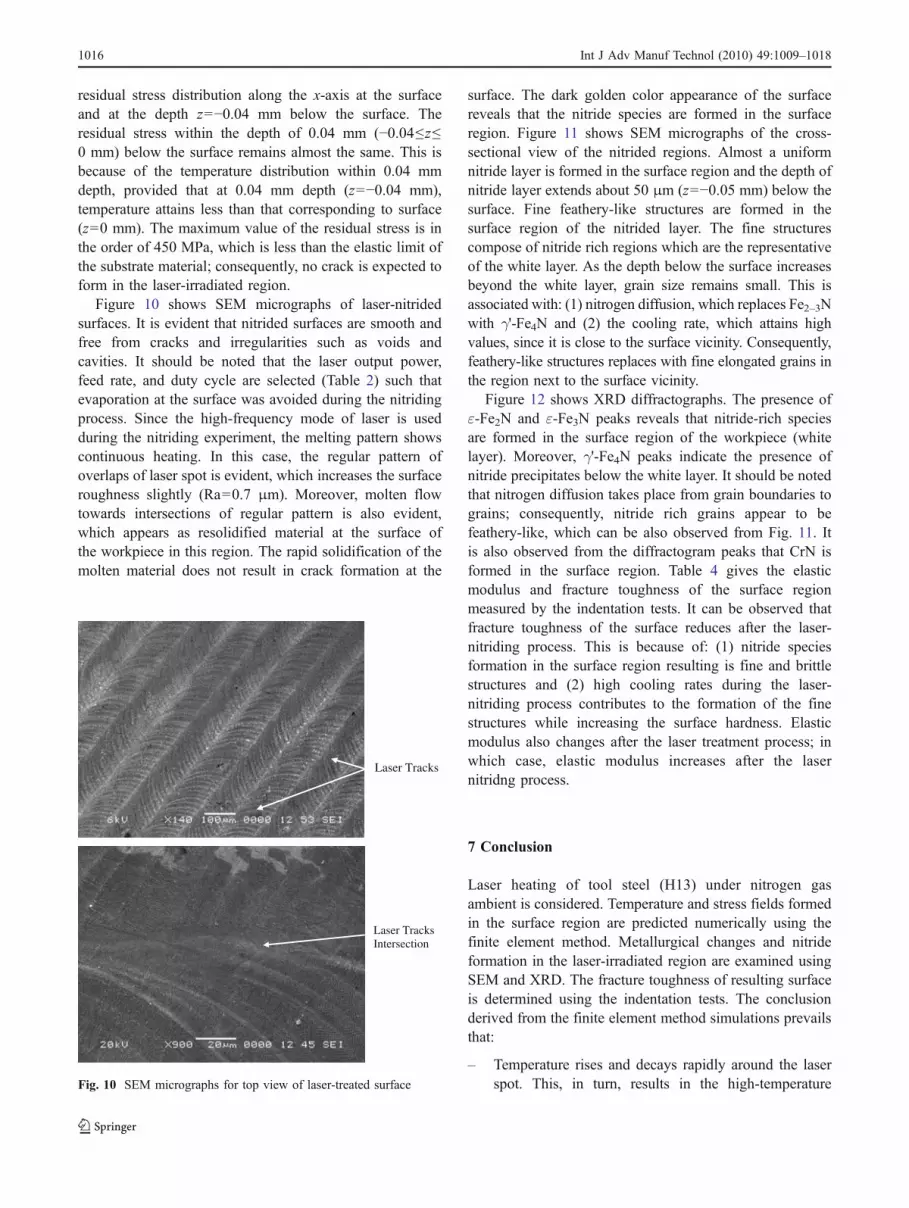
Figure 10 shows SEM micrographs of laser-nitridedsurfaces. It is evident that nitrided surfaces are smooth andfree from cracks and irregularities such as voids andcavities. It should be noted that the laser output power,feed rate, and duty cycle are selected (Table 2) such thatevaporation at the surface was avoided during the nitridingprocess. Since the high-frequency mode of laser is usedduring the nitriding experiment, the melting pattern showscontinuous heating. In this case, the regular pattern ofoverlaps of laser spot is evident, which increases the surfaceroughness slightly (Ra=0.7 μm). Moreover, molten flowtowards intersections of regular pattern is also evident,which appears as resolidified material at the surface ofthe workpiece in this region. The rapid solidification of themolten material does not result in crack formation at the
surface. The dark golden color appearance of the surfacereveals that the nitride species are formed in the surfaceregion. Figure 11 shows SEM micrographs of the cross-sectional view of the nitrided regions. Almost a uniformnitride layer is formed in the surface region and the depth ofnitride layer extends about 50 μm (z=−0.05 mm) below thesurface. Fine feathery-like structures are formed in thesurface region of the nitrided layer. The fine structurescompose of nitride rich regions which are the representativeof the white layer. As the depth below the surface increasesbeyond the white layer, grain size remains small. This isassociated with: (1) nitrogen diffusion, which replaces Fe2–3Nwith γ'-Fe4N and (2) the cooling rate, which attains highvalues, since it is close to the surface vicinity. Consequently,feathery-like structures replaces with fine elongated grains inthe region next to the surface vicinity.
Figure 12 shows XRD diffractographs. The presence ofε-Fe2N and ε-Fe3N peaks reveals that nitride-rich speciesare formed in the surface region of the workpiece (whitelayer). Moreover, γ'-Fe4N peaks indicate the presence ofnitride precipitates below the white layer. It should be notedthat nitrogen diffusion takes place from grain boundaries tograins; consequently, nitride rich grains appear to befeathery-like, which can be also observed from Fig. 11. Itis also observed from the diffractogram peaks that CrN isformed in the surface region. Table 4 gives the elasticmodulus and fracture toughness of the surface regionmeasured by the indentation tests. It can be observed thatfracture toughness of the surface reduces after the laser-nitriding process. This is because of: (1) nitride speciesformation in the surface region resulting is fine and brittlestructures and (2) high cooling rates during the laser-nitriding process contributes to the formation of the finestructures while increasing the surface hardness. Elasticmodulus also changes after the laser treatment process; inwhich case, elastic modulus increases after the lasernitridng process.
7 Conclusion
Laser heating of tool steel (H13) under nitrogen gasambient is considered. Temperature and stress fields formedin the surface region are predicted numerically using thefinite element method. Metallurgical changes and nitrideformation in the laser-irradiated region are examined usingSEM and XRD. The fracture toughness of resulting surfaceis determined using the indentation tests. The conclusionderived from the finite element method simulations prevailsthat:
– Temperature rises and decays rapidly around the laserspot. This, in turn, results in the high-temperature
Laser Tracks
Laser Tracks Intersection
Fig. 10 SEM micrographs for top view of laser-treated surface
1016 Int J Adv Manuf Technol (2010) 49:1009–1018

gradient around the laser spot, since the elastic modulusconsidered as temperature dependent in the simulationsand becomes less with increasing temperature, stresslevel reduces significantly at high temperatures despitethe fact that the temperature gradient is high in thisregion. Temperature some distance away from the laserbeam location attains values above 1,000 K due to theconduction heating. This, in turn, results in high-temperature gradients and high von Mises stress levelsin this region. The maximum magnitude of residual
stress predicted from the simulations is in the order of40 MPa, which is lower than the elastic limit of thesubstrate material. Consequently, no crack formation isexpected within the depth of 40 μm below the surface.
The conclusion obtained from the experimental dataprevails that:
– No crack is observed from the SEM micrographs ofthe workpieces as concluded from the simulations. Thepresence of feathery-like and compact structures inthe surface region of the laser-treated workpiece revealthe formation of nitride species in this region. This isalso observed from the XRDs. The main nitridecompounds are ε-Fe2N and ε-Fe3N with the presenceof γ'-Fe4N. The fracture toughness of the laser-nitridedsurface reduces due to the brittle structure formed in thesurface region.
Table 4 Elastic modulus and fracture toughness obtained afterindentation tests. The error estimated based on the repeats of theindentation test is 7%
Fracture toughness(MPam1/2 )
E (GPa)
As-received surface 32 190
Laser-treated surface 17 230
3000
3300
3600
3900
4200
4500
30 40 50 60 70 80
2 θ
RE
LA
TIV
E IN
TE
NS
ITY
ε -Fe2-3Nγ '-Fe4Nε -Fe2-3N + γ '-Fe4NCrN
Fig. 12 XRD diffractogram for laser nitrided-workpiece
Nitride Layer
Feathery Like Structure Fine Elongated Grains Structure
Fig. 11 SEM micrographs ofcross-section of laser-nitridedworkpiece
Int J Adv Manuf Technol (2010) 49:1009–1018 1017
Acknowledgements Acknowledgements are due to King FahdUniversity of Petroleum and Minerals and Karmetal AS for thesupport and encouragement.
References
1. Copola CJ, Avram I, Terzzoli MC, Duhalde S, Morales C, PerezT, Audebert F, Delaporte Ph, Sentis M (2002) Influence of laserparameters on the nitriding of low carbon steel. Appl Surf Sci197–198:896–903
2. Sun F, Liu J, Yang Y, Yu H (2005) Nitridation of iron by CW-CO2
laser nitriding technologies. Mater Sci Eng B 122:29–333. Watkins TR, England RD, Klepser C, Jayaraman N (2000)
Measurement and analysis of residual stresses in ε-phase ironnitride layers as a function of depth', International Center forDiffraction Data 2000. Adv X-ray anal 43:31–38
4. Han M, Carpene E, Landry F, Lieb KP, Schaaf P (2001) Thermalstability of laser-produced iron nitrides. J Appl Physi 89:4619–4624
5. Vedani M, Previtali B, Vimercati GM, Sanvito A, Somaschini G(2007) Problems in laser repair welding a surface treated toolsteel. Surf Coat Technol 201:4518–4525
6. Schaaf P, Kahle M, Carpene E (2005) Reactive lasrer plasmacoating formation. Surf Coat Technol 200:608–611
7. Binczycka H, Kahle M, Cusenza S, Carpene E, Schaar P (2006)Interstitial ordering of nitrogen and carbon in laser nitrided andlaser carburized austenitic stainless steel. J Phys, Condens Matter18:10561–10570
8. Carpene E, Schaaf P, Han M, Lieb K-P, Shinn M (2002) Reactivesurface processing by irradiation with excimer laser, Nd:YAGlaser, free electron laser and Ti:sapphire laser in nitrogenatmosphere. Appl Surf Sci 186:195–199
9. Han M, Lieb K-P, Carpene E, Schaaf P (2003) Laser-plumedynamics during excimer laser nitriding of iron. J Appl Physi93:5742–5749
10. Hubler R, Tentardini EK, Blando E, Teixeira SR, VasconcellosMZ, Soares M, Kamijo E, Fujiwara M (1999) The energy
dependence on microstructure of (Ti-Al-V) nitrides depositeddual ion beam sputtering. Surf Coat Technol 116–119:969–972
11. Chudina OV (2004) Nitriding of laser-alloyed steel. Met Sci HeatTreat 46(1–2):36–39
12. Mudali UK, Khtak HS, Raj B, Uhlemann M (2004) Surfacealloying of nitrogen to improve corrosion resistance of steels andstainless steels. Mater Manuf Process 19:61–73
13. Jendrzejewski R, Silwinski G, Martev I, Nedialkov N, Atanasov P(2000) Laser treatment of the 38HMJ steel surface in a liquidnitrogen environment. Proc SPIE Int Soc Opt Eng 4238:149–154
14. Yilbas BS, Nickel J, Coban A, Sami M, Shuja SZ, Aleem A(1997) Laser melting of plasma nitrided Ti-6Al-4V alloy. Wear212(1):140–149
15. Yilbas BS, Karatas C, Arif AFM, Abdul Aleem BJ (2009) Lasergas assisted nitriding of alumina surfaces. Surf Eng 25:235–240
16. Yilbas BS, Danisman K, Yilbas Z (1991) Measurement oftemperature-dependent reflectivity of Cu and Al in the range30–1000 C. Meas Sci Technol 2:668–674
17. Arif AFM, Yilbas BS (2008) Thermal stress developed duringlaser cutting process: consideration of different materials. Int JAdv Manuf Technol 37:698–704
18. Incropera FP, DeWitt DP (1996) Fundamentals of heat and masstransfer, 4th edn. John Wiley & Sons, New York, pp 829–830
19. Totemeier TC, Wright RN (2006) Residual stress determination inthermally sprayed coatings—a comparison of curvature modelsand X-ray techniques. Surf Coat Technol 200:3955–3962
20. Oliver WC, Pharr GM (1992) Improved technique for determininghardness and elastic modulus using load and displacement sensingindentation experiments. J Mater Res 7:1564–1580
21. Niihara K, Morena R, Hasselman DPH (1983) Indentation fracturetoughness of brittle materials for palmqvist cracks. Fract MechCeram 5:97–105
22. Li H, Khor KA, Cheang P (2002) Young's modulus and fracturetoughness determination of high velocity oxy-fuel-sprayed bio-ceramic coatings. Surf Coat Technol 155:21–32
23. Shuja SZ, Yilbas BS, Budair MO (1998) Modeling of laserheating of solid substance including assisting gas impingement.Numer Heat Transf, Part A 33:315–339
1018 Int J Adv Manuf Technol (2010) 49:1009–1018


