Embed Size (px)
Citation preview
Journal of Economics and Business 59 (2007) 466–486
Large shareholder monitoring and regulation:The Japanese banking experience
Kenneth A. Kim a,∗, Sang-Hyop Lee b, S. Ghon Rhee c
a School of Management, State University of New York at Buffalo, Buffalo, NY 14260, United Statesb Department of Economics, University of Hawaii, Honolulu, HI 96822, United States
c Shidler College of Business, University of Hawaii, Honolulu, HI 96822, United States
Abstract
During a period where Japanese banks operated under a less restrictive regulatory environment,1986–1988, we find positive relations between bank risks and ownership concentration. This empiricalevidence suggests that shareholder monitoring is present when the potential return to monitoring is high (the“shareholder monitoring hypothesis”). During the periods before and after this particular period, we do notobserve evidence of shareholder oversight. These results are consistent with the argument that regulation(an external governance mechanism) and shareholder monitoring (an internal governance mechanism) aresubstitutes for one another (the “substitution hypothesis”) because the pre- and post-periods are characterizedby stricter regulatory environments. Finally, tests on bank performance lend supporting evidence to bothhypotheses.© 2007 Elsevier Inc. All rights reserved.
JEL classification: G21; G28; G32
Keywords: Large shareholders; Japanese banks; Bank risk; Shareholder monitoring; Regulation
1. Introduction
Researchers contend that regulation and shareholder monitoring are substitute governancemechanisms. For example, Demsetz and Lehn (1985) suggest that “systematic regulation restrictsoptions available to owners” and “regulation also provides some subsidized monitoring and disci-plining of the management of regulated firms”. Therefore, for example, financial firms and utilityfirms probably do not have active shareholders. Black (1998) also argues that regulation obstructsthe potential for effective shareholder oversight. When a firm operates in a regulated industry
∗ Corresponding author. Tel.: +1 716 645 3293; fax: +1 716 645 3283.E-mail address: [email protected] (K.A. Kim).
0148-6195/$ – see front matter © 2007 Elsevier Inc. All rights reserved.doi:10.1016/j.jeconbus.2007.04.007
K.A. Kim et al. / Journal of Economics and Business 59 (2007) 466–486 467
or environment, the gains to shareholder monitoring may be limited. The implication of thesecontentions is that an internal governance mechanism (e.g., shareholder monitoring) can be asubstitute for an external governance mechanism (i.e., regulation).
Concentrated ownership is often used to identify shareholder monitoring (e.g., Demsetz &Lehn, 1985; La Porta, Lopez-de-Silanes, Shleifer, & Vishny, 1998; Shleifer & Vishny, 1986).When a public firm’s ownership is concentrated into the hands of a few large shareholders,then these large shareholders should have both the desire and the power to monitor the firm’soperations and management. For example, according to Shleifer and Vishny (1997, 1986), largeshareholders have the incentive to collect information and monitor management for the purposesof profit maximization. If large shareholders are inactive, then there is an obvious cost as theirinactivity (or shirking) is significantly borne to large shareholders (Demsetz & Lehn, 1985). Assuch, Demsetz (1983, 1986) argues that a shareholder’s ability to exercise oversight and control“must be the primary explanation for ownership concentration”. In a similar vein, Grossman andHart (1986) contend that observed ownership concentration is, in effect, the same as observing theextent to which large shareholders have control. However, the benefits to control are unlikely tobe equal across firms. Demsetz and Lehn (1985) contend that large shareholders will be present inrisky firms, as the payoff potential to active monitoring of risky firms is high. The mere presenceof large owners in risky firms strongly suggests they are monitoring, as the downside potential ofnot monitoring is also especially high in risky firms.
In empirical tests, Demsetz and Lehn (1985) find that firms in regulated industries have lowerownership concentrations. For unregulated firms, they find the relation between ownership con-centration and firm risks to be positive. Their finding that ownership concentration and regulationare negatively related supports the “substitution hypothesis”. Their finding that ownership con-centration and firm risks are positively related supports the “shareholder monitoring hypothesis”.Holderness, Kroszer, and Sheehan (1999), and Himmelberg, Hubbard, and Palia (1998) also finda positive relation between ownership concentration and firm risk. They too suggest that thisevidence is indicative of monitoring by large shareholders.
Other researchers find support for the substitution hypothesis. Kole and Lehn (1999) find thatcontrolling shareholders in the US airlines industry instituted numerous governance mechanismsafter the industry was deregulated. Anderson and Fraser (2000) study US banks during more reg-ulated and less regulated periods and find managerial shareholdings and risk-taking are positivelyrelated only during the less regulated period. Konishi and Yasuda (2004) study risk-taking byJapanese banks after its capital adequacy requirement was increased. They find that risk-takingby the banks’ stable shareholders declined after the capital adequacy requirement was increased.All of these papers’ findings can be viewed as being consistent with the substitution hypothe-sis. Owners are more active when there is less regulation. Booth, Cornett, and Tehranian (2002)find that two internal governance mechanisms, board quality (proxied by the fraction of indepen-dent directors) and officer/director stock ownership, are substitutes for each other. However, forregulated industries (banks and utilities), they find that independent boards and officer/directorstock ownership are not substitute governance mechanisms. Therefore, they also contend that anexternal governance mechanism (i.e., regulation) serves as a substitute for internal governancemechanisms (i.e., independent directors and stock ownership).
La Porta et al. (1998) conduct a cross-country test of the substitution hypothesis. They findthat firms in countries with relatively weak shareholder protection laws have relatively highownership concentrations, which support the substitution hypothesis—shareholders look out fortheir own interests when laws do not. Caprio et al. (2003) also conduct a cross-country test whilespecifically focusing on the relation between bank governance and bank value. They find that

468 K.A. Kim et al. / Journal of Economics and Business 59 (2007) 466–486
banks in countries with strong legal environments are often widely held, which is consistent withLa Porta et al. (1998) and the substitution hypothesis.1
In general, the literature has tested the substitution hypothesis in one of three ways. Papershave either (1) contrasted periods before and/or after a change in the regulatory environment (e.g.,Anderson & Fraser, 2000; Kole & Lehn, 1999; Konishi & Yasuda, 2004), (2) contrasted firmsfrom regulated industries to firms from nonregulated industries (e.g., Booth et al., 2002; Demsetz& Lehn, 1985), or (3) contrasted the internal governance of firms from countries with differentregulatory environments (e.g., La Porta et al., 1998; Caprio et al., 2003). We offer additionalevidence on the substitution hypothesis taking the first approach mentioned above. However, inour paper, we study an industry that experiences a significant deregulation, and then experiencesa significant increase in regulation (we will discuss other aspects of our study that differentiatesour study from others, shortly). Therefore, we will be able to test the substitution hypothesissurrounding two shifts (in opposing directions) in the regulatory environment, within the sameindustry. Specifically, we study large shareholders of Japanese banks under three different reg-ulatory regime periods. According to the substitution hypothesis, when deregulation occurs weshould observe oversight by large shareholders, which, in turn, implies a positive relation betweenbank risk and ownership concentration during the deregulated period. When an increase in regu-lation subsequently occurs, then the positive relation between risk and ownership concentrationis expected to disappear.2
The Japanese bank environment during the mid-to-late 1980s provides an excellent settingto examine the relation between regulation and shareholder oversight. In 1986, Japanese bankregulators lowered the bank capital adequacy ratio requirement and increased deposit insurance.These two significant changes potentially create a flexible and conducive environment for bankshareholders to exercise oversight. A lower capital ratio requirement and higher deposit insur-ance give banks more freedom and ability to engage in value maximizing activities. In 1988,however, the Bank for International Settlements (BIS) passed the Basle Accord that required aspecific minimum capital ratio for all member banks. For almost all Japanese banks, this meanta significant increase in their capital ratios (Wagster, 1996). As a result, this “tighter” regulatoryregime after 1988 may have diminished the incentives for bank shareholders to be active. TheJapanese experience before, during, and after 1986–1988, therefore, offers a unique opportunityto examine the impact of regulation on shareholder oversight.
We form three periods to conduct our hypothesis tests. Specifically, we examine periods from1983 to 1985, from 1986 to 1988, and from 1989 to 1996. The first and last periods represent
1 Gonzalez (2005) studies bank risk-taking in 36 countries and argue that the relation between bank risk-taking and bankregulation is conditioned on the bank’s charter value. To test his hypothesis, he uses a market-to-book ratio of total assetsas a proxy for the bank’s charter value and interacts it with a high regulation dummy when explaining bank risk-taking.He finds risk-taking is higher when regulatory restrictions are higher, but primarily when charter values are low. Barth etal. (2004) study bank regulations from more than 60 countries and find that banks in less regulated countries have a higherprobability of suffering a major banking crisis. They also study bank ownership, but their focus is on state-ownership,which they find is harmful to the financial system.
2 There are at least three dimensions to private (i.e., internal) monitoring: (i) ownership structure, (ii) boards of directors,and (iii) executive compensation contracts. Prowse (1992) finds that large owners of nonfinancial Japanese firms are activemonitors of firm-specific risk, while Kang and Shivdasani (1999) find that board composition of nonfinancial Japanesefirms is not related to firm-specific risk. Due to these prior findings for nonfinancial Japanese firms, we only focus onownership concentration as a potential internal monitoring mechanism for Japanese banks. An effective incentive-inducingcompensation contract is another viable mechanism used to motivate managers to monitor risk and to engage in profit-maximization. However, under the Japanese Commercial Code, executive stock options only became available in themid-1990s.
K.A. Kim et al. / Journal of Economics and Business 59 (2007) 466–486 469
periods before and after the less restrictive regulatory “event period”, 1986–1988. According to thesubstitution hypothesis, the period 1986–1988 represents the only period where the less restrictiveregulatory environment could have allowed shareholder oversight to matter in an economicallymeaningful sense, and thus for shareholder monitoring to take place. To test this hypothesis, weempirically identify the relation (using regression analyses) between ownership concentration andbank-specific risk during the 1986–1988 period. A positive relation would reveal monitoring bylarge shareholders. Consistent with the monitoring hypothesis, we find a positive relation betweenownership and risk during the 1986–1988 period.3 This positive relation does not exist in theprior period, 1983–1985. With the introduction of the Basle Accord in 1988, however, it marksthe beginning of a stricter regulatory environment. Consequently, during this latter period, from1989 to 1996, we find that the positive relation between ownership concentration and bank riskvirtually disappears.4 Additional sensitivity analysis suggests that the relation between ownershipand risk is weak during 1988–1990, but that the relation disappears after 1990. These sensitivityresults are, we believe, a reflection of the gradual adoption of the Basel Accord that took place inJapan; a partial implementation of the Accord took place in 1991 and a full implementation tookplace in 1993.5
We also examine the relation between shareholder concentration and bank performance. Eco-nomic incentives are an important driving force behind shareholder oversight.6 For banks inparticular, Barth, Caprio, and Levine (2004) suggest that strict banking regulations may limitbank agents from exerting corporate control that would promote bank profitability. We expect thatJapanese bank shareholders that become active when the regulatory environment becomes lessrestrictive will be the most profitable. Consistent with our expectation, our empirical results reveala stronger positive relation between ownership concentration and bank performance (accountingprofits) during the less restrictive regulatory environment (1986–1988) when compared to otherperiods.
Overall, the observed relations between bank risk and ownership concentration and betweenownership concentration and bank performance, during the less restrictive regulated period andmore regulated periods, lend support for the substitution hypothesis and the shareholder monitor-ing hypothesis. That is, regulation and shareholder monitoring appear to be substitute governancemechanisms. During a less restrictive regulatory period where the capital ratio requirement wasdecreased and deposit insurance was increased, shareholder monitoring was present in bankswith greater risk, and those shareholder-monitored banks captured more profits than other banks.Because we focus on a single industry that experiences a significant decrease in regulation and thena significant increase in regulation, our findings provide important additional empirical supportfor the thesis that shareholder oversight and regulation substitute for one another.
3 There is an issue as to which, ownership or risk, should be the dependent variable. Because our focus is on monitoring,we treat ownership structure as the dependent variable, consistent with the monitoring literature (e.g., Demsetz & Lehn,1985; Grossman & Hart, 1986; La Porta et al., 1998).
4 It is important to note that the substitution hypothesis does not necessarily imply that ownership structure will changefrom one period to the next. Instead, the hypothesis implies that the relation between ownership concentration and bankrisk will change.
5 We are grateful to the referee for suggesting this investigation.6 There are many papers that claim that “good” governance can lead to higher valuations and/or profitability. For
example, Black, Jang, and Kim (2006) is a good recent paper and Morck et al. (1988) is a classic paper that make thisclaim. However, there are some papers that contend there is no relation between governance and firm value (e.g., Demsetz& Lehn, 1985; Demsetz & Villalonga, 2001 are representative of a good recent paper and a classic paper, respectively).
470 K.A. Kim et al. / Journal of Economics and Business 59 (2007) 466–486
Our paper is most similar to Anderson and Fraser (2000) and Konishi and Yasuda (2004).The first paper examines the relation between managerial shareholdings and risk-taking duringmore and less regulated periods for the US banking industry. The second paper studies stableshareholders and risk-taking after a higher capital adequacy ratio was imposed in Japan. Thoughtheir papers and our paper study bank risk and bank ownership, theirs focus on risk-taking, whileours focuses on monitoring. Their papers rely on capital market measures of risk (i.e., the varianceof stock market rates of returns). In our study, in addition to stock return variance, we introduceadditional risk measures specific to the banking industry such as write-offs for loans losses, a dataitem that is typically difficult to obtain. In addition, we also study the relation between ownershipand profitability. Finally, while our paper studies Japanese banks, as Konishi and Yasuda (2004) do,we conduct cross-sectional tests during different periods, with some emphasis on the deregulatedperiod, while they conduct a time-series test focusing more on the regulated period. Overall, webelieve we are offering important additional empirical evidence on the substitution hypothesis.
The rest of our paper is organized as follows. The next section describes the regulatory envi-ronment for Japanese banks. Section 3 discusses our data and empirical design. Section 4 presentsthe empirical results and Section 5 concludes.
2. The Japanese regulatory environment
Throughout the 1960s and 1970s, Japan’s banking structure was characterized by strictregulation.7 During the early 1980s, however, Japan underwent significant financial marketsderegulation, which included the relaxation of bank lending practices (Marsh & Paul, 1997).Throughout the rest of the 1980s, the Japanese banking environment continued to experience dis-tinct regime shifts characterized by significant changes in its regulatory environment. We describethe most salient changes that occurred during this time period, and their potential implications onshareholder behavior, in the following subsections.
2.1. Changes in 1986: capital adequacy and deposit insurance
In 1985, the Financial System Research Council, under the Ministry of Finance, recommendedsignificant revisions to the capital ratio. Traditionally, capital was viewed as security on deposits,but the Council suggested that capital should be viewed as the last reserve to prevent asset deteri-oration (Sasaki, 1994). In light of this recommendation, the Ministry of Finance re-evaluated thecapital adequacy requirement and made major revisions that took effect in May 1986. Originally,the capital ratio was based on a capital-to-deposit ratio and was set at 10%. Under the new require-ment, the ratio became a capital-to-asset ratio and was set at 4%. During this time period, depositsrepresented over 80% of total assets on average. Therefore, going from a 10% capital-to-depositratio to a 4% capital-to-assets ratio represented a significant relaxation in the capital ratio require-ment. In addition, under this new capital ratio requirement, 70% of hidden reserves was allowedas capital (Sasaki, 1994). Hidden reserves are unrealized capital gains on equity that Japanesebanks carry at cost on their books. Wagster (1996) finds that in 1987, Japanese banks’ capital-to-assets ratio was 12.35% when including hidden reserves, but only 2.11% without includingthese hidden reserves. Prior to 1986, banks were usually undercapitalized, but by allowing hiddenreserves into the capital ratio, banks suddenly became overcapitalized. Therefore, in effect, 1986
7 See Kitagawa and Kurosawa (1994) for an excellent overview of the history of Japanese bank regulation.
K.A. Kim et al. / Journal of Economics and Business 59 (2007) 466–486 471
represents a year in which significant deregulation took place in the Japanese banking industry.As a result, bank shareholders gained additional flexibility, as the regulatory capital adequacyratio requirement became easier to manage.
In addition to the relaxing of the capital ratio requirement, another major event that tookplace in 1986 was the raising of the Japanese banks’ deposit insurance. The Deposit InsuranceCorporation raised deposit insurance, to a single depositor, to 10 million yen from its original 3million yen.8 This 233% increase is higher than the increase that occurred in the United States in1980 where it went from $40,000 to the current $100,000. An increase in deposit insurance is aparticularly relevant event for our study because it is well known that deposit insurance providesbanks with risk-taking incentives.9 As specifically stated by Wheelock and Kumbhakar (1995),“deposit insurance subsidizes risk-taking, therefore, creating a ‘moral hazard’ in that banks withinsured deposits will find it optimal to assume more risk than they would otherwise.” Therefore,in the context of higher deposit insurance, shareholders may encourage bank management toengage in more risk-taking (Crawford, Ezzell, & Miles, 1995). At the same time, shareholderswill voluntarily expend a monitoring effort because if the risk pays off, then they are the ones thatultimately enjoy the benefits, while losses are limited to the little equity that exists. Consequently,these contentions suggest that some Japanese bank shareholders (those that can best respond tothe costs and benefits of monitoring) will engage in more risk-taking after the 1986 increase indeposit insurance. In fact, Benston (1986) and Kane (1985) argue that the increase in depositinsurance that occurred in the US contributed to additional risk-taking during the 1980s.10
Overall, the period immediately following 1986 represents a less restrictive regulatory periodand, consequently, it also represents a period of optimal risk-taking and “control potential” (orpayoff potential) to those that can provide internal monitoring. Therefore, according to the sub-stitution hypothesis, it is during this period where we should observe shareholder oversight.However, the 1988 Basle Accord later imposed regulations on Japanese banking that may haveconstrained and limited the returns to shareholder oversight. We discuss this issue in more detailin the next subsection.
2.2. The 1988 Basle Accord
The 1988 Basle Accord imposed international standards on bank capital requirements.11 Theoverall goal was to reduce risk in the international banking system by regulating bank capital for allmember countries, which included the G-10 countries along with Switzerland and Luxembourg.However, as pointed out by Wagster (1996), the ulterior motive behind the Accord was to eliminatethe funding-cost advantage of Japanese banks. Before the establishment of the Accord, it was well
8 With the enactment of the Deposit Insurance Law of 1971, the Japanese Deposit Insurance Corporation was establishedand modeled after the US Federal Deposit Insurance Corporation (Tatewaki, 1991).
9 Refer to Demirguc-Kunt and Kane (2002), Noe, Rebello, and Wall (1996), Keeley (1990), Kareken and Wallace(1978), Merton (1978), and Sharpe (1978).10 Saunders et al. (1990) empirically confirm the Benston (1986) and Kane (1985) argument by showing that banks
engaged in high levels of risk-taking during the period surrounding the passage of the 1980 Depository InstitutionsDeregulation and Monetary Control Act (DIDMCA). One of the provisions of the Act increased deposit insurance from$40,000 to $100,000. Other evidence regarding consequences to the 1980 change in deposit insurance includes Allenand Wilhelm (1988) and Cornett and Tehranian (1989). These papers conduct event-studies and find positive returns toFederal Reserve System member banks.11 See Montgomery (2005), Hall (1993), Wagster (1996), and Marsh and Paul (1997) for detailed overviews on the Basle
Accord.
472 K.A. Kim et al. / Journal of Economics and Business 59 (2007) 466–486
known that Japanese banks enjoyed lower capital ratios (when excluding hidden reserves) thantheir international counterparts. In this paper, we argue that the additional regulatory presencecreated by the Accord and required increase in bank equity led bank stockholders to become lessactive—i.e., the Accord, by enforcing capital standards, provides subsidized monitoring. Thisidea is similar to a proposition put forth by Besanko and Kanatas (1996) where they argue thathigher capital requirements will lead to a decrease in effort by bank managers. Recently, Konishiand Yasuda (2004) provide some empirical support for this contention. They find decreases inJapanese bank risk-taking following the Accord.
The Basle Accord raised the capital standard to 8% and it was to be met by March 1993. Thiswas complemented with a Ministry of Finance revision to the capital ratio that was to take effectby 1991. By 1991, banks were to achieve at least a 4% ratio of capital-to-assets without includinghidden capital (Kester, 1991). In response to the increase in the capital adequacy requirement,several observations have been noted. Kester (1991) and Sasaki (1994) find that banks primarilymet the new capital ratio requirement by issuing new equity between January 1988 and June 1989.When banks are forced to increase equity, however, they may be moving away from their optimalcapital structures, and their ability to capture subsidies from deposit insurance may diminish.Horiuchi and Shimizu (1998) observe decreases in loans made by Japanese banks which ledto increases in the capital ratio. Hall (1993) argues that Japanese banks reduced their loansto businesses during the period 1990–1993 to reduce the amount of risky assets they had ontheir books in order to maintain appropriate capital levels. Montgomery (2005) makes a similarobservation. She finds that banks shifted away from loans and corporate bonds in their portfoliosand shifted toward government bonds. Marsh and Paul (1997) observe a slightly different outcome.They argue that some banks responded to the higher capital requirements by increasing their riskylending to capture more retained earnings as a way to meet the capital requirements. However, theyalso argue that owners lost the incentive to ensure profitability under a higher capital requirementregime. Therefore, the Marsh and Paul (1997) findings reveal a perverse result: riskier lendingpractices without complementary monitoring.
2.3. The shareholder monitoring hypothesis and the substitution hypothesis
Based on our discussion, we examine three periods: the 1983–1985 period, the 1986–1988period, and the 1989–1996 period. In view of two major regulatory changes, the decrease in thecapital adequacy requirement and the increase in deposit insurance that occurred in 1986, we arguethat 1986 represents the first year when the regulatory environment was flexible and conducivefor bank shareholder oversight to take place. However, we also argue that the passage of theBasle Accord that occurred in 1988 marks the end of this brief era. Based on our contentions, weexpect the following results. First, we should observe a significant positive relation between bank-specific risk measures and ownership concentration (i.e., the shareholder monitoring hypothesis)for the period from 1986 to 1988. That is, when the regulatory environment is less restrictive,then shareholders become more active (i.e., the substitution hypothesis).
Second, we should also observe a significant positive relation between bank profitability andownership concentration for the same period from 1986 to 1988. When the nature of the regulatoryenvironment shifts, we expect owners and their risk-taking to respond optimally (depending onthe specific period transition) at the firm level in response to the profit opportunities that exists.
Finally, for the periods before and after the 1986–1988 period, which are periods characterizedby stricter regulation, we do not expect to see positive relations between ownership concentrationand bank risk, and between ownership concentration and profitability, as regulation provides sub-
K.A. Kim et al. / Journal of Economics and Business 59 (2007) 466–486 473
sidized monitoring and restricts banks’ activities and flexibilities. Because the Basel Accord wasadopted in a phased-in manner, with a partial implementation in 1991 and a full implementationin 1993, the last period extends from 1989 to 1996 to assess the impact of this gradual adoption.The following section discusses how we conduct our empirical tests.
3. Data and empirical design
In our study, we test the relation between bank risk and ownership concentration by usingordinary-least-squares (OLS) regressions. We use ownership concentration as a dependent variableusing three distinct measures of bank risk as explanatory variables. At this point, we shouldmention that some papers use bank risk as a dependent variable and ownership structure as anexplanatory variable. However, because our hypothesis is based on the relation, not necessarilythe directional causation, between risk and ownership, and, perhaps more importantly, becauseour paper’s focus is on “monitoring”, we treat ownership concentration as a dependent variableand various measures of risks as explanatory variables, which is consistent with the monitoringliterature (we will discuss this issue again shortly).
The relation between ownership concentration and risk can be confounded by the bank’s chartervalue. Therefore, we include a proxy for charter value in the regression model as an importantcontrol variable. We also employ firm size as another control variable, as it has been suggestedby prior research as being directly related to ownership concentration. In subsequent tests of thestructural change between periods, we pool our data and include period dummies. Finally, in testson bank profitability, we include a keiretsu dummy variable. Keiretsu banks are able to capture“rents” from their client firms, and as such they should be more profitable than other banks. Amore detailed discussion of our dependent and explanatory variables follows.
3.1. Dependent variables: ownership concentration and profitability
Bank ownership data is collected from the Japan Company Handbooks, published by ToyoKeizai Inc., from 1983 to 1996. This source identifies the top 6 to top 10 shareholders based ontheir percentage ownership. For 1991, there are 65 banks in our sample.12 Consistent with Demsetzand Lehn (1985) and Prowse (1992), we use the following measure of ownership concentration:
LTOP6 = log
[TOP6
100 − TOP6
]
TOP6 represents the concentration of ownership of the top six largest shareholders.13 The logtransformation is calculated to create an unbound dependent variable.
To ensure the robustness of the LTOP6 results, we also employ the following alternativeownership concentration measure:
LHERF = log
[HINDEX
1 − HINDEX
]
12 Our sample includes all commercial banks that include both city banks and regional banks. The distinction betweenthe two types of banks is based solely on the location of their headquarters. In our study, when we distinguish betweenthese two bank types, we find that it does not affect our findings.13 In almost 10% of the observations, there was a tie for fifth place. Using TOP6 completely eliminates any potential
problems that ties might introduce.
474 K.A. Kim et al. / Journal of Economics and Business 59 (2007) 466–486
HINDEX is the Herfindahl index, which is calculated in the following manner: the percent owner-ship stakes of each of the top six largest shareholders are individually squared and then summed.LHERF is used in regressions where ownership concentration is a dependent variable. Demsetzand Lehn (1985) also employ a Herfindahl index to ensure the robustness of their ownershipconcentration results. The benefit of using the Herfinhahl index is that it gives more weight tolarger ownership stakes.
We are well aware that some papers that examine the relation between risk and ownershipconcentration treat risk as the dependent variable (recent papers that do this include Anderson &Fraser, 2000; Gonzalez, 2005; Konishi & Yasuda, 2004). However, how one thinks of the relationbetween bank risk and ownership concentration depends on one’s viewpoint (see Saunders, Strock,& Travlos, 1990, p. 645). Demsetz and Lehn (1985) and Grossman and Hart (1986) point out thatownership concentration is endogenous to firm-specific factors. That is, some firms, such as riskierfirms, need monitoring owners. Therefore, empirical papers that study ownership monitoring havetreated ownership structure as a dependent variable (e.g., Demsetz & Lehn, 1985; Holderness etal., 1999; La Porta et al., 1998). Because our paper treats owners as monitors of risk rather thanas risk-takers, we allow ownership to be the dependent variable. Note also that our paper is morefocused on the relation between risk and ownership concentration rather than on the direction ofcausality.14
In subsequent analyses, bank profitability is a dependent variable. Shleifer and Vishny (1986,1997) contend that large shareholders monitor management for the purposes of profit maximiza-tion. Morck, Shleifer, and Vishny (1988) and McConnell and Servaes (1990) argue that largeowners, by virtue of their oversight and activism, enhance firm value. For these reasons, the priortheoretical literature (e.g. Huddart, 1993) and the prior empirical literature (e.g., McConnell &Servaes, 1990; Morck et al., 1988), often consider firm performance as being endogenous toownership. Of course, it is entirely possible for owners to simply desire more shares in firms theybelieve will have higher returns. This possibility raises a question of causality. To control for thispossibility, we regress profitability on lagged ownership variables. This way, we are examiningthe effect of ownership on subsequent profitability, and not the other way around.
Bank profit is calculated as net income to book equity (ROE). We use accounting profits asour measure of bank profitability rather than stock market rates of return because, as stated byDemsetz and Lehn (1985), stock market returns adjust for any divergences between the interests ofmanagement and owners, while accounting measures do not. Smith (1996) and Weisbach (1988)also make similar claims in stating a preference for using accounting profit to identify the effectsof active governance. Stock market valuations reflect the market’s present valuation of long-runreturns, while accounting returns reflect the immediate effect of shareholder oversight.
3.2. Explanatory variables
The financial statements data and stock returns data used in this study are retrieved from thePACAP Database-Japan.15 To test for the relation between bank risk and ownership concentrationwe employ three distinct, but most commonly cited measures of bank risk. Prior literature providesjustification for each measure as an appropriate proxy for bank risk. A discussion of each bankrisk variable, and a discussion of our control variables, is provided below.
14 Incidentally, the results remain qualitatively the same when risk is the dependent variable.15 PACAP Database-Japan is created in cooperation with Daiwa Institute of Research and Toyo Keizai.
K.A. Kim et al. / Journal of Economics and Business 59 (2007) 466–486 475
3.2.1. Bank specific risk measuresThe variance of stock returns (VRET) is a commonly used measure of bank risk (e.g., Demsetz
& Lehn, 1985; Houston & James, 1995; Saunders et al., 1990, among others). Demsetz and Lehn(1985) state that stock return volatility measures the instability of the firm’s environment. In fact,Saunders et al. (1990) state that stock return variance is the most appropriate indicator of risk forcommercial banks. Similar to Houston and James (1995) and Anderson and Fraser (2000), wealso use the variance of daily stock returns (VRET) and we calculate this for each year.16 Weexpect a positive relation between stock return volatility and ownership concentration. If stockreturn variance is high, then shareholder monitoring should be present.
The equity to asset ratio (EA) is also one of the most commonly used proxies for bankrisk-taking. When equity levels are low, bank risk is high because capital represents collat-eral against bank liabilities and protects banks from insolvency when asset values decline.17
Conservative owners or managers will maintain high levels of capital. Barth, Bartholomew,and Bradley (1990), Cebenoyan, Cooperman, and Register (1995), and Knopf and Teall (1996)suggest that these capitalization ratios are also a good measure of thrift risk-taking. Gibson(1995) also uses the capital ratio as a proxy for bank risk-taking in his study of Japanese banks.Using annual observations, we calculate the capital ratio (EA) as the total value of book equityto the total value of book assets.18 Because a low capital ratio reflects high bank risk, weexpect a negative relation between the capital ratio variable and the ownership concentrationvariable.
Finally, we also use write-off for loan losses (WR) as a measure of bank risk (Gorton &Rosen, 1995). Most empirical studies are unable to use this risk measure due its unavailability(Sharpe, 1994 makes a similar contention). When borrowers default on their bank loans, bankswill write off these defaults on their balance sheets. For our write-off measure (WR), we use theratio of total write-offs to total investments, loans, and receivables.19 Because a higher amountof write-offs reveals risky lending behavior, we expect a positive relation between the write-off variable and the ownership concentration variable. The next subsection discusses controlvariables.20,21
3.2.2. Control variablesIf the bank’s charter value is high, then bank shareholders may own more of the bank’s stocks.
Therefore, a bank’s charter value may represent an important explanatory variable for ownershipconcentration. In addition, because banks with high charter values have low risk, as risk-takingmight jeopardize high charter values (Anderson & Fraser, 2000; Konishi & Yasuda, 2004), it
16 We have also considered various forms of firm-specific risk derived from market models, such as standard errors orbetas, but including these risk measures would represent a dual test of our hypothesis and of the capital asset pricingmodel for banks. In addition, Saunders et al. (1990) specifically state that stock return variance represents a superior riskmeasure to beta.17 See Pringle (1974), Santomero and Watson (1977), Taggart and Greenbaum (1978), Buser, Chen, and Kane (1981),
Marcus (1983), and Houston and James (1995).18 We discuss results using variants of our capital ratio measure later in the paper.19 We discuss results using variants of our write-off ratio measure later in the paper.20 Houston and James (1995) and Knopf and Teall (1996) provide additional discussions on financial institution risk
measures that are employed in our study.21 It has been suggested that the degree of derivative exposure would represent another excellent measure of bank risk.
However, a developed derivative market does not exist in Japan. Japanese banks may invest in the US derivative market,but we do not have this data.
476 K.A. Kim et al. / Journal of Economics and Business 59 (2007) 466–486
implies that some large shareholders may be present in banks with low risk. That is, a bank’scharter value could confound the hypothesized positive relation between risk and ownershipconcentration. To control for these possibilities, we include a dummy variable equal to one ifthe bank has a “high” charter value (i.e., above the median charter value) in the ownershipconcentration regression. Our measure of charter value follows Keeley’s (1990) adaptation ofTobin’s Q, which is calculated as the sum of the market value of equity plus the book value ofliabilities divided by the book value of assets. This measure of charter value (KEELEYSQ) is alsoused in Anderson and Fraser (2000) and Konishi and Yasuda (2004).
The natural log of the market value of equity represents our proxy for firm size (LMVE). Largerfirms will have lower ownership concentrations simply because, as succinctly stated by Prowse(1992), “the larger the firm, the greater is the cost of obtaining a given fraction of ownership.” Whatthis implies is a wealth constraint. However, Prowse (1992) argues that institutional investors arenot wealth constrained. To verify his contention, Prowse (1992) examines a sample of firms withhigh institutional ownership and finds no significant relation between firm size and ownershipconcentration. In our bank sample, we observe that large shareholders of banks are institutionalinvestors. Therefore, we also predict no significant relation between bank size and ownershipconcentration. Consistent with Prowse (1992), this would reveal that large shareholders are notwealth constrained.
In our profitability tests, where ROE is a dependent variable, we also include a keiretsu dummyvariable (KEIRETSU) equal to one if the bank is one of the keiretsu main banks. Keiretsu banksare known to extract rents from their client firms (Weinstein & Yafeh, 1998). In exchange formaintaining close relationships with client firms, keiretsu banks “pressure” client firms to maintainhigh levels of bank debt at high interest rates (Weinstein & Yafeh, 1998). Therefore, keiretsu banksare likely to be more profitable than other banks.
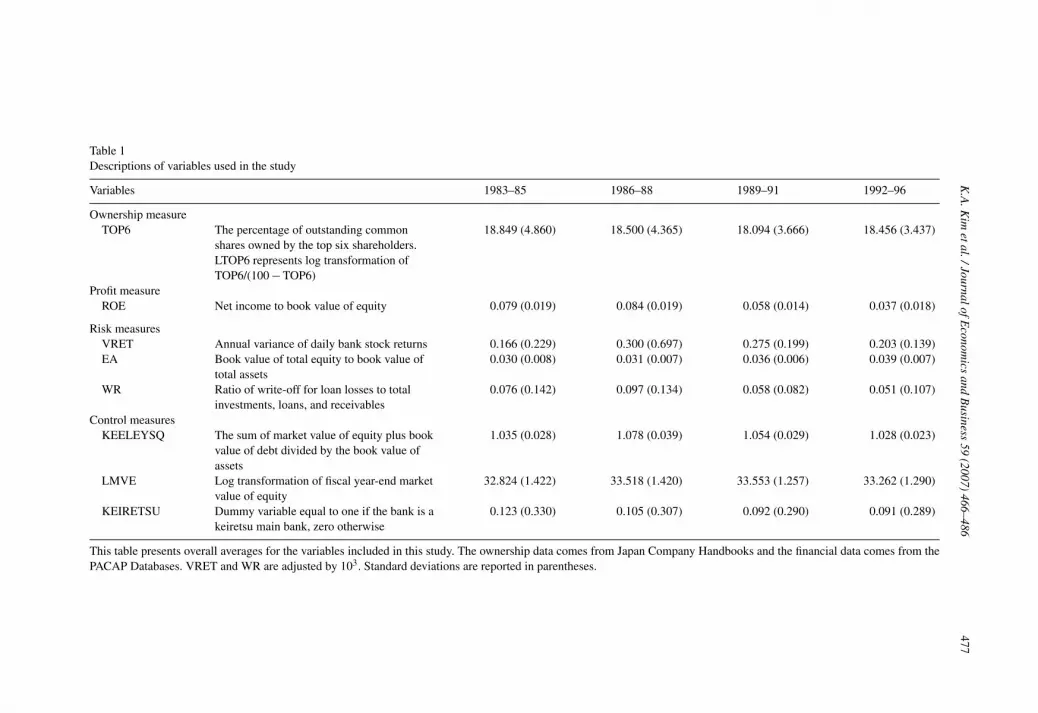
All variables that are employed in this study are described in Table 1. Summary statisticsare also reported by different periods. First, we observe that the top six shareholders (TOP6)hold over 18% of the bank, on average, and that TOP6 does not vary much across differentperiods.22 On the other hand, we see that our risk measures fluctuate substantially over timebut they do not show any consistent pattern across different periods. It is important to note,however, that our hypothesis does not necessarily imply that aggregate ownership concentrationwill change across different periods, instead, our hypothesis predicts that we observe differentcross-sectional relations between ownership structure and risk for each period, where we onlyanticipate a positive relationship between risk and ownership concentration for the middle period(1986–1988).
The mean of ROE shows that Japanese banks were profitable during the 1980s, but it is quiterevealing that bank profits were highest during the 1986–1988 period and they began to declinetoward the end of the 1980s. Approximately 10% of our bank-year observations are keiretsubanks.
22 The banks’ ownership “composition” is quite homogenous. Insurance companies are invariably the primary largeshareholders of banks followed by other financial institutions (which consists of other banks and long-term credit banks),and nonfinancial corporations. There are no cases where an inside shareholder, or any individual, is among the top sixshareholders. Due to the observed homogeneity with regard to the banks’ ownership composition, we do not report separateresults by owner-type. Prowse (1992) finds that when Japanese financial institutions (including insurance companies) arelarge shareholders then they are active monitors. Kim and Nofsinger (2005, p. 220) find that Japanese institutional owners(in particular, financial institutions such as insurance companies and nonfinancial corporations) are equally active in theirinvesting behavior.
K.A
.Kim
etal./JournalofEconom
icsand
Business
59(2007)
466–486477
Table 1Descriptions of variables used in the study
Variables 1983–85 1986–88 1989–91 1992–96
Ownership measureTOP6 The percentage of outstanding common
shares owned by the top six shareholders.LTOP6 represents log transformation ofTOP6/(100 − TOP6)
18.849 (4.860) 18.500 (4.365) 18.094 (3.666) 18.456 (3.437)
Profit measureROE Net income to book value of equity 0.079 (0.019) 0.084 (0.019) 0.058 (0.014) 0.037 (0.018)
Risk measuresVRET Annual variance of daily bank stock returns 0.166 (0.229) 0.300 (0.697) 0.275 (0.199) 0.203 (0.139)EA Book value of total equity to book value of
total assets0.030 (0.008) 0.031 (0.007) 0.036 (0.006) 0.039 (0.007)
WR Ratio of write-off for loan losses to totalinvestments, loans, and receivables
0.076 (0.142) 0.097 (0.134) 0.058 (0.082) 0.051 (0.107)
Control measuresKEELEYSQ The sum of market value of equity plus book
value of debt divided by the book value ofassets
1.035 (0.028) 1.078 (0.039) 1.054 (0.029) 1.028 (0.023)
LMVE Log transformation of fiscal year-end marketvalue of equity
32.824 (1.422) 33.518 (1.420) 33.553 (1.257) 33.262 (1.290)
KEIRETSU Dummy variable equal to one if the bank is akeiretsu main bank, zero otherwise
0.123 (0.330) 0.105 (0.307) 0.092 (0.290) 0.091 (0.289)
This table presents overall averages for the variables included in this study. The ownership data comes from Japan Company Handbooks and the financial data comes from thePACAP Databases. VRET and WR are adjusted by 103. Standard deviations are reported in parentheses.
478 K.A. Kim et al. / Journal of Economics and Business 59 (2007) 466–486
4. Regression results
4.1. Ownership concentration
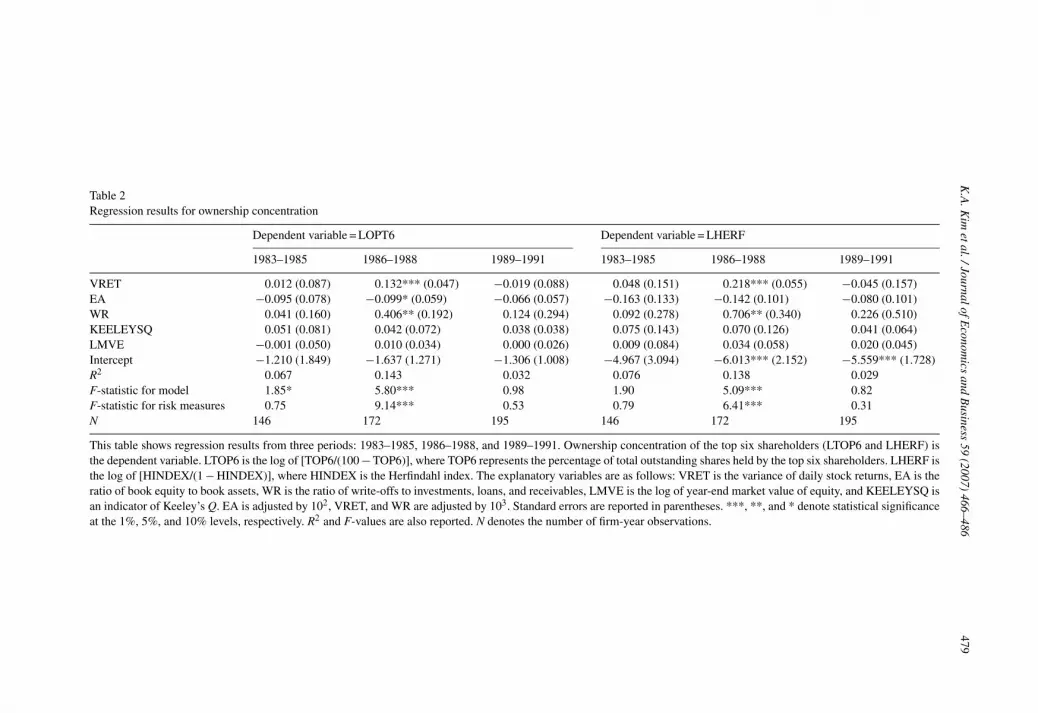
In Table 2, we present OLS regression results examining the relation between risk and own-ership concentration before, during, and after the 1986–1988 period. LTOP6 and LHERF are thedependent variables, and our three risk measures are the key explanatory variables. In estimatingthe regression models, we relax the assumption of independence and homoscedasticity underOLS. Thus, the estimated standard errors are robust to any potential bias from inter-dependenceand heteroscedasticity across observations.
From Table 2, for models where LTOP6 is the dependent variable, we see that all three bank-risk variables are statistically significant with the correct signs only during the middle period from1986 to 1988. Models using LHERF as the dependent variable yield qualitatively similar findings,i.e., risk variables are only statistically significant with correct signs during the middle period.When volatility of bank stocks is high, when bank equity is low, and when write-off for loan lossesis high, the relation between bank risk measures and ownership concentration is strong.23 Duringthe middle period, the three risk measures are not only significant, but they also have larger param-eter coefficients (for the most part) as compared to the other periods, suggesting that the relationbetween ownership concentration and risk is most sensitive during the middle period. To ensurethe robustness of these results, we also conduct several specification checks, including the consid-eration of several alternative measures of EA,24 and by deflating write-offs (WR) by total loansonly. However, regardless of how we measure risks, the findings remain qualitatively the same.25
Thus far, our empirical results support the shareholder monitoring hypothesis. When risk ishigh, there will be more control potential and higher payoff potential accrued, and, as a result,shareholders will maintain a significant ownership presence to facilitate oversight and to enjoy thepotential payoff from their risk-taking. In addition, the fact that the relation between ownershipand risk is strongest for the 1986–1988 period lends support to the substitution hypothesis thatshareholder oversight emerges when regulatory scrutiny diminishes. An additional noteworthyobservation: while it may not be surprising that the market-based measure reacted as it did, givenour hypotheses, it is somewhat impressive that the accounting based measures also show up assignificant given the short 1986–1988 period. Therefore, we view our evidence supporting thesubstitution and monitoring hypotheses as being quite strong. Finally, it is also noteworthy thatthe R2 and F-statistics are highest during this middle period and that the risk variables are jointlysignificant only during the middle period (the F-statistics for the risk measures are statisticallysignificant at the 1% level).26
23 Even though three proxies of bank risk-taking are introduced in a regression model, we confirm that multicollinearityis not affecting our parameter estimate results on the basis of a variance-inflation-factor (VIF) test. We also execute atwo-factor model using each risk measure and our LMVE control variable. The results are qualitatively the same asthose of our multiple regression model. In addition, we also conduct our analysis using intra-firm means of all variables.However, the drastically reduced sample size and statistical power of this analysis leads to increases in significance levelsof our parameter estimates.24 See Pettway, Kaneko, and Young (1991) for a discussion on calculating these alternative ratios.25 We initially include year dummies in each regression model, but these dummies are statistically insignificant and they
had no material affect on the other results. Therefore, we do not report results that include year dummies.26 We also restricted our sample to banks that had available data for every period. This restriction ensures that differences
in results among the periods are due to regulatory changes and not due to the comparison of a different mix of banks.Overall, the regression results of the restricted sample are qualitatively similar to the reported results. However, due tothe issue of selectivity bias of using survived firms, we do not report them.
K.A
.Kim
etal./JournalofEconom
icsand
Business
59(2007)
466–486479
Table 2Regression results for ownership concentration
Dependent variable = LOPT6 Dependent variable = LHERF
1983–1985 1986–1988 1989–1991 1983–1985 1986–1988 1989–1991
VRET 0.012 (0.087) 0.132*** (0.047) −0.019 (0.088) 0.048 (0.151) 0.218*** (0.055) −0.045 (0.157)EA −0.095 (0.078) −0.099* (0.059) −0.066 (0.057) −0.163 (0.133) −0.142 (0.101) −0.080 (0.101)WR 0.041 (0.160) 0.406** (0.192) 0.124 (0.294) 0.092 (0.278) 0.706** (0.340) 0.226 (0.510)KEELEYSQ 0.051 (0.081) 0.042 (0.072) 0.038 (0.038) 0.075 (0.143) 0.070 (0.126) 0.041 (0.064)LMVE −0.001 (0.050) 0.010 (0.034) 0.000 (0.026) 0.009 (0.084) 0.034 (0.058) 0.020 (0.045)Intercept −1.210 (1.849) −1.637 (1.271) −1.306 (1.008) −4.967 (3.094) −6.013*** (2.152) −5.559*** (1.728)R2 0.067 0.143 0.032 0.076 0.138 0.029F-statistic for model 1.85* 5.80*** 0.98 1.90 5.09*** 0.82F-statistic for risk measures 0.75 9.14*** 0.53 0.79 6.41*** 0.31N 146 172 195 146 172 195
This table shows regression results from three periods: 1983–1985, 1986–1988, and 1989–1991. Ownership concentration of the top six shareholders (LTOP6 and LHERF) isthe dependent variable. LTOP6 is the log of [TOP6/(100 − TOP6)], where TOP6 represents the percentage of total outstanding shares held by the top six shareholders. LHERF isthe log of [HINDEX/(1 − HINDEX)], where HINDEX is the Herfindahl index. The explanatory variables are as follows: VRET is the variance of daily stock returns, EA is theratio of book equity to book assets, WR is the ratio of write-offs to investments, loans, and receivables, LMVE is the log of year-end market value of equity, and KEELEYSQ isan indicator of Keeley’s Q. EA is adjusted by 102, VRET, and WR are adjusted by 103. Standard errors are reported in parentheses. ***, **, and * denote statistical significanceat the 1%, 5%, and 10% levels, respectively. R2 and F-values are also reported. N denotes the number of firm-year observations.
480 K.A. Kim et al. / Journal of Economics and Business 59 (2007) 466–486
Charter value (KEELEYSQ) is not significantly related to ownership concentration for anyperiod. Just as important, whether or not we include charter value in the regression model doesnot affect the reported empirical relation between ownership concentration and risk. Therefore,while charter value and risk may be negatively related to each other, their potential relation doesnot seem to confound the relation between ownership and risk. In additional tests where chartervalue and risk are used as interaction variables, the results again do not qualitatively differ fromwhat is reported.
The bank size variable (LMVE) is not statistically significant for any period. The insignifi-cant LMVE finding is consistent with prior literature. When the largest owners are institutionalshareholders, as is the case for our bank sample, then we should observe no significant relationbetween firm size and ownership concentration because institutional shareholders are usually notwealth-constrained (Prowse, 1992).27
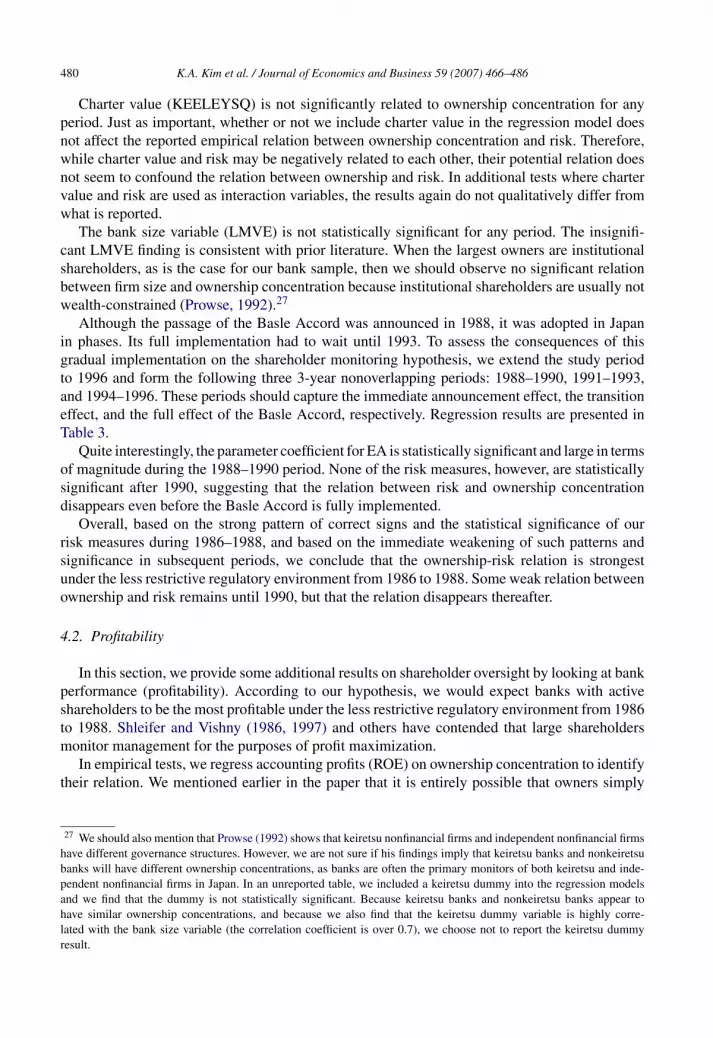
Although the passage of the Basle Accord was announced in 1988, it was adopted in Japanin phases. Its full implementation had to wait until 1993. To assess the consequences of thisgradual implementation on the shareholder monitoring hypothesis, we extend the study periodto 1996 and form the following three 3-year nonoverlapping periods: 1988–1990, 1991–1993,and 1994–1996. These periods should capture the immediate announcement effect, the transitioneffect, and the full effect of the Basle Accord, respectively. Regression results are presented inTable 3.
Quite interestingly, the parameter coefficient for EA is statistically significant and large in termsof magnitude during the 1988–1990 period. None of the risk measures, however, are statisticallysignificant after 1990, suggesting that the relation between risk and ownership concentrationdisappears even before the Basle Accord is fully implemented.
Overall, based on the strong pattern of correct signs and the statistical significance of ourrisk measures during 1986–1988, and based on the immediate weakening of such patterns andsignificance in subsequent periods, we conclude that the ownership-risk relation is strongestunder the less restrictive regulatory environment from 1986 to 1988. Some weak relation betweenownership and risk remains until 1990, but that the relation disappears thereafter.
4.2. Profitability
In this section, we provide some additional results on shareholder oversight by looking at bankperformance (profitability). According to our hypothesis, we would expect banks with activeshareholders to be the most profitable under the less restrictive regulatory environment from 1986to 1988. Shleifer and Vishny (1986, 1997) and others have contended that large shareholdersmonitor management for the purposes of profit maximization.
In empirical tests, we regress accounting profits (ROE) on ownership concentration to identifytheir relation. We mentioned earlier in the paper that it is entirely possible that owners simply
27 We should also mention that Prowse (1992) shows that keiretsu nonfinancial firms and independent nonfinancial firmshave different governance structures. However, we are not sure if his findings imply that keiretsu banks and nonkeiretsubanks will have different ownership concentrations, as banks are often the primary monitors of both keiretsu and inde-pendent nonfinancial firms in Japan. In an unreported table, we included a keiretsu dummy into the regression modelsand we find that the dummy is not statistically significant. Because keiretsu banks and nonkeiretsu banks appear tohave similar ownership concentrations, and because we also find that the keiretsu dummy variable is highly corre-lated with the bank size variable (the correlation coefficient is over 0.7), we choose not to report the keiretsu dummyresult.
K.A. Kim et al. / Journal of Economics and Business 59 (2007) 466–486 481
Table 3Regression results for ownership concentration during the phase-in period of the Basle Accord
1988–1990 1991–1993 1994–1996
VRET 0.035 (0.905) −0.080 (0.098) 0.159 (0.139)EA −0.093* (0.054) −0.031 (0.057) −0.008 (0.041)WR 0.133 (0.243) 0.100 (0.326) 0.205 (0.125)KEELEYSQ −0.012 (0.050) 0.015 (0.044) 0.010 (0.056)LMVE 0.016 (0.027) 0.003 (0.022) −0.024 (0.024)Intercept −1.737 (1.013) −1.508 (0.870) −0.789 (0.877)R2 0.069 0.012 0.033F-statistic for model 1.55 0.29 1.12F-statistic for risk measures 1.31 0.37 1.68N 191 197 196
This table shows regression results from three periods: 1988–1990, 1991–1993, and 1994–1996. LTOP6 is the dependentvariable. LTOP6 is the log of [TOP6/(100 − TOP6)], where TOP6 represents the percentage of total outstanding sharesheld by the top six shareholders. Explanatory variables are as follows: VRET is the variance of daily stock returns, EA isthe ratio of book equity to book assets, WR is the ratio of write-offs to investments, loans, and receivables, LMVE is thelog of year-end market value of equity, and KEELEYSQ is an indicator of Keeley’s Q. EA is adjusted by 102, VRET, andWR are adjusted by 103. Standard errors are reported in parentheses. ***, **, and * denote statistical significance at the1%, 5%, and 10% levels, respectively. R2 and F-values are also reported. N denotes the number of firm-year observations.
hold more shares in firms that are expected to have high returns. To avoid this potential reversecausality, we lag the LTOP6 variable and use this t − 1 variable as an explanatory variable inour regression models that use subsequent accounting profits (ROE) at time t as the dependentvariable.28 If shareholders engage in profit maximizing behaviors during 1986–1988, then therelation between lagged LTOP6 and subsequent ROE should be most sensitive during this middleperiod as compared to other periods.
Along with the ownership variable (LTOP6), we control for other factors that are relatedto bank profits. Specifically, we use write-offs (WR) as a risk variable.29 We also include thebank’s charter value (KEELEYSQ) as an important control variable. Banks with higher chartervalues are likely to have higher accounting profits, and this might be especially true during moreheavily regulated periods where banks have less freedom to engage in a range of their ownactivities leaving factors such as charter value as potentially having greater explanatory poweron performance than otherwise. Because keiretsu banks can capture rents from their client firms(see our discussion in Section 3.2.2), we also include a keiretsu dummy variable (KEIRETSU).We also consider including LMVE as a control variable, in order to capture any economies ofscale effects, however, as mentioned earlier (in footnote 25) the correlation between the keiretsudummy variable and the LMVE variable is very high (over 0.7). In determining which of thesetwo variables to use, we decided to go with the KEIRETSU dummy variable as the keiretsu banks’ability to capture rents is well established in the academic literature (e.g., Weinstein & Yafeh,1998).
In Table 4, we present regression results on the relation between accounting profit and own-ership concentration. In addition to the 1983–1985, 1986–1988, and 1989–1991 periods, we also
28 See Section 3.1 for a discussion on using accounting profits (ROE) as our measure of bank profitability as opposed tomarket measures such as stock returns.29 The write-off amount is not directly related to reported profits, as write-offs only reduce the allowance for loan losses.
Large write-offs do often lead to an increase in the provision for loan losses, which does lower reported profits, but thathappens with a lag. We thank Don Fraser for pointing this out to us.
482K
.A.K
imetal./JournalofE
conomics
andB
usiness59
(2007)466–486
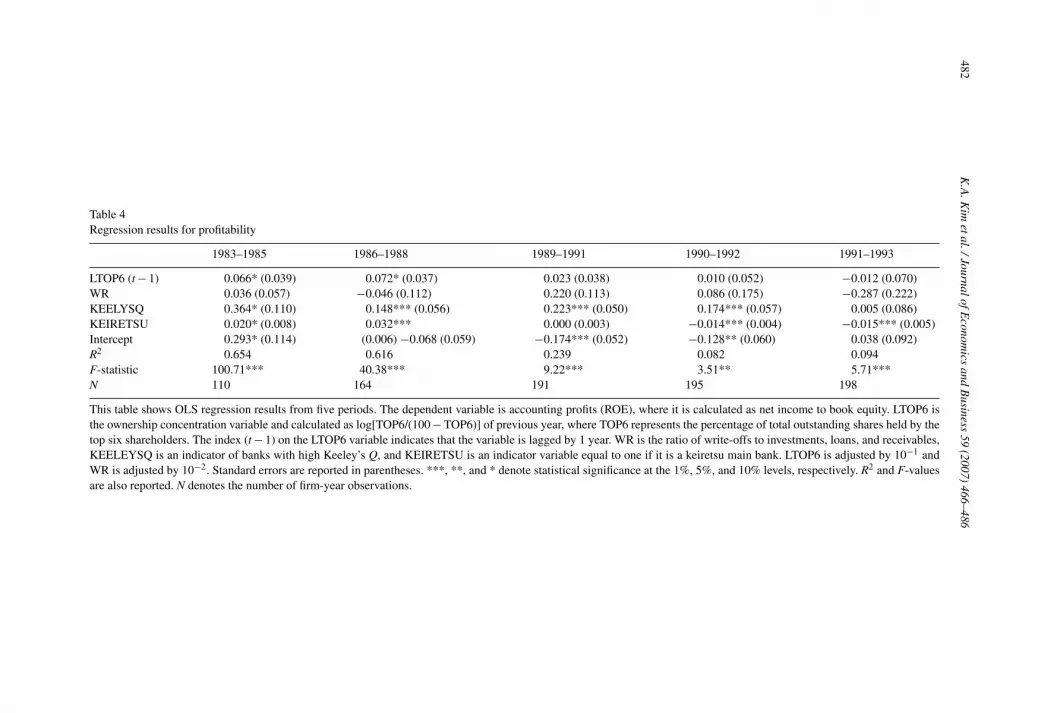
Table 4Regression results for profitability
1983–1985 1986–1988 1989–1991 1990–1992 1991–1993
LTOP6 (t − 1) 0.066* (0.039) 0.072* (0.037) 0.023 (0.038) 0.010 (0.052) −0.012 (0.070)WR 0.036 (0.057) −0.046 (0.112) 0.220 (0.113) 0.086 (0.175) −0.287 (0.222)KEELYSQ 0.364* (0.110) 0.148*** (0.056) 0.223*** (0.050) 0.174*** (0.057) 0.005 (0.086)KEIRETSU 0.020* (0.008) 0.032*** 0.000 (0.003) −0.014*** (0.004) −0.015*** (0.005)Intercept 0.293* (0.114) (0.006) −0.068 (0.059) −0.174*** (0.052) −0.128** (0.060) 0.038 (0.092)R2 0.654 0.616 0.239 0.082 0.094F-statistic 100.71*** 40.38*** 9.22*** 3.51** 5.71***N 110 164 191 195 198
This table shows OLS regression results from five periods. The dependent variable is accounting profits (ROE), where it is calculated as net income to book equity. LTOP6 isthe ownership concentration variable and calculated as log[TOP6/(100 − TOP6)] of previous year, where TOP6 represents the percentage of total outstanding shares held by thetop six shareholders. The index (t − 1) on the LTOP6 variable indicates that the variable is lagged by 1 year. WR is the ratio of write-offs to investments, loans, and receivables,KEELEYSQ is an indicator of banks with high Keeley’s Q, and KEIRETSU is an indicator variable equal to one if it is a keiretsu main bank. LTOP6 is adjusted by 10−1 andWR is adjusted by 10−2. Standard errors are reported in parentheses. ***, **, and * denote statistical significance at the 1%, 5%, and 10% levels, respectively. R2 and F-valuesare also reported. N denotes the number of firm-year observations.
K.A. Kim et al. / Journal of Economics and Business 59 (2007) 466–486 483
consider 1990–1992 and 1991–1993 periods. These last two periods represent different ways ofdenoting the period following the passage of the Basle Accord. From this table, we see that thelagged ownership concentration variable (LTOP6) is positively related to subsequent profitabilityin both the 1983–1985 and 1986–1988 periods. However, the estimated coefficient is larger inthe latter period, suggesting that ROE responds to LTOP6 most sensitively under a less restrictiveregulatory environment.30 The estimated coefficient becomes smaller and also loses its statisticalsignificance after 1989. This finding again lends support to the substitution hypothesis. Whenthe regulatory environment is less restrictive, shareholders will exert more active oversight as thepotential gains to control and oversight are larger.
Somewhat surprisingly, the risk variable (WR) is not significant in all periods. As expected,charter value (KEELEYSQ) is positively related to accounting profits in most periods. Theestimated coefficient of the KEIRETSU dummy variable is positive and significant duringthe 1983–1988 period. However, quite surprisingly, keiretsu banks are less profitable during1990–1993 when many Japanese banks began to experience financial difficulties. We do not pur-sue why this is the case, but it appears that factors other than risk-taking and charter value (suchas concentrated ownership) are also contributing to accounting profits differently through time.
We conduct various robustness checks including fixed-effects (FE) regression results. The FEmethod addresses the endogeneity problem of the independent variables, especially with regardto the potential correlation between LTOP6 and the banks’ unobserved heterogeneity which mayaffect the bank performance measure.31 The results from this additional analysis yield qualitativelysimilar findings as the OLS results and we do not report the results here.
5. Conclusion
We examine ownership concentration and bank risk during the period from 1983 to 1996for a sample of Japanese commercial banks. During the event period of 1986–1988 when thecapital ratio requirement significantly decreased and deposit insurance significantly increased, apositive relation is exhibited between three measures of bank risks and ownership concentration.This finding reveals shareholder oversight during a period where the regulatory environmentwas less restrictive. We also find a stronger relation between ownership concentration and bankperformance (accounting profits) under the less restrictive regulatory environment. Both theserisk and profit findings do not persist in subsequent periods, which are distinguished by the BasleAccord regime.
Overall, our research reveals that large shareholders of banks can potentially be important forbank governance (shareholder monitoring hypothesis). Perhaps most importantly, our findingsindicate that bank shareholders will exert oversight when the regulatory environment providesmore flexibility and more freedom to shareholders. As such, our findings lend support to thesubstitution hypothesis that regulatory oversight (an external governance mechanism) and share-holder oversight (an internal governance mechanism) substitute for one another. While our paperdoes not attempt to argue that one governance mechanism is better than another, our results doecho the sentiments of Chami et al. (2005), who stress that the balance between bank regulations
30 We recognize that the denominator in the ROE measure will be affected by regulation. In fact, we observe that themean ROE is lowest in the third period, as one might expect given the regulatory increase in the capital ratio. However,because our ROE regression analysis is cross-sectional and not a time-series, our analysis does not suffer significantlyfrom this measurement bias, at least not in an unambiguous way.31 The keiretsu dummy variable is left out of the FE regression because it does not vary over periods.
484 K.A. Kim et al. / Journal of Economics and Business 59 (2007) 466–486
and shareholder oversight (i.e., market discipline) is a delicate and complicated issue, and thuslikely to be a difficult one to address in the on-going deliberations on the future of bank regulation.
Acknowledgements
The authors thank an anonymous referee, Rosita Chang, Don Fraser, Akiyoshi Horiuchi, Jun-Koo Kang, Gene Lai, Piman Limpaphayom, Jung Wook Shim, Tim Tyrell, John Wagster, MasahiroYoshikawa, seminar participants at the University of Wisconsin-Milwaukee, Southern IllinoisUniversity at Carbondale, Hitotsubashi University, and the 2006 BOK/KAEA meeting in Seoul,Korea, for comments on earlier versions of this paper. We also thank Pattanaporn Kitsabunnarat forpatiently helping us understand some of the data, and Gunnar Larson for excellent copy-editing.A prior version of this paper is Bank of Korea Working Paper #269. The usual disclaimer applies.
References
Allen, P. R., & Wilhelm, W. J. (1988). The impact of the 1980 depository institutions deregulation and monetary controlact on market value and risk: Evidence from the capital markets. Journal of Money, Credit, and Banking, 20, 364–380.
Anderson, R. C., & Fraser, D. R. (2000). Corporate control, bank risk taking, and the health of the banking industry.Journal of Banking and Finance, 24, 1383–1398.
Barth, J. R., Bartholomew, P. F., & Bradley, M. C. (1990). The determinants of thrift institutions resolution costs. Journalof Finance, 45, 731–754.
Barth, J. R., Caprio, G., & Levine, R. (2004). Bank regulation and supervision: What works best. Journal of FinancialIntermediation, 13, 205–236.
Benston, G. J. (1986). In Benston, et al. (Eds.), Chapter 1 in perspectives on safe and sound banking: Past, present, andfuture. Cambridge: MIT Press.
Besanko, D., & Kanatas, G. (1996). The regulation of bank capital: Do capital standards promote bank safety? Journalof Financial Intermediation, 5, 160–183.
Black, B. S. (1998). Institutional investors and the case for institutional voice. In Joel M. Stern & Donald H. Chew (Eds.),The revolution in corporate finance. Blackwell Publishers, Ltd.
Black, B. S., Jang, H., & Kim, W. (2006). Does corporate governance predict firms’ market values? Evidence from Korea.Journal of Law, Economics and Organization, 22, 366–413.
Booth, J. R., Cornett, M. M., & Tehranian, H. (2002). Boards of directors, ownership, and regulation. Journal of Bankingand Finance, 26, 1973–1996.
Buser, S. A., Chen, A. H., & Kane, E. J. (1981). Federal deposit insurance, regulatory policy, and optimal bank capital.Journal of Finance, 35, 51–60.
Caprio, G., Laeven, L., & Levine, R. (2003). Governance and bank valuation, World Bank working paper.Cebenoyan, A. S., Cooperman, E. S., & Register, C. A. (1995). Deregulation, regulation, equity ownership, and S&L
risk-taking. Financial Management, 24, 63–76.Chami, R., Khan, M. S., Sharma, S. (2005). Emerging issues in banking regulation, IMF working paper.Cornett, M. M., & Tehranian, H. (1989). Stock market reactions to the depository institutions deregulation and monetary
control act of 1980. Journal of Banking and Finance, 13, 81–100.Crawford, A. J., Ezzell, J. R., & Miles, J. A. (1995). Bank CEO pay-performance relations and the effects of deregulation.
Journal of Business, 68, 231–256.Demirguc-Kunt, A., & Kane, E. J. (2002). Deposit insurance around the world: Where does it work? Journal of Economic
Perspectives, 16, 175–195.Demsetz, H. (1983). The structure of ownership and the theory of the firm. Journal of Law and Economics, 26, 375–390.Demsetz, H. (1986). Corporate control, insider trading, and rates of return. American Economic Review, 76, 313–316.Demsetz, H., & Lehn, K. (1985). The structure of corporate ownership: Causes and consequences. Journal of Political
Economy, 93, 1155–1177.Demsetz, H., & Villalonga, B. (2001). Ownership structure and corporate performance. Journal of Corporate Finance, 7,
209–233.Gibson, M. S. (1995). Can bank health affect investment? Evidence from Japan. Journal of Business, 68, 281–308.Gonzalez, F. (2005). Bank regulation and risk-taking incentives: An international comparision of bank risk. Journal of
Banking and Finance, 29, 1153–1184.
K.A. Kim et al. / Journal of Economics and Business 59 (2007) 466–486 485
Gorton, G., & Rosen, R. (1995). Corporate control, portfolio choice, and the decline of banking. Journal of Finance, 50,1377–1420.
Grossman, S., & Hart, O. (1986). The costs and benefits of ownership: A theory of vertical and lateral integration. Journalof Political Economy, 94, 691–719.
Hall, B. J. (1993). How has the Basle Accord affected bank portfolios? Journal of the Japanese and InternationalEconomies, 7, 408–440.
Himmelberg, C. P., Hubbard, R. G., & Palia, D. (1998). Understanding the determinants of managerial ownership and thelink between ownership and performance. Journal of Financial Economics, 53, 353–384.
Holderness, C. G., Kroszer, R. S., & Sheehan, D. (1999). Were the good old days that good? Changes in managerial stockownership since the Great Depression. Journal of Finance, 54, 435–469.
Horiuchi, A., & Shimizu, K. (1998). The deterioration of bank balance sheets in Japan: Risk-taking and recapitalization.Pacific-Basin Finance Journal, 6, 1–26.
Houston, J. F., & James, C. (1995). CEO compensation and bank risk: Is compensation in banking structured to promoterisk taking? Journal of Monetary Economics, 36, 405–431.
Huddart, S. (1993). The effect of a large shareholder on corporate value. Management Science, 39, 1407–1421.Kane, E. J. (1985). The gathering crisis on federal deposit insurance. Cambridge: MIT Press.Kang, J.-K., & Shivdasani, A. (1999). Alternative mechanisms for corporate governance in Japan: An analysis of
independent and bank-affiliated firms. Pacific-Basin Finance Journal, 7, 1–22.Kareken, J., & Wallace, N. (1978). Deposit insurance and bank regulation: A partial equilibrium exposition. Journal of
Business, 51, 413–438.Keeley, M. C. (1990). Deposit insurance, risk, and market power in banking. American Economic Review, 80, 1183–
1200.Kester, W. C. (1991). Japanese takeovers: The global contest for corporate control. Cambridge, MA: Harvard Business
School Press.Kim, K. A., & Nofsinger, J. R. (2005). Institutional herding, business groups, and economic regimes: Evidence from
Japan. Journal of Business, 78, 213–242.Kitagawa, H., & Kurosawa, Y. (1994). Japan: Development and structural change in the banking system. In H. T. Patrick
& Y. C. Park (Eds.), The financial development of Japan, Korea, and Taiwan. Oxford University Press.Knopf, J. D., & Teall, J. L. (1996). Risk-taking behavior in the U.S. thrift industry: Ownership structure and regulatory
changes. Journal of Banking and Finance, 20, 1329–1350.Kole, S., & Lehn, K. (1999). Deregulation and the adaptation of governance structure: The case of U.S. airline industry.
Journal of Financial Economics, 52, 79–117.Konishi, M., & Yasuda, Y. (2004). Factors affecting bank risk taking: Evidence from Japan. Journal of Banking and
Finance, 28, 215–232.La Porta, R., Lopez-de-Silanes, F., Shleifer, A., & Vishny, R. W. (1998). Law and finance. Journal of Political Economy,
106, 1113–1155.Marcus, A. J. (1983). The bank capital decision: A time series-cross sectional analysis. Journal of Finance, 38, 1217–1232.Marsh, T.A. & Paul, J.-M. (1997). BIS capital regulations and Japanese banks’ bad loan problems, U.C. Berkeley working
paper.Merton, R. (1978). On the cost of deposit insurance when there are surveillance costs. Journal of Business, 51, 439–452.McConnell, J. J., & Servaes, H. (1990). Additional evidence on equity ownership and corporate value. Journal of Financial
Economics, 27, 595–612.Montgomery, H. (2005). The effect of the Basle Accord on bank portfolios in Japan. Journal of the Japanese and
International Economies, 19, 24–36.Morck, R., Shleifer, A., & Vishny, R. (1988). Management ownership and market valuation: An empirical analysis. Journal
of Financial Economics, 20, 293–315.Noe, T. H., Rebello, M. J., & Wall, L. D. (1996). Managerial rents and regulatory intervention in troubled banks. Journal
of Banking and Finance, 20, 331–350.Pettway, R. H., Kaneko, T., & Young, M. T. (1991). International bank capital standards and the costs of issuing capital
securities by Japanese banks. Journal of Banking and Finance, 15, 559–580.Pringle, J. J. (1974). The capital decision in commercial banks. Journal of Finance, 29, 779–795.Prowse, S. D. (1992). The structure of corporate ownership in Japan. Journal of Finance, 47, 1121–1140.Santomero, A. M., & Watson, R. D. (1977). Determining an optimal capital standard for the banking industry. Journal of
Finance, 32, 1267–1282.Sasaki, T. (1994). Bank regulation. In Capital markets and financial services in Japan. Tokyo, Japan: Japan Securities
Research Institute.
486 K.A. Kim et al. / Journal of Economics and Business 59 (2007) 466–486
Saunders, A., Strock, E., & Travlos, N. G. (1990). Ownership structure, deregulation, and bank risk taking. Journal ofFinance, 45, 643–654.
Sharpe, W. (1978). Bank capital adequacy, deposit insurance and security values. Journal of Financial QuantitativeAnalysis, 13, 857–902.
Sharpe, I. G. (1994). Determinants of capital structure of Australian trading banks. Asia Pacific Journal of Management,12, 97–121.
Shleifer, A., & Vishny, R. W. (1986). Large shareholders and corporate control. Journal of Political Economy, 94, 461–488.Shleifer, A., & Vishny, R. W. (1997). A survey of corporate governance. Journal of Finance, 52, 737–783.Smith, M. P. (1996). Shareholder activism by institutional investors: Evidence from CalPERS. Journal of Finance, 51,
227–252.Taggart, R. A., & Greenbaum, S. I. (1978). Bank capital and public regulation. Journal of Money, Credit, and Banking,
10, 158–169.Tatewaki, K. (1991). Banking and finance in Japan. New York: Routledge Publishers.Toyo Keizai. (1983–1996). Japanese company handbook. Toyo Keizai Inc..Wagster, J. (1996). The impact of the 1988 Basle Accord on international banks. Journal of Finance, 51, 1321–1346.Weinstein, D. E., & Yafeh, Y. (1998). On the costs of a bank-centered financial system: Evidence from the changing main
bank relations in Japan. Journal of Finance, 53, 635–672.Weisbach, M. S. (1988). Outside directors and CEO turnover. Journal of Financial Economics, 20, 431–460.Wheelock, D. C., & Kumbhakar, S. C. (1995). Which banks choose deposit insurance? Evidence of adverse selection and
moral hazard in a voluntary insurance system. Journal of Money, Credit and Banking, 27, 186–201.