Embed Size (px)
Citation preview
Available online at www.sciencedirect.com
www.elsevier.com/locate/specom
Speech Communication 52 (2010) 954–967
Language-independent processing in speech perception: Identificationof English intervocalic consonants by speakers of eight
European languages
Martin Cooke a,b,*, Maria Luisa Garcia Lecumberri b, Odette Scharenborg c,Wim A. van Dommelen d
a Ikerbasque, Basque Foundation for Science, 48011, Bilbao, Spainb Language and Speech Laboratory, Faculty of Letters, University of the Basque Country, Paseo de la Universidad, 5, 01006, Vitoria, Spain
c Centre for Language and Speech Technology, Radboud University Nijmegen, P.O. Box 9103, 6500 HD Nijmegen, The Netherlandsd Department of Language and Communication Studies, NTNU, NO-7491, Trondheim, Norway
Received 2 September 2009; received in revised form 12 April 2010; accepted 12 April 2010
Abstract
Processing speech in a non-native language requires listeners to cope with influences from their first language and to overcome theeffects of limited exposure and experience. These factors may be particularly important when listening in adverse conditions. However,native listeners also suffer in noise, and the intelligibility of speech in noise clearly depends on factors which are independent of a listener’sfirst language. The current study explored the issue of language-independence by comparing the responses of eight listener groups dif-fering in native language when confronted with the task of identifying English intervocalic consonants in three masker backgrounds, viz.stationary speech-shaped noise, temporally-modulated speech-shaped noise and competing English speech. The study analysed the effectsof (i) noise type, (ii) speaker, (iii) vowel context, (iv) consonant, (v) phonetic feature classes, (vi) stress position, (vii) gender and (viii)stimulus onset relative to noise onset. A significant degree of similarity in the response to many of these factors was evident acrossall eight language groups, suggesting that acoustic and auditory considerations play a large role in determining intelligibility. Lan-guage-specific influences were observed in the rankings of individual consonants and in the masking effect of competing speech relativeto speech-modulated noise.� 2010 Elsevier B.V. All rights reserved.
Keywords: Consonant identification; Non-native; Cross-language; Noise
1. Introduction
Understanding speech produced in a non-native lan-guage can be a challenging experience, especially in theless-than-ideal conditions typical of many communicativesituations. Non-native speech perception is heavily influ-enced by a listener’s first language (L1) sound system (Best,1995; Flege, 1995; Kuhl, 1993). Between-language phonetic
0167-6393/$ - see front matter � 2010 Elsevier B.V. All rights reserved.
doi:10.1016/j.specom.2010.04.004
* Corresponding author at: Ikerbasque, Basque Foundation for Science,48011, Bilbao, Spain.
E-mail addresses: [email protected], [email protected](M. Cooke).
distance (Hazan and Simpson, 2000), language competence(Imai et al., 2005) and orthographic interference (Deteyand Nespoulous, 2008) are other factors which contributeto intelligibility for non-native listeners (NNLs). However,the ease with which a spoken message is understood underadverse conditions is influenced by other factors too.Speakers differ in intrinsic intelligibility (Bradlow et al.,1996; Hazan and Simpson, 2000; Barker and Cooke,2007) while different speaking styles make speech more orless likely to be understood (Bradlow and Bent, 2002;Picheny et al., 1985; Bradlow and Alexander, 2007). Thetype and level of the background noise is also relevant:competing speakers produce less masking in the auditory
M. Cooke et al. / Speech Communication 52 (2010) 954–967 955
periphery than stationary or slowly-varying noise whenmatched for level (Festen and Plomp, 1990) but concurrentspeech can also have a negative impact due to the informa-tional masking effect of linguistic interference (Carhartet al., 1969; Brungart et al., 2001). Differences related toindividual speakers, speaking styles and noise types affectnot only non-native listeners but native listeners (NLs)too (Bradlow and Pisoni, 1999). However, what is currentlyunclear is whether such factors influence NLs and NNLs tothe same extent. Determination of the relative contribu-tions of language-independent and language-dependentprocessing is fundamental in understanding speech percep-tion and has important consequences for applications suchas speech enhancement, for instance, in predicting thelikely benefit of specific signal treatments.
One approach to teasing apart the two types of process-ing is to compare NL and NNL responses on tasks whichsimulate adverse conditions such as added noise (Floren-tine et al., 1984; van Wijngaarden et al., 2002; Cutleret al., 2004), simulated reverberation (Takata and Nabelek,1990; Rogers et al., 2006) or synthetic speech (Alamsaoutraet al., 2006). For practical reasons, most studies of this typehave been limited to pairs of languages, usually with Eng-lish as the target language, paired variously with French(Florentine et al., 1984), Japanese (Takata and Nabelek,1990), Italian (Mackay et al., 2001), Dutch (Cutler et al.,2004) or Spanish (Mayo et al., 1997; Garcıa Lecumberriand Cooke, 2006; Rogers et al., 2006), among others. How-ever, it is difficult to draw strong conclusions about lan-guage-independent factors affecting speech intelligibilityfrom paired-language studies, since the reduction in perfor-mance of non-native listeners could be ascribed to either L1influences or to acoustic factors. Examining differenceswith respect to native controls is insufficient since the NLgroup itself has its own L1 influences which affect intelligi-bility in adverse conditions. An example for English wouldbe the orthographic influence on /h,ð/ distinctions whichmay further complicate the acoustic-based confusion, pos-sibly even more so than for some non-native listeners lack-ing this orthographic influence in their own language.1
Comparing NLs and a single NNL group may be validwhen the issue is one of examining the effects of linguisticcompetence. However, two groups may be insufficient toassess language-independent factors, particularly if one ofthem has the additional advantage of native competenceand the consequent extensive exposure to the stimuli inquestion. The use of several NNL groups processing thesame target language may provide a clearer picture of lan-guage-dependent and independent influences.
Occasionally, three L1s have been compared (e.g. Eng-lish–Spanish–Japanese in Hazan and Simpson, 2000; Eng-lish–Spanish–Dutch in Cutler et al., 2008). In the latter
1 Other than English, of the languages tested in the current study onlySpanish has these sounds, and then very rarely in positions where anorthography-based influence might arise. For Spanish listeners, English /ð/ is typically confused with /d/.
study, Cutler et al. presented Dutch listeners with a subsetof stimulus conditions previously tested with English andSpanish listeners by Garcıa Lecumberri and Cooke(2006) to address the issue of whether a disproportionateeffect of noise relative to quiet on Spanish listeners foundby Garcıa Lecumberri and Cooke (2006), but not for Dutchlisteners in (Cutler et al., 2004), was due to listener or stim-uli differences. The Cutler et al. (2008) study demonstratesthe potential value of using a wider range of listener groupsdiffering in L1 in understanding the specific contributionsof task and other factors to both native and non-nativespeech perception.
The current study extends this multi-language approachto eight European languages. All listeners undertook thesame task, which was to identify consonants in vowel–con-sonant–vowel (VCV) tokens produced by British Englishspeakers in a range of additive noise conditions. While inprinciple the data gathered from multi-language studiescan be used to address issues involving detailed explana-tions for response patterns for specific L1 groups, the mainfocus of the current study was to investigate and measureresponses across groups of listeners with different L1s inorder to distinguish language-independent from language-specific processing in speech perception.
The key issue for the current study is the extent to whichdifferent L1 groups respond similarly to variables such asspeaker (Bradlow and Pisoni, 1999) and vowel context(Dubno and Levitt, 1981; Hazan and Simpson, 2000; Jianget al., 2006). For example, are consonants in some vowelcontexts more intelligible for all listener groups regardlessof L1? If some vowel contexts are favoured by all groups,then an acoustic basis for the preference is more likely thanan explanation based on a learned relationship whichought to be sensitive to the L1 of a listener group. Noiseis known to affect the role played by specific perceptualcues (Wang and Bilger, 1973; Hazan and Simpson, 2000;Parikh and Loizou, 2005; Jiang et al., 2006; van Engenand Bradlow, 2007) so it might be expected that, forinstance, the ranking of speaker intelligibility will be mas-ker-dependent. Here, we examine the similarity of listenergroup responses for to the following factors: (i) noise type,(ii) speaker, (iii) vowel context, (iv) consonant, (v) phoneticfeature classes, (vi) stress position, (vii) gender and (viii)stimulus onset relative to noise onset.
2. Methods
2.1. Listener groups
Listeners were speakers of one of eight European lan-guages. As well as a native group of British English listen-ers (en), native listeners of Czech (cz), Dutch (du), German(ge), Italian (it), Norwegian (no), Romanian (ro) and Span-ish (sp) participated. This set of languages, four Germanic,three Romance and one Slavic, was chosen on the prag-matic basis that countries where these languages are spo-ken hosted participants in the Marie Curie Research
956 M. Cooke et al. / Speech Communication 52 (2010) 954–967
Training Network “Sound to Sense”, with the exception ofthe German group. Listeners were students and staff at thefollowing institutions: University of Sheffield, Charles Uni-versity Prague, Radboud University Nijmegen, Universityof Oldenburg, University Federico II (Naples), NorwegianUniversity of Science and Technology (Trondheim), Uni-versity of Cluj-Napoca and the University of the BasqueCountry (Vitoria). All listeners were tested in their owninstitutions. They were asked to report if they were awareof having any hearing problems and to rate their level ofEnglish on a 4-point scale. Table 1 summarises listenergroup information. A Kruskal–Wallis rank sum test indi-cated that the distribution of self-assessed competencewas not the same for each group (c2(6, N = 465) = 54.0,p < 0.001). We examine the relationship between self-assessed competence and performance in this task in Sec-tion 3.2.
2.2. Speech material
Speech material was drawn from an existing corpus ofBritish English intervocalic consonants (VCVs) spoken ina number of vowel and stress combinations (Cooke andScharenborg, 2008), recorded at the University of Sheffield.This corpus contains VCV tokens formed from all 24 con-sonants of British English (/p, b, t, d, k, g, tS, dZ, f, v, h, ð, s,z, S, Z, h, m, n, N, l, r, j, w/) in the context of all nine com-binations of the vowels /i:, u:, �/ for both front and endstress (e.g. /0�b�/ versus /�0b�/). Note that while thesepatterns are not all valid combinations for English (thelong/tense vowels cannot be followed by the velar nasal),speakers were aware that they were producing nonsensetokens. The current study used VCV tokens from four maleand four female talkers.
2.3. Maskers
Listeners identified VCVs in quiet and six different addi-tive noise backgrounds but the current analysis focuses ona representative subset of noise conditions, viz. speech-shaped noise (SSN), speech-modulated noise (SMN) and
Table 1Listener group data. These figures are based on the 178 listeners whoseresponses were analysed in the paper and does not include participantswho were removed from the analysis as outliers after taking part in thetests. SAC indicates self-assessed competence level in English based on thescale 1 = basic, 2 = intermediate, 3 = advanced, 4 = fluent.
Native language N Age: mean (SD) SAC: mean (SD)
English 23 29 (8.3)Czech 18 21 (2.9) 2.44 (0.60)Dutch 15 30 (9.0) 3.07 (0.69)German 18 26 (3.5) 2.33 (0.67)Italian 18 28 (5.3) 2.44 (0.60)Norwegian 21 23 (2.8) 2.95 (0.66)Romanian 26 23 (0.6) 2.58 (0.80)Spanish 39 22 (4.9) 2.77 (0.48)
competing speaker (CS). The three noise backgrounds wereselected on the basis that they provide different types ofspectral and temporal masking and because they permitthe roles of informational and energetic masking to beexamined. Energetic masking refers to the effect of interac-tions between target and masker in the auditory periphery,while informational masking is a cover term for the effectof more central processes which reduce intelligibility stillfurther once energetic masking has been taken intoaccount. Speech-shaped noise is a pure energetic maskerwith a fixed spectrum and no significant temporal modula-tions. Speech-modulated noise shares its spectral shapewith SSN but has temporal envelope modulations derivedfrom natural speech. SMN is also a pure energetic masker,containing no intelligible components, but it differs fromSSN in permitting occasional clear glimpses across theentire spectrum of any signal mixed with it. A competingspeaker contains significant modulations in both frequencyand time and produces both energetic and informationalmasking since audible components of the masker can com-pete with those of the target, both for a listener’s attentionand in the assembly of speech fragments into a coherentstream.
Masker signals for each of the three noise conditionswere derived from speech material from eight talkers (fourmale, four female) drawn from an existing corpus (Lu,2010). Speech-shaped noise was generated by passing whitenoise through a 50 coefficient filter derived from the LPCspectrum resulting from the sum of 200 sentences. Compet-ing speech maskers were randomly-chosen segments fromthe sentence material. As a consequence, the four maleand four female background talkers were equally-likely tobe chosen as maskers. Two of the female talkers who con-tributed the background material were among the setwhose VCV tokens were used, so on about 3% of trialsthe foreground and background talkers were identical.To generate speech-modulated noise maskers, envelopesfrom random segments of competing speech were multi-plied sample-wise with fragments of SSN.
2.4. Stimuli
Each test condition involved the identification of a set of384 VCV tokens, made up of one front-stressed and oneend-stressed instance of each of the 24 consonants fromeach of eight speakers. Vowel contexts were chosen ran-domly and consequently were approximately uniformly-distributed across the test material. In the masked condi-tions, tokens were added to noise signals of 1200 ms dura-tion. The onset time of the VCV token relative to the noisewas varied in order to make the appearance of the targetitem unpredictable within the noise, since it has been sug-gested that predictability may benefit native listeners morethan non-natives (Cutler et al., 2008). Onsets took one ofeight values linearly-spaced in the range 0–400 ms. Onsettimes were balanced so that each consonant occurred thesame number of times at each of the eight onsets. For each
M. Cooke et al. / Speech Communication 52 (2010) 954–967 957
token, the noise signal was scaled to produce a global SNRof �6 dB in the region where the token was present. ThisSNR value was chosen on the basis of pilot tests and pre-vious experiments to produce consonant identificationrates avoiding floor and ceiling effects for both nativeand non-native listeners (Garcıa Lecumberri and Cooke,2006).
2.5. Perception tests
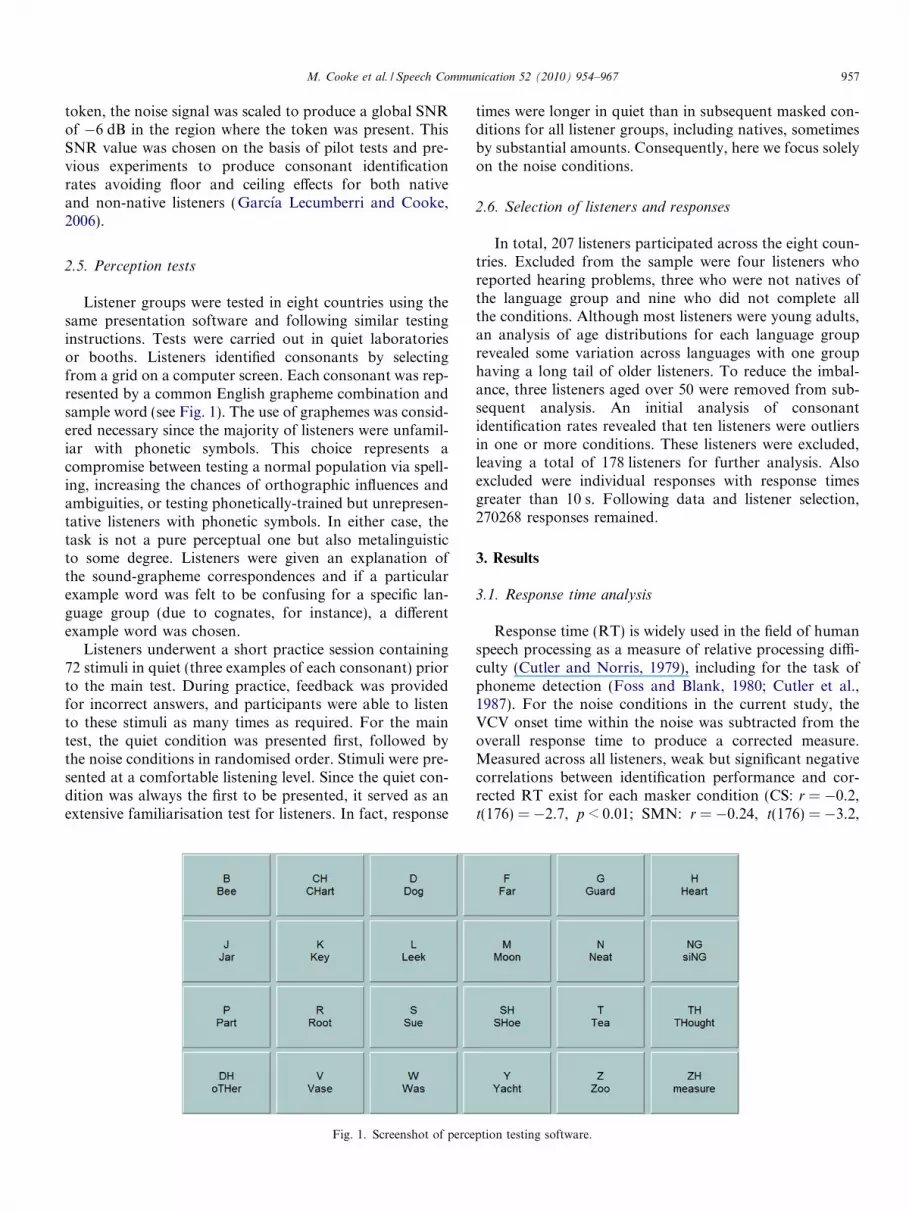
Listener groups were tested in eight countries using thesame presentation software and following similar testinginstructions. Tests were carried out in quiet laboratoriesor booths. Listeners identified consonants by selectingfrom a grid on a computer screen. Each consonant was rep-resented by a common English grapheme combination andsample word (see Fig. 1). The use of graphemes was consid-ered necessary since the majority of listeners were unfamil-iar with phonetic symbols. This choice represents acompromise between testing a normal population via spell-ing, increasing the chances of orthographic influences andambiguities, or testing phonetically-trained but unrepresen-tative listeners with phonetic symbols. In either case, thetask is not a pure perceptual one but also metalinguisticto some degree. Listeners were given an explanation ofthe sound-grapheme correspondences and if a particularexample word was felt to be confusing for a specific lan-guage group (due to cognates, for instance), a differentexample word was chosen.
Listeners underwent a short practice session containing72 stimuli in quiet (three examples of each consonant) priorto the main test. During practice, feedback was providedfor incorrect answers, and participants were able to listento these stimuli as many times as required. For the maintest, the quiet condition was presented first, followed bythe noise conditions in randomised order. Stimuli were pre-sented at a comfortable listening level. Since the quiet con-dition was always the first to be presented, it served as anextensive familiarisation test for listeners. In fact, response
Fig. 1. Screenshot of perce
times were longer in quiet than in subsequent masked con-ditions for all listener groups, including natives, sometimesby substantial amounts. Consequently, here we focus solelyon the noise conditions.
2.6. Selection of listeners and responses
In total, 207 listeners participated across the eight coun-tries. Excluded from the sample were four listeners whoreported hearing problems, three who were not natives ofthe language group and nine who did not complete allthe conditions. Although most listeners were young adults,an analysis of age distributions for each language grouprevealed some variation across languages with one grouphaving a long tail of older listeners. To reduce the imbal-ance, three listeners aged over 50 were removed from sub-sequent analysis. An initial analysis of consonantidentification rates revealed that ten listeners were outliersin one or more conditions. These listeners were excluded,leaving a total of 178 listeners for further analysis. Alsoexcluded were individual responses with response timesgreater than 10 s. Following data and listener selection,270268 responses remained.
3. Results
3.1. Response time analysis
Response time (RT) is widely used in the field of humanspeech processing as a measure of relative processing diffi-culty (Cutler and Norris, 1979), including for the task ofphoneme detection (Foss and Blank, 1980; Cutler et al.,1987). For the noise conditions in the current study, theVCV onset time within the noise was subtracted from theoverall response time to produce a corrected measure.Measured across all listeners, weak but significant negativecorrelations between identification performance and cor-rected RT exist for each masker condition (CS: r = �0.2,t(176) = �2.7, p < 0.01; SMN: r = �0.24, t(176) = �3.2,
ption testing software.
958 M. Cooke et al. / Speech Communication 52 (2010) 954–967
p < 0.01; SSN: r = �0.15, t(176) = �1.97, p = 0.051).Thus, for all test conditions, shorter response times corre-late with a better identification performance, although thecorrelation is marginal in the case of the SSN masker.
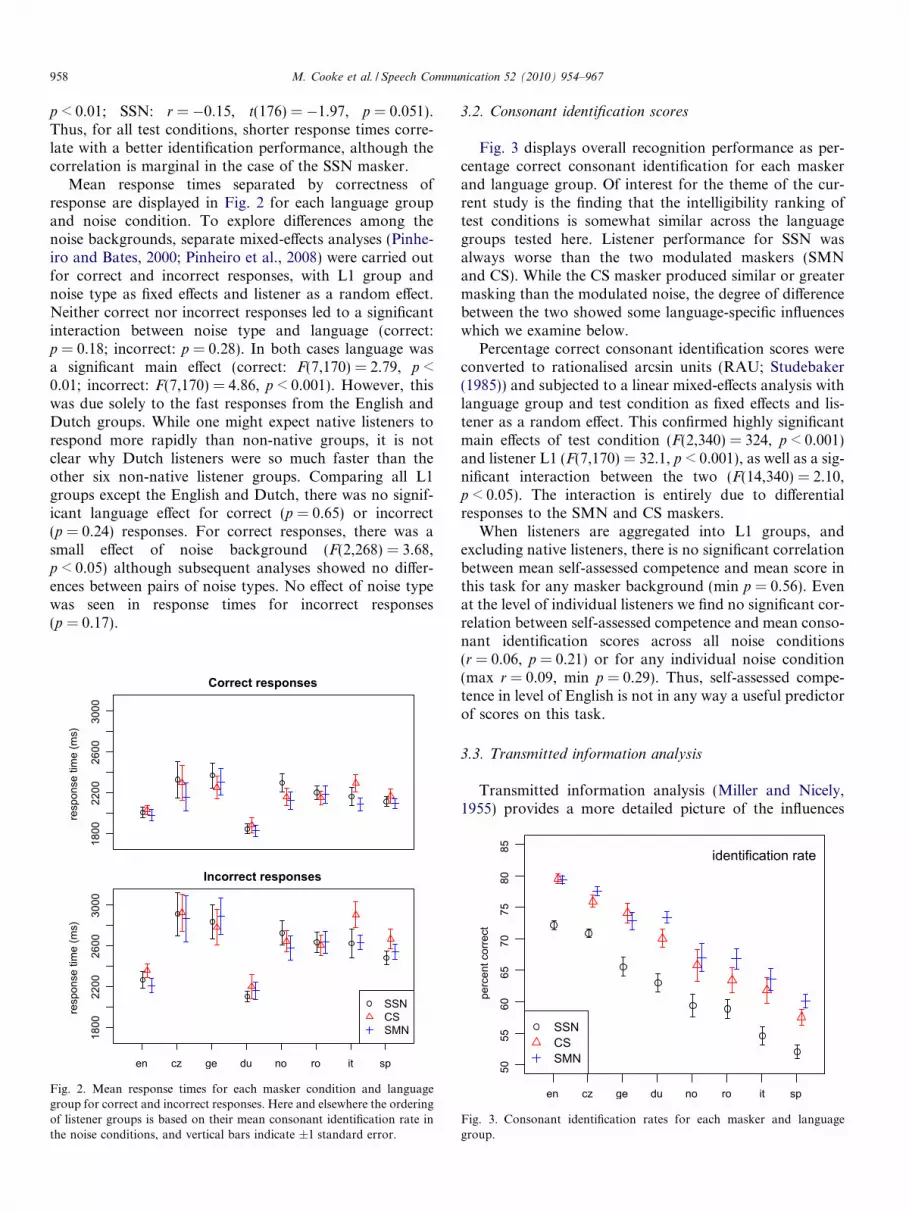
Mean response times separated by correctness ofresponse are displayed in Fig. 2 for each language groupand noise condition. To explore differences among thenoise backgrounds, separate mixed-effects analyses (Pinhe-iro and Bates, 2000; Pinheiro et al., 2008) were carried outfor correct and incorrect responses, with L1 group andnoise type as fixed effects and listener as a random effect.Neither correct nor incorrect responses led to a significantinteraction between noise type and language (correct:p = 0.18; incorrect: p = 0.28). In both cases language wasa significant main effect (correct: F(7,170) = 2.79, p <0.01; incorrect: F(7,170) = 4.86, p < 0.001). However, thiswas due solely to the fast responses from the English andDutch groups. While one might expect native listeners torespond more rapidly than non-native groups, it is notclear why Dutch listeners were so much faster than theother six non-native listener groups. Comparing all L1groups except the English and Dutch, there was no signif-icant language effect for correct (p = 0.65) or incorrect(p = 0.24) responses. For correct responses, there was asmall effect of noise background (F(2,268) = 3.68,p < 0.05) although subsequent analyses showed no differ-ences between pairs of noise types. No effect of noise typewas seen in response times for incorrect responses(p = 0.17).
Fig. 2. Mean response times for each masker condition and languagegroup for correct and incorrect responses. Here and elsewhere the orderingof listener groups is based on their mean consonant identification rate inthe noise conditions, and vertical bars indicate ±1 standard error.
3.2. Consonant identification scores
Fig. 3 displays overall recognition performance as per-centage correct consonant identification for each maskerand language group. Of interest for the theme of the cur-rent study is the finding that the intelligibility ranking oftest conditions is somewhat similar across the languagegroups tested here. Listener performance for SSN wasalways worse than the two modulated maskers (SMNand CS). While the CS masker produced similar or greatermasking than the modulated noise, the degree of differencebetween the two showed some language-specific influenceswhich we examine below.
Percentage correct consonant identification scores wereconverted to rationalised arcsin units (RAU; Studebaker(1985)) and subjected to a linear mixed-effects analysis withlanguage group and test condition as fixed effects and lis-tener as a random effect. This confirmed highly significantmain effects of test condition (F(2,340) = 324, p < 0.001)and listener L1 (F(7,170) = 32.1, p < 0.001), as well as a sig-nificant interaction between the two (F(14,340) = 2.10,p < 0.05). The interaction is entirely due to differentialresponses to the SMN and CS maskers.
When listeners are aggregated into L1 groups, andexcluding native listeners, there is no significant correlationbetween mean self-assessed competence and mean score inthis task for any masker background (min p = 0.56). Evenat the level of individual listeners we find no significant cor-relation between self-assessed competence and mean conso-nant identification scores across all noise conditions(r = 0.06, p = 0.21) or for any individual noise condition(max r = 0.09, min p = 0.29). Thus, self-assessed compe-tence in level of English is not in any way a useful predictorof scores on this task.
3.3. Transmitted information analysis
Transmitted information analysis (Miller and Nicely,1955) provides a more detailed picture of the influences
Fig. 3. Consonant identification rates for each masker and languagegroup.
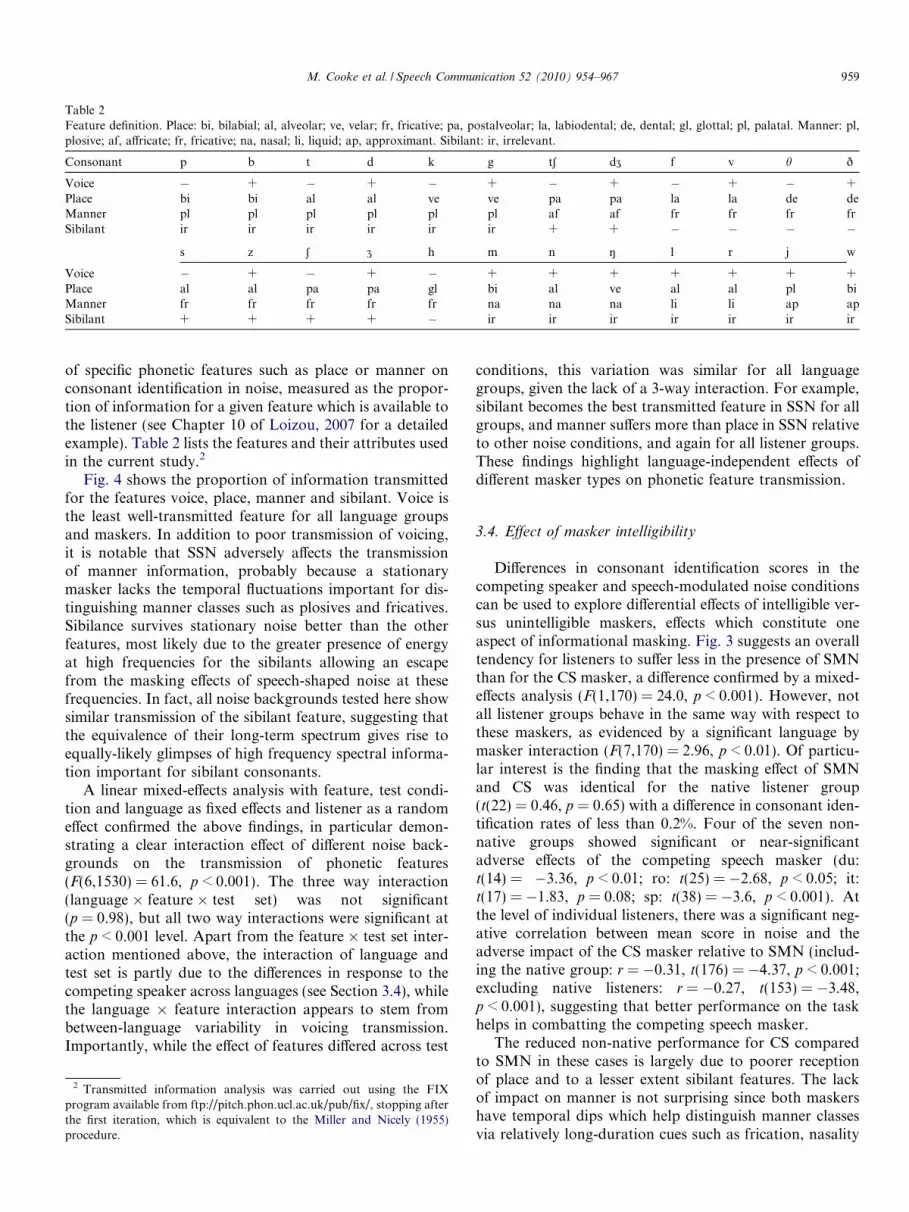
Table 2Feature definition. Place: bi, bilabial; al, alveolar; ve, velar; fr, fricative; pa, postalveolar; la, labiodental; de, dental; gl, glottal; pl, palatal. Manner: pl,plosive; af, affricate; fr, fricative; na, nasal; li, liquid; ap, approximant. Sibilant: ir, irrelevant.
Consonant p b t d k g tS dZ f v h ð
Voice � + � + � + � + � + � +Place bi bi al al ve ve pa pa la la de deManner pl pl pl pl pl pl af af fr fr fr frSibilant ir ir ir ir ir ir + + � � � �
s z S Z h m n N l r j w
Voice � + � + � + + + + + + +Place al al pa pa gl bi al ve al al pl biManner fr fr fr fr fr na na na li li ap apSibilant + + + + � ir ir ir ir ir ir ir
M. Cooke et al. / Speech Communication 52 (2010) 954–967 959
of specific phonetic features such as place or manner onconsonant identification in noise, measured as the propor-tion of information for a given feature which is available tothe listener (see Chapter 10 of Loizou, 2007 for a detailedexample). Table 2 lists the features and their attributes usedin the current study.2
Fig. 4 shows the proportion of information transmittedfor the features voice, place, manner and sibilant. Voice isthe least well-transmitted feature for all language groupsand maskers. In addition to poor transmission of voicing,it is notable that SSN adversely affects the transmissionof manner information, probably because a stationarymasker lacks the temporal fluctuations important for dis-tinguishing manner classes such as plosives and fricatives.Sibilance survives stationary noise better than the otherfeatures, most likely due to the greater presence of energyat high frequencies for the sibilants allowing an escapefrom the masking effects of speech-shaped noise at thesefrequencies. In fact, all noise backgrounds tested here showsimilar transmission of the sibilant feature, suggesting thatthe equivalence of their long-term spectrum gives rise toequally-likely glimpses of high frequency spectral informa-tion important for sibilant consonants.
A linear mixed-effects analysis with feature, test condi-tion and language as fixed effects and listener as a randomeffect confirmed the above findings, in particular demon-strating a clear interaction effect of different noise back-grounds on the transmission of phonetic features(F(6,1530) = 61.6, p < 0.001). The three way interaction(language � feature � test set) was not significant(p = 0.98), but all two way interactions were significant atthe p < 0.001 level. Apart from the feature � test set inter-action mentioned above, the interaction of language andtest set is partly due to the differences in response to thecompeting speaker across languages (see Section 3.4), whilethe language � feature interaction appears to stem frombetween-language variability in voicing transmission.Importantly, while the effect of features differed across test
2 Transmitted information analysis was carried out using the FIXprogram available from ftp://pitch.phon.ucl.ac.uk/pub/fix/, stopping afterthe first iteration, which is equivalent to the Miller and Nicely (1955)procedure.
conditions, this variation was similar for all languagegroups, given the lack of a 3-way interaction. For example,sibilant becomes the best transmitted feature in SSN for allgroups, and manner suffers more than place in SSN relativeto other noise conditions, and again for all listener groups.These findings highlight language-independent effects ofdifferent masker types on phonetic feature transmission.
3.4. Effect of masker intelligibility
Differences in consonant identification scores in thecompeting speaker and speech-modulated noise conditionscan be used to explore differential effects of intelligible ver-sus unintelligible maskers, effects which constitute oneaspect of informational masking. Fig. 3 suggests an overalltendency for listeners to suffer less in the presence of SMNthan for the CS masker, a difference confirmed by a mixed-effects analysis (F(1,170) = 24.0, p < 0.001). However, notall listener groups behave in the same way with respect tothese maskers, as evidenced by a significant language bymasker interaction (F(7,170) = 2.96, p < 0.01). Of particu-lar interest is the finding that the masking effect of SMNand CS was identical for the native listener group(t(22) = 0.46, p = 0.65) with a difference in consonant iden-tification rates of less than 0.2%. Four of the seven non-native groups showed significant or near-significantadverse effects of the competing speech masker (du:t(14) = �3.36, p < 0.01; ro: t(25) = �2.68, p < 0.05; it:t(17) = �1.83, p = 0.08; sp: t(38) = �3.6, p < 0.001). Atthe level of individual listeners, there was a significant neg-ative correlation between mean score in noise and theadverse impact of the CS masker relative to SMN (includ-ing the native group: r = �0.31, t(176) = �4.37, p < 0.001;excluding native listeners: r = �0.27, t(153) = �3.48,p < 0.001), suggesting that better performance on the taskhelps in combatting the competing speech masker.
The reduced non-native performance for CS comparedto SMN in these cases is largely due to poorer receptionof place and to a lesser extent sibilant features. The lackof impact on manner is not surprising since both maskershave temporal dips which help distinguish manner classesvia relatively long-duration cues such as frication, nasality
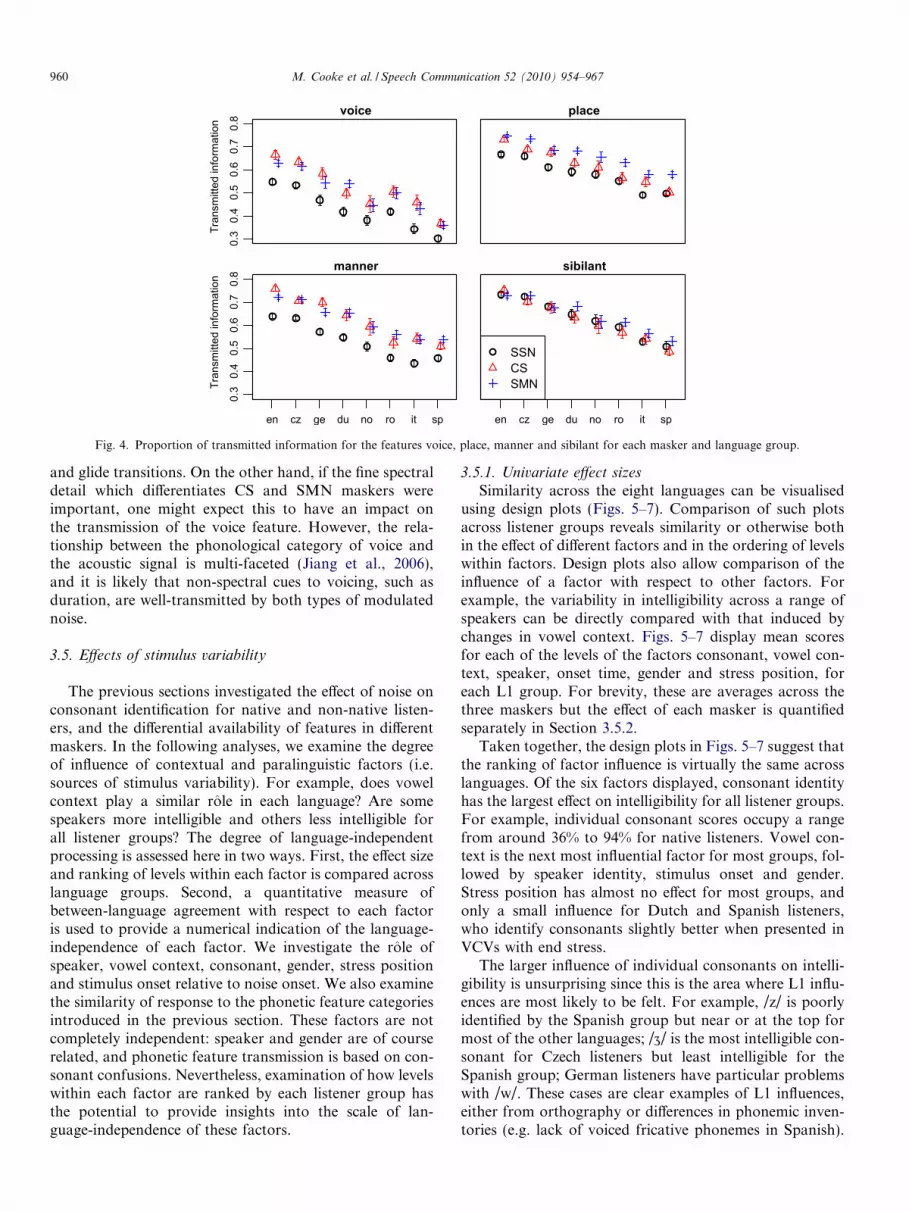
Fig. 4. Proportion of transmitted information for the features voice, place, manner and sibilant for each masker and language group.
960 M. Cooke et al. / Speech Communication 52 (2010) 954–967
and glide transitions. On the other hand, if the fine spectraldetail which differentiates CS and SMN maskers wereimportant, one might expect this to have an impact onthe transmission of the voice feature. However, the rela-tionship between the phonological category of voice andthe acoustic signal is multi-faceted (Jiang et al., 2006),and it is likely that non-spectral cues to voicing, such asduration, are well-transmitted by both types of modulatednoise.
3.5. Effects of stimulus variability
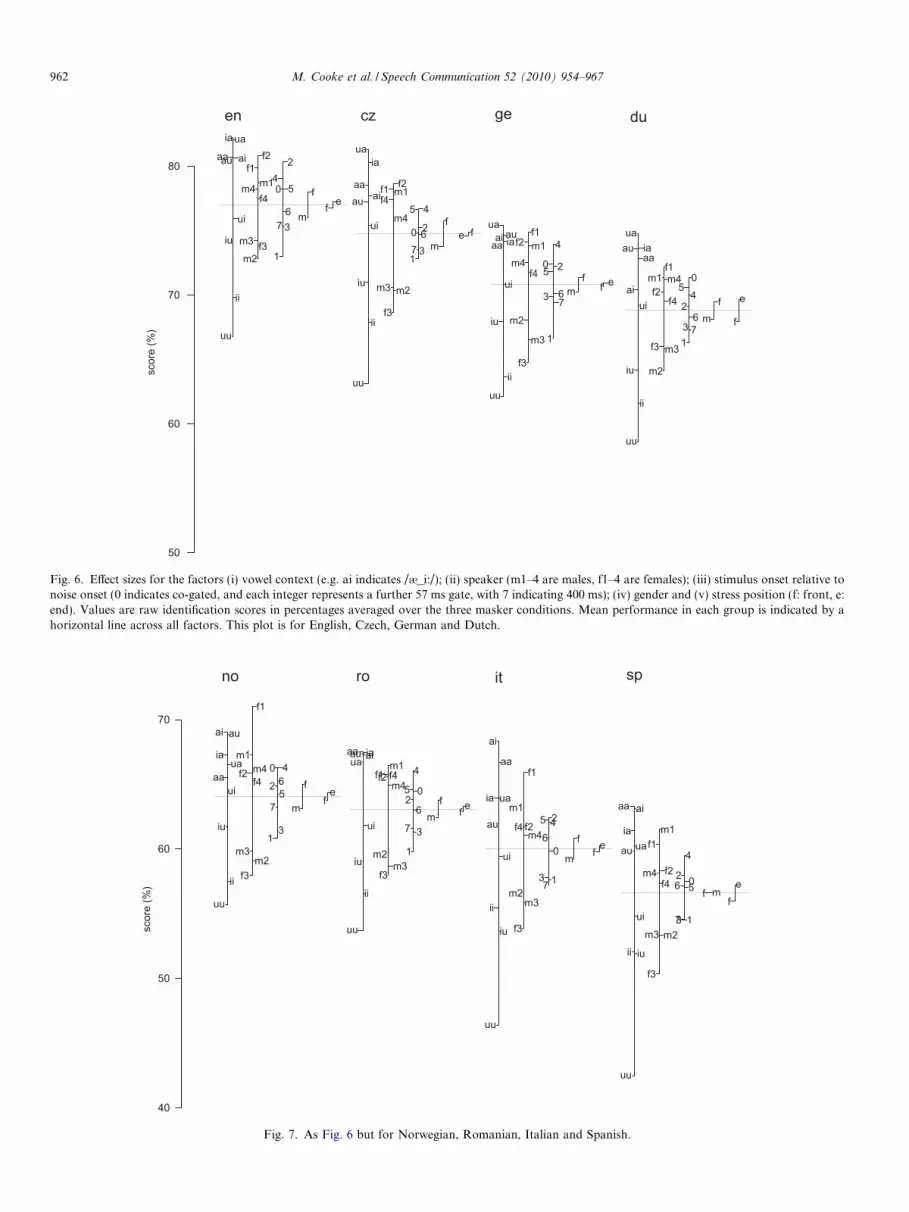
The previous sections investigated the effect of noise onconsonant identification for native and non-native listen-ers, and the differential availability of features in differentmaskers. In the following analyses, we examine the degreeof influence of contextual and paralinguistic factors (i.e.sources of stimulus variability). For example, does vowelcontext play a similar role in each language? Are somespeakers more intelligible and others less intelligible forall listener groups? The degree of language-independentprocessing is assessed here in two ways. First, the effect sizeand ranking of levels within each factor is compared acrosslanguage groups. Second, a quantitative measure ofbetween-language agreement with respect to each factoris used to provide a numerical indication of the language-independence of each factor. We investigate the role ofspeaker, vowel context, consonant, gender, stress positionand stimulus onset relative to noise onset. We also examinethe similarity of response to the phonetic feature categoriesintroduced in the previous section. These factors are notcompletely independent: speaker and gender are of courserelated, and phonetic feature transmission is based on con-sonant confusions. Nevertheless, examination of how levelswithin each factor are ranked by each listener group hasthe potential to provide insights into the scale of lan-guage-independence of these factors.
3.5.1. Univariate effect sizes
Similarity across the eight languages can be visualisedusing design plots (Figs. 5–7). Comparison of such plotsacross listener groups reveals similarity or otherwise bothin the effect of different factors and in the ordering of levelswithin factors. Design plots also allow comparison of theinfluence of a factor with respect to other factors. Forexample, the variability in intelligibility across a range ofspeakers can be directly compared with that induced bychanges in vowel context. Figs. 5–7 display mean scoresfor each of the levels of the factors consonant, vowel con-text, speaker, onset time, gender and stress position, foreach L1 group. For brevity, these are averages across thethree maskers but the effect of each masker is quantifiedseparately in Section 3.5.2.
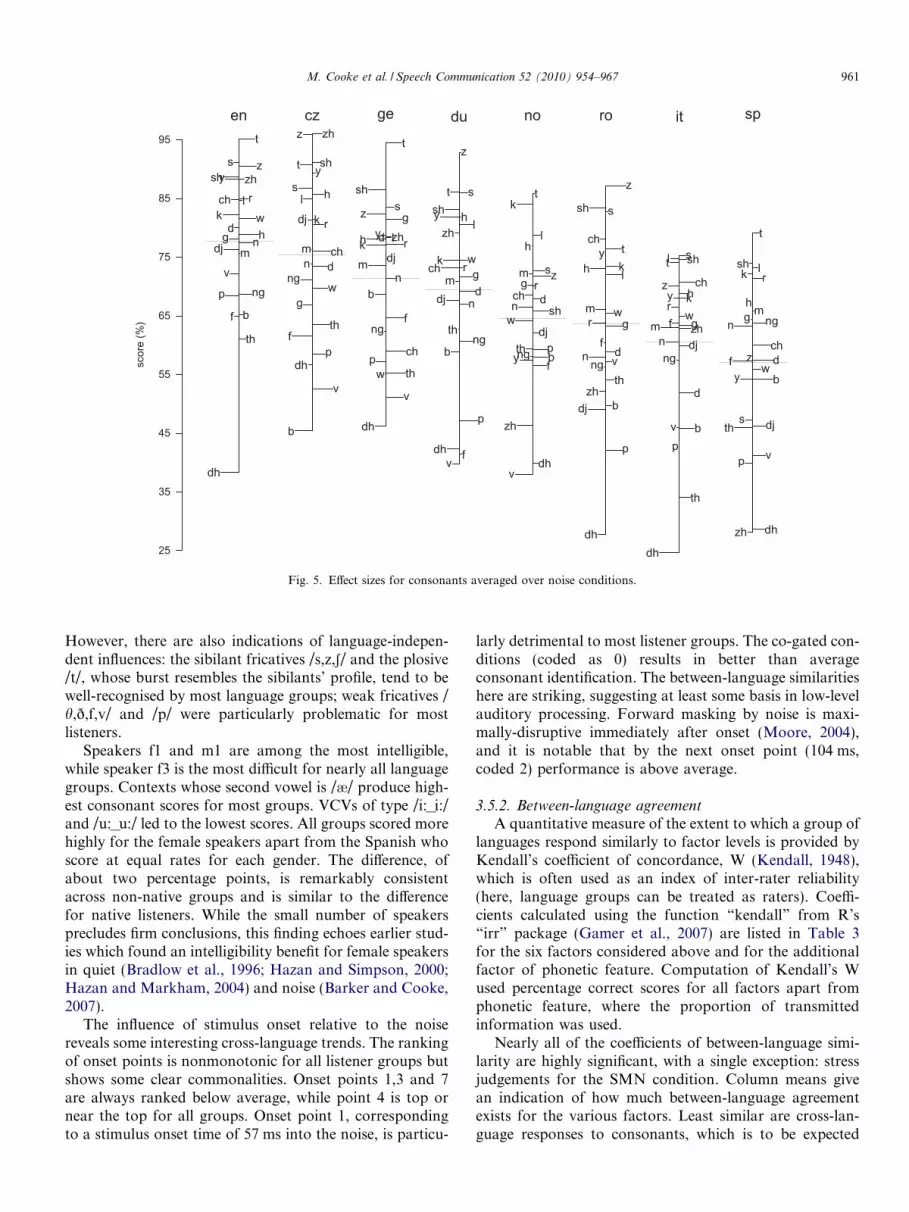
Taken together, the design plots in Figs. 5–7 suggest thatthe ranking of factor influence is virtually the same acrosslanguages. Of the six factors displayed, consonant identityhas the largest effect on intelligibility for all listener groups.For example, individual consonant scores occupy a rangefrom around 36% to 94% for native listeners. Vowel con-text is the next most influential factor for most groups, fol-lowed by speaker identity, stimulus onset and gender.Stress position has almost no effect for most groups, andonly a small influence for Dutch and Spanish listeners,who identify consonants slightly better when presented inVCVs with end stress.
The larger influence of individual consonants on intelli-gibility is unsurprising since this is the area where L1 influ-ences are most likely to be felt. For example, /z/ is poorlyidentified by the Spanish group but near or at the top formost of the other languages; /Z/ is the most intelligible con-sonant for Czech listeners but least intelligible for theSpanish group; German listeners have particular problemswith /w/. These cases are clear examples of L1 influences,either from orthography or differences in phonemic inven-tories (e.g. lack of voiced fricative phonemes in Spanish).
25
35
45
55
65
75
85
95sc
ore
(%)
dh
th
f b
p ngv
mdj ng hdwk
lch r
y zhshzs
t
en
b
v
dhp
fth
gw
ngdnchm
rdj k
l hsyt sh
z zhcz
dh
v
w thp
ch
ngf
bn
m djk rh ld zhy
gz ssh
t
ge
vfdh
p
bng
th
ndj dm gch rk w
zhl
y hshst
z
du
vdh
zh
fy bng pth
djw
shn dchrg
zm s
hl
kt
no
dh
p
dj bzh
thng vn d
fgr
wm
lh ky t
ch
ssh
z
ro
dh
th
pbv
d
ngdjnzhm gf w
rky h
z cht shl s
it
zh dh
p v
th djs
bywf dz
ch
n ngg mh
rk lsh
t
sp
Fig. 5. Effect sizes for consonants averaged over noise conditions.
M. Cooke et al. / Speech Communication 52 (2010) 954–967 961
However, there are also indications of language-indepen-dent influences: the sibilant fricatives /s,z,S/ and the plosive/t/, whose burst resembles the sibilants’ profile, tend to bewell-recognised by most language groups; weak fricatives /h,ð,f,v/ and /p/ were particularly problematic for mostlisteners.
Speakers f1 and m1 are among the most intelligible,while speaker f3 is the most difficult for nearly all languagegroups. Contexts whose second vowel is /�/ produce high-est consonant scores for most groups. VCVs of type /i:_i:/and /u:_u:/ led to the lowest scores. All groups scored morehighly for the female speakers apart from the Spanish whoscore at equal rates for each gender. The difference, ofabout two percentage points, is remarkably consistentacross non-native groups and is similar to the differencefor native listeners. While the small number of speakersprecludes firm conclusions, this finding echoes earlier stud-ies which found an intelligibility benefit for female speakersin quiet (Bradlow et al., 1996; Hazan and Simpson, 2000;Hazan and Markham, 2004) and noise (Barker and Cooke,2007).
The influence of stimulus onset relative to the noisereveals some interesting cross-language trends. The rankingof onset points is nonmonotonic for all listener groups butshows some clear commonalities. Onset points 1,3 and 7are always ranked below average, while point 4 is top ornear the top for all groups. Onset point 1, correspondingto a stimulus onset time of 57 ms into the noise, is particu-
larly detrimental to most listener groups. The co-gated con-ditions (coded as 0) results in better than averageconsonant identification. The between-language similaritieshere are striking, suggesting at least some basis in low-levelauditory processing. Forward masking by noise is maxi-mally-disruptive immediately after onset (Moore, 2004),and it is notable that by the next onset point (104 ms,coded 2) performance is above average.
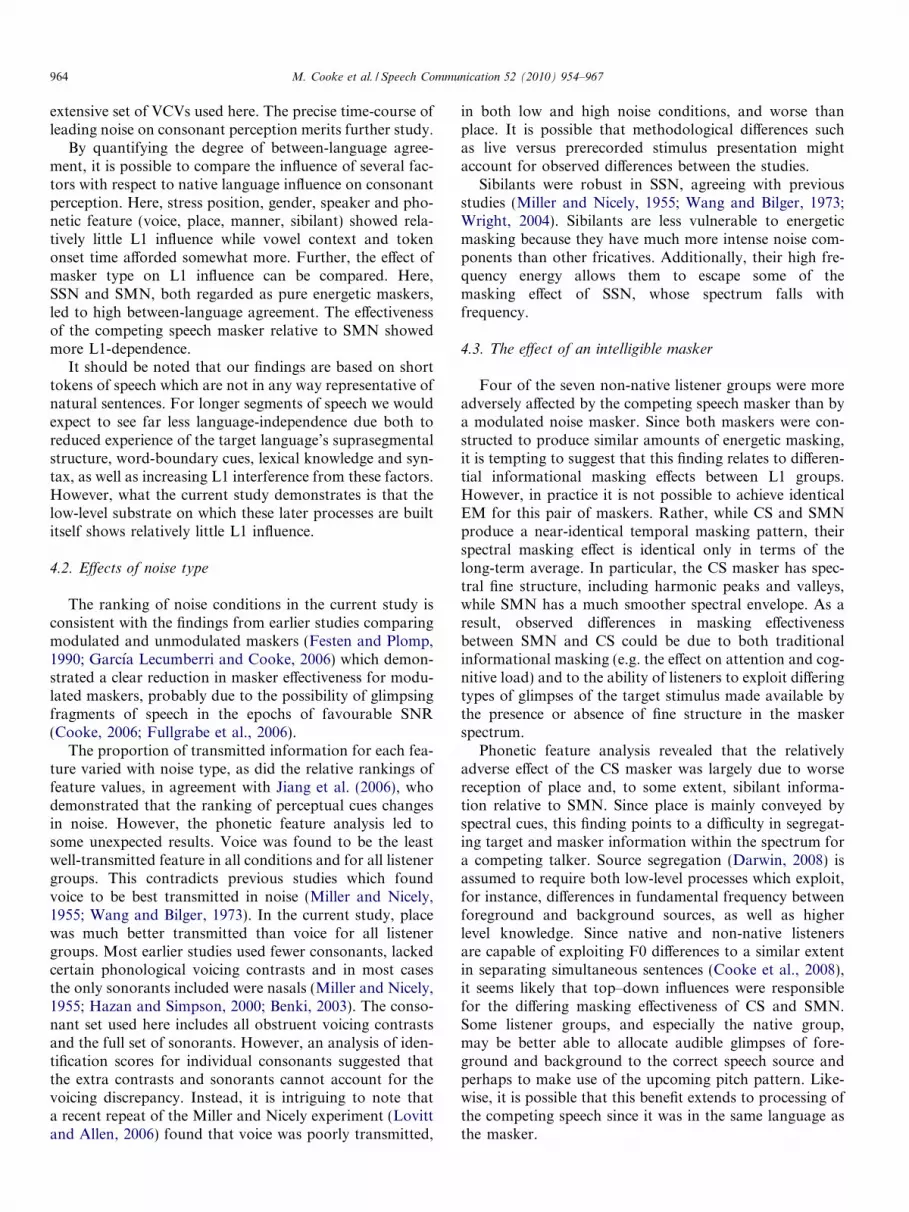
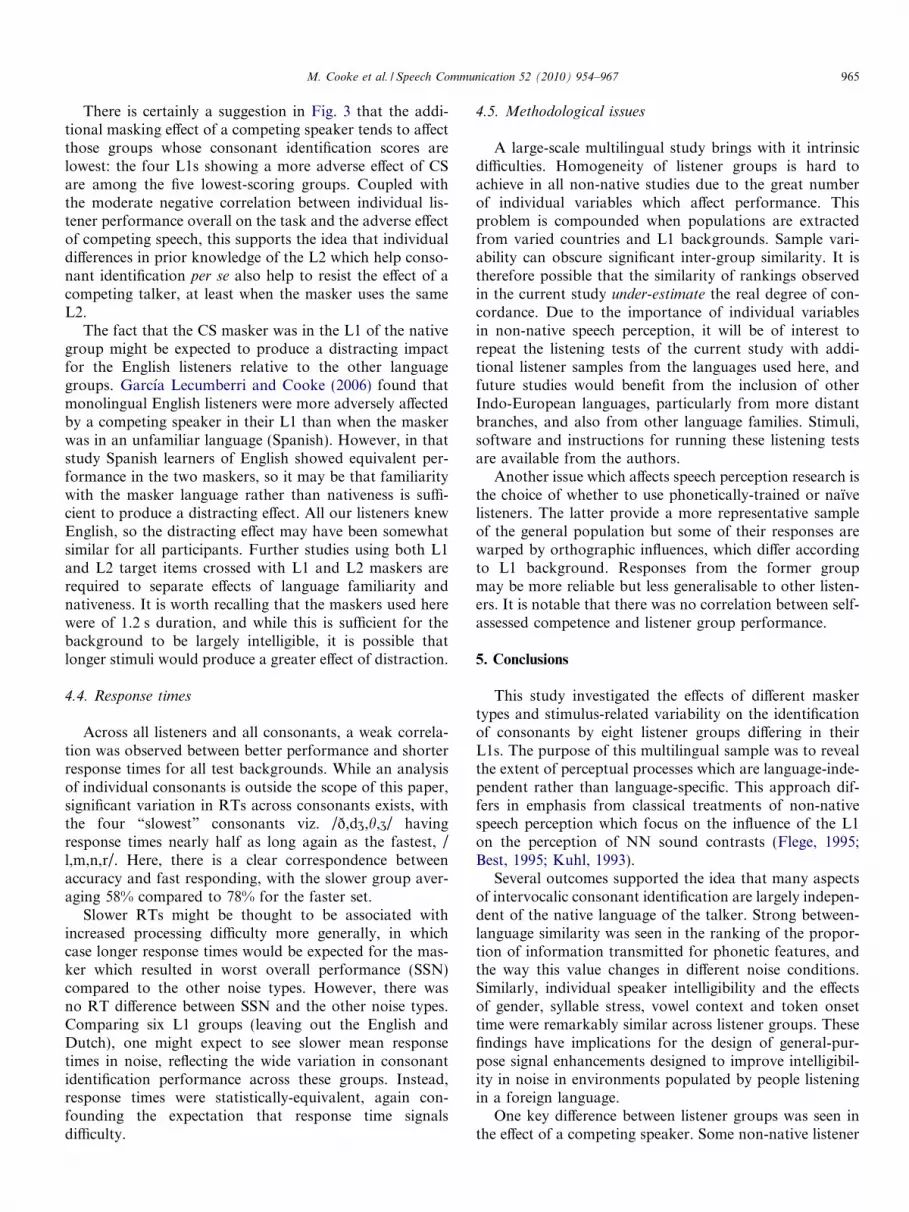
3.5.2. Between-language agreementA quantitative measure of the extent to which a group of
languages respond similarly to factor levels is provided byKendall’s coefficient of concordance, W (Kendall, 1948),which is often used as an index of inter-rater reliability(here, language groups can be treated as raters). Coeffi-cients calculated using the function “kendall” from R’s“irr” package (Gamer et al., 2007) are listed in Table 3for the six factors considered above and for the additionalfactor of phonetic feature. Computation of Kendall’s Wused percentage correct scores for all factors apart fromphonetic feature, where the proportion of transmittedinformation was used.
Nearly all of the coefficients of between-language simi-larity are highly significant, with a single exception: stressjudgements for the SMN condition. Column means givean indication of how much between-language agreementexists for the various factors. Least similar are cross-lan-guage responses to consonants, which is to be expected
50
60
70
80sc
ore
(%) uu
ii
iu
ui
au aiaa
uaia
m2f3m3
f4m4 m1f1
f2
1
376
0 54
2
m
ff e
en
uu
ii
iu
ui
au aiaa
iaua
f3
m2m3
m4
f4m1f1 f2
13760 2
5 4
m
fe f
cz
uu
ii
iu
ui
aa iaai auua
f3
m3
m2
f4m4
m1f2f1
1
73 6
5 20
4
mf
f e
ge
uu
ii
iu
uiai
aaau iaua
m2
m3f3
f4f2
m4m1f1
1736
24
50
mf
f
e
du
Fig. 6. Effect sizes for the factors (i) vowel context (e.g. ai indicates /�_i:/); (ii) speaker (m1–4 are males, f1–4 are females); (iii) stimulus onset relative tonoise onset (0 indicates co-gated, and each integer represents a further 57 ms gate, with 7 indicating 400 ms); (iv) gender and (v) stress position (f: front, e:end). Values are raw identification scores in percentages averaged over the three masker conditions. Mean performance in each group is indicated by ahorizontal line across all factors. This plot is for English, Czech, German and Dutch.
40
50
60
70
scor
e (%
)
uu
ii
iu
uiaa
uaia
auai
f3m2
m3
f4f2 m4m1
f1
13
75
2 60 4
m
ff
e
uu
ii
iu
ui
ua aiau iaaa
f3m3
m2
m4f2 f4f1
m1
1
37
62
05
4
mf
f e
rono
uu
iu
ii
ui
au
uaia
aa
ai
f3
m3m2
m4f4 f2
m1
f1
7 13
06
45 2
m
ff
e
it
uu
iuii
ui
au uaia
aiaa
f3
m2m3
f4m4 f2
f1m1
3 17
56 02
4
f mf
e
sp
Fig. 7. As Fig. 6 but for Norwegian, Romanian, Italian and Spanish.
962 M. Cooke et al. / Speech Communication 52 (2010) 954–967
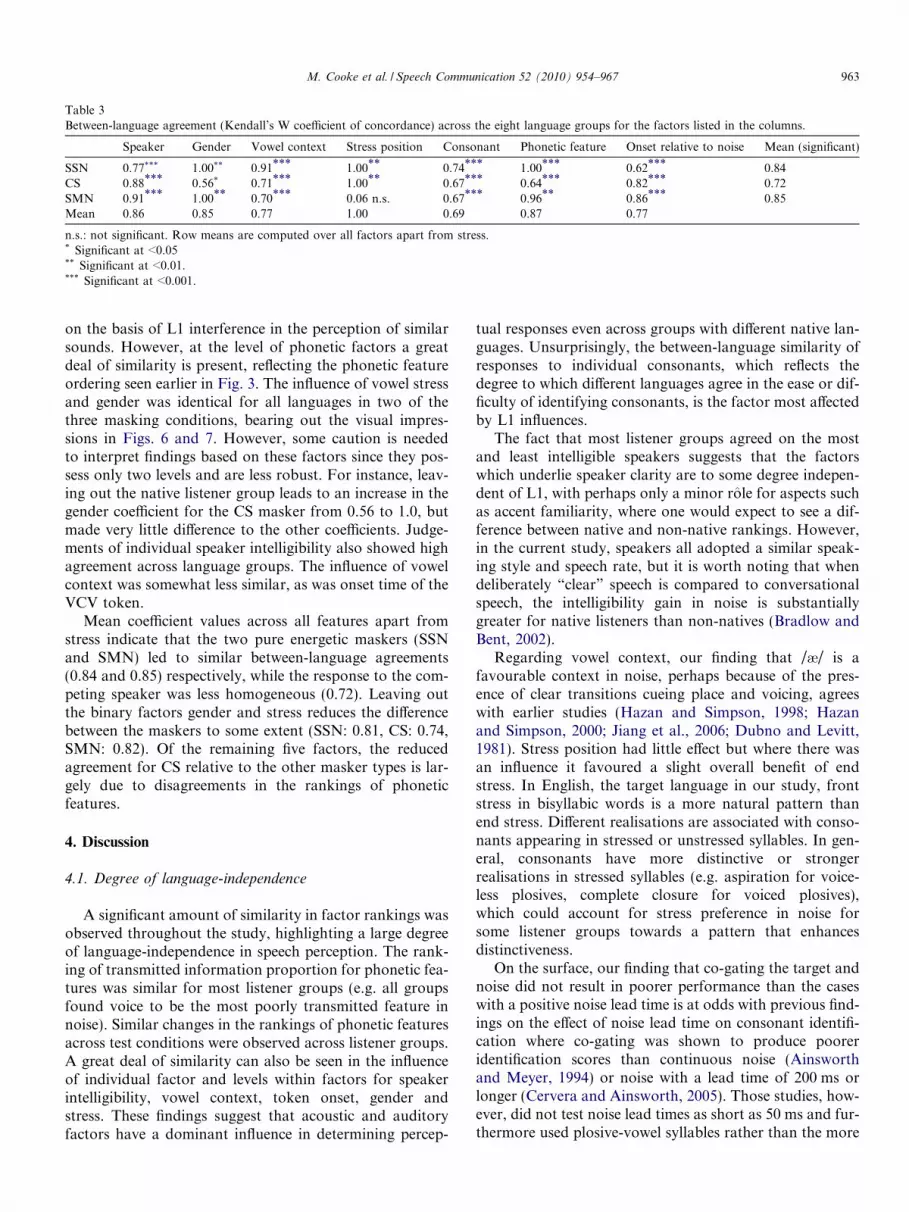
Table 3Between-language agreement (Kendall’s W coefficient of concordance) across the eight language groups for the factors listed in the columns.
Speaker Gender Vowel context Stress position Consonant Phonetic feature Onset relative to noise Mean (significant)
SSN 0.77*** 1.00** 0.91*** 1.00** 0.74*** 1.00*** 0.62*** 0.84CS 0.88*** 0.56* 0.71*** 1.00** 0.67*** 0.64*** 0.82*** 0.72SMN 0.91*** 1.00** 0.70*** 0.06 n.s. 0.67*** 0.96** 0.86*** 0.85Mean 0.86 0.85 0.77 1.00 0.69 0.87 0.77
n.s.: not significant. Row means are computed over all factors apart from stress.* Significant at <0.05** Significant at <0.01.*** Significant at <0.001.
M. Cooke et al. / Speech Communication 52 (2010) 954–967 963
on the basis of L1 interference in the perception of similarsounds. However, at the level of phonetic factors a greatdeal of similarity is present, reflecting the phonetic featureordering seen earlier in Fig. 3. The influence of vowel stressand gender was identical for all languages in two of thethree masking conditions, bearing out the visual impres-sions in Figs. 6 and 7. However, some caution is neededto interpret findings based on these factors since they pos-sess only two levels and are less robust. For instance, leav-ing out the native listener group leads to an increase in thegender coefficient for the CS masker from 0.56 to 1.0, butmade very little difference to the other coefficients. Judge-ments of individual speaker intelligibility also showed highagreement across language groups. The influence of vowelcontext was somewhat less similar, as was onset time of theVCV token.
Mean coefficient values across all features apart fromstress indicate that the two pure energetic maskers (SSNand SMN) led to similar between-language agreements(0.84 and 0.85) respectively, while the response to the com-peting speaker was less homogeneous (0.72). Leaving outthe binary factors gender and stress reduces the differencebetween the maskers to some extent (SSN: 0.81, CS: 0.74,SMN: 0.82). Of the remaining five factors, the reducedagreement for CS relative to the other masker types is lar-gely due to disagreements in the rankings of phoneticfeatures.
4. Discussion
4.1. Degree of language-independence
A significant amount of similarity in factor rankings wasobserved throughout the study, highlighting a large degreeof language-independence in speech perception. The rank-ing of transmitted information proportion for phonetic fea-tures was similar for most listener groups (e.g. all groupsfound voice to be the most poorly transmitted feature innoise). Similar changes in the rankings of phonetic featuresacross test conditions were observed across listener groups.A great deal of similarity can also be seen in the influenceof individual factor and levels within factors for speakerintelligibility, vowel context, token onset, gender andstress. These findings suggest that acoustic and auditoryfactors have a dominant influence in determining percep-
tual responses even across groups with different native lan-guages. Unsurprisingly, the between-language similarity ofresponses to individual consonants, which reflects thedegree to which different languages agree in the ease or dif-ficulty of identifying consonants, is the factor most affectedby L1 influences.
The fact that most listener groups agreed on the mostand least intelligible speakers suggests that the factorswhich underlie speaker clarity are to some degree indepen-dent of L1, with perhaps only a minor role for aspects suchas accent familiarity, where one would expect to see a dif-ference between native and non-native rankings. However,in the current study, speakers all adopted a similar speak-ing style and speech rate, but it is worth noting that whendeliberately “clear” speech is compared to conversationalspeech, the intelligibility gain in noise is substantiallygreater for native listeners than non-natives (Bradlow andBent, 2002).
Regarding vowel context, our finding that /�/ is afavourable context in noise, perhaps because of the pres-ence of clear transitions cueing place and voicing, agreeswith earlier studies (Hazan and Simpson, 1998; Hazanand Simpson, 2000; Jiang et al., 2006; Dubno and Levitt,1981). Stress position had little effect but where there wasan influence it favoured a slight overall benefit of endstress. In English, the target language in our study, frontstress in bisyllabic words is a more natural pattern thanend stress. Different realisations are associated with conso-nants appearing in stressed or unstressed syllables. In gen-eral, consonants have more distinctive or strongerrealisations in stressed syllables (e.g. aspiration for voice-less plosives, complete closure for voiced plosives),which could account for stress preference in noise forsome listener groups towards a pattern that enhancesdistinctiveness.
On the surface, our finding that co-gating the target andnoise did not result in poorer performance than the caseswith a positive noise lead time is at odds with previous find-ings on the effect of noise lead time on consonant identifi-cation where co-gating was shown to produce pooreridentification scores than continuous noise (Ainsworthand Meyer, 1994) or noise with a lead time of 200 ms orlonger (Cervera and Ainsworth, 2005). Those studies, how-ever, did not test noise lead times as short as 50 ms and fur-thermore used plosive-vowel syllables rather than the more
964 M. Cooke et al. / Speech Communication 52 (2010) 954–967
extensive set of VCVs used here. The precise time-course ofleading noise on consonant perception merits further study.
By quantifying the degree of between-language agree-ment, it is possible to compare the influence of several fac-tors with respect to native language influence on consonantperception. Here, stress position, gender, speaker and pho-netic feature (voice, place, manner, sibilant) showed rela-tively little L1 influence while vowel context and tokenonset time afforded somewhat more. Further, the effect ofmasker type on L1 influence can be compared. Here,SSN and SMN, both regarded as pure energetic maskers,led to high between-language agreement. The effectivenessof the competing speech masker relative to SMN showedmore L1-dependence.
It should be noted that our findings are based on shorttokens of speech which are not in any way representative ofnatural sentences. For longer segments of speech we wouldexpect to see far less language-independence due both toreduced experience of the target language’s suprasegmentalstructure, word-boundary cues, lexical knowledge and syn-tax, as well as increasing L1 interference from these factors.However, what the current study demonstrates is that thelow-level substrate on which these later processes are builtitself shows relatively little L1 influence.
4.2. Effects of noise type
The ranking of noise conditions in the current study isconsistent with the findings from earlier studies comparingmodulated and unmodulated maskers (Festen and Plomp,1990; Garcıa Lecumberri and Cooke, 2006) which demon-strated a clear reduction in masker effectiveness for modu-lated maskers, probably due to the possibility of glimpsingfragments of speech in the epochs of favourable SNR(Cooke, 2006; Fullgrabe et al., 2006).
The proportion of transmitted information for each fea-ture varied with noise type, as did the relative rankings offeature values, in agreement with Jiang et al. (2006), whodemonstrated that the ranking of perceptual cues changesin noise. However, the phonetic feature analysis led tosome unexpected results. Voice was found to be the leastwell-transmitted feature in all conditions and for all listenergroups. This contradicts previous studies which foundvoice to be best transmitted in noise (Miller and Nicely,1955; Wang and Bilger, 1973). In the current study, placewas much better transmitted than voice for all listenergroups. Most earlier studies used fewer consonants, lackedcertain phonological voicing contrasts and in most casesthe only sonorants included were nasals (Miller and Nicely,1955; Hazan and Simpson, 2000; Benki, 2003). The conso-nant set used here includes all obstruent voicing contrastsand the full set of sonorants. However, an analysis of iden-tification scores for individual consonants suggested thatthe extra contrasts and sonorants cannot account for thevoicing discrepancy. Instead, it is intriguing to note thata recent repeat of the Miller and Nicely experiment (Lovittand Allen, 2006) found that voice was poorly transmitted,
in both low and high noise conditions, and worse thanplace. It is possible that methodological differences suchas live versus prerecorded stimulus presentation mightaccount for observed differences between the studies.
Sibilants were robust in SSN, agreeing with previousstudies (Miller and Nicely, 1955; Wang and Bilger, 1973;Wright, 2004). Sibilants are less vulnerable to energeticmasking because they have much more intense noise com-ponents than other fricatives. Additionally, their high fre-quency energy allows them to escape some of themasking effect of SSN, whose spectrum falls withfrequency.
4.3. The effect of an intelligible masker
Four of the seven non-native listener groups were moreadversely affected by the competing speech masker than bya modulated noise masker. Since both maskers were con-structed to produce similar amounts of energetic masking,it is tempting to suggest that this finding relates to differen-tial informational masking effects between L1 groups.However, in practice it is not possible to achieve identicalEM for this pair of maskers. Rather, while CS and SMNproduce a near-identical temporal masking pattern, theirspectral masking effect is identical only in terms of thelong-term average. In particular, the CS masker has spec-tral fine structure, including harmonic peaks and valleys,while SMN has a much smoother spectral envelope. As aresult, observed differences in masking effectivenessbetween SMN and CS could be due to both traditionalinformational masking (e.g. the effect on attention and cog-nitive load) and to the ability of listeners to exploit differingtypes of glimpses of the target stimulus made available bythe presence or absence of fine structure in the maskerspectrum.
Phonetic feature analysis revealed that the relativelyadverse effect of the CS masker was largely due to worsereception of place and, to some extent, sibilant informa-tion relative to SMN. Since place is mainly conveyed byspectral cues, this finding points to a difficulty in segregat-ing target and masker information within the spectrum fora competing talker. Source segregation (Darwin, 2008) isassumed to require both low-level processes which exploit,for instance, differences in fundamental frequency betweenforeground and background sources, as well as higherlevel knowledge. Since native and non-native listenersare capable of exploiting F0 differences to a similar extentin separating simultaneous sentences (Cooke et al., 2008),it seems likely that top–down influences were responsiblefor the differing masking effectiveness of CS and SMN.Some listener groups, and especially the native group,may be better able to allocate audible glimpses of fore-ground and background to the correct speech source andperhaps to make use of the upcoming pitch pattern. Like-wise, it is possible that this benefit extends to processing ofthe competing speech since it was in the same language asthe masker.
M. Cooke et al. / Speech Communication 52 (2010) 954–967 965
There is certainly a suggestion in Fig. 3 that the addi-tional masking effect of a competing speaker tends to affectthose groups whose consonant identification scores arelowest: the four L1s showing a more adverse effect of CSare among the five lowest-scoring groups. Coupled withthe moderate negative correlation between individual lis-tener performance overall on the task and the adverse effectof competing speech, this supports the idea that individualdifferences in prior knowledge of the L2 which help conso-nant identification per se also help to resist the effect of acompeting talker, at least when the masker uses the sameL2.
The fact that the CS masker was in the L1 of the nativegroup might be expected to produce a distracting impactfor the English listeners relative to the other languagegroups. Garcıa Lecumberri and Cooke (2006) found thatmonolingual English listeners were more adversely affectedby a competing speaker in their L1 than when the maskerwas in an unfamiliar language (Spanish). However, in thatstudy Spanish learners of English showed equivalent per-formance in the two maskers, so it may be that familiaritywith the masker language rather than nativeness is suffi-cient to produce a distracting effect. All our listeners knewEnglish, so the distracting effect may have been somewhatsimilar for all participants. Further studies using both L1and L2 target items crossed with L1 and L2 maskers arerequired to separate effects of language familiarity andnativeness. It is worth recalling that the maskers used herewere of 1.2 s duration, and while this is sufficient for thebackground to be largely intelligible, it is possible thatlonger stimuli would produce a greater effect of distraction.
4.4. Response times
Across all listeners and all consonants, a weak correla-tion was observed between better performance and shorterresponse times for all test backgrounds. While an analysisof individual consonants is outside the scope of this paper,significant variation in RTs across consonants exists, withthe four “slowest” consonants viz. /ð,dZ,h,Z/ havingresponse times nearly half as long again as the fastest, /l,m,n,r/. Here, there is a clear correspondence betweenaccuracy and fast responding, with the slower group aver-aging 58% compared to 78% for the faster set.
Slower RTs might be thought to be associated withincreased processing difficulty more generally, in whichcase longer response times would be expected for the mas-ker which resulted in worst overall performance (SSN)compared to the other noise types. However, there wasno RT difference between SSN and the other noise types.Comparing six L1 groups (leaving out the English andDutch), one might expect to see slower mean responsetimes in noise, reflecting the wide variation in consonantidentification performance across these groups. Instead,response times were statistically-equivalent, again con-founding the expectation that response time signalsdifficulty.
4.5. Methodological issues
A large-scale multilingual study brings with it intrinsicdifficulties. Homogeneity of listener groups is hard toachieve in all non-native studies due to the great numberof individual variables which affect performance. Thisproblem is compounded when populations are extractedfrom varied countries and L1 backgrounds. Sample vari-ability can obscure significant inter-group similarity. It istherefore possible that the similarity of rankings observedin the current study under-estimate the real degree of con-cordance. Due to the importance of individual variablesin non-native speech perception, it will be of interest torepeat the listening tests of the current study with addi-tional listener samples from the languages used here, andfuture studies would benefit from the inclusion of otherIndo-European languages, particularly from more distantbranches, and also from other language families. Stimuli,software and instructions for running these listening testsare available from the authors.
Another issue which affects speech perception research isthe choice of whether to use phonetically-trained or naıvelisteners. The latter provide a more representative sampleof the general population but some of their responses arewarped by orthographic influences, which differ accordingto L1 background. Responses from the former groupmay be more reliable but less generalisable to other listen-ers. It is notable that there was no correlation between self-assessed competence and listener group performance.
5. Conclusions
This study investigated the effects of different maskertypes and stimulus-related variability on the identificationof consonants by eight listener groups differing in theirL1s. The purpose of this multilingual sample was to revealthe extent of perceptual processes which are language-inde-pendent rather than language-specific. This approach dif-fers in emphasis from classical treatments of non-nativespeech perception which focus on the influence of the L1on the perception of NN sound contrasts (Flege, 1995;Best, 1995; Kuhl, 1993).
Several outcomes supported the idea that many aspectsof intervocalic consonant identification are largely indepen-dent of the native language of the talker. Strong between-language similarity was seen in the ranking of the propor-tion of information transmitted for phonetic features, andthe way this value changes in different noise conditions.Similarly, individual speaker intelligibility and the effectsof gender, syllable stress, vowel context and token onsettime were remarkably similar across listener groups. Thesefindings have implications for the design of general-pur-pose signal enhancements designed to improve intelligibil-ity in noise in environments populated by people listeningin a foreign language.
One key difference between listener groups was seen inthe effect of a competing speaker. Some non-native listener
966 M. Cooke et al. / Speech Communication 52 (2010) 954–967
groups found competing speech in the same language as thetarget tokens more disruptive relative to a speech-modu-lated noise masker designed to produce similar amountsof energetic masking. The adverse impact of a competingspeaker was smaller for listeners who performed well inthe task overall, suggesting that the prior knowledge ofthe target language which helps in L2 consonant identifica-tion in noise also assists in dealing with a competingspeaker.
Acknowledgements
Corpus recording, annotation and native English listen-ing tests took place while Martin Cooke was at the Uni-versity of Sheffield, UK. We extend our thanks toFrancesco Cutugno, Mircea Giurgiu, Bernd Meyer andJan Volin for coordinating listener groups in Naples,Cluj-Napoca, Oldenburg and Prague; Youyi Lu (Univer-sity of Sheffield) for speech material; Stuart Rosen(UCL) for making available the FIX software package;and the developers of the R statistical language R Devel-opment Core Team (2008). All authors were supportedby the EU Marie Curie Research Training Network“Sound to Sense”. Odette Scharenborg was supported bya Veni-grant from the Netherlands Organisation for Scien-tific Research (NWO). We also thank Marc Swerts and thereviewers for their insightful comments on an earlier ver-sion of the paper.
References
Ainsworth, W., Meyer, G., 1994. Recognition of plosive syllables in noise:comparison of an auditory model with human performance. J. Acoust.Soc. Am. 96, 687–694.
Alamsaoutra, D.M., Kohnert, K.J., Munson, B., Reichle, J., 2006.Synthesized speech intelligibility among native speakers and non-native speakers of English. Augment. Altern. Commun. 22, 258–268.
Barker, J., Cooke, M., 2007. Modelling speaker intelligibility in noise.Speech Commun. 49, 402–417.
Benki, J., 2003. Analysis of English nonsense syllable recognition in noise.Phonetica 60, 129–157.
Best, C., 1995. A direct realist view of cross-language speech perception.In: Strange, W. (Ed.), Speech Perception and Linguistic Experience.Timonium, pp. 171–204.
Bradlow, A., Alexander, J., 2007. Semantic and phonetic enhancementsfor speech-in-noise recognition by native and non-native listeners. J.Acoust. Soc. Am. 121, 2339–2349.
Bradlow, A., Bent, T., 2002. The clear speech effect for non-nativelisteners. J. Acoust. Soc. Am. 112, 272–284.
Bradlow, A., Pisoni, D., 1999. Recognition of spoken words by native andnon-native listeners: talker-, listener-, and item-related factors. J.Acoust. Soc. Am. 106, 2074–2085.
Bradlow, A., Torretta, G., Pisoni, D., 1996. Intelligibility of normalspeech I: global and fine-grained acoustic–phonetic talker character-istics. Speech Commun. 20, 255–272.
Brungart, D., Simpson, B., Ericson, M., Scott, K., 2001. Informationaland energetic masking effects in the perception of multiple simulta-neous talkers. J. Acoust. Soc. Am. 100, 2527–2538.
Carhart, R., Tillman, T., Greetis, E., 1969. Perceptual masking in multiplesound backgrounds. J. Acoust. Soc. Am. 45, 694–703.
Cervera, T., Ainsworth, W., 2005. Effects of preceding noise on theperception of voiced plosives. Acta Acust. 91, 132–144.
Cooke, M., 2006. A glimpsing model of speech perception in noise. J.Acoust. Soc. Am. 119, 1562–1573.
Cooke, M., Scharenborg, O., 2008. The interspeech 2008 consonantchallenge. In: Proceedings of the Interspeech. pp. 1765–1768.
Cooke, M., Garcıa Lecumberri, M., Barker, J., 2008. The foreign languagecocktail party problem: energetic and informational masking effects innon-native speech perception. J. Acoust. Soc. Am. 123, 414–427.
Cutler, A., Norris, D., 1979. Monitoring sentence comprehension. In:Cooper, W., Walker, E. (Eds.), Sentence Processing. Erlbaum, pp.171–204.
Cutler, A., Mehler, J., Norris, D., Segui, J., 1987. Phoneme identificationand the lexicon. Cognit. Psychol. 19, 141–177.
Cutler, A., Weber, A., Smits, R., Cooper, N., 2004. Patterns of Englishphoneme confusions by native and non-native listeners. J. Acoust. Soc.Am. 116, 3668–3678.
Cutler, A., Garcıa Lecumberri, M., Cooke, M., 2008. Consonantidentification in noise by native and non-native listeners: effects oflocal context. J. Acoust. Soc. Am. 124, 1264–1268.
Darwin, C., 2008. Listening to speech in the presence of other sounds.Philos. Trans. R. Soc. B 363, 1011–1021.
Detey, S., Nespoulous, J., 2008. Can orthography influence secondlanguage syllabic segmentation? Japanese epenthetic vowels andFrench consonant clusters. Lingua 118, 66–81.
Dubno, J., Levitt, H., 1981. Predicting consonant confusions fromacoustic analysis. J. Acoust. Soc. Am. 69, 249–261.
Festen, J., Plomp, R., 1990. Effects of fluctuating noise and interferingspeech on the speech-reception threshold for impaired and normalhearing. J. Acoust. Soc. Am. 88, 1725–1736.
Flege, J., 1995. Second language speech learning: theory, findings andproblems. In: Strange, W. (Ed.), Speech Perception and LinguisticExperience. Timonium, pp. 233–277.
Florentine, M., Buus, S., Scharf, B., Canevet, G., 1984. Speech receptionthresholds in noise for native and non-native listeners. J. Acoust. Soc.Am. 75, s84.
Foss, D., Blank, M., 1980. Identifying the speech codes. Cognit. Psychol.12, 1–31.
Fullgrabe, C., Berthommier, F., Lorenzi, C., 2006. Masking release forconsonant features in temporally fluctuating background noise. Hear.Res. 211, 74–84.
Gamer, M., Lemon, J., Fellows, I., 2007. irr: Various Coefficients ofInterrater Reliability and Agreement. R Package Version 0.70.<http://www.r-project.org>.
Garcıa Lecumberri, M.L., Cooke, M.P., 2006. Effect of masker type onnative and non-native consonant perception in noise. J. Acoust. Soc.Am. 119, 2445–2454.
Hazan, V., Markham, D., 2004. Acoustic–phonetic correlates of talkerintelligibility for adults and children. J. Acoust. Soc. Am. 116, 3108–3118.
Hazan, V., Simpson, A., 1998. The effect of cue-enhancement on theintelligibility of nonsense word and sentence materials presented innoise. Speech Commun. 24, 211–226.
Hazan, V., Simpson, A., 2000. The effect of cue-enhancement onconsonant intelligibility in noise: speaker and listener effects. Lang.Speech 43, 273–294.
Imai, S., Walley, A., Flege, J., 2005. Lexical frequency and neighborhooddensity effects on the recognition of native and Spanish accented wordsby native English and Spanish listeners. J. Acoust. Soc. Am. 117, 896–907.
Jiang, J., Chen, M., Alwan, A., 2006. On the perception of voicing insyllable-initial plosives in noise. J. Acoust. Soc. Am. 119, 1092–1105.
Kendall, M., 1948. Rank Correlation Methods. Griffin.Kuhl, P., 1993. An examination of the perceptual magnet effect. J. Acoust.
Soc. Am. 93, 2423.Loizou, P., 2007. Speech Enhancement: Theory and Practice. CRC Press.Lovitt, A., Allen, J., 2006. 50 years late: repeating Miller–Nicely 1955. In:
Proceedings of the Interspeech. pp. 2154–2157.Lu, Y., 2010. Production and Perceptual Analysis of Speech Produced in
Noise. Ph.D. Thesis. University of Sheffield.
M. Cooke et al. / Speech Communication 52 (2010) 954–967 967
Mackay, I., Meador, D., Flege, J., 2001. The identification of Englishconsonants by native speakers of Italian. Phonetica 58, 103–125.
Mayo, L., Florentine, M., Buus, S., 1997. Age of second-languageacquisition and perception of speech in noise. J. Speech Lang. Hear.Res. 40, 686–693.
Miller, G., Nicely, P., 1955. Analysis of perceptual confusions amongsome English consonants. J. Acoust. Soc. Am. 27, 338–352.
Moore, B., 2004. An Introduction to the Psychology of Hearing.Academic Press.
Parikh, G., Loizou, P., 2005. The influence of noise on vowel andconsonant cues. J. Acoust. Soc. Am. 118, 3874–3888.
Picheny, M., Durlach, N., Braida, L., 1985. Speaking clearly for the hardof hearing. I. Intelligibility differences between clear and conversa-tional speech. J. Speech Hear. Res. 28, 96–103.
Pinheiro, J., Bates, D., 2000. Mixed-Effects Models in S and S-PLUS.Springer.
Pinheiro, J., Bates, D., DebRoy, S., Sarkar, D., R Core Team, 2008. nlme:Linear and Nonlinear Mixed Effects Models. R Package Version 3.1-89.
R Development Core Team, 2008. R: A Language and Environment forStatistical Computing. R Foundation for Statistical Computing,
Vienna, Austria. ISBN: 3-900051-07-0. <http://www.r-project.org>.
Rogers, C., Lister, J., Febo, D., Besing, J., Abrams, H., 2006. Effects ofbilingualism, noise and reverberation on speech perception by listenerswith normal hearing. Appl. Psycholinguist. 27, 465–485.
Studebaker, G., 1985. A rationalized arcsine transform. J. Speech Hear.Res. 28, 455–462.
Takata, Y., Nabelek, A., 1990. English consonant recognition in noise andin reverberation by Japanese and American listeners. J. Acoust. Soc.Am. 88, 663–666.
Van Engen, K., Bradlow, A., 2007. Sentence recognition in native- andforeign-language multi-talker background noise. J. Acoust. Soc. Am.121, 519–526.
van Wijngaarden, S., Steeneken, H., Houtgast, T., 2002. Quantifying theintelligibility of speech in noise for non-native listeners. J. Acoust. Soc.Am. 111, 1906–1916.
Wang, M., Bilger, R., 1973. Consonant confusions in noise: a study ofperceptual features. J. Acoust. Soc. Am. 54, 1248–1266.
Wright, R., 2004. A review of perceptual cues and cue robustness. In:Hayes, B., Kirchner, R., Steriade, D. (Eds.), Phonetically BasedPhonology. Cambridge University Press, pp. 34–57.


