Embed Size (px)
Citation preview
Labour Market and Related Payments
a monthly profile
Note: The Australian Bureau of Statistics (ABS) produces the official unemployment
statistics. The figures contained in this publication are different from the ABS
unemployment figures as the ABS and the Department Social Services (DSS) use
different definitions to identify the unemployed and different methods of counting
(see the Appendix for more information).
This publication can be found on the Department of Social Services website at DSS -
Labour Market and Related Payments Publication (http://www.dss.gov.au/lmrp).
April 2018 Embargoed
Until 11.30 am, 30 May 2018
1
Contents
Introduction ............................................................................................................................... 2
Statistical Highlights ................................................................................................................. 3
Table 1 - Labour Market Payments - Time Series..................................................................... 4
Table 2 - Newstart Allowees - Derivation of the Job Seeker Population .................................. 5
Table 3 - Youth Allowees (Other) - Derivation of the Job Seeker Population .......................... 6
Table 4 - Job Seekers Receiving Newstart Allowance and Youth Allowance (Other) Time
Series ......................................................................................................................................... 7
Table 5 - Job Seekers Receiving Newstart Allowance and Youth Allowance (Other) By
State ........................................................................................................................................... 8
Table 6 - Job Seekers Receiving Newstart Allowance and Youth Allowance (Other) By Age
and Gender ................................................................................................................................ 9
Table 7a-i –Job Seekers Receiving Newstart Allowance and Youth Allowance (Other) By
Statistical Area Level 3 (SA3) ................................................................................................. 10
Table 8a - Job Seekers Receiving Newstart Allowance Fortnightly Earnings and Gender ... 19
Table 8b - Job Seekers Receiving Youth Allowance (Other) Fortnightly Earnings and
Gender ..................................................................................................................................... 20
Explanatory Notes ................................................................................................................... 21
Glossary ................................................................................................................................... 27
Appendix ................................................................................................................................. 30
Comparisons Between DSS Unemployment Labour Market Payment Numbers And ABS
Labour Force Unemployment Statistics .................................................................................. 30
Other recipient information ..................................................................................................... 33
2
Introduction
This publication presents statistical information on a monthly basis for the various
types of labour market payments delivered by the Department of Human Services
(DHS) on behalf of the Department of Social Services (DSS). This publication was
produced previously by the Department of Education, Employment and Workplace
Relations (DEEWR).
This publication covers Newstart (NSA) and Youth Allowance (other) (YA(o)) in
some detail, and to a lesser extent, Partner Allowance (PA), Widow Allowance (WA),
Youth Allowance (Full Time Student)(YA(FTS)) and Youth Allowance (Australian
Apprentices) (YA(a)).
Table 1 provides information on the total number of NSA and YA recipients.
The YA population is broken down into YA(o), YA(FTS) and YA(Australian
Apprentices) categories. The total numbers of PA and WA recipients are also
provided in this table.
Tables 2 and 3 show the derivation of the NSA and YA(o) job seeker
populations (see the reference to job seekers in the ‘Comparability of data’
section of the Explanatory Notes). These populations are added together to
derive the total number of job seekers.
Tables 4 to 8 provide information on the total job seeker population.
When using time series figures, it is important to note that changes have occurred
over time to the conditions of eligibility for different payments. Details of these
changes are provided in the Explanatory Notes.
All media inquiries should be directed to the DSS Media Team at [email protected].
For more general inquiries regarding further statistical information please refer to the
last page of this publication for other contact details.
The next issue of this publication is scheduled for release on 27 June 2018.
3
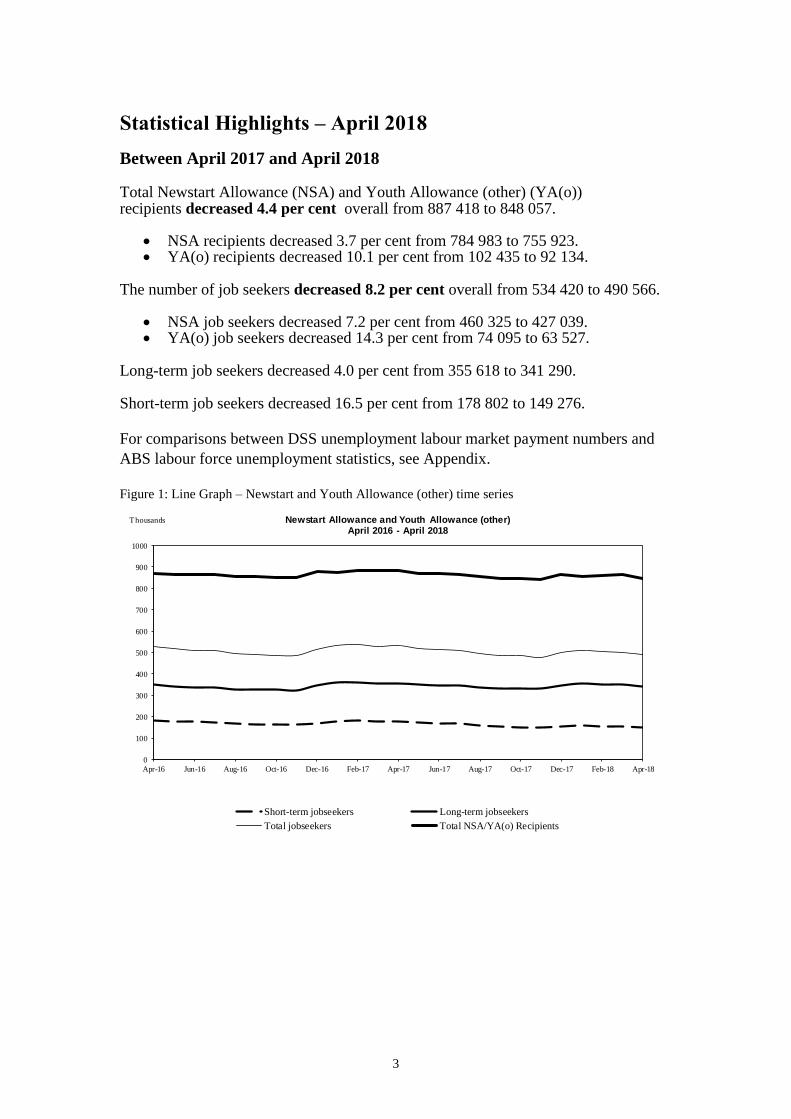
Statistical Highlights – April 2018
Between April 2017 and April 2018 Total Newstart Allowance (NSA) and Youth Allowance (other) (YA(o)) recipients decreased 4.4 per cent overall from 887 418 to 848 057.
NSA recipients decreased 3.7 per cent from 784 983 to 755 923. YA(o) recipients decreased 10.1 per cent from 102 435 to 92 134.
The number of job seekers decreased 8.2 per cent overall from 534 420 to 490 566.
NSA job seekers decreased 7.2 per cent from 460 325 to 427 039. YA(o) job seekers decreased 14.3 per cent from 74 095 to 63 527.
Long-term job seekers decreased 4.0 per cent from 355 618 to 341 290. Short-term job seekers decreased 16.5 per cent from 178 802 to 149 276.
For comparisons between DSS unemployment labour market payment numbers and
ABS labour force unemployment statistics, see Appendix.
Figure 1: Line Graph – Newstart and Youth Allowance (other) time series
0
100
200
300
400
500
600
700
800
900
1000
Apr-16 Jun-16 Aug-16 Oct-16 Dec-16 Feb-17 Apr-17 Jun-17 Aug-17 Oct-17 Dec-17 Feb-18 Apr-18
Thousands Newstart Allowance and Youth Allowance (other)April 2016 - April 2018
Short-term jobseekers Long-term jobseekers
Total jobseekers Total NSA/YA(o) Recipients
4
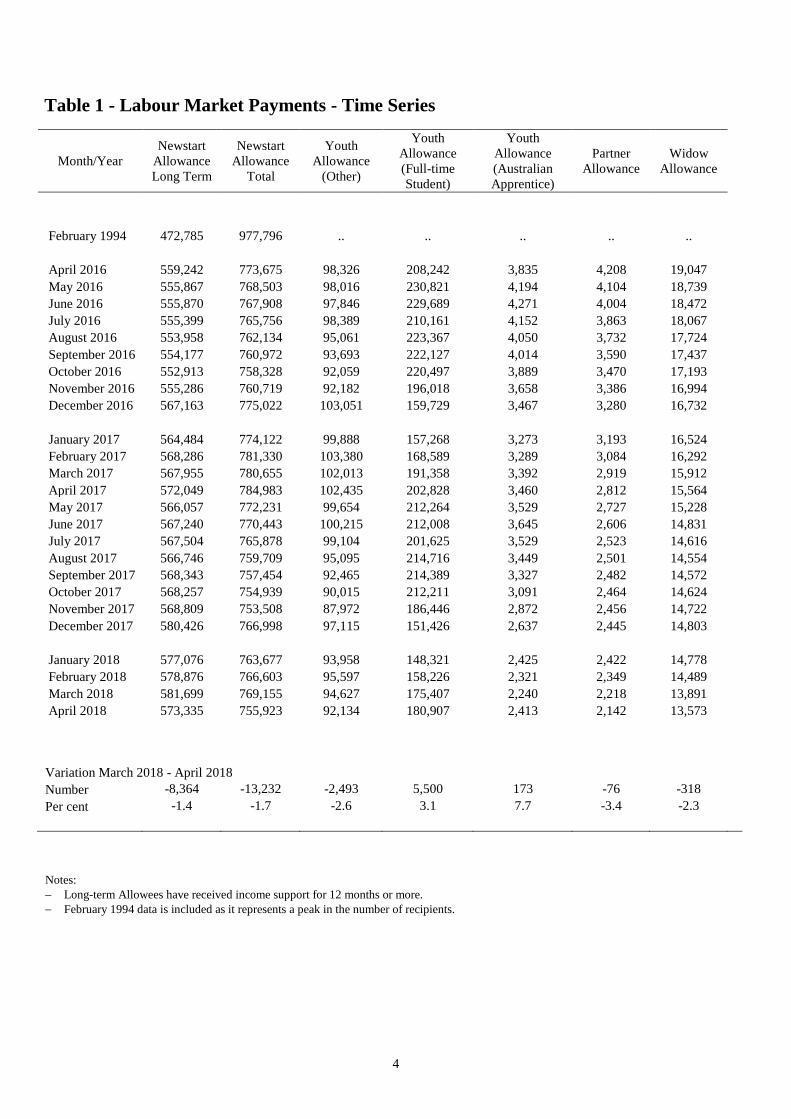
Table 1 - Labour Market Payments - Time Series
Month/Year
Newstart
Allowance
Long Term
Newstart
Allowance
Total
Youth
Allowance
(Other)
Youth
Allowance
(Full-time
Student)
Youth
Allowance
(Australian
Apprentice)
Partner
Allowance
Widow
Allowance
February 1994 472,785 977,796 .. .. .. .. ..
April 2016 559,242 773,675 98,326 208,242 3,835 4,208 19,047
May 2016 555,867 768,503 98,016 230,821 4,194 4,104 18,739
June 2016 555,870 767,908 97,846 229,689 4,271 4,004 18,472
July 2016 555,399 765,756 98,389 210,161 4,152 3,863 18,067
August 2016 553,958 762,134 95,061 223,367 4,050 3,732 17,724
September 2016 554,177 760,972 93,693 222,127 4,014 3,590 17,437
October 2016 552,913 758,328 92,059 220,497 3,889 3,470 17,193
November 2016 555,286 760,719 92,182 196,018 3,658 3,386 16,994
December 2016 567,163 775,022 103,051 159,729 3,467 3,280 16,732
January 2017 564,484 774,122 99,888 157,268 3,273 3,193 16,524
February 2017 568,286 781,330 103,380 168,589 3,289 3,084 16,292
March 2017 567,955 780,655 102,013 191,358 3,392 2,919 15,912
April 2017 572,049 784,983 102,435 202,828 3,460 2,812 15,564
May 2017 566,057 772,231 99,654 212,264 3,529 2,727 15,228
June 2017 567,240 770,443 100,215 212,008 3,645 2,606 14,831
July 2017 567,504 765,878 99,104 201,625 3,529 2,523 14,616
August 2017 566,746 759,709 95,095 214,716 3,449 2,501 14,554
September 2017 568,343 757,454 92,465 214,389 3,327 2,482 14,572
October 2017 568,257 754,939 90,015 212,211 3,091 2,464 14,624
November 2017 568,809 753,508 87,972 186,446 2,872 2,456 14,722
December 2017 580,426 766,998 97,115 151,426 2,637 2,445 14,803
January 2018 577,076 763,677 93,958 148,321 2,425 2,422 14,778
February 2018 578,876 766,603 95,597 158,226 2,321 2,349 14,489
March 2018 581,699 769,155 94,627 175,407 2,240 2,218 13,891
April 2018 573,335 755,923 92,134 180,907 2,413 2,142 13,573
Variation March 2018 - April 2018
Number -8,364 -13,232 -2,493 5,500 173 -76 -318
Per cent -1.4 -1.7 -2.6 3.1 7.7 -3.4 -2.3
Notes:
Long-term Allowees have received income support for 12 months or more.
February 1994 data is included as it represents a peak in the number of recipients.
5
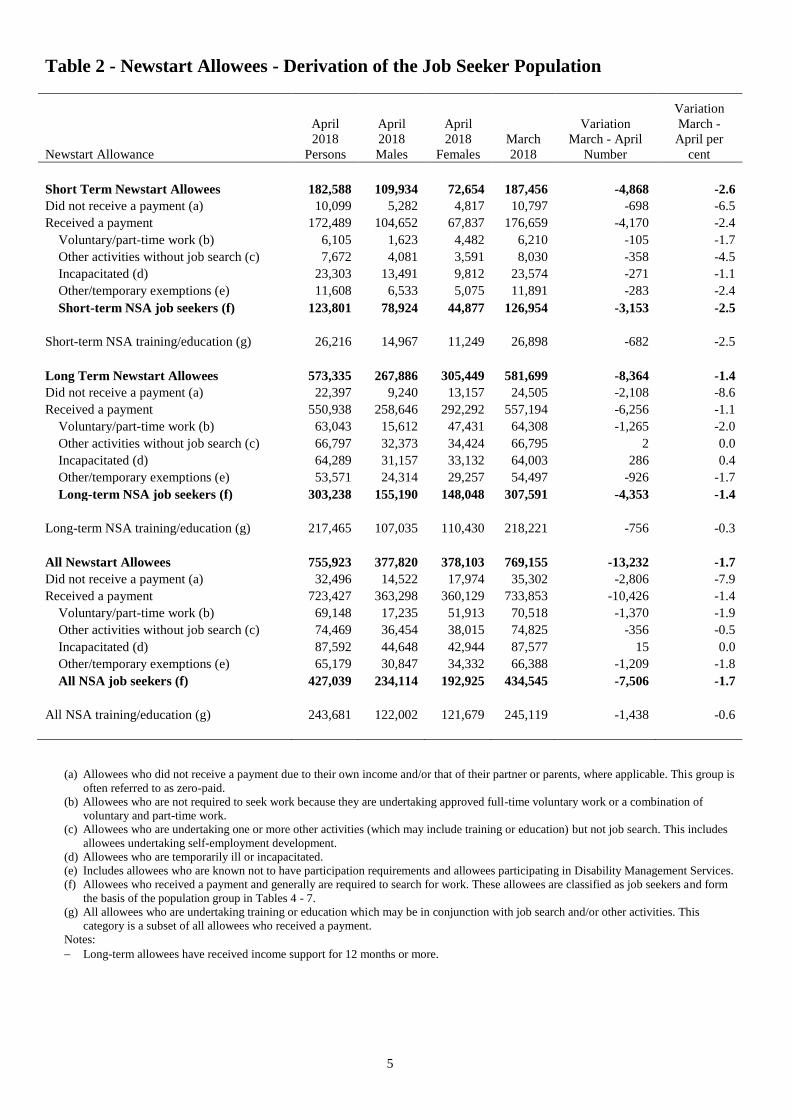
Table 2 - Newstart Allowees - Derivation of the Job Seeker Population
Newstart Allowance
April
2018
Persons
April
2018
Males
April
2018
Females
March
2018
Variation
March - April
Number
Variation
March -
April per
cent
Short Term Newstart Allowees 182,588 109,934 72,654 187,456 -4,868 -2.6
Did not receive a payment (a) 10,099 5,282 4,817 10,797 -698 -6.5
Received a payment 172,489 104,652 67,837 176,659 -4,170 -2.4
Voluntary/part-time work (b) 6,105 1,623 4,482 6,210 -105 -1.7
Other activities without job search (c) 7,672 4,081 3,591 8,030 -358 -4.5
Incapacitated (d) 23,303 13,491 9,812 23,574 -271 -1.1
Other/temporary exemptions (e) 11,608 6,533 5,075 11,891 -283 -2.4
Short-term NSA job seekers (f) 123,801 78,924 44,877 126,954 -3,153 -2.5
Short-term NSA training/education (g) 26,216 14,967 11,249 26,898 -682 -2.5
Long Term Newstart Allowees 573,335 267,886 305,449 581,699 -8,364 -1.4
Did not receive a payment (a) 22,397 9,240 13,157 24,505 -2,108 -8.6
Received a payment 550,938 258,646 292,292 557,194 -6,256 -1.1
Voluntary/part-time work (b) 63,043 15,612 47,431 64,308 -1,265 -2.0
Other activities without job search (c) 66,797 32,373 34,424 66,795 2 0.0
Incapacitated (d) 64,289 31,157 33,132 64,003 286 0.4
Other/temporary exemptions (e) 53,571 24,314 29,257 54,497 -926 -1.7
Long-term NSA job seekers (f) 303,238 155,190 148,048 307,591 -4,353 -1.4
Long-term NSA training/education (g) 217,465 107,035 110,430 218,221 -756 -0.3
All Newstart Allowees 755,923 377,820 378,103 769,155 -13,232 -1.7
Did not receive a payment (a) 32,496 14,522 17,974 35,302 -2,806 -7.9
Received a payment 723,427 363,298 360,129 733,853 -10,426 -1.4
Voluntary/part-time work (b) 69,148 17,235 51,913 70,518 -1,370 -1.9
Other activities without job search (c) 74,469 36,454 38,015 74,825 -356 -0.5
Incapacitated (d) 87,592 44,648 42,944 87,577 15 0.0
Other/temporary exemptions (e) 65,179 30,847 34,332 66,388 -1,209 -1.8
All NSA job seekers (f) 427,039 234,114 192,925 434,545 -7,506 -1.7
All NSA training/education (g) 243,681 122,002 121,679 245,119 -1,438 -0.6
(a) Allowees who did not receive a payment due to their own income and/or that of their partner or parents, where applicable. This group is
often referred to as zero-paid.
(b) Allowees who are not required to seek work because they are undertaking approved full-time voluntary work or a combination of
voluntary and part-time work.
(c) Allowees who are undertaking one or more other activities (which may include training or education) but not job search. This includes
allowees undertaking self-employment development.
(d) Allowees who are temporarily ill or incapacitated.
(e) Includes allowees who are known not to have participation requirements and allowees participating in Disability Management Services.
(f) Allowees who received a payment and generally are required to search for work. These allowees are classified as job seekers and form
the basis of the population group in Tables 4 - 7.
(g) All allowees who are undertaking training or education which may be in conjunction with job search and/or other activities. This
category is a subset of all allowees who received a payment.
Notes:
Long-term allowees have received income support for 12 months or more.
6
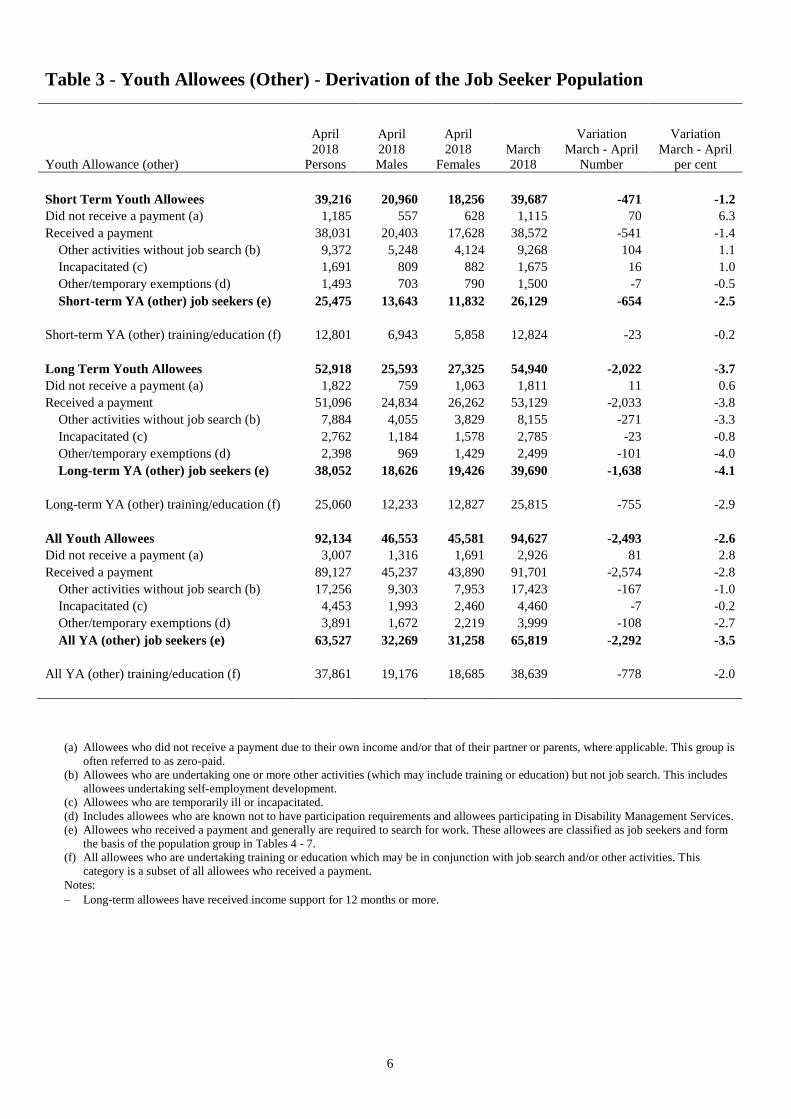
Table 3 - Youth Allowees (Other) - Derivation of the Job Seeker Population
Youth Allowance (other)
April
2018
Persons
April
2018
Males
April
2018
Females
March
2018
Variation
March - April
Number
Variation
March - April
per cent
Short Term Youth Allowees 39,216 20,960 18,256 39,687 -471 -1.2
Did not receive a payment (a) 1,185 557 628 1,115 70 6.3
Received a payment 38,031 20,403 17,628 38,572 -541 -1.4
Other activities without job search (b) 9,372 5,248 4,124 9,268 104 1.1
Incapacitated (c) 1,691 809 882 1,675 16 1.0
Other/temporary exemptions (d) 1,493 703 790 1,500 -7 -0.5
Short-term YA (other) job seekers (e) 25,475 13,643 11,832 26,129 -654 -2.5
Short-term YA (other) training/education (f) 12,801 6,943 5,858 12,824 -23 -0.2
Long Term Youth Allowees 52,918 25,593 27,325 54,940 -2,022 -3.7
Did not receive a payment (a) 1,822 759 1,063 1,811 11 0.6
Received a payment 51,096 24,834 26,262 53,129 -2,033 -3.8
Other activities without job search (b) 7,884 4,055 3,829 8,155 -271 -3.3
Incapacitated (c) 2,762 1,184 1,578 2,785 -23 -0.8
Other/temporary exemptions (d) 2,398 969 1,429 2,499 -101 -4.0
Long-term YA (other) job seekers (e) 38,052 18,626 19,426 39,690 -1,638 -4.1
Long-term YA (other) training/education (f) 25,060 12,233 12,827 25,815 -755 -2.9
All Youth Allowees 92,134 46,553 45,581 94,627 -2,493 -2.6
Did not receive a payment (a) 3,007 1,316 1,691 2,926 81 2.8
Received a payment 89,127 45,237 43,890 91,701 -2,574 -2.8
Other activities without job search (b) 17,256 9,303 7,953 17,423 -167 -1.0
Incapacitated (c) 4,453 1,993 2,460 4,460 -7 -0.2
Other/temporary exemptions (d) 3,891 1,672 2,219 3,999 -108 -2.7
All YA (other) job seekers (e) 63,527 32,269 31,258 65,819 -2,292 -3.5
All YA (other) training/education (f) 37,861 19,176 18,685 38,639 -778 -2.0
(a) Allowees who did not receive a payment due to their own income and/or that of their partner or parents, where applicable. This group is
often referred to as zero-paid.
(b) Allowees who are undertaking one or more other activities (which may include training or education) but not job search. This includes
allowees undertaking self-employment development.
(c) Allowees who are temporarily ill or incapacitated.
(d) Includes allowees who are known not to have participation requirements and allowees participating in Disability Management Services.
(e) Allowees who received a payment and generally are required to search for work. These allowees are classified as job seekers and form
the basis of the population group in Tables 4 - 7.
(f) All allowees who are undertaking training or education which may be in conjunction with job search and/or other activities. This
category is a subset of all allowees who received a payment.
Notes:
Long-term allowees have received income support for 12 months or more.
7
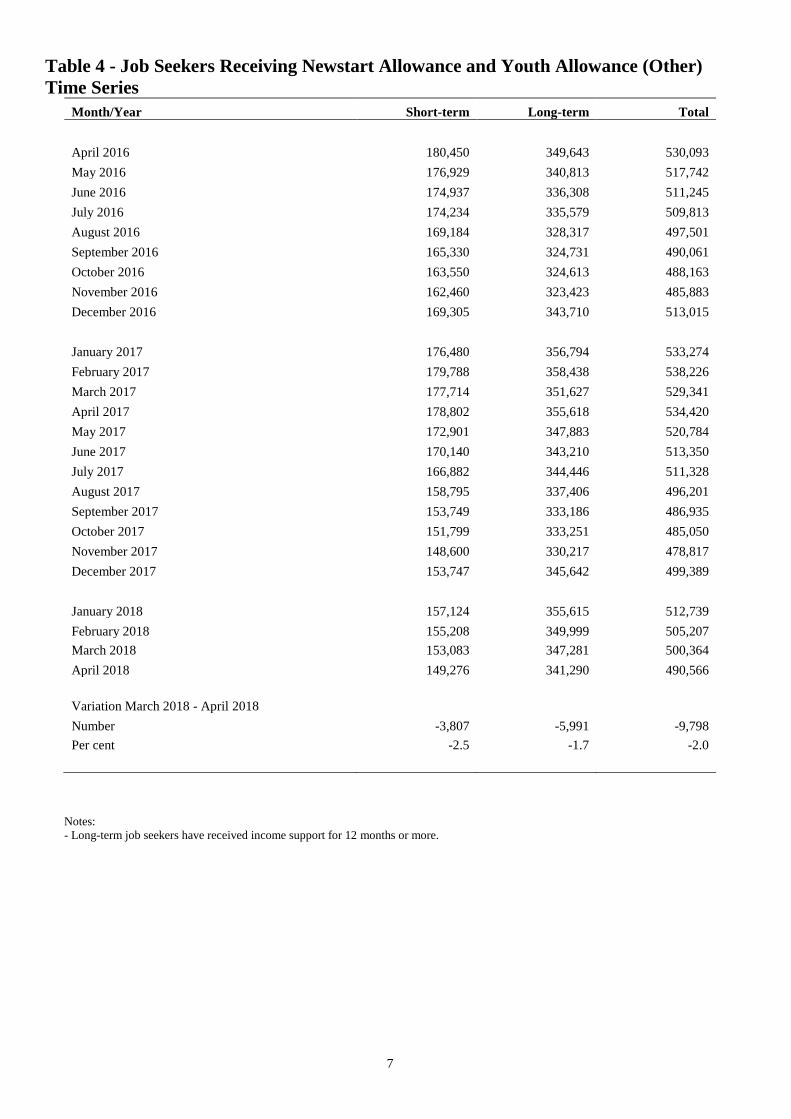
Table 4 - Job Seekers Receiving Newstart Allowance and Youth Allowance (Other)
Time Series
Month/Year Short-term Long-term Total
April 2016 180,450 349,643 530,093
May 2016 176,929 340,813 517,742
June 2016 174,937 336,308 511,245
July 2016 174,234 335,579 509,813
August 2016 169,184 328,317 497,501
September 2016 165,330 324,731 490,061
October 2016 163,550 324,613 488,163
November 2016 162,460 323,423 485,883
December 2016 169,305 343,710 513,015
January 2017 176,480 356,794 533,274
February 2017 179,788 358,438 538,226
March 2017 177,714 351,627 529,341
April 2017 178,802 355,618 534,420
May 2017 172,901 347,883 520,784
June 2017 170,140 343,210 513,350
July 2017 166,882 344,446 511,328
August 2017 158,795 337,406 496,201
September 2017 153,749 333,186 486,935
October 2017 151,799 333,251 485,050
November 2017 148,600 330,217 478,817
December 2017 153,747 345,642 499,389
January 2018 157,124 355,615 512,739
February 2018 155,208 349,999 505,207
March 2018 153,083 347,281 500,364
April 2018 149,276 341,290 490,566
Variation March 2018 - April 2018
Number -3,807 -5,991 -9,798
Per cent -2.5 -1.7 -2.0
Notes:
- Long-term job seekers have received income support for 12 months or more.
8
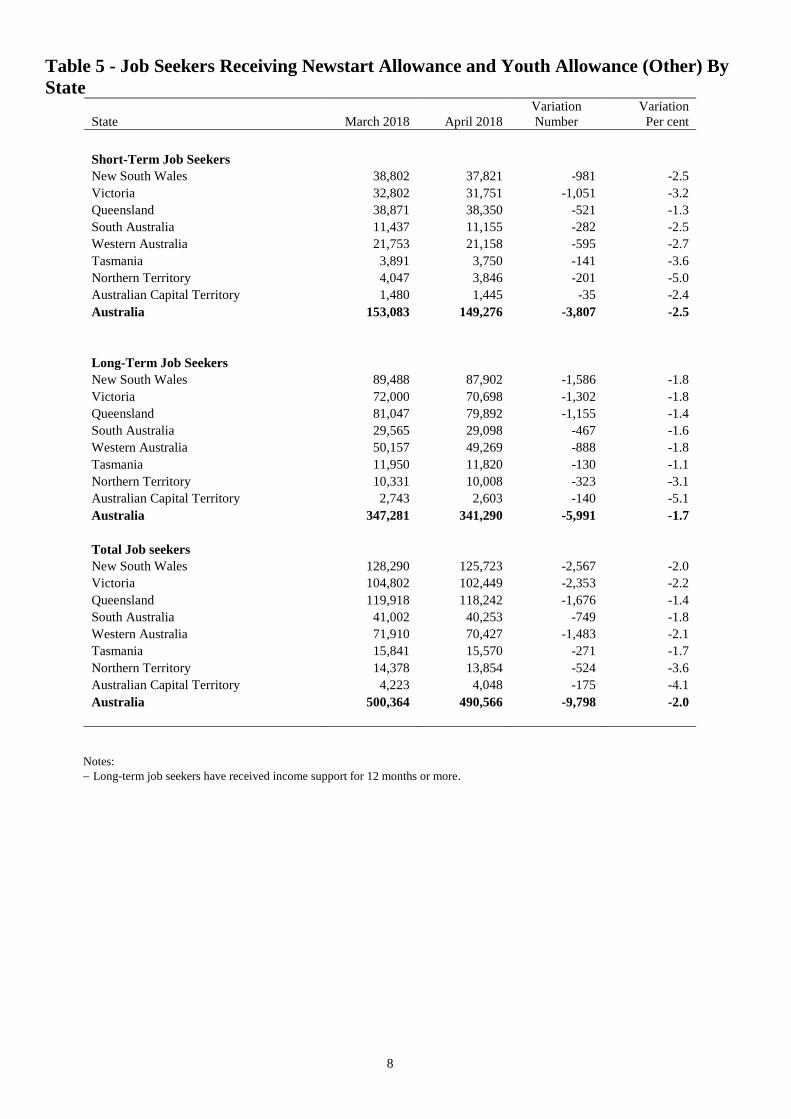
Table 5 - Job Seekers Receiving Newstart Allowance and Youth Allowance (Other) By
State
State March 2018 April 2018
Variation
Number
Variation
Per cent
Short-Term Job Seekers
New South Wales 38,802 37,821 -981 -2.5
Victoria 32,802 31,751 -1,051 -3.2
Queensland 38,871 38,350 -521 -1.3
South Australia 11,437 11,155 -282 -2.5
Western Australia 21,753 21,158 -595 -2.7
Tasmania 3,891 3,750 -141 -3.6
Northern Territory 4,047 3,846 -201 -5.0
Australian Capital Territory 1,480 1,445 -35 -2.4
Australia 153,083 149,276 -3,807 -2.5
Long-Term Job Seekers
New South Wales 89,488 87,902 -1,586 -1.8
Victoria 72,000 70,698 -1,302 -1.8
Queensland 81,047 79,892 -1,155 -1.4
South Australia 29,565 29,098 -467 -1.6
Western Australia 50,157 49,269 -888 -1.8
Tasmania 11,950 11,820 -130 -1.1
Northern Territory 10,331 10,008 -323 -3.1
Australian Capital Territory 2,743 2,603 -140 -5.1
Australia 347,281 341,290 -5,991 -1.7
Total Job seekers
New South Wales 128,290 125,723 -2,567 -2.0
Victoria 104,802 102,449 -2,353 -2.2
Queensland 119,918 118,242 -1,676 -1.4
South Australia 41,002 40,253 -749 -1.8
Western Australia 71,910 70,427 -1,483 -2.1
Tasmania 15,841 15,570 -271 -1.7
Northern Territory 14,378 13,854 -524 -3.6
Australian Capital Territory 4,223 4,048 -175 -4.1
Australia 500,364 490,566 -9,798 -2.0
Notes:
Long-term job seekers have received income support for 12 months or more.
9
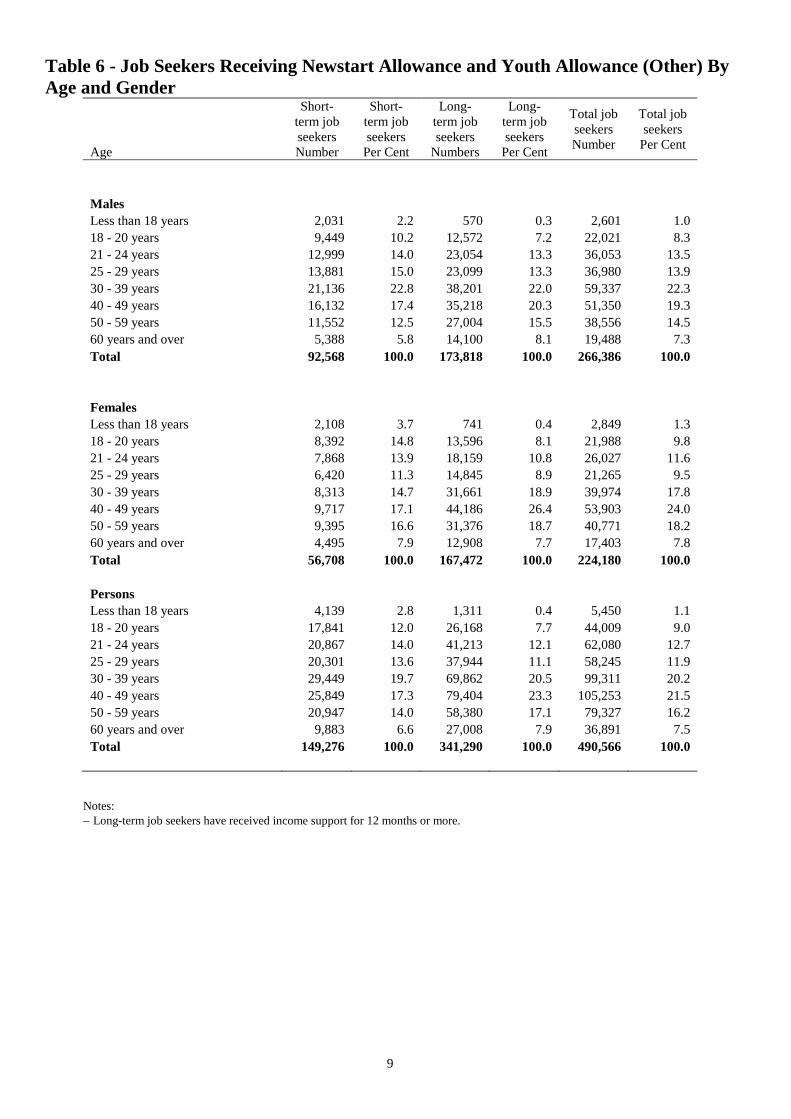
Table 6 - Job Seekers Receiving Newstart Allowance and Youth Allowance (Other) By
Age and Gender
Age
Short-
term job
seekers
Number
Short-
term job
seekers
Per Cent
Long-
term job
seekers
Numbers
Long-
term job
seekers
Per Cent
Total job
seekers
Number
Total job
seekers
Per Cent
Males
Less than 18 years 2,031 2.2 570 0.3 2,601 1.0
18 - 20 years 9,449 10.2 12,572 7.2 22,021 8.3
21 - 24 years 12,999 14.0 23,054 13.3 36,053 13.5
25 - 29 years 13,881 15.0 23,099 13.3 36,980 13.9
30 - 39 years 21,136 22.8 38,201 22.0 59,337 22.3
40 - 49 years 16,132 17.4 35,218 20.3 51,350 19.3
50 - 59 years 11,552 12.5 27,004 15.5 38,556 14.5
60 years and over 5,388 5.8 14,100 8.1 19,488 7.3
Total 92,568 100.0 173,818 100.0 266,386 100.0
Females
Less than 18 years 2,108 3.7 741 0.4 2,849 1.3
18 - 20 years 8,392 14.8 13,596 8.1 21,988 9.8
21 - 24 years 7,868 13.9 18,159 10.8 26,027 11.6
25 - 29 years 6,420 11.3 14,845 8.9 21,265 9.5
30 - 39 years 8,313 14.7 31,661 18.9 39,974 17.8
40 - 49 years 9,717 17.1 44,186 26.4 53,903 24.0
50 - 59 years 9,395 16.6 31,376 18.7 40,771 18.2
60 years and over 4,495 7.9 12,908 7.7 17,403 7.8
Total 56,708 100.0 167,472 100.0 224,180 100.0
Persons
Less than 18 years 4,139 2.8 1,311 0.4 5,450 1.1
18 - 20 years 17,841 12.0 26,168 7.7 44,009 9.0
21 - 24 years 20,867 14.0 41,213 12.1 62,080 12.7
25 - 29 years 20,301 13.6 37,944 11.1 58,245 11.9
30 - 39 years 29,449 19.7 69,862 20.5 99,311 20.2
40 - 49 years 25,849 17.3 79,404 23.3 105,253 21.5
50 - 59 years 20,947 14.0 58,380 17.1 79,327 16.2
60 years and over 9,883 6.6 27,008 7.9 36,891 7.5
Total 149,276 100.0 341,290 100.0 490,566 100.0
Notes:
Long-term job seekers have received income support for 12 months or more.
10
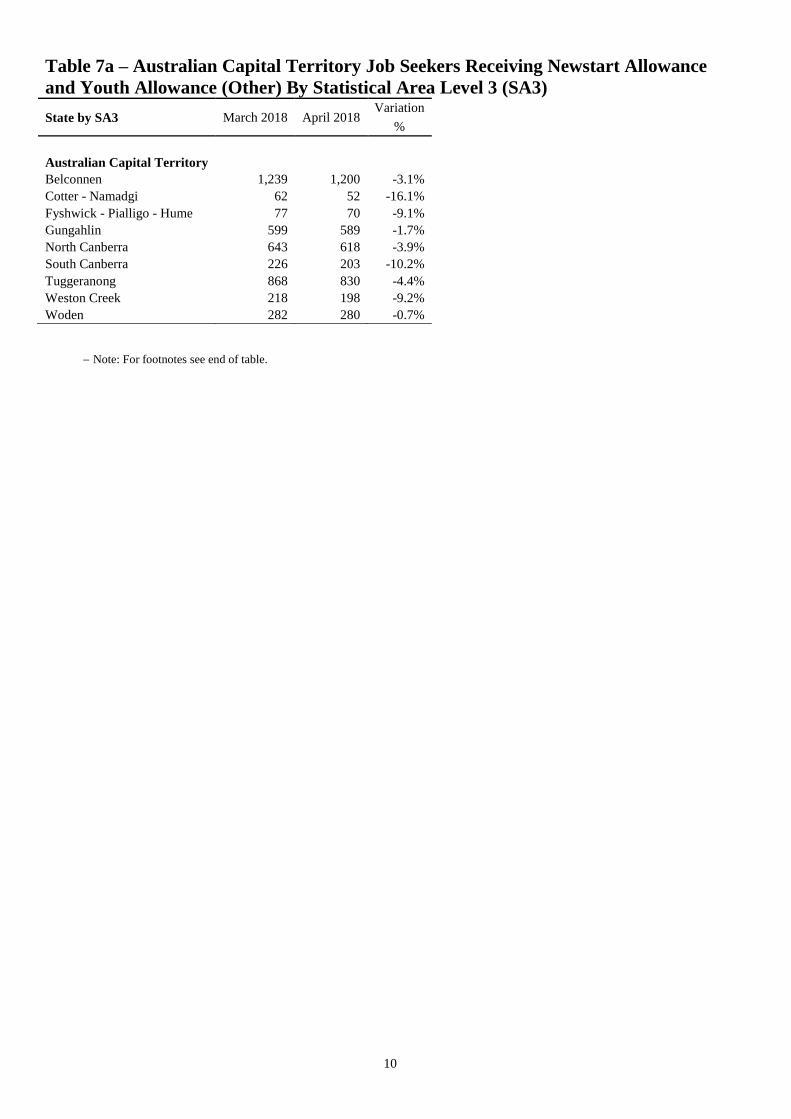
Table 7a – Australian Capital Territory Job Seekers Receiving Newstart Allowance
and Youth Allowance (Other) By Statistical Area Level 3 (SA3)
State by SA3 March 2018 April 2018 Variation
%
Australian Capital Territory
Belconnen 1,239 1,200 -3.1%
Cotter - Namadgi 62 52 -16.1%
Fyshwick - Pialligo - Hume 77 70 -9.1%
Gungahlin 599 589 -1.7%
North Canberra 643 618 -3.9%
South Canberra 226 203 -10.2%
Tuggeranong 868 830 -4.4%
Weston Creek 218 198 -9.2%
Woden 282 280 -0.7%
Note: For footnotes see end of table.
11
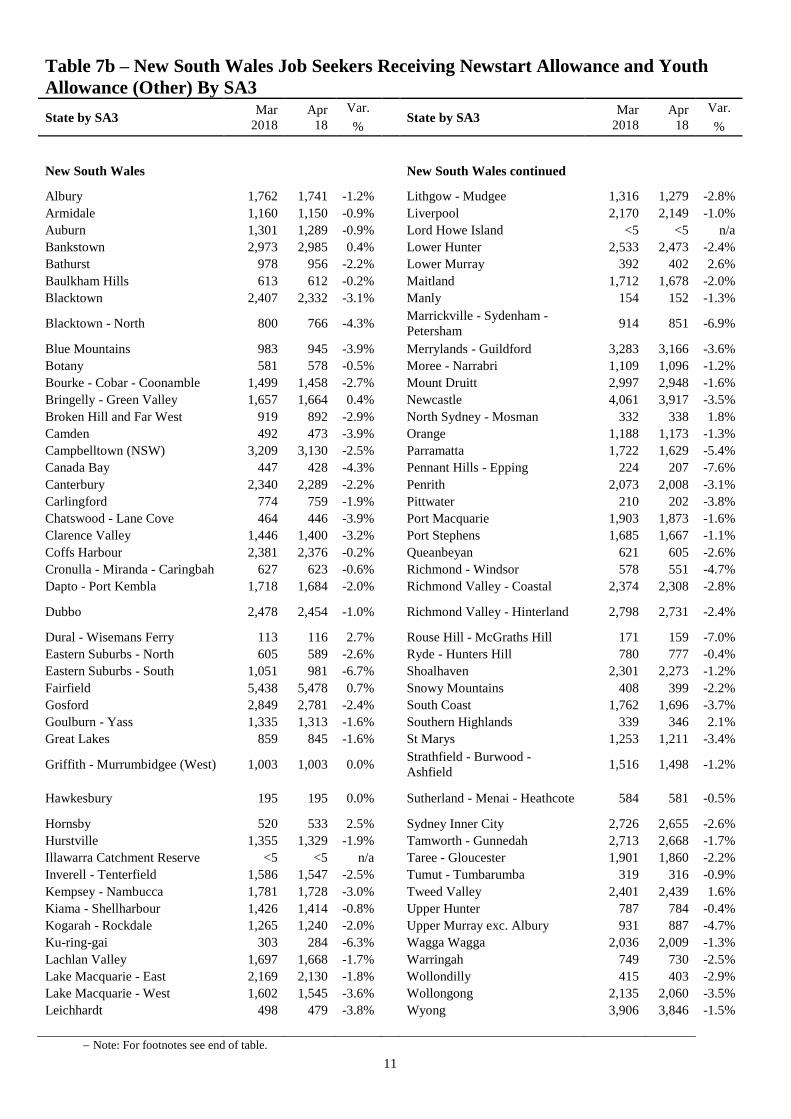
Table 7b – New South Wales Job Seekers Receiving Newstart Allowance and Youth
Allowance (Other) By SA3
State by SA3 Mar
2018
Apr
18
Var. State by SA3
Mar
2018
Apr
18
Var.
% %
New South Wales
New South Wales continued
Albury 1,762 1,741 -1.2%
Lithgow - Mudgee 1,316 1,279 -2.8%
Armidale 1,160 1,150 -0.9%
Liverpool 2,170 2,149 -1.0%
Auburn 1,301 1,289 -0.9%
Lord Howe Island <5 <5 n/a
Bankstown 2,973 2,985 0.4%
Lower Hunter 2,533 2,473 -2.4%
Bathurst 978 956 -2.2%
Lower Murray 392 402 2.6%
Baulkham Hills 613 612 -0.2%
Maitland 1,712 1,678 -2.0%
Blacktown 2,407 2,332 -3.1%
Manly 154 152 -1.3%
Blacktown - North 800 766 -4.3%
Marrickville - Sydenham -
Petersham 914 851 -6.9%
Blue Mountains 983 945 -3.9%
Merrylands - Guildford 3,283 3,166 -3.6%
Botany 581 578 -0.5%
Moree - Narrabri 1,109 1,096 -1.2%
Bourke - Cobar - Coonamble 1,499 1,458 -2.7%
Mount Druitt 2,997 2,948 -1.6%
Bringelly - Green Valley 1,657 1,664 0.4%
Newcastle 4,061 3,917 -3.5%
Broken Hill and Far West 919 892 -2.9%
North Sydney - Mosman 332 338 1.8%
Camden 492 473 -3.9%
Orange 1,188 1,173 -1.3%
Campbelltown (NSW) 3,209 3,130 -2.5%
Parramatta 1,722 1,629 -5.4%
Canada Bay 447 428 -4.3%
Pennant Hills - Epping 224 207 -7.6%
Canterbury 2,340 2,289 -2.2%
Penrith 2,073 2,008 -3.1%
Carlingford 774 759 -1.9%
Pittwater 210 202 -3.8%
Chatswood - Lane Cove 464 446 -3.9%
Port Macquarie 1,903 1,873 -1.6%
Clarence Valley 1,446 1,400 -3.2%
Port Stephens 1,685 1,667 -1.1%
Coffs Harbour 2,381 2,376 -0.2%
Queanbeyan 621 605 -2.6%
Cronulla - Miranda - Caringbah 627 623 -0.6%
Richmond - Windsor 578 551 -4.7%
Dapto - Port Kembla 1,718 1,684 -2.0%
Richmond Valley - Coastal 2,374 2,308 -2.8%
Dubbo 2,478 2,454 -1.0%
Richmond Valley - Hinterland 2,798 2,731 -2.4%
Dural - Wisemans Ferry 113 116 2.7%
Rouse Hill - McGraths Hill 171 159 -7.0%
Eastern Suburbs - North 605 589 -2.6%
Ryde - Hunters Hill 780 777 -0.4%
Eastern Suburbs - South 1,051 981 -6.7%
Shoalhaven 2,301 2,273 -1.2%
Fairfield 5,438 5,478 0.7%
Snowy Mountains 408 399 -2.2%
Gosford 2,849 2,781 -2.4%
South Coast 1,762 1,696 -3.7%
Goulburn - Yass 1,335 1,313 -1.6%
Southern Highlands 339 346 2.1%
Great Lakes 859 845 -1.6%
St Marys 1,253 1,211 -3.4%
Griffith - Murrumbidgee (West) 1,003 1,003 0.0%
Strathfield - Burwood -
Ashfield 1,516 1,498 -1.2%
Hawkesbury 195 195 0.0%
Sutherland - Menai - Heathcote 584 581 -0.5%
Hornsby 520 533 2.5%
Sydney Inner City 2,726 2,655 -2.6%
Hurstville 1,355 1,329 -1.9%
Tamworth - Gunnedah 2,713 2,668 -1.7%
Illawarra Catchment Reserve <5 <5 n/a
Taree - Gloucester 1,901 1,860 -2.2%
Inverell - Tenterfield 1,586 1,547 -2.5%
Tumut - Tumbarumba 319 316 -0.9%
Kempsey - Nambucca 1,781 1,728 -3.0%
Tweed Valley 2,401 2,439 1.6%
Kiama - Shellharbour 1,426 1,414 -0.8%
Upper Hunter 787 784 -0.4%
Kogarah - Rockdale 1,265 1,240 -2.0%
Upper Murray exc. Albury 931 887 -4.7%
Ku-ring-gai 303 284 -6.3%
Wagga Wagga 2,036 2,009 -1.3%
Lachlan Valley 1,697 1,668 -1.7%
Warringah 749 730 -2.5%
Lake Macquarie - East 2,169 2,130 -1.8%
Wollondilly 415 403 -2.9%
Lake Macquarie - West 1,602 1,545 -3.6%
Wollongong 2,135 2,060 -3.5%
Leichhardt 498 479 -3.8%
Wyong 3,906 3,846 -1.5%
Note: For footnotes see end of table.
12
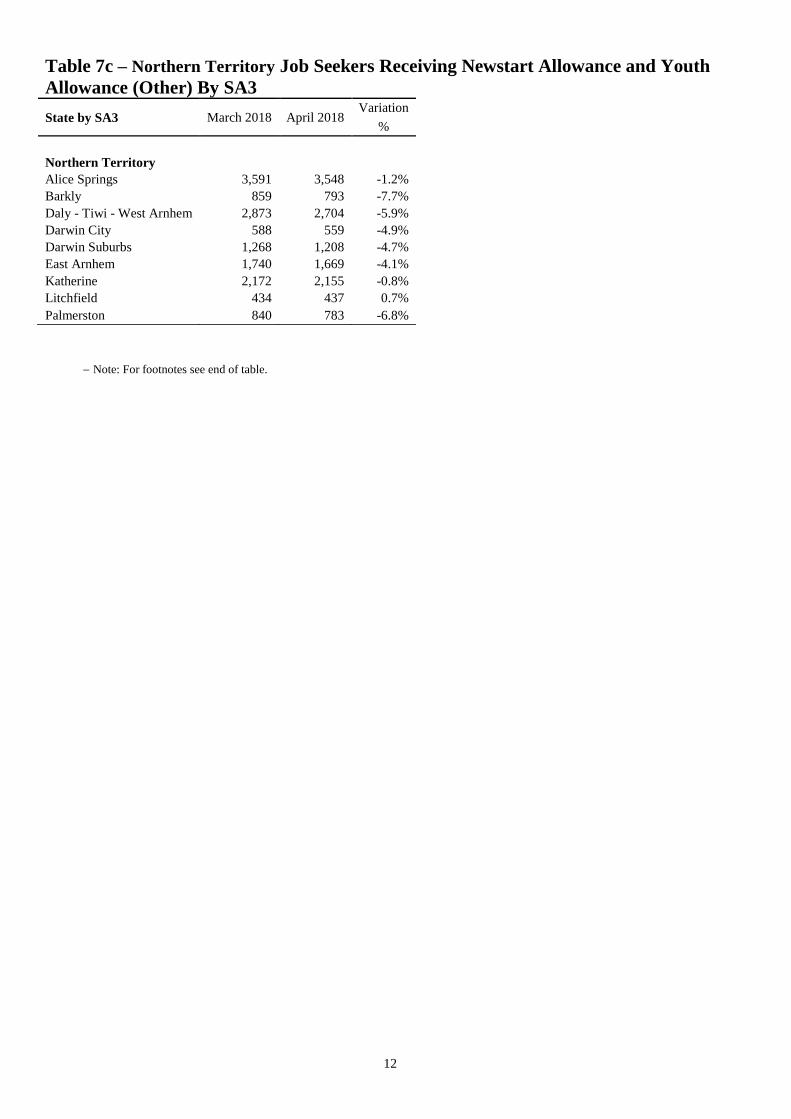
Table 7c – Northern Territory Job Seekers Receiving Newstart Allowance and Youth
Allowance (Other) By SA3
State by SA3 March 2018 April 2018 Variation
%
Northern Territory
Alice Springs 3,591 3,548 -1.2%
Barkly 859 793 -7.7%
Daly - Tiwi - West Arnhem 2,873 2,704 -5.9%
Darwin City 588 559 -4.9%
Darwin Suburbs 1,268 1,208 -4.7%
East Arnhem 1,740 1,669 -4.1%
Katherine 2,172 2,155 -0.8%
Litchfield 434 437 0.7%
Palmerston 840 783 -6.8%
Note: For footnotes see end of table.
13
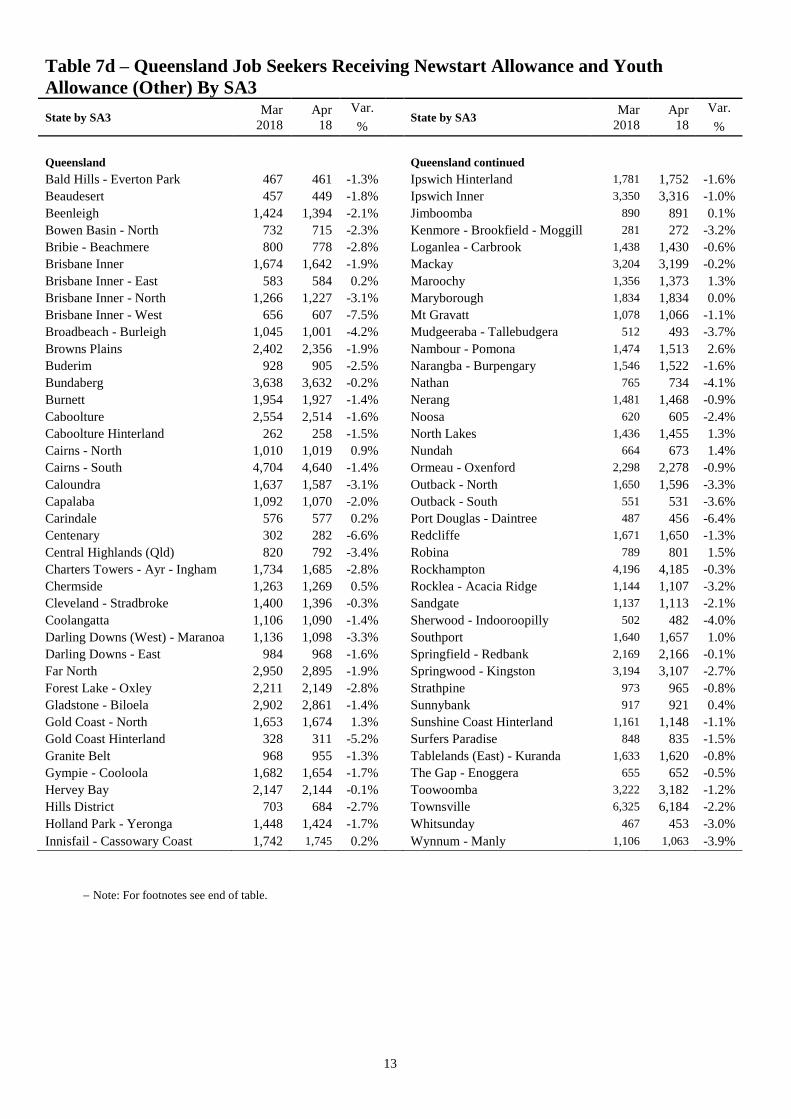
Table 7d – Queensland Job Seekers Receiving Newstart Allowance and Youth
Allowance (Other) By SA3
State by SA3 Mar
2018
Apr
18
Var. State by SA3
Mar
2018
Apr
18
Var.
% %
Queensland
Queensland continued
Bald Hills - Everton Park 467 461 -1.3% Ipswich Hinterland 1,781 1,752 -1.6%
Beaudesert 457 449 -1.8% Ipswich Inner 3,350 3,316 -1.0%
Beenleigh 1,424 1,394 -2.1% Jimboomba 890 891 0.1%
Bowen Basin - North 732 715 -2.3% Kenmore - Brookfield - Moggill 281 272 -3.2%
Bribie - Beachmere 800 778 -2.8% Loganlea - Carbrook 1,438 1,430 -0.6%
Brisbane Inner 1,674 1,642 -1.9% Mackay 3,204 3,199 -0.2%
Brisbane Inner - East 583 584 0.2% Maroochy 1,356 1,373 1.3%
Brisbane Inner - North 1,266 1,227 -3.1% Maryborough 1,834 1,834 0.0%
Brisbane Inner - West 656 607 -7.5% Mt Gravatt 1,078 1,066 -1.1%
Broadbeach - Burleigh 1,045 1,001 -4.2% Mudgeeraba - Tallebudgera 512 493 -3.7%
Browns Plains 2,402 2,356 -1.9% Nambour - Pomona 1,474 1,513 2.6%
Buderim 928 905 -2.5% Narangba - Burpengary 1,546 1,522 -1.6%
Bundaberg 3,638 3,632 -0.2% Nathan 765 734 -4.1%
Burnett 1,954 1,927 -1.4% Nerang 1,481 1,468 -0.9%
Caboolture 2,554 2,514 -1.6% Noosa 620 605 -2.4%
Caboolture Hinterland 262 258 -1.5% North Lakes 1,436 1,455 1.3%
Cairns - North 1,010 1,019 0.9% Nundah 664 673 1.4%
Cairns - South 4,704 4,640 -1.4% Ormeau - Oxenford 2,298 2,278 -0.9%
Caloundra 1,637 1,587 -3.1% Outback - North 1,650 1,596 -3.3%
Capalaba 1,092 1,070 -2.0% Outback - South 551 531 -3.6%
Carindale 576 577 0.2% Port Douglas - Daintree 487 456 -6.4%
Centenary 302 282 -6.6% Redcliffe 1,671 1,650 -1.3%
Central Highlands (Qld) 820 792 -3.4% Robina 789 801 1.5%
Charters Towers - Ayr - Ingham 1,734 1,685 -2.8% Rockhampton 4,196 4,185 -0.3%
Chermside 1,263 1,269 0.5% Rocklea - Acacia Ridge 1,144 1,107 -3.2%
Cleveland - Stradbroke 1,400 1,396 -0.3% Sandgate 1,137 1,113 -2.1%
Coolangatta 1,106 1,090 -1.4% Sherwood - Indooroopilly 502 482 -4.0%
Darling Downs (West) - Maranoa 1,136 1,098 -3.3% Southport 1,640 1,657 1.0%
Darling Downs - East 984 968 -1.6% Springfield - Redbank 2,169 2,166 -0.1%
Far North 2,950 2,895 -1.9% Springwood - Kingston 3,194 3,107 -2.7%
Forest Lake - Oxley 2,211 2,149 -2.8% Strathpine 973 965 -0.8%
Gladstone - Biloela 2,902 2,861 -1.4% Sunnybank 917 921 0.4%
Gold Coast - North 1,653 1,674 1.3% Sunshine Coast Hinterland 1,161 1,148 -1.1%
Gold Coast Hinterland 328 311 -5.2% Surfers Paradise 848 835 -1.5%
Granite Belt 968 955 -1.3% Tablelands (East) - Kuranda 1,633 1,620 -0.8%
Gympie - Cooloola 1,682 1,654 -1.7% The Gap - Enoggera 655 652 -0.5%
Hervey Bay 2,147 2,144 -0.1% Toowoomba 3,222 3,182 -1.2%
Hills District 703 684 -2.7% Townsville 6,325 6,184 -2.2%
Holland Park - Yeronga 1,448 1,424 -1.7% Whitsunday 467 453 -3.0%
Innisfail - Cassowary Coast 1,742 1,745 0.2% Wynnum - Manly 1,106 1,063 -3.9%
Note: For footnotes see end of table.
14
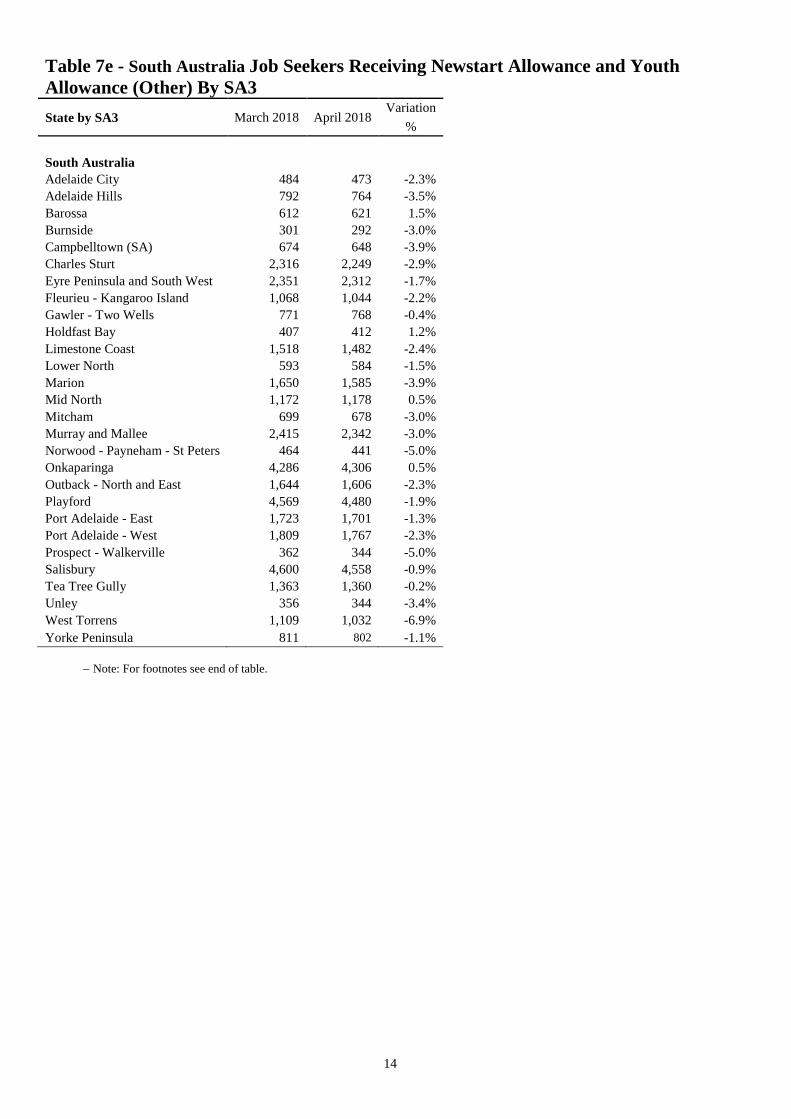
Table 7e - South Australia Job Seekers Receiving Newstart Allowance and Youth
Allowance (Other) By SA3
State by SA3 March 2018 April 2018 Variation
%
South Australia
Adelaide City 484 473 -2.3%
Adelaide Hills 792 764 -3.5%
Barossa 612 621 1.5%
Burnside 301 292 -3.0%
Campbelltown (SA) 674 648 -3.9%
Charles Sturt 2,316 2,249 -2.9%
Eyre Peninsula and South West 2,351 2,312 -1.7%
Fleurieu - Kangaroo Island 1,068 1,044 -2.2%
Gawler - Two Wells 771 768 -0.4%
Holdfast Bay 407 412 1.2%
Limestone Coast 1,518 1,482 -2.4%
Lower North 593 584 -1.5%
Marion 1,650 1,585 -3.9%
Mid North 1,172 1,178 0.5%
Mitcham 699 678 -3.0%
Murray and Mallee 2,415 2,342 -3.0%
Norwood - Payneham - St Peters 464 441 -5.0%
Onkaparinga 4,286 4,306 0.5%
Outback - North and East 1,644 1,606 -2.3%
Playford 4,569 4,480 -1.9%
Port Adelaide - East 1,723 1,701 -1.3%
Port Adelaide - West 1,809 1,767 -2.3%
Prospect - Walkerville 362 344 -5.0%
Salisbury 4,600 4,558 -0.9%
Tea Tree Gully 1,363 1,360 -0.2%
Unley 356 344 -3.4%
West Torrens 1,109 1,032 -6.9%
Yorke Peninsula 811 802 -1.1%
Note: For footnotes see end of table.
15
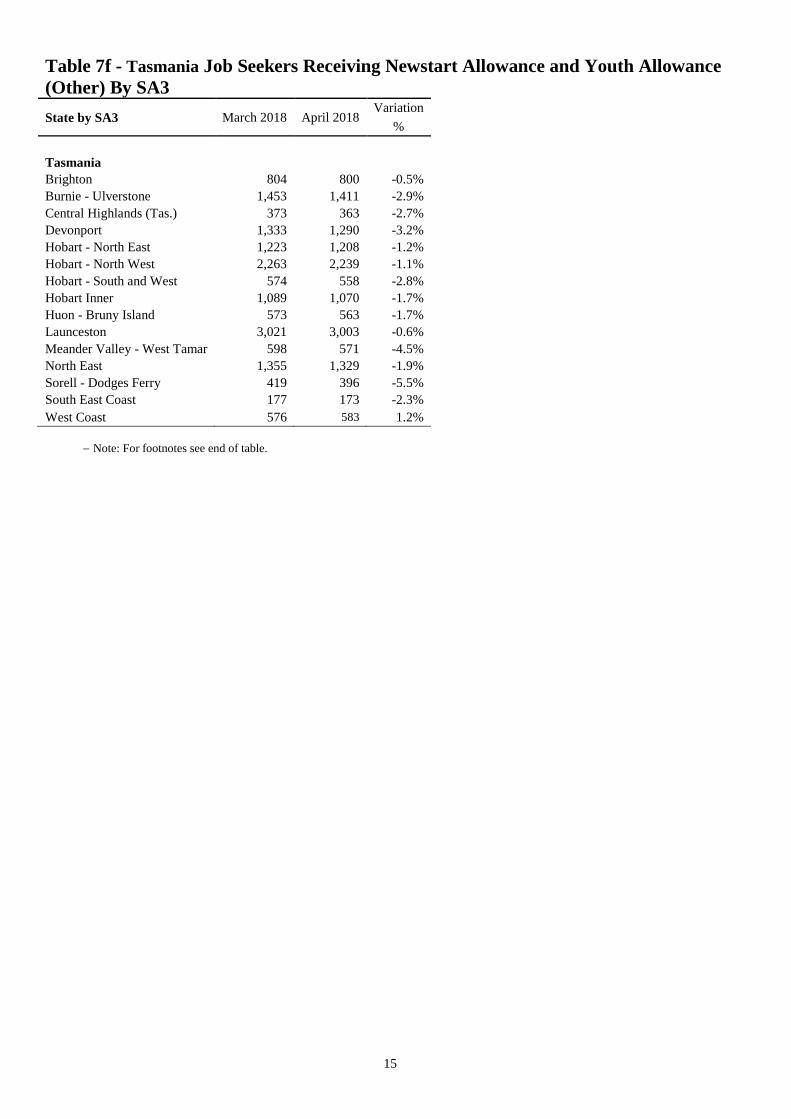
Table 7f - Tasmania Job Seekers Receiving Newstart Allowance and Youth Allowance
(Other) By SA3
State by SA3 March 2018 April 2018 Variation
%
Tasmania
Brighton 804 800 -0.5%
Burnie - Ulverstone 1,453 1,411 -2.9%
Central Highlands (Tas.) 373 363 -2.7%
Devonport 1,333 1,290 -3.2%
Hobart - North East 1,223 1,208 -1.2%
Hobart - North West 2,263 2,239 -1.1%
Hobart - South and West 574 558 -2.8%
Hobart Inner 1,089 1,070 -1.7%
Huon - Bruny Island 573 563 -1.7%
Launceston 3,021 3,003 -0.6%
Meander Valley - West Tamar 598 571 -4.5%
North East 1,355 1,329 -1.9%
Sorell - Dodges Ferry 419 396 -5.5%
South East Coast 177 173 -2.3%
West Coast 576 583 1.2%
Note: For footnotes see end of table.
16
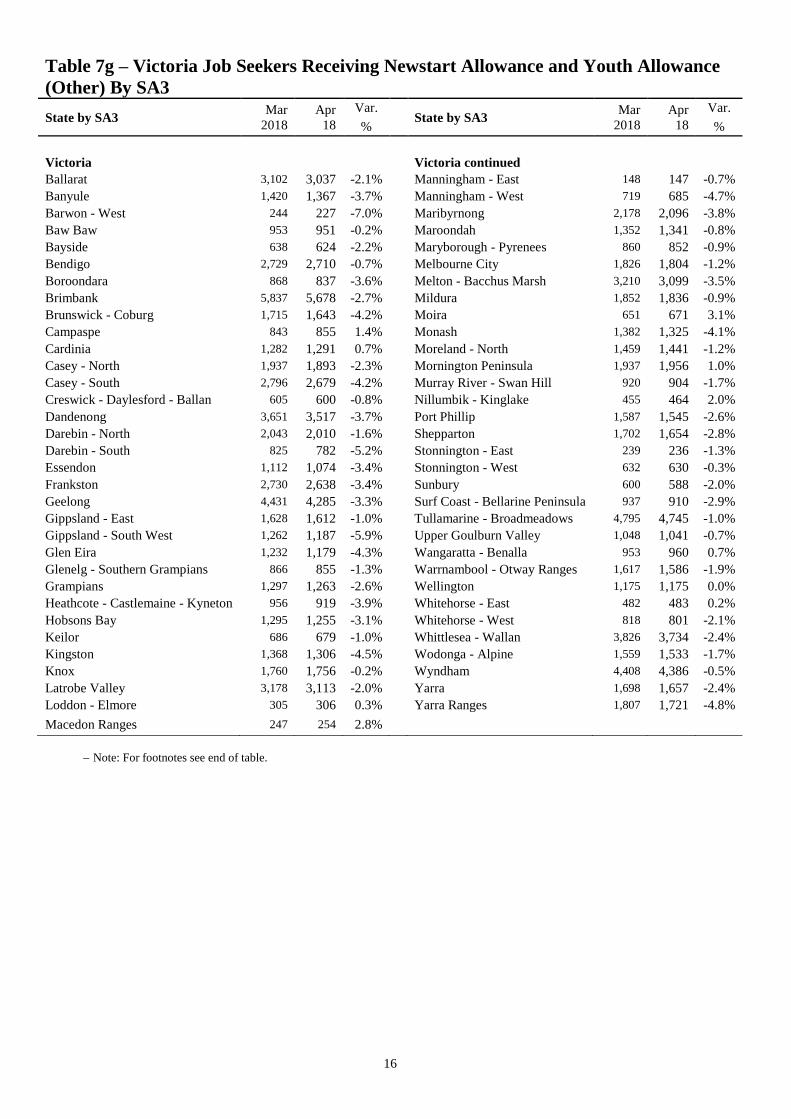
Table 7g – Victoria Job Seekers Receiving Newstart Allowance and Youth Allowance
(Other) By SA3
State by SA3 Mar
2018
Apr
18
Var. State by SA3
Mar
2018
Apr
18
Var.
% %
Victoria
Victoria continued
Ballarat 3,102 3,037 -2.1%
Manningham - East 148 147 -0.7%
Banyule 1,420 1,367 -3.7%
Manningham - West 719 685 -4.7%
Barwon - West 244 227 -7.0%
Maribyrnong 2,178 2,096 -3.8%
Baw Baw 953 951 -0.2%
Maroondah 1,352 1,341 -0.8%
Bayside 638 624 -2.2%
Maryborough - Pyrenees 860 852 -0.9%
Bendigo 2,729 2,710 -0.7%
Melbourne City 1,826 1,804 -1.2%
Boroondara 868 837 -3.6%
Melton - Bacchus Marsh 3,210 3,099 -3.5%
Brimbank 5,837 5,678 -2.7%
Mildura 1,852 1,836 -0.9%
Brunswick - Coburg 1,715 1,643 -4.2%
Moira 651 671 3.1%
Campaspe 843 855 1.4%
Monash 1,382 1,325 -4.1%
Cardinia 1,282 1,291 0.7%
Moreland - North 1,459 1,441 -1.2%
Casey - North 1,937 1,893 -2.3%
Mornington Peninsula 1,937 1,956 1.0%
Casey - South 2,796 2,679 -4.2%
Murray River - Swan Hill 920 904 -1.7%
Creswick - Daylesford - Ballan 605 600 -0.8%
Nillumbik - Kinglake 455 464 2.0%
Dandenong 3,651 3,517 -3.7%
Port Phillip 1,587 1,545 -2.6%
Darebin - North 2,043 2,010 -1.6%
Shepparton 1,702 1,654 -2.8%
Darebin - South 825 782 -5.2%
Stonnington - East 239 236 -1.3%
Essendon 1,112 1,074 -3.4%
Stonnington - West 632 630 -0.3%
Frankston 2,730 2,638 -3.4%
Sunbury 600 588 -2.0%
Geelong 4,431 4,285 -3.3%
Surf Coast - Bellarine Peninsula 937 910 -2.9%
Gippsland - East 1,628 1,612 -1.0%
Tullamarine - Broadmeadows 4,795 4,745 -1.0%
Gippsland - South West 1,262 1,187 -5.9%
Upper Goulburn Valley 1,048 1,041 -0.7%
Glen Eira 1,232 1,179 -4.3%
Wangaratta - Benalla 953 960 0.7%
Glenelg - Southern Grampians 866 855 -1.3%
Warrnambool - Otway Ranges 1,617 1,586 -1.9%
Grampians 1,297 1,263 -2.6%
Wellington 1,175 1,175 0.0%
Heathcote - Castlemaine - Kyneton 956 919 -3.9%
Whitehorse - East 482 483 0.2%
Hobsons Bay 1,295 1,255 -3.1%
Whitehorse - West 818 801 -2.1%
Keilor 686 679 -1.0%
Whittlesea - Wallan 3,826 3,734 -2.4%
Kingston 1,368 1,306 -4.5%
Wodonga - Alpine 1,559 1,533 -1.7%
Knox 1,760 1,756 -0.2%
Wyndham 4,408 4,386 -0.5%
Latrobe Valley 3,178 3,113 -2.0%
Yarra 1,698 1,657 -2.4%
Loddon - Elmore 305 306 0.3%
Yarra Ranges 1,807 1,721 -4.8%
Macedon Ranges 247 254 2.8%
Note: For footnotes see end of table.
17
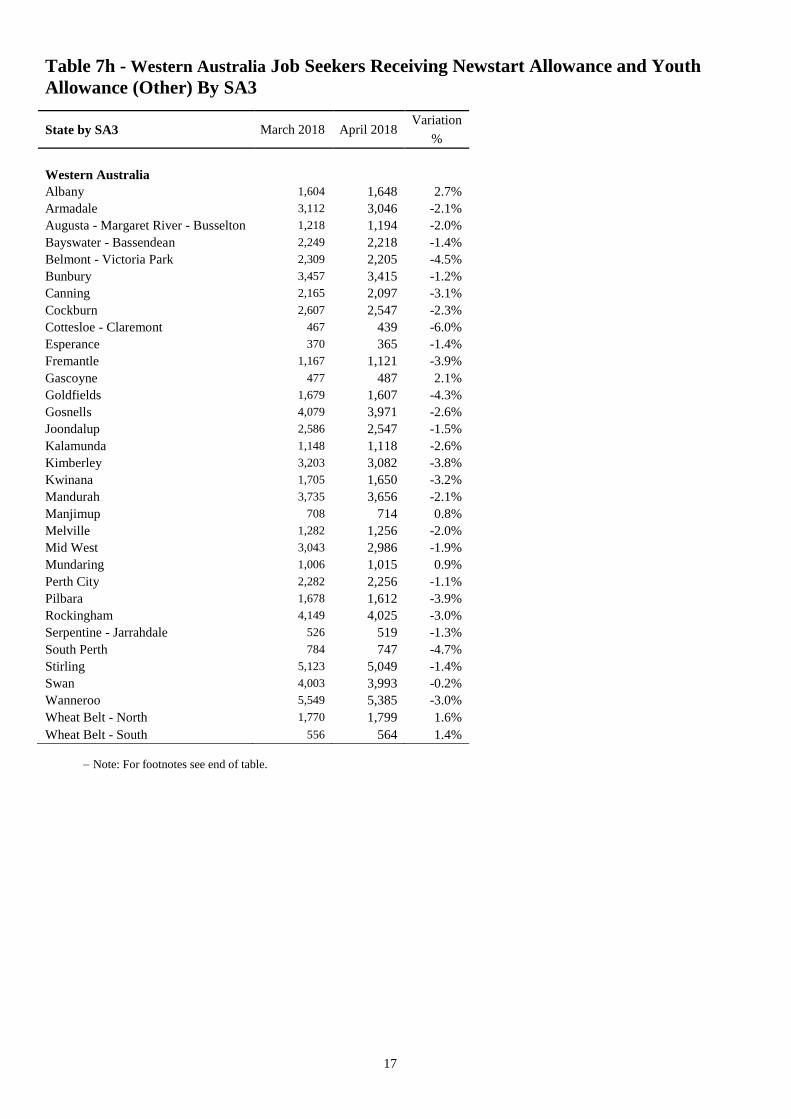
Table 7h - Western Australia Job Seekers Receiving Newstart Allowance and Youth
Allowance (Other) By SA3
State by SA3 March 2018 April 2018 Variation
%
Western Australia
Albany 1,604 1,648 2.7%
Armadale 3,112 3,046 -2.1%
Augusta - Margaret River - Busselton 1,218 1,194 -2.0%
Bayswater - Bassendean 2,249 2,218 -1.4%
Belmont - Victoria Park 2,309 2,205 -4.5%
Bunbury 3,457 3,415 -1.2%
Canning 2,165 2,097 -3.1%
Cockburn 2,607 2,547 -2.3%
Cottesloe - Claremont 467 439 -6.0%
Esperance 370 365 -1.4%
Fremantle 1,167 1,121 -3.9%
Gascoyne 477 487 2.1%
Goldfields 1,679 1,607 -4.3%
Gosnells 4,079 3,971 -2.6%
Joondalup 2,586 2,547 -1.5%
Kalamunda 1,148 1,118 -2.6%
Kimberley 3,203 3,082 -3.8%
Kwinana 1,705 1,650 -3.2%
Mandurah 3,735 3,656 -2.1%
Manjimup 708 714 0.8%
Melville 1,282 1,256 -2.0%
Mid West 3,043 2,986 -1.9%
Mundaring 1,006 1,015 0.9%
Perth City 2,282 2,256 -1.1%
Pilbara 1,678 1,612 -3.9%
Rockingham 4,149 4,025 -3.0%
Serpentine - Jarrahdale 526 519 -1.3%
South Perth 784 747 -4.7%
Stirling 5,123 5,049 -1.4%
Swan 4,003 3,993 -0.2%
Wanneroo 5,549 5,385 -3.0%
Wheat Belt - North 1,770 1,799 1.6%
Wheat Belt - South 556 564 1.4%
Note: For footnotes see end of table.
18
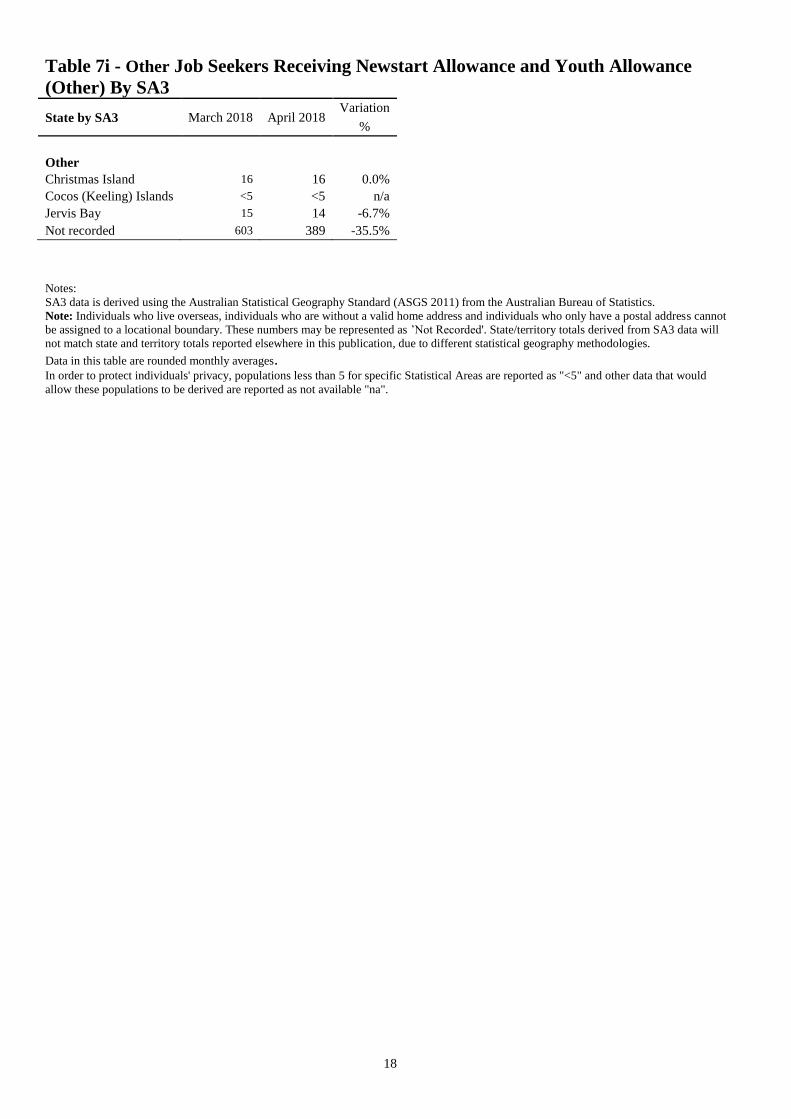
Table 7i - Other Job Seekers Receiving Newstart Allowance and Youth Allowance
(Other) By SA3
State by SA3 March 2018 April 2018 Variation
%
Other
Christmas Island 16 16 0.0%
Cocos (Keeling) Islands <5 <5 n/a
Jervis Bay 15 14 -6.7%
Not recorded 603 389 -35.5%
Notes:
SA3 data is derived using the Australian Statistical Geography Standard (ASGS 2011) from the Australian Bureau of Statistics.
Note: Individuals who live overseas, individuals who are without a valid home address and individuals who only have a postal address cannot
be assigned to a locational boundary. These numbers may be represented as ’Not Recorded'. State/territory totals derived from SA3 data will
not match state and territory totals reported elsewhere in this publication, due to different statistical geography methodologies.
Data in this table are rounded monthly averages. In order to protect individuals' privacy, populations less than 5 for specific Statistical Areas are reported as "<5" and other data that would
allow these populations to be derived are reported as not available "na".
19
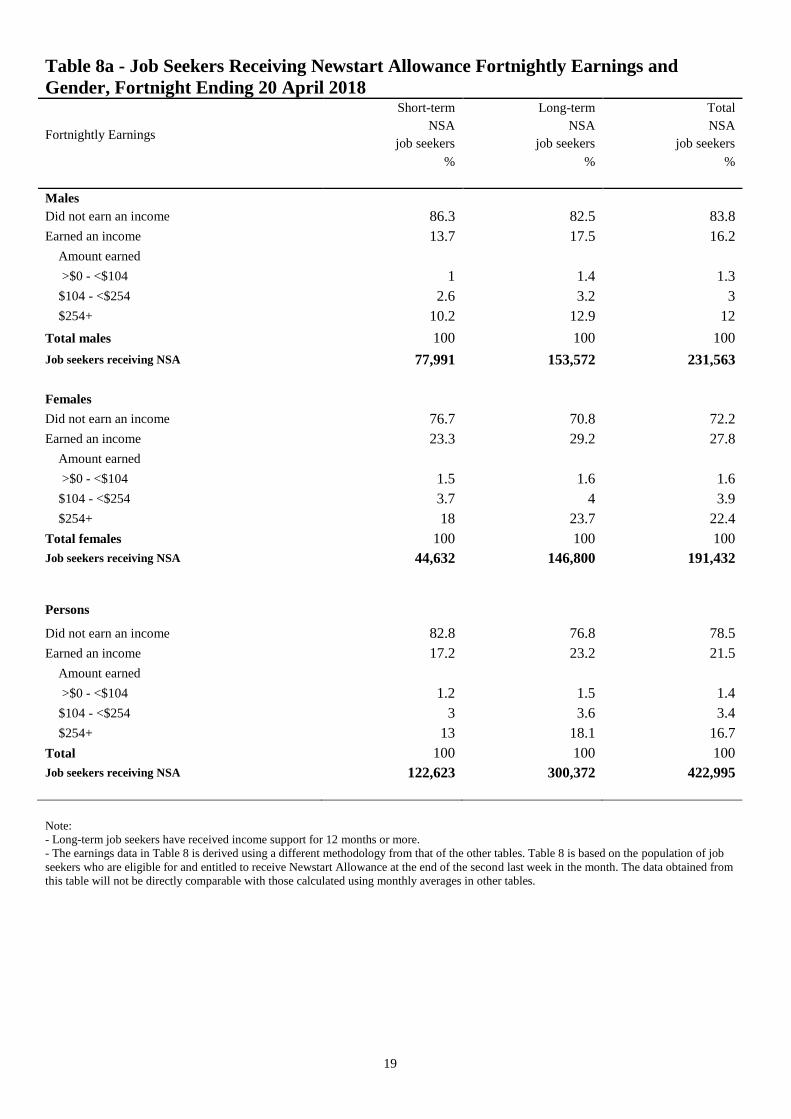
Table 8a - Job Seekers Receiving Newstart Allowance Fortnightly Earnings and
Gender, Fortnight Ending 20 April 2018
Fortnightly Earnings
Short-term Long-term Total
NSA NSA NSA
job seekers job seekers job seekers
% % %
Males
Did not earn an income 86.3 82.5 83.8
Earned an income 13.7 17.5 16.2
Amount earned
>$0 - <$104 1 1.4 1.3
$104 - <$254 2.6 3.2 3
$254+ 10.2 12.9 12
Total males 100 100 100
Job seekers receiving NSA 77,991 153,572 231,563
Females
Did not earn an income 76.7 70.8 72.2
Earned an income 23.3 29.2 27.8
Amount earned
>$0 - <$104 1.5 1.6 1.6
$104 - <$254 3.7 4 3.9
$254+ 18 23.7 22.4
Total females 100 100 100
Job seekers receiving NSA 44,632 146,800 191,432
Persons
Did not earn an income 82.8 76.8 78.5
Earned an income 17.2 23.2 21.5
Amount earned
>$0 - <$104 1.2 1.5 1.4
$104 - <$254 3 3.6 3.4
$254+ 13 18.1 16.7
Total 100 100 100
Job seekers receiving NSA 122,623 300,372 422,995
Note:
- Long-term job seekers have received income support for 12 months or more.
- The earnings data in Table 8 is derived using a different methodology from that of the other tables. Table 8 is based on the population of job
seekers who are eligible for and entitled to receive Newstart Allowance at the end of the second last week in the month. The data obtained from
this table will not be directly comparable with those calculated using monthly averages in other tables.
20
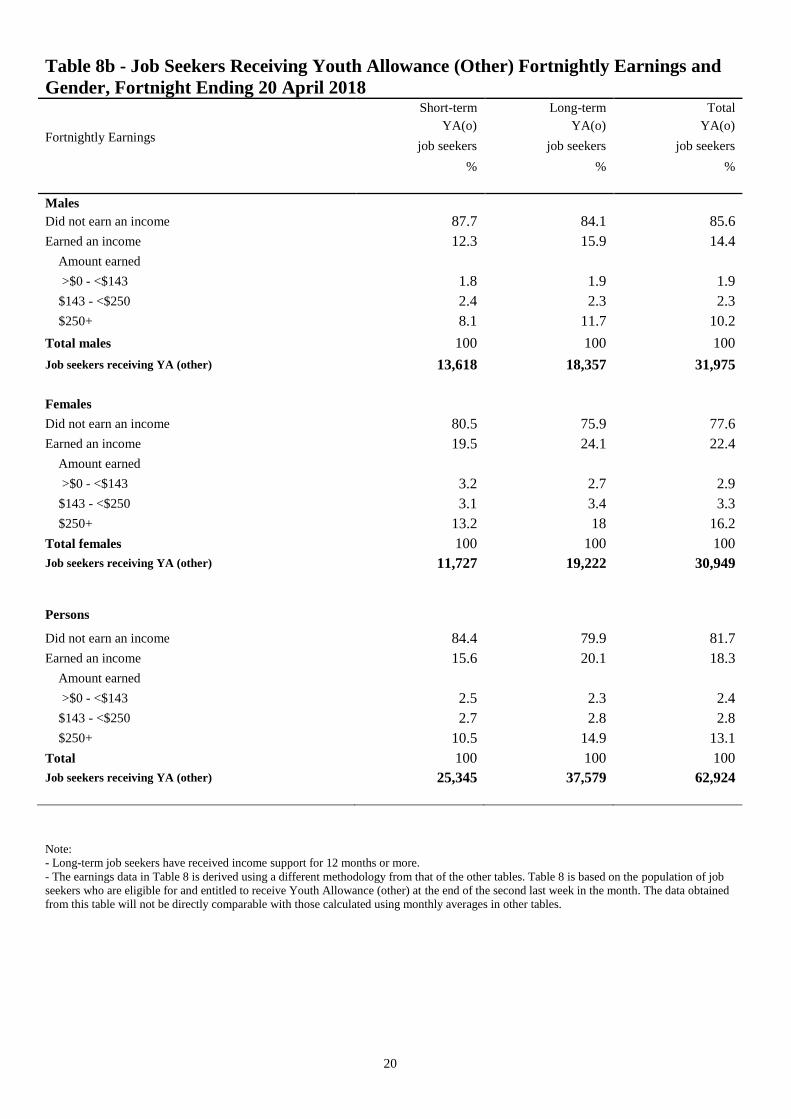
Table 8b - Job Seekers Receiving Youth Allowance (Other) Fortnightly Earnings and
Gender, Fortnight Ending 20 April 2018
Fortnightly Earnings
Short-term Long-term Total
YA(o) YA(o) YA(o)
job seekers job seekers job seekers
% % %
Males
Did not earn an income 87.7 84.1 85.6
Earned an income 12.3 15.9 14.4
Amount earned
>$0 - <$143 1.8 1.9 1.9
$143 - <$250 2.4 2.3 2.3
$250+ 8.1 11.7 10.2
Total males 100 100 100
Job seekers receiving YA (other) 13,618 18,357 31,975
Females
Did not earn an income 80.5 75.9 77.6
Earned an income 19.5 24.1 22.4
Amount earned
>$0 - <$143 3.2 2.7 2.9
$143 - <$250 3.1 3.4 3.3
$250+ 13.2 18 16.2
Total females 100 100 100
Job seekers receiving YA (other) 11,727 19,222 30,949
Persons
Did not earn an income 84.4 79.9 81.7
Earned an income 15.6 20.1 18.3
Amount earned
>$0 - <$143 2.5 2.3 2.4
$143 - <$250 2.7 2.8 2.8
$250+ 10.5 14.9 13.1
Total 100 100 100
Job seekers receiving YA (other) 25,345 37,579 62,924
Note:
- Long-term job seekers have received income support for 12 months or more.
- The earnings data in Table 8 is derived using a different methodology from that of the other tables. Table 8 is based on the population of job
seekers who are eligible for and entitled to receive Youth Allowance (other) at the end of the second last week in the month. The data obtained
from this table will not be directly comparable with those calculated using monthly averages in other tables.
21
Explanatory Notes
Introduction This publication provides monthly statistical information on DSS labour market and related payments delivered by DHS. These Explanatory Notes provide details of the scope and methodology of the publication, as well as the policy changes which have affected the data since the publication was introduced in December 1995 by the then Department of Social Security. Prior to December 1995, this publication was titled the Monthly Job Search and Newstart Allowance Statistics.
Scope The primary focus of the publication is to provide information on unemployed people on Newstart Allowance and Youth Allowance, with a particular focus on the total number of job seekers. The numbers of people on Partner Allowance and Widow Allowance are also reported.
Methodology Data in this publication relate to the average number of people who are both eligible (e.g. meet ‘unemployed’ qualification) and entitled (e.g. meet income and assets criteria) to receive a payment calculated over a reference month. Averages are calculated using figures collected for each Friday throughout the reference month. Table 1 provides information on the total number of unemployed people on Newstart Allowance and Youth Allowance. The Youth Allowance population is split into Youth Allowance (full-time students), Youth Allowance (Australian Apprentices) and Youth Allowance (other) categories. Numbers of people on Partner Allowance and Widow Allowance are also provided. Tables 2 and 3 provide a summary of the Newstart Allowance and Youth Allowance (other) populations and show the derivation of the respective job seeker populations (see the reference to job seekers in the Comparability of Data section of these Explanatory Notes). These populations are added together to derive the total number of job seekers. Tables 4 to 8 provide information on the total job seeker population. The Statistical Areas Level 3 reported in Table 7 are based on the recipient's geo-coded address against the Australian Statistical Geography Standard (ASGS) 2011. The earnings data in Table 8 (a and b) is derived using a different methodology from that of the other tables in the publication. Table 8 is based on the population of job seekers who are eligible for and entitled to receive Newstart Allowance or Youth Allowance (other) at the end of the second last week in the month. The data obtained from this table will not be directly comparable with those calculated using monthly averages in other tables.
Payment History
Youth Allowance
The maximum age for Youth Allowance (other) was increased for new claimants from 20 to 21
years of age from 1 July 2012 and the income free area was increased to $143.
22
From 1 January 2016, to receive Youth Allowance (other) young people without a Year 12 or
equivalent qualification (Certificate III) will need to participate in :
approved full-time study, or
a combination of 25 hours a week of approved part-time study and part-time work , or
other approved activities of 25* hours per week, in addition to up to 20 job searches each
month (noting that it is * 15 hours a week for early school leavers with a partial capacity
to work or who are principal carer parents and have part-time requirements)
until they attain Year 12 or equivalent, or a Certificate III, or turn 22 years of age.
Earn or learn arrangements were phased in, applying from 1 July 2009 to all new recipients of
Youth Allowance and from 1 July 2010 for all job seekers in receipt of Youth Allowance prior to
1 July 2009.
From 1 July 1998 Youth Allowance was introduced to provide income support to young people,
including students, those looking for work, and those who are sick. Youth allowees may be
undertaking full-time study, full-time job search or a combination of approved activities. Some
young people will be exempt from the activity test because of their personal circumstances, e.g.
illness, homelessness or major personal crisis. The Youth Allowance replaced:
AUSTUDY for 16-24 year olds (and certain 15 year olds);
Newstart Allowance for 16-20 year olds (and certain 15 year olds);
Youth Training Allowance for 16-17 year olds (and certain 15 year olds);
Sickness Allowance for 16-20 year olds (and certain 15 year olds); and
More-than-minimum rate Family Payment for secondary students aged 16-18 not getting
AUSTUDY.
Special provisions applied for 18 to 20 year olds who were already on Newstart or Sickness
Allowance at the date of announcement of Youth Allowance, and who remained on payment
when Youth Allowance commenced on 1 July 1998. This group were able to remain on their
existing payment and retain their existing benefits.
Youth Allowance had a significant downward effect on Newstart Allowance numbers from July
1998 and total job seeker numbers due to the parental means test.
Newstart Allowance
On 1 January 2013, grandfathering provisions ceased for Parenting Payment recipients who had
been receiving payment prior to 1 July 2006 and had a youngest child aged 6+ years (partnered
recipients) or 8+ years (single recipients). The change caused a large one-off increase in the
number of Newstart Allowees, as previously grandfathered Parenting Payment recipients who
were eligible transferred to Newstart Allowance.
On 1 July 2012, the qualification age for Newstart Allowance was increased for new claimants
from 21 to 22 years of age. From 1 July 1998, Newstart Allowance for 16-20 year olds (and certain 15 year olds) was
replaced by Youth Allowance. Young people aged 18 to 20 years old who were on Newstart or
23
Sickness Allowance at the date of announcement of Youth Allowance and when Youth
Allowance commenced on 1 July 1998, were able to remain on Newstart Allowance.
From 20 October 1996, Job Search Allowance and Newstart Allowance were combined into one
payment - Newstart Allowance - which was payable to eligible recipients aged 18 years and over
and to some people who were in receipt of Job Search Allowance and aged under 18 at 31
December 1994 (see Job Search Allowance).
Prior to 20 October 1996, Newstart Allowance was payable to eligible persons over 18 years
who had been registered as unemployed with the Commonwealth Employment Service (CES) for
12 months or more.
Job Search Allowance
From 20 October 1996, the payment was combined with Newstart Allowance to form one
payment called Newstart Allowance (see Newstart Allowance). All Job Search Allowance
recipients were transferred to Newstart Allowance.
Sickness Allowance
From 17 March 1996, persons in receipt of Newstart Allowance or Youth Training Allowance
who became temporarily incapacitated no longer transferred to Sickness Allowance after 13
weeks. This change had the effect of increasing total Newstart Allowance/Youth Training
Allowance figures but did not affect job seeker figures as those recipients who were
incapacitated were excluded from the Newstart and Youth Training job seeker populations.
Under current arrangements, these recipients remain on their existing payments but are exempt
from the activity test for the duration of their medical certificates. People who become
unemployed because of illness, and those who suffer a potential loss of income due to sickness,
are paid Newstart Allowance because they are unemployed.
Sickness Allowance for 16 to 20 year olds (and certain 15 year olds) was replaced by Youth
Allowance, which was introduced on 1 July 1998 (see Youth Allowance).
Partner Allowance
From 20 October 2003, Partner Allowance was closed to new claimants. People on Partner
Allowance before this date can remain on the allowance while they remain ‘current’, that is
retain eligibility and entitlement for the allowance.
From 1 July 1995 Partner Allowance has only been granted to persons who are dependent
partners of pensioners and allowees and who were born before 1 July 1955, have no dependent
children and have little or no recent workforce experience. Other dependent partners have to
qualify for an income support payment in their own right, such as Newstart Allowance.
Partner Allowance was introduced in October 1994, and was paid to partners of persons
receiving Job Search Allowance, Newstart Allowance, Sickness Allowance or Special Benefit if
certain eligibility criteria were satisfied.
24
Youth Training Allowance
Youth Training Allowance was replaced by Youth Allowance on 1 July 1998 (see Youth
Allowance).
Widow Allowance
From 1 July 2005 Widow Allowance new grants may only be made to women born on or before
1 July 1955.
Widow Allowance, introduced on 1 January 1995, is payable to females aged 50 years or over
who have become widowed, divorced or separated since turning 40 years (50 prior to 20 March
1997), if they meet a number of other criteria relating to current marital status and recent work
experience.
Mature Age Allowance
From 20 October 2003, Mature Age Allowance was closed to new claimants. The payment
ceased by October 2008.
Mature Age Allowance was introduced on 24 March 1994, and was paid to long-term
unemployed persons aged 60 years and over (but below Age Pension age) who had been
receiving income support for 9 months or more and who were eligible for Newstart Allowance.
The introduction of Mature Age Allowance had a downwards effect on Newstart Allowance
numbers from April 1994 until October 2003.
Comparability of Data
There have been significant changes to the data presented in this publication due to a number of
events. The main changes are: the method of counting recipients;
the inclusion of some CDEP recipients in the total recipient numbers;
the introduction of Youth Allowance in July 1998;
the way ‘job seeker’ is defined;
the way duration is calculated;
the eligibility for Newstart Allowance and Youth Allowance (other) from July 2012;
the cessation of grandfathered Parenting Payment provisions, which saw an increase in
the number of Newstart recipients in January 2013; and
the introduction of jobactive, an employment services model with a stronger focus on job
search, which replaced Job Services Australia on 1 July 2015.
People using this data to construct time series should note the following comments.
Definition of Recipients
From July 2002, the number of people receiving labour market and related payments reports
recipients who are both eligible and entitled to receive a payment. These recipients are otherwise
known as ‘current’ recipients.
25
Revised historical data (using this methodology) from May 1998 to June 2002 is in the July 2002
publication.
Due to improved data sources, data from July 2003 has slight differences from the recipient
numbers used in previous editions.
Before July 2002, all recipients who received a payment within a given fortnight were counted.
From mid 1998, recipients who received a ‘one-off’ payment were excluded. One-off payments
can occur, for instance, when a normal payment is interrupted (e.g. payment is cancelled and
then restored within that pay period) and a portion of the normal payment is paid.
Community Development Employment Projects (CDEP)
From 20 March 2000, eligible participants in CDEP started receiving CDEP participant
supplement and other add-ons, such as rent assistance, as part of income support payments. This
added a number of new recipients to those eligible for payments reported in this publication.
Community Development Employment Projects (CDEP) ceased on 30 June 2015.
Introduction of Youth Allowance
The sum of the number of Newstart Allowees and Youth Training Allowees prior to July 1998 is
broadly comparable with the sum of Newstart Allowees and Youth Allowees (other) after July
1998, other than the inclusion of Sickness Allowees in the Youth Allowance (other) population.
There is greater comparability between total Newstart Allowance and Youth Training Allowance
job seekers prior to July 1998 and total Newstart Allowance and Youth Allowance (other) job
seekers after July 1998. This is because the Sickness Allowance group is excluded from the job
seeker total.
A pre and post July 1998 comparison will reflect the exclusion of some 18 to 20 year old
unemployed people due to the application of the Youth Allowance parental means test (see the
Youth Allowance section under Payment History).
Job seekers
From July 2009, all recipients with job search requirements are classified as job seekers in this
report.
Prior to 1 July 2009, some people with another activity (such as training) in addition to job
search were classified according to that other activity and not as job seekers. Other people who
were receiving Intensive Support Customised Assistance under Job Network arrangements were
classified as job seekers although they may not always have been undertaking job search.
From July 1998, the definition of job seekers excludes all people who did not receive a payment
due to their own and/or their partner’s income, or where applicable, parental income, and those
known not to be required to search for work.
26
Before July 1998, job seekers excluded allowees who did not receive a payment, allowees who
were incapacitated, and allowees who were undertaking training. Some people who were not
required to search for work were classified as job seekers, including people undertaking full-time
voluntary work, people on jury duty and pregnant women around the time of the birth of their
child.
Duration
Duration refers to duration on income support and includes time spent on other income support
payments.
Since May 1998, duration has been defined according to the time a recipient spends on income
support - short-term recipients are those who have been on income support for up to 12 months
and long-term recipients are those who have been on income support for 12 months or more.
Prior to 1998, duration was defined according to the time a recipient was registered as
unemployed - short-term recipients were people who were registered as unemployed for up to 12
months and long-term recipients were people who were registered for 12 months or more.
Symbols n.a. not available .. not applicable
27
Glossary
Activity test status
The activity that a Newstart Allowance or Youth Allowance (other) recipient has agreed to
undertake in order to meet the activity test. To satisfy the activity test recipients must be actively
seeking and willing to take up work or undertaking activities to improve their employment
prospects.
Age
Age in years at time of data collection.
Area Support Office
The term Area Support Office was replaced by Service Zone in July 2011.
Community Development Employment Projects (CDEP)
Community Development Employment Projects (CDEP) ceased on 30 June 2015.
The CDEP program was administered by the Department of Social Services. Reforms to CDEP
were introduced from 1 July 2009. Operating mainly in remote areas, the CDEP program aimed
to help unemployed Indigenous Australians to find and keep jobs. Under the CDEP program,
there were two main ways (‘streams’) that CDEP providers assisted Indigenous Australians:
Work Readiness Services help individuals to develop their skills, improve their chances of
getting a job, and move to work outside of the CDEP program; and Community Development
focused on supporting and developing Indigenous communities and organisations.
CDEP Participant Supplement (CPS)
The CDEP Participant Supplement (CPS) is payable to eligible CDEP participants. It can be paid
fortnightly or as a 12 weekly payment. Community Development Employment Projects (CDEP)
ceased on 30 June 2015.
Customer Service Centre
Customer Service Centre was replaced by the term Service Centre in July 2011.
Did not receive a payment
Persons who did not receive a payment due to their own income and/or that of their partner, or
parents, where applicable. This group is often referred to as ‘zero paid’.
Fortnightly earnings
Amount of income earned, derived, or received by a person for the person's own use or benefit in
the previous fortnight.
28
Incapacitated
A person on Newstart Allowance or Youth Allowance (other) who has an activity test status
indicating they are temporarily ill or incapacitated. Refer to the entry for Sickness Allowance in
the Explanatory Notes.
Job seeker
A person on Newstart Allowance or Youth Allowance (other) who would usually be engaged in
job search. See Explanatory Notes for definition and history.
Long-term recipients
Persons who have been receiving income support for 12 months or more. Duration of long-term
recipients can be reset to zero if they exited from payments for more than 13 weeks.
Newstart Allowance (NSA)
Newstart Allowance is payable to eligible unemployed persons aged 22 years and over (but
below Age Pension age) who satisfy the activity test. See Explanatory Notes for history.
Partner Allowance (PA)
From 20 October 2003, Partner Allowance was closed to new claimants. People on Partner
Allowance before this date can remain on the allowance while they remain ‘current’, that is
retain eligibility and entitlement for the allowance.
Partner Allowance was for dependent partners of pensioners and allowees. Partners had to be
born before 1 July 1955, have no dependent children and have little or no recent workforce
experience. Partner Allowance had no job search requirement. See Explanatory Notes for
history.
Service Centre
A DHS Service Centre that provides DSS and other payments and related information and
services to recipients. Service Centres are managed by Service Zones. Reporting by Service
Centres and Service Zones was replaced in July 2017 with Statistical Areas Level 3.
Service Zone
A set of Service Centres, grouped together for operational purposes on a geographic basis.
Service Zones replaced Areas and Area Support Offices in July 2011. Reporting by Service
Centres and Service Zones was replaced in July 2017 with Statistical Areas Level 3.
Short-term recipients
Persons on Newstart Allowance or Youth Allowance who have been receiving income support
for less than 12 months. Duration of short-term recipients can be reset to zero if they exited from
payments for more than 6 weeks.
29
Statistical Areas Level 3
Statistical Areas Level 3 are derived using the recipient’s geo-coded address against the
Australian Statistical Geography Standard (ASGS) of 2011, produced by the Australian Bureau
of Statistics (ABS). For further details, see the ABS website: ABS Statistical Geography
<http://www.abs.gov.au/websitedbs/D3310114.nsf/home/Geography?opendocument#from-
banner=LN>
Widow Allowance (WA)
From 1 July 2005 Widow Allowance new grants may only be made to women born on or before
1 July 1955.
Widow Allowance, a non-activity tested payment, is payable to females aged 50 years or over
who have become widowed, divorced or separated since turning 40 years if they have little or no
recent work experience and meet a number of other criteria relating to current marital status. See
Explanatory Notes for history.
Youth Training Allowance (YTA)
From 1 January 1995 eligible persons aged under 18 years who were registered as unemployed
with the CES were paid Youth Training Allowance. From 1 July 1998, Youth Training
Allowance was replaced by Youth Allowance. See Explanatory Notes for history.
Youth Allowance (YA)
Youth Allowance is payable to eligible full-time students aged 16 to 25 years, and to eligible
unemployed persons aged 16 to 21 years who satisfy the activity test. Note, there are certain
exceptions for some 15 and 25 year olds. See Explanatory Notes for history.
Youth Allowees may be undertaking full-time study, full-time job search or a combination of
approved activities. Some young people will be exempt from the activity test because of their
personal circumstances, e.g. illness, homelessness or major personal crisis. See the Explanatory
Notes for more information.
To receive Youth Allowance young people under 22 years of age without a Year 12 or
equivalent qualification will usually need to:
participate in education and training full-time; or
participate full-time (that is, for at least 25 hours a week) in part-time study or training, in
combination with other approved activities, until they attain Year 12 or an equivalent
Certificate Level II or above qualification.
Youth Allowance (other)
Youth Allowance recipients who are not full-time students or full-time Australian Apprentices.
Zero paid
See ‘Did not receive a payment’.
30
Appendix
Comparisons Between DSS Unemployment Labour Market Payment Numbers And ABS
Labour Force Unemployment Statistics
Official statistics
Official unemployment statistics are released by the Australian Bureau of Statistics (ABS). The
ABS uses definitions recommended by the International Labour Organization which have been
accepted internationally as the most appropriate for the compilation of official statistics of
unemployment.
ABS definition
The ABS unemployment statistics measure the number of persons who, for a particular reference
period, did not undertake any paid work, were actively looking for work and were available to
start work.
DSS Unemployment Labour Market Payment Statistics
The labour market payment statistics give the number of persons who are both eligible and
entitled to receive Newstart Allowance or Youth Allowance (other). The criteria for receipt of
these payments do not match those the ABS uses to determine whether a person is classed as
unemployed or employed for statistical purposes.
Differences
Care should be taken when comparing the ABS labour force and DSS labour market payment
data. There are a number of reasons why the two series cannot be directly compared.
Duration
Both DSS and the ABS classify long-term duration as over 12 months, but use substantially
different definitions of duration:
DSS measures duration of income support. This includes not just time on unemployment
benefits but time on any income support payment.
The ABS measures length of time unemployed using their unemployment definition.
DSS unemployed recipients can have breaks without payment and still be classified as long-term
income support recipients:
Recipients who do not receive a payment due to their earnings can have up to 12 weeks
without a payment before they are automatically cancelled. This reduces disincentives to
accept short-term work.
31
Long-term recipients can have 13 weeks off payment after payment is cancelled and keep
their long-term status if they return to income support. This means they keep access to
assistance such as the higher payment rate for recipients over 60.
For the ABS statistics, any hours of work for a period as short as two weeks count as a break
from unemployment and so are enough to reset a person’s unemployment duration.
The difference between these two concepts, together with the fact that DSS recipients are able to
have ongoing part-time work (see ‘employment’ below) mean that many unemployed recipients
remain classified by DSS as long-term recipients when they would be classified as short-term
unemployed under the ABS definition.
Seasonal adjustment
The ABS produces a seasonally adjusted series. The DSS labour market payment numbers data
are not seasonally adjusted.
Classification
The ABS classifies a person as unemployed if he or she is aged 15 years and over, was not
employed during the week before the interview, has actively looked for full-time or part-time
work and is available to start work. From February 2004, people who had not actively looked for
work because they were waiting to start a job within four weeks are also classified as
unemployed.
The Newstart Allowance and Youth Allowance (other) series generally count people who are
eligible for and entitled to receive a payment aged over 15 years and under Age Pension age.
Employment
Newstart Allowance and Youth Allowance (other) recipients may be employed part-time, but
within an income test limit; the ABS classifies a person as "employed" if, among other things, he
or she has worked for one hour or more during the survey period.
Timing
The timing of collections of the series are different:
DSS reports monthly average numbers of people both eligible for and entitled to receive
Newstart Allowance and Youth Allowance (other). These monthly averages are
calculated using figures collected for each Friday throughout the reference month.
ABS numbers are based on a sample survey which interviews occupants of selected
dwellings covering around 0.33% of the total Australian population. These persons are
generally interviewed during the two weeks beginning the Sunday between the 5th and
11th of each month and the information obtained relates to the week before the interview
takes place.
32
Treatment of partners
The ABS series includes unemployed persons whose spouse is working, irrespective of income,
whereas Newstart Allowance and Youth Allowance (other) recipients are subject to an income
and assets test for themselves and their spouse.
Pensioners
The ABS series includes persons being paid a pension but looking for work (e.g. sole parents in
receipt of Parenting Payments looking for work).
Non job seekers
The overall Newstart Allowance and Youth Allowance (other) series includes persons who are
not required to undertake jobsearch. These persons are separately identified in Tables 2 and 3,
and have then been excluded in subsequent tables. These people may be undertaking training, the
development of self-employment opportunities, full-time voluntary work or a combination of
voluntary and part-time work which excludes them from jobsearch obligations. They may also be
incapacitated or have another temporary exemption from jobsearch.
Waiting periods
The ABS series includes persons who are serving a waiting period before being granted Newstart
Allowance or Youth Allowance (other), or whose allowance was deferred.
Survey
The ABS figures are derived from a Labour Force Survey which is a sample survey, whereas the
DSS statistics are a complete count of those both eligible for and entitled to receive Newstart
Allowance and Youth Allowance (other).
See also: The Australian Bureau of Statistics release “6105.0 - Australian Labour Market
Statistics, July 2014 – The unemployed and recipients of Government unemployment benefits -
differences explained”
<http://www.abs.gov.au/ausstats/[email protected]/Latestproducts/6105.0Feature%20Article54July%202
014?opendocument&tabname=Summary&prodno=6105.0&issue=July%202014&num=&view=
>
33
For More Information
Other recipient information
The Department of Social Services publishes statistics about the various pensions, benefits and
family payments which the Department administers, on a quarterly basis on the Australian
Government’s centralised data publishing site, data.gov.au
(http://www.data.gov.au/organization/about/department-of-social-services). Historical data is
available in a statistical overview available on the Department’s website, DSS - Statistical Paper
Series (<http://www.dss.gov.au/about-the-department/publications-articles/research-
publications/statistical-paper-series>).
Labour market information
Other statistics on recipients of labour market related payments are available on request.
In addition to Newstart and Youth Allowances, statistics are also available on Partner
Allowance, Parenting Payment, Sickness Allowance, ABSTUDY and Widow Allowance.
For enquiries email:


