Embed Size (px)
Citation preview

Geoderma 209-210 (2013) 86–97
Contents lists available at SciVerse ScienceDirect
Geoderma
j ourna l homepage: www.e lsev ie r .com/ locate /geoderma
Laboratory Vis–NIR spectroscopy as an alternative method forestimating the soil aggregate stability indexes of Mediterranean soils
C. Gomez a,⁎, Y. Le Bissonnais b, M. Annabi c, H. Bahri d, D. Raclot a
a IRD, UMR LISAH (INRA-IRD-SupAgro), F-34060 Montpellier, Franceb INRA, UMR LISAH (INRA-IRD-SupAgro), F-34060 Montpellier, Francec INRAT, Institut National de Recherche Agronomique de Tunisie, Ariana, Tunisiad INRGREF, Institut National de Recherche en Génie Rural Eaux et Forêts, Ariana, Tunisia
⁎ Corresponding author. Tel.: +33 4 99 61 28 41.E-mail address: [email protected] (C. Gomez).
0016-7061/$ – see front matter © 2013 Elsevier B.V. Allhttp://dx.doi.org/10.1016/j.geoderma.2013.06.002
a b s t r a c t
a r t i c l e i n f oArticle history:Received 25 September 2012Received in revised form 3 June 2013Accepted 9 June 2013Available online xxxx
Keywords:Soil aggregate stabilityMediterranean soilsVis–NIR spectroscopySpectrotransfert functionPedotransfert functionTunisia
The characterization of soil aggregate stability is an important step for assessing the susceptibility of soil towater erosion. A normalized international method has recently been proposed for estimating soil aggregatestability indexes (ISO/FDIS 10930, 2012), but extensive measurements of the soil aggregate stability formapping erosion risks on the regional scale remain a fastidious enterprise. This paper explores three differentapproaches as an alternative to the normalized international measurements. The first, called the PTFsApproach, estimates aggregate stability indexes via elementary soil properties using multiple linear regres-sion. The second one, called the RS Approach, estimates aggregate stability indexes via Laboratory (Lab) Vis-ible–Near Infrared (Vis–NIR) spectra using multivariate linear regressions. The third, called the RS + PTFsApproach first used the Lab Vis–NIR spectra to predict the elementary soil properties using multivariate linearregressions, which are then used to predict the soil aggregate stability indexes using multiple linear regres-sion. These tests were performed on a collection of 113 soil samples from the Mediterranean region of North-ern Tunisia. Four soil aggregate stability indexes were considered: three indexes calculated using threedisruptive tests that correspond to various wetting conditions and energies, and the fourth index was themean of the first three. This study shows that Lab Vis–NIR spectroscopy may be used directly in multivariateregression models to estimate two soil aggregate stability indexes (R2
val between 0.52 and 0.57, RPD between1.47 and 1.61) with accuracy comparable to the multiple linear models in the PTFs Approach. Further inves-tigations on various soil types, especially those for which the soil aggregate stability indexes were stronglycorrelated to organic carbon content, are encouraged to extend the utility and applicability of Lab Vis–NIRspectroscopy as an alternative method for soil aggregate stability indexes estimates.
© 2013 Elsevier B.V. All rights reserved.
1. Introduction
The field evaluation of soil susceptibility to water erosion is bothexpensive and time consuming. Soil aggregate stability is consideredto be one of the main soil properties regulating soil erodibility(Barthès and Roose, 2002; Bryan, 2000; Cerdá, 1998) because weakaggregates are more likely to disintegrate during heaving rainfallevents when soils are not covered by vegetation, which leads torunoff and erosion. Many studies confirm that soil aggregate stabilityis a relevant indicator of soil erodibility and runoff, especially forMediterranean areas where intense storms are frequent (Amezketaet al, 1996; Cammeraat and Imeson, 1998; Le Bissonnais et al,2007). Although determining the soil aggregate stability is both easierand cheaper than field erosion measurements, and a normalizedinternational method has recently been proposed (ISO/FDIS, 10930,2012) (Le Bissonnais et al, 1996), extensive measurements of the
rights reserved.
soil aggregate stability for mapping erosion risks on the regionalscale remain a fastidious enterprise. An alternative to the normalizedinternational measurements of such a complex physical propertyof soils has been proposed using pedotransfert functions (PTFs)(Bouma, 1989), which relate this complex property to simpler andmore easily measurable elementary soil properties such as the soil or-ganic carbon, texture and calcium carbonate contents. This approachhas been especially developed for hydraulic properties (Bruand etal., 2003; Pachepsky, 2006); however, it has also been shown to beadaptable for other physical soil properties, such as the soil aggregatestability (Chenu et al., 2011; Shalmani, 2010; Tavares Filho et al.,2012).
The Laboratory (Lab) Visible–Near Infrared (Vis–NIR) spectroscopy(350–2500 nm) has proven to be a powerful tool for estimating certainelementary soil properties (e.g., Ben Dor and Banin, 1995; Brown et al.,2006; Viscarra Rossel et al., 2006). Vis–NIR spectroscopy is rapid, fast,non-destructive and straightforward relative to the laboratory analysisof the elementary soil properties. Furthermore, a single Vis–NIR spec-trumallows for the simultaneous characterization of various elementary
87C. Gomez et al. / Geoderma 209-210 (2013) 86–97
soil properties. Various methods have been used to relate soil spectra toelementary soil properties, such as the multiple regression analysis(Ben-Dor and Banin, 1995), the stepwise multiple linear regression(Shibusawa et al., 2001), the multivariate adaptive regression splines(Shepherd and Walsh, 2002), the principal components regression(e.g. Chang et al., 2001), and the continuum removal technique(Gomez et al., 2008b). Among these methods, the partial least-squaresregression (PLSR) (e.g. Chang and Laird, 2002) is the most commonmultivariate statistical technique for spectral calibration and predictionof soil properties.
As the soil aggregate stability indexes are usually highly correlatedto some elementary soil properties (Chenu et al, 2011; Le Bissonnaiset Singer, 1993; Le Bissonnais et al., 2007), it is interesting to testthe soil aggregate stability indexes estimation from Lab Vis–NIR spec-tra, as an alternative to the normalized international measurements.Canasveras et al. (2010) used Lab spectral data acquired on variousspectral domains (UV, Vis, NIR and MIR) to estimate several soilaggregate stability indexes for soils from southwestern Spain. Theirmodels performances were relatively modest, but useful for discrim-inating between low, medium and high aggregate stability classes.
The aim of this paper is to evaluate alternativemethods to the nor-malized international method (ISO/FDIS, 10930, 2012) for estimatingsoil aggregate stability indexes. This paper explores three differentapproaches for estimating the soil aggregate stability indexes. Thefirst, called the PTFs Approach, estimates aggregate stability indexesvia elementary soil properties using multiple linear regressions. Thesecond one, called the RS Approach, directly linked the Lab Vis–NIRdata to soil aggregate stability indexes estimated using multivariateregression models. And the third approach, called the RS + PTFsApproach, used i) the Lab Vis–NIR data to predict the elementary soilproperties using multivariate regression models, which are then ii)used to predict the soil aggregate stability indexes, via multiplelinear regressions. These tests were performed on a sample collectionof 113 soils from the Mediterranean region of Tunisia. Four soil
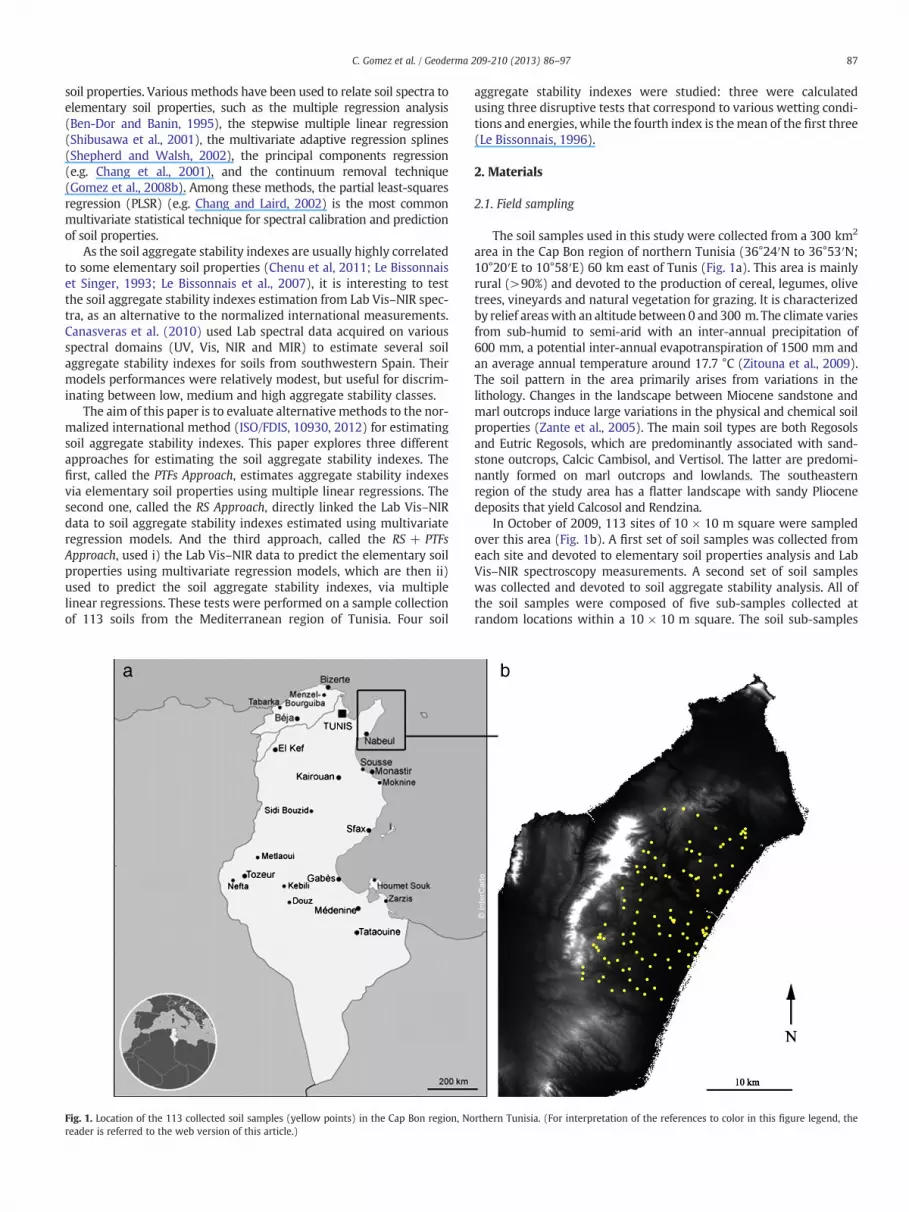
Fig. 1. Location of the 113 collected soil samples (yellow points) in the Cap Bon region, Noreader is referred to the web version of this article.)
aggregate stability indexes were studied: three were calculatedusing three disruptive tests that correspond to various wetting condi-tions and energies, while the fourth index is themean of the first three(Le Bissonnais, 1996).
2. Materials
2.1. Field sampling
The soil samples used in this study were collected from a 300 km2
area in the Cap Bon region of northern Tunisia (36°24′N to 36°53′N;10°20′E to 10°58′E) 60 km east of Tunis (Fig. 1a). This area is mainlyrural (>90%) and devoted to the production of cereal, legumes, olivetrees, vineyards and natural vegetation for grazing. It is characterizedby relief areaswith an altitude between 0 and 300 m. The climate variesfrom sub-humid to semi-arid with an inter-annual precipitation of600 mm, a potential inter-annual evapotranspiration of 1500 mm andan average annual temperature around 17.7 °C (Zitouna et al., 2009).The soil pattern in the area primarily arises from variations in thelithology. Changes in the landscape between Miocene sandstone andmarl outcrops induce large variations in the physical and chemical soilproperties (Zante et al., 2005). The main soil types are both Regosolsand Eutric Regosols, which are predominantly associated with sand-stone outcrops, Calcic Cambisol, and Vertisol. The latter are predomi-nantly formed on marl outcrops and lowlands. The southeasternregion of the study area has a flatter landscape with sandy Pliocenedeposits that yield Calcosol and Rendzina.
In October of 2009, 113 sites of 10 × 10 m square were sampledover this area (Fig. 1b). A first set of soil samples was collected fromeach site and devoted to elementary soil properties analysis and LabVis–NIR spectroscopy measurements. A second set of soil sampleswas collected and devoted to soil aggregate stability analysis. All ofthe soil samples were composed of five sub-samples collected atrandom locations within a 10 × 10 m square. The soil sub-samples
rthern Tunisia. (For interpretation of the references to color in this figure legend, the

88 C. Gomez et al. / Geoderma 209-210 (2013) 86–97
devoted to elementary soil properties analysis and Vis–NIR spectros-copy measurement were collected to a depth of 10 cm. The soilsub-samples devoted to soil aggregate stability analysis were alsocollected to a depth of 10 cm except in the presence of soil crust, inwhich case the samples were collected between 2 and 10 cm.
2.2. Basic soil analysis
The 113 soil samples devoted to the elementary soil properties anal-ysis were homogenized, air-dried and sieved at 2 mm prior to beingtransported to the laboratory. Eight elementary soil properties weredetermined using classical physico-chemical soil analysis (Baize andJabiol, 1995). These properties included:
- the calcium carbonate content (CaCO3) determined according tothe method NF ISO 10693,
- the clay content (granulometric fraction b 2 μm), silt content(granulometric fraction between 2 and 50 μm) and sand content(granulometric fraction between 0.05 and 2 mm) determinedaccording to the method NF X 31-107,
- the free iron content determined according to the Mehra-Jacksonmethod (ICP-AES),
- the cation-exchange capacity (CEC) determined according to theMetson Method NF X 31-130,
- the organic carbon content (OC) determined according to themethod NF ISO 10694,
- and the pH H2O determined according to the method NF ISO10390.
Fig. 2. The three different approaches to estimate the aggregate stability indexes as analternative to the normalized international measurements: PTFs, RS and RS + PTFsApproaches.
2.3. Soil aggregate stability measurements
The soil aggregate stability was determined on the 113 soil sam-ples according to the normalized international method described byLe Bissonnais (1996) (ISO/FDIS, 10930, 2012). This method combinesthree disruptive tests corresponding to various wetting conditionsand energies: fast wetting, slow wetting and mechanical breakdownby shaking after pre-wetting. Aggregate soil samples are homoge-nized, air-dried and sieved using sieves between 3 and 5 mm. Thesecalibrated aggregates are then dried at 40 °C for 24 h immediatelyprior to the tests to standardize their aggregate moisture contentsand thus prevent any differences due to the initial moisture levels.For the fast wetting test, approximately 5 g of the calibrated aggre-gates is rapidly immersed in 50 mL deionized water for 10 min. Forthe slow wetting test, a similar amount of the aggregates is preparedusing capillary-induced rewetting with water on a tension table at apotential of −0.3 kPa for 30 min. For the mechanical breakdowntest, the aggregates are wetted in ethanol, immersed in 250 mL ofdeionized water and agitated using a rapid end-over-end movement.Three replicates of each test are performed. After each test, thefragmented samples are collected and transferred to a 50 μm sievethat has been previously immersed in ethanol; the sieve is thengently moved five times with a Hénin apparatus to generate a helicoi-dal movement. Any aggregates remaining on the sieve are collected,dried at 105 °C and gently dry-sieved using a column of six sieves:2000, 1000, 500, 200, 100 and 50 μm. The mass proportion of eachsize fraction of the stable aggregates is calculated. The results areexpressed as the mean weight diameter (MWD), which correspondsto the sum of the mass fraction remaining on each sieve multipliedby the mean of the inter-sieve sizes. The MWDs are calculated foreach treatment (MWD_FW, MWD_MB and MWD_SW for fast wet-ting, mechanical breakdown and slow wetting, respectively) and themean of the three tests is also calculated (MWD_Mean). The calculat-ed MWDs can range between 25 μm and 3500 μm with higher valuescorresponding to a higher aggregate stability (Le Bissonnais, 1996).Five stability classes were defined by Le Bissonnais (1996) according
to MWD values: very unstable (b0.4 mm), unstable (0.4–0.8 mm),medium (0.8–1.3 mm), stable (1.3–2 mm) and very stable (>2 mm).
2.3. Laboratory reflectance measurements
The Vis–NIR reflectance spectra of the 113 soil samples were mea-sured in the laboratory using a black room to better control the irra-diance conditions. Two 90 W tungsten halogen light sources withaluminum reflectors (24 V, ~3000 K color temperature, DC powersupply) were placed on each side of the sample with the light beam45° from vertical and a distance of 50 cm between the lamps andthe sample. Spectral hemispherical–conical reflectances were collect-ed over the 350–2500 nm wavelength domain with a portablespectroradiometer (ASD Fieldspec®3). The spectral resolution rangedfrom 3 nm (at 700 nm) to 10 nm (in the NIR) and the spectral sam-pling interval varied from 1.4 nm between 350 and 1000 nm to2 nm between 1000 and 2500 nm. The spectral data were resampledto a 1 nm output value. The sensor was positioned 60 cm from thesample at its nadir to provide an 8 cm diameter spot with an 8°lens. The soil was placed in a Petri dish with a height × diameter of1 × 14 cm. A white Spectralon panel (0.3 × 0.3 m2 labsphere, NorthSutton, USA) provided the absolute reflectance factors for the labora-tory measurements. Three consecutive series of 50 individual reflec-tance measurements were acquired and provided a signal to noiseratio above 1000 with the exception of the extremities of the spectra,i.e., the ranges between 350 to 399 nm and between 2451 to2500 nm, which were not used in this study.
3. Methodology
3.1. Approach comparison
Three approaches were evaluated as alternative methods to thenormalized international method (ISO/FDIS, 10930, 2012) for esti-mating soil aggregate stability indexes:
1- Pedotransfert functions g (PTFs) were established to estimate theMWD indexes from the elementary soil properties (Chenu et al.,2011; Le Bissonnais et al., 2007) using multiple linear regressions(called “PTFs Approach”, Fig. 2).
2- Spectrotransfert functions f1 were built to estimate the MWD in-dexes from the Lab Vis–NIR soil spectra using multivariate linearmodels (called “RS Approach”, Fig. 2).

Table 1Elementary soil properties and the four aggregate stability indexes of the 113 soilsamples.
Min Max Mean Sd
CaCO3 (g/kg) 0.5 375 65 84.8Clay (g/kg) 46 747 329.4 187.5Sand (g/kg) 41 909 505.4 231.4Silt (g/kg) 39 332 163.5 61.2Iron (g/100 g) 0.2 2.3 1.1 0.5CEC (cmol+/kg) 2.8 34.1 15.4 7.8Organic carbon (g/kg) 2.1 28 10.3 4.6pH 6.7 9 8.3 0.3MWD_MB (mm) 0.38 2.8 1.24 0.68MWD_SW (mm) 0.51 3.06 1.79 0.64MWD_FW (mm) 0.35 2.82 0.9 0.46MWD_Mean (mm) 0.46 2.52 1.31 0.50
89C. Gomez et al. / Geoderma 209-210 (2013) 86–97
3- Spectrotransfert functions f2 were built to estimate the elementarysoil properties from the Lab Vis–NIR soil spectra using multivariatelinear models. PTFs h were then built to estimate the MWD index-es from these estimated elementary soil properties using multiplelinear regressions (called “RS + PTFs Approach”, Fig. 2).
3.2. Calibration and validation set
The dataset was split into a calibration set (84 samples = 3/4 of thetotal database) and a validation set (28 samples = 1/4 of the total data-base). For each model, the 113 reference values were sorted in an as-cending order. The method i) starts by selecting the sample with thelower reference value and put it in a calibration set, ii) then the nextthree samples are put in the validation set, and iii) then the procedureis continued by alternately placing the following in the validation setand the next three samples in the calibration set.
3.3. Multiple linear models
Multiple linear models (MLR) were used to build PTFs g and h(Fig. 2), which established the relationship between the soil aggre-gate stability indexes and elementary soil properties. MLR is welladapted when the number of observations (the soil samples in thisstudy) is superior to the number of variables (the elementary soilproperties in this study). As MLR needs independent variables toavoid over fitting, the choice of the elementary soil properties usedin the PTFs has to be done with caution. The Variance Inflation Factor(VIF) has been calculated for each variable, to check the impact ofmulti-collinearity in each MLR model. High levels of multicollinearity(VIF > 10) can falsely inflate the least squares estimates (Kutner etal., 2004; O'Brien R., 2007); therefore only variables with lower VIFvalues will be maintained in the MLR models.
An analysis was conducted to detect and remove outliers from thesamples in the calibration set. Outliers are commonly defined asobservations that are inconsistent with the majority of the data
Table 2Pearson coefficient of correlation R.
MWD_FW MWD_SW MWD_MB MWD_Mean
MWD_SW 0.56MWD_MB 0.50 0.65MWD_Mean 0.77 0.88 0.88Clay 0.61 0.45 0.58 0.64Silt 0.30 0.51 0.59 0.57Sand −0.58 −0.50 −0.63 −0.67CaCO3 −0.16 0.06 −0.08 −0.06OC −0.09 −0.02 −0.10 −0.08CEC 0.58 0.41 0.51 0.58Iron 0.59 0.50 0.64 0.68pH 0.17 0.31 0.38 0.35
(Chiang et al., 2003; Pearson, 2002), such as observations that signif-icantly deviate from the normal values. Outliers are detected whenthe predicted value has a residual difference significantly greaterthan the mean of the predicted values (>2.5 times).
3.4. Partial least-squares regression
Partial least-squares regression models (PLSR, Tenenhaus, 1998)were used to build the spectrotransfert functions, which establishedthe relationship between the soil aggregate stability indexes and theLab Vis–NIR spectra (functions f1), as well as between the elementarysoil properties and the Lab Vis–NIR spectra (functions f2) (Fig. 2). Themaximum number of latent variables (LV) in the PLSR was defined as10, and the optimal number of LV was determined via predictedresidual error sum of squares (PRESS) analysis, taking care to avoidboth under- and over-fitting. A leave-one-out cross-validation proce-dure was adopted to verify the predictive capability of the PLS modelfor the calibration set. Each time, n − 1 samples were used to buildthe regression model from all n samples within the dataset. Basedon this model, the soil property value for the sample not used duringmodel development was predicted. This procedure was repeatedfor all n samples to obtain predictions for each sample. Beforeestablishing the spectrotransfert functions, the Vis–NIR reflectancespectra were converted to “absorbance” (log [1 / reflectance]), andnoise reduction was achieved using standard pretreatments: aSavitzky–Golay filter with second order polynomial smoothing, win-dow widths of 30 nm (Savitzky and Golay, 1964), mean centeringand variance scaling. As for the linear model construction, an analy-sis was conducted to detect and remove the outliers in the calibra-tion set. An outlier can be defined as (i) a spectral outlier when thesample is spectrally different than the rest of the samples or (ii) avalue outlier when the predicted value has a residual difference signif-icantly greater than the mean of the predicted values (>2.5 times).Principal component analysis (PCA) was performed on the spectra todetect the spectral outliers. The Mahalanobis distance (Mark andTunnell, 1985) was applied to the PCA-reduced data, and an H valueof 3 was selected for outlier identification based on the Mahalanobisdistance.
3.5. Models evaluation
The prediction performance was evaluated using the coefficient ofdetermination R2
cal and R2val of predicted against measured values in
the calibration and validation set respectively. The root mean squareerrors of calibration (RMSEC) and the root mean square errors inthe validation set (RMSEP) were also analyzed for all the models.The ratio of performance to deviation (RPD), which is the ratio ofthe standard deviation in the validation set to the RMSEP, was usedas an index of model accuracy. Chang and Laird (2002) definedthree classes of RPD: category A (RPD > 2) are models that accuratelypredict the property in question, category B (RPD between 1.4 and 2)
Clay Silt Sand CaCO3 OC CEC Iron
0.61−0.98 −0.77−0.11 0.23 0.03
0.05 0.34 −0.13 0.430.97 0.65 −0.97 −0.11 0.160.88 0.57 −0.87 −0.27 −0.03 0.830.42 0.44 −0.46 0.27 0.04 0.39 0.32
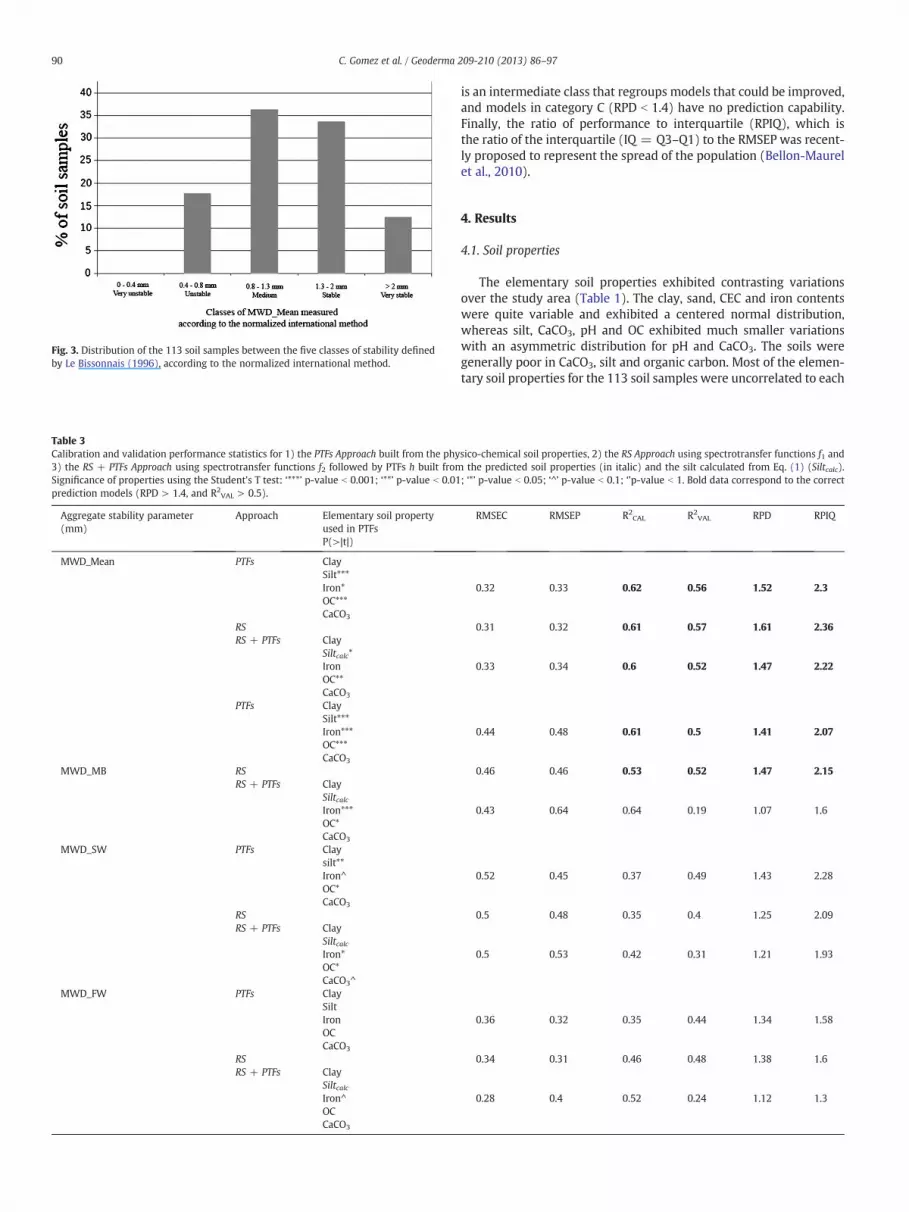
Fig. 3. Distribution of the 113 soil samples between the five classes of stability definedby Le Bissonnais (1996), according to the normalized international method.
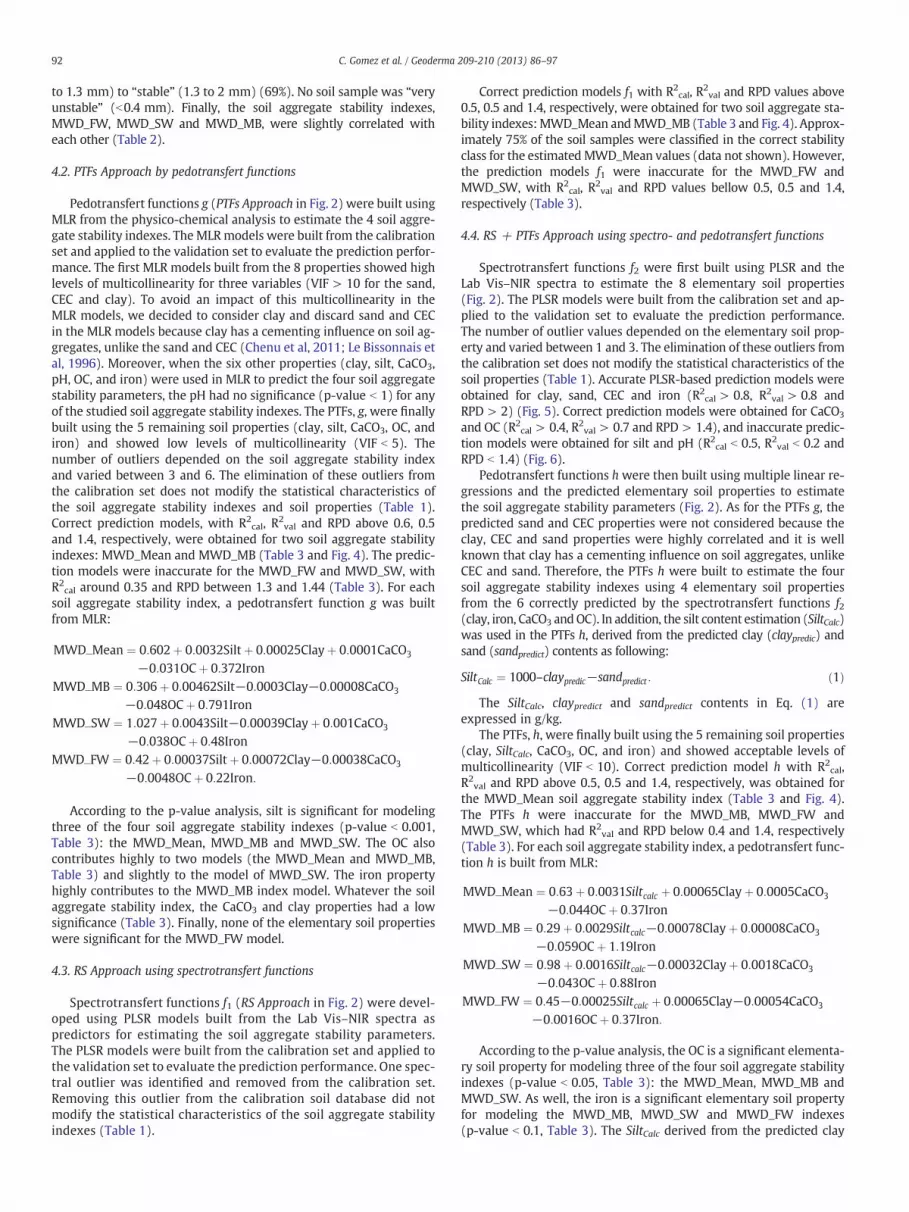
Table 3Calibration and validation performance statistics for 1) the PTFs Approach built from the phy3) the RS + PTFs Approach using spectrotransfer functions f2 followed by PTFs h built fromSignificance of properties using the Student's T test: ‘***’ p-value b 0.001; ‘**’ p-value b 0.01prediction models (RPD > 1.4, and R2
VAL > 0.5).
Aggregate stability parameter(mm)
Approach Elementary soil propertyused in PTFsP(>|t|)
MWD_Mean PTFs ClaySilt***Iron*OC***CaCO3
RSRS + PTFs Clay
Siltcalc*IronOC**CaCO3
PTFs ClaySilt***Iron***OC***CaCO3
MWD_MB RSRS + PTFs Clay
SiltcalcIron***OC*CaCO3
MWD_SW PTFs Claysilt**Iron^OC*CaCO3
RSRS + PTFs Clay
SiltcalcIron*OC*CaCO3^
MWD_FW PTFs ClaySiltIronOCCaCO3
RSRS + PTFs Clay
SiltcalcIron^OCCaCO3
90 C. Gomez et al. / Geoderma 209-210 (2013) 86–97
is an intermediate class that regroups models that could be improved,and models in category C (RPD b 1.4) have no prediction capability.Finally, the ratio of performance to interquartile (RPIQ), which isthe ratio of the interquartile (IQ = Q3–Q1) to the RMSEP was recent-ly proposed to represent the spread of the population (Bellon-Maurelet al., 2010).
4. Results
4.1. Soil properties
The elementary soil properties exhibited contrasting variationsover the study area (Table 1). The clay, sand, CEC and iron contentswere quite variable and exhibited a centered normal distribution,whereas silt, CaCO3, pH and OC exhibited much smaller variationswith an asymmetric distribution for pH and CaCO3. The soils weregenerally poor in CaCO3, silt and organic carbon. Most of the elemen-tary soil properties for the 113 soil samples were uncorrelated to each
sico-chemical soil properties, 2) the RS Approach using spectrotransfer functions f1 andthe predicted soil properties (in italic) and the silt calculated from Eq. (1) (Siltcalc).
; ‘*’ p-value b 0.05; ‘^’ p-value b 0.1; ‘’p-value b 1. Bold data correspond to the correct
RMSEC RMSEP R2CAL R2
VAL RPD RPIQ
0.32 0.33 0.62 0.56 1.52 2.3
0.31 0.32 0.61 0.57 1.61 2.36
0.33 0.34 0.6 0.52 1.47 2.22
0.44 0.48 0.61 0.5 1.41 2.07
0.46 0.46 0.53 0.52 1.47 2.15
0.43 0.64 0.64 0.19 1.07 1.6
0.52 0.45 0.37 0.49 1.43 2.28
0.5 0.48 0.35 0.4 1.25 2.09
0.5 0.53 0.42 0.31 1.21 1.93
0.36 0.32 0.35 0.44 1.34 1.58
0.34 0.31 0.46 0.48 1.38 1.6
0.28 0.4 0.52 0.24 1.12 1.3
91C. Gomez et al. / Geoderma 209-210 (2013) 86–97
other with the following exceptions: i) the high positive correlationbetween clay and CEC (R = 0.97) and the high negative correlationsbetween the clay and sand (R = −0.98), and between CEC and sand(R = −0.97), ii) an intermediate positive correlation between ironand clay (R = 0.88), and an intermediate negative correlation be-tween iron and sand (R = −0.87) (Table 2). Finally, there is nosignificant correlation between the soil aggregate stability indexes
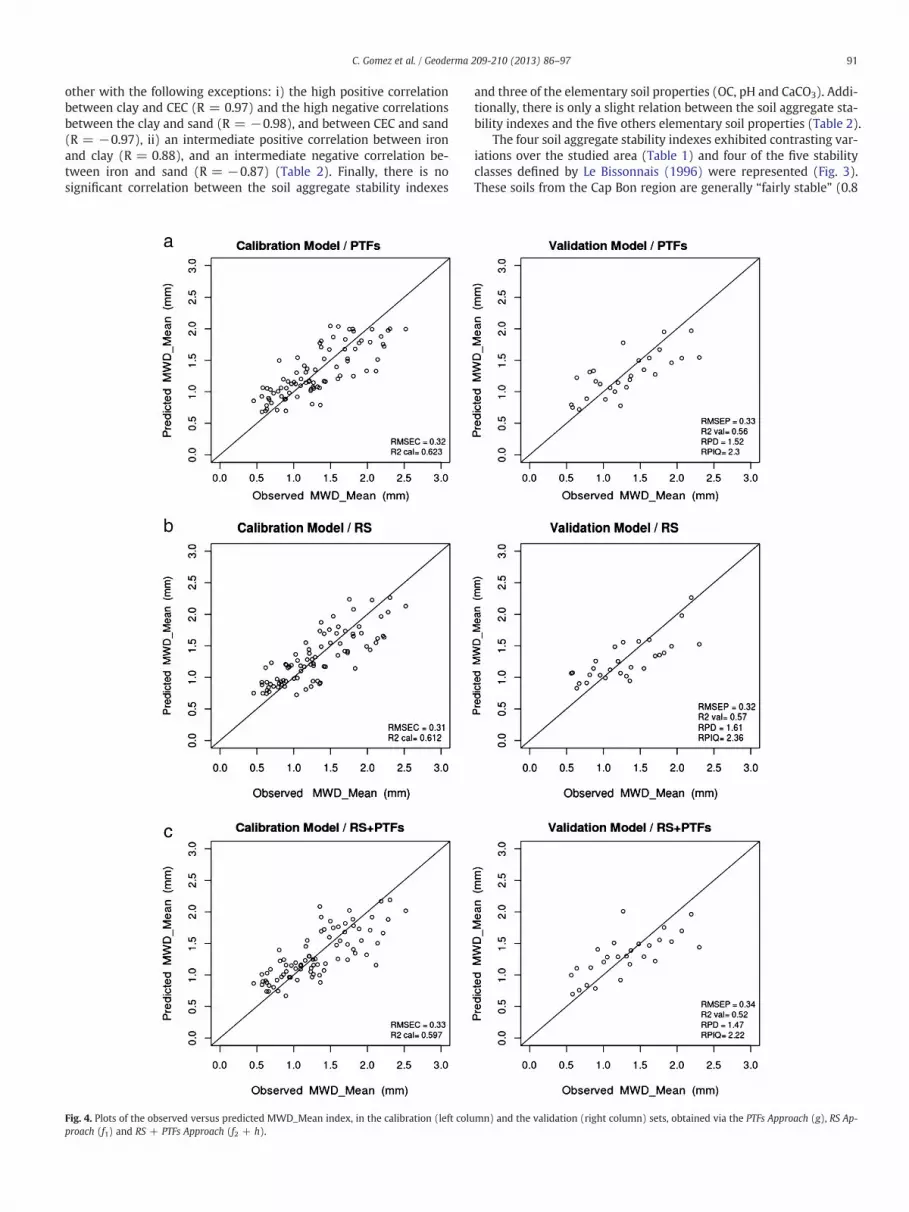
Fig. 4. Plots of the observed versus predicted MWD_Mean index, in the calibration (left coluproach (f1) and RS + PTFs Approach (f2 + h).
and three of the elementary soil properties (OC, pH and CaCO3). Addi-tionally, there is only a slight relation between the soil aggregate sta-bility indexes and the five others elementary soil properties (Table 2).
The four soil aggregate stability indexes exhibited contrasting var-iations over the studied area (Table 1) and four of the five stabilityclasses defined by Le Bissonnais (1996) were represented (Fig. 3).These soils from the Cap Bon region are generally “fairly stable” (0.8
mn) and the validation (right column) sets, obtained via the PTFs Approach (g), RS Ap-
92 C. Gomez et al. / Geoderma 209-210 (2013) 86–97
to 1.3 mm) to “stable” (1.3 to 2 mm) (69%). No soil sample was “veryunstable” (b0.4 mm). Finally, the soil aggregate stability indexes,MWD_FW, MWD_SW and MWD_MB, were slightly correlated witheach other (Table 2).
4.2. PTFs Approach by pedotransfert functions
Pedotransfert functions g (PTFs Approach in Fig. 2) were built usingMLR from the physico-chemical analysis to estimate the 4 soil aggre-gate stability indexes. The MLRmodels were built from the calibrationset and applied to the validation set to evaluate the prediction perfor-mance. The first MLR models built from the 8 properties showed highlevels of multicollinearity for three variables (VIF > 10 for the sand,CEC and clay). To avoid an impact of this multicollinearity in theMLR models, we decided to consider clay and discard sand and CECin the MLR models because clay has a cementing influence on soil ag-gregates, unlike the sand and CEC (Chenu et al, 2011; Le Bissonnais etal, 1996). Moreover, when the six other properties (clay, silt, CaCO3,pH, OC, and iron) were used in MLR to predict the four soil aggregatestability parameters, the pH had no significance (p-value b 1) for anyof the studied soil aggregate stability indexes. The PTFs, g, were finallybuilt using the 5 remaining soil properties (clay, silt, CaCO3, OC, andiron) and showed low levels of multicollinearity (VIF b 5). Thenumber of outliers depended on the soil aggregate stability indexand varied between 3 and 6. The elimination of these outliers fromthe calibration set does not modify the statistical characteristics ofthe soil aggregate stability indexes and soil properties (Table 1).Correct prediction models, with R2
cal, R2val and RPD above 0.6, 0.5
and 1.4, respectively, were obtained for two soil aggregate stabilityindexes: MWD_Mean and MWD_MB (Table 3 and Fig. 4). The predic-tion models were inaccurate for the MWD_FW and MWD_SW, withR2
cal around 0.35 and RPD between 1.3 and 1.44 (Table 3). For eachsoil aggregate stability index, a pedotransfert function g was builtfrom MLR:
MWDXMean ¼ 0:602þ 0:0032Siltþ 0:00025Clayþ 0:0001CaCO3
−0:031OCþ 0:372IronMWDXMB ¼ 0:306þ 0:00462Silt−0:0003Clay−0:00008CaCO3
−0:048OCþ 0:791IronMWDXSW ¼ 1:027þ 0:0043Silt−0:00039Clayþ 0:001CaCO3
−0:038OCþ 0:48IronMWDXFW ¼ 0:42þ 0:00037Siltþ 0:00072Clay−0:00038CaCO3
−0:0048OCþ 0:22Iron:
According to the p-value analysis, silt is significant for modelingthree of the four soil aggregate stability indexes (p-value b 0.001,Table 3): the MWD_Mean, MWD_MB and MWD_SW. The OC alsocontributes highly to two models (the MWD_Mean and MWD_MB,Table 3) and slightly to the model of MWD_SW. The iron propertyhighly contributes to the MWD_MB index model. Whatever the soilaggregate stability index, the CaCO3 and clay properties had a lowsignificance (Table 3). Finally, none of the elementary soil propertieswere significant for the MWD_FW model.
4.3. RS Approach using spectrotransfert functions
Spectrotransfert functions f1 (RS Approach in Fig. 2) were devel-oped using PLSR models built from the Lab Vis–NIR spectra aspredictors for estimating the soil aggregate stability parameters.The PLSR models were built from the calibration set and applied tothe validation set to evaluate the prediction performance. One spec-tral outlier was identified and removed from the calibration set.Removing this outlier from the calibration soil database did notmodify the statistical characteristics of the soil aggregate stabilityindexes (Table 1).
Correct prediction models f1 with R2cal, R2
val and RPD values above0.5, 0.5 and 1.4, respectively, were obtained for two soil aggregate sta-bility indexes:MWD_Mean andMWD_MB (Table 3 and Fig. 4). Approx-imately 75% of the soil samples were classified in the correct stabilityclass for the estimatedMWD_Mean values (data not shown). However,the prediction models f1 were inaccurate for the MWD_FW andMWD_SW, with R2
cal, R2val and RPD values bellow 0.5, 0.5 and 1.4,
respectively (Table 3).
4.4. RS + PTFs Approach using spectro- and pedotransfert functions
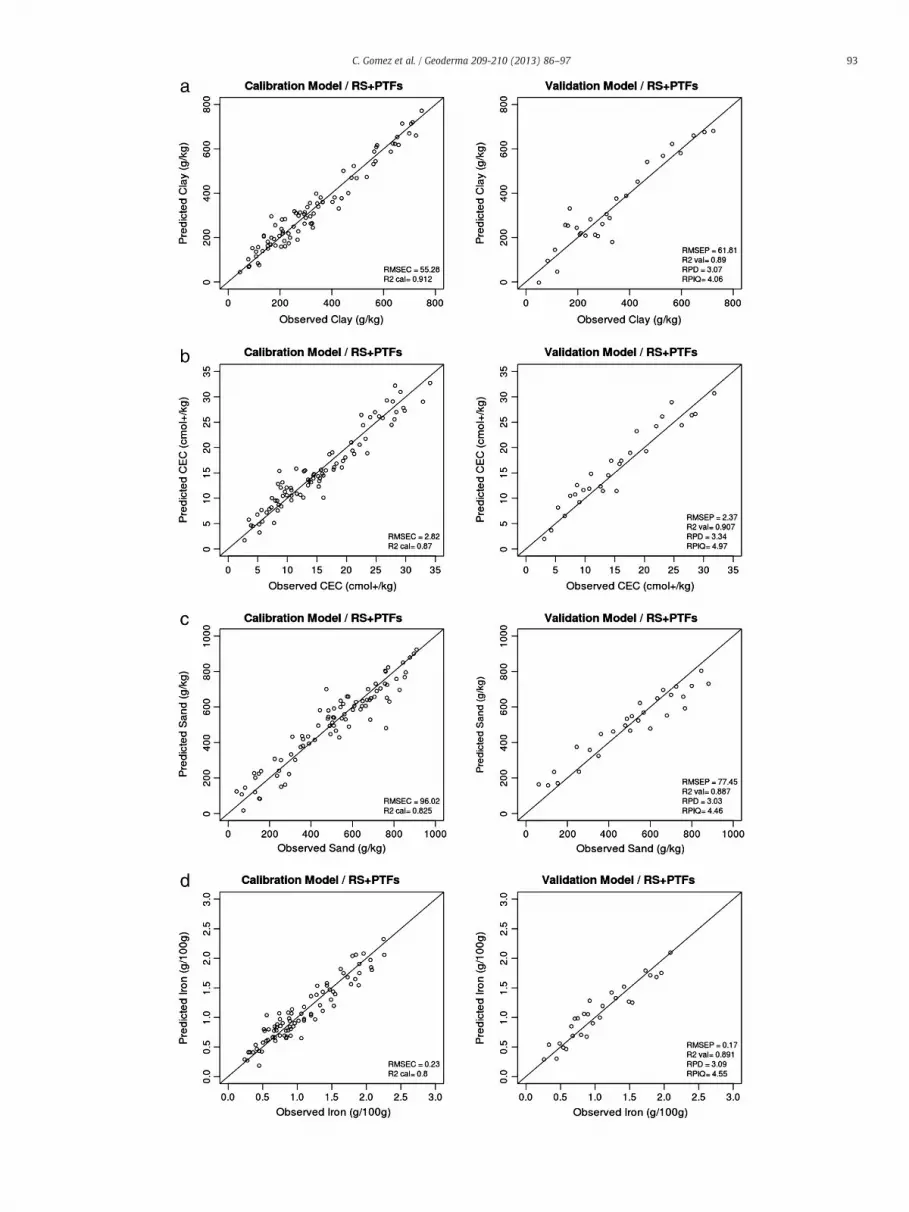
Spectrotransfert functions f2 were first built using PLSR and theLab Vis–NIR spectra to estimate the 8 elementary soil properties(Fig. 2). The PLSR models were built from the calibration set and ap-plied to the validation set to evaluate the prediction performance.The number of outlier values depended on the elementary soil prop-erty and varied between 1 and 3. The elimination of these outliers fromthe calibration set does not modify the statistical characteristics of thesoil properties (Table 1). Accurate PLSR-based prediction models wereobtained for clay, sand, CEC and iron (R2cal > 0.8, R2
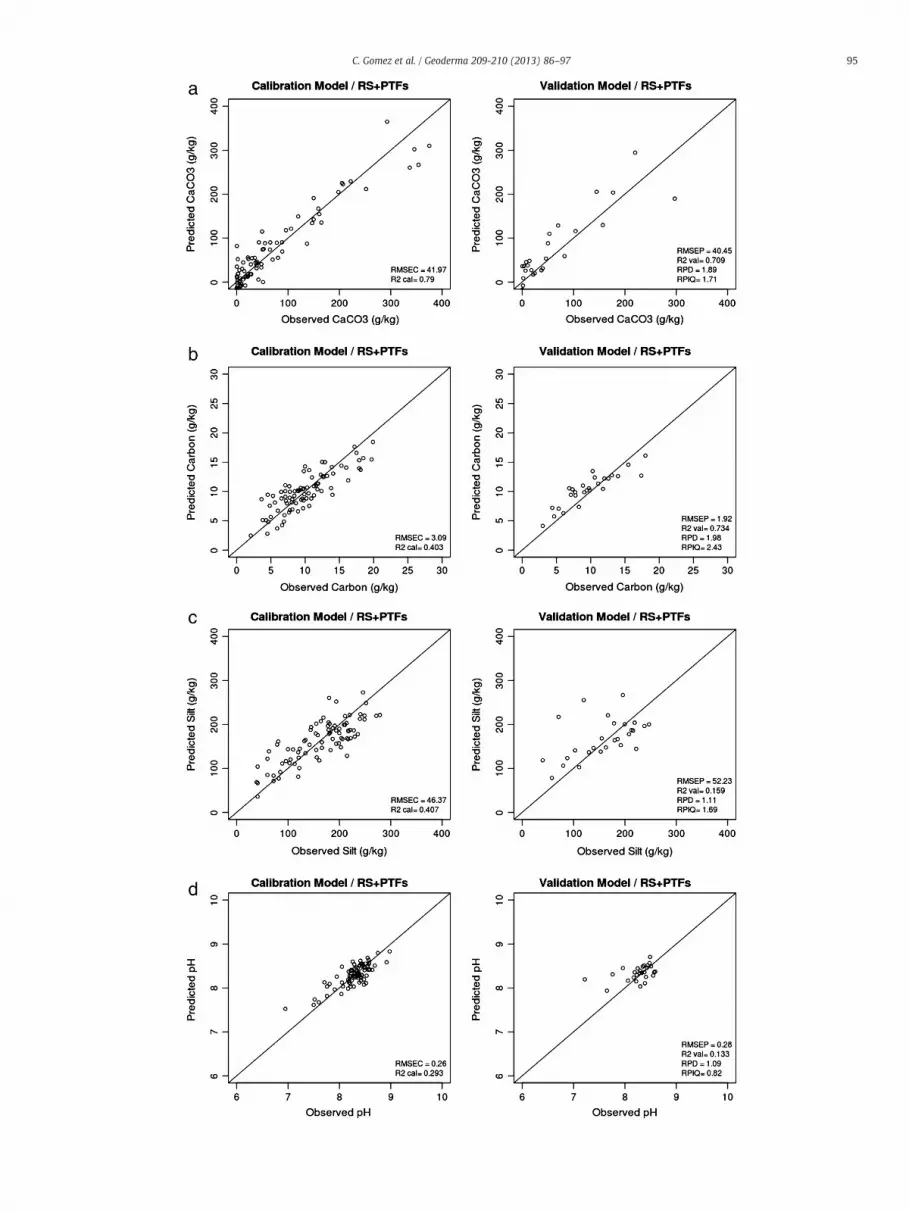
val > 0.8 andRPD > 2) (Fig. 5). Correct prediction models were obtained for CaCO3
and OC (R2cal > 0.4, R2val > 0.7 and RPD > 1.4), and inaccurate predic-
tion models were obtained for silt and pH (R2cal b 0.5, R2val b 0.2 and
RPD b 1.4) (Fig. 6).Pedotransfert functions hwere then built using multiple linear re-
gressions and the predicted elementary soil properties to estimatethe soil aggregate stability parameters (Fig. 2). As for the PTFs g, thepredicted sand and CEC properties were not considered because theclay, CEC and sand properties were highly correlated and it is wellknown that clay has a cementing influence on soil aggregates, unlikeCEC and sand. Therefore, the PTFs h were built to estimate the foursoil aggregate stability indexes using 4 elementary soil propertiesfrom the 6 correctly predicted by the spectrotransfert functions f2(clay, iron, CaCO3 andOC). In addition, the silt content estimation (SiltCalc)was used in the PTFs h, derived from the predicted clay (claypredic) andsand (sandpredict) contents as following:
SiltCalc ¼ 1000–claypredic−sandpredict : ð1ÞThe SiltCalc, claypredict and sandpredict contents in Eq. (1) are
expressed in g/kg.The PTFs, h, were finally built using the 5 remaining soil properties
(clay, SiltCalc, CaCO3, OC, and iron) and showed acceptable levels ofmulticollinearity (VIF b 10). Correct prediction model h with R2
cal,R2
val and RPD above 0.5, 0.5 and 1.4, respectively, was obtained forthe MWD_Mean soil aggregate stability index (Table 3 and Fig. 4).The PTFs h were inaccurate for the MWD_MB, MWD_FW andMWD_SW, which had R2
val and RPD below 0.4 and 1.4, respectively(Table 3). For each soil aggregate stability index, a pedotransfert func-tion h is built from MLR:
MWDXMean ¼ 0:63þ 0:0031Siltcalc þ 0:00065Clayþ 0:0005CaCO3
−0:044OCþ 0:37IronMWDXMB ¼ 0:29þ 0:0029Siltcalc−0:00078Clayþ 0:00008CaCO3
−0:059OCþ 1:19IronMWDXSW ¼ 0:98þ 0:0016Siltcalc−0:00032Clayþ 0:0018CaCO3
−0:043OCþ 0:88IronMWDXFW ¼ 0:45−0:00025Siltcalc þ 0:00065Clay−0:00054CaCO3
−0:0016OCþ 0:37Iron:
According to the p-value analysis, the OC is a significant elementa-ry soil property for modeling three of the four soil aggregate stabilityindexes (p-value b 0.05, Table 3): the MWD_Mean, MWD_MB andMWD_SW. As well, the iron is a significant elementary soil propertyfor modeling the MWD_MB, MWD_SW and MWD_FW indexes(p-value b 0.1, Table 3). The SiltCalc derived from the predicted clay
93C. Gomez et al. / Geoderma 209-210 (2013) 86–97

94 C. Gomez et al. / Geoderma 209-210 (2013) 86–97
and sand contents contributes slightly to the MWD_Mean indexmodel. Whatever the soil aggregate stability index, the CaCO3 andclay properties had no significance (p-value b 1, Table 3).
The result obtained for estimating the MWD_Mean index from theRS + PTFs Approach is similar to this of the PTFs and RS Approaches(R2
cal > 0.6, R2val > 0.5 and RPD > 1.45, Table 3). Moreover, for esti-
mating the MWD_Mean index, the elementary soil properties thatwere significantly involved for the PTFs h were the same as for thePTFs g (silt and OC, Table 3). The results obtained for estimating theMWD_SW and MWD_FW indexes from the RS + PTFs Approach arealso similar to those of the PTFs and RS Approaches (Table 3). Finally,the RS + PTFs Approach applied for estimating the MWD_MB indexprovided inaccurate predictions compared to the PTFs and RSApproaches (Table 3).
5. Discussion
5.1. Pedotransfert functions for soil aggregate stability assessment
Several previous studies showed that soil aggregate stability wasstrongly correlated to the OC and clay contents (Chenu et al., 2000;Tisdall and Oades, 1982). Multiple linear or non-linear regressions(e.g., PTFs) have been established using these two soil propertiescombined with additional soil properties, such as CaCO3, iron oxidesor pH, for tropical soils (Chappell et al., 1999; Idowu, 2003; Sung,2012), sub-tropical soils (Tavares Filho et al., 2012), temperate soils(Chenu et al, 2011) and arid soils (Besalatpour, 2012). These additionalsoil properties generally added little significance to these regressions,although some studies created PTFs using other properties such as par-ticle density or soil mechanical resistance (Shalmani et al., 2010). Therelation between the OC content and stability indexes was also ob-served in Mediterranean soils by Le Bissonnais et al. (2007) and a PTFlinking these indexes to elementary soil properties has been developed.The OC thus appeared to be a predominant indicator of soil aggregatestability and erodibility for various soil types.
As the OC is uncorrelated to the soil aggregate stability indexes forour soil dataset (Table 2), the OC appears not to be a predominantindicator of soil aggregate stability for the studied area. This low influ-ence of the OC on the stability can be explained in part by the narrow,low OC content range for most of the soils, where 98% of the samplesfell within the 2–20 g/kg range. Moreover, no single soil property hasa significant relationship to any of the soil aggregate stability indexes(Table 2). In addition, no high correlation between the stability index-es was found as was generally the case for Le Bissonnais (1996)(Table 2). Both this lack of relationship between any single soil prop-erty and the soil aggregate stability index and the low influence of OCon the stability were also observed by Canasveras et al. (2010) for apopulation of 80 soil samples collected from Spanish Mediterraneansoils also characterized by narrow, low OC content range with 93%of the samples falling within the 5–25 g/kg range.
Despite the lack of any relationship, the pedotransfert functions g(PTFs Approach) were able to correctly predict the MWD_Mean andMWD_MB soil aggregate stability indexes based on the R2
val (>0.5)and RPD (>1.4) (Table 3). Silt and OC are the most significant proper-ties in both regressions (p-value b 0.001), whereas the iron has ahigh influence on MWD_MB model (p-value b 0.001) and a slight in-fluence on MWD_Mean model (p-value b 0.05) (Table 3). Therefore,for the range of studied soils, the silt and OC properties seem to deter-mine a portion of the soil aggregate stability. The mean percentage ofthe silt contents is moderate (16%, Table 1) and the mean percentageof the OC contents is low (1%, Table 1). As shown in the literature,soils with a high percentage of silt often show low aggregate stability
Fig. 5. Plots of the observed versus predicted elementary soil properties, in the calibrationb) CEC, c) sand and d) iron.
and both high crusting and runoff risks. This finding is especially truefor dry conditions when the OC content is low because water entrydestroys the aggregate structure via slaking (Amezketa et al., 1996;Le Bissonnais et al, 1996). The lack of accuracy for the PTF g predic-tions of the other two stability indexes (MWD_FW and MWD_SW)agrees with the low influence of OC on soil aggregate stability inour soil dataset, because these two indexes are well related to OCdue to its positive effect against slaking by reducing the wettability(Chenu et al., 2000).
5.2. Soil aggregate stability assessment using Vis–NIR spectra
The spectrotransfert functions f1 (RS Approach) for assessingthe soil aggregate stability using Lab Vis–NIR spectra yielded similarresults to the PTFs Approach g with correct estimations for theMWD_Mean and MWD_MB and inaccurate estimations for theMWD_FW and MWD_SW (Table 3). Canasveras et al. (2010), whoused Mediterranean soils with no relation between their single elemen-tary soil properties (including OC) and the soil aggregate stability, devel-oped inaccurate spectrotransfert functions and PTF (R2
val approximately0.4) to predict a soil aggregate stability index comparable to theMWD_FW index, like in our study.
The elementary soil property prediction models f2 were built fromthe Lab Vis–NIR spectra and allowed for the estimation of 6 of theeight studied soil properties with respect to their common quality in-dicators (Fig. 5). The accuracies of our prediction models for sand,clay, iron, CEC and CaCO3 predictions agree with the literature(Ben-Dor and Banin, 1995; Chang et al., 2001; Cozzolino and Moron,2003; Gomez et al., 2008a; Gomez et al., 2008b; Shepherd andWalsh, 2002), but are slightly lower than in the literature for OC, pHand silt predictions (Chang and Laird, 2002; Chang et al., 2001;Cozzolino and Moron, 2003; Shepherd and Walsh, 2002). This re-duced accuracy may be due to the narrow and low OC, pH and siltcontents in our soil data set (Table 1).
The RS + PTFs Approach combines a spectrotransfert function f2for assessing the elementary soil properties and a PTF h and allowsfor the correct estimation of the MWD_Mean index, as for the PTFsApproach g and RS Approach f1. Nevertheless, the RS + PTFs Approachyielded slightly less accurate results for this stability index than theRS Approach and the PTFs Approach. The accuracy of the MWD_Meanprediction model varied between RPD = 1.47 (RS + PTFs Approach,f2 + h) and RPD = 1.58 (RS Approach f1) (Table 3 and Fig. 4). TheMWD_MB index can also be estimated by the PTFs Approach g andRS Approach f1, with similar models performance. The accuracy ofthe MWD_MB prediction model varied between RPD = 1.52 (PTFsApproach g) and RPD = 1.58 (RS Approach f1) (Table 3). As theRS + PTFs Approach is a succession of two regression models, it maylead to the accumulation of uncertainties (estimation error obtainedfor f2 added to the estimation error for h), which may explain thelower prediction accuracy than that obtained with the RS Approach.
To our knowledge, soil aggregate stability indexes do not corre-spond to a specific spectral response; therefore the spectrotransfertfunctions use a combination of correlations between the elementarysoil properties and the soil aggregate stability. The relative ability ofspectroscopy to predict soil aggregate stability would depend on theperformance of the PLSR models to estimate elementary soil proper-ties. If the stability indexes are well correlated to one or several inde-pendent elementary soil properties easily predicted via PLSR, as isoften the case for OC, then the RS Approach using spectrotransfertfunctions should be pertinent. On the contrary, if the relationshipbetween soil aggregate stability and elementary soil properties ispoor, there is only little chance to obtain significant spectrotransfert
(left column) and the validation (right column) sets obtained via PLSR for the a) clay,
95C. Gomez et al. / Geoderma 209-210 (2013) 86–97
96 C. Gomez et al. / Geoderma 209-210 (2013) 86–97
functions for predicting the soil aggregate stability. In our study, nosingle property showed a significant correlation to the soil aggregatestability despite the large population of soil samples, and multiple re-gressions only yielded moderately accurate predictions for only twoof the four stability indexes. In addition, of the four main elementarysoil properties used for these predictions (silt, iron, clay, OC), threewere slightly correlated to other (Table 1), and the fourth (OC) onlyshowed a limited range of variation (Table 2). In theory, we would ex-pect to obtain a better spectrotransfert function performance, for soilpopulations with a larger range of variation for specific elementarysoil properties such as OC, clay and iron oxides. Therefore, further in-vestigations should be performed on soil samples where both the soilaggregate stability is strongly correlated to the OC content and the OCcan be predicted with high accuracy using Vis–NIR data.
The results obtained from PTFs and RS Approach, even thoughmoderate in term of accuracy, would allow an increasing knowledgeof the soil stability of the studied region. A first use of these predictionresults could be quantitative with a use of the MWD estimationsto evaluate erodibility parameters of process-based erosion models(Gumiere et al, 2011; Yan et al, 2008), although more accurate predic-tions would be preferable for this use. A second use of these predictionresults could be more qualitative. For instance, the MWD estimationscould be divided into the stability classes defined by Le Bissonnais(1996) to build the maps of soil erodibility used for regional coarsescale erosion risk modeling (Kirkby et al., 2008; Le Bissonnais et al.,2002).
The RS Approach proposed in this paper could be used for thespatialization of soil aggregate stability over large areas using remotesensing hyperspectral data. However, although Vis–NIR data acquiredby both field and airborne sensors can be used to increase elementarysoil property mapping with a high spatial resolution on both the fieldand regional scale (Viscarra Rossel and McBratney, 1998; Lagacherie etal., 2012; Gomez et al, 2008a; Gomez et al, 2012), the use of Vis–NIRdata acquired either in situ or from aircraft is still challenging. Indeed,the presence of different environmental factors, such as soil moisture,both dry and green vegetation, rocks and roughness, can affect boththe soil spectra and the performance of soil property estimations de-rived from it (Lagacherie et al., 2008). With an R2
val of approximately0.56 and accounting for the signature degradation between laboratoryand airborne spectrometers, it does not currently seem realistic to ob-tain reasonably significant soil aggregate stability estimations fromVis–NIR hyperspectral data. This approach should be tested in otherareas with larger variations in their elementary soil properties wherean improved performance for the spectrotransfert functions could beexpected.
6. Conclusions
This study was conducted to explore alternative methods ofnormalized international method to estimate soil aggregate stabilityindexes. We evaluated three different approaches using 113 soilsfrom a Tunisian Mediterranean region. The PTFs Approach estimatesaggregate stability indexes via elementary soil properties usingMLR. The RS Approach used multivariate regression models buildfrom Lab Vis–NIR data to predict the soil aggregate stability indexes.The RS + PTFs Approach first used multivariate regression modelsbuilt from Lab Vis–NIR data to predict the elementary soil propertiesand then used MLR to estimate the soil aggregate stability indexesfrom these estimated elementary soil properties. Our study demon-strated that the performance of the RS + PTFs Approach is lowerthan both others approaches. The RS Approach could be as efficientas the PTFs Approach and is therefore a promising result because of
Fig. 6. Plots of the observed versus predicted elementary soil properties, in the calibration (b) OC, c) silt and d) pH.
the rapidity, non-destructive and straightforward of the spectromet-ric measurements. A useful application of these spectrotransfertfunctions could be the spatialization of soil aggregate stability forlarge areas using remote sensing hyperspectral data. However, itdoes not currently seem realistic to obtain reasonably significantsoil aggregate stability estimations from Vis–NIR hyperspectral data.This approach should be tested in other areas with larger variationsin their elementary soil properties where an improved performancefor the spectrotransfert functions could be expected.
Acknowledgments
This research was granted by INRA, IRD, the French NationalResearch Agency (ANR) (ANR-08-BLAN-0284-01) and the MISTRAL2011 project Sicmed-Lebna “Biophysical and socio-economical analysisof water management within the Tunisian Cap Bon Peninsula: theLebna study area”. The authors are indebted to Yves Blanca (IRD-UMRLISAH Montpellier), Zakia Jenhaoui (IRD-UMR LISAH Tunis) for thesoil sampling in 2009 over the Lebna catchment and to Hedi Hamrouni(DG/ACTA Sol, Tunis) for his significant support to this study. Finally,weare indebted to Emna Boukari and Amira Askri for the soil aggregatestability measurements.
References
Amezketa, E., Singer, M.J., Le Bissonnais, Y., 1996. Testing a new procedure for measur-ing water-stable aggregation. Soil Science Society of America Journal 60, 888–894.
Baize, D., Jabiol, B., 1995. Guide pour la description des sols. INRA édition, Paris.Barthès, B., Roose, E., 2002. Soil aggregate stability as an indicator of soil susceptibility
to runoff and erosion; validation at several levels. Catena 4, 133–149.Bellon-Maurel, V., Fernandez-Ahumada, E., Palagos, B., Roger, J.M., McBratney, A., 2010.
Prediction of soil attributes by NIR spectroscopy. A critical review of chemometricindicators commonly used for assessing the quality of the prediction. Trac-Trendsin Analytical Chemistry 29 (9), 1073–1081.
Ben-Dor, E., Banin, A., 1995. Near infrared analysis (NIRA) as a rapid method to simul-taneously evaluate, several soil properties. Soil Science Society of America Journal59, 364–372.
Besalatpour, A., Hajabbasi, M.A., Ayoubi, S., Gharipour, A., Jazi, A.Y., 2012. Prediction ofsoil physical properties by optimized support vector machines. InternationalAgrophysics 26, 109–115.
Bouma, J., 1989. Using soil survey data for quantitative land evaluation. Advances inSoil Science 9, 177–213.
Brown, D.J., Shepherd, K.D., Walsh, M.G., Mays, M.D., Reinsch, T.G., 2006. Global soilcharacterization with VNIR diff use reflectance spectroscopy. Geoderma 132,273–290.
Bruand, A., Pérez Fernandez, P., Duval, O., 2003. Use of class pedotransfert functionsbased on texture and bulk density of clods to generate water retention curves.Soil Use and Management 19, 232–242.
Bryan, R., 2000. Soil erodibility and processes of water erosion on hillslope. Geomor-phology 32, 385–415.
Cammeraat, L.H., Imeson, A.C., 1998. Deriving indicators of soil degradation from soilaggregation studies in SE Spain and S France. Geomorphology 23, 307–321.
Cañasveras, J.C., Barrón, V., del Campillo, M.C., Torrent, J., Gómez, J.A., 2010. Estimationof soil aggregate stability indices in Mediterranean soils by diffuse reflectancespectroscopy. Geoderma 158 (1–2), 78–84.
Cerdá, A., 1998. Soil aggregate stability under different Mediterranean vegetationtypes. Catena 32, 73–86.
Chang, C.-W., Laird, D.A., 2002. Near-infrared reflectance spectroscopic analysis of soilC and N. Soil Science 167 (2), 110–116.
Chang, C.-W., Laird, D.A., Mausbach, M.J., Hurburgh Jr., C.R., 2001. Near-infrared reflec-tance spectroscopy—principal components regression analysis of soil properties.Soil Science Society of America Journal 65, 480–490.
Chappell, N.A., Ternan, J.L., Bidin, K., 1999. Correlation of physicochemical propertiesand sub-erosional landforms with soil aggregate stability variations in a tropicalUltisol disturbed by forestry operations. Soil and Tillage Research 50, 55–71.
Chenu, C., Le Bissonnais, Y., Arrouays, D., 2000. Organic matter influence on clay wetta-bility and soil aggregate stability. Soil Science Society of America Journal 64 (4),1479–1486.
Chenu, C., Abiven, S., Annabi, M., Barray, S., Bertrand, M., Bureau, F., Cosentino, D.,Darboux, F., Duval, O., Fourrié, L., Francou, C., Houot, S., Jolivet, C., Laval, K., LeBissonnais, Y., Lemée, L., Menasseri, S., Pétraud, J.P., Verbeque, B., 2011. Mise aupoint d'outils de prévision de l'évolution de la stabilité de la structure de solssous l'effet de la gestion organique des sols. Etudes et Gestion des Sols 18 (3),137–151.
left column) and the validation (right column) sets obtained via PLSR for the a) CaCO3,
97C. Gomez et al. / Geoderma 209-210 (2013) 86–97
Chiang, L.H., Pell, R.J., Seasholtz, M.B., 2003. Exploring process data with the use ofrobust outlier detection algorithms. Journal of Process Control 13 (5), 437–449.
Cozzolino, D., Moron, A., 2003. The potential of near-infrared reflectance spectroscopyto analyse soil chemical and physical characteristics. Journal of AgriculturalSciences 140, 65–71.
Gomez, C. Coulouma G., Lagacherie, P., 2012. Regional predictions of eight common soilproperties and their spatial structures from hyperspectral Vis–NIR data. Geoderma189–190, 176–185.
Gomez, C., Viscarra Rossel, R.A., McBratney, A.B., 2008a. Soil organic carbon predictionby hyperspectral remote sensing and field Vis–NIR spectroscopy: an Australiancase study. Geoderma 146 (3–4), 403–411.
Gomez, C., Lagacherie, P., Coulouma, G., 2008b. Continuum removal versus PLSRmethod for clay and calcium carbonate content estimation from laboratory andairborne hyperspectral measurements. Geoderma 148 (2), 141–148.
Gumiere, S.J., Raclot, D., Cheviron, B., Davy, G., Louchart, X., Fabre, J.C., Moussa, R.,Le Bissonnais, Y., 2011. MHYDAS-Erosion a distributed single-storm watererosion model for agricultural catchment. Hydrological Processes 25 (11),1717–1728. http://dx.doi.org/10.1002/hyp.7931.
Idowu, O.J., 2003. Relationships between soil aggregate stability and selected soilproperties in humid tropical environment. Communications in Soil Science andPlant Analysis 34 (5–6), 695–708.
ISO/FDIS 10930, 2012. Soil quality — measurement of the stability of soil aggregatessubjected to the action of water. http://www.iso.org/iso/iso_catalogue/ (13 pp.).
Kirkby, M.J., Irvine, B.J., Jones, R.J.A., Govers, G., Boer, M., Cerdan, O., Daroussin, J., Gobin,A., Grimm, M., Le Bissonnais, Y., Kosmas, C., Mantel, S., Puigdefabregas, J., vanLynden, G., 2008. The PESERA coarse scale erosion model for Europe: I — modelrationale and implementation. European Journal of Soil Science 59, 1293–1306.
Kutner, M.H., Nachtsheim, C.J., Neter, J., 2004. Applied Linear Regression Models, 4thEd. McGraw-Hill Irwin, Inc., Boston.
Lagacherie, P., Baret, F., Feret, J.-B., Madeira Netto, J., Robbez-Masson, J.-M., 2008.Estimation of soil clay and calcium carbonate using laboratory, field and airbornehyperspectral measurements. Remote Sensing of Environment 112 (3), 825–835.
Lagacherie, P., Bailly, J.S., Monestiez, P., Gomez, C., 2012. Using scattered soil sensingfield surveys to map soil properties over a region. An example with airbornehyperspectral imagery. European Journal of Soil Science 63, 110–119.
Le Bissonnais, Y., 1996. Soil aggregate stability and assessment of soil crustability anderodibility: I theory and methodology. European Journal of Soil Science 47,425–431.
Le Bissonnais, Y., Singer, M.J., 1993. Seal formation, runoff and interrill erosion from 17California soils. Soil Science Society of America Journal 57, 224–229.
Le Bissonnais, Y., Montier, C., Jamagne, M., Daroussin, J., King, D., 2002. Mappingerosion risk for cultivated soil in France. Catena 46, 207–220.
Le Bissonnais, Y., Blavet, D., De Noni, G., Laurent, J.Y., Asseline, J., Chenu, C., 2007. Erod-ibility of Mediterranean vineyard soils: relevant soil aggregate stability methodsand significant soil variables. European Journal of Soil Science 58, 188–195.
Mark, H.L., Tunnell, D., 1985. Qualitative near infrared reflectance analysis usingMahalanobis distances. Analytical Chemistry 57 (7), 1449–1456.
O'Brien, R., 2007. A caution regarding rules of thumb for variance inflation factors.Quality and Quantity 41, 673–690.
Pachepsky, Y.A., Rawls, W.J., Lin, H.S., 2006. Hydropedology and pedotransfer functions.Geoderma 131, 308–316.
Pearson, R.K., 2002. Outliers in process modeling and identification. IEEE Transactionson Control Systems Technology 10 (1), 55–63.
Savitzky, A., Golay, M.J.E., 1964. Smoothing and differentiation of data by simplifiedleast squares procedures. Analytical Chemistry 36 (8), 1627–1639.
Shalmani, A.A., Shahrestani, M.S., Asadi, H., Bagheri, F., 2010. Comparison of regressionpedotransfer functions and artificial neural networks for soil aggregate stabilitysimulation. In: Gilkes, R.J., Prakongkep, N. (Eds.), Proceedings of the 19th WorldCongress of Soil Science: Soil Solutions for a Changing World, pp. 5–7 (Brisbane,Australia, 1–6 August 2010).
Shepherd, K.D., Walsh, M.G., 2002. Development of reflectance spectral libraries forcharacterization of soil properties. Soil Science Society of America Journal 66,988–998.
Shibusawa, S., Made Anom, S.W., Sato, H.P., Sasao, A., 2001. Soil mapping using the real-time soil spectrometer. In: Gerenier, G., Blackmore, S. (Eds.), ECPA 2001, 2. agroMontpellier, Montpellier, France, pp. 485–490.
Sung, C.T.B., 2012. Soil aggregate stability of tropical soils in relation to their organicmatter constituents and other soil properties. Pertanika Journal of Tropical Agricul-tural Science 35, 135–148.
Tavares Filho, J., Matsuda Feltran, C.T., Francirlei de Oliveira, J., De Almeida, E., De FátimaGuimarães, M., 2012. Atributos de solo determinantes para a estimativa do índice deestabilidade de agregados. Pesquisa Agropecuária Brasileira 47 (3), 436–441.
Tenenhaus, M., 1998. La régression PLS. Editions Technip, Paris (254 pp.).Tisdall, J.M., Oades, J.M., 1982. Organic matter and water-stable aggregates in soils.
Journal of Soil Science 33, 141–163.Viscarra Rossel, R.A., McBratney, A.B., 1998. Laboratory evaluation of a proximal sens-
ing technique for simultaneous measurement of clay and water content. Geoderma85, 19–39.
Viscarra Rossel, R.A., Walvoort, D.J.J., Mc Bratney, A.B., Janik, L.J., Skjemstad, J.O., 2006.Visible, near-infrared, mid-infrared or combined diffuse reflectance spectroscopyfor simultaneous assessment of various soil properties. Geoderma 131, 59–75.
Yan, F.-L., Shi, Z.-H., Li, Z.-X., Cai, C.-F., 2008. Estimating interrill soil erosion from ag-gregate stability of ultisols in subtropical china. Soil and Tillage Research 100,34–41.
Zante, P., Collinet, J., Pepin, Y., 2005. Caractéristiques pédologiques et hydrométéorologiquesdu bassin versant de Kamech, Cap Bon, Tunisie. UMR LISAH IRD Tunis, DG ACTA Direc-tion des Sols Tunis, INRGREF Tunis. (21 p. + 6 annexes).
Zitouna, R., 2009. Modélisation de la variabilité du flux de chaleur latente de la parcelleau bassin versant dans un milieu cultivé méditerranéen hétérogène (Ph.D. reportfrom University of Montpellier 2).


