Embed Size (px)
Citation preview
Journal of Engineering Volume 20 June - 2014 Number 6
144
Kinetics of the Saponification of Mixed Fats Consisting of Olein and Stearin
Dr. Raghad Fareed Kassim Almilly
Lecturer
Department of Chemical Engineering
College of Engineering - Baghdad University
Email: [email protected]
ABSTRACT
This research presents the kinetics of the saponification reaction using mixed fats of olein
and stearin [in the ratio (3:1)] with NaOH solution . In this reaction , excess solution of NaOH
was used to ensure the reaction being irreversible . Three parameters were varied to show their
effects on the reaction rate .They are : percentage excess of NaOH solution (10 % - 100 %) ,
temperature (100-150)oC , and stirring speed (400-1100) rpm. It was noticed that increasing the
percentage excess of NaOH solution enhances the rate of reaction while increasing temperature
decreases the reaction rate since it is exothermic reaction. Increasing stirring speed also
improves the reaction rate because it is mass transfer controlled .Calculations of the activation
energy and the frequency factor were also performed.
A new mathematical model for calculation of the reaction – rate constant was derived . It is
shown that a good approximation was obtained between the experimental and calculated values
of the reaction – rate constant k .
Key words: kinetics, saponification reaction , mixed fats , olein and stearin , mathematical
model.
االولين والستيارينحركية تفاعل الصوبنة لمسيج من زيتي
د. رغذ فريذ قاسم الملي
يذسط قسى انهذست انكبوت
خبيعت بغذاد -كهت انهذست
الخالصة
( [ يع يحهىل هذسوكسذ 1:1قذو هزا انبحث حشكت حفبعم انصىبت ببسخخذاو خهظ ي صخ االون وانسخبس ] بسبت )
انصىدىو .سخخذو ف هزا انخفبعم سبت صائذة ي يحهىل هذسوكسذ انصىدىو نضب كى انخفبعم غش عكس . حى حغش
% ( , 100 -% 10شعت انخفبعم وهى سبت انضبدة انئىت نحهىل هذسوكسذ انصىدىو )ثالثت عىايم نبب حأثشهى عهى س
( دوسة/ دققت. وقذ نىحظ ا صبدة سبت انضبدة انئىت نحهىل 1100-000( و , و سشعت انخهظ )150-100دسخت انحشاسة )
. انخفبعم أله حفبعم ببعث نهحشاسةانحشاسة حقهم سشعت هذسوكسذ انصىدىو حؤدي انى صبدة سشعت انخفبعم بب صبدة دسخت
كزنك حى احخسبة خ سطش عههب اخقبل انبدة.أضب صبدة سشعت انخهظ حؤدي انى صبدة سشعت انخفبعم أله ي انخفبعالث ان
ب وخىد حقبسة خذ ب انقى طبقت انخشظ وعبيم انزبزبت. حى اشخقبق ىرج سبض خذذ نحسبة ثببج سشعت انخفبعم . نقذ ح
انعهت وانقى انحسىبت نثببج سشعت انخفبعم.
.انحشكت , حفبعم انصىبت , يضح ي انضىث , االون وانسخبس , ىرج سبض :الرئيسيةالكلمات
Journal of Engineering Volume 20 June - 2014 Number 6
145
1. INTRODUCTION
It has been said that the use of soap is a gauge of the civilization of a nation . Many literature
were published in the field of saponification of various fats and fatty acids.Frost and
Schwemer,1952. had studied the differential rate equations for the kinetics of competitive
consecutive second – order reactions . Measurements of the rate of saponification of ethyl
adipate and ethyl succinate were used to verify the theoretical approach . Newberger and
Kadlec , 1973 had studied the kinetics of the saponification of diethyl adipate between 302K and
358K , for both stirred and tubular reactors . They had suggested numerical search method to
verify the proposed model. Vicente, et al., 2006. Studied the kinetics of Brassica Carinata oil
methanolysis . They found that the methanolysis reaction can be described as a pseudo –
homogeneous catalyzed reaction , following a second – order mechanism for the forward and
reverse reactions . They also found that higher temperature and catalyst concentrations increased
the reaction rates . Appleton Appleton, 2007, had published a handbook of soap manufacture .
He had made a review of oils and fats and their saponification . He had presented the steps of
soap – making even soap perfuming and molding . Lab. Report , 2012, was presented to
determine the order, rate constant , activation energy , and pre – exponential factor for the
reaction of ethyl acetate with base using conductance measurements. An experimental study of
the reaction kinetics of a simple homogenous liquid – phase system was published , Chem. Eng.
Lab. , 2013. The reaction kinetics of the saponification of isopropyl acetate with sodium
hydroxide was presented.
There are some aspects of interest still need to be studied . Determination the order , rate
constant and many other parameters in the saponification kinetics are of great importance . The
objective of this research is to study the parameters that affect saponification reaction. These
parameters can be used to model the reaction to a large – scale applications , enhance an existed
production and adopt an optimum set of parameters for a new production .
2. THEORITICAL ASPECTS
2.1 Saponification Reaction
The saponification reaction is of the form
Fat + sodium hydroxide = soap + glycerol
The fat used is a mixture of olein and stearin with a ratio (3:1) . These fats are the most important
ones from a soap –maker's point of view , Appleton , 2007 . Using (3:1) ratio ensures the
product (soap) to be soft enough (by using olein ) and solid enough (by using stearin ) for toilet
use. Appleton had published various types of fats and fatty acids . Olein (derived from olive and
cotton – seed oil ) is saponified according to the following reaction :
C3H5(C18H33O2)3 + 3NaOH = 3NaO2C18H33 + C3H5(OH)3
olein sodium sodium oleate glycerol
hydroxide ( soap )
Stearin ( derived from tallow ) is saponified according to the following reaction :
C3H5(C18H35O2)3 + 3NaOH = 3NaO2C18H35 + C3H5(OH)3
Journal of Engineering Volume 20 June - 2014 Number 6
146
stearin sodium sodium stearate glycerol
hydroxide ( soap )
Therefore; the chemical equation for saponification reaction can be represented by :
A + B = R + S
Where A , B refer to the reactants ( fat and caustic soda ) and R , S refer to the products ( soap
and glycerol). The reaction rate is , Smith ,1981.
rA = k CA CB – k ' CR CS
where : k is the forward reaction – rate constant
k' is the backward reaction – rate constant
represents the molar concentration of the specified substance in (mol / l ) C
If an excess of NaOH solution is added , the reaction will be considered as irreversible , such as
Smith , 1981.
A + B → R + S
and the rate equation will be :
rA = k CA CB
Since the reaction is in liquid phase (constant volume),Smith , 1981.
rA = - dCA / dt = k CA CB (1)
2.2 Kinetics of Saponification Reaction
The kinetics study of this work consists of the following:
(i) Determination of the order of the reaction
(ii) Determination of the rate constant
(iii) Determination of the activation energy
(iv) Determination of the frequency factor or ( pre - exponential ) factor
under the variation of three parameters : the percentage excess of NaOH , the temperature and
the stirring speed.
The basic relation in kinetics study is the concentration –time relation of the reactants. The
concentration – time data can be detected using titration of samples and refractive indices
determination.
2.3 Modeling the Rate Equation
Previous works that studied the kinetics of saponification reaction had either simplified the
solution of the differential equation by approximation, Lab. Report, 2012 or solved it by
iteration , Newberger, and Kadlec , 1973.
Journal of Engineering Volume 20 June - 2014 Number 6
147
In this work, the differential equation will be dealt as it is and solved with somewhat tedious
integration method , as follows:
rA = - dCA / dt = k CA CB (1)
The fractional conversion , xA , is defined as :
xA = ( CAo – CA ) / CAo
Differentiation:
- dCA / dt = CAo dxA / dt (2)
CA and CB are defined through xA as:
CA = CAo (1 – xA) (3)
CB = CBo – 3 (CAo - CA ) (4)
Where Eq. (3) is the stoichiometric factor and CAo , CBo are the initial concentrations of
reactants A and B , respectively. Dividing Eq. (4) by CAo yields:
CB / CAo = CBo / CAo – 3( CAo - CA ) / CAo
CB / CAo = CBo / CAo – 3 xA
or CB = CBo – 3 xA CAo (5)
Substituting Eqs. (2) , (3) , and (5) into Eq. (1) , yields :
CAo dxA / dt = k CAo (1 – xA) (CBo –3xACAo)
Dividing by CAo leads to:
dxA/dt= k (1–xA) (CBo–3xACAo) (6)
Separating the variables , yields :
dxA/(1–xA)(CBo–3xACAo)=kdt (7)
Integrating from t = 0 , xA = 0 to t = t and xA = xA yields :
∫
( )( )
∫
(8)
Using fractional integration :
( )( )
(9)
Multiplying by ( 1- xA ) (CBo – 3 xA CAo), yields :
1 = E (CBo–3 xA CAo) + F (1–xA) (10)
1 = E CBo - 3 E xA CAo + F – F xA
Equating the coefficients of xAo :
1 = E CBo + F (11)
Equating the coefficients of xA1 :
Journal of Engineering Volume 20 June - 2014 Number 6
148
0 = - 3 E CAo - F (12)
Therefore; F = - 3 E CAo
Substituting into Eq. (11) , yields:
1 = E CBo – 3 E CAo (13)
or E = 1 / (CBo−3CAo) (14)
and F = - 3 CAo / (CBo−3CAo) (15)
Substituting Eqs. (14) and (15) into Eq. (9) , yields :
( ) ( )
( ) ( )
( ) ( )
and
∫
( )( )
( )∫
( )
( ) ∫
( )
Substituting into Eq. (8) , yields :
( )[∫
( )
∫
( )
] ∫
Integrating , yields :
( )[ ( ) ( )]
or
( )*
+
so *
+
( )
is the proposed model . This model can be verified through the experimental work .
3. EXPERIMENTAL WORK
3.1 Apparatus
The apparatus used in this work consists of 1000 ml- beaker (modified with lower tapped glass
tube to ensure the separation of the lower glycerol layer from the upper soap layer ) , hot plate
stirrer (RLABINCO , Model L-81,The Netherlands) . It's provided with two nobs ; one for
controlling the temperature (100 - 150 ) oC and the other for controlling the stirring speed (400 –
1100 ) rpm . The apparatus also consists of thermometer ( for measuring the actual temperature
of the reacting mixture ) , various glassware for preparation of solutions and titration of samples ,
Journal of Engineering Volume 20 June - 2014 Number 6
149
Refractometer ( Model Optika , no. 2WAJ SN 281006 , Italy ) . The refractometer is used to
measure the refractive index of the samples .
3.2 Materials Materials used are : olein and stearin fats ( source: Republic Company of Vegetable Oils) ,
sodium hydroxide (NaOH) solution (Aldrich mark) standardized against standard hydrochloric
acid (HCl) solution (commercial grade ) , Vogel , 1961. , saturated solution of brine , distilled
water .
3.3 Procedure
The procedure consists of the following steps:
1-Weighing the required amounts of fats then transferring them to the beaker.
2- Switch on the heater and stirrer and fixing them on certain values.
3-Adding an excess amount of sodium hydroxide solution with changeable percentage excess
(10% - 100%).
4-Beginning the reaction for specified CAo and CBo .
5-Taking a sample every 5-10 minutes till the end of the reaction (soap formation). Samples
were titrated against standard HCl solution using methyl orange as an indicator ,Vogel , 1961.
also the refractive indices were measured for these samples.
6-Adding distilled water to cool the reaction mixture and to suppress the froth of the soap when
necessary .
7-Adding saturated brine solution to facilitate the separation of layers.
8-The soap was then molded, dried, and used.
4. RESULTS AND DISCUSSION
Experiments were performed at different levels of the three parameters ( percentage excess of
NaOH solution (10%-100%) , temperature (100-150) oC , and stirring speed (400-1100) rpm .
Each experiment depicted a concentration – time curve . To calculate the order of the reaction
and the rate constant , the differential method was adopted . This was achieved by calculating
different slopes at different concentrations of tangent points of the concentration – time curve .
These slopes represented dCA/dt (reaction rate with respect to the limiting reactant A) . Taking
the natural logarithms for each dCA/dt and CA , then drawing data gives a straight line of slope
equal nA ( the order of the reaction with respect to A ) and of intercept equals ln k. The inverse
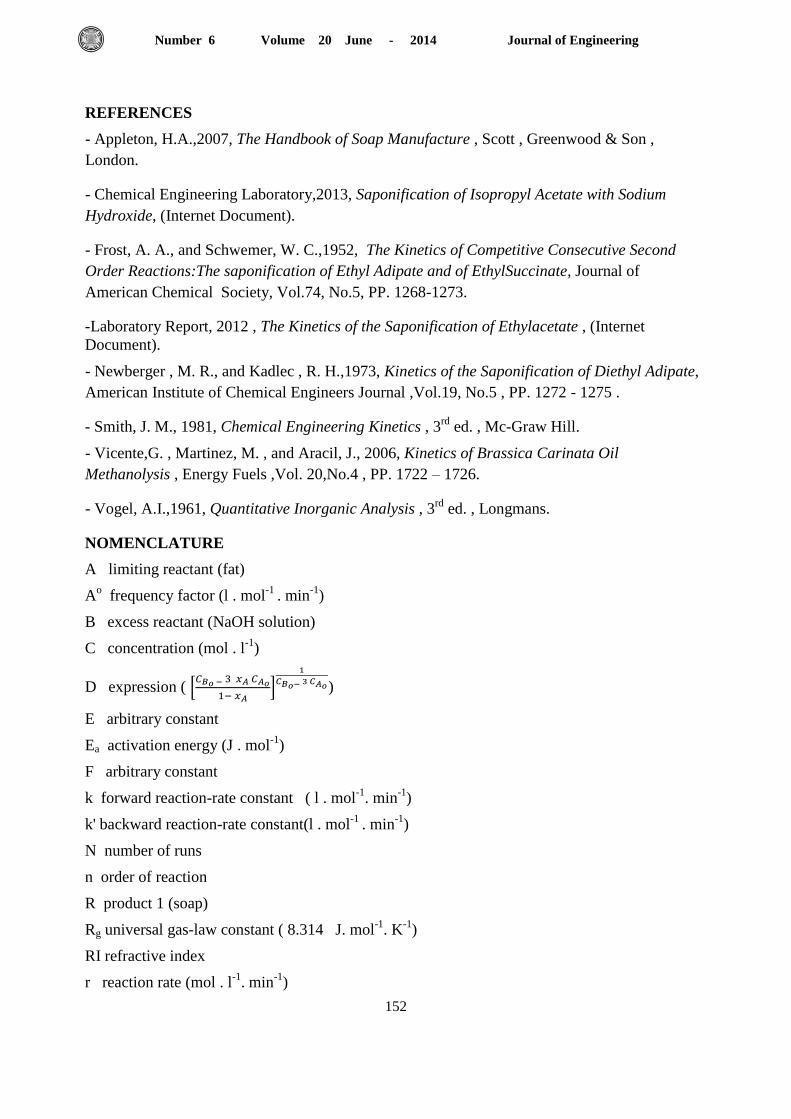
of ln k gives the experimental value of k (reaction – rate constant).Table 1 shows a sample of
concentration –time data for both reactant A and reactant B , with the refractive indices and
conversions for run no.(4).Fig.1 shows the concentration - time curve of reactant A. The curve
shows decreasing of CA with time until complete consumption. This is because reactant A is the
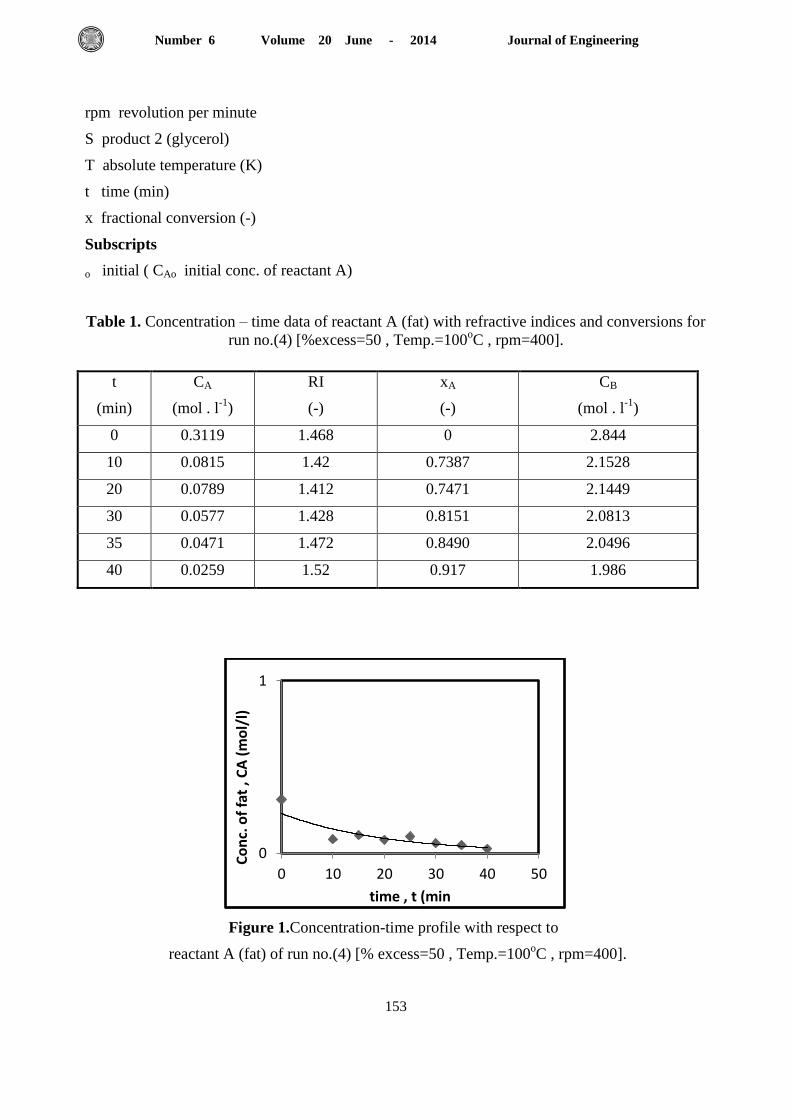
limiting reactant . Table 2 shows data for the slopes determined at the tangent points of Fig. 1.
The data illustrate decreasing of slopes' magnitudes for the points . This means decreasing the
rate of reaction with the concentration decrease, which indicates the progress of reaction. Table
3 shows the logarithm of the rate of reaction ln (-dCA/dt) with the logarithm of the concentration
lnCA. Fig. 2 depicted these data. It was shown that the order of reaction with respect to A is
approximately 1. The value of the rate constant was also determined. These calculations were
also done for the excess reactant B ( NaOH solution ) to find the order of the reaction with
Journal of Engineering Volume 20 June - 2014 Number 6
150
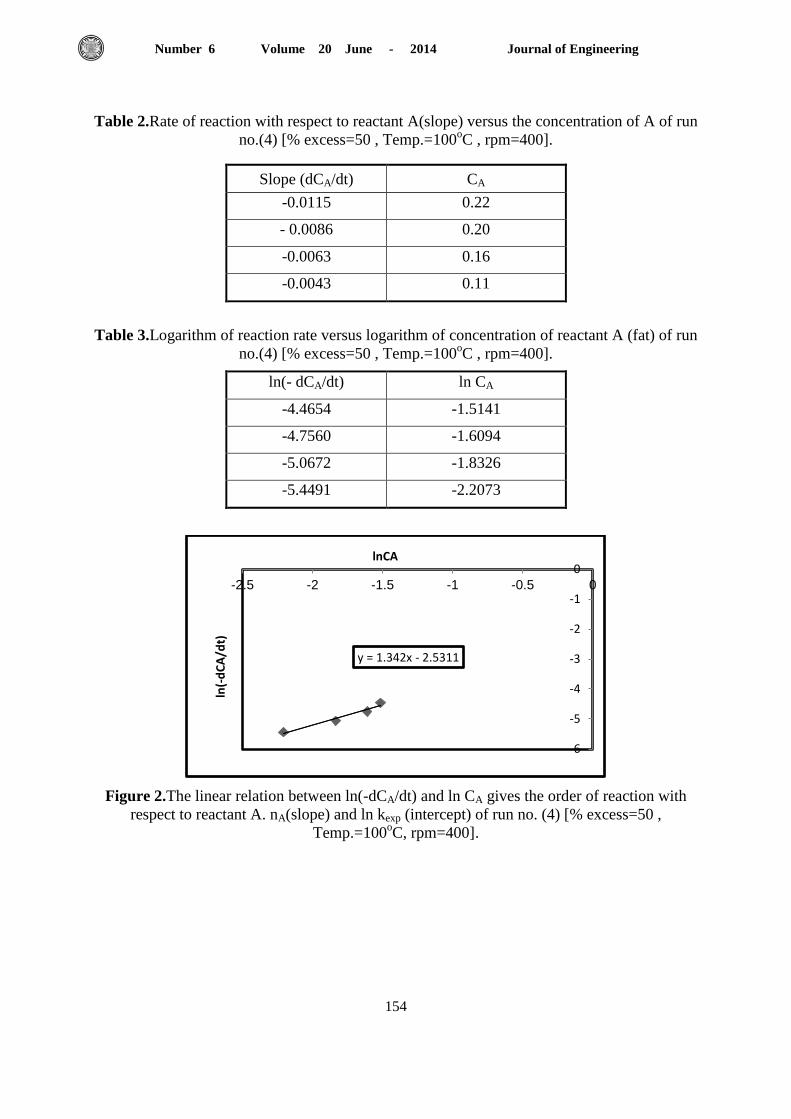
respect to it (nB). Fig. 3 traces the concentration - time profile of reactant B. It is clear that
reactant B dose not tend to complete consumption , since it is the excess reactant. Table 4
shows (- dCB / dt) versus CB data . Similarly , the rate of reaction decreased with decrease in
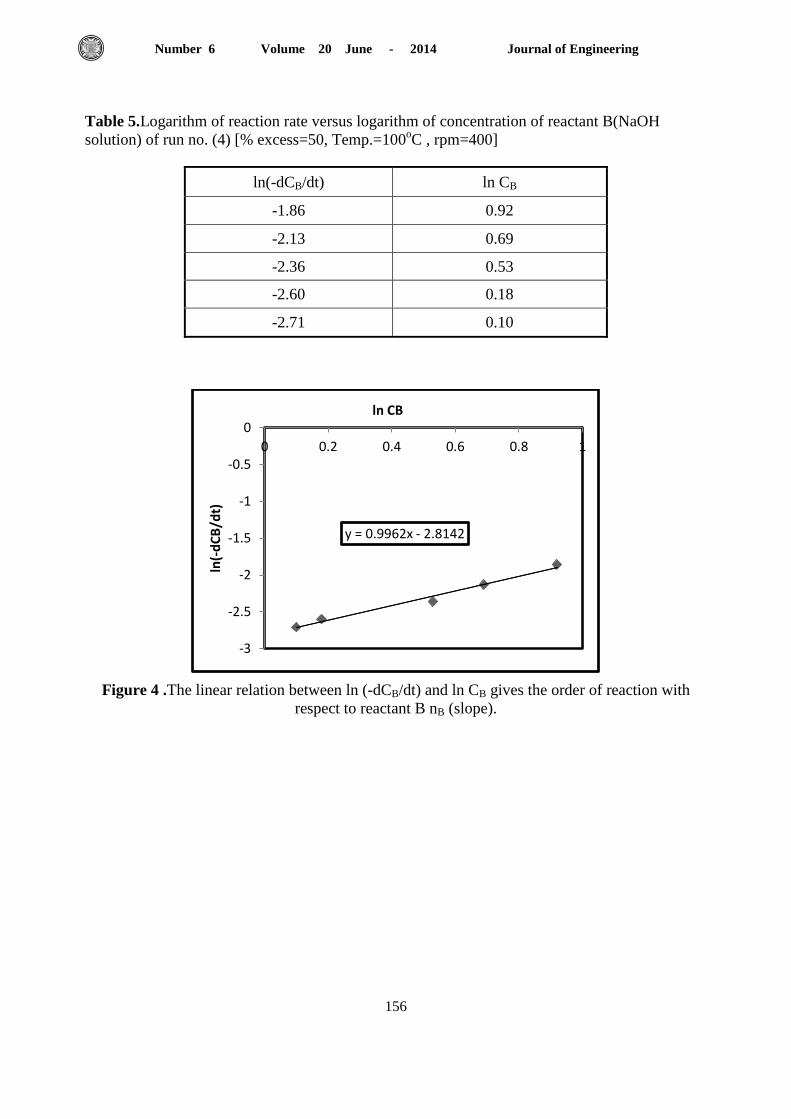
concentration .Table 5 shows the variation of ln (-dCB/dt) with ln CB .Fig. 4 traces ln(-dCB/dt)
against lnCB. The relation is linear with slope equals nB. Again the value of nB is about 1 .
Experimental results showed that the order of reaction for each reactant nA , nB ≈1 , so the
overall order of reaction was second order . This result agreed with the fact that most of
esterification reactions are second order .Saponification reaction is an example of these
reactions. It was also noticed that the values of the refractive index RI decreases as the
conversion increases. After approximately 50% conversion, the values of RI increases again. To
explain this behavior, the relationship between RI and the density must be noticed. RI is a
physical property that inversely proportional to density. As NaOH solution was added to the
fat , the density of the fat is increased (RI is decreased).When the soap was produced the density
again decreased (RI is increased). The concentration - time data were substituted in the
mathematical model using conversions instead of concentrations.
Fig. 5 shows the relation between the expression ln D (*
+
) and time.
The relation is linear with slope equal kcalc . The calculated values of the reaction-rate
constant were somewhat deviate from the experimental ones. It was noticed that k values
obtained from the mathematical model were overestimated when the percentage excess of NaOH
solution were too low or too high. At medium levels of % excess of NaOH solution the
calculated values of k were underestimated. This can be discussed as follows: at low values of
% excess of NaOH solution , the reaction rate decreases because of the decreased concentration
of NaOH giving reduced values of reaction –rate constant kexp .This makes the calculated
values be higher . High values of % excess of NaOH solution reduce the number of reacting
molecules , as a result of hindering their movement , causing reduced values of kexp again. This
also makes kcalc be higher. The average error between experimental and calculated values of k
was calculated by the following equation:
Av. Error =∑ (
)
Where N is the number of runs . The average error was approximately 20%. This figure may be
accepted because the experimental errors were thought to be lumped within it . Fortunately; the
underestimated values of kcalc resulted from the mathematical model allow safe design and
simulation calculations.
Fig. 6 shows the effect of increasing the percentage excess of NaOH solution on reaction – rate
constants ( kexp and kcalc ) . The calculated values trace lower curve than experimental ones
except at approximately 100% excess . Evidently, increasing NaOH solution enhances the rate
of reaction because it suppresses the backward reaction according to Le Chatelier rule .
Journal of Engineering Volume 20 June - 2014 Number 6
151
The effect of temperature is presented in Fig. 7 . The natural logarithms of k is plotted against
the reciprocal of the absolute temperature . This figure shows a linear relation between ln k and
1/T as it was predicted by Arrhenius.
(
)
where the slope (
) represents the negative value of the activation energy divided by the
universal perfect-gas law constant . The intercept of the plot ( ln Ao ) determines the frequency
factor . The values of the activation energy and the frequency factor were found to be as follows:
Ea exp = -20.44 J.mol-1
and
Aoexp =9.8358×10
-5 l.mol
-1.min
-1
While Ea calc = -4.67 J.mol-1
and
Aocalc = 6.2×10
-3 l.mol
-1.min
-1
The experimental and calculated values are different by an order of magnitude which is
attributed to the experimental error .The value of the activation energy is rather low. This
indicates that the reaction is fast since the activation energy represents the energy barrier that
molecules must gain to reach the final product .
Fig. 8 shows the effect of stirring speed upon the rate constants. It is clear that the effect of
stirring is considerable on the reaction rate. This leads to the conclusion that the reaction is mass
- transfer controlled. This viewpoint agrees well with the notation of underestimated values of
kexp at high values of percentage excess of NaOH solution. Therefore; increasing stirring speed
enhances the reaction rate. However, there is a constraint limited by the soap - froth rising .If the
values of kexp were normalized (i.e. making the total increase in kexp corresponds 100% ) as
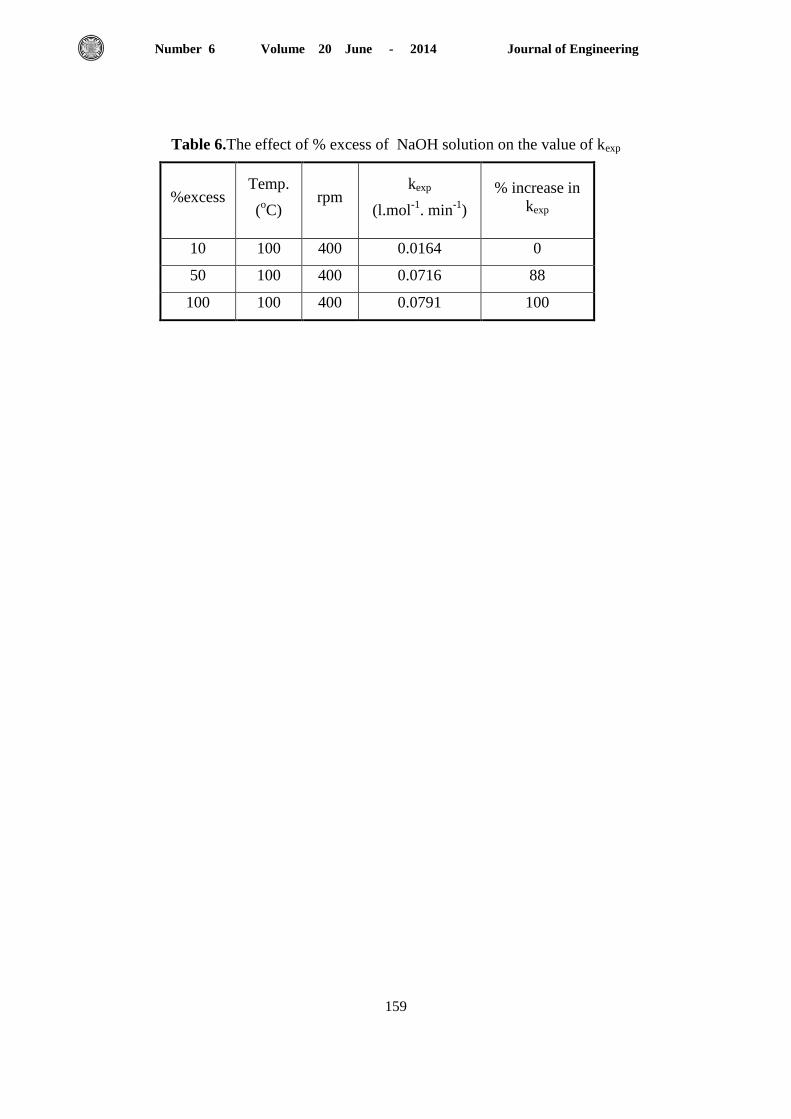
shown in Table 6. This was done for the runs that have only the excess ratio varied , i.e. the
temperature and stirring speed were fixed . The normalization shows that percentage excess over
50% has less effect on the value of kexp than the percentage excess below 50%. This may be
attributed to the hindrance of reacting molecules by the NaOH molecules which confirms the
mass- transfer control on the reaction.
5. CONCLUSIONS
- The % excess of NaOH solution plays an important role in the saponification reaction. 88% of
increased value of the rate constant k can be achieved at 50% excess . Adding more solution of
NaOH seems to be unnecessary and costing .
- The saponification reaction is mass – transfer controlled and stirring speed appears as an
effective parameter , although excessive stirring may raise the froth of the soap .
- The derived mathematical model is adequately described the system especially at moderate
values of % excess of NaOH solution .
- The mathematical model can be applied to scale – up the laboratory batch reactor to a large –
scale continuously stirred tank reactor (CSTR).
Journal of Engineering Volume 20 June - 2014 Number 6
152
REFERENCES
- Appleton, H.A.,2007, The Handbook of Soap Manufacture , Scott , Greenwood & Son ,
London.
- Chemical Engineering Laboratory,2013, Saponification of Isopropyl Acetate with Sodium
Hydroxide, (Internet Document).
- Frost, A. A., and Schwemer, W. C.,1952, The Kinetics of Competitive Consecutive Second
Order Reactions:The saponification of Ethyl Adipate and of EthylSuccinate, Journal of
American Chemical Society, Vol.74, No.5, PP. 1268-1273.
-Laboratory Report, 2012 , The Kinetics of the Saponification of Ethylacetate , (Internet
Document).
- Newberger , M. R., and Kadlec , R. H.,1973, Kinetics of the Saponification of Diethyl Adipate,
American Institute of Chemical Engineers Journal ,Vol.19, No.5 , PP. 1272 - 1275 .
- Smith, J. M., 1981, Chemical Engineering Kinetics , 3rd
ed. , Mc-Graw Hill.
- Vicente,G. , Martinez, M. , and Aracil, J., 2006, Kinetics of Brassica Carinata Oil
Methanolysis , Energy Fuels ,Vol. 20,No.4 , PP. 1722 – 1726.
- Vogel, A.I.,1961, Quantitative Inorganic Analysis , 3rd
ed. , Longmans.
NOMENCLATURE
A limiting reactant (fat)
Ao frequency factor (l . mol
-1 . min
-1)
B excess reactant (NaOH solution)
C concentration (mol . l-1
)
D expression ( *
+
)
E arbitrary constant
Ea activation energy (J . mol-1
)
F arbitrary constant
k forward reaction-rate constant ( l . mol-1
. min-1
)
k' backward reaction-rate constant(l . mol-1
. min-1
)
N number of runs
n order of reaction
R product 1 (soap)
Rg universal gas-law constant ( 8.314 J. mol-1
. K-1
)
RI refractive index
r reaction rate (mol . l-1
. min-1
)
Journal of Engineering Volume 20 June - 2014 Number 6
153
rpm revolution per minute
S product 2 (glycerol)
T absolute temperature (K)
t time (min)
x fractional conversion (-)
Subscripts
o initial ( CAo initial conc. of reactant A)
Table 1. Concentration – time data of reactant A (fat) with refractive indices and conversions for
run no.(4) [%excess=50 , Temp.=100oC , rpm=400].
Figure 1.Concentration-time profile with respect to
reactant A (fat) of run no.(4) [% excess=50 , Temp.=100oC , rpm=400].
0
1
0 10 20 30 40 50
Co
nc.
of
fat
, CA
(m
ol/
l)
time , t (min
t
(min)
CA
(mol . l-1
)
RI
(-)
xA
(-)
CB
(mol . l-1
)
0 0.3119 1.468 0 2.844
10 0.0815 1.42 0.7387 2.1528
20 0.0789 1.412 0.7471 2.1449
30 0.0577 1.428 0.8151 2.0813
35 0.0471 1.472 0.8490 2.0496
40 0.0259 1.52 0.917 1.986
Journal of Engineering Volume 20 June - 2014 Number 6
154
Table 2.Rate of reaction with respect to reactant A(slope) versus the concentration of A of run
no.(4) [% excess=50 , Temp.=100oC , rpm=400].
Slope (dCA/dt) CA
-0.0115 0.22
- 0.0086 0.20
-0.0063 0.16
-0.0043 0.11
Table 3.Logarithm of reaction rate versus logarithm of concentration of reactant A (fat) of run
no.(4) [% excess=50 , Temp.=100oC , rpm=400].
ln(- dCA/dt) ln CA
-4.4654 -1.5141
-4.7560 -1.6094
-5.0672 -1.8326
-5.4491 -2.2073
Figure 2.The linear relation between ln(-dCA/dt) and ln CA gives the order of reaction with
respect to reactant A. nA(slope) and ln kexp (intercept) of run no. (4) [% excess=50 ,
Temp.=100oC, rpm=400].
y = 1.342x - 2.5311
-6
-5
-4
-3
-2
-1
0-2.5 -2 -1.5 -1 -0.5 0
ln(-
dC
A/d
t)
lnCA
Journal of Engineering Volume 20 June - 2014 Number 6
155
Figure 3.Concentration-time profile with respect to reactant B (NaOH solution) of run no. (4)
[% excess=50 , Temp.=100oC , rpm=400].
Table 4. Rate of reaction with respect to reactant B(slope) versus the concentration of B of run
no.(4) [% excess=50 , Temp.=100oC , rpm=400].
Slope ( dCB / dt) CB
-0.1556 2.5
-0.1183 2.0
-0.0942 1.7
-0.0740 1.2
-0.0663 1.1
0
0.5
1
1.5
2
2.5
3
0 10 20 30 40 50
NaO
H C
on
c. ,
CB
(m
ol/
l)
time , t (min)
Journal of Engineering Volume 20 June - 2014 Number 6
156
Table 5.Logarithm of reaction rate versus logarithm of concentration of reactant B(NaOH
solution) of run no. (4) [% excess=50, Temp.=100oC , rpm=400]
Figure 4 .The linear relation between ln (-dCB/dt) and ln CB gives the order of reaction with
respect to reactant B nB (slope).
y = 0.9962x - 2.8142
-3
-2.5
-2
-1.5
-1
-0.5
0
0 0.2 0.4 0.6 0.8 1
ln(-
dC
B/d
t)
ln CB
ln(-dCB/dt) ln CB
-1.86 0.92
-2.13 0.69
-2.36 0.53
-2.60 0.18
-2.71 0.10

Journal of Engineering Volume 20 June - 2014 Number 6
157
Figure 5.The proposed model shows linearity between ln D (*
+
) and time
with CAo and CBo of run no. (4) the slope determines kcalc.
Figure 6.The effect of % excess of NaOH solution on the experimental and calculated reaction -
rate constants kexp and kcalc.
y = 0.0221x + 0.6511
0
0.2
0.4
0.6
0.8
1
1.2
1.4
1.6
1.8
0 10 20 30 40 50
ln
D
time , t (min
0
0.02
0.04
0.06
0.08
0.1
0.12
0.14
0 50 100 150
reac
tio
n r
ate
co
nst
ant
k ,
l.m
ol-
1.m
in-1
percentage excess of NaOH solution
kexp
kcalc
Journal of Engineering Volume 20 June - 2014 Number 6
158
Figure 7.Plot of Arrhenius equation for saponification of mixed olein and stearin with NaOH
solution .The slope gives(-Ea/Rg) and the intercept gives ln Ao.
Figure 8.The effect of stirring speed on the experimental and calculated reaction- rate constants.
y = 2.459x - 9.2269
y = 0.562x - 5.0899 -4.5
-4
-3.5
-3
-2.5
-2
-1.5
-1
-0.5
0
2.3 2.4 2.5 2.6 2.7 2.8
ln k
1/T x1000 , K-1
ln kexp
ln kcalc
0
0.02
0.04
0.06
0.08
0.1
0.12
0 500 1000 1500
rate
co
nst
ant
k ,
l.m
ol-
1.m
in-1
rpm
kexp
kcalc
Journal of Engineering Volume 20 June - 2014 Number 6
159
Table 6.The effect of % excess of NaOH solution on the value of kexp
%excess Temp.
(oC)
rpm kexp
(l.mol-1
. min-1
)
% increase in
kexp
10 100 400 0.0164 0
50 100 400 0.0716 88
100 100 400 0.0791 100


