Embed Size (px)
Citation preview
Karnataka Soaps & Detergents Ltd. (A Govt . of Karnataka Undertaking)
NO. KSDL/HRD/59[C]-A/2017-18/ Date: 10/04/2018
This is to verify that MS. Aalekhya RS, MBA student, USN: 1AZ16MBA01 of Acharya Institute Of Technology, Acharya Dr. Sarvapalli Radhakrishna Road, Hesaraghatta Main Road,Bengaluru·560090. Affiliated to Visvesvaraya University, Belgaum, has done Project work on the "A Study On Material Management And Inventory Control "at Karnataka Soaps And Detergents Limited, Bengalur-560055, from 15·01 ·2018 to 10·04·2018.
During her Project work in the Organisation , We have found her Character & Conduct to
be good
We wish her success in Life and Career.
Karnataka Soaps &Detergents limited, Bangalore Pune Highway, Rajajinagar, Bengaluru, Karnataka 560055
Date: 25/05/2018
CERTIFICATE
This is to certify that Ms. Aalekhya RS bearing USN 1AZ16MBA01
is a bonafide student of Master of Business Administration course of the
Institute 2016-18 batch, affiliated to Visvesvaraya Technological University,
Belagavi. Project report on "A Study on Material Management and
Inventory Control at Karnataka Soap and Detergents Limited,
Bangalore" is prepared by her under the guidance of Prof. Mallika B K, in
partial fulfillment of the requirements for the award of the degree of Master of
Business Administration, Visvesvaraya Technological University, Belagavi,
Kamataka.
JpJ ~ ~
Signature of Internal Guide Signature of HOD
k Signature of Principal
PRINCIPAL J\CHARYA INSTITUTE OF TEL,m~OLOGY Soldevanahalli Bangalore-560 107
Acharya Dr. Sarvepalli Radhakrishnan Road, Soladevanahalli, Acharya P.O., Bangalore 560 107, Karnataka, India • W\NW.acharya.ac 111/a1t/ • Ph: +91-80-225 555 55 Extn. : 2102 • Fax: +91-80-237 002 42 • E-mail: principalait@acharya ac.111
ACKNOWLEDGEMENT
I would like to thank my people who have helped and supported me while doing my Project
report and work.There is not enough word to offer vote of thanks to Dr. Nijaguna G, Head of
the Department of MBA, AIT Bengaluru for his help in initiating the project report in
advance for the regular motivation, my guides Prof. Mallika B K faculty of MBA
Department, AIT Bengaluru and Mr.Rajiv Manager of Accounts- KARNATAKA SOAPS
AND DETERGENTS Ltd for their admirable help, suggestions and opinions on the
contribution during and after the project report period. I would also like to thank Mr.Krishna
Murthy HR at KS&DL for giving me the permission to carry my project work.
Place: Bengaluru Aalekhya R S
Date: USN: 1AZ16MBA01
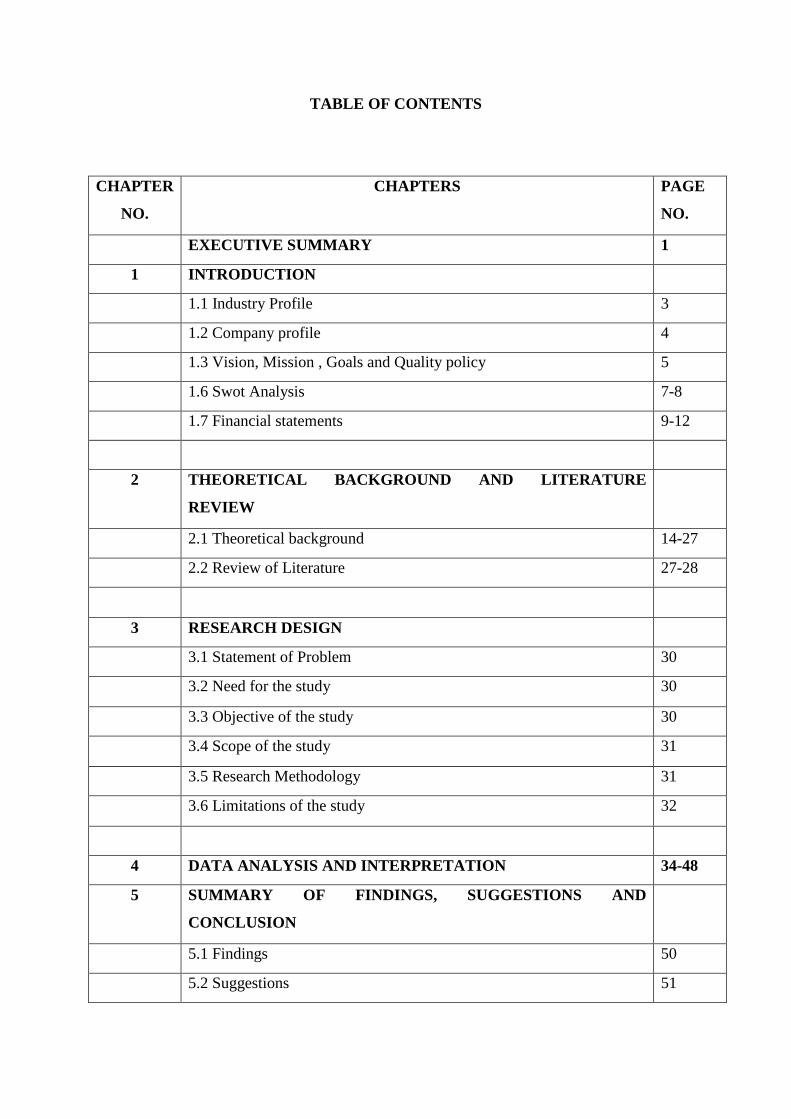
TABLE OF CONTENTS
CHAPTER
NO.
CHAPTERS PAGE
NO.
EXECUTIVE SUMMARY 1
1 INTRODUCTION
1.1 Industry Profile 3
1.2 Company profile 4
1.3 Vision, Mission , Goals and Quality policy 5
1.6 Swot Analysis 7-8
1.7 Financial statements 9-12
2 THEORETICAL BACKGROUND AND LITERATURE
REVIEW
2.1 Theoretical background 14-27
2.2 Review of Literature 27-28
3 RESEARCH DESIGN
3.1 Statement of Problem 30
3.2 Need for the study 30
3.3 Objective of the study 30
3.4 Scope of the study 31
3.5 Research Methodology 31
3.6 Limitations of the study 32
4 DATA ANALYSIS AND INTERPRETATION 34-48
5 SUMMARY OF FINDINGS, SUGGESTIONS AND
CONCLUSION
5.1 Findings 50
5.2 Suggestions 51
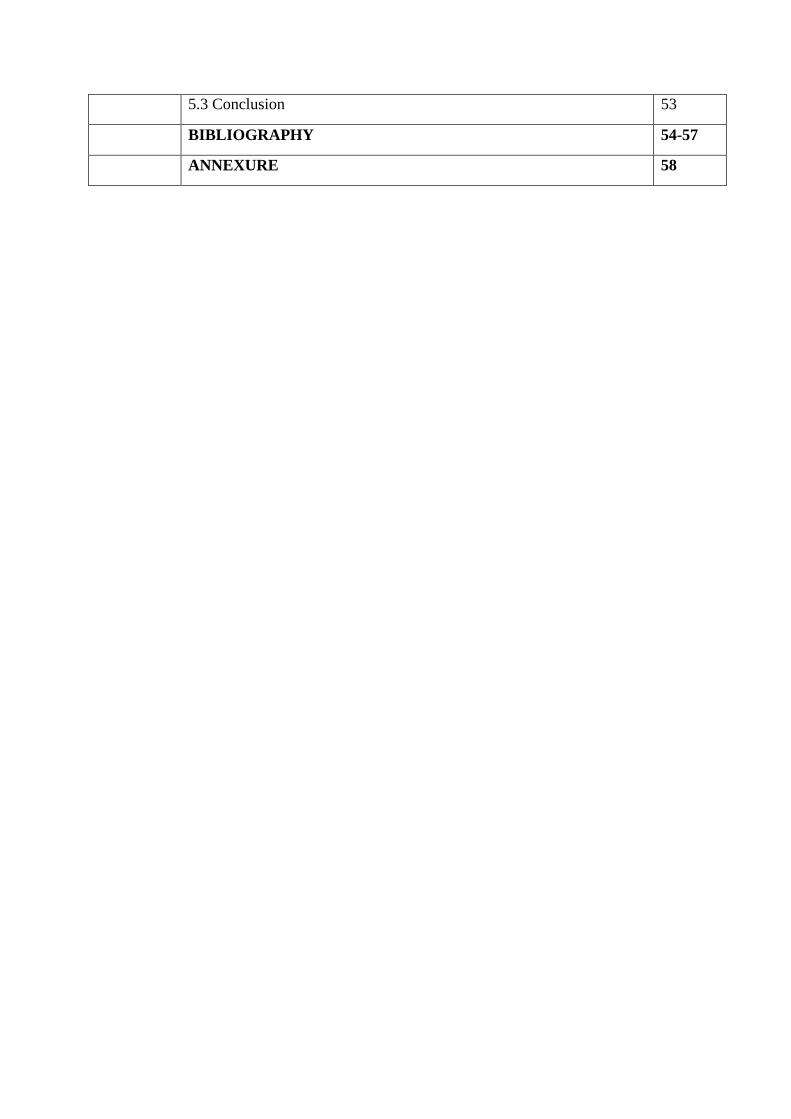
5.3 Conclusion 53
BIBLIOGRAPHY 54-57
ANNEXURE 58
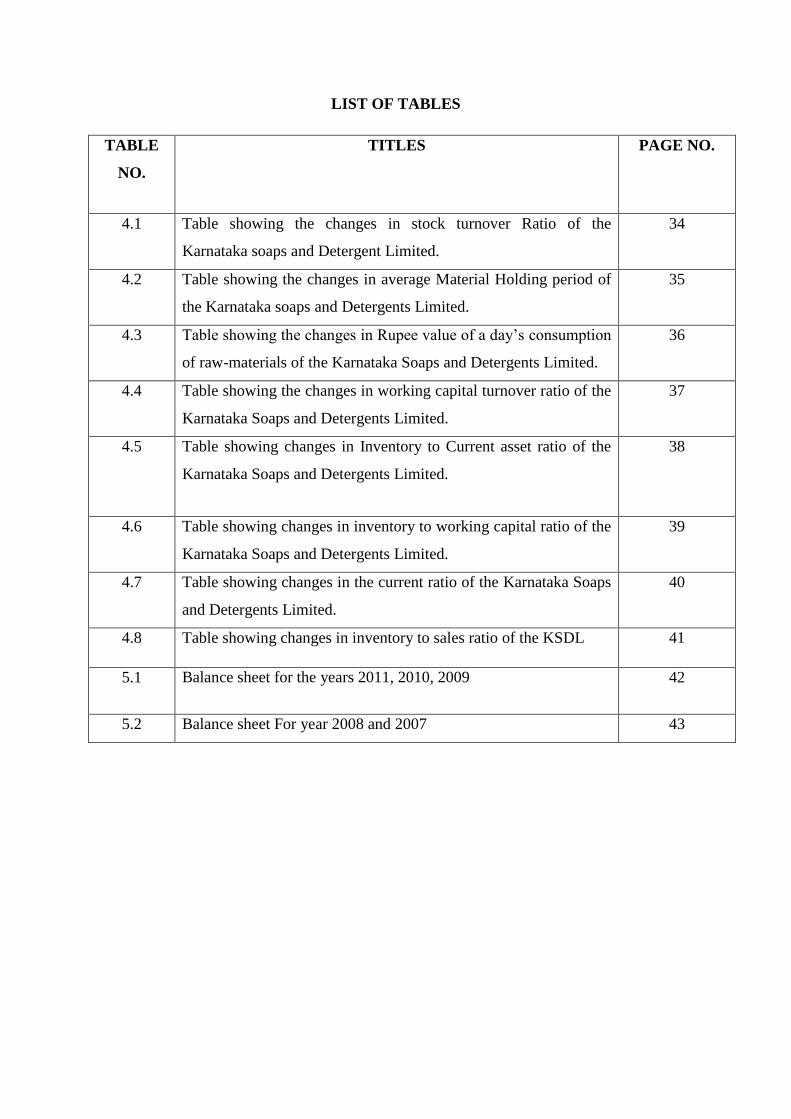
LIST OF TABLES
TABLE
NO.
TITLES PAGE NO.
4.1 Table showing the changes in stock turnover Ratio of the
Karnataka soaps and Detergent Limited.
34
4.2 Table showing the changes in average Material Holding period of
the Karnataka soaps and Detergents Limited.
35
4.3 Table showing the changes in Rupee value of a day’s consumption
of raw-materials of the Karnataka Soaps and Detergents Limited.
36
4.4 Table showing the changes in working capital turnover ratio of the
Karnataka Soaps and Detergents Limited.
37
4.5 Table showing changes in Inventory to Current asset ratio of the
Karnataka Soaps and Detergents Limited.
38
4.6 Table showing changes in inventory to working capital ratio of the
Karnataka Soaps and Detergents Limited.
39
4.7 Table showing changes in the current ratio of the Karnataka Soaps
and Detergents Limited.
40
4.8 Table showing changes in inventory to sales ratio of the KSDL 41
5.1 Balance sheet for the years 2011, 2010, 2009
42
5.2 Balance sheet For year 2008 and 2007 43
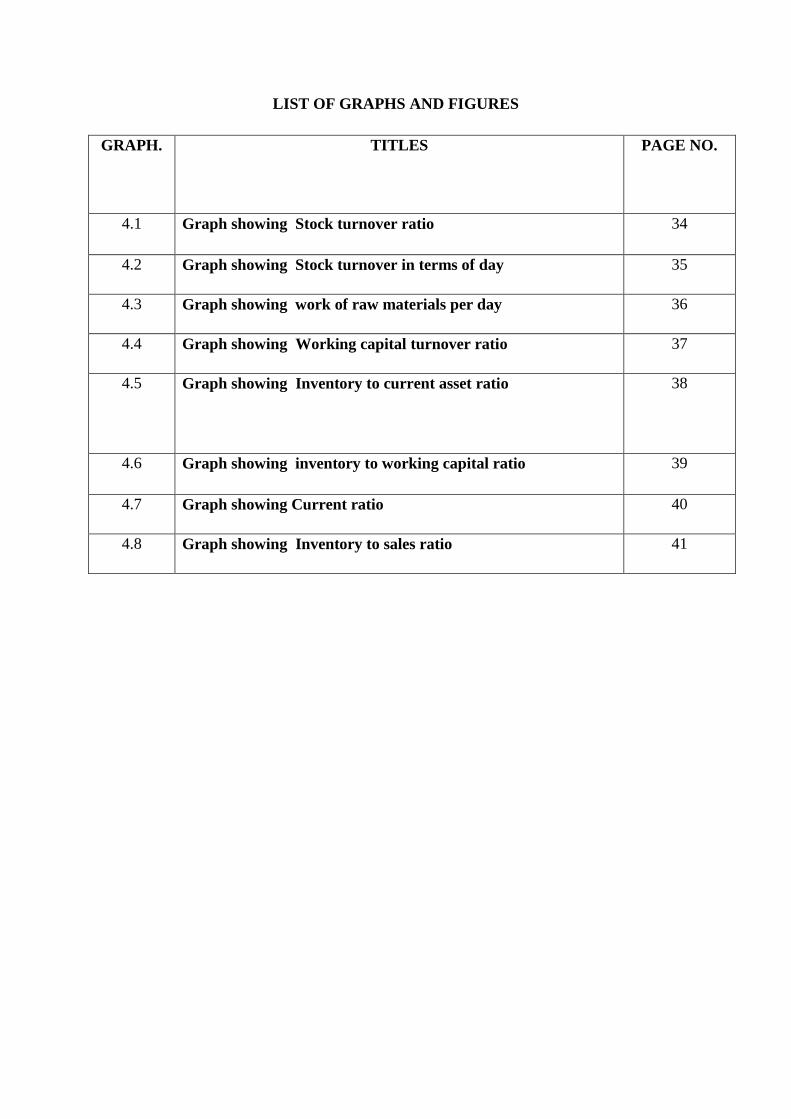
LIST OF GRAPHS AND FIGURES
GRAPH. TITLES PAGE NO.
4.1 Graph showing Stock turnover ratio 34
4.2 Graph showing Stock turnover in terms of day 35
4.3 Graph showing work of raw materials per day 36
4.4 Graph showing Working capital turnover ratio 37
4.5 Graph showing Inventory to current asset ratio 38
4.6 Graph showing inventory to working capital ratio 39
4.7 Graph showing Current ratio 40
4.8 Graph showing Inventory to sales ratio 41
1
EXECUTIVE SUMMARY
This project work was done in Karnataka Soaps and Detergents limited Bengaluru. The topic
which was selected is to do a project report work on “ A Study on Material Management and
Inventory Control at KS&DL”
India is rich in natural resources especially huge forest area containing vast amount of
untapped Sandalwood trees. His majesty of Mysore took the initiative to utilize the natural
cleansing nature and a beautiful aroma of sandalwood to be used as daily cleansing and
beauty products .Thus KS&DL was established in 1916.Now KS&DL is one of the leading
soap manufacturers whose product are also of export quality and are giving a tuff competition
to the present private entities which manugacture cleansing product.
This report aims to analyze the various levels of inventory control and material management
in KS&DL .And also to study the influence of inventory management techniques on the
financial position of KS&DL.
The study was conducted for short period of 3 months where the data related to inventory
and material management was analyzed through effective Analytical tools i, e Here the
company uses ABC analysis and FNS technology to control the inventory ,Hence after a
careful analysis .
The arrived conclusion is this , For better financial performance of KS&DL it should take
the necessary measures to beat certain deficiencies. This can be achieved by reducing costs,
effective labor time, proper use of funds and effective material management.
2
CHAPTER 1
INTRODUCTION
3
INDUSTRY PROFILE:-
Soap is one of the essential part of life in today's world. Since it is a non-powerful buyer
product, it has a large market. The entire cleaning industry is undergoing changes for a
number of reasons, such as the increase in raw material costs due to government relations and
vitality issues. Constantly changing innovations and the constant desire of individuals and
associations to create better products at more realistic speeds are also driving dynamic
progress. More cleaner manufacturers are trying to capture the guideline of the entire industry
by showing and keeping enough items. India's cleaning business faces vicious competition,
and multinational companies overwhelm the market. Especially during 1992-1993, they also
face extreme risks from a dynamic and ambitious new channel. We once again consider the
historical background of detergents and cleaners. Almost 2,000 years ago, humans thought
about detergents in the 1970s. Whenever Mr. Gao accidentally discovered the detergent,
when the meat was flowing in the fiery haze. This kind of bulging like items is a detergent,
and has the characteristics of foaming and cleaning. In 1193 the main business group of A.D.
cleaners was manufactured and promoted in London by M/s Bristol Cleaner, and since then.
The main patent for making cleaners was taken in London. The use of detergents in the world
in 1886 is said to be 21,000 tons.
HISTORY OF THE SOAP
Started manufacturing facial cleansers in North America. Some U.S. organizations have had a
200-year history. In middle age cleaners are manufactured in different places in Italy, France,
the United Kingdom and different countries. France finally set up popular and numerous
small production lines. In India, the main detergent industry was established by the
Northwest Cleaners Organization after opening Swadeshi in Meerat in 1897. Since 1905,
more manufacturing plants have been established.
THE INDIAN SOAP INDUSTRY PICTURE:
The Indian cleanser industry has for quite some time been overwhelmed by handfull of
organizations, for example,
1. Hindustan levers restricted.
2. Goodbye oil factories (assumed control by HUL)
3. Godrej cleansers private restricted.
The Indian cleanser industry kept on thriving extremely well until 1967-68, yet started to
stagnate and soon it began to recoup and encountered a short rise in 1974. This expansion
sought after can be ascribed due to;
Development of populace.
Pay and utilization increment.
4
Increment in urbanization.
Development in level of individual cleanliness.
Cleanser produce has 2 characterizations, composed and sloppy areas. KSDL goes under
sorted out area
PRESENT STATUS:
Market outlook:
India is the perfect market for cleaning products. The use of powder and bar per capita of the
national cleaners was kept at 1.6 kg and the amount of detergent used was 543 g. Hindustan’s
liver stands above the cleansing business and it provides the smallest part of Indian
settlements throughout the entire cleansing business.
In India, the annual amount of cleaners exhibited was 7.4 trillion carats, and the rate of
decline was 4%. Our expectation is to increase the value of the rupee and its potential is high,
on the grounds that the Indian cleaners display is false, and that incredibly unbelievable
emotions are distributed according to the value of income, as well as the range of inner
feelings laid out within the out structure.
1.3 COMPANY PROFILE:
India is a fertile land known for its woods. Ivory, silk, shoes; precious jewelry is a mystery
for centuries. The most fascinating aroma in the world came with their laces and their
colorful spells. The richest sandalwood assets in the world come from a remote stretch of
remote forest and arrive in Karnataka, South India.
Inspired by Her Majesty Queen Maharana, later Jayachamarajendra Wodeyar began
exchanging sandalwood logs and sending them to Europe and new targets, but with the
beginning of the First World War India faced with sandalwood problems. Serious crisis
5
VISION AND MISSION OF THE ORGANIZATION
VISION STATEMENT:
Keeping pace with globalization, global models and countries in the use of innovation
strategies in all parts of administrative management
Making accessible innovation item and administrations and no more moderate cost to
the general population everywhere, with regards to the approach of a welfare state.
Making full scale endeavors to accomplish unfathomable benefits.
Most critically to acquire the priceless remote trade, both to the state and to the
nation.
MISSION STATEMENT:
To be an independent organisation.
To maintain brand loyalness.
To expand upon the notoriety of Mysore shoe cleanser in view of unadulterated shoe
oil.
QUALITY POLICY
AN ISO-9002 COMPANY
With more than 80 years of flawless traditions, KS and DL are centered on the charisma of
the customer, through a comprehensive quality organization and by considering the diligent
changes of all experts. KS&DL has been confirmed by ISO 9002.
In order to improve the quality of the organizational structure and to provide impetus for total
quality management during the use of chemicals and chemicals, the organization decided to
acquire ISO-9002 by the end of March 1999. The mobile configuration was mapped in a
similar manner and roadblocks were set up for this purpose. The mission statement was
published in mid-October 1998.
6
COMPETITORS
Hindhustan UniLever Ltd.,
Godrej Private Ltd.,
ITC Limited,.
Nirma Soaps Private Ltd.,
.Jyothi Laboratories.
FUTURE GROWTH AND PROSPECTUS:
• New high-performance laundry detergent sold in bulk using bulk packaging.
• Get market leadership.
• Introduce new trade plans to increase sales.
• Actively promote and promote as part of promotional activities.
Reduce distribution costs.
• Reduce costs in all areas.
• Make immediate decisions in some procurement activities.
• Promptly launch and implement market-driven decisions.
• Ensure effective internal controls.
7
SWOT ANALYSIS:-
STRENGTHS
An ISO 14001 organization, which resolves to save the indigenous habitat in the generation
of its quality items as per the general inclination of its clients.
• The industrial facility is situated in the core of the city and has all framework offices.
They have brisk development of crude materials and completed items. Because of its
closeness, residence development of men and material are simple.
• A great dealership arrange, which guarantees that the items achieve each circle.
• A next to no opposition for its real items shoe cleanser.
• An ISO 9002 guaranteed organization has its own image picture.
• Diversified item run stays with the stable.
• Abundant accessibility of crude materials.
WEAKNES
Slow development rate 6.2 developments more than 40 years against the result80%.
• High arranged reason because of extreme Labor drive.
• Low turn over bringing about low benefits.
• Defective showcasing methodology needs powerful publicizing and
reputation.
• Needs refreshing with times as far as plant and hardware.
8
• R&D isn't viable in as much as it has not made any achievement in new
items.
• The substantial extent of the objective zone is upper white collar class and
privileged individuals, it has not very many offer to bring down working
class.
• It has just 8% of the aggregate cleanser piece of the overall industry.
• Due to absence of direct deals, obligations with numerous merchants
turning awful.
• Unskilled work combined with abundance work hampers gainfulness.
OPPORTUNITIES
1.The toilet cleanser and the cleansers showcase is an over extending industry and a
noteworthy organization likes KS& DL with its assembling skill can make major decisions
on the off chance that it achieves crest producing limit.
2.Good fare market should tap outside market overwhelmingly.
3.At present it has good crude material sources to upgrade creation.
Threats
1. Competition from other worldwide pioneers like hul.
2. Government obstruction may lessen development potential.
3. As the organization relies upon woods for its fundamental crude materials makes the
organization to discover concoction contrasting option to sandalwood.
4. To ensure the monetary enthusiasm of the organization.
9
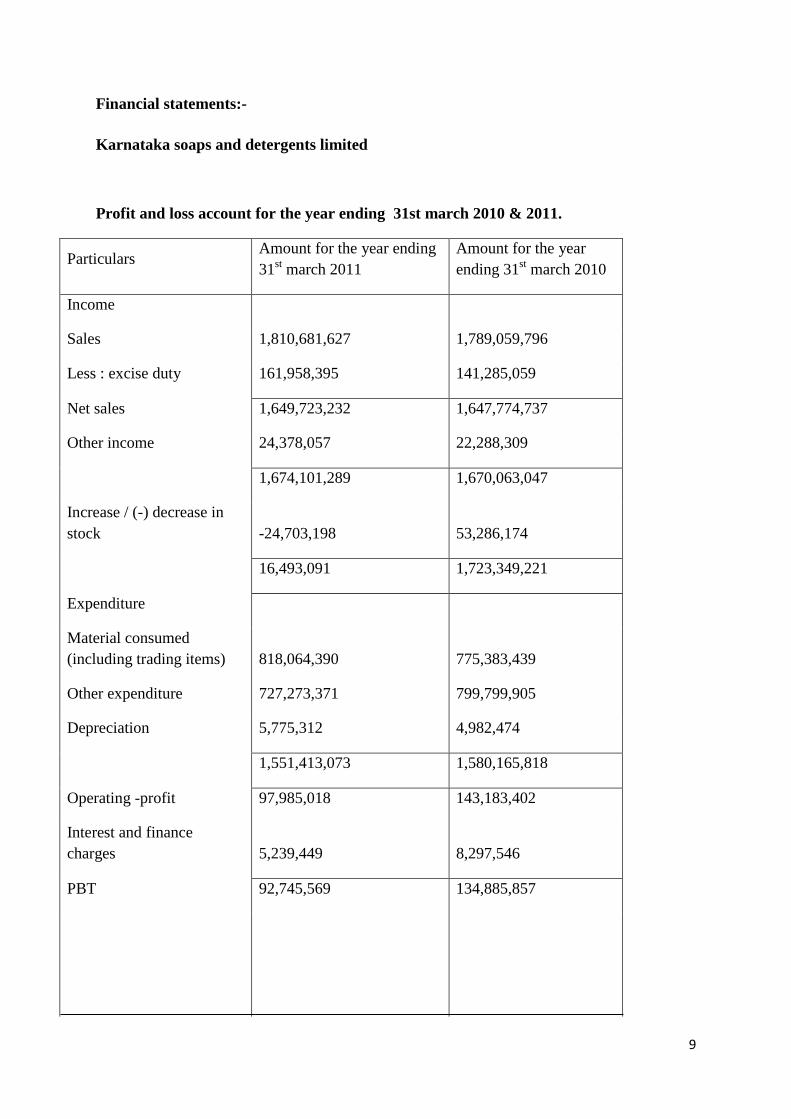
Financial statements:-
Karnataka soaps and detergents limited
Profit and loss account for the year ending 31st march 2010 & 2011.
Particulars Amount for the year ending
31st march 2011
Amount for the year
ending 31st march 2010
Income
Sales 1,810,681,627 1,789,059,796
Less : excise duty 161,958,395 141,285,059
Net sales 1,649,723,232 1,647,774,737
Other income 24,378,057 22,288,309
1,674,101,289 1,670,063,047
Increase / (-) decrease in
stock -24,703,198 53,286,174
16,493,091 1,723,349,221
Expenditure
Material consumed
(including trading items) 818,064,390 775,383,439
Other expenditure 727,273,371 799,799,905
Depreciation 5,775,312 4,982,474
1,551,413,073 1,580,165,818
Operating -profit 97,985,018 143,183,402
Interest and finance
charges 5,239,449 8,297,546
PBT 92,745,569 134,885,857
10
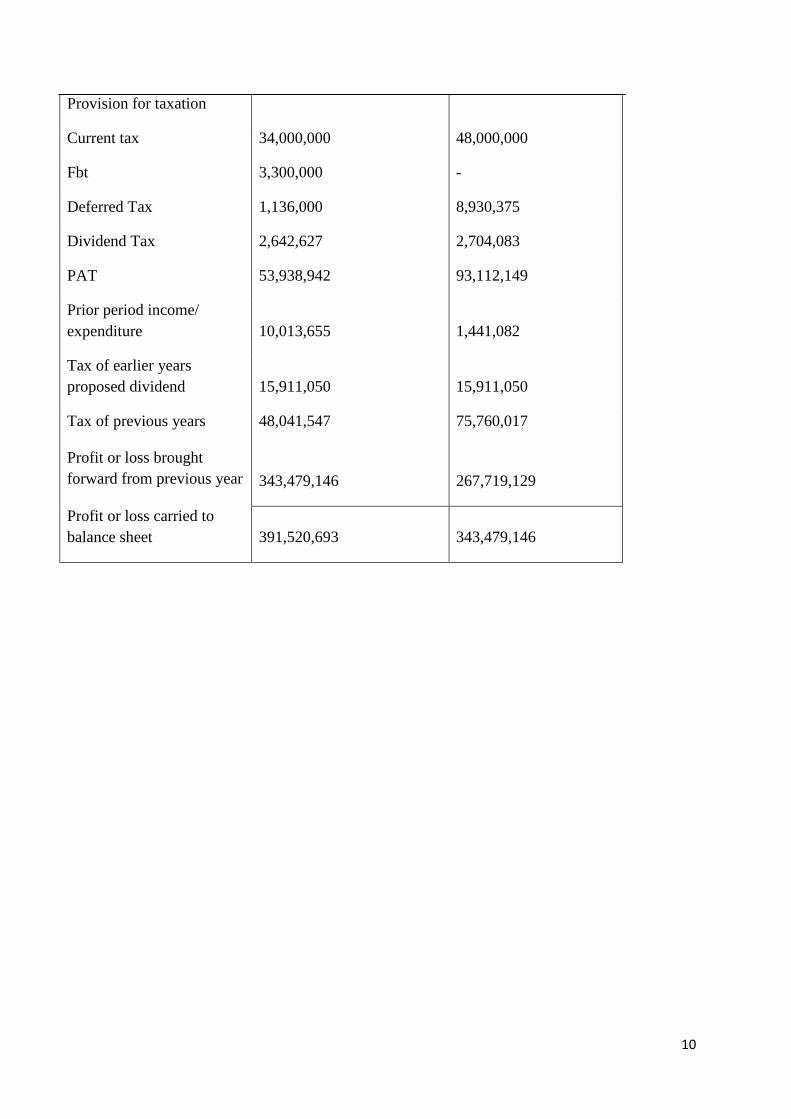
Provision for taxation
Current tax 34,000,000 48,000,000
Fbt 3,300,000 -
Deferred Tax 1,136,000 8,930,375
Dividend Tax 2,642,627 2,704,083
PAT 53,938,942 93,112,149
Prior period income/
expenditure 10,013,655 1,441,082
Tax of earlier years
proposed dividend 15,911,050 15,911,050
Tax of previous years 48,041,547 75,760,017
Profit or loss brought
forward from previous year 343,479,146 267,719,129
Profit or loss carried to
balance sheet 391,520,693 343,479,146
11
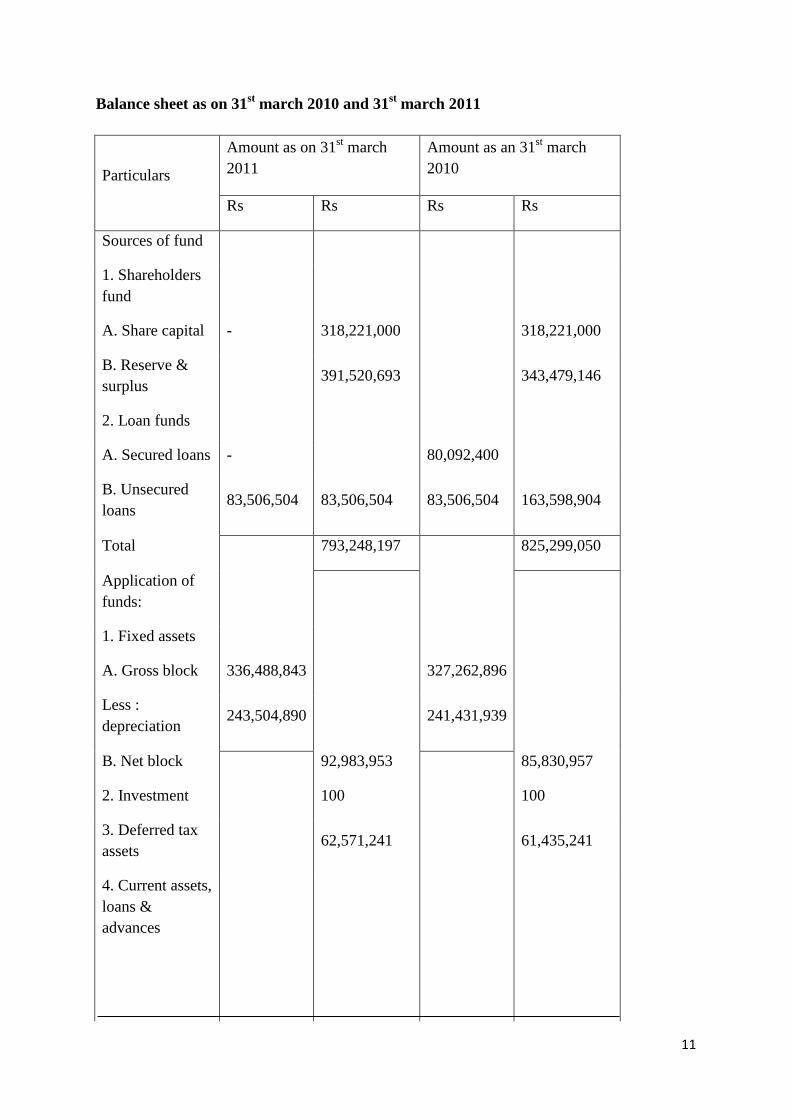
Balance sheet as on 31st march 2010 and 31
st march 2011
Particulars
Amount as on 31st march
2011
Amount as an 31st march
2010
Rs Rs Rs Rs
Sources of fund
1. Shareholders
fund
A. Share capital - 318,221,000 318,221,000
B. Reserve &
surplus 391,520,693 343,479,146
2. Loan funds
A. Secured loans - 80,092,400
B. Unsecured
loans 83,506,504 83,506,504 83,506,504 163,598,904
Total 793,248,197 825,299,050
Application of
funds:
1. Fixed assets
A. Gross block 336,488,843 327,262,896
Less :
depreciation 243,504,890 241,431,939
B. Net block 92,983,953 85,830,957
2. Investment 100 100
3. Deferred tax
assets 62,571,241 61,435,241
4. Current assets,
loans &
advances
12
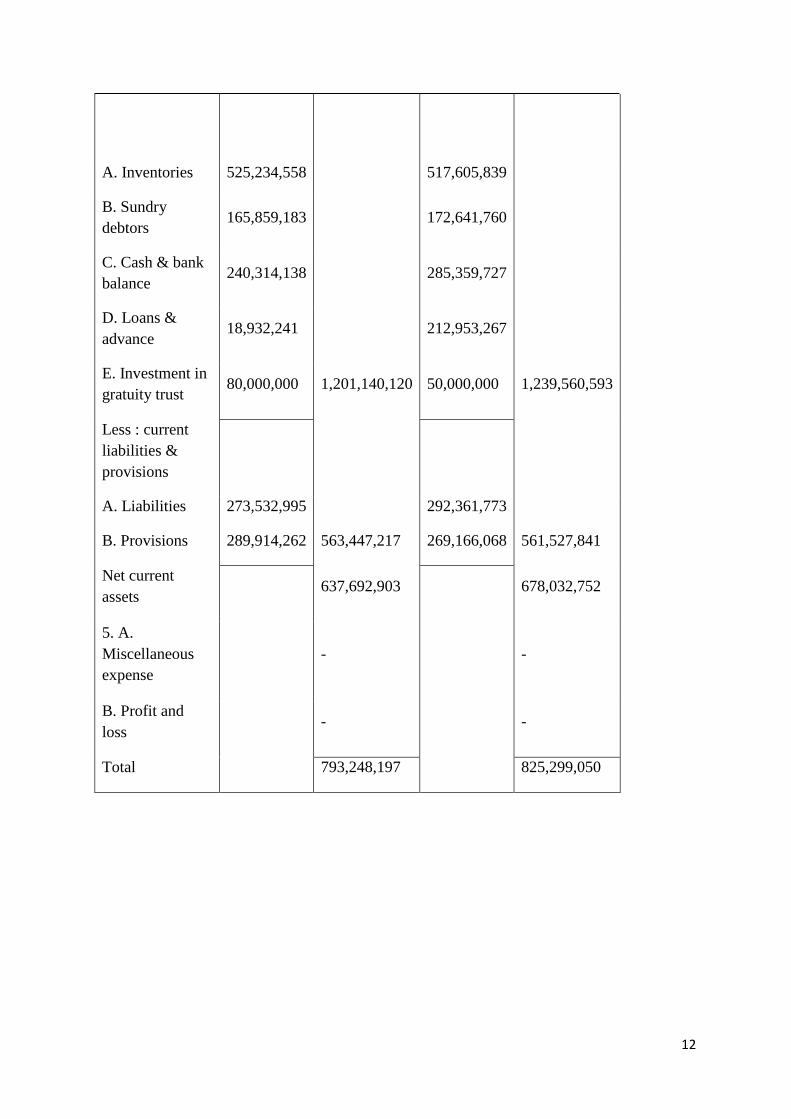
A. Inventories 525,234,558 517,605,839
B. Sundry
debtors 165,859,183 172,641,760
C. Cash & bank
balance 240,314,138 285,359,727
D. Loans &
advance 18,932,241 212,953,267
E. Investment in
gratuity trust 80,000,000 1,201,140,120 50,000,000 1,239,560,593
Less : current
liabilities &
provisions
A. Liabilities 273,532,995 292,361,773
B. Provisions 289,914,262 563,447,217 269,166,068 561,527,841
Net current
assets 637,692,903 678,032,752
5. A.
Miscellaneous
expense
- -
B. Profit and
loss - -
Total 793,248,197 825,299,050
13
CHAPTER 2
THEORETICAL BACKGROUND AND LITERATURE
REVIEW
14
Introduction to Materials
As materials constitute an exceptionally noteworthy of aggregate cost of completed task in a
large portion of the assembling ventures. Thus, an appropriate chronicle and control over the
material expenses is basics. Material speaks to huge speculation of capital and a considerable
level of cost of creation. Hence, there exists on clear requirement for compelling material
administration in an association. Material administration considers both the hypothesis of
costing materials and inventories and machines of cost figurings and record keeping.
TYPES OF MATERIALS
A. Direct materials.
B. Indirect materials.
A. Direct materials: Direct materials are those materials, which can be recognized or
promptly followed with the cost target which might be a venture, a gathering of items a client
a request or an undertaking. An immediate material is equipped for being clearly connected
with the cost objective. Materials are delegated coordinate due to their significance as
opposed to physical conclusion is the final result. Coordinate materials have the
accompanying highlights.
B. Indirect materials: Indirect materials are material traceable to completed item.
Illustrations are oils, squander materials, blossoms, clothes, cleaning materials. At times the
cost of materials is hard to dole out in this way it is dealt with as circuitous materials.
INTRODUCTION TO MATERIAL MANAGEMENT
. Each material director should attempt to apply appropriate material arranging, obtaining,
taking care of, putting away, materials in order to accomplish the coveted goal of stock
holding costs. This has required proficient administration work which requests a capacity to
unite clashing but then interrelated capacities viz, materials arranging, obtaining, getting and
examination, stores, stock control, scrap and surplus transfer
15
Materials Management's scope:
1. Pay attention to getting ideas.
2. Storage control and storage management.
3. Material coordination, development control and care perspectives.
4. Get, supply, transport, process materials, and more.
5. Supply administration or coordinations administration.
6. All the interrelated exercises worried about materials.
FUNCTIONS OF MATERIAL MANAGEMENT
A. Material requirement planning:
B. Purchasing:
C. Receiving and inspection of materials:
D. Stores:
E. Materials handling:
D. Dispatch of finished products:
MATERIAL CONTROL IN KS &DL
Production planning and control:
Arrangement of items and materials required to be bought keeping in mind the end goal to
acknowledge connected creation projects or deals gauge endorsed by the best administration.
Control of stacking and different exercises to be completed simultaneously to keep away
from robberies underway.
16
Storage exercises:
Control of physical materials practicing control over materials in stock to counteract physical
crumbling of robbery and so on.
,Inventory planning and control:
Control over policies and procedures to regulate systematically the materials kept in stock.
External transport:
Control of proficient use of outside transport exercises. These exercises are worried about the
development of materials from providers to the fabricates and from the produces to clients.,
Internal transport and materials handling:
Control over the proficient utilization of materials transport and materials instruments. The
inner transport and material taking care of devices are utilized for development of materials
starting with one point then onto the next inside processing plant premises.
INTRODUCTION TO INVENTORY
Inventory is the largest existing resource in most organizations in India. Under normal
circumstances, the inventory of each penny cash resource in India's open restricted
organization is about 60. Due to the large scale of corporate inventories, it is necessary to
focus a large number of assets on these assets. In this way, it is completely basic, able to
supervise stocks proficiently and successfully, and has specific end goals that are far from
meaningless risks. A company that ignores inventory management will jeopardize its long-
term benefits and may eventually explode..
17
PROBLEMS OF INVENTORY:
Maintain a large number of raw materials inventory and the precise and smooth
production of work in progress and complete the continuous trading activities of the
products.
Maintain the basic benefits of inventory to increase revenue.
LEVEL OF INVENTORIES
Keeping up and insufficient level of inventories is additionally perilous. The results of under-
interest in inventories are (a) creation hold-ups and (b) inability to meet conveyance
responsibilities. A powerful stock administration ought to
Optimal records ought to be acquainted with control materials amid generation and
amounts made for stock.
The stockpiling of all materials ought to be very much arranged subject to sufficient
shields and supervision.
An proficient arrangement of inward review and interior check ought to be worked
with the goal that all exchanges including materials are checked by solid and
autonomous people.
There ought to be consistent answering to administration with respect to buys, issues
and supply of materials. Uncommon reports ought to be set up for old things,
deterioration, comes back to providers, strange misfortunes, and so forth.
18
TYPES OF INVENTORY
Inventories may be held for a variety of purposes, but general, there are five types of
inventories that an organization can use for serving these purpose. There are:
Development of inventories:
Movement of goods are additionally known travel inventory. Their reality possesses the way
that exchange time is engaged with exchanging generous measure of assets.
Cushion inventory:
cradle inventories are held to secure against the vulnerabilities of interest and supply. What's
more, association for the most part knows the normal interest for different things that it
needs..
Decoupling inventories:
the possibility of the decoupling inventories is to decouple, separate, diverse parts of the
creation framework. As we can watch effortlessly, extraordinary machines or gear and
individuals ordinarily work at various rates-some slower and some speedier.
Cycle inventories:
cycle inventories are held for the reason that buys are generally made in parts as opposed to
for the correct sums which might be required at a state of time. Obviously if all buys are
made precisely as and when the thing is required, there would be no cycle inventories.
19
INVENTORY COSTS
1.Purchase cost: This alludes to the ostensible cost of stock. It is the price tag for the things
that are purchased from outside sources, and the generation cost if the things are obtained
inside the association. This might be steady per unit, or it might differ as the amount bought
or delivered increments or declines.
2. Conveying costs: costs acquired for keeping up a given level of stock are called conveying
costs. They incorporate capacity, protection, duties, weakening and oldness. The capacity
costs involve cost of storage room (warehousing), stores dealing with costs and
administrative and staff benefit costs (managerial expenses) caused in recording and giving
extraordinary offices, for example, fencing, lines, racks and so on.
1.27 STOCK LEVELS
Greatest level: the most extreme stock level is the level above which stocks ought not
ordinarily be permitted to rise. It is the most extreme amount of a material that might be in
store..
Equation: = Re-arrange level + Re-arrange amount – (least utilization * least re-arrange
period)
Least level: least level is that beneath which stock ought not ordinarily be permitted to fall.
On the off chance that any thing of materials fall beneath this level, there is a risk of stoppage
underway and top need ought to be given tot the buy of new materials. I setting this level, the
accompanying components must be considered.
Equation: = Re-arrange level – (Normal consumption* Normal re-arrange period)
20
Re-arrange level: this is level of material at which another request for material is put. It is at
this level buy order is made out. This level is above least level however underneath most
extreme level. It is after a thought of the accompanying elements:
1.Rate of utilization of material,
2.Minimum level,
Lead time or conveyance time, i.e., the ordinarily taken from the season of raising buy order
to receipt of materials.
Equation: = (Maximum utilization * Maximum re-arrange period.
Recipe: =Average or ordinary utilization * Maximum re-arrange period for crisis buys
Normal stock level: normal stock level is computed by the accompanying equation:
Normal stock level = least level + most extreme level
2 . Normal stock level may likewise be processed by the accompanying equation:
Normal stock level = least level + ½ (Re-arrange amount)
SELECTIVES APPROACHES TO INVENTORY CONTROL
By and by, all things of stock can't, and require not, be controlled with meet consideration. A
viable stock requires a comprehension and information of the idea of inventories. Here we
might think about the accompanying sorts: ABC; JIT; Out sourcing; Computerized Inventory
control frameworks; VED; HML; SDE; S-OS; FNS; XYZ;
1. Re-arrange amount (or Economic Order Quantity):-
Re-arrange amount is the amount to be requested at whatever point materials are to be buy.
By setting this amount, the purchaser is spared the assignment of re-ascertaining the amount
21
he should purchase each time he arranges. This amount may, obviously, be modified if
conditions warrant it.
Monetary request amount might be controlled by the accompanying equation:
EOQ = 2.A.B/C.S Where EOQ = Economic request amount
A = Annual utilization
B = Buying cost per arrange
C = Cost of unit of materials
S = Storage and conveying cost level of cost
Then again, EOQ = 2.A.B/S Where S = Storage cost per unit per annum
2. ABC Inventory Control System:
The accompanying advances are engaged with actualizing the ABC investigation:
cost per unit for
every thing.
units cost.
elevated aggregate esteem et cetera.
ompute the proportions (rate) of number of units of every thing to add up to units of all
things and the proportion of aggregate estimation of every thing to add up to estimation of all
things.
ee classes A, B and C.
3. VED Analysis:
In VED investigation, the things are characterized based on their fundamentally to the
creation processor different administrations. In the VED arrangement of materials, V remains
for fundamental things without which the generation would reach a stop. E in the framework
signifies fundamental thing whose stock out unfavorably influence the proficiency of the
creation framework.
22
4. HML investigation:
This is like the ABC examination aside from that, in this investigation, the things are
characterized based on unit cost as opposed to their use esteem. The things are ordered in like
manner as their cost for unit is H-high, M-medium, or L-low.
5. SDE ANALYSIS:
This uses the basis of the accessibility of things. In this examination, S remains for rare thing
which are hard to come by.
6. S-OS examination:
S-OS examination is base on the idea of providers, wherein S speaks to the opportune things
and OS speaks to the Off-convenient things. This arrangement of thing is finished with the
point of deciding appropriate obtainment systems.
7. FSN Analysis:
In light of the utilization example of the things, the FSN order calls for grouping of things, as
Fast-moving, Slow-moving, non-moving.
8. XYZ Analysis:
XYZ examination depends on the end stock estimation of various things. Things, whose
stock qualities are high, are classed as X things while those with low interest in them are
named as Z things. Different things are the Y things whose stock esteem is neither too high
not very low.
METHODS OF PRICING MATERIAL ISSUES
It ought to be noticed that strategies talked about here are techniques for evaluating the issue
of materials and not the techniques for physically issuing materials.A portion of the essential
strategies for valuing issues are as per the following:
1. To begin with IN-FIRST-OUT
These strategy depends upon the presumption that materials who are obtained first are
submitted first. It Uses the cost of the principal group of materials bought for all issues until
23
the point that all units from this clump have been issued. After the main bunch is completely
issued, the cost of the following group got turns into the issue cost.
Favorable circumstances
The accompanying favorable circumstances are asserted for FIFO strategy:
This strategy depends on a practical suspicion that materials which are gotten first are
issued first.
Materials are issued at real cost. Along these lines, no hidden benefit or misfortune
comes about because of the utilization of this strategy.
Closing stock valuation is at fetched and at the most recent market costs.
This technique is very easy to work and straightforward.
Impediments
Materials are not changed at the present market costs. Thusly, in the midst of rising
costs, charge to generation is unduly low.
This technique once in a while delivers out of line comes about as between one
employment and another. For instance, materials obtained @ Rs. 10 might be issued to work
A, yet materials issued t comparable hoard B might be from a later supply which is @ Rs. 12.
This makes examinations troublesome on the grounds that two comparable occupations
began in the meantime may indicate diverse expenses.
When exchanges are vast in number and the cost varies as often as possible, the
technique includes more figurings and expands the likelihood of mistakes.
2.LAST-IN-FIRST-OUT(LIFO)
The technique is simply invert of FIFO. It depends on the presumption that last buys of
materials are issued first and prior receipts are issued in the last. LIFO technique utilizes the
24
cost of the last group got for all issues until the point that all units from this clump have been
issued. From that point forward, cost of the past clump got is utilized.
The understudies should take note of that in genuine practices materials issued to creation
may not be from the most recent part buy. This is just an accounting strategy and must not be
mistaken for physical technique for issue utilized by the vendor who dependably tries to issue
the most seasoned stock first. Two vital purposes of this strategy are:
Issues are pieced at genuine cost and most recent costs paid.
Closing stock is esteemed at the old costs and is totally out of line with current costs.
Preferences
This strategy has following favorable circumstances:
The estimation of materials issued is firmly identified with current market costs.
As materials are issued at genuine cost, it doesn't bring about any hidden benefit or
misfortune.
When costs are rising, the higher costs of the lost late buys are charged to creation.
This diminishes benefit figure and results in salary charge sparing.
Detriments
Although stock is esteemed at taken a toll, the cost is that of the most punctual
obtained, so stock esteem does not speak to its present esteem.
This strategy isn't practical as it doesn't comply with the physical stream of materials.
25
Like FIFO, in this technique additionally, the materials cost of comparable
occupations may vary basically on the grounds that the earlier activity depleted the supply of
lower costs stock. This renders correlations between employments troublesome.
When costs vary all the time, the estimation convolutes the stores record and expands
the likelihood of administrative blunders.
3. Normal COST METHODS
These strategies depend on the supposition that when materials obtained in various parts are
put away together, their character is parcels, and subsequently, these ought to be changed at a
normal cost. Fundamentally, normal costs are of two sorts straightforward normal and
weighted normal.
4. Straightforward AVERAGE METHOD
Straightforward normal cost is ascertaining by including all the diverse costs and separating
by the quantity of such costs. It doesn't account amounts of materials while registering
normal cost. For example, when 100 units are buy @ Rs. 9 for every unit and 900 units are
acquired @ Rs. 7 for each unit, the straightforward normal cost will be = (9+7)/2 = Rs. 8.
The main preferred standpoint of this strategy is that it is easy to comprehend and simple to
work.
Burdens
Materials are not charged out at real cost. In this manner, hidden benefit or misfortune
will more often than not emerge out of evaluating.
This strategy is informal and ordinarily creates unsuitable outcomes. The estimation
of shutting stock might be a negative figure which is very crazy.
26
5. Measured AVERAGE METHOD
This technique gives due weight to the characteristics held at each cost while ascertaining the
normal cost. The weighted normal cost is figured by isolating the aggregate cost of material
in stock from which the material to be estimated could have been drawn, by that aggregate
amount of material in that stock. The basic recipe is that weighted normal cost whenever is
the adjust esteem figure partitioned by the adjust units figure.
Points of interest
This technique levels out the impact of broadly shifting costs of various buys.
The new issue cost is ascertained just at the season of each new buy and not at the
season of each. This decreases crafted by making figurings.
No undiscovered benefit or misfortune emerges.
Inconveniences
Its principle hindrances are:
Where receipts are various, this technique requires a decent arrangement of counts.
Issue costs for the most part rushed to various decimal focuses.
Materials are not issued at the present market costs.
27
2.2 LITERATURE REVIEW:-
Supply chain and inventory management information GP Cachon
Aggressive weights will drive real changes in stock administration in the following few a
long time. Changes will come about because of organizations recognizing and profiting by
the openingsnto deal with their whole supply chains as single substances. Inventory network
administration.
.Production and inventory management DW Fogarty, The production network is an office
system that changes the acquisition of materials, materials to the middle of the road and
finished items, and distributes the completed items to the customer's supply chain as a single
factor. Storage Network Management
Production and inventory management CW Yau
Late CII investigate has shown that formal material administration programs have the
potential to yield critical development cost funds, yet little and medium-sized business
temporary workers may not feel that an incorporated material administration program
Supply chain logistics managementDJ Bowersox
An Order Based Materials Management (OBMM) strategy utilizing figures of genuine client
requests to decide part stocking levels. There might be a few kinds of requests and a few sorts
of client request figures for them
Theory of inventory management TM Whitin Substrate handling frameworks and techniques
are portrayed for preparing substrates. The preparing incorporates exchanging electronic
recognizable proof (ID) data of at least one materials contained in at least one handling
subsystems.
Using inventory study for competitive advantage through supply
chain management.
Ex-amples of work profitability drivers in the development business incorporate climate
conditions,coordination of subcontractors, booked extra time, and material administration,
and in addition workermotivation, preparing, background, and supervision, among numerous
others
28
Decision for material management RG Brown
Store network management is often seen as a company that is located between fully vertically
merged companies, where the entire logistics is required by independent companies, and
where each channel is partially free to work
.Introduction to materials management JRT Arnold
Proficient and sparing innovation that can be utilized to store a lot of warmth or cool in an
unequivocal volume is the subject of research for quite a while. Warm capacity assumes an
essential part in building vitality preservation
Corporate inventory management with value maximization in view G
Michalski
The adequacy of inactive cooling by stage change materials (PCM) is contrasted and that of
dynamic (constrained air) cooling. Numerical reenactments were performed at various release
rate
.Inventory management with asset-based financing JA Buzacott,
Lessen appropriation and store network expenses and increment precision and productivity
with Rootstock's dependable and adaptable scanner tag and Mobile information gathering
capacities.LB Toktay, LM Wein, SA Zenios
Definite zones (Location IDs and Location Numbers) give the premise to cutting edge
pickingand set away procedures. Simple incorporation with computerized distribution center
frameworks is provided.
.Operations research in production planning, scheduling,
and inventory control
Keep up and control stock through simple touse screens for refreshing thing stock amounts
what's more, subtle elements
Inventory management optimization as part of operational risk management
Helpful approach setting by Product Groupsand Item Commodity Code limit the exertion of
introductory setup and continuous refreshing of strategies for Products and Items.
29
CHAPTER – 3
RESEARCH DESIGN
30
TOPIC OF THE STUDY
“A STUDY ON MATERIAL MANAGEMENT AND INVENTORY CONTROL” at
Karnataka Soaps and Detergents Limited, Bangalore.
STATEMENT OF THE PROBLEM
The problem selected to the analysis is “to study the effectiveness of material management
and control” at KS&DL, Bangalore. The effectiveness of the prevailed inventory system is
analyzing simultaneously efficiency of the manufacturing firm.
It is concerned with the management of inventories as well as efficiency in cost reduction.
The variation of prices of raw materials are also seems very difficult for the smooth
functioning in to account for the analysis as these two aspects relates to material
management.
OBJECTIVES OF THE STUDY
1. To examine the various levels of inventory maintenance at KS&DL.
2. To analyse the affect of inventory on liquidity position of KS&DL.
3. To find the various inventory control technique adopted by KSDL ,for inventory
management.
4. To investigate the material control framework at KS&DL.
SCOPE OF THE STUDY
Since the topic has a wide scope in every manufacturing sector, the research was undertaken
at KSDL., Bangalore.
31
NEED OF THE STUDY
Stock administration framework gives data to productively deal with the stream of material,
viably use and hardware, coordination, inward exercises and informative with clients. Stock
administration does not settle on choices or oversee activities they give the data to directors
who settle on more exact and auspicious choices.
• To know the advance and procedure of Inventory position of the firm
• To know how to keep up ideal level of stock in an association
• The think about is required in light of the fact that the administration must
see that intemperate interest in stock ought to be limited and in the
meantime it ought to shield the organization from the issue of stock out.
SOURCES OF DATA COLLECTION
Primary Data: The technique which was embraced to gather the essential information is
"Close to home Interview". Keeping in mind the end goal to gather the data, coordinate
individual meeting, yearly reports kept up by the firm and discourse was made with various
work force of procurement divisions, stores office and different offices. So far data is
gathered through exploratory research outline. There is no formal plan pr structure poll in the
examination.
Secondary Data: For social event optional information different sources were utilized.
• Different bookkeeping records of the organization
• Text books and other contextual analyses
• The auxiliary information is acquired by alluding to few books in
connection to the stock reports, yearly reports and so forth.
• Gathering data from the past records and shows of results of KS&DL and
from Internet
32
TOOL USED FOR DATA ANALYSIS
To break down the organization's yearly report which are applicable to stock, the Ratio
investigation has been attempted as a device in this study.Different proportions identified
with stock administration have been utilized, and the varieties of the proportions are appeared
through the different diagrams.
LIMITATIONS OF THE STUDY
The investigation of material administration and control at Karnataka Soaps and Detergents
Limited, has a few Limitations as each examination has its own particular impediments.
Time confinement is the restriction, the exploration directed was for a limited ability to focus
time.
• The data which was required couldn't be made open by association.
• Discussion with every single related authority was unrealistic.
• Financial explanations are basic between time reports for a superior
investigation and stock examination are under chosen approach as it were.
• This venture is only a concise investigation of the company's stock
administration.
33
CHAPTER 04
DATA ANALYSIS AND INTERPRETATION
34
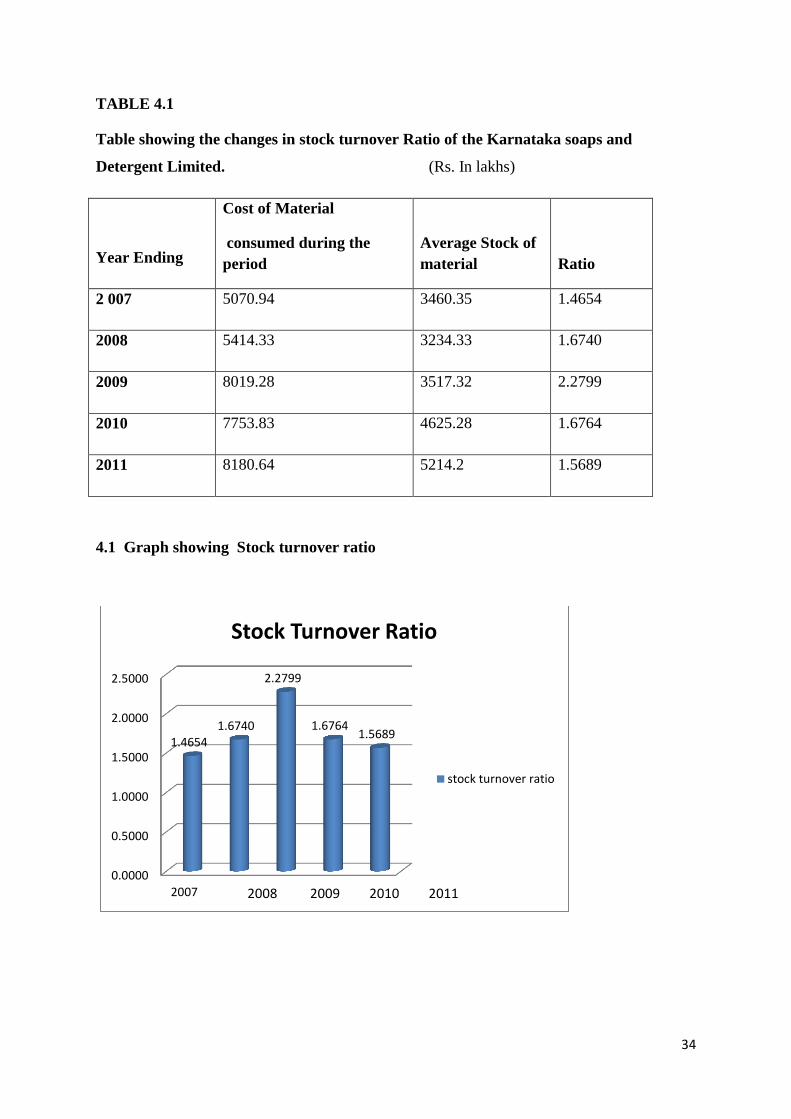
TABLE 4.1
Table showing the changes in stock turnover Ratio of the Karnataka soaps and
Detergent Limited. (Rs. In lakhs)
Year Ending
Cost of Material
consumed during the
period
Average Stock of
material Ratio
2 007 5070.94 3460.35 1.4654
2008 5414.33 3234.33 1.6740
2009 8019.28 3517.32 2.2799
2010 7753.83 4625.28 1.6764
2011 8180.64 5214.2 1.5689
4.1 Graph showing Stock turnover ratio
0.0000
0.5000
1.0000
1.5000
2.0000
2.5000
2007
1.4654 1.6740
2.2799
1.6764 1.5689
Stock Turnover Ratio
stock turnover ratio
2008 2009 2010 2011
35
ANALYSIS
The above data and chart shows that the stock Turnover ratio for five financial years of the
Karnataka Soap And Detergent Limited. When analysis the above table and chart, it has been
absorbed that the stock turnover ratios of the company have been increased gradually, that is
financial year 2006-2007, the stock earnings ratio of the KSDL was 1.4654 and in the year
2007-08 the Ratio has doubled up drastically to 1.6740 but in the next year that is in 2008-09
the stock Turnover Ratio of the company has increased slightly and ended up at 2.2799. But
in the year the 2009-10, the stock Turnover Ratio at has a pointed 1.6764. At the last year of
the analysis that is in 2010-11 the stock Turnover Ratio of the company has slightly
decreased and pointed at 1.5689.
INTERPRETATION
In the context of interpretation of Stock Turnover Ration, it may be noted that a high stock
Turnover Ratio may also be taken to mean that the concern buys in small lots, and so its
goods are turned over or sold out many a times during the year. And the low Stock Turnover
Ratio may be taken to mean that the concern buys in bulk, and so, it’s goods are turned over
or sold only a few times during the year.
It is possible to find out whether the inventory comprises of obsolete stock of raw- materials
or fast moving raw-materials. A proper understanding of the pattern of consumption of raw-
materials can be ascertaining the following:
The average cost of raw-materials consumed daily.
The number of days for which the organization can continue its production
activities with the help of the raw-materials held by it, and
The following two parameters are used to get an idea about the above aspects which are being
used to analyse the data of the Karnataka Soaps and Detergent Limited.
36
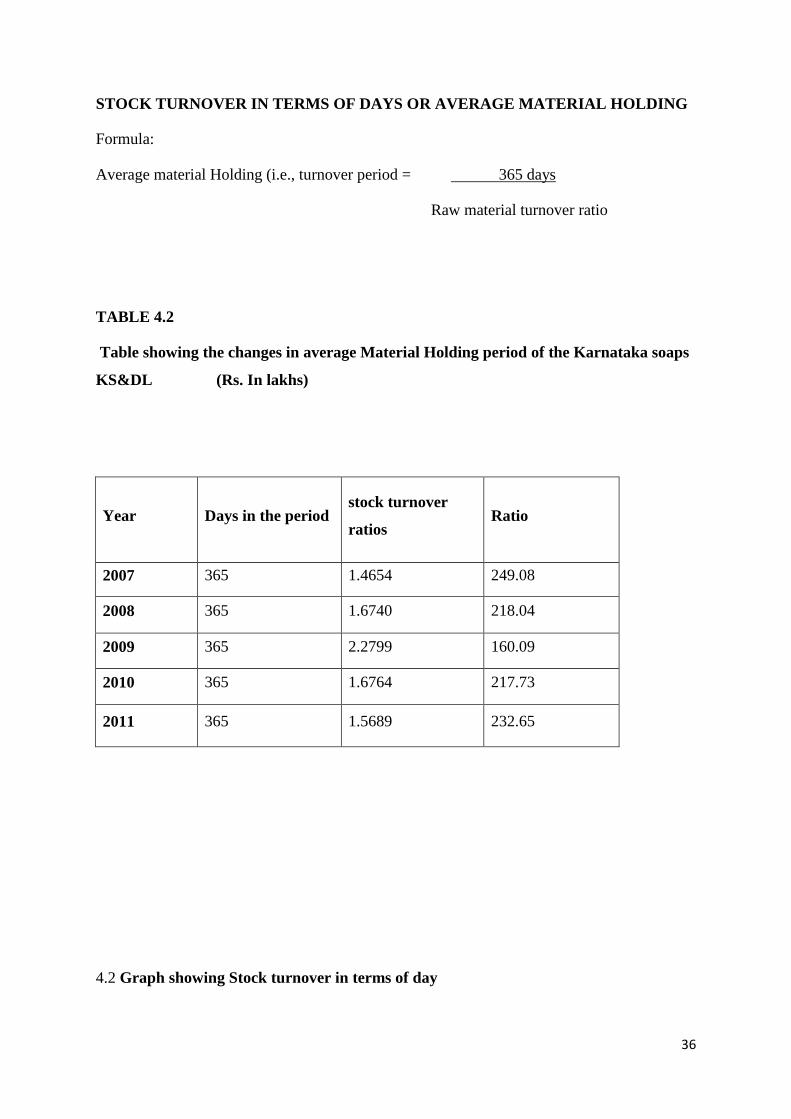
STOCK TURNOVER IN TERMS OF DAYS OR AVERAGE MATERIAL HOLDING
Formula:
Average material Holding (i.e., turnover period = 365 days
Raw material turnover ratio
TABLE 4.2
Table showing the changes in average Material Holding period of the Karnataka soaps
KS&DL (Rs. In lakhs)
Year Days in the period stock turnover
ratios Ratio
2007 365 1.4654 249.08
2008 365 1.6740 218.04
2009 365 2.2799 160.09
2010 365 1.6764 217.73
2011 365 1.5689 232.65
4.2 Graph showing Stock turnover in terms of day
37
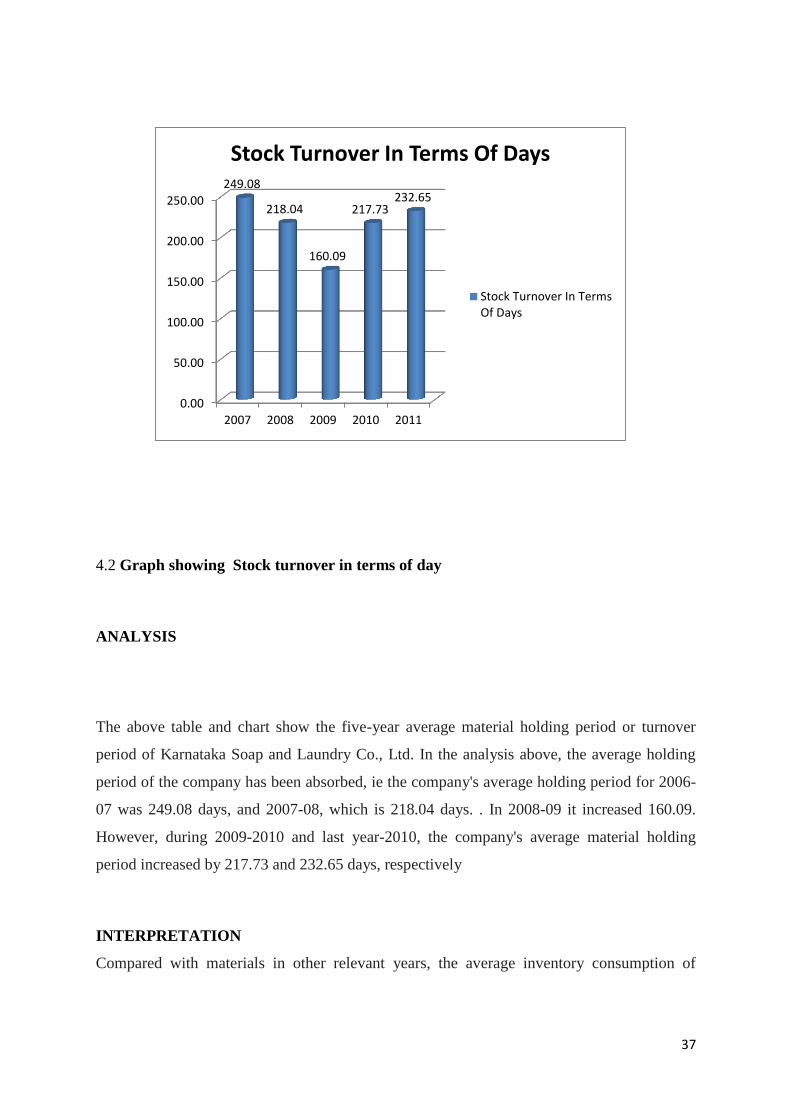
4.2 Graph showing Stock turnover in terms of day
ANALYSIS
The above table and chart show the five-year average material holding period or turnover
period of Karnataka Soap and Laundry Co., Ltd. In the analysis above, the average holding
period of the company has been absorbed, ie the company's average holding period for 2006-
07 was 249.08 days, and 2007-08, which is 218.04 days. . In 2008-09 it increased 160.09.
However, during 2009-2010 and last year-2010, the company's average material holding
period increased by 217.73 and 232.65 days, respectively
INTERPRETATION
Compared with materials in other relevant years, the average inventory consumption of
0.00
50.00
100.00
150.00
200.00
250.00
2007 2008 2009 2010 2011
249.08
218.04
160.09
217.73 232.65
Stock Turnover In Terms Of Days
Stock Turnover In TermsOf Days
38
materials for 2008-2009 was only 160.09 days, while the average inventory consumption in
other years was higher than the average material holding period.
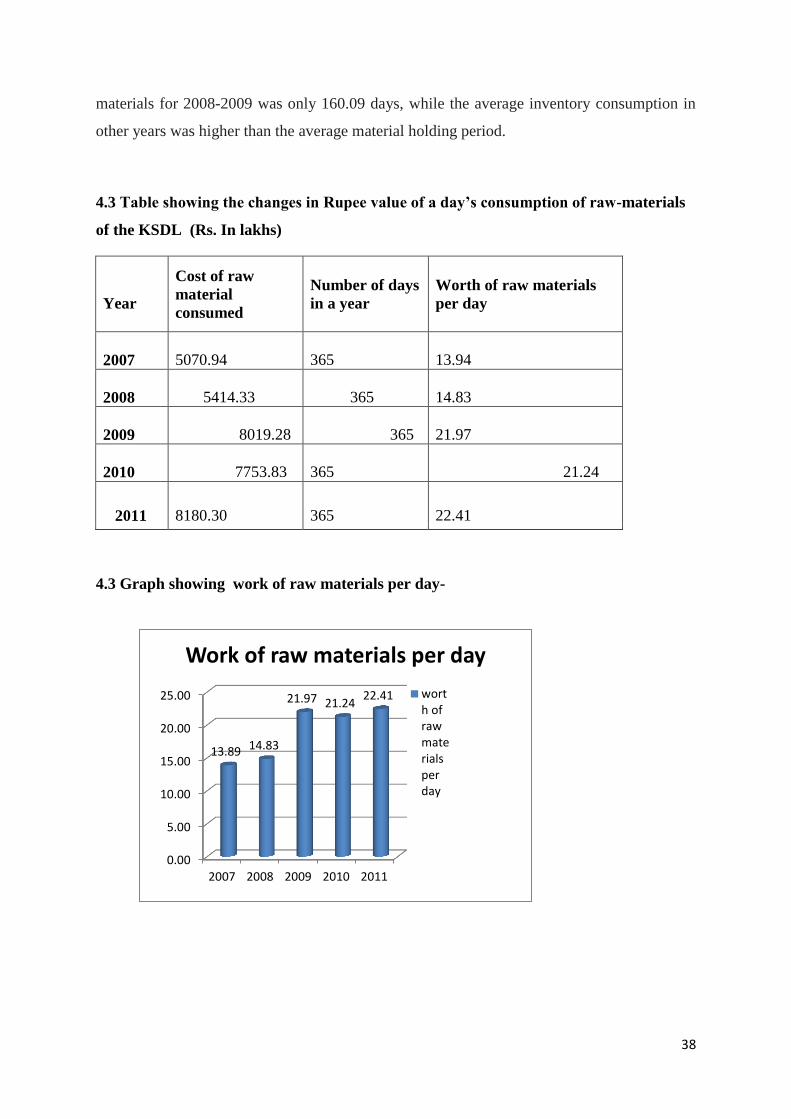
4.3 Table showing the changes in Rupee value of a day’s consumption of raw-materials
of the KSDL (Rs. In lakhs)
4.3 Graph showing work of raw materials per day-
Year
Cost of raw
material
consumed
Number of days
in a year
Worth of raw materials
per day
2007 5070.94
365 13.94
2008
5414.33 365
14.83
2009 8019.28 365
21.97
2010 7753.83
365 21.24
2011 8180.30
365
22.41
0.00
5.00
10.00
15.00
20.00
25.00
2007 2008 2009 2010 2011
13.89 14.83
21.97 21.24 22.41
Work of raw materials per day
worth ofrawmaterialsperday
39
ANALYSIS
The table and chart above show the raw material value of Karnataka Soap and Laundry Co.,
Ltd. for five years each day. In analysing the above tables and charts, it has been recognized
that the value of raw materials for daily use of materials gradually increases. In 2006-07, the
daily value of raw materials was 138,900 rupees. In the second year of 2007-08, it has
increased to 14.83 million rupees per day. In the new year of 2008-09 and 2009-10, they
gradually increased to INR 21.9,700 and INR 212,100 respectively. However, in the analysis
last year, the value of raw materials used per day had increased to 224,100 rupees in 2010-11.
INTERPRETATION
As there is a high usage of raw-materials per day for production there is a high rate of sales as
well as profit in the respected years above which states the improvements in the production
process.
. WORKING CAPITAL TURNOVER RATIO
It is computed as follow:
Working Capital Turnover Ratio = Sales(or Cost of sales)
Net Working Capital
40
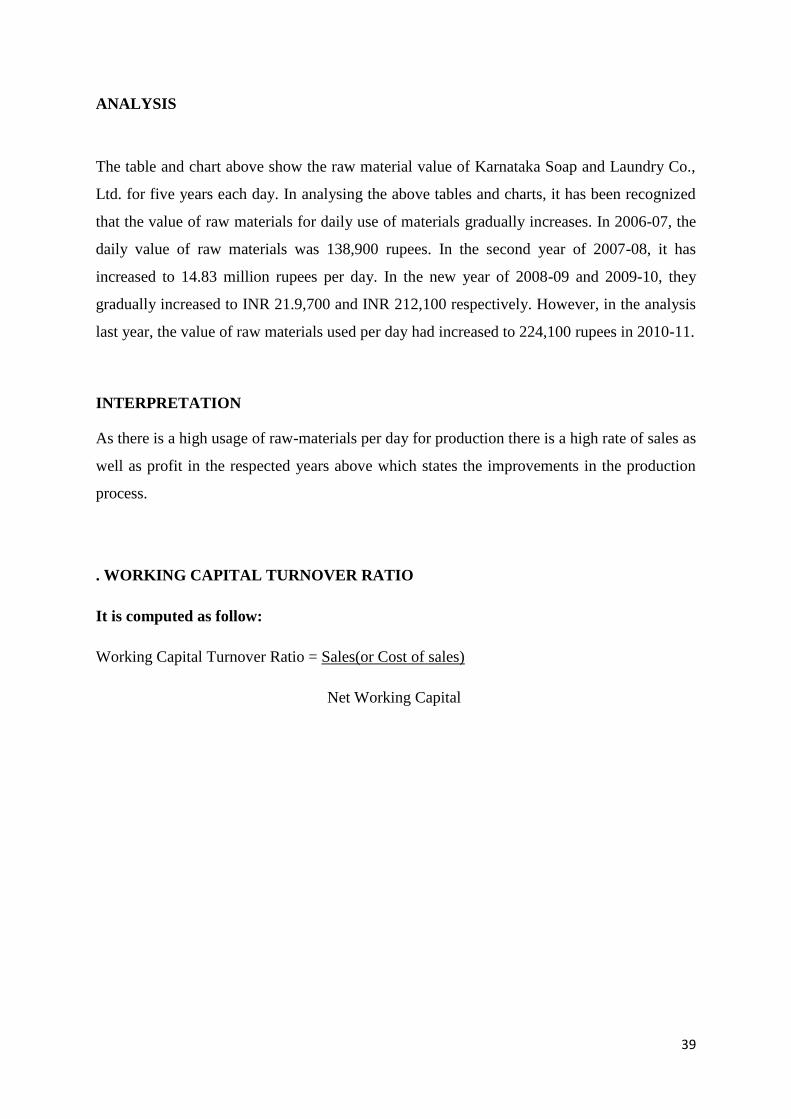
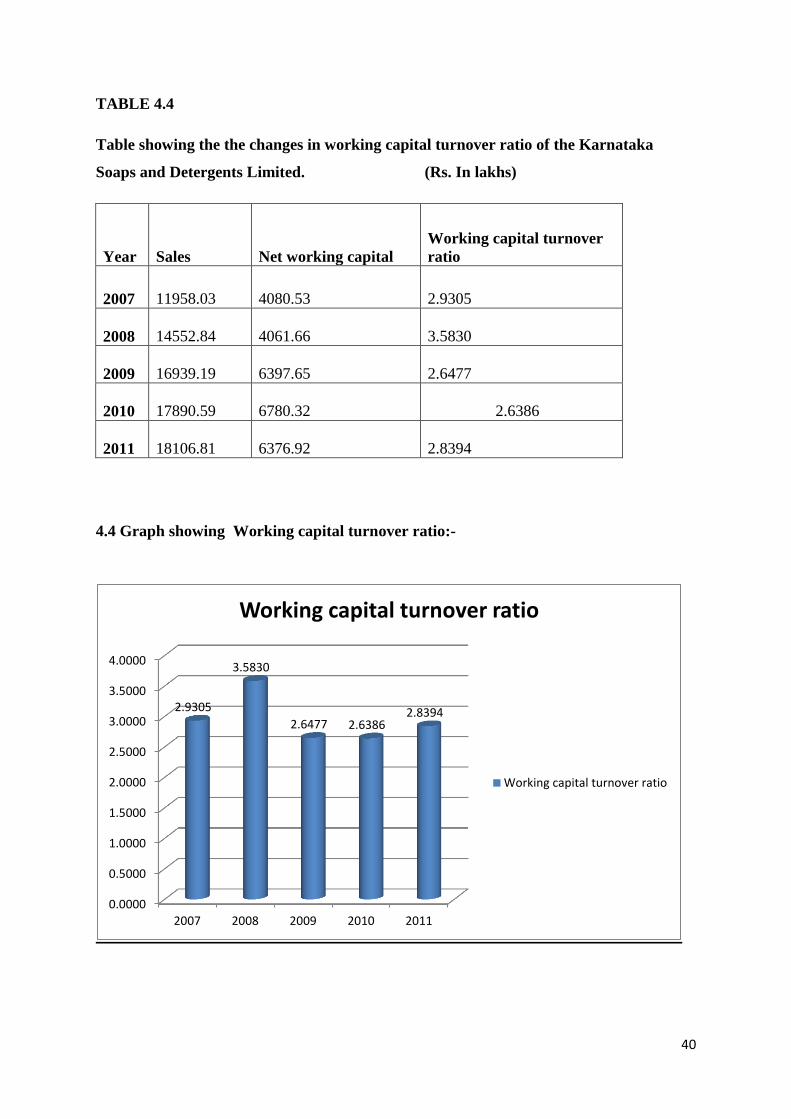
TABLE 4.4
Table showing the the changes in working capital turnover ratio of the Karnataka
Soaps and Detergents Limited. (Rs. In lakhs)
Year Sales Net working capital
Working capital turnover
ratio
2007
11958.03 4080.53
2.9305
2008
14552.84
4061.66
3.5830
2009
16939.19
6397.65
2.6477
2010
17890.59 6780.32 2.6386
2011 18106.81
6376.92 2.8394
4.4 Graph showing Working capital turnover ratio:-
0.0000
0.5000
1.0000
1.5000
2.0000
2.5000
3.0000
3.5000
4.0000
2007 2008 2009 2010 2011
2.9305
3.5830
2.6477 2.6386 2.8394
Working capital turnover ratio
Working capital turnover ratio
41
ANALYSIS
The table and chart above show the five-year turnover of Karnataka soap and detergent
company. In analysing the above tables and charts, it has been recognized that the five-year
turnover rate changes every year. In 2006-07, the turnover rate was 2.9305. In the second
year of 2007-08, it has increased to 3.5830. In the coming years, in 2008-09 and 2009-10,
they gradually dropped to 2.6477 and 2.386 respectively. In the final year of the 2010-11
analysis, the job conversion ratio has increased to 2.8394.
INTERPRETATION
The above analysis shows that the company is using more than net working capital because it
shows the number of declines from 2008-09 to 2009-10. However, in 2007-08, the company's
use of working capital to generate sales has been restored, and this ratio is high because it
shows a ratio of 3.5830, which is beneficial to the company.
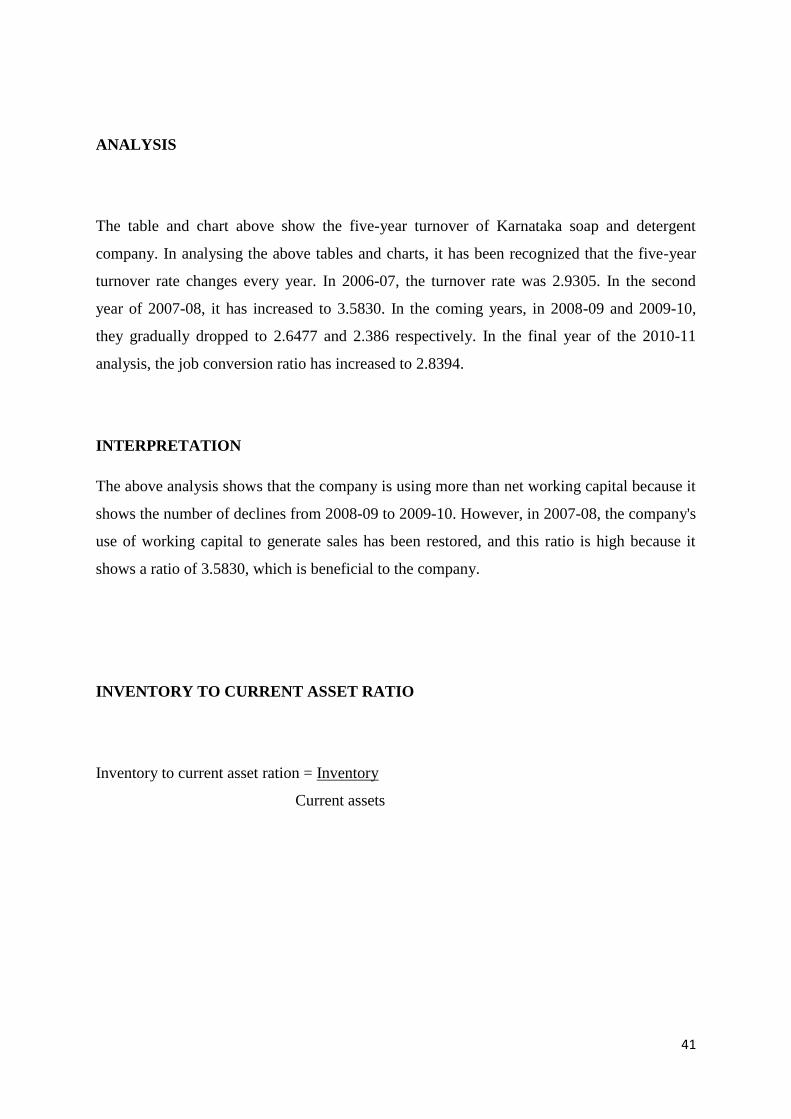
INVENTORY TO CURRENT ASSET RATIO
Inventory to current asset ration = Inventory
Current assets
42
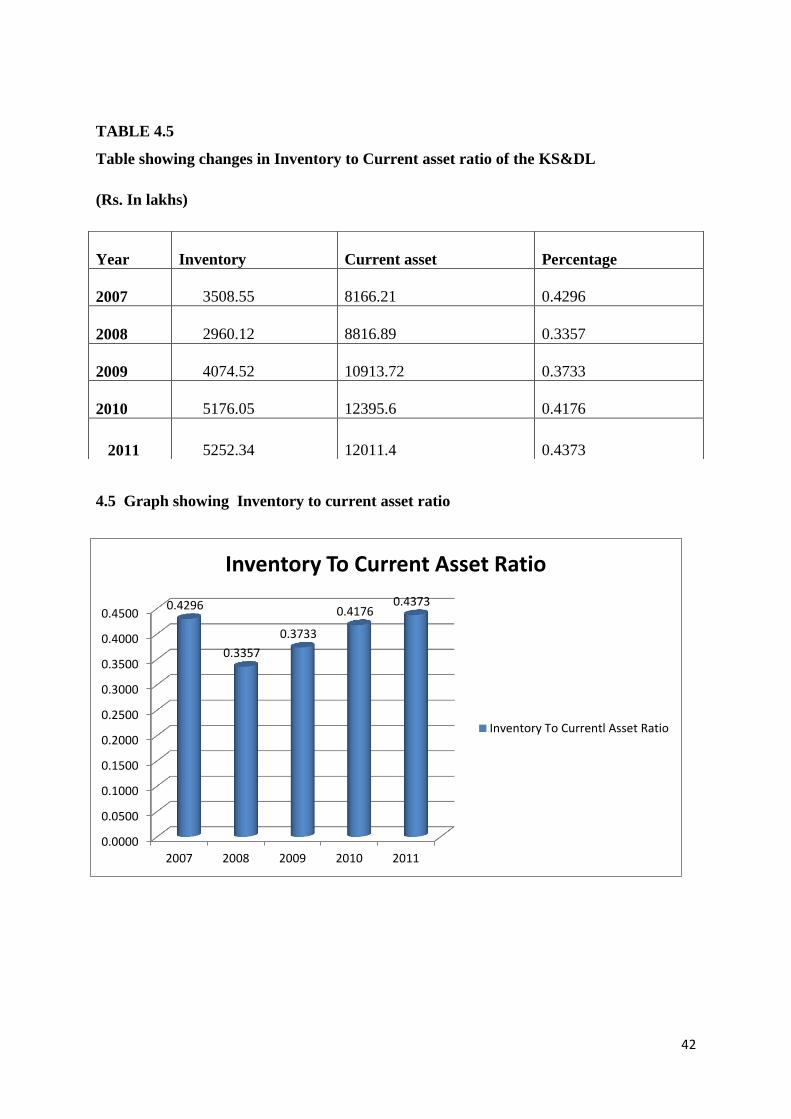
TABLE 4.5
Table showing changes in Inventory to Current asset ratio of the KS&DL
(Rs. In lakhs)
4.5 Graph showing Inventory to current asset ratio
Year
Inventory Current asset Percentage
2007
3508.55
8166.21
0.4296
2008
2960.12
8816.89
0.3357
2009
4074.52
10913.72
0.3733
2010
5176.05
12395.6
0.4176
2011
5252.34
12011.4
0.4373
0.0000
0.0500
0.1000
0.1500
0.2000
0.2500
0.3000
0.3500
0.4000
0.4500
2007 2008 2009 2010 2011
0.4296
0.3357
0.3733
0.4176 0.4373
Inventory To Current Asset Ratio
Inventory To Currentl Asset Ratio
43
ANALYSIS
The table and chart above show the five-year inventory-to-current assets ratio of Karnataka
Soap and Laundry Co., Ltd. In the analysis of the above tables and charts, the ratio of
inventory to current assets of the company has changed year by year, that is, in 2006-07, the
company’s ratio of inventory to current assets was 0.4296. In 2007-08, this ratio has dropped
to 0.3357. However, in 2008-09, next year, the company's inventory and current assets ratio
will increase to 0.3733. In 2009-10, the ratio of inventory to current assets increased to
0.4176. In the analysis year of 2010-11, the proportion of the company rose slightly again,
reaching 0.4373.
INTERPRETATION
This ratio indicates the inventory components in the current assets. The inventory component
in 2007-08 was least which shows fewer funds blocked as stocks
INVENTORY TO WORKING CAPITAL ratio:-
Inventory to working capital ratio = Inventory
Working capital
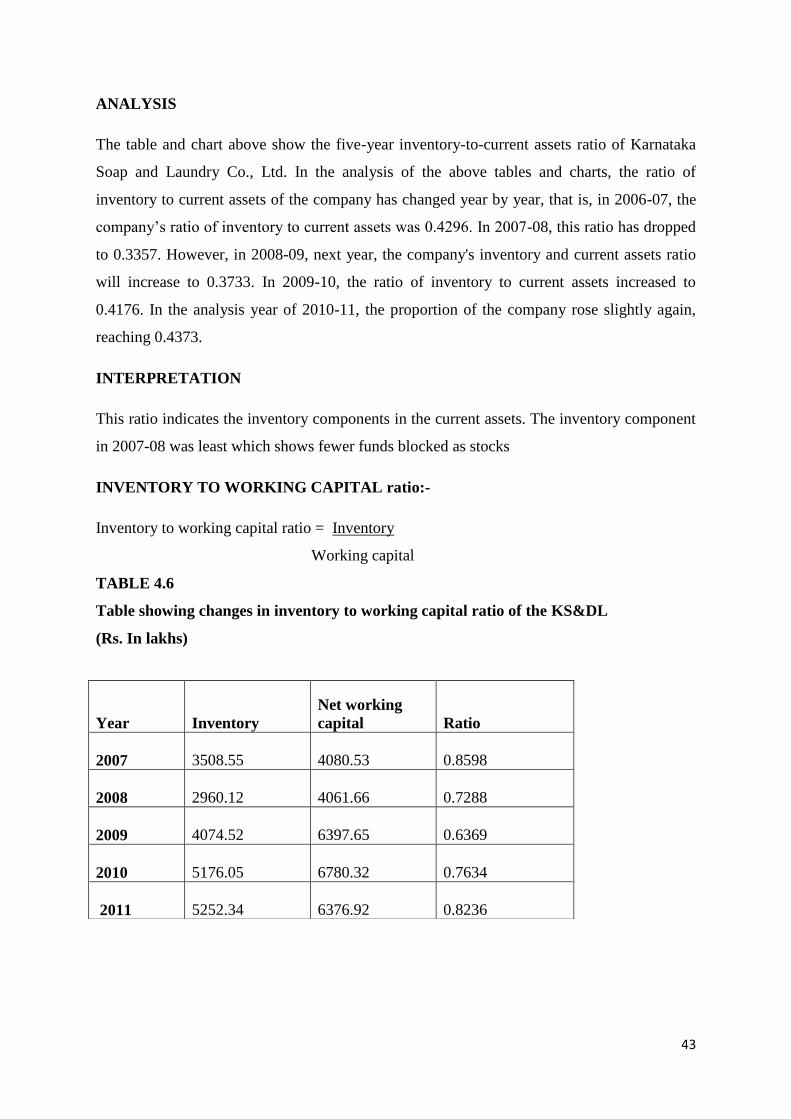
TABLE 4.6
Table showing changes in inventory to working capital ratio of the KS&DL
(Rs. In lakhs)
Year Inventory
Net working
capital Ratio
2007 3508.55 4080.53 0.8598
2008
2960.12 4061.66 0.7288
2009 4074.52 6397.65 0.6369
2010 5176.05 6780.32 0.7634
2011 5252.34 6376.92 0.8236
44
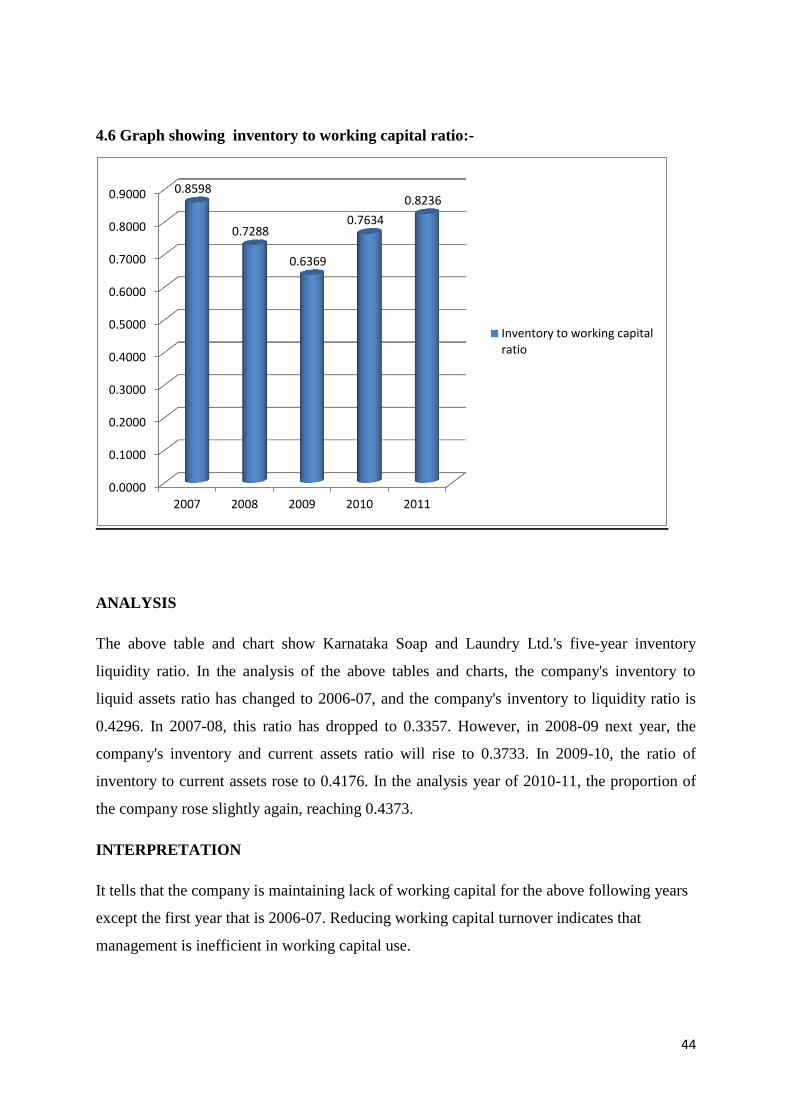
4.6 Graph showing inventory to working capital ratio:-
ANALYSIS
The above table and chart show Karnataka Soap and Laundry Ltd.'s five-year inventory
liquidity ratio. In the analysis of the above tables and charts, the company's inventory to
liquid assets ratio has changed to 2006-07, and the company's inventory to liquidity ratio is
0.4296. In 2007-08, this ratio has dropped to 0.3357. However, in 2008-09 next year, the
company's inventory and current assets ratio will rise to 0.3733. In 2009-10, the ratio of
inventory to current assets rose to 0.4176. In the analysis year of 2010-11, the proportion of
the company rose slightly again, reaching 0.4373.
INTERPRETATION
It tells that the company is maintaining lack of working capital for the above following years
except the first year that is 2006-07. Reducing working capital turnover indicates that
management is inefficient in working capital use.
0.0000
0.1000
0.2000
0.3000
0.4000
0.5000
0.6000
0.7000
0.8000
0.9000
2007 2008 2009 2010 2011
0.8598
0.7288
0.6369
0.7634
0.8236
Inventory to working capitalratio
45
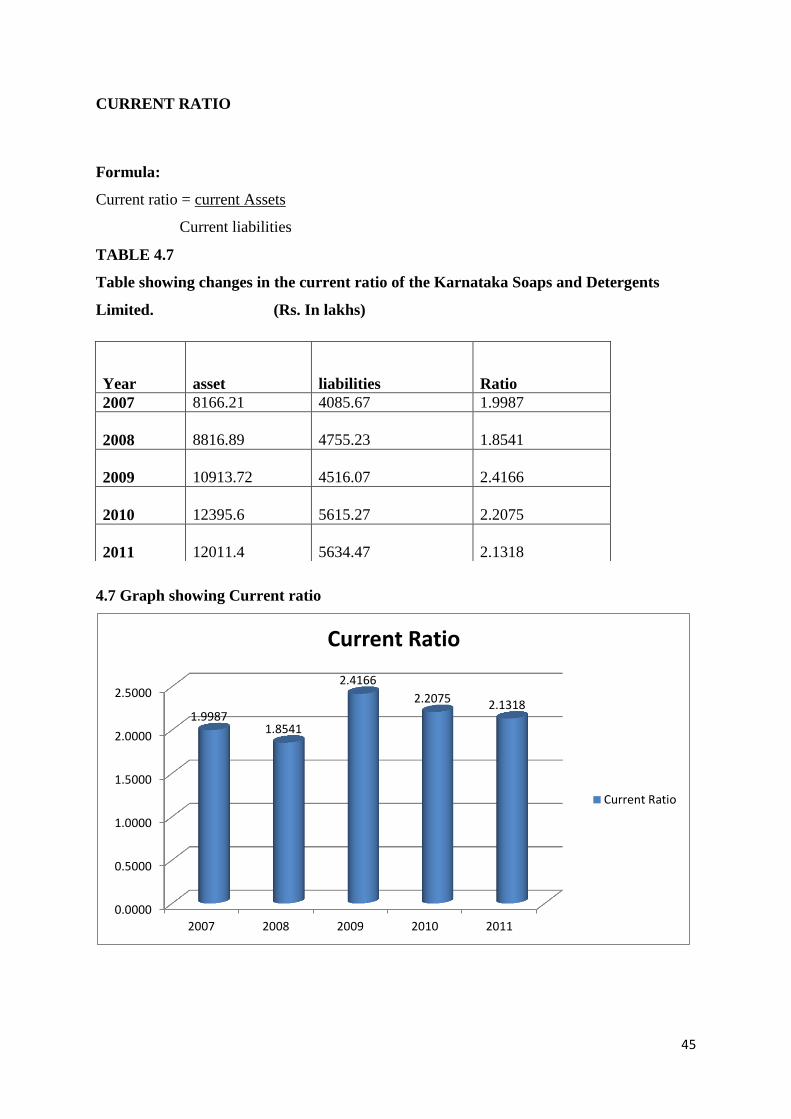
CURRENT RATIO
Formula:
Current ratio = current Assets
Current liabilities
TABLE 4.7
Table showing changes in the current ratio of the Karnataka Soaps and Detergents
Limited. (Rs. In lakhs)
4.7 Graph showing Current ratio
0.0000
0.5000
1.0000
1.5000
2.0000
2.5000
2007 2008 2009 2010 2011
1.9987 1.8541
2.4166
2.2075 2.1318
Current Ratio
Current Ratio
Year asset liabilities Ratio
2007 8166.21 4085.67 1.9987
2008 8816.89 4755.23 1.8541
2009 10913.72 4516.07 2.4166
2010 12395.6 5615.27 2.2075
2011 12011.4 5634.47 2.1318
46
ANALYSIS
The table above shows the current annual proportion of Karnataka Soap and Detergent Co.,
Ltd. When analyzing the above tables and charts, it did not show liquidity nor was it capable
of fulfilling its current obligations in a timely manner. At Karnataka Soap and Detergent Co.,
Ltd., it only faces high liquidity problems, not liquid assets, but it may be in a liquidity
position last year. That is, in 2006-07, the current ratio of the company was 1.9987. In 2007-
08, the ratio fell again, which was 1.8541. In the second year of 2008-09, the company's
current ratio increased slightly to a maximum of 2.4166. In 2009-10 and 2010-11, the
company's current ratio gradually increased to 2.2075 and 2.1318 respectively.
INTERPRETATION
It indicates that the improvements have been taken place in the liquidity position of the ksdl,
till the year 2008-2009. Through the company’s liquidity position has been increased
gradually, the company is not able to pay its liabilities as and when it requires because the
liquidity position is not sufficient as far as seen.
INVENTORY TO SALES RATIO :-
Inventory to sales ratio = Inventory
Sales
47
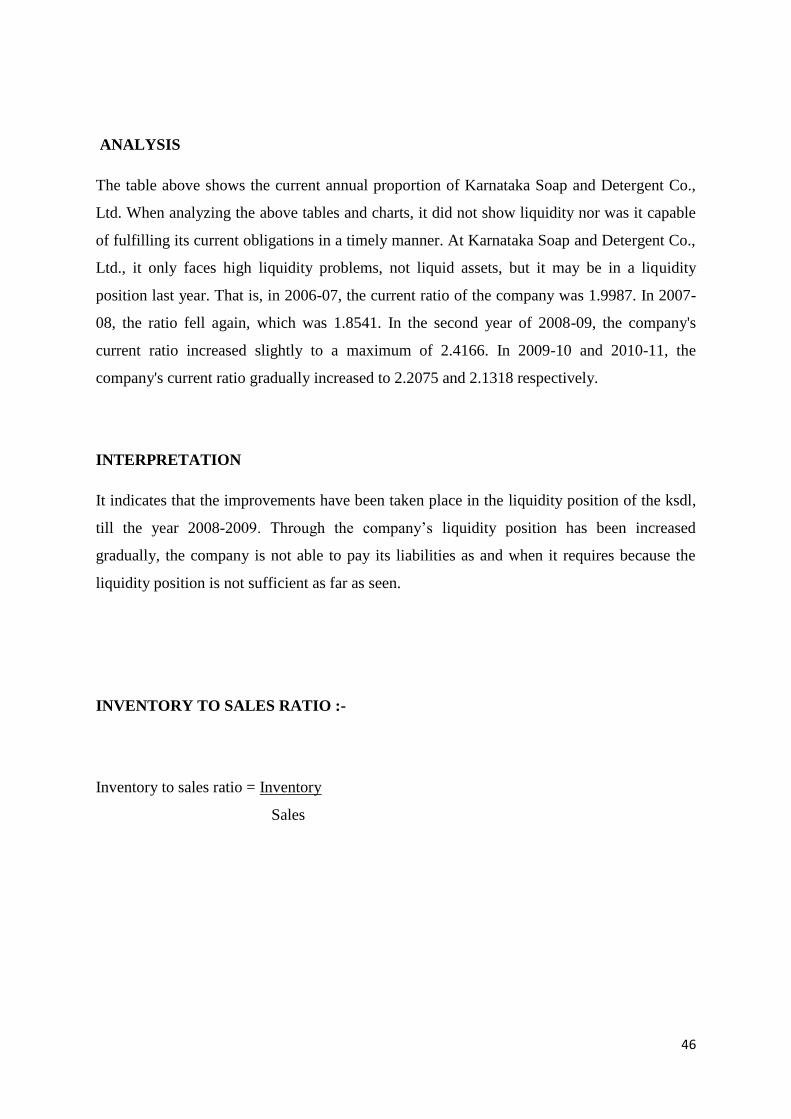
TABLE 4.8
Table showing changes in inventory to sales ratio of the KSDL
(Rs. In lakhs)
4.8 Graph showing Inventory to sales ratio
ANALYSIS
0.0000
0.0500
0.1000
0.1500
0.2000
0.2500
0.3000
2007 2008 2009 2010 2011
29.34
20.34
24.05
28.93 29.01
Inventory To Sales Ratio
Inventory To Sales Ratio
Year Inventory Sales Ratio
2007 3508.55 11958.03 29.34
2008 2960.12 14552.84 20.34
2009 4074.52 16939.19 24.05
2010 5176.05 17890.59 28.93
2011 5252.34 18106.81 29.01
48
The table and chart above show the five-year inventory and sales ratio of Karnataka Soap and
Detergent Co., Ltd. Here, the increase in inventory is due to an increase in inventory. More
inventory, more sales and higher returns will be better. In 2006-07, the sales ratio was 02934.
The second year, the 2007-08 sales ratio, fell to 0.2034. In 2008-09, the sales ratio increased
to 0.2405, and in 2009-09, the sales ratio increased to 0.2893. In the last year of 2010-11, this
proportion increased to 0.2903.
INTERPRETATION
In the context of interpretation it can be said that the company is not selling more quantities
of its products as the inventories are being increased at a high rate, so that it could minimize
its profit and undergone for some loss.
49
CHAPTER 5
FINDINGS, SUGGESTION AND CONCLUSION
50
Based on the study “Material Management and Control” the following observations were
made.
The different inventory holding points at KS&DL are:
Raw materials: company store.
Spares goods: Stores and Shop.
Work-in-.,progress: Shop.
Finished goods: Carry and forward godowns.
1. Material is purchased by placing an order from a registered supplier. Materials are issued
by the store department when they receive the authorization request.
2. KS&DL adopts centralized procurement.
3. The physical verification of the inventory will be conducted periodically.
4. The store department will ensure continuous flow of materials to the production
department. Raw materials are issued using the FIFO method (first-in, first-out method).
5.The store department uses ABC analysis and FNS technology to control raw materials
inventory. ABC analysis was performed on raw materials such as oils, spices, chemical raw
materials, and packaging materials. FNS technology is particularly suitable for chemical raw
materials such as sodium sulfate, silicon heat, oil red AB, potassium sulfate, potassium and so
on. .
6. Inventory of raw materials, chemicals, fragrances, packaging materials, fuels, stores and
spare parts is priced by weighted average cost.
7.Work-in-progress costs include materials, labor, and administrative expenses incurred to
bring inventory up to date.
51
8.The value of the finished product includes the consumption tax of the goods at the factory.
Damaged goods will be valued as 50% of the production cost of the finished product that
year.
9. The electricity of waste, bitumen and sandalwood is valued at realizable value. 11. Sales In
the case of domestic sales, the point in time when the finished product is sent to the
manufacturer and the export sales are calculated on the same day as the calculation of the bill
of lading.
SUGGESTIONS:-
The following suggestions may help the organization to turn around.
1.Even through company teamwork, each team member should be motivated to complete the
work more effectively.
2. The KS&DL should maintain coordination between labor and senior management.
3.Companies should expect to increase the effectiveness of their R&D activities. 4. The
effectiveness of the plant's resources for performance performance is mainly due to the high
cost of oil, which exceeds Rs. 2,00,000 per barrel of fat, and varies depending on the type of
oil required. Even with the power of sandalwood, the tar received in metric tons must be
properly used because of its limited supply of plants.
5. Adopt an open procurement system for all competitive suppliers and choose the best
supplier that can supply a better quantity of materials at a lower price.
6. The store department should be computerized so that other departments, namely the
production department and material department, can understand the supply of materials in the
store.
7. The name, cost, date of issue, date of next replacement, and order quantity should be
indicated on the record card for each material.
52
8. The store department should periodically assess the level of reordering.
9. If they adopt a "just-in-time" approach in their organization, they may reduce costs.
10. KS&DL should replace obsolete technology used in the production process to reduce
production costs.
11. The time limit should be determined for each batch to reduce wasted time.
12. Separate reports should be maintained and reviewed to control waste and waste.
53
CONCLUSION
The conclusion from the analysis is that material management is very important for all
manufacturing problems because materials are an important part of the product. The cost of
production is influenced by many factors, among which material is also one of the elements.
The study has been extended to other sectors where some of the shortcomings have been
noted poor marketing services, misunderstandings between workers and management, idle
capacity, delayed payment payments, keeping records of accounting manuals, delays in the
allocation of finished products, manual record collection And issue raw materials that
consume more time. The conclusion is that, to do better, KS&DL should take necessary
measures to overcome these deficiencies. This can be achieved by reducing costs, effective
labor time, proper use of funds and effective material management.
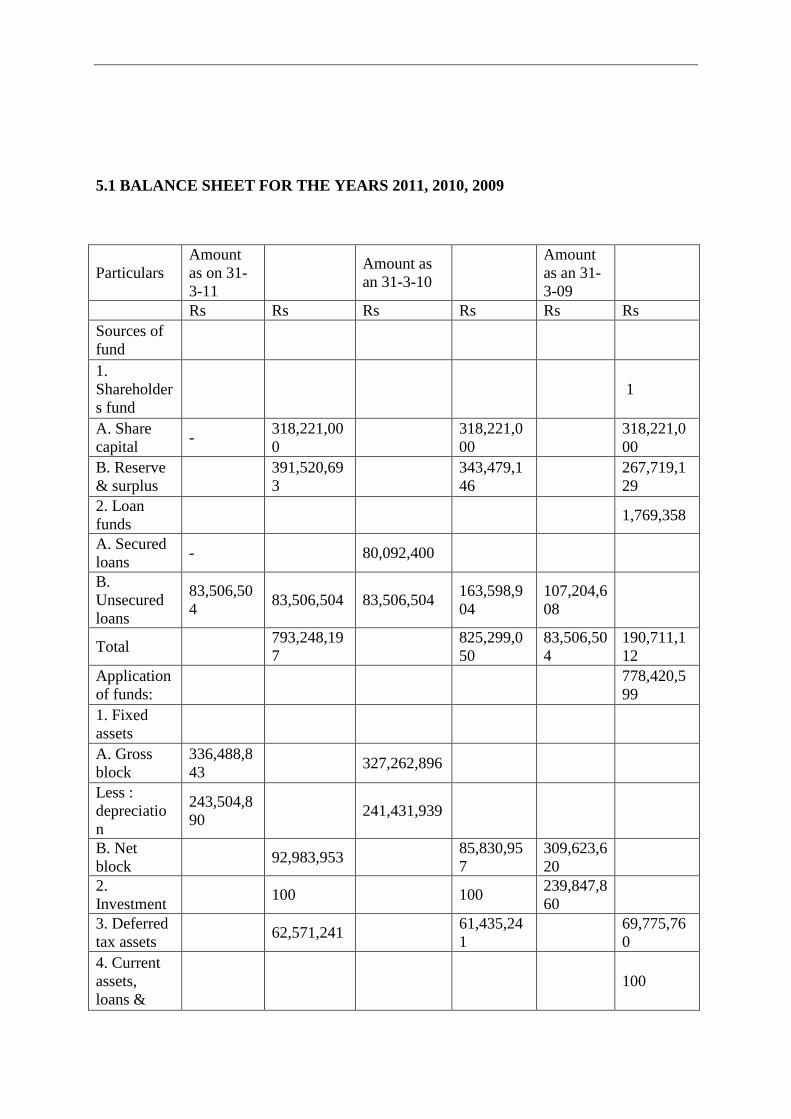
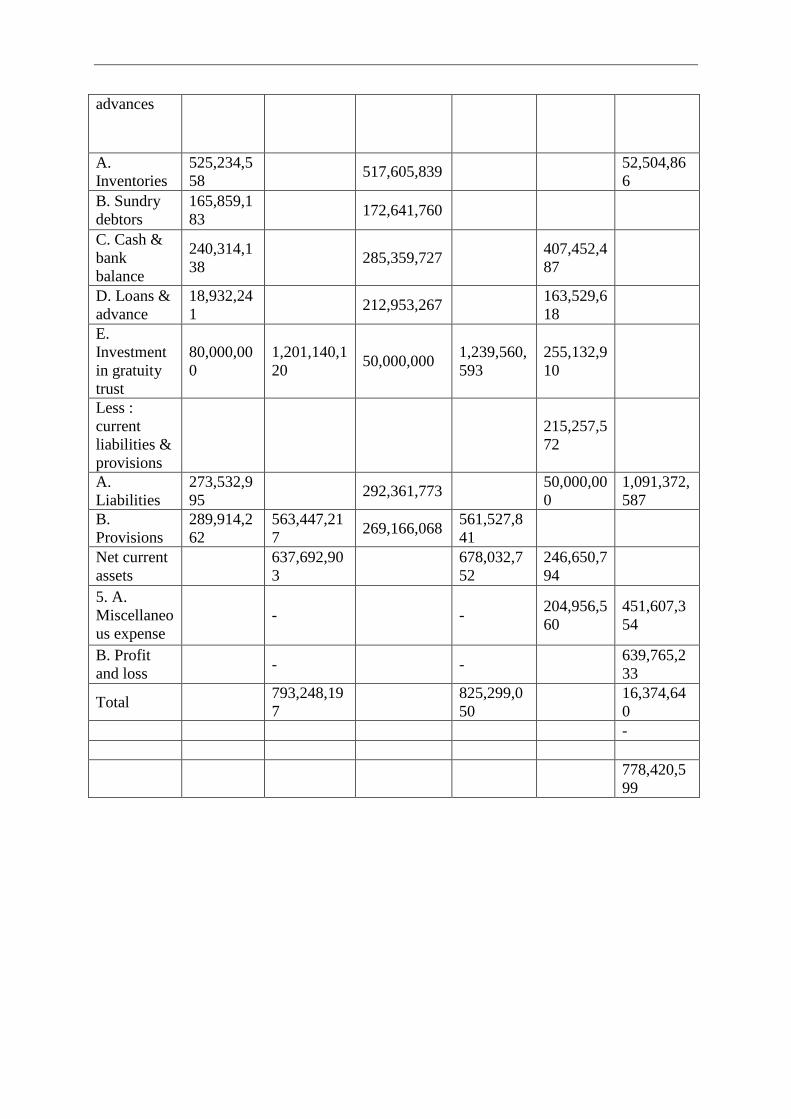
5.1 BALANCE SHEET FOR THE YEARS 2011, 2010, 2009
Particulars
Amount
as on 31-
3-11
Amount as
an 31-3-10
Amount
as an 31-
3-09
Rs Rs Rs Rs Rs Rs
Sources of
fund
1.
Shareholder
s fund
1
A. Share
capital -
318,221,00
0
318,221,0
00
318,221,0
00
B. Reserve
& surplus
391,520,69
3
343,479,1
46
267,719,1
29
2. Loan
funds 1,769,358
A. Secured
loans - 80,092,400
B.
Unsecured
loans
83,506,50
4 83,506,504 83,506,504
163,598,9
04
107,204,6
08
Total 793,248,19
7
825,299,0
50
83,506,50
4
190,711,1
12
Application
of funds:
778,420,5
99
1. Fixed
assets
A. Gross
block
336,488,8
43 327,262,896
Less :
depreciatio
n
243,504,8
90 241,431,939
B. Net
block 92,983,953
85,830,95
7
309,623,6
20
2.
Investment 100 100
239,847,8
60
3. Deferred
tax assets 62,571,241
61,435,24
1
69,775,76
0
4. Current
assets,
loans &
100
advances
A.
Inventories
525,234,5
58 517,605,839
52,504,86
6
B. Sundry
debtors
165,859,1
83 172,641,760
C. Cash &
bank
balance
240,314,1
38 285,359,727
407,452,4
87
D. Loans &
advance
18,932,24
1 212,953,267
163,529,6
18
E.
Investment
in gratuity
trust
80,000,00
0
1,201,140,1
20 50,000,000
1,239,560,
593
255,132,9
10
Less :
current
liabilities &
provisions
215,257,5
72
A.
Liabilities
273,532,9
95 292,361,773
50,000,00
0
1,091,372,
587
B.
Provisions
289,914,2
62
563,447,21
7 269,166,068
561,527,8
41
Net current
assets
637,692,90
3
678,032,7
52
246,650,7
94
5. A.
Miscellaneo
us expense
- - 204,956,5
60
451,607,3
54
B. Profit
and loss - -
639,765,2
33
Total 793,248,19
7
825,299,0
50
16,374,64
0
-
778,420,5
99
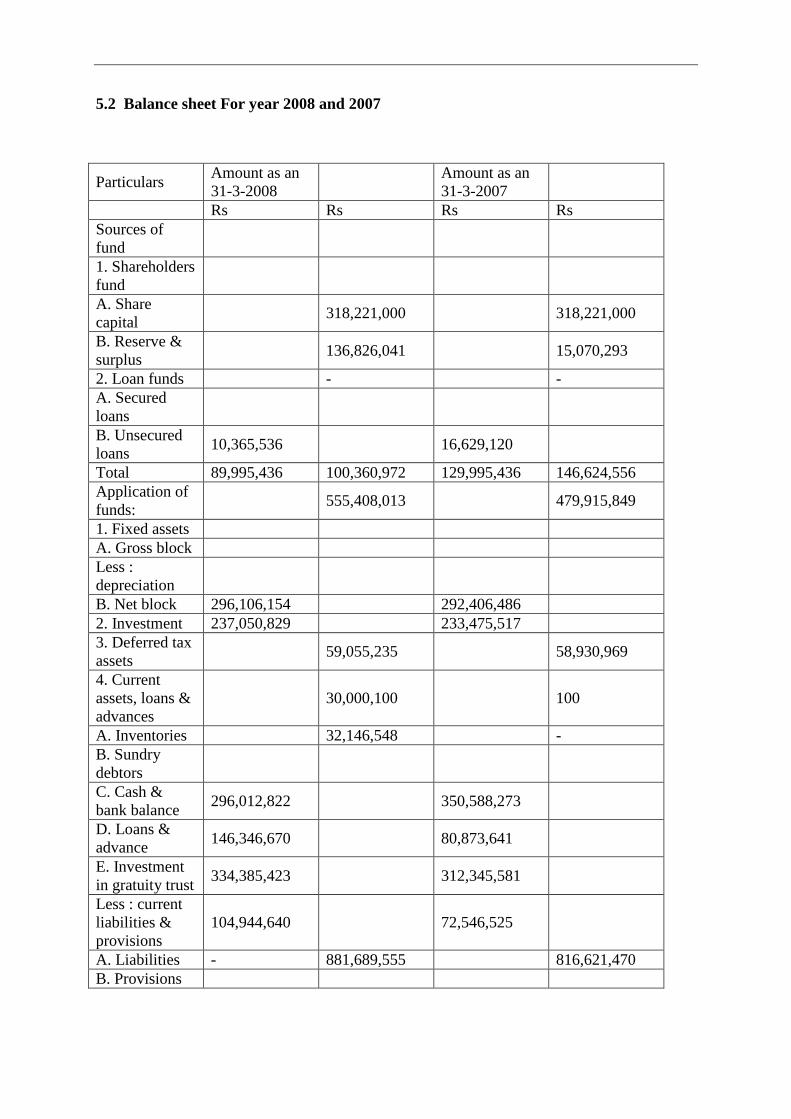
5.2 Balance sheet For year 2008 and 2007
Particulars Amount as an
31-3-2008
Amount as an
31-3-2007
Rs Rs Rs Rs
Sources of
fund
1. Shareholders
fund
A. Share
capital 318,221,000 318,221,000
B. Reserve &
surplus 136,826,041 15,070,293
2. Loan funds - -
A. Secured
loans
B. Unsecured
loans 10,365,536 16,629,120
Total 89,995,436 100,360,972 129,995,436 146,624,556
Application of
funds: 555,408,013 479,915,849
1. Fixed assets
A. Gross block
Less :
depreciation
B. Net block 296,106,154 292,406,486
2. Investment 237,050,829 233,475,517
3. Deferred tax
assets 59,055,235 58,930,969
4. Current
assets, loans &
advances
30,000,100 100
A. Inventories 32,146,548 -
B. Sundry
debtors
C. Cash &
bank balance 296,012,822 350,588,273
D. Loans &
advance 146,346,670 80,873,641
E. Investment
in gratuity trust 334,385,423 312,345,581
Less : current
liabilities &
provisions
104,944,640 72,546,525
A. Liabilities - 881,689,555 816,621,470
B. Provisions
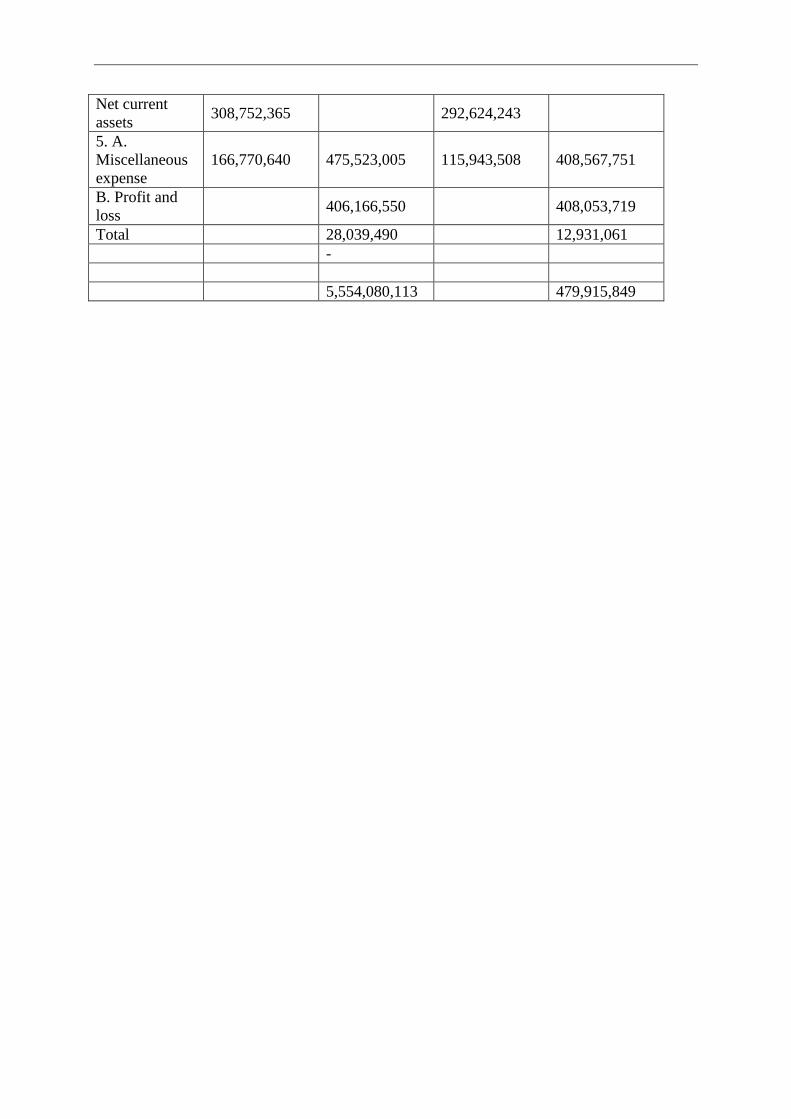
Net current
assets 308,752,365 292,624,243
5. A.
Miscellaneous
expense
166,770,640 475,523,005 115,943,508 408,567,751
B. Profit and
loss 406,166,550 408,053,719
Total 28,039,490 12,931,061
-
5,554,080,113 479,915,849
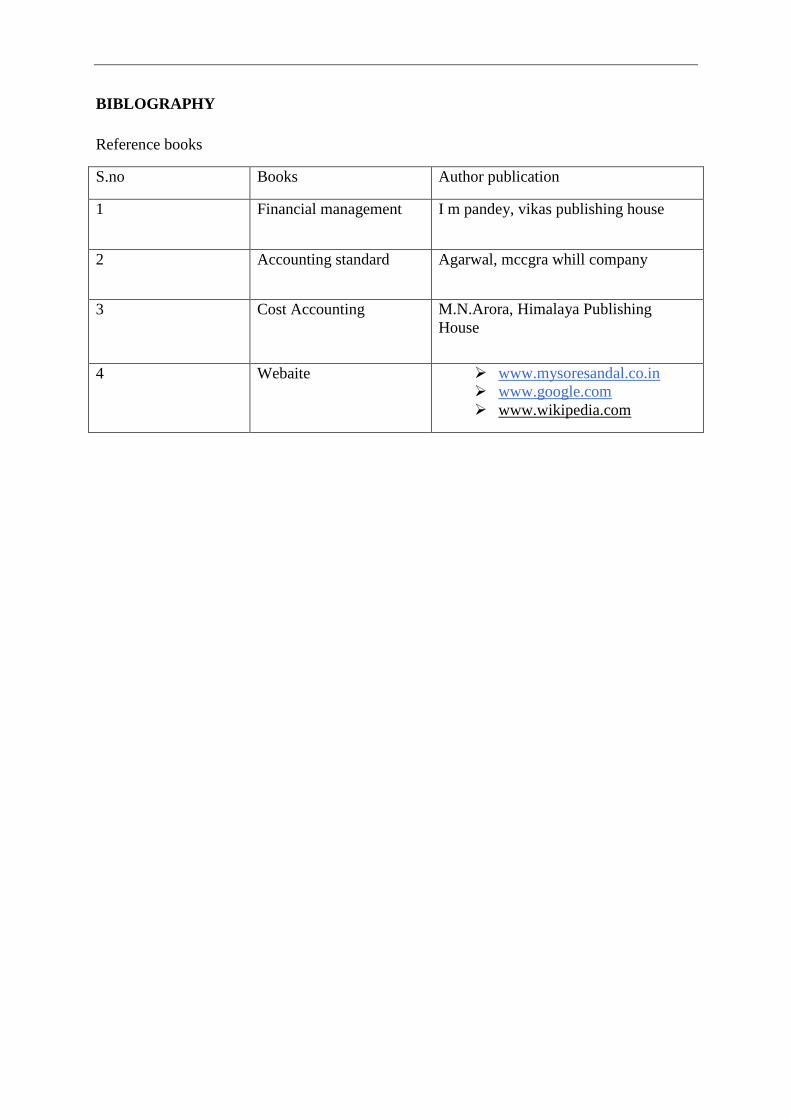
BIBLOGRAPHY
Reference books
S.no Books Author publication
1 Financial management I m pandey, vikas publishing house
2 Accounting standard Agarwal, mccgra whill company
3 Cost Accounting
M.N.Arora, Himalaya Publishing
House
4 Webaite www.mysoresandal.co.in
www.google.com
www.wikipedia.com
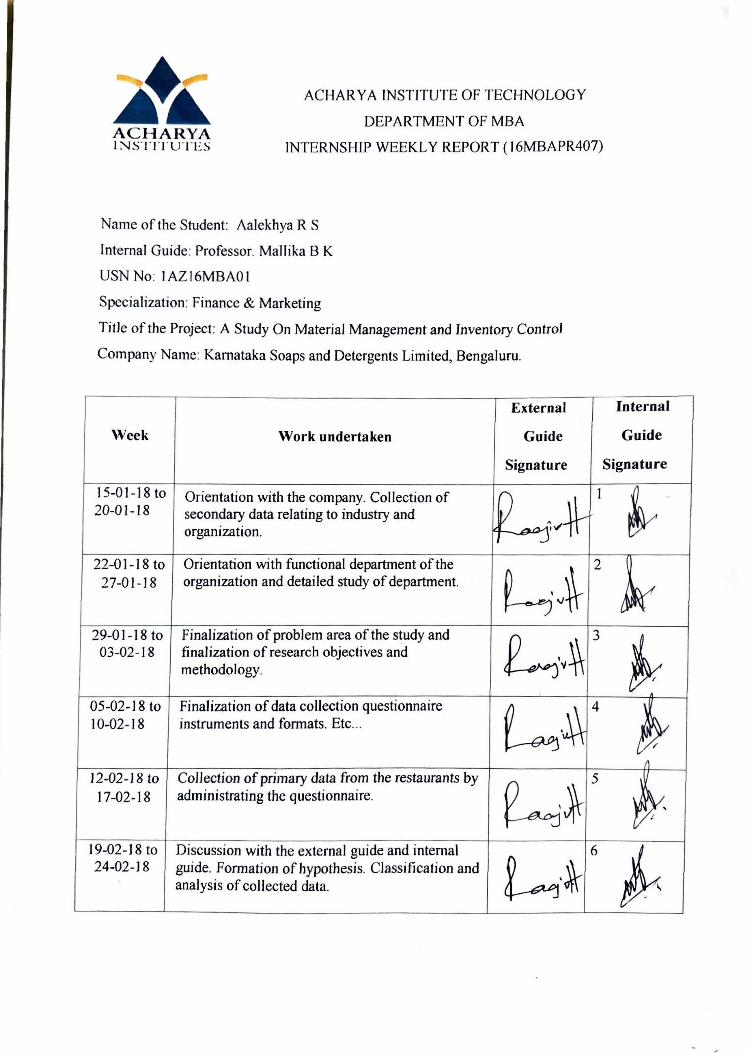
ACHARYA IN.STITUTLS
A CHARY A INSTITUTE OF TECHNOLOGY
DEPARTMENT OF MBA
INTERNSHIP WEEKLY REPORT ( I 6MBAPR407)
Name of the Student: Aalekhya RS
Internal Guide: Professor. Mallika B K
USN No: 1AZ16MBA0I
Specialization: Finance & Marketing
Title of the Project: A Study On Material Management and Inventory Control
Company Name: Kamataka Soaps and Detergents Limited, Bengaluru.
External
Week Work undertaken Guide
Internal
Guide
Signature Signature
I 5-01 -18 to Orientation with the company. Collection of 14 1
~ · 20-01-18 secondary data relating to industry and ' organization. ~ ,..
22-01-18 to Orientation with functional department of the
h"~ 2
27-0 I - I 8 organization and detailed study of department.
L~ 29-01-18 to Finalization of problem area of the study and
~-,i 3
jy, 03-02-18 finalization of research objectives and methodology.
05-02-18 to Finalization of data collection questionnaire
~ -.\-\ 4 ' 10-02-18 instruments and formats. Etc ...
,,. ,
12-02-18 to Collection of primary data from the restaurants by
~i 5 I
17-02-18 administrating the questionnaire. ' I
19-02-18 to Discussion with the external guide and internal 6 t 24-02-18 guide. Formation of hypothesis. Classification and ~l analysis of collected data.
I I
I I I
' .
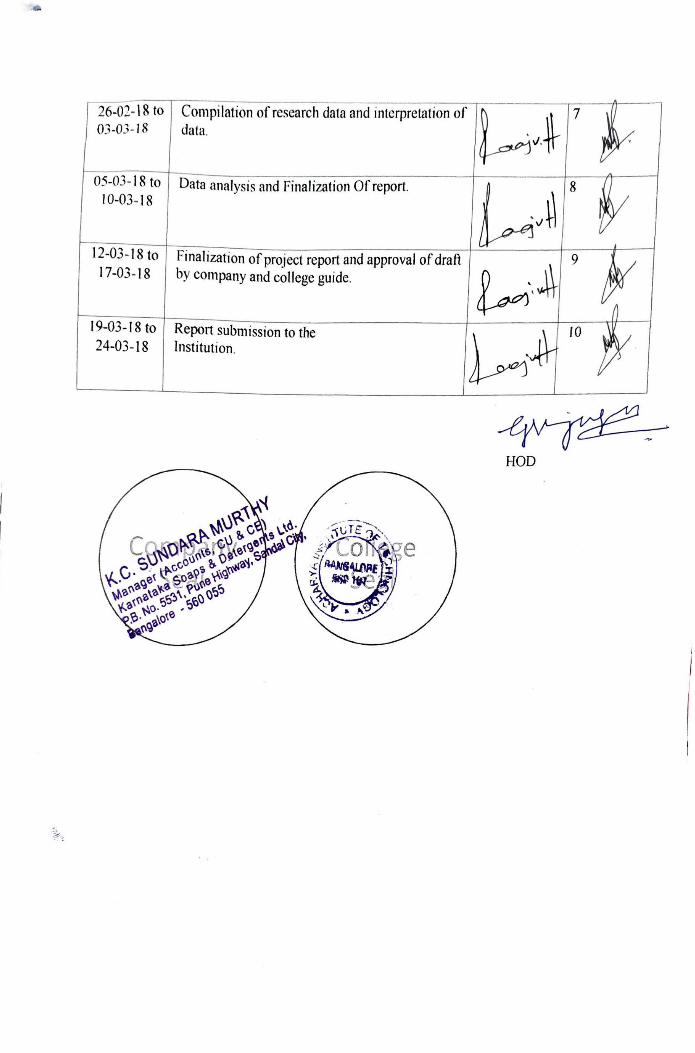
26-02-18 to
03-03-18
05-03-18 to 10-03-18
12-03-18to 17-03-18
19-03-18to 24-03-18
Compilation of research data and interpretation of
~,l 7
data.
Data analysis and Finalization Of report.
~j 8
Finalization of project report and approval of draft 9
~ --A by company and college guide.
Report submission to the
~ /0
Institution.
HOD


