Embed Size (px)
Citation preview
Jyske BankQ2 2021
17 August 2021
SummaryQ2 2021
Summary 02Financials 11Volumes 18Jyske Bank in brief 22Macroeconomics 26Calendar and contacts 30
3
Financial results
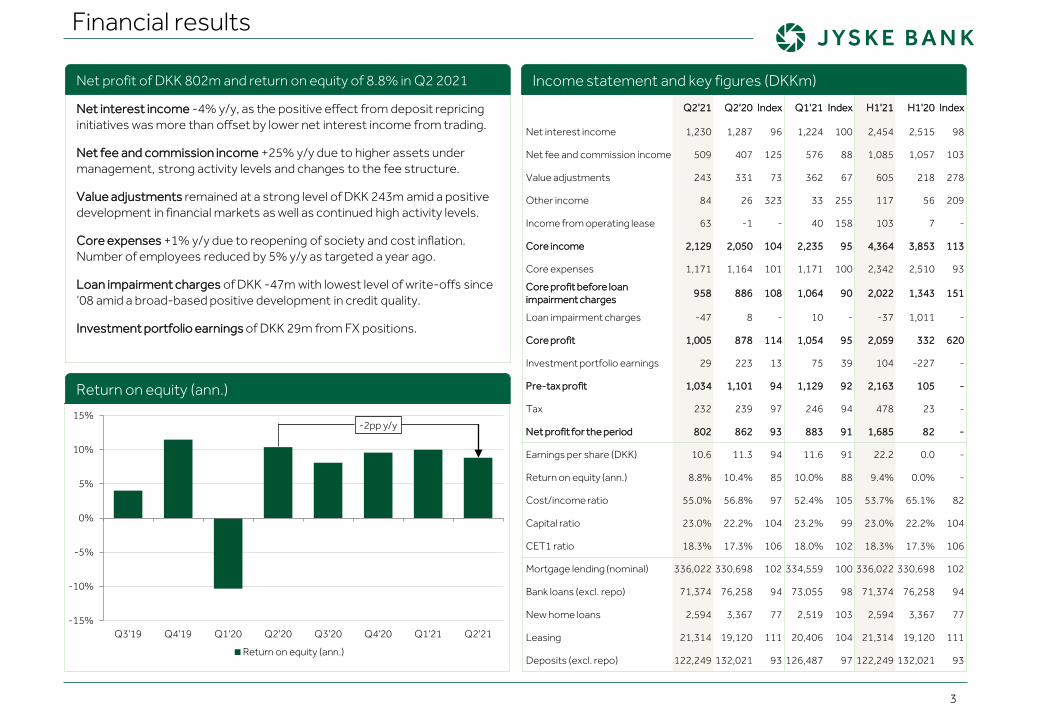
Net interest income -4% y/y, as the positive effect from deposit repricing initiatives was more than offset by lower net interest income from trading.
Net fee and commission income +25% y/y due to higher assets under management, strong activity levels and changes to the fee structure.
Value adjustments remained at a strong level of DKK 243m amid a positive development in financial markets as well as continued high activity levels.
Core expenses +1% y/y due to reopening of society and cost inflation. Number of employees reduced by 5% y/y as targeted a year ago.
Loan impairment charges of DKK -47m with lowest level of write-offs since ‘08 amid a broad-based positive development in credit quality.
Investment portfolio earnings of DKK 29m from FX positions.
Return on equity (ann.)
Net profit of DKK 802m and return on equity of 8.8% in Q2 2021
-15%
-10%
-5%
0%
5%
10%
15%
Q3'19 Q4'19 Q1'20 Q2'20 Q3'20 Q4'20 Q1'21 Q2'21
-2pp y/y
Return on equity (ann.)
Q2'21 Q2'20 Index Q1'21 Index H1'21 H1'20 Index
Net interest income 1,230 1,287 96 1,224 100 2,454 2,515 98
Net fee and commission income 509 407 125 576 88 1,085 1,057 103
Value adjustments 243 331 73 362 67 605 218 278
Other income 84 26 323 33 255 117 56 209
Income from operating lease 63 -1 - 40 158 103 7 -
Core income 2,129 2,050 104 2,235 95 4,364 3,853 113
Core expenses 1,171 1,164 101 1,171 100 2,342 2,510 93
Core profit before loan impairment charges
958 886 108 1,064 90 2,022 1,343 151
Loan impairment charges -47 8 - 10 - -37 1,011 -
Core profit 1,005 878 114 1,054 95 2,059 332 620
Investment portfolio earnings 29 223 13 75 39 104 -227 -
Pre-tax profit 1,034 1,101 94 1,129 92 2,163 105 -
Tax 232 239 97 246 94 478 23 -
Net profit for the period 802 862 93 883 91 1,685 82 -
Earnings per share (DKK) 10.6 11.3 94 11.6 91 22.2 0.0 -
Return on equity (ann.) 8.8% 10.4% 85 10.0% 88 9.4% 0.0% -
Cost/income ratio 55.0% 56.8% 97 52.4% 105 53.7% 65.1% 82
Capital ratio 23.0% 22.2% 104 23.2% 99 23.0% 22.2% 104
CET1 ratio 18.3% 17.3% 106 18.0% 102 18.3% 17.3% 106
Mortgage lending (nominal) 336,022 330,698 102 334,559 100 336,022 330,698 102
Bank loans (excl. repo) 71,374 76,258 94 73,055 98 71,374 76,258 94
New home loans 2,594 3,367 77 2,519 103 2,594 3,367 77
Leasing 21,314 19,120 111 20,406 104 21,314 19,120 111
Deposits (excl. repo) 122,249 132,021 93 126,487 97 122,249 132,021 93
Income statement and key figures (DKKm)
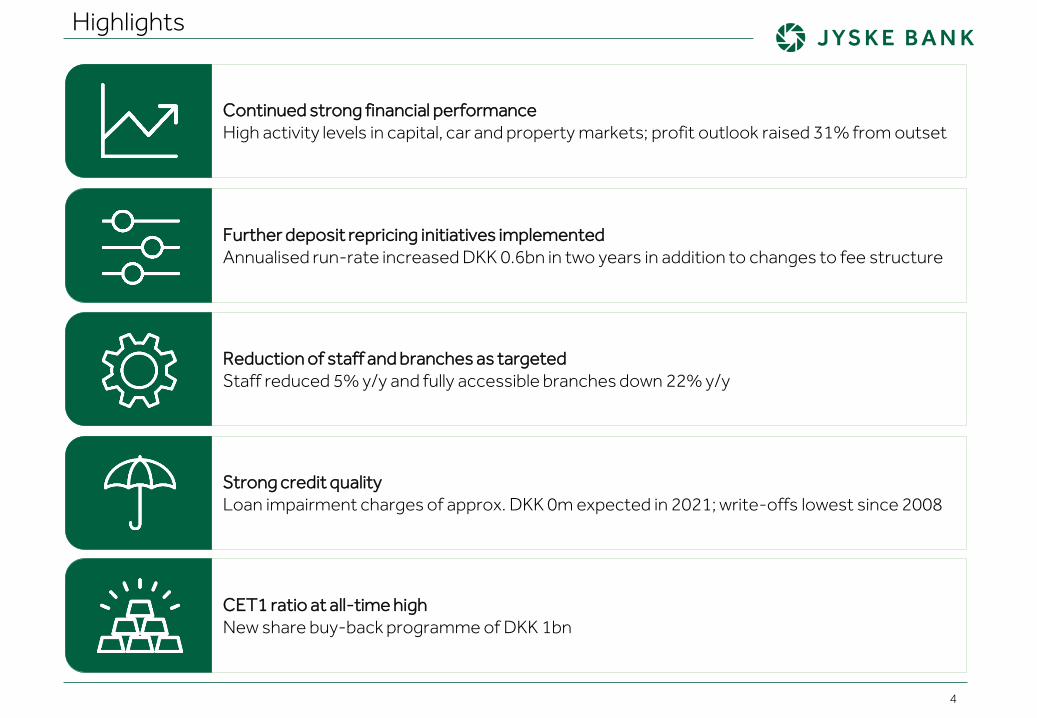
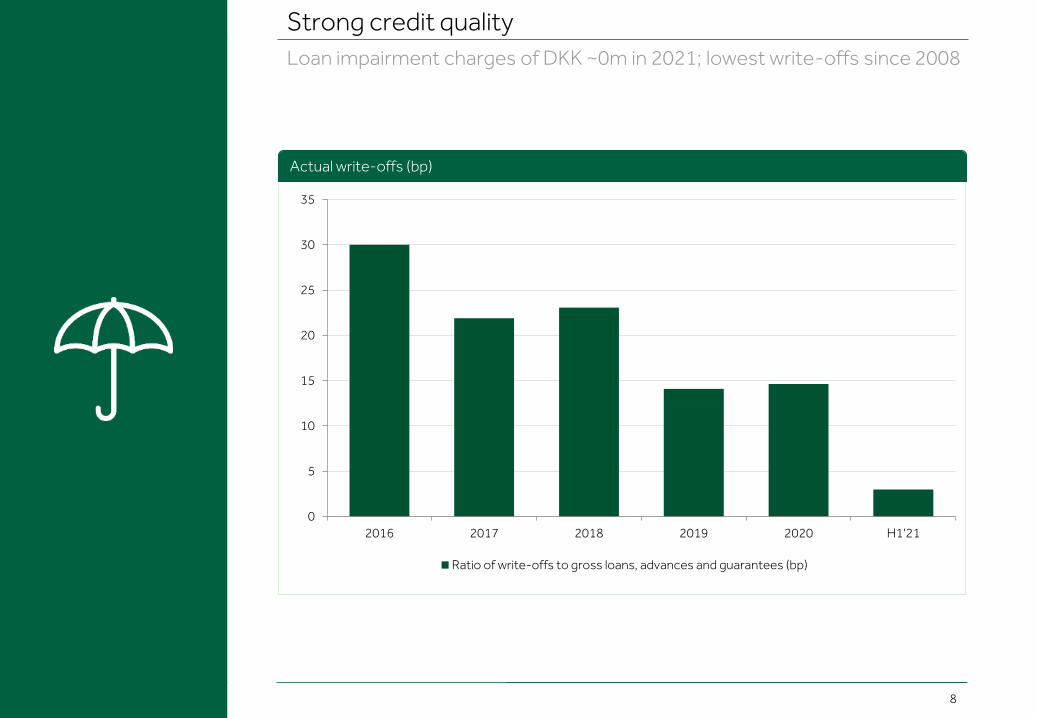
Strong credit qualityLoan impairment charges of approx. DKK 0m expected in 2021; write-offs lowest since 2008
4
Highlights
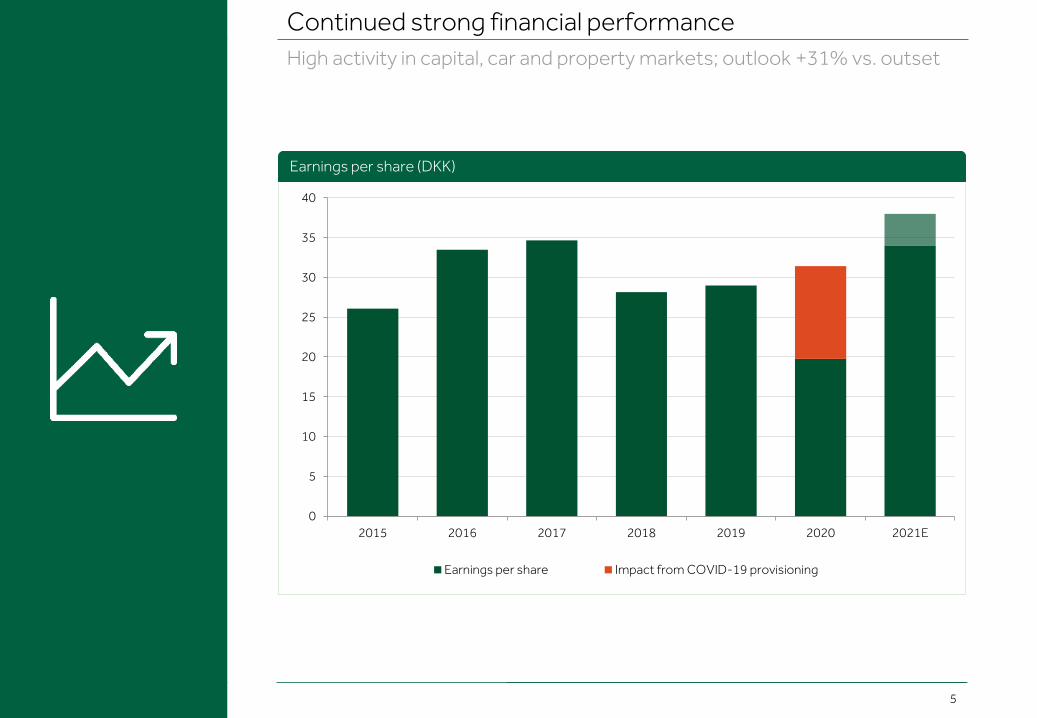
Continued strong financial performanceHigh activity levels in capital, car and property markets; profit outlook raised 31% from outset
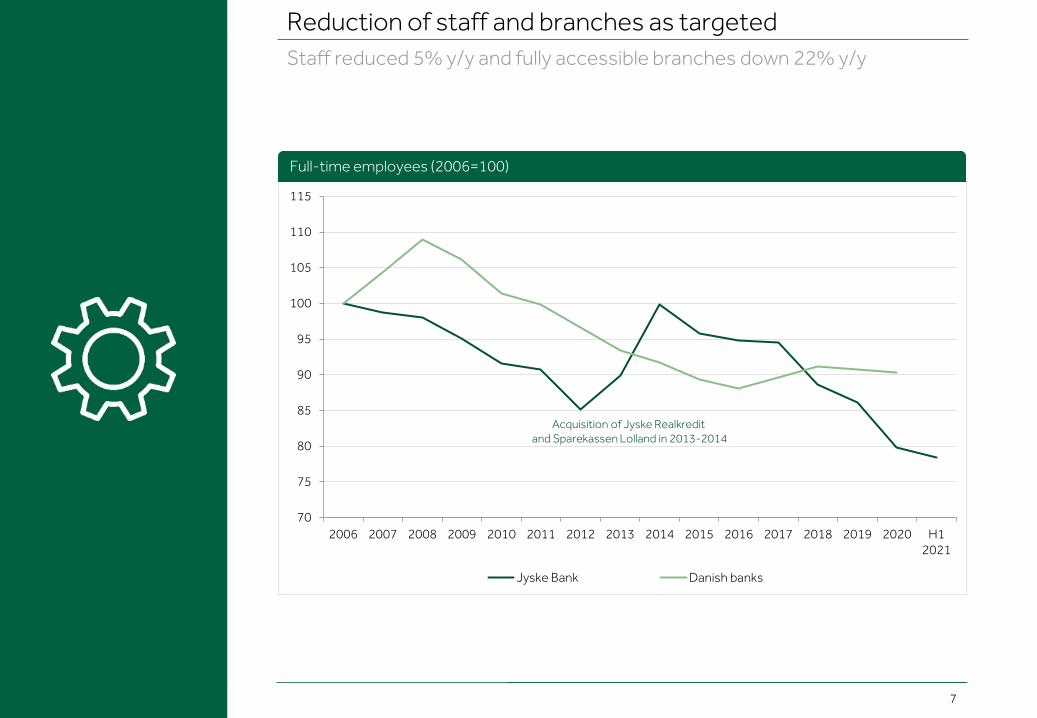
Reduction of staff and branches as targetedStaff reduced 5% y/y and fully accessible branches down 22% y/y
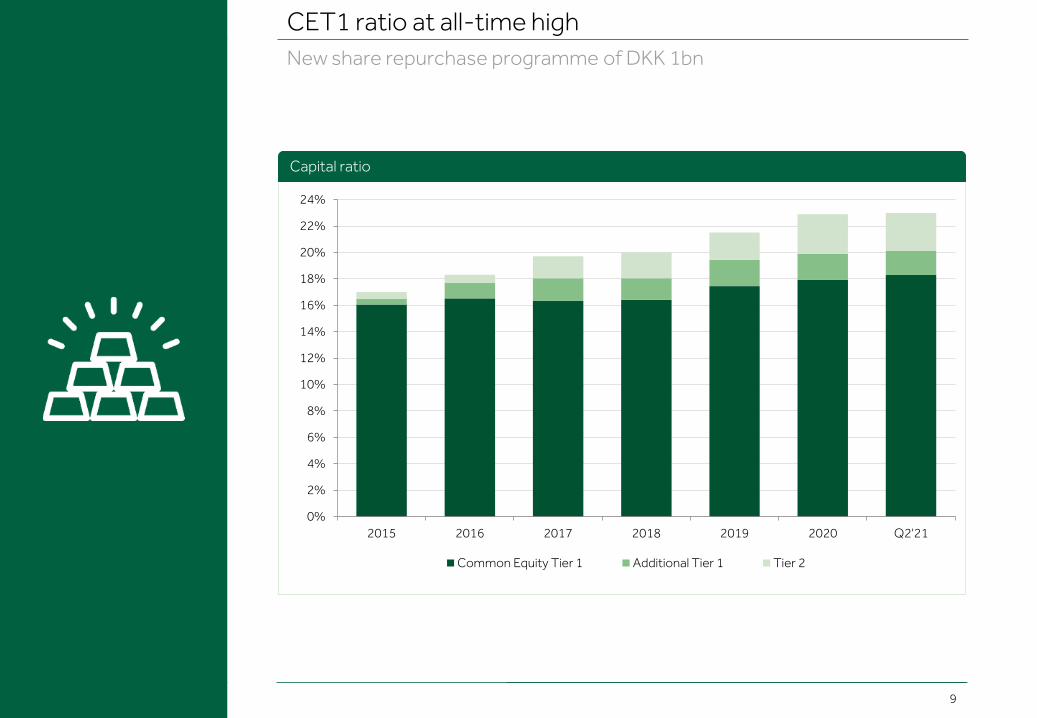
CET1 ratio at all-time highNew share buy-back programme of DKK 1bn
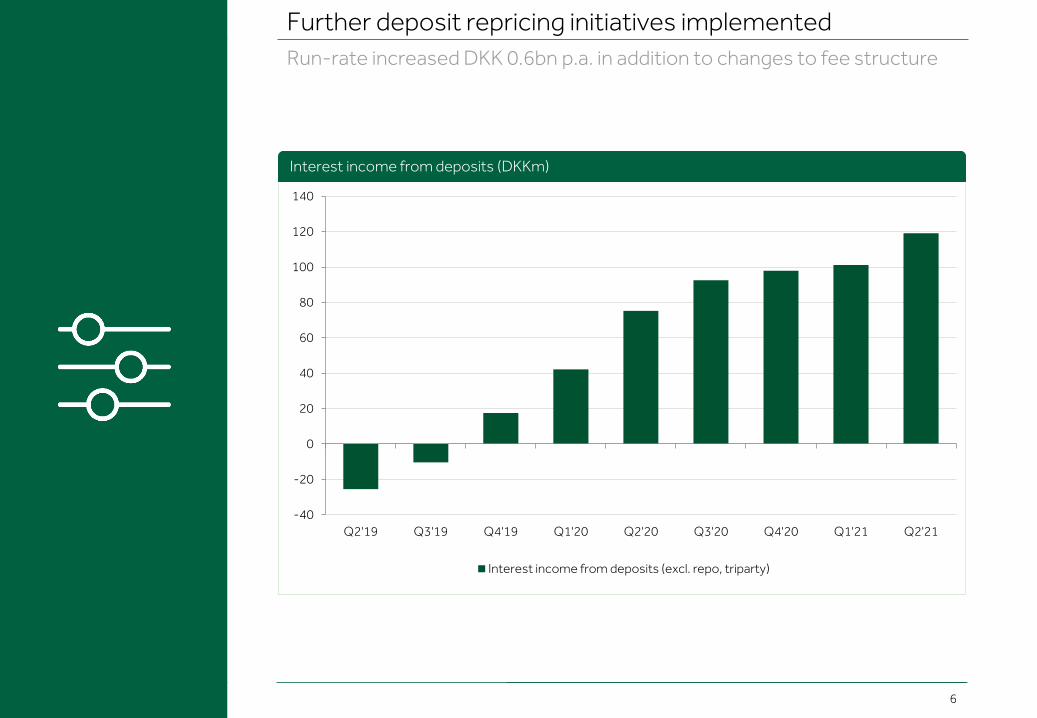
Further deposit repricing initiatives implementedAnnualised run-rate increased DKK 0.6bn in two years in addition to changes to fee structure
5
Continued strong financial performanceHigh activity in capital, car and property markets; outlook +31% vs. outset
0
5
10
15
20
25
30
35
40
2015 2016 2017 2018 2019 2020 2021E
Earnings per share Impact from COVID-19 provisioning
Earnings per share (DKK)
6
Further deposit repricing initiatives implementedRun-rate increased DKK 0.6bn p.a. in addition to changes to fee structure
-40
-20
0
20
40
60
80
100
120
140
Q2'19 Q3'19 Q4'19 Q1'20 Q2'20 Q3'20 Q4'20 Q1'21 Q2'21
Interest income from deposits (excl. repo, triparty)
Interest income from deposits (DKKm)
7
Reduction of staff and branches as targetedStaff reduced 5% y/y and fully accessible branches down 22% y/y
70
75
80
85
90
95
100
105
110
115
2006 2007 2008 2009 2010 2011 2012 2013 2014 2015 2016 2017 2018 2019 2020 H12021
Jyske Bank Danish banks
Acquisition of Jyske Realkredit and Sparekassen Lolland in 2013-2014
Full-time employees (2006=100)
8
Strong credit qualityLoan impairment charges of DKK ~0m in 2021; lowest write-offs since 2008
0
5
10
15
20
25
30
35
2016 2017 2018 2019 2020 H1'21
Ratio of write-offs to gross loans, advances and guarantees (bp)
Actual write-offs (bp)
9
CET1 ratio at all-time highNew share repurchase programme of DKK 1bn
0%
2%
4%
6%
8%
10%
12%
14%
16%
18%
20%
22%
24%
2015 2016 2017 2018 2019 2020 Q2'21
Common Equity Tier 1 Additional Tier 1 Tier 2
Capital ratio
10
Outlook
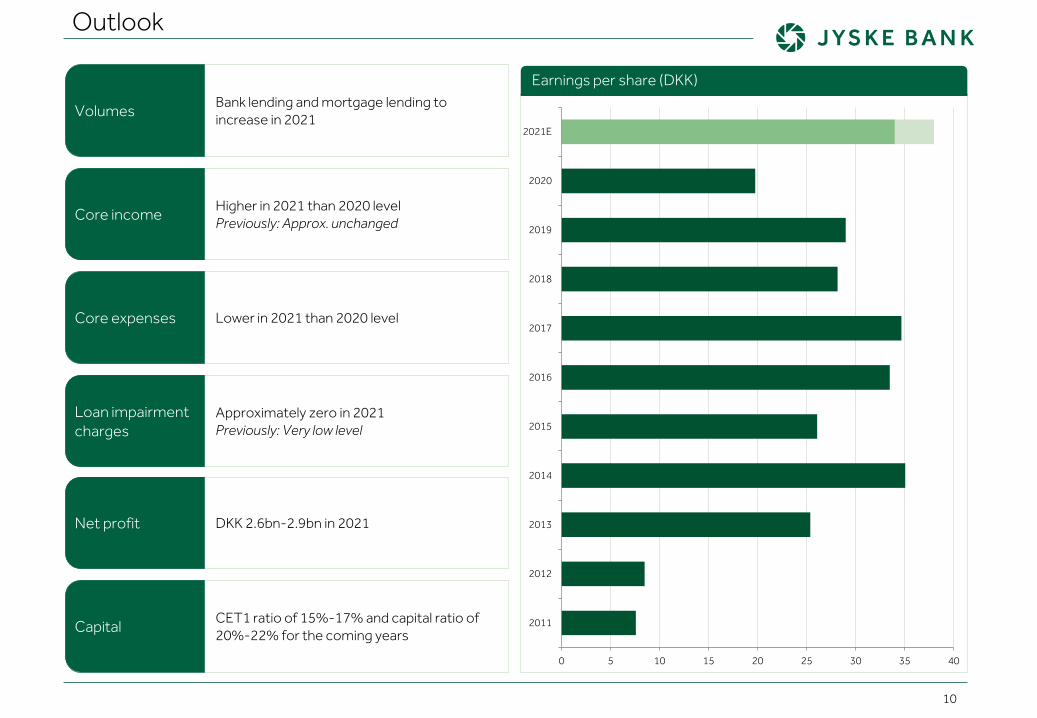
Bank lending and mortgage lending to increase in 2021
Lower in 2021 than 2020 level
CET1 ratio of 15%-17% and capital ratio of 20%-22% for the coming years
Higher in 2021 than 2020 levelPreviously: Approx. unchanged
Approximately zero in 2021Previously: Very low level
DKK 2.6bn-2.9bn in 2021
0 5 10 15 20 25 30 35 40
2011
2012
2013
2014
2015
2016
2017
2018
2019
2020
2021E
Volumes
Core expenses
Capital
Core income
Loan impairmentcharges
Net profit
Earnings per share (DKK)
FinancialsQ2 2021
Summary 02Financials 11Volumes 18Jyske Bank in brief 22Macroeconomics 26Calendar and contacts 30
12
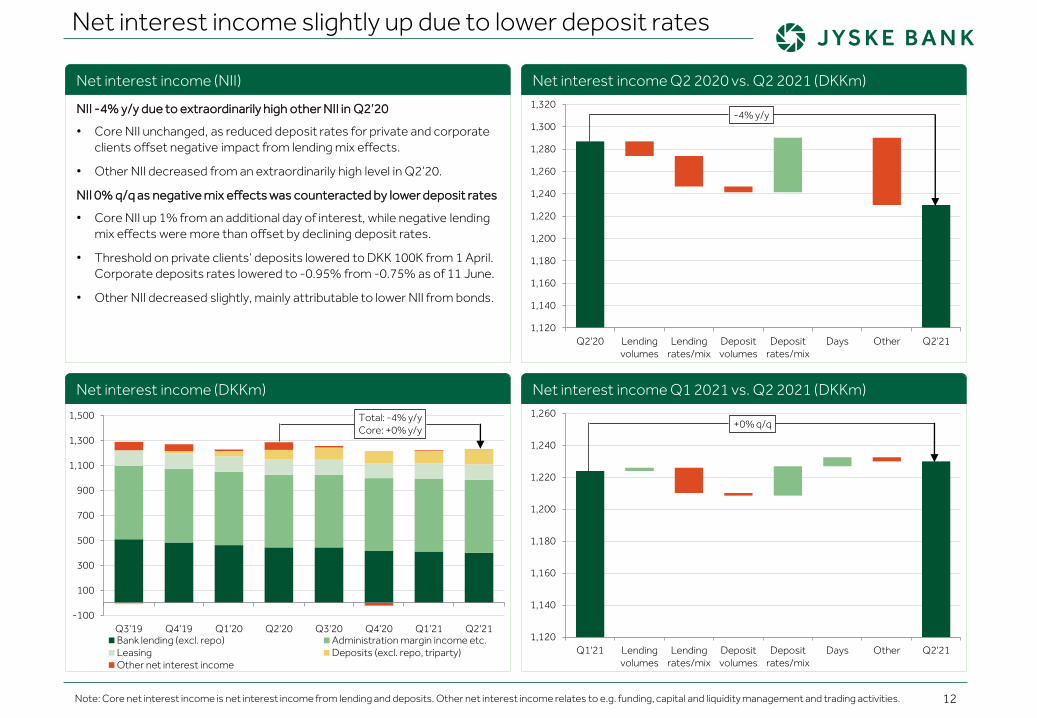
Net interest income slightly up due to lower deposit rates
NII -4% y/y due to extraordinarily high other NII in Q2’20
• Core NII unchanged, as reduced deposit rates for private and corporate clients offset negative impact from lending mix effects.
• Other NII decreased from an extraordinarily high level in Q2’20.
NII 0% q/q as negative mix effects was counteracted by lower deposit rates
• Core NII up 1% from an additional day of interest, while negative lending mix effects were more than offset by declining deposit rates.
• Threshold on private clients’ deposits lowered to DKK 100K from 1 April. Corporate deposits rates lowered to -0.95% from -0.75% as of 11 June.
• Other NII decreased slightly, mainly attributable to lower NII from bonds.
1,120
1,140
1,160
1,180
1,200
1,220
1,240
1,260
1,280
1,300
1,320
Q2'20 Lendingvolumes
Lendingrates/mix
Depositvolumes
Depositrates/mix
Days Other Q2'21
-4% y/y
1,120
1,140
1,160
1,180
1,200
1,220
1,240
1,260
Q1'21 Lendingvolumes
Lendingrates/mix
Depositvolumes
Depositrates/mix
Days Other Q2'21
+0% q/q
Note: Core net interest income is net interest income from lending and deposits. Other net interest income relates to e.g. funding, capital and liquidity management and trading activities.
-100
100
300
500
700
900
1,100
1,300
1,500
Q3'19 Q4'19 Q1'20 Q2'20 Q3'20 Q4'20 Q1'21 Q2'21
Total: -4% y/y Core: +0% y/y
Bank lending (excl. repo) Administration margin income etc.Leasing Deposits (excl. repo, triparty)Other net interest income
Net interest income (NII) Net interest income Q2 2020 vs. Q2 2021 (DKKm)
Net interest income Q1 2021 vs. Q2 2021 (DKKm)Net interest income (DKKm)
13
Net fee income supported by high activity levels
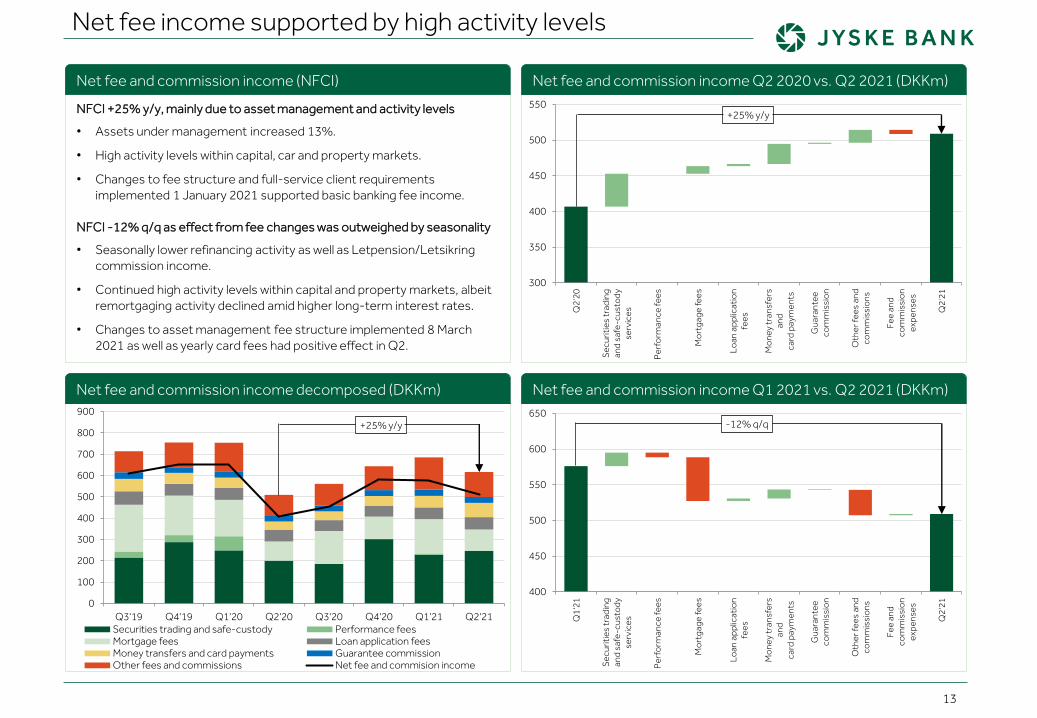
NFCI +25% y/y, mainly due to asset management and activity levels
• Assets under management increased 13%.
• High activity levels within capital, car and property markets.
• Changes to fee structure and full-service client requirementsimplemented 1 January 2021 supported basic banking fee income.
NFCI -12% q/q as effect from fee changes was outweighed by seasonality
• Seasonally lower refinancing activity as well as Letpension/Letsikringcommission income.
• Continued high activity levels within capital and property markets, albeitremortgaging activity declined amid higher long-term interest rates.
• Changes to asset management fee structure implemented 8 March 2021 as well as yearly card fees had positive effect in Q2.
300
350
400
450
500
550
Q2'
20
Secu
ritie
s tr
adin
gan
d sa
fe-c
usto
dyse
rvic
es
Perf
orm
ance
fees
Mor
tgag
e fe
es
Loan
app
licat
ion
fees
Mon
ey tr
ansf
ers
and
card
pay
men
ts
Gua
rant
eeco
mm
issi
on
Oth
er fe
es a
ndco
mm
issi
ons
Fee
and
com
mis
sion
expe
nses
Q2'
21
+25% y/y
400
450
500
550
600
650
Q1'
21
Secu
ritie
s tr
adin
gan
d sa
fe-c
usto
dyse
rvic
es
Perf
orm
ance
fees
Mor
tgag
e fe
es
Loan
app
licat
ion
fees
Mon
ey tr
ansf
ers
and
card
pay
men
ts
Gua
rant
eeco
mm
issi
on
Oth
er fe
es a
ndco
mm
issi
ons
Fee
and
com
mis
sion
expe
nses
Q2'
21
-12% q/q
0
100
200
300
400
500
600
700
800
900
Q3'19 Q4'19 Q1'20 Q2'20 Q3'20 Q4'20 Q1'21 Q2'21
+25% y/y
Securities trading and safe-custody Performance feesMortgage fees Loan application feesMoney transfers and card payments Guarantee commissionOther fees and commissions Net fee and commision income
Net fee and commission income decomposed (DKKm)
Net fee and commission income (NFCI) Net fee and commission income Q2 2020 vs. Q2 2021 (DKKm)
Net fee and commission income Q1 2021 vs. Q2 2021 (DKKm)
14
Value adjustments remained at a high level
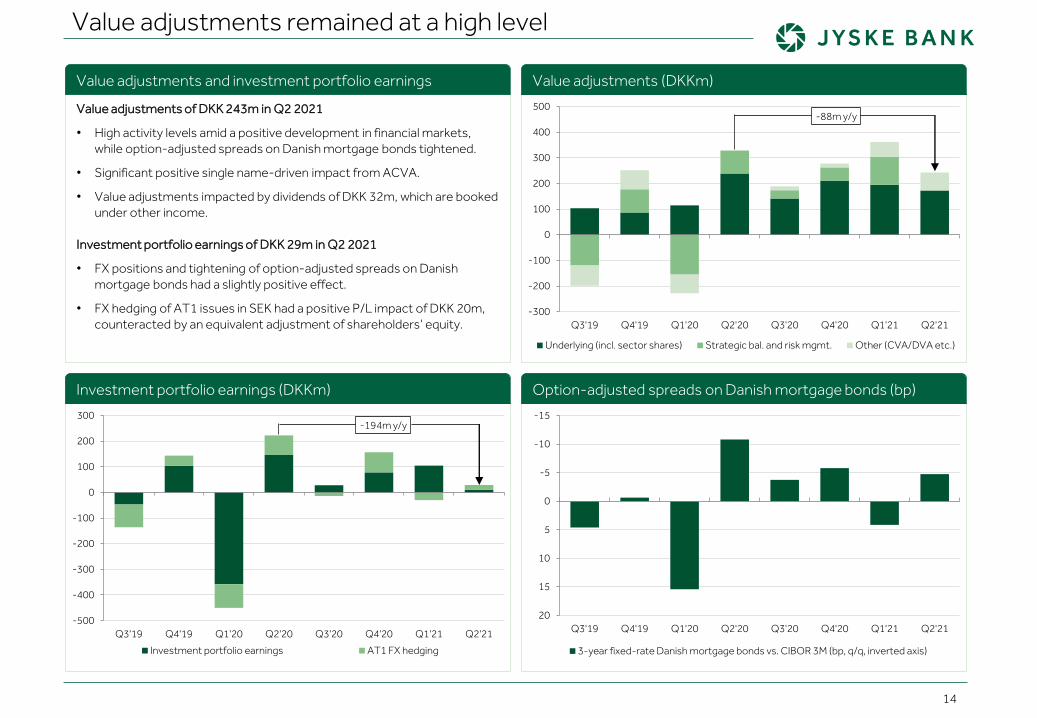
Value adjustments of DKK 243m in Q2 2021
• High activity levels amid a positive development in financial markets, while option-adjusted spreads on Danish mortgage bonds tightened.
• Significant positive single name-driven impact from ACVA.
• Value adjustments impacted by dividends of DKK 32m, which are booked under other income.
Investment portfolio earnings of DKK 29m in Q2 2021
• FX positions and tightening of option-adjusted spreads on Danish mortgage bonds had a slightly positive effect.
• FX hedging of AT1 issues in SEK had a positive P/L impact of DKK 20m, counteracted by an equivalent adjustment of shareholders’ equity.
-15
-10
-5
0
5
10
15
20Q3'19 Q4'19 Q1'20 Q2'20 Q3'20 Q4'20 Q1'21 Q2'21
3-year fixed-rate Danish mortgage bonds vs. CIBOR 3M (bp, q/q, inverted axis)
-500
-400
-300
-200
-100
0
100
200
300
Q3'19 Q4'19 Q1'20 Q2'20 Q3'20 Q4'20 Q1'21 Q2'21
-194m y/y
Investment portfolio earnings AT1 FX hedging
-300
-200
-100
0
100
200
300
400
500
Q3'19 Q4'19 Q1'20 Q2'20 Q3'20 Q4'20 Q1'21 Q2'21
-88m y/y
Underlying (incl. sector shares) Strategic bal. and risk mgmt. Other (CVA/DVA etc.)
Value adjustments and investment portfolio earnings Value adjustments (DKKm)
Investment portfolio earnings (DKKm) Option-adjusted spreads on Danish mortgage bonds (bp)
15
Core expenses stable amid continued headcount reduction
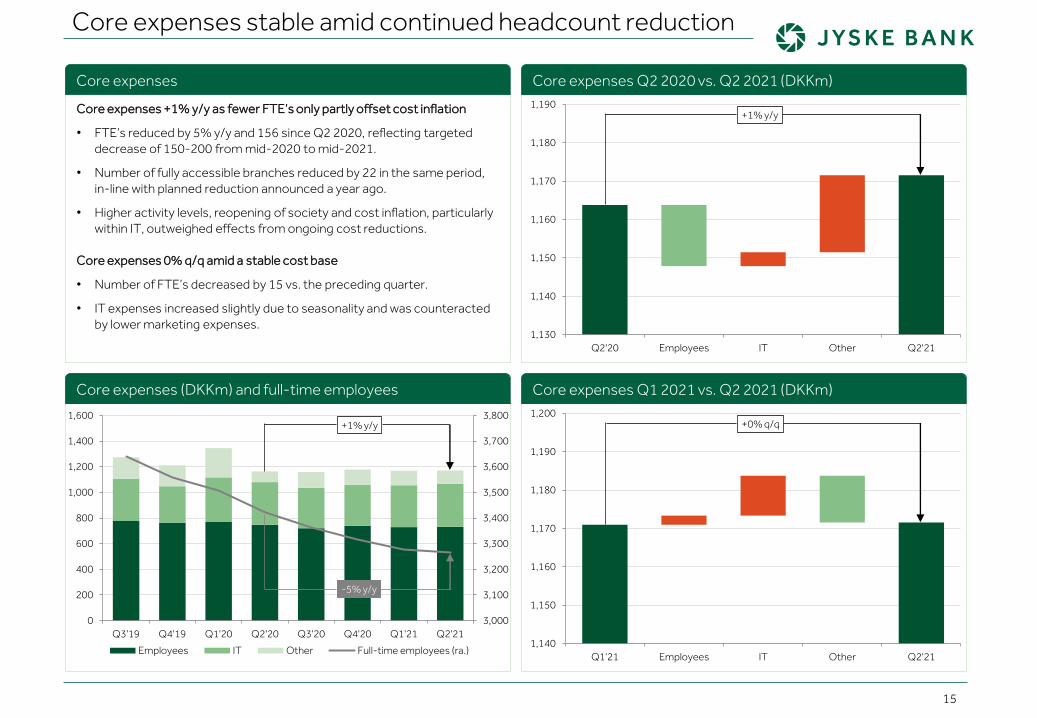
Core expenses +1% y/y as fewer FTE’s only partly offset cost inflation
• FTE’s reduced by 5% y/y and 156 since Q2 2020, reflecting targeted decrease of 150-200 from mid-2020 to mid-2021.
• Number of fully accessible branches reduced by 22 in the same period, in-line with planned reduction announced a year ago.
• Higher activity levels, reopening of society and cost inflation, particularly within IT, outweighed effects from ongoing cost reductions.
Core expenses 0% q/q amid a stable cost base
• Number of FTE’s decreased by 15 vs. the preceding quarter.
• IT expenses increased slightly due to seasonality and was counteracted by lower marketing expenses.
3,000
3,100
3,200
3,300
3,400
3,500
3,600
3,700
3,800
0
200
400
600
800
1,000
1,200
1,400
1,600
Q3'19 Q4'19 Q1'20 Q2'20 Q3'20 Q4'20 Q1'21 Q2'21
+1% y/y
-5% y/y
Employees IT Other Full-time employees (ra.)
1,130
1,140
1,150
1,160
1,170
1,180
1,190
Q2'20 Employees IT Other Q2'21
+1% y/y
1,140
1,150
1,160
1,170
1,180
1,190
1,200
Q1'21 Employees IT Other Q2'21
+0% q/q
Core expenses
Core expenses (DKKm) and full-time employees Core expenses Q1 2021 vs. Q2 2021 (DKKm)
Core expenses Q2 2020 vs. Q2 2021 (DKKm)
16
Solid credit quality with write-offs at lowest level since ‘08
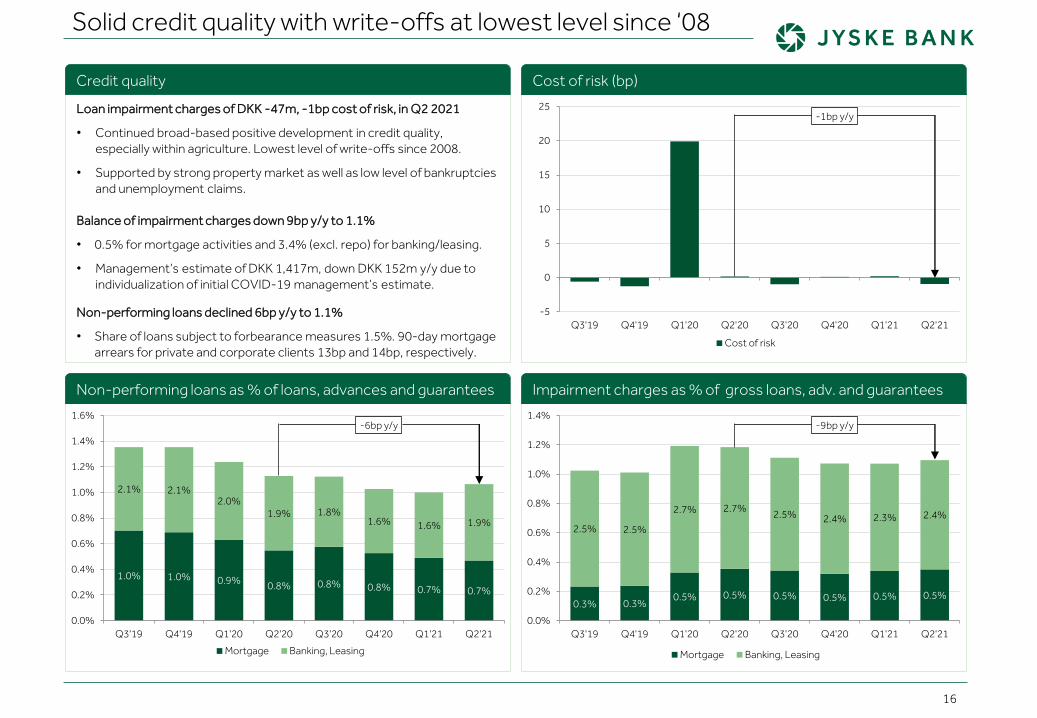
Loan impairment charges of DKK -47m, -1bp cost of risk, in Q2 2021
• Continued broad-based positive development in credit quality, especially within agriculture. Lowest level of write-offs since 2008.
• Supported by strong property market as well as low level of bankruptciesand unemployment claims.
Balance of impairment charges down 9bp y/y to 1.1%
• 0.5% for mortgage activities and 3.4% (excl. repo) for banking/leasing.
• Management’s estimate of DKK 1,417m, down DKK 152m y/y due to individualization of initial COVID-19 management’s estimate.
Non-performing loans declined 6bp y/y to 1.1%
• Share of loans subject to forbearance measures 1.5%. 90-day mortgage arrears for private and corporate clients 13bp and 14bp, respectively.
0.3% 0.3%0.5% 0.5% 0.5% 0.5% 0.5% 0.5%
2.5% 2.5%
2.7% 2.7% 2.5% 2.4% 2.3% 2.4%
0.0%
0.2%
0.4%
0.6%
0.8%
1.0%
1.2%
1.4%
Q3'19 Q4'19 Q1'20 Q2'20 Q3'20 Q4'20 Q1'21 Q2'21
-9bp y/y
Mortgage Banking, Leasing
1.0% 1.0% 0.9% 0.8% 0.8% 0.8% 0.7% 0.7%
2.1% 2.1%2.0%
1.9% 1.8%1.6% 1.6% 1.9%
0.0%
0.2%
0.4%
0.6%
0.8%
1.0%
1.2%
1.4%
1.6%
Q3'19 Q4'19 Q1'20 Q2'20 Q3'20 Q4'20 Q1'21 Q2'21
-6bp y/y
Mortgage Banking, Leasing
Credit quality Cost of risk (bp)
Impairment charges as % of gross loans, adv. and guaranteesNon-performing loans as % of loans, advances and guarantees
-5
0
5
10
15
20
25
Q3'19 Q4'19 Q1'20 Q2'20 Q3'20 Q4'20 Q1'21 Q2'21
-1bp y/y
Cost of risk
17
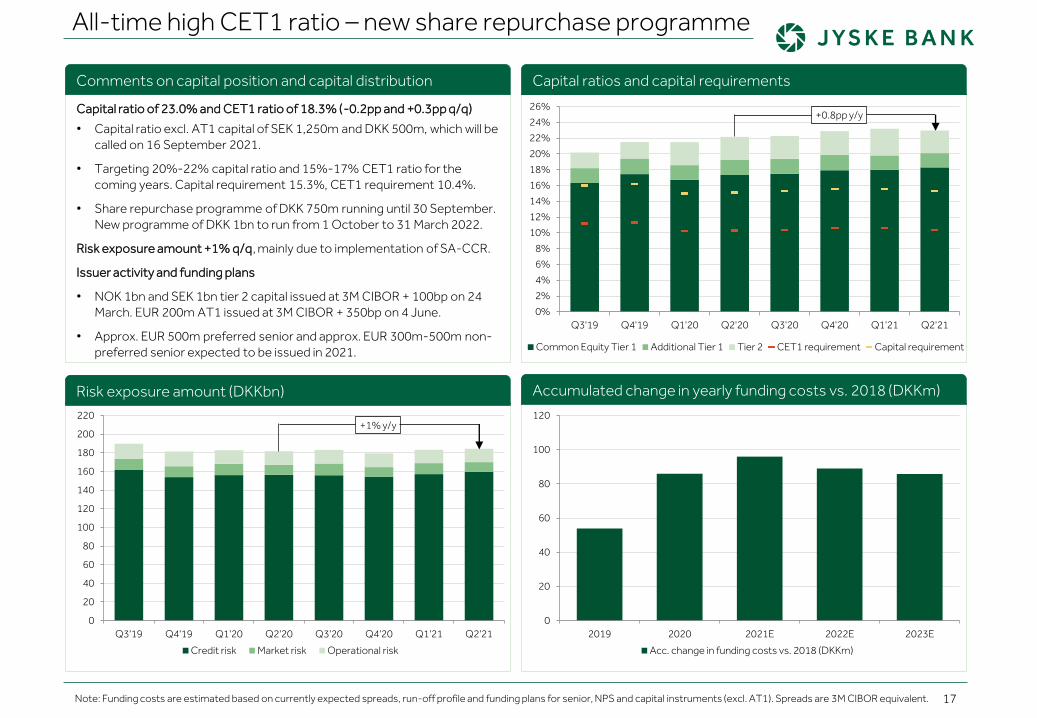
All-time high CET1 ratio – new share repurchase programme
Capital ratio of 23.0% and CET1 ratio of 18.3% (-0.2pp and +0.3pp q/q)
• Capital ratio excl. AT1 capital of SEK 1,250m and DKK 500m, which will be called on 16 September 2021.
• Targeting 20%-22% capital ratio and 15%-17% CET1 ratio for the coming years. Capital requirement 15.3%, CET1 requirement 10.4%.
• Share repurchase programme of DKK 750m running until 30 September. New programme of DKK 1bn to run from 1 October to 31 March 2022.
Risk exposure amount +1% q/q, mainly due to implementation of SA-CCR.
Issuer activity and funding plans
• NOK 1bn and SEK 1bn tier 2 capital issued at 3M CIBOR + 100bp on 24 March. EUR 200m AT1 issued at 3M CIBOR + 350bp on 4 June.
• Approx. EUR 500m preferred senior and approx. EUR 300m-500m non-preferred senior expected to be issued in 2021.
0%2%4%6%8%
10%12%14%16%18%20%22%24%26%
Q3'19 Q4'19 Q1'20 Q2'20 Q3'20 Q4'20 Q1'21 Q2'21
+0.8pp y/y
Common Equity Tier 1 Additional Tier 1 Tier 2 CET1 requirement Capital requirement
0
20
40
60
80
100
120
140
160
180
200
220
Q3'19 Q4'19 Q1'20 Q2'20 Q3'20 Q4'20 Q1'21 Q2'21
+1% y/y
Credit risk Market risk Operational risk
Comments on capital position and capital distribution Capital ratios and capital requirements
0
20
40
60
80
100
120
2019 2020 2021E 2022E 2023E
Acc. change in funding costs vs. 2018 (DKKm)
Note: Funding costs are estimated based on currently expected spreads, run-off profile and funding plans for senior, NPS and capital instruments (excl. AT1). Spreads are 3M CIBOR equivalent.
Risk exposure amount (DKKbn) Accumulated change in yearly funding costs vs. 2018 (DKKm)
VolumesQ2 2021
Summary 02Financials 11Volumes 18Jyske Bank in brief 22Macroeconomics 26Calendar and contacts 30
19
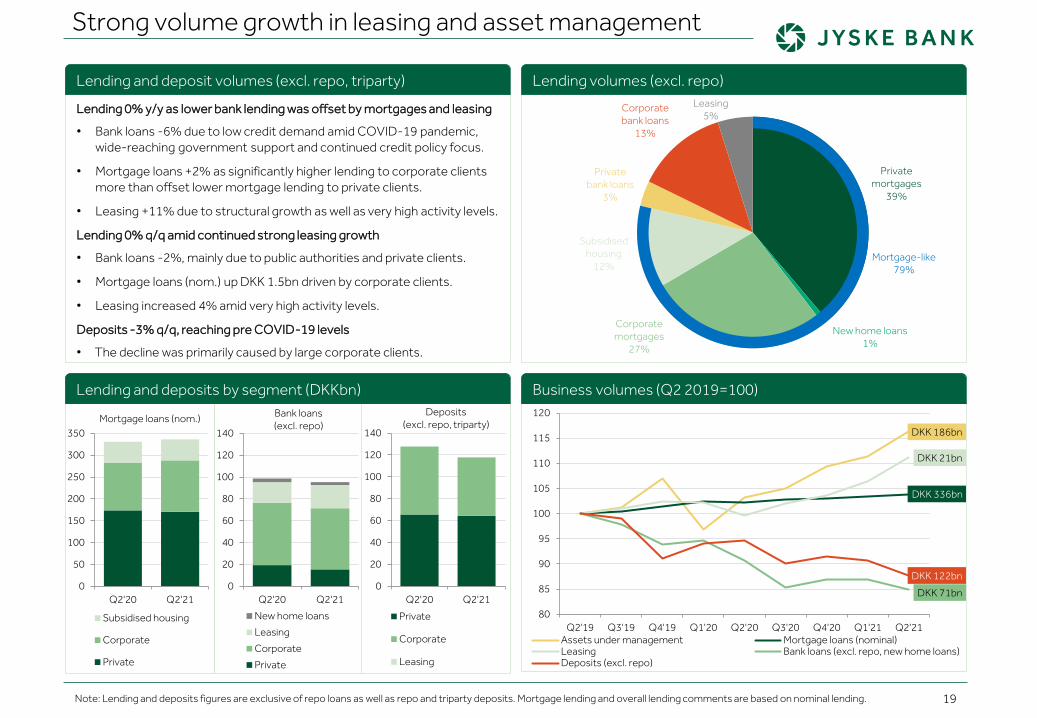
Strong volume growth in leasing and asset management
Lending 0% y/y as lower bank lending was offset by mortgages and leasing
• Bank loans -6% due to low credit demand amid COVID-19 pandemic, wide-reaching government support and continued credit policy focus.
• Mortgage loans +2% as significantly higher lending to corporate clients more than offset lower mortgage lending to private clients.
• Leasing +11% due to structural growth as well as very high activity levels.
Lending 0% q/q amid continued strong leasing growth
• Bank loans -2%, mainly due to public authorities and private clients.
• Mortgage loans (nom.) up DKK 1.5bn driven by corporate clients.
• Leasing increased 4% amid very high activity levels.
Deposits -3% q/q, reaching pre COVID-19 levels
• The decline was primarily caused by large corporate clients.
0
20
40
60
80
100
120
140
Q2'20 Q2'21
Tus
inde
Bank loans(excl. repo)
New home loans
Leasing
Corporate
Private
0
20
40
60
80
100
120
140
Q2'20 Q2'21
Tus
inde
Deposits(excl. repo, triparty)
Private
Corporate
Leasing
0
50
100
150
200
250
300
350
Q2'20 Q2'21
Tus
inde
Mortgage loans (nom.)
Subsidised housing
Corporate
Private
Note: Lending and deposits figures are exclusive of repo loans as well as repo and triparty deposits. Mortgage lending and overall lending comments are based on nominal lending.
Lending and deposit volumes (excl. repo, triparty)
Private mortgages
39%
New home loans1%
Corporate mortgages
27%
Subsidised housing
12%
Privatebank loans
3%
Corporatebank loans
13%
Leasing5%
Mortgage-like79%
Lending and deposits by segment (DKKbn)
Lending volumes (excl. repo)
Business volumes (Q2 2019=100)
DKK 186bn
DKK 336bn
DKK 21bn
DKK 71bn
DKK 122bn
80
85
90
95
100
105
110
115
120
Q2'19 Q3'19 Q4'19 Q1'20 Q2'20 Q3'20 Q4'20 Q1'21 Q2'21Assets under management Mortgage loans (nominal)Leasing Bank loans (excl. repo, new home loans)Deposits (excl. repo)
20
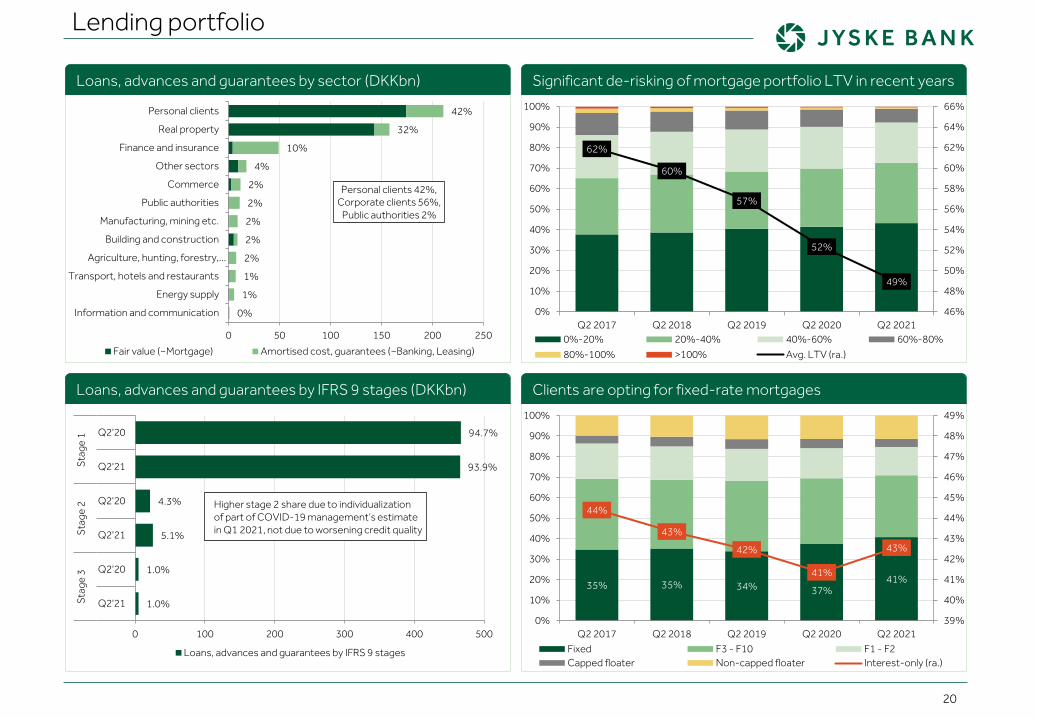
Lending portfolio
94.7%
93.9%
4.3%
5.1%
1.0%
1.0%
0 100 200 300 400 500
Q2'20
Q2'21
Q2'20
Q2'21
Q2'20
Q2'21
Stag
e 1
Stag
e 2
Stag
e 3
Loans, advances and guarantees by IFRS 9 stages
Higher stage 2 share due to individualizationof part of COVID-19 management’s estimatein Q1 2021, not due to worsening credit quality
Loans, advances and guarantees by IFRS 9 stages (DKKbn)
Loans, advances and guarantees by sector (DKKbn) Significant de-risking of mortgage portfolio LTV in recent years
62%
60%
57%
52%
49%
46%
48%
50%
52%
54%
56%
58%
60%
62%
64%
66%
0%
10%
20%
30%
40%
50%
60%
70%
80%
90%
100%
Q2 2017 Q2 2018 Q2 2019 Q2 2020 Q2 20210%-20% 20%-40% 40%-60% 60%-80%80%-100% >100% Avg. LTV (ra.)
35% 35% 34% 37%41%
44%
43%
42%
41%
43%
39%
40%
41%
42%
43%
44%
45%
46%
47%
48%
49%
0%
10%
20%
30%
40%
50%
60%
70%
80%
90%
100%
Q2 2017 Q2 2018 Q2 2019 Q2 2020 Q2 2021Fixed F3 - F10 F1 - F2Capped floater Non-capped floater Interest-only (ra.)
Clients are opting for fixed-rate mortgages
42%
32%
10%
4%
2%
2%
2%
2%
2%
1%
1%
0%
0 50 100 150 200 250
Personal clients
Real property
Finance and insurance
Other sectors
Commerce
Public authorities
Manufacturing, mining etc.
Building and construction
Agriculture, hunting, forestry,…
Transport, hotels and restaurants
Energy supply
Information and communication
Personal clients 42%,Corporate clients 56%,
Public authorities 2%
Fair value (~Mortgage) Amortised cost, guarantees (~Banking, Leasing)
21
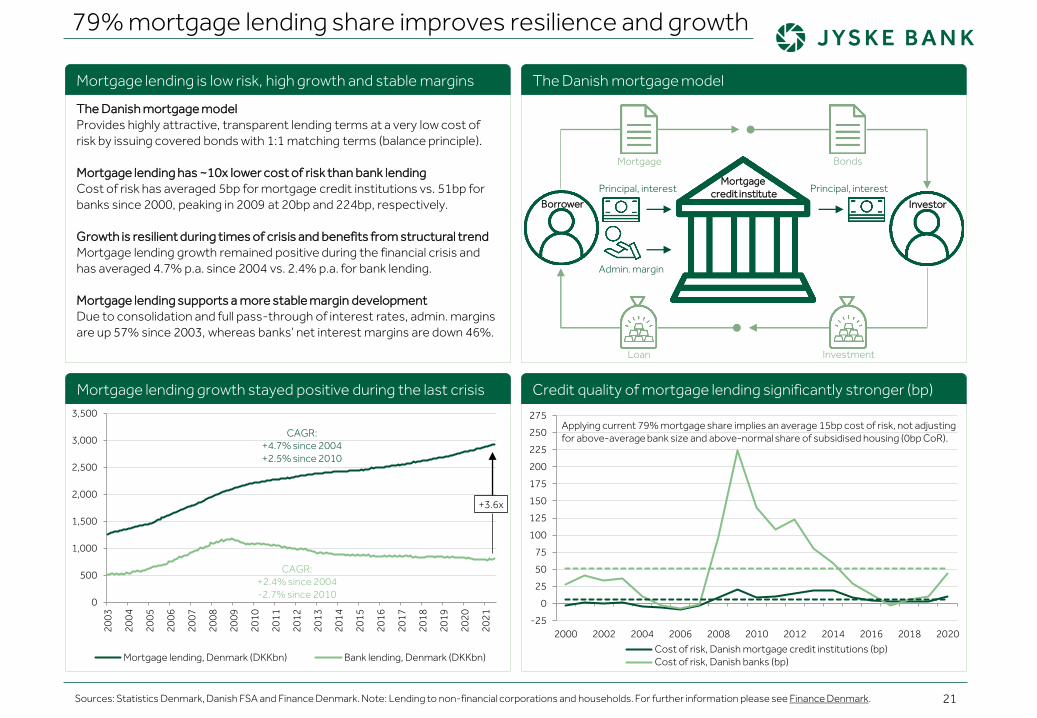
79% mortgage lending share improves resilience and growth
The Danish mortgage modelProvides highly attractive, transparent lending terms at a very low cost of risk by issuing covered bonds with 1:1 matching terms (balance principle).
Mortgage lending has ~10x lower cost of risk than bank lendingCost of risk has averaged 5bp for mortgage credit institutions vs. 51bp for banks since 2000, peaking in 2009 at 20bp and 224bp, respectively.
Growth is resilient during times of crisis and benefits from structural trendMortgage lending growth remained positive during the financial crisis and has averaged 4.7% p.a. since 2004 vs. 2.4% p.a. for bank lending.
Mortgage lending supports a more stable margin developmentDue to consolidation and full pass-through of interest rates, admin. margins are up 57% since 2003, whereas banks’ net interest margins are down 46%.
Sources: Statistics Denmark, Danish FSA and Finance Denmark. Note: Lending to non-financial corporations and households. For further information please see Finance Denmark.
Mortgage lending is low risk, high growth and stable margins The Danish mortgage model
Mortgage Bonds
Principal, interest
Admin. margin
Principal, interestMortgage
credit instituteBorrower Investor
Loan Investment
-25
0
25
50
75
100
125
150
175
200
225
250
275
2000 2002 2004 2006 2008 2010 2012 2014 2016 2018 2020Cost of risk, Danish mortgage credit institutions (bp)Cost of risk, Danish banks (bp)
Applying current 79% mortgage share implies an average 15bp cost of risk, not adjustingfor above-average bank size and above-normal share of subsidised housing (0bp CoR).
Credit quality of mortgage lending significantly stronger (bp)
0
500
1,000
1,500
2,000
2,500
3,000
3,500
2003
2004
2005
2006
2007
2008
2009
2010
2011
2012
2013
2014
2015
2016
2017
2018
2019
2020
2021
CAGR: +4.7% since 2004 +2.5% since 2010
Tus
inde
+3.6x
CAGR: +2.4% since 2004 -2.7% since 2010
Mortgage lending, Denmark (DKKbn) Bank lending, Denmark (DKKbn)
Mortgage lending growth stayed positive during the last crisis
Jyske Bank in brief
Summary 02Financials 11Volumes 18Jyske Bank in brief 22Macroeconomics 26Calendar and contacts 30
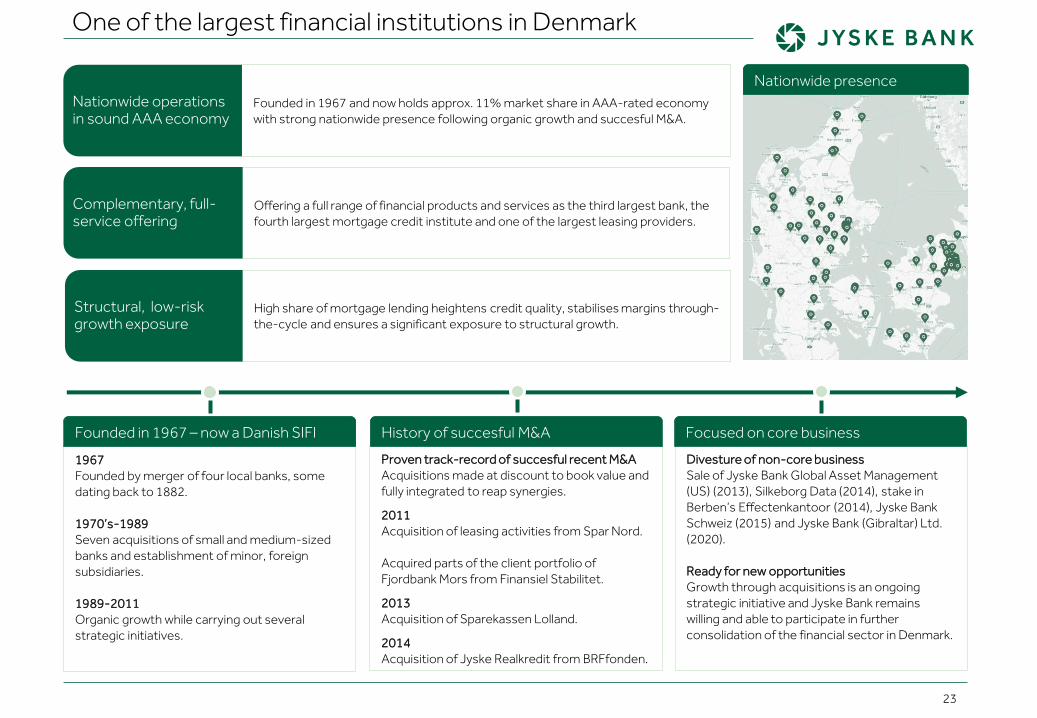
Founded in 1967 and now holds approx. 11% market share in AAA-rated economywith strong nationwide presence following organic growth and succesful M&A.
Offering a full range of financial products and services as the third largest bank, the fourth largest mortgage credit institute and one of the largest leasing providers.
High share of mortgage lending heightens credit quality, stabilises margins through-the-cycle and ensures a significant exposure to structural growth.
Divesture of non-core businessSale of Jyske Bank Global Asset Management (US) (2013), Silkeborg Data (2014), stake in Berben’s Effectenkantoor (2014), Jyske Bank Schweiz (2015) and Jyske Bank (Gibraltar) Ltd. (2020).
Ready for new opportunitiesGrowth through acquisitions is an ongoing strategic initiative and Jyske Bank remains willing and able to participate in further consolidation of the financial sector in Denmark.
Proven track-record of succesful recent M&AAcquisitions made at discount to book value and fully integrated to reap synergies.
2011Acquisition of leasing activities from Spar Nord.
Acquired parts of the client portfolio of Fjordbank Mors from Finansiel Stabilitet.
2013Acquisition of Sparekassen Lolland.
2014Acquisition of Jyske Realkredit from BRFfonden.
1967Founded by merger of four local banks, somedating back to 1882.
1970’s-1989Seven acquisitions of small and medium-sizedbanks and establishment of minor, foreignsubsidiaries.
1989-2011Organic growth while carrying out severalstrategic initiatives.
23
One of the largest financial institutions in Denmark
Nationwide operations in sound AAA economy
Complementary, full-service offering
Structural, low-risk growth exposure
Founded in 1967 – now a Danish SIFI History of succesful M&A Focused on core business
Nationwide presence
24
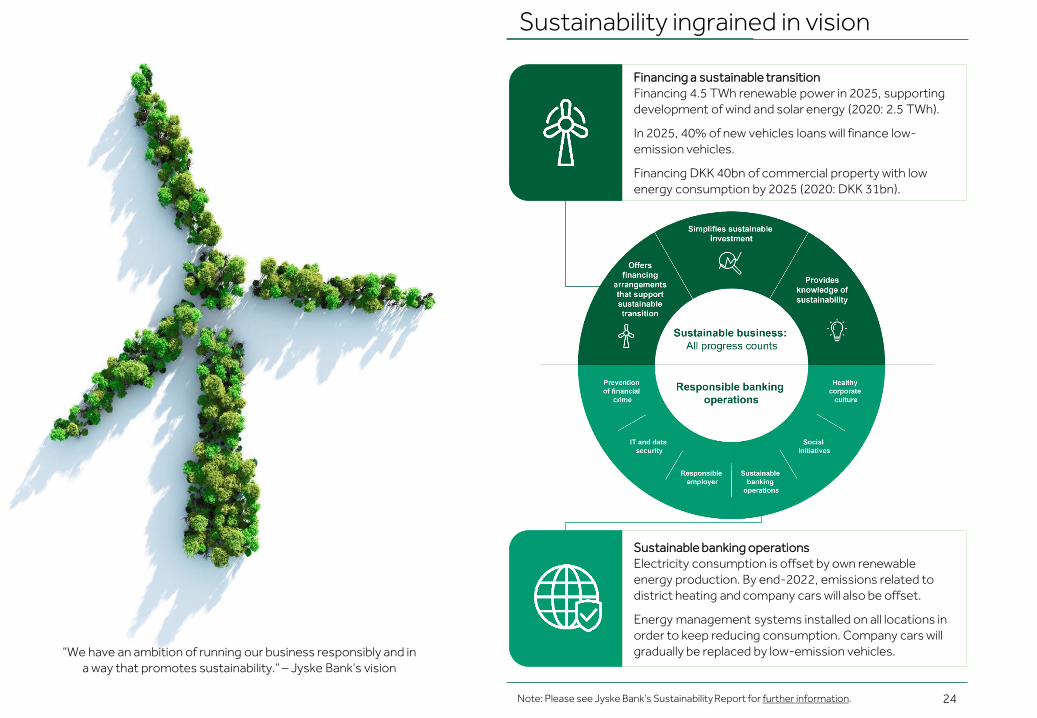
Sustainability ingrained in vision
Financing a sustainable transitionFinancing 4.5 TWh renewable power in 2025, supporting development of wind and solar energy (2020: 2.5 TWh).
In 2025, 40% of new vehicles loans will finance low-emission vehicles.
Financing DKK 40bn of commercial property with low energy consumption by 2025 (2020: DKK 31bn).
Sustainable banking operationsElectricity consumption is offset by own renewable energy production. By end-2022, emissions related to district heating and company cars will also be offset.
Energy management systems installed on all locations in order to keep reducing consumption. Company cars will gradually be replaced by low-emission vehicles.
Note: Please see Jyske Bank’s Sustainability Report for further information.
“We have an ambition of running our business responsibly and in a way that promotes sustainability.” – Jyske Bank’s vision
Macroeconomics
Summary 02Financials 11Volumes 18Jyske Bank in brief 22Macroeconomics 26Calendar and contacts 30
26
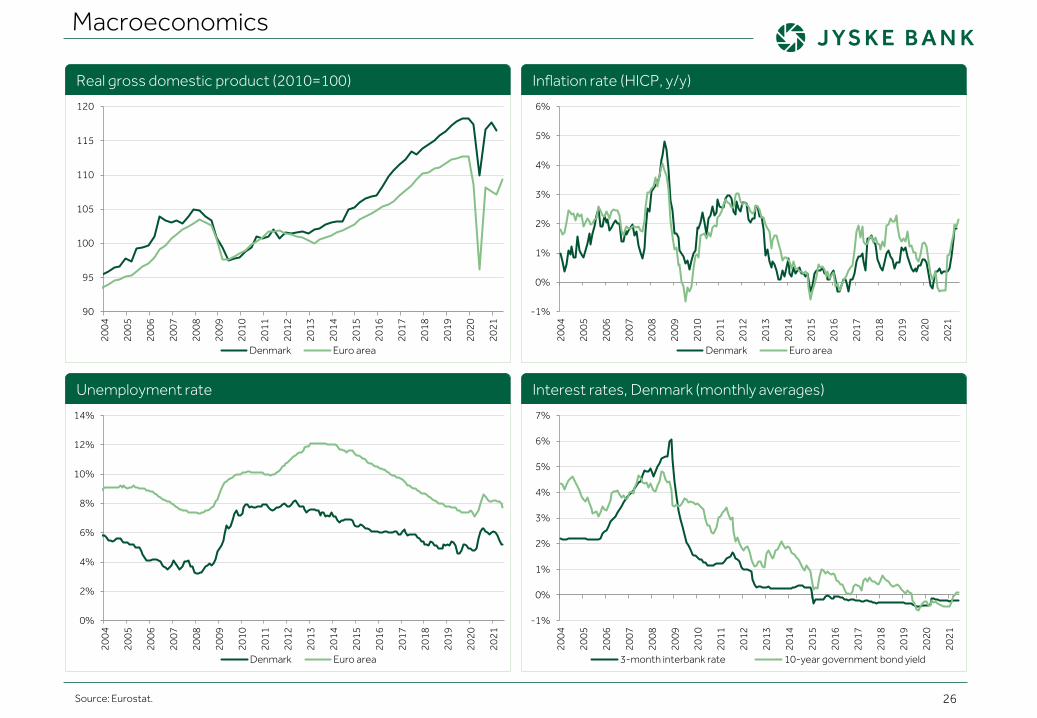
Macroeconomics
Source: Eurostat.
90
95
100
105
110
115
12020
04
2005
2006
2007
2008
2009
2010
2011
2012
2013
2014
2015
2016
2017
2018
2019
2020
2021
Denmark Euro area
-1%
0%
1%
2%
3%
4%
5%
6%
2004
2005
2006
2007
2008
2009
2010
2011
2012
2013
2014
2015
2016
2017
2018
2019
2020
2021
Denmark Euro area
0%
2%
4%
6%
8%
10%
12%
14%
2004
2005
2006
2007
2008
2009
2010
2011
2012
2013
2014
2015
2016
2017
2018
2019
2020
2021
Denmark Euro area
-1%
0%
1%
2%
3%
4%
5%
6%
7%
2004
2005
2006
2007
2008
2009
2010
2011
2012
2013
2014
2015
2016
2017
2018
2019
2020
2021
3-month interbank rate 10-year government bond yield
Interest rates, Denmark (monthly averages)
Inflation rate (HICP, y/y)
Unemployment rate
Real gross domestic product (2010=100)
27
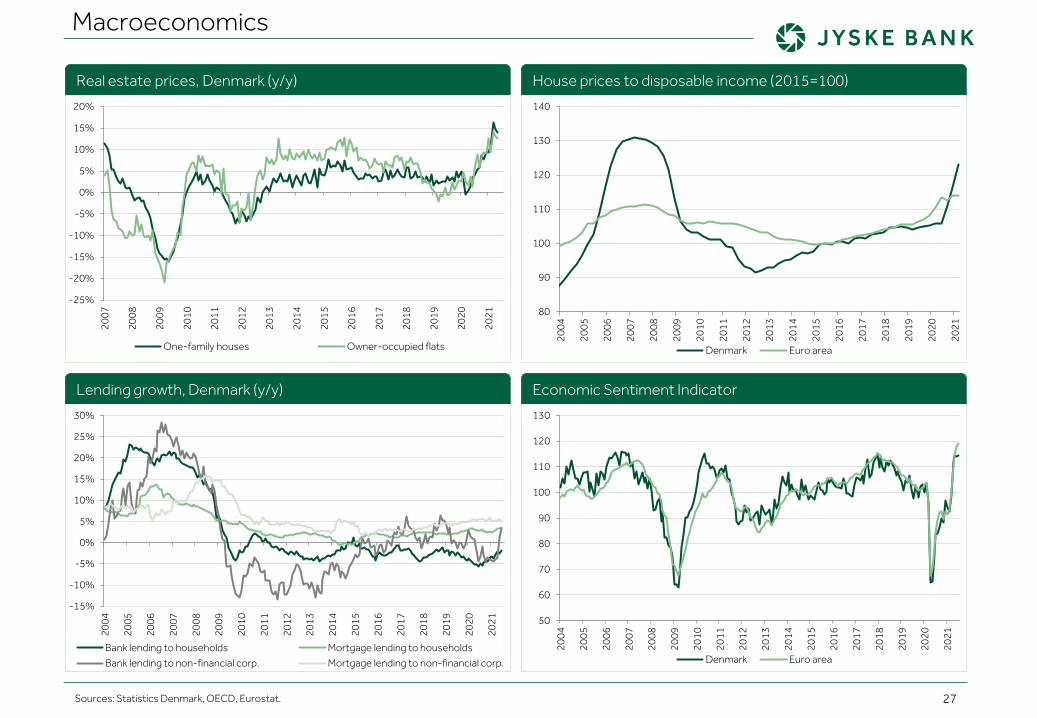
Macroeconomics
Sources: Statistics Denmark, OECD, Eurostat.
-25%
-20%
-15%
-10%
-5%
0%
5%
10%
15%
20%20
07
2008
2009
2010
2011
2012
2013
2014
2015
2016
2017
2018
2019
2020
2021
One-family houses Owner-occupied flats
Real estate prices, Denmark (y/y)
80
90
100
110
120
130
140
2004
2005
2006
2007
2008
2009
2010
2011
2012
2013
2014
2015
2016
2017
2018
2019
2020
2021
Denmark Euro area
House prices to disposable income (2015=100)
-15%
-10%
-5%
0%
5%
10%
15%
20%
25%
30%
2004
2005
2006
2007
2008
2009
2010
2011
2012
2013
2014
2015
2016
2017
2018
2019
2020
2021
Bank lending to households Mortgage lending to householdsBank lending to non-financial corp. Mortgage lending to non-financial corp.
Lending growth, Denmark (y/y)
50
60
70
80
90
100
110
120
130
2004
2005
2006
2007
2008
2009
2010
2011
2012
2013
2014
2015
2016
2017
2018
2019
2020
2021
Denmark Euro area
Economic Sentiment Indicator
Financial results and key figures
28
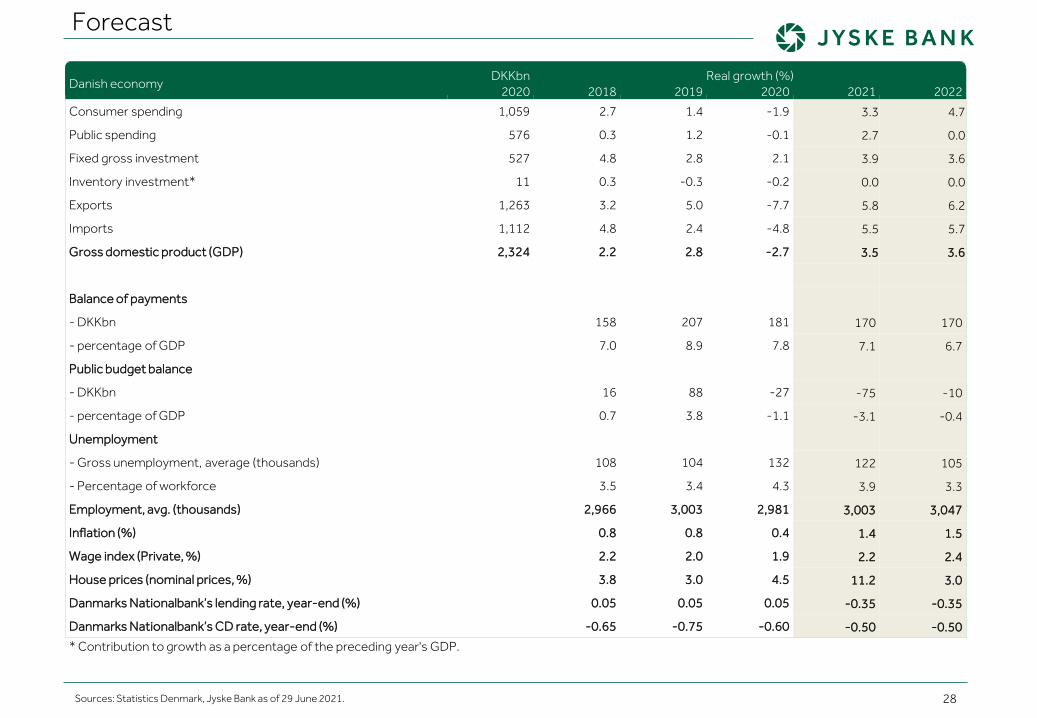
Forecast
Danish economyDKKbn Real growth (%)
2020 2018 2019 2020 2021 2022Consumer spending 1,059 2.7 1.4 -1.9 3.3 4.7
Public spending 576 0.3 1.2 -0.1 2.7 0.0
Fixed gross investment 527 4.8 2.8 2.1 3.9 3.6
Inventory investment* 11 0.3 -0.3 -0.2 0.0 0.0
Exports 1,263 3.2 5.0 -7.7 5.8 6.2
Imports 1,112 4.8 2.4 -4.8 5.5 5.7
Gross domestic product (GDP) 2,324 2.2 2.8 -2.7 3.5 3.6
Balance of payments
- DKKbn 158 207 181 170 170
- percentage of GDP 7.0 8.9 7.8 7.1 6.7
Public budget balance
- DKKbn 16 88 -27 -75 -10
- percentage of GDP 0.7 3.8 -1.1 -3.1 -0.4
Unemployment
- Gross unemployment, average (thousands) 108 104 132 122 105
- Percentage of workforce 3.5 3.4 4.3 3.9 3.3
Employment, avg. (thousands) 2,966 3,003 2,981 3,003 3,047
Inflation (%) 0.8 0.8 0.4 1.4 1.5
Wage index (Private, %) 2.2 2.0 1.9 2.2 2.4
House prices (nominal prices, %) 3.8 3.0 4.5 11.2 3.0
Danmarks Nationalbank’s lending rate, year-end (%) 0.05 0.05 0.05 -0.35 -0.35
Danmarks Nationalbank’s CD rate, year-end (%) -0.65 -0.75 -0.60 -0.50 -0.50* Contribution to growth as a percentage of the preceding year's GDP.
Sources: Statistics Denmark, Jyske Bank as of 29 June 2021.
Financial calendar and contacts
Head of Investor Relations & Sustainability
Phone: +45 89 89 64 29
Mobile: +45 21 58 25 15
E-mail: [email protected]
23 Feb. 2021 Announcement of the 2020 results
23 Feb. 2021 Annual report
23 Feb. 2021 Risk Management Report 2020
23 Mar. 2021 Annual General Meeting
04 May. 2021 Interim report for the first quarter of 2021
17 Aug. 2021 Interim report for the first half of 2021
02 Nov. 2021 Interim report for the first nine months of 2021
Senior Analyst, Investor Relations & Sustainability (Equity IR)
Phone: +45 89 89 71 85
Mobile: +45 24 44 83 70
E-mail: [email protected]
Note: [email protected] and investor.jyskebank.com/investorrelations for further information.
Trine Lysholt Nørgaard
Financial calendar 2021
Simon Hagbart Madsen
30
Disclaimer
This presentation and the information contained therein is furnished and has been prepared solely for information purposes by Jyske Bank A/S. It is furnished for your private information with the express understanding, which recipient acknowledges, that it is not an offer, recommendation or solicitation to buy, hold or sell, or a means by which any security may be offered or sold.
The information contained and presented in this presentation, other than the information emanating from and relating to Jyske Bank A/S itself, has been obtained by Jyske Bank A/S from sources believed to be reliable. Jyske Bank A/S can not verify such information, however, and because of the possibility of human or mechanical error by our sources, Jyske Bank A/S or others, no representation is made that such information contained herein is accurate in all material respects or complete. Jyske Bank A/S does not accept any liability for the accuracy, up-to-dateness, adequacy, or completeness of any such information and is not responsible for any errors or omissions or the result obtained from the use of such information. The statements contained herein are statements of our non-binding opinion, not statement of fact or recommendations to buy, hold or sell any securities. Changes to assumptions may have a material impact on any performance detailed. Historic information on performance is not indicative of future performance. Jyske Bank A/S may have issued, and may in the future issue, other presentations or information that are inconsistent with, and reach different conclusions from, the information presented herein. Those presentations or the information reflect the different assumptions, views and analytical methods of the analysts who prepared them and Jyske Bank A/S is under no obligation to ensure that such other presentations or information are brought to the attention of any recipient of the information contained herein.
Nothing in this presentation constitutes investment, legal, accounting or tax advice, or a representation that any investment or strategy is suitable or appropriate to your individual circumstances, or otherwise constitutes a personal recommendation to you. This presentation is intended only for and directed to persons sufficiently expert to understand the risks involved, namely market professionals. This publication does not replace personal consultancy. Prior to taking any investment decision you should contact your independent investment adviser, your legal or tax adviser, or any other specialist for further and more up-to–date information on specific investment opportunities and for individual investment advice and in order to confirm that the transaction complies with your objectives and constraints, regarding the appropriateness of investing in any securities or investment strategies discussed herein.
Jyske Bank A/S or its affiliates (and their directors, officers or employees) may have effected or may effect transactions for its own account (buy or sell or have a long or short position) in any investment outlined herein or any investment related to such an investment. Jyske Bank A/S or its affiliates may also have investment banking or other commercial relationship with the issuer of any security mentioned herein. Please note that Jyske Bank A/S or an associated enterprise of Jyske Bank A/S may have been a member of a syndicate of banks, which has underwritten the most recent offering of securities of any company mentioned herein in the last five years. Jyske Bank A/S or an associated enterprise may also have, within the last three years, served as manager or co-manager of a public offering of securities for, or currently may make a primary market in issues of, any or all of the entities mentioned herein or may be providing, or have provided within the previous 12 months, significant advice or investment services in relation to the investment concerned or a related investment.
Any particular security or investment referred to in this presentation may involve a high degree of risk, which may include principal, interest rate, index, currency, credit, political, liquidity, time value, commodity and market risk and is not suitable for all investors. Any securities may experience sudden and large falls in their value causing losses equal to the original investment when that investment is realized. Any transaction entered into is in reliance only upon your judgment as to both financial, suitability and risk criteria. Jyske Bank A/S does not hold itself out to be an advisor in these circumstances, nor does any of its staff have the authority to do so.


