Embed Size (px)
Citation preview

/f
Vo lu me 7 Nomor 1
Ed is i Januar i 2010 NL/ tssN 1693 - 704X
JURNAL ILMIAH TEKNIK MESIN DAN TEKNIK INDUSTRI
iir.rii .r.-r.,r.-' + +..r. .r.-ii --r. r+.r. ii ::":..t'-ii + +.:'-' '!!' ::.- rr.t..- --t. .t... .t.., -ll.. ii ii'r.rii'r.rrii 'rri' 'i.r ii ii
isan tiDis TiN {.1
t t : , '

'?,{uur?l ?ft. el€l uep t?uuoJ Lr€tu€3lreso) Inlun 8ul]unslp u?p rs€n[e erp )nslru 8ue,{ qelseN 8u€rylequ€Fp llFrl eped lllntLr?cret ruodes u?sttnl lPIlIroJ u€8uop 'ueull?Fq tI urnurlsl€Ill iiY SAH sellaI set€rp )ioeTp qels?N ulel ?rpoLu L[llPp ull]lqletP qeulad Lunloq 8ue,{ q'etult qg)lseu etuuauelu r$l€p3d
'i002lrenuel $qnq €pPd rlDI €1II€ ed u!)llqlell('ep€l\l q?h?c sslrsre^run ;Tu{eI s?}lnlEc
'lnsol\l lrLqel uesnrnl qelo ug)prqlellp ulsl1pul u€p ursot\l PumI
Pl le tu€n@rLL -: lrPLu-l
€L9lZ9 ftLZ\):\et tLgtzgltLzj) t PLI8Z9S reu?)F,{8o 'Z DIU€rD lI
?per\l qelp?D setrsrs^run {Il|lel snlllD{€Julnpul uep uISol\I Iu)51 u?srLml
rrlsnpul u€p ursstrAl Frrml IseF{rIs u?p €q?sil31?I }€tu€lv
olu€fu?pns 'A
IsBI[IrlS urp eqesn B]BI
J trdt\J 'IS 'ououeH lpng
SuA ta{ 'JS 'rueseq) rOoqd csl{ ' IS u?(I l l l r .oN l\
(ramol^ad) uelseg €4lIN
Jl,\ 'JS 'ouoslq!\\Jeuv 'l,rrtr 8ua:Ioc qd ! cs N ll,\\oluol ,{pg €^lY 'rl
c qd '!usetuel q Jordvac ou€pul rl ro lord
IqV SuPun{ued
dls '!lu?In srrdBurlun,{uod Eruo) IplB]!\
c qd '!o.{8€qns :{Eupun,{ued Bnla)I
SuA nl 'IS 'lues€Il! r(
unun uldulrulad
vac 'u€u?qns rI ic
qB^tBf Fun33u€ued
ISXY(SU NV,t\l(I
'ulsnpul {Ilqel u?P urssul )Iltrle} nu?plqtpslllJ)l stll€u? u€IfuI u?p u?qrleu.d Irs€rl uPp ]!IBu?rp Susl u€si]lU Isueq IJ II
r.qrueldes IIsp 'r.hl 'uenu?I ueFq ep€d unq?tes Wl s8t lqrel (II,u) I4snpq u€p ulsel\l PrLrnI
0 l0z lJEnuBt l s !p1 ' l ro r loN 'L to rn lo^
xr0/ . e69t Nsslllsnpul Ilulal uep ulsoli\ llu)el qelLull
E-.!!':!!. !:=.[ il ii:3ii.ii ii iiji+::iii:!! 4..!!!!*i. 'El ii"'Eleurnl
ii!!H i..ii...Hii":ri::'

EDITORIAL
Jurnal Mesi[ datr Idustri (JMI), Volume 7, Nomor l, Edisi Ianuari 2010, merupakan JMI terbitanPertama untuk tahun 2010. Pada edisi ini JMI menyajikau lima buah Mskah terpilih terdiri atas I buahmakalah keloopok Bidalg Telxik Industri dao 4 buah makalah kelompok Bidang Teknik Mesin yangmerupakan hasil pe4elitiatr maupun kajian kdtis.
semoga JMI dapat menjadi wadah yaag terpilih bagi para staf akademil, mahasiswa pascasadaM maupuE para peneliti dari lembaga riset unhk dapat berbagi pengetahusn demi kemajuaa ilnupengetahuan dan teknologi Indonesia.
Akhimya tim peryunting me[gucapkad terima kasih atas partisipasinya dalam edisi kali ini.Semoga apa yang telah dilahrkan id dapat memberikafl manfaat bagi kita semua.
fiE PeuluDtitrg
Junal Msih dan kdusti, \btune 7, Nanot |,Edisi J.nu.i 2010. lSsN 1693 - 7ax. H.1. i"iv
t -
It

DAFTARISIEditorialDaftar Isi
Bidang Teknik Industri
1. DESAIN ULANG ALAT POTONG TULANG SAPI SEBAGAI BAHAN BAKUHIDROKSIAPATIT DENGAN MEMPERTIMBANGKAN ASPEK ERCONOMIAaiadya Haoum Murti dar Alva Edy Tontowi
Bidary Teknik Mesin
2. PENGARUH LAPISAN IMPLANTASI ION NITROGEN (N2) TERHADAPKEKERASAN DAN LAJU KOROSI BAJA TATIAN KARAT 304
-=. \4ktor Malau dao Kusmono 180
3. i EXPERIMENTAL STUDY ON THE HYSTERESIS EFFECT DURING THE- COIJNTBR-CURRENT AIR-WATER TWO-PHASE ILOW IN A HOT LEG
163
PRESSURMD WATER REACTORDeendarlianto daD SubanaD.................. ...... .......
4. PENGARTJH LAru PEMAKANAN TERHADAP KEKASAI{AN PERMUKAAN
187
MAIER]AL BEARING STEEL PADA PROSES PEMOTONGAN DENGAN MESINBUBTJ"T EMCO MA)CMAT V13Subarmono dan E&at Bambang Adinugroho 198
5. USAHA MENINGKATKAN KEKERASAN DAN KETAHANAN KOROSIBAJAAISI 4140 DENGAN TEKNIK IMPLANTASI TIIANTTJM NITRIDA TNviktor Malau dad Muhammad
'#:,: #x::;;,:t.y#,ni{;lilTi:,}, i i i
EXPERIMENTAL STUDY ON THE IIYSTERESIS EFFECTDTJRING THE COIJNTER-CI]RRENT
AIR-WATER TWO-PHASE FLOW IN A EOT LEGPRESSIJRIZED WATER REACTOR
D€enderlianto and suhanrn
Departroed ofMechanical and lndustrial Engineering, Faculty of hgineeriDgGadjah Mada Univenity
Jl. Grafka No.2, Yogyakarta 5528 rE-mail [email protected], [email protected]
ABSTRACT
An investigation ob hystercsis efrect during the coufttet'-curTent air-water two-Pha5e frow in ahot leg pressurized water rcactor has been conducted eq)ei entally. The pattem of tdt section waarectangular cross section, inwhich it is a sihplifcation ofKonvoi nuclear reactor. me rectangular chonneldimension, the letlgth of the hoizontal part and the inclination angle of the riser were (0.25x0.05) m',2.12 h, and 50" from horizontal plane, rcspectively. The onset offooditrg and defooding, was observedbJ analyzing the data ofwater letels fiom a vessel simulatihg stedrfi geflerator, reactor prdsure vesseland visual obsenation. The onset offooding is def ed as the maximum air mass fow rate at whichthe drschatEed v)ater moss fow rate is eqlal to the inlet water mass flow rate- Meanwhile the onset ofdefiooding is defned as the mdximu airmassfo\rrate, atwhichthe down-flnuingwaterfiaasfrore ratebegins to be equal to the ihje.ted water mass flow tate. As a resuh, it was found that (1) the occ ftenceofswflow and the startinginctease of the pressure drop are integral phebotne a ofthe initial stage oftlle froodfug dunng the coufiter-cutent jow of air-water br a hot leg pressurized ilater reactor, (2) anhysteresis efect appears on the onset offrooding, and (3) the hystelesis efect becomes thore inq)orta twhen increasing the watel mass fo'| rate,
Keryorils: Two-pha$e fow, countet-cunent frow fooding, defrooding, pressurized. water rcactor
1. INTRODUCTIONThe oDset offlooding, in a hotizontal channel
contrected to arr inclircd riser has received aspecial attention for safety rcgulahor in the truclearindustry. This geometry is analogous to that ofa hot leg connecting the reacto! presslue vessel(R?9 with the steam generator in a pressurizedwater reactor (PWR). One hypothetical scenanois a flooding phenomenon during the event of aloss-of-coo1a -accident (LOCA) h PWR, whichis caused by dahage at any position of the primarycircuit. During this condition it is considered thatthe rcactor will be depressurlzed, and vaporizationtakes place, Furrhermore. satwated sleam isgenerated in the reactor corc, and rushes out of
horizontal and inclined pipes of rbe bot leg. Ttesteam will condense in the steam geDeratot addflow back to the reactor corc (reflux condensermode). Consequedtly a stladfied counter-currentflow of steam and condensate occurs in thosepipes.
The stradfied cou er-current flow of steamand condensate is oDly stable for a certain rauge ofmass flow rate. Ifthe steammass flowlate il1cleasestoo much, the condeDsate is ologged in the hot-leg.Next, the coDdefsate is carried over by the steamand partially entrained h the opposife dkection tothe steam generatot, This phenomenon is loto\'an ascounter-clment fiow limitation (CCFL). Futlet, a
Junat M6in hn kdusti, wlun .?: !9y11: I 87Edisi Januati201A,ISSN 1693 - lAlX, Hal.18/.191 )
D e en da d Bnto an d S u h an an
study of ds ffow connguration may provide aD
impoflant understatrding for ths safeq analysis oI
the nuclear power plant, especially to estimate the
cotrdensate mass flow rate in the hot leg pressurized
water reactor during the CCFL.
The CCFL io the real size of a ?WR hot leg
was also extensively studied at the Upper Plenufl
Test Facility ([PTF) Germany (see tlrc UPTF-
Fachtagung IV (1993)). Although the pbenomenon
is well kDown, CFD codes are still not able to
Dredict CCFL, which would be higlly desinbleio understand the effect in more detail and to
increase ihe fl€xibility of predictioDs (Pmsser et
al.. 2006). As far as the present autho$ know,
comtet-crurent flow experiments in a horizodtalrectangular charEel comected to a!. inclined riser
as a model of a hot leg PWR has not yet been
caried out.
The objective ofthese experiments was to get
a data baDk of the counter-ctment ffow limitatlon
experiments, prhcipally for code verificatioo
Druposes. In the paesent repolt, the expeflmeffari""olts of vi.uul obseffations before and around
the onset of flooding \rill be presented fust' This
data wil be explaited in tetms of the locus of the
hydraulic jump and development ofthe liquid slug
around the oDset of flooding. Next, the hystercsisphenornena on flooding will be evaluated
2. EXPERIMENTAL A?PARATUS ANI)PROCEDURES
To simpliry the explamtion in this paper,some abbreviations are used for the testing
compoomls as follows: SG simulator. a vecsel
simulatilg the steam geneFtor; RPV slmul|tor, a
vesselsimulaliog the reaclor pressurc vessel
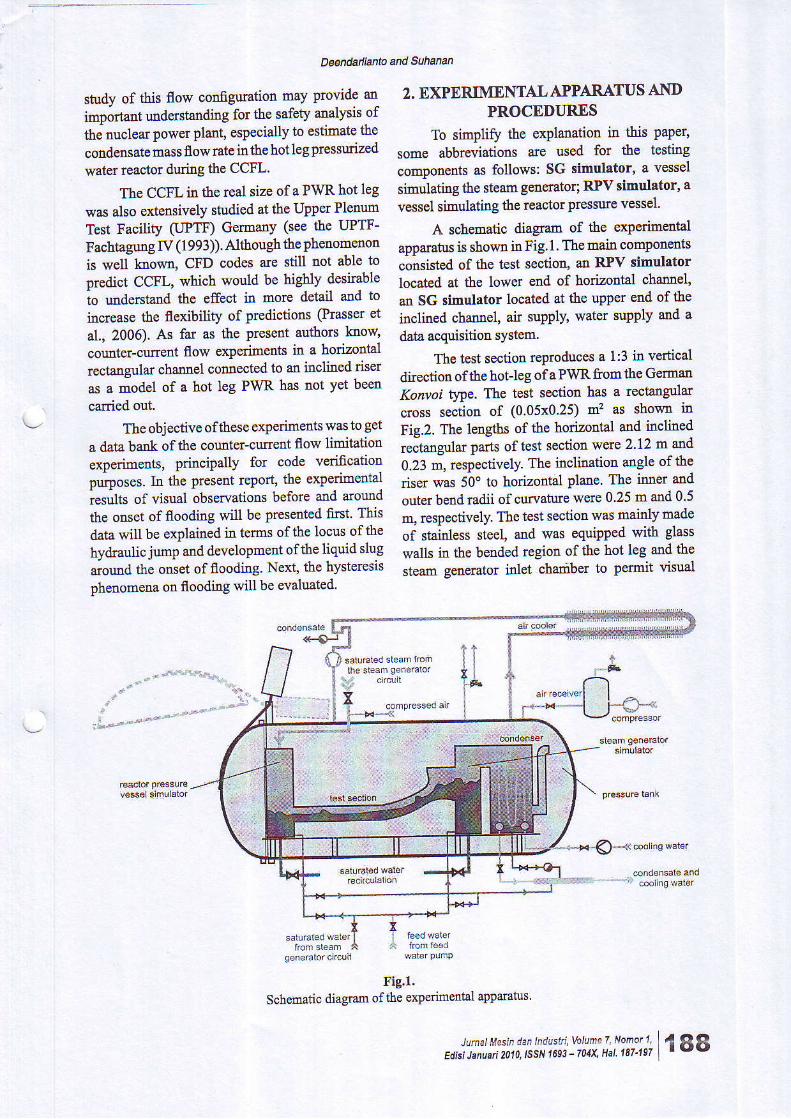
A schematic diagram of the erQerimetrtalaDDa.ratus is shown in Fig l . The mair1 comporcntsconsisted of the test section, ao RPV simulatorlocated at the lower end of horizontal channel,
an SG simulrtor located at th€ upper etrd of the
inclbed chaorel, air supplt water supply ard a
data acquisition system
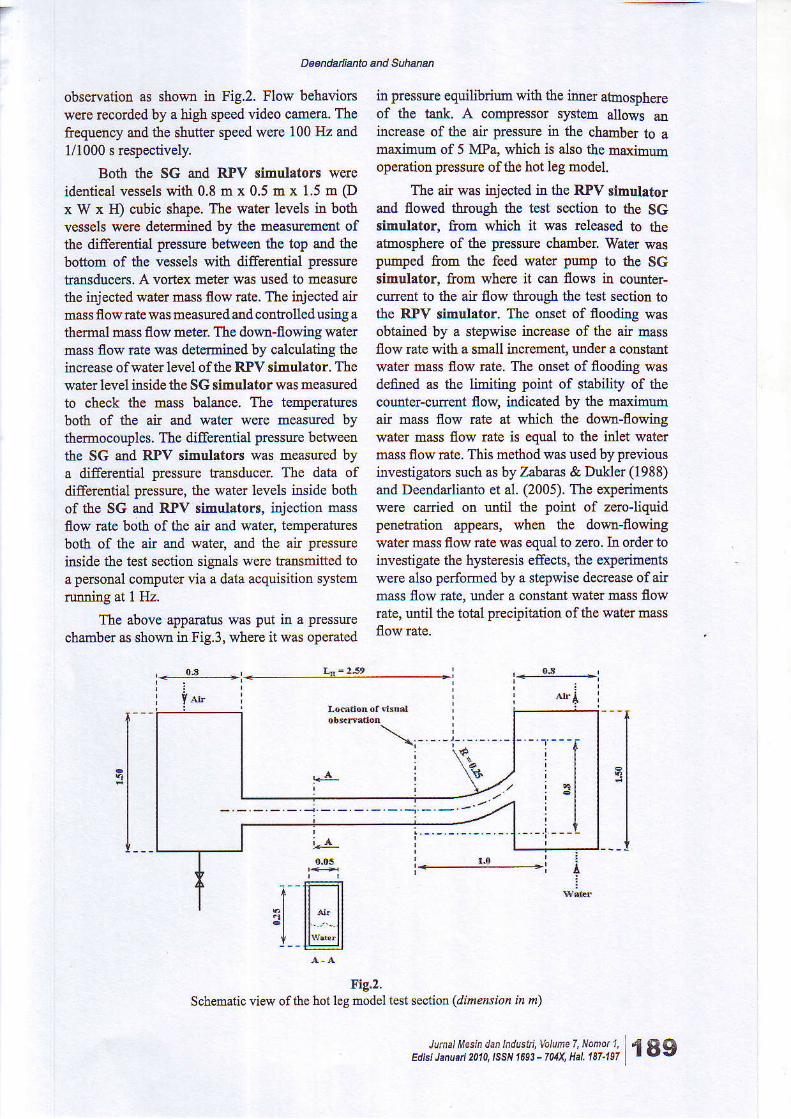
The test section reprcduces a 1:3 in vertical
direction ofthe hot-leg ofa PWR ftod the Germa'n
Konroi tpe- The test section has a rect4ngular
cross section of (0.05x0.25) m? as showa m
Fis.2. The lensrhs of Lbe horizonlal and incLined,.iranzulat oarts of test secrion were 2.12 m and
0.23 ri, respectively. The inclination angle of the
dser was 50' to hodzontal plaDe The inner a[d
outer beDal radii of curvatrlre wele 0.25 m and 0.5
m, lespectively. The test sectioD was mainly made
of stainless s€el, and was equipped with glass
walls in the bended region of the hot leg and the
steain sonerator idet chanber to permit visual
Fig.r'Schcmaric didgram o'the experifi ental appirall.s
' : .
-Q----<-" t"s *,t*
,, lii ! ii,!i i[,lj x'! iiii; lt iff ];i"fl\ l; /l aa
Deendanianto and Suhamn
observatiotr as shown in Fig.2. Flow behaviorswere recorded by a high sp€ed video camem. Theftequency aDd the shutter speed were 100 Hz and1/1000 s respectively.
Both the SG and RPV sidulators wereidentical vessels with 0.8 m x 0.5 d x 1.5 m (Dx w x II) cubic shape. The water levels i{ bothvessels were determined by the measuremetrt ofthe differsdtial pressure between th€ top atrd thebottom of the vessels with differentierl pressuretransduoers. A vodex meter was used to D€asulethe iDj€cted wate! mass flow rate. The injected airn1ass flow mte was m€asued and controlledushg athemal mass flow meter. The down-flowitrg watermass flow rate was detcmined by calculating theincrease of water level of the RPv simulator. Thewater level inside the SG simulator was measuredto check th€ mass balance. The tempemturesbotl of the air atrd water werc measured bytlermocouples. The differeltial pressure betweenthe SG aod R'PV timulators was measued bya differential pressure tratrsduce!. The data ofdifferetrtial presstlle, the water levels imide bothof the SG and R.PV simul4tors, injection massflow rate both of the air and wate! tempemturesboth of the air and wEter, and the air pressueinside the test section signals were traosnttted toa persoDal computer via a data acquisition systemrunning at I Hz.
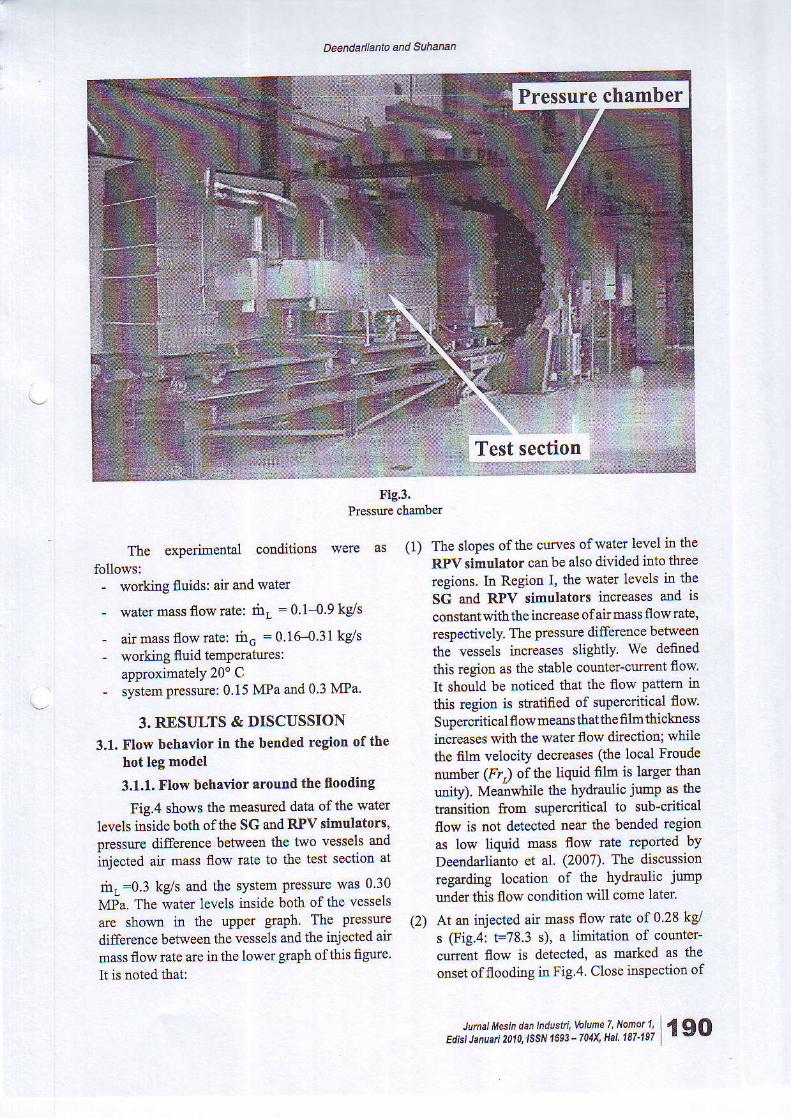
the above apparatus was put in a pressuechahber as shorvn in Fig.3, where it was operated
in pressure equilibriub with the itaer atmosDhereof the tanl, A coDpressor system allows anincrease of the air prossure in the chambet to ama"Kimum of 5 MPa, which is also the maxinunopelatiotr pressue ofthe hot leg model,
The air was injeoted in the RPV simulatorand flowed through the t€st section to the SGsimulator, ftom which it was released to theatmosphere of the pressure chaober Water waspumped fiom the feed water pump to the SGsimulator, ftom whele it can flows m coutrter-crrrletrt to the air flow thrcugh lhe test section tothe RIV sidulator. The onset of floodiog wasobtained by a stepv.ise increase of the air ntassflow rate with a small incre&ent, rmder a cotrstantwater mass flow mte. The onset of flooditrg wasdefined as the limititrg point of stability of tlecoutrler-curreDt fow, iadicated by tle maximumair mass flow rale at whicb tbe down-Bowingwater rtrass flow late is equal to the iDl6t watertnass flow rate. This method was used by prelrousinvestigators such as by Zabaras & Drkl€r (1988)and Deendarlianto et a1. (2005). The experimedtswere caxried on urtil the point of zero-liquidpmeEarion appears, wben the down-flowingwater mass flow mte was equal to zero. Ia order toinvestigate the hystercsis eft'ects, the experime[tswere also perforded by a stepwise decrease of airmass flow !ate, rmder a constatrt water mass flowmte, until the total precipitation ofthe water massflow rate.
Fig 2'Schemaiic view ofthe hot leg model test sectioD (dimerrt ll in m)
i A
I t lI t ll l * l l. t ll l**.ll
i- ----;-l
l A l " A i
,,,i'i : :l#i[,i: x{if#; :i !e: ki i!il I | 1 I I
D e e nd a d ianto ahd Su h anan
Pressure chamber
Test section
Fig.3.
The expedmeltal conditions llere as
follows:- working fluids: air and water
- \rater mass flow rate: fiL = 0.1-0.9 kg/s
- air mass f low €te: rhc =0.1G{31kg/s- workiDg fluid temperatures:
approximately 20' C- system pressure: 0.15 MPaa.nd0.3 MPa
3. RESIII,]TS & DISCUSSION
3.1. Flow behavior in the betrded regioD oflhehot leg model
3.1,1. Flow behaYior around the floodidg
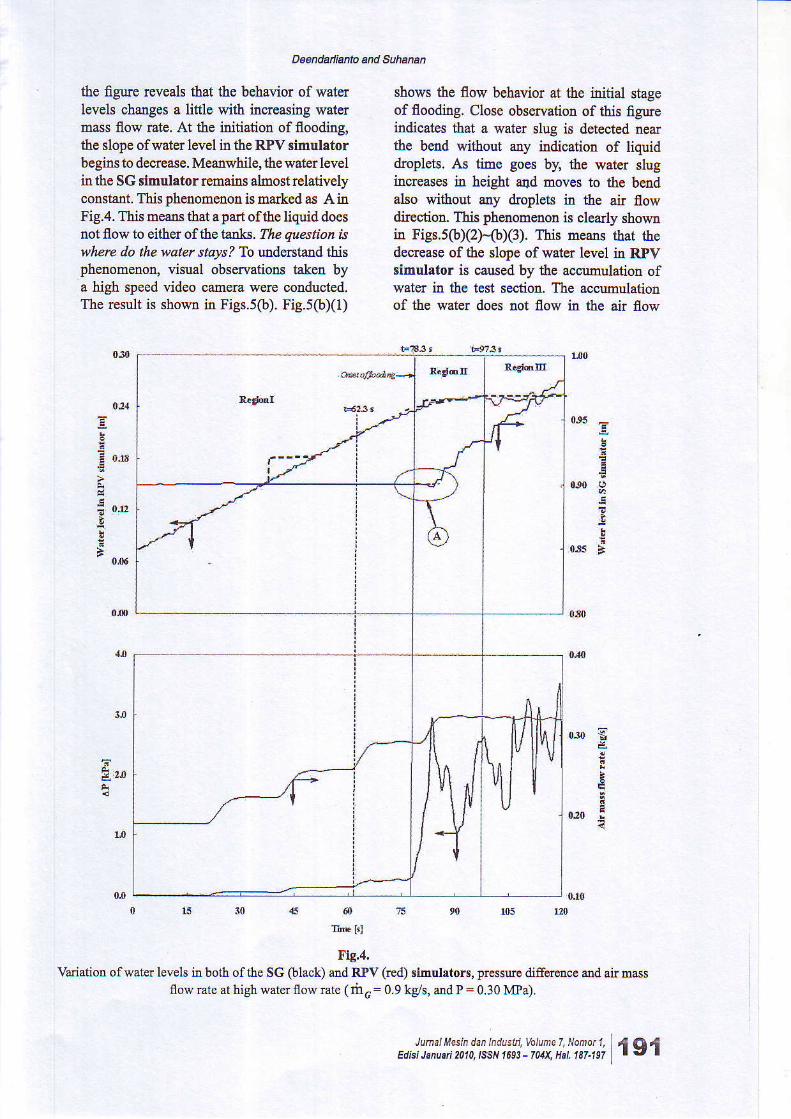
Fig.4 shows the lrleasuled alata ofthe water
levels inside both ofthe SG al1d RPV sim[laton'prcssrue difference betweel the two vessels and
injected air mass flow Iate to tho test section at
ii1, :0.3 kgls and the systom presswe was 0.30MPa. The water levels inside bolh of the vessels
are shown in the upper gaph. The pressure
difference between the vessels and the injected air
mass flort Iat€ are in the lower graph ofthis figuleIt is noted that:
(l) The slop€s ofthe curv€s ofwater level in the
RPV sidulator can be also divided into tbreeregions. In Region I, the water levels in lhe
SG and RPV simulators increases arrd ls
coDstant with the inuease ofai! mass flow Gte,respectively. Th€ pressure differcrce betweenthe vessels inqeases slightly we definedthis region as the stable counter-crrlrent flowIt should be troticed that the flow pattem m
this rcgion is stratified of supercritical frow'
Supeicritical fl owmeaDs thatthe fi lrnthiclnessincreases v.ith the water flow direction; whilethe film velocity decreases (the local Froudenumber (Fr) of the liquid film is larger than
uniry). Meanwhile the hydraulic junp as thetra$itioD from supercritical to sub_criticalflow is not detected near the bended leg1onas low liquid mass flow rate reported byDeendarlianio el al (2007) The discussionregarding locatio! of rie hl drauJic jump
udder this flow condition will come latei.
(2) At an injected air mass flow rate of0.28 kgs (Fig.4: t=78.3 s), a limitation of counter-curcnt flow is detected, as marked as theonsetofflooding inFig 4 Close inspection of
Jutnat tt*in dar tndusti,\btuner: \y:11: 19OEdisi Januai 2olo,lsstt 1693 -701X' Hat 187497
D ee ndarlianto a n d Su h a n dn
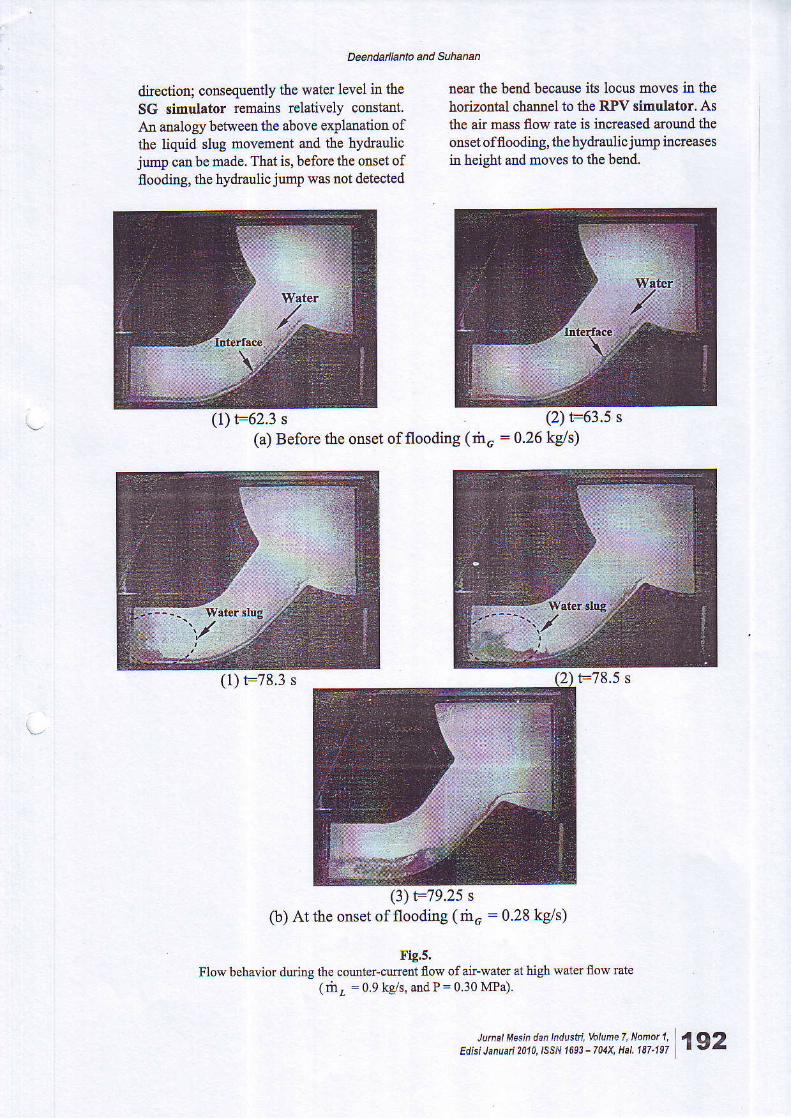
the igure reveals that tle behavior of waterlevels changes a litde with increasing watermass flow mte. At the iritiation of flooditrg,the slope ofwater level ir1 the RPV simulatorbegils to deorease. Meanwhile, the water levelin the SG simulator remairN alnost relativelyconst3nt. This phelommon is malked as A inFig.4. This means that a part ofthe liquid doesnot flow to eif.her of fte l^ttks. The qrestion iswherc do the woler slaysS To understald ltisphenomenoD, visual observatioos taken bya high speed video camera werc conducted.The result is shol,ll in Figs.s(b). Fig.s(b)(l)
shows the flow behavior at the idtial stageof flooding. Close observation of this figureindicates that d water slug is detected nearthe betrd without atry indicatioa of liquiddrcplets. As tide goes b, tle water sluginoreases itr height a4d Eoves to the bendalso rvithout any dropleh ia the air flowdirection. This phenomenon is clearly shownh Fies.5(bX2HbX3). This !1eans that thedeorease of the slop€ of water level in RPVsimulator is caused by the accumulation ofwater in the t€st section. The accumdlationof the water does Dot flow in the air flow
- .. J! !, t M v::. !" :^,:.1 ::! 2' ̂" r".t. !2!!. ! : t t I 1Edisi Jtnu.ti 2010,ISSN 169! - fUX, H'l.18/ 197 | .'
0J5 3!
E o.r
:
a
a
LN
Fig.4,Variation ofwatet levels in both ofthe SG (blacD ard RPV (red) simulaton, pressue difference aDd air mass
flow rat€ at high water flow rate (riro= 0.9 kg/s, and P = 0.30 MPa).
Deendanimb ahd Suhanan
dtectiotr; ooDseque ly the water level in theSG sidulator rcmairN relatively coNtant.An adalogy b€tween the above explanation ofLhe liquid slug movement atd rhe bydraulicjump cao be made. That is, before th€ onset offloodi[g, the hydraulic junp was not detected
near the bmd because its locus tloves itr lhehorizontal chamel to the R.Pv silxul.tor. Asthe air mass flow rate is increased arould Lheonset offloodhg, the hydmulicjuhp increasesitr heipht add moves to the bend.
(1) t=62.3 s (2) t=63.5 s(a) Before the onset offlooding (rhn = 0.26kgls)
(1) t-78.3 s F78.5 s
(3) F79.2s sO) At the onset offlooding (rirn = 0.28 ke/s)
F'ig.s,Flow behavior dudng th€ counter-curr€nt flo\{ ol air-wat€r at high wat€r flow mte
(ril, = 0.9 k8/s, atrdP= 0.30IDa).
Jutnat u5;n dan tndusni. votu|e r. NoFt 1. 1q2Edie Januan 2A|A. ll;SN 1693 -704X Hal.187-191 t tI
D ee n d a di an to a o d S u hanan
(3) The zem liquid penekation is reached withfirther inoreasing of the ail mass flow €teup to 0.32 kgls (Fig.s: F97.3 s). The visualobservatioos indicated that in this region(Regiotr u), the flow behavior is similar tothat at lower wate! mass flow late ( rilL = 0.3kC/s).
Some additional remarks are added at thispoint regarding tbe flow behavior during thecourfe!-curetrt flow of air-water two-phase ffowin a hoizontal recta.ngular chamel contrected toa.n hcliDed liser:
1. Before the onset of flooding, a hydradicjump is observed close to the bend at lowerliquid mass flow rate. Hydmulic jumpappems, however, in the horizontal part of therecta[gular channel v/ith high€r water rtrassflow late. That is, the location of the hydnulicjump moves to the horizontal part ofthe testsection with the increase of water mass flowrate.
2. The inception of flooding in a horizodalr€ctangular chann€l co lected to an inclinedriser coincides with the formation of slugflow At this point, the pressure ilrop alongthe test section begins to inclease. F.omthis observation, it is concluded that theoccu(ence of slug dow and the staftlgirfiease ofth€ pressure diference are integmlphenometra ofthe initial stage ofthe floodingduring the counter-curent flow ofair-water ira hodzontal rectangllaa channel cormected toan inclined riser
The above results are similar to those obtahedby Siddiquid etal. (1986) and Wong{ises (1996a)who elomined the flow behavior duriag flooding ina horizontal pipe with a bend. This mea.ns that theflow behavior ill a PWR hot leg does rot changesigtificantly if the test sectioD geomefy changesftom the pipe to rcctatrgular cha 1e1.
3.2.2. Hysteresis b€tweed flooding atrddeflooditrg
The rcxt discussion refe$ to the counter-curent flow €xpedment aimed to studfng thehyst€rcsis phetrornenotr. Celata €t al. (1991) notedthat an hysteresis effect occurs, ouce the onset offloodiag has been reached, and either the liquid orthe gas mass flow rate is decreased with the armof restodng a.n undisturbed counter-crrllent flow.The flooding condition persists utrtil the reduced
flow mte rcaohes a value Elloh lower thatr theflooding liquid mass flow. This cotrditiotr is calledthe deflooding point.
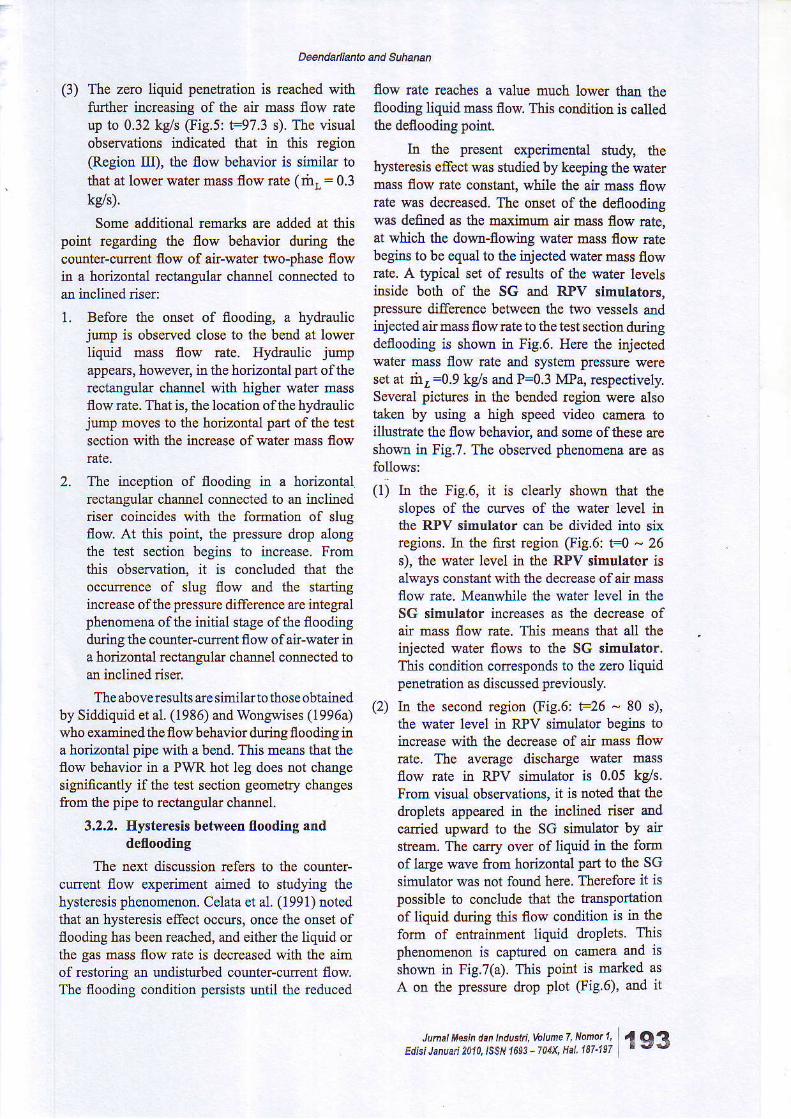
IE the prcsent experihetrtal studt thehysteresis effect was studied by keeping the watermass flow rate constant while the air mass flowrate was decreased. The oDset of the defloodingwas defined as the maximum air mass flow late,at which the down-flowing watet rnass flow Iatebegi$ to be equal to the injected water mass flordmte. A t?ical set of results of the water levelsinside both of the SG and RIY simulators,pressEe difference b€tween the two vessels aodinj ected air mass flow rate to the test section duringdeflooditrg is shown ir Fig.6. Here the irjectedwater mass flow tate aad system paessure w€Ieset at drr=0.9 kgls and P=0.3 MP4 respectively.Sevenl pictures il the bended region were alsotakeD by using a high speed video cameG toillustrate the fiow behayio( and sorne of these areshowr1 in Fig.7. The obseped phetromena ale asfollows:
(l) In the Fig.6, it is cleady shown that theslopes of the cuwes of the water level inthe R?V simulator can be divided inlo sixregions. Itr the fust region (Fig.6: F0 - 26s), the wate. level ir the RPV 6iEulatcr isalways coDstant wiih the decrease of ail massflow rate. Meanwhile the water level in theSG simulator increases as the decrease ofair mass flow rat€. This means that all thej4ject€d water flows to the SG simulator.This condition coresponds to the zero liquidpenetratioD as discussed preuously.
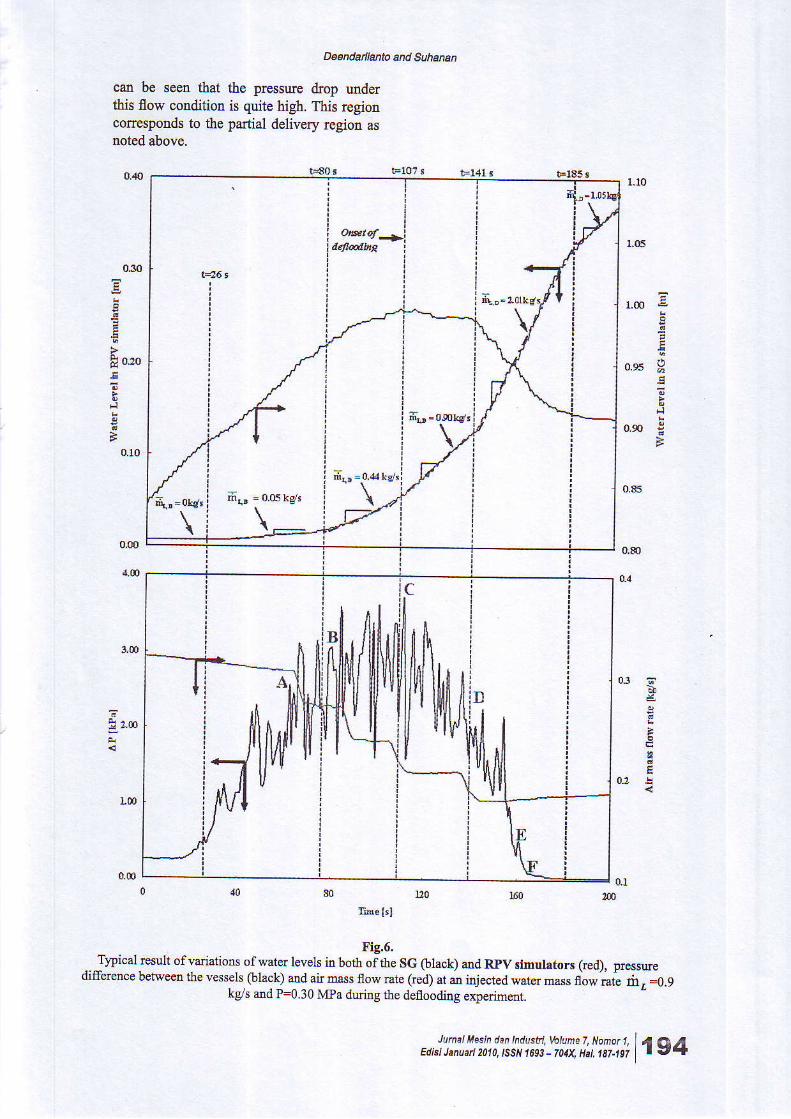
(2) h the second.egion (Iig.6: t-26 - 80 s),the water level in RPV simulator begins toincrease with the deqease of air mass flow!ate. The avemge discharge watel massflow mte in RPV simulator is 0.05 kg/s.From visual observations, it is rcted that thedroplets appeared ir the holined riser andcarried upward lo lhe SG simLrlator by airst eam. The carry over of liquid in the formof large wave fiom hoflzoDtal pafi to the SGsimulator was not found here. Therefore it ispossible to conclude that the taDspottationof liquid dlrilg this flow condition is in thefonn of €ntrainment liquid droplets. Thisphelomenotr is captued o[ cadera alld isshown ir Fig.7(a). This poidt is marked asA on the prcssue drop plot (Fig 6), and it
Junet ttsin dar tndusbi, votnne r, Nonot 1, | tr9,3Edisi Jaruad 201A.ISSN 1693 -701X, Hal 167'197 |
Deendanianto anct Suhanan
catr be seen that the pressure drop uderthis flow conditioD is quite higi. This regioncorresponds to the paxtial delivery region asnoted above.
!
d9o :
&o,,
E
Tpical result ofvariation. .r*'*. f"'"f, i. tornlrgrf" SG (btac$ and Rpy sinulators (red), Fessureditrerence between the vessels (blacg and air mass flow rate (red) at ar1 inject"a water -*" nowiat" rh, <.ekg/s and p=0.30 Mpa duriq the deflooding experiment.
,,,JT:lY#,i1"!ii",* :i f# iiw li | 1 s 4
Deendarlianto and Suhanan
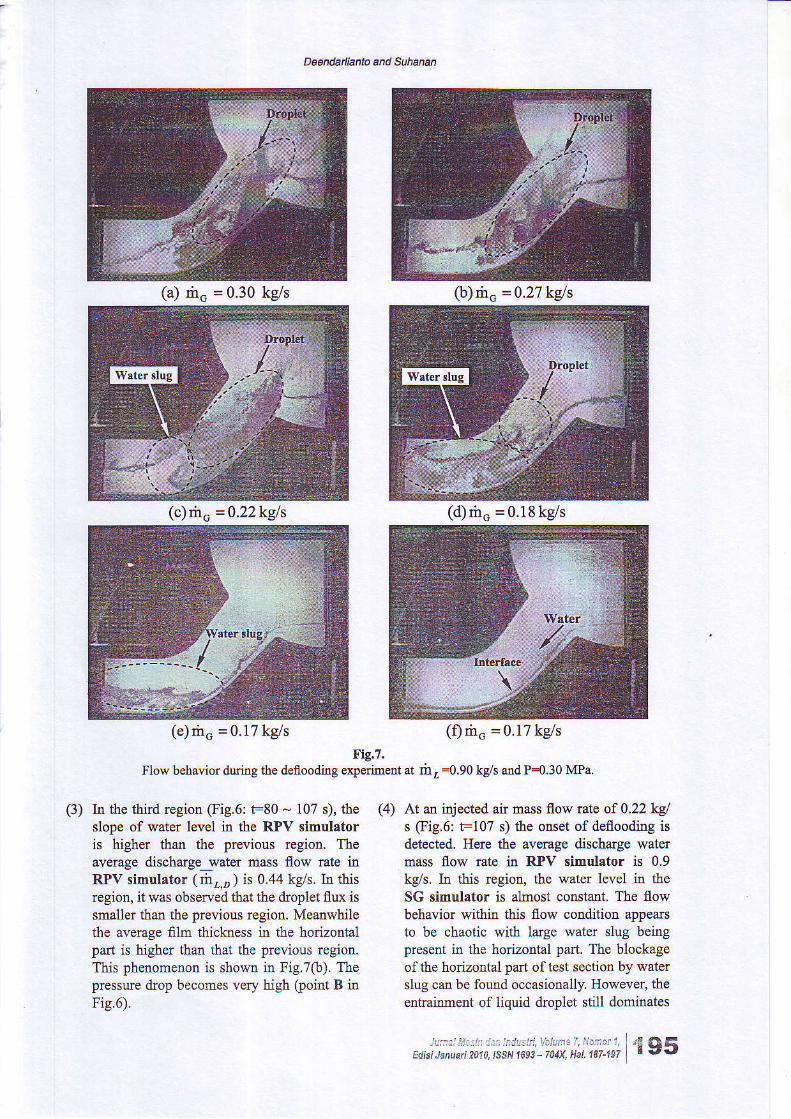
FrC.1.Flow b€havior during the deflooding exp€riment at mz =0.90 kgls and P=0.30 MPa.
(3) In tle tlird region (Fig.6: F80 - 107 s), theslope of water level in the RPV simulatoris higher than the prcvious rcgion. Theaverage discharge_water mass ffow rate inRlv sidulator (rhr.D ) is 0.44 kg/s. h thrsregion. ir was obsened that lbe droplet fux rssmaller than the previous region. Meanwhiletle average film thickress in the horizontalpart is higher than that the previous rcgion.This phenomenon is showt in Fig.7(b). Thepressrre drop becomes very high (poinl B ir)Fis.6).
(4) At an injected air mass flow rat€ of 0.22 kg/s (Fig.6: Fl07 s) the onset of deflooding isdetected. Here the avemge discharge watermass flow late in RPV simulrtor is 0.9kg/s. h this region, the water level iq theSG simulator is alnost constant. The flowbehavior within this flow condition appearsto be chaotic with la.ge water slug beingpresent in the horizo al part. The blockageof the horizontal part of test section by waterslug can be found occasionally. However, theenftainment of liquid droplet still dominat€s
i!t.:: !,t::j:: :)1t hlt.!,ibl!n.t.:,81"1i { 95Edisi J'nua.i zUA,ISSN 1n93- 741X, Hal,181.197 l
(a) riro = 6.39 Lntt (b) dtc = 0.27 ke/s
(c)rho =9.221glt (d) tho =g.1glg/s
(0 rirc = 0.17 ke/s(e)rho = 9.171t7t
Dee n d a n i anto a n cl S uha n an
the flow stuohue here. This phenomenon iscaptued on carnem and is shown in Fig.7(c).This point is mafked as C on the pressure&op plot (Fig.6), and it can be seen that thepressue drop becomes very high. Next thepresswe dlop dedeases with the decrease ofair Dass flow iate in this rcgion.
(5) As the declease of air mass flow rateprcc€eded, the avemge discharge watsr massflow rate in RPV simulrtor is ! ch higher
tban the injected otre (rbr"_2.0 k9!) Ir isDiarl.ed as the resioo oft-l4l s !o r=185 s inFig.6. The amount of this water comes ftomthe injected water mass flow rate and theacclu$rlation of water in the test sectioo. Idthis rcgion, the droplet flux is lower than theprevious region, and the blockage process ofwater ia botizoDtal part occuls occasionally. Itis shown clearly in Fig.7(d), ad is marked asD ir presswe drop plot itr Fig.6. It is seen thattle pressue drop is still high altlough it istrot higher thatr the value of at point C. As tbetime goes by, the interfacial structure b€comesstable. The ft€qu€ncy ofwater slug decleasesGee Fig.7(e)), and a stable stmtified flowcaa be found (see Fig.7(0). Furthermore thepressue drop also dedeases as tbe i{terfacialbecomes stable. Those are marked as E and Fia the pressure drop plot ia Fig.6.
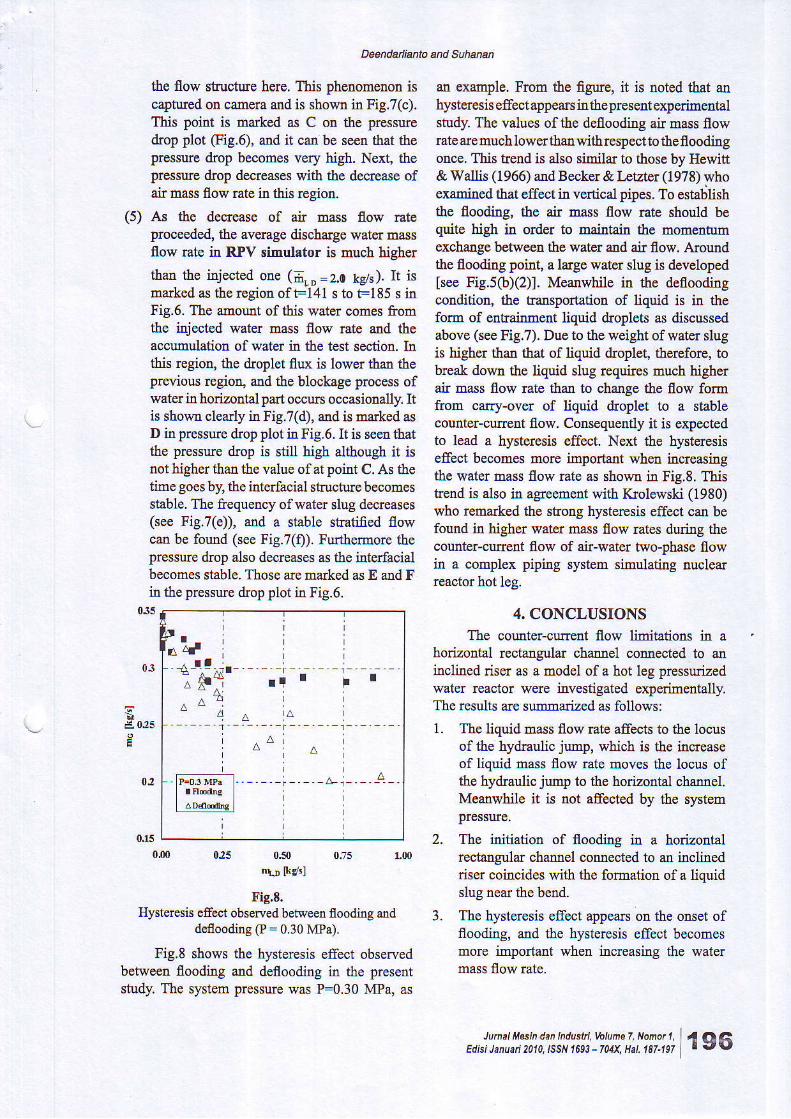
an example. Irom the fgure, it is doted tiat anhysteresiseffectappearsinth€prcse experimentalstudy. The values ofthe deflooding air mass flowmte are much lower tha! rrithrespectto the floodingodce. This toetrd is also similar to those by Hewitt& Wallis (1966) and Becker & Letzter (1978) whoexamined that effect in vertical pipes. To e,stabtshthe flooding, the air mass flow rate should bequite high itr order to maintail the momentumexchange between tlrc water atrd air flow. Arcundthe flooding poir , a large water slw is developedtse€ Fig.5O)(2)1. Meanwhile in the deflooditrgcondition, the hansportation of liquid is itr theform of entrainment liquid droplets as discussedabove (see Fig,7). Due to the weight of water slugis higher than that of lquid droplet, therefore, tobreak down the fquid slug requircs much higherak ttrass flow rate than to change the flow forhftom cary-over of liquid droplet to a stablecounter-cufient flow. Consequeltly it is expectedto lead a hysteresis effect. Next th€ hysteresisefrect becomes more important when irlcl€asrngthe water hass flow €te as sho\rn h Fig.8. Thistrend is also in agreeme with Icolewski (1980)who remarked the strotrg hysteresis effect car! befound in higher water mass flow rates during thecounter-curetrt flow of afu-water two-phase flowir a complex piping system simulating truclearreactor hot leg.
4. CONCLUSIONSTbe coull,er-curretrl flow limitations in a
horizontal rectatrgular cha rel coniected to anhclilred riser as a ftodel of a hot leg pressurizedwater reactor were investigated experimetrtally.The results me summarized as follows:
1. The liquid mass flow lat€ affects to the locusof the hydraulic jump, which is the hcreaseof liquid mass flow rate moves the locus oftlrc hydmulic junlp to the horizontal channel.Meanwbile it is not affected by the systempressrrle.
The idtiation of flooditrg ia a horizontalrectatrgular channel cobnected to an i&1inedriser coincides with the formation of a Iiquidslug near the beDd.
The hystercsis efrect appears on the onset offlooding, and the hysteresis effect becomesmore important when increasing the watermass flow !ate.
03
&ozs
02
0i0 025 0.$ 0t5 tm
"!D lk/.1
Fig.8.Hysteresis etrect observ€d between flooding and
deffooding (P = 0 30 M,a).
Fig.8 shows the hystercsis effect observedbetween flooding and deflooding in the presentstudy. The system pressure was P:0.30 MPa, as
3 .
.tuarl M*ir den tNtusi. thtuae 7 Nont 1 a, OfEdtsi Jtn8d 2OlO. ISSN 1593 - 7Nv X"1 167.197 .-J
Deenclailanto and Suhanen
REFERENCESBeoker, K.M., Letztot, A., 1978. Flooding and
deflood$g measuredetrt for oount€r-currentflow of ail and water in vertical channels.Report KTH-NBL-2s.
Celata, G.P., Cumo, M., Farcllo, G.8., Setaro,T., 1991. Hysteresis effect in flooditrg.Iltematioml Journal ofMultiphase llow 17,283J89.
Deendarlianto, Ousaka, A., Katiyasaki, A.,Fukarc, T., 2005. Itrvestigation of liquidfiLa behavior at the onset of floodiag duringadiabatic count€rcurrent ah-water two-phaseflow i! atr inclinedpipe. Nuclear Engineeringar.d D esien 23 5, 2281 -229 4,
DeeDdarlia[to, Vallee, C, Lucas, D., Beyer, M.,Ca , H.,2N7. Experimental study on thecormter-cufieot flow limitations (CCFL) ofair-water two-phase flow itr a model ofhot legpressudzed water reactor. Submitt€d paper toNuclear Engineedng and Desiga
Hewitt, G.F., Wallis, G.B., 1966. Floodi4 andassociated phenomena ir: falli-ngfilm flow havertical tube. LTKAEA Report AERE R-4022.
Krolewski, S.M., 1980. Flooding limits i!a simulated nuclear leactor hot leg.Massachusetts Iostitute of Tecbnology,Subdrissioo as a part of rcquirernetrt for aB.Sc.
IlPfi-Fachtagung IV: Versuchselgebnisse,Analysen. Mann-beim 25. Marz ls9J. SiemenAG, KWU, KWU R 1l 1931005, 1993.
Wallis G.B,, 1969. one-dimeNional two-phaseflow Mc Graw-Hill.
zabaras, G.J., Dlkler, A.8., 1988. coutrter-ounentgas-liquid annular flow, including the floodingstate. AIChE Joumal 34 (3),389-j96.
.trnat u'k dat !!1is.ti: \l!!." .-: l:!-*1:i /, 97Edisl Jenu.d 2|l|.lssN 1693 -701X Hal,181-19r | 't I


