Embed Size (px)
Citation preview

2019Interim Report
(A joint stock company incorporated in the People's Republic of China with limited liability)Stock Code: 1288
JOINT DEDICATION
TO BUILDA BEAUTIFUL
CHINA
INTERIMREPORT2019
Add: No.69, Jianguomen Nei Avenue, Dongcheng District, Beijing, P.R. ChinaPostal Code: 100005 Tel: 86-10-85108888
http://www.abchina.com

Contents
1Interim Report 2019
Definitions 2
Basic Corporate Information and Major Financial Indicators 4
Discussion and Analysis 10
Environment and Prospects 10
Financial Statement Analysis 12
Business Review 31
County Area Banking Business 55
Risk Management and Internal Control 62
Capital Management 79
Changes in Share Capital and Shareholdings of Substantial Shareholders 80
Details of Preference Shares 85
Directors, Supervisors and Senior Management 88
Significant Events 89
Appendix I Capital Adequacy Ratio Information 95
Appendix II Liquidity Coverage Ratio Information 113
Appendix III Leverage Ratio Information 115
Appendix IV Net Stable Funding Ratio Information 116
Appendix V Interim Financial Information (Unaudited) 123
Appendix VI Unreviewed Supplementary Financial Information 250
Definitions
2
In this report, unless the context otherwise requires, the following terms shall have the meanings set out below:
1. A Share(s) Ordinary shares listed domestically which are subscribed and traded in
Renminbi
2. ABC/Agricultural Bank of
China/the Bank/
the Group/We
Agricultural Bank of China Limited, or Agricultural Bank of China Limited and
its subsidiaries
3. CASs/PRC GAAP The Accounting Standards for Enterprises promulgated on 15 February 2006
by the Ministry of Finance of the People’s Republic of China and other related
rules and regulations subsequently issued
4. CBIRC China Banking and Insurance Regulatory Commission, or its predecessors,
the former China Banking Regulatory Commission and/or the former China
Insurance Regulatory Commission, where the context requires
5. County Area(s) The county-level regions (excluding the district-level areas in the cities) in the
People’s Republic of China and the areas under their administration, including
counties and county-level cities
6. County Area Banking Business We provide customers in the County Areas with a broad range of financial
services through our branch outlets located in counties and county-level cities
in the People’s Republic of China. We refer to such banking business as the
“County Area Banking Business” or “Sannong Banking Business”
7. County Area Banking Division An internal division with management mechanism adopted by us for
specialized operation of financial services provided to Sannong and the
County Areas, as required under our restructuring into a joint stock limited
liability company, which focuses on the County Area Banking Business with
independence in aspects such as governance mechanism, operational decision
making, financial accounting as well as incentive and constraint mechanism
to a certain extent
8. CSRC China Securities Regulatory Commission
9. H Share(s) Shares listed on The Stock Exchange of Hong Kong Limited and subscribed
and traded in Hong Kong Dollars, the nominal value of which are
denominated in Renminbi
10. Hong Kong Listing Rules The Rules Governing the Listing of Securities on The Stock Exchange of Hong
Kong Limited
Definitions
3Interim Report 2019
11. Hong Kong Stock Exchange The Stock Exchange of Hong Kong Limited
12. Huijin Central Huijin Investment Ltd.
13. MOF Ministry of Finance of the People’s Republic of China
14. PBOC The People’s Bank of China
15. Sannong Agriculture, rural areas and farmers
16. SSF National Council for Social Security Fund of the People’s Republic of China
Basic Corporate Information and Major Financial Indicators
4
Basic Corporate Information
Legal name in Chinese Abbreviation
中國農業銀行股份有限公司中國農業銀行
Legal name in English Abbreviation
AGRICULTURAL BANK OF CHINA LIMITED
AGRICULTURAL BANK OF CHINA (ABC)
Legal representative ZHOU Mubing
Authorized representative ZHOU Wanfu
Secretary to the Board of Directors and Company Secretary
ZHOU Wanfu
Address: No. 69, Jianguomen Nei Avenue,
Dongcheng District, Beijing, PRC
Tel: 86-10-85109619 (Investors Relations)
Fax: 86-10-85126571
E-mail: [email protected]
Selected media for information disclosure
China Securities Journal, Shanghai Securities News,
Securities Times and Securities Daily
Website of Shanghai Stock Exchange publishing the interim report (A Shares)
www.sse.com.cn
Website of Hong Kong Stock Exchange publishing the interim report (H Shares)
www.hkexnews.hk
Location where copies of the interim report are kept
Office of the Board of Directors of the Bank
Listing exchange of A Shares Shanghai Stock Exchange
Stock name 農業銀行Stock code 601288
Share registrar China Securities Depository and Clearing Corporation Limited,
Shanghai Branch (Address: 3/F, China Insurance Building, No. 166
Lujiazui East Road, New Pudong District, Shanghai, PRC)
Listing exchange of H Shares The Stock Exchange of Hong Kong Limited
Stock name ABC
Stock code 1288
Share registrar Computershare Hong Kong Investor Services Limited (Address:
Shops 1712–1716, 17th Floor, Hopewell Center, 183 Queen’s Road
East, Wanchai, Hong Kong)
Basic Corporate Information and Major Financial Indicators
5Interim Report 2019
Trading exchange and platform of
preference shares
The Integrated Business Platform of Shanghai Stock Exchange
Stock name (stock code) 農行優1 (360001) 農行優2 (360009)
Share registrar China Securities Depository and Clearing Corporation Limited,
Shanghai Branch (Address: 3/F, China Insurance Building, No. 166
Lujiazui East Road, New Pudong District, Shanghai, PRC)
Legal advisor as to laws of
Mainland China
King & Wood Mallesons
Address 17–18/F, East Tower, World Financial Centre, No. 1, East 3rd Ring
Middle Road, Chaoyang District, Beijing
Legal advisor as to laws of
Hong Kong
Fangda Partners
Address 26/F, One Exchange Square, 8 Connaught Place, Central, Hong
Kong
Domestic auditor PricewaterhouseCoopers Zhong Tian LLP
Address 11/F, PricewaterhouseCoopers Center, Link Square 2, 202 Hu Bin
Road, Huangpu District, Shanghai
Name of the undersigned
accountants
JIANG Kun, HAN Dan
International auditor PricewaterhouseCoopers
Address 22/F, Prince’s Building, Central, Hong Kong
Sponsor institution of continuous
supervision and guidance
CITIC Securities Co., Ltd.
Address North Tower, Excellence Times Plaza II
No. 8 Zhong Xin San Road, Futian District, Shenzhen, Guangdong
Name of the undersigned
sponsor representatives
ZHU Yu, SUN Yi
The period of continuous
supervision and guidance
2 July 2018 to 31 December 2019
Basic Corporate Information and Major Financial Indicators
6
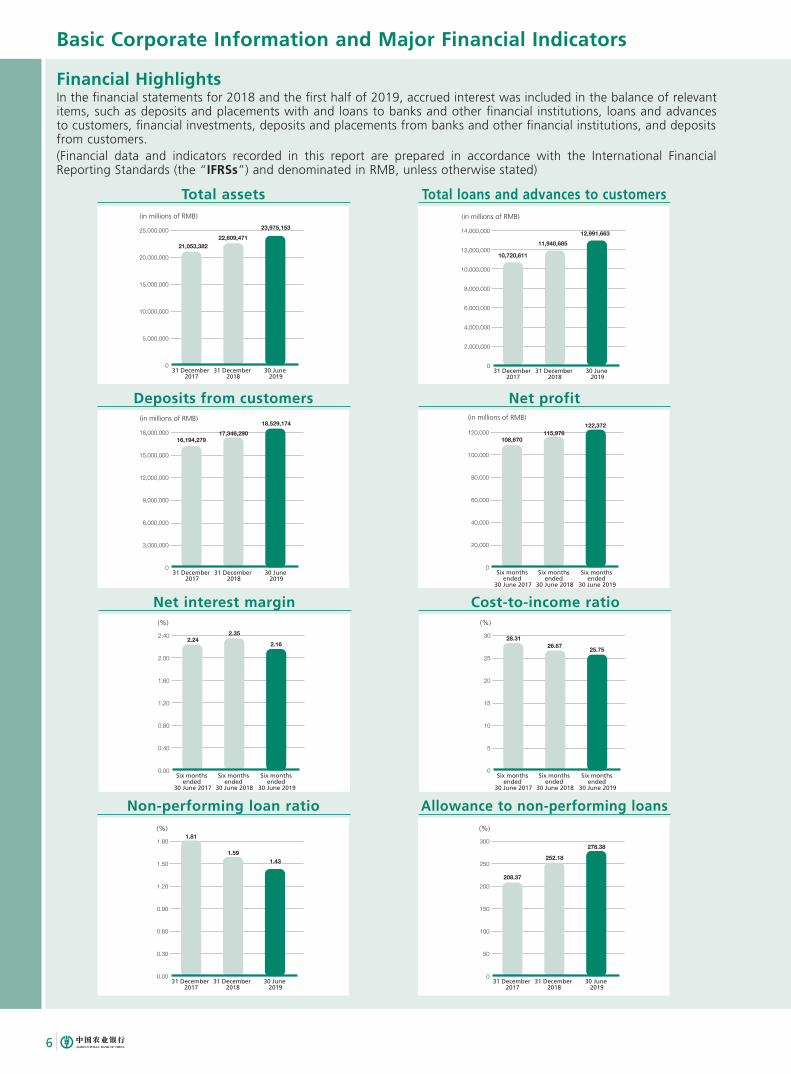
Financial HighlightsIn the financial statements for 2018 and the first half of 2019, accrued interest was included in the balance of relevant items, such as deposits and placements with and loans to banks and other financial institutions, loans and advances to customers, financial investments, deposits and placements from banks and other financial institutions, and deposits from customers.(Financial data and indicators recorded in this report are prepared in accordance with the International Financial Reporting Standards (the “IFRSs”) and denominated in RMB, unless otherwise stated)
Total assets Total loans and advances to customers
Deposits from customers Net profit
Net interest margin Cost-to-income ratio
Non-performing loan ratio Allowance to non-performing loans
0
5,000,000
10,000,000
15,000,000
20,000,000
25,000,000
21,053,38222,609,471
23,975,153
31 December 2017
31 December 2018
30 June 2019
(in millions of RMB)
0
2,000,000
4,000,000
6,000,000
8,000,000
10,000,000
12,000,000
14,000,000
10,720,611
11,940,68512,991,663
31 December 2017
31 December 2018
30 June 2019
(in millions of RMB)
0
3,000,000
6,000,000
9,000,000
12,000,000
15,000,000
18,000,00016,194,279
17,346,29018,529,174
31 December 2017
31 December 2018
30 June 2019
(in millions of RMB)
0
20,000
40,000
60,000
80,000
100,000
120,000108,670
115,976122,372
(in millions of RMB)
Six months ended
30 June 2017
Six months ended
30 June 2018
Six months ended
30 June 2019
0.00
0.40
0.80
1.20
1.60
2.00
2.40 2.242.35
2.16
(%)
Six months ended
30 June 2017
Six months ended
30 June 2018
Six months ended
30 June 2019
0
5
10
15
20
25
30
(%)
28.3126.67 25.75
Six months ended
30 June 2017
Six months ended
30 June 2018
Six months ended
30 June 2019
0.00
0.30
0.60
0.90
1.20
1.50
1.801.81
1.591.43
(%)
31 December 2017
31 December 2018
30 June 2019
0
50
100
150
200
250
300
(%)
208.37
252.18
278.38
31 December 2017
31 December 2018
30 June 2019
Basic Corporate Information and Major Financial Indicators
7Interim Report 2019
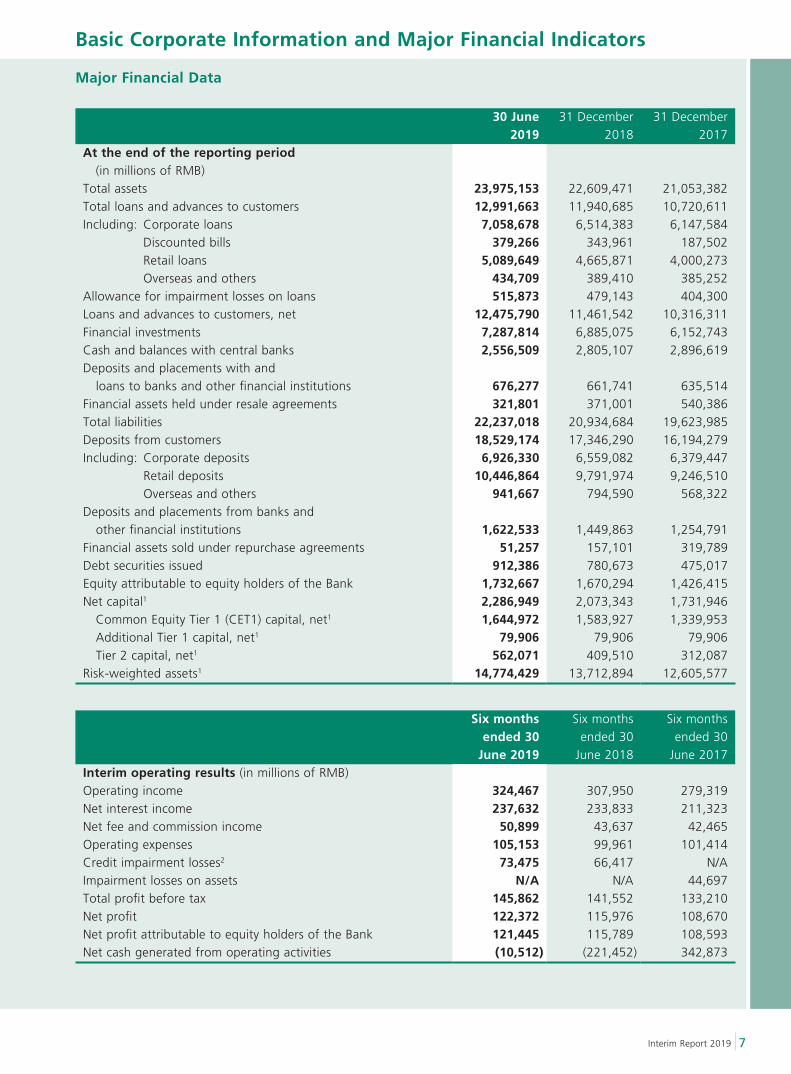
Major Financial Data
30 June 2019
31 December 2018
31 December 2017
At the end of the reporting period (in millions of RMB)Total assets 23,975,153 22,609,471 21,053,382Total loans and advances to customers 12,991,663 11,940,685 10,720,611Including: Corporate loans 7,058,678 6,514,383 6,147,584
Discounted bills 379,266 343,961 187,502Retail loans 5,089,649 4,665,871 4,000,273Overseas and others 434,709 389,410 385,252
Allowance for impairment losses on loans 515,873 479,143 404,300Loans and advances to customers, net 12,475,790 11,461,542 10,316,311Financial investments 7,287,814 6,885,075 6,152,743Cash and balances with central banks 2,556,509 2,805,107 2,896,619Deposits and placements with and loans to banks and other financial institutions 676,277 661,741 635,514Financial assets held under resale agreements 321,801 371,001 540,386Total liabilities 22,237,018 20,934,684 19,623,985Deposits from customers 18,529,174 17,346,290 16,194,279Including: Corporate deposits 6,926,330 6,559,082 6,379,447
Retail deposits 10,446,864 9,791,974 9,246,510Overseas and others 941,667 794,590 568,322
Deposits and placements from banks and other financial institutions 1,622,533 1,449,863 1,254,791Financial assets sold under repurchase agreements 51,257 157,101 319,789Debt securities issued 912,386 780,673 475,017Equity attributable to equity holders of the Bank 1,732,667 1,670,294 1,426,415Net capital1 2,286,949 2,073,343 1,731,946 Common Equity Tier 1 (CET1) capital, net1 1,644,972 1,583,927 1,339,953 Additional Tier 1 capital, net1 79,906 79,906 79,906 Tier 2 capital, net1 562,071 409,510 312,087Risk-weighted assets1 14,774,429 13,712,894 12,605,577
Six months ended 30
June 2019
Six months ended 30
June 2018
Six months ended 30
June 2017Interim operating results (in millions of RMB)Operating income 324,467 307,950 279,319Net interest income 237,632 233,833 211,323Net fee and commission income 50,899 43,637 42,465Operating expenses 105,153 99,961 101,414Credit impairment losses2 73,475 66,417 N/AImpairment losses on assets N/A N/A 44,697Total profit before tax 145,862 141,552 133,210Net profit 122,372 115,976 108,670Net profit attributable to equity holders of the Bank 121,445 115,789 108,593Net cash generated from operating activities (10,512) (221,452) 342,873
Basic Corporate Information and Major Financial Indicators
8
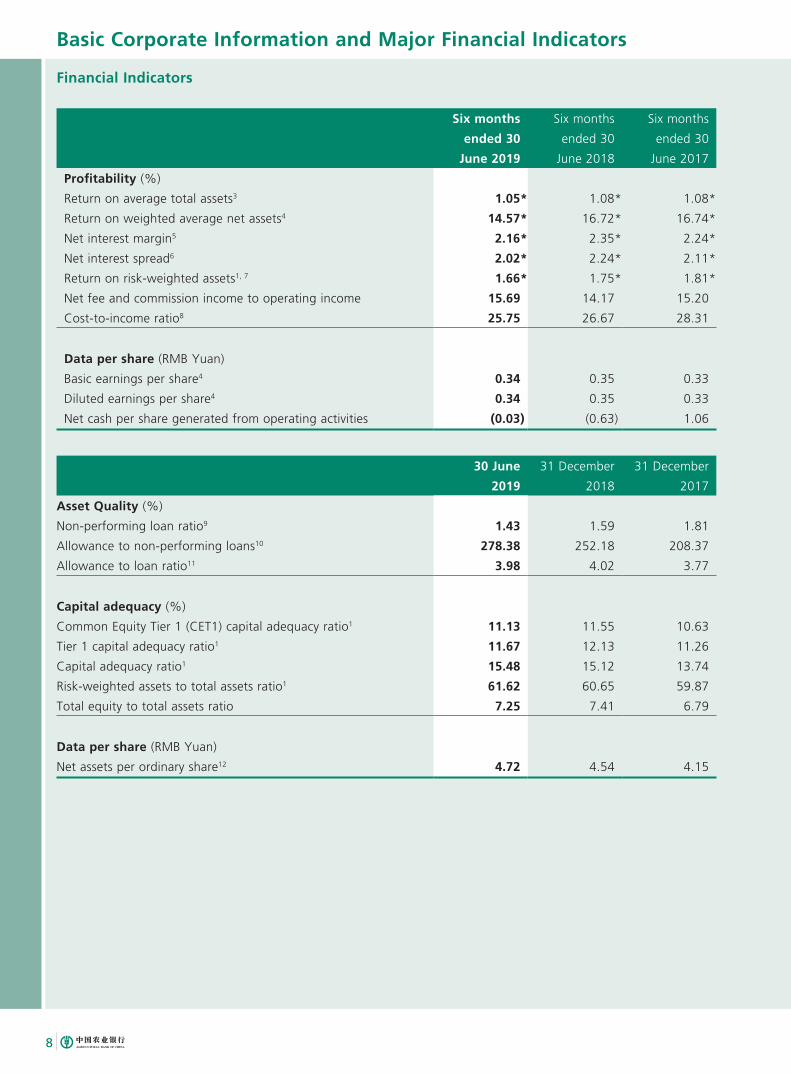
Financial Indicators
Six months
ended 30
June 2019
Six months
ended 30
June 2018
Six months
ended 30
June 2017
Profitability (%)
Return on average total assets3 1.05* 1.08* 1.08*
Return on weighted average net assets4 14.57* 16.72* 16.74*
Net interest margin5 2.16* 2.35* 2.24*
Net interest spread6 2.02* 2.24* 2.11*
Return on risk-weighted assets1, 7 1.66* 1.75* 1.81*
Net fee and commission income to operating income 15.69 14.17 15.20
Cost-to-income ratio8 25.75 26.67 28.31
Data per share (RMB Yuan)
Basic earnings per share4 0.34 0.35 0.33
Diluted earnings per share4 0.34 0.35 0.33
Net cash per share generated from operating activities (0.03) (0.63) 1.06
30 June
2019
31 December
2018
31 December
2017
Asset Quality (%)
Non-performing loan ratio9 1.43 1.59 1.81
Allowance to non-performing loans10 278.38 252.18 208.37
Allowance to loan ratio11 3.98 4.02 3.77
Capital adequacy (%)
Common Equity Tier 1 (CET1) capital adequacy ratio1 11.13 11.55 10.63
Tier 1 capital adequacy ratio1 11.67 12.13 11.26
Capital adequacy ratio1 15.48 15.12 13.74
Risk-weighted assets to total assets ratio1 61.62 60.65 59.87
Total equity to total assets ratio 7.25 7.41 6.79
Data per share (RMB Yuan)
Net assets per ordinary share12 4.72 4.54 4.15
Basic Corporate Information and Major Financial Indicators
9Interim Report 2019
Notes: 1. Figures were calculated in accordance with the Capital Rules for Commercial Banks (Provisional) and other relevant regulations.
2. The data of the item for the corresponding period of 2018 was reclassified to conform with the presentation of the financial statements for this reporting period.
3. Calculated by dividing net profit by the average balances of total assets at the beginning and the end of the period. 4. Calculated in accordance with the Rules for the Compilation and Submission of Information Disclosure by Companies
that Offer Securities to the Public No. 9 — Computation and Disclosure of Return on Net Assets and Earnings per Share (2010 Revision) issued by the CSRC and International Accounting Standard 33 — Earnings per share.
5. Calculated by dividing net interest income by the average balances of interest-earning assets. 6. Calculated as the difference between the average yield on interest-earning assets and the average cost of interest-
bearing liabilities. 7. Calculated by dividing net profit by risk-weighted assets at the end of the period. The risk-weighted assets are
calculated in accordance with the relevant regulations of the CBIRC. 8. Calculated by dividing operating and administrative expenses by operating income in accordance with CASs, which is
consistent with the corresponding figures as stated in the financial report of the Bank prepared in accordance with CASs.
9. Calculated by dividing the balance of non-performing loans (excluding accrued interest) by the balance of total loans and advances to customers (excluding accrued interest).
10. Calculated by dividing the balance of allowance for impairment losses on loans (excluding accrued interest) by the balance of non-performing loans (excluding accrued interest), among which, the balance of allowance for impairment losses on loans (excluding accrued interest) does not include the balance of allowance for impairment losses on loans at fair value through other comprehensive income.
11. Calculated by dividing the balance of allowance for impairment losses on loans (excluding accrued interest) by the balance of total loans and advances to customers (excluding accrued interest), among which, the balance of allowance for impairment losses on loans (excluding accrued interest) does not include the balance of allowance for impairment losses on loans at fair value through other comprehensive income.
12. Calculated by dividing equity attributable to ordinary equity holders of the Bank after deduction of preference shares at the end of the period by the total number of ordinary shares at the end of the period.
* Annualized figures.
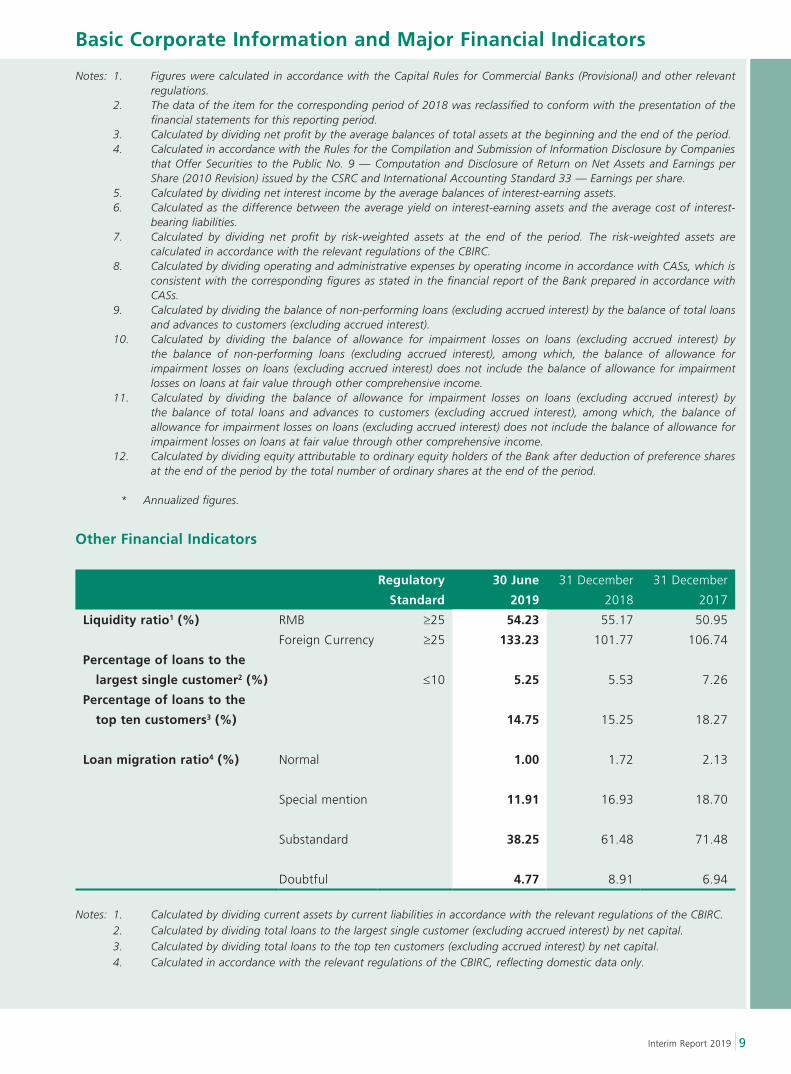
Other Financial Indicators
Regulatory
Standard
30 June
2019
31 December
2018
31 December
2017
Liquidity ratio1 (%) RMB ≥25 54.23 55.17 50.95
Foreign Currency ≥25 133.23 101.77 106.74
Percentage of loans to the
largest single customer2 (%) ≤10 5.25 5.53 7.26
Percentage of loans to the
top ten customers3 (%) 14.75 15.25 18.27
Loan migration ratio4 (%) Normal 1.00 1.72 2.13
Special mention 11.91 16.93 18.70
Substandard 38.25 61.48 71.48
Doubtful 4.77 8.91 6.94
Notes: 1. Calculated by dividing current assets by current liabilities in accordance with the relevant regulations of the CBIRC. 2. Calculated by dividing total loans to the largest single customer (excluding accrued interest) by net capital. 3. Calculated by dividing total loans to the top ten customers (excluding accrued interest) by net capital. 4. Calculated in accordance with the relevant regulations of the CBIRC, reflecting domestic data only.
Discussion and Analysis
10
Environment and Prospects
During the first half of 2019, global economy was slowing down. The growth momentum of the major developed
economies continued to slow. The US economy experienced moderate growth with a decline in its GDP growth
following a surge in the first quarter, a decelerated growth in commodity price and the unemployment rate remaining
low. Eurozone economic growth continued to ease down, albeit with a moderate level of inflation and a decrease in
the unemployment rate. The UK economy continued its slow growth, with Brexit creating greater uncertainty. The
Japanese economy experienced a slight rebound in growth, with low inflation and unemployment rate. Emerging
market economies experienced a differentiated performance. For example, the economic growth in India moderated,
while the economies of Russia and South Africa steadily recovered.
In the first half of 2019, China economy remained resilient, with a GDP growth of 6.3% as compared to the
corresponding period of the previous year. The growth impetus conversion was accelerated and the effectiveness of
the structure optimisation was embodied. Due to the decelerated growth in manufacturing industry and infrastructure
investment, the growth in fixed asset investment has slightly slowed down. Because of the increased household
leverage and decreased auto sales, the growth in consumption was eased down. Consumption contributed 60.1% to
economic growth. Trade friction led to a slight decrease in the export growth. The CPI rose moderately, while the PPI
declined. As the supply-side structural reform was deepened with the leverage ratio of industrial enterprise declined,
while investment into the weak areas maintained strong growth.
During the first half of 2019, the Chinese government continued to adopt proactive fiscal policies and prudent
monetary policies. The fiscal policies were focused on reducing taxes and fees, bolstering weak areas, and economic
restructuring. Monetary policies remained moderate, with counter-cyclic adjustments being adopted timely and
appropriately. The PBOC maintained reasonable and adequate liquidity by using monetary policy tools, including
lowering of the deposit reserve ratio, flexibly conducting open market operations, and launching innovated tools,
namely the Targeted Medium-term Lending Facility (TMLF) and Central Bank Bills Swap (CBS). The risk-free interest
rate in the market generally declined and a decrease in bond defaults facilitated credit spreads became narrow. By
deepening supply-side structural reform in the financial sector, the ability to support the weak areas of economy and
innovation was further enhanced.
Discussion and Analysis
11Interim Report 2019
Looking forward to the second half of 2019, the global economy will face many uncertainties with a weakening
trend in growth impetus. According to the IMF estimate in July, global economic growth for 2019 will be 3.2%, a
decrease of 0.1% as compared to the last estimate. It is expected that China economy will grow within a reasonable
range. Consumption growth is expected to maintain stable as the effectiveness of the policies for tax reduction
and household consumption stimulation was gradually embodied. Growth in infrastructure investment will recover
as new infrastructure investment becomes a highlight, supported by a policy allowing special bonds to be used as
capital funding for qualified large projects. Fiscal policies will be focused more effectively by launching a range of
tax reduction measures. Monetary policies will be targeted at enhancing coordination among them and improving
the efficiency of their channels to market. Policies like these will maintain appropriate levels of liquidity and stable
market interest rates, as well as keeping the growth in M2 and total social financing proportionate to nominal GDP
growth. Liberalization of interest rates will continue, the RMB exchange rate will basically remain stable within a
reasonable and balanced range, and the financial regulatory mechanism will be further improved. The supply-side
structural reform in the financial sector will be further encouraged, so that the financing and the credit structure will
be improved, making the financial system more compatible with the supply and demand of the real economy.
In the second half of 2019, we will actively implement the supply-side reform in the financial sector, and focus on
digital transformation as our primary operating strategy. Focusing on bolstering weak areas of our business and key
business areas, we will improve our ability to serve the real economy. First, we will strengthen our competitiveness
in “Sannong” and County Areas through innovation. We will accelerate digital transformation and enhance our
competitiveness in businesses in “Sannong” and County Areas through new technologies, means and operating
models. We will add the functions of payment, wealth management, e-commerce and poverty alleviation to “Huinong
E-loan”, to build it as an Internet financing product with our own features. Second, we will promote transformation
of our retail business by implementing digital transformation and developing our traditional business concurrently.
We will focus on enhancing the competitiveness of our retail business through achieving breakthroughs in four areas,
namely, methods for obtaining and retaining customers, digital products and services, comprehensive collaboration
of our online and offline channels, and capability empowered by financial technology. Finally, we will continuously
promote innovation in systems and operating procedures, to clear the major obstacles in digital transformation. We
will accelerate modification of our systems related to our online financing business, optimize our online and offline
integrated operating and service procedures, and establish a risk control model appropriate for the online business.
Discussion and Analysis
12
Financial Statement Analysis
Income Statement Analysis
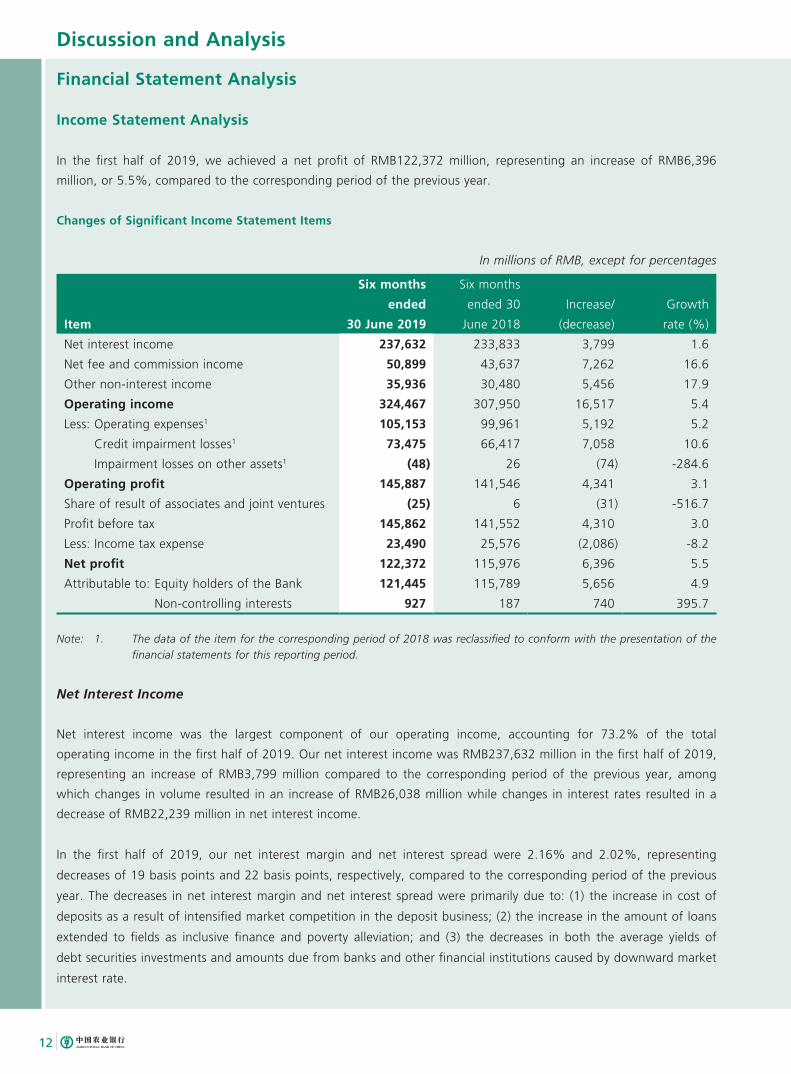
In the first half of 2019, we achieved a net profit of RMB122,372 million, representing an increase of RMB6,396
million, or 5.5%, compared to the corresponding period of the previous year.
Changes of Significant Income Statement Items
In millions of RMB, except for percentages
Item
Six months
ended
30 June 2019
Six months
ended 30
June 2018
Increase/
(decrease)
Growth
rate (%)
Net interest income 237,632 233,833 3,799 1.6
Net fee and commission income 50,899 43,637 7,262 16.6
Other non-interest income 35,936 30,480 5,456 17.9
Operating income 324,467 307,950 16,517 5.4
Less: Operating expenses1 105,153 99,961 5,192 5.2
Credit impairment losses1 73,475 66,417 7,058 10.6
Impairment losses on other assets1 (48) 26 (74) -284.6
Operating profit 145,887 141,546 4,341 3.1
Share of result of associates and joint ventures (25) 6 (31) -516.7
Profit before tax 145,862 141,552 4,310 3.0
Less: Income tax expense 23,490 25,576 (2,086) -8.2
Net profit 122,372 115,976 6,396 5.5
Attributable to: Equity holders of the Bank 121,445 115,789 5,656 4.9
Non-controlling interests 927 187 740 395.7
Note: 1. The data of the item for the corresponding period of 2018 was reclassified to conform with the presentation of the financial statements for this reporting period.
Net Interest Income
Net interest income was the largest component of our operating income, accounting for 73.2% of the total
operating income in the first half of 2019. Our net interest income was RMB237,632 million in the first half of 2019,
representing an increase of RMB3,799 million compared to the corresponding period of the previous year, among
which changes in volume resulted in an increase of RMB26,038 million while changes in interest rates resulted in a
decrease of RMB22,239 million in net interest income.
In the first half of 2019, our net interest margin and net interest spread were 2.16% and 2.02%, representing
decreases of 19 basis points and 22 basis points, respectively, compared to the corresponding period of the previous
year. The decreases in net interest margin and net interest spread were primarily due to: (1) the increase in cost of
deposits as a result of intensified market competition in the deposit business; (2) the increase in the amount of loans
extended to fields as inclusive finance and poverty alleviation; and (3) the decreases in both the average yields of
debt securities investments and amounts due from banks and other financial institutions caused by downward market
interest rate.
Discussion and Analysis
13Interim Report 2019
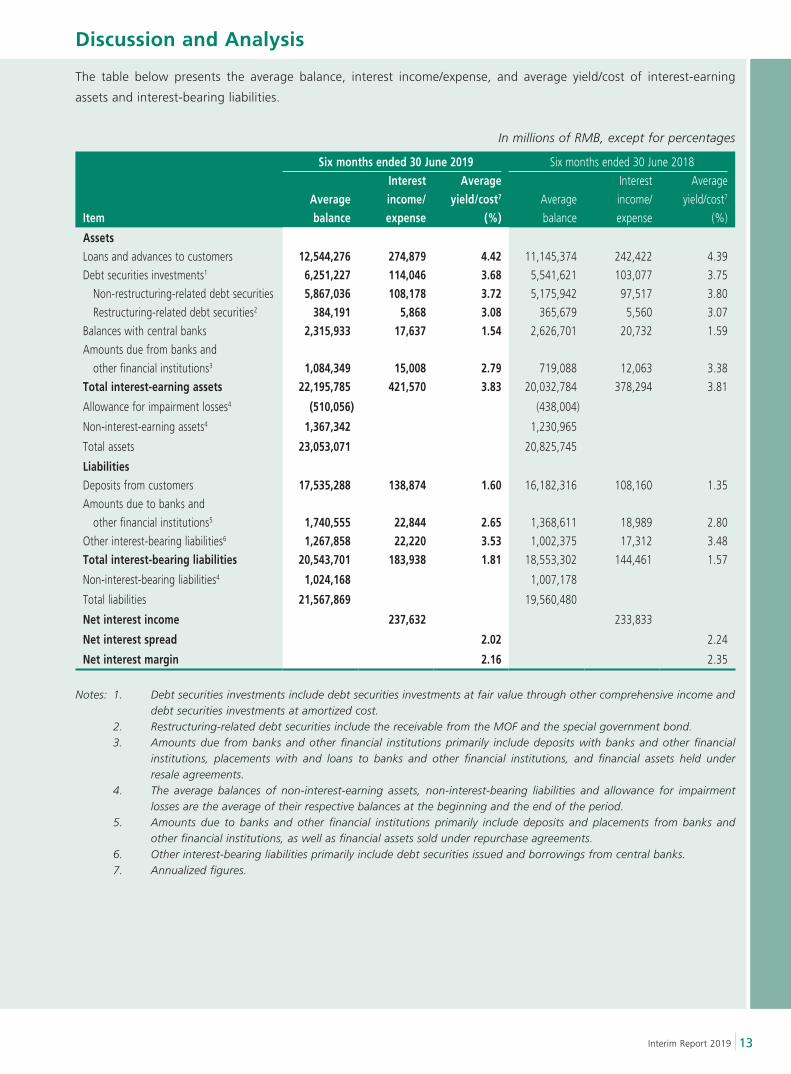
The table below presents the average balance, interest income/expense, and average yield/cost of interest-earning
assets and interest-bearing liabilities.
In millions of RMB, except for percentages
Six months ended 30 June 2019 Six months ended 30 June 2018
ItemAverage balance
Interest income/expense
Average yield/cost7
(%)Average
balance
Interest
income/
expense
Average
yield/cost7
(%)
AssetsLoans and advances to customers 12,544,276 274,879 4.42 11,145,374 242,422 4.39
Debt securities investments1 6,251,227 114,046 3.68 5,541,621 103,077 3.75
Non-restructuring-related debt securities 5,867,036 108,178 3.72 5,175,942 97,517 3.80
Restructuring-related debt securities2 384,191 5,868 3.08 365,679 5,560 3.07
Balances with central banks 2,315,933 17,637 1.54 2,626,701 20,732 1.59
Amounts due from banks and
other financial institutions3 1,084,349 15,008 2.79 719,088 12,063 3.38
Total interest-earning assets 22,195,785 421,570 3.83 20,032,784 378,294 3.81
Allowance for impairment losses4 (510,056) (438,004)
Non-interest-earning assets4 1,367,342 1,230,965
Total assets 23,053,071 20,825,745
LiabilitiesDeposits from customers 17,535,288 138,874 1.60 16,182,316 108,160 1.35
Amounts due to banks and
other financial institutions5 1,740,555 22,844 2.65 1,368,611 18,989 2.80
Other interest-bearing liabilities6 1,267,858 22,220 3.53 1,002,375 17,312 3.48
Total interest-bearing liabilities 20,543,701 183,938 1.81 18,553,302 144,461 1.57
Non-interest-bearing liabilities4 1,024,168 1,007,178
Total liabilities 21,567,869 19,560,480
Net interest income 237,632 233,833
Net interest spread 2.02 2.24
Net interest margin 2.16 2.35
Notes: 1. Debt securities investments include debt securities investments at fair value through other comprehensive income and debt securities investments at amortized cost.
2. Restructuring-related debt securities include the receivable from the MOF and the special government bond. 3. Amounts due from banks and other financial institutions primarily include deposits with banks and other financial
institutions, placements with and loans to banks and other financial institutions, and financial assets held under resale agreements.
4. The average balances of non-interest-earning assets, non-interest-bearing liabilities and allowance for impairment losses are the average of their respective balances at the beginning and the end of the period.
5. Amounts due to banks and other financial institutions primarily include deposits and placements from banks and other financial institutions, as well as financial assets sold under repurchase agreements.
6. Other interest-bearing liabilities primarily include debt securities issued and borrowings from central banks. 7. Annualized figures.
Discussion and Analysis
14
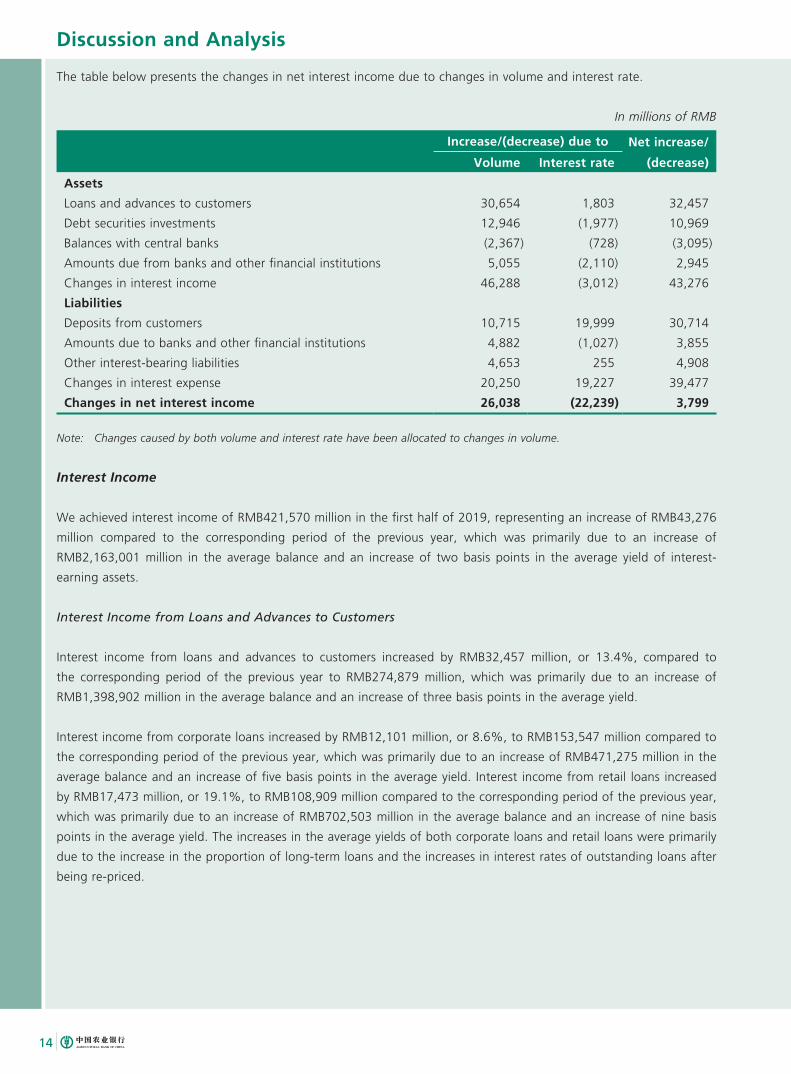
The table below presents the changes in net interest income due to changes in volume and interest rate.
In millions of RMB
Increase/(decrease) due to Net increase/
(decrease)Volume Interest rate
Assets
Loans and advances to customers 30,654 1,803 32,457
Debt securities investments 12,946 (1,977) 10,969
Balances with central banks (2,367) (728) (3,095)
Amounts due from banks and other financial institutions 5,055 (2,110) 2,945
Changes in interest income 46,288 (3,012) 43,276
Liabilities
Deposits from customers 10,715 19,999 30,714
Amounts due to banks and other financial institutions 4,882 (1,027) 3,855
Other interest-bearing liabilities 4,653 255 4,908
Changes in interest expense 20,250 19,227 39,477
Changes in net interest income 26,038 (22,239) 3,799
Note: Changes caused by both volume and interest rate have been allocated to changes in volume.
Interest Income
We achieved interest income of RMB421,570 million in the first half of 2019, representing an increase of RMB43,276
million compared to the corresponding period of the previous year, which was primarily due to an increase of
RMB2,163,001 million in the average balance and an increase of two basis points in the average yield of interest-
earning assets.
Interest Income from Loans and Advances to Customers
Interest income from loans and advances to customers increased by RMB32,457 million, or 13.4%, compared to
the corresponding period of the previous year to RMB274,879 million, which was primarily due to an increase of
RMB1,398,902 million in the average balance and an increase of three basis points in the average yield.
Interest income from corporate loans increased by RMB12,101 million, or 8.6%, to RMB153,547 million compared to
the corresponding period of the previous year, which was primarily due to an increase of RMB471,275 million in the
average balance and an increase of five basis points in the average yield. Interest income from retail loans increased
by RMB17,473 million, or 19.1%, to RMB108,909 million compared to the corresponding period of the previous year,
which was primarily due to an increase of RMB702,503 million in the average balance and an increase of nine basis
points in the average yield. The increases in the average yields of both corporate loans and retail loans were primarily
due to the increase in the proportion of long-term loans and the increases in interest rates of outstanding loans after
being re-priced.
Discussion and Analysis
15Interim Report 2019
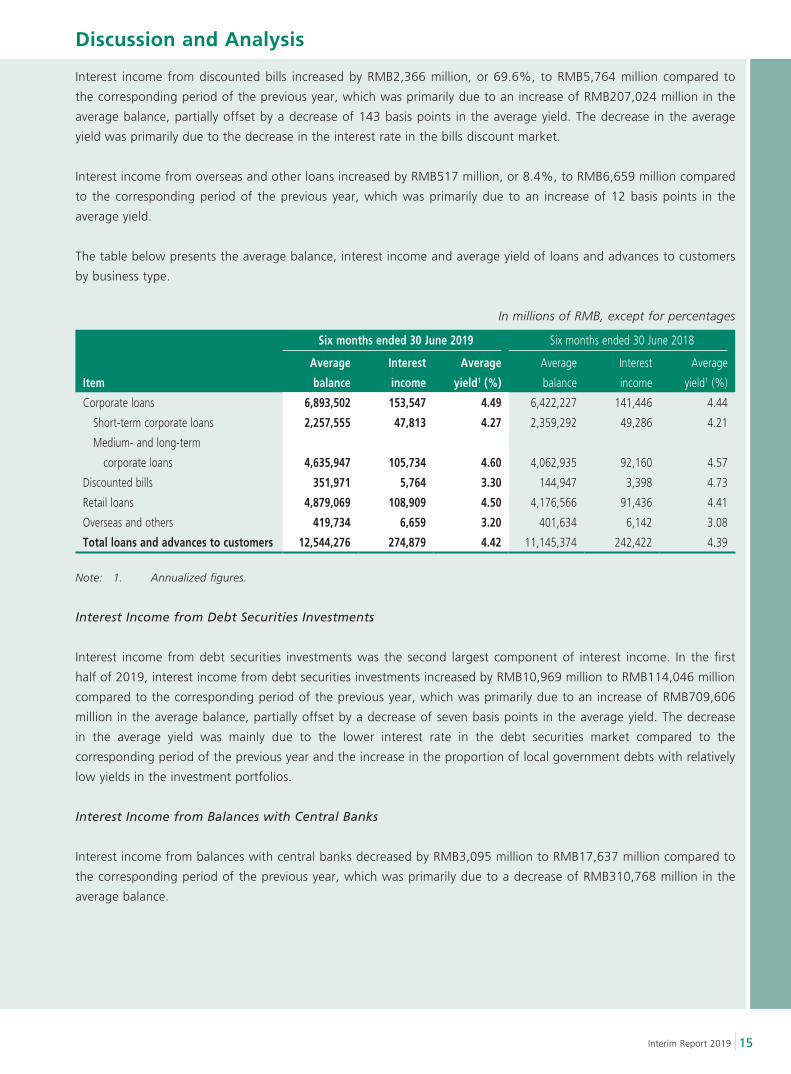
Interest income from discounted bills increased by RMB2,366 million, or 69.6%, to RMB5,764 million compared to
the corresponding period of the previous year, which was primarily due to an increase of RMB207,024 million in the
average balance, partially offset by a decrease of 143 basis points in the average yield. The decrease in the average
yield was primarily due to the decrease in the interest rate in the bills discount market.
Interest income from overseas and other loans increased by RMB517 million, or 8.4%, to RMB6,659 million compared
to the corresponding period of the previous year, which was primarily due to an increase of 12 basis points in the
average yield.
The table below presents the average balance, interest income and average yield of loans and advances to customers
by business type.
In millions of RMB, except for percentages
Six months ended 30 June 2019 Six months ended 30 June 2018
Item
Average
balance
Interest
income
Average
yield1 (%)
Average
balance
Interest
income
Average
yield1 (%)
Corporate loans 6,893,502 153,547 4.49 6,422,227 141,446 4.44
Short-term corporate loans 2,257,555 47,813 4.27 2,359,292 49,286 4.21
Medium- and long-term
corporate loans 4,635,947 105,734 4.60 4,062,935 92,160 4.57
Discounted bills 351,971 5,764 3.30 144,947 3,398 4.73
Retail loans 4,879,069 108,909 4.50 4,176,566 91,436 4.41
Overseas and others 419,734 6,659 3.20 401,634 6,142 3.08
Total loans and advances to customers 12,544,276 274,879 4.42 11,145,374 242,422 4.39
Note: 1. Annualized figures.
Interest Income from Debt Securities Investments
Interest income from debt securities investments was the second largest component of interest income. In the first
half of 2019, interest income from debt securities investments increased by RMB10,969 million to RMB114,046 million
compared to the corresponding period of the previous year, which was primarily due to an increase of RMB709,606
million in the average balance, partially offset by a decrease of seven basis points in the average yield. The decrease
in the average yield was mainly due to the lower interest rate in the debt securities market compared to the
corresponding period of the previous year and the increase in the proportion of local government debts with relatively
low yields in the investment portfolios.
Interest Income from Balances with Central Banks
Interest income from balances with central banks decreased by RMB3,095 million to RMB17,637 million compared to
the corresponding period of the previous year, which was primarily due to a decrease of RMB310,768 million in the
average balance.
Discussion and Analysis
16
Interest Income from Amounts Due from Banks and Other Financial Institutions
Interest income from amounts due from banks and other financial institutions increased by RMB2,945 million to
RMB15,008 million compared to the corresponding period of the previous year, which was primarily due to an
increase of RMB365,261 million in the average balance, partially offset by a decrease of 59 basis points in the average
yield. The decrease in the average yield was primarily due to the lower interest rate in the monetary market compared
to the corresponding period of the previous year.
Interest Expense
Interest expense increased by RMB39,477 million to RMB183,938 million compared to the corresponding period of the
previous year, which was mainly due to an increase of RMB1,990,399 million in the average balance and an increase
of 24 basis points in the average cost.
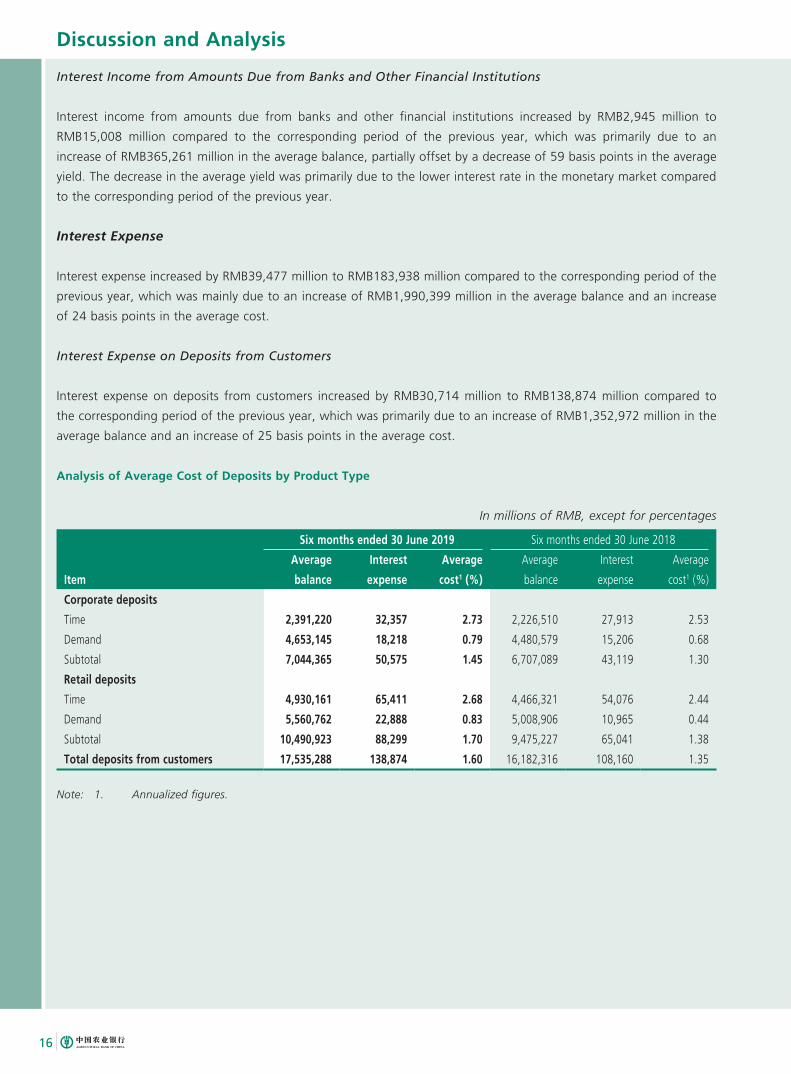
Interest Expense on Deposits from Customers
Interest expense on deposits from customers increased by RMB30,714 million to RMB138,874 million compared to
the corresponding period of the previous year, which was primarily due to an increase of RMB1,352,972 million in the
average balance and an increase of 25 basis points in the average cost.
Analysis of Average Cost of Deposits by Product Type
In millions of RMB, except for percentages
Six months ended 30 June 2019 Six months ended 30 June 2018
Item
Average
balance
Interest
expense
Average
cost1 (%)
Average
balance
Interest
expense
Average
cost1 (%)
Corporate deposits
Time 2,391,220 32,357 2.73 2,226,510 27,913 2.53
Demand 4,653,145 18,218 0.79 4,480,579 15,206 0.68
Subtotal 7,044,365 50,575 1.45 6,707,089 43,119 1.30
Retail deposits
Time 4,930,161 65,411 2.68 4,466,321 54,076 2.44
Demand 5,560,762 22,888 0.83 5,008,906 10,965 0.44
Subtotal 10,490,923 88,299 1.70 9,475,227 65,041 1.38
Total deposits from customers 17,535,288 138,874 1.60 16,182,316 108,160 1.35
Note: 1. Annualized figures.
Discussion and Analysis
17Interim Report 2019
Interest Expense on Amounts Due to Banks and Other Financial Institutions
Interest expense on amounts due to banks and other financial institutions increased by RMB3,855 million to
RMB22,844 million compared to the corresponding period of the previous year, which was primarily due to an
increase of RMB371,944 million in the average balance, partially offset by a decrease of 15 basis points in average
cost. The decrease in the average cost was primarily due to the lower average cost of cooperative deposits from banks
and other financial institutions compared to the corresponding period of the previous year as affected by market
environment.
Interest Expense on Other Interest-bearing Liabilities
Interest expense on other interest-bearing liabilities increased by RMB4,908 million to RMB22,220 million compared
to the corresponding period of the previous year, primarily due to an increase of RMB265,483 million in the average
balance and an increase of five basis points in the average cost. The increase in the average balance was mainly due to
the issuances of interbank certificates of deposit and tier-2 capital bonds by the Bank. The increase in the average cost
was mainly due to the higher interest rate of the newly issued tier-2 capital bonds.
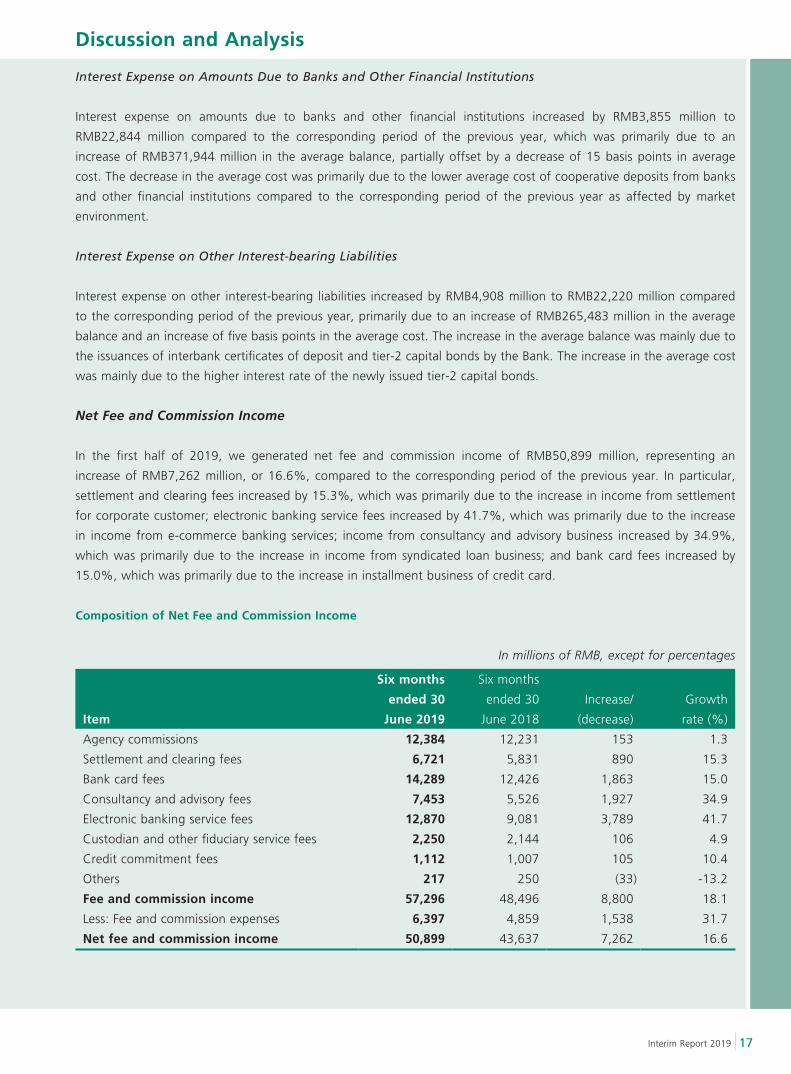
Net Fee and Commission Income
In the first half of 2019, we generated net fee and commission income of RMB50,899 million, representing an
increase of RMB7,262 million, or 16.6%, compared to the corresponding period of the previous year. In particular,
settlement and clearing fees increased by 15.3%, which was primarily due to the increase in income from settlement
for corporate customer; electronic banking service fees increased by 41.7%, which was primarily due to the increase
in income from e-commerce banking services; income from consultancy and advisory business increased by 34.9%,
which was primarily due to the increase in income from syndicated loan business; and bank card fees increased by
15.0%, which was primarily due to the increase in installment business of credit card.
Composition of Net Fee and Commission Income
In millions of RMB, except for percentages
Item
Six months
ended 30
June 2019
Six months
ended 30
June 2018
Increase/
(decrease)
Growth
rate (%)
Agency commissions 12,384 12,231 153 1.3
Settlement and clearing fees 6,721 5,831 890 15.3
Bank card fees 14,289 12,426 1,863 15.0
Consultancy and advisory fees 7,453 5,526 1,927 34.9
Electronic banking service fees 12,870 9,081 3,789 41.7
Custodian and other fiduciary service fees 2,250 2,144 106 4.9
Credit commitment fees 1,112 1,007 105 10.4
Others 217 250 (33) -13.2
Fee and commission income 57,296 48,496 8,800 18.1
Less: Fee and commission expenses 6,397 4,859 1,538 31.7
Net fee and commission income 50,899 43,637 7,262 16.6
Discussion and Analysis
18
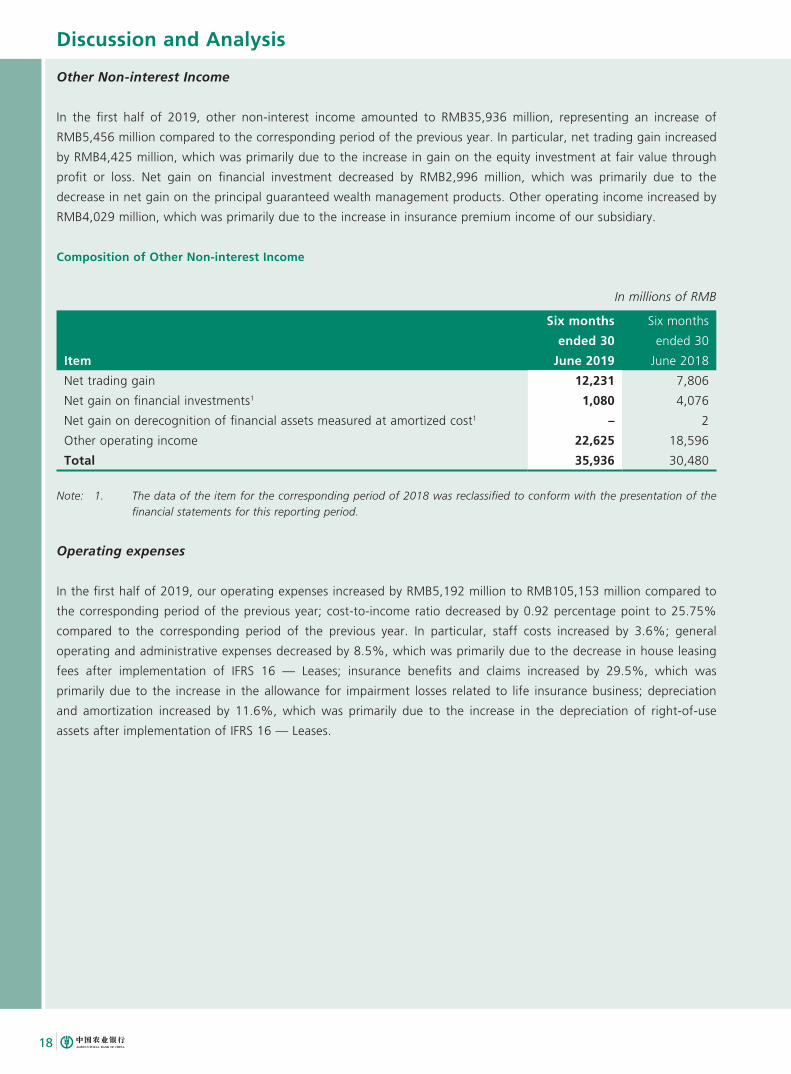
Other Non-interest Income
In the first half of 2019, other non-interest income amounted to RMB35,936 million, representing an increase of
RMB5,456 million compared to the corresponding period of the previous year. In particular, net trading gain increased
by RMB4,425 million, which was primarily due to the increase in gain on the equity investment at fair value through
profit or loss. Net gain on financial investment decreased by RMB2,996 million, which was primarily due to the
decrease in net gain on the principal guaranteed wealth management products. Other operating income increased by
RMB4,029 million, which was primarily due to the increase in insurance premium income of our subsidiary.
Composition of Other Non-interest Income
In millions of RMB
Item
Six months
ended 30
June 2019
Six months
ended 30
June 2018
Net trading gain 12,231 7,806
Net gain on financial investments1 1,080 4,076
Net gain on derecognition of financial assets measured at amortized cost1 – 2
Other operating income 22,625 18,596
Total 35,936 30,480
Note: 1. The data of the item for the corresponding period of 2018 was reclassified to conform with the presentation of the financial statements for this reporting period.
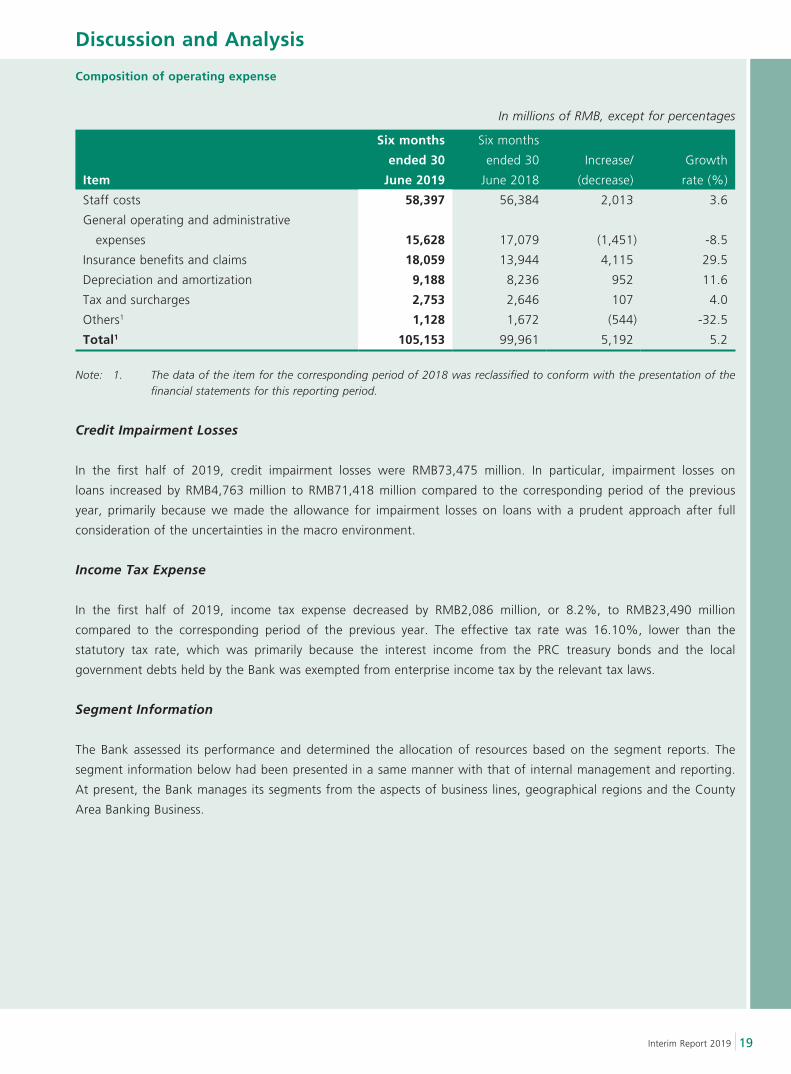
Operating expenses
In the first half of 2019, our operating expenses increased by RMB5,192 million to RMB105,153 million compared to
the corresponding period of the previous year; cost-to-income ratio decreased by 0.92 percentage point to 25.75%
compared to the corresponding period of the previous year. In particular, staff costs increased by 3.6%; general
operating and administrative expenses decreased by 8.5%, which was primarily due to the decrease in house leasing
fees after implementation of IFRS 16 — Leases; insurance benefits and claims increased by 29.5%, which was
primarily due to the increase in the allowance for impairment losses related to life insurance business; depreciation
and amortization increased by 11.6%, which was primarily due to the increase in the depreciation of right-of-use
assets after implementation of IFRS 16 — Leases.
Discussion and Analysis
19Interim Report 2019
Composition of operating expense
In millions of RMB, except for percentages
Item
Six months
ended 30
June 2019
Six months
ended 30
June 2018
Increase/
(decrease)
Growth
rate (%)
Staff costs 58,397 56,384 2,013 3.6
General operating and administrative
expenses 15,628 17,079 (1,451) -8.5
Insurance benefits and claims 18,059 13,944 4,115 29.5
Depreciation and amortization 9,188 8,236 952 11.6
Tax and surcharges 2,753 2,646 107 4.0
Others1 1,128 1,672 (544) -32.5
Total1 105,153 99,961 5,192 5.2
Note: 1. The data of the item for the corresponding period of 2018 was reclassified to conform with the presentation of the financial statements for this reporting period.
Credit Impairment Losses
In the first half of 2019, credit impairment losses were RMB73,475 million. In particular, impairment losses on
loans increased by RMB4,763 million to RMB71,418 million compared to the corresponding period of the previous
year, primarily because we made the allowance for impairment losses on loans with a prudent approach after full
consideration of the uncertainties in the macro environment.
Income Tax Expense
In the first half of 2019, income tax expense decreased by RMB2,086 million, or 8.2%, to RMB23,490 million
compared to the corresponding period of the previous year. The effective tax rate was 16.10%, lower than the
statutory tax rate, which was primarily because the interest income from the PRC treasury bonds and the local
government debts held by the Bank was exempted from enterprise income tax by the relevant tax laws.
Segment Information
The Bank assessed its performance and determined the allocation of resources based on the segment reports. The
segment information below had been presented in a same manner with that of internal management and reporting.
At present, the Bank manages its segments from the aspects of business lines, geographical regions and the County
Area Banking Business.
Discussion and Analysis
20
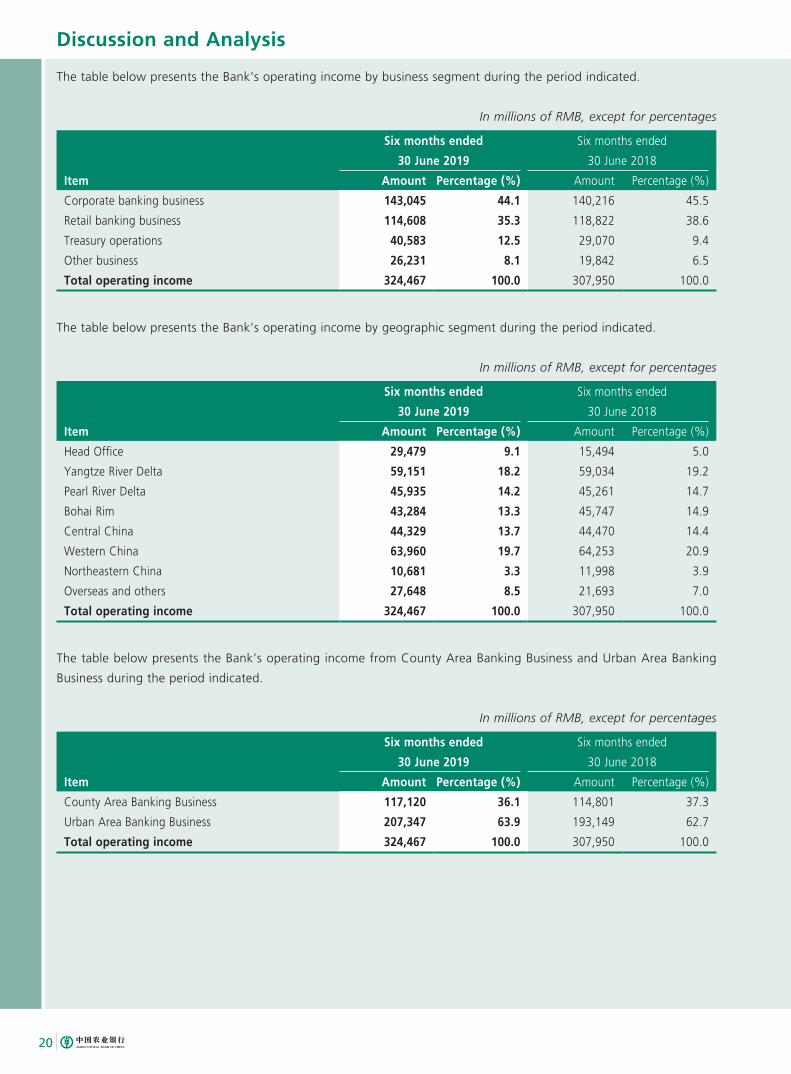
The table below presents the Bank’s operating income by business segment during the period indicated.
In millions of RMB, except for percentages
Six months ended
30 June 2019
Six months ended
30 June 2018
Item Amount Percentage (%) Amount Percentage (%)
Corporate banking business 143,045 44.1 140,216 45.5
Retail banking business 114,608 35.3 118,822 38.6
Treasury operations 40,583 12.5 29,070 9.4
Other business 26,231 8.1 19,842 6.5
Total operating income 324,467 100.0 307,950 100.0
The table below presents the Bank’s operating income by geographic segment during the period indicated.
In millions of RMB, except for percentages
Six months ended
30 June 2019
Six months ended
30 June 2018
Item Amount Percentage (%) Amount Percentage (%)
Head Office 29,479 9.1 15,494 5.0
Yangtze River Delta 59,151 18.2 59,034 19.2
Pearl River Delta 45,935 14.2 45,261 14.7
Bohai Rim 43,284 13.3 45,747 14.9
Central China 44,329 13.7 44,470 14.4
Western China 63,960 19.7 64,253 20.9
Northeastern China 10,681 3.3 11,998 3.9
Overseas and others 27,648 8.5 21,693 7.0
Total operating income 324,467 100.0 307,950 100.0
The table below presents the Bank’s operating income from County Area Banking Business and Urban Area Banking
Business during the period indicated.
In millions of RMB, except for percentages
Six months ended
30 June 2019
Six months ended
30 June 2018
Item Amount Percentage (%) Amount Percentage (%)
County Area Banking Business 117,120 36.1 114,801 37.3
Urban Area Banking Business 207,347 63.9 193,149 62.7
Total operating income 324,467 100.0 307,950 100.0
Discussion and Analysis
21Interim Report 2019
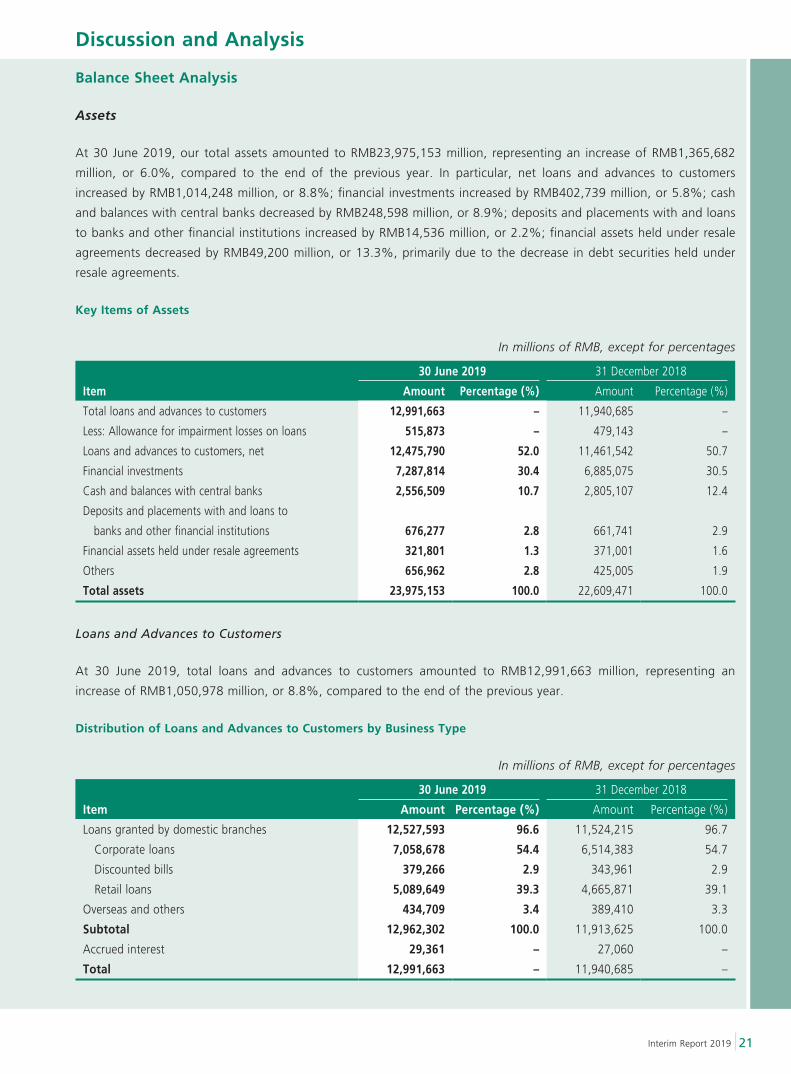
Balance Sheet Analysis
Assets
At 30 June 2019, our total assets amounted to RMB23,975,153 million, representing an increase of RMB1,365,682
million, or 6.0%, compared to the end of the previous year. In particular, net loans and advances to customers
increased by RMB1,014,248 million, or 8.8%; financial investments increased by RMB402,739 million, or 5.8%; cash
and balances with central banks decreased by RMB248,598 million, or 8.9%; deposits and placements with and loans
to banks and other financial institutions increased by RMB14,536 million, or 2.2%; financial assets held under resale
agreements decreased by RMB49,200 million, or 13.3%, primarily due to the decrease in debt securities held under
resale agreements.
Key Items of Assets
In millions of RMB, except for percentages
30 June 2019 31 December 2018
Item Amount Percentage (%) Amount Percentage (%)
Total loans and advances to customers 12,991,663 – 11,940,685 –
Less: Allowance for impairment losses on loans 515,873 – 479,143 –
Loans and advances to customers, net 12,475,790 52.0 11,461,542 50.7
Financial investments 7,287,814 30.4 6,885,075 30.5
Cash and balances with central banks 2,556,509 10.7 2,805,107 12.4
Deposits and placements with and loans to
banks and other financial institutions 676,277 2.8 661,741 2.9
Financial assets held under resale agreements 321,801 1.3 371,001 1.6
Others 656,962 2.8 425,005 1.9
Total assets 23,975,153 100.0 22,609,471 100.0
Loans and Advances to Customers
At 30 June 2019, total loans and advances to customers amounted to RMB12,991,663 million, representing an
increase of RMB1,050,978 million, or 8.8%, compared to the end of the previous year.
Distribution of Loans and Advances to Customers by Business Type
In millions of RMB, except for percentages
30 June 2019 31 December 2018
Item Amount Percentage (%) Amount Percentage (%)
Loans granted by domestic branches 12,527,593 96.6 11,524,215 96.7
Corporate loans 7,058,678 54.4 6,514,383 54.7
Discounted bills 379,266 2.9 343,961 2.9
Retail loans 5,089,649 39.3 4,665,871 39.1
Overseas and others 434,709 3.4 389,410 3.3
Subtotal 12,962,302 100.0 11,913,625 100.0
Accrued interest 29,361 – 27,060 –
Total 12,991,663 – 11,940,685 –
Discussion and Analysis
22
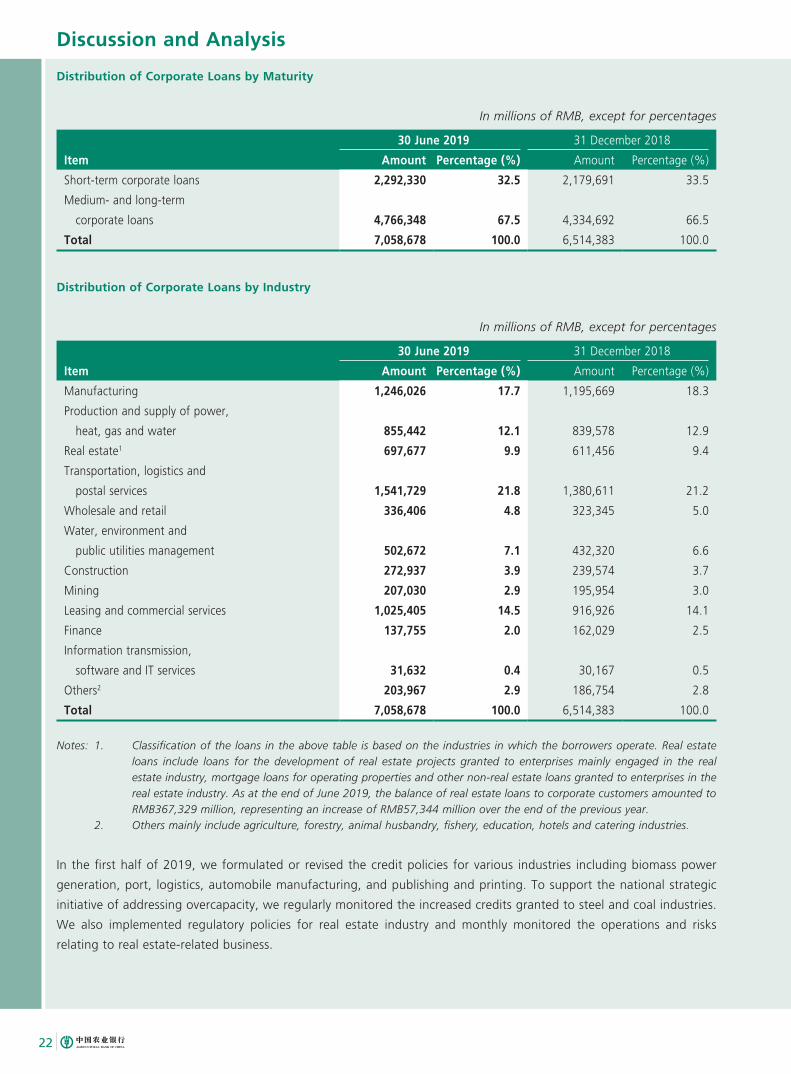
Distribution of Corporate Loans by Maturity
In millions of RMB, except for percentages
30 June 2019 31 December 2018
Item Amount Percentage (%) Amount Percentage (%)
Short-term corporate loans 2,292,330 32.5 2,179,691 33.5
Medium- and long-term
corporate loans 4,766,348 67.5 4,334,692 66.5
Total 7,058,678 100.0 6,514,383 100.0
Distribution of Corporate Loans by Industry
In millions of RMB, except for percentages
30 June 2019 31 December 2018
Item Amount Percentage (%) Amount Percentage (%)
Manufacturing 1,246,026 17.7 1,195,669 18.3
Production and supply of power,
heat, gas and water 855,442 12.1 839,578 12.9
Real estate1 697,677 9.9 611,456 9.4
Transportation, logistics and
postal services 1,541,729 21.8 1,380,611 21.2
Wholesale and retail 336,406 4.8 323,345 5.0
Water, environment and
public utilities management 502,672 7.1 432,320 6.6
Construction 272,937 3.9 239,574 3.7
Mining 207,030 2.9 195,954 3.0
Leasing and commercial services 1,025,405 14.5 916,926 14.1
Finance 137,755 2.0 162,029 2.5
Information transmission,
software and IT services 31,632 0.4 30,167 0.5
Others2 203,967 2.9 186,754 2.8
Total 7,058,678 100.0 6,514,383 100.0
Notes: 1. Classification of the loans in the above table is based on the industries in which the borrowers operate. Real estate loans include loans for the development of real estate projects granted to enterprises mainly engaged in the real estate industry, mortgage loans for operating properties and other non-real estate loans granted to enterprises in the real estate industry. As at the end of June 2019, the balance of real estate loans to corporate customers amounted to RMB367,329 million, representing an increase of RMB57,344 million over the end of the previous year.
2. Others mainly include agriculture, forestry, animal husbandry, fishery, education, hotels and catering industries.
In the first half of 2019, we formulated or revised the credit policies for various industries including biomass power
generation, port, logistics, automobile manufacturing, and publishing and printing. To support the national strategic
initiative of addressing overcapacity, we regularly monitored the increased credits granted to steel and coal industries.
We also implemented regulatory policies for real estate industry and monthly monitored the operations and risks
relating to real estate-related business.
Discussion and Analysis
23Interim Report 2019
At 30 June 2019, the five major industries of the corporate borrowers included: (1) transportation, logistics and
postal services, (2) manufacturing, (3) leasing and commercial services, (4) production and supply of power, heat,
gas and water, and (5) real estate. Aggregate loan balance of the top five major industries accounted for 76.0% of
the total corporate loans, increased by 0.1 percentage point compared to the end of the previous year. The industry
with the largest increase in proportion to the total corporate loans was transportation, logistics and postal services,
while production and supply of power, heat, gas and water recorded the largest decrease in proportion to the total
corporate loans.
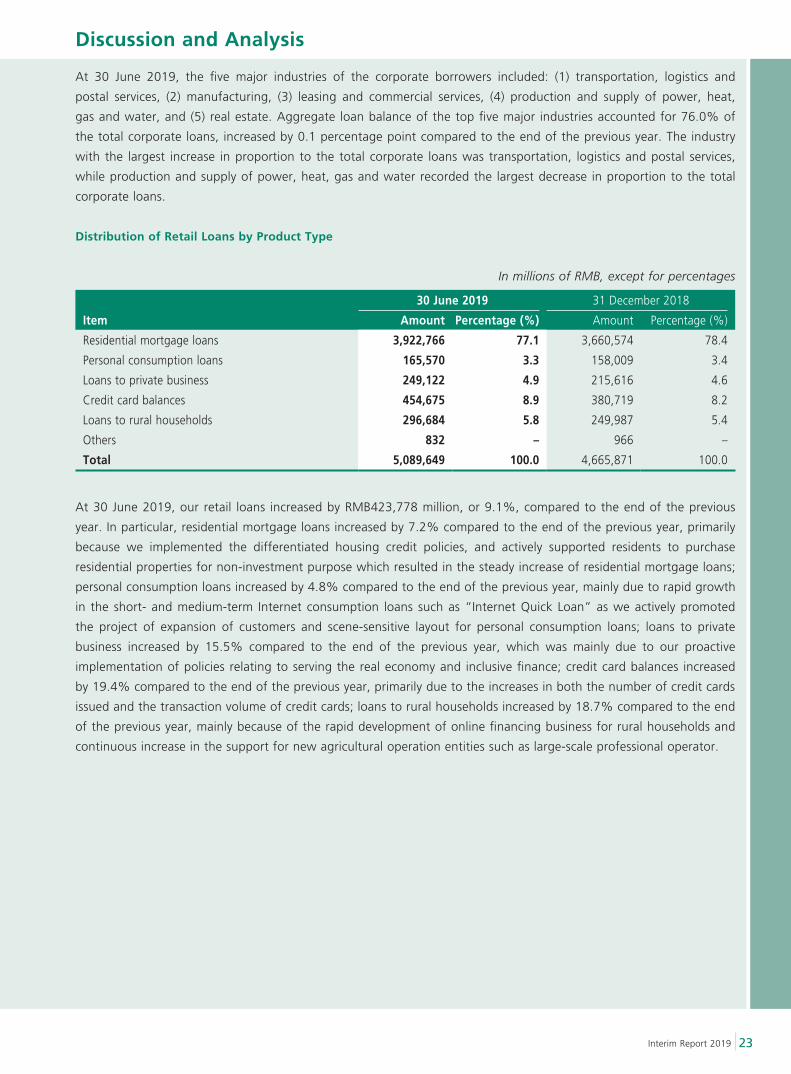
Distribution of Retail Loans by Product Type
In millions of RMB, except for percentages
30 June 2019 31 December 2018
Item Amount Percentage (%) Amount Percentage (%)
Residential mortgage loans 3,922,766 77.1 3,660,574 78.4
Personal consumption loans 165,570 3.3 158,009 3.4
Loans to private business 249,122 4.9 215,616 4.6
Credit card balances 454,675 8.9 380,719 8.2
Loans to rural households 296,684 5.8 249,987 5.4
Others 832 – 966 –
Total 5,089,649 100.0 4,665,871 100.0
At 30 June 2019, our retail loans increased by RMB423,778 million, or 9.1%, compared to the end of the previous
year. In particular, residential mortgage loans increased by 7.2% compared to the end of the previous year, primarily
because we implemented the differentiated housing credit policies, and actively supported residents to purchase
residential properties for non-investment purpose which resulted in the steady increase of residential mortgage loans;
personal consumption loans increased by 4.8% compared to the end of the previous year, mainly due to rapid growth
in the short- and medium-term Internet consumption loans such as “Internet Quick Loan” as we actively promoted
the project of expansion of customers and scene-sensitive layout for personal consumption loans; loans to private
business increased by 15.5% compared to the end of the previous year, which was mainly due to our proactive
implementation of policies relating to serving the real economy and inclusive finance; credit card balances increased
by 19.4% compared to the end of the previous year, primarily due to the increases in both the number of credit cards
issued and the transaction volume of credit cards; loans to rural households increased by 18.7% compared to the end
of the previous year, mainly because of the rapid development of online financing business for rural households and
continuous increase in the support for new agricultural operation entities such as large-scale professional operator.
Discussion and Analysis
24
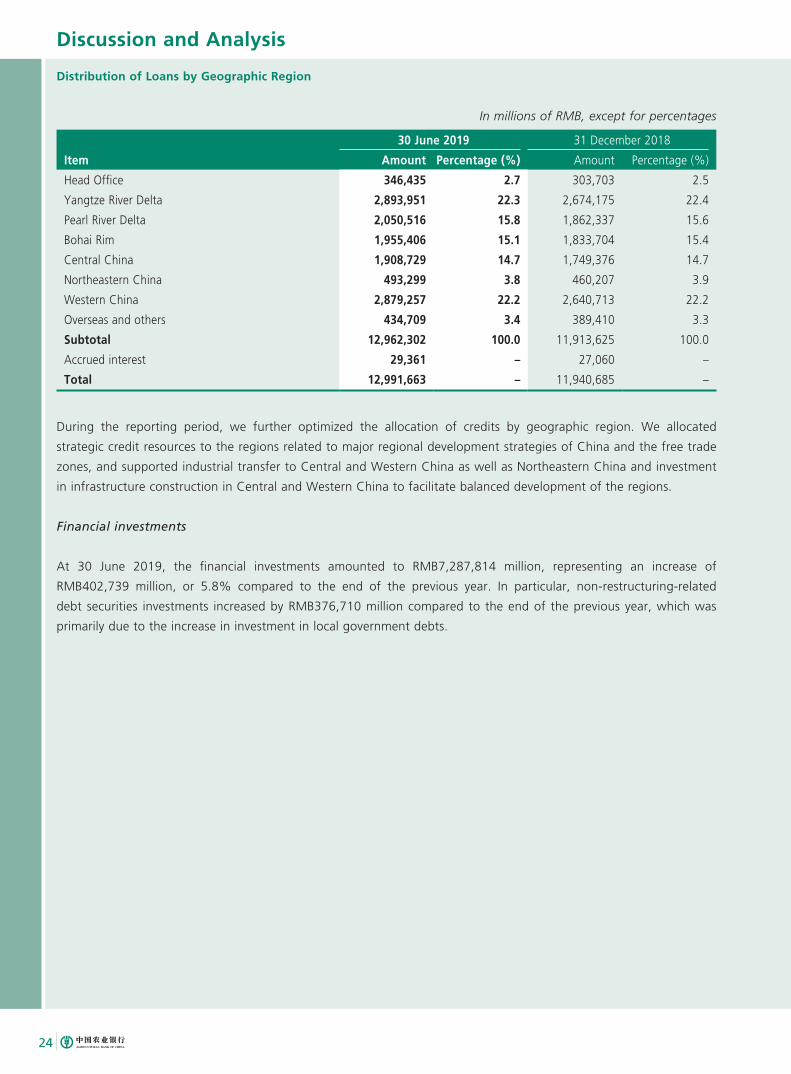
Distribution of Loans by Geographic Region
In millions of RMB, except for percentages
30 June 2019 31 December 2018
Item Amount Percentage (%) Amount Percentage (%)
Head Office 346,435 2.7 303,703 2.5
Yangtze River Delta 2,893,951 22.3 2,674,175 22.4
Pearl River Delta 2,050,516 15.8 1,862,337 15.6
Bohai Rim 1,955,406 15.1 1,833,704 15.4
Central China 1,908,729 14.7 1,749,376 14.7
Northeastern China 493,299 3.8 460,207 3.9
Western China 2,879,257 22.2 2,640,713 22.2
Overseas and others 434,709 3.4 389,410 3.3
Subtotal 12,962,302 100.0 11,913,625 100.0
Accrued interest 29,361 – 27,060 –
Total 12,991,663 – 11,940,685 –
During the reporting period, we further optimized the allocation of credits by geographic region. We allocated
strategic credit resources to the regions related to major regional development strategies of China and the free trade
zones, and supported industrial transfer to Central and Western China as well as Northeastern China and investment
in infrastructure construction in Central and Western China to facilitate balanced development of the regions.
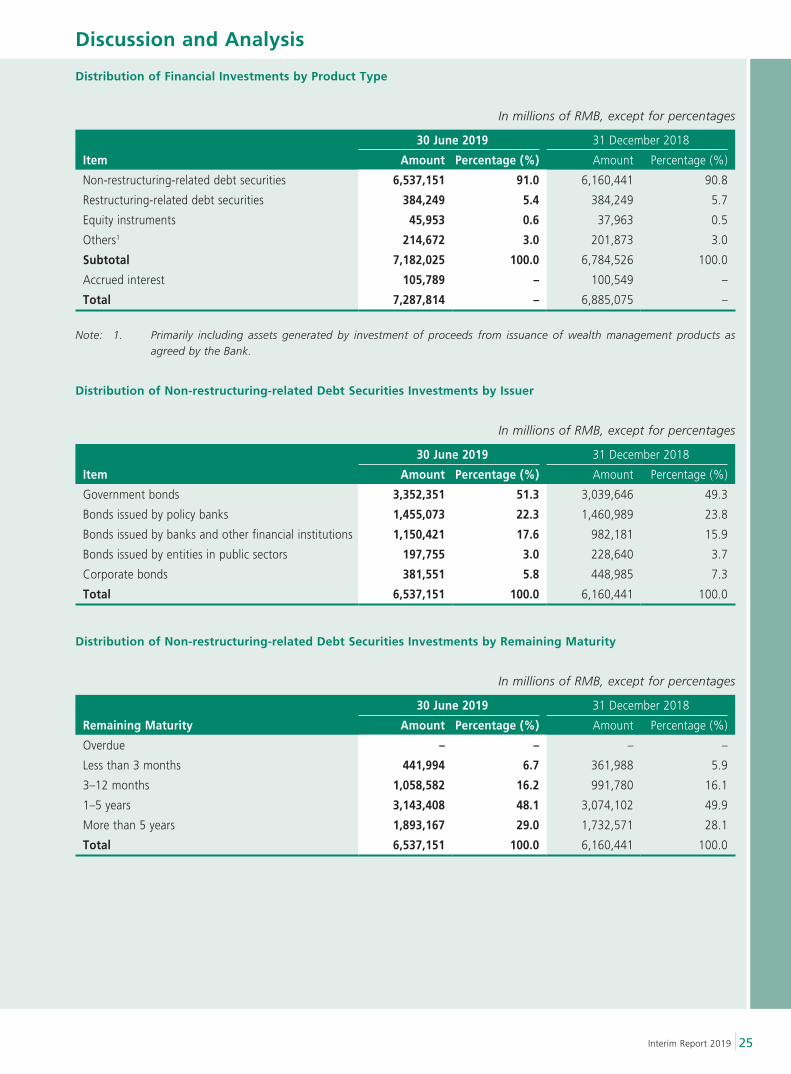
Financial investments
At 30 June 2019, the financial investments amounted to RMB7,287,814 million, representing an increase of
RMB402,739 million, or 5.8% compared to the end of the previous year. In particular, non-restructuring-related
debt securities investments increased by RMB376,710 million compared to the end of the previous year, which was
primarily due to the increase in investment in local government debts.
Discussion and Analysis
25Interim Report 2019
Distribution of Financial Investments by Product Type
In millions of RMB, except for percentages
30 June 2019 31 December 2018
Item Amount Percentage (%) Amount Percentage (%)
Non-restructuring-related debt securities 6,537,151 91.0 6,160,441 90.8
Restructuring-related debt securities 384,249 5.4 384,249 5.7
Equity instruments 45,953 0.6 37,963 0.5
Others1 214,672 3.0 201,873 3.0
Subtotal 7,182,025 100.0 6,784,526 100.0
Accrued interest 105,789 – 100,549 –
Total 7,287,814 – 6,885,075 –
Note: 1. Primarily including assets generated by investment of proceeds from issuance of wealth management products as agreed by the Bank.
Distribution of Non-restructuring-related Debt Securities Investments by Issuer
In millions of RMB, except for percentages
30 June 2019 31 December 2018
Item Amount Percentage (%) Amount Percentage (%)
Government bonds 3,352,351 51.3 3,039,646 49.3
Bonds issued by policy banks 1,455,073 22.3 1,460,989 23.8
Bonds issued by banks and other financial institutions 1,150,421 17.6 982,181 15.9
Bonds issued by entities in public sectors 197,755 3.0 228,640 3.7
Corporate bonds 381,551 5.8 448,985 7.3
Total 6,537,151 100.0 6,160,441 100.0
Distribution of Non-restructuring-related Debt Securities Investments by Remaining Maturity
In millions of RMB, except for percentages
30 June 2019 31 December 2018
Remaining Maturity Amount Percentage (%) Amount Percentage (%)
Overdue – – – –
Less than 3 months 441,994 6.7 361,988 5.9
3–12 months 1,058,582 16.2 991,780 16.1
1–5 years 3,143,408 48.1 3,074,102 49.9
More than 5 years 1,893,167 29.0 1,732,571 28.1
Total 6,537,151 100.0 6,160,441 100.0
Discussion and Analysis
26
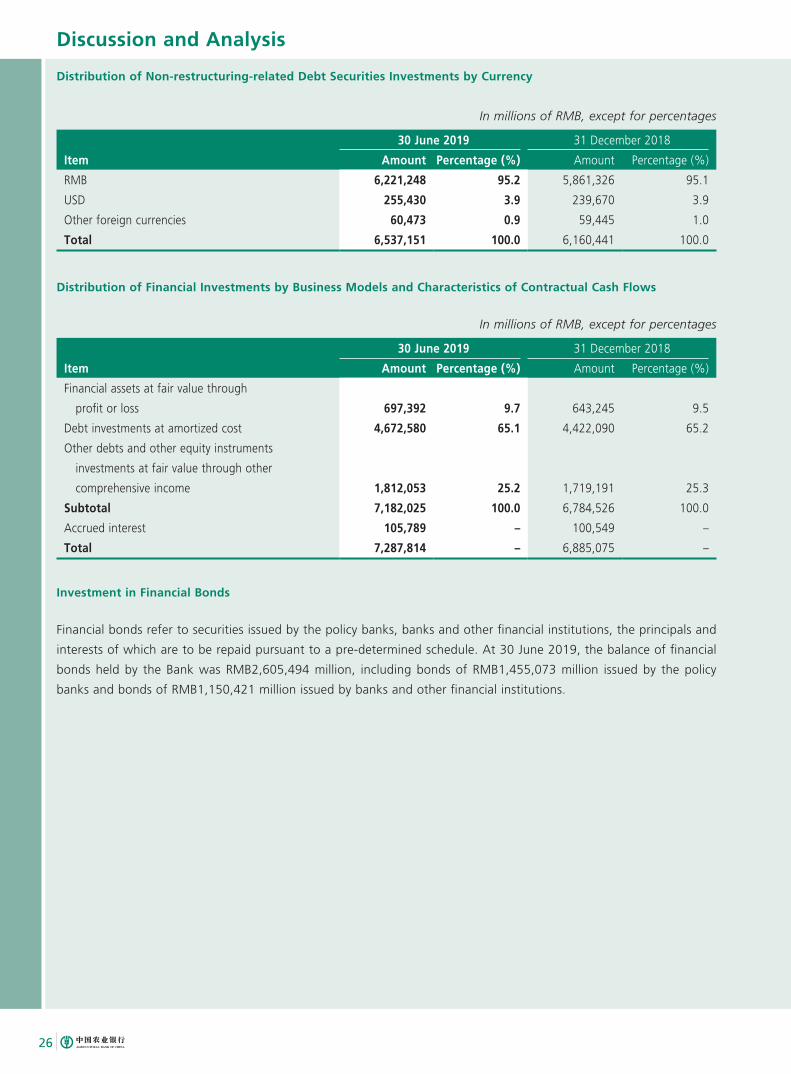
Distribution of Non-restructuring-related Debt Securities Investments by Currency
In millions of RMB, except for percentages
30 June 2019 31 December 2018
Item Amount Percentage (%) Amount Percentage (%)
RMB 6,221,248 95.2 5,861,326 95.1
USD 255,430 3.9 239,670 3.9
Other foreign currencies 60,473 0.9 59,445 1.0
Total 6,537,151 100.0 6,160,441 100.0
Distribution of Financial Investments by Business Models and Characteristics of Contractual Cash Flows
In millions of RMB, except for percentages
30 June 2019 31 December 2018
Item Amount Percentage (%) Amount Percentage (%)
Financial assets at fair value through
profit or loss 697,392 9.7 643,245 9.5
Debt investments at amortized cost 4,672,580 65.1 4,422,090 65.2
Other debts and other equity instruments
investments at fair value through other
comprehensive income 1,812,053 25.2 1,719,191 25.3
Subtotal 7,182,025 100.0 6,784,526 100.0
Accrued interest 105,789 – 100,549 –
Total 7,287,814 – 6,885,075 –
Investment in Financial Bonds
Financial bonds refer to securities issued by the policy banks, banks and other financial institutions, the principals and
interests of which are to be repaid pursuant to a pre-determined schedule. At 30 June 2019, the balance of financial
bonds held by the Bank was RMB2,605,494 million, including bonds of RMB1,455,073 million issued by the policy
banks and bonds of RMB1,150,421 million issued by banks and other financial institutions.
Discussion and Analysis
27Interim Report 2019
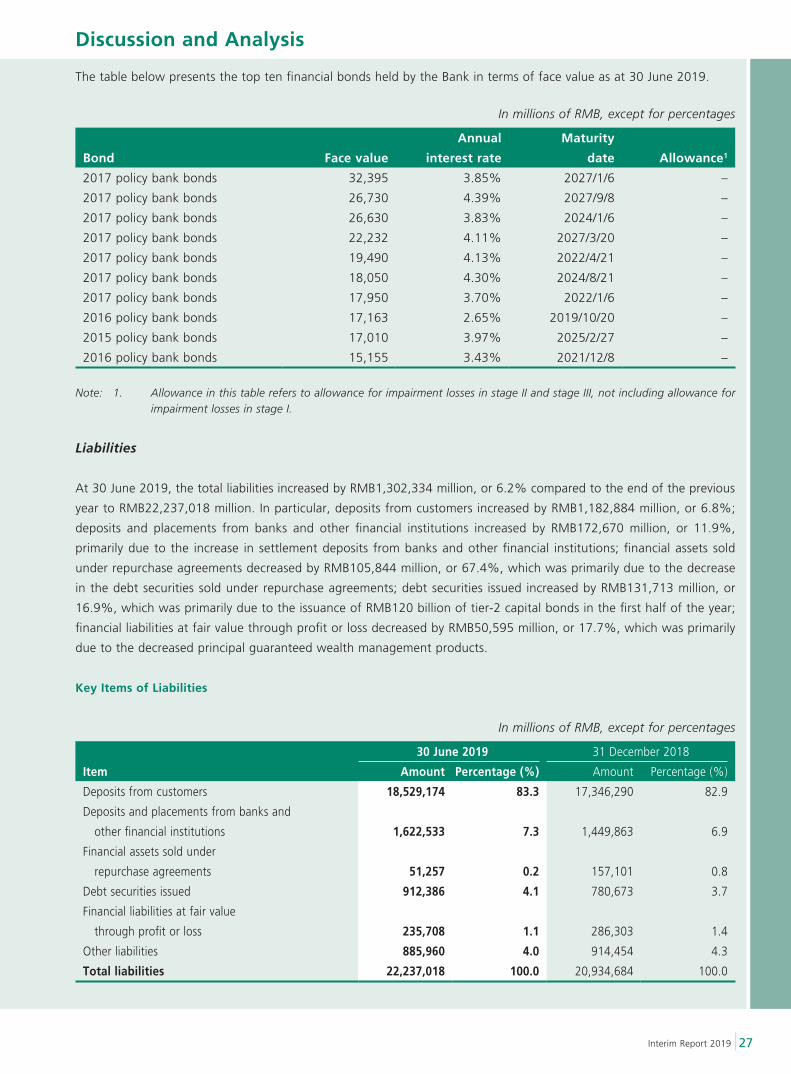
The table below presents the top ten financial bonds held by the Bank in terms of face value as at 30 June 2019.
In millions of RMB, except for percentages
Bond Face value
Annual
interest rate
Maturity
date Allowance1
2017 policy bank bonds 32,395 3.85% 2027/1/6 –
2017 policy bank bonds 26,730 4.39% 2027/9/8 –
2017 policy bank bonds 26,630 3.83% 2024/1/6 –
2017 policy bank bonds 22,232 4.11% 2027/3/20 –
2017 policy bank bonds 19,490 4.13% 2022/4/21 –
2017 policy bank bonds 18,050 4.30% 2024/8/21 –
2017 policy bank bonds 17,950 3.70% 2022/1/6 –
2016 policy bank bonds 17,163 2.65% 2019/10/20 –
2015 policy bank bonds 17,010 3.97% 2025/2/27 –
2016 policy bank bonds 15,155 3.43% 2021/12/8 –
Note: 1. Allowance in this table refers to allowance for impairment losses in stage II and stage III, not including allowance for impairment losses in stage I.
Liabilities
At 30 June 2019, the total liabilities increased by RMB1,302,334 million, or 6.2% compared to the end of the previous
year to RMB22,237,018 million. In particular, deposits from customers increased by RMB1,182,884 million, or 6.8%;
deposits and placements from banks and other financial institutions increased by RMB172,670 million, or 11.9%,
primarily due to the increase in settlement deposits from banks and other financial institutions; financial assets sold
under repurchase agreements decreased by RMB105,844 million, or 67.4%, which was primarily due to the decrease
in the debt securities sold under repurchase agreements; debt securities issued increased by RMB131,713 million, or
16.9%, which was primarily due to the issuance of RMB120 billion of tier-2 capital bonds in the first half of the year;
financial liabilities at fair value through profit or loss decreased by RMB50,595 million, or 17.7%, which was primarily
due to the decreased principal guaranteed wealth management products.
Key Items of Liabilities
In millions of RMB, except for percentages
30 June 2019 31 December 2018
Item Amount Percentage (%) Amount Percentage (%)
Deposits from customers 18,529,174 83.3 17,346,290 82.9
Deposits and placements from banks and
other financial institutions 1,622,533 7.3 1,449,863 6.9
Financial assets sold under
repurchase agreements 51,257 0.2 157,101 0.8
Debt securities issued 912,386 4.1 780,673 3.7
Financial liabilities at fair value
through profit or loss 235,708 1.1 286,303 1.4
Other liabilities 885,960 4.0 914,454 4.3
Total liabilities 22,237,018 100.0 20,934,684 100.0
Discussion and Analysis
28
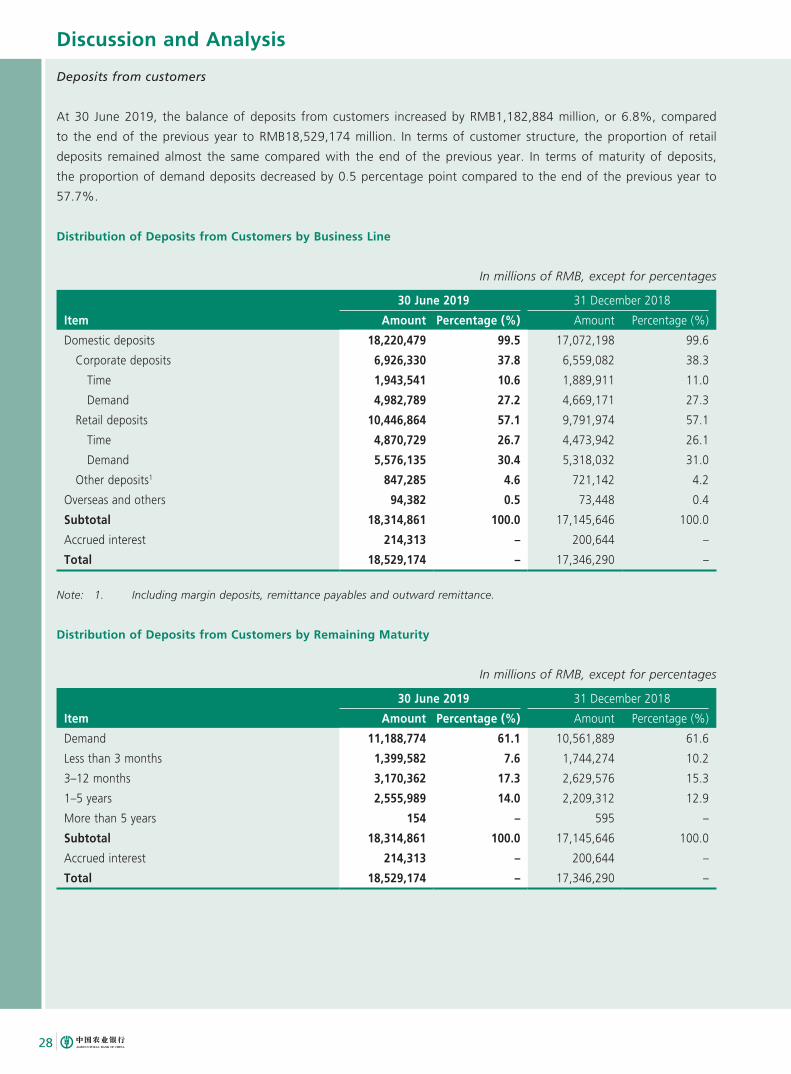
Deposits from customers
At 30 June 2019, the balance of deposits from customers increased by RMB1,182,884 million, or 6.8%, compared
to the end of the previous year to RMB18,529,174 million. In terms of customer structure, the proportion of retail
deposits remained almost the same compared with the end of the previous year. In terms of maturity of deposits,
the proportion of demand deposits decreased by 0.5 percentage point compared to the end of the previous year to
57.7%.
Distribution of Deposits from Customers by Business Line
In millions of RMB, except for percentages
30 June 2019 31 December 2018
Item Amount Percentage (%) Amount Percentage (%)
Domestic deposits 18,220,479 99.5 17,072,198 99.6
Corporate deposits 6,926,330 37.8 6,559,082 38.3
Time 1,943,541 10.6 1,889,911 11.0
Demand 4,982,789 27.2 4,669,171 27.3
Retail deposits 10,446,864 57.1 9,791,974 57.1
Time 4,870,729 26.7 4,473,942 26.1
Demand 5,576,135 30.4 5,318,032 31.0
Other deposits1 847,285 4.6 721,142 4.2
Overseas and others 94,382 0.5 73,448 0.4
Subtotal 18,314,861 100.0 17,145,646 100.0
Accrued interest 214,313 – 200,644 –
Total 18,529,174 – 17,346,290 –
Note: 1. Including margin deposits, remittance payables and outward remittance.
Distribution of Deposits from Customers by Remaining Maturity
In millions of RMB, except for percentages
30 June 2019 31 December 2018
Item Amount Percentage (%) Amount Percentage (%)
Demand 11,188,774 61.1 10,561,889 61.6
Less than 3 months 1,399,582 7.6 1,744,274 10.2
3–12 months 3,170,362 17.3 2,629,576 15.3
1–5 years 2,555,989 14.0 2,209,312 12.9
More than 5 years 154 – 595 –
Subtotal 18,314,861 100.0 17,145,646 100.0
Accrued interest 214,313 – 200,644 –
Total 18,529,174 – 17,346,290 –
Discussion and Analysis
29Interim Report 2019
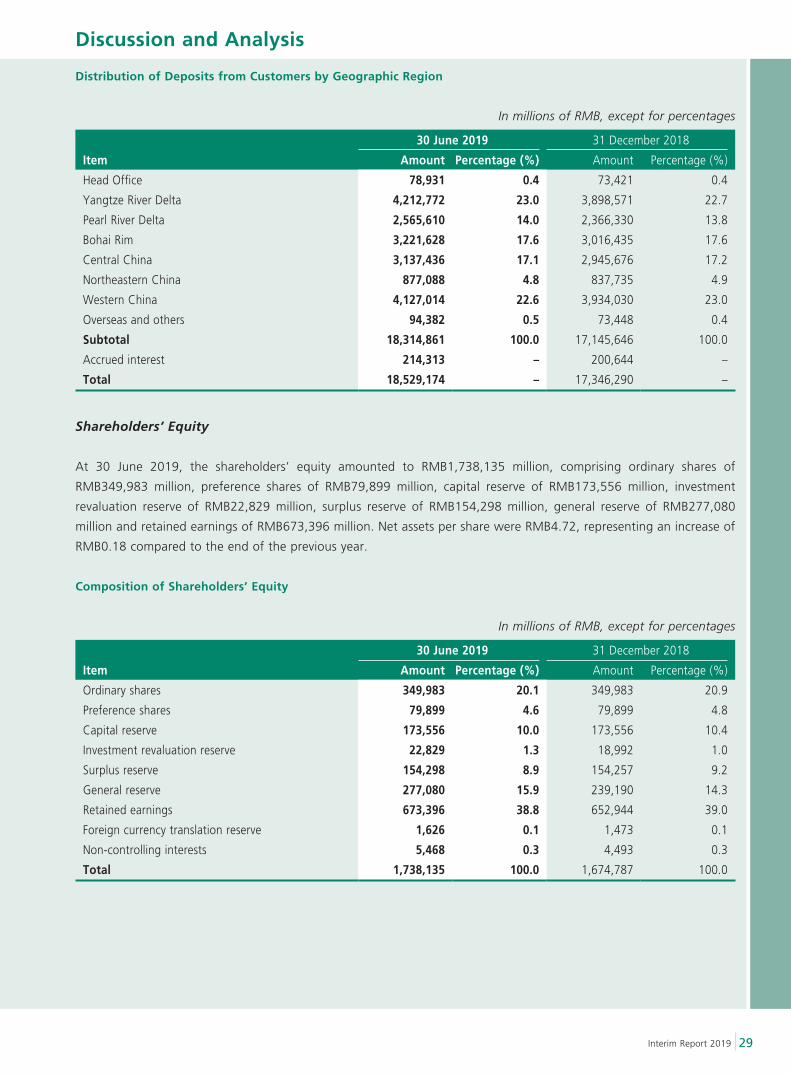
Distribution of Deposits from Customers by Geographic Region
In millions of RMB, except for percentages
30 June 2019 31 December 2018
Item Amount Percentage (%) Amount Percentage (%)
Head Office 78,931 0.4 73,421 0.4
Yangtze River Delta 4,212,772 23.0 3,898,571 22.7
Pearl River Delta 2,565,610 14.0 2,366,330 13.8
Bohai Rim 3,221,628 17.6 3,016,435 17.6
Central China 3,137,436 17.1 2,945,676 17.2
Northeastern China 877,088 4.8 837,735 4.9
Western China 4,127,014 22.6 3,934,030 23.0
Overseas and others 94,382 0.5 73,448 0.4
Subtotal 18,314,861 100.0 17,145,646 100.0
Accrued interest 214,313 – 200,644 –
Total 18,529,174 – 17,346,290 –
Shareholders’ Equity
At 30 June 2019, the shareholders’ equity amounted to RMB1,738,135 million, comprising ordinary shares of
RMB349,983 million, preference shares of RMB79,899 million, capital reserve of RMB173,556 million, investment
revaluation reserve of RMB22,829 million, surplus reserve of RMB154,298 million, general reserve of RMB277,080
million and retained earnings of RMB673,396 million. Net assets per share were RMB4.72, representing an increase of
RMB0.18 compared to the end of the previous year.
Composition of Shareholders’ Equity
In millions of RMB, except for percentages
30 June 2019 31 December 2018
Item Amount Percentage (%) Amount Percentage (%)
Ordinary shares 349,983 20.1 349,983 20.9
Preference shares 79,899 4.6 79,899 4.8
Capital reserve 173,556 10.0 173,556 10.4
Investment revaluation reserve 22,829 1.3 18,992 1.0
Surplus reserve 154,298 8.9 154,257 9.2
General reserve 277,080 15.9 239,190 14.3
Retained earnings 673,396 38.8 652,944 39.0
Foreign currency translation reserve 1,626 0.1 1,473 0.1
Non-controlling interests 5,468 0.3 4,493 0.3
Total 1,738,135 100.0 1,674,787 100.0
Discussion and Analysis
30
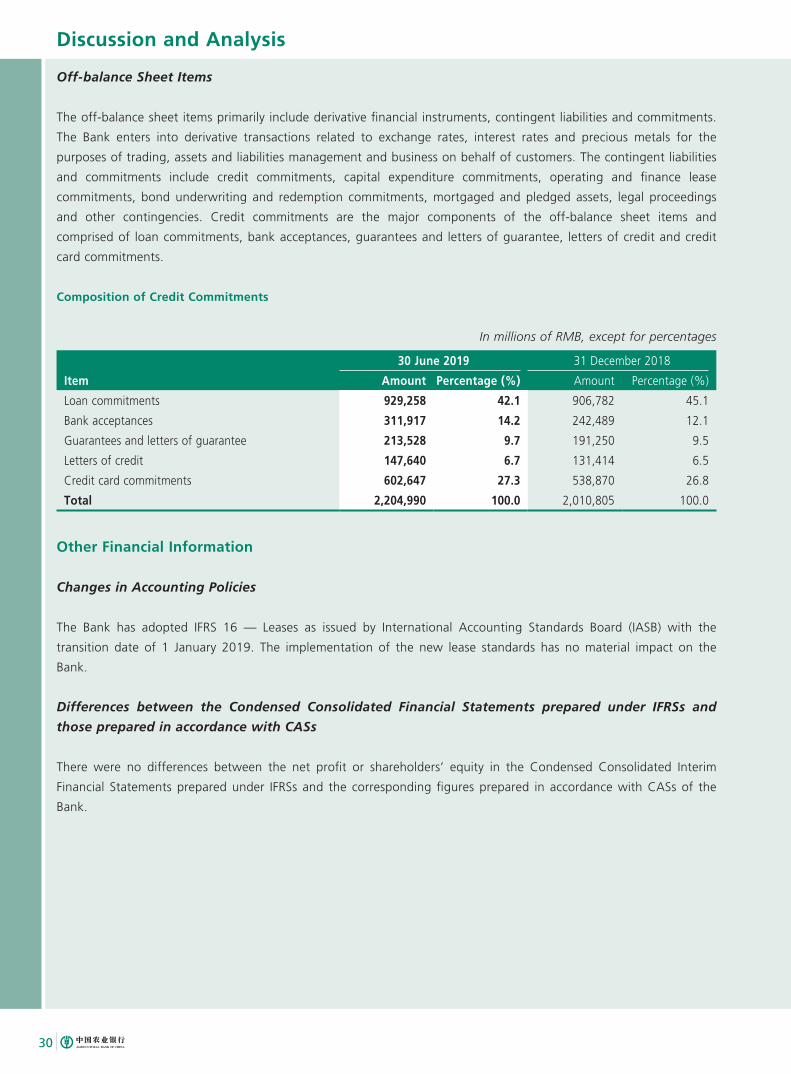
Off-balance Sheet Items
The off-balance sheet items primarily include derivative financial instruments, contingent liabilities and commitments.
The Bank enters into derivative transactions related to exchange rates, interest rates and precious metals for the
purposes of trading, assets and liabilities management and business on behalf of customers. The contingent liabilities
and commitments include credit commitments, capital expenditure commitments, operating and finance lease
commitments, bond underwriting and redemption commitments, mortgaged and pledged assets, legal proceedings
and other contingencies. Credit commitments are the major components of the off-balance sheet items and
comprised of loan commitments, bank acceptances, guarantees and letters of guarantee, letters of credit and credit
card commitments.
Composition of Credit Commitments
In millions of RMB, except for percentages
30 June 2019 31 December 2018
Item Amount Percentage (%) Amount Percentage (%)
Loan commitments 929,258 42.1 906,782 45.1
Bank acceptances 311,917 14.2 242,489 12.1
Guarantees and letters of guarantee 213,528 9.7 191,250 9.5
Letters of credit 147,640 6.7 131,414 6.5
Credit card commitments 602,647 27.3 538,870 26.8
Total 2,204,990 100.0 2,010,805 100.0
Other Financial Information
Changes in Accounting Policies
The Bank has adopted IFRS 16 — Leases as issued by International Accounting Standards Board (IASB) with the
transition date of 1 January 2019. The implementation of the new lease standards has no material impact on the
Bank.
Differences between the Condensed Consolidated Financial Statements prepared under IFRSs and
those prepared in accordance with CASs
There were no differences between the net profit or shareholders’ equity in the Condensed Consolidated Interim
Financial Statements prepared under IFRSs and the corresponding figures prepared in accordance with CASs of the
Bank.
Discussion and Analysis
31Interim Report 2019
Business Review
Corporate Banking
During the reporting period, adhering to customer-centered and innovation principles, we sped up the digital
transformation in the corporate banking business leveraging group advantages. At the end of June 2019, the balance
of the domestic corporate deposits amounted to RMB6,926,330 million, representing an increase of RMB367,248
million over the end of the previous year. The balance of the domestic corporate loans and discounted bills amounted
to RMB7,437,944 million, representing an increase of RMB579,600 million over the end of the previous year. 13,576
projects were included in our major marketing projects pool, up by 2,350 projects as compared to the end of the
previous year. As at the end of June 2019, we had 5.7101 million corporate banking customers, representing an
increase of 471.1 thousand compared to the end of the previous year, of which 147.7 thousand customers had
outstanding loan balances, representing an increase of 65.2 thousand customers compared to the end of the previous
year.
We provided services to support national strategies and key areas of the real economy. We supported the
“Belt and Road Initiative” and served strategies for coordinated development in major regions such as the
coordinated development of Beijing-Tianjin-Hebei Region, Yangtze Economic Belt and Guangdong-Hong Kong-
Macao Greater Bay Area, with new loans of RMB575,956 million for the first half of the year. To support mixed
ownership reform of state-owned enterprises, we established cooperations with 757 key state-owned enterprise
customers which are under mixed ownership reform.
We provided services for emerging drivers for the economic growth. We adjusted our credit structure to support
manufacturing and industrial transformation and upgrade as well as further expand financial services related
to consumption and people’s livelihood. At the end of June 2019, the balance of loans for strategic emerging
industries amounted to RMB520,627 million1. The balance of loans for happiness industries amounted to
RMB169,239 million.
We supported the healthy development of private enterprises. The Bank provided targeted financial support
for quality private enterprises by increasing credit, strengthening marketing, innovating financial services, and
enhancing bank-enterprise exchanges. At the end of June 2019, private enterprises with outstanding loan
balances reached 131.2 thousand, representing an increase of 63.5 thousand compared to the end of the
previous year. The loan balance stood at RMB1,564,729 million, representing an increase of RMB156,165 million
compared to the end of the previous year.
We accelerated FinTech innovation and digital transformation. We launched and promoted a smart credit
management platform, which realized “one portrait for one customer” for more than 5.7 million corporate
customers across the Bank, providing technical support for refined customer management. We kept promoting
“online, chained and scene-sensitive” corporate business products. By diversifying online channels, we actively
carried out the chain marketing and the construction of featured financial scenes. In the first half of 2019, our
active customers for corporate internet banking and corporate mobile banking increased by 463.1 thousand and
335.1 thousand, respectively.
1 According to the requirements of the CBIRC, the Bank adjusted the statistics calculation method of loans for strategic emerging industries.
Discussion and Analysis
32
Institutional Banking
We strengthened direct operation and marketing function by the Head Office and tier-1 branches. We adopted
new marketing approaches through establishing “customer circles, customer chains and product pools” and new
integrated service model of “intelligence + technologies + resources”. We expedited the “smart customers” for
institutional banking. As at the end of June 2019, we had 428.6 thousand institutional customers and 587.5 thousand
accounts, respectively.
We built “smart customers” for institutional banking. We introduced smart government service and pioneered
its launching on the state government service platform, and sped up the offering of smart services for school,
hospital and fiscal administration.
In terms of financial services to the government, we steadily promoted the business on centralised receipt and
payment for treasuries at different level of governments. We continuously enlarged our coverages over provinces
regarding qualifications on financial agency and electronic social security card issuance and provided services.
In terms of services with respect to people’s livelihood, we actively promoted marketing in connection with
projects specialised for schools and hospitals.
In terms of services to bancassurance, we continued to rank first among the four major commercial banks
in terms of income from bancassurance business, with the proportion of medium-and long-term guaranteed
products kept increasing.
In terms of services to financial institutions, we had 41.8 million contracted customers for third-party depositary
services and promoted the coordinated development of inter-bank deposit in terms of volume and price.
Transaction Banking
We continued to promote the construction of a transaction banking system, which was based on our accounts and
payment settlement and mainly developed cash management business and supply chain financing. By expediting
the marketing in key financial scenes for corporate customers and continuously strengthening the innovation of key
products, we promoted the digital transformation of transaction banking.
We further implemented the project of “increasing accounts and raising quality” targeting at corporate accounts
and developed corporate customers through online channels and in financial scenes, resulting in a stable growth
in the amount of corporate accounts. As at the end of June 2019, our corporate RMB-denominated settlement
accounts reached 7.3103 million1.
1 The Bank had changed the criteria for corporate RMB-denominated settlement accounts, which includes corporate RMB-denominated settlement accounts in normal status during the reporting period and dormant accounts within 5 years.
Discussion and Analysis
33Interim Report 2019
We promoted the digital transformation of transaction banking business. We implemented the development
strategy of “Internet + transaction + financing”. The construction of financial scenes related to industrial
chains was promoted and the marketing of corporate customers in consumption scenes was accelerated. We
innovatively developed inter-bank guaranteed payment and “Gongxin Bao” (agency payment of salaries to
migrant workers), actively promoted online bill pool discounting, and accelerated the iterative innovation of
products featuring easy collection and payment. As at the end of June 2019, we had 2.4655 million active
transaction banking customers.
Investment Banking
Adhering to the principle of serving the real economy, we provided the “financing + talents” investment banking
solutions to meet diversified financing needs of customers including bond financing, M&A and reorganization as well
as asset securitization. We streamlined the service procedures and improved innovation ability, strengthening market
competitiveness of our investment banking business. In the first half of 2019, we achieved an income of RMB6,286
million from the investment banking business, representing an increase of 41.07% as compared to the corresponding
period of the previous year.
We supported national key strategies. We established regional synergy centers to serve key areas such as
Guangdong-Hong Kong-Macao Greater Bay Area. We supported the development of private enterprises with
services of bond financing instruments, debt financing plans and stock participating M&A.
We strengthened our market competitiveness. In the first half of 2019, we underwrote debt financing
instruments at an amount of RMB184.6 billion, up by 32.6% year on year, ranking first among large four
commercial banks. We maintained our leading positions in the market with balances both of the syndicated
loans of more than RMB1 trillion and M&A loans at more than RMB100 billion. Asset securitization business
witnessed relatively rapid growth. We launched such first projects in the market including the first green financial
leasing asset securitization project and the first credit asset securitization project in the Northeast China. We
implemented a number of cross-border projects with great market influence, including cross-border M&A,
syndicated loans, Panda Bonds, etc.
Our market influence continued to expand. We were awarded “Market Contribution Award in Asset-backed
Securities” by the National Interbank Funding Center, “Endeavor Award” in Debt Financing Plans by the Beijing
Financial Assets Exchange and “Phecda Award in Investment Banking of Full-featured Bank” by the Securities
Times.
Discussion and Analysis
34
Retail Banking
In the first half of 2019, following the customer-oriented philosophy, we fully promoted digital transformation of
retail banking business in respect of product, marketing and channel, which were driven by FinTech and business
innovation, focusing on building the Bank into a preferred smart retail bank for customers.
Efforts were made to create a retail customer information center comprising a retail customer information mart
and retail customer profiles and a work platform for analysing retail data was put into operation to conduct
digital targeted marketing. In the first half of the year, we served 0.25 billion customers, and sold financial
products amounting to RMB276 billion by digital targeted marketing, with product coverage increased steadily.
An open banking product system was built to realize full integration of financial services into various kinds of
scenes. We actively adhered financial services to customers, including opening of tier-II and tier-III accounts,
payment, credit card and loan on the national government platforms and in various kinds of scenes of life.
Transformations of product research and development model and operation model were promoted by launching
a group of competitive online products including Yinliduo, fast e-loan for business and Lefenyi.
The synergy between the corporate and retail business was enhanced. We strengthened development of source
businesses such as social security insurance, public finance, provident fund and public utility payment, optimized
the payroll service system, sped up issuance and promotion of electronic social security cards, and actively seized
the ETC market share, to expand our market influence continuously.
Retail banking procedures were further optimized. We established a retail banking procedure optimization
mechanism named “the Voice of Customers” and endeavored to build one-stop transaction experience for
customers featuring “one-time visit, one-time code entering and one-time signature”.
Retail Loans
We further promoted digital transformation of retail loan business and continuously improved our service ability for
retail loans. At the end of June 2019, the balance of retail loans amounted to RMB5,089,649 million, representing an
increase of 9.1% over the end of the previous year.
We strictly implemented regulatory requirements and kept optimizing customer structure of retail residential
mortgage loans. At the end of June 2019, the balance of retail residential mortgage loans amounted to
RMB3,922,766 million, representing an increase of RMB262,192 million over the end of the previous year.
We promoted the project of “Customers Expansion” in respect of personal consumption loans leveraging big
data. Focusing on scenes related to home improvement and automobile and acquiring customers through
online channels, we promoted scene-based layout for personal consumption loans. In the first half of 2019, the
personal consumption loans increased by RMB7,561 million, ranking first among the four major commercial
banks.
Discussion and Analysis
35Interim Report 2019
We exerted ourselves to build a new model of “digital financial services for individuals, private enterprises
and micro and small enterprises”. We cooperated with Yichang Municipal Government of Hubei Province to
incorporate our personal loan business into the government platform, on which citizens could apply for “e-loan
for startup” online through the “Citizens e-Home”. An innovative product named “Personal Mortgage e-Loan”
was started trial operation of the first phase in Xiamen Branch.
Retail Deposits
In the first half of 2019, adhering to the customer-oriented principle, we built “ABC Retail Deposit” product
series, optimized product functions, and improved our digital marketing capability. Our retail deposits realized
steady growth.
At the end of June 2019, the balance of domestic retail deposits reached RMB10,446,864 million, representing
an increase of RMB654,890 million over the end of the previous year.
Bank Card Business
We accelerated the application of FinTech, continued to improve flow operation and operation in various kinds
of scenes, and improved customers’ experience of using cards. We enriched scenes of using card, promoted
functions as Quick Pass and quick e-payment of debit cards and worked with UnionPay to conduct several
consumption promotions for personal accounts, endeavoring to improve transaction activeness and brand
influence of our debit cards. At the end of June 2019, we cumulatively issued 1,019 million debit cards, ranking
first among the four major commercial banks, representing an increase of 31 million over the end of the previous
year.
We actively developed young customers by launching new products such as Center-Position Debut Card and
Dream-sparking Xiong’an Card. We improved product series of consumption credit and customers’ experience,
developed market segments including car purchase, home improvement and education, and introduced a
popular product named “Lefenyi”. We accelerated the development of credit cards in mobile banking channel
and enriching scenes of using card. We achieved Internet-based issuance of ETC credit cards, point-supported
payment on Ctrip APP and upgrading and optimization of the discount center platform. As at the end of June
2019, the number of credit cards cumulatively issued reached 114 million, and the transaction volume for credit
cards in the first half of the year amounted to RMB959.9 billion.
Discussion and Analysis
36
Debit Cards and Credit Cards Issued and Transaction Volume
Item
30 June
2019
31 December
2018
Growth rate
(%)
Number of debit cards issued (unit: 10,000) 101,904.57 98,829.83 3.11%
Number of credit cards issued (unit: 10,000) 11,372.44 10,282.06 10.6%
Jan–June
2019
Jan–June
2018
Growth rate
(%)
Transaction volume for debit cards (RMB100 million)1 116,156.17 104,867.79 10.76%
Transaction volume for credit cards (RMB100 million) 9,598.51 8,422.47 13.96%
Note: 1. The Bank adjusted the statistics calculation methods on transaction volume for debit cards, including online and offline transaction volume for debit cards.
Private Banking Business
As at the end of June 2019, the number of private banking customers reached 118 thousand and the balance of
assets under management amounted to RMB1,298.5 billion, representing an increase of 12 thousand and RMB175.1
billion, respectively, as compared with the end of the previous year.
Leveraging the synergies, we launched exclusive products and services for private banking, such as deposits,
loans, insurance and cross-border finance, to build a platform offering comprehensive products and services.
Achieving a prudent operation of products, we rolled out new series of products including Tian Tian Ying, An
Ying, He Ying, Bo Ying and Chuan Ying to comprehensively cater to customers’ diversified demands including
liquidity management, asset allocation and family wealth inheritance.
Focusing on the ecosystem of family wealth inheritance, we promoted the scale-up development of the family
trust business, and provided comprehensive solutions such as integrated services in relation to the release of
restricted shares and legal and taxation consulting services.
Optimizing the marketing system of private banking, we carried out series of events themed “Wealth and
Wisdom of Private Banking”, and proceeded to enhance our capabilities to serve customers, supported by
professional marketing, event marketing and brand marketing.
Discussion and Analysis
37Interim Report 2019
Treasury Operations
The treasury operations of the Bank include money market activities and investment portfolio management activities.
In the first half of 2019, on the condition of ensuring the bank-wide liquidity, we flexibly adjusted operation
strategies. The investment return on assets remained at a relatively high level among the peers.
Money Market Activities
As a primary dealer in the open market, we proactively served for the dissemination of monetary policies,
supported liquidity of small and medium-sized financial institutions, developed interbank business steadily, and
maintained a proper and steady level of liquidity in the market.
We reinforced research on monetary policies and forecast of market liquidity, expanded our financing channels
by using various kinds of financial instruments, and improved efficiency of fund utilization on the condition of
ensuring the bank-wide liquidity.
In the first half of 2019, our RMB-denominated financing transactions amounted to RMB22,747.96 billion, up by
73.1% year on year, including RMB22,051.09 billion in lending and RMB696.87 billion in borrowing.
Investment Portfolio Management
At 30 June 2019, the Bank’s financial investment amounted to RMB7,287,814 million, representing an increase of
RMB402,739 million or 5.8% as compared to the end of the previous year.
Trading Activities
We maintained leading positions among the peers in respect of both the bond market-making business and the
bond trading business in the inter-bank market.
In the first half of 2019, the yield of the domestic bond market fluctuated within a range. We flexibly adjusted
the positions of our portfolios and trading activities achieved good performance.
Banking Book Activities
In the first half of 2019, considering the comprehensive yield on bonds and market rate movements, we chose
bonds whose types and maturities satisfied our risk appetite and increased investment in local government debts
appropriately.
To serve the real economy, we invested in industry bonds actively.
We consistently and dynamically adjusted the structure of investment portfolios to reduce the risk of portfolios
and increase their yields.
Discussion and Analysis
38
Asset Management
Wealth Management
At the end of June 2019, the balance of the wealth management products in the Bank reached RMB1,511,781
million, which included personal wealth management products of RMB1,270,723 million and corporate wealth
management products of RMB241,058 million. The size of net-worth wealth management products amounted
to RMB478,181 million.
During the reporting period, to comply with regulatory requirements, we pushed forward the transformation
of asset management business. While we gradually reduced the size of wealth management products with
expected yield, we developed new net-worth products. Signing contract online was launched and functions of
wealth management product of “Constant Pay”, including “7*24” hours redemption; credit card repayment and
loan repayment were improved, which enhanced customer experience towards outstanding net-worth wealth
management product.
In July 2019, our wholly-owned subsidiary Agricultural Bank of China Wealth Management Co., Ltd. was
approved to commence its operation officially.
Custody Service
As at the end of June 2019, we had RMB9,855,748 million of assets under custody. In the first half of 2019, the
commission income from custody service and other fiduciary services amounted to RMB2,250 million.
Seizing opportunities arising from national major strategies and innovation development, we enhanced the
marketing of key projects.
The digital transformation was pushed forward steadily. We rolled out a new generation of custody operation
platform and completed a project for product full lifecycle management, which further enhanced our online
custody service level.
Pension
At the end of June 2019, the pension funds under the Bank’s custody amounted to RMB538,644 million,
representing a growth of 9.5% as compared to the end of the previous year. The pension assets under entrusted
management amounted to RMB47,088 million.
We made efforts to develop the pension business by initiating the research on the third pillar of the pension
model and actively expanding enterprise annuity fund projects. Great breakthrough was achieved in business
related to professional annuity, as we obtained the qualification of trustee for professional annuity schemes in 18
provinces and cities as well as the qualification of custodian for professional annuity schemes in 17 provinces and
cities.
Discussion and Analysis
39Interim Report 2019
Precious Metals
We promoted the account-based precious metals business to satisfy investment needs of personal customers. We
steadily developed the precious metal leasing business to serve companies in industrial chain.
In the first half of 2019, 2,325.38 tons of gold and 26,490.66 tons of silver were traded for the Bank’s own
account as well as on behalf of customers, holding the leading positions in terms of market shares.
Treasury Transactions on Behalf of Customers
In the first half of 2019, the transaction volume of foreign exchange sales and settlements as well as foreign
exchange trading on behalf of customers amounted to USD175.889 billion.
In terms of the “Bond Connect”, the transaction volume was over RMB120 billion, holding the leading market
position. In terms of Zhaishibao, one of the Bank’s counter bond businesses, we were one of the first to
distribute local government bonds. We held the leading market position in terms of distribution volumes in local
government bonds and bonds issued by China Development Bank, respectively.
We won 12 awards, including the “Best Market Maker in 2018” and the “Best Spot Market Maker in 2018” by
China Foreign Exchange Trade System.
Agency Distribution of Fund Products
Deepening cooperation with outstanding fund companies and focusing on niches in the market, we rolled out
several popular fund products to cater for customers’ diversified and personalized needs.
By hosting customer salons themed “Hundred Cities and Ten Thousand Families” and organizing a series of
activities providing customers with consultancy services on funds they invested, we strengthened our professional
marketing. Efforts were made to develop the brand of “Selective Fund”, build our research and investment
teams and improve services for customers.
We constructed the fund business system and launched a new version of the module for fund products of smart
mobile banking to improve customer experience.
In the first half of 2019, fund products distributed by the Bank totaled RMB134.573 billion.
Agency Sales of PRC Government Bonds
In the first half of 2019, as an agent to the PRC Government, we distributed 12 tranches of savings PRC
government bonds with the actual sales amount of RMB31.775 billion, including eight tranches of savings PRC
government bonds (in electronic form) of RMB20.317 billion and four tranches of savings PRC government
bonds (in certificate form) of RMB11.458 billion.
Discussion and Analysis
40
Internet Finance
During the reporting period, we actively responded to the emerging conditions and challenges in the Bank 4.0 era.
Focusing on coordinated support for services and innovation-driven development, we consolidated the foundation
of online platforms, accelerated the construction of scene-based finance and the construction of open banking,
continually optimized customer experience, enlarged customer base and increased platform traffic, so as to
consolidate a foundation for our digital transformation.
Smart Mobile Banking
Implementing the strategy of “Leading Position in Mobile Banking Market”, we accelerated the iteration of the mobile
banking and introduced intelligent engines. We launched the new version of Mobile Banking featuring rich smart
applications and better interactive experience.
Diversified product functions. For services targeted at public investors, we launched the product of “Yinliduo”.
Mid- and high-end service zones for fund investment, wealth management and private banking were set up. For
professional investment customers, we provided service for trading of foreign exchange, precious metals and
commodities.
Optimized customer experience. Optical Character recognition (OCR), face recognition and other technologies
were applied to achieve convenient and real-time account opening, and the columns such as transferring, wealth
management, insurance and loan inquiry were updated.
Supplied smart services. “ABC Smart Financing” service was rolled out, characterized with automatic allocation
of financing portfolio products and T+0 full-dimensional asset-liability profiles. A smart engine for mobile
banking commenced operation with a function of behavioral data collecting and personalized recommendation
based on the type and location of a customer, dynamically displaying distinctive interfaces for varied individuals
and offering localized services based on an exclusive interface for varied provinces.
We built the brand of “Thursday, Mobile Banking Day” to boost sales. Blockbuster products including exclusive
wealth management, bonds and certificates of deposit were released every Thursday, which stimulated the sales
of key products.
As at the end of June 2019, the number of personal mobile banking users reached 284 million, up by 10.5% as
compared to the end of the previous year. In the first half of 2019, the number of transactions was 7.86 billion,
representing a year-on-year increase of 27.8%, and the transaction volume amounted to RMB28.55 trillion,
representing a year-on-year increase of 26.2%.
Discussion and Analysis
41Interim Report 2019
Corporate Service Platform
Benchmarking against the standards of unified platform, extensive products, nice experience and service positioning,
we upgraded our unified corporate financial service platform in an effort to provide one-stop and steward-type
services.
The foundation of the platform was optimized. We separated the application layer from the service layer of the
platform to realize modular and defined services.
The business processes were optimized. OCR was used to automatically identify a customer’s ID information and
the data of industrial and commercial administrations was introduced as reference, that customers were free
to fill in forms to open accounts. Further, The Customer Manager App was also available to realize online and
offline interaction and thus enabling a more intelligent account opening process.
The functions of products were enhanced. Functions related to multi-level account books, batch agency
payment, payment, notes and bonds were upgraded.
As at the end of June 2019, the number of users of the corporate banking service platform reached 6.76 million,
up by 9.0% compared to the end of the previous year. The transaction volume for the first half of 2019 was
RMB83.05 trillion. The total number of corporate mobile banking users reached 1.38 million, up by 48.4%
compared to the end of the previous year. The transaction volume for the first half of 2019 was RMB400.7
billion, which was 11.6 times of that for the corresponding period of the previous year.
Online Credit
We built the product system of our online credit business. Based on the three business lines of “retail, small and
micro, County Areas” and the supply chain financing sector, we innovated online credit products, and accelerated to
build distributing channels for them.
Leveraging the online platforms as props, we improved a series of products such as “Personal E-loan”, “Micro
E-loan”, Huinong E-loan” and “Industrial E-loan” in mobile banking. We advanced the optimization of loan
service process, in particular, such products as “Industrial E-loan•Supply Chain Quick Loan” and “Huinong
E-loan•Rural Households Loan” were accessed to the personal Internet banking while the functions of “Micro
E-loan•Internet Loan” were embedded in the corporate banking platform.
At the end of June 2019, the balance of the Bank’s online credit reached RMB343.6 billion.
Open Banking and Scene-based Finance
During the reporting period, we persistently optimized various types of scene-based services, accelerated the R&D and
launching of products for open banking platforms, and built “ABC Wisdom+”, a scene-based finance brand.
We completed the top-level design of open banking and scene-based finance, pressed full steam ahead with the
construction of open banking platforms and product matrix, commenced the formulation of relevant systems
and standards, and pinned down scene construction patterns and innovation direction.
Discussion and Analysis
42
We commenced sales and marketing of scene-based finance. Targeting at the three types of scenes, which are,
government services and people’s livelihood, consumption and retail sales, and industrial chains, we accelerated
the development of scene-based finance business. We promoted scenes for government services and people’s
livelihood, we asserted the commitment to participating in serving the construction of smart cities, seized the
opportunities to access scenes for national government services, and initiated products for smart government
services. We dedicated to expand scenes for consumption and retail sales, and exerted great effort to expand
key scenes such as smart property management, smart house, smart canteen, and smart travel thriving. We
optimized the scenes for industrial chains, we formulated a plan to build scenes related to Huinong industrial
circle and advanced the key program for “Huinong E-tong — Further Improvement of Industrial Chains”.
Moreover, we entered into a cooperation agreement on digital ecosystem with Tencent to extensively participate
in building smart cities.
We strengthened cooperation with FinTech companies and Internet platforms, explored paths toward and
models of construction and promotion of scene-based finance for open banking, and endeavored to generate
comprehensive industrial solutions.
In the first half of 2019, the number of projects based on Internet scenes reached 2,634.
Inclusive Finance
In the first half of 2019, we promoted the digital transformation of inclusive finance in line with the idea of “Internet-
based, Data-based, Intelligent and Open”. At the end of June 2019, the balance of inclusive loans to small and micro
enterprises reached RMB510,917 million, representing an increase of RMB136,489 million or 36.45% compared
to the end of the previous year, which was higher than the overall growth rate of loans of the Bank by 27.65
percentage points. The number of customers with outstanding loans was 946.9 thousand, representing an increase
of 223.7 thousand compared to the end of the previous year. The balance and the ratio of non-performing loans
both recorded a drop, while NPL ratio was controlled within the range of regulatory tolerance. The annualized yield
of loans cumulatively granted reached was 4.68%, which was maintained at a reasonable level. We met the CBIRC’s
requirement of “two growth objects and two control objects” by phases and the requirement of 30% increase in
loan balance proposed in 2019 Report on the Work of the Government by the State Council. The inclusive loans in
compliance with the requirement of the PBOC for lowering depository reserve ratio increased by RMB193,520 million,
compared to the end of the previous year, accounting for 22.11% of new loans in RMB of the Bank, which was higher
than the second level stipulated by the PBOC for targeted deduction of depository reserve ratio.
We built a digital product system of “Micro E-loan” and stepped up the innovation focusing on the small-sum
internet financing product “Micro Quick Loan”, the intelligent financing product “Quick Loan” and the online
supply chain financing product “Supply Chain Quick Loan”.
We built a bank-government comovement scene, and accessed an online pre-filling in form system for account
opening of companies to the governmental service platform of China, thereby becoming the first financial
institution providing online financial service on such platform.
We set up differentiate credit policy system. Policies applied to qualified small and micro enterprises differed in
such aspects as customer classification and management and control on industry credit limit. Power to examine
and approve loans to small and micro enterprises was delegated to qualified branches.
Discussion and Analysis
43Interim Report 2019
The Head Office established the business structure of “Inclusive Banking Division + 8 Back Office Centers”.
37 tier-1 branches (branches directly managed by the Head Office) and major tier-2 branches established their
Inclusive Banking Divisions to form the inclusive finance service system supported by “Sannong + Small and
Micro Enterprises” with our own feature. For details of the County Area Banking Division and County Area
Banking Business, please refer to “Discussion and Analysis — County Area Banking Business”.
By leveraging the main role of specialized institutions in small and micro enterprise banking services, 799
specialized institutions were established in tier-2 branches and sub-branches and dynamically adjusted. 100 sub-
branches were entitled “Demonstration Outlets for Financial Services to Small and Micro Enterprise” in hubs of
small and micro enterprises to enhance our capabilities to provide professional and tailored services.
Green Finance
Green Credit
During the reporting period, we improved systems and process management to speed up the development of green
credit business, making a contribution to build “A Beautiful China” and implement the national strategy of Prevent
and Control Pollution. At the end of June 2019, the balance of loans in green credit business reached RMB1,128,386
million.
We strengthened polices to guide the green credit. Under guidance of the annual credit policy, credit funds were
navigated into green projects and such industries as energy conservation and environmental protection, clean
production and clean energy.
Regional credit products were innovated. In line with construction of the pilot zone for reform and innovations
of green finance in Zhejiang Province, we supported Huzhou Branch in Zhejiang Province to launch an exclusive
financial service product “Green Finance Loan to Manufacturing Industry”, to strengthen our ability to serve
regional economies.
As among the first batch of domestic financial institutions to sign the Green Investment Principles for the Belt
and Road Initiatives, we made full use of green financial instruments to raise funds for green projects and
promote green supply chain management.
Environmental and social risk management was enhanced. We applied the requirements for environmental and
social risk management to the procedures of credit business. We implemented differentiated and whole-process
control and strictly implemented the “One Vote for Veto” with respect to environmental and social risks.
Green Investment Banking
We introduced the green concept into all types of products and services of the investment banking business and
strived to develop into “a leading bank in green investment banking”.
In the first half of 2019, we financed the development of customers from such green industries. We provided
over RMB50 billion financial supports to industries such as clean energy, transportation, hydro power,
environmental governance and sewage treatment through underwriting bonds, asset-backed securities,
syndicated loans and M&A loans.
Discussion and Analysis
44
Cross-border Financial Service
During the reporting period, in active response to “the Belt and Road Initiative” and the national strategies of “Going
Global” of enterprises and RMB internationalization, we optimized the comprehensive cross-border financial service
system and promoted product innovation and transformation. At the end of June 2019, the total assets and net profit
of our overseas branches and subsidiaries reached USD142 billion and USD320 million, respectively.
We continued to improve the network layout in major international and regional financial centers as well as
major countries and regions maintaining close ties with China. As at the end of June 2019, we established 22
overseas institutions and one joint venture bank in 17 countries and regions.
The international settlement and trade financing business achieved steady development, and cross-border
financial service capability and market competitiveness were further enhanced. In the first half of 2019, the
total volume of international trade financing (including financing under domestic letter of credit) conducted by
domestic branches of the Bank reached USD59.82 billion. A volume of international settlement of USD588.707
billion was completed, representing a year-on-year increase of 18.3%.
The cross-border RMB business was vigorously developed. In the first half of 2019, the cross-border RMB
settlement amounted to RMB624.747 billion, representing a year-on-year increase of 12.0%. Dubai Branch as
RMB business clearing bank for the United Arab Emirates had seen rapid development in RMB clearing business.
The interconnected RMB businesses in cross-border financial markets realized fast growth that “Bond Connect”
business realized a year-on-year increase of 319.72%.
Integrated Operation
We have established an integrated operation platform covering fund management, securities and investment banking,
financial leasing, life insurance and debt-to-equity swap business, and newly established an asset management
subsidiary to continuously promote the implementation of integrated operation strategy. In the first half of 2019, our
five subsidiaries of integrated operation focused on their principal businesses, delved into respective professional and
operated prudently centering on the Group’s overall development strategy. The synergies arising from our integrated
operation gradually emerged and our market competitiveness was steadily enhanced. At the end of June 2019, total
assets of our five subsidiaries of integrated operation amounted to RMB219.49 billion, representing an increase of
RMB15,051 million as compared to the end of the previous year and the net profit for the first half of 2019 amounted
to RMB3,163 million.
ABC-CA Fund Management Co., Ltd. managed 142 funds and the total assets under its management amounted
to RMB507.8 billion. In the first half of the year, all the public funds under management achieved earnings.
ABC International Holdings Limited continued to hold its leading position among its peers in terms of the
indicator of core investment banking business. As at the end of June 2019, it ranked fifth among Chinese and
foreign investment banks in Hong Kong and first among investment banks owned by the four major commercial
banks in terms of new share underwriting. In the first half of the year, it completed 14 listing sponsorship and
underwriting projects and 20 bond issuance projects, representing a year-on-year increase of 55.6% and 42.9%
in number, respectively.
Discussion and Analysis
45Interim Report 2019
ABC Financial Leasing Co., Ltd. focused on its principal leasing business with its quality leasing assets steadily
increased. At the end of June 2019, the balance of its leasing assets amounted to RMB45.732 billion, up by
13.8% compared to the end of the previous year. It innovated business models in aspects of green travel and
energy conservation and emission reduction. It completed the initial public offering of green bonds of RMB3
billion to support the development of green leasing.
ABC Life Insurance Co., Ltd. achieved a new breakthrough in premium income. Total premium income in the
first half of the year was RMB18.967 billion, a year-on-year increase of 32.0%. The business structure continued
to be optimized. In the first half of the year, the income from regularly-paid premium was RMB6.760 billion,
representing a year-on-year increase of 6.0%, and the percentage of new issuance regular premiums income
reached 87.62%, representing a year-on-year increase of 8 percentage points.
ABC Financial Asset Investment Co., Ltd. actively promoted the completion and implementation of market-based
debt-to-equity swap projects. At the end of June 2019, its total assets reached RMB43,741 million, an increase
of 30.8% over the end of the previous year. In the first half of 2019, the market-based debt-to-equity swap
projects completed amounted to RMB23,334 million, remaining the leading position among peers.
Distribution Channels
Offline channels
During the reporting period, we continued to promote the transformation of branch outlets, which focused on
“three reductions, two increases and one change” (reductions in outlet area, counter clerks and cost, increases of
marketing capacity and risk control capability, and change of operational system and procedures). Aiming to enhance
the efficiency of branch outlets, we comprehensively improved the marketing service capability, risk management and
control capability, value creation ability and market competitiveness of the branch outlets.
We promoted “hard transformation” of branch outlets by “three reductions” in an orderly manner. We
constantly optimized layout and function zones of branch outlets and transformed them towards more intelligent
ones with less labor forces. As at the end of June 2019, a total of 2,728 branch outlets completed “hard
transformation”, which helped reduce 14,000 counters of cash services and transferred. 14,600 counter clerks to
the posts of marketing services.
We promoted “soft transformation” of branch outlets by “two increases”. Focusing on “financial ecosystem
construction”, we built comprehensive financial service scenes and a “life + finance” multi-service platform
through “smart shelf”, forming a new marketing and service mode of branch outlets with integrated online
and offline channels. As at the end of June 2019, all the branch outlets completed “soft transformation”, with
enhanced capabilities of marketing and acquiring customers and steadily improved operational efficiency.
Discussion and Analysis
46
We continued to optimize operational mode by “one change”. We completed comprehensive transformation
of counter business, with coverage rate of electronic certificates, seals and signatures reaching 99%. We
comprehensively promoted a new generation of intelligent service platform named super counter1 and
continuously expanded its coverage. At the end of June 2019, 22 thousand branch outlets had super counters
and 48 thousand machines were in place. The super counter had 305 products and functions including bank
card, wealth management, fund, cash business, bill business and account opening and contract signing for
corporate customers, leading our peers in terms of business scope. 94% of our counter activities were replaced
by super counters. Our abilities of intelligent operation, integrated operation and operation through integrated
online and offline channels were further enhanced.
Online Channels
During the reporting period, we conducted 28.385 billion financial transactions through electronic channels,
representing a year-on-year increase of 9.96%, and the transaction volume reached RMB506.48 trillion, representing
a year-on-year increase of 2.56%.
Mobile Banking
As at the end of June 2019, the total number of personal mobile banking users reached 284 million, up by 10.5%
as compared to the end of the previous year, and transaction volume in the first half of 2019 was RMB28.55 trillion,
representing a year-on-year increase of 26.2%. The total number of corporate mobile banking users reached 1.38
million up by 48.4% as compared to the end of the previous year, and the cumulative transaction volume in the first
half of 2019 was RMB400.7 billion in the first half of 2019, 11.6 times of that in the corresponding period of the
previous year.
Internet Banking
As at the end of June 2019, the number of registered customers in personal internet banking was 290 million,
representing an increase of 9.28% as compared to the end of the previous year, and transaction volume in the first
half of 2019 reached RMB16.54 trillion. The number of customers of the corporate financial service platform reached
6.76 million, representing an increase of 9.0% as compared to the end of the previous year, and the transaction
volume in the first half of 2019 reached RMB83.05 trillion.
Telephone Banking
We vigorously promoted the intelligent transformation of customer service mode. We launched the intelligent call
service platform to build an intelligent voice navigation system to continuously improve customer experience. In the
first half of 2019, a total of 173 million calls were received by our telephone banking from customers, among which
49 million calls were transferred to the customer service center and 45 million calls were handled by customer service
staff, with the completion rate and satisfaction rate of 90.51% and 99.59%, respectively.
1 The super counter is an intelligent customer service channel and platform independently developed by the Bank. It consists of “software” + “hardware” + “back office”, with “software” as the core, i.e. the application that integrates the business processes and operating modes of the bank. The super counter realized a business operation and risk control mode of “customer self-service, separation of front and back office, and automatic triggering of account process”.
Discussion and Analysis
47Interim Report 2019
Self-service Banking
We promoted an equipment management system and an intelligent service system for branch outlets and built
an intelligent terminal application store to push forward unified, intelligent and comprehensive management of
equipment in our branch outlets. As at the end of June 2019, we had 91.2 thousand sets of cash-related self-service
facilities and 39.7 thousand sets of self-service terminals, and the daily average transaction volume was 17.94 million.
Information Technology
We accelerated innovation in FinTech and endeavored to build a new generation of digital IT platform to provide
strong technical support for digital transformation, aiming to build ourselves into a smart bank with first-class
customer experience.
Promote Innovation in FinTech Comprehensively
Regarding application of mobile internet technology, we launched an intelligent mobile banking service version
2.0, which uploaded fund, wealth management, private banking and other special services as well as “ABC
Smart Financing” service, and launched applications including convenient and real-time account opening, real-
time views for balance sheet of customers, unconscious pay for offline merchants, so as to continuously improve
our service capacity. We launched the “Taxation E-loan” (an online bank-tax small-amount network financing
product) and “Factoring E-financing” (an online factoring financing product).
Regarding application of artificial intelligence technology, our Finance Brain Platform was equipped with the
function for classifying types of vouchers, which could identify 35 types of bills with an accuracy rate of 99.7%.
The merchant service public account and credit management platform had accessed to Finance Brain OCR
identification service, with an accuracy rate of up to 98%. We optimized our self-service voice interaction and
navigation system with an accuracy rate of 93.4%.
Regarding application of big data technology, we completed upgrading & expansion of the big data platform
to comprehensively improve its computing performance. We accelerated the introduction & integration of
internal and external data resources, and promoted centralized access of external data related to industrial
and commercial, judicial, public opinion information. We comprehensively sorted out four types of data assets,
including basic data, indicator report, mining model and data label, and continued to promote the construction
of service platforms of artificial intelligence, business intelligence, manager cockpit, so as to build a middle-end
data center.
Regarding application of cloud computing technology, we completed the joint innovation project of constructing
a new generation of infrastructure for the cloud platform and verified the feasibility of key technologies related
to distributed storage, software-defined network. We promoted the application and construction of basic cloud
and built two sets of cloud platform environments in the production and operation, namely development test
cloud and production cloud.
Regarding application of block chain technology, we completed the first phase of R&D of the block chain-based
project of online receivables management platform, and achieved functions including supplier access, signing
contract, transferring and financing.
Discussion and Analysis
48
Regarding application of cyber security technology, we made efforts to improve the cyber security technical
protection system continuously. We completed the upgrading or promotion of tools including a basic sensor
platform for trend of cyber security, a security monitoring system for internet application, an internet application
firewall, a new generation of terminal security & management system, to comprehensively improve our
protection capabilities for cyber security.
Improve Technological Level of Our Operation and Management
We promoted the construction of key projects related to online credit, smart city and open banking, to promote
digital transformation in products, scenes, data, risk control and channels.
We improved intelligent level for prevention and control of cases continuously. We promoted the construction
of an intelligent anti-fraud platform for enterprises, and launched the platform for prevention, early warning and
monitoring of cases in stages, initially building a prevention and control system covering the whole process from
collection information to disposing of cases. We facilitated the promotion of the overseas anti-money laundering
monitoring & management system in Singapore, Tokyo and other overseas institutions.
We completed the project of smart credit 1.0, launching six main applications, namely smart identification, smart
information collection, decision-making center, smart portrait, smart portal and smart retrieval, employed face
recognition in key operation processes, which greatly reduced time to generate financial statements with an
identification accuracy rate higher than 85%.
We popularized the super counter’s function of opening accounts for corporate customers, realizing online
appointment for opening accounts, remote verification via video, online due diligence, interconnected products
signing as well as integration of online and offline processes, to effectively support intelligent transformation of
the branch outlets.
Ensure the Safe Running of Information System
We promoted the construction project of “two cities and three centers” in Beijing and Shanghai and delivered
the computer facilities in Shanghai Free Trade Zone for use.
We made great efforts to promote the reinforcement of important and sensitive systems to enhance high
availability of the systems and automatic operation & maintenance level.
We upgraded the structure of backbone network and adopted segment routing technology earlier than our
rivals, which improved the customer experience in terms of backbone network transmission, and enhanced the
security protection for multiple businesses and multiple customers.
During the reporting period, the transaction volume generated by our operations increased rapidly. The daily
average transaction volume handled by our core system reached 640 million transactions and the highest daily
transaction volume reached 791 million transactions. The utilization rate during major business hours of our core
system reached 100%, maintaining stable and sustainable service operating capabilities.
Discussion and Analysis
49Interim Report 2019
Human Resources Management and Organization Management
Organization structure and human resources reform
We built the organization structure for digital transformation, in order to promote the integration of business
and technology. The data analysis teams were established and exchange between talents in business
departments and departments of science and technology was conducted.
We promoted the innovation and reform of technology and products. A Xi’an R&D Department under the
research and development center (a tier-2 department) was established. A grading system for IT-related positions
was established in the research and development center and the data center. The administrative measure for
product managers was formulated.
We set up the ABC wealth management subsidiary and the pension financial center to promote the development
of emerging businesses.
We reorganized the internal control and compliance supervision department and set up a separate legal
department to provide organizational guarantees for preventing and mitigating financial risk.
We downsized single sub-branches in the city and the middle and back offices under tier-2 branches, and guided
the flow of human resources to staff front lines of our businesses.
Development and Cultivation of Human Resources
During the reporting period, we continued to build a talent pool of competent and professional officials.
We optimized leadership teams in tier-1 branches, tier-2 branches and sub-branches. We made greater effort to
nurture outstanding young leaders, by reasonably optimizing their career path and shortening their promotion
time.
We implemented the young talent projects both in the County Areas and urban areas to build sufficient reserve
forces with high-quality for foundation-level institutions.
Focusing on the transformation of branch outlets, we optimized the positions in foundation-level institutions and
increased marketing staff in branch outlets.
We formulated a five-year plan for education and training and implemented a special round of training on
digital transformation. More trainings on transformation and position transfer for employees in foundation-level
institutions were held. 55 sessions of trainings as Fintech as the theme were held in the Head Office for deputy
leaders in foundation-level institutions.
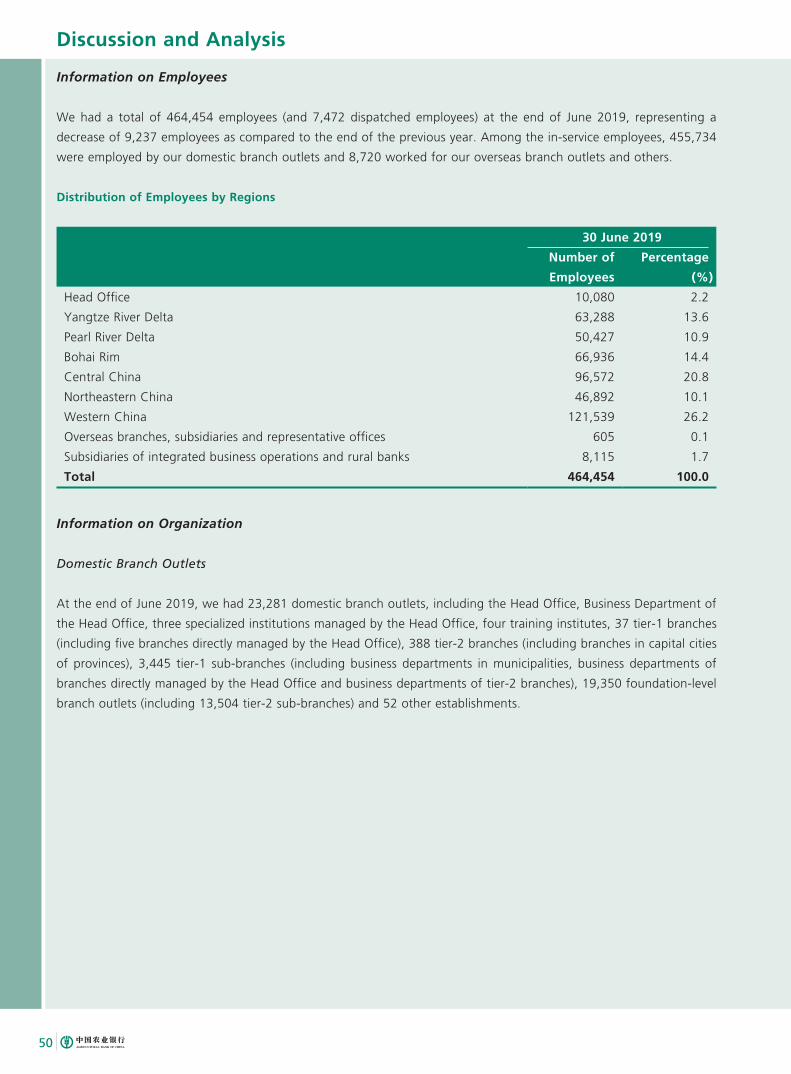
Discussion and Analysis
50
Information on Employees
We had a total of 464,454 employees (and 7,472 dispatched employees) at the end of June 2019, representing a
decrease of 9,237 employees as compared to the end of the previous year. Among the in-service employees, 455,734
were employed by our domestic branch outlets and 8,720 worked for our overseas branch outlets and others.
Distribution of Employees by Regions
30 June 2019
Number of
Employees
Percentage
(%)
Head Office 10,080 2.2
Yangtze River Delta 63,288 13.6
Pearl River Delta 50,427 10.9
Bohai Rim 66,936 14.4
Central China 96,572 20.8
Northeastern China 46,892 10.1
Western China 121,539 26.2
Overseas branches, subsidiaries and representative offices 605 0.1
Subsidiaries of integrated business operations and rural banks 8,115 1.7
Total 464,454 100.0
Information on Organization
Domestic Branch Outlets
At the end of June 2019, we had 23,281 domestic branch outlets, including the Head Office, Business Department of
the Head Office, three specialized institutions managed by the Head Office, four training institutes, 37 tier-1 branches
(including five branches directly managed by the Head Office), 388 tier-2 branches (including branches in capital cities
of provinces), 3,445 tier-1 sub-branches (including business departments in municipalities, business departments of
branches directly managed by the Head Office and business departments of tier-2 branches), 19,350 foundation-level
branch outlets (including 13,504 tier-2 sub-branches) and 52 other establishments.
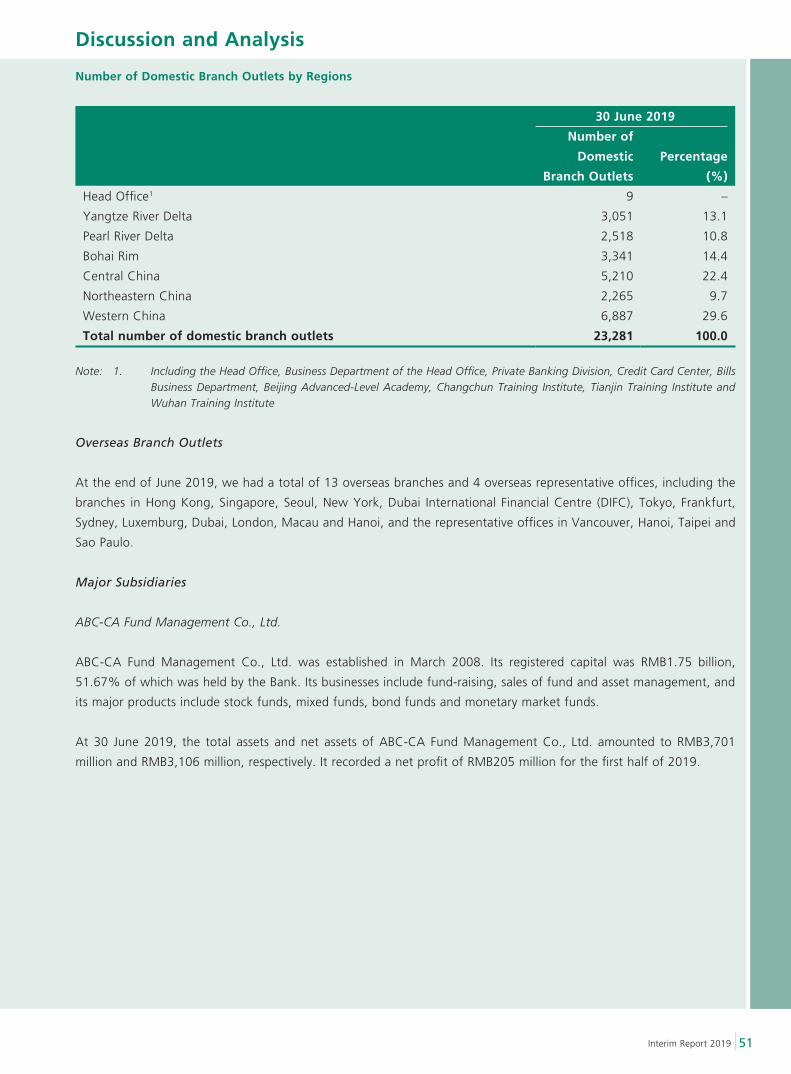
Discussion and Analysis
51Interim Report 2019
Number of Domestic Branch Outlets by Regions
30 June 2019
Number of
Domestic
Branch Outlets
Percentage
(%)
Head Office1 9 –
Yangtze River Delta 3,051 13.1
Pearl River Delta 2,518 10.8
Bohai Rim 3,341 14.4
Central China 5,210 22.4
Northeastern China 2,265 9.7
Western China 6,887 29.6
Total number of domestic branch outlets 23,281 100.0
Note: 1. Including the Head Office, Business Department of the Head Office, Private Banking Division, Credit Card Center, Bills Business Department, Beijing Advanced-Level Academy, Changchun Training Institute, Tianjin Training Institute and Wuhan Training Institute
Overseas Branch Outlets
At the end of June 2019, we had a total of 13 overseas branches and 4 overseas representative offices, including the
branches in Hong Kong, Singapore, Seoul, New York, Dubai International Financial Centre (DIFC), Tokyo, Frankfurt,
Sydney, Luxemburg, Dubai, London, Macau and Hanoi, and the representative offices in Vancouver, Hanoi, Taipei and
Sao Paulo.
Major Subsidiaries
ABC-CA Fund Management Co., Ltd.
ABC-CA Fund Management Co., Ltd. was established in March 2008. Its registered capital was RMB1.75 billion,
51.67% of which was held by the Bank. Its businesses include fund-raising, sales of fund and asset management, and
its major products include stock funds, mixed funds, bond funds and monetary market funds.
At 30 June 2019, the total assets and net assets of ABC-CA Fund Management Co., Ltd. amounted to RMB3,701
million and RMB3,106 million, respectively. It recorded a net profit of RMB205 million for the first half of 2019.
Discussion and Analysis
52
ABC International Holdings Limited
ABC International Holdings Limited was established in Hong Kong in November 2009. The registered capital of ABC
International Holdings Limited was HKD4,113 million, 100% of which was held by the Bank. ABC International
Holdings Limited is eligible to engage in providing comprehensive and integrated financial services in Hong Kong,
including sponsor and underwriter for listing, issuance and underwriting of bonds, financial consultation, investment
management, asset management, institutional sales, securities brokerage and securities consultation, and is also
eligible to engage in fund management, financial consultation, investment and non-financial licensed capital market
businesses in mainland China.
At 30 June 2019, the total assets and net assets of ABC International Holdings Limited amounted to HKD39,713
million and HKD7,945 million, respectively. It recorded a net profit of HKD786 million for the first half of 2019.
ABC Financial Leasing Co., Ltd.
ABC Financial Leasing Co., Ltd. was established in September 2010 and its registered capital was RMB9.5 billion,
100% of which was held by the Bank. The principal scope of business includes financial leasing, transfer and
acceptance of financial leasing assets, fixed-income securities investment business, acceptance of leasing deposits
from lessees, absorbing time deposit with a maturity of three months or above from non-bank shareholders, interbank
lending, borrowing from financial institutions, overseas borrowings, selling and disposal of leased items, economic
consultation, establishment of project companies in domestic bonded zones to carry out financial leasing business,
provision of guarantee for external financing to subsidiaries and project companies, and other businesses approved by
the CBIRC.
At 30 June 2019, the total assets and net assets of ABC Financial Leasing Co., Ltd. amounted to RMB52,952 million
and RMB9,643 million, respectively. It recorded a net profit of RMB150 million for the first half of 2019.
ABC Life Insurance Co., Ltd.
The registered capital of ABC Life Insurance Co., Ltd. was RMB2,950 million, 51% of which was held by the Bank.
Its principal scope of business includes various types of personal insurance such as life insurance, health insurance
and accident insurance; reinsurance business for the abovementioned businesses; businesses with the application of
insurance funds as permitted by the laws and regulations of the PRC; and other businesses approved by the CBIRC.
At 30 June 2019, the total assets and net assets of ABC Life Insurance Co., Ltd. amounted to RMB84,163 million and
RMB6,708 million, respectively. It recorded a net profit of RMB1,857 million for the first half of 20191.
China Agricultural Finance Co., Ltd.
The registered capital of China Agricultural Finance Co., Ltd. was HKD588.79 million, 100% of which was held by the
Bank.
1 The financial data of ABC Life Insurance has been adjusted in accordance with the accounting policies of the Group. On the basis of IAS 39 currently adopted by the insurance industry, ABC Life Insurance achieved a net profit of RMB580 million in the first half of 2019.
Discussion and Analysis
53Interim Report 2019
ABC Financial Asset Investment Company Limited
The registered capital of ABC Financial Asset Investment Company Limited is RMB10 billion, which is 100% held by
the Bank. Its principal scope of business includes: focusing on debt-to-equity conversion and ancillary supporting
business, conducting public fund raising from qualified public investors for debt-to-equity conversion in accordance
with relevant laws and regulations, issuance of financial bonds specifically for debt-to-equity conversion, as well as
other businesses as approved by the CBIRC.
At 30 June 2019, the total assets and net assets of ABC Financial Asset Investment Company Limited amounted to
RMB43,741 million and RMB10,621 million, respectively. It recorded a net profit of RMB271 million for the first half of
2019.
Agricultural Bank of China (UK) Limited
Agricultural Bank of China (UK) Limited is a wholly-owned subsidiary of the Bank incorporated in the United Kingdom,
with a registered capital of USD0.1 billion. According to its strategy of overseas businesses development, the Bank
is currently completing procedures related to closure of Agricultural Bank of China (UK) Limited during the reporting
period and had transferred the related business to the London Branch.
Agricultural Bank of China (Luxembourg) Limited
Agricultural Bank of China (Luxembourg) Limited is a wholly-owned subsidiary of the Bank incorporated in
Luxembourg, with a registered capital of EUR20 million. Its scope of business includes various banking businesses such
as retail, wholesale and treasury transactions.
At 30 June 2019, Agricultural Bank of China (Luxembourg) Limited had total assets of USD29 million. It recorded a net
loss of USD0.29 million.
Agricultural Bank of China (Moscow) Limited
Agricultural Bank of China (Moscow) Limited is a wholly-owned subsidiary of the Bank incorporated in Russia, with a
registered capital of RUB7,556 million. Its scope of business includes wholesale banking business such as international
settlement, corporate deposits, syndicated loans, bilateral loans, trade financing and foreign exchange trading.
At 30 June 2019, Agricultural Bank of China (Moscow) Limited had total assets of USD195 million. It recorded a net
profit of USD2.22 million.
ABC Hubei Hanchuan Rural Bank Limited Liability Company
ABC Hubei Hanchuan Rural Bank Limited Liability Company was established in August 2008 in Hanchuan, Hubei
Province, with a registered capital of RMB31 million, 50% of which was held by the Bank. At 30 June 2019, the total
assets and net assets of ABC Hubei Hanchuan Rural Bank Limited Liability Company amounted to RMB307 million and
RMB64 million, respectively. It recorded a net profit of RMB1,417.3 thousand for the first half of 2019.
Discussion and Analysis
54
ABC Hexigten Rural Bank Limited Liability Company
ABC Hexigten Rural Bank Limited Liability Company was established in August 2008 in Hexigten Banner, Chifeng
City, Inner Mongolia Autonomous Region, with a registered capital of RMB19.60 million, 51.02% of which was held
by the Bank. At 30 June 2019, the total assets and net assets of ABC Hexigten Rural Bank Limited Liability Company
amounted to RMB148 million and RMB35 million, respectively. It recorded a net loss of RMB671 thousand for the first
half of 2019.
ABC Ansai Rural Bank Limited Liability Company
ABC Ansai Rural Bank Limited Liability Company was established in March 2010 in Ansai County, Yan’an City, Shaanxi
Province, with a registered capital of RMB40 million, 51% of which was held by the Bank. At 30 June 2019, the total
assets and net assets of ABC Ansai Rural Bank Limited Liability Company amounted to RMB550 million and RMB64
million, respectively. It recorded a net loss of RMB525.6 thousand for the first half of 2019.
ABC Jixi Rural Bank Limited Liability Company
ABC Jixi Rural Bank Limited Liability Company was established in May 2010 in Jixi County, Xuancheng City, Anhui
Province, with a registered capital of RMB29.40 million, 51.02% of which was held by the Bank. At 30 June 2019, the
total assets and net assets of ABC Jixi Rural Bank Limited Liability Company amounted to RMB224 million and RMB41
million, respectively. It recorded a net loss of RMB602.3 thousand for the first half of 2019.
ABC Zhejiang Yongkang Rural Bank Limited Liability Company
ABC Zhejiang Yongkang Rural Bank Limited Liability Company was established in June 2012 in Yongkang County,
Jinhua City, Zhejiang Province, with a registered capital of RMB210 million, 51% of which was held by the Bank.
At 30 June 2019, the total assets and net assets of ABC Zhejiang Yongkang Rural Bank Limited Liability Company
amounted to RMB580 million and RMB254 million, respectively. It recorded a net profit of RMB4,430.4 thousand for
the first half of 2019.
ABC Xiamen Tong’an Rural Bank Limited Liability Company
ABC Xiamen Tong’an Rural Bank Limited Liability Company was established in June 2012 in Tong’an District, Xiamen
City, Fujian Province, with a registered capital of RMB100 million, 51% of which was held by the Bank. At 30 June
2019, the total assets and net assets of ABC Xiamen Tong’an Rural Bank Limited Liability Company amounted to
RMB1,004 million and RMB165 million, respectively. It recorded a net profit of RMB7,375.8 thousand for the first half
of 2019.
Major Company Invested by the Company
Sino-Congolese Bank for Africa was established by the Bank in the Republic of Congo, in which the Bank invested
XAF26,671.40 million, with a shareholding of 50%.
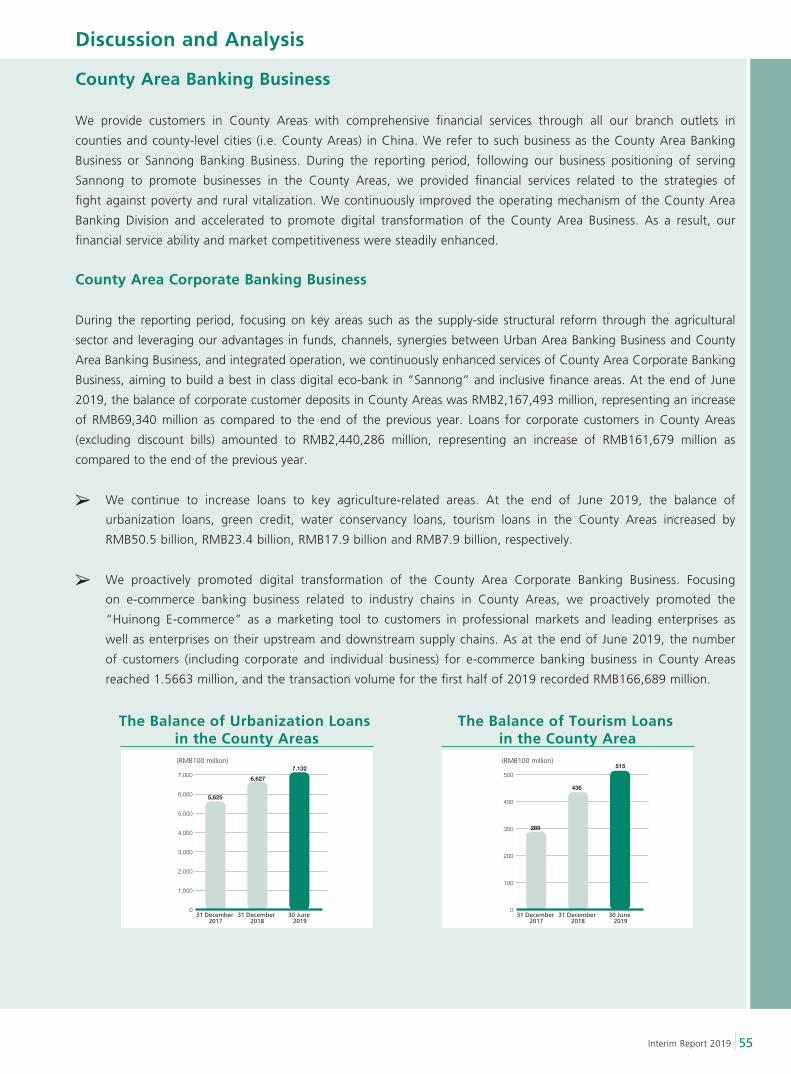
Discussion and Analysis
55Interim Report 2019
County Area Banking Business
We provide customers in County Areas with comprehensive financial services through all our branch outlets in
counties and county-level cities (i.e. County Areas) in China. We refer to such business as the County Area Banking
Business or Sannong Banking Business. During the reporting period, following our business positioning of serving
Sannong to promote businesses in the County Areas, we provided financial services related to the strategies of
fight against poverty and rural vitalization. We continuously improved the operating mechanism of the County Area
Banking Division and accelerated to promote digital transformation of the County Area Business. As a result, our
financial service ability and market competitiveness were steadily enhanced.
County Area Corporate Banking Business
During the reporting period, focusing on key areas such as the supply-side structural reform through the agricultural
sector and leveraging our advantages in funds, channels, synergies between Urban Area Banking Business and County
Area Banking Business, and integrated operation, we continuously enhanced services of County Area Corporate Banking
Business, aiming to build a best in class digital eco-bank in “Sannong” and inclusive finance areas. At the end of June
2019, the balance of corporate customer deposits in County Areas was RMB2,167,493 million, representing an increase
of RMB69,340 million as compared to the end of the previous year. Loans for corporate customers in County Areas
(excluding discount bills) amounted to RMB2,440,286 million, representing an increase of RMB161,679 million as
compared to the end of the previous year.
We continue to increase loans to key agriculture-related areas. At the end of June 2019, the balance of
urbanization loans, green credit, water conservancy loans, tourism loans in the County Areas increased by
RMB50.5 billion, RMB23.4 billion, RMB17.9 billion and RMB7.9 billion, respectively.
We proactively promoted digital transformation of the County Area Corporate Banking Business. Focusing
on e-commerce banking business related to industry chains in County Areas, we proactively promoted the
“Huinong E-commerce” as a marketing tool to customers in professional markets and leading enterprises as
well as enterprises on their upstream and downstream supply chains. As at the end of June 2019, the number
of customers (including corporate and individual business) for e-commerce banking business in County Areas
reached 1.5663 million, and the transaction volume for the first half of 2019 recorded RMB166,689 million.
The Balance of Urbanization Loans in the County Areas
The Balance of Tourism Loans in the County Area
0
1,000
2,000
3,000
4,000
5,000
6,000
7,000
31 December 2017
31 December 2018
30 June 2019
(RMB100 million)
5,625
6,6277,132
0
100
200
300
400
500
31 December 2017
31 December 2018
30 June 2019
(RMB100 million)
289
436
515
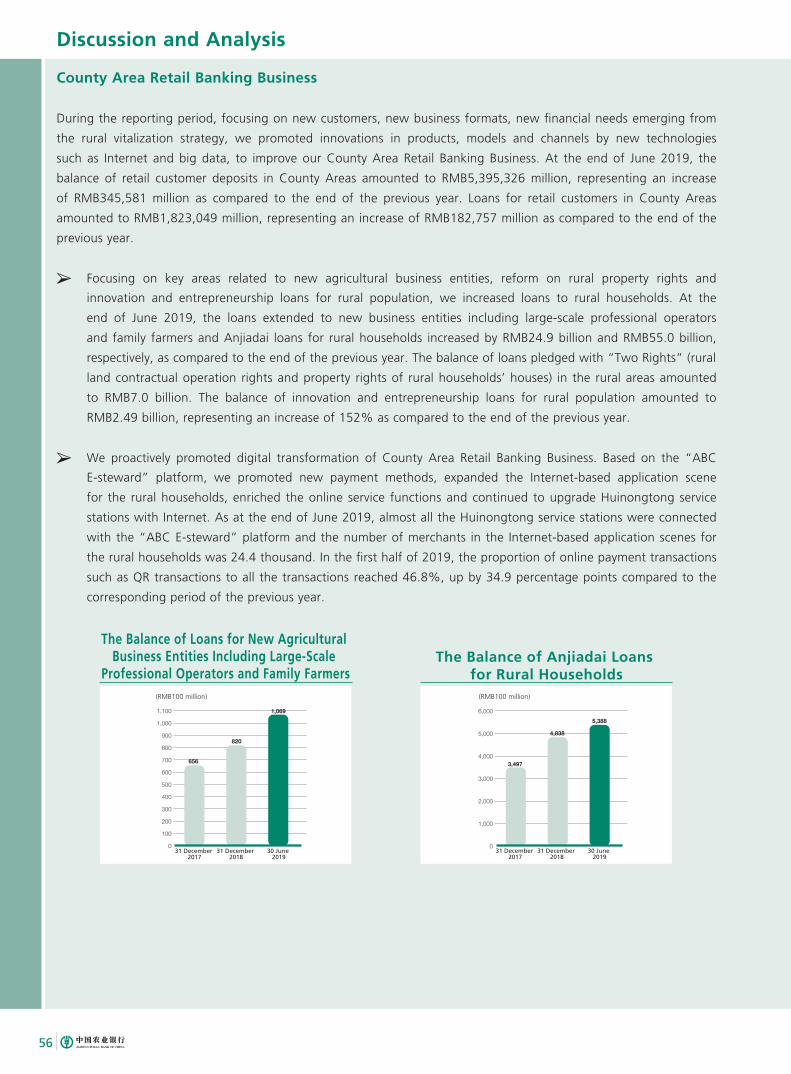
Discussion and Analysis
56
County Area Retail Banking Business
During the reporting period, focusing on new customers, new business formats, new financial needs emerging from
the rural vitalization strategy, we promoted innovations in products, models and channels by new technologies
such as Internet and big data, to improve our County Area Retail Banking Business. At the end of June 2019, the
balance of retail customer deposits in County Areas amounted to RMB5,395,326 million, representing an increase
of RMB345,581 million as compared to the end of the previous year. Loans for retail customers in County Areas
amounted to RMB1,823,049 million, representing an increase of RMB182,757 million as compared to the end of the
previous year.
Focusing on key areas related to new agricultural business entities, reform on rural property rights and
innovation and entrepreneurship loans for rural population, we increased loans to rural households. At the
end of June 2019, the loans extended to new business entities including large-scale professional operators
and family farmers and Anjiadai loans for rural households increased by RMB24.9 billion and RMB55.0 billion,
respectively, as compared to the end of the previous year. The balance of loans pledged with “Two Rights” (rural
land contractual operation rights and property rights of rural households’ houses) in the rural areas amounted
to RMB7.0 billion. The balance of innovation and entrepreneurship loans for rural population amounted to
RMB2.49 billion, representing an increase of 152% as compared to the end of the previous year.
We proactively promoted digital transformation of County Area Retail Banking Business. Based on the “ABC
E-steward” platform, we promoted new payment methods, expanded the Internet-based application scene
for the rural households, enriched the online service functions and continued to upgrade Huinongtong service
stations with Internet. As at the end of June 2019, almost all the Huinongtong service stations were connected
with the “ABC E-steward” platform and the number of merchants in the Internet-based application scenes for
the rural households was 24.4 thousand. In the first half of 2019, the proportion of online payment transactions
such as QR transactions to all the transactions reached 46.8%, up by 34.9 percentage points compared to the
corresponding period of the previous year.
The Balance of Loans for New Agricultural Business Entities Including Large-Scale
Professional Operators and Family FarmersThe Balance of Anjiadai Loans
for Rural Households
0
1,000
2,000
3,000
4,000
5,000
6,000
3,497
4,838
5,388
(RMB100 million)
31 December 2017
31 December 2018
30 June 2019
(RMB100 million)
0
100
200
300
400
500
600
700
800
900
1,000
1,100
31 December 2017
31 December 2018
30 June 2019
656
820
1,069
Discussion and Analysis
57Interim Report 2019
Financial Poverty Alleviation
During the reporting period, we continuously increased loans to poor areas, improved the precision of targeted
financial poverty alleviation, enhanced basic financial service in poor areas, and steadily promoted poverty alleviation
in designated areas.
Loans to poor areas achieved fast growth. As for the branches in poor areas, we allocated a separate scale of
loans, adopted preferential economic capital measures and prioritized the allocation of financial resources. At the
end of June 2019, the balance of loans in the 832 key counties of national poverty alleviation was RMB1,033.1
billion, representing a growth of 12% as compared to the end of the previous year. The balance of loans in
extreme poverty areas was RMB372.4 billion, representing a growth of 12.0% as compared to the end of the
previous year.
The precision of targeted financial poverty alleviation continued to improve. Focusing on combining the interest
of banks and enterprises able to alleviate poverty as well as poor households, we actively innovated poverty
alleviation products and models. In the first half of 2019, the total amount of loans accumulatively granted for
targeted poverty alleviation was RMB120.8 billion. At the end of June 2019, the balance of targeted poverty
alleviation loans was RMB363.5 billion1.
The coverage of basic financial services was expanded significantly. We prioritized to set up new branch outlets
and self-service outlets in poor areas and actively promoted mobile banking, online banking and the Huinong
E-tong platform in poor areas. We also focused on facilitating the construction of Jinsui Huinongtong service
stations in poor areas, and piloted mobile financial service vehicles in the “Three Regions and Three Prefectures”.
As at the end of June 2019, 57 branch outlets and 44 self-service outlets in poor villages and towns were in
the stage of site selection or construction. As at the end of June 2019, our electronic machines covered 78.6%
and 76.7% of administrative villages in key counties of poverty alleviation and in extreme poverty counties in
“Three Regions and Three Prefectures”, respectively, representing an increase of 8.7 percentage points and 24.1
percentage points as compared to the end of the previous year, respectively.
Remarkable results were achieved in poverty alleviation in designated areas. We continued to implement special
supporting measures, for instance, credit scale and economic capital shall be borne by the Head Office, for
the four designated counties for poverty alleviation, namely Raoyang County and Wuqiang County in Hebei,
Huangping County in Guizhou and Xiushan County in Chongqing. At the end of June 2019, the balance of loans
to the four designated counties for poverty alleviation was RMB9.5 billion.
1 According to the Notice of the People’s Bank of China on Issues Concerning the Financial Statistical System for Financial Institutions for 2019 (Yin Fa [2018] No. 346), the Bank adjusted the statistical methods for targeted poverty alleviation loans.
Discussion and Analysis
58
Taking Three Major Poverty Alleviation Actions,
to Contribute to the Strategy of Fight against Poverty
During the reporting period, focusing on serving the strategy of rural revitalization, we took three major poverty
alleviation actions, namely poverty alleviation collaboration between the branches in eastern and western regions,
poverty alleviation through consumption and poverty alleviation through education and employment, to contribute
to the strategy of fight against poverty.
Firstly, we promoted poverty alleviation collaboration between branches in the eastern and western regions. During
the reporting period, 12 branches in the eastern regions including Beijing, Shanghai and Tianjin collaborated with
relevant poor areas in “Three Regions and Three Prefectures”. 12 branches in the eastern regions accumulatively
sorted out 36 potential investment projects in “Three Regions and Three Prefectures”, dispatched 7 division-level
cadres to work in branches in “Three Regions and Three Prefectures”, and helped to sell characterized products
from “Three Regions and Three Prefectures”.
Secondly, we promoted poverty alleviation through consumption. To interface with the “e-commerce channel
for poverty alleviation” from the Ministry of Commerce, we established the Internet e-commerce banking service
zone — “poverty alleviation mall”, targeted at counties of national poverty alleviation, to provide whole-process
financial services to merchants in poor counties for their online sale of agricultural products. As a result, we built
a new engine for e-commerce poverty alleviation, which increased coverage density of Internet channels over
poor counties. We held exhibitions for featured products from poor areas, helped customers and enterprises and
farmers in poor areas to establish the supply-buyer relationship. Labor unions and back offices at all levels of the
Bank actively purchased products from poor areas. At the end of June 2019, transaction volume under the action
of poverty alleviation through consumption amounted to RMB96.31 million. There were 374 shops on operation in
the poverty alleviation mall, and 1,137 varieties of featured goods on sale from poor areas. Among 832 state-level
poverty alleviation counties, 254 or 30.53% of which were doing the business in the poverty alleviation mall of the
Bank.
Finally, we promoted poverty alleviation through education and employment. We started “Jinsui Yuanmeng”
activity for 2019 to provide education assistance to freshmen from poor family in extreme poverty counties. During
the recruitments in 2019, all the college graduates from poor families who applied for the Bank had been provided
with opportunities of participating in written tests and interviews.
Discussion and Analysis
59Interim Report 2019
Financial Position
Assets and Liabilities
At 30 June 2019, total assets of the County Area Banking Business reached RMB8,684,222 million, representing
an increase of 7.6% compared to the end of the previous year. Total loans and advances to customers reached
RMB4,388,970 million, representing an increase of 9.6% compared to the end of the previous year. Deposits from
customers reached RMB7,869,883 million, representing an increase of 6.6% compared to the end of the previous
year.
The table below presents the major items of assets and liabilities of the County Area Banking Business as of the dates
indicated.
In millions of RMB, except for percentages
30 June 2019 31 December 2018
Item Amount Percentage (%) Amount Percentage (%)
Total loans and advances to customers 4,388,970 – 4,005,882 –
Allowance for impairment losses on loans (223,684) – (210,395) –
Loans and advances to customers, net 4,165,286 48.0 3,795,487 47.0
Intra-bank balance1 3,747,639 43.1 3,603,324 44.7
Other assets 771,297 8.9 668,563 8.3
Total assets 8,684,222 100.0 8,067,374 100.0
Deposits from customers 7,869,883 97.0 7,380,598 97.7
Other liabilities 240,654 3.0 173,006 2.3
Total liabilities 8,110,537 100.0 7,553,604 100.0
Note: 1. Intra-bank balance refers to funds provided by the County Area Banking Business to other business segments within the Bank through internal funds transfers.
Discussion and Analysis
60
Profit
In the first half of 2019, total profit before tax of the County Area Banking Business increased by 7.6% to RMB45,684
million compared to the corresponding period of the previous year.
The table below presents the major income items of the County Area Banking Business for the periods indicated.
In millions of RMB, except for percentages
Six months
ended 30
June 2019
Six months
ended 30
June 2018
Increase/
(decrease)
Growth Rate
(%)
External interest income 95,936 84,584 11,352 13.4
Less: External interest expense 57,923 44,575 13,348 29.9
Interest income from intra-bank balance1 57,514 56,149 1,365 2.4
Net interest income 95,527 96,158 (631) -0.7
Net fee and commission income 19,143 16,656 2,487 14.9
Other non-interest income 2,450 1,987 463 23.3
Operating income 117,120 114,801 2,319 2.0
Less: Operating expenses2 39,121 38,619 502 1.3
Credit impairment losses2 32,350 33,721 (1,371) -4.1
Impairment losses on other assets2 (35) 9 (44) -488.9
Total profit before tax 45,684 42,452 3,232 7.6
Notes: 1. Interest income from intra-bank balance represents the interest income earned on funds provided by our County Area Banking Business to other business segments at internal funds transfer pricing, which is determined based on the market interest rate.
2. The data of the line item for the corresponding period of 2018 were reclassified to conform with the presentation of the financial statements for this reporting period.
Key Financial Indicators
In the first half of 2019, the return on average total assets of the County Area Banking Business was 0.92%,
representing an increase of two basis points compared to the corresponding period of the previous year. The interest
spread between average cost of deposits and average yield of loans was 3.08%, 26 basis points higher than that
of the Bank. At 30 June 2019, the non-performing loan ratio of the County Area Banking Business was 1.82%,
representing a decrease of 0.26 percentage point compared to the end of previous year. The allowance to non-
performing loans was 280.01% and the allowance to loan ratio was 5.10%.
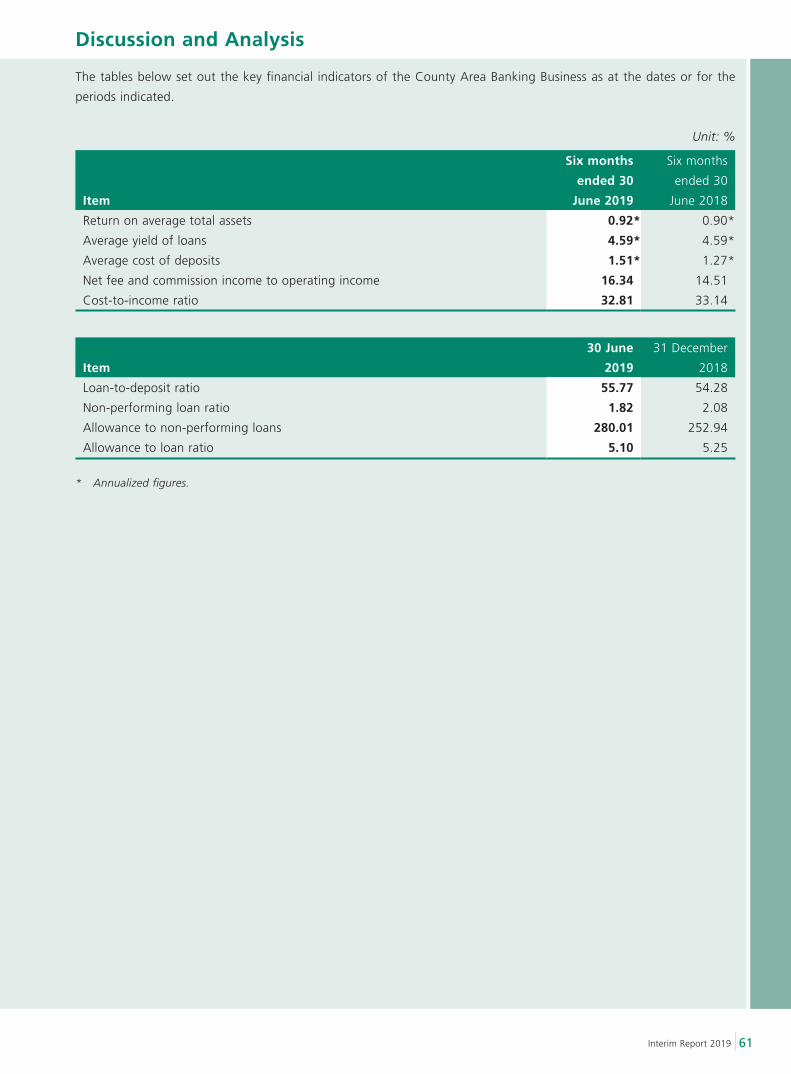
Discussion and Analysis
61Interim Report 2019
The tables below set out the key financial indicators of the County Area Banking Business as at the dates or for the
periods indicated.
Unit: %
Item
Six months
ended 30
June 2019
Six months
ended 30
June 2018
Return on average total assets 0.92* 0.90*
Average yield of loans 4.59* 4.59*
Average cost of deposits 1.51* 1.27*
Net fee and commission income to operating income 16.34 14.51
Cost-to-income ratio 32.81 33.14
Item
30 June
2019
31 December
2018
Loan-to-deposit ratio 55.77 54.28
Non-performing loan ratio 1.82 2.08
Allowance to non-performing loans 280.01 252.94
Allowance to loan ratio 5.10 5.25
* Annualized figures.
Discussion and Analysis
62
Risk Management and Internal Control
Risk Management
Comprehensive Risk Management System
In the first half of 2019, we continued to enhance the comprehensive risk management and well maintained the
risk limitation. With the “Clean-up Plan” progressing orderly, we recorded consistent declines in both the balance
and ratio of non-performing loans. As a result, the asset quality remained stable and was on an upward trajectory.
Allowance to non-performing loans continued to increase and thus risk resilience was further enhanced. By strictly
applying credit exposure management to industries with excessive production capacity, our credit structure continued
to be optimized. As the market risk management policy system was improved, market risk exposure limits were kept
within the target scope, and the market risk exposure was under control as a whole. Additionally, we strengthened
the asset-liability balance management and kept an adequate reserve of high-quality liquid assets with unimpeded
market financing channels, and thus effectively balanced liquidity, security and profitability on condition that the
security of liquidity was guaranteed.
Credit Risk
Credit risk is the risk of economic loss arising from the failure of a debtor (or counterparty) to fulfill its obligations to
perform contractual liabilities. The Bank’s credit risk is primarily originated from loan portfolio, investment portfolio,
guarantee business and various other on- and off-balance sheet credit risk exposures.
Credit Risk Management
In the first half of 2019, we continuously optimized the credit structure and developed innovative patterns of credit
business and management. Further, we took forward-looking risk management measures, determined the risk
limitations, formulated risk plans and mitigated various potential risks in a timely manner. By innovating disposal
patterns of securitization of non-performing loans and debt-to-equity swaps, we made efforts to transfer in batches
and write off non-performing loans.
Risk Management of Corporate Banking Business
We refined the credit policy system. Particularly, we continued to optimize industry-specific credit policies, and
formulated or revised credit policies related to industries such as biomass power generation, port, logistics, automobile
manufacturing, and publishing and printing. To support the strategic development of major regions including
the Guangdong-Hong Kong-Macau Bay Area, Xiongan New Area and the Yangtze Economic Belt, we formulated
differential credit policies. We further improved credit policies for the private enterprises as well.
We developed innovative patterns of credit business and management to reduce risk. Vigorously promoting the
development model of industry chain finance, we selected a group of customers of key industry chains to set classic
examples for business development to reduce risk at root. We put into operation and promoted the smart credit
management platform featuring “smart identification, smart collection, decision-making hub, smart profiling, smart
portal, and smart retrieval”, reducing risk by innovative management models.
Discussion and Analysis
63Interim Report 2019
We pushed ahead with differential credit management in key fields. In this regard, to strengthen the standardized
management on credit business to small and micro enterprises by templates and batches, we developed “Micro
E-loan” digital product series and improved the big data-based cloud rating model for small and micro enterprises.
Besides, we improved credit policies for agriculture-related industries by formulating differential regional credit policies
for agriculture-related industries and bolstering credit support for resort towns, rural revitalization and featured
agriculture.
We kept strengthening the post-disbursement management and the collection and disposal of non-performing assets.
In this respect, we continued to strengthen post-disbursement management of key customers, expanded the scope
of risk monitoring for customers with large credit exposures, and enhanced the post-disbursement management of
online credit business by improving the mechanism of entrusted payment. We applied measures characterized with
more collection, more write-offs, more restructuring, and targeted transfer in batches to dispose of non-performing
assets. Securitization of the non-performing loans and market-based debt-to-equity swaps were promoted to reduce
the existing non-performing loans.
Risk Management of Retail Banking Business
We built a retail customer information center comprising a retail customer information mart and retail customer
profiles, and launched a work platform for retail data analysts to provide a solid data foundation and effective
information management tools for target marketing and risk management of retail banking business. Optimizing IT
systems of exposure limit management for retail banking business and identification of fraud risk related to retail
loans, we achieved accurate identification of risks from retail banking business. We promoted new loan products
such as agricultural industry chain finance to prevent and control retail banking business risk through product
innovation. Moreover, we continued to reinforce risk monitoring on retail loans, optimized the risk control model, and
strengthened the collection and write-offs of non-performing loans from the retail banking business.
Risk Management of Credit Card Business
We promoted the construction of the smart risk control system 2.0 for credit cards to enhance digital risk control.
We continued to strengthen the centralized operation and management of the credit card business by establishing
the risk control mechanism featuring centralized telephone investigation, approval, monitoring and collection, which
significantly improved the intensification of risk control. By improving target customer database and the target
customer database for instalment business, we achieved precise marketing and thus reduced the incidence of risks.
Moreover, we introduced external data such as education background, housing provident fund and personal income
tax to enhance customer risk identification, and rated customer frauds via IT system, so as to provide basis for
decision-making before the credit.
Risk Management of Treasury Business
We constantly monitored the transaction prices in financial markets and risk conditions of existing treasury business
customers and counterparties, timely updated the list of customers that required special attention and dynamically
adjusted the measures to address risks. We worked out plans for disposal of existing non-standard assets, improved
management of credit bond before, during and after investment, and continued to establish the platform for unified
management of market risk limits.
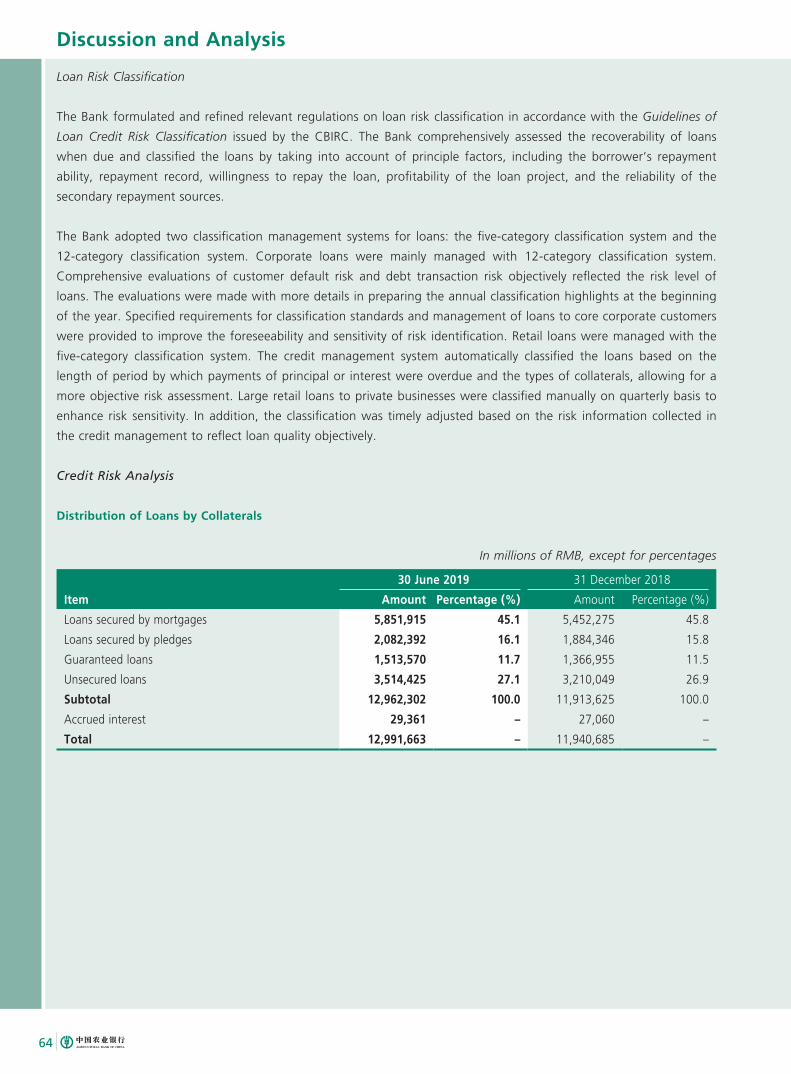
Discussion and Analysis
64
Loan Risk Classification
The Bank formulated and refined relevant regulations on loan risk classification in accordance with the Guidelines of
Loan Credit Risk Classification issued by the CBIRC. The Bank comprehensively assessed the recoverability of loans
when due and classified the loans by taking into account of principle factors, including the borrower’s repayment
ability, repayment record, willingness to repay the loan, profitability of the loan project, and the reliability of the
secondary repayment sources.
The Bank adopted two classification management systems for loans: the five-category classification system and the
12-category classification system. Corporate loans were mainly managed with 12-category classification system.
Comprehensive evaluations of customer default risk and debt transaction risk objectively reflected the risk level of
loans. The evaluations were made with more details in preparing the annual classification highlights at the beginning
of the year. Specified requirements for classification standards and management of loans to core corporate customers
were provided to improve the foreseeability and sensitivity of risk identification. Retail loans were managed with the
five-category classification system. The credit management system automatically classified the loans based on the
length of period by which payments of principal or interest were overdue and the types of collaterals, allowing for a
more objective risk assessment. Large retail loans to private businesses were classified manually on quarterly basis to
enhance risk sensitivity. In addition, the classification was timely adjusted based on the risk information collected in
the credit management to reflect loan quality objectively.
Credit Risk Analysis
Distribution of Loans by Collaterals
In millions of RMB, except for percentages
30 June 2019 31 December 2018
Item Amount Percentage (%) Amount Percentage (%)
Loans secured by mortgages 5,851,915 45.1 5,452,275 45.8
Loans secured by pledges 2,082,392 16.1 1,884,346 15.8
Guaranteed loans 1,513,570 11.7 1,366,955 11.5
Unsecured loans 3,514,425 27.1 3,210,049 26.9
Subtotal 12,962,302 100.0 11,913,625 100.0
Accrued interest 29,361 – 27,060 –
Total 12,991,663 – 11,940,685 –
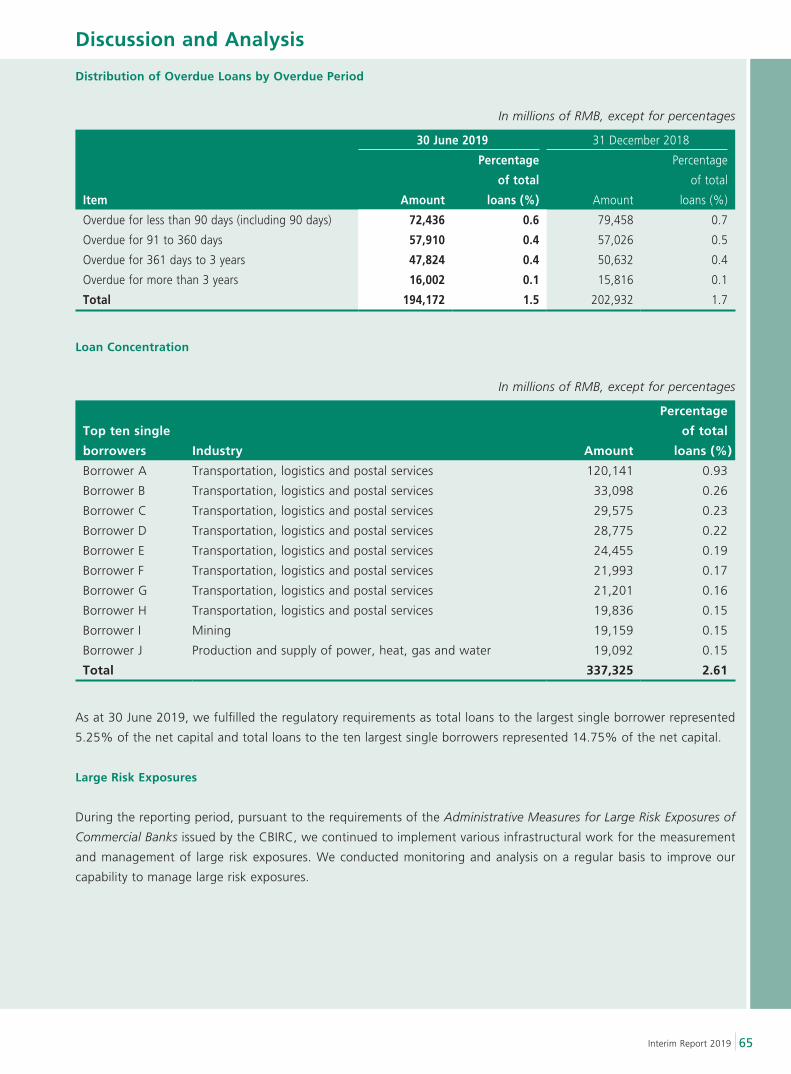
Discussion and Analysis
65Interim Report 2019
Distribution of Overdue Loans by Overdue Period
In millions of RMB, except for percentages
30 June 2019 31 December 2018
Item Amount
Percentage
of total
loans (%) Amount
Percentage
of total
loans (%)
Overdue for less than 90 days (including 90 days) 72,436 0.6 79,458 0.7
Overdue for 91 to 360 days 57,910 0.4 57,026 0.5
Overdue for 361 days to 3 years 47,824 0.4 50,632 0.4
Overdue for more than 3 years 16,002 0.1 15,816 0.1
Total 194,172 1.5 202,932 1.7
Loan Concentration
In millions of RMB, except for percentages
Top ten single
borrowers Industry Amount
Percentage
of total
loans (%)
Borrower A Transportation, logistics and postal services 120,141 0.93
Borrower B Transportation, logistics and postal services 33,098 0.26
Borrower C Transportation, logistics and postal services 29,575 0.23
Borrower D Transportation, logistics and postal services 28,775 0.22
Borrower E Transportation, logistics and postal services 24,455 0.19
Borrower F Transportation, logistics and postal services 21,993 0.17
Borrower G Transportation, logistics and postal services 21,201 0.16
Borrower H Transportation, logistics and postal services 19,836 0.15
Borrower I Mining 19,159 0.15
Borrower J Production and supply of power, heat, gas and water 19,092 0.15
Total 337,325 2.61
As at 30 June 2019, we fulfilled the regulatory requirements as total loans to the largest single borrower represented
5.25% of the net capital and total loans to the ten largest single borrowers represented 14.75% of the net capital.
Large Risk Exposures
During the reporting period, pursuant to the requirements of the Administrative Measures for Large Risk Exposures of
Commercial Banks issued by the CBIRC, we continued to implement various infrastructural work for the measurement
and management of large risk exposures. We conducted monitoring and analysis on a regular basis to improve our
capability to manage large risk exposures.
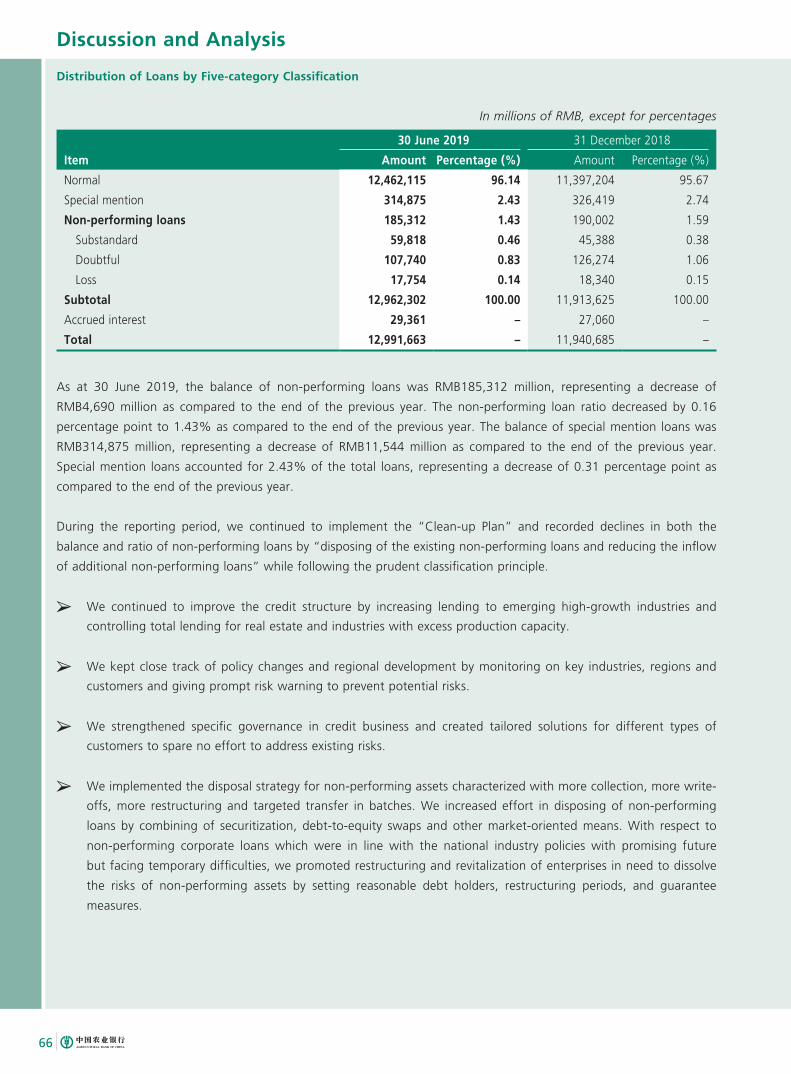
Discussion and Analysis
66
Distribution of Loans by Five-category Classification
In millions of RMB, except for percentages
30 June 2019 31 December 2018
Item Amount Percentage (%) Amount Percentage (%)
Normal 12,462,115 96.14 11,397,204 95.67
Special mention 314,875 2.43 326,419 2.74
Non-performing loans 185,312 1.43 190,002 1.59
Substandard 59,818 0.46 45,388 0.38
Doubtful 107,740 0.83 126,274 1.06
Loss 17,754 0.14 18,340 0.15
Subtotal 12,962,302 100.00 11,913,625 100.00
Accrued interest 29,361 – 27,060 –
Total 12,991,663 – 11,940,685 –
As at 30 June 2019, the balance of non-performing loans was RMB185,312 million, representing a decrease of
RMB4,690 million as compared to the end of the previous year. The non-performing loan ratio decreased by 0.16
percentage point to 1.43% as compared to the end of the previous year. The balance of special mention loans was
RMB314,875 million, representing a decrease of RMB11,544 million as compared to the end of the previous year.
Special mention loans accounted for 2.43% of the total loans, representing a decrease of 0.31 percentage point as
compared to the end of the previous year.
During the reporting period, we continued to implement the “Clean-up Plan” and recorded declines in both the
balance and ratio of non-performing loans by “disposing of the existing non-performing loans and reducing the inflow
of additional non-performing loans” while following the prudent classification principle.
We continued to improve the credit structure by increasing lending to emerging high-growth industries and
controlling total lending for real estate and industries with excess production capacity.
We kept close track of policy changes and regional development by monitoring on key industries, regions and
customers and giving prompt risk warning to prevent potential risks.
We strengthened specific governance in credit business and created tailored solutions for different types of
customers to spare no effort to address existing risks.
We implemented the disposal strategy for non-performing assets characterized with more collection, more write-
offs, more restructuring and targeted transfer in batches. We increased effort in disposing of non-performing
loans by combining of securitization, debt-to-equity swaps and other market-oriented means. With respect to
non-performing corporate loans which were in line with the national industry policies with promising future
but facing temporary difficulties, we promoted restructuring and revitalization of enterprises in need to dissolve
the risks of non-performing assets by setting reasonable debt holders, restructuring periods, and guarantee
measures.
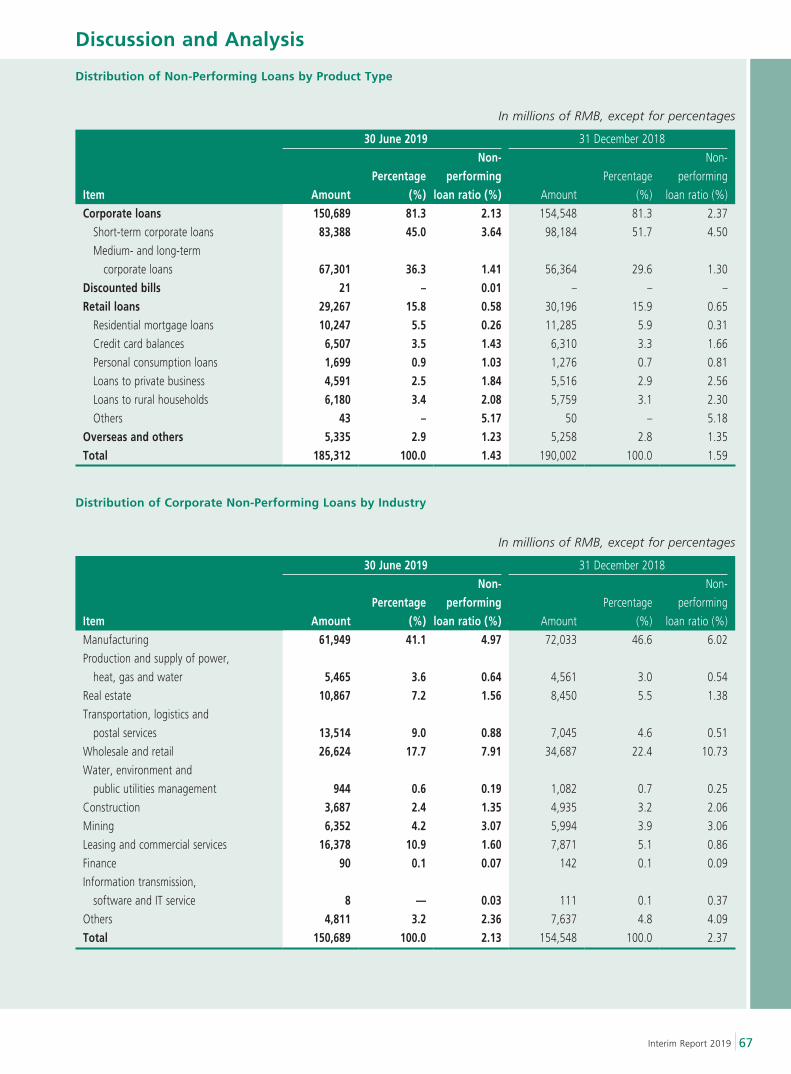
Discussion and Analysis
67Interim Report 2019
Distribution of Non-Performing Loans by Product Type
In millions of RMB, except for percentages
30 June 2019 31 December 2018
Item Amount Percentage
(%)
Non-performing
loan ratio (%) Amount
Percentage
(%)
Non-
performing
loan ratio (%)
Corporate loans 150,689 81.3 2.13 154,548 81.3 2.37
Short-term corporate loans 83,388 45.0 3.64 98,184 51.7 4.50
Medium- and long-term
corporate loans 67,301 36.3 1.41 56,364 29.6 1.30
Discounted bills 21 – 0.01 – – –
Retail loans 29,267 15.8 0.58 30,196 15.9 0.65
Residential mortgage loans 10,247 5.5 0.26 11,285 5.9 0.31
Credit card balances 6,507 3.5 1.43 6,310 3.3 1.66
Personal consumption loans 1,699 0.9 1.03 1,276 0.7 0.81
Loans to private business 4,591 2.5 1.84 5,516 2.9 2.56
Loans to rural households 6,180 3.4 2.08 5,759 3.1 2.30
Others 43 – 5.17 50 – 5.18
Overseas and others 5,335 2.9 1.23 5,258 2.8 1.35
Total 185,312 100.0 1.43 190,002 100.0 1.59
Distribution of Corporate Non-Performing Loans by Industry
In millions of RMB, except for percentages
30 June 2019 31 December 2018
Item AmountPercentage
(%)
Non-performing
loan ratio (%) Amount
Percentage
(%)
Non-
performing
loan ratio (%)
Manufacturing 61,949 41.1 4.97 72,033 46.6 6.02
Production and supply of power,
heat, gas and water 5,465 3.6 0.64 4,561 3.0 0.54
Real estate 10,867 7.2 1.56 8,450 5.5 1.38
Transportation, logistics and
postal services 13,514 9.0 0.88 7,045 4.6 0.51
Wholesale and retail 26,624 17.7 7.91 34,687 22.4 10.73
Water, environment and
public utilities management 944 0.6 0.19 1,082 0.7 0.25
Construction 3,687 2.4 1.35 4,935 3.2 2.06
Mining 6,352 4.2 3.07 5,994 3.9 3.06
Leasing and commercial services 16,378 10.9 1.60 7,871 5.1 0.86
Finance 90 0.1 0.07 142 0.1 0.09
Information transmission,
software and IT service 8 — 0.03 111 0.1 0.37
Others 4,811 3.2 2.36 7,637 4.8 4.09
Total 150,689 100.0 2.13 154,548 100.0 2.37
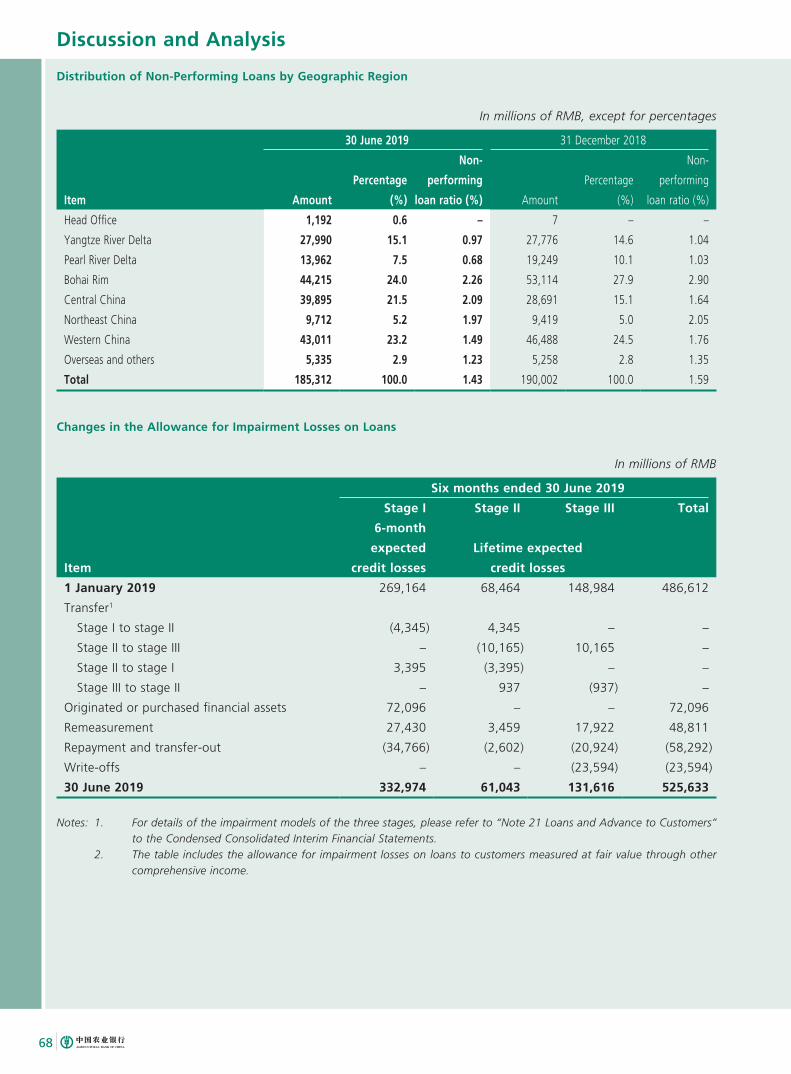
Discussion and Analysis
68
Distribution of Non-Performing Loans by Geographic Region
In millions of RMB, except for percentages
30 June 2019 31 December 2018
Item Amount
Percentage
(%)
Non-
performing
loan ratio (%) Amount
Percentage
(%)
Non-
performing
loan ratio (%)
Head Office 1,192 0.6 – 7 – –
Yangtze River Delta 27,990 15.1 0.97 27,776 14.6 1.04
Pearl River Delta 13,962 7.5 0.68 19,249 10.1 1.03
Bohai Rim 44,215 24.0 2.26 53,114 27.9 2.90
Central China 39,895 21.5 2.09 28,691 15.1 1.64
Northeast China 9,712 5.2 1.97 9,419 5.0 2.05
Western China 43,011 23.2 1.49 46,488 24.5 1.76
Overseas and others 5,335 2.9 1.23 5,258 2.8 1.35
Total 185,312 100.0 1.43 190,002 100.0 1.59
Changes in the Allowance for Impairment Losses on Loans
In millions of RMB
Six months ended 30 June 2019
Stage I Stage II Stage III Total
Item
6-month
expected
credit losses
Lifetime expected
credit losses
1 January 2019 269,164 68,464 148,984 486,612
Transfer1
Stage I to stage II (4,345) 4,345 – –
Stage II to stage III – (10,165) 10,165 –
Stage II to stage I 3,395 (3,395) – –
Stage III to stage II – 937 (937) –
Originated or purchased financial assets 72,096 – – 72,096
Remeasurement 27,430 3,459 17,922 48,811
Repayment and transfer-out (34,766) (2,602) (20,924) (58,292)
Write-offs – – (23,594) (23,594)
30 June 2019 332,974 61,043 131,616 525,633
Notes: 1. For details of the impairment models of the three stages, please refer to “Note 21 Loans and Advance to Customers” to the Condensed Consolidated Interim Financial Statements.
2. The table includes the allowance for impairment losses on loans to customers measured at fair value through other comprehensive income.
Discussion and Analysis
69Interim Report 2019
Market Risk
Market risk refers to the risk of losses in the on- and off-balance sheet businesses of banks as a result of an
adverse change in market prices. Market risk comprises interest rate risk, exchange rate risk, stock price risk and
commodity price risk. The Bank is exposed to market risks, primarily including interest rate risk and exchange rate
risk. The Bank’s organizational structure of market risk management comprises the Board of Directors and its Risk
Management/Consumers’ Interest Protection Committee, senior management and its Risk Management and Internal
Control Committee, the Risk Management Department, the Asset and Liability Management Department and other
departments (institutions) bearing market risks.
During the reporting period, we formulated the market risk management policies for 2019, and further improved the
market risk management policy system. We continued to optimize various functions of the IT system for market risk
management, including limits statistics, capital measurement and parameter management. We also continued to carry
out comprehensive validation of Internal Model Approach. We strengthened the derivative transactions management
and reasonably controlled the size and duration of financial investments measured at fair value through other
comprehensive income. Further, we kept exposures from different proprietary transactions at relatively low levels. As a
result, our exposures to market risk were under control as a whole.
Market Risk Exposure Limit Management
The Bank’s market risk exposure limits are classified into directive limits and indicative limits.
In the first half of 2019, we further enhanced market risk exposure limit management, and refined the categorization
of limits by setting different market risk exposure limits based on the types of products and risks and other
dimensions. We also leveraged the IT system to measure, monitor and report risk exposure limits automatically. During
the reporting period, the market risk exposure limits of the Bank were all kept within the designated ranges.
Segregation of Trading Book and Banking Book
To enhance the effectiveness of market risk management and the accuracy of the measurement of regulatory capital
for market risk, the Bank classified all of the on- and off-balance sheet assets and liabilities into either the trading
book or the banking book. The trading book includes the financial instruments and commodity positions held for
trading or hedging against the risk of other items in the trading book. Any other positions are classified into the
banking book.
Market Risk Management for Trading Book
The Bank managed the market risk of the trading book through various approaches such as Value at Risk (VaR),
exposure limit management, sensitivity analysis, duration analysis, exposure analysis and stress testing.
We adopted a historical simulation method with a confidence interval of 99% based on a holding period of one
day and historical data for 250 days to measure the VaR for the trading book of the Head Office and domestic and
overseas branches of the Bank. Based on the domestic and overseas markets, the Bank selected applicable parameters
for the models and risk factors in order to actually reflect the levels of market risks. We verified the accuracy and
reliability of the risk measurement models through data analysis, parallel modeling and back-testing.
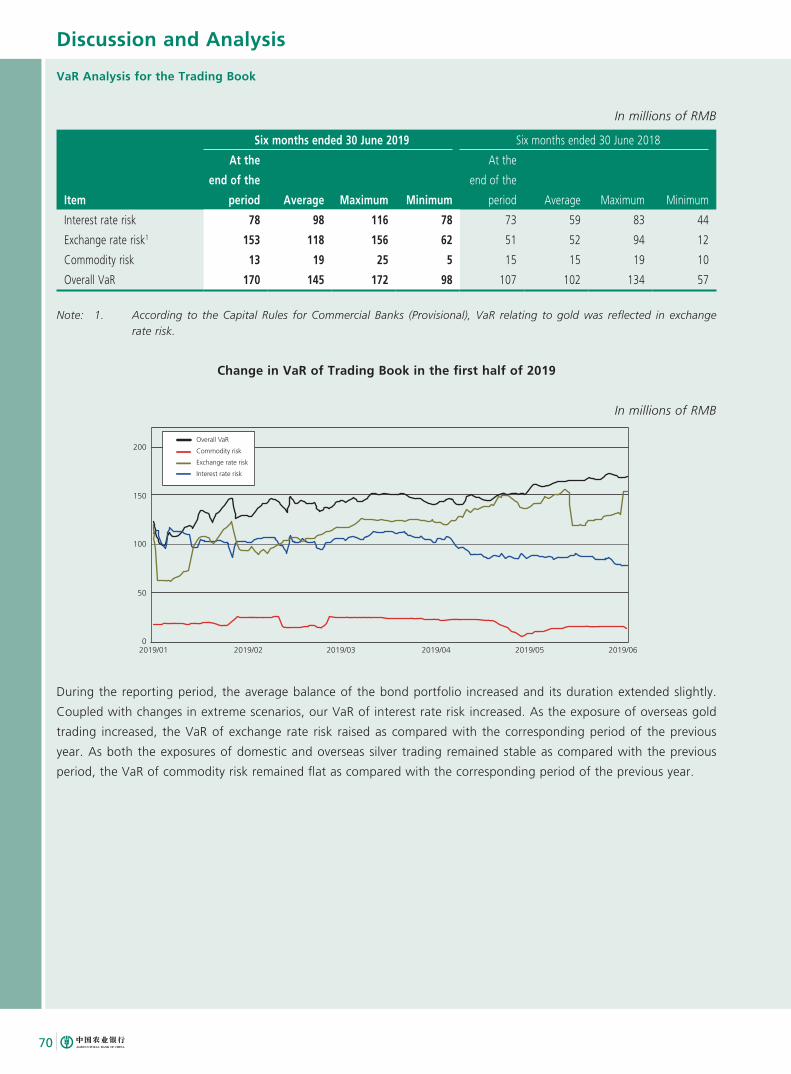
Discussion and Analysis
70
VaR Analysis for the Trading Book
In millions of RMB
Six months ended 30 June 2019 Six months ended 30 June 2018
Item
At the
end of the
period Average Maximum Minimum
At the
end of the
period Average Maximum Minimum
Interest rate risk 78 98 116 78 73 59 83 44
Exchange rate risk1 153 118 156 62 51 52 94 12
Commodity risk 13 19 25 5 15 15 19 10
Overall VaR 170 145 172 98 107 102 134 57
Note: 1. According to the Capital Rules for Commercial Banks (Provisional), VaR relating to gold was reflected in exchange rate risk.
Change in VaR of Trading Book in the first half of 2019
In millions of RMB
200
150
100
50
02019/01 2019/02 2019/03 2019/04 2019/05 2019/06
Overall VaR
Commodity risk
Exchange rate risk
Interest rate risk
During the reporting period, the average balance of the bond portfolio increased and its duration extended slightly.
Coupled with changes in extreme scenarios, our VaR of interest rate risk increased. As the exposure of overseas gold
trading increased, the VaR of exchange rate risk raised as compared with the corresponding period of the previous
year. As both the exposures of domestic and overseas silver trading remained stable as compared with the previous
period, the VaR of commodity risk remained flat as compared with the corresponding period of the previous year.
Discussion and Analysis
71Interim Report 2019
Market Risk Management for Banking Book
The Bank managed market risk of the banking book by combining of technical measures such as exposure limit
management, stress testing, scenario analysis and gap analysis.
Interest Rate Risk Management
The interest rate risk of the banking book refers to risk of losses in the economic value or overall gain of the banking
book as a result of adverse changes in the interest rate level, term structure, and other interest-related factors.
During the reporting period, we established an effective management system for interest rate risk in the banking
book according to systematical importance, risk condition and business complexity, which included risk management
structure, risk management strategies, policies and processes, mechanisms related to risk identification, measurement,
monitoring, control and mitigation, mechanisms of internal control and internal audit, risk management systems and
information disclosure and reporting.
We paid close attention to the changes in external interest rate environment, strengthened risk monitoring and
forecast, and timely adjusted the product portfolio and term structure of assets and liabilities. We also continuously
improved the quality of interest rate risk data and increased the accuracy of risk measurement and monitoring.
During the reporting period, the overall interest rate risk remained stable with all risk exposure limits kept within the
designated ranges.
Exchange Rate Risk Management
Exchange rate risk refers to the risk arising from currency mismatches of assets and liabilities. Exchange rate risk mainly
consists of the trading exchange rate risk that could be hedged, and the exchange rate risk caused by non-trading
assets and liabilities (the “non-trading exchange rate risk”), which are difficult to be avoided in operations.
During the reporting period, we performed exchange rate risk exposure monitoring and sensitivity analysis regularly
and continuously refined exchange rate risk measurement. Through proper matching of foreign currencies, we flexibly
adjusted the trading exchange rate risk exposure, while maintaining the non-trading exchange rate risk exposure
stable. Therefore, the risk exposure of exchange rate of the Bank was controlled within a reasonable range.
Interest Rate Risk Analysis
As at 30 June 2019, the accumulative negative gap with interest rate sensitivity due within one year amounted to
RMB1,599,480 million, representing an increase of RMB2,012 million in absolute terms as compared to the end of the
previous year.
Discussion and Analysis
72
Interest Rate Risk Gap
In millions of RMB
Within
1 month
1–3
months
3–12
months
Subtotal of
1 year and
below 1–5 years
Over
5 years
Non-interest
earning
30 June 2019 (8,415,455) 474,470 6,341,505 (1,599,480) 991,538 1,940,247 64,402
31 December 2018 (3,394,064) 385,096 1,411,500 (1,597,468) 1,214,752 1,830,838 34,524
Note: Please refer to “Note 47.3 Financial Risk Management: Market Risk” to the Condensed Consolidated Interim Financial Statements for more details.
Interest Rate Sensitivity Analysis
In millions of RMB
30 June 2019 31 December 2018
Movements in basis points
Movements
in net interest
income
Movements
in other
comprehensive
income
Movements
in net interest
income
Movements
in other
comprehensive
income
Increased by 100 basis points (52,914) (43,583) (24,024) (67,879)
Decreased by 100 basis points 52,914 43,583 24,024 67,879
The interest rate sensitivity analysis above indicates the movements within the next twelve months in net interest
income and other comprehensive income under various interest rate conditions, assuming that there is a parallel
shift in the yield curve and without taking into account any risk management measures probably adopted by the
management to reduce interest rate risk.
Based on the composition of the assets and liabilities as at 30 June 2019, if the interest rates instantaneously increase
(or decrease) by 100 basis points, the net interest income and other comprehensive income would decrease (or
increase) by RMB52,914 million and RMB43,583 million, respectively.
Exchange Rate Risk Analysis
The Bank’s exchange rate risk is mainly the risk exposure arising from the exchange rate of USD against RMB.
In the first half of 2019, the mid-point rate of RMB against USD depreciated accumulatively by 115 basis points or
0.17%. As at 30 June 2019, the foreign exchange exposure of on- and off-balance sheet financial assets/liabilities
was USD2,727 million, representing an increase of USD474 million in absolute terms as compared to the end of the
previous year.
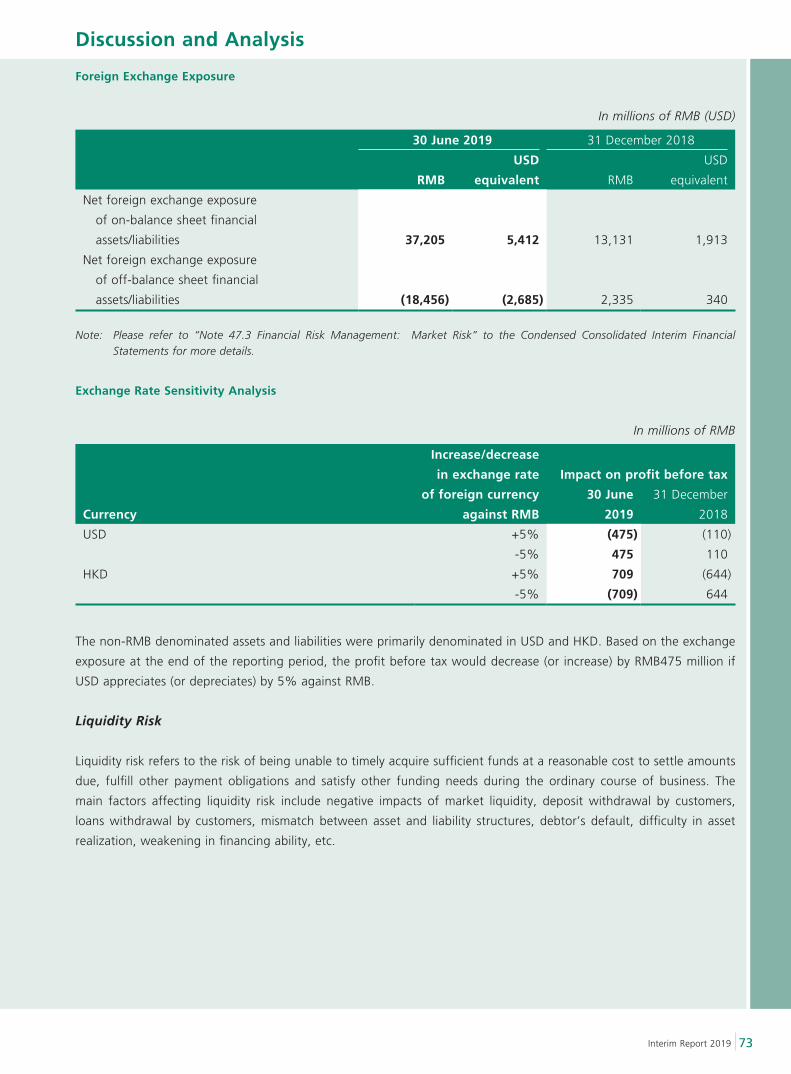
Discussion and Analysis
73Interim Report 2019
Foreign Exchange Exposure
In millions of RMB (USD)
30 June 2019 31 December 2018
RMB
USD
equivalent RMB
USD
equivalent
Net foreign exchange exposure
of on-balance sheet financial
assets/liabilities 37,205 5,412 13,131 1,913
Net foreign exchange exposure
of off-balance sheet financial
assets/liabilities (18,456) (2,685) 2,335 340
Note: Please refer to “Note 47.3 Financial Risk Management: Market Risk” to the Condensed Consolidated Interim Financial Statements for more details.
Exchange Rate Sensitivity Analysis
In millions of RMB
Increase/decrease
in exchange rate
of foreign currency
against RMB
Impact on profit before tax
Currency
30 June
2019
31 December
2018
USD +5% (475) (110)
-5% 475 110
HKD +5% 709 (644)
-5% (709) 644
The non-RMB denominated assets and liabilities were primarily denominated in USD and HKD. Based on the exchange
exposure at the end of the reporting period, the profit before tax would decrease (or increase) by RMB475 million if
USD appreciates (or depreciates) by 5% against RMB.
Liquidity Risk
Liquidity risk refers to the risk of being unable to timely acquire sufficient funds at a reasonable cost to settle amounts
due, fulfill other payment obligations and satisfy other funding needs during the ordinary course of business. The
main factors affecting liquidity risk include negative impacts of market liquidity, deposit withdrawal by customers,
loans withdrawal by customers, mismatch between asset and liability structures, debtor’s default, difficulty in asset
realization, weakening in financing ability, etc.
Discussion and Analysis
74
Liquidity Risk Management
Liquidity Risk Management Governance Structure
The liquidity risk management governance structure of the Bank consists of the decision-making system, the execution
system and the supervision system, among which, the decision-making system consists of the Board of Directors
and its Risk Management Committee/Consumers’ Interest Protection Committee and the Senior Management; the
execution system consists of liquidity management departments, asset and liability business departments, information
and technology departments, etc.; and the supervision system consists of the Board of Supervisors, the audit office,
the compliance management department and legal affairs department.
Liquidity Risk Management Strategy and Policy
The Bank adhered to a prudent liquidity management strategy and stipulated the general goals, management model,
major policies and procedures of liquidity management. Following regulatory requirements, external macroeconomic
environment and business development, we formulated our liquidity risk management policy. We effectively
maintained balance among liquidity, security and profitability, provided that the security of liquidity was guaranteed.
Liquidity Risk Management Objectives
The objectives of the Bank’s liquidity risk management were to effectively identify, measure, monitor and report
liquidity risk by establishing a scientific and refined liquidity risk management system; to timely fulfill the liquidity
needs of assets, liabilities and off-balance sheet businesses and for the payment obligations under ordinary
operating conditions or under stress, while effectively balancing both capital efficiency and security of liquidity; and
to strengthen the liquidity risk management and monitoring of our branches, subsidiaries and all business lines to
effectively prevent the overall liquidity risk of the Group.
Liquidity Risk Management Method
We paid close attention to changes in external economic and financial situation, monetary policies and market
liquidity, continued to monitor the operation of asset and liability businesses and the liquidity condition across the
Bank, and strengthened forecast and anticipation for liquidity risks. We strengthened the asset-liability management
to mitigate risks related to mismatch of maturity. We secured the sources of core deposits and facilitated the use of
financial instruments, to keep our financing channels smooth in the market. We improved the liquidity management
mechanism through strengthening the monitoring, alerting and overall allocation of funds. With adequate high liquid
asset reserve and reasonable and moderate buffers, we satisfied various payment demands. In addition, we refined the
functions of the liquidity management system to improve our electronic management.
Stress Test Situation
Based on the market condition and operation practice, the Bank set liquidity risk stress scenarios on full consideration
of various risk factors which may affect the liquidity. We conducted stress test quarterly. According to the test results,
under the prescribed stress scenarios, we have passed all the shortest survival period tests as required by regulatory
authorities.
Discussion and Analysis
75Interim Report 2019
Main Factors Affecting Liquidity Risk
In the first half of 2019, the internal and external liquidity situations faced by the Bank was complicated. Global trade
frictions brought about more uncertainties, accompanied by increased risk of global economy downturn and greater
fluctuations in the financial market, posing a great impact on the liquidity in the domestic market. The financial
supply-side structural reform continued to advance and countercyclical adjustments were made. The market funds
were structurally tight with greater fluctuations in market interest rate. We faced many challenges in our liquidity
risk management such as increased volatility of liabilities, greater pressure from maturity mismatch management
and structural optimization of assets and liabilities, and increased difficulty in balancing the liquidity, security and
profitability.
Liquidity Risk Analysis
During the reporting period, we managed cash flows brought by maturing fund properly and the overall liquidity
was sufficient, secured and under control. As at the end of June 2019, we fulfilled the regulatory requirements with
liquidity ratios for RMB and foreign currency of 54.23% and 133.23%, respectively. The average of the liquidity
coverage ratio over the second quarter in 2019 decreased by 17.4 percentage points to 123.2% as compared to the
previous quarter. As at the end of June 2019, the net stable funding ratio was 129.6%, with available net stable fund
of RMB16,662.9 billion in numerator and the net stable fund required of RMB12,860.8 billion in denominator.
Liquidity Gap Analysis
The table below presents the Bank’s net position of liquidity as at the dates indicated.
In millions of RMB
Past due On demand
Within
1 month
1–3
months
3–12
months 1–5 years
Over
5 years Undated Total
30 June 2019 29,410 (11,646,559) 22,941 (628,310) 197,555 3,374,518 7,744,787 2,302,365 1,396,707
31 December 2018 20,466 (10,794,068) 221,913 (979,235) (71,719) 3,467,506 7,108,745 2,509,038 1,482,646
Note: Please refer to “Note 47.2 Financial Risk Management: Liquidity Risk” to the Condensed Consolidated Interim Financial Statements for more details.
For details of liquidity coverage ratio and net stable funding ratio of the Bank, please refer to “Appendix II Liquidity
Coverage Ratio Information” and “Appendix IV Net Stable Funding Ratio Information”, respectively.
Discussion and Analysis
76
Operational Risk
Operational Risk Management
Operational risk refers to the risk of loss resulting from inadequate or problematic internal control procedures, from
human or information system related factors, or from external affairs, including legal risk, but not including strategy
risk or reputation risk.
During the reporting period, we further improved our operational risk management system to strengthen the
professionality of operational risk management. We optimized the information system for operational risk
management, which enabled us to automatically aggregate operational risk data. We integrated and deepened the
application of operational risk management tools and performed operational risk assessment, which enhanced our
initiative and foreseeability of risk prevention and control. By monitoring, analyzing, tracking and supervision major
operational risk events, we reinforced the pertinence and effectiveness of operational risk management.
Legal Risk Management
Legal risk refers to any risk of banks suffering from adverse consequences including legal liabilities, loss of rights
and reputational damage due to the breach of laws, administrative rules and regulations, or terms of contracts of its
business operations and legal failure to duly regulate and exercise rights, or external legal factors. Legal risk includes
risk directly resulted from legal factors, as well as the risk associated with other forms of risks.
During the reporting period, we strengthened legal risk management and propelled operation compliance. We built
an integrated mechanism for managing the Group’s legal risk at home and abroad. We implemented a cross-border
data compliance project to ensure the legality of processing relevant cross-border data. We followed up domestic
key cases and risk events, prudently handled overseas litigation-related risk and strengthened the enforcement of
effective judgment documents. We optimized the contract text system mainly comprising standard form contracts
and supplemented by non-standard form contracts. We also strengthened trademark management and carried out
management of patent application and maintenance. Moreover, we established a mechanism for evaluating the
professional competence of the person in charge of the legal department to build a professional legal team. We
developed the intelligent management platform, work platform and information platform to deal with legal affairs.
Reputation Risk
Reputation risk refers to the risk resulting from negative feedback from related stakeholders due to the operation,
management or other acts of the Bank or external events.
During the reporting period, we continuously improved the policies and mechanism for reputation risk management,
and prevented reputation risk and responded to reputation events in a proactive and effective manner. We effectively
addressed reputation risk by exerting greater effort on monitoring negative public opinions and actively responding
to public concerns. Highlighting the prevention and control in advance, we conducted inspections on reputation
risk clues. Moreover, we launched a public opinion management information system to promote informatization
management of reputation risk.
Discussion and Analysis
77Interim Report 2019
Country Risk
Country risk represents the risk due to changes and incidents occurred in the economy, politics and society of a
specific country or region, which results in the borrowers or debtors in that country or region incapable of or unwilling
to pay their debts owed to the Bank or otherwise leads to business losses or other losses to the Bank in that country or
region.
During the reporting period, confronted with intricate and changing international environment, we constantly
followed and monitored country risk situation to promptly get informed of potential risks. We managed country risk
effectively through tools and approaches such as country risk evaluation and rating, limit approval and adjustment,
risk exposure statistics, research and analysis of market, and stress test. We also propelled the establishment of
information systems to promote the informatization management of country risk.
Risk Consolidated
We continuously promoted the risk consolidation management of the Group. We conducted off-site assessments
on the effectiveness of risk management of our subsidiaries and enhanced the evaluation on the risk management
capabilities of our subsidiaries. In addition, we proceeded to improve concentration risk and limit management, by
including our subsidiaries into the assessment of credit concentration risk and setting industrial credit limits for each
subsidiary and monitoring on a regular basis. Under the guidance of the Bank, the subsidiaries reviewed and revised
their own risk appetite and risk management policies within the unified framework of the Group’s risk appetite.
Internal Control
Internal Control Construction
During the reporting period, we moved on to upgrade the internal control mechanism and strived to improve the
effectiveness of internal control to ensure operation compliance.
The compliance management of the Group was strengthened. We enhanced the integrated management of
the Group, by controlling scales of internal transactions and building a firewall for internal transaction risks, to
prevent and mitigate the internal transaction risks of the Group. We intensified compliance trainings for overseas
operations and improved overseas compliance management.
The establishment of compliance culture was advanced. We emphasized the guiding role of compliance concept
and furthered the application of cases for warning and education. Besides, we revised the code of conduct
for employees with more specified compliance requirements for employees, so as to harness the roles of the
compliance culture in guiding, restricting, cohering and inspiring.
Targeted case prevention and control was enhanced. We underlined dual accountabilities on institution and
business line, continued to implement actions to support the “Year to Strengthen Management Basics and
Foundation-level Management” initiatives and promoted “Three Lines and One Grid” in an all-round way,
and honed our capability in prevention of cases of compliance violations by means of technology. We set up
a cross-departmental laboratory for monitoring, developed high-accuracy models for prevention of cases of
compliance violations and sped up the establishment of a monitoring and alerting platform for preventing cases
of compliance violations, an anti-fraud platform and the intelligent risk control system.
Discussion and Analysis
78
Efforts were made to improve the quality and efficiency of examinations and rectifications. We focused on
the risk prevention and control in key areas such as real estate, private sector, small and micro enterprises and
poverty alleviation, conducted in-depth scrutinization for risk of cases, and rectified market chaos. By optimizing
internal control evaluation, we detected internal control defects and potential risks to fix the bugs in regimes,
processes and systems. We implemented the rectification for issues identified in internal and external audit and
regulatory inspections, so as to promote the business improvement.
Anti-money Laundering
During the reporting period, we promoted the construction of our compliance management capability for global anti-
money laundering in an all-round manner with reference to the highest international standards and the best practices
within the industry.
A development plan for the global anti-money laundering center was prepared to give overall deployment for
establishing a worldwide first-class anti-money laundering center from such aspects as specifying the goal,
enhancing the construction of the anti-money laundering compliance project and strengthening the guarantee
by organizational resources.
A joint investigation and information discussion mechanism for money-laundering risks was established and
improved to carry out collection, analysis, digging and joint investigation for clues to the relevant risks.
An intelligent management mode for anti-money laundering was developed. A multi-dimensional data analysis
tool was applied to accelerate the application of intelligent technology in the identification of customers and risk
evaluation.
Discussion and Analysis
79Interim Report 2019
Capital Management
During the reporting period, we implemented our capital plan for 2019–2021 in accordance with the regulatory
requirements of the Capital Rules for Commercial Banks (Provisional), focused on capital restriction and guidance
on business, enhanced internal and external capital replenishment capability, improved our long-term mechanism of
capital management, and maintained healthy capital adequacy ratio. We implemented advanced capital management
method and measured capital adequacy ratio with the advanced capital measurement method and other method
during the consolidation period according to the requirements of the CBIRC.
We has formulated the Three Year Action Plan of Improving the Bank’s Capital Adequacy Ratio (the “Consolidation
Plan”), which specified the target capital adequacy ratio for 2017–2019. Focusing on both capital replenishment and
capital conservation, we formulated the working plan for improving capital adequacy ratios, and proposed specific
measures to further improve the capital management system. During the reporting period, we implemented the
Consolidation Plan steadily and achieved the milestone objective of the Plan. As a result, our capital adequacy ratios
increased steadily, which provided strong support to our business development and operation transformation.
Management of Capital Financing
During the reporting period, we improved the capital replenishment system. To replenish capital, we proactively
explored external sources except for retaining profit.
In March and April 2019, we completed issuances of two batches of tier-2 capital bonds in the inter-bank bond
market of China, in the amount of RMB60 billion each batch and RMB120 billion in total. After deducting expenses in
relation to the issuance, the proceeds were fully used to replenish our Tier 2 capital.
In August and September 2019, we completed issuances of two batches of write-down undated capital bonds in
the inter-bank bond market of China in the amount of RMB85 billion and RMB35 billion, respectively, which totaling
RMB120 billion. After deducting expenses in relation to the issuance, the proceeds were fully used to replenish our
additional Tier 1 capital.
In May 2019, we fully redeemed the 15-year subordinated bonds issued in May 2009 in the amount of RMB25 billion.
In August 2019, we fully redeemed the 10-year tier-2 capital bonds issued in August 2014 in the amount of RMB30
billion.
For details of such issuances and redemptions, please refer to the relevant announcements published on the websites
of Shanghai Stock Exchange (www.sse.com.cn) and the Hong Kong Stock Exchange (www.hkexnews.hk).
Management of Economic Capital
During the reporting period, we constrained total capital, optimized asset structure, and controlled the growth rate of
risk assets, in an effort to achieve capital-intensive development. We continued to improve the mechanism for allocation
of economic capital, emphasizing the guidance of strategic objectives and the idea of value return, and strengthened the
monitoring and evaluation of economic capital, so as to constantly enhance sophisticated capital management.
Capital Adequacy Ratio and Leverage Ratio
For details of our capital adequacy ratio and leverage ratio, please refer to “Appendix I Capital Adequacy Ratio
Information” and “Appendix III Leverage Ratio Information”.
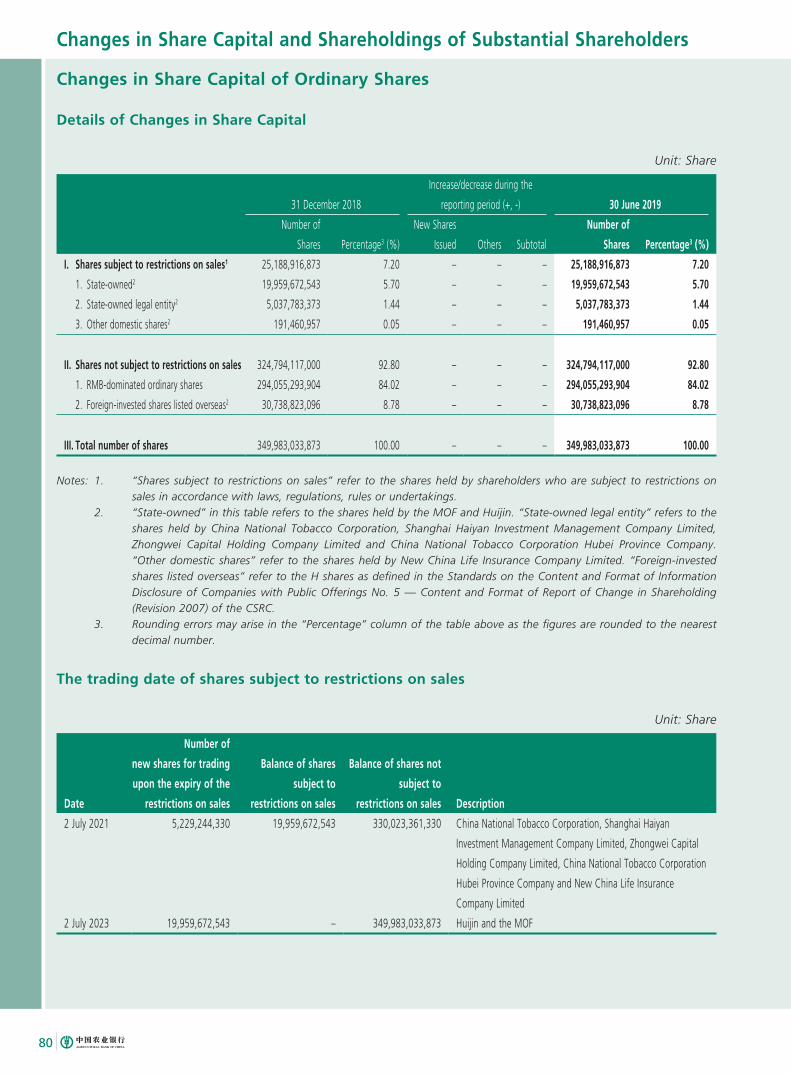
Changes in Share Capital and Shareholdings of Substantial Shareholders
80
Changes in Share Capital of Ordinary Shares
Details of Changes in Share Capital
Unit: Share
31 December 2018
Increase/decrease during the
reporting period (+, -) 30 June 2019
Number of
Shares Percentage3 (%)
New Shares
Issued Others Subtotal
Number of
Shares Percentage3 (%)
I. Shares subject to restrictions on sales1 25,188,916,873 7.20 – – – 25,188,916,873 7.20
1. State-owned2 19,959,672,543 5.70 – – – 19,959,672,543 5.70
2. State-owned legal entity2 5,037,783,373 1.44 – – – 5,037,783,373 1.44
3. Other domestic shares2 191,460,957 0.05 – – – 191,460,957 0.05
II. Shares not subject to restrictions on sales 324,794,117,000 92.80 – – – 324,794,117,000 92.80
1. RMB-dominated ordinary shares 294,055,293,904 84.02 – – – 294,055,293,904 84.02
2. Foreign-invested shares listed overseas2 30,738,823,096 8.78 – – – 30,738,823,096 8.78
III. Total number of shares 349,983,033,873 100.00 – – – 349,983,033,873 100.00
Notes: 1. “Shares subject to restrictions on sales” refer to the shares held by shareholders who are subject to restrictions on sales in accordance with laws, regulations, rules or undertakings.
2. “State-owned” in this table refers to the shares held by the MOF and Huijin. “State-owned legal entity” refers to the shares held by China National Tobacco Corporation, Shanghai Haiyan Investment Management Company Limited, Zhongwei Capital Holding Company Limited and China National Tobacco Corporation Hubei Province Company. “Other domestic shares” refer to the shares held by New China Life Insurance Company Limited. “Foreign-invested shares listed overseas” refer to the H shares as defined in the Standards on the Content and Format of Information Disclosure of Companies with Public Offerings No. 5 — Content and Format of Report of Change in Shareholding (Revision 2007) of the CSRC.
3. Rounding errors may arise in the “Percentage” column of the table above as the figures are rounded to the nearest decimal number.
The trading date of shares subject to restrictions on sales
Unit: Share
Date
Number of
new shares for trading
upon the expiry of the
restrictions on sales
Balance of shares
subject to
restrictions on sales
Balance of shares not
subject to
restrictions on sales Description
2 July 2021 5,229,244,330 19,959,672,543 330,023,361,330 China National Tobacco Corporation, Shanghai Haiyan
Investment Management Company Limited, Zhongwei Capital
Holding Company Limited, China National Tobacco Corporation
Hubei Province Company and New China Life Insurance
Company Limited
2 July 2023 19,959,672,543 – 349,983,033,873 Huijin and the MOF
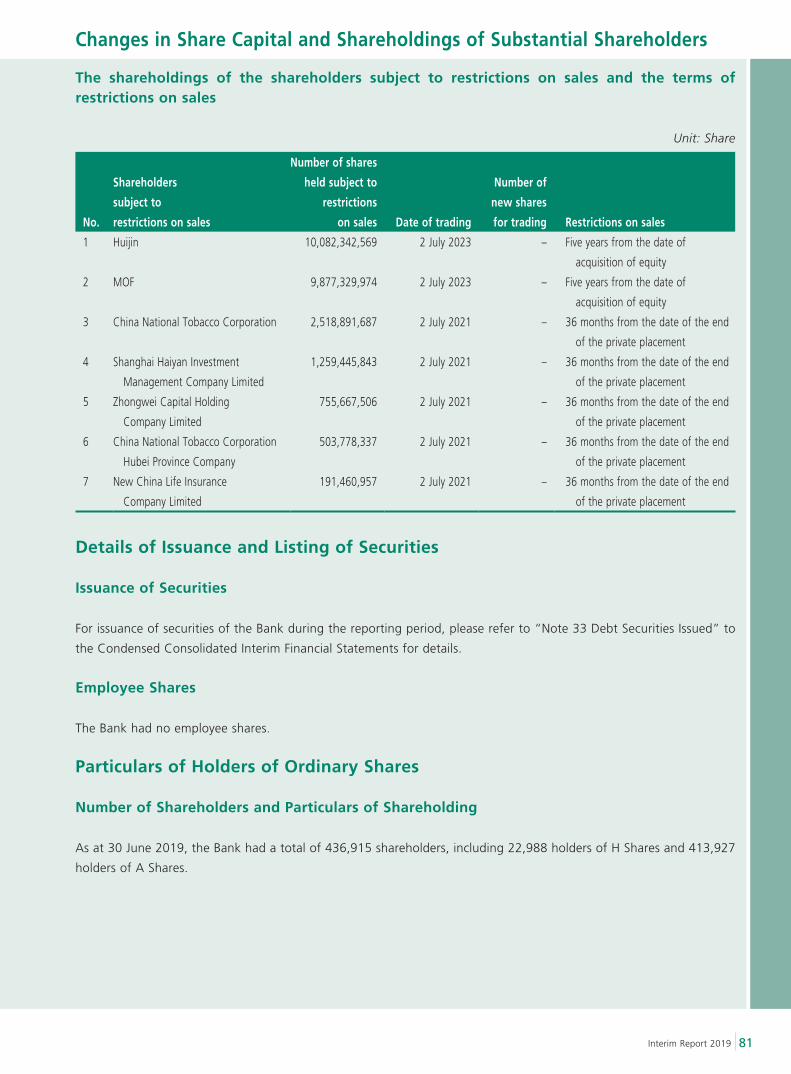
Changes in Share Capital and Shareholdings of Substantial Shareholders
81Interim Report 2019
The shareholdings of the shareholders subject to restrictions on sales and the terms of restrictions on sales
Unit: Share
No.
Shareholders
subject to
restrictions on sales
Number of shares
held subject to
restrictions
on sales Date of trading
Number of
new shares
for trading Restrictions on sales
1 Huijin 10,082,342,569 2 July 2023 – Five years from the date of
acquisition of equity
2 MOF 9,877,329,974 2 July 2023 – Five years from the date of
acquisition of equity
3 China National Tobacco Corporation 2,518,891,687 2 July 2021 – 36 months from the date of the end
of the private placement
4 Shanghai Haiyan Investment
Management Company Limited
1,259,445,843 2 July 2021 – 36 months from the date of the end
of the private placement
5 Zhongwei Capital Holding
Company Limited
755,667,506 2 July 2021 – 36 months from the date of the end
of the private placement
6 China National Tobacco Corporation
Hubei Province Company
503,778,337 2 July 2021 – 36 months from the date of the end
of the private placement
7 New China Life Insurance
Company Limited
191,460,957 2 July 2021 – 36 months from the date of the end
of the private placement
Details of Issuance and Listing of Securities
Issuance of Securities
For issuance of securities of the Bank during the reporting period, please refer to “Note 33 Debt Securities Issued” to
the Condensed Consolidated Interim Financial Statements for details.
Employee Shares
The Bank had no employee shares.
Particulars of Holders of Ordinary Shares
Number of Shareholders and Particulars of Shareholding
As at 30 June 2019, the Bank had a total of 436,915 shareholders, including 22,988 holders of H Shares and 413,927
holders of A Shares.
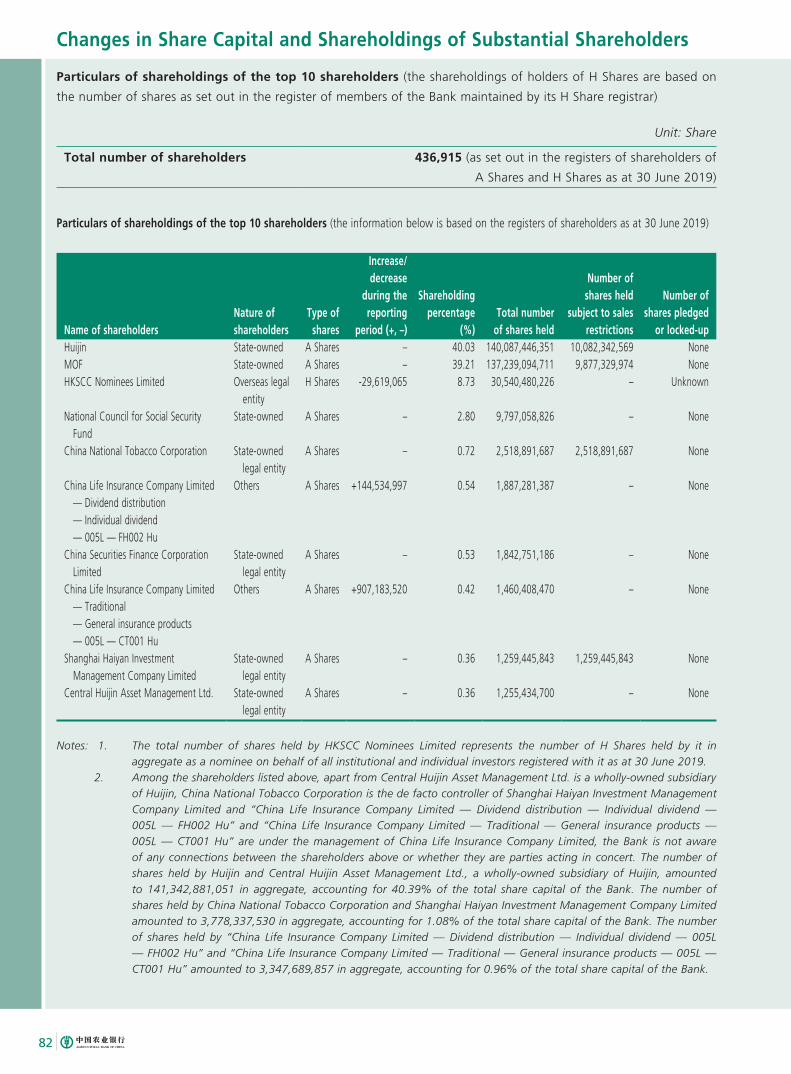
Changes in Share Capital and Shareholdings of Substantial Shareholders
82
Particulars of shareholdings of the top 10 shareholders (the shareholdings of holders of H Shares are based on
the number of shares as set out in the register of members of the Bank maintained by its H Share registrar)
Unit: Share
Total number of shareholders 436,915 (as set out in the registers of shareholders of
A Shares and H Shares as at 30 June 2019)
Particulars of shareholdings of the top 10 shareholders (the information below is based on the registers of shareholders as at 30 June 2019)
Name of shareholdersNature ofshareholders
Type ofshares
Increase/decrease
during the reporting
period (+, –)
Shareholdingpercentage
(%)Total number
of shares held
Number of shares held
subject to sales restrictions
Number ofshares pledged
or locked-upHuijin State-owned A Shares – 40.03 140,087,446,351 10,082,342,569 NoneMOF State-owned A Shares – 39.21 137,239,094,711 9,877,329,974 NoneHKSCC Nominees Limited Overseas legal
entityH Shares -29,619,065 8.73 30,540,480,226 – Unknown
National Council for Social Security Fund
State-owned A Shares – 2.80 9,797,058,826 – None
China National Tobacco Corporation State-owned legal entity
A Shares – 0.72 2,518,891,687 2,518,891,687 None
China Life Insurance Company Limited — Dividend distribution — Individual dividend — 005L — FH002 Hu
Others A Shares +144,534,997 0.54 1,887,281,387 – None
China Securities Finance Corporation Limited
State-owned legal entity
A Shares – 0.53 1,842,751,186 – None
China Life Insurance Company Limited — Traditional — General insurance products — 005L — CT001 Hu
Others A Shares +907,183,520 0.42 1,460,408,470 – None
Shanghai Haiyan Investment Management Company Limited
State-owned legal entity
A Shares – 0.36 1,259,445,843 1,259,445,843 None
Central Huijin Asset Management Ltd. State-owned legal entity
A Shares – 0.36 1,255,434,700 – None
Notes: 1. The total number of shares held by HKSCC Nominees Limited represents the number of H Shares held by it in aggregate as a nominee on behalf of all institutional and individual investors registered with it as at 30 June 2019.
2. Among the shareholders listed above, apart from Central Huijin Asset Management Ltd. is a wholly-owned subsidiary of Huijin, China National Tobacco Corporation is the de facto controller of Shanghai Haiyan Investment Management Company Limited and “China Life Insurance Company Limited — Dividend distribution — Individual dividend — 005L — FH002 Hu” and “China Life Insurance Company Limited — Traditional — General insurance products — 005L — CT001 Hu” are under the management of China Life Insurance Company Limited, the Bank is not aware of any connections between the shareholders above or whether they are parties acting in concert. The number of shares held by Huijin and Central Huijin Asset Management Ltd., a wholly-owned subsidiary of Huijin, amounted to 141,342,881,051 in aggregate, accounting for 40.39% of the total share capital of the Bank. The number of shares held by China National Tobacco Corporation and Shanghai Haiyan Investment Management Company Limited amounted to 3,778,337,530 in aggregate, accounting for 1.08% of the total share capital of the Bank. The number of shares held by “China Life Insurance Company Limited — Dividend distribution — Individual dividend — 005L — FH002 Hu” and “China Life Insurance Company Limited — Traditional — General insurance products — 005L — CT001 Hu” amounted to 3,347,689,857 in aggregate, accounting for 0.96% of the total share capital of the Bank.
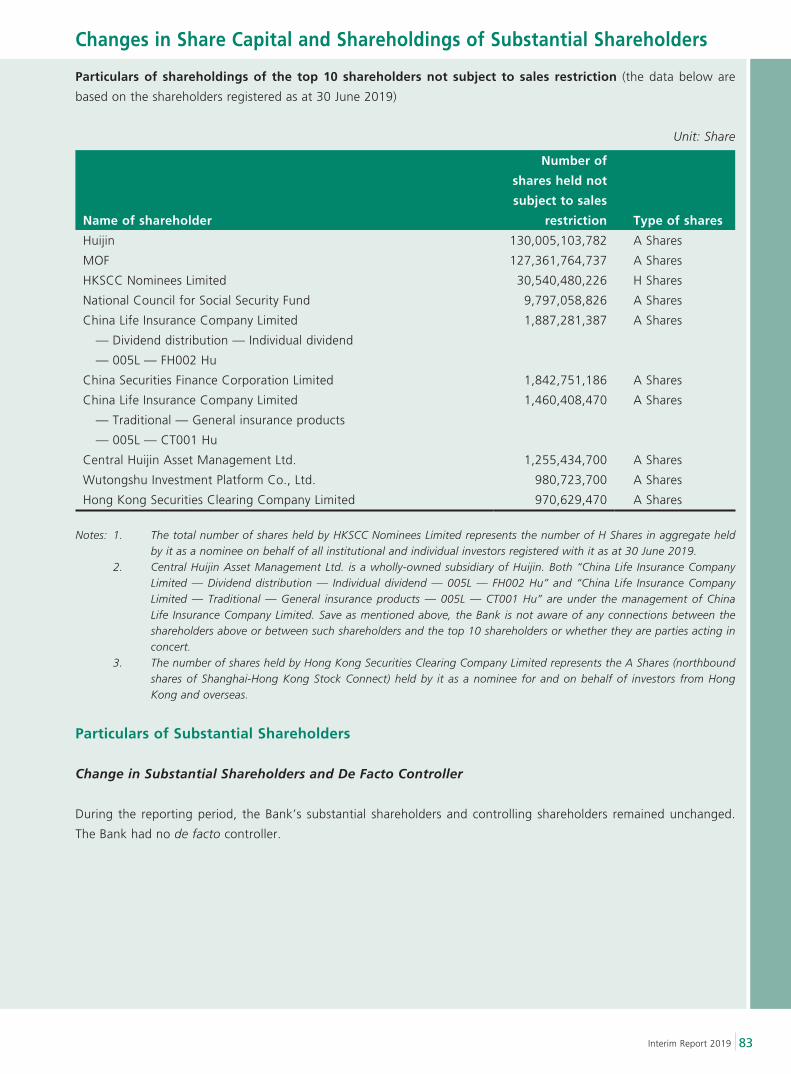
Changes in Share Capital and Shareholdings of Substantial Shareholders
83Interim Report 2019
Particulars of shareholdings of the top 10 shareholders not subject to sales restriction (the data below are
based on the shareholders registered as at 30 June 2019)
Unit: Share
Name of shareholder
Number of
shares held not
subject to sales
restriction Type of shares
Huijin 130,005,103,782 A Shares
MOF 127,361,764,737 A Shares
HKSCC Nominees Limited 30,540,480,226 H Shares
National Council for Social Security Fund 9,797,058,826 A Shares
China Life Insurance Company Limited
— Dividend distribution — Individual dividend
— 005L — FH002 Hu
1,887,281,387 A Shares
China Securities Finance Corporation Limited 1,842,751,186 A Shares
China Life Insurance Company Limited
— Traditional — General insurance products
— 005L — CT001 Hu
1,460,408,470 A Shares
Central Huijin Asset Management Ltd. 1,255,434,700 A Shares
Wutongshu Investment Platform Co., Ltd. 980,723,700 A Shares
Hong Kong Securities Clearing Company Limited 970,629,470 A Shares
Notes: 1. The total number of shares held by HKSCC Nominees Limited represents the number of H Shares in aggregate held by it as a nominee on behalf of all institutional and individual investors registered with it as at 30 June 2019.
2. Central Huijin Asset Management Ltd. is a wholly-owned subsidiary of Huijin. Both “China Life Insurance Company Limited — Dividend distribution — Individual dividend — 005L — FH002 Hu” and “China Life Insurance Company Limited — Traditional — General insurance products — 005L — CT001 Hu” are under the management of China Life Insurance Company Limited. Save as mentioned above, the Bank is not aware of any connections between the shareholders above or between such shareholders and the top 10 shareholders or whether they are parties acting in concert.
3. The number of shares held by Hong Kong Securities Clearing Company Limited represents the A Shares (northbound shares of Shanghai-Hong Kong Stock Connect) held by it as a nominee for and on behalf of investors from Hong Kong and overseas.
Particulars of Substantial Shareholders
Change in Substantial Shareholders and De Facto Controller
During the reporting period, the Bank’s substantial shareholders and controlling shareholders remained unchanged.
The Bank had no de facto controller.
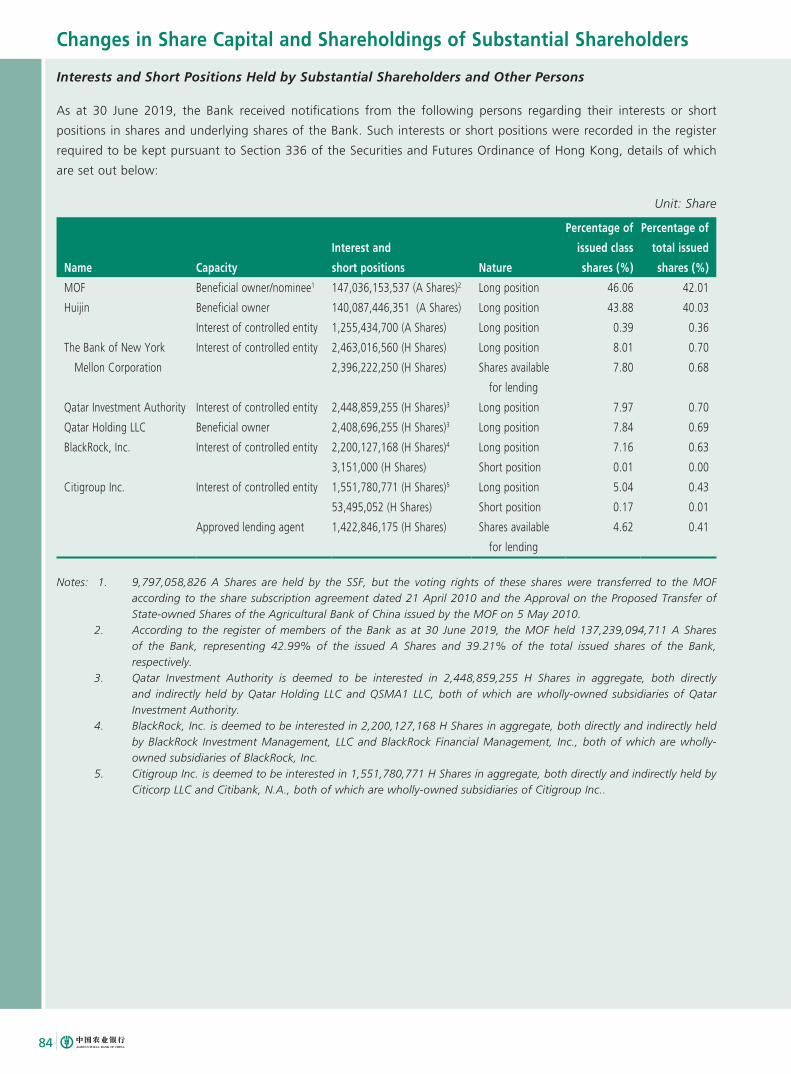
Changes in Share Capital and Shareholdings of Substantial Shareholders
84
Interests and Short Positions Held by Substantial Shareholders and Other Persons
As at 30 June 2019, the Bank received notifications from the following persons regarding their interests or short
positions in shares and underlying shares of the Bank. Such interests or short positions were recorded in the register
required to be kept pursuant to Section 336 of the Securities and Futures Ordinance of Hong Kong, details of which
are set out below:
Unit: Share
Name Capacity
Interest and
short positions Nature
Percentage of
issued class
shares (%)
Percentage of
total issued
shares (%)
MOF Beneficial owner/nominee1 147,036,153,537 (A Shares)2 Long position 46.06 42.01
Huijin Beneficial owner 140,087,446,351 (A Shares) Long position 43.88 40.03
Interest of controlled entity 1,255,434,700 (A Shares) Long position 0.39 0.36
The Bank of New York
Mellon Corporation
Interest of controlled entity 2,463,016,560 (H Shares) Long position 8.01 0.70
2,396,222,250 (H Shares) Shares available
for lending
7.80 0.68
Qatar Investment Authority Interest of controlled entity 2,448,859,255 (H Shares)3 Long position 7.97 0.70
Qatar Holding LLC Beneficial owner 2,408,696,255 (H Shares)3 Long position 7.84 0.69
BlackRock, Inc. Interest of controlled entity 2,200,127,168 (H Shares)4 Long position 7.16 0.63
3,151,000 (H Shares) Short position 0.01 0.00
Citigroup Inc. Interest of controlled entity 1,551,780,771 (H Shares)5 Long position 5.04 0.43
53,495,052 (H Shares) Short position 0.17 0.01
Approved lending agent 1,422,846,175 (H Shares) Shares available
for lending
4.62 0.41
Notes: 1. 9,797,058,826 A Shares are held by the SSF, but the voting rights of these shares were transferred to the MOF according to the share subscription agreement dated 21 April 2010 and the Approval on the Proposed Transfer of State-owned Shares of the Agricultural Bank of China issued by the MOF on 5 May 2010.
2. According to the register of members of the Bank as at 30 June 2019, the MOF held 137,239,094,711 A Shares of the Bank, representing 42.99% of the issued A Shares and 39.21% of the total issued shares of the Bank, respectively.
3. Qatar Investment Authority is deemed to be interested in 2,448,859,255 H Shares in aggregate, both directly and indirectly held by Qatar Holding LLC and QSMA1 LLC, both of which are wholly-owned subsidiaries of Qatar Investment Authority.
4. BlackRock, Inc. is deemed to be interested in 2,200,127,168 H Shares in aggregate, both directly and indirectly held by BlackRock Investment Management, LLC and BlackRock Financial Management, Inc., both of which are wholly-owned subsidiaries of BlackRock, Inc.
5. Citigroup Inc. is deemed to be interested in 1,551,780,771 H Shares in aggregate, both directly and indirectly held by Citicorp LLC and Citibank, N.A., both of which are wholly-owned subsidiaries of Citigroup Inc..
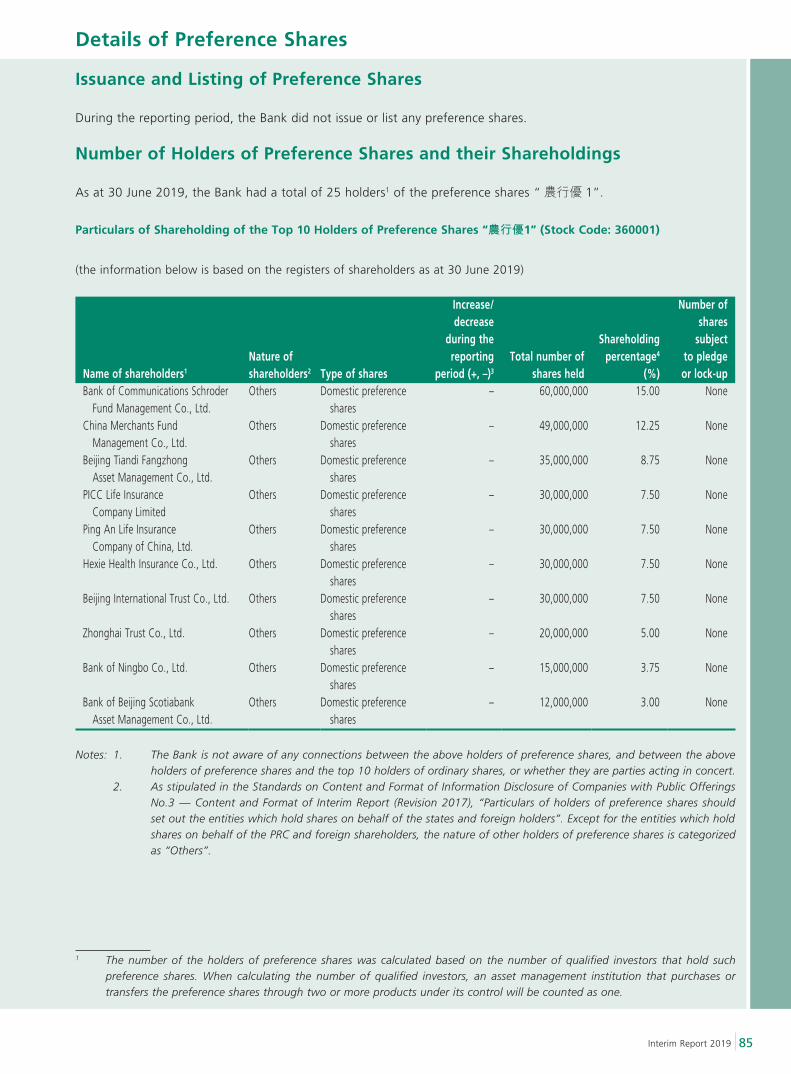
Details of Preference Shares
85Interim Report 2019
Issuance and Listing of Preference Shares
During the reporting period, the Bank did not issue or list any preference shares.
Number of Holders of Preference Shares and their Shareholdings
As at 30 June 2019, the Bank had a total of 25 holders1 of the preference shares “農行優 1”.
Particulars of Shareholding of the Top 10 Holders of Preference Shares “農行優1” (Stock Code: 360001)
(the information below is based on the registers of shareholders as at 30 June 2019)
Name of shareholders1
Nature ofshareholders2 Type of shares
Increase/decrease
during the reporting
period (+, –)3
Total number of shares held
Shareholdingpercentage4
(%)
Number ofshares
subjectto pledgeor lock-up
Bank of Communications Schroder Fund Management Co., Ltd.
Others Domestic preference shares
– 60,000,000 15.00 None
China Merchants Fund Management Co., Ltd.
Others Domestic preference shares
– 49,000,000 12.25 None
Beijing Tiandi Fangzhong Asset Management Co., Ltd.
Others Domestic preference shares
– 35,000,000 8.75 None
PICC Life Insurance Company Limited
Others Domestic preference shares
– 30,000,000 7.50 None
Ping An Life Insurance Company of China, Ltd.
Others Domestic preference shares
– 30,000,000 7.50 None
Hexie Health Insurance Co., Ltd. Others Domestic preference shares
– 30,000,000 7.50 None
Beijing International Trust Co., Ltd. Others Domestic preference shares
– 30,000,000 7.50 None
Zhonghai Trust Co., Ltd. Others Domestic preference shares
– 20,000,000 5.00 None
Bank of Ningbo Co., Ltd. Others Domestic preference shares
– 15,000,000 3.75 None
Bank of Beijing Scotiabank Asset Management Co., Ltd.
Others Domestic preference shares
– 12,000,000 3.00 None
Notes: 1. The Bank is not aware of any connections between the above holders of preference shares, and between the above holders of preference shares and the top 10 holders of ordinary shares, or whether they are parties acting in concert.
2. As stipulated in the Standards on Content and Format of Information Disclosure of Companies with Public Offerings No.3 — Content and Format of Interim Report (Revision 2017), “Particulars of holders of preference shares should set out the entities which hold shares on behalf of the states and foreign holders”. Except for the entities which hold shares on behalf of the PRC and foreign shareholders, the nature of other holders of preference shares is categorized as “Others”.
1 The number of the holders of preference shares was calculated based on the number of qualified investors that hold such preference shares. When calculating the number of qualified investors, an asset management institution that purchases or transfers the preference shares through two or more products under its control will be counted as one.
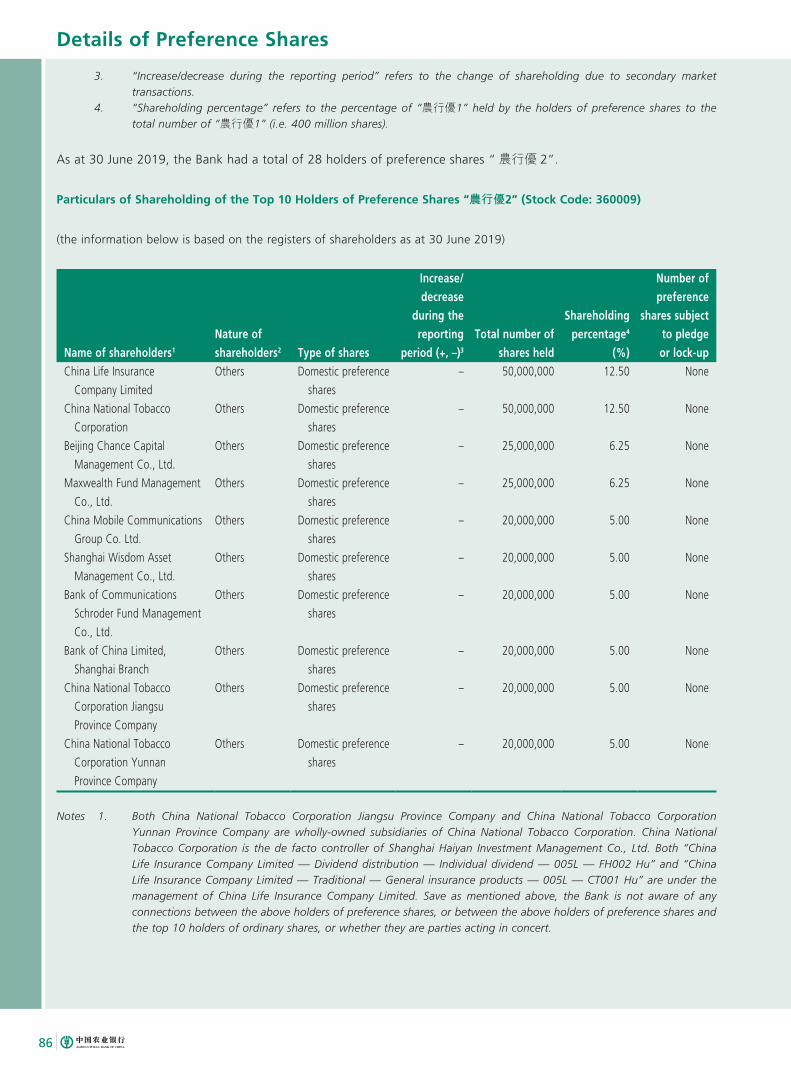
Details of Preference Shares
86
3. “Increase/decrease during the reporting period” refers to the change of shareholding due to secondary market transactions.
4. “Shareholding percentage” refers to the percentage of “農行優1” held by the holders of preference shares to the total number of “農行優1” (i.e. 400 million shares).
As at 30 June 2019, the Bank had a total of 28 holders of preference shares “農行優 2”.
Particulars of Shareholding of the Top 10 Holders of Preference Shares “農行優2” (Stock Code: 360009)
(the information below is based on the registers of shareholders as at 30 June 2019)
Name of shareholders1
Nature ofshareholders2 Type of shares
Increase/decrease
during thereporting
period (+, –)3
Total number of shares held
Shareholdingpercentage4
(%)
Number ofpreference
shares subjectto pledgeor lock-up
China Life Insurance
Company Limited
Others Domestic preference
shares
– 50,000,000 12.50 None
China National Tobacco
Corporation
Others Domestic preference
shares
– 50,000,000 12.50 None
Beijing Chance Capital
Management Co., Ltd.
Others Domestic preference
shares
– 25,000,000 6.25 None
Maxwealth Fund Management
Co., Ltd.
Others Domestic preference
shares
– 25,000,000 6.25 None
China Mobile Communications
Group Co. Ltd.
Others Domestic preference
shares
– 20,000,000 5.00 None
Shanghai Wisdom Asset
Management Co., Ltd.
Others Domestic preference
shares
– 20,000,000 5.00 None
Bank of Communications
Schroder Fund Management
Co., Ltd.
Others Domestic preference
shares
– 20,000,000 5.00 None
Bank of China Limited,
Shanghai Branch
Others Domestic preference
shares
– 20,000,000 5.00 None
China National Tobacco
Corporation Jiangsu
Province Company
Others Domestic preference
shares
– 20,000,000 5.00 None
China National Tobacco
Corporation Yunnan
Province Company
Others Domestic preference
shares
– 20,000,000 5.00 None
Notes 1. Both China National Tobacco Corporation Jiangsu Province Company and China National Tobacco Corporation Yunnan Province Company are wholly-owned subsidiaries of China National Tobacco Corporation. China National Tobacco Corporation is the de facto controller of Shanghai Haiyan Investment Management Co., Ltd. Both “China Life Insurance Company Limited — Dividend distribution — Individual dividend — 005L — FH002 Hu” and “China Life Insurance Company Limited — Traditional — General insurance products — 005L — CT001 Hu” are under the management of China Life Insurance Company Limited. Save as mentioned above, the Bank is not aware of any connections between the above holders of preference shares, or between the above holders of preference shares and the top 10 holders of ordinary shares, or whether they are parties acting in concert.
Details of Preference Shares
87Interim Report 2019
2. As stipulated in the No.3 Standards on the Content and Format of Information Disclosure of Companies with Public Offerings — Content and Format of the Interim Report (Revision 2017), “Particulars of holders of preference shares should set out the entities which hold shares on behalf of the states and foreign holders”. Except for the entities which hold shares on behalf of the PRC and foreign shareholders, the nature of other holders of preference shares is categorized as “Others”.
3. “Increase/decrease during the reporting period” refers to the change of shareholding due to secondary market transactions.
4. “Shareholding percentage” refers to the percentage of “農行優2” held by holders of preference shares to the total number of “農行優2” (i.e. 400 million shares).
The preference shares “農行優 1” and “農行優 2” of the Bank are shares not subject to restrictions on sale, and the
top 10 holders of preference shares “農行優 1” and “農行優 2” who are not subject to restrictions on sale are same
as the top 10 holders of preference shares.
Profit Distribution of Preference Shares
Dividends of the Bank’s preference shares are paid in cash and shall be paid annually. When the Bank resolves to
cancel part or all of the dividends to holders of preference shares, such undistributed dividends of current period shall
not be accumulated to subsequent dividend periods. The holders of preference shares of the Bank, upon receiving
dividends at the agreed rate, shall not participate in the distribution of the remaining profit attributable to the holders
of ordinary shares.
During the reporting period, on 11 March 2019, the Bank paid cash dividends of RMB5.50 (tax inclusive) per
preference share and RMB2.2 billion (tax inclusive) in aggregate (calculated at a coupon rate of 5.50%) to all holders
of “農行優 2” (stock code: 360009) whose names appeared on the register of members at the close of business on
8 March 2019. On 30 August 2019, the Board of Directors resolved and approved the Dividend Payment Scheme
of 2018–2019 for the First Tranche of the Preference Shares. On 5 November 2019, we will pay cash dividends of
RMB6.00 (tax inclusive) per preference share and RMB2.4 billion (tax inclusive) in aggregate, calculated by a coupon
rate of 6.00% to all holders of “農行優1” (stock code: 360001) whose names will appear on the register of members
at the close of business on 4 November 2019.
Please refer to the announcements of the Bank published on the website of Shanghai Stock Exchange
(www.sse.com.cn) for details.
Redemption or Conversion of Preference Shares
During the reporting period, there was no redemption or conversion of the preference shares issued by the Bank.
Restoration of Voting Rights of Preference Shares
During the reporting period, there was no restoration of voting rights of the preference shares issued by the Bank.
Accounting Policies
In accordance with International Financial Reporting Standard 9 — Financial Instruments and International Accounting
Standard 32 — Financial Instruments: Presentation and other accounting standards issued by International Accounting
Standard Board, the Bank is of the view that the terms of preference shares “農行優1” (stock code: 360001) and “農行優 2” (stock code: 360009) meet the definition of equity instruments.
Directors, Supervisors and Senior Management
88
Directors, Supervisors and Senior Management of the Bank
As at the date of this interim report published by the Bank, the compositions of the Board of Directors, the Board of
Supervisors and Senior Management of the Bank were as follows:
The Board of Directors of the Bank consisted of 15 Directors, including four Executive Directors, namely Mr. ZHOU
Mubing, Mr. WANG Wei, Mr. CAI Dong and Ms. ZHANG Keqiu; six Non-executive Directors, namely Mr. XU Jiandong,
Mr. CHEN Jianbo, Mr. LIAO Luming, Mr. LI Qiyun, Mr. LI Wei and Mr. WU Jiangtao; and five Independent Non-
executive Directors, namely Ms. XIAO Xing, Mr. WANG Xinxin, Mr. HUANG Zhenzhong, Ms. LEUNG KO May Yee,
Margaret and Mr. LIU Shouying.
The Board of Supervisors of the Bank consisted of eight Supervisors, including two Supervisors Representing
Shareholders, namely Mr. WANG Jingdong and Mr. WANG Xingchun; three Supervisors Representing Employees,
namely Mr. LIU Chengxu1, Mr. XIA Taili and Mr. SHAO Lihong; and three External Supervisors, namely Mr. LI Wang,
Mr. ZHANG Jie and Ms. LIU Hongxia.
The Senior Management of the Bank consisted of seven members, namely Mr. WANG Wei,
Mr. CAI Dong, Ms. ZHANG Keqiu, Mr. ZHAN Dongsheng, Mr. CUI Yong, Mr. LI Zhicheng and Mr. ZHOU Wanfu.
As at 30 June 2019, except for Mr. ZHOU Wanfu, the Secretary to the Board of Directors of the Bank, who held
10,000 A Shares of the Bank, none of the incumbent Directors, Supervisors or Senior Management of the Bank
or who left office during the reporting period held any share of the Bank. During the reporting period, none of
incumbent Directors, Supervisors or Senior Management of the Bank or who left office during the reporting period
held any share option, or were granted any restricted shares of the Bank.
Departure of Directors, Supervisors and Senior Management
On 2 January 2019, Mr. GONG Chao ceased to be the Secretary of the Party Discipline Committee of the Bank.
On 9 January 2019, Mr. HU Xiaohui resigned as a Non-executive Director of the Bank due to his age.
On 30 August 2019, Mr. WEN Tiejun and Mr. Francis YUEN Tin-fan ceased to be Independent Non-executive Directors
of the Bank due to the expiration of their terms of office.
1 The term of office of Mr. LIU Chengxu has been expired. In order to meet the requirement that the members of the Supervisors Representing Employees of the Bank shall represent at least one-third of the total members of the Board of Supervisors, Mr. LIU Chengxu continued to perform his duties as a Supervisor Representing Employees.
Significant Events
89Interim Report 2019
Corporate Governance
During the reporting period, the Bank fully complied with the laws and regulations including the Company Law
of the People’s Republic of China, the Securities Law of the People’s Republic of China, the Law of the People’s
Republic of China on Commercial Banks and the principles and code provisions of the Corporate Governance Code
set out in Appendix 14 to the Hong Kong Listing Rules. The Bank continuously promoted the modernization of its
corporate governance system and governance capacities, strengthened the construction of its systems, optimized its
organizational structure, made adjustments to the composition of the Board of Directors and consistently improve the
efficiency of its corporate governance.
Shareholders’ General Meetings
During the reporting period, the Bank held one annual general meeting and one extraordinary general meeting, at
which the Bank considered and approved 15 proposals and attended three debriefing sessions in total, details of
which are as follows:
On 1 March 2019, the Bank held the first extraordinary general meeting for 2019 in Beijing, at which five proposals
were considered and approved, including the fixed assets investment budget for 2019, election of Executive Directors
and Non-executive Directors.
On 30 May 2019, the Bank held the 2018 Annual General Meeting in Beijing, at which 10 proposals were considered
and approved, including the final financial accounts for 2018 and the profit distribution plan for 2018, and attended
three debriefing sessions in respect of the 2018 work report of Independent Non-executive Directors, the report on
related party transactions management of the Bank, etc.
The above shareholders’ general meetings were convened or held in strict compliance with the laws, regulations and
listing rules of Hong Kong and the PRC. The Directors, Supervisors and the senior management of the Bank attended
the meetings and discussed with shareholders about matters they concerned. The Bank published the poll results
announcements and legal opinions on the above shareholders’ general meetings in a timely manner in accordance
with regulatory requirements. Such poll results announcements were published on the website of the Hong Kong
Stock Exchange on 1 March 2019 and 30 May 2019, respectively, and on the website of the Shanghai Stock Exchange
as well as on the media designated by the Bank for information disclosure on 2 March 2019 and 31 May 2019,
respectively.
Internal Audit
During the reporting period, the Bank adopted risk-oriented approaches to conduct risk and management audits on
the key aspects, including credit business, financial management, intermediate business, and internal control; to carry
out specific audits on various aspects, including writing-off of bad debts and reduction of non-performing loans,
targeted poverty alleviation, consolidated management at group level, anti-money laundering and sanctions compliance,
protection of consumers’ rights and overseas institutions; and implement the audit on economic responsibilities of the
senior management. The Bank continued to conduct off-site supervision, monitor the rectification of the issues identified
during the internal audit, and focus on improving the effectiveness of rectification and supervision. We also promoted
the digital transformation of internal audit and reinforced the skills training for audit to effectively improve the capacity
of audit and supervision.
Significant Events
90
Profit and Dividends Distribution
As approved by the 2018 Annual General Meeting of the Bank, the Bank paid cash dividends of RMB0.1739 (tax
inclusive) per ordinary share and RMB60,862 million (tax inclusive) in aggregate to holders of ordinary shares whose
names appeared on the register of members at the close of business on 18 June 2019. The Bank did not propose to
pay any interim dividend for 2019 nor increase share capital by capitalizing its capital reserve.
Material Litigation and Arbitration Matters
During the reporting period, there were no litigation or arbitration matters with material impact on the operations of
the Bank.
As at 30 June 2019, the value of the objects of the pending litigation or arbitration matters in which the Bank
was involved as a defendant, a respondent or a third party amounted to approximately RMB5,682 million. The
management believes that the Bank has made provision in full for potential losses arising from the aforesaid litigation
or arbitration matters which will not cause any material adverse effect on the Bank’s financial position or operating
results.
Major Asset Acquisition, Disposal and Merger
During the reporting period, the Bank did not carry out any major asset acquisition, disposal or merger.
Related Party Transactions
During the reporting period, the Bank applied standardization management to related party transactions, in strict
compliance with the regulations issued by the CBIRC and the CSRC as well as the listing rules of Shanghai and Hong
Kong. During the reporting period, the related party transactions of the Bank were conducted on normal commercial
terms and in accordance with laws and regulations; its pricing for interest rates was subject to the fair commercial
principles and actions that damaged the interests of the Bank and minority shareholders were not identified.
During the reporting period, the Bank extended loans to related parties who are natural persons (as defined in the
Administrative Measures for Information Disclosure of Listed Companies (issued by the CSRC). As at 30 June 2019,
the balance of loans amounted to RMB6,336.1 thousand. Such loans were in compliance with its pricing policies
stipulated in its business practices and guarantees were provided for such loans.
For the related party transactions as defined in applicable accounting standards, please refer to “Note 43 Related Party
Transactions” to the Condensed Consolidated Interim Financial Statements.
During the reporting period, the Bank conducted a slew of connected transactions with the connected persons (as
defined in the Hong Kong Listing Rules) of the Bank in the ordinary course of business. Such transactions and/or the
related party transactions set forth in the Notes to the Financial Statements did not constitute connected transactions
under the Hong Kong Listing Rules or satisfy the applicable exemption conditions set out under the Hong Kong
Listing Rules, and therefore were fully exempted from compliance with the requirements of reporting, independent
shareholders’ approval, annual review and all requirements in relation to disclosures.
Significant Events
91Interim Report 2019
Use of Proceeds
All the proceeds raised were used to strengthen the Bank’s capital base to support the future development of its
business as disclosed in the prospectus, offering documents and other documents.
Details and Performance of Material Contracts
Material Custody, Contract and Lease
During the reporting period, the Bank did not enter into any material custody, contracting or leasing arrangements
on the assets of other companies, which were subject to disclosure and no other companies entered into any material
custody, contracting or leasing arrangements on our assets, which were subject to disclosure.
Material Guarantees
Provision of guarantees is one of the regular off-balance-sheet businesses of the Bank in its ordinary and usual
course of business. During the reporting period, the Bank did not have any material guarantee that was required to
be disclosed, except for the financial guarantee services within the business scope as approved by the PBOC and the
CBIRC.
Material Equity Investments Obtained and Material Non-equity Investments in Progress
In July 2018, the Bank entered into the Promoters’ Agreement on National Financing Guarantee Fund Co., Ltd.,
pursuant to which, it will invest RMB3 billion in National Financing Guarantee Fund Co., Ltd., representing a
contribution proportion of 4.5386%, which will be paid up annually in four years from 2018. In November 2018, the
Bank completed the first contribution of RMB0.75 billion. In June 2019, the Bank completed the second contribution
of RMB0.75 billion.
On 26 November 2018, the Board of Directors of the Bank considered and approved the proposed contribution of
not exceeding RMB12 billion to establish Agricultural Bank of China Wealth Management Co., Ltd., which will be
100% held by the Bank. In January 2019, the application for the establishment of Agricultural Bank of China Wealth
Management Co., Ltd. was approved by the CBIRC. In July 2019, Agricultural Bank of China Wealth Management Co.,
Ltd was approved to commence operation.
During the reporting period, saved as disclosed above, the Bank did not have any other material equity and non-equity
investment.
Commitments
During the reporting period, the Bank did not have any commitment that had been duly fulfilled and completed. As at
the end of the reporting period, the Bank did not have any expired commitment that had not been duly performed.
Significant Events
92
Penalties Imposed on the Bank and its Directors, Supervisors, Senior Management and Controlling Shareholders
During the reporting period, neither the Bank nor any of its Directors, Supervisors, Senior Management or controlling
shareholders was investigated by competent authorities, subject to coercive measures imposed by judicial authorities
or disciplinary authorities, transferred to judicial authorities for prosecution or held criminally liable, investigated,
suffered administrative punishment, barred from the market or disqualified by the CSRC, subject to material
administrative punishments imposed by the Administration of Environmental Protection, Work Safety or Taxation or
other administrative authorities, or publicly denounced by any stock exchange.
Integrity of the Bank and Controlling Shareholder
There were no judicial decisions in effect not performed, nor any outstanding debt with large amount matured and
not paid, by the Bank or its controlling shareholders.
Purchase, Sale or Redemption of the Bank’s Shares
During the reporting period, neither the Bank nor its subsidiaries purchased, sold or redeemed any of its listed shares.
Implementation of Share Incentive Plan
During the reporting period, the Bank did not implement any share incentive scheme such as share appreciation rights
scheme for the management and employee share ownership scheme.
Securities Transactions by Directors and Supervisors
The Bank has adopted a code of conduct for securities transactions by Directors and Supervisors with terms no less
exacting than those set out in the Model Code for Securities Transactions by Directors of Listed Issuers in Appendix
10 to the Hong Kong Listing Rules. Each of the Directors and Supervisors of the Bank had confirmed that they had
complied with such code of conduct during the reporting period.
Rights of Directors and Supervisors to Acquire Shares or Debentures
As at 30 June 2019, the Bank did not grant any rights to acquire shares or debentures to any Director or Supervisor,
nor was any of such rights exercised by any Director or Supervisor. Neither the Bank nor its subsidiaries entered
into any agreement or arrangement enabling the Directors or Supervisors to obtain benefits by acquiring shares or
debentures of the Bank or any other corporations.
Significant Events
93Interim Report 2019
Interests in Shares, Underlying Shares and Debentures Held by Directors and Supervisors
As at 30 June 2019, none of the Directors or Supervisors of the Bank had any interests or short positions in the
shares, underlying shares or debentures of the Bank or any of its associated corporations (as defined in Part XV of
the Securities and Futures Ordinance of Hong Kong) which were required to be notified to the Bank and the Hong
Kong Stock Exchange pursuant to Divisions 7 and 8 of Part XV of the Securities and Futures Ordinance of Hong Kong
(including interests and short positions they are deemed to have under such provisions of the Securities and Futures
Ordinance of Hong Kong), or any interests or short positions which were required to be recorded in the register
referred to in Section 352 of the Securities and Futures Ordinance of Hong Kong, or any interests or short positions
which were required to be notified to the Bank and the Hong Kong Stock Exchange pursuant to the Model Code for
Securities Transactions by Directors of Listed Issuers as set out in Appendix 10 to the Hong Kong Listing Rules. For the
interests and short positions of substantial shareholders of the Bank and other persons, please refer to “Changes in
Share Capital and Shareholdings of Substantial Shareholders”.
Interim Review
The 2019 Interim Financial Report prepared by the Bank in accordance with the CASs and IFRSs was reviewed by
PricewaterhouseCoopers Zhong Tian LLP and PricewaterhouseCoopers in accordance with the PRC and International
Standards on Review Engagements, respectively.
The interim report of the Bank has been reviewed and approved by the Board of Directors and its Audit and
Compliance Committee.
Change of External Auditors
During the reporting period, there was no change of the external auditors of the Bank.
Consumer Interests Protection
Adhering to the philosophy of “Consistently Putting Customers First”, the Bank implemented the protection for
consumers’ rights and interests into the whole-process of products and services, including the design of products,
pricing management, formulation of agreements, approval and access, marketing and promotion, after-sale
management, and dealing with complaints, in order to ensure that consumers are treated with fairness, justice and
integrity. The Bank has formulated and published privacy policy and optimized the mechanisms related to personal
information protection, to ensure the security of personal information of customers. The Bank carried out the “Year of
Improvement for Transformation and Services” activity to promote the improvement of network services and customer
experience. The Bank advanced to implement the professional standard related to classification of complaints from
financial consumers, to make the normalisation and standardisation complaints management. The Bank conducted
activities to publicise and popularise specific financial knowledge, to improve the financial literacy of the consumers.

Significant Events
94
Targeted Poverty Alleviation
For the details of targeted poverty alleviation carried out by the Bank during the reporting period, please refer to
“Discussion and Analysis — County Area Banking Business — Financial Poverty Alleviation”.
Issuance and Redemption of Capital Bonds
For the details of issuance and redemption of capital bonds of the Bank, please refer to “Discussion and Analysis —
Capital Management — Management of Capital Financing”.
Appendix I Capital Adequacy Ratio Information
95Interim Report 2019
Pursuant to the Capital Rules for Commercial Banks (Provisional), the Notice of the China Banking Regulatory
Commission on Issuing the Supporting Policy Documents for the Capital Regulation of Commercial Banks and other
regulatory requirements, the Bank discloses the following information.
I. Capital Adequacy Ratio Information
As of 30 June 2019, given relevant rules is in the parallel implementation period, the Bank’s capital adequacy
ratio, Tier 1 capital adequacy ratio and CET 1 capital adequacy ratio, which were calculated in accordance
with the Capital Rules for Commercial Banks (Provisional), were 15.48%, 11.67% and 11.13%, respectively,
and were in compliance with the regulatory requirements. During the first half of 2019, the Bank conducted
the issue of Tier 2 capital bonds of RMB120 billion in PRC inter-banks securities market. The Bank proactively
optimized and adjusted structure of assets. Accordingly, the growth rate of net capital was higher than that of
risk-weighted assets, leading to a increase of 0.36 percentage point in capital adequacy ratio as compared to
the end of 2018.
II. Scope for Calculating Capital Adequacy Ratio
The scope for calculating the Bank’s consolidated capital adequacy ratio includes the Bank and the financial
institutions in which the Bank has direct or indirect investments in compliance with the requirements of the
Capital Rules for Commercial Banks (Provisional). The scope for calculating the Bank’s unconsolidated capital
adequacy ratio covers all the domestic and overseas branches of the Bank.
III. Capital Adequacy Ratio and Risk-weighted Assets
According to the application scope of the advanced approach of capital management as approved by the
regulatory bodies, the Bank adopted the foundation Internal Ratings-Based (IRB) approach for non-retail
exposures and IRB approach for retail exposures to measure credit risk-weighted assets, weighting approach for
credit risk-weighted assets uncovered by IRB approach. Internal Model Approach (IMA) was adopted to measure
market risk-weighted assets. Standardized Approach (SA) was adopted to measure market risk-weighted assets
uncovered by IMA. Standardized Approach was adopted to measure operational risk-weighted assets.
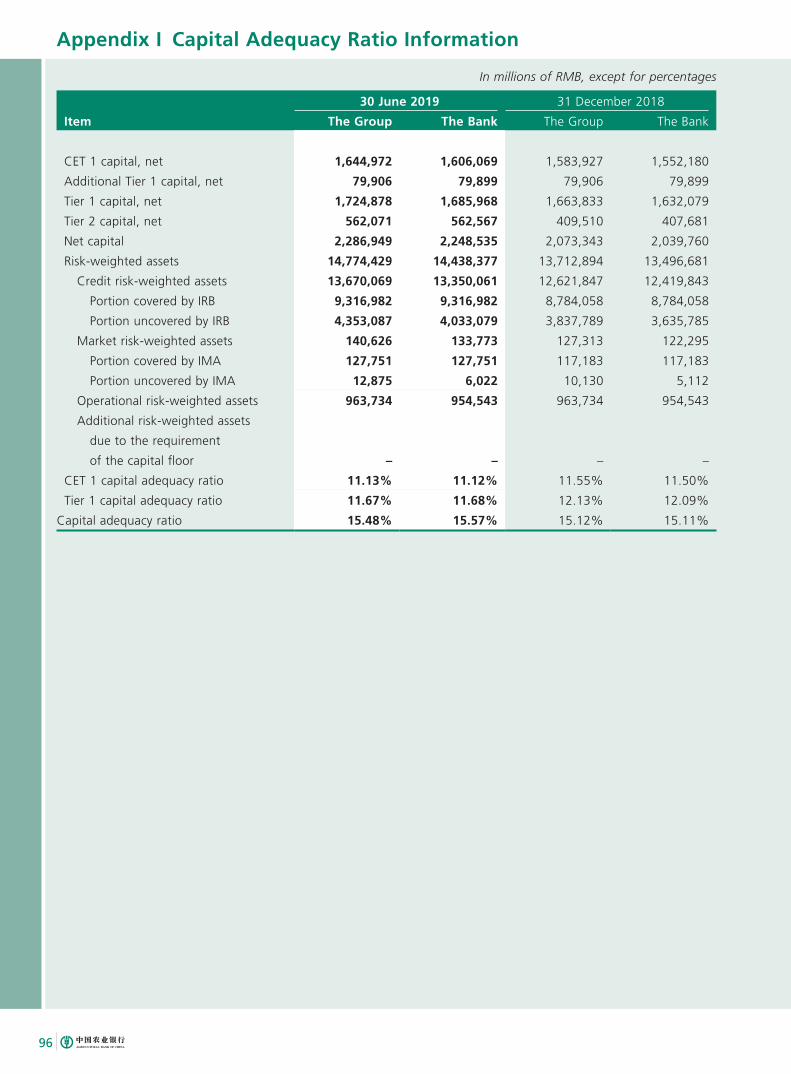
Appendix I Capital Adequacy Ratio Information
96
In millions of RMB, except for percentages
30 June 2019 31 December 2018
Item The Group The Bank The Group The Bank
CET 1 capital, net 1,644,972 1,606,069 1,583,927 1,552,180
Additional Tier 1 capital, net 79,906 79,899 79,906 79,899
Tier 1 capital, net 1,724,878 1,685,968 1,663,833 1,632,079
Tier 2 capital, net 562,071 562,567 409,510 407,681
Net capital 2,286,949 2,248,535 2,073,343 2,039,760
Risk-weighted assets 14,774,429 14,438,377 13,712,894 13,496,681
Credit risk-weighted assets 13,670,069 13,350,061 12,621,847 12,419,843
Portion covered by IRB 9,316,982 9,316,982 8,784,058 8,784,058
Portion uncovered by IRB 4,353,087 4,033,079 3,837,789 3,635,785
Market risk-weighted assets 140,626 133,773 127,313 122,295
Portion covered by IMA 127,751 127,751 117,183 117,183
Portion uncovered by IMA 12,875 6,022 10,130 5,112
Operational risk-weighted assets 963,734 954,543 963,734 954,543
Additional risk-weighted assets
due to the requirement
of the capital floor – – – –
CET 1 capital adequacy ratio 11.13% 11.12% 11.55% 11.50%
Tier 1 capital adequacy ratio 11.67% 11.68% 12.13% 12.09%
Capital adequacy ratio 15.48% 15.57% 15.12% 15.11%
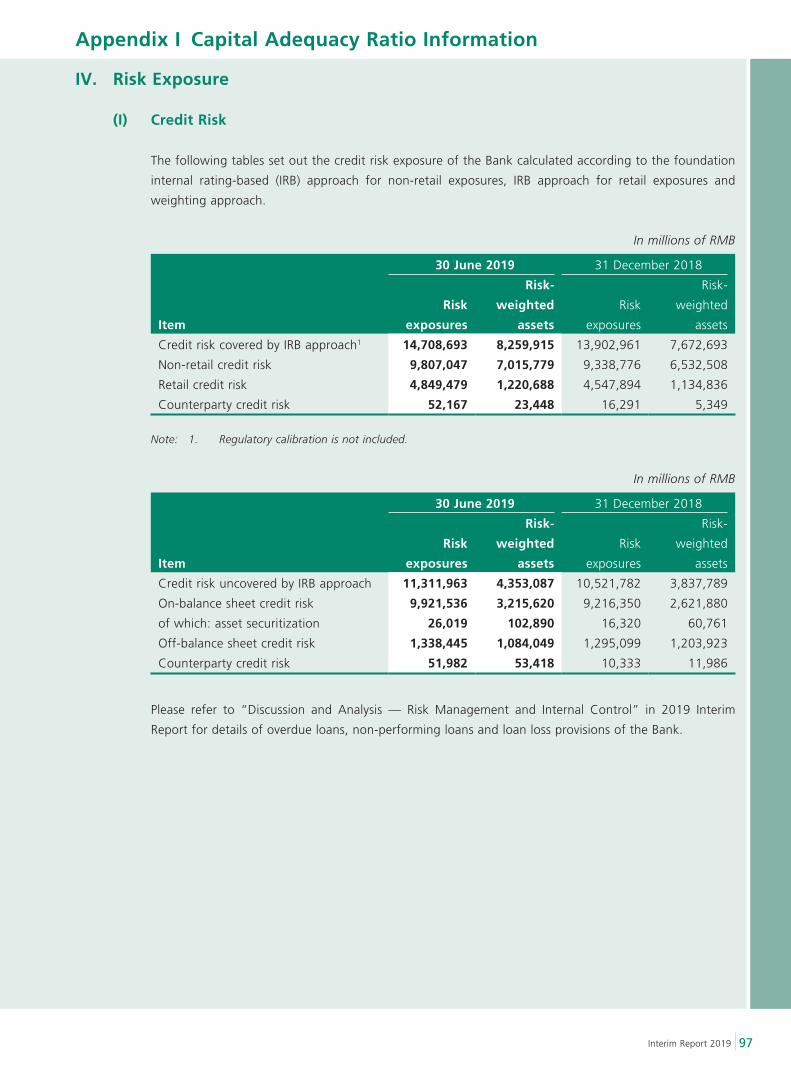
Appendix I Capital Adequacy Ratio Information
97Interim Report 2019
IV. Risk Exposure
(I) Credit Risk
The following tables set out the credit risk exposure of the Bank calculated according to the foundation
internal rating-based (IRB) approach for non-retail exposures, IRB approach for retail exposures and
weighting approach.
In millions of RMB
30 June 2019 31 December 2018
Item
Risk
exposures
Risk-
weighted
assets
Risk
exposures
Risk-
weighted
assets
Credit risk covered by IRB approach1 14,708,693 8,259,915 13,902,961 7,672,693
Non-retail credit risk 9,807,047 7,015,779 9,338,776 6,532,508
Retail credit risk 4,849,479 1,220,688 4,547,894 1,134,836
Counterparty credit risk 52,167 23,448 16,291 5,349
Note: 1. Regulatory calibration is not included.
In millions of RMB
30 June 2019 31 December 2018
Item
Risk
exposures
Risk-
weighted
assets
Risk
exposures
Risk-
weighted
assets
Credit risk uncovered by IRB approach 11,311,963 4,353,087 10,521,782 3,837,789
On-balance sheet credit risk 9,921,536 3,215,620 9,216,350 2,621,880
of which: asset securitization 26,019 102,890 16,320 60,761
Off-balance sheet credit risk 1,338,445 1,084,049 1,295,099 1,203,923
Counterparty credit risk 51,982 53,418 10,333 11,986
Please refer to “Discussion and Analysis — Risk Management and Internal Control” in 2019 Interim
Report for details of overdue loans, non-performing loans and loan loss provisions of the Bank.
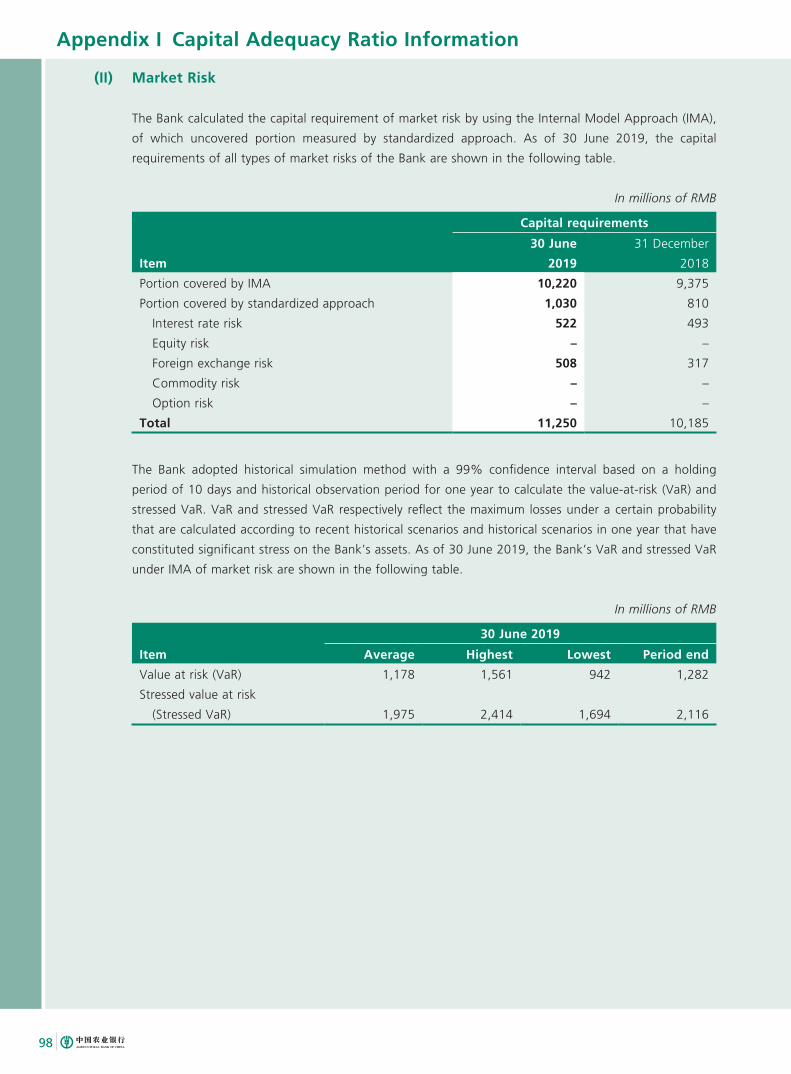
Appendix I Capital Adequacy Ratio Information
98
(II) Market Risk
The Bank calculated the capital requirement of market risk by using the Internal Model Approach (IMA),
of which uncovered portion measured by standardized approach. As of 30 June 2019, the capital
requirements of all types of market risks of the Bank are shown in the following table.
In millions of RMB
Capital requirements
Item
30 June
2019
31 December
2018
Portion covered by IMA 10,220 9,375
Portion covered by standardized approach 1,030 810
Interest rate risk 522 493
Equity risk – –
Foreign exchange risk 508 317
Commodity risk – –
Option risk – –
Total 11,250 10,185
The Bank adopted historical simulation method with a 99% confidence interval based on a holding
period of 10 days and historical observation period for one year to calculate the value-at-risk (VaR) and
stressed VaR. VaR and stressed VaR respectively reflect the maximum losses under a certain probability
that are calculated according to recent historical scenarios and historical scenarios in one year that have
constituted significant stress on the Bank’s assets. As of 30 June 2019, the Bank’s VaR and stressed VaR
under IMA of market risk are shown in the following table.
In millions of RMB
30 June 2019
Item Average Highest Lowest Period end
Value at risk (VaR) 1,178 1,561 942 1,282
Stressed value at risk
(Stressed VaR) 1,975 2,414 1,694 2,116
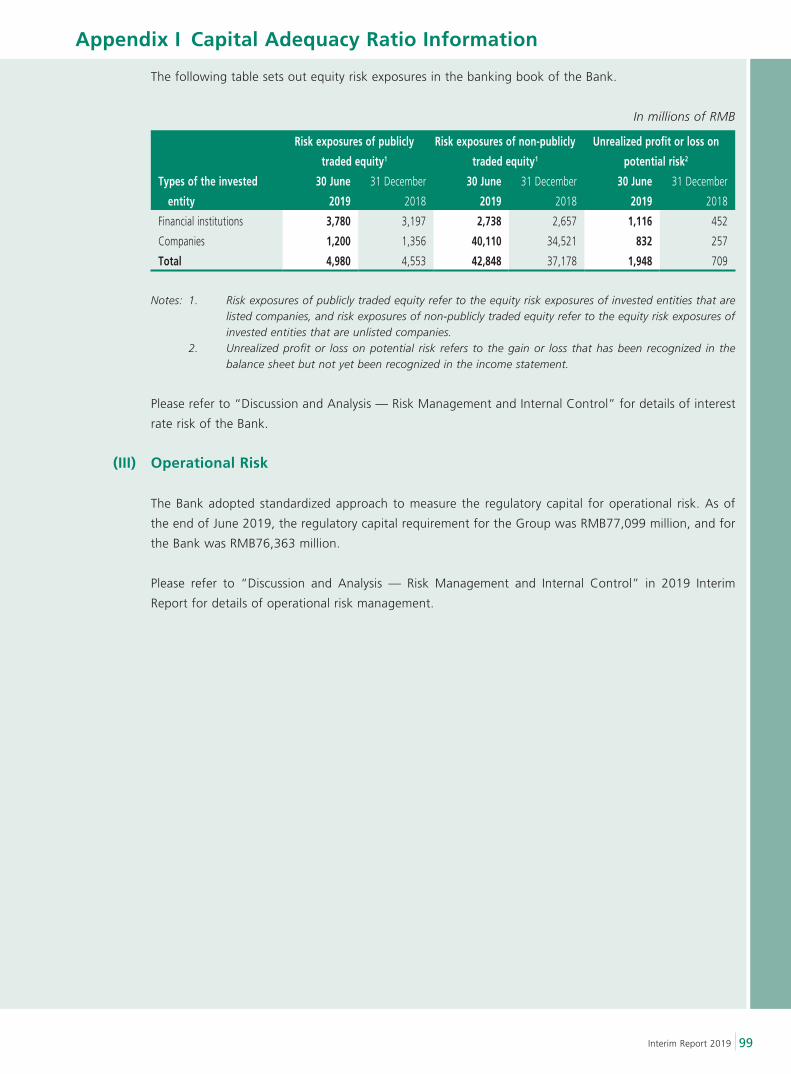
Appendix I Capital Adequacy Ratio Information
99Interim Report 2019
The following table sets out equity risk exposures in the banking book of the Bank.
In millions of RMB
Risk exposures of publicly
traded equity1
Risk exposures of non-publicly
traded equity1
Unrealized profit or loss on
potential risk2
Types of the invested
entity
30 June
2019
31 December
2018
30 June
2019
31 December
2018
30 June
2019
31 December
2018
Financial institutions 3,780 3,197 2,738 2,657 1,116 452
Companies 1,200 1,356 40,110 34,521 832 257
Total 4,980 4,553 42,848 37,178 1,948 709
Notes: 1. Risk exposures of publicly traded equity refer to the equity risk exposures of invested entities that are listed companies, and risk exposures of non-publicly traded equity refer to the equity risk exposures of invested entities that are unlisted companies.
2. Unrealized profit or loss on potential risk refers to the gain or loss that has been recognized in the balance sheet but not yet been recognized in the income statement.
Please refer to “Discussion and Analysis — Risk Management and Internal Control” for details of interest
rate risk of the Bank.
(III) Operational Risk
The Bank adopted standardized approach to measure the regulatory capital for operational risk. As of
the end of June 2019, the regulatory capital requirement for the Group was RMB77,099 million, and for
the Bank was RMB76,363 million.
Please refer to “Discussion and Analysis — Risk Management and Internal Control” in 2019 Interim
Report for details of operational risk management.
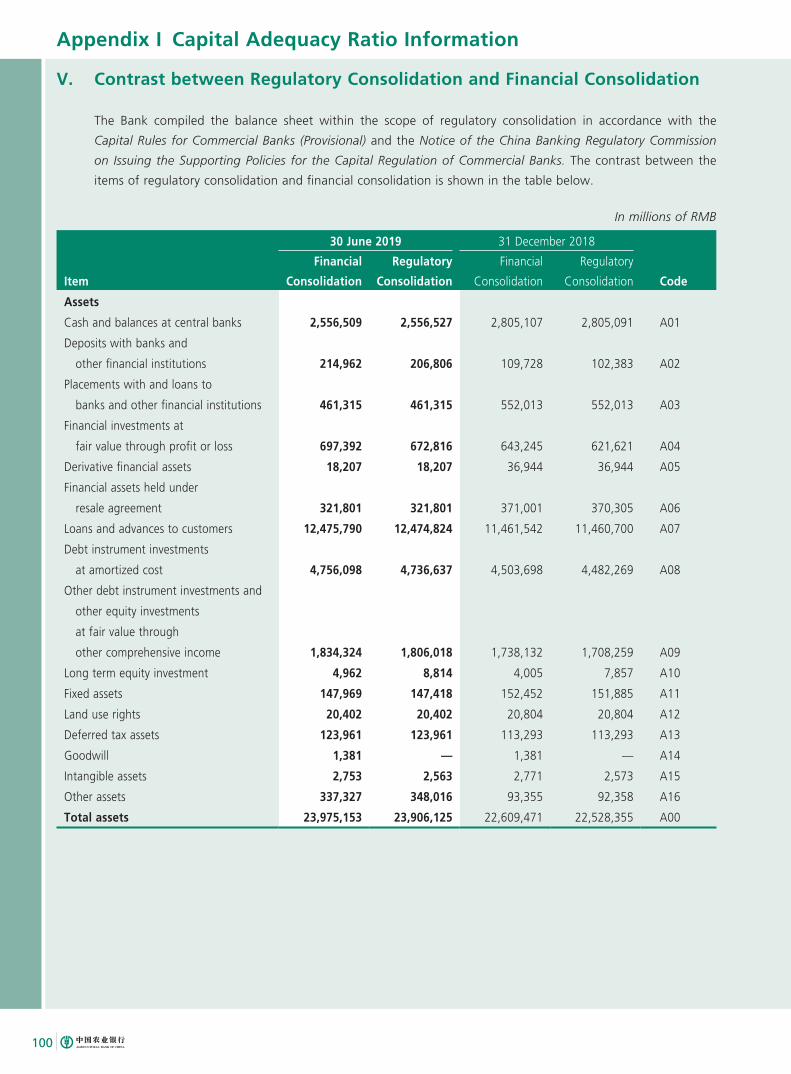
Appendix I Capital Adequacy Ratio Information
100
V. Contrast between Regulatory Consolidation and Financial Consolidation
The Bank compiled the balance sheet within the scope of regulatory consolidation in accordance with the
Capital Rules for Commercial Banks (Provisional) and the Notice of the China Banking Regulatory Commission
on Issuing the Supporting Policies for the Capital Regulation of Commercial Banks. The contrast between the
items of regulatory consolidation and financial consolidation is shown in the table below.
In millions of RMB
30 June 2019 31 December 2018
Item
Financial
Consolidation
Regulatory
Consolidation
Financial
Consolidation
Regulatory
Consolidation Code
Assets
Cash and balances at central banks 2,556,509 2,556,527 2,805,107 2,805,091 A01
Deposits with banks and
other financial institutions 214,962 206,806 109,728 102,383 A02
Placements with and loans to
banks and other financial institutions 461,315 461,315 552,013 552,013 A03
Financial investments at
fair value through profit or loss 697,392 672,816 643,245 621,621 A04
Derivative financial assets 18,207 18,207 36,944 36,944 A05
Financial assets held under
resale agreement 321,801 321,801 371,001 370,305 A06
Loans and advances to customers 12,475,790 12,474,824 11,461,542 11,460,700 A07
Debt instrument investments
at amortized cost 4,756,098 4,736,637 4,503,698 4,482,269 A08
Other debt instrument investments and
other equity investments
at fair value through
other comprehensive income 1,834,324 1,806,018 1,738,132 1,708,259 A09
Long term equity investment 4,962 8,814 4,005 7,857 A10
Fixed assets 147,969 147,418 152,452 151,885 A11
Land use rights 20,402 20,402 20,804 20,804 A12
Deferred tax assets 123,961 123,961 113,293 113,293 A13
Goodwill 1,381 — 1,381 — A14
Intangible assets 2,753 2,563 2,771 2,573 A15
Other assets 337,327 348,016 93,355 92,358 A16
Total assets 23,975,153 23,906,125 22,609,471 22,528,355 A00
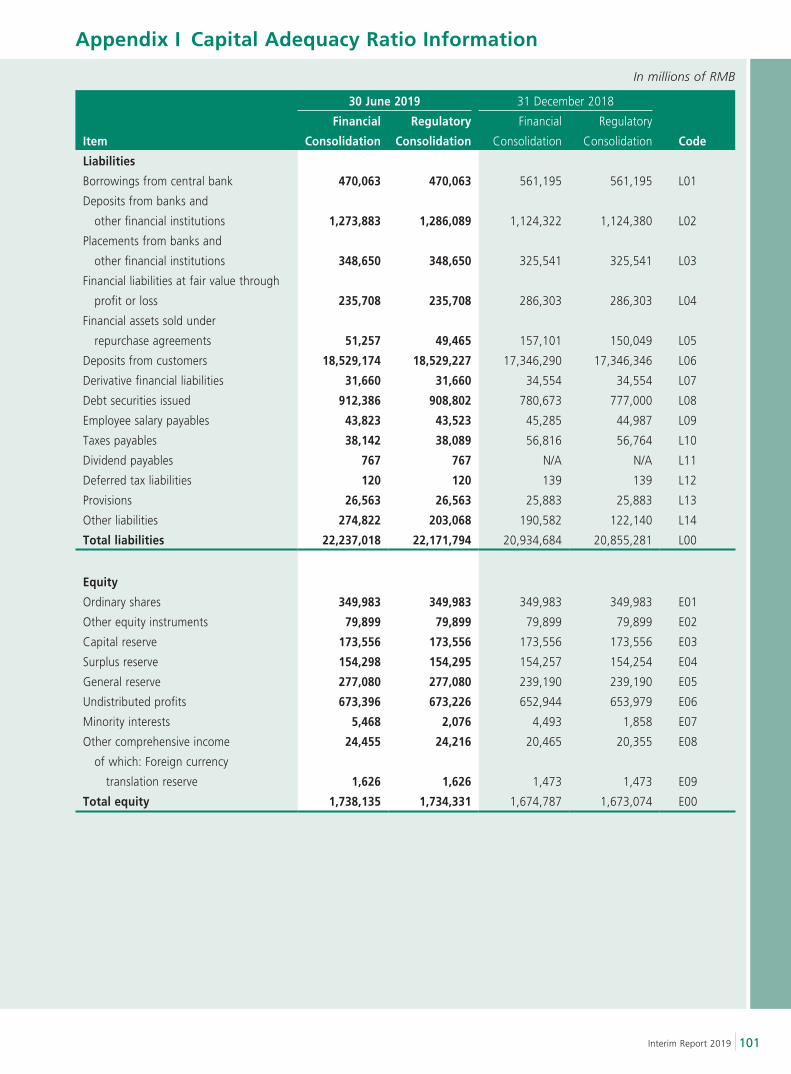
Appendix I Capital Adequacy Ratio Information
101Interim Report 2019
In millions of RMB
30 June 2019 31 December 2018
Item
Financial
Consolidation
Regulatory
Consolidation
Financial
Consolidation
Regulatory
Consolidation Code
Liabilities
Borrowings from central bank 470,063 470,063 561,195 561,195 L01
Deposits from banks and
other financial institutions 1,273,883 1,286,089 1,124,322 1,124,380 L02
Placements from banks and
other financial institutions 348,650 348,650 325,541 325,541 L03
Financial liabilities at fair value through
profit or loss 235,708 235,708 286,303 286,303 L04
Financial assets sold under
repurchase agreements 51,257 49,465 157,101 150,049 L05
Deposits from customers 18,529,174 18,529,227 17,346,290 17,346,346 L06
Derivative financial liabilities 31,660 31,660 34,554 34,554 L07
Debt securities issued 912,386 908,802 780,673 777,000 L08
Employee salary payables 43,823 43,523 45,285 44,987 L09
Taxes payables 38,142 38,089 56,816 56,764 L10
Dividend payables 767 767 N/A N/A L11
Deferred tax liabilities 120 120 139 139 L12
Provisions 26,563 26,563 25,883 25,883 L13
Other liabilities 274,822 203,068 190,582 122,140 L14
Total liabilities 22,237,018 22,171,794 20,934,684 20,855,281 L00
Equity
Ordinary shares 349,983 349,983 349,983 349,983 E01
Other equity instruments 79,899 79,899 79,899 79,899 E02
Capital reserve 173,556 173,556 173,556 173,556 E03
Surplus reserve 154,298 154,295 154,257 154,254 E04
General reserve 277,080 277,080 239,190 239,190 E05
Undistributed profits 673,396 673,226 652,944 653,979 E06
Minority interests 5,468 2,076 4,493 1,858 E07
Other comprehensive income 24,455 24,216 20,465 20,355 E08
of which: Foreign currency
translation reserve 1,626 1,626 1,473 1,473 E09
Total equity 1,738,135 1,734,331 1,674,787 1,673,074 E00
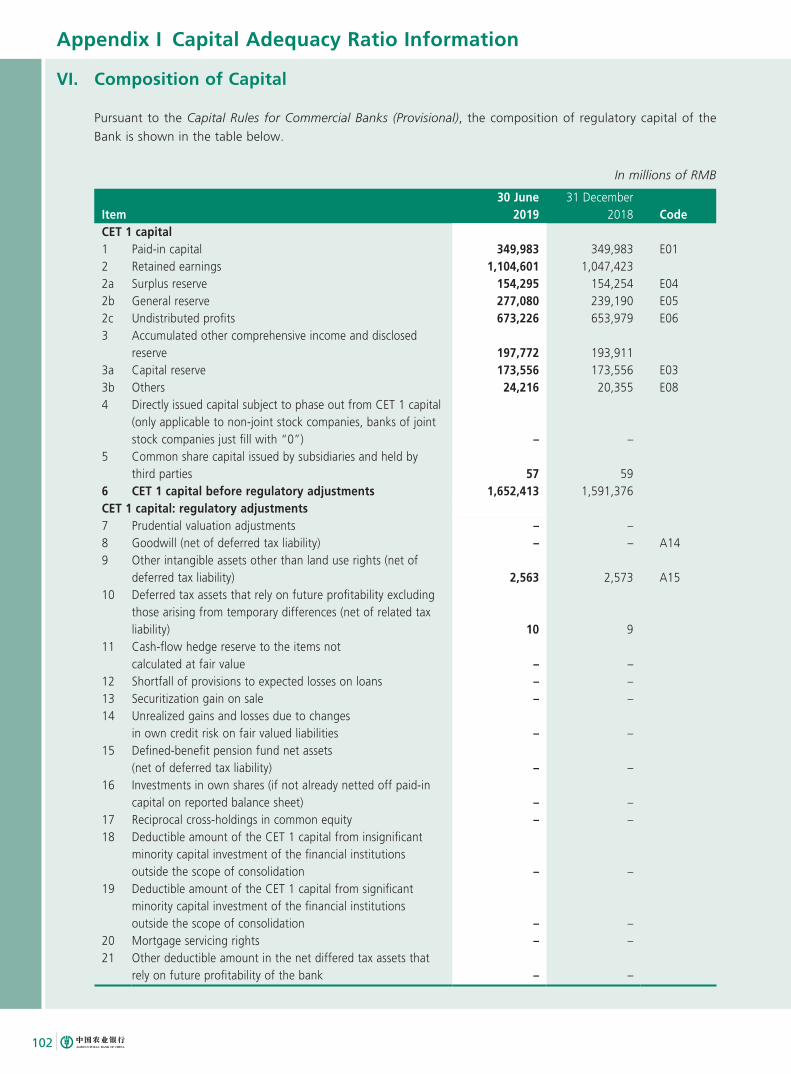
Appendix I Capital Adequacy Ratio Information
102
VI. Composition of Capital
Pursuant to the Capital Rules for Commercial Banks (Provisional), the composition of regulatory capital of the
Bank is shown in the table below.
In millions of RMB
Item30 June
201931 December
2018 CodeCET 1 capital1 Paid-in capital 349,983 349,983 E012 Retained earnings 1,104,601 1,047,4232a Surplus reserve 154,295 154,254 E042b General reserve 277,080 239,190 E052c Undistributed profits 673,226 653,979 E063 Accumulated other comprehensive income and disclosed
reserve 197,772 193,9113a Capital reserve 173,556 173,556 E033b Others 24,216 20,355 E084 Directly issued capital subject to phase out from CET 1 capital
(only applicable to non-joint stock companies, banks of joint stock companies just fill with “0”) – –
5 Common share capital issued by subsidiaries and held by third parties 57 59
6 CET 1 capital before regulatory adjustments 1,652,413 1,591,376CET 1 capital: regulatory adjustments7 Prudential valuation adjustments – –8 Goodwill (net of deferred tax liability) – – A149 Other intangible assets other than land use rights (net of
deferred tax liability) 2,563 2,573 A1510 Deferred tax assets that rely on future profitability excluding
those arising from temporary differences (net of related tax liability) 10 9
11 Cash-flow hedge reserve to the items not calculated at fair value – –
12 Shortfall of provisions to expected losses on loans – –13 Securitization gain on sale – –14 Unrealized gains and losses due to changes
in own credit risk on fair valued liabilities – –15 Defined-benefit pension fund net assets
(net of deferred tax liability) – –16 Investments in own shares (if not already netted off paid-in
capital on reported balance sheet) – –17 Reciprocal cross-holdings in common equity – –18 Deductible amount of the CET 1 capital from insignificant
minority capital investment of the financial institutions outside the scope of consolidation – –
19 Deductible amount of the CET 1 capital from significant minority capital investment of the financial institutions outside the scope of consolidation – –
20 Mortgage servicing rights – –21 Other deductible amount in the net differed tax assets that
rely on future profitability of the bank – –
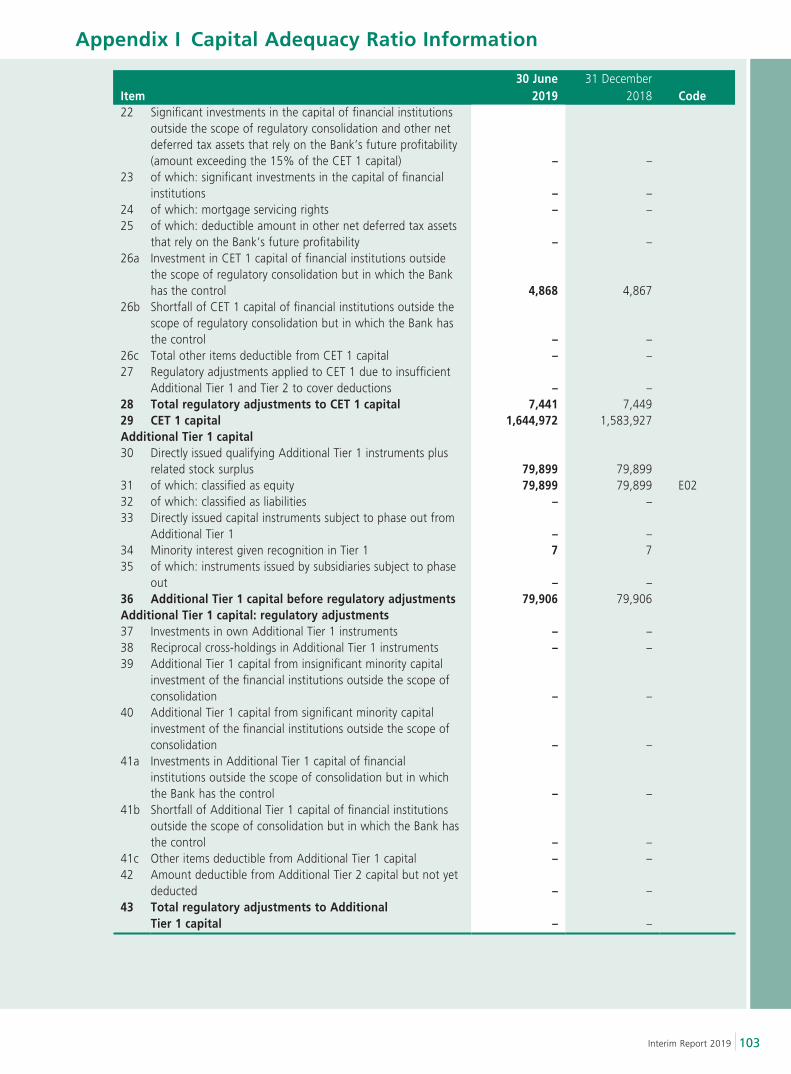
Appendix I Capital Adequacy Ratio Information
103Interim Report 2019
Item30 June
201931 December
2018 Code22 Significant investments in the capital of financial institutions
outside the scope of regulatory consolidation and other net deferred tax assets that rely on the Bank’s future profitability (amount exceeding the 15% of the CET 1 capital) – –
23 of which: significant investments in the capital of financial institutions – –
24 of which: mortgage servicing rights – –25 of which: deductible amount in other net deferred tax assets
that rely on the Bank’s future profitability – –26a Investment in CET 1 capital of financial institutions outside
the scope of regulatory consolidation but in which the Bank has the control 4,868 4,867
26b Shortfall of CET 1 capital of financial institutions outside the scope of regulatory consolidation but in which the Bank has the control – –
26c Total other items deductible from CET 1 capital – –27 Regulatory adjustments applied to CET 1 due to insufficient
Additional Tier 1 and Tier 2 to cover deductions – –28 Total regulatory adjustments to CET 1 capital 7,441 7,44929 CET 1 capital 1,644,972 1,583,927Additional Tier 1 capital30 Directly issued qualifying Additional Tier 1 instruments plus
related stock surplus 79,899 79,89931 of which: classified as equity 79,899 79,899 E0232 of which: classified as liabilities – –33 Directly issued capital instruments subject to phase out from
Additional Tier 1 – –34 Minority interest given recognition in Tier 1 7 735 of which: instruments issued by subsidiaries subject to phase
out – –36 Additional Tier 1 capital before regulatory adjustments 79,906 79,906Additional Tier 1 capital: regulatory adjustments37 Investments in own Additional Tier 1 instruments – –38 Reciprocal cross-holdings in Additional Tier 1 instruments – –39 Additional Tier 1 capital from insignificant minority capital
investment of the financial institutions outside the scope of consolidation – –
40 Additional Tier 1 capital from significant minority capital investment of the financial institutions outside the scope of consolidation – –
41a Investments in Additional Tier 1 capital of financial institutions outside the scope of consolidation but in which the Bank has the control – –
41b Shortfall of Additional Tier 1 capital of financial institutions outside the scope of consolidation but in which the Bank has the control – –
41c Other items deductible from Additional Tier 1 capital – –42 Amount deductible from Additional Tier 2 capital but not yet
deducted – –43 Total regulatory adjustments to Additional
Tier 1 capital – –
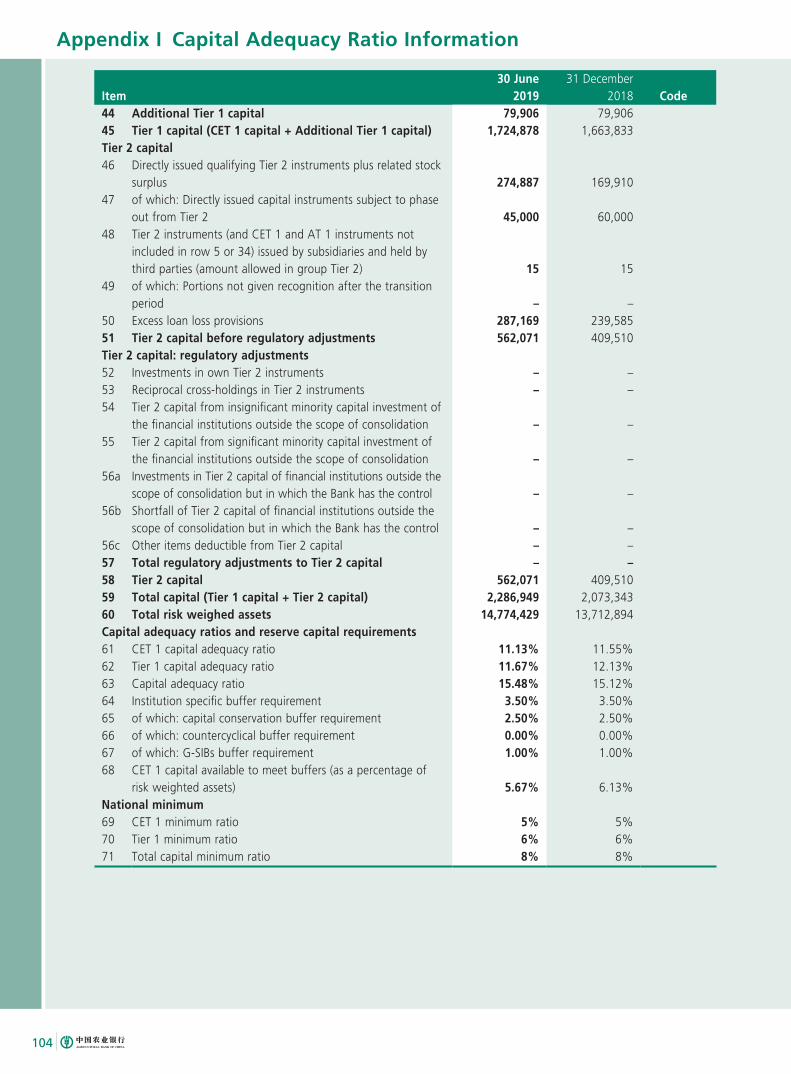
Appendix I Capital Adequacy Ratio Information
104
Item30 June
201931 December
2018 Code44 Additional Tier 1 capital 79,906 79,90645 Tier 1 capital (CET 1 capital + Additional Tier 1 capital) 1,724,878 1,663,833Tier 2 capital46 Directly issued qualifying Tier 2 instruments plus related stock
surplus 274,887 169,91047 of which: Directly issued capital instruments subject to phase
out from Tier 2 45,000 60,00048 Tier 2 instruments (and CET 1 and AT 1 instruments not
included in row 5 or 34) issued by subsidiaries and held by third parties (amount allowed in group Tier 2) 15 15
49 of which: Portions not given recognition after the transition period – –
50 Excess loan loss provisions 287,169 239,58551 Tier 2 capital before regulatory adjustments 562,071 409,510Tier 2 capital: regulatory adjustments52 Investments in own Tier 2 instruments – –53 Reciprocal cross-holdings in Tier 2 instruments – –54 Tier 2 capital from insignificant minority capital investment of
the financial institutions outside the scope of consolidation – –55 Tier 2 capital from significant minority capital investment of
the financial institutions outside the scope of consolidation – –56a Investments in Tier 2 capital of financial institutions outside the
scope of consolidation but in which the Bank has the control – –56b Shortfall of Tier 2 capital of financial institutions outside the
scope of consolidation but in which the Bank has the control – –56c Other items deductible from Tier 2 capital – –57 Total regulatory adjustments to Tier 2 capital – –58 Tier 2 capital 562,071 409,51059 Total capital (Tier 1 capital + Tier 2 capital) 2,286,949 2,073,34360 Total risk weighed assets 14,774,429 13,712,894Capital adequacy ratios and reserve capital requirements61 CET 1 capital adequacy ratio 11.13% 11.55%62 Tier 1 capital adequacy ratio 11.67% 12.13%63 Capital adequacy ratio 15.48% 15.12%64 Institution specific buffer requirement 3.50% 3.50%65 of which: capital conservation buffer requirement 2.50% 2.50%66 of which: countercyclical buffer requirement 0.00% 0.00%67 of which: G-SIBs buffer requirement 1.00% 1.00%68 CET 1 capital available to meet buffers (as a percentage of
risk weighted assets) 5.67% 6.13%National minimum69 CET 1 minimum ratio 5% 5%70 Tier 1 minimum ratio 6% 6%71 Total capital minimum ratio 8% 8%
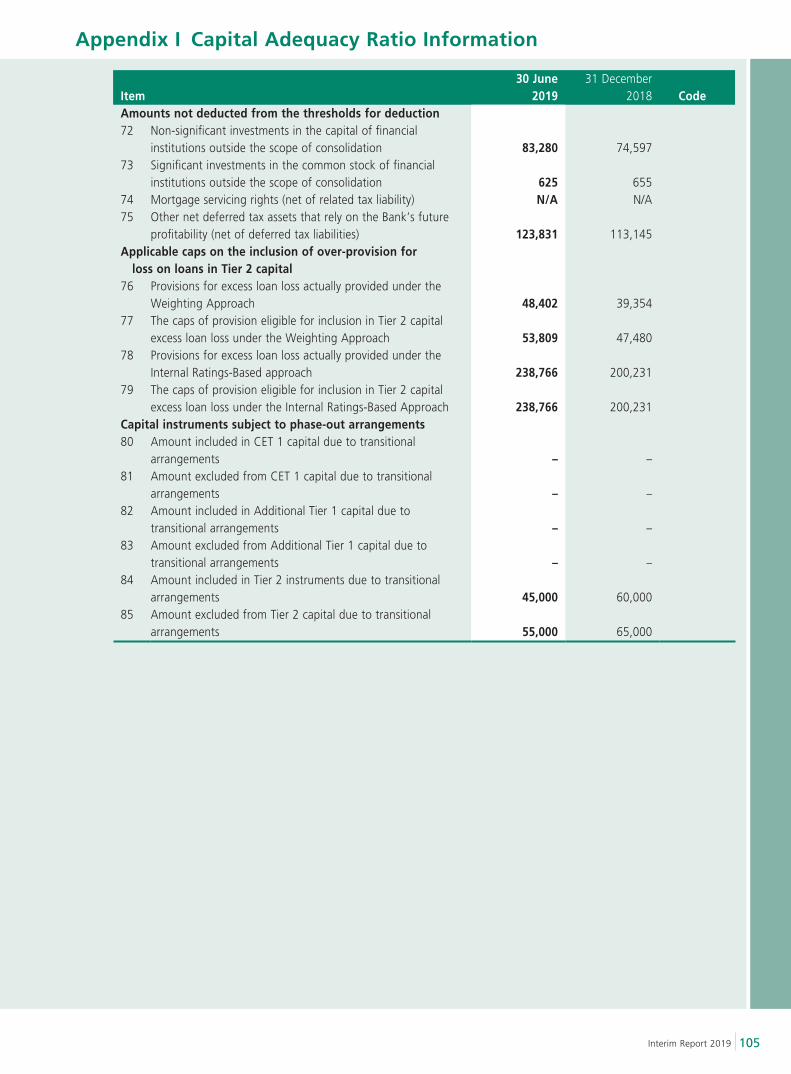
Appendix I Capital Adequacy Ratio Information
105Interim Report 2019
Item30 June
201931 December
2018 CodeAmounts not deducted from the thresholds for deduction72 Non-significant investments in the capital of financial
institutions outside the scope of consolidation 83,280 74,59773 Significant investments in the common stock of financial
institutions outside the scope of consolidation 625 65574 Mortgage servicing rights (net of related tax liability) N/A N/A75 Other net deferred tax assets that rely on the Bank’s future
profitability (net of deferred tax liabilities) 123,831 113,145Applicable caps on the inclusion of over-provision for loss on loans in Tier 2 capital76 Provisions for excess loan loss actually provided under the
Weighting Approach 48,402 39,35477 The caps of provision eligible for inclusion in Tier 2 capital
excess loan loss under the Weighting Approach 53,809 47,48078 Provisions for excess loan loss actually provided under the
Internal Ratings-Based approach 238,766 200,23179 The caps of provision eligible for inclusion in Tier 2 capital
excess loan loss under the Internal Ratings-Based Approach 238,766 200,231Capital instruments subject to phase-out arrangements80 Amount included in CET 1 capital due to transitional
arrangements – –81 Amount excluded from CET 1 capital due to transitional
arrangements – –82 Amount included in Additional Tier 1 capital due to
transitional arrangements – –83 Amount excluded from Additional Tier 1 capital due to
transitional arrangements – –84 Amount included in Tier 2 instruments due to transitional
arrangements 45,000 60,00085 Amount excluded from Tier 2 capital due to transitional
arrangements 55,000 65,000
Appendix I Capital Adequacy Ratio Information
106
VII. Main Features of Eligible Capital Instruments
As of 30 June 2019, the eligible capital instruments of the Bank included common stocks, preference shares
and Tier 2 capital instrument. In July 2010, A Shares of the Bank were listed on the Shanghai Stock Exchange
and H Shares of the Bank were listed on the Hong Kong Stock Exchange. In September 2014, the Bank was
approved to conduct a private issue of no more than 800 million preference shares in China to raise no more
than RMB80 billion with multiple issuances. In November 2014 and March 2015, the Bank issued 800 million
preference shares with two issuances, with RMB80 billion raised. All of the raised funds after deducting issue
expenses are used to replenish Additional Tier 1 capital. In June 2018, the Bank conducted a private issue of
25,188,916,873 A Shares to raise RMB100 billion. All of the raised funds after deducting issue expenses are
used to replenish CET 1 capital.
During the period from 2009 to 2012, the Bank issued in aggregate conventional subordinated
bonds amounting to RMB150 billion in the PRC inter-bank bond market. Pursuant to the
requirement of Capital Rules for Commercial Banks (Provisional), the amount of conventional
subordinated bonds that can be included in regulatory capital shall be reduced year by year from
2013, and as of 30 June 2019, the aggregate amount that could be included in Tier 2 capital was
RMB45 billion. In August 2014, the Bank issued tier 2 capital bonds amounting to RMB30 billion
in the PRC inter-bank bond market, which was all included in Tier 2 capital. The Bank issued
tier-2 capital bonds amounting to RMB80 billion in the PRC inter-bank bond market in two tranches, in October
2017 and in April 2018, respectively, and the raised funds after deducting issue expenses were all included into
Tier 2 capital. Besides, the Bank issued tier 2 capital bonds amounting to RMB120 billion in the PRC inter-bank
bond market in March 2019 and April 2019, respectively, and RMB120 billion raised from these two issuances
after deducting issue expenses was all included into Tier 2 capital.
In addition, the Bank issued 2019 undated tier 1 capital bonds (first tranche) amounting to RMB85 billion in
the PRC inter-bank bond market in August 2019, and the raised funds after deducting issue expenses were all
included into additional Tier 1 capital.
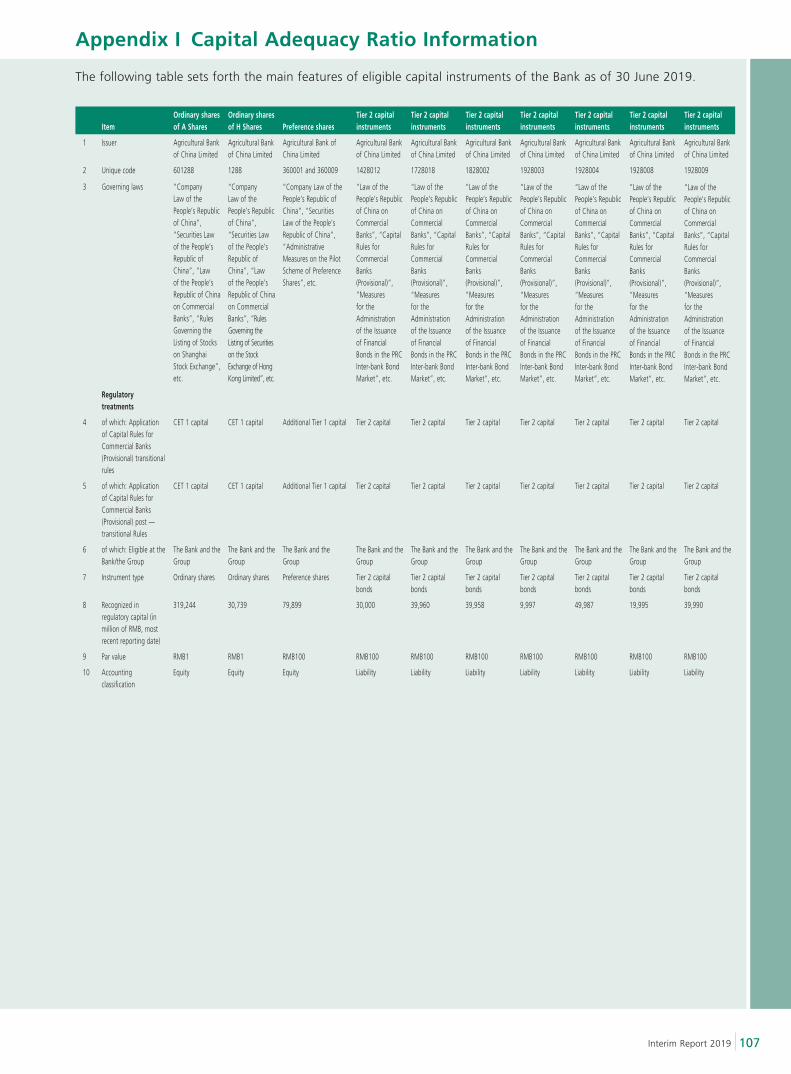
Appendix I Capital Adequacy Ratio Information
107Interim Report 2019
The following table sets forth the main features of eligible capital instruments of the Bank as of 30 June 2019.
ItemOrdinary sharesof A Shares
Ordinary sharesof H Shares Preference shares
Tier 2 capitalinstruments
Tier 2 capitalinstruments
Tier 2 capitalinstruments
Tier 2 capitalinstruments
Tier 2 capitalinstruments
Tier 2 capitalinstruments
Tier 2 capitalinstruments
1 Issuer Agricultural Bank of China Limited
Agricultural Bank of China Limited
Agricultural Bank of China Limited
Agricultural Bank of China Limited
Agricultural Bank of China Limited
Agricultural Bank of China Limited
Agricultural Bank of China Limited
Agricultural Bank of China Limited
Agricultural Bank of China Limited
Agricultural Bank of China Limited
2 Unique code 601288 1288 360001 and 360009 1428012 1728018 1828002 1928003 1928004 1928008 1928009
3 Governing laws “Company Law of the People’s Republic of China”, “Securities Law of the People’s Republic of China”, “Law of the People’s Republic of China on Commercial Banks”, “Rules Governing the Listing of Stocks on Shanghai Stock Exchange”, etc.
“Company Law of the People’s Republic of China”, “Securities Law of the People’s Republic of China”, “Law of the People’s Republic of China on Commercial Banks”, “Rules Governing the Listing of Securities on the Stock Exchange of Hong Kong Limited”, etc.
“Company Law of the People’s Republic of China”, “Securities Law of the People’s Republic of China”, “Administrative Measures on the Pilot Scheme of Preference Shares”, etc.
“Law of the People’s Republic of China on Commercial Banks”, “Capital Rules for Commercial Banks (Provisional)”, “Measures for the Administration of the Issuance of Financial Bonds in the PRC Inter-bank Bond Market”, etc.
“Law of the People’s Republic of China on Commercial Banks”, “Capital Rules for Commercial Banks (Provisional)”, “Measures for the Administration of the Issuance of Financial Bonds in the PRC Inter-bank Bond Market”, etc.
“Law of the People’s Republic of China on Commercial Banks”, “Capital Rules for Commercial Banks (Provisional)”, “Measures for the Administration of the Issuance of Financial Bonds in the PRC Inter-bank Bond Market”, etc.
“Law of the People’s Republic of China on Commercial Banks”, “Capital Rules for Commercial Banks (Provisional)”, “Measures for the Administration of the Issuance of Financial Bonds in the PRC Inter-bank Bond Market”, etc.
“Law of the People’s Republic of China on Commercial Banks”, “Capital Rules for Commercial Banks (Provisional)”, “Measures for the Administration of the Issuance of Financial Bonds in the PRC Inter-bank Bond Market”, etc.
“Law of the People’s Republic of China on Commercial Banks”, “Capital Rules for Commercial Banks (Provisional)”, “Measures for the Administration of the Issuance of Financial Bonds in the PRC Inter-bank Bond Market”, etc.
“Law of the People’s Republic of China on Commercial Banks”, “Capital Rules for Commercial Banks (Provisional)”, “Measures for the Administration of the Issuance of Financial Bonds in the PRC Inter-bank Bond Market”, etc.
Regulatory treatments
4 of which: Application of Capital Rules for Commercial Banks (Provisional) transitional rules
CET 1 capital CET 1 capital Additional Tier 1 capital Tier 2 capital Tier 2 capital Tier 2 capital Tier 2 capital Tier 2 capital Tier 2 capital Tier 2 capital
5 of which: Application of Capital Rules for Commercial Banks (Provisional) post —transitional Rules
CET 1 capital CET 1 capital Additional Tier 1 capital Tier 2 capital Tier 2 capital Tier 2 capital Tier 2 capital Tier 2 capital Tier 2 capital Tier 2 capital
6 of which: Eligible at the Bank/the Group
The Bank and the Group
The Bank and the Group
The Bank and the Group
The Bank and the Group
The Bank and the Group
The Bank and the Group
The Bank and the Group
The Bank and the Group
The Bank and the Group
The Bank and the Group
7 Instrument type Ordinary shares Ordinary shares Preference shares Tier 2 capital bonds
Tier 2 capital bonds
Tier 2 capital bonds
Tier 2 capital bonds
Tier 2 capital bonds
Tier 2 capital bonds
Tier 2 capital bonds
8 Recognized in regulatory capital (in million of RMB, most recent reporting date)
319,244 30,739 79,899 30,000 39,960 39,958 9,997 49,987 19,995 39,990
9 Par value RMB1 RMB1 RMB100 RMB100 RMB100 RMB100 RMB100 RMB100 RMB100 RMB100
10 Accounting classification
Equity Equity Equity Liability Liability Liability Liability Liability Liability Liability
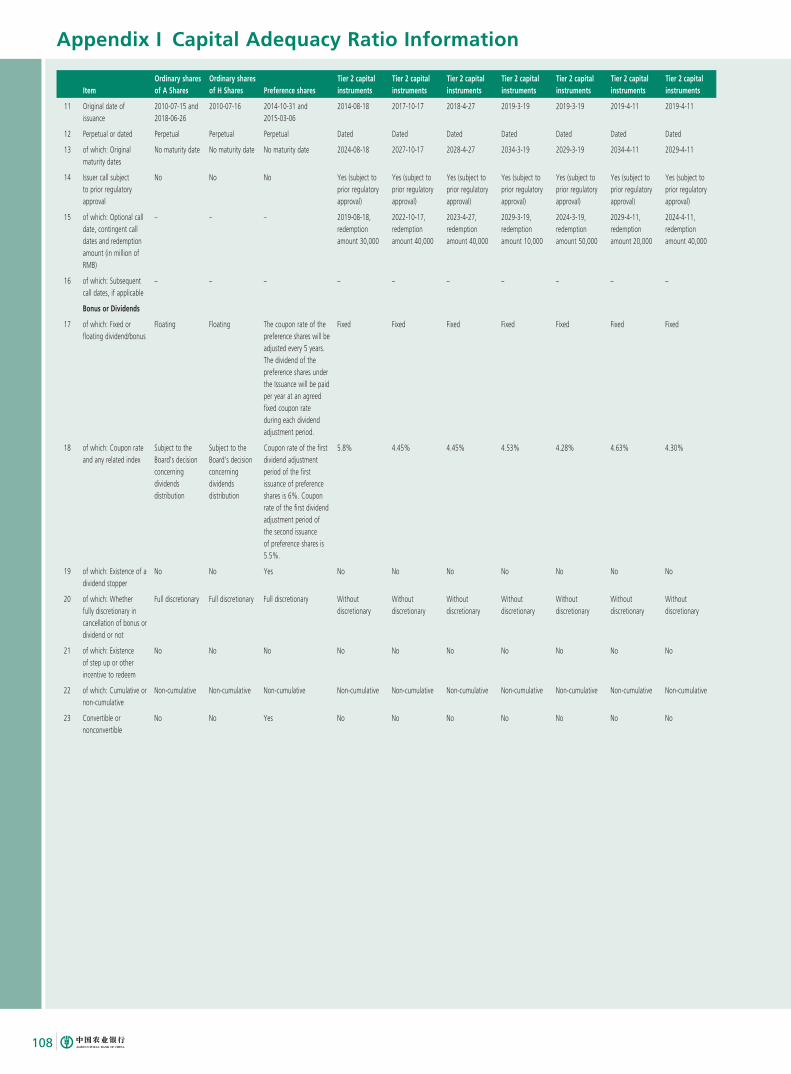
Appendix I Capital Adequacy Ratio Information
108
ItemOrdinary sharesof A Shares
Ordinary sharesof H Shares Preference shares
Tier 2 capitalinstruments
Tier 2 capitalinstruments
Tier 2 capitalinstruments
Tier 2 capitalinstruments
Tier 2 capitalinstruments
Tier 2 capitalinstruments
Tier 2 capitalinstruments
11 Original date of issuance
2010-07-15 and2018-06-26
2010-07-16 2014-10-31 and2015-03-06
2014-08-18 2017-10-17 2018-4-27 2019-3-19 2019-3-19 2019-4-11 2019-4-11
12 Perpetual or dated Perpetual Perpetual Perpetual Dated Dated Dated Dated Dated Dated Dated
13 of which: Original maturity dates
No maturity date No maturity date No maturity date 2024-08-18 2027-10-17 2028-4-27 2034-3-19 2029-3-19 2034-4-11 2029-4-11
14 Issuer call subject to prior regulatory approval
No No No Yes (subject to prior regulatory approval)
Yes (subject to prior regulatory approval)
Yes (subject to prior regulatory approval)
Yes (subject to prior regulatory approval)
Yes (subject to prior regulatory approval)
Yes (subject to prior regulatory approval)
Yes (subject to prior regulatory approval)
15 of which: Optional call date, contingent call dates and redemption amount (in million of RMB)
– – – 2019-08-18, redemption amount 30,000
2022-10-17, redemption amount 40,000
2023-4-27, redemption amount 40,000
2029-3-19, redemption amount 10,000
2024-3-19, redemption amount 50,000
2029-4-11, redemption amount 20,000
2024-4-11, redemption amount 40,000
16 of which: Subsequent call dates, if applicable
– – – – – – – – – –
Bonus or Dividends
17 of which: Fixed or floating dividend/bonus
Floating Floating The coupon rate of the preference shares will be adjusted every 5 years. The dividend of the preference shares under the Issuance will be paid per year at an agreed fixed coupon rate during each dividend adjustment period.
Fixed Fixed Fixed Fixed Fixed Fixed Fixed
18 of which: Coupon rate and any related index
Subject to the Board’s decision concerning dividends distribution
Subject to the Board’s decision concerning dividends distribution
Coupon rate of the first dividend adjustment period of the first issuance of preference shares is 6%. Coupon rate of the first dividend adjustment period of the second issuance of preference shares is 5.5%.
5.8% 4.45% 4.45% 4.53% 4.28% 4.63% 4.30%
19 of which: Existence of a dividend stopper
No No Yes No No No No No No No
20 of which: Whether fully discretionary in cancellation of bonus or dividend or not
Full discretionary Full discretionary Full discretionary Without discretionary
Without discretionary
Without discretionary
Without discretionary
Without discretionary
Without discretionary
Without discretionary
21 of which: Existence of step up or other incentive to redeem
No No No No No No No No No No
22 of which: Cumulative or non-cumulative
Non-cumulative Non-cumulative Non-cumulative Non-cumulative Non-cumulative Non-cumulative Non-cumulative Non-cumulative Non-cumulative Non-cumulative
23 Convertible or nonconvertible
No No Yes No No No No No No No
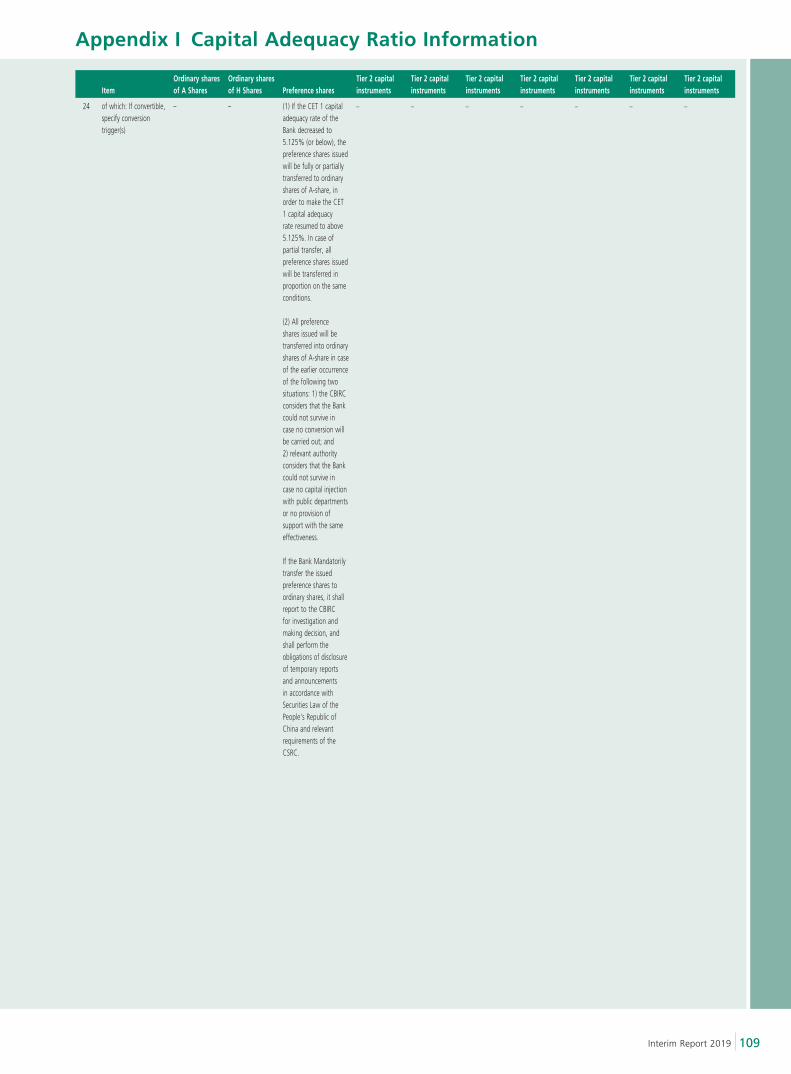
Appendix I Capital Adequacy Ratio Information
109Interim Report 2019
ItemOrdinary sharesof A Shares
Ordinary sharesof H Shares Preference shares
Tier 2 capitalinstruments
Tier 2 capitalinstruments
Tier 2 capitalinstruments
Tier 2 capitalinstruments
Tier 2 capitalinstruments
Tier 2 capitalinstruments
Tier 2 capitalinstruments
24 of which: If convertible, specify conversion trigger(s)
– – (1) If the CET 1 capital adequacy rate of the Bank decreased to 5.125% (or below), the preference shares issued will be fully or partially transferred to ordinary shares of A-share, in order to make the CET 1 capital adequacy rate resumed to above 5.125%. In case of partial transfer, all preference shares issued will be transferred in proportion on the same conditions.
(2) All preference shares issued will be transferred into ordinary shares of A-share in case of the earlier occurrence of the following two situations: 1) the CBIRC considers that the Bank could not survive in case no conversion will be carried out; and 2) relevant authority considers that the Bank could not survive in case no capital injection with public departments or no provision of support with the same effectiveness.
If the Bank Mandatorily transfer the issued preference shares to ordinary shares, it shall report to the CBIRC for investigation and making decision, and shall perform the obligations of disclosure of temporary reports and announcements in accordance with Securities Law of the People’s Republic of China and relevant requirements of the CSRC.
– – – – – – –
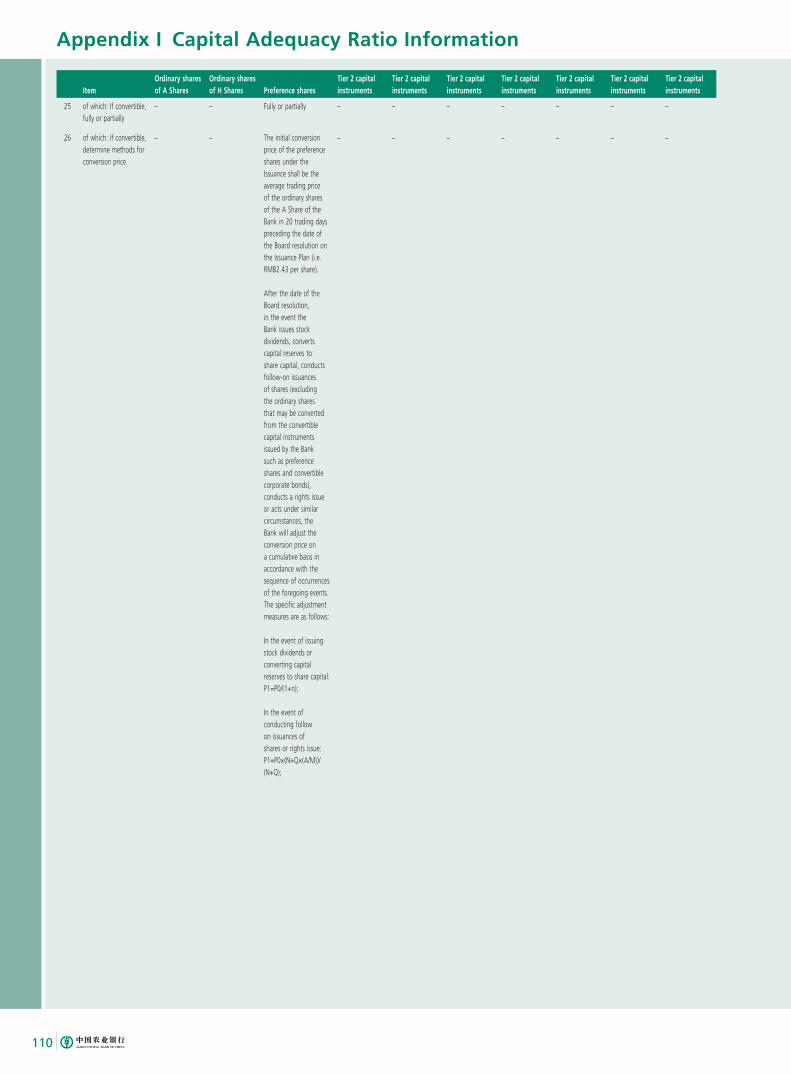
Appendix I Capital Adequacy Ratio Information
110
ItemOrdinary sharesof A Shares
Ordinary sharesof H Shares Preference shares
Tier 2 capitalinstruments
Tier 2 capitalinstruments
Tier 2 capitalinstruments
Tier 2 capitalinstruments
Tier 2 capitalinstruments
Tier 2 capitalinstruments
Tier 2 capitalinstruments
25 of which: If convertible, fully or partially
– – Fully or partially – – – – – – –
26 of which: If convertible, determine methods for conversion price
– – The initial conversion price of the preference shares under the Issuance shall be the average trading price of the ordinary shares of the A Share of the Bank in 20 trading days preceding the date of the Board resolution on the Issuance Plan (i.e. RMB2.43 per share).
After the date of the Board resolution, in the event the Bank issues stock dividends, converts capital reserves to share capital, conducts follow-on issuances of shares (excluding the ordinary shares that may be converted from the convertible capital instruments issued by the Bank such as preference shares and convertible corporate bonds), conducts a rights issue or acts under similar circumstances, the Bank will adjust the conversion price on a cumulative basis in accordance with the sequence of occurrences of the foregoing events.The specific adjustment measures are as follows:
In the event of issuing stock dividends or converting capital reserves to share capital:P1=P0/(1+n);
In the event of conducting follow on issuances of shares or rights issue: P1=P0×(N+Q×(A/M))/(N+Q);
– – – – – – –
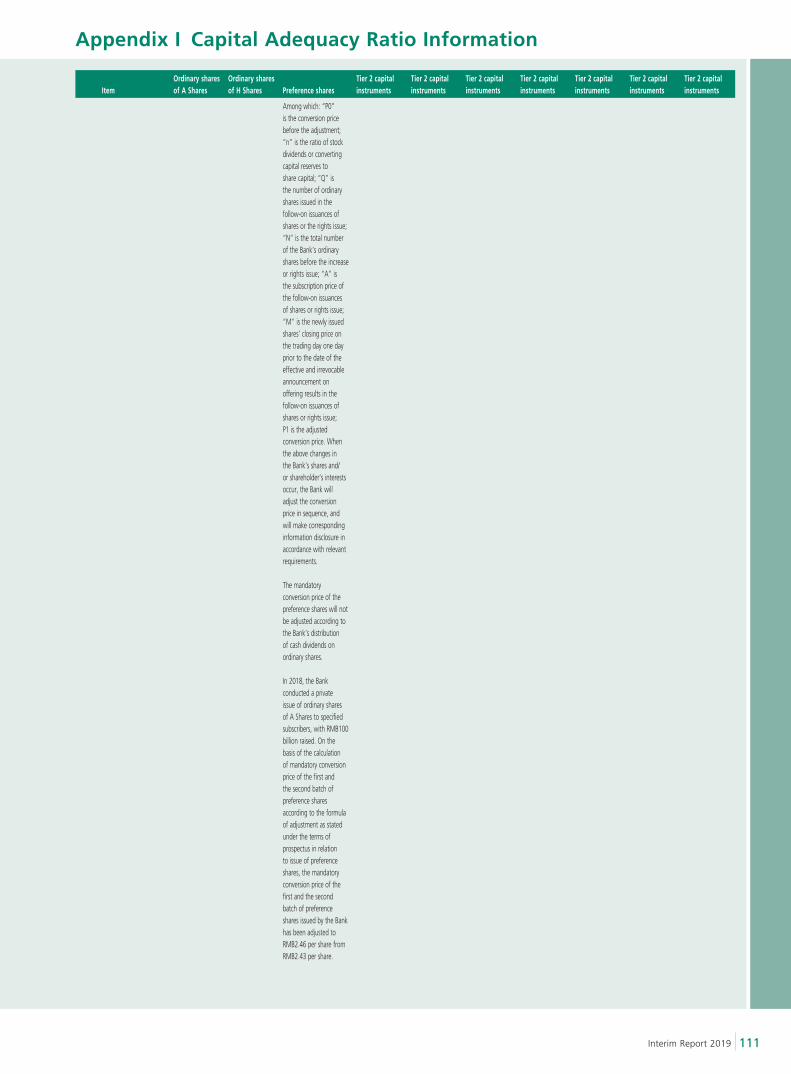
Appendix I Capital Adequacy Ratio Information
111Interim Report 2019
ItemOrdinary sharesof A Shares
Ordinary sharesof H Shares Preference shares
Tier 2 capitalinstruments
Tier 2 capitalinstruments
Tier 2 capitalinstruments
Tier 2 capitalinstruments
Tier 2 capitalinstruments
Tier 2 capitalinstruments
Tier 2 capitalinstruments
Among which: “P0” is the conversion price before the adjustment; “n” is the ratio of stock dividends or converting capital reserves to share capital; “Q” is the number of ordinary shares issued in the follow-on issuances of shares or the rights issue; “N” is the total number of the Bank’s ordinary shares before the increase or rights issue; “A” is the subscription price of the follow-on issuances of shares or rights issue; “M” is the newly issued shares’ closing price on the trading day one day prior to the date of the effective and irrevocable announcement on offering results in the follow-on issuances of shares or rights issue; P1 is the adjusted conversion price. When the above changes in the Bank’s shares and/or shareholder’s interests occur, the Bank will adjust the conversion price in sequence, and will make corresponding information disclosure in accordance with relevant requirements.
The mandatory conversion price of the preference shares will not be adjusted according to the Bank’s distribution of cash dividends on ordinary shares.
In 2018, the Bank conducted a private issue of ordinary shares of A Shares to specified subscribers, with RMB100 billion raised. On the basis of the calculation of mandatory conversion price of the first and the second batch of preference shares according to the formula of adjustment as stated under the terms of prospectus in relation to issue of preference shares, the mandatory conversion price of the first and the second batch of preference shares issued by the Bank has been adjusted to RMB2.46 per share from RMB2.43 per share.
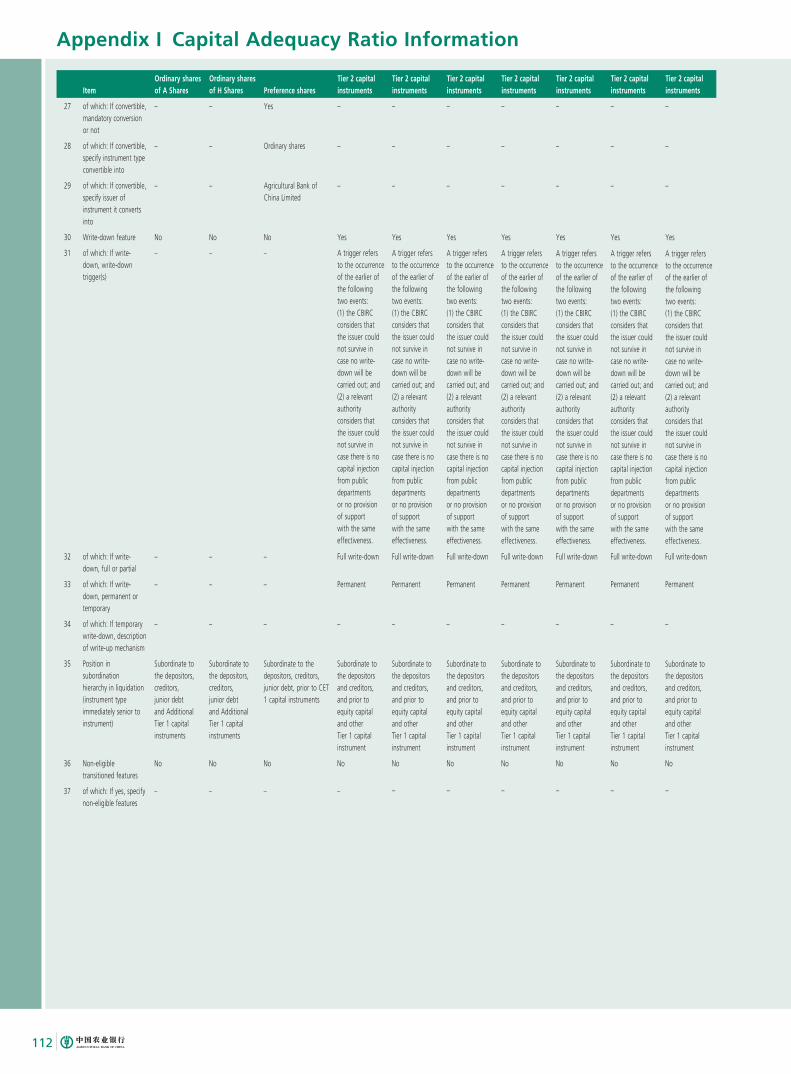
Appendix I Capital Adequacy Ratio Information
112
ItemOrdinary sharesof A Shares
Ordinary sharesof H Shares Preference shares
Tier 2 capitalinstruments
Tier 2 capitalinstruments
Tier 2 capitalinstruments
Tier 2 capitalinstruments
Tier 2 capitalinstruments
Tier 2 capitalinstruments
Tier 2 capitalinstruments
27 of which: If convertible, mandatory conversion or not
– – Yes – – – – – – –
28 of which: If convertible, specify instrument type convertible into
– – Ordinary shares – – – – – – –
29 of which: If convertible, specify issuer of instrument it converts into
– – Agricultural Bank of China Limited
– – – – – – –
30 Write-down feature No No No Yes Yes Yes Yes Yes Yes Yes
31 of which: If write-down, write-down trigger(s)
– – – A trigger refers to the occurrence of the earlier of the following two events: (1) the CBIRC considers that the issuer could not survive in case no write-down will be carried out; and (2) a relevant authority considers that the issuer could not survive in case there is no capital injection from public departments or no provision of support with the same effectiveness.
A trigger refers to the occurrence of the earlier of the following two events: (1) the CBIRC considers that the issuer could not survive in case no write-down will be carried out; and (2) a relevant authority considers that the issuer could not survive in case there is no capital injection from public departments or no provision of support with the same effectiveness.
A trigger refers to the occurrence of the earlier of the following two events: (1) the CBIRC considers that the issuer could not survive in case no write-down will be carried out; and (2) a relevant authority considers that the issuer could not survive in case there is no capital injection from public departments or no provision of support with the same effectiveness.
A trigger refers to the occurrence of the earlier of the following two events: (1) the CBIRC considers that the issuer could not survive in case no write-down will be carried out; and (2) a relevant authority considers that the issuer could not survive in case there is no capital injection from public departments or no provision of support with the same effectiveness.
A trigger refers to the occurrence of the earlier of the following two events: (1) the CBIRC considers that the issuer could not survive in case no write-down will be carried out; and (2) a relevant authority considers that the issuer could not survive in case there is no capital injection from public departments or no provision of support with the same effectiveness.
A trigger refers to the occurrence of the earlier of the following two events: (1) the CBIRC considers that the issuer could not survive in case no write-down will be carried out; and (2) a relevant authority considers that the issuer could not survive in case there is no capital injection from public departments or no provision of support with the same effectiveness.
A trigger refers to the occurrence of the earlier of the following two events: (1) the CBIRC considers that the issuer could not survive in case no write-down will be carried out; and (2) a relevant authority considers that the issuer could not survive in case there is no capital injection from public departments or no provision of support with the same effectiveness.
32 of which: If write-down, full or partial
– – – Full write-down Full write-down Full write-down Full write-down Full write-down Full write-down Full write-down
33 of which: If write-down, permanent or temporary
– – – Permanent Permanent Permanent Permanent Permanent Permanent Permanent
34 of which: If temporary write-down, description of write-up mechanism
– – – – – – – – – –
35 Position in subordination hierarchy in liquidation (instrument type immediately senior to instrument)
Subordinate to the depositors, creditors, junior debt and Additional Tier 1 capital instruments
Subordinate to the depositors, creditors, junior debt and Additional Tier 1 capital instruments
Subordinate to the depositors, creditors, junior debt, prior to CET 1 capital instruments
Subordinate to the depositors and creditors, and prior to equity capital and other Tier 1 capital instrument
Subordinate to the depositors and creditors, and prior to equity capital and other Tier 1 capital instrument
Subordinate to the depositors and creditors, and prior to equity capital and other Tier 1 capital instrument
Subordinate to the depositors and creditors, and prior to equity capital and other Tier 1 capital instrument
Subordinate to the depositors and creditors, and prior to equity capital and other Tier 1 capital instrument
Subordinate to the depositors and creditors, and prior to equity capital and other Tier 1 capital instrument
Subordinate to the depositors and creditors, and prior to equity capital and other Tier 1 capital instrument
36 Non-eligible transitioned features
No No No No No No No No No No
37 of which: If yes, specify non-eligible features
– – – – – – – – – –
Appendix II Liquidity Coverage Ratio Information
113Interim Report 2019
The Bank disclosed the following information of liquidity coverage ratio in accordance with relevant regulations of the
CBIRC.
Regulatory Requirements of Liquidity Coverage Ratio
In accordance with the Rules on Liquidity Risk Management of Commercial Banks issued by the CBIRC, it is required
that the liquidity coverage ratio of commercial banks should be no less than 100%. In addition, in accordance with
the Rules on Disclosure for Liquidity Coverage Ratio Information of Commercial Banks, commercial banks are required
to disclose the liquidity coverage ratio information at the same frequency as the frequency at which they issue the
financial report, and to disclose the simple arithmetic average of the liquidity coverage ratios based on daily data in
every quarter from 2017 and the number of daily data adopted in calculation of such average.
Liquidity Coverage Ratio
The Bank calculated the liquidity coverage ratio in accordance with the Rules on Liquidity Risk Management of
Commercial Banks and applicable calculation requirements. The average of daily liquidity coverage ratio of the Bank
was 123.2% in the second quarter of 2019, representing a decrease of 17.4 percentage points over the previous
quarter, and 91 numerical values of liquidity coverage ratios were used in calculating such average. Our high-quality
liquid assets are mainly cash, excess reserve with the central bank able to be withdrawn under stress conditions,
and securities falling within the Level 1 and Level 2 assets as defined in the Rules on Liquidity Risk Management of
Commercial Banks.
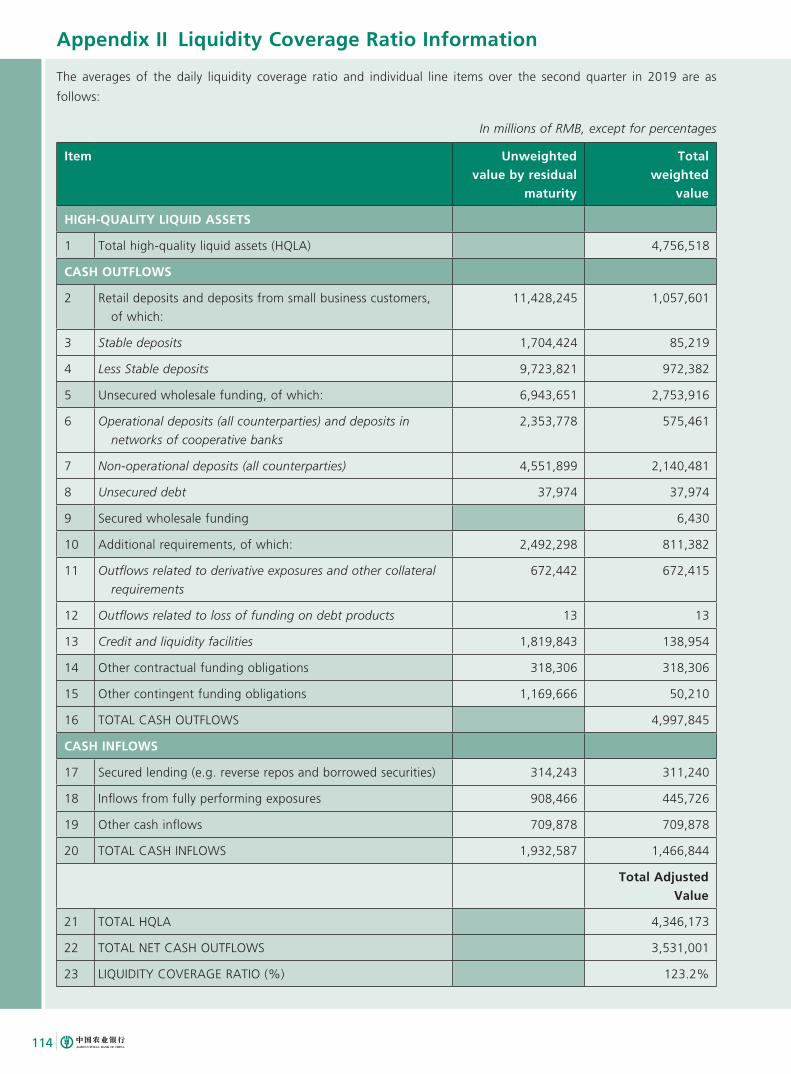
Appendix II Liquidity Coverage Ratio Information
114
The averages of the daily liquidity coverage ratio and individual line items over the second quarter in 2019 are as
follows:
In millions of RMB, except for percentages
Item Unweighted value by residual
maturity
Totalweighted
value
HIGH-QUALITY LIQUID ASSETS
1 Total high-quality liquid assets (HQLA) 4,756,518
CASH OUTFLOWS
2 Retail deposits and deposits from small business customers,
of which:
11,428,245 1,057,601
3 Stable deposits 1,704,424 85,219
4 Less Stable deposits 9,723,821 972,382
5 Unsecured wholesale funding, of which: 6,943,651 2,753,916
6 Operational deposits (all counterparties) and deposits in
networks of cooperative banks
2,353,778 575,461
7 Non-operational deposits (all counterparties) 4,551,899 2,140,481
8 Unsecured debt 37,974 37,974
9 Secured wholesale funding 6,430
10 Additional requirements, of which: 2,492,298 811,382
11 Outflows related to derivative exposures and other collateral
requirements
672,442 672,415
12 Outflows related to loss of funding on debt products 13 13
13 Credit and liquidity facilities 1,819,843 138,954
14 Other contractual funding obligations 318,306 318,306
15 Other contingent funding obligations 1,169,666 50,210
16 TOTAL CASH OUTFLOWS 4,997,845
CASH INFLOWS
17 Secured lending (e.g. reverse repos and borrowed securities) 314,243 311,240
18 Inflows from fully performing exposures 908,466 445,726
19 Other cash inflows 709,878 709,878
20 TOTAL CASH INFLOWS 1,932,587 1,466,844
Total Adjusted Value
21 TOTAL HQLA 4,346,173
22 TOTAL NET CASH OUTFLOWS 3,531,001
23 LIQUIDITY COVERAGE RATIO (%) 123.2%
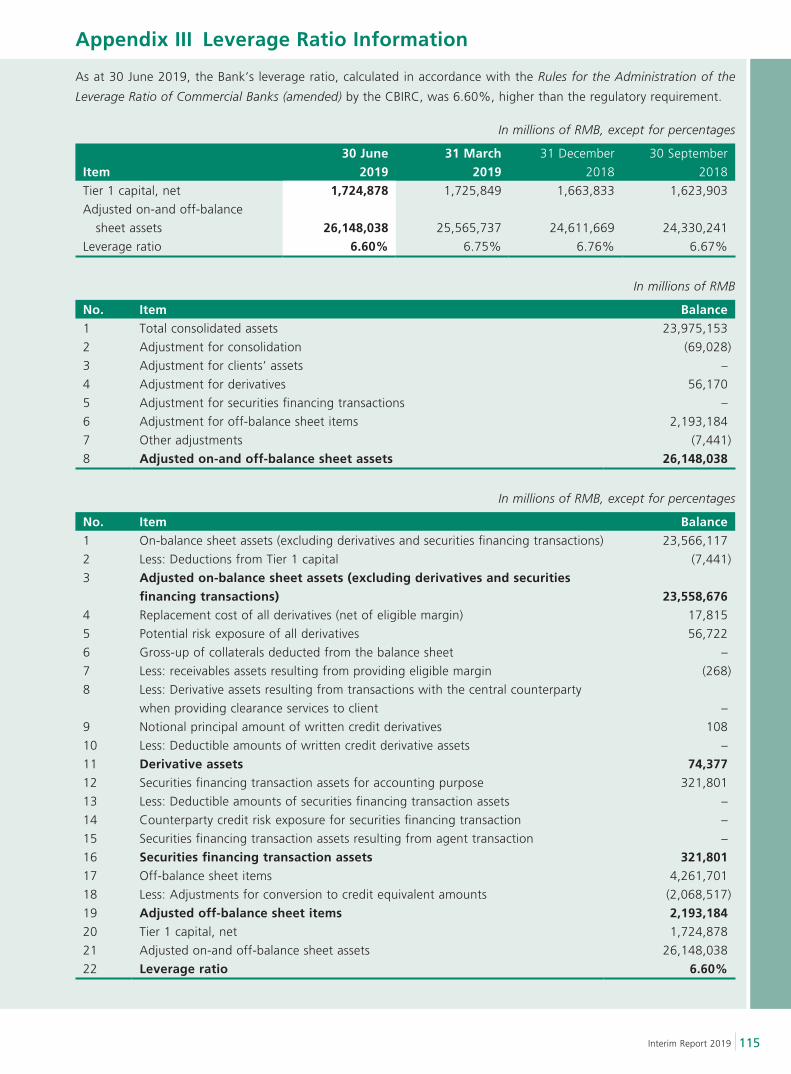
Appendix III Leverage Ratio Information
115Interim Report 2019
As at 30 June 2019, the Bank’s leverage ratio, calculated in accordance with the Rules for the Administration of the
Leverage Ratio of Commercial Banks (amended) by the CBIRC, was 6.60%, higher than the regulatory requirement.
In millions of RMB, except for percentages
Item30 June
201931 March
201931 December
2018
30 September
2018
Tier 1 capital, net 1,724,878 1,725,849 1,663,833 1,623,903
Adjusted on-and off-balance
sheet assets 26,148,038 25,565,737 24,611,669 24,330,241
Leverage ratio 6.60% 6.75% 6.76% 6.67%
In millions of RMB
No. Item Balance1 Total consolidated assets 23,975,153
2 Adjustment for consolidation (69,028)
3 Adjustment for clients’ assets –
4 Adjustment for derivatives 56,170
5 Adjustment for securities financing transactions –
6 Adjustment for off-balance sheet items 2,193,184
7 Other adjustments (7,441)
8 Adjusted on-and off-balance sheet assets 26,148,038
In millions of RMB, except for percentages
No. Item Balance1 On-balance sheet assets (excluding derivatives and securities financing transactions) 23,566,117
2 Less: Deductions from Tier 1 capital (7,441)
3 Adjusted on-balance sheet assets (excluding derivatives and securities financing transactions) 23,558,676
4 Replacement cost of all derivatives (net of eligible margin) 17,815
5 Potential risk exposure of all derivatives 56,722
6 Gross-up of collaterals deducted from the balance sheet –
7 Less: receivables assets resulting from providing eligible margin (268)
8 Less: Derivative assets resulting from transactions with the central counterparty
when providing clearance services to client –
9 Notional principal amount of written credit derivatives 108
10 Less: Deductible amounts of written credit derivative assets –
11 Derivative assets 74,37712 Securities financing transaction assets for accounting purpose 321,801
13 Less: Deductible amounts of securities financing transaction assets –
14 Counterparty credit risk exposure for securities financing transaction –
15 Securities financing transaction assets resulting from agent transaction –
16 Securities financing transaction assets 321,80117 Off-balance sheet items 4,261,701
18 Less: Adjustments for conversion to credit equivalent amounts (2,068,517)
19 Adjusted off-balance sheet items 2,193,18420 Tier 1 capital, net 1,724,878
21 Adjusted on-and off-balance sheet assets 26,148,038
22 Leverage ratio 6.60%
Appendix IV Net Stable Funding Ratio Information
116
The Bank disclosed the following information of net stable funding ratio in accordance with relevant regulations of the
CBIRC.
Regulatory Requirements of Net Stable Funding Ratio
In accordance with the Rules on Liquidity Risk Management of Commercial Banks issued by the CBIRC, it is required
that the net stable funding ratio of commercial banks should be no less than 100%. In addition, as required by the
Rules on Disclosure of Net Stable Funding Ratio Information of Commercial Banks, commercial banks shall disclose the
net stable funding ratio information of the latest two quarters in a financial report or on their official websites on a
semiannual basis at least.
Net Stable Funding Ratio
The Bank calculated net stable funding ratio in accordance with the Rules on Liquidity Risk Management of
Commercial Banks and applicable statistical requirements. The net stable funding ratio of the Bank in the fourth
quarter of 2018 was 127.4%, with a weighted value of RMB15,646.9 billion for available stable funds and a
weighted value of RMB12,282.2 billion for required stable funds. In the first quarter of 2019, the net stable funding
ratio increased by 1.4 percentage points to 128.8% compared to the previous quarter, with a weighted value of
RMB16,497.3 billion for available stable funds and a weighted value of RMB12,811.5 billion for required stable funds.
In the second quarter of 2019, the net stable funding ratio increased by 0.8 percentage point to 129.6% compared to
the previous quarter, with a weighted value of RMB16,662.9 billion for available stable funds and a weighted value of
RMB12,860.8 billion for required stable funds.
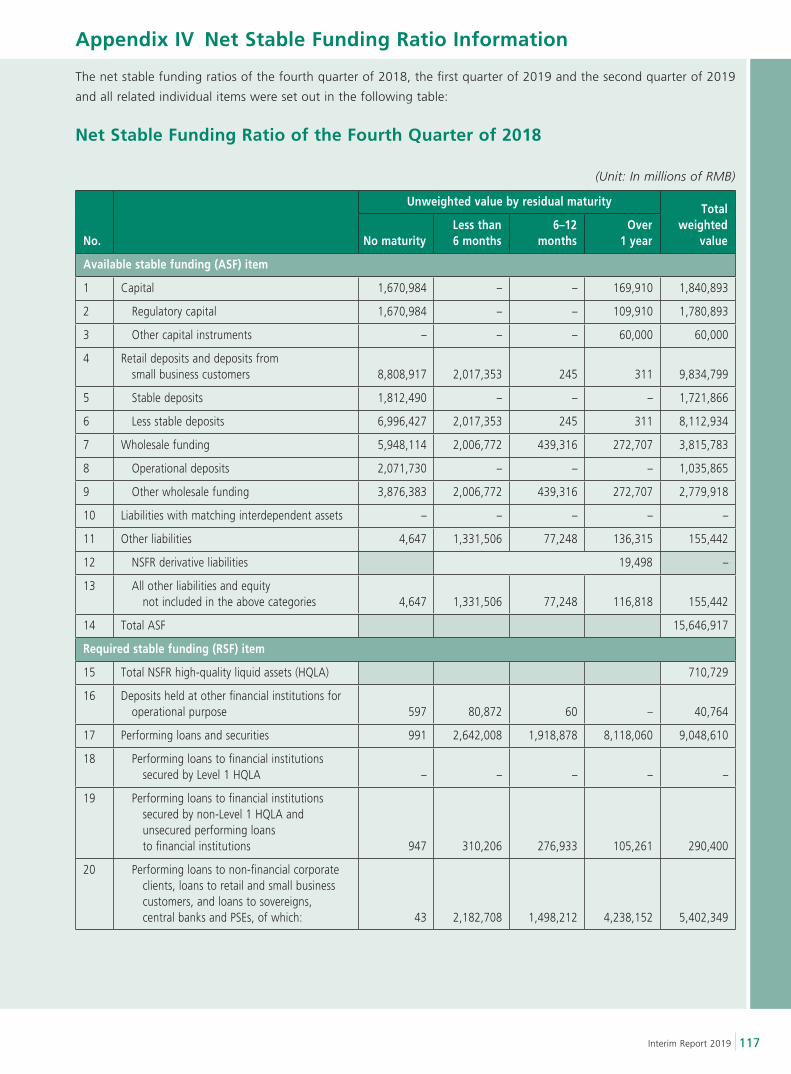
Appendix IV Net Stable Funding Ratio Information
117Interim Report 2019
The net stable funding ratios of the fourth quarter of 2018, the first quarter of 2019 and the second quarter of 2019
and all related individual items were set out in the following table:
Net Stable Funding Ratio of the Fourth Quarter of 2018
(Unit: In millions of RMB)
No.
Unweighted value by residual maturityTotal
weightedvalueNo maturity
Less than6 months
6–12months
Over1 year
Available stable funding (ASF) item
1 Capital 1,670,984 – – 169,910 1,840,893
2 Regulatory capital 1,670,984 – – 109,910 1,780,893
3 Other capital instruments – – – 60,000 60,000
4 Retail deposits and deposits from small business customers 8,808,917 2,017,353 245 311 9,834,799
5 Stable deposits 1,812,490 – – – 1,721,866
6 Less stable deposits 6,996,427 2,017,353 245 311 8,112,934
7 Wholesale funding 5,948,114 2,006,772 439,316 272,707 3,815,783
8 Operational deposits 2,071,730 – – – 1,035,865
9 Other wholesale funding 3,876,383 2,006,772 439,316 272,707 2,779,918
10 Liabilities with matching interdependent assets – – – – –
11 Other liabilities 4,647 1,331,506 77,248 136,315 155,442
12 NSFR derivative liabilities 19,498 –
13 All other liabilities and equity not included in the above categories 4,647 1,331,506 77,248 116,818 155,442
14 Total ASF 15,646,917
Required stable funding (RSF) item
15 Total NSFR high-quality liquid assets (HQLA) 710,729
16 Deposits held at other financial institutions for operational purpose 597 80,872 60 – 40,764
17 Performing loans and securities 991 2,642,008 1,918,878 8,118,060 9,048,610
18 Performing loans to financial institutions secured by Level 1 HQLA – – – – –
19 Performing loans to financial institutions secured by non-Level 1 HQLA and unsecured performing loans to financial institutions 947 310,206 276,933 105,261 290,400
20 Performing loans to non-financial corporate clients, loans to retail and small business customers, and loans to sovereigns, central banks and PSEs, of which: 43 2,182,708 1,498,212 4,238,152 5,402,349
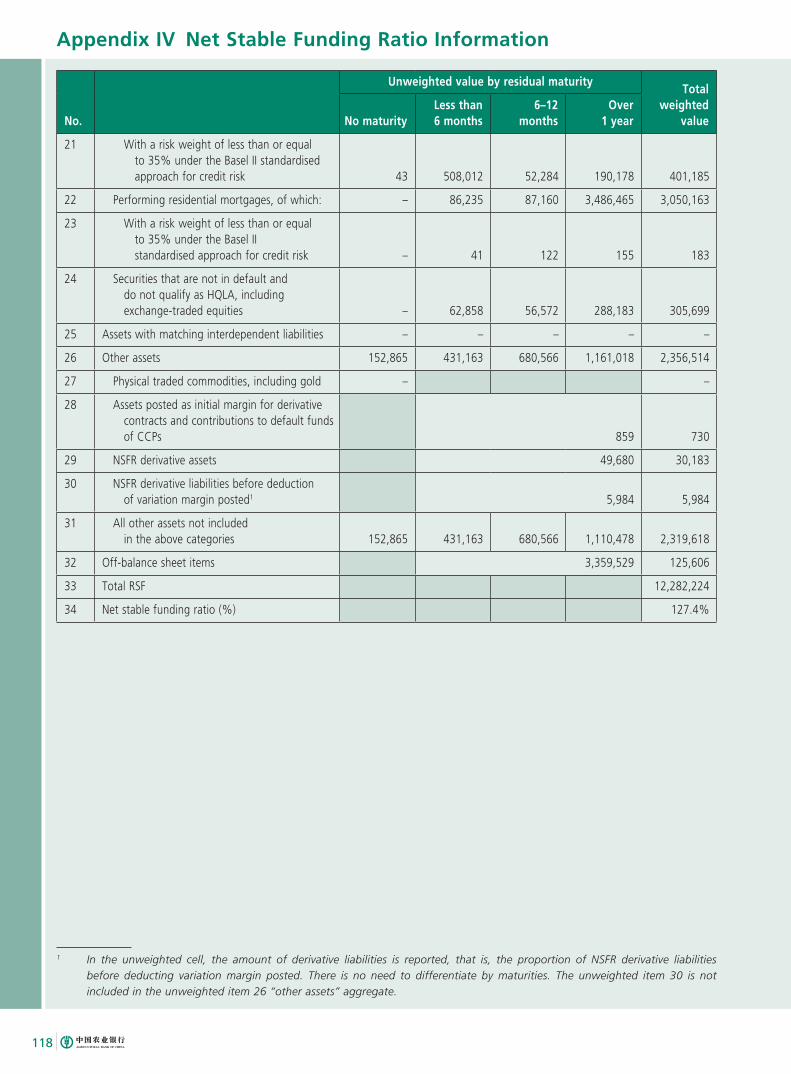
Appendix IV Net Stable Funding Ratio Information
118
No.
Unweighted value by residual maturityTotal
weightedvalueNo maturity
Less than6 months
6–12months
Over1 year
21 With a risk weight of less than or equal to 35% under the Basel II standardised approach for credit risk 43 508,012 52,284 190,178 401,185
22 Performing residential mortgages, of which: – 86,235 87,160 3,486,465 3,050,163
23 With a risk weight of less than or equal to 35% under the Basel II standardised approach for credit risk – 41 122 155 183
24 Securities that are not in default and do not qualify as HQLA, including exchange-traded equities – 62,858 56,572 288,183 305,699
25 Assets with matching interdependent liabilities – – – – –
26 Other assets 152,865 431,163 680,566 1,161,018 2,356,514
27 Physical traded commodities, including gold – –
28 Assets posted as initial margin for derivative contracts and contributions to default funds of CCPs 859 730
29 NSFR derivative assets 49,680 30,183
30 NSFR derivative liabilities before deduction of variation margin posted1 5,984 5,984
31 All other assets not included in the above categories 152,865 431,163 680,566 1,110,478 2,319,618
32 Off-balance sheet items 3,359,529 125,606
33 Total RSF 12,282,224
34 Net stable funding ratio (%) 127.4%
1 In the unweighted cell, the amount of derivative liabilities is reported, that is, the proportion of NSFR derivative liabilities before deducting variation margin posted. There is no need to differentiate by maturities. The unweighted item 30 is not included in the unweighted item 26 “other assets” aggregate.
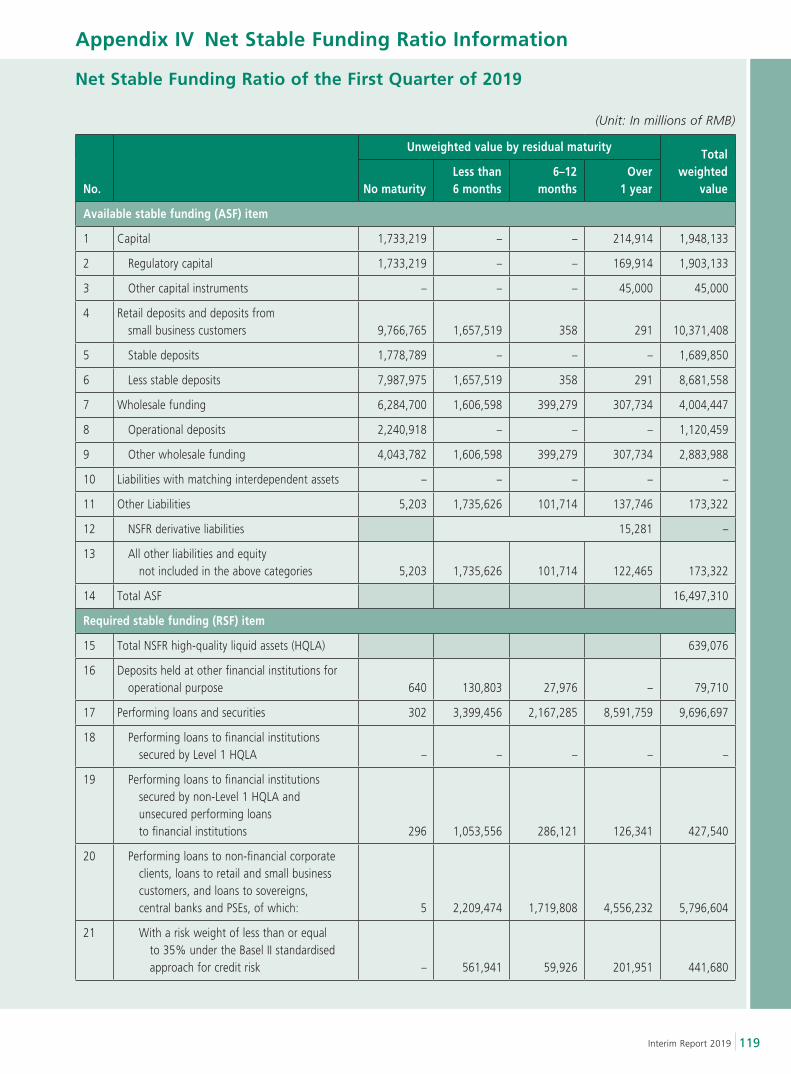
Appendix IV Net Stable Funding Ratio Information
119Interim Report 2019
Net Stable Funding Ratio of the First Quarter of 2019
(Unit: In millions of RMB)
No.
Unweighted value by residual maturityTotal
weightedvalueNo maturity
Less than6 months
6–12months
Over1 year
Available stable funding (ASF) item
1 Capital 1,733,219 – – 214,914 1,948,133
2 Regulatory capital 1,733,219 – – 169,914 1,903,133
3 Other capital instruments – – – 45,000 45,000
4 Retail deposits and deposits from small business customers 9,766,765 1,657,519 358 291 10,371,408
5 Stable deposits 1,778,789 – – – 1,689,850
6 Less stable deposits 7,987,975 1,657,519 358 291 8,681,558
7 Wholesale funding 6,284,700 1,606,598 399,279 307,734 4,004,447
8 Operational deposits 2,240,918 – – – 1,120,459
9 Other wholesale funding 4,043,782 1,606,598 399,279 307,734 2,883,988
10 Liabilities with matching interdependent assets – – – – –
11 Other Liabilities 5,203 1,735,626 101,714 137,746 173,322
12 NSFR derivative liabilities 15,281 –
13 All other liabilities and equity not included in the above categories 5,203 1,735,626 101,714 122,465 173,322
14 Total ASF 16,497,310
Required stable funding (RSF) item
15 Total NSFR high-quality liquid assets (HQLA) 639,076
16 Deposits held at other financial institutions for operational purpose 640 130,803 27,976 – 79,710
17 Performing loans and securities 302 3,399,456 2,167,285 8,591,759 9,696,697
18 Performing loans to financial institutions secured by Level 1 HQLA – – – – –
19 Performing loans to financial institutions secured by non-Level 1 HQLA and unsecured performing loans to financial institutions 296 1,053,556 286,121 126,341 427,540
20 Performing loans to non-financial corporate clients, loans to retail and small business customers, and loans to sovereigns, central banks and PSEs, of which: 5 2,209,474 1,719,808 4,556,232 5,796,604
21 With a risk weight of less than or equal to 35% under the Basel II standardised approach for credit risk – 561,941 59,926 201,951 441,680
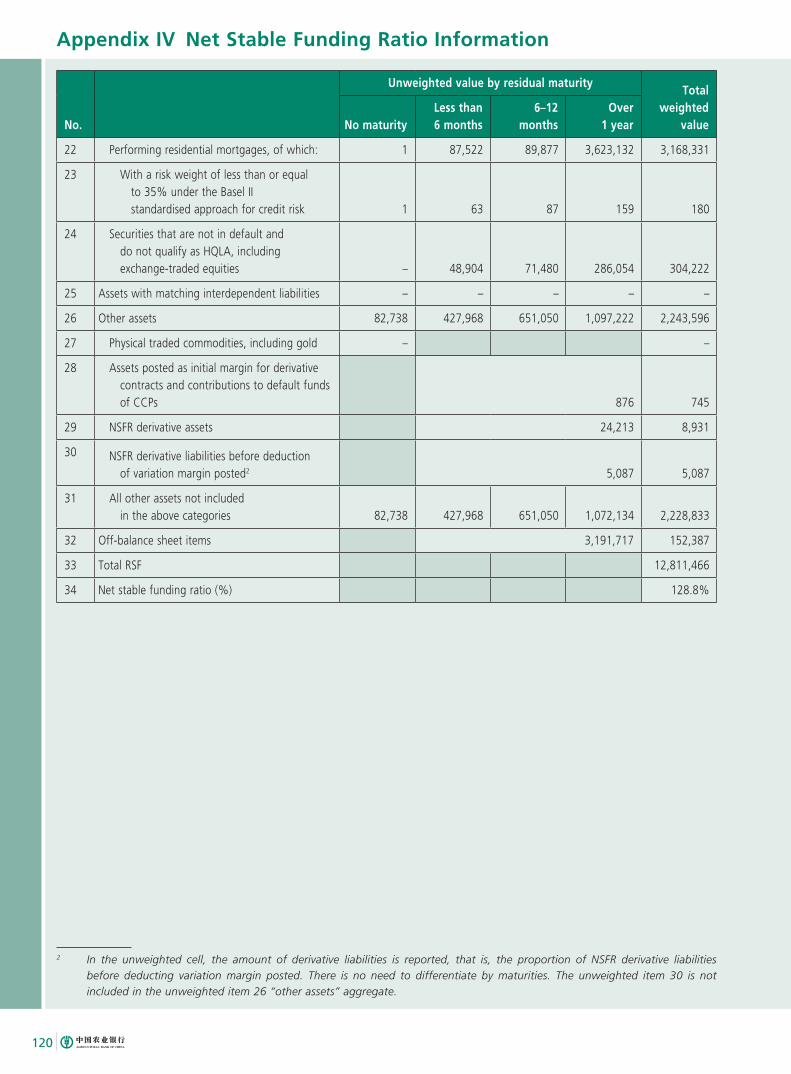
Appendix IV Net Stable Funding Ratio Information
120
No.
Unweighted value by residual maturityTotal
weightedvalueNo maturity
Less than6 months
6–12months
Over1 year
22 Performing residential mortgages, of which: 1 87,522 89,877 3,623,132 3,168,331
23 With a risk weight of less than or equal to 35% under the Basel II standardised approach for credit risk 1 63 87 159 180
24 Securities that are not in default and do not qualify as HQLA, including exchange-traded equities – 48,904 71,480 286,054 304,222
25 Assets with matching interdependent liabilities – – – – –
26 Other assets 82,738 427,968 651,050 1,097,222 2,243,596
27 Physical traded commodities, including gold – –
28 Assets posted as initial margin for derivative contracts and contributions to default funds of CCPs 876 745
29 NSFR derivative assets 24,213 8,931
30 NSFR derivative liabilities before deduction of variation margin posted2 5,087 5,087
31 All other assets not included in the above categories 82,738 427,968 651,050 1,072,134 2,228,833
32 Off-balance sheet items 3,191,717 152,387
33 Total RSF 12,811,466
34 Net stable funding ratio (%) 128.8%
2 In the unweighted cell, the amount of derivative liabilities is reported, that is, the proportion of NSFR derivative liabilities before deducting variation margin posted. There is no need to differentiate by maturities. The unweighted item 30 is not included in the unweighted item 26 “other assets” aggregate.

Appendix IV Net Stable Funding Ratio Information
121Interim Report 2019
Net Stable Funding Ratio of the Second Quarter of 2019
(Unit: In millions of RMB)
No.
Unweighted value by residual maturityTotal
weightedvalueNo maturity
Less than6 months
6–12months
Over1 year
Available stable funding (ASF) item
1 Capital 1,732,910 – – 274,887 2,007,797
2 Regulatory capital 1,732,910 – – 229,887 1,962,797
3 Other capital instruments – – – 45,000 45,000
4 Retail deposits and deposits from small business customers 9,856,145 1,551,680 212 35 10,351,017
5 Stable deposits 1,674,979 – – – 1,591,230
6 Less stable deposits 8,181,166 1,551,680 212 35 8,759,787
7 Wholesale funding 6,591,988 1,829,444 270,243 342,542 4,110,741
8 Operational deposits 2,410,356 – – – 1,205,178
9 Other wholesale funding 4,181,632 1,829,444 270,243 342,542 2,905,563
10 Liabilities with matching interdependent assets – – – – –
11 Other Liabilities 12 1,580,234 125,972 129,356 193,379
12 NSFR derivative liabilities (1,037) –
13 All other liabilities and equity not included in the above categories 12 1,580,234 125,972 130,393 193,379
14 Total ASF 16,662,935
Required stable funding (RSF) item
15 Total NSFR high-quality liquid assets (HQLA) 664,933
16 Deposits held at other financial institutions for operational purpose 512 115,501 90,834 – 103,423
17 Performing loans and securities 3,197 3,069,115 2,177,651 8,791,676 9,857,513
18 Performing loans to financial institutions secured by Level 1 HQLA – – – 84,215 84,215
19 Performing loans to financial institutions secured by non-Level 1 HQLA and unsecured performing loans to financial institutions 787 631,750 235,787 46,960 259,734
20 Performing loans to non-financial corporate clients, loans to retail and small business customers, and loans to sovereigns, central banks and PSEs, of which: 5 2,276,539 1,781,734 4,625,429 5,920,351
21 With a risk weight of less than or equal to 35% under the Basel II standardised approach for credit risk – 591,656 62,589 180,729 438,481
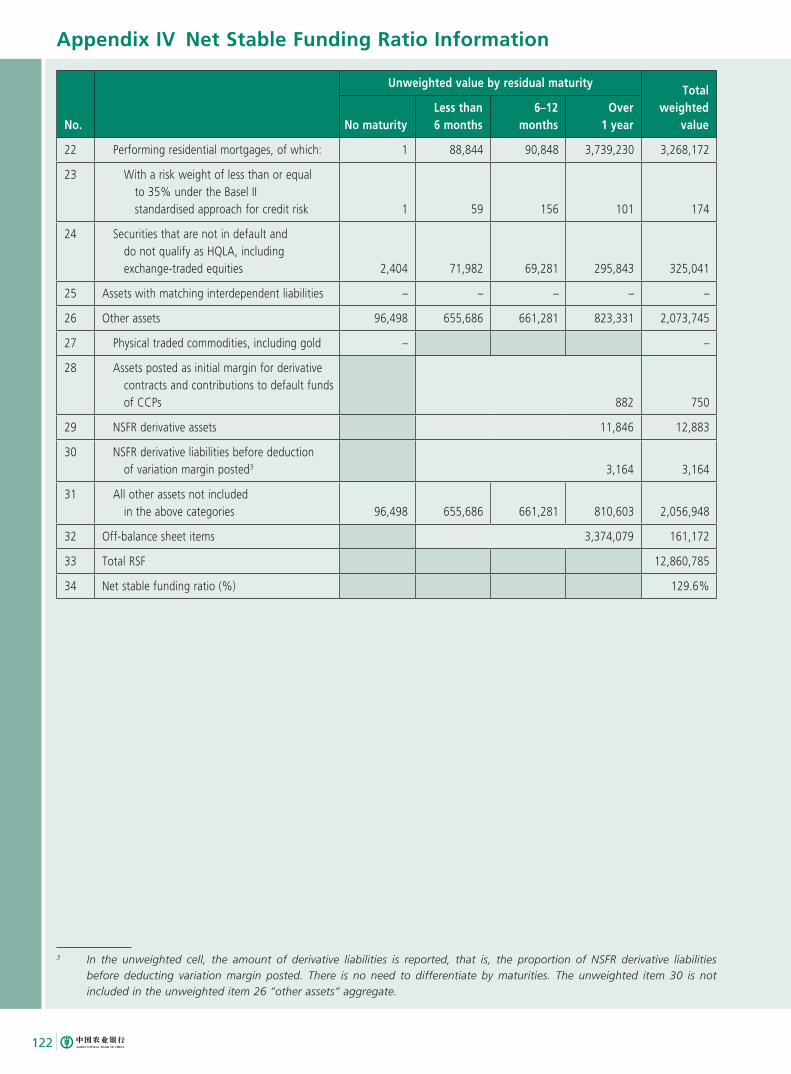
Appendix IV Net Stable Funding Ratio Information
122
No.
Unweighted value by residual maturityTotal
weightedvalueNo maturity
Less than6 months
6–12months
Over1 year
22 Performing residential mortgages, of which: 1 88,844 90,848 3,739,230 3,268,172
23 With a risk weight of less than or equal to 35% under the Basel II standardised approach for credit risk 1 59 156 101 174
24 Securities that are not in default and do not qualify as HQLA, including exchange-traded equities 2,404 71,982 69,281 295,843 325,041
25 Assets with matching interdependent liabilities – – – – –
26 Other assets 96,498 655,686 661,281 823,331 2,073,745
27 Physical traded commodities, including gold – –
28 Assets posted as initial margin for derivative contracts and contributions to default funds of CCPs 882 750
29 NSFR derivative assets 11,846 12,883
30 NSFR derivative liabilities before deduction of variation margin posted3 3,164 3,164
31 All other assets not included in the above categories 96,498 655,686 661,281 810,603 2,056,948
32 Off-balance sheet items 3,374,079 161,172
33 Total RSF 12,860,785
34 Net stable funding ratio (%) 129.6%
3 In the unweighted cell, the amount of derivative liabilities is reported, that is, the proportion of NSFR derivative liabilities before deducting variation margin posted. There is no need to differentiate by maturities. The unweighted item 30 is not included in the unweighted item 26 “other assets” aggregate.

Interim Financial Information(Unaudited)
124
Report on review of Interim Financial Information
To the Board of Directors of Agricultural Bank of China Limited(Incorporated in the People’s Republic of China with Limited Liability)
Introduction
We have reviewed the interim financial information set out on pages 125 to 249, which comprises the condensed consolidated interim statement of financial position of Agricultural Bank of China Limited (the “Bank”) and its subsidiaries (together, the “Group”) as at 30 June 2019 and the condensed consolidated interim income statement, the condensed consolidated interim statement of comprehensive income, the condensed consolidated interim statement of changes in equity and the condensed consolidated interim statement of cash flows for the six-month period then ended, and a summary of significant accounting policies and other explanatory notes (the “Interim Financial Information”). The Rules Governing the Listing of Securities on The Stock Exchange of Hong Kong Limited require the preparation of a report on interim financial information to be in compliance with the relevant provisions thereof and International Accounting Standard 34 “Interim Financial Reporting”. The directors of the Bank are responsible for the preparation and presentation of this Interim Financial Information in accordance with International Accounting Standard 34 “Interim Financial Reporting”. Our responsibility is to express a conclusion on this Interim Financial Information based on our review and to report our conclusion solely to you, as a body, in accordance with our agreed terms of engagement and for no other purpose. We do not assume responsibility towards or accept liability to any other person for the contents of this report.
Scope of review
We conducted our review in accordance with International Standard on Review Engagements 2410, “Review of Interim Financial Information Performed by the Independent Auditor of the Entity”. A review of interim financial information consists of making inquiries, primarily of persons responsible for financial and accounting matters, and applying analytical and other review procedures. A review is substantially less in scope than an audit conducted in accordance with International Standards on Auditing and consequently does not enable us to obtain assurance that we would become aware of all significant matters that might be identified in an audit. Accordingly, we do not express an audit opinion.
Conclusion
Based on our review, nothing has come to our attention that causes us to believe that the Interim Financial Information of the Group is not prepared, in all material respects, in accordance with International Accounting Standard 34 “Interim Financial Reporting”.
PricewaterhouseCoopersCertified Public Accountants
Hong Kong, 30 August 2019
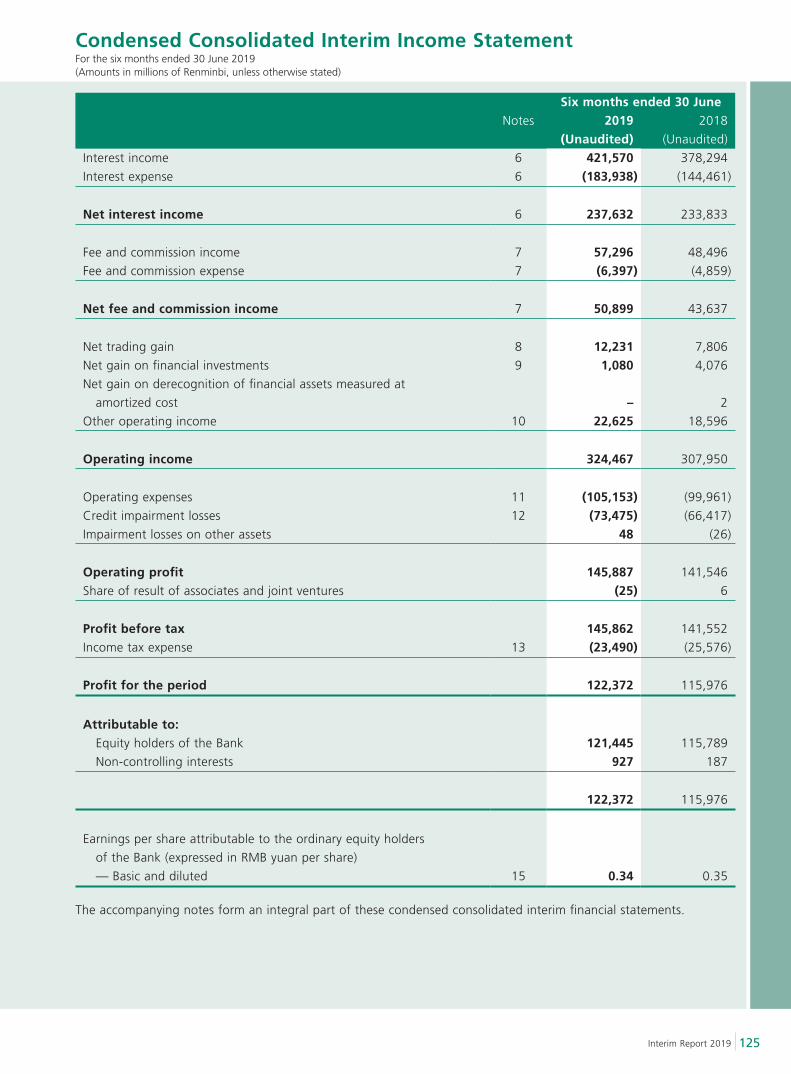
125Interim Report 2019
Condensed Consolidated Interim Income StatementFor the six months ended 30 June 2019(Amounts in millions of Renminbi, unless otherwise stated)
Six months ended 30 JuneNotes 2019 2018
(Unaudited) (Unaudited)
Interest income 6 421,570 378,294
Interest expense 6 (183,938) (144,461)
Net interest income 6 237,632 233,833
Fee and commission income 7 57,296 48,496
Fee and commission expense 7 (6,397) (4,859)
Net fee and commission income 7 50,899 43,637
Net trading gain 8 12,231 7,806
Net gain on financial investments 9 1,080 4,076
Net gain on derecognition of financial assets measured at
amortized cost – 2
Other operating income 10 22,625 18,596
Operating income 324,467 307,950
Operating expenses 11 (105,153) (99,961)
Credit impairment losses 12 (73,475) (66,417)
Impairment losses on other assets 48 (26)
Operating profit 145,887 141,546
Share of result of associates and joint ventures (25) 6
Profit before tax 145,862 141,552
Income tax expense 13 (23,490) (25,576)
Profit for the period 122,372 115,976
Attributable to: Equity holders of the Bank 121,445 115,789
Non-controlling interests 927 187
122,372 115,976
Earnings per share attributable to the ordinary equity holders
of the Bank (expressed in RMB yuan per share)
— Basic and diluted 15 0.34 0.35
The accompanying notes form an integral part of these condensed consolidated interim financial statements.
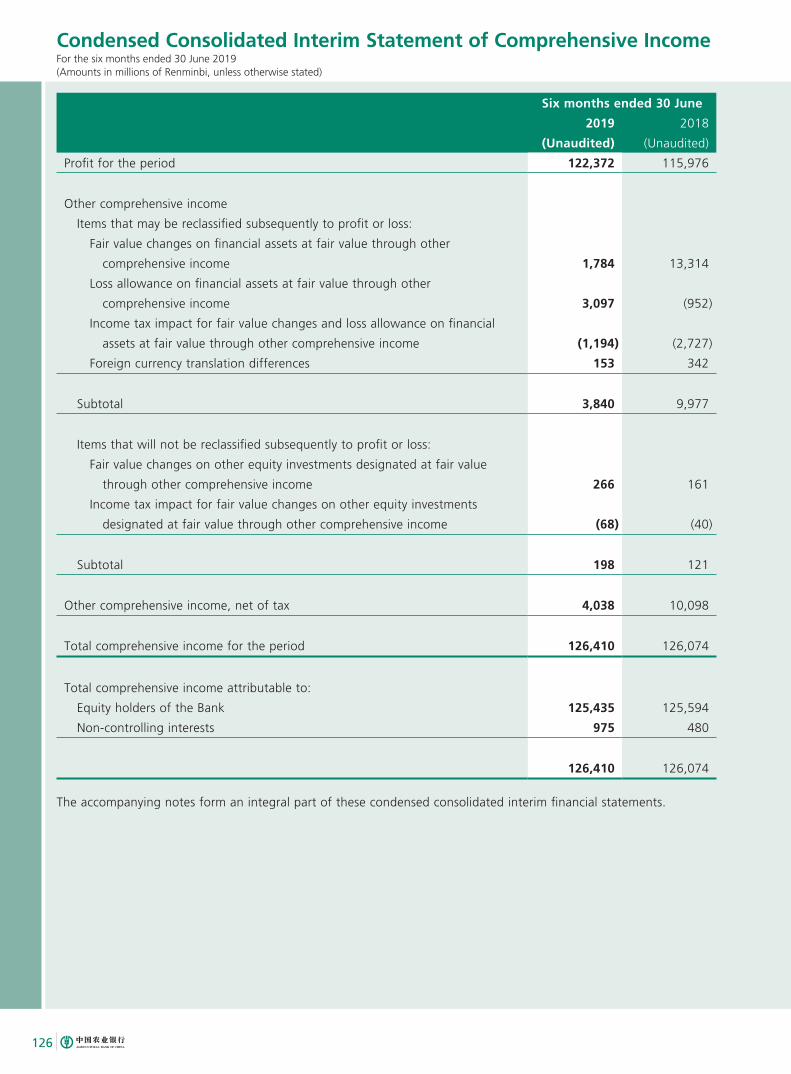
126
Condensed Consolidated Interim Statement of Comprehensive IncomeFor the six months ended 30 June 2019(Amounts in millions of Renminbi, unless otherwise stated)
Six months ended 30 June
2019 2018
(Unaudited) (Unaudited)
Profit for the period 122,372 115,976
Other comprehensive income
Items that may be reclassified subsequently to profit or loss:
Fair value changes on financial assets at fair value through other
comprehensive income 1,784 13,314
Loss allowance on financial assets at fair value through other
comprehensive income 3,097 (952)
Income tax impact for fair value changes and loss allowance on financial
assets at fair value through other comprehensive income (1,194) (2,727)
Foreign currency translation differences 153 342
Subtotal 3,840 9,977
Items that will not be reclassified subsequently to profit or loss:
Fair value changes on other equity investments designated at fair value
through other comprehensive income 266 161
Income tax impact for fair value changes on other equity investments
designated at fair value through other comprehensive income (68) (40)
Subtotal 198 121
Other comprehensive income, net of tax 4,038 10,098
Total comprehensive income for the period 126,410 126,074
Total comprehensive income attributable to:
Equity holders of the Bank 125,435 125,594
Non-controlling interests 975 480
126,410 126,074
The accompanying notes form an integral part of these condensed consolidated interim financial statements.
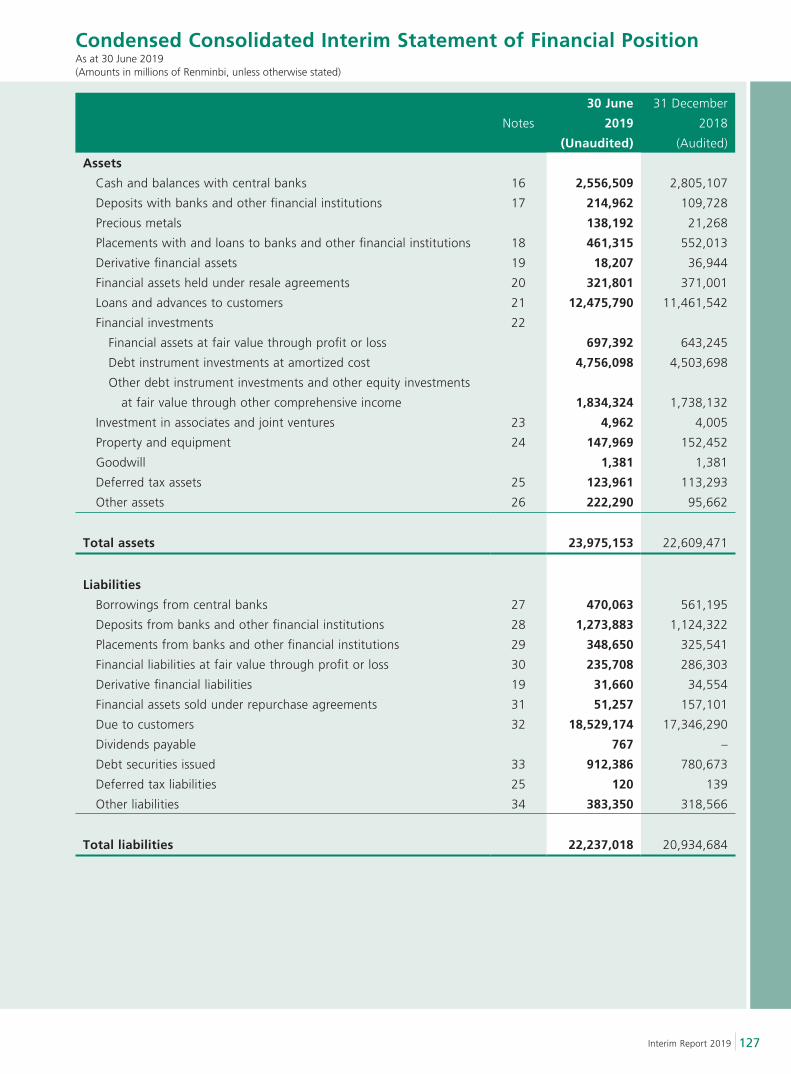
127Interim Report 2019
Condensed Consolidated Interim Statement of Financial PositionAs at 30 June 2019(Amounts in millions of Renminbi, unless otherwise stated)
Notes
30 June
2019
31 December
2018
(Unaudited) (Audited)
Assets
Cash and balances with central banks 16 2,556,509 2,805,107
Deposits with banks and other financial institutions 17 214,962 109,728
Precious metals 138,192 21,268
Placements with and loans to banks and other financial institutions 18 461,315 552,013
Derivative financial assets 19 18,207 36,944
Financial assets held under resale agreements 20 321,801 371,001
Loans and advances to customers 21 12,475,790 11,461,542
Financial investments 22
Financial assets at fair value through profit or loss 697,392 643,245
Debt instrument investments at amortized cost 4,756,098 4,503,698
Other debt instrument investments and other equity investments
at fair value through other comprehensive income 1,834,324 1,738,132
Investment in associates and joint ventures 23 4,962 4,005
Property and equipment 24 147,969 152,452
Goodwill 1,381 1,381
Deferred tax assets 25 123,961 113,293
Other assets 26 222,290 95,662
Total assets 23,975,153 22,609,471
Liabilities
Borrowings from central banks 27 470,063 561,195
Deposits from banks and other financial institutions 28 1,273,883 1,124,322
Placements from banks and other financial institutions 29 348,650 325,541
Financial liabilities at fair value through profit or loss 30 235,708 286,303
Derivative financial liabilities 19 31,660 34,554
Financial assets sold under repurchase agreements 31 51,257 157,101
Due to customers 32 18,529,174 17,346,290
Dividends payable 767 –
Debt securities issued 33 912,386 780,673
Deferred tax liabilities 25 120 139
Other liabilities 34 383,350 318,566
Total liabilities 22,237,018 20,934,684
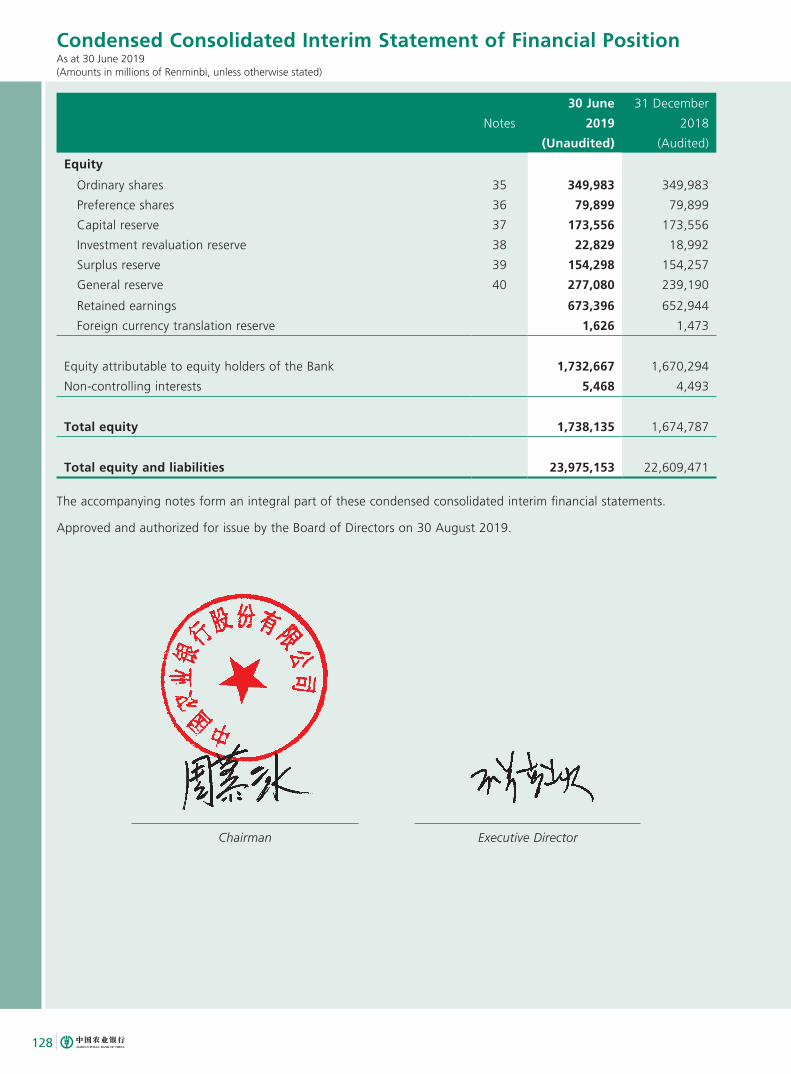
128
Condensed Consolidated Interim Statement of Financial PositionAs at 30 June 2019(Amounts in millions of Renminbi, unless otherwise stated)
Notes
30 June
2019
31 December
2018
(Unaudited) (Audited)
Equity
Ordinary shares 35 349,983 349,983
Preference shares 36 79,899 79,899
Capital reserve 37 173,556 173,556
Investment revaluation reserve 38 22,829 18,992
Surplus reserve 39 154,298 154,257
General reserve 40 277,080 239,190
Retained earnings 673,396 652,944
Foreign currency translation reserve 1,626 1,473
Equity attributable to equity holders of the Bank 1,732,667 1,670,294
Non-controlling interests 5,468 4,493
Total equity 1,738,135 1,674,787
Total equity and liabilities 23,975,153 22,609,471
The accompanying notes form an integral part of these condensed consolidated interim financial statements.
Approved and authorized for issue by the Board of Directors on 30 August 2019.
Chairman Executive Director
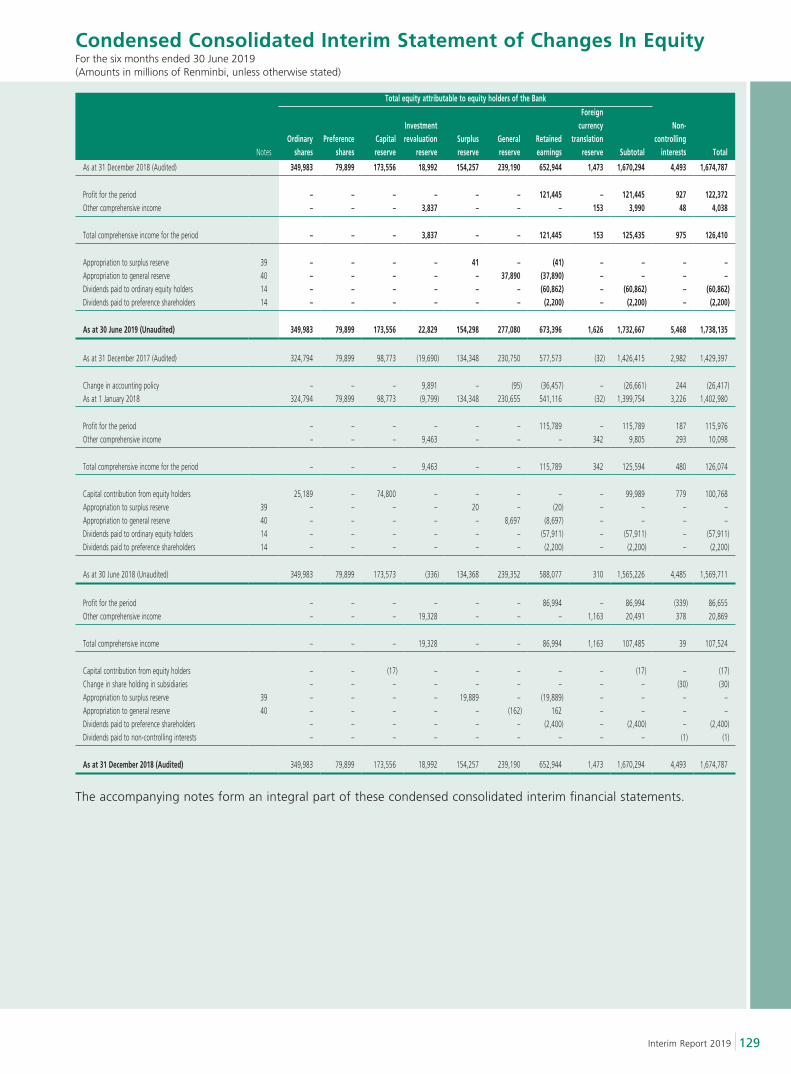
129Interim Report 2019
Condensed Consolidated Interim Statement of Changes In EquityFor the six months ended 30 June 2019(Amounts in millions of Renminbi, unless otherwise stated)
Total equity attributable to equity holders of the Bank
NotesOrdinary
sharesPreference
sharesCapital reserve
Investment revaluation
reserveSurplus reserve
General reserve
Retained earnings
Foreign currency
translation reserve Subtotal
Non-controlling
interests Total
As at 31 December 2018 (Audited) 349,983 79,899 173,556 18,992 154,257 239,190 652,944 1,473 1,670,294 4,493 1,674,787
Profit for the period – – – – – – 121,445 – 121,445 927 122,372Other comprehensive income – – – 3,837 – – – 153 3,990 48 4,038
Total comprehensive income for the period – – – 3,837 – – 121,445 153 125,435 975 126,410
Appropriation to surplus reserve 39 – – – – 41 – (41) – – – –Appropriation to general reserve 40 – – – – – 37,890 (37,890) – – – –Dividends paid to ordinary equity holders 14 – – – – – – (60,862) – (60,862) – (60,862)Dividends paid to preference shareholders 14 – – – – – – (2,200) – (2,200) – (2,200)
As at 30 June 2019 (Unaudited) 349,983 79,899 173,556 22,829 154,298 277,080 673,396 1,626 1,732,667 5,468 1,738,135
As at 31 December 2017 (Audited) 324,794 79,899 98,773 (19,690) 134,348 230,750 577,573 (32) 1,426,415 2,982 1,429,397
Change in accounting policy – – – 9,891 – (95) (36,457) – (26,661) 244 (26,417)As at 1 January 2018 324,794 79,899 98,773 (9,799) 134,348 230,655 541,116 (32) 1,399,754 3,226 1,402,980
Profit for the period – – – – – – 115,789 – 115,789 187 115,976Other comprehensive income – – – 9,463 – – – 342 9,805 293 10,098
Total comprehensive income for the period – – – 9,463 – – 115,789 342 125,594 480 126,074
Capital contribution from equity holders 25,189 – 74,800 – – – – – 99,989 779 100,768Appropriation to surplus reserve 39 – – – – 20 – (20) – – – –Appropriation to general reserve 40 – – – – – 8,697 (8,697) – – – –Dividends paid to ordinary equity holders 14 – – – – – – (57,911) – (57,911) – (57,911)Dividends paid to preference shareholders 14 – – – – – – (2,200) – (2,200) – (2,200)
As at 30 June 2018 (Unaudited) 349,983 79,899 173,573 (336) 134,368 239,352 588,077 310 1,565,226 4,485 1,569,711
Profit for the period – – – – – – 86,994 – 86,994 (339) 86,655Other comprehensive income – – – 19,328 – – – 1,163 20,491 378 20,869
Total comprehensive income – – – 19,328 – – 86,994 1,163 107,485 39 107,524
Capital contribution from equity holders – – (17) – – – – – (17) – (17)Change in share holding in subsidiaries – – – – – – – – – (30) (30)Appropriation to surplus reserve 39 – – – – 19,889 – (19,889) – – – –Appropriation to general reserve 40 – – – – – (162) 162 – – – –Dividends paid to preference shareholders – – – – – – (2,400) – (2,400) – (2,400)Dividends paid to non-controlling interests – – – – – – – – – (1) (1)
As at 31 December 2018 (Audited) 349,983 79,899 173,556 18,992 154,257 239,190 652,944 1,473 1,670,294 4,493 1,674,787
The accompanying notes form an integral part of these condensed consolidated interim financial statements.
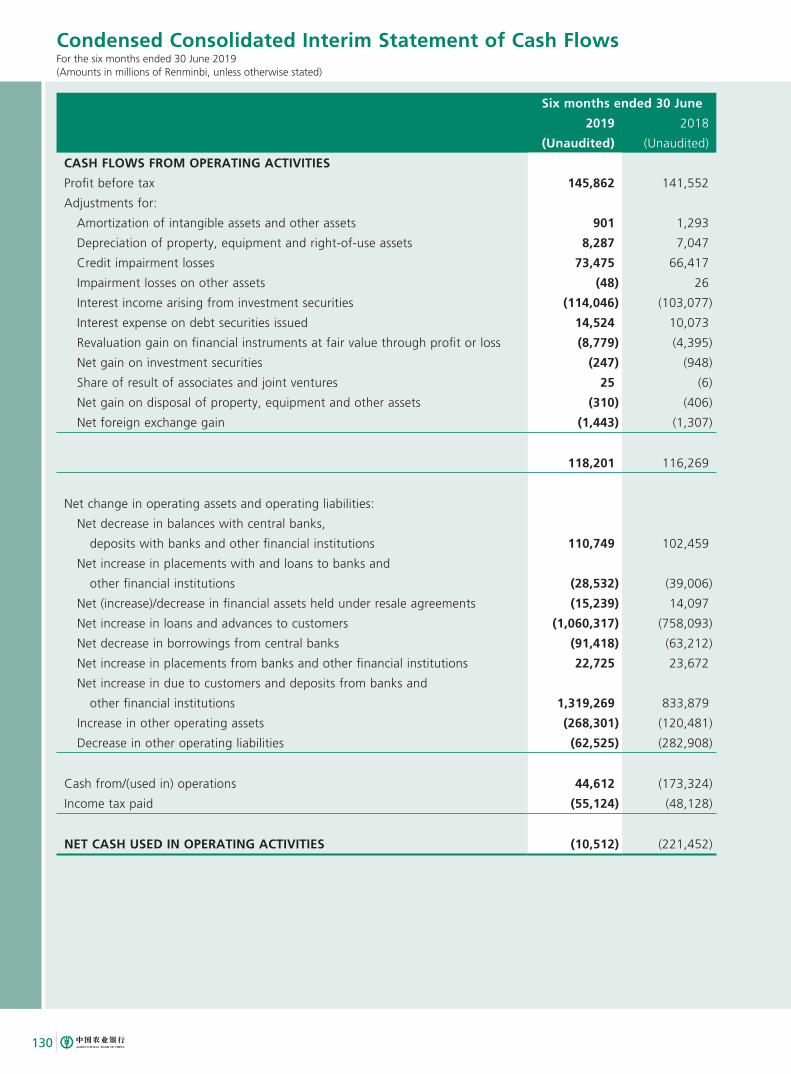
130
Condensed Consolidated Interim Statement of Cash Flows For the six months ended 30 June 2019(Amounts in millions of Renminbi, unless otherwise stated)
Six months ended 30 June
2019 2018
(Unaudited) (Unaudited)
CASH FLOWS FROM OPERATING ACTIVITIES
Profit before tax 145,862 141,552
Adjustments for:
Amortization of intangible assets and other assets 901 1,293
Depreciation of property, equipment and right-of-use assets 8,287 7,047
Credit impairment losses 73,475 66,417
Impairment losses on other assets (48) 26
Interest income arising from investment securities (114,046) (103,077)
Interest expense on debt securities issued 14,524 10,073
Revaluation gain on financial instruments at fair value through profit or loss (8,779) (4,395)
Net gain on investment securities (247) (948)
Share of result of associates and joint ventures 25 (6)
Net gain on disposal of property, equipment and other assets (310) (406)
Net foreign exchange gain (1,443) (1,307)
118,201 116,269
Net change in operating assets and operating liabilities:
Net decrease in balances with central banks,
deposits with banks and other financial institutions 110,749 102,459
Net increase in placements with and loans to banks and
other financial institutions (28,532) (39,006)
Net (increase)/decrease in financial assets held under resale agreements (15,239) 14,097
Net increase in loans and advances to customers (1,060,317) (758,093)
Net decrease in borrowings from central banks (91,418) (63,212)
Net increase in placements from banks and other financial institutions 22,725 23,672
Net increase in due to customers and deposits from banks and
other financial institutions 1,319,269 833,879
Increase in other operating assets (268,301) (120,481)
Decrease in other operating liabilities (62,525) (282,908)
Cash from/(used in) operations 44,612 (173,324)
Income tax paid (55,124) (48,128)
NET CASH USED IN OPERATING ACTIVITIES (10,512) (221,452)
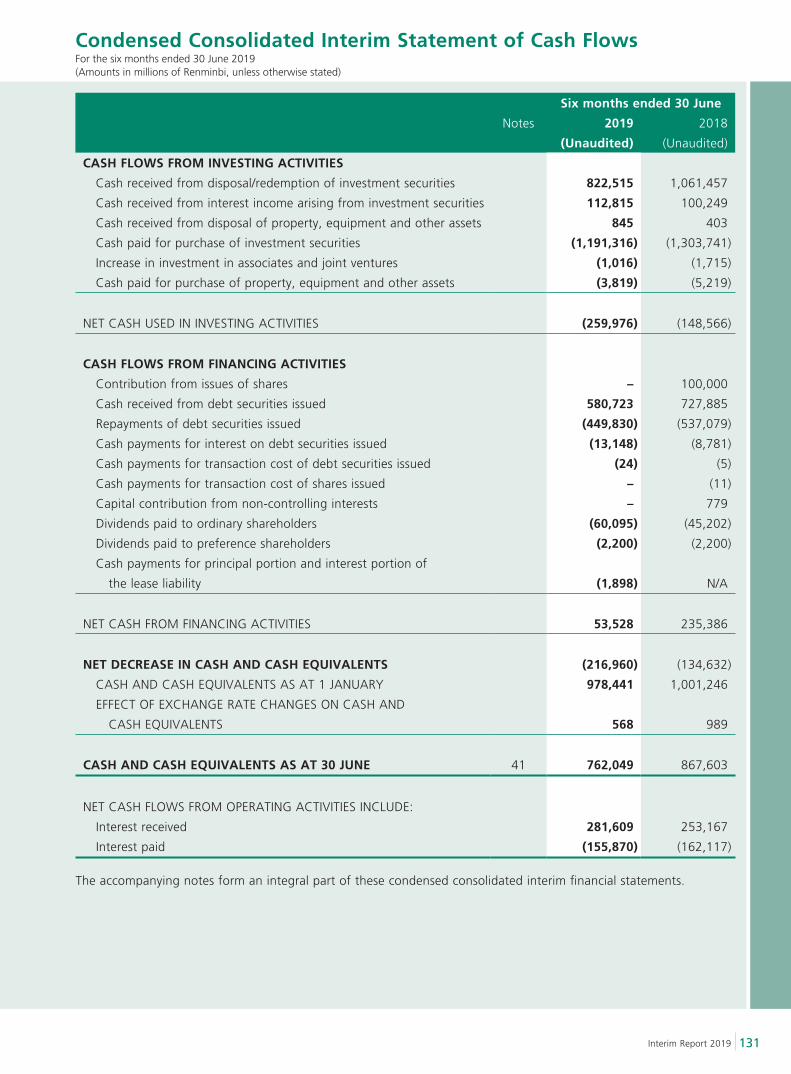
131Interim Report 2019
Condensed Consolidated Interim Statement of Cash Flows For the six months ended 30 June 2019(Amounts in millions of Renminbi, unless otherwise stated)
Six months ended 30 June
Notes 2019 2018
(Unaudited) (Unaudited)
CASH FLOWS FROM INVESTING ACTIVITIES
Cash received from disposal/redemption of investment securities 822,515 1,061,457
Cash received from interest income arising from investment securities 112,815 100,249
Cash received from disposal of property, equipment and other assets 845 403
Cash paid for purchase of investment securities (1,191,316) (1,303,741)
Increase in investment in associates and joint ventures (1,016) (1,715)
Cash paid for purchase of property, equipment and other assets (3,819) (5,219)
NET CASH USED IN INVESTING ACTIVITIES (259,976) (148,566)
CASH FLOWS FROM FINANCING ACTIVITIES
Contribution from issues of shares – 100,000
Cash received from debt securities issued 580,723 727,885
Repayments of debt securities issued (449,830) (537,079)
Cash payments for interest on debt securities issued (13,148) (8,781)
Cash payments for transaction cost of debt securities issued (24) (5)
Cash payments for transaction cost of shares issued – (11)
Capital contribution from non-controlling interests – 779
Dividends paid to ordinary shareholders (60,095) (45,202)
Dividends paid to preference shareholders (2,200) (2,200)
Cash payments for principal portion and interest portion of
the lease liability (1,898) N/A
NET CASH FROM FINANCING ACTIVITIES 53,528 235,386
NET DECREASE IN CASH AND CASH EQUIVALENTS (216,960) (134,632)
CASH AND CASH EQUIVALENTS AS AT 1 JANUARY 978,441 1,001,246
EFFECT OF EXCHANGE RATE CHANGES ON CASH AND
CASH EQUIVALENTS 568 989
CASH AND CASH EQUIVALENTS AS AT 30 JUNE 41 762,049 867,603
NET CASH FLOWS FROM OPERATING ACTIVITIES INCLUDE:
Interest received 281,609 253,167
Interest paid (155,870) (162,117)
The accompanying notes form an integral part of these condensed consolidated interim financial statements.
132
Notes to the Condensed Consolidated Interim Financial StatementsFor the six months ended 30 June 2019(Amounts in millions of Renminbi, unless otherwise stated)
1 GENERAL INFORMATION
Agricultural Bank of China Limited (the “Bank”) is the successor entity to the Agricultural Bank of China (the
“Predecessor Entity”) which was a wholly state-owned commercial bank approved for setup by the People’s Bank
of China (the “PBOC”) and founded on 23 February 1979 in the People’s Republic of China (the “PRC”). On 15
January 2009, the Bank was established after the completion of the financial restructuring of the Predecessor
Entity. The Bank’s establishment was authorized by the PBOC. The Bank was listed on the Shanghai Stock
Exchange and the Stock Exchange of Hong Kong Limited on 15 July 2010 and 16 July 2010, respectively.
The Bank operates under financial services certificate No. B0002H111000001 issued by the China Banking and
Insurance Regulatory Commission (the former “China Banking and Regulatory Commission, CBRC” and “China
Insurance Regulatory Commission, CIRC”, the “CBIRC”), and business license No. 911100001000054748 issued
by Beijing Administration of Industry and Commerce. The registered office of the Bank is located at No. 69
Jianguomen Nei Avenue, Dongcheng District, Beijing, the PRC.
The principal activities of the Bank and its subsidiaries (collectively, the “Group”) include Renminbi (“RMB”) and
foreign currency deposits, loans, clearing and settlement services, assets custodian services, fund management,
financial leasing services, insurance services and other services as approved by relevant regulators, and the
provision of related services by its overseas establishments as approved by the respective local regulators.
The head office and domestic branches of the Bank and its subsidiaries operating in the Mainland China
are referred to as “Domestic Operations”. Branches and subsidiaries registered and operating outside of the
Mainland China are referred to as “Overseas Operations”.
2 BASIS OF PREPARATION
The unaudited condensed consolidated interim financial statements for the six months ended 30 June 2019 have
been prepared in accordance with International Accounting Standard (“IAS”) 34 “Interim Financial Reporting”,
as well as with all applicable disclosure provisions of the Rules Governing the Listing of Securities on the Stock
Exchange of Hong Kong Limited.
133Interim Report 2019
Notes to the Condensed Consolidated Interim Financial StatementsFor the six months ended 30 June 2019(Amounts in millions of Renminbi, unless otherwise stated)
3 PRINCIPAL ACCOUNTING POLICIES
The unaudited condensed consolidated interim financial statements have been prepared on the historical cost
basis, except for certain financial instruments which are measured at fair value. Except for those described below,
the accounting policies and methods of computation used in preparing the condensed consolidated interim
financial statements are the same as those followed in the preparation of the Group’s annual consolidated
financial statements for the year ended 31 December 2018.
The condensed consolidated interim financial statements should be read in conjunction with the Group’s annual
consolidated financial statements for the year ended 31 December 2018, which have been audited.
3.1 Standards and amendments effective in 2019 relevant to and adopted by the Group
In the current interim period, the Group has adopted the following International Financial Reporting
Standards (“IFRSs”) and amendments issued by the International Accounting Standards Board (“IASB”),
that are mandatorily effective for the current interim period. Descriptions of these standards and
amendments were disclosed in the Group’s annual consolidated financial statements for the year ended 31
December 2018.
(1) IFRS 16 (i) Leases
(2) IFRIC 23 Uncertainty over Income Tax Treatments
(3) Amendments to IFRS 9 Prepayment Features with Negative Compensation and
Modifications of Financial Liabilities
(4) Amendments to IFRS 3,
IFRS 11, IAS 12 and IAS 23
The Annual Improvements to IFRSs 2015–2017 Cycle
(5) Amendments to IAS 19 Employee Benefits’ Regarding Plan Amendment,
Curtailment or Settlement
(6) Amendments to IAS 28 Long-term Interests in Associates and Joint Ventures
The adoption of these standards and amendments does not have a significant impact on the operating
results, comprehensive income, or financial position of the Group.
(i) The Group has adopted IFRS 16 as issued by the IASB with the transition date of 1 January 2019. As permitted under the specific transitional provisions in the standard, the Group did not restated comparative figures. The reclassifications and the adjustments arising from the new leasing rules are therefore recognized in the opening balance sheet on 1 January 2019.
134
Notes to the Condensed Consolidated Interim Financial StatementsFor the six months ended 30 June 2019(Amounts in millions of Renminbi, unless otherwise stated)
3 PRINCIPAL ACCOUNTING POLICIES (Continued)
3.1 Standards and amendments effective in 2019 relevant to and adopted by the Group (Continued)
The specific accounting policies affected by the new leasing rules are as follows:
The implementation of the new leasing rules mainly affects the Group’s leasing business as the lessee.
The Group recognized the right-of-use assets at the commencement date, and recognized the lease
liabilities at the present value of the outstanding lease payments. The Group’s right-of-use assets mainly
include rented houses and buildings. The right-of-use assets are measured at costs comprising the
following: the amount of the initial measurement of lease liabilities, any lease payments made at or before
the commencement date, any initial direct costs, restoration costs and less any lease incentives received. If
the Group could reasonably determine the ownership of the leased asset when the lease term expires, the
right-of-use assets are depreciated over the asset’s remaining useful life. Otherwise, the right-of-use assets
are depreciated over the shorter period of the asset’s useful life and the lease term on a straight-line basis.
When the recoverable costs of right-of-use assets are lower than the carrying amount, the value of right-of-
use assets will be decreased down to the recoverable costs.
Short-term leases and leases of low-value assets are recognized on a straight-line basis as an expense in
profit or loss. Short-term leases are leases with a lease term of 12 months or less. Leases of low value assets
are the underlying assets are of low value when new.
The impact of the Group’s implementation of the new lease rules are as follows:
The Group has recognized the lease liabilities in relation to leases which had previously be classified as
‘operating leases’ under the principles of IAS 17 leases as of 31 December 2018. The lease liabilities were
measured at the present value of the remaining lease payment discounted by the lessee’s incremental
borrowing rate on the date of initial application, and deducted the adjustment amount of short-term leases
and leases of low-value assets. The incremental borrowing rate applied to the lease liabilities was based
on the related yield-to-maturity of bonds issued, comprehensively considering the remaining lease term,
lease business scale and guarantee conditions. The right-of-use assets were measured at the amount equal
to lease liabilities, adjusted by the amount of any prepaid or accrued lease payments relating to that lease
recognized in the balance sheet as at 31 December 2018. In addition, in applying new leasing rules for
the first time, the Group has used the practical expedients permitted by the standard, mainly including the
accounting for operating leases with a remaining lease term of less than 12 months as at 1 January 2019
as short-term leases, not recognizing lease liabilities and right-of-use assets for short-term leases and low-
value leases.
On 1 January 2019, the Group recognized the right-of-use assets amounted RMB11,095 million and lease
liabilities amounted RMB10,428 million. The implementation of IFRS 16 does not have any impact on net
asset of the Group as at 1 January 2019.
135Interim Report 2019
Notes to the Condensed Consolidated Interim Financial StatementsFor the six months ended 30 June 2019(Amounts in millions of Renminbi, unless otherwise stated)
3 PRINCIPAL ACCOUNTING POLICIES (Continued)
3.2 Standards and amendments relevant to the Group that are not yet effective in the current interim period and have not been adopted before their effective dates by the Group
The Group has not adopted the following new or amended standards and interpretations issued by the
IASB and the IFRS Interpretations Committee (“IFRIC”), that have been issued but are not yet effective.
Effective for
annual periods
beginning on
or after
(1) Amendments to IAS 1 and
IAS 8
The Definition of Material 1 January 2020
(2) Amendments to IFRS 3 The Definition of A Business 1 January 2020
(3) IFRS 17 Insurance Contracts 1 January 2021
(4) Amendments to IFRS 10
and IAS 28
Sale or Contribution of Assets between
An Investor and Its Associate or
Joint Venture
The amendments
were originally
intended to be
effective for annual
periods beginning
on or after
1 January 2016. The
effective date has
now been deferred.
Descriptions of these standards and amendments were disclosed in the Group’s annual consolidated
financial statements for the year ended 31 December 2018. The Group anticipates that the adoption of
these standards and amendments will not have a significant impact on the Group’s consolidated financial
statements.
4 CRITICAL ACCOUNTING ESTIMATES AND JUDGEMENTS IN APPLYING ACCOUNTING POLICIES
The preparation of condensed consolidated interim financial statements requires management to make
judgments, estimates and assumptions that affect the application of accounting policies and the reported
amounts of assets and liabilities, and income and expense. Actual results may differ from these estimates.
In preparing these condensed consolidated interim financial statements, the significant judgments made by
management in applying the Group’s accounting policies and the key sources of estimation uncertainty were
the same as those that applied to the Group’s annual consolidated financial statements for the year ended 31
December 2018.
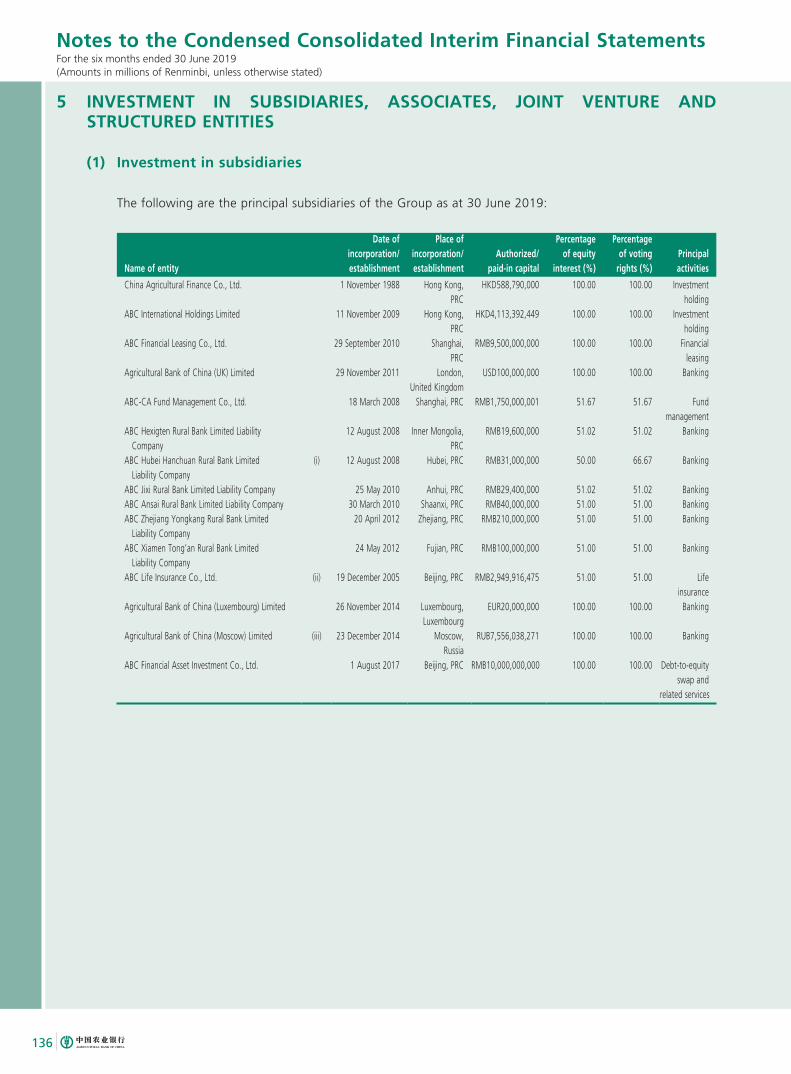
136
Notes to the Condensed Consolidated Interim Financial StatementsFor the six months ended 30 June 2019(Amounts in millions of Renminbi, unless otherwise stated)
5 INVESTMENT IN SUBSIDIARIES, ASSOCIATES, JOINT VENTURE AND STRUCTURED ENTITIES
(1) Investment in subsidiaries
The following are the principal subsidiaries of the Group as at 30 June 2019:
Name of entity
Date of incorporation/establishment
Place of incorporation/establishment
Authorized/paid-in capital
Percentage of equity
interest (%)
Percentage of voting
rights (%)Principal activities
China Agricultural Finance Co., Ltd. 1 November 1988 Hong Kong, PRC
HKD588,790,000 100.00 100.00 Investment holding
ABC International Holdings Limited 11 November 2009 Hong Kong, PRC
HKD4,113,392,449 100.00 100.00 Investment holding
ABC Financial Leasing Co., Ltd. 29 September 2010 Shanghai, PRC
RMB9,500,000,000 100.00 100.00 Financial leasing
Agricultural Bank of China (UK) Limited 29 November 2011 London, United Kingdom
USD100,000,000 100.00 100.00 Banking
ABC-CA Fund Management Co., Ltd. 18 March 2008 Shanghai, PRC RMB1,750,000,001 51.67 51.67 Fund management
ABC Hexigten Rural Bank Limited Liability Company
12 August 2008 Inner Mongolia, PRC
RMB19,600,000 51.02 51.02 Banking
ABC Hubei Hanchuan Rural Bank Limited Liability Company
(i) 12 August 2008 Hubei, PRC RMB31,000,000 50.00 66.67 Banking
ABC Jixi Rural Bank Limited Liability Company 25 May 2010 Anhui, PRC RMB29,400,000 51.02 51.02 BankingABC Ansai Rural Bank Limited Liability Company 30 March 2010 Shaanxi, PRC RMB40,000,000 51.00 51.00 BankingABC Zhejiang Yongkang Rural Bank Limited Liability Company
20 April 2012 Zhejiang, PRC RMB210,000,000 51.00 51.00 Banking
ABC Xiamen Tong’an Rural Bank Limited Liability Company
24 May 2012 Fujian, PRC RMB100,000,000 51.00 51.00 Banking
ABC Life Insurance Co., Ltd. (ii) 19 December 2005 Beijing, PRC RMB2,949,916,475 51.00 51.00 Life insurance
Agricultural Bank of China (Luxembourg) Limited 26 November 2014 Luxembourg, Luxembourg
EUR20,000,000 100.00 100.00 Banking
Agricultural Bank of China (Moscow) Limited (iii) 23 December 2014 Moscow, Russia
RUB7,556,038,271 100.00 100.00 Banking
ABC Financial Asset Investment Co., Ltd. 1 August 2017 Beijing, PRC RMB10,000,000,000 100.00 100.00 Debt-to-equity swap and
related services
137Interim Report 2019
Notes to the Condensed Consolidated Interim Financial StatementsFor the six months ended 30 June 2019(Amounts in millions of Renminbi, unless otherwise stated)
5 INVESTMENT IN SUBSIDIARIES, ASSOCIATES, JOINT VENTURE AND STRUCTURED ENTITIES (Continued)
(1) Investment in subsidiaries (Continued)
The following are the principal subsidiaries of the Group as at 30 June 2019 (Continued):
For the six months ended 30 June 2019, there were no changes in the proportion of equity interest or
voting rights the Group held in its subsidiaries.
(i) Two of the three directors on the board of ABC Hubei Hanchuan Rural Bank Limited Liability Company were appointed by the Bank. The Bank concluded that it has effective control over and has included this entity in its consolidation scope.
(ii) On 31 December 2012, the Bank acquired 51% of the issued share capital of Jiahe Life Insurance Co., Ltd. and renamed it as ABC Life Insurance Co., Ltd. (“ABC Life Insurance”). The Group recognized goodwill of RMB1,381 million as a result of this acquisition. During the year ended 31 December 2016, the Group and other investors contributed additional capital totalling RMB3,761 million to ABC Life Insurance, comprising registered capital of RMB917 million and capital reserve of RMB2,844 million. After the capital injection, the proportion of equity interest and voting rights the Group held in ABC Life Insurance remained at 51%.
As at 30 June 2019, there was no objective evidence noted for any goodwill impairment and no impairment loss was recognized.
(iii) As at 30 June 2019, the Group contributed additional capital totally RMB617million to Agricultural Bank of China (Moscow) Limited, which injected RMB617 million to registered capital of Agricultural Bank of China (Moscow) Limited. After the capital injection, the proportion of equity interest and voting rights the Group held in Agricultural Bank of China (Moscow) Limited remained at 100%.
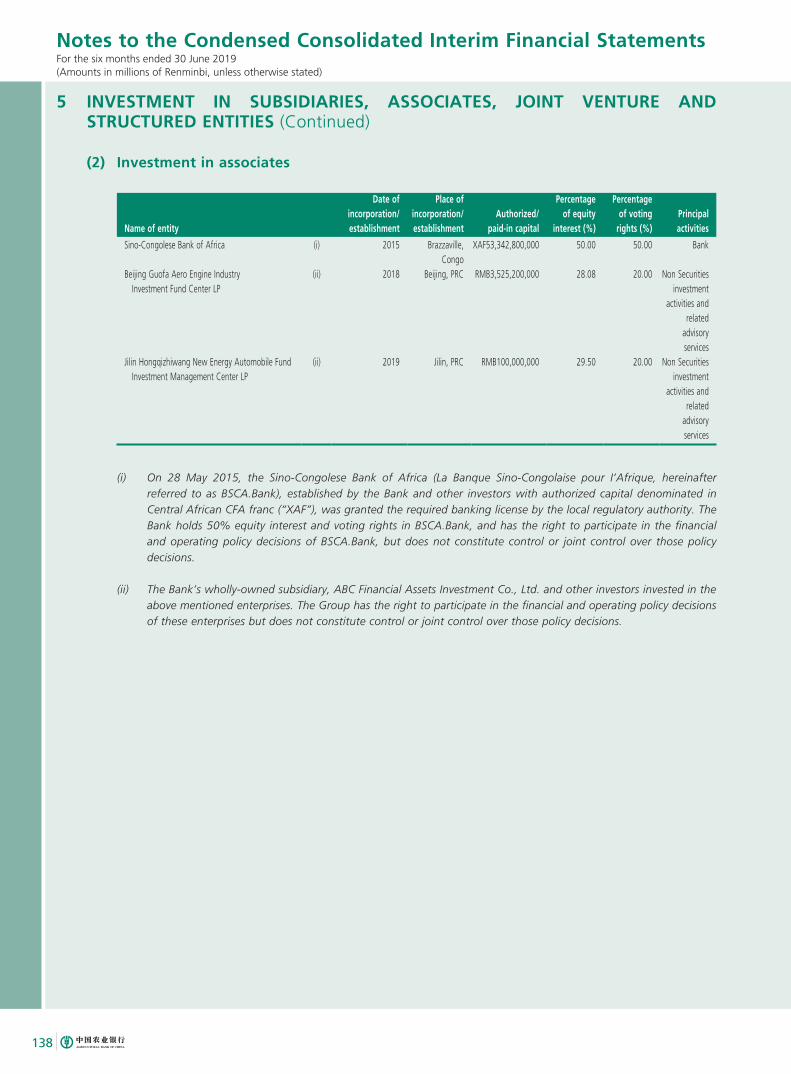
138
Notes to the Condensed Consolidated Interim Financial StatementsFor the six months ended 30 June 2019(Amounts in millions of Renminbi, unless otherwise stated)
5 INVESTMENT IN SUBSIDIARIES, ASSOCIATES, JOINT VENTURE AND STRUCTURED ENTITIES (Continued)
(2) Investment in associates
Name of entity
Date of incorporation/establishment
Place of incorporation/establishment
Authorized/paid-in capital
Percentage of equity
interest (%)
Percentage of voting
rights (%)Principalactivities
Sino-Congolese Bank of Africa (i) 2015 Brazzaville, Congo
XAF53,342,800,000 50.00 50.00 Bank
Beijing Guofa Aero Engine Industry Investment Fund Center LP
(ii) 2018 Beijing, PRC RMB3,525,200,000 28.08 20.00 Non Securities investment
activities and related
advisory services
Jilin Hongqizhiwang New Energy Automobile Fund Investment Management Center LP
(ii) 2019 Jilin, PRC RMB100,000,000 29.50 20.00 Non Securities investment
activities and related
advisory services
(i) On 28 May 2015, the Sino-Congolese Bank of Africa (La Banque Sino-Congolaise pour I’Afrique, hereinafter referred to as BSCA.Bank), established by the Bank and other investors with authorized capital denominated in Central African CFA franc (“XAF”), was granted the required banking license by the local regulatory authority. The Bank holds 50% equity interest and voting rights in BSCA.Bank, and has the right to participate in the financial and operating policy decisions of BSCA.Bank, but does not constitute control or joint control over those policy decisions.
(ii) The Bank’s wholly-owned subsidiary, ABC Financial Assets Investment Co., Ltd. and other investors invested in the above mentioned enterprises. The Group has the right to participate in the financial and operating policy decisions of these enterprises but does not constitute control or joint control over those policy decisions.
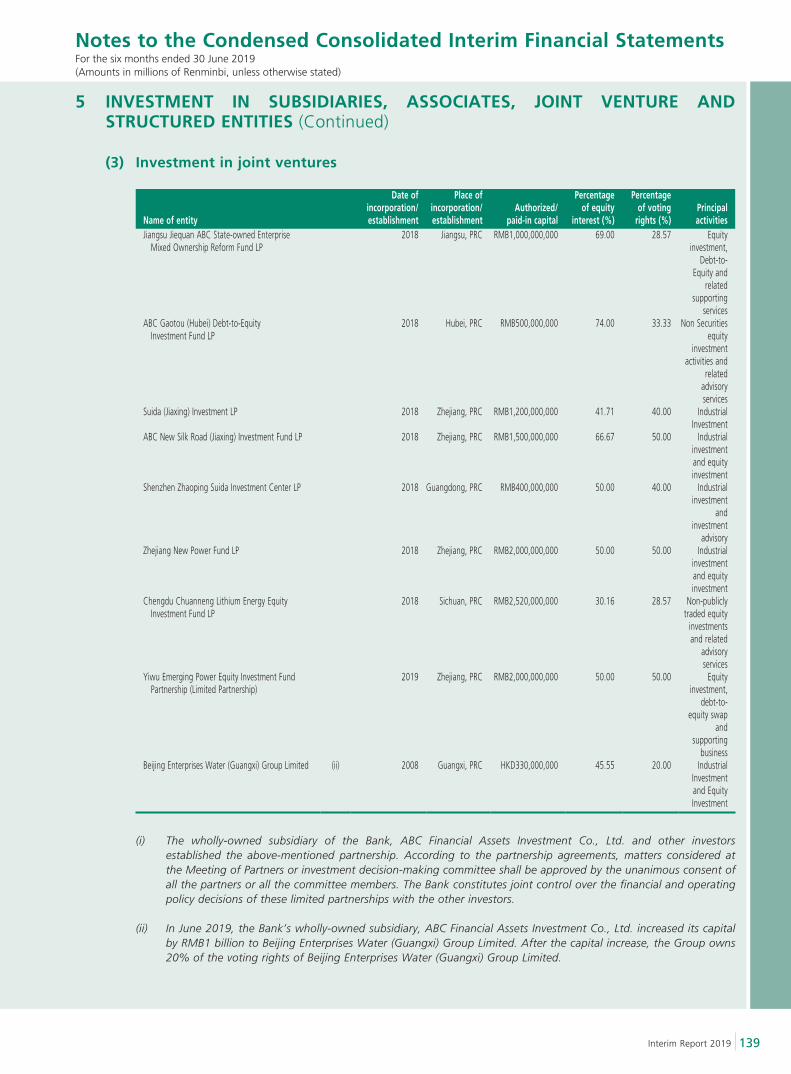
139Interim Report 2019
Notes to the Condensed Consolidated Interim Financial StatementsFor the six months ended 30 June 2019(Amounts in millions of Renminbi, unless otherwise stated)
5 INVESTMENT IN SUBSIDIARIES, ASSOCIATES, JOINT VENTURE AND STRUCTURED ENTITIES (Continued)
(3) Investment in joint ventures
Name of entity
Date of incorporation/establishment
Place of incorporation/establishment
Authorized/paid-in capital
Percentageof equity
interest (%)
Percentageof voting
rights (%)Principalactivities
Jiangsu Jiequan ABC State-owned Enterprise Mixed Ownership Reform Fund LP
2018 Jiangsu, PRC RMB1,000,000,000 69.00 28.57 Equity investment,
Debt-to-Equity and
related supporting
servicesABC Gaotou (Hubei) Debt-to-Equity Investment Fund LP
2018 Hubei, PRC RMB500,000,000 74.00 33.33 Non Securities equity
investment activities and
related advisory services
Suida (Jiaxing) Investment LP 2018 Zhejiang, PRC RMB1,200,000,000 41.71 40.00 Industrial Investment
ABC New Silk Road (Jiaxing) Investment Fund LP 2018 Zhejiang, PRC RMB1,500,000,000 66.67 50.00 Industrial investment and equity investment
Shenzhen Zhaoping Suida Investment Center LP 2018 Guangdong, PRC RMB400,000,000 50.00 40.00 Industrial investment
and investment
advisoryZhejiang New Power Fund LP 2018 Zhejiang, PRC RMB2,000,000,000 50.00 50.00 Industrial
investment and equity investment
Chengdu Chuanneng Lithium Energy Equity Investment Fund LP
2018 Sichuan, PRC RMB2,520,000,000 30.16 28.57 Non-publicly traded equity
investments and related
advisory services
Yiwu Emerging Power Equity Investment Fund Partnership (Limited Partnership)
2019 Zhejiang, PRC RMB2,000,000,000 50.00 50.00 Equity investment,
debt-to-equity swap
and supporting
businessBeijing Enterprises Water (Guangxi) Group Limited (ii) 2008 Guangxi, PRC HKD330,000,000 45.55 20.00 Industrial
Investment and Equity Investment
(i) The wholly-owned subsidiary of the Bank, ABC Financial Assets Investment Co., Ltd. and other investors established the above-mentioned partnership. According to the partnership agreements, matters considered at the Meeting of Partners or investment decision-making committee shall be approved by the unanimous consent of all the partners or all the committee members. The Bank constitutes joint control over the financial and operating policy decisions of these limited partnerships with the other investors.
(ii) In June 2019, the Bank’s wholly-owned subsidiary, ABC Financial Assets Investment Co., Ltd. increased its capital by RMB1 billion to Beijing Enterprises Water (Guangxi) Group Limited. After the capital increase, the Group owns 20% of the voting rights of Beijing Enterprises Water (Guangxi) Group Limited.
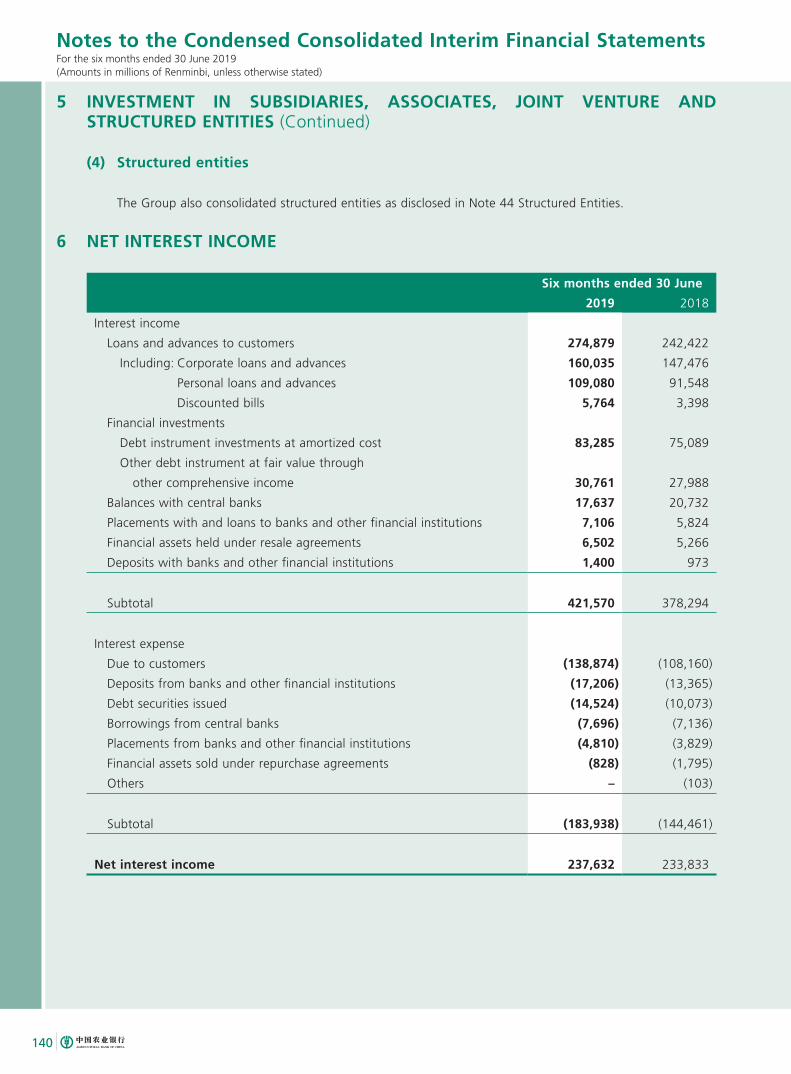
140
Notes to the Condensed Consolidated Interim Financial StatementsFor the six months ended 30 June 2019(Amounts in millions of Renminbi, unless otherwise stated)
5 INVESTMENT IN SUBSIDIARIES, ASSOCIATES, JOINT VENTURE AND STRUCTURED ENTITIES (Continued)
(4) Structured entities
The Group also consolidated structured entities as disclosed in Note 44 Structured Entities.
6 NET INTEREST INCOME
Six months ended 30 June
2019 2018
Interest income
Loans and advances to customers 274,879 242,422
Including: Corporate loans and advances 160,035 147,476
Personal loans and advances 109,080 91,548
Discounted bills 5,764 3,398
Financial investments
Debt instrument investments at amortized cost 83,285 75,089
Other debt instrument at fair value through
other comprehensive income 30,761 27,988
Balances with central banks 17,637 20,732
Placements with and loans to banks and other financial institutions 7,106 5,824
Financial assets held under resale agreements 6,502 5,266
Deposits with banks and other financial institutions 1,400 973
Subtotal 421,570 378,294
Interest expense
Due to customers (138,874) (108,160)
Deposits from banks and other financial institutions (17,206) (13,365)
Debt securities issued (14,524) (10,073)
Borrowings from central banks (7,696) (7,136)
Placements from banks and other financial institutions (4,810) (3,829)
Financial assets sold under repurchase agreements (828) (1,795)
Others – (103)
Subtotal (183,938) (144,461)
Net interest income 237,632 233,833
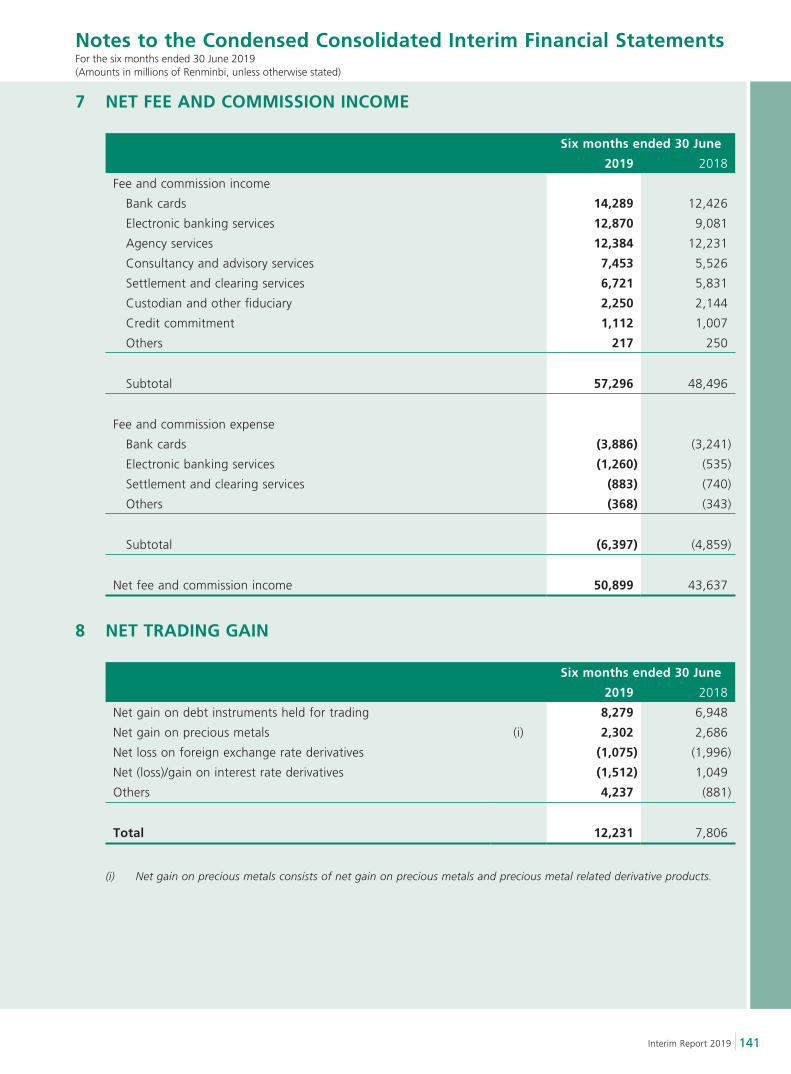
141Interim Report 2019
Notes to the Condensed Consolidated Interim Financial StatementsFor the six months ended 30 June 2019(Amounts in millions of Renminbi, unless otherwise stated)
7 NET FEE AND COMMISSION INCOME
Six months ended 30 June
2019 2018
Fee and commission income
Bank cards 14,289 12,426
Electronic banking services 12,870 9,081
Agency services 12,384 12,231
Consultancy and advisory services 7,453 5,526
Settlement and clearing services 6,721 5,831
Custodian and other fiduciary 2,250 2,144
Credit commitment 1,112 1,007
Others 217 250
Subtotal 57,296 48,496
Fee and commission expense
Bank cards (3,886) (3,241)
Electronic banking services (1,260) (535)
Settlement and clearing services (883) (740)
Others (368) (343)
Subtotal (6,397) (4,859)
Net fee and commission income 50,899 43,637
8 NET TRADING GAIN
Six months ended 30 June
2019 2018
Net gain on debt instruments held for trading 8,279 6,948
Net gain on precious metals (i) 2,302 2,686
Net loss on foreign exchange rate derivatives (1,075) (1,996)
Net (loss)/gain on interest rate derivatives (1,512) 1,049
Others 4,237 (881)
Total 12,231 7,806
(i) Net gain on precious metals consists of net gain on precious metals and precious metal related derivative products.
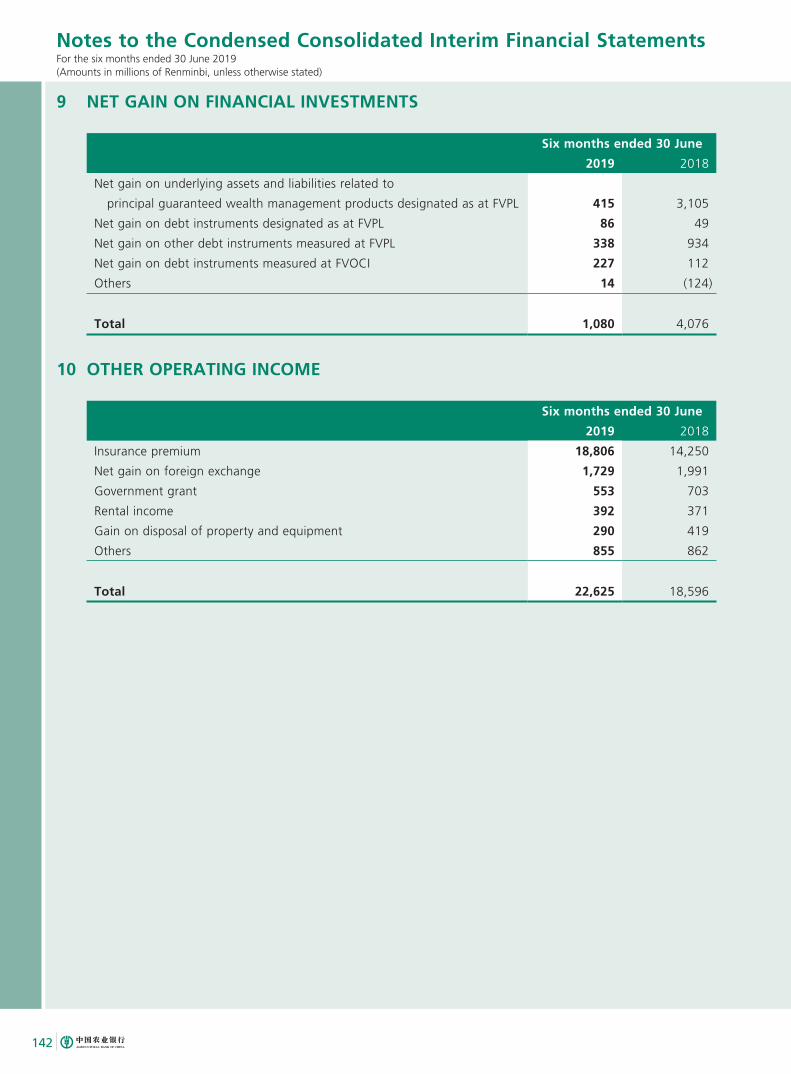
142
Notes to the Condensed Consolidated Interim Financial StatementsFor the six months ended 30 June 2019(Amounts in millions of Renminbi, unless otherwise stated)
9 NET GAIN ON FINANCIAL INVESTMENTS
Six months ended 30 June
2019 2018
Net gain on underlying assets and liabilities related to
principal guaranteed wealth management products designated as at FVPL 415 3,105
Net gain on debt instruments designated as at FVPL 86 49
Net gain on other debt instruments measured at FVPL 338 934
Net gain on debt instruments measured at FVOCI 227 112
Others 14 (124)
Total 1,080 4,076
10 OTHER OPERATING INCOME
Six months ended 30 June
2019 2018
Insurance premium 18,806 14,250
Net gain on foreign exchange 1,729 1,991
Government grant 553 703
Rental income 392 371
Gain on disposal of property and equipment 290 419
Others 855 862
Total 22,625 18,596
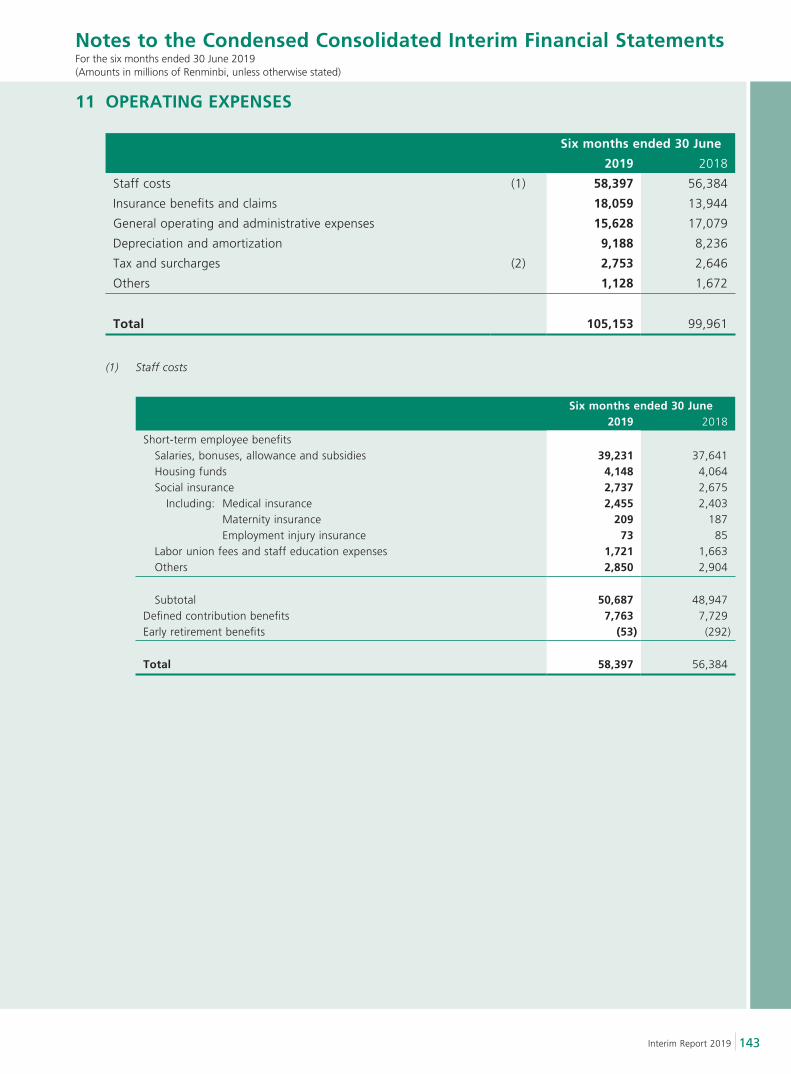
143Interim Report 2019
Notes to the Condensed Consolidated Interim Financial StatementsFor the six months ended 30 June 2019(Amounts in millions of Renminbi, unless otherwise stated)
11 OPERATING EXPENSES
Six months ended 30 June
2019 2018
Staff costs (1) 58,397 56,384
Insurance benefits and claims 18,059 13,944
General operating and administrative expenses 15,628 17,079
Depreciation and amortization 9,188 8,236
Tax and surcharges (2) 2,753 2,646
Others 1,128 1,672
Total 105,153 99,961
(1) Staff costs
Six months ended 30 June2019 2018
Short-term employee benefits Salaries, bonuses, allowance and subsidies 39,231 37,641 Housing funds 4,148 4,064 Social insurance 2,737 2,675 Including: Medical insurance 2,455 2,403 Maternity insurance 209 187 Employment injury insurance 73 85 Labor union fees and staff education expenses 1,721 1,663 Others 2,850 2,904
Subtotal 50,687 48,947Defined contribution benefits 7,763 7,729Early retirement benefits (53) (292)
Total 58,397 56,384
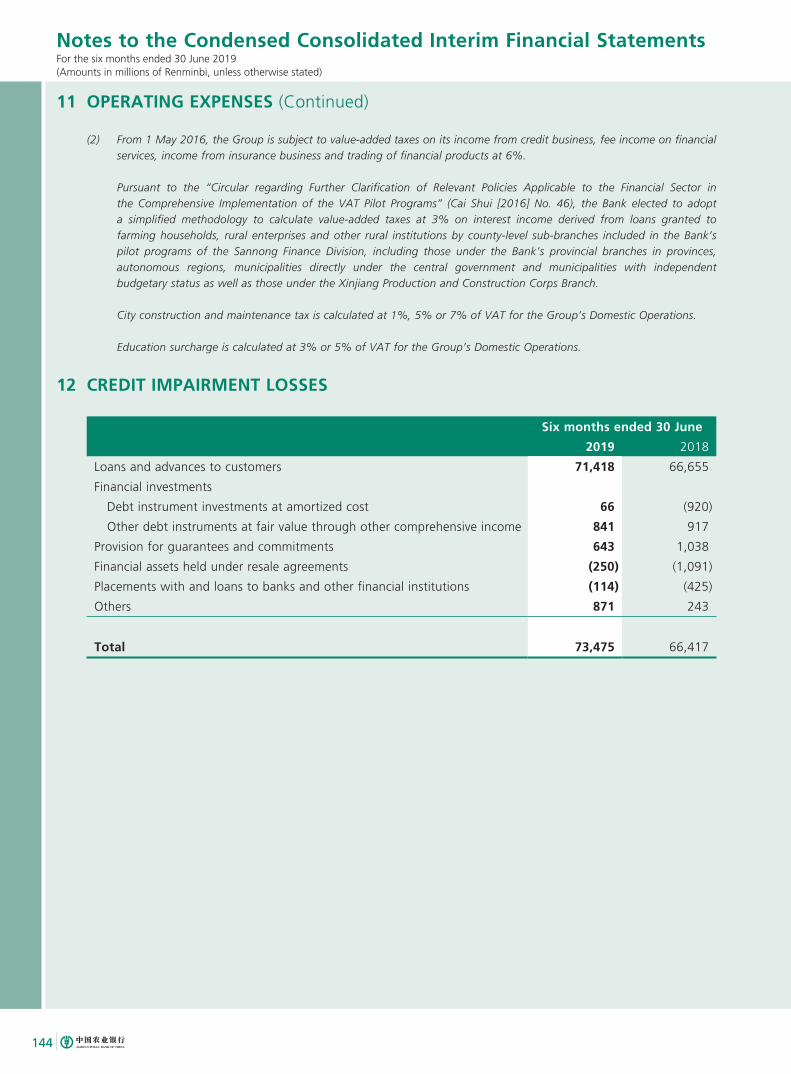
144
Notes to the Condensed Consolidated Interim Financial StatementsFor the six months ended 30 June 2019(Amounts in millions of Renminbi, unless otherwise stated)
11 OPERATING EXPENSES (Continued)
(2) From 1 May 2016, the Group is subject to value-added taxes on its income from credit business, fee income on financial services, income from insurance business and trading of financial products at 6%.
Pursuant to the “Circular regarding Further Clarification of Relevant Policies Applicable to the Financial Sector in the Comprehensive Implementation of the VAT Pilot Programs” (Cai Shui [2016] No. 46), the Bank elected to adopt a simplified methodology to calculate value-added taxes at 3% on interest income derived from loans granted to farming households, rural enterprises and other rural institutions by county-level sub-branches included in the Bank’s pilot programs of the Sannong Finance Division, including those under the Bank’s provincial branches in provinces, autonomous regions, municipalities directly under the central government and municipalities with independent budgetary status as well as those under the Xinjiang Production and Construction Corps Branch.
City construction and maintenance tax is calculated at 1%, 5% or 7% of VAT for the Group’s Domestic Operations.
Education surcharge is calculated at 3% or 5% of VAT for the Group’s Domestic Operations.
12 CREDIT IMPAIRMENT LOSSES
Six months ended 30 June
2019 2018
Loans and advances to customers 71,418 66,655
Financial investments
Debt instrument investments at amortized cost 66 (920)
Other debt instruments at fair value through other comprehensive income 841 917
Provision for guarantees and commitments 643 1,038
Financial assets held under resale agreements (250) (1,091)
Placements with and loans to banks and other financial institutions (114) (425)
Others 871 243
Total 73,475 66,417
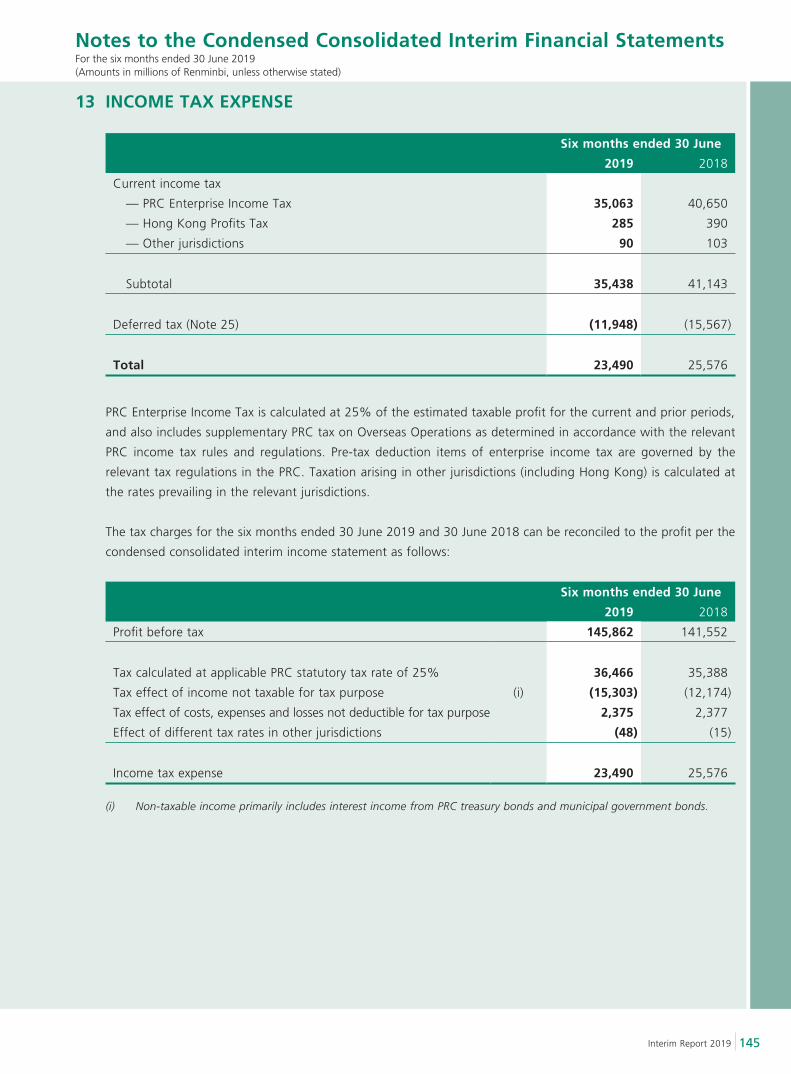
145Interim Report 2019
Notes to the Condensed Consolidated Interim Financial StatementsFor the six months ended 30 June 2019(Amounts in millions of Renminbi, unless otherwise stated)
13 INCOME TAX EXPENSE
Six months ended 30 June
2019 2018
Current income tax
— PRC Enterprise Income Tax 35,063 40,650
— Hong Kong Profits Tax 285 390
— Other jurisdictions 90 103
Subtotal 35,438 41,143
Deferred tax (Note 25) (11,948) (15,567)
Total 23,490 25,576
PRC Enterprise Income Tax is calculated at 25% of the estimated taxable profit for the current and prior periods,
and also includes supplementary PRC tax on Overseas Operations as determined in accordance with the relevant
PRC income tax rules and regulations. Pre-tax deduction items of enterprise income tax are governed by the
relevant tax regulations in the PRC. Taxation arising in other jurisdictions (including Hong Kong) is calculated at
the rates prevailing in the relevant jurisdictions.
The tax charges for the six months ended 30 June 2019 and 30 June 2018 can be reconciled to the profit per the
condensed consolidated interim income statement as follows:
Six months ended 30 June
2019 2018
Profit before tax 145,862 141,552
Tax calculated at applicable PRC statutory tax rate of 25% 36,466 35,388
Tax effect of income not taxable for tax purpose (i) (15,303) (12,174)
Tax effect of costs, expenses and losses not deductible for tax purpose 2,375 2,377
Effect of different tax rates in other jurisdictions (48) (15)
Income tax expense 23,490 25,576
(i) Non-taxable income primarily includes interest income from PRC treasury bonds and municipal government bonds.
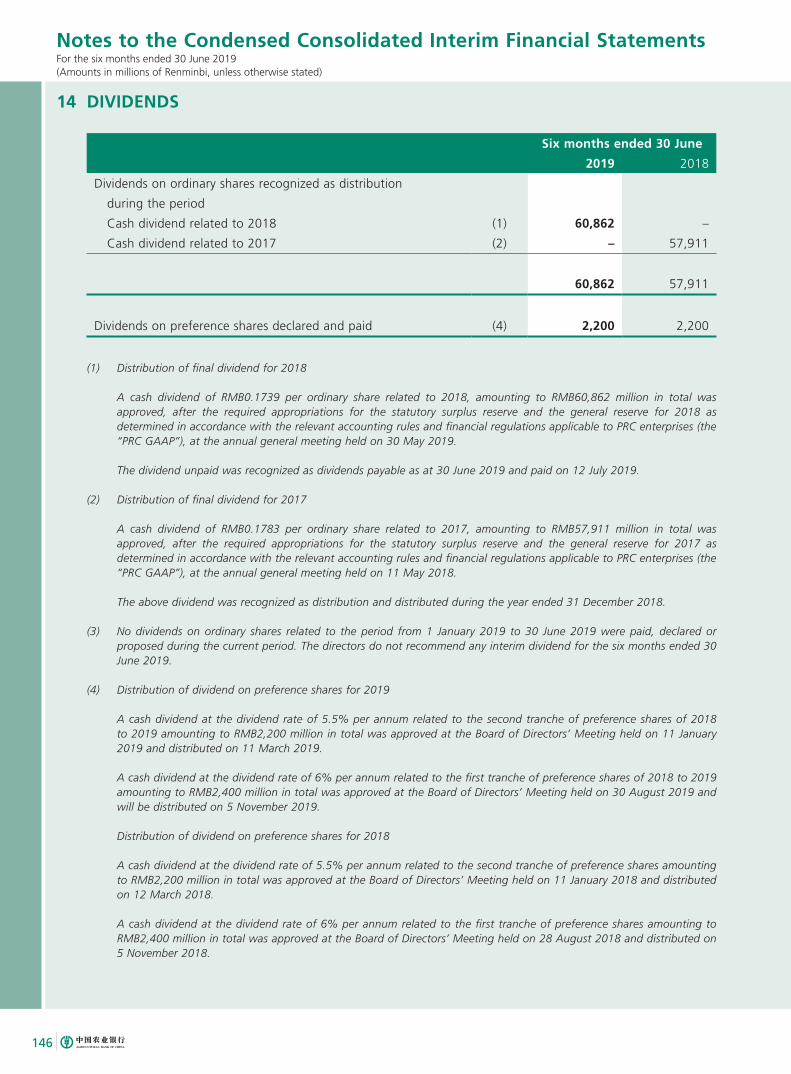
146
Notes to the Condensed Consolidated Interim Financial StatementsFor the six months ended 30 June 2019(Amounts in millions of Renminbi, unless otherwise stated)
14 DIVIDENDS
Six months ended 30 June
2019 2018
Dividends on ordinary shares recognized as distribution
during the period
Cash dividend related to 2018 (1) 60,862 –
Cash dividend related to 2017 (2) – 57,911
60,862 57,911
Dividends on preference shares declared and paid (4) 2,200 2,200
(1) Distribution of final dividend for 2018
A cash dividend of RMB0.1739 per ordinary share related to 2018, amounting to RMB60,862 million in total was approved, after the required appropriations for the statutory surplus reserve and the general reserve for 2018 as determined in accordance with the relevant accounting rules and financial regulations applicable to PRC enterprises (the “PRC GAAP”), at the annual general meeting held on 30 May 2019.
The dividend unpaid was recognized as dividends payable as at 30 June 2019 and paid on 12 July 2019.
(2) Distribution of final dividend for 2017
A cash dividend of RMB0.1783 per ordinary share related to 2017, amounting to RMB57,911 million in total was approved, after the required appropriations for the statutory surplus reserve and the general reserve for 2017 as determined in accordance with the relevant accounting rules and financial regulations applicable to PRC enterprises (the “PRC GAAP”), at the annual general meeting held on 11 May 2018.
The above dividend was recognized as distribution and distributed during the year ended 31 December 2018.
(3) No dividends on ordinary shares related to the period from 1 January 2019 to 30 June 2019 were paid, declared or proposed during the current period. The directors do not recommend any interim dividend for the six months ended 30 June 2019.
(4) Distribution of dividend on preference shares for 2019
A cash dividend at the dividend rate of 5.5% per annum related to the second tranche of preference shares of 2018 to 2019 amounting to RMB2,200 million in total was approved at the Board of Directors’ Meeting held on 11 January 2019 and distributed on 11 March 2019.
A cash dividend at the dividend rate of 6% per annum related to the first tranche of preference shares of 2018 to 2019 amounting to RMB2,400 million in total was approved at the Board of Directors’ Meeting held on 30 August 2019 and will be distributed on 5 November 2019.
Distribution of dividend on preference shares for 2018
A cash dividend at the dividend rate of 5.5% per annum related to the second tranche of preference shares amounting to RMB2,200 million in total was approved at the Board of Directors’ Meeting held on 11 January 2018 and distributed on 12 March 2018.
A cash dividend at the dividend rate of 6% per annum related to the first tranche of preference shares amounting to RMB2,400 million in total was approved at the Board of Directors’ Meeting held on 28 August 2018 and distributed on 5 November 2018.
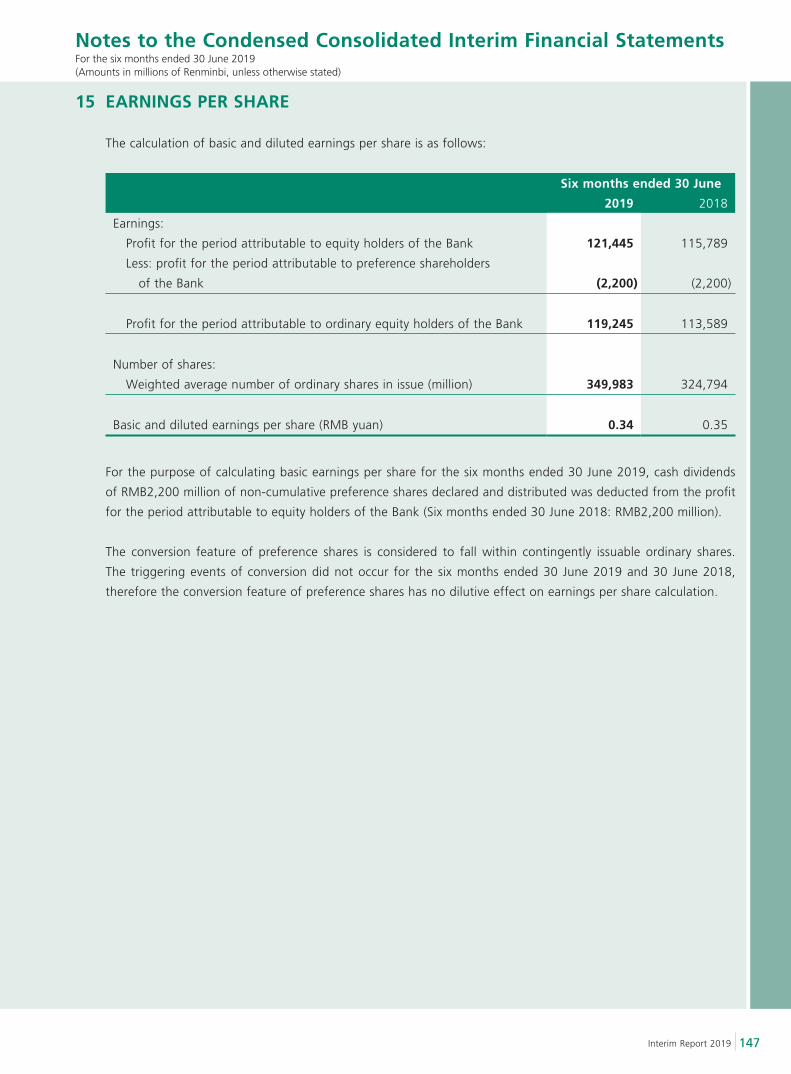
147Interim Report 2019
Notes to the Condensed Consolidated Interim Financial StatementsFor the six months ended 30 June 2019(Amounts in millions of Renminbi, unless otherwise stated)
15 EARNINGS PER SHARE
The calculation of basic and diluted earnings per share is as follows:
Six months ended 30 June
2019 2018
Earnings:
Profit for the period attributable to equity holders of the Bank 121,445 115,789
Less: profit for the period attributable to preference shareholders
of the Bank (2,200) (2,200)
Profit for the period attributable to ordinary equity holders of the Bank 119,245 113,589
Number of shares:
Weighted average number of ordinary shares in issue (million) 349,983 324,794
Basic and diluted earnings per share (RMB yuan) 0.34 0.35
For the purpose of calculating basic earnings per share for the six months ended 30 June 2019, cash dividends
of RMB2,200 million of non-cumulative preference shares declared and distributed was deducted from the profit
for the period attributable to equity holders of the Bank (Six months ended 30 June 2018: RMB2,200 million).
The conversion feature of preference shares is considered to fall within contingently issuable ordinary shares.
The triggering events of conversion did not occur for the six months ended 30 June 2019 and 30 June 2018,
therefore the conversion feature of preference shares has no dilutive effect on earnings per share calculation.
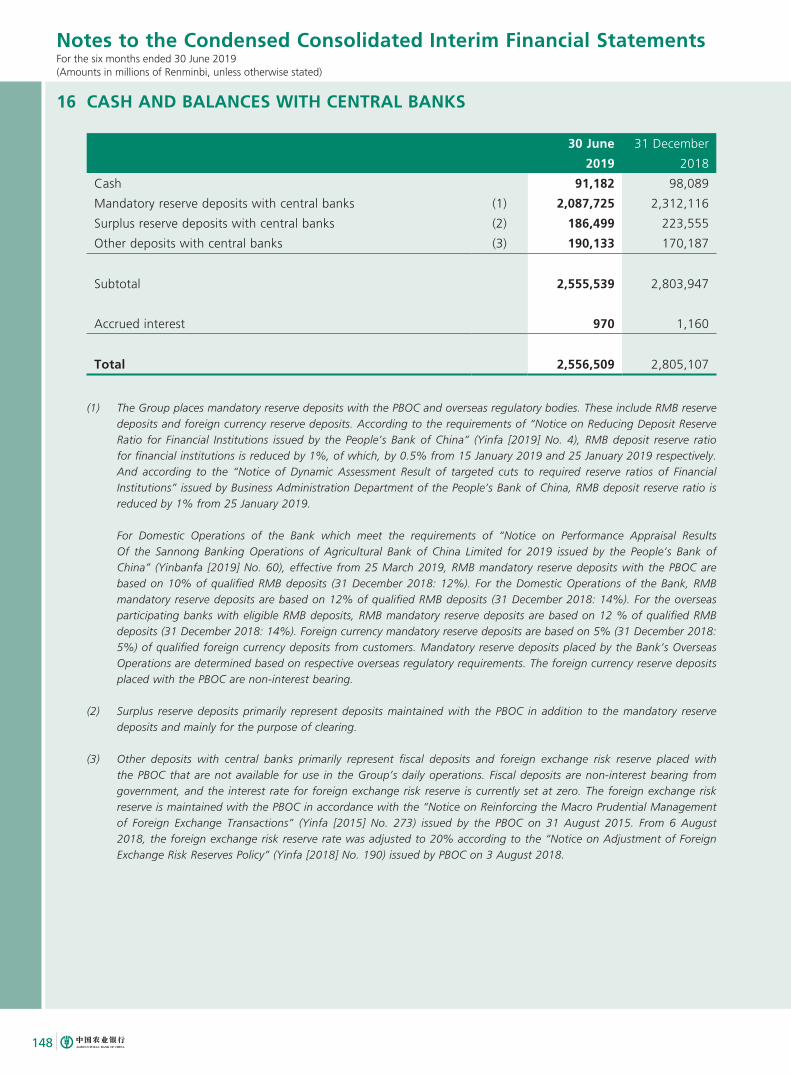
148
Notes to the Condensed Consolidated Interim Financial StatementsFor the six months ended 30 June 2019(Amounts in millions of Renminbi, unless otherwise stated)
16 CASH AND BALANCES WITH CENTRAL BANKS
30 June
2019
31 December
2018
Cash 91,182 98,089
Mandatory reserve deposits with central banks (1) 2,087,725 2,312,116
Surplus reserve deposits with central banks (2) 186,499 223,555
Other deposits with central banks (3) 190,133 170,187
Subtotal 2,555,539 2,803,947
Accrued interest 970 1,160
Total 2,556,509 2,805,107
(1) The Group places mandatory reserve deposits with the PBOC and overseas regulatory bodies. These include RMB reserve deposits and foreign currency reserve deposits. According to the requirements of “Notice on Reducing Deposit Reserve Ratio for Financial Institutions issued by the People’s Bank of China” (Yinfa [2019] No. 4), RMB deposit reserve ratio for financial institutions is reduced by 1%, of which, by 0.5% from 15 January 2019 and 25 January 2019 respectively. And according to the “Notice of Dynamic Assessment Result of targeted cuts to required reserve ratios of Financial Institutions” issued by Business Administration Department of the People’s Bank of China, RMB deposit reserve ratio is reduced by 1% from 25 January 2019.
For Domestic Operations of the Bank which meet the requirements of “Notice on Performance Appraisal Results Of the Sannong Banking Operations of Agricultural Bank of China Limited for 2019 issued by the People’s Bank of China” (Yinbanfa [2019] No. 60), effective from 25 March 2019, RMB mandatory reserve deposits with the PBOC are based on 10% of qualified RMB deposits (31 December 2018: 12%). For the Domestic Operations of the Bank, RMB mandatory reserve deposits are based on 12% of qualified RMB deposits (31 December 2018: 14%). For the overseas participating banks with eligible RMB deposits, RMB mandatory reserve deposits are based on 12 % of qualified RMB deposits (31 December 2018: 14%). Foreign currency mandatory reserve deposits are based on 5% (31 December 2018: 5%) of qualified foreign currency deposits from customers. Mandatory reserve deposits placed by the Bank’s Overseas Operations are determined based on respective overseas regulatory requirements. The foreign currency reserve deposits placed with the PBOC are non-interest bearing.
(2) Surplus reserve deposits primarily represent deposits maintained with the PBOC in addition to the mandatory reserve deposits and mainly for the purpose of clearing.
(3) Other deposits with central banks primarily represent fiscal deposits and foreign exchange risk reserve placed with the PBOC that are not available for use in the Group’s daily operations. Fiscal deposits are non-interest bearing from government, and the interest rate for foreign exchange risk reserve is currently set at zero. The foreign exchange risk reserve is maintained with the PBOC in accordance with the “Notice on Reinforcing the Macro Prudential Management of Foreign Exchange Transactions” (Yinfa [2015] No. 273) issued by the PBOC on 31 August 2015. From 6 August 2018, the foreign exchange risk reserve rate was adjusted to 20% according to the “Notice on Adjustment of Foreign Exchange Risk Reserves Policy” (Yinfa [2018] No. 190) issued by PBOC on 3 August 2018.
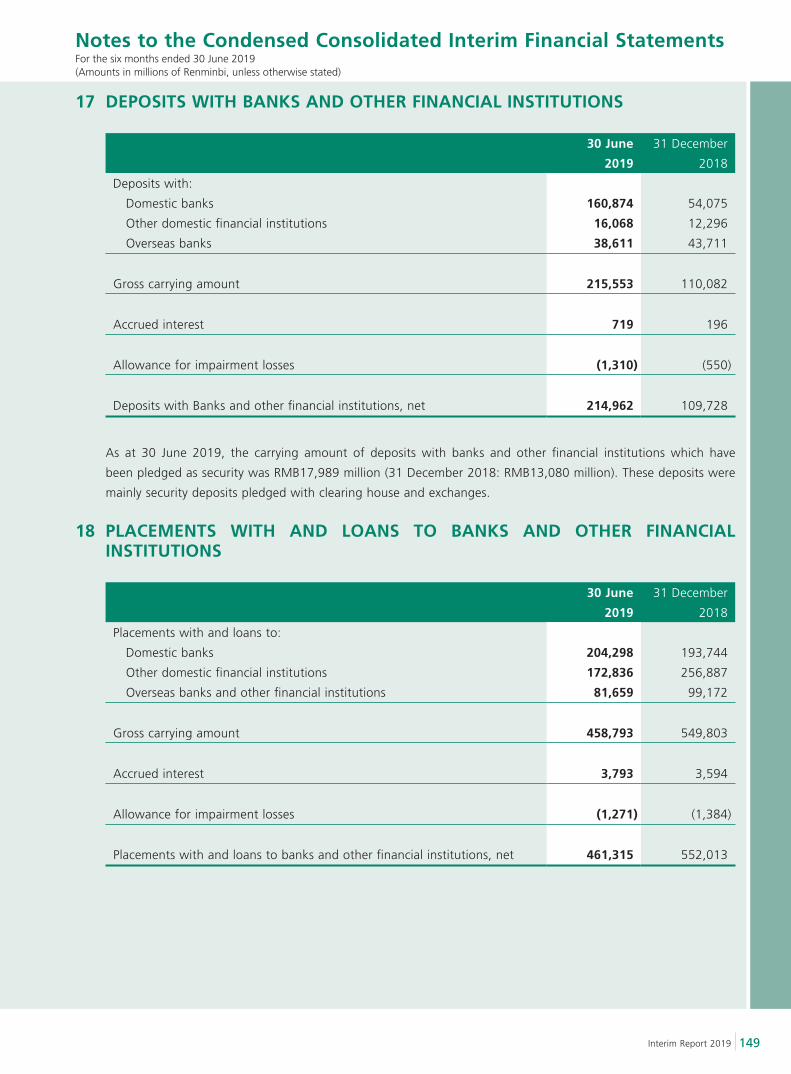
149Interim Report 2019
Notes to the Condensed Consolidated Interim Financial StatementsFor the six months ended 30 June 2019(Amounts in millions of Renminbi, unless otherwise stated)
17 DEPOSITS WITH BANKS AND OTHER FINANCIAL INSTITUTIONS
30 June
2019
31 December
2018
Deposits with:
Domestic banks 160,874 54,075
Other domestic financial institutions 16,068 12,296
Overseas banks 38,611 43,711
Gross carrying amount 215,553 110,082
Accrued interest 719 196
Allowance for impairment losses (1,310) (550)
Deposits with Banks and other financial institutions, net 214,962 109,728
As at 30 June 2019, the carrying amount of deposits with banks and other financial institutions which have
been pledged as security was RMB17,989 million (31 December 2018: RMB13,080 million). These deposits were
mainly security deposits pledged with clearing house and exchanges.
18 PLACEMENTS WITH AND LOANS TO BANKS AND OTHER FINANCIAL INSTITUTIONS
30 June
2019
31 December
2018
Placements with and loans to:
Domestic banks 204,298 193,744
Other domestic financial institutions 172,836 256,887
Overseas banks and other financial institutions 81,659 99,172
Gross carrying amount 458,793 549,803
Accrued interest 3,793 3,594
Allowance for impairment losses (1,271) (1,384)
Placements with and loans to banks and other financial institutions, net 461,315 552,013
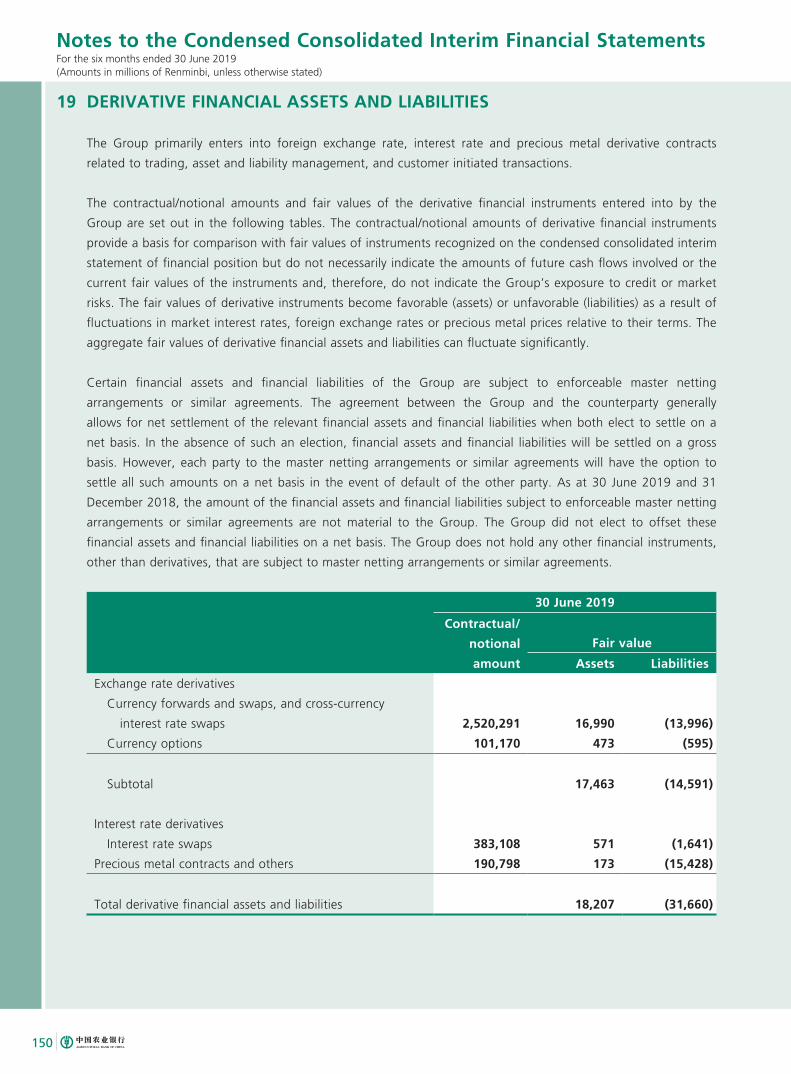
150
Notes to the Condensed Consolidated Interim Financial StatementsFor the six months ended 30 June 2019(Amounts in millions of Renminbi, unless otherwise stated)
19 DERIVATIVE FINANCIAL ASSETS AND LIABILITIES
The Group primarily enters into foreign exchange rate, interest rate and precious metal derivative contracts
related to trading, asset and liability management, and customer initiated transactions.
The contractual/notional amounts and fair values of the derivative financial instruments entered into by the
Group are set out in the following tables. The contractual/notional amounts of derivative financial instruments
provide a basis for comparison with fair values of instruments recognized on the condensed consolidated interim
statement of financial position but do not necessarily indicate the amounts of future cash flows involved or the
current fair values of the instruments and, therefore, do not indicate the Group’s exposure to credit or market
risks. The fair values of derivative instruments become favorable (assets) or unfavorable (liabilities) as a result of
fluctuations in market interest rates, foreign exchange rates or precious metal prices relative to their terms. The
aggregate fair values of derivative financial assets and liabilities can fluctuate significantly.
Certain financial assets and financial liabilities of the Group are subject to enforceable master netting
arrangements or similar agreements. The agreement between the Group and the counterparty generally
allows for net settlement of the relevant financial assets and financial liabilities when both elect to settle on a
net basis. In the absence of such an election, financial assets and financial liabilities will be settled on a gross
basis. However, each party to the master netting arrangements or similar agreements will have the option to
settle all such amounts on a net basis in the event of default of the other party. As at 30 June 2019 and 31
December 2018, the amount of the financial assets and financial liabilities subject to enforceable master netting
arrangements or similar agreements are not material to the Group. The Group did not elect to offset these
financial assets and financial liabilities on a net basis. The Group does not hold any other financial instruments,
other than derivatives, that are subject to master netting arrangements or similar agreements.
30 June 2019
Contractual/
notional
amount
Fair value
Assets Liabilities
Exchange rate derivatives
Currency forwards and swaps, and cross-currency
interest rate swaps 2,520,291 16,990 (13,996)
Currency options 101,170 473 (595)
Subtotal 17,463 (14,591)
Interest rate derivatives
Interest rate swaps 383,108 571 (1,641)
Precious metal contracts and others 190,798 173 (15,428)
Total derivative financial assets and liabilities 18,207 (31,660)
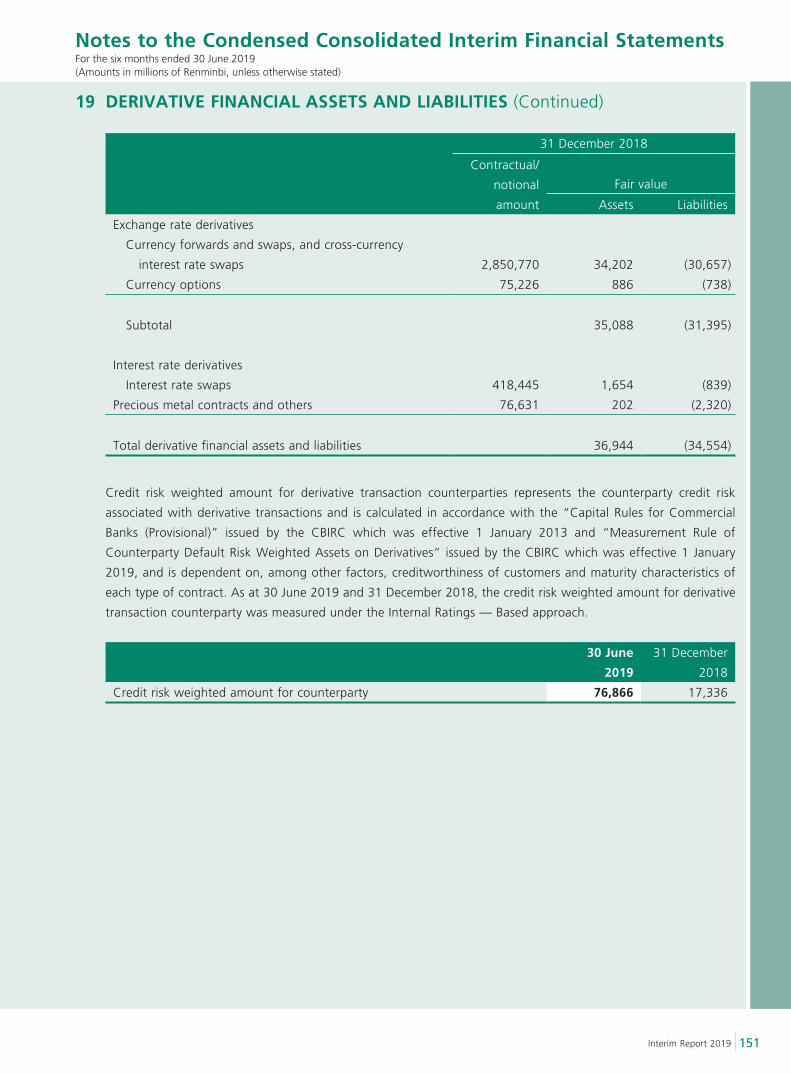
151Interim Report 2019
Notes to the Condensed Consolidated Interim Financial StatementsFor the six months ended 30 June 2019(Amounts in millions of Renminbi, unless otherwise stated)
19 DERIVATIVE FINANCIAL ASSETS AND LIABILITIES (Continued)
31 December 2018
Contractual/
notional
amount
Fair value
Assets Liabilities
Exchange rate derivatives
Currency forwards and swaps, and cross-currency
interest rate swaps 2,850,770 34,202 (30,657)
Currency options 75,226 886 (738)
Subtotal 35,088 (31,395)
Interest rate derivatives
Interest rate swaps 418,445 1,654 (839)
Precious metal contracts and others 76,631 202 (2,320)
Total derivative financial assets and liabilities 36,944 (34,554)
Credit risk weighted amount for derivative transaction counterparties represents the counterparty credit risk
associated with derivative transactions and is calculated in accordance with the “Capital Rules for Commercial
Banks (Provisional)” issued by the CBIRC which was effective 1 January 2013 and “Measurement Rule of
Counterparty Default Risk Weighted Assets on Derivatives” issued by the CBIRC which was effective 1 January
2019, and is dependent on, among other factors, creditworthiness of customers and maturity characteristics of
each type of contract. As at 30 June 2019 and 31 December 2018, the credit risk weighted amount for derivative
transaction counterparty was measured under the Internal Ratings — Based approach.
30 June
2019
31 December
2018
Credit risk weighted amount for counterparty 76,866 17,336
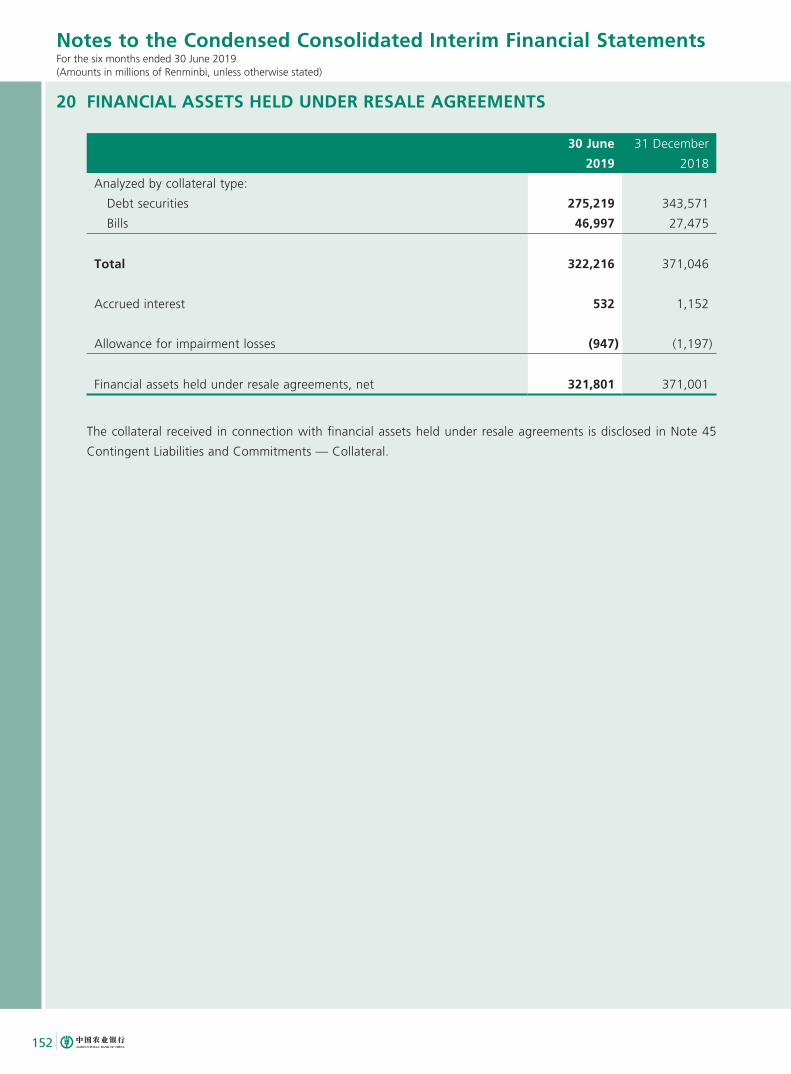
152
Notes to the Condensed Consolidated Interim Financial StatementsFor the six months ended 30 June 2019(Amounts in millions of Renminbi, unless otherwise stated)
20 FINANCIAL ASSETS HELD UNDER RESALE AGREEMENTS
30 June
2019
31 December
2018
Analyzed by collateral type:
Debt securities 275,219 343,571
Bills 46,997 27,475
Total 322,216 371,046
Accrued interest 532 1,152
Allowance for impairment losses (947) (1,197)
Financial assets held under resale agreements, net 321,801 371,001
The collateral received in connection with financial assets held under resale agreements is disclosed in Note 45
Contingent Liabilities and Commitments — Collateral.
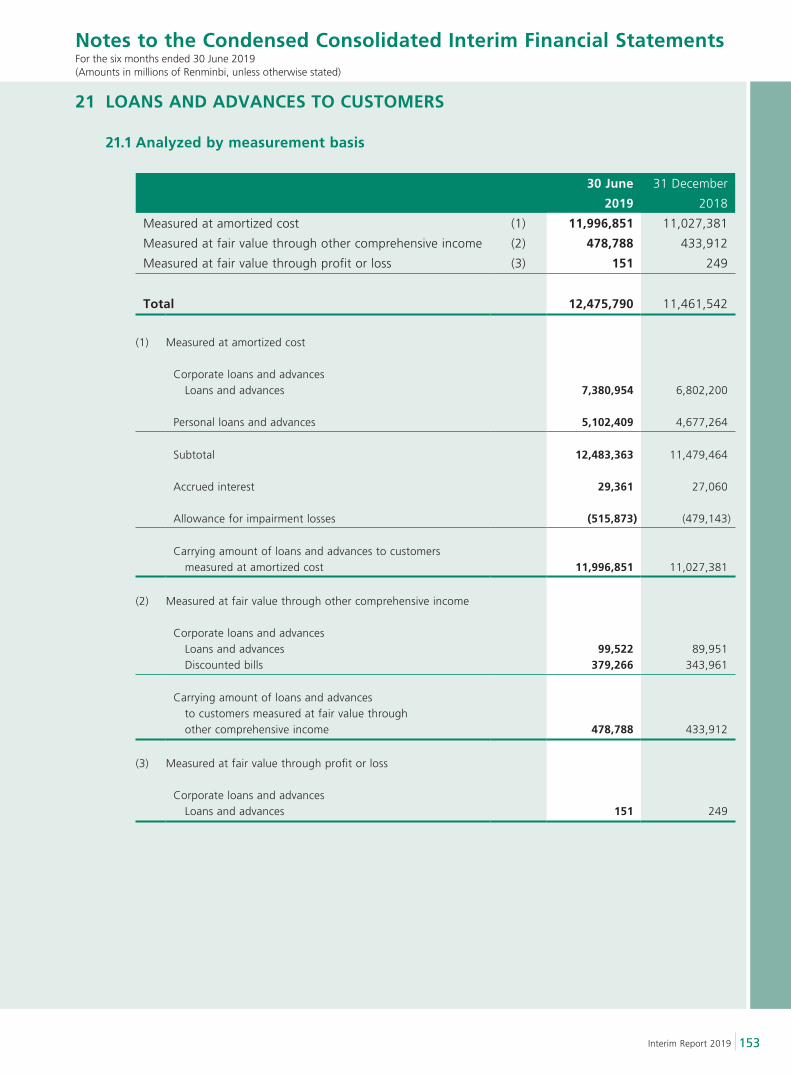
153Interim Report 2019
Notes to the Condensed Consolidated Interim Financial StatementsFor the six months ended 30 June 2019(Amounts in millions of Renminbi, unless otherwise stated)
21 LOANS AND ADVANCES TO CUSTOMERS
21.1 Analyzed by measurement basis
30 June
2019
31 December
2018
Measured at amortized cost (1) 11,996,851 11,027,381
Measured at fair value through other comprehensive income (2) 478,788 433,912
Measured at fair value through profit or loss (3) 151 249
Total 12,475,790 11,461,542
(1) Measured at amortized cost
Corporate loans and advances Loans and advances 7,380,954 6,802,200
Personal loans and advances 5,102,409 4,677,264
Subtotal 12,483,363 11,479,464
Accrued interest 29,361 27,060
Allowance for impairment losses (515,873) (479,143)
Carrying amount of loans and advances to customers measured at amortized cost 11,996,851 11,027,381
(2) Measured at fair value through other comprehensive income
Corporate loans and advances Loans and advances 99,522 89,951 Discounted bills 379,266 343,961
Carrying amount of loans and advances to customers measured at fair value through other comprehensive income 478,788 433,912
(3) Measured at fair value through profit or loss
Corporate loans and advances Loans and advances 151 249
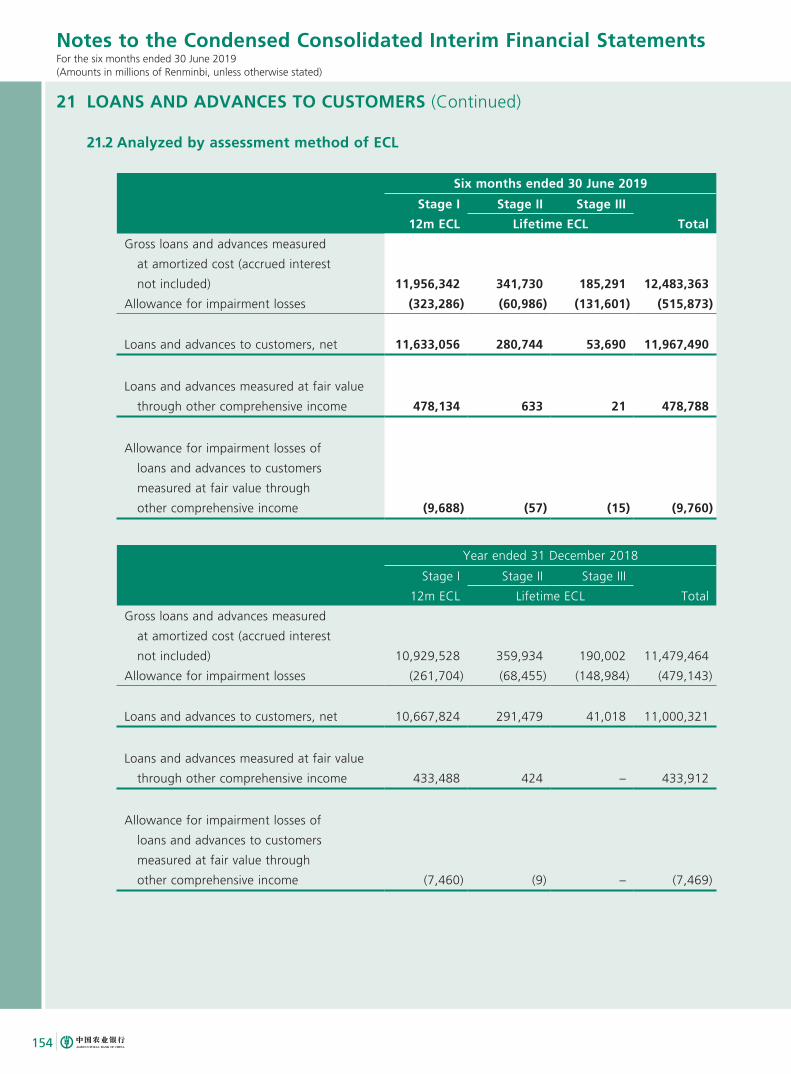
154
Notes to the Condensed Consolidated Interim Financial StatementsFor the six months ended 30 June 2019(Amounts in millions of Renminbi, unless otherwise stated)
21 LOANS AND ADVANCES TO CUSTOMERS (Continued)
21.2 Analyzed by assessment method of ECL
Six months ended 30 June 2019
Stage I Stage II Stage III
12m ECL Lifetime ECL Total
Gross loans and advances measured
at amortized cost (accrued interest
not included) 11,956,342 341,730 185,291 12,483,363
Allowance for impairment losses (323,286) (60,986) (131,601) (515,873)
Loans and advances to customers, net 11,633,056 280,744 53,690 11,967,490
Loans and advances measured at fair value
through other comprehensive income 478,134 633 21 478,788
Allowance for impairment losses of
loans and advances to customers
measured at fair value through
other comprehensive income (9,688) (57) (15) (9,760)
Year ended 31 December 2018
Stage I Stage II Stage III
12m ECL Lifetime ECL Total
Gross loans and advances measured
at amortized cost (accrued interest
not included) 10,929,528 359,934 190,002 11,479,464
Allowance for impairment losses (261,704) (68,455) (148,984) (479,143)
Loans and advances to customers, net 10,667,824 291,479 41,018 11,000,321
Loans and advances measured at fair value
through other comprehensive income 433,488 424 – 433,912
Allowance for impairment losses of
loans and advances to customers
measured at fair value through
other comprehensive income (7,460) (9) – (7,469)
155Interim Report 2019
Notes to the Condensed Consolidated Interim Financial StatementsFor the six months ended 30 June 2019(Amounts in millions of Renminbi, unless otherwise stated)
21 LOANS AND ADVANCES TO CUSTOMERS (Continued)
21.2 Analyzed by assessment method of ECL (Continued)
The ECL for corporate loans and advances in stage I and stage II, as well as personal loans and advances,
were measured in accordance with the risk parameters modelling method. The ECL for corporate loans and
advances in Stage III were calculated using the cash flow discount model. For details, see Note 47.1 Credit
Risk.
At 30 June 2019, the Group’s exposure of credit-impaired Stage III loans and advances covered by collateral
and pledge of the Group was RMB46,135 million (31 December 2018: RMB30,599 million).
21.3 Analyzed by movements in loss allowance
The movements of loss allowance is mainly affected by:
— Transfers between stages due to financial instruments experiencing significant increases (or decreases)
in credit risk or becoming credit-impaired;
— Allowance for new financial instruments recognized;
— Remeasurement includes the impact of changes in model assumptions, updates of model parameters,
changes in probability of default and loss given default; changes in ECL due to transfer of financial
assets between stages; changes in ECL due to unwinding of discount over time; changes in foreign
exchange translations for assets denominated in foreign currencies and other movements; and
— The reversal of allowances caused by repayment, write-offs and transfer of financial assets.
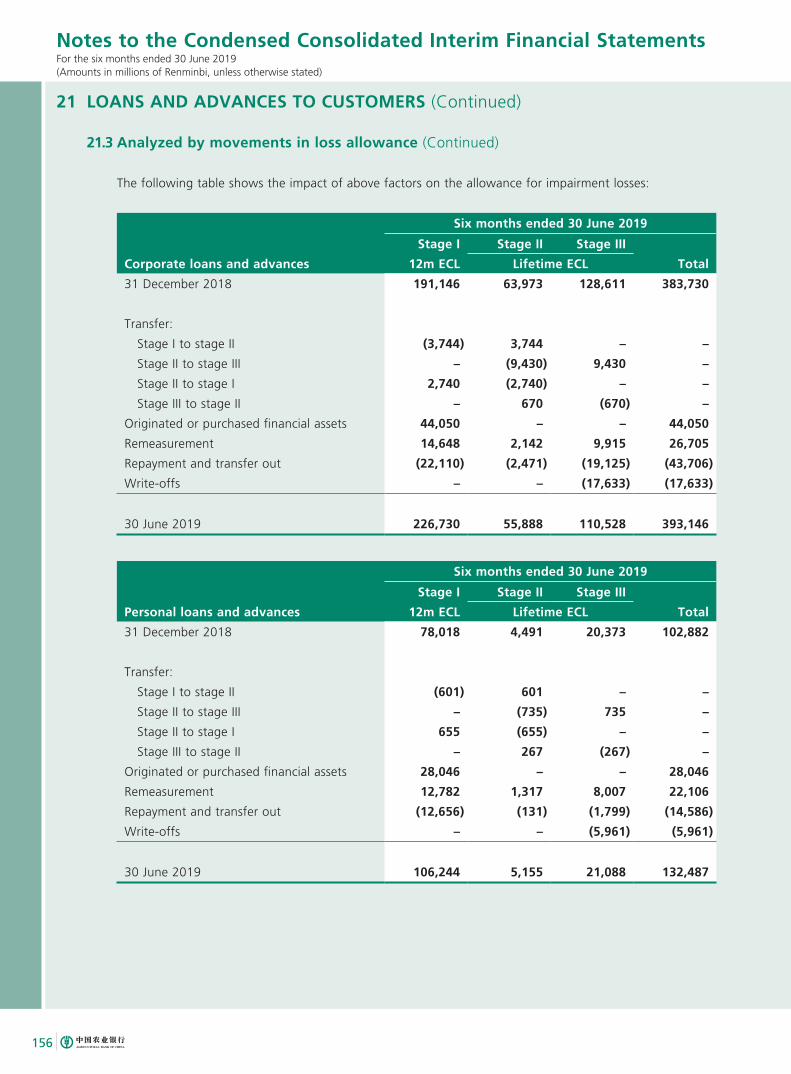
156
Notes to the Condensed Consolidated Interim Financial StatementsFor the six months ended 30 June 2019(Amounts in millions of Renminbi, unless otherwise stated)
21 LOANS AND ADVANCES TO CUSTOMERS (Continued)
21.3 Analyzed by movements in loss allowance (Continued)
The following table shows the impact of above factors on the allowance for impairment losses:
Six months ended 30 June 2019
Corporate loans and advances
Stage I Stage II Stage III
12m ECL Lifetime ECL Total
31 December 2018 191,146 63,973 128,611 383,730
Transfer:
Stage I to stage II (3,744) 3,744 – –
Stage II to stage III – (9,430) 9,430 –
Stage II to stage I 2,740 (2,740) – –
Stage III to stage II – 670 (670) –
Originated or purchased financial assets 44,050 – – 44,050
Remeasurement 14,648 2,142 9,915 26,705
Repayment and transfer out (22,110) (2,471) (19,125) (43,706)
Write-offs – – (17,633) (17,633)
30 June 2019 226,730 55,888 110,528 393,146
Six months ended 30 June 2019
Personal loans and advances
Stage I Stage II Stage III
12m ECL Lifetime ECL Total
31 December 2018 78,018 4,491 20,373 102,882
Transfer:
Stage I to stage II (601) 601 – –
Stage II to stage III – (735) 735 –
Stage II to stage I 655 (655) – –
Stage III to stage II – 267 (267) –
Originated or purchased financial assets 28,046 – – 28,046
Remeasurement 12,782 1,317 8,007 22,106
Repayment and transfer out (12,656) (131) (1,799) (14,586)
Write-offs – – (5,961) (5,961)
30 June 2019 106,244 5,155 21,088 132,487
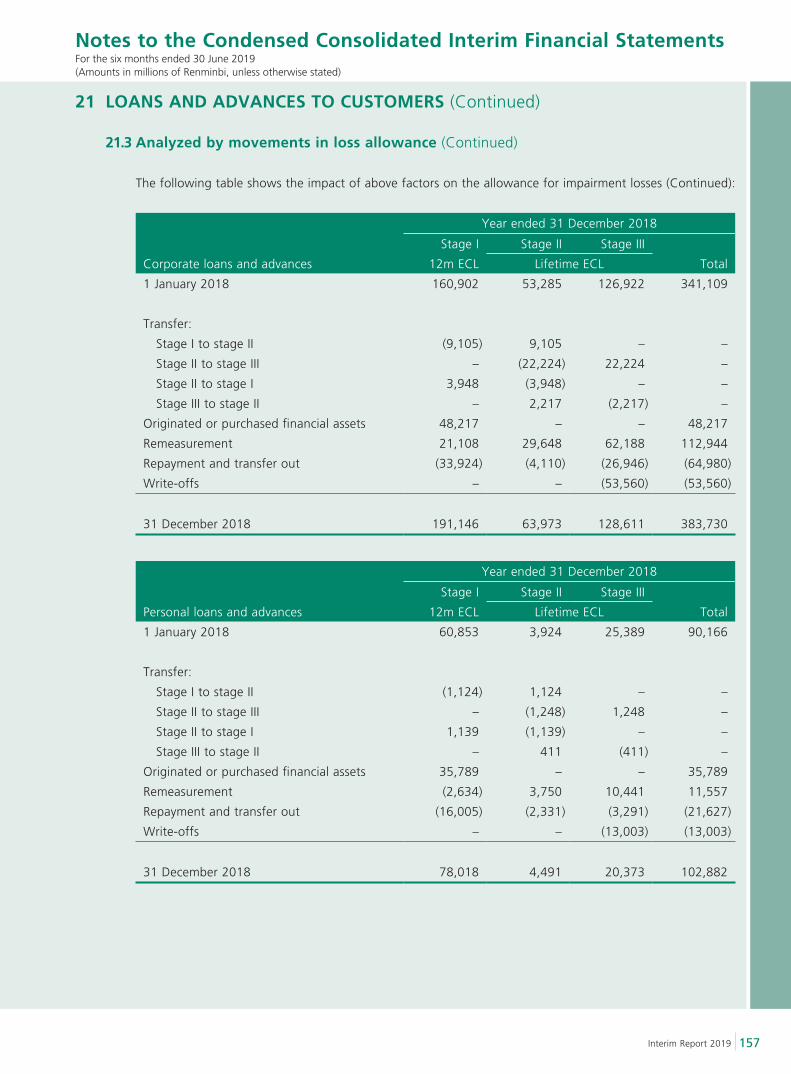
157Interim Report 2019
Notes to the Condensed Consolidated Interim Financial StatementsFor the six months ended 30 June 2019(Amounts in millions of Renminbi, unless otherwise stated)
21 LOANS AND ADVANCES TO CUSTOMERS (Continued)
21.3 Analyzed by movements in loss allowance (Continued)
The following table shows the impact of above factors on the allowance for impairment losses (Continued):
Year ended 31 December 2018
Corporate loans and advances
Stage I Stage II Stage III
12m ECL Lifetime ECL Total
1 January 2018 160,902 53,285 126,922 341,109
Transfer:
Stage I to stage II (9,105) 9,105 – –
Stage II to stage III – (22,224) 22,224 –
Stage II to stage I 3,948 (3,948) – –
Stage III to stage II – 2,217 (2,217) –
Originated or purchased financial assets 48,217 – – 48,217
Remeasurement 21,108 29,648 62,188 112,944
Repayment and transfer out (33,924) (4,110) (26,946) (64,980)
Write-offs – – (53,560) (53,560)
31 December 2018 191,146 63,973 128,611 383,730
Year ended 31 December 2018
Personal loans and advances
Stage I Stage II Stage III
12m ECL Lifetime ECL Total
1 January 2018 60,853 3,924 25,389 90,166
Transfer:
Stage I to stage II (1,124) 1,124 – –
Stage II to stage III – (1,248) 1,248 –
Stage II to stage I 1,139 (1,139) – –
Stage III to stage II – 411 (411) –
Originated or purchased financial assets 35,789 – – 35,789
Remeasurement (2,634) 3,750 10,441 11,557
Repayment and transfer out (16,005) (2,331) (3,291) (21,627)
Write-offs – – (13,003) (13,003)
31 December 2018 78,018 4,491 20,373 102,882
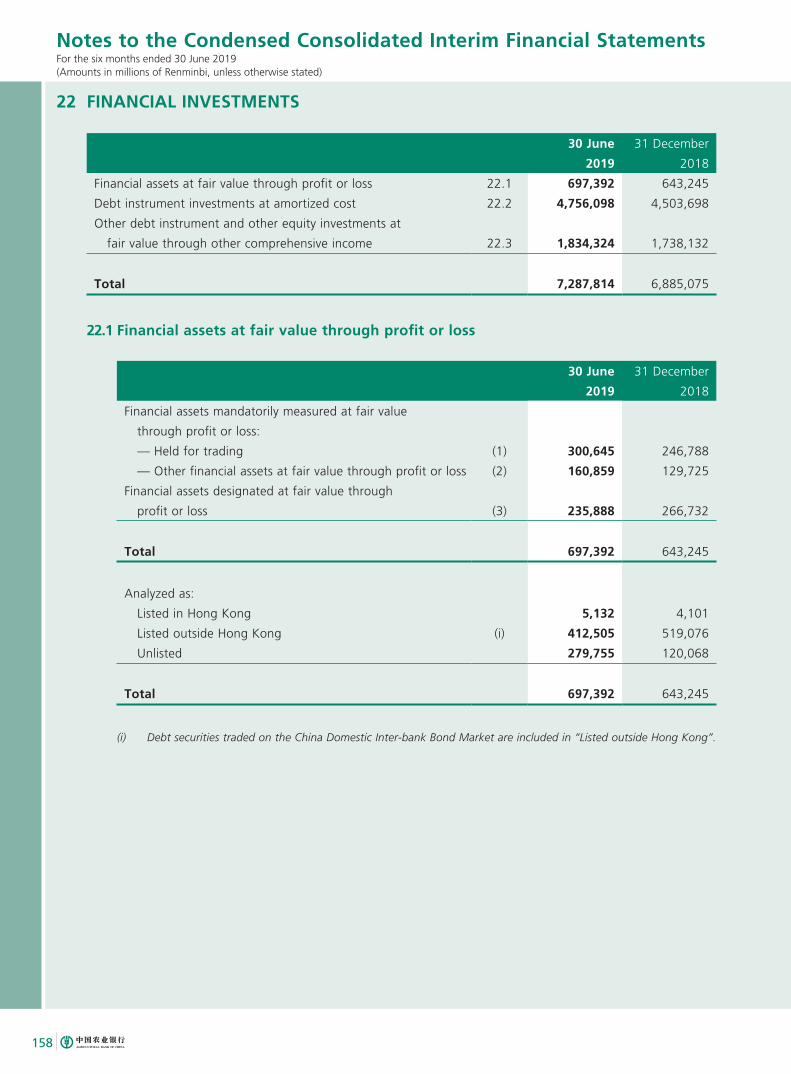
158
Notes to the Condensed Consolidated Interim Financial StatementsFor the six months ended 30 June 2019(Amounts in millions of Renminbi, unless otherwise stated)
22 FINANCIAL INVESTMENTS
30 June
2019
31 December
2018
Financial assets at fair value through profit or loss 22.1 697,392 643,245
Debt instrument investments at amortized cost 22.2 4,756,098 4,503,698
Other debt instrument and other equity investments at
fair value through other comprehensive income 22.3 1,834,324 1,738,132
Total 7,287,814 6,885,075
22.1 Financial assets at fair value through profit or loss
30 June
2019
31 December
2018
Financial assets mandatorily measured at fair value
through profit or loss:
— Held for trading (1) 300,645 246,788
— Other financial assets at fair value through profit or loss (2) 160,859 129,725
Financial assets designated at fair value through
profit or loss (3) 235,888 266,732
Total 697,392 643,245
Analyzed as:
Listed in Hong Kong 5,132 4,101
Listed outside Hong Kong (i) 412,505 519,076
Unlisted 279,755 120,068
Total 697,392 643,245
(i) Debt securities traded on the China Domestic Inter-bank Bond Market are included in “Listed outside Hong Kong”.
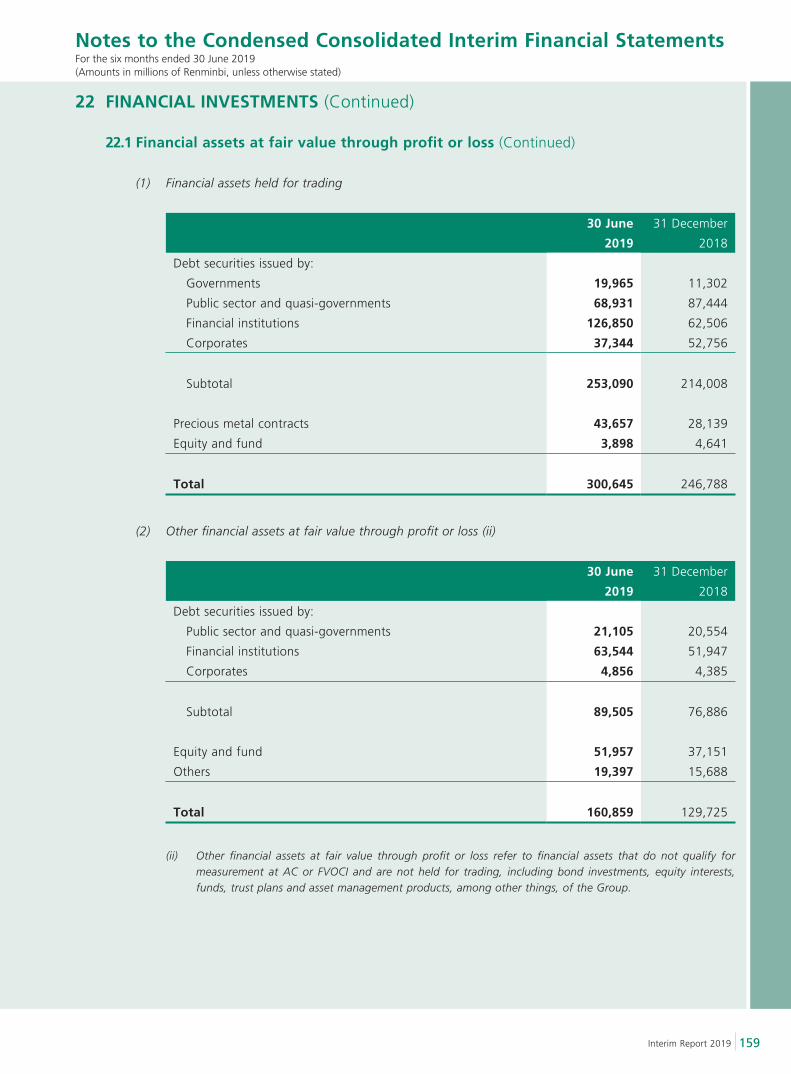
159Interim Report 2019
Notes to the Condensed Consolidated Interim Financial StatementsFor the six months ended 30 June 2019(Amounts in millions of Renminbi, unless otherwise stated)
22 FINANCIAL INVESTMENTS (Continued)
22.1 Financial assets at fair value through profit or loss (Continued)
(1) Financial assets held for trading
30 June
2019
31 December
2018
Debt securities issued by:
Governments 19,965 11,302
Public sector and quasi-governments 68,931 87,444
Financial institutions 126,850 62,506
Corporates 37,344 52,756
Subtotal 253,090 214,008
Precious metal contracts 43,657 28,139
Equity and fund 3,898 4,641
Total 300,645 246,788
(2) Other financial assets at fair value through profit or loss (ii)
30 June
2019
31 December
2018
Debt securities issued by:
Public sector and quasi-governments 21,105 20,554
Financial institutions 63,544 51,947
Corporates 4,856 4,385
Subtotal 89,505 76,886
Equity and fund 51,957 37,151
Others 19,397 15,688
Total 160,859 129,725
(ii) Other financial assets at fair value through profit or loss refer to financial assets that do not qualify for measurement at AC or FVOCI and are not held for trading, including bond investments, equity interests, funds, trust plans and asset management products, among other things, of the Group.
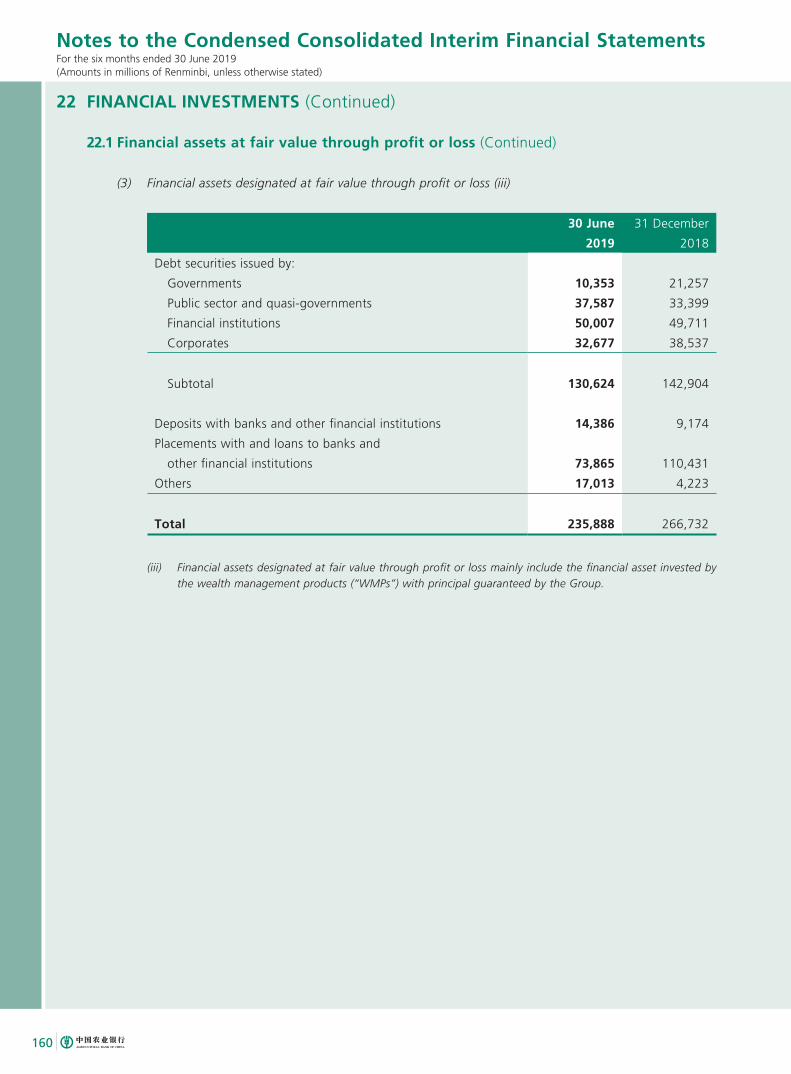
160
Notes to the Condensed Consolidated Interim Financial StatementsFor the six months ended 30 June 2019(Amounts in millions of Renminbi, unless otherwise stated)
22 FINANCIAL INVESTMENTS (Continued)
22.1 Financial assets at fair value through profit or loss (Continued)
(3) Financial assets designated at fair value through profit or loss (iii)
30 June
2019
31 December
2018
Debt securities issued by:
Governments 10,353 21,257
Public sector and quasi-governments 37,587 33,399
Financial institutions 50,007 49,711
Corporates 32,677 38,537
Subtotal 130,624 142,904
Deposits with banks and other financial institutions 14,386 9,174
Placements with and loans to banks and
other financial institutions 73,865 110,431
Others 17,013 4,223
Total 235,888 266,732
(iii) Financial assets designated at fair value through profit or loss mainly include the financial asset invested by the wealth management products (“WMPs”) with principal guaranteed by the Group.
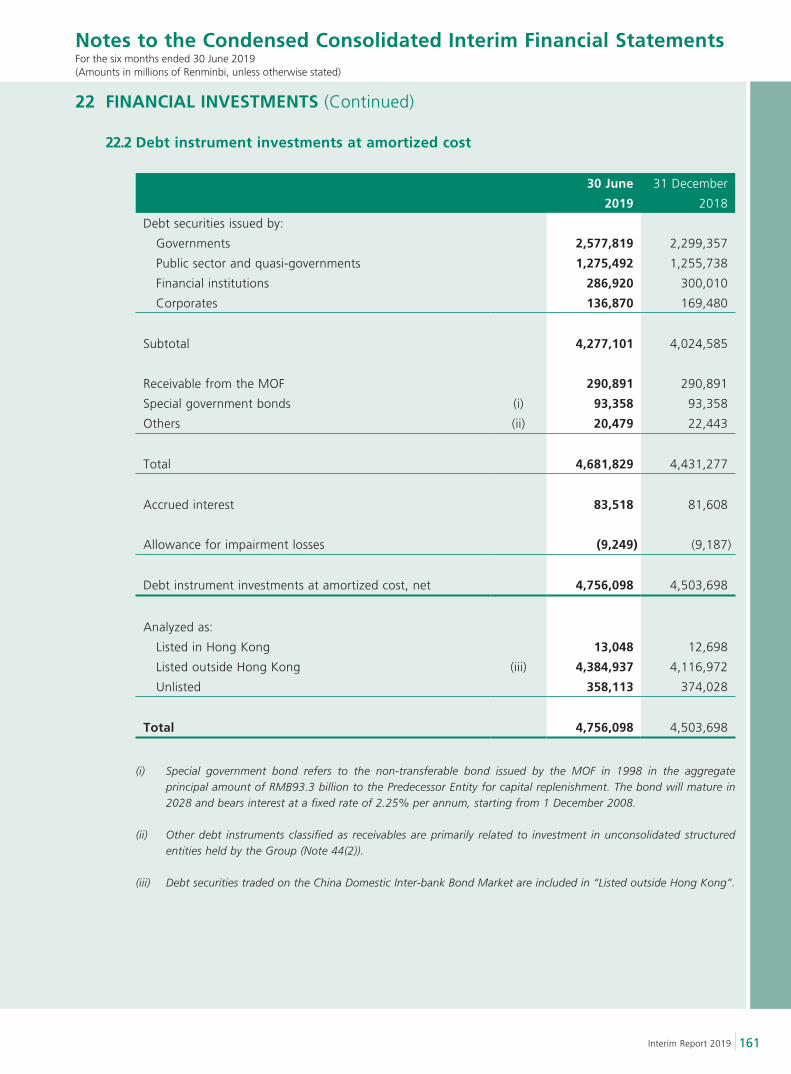
161Interim Report 2019
Notes to the Condensed Consolidated Interim Financial StatementsFor the six months ended 30 June 2019(Amounts in millions of Renminbi, unless otherwise stated)
22 FINANCIAL INVESTMENTS (Continued)
22.2 Debt instrument investments at amortized cost
30 June
2019
31 December
2018
Debt securities issued by:
Governments 2,577,819 2,299,357
Public sector and quasi-governments 1,275,492 1,255,738
Financial institutions 286,920 300,010
Corporates 136,870 169,480
Subtotal 4,277,101 4,024,585
Receivable from the MOF 290,891 290,891
Special government bonds (i) 93,358 93,358
Others (ii) 20,479 22,443
Total 4,681,829 4,431,277
Accrued interest 83,518 81,608
Allowance for impairment losses (9,249) (9,187)
Debt instrument investments at amortized cost, net 4,756,098 4,503,698
Analyzed as:
Listed in Hong Kong 13,048 12,698
Listed outside Hong Kong (iii) 4,384,937 4,116,972
Unlisted 358,113 374,028
Total 4,756,098 4,503,698
(i) Special government bond refers to the non-transferable bond issued by the MOF in 1998 in the aggregate principal amount of RMB93.3 billion to the Predecessor Entity for capital replenishment. The bond will mature in 2028 and bears interest at a fixed rate of 2.25% per annum, starting from 1 December 2008.
(ii) Other debt instruments classified as receivables are primarily related to investment in unconsolidated structured entities held by the Group (Note 44(2)).
(iii) Debt securities traded on the China Domestic Inter-bank Bond Market are included in “Listed outside Hong Kong”.
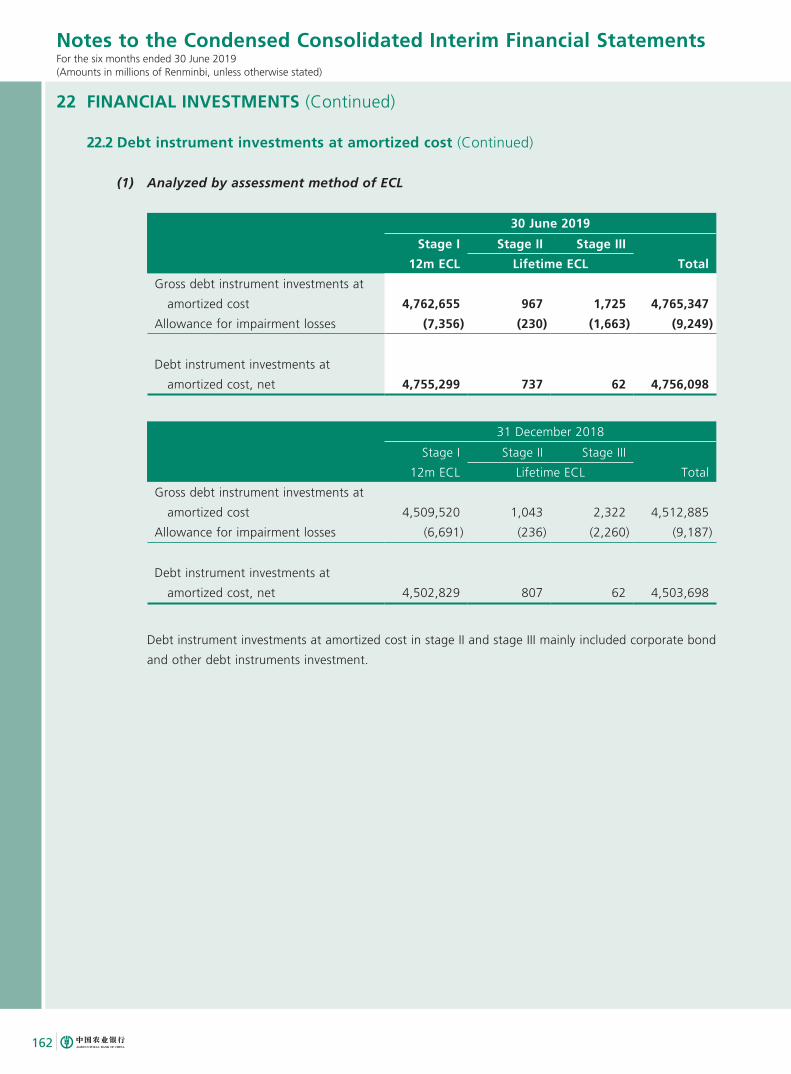
162
Notes to the Condensed Consolidated Interim Financial StatementsFor the six months ended 30 June 2019(Amounts in millions of Renminbi, unless otherwise stated)
22 FINANCIAL INVESTMENTS (Continued)
22.2 Debt instrument investments at amortized cost (Continued)
(1) Analyzed by assessment method of ECL
30 June 2019
Stage I Stage II Stage III
12m ECL Lifetime ECL Total
Gross debt instrument investments at
amortized cost 4,762,655 967 1,725 4,765,347
Allowance for impairment losses (7,356) (230) (1,663) (9,249)
Debt instrument investments at
amortized cost, net 4,755,299 737 62 4,756,098
31 December 2018
Stage I Stage II Stage III
12m ECL Lifetime ECL Total
Gross debt instrument investments at
amortized cost 4,509,520 1,043 2,322 4,512,885
Allowance for impairment losses (6,691) (236) (2,260) (9,187)
Debt instrument investments at
amortized cost, net 4,502,829 807 62 4,503,698
Debt instrument investments at amortized cost in stage II and stage III mainly included corporate bond
and other debt instruments investment.
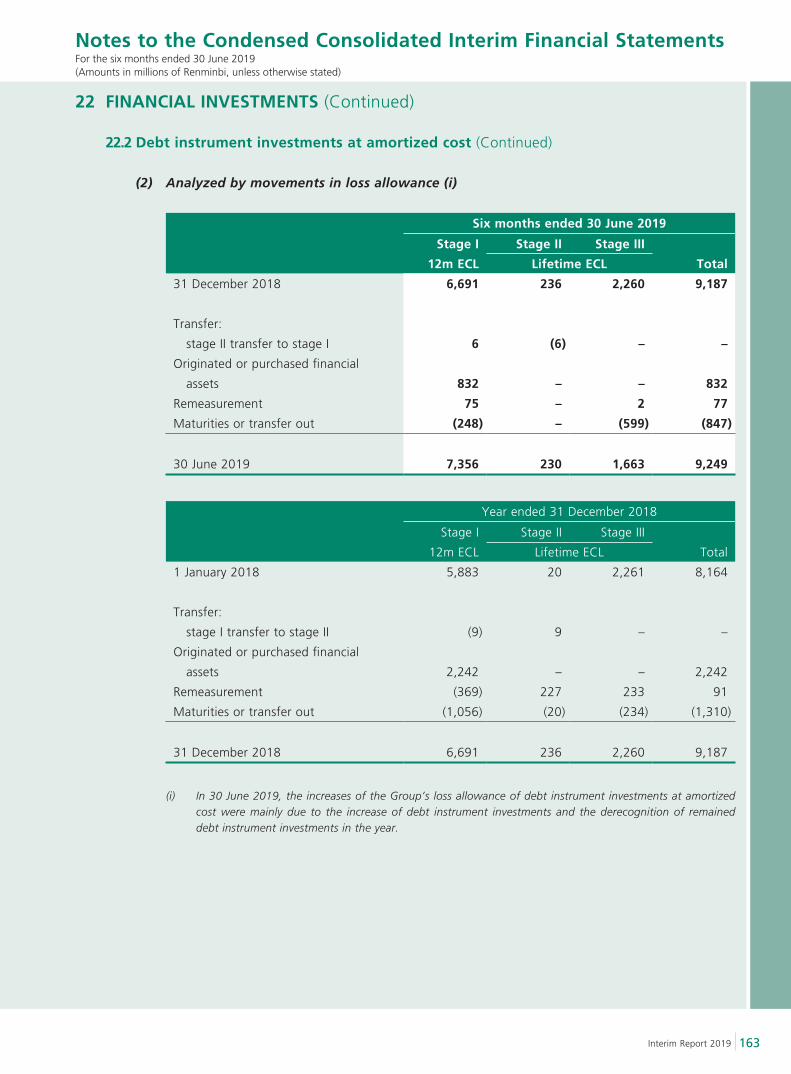
163Interim Report 2019
Notes to the Condensed Consolidated Interim Financial StatementsFor the six months ended 30 June 2019(Amounts in millions of Renminbi, unless otherwise stated)
22 FINANCIAL INVESTMENTS (Continued)
22.2 Debt instrument investments at amortized cost (Continued)
(2) Analyzed by movements in loss allowance (i)
Six months ended 30 June 2019
Stage I Stage II Stage III
12m ECL Lifetime ECL Total
31 December 2018 6,691 236 2,260 9,187
Transfer:
stage II transfer to stage I 6 (6) – –
Originated or purchased financial
assets 832 – – 832
Remeasurement 75 – 2 77
Maturities or transfer out (248) – (599) (847)
30 June 2019 7,356 230 1,663 9,249
Year ended 31 December 2018
Stage I Stage II Stage III
12m ECL Lifetime ECL Total
1 January 2018 5,883 20 2,261 8,164
Transfer:
stage I transfer to stage II (9) 9 – –
Originated or purchased financial
assets 2,242 – – 2,242
Remeasurement (369) 227 233 91
Maturities or transfer out (1,056) (20) (234) (1,310)
31 December 2018 6,691 236 2,260 9,187
(i) In 30 June 2019, the increases of the Group’s loss allowance of debt instrument investments at amortized cost were mainly due to the increase of debt instrument investments and the derecognition of remained debt instrument investments in the year.
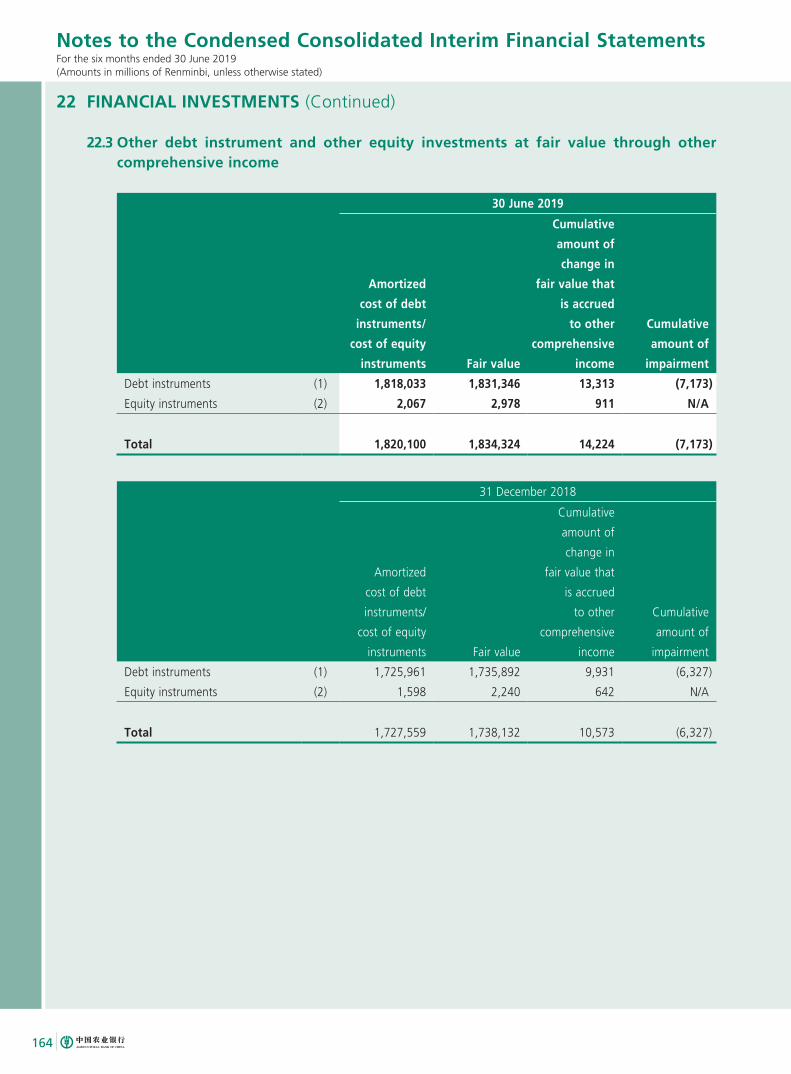
164
Notes to the Condensed Consolidated Interim Financial StatementsFor the six months ended 30 June 2019(Amounts in millions of Renminbi, unless otherwise stated)
22 FINANCIAL INVESTMENTS (Continued)
22.3 Other debt instrument and other equity investments at fair value through other comprehensive income
30 June 2019
Amortized
cost of debt
instruments/
cost of equity
instruments Fair value
Cumulative
amount of
change in
fair value that
is accrued
to other
comprehensive
income
Cumulative
amount of
impairment
Debt instruments (1) 1,818,033 1,831,346 13,313 (7,173)
Equity instruments (2) 2,067 2,978 911 N/A
Total 1,820,100 1,834,324 14,224 (7,173)
31 December 2018
Amortized
cost of debt
instruments/
cost of equity
instruments Fair value
Cumulative
amount of
change in
fair value that
is accrued
to other
comprehensive
income
Cumulative
amount of
impairment
Debt instruments (1) 1,725,961 1,735,892 9,931 (6,327)
Equity instruments (2) 1,598 2,240 642 N/A
Total 1,727,559 1,738,132 10,573 (6,327)
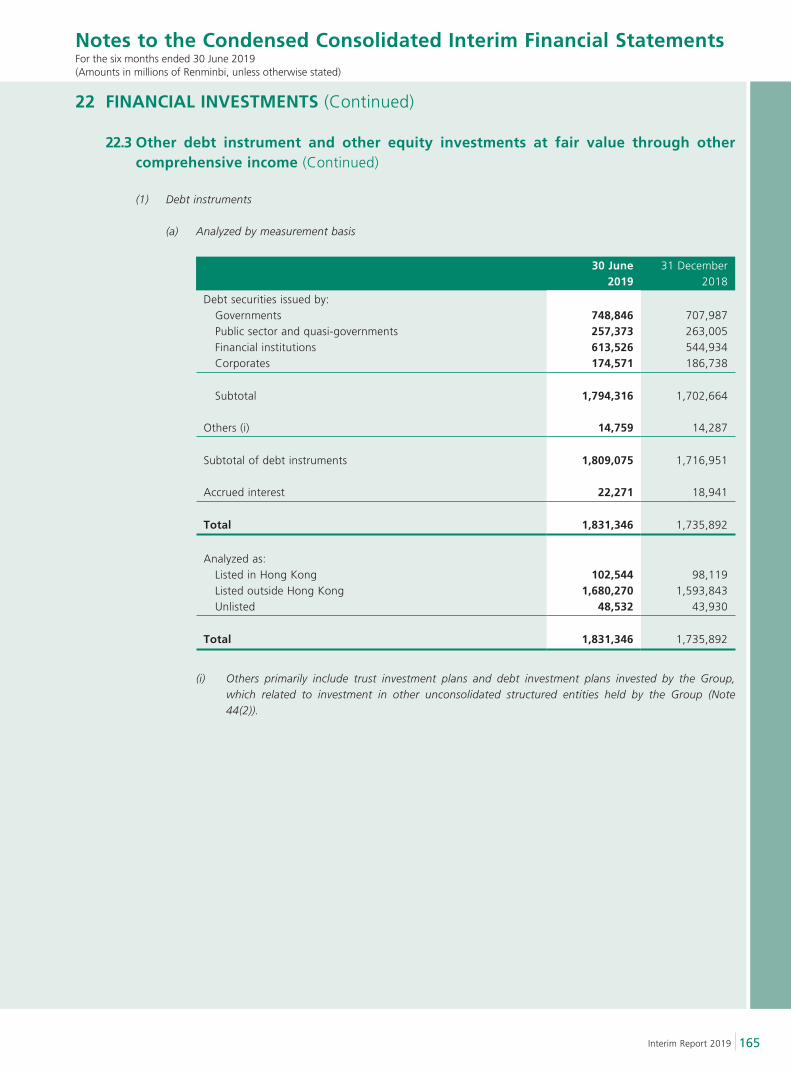
165Interim Report 2019
Notes to the Condensed Consolidated Interim Financial StatementsFor the six months ended 30 June 2019(Amounts in millions of Renminbi, unless otherwise stated)
22 FINANCIAL INVESTMENTS (Continued)
22.3 Other debt instrument and other equity investments at fair value through other comprehensive income (Continued)
(1) Debt instruments
(a) Analyzed by measurement basis
30 June 2019
31 December 2018
Debt securities issued by: Governments 748,846 707,987 Public sector and quasi-governments 257,373 263,005 Financial institutions 613,526 544,934 Corporates 174,571 186,738
Subtotal 1,794,316 1,702,664
Others (i) 14,759 14,287
Subtotal of debt instruments 1,809,075 1,716,951
Accrued interest 22,271 18,941
Total 1,831,346 1,735,892
Analyzed as: Listed in Hong Kong 102,544 98,119 Listed outside Hong Kong 1,680,270 1,593,843 Unlisted 48,532 43,930
Total 1,831,346 1,735,892
(i) Others primarily include trust investment plans and debt investment plans invested by the Group, which related to investment in other unconsolidated structured entities held by the Group (Note 44(2)).
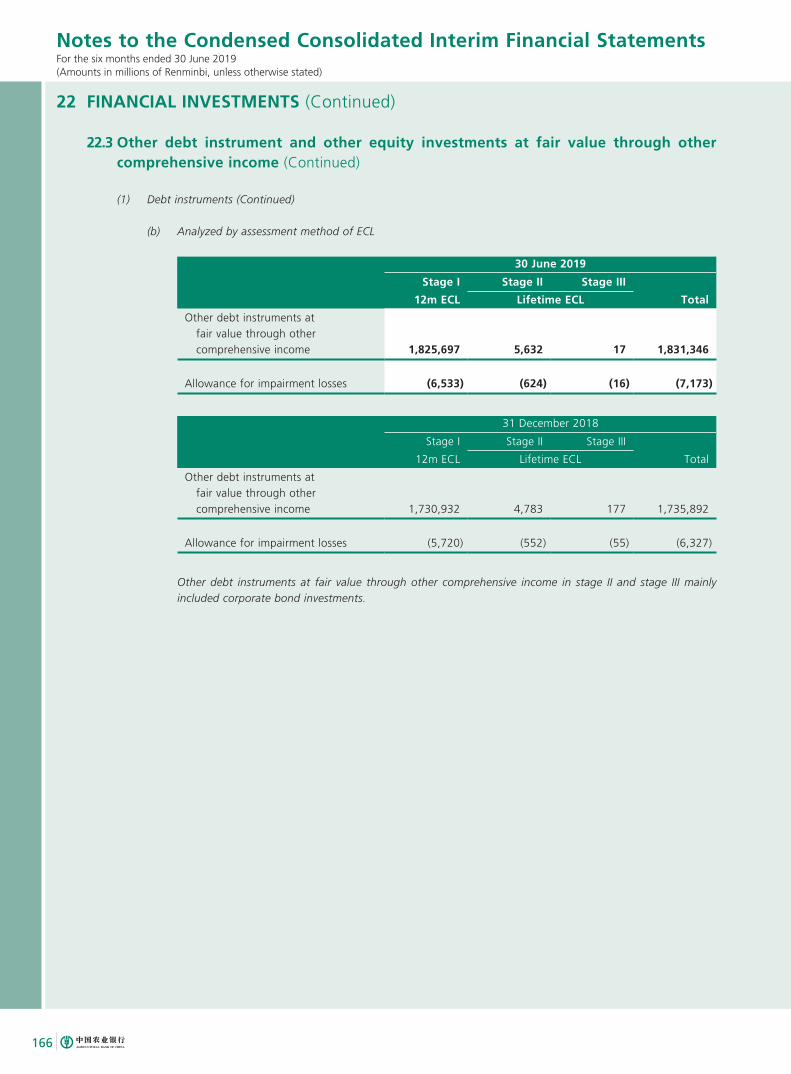
166
Notes to the Condensed Consolidated Interim Financial StatementsFor the six months ended 30 June 2019(Amounts in millions of Renminbi, unless otherwise stated)
22 FINANCIAL INVESTMENTS (Continued)
22.3 Other debt instrument and other equity investments at fair value through other comprehensive income (Continued)
(1) Debt instruments (Continued)
(b) Analyzed by assessment method of ECL
30 June 2019
Stage I Stage II Stage III
12m ECL Lifetime ECL Total
Other debt instruments at fair value through other comprehensive income 1,825,697 5,632 17 1,831,346
Allowance for impairment losses (6,533) (624) (16) (7,173)
31 December 2018
Stage I Stage II Stage III
12m ECL Lifetime ECL Total
Other debt instruments at fair value through other comprehensive income 1,730,932 4,783 177 1,735,892
Allowance for impairment losses (5,720) (552) (55) (6,327)
Other debt instruments at fair value through other comprehensive income in stage II and stage III mainly included corporate bond investments.
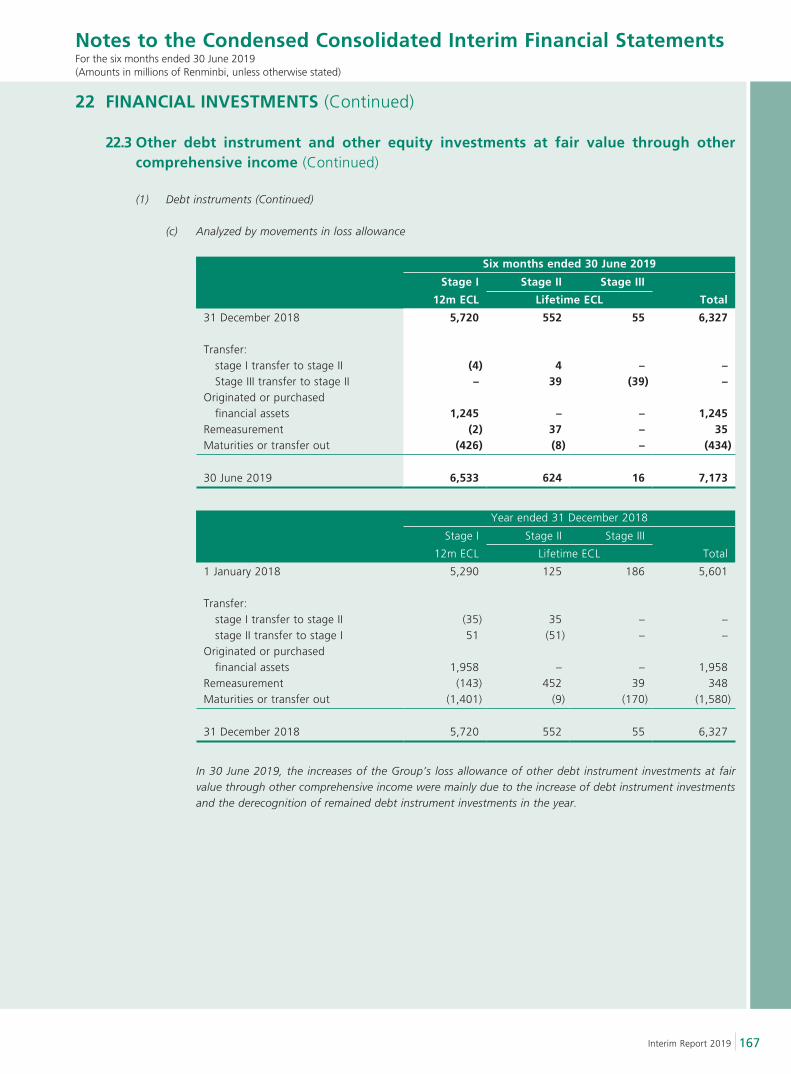
167Interim Report 2019
Notes to the Condensed Consolidated Interim Financial StatementsFor the six months ended 30 June 2019(Amounts in millions of Renminbi, unless otherwise stated)
22 FINANCIAL INVESTMENTS (Continued)
22.3 Other debt instrument and other equity investments at fair value through other comprehensive income (Continued)
(1) Debt instruments (Continued)
(c) Analyzed by movements in loss allowance
Six months ended 30 June 2019
Stage I Stage II Stage III
12m ECL Lifetime ECL Total
31 December 2018 5,720 552 55 6,327
Transfer: stage I transfer to stage II (4) 4 – – Stage III transfer to stage II – 39 (39) –Originated or purchased financial assets 1,245 – – 1,245Remeasurement (2) 37 – 35Maturities or transfer out (426) (8) – (434)
30 June 2019 6,533 624 16 7,173
Year ended 31 December 2018
Stage I Stage II Stage III
12m ECL Lifetime ECL Total
1 January 2018 5,290 125 186 5,601
Transfer: stage I transfer to stage II (35) 35 – – stage II transfer to stage I 51 (51) – –Originated or purchased financial assets 1,958 – – 1,958Remeasurement (143) 452 39 348Maturities or transfer out (1,401) (9) (170) (1,580)
31 December 2018 5,720 552 55 6,327
In 30 June 2019, the increases of the Group’s loss allowance of other debt instrument investments at fair value through other comprehensive income were mainly due to the increase of debt instrument investments and the derecognition of remained debt instrument investments in the year.
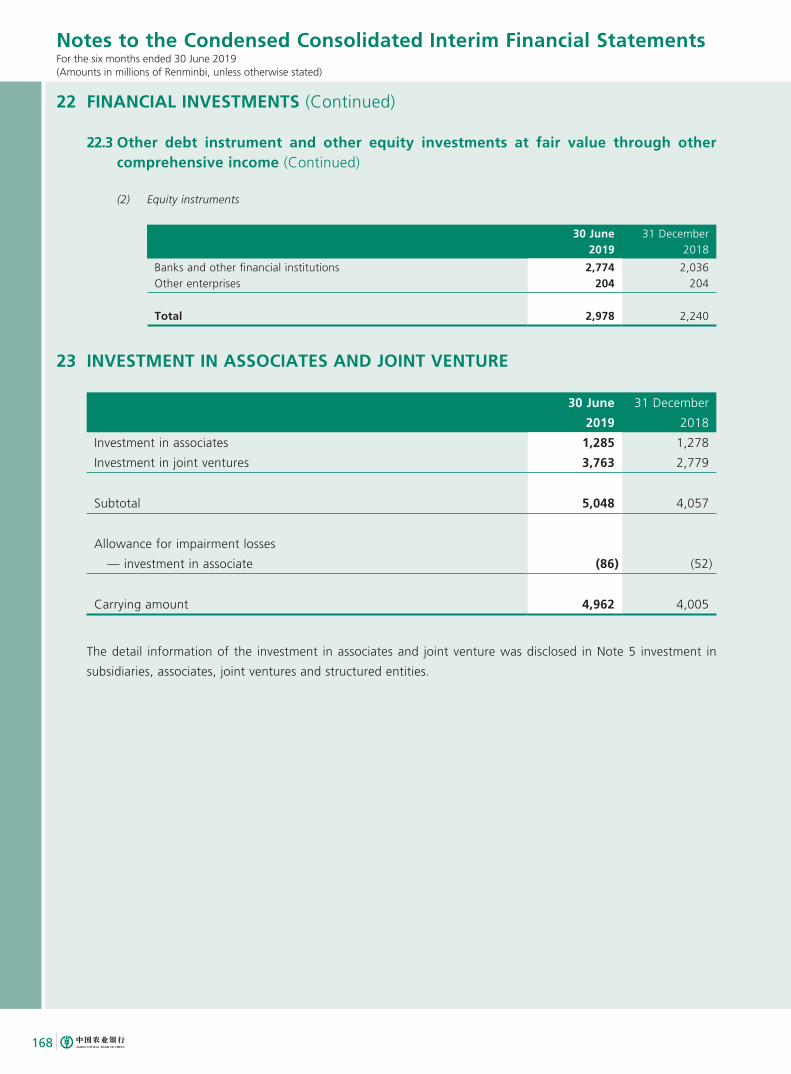
168
Notes to the Condensed Consolidated Interim Financial StatementsFor the six months ended 30 June 2019(Amounts in millions of Renminbi, unless otherwise stated)
22 FINANCIAL INVESTMENTS (Continued)
22.3 Other debt instrument and other equity investments at fair value through other comprehensive income (Continued)
(2) Equity instruments
30 June 2019
31 December 2018
Banks and other financial institutions 2,774 2,036Other enterprises 204 204
Total 2,978 2,240
23 INVESTMENT IN ASSOCIATES AND JOINT VENTURE
30 June
2019
31 December
2018
Investment in associates 1,285 1,278
Investment in joint ventures 3,763 2,779
Subtotal 5,048 4,057
Allowance for impairment losses
— investment in associate (86) (52)
Carrying amount 4,962 4,005
The detail information of the investment in associates and joint venture was disclosed in Note 5 investment in
subsidiaries, associates, joint ventures and structured entities.
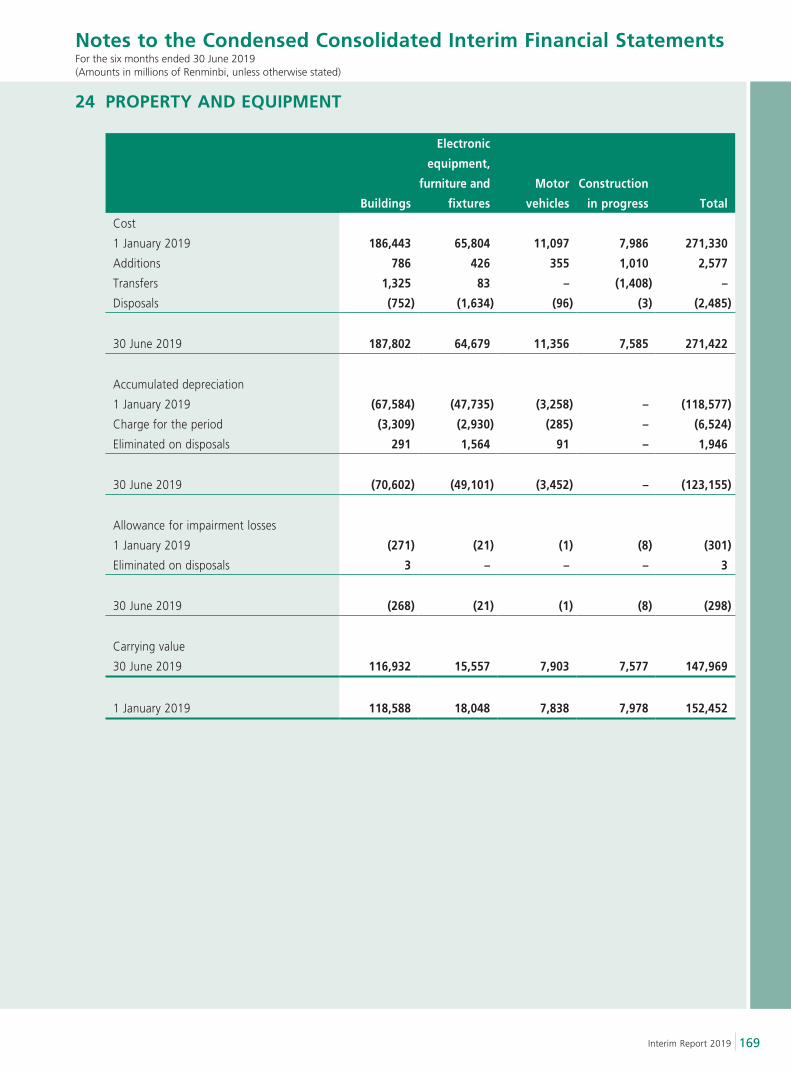
169Interim Report 2019
Notes to the Condensed Consolidated Interim Financial StatementsFor the six months ended 30 June 2019(Amounts in millions of Renminbi, unless otherwise stated)
24 PROPERTY AND EQUIPMENT
Buildings
Electronic
equipment,
furniture and
fixtures
Motor
vehicles
Construction
in progress Total
Cost
1 January 2019 186,443 65,804 11,097 7,986 271,330
Additions 786 426 355 1,010 2,577
Transfers 1,325 83 – (1,408) –
Disposals (752) (1,634) (96) (3) (2,485)
30 June 2019 187,802 64,679 11,356 7,585 271,422
Accumulated depreciation
1 January 2019 (67,584) (47,735) (3,258) – (118,577)
Charge for the period (3,309) (2,930) (285) – (6,524)
Eliminated on disposals 291 1,564 91 – 1,946
30 June 2019 (70,602) (49,101) (3,452) – (123,155)
Allowance for impairment losses
1 January 2019 (271) (21) (1) (8) (301)
Eliminated on disposals 3 – – – 3
30 June 2019 (268) (21) (1) (8) (298)
Carrying value
30 June 2019 116,932 15,557 7,903 7,577 147,969
1 January 2019 118,588 18,048 7,838 7,978 152,452
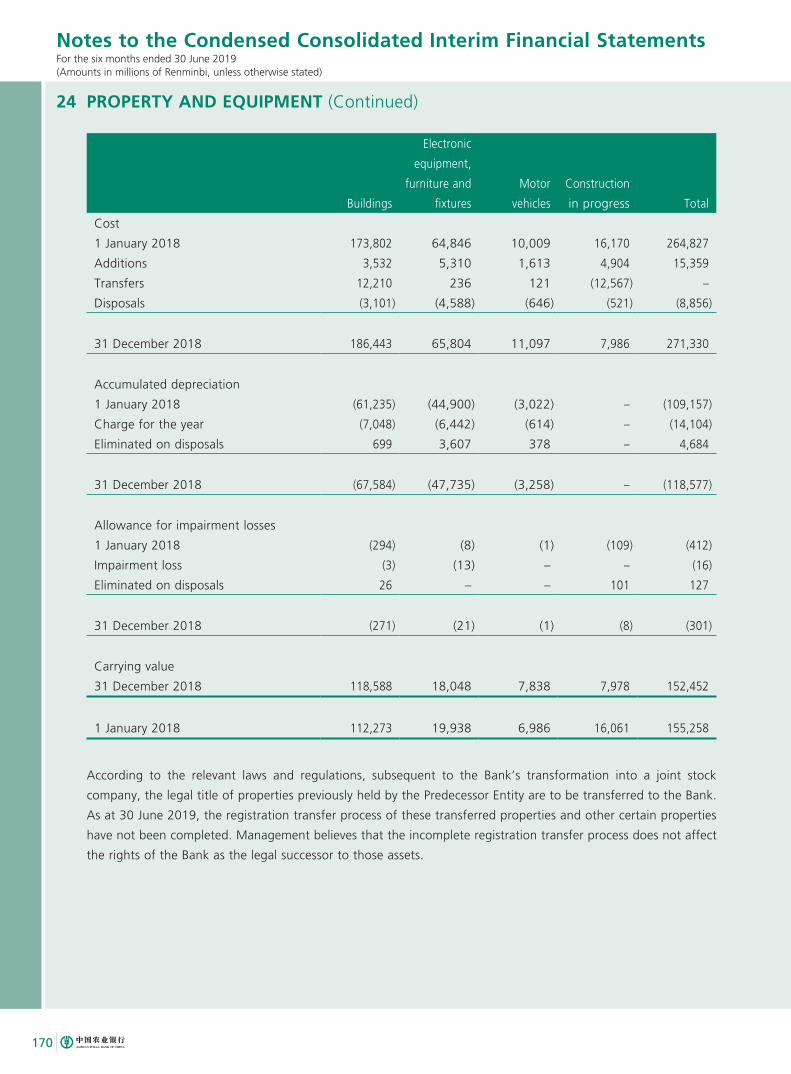
170
Notes to the Condensed Consolidated Interim Financial StatementsFor the six months ended 30 June 2019(Amounts in millions of Renminbi, unless otherwise stated)
24 PROPERTY AND EQUIPMENT (Continued)
Buildings
Electronic
equipment,
furniture and
fixtures
Motor
vehicles
Construction
in progress Total
Cost
1 January 2018 173,802 64,846 10,009 16,170 264,827
Additions 3,532 5,310 1,613 4,904 15,359
Transfers 12,210 236 121 (12,567) –
Disposals (3,101) (4,588) (646) (521) (8,856)
31 December 2018 186,443 65,804 11,097 7,986 271,330
Accumulated depreciation
1 January 2018 (61,235) (44,900) (3,022) – (109,157)
Charge for the year (7,048) (6,442) (614) – (14,104)
Eliminated on disposals 699 3,607 378 – 4,684
31 December 2018 (67,584) (47,735) (3,258) – (118,577)
Allowance for impairment losses
1 January 2018 (294) (8) (1) (109) (412)
Impairment loss (3) (13) – – (16)
Eliminated on disposals 26 – – 101 127
31 December 2018 (271) (21) (1) (8) (301)
Carrying value
31 December 2018 118,588 18,048 7,838 7,978 152,452
1 January 2018 112,273 19,938 6,986 16,061 155,258
According to the relevant laws and regulations, subsequent to the Bank’s transformation into a joint stock
company, the legal title of properties previously held by the Predecessor Entity are to be transferred to the Bank.
As at 30 June 2019, the registration transfer process of these transferred properties and other certain properties
have not been completed. Management believes that the incomplete registration transfer process does not affect
the rights of the Bank as the legal successor to those assets.
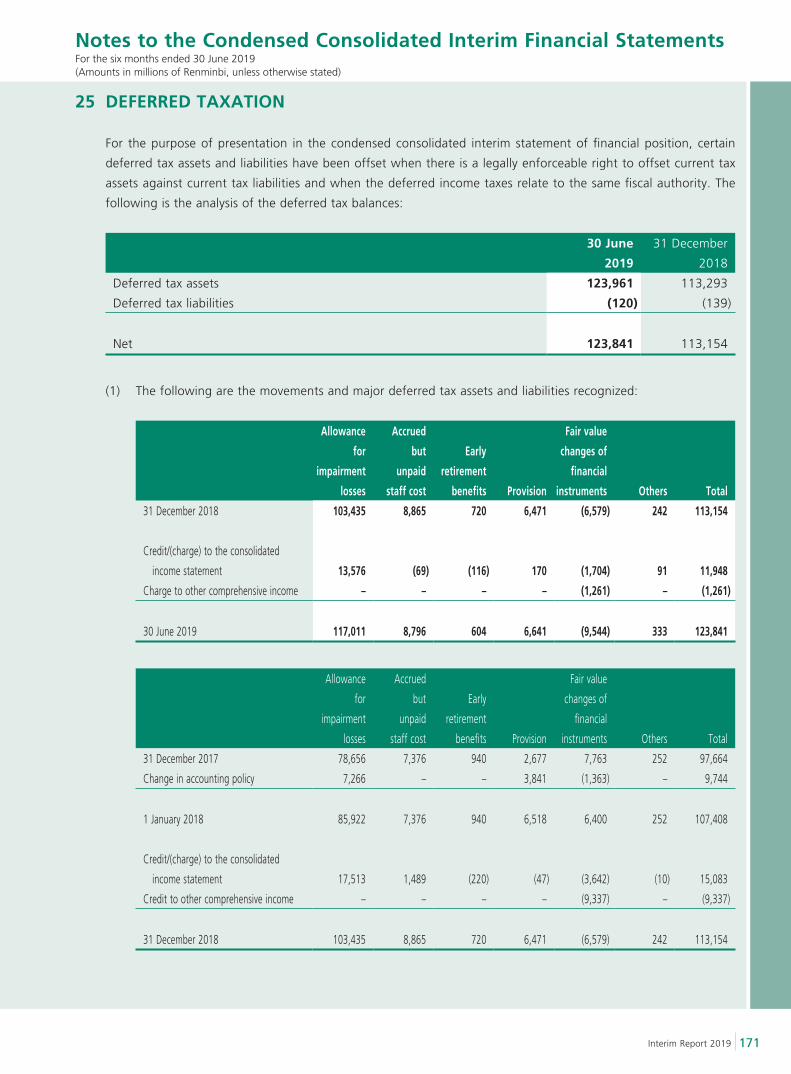
171Interim Report 2019
Notes to the Condensed Consolidated Interim Financial StatementsFor the six months ended 30 June 2019(Amounts in millions of Renminbi, unless otherwise stated)
25 DEFERRED TAXATION
For the purpose of presentation in the condensed consolidated interim statement of financial position, certain
deferred tax assets and liabilities have been offset when there is a legally enforceable right to offset current tax
assets against current tax liabilities and when the deferred income taxes relate to the same fiscal authority. The
following is the analysis of the deferred tax balances:
30 June
2019
31 December
2018
Deferred tax assets 123,961 113,293
Deferred tax liabilities (120) (139)
Net 123,841 113,154
(1) The following are the movements and major deferred tax assets and liabilities recognized:
Allowance
for
impairment
losses
Accrued
but
unpaid
staff cost
Early
retirement
benefits Provision
Fair value
changes of
financial
instruments Others Total
31 December 2018 103,435 8,865 720 6,471 (6,579) 242 113,154
Credit/(charge) to the consolidated
income statement 13,576 (69) (116) 170 (1,704) 91 11,948
Charge to other comprehensive income – – – – (1,261) – (1,261)
30 June 2019 117,011 8,796 604 6,641 (9,544) 333 123,841
Allowance
for
impairment
losses
Accrued
but
unpaid
staff cost
Early
retirement
benefits Provision
Fair value
changes of
financial
instruments Others Total
31 December 2017 78,656 7,376 940 2,677 7,763 252 97,664
Change in accounting policy 7,266 – – 3,841 (1,363) – 9,744
1 January 2018 85,922 7,376 940 6,518 6,400 252 107,408
Credit/(charge) to the consolidated
income statement 17,513 1,489 (220) (47) (3,642) (10) 15,083
Credit to other comprehensive income – – – – (9,337) – (9,337)
31 December 2018 103,435 8,865 720 6,471 (6,579) 242 113,154
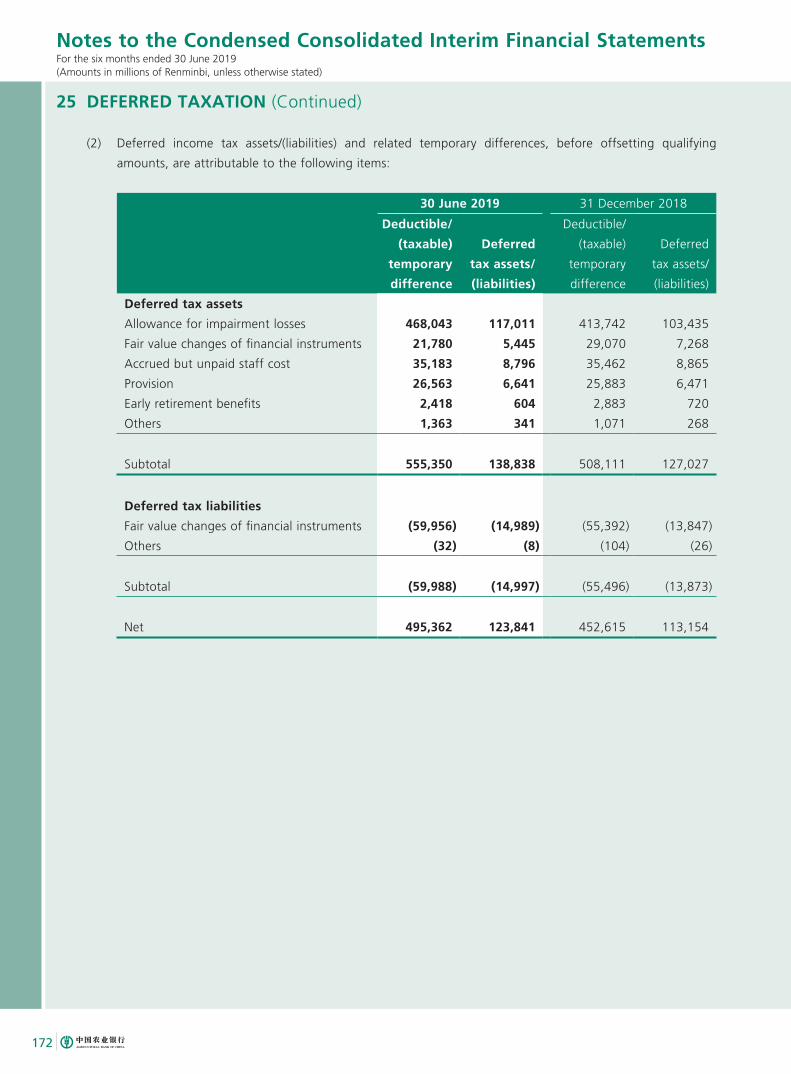
172
Notes to the Condensed Consolidated Interim Financial StatementsFor the six months ended 30 June 2019(Amounts in millions of Renminbi, unless otherwise stated)
25 DEFERRED TAXATION (Continued)
(2) Deferred income tax assets/(liabilities) and related temporary differences, before offsetting qualifying
amounts, are attributable to the following items:
30 June 2019 31 December 2018
Deductible/
(taxable)
temporary
difference
Deferred
tax assets/
(liabilities)
Deductible/
(taxable)
temporary
difference
Deferred
tax assets/
(liabilities)
Deferred tax assets
Allowance for impairment losses 468,043 117,011 413,742 103,435
Fair value changes of financial instruments 21,780 5,445 29,070 7,268
Accrued but unpaid staff cost 35,183 8,796 35,462 8,865
Provision 26,563 6,641 25,883 6,471
Early retirement benefits 2,418 604 2,883 720
Others 1,363 341 1,071 268
Subtotal 555,350 138,838 508,111 127,027
Deferred tax liabilities
Fair value changes of financial instruments (59,956) (14,989) (55,392) (13,847)
Others (32) (8) (104) (26)
Subtotal (59,988) (14,997) (55,496) (13,873)
Net 495,362 123,841 452,615 113,154
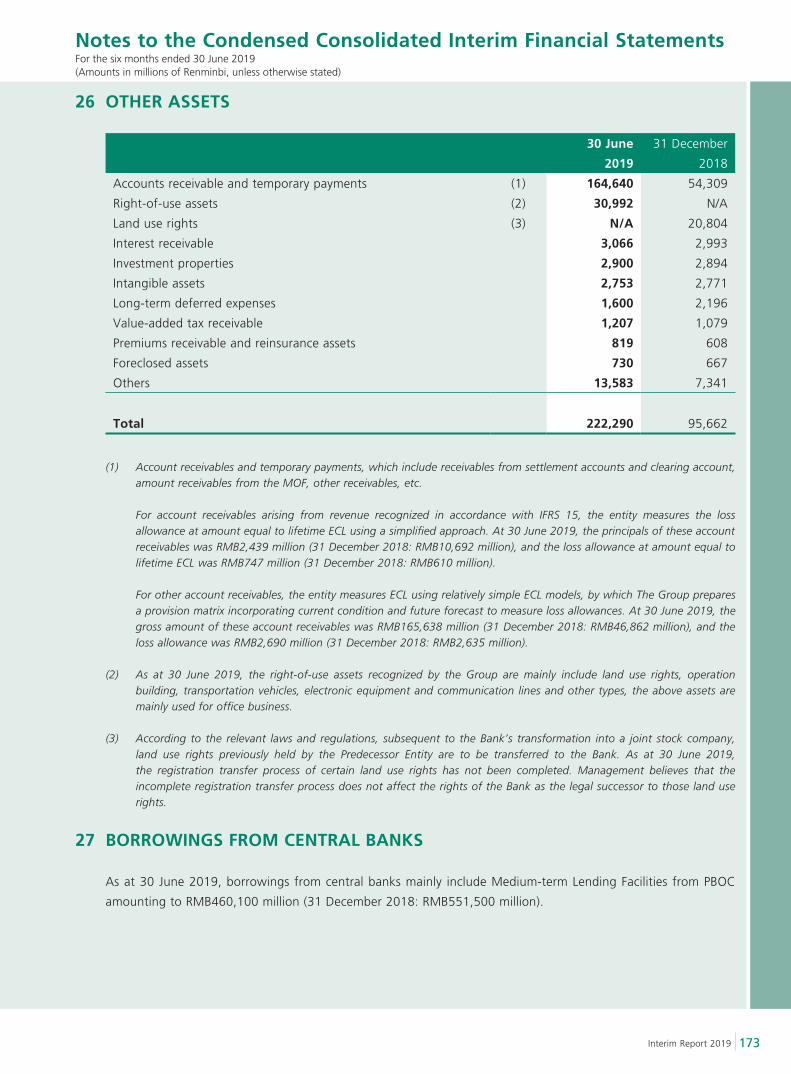
173Interim Report 2019
Notes to the Condensed Consolidated Interim Financial StatementsFor the six months ended 30 June 2019(Amounts in millions of Renminbi, unless otherwise stated)
26 OTHER ASSETS
30 June
2019
31 December
2018
Accounts receivable and temporary payments (1) 164,640 54,309
Right-of-use assets (2) 30,992 N/A
Land use rights (3) N/A 20,804
Interest receivable 3,066 2,993
Investment properties 2,900 2,894
Intangible assets 2,753 2,771
Long-term deferred expenses 1,600 2,196
Value-added tax receivable 1,207 1,079
Premiums receivable and reinsurance assets 819 608
Foreclosed assets 730 667
Others 13,583 7,341
Total 222,290 95,662
(1) Account receivables and temporary payments, which include receivables from settlement accounts and clearing account, amount receivables from the MOF, other receivables, etc.
For account receivables arising from revenue recognized in accordance with IFRS 15, the entity measures the loss allowance at amount equal to lifetime ECL using a simplified approach. At 30 June 2019, the principals of these account receivables was RMB2,439 million (31 December 2018: RMB10,692 million), and the loss allowance at amount equal to lifetime ECL was RMB747 million (31 December 2018: RMB610 million).
For other account receivables, the entity measures ECL using relatively simple ECL models, by which The Group prepares a provision matrix incorporating current condition and future forecast to measure loss allowances. At 30 June 2019, the gross amount of these account receivables was RMB165,638 million (31 December 2018: RMB46,862 million), and the loss allowance was RMB2,690 million (31 December 2018: RMB2,635 million).
(2) As at 30 June 2019, the right-of-use assets recognized by the Group are mainly include land use rights, operation building, transportation vehicles, electronic equipment and communication lines and other types, the above assets are mainly used for office business.
(3) According to the relevant laws and regulations, subsequent to the Bank’s transformation into a joint stock company, land use rights previously held by the Predecessor Entity are to be transferred to the Bank. As at 30 June 2019, the registration transfer process of certain land use rights has not been completed. Management believes that the incomplete registration transfer process does not affect the rights of the Bank as the legal successor to those land use rights.
27 BORROWINGS FROM CENTRAL BANKS
As at 30 June 2019, borrowings from central banks mainly include Medium-term Lending Facilities from PBOC
amounting to RMB460,100 million (31 December 2018: RMB551,500 million).
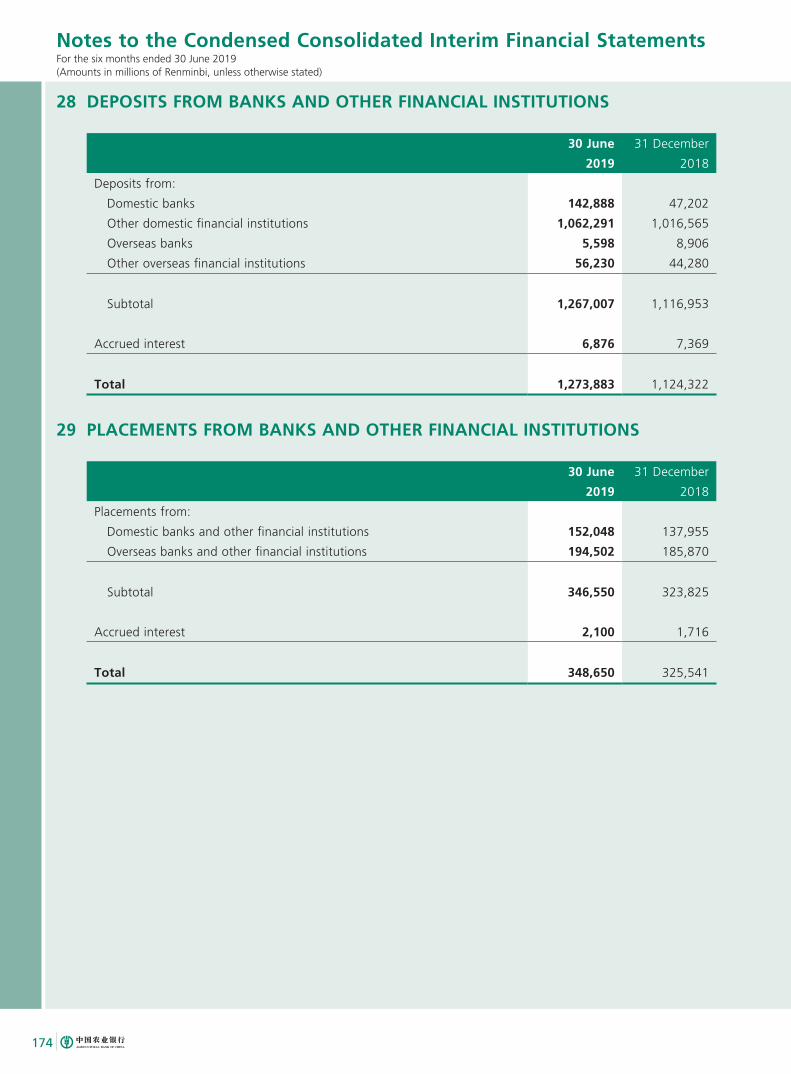
174
Notes to the Condensed Consolidated Interim Financial StatementsFor the six months ended 30 June 2019(Amounts in millions of Renminbi, unless otherwise stated)
28 DEPOSITS FROM BANKS AND OTHER FINANCIAL INSTITUTIONS
30 June
2019
31 December
2018
Deposits from:
Domestic banks 142,888 47,202
Other domestic financial institutions 1,062,291 1,016,565
Overseas banks 5,598 8,906
Other overseas financial institutions 56,230 44,280
Subtotal 1,267,007 1,116,953
Accrued interest 6,876 7,369
Total 1,273,883 1,124,322
29 PLACEMENTS FROM BANKS AND OTHER FINANCIAL INSTITUTIONS
30 June
2019
31 December
2018
Placements from:
Domestic banks and other financial institutions 152,048 137,955
Overseas banks and other financial institutions 194,502 185,870
Subtotal 346,550 323,825
Accrued interest 2,100 1,716
Total 348,650 325,541
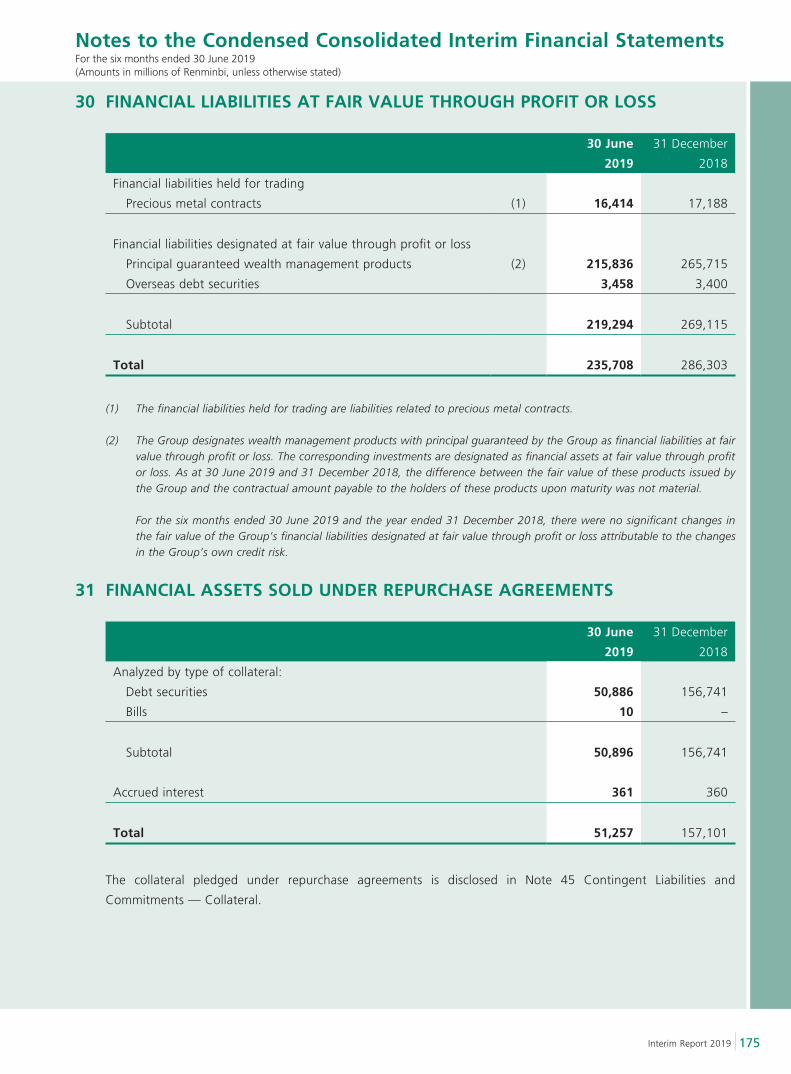
175Interim Report 2019
Notes to the Condensed Consolidated Interim Financial StatementsFor the six months ended 30 June 2019(Amounts in millions of Renminbi, unless otherwise stated)
30 FINANCIAL LIABILITIES AT FAIR VALUE THROUGH PROFIT OR LOSS
30 June
2019
31 December
2018
Financial liabilities held for trading
Precious metal contracts (1) 16,414 17,188
Financial liabilities designated at fair value through profit or loss
Principal guaranteed wealth management products (2) 215,836 265,715
Overseas debt securities 3,458 3,400
Subtotal 219,294 269,115
Total 235,708 286,303
(1) The financial liabilities held for trading are liabilities related to precious metal contracts.
(2) The Group designates wealth management products with principal guaranteed by the Group as financial liabilities at fair value through profit or loss. The corresponding investments are designated as financial assets at fair value through profit or loss. As at 30 June 2019 and 31 December 2018, the difference between the fair value of these products issued by the Group and the contractual amount payable to the holders of these products upon maturity was not material.
For the six months ended 30 June 2019 and the year ended 31 December 2018, there were no significant changes in the fair value of the Group’s financial liabilities designated at fair value through profit or loss attributable to the changes in the Group’s own credit risk.
31 FINANCIAL ASSETS SOLD UNDER REPURCHASE AGREEMENTS
30 June
2019
31 December
2018
Analyzed by type of collateral:
Debt securities 50,886 156,741
Bills 10 –
Subtotal 50,896 156,741
Accrued interest 361 360
Total 51,257 157,101
The collateral pledged under repurchase agreements is disclosed in Note 45 Contingent Liabilities and
Commitments — Collateral.
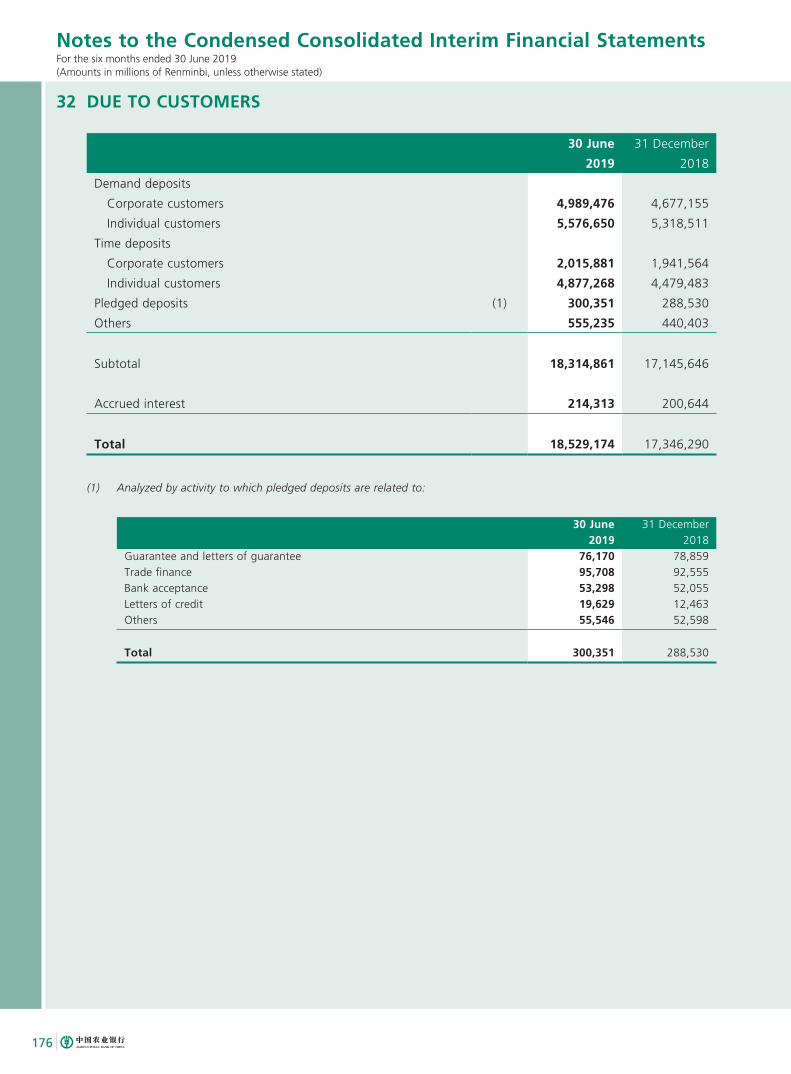
176
Notes to the Condensed Consolidated Interim Financial StatementsFor the six months ended 30 June 2019(Amounts in millions of Renminbi, unless otherwise stated)
32 DUE TO CUSTOMERS
30 June
2019
31 December
2018
Demand deposits
Corporate customers 4,989,476 4,677,155
Individual customers 5,576,650 5,318,511
Time deposits
Corporate customers 2,015,881 1,941,564
Individual customers 4,877,268 4,479,483
Pledged deposits (1) 300,351 288,530
Others 555,235 440,403
Subtotal 18,314,861 17,145,646
Accrued interest 214,313 200,644
Total 18,529,174 17,346,290
(1) Analyzed by activity to which pledged deposits are related to:
30 June 2019
31 December 2018
Guarantee and letters of guarantee 76,170 78,859Trade finance 95,708 92,555Bank acceptance 53,298 52,055Letters of credit 19,629 12,463Others 55,546 52,598
Total 300,351 288,530
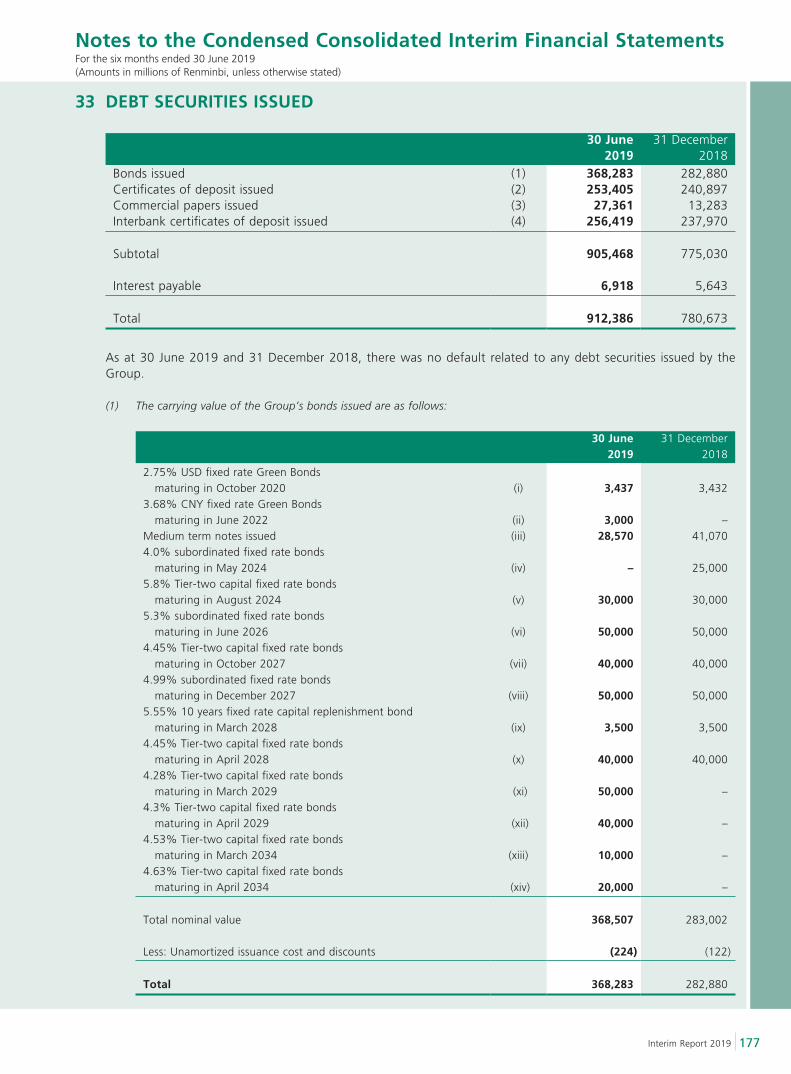
177Interim Report 2019
Notes to the Condensed Consolidated Interim Financial StatementsFor the six months ended 30 June 2019(Amounts in millions of Renminbi, unless otherwise stated)
33 DEBT SECURITIES ISSUED
30 June 2019
31 December 2018
Bonds issued (1) 368,283 282,880Certificates of deposit issued (2) 253,405 240,897Commercial papers issued (3) 27,361 13,283Interbank certificates of deposit issued (4) 256,419 237,970
Subtotal 905,468 775,030
Interest payable 6,918 5,643
Total 912,386 780,673
As at 30 June 2019 and 31 December 2018, there was no default related to any debt securities issued by the Group.
(1) The carrying value of the Group’s bonds issued are as follows:
30 June 2019
31 December 2018
2.75% USD fixed rate Green Bonds maturing in October 2020 (i) 3,437 3,4323.68% CNY fixed rate Green Bonds maturing in June 2022 (ii) 3,000 –Medium term notes issued (iii) 28,570 41,0704.0% subordinated fixed rate bonds maturing in May 2024 (iv) – 25,0005.8% Tier-two capital fixed rate bonds maturing in August 2024 (v) 30,000 30,0005.3% subordinated fixed rate bonds maturing in June 2026 (vi) 50,000 50,0004.45% Tier-two capital fixed rate bonds maturing in October 2027 (vii) 40,000 40,0004.99% subordinated fixed rate bonds maturing in December 2027 (viii) 50,000 50,0005.55% 10 years fixed rate capital replenishment bond maturing in March 2028 (ix) 3,500 3,5004.45% Tier-two capital fixed rate bonds maturing in April 2028 (x) 40,000 40,0004.28% Tier-two capital fixed rate bonds maturing in March 2029 (xi) 50,000 –4.3% Tier-two capital fixed rate bonds maturing in April 2029 (xii) 40,000 –4.53% Tier-two capital fixed rate bonds maturing in March 2034 (xiii) 10,000 –4.63% Tier-two capital fixed rate bonds maturing in April 2034 (xiv) 20,000 –
Total nominal value 368,507 283,002
Less: Unamortized issuance cost and discounts (224) (122)
Total 368,283 282,880
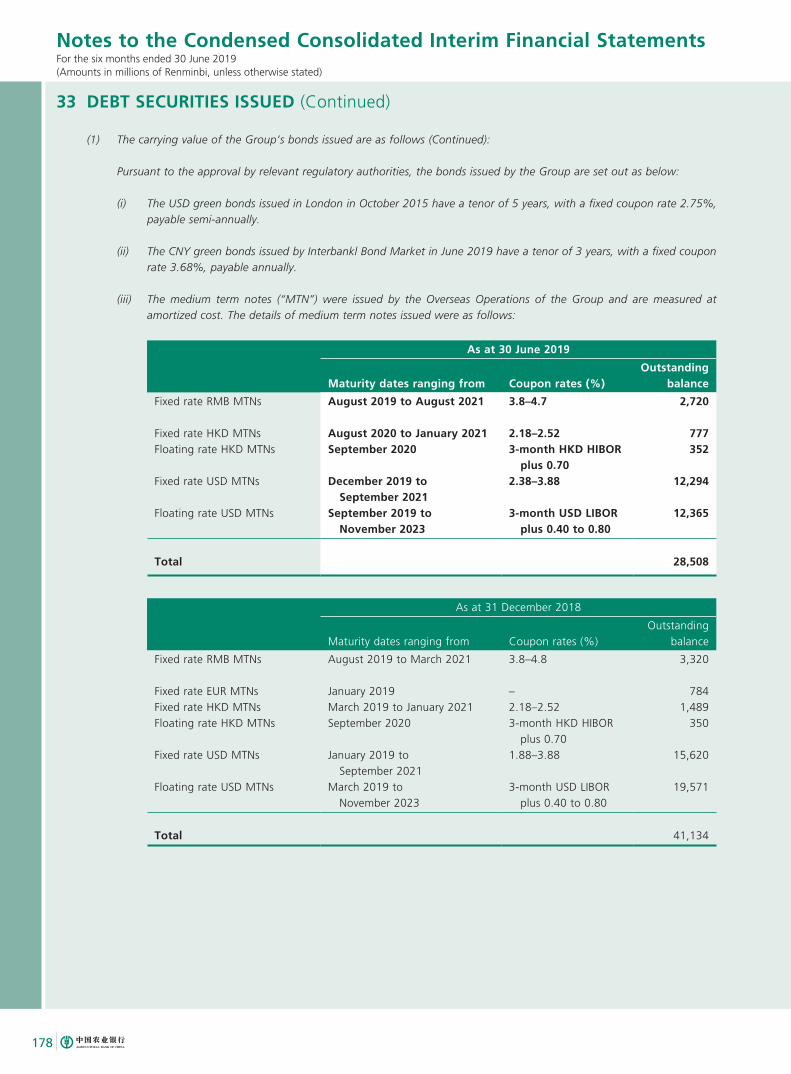
178
Notes to the Condensed Consolidated Interim Financial StatementsFor the six months ended 30 June 2019(Amounts in millions of Renminbi, unless otherwise stated)
33 DEBT SECURITIES ISSUED (Continued)
(1) The carrying value of the Group’s bonds issued are as follows (Continued):
Pursuant to the approval by relevant regulatory authorities, the bonds issued by the Group are set out as below:
(i) The USD green bonds issued in London in October 2015 have a tenor of 5 years, with a fixed coupon rate 2.75%, payable semi-annually.
(ii) The CNY green bonds issued by Interbankl Bond Market in June 2019 have a tenor of 3 years, with a fixed coupon rate 3.68%, payable annually.
(iii) The medium term notes (“MTN”) were issued by the Overseas Operations of the Group and are measured at amortized cost. The details of medium term notes issued were as follows:
As at 30 June 2019
Maturity dates ranging from Coupon rates (%)Outstanding
balance
Fixed rate RMB MTNs August 2019 to August 2021 3.8–4.7 2,720
Fixed rate HKD MTNs August 2020 to January 2021 2.18–2.52 777Floating rate HKD MTNs September 2020 3-month HKD HIBOR
plus 0.70352
Fixed rate USD MTNs December 2019 to September 2021
2.38–3.88 12,294
Floating rate USD MTNs September 2019 to November 2023
3-month USD LIBOR plus 0.40 to 0.80
12,365
Total 28,508
As at 31 December 2018
Maturity dates ranging from Coupon rates (%)Outstanding
balance
Fixed rate RMB MTNs August 2019 to March 2021 3.8–4.8 3,320
Fixed rate EUR MTNs January 2019 – 784Fixed rate HKD MTNs March 2019 to January 2021 2.18–2.52 1,489Floating rate HKD MTNs September 2020 3-month HKD HIBOR
plus 0.70350
Fixed rate USD MTNs January 2019 to September 2021
1.88–3.88 15,620
Floating rate USD MTNs March 2019 to November 2023
3-month USD LIBOR plus 0.40 to 0.80
19,571
Total 41,134
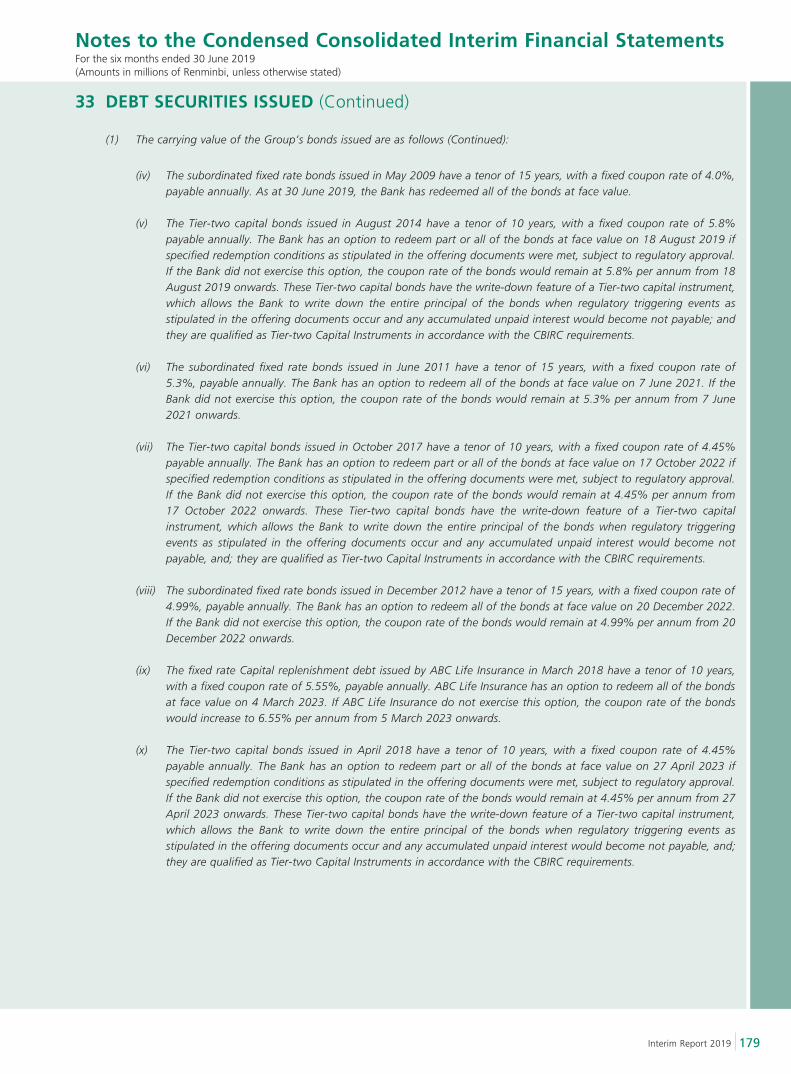
179Interim Report 2019
Notes to the Condensed Consolidated Interim Financial StatementsFor the six months ended 30 June 2019(Amounts in millions of Renminbi, unless otherwise stated)
33 DEBT SECURITIES ISSUED (Continued)
(1) The carrying value of the Group’s bonds issued are as follows (Continued):
(iv) The subordinated fixed rate bonds issued in May 2009 have a tenor of 15 years, with a fixed coupon rate of 4.0%, payable annually. As at 30 June 2019, the Bank has redeemed all of the bonds at face value.
(v) The Tier-two capital bonds issued in August 2014 have a tenor of 10 years, with a fixed coupon rate of 5.8% payable annually. The Bank has an option to redeem part or all of the bonds at face value on 18 August 2019 if specified redemption conditions as stipulated in the offering documents were met, subject to regulatory approval. If the Bank did not exercise this option, the coupon rate of the bonds would remain at 5.8% per annum from 18 August 2019 onwards. These Tier-two capital bonds have the write-down feature of a Tier-two capital instrument, which allows the Bank to write down the entire principal of the bonds when regulatory triggering events as stipulated in the offering documents occur and any accumulated unpaid interest would become not payable; and they are qualified as Tier-two Capital Instruments in accordance with the CBIRC requirements.
(vi) The subordinated fixed rate bonds issued in June 2011 have a tenor of 15 years, with a fixed coupon rate of 5.3%, payable annually. The Bank has an option to redeem all of the bonds at face value on 7 June 2021. If the Bank did not exercise this option, the coupon rate of the bonds would remain at 5.3% per annum from 7 June 2021 onwards.
(vii) The Tier-two capital bonds issued in October 2017 have a tenor of 10 years, with a fixed coupon rate of 4.45% payable annually. The Bank has an option to redeem part or all of the bonds at face value on 17 October 2022 if specified redemption conditions as stipulated in the offering documents were met, subject to regulatory approval. If the Bank did not exercise this option, the coupon rate of the bonds would remain at 4.45% per annum from 17 October 2022 onwards. These Tier-two capital bonds have the write-down feature of a Tier-two capital instrument, which allows the Bank to write down the entire principal of the bonds when regulatory triggering events as stipulated in the offering documents occur and any accumulated unpaid interest would become not payable, and; they are qualified as Tier-two Capital Instruments in accordance with the CBIRC requirements.
(viii) The subordinated fixed rate bonds issued in December 2012 have a tenor of 15 years, with a fixed coupon rate of 4.99%, payable annually. The Bank has an option to redeem all of the bonds at face value on 20 December 2022. If the Bank did not exercise this option, the coupon rate of the bonds would remain at 4.99% per annum from 20 December 2022 onwards.
(ix) The fixed rate Capital replenishment debt issued by ABC Life Insurance in March 2018 have a tenor of 10 years, with a fixed coupon rate of 5.55%, payable annually. ABC Life Insurance has an option to redeem all of the bonds at face value on 4 March 2023. If ABC Life Insurance do not exercise this option, the coupon rate of the bonds would increase to 6.55% per annum from 5 March 2023 onwards.
(x) The Tier-two capital bonds issued in April 2018 have a tenor of 10 years, with a fixed coupon rate of 4.45% payable annually. The Bank has an option to redeem part or all of the bonds at face value on 27 April 2023 if specified redemption conditions as stipulated in the offering documents were met, subject to regulatory approval. If the Bank did not exercise this option, the coupon rate of the bonds would remain at 4.45% per annum from 27 April 2023 onwards. These Tier-two capital bonds have the write-down feature of a Tier-two capital instrument, which allows the Bank to write down the entire principal of the bonds when regulatory triggering events as stipulated in the offering documents occur and any accumulated unpaid interest would become not payable, and; they are qualified as Tier-two Capital Instruments in accordance with the CBIRC requirements.
180
Notes to the Condensed Consolidated Interim Financial StatementsFor the six months ended 30 June 2019(Amounts in millions of Renminbi, unless otherwise stated)
33 DEBT SECURITIES ISSUED (Continued)
(1) The carrying value of the Group’s bonds issued are as follows (Continued):
(xi) The Tier-two capital bonds issued in March 2019 have a tenor of 10 years, with a fixed coupon rate of 4.28% payable annually. The Bank has an option to redeem part or all of the bonds at face value on 19 March 2029 if specified redemption conditions as stipulated in the offering documents were met, subject to regulatory approval. If the Bank did not exercise this option, the coupon rate of the bonds would remain at 4.28% per annum from 19 March 2029 onwards. These Tier-two capital bonds have the write-down feature of a Tier-two capital instrument, which allows the Bank to write down the entire principal of the bonds when regulatory triggering events as stipulated in the offering documents occur and any accumulated unpaid interest would become not payable, and; they are qualified as Tier-two Capital Instruments in accordance with the CBIRC requirements.
(xii) The Tier-two capital bonds issued in April 2019 have a tenor of 10 years, with a fixed coupon rate of 4.3% payable annually. The Bank has an option to redeem part or all of the bonds at face value on 11 April 2024 if specified redemption conditions as stipulated in the offering documents were met, subject to regulatory approval. If the Bank did not exercise this option, the coupon rate of the bonds would remain at 4.3% per annum from 11 April 2024 onwards. These Tier-two capital bonds have the write-down feature of a Tier-two capital instrument, which allows the Bank to write down the entire principal of the bonds when regulatory triggering events as stipulated in the offering documents occur and any accumulated unpaid interest would become not payable, and; they are qualified as Tier-two Capital Instruments in accordance with the CBIRC requirements.
(xiii) The Tier-two capital bonds issued in March 2019 have a tenor of 15 years, with a fixed coupon rate of 4.53% payable annually. The Bank has an option to redeem part or all of the bonds at face value on 19 March 2024 if specified redemption conditions as stipulated in the offering documents were met, subject to regulatory approval. If the Bank did not exercise this option, the coupon rate of the bonds would remain at 4.53% per annum from 19 March 2024 onwards. These Tier-two capital bonds have the write-down feature of a Tier-two capital instrument, which allows the Bank to write down the entire principal of the bonds when regulatory triggering events as stipulated in the offering documents occur and any accumulated unpaid interest would become not payable, and; they are qualified as Tier-two Capital Instruments in accordance with the CBIRC requirements.
(xiv) The Tier-two capital bonds issued in April 2019 have a tenor of 15 years, with a fixed coupon rate of 4.63% payable annually. The Bank has an option to redeem part or all of the bonds at face value on 11 April 2029 if specified redemption conditions as stipulated in the offering documents were met, subject to regulatory approval. If the Bank did not exercise this option, the coupon rate of the bonds would remain at 4.63% per annum from 11 April 2029 onwards. These Tier-two capital bonds have the write-down feature of a Tier-two capital instrument, which allows the Bank to write down the entire principal of the bonds when regulatory triggering events as stipulated in the offering documents occur and any accumulated unpaid interest would become not payable, and; they are qualified as Tier-two Capital Instruments in accordance with the CBIRC requirements.
181Interim Report 2019
Notes to the Condensed Consolidated Interim Financial StatementsFor the six months ended 30 June 2019(Amounts in millions of Renminbi, unless otherwise stated)
33 DEBT SECURITIES ISSUED (Continued)
(2) As at 30 June 2019, the certificates of deposit were issued by the Overseas Operations of the Group and were measured at amortized cost. The terms of the certificates of deposit ranged from 1 month to 7 years, with interest rates ranging from 0% to 4.8%. As at 31 December 2018, the terms of the certificates of deposit ranged from two months to seven years with interest rates ranging from 0% to 4.60% per annum.
(3) As at 30 June 2019, the commercial papers were issued by the Overseas Operations of the Group and were measured at amortized cost. The terms of the commercial papers ranged from 2 months to 1 year, with interest rates ranging from 0% to 3.14%. As at 31 December 2018, the terms of the commercial papers ranged from two month to one year, with interest rates ranging from 0% to 3.22% per annum.
(4) As at 30 June 2019, the interbank certificate of deposit were issued by the Bank’s Head Office. The term of the interbank certificate of deposit ranged from 1 month to 1 year, with interest rates ranging from 2.20% to 3.60%. As at 31 December 2018, the terms of the interbank certificates of deposit ranged from three months to one year, with interest rates ranging from 3.20% to 4.40% per annum.
34 OTHER LIABILITIES
30 June
2019
31 December
2018
Clearing and settlement 114,443 53,578
Insurance liabilities 71,665 68,351
Staff costs payable (1) 43,823 45,285
Income taxes payable 29,562 49,248
Provision (2) 26,563 25,883
Lease liabilities 10,136 N/A
VAT and other taxes payable 8,580 7,568
Dormant accounts 4,568 4,249
Amount payable to the MOF 1,835 1,567
Interest payable 234 238
Others 71,941 62,599
Total 383,350 318,566
182
Notes to the Condensed Consolidated Interim Financial StatementsFor the six months ended 30 June 2019(Amounts in millions of Renminbi, unless otherwise stated)
34 OTHER LIABILITIES (Continued)
(1) Staff costs payable
30 June 2019
31 December 2018
Short-term employee benefits (i) 38,656 39,698Defined contribution benefits (ii) 2,749 2,704Early retirement benefits (iii) 2,418 2,883
Total 43,823 45,285
(i) Short-term employee benefits
Six months ended 30 June 20191 January Accruals Reductions 30 June
Salaries, bonuses, allowance and subsidies (a) 29,559 39,231 (41,653) 27,137Housing funds (a) 186 4,148 (4,047) 287Social insurance Including: (a) 255 2,737 (2,695) 297 — Medical insurance 235 2,455 (2,420) 270 — Maternity insurance 13 209 (204) 18 — Employment injury insurance 7 73 (71) 9Labor union fees and staff education expenses 6,206 1,721 (703) 7,224Others 3,492 2,850 (2,631) 3,711
Total 39,698 50,687 (51,729) 38,656
Year ended 31 December 20181 January Accruals Reductions 31 December
Salaries, bonuses, allowance and subsidies (a) 26,829 75,976 (73,246) 29,559Housing funds (a) 157 8,328 (8,299) 186Social insurance Including: (a) 171 5,371 (5,287) 255 — Medical insurance 159 4,829 (4,753) 235 — Maternity insurance 7 381 (375) 13 — Employment injury insurance 5 161 (159) 7Labor union fees and staff education expenses 5,344 3,365 (2,503) 6,206Others 3,393 12,469 (12,370) 3,492
Total 35,894 105,509 (101,705) 39,698
(a) Salaries, bonuses, allowance and subsidies, housing funds and social insurance are timely distributed and paid in accordance with the relevant laws and regulations and the Group’s policy.
183Interim Report 2019
Notes to the Condensed Consolidated Interim Financial StatementsFor the six months ended 30 June 2019(Amounts in millions of Renminbi, unless otherwise stated)
34 OTHER LIABILITIES (Continued)
(1) Staff costs payable (Continued)
(ii) Defined contribution benefits
Six months ended 30 June 20191 January Accruals Reductions 30 June
Basic pensions 518 5,783 (5,771) 530Unemployment insurance 31 174 (164) 41Annuity Scheme 2,155 1,806 (1,783) 2,178
Total 2,704 7,763 (7,718) 2,749
Year ended 31 December 20181 January Accruals Reductions 31 December
Basic pensions 527 11,808 (11,817) 518Unemployment insurance 32 319 (320) 31Annuity Scheme 7 5,721 (3,573) 2,155
Total 566 17,848 (15,710) 2,704
The defined contribution benefits are timely distributed and paid in accordance with the relevant laws and regulations and the Group’s policy.
(iii) Early retirement benefits
Six months ended 30 June 20191 January Accruals Reductions 30 June
Early retirement benefits 2,883 (53) (412) 2,418
Year ended 31 December 20181 January Accruals Reductions 31 December
Early retirement benefits 3,762 257 (1,136) 2,883
The principal assumptions used for the purpose of the actuarial valuations were as follows:
30 June 2019
31 December 2018
Discount rate 3.00% 3.00%Annual average medical expense growth rate 8.00% 8.00%Annual subsidies growth rate 8.00% 8.00%Normal retirement age — Male 60 60 — Female 55 55
Assumptions regarding future mortality experience are based on the China Life Insurance Mortality Table (year 2010–2013) (published historical statistics in China).
Any difference arising from the actual result or changes in assumptions may affect the amount of expense recognized in the consolidated interim income statement.
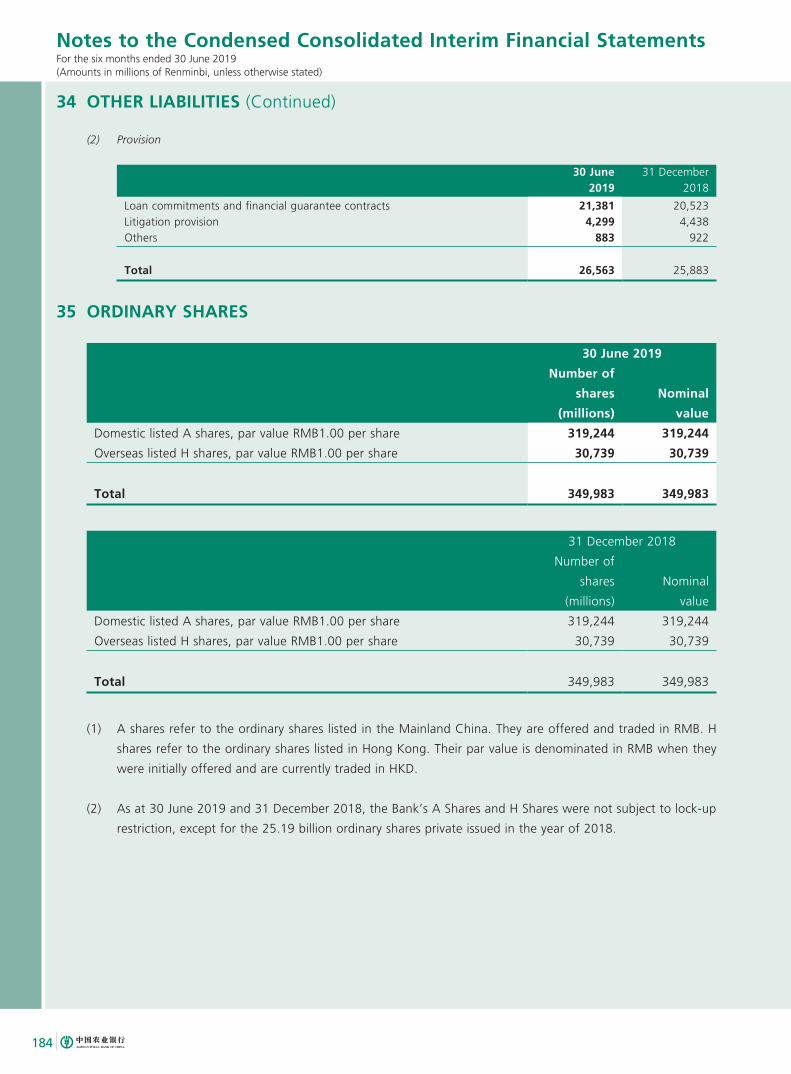
184
Notes to the Condensed Consolidated Interim Financial StatementsFor the six months ended 30 June 2019(Amounts in millions of Renminbi, unless otherwise stated)
34 OTHER LIABILITIES (Continued)
(2) Provision
30 June 2019
31 December 2018
Loan commitments and financial guarantee contracts 21,381 20,523Litigation provision 4,299 4,438Others 883 922
Total 26,563 25,883
35 ORDINARY SHARES
30 June 2019
Number of
shares
(millions)
Nominal
value
Domestic listed A shares, par value RMB1.00 per share 319,244 319,244
Overseas listed H shares, par value RMB1.00 per share 30,739 30,739
Total 349,983 349,983
31 December 2018
Number of
shares
(millions)
Nominal
value
Domestic listed A shares, par value RMB1.00 per share 319,244 319,244
Overseas listed H shares, par value RMB1.00 per share 30,739 30,739
Total 349,983 349,983
(1) A shares refer to the ordinary shares listed in the Mainland China. They are offered and traded in RMB. H
shares refer to the ordinary shares listed in Hong Kong. Their par value is denominated in RMB when they
were initially offered and are currently traded in HKD.
(2) As at 30 June 2019 and 31 December 2018, the Bank’s A Shares and H Shares were not subject to lock-up
restriction, except for the 25.19 billion ordinary shares private issued in the year of 2018.
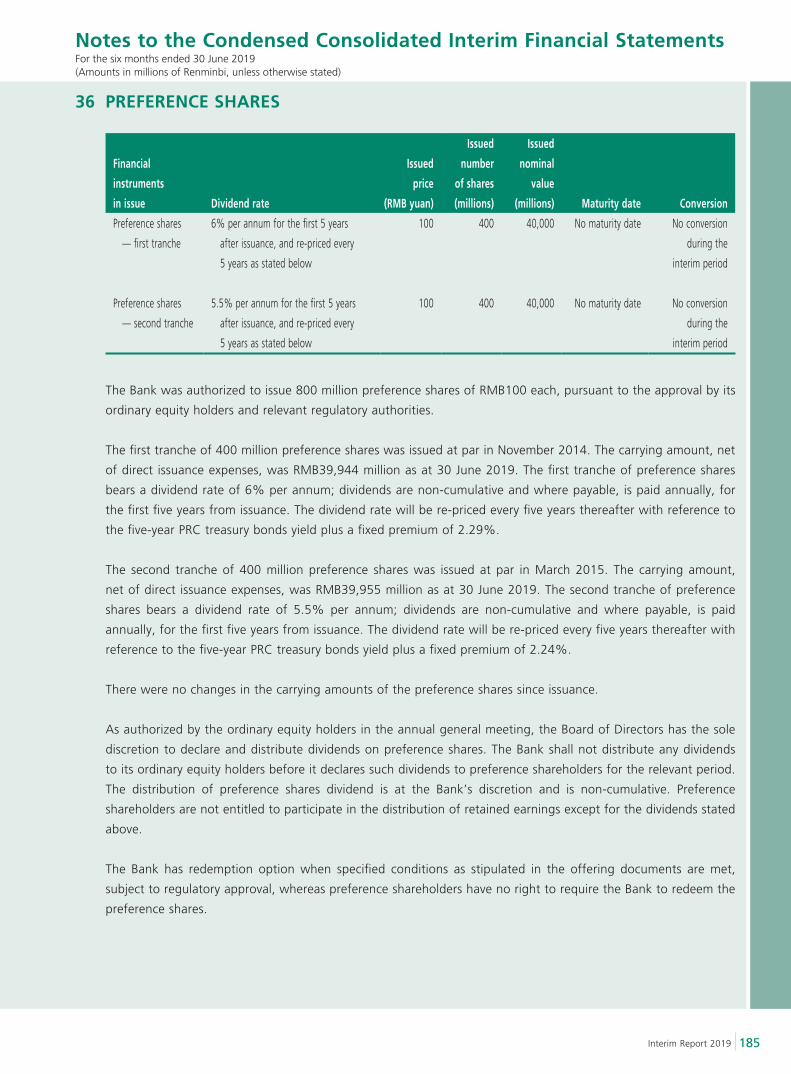
185Interim Report 2019
Notes to the Condensed Consolidated Interim Financial StatementsFor the six months ended 30 June 2019(Amounts in millions of Renminbi, unless otherwise stated)
36 PREFERENCE SHARES
Financial
instruments
in issue Dividend rate
Issued
price
(RMB yuan)
Issued
number
of shares
(millions)
Issued
nominal
value
(millions) Maturity date Conversion
Preference shares
— first tranche
6% per annum for the first 5 years
after issuance, and re-priced every
5 years as stated below
100 400 40,000 No maturity date No conversion
during the
interim period
Preference shares
— second tranche
5.5% per annum for the first 5 years
after issuance, and re-priced every
5 years as stated below
100 400 40,000 No maturity date No conversion
during the
interim period
The Bank was authorized to issue 800 million preference shares of RMB100 each, pursuant to the approval by its
ordinary equity holders and relevant regulatory authorities.
The first tranche of 400 million preference shares was issued at par in November 2014. The carrying amount, net
of direct issuance expenses, was RMB39,944 million as at 30 June 2019. The first tranche of preference shares
bears a dividend rate of 6% per annum; dividends are non-cumulative and where payable, is paid annually, for
the first five years from issuance. The dividend rate will be re-priced every five years thereafter with reference to
the five-year PRC treasury bonds yield plus a fixed premium of 2.29%.
The second tranche of 400 million preference shares was issued at par in March 2015. The carrying amount,
net of direct issuance expenses, was RMB39,955 million as at 30 June 2019. The second tranche of preference
shares bears a dividend rate of 5.5% per annum; dividends are non-cumulative and where payable, is paid
annually, for the first five years from issuance. The dividend rate will be re-priced every five years thereafter with
reference to the five-year PRC treasury bonds yield plus a fixed premium of 2.24%.
There were no changes in the carrying amounts of the preference shares since issuance.
As authorized by the ordinary equity holders in the annual general meeting, the Board of Directors has the sole
discretion to declare and distribute dividends on preference shares. The Bank shall not distribute any dividends
to its ordinary equity holders before it declares such dividends to preference shareholders for the relevant period.
The distribution of preference shares dividend is at the Bank’s discretion and is non-cumulative. Preference
shareholders are not entitled to participate in the distribution of retained earnings except for the dividends stated
above.
The Bank has redemption option when specified conditions as stipulated in the offering documents are met,
subject to regulatory approval, whereas preference shareholders have no right to require the Bank to redeem the
preference shares.
186
Notes to the Condensed Consolidated Interim Financial StatementsFor the six months ended 30 June 2019(Amounts in millions of Renminbi, unless otherwise stated)
36 PREFERENCE SHARES (Continued)
Upon liquidation, the claims of preference shareholders have priority over ordinary equity holders on the residual
assets of the Bank, but are subordinated to those of depositors, general creditors, Tier-two Capital Instruments
holders or any other subordinated debt holders with equivalent rights.
Upon occurrence of the triggering events as stipulated in paragraph 2(3) of the Guidance of the China Banking
Regulatory Commission on Commercial Banks’ Innovation on Capital Instruments (CBRC No. 56 [2012]) and
subject to regulatory approval, the first tranche of preference shares and the second tranche of preference
shares shall be mandatorily converted into ordinary A shares of the Bank at the conversion price agreed, partially
or entirely. The initial conversion price of the preference shares issued by the Bank was RMB2.43 per share. In
June 2018, the Bank has issued 25.19 billion ordinary A shares to specific investors. The conversion price of the
preference shares will be adjusted where certain events occur including bonus issues, rights issue, capitalization
of reserves and new issuances of ordinary shares, subject to terms and formulas provided for in the offering
documents, to maintain the relative interests between preference shareholders and ordinary equity holders.
Upon completion of the private placement of ordinary shares by the Bank, the mandatory conversion price of
the first tranche of preference shares and the second tranche of preference shares issued by the Bank will be
adjusted from RMB2.43 per share to RMB2.46 per share.
These preference shares are classified as equity instruments, and presented as equity in the condensed
consolidated interim statement of financial position; and are qualified as Additional Tier-one Capital Instruments
in accordance with the CBIRC requirements.
37 CAPITAL RESERVE
The capital reserve represents the premium related to ordinary shares publicly issued by the Bank in 2010 and
private placement of ordinary shares to the specific stakeholders in 2018. Share premium was recorded in
the capital reserve after deducting direct issue expenses, which consisted primarily of underwriting fees and
professional fees.
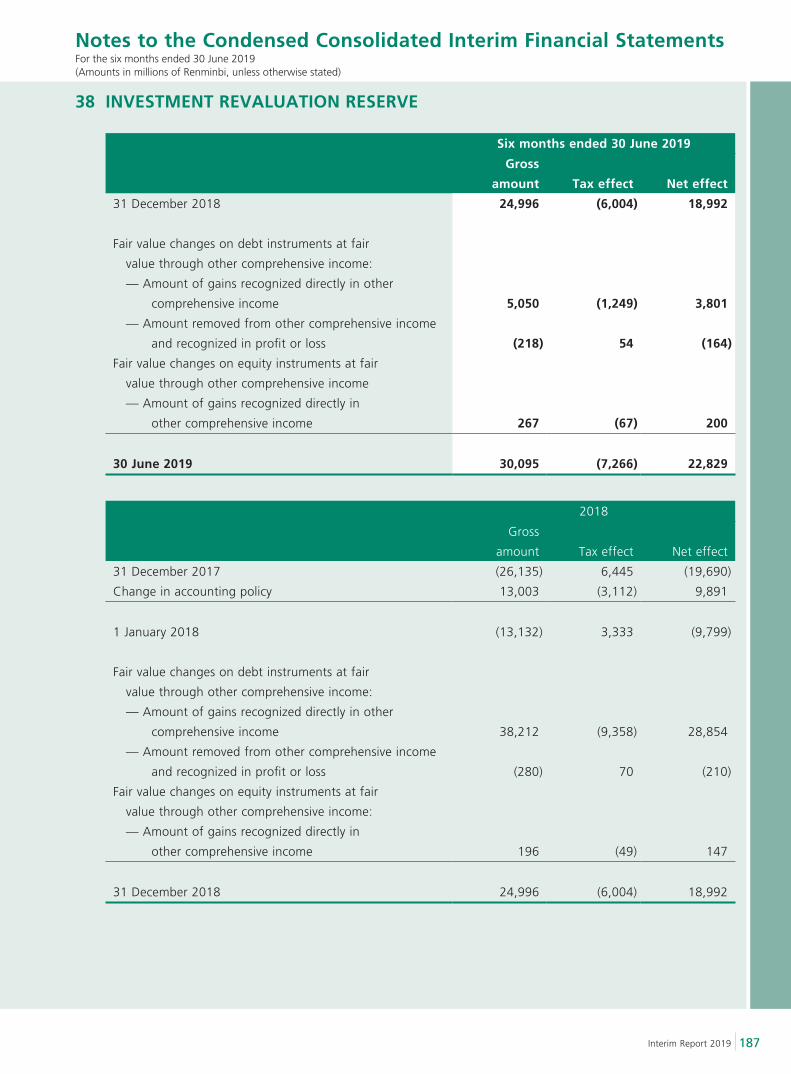
187Interim Report 2019
Notes to the Condensed Consolidated Interim Financial StatementsFor the six months ended 30 June 2019(Amounts in millions of Renminbi, unless otherwise stated)
38 INVESTMENT REVALUATION RESERVE
Six months ended 30 June 2019
Gross
amount Tax effect Net effect
31 December 2018 24,996 (6,004) 18,992
Fair value changes on debt instruments at fair
value through other comprehensive income:
— Amount of gains recognized directly in other
comprehensive income 5,050 (1,249) 3,801
— Amount removed from other comprehensive income
and recognized in profit or loss (218) 54 (164)
Fair value changes on equity instruments at fair
value through other comprehensive income
— Amount of gains recognized directly in
other comprehensive income 267 (67) 200
30 June 2019 30,095 (7,266) 22,829
2018
Gross
amount Tax effect Net effect
31 December 2017 (26,135) 6,445 (19,690)
Change in accounting policy 13,003 (3,112) 9,891
1 January 2018 (13,132) 3,333 (9,799)
Fair value changes on debt instruments at fair
value through other comprehensive income:
— Amount of gains recognized directly in other
comprehensive income 38,212 (9,358) 28,854
— Amount removed from other comprehensive income
and recognized in profit or loss (280) 70 (210)
Fair value changes on equity instruments at fair
value through other comprehensive income:
— Amount of gains recognized directly in
other comprehensive income 196 (49) 147
31 December 2018 24,996 (6,004) 18,992
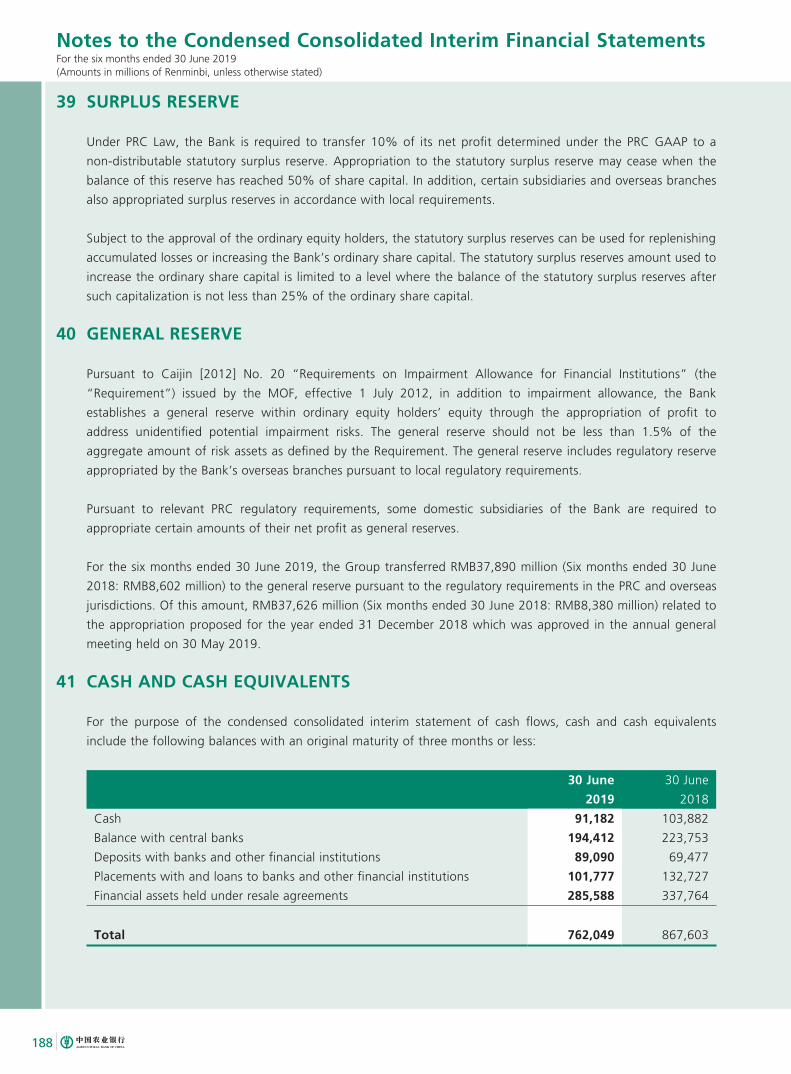
188
Notes to the Condensed Consolidated Interim Financial StatementsFor the six months ended 30 June 2019(Amounts in millions of Renminbi, unless otherwise stated)
39 SURPLUS RESERVE
Under PRC Law, the Bank is required to transfer 10% of its net profit determined under the PRC GAAP to a
non-distributable statutory surplus reserve. Appropriation to the statutory surplus reserve may cease when the
balance of this reserve has reached 50% of share capital. In addition, certain subsidiaries and overseas branches
also appropriated surplus reserves in accordance with local requirements.
Subject to the approval of the ordinary equity holders, the statutory surplus reserves can be used for replenishing
accumulated losses or increasing the Bank’s ordinary share capital. The statutory surplus reserves amount used to
increase the ordinary share capital is limited to a level where the balance of the statutory surplus reserves after
such capitalization is not less than 25% of the ordinary share capital.
40 GENERAL RESERVE
Pursuant to Caijin [2012] No. 20 “Requirements on Impairment Allowance for Financial Institutions” (the
“Requirement”) issued by the MOF, effective 1 July 2012, in addition to impairment allowance, the Bank
establishes a general reserve within ordinary equity holders’ equity through the appropriation of profit to
address unidentified potential impairment risks. The general reserve should not be less than 1.5% of the
aggregate amount of risk assets as defined by the Requirement. The general reserve includes regulatory reserve
appropriated by the Bank’s overseas branches pursuant to local regulatory requirements.
Pursuant to relevant PRC regulatory requirements, some domestic subsidiaries of the Bank are required to
appropriate certain amounts of their net profit as general reserves.
For the six months ended 30 June 2019, the Group transferred RMB37,890 million (Six months ended 30 June
2018: RMB8,602 million) to the general reserve pursuant to the regulatory requirements in the PRC and overseas
jurisdictions. Of this amount, RMB37,626 million (Six months ended 30 June 2018: RMB8,380 million) related to
the appropriation proposed for the year ended 31 December 2018 which was approved in the annual general
meeting held on 30 May 2019.
41 CASH AND CASH EQUIVALENTS
For the purpose of the condensed consolidated interim statement of cash flows, cash and cash equivalents
include the following balances with an original maturity of three months or less:
30 June
2019
30 June
2018
Cash 91,182 103,882
Balance with central banks 194,412 223,753
Deposits with banks and other financial institutions 89,090 69,477
Placements with and loans to banks and other financial institutions 101,777 132,727
Financial assets held under resale agreements 285,588 337,764
Total 762,049 867,603
189Interim Report 2019
Notes to the Condensed Consolidated Interim Financial StatementsFor the six months ended 30 June 2019(Amounts in millions of Renminbi, unless otherwise stated)
42 OPERATING SEGMENTS
Operating segments are identified on the basis of internal management reports with respect to the components
of the Group that are regularly reviewed by the Board and relevant management committees, which constitute
the chief operating decision makers, for the purposes of allocating resources to segments and assessing their
performance. The Group’s chief operating decision makers review three different sets of financial information
based on (i) geographical locations, (ii) business activities and (iii) County Area and Urban Area banking business.
The measurement of segment assets and liabilities, as well as segment revenue, expense and results is based on
the Group’s accounting policies. There is no difference between the accounting policies used in the preparation
of the condensed consolidated interim financial statements and those used in preparing the operating segment
information.
Transactions between segments are conducted under normal commercial terms and conditions. Internal charges
and transfer pricing are determined with reference to market rates and have been reflected in the performance
of each segment.
Segment revenue, results, assets and liabilities include items directly attributable to a segment as well as those
that can be allocated on a reasonable basis.
Geographical operating segments
The details of the geographical operating segments are as follows:
Head Office
Yangtze River Delta: Shanghai, Jiangsu, Zhejiang, Ningbo
Pearl River Delta: Guangdong, Shenzhen, Fujian, Xiamen
Bohai Rim: Beijing, Tianjin, Hebei, Shandong, Qingdao
Central China: Shanxi, Hubei, Henan, Hunan, Jiangxi, Hainan, Anhui
Western China: Chongqing, Sichuan, Guizhou, Yunnan, Shaanxi, Gansu, Qinghai, Ningxia,
Xinjiang (including Xinjiang Bingtuan), Tibet, Inner Mongolia, Guangxi
Northeastern China: Liaoning, Heilongjiang, Jilin, Dalian
Overseas and Others: Subsidiaries and overseas branches
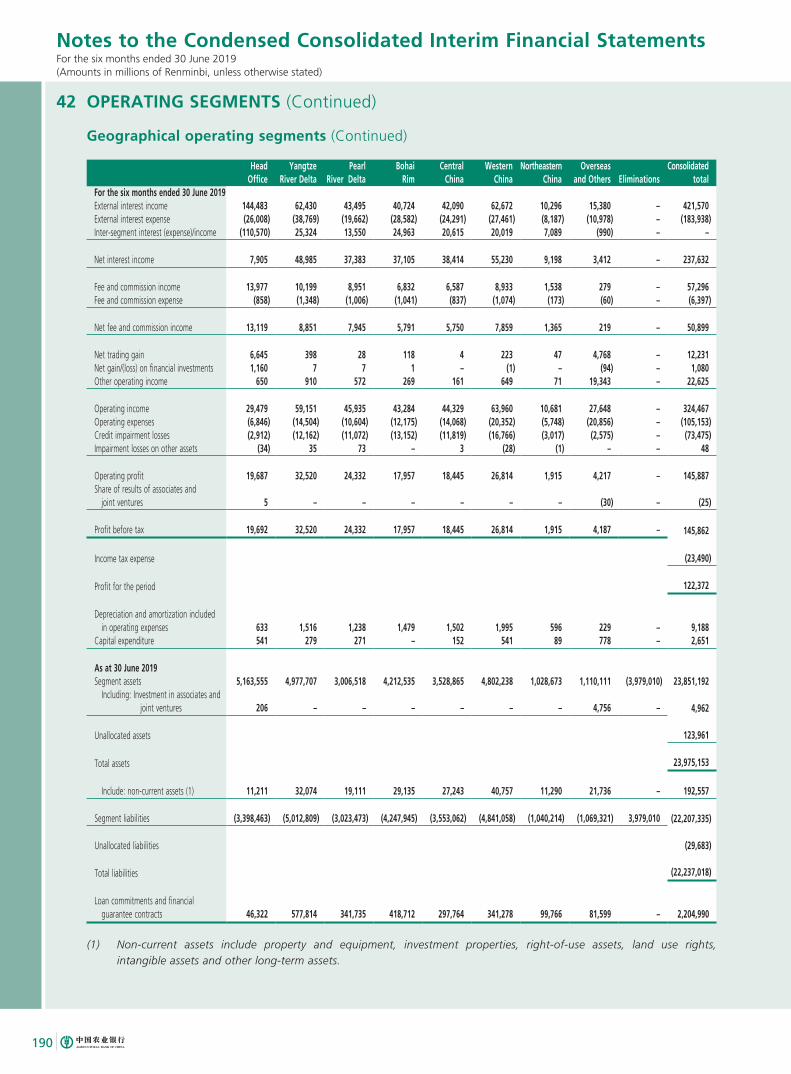
190
Notes to the Condensed Consolidated Interim Financial StatementsFor the six months ended 30 June 2019(Amounts in millions of Renminbi, unless otherwise stated)
42 OPERATING SEGMENTS (Continued)
Geographical operating segments (Continued)
Head Office
Yangtze River Delta
Pearl River Delta
Bohai Rim
Central China
Western China
Northeastern China
Overseas and Others Eliminations
Consolidatedtotal
For the six months ended 30 June 2019External interest income 144,483 62,430 43,495 40,724 42,090 62,672 10,296 15,380 – 421,570External interest expense (26,008) (38,769) (19,662) (28,582) (24,291) (27,461) (8,187) (10,978) – (183,938)Inter-segment interest (expense)/income (110,570) 25,324 13,550 24,963 20,615 20,019 7,089 (990) – –
Net interest income 7,905 48,985 37,383 37,105 38,414 55,230 9,198 3,412 – 237,632
Fee and commission income 13,977 10,199 8,951 6,832 6,587 8,933 1,538 279 – 57,296Fee and commission expense (858) (1,348) (1,006) (1,041) (837) (1,074) (173) (60) – (6,397)
Net fee and commission income 13,119 8,851 7,945 5,791 5,750 7,859 1,365 219 – 50,899
Net trading gain 6,645 398 28 118 4 223 47 4,768 – 12,231Net gain/(loss) on financial investments 1,160 7 7 1 – (1) – (94) – 1,080Other operating income 650 910 572 269 161 649 71 19,343 – 22,625
Operating income 29,479 59,151 45,935 43,284 44,329 63,960 10,681 27,648 – 324,467Operating expenses (6,846) (14,504) (10,604) (12,175) (14,068) (20,352) (5,748) (20,856) – (105,153)Credit impairment losses (2,912) (12,162) (11,072) (13,152) (11,819) (16,766) (3,017) (2,575) – (73,475)Impairment losses on other assets (34) 35 73 – 3 (28) (1) – – 48
Operating profit 19,687 32,520 24,332 17,957 18,445 26,814 1,915 4,217 – 145,887Share of results of associates and joint ventures 5 – – – – – – (30) – (25)
Profit before tax 19,692 32,520 24,332 17,957 18,445 26,814 1,915 4,187 – 145,862
Income tax expense (23,490)
Profit for the period 122,372
Depreciation and amortization included in operating expenses 633 1,516 1,238 1,479 1,502 1,995 596 229 – 9,188Capital expenditure 541 279 271 – 152 541 89 778 – 2,651
As at 30 June 2019Segment assets 5,163,555 4,977,707 3,006,518 4,212,535 3,528,865 4,802,238 1,028,673 1,110,111 (3,979,010) 23,851,192 Including: Investment in associates and joint ventures 206 – – – – – – 4,756 – 4,962
Unallocated assets 123,961
Total assets 23,975,153
Include: non-current assets (1) 11,211 32,074 19,111 29,135 27,243 40,757 11,290 21,736 – 192,557
Segment liabilities (3,398,463) (5,012,809) (3,023,473) (4,247,945) (3,553,062) (4,841,058) (1,040,214) (1,069,321) 3,979,010 (22,207,335)
Unallocated liabilities (29,683)
Total liabilities (22,237,018)
Loan commitments and financial guarantee contracts 46,322 577,814 341,735 418,712 297,764 341,278 99,766 81,599 – 2,204,990
(1) Non-current assets include property and equipment, investment properties, right-of-use assets, land use rights, intangible assets and other long-term assets.
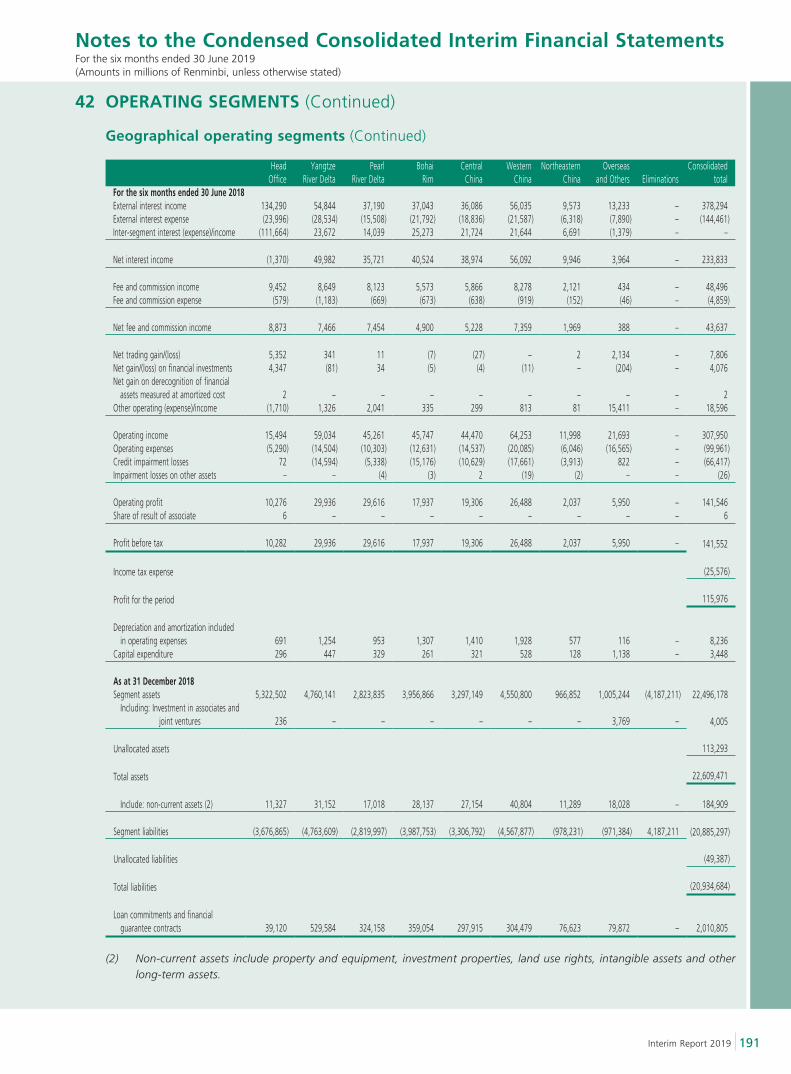
191Interim Report 2019
Notes to the Condensed Consolidated Interim Financial StatementsFor the six months ended 30 June 2019(Amounts in millions of Renminbi, unless otherwise stated)
42 OPERATING SEGMENTS (Continued)
Geographical operating segments (Continued)
Head Office
Yangtze River Delta
Pearl River Delta
Bohai Rim
Central China
Western China
Northeastern China
Overseas and Others Eliminations
Consolidated total
For the six months ended 30 June 2018External interest income 134,290 54,844 37,190 37,043 36,086 56,035 9,573 13,233 – 378,294External interest expense (23,996) (28,534) (15,508) (21,792) (18,836) (21,587) (6,318) (7,890) – (144,461)Inter-segment interest (expense)/income (111,664) 23,672 14,039 25,273 21,724 21,644 6,691 (1,379) – –
Net interest income (1,370) 49,982 35,721 40,524 38,974 56,092 9,946 3,964 – 233,833
Fee and commission income 9,452 8,649 8,123 5,573 5,866 8,278 2,121 434 – 48,496Fee and commission expense (579) (1,183) (669) (673) (638) (919) (152) (46) – (4,859)
Net fee and commission income 8,873 7,466 7,454 4,900 5,228 7,359 1,969 388 – 43,637
Net trading gain/(loss) 5,352 341 11 (7) (27) – 2 2,134 – 7,806Net gain/(loss) on financial investments 4,347 (81) 34 (5) (4) (11) – (204) – 4,076Net gain on derecognition of financial assets measured at amortized cost 2 – – – – – – – – 2Other operating (expense)/income (1,710) 1,326 2,041 335 299 813 81 15,411 – 18,596
Operating income 15,494 59,034 45,261 45,747 44,470 64,253 11,998 21,693 – 307,950Operating expenses (5,290) (14,504) (10,303) (12,631) (14,537) (20,085) (6,046) (16,565) – (99,961)Credit impairment losses 72 (14,594) (5,338) (15,176) (10,629) (17,661) (3,913) 822 – (66,417)Impairment losses on other assets – – (4) (3) 2 (19) (2) – – (26)
Operating profit 10,276 29,936 29,616 17,937 19,306 26,488 2,037 5,950 – 141,546Share of result of associate 6 – – – – – – – – 6
Profit before tax 10,282 29,936 29,616 17,937 19,306 26,488 2,037 5,950 – 141,552
Income tax expense (25,576)
Profit for the period 115,976
Depreciation and amortization included in operating expenses 691 1,254 953 1,307 1,410 1,928 577 116 – 8,236Capital expenditure 296 447 329 261 321 528 128 1,138 – 3,448
As at 31 December 2018Segment assets 5,322,502 4,760,141 2,823,835 3,956,866 3,297,149 4,550,800 966,852 1,005,244 (4,187,211) 22,496,178 Including: Investment in associates and joint ventures 236 – – – – – – 3,769 – 4,005
Unallocated assets 113,293
Total assets 22,609,471
Include: non-current assets (2) 11,327 31,152 17,018 28,137 27,154 40,804 11,289 18,028 – 184,909
Segment liabilities (3,676,865) (4,763,609) (2,819,997) (3,987,753) (3,306,792) (4,567,877) (978,231) (971,384) 4,187,211 (20,885,297)
Unallocated liabilities (49,387)
Total liabilities (20,934,684)
Loan commitments and financial guarantee contracts 39,120 529,584 324,158 359,054 297,915 304,479 76,623 79,872 – 2,010,805
(2) Non-current assets include property and equipment, investment properties, land use rights, intangible assets and other long-term assets.
192
Notes to the Condensed Consolidated Interim Financial StatementsFor the six months ended 30 June 2019(Amounts in millions of Renminbi, unless otherwise stated)
42 OPERATING SEGMENTS (Continued)
Business operating segments
The details of the business operating segments are as follows:
Corporate banking
The corporate banking segment provides financial products and services to corporations, government agencies
and financial institutions. The range of products and services includes corporate loans and advances, trade
finance, deposit products, corporate wealth management services and other types of corporate intermediary
services.
Personal banking
The personal banking segment provides financial products and services to individual customers. The range of
products and services includes personal loans, deposit products, card business, personal wealth management
services and other types of personal intermediary services.
Treasury operations
The Group’s treasury operations conduct money market and repurchase transactions, debt instruments
investments, precious metal transactions and derivative transactions for its own accounts or on behalf of
customers.
Others
Others comprise components of the Group that are not attributable to any of the above segments, along with
certain assets, liabilities, income or expenses of the Head Office that could not be allocated on a reasonable
basis.
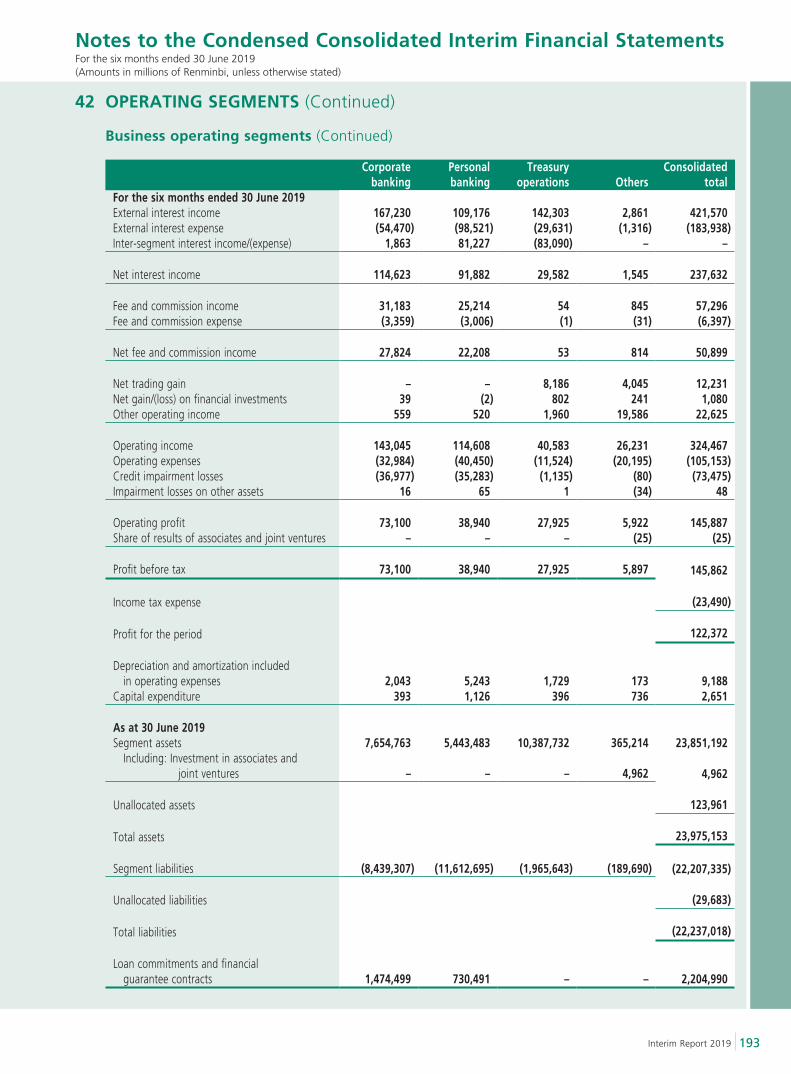
193Interim Report 2019
Notes to the Condensed Consolidated Interim Financial StatementsFor the six months ended 30 June 2019(Amounts in millions of Renminbi, unless otherwise stated)
42 OPERATING SEGMENTS (Continued)
Business operating segments (Continued)
Corporate banking
Personal banking
Treasury operations Others
Consolidated total
For the six months ended 30 June 2019External interest income 167,230 109,176 142,303 2,861 421,570External interest expense (54,470) (98,521) (29,631) (1,316) (183,938)Inter-segment interest income/(expense) 1,863 81,227 (83,090) – –
Net interest income 114,623 91,882 29,582 1,545 237,632
Fee and commission income 31,183 25,214 54 845 57,296Fee and commission expense (3,359) (3,006) (1) (31) (6,397)
Net fee and commission income 27,824 22,208 53 814 50,899
Net trading gain – – 8,186 4,045 12,231Net gain/(loss) on financial investments 39 (2) 802 241 1,080Other operating income 559 520 1,960 19,586 22,625
Operating income 143,045 114,608 40,583 26,231 324,467Operating expenses (32,984) (40,450) (11,524) (20,195) (105,153)Credit impairment losses (36,977) (35,283) (1,135) (80) (73,475)Impairment losses on other assets 16 65 1 (34) 48
Operating profit 73,100 38,940 27,925 5,922 145,887Share of results of associates and joint ventures – – – (25) (25)
Profit before tax 73,100 38,940 27,925 5,897 145,862
Income tax expense (23,490)
Profit for the period 122,372
Depreciation and amortization included in operating expenses 2,043 5,243 1,729 173 9,188Capital expenditure 393 1,126 396 736 2,651
As at 30 June 2019Segment assets 7,654,763 5,443,483 10,387,732 365,214 23,851,192 Including: Investment in associates and joint ventures – – – 4,962 4,962
Unallocated assets 123,961
Total assets 23,975,153
Segment liabilities (8,439,307) (11,612,695) (1,965,643) (189,690) (22,207,335)
Unallocated liabilities (29,683)
Total liabilities (22,237,018)
Loan commitments and financial guarantee contracts 1,474,499 730,491 – – 2,204,990
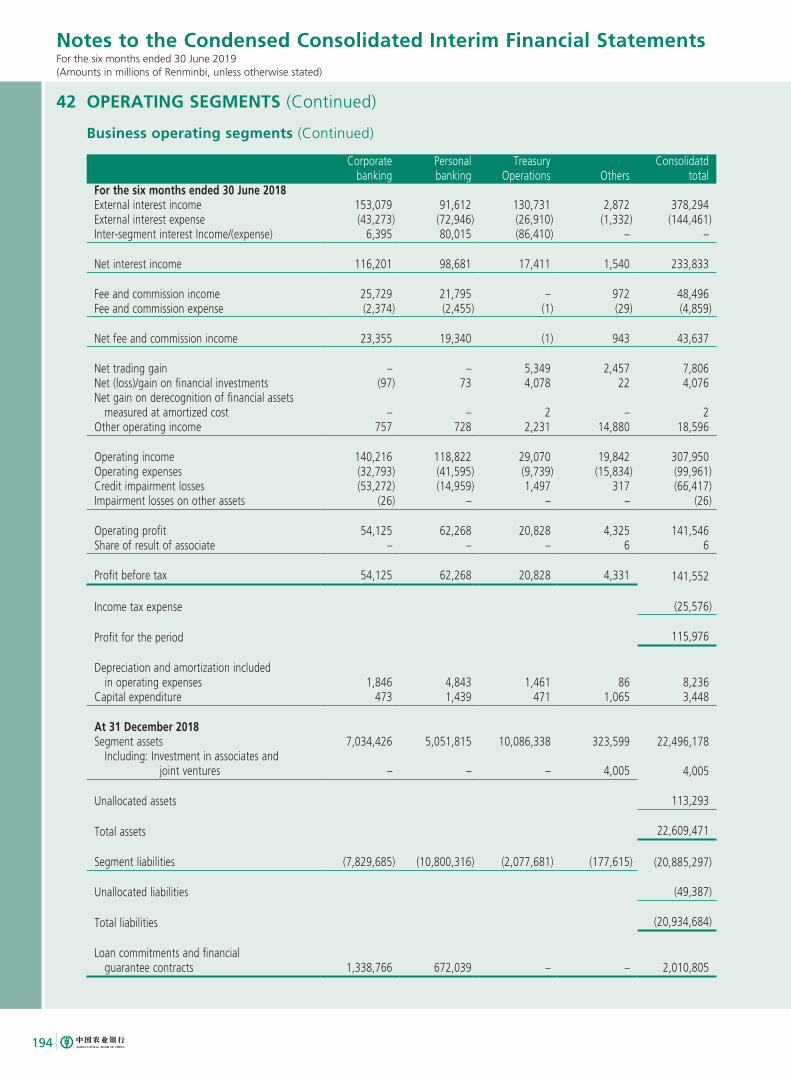
194
Notes to the Condensed Consolidated Interim Financial StatementsFor the six months ended 30 June 2019(Amounts in millions of Renminbi, unless otherwise stated)
42 OPERATING SEGMENTS (Continued)
Business operating segments (Continued)
Corporate banking
Personal banking
Treasury Operations Others
Consolidatd total
For the six months ended 30 June 2018External interest income 153,079 91,612 130,731 2,872 378,294External interest expense (43,273) (72,946) (26,910) (1,332) (144,461)Inter-segment interest Income/(expense) 6,395 80,015 (86,410) – –
Net interest income 116,201 98,681 17,411 1,540 233,833
Fee and commission income 25,729 21,795 – 972 48,496Fee and commission expense (2,374) (2,455) (1) (29) (4,859)
Net fee and commission income 23,355 19,340 (1) 943 43,637
Net trading gain – – 5,349 2,457 7,806Net (loss)/gain on financial investments (97) 73 4,078 22 4,076Net gain on derecognition of financial assets measured at amortized cost – – 2 – 2Other operating income 757 728 2,231 14,880 18,596
Operating income 140,216 118,822 29,070 19,842 307,950Operating expenses (32,793) (41,595) (9,739) (15,834) (99,961)Credit impairment losses (53,272) (14,959) 1,497 317 (66,417)Impairment losses on other assets (26) – – – (26)
Operating profit 54,125 62,268 20,828 4,325 141,546Share of result of associate – – – 6 6
Profit before tax 54,125 62,268 20,828 4,331 141,552
Income tax expense (25,576)
Profit for the period 115,976
Depreciation and amortization included in operating expenses 1,846 4,843 1,461 86 8,236Capital expenditure 473 1,439 471 1,065 3,448
At 31 December 2018Segment assets 7,034,426 5,051,815 10,086,338 323,599 22,496,178 Including: Investment in associates and joint ventures – – – 4,005 4,005
Unallocated assets 113,293
Total assets 22,609,471
Segment liabilities (7,829,685) (10,800,316) (2,077,681) (177,615) (20,885,297)
Unallocated liabilities (49,387)
Total liabilities (20,934,684)
Loan commitments and financial guarantee contracts 1,338,766 672,039 – – 2,010,805

195Interim Report 2019
Notes to the Condensed Consolidated Interim Financial StatementsFor the six months ended 30 June 2019(Amounts in millions of Renminbi, unless otherwise stated)
42 OPERATING SEGMENTS (Continued)
County Area and Urban Area segments
The Group’s operating segments organized by County Area and Urban Area banking business are set out as
follows:
County Area banking business
The Group’s County Area banking business provides a broad range of financial products and services to
customers in designated County Area, through its operating branches in the counties or county-level cities
throughout the PRC. The products and services mainly comprise loans, deposits, bank cards, and other types of
intermediary services.
Urban Area banking business
The Group’s Urban Area banking business comprises all banking activities outside of the County Area banking
business, overseas branches and subsidiaries.
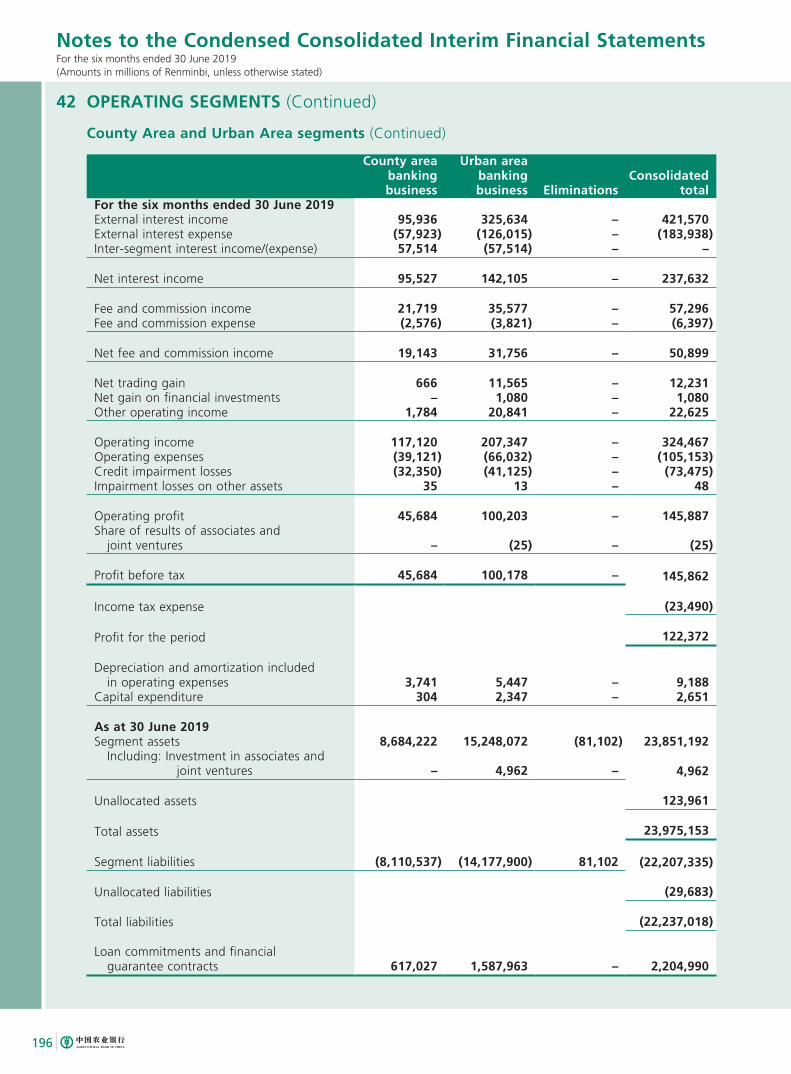
196
Notes to the Condensed Consolidated Interim Financial StatementsFor the six months ended 30 June 2019(Amounts in millions of Renminbi, unless otherwise stated)
42 OPERATING SEGMENTS (Continued)
County Area and Urban Area segments (Continued)
County area banking business
Urban area banking business Eliminations
Consolidated total
For the six months ended 30 June 2019External interest income 95,936 325,634 – 421,570External interest expense (57,923) (126,015) – (183,938)Inter-segment interest income/(expense) 57,514 (57,514) – –
Net interest income 95,527 142,105 – 237,632
Fee and commission income 21,719 35,577 – 57,296Fee and commission expense (2,576) (3,821) – (6,397)
Net fee and commission income 19,143 31,756 – 50,899
Net trading gain 666 11,565 – 12,231Net gain on financial investments – 1,080 – 1,080Other operating income 1,784 20,841 – 22,625
Operating income 117,120 207,347 – 324,467Operating expenses (39,121) (66,032) – (105,153)Credit impairment losses (32,350) (41,125) – (73,475)Impairment losses on other assets 35 13 – 48
Operating profit 45,684 100,203 – 145,887Share of results of associates and joint ventures – (25) – (25)
Profit before tax 45,684 100,178 – 145,862
Income tax expense (23,490)
Profit for the period 122,372
Depreciation and amortization included in operating expenses 3,741 5,447 – 9,188Capital expenditure 304 2,347 – 2,651
As at 30 June 2019Segment assets 8,684,222 15,248,072 (81,102) 23,851,192 Including: Investment in associates and joint ventures – 4,962 – 4,962
Unallocated assets 123,961
Total assets 23,975,153
Segment liabilities (8,110,537) (14,177,900) 81,102 (22,207,335)
Unallocated liabilities (29,683)
Total liabilities (22,237,018)
Loan commitments and financial guarantee contracts 617,027 1,587,963 – 2,204,990
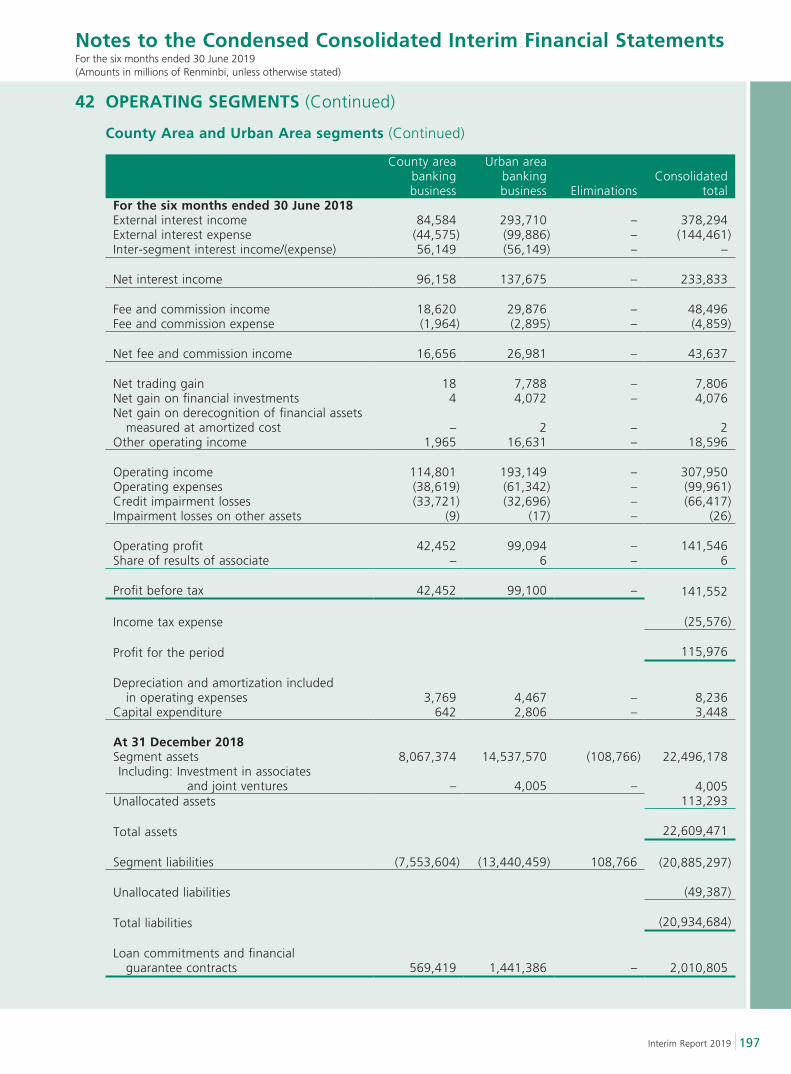
197Interim Report 2019
Notes to the Condensed Consolidated Interim Financial StatementsFor the six months ended 30 June 2019(Amounts in millions of Renminbi, unless otherwise stated)
42 OPERATING SEGMENTS (Continued)
County Area and Urban Area segments (Continued)
County areabankingbusiness
Urban areabankingbusiness Eliminations
Consolidatedtotal
For the six months ended 30 June 2018External interest income 84,584 293,710 – 378,294External interest expense (44,575) (99,886) – (144,461)Inter-segment interest income/(expense) 56,149 (56,149) – –
Net interest income 96,158 137,675 – 233,833
Fee and commission income 18,620 29,876 – 48,496Fee and commission expense (1,964) (2,895) – (4,859)
Net fee and commission income 16,656 26,981 – 43,637
Net trading gain 18 7,788 – 7,806Net gain on financial investments 4 4,072 – 4,076Net gain on derecognition of financial assets measured at amortized cost – 2 – 2Other operating income 1,965 16,631 – 18,596
Operating income 114,801 193,149 – 307,950Operating expenses (38,619) (61,342) – (99,961)Credit impairment losses (33,721) (32,696) – (66,417)Impairment losses on other assets (9) (17) – (26)
Operating profit 42,452 99,094 – 141,546Share of results of associate – 6 – 6
Profit before tax 42,452 99,100 – 141,552
Income tax expense (25,576)
Profit for the period 115,976
Depreciation and amortization included in operating expenses 3,769 4,467 – 8,236Capital expenditure 642 2,806 – 3,448
At 31 December 2018Segment assets 8,067,374 14,537,570 (108,766) 22,496,178
Including: Investment in associates and joint ventures – 4,005 – 4,005
Unallocated assets 113,293
Total assets 22,609,471
Segment liabilities (7,553,604) (13,440,459) 108,766 (20,885,297)
Unallocated liabilities (49,387)
Total liabilities (20,934,684)
Loan commitments and financial guarantee contracts 569,419 1,441,386 – 2,010,805
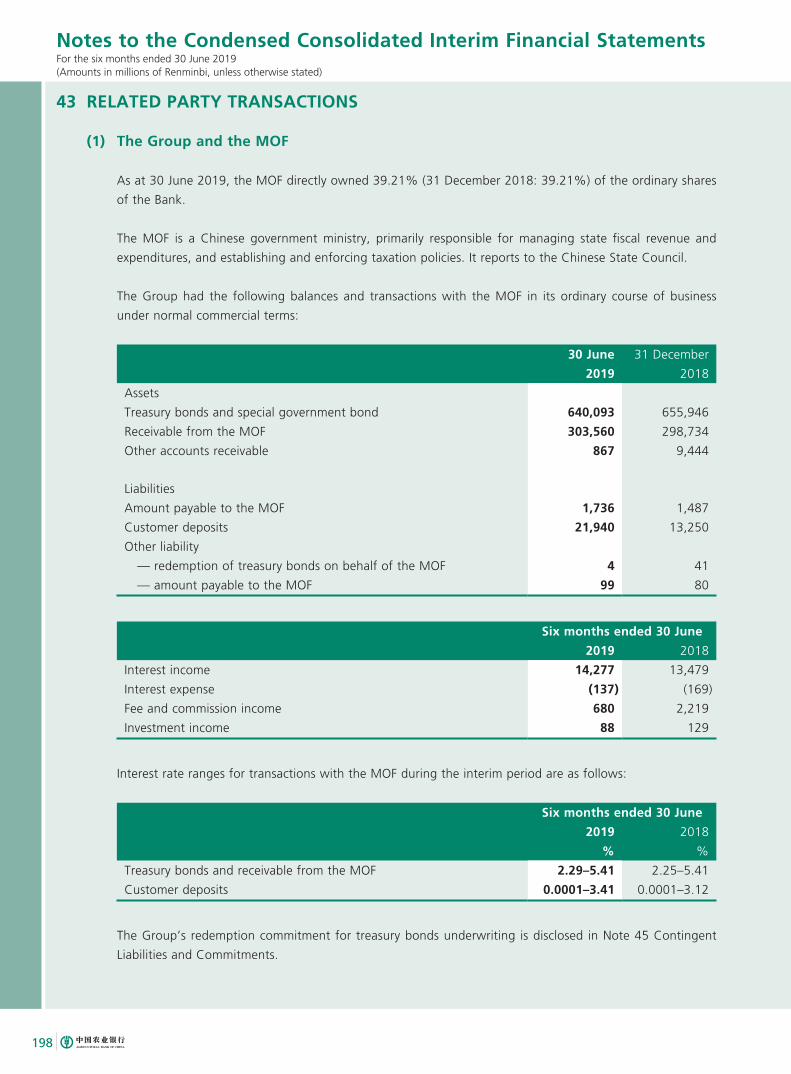
198
Notes to the Condensed Consolidated Interim Financial StatementsFor the six months ended 30 June 2019(Amounts in millions of Renminbi, unless otherwise stated)
43 RELATED PARTY TRANSACTIONS
(1) The Group and the MOF
As at 30 June 2019, the MOF directly owned 39.21% (31 December 2018: 39.21%) of the ordinary shares
of the Bank.
The MOF is a Chinese government ministry, primarily responsible for managing state fiscal revenue and
expenditures, and establishing and enforcing taxation policies. It reports to the Chinese State Council.
The Group had the following balances and transactions with the MOF in its ordinary course of business
under normal commercial terms:
30 June
2019
31 December
2018
Assets
Treasury bonds and special government bond 640,093 655,946
Receivable from the MOF 303,560 298,734
Other accounts receivable 867 9,444
Liabilities
Amount payable to the MOF 1,736 1,487
Customer deposits 21,940 13,250
Other liability
— redemption of treasury bonds on behalf of the MOF 4 41
— amount payable to the MOF 99 80
Six months ended 30 June
2019 2018
Interest income 14,277 13,479
Interest expense (137) (169)
Fee and commission income 680 2,219
Investment income 88 129
Interest rate ranges for transactions with the MOF during the interim period are as follows:
Six months ended 30 June
2019 2018
% %
Treasury bonds and receivable from the MOF 2.29–5.41 2.25–5.41
Customer deposits 0.0001–3.41 0.0001–3.12
The Group’s redemption commitment for treasury bonds underwriting is disclosed in Note 45 Contingent
Liabilities and Commitments.
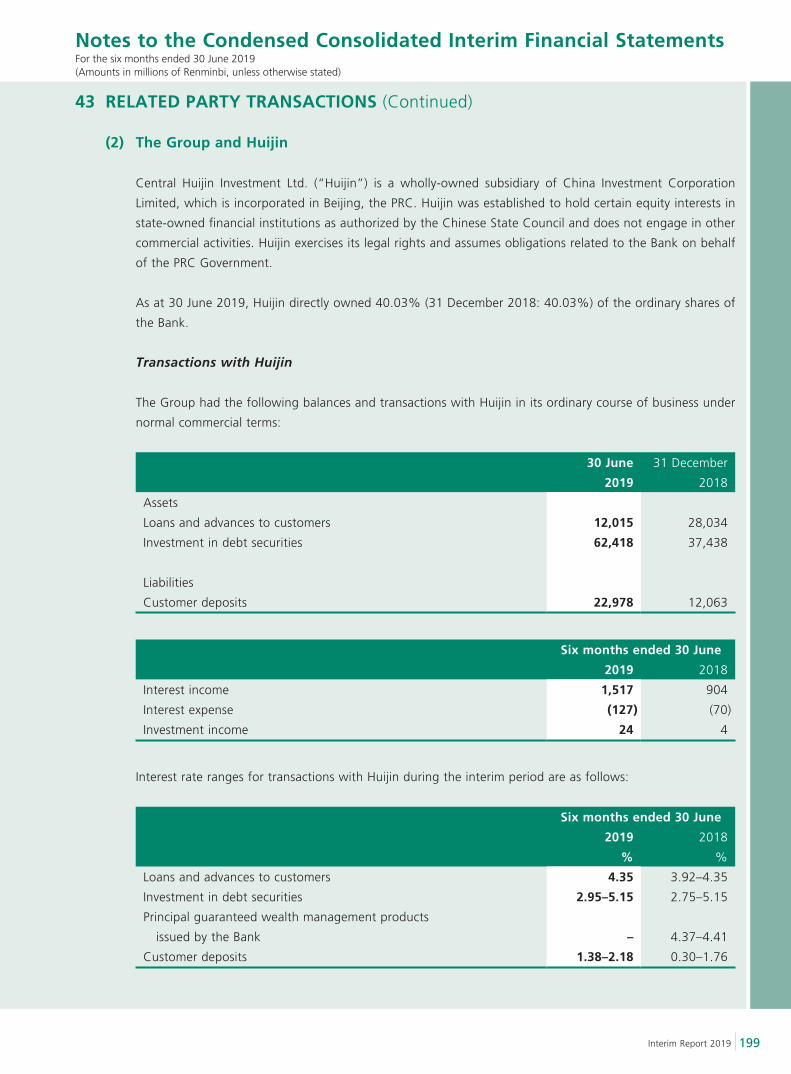
199Interim Report 2019
Notes to the Condensed Consolidated Interim Financial StatementsFor the six months ended 30 June 2019(Amounts in millions of Renminbi, unless otherwise stated)
43 RELATED PARTY TRANSACTIONS (Continued)
(2) The Group and Huijin
Central Huijin Investment Ltd. (“Huijin”) is a wholly-owned subsidiary of China Investment Corporation
Limited, which is incorporated in Beijing, the PRC. Huijin was established to hold certain equity interests in
state-owned financial institutions as authorized by the Chinese State Council and does not engage in other
commercial activities. Huijin exercises its legal rights and assumes obligations related to the Bank on behalf
of the PRC Government.
As at 30 June 2019, Huijin directly owned 40.03% (31 December 2018: 40.03%) of the ordinary shares of
the Bank.
Transactions with Huijin
The Group had the following balances and transactions with Huijin in its ordinary course of business under
normal commercial terms:
30 June
2019
31 December
2018
Assets
Loans and advances to customers 12,015 28,034
Investment in debt securities 62,418 37,438
Liabilities
Customer deposits 22,978 12,063
Six months ended 30 June
2019 2018
Interest income 1,517 904
Interest expense (127) (70)
Investment income 24 4
Interest rate ranges for transactions with Huijin during the interim period are as follows:
Six months ended 30 June
2019 2018
% %
Loans and advances to customers 4.35 3.92–4.35
Investment in debt securities 2.95–5.15 2.75–5.15
Principal guaranteed wealth management products
issued by the Bank – 4.37–4.41
Customer deposits 1.38–2.18 0.30–1.76
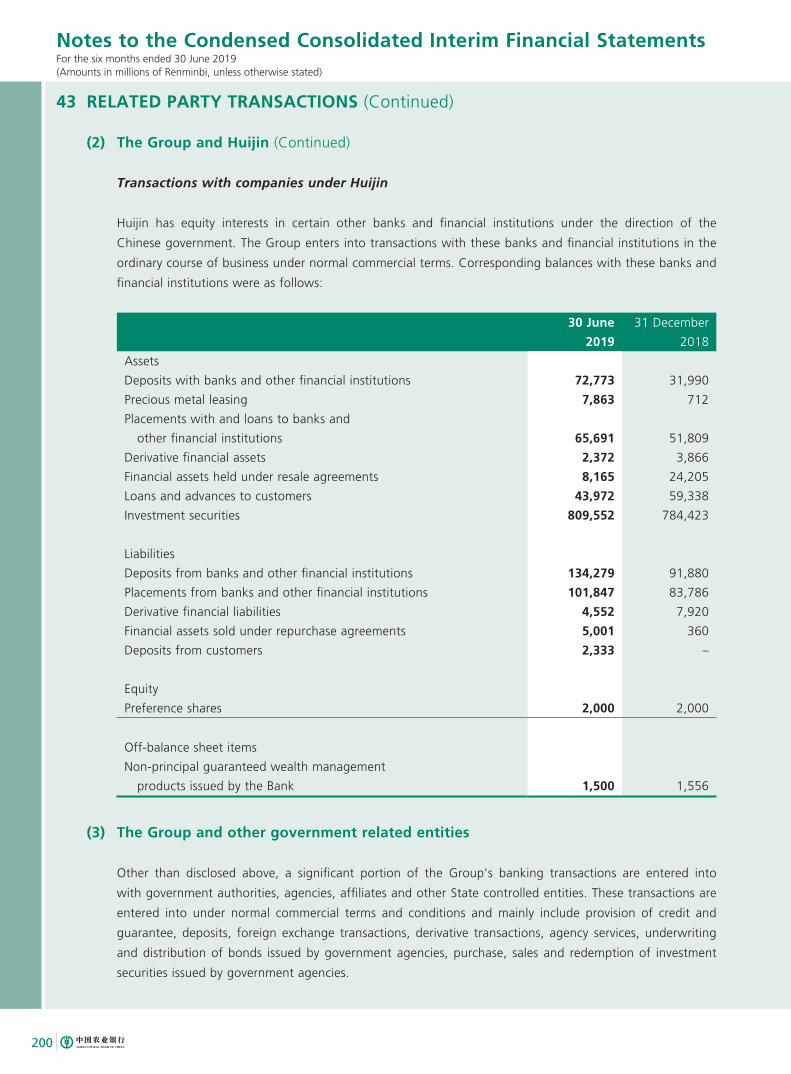
200
Notes to the Condensed Consolidated Interim Financial StatementsFor the six months ended 30 June 2019(Amounts in millions of Renminbi, unless otherwise stated)
43 RELATED PARTY TRANSACTIONS (Continued)
(2) The Group and Huijin (Continued)
Transactions with companies under Huijin
Huijin has equity interests in certain other banks and financial institutions under the direction of the
Chinese government. The Group enters into transactions with these banks and financial institutions in the
ordinary course of business under normal commercial terms. Corresponding balances with these banks and
financial institutions were as follows:
30 June
2019
31 December
2018
Assets
Deposits with banks and other financial institutions 72,773 31,990
Precious metal leasing 7,863 712
Placements with and loans to banks and
other financial institutions 65,691 51,809
Derivative financial assets 2,372 3,866
Financial assets held under resale agreements 8,165 24,205
Loans and advances to customers 43,972 59,338
Investment securities 809,552 784,423
Liabilities
Deposits from banks and other financial institutions 134,279 91,880
Placements from banks and other financial institutions 101,847 83,786
Derivative financial liabilities 4,552 7,920
Financial assets sold under repurchase agreements 5,001 360
Deposits from customers 2,333 –
Equity
Preference shares 2,000 2,000
Off-balance sheet items
Non-principal guaranteed wealth management
products issued by the Bank 1,500 1,556
(3) The Group and other government related entities
Other than disclosed above, a significant portion of the Group’s banking transactions are entered into
with government authorities, agencies, affiliates and other State controlled entities. These transactions are
entered into under normal commercial terms and conditions and mainly include provision of credit and
guarantee, deposits, foreign exchange transactions, derivative transactions, agency services, underwriting
and distribution of bonds issued by government agencies, purchase, sales and redemption of investment
securities issued by government agencies.
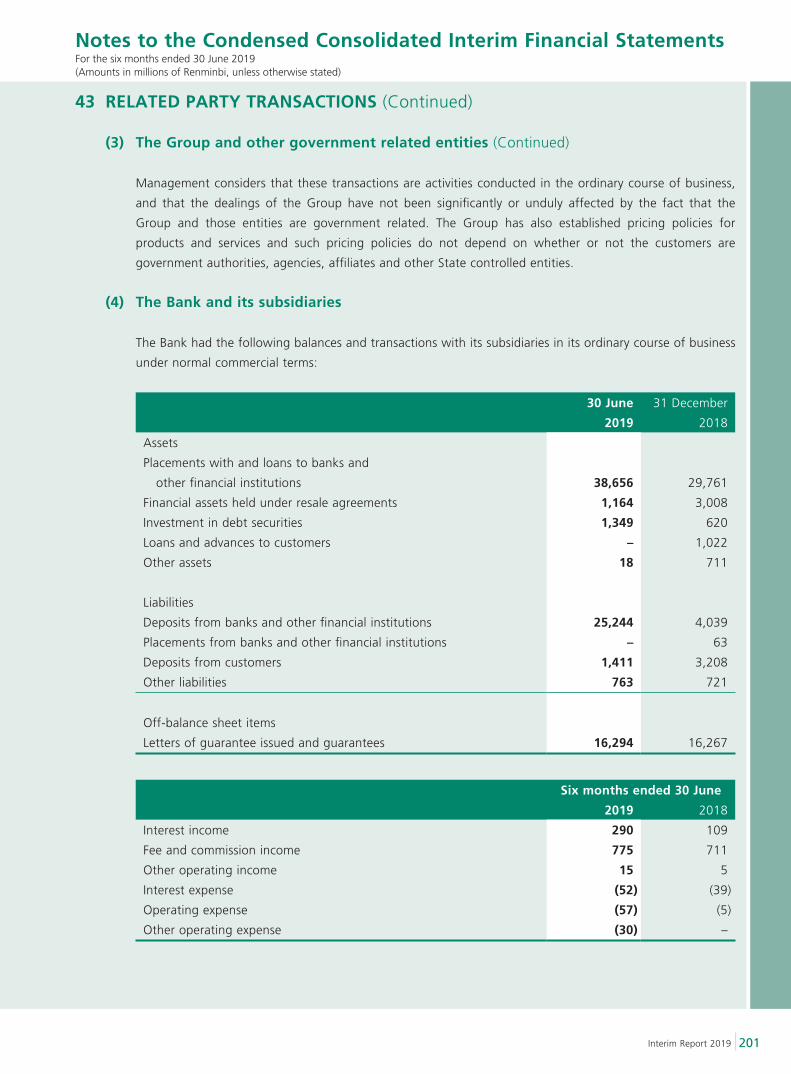
201Interim Report 2019
Notes to the Condensed Consolidated Interim Financial StatementsFor the six months ended 30 June 2019(Amounts in millions of Renminbi, unless otherwise stated)
43 RELATED PARTY TRANSACTIONS (Continued)
(3) The Group and other government related entities (Continued)
Management considers that these transactions are activities conducted in the ordinary course of business,
and that the dealings of the Group have not been significantly or unduly affected by the fact that the
Group and those entities are government related. The Group has also established pricing policies for
products and services and such pricing policies do not depend on whether or not the customers are
government authorities, agencies, affiliates and other State controlled entities.
(4) The Bank and its subsidiaries
The Bank had the following balances and transactions with its subsidiaries in its ordinary course of business
under normal commercial terms:
30 June
2019
31 December
2018
Assets
Placements with and loans to banks and
other financial institutions 38,656 29,761
Financial assets held under resale agreements 1,164 3,008
Investment in debt securities 1,349 620
Loans and advances to customers – 1,022
Other assets 18 711
Liabilities
Deposits from banks and other financial institutions 25,244 4,039
Placements from banks and other financial institutions – 63
Deposits from customers 1,411 3,208
Other liabilities 763 721
Off-balance sheet items
Letters of guarantee issued and guarantees 16,294 16,267
Six months ended 30 June
2019 2018
Interest income 290 109
Fee and commission income 775 711
Other operating income 15 5
Interest expense (52) (39)
Operating expense (57) (5)
Other operating expense (30) –
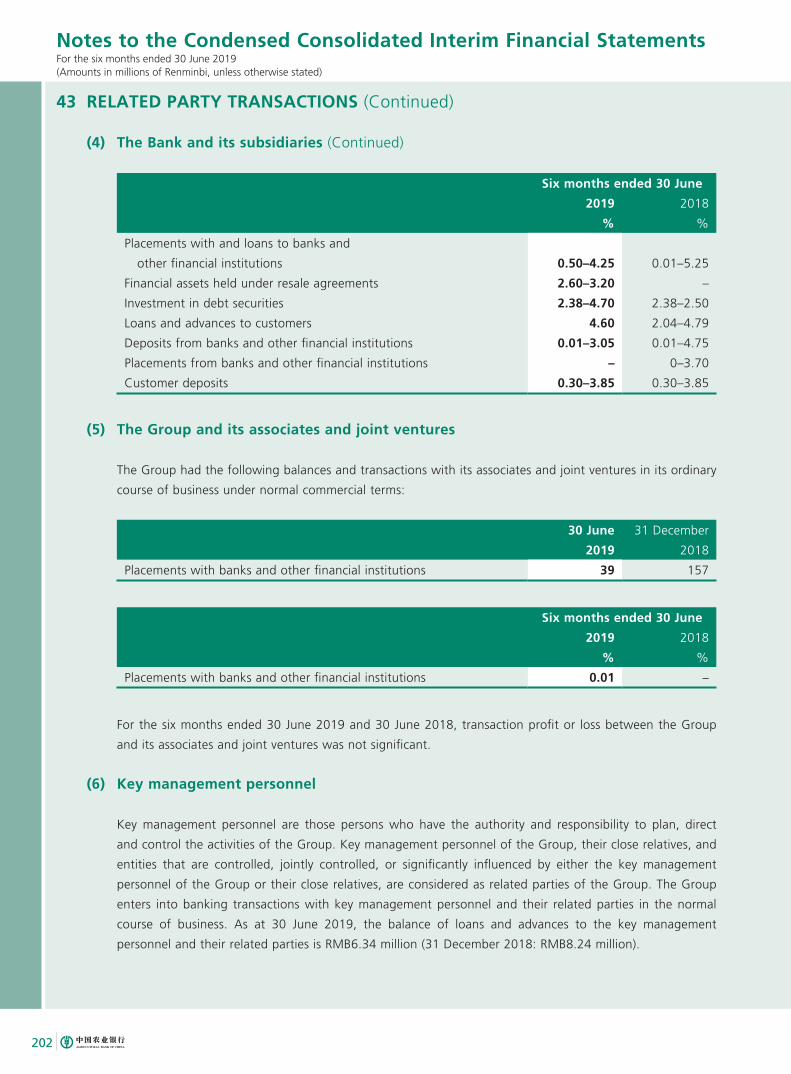
202
Notes to the Condensed Consolidated Interim Financial StatementsFor the six months ended 30 June 2019(Amounts in millions of Renminbi, unless otherwise stated)
43 RELATED PARTY TRANSACTIONS (Continued)
(4) The Bank and its subsidiaries (Continued)
Six months ended 30 June
2019 2018
% %
Placements with and loans to banks and
other financial institutions 0.50–4.25 0.01–5.25
Financial assets held under resale agreements 2.60–3.20 –
Investment in debt securities 2.38–4.70 2.38–2.50
Loans and advances to customers 4.60 2.04–4.79
Deposits from banks and other financial institutions 0.01–3.05 0.01–4.75
Placements from banks and other financial institutions – 0–3.70
Customer deposits 0.30–3.85 0.30–3.85
(5) The Group and its associates and joint ventures
The Group had the following balances and transactions with its associates and joint ventures in its ordinary
course of business under normal commercial terms:
30 June
2019
31 December
2018
Placements with banks and other financial institutions 39 157
Six months ended 30 June
2019 2018
% %
Placements with banks and other financial institutions 0.01 –
For the six months ended 30 June 2019 and 30 June 2018, transaction profit or loss between the Group
and its associates and joint ventures was not significant.
(6) Key management personnel
Key management personnel are those persons who have the authority and responsibility to plan, direct
and control the activities of the Group. Key management personnel of the Group, their close relatives, and
entities that are controlled, jointly controlled, or significantly influenced by either the key management
personnel of the Group or their close relatives, are considered as related parties of the Group. The Group
enters into banking transactions with key management personnel and their related parties in the normal
course of business. As at 30 June 2019, the balance of loans and advances to the key management
personnel and their related parties is RMB6.34 million (31 December 2018: RMB8.24 million).
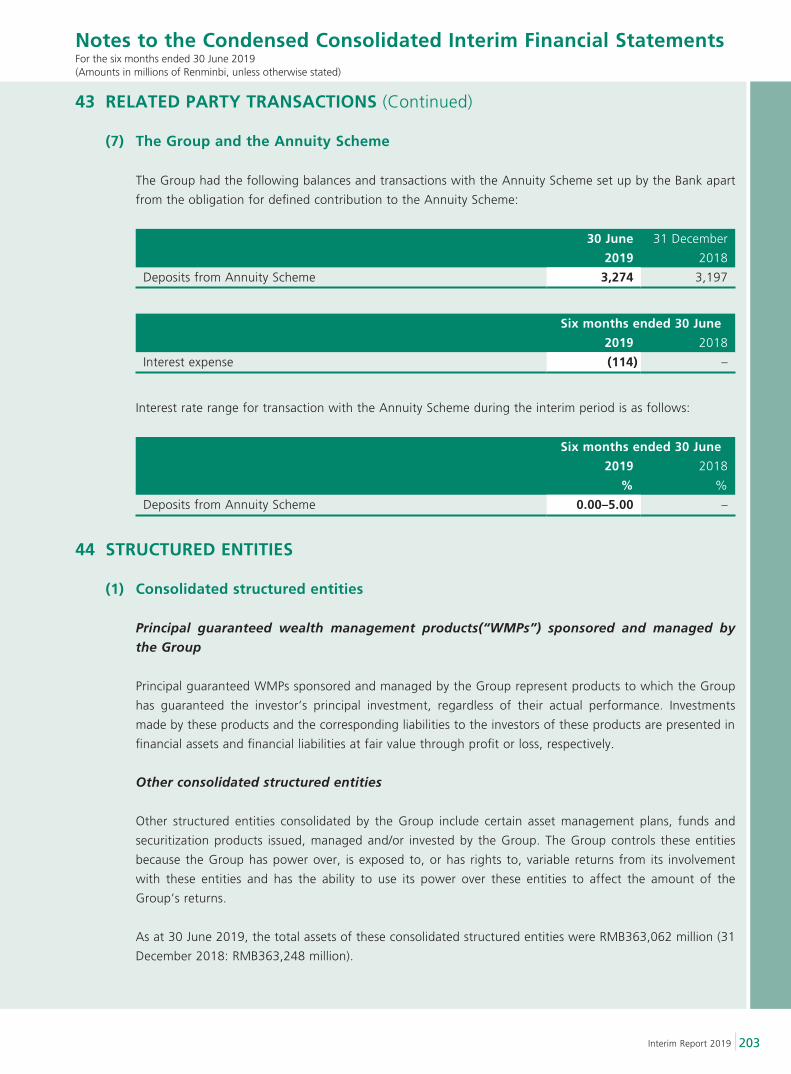
203Interim Report 2019
Notes to the Condensed Consolidated Interim Financial StatementsFor the six months ended 30 June 2019(Amounts in millions of Renminbi, unless otherwise stated)
43 RELATED PARTY TRANSACTIONS (Continued)
(7) The Group and the Annuity Scheme
The Group had the following balances and transactions with the Annuity Scheme set up by the Bank apart
from the obligation for defined contribution to the Annuity Scheme:
30 June
2019
31 December
2018
Deposits from Annuity Scheme 3,274 3,197
Six months ended 30 June
2019 2018
Interest expense (114) –
Interest rate range for transaction with the Annuity Scheme during the interim period is as follows:
Six months ended 30 June
2019 2018
% %
Deposits from Annuity Scheme 0.00–5.00 –
44 STRUCTURED ENTITIES
(1) Consolidated structured entities
Principal guaranteed wealth management products(“WMPs”) sponsored and managed by the Group
Principal guaranteed WMPs sponsored and managed by the Group represent products to which the Group
has guaranteed the investor’s principal investment, regardless of their actual performance. Investments
made by these products and the corresponding liabilities to the investors of these products are presented in
financial assets and financial liabilities at fair value through profit or loss, respectively.
Other consolidated structured entities
Other structured entities consolidated by the Group include certain asset management plans, funds and
securitization products issued, managed and/or invested by the Group. The Group controls these entities
because the Group has power over, is exposed to, or has rights to, variable returns from its involvement
with these entities and has the ability to use its power over these entities to affect the amount of the
Group’s returns.
As at 30 June 2019, the total assets of these consolidated structured entities were RMB363,062 million (31
December 2018: RMB363,248 million).
204
Notes to the Condensed Consolidated Interim Financial StatementsFor the six months ended 30 June 2019(Amounts in millions of Renminbi, unless otherwise stated)
44 STRUCTURED ENTITIES (Continued)
(2) Unconsolidated structured entities
Unconsolidated structured entities sponsored and managed by the Group
Unconsolidated structured entities sponsored and managed by the Group mainly include non-principal
guaranteed WMPs, which are not subject to any guarantee by the Group of the principal invested or
interest to be paid. The WMPs invest in a range of primarily fixed-rate assets, most typically money market
instruments, debt securities and loan assets. As the manager of these WMPs, the Group invests, on behalf
of the investors in these WMPs, the funds raised in the assets as described in the investment plan related to
each WMP and receives fee and commission income.
As at 30 June 2019, the total assets invested by these WMPs amounted to RMB1,537,897 million (31
December 2018: RMB1,706,487 million) and the corresponding outstanding WMPs issued by the Group
amounted to RMB1,307,820 million (31 December 2018: RMB1,408,263 million). For the six months ended
30 June 2019, the Group’s interest in these WMPs included net fee and commission income of RMB2,296
million (Six months ended 30 June 2018: RMB1,753 million) and net interest income of RMB302 million (Six
months ended 30 June 2018: RMB378 million), which related to placements and repo transactions entered
into by the Group with these WMP Vehicles.
The Group has entered into placements and repo transactions at market interest rates with these WMPs.
The average balance for the six months ended 30 June 2019 and the outstanding balance as at 30 June
2019 of these transactions were RMB14,131 million (weighted average outstanding period of 5.20
days) (Six months ended 30 June 2018: RMB10,577 million and 5.28 days) and RMB67,847 million (31
December 2018: RMB142,914 million), respectively.The Group was under no obligation to enter into these
transactions. As at 30 June 2019 and 31 December 2018, the outstanding balance of these transactions
was presented in placements with and loans to banks and other financial institutions and financial assets
held under resale agreements, which represented the Group’s maximum exposure to the WMPs.
There were no contractual liquidity arrangements, guarantees or other commitments among or between
the Group, WMPs or any third parties that could increase the level of the Group’s risk from WMPs disclosed
above during the period ended 30 June 2019 and the year ended 31 December 2018. The Group was
not required to absorb any losses incurred by WMPs. During the period ended 30 June 2019 and the year
ended 31 December 2018, no loss was incurred by these WMPs relating to the Group’s interests in these
WMPs, and the WMPs did not experience difficulty in financing their activities.
In addition, other unconsolidated structured entities sponsored and managed by the Group included
funds and asset management plans. As at 30 June 2019, the total assets of these products amounted
to RMB579,813 million (31 December 2018: RMB684,653 million). During the period ended 30 June
2019, the Group’s interest in these products mainly included net fee and commission income of RMB483
million(2018: RMB1,093 million).
205Interim Report 2019
Notes to the Condensed Consolidated Interim Financial StatementsFor the six months ended 30 June 2019(Amounts in millions of Renminbi, unless otherwise stated)
44 STRUCTURED ENTITIES (Continued)
(2) Unconsolidated structured entities (Continued)
Other unconsolidated structured entities held by the Group
The Group invests in other unconsolidated structured entities which are sponsored and managed by other
entities for investment return, and records trading gains or losses and interest income therefrom. These
unconsolidated structured entities primarily include asset management plans, funds and asset-backed
securities. As at 30 June 2019, the related carrying amount of investments and the maximum exposure by
the Group to these other unconsolidated structured entities was RMB68,884 million (31 December 2018:
RMB60,663 million), included under the financial assets at fair value through profit or loss, Other debt
instrument investments at fair value through other comprehensive income and debt instrument investments
at amortized cost categories in the consolidated statement of financial position. The information on the size
of total assets of these unconsolidated structured entities was not readily available from the public domain.
45 CONTINGENT LIABILITIES AND COMMITMENTS
Legal proceedings and others
The Bank and its subsidiaries are involved as defendants in certain lawsuits arising from their normal business
operations. As at 30 June 2019, provisions of RMB4,299 million were made by the Group (31 December
2018: RMB4,438 million) based on court judgments or advice of legal counsel, and included in Note 34 Other
Liabilities. Management of the Group believes that the final result of these lawsuits will not have a material
impact on the financial position or operations of the Group.
On 28 September 2016, the Bank and its New York Branch entered into a Cease and Desist Order with the
Board of Governors of the Federal Reserve System of the United States. On 4 November 2016, the Bank and
its New York Branch entered into a Consent Order with New York State Department of Financial Services (the
“Department”) and paid a civil monetary penalty to the Department accordingly. As at 31 December 2016, the
above-mentioned civil monetary penalty was paid and reflected in the consolidated financial statements for the
year ended 31 December 2016.
The Bank and its New York Branch are taking affirmative actions to respond to other requirements under these
two orders. As at the date of these financial statements, the Group is of the view that it is not practicable to
estimate whether there will be any further regulatory actions undertaken by the US regulators as this will be
dependent upon the regulatory conclusion after the Bank’s and its New York Branch’s actions towards the other
requirements under these two orders. As such, the Group did not accrue any further provision over this matter as
at 30 June 2019.
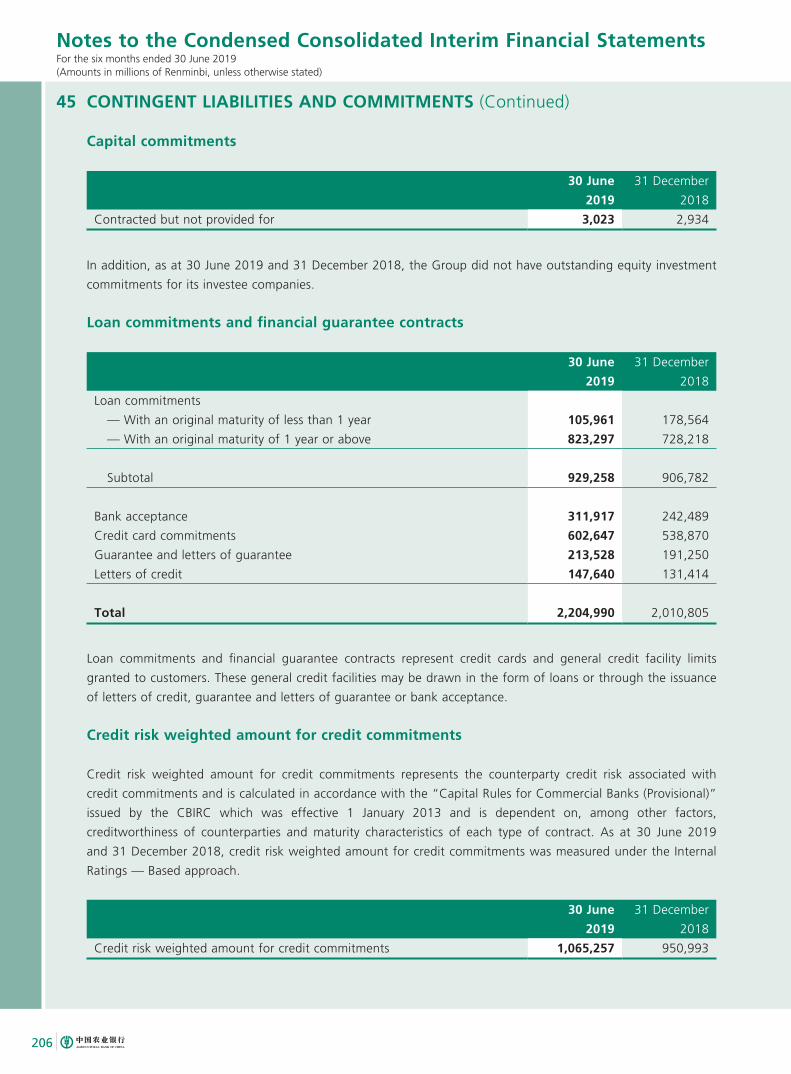
206
Notes to the Condensed Consolidated Interim Financial StatementsFor the six months ended 30 June 2019(Amounts in millions of Renminbi, unless otherwise stated)
45 CONTINGENT LIABILITIES AND COMMITMENTS (Continued)
Capital commitments
30 June
2019
31 December
2018
Contracted but not provided for 3,023 2,934
In addition, as at 30 June 2019 and 31 December 2018, the Group did not have outstanding equity investment
commitments for its investee companies.
Loan commitments and financial guarantee contracts
30 June
2019
31 December
2018
Loan commitments
— With an original maturity of less than 1 year 105,961 178,564
— With an original maturity of 1 year or above 823,297 728,218
Subtotal 929,258 906,782
Bank acceptance 311,917 242,489
Credit card commitments 602,647 538,870
Guarantee and letters of guarantee 213,528 191,250
Letters of credit 147,640 131,414
Total 2,204,990 2,010,805
Loan commitments and financial guarantee contracts represent credit cards and general credit facility limits
granted to customers. These general credit facilities may be drawn in the form of loans or through the issuance
of letters of credit, guarantee and letters of guarantee or bank acceptance.
Credit risk weighted amount for credit commitments
Credit risk weighted amount for credit commitments represents the counterparty credit risk associated with
credit commitments and is calculated in accordance with the “Capital Rules for Commercial Banks (Provisional)”
issued by the CBIRC which was effective 1 January 2013 and is dependent on, among other factors,
creditworthiness of counterparties and maturity characteristics of each type of contract. As at 30 June 2019
and 31 December 2018, credit risk weighted amount for credit commitments was measured under the Internal
Ratings — Based approach.
30 June
2019
31 December
2018
Credit risk weighted amount for credit commitments 1,065,257 950,993
207Interim Report 2019
Notes to the Condensed Consolidated Interim Financial StatementsFor the six months ended 30 June 2019(Amounts in millions of Renminbi, unless otherwise stated)
45 CONTINGENT LIABILITIES AND COMMITMENTS (Continued)
Collateral
Assets pledged
At the end of each reporting period, the carrying amounts of assets pledged as collateral under repurchase
agreements are as follows:
30 June
2019
31 December
2018
Debt securities 54,348 163,937
Bills 10 –
Total 54,358 163,937
As at 30 June 2019, The financial assets sold under repurchase agreements (Note 31) by the Group are due
within 12 months from the effective dates of these agreements.
Financial assets sold under repurchase agreements included certain transactions under which, title of the pledged
securities has been transferred to counterparties. These transactions have been disclosed in Note 46 Transferred
Financial Assets.
In addition, debt securities and deposits with banks and other financial institutions pledged in accordance with
regulatory requirements or as collateral for derivative transactions and borrowings from central banks etc. by the
Group as at 30 June 2019 amounted to RMB695,464 million in total (31 December 2018: RMB826,551 million).
Collateral accepted
The Group received debt securities and bills as collateral in connection with the securities lending transactions
and the purchase of assets under resale agreements (Note 20 Financial Assets Held Under Resale Agreements).
The Group did not hold any collateral that can be resold or re-pledged as at 30 June 2019 and 31 December
2018.
Redemption commitment for treasury bonds
The Group is entrusted by the MOF to underwrite certain treasury bonds. The investors of these treasury bonds
have a right to redeem the bonds at par at any time prior to maturity and the Group is committed to honor such
redemption requests. The redemption price is calculated as the par value of the bond plus unpaid interest in
accordance with the terms of the related early redemption arrangement.
208
Notes to the Condensed Consolidated Interim Financial StatementsFor the six months ended 30 June 2019(Amounts in millions of Renminbi, unless otherwise stated)
45 CONTINGENT LIABILITIES AND COMMITMENTS (Continued)
Redemption commitment for treasury bonds (Continued)
As at 30 June 2019, the nominal value of treasury bonds the Group was obligated to redeem prior to maturity
was RMB72,000 million (31 December 2018: RMB70,702 million). The original maturities of these bonds vary
from 3 to 5 years. Management of the Group expects the amount of redemption before the maturity dates of
these bonds will not be material.
The MOF will not provide funding for the early redemption of these bonds on a back-to-back basis, but will settle
the principal and interest upon maturity.
Commitment on security underwriting
As at 30 June 2019 and 31 December 2018, the Group did not have unfulfilled commitment in respect of
securities underwriting business.
46 TRANSFERRED FINANCIAL ASSETS
The Group enters into transactions in the normal course of business whereby it transfers recognized financial
assets to third parties or to structured entities. In some cases these transfers may give rise to full or partial de-
recognition of the financial assets concerned. In other cases where the transferred assets do not qualify for de-
recognition as the Group retains substantially all the risks and rewards of these assets, the Group continues to
recognize the transferred assets.
Securitization transactions
The Group enters into securitization transactions by which it transfers loans to structured entities which issue
asset-backed securities to investors. The Group assessed among other factors, whether or not to derecognize the
transferred assets by evaluating the extent to which it retains the risks and rewards of the assets and whether it
has relinquished control over these assets.
As at 30 June 2019, the total amount of unexpired asset-backed securities included accumulative loans
transferred by the Group before impairment allowance was RMB75,451 million(31 December 2018 RMB37,378
million). RMB18,520 million of this balance (31 December 2018: RMB16,699 million) was in respect of non-
performing loans and the Group concluded that these loans transferred were qualified for full de-recognition.
The remaining balance of RMB56,931 million (31 December 2018: RMB20,679 million) was in respect of
performing loans and the Group concluded that it had continuing involvement in these assets. As at 30 June
2019, the Group continued to recognize assets of RMB8,275 million (31 December 2018: RMB2,367 million)
under loans and advances to customers. The Group also recognized other assets and other liabilities of the same
amount arising from such continuing involvement.
209Interim Report 2019
Notes to the Condensed Consolidated Interim Financial StatementsFor the six months ended 30 June 2019(Amounts in millions of Renminbi, unless otherwise stated)
46 TRANSFERRED FINANCIAL ASSETS (Continued)
Transfer of non-performing loans
During the period ended 30 June 2019, the Group transferred non-performing loans through disposal to third
parties or issuing asset-back securities, with gross loan balance of RMB21,338 million (During the period ended
30 June 2018: RMB12,175 million), of which RMB1,822 million (During the period ended 30 June 2018: Nil)
was through issuing asset-back securities disclosed above. The Group concluded that these transferred assets
qualified for full derecognition.
Financial assets sold under repurchase agreements
The Group did not derecognize financial assets transferred as collateral in connection with repurchase
agreements. As at 30 June 2019, of these collateral pledged disclosed in Note 45 Contingent Liabilities and
Commitments — Collateral, RMB37,941 million (31 December 2018: RMB46,250 million) represented debt
securities whereby legal title has been transferred to counterparties.
Securities lending transactions
For debt securities lent to counterparties under securities lending agreements, the counterparties are allowed
to sell or repledge these securities in the absence of default by the Group, but have an obligation to return the
securities at the maturity of the contract. The Group has determined that it retains substantially all the risks and
rewards of these securities and therefore has not derecognized them. As at 30 June 2019, the carrying amount
of debt securities lent to counterparties was RMB35,983 million (31 December 2018: RMB49,342 million).
47 FINANCIAL RISK MANAGEMENT
Overview
The Group’s primary risk management objective is to maintain risk within acceptable parameters to meet the
requirements of regulators, depositors and other stakeholders, as well as to maximize return for investors within
an acceptable level of risk.
The Group has designed risk management policies, which address, among other things, the establishment of
risk limits and controls to identify, analyze, monitor and report risks. Relevant and timely information used to
conduct these risk management activities is provided through information systems maintained by the Group and
intended to address the Group’s information needs in this area. The Group regularly reviews its risk management
policies and systems to address changes in markets, products and emerging best practices.
The most significant types of risk to which the Group is exposed are credit risk, market risk and liquidity risk.
Market risk includes foreign exchange rate risk, interest rate risk and other price risk.
210
Notes to the Condensed Consolidated Interim Financial StatementsFor the six months ended 30 June 2019(Amounts in millions of Renminbi, unless otherwise stated)
47 FINANCIAL RISK MANAGEMENT (Continued)
Risk management framework
The Board of Directors is responsible for establishing the overall risk appetite of the Group and reviewing and
approving its risk management objectives and strategies.
Within this framework, the Group’s senior management has overall responsibility for managing all aspects of
risk, including implementing risk management strategies, initiatives and credit policies and approving internal
rules, measures and procedures related to risk management. The Risk Management Department of the Group
implements procedures for managing the significant risks to which the Group is exposed.
47.1 Credit risk
Credit risk management
Credit risk represents the potential loss that may arise from a customer or counterparty’s failure to meet
its obligations when due. Credit risk can also arise from operational failures that result in an unauthorized
or inappropriate advance, commitment or investment. The Group’s major credit risks arise from loans and
receivables, treasury operations and off-balance sheet related credit risk exposures.
The Group’s credit risk management and governance structure comprise the Board of Directors and
its Risk Management Committee, Senior Management and its Risk Management Committee, Credit
Approval Committee and Asset Disposal Committee, as well as the Risk Management Department, Credit
Management Department, Credit Approval Department and related front-office customer departments. The
Group’s credit risk management function operates under centralized management and authorization under
a range of specified limits.
The Group performs standardized credit management procedures, including credit due diligence and
proposal submission, credit underwriting review, loan disbursement, post-lending monitoring and non-
performing loan management. The Group enhances its credit risk management by strictly complying with its
credit management procedures; strengthening customer investigation, credit rating, lending approval and
post-lending monitoring measures; enhancing risk mitigation effect of loans through collateral; accelerating
disposal process of non-performing loans and continuously upgrading the credit management system.
The Group writes off financial assets, in whole or in part, when it has exhausted all practical recovery
efforts and has concluded there is no reasonable expectation of recovery. Indicators that there is no
reasonable expectation of recovery include ceasing enforcement activity and where the Group’s recovery
method is foreclosing on collateral and the value of the collateral is such that there is no reasonable
expectation of recovering in full.
211Interim Report 2019
Notes to the Condensed Consolidated Interim Financial StatementsFor the six months ended 30 June 2019(Amounts in millions of Renminbi, unless otherwise stated)
47 FINANCIAL RISK MANAGEMENT (Continued)
47.1 Credit risk (Continued)
Credit risk management (Continued)
The Group may write-off financial assets that are still subject to enforcement activity. The outstanding
contractual amounts of such assets written off during six months ended 30 June 2019 was RMB23,595
million (During the period ended 30 June 2018: RMB30,654 million). The Group still seeks to recover amounts
it is legally owned in full, but which have been written off due to no reasonable expectation of full recovery.
During the reporting period, the Group continually strengthened the comprehensive risk management and
held to the bottom line with acceptable results. The “Clean Sheet Plan” had been steadily implemented.
Non-performing loans had achieved double down again, and the quality of assets had a better
development. The provision coverage rate continued to increase, and the risk compensation capability was
enhanced. Meanwhile, the exposure in the industry with excessive loans was under strict control, and the
credit structure was optimized. The Group improved the market risk management system, and the market
risk limits were within the targeted range. In that case, the market business risk was generally controlled.
The Group also strengthened the asset-liability matching management, eliminated difficulty in financing
channels and guaranteed adequate supply of high-quality liquid asset to ensure the safety of liquidity.
Under such a circumstance, the Group balanced the liquidity, safety and profitability in an effective way.
Apart from the credit risk exposures on credit-related assets, the credit risk arising from treasury operation
business is managed by selecting counterparties with acceptable credit quality, balancing credit risk and
return, referencing to both internal and external credit rating information where available and by applying
appropriate limits subject to different level of management authority, and by timely reviewing and
adjusting those limits in credit system. In addition, the Group also provide loan commitments and financial
guarantee services to customers which may require the Group to make payments on behalf of customers
upon their failure to perform under the terms of the related contract. Risks arising from loan commitments
and financial guarantees are similar to those associated with loans and advances. These transactions are,
therefore, subject to the same risk management policies and procedures.
Measurement of ECL
The Group applies the ECL model to calculate loss allowances for its debt financial instruments carried at
amortized cost and FVOCI, as well as loan commitments and financial guarantee contracts.
Methods applied by the Group in assessing the expected credit losses of its financial assets include risk
parameters and the discounted cash flow (“DCF”) model. Retail credit assets and Stage I and Stage II
wholesale credit assets are assessed using risk parameters, while Stage III wholesale credit assets are subject
to the discounted cash flow method.
212
Notes to the Condensed Consolidated Interim Financial StatementsFor the six months ended 30 June 2019(Amounts in millions of Renminbi, unless otherwise stated)
47 FINANCIAL RISK MANAGEMENT (Continued)
47.1 Credit risk (Continued)
Measurement of ECL (Continued)
The Group assesses ECL in light of forward-looking information and uses complex models and assumptions
in calculating the expected credit losses. These models and assumptions relate to the future macroeconomic
conditions and the borrowers’ creditworthiness (e.g., the likelihood of default by customers and the
corresponding losses). In assessing the expected credit risks in accordance with accounting standards, the
Group uses the judgments, assumptions and estimates where appropriate, including:
— Segmentation of portfolio sharing similar credit risk characteristics for the purposes of measuring ECL
— Parameters for measuring ECL
— Criteria for significant increase in credit risk and default definition
— Definition of credit-impaired financial asset
— Forward-looking information
— Estimation of future cash flows for Stage III wholesale credit assets
Segmentation of portfolio sharing similar credit risk characteristics for the purposes of measuring
ECL
For measurement of ECL, segmentation of portfolio is based on similar credit risk characteristics. The Group
classified clients into wholesale clients and retail clients based on the nature of debtors. In performing the
portfolio segmentation of wholesale credit assets, the Group considers the type of borrower, industry, loan
usage, and security type. When performing the portfolio segmentation for retail credit assets, the Group
considers loan product type and security type to ensure the reliability of its credit risk segmentation.
Parameters for measuring ECL
According to whether there is a significant increase in credit risk and whether a financial asset has become
credit-impaired, the Group recognizes an impairment allowance based on the expected credit loss for
the next 12 months or the entire lifetime of the financial asset. The key parameters of ECL measurement
include probability of default (PD), loss given default (LGD) and exposure at default (EAD). The Group
establishes its PD model, LGD model and EAD model based on the internal rating based system as
currently used for its risk management purpose, in accordance with the requirements of IFRS 9, in light of
quantitative analyzes of historical statistics (such as counterparty ratings, guarantee methods and collateral
types, repayment methods, etc.) and forward-looking information.
213Interim Report 2019
Notes to the Condensed Consolidated Interim Financial StatementsFor the six months ended 30 June 2019(Amounts in millions of Renminbi, unless otherwise stated)
47 FINANCIAL RISK MANAGEMENT (Continued)
47.1 Credit risk (Continued)
Measurement of ECL (Continued)
Parameters for measuring ECL (Continued)
The parameters are defined as follows:
— PD represents the likelihood of a borrower defaulting on its financial obligation, either over the next
12 months (12m PD), or over the remaining lifetime (Lifetime PD) of the obligation;
— EAD is based on the amounts the Group expects to be owed at the time of default, over the next 12
months (12m EAD) or over the remaining lifetime (Lifetime EAD).
— LGD represents the Group’s expectation of the extent of loss on defaulted exposure. LGD is expressed
as a percentage loss per unit of exposure at the time of default (EAD). LGD is calculated on a
12-month or lifetime basis, where 12-month LGD is the percentage of loss expected to be made if the
default occurs in the next 12 months and Lifetime LGD is the percentage of loss expected to be made
if default occurs over the remaining expected lifetime of the loan.
Criteria for significant increase in credit risk (“SICR”) and default definition
The Group assesses whether or not the credit risk of the relevant financial instruments has increased
significantly since the initial recognition at each balance sheet date. For the purpose of staging assessment
of its financial assets, the Group thoroughly considers various reasonable and supportable information
that may reflect whether or not there has been a significant change in their credit risk, including forward-
looking information. Key factors considered include regulatory and operating environments, internal and
external credit ratings, solvency, viability as a going concern, terms of loan contracts, repayment behaviors,
among others. Based on the single financial instrument or the combination of financial instruments with
similar characteristics of credit risk, the Group compares the risk of default of financial instruments on the
balance sheet date with that on the initial recognition date in order to figure out the changes of default risk
in the expected lifetime of financial instruments. The definition of default refers to the failure to pay the
debt as agreed in the contract, or other violations of the debt contract or have a significant impact on the
normal debt repayment.
214
Notes to the Condensed Consolidated Interim Financial StatementsFor the six months ended 30 June 2019(Amounts in millions of Renminbi, unless otherwise stated)
47 FINANCIAL RISK MANAGEMENT (Continued)
47.1 Credit risk (Continued)
Measurement of ECL (Continued)
Criteria for significant increase in credit risk (“SICR”) and default definition (Continued)
The Group sets quantitative and qualitative criteria to determine whether or not the credit risk of a financial instrument has increased significantly since its initial recognition. The criteria include changes in the borrower’s PD, changes in its credit risk classification and other factors. In particular, when the credit risk classification changes from Normal upon initial recognition to Special Mention, there has been SICR. When the borrower’s PD rises to a certain level, there has been a significant increase in credit risk. Criteria to determine significant increase in credit risk varied based on the original PD upon initial recognition. According to IFRS 9, a backstop is applied and the financial instrument considered to have experienced a significant increase in credit risk if the borrower is more than 30 days past due on its contractual payments.
The Group assumes that the credit risk on a financial instrument has not increased significantly since initial recognition if the financial instrument is determined to have low credit risk at the reporting date. The Group recognizes a financial instrument as having low credit risk if its internal rating is consistent with the globally accepted definition for low credit risk.
Definition of credit-impaired financial asset
The criteria with a date of transition of 1 January 2018 adopted by the Group to determine whether a credit impairment occurs under IFRS 9 is consistent with the internal credit risk management objectives for relevant financial instrument, in addition to consideration of quantitative and qualitative indicators. In assessing whether a borrower has become credit-impaired, the Group mainly considers the following factors:
— Significant financial difficulty of the issuer or the borrower;
— A breach of contract, such as a default or past due event in relation to interest or principal payment;
— The lender of the borrower, for economic or contractual reasons relating to the borrower’s financial difficulty, having granted to the borrower a concession that the lender would not otherwise consider;
— It is becoming probable that the borrower will enter bankruptcy or other financial reorganisation;
— The disappearance of an active market for that financial asset because of financial difficulties;
— The purchase or origination of a financial asset at a deep discount that reflects the incurred credit losses;
— The borrower is overdue for more than 90 days in any principal, advances, interest or investment in bonds due to the Group.
The credit impairment of a financial asset may be caused by the combined effect of multiple events rather than any single discrete event.
215Interim Report 2019
Notes to the Condensed Consolidated Interim Financial StatementsFor the six months ended 30 June 2019(Amounts in millions of Renminbi, unless otherwise stated)
47 FINANCIAL RISK MANAGEMENT (Continued)
47.1 Credit risk (Continued)
Measurement of ECL (Continued)
Forward-looking information
The assessment of whether or not there has been a significant increase in credit risk and the calculation of
ECL both involve forward-looking information. Through the analysis of historical data, the Group identifies
the key economic indicators that affect the credit risk and ECL of various portfolio. Key economic indicators
include Gross Domestic Product (GDP), Money Supply (M2) and Consumer Price Index (CPI), etc.
The impact of these economic indicators on the PDs and the LGDs varies from one portfolio to another.
The Group comprehensively considers internal and external data, expert forecasts and statistical analyzes to
determine the correlation between these economic indicators and the PDs and LGDs. The Group assess and
forecasts these economic indicators at least on an annual basis, calculates the best estimates for the future,
and regularly reviews and assesses results. Among the forecasted economic indicators, the core economic
indicator GDP of base scenario aligned with the development target set and published by the central
government.
Based on statistical analyzes and expert judgements, the Group determines the weightings of multiple
scenarios and the corresponding macro-economic forecast under each scenario. The macro-economic
forecasts of core indicator under upside and downside scenarios deviate less than 10% of that under base
scenario. The weighting of base scenario is greater than the aggregated weightings of the rest scenarios.
The Group uses the weighted 12-month ECL (Stage I) or weighted lifetime ECL (Stage II and Stage III) to
measure relevant impairment allowances. These weighted credit losses are calculated by multiplying the
expected credit loss under each scenario by the assigned scenario weighting.
Estimation of future cash flows for Stage III wholesale credit assets
The Group measures the ECL for stage III wholesale credit assets using DCF method. Under DCF method,
the loss allowance is calculated based on the estimation of future cash flows. At each measurement date,
the Group projects the future cash inflows of relevant assets under different scenarios to estimate the
probability weighted cash flow of each future period. The cash flows are discounted and aggregated to get
the present value of the assets’ future cash flows.
216
Notes to the Condensed Consolidated Interim Financial StatementsFor the six months ended 30 June 2019(Amounts in millions of Renminbi, unless otherwise stated)
47 FINANCIAL RISK MANAGEMENT (Continued)
47.1 Credit risk (Continued)
Maximum exposure to credit risk before taking into account any collateral held or other
credit enhancements
The maximum exposure to credit risk represents the credit risk exposure to the Group at the end of
each reporting period, without taking into account any collateral held or other credit enhancements.
The exposure to credit risk at the end of each reporting period primarily arises from credit and treasury
operations; as well as off-balance sheet items such as loan commitments, credit card commitments, bank
acceptance, guarantee and letters of guarantee and letters of credit, as credit risks arising from these items
are similar to those associated with loans and receivables.
A summary of the maximum exposure to credit risk is as follows:
30 June
2019
31 December
2018
Balances with central banks 2,465,327 2,707,018
Deposits with banks and other financial institutions 214,962 109,728
Placements with and loans to banks and
other financial institutions 461,315 552,013
Derivative financial assets 18,207 36,944
Financial assets held under resale agreements 321,801 371,001
Loans and advances to customers 12,475,790 11,461,542
Financial investments
Financial asset at fair value through profit or loss 643,782 591,787
Debt instrument investments at amortized cost 4,756,098 4,503,698
Other debt instrument investments at fair value through
other comprehensive income 1,831,346 1,735,892
Other financial assets 169,797 58,992
Subtotal 23,358,425 22,128,615
Loan commitments and financial guarantee contracts 2,183,609 1,990,282
Total 25,542,034 24,118,897
The Group has implemented specific policies and credit enhancement practices to mitigate credit risk
exposure to an acceptable level. The most typical practice is obtaining guarantee deposits, collateral and
guarantees. The amount and type of acceptable collateral are determined through the assessment of credit
risk of borrowers or counterparties. The Group implements guidelines on the acceptability of specific classes
of collateral and evaluation parameters.
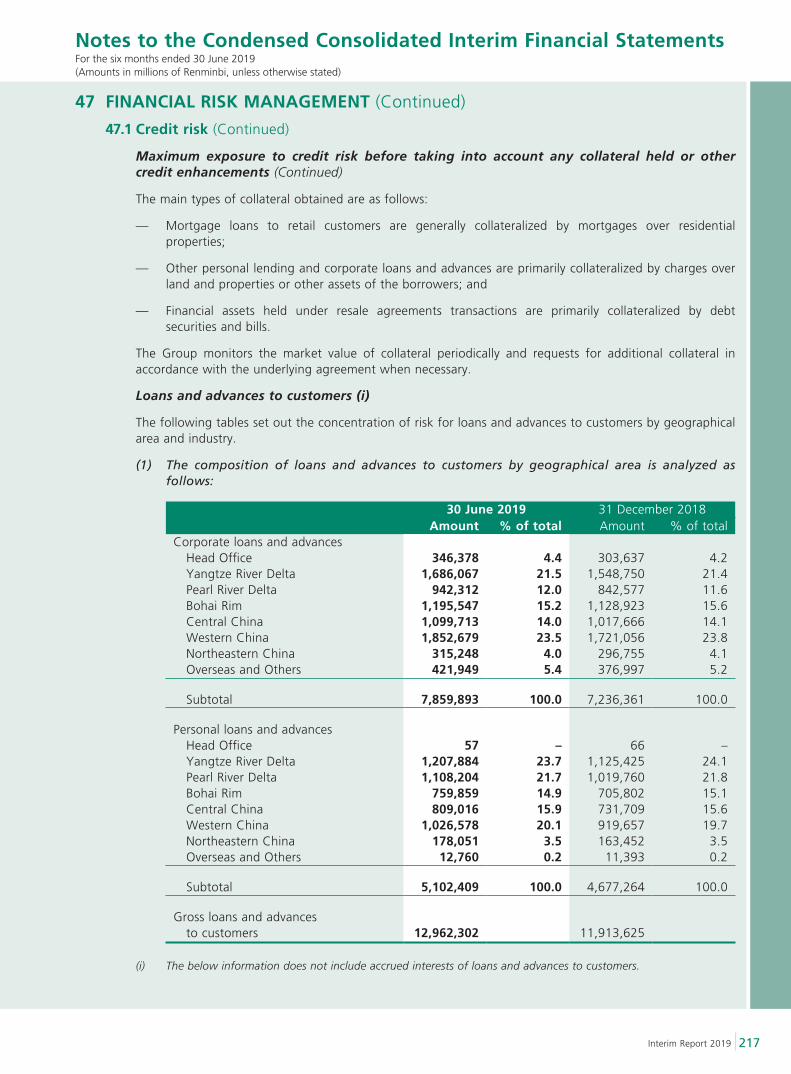
217Interim Report 2019
Notes to the Condensed Consolidated Interim Financial StatementsFor the six months ended 30 June 2019(Amounts in millions of Renminbi, unless otherwise stated)
47 FINANCIAL RISK MANAGEMENT (Continued)
47.1 Credit risk (Continued)
Maximum exposure to credit risk before taking into account any collateral held or other credit enhancements (Continued)
The main types of collateral obtained are as follows:
— Mortgage loans to retail customers are generally collateralized by mortgages over residential properties;
— Other personal lending and corporate loans and advances are primarily collateralized by charges over land and properties or other assets of the borrowers; and
— Financial assets held under resale agreements transactions are primarily collateralized by debt securities and bills.
The Group monitors the market value of collateral periodically and requests for additional collateral in accordance with the underlying agreement when necessary.
Loans and advances to customers (i)
The following tables set out the concentration of risk for loans and advances to customers by geographical area and industry.
(1) The composition of loans and advances to customers by geographical area is analyzed as follows:
30 June 2019 31 December 2018Amount % of total Amount % of total
Corporate loans and advances Head Office 346,378 4.4 303,637 4.2 Yangtze River Delta 1,686,067 21.5 1,548,750 21.4 Pearl River Delta 942,312 12.0 842,577 11.6 Bohai Rim 1,195,547 15.2 1,128,923 15.6 Central China 1,099,713 14.0 1,017,666 14.1 Western China 1,852,679 23.5 1,721,056 23.8 Northeastern China 315,248 4.0 296,755 4.1 Overseas and Others 421,949 5.4 376,997 5.2
Subtotal 7,859,893 100.0 7,236,361 100.0
Personal loans and advances Head Office 57 – 66 – Yangtze River Delta 1,207,884 23.7 1,125,425 24.1 Pearl River Delta 1,108,204 21.7 1,019,760 21.8 Bohai Rim 759,859 14.9 705,802 15.1 Central China 809,016 15.9 731,709 15.6 Western China 1,026,578 20.1 919,657 19.7 Northeastern China 178,051 3.5 163,452 3.5 Overseas and Others 12,760 0.2 11,393 0.2
Subtotal 5,102,409 100.0 4,677,264 100.0
Gross loans and advances to customers 12,962,302 11,913,625
(i) The below information does not include accrued interests of loans and advances to customers.
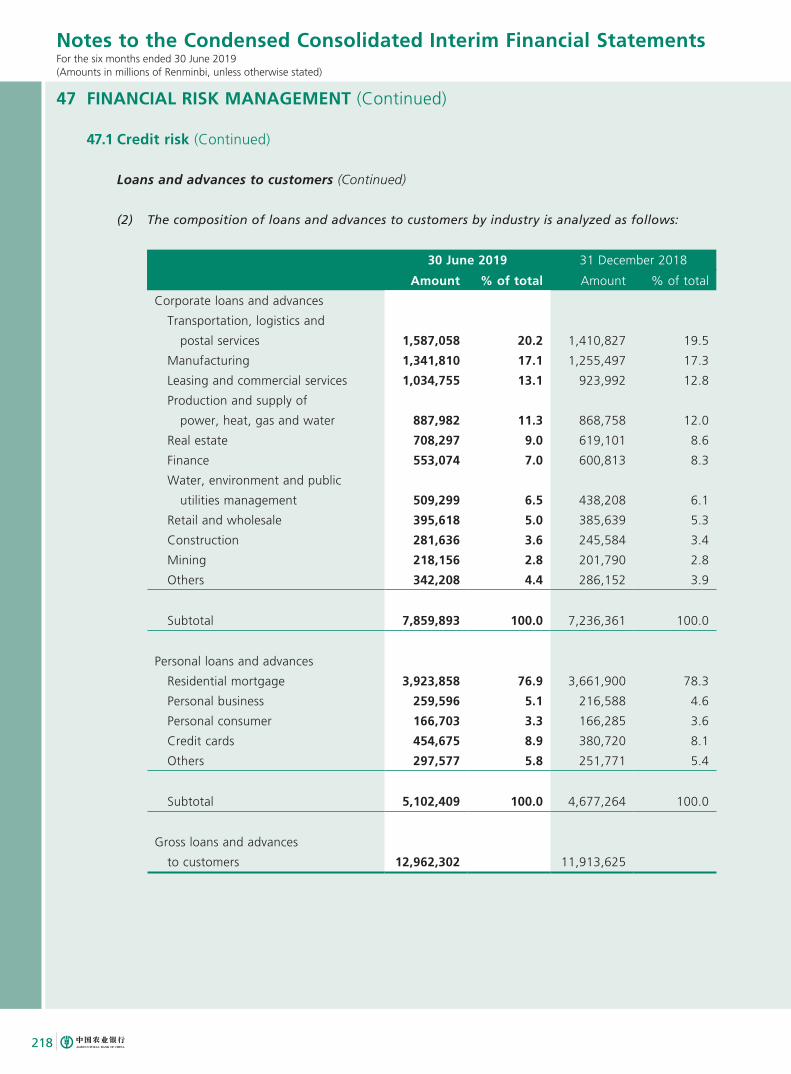
218
Notes to the Condensed Consolidated Interim Financial StatementsFor the six months ended 30 June 2019(Amounts in millions of Renminbi, unless otherwise stated)
47 FINANCIAL RISK MANAGEMENT (Continued)
47.1 Credit risk (Continued)
Loans and advances to customers (Continued)
(2) The composition of loans and advances to customers by industry is analyzed as follows:
30 June 2019 31 December 2018
Amount % of total Amount % of total
Corporate loans and advances
Transportation, logistics and
postal services 1,587,058 20.2 1,410,827 19.5
Manufacturing 1,341,810 17.1 1,255,497 17.3
Leasing and commercial services 1,034,755 13.1 923,992 12.8
Production and supply of
power, heat, gas and water 887,982 11.3 868,758 12.0
Real estate 708,297 9.0 619,101 8.6
Finance 553,074 7.0 600,813 8.3
Water, environment and public
utilities management 509,299 6.5 438,208 6.1
Retail and wholesale 395,618 5.0 385,639 5.3
Construction 281,636 3.6 245,584 3.4
Mining 218,156 2.8 201,790 2.8
Others 342,208 4.4 286,152 3.9
Subtotal 7,859,893 100.0 7,236,361 100.0
Personal loans and advances
Residential mortgage 3,923,858 76.9 3,661,900 78.3
Personal business 259,596 5.1 216,588 4.6
Personal consumer 166,703 3.3 166,285 3.6
Credit cards 454,675 8.9 380,720 8.1
Others 297,577 5.8 251,771 5.4
Subtotal 5,102,409 100.0 4,677,264 100.0
Gross loans and advances
to customers 12,962,302 11,913,625
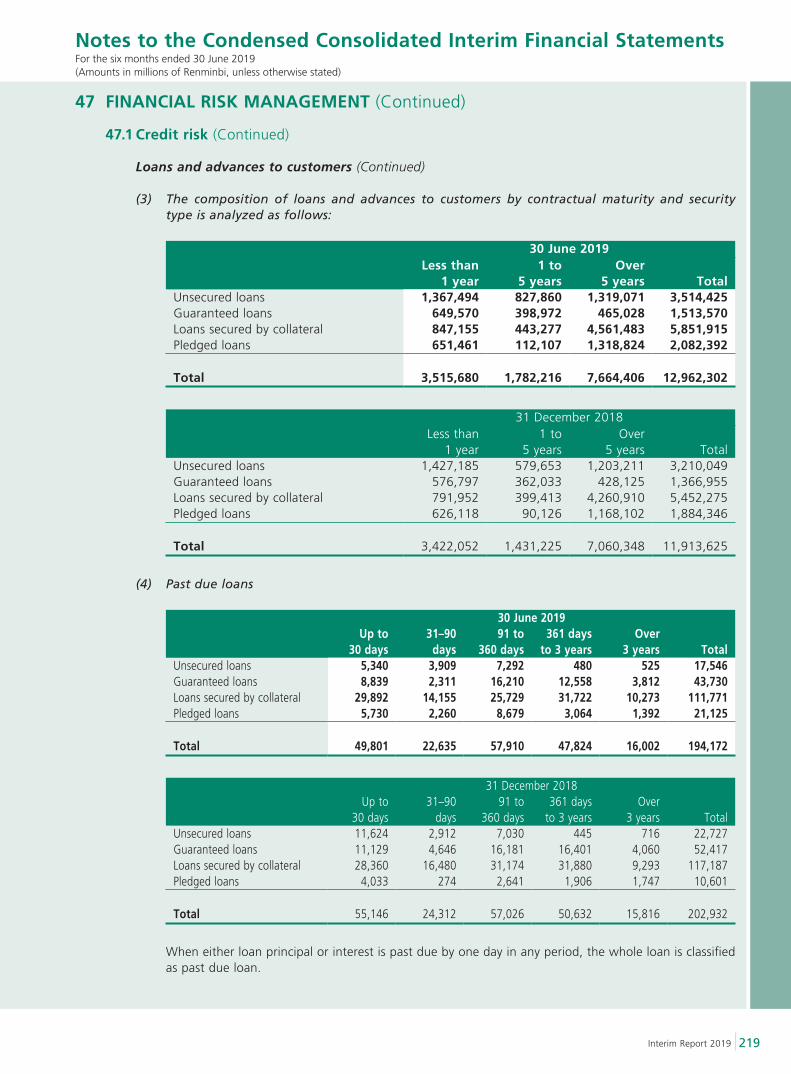
219Interim Report 2019
Notes to the Condensed Consolidated Interim Financial StatementsFor the six months ended 30 June 2019(Amounts in millions of Renminbi, unless otherwise stated)
47 FINANCIAL RISK MANAGEMENT (Continued)
47.1 Credit risk (Continued)
Loans and advances to customers (Continued)
(3) The composition of loans and advances to customers by contractual maturity and security type is analyzed as follows:
30 June 2019Less than
1 year1 to
5 yearsOver
5 years TotalUnsecured loans 1,367,494 827,860 1,319,071 3,514,425Guaranteed loans 649,570 398,972 465,028 1,513,570Loans secured by collateral 847,155 443,277 4,561,483 5,851,915Pledged loans 651,461 112,107 1,318,824 2,082,392
Total 3,515,680 1,782,216 7,664,406 12,962,302
31 December 2018Less than
1 year1 to
5 yearsOver
5 years TotalUnsecured loans 1,427,185 579,653 1,203,211 3,210,049Guaranteed loans 576,797 362,033 428,125 1,366,955Loans secured by collateral 791,952 399,413 4,260,910 5,452,275Pledged loans 626,118 90,126 1,168,102 1,884,346
Total 3,422,052 1,431,225 7,060,348 11,913,625
(4) Past due loans
30 June 2019Up to
30 days31–90
days91 to
360 days361 days
to 3 yearsOver
3 years TotalUnsecured loans 5,340 3,909 7,292 480 525 17,546Guaranteed loans 8,839 2,311 16,210 12,558 3,812 43,730Loans secured by collateral 29,892 14,155 25,729 31,722 10,273 111,771Pledged loans 5,730 2,260 8,679 3,064 1,392 21,125
Total 49,801 22,635 57,910 47,824 16,002 194,172
31 December 2018Up to
30 days31–90
days91 to
360 days361 days
to 3 yearsOver
3 years TotalUnsecured loans 11,624 2,912 7,030 445 716 22,727Guaranteed loans 11,129 4,646 16,181 16,401 4,060 52,417Loans secured by collateral 28,360 16,480 31,174 31,880 9,293 117,187Pledged loans 4,033 274 2,641 1,906 1,747 10,601
Total 55,146 24,312 57,026 50,632 15,816 202,932
When either loan principal or interest is past due by one day in any period, the whole loan is classified as past due loan.
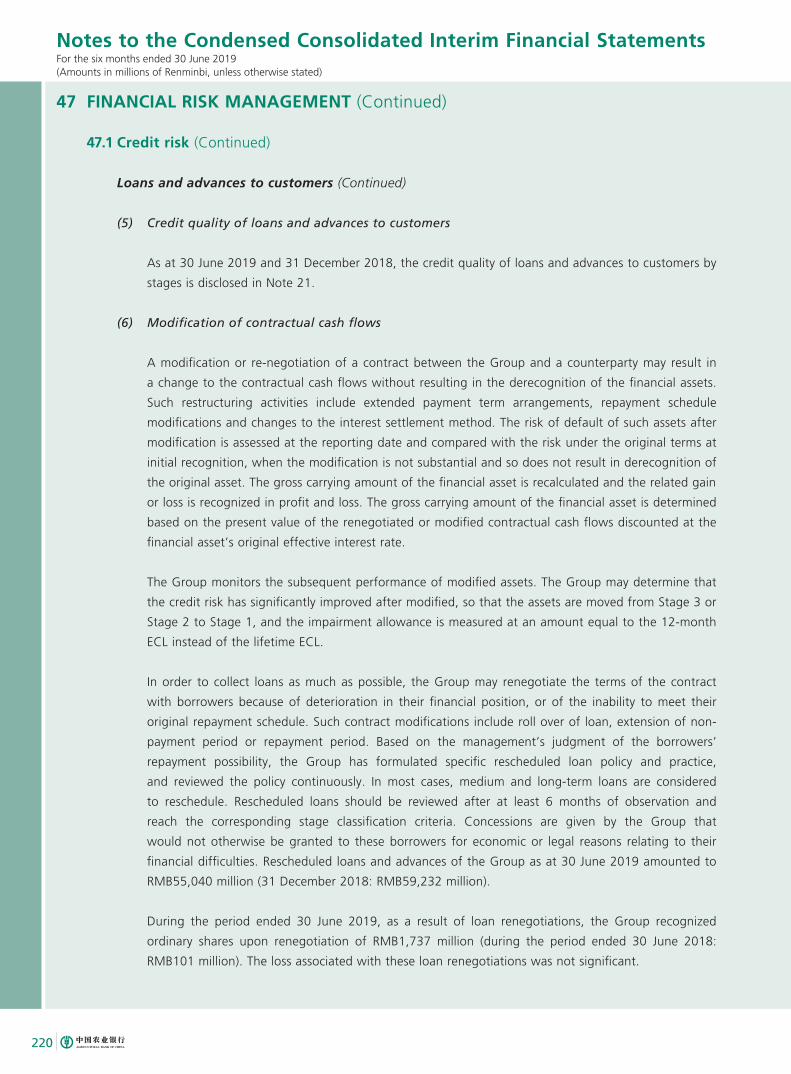
220
Notes to the Condensed Consolidated Interim Financial StatementsFor the six months ended 30 June 2019(Amounts in millions of Renminbi, unless otherwise stated)
47 FINANCIAL RISK MANAGEMENT (Continued)
47.1 Credit risk (Continued)
Loans and advances to customers (Continued)
(5) Credit quality of loans and advances to customers
As at 30 June 2019 and 31 December 2018, the credit quality of loans and advances to customers by
stages is disclosed in Note 21.
(6) Modification of contractual cash flows
A modification or re-negotiation of a contract between the Group and a counterparty may result in
a change to the contractual cash flows without resulting in the derecognition of the financial assets.
Such restructuring activities include extended payment term arrangements, repayment schedule
modifications and changes to the interest settlement method. The risk of default of such assets after
modification is assessed at the reporting date and compared with the risk under the original terms at
initial recognition, when the modification is not substantial and so does not result in derecognition of
the original asset. The gross carrying amount of the financial asset is recalculated and the related gain
or loss is recognized in profit and loss. The gross carrying amount of the financial asset is determined
based on the present value of the renegotiated or modified contractual cash flows discounted at the
financial asset’s original effective interest rate.
The Group monitors the subsequent performance of modified assets. The Group may determine that
the credit risk has significantly improved after modified, so that the assets are moved from Stage 3 or
Stage 2 to Stage 1, and the impairment allowance is measured at an amount equal to the 12-month
ECL instead of the lifetime ECL.
In order to collect loans as much as possible, the Group may renegotiate the terms of the contract
with borrowers because of deterioration in their financial position, or of the inability to meet their
original repayment schedule. Such contract modifications include roll over of loan, extension of non-
payment period or repayment period. Based on the management’s judgment of the borrowers’
repayment possibility, the Group has formulated specific rescheduled loan policy and practice,
and reviewed the policy continuously. In most cases, medium and long-term loans are considered
to reschedule. Rescheduled loans should be reviewed after at least 6 months of observation and
reach the corresponding stage classification criteria. Concessions are given by the Group that
would not otherwise be granted to these borrowers for economic or legal reasons relating to their
financial difficulties. Rescheduled loans and advances of the Group as at 30 June 2019 amounted to
RMB55,040 million (31 December 2018: RMB59,232 million).
During the period ended 30 June 2019, as a result of loan renegotiations, the Group recognized
ordinary shares upon renegotiation of RMB1,737 million (during the period ended 30 June 2018:
RMB101 million). The loss associated with these loan renegotiations was not significant.
221Interim Report 2019
Notes to the Condensed Consolidated Interim Financial StatementsFor the six months ended 30 June 2019(Amounts in millions of Renminbi, unless otherwise stated)
47 FINANCIAL RISK MANAGEMENT (Continued)
47.1 Credit risk (Continued)
Loans and advances to customers (Continued)
(7) Assets foreclosed under credit enhancement arrangement
Such assets are disclosed as foreclosed assets in Note 22.1 Financial assets at fair value through profit
or loss and Note 26 Other assets.
Debt instruments
(1) Credit quality of debt instruments
Analysis of the expected credit loss stages of debt instrument investments at amortized cost and other
debt instruments at fair value through other comprehensive income were disclosed in Note 22.2 and
Note 22.3, respectively.
(2) Debt instruments analyzed by credit rating
The Group adopts a credit rating approach to manage the credit risk of the debt securities portfolio
held. The Group classified the credit risk levels of financial assets measured by ECL into “Low”(credit
risk in good condition), “Medium”(increased credit risk), and “High”(credit risk in severe condition),
based on the quality of assets. The credit risk level is used for the purpose of the group’s internal
credit risk management. “Low” refers to assets with good credit quality. There is no sufficient reason
to doubt that the assets are not expected to fulfill its contractual obligation to repay or if there is any
other behaviors breaching the debt contracts that would significantly impact the repayment of debt
according to contract terms. “Medium” refers to assets facing obvious negative factors impacting
its repayment capacity, but not yet have non-repayment behaviors. “High” refers to non-repayment
according to the debt contract terms, or other behaviors breaching the debt contracts or having
significant impact on the repayment of debt according to contract terms.
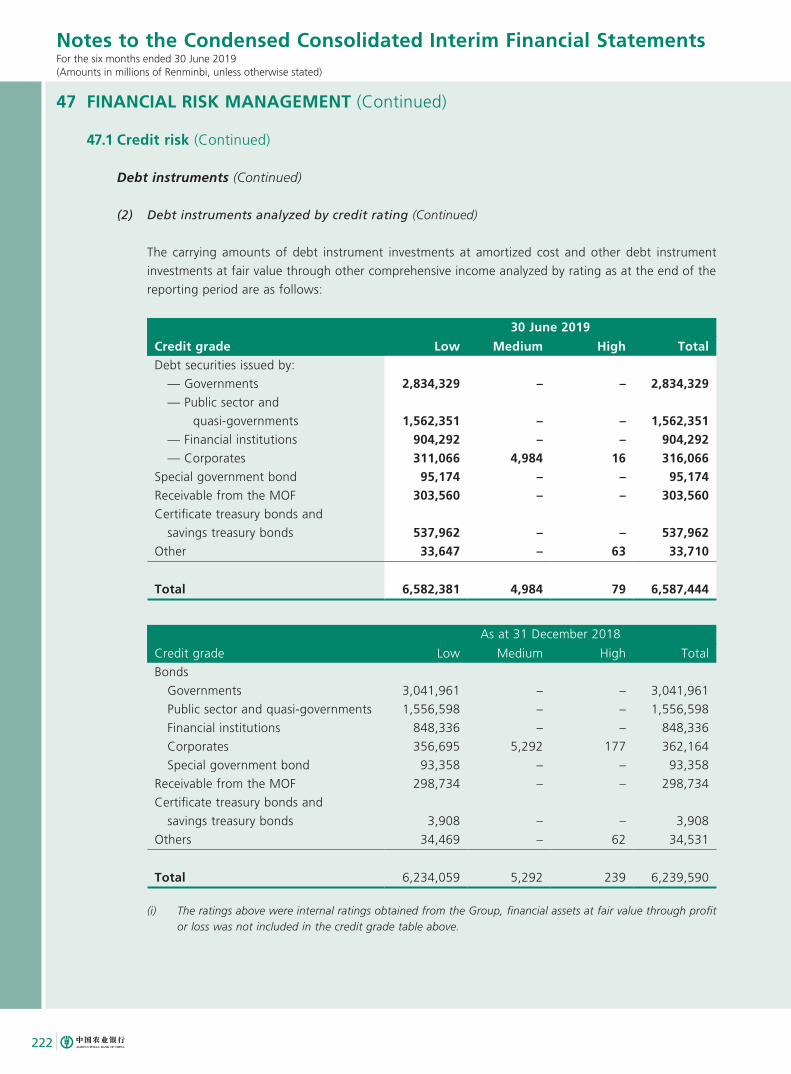
222
Notes to the Condensed Consolidated Interim Financial StatementsFor the six months ended 30 June 2019(Amounts in millions of Renminbi, unless otherwise stated)
47 FINANCIAL RISK MANAGEMENT (Continued)
47.1 Credit risk (Continued)
Debt instruments (Continued)
(2) Debt instruments analyzed by credit rating (Continued)
The carrying amounts of debt instrument investments at amortized cost and other debt instrument
investments at fair value through other comprehensive income analyzed by rating as at the end of the
reporting period are as follows:
30 June 2019
Credit grade Low Medium High TotalDebt securities issued by:
— Governments 2,834,329 – – 2,834,329 — Public sector and
quasi-governments 1,562,351 – – 1,562,351 — Financial institutions 904,292 – – 904,292 — Corporates 311,066 4,984 16 316,066Special government bond 95,174 – – 95,174Receivable from the MOF 303,560 – – 303,560Certificate treasury bonds and
savings treasury bonds 537,962 – – 537,962Other 33,647 – 63 33,710
Total 6,582,381 4,984 79 6,587,444
As at 31 December 2018
Credit grade Low Medium High Total
Bonds
Governments 3,041,961 – – 3,041,961
Public sector and quasi-governments 1,556,598 – – 1,556,598
Financial institutions 848,336 – – 848,336
Corporates 356,695 5,292 177 362,164
Special government bond 93,358 – – 93,358
Receivable from the MOF 298,734 – – 298,734
Certificate treasury bonds and
savings treasury bonds 3,908 – – 3,908
Others 34,469 – 62 34,531
Total 6,234,059 5,292 239 6,239,590
(i) The ratings above were internal ratings obtained from the Group, financial assets at fair value through profit or loss was not included in the credit grade table above.
223Interim Report 2019
Notes to the Condensed Consolidated Interim Financial StatementsFor the six months ended 30 June 2019(Amounts in millions of Renminbi, unless otherwise stated)
47 FINANCIAL RISK MANAGEMENT (Continued)
47.2 Liquidity risk
Liquidity risk is the risk that funds will not be available to meet liabilities as they fall due. This may arise
from cash flows or maturity mismatches of assets and liabilities.
The Group’s Assets and Liabilities Management Department manages its liquidity risk through:
— Optimizing asset and liability structure;
— Maintaining stability of deposit base;
— Making projections of future cash flows, and evaluating the appropriate liquid asset position;
— Maintaining an efficient internal funds transfer mechanism within the Group; and
— Performing stress testing on a regular basis.
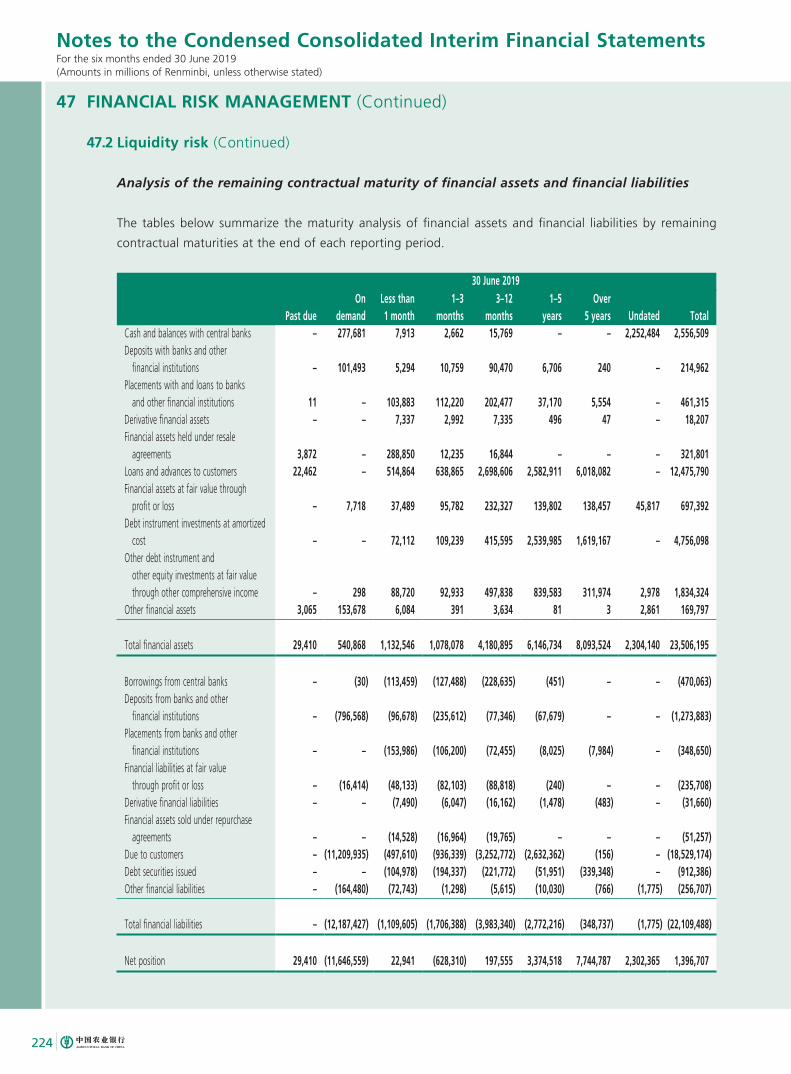
224
Notes to the Condensed Consolidated Interim Financial StatementsFor the six months ended 30 June 2019(Amounts in millions of Renminbi, unless otherwise stated)
47 FINANCIAL RISK MANAGEMENT (Continued)
47.2 Liquidity risk (Continued)
Analysis of the remaining contractual maturity of financial assets and financial liabilities
The tables below summarize the maturity analysis of financial assets and financial liabilities by remaining
contractual maturities at the end of each reporting period.
30 June 2019
Past dueOn
demandLess than 1 month
1–3 months
3–12 months
1–5 years
Over 5 years Undated Total
Cash and balances with central banks – 277,681 7,913 2,662 15,769 – – 2,252,484 2,556,509Deposits with banks and other financial institutions – 101,493 5,294 10,759 90,470 6,706 240 – 214,962Placements with and loans to banks and other financial institutions 11 – 103,883 112,220 202,477 37,170 5,554 – 461,315Derivative financial assets – – 7,337 2,992 7,335 496 47 – 18,207Financial assets held under resale agreements 3,872 – 288,850 12,235 16,844 – – – 321,801Loans and advances to customers 22,462 – 514,864 638,865 2,698,606 2,582,911 6,018,082 – 12,475,790Financial assets at fair value through profit or loss – 7,718 37,489 95,782 232,327 139,802 138,457 45,817 697,392Debt instrument investments at amortized cost – – 72,112 109,239 415,595 2,539,985 1,619,167 – 4,756,098Other debt instrument and other equity investments at fair value through other comprehensive income – 298 88,720 92,933 497,838 839,583 311,974 2,978 1,834,324Other financial assets 3,065 153,678 6,084 391 3,634 81 3 2,861 169,797
Total financial assets 29,410 540,868 1,132,546 1,078,078 4,180,895 6,146,734 8,093,524 2,304,140 23,506,195
Borrowings from central banks – (30) (113,459) (127,488) (228,635) (451) – – (470,063)Deposits from banks and other financial institutions – (796,568) (96,678) (235,612) (77,346) (67,679) – – (1,273,883)Placements from banks and other financial institutions – – (153,986) (106,200) (72,455) (8,025) (7,984) – (348,650)Financial liabilities at fair value through profit or loss – (16,414) (48,133) (82,103) (88,818) (240) – – (235,708)Derivative financial liabilities – – (7,490) (6,047) (16,162) (1,478) (483) – (31,660)Financial assets sold under repurchase agreements – – (14,528) (16,964) (19,765) – – – (51,257)Due to customers – (11,209,935) (497,610) (936,339) (3,252,772) (2,632,362) (156) – (18,529,174)Debt securities issued – – (104,978) (194,337) (221,772) (51,951) (339,348) – (912,386)Other financial liabilities – (164,480) (72,743) (1,298) (5,615) (10,030) (766) (1,775) (256,707)
Total financial liabilities – (12,187,427) (1,109,605) (1,706,388) (3,983,340) (2,772,216) (348,737) (1,775) (22,109,488)
Net position 29,410 (11,646,559) 22,941 (628,310) 197,555 3,374,518 7,744,787 2,302,365 1,396,707
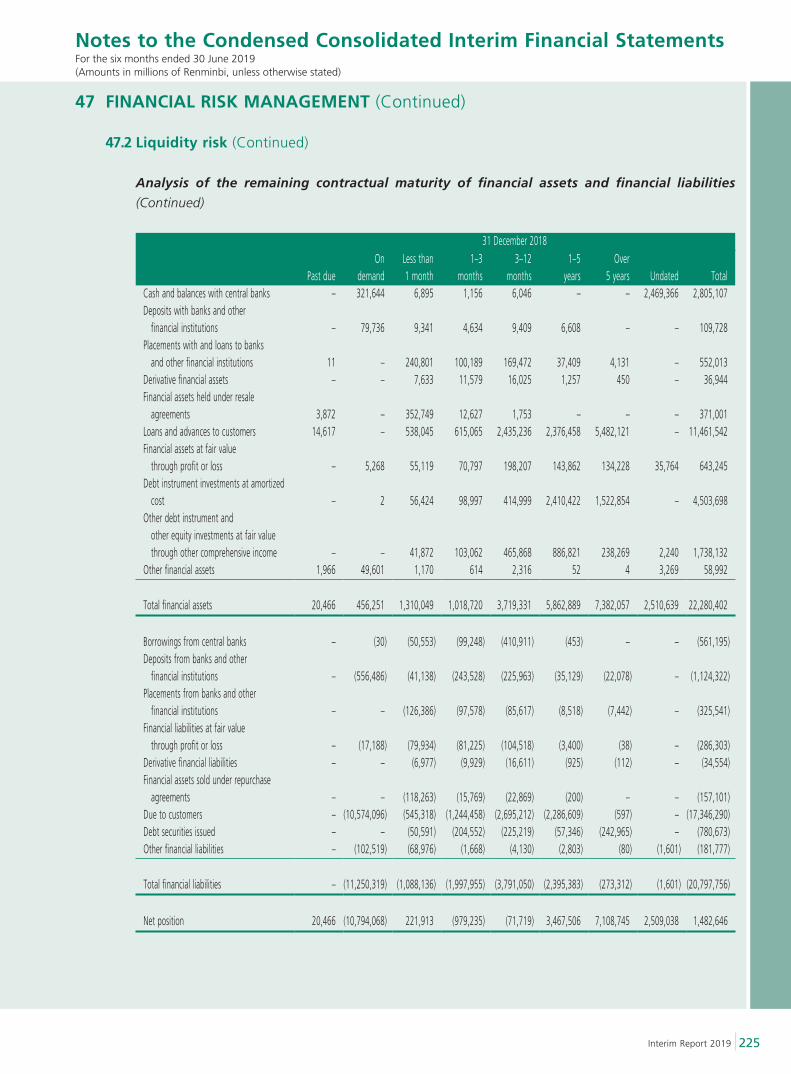
225Interim Report 2019
Notes to the Condensed Consolidated Interim Financial StatementsFor the six months ended 30 June 2019(Amounts in millions of Renminbi, unless otherwise stated)
47 FINANCIAL RISK MANAGEMENT (Continued)
47.2 Liquidity risk (Continued)
Analysis of the remaining contractual maturity of financial assets and financial liabilities
(Continued)
31 December 2018
Past dueOn
demandLess than 1 month
1–3 months
3–12 months
1–5 years
Over 5 years Undated Total
Cash and balances with central banks – 321,644 6,895 1,156 6,046 – – 2,469,366 2,805,107Deposits with banks and other financial institutions – 79,736 9,341 4,634 9,409 6,608 – – 109,728Placements with and loans to banks and other financial institutions 11 – 240,801 100,189 169,472 37,409 4,131 – 552,013Derivative financial assets – – 7,633 11,579 16,025 1,257 450 – 36,944Financial assets held under resale agreements 3,872 – 352,749 12,627 1,753 – – – 371,001Loans and advances to customers 14,617 – 538,045 615,065 2,435,236 2,376,458 5,482,121 – 11,461,542Financial assets at fair value through profit or loss – 5,268 55,119 70,797 198,207 143,862 134,228 35,764 643,245Debt instrument investments at amortized cost – 2 56,424 98,997 414,999 2,410,422 1,522,854 – 4,503,698Other debt instrument and other equity investments at fair value through other comprehensive income – – 41,872 103,062 465,868 886,821 238,269 2,240 1,738,132Other financial assets 1,966 49,601 1,170 614 2,316 52 4 3,269 58,992
Total financial assets 20,466 456,251 1,310,049 1,018,720 3,719,331 5,862,889 7,382,057 2,510,639 22,280,402
Borrowings from central banks – (30) (50,553) (99,248) (410,911) (453) – – (561,195)Deposits from banks and other financial institutions – (556,486) (41,138) (243,528) (225,963) (35,129) (22,078) – (1,124,322)Placements from banks and other financial institutions – – (126,386) (97,578) (85,617) (8,518) (7,442) – (325,541)Financial liabilities at fair value through profit or loss – (17,188) (79,934) (81,225) (104,518) (3,400) (38) – (286,303)Derivative financial liabilities – – (6,977) (9,929) (16,611) (925) (112) – (34,554)Financial assets sold under repurchase agreements – – (118,263) (15,769) (22,869) (200) – – (157,101)Due to customers – (10,574,096) (545,318) (1,244,458) (2,695,212) (2,286,609) (597) – (17,346,290)Debt securities issued – – (50,591) (204,552) (225,219) (57,346) (242,965) – (780,673)Other financial liabilities – (102,519) (68,976) (1,668) (4,130) (2,803) (80) (1,601) (181,777)
Total financial liabilities – (11,250,319) (1,088,136) (1,997,955) (3,791,050) (2,395,383) (273,312) (1,601) (20,797,756)
Net position 20,466 (10,794,068) 221,913 (979,235) (71,719) 3,467,506 7,108,745 2,509,038 1,482,646
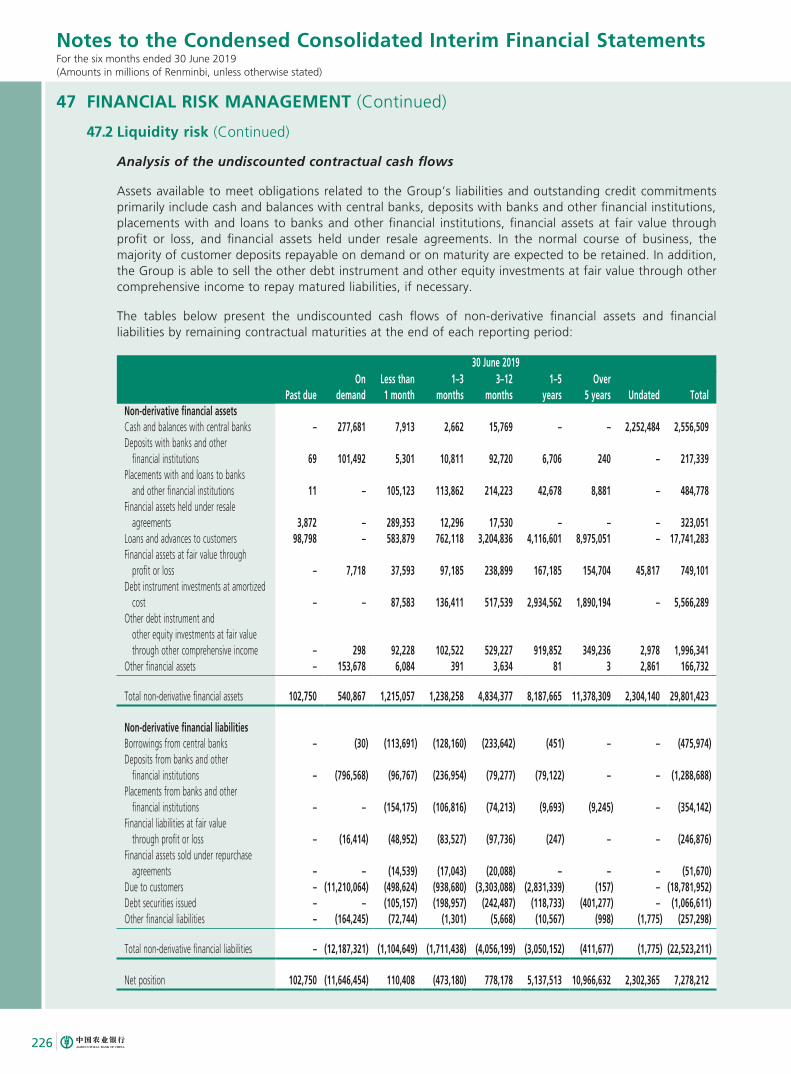
226
Notes to the Condensed Consolidated Interim Financial StatementsFor the six months ended 30 June 2019(Amounts in millions of Renminbi, unless otherwise stated)
47 FINANCIAL RISK MANAGEMENT (Continued)
47.2 Liquidity risk (Continued)
Analysis of the undiscounted contractual cash flows
Assets available to meet obligations related to the Group’s liabilities and outstanding credit commitments primarily include cash and balances with central banks, deposits with banks and other financial institutions, placements with and loans to banks and other financial institutions, financial assets at fair value through profit or loss, and financial assets held under resale agreements. In the normal course of business, the majority of customer deposits repayable on demand or on maturity are expected to be retained. In addition, the Group is able to sell the other debt instrument and other equity investments at fair value through other comprehensive income to repay matured liabilities, if necessary.
The tables below present the undiscounted cash flows of non-derivative financial assets and financial liabilities by remaining contractual maturities at the end of each reporting period:
30 June 2019
Past dueOn
demandLess than 1 month
1–3 months
3–12 months
1–5 years
Over 5 years Undated Total
Non-derivative financial assetsCash and balances with central banks – 277,681 7,913 2,662 15,769 – – 2,252,484 2,556,509Deposits with banks and other financial institutions 69 101,492 5,301 10,811 92,720 6,706 240 – 217,339Placements with and loans to banks and other financial institutions 11 – 105,123 113,862 214,223 42,678 8,881 – 484,778Financial assets held under resale agreements 3,872 – 289,353 12,296 17,530 – – – 323,051Loans and advances to customers 98,798 – 583,879 762,118 3,204,836 4,116,601 8,975,051 – 17,741,283Financial assets at fair value through profit or loss – 7,718 37,593 97,185 238,899 167,185 154,704 45,817 749,101Debt instrument investments at amortized cost – – 87,583 136,411 517,539 2,934,562 1,890,194 – 5,566,289Other debt instrument and other equity investments at fair value through other comprehensive income – 298 92,228 102,522 529,227 919,852 349,236 2,978 1,996,341Other financial assets – 153,678 6,084 391 3,634 81 3 2,861 166,732
Total non-derivative financial assets 102,750 540,867 1,215,057 1,238,258 4,834,377 8,187,665 11,378,309 2,304,140 29,801,423
Non-derivative financial liabilitiesBorrowings from central banks – (30) (113,691) (128,160) (233,642) (451) – – (475,974)Deposits from banks and other financial institutions – (796,568) (96,767) (236,954) (79,277) (79,122) – – (1,288,688)Placements from banks and other financial institutions – – (154,175) (106,816) (74,213) (9,693) (9,245) – (354,142)Financial liabilities at fair value through profit or loss – (16,414) (48,952) (83,527) (97,736) (247) – – (246,876)Financial assets sold under repurchase agreements – – (14,539) (17,043) (20,088) – – – (51,670)Due to customers – (11,210,064) (498,624) (938,680) (3,303,088) (2,831,339) (157) – (18,781,952)Debt securities issued – – (105,157) (198,957) (242,487) (118,733) (401,277) – (1,066,611)Other financial liabilities – (164,245) (72,744) (1,301) (5,668) (10,567) (998) (1,775) (257,298)
Total non-derivative financial liabilities – (12,187,321) (1,104,649) (1,711,438) (4,056,199) (3,050,152) (411,677) (1,775) (22,523,211)
Net position 102,750 (11,646,454) 110,408 (473,180) 778,178 5,137,513 10,966,632 2,302,365 7,278,212
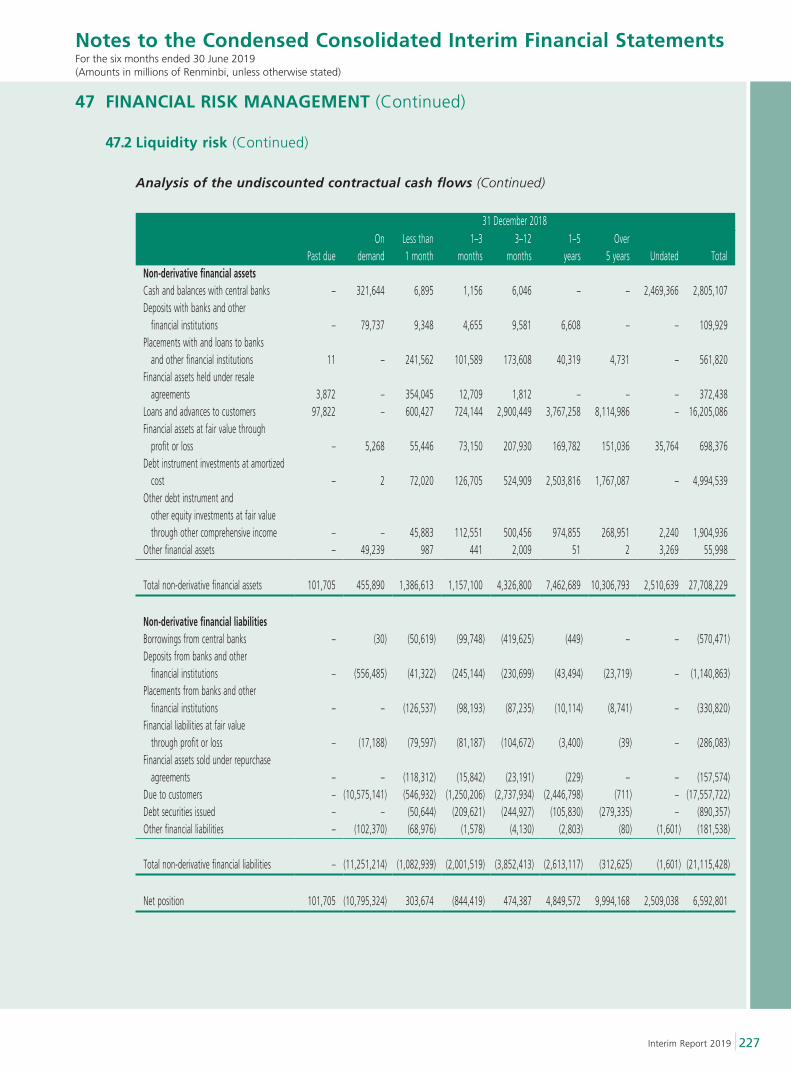
227Interim Report 2019
Notes to the Condensed Consolidated Interim Financial StatementsFor the six months ended 30 June 2019(Amounts in millions of Renminbi, unless otherwise stated)
47 FINANCIAL RISK MANAGEMENT (Continued)
47.2 Liquidity risk (Continued)
Analysis of the undiscounted contractual cash flows (Continued)
31 December 2018
Past dueOn
demandLess than 1 month
1–3 months
3–12 months
1–5 years
Over 5 years Undated Total
Non-derivative financial assetsCash and balances with central banks – 321,644 6,895 1,156 6,046 – – 2,469,366 2,805,107Deposits with banks and other financial institutions – 79,737 9,348 4,655 9,581 6,608 – – 109,929Placements with and loans to banks and other financial institutions 11 – 241,562 101,589 173,608 40,319 4,731 – 561,820Financial assets held under resale agreements 3,872 – 354,045 12,709 1,812 – – – 372,438Loans and advances to customers 97,822 – 600,427 724,144 2,900,449 3,767,258 8,114,986 – 16,205,086Financial assets at fair value through profit or loss – 5,268 55,446 73,150 207,930 169,782 151,036 35,764 698,376Debt instrument investments at amortized cost – 2 72,020 126,705 524,909 2,503,816 1,767,087 – 4,994,539Other debt instrument and other equity investments at fair value through other comprehensive income – – 45,883 112,551 500,456 974,855 268,951 2,240 1,904,936Other financial assets – 49,239 987 441 2,009 51 2 3,269 55,998
Total non-derivative financial assets 101,705 455,890 1,386,613 1,157,100 4,326,800 7,462,689 10,306,793 2,510,639 27,708,229
Non-derivative financial liabilitiesBorrowings from central banks – (30) (50,619) (99,748) (419,625) (449) – – (570,471)Deposits from banks and other financial institutions – (556,485) (41,322) (245,144) (230,699) (43,494) (23,719) – (1,140,863)Placements from banks and other financial institutions – – (126,537) (98,193) (87,235) (10,114) (8,741) – (330,820)Financial liabilities at fair value through profit or loss – (17,188) (79,597) (81,187) (104,672) (3,400) (39) – (286,083)Financial assets sold under repurchase agreements – – (118,312) (15,842) (23,191) (229) – – (157,574)Due to customers – (10,575,141) (546,932) (1,250,206) (2,737,934) (2,446,798) (711) – (17,557,722)Debt securities issued – – (50,644) (209,621) (244,927) (105,830) (279,335) – (890,357)Other financial liabilities – (102,370) (68,976) (1,578) (4,130) (2,803) (80) (1,601) (181,538)
Total non-derivative financial liabilities – (11,251,214) (1,082,939) (2,001,519) (3,852,413) (2,613,117) (312,625) (1,601) (21,115,428)
Net position 101,705 (10,795,324) 303,674 (844,419) 474,387 4,849,572 9,994,168 2,509,038 6,592,801
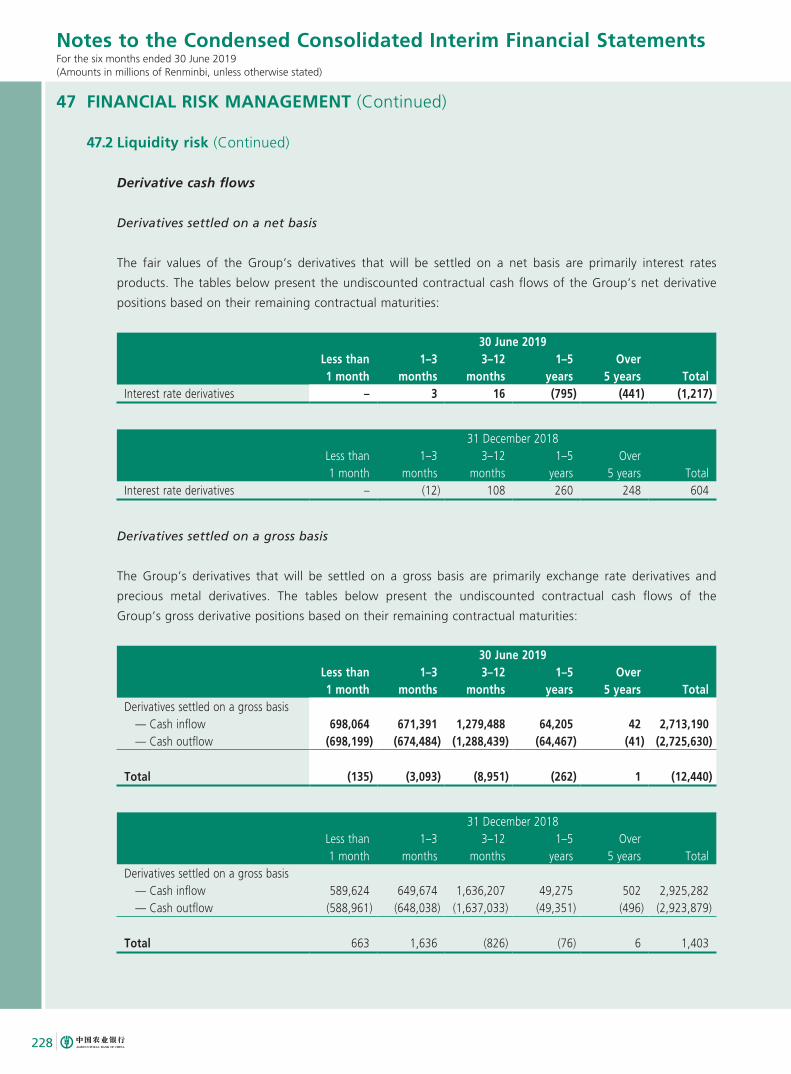
228
Notes to the Condensed Consolidated Interim Financial StatementsFor the six months ended 30 June 2019(Amounts in millions of Renminbi, unless otherwise stated)
47 FINANCIAL RISK MANAGEMENT (Continued)
47.2 Liquidity risk (Continued)
Derivative cash flows
Derivatives settled on a net basis
The fair values of the Group’s derivatives that will be settled on a net basis are primarily interest rates
products. The tables below present the undiscounted contractual cash flows of the Group’s net derivative
positions based on their remaining contractual maturities:
30 June 2019Less than 1 month
1–3 months
3–12 months
1–5 years
Over 5 years Total
Interest rate derivatives – 3 16 (795) (441) (1,217)
31 December 2018Less than 1 month
1–3 months
3–12 months
1–5 years
Over 5 years Total
Interest rate derivatives – (12) 108 260 248 604
Derivatives settled on a gross basis
The Group’s derivatives that will be settled on a gross basis are primarily exchange rate derivatives and
precious metal derivatives. The tables below present the undiscounted contractual cash flows of the
Group’s gross derivative positions based on their remaining contractual maturities:
30 June 2019Less than 1 month
1–3 months
3–12 months
1–5 years
Over 5 years Total
Derivatives settled on a gross basis — Cash inflow 698,064 671,391 1,279,488 64,205 42 2,713,190 — Cash outflow (698,199) (674,484) (1,288,439) (64,467) (41) (2,725,630)
Total (135) (3,093) (8,951) (262) 1 (12,440)
31 December 2018Less than 1 month
1–3 months
3–12 months
1–5 years
Over 5 years Total
Derivatives settled on a gross basis — Cash inflow 589,624 649,674 1,636,207 49,275 502 2,925,282 — Cash outflow (588,961) (648,038) (1,637,033) (49,351) (496) (2,923,879)
Total 663 1,636 (826) (76) 6 1,403
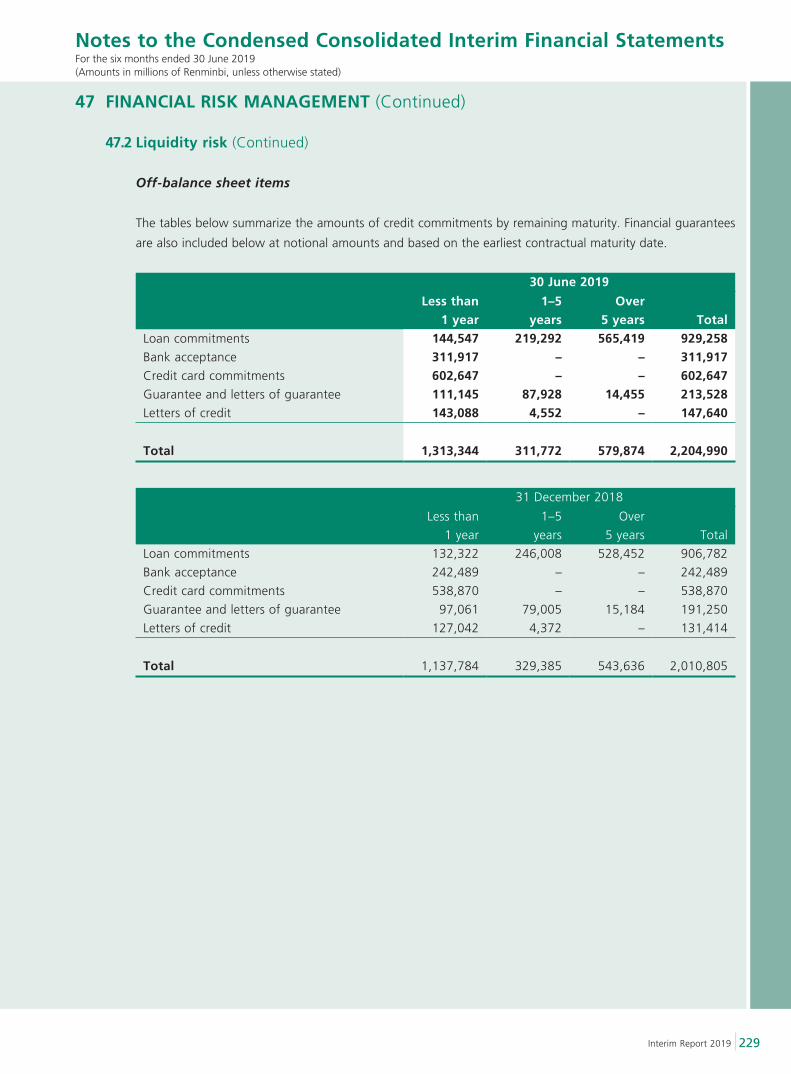
229Interim Report 2019
Notes to the Condensed Consolidated Interim Financial StatementsFor the six months ended 30 June 2019(Amounts in millions of Renminbi, unless otherwise stated)
47 FINANCIAL RISK MANAGEMENT (Continued)
47.2 Liquidity risk (Continued)
Off-balance sheet items
The tables below summarize the amounts of credit commitments by remaining maturity. Financial guarantees
are also included below at notional amounts and based on the earliest contractual maturity date.
30 June 2019
Less than 1 year
1–5 years
Over 5 years Total
Loan commitments 144,547 219,292 565,419 929,258Bank acceptance 311,917 – – 311,917Credit card commitments 602,647 – – 602,647Guarantee and letters of guarantee 111,145 87,928 14,455 213,528Letters of credit 143,088 4,552 – 147,640
Total 1,313,344 311,772 579,874 2,204,990
31 December 2018
Less than
1 year
1–5
years
Over
5 years Total
Loan commitments 132,322 246,008 528,452 906,782
Bank acceptance 242,489 – – 242,489
Credit card commitments 538,870 – – 538,870
Guarantee and letters of guarantee 97,061 79,005 15,184 191,250
Letters of credit 127,042 4,372 – 131,414
Total 1,137,784 329,385 543,636 2,010,805
230
Notes to the Condensed Consolidated Interim Financial StatementsFor the six months ended 30 June 2019(Amounts in millions of Renminbi, unless otherwise stated)
47 FINANCIAL RISK MANAGEMENT (Continued)
47.3 Market risk
Market risk represents the potential loss arising from changes in market rates of interest and foreign exchange, as well as commodity and equity prices. Market risk arises from both the Group’s proprietary positions and customer driven transactions, in both cases related to on- and off-balance sheet activities.
The Group is primarily exposed to interest rate risk through its lending, fixed-income and funding activities. Interest rate risk is inherent in many of the Group’s businesses and this situation is common among large banks. It fundamentally arises through mismatches between the maturity and re-pricing dates of interest-earning assets and interest-bearing liabilities. As discussed further below, interest rate risk is actively managed.
Foreign exchange rate risk is the potential loss related to changes in foreign exchange rates affecting the translation of foreign currency denominated monetary assets and liabilities. The risk of loss results from movements in foreign currency exchange rates.
The Group is also exposed to commodity risk, primarily related to gold and other precious metals. The risk of loss results from movements in commodity price. The Group manages the risk related to gold price together with foreign exchange rate risk.
The Group has determined that the levels of market risk related to changes in equity prices and commodity prices other than gold, with respect to the related exposures in its trading and investment portfolios, are immaterial.
Segregation of Trading Book and Banking Book
To enhance the effectiveness of market risk management, as well as the accuracy of determining the levels of regulatory capital required related to market risk, the Group segregates all financial instruments and commodities, both on-and off-balance sheet, into either the trading book or banking book. The trading book is comprised of financial instruments and commodity positions held for trading, including all derivatives instruments. Any other financial instruments are included in the banking book.
Market Risk Management for Trading Book
The Group manages market risk in the trading book through methodologies that include Value at Risk (VaR), monitoring and management of established limits, sensitivity analysis, duration analysis, exposure analysis and stress testing.
The Group has formulated policies, which are subject to review annually or as circumstances otherwise dictate, to manage market risk. Further, in this regard, the Group’s market risk management is focused on movements in domestic and global financial markets, as well as the composition of the trading book and management’s trading strategies, within approved limits. Moreover, the Group has implemented more specific policies for financial instruments, closely monitoring the exposure to specific issuers and counterparties, as well as the tenor of individual positions and trading strategies. The foundation of the Group’s limit and risk monitoring system is based on VaR, which is used consistently to monitor all classes of financial instruments in the trading book.
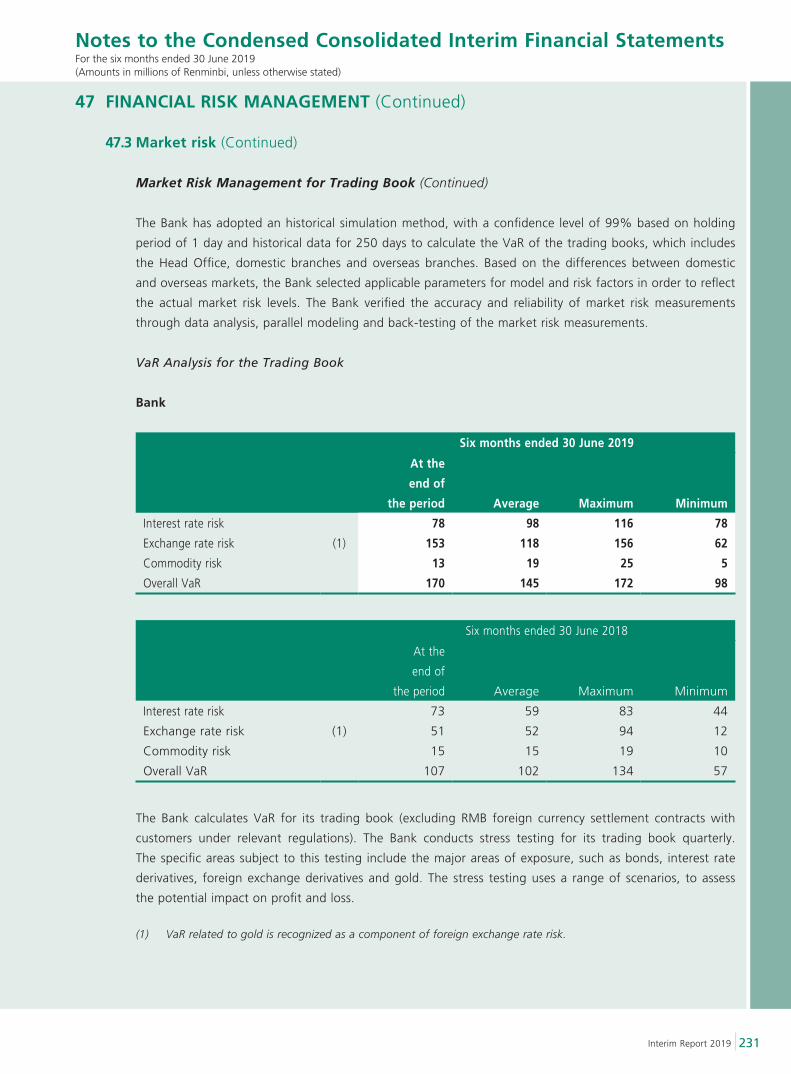
231Interim Report 2019
Notes to the Condensed Consolidated Interim Financial StatementsFor the six months ended 30 June 2019(Amounts in millions of Renminbi, unless otherwise stated)
47 FINANCIAL RISK MANAGEMENT (Continued)
47.3 Market risk (Continued)
Market Risk Management for Trading Book (Continued)
The Bank has adopted an historical simulation method, with a confidence level of 99% based on holding
period of 1 day and historical data for 250 days to calculate the VaR of the trading books, which includes
the Head Office, domestic branches and overseas branches. Based on the differences between domestic
and overseas markets, the Bank selected applicable parameters for model and risk factors in order to reflect
the actual market risk levels. The Bank verified the accuracy and reliability of market risk measurements
through data analysis, parallel modeling and back-testing of the market risk measurements.
VaR Analysis for the Trading Book
Bank
Six months ended 30 June 2019
At the
end of
the period Average Maximum Minimum
Interest rate risk 78 98 116 78
Exchange rate risk (1) 153 118 156 62
Commodity risk 13 19 25 5
Overall VaR 170 145 172 98
Six months ended 30 June 2018
At the
end of
the period Average Maximum Minimum
Interest rate risk 73 59 83 44
Exchange rate risk (1) 51 52 94 12
Commodity risk 15 15 19 10
Overall VaR 107 102 134 57
The Bank calculates VaR for its trading book (excluding RMB foreign currency settlement contracts with
customers under relevant regulations). The Bank conducts stress testing for its trading book quarterly.
The specific areas subject to this testing include the major areas of exposure, such as bonds, interest rate
derivatives, foreign exchange derivatives and gold. The stress testing uses a range of scenarios, to assess
the potential impact on profit and loss.
(1) VaR related to gold is recognized as a component of foreign exchange rate risk.
232
Notes to the Condensed Consolidated Interim Financial StatementsFor the six months ended 30 June 2019(Amounts in millions of Renminbi, unless otherwise stated)
47 FINANCIAL RISK MANAGEMENT (Continued)
47.3 Market risk (Continued)
Market Risk Management for Banking Book
The Group manages market risk related to the banking book by consistently applying techniques across the
Group that include exposure limit management, stress testing, scenario analysis and gap analysis.
Interest Rate Risk Management
The interest rate risk existing in the banking book broadly relates to the mismatch of the maturity or re-
pricing dates of interest rate-sensitive financial assets and financial liabilities, as well as inconsistencies in
the change of the benchmark interest rates on which most domestic interest rate-sensitive financial assets
and financial liabilities are based.
The Group closely monitors changes in the macro-economic environment and the monetary policies of the
PBOC, enabling it to timely and flexibly adjusts its pricing strategy. The Group establishes comprehensive
interest rate risk management policies and protocols and has improved the consistency of interest rate risk
measurement, monitoring, analysis and management of interest rate risk across the Group.
The Group regularly measures and analyzes the Group’s interest rate risk by conducting gap analysis,
sensitivity analysis, scenario analysis and stress testing to manage interest rate risk within established limits.
Foreign Exchange Rate Risk Management
Foreign exchange rate risk relates to the mismatch of foreign currency denominated monetary assets and
liabilities, and the potential loss related to changes in foreign exchange rates, which largely arises through
operational activities.
The Group performs monitoring and sensitivity analysis of foreign exchange rate risk exposure, manages
the mismatch of foreign currency denominated assets and liabilities to effectively manage foreign exchange
rate risk exposure within acceptable limits.
Market Risk Exposure Limit Management
Market risk exposure limits are classified as either directive limits or indicative limits, based on the
characteristics of the underlying instruments or transactions, including exposure limit monitoring,
enforcement of stop-loss limit, VaR limits, and stress testing limits.
The Group is committed to continuous improvement of its market risk exposure limit management. The
Group establishes exposure limits reflecting its risk appetite and continuously refines the categorization of
market risk exposure limits. Further, it regularly monitors, reports, refines, and implements improvements to
the market risk exposure limit process.
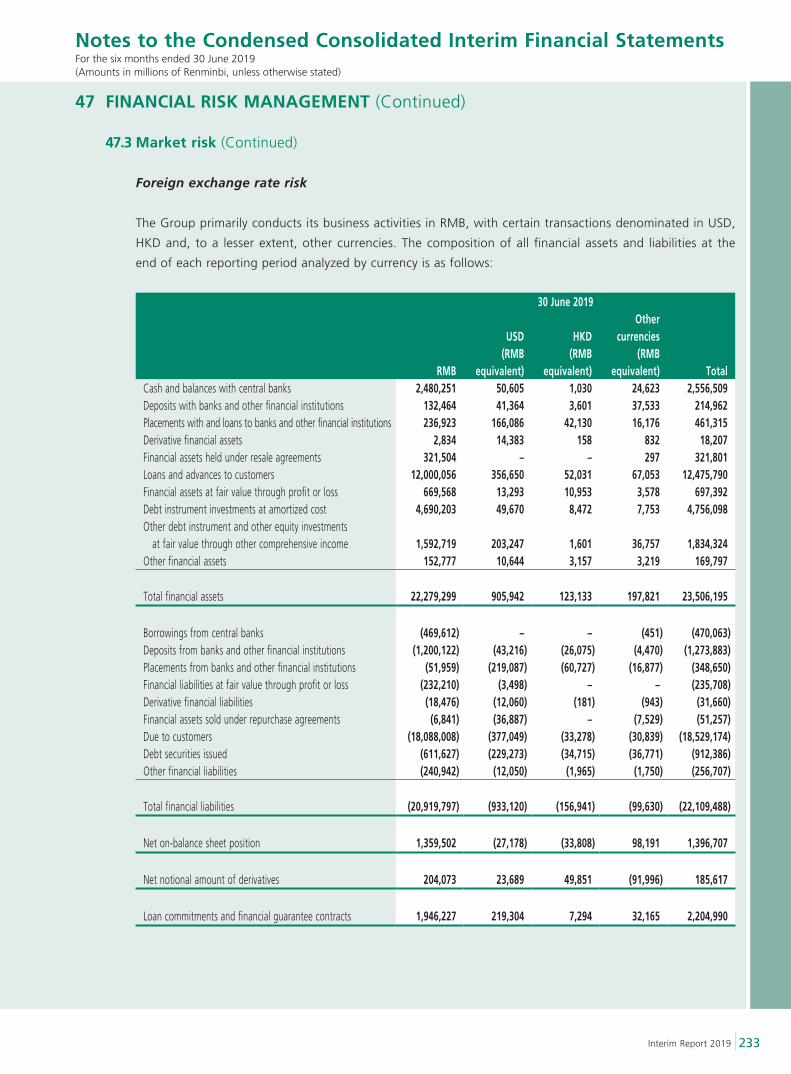
233Interim Report 2019
Notes to the Condensed Consolidated Interim Financial StatementsFor the six months ended 30 June 2019(Amounts in millions of Renminbi, unless otherwise stated)
47 FINANCIAL RISK MANAGEMENT (Continued)
47.3 Market risk (Continued)
Foreign exchange rate risk
The Group primarily conducts its business activities in RMB, with certain transactions denominated in USD,
HKD and, to a lesser extent, other currencies. The composition of all financial assets and liabilities at the
end of each reporting period analyzed by currency is as follows:
30 June 2019
RMB
USD (RMB
equivalent)
HKD (RMB
equivalent)
Other currencies
(RMB equivalent) Total
Cash and balances with central banks 2,480,251 50,605 1,030 24,623 2,556,509Deposits with banks and other financial institutions 132,464 41,364 3,601 37,533 214,962Placements with and loans to banks and other financial institutions 236,923 166,086 42,130 16,176 461,315Derivative financial assets 2,834 14,383 158 832 18,207Financial assets held under resale agreements 321,504 – – 297 321,801Loans and advances to customers 12,000,056 356,650 52,031 67,053 12,475,790Financial assets at fair value through profit or loss 669,568 13,293 10,953 3,578 697,392Debt instrument investments at amortized cost 4,690,203 49,670 8,472 7,753 4,756,098Other debt instrument and other equity investments at fair value through other comprehensive income 1,592,719 203,247 1,601 36,757 1,834,324Other financial assets 152,777 10,644 3,157 3,219 169,797
Total financial assets 22,279,299 905,942 123,133 197,821 23,506,195
Borrowings from central banks (469,612) – – (451) (470,063)Deposits from banks and other financial institutions (1,200,122) (43,216) (26,075) (4,470) (1,273,883)Placements from banks and other financial institutions (51,959) (219,087) (60,727) (16,877) (348,650)Financial liabilities at fair value through profit or loss (232,210) (3,498) – – (235,708)Derivative financial liabilities (18,476) (12,060) (181) (943) (31,660)Financial assets sold under repurchase agreements (6,841) (36,887) – (7,529) (51,257)Due to customers (18,088,008) (377,049) (33,278) (30,839) (18,529,174)Debt securities issued (611,627) (229,273) (34,715) (36,771) (912,386)Other financial liabilities (240,942) (12,050) (1,965) (1,750) (256,707)
Total financial liabilities (20,919,797) (933,120) (156,941) (99,630) (22,109,488)
Net on-balance sheet position 1,359,502 (27,178) (33,808) 98,191 1,396,707
Net notional amount of derivatives 204,073 23,689 49,851 (91,996) 185,617
Loan commitments and financial guarantee contracts 1,946,227 219,304 7,294 32,165 2,204,990
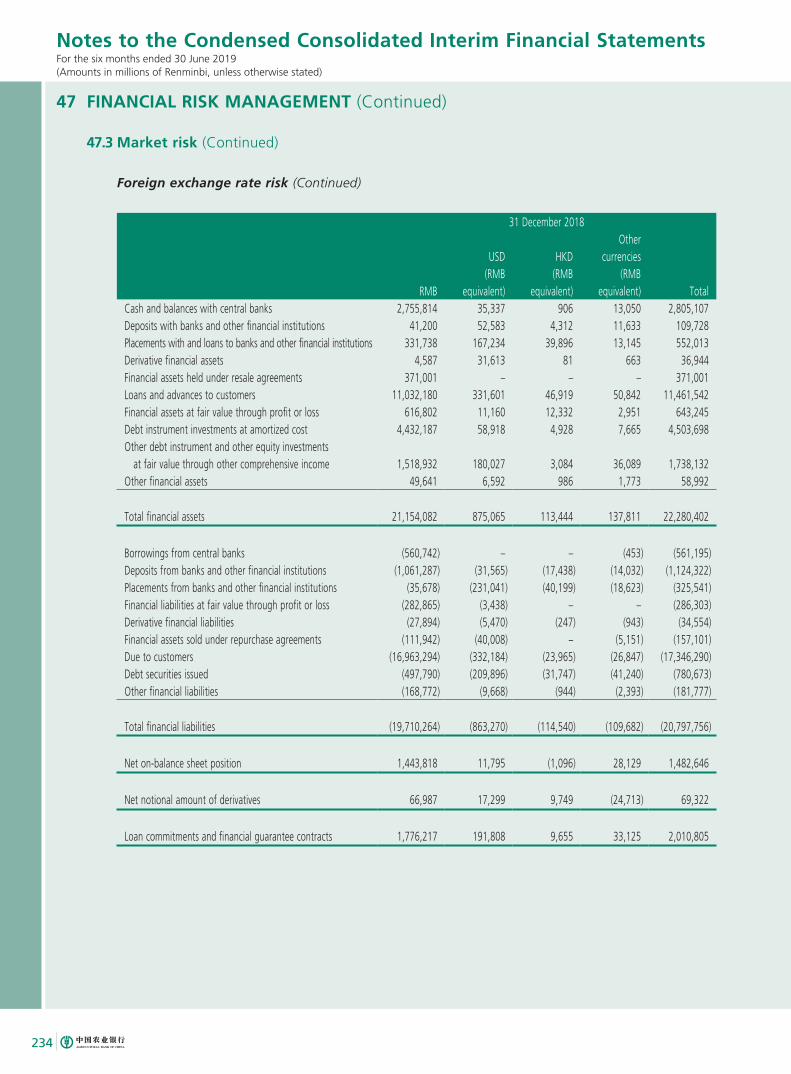
234
Notes to the Condensed Consolidated Interim Financial StatementsFor the six months ended 30 June 2019(Amounts in millions of Renminbi, unless otherwise stated)
47 FINANCIAL RISK MANAGEMENT (Continued)
47.3 Market risk (Continued)
Foreign exchange rate risk (Continued)
31 December 2018
RMB
USD (RMB
equivalent)
HKD (RMB
equivalent)
Other currencies
(RMB equivalent) Total
Cash and balances with central banks 2,755,814 35,337 906 13,050 2,805,107Deposits with banks and other financial institutions 41,200 52,583 4,312 11,633 109,728Placements with and loans to banks and other financial institutions 331,738 167,234 39,896 13,145 552,013Derivative financial assets 4,587 31,613 81 663 36,944Financial assets held under resale agreements 371,001 – – – 371,001Loans and advances to customers 11,032,180 331,601 46,919 50,842 11,461,542Financial assets at fair value through profit or loss 616,802 11,160 12,332 2,951 643,245Debt instrument investments at amortized cost 4,432,187 58,918 4,928 7,665 4,503,698Other debt instrument and other equity investments at fair value through other comprehensive income 1,518,932 180,027 3,084 36,089 1,738,132Other financial assets 49,641 6,592 986 1,773 58,992
Total financial assets 21,154,082 875,065 113,444 137,811 22,280,402
Borrowings from central banks (560,742) – – (453) (561,195)Deposits from banks and other financial institutions (1,061,287) (31,565) (17,438) (14,032) (1,124,322)Placements from banks and other financial institutions (35,678) (231,041) (40,199) (18,623) (325,541)Financial liabilities at fair value through profit or loss (282,865) (3,438) – – (286,303)Derivative financial liabilities (27,894) (5,470) (247) (943) (34,554)Financial assets sold under repurchase agreements (111,942) (40,008) – (5,151) (157,101)Due to customers (16,963,294) (332,184) (23,965) (26,847) (17,346,290)Debt securities issued (497,790) (209,896) (31,747) (41,240) (780,673)Other financial liabilities (168,772) (9,668) (944) (2,393) (181,777)
Total financial liabilities (19,710,264) (863,270) (114,540) (109,682) (20,797,756)
Net on-balance sheet position 1,443,818 11,795 (1,096) 28,129 1,482,646
Net notional amount of derivatives 66,987 17,299 9,749 (24,713) 69,322
Loan commitments and financial guarantee contracts 1,776,217 191,808 9,655 33,125 2,010,805
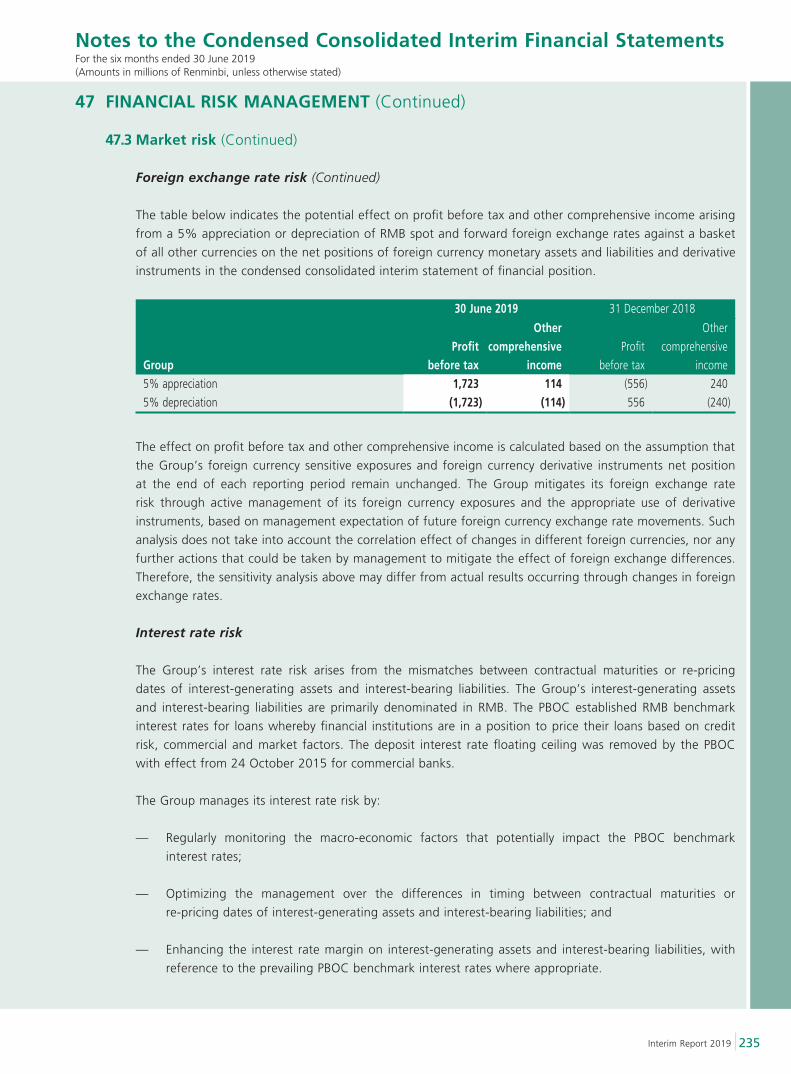
235Interim Report 2019
Notes to the Condensed Consolidated Interim Financial StatementsFor the six months ended 30 June 2019(Amounts in millions of Renminbi, unless otherwise stated)
47 FINANCIAL RISK MANAGEMENT (Continued)
47.3 Market risk (Continued)
Foreign exchange rate risk (Continued)
The table below indicates the potential effect on profit before tax and other comprehensive income arising
from a 5% appreciation or depreciation of RMB spot and forward foreign exchange rates against a basket
of all other currencies on the net positions of foreign currency monetary assets and liabilities and derivative
instruments in the condensed consolidated interim statement of financial position.
30 June 2019 31 December 2018
GroupProfit
before tax
Other comprehensive
incomeProfit
before tax
Other
comprehensive
income
5% appreciation 1,723 114 (556) 240
5% depreciation (1,723) (114) 556 (240)
The effect on profit before tax and other comprehensive income is calculated based on the assumption that
the Group’s foreign currency sensitive exposures and foreign currency derivative instruments net position
at the end of each reporting period remain unchanged. The Group mitigates its foreign exchange rate
risk through active management of its foreign currency exposures and the appropriate use of derivative
instruments, based on management expectation of future foreign currency exchange rate movements. Such
analysis does not take into account the correlation effect of changes in different foreign currencies, nor any
further actions that could be taken by management to mitigate the effect of foreign exchange differences.
Therefore, the sensitivity analysis above may differ from actual results occurring through changes in foreign
exchange rates.
Interest rate risk
The Group’s interest rate risk arises from the mismatches between contractual maturities or re-pricing
dates of interest-generating assets and interest-bearing liabilities. The Group’s interest-generating assets
and interest-bearing liabilities are primarily denominated in RMB. The PBOC established RMB benchmark
interest rates for loans whereby financial institutions are in a position to price their loans based on credit
risk, commercial and market factors. The deposit interest rate floating ceiling was removed by the PBOC
with effect from 24 October 2015 for commercial banks.
The Group manages its interest rate risk by:
— Regularly monitoring the macro-economic factors that potentially impact the PBOC benchmark
interest rates;
— Optimizing the management over the differences in timing between contractual maturities or
re-pricing dates of interest-generating assets and interest-bearing liabilities; and
— Enhancing the interest rate margin on interest-generating assets and interest-bearing liabilities, with
reference to the prevailing PBOC benchmark interest rates where appropriate.
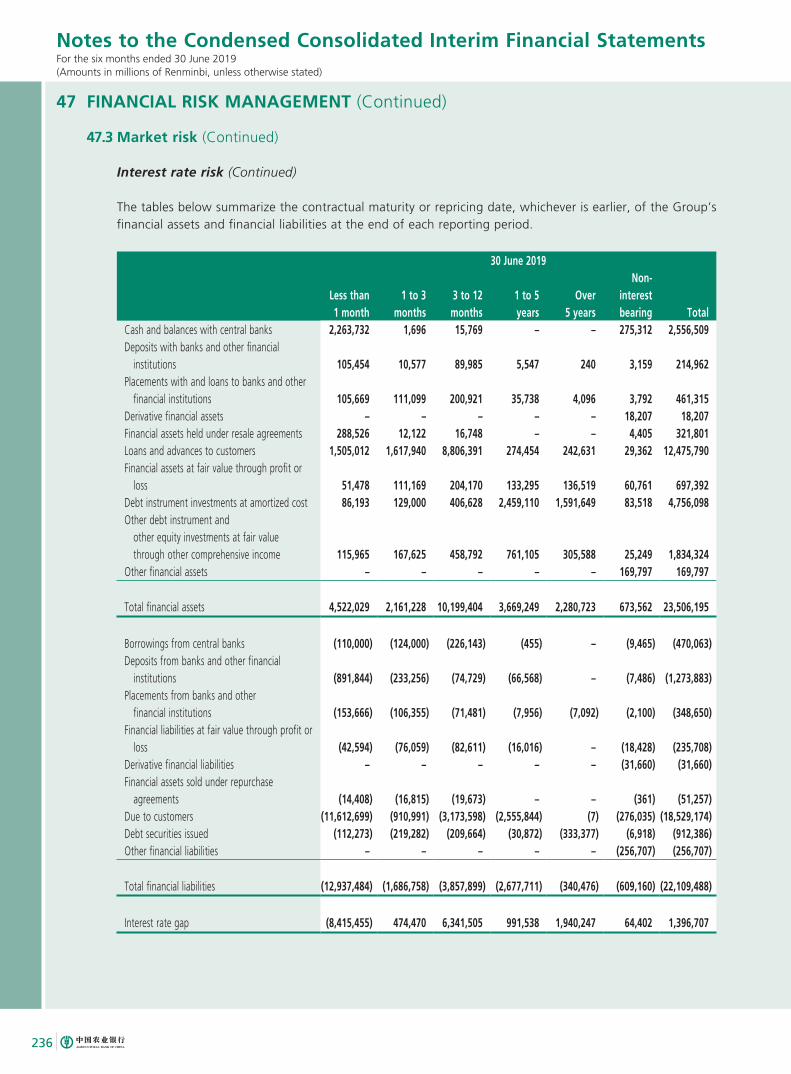
236
Notes to the Condensed Consolidated Interim Financial StatementsFor the six months ended 30 June 2019(Amounts in millions of Renminbi, unless otherwise stated)
47 FINANCIAL RISK MANAGEMENT (Continued)
47.3 Market risk (Continued)
Interest rate risk (Continued)
The tables below summarize the contractual maturity or repricing date, whichever is earlier, of the Group’s financial assets and financial liabilities at the end of each reporting period.
30 June 2019
Less than 1 month
1 to 3 months
3 to 12 months
1 to 5 years
Over 5 years
Non-interest bearing Total
Cash and balances with central banks 2,263,732 1,696 15,769 – – 275,312 2,556,509Deposits with banks and other financial institutions 105,454 10,577 89,985 5,547 240 3,159 214,962Placements with and loans to banks and other financial institutions 105,669 111,099 200,921 35,738 4,096 3,792 461,315Derivative financial assets – – – – – 18,207 18,207Financial assets held under resale agreements 288,526 12,122 16,748 – – 4,405 321,801Loans and advances to customers 1,505,012 1,617,940 8,806,391 274,454 242,631 29,362 12,475,790Financial assets at fair value through profit or loss 51,478 111,169 204,170 133,295 136,519 60,761 697,392Debt instrument investments at amortized cost 86,193 129,000 406,628 2,459,110 1,591,649 83,518 4,756,098Other debt instrument and other equity investments at fair value through other comprehensive income 115,965 167,625 458,792 761,105 305,588 25,249 1,834,324Other financial assets – – – – – 169,797 169,797
Total financial assets 4,522,029 2,161,228 10,199,404 3,669,249 2,280,723 673,562 23,506,195
Borrowings from central banks (110,000) (124,000) (226,143) (455) – (9,465) (470,063)Deposits from banks and other financial institutions (891,844) (233,256) (74,729) (66,568) – (7,486) (1,273,883)Placements from banks and other financial institutions (153,666) (106,355) (71,481) (7,956) (7,092) (2,100) (348,650)Financial liabilities at fair value through profit or loss (42,594) (76,059) (82,611) (16,016) – (18,428) (235,708)Derivative financial liabilities – – – – – (31,660) (31,660)Financial assets sold under repurchase agreements (14,408) (16,815) (19,673) – – (361) (51,257)Due to customers (11,612,699) (910,991) (3,173,598) (2,555,844) (7) (276,035) (18,529,174)Debt securities issued (112,273) (219,282) (209,664) (30,872) (333,377) (6,918) (912,386)Other financial liabilities – – – – – (256,707) (256,707)
Total financial liabilities (12,937,484) (1,686,758) (3,857,899) (2,677,711) (340,476) (609,160) (22,109,488)
Interest rate gap (8,415,455) 474,470 6,341,505 991,538 1,940,247 64,402 1,396,707
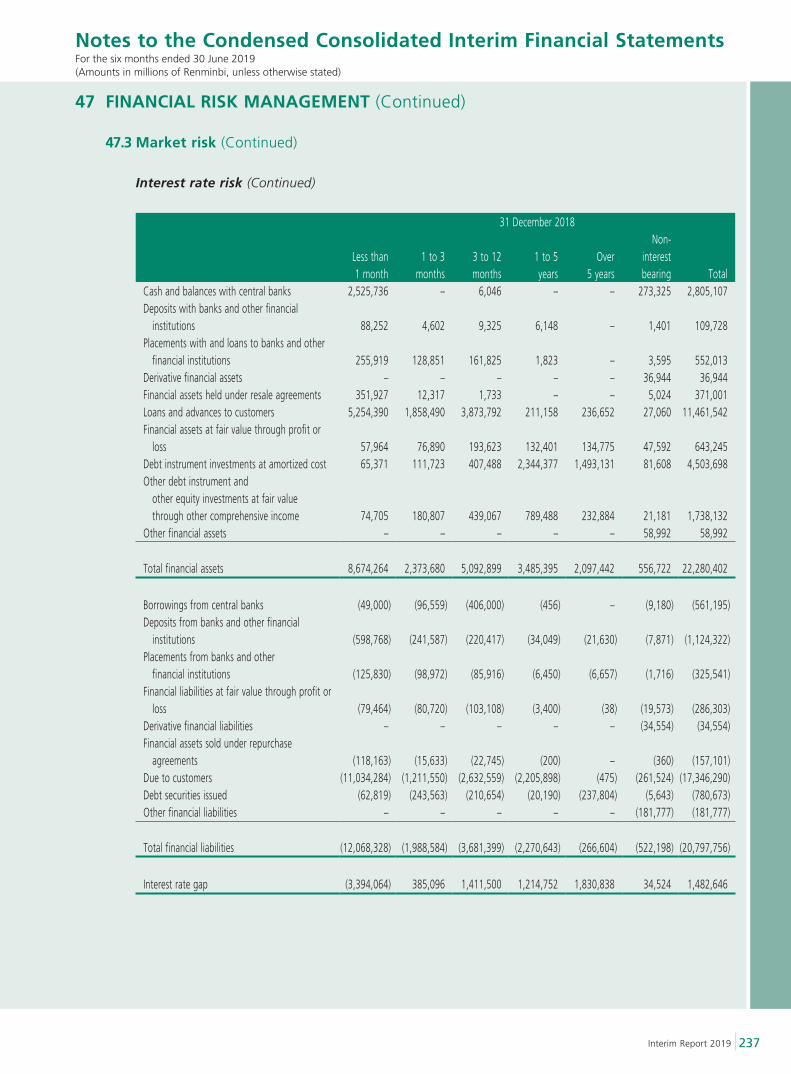
237Interim Report 2019
Notes to the Condensed Consolidated Interim Financial StatementsFor the six months ended 30 June 2019(Amounts in millions of Renminbi, unless otherwise stated)
47 FINANCIAL RISK MANAGEMENT (Continued)
47.3 Market risk (Continued)
Interest rate risk (Continued)
31 December 2018
Less than 1 month
1 to 3 months
3 to 12 months
1 to 5 years
Over 5 years
Non-interest bearing Total
Cash and balances with central banks 2,525,736 – 6,046 – – 273,325 2,805,107Deposits with banks and other financial institutions 88,252 4,602 9,325 6,148 – 1,401 109,728Placements with and loans to banks and other financial institutions 255,919 128,851 161,825 1,823 – 3,595 552,013Derivative financial assets – – – – – 36,944 36,944Financial assets held under resale agreements 351,927 12,317 1,733 – – 5,024 371,001Loans and advances to customers 5,254,390 1,858,490 3,873,792 211,158 236,652 27,060 11,461,542Financial assets at fair value through profit or loss 57,964 76,890 193,623 132,401 134,775 47,592 643,245Debt instrument investments at amortized cost 65,371 111,723 407,488 2,344,377 1,493,131 81,608 4,503,698Other debt instrument and other equity investments at fair value through other comprehensive income 74,705 180,807 439,067 789,488 232,884 21,181 1,738,132Other financial assets – – – – – 58,992 58,992
Total financial assets 8,674,264 2,373,680 5,092,899 3,485,395 2,097,442 556,722 22,280,402
Borrowings from central banks (49,000) (96,559) (406,000) (456) – (9,180) (561,195)Deposits from banks and other financial institutions (598,768) (241,587) (220,417) (34,049) (21,630) (7,871) (1,124,322)Placements from banks and other financial institutions (125,830) (98,972) (85,916) (6,450) (6,657) (1,716) (325,541)Financial liabilities at fair value through profit or loss (79,464) (80,720) (103,108) (3,400) (38) (19,573) (286,303)Derivative financial liabilities – – – – – (34,554) (34,554)Financial assets sold under repurchase agreements (118,163) (15,633) (22,745) (200) – (360) (157,101)Due to customers (11,034,284) (1,211,550) (2,632,559) (2,205,898) (475) (261,524) (17,346,290)Debt securities issued (62,819) (243,563) (210,654) (20,190) (237,804) (5,643) (780,673)Other financial liabilities – – – – – (181,777) (181,777)
Total financial liabilities (12,068,328) (1,988,584) (3,681,399) (2,270,643) (266,604) (522,198) (20,797,756)
Interest rate gap (3,394,064) 385,096 1,411,500 1,214,752 1,830,838 34,524 1,482,646
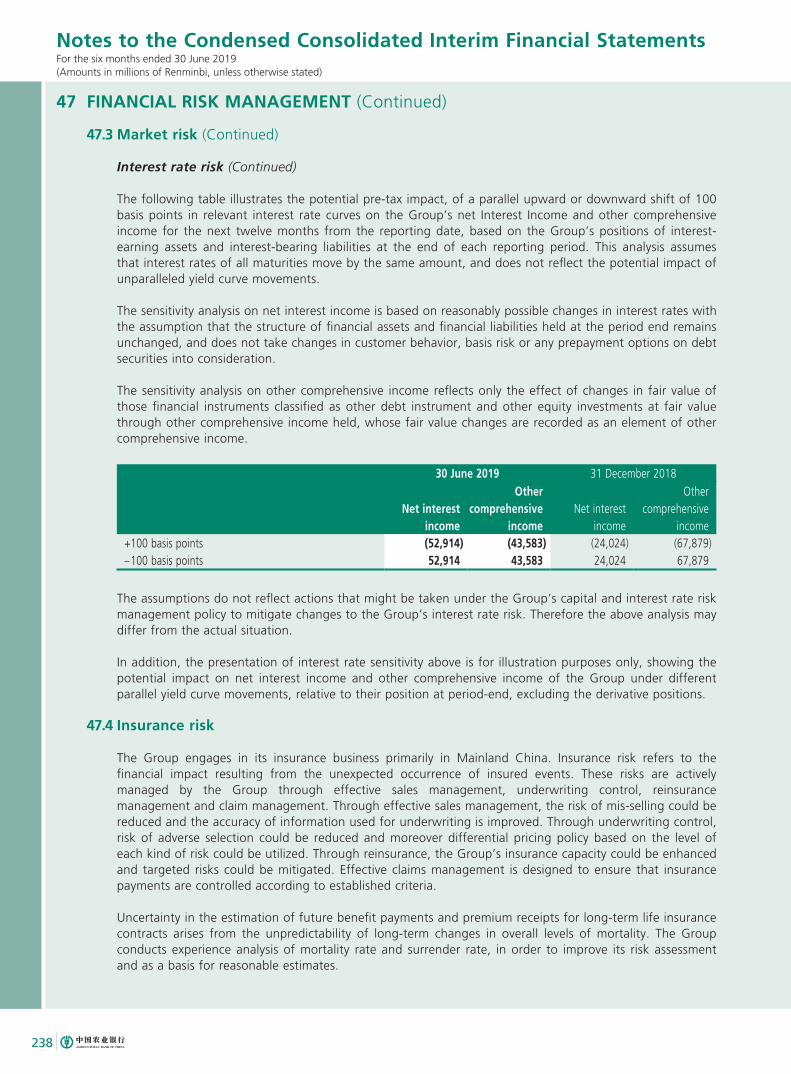
238
Notes to the Condensed Consolidated Interim Financial StatementsFor the six months ended 30 June 2019(Amounts in millions of Renminbi, unless otherwise stated)
47 FINANCIAL RISK MANAGEMENT (Continued)
47.3 Market risk (Continued)
Interest rate risk (Continued)
The following table illustrates the potential pre-tax impact, of a parallel upward or downward shift of 100 basis points in relevant interest rate curves on the Group’s net Interest Income and other comprehensive income for the next twelve months from the reporting date, based on the Group’s positions of interest-earning assets and interest-bearing liabilities at the end of each reporting period. This analysis assumes that interest rates of all maturities move by the same amount, and does not reflect the potential impact of unparalleled yield curve movements.
The sensitivity analysis on net interest income is based on reasonably possible changes in interest rates with the assumption that the structure of financial assets and financial liabilities held at the period end remains unchanged, and does not take changes in customer behavior, basis risk or any prepayment options on debt securities into consideration.
The sensitivity analysis on other comprehensive income reflects only the effect of changes in fair value of those financial instruments classified as other debt instrument and other equity investments at fair value through other comprehensive income held, whose fair value changes are recorded as an element of other comprehensive income.
30 June 2019 31 December 2018
Net interest income
Other comprehensive
incomeNet interest
income
Other comprehensive
income+100 basis points (52,914) (43,583) (24,024) (67,879)– 100 basis points 52,914 43,583 24,024 67,879
The assumptions do not reflect actions that might be taken under the Group’s capital and interest rate risk management policy to mitigate changes to the Group’s interest rate risk. Therefore the above analysis may differ from the actual situation.
In addition, the presentation of interest rate sensitivity above is for illustration purposes only, showing the potential impact on net interest income and other comprehensive income of the Group under different parallel yield curve movements, relative to their position at period-end, excluding the derivative positions.
47.4 Insurance risk
The Group engages in its insurance business primarily in Mainland China. Insurance risk refers to the financial impact resulting from the unexpected occurrence of insured events. These risks are actively managed by the Group through effective sales management, underwriting control, reinsurance management and claim management. Through effective sales management, the risk of mis-selling could be reduced and the accuracy of information used for underwriting is improved. Through underwriting control, risk of adverse selection could be reduced and moreover differential pricing policy based on the level of each kind of risk could be utilized. Through reinsurance, the Group’s insurance capacity could be enhanced and targeted risks could be mitigated. Effective claims management is designed to ensure that insurance payments are controlled according to established criteria.
Uncertainty in the estimation of future benefit payments and premium receipts for long-term life insurance contracts arises from the unpredictability of long-term changes in overall levels of mortality. The Group conducts experience analysis of mortality rate and surrender rate, in order to improve its risk assessment and as a basis for reasonable estimates.
239Interim Report 2019
Notes to the Condensed Consolidated Interim Financial StatementsFor the six months ended 30 June 2019(Amounts in millions of Renminbi, unless otherwise stated)
48 CAPITAL MANAGEMENT
The Group’s capital management objectives are as follows:
— maintain an adequate capital base to support the development of its business;
— support the Group’s financial stability and profitable growth;
— allocate capital through an efficient and risk based approach to optimize risk-adjusted return to
shareholders; and
— safeguard the long-term sustainability of the Group’s franchise so that it can continue to provide sufficient
shareholder returns and benefits for other stakeholders.
The “Capital Rules for Commercial Banks (Provisional)” issued by the CBIRC in 2012 includes, among other
things, requirements for minimum capital, capital conservation buffer, additional capital surcharge for
systemically important banks, countercyclical buffer and Pillar II capital as follows:
— minimum regulatory requirements for Common Equity Tier-one Capital Adequacy Ratio, Tier-one Capital
Adequacy Ratio and Capital Adequacy Ratio are 5%, 6% and 8%, respectively;
— capital conservation buffer requires additional 2.5% of Common Equity Tier-one Capital Adequacy Ratio;
— additional capital surcharge for systemically important banks requires additional 1% of Common Equity
Tier-one Capital Adequacy Ratio;
— should the regulators require countercyclical buffer under particular circumstances or regulators impose
additional Pillar II capital requirements for specific banks, these requirements shall be met within the
specified time limits.
In April 2014, the CBIRC officially approved the Group to adopt advanced capital management approach. Within
the scope of the approval, the Internal Ratings-Based approach is adopted to Credit Risk-weighted Assets for
both retail and non-retail risk exposures, and the Standardized approach for both Operational Risk-weighted
Assets and Market Risk-weighted Assets. The CBIRC will determine the parallel run period for the Group,
which should last for at least three years. During the parallel run period, the Group should calculate its Capital
Adequacy Ratios under the advanced approach and the non-advanced approach, and should conform to the
capital floor requirements as stipulated in the “Capital Rules for Commercial Banks (Provisional)”.
In January 2017, the CBIRC has officially approved the Group to adopt the Internal Models approach to measure
its Market Risk-weighted Assets for qualified risk exposures.
Capital adequacy and the utilization of regulatory capital are closely monitored by the Group’s management in
accordance with the guidelines developed by the Basel Committee and relevant regulations promulgated by the
CBIRC. Required information related to capital levels and utilization is filed quarterly with the CBIRC.
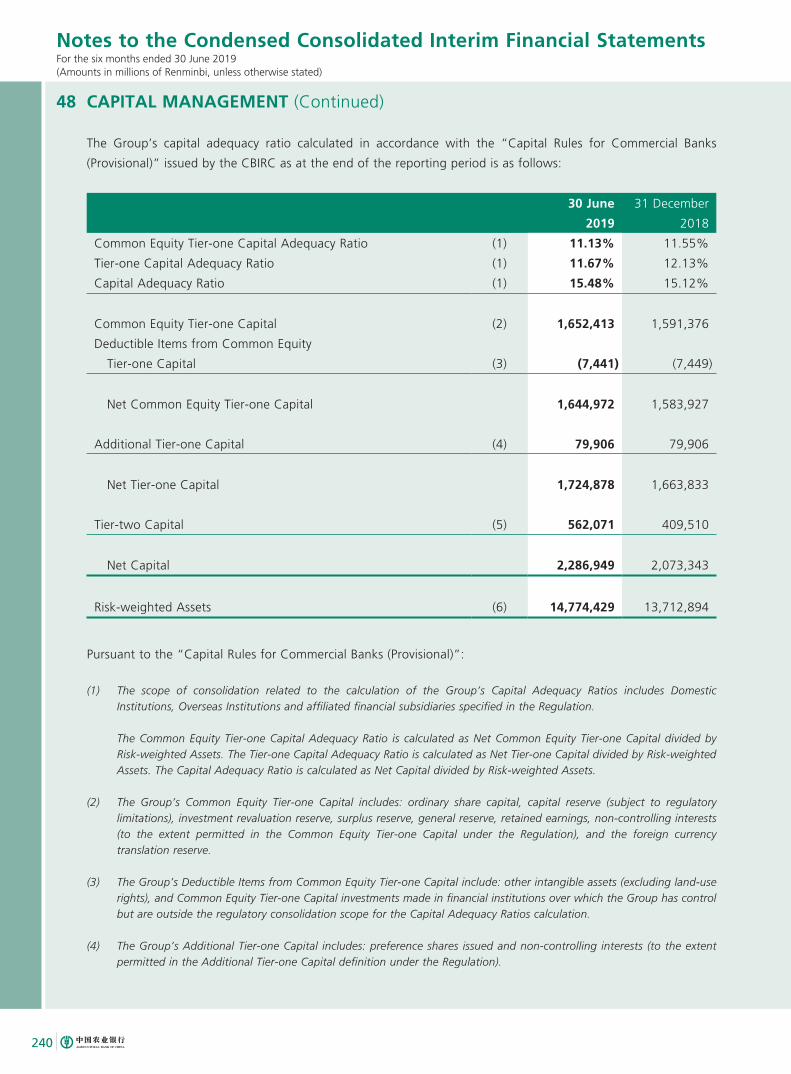
240
Notes to the Condensed Consolidated Interim Financial StatementsFor the six months ended 30 June 2019(Amounts in millions of Renminbi, unless otherwise stated)
48 CAPITAL MANAGEMENT (Continued)
The Group’s capital adequacy ratio calculated in accordance with the “Capital Rules for Commercial Banks
(Provisional)” issued by the CBIRC as at the end of the reporting period is as follows:
30 June
2019
31 December
2018
Common Equity Tier-one Capital Adequacy Ratio (1) 11.13% 11.55%
Tier-one Capital Adequacy Ratio (1) 11.67% 12.13%
Capital Adequacy Ratio (1) 15.48% 15.12%
Common Equity Tier-one Capital (2) 1,652,413 1,591,376
Deductible Items from Common Equity
Tier-one Capital (3) (7,441) (7,449)
Net Common Equity Tier-one Capital 1,644,972 1,583,927
Additional Tier-one Capital (4) 79,906 79,906
Net Tier-one Capital 1,724,878 1,663,833
Tier-two Capital (5) 562,071 409,510
Net Capital 2,286,949 2,073,343
Risk-weighted Assets (6) 14,774,429 13,712,894
Pursuant to the “Capital Rules for Commercial Banks (Provisional)”:
(1) The scope of consolidation related to the calculation of the Group’s Capital Adequacy Ratios includes Domestic Institutions, Overseas Institutions and affiliated financial subsidiaries specified in the Regulation.
The Common Equity Tier-one Capital Adequacy Ratio is calculated as Net Common Equity Tier-one Capital divided by Risk-weighted Assets. The Tier-one Capital Adequacy Ratio is calculated as Net Tier-one Capital divided by Risk-weighted Assets. The Capital Adequacy Ratio is calculated as Net Capital divided by Risk-weighted Assets.
(2) The Group’s Common Equity Tier-one Capital includes: ordinary share capital, capital reserve (subject to regulatory limitations), investment revaluation reserve, surplus reserve, general reserve, retained earnings, non-controlling interests (to the extent permitted in the Common Equity Tier-one Capital under the Regulation), and the foreign currency translation reserve.
(3) The Group’s Deductible Items from Common Equity Tier-one Capital include: other intangible assets (excluding land-use rights), and Common Equity Tier-one Capital investments made in financial institutions over which the Group has control but are outside the regulatory consolidation scope for the Capital Adequacy Ratios calculation.
(4) The Group’s Additional Tier-one Capital includes: preference shares issued and non-controlling interests (to the extent permitted in the Additional Tier-one Capital definition under the Regulation).
241Interim Report 2019
Notes to the Condensed Consolidated Interim Financial StatementsFor the six months ended 30 June 2019(Amounts in millions of Renminbi, unless otherwise stated)
48 CAPITAL MANAGEMENT (Continued)
(5) The Group’s Tier-two Capital includes: Tier-two capital instruments and related premium (to the extent allowed under the Regulation), excessive allowance for loan losses, and minority interests (to the extent permitted in the Tier-two Capital definition under the Regulation).
(6) Risk-weighted Assets include Credit Risk-weighted Assets, Market Risk-weighted Assets and Operational Risk-weighted Assets.
49 FAIR VALUE OF FINANCIAL INSTRUMENTS
The majority of the Group’s assets and liabilities in the condensed consolidated interim statement of financial
position are financial assets and financial liabilities. Fair value measurement of non-financial assets and non-
financial liabilities do not have a material impact on the Group’s financial position and operations, taken as a
whole.
The Group does not have any financial assets or financial liabilities subject to non-recurring fair value
measurements for the years ended 30 June 2019 and 31 December 2018.
49.1 Valuation technique, input and process
The fair value of the Group’s financial assets and financial liabilities are determined as follows:
— If traded in active markets, fair values of financial assets and financial liabilities with standard terms
and conditions are determined with reference to quoted market bid prices and ask prices, respectively;
— If not traded in active markets, fair values of financial assets and financial liabilities are determined by
using valuation techniques. These valuation techniques include the use of recent transaction prices of
the same or similar instruments, discounted cash flow analysis and generally accepted pricing models.
The Group has established an independent valuation process for financial assets and financial liabilities. The
Financial Accounting Department of head office establishes the valuation models for financial assets and
financial liabilities of head office and its branches in China and independently implements the valuation on
a regular basis; and the Risk Management Department is responsible for validating the valuation model,
the Operations Departments records the accounting for these items. Overseas branches and sub-branches
designate departments or personnel that are independent from the front trading office to perform
valuation in accordance with the local regulatory requirements and their own department settings.
The board of directors shall be responsible for establishing and improving the internal control system
related to the valuation of financial instruments and approving valuation policies.
During the interim period, there was no significant change in the valuation techniques or inputs used to
determine fair value measurements.
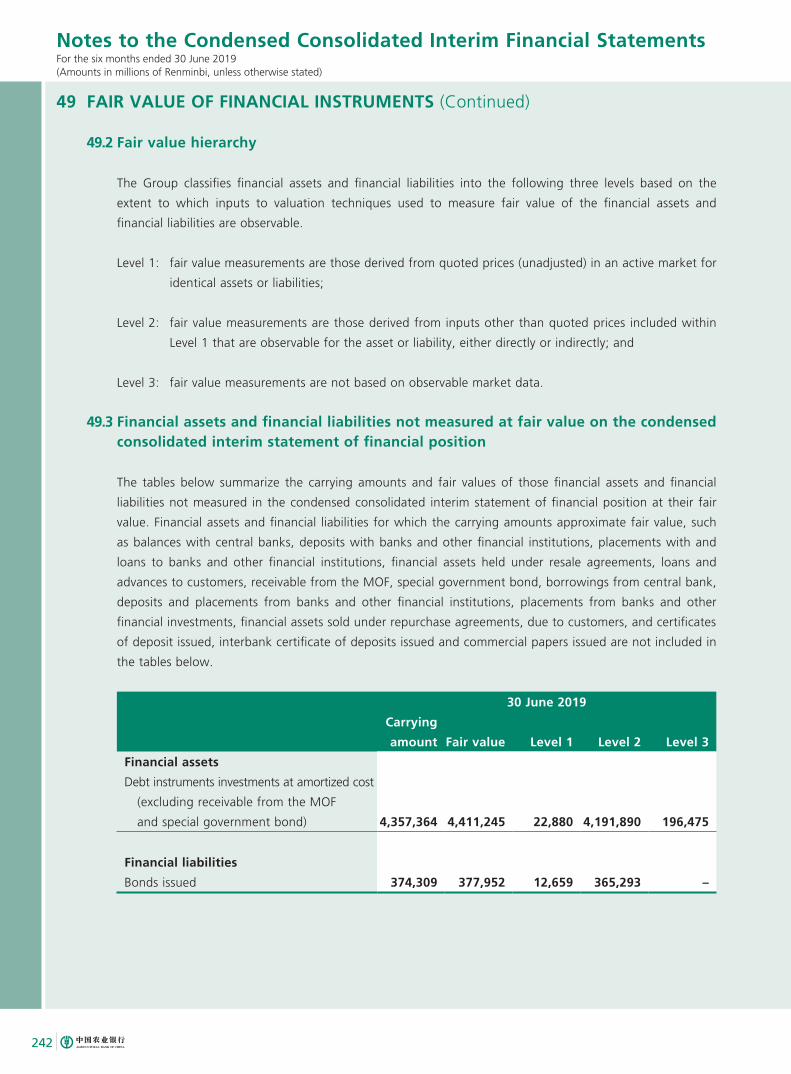
242
Notes to the Condensed Consolidated Interim Financial StatementsFor the six months ended 30 June 2019(Amounts in millions of Renminbi, unless otherwise stated)
49 FAIR VALUE OF FINANCIAL INSTRUMENTS (Continued)
49.2 Fair value hierarchy
The Group classifies financial assets and financial liabilities into the following three levels based on the
extent to which inputs to valuation techniques used to measure fair value of the financial assets and
financial liabilities are observable.
Level 1: fair value measurements are those derived from quoted prices (unadjusted) in an active market for
identical assets or liabilities;
Level 2: fair value measurements are those derived from inputs other than quoted prices included within
Level 1 that are observable for the asset or liability, either directly or indirectly; and
Level 3: fair value measurements are not based on observable market data.
49.3 Financial assets and financial liabilities not measured at fair value on the condensed consolidated interim statement of financial position
The tables below summarize the carrying amounts and fair values of those financial assets and financial
liabilities not measured in the condensed consolidated interim statement of financial position at their fair
value. Financial assets and financial liabilities for which the carrying amounts approximate fair value, such
as balances with central banks, deposits with banks and other financial institutions, placements with and
loans to banks and other financial institutions, financial assets held under resale agreements, loans and
advances to customers, receivable from the MOF, special government bond, borrowings from central bank,
deposits and placements from banks and other financial institutions, placements from banks and other
financial investments, financial assets sold under repurchase agreements, due to customers, and certificates
of deposit issued, interbank certificate of deposits issued and commercial papers issued are not included in
the tables below.
30 June 2019
Carrying
amount Fair value Level 1 Level 2 Level 3
Financial assets
Debt instruments investments at amortized cost
(excluding receivable from the MOF
and special government bond) 4,357,364 4,411,245 22,880 4,191,890 196,475
Financial liabilities
Bonds issued 374,309 377,952 12,659 365,293 –
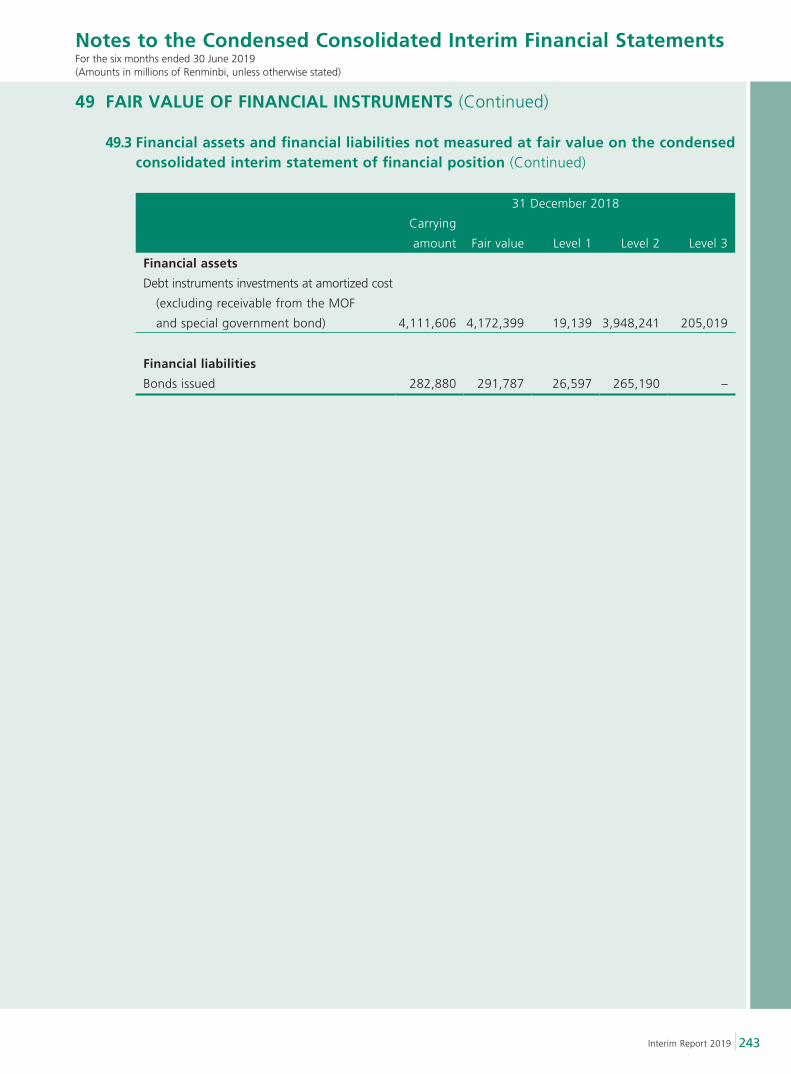
243Interim Report 2019
Notes to the Condensed Consolidated Interim Financial StatementsFor the six months ended 30 June 2019(Amounts in millions of Renminbi, unless otherwise stated)
49 FAIR VALUE OF FINANCIAL INSTRUMENTS (Continued)
49.3 Financial assets and financial liabilities not measured at fair value on the condensed consolidated interim statement of financial position (Continued)
31 December 2018
Carrying
amount Fair value Level 1 Level 2 Level 3
Financial assets
Debt instruments investments at amortized cost
(excluding receivable from the MOF
and special government bond) 4,111,606 4,172,399 19,139 3,948,241 205,019
Financial liabilities
Bonds issued 282,880 291,787 26,597 265,190 –
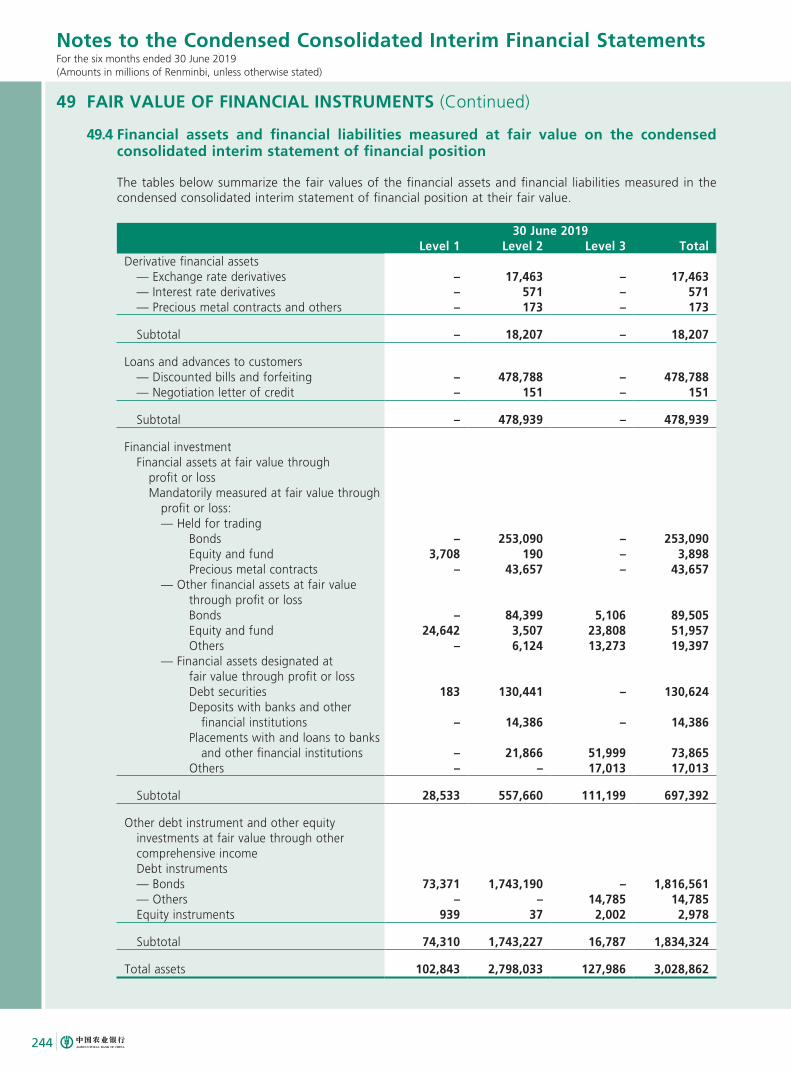
244
Notes to the Condensed Consolidated Interim Financial StatementsFor the six months ended 30 June 2019(Amounts in millions of Renminbi, unless otherwise stated)
49 FAIR VALUE OF FINANCIAL INSTRUMENTS (Continued)
49.4 Financial assets and financial liabilities measured at fair value on the condensed consolidated interim statement of financial position
The tables below summarize the fair values of the financial assets and financial liabilities measured in the condensed consolidated interim statement of financial position at their fair value.
30 June 2019Level 1 Level 2 Level 3 Total
Derivative financial assets — Exchange rate derivatives – 17,463 – 17,463 — Interest rate derivatives – 571 – 571 — Precious metal contracts and others – 173 – 173
Subtotal – 18,207 – 18,207
Loans and advances to customers — Discounted bills and forfeiting – 478,788 – 478,788 — Negotiation letter of credit – 151 – 151
Subtotal – 478,939 – 478,939
Financial investment Financial assets at fair value through profit or loss Mandatorily measured at fair value through profit or loss: — Held for trading Bonds – 253,090 – 253,090 Equity and fund 3,708 190 – 3,898 Precious metal contracts – 43,657 – 43,657 — Other financial assets at fair value through profit or loss Bonds – 84,399 5,106 89,505 Equity and fund 24,642 3,507 23,808 51,957 Others – 6,124 13,273 19,397 — Financial assets designated at fair value through profit or loss Debt securities 183 130,441 – 130,624 Deposits with banks and other financial institutions – 14,386 – 14,386 Placements with and loans to banks and other financial institutions – 21,866 51,999 73,865 Others – – 17,013 17,013
Subtotal 28,533 557,660 111,199 697,392
Other debt instrument and other equity investments at fair value through other comprehensive income Debt instruments — Bonds 73,371 1,743,190 – 1,816,561 — Others – – 14,785 14,785 Equity instruments 939 37 2,002 2,978
Subtotal 74,310 1,743,227 16,787 1,834,324
Total assets 102,843 2,798,033 127,986 3,028,862
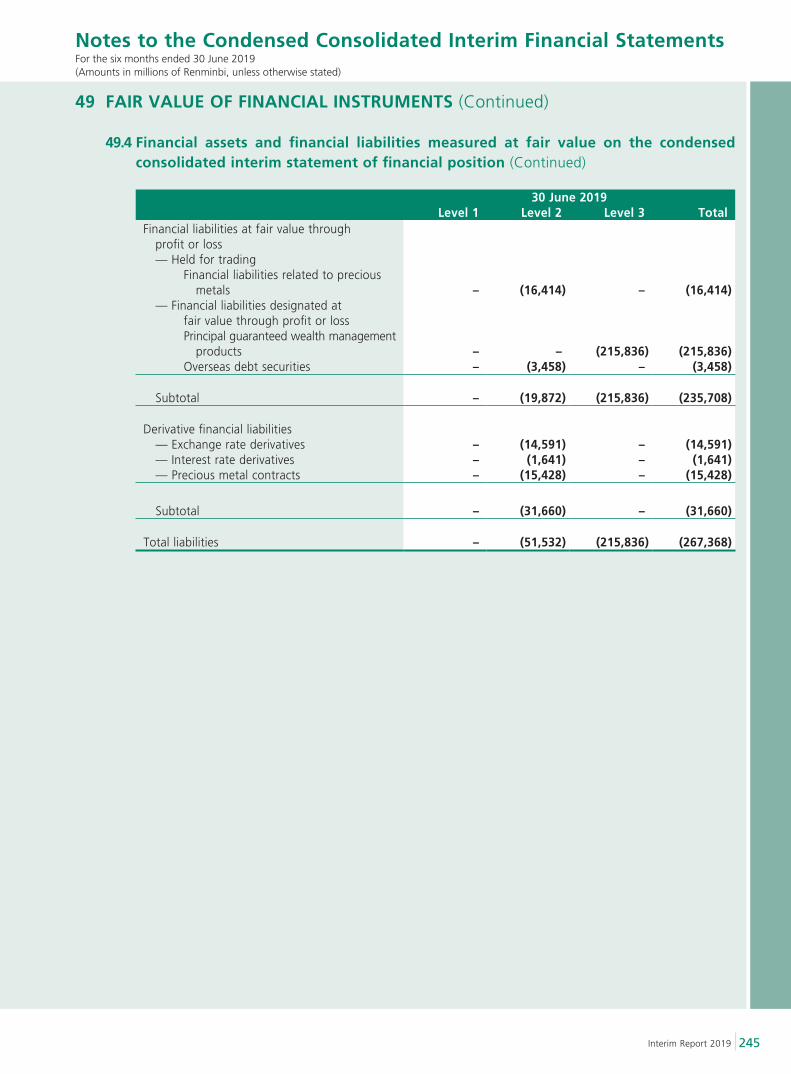
245Interim Report 2019
Notes to the Condensed Consolidated Interim Financial StatementsFor the six months ended 30 June 2019(Amounts in millions of Renminbi, unless otherwise stated)
30 June 2019Level 1 Level 2 Level 3 Total
Financial liabilities at fair value through profit or loss — Held for trading Financial liabilities related to precious metals – (16,414) – (16,414) — Financial liabilities designated at fair value through profit or loss Principal guaranteed wealth management products – – (215,836) (215,836) Overseas debt securities – (3,458) – (3,458)
Subtotal – (19,872) (215,836) (235,708)
Derivative financial liabilities — Exchange rate derivatives – (14,591) – (14,591) — Interest rate derivatives – (1,641) – (1,641) — Precious metal contracts – (15,428) – (15,428)
Subtotal – (31,660) – (31,660)
Total liabilities – (51,532) (215,836) (267,368)
49 FAIR VALUE OF FINANCIAL INSTRUMENTS (Continued)
49.4 Financial assets and financial liabilities measured at fair value on the condensed consolidated interim statement of financial position (Continued)
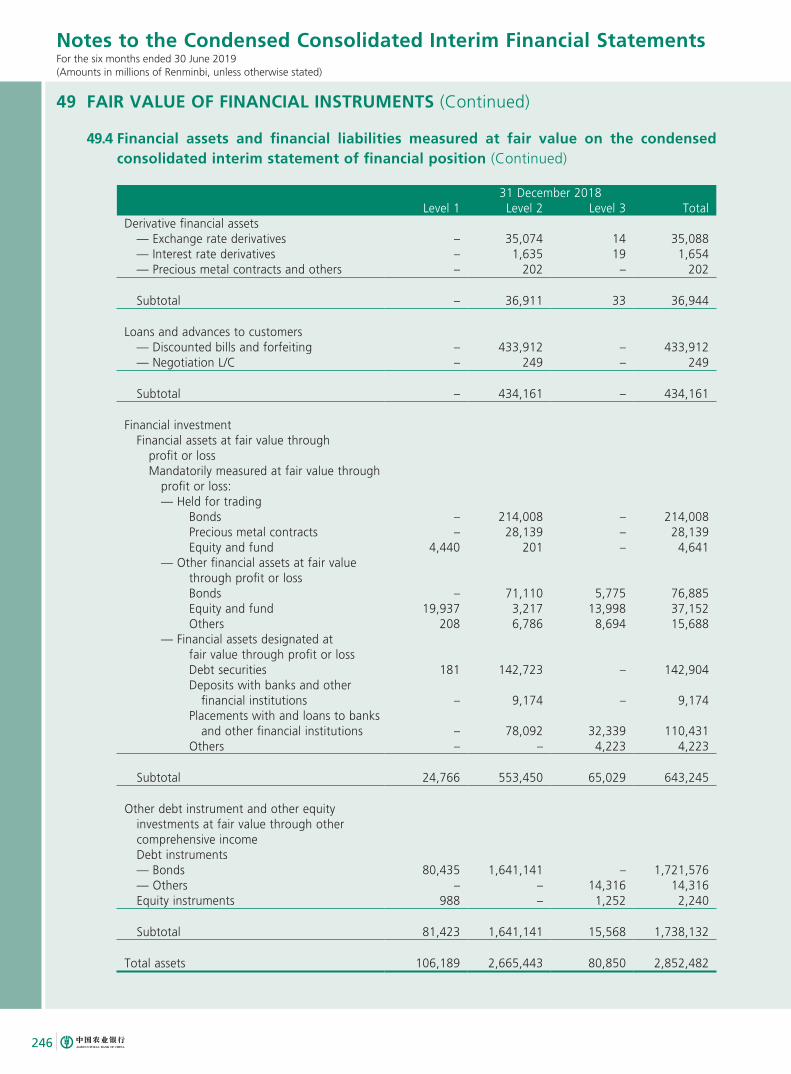
246
Notes to the Condensed Consolidated Interim Financial StatementsFor the six months ended 30 June 2019(Amounts in millions of Renminbi, unless otherwise stated)
49 FAIR VALUE OF FINANCIAL INSTRUMENTS (Continued)
49.4 Financial assets and financial liabilities measured at fair value on the condensed consolidated interim statement of financial position (Continued)
31 December 2018Level 1 Level 2 Level 3 Total
Derivative financial assets — Exchange rate derivatives – 35,074 14 35,088 — Interest rate derivatives – 1,635 19 1,654 — Precious metal contracts and others – 202 – 202
Subtotal – 36,911 33 36,944
Loans and advances to customers — Discounted bills and forfeiting – 433,912 – 433,912 — Negotiation L/C – 249 – 249
Subtotal – 434,161 – 434,161
Financial investment Financial assets at fair value through profit or loss Mandatorily measured at fair value through profit or loss: — Held for trading Bonds – 214,008 – 214,008 Precious metal contracts – 28,139 – 28,139 Equity and fund 4,440 201 – 4,641 — Other financial assets at fair value through profit or loss Bonds – 71,110 5,775 76,885 Equity and fund 19,937 3,217 13,998 37,152 Others 208 6,786 8,694 15,688 — Financial assets designated at fair value through profit or loss Debt securities 181 142,723 – 142,904 Deposits with banks and other financial institutions – 9,174 – 9,174 Placements with and loans to banks and other financial institutions – 78,092 32,339 110,431 Others – – 4,223 4,223
Subtotal 24,766 553,450 65,029 643,245
Other debt instrument and other equity investments at fair value through other comprehensive income Debt instruments — Bonds 80,435 1,641,141 – 1,721,576 — Others – – 14,316 14,316 Equity instruments 988 – 1,252 2,240
Subtotal 81,423 1,641,141 15,568 1,738,132
Total assets 106,189 2,665,443 80,850 2,852,482
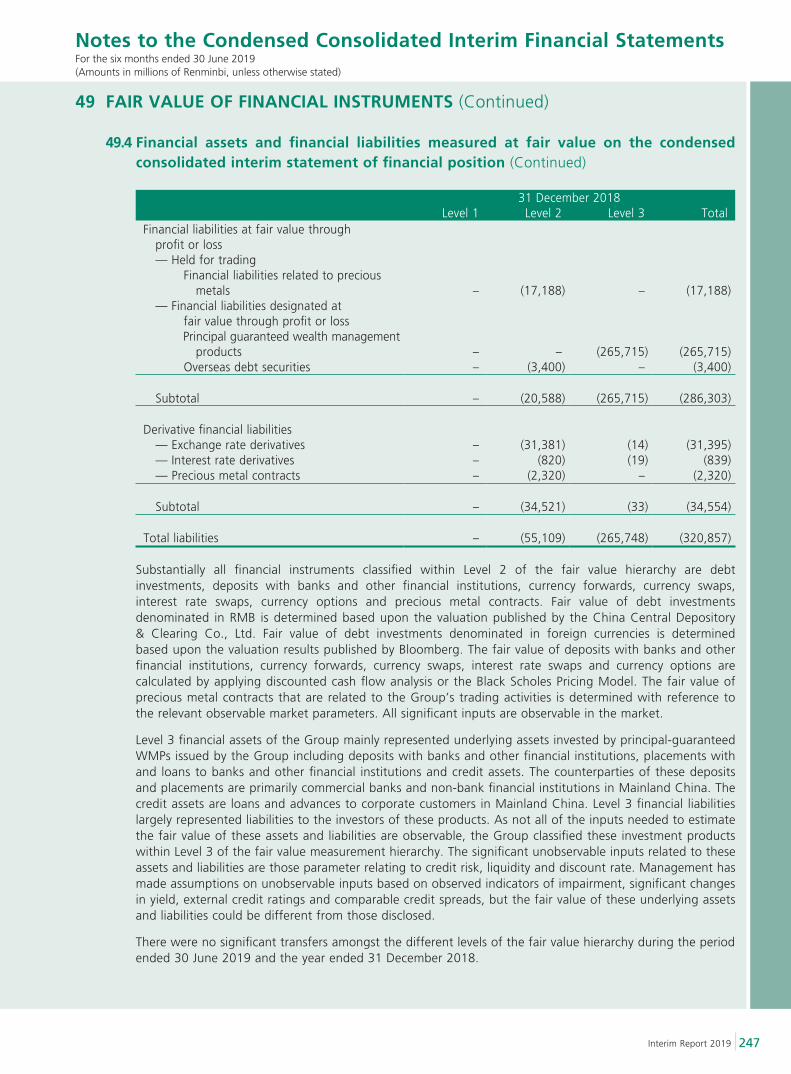
247Interim Report 2019
Notes to the Condensed Consolidated Interim Financial StatementsFor the six months ended 30 June 2019(Amounts in millions of Renminbi, unless otherwise stated)
31 December 2018Level 1 Level 2 Level 3 Total
Financial liabilities at fair value through profit or loss — Held for trading Financial liabilities related to precious metals – (17,188) – (17,188) — Financial liabilities designated at fair value through profit or loss Principal guaranteed wealth management products – – (265,715) (265,715) Overseas debt securities – (3,400) – (3,400)
Subtotal – (20,588) (265,715) (286,303)
Derivative financial liabilities — Exchange rate derivatives – (31,381) (14) (31,395) — Interest rate derivatives – (820) (19) (839) — Precious metal contracts – (2,320) – (2,320)
Subtotal – (34,521) (33) (34,554)
Total liabilities – (55,109) (265,748) (320,857)
Substantially all financial instruments classified within Level 2 of the fair value hierarchy are debt investments, deposits with banks and other financial institutions, currency forwards, currency swaps, interest rate swaps, currency options and precious metal contracts. Fair value of debt investments denominated in RMB is determined based upon the valuation published by the China Central Depository & Clearing Co., Ltd. Fair value of debt investments denominated in foreign currencies is determined based upon the valuation results published by Bloomberg. The fair value of deposits with banks and other financial institutions, currency forwards, currency swaps, interest rate swaps and currency options are calculated by applying discounted cash flow analysis or the Black Scholes Pricing Model. The fair value of precious metal contracts that are related to the Group’s trading activities is determined with reference to the relevant observable market parameters. All significant inputs are observable in the market.
Level 3 financial assets of the Group mainly represented underlying assets invested by principal-guaranteed WMPs issued by the Group including deposits with banks and other financial institutions, placements with and loans to banks and other financial institutions and credit assets. The counterparties of these deposits and placements are primarily commercial banks and non-bank financial institutions in Mainland China. The credit assets are loans and advances to corporate customers in Mainland China. Level 3 financial liabilities largely represented liabilities to the investors of these products. As not all of the inputs needed to estimate the fair value of these assets and liabilities are observable, the Group classified these investment products within Level 3 of the fair value measurement hierarchy. The significant unobservable inputs related to these assets and liabilities are those parameter relating to credit risk, liquidity and discount rate. Management has made assumptions on unobservable inputs based on observed indicators of impairment, significant changes in yield, external credit ratings and comparable credit spreads, but the fair value of these underlying assets and liabilities could be different from those disclosed.
There were no significant transfers amongst the different levels of the fair value hierarchy during the period ended 30 June 2019 and the year ended 31 December 2018.
49 FAIR VALUE OF FINANCIAL INSTRUMENTS (Continued)
49.4 Financial assets and financial liabilities measured at fair value on the condensed consolidated interim statement of financial position (Continued)
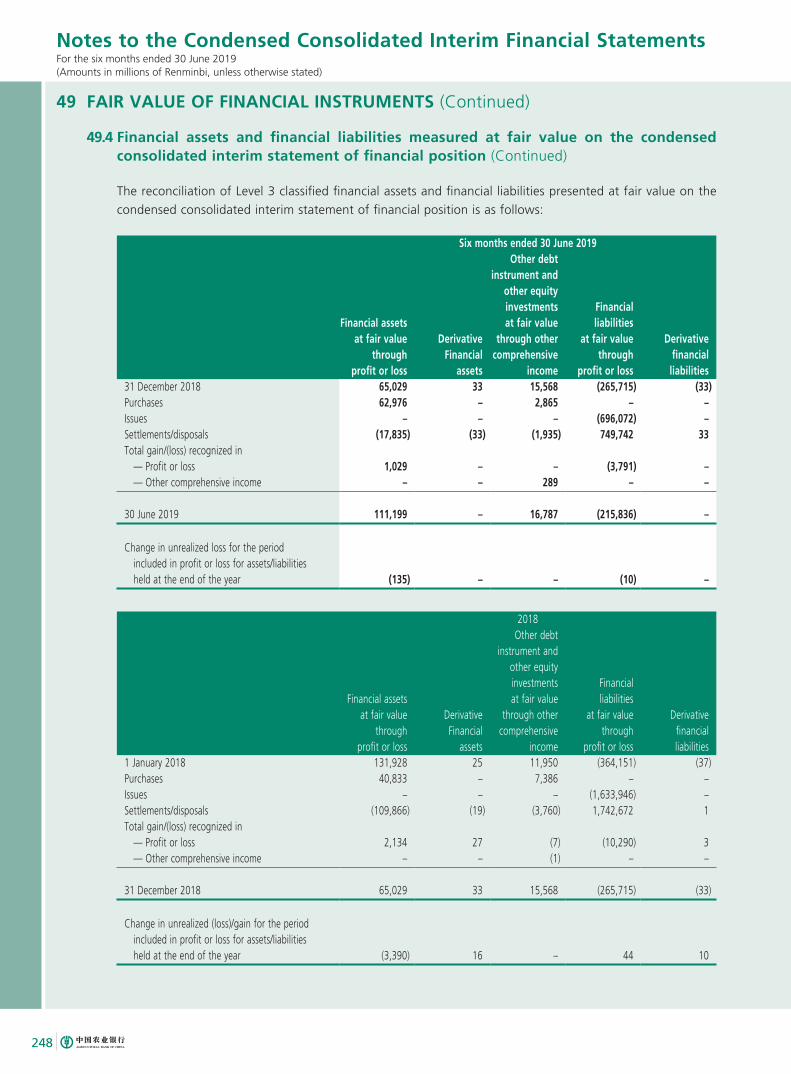
248
Notes to the Condensed Consolidated Interim Financial StatementsFor the six months ended 30 June 2019(Amounts in millions of Renminbi, unless otherwise stated)
49 FAIR VALUE OF FINANCIAL INSTRUMENTS (Continued)
49.4 Financial assets and financial liabilities measured at fair value on the condensed consolidated interim statement of financial position (Continued)
The reconciliation of Level 3 classified financial assets and financial liabilities presented at fair value on the
condensed consolidated interim statement of financial position is as follows:
Six months ended 30 June 2019
Financial assets at fair value
through profit or loss
Derivative Financial
assets
Other debt instrument and
other equity investments at fair value
through other comprehensive
income
Financial liabilities
at fair value through
profit or loss
Derivative financial liabilities
31 December 2018 65,029 33 15,568 (265,715) (33)Purchases 62,976 – 2,865 – –Issues – – – (696,072) –Settlements/disposals (17,835) (33) (1,935) 749,742 33Total gain/(loss) recognized in — Profit or loss 1,029 – – (3,791) – — Other comprehensive income – – 289 – –
30 June 2019 111,199 – 16,787 (215,836) –
Change in unrealized loss for the period included in profit or loss for assets/liabilities held at the end of the year (135) – – (10) –
2018
Financial assets at fair value
through profit or loss
Derivative Financial
assets
Other debt instrument and
other equity investments at fair value
through other comprehensive
income
Financial liabilities
at fair value through
profit or loss
Derivative financial liabilities
1 January 2018 131,928 25 11,950 (364,151) (37)Purchases 40,833 – 7,386 – –Issues – – – (1,633,946) –Settlements/disposals (109,866) (19) (3,760) 1,742,672 1Total gain/(loss) recognized in — Profit or loss 2,134 27 (7) (10,290) 3 — Other comprehensive income – – (1) – –
31 December 2018 65,029 33 15,568 (265,715) (33)
Change in unrealized (loss)/gain for the period included in profit or loss for assets/liabilities held at the end of the year (3,390) 16 – 44 10
249Interim Report 2019
Notes to the Condensed Consolidated Interim Financial StatementsFor the six months ended 30 June 2019(Amounts in millions of Renminbi, unless otherwise stated)
49 FAIR VALUE OF FINANCIAL INSTRUMENTS (Continued)
49.4 Financial assets and financial liabilities measured at fair value on the condensed consolidated interim statement of financial position (Continued)
In Level 3 of the fair value hierarchy, total gains or losses included in profit or loss for the period are
presented in net gain on financial investments (Note 9) of the condensed consolidated interim income
statement.
50 EVENTS AFTER THE REPORTING PERIOD
The issuance of Undated Capital Bonds
In August 2019, The Bank issued Agricultural Bank of China Limited 2019 Undated Additional Tier 1 Capital
Bonds (Series 1) with the total amount of RMB85 billion. The proceeds from the issuance of the bonds will be
used to replenish the Bank’s additional Tier 1 capital.
51 COMPARATIVES
The comparative amounts of Net gain on financial investments, Net gain on derecognition of financial assets
measured at amortized cost, Operating expenses, Credit impairment losses, Impairment losses on other assets
and other comprehensive income have been reclassified to conform with the current period’s presentation.
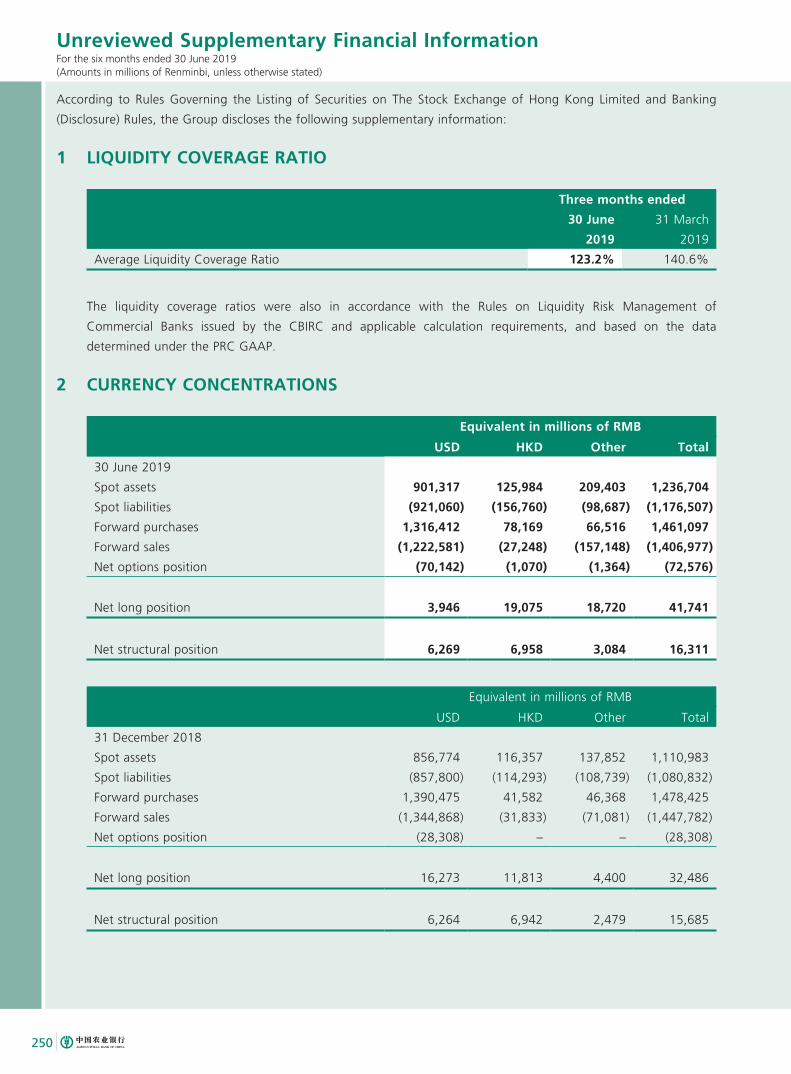
250
Unreviewed Supplementary Financial InformationFor the six months ended 30 June 2019(Amounts in millions of Renminbi, unless otherwise stated)
According to Rules Governing the Listing of Securities on The Stock Exchange of Hong Kong Limited and Banking
(Disclosure) Rules, the Group discloses the following supplementary information:
1 LIQUIDITY COVERAGE RATIO
Three months ended
30 June 31 March
2019 2019
Average Liquidity Coverage Ratio 123.2% 140.6%
The liquidity coverage ratios were also in accordance with the Rules on Liquidity Risk Management of
Commercial Banks issued by the CBIRC and applicable calculation requirements, and based on the data
determined under the PRC GAAP.
2 CURRENCY CONCENTRATIONS
Equivalent in millions of RMB
USD HKD Other Total
30 June 2019
Spot assets 901,317 125,984 209,403 1,236,704
Spot liabilities (921,060) (156,760) (98,687) (1,176,507)
Forward purchases 1,316,412 78,169 66,516 1,461,097
Forward sales (1,222,581) (27,248) (157,148) (1,406,977)
Net options position (70,142) (1,070) (1,364) (72,576)
Net long position 3,946 19,075 18,720 41,741
Net structural position 6,269 6,958 3,084 16,311
Equivalent in millions of RMB
USD HKD Other Total
31 December 2018
Spot assets 856,774 116,357 137,852 1,110,983
Spot liabilities (857,800) (114,293) (108,739) (1,080,832)
Forward purchases 1,390,475 41,582 46,368 1,478,425
Forward sales (1,344,868) (31,833) (71,081) (1,447,782)
Net options position (28,308) – – (28,308)
Net long position 16,273 11,813 4,400 32,486
Net structural position 6,264 6,942 2,479 15,685
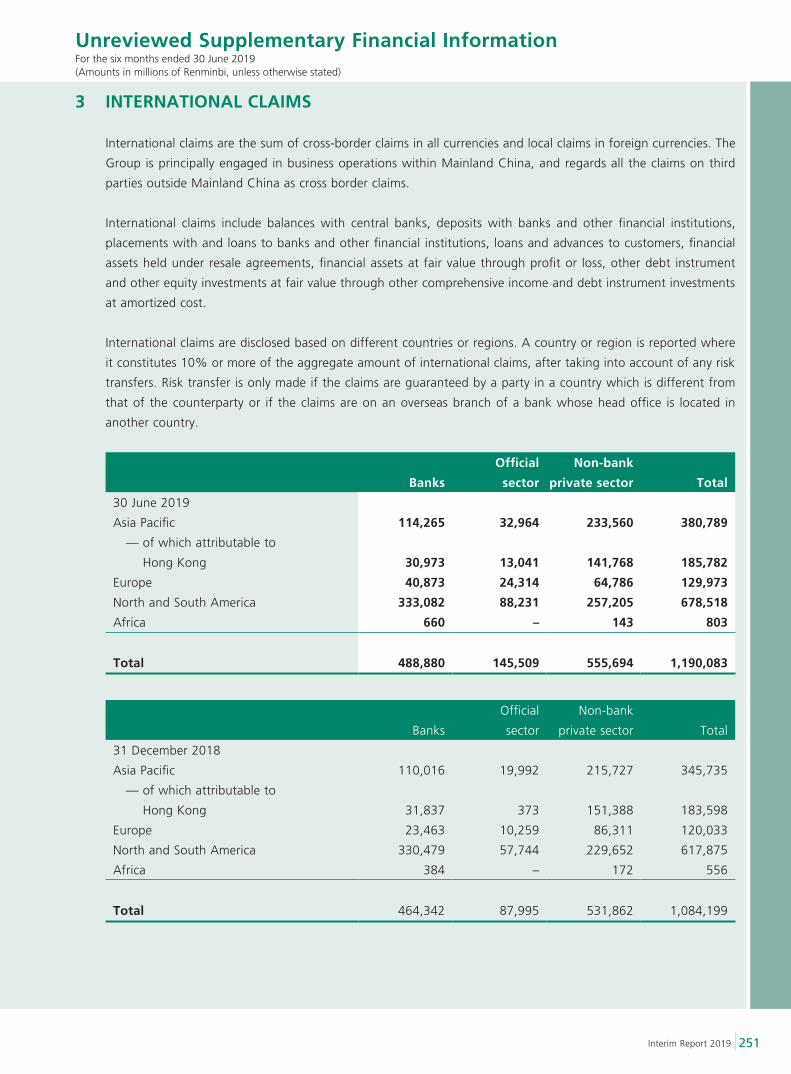
251Interim Report 2019
Unreviewed Supplementary Financial InformationFor the six months ended 30 June 2019(Amounts in millions of Renminbi, unless otherwise stated)
3 INTERNATIONAL CLAIMS
International claims are the sum of cross-border claims in all currencies and local claims in foreign currencies. The
Group is principally engaged in business operations within Mainland China, and regards all the claims on third
parties outside Mainland China as cross border claims.
International claims include balances with central banks, deposits with banks and other financial institutions,
placements with and loans to banks and other financial institutions, loans and advances to customers, financial
assets held under resale agreements, financial assets at fair value through profit or loss, other debt instrument
and other equity investments at fair value through other comprehensive income and debt instrument investments
at amortized cost.
International claims are disclosed based on different countries or regions. A country or region is reported where
it constitutes 10% or more of the aggregate amount of international claims, after taking into account of any risk
transfers. Risk transfer is only made if the claims are guaranteed by a party in a country which is different from
that of the counterparty or if the claims are on an overseas branch of a bank whose head office is located in
another country.
Banks
Official
sector
Non-bank
private sector Total
30 June 2019
Asia Pacific 114,265 32,964 233,560 380,789
— of which attributable to
Hong Kong 30,973 13,041 141,768 185,782
Europe 40,873 24,314 64,786 129,973
North and South America 333,082 88,231 257,205 678,518
Africa 660 – 143 803
Total 488,880 145,509 555,694 1,190,083
Banks
Official
sector
Non-bank
private sector Total
31 December 2018
Asia Pacific 110,016 19,992 215,727 345,735
— of which attributable to
Hong Kong 31,837 373 151,388 183,598
Europe 23,463 10,259 86,311 120,033
North and South America 330,479 57,744 229,652 617,875
Africa 384 – 172 556
Total 464,342 87,995 531,862 1,084,199
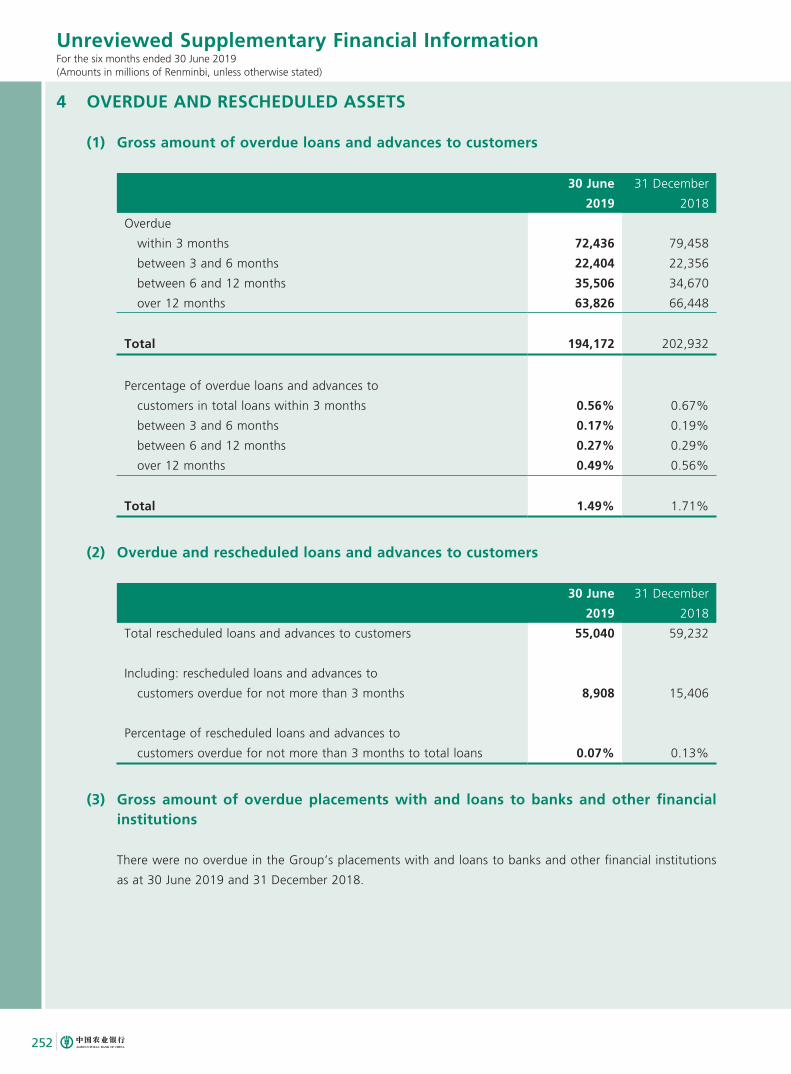
252
Unreviewed Supplementary Financial InformationFor the six months ended 30 June 2019(Amounts in millions of Renminbi, unless otherwise stated)
4 OVERDUE AND RESCHEDULED ASSETS
(1) Gross amount of overdue loans and advances to customers
30 June 31 December
2019 2018
Overdue
within 3 months 72,436 79,458
between 3 and 6 months 22,404 22,356
between 6 and 12 months 35,506 34,670
over 12 months 63,826 66,448
Total 194,172 202,932
Percentage of overdue loans and advances to
customers in total loans within 3 months 0.56% 0.67%
between 3 and 6 months 0.17% 0.19%
between 6 and 12 months 0.27% 0.29%
over 12 months 0.49% 0.56%
Total 1.49% 1.71%
(2) Overdue and rescheduled loans and advances to customers
30 June 31 December
2019 2018
Total rescheduled loans and advances to customers 55,040 59,232
Including: rescheduled loans and advances to
customers overdue for not more than 3 months 8,908 15,406
Percentage of rescheduled loans and advances to
customers overdue for not more than 3 months to total loans 0.07% 0.13%
(3) Gross amount of overdue placements with and loans to banks and other financial institutions
There were no overdue in the Group’s placements with and loans to banks and other financial institutions
as at 30 June 2019 and 31 December 2018.

2019Interim Report
(A joint stock company incorporated in the People's Republic of China with limited liability)Stock Code: 1288
JOINT DEDICATION
TO BUILDA BEAUTIFUL
CHINA
INTERIMREPORT2019
Add: No.69, Jianguomen Nei Avenue, Dongcheng District, Beijing, P.R. ChinaPostal Code: 100005 Tel: 86-10-85108888
http://www.abchina.com


