Embed Size (px)
Citation preview

J A N E F R A S E RC H I E F E X EC U T I V E O F F I C E R, C I T I
1
I N V E S T O R D AY
PROPRIETARY AND PROTECTED INFORMATION. MAY NOT BE COPIED, SHARED OR DISTRIBUTED WITHOUT CITIGROUP WRITTEN CONSENT. ©2022 CITIGROUP INC.
Improve Business Mix, Leverage Synergies, Deliver Growth
Modernize Our Bank
Create a Winning Culture
The Path to Improved Performance
3

Be the preeminent banking partner for institutions with cross-borderneeds, a global leader in wealth management and a valuedpersonal bank in our home market
4

Leading with Our Core Competitive Advantage
from clients operating in
comes from MNCs that operate85% of network revenue
over 10countries
Bank92%Fortune 500
of the
beyond the top 60GDP countries
2X revenue
SEAMLESSDIFFERENTIATED
CONNECTEDADAPTABLE
Network Mindset
5
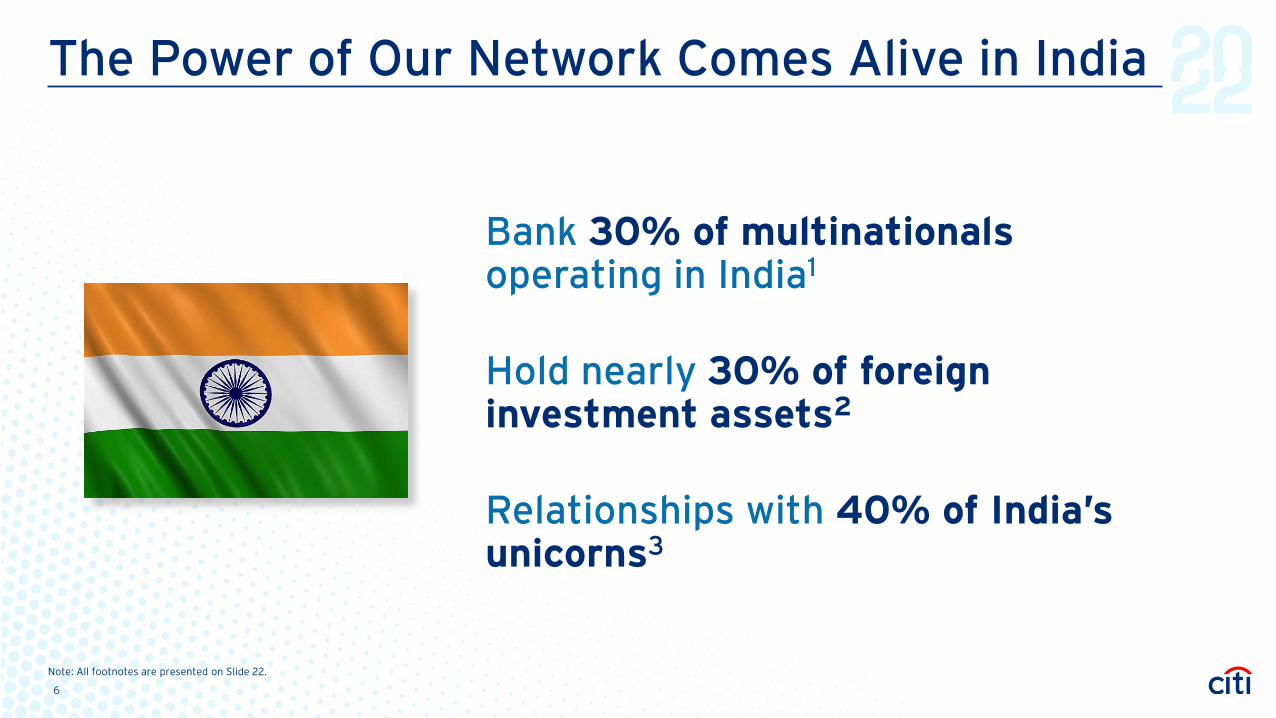
The Power of Our Network Comes Alive in India
Bank 30% of multinationals operating in India1
Hold nearly 30% of foreign investment assets2
Relationships with 40% of India’s unicorns3
6
Note: All footnotes are presented on Slide 22.

5 Core
Interconnected
Businesses
F O C U S E D S T R AT E GY
Services
Markets
Banking
Global Wealth Management
U.S. Personal Banking
7
Note: All footnotes are presented on Slide 22.

KEY PERFORMANCE INDICATORS
• Drives network value
• +$300B wallet; sticky relationships
• Invest for continued leadership; grow with new client segments
F O C U S E D S T R AT E GY
Services
Treasury and Trade Solutions
Securities Services
#1 in Treasury and Trade Solutions1
#4 in Securities Services2 Treasury and Trade Solutions• Average Deposits
• USD Clearing Volume3
• Cross-Border Transaction Value4
Securities Services• Assets Under Custody / Assets
Under Administration5
• Deposits
8
Note: All footnotes are presented on Slide 22.

F O C U S E D S T R AT E GY
Markets
Fixed Income
Equities
#4 in Markets1
#2 in Fixed Income2
#5 in Equities3
• Maintain leadership in top FICC franchise; continue to grow Equities
• Emphasize profitability
• Maximize linkages across ICG
KEY PERFORMANCE INDICATORS
• Revenue / RWA
• Fixed Income Wallet Share
• Equities Wallet Share
9
Note: All footnotes are presented on Slide 22.
F O C U S E D S T R AT E GY
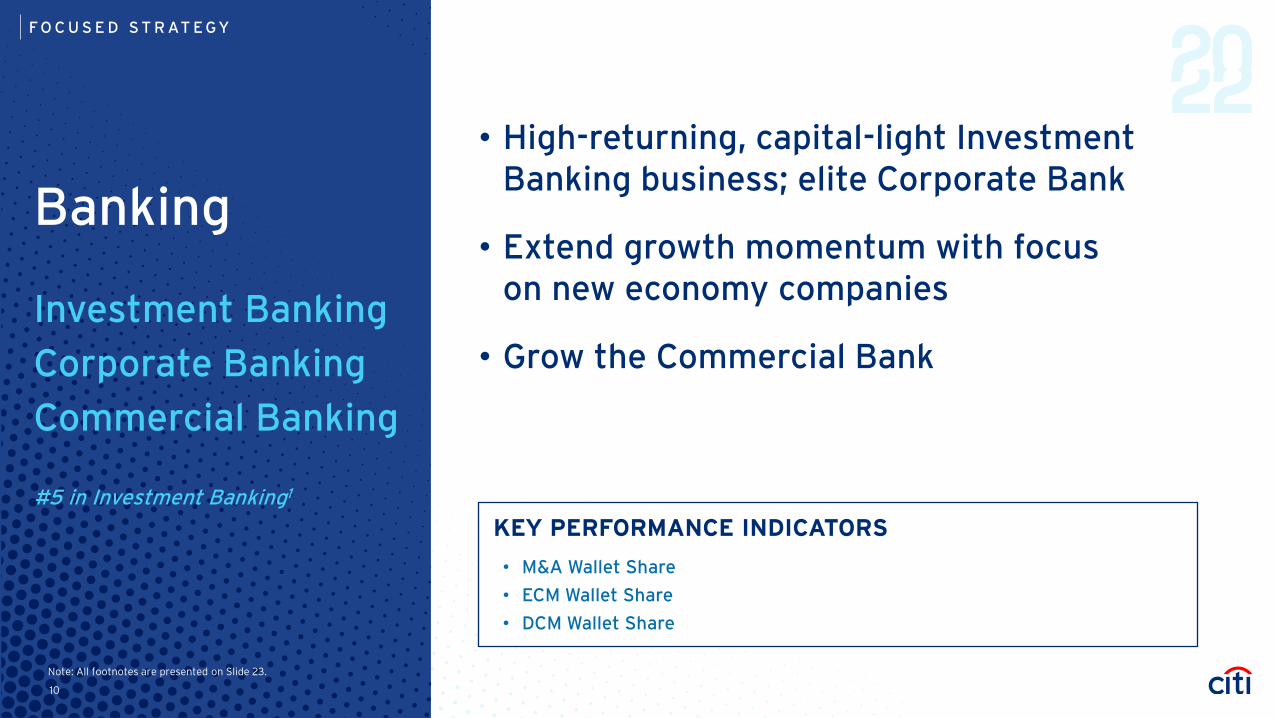
Banking
Investment Banking
Corporate Banking
Commercial Banking
#5 in Investment Banking1
• High-returning, capital-light Investment Banking business; elite Corporate Bank
• Extend growth momentum with focus on new economy companies
• Grow the Commercial Bank
KEY PERFORMANCE INDICATORS
• M&A Wallet Share
• ECM Wallet Share
• DCM Wallet Share
10
Note: All footnotes are presented on Slide 23.
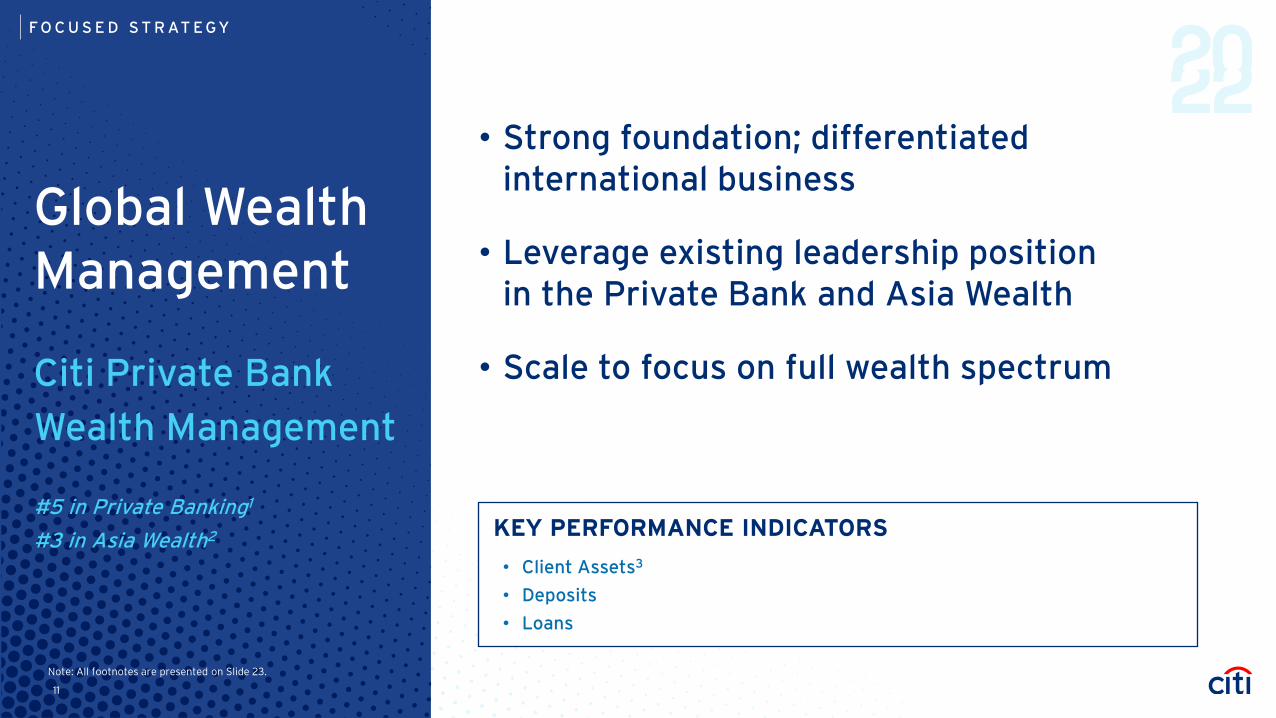
F O C U S E D S T R AT E GY
Global Wealth Management
Citi Private Bank
Wealth Management
#5 in Private Banking1
#3 in Asia Wealth2
• Strong foundation; differentiated international business
• Leverage existing leadership position in the Private Bank and Asia Wealth
• Scale to focus on full wealth spectrum
KEY PERFORMANCE INDICATORS
• Client Assets3
• Deposits
• Loans
11
Note: All footnotes are presented on Slide 23.
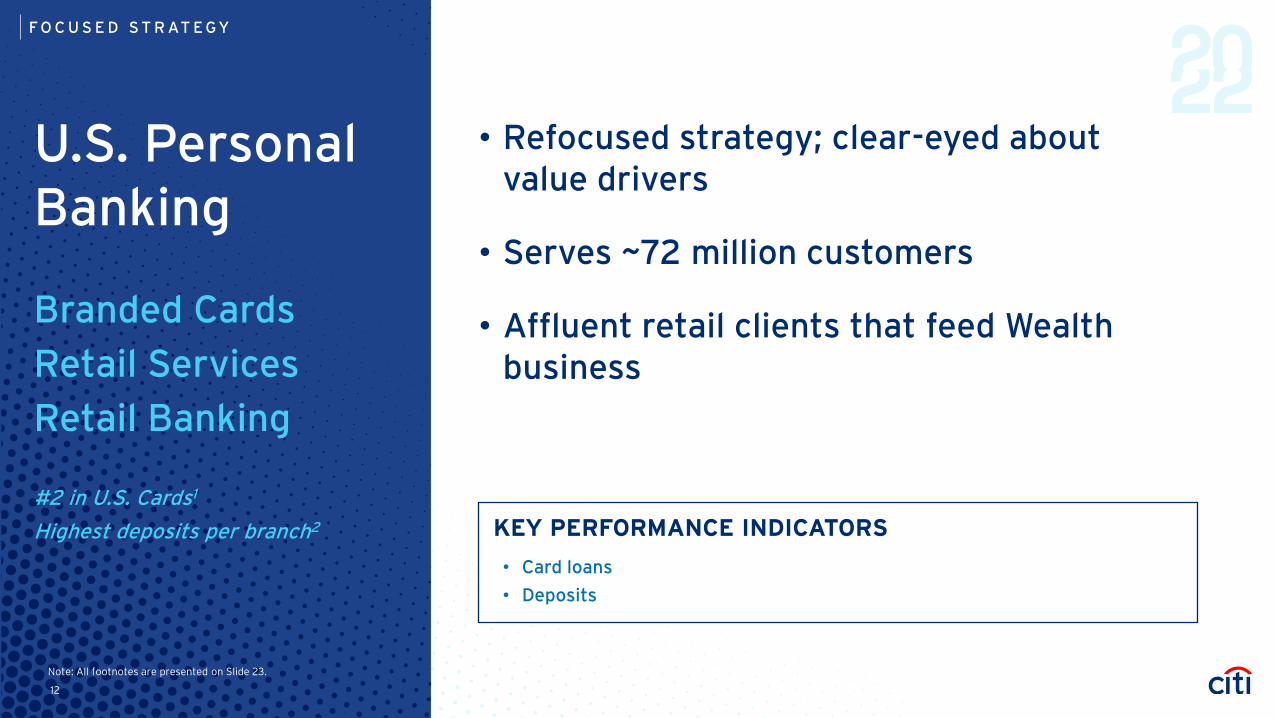
F O C U S E D S T R AT E GY
U.S. Personal Banking
Branded Cards
Retail Services
Retail Banking
#2 in U.S. Cards1
Highest deposits per branch2
• Refocused strategy; clear-eyed about value drivers
• Serves ~72 million customers
• Affluent retail clients that feed Wealth business
KEY PERFORMANCE INDICATORS
• Card loans
• Deposits
12
Note: All footnotes are presented on Slide 23.

Stronger Synergies
INSTITUTIONALCLIENTS GROUP
PERSONAL BANKING AND WEALTH MANAGEMENT
13

Improved Business Mix
Markets
Banking
U.S. Personal Banking
Services
CCB3
Wealth
ACCELERATED GROWTH
RoT
CE
1
Revenue Growth CAGR
TARGETED SHARE GAINS
Scale = Tangible Common Equity2
14
Note: All footnotes are presented on Slide 23.

Lean into Citi’s uniquely global network
Grow the Commercial Bank
Scale in Wealth
Target share gains in Banking, Markets and U.S. Personal Banking
Defining Our Ambition
15

Building a Modern, Efficient and Simpler Bank
• Automating and digitizing
• Delivering scale and speed
• Committing to become a leaner and flatter firm
• Pacing our changes with divestitures and Transformation efforts
• Prioritizing and investing in safety and soundness
• Addressing root causes
RISK AND CONTROLS
OPERATING MODEL
ORGANIZATIONALSTRUCTURE
16
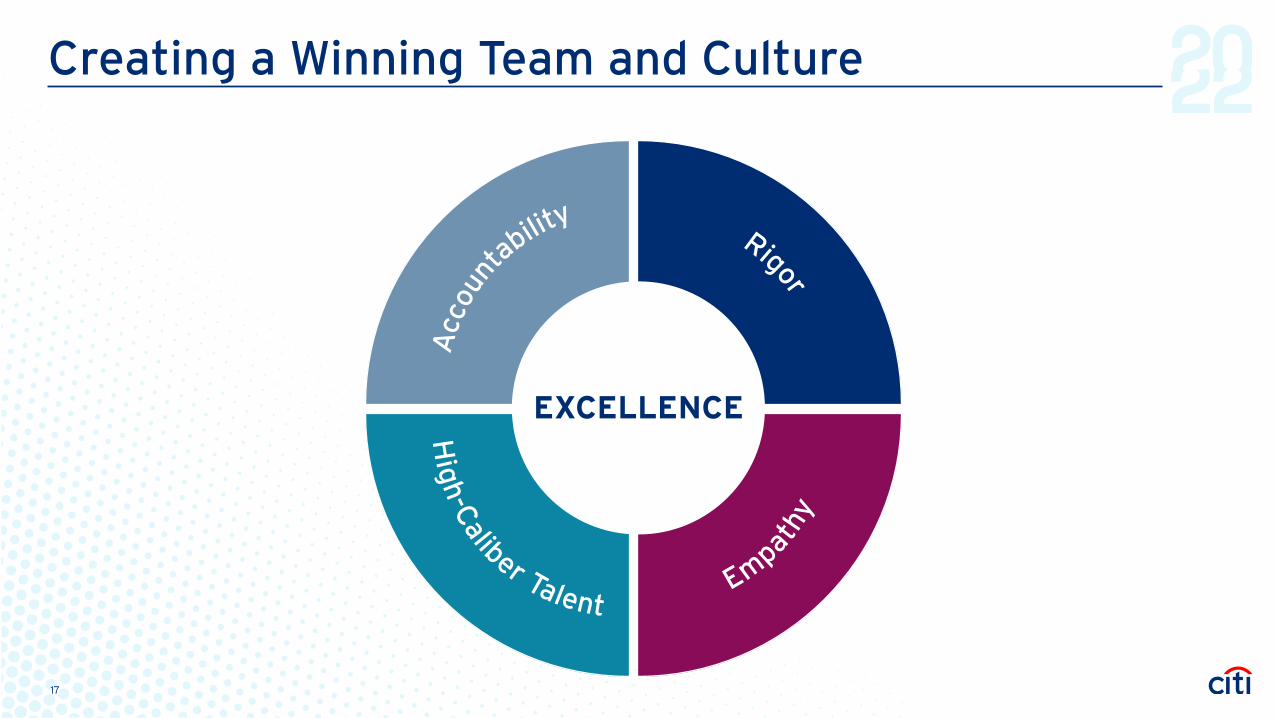
Creating a Winning Team and Culture
EXCELLENCE
17

Significant Progress in Year One
TRANSFORMATIONSTRATEGY CULTURE AND TALENT
Established 6 major programs to drive planning and execution
Submitted plans to regulators
Progressing efforts to strengthen risk and controls and modernize operating model
Completed Strategic Refresh
Integrated Wealth businesses
Focused on 5 core, interconnected businesses
Announced Asia consumer exits with a clear path in 8 countries
Announced exit of Mexico consumer, small business and middle-market banking operations
Brought in external talent and elevated leaders to new roles
Enhanced culture of accountability
Adjusted compensation plans to be more aligned with shareholders
Met our diversity representation goals; building on prior work
18
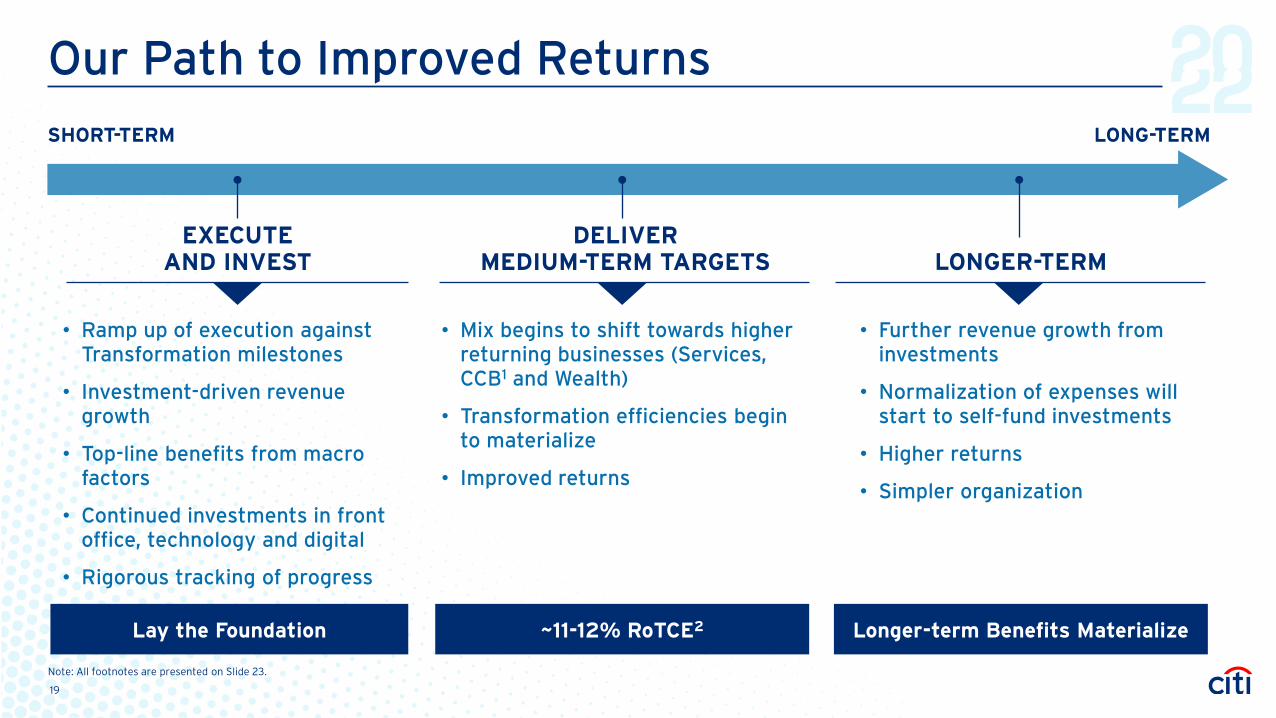
Our Path to Improved Returns
SHORT-TERM LONG-TERM
EXECUTEAND INVEST
DELIVER MEDIUM-TERM TARGETS LONGER-TERM
• Ramp up of execution against Transformation milestones
• Investment-driven revenue growth
• Top-line benefits from macro factors
• Continued investments in front office, technology and digital
• Rigorous tracking of progress
• Mix begins to shift towards higher returning businesses (Services, CCB1 and Wealth)
• Transformation efficiencies begin to materialize
• Improved returns
• Further revenue growth from investments
• Normalization of expenses will start to self-fund investments
• Higher returns
• Simpler organization
~11-12% RoTCE2Lay the Foundation Longer-term Benefits Materialize
19
Note: All footnotes are presented on Slide 23.

I N V E S T O R D AY
PROPRIETARY AND PROTECTED INFORMATION. MAY NOT BE COPIED, SHARED OR DISTRIBUTED WITHOUT CITIGROUP WRITTEN CONSENT. ©2022 CITIGROUP INC.
Forward-looking Statements
Certain statements in this presentation are “forward-looking statements” within the Private Securities Litigation Reform Act of 1995, including statements made orally by Citi’s management. Such statements may be identified by words such as believe, expect, anticipate, intend, estimate, may increase, may fluctuate, target, illustrative and similar expressions or future or conditional verbs such as will, should, would and could. These statements are based on management’s current expectations and are subject to uncertainty and changes in circumstances. These statements are not guarantees of future results or occurrences. Actual results and capital and other financial condition may differ materially from those included in these statements due to a variety of factors, including, among others: the efficacy of Citi’s business strategies and execution of those strategies, such as those relating to its growth, investment, efficiency and capital optimization initiatives; governmental or regulatory requirements, actions or approvals; macroeconomic and other challenges and uncertainties, such as those related to the COVID-19 pandemic, inflationary pressures and the level of interest rates; the precautionary statements included in this presentation; and those contained in Citigroup’s filings with the U.S. Securities and Exchange Commission, including without limitation the “Risk Factors” section of Citigroup’s 2021 Form 10-K. Any forward-looking statements made by or on behalf of Citigroup speak only as to the date they are made, and Citi does not undertake to update forward-looking statements to reflect the impact of circumstances or events that arise after the date the forward-looking statements were made.
21
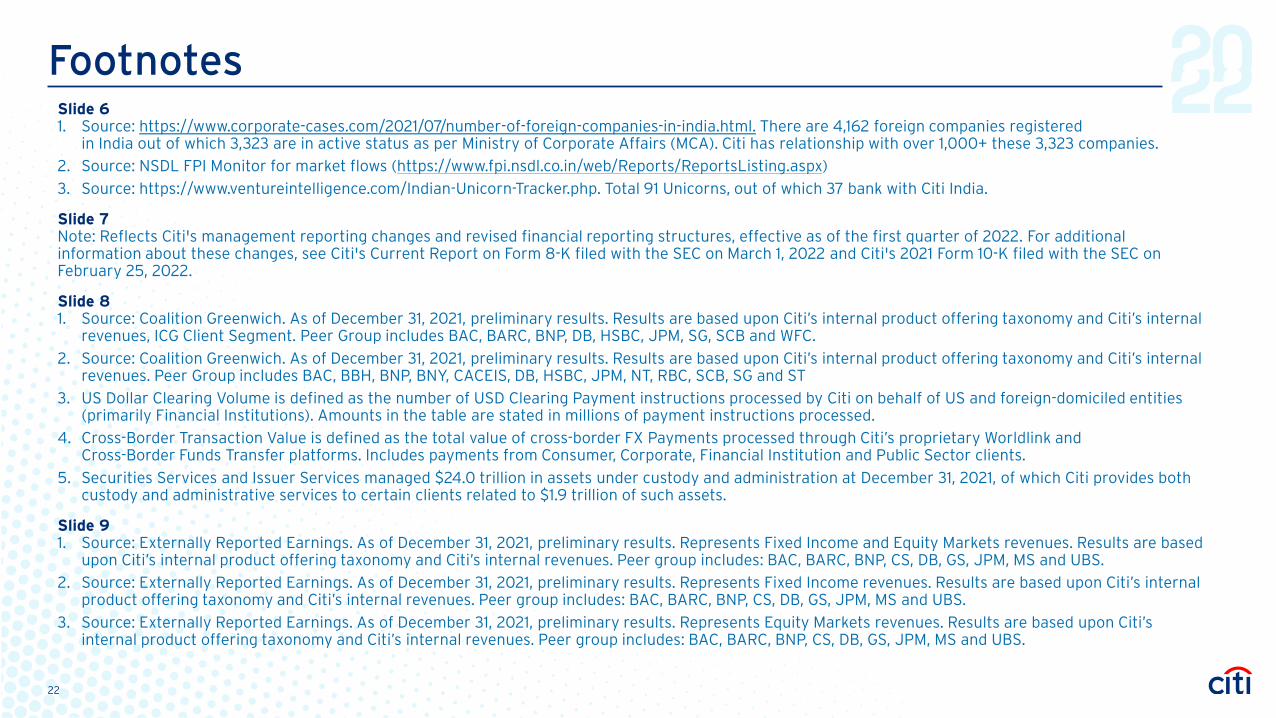
FootnotesSlide 61. Source: https://www.corporate-cases.com/2021/07/number-of-foreign-companies-in-india.html. There are 4,162 foreign companies registered
in India out of which 3,323 are in active status as per Ministry of Corporate Affairs (MCA). Citi has relationship with over 1,000+ these 3,323 companies.
2. Source: NSDL FPI Monitor for market flows (https://www.fpi.nsdl.co.in/web/Reports/ReportsListing.aspx)
3. Source: https://www.ventureintelligence.com/Indian-Unicorn-Tracker.php. Total 91 Unicorns, out of which 37 bank with Citi India.
Slide 7Note: Reflects Citi's management reporting changes and revised financial reporting structures, effective as of the first quarter of 2022. For additional information about these changes, see Citi's Current Report on Form 8-K filed with the SEC on March 1, 2022 and Citi's 2021 Form 10-K filed with the SEC on February 25, 2022.
Slide 81. Source: Coalition Greenwich. As of December 31, 2021, preliminary results. Results are based upon Citi’s internal product offering taxonomy and Citi’s internal
revenues, ICG Client Segment. Peer Group includes BAC, BARC, BNP, DB, HSBC, JPM, SG, SCB and WFC.
2. Source: Coalition Greenwich. As of December 31, 2021, preliminary results. Results are based upon Citi’s internal product offering taxonomy and Citi’s internal revenues. Peer Group includes BAC, BBH, BNP, BNY, CACEIS, DB, HSBC, JPM, NT, RBC, SCB, SG and ST
3. US Dollar Clearing Volume is defined as the number of USD Clearing Payment instructions processed by Citi on behalf of US and foreign-domiciled entities (primarily Financial Institutions). Amounts in the table are stated in millions of payment instructions processed.
4. Cross-Border Transaction Value is defined as the total value of cross-border FX Payments processed through Citi’s proprietary Worldlink and Cross-Border Funds Transfer platforms. Includes payments from Consumer, Corporate, Financial Institution and Public Sector clients.
5. Securities Services and Issuer Services managed $24.0 trillion in assets under custody and administration at December 31, 2021, of which Citi provides both custody and administrative services to certain clients related to $1.9 trillion of such assets.
Slide 91. Source: Externally Reported Earnings. As of December 31, 2021, preliminary results. Represents Fixed Income and Equity Markets revenues. Results are based
upon Citi’s internal product offering taxonomy and Citi’s internal revenues. Peer group includes: BAC, BARC, BNP, CS, DB, GS, JPM, MS and UBS.
2. Source: Externally Reported Earnings. As of December 31, 2021, preliminary results. Represents Fixed Income revenues. Results are based upon Citi’s internal product offering taxonomy and Citi’s internal revenues. Peer group includes: BAC, BARC, BNP, CS, DB, GS, JPM, MS and UBS.
3. Source: Externally Reported Earnings. As of December 31, 2021, preliminary results. Represents Equity Markets revenues. Results are based upon Citi’s internal product offering taxonomy and Citi’s internal revenues. Peer group includes: BAC, BARC, BNP, CS, DB, GS, JPM, MS and UBS.
22

Footnotes (continued)Slide 101. Source: Based on wallet share data per Dealogic as of Feb 23, 2022.
Slide 111. Source: Tricumen, an intelligence provider for financial services; benchmarking in $25MM+ wealth band, 2020.
2. Source: Tricumen, an intelligence provider for financial services; benchmarking in $200K to $10MM wealth band, 2020.
3. Client Assets include AUMs, deposits and trust and custody assets.
Slide 121. Based on End of Period Loans as of December 31, 2021. Includes Citi Branded Cards and Citi Retail Services.
2. Source: FDIC and other regulatory filings. Based on Citi’s internal definition of deposits, which excludes commercial deposits. Nationwide deposits divided by total branches. Citi includes branch-driven consumer wealth deposits reported under Global Wealth Management.
Slide 141. Return on Tangible Common Equity (RoTCE) is a non-GAAP financial measure. RoTCE represents annualized net income available to common
shareholders as a percentage of average TCE.
2. Tangible Common Equity (TCE) is a non-GAAP financial measure. TCE is defined as common stockholders’ equity less goodwill and identifiable intangible assets (other than mortgage servicing rights (MSRs)).
3. Citi Commercial Bank (CCB) is not an Operating Segment or Reporting Unit. The CCB Financial metrics represent Citi's business with mid-sized companies across our product suite. Financial results from this client group are embedded in the ICG's various products, including Services, Banking and Markets.
Slide 191. Citi Commercial Bank (CCB) is not an Operating Segment or Reporting Unit. The CCB Financial metrics represent Citi's business with mid-sized
companies across our product suite. Financial results from this client group are embedded in the ICG's various products, including Services, Banking and Markets.
2. Return on Tangible Common Equity (RoTCE) is a non-GAAP financial measure. RoTCE represents annualized net income available to common shareholders as a percentage of average TCE.
23


