Embed Size (px)
Citation preview

It has been done elsewhere, it can be done everywhere
Impact of smoke-free legislation on smoking
Gera Eveline Nagelhout

Colophon
Cover design and lay-out: roosgeeftvorm
Production: Datawyse, Universitaire Pers Maastricht
© Gera Nagelhout, 2012
ISBN: 978 94 6159 162 3
The research presented in this thesis was conducted at the School for Public Health and Primary
Care: CAPHRI, Department of Health Promotion, of Maastricht University. CAPHRI participates in the
Netherlands School of Primary Care Research CaRe. CAPHRI was classified as ‘excellent’ by the external
evaluation committee of leading international experts that reviewed CAPHRI in December 2010.
It has been done elsewhere, it can be done everywhere
Impact of smoke-free legislation on smoking
PROEFSCHRIFT
Ter verkrijging van de graad van doctor
aan de Universiteit Maastricht,
op gezag van de Rector Magnificus,
Prof. dr. L. L. G. Soete,
volgens het besluit van het College van Decanen,
in het openbaar te verdedigen
op woensdag 10 oktober 2012 om 16.00 uur
door
Gera Eveline Nagelhout
UNIVERSITAIREPERS MAASTRICHT
U P
M

Promotores
Prof. dr. M. C. Willemsen
Prof. dr. H. de Vries
Beoordelingscommissie
Prof. dr. N. K. de Vries (voorzitter)
Prof. dr. R. A. Knibbe
Prof. dr. E. H. S. Lechner (Open Universiteit Heerlen)
Prof. dr. C. P. van Schayck
Prof. dr. K. Stronks (Academisch Medisch Centrum Amsterdam)
The research described in this thesis was funded by the Netherlands Organisation
for Health Research and Development (ZonMw)

Dit proefschrift draag ik op aan mijn vader Dries Nagelhout

Contents
Chapter 1 Introduction 7
Chapter 2 Methods of the ITC Netherlands Survey 23
Part 1 Population impact of smoke-free legislation on smoking 37
Chapter 3 Smoke-free workplace and hospitality industry legislation 39
Chapter 4 Comprehensive and partial smoke-free legislation 55
Chapter 5 Smoke-free legislation and other effective policies 69
Part 2 Individual pathways of change after smoke-free legislation 89
Chapter 6 Increases in support for smoke-free legislation 91
Chapter 7 Newspaper coverage and a media campaign 107
Chapter 8 Policies that reduce the social acceptability of smoking 121
Chapter 9 Smoking in bars after smoke-free legislation 137
Chapter 10 Explaining the effect of smoke-free legislation on cessation 159
Part 3 Unintended consequences of smoke-free legislation 175
Chapter 11 Smoke-free legislation and smoking in smokers’ homes 177
Chapter 12 Smoke-free legislation and stigmatisation of smokers 197
Chapter 13 Widening socioeconomic inequalities in smoking 207
Chapter 14 Inequalities in cessation after three tobacco control policies 221
Chapter 15 Discussion 235
References 255
Summary 275
Samenvatting 283
Dankwoord 291
Curriculum Vitae 297

“What the smoker does to himself may be his
business, but what the smoker does to the
non-smoker is quite a different matter.”
(The Roper organization)
| 6 |

Chapter 1
~~~
Introduction
| 7 |
| 8 |
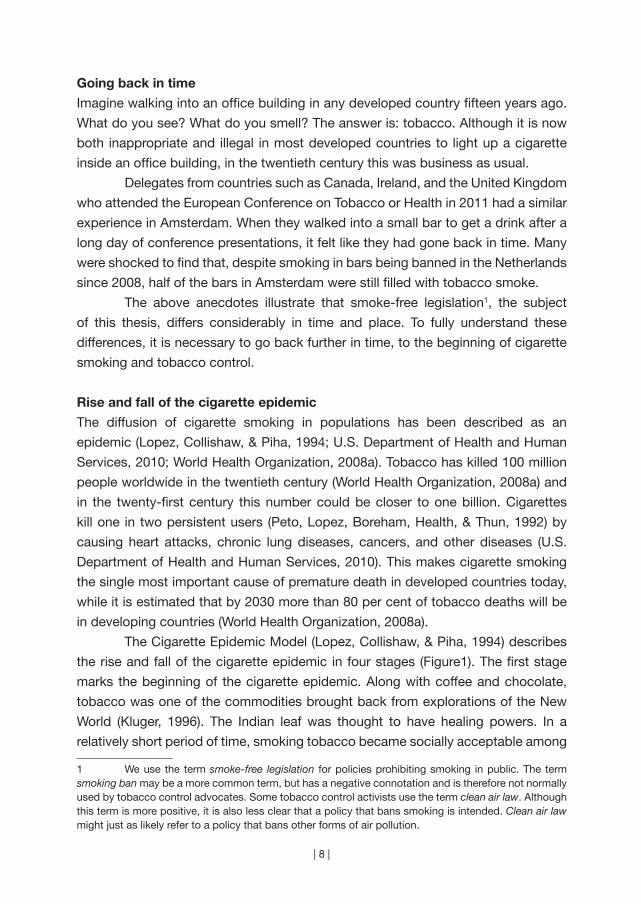
Going back in time
Imagine walking into an office building in any developed country fifteen years ago.
What do you see? What do you smell? The answer is: tobacco. Although it is now
both inappropriate and illegal in most developed countries to light up a cigarette
inside an office building, in the twentieth century this was business as usual.
Delegates from countries such as Canada, Ireland, and the United Kingdom
who attended the European Conference on Tobacco or Health in 2011 had a similar
experience in Amsterdam. When they walked into a small bar to get a drink after a
long day of conference presentations, it felt like they had gone back in time. Many
were shocked to find that, despite smoking in bars being banned in the Netherlands
since 2008, half of the bars in Amsterdam were still filled with tobacco smoke.
The above anecdotes illustrate that smoke-free legislation1, the subject
of this thesis, differs considerably in time and place. To fully understand these
differences, it is necessary to go back further in time, to the beginning of cigarette
smoking and tobacco control.
Rise and fall of the cigarette epidemic
The diffusion of cigarette smoking in populations has been described as an
epidemic (Lopez, Collishaw, & Piha, 1994; U.S. Department of Health and Human
Services, 2010; World Health Organization, 2008a). Tobacco has killed 100 million
people worldwide in the twentieth century (World Health Organization, 2008a) and
in the twenty-first century this number could be closer to one billion. Cigarettes
kill one in two persistent users (Peto, Lopez, Boreham, Health, & Thun, 1992) by
causing heart attacks, chronic lung diseases, cancers, and other diseases (U.S.
Department of Health and Human Services, 2010). This makes cigarette smoking
the single most important cause of premature death in developed countries today,
while it is estimated that by 2030 more than 80 per cent of tobacco deaths will be
in developing countries (World Health Organization, 2008a).
The Cigarette Epidemic Model (Lopez, Collishaw, & Piha, 1994) describes
the rise and fall of the cigarette epidemic in four stages (Figure1). The first stage
marks the beginning of the cigarette epidemic. Along with coffee and chocolate,
tobacco was one of the commodities brought back from explorations of the New
World (Kluger, 1996). The Indian leaf was thought to have healing powers. In a
relatively short period of time, smoking tobacco became socially acceptable among
1 We use the term smoke-free legislation for policies prohibiting smoking in public. The term smoking ban may be a more common term, but has a negative connotation and is therefore not normally used by tobacco control advocates. Some tobacco control activists use the term clean air law. Although this term is more positive, it is also less clear that a policy that bans smoking is intended. Clean air law might just as likely refer to a policy that bans other forms of air pollution.

| 9 |
chapter 1 | Introduction
men in the Old World and its prevalence began to increase. Smoking-attributable
mortality was low at this stage of the epidemic, owing to the time lag between
initiating smoking and dying from its effects (Lopez et al., 1994). As a result of low
mortality, governments were not likely to take action against smoking at this stage.
Figure 1: Cigarette Epidemic Model (Lopez et al., 1994).
The second stage of the epidemic is characterised by the rapidly increasing
prevalence of smoking among men (Lopez et al., 1994). Selling tobacco became a
booming business when mechanical cigarette production replaced the handmade
process. Tobacco companies started spending large sums of money on marketing
(Kluger, 1996). Tobacco was marketed as a healthy product that would make the
user appear adventurous, masculine, and glamorous. At the end of the second stage
of the epidemic, non-smoking boys and men were the exception rather than the rule
and tobacco companies started to focus their marketing and packaging on women
as well. At this stage of the epidemic, male deaths from lung cancer were gradually
increasing and began to be noticed by doctors and epidemiologists. However, a
causal link between smoking and lung cancer could not yet be established. Some
medical journals started declining offers of tobacco advertisements, but the general
public was unaware of the potential dangers of smoking and governments allowed
tobacco marketing to continue unrestricted.
| 10 |
The third stage of the cigarette epidemic is marked by the beginning of tobacco
control. In this stage of the epidemic, smoking prevalence begins to decline among
men and levels-off among women. In the developed world, this stage was reached
during the 1950s and 60s when the first scientific studies showed that smoking
causes lung cancer (Doll & Hill, 1950; Levin, Goldstein, & Gerhardt, 1950; U.S.
Department of Health Education and Welfare, 1964). Governments realised that
they should inform the public about the dangers of smoking and they started to
implement educational programmes. Gradually it became clear that the educational
approach to tobacco control was not enough to counter the tobacco epidemic.
Not all smokers who were aware of the dangers of smoking could quit, because
smoking is strongly influenced by the physical and social environment (Christakis &
Fowler, 2008) and is highly addictive (Krasnegor, 1979). Many governments therefore
restricted tobacco advertising, implemented health warnings on tobacco products,
and increased tobacco taxes. Also, addressing the nuisance for flight attendants,
the first smoking restrictions in airplanes were realised (International Agency for
Research on Cancer, 2009a).
In the fourth stage of the epidemic, smoking prevalence declines among
both men and women and there is a rapid rise in smoking-attributable mortality
among women (Lopez et al., 1994). In the developed world, this stage was reached
in the 1980s. During this period, it began to be noticed that non-smoking spouses
of smokers were dying of lung cancer. Studies revealed that exposure to second-
hand smoke2 is indeed dangerous for non-smokers (Hirayama, 1981; White &
Froeb, 1980). In 1986, the US Surgeon General concluded that there was strong
and consistent evidence that “involuntary smoking causes disease, including lung
cancer, in healthy non-smokers” (U.S. Department of Health and Human Services,
1986). The 1986 US Surgeon General’s report was a landmark for tobacco control.
The tobacco industry could no longer claim that smokers had the right to smoke
wherever they wanted. This paved the way for smoke-free legislation to protect
non-smokers from the health dangers of second-hand smoking.
2 Second-hand smoke (SHS) is the tobacco smoke that people inhale when they are in the proximity of a smoker. Passive smoking may be a more well-known term, but it does not reflect the fact that exposure to SHS is actively making people sick. Environmental tobacco smoke (ETS) is a term that is often used by the tobacco industry to downplay the detrimental effects of SHS. Currently, some tobacco control researchers are moving away from using SHS and instead use the term tobacco smoke pollution (TSP). SHS is used in the introduction of this thesis because it is a neutral term, while the term TSP emphasises the negative nature of exposure to tobacco smoke.
| 11 |
chapter 1 | Introduction
Globalisation of tobacco control
In the early days, tobacco control consisted mainly of an educational approach that
aimed to inform the public of the dangers of smoking. This approach was broadened
after a ‘new public health’ approach was proposed, first in the US Surgeon General’s
Report on Health Promotion and Disease Prevention (Public Health Service, 1979),
and later in the Ottawa Charter for Health Promotion that was adopted at the first
International Conference on Health Promotion (World Health Organization, Health
and Welfare Canada, & Canadian Public Health Association, 1986). According to
this new approach, health promotion should employ an ecological perspective that
no longer focused solely on individual behaviour change, but also on the physical,
socio-cultural, economical, and political environment (Lechner, Kremers, Meertens,
& Vries, 2007; Swinburn, Egger, & Raza, 1999). The Ottawa Charter called for
building healthy public policy by putting health on the agenda of policy makers.
The World Health Organization (WHO) was urged to support countries in setting up
strategies and programmes for health promotion.
In 1986, the same year as the publication of the Ottawa Charter, the 39th
World Health Assembly (WHA) adopted a resolution encouraging WHO member
states to implement comprehensive tobacco control policies. The resolution also
called for a global public health approach and international action to combat the
tobacco epidemic. The WHO realised that a global tobacco control strategy was
necessary, because the tobacco epidemic was an international problem and the
tobacco industry increasingly operated globally (Bettcher & Subramaniam, 2001).
The World Bank understood that the economics of tobacco control were critical to
the debate on global tobacco control and published the report ‘Curbing the epidemic:
Governments and the economics of tobacco control’ (Jha & Chaloupka, 1999).
This report concluded that tobacco control does not harm economies. Previously
confidential internal documents from the tobacco industry obtained through US
litigation revealed that the tobacco industry worked hard to discredit this World
Bank report (Mamudu, Hammond, & Glantz, 2008). However, it did not succeed.
The World Bank report was released during the 52nd WHA in 1999. Influenced
by this authoritative report, the WHA approved the beginning of negotiations for a
global tobacco control strategy.
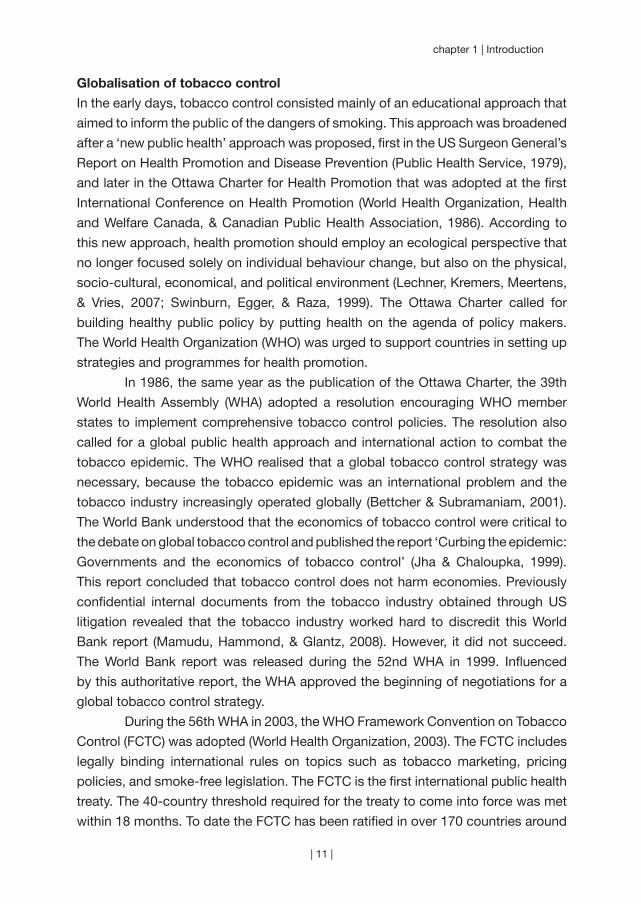
During the 56th WHA in 2003, the WHO Framework Convention on Tobacco
Control (FCTC) was adopted (World Health Organization, 2003). The FCTC includes
legally binding international rules on topics such as tobacco marketing, pricing
policies, and smoke-free legislation. The FCTC is the first international public health
treaty. The 40-country threshold required for the treaty to come into force was met
within 18 months. To date the FCTC has been ratified in over 170 countries around

| 12 |
the world. Through this action these countries have legally committed themselves
to implementing national legislation that is consistent with the FCTC. To help
countries fulfil the FCTC commitments, the WHO defined a policy package of FCTC
policies that have been proven to reduce the prevalence of smoking (World Health
Organization, 2008a) and are, therefore, the most important to implement. These
policies are known under the acronym MPOWER (Figure 2) and are consistent with
the policies that the World Bank designated in 2003 as the most cost effective
tobacco control measures (World Bank, 2003). MPOWER urges governments to
monitor the impact of tobacco control policies on tobacco use and to implement
smoke-free legislation, smoking cessation assistance, educational campaigns,
health warning labels, advertising bans, and tobacco tax increases.
Figure 2: The MPOWER acronym (World Health Organization, 2008a).
• Monitor tobacco use and prevention policies
• Protect people from tobacco smoke
• Offer help to quit tobacco use
• Warn about the dangers of tobacco
• Enforce bans on tobacco advertising, promotion and sponsorship
• Raise taxes on tobacco
Evaluating the impact of international policies
The goal of this thesis is to evaluate the impact of FCTC policies. Evaluating the
impact of policies is important in order to evaluate existing policies and to inform and
support future policies. However, there are considerable methodological challenges.
Tobacco control policies cannot be evaluated with randomised controlled trials,
because researchers cannot control policy implementation. One of the difficulties
with using before-and-after designs is that policies are often implemented
simultaneously and may interact with existing policies and social factors. Although
studies with interrupted time series designs can separate intervention effects from
secular trends, it is not possible to disentangle the effects of interventions that
are implemented simultaneously. Evaluating the impact of one policy on smoking
behaviour when other policies that have an impact on smoking are simultaneously
implemented can be like “unraveling gossamer with boxing gloves” (Chapman,
1993). An elegant solution to this methodological challenge is to use a quasi-
experimental design in which jurisdictions (countries, states, or provinces) that have
implemented a tobacco control policy are compared to other jurisdictions that have
not. Previous evaluation studies of tobacco control policies have mostly compared
US states that did and did not implement a certain policy (Farrelly, Pechacek, &

| 13 |
chapter 1 | Introduction
Chaloupka, 2003; Hyland, Li et al., 2006; Wakefield & Chaloupka, 2000). However,
owing to the national level of FCTC policies, these policies can best be evaluated
by international studies that compare several countries.
Some existing international studies have the potential to evaluate FCTC
policies. For example, the WHO, Centres for Disease Control and Prevention, and
the Canadian Public Health Association, initiated the Global Tobacco Surveillance
System, which includes the Global Youth Tobacco Survey (GYTS) in more than 150
countries and the Global Adult Tobacco Survey (GATS) in 14 countries (Warren et
al., 2009). In Europe, the European Commission regularly conducts Eurobarometer
surveys on tobacco, and the Tobacco Control Scale surveys tobacco control
activity at the national level (Joossens & Raw, 2011). Some studies have combined
national-level information from the Tobacco Control Scale with smoking behaviour
information from European surveys to give an indication of the association between
tobacco control policies and smoking on an ecological level (Hublet et al., 2009;
Martínez-Sánchez et al., 2010; Schaap et al., 2008). However, because these studies
employ macro-level data, they cannot identify the individual pathways of change or
how the policies affect smoking. Moreover, these existing studies are limited by
their cross-sectional design and can, therefore, make no causal inferences about
the impact of policies.
The International Tobacco Control Policy Evaluation Project (ITC Project)
was specifically designed to evaluate the impact of FCTC policies as they were
being implemented in many countries throughout the world (Fong, Cummings, &
Shopland, 2006). The ITC Project was set up prior to the FCTC coming into force in
2003, when the founding researchers realised that the treaty would provide a unique
opportunity to evaluate the impact of tobacco control policies. The ITC Project, the
first ever international cohort survey of tobacco use, is currently conducted in 20
countries, and is constantly working to persuade additional countries to participate.
It uses a quasi-experimental design by which countries that have implemented a
particular tobacco control policy are compared to those that have not. Because
all ITC Surveys use a longitudinal cohort design by which individual smokers are
interviewed in multiple survey waves before and after the implementation of tobacco
control policies, it is also possible to examine the effects of exposure to policies
within a single country. This design allows for testing hypotheses on the impact of
policy measures on tobacco consumption through micro-level changes in smokers’
attitudes, beliefs, and cognitions (Fong et al., 2006).
| 14 |
For this thesis, data from the ITC Project have been used to evaluate the impact
of FCTC policies. Most chapters used data from the ITC Netherlands Survey. The
ITC Netherlands Survey was initiated in 2008 to evaluate the impact of Dutch FCTC
policies. The following FCTC policies were implemented immediately after the
first wave of the ITC Netherlands Survey in 2008: smoke-free hospitality industry
legislation with an accompanying implementation campaign, a mass media smoking
cessation campaign, and a small tax increase. The impacts of these policies are
evaluated in this thesis, but the main focus is on the impact of smoke-free hospitality
industry legislation. Smoke-free legislation is one of the key FCTC policies and can
have an impact on both non-smokers (reduced second-hand smoking) and smokers
(reduced active smoking). The largest population health impact may come from
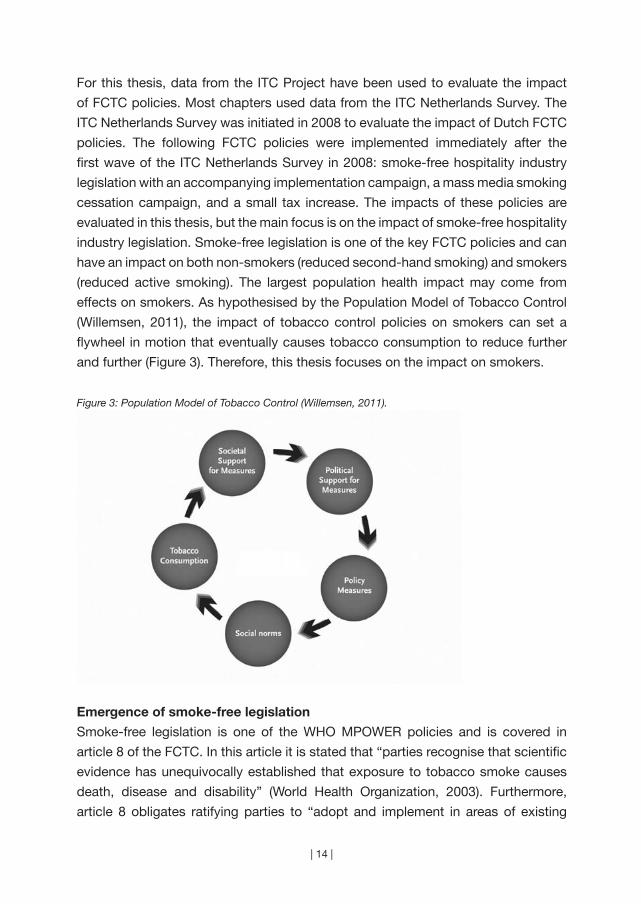
effects on smokers. As hypothesised by the Population Model of Tobacco Control
(Willemsen, 2011), the impact of tobacco control policies on smokers can set a
flywheel in motion that eventually causes tobacco consumption to reduce further
and further (Figure 3). Therefore, this thesis focuses on the impact on smokers.
Figure 3: Population Model of Tobacco Control (Willemsen, 2011).
Emergence of smoke-free legislation
Smoke-free legislation is one of the WHO MPOWER policies and is covered in
article 8 of the FCTC. In this article it is stated that “parties recognise that scientific
evidence has unequivocally established that exposure to tobacco smoke causes
death, disease and disability” (World Health Organization, 2003). Furthermore,
article 8 obligates ratifying parties to “adopt and implement in areas of existing
| 15 |
chapter 1 | Introduction
national jurisdiction (…) effective legislative, executive, administrative and/or other
measures, providing for protection from exposure to tobacco smoke in indoor
workplaces, public transport, indoor public places and, as appropriate, other public
places” (World Health Organization, 2003).
Most countries do not ban smoking immediately in all indoor workplaces,
public transport, and indoor public places. The emergence of smoke-free legislation
can be divided into four ‘waves’ (Siegel & Skeer, 2003). Most countries first
implement smoking restrictions in indoor public areas and on public transport (e.g.
airplanes, elevators, children’s day care facilities, hospitals, and movie theatres).
The second wave of smoke-free legislation occurs in workplaces. This often begins
with voluntary company policies or local initiatives, and is later followed by national
smoke-free workplace legislation. The hospitality industry is often exempted at this
stage because its entertainment function means that smoking restrictions enjoy
considerably less support in these ‘social’ settings. Also, the tobacco industry is keen
to retain the ‘last bastion’ of socially acceptable smoking where young adults start
or establish their smoking behaviour and therefore fights harder over this particular
field (Ling & Glantz, 2002; Magzamen & Glantz, 2001). The third wave of smoke-
free legislation occurs in restaurants. Sometimes restaurants are not required to be
smoke-free, but separate seating areas for non-smokers are created. The last wave
generally consists of smoking restrictions in bars and casinos. Smoke-free bars
send an especially strong message that smoking is no longer socially acceptable
(Magzamen & Glantz, 2001).
Some countries do not implement smoke-free legislation in four ‘waves’,
but implement smoke-free workplace legislation in one legislative action without
exceptions for the hospitality industry. For example, Ireland was the first to implement
national comprehensive smoke-free legislation in all workplaces, including bars and
restaurants, in March 2004. This legislation proved to be an immediate success
(Howell, 2004) and the Irish people even chose their smoke-free legislation as
Ireland’s most positive event of 2004 (Howell & Allwright, 2005).
The Netherlands is an interesting case study for smoke-free legislation
because the emergence of smoke-free hospitality industry legislation was more
controversial and problematic than in many other countries. The Netherlands ratified
the FCTC in 2005. Prior to this, smoking had already been banned in government
buildings and public places (since 1990) and in workplaces (since 2004) with the
exception of the hospitality industry. A self-regulation plan was arranged with the
hospitality industry that should have resulted in completely smoke-free restaurants
and hotels and mostly smoke-free bars and discos. When these results were not
achieved, the government decided to implement smoke-free hospitality industry
| 16 |
legislation in July 2008. From May to September 2008 the Dutch Ministry of
Health ran a media campaign in which the date of implementation of the smoke-
free legislation was communicated but no reference was made to the health
consequences of second-hand smoke. The television commercial for this campaign
showed a man dressed as a large cigarette being thrown out of hospitality industry
venues on to the street. The Dutch expert centre on tobacco control (STIVORO) also
ran a media campaign about smoking cessation, but the smoke-free legislation and
second-hand smoke were not mentioned.
An organisation ‘Red de Kleine Horeca Ondernemer’ (‘Save the small
hospitality industry entrepreneur’) was formed by owners of small bars to argue
against the legislation. Ties between this organisation and the tobacco industry
were confirmed by investigative journalism (Baltesen & Rosenberg, 2009). The
organisation financed court appeals, staged demonstrations, and lobbied for an
exemption to the legislation for small bars. The group of bar owners that supported
these actions received a disproportionately high level of media attention, which
fuelled resistance to the legislation and increased the number of non-complying
bars. The legal actions of these bar owners resulted in a temporary suspension of
the smoke-free legislation for bars without employees in July 2009. In March 2010,
the Dutch Supreme Court ruled that the legislation was not discriminatory to bars
without employees, and from that date onwards the legislation was again applied
to all bars. However, since July 2011, a new Dutch government has suspended the
legislation for bars without employees smaller than 70 square metres and has not
fined these venues for allowing smoking since November 2010.
Structure of this thesis
This introductory chapter is followed by a chapter describing the methods of the
ITC Netherlands Survey (chapter 2). The remainder of the thesis is grouped into
three parts: 1) population impact of smoke-free legislation on smoking, 2) individual
pathways of change after smoke-free legislation, and 3) unintended consequences
of smoke-free legislation. These three parts are introduced briefly here.
Population impact of smoke-free legislation on smoking
Researchers from the tobacco industry were the first to find evidence that smoke-
free legislation may cause smokers to reduce their cigarette consumption or
quit smoking (Cilcote, 1985; Heironimus, 1992). More studies have since been
conducted by health promotion scientists on whether banning smoking has an
impact on smoking cessation. Reviews of studies on voluntary workplace smoking
restrictions found that smoking restrictions were associated with reductions in

| 17 |
chapter 1 | Introduction
cigarette consumption (Brownson, Eriksen, Davis, & Warner, 1997; Chapman et al.,
1999; Eriksen & Gottlieb, 1998; Fichtenberg & Glantz, 2002; Hopkins et al., 2001;
Moher, Hey, & Lancaster, 2005). Evidence of an impact on smoking prevalence and
smoking cessation was less consistent. One review examined studies of local and
state-level smoke-free legislation in the United States and concluded that smoke-
free legislation was associated with lower cigarette consumption, lower prevalence
rates, and higher cessation rates (Levy & Friend, 2003). However, the studies that
were included in these reviews generally had weak designs (Eriksen & Gottlieb,
1998; Moher et al., 2005). Control populations were lacking and secular trends were
not taken into account (Chapman et al., 1999; Eriksen & Gottlieb, 1998; Moher et
al., 2005). Moreover, the studies did not control for other policies already in place
or implemented at the same time (Levy & Friend, 2003), while voluntary workplace
smoking restrictions were almost always accompanied by cessation assistance
(Eriksen & Gottlieb, 1998; Moher et al., 2005).
In 2008, there were still several gaps in the literature on the impact of
smoke-free legislation on smoking, including: the impact of national smoke-free
legislation on smoking (Hopkins et al., 2001), the impact of smoking restrictions
in settings other than the workplace (Chapman et al., 1999), and the differential
impact of comprehensive and partial smoking restrictions (Fichtenberg & Glantz,
2002; Hopkins et al., 2001; Levy & Friend, 2003). Also, evidence on how the impact
of smoking restrictions compared with the impact of other tobacco control policies
was lacking (Levy & Friend, 2003). The studies in the first part of this thesis were
conducted to fill these gaps in the literature. We examined the impact of national
smoke-free workplace legislation and smoke-free hospitality industry legislation
(chapter 3), the impact of comprehensive and partial smoke-free legislation (chapter
4), and the impact of smoke-free legislation compared with the impact of other
tobacco control policies (chapter 5). Outcomes studied are: smoking prevalence
(chapters 3 and 5), smoking cessation (chapters 3 and 4), and smoking-attributable
deaths (chapter 5).
Individual pathways of change after smoke-free legislation
It is not only important to know whether policies have an impact on tobacco
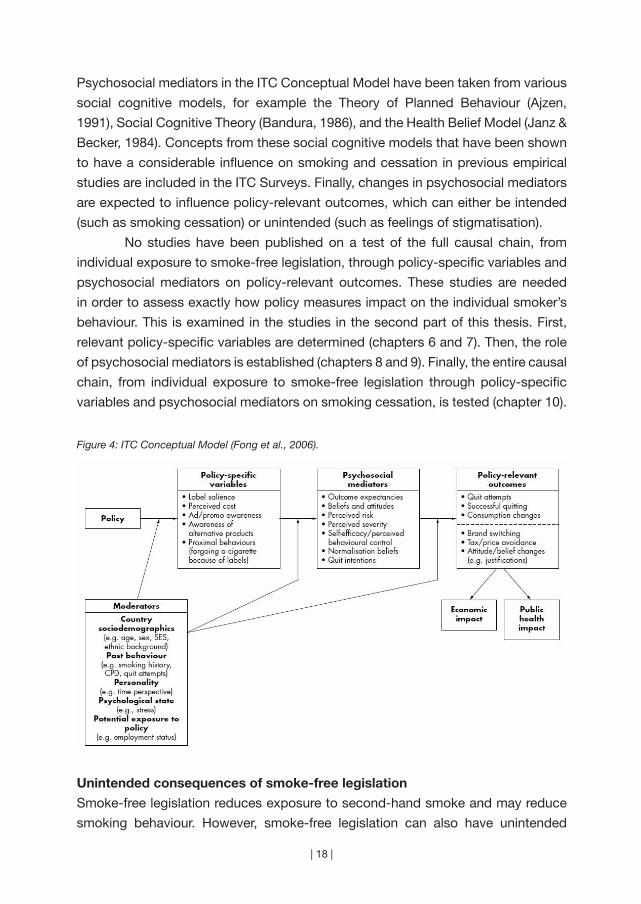
consumption, but also to understand how this process occurs. The ITC Conceptual
Model (Fong et al., 2006) describes the individual pathways of change from tobacco
control policies to tobacco consumption. According to this model, tobacco control
policies influence individuals by first influencing factors that are most proximal
to the policy itself, such as increased support for smoke-free legislation (Figure
4). These policy-specific variables in turn influence psychosocial mediators.
| 18 |
Psychosocial mediators in the ITC Conceptual Model have been taken from various
social cognitive models, for example the Theory of Planned Behaviour (Ajzen,
1991), Social Cognitive Theory (Bandura, 1986), and the Health Belief Model (Janz &
Becker, 1984). Concepts from these social cognitive models that have been shown
to have a considerable influence on smoking and cessation in previous empirical
studies are included in the ITC Surveys. Finally, changes in psychosocial mediators
are expected to influence policy-relevant outcomes, which can either be intended
(such as smoking cessation) or unintended (such as feelings of stigmatisation).
No studies have been published on a test of the full causal chain, from
individual exposure to smoke-free legislation, through policy-specific variables and
psychosocial mediators on policy-relevant outcomes. These studies are needed
in order to assess exactly how policy measures impact on the individual smoker’s
behaviour. This is examined in the studies in the second part of this thesis. First,
relevant policy-specific variables are determined (chapters 6 and 7). Then, the role
of psychosocial mediators is established (chapters 8 and 9). Finally, the entire causal
chain, from individual exposure to smoke-free legislation through policy-specific
variables and psychosocial mediators on smoking cessation, is tested (chapter 10).
Figure 4: ITC Conceptual Model (Fong et al., 2006).
Unintended consequences of smoke-free legislation
Smoke-free legislation reduces exposure to second-hand smoke and may reduce
smoking behaviour. However, smoke-free legislation can also have unintended
| 19 |
chapter 1 | Introduction
consequences. These are explicitly modeled in the ITC Conceptual Model to provide
a more complete picture of the effects of policies. This information can be used for
the development of future tobacco control strategies.
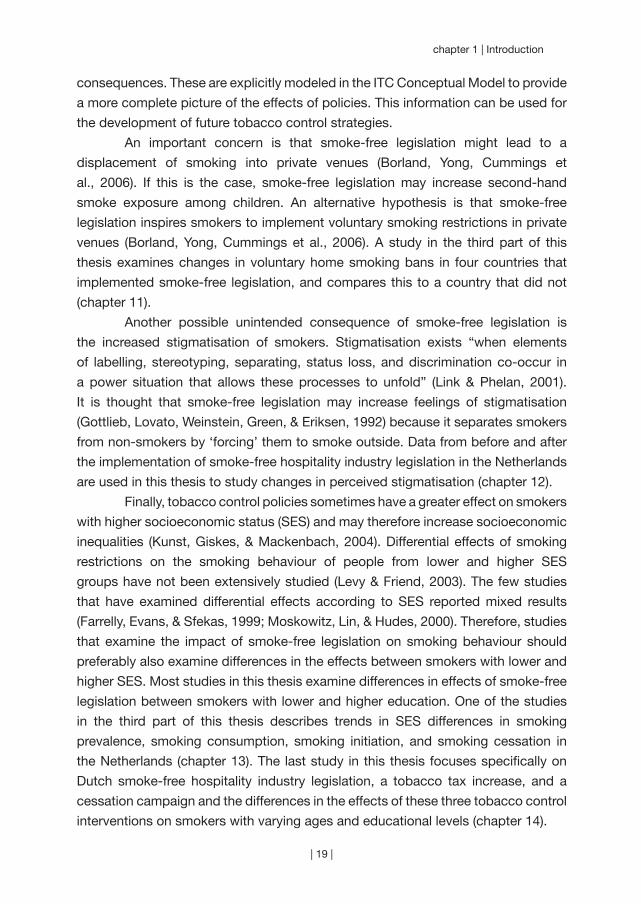
An important concern is that smoke-free legislation might lead to a
displacement of smoking into private venues (Borland, Yong, Cummings et
al., 2006). If this is the case, smoke-free legislation may increase second-hand
smoke exposure among children. An alternative hypothesis is that smoke-free
legislation inspires smokers to implement voluntary smoking restrictions in private
venues (Borland, Yong, Cummings et al., 2006). A study in the third part of this
thesis examines changes in voluntary home smoking bans in four countries that
implemented smoke-free legislation, and compares this to a country that did not
(chapter 11).
Another possible unintended consequence of smoke-free legislation is
the increased stigmatisation of smokers. Stigmatisation exists “when elements
of labelling, stereotyping, separating, status loss, and discrimination co-occur in
a power situation that allows these processes to unfold” (Link & Phelan, 2001).
It is thought that smoke-free legislation may increase feelings of stigmatisation
(Gottlieb, Lovato, Weinstein, Green, & Eriksen, 1992) because it separates smokers
from non-smokers by ‘forcing’ them to smoke outside. Data from before and after
the implementation of smoke-free hospitality industry legislation in the Netherlands
are used in this thesis to study changes in perceived stigmatisation (chapter 12).
Finally, tobacco control policies sometimes have a greater effect on smokers
with higher socioeconomic status (SES) and may therefore increase socioeconomic
inequalities (Kunst, Giskes, & Mackenbach, 2004). Differential effects of smoking
restrictions on the smoking behaviour of people from lower and higher SES
groups have not been extensively studied (Levy & Friend, 2003). The few studies
that have examined differential effects according to SES reported mixed results
(Farrelly, Evans, & Sfekas, 1999; Moskowitz, Lin, & Hudes, 2000). Therefore, studies
that examine the impact of smoke-free legislation on smoking behaviour should
preferably also examine differences in the effects between smokers with lower and
higher SES. Most studies in this thesis examine differences in effects of smoke-free
legislation between smokers with lower and higher education. One of the studies
in the third part of this thesis describes trends in SES differences in smoking
prevalence, smoking consumption, smoking initiation, and smoking cessation in
the Netherlands (chapter 13). The last study in this thesis focuses specifically on
Dutch smoke-free hospitality industry legislation, a tobacco tax increase, and a
cessation campaign and the differences in the effects of these three tobacco control
interventions on smokers with varying ages and educational levels (chapter 14).
| 20 |
Research questions in this thesis
Most chapters in this thesis used data from the ITC Netherlands Survey. Chapter 2
describes a study about the methods of the ITC Netherlands Survey. This chapter
is followed by twelve studies on the impact of smoke-free legislation on smoking,
grouped in three parts.
Part 1 – Population impact of smoke-free legislation on smoking
Part 1 focuses on the population impact of smoke-free legislation on smoking. The
following research questions are addressed:
1. What is the impact of smoke-free workplace legislation and smoke-free
hospitality industry legislation on smoking prevalence and smoking cessation?
2. What is the impact of comprehensive and partial smoke-free legislation on
smoking cessation?
3. What is the impact of smoke-free legislation and other effective tobacco control
policies on smoking prevalence and smoking-attributable deaths?
Chapter 3 describes the impact on trends in smoking prevalence and smoking
cessation in the Netherlands of implementing smoke-free workplace legislation and
later extending this legislation to the hospitality industry (research question (RQ) 1).
Chapter 4 uses a quasi-experimental analytical approach to examine the impact
of both comprehensive and partial smoke-free legislation in Europe on smoking
cessation (RQ 2). Chapter 5 presents the results of a simulation model on the impact
of smoke-free legislation and other effective tobacco control policies that are part
of the MPOWER package, on smoking prevalence and smoking-attributable deaths
in the Netherlands (RQ 3).
Part 2 – Individual pathways of change after smoke-free legislation
Part 2 focuses on individual pathways of change after smoke-free legislation. The
following research questions are addressed:
4. What is the impact of implementing smoke-free legislation on support for
smoke-free legislation among smokers?
5. What is the impact of newspaper coverage on smoke-free legislation and of an
implementation campaign on policy-specific variables?
6. Is exposure to smoke-free legislation associated with reduced social
acceptability of smoking and is this a predictor of smoking cessation?
7. What are policy-specific and psychosocial predictors of smoking in bars after
the implementation of smoke-free legislation?
8. Which policy-specific variables and psychosocial mediators form the causal chain
between individual exposure to smoke-free legislation and smoking cessation?
| 21 |
chapter 1 | Introduction
Chapter 6 uses a quasi-experimental design to examine the impact of implementing
smoke-free legislation on support for smoke-free legislation among smokers in
Europe (RQ 4). Chapter 7 presents the results of a content analysis of newspaper
coverage on smoke-free legislation in the Netherlands and examines the impact
of this newspaper coverage and the Dutch implementation campaign on policy-
specific variables (RQ 5). Chapter 8 describes the association of exposure to smoke-
free legislation, warning labels, and anti-tobacco information with reduced social
acceptability of smoking, and describes the impact of this on smoking cessation in
Europe (RQ 6). Chapter 9 presents the results of an analysis of the policy-specific
and psychosocial predictors of smoking in bars after the implementation of smoke-
free legislation in Europe (RQ 7). Chapter 10 examines the entire causal chain, from
individual exposure to smoke-free legislation, through policy-specific variables and
psychosocial mediators on smoking cessation in the Netherlands (RQ 8).
Part 3 - Unintended consequences of smoke-free legislation
Part 3 examines possible unintended consequences of smoke-free legislation. The
following research questions are addressed:
9. What is the impact of smoke-free legislation on voluntary home smoking bans?
10. What is the impact of smoke-free legislation and smoking outside on the
stigmatisation of smokers?
11. Are there trends in socioeconomic inequalities in smoking prevalence, smoking
consumption, smoking initiation, and smoking cessation?
12. Are there age or educational inequalities in exposure to, and effects of, smoke-
free legislation, a tobacco tax increase, and a campaign on smoking cessation?
Chapter 11 uses a quasi-experimental design to examine the impact of smoke-free
legislation on voluntary home smoking bans in Europe (RQ 9). Chapter 12 focuses
on the impact of smoke-free legislation and smoking outside on the stigmatisation
of smokers (RQ 10). Chapter 13 describes trends in socioeconomic inequalities
in smoking prevalence, smoking consumption, smoking initiation, and smoking
cessation in the Netherlands (RQ 11). Chapter 14 focuses on age and educational
inequalities in exposure to, and effects of, smoke-free legislation, a tobacco tax
increase, and a cessation campaign on smoking cessation in the Netherlands (RQ 12).
Chapter 15 discusses the results of the studies in this thesis. Important findings
from the studies are discussed in relation to other studies that have been conducted
since the start of this PhD study. Methodological limitations of the studies in this
thesis are discussed, as well as priorities for future research and recommendations
for tobacco control policy.

“The thing about quotes on the internet is you
can not confirm their validity”
(Abraham Lincoln)
| 22 |
Chapter 2
~~~
Methods of the ITC Netherlands Survey
Parts of this chapter have been published as:
Nagelhout, G. E., Willemsen, M. C., Thompson, M. E., Fong, G. T.,
Van den Putte, B., & De Vries, H. (2010). Is web interviewing a good
alternative to telephone interviewing? Findings from the International
Tobacco Control (ITC) Netherlands Survey. BMC Public Health, 10, 351.
| 23 |
| 24 |
Web interviewing is becoming increasingly popular worldwide, because
it has several advantages over telephone interviewing such as lower
costs and shorter fieldwork periods. However, there are also concerns
about data quality of web surveys. The aim of this study was to compare
the International Tobacco Control (ITC) Netherlands web and telephone
samples on demographic and smoking-related variables to assess
differences in data quality. Wave 1 of the ITC Netherlands Survey was
completed by 1,668 web respondents and 404 telephone respondents
of 18 years and older. The two surveys were conducted in parallel among
adults who reported smoking at least monthly and had smoked at least
100 cigarettes over their lifetime. Both the web and telephone survey had
a cooperation rate of 78%. Web respondents with a fixed line telephone
were significantly more often married, had a lower educational level,
and were older than web respondents without a fixed line telephone.
Telephone respondents with internet access were significantly more often
married, had a higher educational level, and were younger than telephone
respondents without internet. Web respondents were significantly less
often married and lower educated than the Dutch population of smokers.
Telephone respondents were significantly less often married and higher
educated than the Dutch population of smokers. Web respondents
used the ‘don’t know’ options more often than telephone respondents.
Telephone respondents were somewhat more negative about smoking,
had less intention to quit smoking, and had more self efficacy for quitting.
The known association between educational level and self efficacy
was present only in the web survey. Differences between the web and
telephone sample were present, but the differences were small and not
consistently favourable for either web or telephone interviewing. Our study
findings suggested sometimes a better data quality in the web than in the
telephone survey. Therefore, web interviewing can be a good alternative
to telephone interviewing.
AB
STR
AC
T
| 25 |
chapter 2 | Methods of the ITC Netherlands Survey
INTRODUCTION
Most chapters in this thesis used data from the International Tobacco Control (ITC)
Netherlands Survey. The ITC Project studies the effects of tobacco control policies
on the attitudes and behaviours of smokers in 20 countries. The ITC Netherlands
Survey is funded by the Netherlands Organisation for Health Research and
Development (ZonMw). In chapters 4, 6, 8, 9, and 11, data from the ITC Netherlands
Survey are compared with data from other ITC Europe countries.
Chapters 3 and 13 used data from the Dutch Continuous Survey of Smoking
Habits (DCSSH) which aims to monitor smoking habits of the Dutch population.
The DCSSH is a unique national population survey, because large samples of
respondents are surveyed every week on their smoking behaviour, use of smoking
cessation aids, attitudes towards smoking, quitting, and tobacco control policies,
and exposure to media campaigns. The DCSSH can be used to examine trends in
smoking behaviour on the population level, because the survey is conducted with
the same methodology (web interviewing) since 2001. The DCSSH is funded by the
Dutch Ministry of Health, Welfare, and Sport.
Chapter 5 used data from the SimSmoke Tobacco Control Policy Simulation
Model which aims to develop nation-specific simulation models projecting the
effects of tobacco control policies on smoking prevalence and smoking-attributable
deaths. The SimSmoke Model is the only simulation model that simultaneously
considers the full set of MPOWER policies. The development of the Netherlands
SimSmoke Model was part of the PPACTE Project ‘Pricing Policies and Control of
Tobacco in Europe’ and is funded partly by the European Commission.
This chapter reports on a study which aimed to compare the ITC Netherlands
web and telephone samples on demographic and smoking-related variables to
assess differences in data quality.
METHODS
Mixed mode design
Findings of the ITC Project are used to generalise to the population of smokers in
different countries. Therefore, using a mode of interviewing that yields representative
results is a very important part of the project. The standard ITC survey mode in
high-income countries is telephone, by means of random digit dialling. The ITC
Netherlands Survey differs from other ITC surveys in that a mixed mode design
was used. Some respondents were surveyed using telephone interviewing, but the
majority of respondents were surveyed by web interviewing using samples drawn
from a large population-based internet panel.
An important objective of tobacco control research in general is studying
| 26 |
differences between smokers of different socioeconomic status groups. Smokers of
lower socioeconomic status groups are less likely to quit smoking (Chandola, Head,
& Bartley, 2004; Lennox, 1992), as is evidenced by lower scores on determinants
of smoking cessation (Siahpush, McNeill, Borland, & Fong, 2006). We will therefore
test whether the differences between smokers of different socioeconomic status
groups in determinants of smoking cessation are present in both the web and
telephone survey.
The web respondents were drawn from TNS NIPObase, a large probability-
based database with over 140,000 potential Dutch web respondents who have
indicated their willingness to participate in research on a regular basis. TNS
NIPObase panel members are actively recruited by TNS NIPO. People cannot
apply for participation, which results in a low number of professional and inattentive
respondents (Willems, Brown, Van Ossenbruggen, & Vonk, 2006). Web panel
members are recruited by phone or mail, but not by internet. A screening procedure
selected respondents that met the inclusion criteria for the ITC Netherlands Survey:
being a monthly smoker of manufactured or roll-your-own cigarettes and having
smoked at least 100 cigarettes in their lifetime. Quotas on gender, geographic region,
household size, and education were determined from the 2007 Dutch Continuous
Survey of Smoking Habits (DCSSH) to get a sample that was representative of
Dutch smokers aged 15 years or older. The DCSSH is a national surveillance survey
on smoking with weekly measurements of over 4,000 smoking respondents in
2007 and uses web respondents from TNS NIPObase. An announcement e-mail
about the first ITC Netherlands web survey was sent to 2,331 smoking respondents
from TNS NIPObase. The announcement e-mail contained information about the
subject of the survey, the time needed to fill it in, and the reimbursement that
respondents could receive. It also contained a link to the website with conditions
from TNS NIPObase. TNS NIPObase panel members had to read and agree to
these conditions before becoming a panel member. The regulations state that
members’ personal information would be protected and that their participation in
the surveys was voluntary. The web survey was completed from April 16 to April 25,
2008 by 1,820 respondents of 15 years and older. We analysed the data from 1,668
respondents who were 18 years and older. The respondents received compensation
for their participation in the survey by earning points for every answered question,
as is standard procedure in the TNS NIPObase web panel. The points could be
exchanged into money, which ranged between 5 and 7 Euro for this survey.
The starting point of sampling the telephone respondents was the TNS
NIPObase, which contains over 80,000 respondents with fixed line telephone
numbers. This database is nationally representative on postal codes and matching

| 27 |
chapter 2 | Methods of the ITC Netherlands Survey
telephone numbers. A sample was drawn by randomly taking telephone numbers
from the database. The last two digits of each randomly drawn number were
automatically replaced by two random digits. In total 28,563 numbers were called by
the interviewers for the first ITC Netherlands telephone survey. When an interviewer
reached an individual on the telephone, the interviewer asked how many people
in the household fit the inclusion criteria: those reporting smoking at least monthly
and who had smoked at least 100 cigarettes in their lifetime. In households where
more than one person fit the criteria, the interviewer asked to speak with the person
whose birthday was coming up next. The fieldwork took place from March 12 to
April 26, 2008 and resulted in 404 completed interviews. The average telephone
interview took 40 minutes. Each telephone respondent received a reimbursement
of 10 euro by mail after completing the survey.
Measurements
The ITC Netherlands web and telephone surveys consisted of 264 questions on
demographics, smoking behaviour, and related issues, with extensive sections on
tobacco control policies such as health warnings, smoke-free laws, advertising, and
prices paid for cigarettes. Fong et al. (2006) provides a description of objectives of
the ITC Project Surveys, and Thompson et al. (2006) provides a description of the
methods used.
Basic demographic variables that have a known association with smoking
cessation (Chandola et al., 2004; Lennox, 1992) were measured: gender, age,
marital status, and educational level. Educational level was measured as a proxy of
socioeconomic status and was categorised into three groups: low (primary education
and lower pre-vocational secondary education), medium (middle pre-vocational
secondary education and secondary vocational education), and high (senior general
secondary education, (pre-)university education and higher professional education).
Respondents who did not want to answer the question about their educational level
were recorded separately.
Commonly used measures in smoking cessation research (Hyland, Borland
et al., 2006), which were also used in an earlier mode comparison study on smoking
(Etter & Perneger, 2001) were used in this study: (1) number of cigarettes smoked
per day, (2) number of previous quit attempts, (3) time (in minutes) before smoking
the first cigarette after waking, (4) attitude towards smoking (assessed by asking
“What is your overall opinion of smoking?” very positive – positive – neither positive
nor negative – negative – very negative – refused - don’t know), (5) intention to quit
smoking (assessed by asking “Are you planning to quit smoking...” within the next
month – within the next 6 months – sometime in the future, beyond 6 months – never
| 28 |
– refused - don’t know; respondents who answered ‘don’t know’ were asked what
they would answer if they were forced to choose an answer), and (6) self efficacy for
quitting (assessed by asking “If you decided to give up smoking completely in the
next 6 months, how sure are you that you would succeed?” not at all sure – slightly
sure – moderately sure – very sure – extremely sure - refused - don’t know). These
questions were the same in wording across modes. Answering categories were
read aloud by the telephone interviewers with the exception of the ‘refused’ and
‘don’t know’ categories. Answering categories were visible on the screen of the
web survey with the exception of the ‘refused’ category. The ‘don’t know’ category
was preceded by an extra space and was displayed in a grey font to make it less
visible.
Analyses
Because young smokers were deliberately over sampled in the web survey to address
the research question of another study, all analyses were conducted with the data
weighted for age. To evaluate coverage in the web sample, telephone respondents
who had internet access were compared to telephone respondents without internet
access. To evaluate coverage in the telephone sample, web respondents that had a
fixed telephone line were compared to web respondents without a fixed line. Since
coverage error was expected to affect which part of the population was contacted,
respondents were compared with respect to demographic variables. This was done
using chi-square tests (gender, marital status, and educational level) and t-tests
(age).
To assess differences in the combination of coverage and non-response
error, respondents from both samples were compared to the demographic
characteristics of smoking respondents of Statistics Netherlands (CBS) from 2006-
2007. The CBS statistics are the official national statistics for the Netherlands, and
use the national registry as a sampling frame. The CBS uses computer assisted
personal interviewing on a sample of 10,000 persons. Survey interviewing occurs
evenly throughout the year. Since non-response error also was expected to affect
which part of the initial sample responds to the survey, respondents were compared
with respect to demographic variables. The web, telephone, and CBS samples were
compared on demographic variables using chi-square tests (gender, marital status,
and educational level).
To assess differences which might be attributed in large part to differences
in measurement error, web and telephone respondents were compared with each
other. Measurement error was expected to arise from reactions to the measurement
instrument. The web and telephone samples were therefore compared on smoking

| 29 |
chapter 2 | Methods of the ITC Netherlands Survey
related questions using chi-square tests and Mann-Whitney U-tests (attitude
towards smoking, intention to quit smoking, and self efficacy for quitting) and t-tests
and Levene’s F-tests (number of cigarettes smoked per day, number of previous quit
attempts, and time before smoking the first cigarette after waking). These analyses
were employed without respondents who had no fixed telephone or who did not
have access to the internet to control for coverage error differences. Furthermore,
linear regression analyses were employed that tested the effects of interviewing
modes on answers to smoking related questions, controlling for gender, marital
status, educational level, and age. Also, interactions between interviewing mode
and educational level were tested.
RESULTS
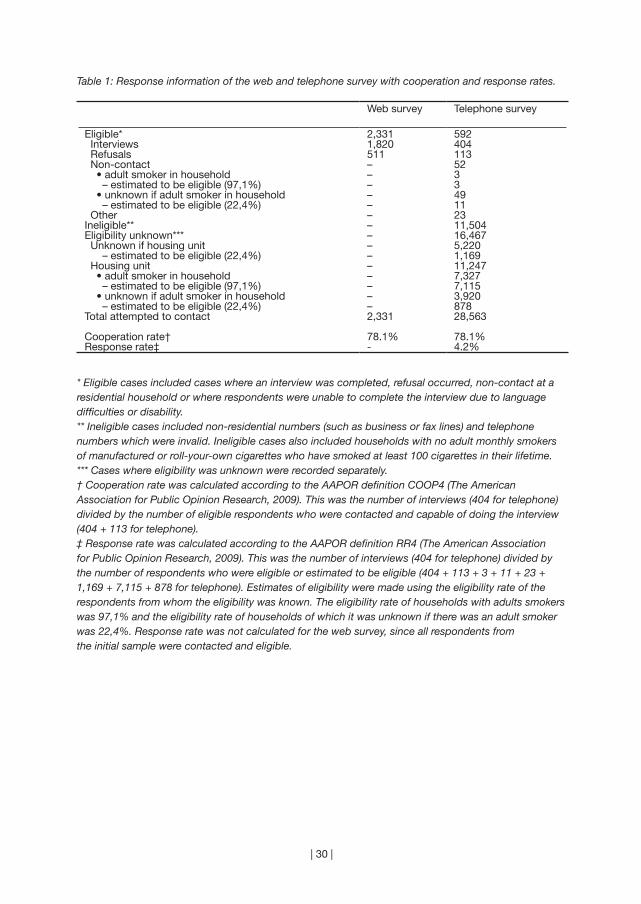
Response
Both the web and telephone survey had a cooperation rate of 78.1%, which means
that 78.1% of the eligible respondents who were contacted and capable of doing the
interview completed the interview (see Table 1). The response rate for the telephone
survey was 4.2%. This means that 4.2% of all eligible telephone respondents,
including non-contacts whose eligibility was estimated, completed the interview. A
response rate could not be calculated for the web survey, since the initial sample
consisted of only eligible respondents who were all e-mailed. Therefore, there were
no non-contacts in the web survey.
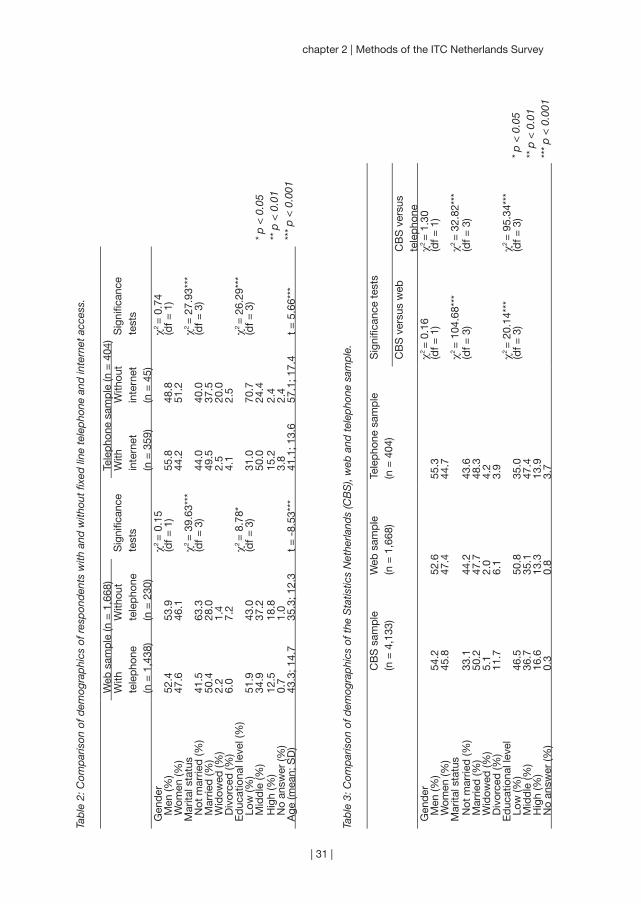
Coverage
As can be seen in Table 2, 1,438 out of 1,668 (86.2%) web respondents had a fixed
line telephone. Web respondents with a fixed line telephone did not differ on gender
from web respondents without a fixed line telephone (p = 0.697). Web respondents
with a fixed line telephone were significantly more often married (p < 0.001), had a
lower educational level (p = 0.032), and were older (p < 0.001) than web respondents
without a fixed line telephone.
Of the telephone respondents, 359 out of 404 (88.9%) had internet access
at home. Telephone respondents with internet access did not differ on gender from
telephone respondents without internet access (p = 0.389). Telephone respondents
with internet access were significantly more often married (p < 0.001), had a
higher educational level (p < 0.001), and were younger (p < 0.001) than telephone
respondents without internet.
| 30 |
Table 1: Response information of the web and telephone survey with cooperation and response rates.
Web survey Telephone survey
Eligible* 2,331 592 Interviews 1,820 404 Refusals 511 113 Non-contact – 52 • adult smoker in household – 3 – estimated to be eligible (97,1%) – 3 • unknown if adult smoker in household – 49 – estimated to be eligible (22,4%) – 11 Other – 23Ineligible** – 11,504Eligibility unknown*** – 16,467 Unknown if housing unit – 5,220 – estimated to be eligible (22,4%) – 1,169 Housing unit – 11,247 • adult smoker in household – 7,327 – estimated to be eligible (97,1%) – 7,115 • unknown if adult smoker in household – 3,920 – estimated to be eligible (22,4%) – 878Total attempted to contact 2,331 28,563
Cooperation rate† 78.1% 78.1%Response rate‡ - 4.2%
* Eligible cases included cases where an interview was completed, refusal occurred, non-contact at a residential household or where respondents were unable to complete the interview due to language difficulties or disability.** Ineligible cases included non-residential numbers (such as business or fax lines) and telephone numbers which were invalid. Ineligible cases also included households with no adult monthly smokers of manufactured or roll-your-own cigarettes who have smoked at least 100 cigarettes in their lifetime.*** Cases where eligibility was unknown were recorded separately.† Cooperation rate was calculated according to the AAPOR definition COOP4 (The American Association for Public Opinion Research, 2009). This was the number of interviews (404 for telephone) divided by the number of eligible respondents who were contacted and capable of doing the interview (404 + 113 for telephone).‡ Response rate was calculated according to the AAPOR definition RR4 (The American Association for Public Opinion Research, 2009). This was the number of interviews (404 for telephone) divided by the number of respondents who were eligible or estimated to be eligible (404 + 113 + 3 + 11 + 23 + 1,169 + 7,115 + 878 for telephone). Estimates of eligibility were made using the eligibility rate of the respondents from whom the eligibility was known. The eligibility rate of households with adults smokers was 97,1% and the eligibility rate of households of which it was unknown if there was an adult smoker was 22,4%. Response rate was not calculated for the web survey, since all respondents from the initial sample were contacted and eligible.
| 31 |
chapter 2 | Methods of the ITC Netherlands Survey
Tab
le 2
: Com
par
ison
of d
emog
rap
hics
of r
esp
ond
ents
with
and
with
out
fixed
line
tel
epho
ne a
nd in
tern
et a
cces
s.
Web
sam
ple
(n =
1,6
68)
Tele
pho
ne s
amp
le (n
= 4
04)
With
te
lep
hone
(n
= 1
,438
)
With
out
tele
pho
ne
(n =
230
)
Sig
nific
ance
te
sts
With
in
tern
et(n
= 3
59)
With
out
inte
rnet
(n =
45)
Sig
nific
ance
te
sts
Gen
der
χ2 =
0.1
5χ2
= 0
.74
Men
(%)
52.4
53.9
(df =
1)
55.8
48.8
(df =
1)
Wom
en (%
)47
.646
.144
.251
.2M
arita
l sta
tus
χ2 =
39.
63**
*χ2
= 2
7.93
***
Not
mar
ried
(%)
41.5
63.3
(df =
3)
44.0
40.0
(df =
3)
Mar
ried
(%)
50.4
28.0
49.5
37.5
Wid
owed
(%)
2.2
1.4
2.5
20.0
Div
orce
d (%
)6.
07.
24.
12.
5E
duc
atio
nal l
evel
(%)
χ2 =
8.7
8*χ2
= 2
6.29
***
Low
(%)
51.9
43.0
(df =
3)
31.0
70.7
(df =
3)
Mid
dle
(%)
34.9
37.2
50.0
24.4
Hig
h (%
)12
.518
.815
.22.
4 N
o an
swer
(%)
0.7
1.0
3.8
2.4
Age
(mea
n; S
D)
43.3
; 14.
735
.3; 1
2.3
t =
-8.
53**
*41
.1; 1
3.6
57.1
; 17.
4t
= 5
.66*
**
* p
< 0
.05
** p
< 0
.01
***
p <
0.0
01
Tab
le 3
: Com
par
ison
of d
emog
rap
hics
of t
he S
tatis
tics
Net
herla
nds
(CB
S),
web
and
tel
epho
ne s
amp
le.
CB
S s
amp
le
(n =
4,1
33)
Web
sam
ple
(n
= 1
,668
)Te
lep
hone
sam
ple
(n
= 4
04)
Sig
nific
ance
tes
ts
CB
S v
ersu
s w
ebC
BS
ver
sus
tele
pho
neG
end
erχ2
= 0
.16
χ2 =
1.3
0 M
en (%
)54
.252
.655
.3(d
f = 1
)(d
f = 1
) W
omen
(%)
45.8
47.4
44.7
Mar
ital s
tatu
sχ2
= 1
04.6
8***
χ2 =
32.
82**
* N
ot m
arrie
d (%
)33
.144
.243
.6(d
f = 3
)(d
f = 3
) M
arrie
d (%
)50
.247
.748
.3 W
idow
ed (%
)5.
12.
04.
2 D
ivor
ced
(%)
11.7
6.1
3.9
Ed
ucat
iona
l lev
elχ2
= 2
0.14
***
χ2 =
95.
34**
* L
ow (%
)46
.550
.835
.0(d
f = 3
)(d
f = 3
) M
idd
le (%
)36
.735
.147
.4 H
igh
(%)
16.6
13.3
13.9
No
answ
er (%
)0.
30.
83.
7
* p
< 0
.05
** p
< 0
.01
***
p <
0.0
01
| 32 |
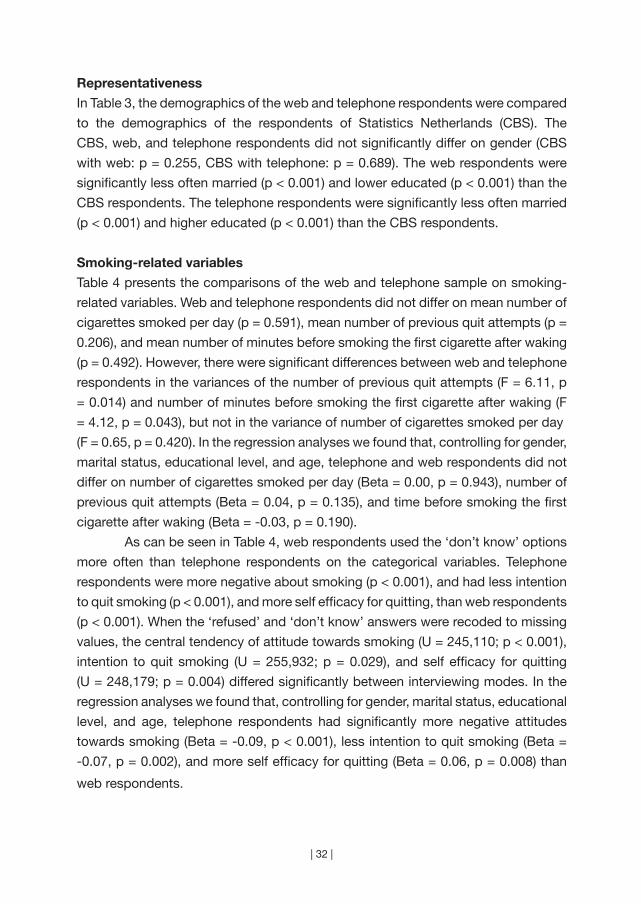
Representativeness
In Table 3, the demographics of the web and telephone respondents were compared
to the demographics of the respondents of Statistics Netherlands (CBS). The
CBS, web, and telephone respondents did not significantly differ on gender (CBS
with web: p = 0.255, CBS with telephone: p = 0.689). The web respondents were
significantly less often married (p < 0.001) and lower educated (p < 0.001) than the
CBS respondents. The telephone respondents were significantly less often married
(p < 0.001) and higher educated (p < 0.001) than the CBS respondents.
Smoking-related variables
Table 4 presents the comparisons of the web and telephone sample on smoking-
related variables. Web and telephone respondents did not differ on mean number of
cigarettes smoked per day (p = 0.591), mean number of previous quit attempts (p =
0.206), and mean number of minutes before smoking the first cigarette after waking
(p = 0.492). However, there were significant differences between web and telephone
respondents in the variances of the number of previous quit attempts (F = 6.11, p
= 0.014) and number of minutes before smoking the first cigarette after waking (F
= 4.12, p = 0.043), but not in the variance of number of cigarettes smoked per day
(F = 0.65, p = 0.420). In the regression analyses we found that, controlling for gender,
marital status, educational level, and age, telephone and web respondents did not
differ on number of cigarettes smoked per day (Beta = 0.00, p = 0.943), number of
previous quit attempts (Beta = 0.04, p = 0.135), and time before smoking the first
cigarette after waking (Beta = -0.03, p = 0.190).
As can be seen in Table 4, web respondents used the ‘don’t know’ options
more often than telephone respondents on the categorical variables. Telephone
respondents were more negative about smoking (p < 0.001), and had less intention
to quit smoking (p < 0.001), and more self efficacy for quitting, than web respondents
(p < 0.001). When the ‘refused’ and ‘don’t know’ answers were recoded to missing
values, the central tendency of attitude towards smoking (U = 245,110; p < 0.001),
intention to quit smoking (U = 255,932; p = 0.029), and self efficacy for quitting
(U = 248,179; p = 0.004) differed significantly between interviewing modes. In the
regression analyses we found that, controlling for gender, marital status, educational
level, and age, telephone respondents had significantly more negative attitudes
towards smoking (Beta = -0.09, p < 0.001), less intention to quit smoking (Beta =
-0.07, p = 0.002), and more self efficacy for quitting (Beta = 0.06, p = 0.008) than
web respondents.

| 33 |
chapter 2 | Methods of the ITC Netherlands Survey
Table 4: Comparison of smoking-related variables in the web and telephone sample.
Web sample(n = 1,668)
Telephone sample (n = 404)
Significance tests
Number of cigarettes smoked per day (mean; SD)
15.3; 8.1 15.0; 8.5 t = -0.54
Number of previous quit attempts (mean; SD) 2.0; 2.2 2.2; 2.5 t = 1.27Time (in minutes) before smoking the first cigarette (mean; SD)
93.1; 189.2 86.5; 154.9 t = -0.69
Attitude towards smoking χ2 = 32.12*** Very positive (%) 1.5 0.8 (df = 6) Positive (%) 12.7 9.2 Neither positive nor negative (%) 64.3 60.0 Negative (%) 17.6 23.3 Very negative (%) 2.4 6.7 Refused (%) 0.0 0.0 Don’t know (%) 1.6 0.0Intention to quit smoking χ2 = 51.25*** Within the next month (%) 5.6 7.8 (df = 5) Within the next 6 months (%) 19.3 20.0 Sometime in the future, beyond 6 months (%) 56.6 44.7 Never (%) 14.3 26.7 Refused (%) 0.0 0.3 Don’t know (%) 4.2 0.6Self efficacy for quitting χ2 = 29.38*** Not at all sure (%) 35.4 30.6 (df = 6) Slightly sure (%) 35.0 29.5 Moderately sure (%) 16.5 22.3 Very sure (%) 6.0 5.6 Extremely sure (%) 4.5 9.7 Refused (%) 0.0 0.3 Don’t know (%) 2.7 1.9
* p < 0.05** p < 0.01 *** p < 0.001
Educational differences
When controlling for gender, marital status, educational level, and age, interactions
of mode of interviewing with educational level were tested with the smoking-related
variables as outcomes. There was a significant interaction effect found of mode of
interviewing with educational level on self efficacy for quitting (Beta = -0.15, p =
0.003). Higher educated respondents had more self efficacy for quitting in the web
sample (Beta = 0.17, p < 0.001), but not in the telephone sample (Beta = 0.05, p =
0.314).

| 34 |
Recontacting respondents
All respondents from the baseline ITC telephone sample were recontacted one
year after the first survey, while all respondents from the baseline ITC web survey
were recontacted one, two, and three years after the first survey. Also, a smaller
sample of the baseline web respondents were recontacted seven months after the
first survey to examine short-term effects of a smoking cessation campaign. The
samples from the follow-up web surveys were replenished with new samples of
smokers to replace the respondents that were lost to follow-up. Figure 1 shows how
many respondents participated in each survey wave.
As can be seen in Figure 1, 1,012 of the 1,820 baseline web respondents
(56%) participated in wave 5. Respondents who participated in wave 5 were
significantly older (mean age = 39.3, SD = 15.3) than respondents who did not
participate in wave 5 (mean age = 33.9, SD = 15.2) (t = -7.5, p < 0.001). Furthermore,
respondents who participated in wave 5 were significantly more likely to be male (χ2
= 8.8, p = 0.003), lower educated (χ2 = 9.1, p = 0.011), and more likely to be a heavier
smoker (t = -2.4, p = 0.017) than respondents who did not participate in wave 5.
Figure 1: Respondents of the ITC Netherlands Survey wave 1 to 5 by interviewing mode and cohort.
Internet Telephone
Wave 1 cohort Wave 3 Wave 4 Wave 5 Wave 1 cohortreplenishment replenishment replenishment
Wave 1 1,820 of 2,331 404 of 592(78%) (78%)
Wave 2 643 of 744(86%)
Wave 3 1,447 of 1,820 270 of 555 296 of 404(80%) (49%) (73%)
Wave 4 1,275 of 1,820 206 of 270 579 of 848(70%) (76%) (68%)
Wave 5 1,012 of 1,820 153 of 270 454 of 579 482 of 598(56%) (57%) (78%) (81%)
| 35 |
chapter 2 | Methods of the ITC Netherlands Survey
CONCLUSION
Data quality differences between the ITC Netherlands web and telephone surveys
were present, but they were small. Cooperation rates were high for both the web
and telephone survey (78%), which can be explained by the use of a well respected
market research company and the use of reimbursements. Web interviewing can
be regarded as a good alternative to telephone interviewing in smoking cessation
research. This conclusion is based on the facts that both our web and telephone
surveys contained coverage and non-response error differences, which were
not consistently favourable for either web or telephone interviewing. Differences
between the web and telephone surveys on smoking-related variables were small.
There were indications of more socially desirable responding with telephone
interviewing, suggesting that web surveys may even obtain better data quality than
telephone surveys.
Budget constraints can be a powerful motivator to choose web interviewing,
since the differences in costs are huge. In our study, the costs were €15 (US$22)
for fieldwork costs and reimbursements per web respondent and €62 (US$90) per
telephone respondent. Because of this cost difference and because we established
that web interviewing can be regarded a good alternative to telephone interviewing,
we decided to go further with web interviewing only.

| 36 |

Part 1
~~~
Population impact of smoke-free legislation on
smoking
| 37 |

“The government is helping us. I thought I
couldn’t quit.” (Joan Desadora, bar owner in
New York about the implementation of
smoke-free legislation)
| 38 |

Chapter 3
~~~
Smoke-free workplace and hospitality industry legislation
Published as:
Nagelhout, G. E., Willemsen, M. C., & De Vries, H. (2011). The
population impact of smoke-free workplace and hospitality industry
legislation on smoking behaviour. Findings from a national population
survey. Addiction, 106, 816-823.
| 39 |
| 40 |
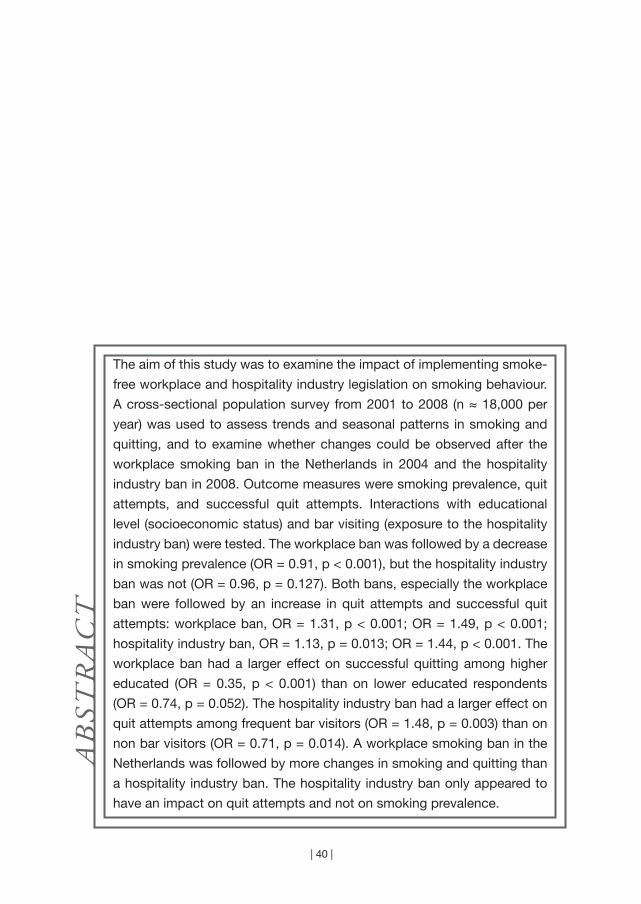
The aim of this study was to examine the impact of implementing smoke-
free workplace and hospitality industry legislation on smoking behaviour.
A cross-sectional population survey from 2001 to 2008 (n ≈ 18,000 per
year) was used to assess trends and seasonal patterns in smoking and
quitting, and to examine whether changes could be observed after the
workplace smoking ban in the Netherlands in 2004 and the hospitality
industry ban in 2008. Outcome measures were smoking prevalence, quit
attempts, and successful quit attempts. Interactions with educational
level (socioeconomic status) and bar visiting (exposure to the hospitality
industry ban) were tested. The workplace ban was followed by a decrease
in smoking prevalence (OR = 0.91, p < 0.001), but the hospitality industry
ban was not (OR = 0.96, p = 0.127). Both bans, especially the workplace
ban were followed by an increase in quit attempts and successful quit
attempts: workplace ban, OR = 1.31, p < 0.001; OR = 1.49, p < 0.001;
hospitality industry ban, OR = 1.13, p = 0.013; OR = 1.44, p < 0.001. The
workplace ban had a larger effect on successful quitting among higher
educated (OR = 0.35, p < 0.001) than on lower educated respondents
(OR = 0.74, p = 0.052). The hospitality industry ban had a larger effect on
quit attempts among frequent bar visitors (OR = 1.48, p = 0.003) than on
non bar visitors (OR = 0.71, p = 0.014). A workplace smoking ban in the
Netherlands was followed by more changes in smoking and quitting than
a hospitality industry ban. The hospitality industry ban only appeared to
have an impact on quit attempts and not on smoking prevalence.
AB
STR
AC
T
| 41 |
chapter 3 | Smoke-free workplace and hospitality industry legislation
INTRODUCTION
The Framework Convention on Tobacco Control (FCTC) was adopted in May
2003 under the auspices of the World Health Organization (WHO) (World Health
Organization, 2003). Article 8 of the FCTC states that parties should adopt and
implement national laws to protect citizens from exposure to second-hand smoke
(SHS) in indoor public places. The Republic of Ireland was the first to implement
a national law banning smoking from all enclosed workplaces, with very limited
exemptions (Smoke Free Partnership, 2006). Only workplaces that were also
private residences – hotel bedrooms, prisons, nursing homes, and psychiatric
hospitals - were exempted. Some of the countries that followed Ireland’s example
temporarily exempted the hospitality industry, because these workplaces also
have an entertainment function for the general public and support for hospitality
industry smoking bans is generally low; examples were Belgium, France, and the
Netherlands (ENSP, 2009). After a period in which the public could get used to
smoke-free workplaces and in which the hospitality industry had the opportunity to
create voluntary smoking bans, those countries extended the workplace smoking
ban to the hospitality industry.
Implementing a workplace smoking ban first and a hospitality industry
smoking ban later compromises the health of hospitality industry employees
(Smoke Free Partnership, 2006). However, it is thought that this stepwise approach
might also stimulate more smokers to quit smoking: first when the workplace ban is
implemented and second when it is extended to the hospitality industry. According
to the WHO, workplace smoking bans not only protect hospitality employees from
exposure to SHS, but also encourages smokers to quit smoking (World Health
Organization, 2008a). Several studies found significant decreases in smoking
prevalence after the implementation of a workplace ban (Farrelly et al., 1999; Gallus
et al., 2007; Hahn et al., 2008; Lemstra, Neudorf, & Opondo, 2008). Other studies
found significant increases in smoking cessation (Farkas, Gilpin, Distefan, & Pierce,
1999; Fowkes, Stewart, Fowkes, Amos, & Price, 2008; Hackshaw, McEwen, West,
& Bauld, 2010; Longo, Johnson, Kruse, Brownson, & Hewett, 2001; Moskowitz et
al., 2000). In addition, a rise in the sales of nicotine replacement products (Galeone
et al., 2006; Lewis, Haw, & McNeill, 2008) and increased calls to smoking cessation
quitlines (Chan et al., 2009; Edwards et al., 2008; Wilson, Thomson, Grigg, & Afzal,
2005) were found, suggesting an increase in smoking cessation. However, there
were also studies that found no decline in smoking prevalence (Edwards et al., 2008;
Elton & Campbell, 2008; Galán et al., 2007), while other studies found decreases in
smoking prevalence too small to reach significance (Haw & Gruer, 2007; Mullally,
Greiner, Allwright, Paul, & Perry, 2009).
| 42 |
The above-cited studies evaluated the effects of workplace smoking bans on
smoking and quitting. Yet it appears no research has examined the effects of an
extension of a workplace ban to the hospitality industry. In this study we will assess
the effects of the implementation of a workplace smoking ban in January 2004 in
the Netherlands and the extension to the hospitality industry in July 2008.
When studying changes in smoking behaviour after the implementation of a
smoking ban, trends in smoking behaviour should be taken into account (Edwards
et al., 2008; Fowkes et al., 2008; Lewis et al., 2008). For example, a decline in
smoking can only be ascribed to a smoking ban when the decrease is larger than
that of previous years. In this study we will relate a seven year trend in smoking and
quitting to the changes after the implementation of the workplace and hospitality
industry smoking ban. Other policies that were implemented in this time period were
tax increases (2001, 2004, and 2008), text warning labels (2002), an advertising ban
(2002), and a youth access law (2003). National mass media smoking cessation
campaigns ran in 2003, 2004, and 2008. Our first hypothesis is that there will be
fewer smokers and more quitters than normal after the implementation of the
workplace and hospitality industry ban in the Netherlands.
Smoking is increasingly a problem for lower socioeconomic status (SES)
groups (World Health Organization, 2008a). There is some evidence that smoking
bans have more impact on the smoking behaviour of higher SES groups (Farrelly et
al., 1999; Fowkes et al., 2008), while other studies did not find differences between
SES groups (Hackshaw et al., 2010; Moskowitz et al., 2000). Therefore, our second
hypothesis is that we expect to observe more changes in smoking and quitting
among people with a higher SES.
Since the Dutch smoking bans were implemented in conjunction with a
tax increase and a mass media smoking cessation campaign, we could not simply
assume that changes in smoking behaviour were due to the bans only. In other
studies this issue was resolved by comparing individuals who were more and less
exposed to the ban (Braverman, Aaro, & Hetland, 2008; Edwards et al., 2008;
Verdonk-Kleinjan et al., 2009). In this study we compared individuals who were not
exposed to the smoking ban in the hospitality industry (i.e. individuals who never
visited bars) with individuals who were somewhat exposed to the ban (i.e. individuals
who visited bars yearly), and those who were most exposed (i.e. individuals who
visited bars monthly). Our third hypothesis is therefore that we expect to observe
more changes in smoking and quitting among individuals who were more exposed
to the ban.
| 43 |
chapter 3 | Smoke-free workplace and hospitality industry legislation
METHODS
Sample
The data source of this study was the Dutch Continuous Survey of Smoking Habits
(DCSSH). This is a cross-sectional population survey of respondents aged 15 years
and older that is used to monitor smoking habits of the Dutch population, using
weekly measurements. The DCSSH is conducted by TNS NIPO for the Dutch expert
centre on tobacco control (STIVORO) and is supported by grants from the Dutch
Ministry of Health. Respondents for the DCSSH were randomly selected from TNS
NIPObase, a database with at present over 140,000 potential respondents who
participate in internet-based research on a regular basis. TNS NIPObase panel
members are actively recruited by TNS NIPO using telephone and mail. Data from
the DCSSH from 2001 until 2008 were used for this study. Approximately 18,000
respondents participated in the survey each year (144,733 in total from 2001 to
2008), with 18,637 respondents in 2008 of whom 9,572 were surveyed after the
implementation of the smoking ban in July 2008. The data were representative for
the Dutch population of 15 years and older after applying weights for gender, age,
educational level, working hours, geographic region, urbanisation and household
size.
Questionnaire
The questionnaire used assessed background characteristics, smoking behaviour,
use of smoking cessation aids, and contained extensive sections on attitudes
towards smoking, quitting and tobacco control policies and campaigns. The
questionnaire was sent to the respondents by e-mail. Respondents could fill in the
questionnaire at their own computer using software from TNS NIPO. For this study,
questions about smoking behaviour and background characteristics from 2001 until
2008 were used.
In line with an earlier study (Willemsen, Hoogenveen, & Van der Lucht,
2002), smoking status at the time of the survey was assessed by asking “Do you
(ever) smoke or not at all?”. Respondents who answered that they smoke were
defined as current smokers. Respondents who answered that they did not smoke
were asked “Have you smoked in the past?”. Respondents who answered that they
had smoked in the past were defined as former smokers and respondents who
answered that they had not smoked in the past were defined as never smokers.
Smoking prevalence was the percentage of respondents who were current smokers.
This was calculated per year (for analyses between years) and per six months (for
analyses within years).
| 44 |
Quit attempts in the last six and twelve months were measured by asking current
smokers “How long ago was your most recent attempt to quit smoking?” and by
asking former smokers “How long ago did you quit smoking?”. In line with earlier
studies (Farkas et al., 1999; Hackshaw et al., 2010), these questions were combined
to construct dichotomous variables measuring a) whether respondents made a quit
attempt in the past year (for analyses between years) and b) whether respondents
made a quit attempt in the past six months (for analyses within years).
Successful quit attempts in the last six and twelve months were measured
with the same question as quit attempts, but excluding the current smokers (i.e.
the unsuccessful quit attempts). This measure was also used in earlier studies
(Capannesi, Boshuizen, Willemsen, & Van Houwelingen, 2009; Willemsen et al.,
2002).
Furthermore, age, gender, educational level, employment status, and
frequency of bar visiting were assessed. Age was categorised into four groups: 15
to 24 years, 25 to 39 years, 40 to 54 years, and 55 years and older. Educational level
was categorised into three groups: low (primary education and lower pre-vocational
secondary education), medium (middle pre-vocational secondary education and
secondary vocational education), and high (senior general secondary education,
(pre-)university education and higher professional education). Employment status
was categorised into currently employed and currently not employed for at least
two days per week. Frequency of bar visiting was categorised as never, yearly, and
monthly visiting.
Analyses
The first hypothesis implies fewer smokers and more quitters than normal after
the implementation of the workplace and hospitality industry smoking ban. To
assess how much smoking and quitting was normal, we performed multivariate
logistic regression analyses on data from 2001 until 2007. Dependent variables
were percentage of smokers, percentage of quitters, and percentage of successful
quitters. Independent variables were ‘year’ for analyses to assess trends and ‘period’
(first six months and last six months of the year) to assess seasonal patterns. These
analyses were repeated for 2003 and 2004 together (to assess trends following
the implementation of the workplace smoking ban), 2004 only (to assess seasonal
patterns following the workplace ban), 2007 and 2008 together (to assess trends
following the hospitality industry ban), and 2008 only (to assess seasonal patterns
following the hospitality industry ban).

| 45 |
chapter 3 | Smoke-free workplace and hospitality industry legislation
The second hypothesis was that we expected to observe more changes in smoking
and quitting among people with a higher SES. Educational level and income are
common indicators of SES (Huisman, Kunst, & Mackenbach, 2005b). In this study,
we used educational level as indicator of SES, because it contained considerably
less missing values (n = 665) than income (n = 30,661). Additional analyses on
the respondents whose income was available resulted in similar conclusions as
the analyses with educational level. The analyses for hypothesis 1 were repeated
with educational level and the interaction of educational level with year and period
added as independent variables.
The third hypothesis states that the changes in smoking and quitting will
be more pronounced among individuals who were more exposed to the hospitality
industry ban. As a proxy of exposure to the ban we used frequency of bar visiting.
The analyses for hypothesis 1 were repeated with frequency of bar visiting and
the interaction of frequency of bar visiting with survey year and period added as
independent variables.
All analyses were conducted with SPSS version 17.
RESULTS
Background characteristics
There were no significant differences in background characteristics between survey
years (Table 1). Also, the background characteristics did not differ between the pre-
and post-ban period in 2008. More frequent bar visitors were significantly younger
(χ2 = 5,726.48, p < 0.001), more often male (χ2 = 336.69, p < 0.001), higher educated
(χ2 = 3,018.78, p < 0.001), and more often employed (χ2 = 2,447.60, p < 0.001).

| 46 |
Table 1: Background characteristics from 2001 to 2008 (weighted data).
2001 2002 2003 2004 2005 2006 2007 2008Age 15-24 (%) 14.7 14.7 14.7 14.7 14.7 14.7 14.7 14.7 25-39 (%) 29.9 30.3 30.3 30.6 30.3 30.3 30.7 30.8 40-54 (%) 26.9 26.5 26.5 26.3 26.4 26.5 26.1 26.0 55 and older (%) 28.4 28.6 28.5 28.4 28.6 28.5 28.5 28.6Gender Men (%) 49.1 49.1 49.1 49.2 49.1 49.1 49.1 49.0 Women (%) 50.9 50.9 50.9 50.8 50.9 50.9 50.9 51.0Educational level Low (%) 44.4 44.5 44.4 44.5 44.4 44.5 44.5 44.5 Medium (%) 33.6 33.6 33.6 33.6 33.6 33.6 33.6 33.6 High (%) 22.0 22.0 22.0 21.9 21.9 21.9 21.9 21.9Employment* Yes (%) - - - - 70.6 70.4 70.9 70.8 No (%) - - - - 29.4 29.6 29.1 29.2Frequency of bar visiting* Monthly (%) - - - - - 22.9 23.5 22.8 Yearly (%) - - - - - 29.5 29.6 30.8 Never (%) - - - - - 47.7 46.9 46.4
* Data on employment and frequency of bar visiting was collected from 2005 and 2006 respectively.
Differences in smoking and quitting between 2001 and 2008
Figure 1 shows smoking prevalence, percentage of quit attempts, and percentage
of successful quit attempts from 2001 until 2008. Table 2 shows that smoking
prevalence significantly decreased in the 2001-2007 period (Odds Ratio (OR) =
0.97, p < 0.001). This decrease was larger in 2004 (OR = 0.91, p < 0.001), after the
workplace smoking ban had been implemented. Smoking prevalence declined from
29.9% in 2003 to 27.9% in 2004. In 2008, when the hospitality industry smoking
ban was implemented, the observed decrease from 27.5% to 26.7% was not
significant (OR = 0.96, p = 0.127). There was no significant seasonal pattern in
smoking prevalence in the 2001-2007 period (OR = 1.00, p = 0.726). In 2004, there
was a significant difference between smoking prevalence in the first and second
half of the year. In the second half of 2004, smoking prevalence was significantly
higher than in the first half (OR = 1.08, p = 0.023). In 2008, smoking prevalence did
not significantly differ between the first and second half of the year (OR = 1.05, p =
0.147). Therefore, we can conclude that the workplace smoking ban was followed
by a decline in smoking prevalence, but the hospitality industry smoking ban was
not.
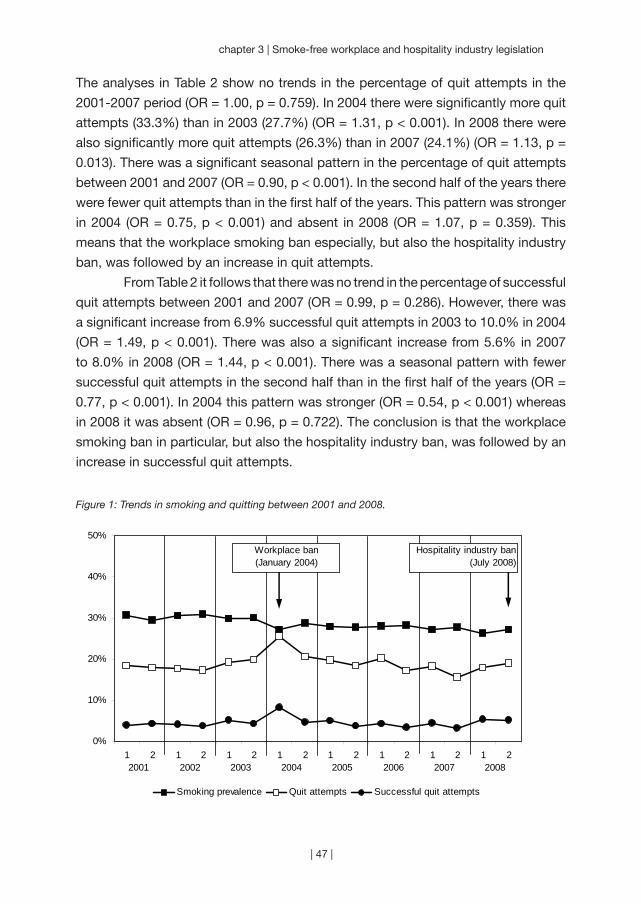
| 47 |
chapter 3 | Smoke-free workplace and hospitality industry legislation
The analyses in Table 2 show no trends in the percentage of quit attempts in the
2001-2007 period (OR = 1.00, p = 0.759). In 2004 there were significantly more quit
attempts (33.3%) than in 2003 (27.7%) (OR = 1.31, p < 0.001). In 2008 there were
also significantly more quit attempts (26.3%) than in 2007 (24.1%) (OR = 1.13, p =
0.013). There was a significant seasonal pattern in the percentage of quit attempts
between 2001 and 2007 (OR = 0.90, p < 0.001). In the second half of the years there
were fewer quit attempts than in the first half of the years. This pattern was stronger
in 2004 (OR = 0.75, p < 0.001) and absent in 2008 (OR = 1.07, p = 0.359). This
means that the workplace smoking ban especially, but also the hospitality industry
ban, was followed by an increase in quit attempts.
From Table 2 it follows that there was no trend in the percentage of successful
quit attempts between 2001 and 2007 (OR = 0.99, p = 0.286). However, there was
a significant increase from 6.9% successful quit attempts in 2003 to 10.0% in 2004
(OR = 1.49, p < 0.001). There was also a significant increase from 5.6% in 2007
to 8.0% in 2008 (OR = 1.44, p < 0.001). There was a seasonal pattern with fewer
successful quit attempts in the second half than in the first half of the years (OR =
0.77, p < 0.001). In 2004 this pattern was stronger (OR = 0.54, p < 0.001) whereas
in 2008 it was absent (OR = 0.96, p = 0.722). The conclusion is that the workplace
smoking ban in particular, but also the hospitality industry ban, was followed by an
increase in successful quit attempts.
Figure 1: Trends in smoking and quitting between 2001 and 2008.
0%
10%
20%
30%
40%
50%
12001
2 12002
2 12003
2 12004
2 12005
2 12006
2 12007
2 12008
2
Smoking prevalence Quit attempts Successful quit attempts
Workplace ban(January 2004)
Hospitality industry ban(July 2008)

| 48 |
Tab
le 2
: Log
istic
reg
ress
ion
anal
yses
: tre
nds
and
sea
sona
l pat
tern
s in
sm
okin
g an
d q
uitt
ing
bet
wee
n 20
01 a
nd 2
008,
od
ds
ratio
s w
ith 9
5% c
onfid
ence
inte
rval
s an
d p
-val
ues.
Sm
okin
g p
reva
lenc
eQ
uit
atte
mp
tsS
ucce
ssfu
lq
uit
atte
mp
tsO
R (9
5% C
I)p
OR
(95%
CI)
pO
R (9
5% C
I)p
Tren
ds
200
1-20
070.
97 (0
.97
to 0
.98)
<0.
001
1.00
(0.9
9 to
1.0
1) 0
.759
0.99
(0.9
7 to
1.0
1) 0
.286
200
3-20
040.
91 (0
.87
to 0
.95)
<0.
001
1.31
(1.2
1 to
1.4
1)<
0.00
11.
49 (1
.31
to 1
.70)
<0.
001
200
7-20
080.
96 (0
.92
to 1
.01)
0.1
271.
13 (1
.03
to 1
.23)
0.0
131.
44 (1
.22
to 1
.69)
<0.
001
Sea
sona
l p
atte
rns
200
1-20
071.
00 (0
.98
to 1
.03)
0.7
260.
90 (0
.85
to 0
.94)
<0.
001
0.77
(0.7
0 to
0.8
5)<
0.00
1 2
004
1.08
(1.0
1 to
1.1
5) 0
.023
0.75
(0.6
6 to
0.8
5)<
0.00
10.
54 (0
.44
to 0
.68)
<0.
001
200
81.
05 (0
.98
to 1
.12)
0.1
471.
07 (0
.93
to 1
.23)
0.3
590.
96 (0
.75
to 1
.22)
0.7
22
Tab
le 3
: Com
par
ison
of q
uit
atte
mp
ts b
y fr
eque
ncy
of b
ar v
isiti
ng p
re-b
an a
nd p
ost-
ban
in 2
008.
Non
bar
vis
itors
(%)
Year
ly b
arV
isito
rs(%
)
Mon
thly
bar
vi
sito
rs(%
)
χ
2p
Janu
ary
– Ju
ne 2
008
(pre
-ban
)18
.317
.518
.5 0
.28
0.86
7Ju
ly –
Dec
emb
er 2
008
(pos
t-b
an)
13.8
20.9
25.1
31.0
00.
001
| 49 |
chapter 3 | Smoke-free workplace and hospitality industry legislation
Interaction effects with educational level
In 2004 a significant interaction with educational level was found in the seasonal
pattern of more successful quit attempts in the first half of 2004 compared to the
second half (OR = 0.64, p = 0.004). This pattern was stronger for higher educated
(OR = 0.35, p < 0.001), than for medium educated (OR = 0.41, p < 0.001), and lower
educated respondents (OR = 0.74, p = 0.052). This difference in seasonal patterns
between educational levels was not prevalent between 2001 and 2007. In 2008
there were no significant interactions with educational level in trends or seasonal
patterns.
Interaction effects with bar visiting in 2007 and 2008
There were no significant interactions with bar visiting in trends in smoking and
quitting between 2007 and 2008. A significant interaction with bar visiting was found
in the seasonal pattern in quit attempts in 2008 (OR = 1.43, p < 0.001). Monthly bar
visitors were significantly more likely to attempt to quit smoking in the second half
of 2008 than in the first half (OR = 1.48, p = 0.003); yearly bar visitors were not more
or less likely to quit (OR = 1.25, p = 0.116); and non bar visitors were significantly
less likely to quit in the second half of 2008 (OR = 0.71, p = 0.014). This difference
in seasonal pattern between monthly, yearly, and non bar visitors was not prevalent
in 2007.
The bivariate analyses in Table 3 reveal that attempting to quit smoking
and bar visiting were unrelated before the implementation of the hospitality industry
ban in 2008 (χ2 = 0.28, p = 0.876), while they were significantly related after the
implementation (χ2 = 31.00, p = 0.001). Monthly bar visitors attempted to quit
smoking almost twice as often as non bar visitors (25% and 14% respectively) post-
ban. When controlling for background variables in a multivariate logistic regression
analysis with the ‘enter’ method, attempting to quit smoking and bar visiting were
unrelated pre-ban (Table 4). Post-ban, bar visitors were more likely to attempt to
quit smoking. When conducting a multivariate logistic regression analysis with the
‘forward’ method (not shown), a model was fitted with age as the only predictor of
attempting to quit smoking pre-ban and both age and bar visiting as predictors of
attempting to quit smoking post-ban.
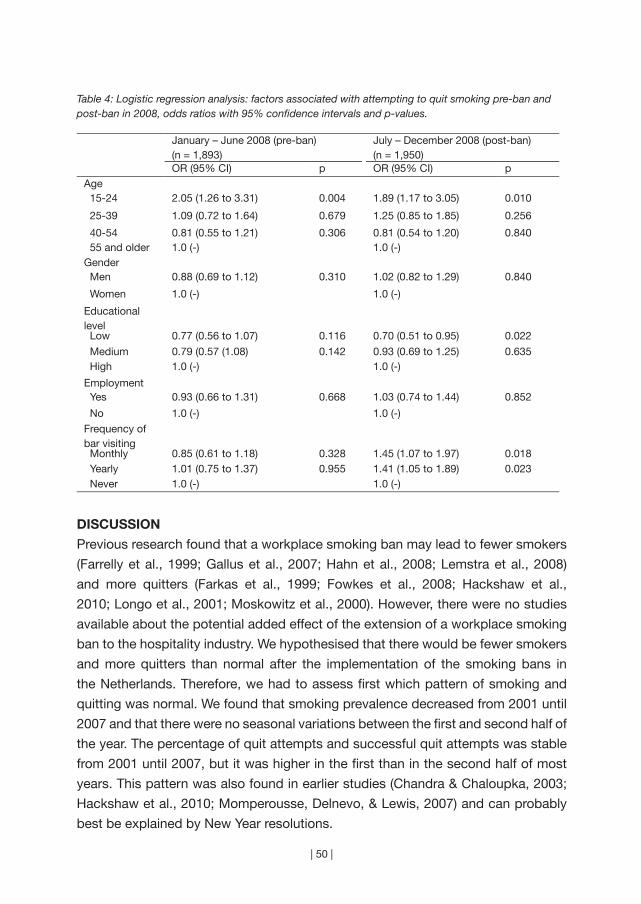
| 50 |
Table 4: Logistic regression analysis: factors associated with attempting to quit smoking pre-ban and post-ban in 2008, odds ratios with 95% confidence intervals and p-values.
January – June 2008 (pre-ban)(n = 1,893)
July – December 2008 (post-ban)(n = 1,950)
OR (95% CI) p OR (95% CI) pAge 15-24 2.05 (1.26 to 3.31) 0.004 1.89 (1.17 to 3.05) 0.010
25-39 1.09 (0.72 to 1.64) 0.679 1.25 (0.85 to 1.85) 0.256
40-54 0.81 (0.55 to 1.21) 0.306 0.81 (0.54 to 1.20) 0.840 55 and older 1.0 (-) 1.0 (-)Gender Men 0.88 (0.69 to 1.12) 0.310 1.02 (0.82 to 1.29) 0.840
Women 1.0 (-) 1.0 (-)
Educational level Low 0.77 (0.56 to 1.07) 0.116 0.70 (0.51 to 0.95) 0.022
Medium 0.79 (0.57 (1.08) 0.142 0.93 (0.69 to 1.25) 0.635 High 1.0 (-) 1.0 (-)
Employment Yes 0.93 (0.66 to 1.31) 0.668 1.03 (0.74 to 1.44) 0.852
No 1.0 (-) 1.0 (-)
Frequency of bar visiting Monthly 0.85 (0.61 to 1.18) 0.328 1.45 (1.07 to 1.97) 0.018 Yearly 1.01 (0.75 to 1.37) 0.955 1.41 (1.05 to 1.89) 0.023 Never 1.0 (-) 1.0 (-)
DISCUSSION
Previous research found that a workplace smoking ban may lead to fewer smokers
(Farrelly et al., 1999; Gallus et al., 2007; Hahn et al., 2008; Lemstra et al., 2008)
and more quitters (Farkas et al., 1999; Fowkes et al., 2008; Hackshaw et al.,
2010; Longo et al., 2001; Moskowitz et al., 2000). However, there were no studies
available about the potential added effect of the extension of a workplace smoking
ban to the hospitality industry. We hypothesised that there would be fewer smokers
and more quitters than normal after the implementation of the smoking bans in
the Netherlands. Therefore, we had to assess first which pattern of smoking and
quitting was normal. We found that smoking prevalence decreased from 2001 until
2007 and that there were no seasonal variations between the first and second half of
the year. The percentage of quit attempts and successful quit attempts was stable
from 2001 until 2007, but it was higher in the first than in the second half of most
years. This pattern was also found in earlier studies (Chandra & Chaloupka, 2003;
Hackshaw et al., 2010; Momperousse, Delnevo, & Lewis, 2007) and can probably
best be explained by New Year resolutions.
| 51 |
chapter 3 | Smoke-free workplace and hospitality industry legislation
We found fewer smokers than normal after the implementation of the workplace
ban, and increases in quit attempts and successful quit attempts. In contrast,
we did not find fewer smokers than normal after the hospitality industry smoking
ban, and smaller increases in quit attempts and successful quit attempts. We can
therefore conclude that a workplace ban is followed by more changes in smoking
and quitting than a hospitality industry ban.
Our second hypothesis was that we expected to observe more changes in
smoking and quitting after the implementation of the hospitality industry ban among
those with a higher socioeconomic status. We did find more successful quitting
among higher educated respondents after the workplace ban, but we did not find
this after the hospitality industry ban. It is an encouraging finding that hospitality
industry smoking bans have the potential to increase smoking cessation in both
higher and lower educational groups.
Our third hypothesis was that we expected to observe more changes in
smoking and quitting among individuals who were more exposed to the hospitality
industry ban. This hypothesis was supported in that we found fewer quit attempts
post-ban than pre-ban for non bar visitors (the normal pattern) and more quit attempts
post-ban than pre-ban for frequent bar visitors. Also, we found that respondents
who visited bars more frequently more often attempted to quit smoking than non
bar visitors post-ban, whereas this pattern could not be observed pre-ban. This
implies that the increase in quit attempts after the implementation of the hospitality
industry ban is at least partly a consequence of the ban.
Our study does not explain why smoking bans affect smoking behaviour.
Workplace bans are often thought to limit smoking behaviour by curtailing smoking
opportunities (Levy & Friend, 2003; Longo et al., 2001). This may not apply to a
hospitality industry ban, since people spend less time in bars than in workplaces,
and can choose to leave or smoke outside whenever they want. Other explanations
for the effects of smoking bans on smoking behaviour are that the ban increases the
social stigma attached to smoking (Gallus et al., 2007; Levy & Friend, 2003), leads
to less socially cued smoking (Edwards et al., 2008; Trotter, Wakefield, & Borland,
2002), and raises awareness of the dangers of smoking (Hahn et al., 2008). It is
conceivable that the hospitality industry ban in the Netherlands did not lead to more
social stigma regarding smoking and to less socially cued smoking, because of the
far less than optimal compliance in bars (ITC Project, 2010b). It is also possible
that the ban failed to increase awareness of the dangers of smoking, because the
implementation campaign by the Dutch government only focused on the date of
implementation and not on the public health reasons for the ban. What remains is
that smokers may have been triggered to use the implementation date as their quit
| 52 |
date (Edwards et al., 2008). There was also a mass media campaign in the period
around the implementation of the ban that encouraged attempts to quit smoking.
Anecdotal evidence from smoking cessation counsellors suggests that smokers
postponed their quit attempts until the date of the introduction of the smoking ban,
because they expected that smoke-free bars would help them to stay off tobacco.
When numerous bars did not comply with the ban, many were disappointed and
gave up on their quit attempt. This might explain why we found that the ban only
generated quit attempts and did not cause more lasting effects. These results
may therefore not be generalisable to other countries with better compliance. We
recommend strong enforcement of smoking bans and combining the introduction
of the ban with offering smokers help in staying quit.
A limitation of this study was that the impact of smoking bans could
not be separately assessed from the impact of tax increases and mass media
campaigns, since these measures were implemented simultaneously. Furthermore,
the trend in smoking behaviour from 2001 to 2007 was used to examine whether
smoking behaviour in 2008 was different than normal. Another approach would
be to compare smoking behaviour between 2008 and 2009. Unfortunately, we
could not compare 2008 with 2009, since changes in the sampling strategy of
the survey caused considerable differences in the background characteristics of
respondents from 2009. In this study we used a large cross-sectional population
survey with continuous measures throughout the year with respondents that were
representative for the Dutch population. The advantage of this large dataset was
that small changes in smoking behaviour could be detected and generalised to the
population. A disadvantage is the cross-sectional nature of the data. Consequently,
we were not able to draw conclusions about causal relationships. Future research
with longitudinal data is therefore recommended.

| 53 |

“The idea of a partial ban, where smoking is still
allowed in certain venues, for example in small
bars, might appeal to policy makers, but is a
recipe for disaster.” (Ann McNeill)
| 54 |
Chapter 4
~~~
Comprehensive and partial smoke-free legislation
Published as:
Nagelhout, G. E., De Vries, H., Allwright, S., McNeill, A., Van den Putte,
B., Boudreau, C., Fong, G. T., & Willemsen, M. C. (2012). Comparative
impact of smoke-free legislation on smoking cessation in three
European countries. European Journal of Public Health, 22(Suppl 1), 4-9.
| 55 |
| 56 |
Little is known about the differential impact of comprehensive and partial
smoke-free legislation on smoking cessation. This study aimed to examine
the impact of comprehensive smoke-free workplace legislation in Ireland
and England, and partial hospitality industry legislation in the Netherlands
on quit attempts and quit success. Nationally representative samples of
2,219 adult smokers were interviewed in three countries as part of the
International Tobacco Control (ITC) Europe Surveys. Quit attempts and
quit success were compared between period 1 (in which smoke-free
legislation was implemented in Ireland and the Netherlands) and period 2
(in which smoke-free legislation was implemented in England). In Ireland,
significantly more smokers attempted to quit smoking in period 1 (50.5%)
than in period 2 (36.4%) (p < 0.001). Percentages of quit attempts and quit
success did not change significantly between periods in the Netherlands.
English smokers were significantly more often successful in their quit
attempt in period 2 (47.3%) than in period 1 (26.4%) (p = 0.011). In the first
period there were more quit attempts in Ireland than in England and fewer
in the Netherlands than in Ireland. Fewer smokers quitted successfully in
the second period in both Ireland and the Netherlands than in England.
The comprehensive smoke-free legislation in Ireland and England may
have had positive effects on quit attempts and quit success respectively.
The partial smoke-free legislation in the Netherlands probably had no
effect on quit attempts or quit success. Therefore, it is recommended that
countries implement comprehensive smoke-free legislation.
AB
STR
AC
T
| 57 |
chapter 4 | Comprehensive and partial smoke-free legislation
INTRODUCTION
Smoke-free legislation is one of the policies recommended by the World Health
Organization (WHO) in the Framework Convention on Tobacco Control (FCTC)
(World Health Organization, 2003). According to the WHO, countries should
implement smoke-free legislation that bans smoking in indoor workplaces and
other public places to decrease exposure to tobacco smoke pollution (second-
hand smoke). Studies have shown that smoke-free legislation can also stimulate
smokers to quit smoking (Callinan, Clarke, Doherty, & Kelleher, 2010; Fichtenberg &
Glantz, 2002). This may happen because smoke-free legislation reduces the social
acceptability of smoking (Albers, Siegel, Cheng, Biener, & Rigotti, 2004; Brown,
Moodie, & Hastings, 2009), increases support for regulating smoking (Brown et al.,
2009; Macy, Middlestadt, Seo, Kolbe, & Jay, 2012), limits smoking opportunities
(Levy & Friend, 2003; Longo et al., 2001), and leads to less socially cued smoking
(Edwards et al., 2008; Trotter et al., 2002).
There is evidence that comprehensive smoke-free legislation (i.e. 100%
smoke-free legislation, without exemptions or designated smoking rooms) has
larger effects on improving indoor air quality (Gleich, Mons, & Pötschke-Langer,
2011), reducing exposure to tobacco smoke pollution (López et al., 2011; Naiman,
Glazier, & Moineddin, 2011) and on reducing acute coronary syndrome admissions
(Ferrante, Linetzky, Virgolini, Schoj, & Apelberg, 2011) than partial smoke-free
legislation. However, any differences in the effects of comprehensive and partial
smoke-free legislation on smoking cessation are not yet studied.
Our study uses data from the International Tobacco Control (ITC) Europe
Project to compare the impact of comprehensive smoke-free workplace legislation
in Ireland and England with the impact of partial smoke-free hospitality industry
legislation in the Netherlands on quit attempts and success.
Ireland
Ireland implemented comprehensive smoke-free workplace legislation that
included the hospitality industry in March 2004. The implementation of the smoke-
free legislation received extensive national (Fahy, Trench, & Clancy, 2009) and
international (McNabb & Hearns, 2005) media attention, as Ireland was the first
country in the world to implement national comprehensive smoke-free legislation.
There was an increase in available smoking cessation support in the period of
the implementation of the smoke-free legislation, but it was considered a missed
opportunity that cessation support was not emphasised in the mass media
campaign (Kosir & Gutierrez, 2009).

| 58 |
Data from a repeated cross-sectional national survey showed that smoking
prevalence first declined from 29% to 26% one year after the implementation, but
increased to 28% another year later (Office of Tobacco Control, 2010). Data from
the ITC Project showed that 80% of smokers who had quit smoking after the ban
reported the ban helped them quit and 88% reported the ban helped them stay quit
(Fong, Hyland et al., 2006). However, changes in actual quit rates and success rates
after the implementation of the legislation were not studied.
England
England implemented comprehensive smoke-free workplace legislation that
included the hospitality industry in July 2007. At the same time, the 17.5% rate
of value-added tax on nicotine replacement therapy sold over-the-counter was
reduced to 5%.
Data from a repeated cross-sectional national survey showed that the
introduction of smoke-free legislation was not associated with additional reductions
in smoking prevalence above the secular trend (Lee, Glantz, & Millett, 2011). Data
from the longitudinal Smoking Toolkit Study showed a small temporary increase
in quit attempts in July and August 2007 compared to July and August 2008, but
did not control for longer term quitting activity (Hackshaw et al., 2010). A further
study suggested that the smoke-free legislation caused an increase in prescribing
of smoking cessation medications, but indicated that there may have only been a
temporal displacement of quit attempts (Szatkowski, Coleman, McNeill, & Lewis,
2011). Changes in quit success after the implementation of the legislation were not
studied.
The Netherlands
The Netherlands implemented smoke-free workplace legislation that excluded
the hospitality industry in January 2004 and implemented smoke-free hospitality
industry legislation in July 2008. Both the 2004 and 2008 bans were implemented
in conjunction with a tobacco tax increase. Tobacco prices increased by 19% in
2004 and 8% in 2008. There were also intensive mass media smoking cessation
campaigns in both years. Workplaces and hospitality venues were allowed to
create designated smoking rooms. Therefore, the Dutch smoke-free legislation is
considered partial instead of comprehensive.
Data from a repeated cross-sectional national survey showed that quit
attempts and quit success increased after the implementation of the 2004 smoke-
free workplace legislation, resulting in a decline in smoking prevalence from 30% in
2003 to 28% in 2004 (Nagelhout, Willemsen, & De Vries, 2011). There was a smaller
| 59 |
chapter 4 | Comprehensive and partial smoke-free legislation
increase in quit attempts and success after the implementation of the smoke-
free hospitality industry legislation, and this resulted in a non-significant decline
in smoking prevalence. However, only short-term effects of the 2008 ban were
assessed.
This study
The current study used three consecutive annual surveys from each country. In Ireland
and the Netherlands, national smoke-free legislation was implemented between the
first and second survey. In England, the smoke-free legislation was implemented
between the second and third survey. This allowed for a quasi-experimental design
in which the change over time in quit attempts and quit success in Ireland and the
Netherlands could be compared with England.
METHODS
Sample
The International Tobacco Control (ITC) Europe Project is a longitudinal study in
which nationally representative samples of adult smokers are surveyed at regular
time intervals (Fong et al., 2006). The current study used three consecutive annual
surveys from Ireland, England, and the Netherlands. We refer to the three surveys
as wave 1, wave 2, and wave 3. However, for England, wave 1 is actually the fourth
wave of ITC United Kingdom. To make the England sample comparable to the wave
1 samples from Ireland and the Netherlands, we have excluded respondents who
had quit smoking between the first and fourth survey.
Respondents from Ireland and England were recruited using a stratified
random digit dialling (RDD) probability sampling design of fixed line telephone
numbers and were surveyed using telephone interviewing. Respondents from
the Netherlands were recruited from a large probability-based database with
respondents who indicated their willingness to participate in surveys on a regular
basis and were surveyed using web interviewing (Nagelhout et al., 2010).
Before the implementation of smoke-free legislation in Ireland, England,
and the Netherlands, 3,754 smokers aged 18 years and older were surveyed.
Smokers were defined as having smoked at least 100 cigarettes in their lifetime
and currently smoked at least once per month. One year later, 2,826 respondents
(75.3%) completed the first follow-up survey. Of those, 2,219 (78.5%) completed
the second follow-up survey. See Figure 1 for a timeline of the survey waves, sample
sizes, and smoke-free legislation implementation dates per country. Smokers who
were lost to follow-up were younger (M = 39.8, SD = 15.2) than smokers who were
followed-up (M = 43.6, SD = 14.1; t = 7.77, p < 0.001) and smokers who were lost to
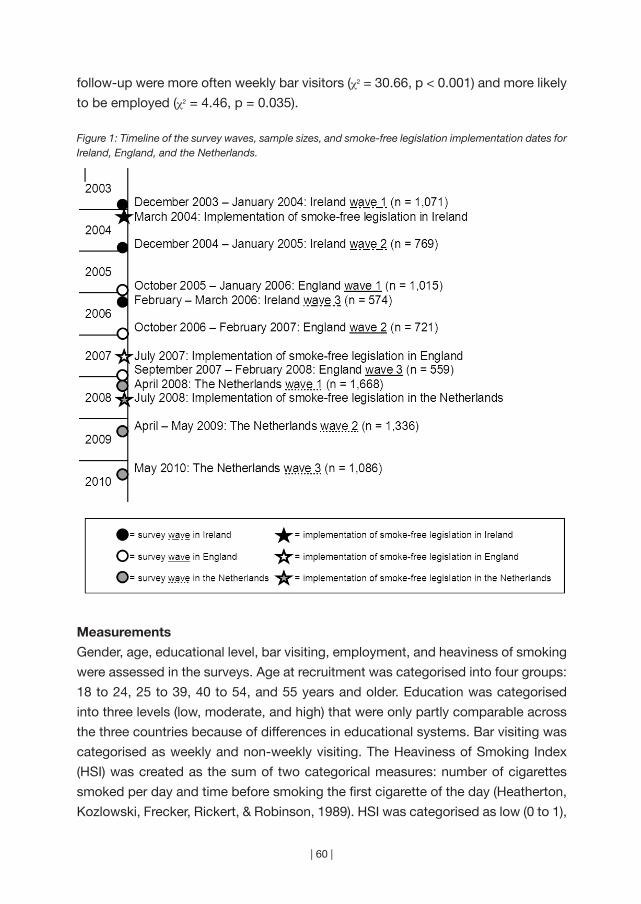
| 60 |
follow-up were more often weekly bar visitors (χ2 = 30.66, p < 0.001) and more likely
to be employed (χ2 = 4.46, p = 0.035).
Figure 1: Timeline of the survey waves, sample sizes, and smoke-free legislation implementation dates for Ireland, England, and the Netherlands.
Measurements
Gender, age, educational level, bar visiting, employment, and heaviness of smoking
were assessed in the surveys. Age at recruitment was categorised into four groups:
18 to 24, 25 to 39, 40 to 54, and 55 years and older. Education was categorised
into three levels (low, moderate, and high) that were only partly comparable across
the three countries because of differences in educational systems. Bar visiting was
categorised as weekly and non-weekly visiting. The Heaviness of Smoking Index
(HSI) was created as the sum of two categorical measures: number of cigarettes
smoked per day and time before smoking the first cigarette of the day (Heatherton,
Kozlowski, Frecker, Rickert, & Robinson, 1989). HSI was categorised as low (0 to 1),
| 61 |
chapter 4 | Comprehensive and partial smoke-free legislation
moderate (2 to 4), and high (5 to 6).
Quit attempts were assessed at waves 2 and 3 with the question “Have
you made any attempts to stop smoking since the last survey?” Success of quit
attempts among respondents who attempted to quit smoking since the last survey
was assessed at waves 2 and 3 by asking whether they were back to smoking or
still stopped. Respondents who were back to smoking, but reported smoking less
than once a month, were defined as quitters (Hyland, Borland et al., 2006).
Analyses
All analyses were weighted and performed with SAS version 9.2. The sampling
weights were calibrated to smoking prevalence by gender-age groups within
country, and the weighted data is thus representative of the adult smoker population
within each country. Generalised Estimating Equation (GEE) models (Hardin &
Hilbe, 2003; Liang & Zeger, 1986) were employed to test whether quit attempts and
success differed between countries and across time periods. Correlations between
observations from individuals who completed multiple waves was handled through
the GEE approach, and all confidence intervals and p-values reported in this paper
are based on the so-called “sandwich” variance estimator. All GEE models used
binomial variations, the logit link, and an exchangeable correlation structure.
Since quit attempts and success were not measured at the baseline surveys,
only two time periods were used in the GEE analyses. Quit attempts between waves
1 and 2 (first period) were compared with quit attempts between waves 2 and 3
(second period) and quit success at wave 2 (first period) was compared with quit
success at wave 3 (second period). Smoke-free legislation was implemented in the
first time period in Ireland and the Netherlands, and in the second time period in
England.
Four GEE models were fitted. Dependent variables were quit attempts
(Models 1 and 2) and quit success (Models 3 and 4). For Models 1 and 3 the
independent variables were period, country, their interaction, gender, and age at
recruitment. As mentioned above, sampling weights are calibrated to smoking
prevalence by gender-age groups, and these two variables were included in all
models, as recommended by survey sampling theory. Of key interest in this study
is the period by country interaction, as it allows for formal testing of whether quit
attempts and/or success evolved over the two time periods differently in each of
the three countries. Models 2 and 4 were also adjusted for educational level at
recruitment, and bar visiting, employment, and heaviness of smoking at prior wave
(i.e. bar visiting, employment, and heaviness of smoking at wave 1 were used to
model quitting in the first time period, and bar visiting, employment, and heaviness
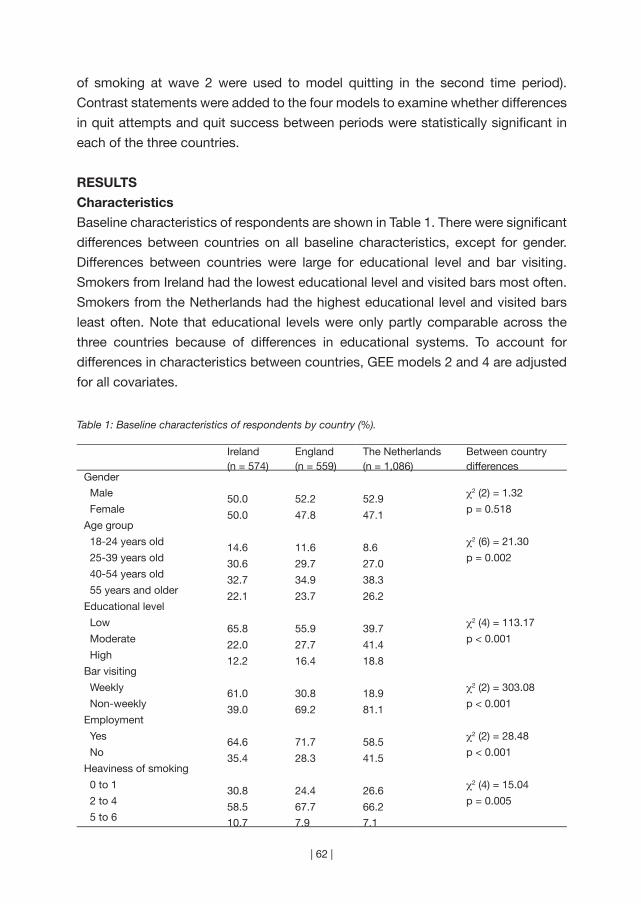
| 62 |
of smoking at wave 2 were used to model quitting in the second time period).
Contrast statements were added to the four models to examine whether differences
in quit attempts and quit success between periods were statistically significant in
each of the three countries.
RESULTS
Characteristics
Baseline characteristics of respondents are shown in Table 1. There were significant
differences between countries on all baseline characteristics, except for gender.
Differences between countries were large for educational level and bar visiting.
Smokers from Ireland had the lowest educational level and visited bars most often.
Smokers from the Netherlands had the highest educational level and visited bars
least often. Note that educational levels were only partly comparable across the
three countries because of differences in educational systems. To account for
differences in characteristics between countries, GEE models 2 and 4 are adjusted
for all covariates.
Table 1: Baseline characteristics of respondents by country (%).
Ireland(n = 574)
England(n = 559)
The Netherlands(n = 1,086)
Between country differences
Gender
Male 50.0 52.2 52.9 χ2 (2) = 1.32
Female 50.0 47.8 47.1 p = 0.518
Age group
18-24 years old 14.6 11.6 8.6 χ2 (6) = 21.30
25-39 years old 30.6 29.7 27.0 p = 0.002
40-54 years old 32.7 34.9 38.3 55 years and older 22.1 23.7 26.2Educational level
Low 65.8 55.9 39.7 χ2 (4) = 113.17
Moderate 22.0 27.7 41.4 p < 0.001
High 12.2 16.4 18.8Bar visiting
Weekly 61.0 30.8 18.9 χ2 (2) = 303.08
Non-weekly 39.0 69.2 81.1 p < 0.001
Employment
Yes 64.6 71.7 58.5 χ2 (2) = 28.48
No 35.4 28.3 41.5 p < 0.001
Heaviness of smoking
0 to 1 30.8 24.4 26.6 χ2 (4) = 15.04
2 to 4 58.5 67.7 66.2 p = 0.005
5 to 6 10.7 7.9 7.1
| 63 |
chapter 4 | Comprehensive and partial smoke-free legislation
Quit attempts
Figure 2 shows that more Irish smokers attempted to quit smoking in the first period
(when the smoke-free legislation was implemented) (50.5%) than in the second
period (36.4%). In England and the Netherlands, the percentage of quit attempts
remained at the same level. Within-country GEE contrasts (not shown in table)
confirmed that the difference in quit attempts between periods was only significant
for Ireland (p < 0.001). This difference remained highly significant after controlling
for all covariates (p = 0.003).
The between-country GEE analyses shown in Table 2 (Models 1 and 2)
revealed that there were significant differences in quit attempts between countries
and periods, as indicated by the significant p-values for the overall tests for country
by period interactions. GEE Model 1 showed that in the first period there were
more quit attempts in Ireland than in England (OR = 1.77, p < 0.001) and fewer quit
attempts in the Netherlands than in Ireland (OR = 0.54, p < 0.001). These differences
remained statistically significant in Model 2 that controlled for all covariates (OR
Ireland versus England = 1.76, p = 0.001; OR the Netherlands versus Ireland = 0.55,
p < 0.001). Significant covariates were age and employment. Smokers aged 40 to
54 years were less likely to attempt to quit smoking than smokers aged 18 to 24 (OR
= 0.60, p = 0.003). Employed smokers were more likely to attempt to quit smoking
than unemployed smokers (OR = 1.32, p = 0.003).
Quit success
As can be seen in Figure 2, English smokers who attempted to quit smoking were more
successful in the second period (when the smoke-free legislation was implemented)
(47.3%) than in the first period (26.4%). In Ireland and the Netherlands, the level of
quit success did not change between periods. Within-country GEE contrasts (not
shown in table) confirmed that the differences in quit success between periods was
only significant for England (p = 0.011). This difference remained significant after
controlling for all covariates (p = 0.006).
The between-country GEE analyses (Models 3 and 4 in Table 2) showed that
there were significant differences in quit success between countries and periods,
as indicated by the significant p-values for the overall tests for country by period
interactions. Model 3 showed that fewer smokers successfully quitted in the second
period in both Ireland (OR = 0.55, p = 0.044) and the Netherlands (OR = 0.45, p
= 0.003) than in England. The differences between the Netherlands and England
remained statistically significant in Model 4 that controlled for all covariates (OR =
0.47, p = 0.004), while the difference between Ireland and England was borderline
significant in Model 4 (OR = 0.56, p = 0.076). Significant covariates were gender and
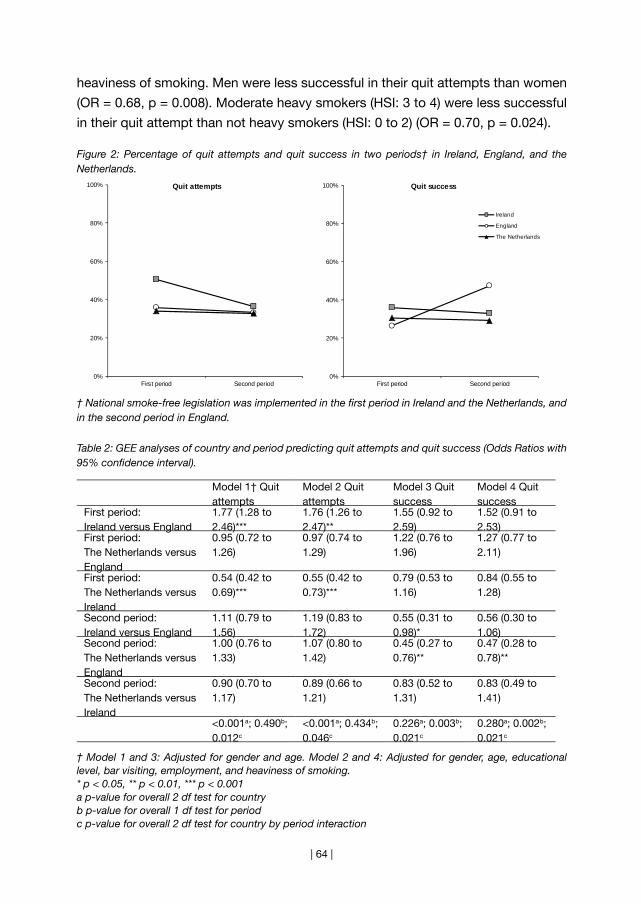
| 64 |
heaviness of smoking. Men were less successful in their quit attempts than women
(OR = 0.68, p = 0.008). Moderate heavy smokers (HSI: 3 to 4) were less successful
in their quit attempt than not heavy smokers (HSI: 0 to 2) (OR = 0.70, p = 0.024).
Figure 2: Percentage of quit attempts and quit success in two periods† in Ireland, England, and the Netherlands.
† National smoke-free legislation was implemented in the first period in Ireland and the Netherlands, and in the second period in England.
Table 2: GEE analyses of country and period predicting quit attempts and quit success (Odds Ratios with 95% confidence interval).
Model 1† Quit attempts
Model 2 Quit attempts
Model 3 Quit success
Model 4 Quit success
First period: Ireland versus England
1.77 (1.28 to 2.46)***
1.76 (1.26 to 2.47)**
1.55 (0.92 to 2.59)
1.52 (0.91 to 2.53)
First period: The Netherlands versus England
0.95 (0.72 to 1.26)
0.97 (0.74 to 1.29)
1.22 (0.76 to 1.96)
1.27 (0.77 to 2.11)
First period: The Netherlands versus Ireland
0.54 (0.42 to 0.69)***
0.55 (0.42 to 0.73)***
0.79 (0.53 to 1.16)
0.84 (0.55 to 1.28)
Second period: Ireland versus England
1.11 (0.79 to 1.56)
1.19 (0.83 to 1.72)
0.55 (0.31 to 0.98)*
0.56 (0.30 to 1.06)
Second period: The Netherlands versus England
1.00 (0.76 to 1.33)
1.07 (0.80 to 1.42)
0.45 (0.27 to 0.76)**
0.47 (0.28 to 0.78)**
Second period: The Netherlands versus Ireland
0.90 (0.70 to 1.17)
0.89 (0.66 to 1.21)
0.83 (0.52 to 1.31)
0.83 (0.49 to 1.41)
<0.001a; 0.490b; 0.012c
<0.001a; 0.434b; 0.046c
0.226a; 0.003b; 0.021c
0.280a; 0.002b; 0.021c
† Model 1 and 3: Adjusted for gender and age. Model 2 and 4: Adjusted for gender, age, educational level, bar visiting, employment, and heaviness of smoking.* p < 0.05, ** p < 0.01, *** p < 0.001a p-value for overall 2 df test for countryb p-value for overall 1 df test for periodc p-value for overall 2 df test for country by period interaction
0%
20%
40%
60%
80%
100%
First period Second period
Quit attempts
0%
20%
40%
60%
80%
100%
First period Second period
Quit success
Ireland
England
The Netherlands

| 65 |
chapter 4 | Comprehensive and partial smoke-free legislation
DISCUSSION
In this study, we found that Irish smokers made more quit attempts in the period in
which comprehensive smoke-free workplace legislation was implemented than in
the period after the implementation. This suggests that if the smoke-free legislation
has increased quit attempts in Ireland, the effect was not sustained. This finding is
in line with the Irish national survey showing a large temporary decline in smoking
prevalence after the implementation of smoke-free legislation (Office of Tobacco
Control, 2010).
In England, we found more quit success in the period in which comprehensive
smoke-free workplace legislation was implemented than in the period before. This
suggests that the smoke-free legislation increased quit success. Previous research
from England found a small temporary increase in quit attempts after the smoke-
free legislation (Hackshaw et al., 2010) and no effects on smoking prevalence (Lee
et al., 2011). We did not find an increase in quit attempts in our study, which can be
explained by the fact that the increase that was found in the earlier study was small
and their study sample was three times larger. Also, the English legislation may not
have had an effect on quit attempts because many English workplaces were already
smoke-free when the national legislation was implemented (Bauld, 2011; Lee et al.,
2011). The reduction in value-added tax on nicotine replacement therapy in England
may have helped smokers who attempted to quit smoking to be more successful.
More research is needed on the synergistic effects of smoke-free legislation with
other tobacco control interventions before strong conclusions can be made (Levy &
Friend, 2003).
We found no changes in quit attempts or quit success between the period
in which partial smoke-free hospitality industry legislation was implemented in
the Netherlands and the period after the implementation. This suggests that the
smoke-free legislation in the Netherlands either did not have an impact on smoking
cessation or that there was a sustained impact. Since the percentage of quit
attempts (33%) and quit success (30%) in the Netherlands was in both periods
comparable to the percentage of quit attempts (36%) and quit success (30%) in the
other countries in the periods in which no legislation was implemented, we believe
it is more likely that the smoke-free legislation in the Netherlands had no impact on
smoking cessation. This may be explained by the limited scope of the legislation
(the hospitality industry) and the fact that only 19% of Dutch smokers visited bars
weekly. Previous research found small short-term increases in quit attempts and
success after the implementation of smoke-free hospitality industry legislation in the
Netherlands (Nagelhout, Willemsen et al., 2011). The fact that we did not find these
small short-term increases could be explained by the smaller sample size in our study.
| 66 |
Smoking cessation can be an important effect of smoke-free legislation (Callinan
et al., 2010). However, smoke-free legislation is implemented primarily to protect
non-smokers from exposure to tobacco smoke pollution. In the Netherlands, the
implementation of smoke-free legislation was not accompanied by a campaign
about tobacco smoke pollution. This may have resulted in low levels of support for
the legislation and high levels of non-compliance among bars (Gonzalez & Glantz,
2011; Nagelhout, Mons et al., 2011). Although an intensive smoking cessation
campaign ran during the implementation of the Dutch legislation, there was no
measurable impact on smoking prevalence (Nagelhout, Willemsen et al., 2011). In
Ireland, it was considered a missed opportunity that cessation support was not
emphasised in the mass media campaign (Kosir & Gutierrez, 2009). Campaign
evaluations should assess whether mentioning cessation support in mass media
campaigns about smoke-free legislation can stimulate smoking cessation without
diluting the message that the legislation is implemented for the protection of non-
smokers.
In most quasi-experimental studies, a control country is used in which no
legislation is implemented and in which cessation behaviour is stable. Unfortunately,
there were no data available from an ITC Europe country with three annual waves
during which no legislation was implemented and cessation behaviour was thus
stable. The lack of data on smoking cessation before the implementation of
smoke-free legislation in Ireland and the Netherlands precluded conclusions
about before-and-after differences in smoking cessation in these countries. Also,
stronger conclusions could have been drawn about the comparative impact of
comprehensive and partial smoke-free legislation when data from more countries
was available. Furthermore, we have not controlled for intention to quit smoking
in our GEE models. This could be seen as a limitation, because intention to quit
smoking is an important causal predictor of smoking cessation (Hyland, Borland
et al., 2006). However, including intention to quit in the models would overcorrect
the models, because smoke-free legislation makes smokers more likely to quit
(Hackshaw et al., 2010). Finally, more than 40% of baseline respondents were lost
to follow-up by the third survey. These respondents were younger, were more often
weekly bar visitors, and more likely to be employed. Therefore, our results may not
be fully generalisable to the smoker population in the three countries.
We found an increase in quit success after the implementation of
comprehensive smoke-free legislation in England. Also, there were indications
that there might have been a temporary increase in quit attempts after the
implementation of comprehensive smoke-free legislation in Ireland. The most likely
explanation for the unchanged percentage of quit attempts and quit success after

| 67 |
chapter 4 | Comprehensive and partial smoke-free legislation
the implementation of partial smoke-free legislation in the Netherlands is that the
legislation had no impact on smoking cessation. It would appear, therefore, that as
well as offering greater protection from tobacco smoke pollution for all employees,
comprehensive smoke-free legislation might also maximise quitting behaviour.
Therefore, we recommend that countries implement comprehensive smoke-free
legislation.

“Smoking is one of the leading causes of statistics”
(Fletcher Knebel)
| 68 |
Chapter 5
~~~
Smoke-free legislation and other effective policies
Published as:
Nagelhout, G. E., Levy, D. T., Blackman, K., Currie, L., Clancy, L., &
Willemsen, M. C. (2012). The effect of tobacco control policies on
smoking prevalence and smoking-attributable deaths. Findings from
the Netherlands SimSmoke Tobacco Control Policy Simulation Model.
Addiction, 107, 407-416.
| 69 |
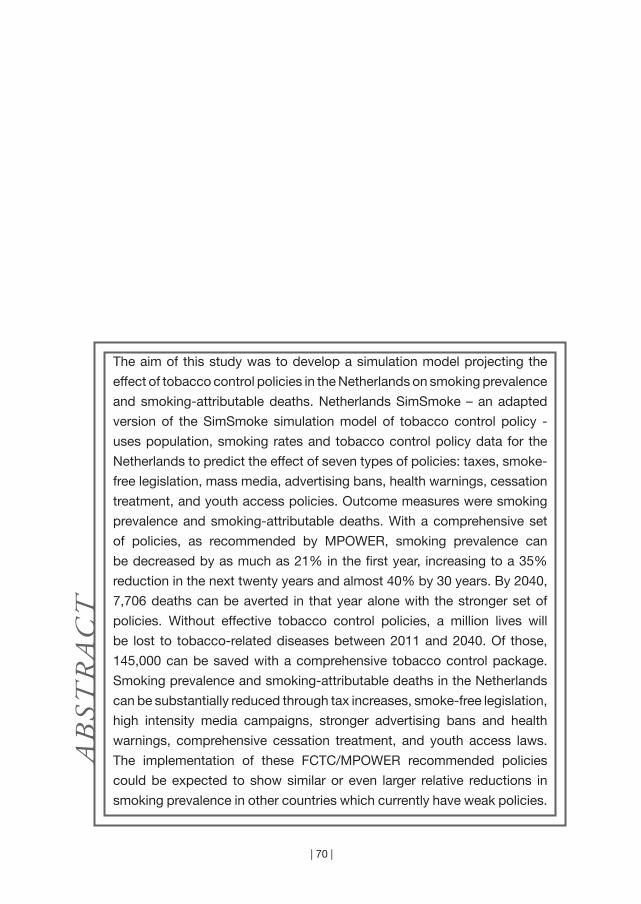
| 70 |
The aim of this study was to develop a simulation model projecting the
effect of tobacco control policies in the Netherlands on smoking prevalence
and smoking-attributable deaths. Netherlands SimSmoke – an adapted
version of the SimSmoke simulation model of tobacco control policy -
uses population, smoking rates and tobacco control policy data for the
Netherlands to predict the effect of seven types of policies: taxes, smoke-
free legislation, mass media, advertising bans, health warnings, cessation
treatment, and youth access policies. Outcome measures were smoking
prevalence and smoking-attributable deaths. With a comprehensive set
of policies, as recommended by MPOWER, smoking prevalence can
be decreased by as much as 21% in the first year, increasing to a 35%
reduction in the next twenty years and almost 40% by 30 years. By 2040,
7,706 deaths can be averted in that year alone with the stronger set of
policies. Without effective tobacco control policies, a million lives will
be lost to tobacco-related diseases between 2011 and 2040. Of those,
145,000 can be saved with a comprehensive tobacco control package.
Smoking prevalence and smoking-attributable deaths in the Netherlands
can be substantially reduced through tax increases, smoke-free legislation,
high intensity media campaigns, stronger advertising bans and health
warnings, comprehensive cessation treatment, and youth access laws.
The implementation of these FCTC/MPOWER recommended policies
could be expected to show similar or even larger relative reductions in
smoking prevalence in other countries which currently have weak policies.
AB
STR
AC
T
| 71 |
chapter 5 | Smoke-free legislation and other effective policies
INTRODUCTION
Globally, it is estimated that 5 million premature deaths each year are attributable to
smoking, with trends driving a rise to 10 million deaths per year by the 2030s (Ezzati
& Lopez, 2003). Substantial evidence indicates that higher cigarette taxes, smoke-
free legislation, advertising bans, and well funded media campaigns can appreciably
reduce adult smoking rates, especially when combined as a comprehensive strategy
(Hopkins et al., 2001; Levy, Chaloupka, & Gitchell, 2004). Evidence is mounting for
health warnings (Hammond, 2011) and cessation treatment coverage (Reda, Kaper,
Fikretler, Severens, & Schayck, 2009).
The World Health Organization has set out the Framework Convention on
Tobacco Control (FCTC). The MPOWER Report (World Health Organization, 2008a)
has defined a set of policies that are consistent with the FCTC. MPOWER suggests
that each nation impose taxes on cigarettes that constitute at least 70% of the retail
price, require large, bold and graphic health warnings, provide broad access to
cessation treatments, conduct a well-funded mass media campaign, and implement
and enforce comprehensive smoke-free legislation and advertising restrictions.
The Netherlands ratified the FCTC in January 2005. Since 2000, the
Netherlands has increased taxes on cigarettes, strengthened advertising restrictions
and health warnings on cigarette packs, implemented smoke-free legislation and
mass media campaigns, and offered a quitline. Although considerable progress
has been made, Dutch tobacco control policies are not compliant with WHO
guidelines. For example, taxes on cigarettes are 57% of the retail price in the
Netherlands (World Health Organization, 2008a) rather than the 70% recommended
by MPOWER guidelines. Also, the Dutch smoke-free legislation does not apply to
all bars and allows for designated smoking rooms in all workplaces. This study uses
a simulation model to examine the effect of Dutch policies implemented since 1996
and to predict the effect of implementing stricter policies fully consistent with WHO
guidelines.
Most statistical studies of tobacco control policies have examined the effect
of only one or, at most, two policies (e. g. Hu, Sung, & Keeler, 1995a, b) because the
ability to untangle the effects of tobacco control policies on smoking rates is often
limited by a lack of data or models that cannot statistically distinguish the effects.
Simulation models combine information from different sources to provide a useful
tool for examining how the effects of public policies unfold over time in complex
social systems (Homer & Hirsch, 2006). Simulation models examining the effect of
tobacco control policies have been developed by Mendez and Warner (Mendez &
Warner, 2004; Mendez, Warner, & Courant, 1998), Tengs et al. (Tengs, Osgood, &
Chen, 2001), Ahmad (Ahmad, 2005; Ahmad & Billimek, 2005) and Levy et al (Levy,
| 72 |
Bauer, & Lee, 2006; Levy, Nikolayev, & Mumford, 2005). In the Netherlands, the
Chronic Disease Model has been used to examine the impact of tobacco control
policies on smoking rates and health risks, but has not modeled the full set of
MPOWER interventions (Hoogenveen, Van Baal, Boshuizen, & Feenstra, 2008;
Van Genugten et al., 2003). The SimSmoke model of Levy et al. simultaneously
considers a broader array of public policies than other models (Levy, Chaloupka,
Gitchell, Mendez, & Warner, 2002) and has been validated in several countries
(Levy, Benjakul, Ross, & Ritthiphakdee, 2008; Levy et al., 2010) and states (Levy,
Bauer, Ross, & Powell, 2007; Levy, Hyland, Higbee, Remer, & Compton, 2007; Levy,
Tworek, Hahn, & Davis, 2008).
In order to examine past trends in smoking rates and the potential effect of
tobacco control policies on future smoking rates, a modified version of SimSmoke
has been developed for the Netherlands. The Netherlands is an interesting case,
since Dutch tobacco control policy has seen a marked improvement between 2000
and 2004, followed by a long period of stagnation. This provides a good setting
to demonstrate the ability of the SimSmoke model to do two things: to calculate
the impact of real policy changes and to examine what could potentially be
accomplished with full implementation of MPOWER policies. The Netherlands has
strong tobacco control policies relative to many of the other high income countries
(Joossens & Raw, 2011).
Using data from the Netherlands on population, birth rates, death rates,
and smoking rates, the model predicts future smoking rates. Using data on relative
mortality risks, the model also estimates the number of smoking-attributable deaths
(SADs). Netherlands SimSmoke shows the effect of policies implemented since
1996. The model also assesses the effect of MPOWER interventions and youth
access restrictions. The following research questions are examined in this study:
1. What would have been the smoking prevalence and SADs in 2010 if tobacco
control policies had remained unchanged from their 1996 levels?
2. What were the effects of tobacco control policies implemented between 1996
and 2010 on smoking prevalence and SADs in 2010?
3. What will be the smoking prevalence and SADs in 2040 if tobacco control
policies remain unchanged from their 2010 levels?
4. What would be the effects of MPOWER policies implemented in 2011 on
smoking prevalence and SADs in 2040?
| 73 |
chapter 5 | Smoke-free legislation and other effective policies
METHODS
Basic model
SimSmoke includes a population model, a smoking model, a smoking-attributable
death model, and policy modules (Levy et al., 2006; Levy et al., 2005). The model
begins in a baseline year with the population divided into smokers, never smokers,
and previous smokers by age and gender. The baseline year for the Netherlands
model was chosen as 1996 because a large survey was conducted and major policy
changes had not yet been implemented.
A discrete time, first-order Markov process is employed to project future
population growth through fertility and deaths, and to project smoking rates.
Individuals are classified as never smokers from birth until they initiate smoking
or die. They may evolve from current to former smoker through cessation or may
return to smoker through relapse. The extent of relapse depends on the number
of years since quitting. Smoking rates, and thereby smoking-attributable deaths,
change over time in response to changes in tobacco control policies.
Population model
Population (1996), mortality (1999), and fertility (2008) data by age and gender were
obtained from Statistics Netherlands (CBS). Population projections from the model
for the year 2010 were close to 2010 estimates.
Smoking model
The 1996 data from the Dutch Continuous Survey of Smoking Habits (DCSSH) was
used to obtain smoking prevalence and cessation rates. This is a cross-sectional
population survey of respondents aged 15 years and older that is used to monitor
smoking habits of the Dutch population, using weekly measurements (Willemsen
et al., 2002). The DCSSH is conducted by TNS NIPO for the Dutch expert centre
on tobacco control (STIVORO). Data on smoking prevalence from the DCSSH
were available for each year from 1988 to 2010 by gender and age group. The
interviewing method changed in 2001 from face-to-face to web surveying and the
sampling method changed in 2009 from household to person-based sampling.
Net initiation rates at each age through age 30 were measured as the
difference between the smoking rate at that age year and the rate at the previous
age year. Cessation rates were measured after age 30 as the number of ex-smokers
who quit in the last year divided by the number of those smoking one year ago
(current smokers plus those quitting in the last year). U.S. relapse rates were used,
because data were not available for the Netherlands, but the rates were calibrated
to the model.
| 74 |
Smoking-attributable death model
Smoking-attributable deaths (SADs) by age, gender and smoking status were
calculated from death rates, smoking rates, and relative risks. The number of current
and former smokers at each age was multiplied by their respective excess risk and
summed to obtain total SADs.
Large scale studies of the relative risk of smoking were not available for the
Netherlands. However, because the Netherlands has a similar smoking history to
the U.S. and is a high income country, we used relative risk estimates from the U.S.
Cancer Prevention Study II (Thun et al., 1997) and other high income countries (Doll,
Peto, Boreham, & Sutherland, 2004).
Policy modules
Policy effect sizes are in terms of percentage reductions applied to smoking
prevalence in the year when a policy is implemented and, unless otherwise specified,
applied to initiation and cessation rates in future years. The effect sizes are shown
relative to the absence of any policy. They are based on literature reviews, advice of
an expert panel and previous model validation. As a high income country, the effects
for the Netherlands were determined primarily from studies for that country and
other high income countries. Policies and potential effect sizes in the Netherlands
are summarised in Table 1.
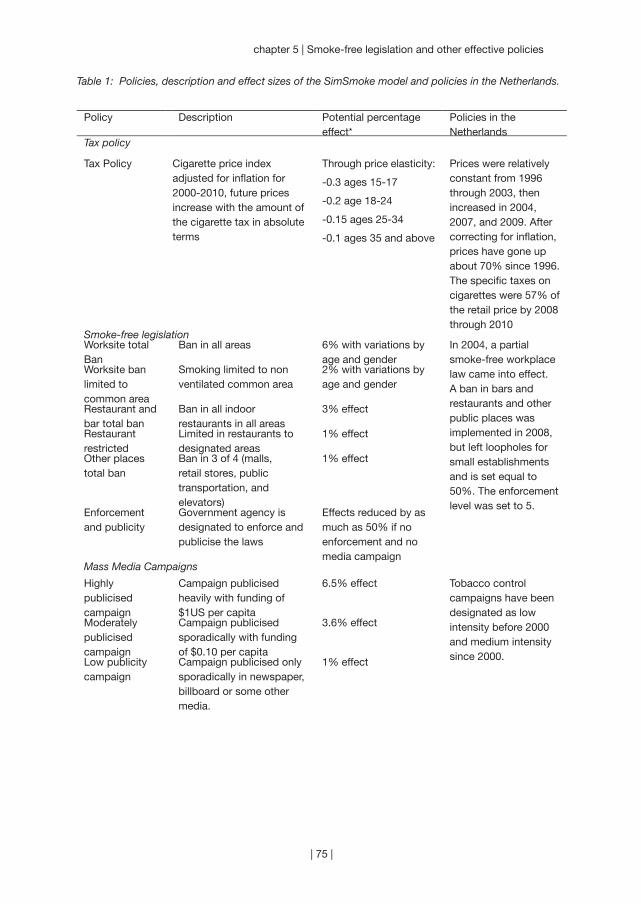
| 75 |
chapter 5 | Smoke-free legislation and other effective policies
Table 1: Policies, description and effect sizes of the SimSmoke model and policies in the Netherlands.
Policy Description Potential percentage effect*
Policies in the Netherlands
Tax policy
Tax Policy Cigarette price index adjusted for inflation for 2000-2010, future prices increase with the amount of the cigarette tax in absolute terms
Through price elasticity:
-0.3 ages 15-17
-0.2 age 18-24
-0.15 ages 25-34
-0.1 ages 35 and above
Prices were relatively constant from 1996 through 2003, then increased in 2004, 2007, and 2009. After correcting for inflation, prices have gone up about 70% since 1996. The specific taxes on cigarettes were 57% of the retail price by 2008 through 2010
Smoke-free legislationWorksite total Ban
Ban in all areas 6% with variations by age and gender
In 2004, a partial smoke-free workplace law came into effect. A ban in bars and restaurants and other public places was implemented in 2008, but left loopholes for small establishments and is set equal to 50%. The enforcement level was set to 5.
Worksite ban limited to common area
Smoking limited to non ventilated common area
2% with variations by age and gender
Restaurant and bar total ban
Ban in all indoor restaurants in all areas
3% effect
Restaurant restricted
Limited in restaurants to designated areas
1% effect
Other places total ban
Ban in 3 of 4 (malls, retail stores, public transportation, and elevators)
1% effect
Enforcement and publicity
Government agency is designated to enforce and publicise the laws
Effects reduced by as much as 50% if no enforcement and no media campaign
Mass Media Campaigns
Highly publicised campaign
Campaign publicised heavily with funding of $1US per capita
6.5% effect Tobacco control campaigns have been designated as low intensity before 2000 and medium intensity since 2000.
Moderately publicised campaign
Campaign publicised sporadically with funding of $0.10 per capita
3.6% effect
Low publicity campaign
Campaign publicised only sporadically in newspaper, billboard or some other media.
1% effect

| 76 |
Table 1 (continued)
Marketing Bans
Ban is applied to television, radio, print, billboard, in-store displays, sponsorships and free samples
5% reduction in prevalence, 6% reduction in initiation, 3% increase in cessation rates
Marketing is considered a weak ban from 1996 increasing to 50% of a moderate ban in 2003 and a 100% moderate ban in 2008. The enforcement level was set to 5.
Moderate Marketing Ban
Ban is applied to all media television, radio, print, billboard
3% reduction in prevalence, 4% reduction in initiation,2% increase in cessation rates
Weak marketing ban
Ban is applied to some of television, radio, print, billboard
1% reduction in prevalence and initiation only
Enforcement and publicity
Government agency is designated to enforce the laws
Effects reduced by as much as 50% if no enforcement
Health warnings
Strong Labels are large, bold and graphic
2% reduction in prevalence, 1% reduction in initiation, 4% increase in cessation rate
Health warnings are considered to increase from low through 2001 to moderate in 2002 and remaining at that level.
Moderate Warning covers at least 1/3 of both sides of package, not bold or graphic
1% reduction in prevalence, 0.5% reduction in initiation, 2.5% increase in cessation
Weak Warning covers less than 1/3 of package, not bold or graphic
1% reduction in prevalence and initiation rates, 1% increase in cessation rate
Publicity Health information is well publicised
1% additional effect on prevalence and initiation rate
Cessation Treatment Policy
Cessation Treatment Policy
Complete availability and reimbursement of pharmaco- and behavioural treatments, quitlines, and brief interventions
4.75% reduction in prevalence, 39% increase in cessation rate
The Netherlands has had NRT available in pharmacies and Buproprion by prescription since 2001, a quitline since 2000, and cessation treatment from some health care providers since 1996.

| 77 |
chapter 5 | Smoke-free legislation and other effective policies
Youth Access Restrictions
Strongly enforced & publicised
Compliance checks are conducted regularly, penalties are heavy, and publicity is strong, vending machine and self-service bans
30% reduction for age < 16 in prevalence and initiation only, 20% reduction for ages 16-17 in prevalence and initiation only
The Netherlands has had a ban on the purchase of tobacco by youth under 18 years of age since 2003. However, enforcement is set at a low level since 2003, with no vending machine and self-service bans.
Well enforced Compliance checks are conducted sporadically, penalties are potent, and little publicity
15% reduction for age < 16 in prevalence and initiation only, 10% reduction for ages 16-17 in prevalence and initiation only
Low enforcement
Compliance checks are not conducted, penalties are weak, and no publicity
3% reduction for age < 16 in prevalence and initiation only, 2% reduction for ages 16-17 in prevalence and initiation only
* Unless otherwise specified, the same percentage effect is applied as a percentage reduction in the prevalence and initiation rate and a percentage increase in the cessation rate, and is applied to all ages and both genders. The effect sizes are shown relative to the absence of any policy.
| 78 |
Analyses
The model estimates the effects over time for two primary outcomes: smoking
prevalence and SADs. The model estimates these outcomes for the tracking period,
from 1996 to 2010, and projects future outcomes for 2011 through 2040.
Based on comparing the actual to the predicted smoking prevalence rates from
1996 to 2000, we calibrated the model by adjusting the first year cessation rates
downward, increasing the relapse rate of first year cessation from 50% to 65%
for males and females, and also modifying the rates to 40% at ages above 65.
To validate the model, we compared the predicted smoking rates overall and by
gender and age to annual smoking rates by age and gender from the yearly DCSSH.
More information about the model validation can be found in the full Netherlands
SimSmoke report (Levy, Blackman, Currie, Clancy, & Willemsen, 2011).
The effect of past policies from 1996 to 2010 was examined relative to a
counterfactual scenario, where no tobacco control policies are implemented. In the
model, we set policies through 2010 to their levels in 1996. The difference between
the smoking rate and SADs with policies held constant at their 1996 levels and
with the actual policies in place yields the net effect of policies implemented since
1996. For the role of single policies, we compared the scenario with only that policy
implemented (in the year in which it was implemented) to the no policy scenario.
Furthermore, the effect of implementing MPOWER policies in 2011 was
examined relative to the status quo scenario, where tobacco control policies were
maintained at their 2010 level. For SADs, we calculated deaths averted as the
difference between the number of deaths under the new policy and the number of
deaths under the status quo.
RESULTS
Smoking prevalence from 1996 to 2010
Between 1996 and 2010, the model predicts that male smoking rates decrease
from 38.4% to 29.0% (a 24.5% decrease in relative terms) and that female smoking
decrease from 29.6% to 24.5% (a 17.2% relative decline). The male and female
models generally tracked well with annual data on smoking prevalence (see for more
details Levy et al., 2011). The model slightly under-predicts the actual reduction in
smoking prevalence, which is a relative decline of 26.9% for males and 17.7% for
females. The model is most accurate in the 25-64 year age range.
Past policy tracking from 1996 to 2010
When tobacco control policies were held constant at their 1996 levels, smoking
prevalence decreased from 34.5% in 1996, to 33.9% in 2000, and to 32.1% in 2010
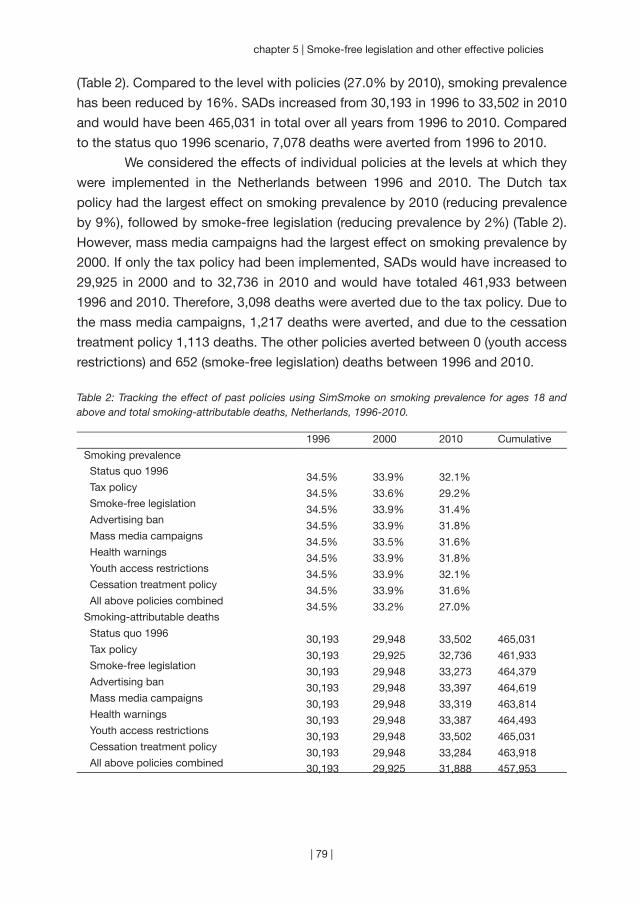
| 79 |
chapter 5 | Smoke-free legislation and other effective policies
(Table 2). Compared to the level with policies (27.0% by 2010), smoking prevalence
has been reduced by 16%. SADs increased from 30,193 in 1996 to 33,502 in 2010
and would have been 465,031 in total over all years from 1996 to 2010. Compared
to the status quo 1996 scenario, 7,078 deaths were averted from 1996 to 2010.
We considered the effects of individual policies at the levels at which they
were implemented in the Netherlands between 1996 and 2010. The Dutch tax
policy had the largest effect on smoking prevalence by 2010 (reducing prevalence
by 9%), followed by smoke-free legislation (reducing prevalence by 2%) (Table 2).
However, mass media campaigns had the largest effect on smoking prevalence by
2000. If only the tax policy had been implemented, SADs would have increased to
29,925 in 2000 and to 32,736 in 2010 and would have totaled 461,933 between
1996 and 2010. Therefore, 3,098 deaths were averted due to the tax policy. Due to
the mass media campaigns, 1,217 deaths were averted, and due to the cessation
treatment policy 1,113 deaths. The other policies averted between 0 (youth access
restrictions) and 652 (smoke-free legislation) deaths between 1996 and 2010.
Table 2: Tracking the effect of past policies using SimSmoke on smoking prevalence for ages 18 and above and total smoking-attributable deaths, Netherlands, 1996-2010.
1996 2000 2010 Cumulative
Smoking prevalence
Status quo 1996 34.5% 33.9% 32.1% Tax policy 34.5% 33.6% 29.2% Smoke-free legislation 34.5% 33.9% 31.4% Advertising ban 34.5% 33.9% 31.8% Mass media campaigns 34.5% 33.5% 31.6% Health warnings 34.5% 33.9% 31.8% Youth access restrictions 34.5% 33.9% 32.1% Cessation treatment policy 34.5% 33.9% 31.6% All above policies combined 34.5% 33.2% 27.0%Smoking-attributable deaths
Status quo 1996 30,193 29,948 33,502 465,031 Tax policy 30,193 29,925 32,736 461,933 Smoke-free legislation 30,193 29,948 33,273 464,379 Advertising ban 30,193 29,948 33,397 464,619 Mass media campaigns 30,193 29,948 33,319 463,814 Health warnings 30,193 29,948 33,387 464,493 Youth access restrictions 30,193 29,948 33,502 465,031 Cessation treatment policy 30,193 29,948 33,284 463,918 All above policies combined 30,193 29,925 31,888 457,953
| 80 |
Future policy projections from 2010 to 2040
If tobacco control policies remain unchanged from their 2010 levels, as in the status
quo scenario, male adult smoking is projected to decrease from 29.6% to 26.7%
from 2010 to 2020, to 24.6% by 2030, and to 23.1% by 2040 (Table 3). In the
status quo scenario, female adult smoking prevalence is projected to decrease from
24.9% in 2010 to 23.5% by 2020, and to 20.9% by 2040 (Table 4). As is seen in
Table 5, the estimated number of SADs in 2010 is 31,888 (21,990 for males and
9,898 for females). Male SADs are projected to reach their highest point in 2024
and female SADs reach their highest point in 2034. The total number of SADs is
projected to rise to 33,013 by 2040. From 2010 to 2040, the cumulative SADs are
projected to be 1,042,836 in the status quo scenario.
When taxes are increased to 70% of the retail price, smoking rates are
projected to decrease to 19.8% for males (Table 3) and 18.0% for females (Table 4)
by 2040. Summing over years from 2011 through 2040, 40,839 deaths are averted
by increased taxes by 2040 (Table 5). Increasing taxes to 70% of the retail price has
the largest effect on smoking prevalence and SADs of all MPOWER policies.
Complete bans on smoking in worksites, bars, restaurant and other public
places, along with strong enforcement, is predicted to decrease smoking prevalence
to 21.8% for males and 19.7% for females by 2040. In total, 27,278 deaths are
averted by 2040.
A comprehensive marketing ban, directed at all promotions as well as
media advertising and having strong enforcement, will decrease smoking to 22.1%
for males and 19.9% for females by 2040. By 2040, 21,104 deaths are averted with
a comprehensive marketing ban.
We considered a well-funded tobacco control campaign directed at all
smokers relative to the current policy of a medium intensity campaign. The model
predicts a decrease in smoking prevalence to 22.0% in males and 19.9% in females
by 2040, with 23,293 deaths averted by 2040.
Implementing graphic health warnings consistent with MPOWER
recommendations is projected to have the smallest impact on smoking prevalence.
Smoking prevalence is projected to decrease to 22.9% for males and 20.6% for
females by 2040, and 4,051 deaths are averted.
With the enforcement of youth access laws, the model predicts a decrease
in smoking prevalence to 21.2% for males and 19.2% for females by 2040. Youth
access laws have the lowest impact on SADs. From 2010 to 2040, 603 deaths are
projected to be averted.
The MPOWER combination of ready availability of nicotine replacement
therapy and buproprion, the provision of quitlines, and the provision of cessation

| 81 |
chapter 5 | Smoke-free legislation and other effective policies
treatment is projected to reduce smoking prevalence to 21.6% in males and 19.4%
in females by 2040. Smoking cessation treatment policies can avert 37,566 SADs
from 2010 to 2040.
The final scenario projects the effect of implementing all MPOWER policies
in 2011. By 2040, smoking prevalence is projected to decrease to 14.0% in males
and 12.7% in females. If the number of lives saved is added up for all years between
2011 and 2040, then 89,736 male and 55,033 female deaths are averted by 2040, or
a total of 144,769 deaths.
Table 3: SimSmoke Projections: male Smoking Prevalence for ages 18 and above, Netherlands, 2010-2040.
2010 2011 2020 2030 2040
Status quo policies 29.6% 29.3% 26.7% 24.6% 23.1%
Independent policy effects
Tax at 70% of retail price 29.6% 26.9% 24.0% 21.5% 19.8%
Complete smoke-free air law 29.6% 28.0% 25.5% 23.4% 21.8%
Comprehensive marketing ban 29.6% 28.3% 25.7% 23.6% 22.1%
High-intensity tobacco control campaign 29.6% 28.3% 25.7% 23.5% 22.0%
Strong health warnings 29.6% 29.2% 26.6% 24.4% 22.9%
Strong youth access enforcement 29.6% 29.3% 26.0% 23.2% 21.2%
Cessation treatment policies 29.6% 28.5% 25.4% 23.1% 21.6%
Combined policy effects
All above policies combined 29.6% 23.2% 19.0% 16.0% 14.0%
% Change in smoking prevalence from status quo
Independent Policy Effects
Tax at 70% of retail price -8.3% -10.3% -12.5% -14.5%
Complete smoke-free air law -4.3% -4.7% -5.1% -5.5%
Comprehensive marketing ban -3.5% -3.8% -4.2% -4.5%
High-intensity tobacco control campaign -3.5% -4.0% -4.4% -4.8%
Strong health warnings -0.2% -0.6% -0.9% -1.0%
Strong youth access enforcement 0.0% -2.7% -5.6% -8.2%
Cessation treatment policies -2.6% -5.2% -6.2% -6.6%
Combined policy effects
All above policies combined -20.8% -28.8% -35.0% -39.5%

| 82 |
Table 4: SimSmoke Projections: female smoking prevalence for ages 18 and above, Netherlands, 2010-2040.
2010 2011 2020 2030 2040
Status quo policies 24.9% 24.8% 23.5% 22.1% 20.9%
Independent policy effects
Tax at 70% of retail price 24.9% 22.8% 21.1% 19.5% 18.0%
Complete smoke-free air law 24.9% 23.7% 22.4% 21.0% 19.7%
Comprehensive marketing ban 24.9% 23.9% 22.6% 21.2% 19.9%
High-intensity tobacco control campaign 24.9% 23.9% 22.5% 21.1% 19.9%
Strong health warnings 24.9% 24.7% 23.3% 21.9% 20.6%
Strong youth access enforcement 24.9% 24.8% 22.9% 20.9% 19.2%
Cessation treatment policies 24.9% 24.1% 22.2% 20.6% 19.4%
Combined policy effects
All above policies combined 24.9% 19.6% 16.7% 14.4% 12.7%
% Change in smoking prevalence from status quo
Independent policy effects
Tax at 70% of retail price -8.2% -10.1% -12.0% -13.7%
Complete smoke-free air law -4.3% -4.7% -5.2% -5.5%
Comprehensive marketing ban -3.5% -3.8% -4.2% -4.5%
High-intensity tobacco control campaign -3.5% -4.1% -4.5% -4.8%
Strong health warnings -0.2% -0.7% -0.9% -1.1%
Strong youth access enforcement 0.0% -2.7% -5.5% -7.9%
Cessation treatment policies -2.6% -5.4% -6.7% -7.2%
Combined policy effects
All above policies combined -20.7% -28.9% -35.0% -39.3%

| 83 |
chapter 5 | Smoke-free legislation and other effective policies
Table 5: Total smoking-attributable deaths, SimSmoke Netherlands, 2010-2040.
2010 2020 2030 2040 Cumulative
Status quo policies 31,888 34,572 36,227 33,013 1,042,836
Independent policy effects
Tax at 70% of retail price 31,888 33,742 34,266 30,864 1,001,997
Complete smoke-free air law 31,888 33,992 34,901 31,691 1,015,557
Comprehensive marketing ban 31,888 34,114 35,202 32,015 1,021,731
High-intensity tobacco control campaign 31,888 34,095 35,095 31,841 1,019,543
Strong health warnings 31,888 34,506 36,031 32,755 1,038,784
Strong youth access enforcement 31,888 34,572 36,217 32,901 1,042,233
Cessation treatment policies 31,888 33,933 34,399 30,722 1,005,269
Combined policy effects
All above policies combined 31,888 31,715 29,212 25,307 898,067
Absolute change in attributable deaths from status quo
Independent policy effects
Tax at 70% of retail price 830 1,960 2,149 40,839
Complete smoke-free air law 580 1,325 1,322 27,278
Comprehensive marketing ban 458 1,025 998 21,104
High-intensity tobacco control campaign 477 1,132 1,172 23,293
Strong health warnings 66 196 259 4,051
Strong youth access enforcement 0 10 112 603
Cessation treatment policies 639 1,828 2,291 37,566
Combined policy effects
All above policies combined 2,857 7,015 7,706 144,769
| 84 |
DISCUSSION
Using the SimSmoke model, we have presented a short and long-term projection of
the role of various tobacco control policies in reducing smoking prevalence and the
number of smoking-attributable deaths. Due to the policies that were implemented
in the Netherlands between 1996 and 2010, smoking prevalence was reduced
by 16% and 7,078 deaths were averted by the year 2010. Almost half of these
deaths (3,098) were averted by the Dutch tax policy. Mass media campaigns (1,217
deaths averted) and the cessation treatment policy (1,113 deaths averted) also
contributed. The low level of enforcement meant that the tobacco purchase ban for
youth implemented in 2003 had negligible effects by 2010. However, the number of
deaths averted by youth access as well as the other policies implemented between
1996 and 2010 continues to grow into the future. By 2040, 148,000 deaths are
averted as a result of the policies already implemented.
While the Netherlands has implemented some tobacco control policies,
there is still ample scope to strengthen tobacco control policies consistent with the
FCTC. Smoking prevalence can be decreased by as much as 21% in the first year,
with a 35% reduction in the next twenty years and almost 40% by 30 years. Because
of the natural history of tobacco-related illnesses, reductions in smoking prevalence
have a relatively small impact on the number of smoking-attributable deaths in the
short-term. By 2040, however, 7,706 deaths can be averted in that year alone with
the stronger set of policies. Without effective tobacco control policies, a million lives
will be lost to tobacco-related diseases between 2011 and 2040, of which 145,000
can be saved with a comprehensive tobacco control package.
Study limitations and strengths
The smoking prevalence results depend first on estimates of the rates of smoking
in 1996, and initiation, cessation and relapse rates. Reliable data were not available
for relapse rates in the Netherlands and are, therefore, based on U.S. rates. The
estimated relative mortality risks for smokers are also based on studies from the
U.S. (Thun et al., 1997) and other high income countries (Doll et al., 2004), but
the rates may differ in the Netherlands. We did not consider differences by socio-
economic status, which may be expected to play an increasing role, nor did we
consider the effect of immigration. Notably, the projections also do not include the
additional deaths averted due to reductions in second-hand smoke exposure.
The policy modules depend on underlying assumptions, estimated
parameters of the predicted effect on initiation and cessation, and assumptions
about the interdependence of policies. While we have not conducted sensitivity
analysis for the current model, we have estimated confidence intervals in previous
| 85 |
chapter 5 | Smoke-free legislation and other effective policies
work (Levy et al., 2004; Levy, Hyland et al., 2007). For example, many studies, with
relatively consistent results, have been conducted on the effects of tax policies,
and we gauge that the effect sizes can vary by as much as 25% above or below
our current estimate. There are also many studies of smoke-free legislation, with
results somewhat less consistent than those of prices, but still falling into similar
ranges. Studies on media campaigns and advertising bans provide a broad range
of estimates, and effect sizes might be expected to vary by about 50% around
the current model estimates. Studies on the overall effect of health warnings and
cessation treatment policies on smoking prevalence are generally lacking, such that
bounds are 100% (from zero to twice) the current estimates. Studies need to be
conducted not only to gauge the initial effect of policies, but also to understand how
those policies unfold over time and depend on other policies in effect. Evidence
indicates that public policies may be synergistic through their cumulative impact
on social norms and their reinforcing effects on smokers’ motivation to quit (Levy,
Hyland et al., 2007). We have made the conservative assumption that the effects
of each policy are a constant proportion of the smoking rate independent of other
policies. However, the effects of health warnings, smoke-free legislation, and
cessation treatment policies are magnified in the model by the publicity of a well-
funded media campaign. In turn, the effects of these other policies on the effect of
a tobacco control campaign are intensified by the publicity that they generate.
Although the Netherlands has more extensive data than most EU nations, it
will be important to continue to collect detailed information on smoking prevalence
by age and gender. In particular, smoking rates at early ages are needed, as well
as information on the prevalence of former smokers, so that cessation rates can be
estimated and quitting can be tracked. In addition, it would be useful to monitor quit
attempt behaviours, the use of pharmacotherapies and quitlines, the involvement of
physicians in advising patients to quit, cigarette prices of the prominent brands and
the amount of smuggled cigarettes, and compliance with marketing restrictions and
smoke-free legislation. As this information is collected and monitored, the model
can be adapted to more accurately reflect trends in smoking rates over time. Most
important, improved data can be used to better monitor and evaluate policies, so
that policies can be modified and adapted in reaction to successes and failures.
Conclusion
The SimSmoke results highlight the relative contribution of numerous policies to
reducing the tobacco health burden. We have shown that policies have already
had an important impact in the Netherlands, but there is room for improvement.
In complying with MPOWER FCTC recommendations (i.e., increasing the tax to
| 86 |
70% of price, strengthening health warnings, media campaigns and the provision
of cessation treatment, as well as the complete prohibition and enforcement of
smoking in public and workplaces, industry marketing, and sales of tobacco to youth)
the smoking rate is projected to fall by 40% in relative terms with 145,000 deaths
averted by 2040. A large increase in taxes alone, or in the provision of cessation
treatments, would substantially reduce the number of lives lost to smoking.
Implementation of the FCTC/MPOWER recommended policies could be
expected to show similar or larger relative reductions in smoking prevalence in
other countries which currently have weak policies. Substantial number of deaths
can thereby be averted, especially in those countries which have a large smoking
population.

| 87 |

| 88 |
Part 2
~~~
Individual pathways of change after smoke-free legislation
| 89 |

“Like surfers, legislators and corporate officials who wish to change everyday social norms must wait for signs of a rising wave of cultural support, catching it at just the right time. Legislate too soon and they will be swamped by the swells of public resistance.
Legislate too late and they will be irrelevant. Legislate at the right moment and an emerging cultural norm still tentatively
struggling for authority . . . acquires much greater social force.” (Robert Kagan)
| 90 |
Chapter 6
~~~
Increases in support for smoke-free legislation
Published as:
Mons, U., Nagelhout, G. E., Guignard, R., McNeill, A., Van den Putte,
B., Willemsen, M. C., Brenner, H., Pötschke-Langer, M., & Breitling, L.
P. (2012). Comprehensive smoke-free policies attract more support
from smokers in Europe than partial policies. European Journal of
Public Health, 22(Suppl 1), 10-16.
| 91 |
| 92 |
Support for smoke-free policies increases over time and particularly after
implementation of the policy. In this study we examined whether the
comprehensiveness of such policies moderates the effect on support among
smokers. We analysed two waves (pre- and post-smoke-free legislation) of
the International Tobacco Control (ITC) surveys in France, Germany, and
the Netherlands, and two pre-legislation waves of the ITC surveys in UK as
control. Of 6,903 baseline smokers, 4,945 (71.6%) could be followed up and
were included in the analyses. Generalised Estimating Equations (GEE) were
used to compare changes in support from pre- to post-legislation to the
secular trend in the control country. Multiple logistic regression models were
employed to identify predictors of individual change in support. In France, the
comprehensive smoking ban was associated with sharp increases in support
for a total smoking ban in drinking establishments and restaurants that were
above secular trends. In Germany and the Netherlands, where smoke-free
policies and compliance are especially deficient in drinking establishments,
only support for a total smoking ban in restaurants increased above the
secular trend. Notable prospective predictors of becoming supportive of
smoking bans in these countries were higher awareness of cigarette smoke
being dangerous to others and weekly visiting of restaurants. Our findings
suggest that smoke-free policies have the potential to improve support
once the policy is in place. This effect seems to be most pronounced with
comprehensive smoking bans, which thus might be the most valid option for
policy-makers despite their potential for creating controversy and resistance
in the beginning.
AB
STR
AC
T

| 93 |
chapter 6 | Increases in support for smoke-free legislation
INTRODUCTION
Despite tobacco smoke pollution (TSP) being a confirmed risk factor for several
severe chronic diseases and acute symptoms (International Agency for Research on
Cancer, 2004; U.S. Department of Health and Human Services, 2006), and a large
body of evidence supporting the effectiveness of smoke-free policies in protecting
non-smokers from TSP (Callinan et al., 2010), the implementation of smoking bans
in the hospitality sector has been the subject of substantial public controversy in
various countries in the past few years.
Public attitudes towards smoke-free policies are considered to be a key
variable in the process of their adoption and with regards to compliance with
the regulations (International Agency for Research on Cancer, 2009a). Before the
enactment of smoke-free policies, supportive public attitudes are helpful in the
process of passing the legislation. After implementation, increasing support might
reflect changes in smoking-related norms. It is assumed that policies banning
smoking reduce the visibility and perceived social acceptability of smoking (Albers
et al., 2004; Alesci, Forster, & Blaine, 2003; Brown et al., 2009), and that once people
experience them, public support increases (Hyland et al., 2009). Most importantly,
smokers being supportive of smoke-free policies are more likely to comply with the
regulations (Nagelhout, Mons et al., 2011).
Previous cross-sectional and longitudinal studies have shown that among
non-smokers and smokers, support for smoking bans generally follows a rising
trend (Brooks & Mucci, 2001; Hyland, Higbee et al., 2009; International Agency
for Research on Cancer, 2009a; Osypuk & Acevedo-Garcia, 2010), and increases
particularly sharply after implementation of smoke-free policies, even if these
are comprehensive and rigid and pre-legislation policy support had been low
(Braverman, Aaro, Bontempo, & Hetland, 2010; Cooper, Borland, Yong, & Hyland,
2010; Edwards et al., 2008; Fong, Hyland et al., 2006; Hyland, Hassan et al., 2009;
Larsson, Boethius, Axelsson, & Montgomery, 2008; Lund, 2006; Palmersheim,
Remington, & Gundersen, 2006; Pursell et al., 2007; Rayens et al., 2007; Tang et al.,
2003; Tang, Cowling, Stevens, & Lloyd, 2004).
Some of these studies also investigated country differences in patterns of
change in policy support: these multiple-country studies either employed a quasi-
experimental design comparing countries with national smoke-free legislation with
countries without such legislation (Brown et al., 2009; Fong, Hyland et al., 2006;
Hyland, Hassan et al., 2009), or used respondents’ self-reported information about
local public smoking bans (Hyland et al., 2009). The quasi-experimental studies
support a positive causal effect of comprehensive smoke-free legislation on policy
support (Brown et al., 2009; Fong, Hyland et al., 2006; Hyland, Hassan et al., 2009).
| 94 |
The findings of a study on the effect of self-reported local smoking restrictions
implied a ‘dose-response relationship’, with smokers reporting smoking bans at
several locations and/or for several years being more likely to support smoking
bans than smokers who reported no or only few smoking restrictions (Hyland et al.,
2009). These findings suggest that comprehensiveness of smoke-free policies is a
relevant factor, but an alternative explanation could be that people supporting such
policies are just more aware of the existence of smoking restrictions. To examine
the question of causality, this study explored the impact of smoke-free legislation
on policy support among smokers in three European countries with differential
comprehensiveness of smoke-free legislation, using longitudinal pre- and post-
legislation data from the prospective International Tobacco Control Policy Evaluation
Project (ITC Project) Europe Surveys. The examined countries were France,
Germany, and the Netherlands. While the French bar and restaurant smoking ban is
nearly comprehensive, the Netherlands and Germany allow for several exemptions.
In France, smoking is allowed in smoking rooms, but the technical requirements
for smoking rooms are so strict that they are actually a rarity. In the Netherlands
and Germany, at the time of the post-legislation survey, smoking was allowed in
smoking rooms in drinking establishments and restaurants. In Germany, smoking
was furthermore allowed in designated smoking venues, i.e. drinking establishments
of a size less than 75m², which chose to operate as smoking venue. More information
about the different legislations can be found elsewhere (Nagelhout, Mons et al., 2011).
Consequently, the difference in comprehensiveness of the regulations
is reflected in the frequency of smoking in hospitality venues. While smoking in
bars was almost eliminated post-legislation in France (proportion of smokers who
noticed smoking at their last visit: 4%), it was still rather common in the Netherlands
(36%) and Germany (50%). For restaurants, the policies were more effective: the
proportion of smokers noticing smoking was slightly higher in the Netherlands (5%)
than in France (2%), but considerably higher in Germany (29%) (ITC Project, 2010a).
These implications are also supported by other studies using different indicators
(Gleich et al., 2011; Nagelhout, Mons et al., 2011).
In addition to examining the impact of smoke-free legislation on policy
support among smokers in these three countries, the multi-country approach was
combined with a quasi-experimental design, using data from two pre-legislation ITC
survey waves from the UK serving as control. As public support for smoking bans
tends to increase even when no bans are in place, using a control allowed us to
disentangle the contribution of secular trends and of the smoke-free legislation to
changes in public support in the countries where such legislation was implemented.
| 95 |
chapter 6 | Increases in support for smoke-free legislation
DATA AND METHODS
Study and sampling design
The prospective ITC Surveys are part of the ITC Project (www.itcproject.org), which
is committed to evaluating the psychosocial and behavioural effects of national
tobacco control policies. The surveys are based on the same conceptual framework
and methods, and use standardised survey questionnaires (Thompson et al., 2006).
The surveys covered probability samples of current smokers aged 18 years
and older, with smokers being defined as having smoked at least 100 cigarettes
in their lifetime and currently smoking at least monthly. In France, Germany and
UK, respondents were recruited and interviewed using random digit dialling (RDD)
and computer-assisted telephone interviews (CATI). In the Netherlands, the sample
consisted of a small RDD CATI sample and a larger computer-assisted web interview
sample (CAWI), which was drawn from a large probability-based internet panel.
Whereas the two Dutch samples showed small differences in socio-demographics
and smoking behaviour (Nagelhout et al., 2010), there were no significant differences
with regard to pre-legislation support for a total smoking ban in bars (crude OR
CAWI vs. CATI = 1.48, 95% CI = 0.92-2.39) or restaurants (0.77, 0.57-1.05). The
samples were thus pooled for the analyses.
For all countries but the UK, respondents were first interviewed before
implementation of the national smoke-free legislation and re-interviewed after
implementation. As UK was used as control country, data were drawn from two
pre-legislation waves. In order to have a pre-legislation observation period as close
as possible to the pre- to post-legislation period in the other countries, we used
waves 4 and 5 of the ITC UK survey. Because Scotland had implemented smoke-
free legislation between these two waves, we excluded respondents from Scotland
from all analyses. The timing of the surveys and the different regulations of the
smoke-free policies are summarised in Table 1.
The analyses presented here were based on the longitudinal samples, i.e.
respondents who had been surveyed both at baseline and follow-up. Of 6,903
baseline smokers, 4,945 (71.6%) could be followed up (Table 1).
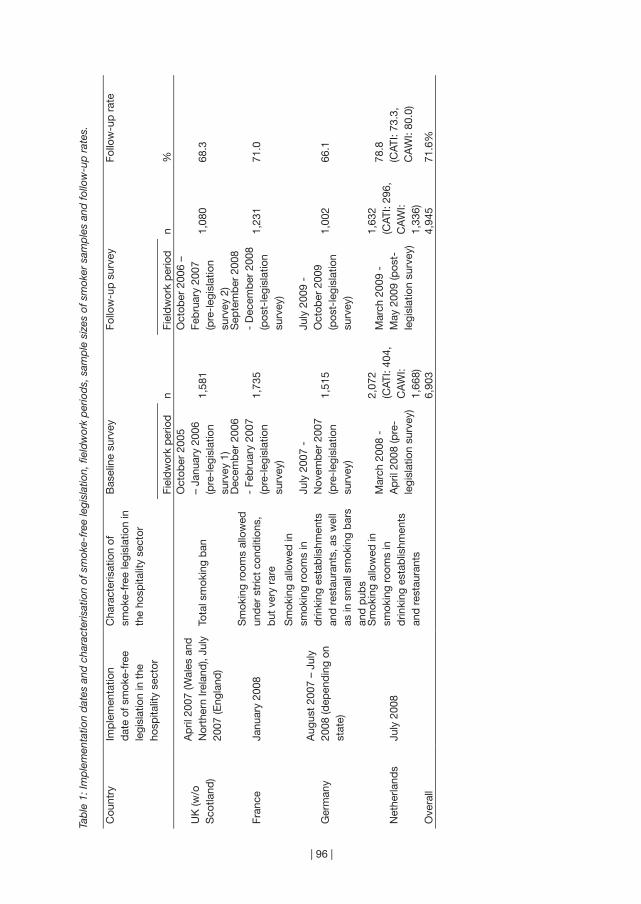
| 96 |
Tab
le 1
: Im
ple
men
tatio
n d
ates
and
cha
ract
eris
atio
n of
sm
oke-
free
legi
slat
ion,
fiel
dw
ork
per
iod
s, s
amp
le s
izes
of s
mok
er s
amp
les
and
follo
w-u
p r
ates
.
Cou
ntry
Imp
lem
enta
tion
dat
e of
sm
oke-
free
le
gisl
atio
n in
the
ho
spita
lity
sect
or
Cha
ract
eris
atio
n of
sm
oke-
free
legi
slat
ion
in
the
hosp
italit
y se
ctor
Bas
elin
e su
rvey
Follo
w-u
p s
urve
yFo
llow
-up
rat
e
Fiel
dw
ork
per
iod
nFi
eld
wor
k p
erio
dn
%
UK
(w/o
S
cotla
nd)
Ap
ril 2
007
(Wal
es a
nd
Nor
ther
n Ire
land
), Ju
ly
2007
(Eng
land
)To
tal s
mok
ing
ban
Oct
ober
200
5 –
Janu
ary
2006
(p
re-l
egis
latio
n su
rvey
1)
1,58
1
Oct
ober
200
6 –
Feb
ruar
y 20
07
(pre
-leg
isla
tion
surv
ey 2
)
1,08
068
.3
Fran
ceJa
nuar
y 20
08S
mok
ing
room
s al
low
ed
und
er s
tric
t co
nditi
ons,
b
ut v
ery
rare
Dec
emb
er 2
006
- Fe
bru
ary
2007
(p
re-l
egis
latio
n su
rvey
)
1,73
5
Sep
tem
ber
200
8 -
Dec
emb
er 2
008
(pos
t-le
gisl
atio
n su
rvey
)
1,23
171
.0
Ger
man
yA
ugus
t 20
07 –
Jul
y 20
08 (d
epen
din
g on
st
ate)
Sm
okin
g al
low
ed in
sm
okin
g ro
oms
in
drin
king
est
ablis
hmen
ts
and
res
taur
ants
, as
wel
l as
in s
mal
l sm
okin
g b
ars
and
pub
s
July
200
7 -
Nov
emb
er 2
007
(pre
-leg
isla
tion
surv
ey)
1,51
5
July
200
9 -
Oct
ober
200
9 (p
ost-
legi
slat
ion
surv
ey)
1,00
266
.1
Net
herla
nds
July
200
8
Sm
okin
g al
low
ed in
sm
okin
g ro
oms
in
drin
king
est
ablis
hmen
ts
and
res
taur
ants
Mar
ch 2
008
- A
pril
200
8 (p
re-
legi
slat
ion
surv
ey)
2,07
2 (C
ATI:
404,
C
AW
I: 1,
668)
Mar
ch 2
009
- M
ay 2
009
(pos
t-le
gisl
atio
n su
rvey
)
1,63
2 (C
ATI:
296,
C
AW
I: 1,
336)
78.8
(C
ATI:
73.3
, C
AW
I: 80
.0)
Ove
rall
6,90
34,
945
71.6
%

| 97 |
chapter 6 | Increases in support for smoke-free legislation
Measures and outcomes
The pre- and post-legislation questionnaires included relevant socio-demographic
variables, such as gender, age, and education. Smoking-related questions of
particular relevance to the present analyses were the Heaviness of Smoking Index
(Heatherton et al., 1989) and intention to quit smoking. Awareness of the harm
of TSP, a potential confounder, was measured by reported agreement with the
statement “Cigarette smoke is dangerous to non-smokers”. The frequency of bar
and restaurant visits was used to assess to what extent respondents would be
exposed to the smoking restrictions in hospitality venues.
Support for smoke-free policies was assessed by asking whether “smoking
should be allowed in all indoor areas, in some indoor areas, or not allowed indoors
at all”, separately for restaurants and drinking establishments: bars and pubs. For
each of these two venues, those who stated that smoking should not be allowed
indoors at all were categorised as supporting a total smoking ban, those who
stated that smoking should be allowed in some indoor areas were categorised as
supporting a partial smoking ban, and those who stated that smoking should be
allowed in all indoor areas were categorised as supporting no smoking restrictions.
Both variables were dichotomised for the multivariate analyses in the form of:
supporting a total smoking ban versus not supporting a total smoking ban.
Statistical analyses
For the descriptive analyses, percentages for country-specific estimates of support
for smoke-free policies were reported.
To evaluate changes in support for smoking bans, separate Generalised
Estimating Equations (GEE) models (Hanley, Negassa, Edwardes, & Forrester, 2003;
Zeger & Liang, 1986) were computed for Germany, France, and the Netherlands,
with UK as control in each of these models. Separate models were computed
with supporting a total smoking ban in drinking establishments, and supporting
a total smoking ban in restaurants as dependent variables (binomial distribution,
logit link, exchangeable correlation structure). Estimates were adjusted for time-
invariant covariates reported at baseline (country, age, gender, education) as well
as for time-varying covariates reported at each survey (wave, frequency of visiting
the respective hospitality venue, TSP harm awareness). Country x wave-interaction
terms were included to account for the pattern of change in the outcome variables
over time and to test for differences from UK as control country.
In order to identify prospective predictors of individual change in policy
support (i.e. transition from not supporting a total smoking ban to supporting a
total smoking ban) in the countries where smoke-free legislation was implemented,
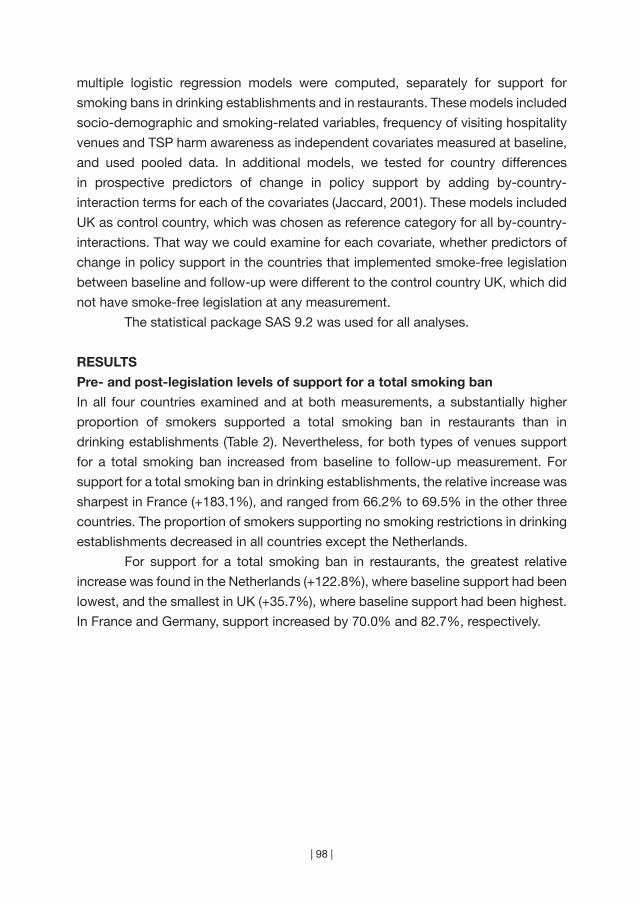
| 98 |
multiple logistic regression models were computed, separately for support for
smoking bans in drinking establishments and in restaurants. These models included
socio-demographic and smoking-related variables, frequency of visiting hospitality
venues and TSP harm awareness as independent covariates measured at baseline,
and used pooled data. In additional models, we tested for country differences
in prospective predictors of change in policy support by adding by-country-
interaction terms for each of the covariates (Jaccard, 2001). These models included
UK as control country, which was chosen as reference category for all by-country-
interactions. That way we could examine for each covariate, whether predictors of
change in policy support in the countries that implemented smoke-free legislation
between baseline and follow-up were different to the control country UK, which did
not have smoke-free legislation at any measurement.
The statistical package SAS 9.2 was used for all analyses.
RESULTS
Pre- and post-legislation levels of support for a total smoking ban
In all four countries examined and at both measurements, a substantially higher
proportion of smokers supported a total smoking ban in restaurants than in
drinking establishments (Table 2). Nevertheless, for both types of venues support
for a total smoking ban increased from baseline to follow-up measurement. For
support for a total smoking ban in drinking establishments, the relative increase was
sharpest in France (+183.1%), and ranged from 66.2% to 69.5% in the other three
countries. The proportion of smokers supporting no smoking restrictions in drinking
establishments decreased in all countries except the Netherlands.
For support for a total smoking ban in restaurants, the greatest relative
increase was found in the Netherlands (+122.8%), where baseline support had been
lowest, and the smallest in UK (+35.7%), where baseline support had been highest.
In France and Germany, support increased by 70.0% and 82.7%, respectively.
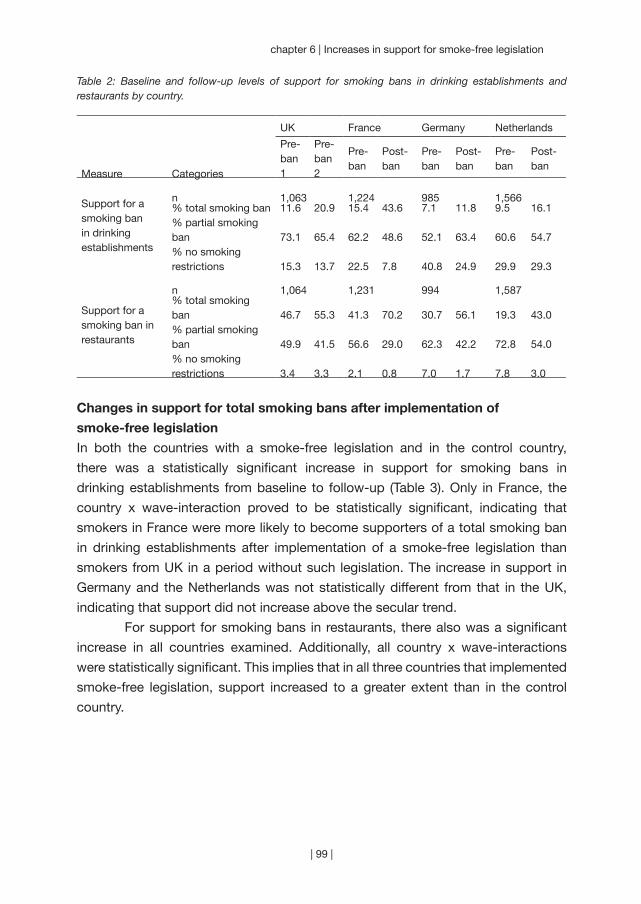
| 99 |
chapter 6 | Increases in support for smoke-free legislation
Table 2: Baseline and follow-up levels of support for smoking bans in drinking establishments and restaurants by country.
UK France Germany Netherlands
Measure Categories
Pre-ban 1
Pre-ban 2
Pre-ban
Post-ban
Pre-ban
Post-ban
Pre-ban
Post-ban
Support for a smoking ban in drinking establishments
n 1,063 1,224 985 1,566% total smoking ban% partial smoking ban% no smoking restrictions
11.6
73.1
15.3
20.9
65.4
13.7
15.4
62.2
22.5
43.6
48.6
7.8
7.1
52.1
40.8
11.8
63.4
24.9
9.5
60.6
29.9
16.1
54.7
29.3
Support for a smoking ban in restaurants
n 1,064 1,231 994 1,587% total smoking ban% partial smoking ban% no smoking restrictions
46.7
49.9
3.4
55.3
41.5
3.3
41.3
56.6
2.1
70.2
29.0
0.8
30.7
62.3
7.0
56.1
42.2
1.7
19.3
72.8
7.8
43.0
54.0
3.0
Changes in support for total smoking bans after implementation of
smoke-free legislation
In both the countries with a smoke-free legislation and in the control country,
there was a statistically significant increase in support for smoking bans in
drinking establishments from baseline to follow-up (Table 3). Only in France, the
country x wave-interaction proved to be statistically significant, indicating that
smokers in France were more likely to become supporters of a total smoking ban
in drinking establishments after implementation of a smoke-free legislation than
smokers from UK in a period without such legislation. The increase in support in
Germany and the Netherlands was not statistically different from that in the UK,
indicating that support did not increase above the secular trend.
For support for smoking bans in restaurants, there also was a significant
increase in all countries examined. Additionally, all country x wave-interactions
were statistically significant. This implies that in all three countries that implemented
smoke-free legislation, support increased to a greater extent than in the control
country.
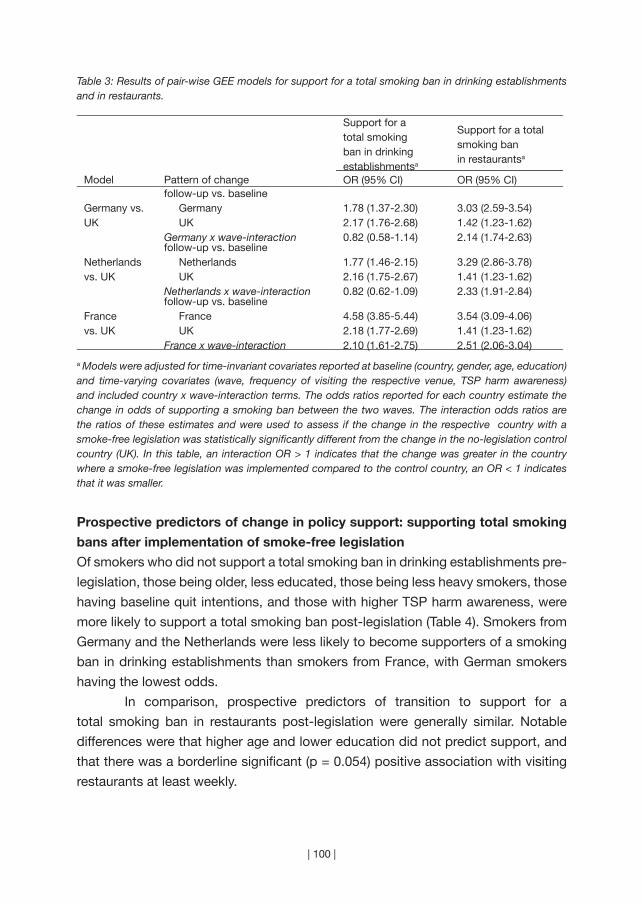
| 100 |
Table 3: Results of pair-wise GEE models for support for a total smoking ban in drinking establishments and in restaurants.
Support for a total smoking ban in drinking establishmentsa
Support for a total smoking ban in restaurantsa
Model Pattern of change OR (95% CI) OR (95% CI)
Germany vs. UK
follow-up vs. baseline Germany UKGermany x wave-interaction
1.78 (1.37-2.30)2.17 (1.76-2.68)0.82 (0.58-1.14)
3.03 (2.59-3.54)1.42 (1.23-1.62)2.14 (1.74-2.63)
Netherlands vs. UK
follow-up vs. baseline Netherlands UKNetherlands x wave-interaction
1.77 (1.46-2.15)2.16 (1.75-2.67)0.82 (0.62-1.09)
3.29 (2.86-3.78)1.41 (1.23-1.62)2.33 (1.91-2.84)
France vs. UK
follow-up vs. baseline France UKFrance x wave-interaction
4.58 (3.85-5.44)2.18 (1.77-2.69)2.10 (1.61-2.75)
3.54 (3.09-4.06)1.41 (1.23-1.62)2.51 (2.06-3.04)
a Models were adjusted for time-invariant covariates reported at baseline (country, gender, age, education) and time-varying covariates (wave, frequency of visiting the respective venue, TSP harm awareness) and included country x wave-interaction terms. The odds ratios reported for each country estimate the change in odds of supporting a smoking ban between the two waves. The interaction odds ratios are the ratios of these estimates and were used to assess if the change in the respective country with a smoke-free legislation was statistically significantly different from the change in the no-legislation control country (UK). In this table, an interaction OR > 1 indicates that the change was greater in the country where a smoke-free legislation was implemented compared to the control country, an OR < 1 indicates that it was smaller.
Prospective predictors of change in policy support: supporting total smoking
bans after implementation of smoke-free legislation
Of smokers who did not support a total smoking ban in drinking establishments pre-
legislation, those being older, less educated, those being less heavy smokers, those
having baseline quit intentions, and those with higher TSP harm awareness, were
more likely to support a total smoking ban post-legislation (Table 4). Smokers from
Germany and the Netherlands were less likely to become supporters of a smoking
ban in drinking establishments than smokers from France, with German smokers
having the lowest odds.
In comparison, prospective predictors of transition to support for a
total smoking ban in restaurants post-legislation were generally similar. Notable
differences were that higher age and lower education did not predict support, and
that there was a borderline significant (p = 0.054) positive association with visiting
restaurants at least weekly.

| 101 |
chapter 6 | Increases in support for smoke-free legislation
Table 4: Prospective predictors of supporting a total smoking ban at follow-up in countries which implemented smoke-free legislation between baseline and follow-up (restricted to respondents who did not support a total smoking ban at baseline), results of multiple logistic regression models.
Support for a total smoking ban in drinking establishments a
France, Germany and the Netherlands pooled
n = 3,282; events = 636
Support for a total smoking ban in restaurants a
France, Germany and the Netherlands pooled
n = 2,566; events = 1,127
Predictor variablea OR (95% CI) OR (95% CI)
Gender male (vs. female)
1.19 (0.99-1.44)
1.18 (1.00-1.39)
Age (in years) 1.02 (1.02-1.03) 1.01 (0.99-1.01)
Education low (vs. high) moderate (vs. high)
1.29 (0.99-1.66) 1.29 (1.01-1.65)
1.02 (0.82-1.28) 1.15 (0.94-1.41)
Heaviness of Smoking Index (HSI) b 0.86 (0.81-0.92) 0.82 (0.78-0.87)
Intention to quit within next 6 months (vs. no intention) 1.27 (1.04-1.55) 1.45 (1.20-1.76)Frequency of visiting the respective hospitality venue visiting at least weekly (vs. less than weekly)
0.97 (0.79-1.20)
1.24 (0.99-1.55)
Agreement with statement “Cigarette smoke is dangerous to others” (TSP harm awareness) c
1.40 (1.23-1.60) 1.31 (1.18-1.44)
Country Germany (vs. France) Netherlands (vs. France)
0.17 (0.13-0.23) 0.36 (0.28-0.46)
0.78 (0.62-0.99) 0.65 (0.52-0.81)
a Covariates refer to baseline. Models included all variables in the table together.b The index ranges from 0 to 6, with higher values indicating higher addiction/heavier smoking. c Five-point scale ranging from strongly disagree (1) to strongly agree (5).
Prospective predictors of change in policy support: country differences
With regards to prospective predictors of becoming a supporter of a total smoking
ban in drinking establishments and in restaurants, respectively, several country
differences were observed (Table 5). Notable country differences to the UK sample
were the significant negative association of heaviness of smoking with supporting
a smoking ban in drinking establishments in the Dutch sample and the positive
associations of lower education in the Dutch and the German sample. Furthermore,
there were interesting significant country differences regarding the associations
of frequently visiting hospitality venues with supporting a total smoking ban in
restaurants: while weekly restaurant visitors in the UK were less likely to support a
smoking ban in restaurants at follow-up compared to non-weekly restaurant

| 102 |
Sup
por
t fo
r a
tota
l sm
okin
g b
an in
drin
king
est
ablis
hmen
ts a
n =
4,2
05; e
vent
s =
792
Sup
por
t fo
r a
tota
l sm
okin
g b
an in
res
taur
ants
a
n =
3,1
14; e
vent
s =
1,3
22
Pre
dic
tor
varia
ble
aFr
ance
O
R (9
5% C
I)G
erm
any
OR
(95%
CI)
Net
herla
nds
OR
(95%
CI)
UK
O
R (9
5% C
I)Fr
ance
O
R (9
5% C
I)G
erm
any
OR
(95%
CI)
Net
herla
nds
OR
(95%
CI)
UK
O
R (9
5% C
I)
Gen
der
mal
e (v
s. fe
mal
e)
1.12
(0.8
6-1.
47)
1.17
(0.7
0-1.
93)
1.33
(0.9
6-1.
84)
1.22
(0.8
5-1.
76)
1.35
(0.9
8-1.
85)
1.25
(0.9
1-1.
73)
1.07
(0.8
4-1.
38)†
1.97
(1.3
6-2.
86)
Age
(in
year
s)1.
03 (1
.02-
1.04
)†1.
04 (1
.02-
1.06
)†1.
01 (1
.00-
1.02
)1.
01 (0
.99-
1.02
)1.
02 (1
.01-
1.03
)1.
01 (0
.99-
1.02
)1.
00 (0
.99-
1.01
)1.
01 (0
.99-
1.03
)
Ed
ucat
ion
l
ow (v
s. h
igh)
mid
dle
(vs.
hig
h)
1.22
(0.8
6-1.
74)
1.04
(0.7
2-1.
49)
0.93
(0.4
7-1.
87)
1.57
(0.9
0-2.
75)†
1.65
(0.9
9-2.
74)†
1.75
(1.1
1-2.
76)†
0.69
(0.4
2-1.
13)
0.69
(0.4
0-1.
20)
1.09
(0.7
2-1.
66)
1.08
(0.7
2-1.
64)
1.26
(0.8
2-1.
93)
1.47
(1.0
3-2.
10)
0.89
(0.6
2-1.
27)
1.06
(0.7
7-1.
45)
1.45
(0.8
4-2.
48)
1.02
(0.5
6-1.
85)
Hea
vine
ss o
f Sm
okin
g In
dex
(H
SI)
b
0.89
(0.8
1-0.
97)
0.93
(0.7
9-1.
10)
0.79
(0.7
1-0.
88)†
1.03
(0.9
1-1.
17)
0.87
(0.7
9-0.
97)
0.84
(0.7
5-0.
93)
0.78
(0.7
1-0.
85)
0.80
(0.7
0-0.
91)
Inte
ntio
n to
qui
t1.
23 (0
.94-
1.61
)1.
22 (0
.71-
2.08
)1.
33 (0
.92-
1.94
)1.
68 (1
.17-
2.42
)1.
25 (0
.90-
1.74
)1.
41 (0
.97-
2.06
)1.
52 (1
.12-
2.05
)1.
22 (0
.81-
1.83
)
Freq
uenc
y of
vis
iting
the
re
spec
tive
hosp
italit
y ve
nue
(drin
king
est
ablis
hmen
ts /
re
stau
rant
s)
v
isiti
ng a
t le
ast
wee
kly
(vs.
less
tha
n w
eekl
y)
1.11
(0.8
4-1.
46)
0.81
(0.4
5-1.
46)
0.82
(0.5
5-1.
23)
0.71
(0.4
8-1.
06)
1.38
(0.9
2-2.
07)†
0.94
(0.6
6-1.
35)
1.70
(1.1
3-2.
55)†
0.61
(0.3
9-0.
96)
Agr
eem
ent
with
sta
tem
ent
“Cig
aret
te s
mok
e is
d
ange
rous
to
othe
rs”
(TS
P
harm
aw
aren
ess)
c
1.47
(1.1
8-1.
83)
1.36
(0.9
5-1.
93)
1.35
(1.1
2-1.
63)
1.25
(0.9
9-1.
55)
1.42
(1.1
5-1.
77)
1.09
(0.9
0-1.
32)
1.38
(1.2
0-1.
59)
1.38
(1.1
1-1.
73)
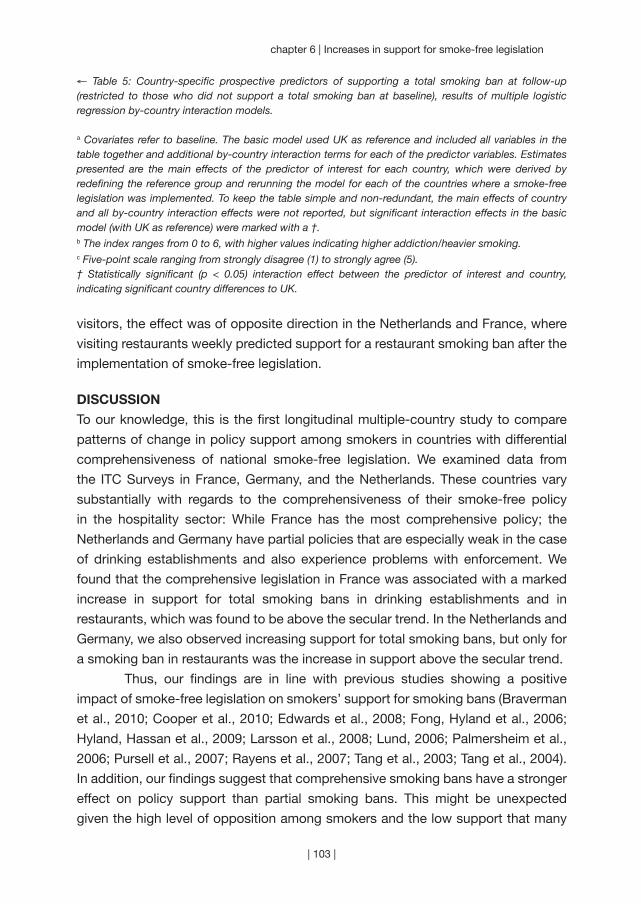
| 103 |
chapter 6 | Increases in support for smoke-free legislation
← Table 5: Country-specific prospective predictors of supporting a total smoking ban at follow-up (restricted to those who did not support a total smoking ban at baseline), results of multiple logistic regression by-country interaction models.
a Covariates refer to baseline. The basic model used UK as reference and included all variables in the table together and additional by-country interaction terms for each of the predictor variables. Estimates presented are the main effects of the predictor of interest for each country, which were derived by redefining the reference group and rerunning the model for each of the countries where a smoke-free legislation was implemented. To keep the table simple and non-redundant, the main effects of country and all by-country interaction effects were not reported, but significant interaction effects in the basic model (with UK as reference) were marked with a †.b The index ranges from 0 to 6, with higher values indicating higher addiction/heavier smoking.c Five-point scale ranging from strongly disagree (1) to strongly agree (5).† Statistically significant (p < 0.05) interaction effect between the predictor of interest and country, indicating significant country differences to UK.
visitors, the effect was of opposite direction in the Netherlands and France, where
visiting restaurants weekly predicted support for a restaurant smoking ban after the
implementation of smoke-free legislation.
DISCUSSION
To our knowledge, this is the first longitudinal multiple-country study to compare
patterns of change in policy support among smokers in countries with differential
comprehensiveness of national smoke-free legislation. We examined data from
the ITC Surveys in France, Germany, and the Netherlands. These countries vary
substantially with regards to the comprehensiveness of their smoke-free policy
in the hospitality sector: While France has the most comprehensive policy; the
Netherlands and Germany have partial policies that are especially weak in the case
of drinking establishments and also experience problems with enforcement. We
found that the comprehensive legislation in France was associated with a marked
increase in support for total smoking bans in drinking establishments and in
restaurants, which was found to be above the secular trend. In the Netherlands and
Germany, we also observed increasing support for total smoking bans, but only for
a smoking ban in restaurants was the increase in support above the secular trend.
Thus, our findings are in line with previous studies showing a positive
impact of smoke-free legislation on smokers’ support for smoking bans (Braverman
et al., 2010; Cooper et al., 2010; Edwards et al., 2008; Fong, Hyland et al., 2006;
Hyland, Hassan et al., 2009; Larsson et al., 2008; Lund, 2006; Palmersheim et al.,
2006; Pursell et al., 2007; Rayens et al., 2007; Tang et al., 2003; Tang et al., 2004).
In addition, our findings suggest that comprehensive smoking bans have a stronger
effect on policy support than partial smoking bans. This might be unexpected
given the high level of opposition among smokers and the low support that many
| 104 |
countries have experienced in the process of debating and implementing smoke-
free policies. But, as others have also suggested (Hyland et al., 2009), smoke-
free legislation seems to have the potential to change attitudes, and acceptance
increases once smokers experience the legislation and its benefits. In contrast,
we assume that in countries with only partial smoking restrictions, initial concerns
among smokers persist, possibly due to ongoing debates about proportionality and
fairness of the regulations. This is reflected in our findings of low pre-legislation
support levels and the only slight increase in support levels for smoking bans in
drinking establishments in Germany and the Netherlands, where the partial smoking
bans are especially deficient in bars and pubs due to exemptions and problems with
compliance (Gleich et al., 2011; Nagelhout, Mons et al., 2011). Germany’s smoke-
free policy is even less effective than that of the Netherlands (Gleich et al., 2011;
Nagelhout, Mons et al., 2011), which might explain why German smokers had even
lower odds of becoming supporters of a smoking ban in drinking establishments
than Dutch smokers. Opposition among smokers generally seems to be more
prevalent in the case of smoking bans in drinking establishments, which had the
lowest pre-legislation support levels. This was also found in other studies (Cooper
et al., 2010; Hyland, Hassan et al., 2009). Possible explanations could be a stronger
association of bars and pubs with (social) smoking compared to other types of
hospitality venues, and tobacco industry efforts to preserve the “last bastion of
socially acceptable smoking” (Magzamen & Glantz, 2001).
An alternative interpretation of the observed changes in support following
the smoking bans would be that these changes were induced by campaigns and
media reports related to the smoking bans. While campaigns were run prior to the
implementation of the legislation in France and the Netherlands, there were no
campaigns in Germany. However, the finding that frequency of visiting restaurants
– and thus the frequency of being directly exposed to and affected by the smoking
ban – seems to play a significant role in the transition to supporting smoking bans
suggests that at least part of the effect is caused by the policy itself. A relevant
mediator might be TSP harm awareness, which was a significant predictor of post-
legislation support. As TSP-related health knowledge can be reinforced by media
reports and social marketing campaigns (Nagelhout et al., 2012; Thrasher et al.,
2011), this could indeed be an important driving factor in the process of normative
changes that occur after implementation of the legislation. However, we could not
further examine the role of campaigns and media reports as detailed information
about exposure among respondents was lacking.
Limitations of this study include differences in the timing of the surveys
and the loss of nearly 30% of respondents to follow-up. Because the smoke-free
| 105 |
chapter 6 | Increases in support for smoke-free legislation
legislation was implemented at different dates in the examined countries, the pre-
and post-legislation surveys were conducted at different times, and also the follow-
up time and time between implementation of the legislation and post-legislation
varied. As secular trends influence the level of policy support, the differences in
timing of the survey might explain pre-legislation country-differences in levels of
support, but the patterns of change should be largely unaffected by survey timing.
In order to assess secular changes we used the UK (without Scotland) as a control
country. Comparable baseline support rates implied that UK was an appropriate
choice for this purpose. However, it is possible that with associated publicity around
the enactment of the smoke-free legislation in Scotland, the secular increase in the
rest of UK might have been an overestimate. This would make our estimate of the
secular trend more conservative.
Loss to follow-up is a common problem in longitudinal studies and can
lead to attrition bias. Non-responder analyses showed that smokers of younger
age (OR = 0.99, 95% CI = 0.98-0.99), those with a pre-legislation intention to quit
(1.15, 1.03-1.29), and weekly visitors of drinking establishments (1.13, 1.01-1.27)
or restaurants (1.27, 1.11-1.46) were somewhat more likely to be lost to follow-up.
However, these odds ratios suggest only limited potential for bias in the results
reported in Table 2.
The relevance of the interviewing modes in the Dutch surveys was explored
in sensitivity analyses running the GEE and the logistic regression models separately
for CAWI- and CATI-respondents, which yielded consistent results (details not
shown).
Finally, our findings were consistent with results from ITC studies from
Ireland, UK, USA, Canada, and Australia (Brown et al., 2009; Fong, Hyland et al.,
2006; Hyland, Hassan et al., 2009), which is in line with a broad generalisability of
our findings for Western industrial nations.
Our study of smokers from four EU-countries demonstrates that smoking
bans have the potential to create and improve support once the policy is in place.
This effect is stronger the more comprehensive the policy, but might not be valid for
partial smoking bans with many exemptions, as these could be cause for ongoing
debates about fairness and proportionality of the regulations. The findings imply
that compliance problems that often occur with partial smoking bans might lessen
with more comprehensive regulations and increasing support. Most importantly,
policy-makers should not waver from implementing comprehensive smoke-
free legislation because of low public acceptance rates, as it seems that despite
potential controversy and resistance in the beginning, comprehensive regulations
attract support from smokers once implemented.

“Whoever controls the media… controls the
culture.” (Allen Ginsberg)
| 106 |

Chapter 7
~~~
Newspaper coverage and a media campaign
Published as:
Nagelhout, G. E., Van den Putte, B., De Vries, H., Crone, M., Fong, G.
T., & Willemsen, M. C. (2012). The influence of newspaper coverage
and a media campaign on smokers’ support for smoke-free bars and
restaurants and on second-hand smoke harm awareness. Findings
from the International Tobacco Control (ITC) Netherlands Survey.
Tobacco Control, 21, 24-29.
| 107 |
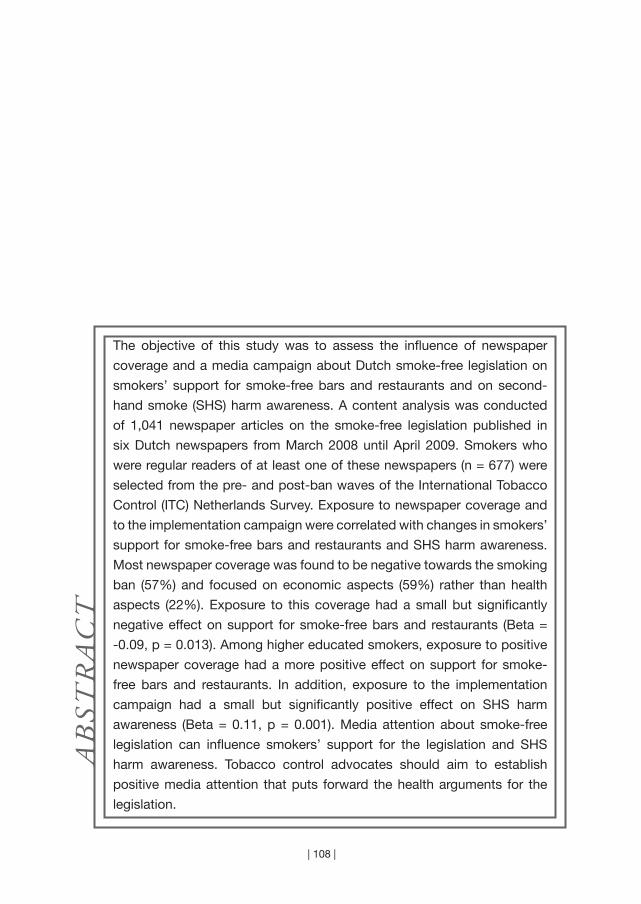
| 108 |
The objective of this study was to assess the influence of newspaper
coverage and a media campaign about Dutch smoke-free legislation on
smokers’ support for smoke-free bars and restaurants and on second-
hand smoke (SHS) harm awareness. A content analysis was conducted
of 1,041 newspaper articles on the smoke-free legislation published in
six Dutch newspapers from March 2008 until April 2009. Smokers who
were regular readers of at least one of these newspapers (n = 677) were
selected from the pre- and post-ban waves of the International Tobacco
Control (ITC) Netherlands Survey. Exposure to newspaper coverage and
to the implementation campaign were correlated with changes in smokers’
support for smoke-free bars and restaurants and SHS harm awareness.
Most newspaper coverage was found to be negative towards the smoking
ban (57%) and focused on economic aspects (59%) rather than health
aspects (22%). Exposure to this coverage had a small but significantly
negative effect on support for smoke-free bars and restaurants (Beta =
-0.09, p = 0.013). Among higher educated smokers, exposure to positive
newspaper coverage had a more positive effect on support for smoke-
free bars and restaurants. In addition, exposure to the implementation
campaign had a small but significantly positive effect on SHS harm
awareness (Beta = 0.11, p = 0.001). Media attention about smoke-free
legislation can influence smokers’ support for the legislation and SHS
harm awareness. Tobacco control advocates should aim to establish
positive media attention that puts forward the health arguments for the
legislation.
AB
STR
AC
T

| 109 |
chapter 7 | Newspaper coverage and a media campaign
INTRODUCTION
In many countries around the world, smoke-free legislation is being implemented to
protect non-smokers from the health dangers of second-hand smoke (SHS) (World
Health Organization, 2008a). Optimal protection is achieved when compliance with
smoking bans is high. Several studies have shown that compliance is positively
related to higher levels of support for the legislation and to greater SHS harm
awareness (Borland, Yong, Siahpush et al., 2006; Li et al., 2010; Thrasher, Besley, &
González, 2010). Both can possibly be influenced by means of well-designed media
campaigns and advocacy. In this study, we assess the influence of newspaper
coverage and a campaign about smoke-free legislation on changes in smokers’
support for the legislation and SHS harm awareness.
Both opponents and proponents of tobacco control believe that media
attention can influence public support for tobacco control policies. This is evidenced
by the fact that influencing media attention about smoking is a known strategy
of tobacco control advocates (American Cancer Society, 2003; National Cancer
Institute, 2008) and the tobacco industry (National Cancer Institute, 2006; World
Health Organization, 2008b) alike. However, research on media attention about
tobacco has mainly focused on describing media coverage, and few studies have
linked this with individual outcomes (National Cancer Institute, 2008). Two recent
studies from the United States found an association between media coverage of
tobacco control policy in a region and support for the policy in that region (Clegg-
Smith et al., 2008; Harris, Shelton, Moreland-Russell, & Luke, 2010). Another
recent US study found no association between self reported media coverage
and support for tobacco control policies (Blake, Viswanath, Blendon, & Vallone,
2010). These studies provided no conclusive evidence on the matter, as their
cross-sectional design made it difficult to reach firm conclusions about causal
relationships. Furthermore, these studies did not report on differential effects of
media coverage between people from higher and lower educational levels. This is
important, because smoking is increasingly a problem for lower educated groups
(World Health Organization, 2008a). The available research suggests that media
campaigns are more effective among higher educated groups (Niederdeppe, Kuang,
Crock, & Skelton, 2008) and that these groups learn more from the media than lower
educated groups (Tichenor, Donohue, & Olien, 1970).
The theoretical concept of framing explains how media attention can
influence attitudes. Frames give context to an issue, which influences how the issue
is perceived and understood (Goffman, 1974). For example, smoke-free legislation
is often framed by tobacco control advocates as a measure to protect the health
of non-smokers but by the tobacco industry as a measure that causes economic
| 110 |
losses to the hospitality industry (Fahy et al., 2009; Magzamen, Charlesworth, &
Glantz, 2001). A study on the effects of newspaper coverage about a tobacco
tax increase found that coverage of economic aspects was associated with less
support for the tax increase, while coverage of health aspects was associated with
more support (Harris et al., 2010).
The case that we present in this study is that of the implementation of
the smoke-free hospitality industry legislation in the Netherlands in July 2008. The
implementation of this legislation did not proceed as planned. A small minority of
bars failed to comply with the smoking ban at first (VWA, 2010), but this small group
received a disproportionate high amount of media attention. This may have fuelled
resistance to the legislation and increased the number of non-complying bars. While
support for legislation typically increases considerably after its implementation
(Fong, Hyland et al., 2006; Hyland, Hassan et al., 2009; Wakefield, Roberts, &
Owen, 1996), support for the Dutch legislation was low before and stayed low
after its implementation (ITC Project, 2010b). In fact, of all European countries,
the Netherlands had the lowest support for smoke-free bars: only 44 percent of
the population (European Commission, 2009). The Dutch government ran a mass
media implementation campaign for the smoke-free legislation on television (849
GRPs3), radio (1,636 GRPs), and posters (144 GRPs) from May to September 2008.
Although the World Health Organization guidelines recommend an emphasis on
the public health arguments for implementing smoke-free legislation (World Health
Organization, 1998), the Dutch implementation campaign only communicated the
date of implementation. The television commercial showed a man dressed as a
large cigarette being thrown out of hospitality industry venues onto the street.
The present study examined the effects of the implementation campaign
and newspaper coverage about the smoke-free legislation on support for smoke-
free bars and restaurants and on SHS harm awareness. The following hypotheses
were tested: 1) positive newspaper coverage has a more positive effect on
support and harm awareness than negative coverage; 2) newspaper coverage of
health aspects has a more positive effect on support and harm awareness than
coverage of economic aspects; 3) the implementation campaign has no effect on
support or harm awareness; 4) there are more positive effects from media attention
among smokers with higher than lower educational levels. To study this, we used
longitudinal data from the International Tobacco Control (ITC) Netherlands Survey
and a content analysis of newspaper coverage about the smoke-free legislation.
3 GRP stands for Gross Rating Point, which is the percentage of the target audience that is reached by the campaign times the frequency of exposure. Normally, government campaigns in the Netherlands have 300 GRPs on television and 640 GRPs on radio.
| 111 |
chapter 7 | Newspaper coverage and a media campaign
METHODS
ITC Netherlands Survey
In this study we used the pre-ban (April 2008) and post-ban (April-May 2009) internet
survey of the ITC Netherlands Survey. All respondents were aged 15 years or older
at the pre-ban survey, smoked manufactured or roll-your-own cigarettes at least
monthly, and had smoked at least 100 cigarettes in their lifetime. The pre-ban survey
was sent to 2,331 smoking panel members of the TNS NIPObase and was returned
by 1,820 respondents (78%). Of the 1,820 pre-ban respondents, 1,447 participated
again in the post-ban survey (80%). Additional details about the methods of the ITC
Netherlands Survey can be found on the ITC Project website (ITC Project, 2009b).
The first aspect of media attention about the smoke-free legislation that
we assessed in this study is newspaper coverage. All post-ban respondents were
presented with a list of 38 newspapers, with a request to indicate which newspapers
they read and how often. This method of asking respondents of a population survey
about their newspaper reading behaviour to assess the population effects of
newspaper coverage was also recently used by Dunlop and Romer (2010). Because
this method requires a content analysis of every included newspaper, we did not
include readers of all 38 newspapers, but only respondents who read at least one
of the six largest newspapers (n = 677 newspaper readers). A smaller number of
the post-ban respondents read one of the other 32 newspapers (n = 351), read no
newspaper at all (n = 415), or did not answer the question (n = 4). Table 1 shows the
number of respondents per newspaper.
The second aspect of media attention about the smoke-free legislation was
the implementation campaign. Recall of exposure to this campaign was assessed
at the post-ban survey by showing post-ban respondents pictures and texts of the
three different parts of the campaign: posters, television, and radio commercials. Of
each part of the campaign we asked how often they had seen or heard something
about this. Response categories were “Never”, “Once or twice”, “Sometimes”,
“Often”, and “Very often”. One exposure variable was created by computing a mean
score of exposure to the three different parts of the campaign for every respondent,
ranging from 0 to 4 (M = 1.12, SD = 0.83).
Support for smoke-free bars and restaurants was assessed at the pre-
and post-ban survey using the question “Do you support or oppose a complete
Dutch smoking ban in drinking establishments: cafés, bars, and pubs?” and “Do
you support or oppose a complete Dutch smoking ban in restaurants?” Response
categories were “Strongly support”, “Support”, “Oppose”, and “Strongly oppose”.
The mean of these two variables was used as indicator of support for smoke-free
bars and restaurants.
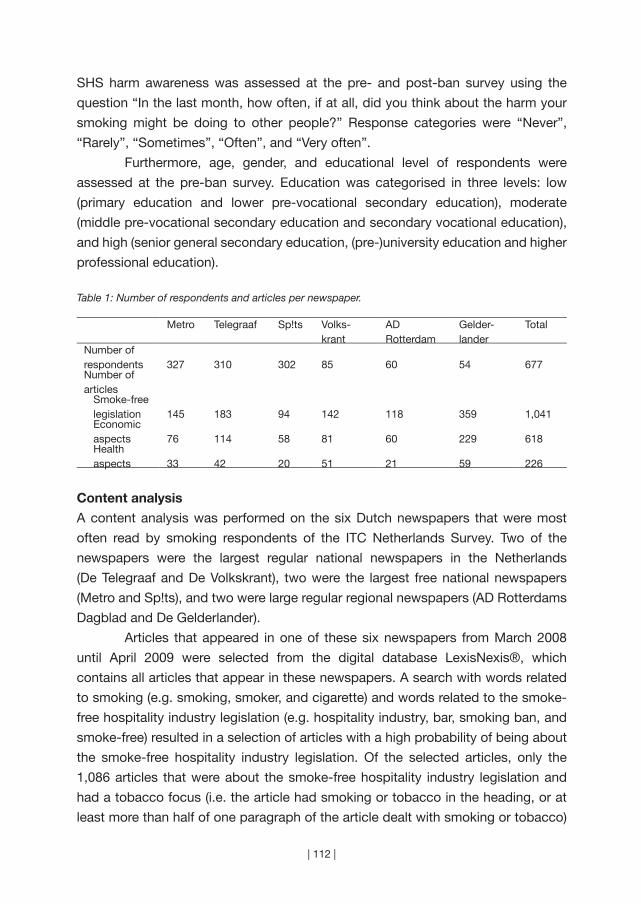
| 112 |
SHS harm awareness was assessed at the pre- and post-ban survey using the
question “In the last month, how often, if at all, did you think about the harm your
smoking might be doing to other people?” Response categories were “Never”,
“Rarely”, “Sometimes”, “Often”, and “Very often”.
Furthermore, age, gender, and educational level of respondents were
assessed at the pre-ban survey. Education was categorised in three levels: low
(primary education and lower pre-vocational secondary education), moderate
(middle pre-vocational secondary education and secondary vocational education),
and high (senior general secondary education, (pre-)university education and higher
professional education).
Table 1: Number of respondents and articles per newspaper.
Metro Telegraaf Sp!ts Volks-krant
AD Rotterdam
Gelder-lander
Total
Number of respondents 327 310 302 85 60 54 677Number of articles
Smoke-free legislation 145 183 94 142 118 359 1,041Economic aspects 76 114 58 81 60 229 618Health aspects 33 42 20 51 21 59 226
Content analysis
A content analysis was performed on the six Dutch newspapers that were most
often read by smoking respondents of the ITC Netherlands Survey. Two of the
newspapers were the largest regular national newspapers in the Netherlands
(De Telegraaf and De Volkskrant), two were the largest free national newspapers
(Metro and Sp!ts), and two were large regular regional newspapers (AD Rotterdams
Dagblad and De Gelderlander).
Articles that appeared in one of these six newspapers from March 2008
until April 2009 were selected from the digital database LexisNexis®, which
contains all articles that appear in these newspapers. A search with words related
to smoking (e.g. smoking, smoker, and cigarette) and words related to the smoke-
free hospitality industry legislation (e.g. hospitality industry, bar, smoking ban, and
smoke-free) resulted in a selection of articles with a high probability of being about
the smoke-free hospitality industry legislation. Of the selected articles, only the
1,086 articles that were about the smoke-free hospitality industry legislation and
had a tobacco focus (i.e. the article had smoking or tobacco in the heading, or at
least more than half of one paragraph of the article dealt with smoking or tobacco)
| 113 |
chapter 7 | Newspaper coverage and a media campaign
were included in the study.
All 1,086 included articles were coded on reference to health and economic
aspects and on slant towards the smoking ban (positive, negative, mixed, or neutral).
The coding on slant was done from the perspective of tobacco control according
to the method of Clegg-Smith et al. (Clegg-Smith et al., 2008). The coding was
done by two coders and had a high level of correspondence with respect to health
aspects (Cohen’s kappa = 0.85) and economic aspects (Cohen’s kappa = 0.85) and
a satisfactory level of correspondence with respect to slant (Cohen’s kappa = 0.62).
A third coder coded the articles on which there was no agreement between the first
two coders and made the decision about the coding. If the third coder disagreed
with each of the first two coders (only possible for codings on slant), that article was
excluded (n = 45), which left 1,041 articles for the analyses.
Analyses
Individual exposure to articles about the smoke-free legislation was estimated by
combining the content analysis of newspaper coverage with information about
the newspaper reading behaviour of the ITC respondents. This method was also
used by Dunlop and Romer (2010), with the difference that the current study does
not use newspaper reading frequency in general but per newspaper. For example,
a respondent who read the newspaper De Telegraaf three times a week and the
newspaper Metro every day could be exposed to half of the 49 articles that were
positive about the smoking ban in De Telegraaf (49 / 2 = 24.5) and all 52 articles
that were positive about the smoking ban in Metro. Maximum exposure of this
respondent to positive articles on the smoking ban would then be estimated to be
24.5 + 52 = 76.5 articles. We do not assume that this respondent did read all 76.5
articles, but we assume that the relative difference in maximum exposure between
respondents indicated the relative differences in actual exposure.
Pearson correlation coefficients were reported between exposure to the
implementation campaign and newspaper coverage and support for smoke-free
bars and restaurants and SHS harm awareness. Linear regression analysis was
used to determine the effect of exposure to the implementation campaign and
newspaper coverage on support for smoke-free bars and restaurants and on harm
awareness. The dependent variables were post-ban support for smoke-free bars
and restaurants and post-ban SHS harm awareness. The predictor variables were
gender, age, educational level, recall of exposure to the implementation campaign,
estimation of exposure to newspaper coverage about the smoke-free legislation, and
the value of the dependent variable on the pre-ban survey. Estimation of exposure
to newspaper coverage consisted of four predictors in the regression analyses: (1)
| 114 |
estimated total number of articles a smoker was exposed to; (2) ratio of coverage
about health aspects and coverage about economic aspects, with higher ratios
meaning relatively more coverage about health aspects than economic aspects; (3)
estimated percentage of articles that were positive towards the smoking ban; and
(4) estimated percentage of articles that were mixed or neutral. The percentage of
articles that were negative towards the ban had a strong negative correlation with
the percentage of positive articles and was therefore not included in the analyses.
When, in additional analyses, the percentage of positive articles was replaced by the
percentage of negative articles, the regression coefficients of negative newspaper
coverage were nearly the same as those of positive newspaper coverage, with the
difference that the coefficients were of different signs. The regression analyses were
repeated with the interaction between educational level and recall of exposure to
the implementation campaign and the interaction between educational level and
estimation of exposure to newspaper coverage.
RESULTS
Characteristics of smoking newspaper readers
Smokers in the ITC Netherlands Survey who were newspaper readers had a mean
age of 39.6 years (SD = 15.5), most of the respondents were male (54%), and had
a moderate educational level (low 30%, moderate 46%, high 23%). Readers of the
six newspapers differed from each other on age and educational level, but not on
gender. For example, readers of De Telegraaf were older (mean age 42.4, SD = 15.3)
and had a lower educational level (low 32%, moderate 50%, high 18%).
Newspaper coverage of smoke-free legislation
As can be seen in Table 1, economic aspects of the legislation were mentioned
in 618 (59%) of the articles and health aspects in 226 (22%) of the articles. Both
economic and health aspects were mentioned in 688 of the articles. Articles that
were not about economic or health aspects (n = 353) mostly dealt with resistance
against the ban, with rules about smoking rooms in bars, and with smoking in coffee
shops. There were differences in coverage between newspapers. The total number
of articles per newspaper ranged from 94 to 359 articles.
Most articles were negative towards the smoking ban (57%), while less than
a third were positive (29%), and only a few articles were mixed (5%) or neutral (9%)
(Table 2). This was also true for articles in which the economic aspects of the legislation
were mentioned (62% was negative). However, articles in which health aspects were
mentioned were about equally positive about the smoking ban (42%) as negative (43%).
Differences were found in the newspaper coverage over time (Figure 1). There was
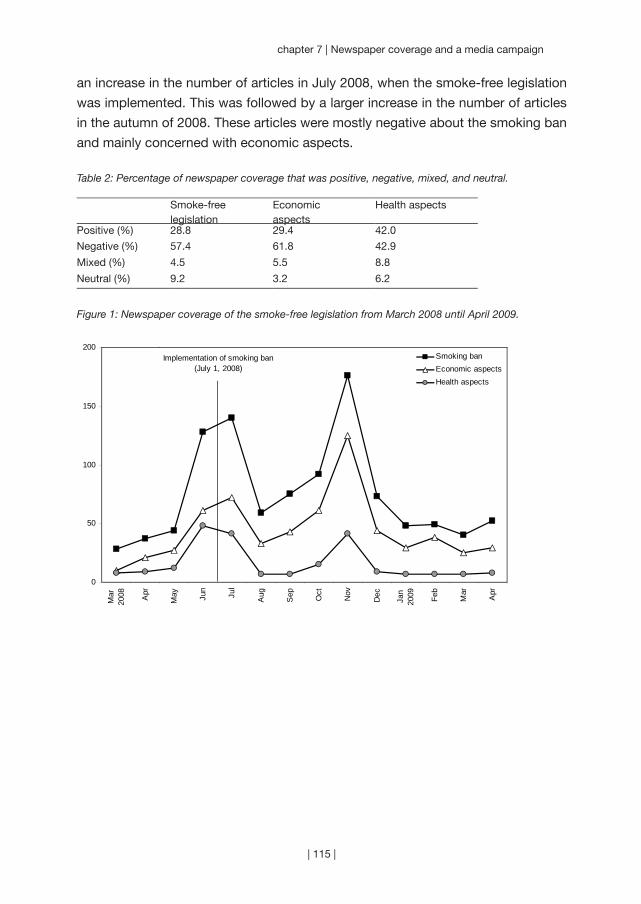
| 115 |
chapter 7 | Newspaper coverage and a media campaign
an increase in the number of articles in July 2008, when the smoke-free legislation
was implemented. This was followed by a larger increase in the number of articles
in the autumn of 2008. These articles were mostly negative about the smoking ban
and mainly concerned with economic aspects.
Table 2: Percentage of newspaper coverage that was positive, negative, mixed, and neutral.
Smoke-free legislation
Economic aspects
Health aspects
Positive (%) 28.8 29.4 42.0
Negative (%) 57.4 61.8 42.9
Mixed (%) 4.5 5.5 8.8
Neutral (%) 9.2 3.2 6.2
Figure 1: Newspaper coverage of the smoke-free legislation from March 2008 until April 2009.
0
50
100
150
200
Mar
2008 Apr
May Ju
n
Jul
Aug
Sep Oct
Nov
Dec
Jan
2009 Feb
Mar
Apr
Smoking banEconomic aspectsHealth aspects
Implementation of smoking ban(July 1, 2008)

| 116 |
Effects of exposure to media attention
The correlations between exposure to newspaper coverage and the implementation
campaign and support for smoke-free bars and restaurants and SHS harm
awareness were generally low (Table 3). There was a negative correlation between
exposure to newspaper coverage and support for smoke-free bars and restaurants.
There was a positive correlation between the ratio of coverage about health aspects
and economic aspects and support for smoke-free bars and restaurants. There was
a positive correlation between exposure to mixed or neutral newspaper coverage and
support for smoke-free bars and restaurants. In addition, there was a positive correlation
between exposure to the implementation campaign and SHS harm awareness.
Table 3: Associations between media attention (implementation campaign and newspaper coverage) and post-ban support for smoke-free bars and restaurants and post-ban SHS harm awareness (correlation coefficients).
Support smoke-free bars and restaurants
SHS harm awareness
Exposure to implementation campaign 0.00 0.12**
Exposure to newspaper coverage about the ban
-0.09* 0.01
Ratio of coverage about health aspects and economic aspects‡
0.11** 0.03
Positive newspaper coverage about the ban
-0.07 -0.02
Negative newspaper coverage about the ban
0.02 0.00
Mixed or neutral newspaper coverage about the ban
0.09* 0.04
‡ A higher ratio means relatively more coverage about health aspects than economic aspects* p < 0.05
** p < 0.01
The regression analyses showed that exposure to newspaper coverage of the
smoke-free legislation had a small negative effect on support for smoke-free bars
and restaurants (Table 4). Exposure to the implementation campaign had a small
positive effect on SHS harm awareness. There were no significant effects of theme
and slant of newspaper coverage.
The regression analyses from Table 4 were repeated with interactions with
educational level. The only significant interaction was between educational level
and positive newspaper coverage on support for smoke-free bars and restaurants
(Beta = 0.10, p = 0.012). Among higher educated smokers, exposure to positive
newspaper coverage had a more positive effect on support for smoke-free bars and
restaurants than among lower educated smokers.
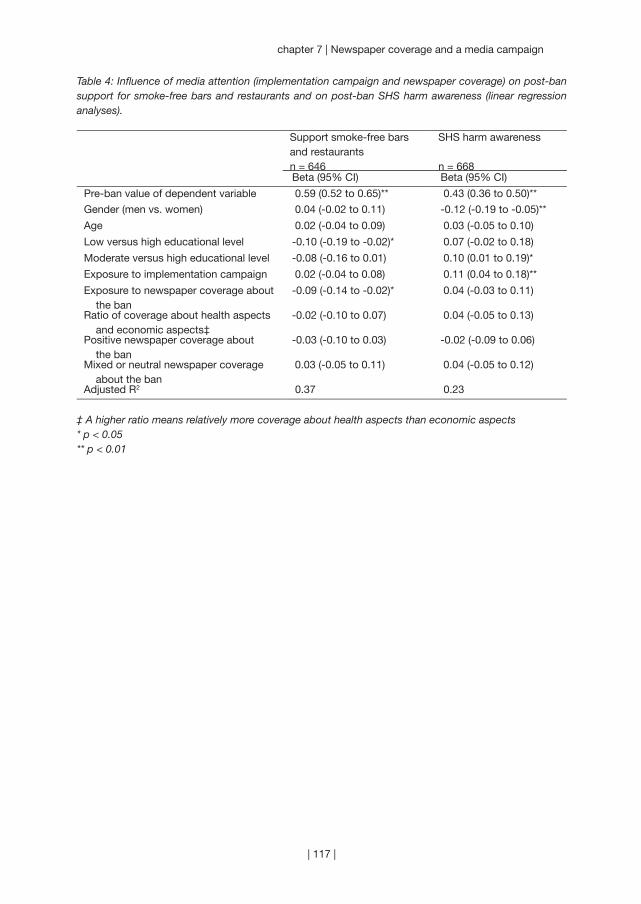
| 117 |
chapter 7 | Newspaper coverage and a media campaign
Table 4: Influence of media attention (implementation campaign and newspaper coverage) on post-ban support for smoke-free bars and restaurants and on post-ban SHS harm awareness (linear regression analyses).
Support smoke-free bars and restaurantsn = 646
SHS harm awareness
n = 668Beta (95% CI) Beta (95% CI)
Pre-ban value of dependent variable 0.59 (0.52 to 0.65)** 0.43 (0.36 to 0.50)**
Gender (men vs. women) 0.04 (-0.02 to 0.11) -0.12 (-0.19 to -0.05)**
Age 0.02 (-0.04 to 0.09) 0.03 (-0.05 to 0.10)
Low versus high educational level -0.10 (-0.19 to -0.02)* 0.07 (-0.02 to 0.18)
Moderate versus high educational level -0.08 (-0.16 to 0.01) 0.10 (0.01 to 0.19)*
Exposure to implementation campaign 0.02 (-0.04 to 0.08) 0.11 (0.04 to 0.18)**
Exposure to newspaper coverage about the ban
-0.09 (-0.14 to -0.02)* 0.04 (-0.03 to 0.11)
Ratio of coverage about health aspects and economic aspects‡
-0.02 (-0.10 to 0.07) 0.04 (-0.05 to 0.13)
Positive newspaper coverage about the ban
-0.03 (-0.10 to 0.03) -0.02 (-0.09 to 0.06)
Mixed or neutral newspaper coverage about the ban
0.03 (-0.05 to 0.11) 0.04 (-0.05 to 0.12)
Adjusted R2 0.37 0.23
‡ A higher ratio means relatively more coverage about health aspects than economic aspects* p < 0.05** p < 0.01
| 118 |
DISCUSSION
Our first hypothesis was that exposure to positive newspaper coverage has a more
positive effect on support for smoke-free bars and restaurants and on SHS harm
awareness than exposure to negative newspaper coverage. However, no effects
were found of positive or negative slant of newspaper coverage. We did find that
smokers who were exposed to a larger amount of newspaper coverage about the
smoke-free legislation were somewhat less likely to support smoke-free bars and
restaurants. This might be explained by the fact that newspaper coverage was
twice as often negative than positive about the ban.
Our second hypothesis was that exposure to newspaper coverage of
health aspects of the smoke-free legislation has a more positive effect on support
and harm awareness than coverage of economic aspects. We did indeed find a
small positive correlation with support for smoke-free bars and restaurants, but
no significant effect in the multivariate analysis. There was, however, very little
newspaper coverage about the health aspects of the smoke-free legislation.
Newspaper coverage contained almost three times more references to economic
aspects than health aspects of the legislation.
Because the implementation campaign of the smoke-free legislation only
communicated the date of implementation, our third hypothesis was that the
campaign has no effect on support and harm awareness. We found no effects
on support for smoke-free bars and restaurants, but we did find a small positive
effect on SHS harm awareness. A possible explanation for this unexpected finding
is that the campaign stimulated thinking about the reason for the smoking ban
and smokers concluded that it was implemented to protect people from the harm
of second-hand smoke. However, the fact that support for smoke-free bars and
restaurants was not positively influenced by the campaign is a missed opportunity.
A clear campaign in which the government explained the health arguments for
the smoke-free legislation could have positively influenced smokers’ support for
the smoke-free legislation. This may also have prevented many of the problems
involving compliance with the ban.
Our last hypothesis was that there are more positive effects from media
attention among smokers with a higher than lower educational level. We indeed
found that newspaper coverage that was positive about the ban had a more positive
effect on support for smoke-free bars and restaurants among higher educated
smokers than among lower educated smokers. Because more support for smoke-
free legislation can increase intentions to quit smoking (Brown et al., 2009) this
could contribute to a widening of health inequalities.
| 119 |
chapter 7 | Newspaper coverage and a media campaign
Studies about newspaper coverage of the smoke-free legislation in California
(Magzamen et al., 2001) and Ireland (Fahy et al., 2009) show that there was a lot
of newspaper coverage about the legislation around the implementation date. Our
study shows that this is also true for the Netherlands. However, while newspaper
coverage of the smoke-free legislation decreased immediately after implementation
in California and Ireland, this did not happen in the Netherlands. A few months after
the implementation of the Dutch smoke-free legislation, there was a large increase
in articles about the legislation. This newspaper coverage was mostly about the
resistance of small bars to the legislation, that was organised by a newly formed
organisation of small bar owners. Investigative journalism revealed that there were
ties between this organisation and the tobacco industry (Baltesen & Rosenberg,
2009). This suggests that the tobacco industry influenced public opinion about the
Dutch smoke-free legislation through media attention.
A limitation of this study is that we estimated the exposure to articles on
smoking by combining individual data on the general amount of newspaper reading
per newspaper with a content analysis of articles that appeared in each newspaper.
We cannot be sure that all readers of a newspaper with many articles on smoking
also read these particular articles. Therefore, although we used a longitudinal design,
causal relationships could not be established with absolute certainty. Causal effects
of exposure to individual articles can be more reliably established in an experimental
design, but this severely limits the time period that can be studied (most often, one
experimental session) and reduces the ecological validity of the study. A second
limitation is that we only looked at coverage of smoking in newspapers and not in
other media. This may not be a problem, since the content of newspapers is highly
associated with the content of other media (National Cancer Institute, 2008).
A year after the implementation of the smoke-free hospitality industry
legislation in the Netherlands, Greece implemented similar legislation. As in the
Netherlands, compliance with the ban was less than optimal. It is suggested that
the unsupportive and pessimistic newspaper coverage in Greece had an important
role in this (Andreou, Gourgoulianis, & Galantomos, 2010). In contrast to Greece
and the Netherlands, the smoke-free legislation in Ireland is known for its immediate
success (Smoke Free Partnership, 2006). A qualitative study suggests that this
success is the result of the efforts of tobacco control advocates who consistently
repeated the health arguments for the legislation in the media and who prevented
anti-ban advocates from shifting the debate to the economic arguments against the
legislation (Fahy et al., 2009). This suggests that media attention about the health
aspects of smoke-free legislation can have an important influence on the success
of the legislation.

“It is our opinion that the single most important
issue facing our industry is the erosion of the
social acceptability of smoking . . . Today it is
probably true to state that even a majority of
smokers feel that theirs is an undesirable habit.”
(Andrew Whist, Philip Morris International)
| 120 |
Chapter 8
~~~
Policies that reduce the social acceptability of smoking
Submitted as:
Rennen, E., Nagelhout, G. E., Van den Putte, B., Janssen, E., Mons,
U., Guignard, R., Beck, F., De Vries, H., Thrasher, J. F., & Willemsen,
M. C. The effects of tobacco control policy awareness on smoking
cessation by reducing the social acceptability of smoking. Findings
from the International Tobacco Control (ITC) Europe Surveys.
| 121 |
| 122 |
This study examined whether awareness of tobacco control policies
had an effect on social unacceptability of smoking and whether social
unacceptability had an effect on smoking cessation. Also, the possible
moderating effects of education and country were investigated.
Representative samples (n = 3,865) of adult smokers in France, the
Netherlands, and Germany were used from two survey waves of the
longitudinal International Tobacco Control (ITC) Europe Surveys. Regression
analyses were used to determine effects of tobacco policy awareness (i.e.
warning labels, anti-tobacco information, smoking restrictions at work) on
aspects of social unacceptability of smoking (i.e. feeling uncomfortable,
subjective norm, societal disapproval) and effects of aspects of social
unacceptability on quit attempt and quit success. Awareness of anti-
tobacco information and awareness of smoking restrictions at work were
related to feeling uncomfortable and to perceived societal disapproval of
smoking, while awareness of warning labels was related to the perceived
subjective norm about smoking. The subjective norm predicted whether
smokers attempted to quit, while feeling uncomfortable and societal
disapproval did not. Interactions with education suggested that societal
disapproval can have a positive impact on cessation among high
educated smokers and may have a negative impact among low educated
smokers. We found associations of tobacco control policy awareness with
aspects of the social unacceptability of smoking, although these were
small. A long-term strategy with ongoing comprehensive tobacco control
programs accompanied by mass media campaigns might be needed
to substantially change the social acceptability of smoking and reduce
tobacco consumption.
AB
STR
AC
T
| 123 |
chapter 8 | Policies that reduce the social acceptability of smoking
INTRODUCTION
The social acceptability of smoking is declining. Indicators of a decreased social
acceptability of smoking are a negative image of smokers, smoke-free homes,
and negative perceptions of the tobacco industry (Chapman & Freeman, 2008).
Denormalisation strategies can be used to reduce the social acceptability of smoking.
These strategies are described as “all the programs and actions undertaken to
reinforce the fact that tobacco use is not a mainstream or normal activity in our
society” (Lavack, 1999). Denormalisation strategies within tobacco control programs
have been used in California (California Department of Health Services, 1998) and
Canada (Steering Committee of the National Strategy to Reduce Tobacco Use in
Canada, 1999) to reduce the social acceptability of smoking as a mechanism to
reduce tobacco consumption.
Different tobacco control policies can be used as part of a larger
denormalisation strategy. Smoke-free legislation limits the places where smoking is
allowed and thus may decrease the social acceptability of smoking (Hamilton, Biener,
& Brennan, 2008; Hammond, Fong, Zanna, Thrasher, & Borland, 2006; Thrasher,
Boado, Sebrié, & Bianco, 2009; Thrasher, Pérez-Hernández, Swayampakala,
Arillo-Santillán, & Bottai, 2010). Other policies that may have an effect on the
social acceptability of smoking are warning labels on tobacco products and media
campaigns against smoking (Hammond et al., 2006; Lavack, 1999; Thrasher et al.,
2011). Most studies about the effects of policies on social acceptability of smoking
focused on one specific policy measure, mainly smoke-free legislation. However,
multiple tobacco control policies are often in place or even implemented at the
same time. For that reason, this study compares awareness of three tobacco
control policies to disentangle which policy measures are most effective in reducing
the social acceptability of smoking. One previous study examined this, showing
that noticing anti-tobacco information and noticing smoking restrictions were
associated with negative perceptions of the social acceptability of smoking, although
the associations were weak (Hammond et al., 2006). It is important to investigate
whether the effects of these policies on the social acceptability of smoking can
be generalised to other countries as well, because this can help policy makers in
deciding which policies they should implement in their country as part of a larger
denormalisation strategy to reduce tobacco consumption.
In many countries and cultural contexts, the decreased social acceptability
of smoking has been shown to reduce tobacco use, through reducing cigarette
consumption (Alamar & Glantz, 2006), increasing quit intentions (Brown et al., 2009;
Hammond et al., 2006; Hosking et al., 2009; Van den Putte, Yzer, & Brunsting, 2005;
Zhang, Cowling, & Tang, 2010), and by increasing smoking cessation (Hammond
| 124 |
et al., 2006; Hosking et al., 2009; Thrasher, Pérez-Hernández et al., 2010; Zhang
et al., 2010). However, different aspects of social acceptability of smoking have
been examined in different studies making comparisons difficult. Whereas several
studies examined whether smokers feel uncomfortable about smoking (Brown et
al., 2009; Hammond et al., 2006; Thrasher et al., 2009), other studies examined the
perceived subjective norm about the disapproval of smoking among people who
are important to them (Brown et al., 2009; Hammond et al., 2006; Thrasher et al.,
2009; Thrasher, Pérez-Hernández et al., 2010), or the perceived societal disapproval
of smoking (Brown et al., 2009; Hammond et al., 2006; Nagelhout, Mons et al.,
2011; Thrasher et al., 2009; Thrasher, Pérez-Hernández et al., 2010). In the current
study, we will therefore examine all these aspects of social acceptability of smoking
separately and establish their relations with awareness of tobacco control policies
and smoking cessation.
In our study, surveys of the International Tobacco Control Policy Evaluation
Project (ITC Project) from France, the Netherlands, and Germany were used, while
focusing on awareness of three tobacco control policies: warning labels, smoking
restrictions at work, and anti-tobacco information. All three countries required text
warning labels on tobacco products at the time of the surveys according to the EU
Tobacco Products Directive (2001/37/EC). However, the labels were found to have a
greater self-reported impact on smoking behaviour in France than in the Netherlands
and Germany (Hitchman et al., 2011). Since 2004, smoke-free workplaces have
been in place in Germany and the Netherlands. France implemented smoke-free
legislation for workplaces in 2007. In-between the two ITC survey waves that were
used in this study, all three countries extended their smoke-free legislation to include
the hospitality industry (Nagelhout, Mons et al., 2011). Anti-tobacco information
was more extensive in France and the Netherlands than in Germany, evidenced by
higher public information campaign spending in these countries (Joossens & Raw,
2007).
The effects of tobacco control policy awareness on social unacceptability
of smoking and smoking cessation are examined in this study by using the
Conceptual Model of the ITC Project (Fong, Cummings, Borland et al., 2006). The
model hypothesises a causal chain from policy (e.g. smoking restrictions at work)
to policy-relevant outcomes (e.g. quit attempt), through policy-specific variables
(e.g. awareness of smoking restrictions at work) and psychosocial mediators (e.g.
social acceptability of smoking). According to this model, the impact of tobacco
control policies on individuals can be understood only by examining experiences
from the individual with these policies, which are conceptualised in this study as
smokers’ awareness of tobacco control policies. In a previous study, we applied the
| 125 |
chapter 8 | Policies that reduce the social acceptability of smoking
ITC Conceptual Model to smoke-free legislation and found a mediated effect from
individual awareness of smoke-free legislation on smoking cessation via policy-
specific variables and psychosocial mediators (Nagelhout, De Vries, Fong et al.,
2012).
Education is included as a possible moderating factor in the ITC
Conceptual Model (Fong, Cummings, Borland et al., 2006). Smoking is more
prevalent among people with a lower education, and they are less likely to quit
(Schaap et al., 2008), both of which may be explained by differences in social
norms across educational groups. For example, one study found that smokers
with higher education experienced more social unacceptability of smoking than
smokers with lower education (Hammond et al., 2006), and another study showed
that social unacceptability of smoking has more impact on smoking patterns of
higher educated smokers compared to lower educated smokers (Stuber, Galea, &
Link, 2008). Studying educational differences is important because denormalisation
strategies could increase differences in smoking behaviour between educational
groups which could result in a widening of health inequalities.
This study aimed at examining relationships between tobacco control
policies, the social unacceptability of smoking, and smoking cessation. The following
research questions were formulated: 1) which policy awareness factors (warning
labels, anti-tobacco information and smoking restrictions at work) are associated
with aspects of social unacceptability of smoking? and 2) which aspects of social
unacceptability of smoking predict smoking cessation? In addition, the possible
moderating effects of education and country were explored for both research
questions.
METHODS
Sample
The ITC Project is a prospective cohort study among adult smokers that aims at
evaluating the effect of national-level tobacco control policies on psychosocial
factors and smoking behaviour (Fong, Cummings, Borland et al., 2006). More
information about ITC survey methods can be found elsewhere (Thompson et al.,
2006). In this study, two survey waves of ITC France, the Netherlands, and Germany
were used. Participants in the survey were smokers aged 18 years and older, who
have smoked more than 100 cigarettes in their life, and smoked at least monthly at
baseline.
A random digit dialing (RDD) telephone design was used to yield a
representative sample of smokers within each country. Respondents were interviewed
with computer assisted telephone interviewing (CATI). In the Netherlands, a web-
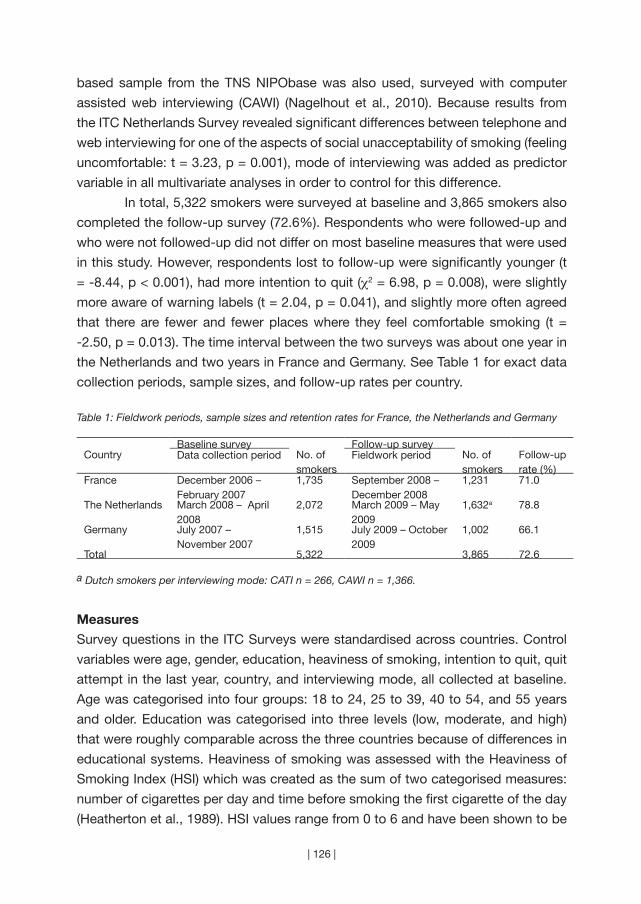
| 126 |
based sample from the TNS NIPObase was also used, surveyed with computer
assisted web interviewing (CAWI) (Nagelhout et al., 2010). Because results from
the ITC Netherlands Survey revealed significant differences between telephone and
web interviewing for one of the aspects of social unacceptability of smoking (feeling
uncomfortable: t = 3.23, p = 0.001), mode of interviewing was added as predictor
variable in all multivariate analyses in order to control for this difference.
In total, 5,322 smokers were surveyed at baseline and 3,865 smokers also
completed the follow-up survey (72.6%). Respondents who were followed-up and
who were not followed-up did not differ on most baseline measures that were used
in this study. However, respondents lost to follow-up were significantly younger (t
= -8.44, p < 0.001), had more intention to quit (χ2 = 6.98, p = 0.008), were slightly
more aware of warning labels (t = 2.04, p = 0.041), and slightly more often agreed
that there are fewer and fewer places where they feel comfortable smoking (t =
-2.50, p = 0.013). The time interval between the two surveys was about one year in
the Netherlands and two years in France and Germany. See Table 1 for exact data
collection periods, sample sizes, and follow-up rates per country.
Table 1: Fieldwork periods, sample sizes and retention rates for France, the Netherlands and Germany
Baseline survey Follow-up surveyCountry Data collection period No. of
smokersFieldwork period No. of
smokersFollow-up rate (%)
France December 2006 – February 2007
1,735 September 2008 – December 2008
1,231 71.0
The Netherlands March 2008 – April 2008
2,072 March 2009 – May 2009
1,632a 78.8
Germany July 2007 – November 2007
1,515 July 2009 – October 2009
1,002 66.1
Total 5,322 3,865 72.6
a Dutch smokers per interviewing mode: CATI n = 266, CAWI n = 1,366.
Measures
Survey questions in the ITC Surveys were standardised across countries. Control
variables were age, gender, education, heaviness of smoking, intention to quit, quit
attempt in the last year, country, and interviewing mode, all collected at baseline.
Age was categorised into four groups: 18 to 24, 25 to 39, 40 to 54, and 55 years
and older. Education was categorised into three levels (low, moderate, and high)
that were roughly comparable across the three countries because of differences in
educational systems. Heaviness of smoking was assessed with the Heaviness of
Smoking Index (HSI) which was created as the sum of two categorised measures:
number of cigarettes per day and time before smoking the first cigarette of the day
(Heatherton et al., 1989). HSI values range from 0 to 6 and have been shown to be
| 127 |
chapter 8 | Policies that reduce the social acceptability of smoking
positively associated with nicotine dependence. Intention to quit was categorised
into having plans to quit within six months (1) and having no plans to quit within
six months (0). People who attempted to quit in the last year (1) were distinguished
from people who did not attempt to quit in the last year (0).
The levels of awareness of three different policies were included (Hammond
et al., 2006). Awareness of warning labels was measured with the question: “In the
last month, how often have you noticed the warning labels on cigarette packages or
on roll-your-own packs?” Awareness of anti-tobacco information was measured by
asking: “In the last 6 months, how often have you noticed advertising or information
that talks about the dangers of smoking, or encourages quitting?” Response options
for these two questions were on a 5-point scale from never (1) to very often (5).
To measure smoking restrictions at work, respondents were asked: “Which of the
following best describes the smoking policy where you work?” with the categories
no restrictions (0), some restrictions (1), and completely restricted (2). Respondents
without a job or with an outdoor job were placed in the category ‘no restrictions’
(Thrasher et al., 2009).
Each of the three aspects of social unacceptability of smoking was measured
with one statement. Feeling uncomfortable about smoking was measured with
the statement “There are fewer and fewer places where I feel comfortable about
smoking” (Brown et al., 2009; Hammond et al., 2006; Thrasher et al., 2009). Perceived
subjective norm about smoking from people who are important was measured with
the statement “People who are important to me believe that I should not smoke”
(Hammond et al., 2006; Thrasher et al., 2009; Thrasher et al., 2011; Thrasher, Pérez-
Hernández et al., 2010; Van den Putte, Yzer, & Brunsting, 2005). Perceived societal
disapproval was measured with the statement “Society disapproves of smoking”
(Brown et al., 2009; Hammond et al., 2006; Nagelhout, Mons et al., 2011; Thrasher
et al., 2009). Answers on the three statements were given on a 5-point Likert scale,
ranging from strongly disagree (1) to strongly agree (5).
Quit attempt (0: no quit attempt; 1: quit attempt) was measured by asking
respondents at the second survey whether they had made any attempts to quit
smoking since the first survey. Quit success (0: no quit success 1: quit success)
was assessed by asking respondents who had attempted to quit whether they were
back to smoking or still stopped. Respondents who were still stopped, or who were
back to smoking but reporting smoking less than once a month, were defined as
successful quitters. Respondents who were back to smoking more than once a
month, were defined as smokers (Hyland, Borland et al., 2006).
| 128 |
Data analysis
All analyses were conducted with SPSS version 19.0 and adjusted for sampling
weights by age and gender, to make the results representative of the adult
smoking population in each country. The analyses were restricted to respondents
who completed both the baseline and the follow-up survey. Differences between
countries and educational levels at baseline were tested with chi-square tests.
Bivariate and multivariate linear regression analyses were performed
to determine correlates of the aspects of social unacceptability of smoking at
baseline. Separate models were run for each aspect of social unacceptability
(feeling uncomfortable, subjective norm, societal disapproval), with the three policy
awareness variables included as independent variables. Multivariate analyses were
controlled for gender, age, education, interviewing mode, heaviness of smoking,
quit attempt in the last year, intention to quit, and country. To test the possible
moderating effects of country and education, policy awareness x country interaction
variables and policy awareness x education interaction variables were included
in separate regression analyses. High education was used as reference category
for interaction analyses with education. France was used as reference country for
interaction analyses with country.
To examine whether aspects of social unacceptability of smoking at baseline
predicted attempting to quit and having quit successfully at follow-up, bivariate and
multivariate logistic regression analyses were used. Quit attempt and quit success
at wave 2 were used as dependent variables in separate models, with the three
aspects of social unacceptability of smoking at wave 1 as independent variables.
Multivariate analyses were controlled for gender, age, education, interviewing
mode, heaviness of smoking, quit attempt in the last year, intention to quit, and
country. Between-country differences were assessed by including unacceptability
aspect x country interaction variables. To assess whether educational level acts as
a moderator, unacceptability aspect x education interaction variables were entered
in separate analyses.
RESULTS
Sample characteristics by country
Demographics, smoking behaviour, policy awareness, and aspects of social
unacceptability by country are shown in Table 2. Significant differences were found
between the countries on all variables except for gender.
Large significant differences between countries were found for the
awareness of warning labels and the awareness of anti-tobacco information:
awareness was higher in France than in Germany and the Netherlands. Country
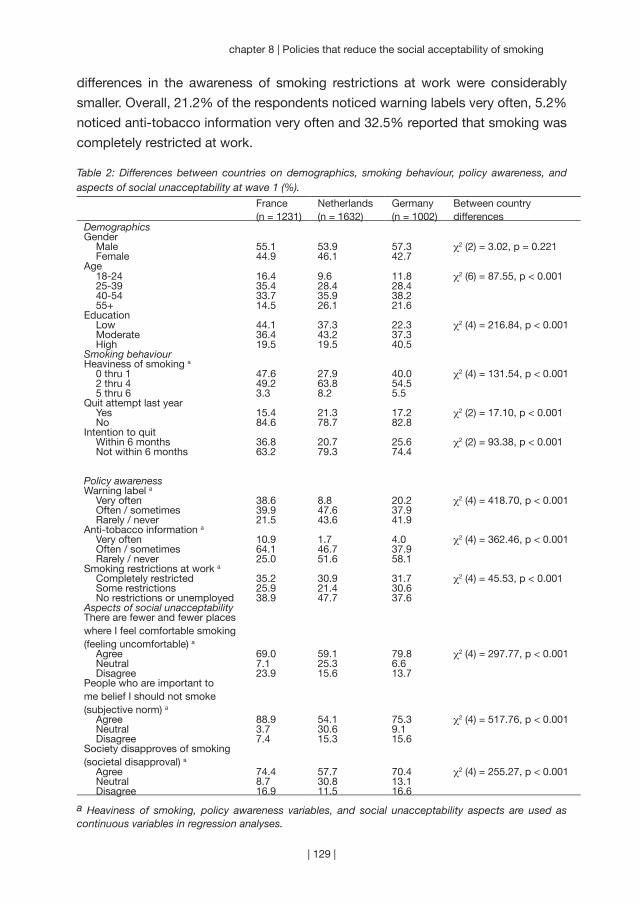
| 129 |
chapter 8 | Policies that reduce the social acceptability of smoking
differences in the awareness of smoking restrictions at work were considerably
smaller. Overall, 21.2% of the respondents noticed warning labels very often, 5.2%
noticed anti-tobacco information very often and 32.5% reported that smoking was
completely restricted at work. Table 2: Differences between countries on demographics, smoking behaviour, policy awareness, and aspects of social unacceptability at wave 1 (%).
France (n = 1231)
Netherlands (n = 1632)
Germany(n = 1002)
Between country differences
DemographicsGender
Male 55.1 53.9 57.3 χ2 (2) = 3.02, p = 0.221Female 44.9 46.1 42.7
Age18-24 16.4 9.6 11.8 χ2 (6) = 87.55, p < 0.00125-39 35.4 28.4 28.440-54 33.7 35.9 38.255+ 14.5 26.1 21.6
Education Low 44.1 37.3 22.3 χ2 (4) = 216.84, p < 0.001Moderate 36.4 43.2 37.3High 19.5 19.5 40.5
Smoking behaviourHeaviness of smoking a
0 thru 1 47.6 27.9 40.0 χ2 (4) = 131.54, p < 0.0012 thru 4 49.2 63.8 54.55 thru 6 3.3 8.2 5.5
Quit attempt last yearYes 15.4 21.3 17.2 χ2 (2) = 17.10, p < 0.001No 84.6 78.7 82.8
Intention to quitWithin 6 months 36.8 20.7 25.6 χ2 (2) = 93.38, p < 0.001Not within 6 months 63.2 79.3 74.4
Policy awarenessWarning label a
Very often 38.6 8.8 20.2 χ2 (4) = 418.70, p < 0.001Often / sometimes 39.9 47.6 37.9Rarely / never 21.5 43.6 41.9
Anti-tobacco information a
Very often 10.9 1.7 4.0 χ2 (4) = 362.46, p < 0.001Often / sometimes 64.1 46.7 37.9Rarely / never 25.0 51.6 58.1
Smoking restrictions at work a
Completely restricted 35.2 30.9 31.7 χ2 (4) = 45.53, p < 0.001Some restrictions 25.9 21.4 30.6No restrictions or unemployed 38.9 47.7 37.6
Aspects of social unacceptabilityThere are fewer and fewer places where I feel comfortable smoking (feeling uncomfortable) a
Agree 69.0 59.1 79.8 χ2 (4) = 297.77, p < 0.001Neutral 7.1 25.3 6.6Disagree 23.9 15.6 13.7
People who are important to me belief I should not smoke (subjective norm) a
Agree 88.9 54.1 75.3 χ2 (4) = 517.76, p < 0.001Neutral 3.7 30.6 9.1Disagree 7.4 15.3 15.6
Society disapproves of smoking (societal disapproval) a
Agree 74.4 57.7 70.4 χ2 (4) = 255.27, p < 0.001Neutral 8.7 30.8 13.1Disagree 16.9 11.5 16.6
a Heaviness of smoking, policy awareness variables, and social unacceptability aspects are used as continuous variables in regression analyses.

| 130 |
In France, smokers had a stronger perception that people who are important to
them believe they should not smoke and that society disapproves of smoking
compared with Germany and the Netherlands. In Germany, smokers stronger
reported that there are fewer and fewer places where they felt comfortable smoking.
The perception of social unacceptability of smoking was lowest among Dutch
smokers. Dutch smokers scored more often neutral on the three aspects of social
unacceptability compared with smokers from the other countries. Overall, 67.6%
of the respondents agreed that there are fewer and fewer places where they feel
comfortable smoking, 70.7% agreed that people important to them think they
should not smoke and 66.3% agreed that society disapproves of smoking.
Aspects of social unacceptability by educational level
Significant differences between educational levels were found for whether smokers
feel uncomfortable about smoking (χ2 = 13.40, p = 0.009). Higher educated smokers
(72.1%) reported more often than moderately (67.2%) and lower educated smokers
(65.3%) that there are fewer and fewer places where they feel comfortable smoking.
No significant differences were found for subjective norm and societal disapproval
between smokers from different educational levels.
Correlates of social unacceptability
To examine which policy awareness factors were associated with the social
unacceptability of smoking, we first performed bivariate linear regression analyses
(not shown in table). Smokers who were more aware of warning labels significantly
more often thought that others believe they should not smoke (β = 0.15, p < 0.001).
Higher awareness of anti-tobacco information was significantly associated with all
aspects of the social unacceptability of smoking (feeling uncomfortable β = 0.08, p <
0.001, subjective norm β = 0.14, p < 0.001, societal disapproval β = 0.09, p < 0.001).
Higher awareness of smoking restrictions at work was significantly associated with
thinking that others believe they should not smoke (β = 0.04, p = 0.017) and thinking
that society disapproves of smoking (β = 0.08, p < 0.001).
We also performed multivariate linear regression analyses (Table 3).
After adjustment for demographic and smoking-related variables, smokers who
were more aware of warning labels more often thought that others believe they
should not smoke (β = 0.04, p = 0.022). Smokers who were more aware of anti-
tobacco information believed more often that there are fewer and fewer places
where they feel comfortable smoking (β = 0.08, p < 0.001) and felt stronger that
society disapproves of smoking (β = 0.05, p = 0.005). More awareness of smoking
restrictions at work was also associated with feeling uncomfortable about smoking
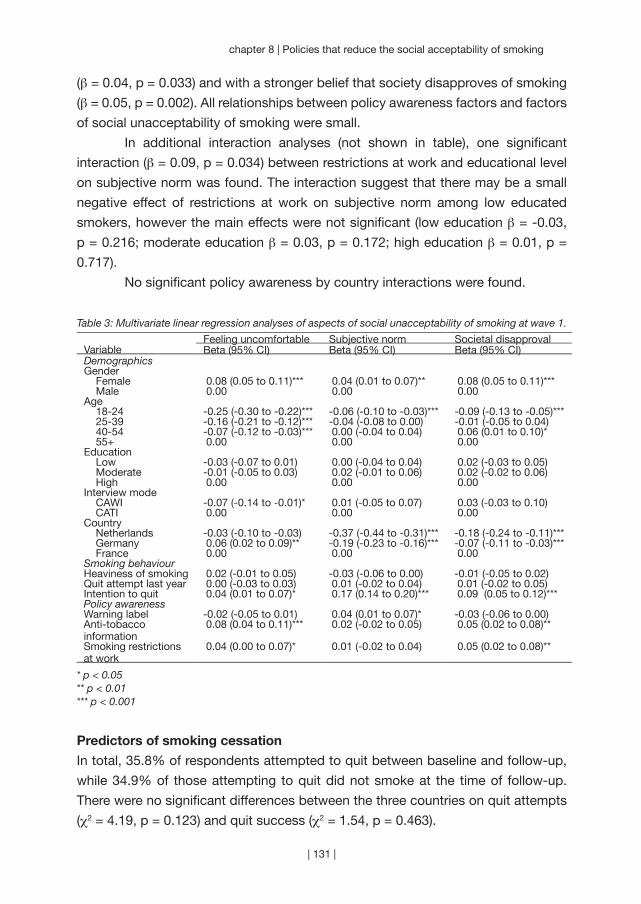
| 131 |
chapter 8 | Policies that reduce the social acceptability of smoking
(β = 0.04, p = 0.033) and with a stronger belief that society disapproves of smoking
(β = 0.05, p = 0.002). All relationships between policy awareness factors and factors
of social unacceptability of smoking were small.
In additional interaction analyses (not shown in table), one significant
interaction (β = 0.09, p = 0.034) between restrictions at work and educational level
on subjective norm was found. The interaction suggest that there may be a small
negative effect of restrictions at work on subjective norm among low educated
smokers, however the main effects were not significant (low education β = -0.03,
p = 0.216; moderate education β = 0.03, p = 0.172; high education β = 0.01, p =
0.717).
No significant policy awareness by country interactions were found.
Table 3: Multivariate linear regression analyses of aspects of social unacceptability of smoking at wave 1.
Feeling uncomfortable Subjective norm Societal disapprovalVariable Beta (95% CI) Beta (95% CI) Beta (95% CI)DemographicsGender
Female 0.08 (0.05 to 0.11)*** 0.04 (0.01 to 0.07)** 0.08 (0.05 to 0.11)***Male 0.00 0.00 0.00
Age18-24 -0.25 (-0.30 to -0.22)*** -0.06 (-0.10 to -0.03)*** -0.09 (-0.13 to -0.05)***25-39 -0.16 (-0.21 to -0.12)*** -0.04 (-0.08 to 0.00) -0.01 (-0.05 to 0.04)40-54 -0.07 (-0.12 to -0.03)*** 0.00 (-0.04 to 0.04) 0.06 (0.01 to 0.10)*55+ 0.00 0.00 0.00
EducationLow -0.03 (-0.07 to 0.01) 0.00 (-0.04 to 0.04) 0.02 (-0.03 to 0.05)Moderate -0.01 (-0.05 to 0.03) 0.02 (-0.01 to 0.06) 0.02 (-0.02 to 0.06)High 0.00 0.00 0.00
Interview modeCAWI -0.07 (-0.14 to -0.01)* 0.01 (-0.05 to 0.07) 0.03 (-0.03 to 0.10)CATI 0.00 0.00 0.00
CountryNetherlands -0.03 (-0.10 to -0.03) -0.37 (-0.44 to -0.31)*** -0.18 (-0.24 to -0.11)***Germany 0.06 (0.02 to 0.09)** -0.19 (-0.23 to -0.16)*** -0.07 (-0.11 to -0.03)***France 0.00 0.00 0.00
Smoking behaviourHeaviness of smoking 0.02 (-0.01 to 0.05) -0.03 (-0.06 to 0.00) -0.01 (-0.05 to 0.02)Quit attempt last year 0.00 (-0.03 to 0.03) 0.01 (-0.02 to 0.04) 0.01 (-0.02 to 0.05)Intention to quit 0.04 (0.01 to 0.07)* 0.17 (0.14 to 0.20)*** 0.09 (0.05 to 0.12)***Policy awarenessWarning label -0.02 (-0.05 to 0.01) 0.04 (0.01 to 0.07)* -0.03 (-0.06 to 0.00)Anti-tobacco information
0.08 (0.04 to 0.11)*** 0.02 (-0.02 to 0.05) 0.05 (0.02 to 0.08)**
Smoking restrictions at work
0.04 (0.00 to 0.07)* 0.01 (-0.02 to 0.04) 0.05 (0.02 to 0.08)**
* p < 0.05** p < 0.01*** p < 0.001
Predictors of smoking cessation
In total, 35.8% of respondents attempted to quit between baseline and follow-up,
while 34.9% of those attempting to quit did not smoke at the time of follow-up.
There were no significant differences between the three countries on quit attempts
(χ2 = 4.19, p = 0.123) and quit success (χ2 = 1.54, p = 0.463).

| 132 |
To examine which aspects of social unacceptability of smoking predicted quit
attempts and quit success, we first performed bivariate logistic regression analyses
(not shown in table). Smokers who perceived a stronger subjective norm about
smoking were more likely to attempt to quit smoking at follow-up (Odds Ratio (OR) =
1.27, p < 0.001). Also, smokers who perceived that society disapproves of smoking
were more likely to attempt to quit (OR = 1.09, p = 0.007). Feeling uncomfortable
was not predictive of attempting to quit smoking. None of the social unacceptability
aspects predicted whether a quit attempt was successful.
We also performed multivariate logistic regression analyses (Table 4).
Smokers who perceived a stronger subjective norm about smoking were more
likely to attempt to quit smoking at follow-up (OR = 1.16, p < 0.001). Feeling
uncomfortable and perceived societal disapproval did not predict whether a smoker
attempted to quit. In the multivariate analyses we also found that none of the social
unacceptability aspects predicted whether a quit attempt was successful.
Two significant interactions between aspects of social unacceptability
and education were found on attempting to quit smoking in additional interaction
analyses (not shown in table). There was a significant interaction between feeling
uncomfortable and education (OR = 0.91, p = 0.021). It seemed that high educated
smokers less often attempted to quit smoking when they felt that there are fewer
and fewer places where it is comfortable to smoke, but the main effects were not
significant (low education OR = 1.03, p = 0.649; moderate education OR = 0.95, p =
0.347; high education OR = 0.87, p = 0.062). There was also a significant interaction
between societal disapproval and education (OR = 1.13, p = 0.009). This interaction
suggested that high educated smokers who perceived societal disapproval of
smoking had higher odds of attempting to quit smoking. With this interaction, the
main effects stratified by educational level were also not significant (low education
OR = 0.94, p = 0.326; moderate education OR = 1.01, p = 0.830; high education OR
= 1.16, p = 0.060).
Interaction analyses for quit success showed that the interaction between
subjective norm and education was significant (OR = 0.85, p = 0.049). A higher
subjective norm seemed to predict more quit success among low educated
smokers, but the main effects were not significant (low education OR = 1.19, p
= 0.163; moderate education OR = 1.03, p = 0.798; high education OR = 0.89,
p = 0.332). Also, the interaction between societal disapproval and education was
significant (OR = 0.72, p = 0.029). This interaction suggested that more societal
disapproval may predict more quit success among high educated smokers and less
quit success among low educated smokers. The main effects for each education
group were, however, not significant (low education OR = 0.87, p = 0.163; moderate
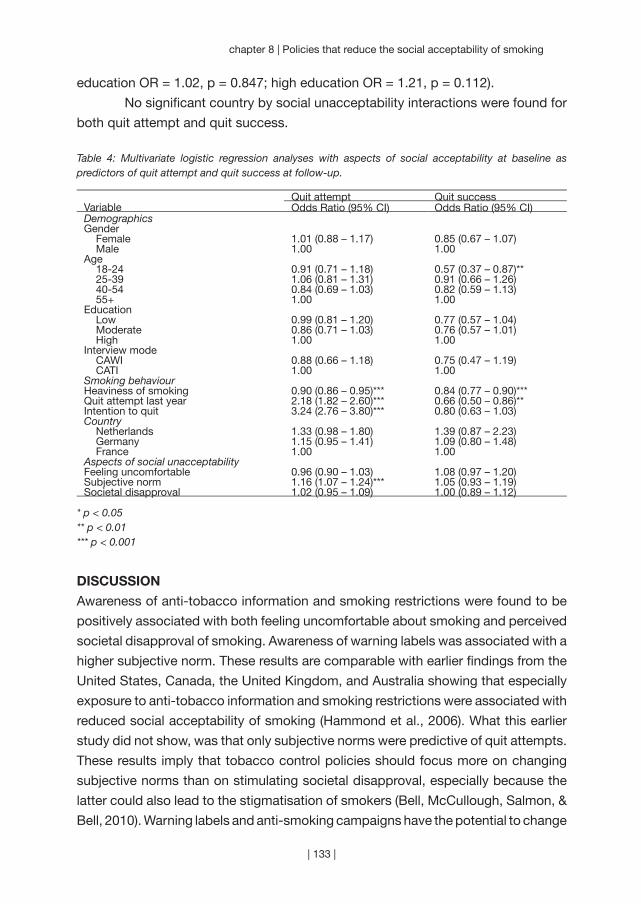
| 133 |
chapter 8 | Policies that reduce the social acceptability of smoking
education OR = 1.02, p = 0.847; high education OR = 1.21, p = 0.112).
No significant country by social unacceptability interactions were found for
both quit attempt and quit success.
Table 4: Multivariate logistic regression analyses with aspects of social acceptability at baseline as predictors of quit attempt and quit success at follow-up.
Quit attempt Quit successVariable Odds Ratio (95% CI) Odds Ratio (95% CI)DemographicsGender
Female 1.01 (0.88 – 1.17) 0.85 (0.67 – 1.07)Male 1.00 1.00
Age18-24 0.91 (0.71 – 1.18) 0.57 (0.37 – 0.87)**25-39 1.06 (0.81 – 1.31) 0.91 (0.66 – 1.26)40-54 0.84 (0.69 – 1.03) 0.82 (0.59 – 1.13)55+ 1.00 1.00
EducationLow 0.99 (0.81 – 1.20) 0.77 (0.57 – 1.04)Moderate 0.86 (0.71 – 1.03) 0.76 (0.57 – 1.01)High 1.00 1.00
Interview modeCAWI 0.88 (0.66 – 1.18) 0.75 (0.47 – 1.19)CATI 1.00 1.00
Smoking behaviourHeaviness of smoking 0.90 (0.86 – 0.95)*** 0.84 (0.77 – 0.90)***Quit attempt last year 2.18 (1.82 – 2.60)*** 0.66 (0.50 – 0.86)**Intention to quit 3.24 (2.76 – 3.80)*** 0.80 (0.63 – 1.03)Country
Netherlands 1.33 (0.98 – 1.80) 1.39 (0.87 – 2.23)Germany 1.15 (0.95 – 1.41) 1.09 (0.80 – 1.48)France 1.00 1.00
Aspects of social unacceptabilityFeeling uncomfortable 0.96 (0.90 – 1.03) 1.08 (0.97 – 1.20)Subjective norm 1.16 (1.07 – 1.24)*** 1.05 (0.93 – 1.19)Societal disapproval 1.02 (0.95 – 1.09) 1.00 (0.89 – 1.12)
* p < 0.05** p < 0.01*** p < 0.001
DISCUSSION
Awareness of anti-tobacco information and smoking restrictions were found to be
positively associated with both feeling uncomfortable about smoking and perceived
societal disapproval of smoking. Awareness of warning labels was associated with a
higher subjective norm. These results are comparable with earlier findings from the
United States, Canada, the United Kingdom, and Australia showing that especially
exposure to anti-tobacco information and smoking restrictions were associated with
reduced social acceptability of smoking (Hammond et al., 2006). What this earlier
study did not show, was that only subjective norms were predictive of quit attempts.
These results imply that tobacco control policies should focus more on changing
subjective norms than on stimulating societal disapproval, especially because the
latter could also lead to the stigmatisation of smokers (Bell, McCullough, Salmon, &
Bell, 2010). Warning labels and anti-smoking campaigns have the potential to change
| 134 |
subjective norms by stimulating social support and interpersonal communication
with friends and family. We did not find strong associations between awareness
of these policies and subjective norms in this study, possible because France, the
Netherlands, and Germany did not have strong warning labels and anti-smoking
campaigns at the time of the ITC surveys.
The observed relationships between policy awareness, social acceptability
of smoking, and quit attempt and quit success were similar between France, the
Netherlands, and Germany. Actions to reduce the social acceptability of smoking
may be most needed in the Netherlands, as only 58% of Dutch smokers agreed that
society disapproves of smoking, compared to about 70% in France and Germany
and about 80% in the United Kingdom, United States, Canada, and Australia
(Hammond et al., 2006).
Smoking restrictions, anti-smoking campaigns, and graphic warning labels
could contribute to reduce the social acceptability of smoking, but further research
is needed to understand their effects across socioeconomic groups. We found
several interactions with educational level, but because the main associations were
weak the effects stratified by educational level were not significant. For both quit
attempts and quit success, the interactions with educational level suggested that
more societal disapproval can have a positive impact on cessation among high
educated smokers, while it may have a negative impact on cessation among low
educated smokers. This finding is in line with previous research (Stuber et al., 2008).
The most important strength of this study is the use of large representative
samples of smokers from three countries. However, there were also some limitations.
Differences between the three countries in time of data collection and time interval
between the waves can influence comparisons of the three countries. However, this
may not have had a large influence, because we did not find any significant country
interactions. A common problem with longitudinal studies is the loss of respondents
to follow-up, which could have affected our results. Finally, the measurement of
social unacceptability of smoking was somewhat limited. It would be an asset
for future studies to use more items to be able to measure each aspect of social
acceptability more thoroughly. Also, it is possible that there are other aspects
of social acceptability of smoking that were not examined in this study, such as
descriptive norms (Van den Putte, Yzer, & Brunsting, 2005). We would therefore
recommend future research in this field to establish the various dimensions of social
acceptability of smoking and to develop and validate measurements for individual
constructs.
Our study has important implications for tobacco control programs that aim
at influencing tobacco consumption through reducing the social acceptability of
| 135 |
chapter 8 | Policies that reduce the social acceptability of smoking
smoking. We found associations of tobacco control policy awareness with aspects of
the social unacceptability of smoking, although these were small. This suggests that
reducing tobacco consumption by substantially changing the social acceptability of
smoking through tobacco control policies might indeed be a long-term process that
requires strong comprehensive policies. The study period of our study of one to two
years might be too short to find substantial effects on the social acceptability of
smoking. It has been shown in California that a long-term comprehensive tobacco
control program with a social-norm change paradigm can stimulate quit attempts
and reduce tobacco consumption (Zhang et al., 2010). Changing the social
acceptability of smoking might thus need ongoing comprehensive tobacco control
programs accompanied by mass media campaigns to ultimately influence smoking
behaviour in the population.

“It has been done elsewhere. It can be done
everywhere.” (Smoke Free Partnership)
| 136 |
Chapter 9
~~~
Smoking in bars after smoke-free legislation
Published as:
Nagelhout, G. E., Mons, U., Allwright, S., Guignard, R., Beck, F.,
Fong, G. T., De Vries, H., & Willemsen, M. C. (2011). Prevalence
and predictors of smoking in “smoke-free” bars. Findings from the
International Tobacco Control (ITC) Europe Surveys. Social Science &
Medicine, 72, 1643-1651.
| 137 |
| 138 |
National-level smoke-free legislation is implemented to protect the public
from exposure to second-hand tobacco smoke (SHS). The first aim of
this study was to investigate how successful the smoke-free hospitality
industry legislation in Ireland (March 2004), France (January 2008), the
Netherlands (July 2008), and Germany (between August 2007 and July
2008) was in reducing smoking in bars. The second aim was to assess
individual smokers’ predictors of smoking in bars post-ban. The third
aim was to examine country differences in predictors and the fourth
aim to examine differences between educational levels (as an indicator
of socioeconomic status). This study used nationally representative
samples of 3,147 adult smokers from the International Tobacco Control
(ITC) Europe Surveys who were surveyed pre- and post-ban. The results
reveal that while the partial smoke-free legislation in the Netherlands and
Germany was effective in reducing smoking in bars (from 88% to 34%
and from 87% to 44% respectively), the effectiveness was much lower
than the comprehensive legislation in Ireland and France which almost
completely eliminated smoking in bars (from 97% to 3% and from 84%
to 3% respectively). Smokers who were more supportive of the ban,
were more aware of the harm of SHS, and who had negative opinions
of smoking were less likely to smoke in bars post-ban. Support for the
ban was a stronger predictor in Germany. SHS harm awareness was
a stronger predictor among less educated smokers in the Netherlands
and Germany. The results indicate the need for strong comprehensive
smoke-free legislation without exceptions. This should be accompanied
by educational campaigns in which the public health rationale for the
legislation is clearly explained.
AB
STR
AC
T

| 139 |
chapter 9 | Smoking in bars after smoke-free legislation
INTRODUCTION
National-level smoke-free legislation is implemented to protect the public from
exposure to second-hand tobacco smoke (SHS) (World Health Organization, 2003).
It is a key policy under the World Health Organization (WHO) Framework Convention
on Tobacco Control (FCTC), which has, as of September 2010 been ratified by
over 170 countries. Smoke-free legislation is being implemented in various settings
and is more successful in reducing SHS in some settings than in others. Smoke-
free bars are often less successful in reducing SHS than smoke-free restaurants or
workplaces (Borland, Yong, Siahpush et al., 2006; Thrasher, Pérez-Hernández et
al., 2010). Many consider bars as the “last bastion” of socially acceptable smoking
(Magzamen & Glantz, 2001). Therefore, the tobacco industry fights harder to keep
bars from becoming smoke-free than in any other setting (Ling & Glantz, 2002). This
has resulted in lower rates of compliance with smoking bans in bars and designated
smoking rooms in bars being permitted in a considerable number of countries
(Magzamen & Glantz, 2001; Smoke Free Partnership, 2006).
Studies have shown that comprehensive smoke-free legislation leads to
more reductions in exposure to SHS and improvements in health than legislation with
designated smoking rooms or other exceptions (Fernández et al., 2009; World Health
Organization, 2007b). This implies that the comprehensiveness of the legislation
affects the level of smoking that may remain in bars after the implementation.
However, individual smokers’ characteristics may also affect whether smokers
choose to smoke in bars post-ban. Identifying these characteristics may help to
deal with the issue of continued smoking in bars after the implementation of smoke-
free legislation.
In this study we used data from the International Tobacco Control (ITC)
Europe Surveys, in which nationally representative probability samples of adult
smokers were surveyed before and after the implementation of national-level
smoke-free legislation. According to the International Tobacco Control’s Conceptual
Model, support for the ban and SHS harm awareness are policy-specific variables
that are immediately affected by the implementation of smoke-free legislation (Fong,
Cummings et al., 2006). Psychosocial variables that are possible mediators of the
relationship between these policy-specific variables and smoking in bars post-ban
are smokers’ attitudes towards smoking (Sheldon, 2010) and perceived societal
approval of smoking (Brown et al., 2009). Findings from baseline ITC Project surveys
showed that support for the ban (Borland, Yong, Siahpush et al., 2006; Li et al., 2010;
Yong et al., 2010) and SHS harm awareness, smokers’ attitudes towards smoking,
and perceived societal approval of smoking (Li et al., 2010) were associated with
smoking in the hospitality industry. However, these findings were cross-sectional,

| 140 |
and the studied countries did not have national-level smoke-free hospitality industry
legislation in place at the time of the survey. In the current study, we tested whether
pre-ban support for the ban, SHS harm awareness, smokers’ attitudes towards
smoking, and perceived societal approval of smoking were predictors of smoking in
bars after implementation of national-level smoke-free legislation.
The benefits of smoke-free bars are likely to be higher among people from
lower socioeconomic status (SES) groups because they are more likely to smoke
and to be employed in bars (European Commission, 2007). However, compliance
with the ban may be lower among low SES groups (Eadie et al., 2008). In the current
study, we examine differences between SES groups in predictors of smoking in
bars post-ban. Identifying these differences may help in designing interventions
that are effective in decreasing smoking in bars post-ban among low SES groups.
The prevalence and predictors of smoking in bars post-ban can be different between
countries, due to cultural differences or the comprehensiveness of the smoke-free
legislation. In the current study, we compared prevalence and predictors of smoking
in bars after the comprehensive smoke-free bar legislation in Ireland and France
and the partial smoke-free bar legislation in the Netherlands and Germany. First,
we describe how the battle over smoke-free bars was fought in these four countries
(see Table 1).
Ireland
Ireland was the first European country to implement nationwide smoke-free
workplace legislation. With support from both government and opposition parties,
smoking was banned from all indoor workplaces from March 2004 (Howell, 2004;
McNicholas, 2004). Violations of the legislation carry a fine of up to €3,000 for the
smoker and the owner.
Prior to the implementation of the legislation, a health alliance was formed
between government departments, the Minister for Health, health authorities,
nongovernmental organisations, health care professional organisations, the newly
formed Office of Tobacco Control and the trade union movement, to argue in favour
of the legislation using consistent messaging (Fahy et al., 2009; Howell & Allwright,
2005). They all positioned the legislation as a civil society public health initiative
with the primary objective of protecting workers from the harmful effects of SHS.
The Office of Tobacco Control created a television and radio campaign in which
the health effects of SHS were explained and the date of implementation of the
legislation was communicated (Allwright, 2004). An alliance of vested interests
came together under the banner of the ‘Irish Hospitality Industry Alliance’ (IHIA) to
co-ordinate a campaign of opposition. This Alliance released a report on predicted
| 141 |
chapter 9 | Smoking in bars after smoke-free legislation
economic consequences of the legislation and argued that the legislation could
not be enforced due to the country’s pub culture. Ties between the Alliance and
the tobacco industry were suspected but not confirmed (McNicholas, 2004).
Pro-ban and anti-ban advocates received a similar amount of media attention
(Fahy et al., 2009).
An extensive evaluation of the Irish smoke-free legislation (Fong, Hyland
et al., 2006) found dramatic declines in reported smoking in all venues post-ban.
Furthermore, there was significantly stronger support for the smoke-free legislation
post-ban among smokers and non-smokers compared to England, which did not
have smoke-free legislation at that time. In addition, the legislation was accompanied
by an increase in smoke-free homes, contrary to the fears of some that smoke-free
public places could result in more smoking at home.
Although many feared that the Irish pub culture would prevent the legislation
from succeeding, the legislation proved to be an immediate success (Howell,
2004; McNicholas, 2004; Office of Tobacco Control, 2004). The Irish people chose
the smoke-free legislation as the most positive event that happened in Ireland in
2004 (Howell & Allwright, 2005). An EU-wide survey in December 2008 revealed
that 80 percent of the Irish population supported the smoke-free bar legislation,
which was considerably higher than the European average of 65 percent (European
Commission, 2009).
France
France implemented nationwide smoke-free legislation in all enclosed public areas,
workplaces, hospitals, schools and transport from February 2007, but made an
exception for the hospitality industry until January 2008. Since the smoke-free
hospitality industry legislation permits enclosed smoking rooms under very strict
conditions – areas separated from the rest of the clientèle, maximum 35m² and 20
percent of the establishment, appropriate ventilation, and no service in the room –
they are not common. Smokers receive a €68 fine for violations and venue owners
a €135 fine when the conditions for smoking rooms are not met or when there are
no no-smoking signs. When venue owners actively incite violations of the law, the
public prosecutor decides on the fine.
Several associations actively argued for the legislation: among others the
national association against tobacco smoking (Comité National Contre le Tabagisme,
CNCT), the non-smokers’ rights association (Droit des Non-Fumeurs, DNF), and the
national institute for prevention and health education (Institut National de Prévention
et d’Éducation pour la Santé, INPES). The Institut National started campaigning
against exposure to SHS in 2004 with television and radio commercials, and
| 142 |
posters. The government ran a television, radio, print, and internet campaign at
the beginning of 2007 in which the date of implementation of the legislation was
communicated and the health effects of SHS were explained. The Comité National
ran three television commercials in January 2008. One of them showed restaurant
employees working, with a voice-over asking “do you know what risks a restaurant
employee has to take?” Opposition to the legislation came mainly from bar owners
and tobacconists. Their main argument against the legislation was fear of economic
losses, since they already faced a 35 percent decrease in the number of cigarettes
sold in 2004 compared to 2002, because of price increases in 2003 and 2004.
At the end of 2008, 67 percent of the French population supported the
smoke-free bar legislation, which was slightly higher than the European average
(European Commission, 2009).
The Netherlands
The Dutch smoke-free workplace legislation was implemented in January 2004,
but excluded the hospitality industry. A self-regulation plan was arranged with the
hospitality industry that should have resulted in completely smoke-free restaurants
and hotels and mostly smoke-free bars and discos by the end of 2008. These
results were not achieved, which caused the government to decide to implement
smoke-free hospitality industry legislation from July 2008. Enclosed smoking rooms
in the hospitality industry were permitted, but serving was not allowed in these
rooms. After a period of three months in which venue owners only got a warning
for violations, venue owners were fined €300 for the first violation and up to €2,400
for the fourth violation within five years. Although the legislation was intended to
protect employees from exposure to SHS, venues without employees were also
obliged to ban smoking. This was considered discriminatory by two Dutch courts,
with the consequence that the legislation was temporarily suspended for bars
without employees from July 2009. In March 2010 the Dutch Supreme Court ruled
that the legislation was not discriminatory, and from that date, the legislation applied
to all bars again. However, the new Dutch government is currently considering
permanently suspending the legislation for bars smaller than 70 square meters
without employees and since November 2010 has not fined these venues for
allowing smoking.
The Ministry of Health ran a television, radio, print and internet campaign
from May to September 2008 in which only the date of implementation of the smoke-
free bar legislation was communicated and no reference to health consequences of
SHS was made. The television commercial of this campaign showed a man dressed
as a large cigarette being thrown out of hospitality industry venues onto the street.
| 143 |
chapter 9 | Smoking in bars after smoke-free legislation
The Dutch expert centre on tobacco control (STIVORO) ran a television, radio,
print, and internet smoking cessation campaign, but the smoke-free legislation and
SHS were not mentioned in this campaign. An organisation “Red de Kleine Horeca
Ondernemer” (“Save the small hospitality industry entrepreneur”) was formed by
small bars to argue against the legislation. Ties between this organisation and the
tobacco industry were confirmed by investigative journalism (Baltesen & Rosenberg,
2009). The organisation financed court appeals, organised demonstrations, and
lobbied for an exemption to the legislation for small bars. Newspaper coverage
on the smoke-free legislation was mostly negative towards the legislation, with the
economic aspects of the legislation dominating the coverage.
At the end of 2008, six months after the implementation of the legislation,
only 44 percent of the Dutch population supported the smoke-free bar legislation,
which was the lowest amongst all European countries (European Commission,
2009).
Germany
The German workplace regulation from 2004 required employers to effectively
protect employees from SHS, but workplaces with public access, such as the
hospitality industry, were excluded from this obligation. An agreement between
the German Ministry of Health and the DEHOGA, the German hotel and restaurant
association, was formed to improve the protection of non-smokers in hospitality
venues. This self-regulation was declared a failure by the Ministry of Health in
February 2007. Following an extensive public debate, a national law banning
smoking in federal buildings and public transport was implemented in September
2007. Between August 2007 and July 2008, each of Germany’s 16 states enacted
smoke-free legislation, banning smoking in educational, recreational, health and
state institutions and in bars and restaurants.
Regarding the smoke-free hospitality industry legislation, implementation
dates, fines, and rules for smoking rooms varied between the federal states. Only
one state had total smoke-free legislation at first (Bavaria), and most states allowed
smoking in designated smoking rooms, but prohibited smoking in one-room bars
and pubs. These exceptional rules caused constitutional complaints by venue
owners who feared economic disadvantages. In July 2008 the Federal Constitutional
Court ruled that the state laws were unconstitutional on the ground that they gave
undue advantage to owners of venues with two or more rooms. The court gave
the state legislators until 31 December 2009 to either remove all exceptions or to
extend them to all hospitality owners. So although the court declared that a total
smoking ban would have been constitutional, they suggested permitting smoking

| 144 |
in drinking establishments without food service, which are smaller than 75 square
metres, do not have a separate smoking room, and do not allow persons under 18
years to enter (German Constitutional Court, 2008). All federal states followed this
suggestion at first, so that at the International Tobacco Control follow-up survey, all
states allowed smoking rooms in restaurants and in bars and pubs, and all states
allowed smoking in small one-room-drinking establishments. The fines for violations
of the smoke-free legislation vary from state to state. While Baden-Württemberg
does not require fines for non-compliant venue owners, the fines in the other states
vary from €50-€500 in Hamburg and Thüringen to up to €10,000 in Mecklenburg-
Vorpommern. Fines for non-compliant smokers vary from €5-€100 in Brandenburg
to up to €5000 in Saxony. When the decision of the German Constitutional Court
was pending, there was no enforcement of penalties. There was no national media
campaign preceding the smoke-free laws.
At the end of 2008, 45 percent of the German population supported the
smoke-free bar legislation, which was similar to the low level of support in the
Netherlands (European Commission, 2009).
Research questions
This study focused on smokers reporting that they themselves have smoked in
bars after the implementation of national smoke-free hospitality industry legislation.
We refer to this behaviour as “smoking in bars post-ban”. In Ireland, smoking in
bars post-ban equates to non-compliance with the ban, as smoking is completely
prohibited in bars in Ireland. In France, Germany, and the Netherlands, smoking in
bars post-ban is either non-compliance or reflects smoking in smoking rooms or (in
Germany) smoking in bars where smoking is allowed.
The present study aims to answer the following research questions: (1)
what is the prevalence of smoking in bars pre- and post-ban in Ireland, France,
the Netherlands, and Germany? (2) are support for the ban, SHS harm awareness,
smokers’ attitudes towards smoking, and perceived societal approval of smoking
predictors of smoking in bars post-ban? (3) Are there differences between countries
in the predictors of smoking in bars post-ban? (4) Are there differences between
SES groups in the predictors of smoking in bars post-ban?

| 145 |
chapter 9 | Smoking in bars after smoke-free legislation
Table 1: Differences between smoke-free bar legislation in Ireland, France, the Netherlands, and Germany.
Ireland France The Netherlands GermanyPeriod of allowing smoking in bars but not in other workplaces
No Yes, one year Yes, four years Yes, four years
Ban preceded by a self-regulation period
No No Yes Yes
Implementation date bar smoking ban
March 2004 January 2008 July 2008 Varying between states from August 2007 to July 2008
Smoking rooms in bars allowed
Not allowed Allowed when it is separated, maximum 35m² and 20% of the bar, appropriate ventilation, and no serving in the room
Allowed when there is no serving in the room
Allowed
Smoking bars allowed
Not allowed Not allowed July 2009-March 2010: allowed for bars without employees. From November 2010: allowed for small bars without employees.
After constitutional complaints: allowed for small one-room-drinking establishments
Fines for violations of bar smoking ban
€3,000 for smoker and owner
€68 for smoker and €135 for owner
First 3 months warning, later €300 to up to €2400 for owner, no fine for smoker
For smoker €5 to up to €5,000, for owner €0 to up to €10,000; no fines when constitutional complaints were pending
Pro-ban advocacy
Campaign with implementation date and health rationale
Campaign with implementation date and health rationale
Campaign with implementation date
No national campaign
Anti-ban advocacy
Media reports on economic losses
Media reports on economic losses
Media reports on economic losses, court appeals, demonstrations, and lobby against ban in small bars
Media reports on economic losses, constitutional complaints against the ban in small bars, lobby against ban in small bars
Population support for bar smoking ban in December 2008 according to Eurobarometer #253
80 percent 67 percent 44 percent 45 percent
| 146 |
METHODS
Sample
Before the implementation of the smoke-free bar legislation in Ireland, France, the
Netherlands, and Germany, 6,393 smokers aged 18 years and older were surveyed.
Smokers were defined as having smoked at least 100 cigarettes in their lifetime and
currently smoke at least once per month. Post-ban 4,634 baseline smokers were
followed up (72.5% follow-up). See Table 2 for fieldwork periods and sample sizes
for each country.
Smokers who were followed up and who were lost to follow-up did not
differ by gender, educational level, number of cigarettes per day, and time before
smoking the first cigarette of the day. However, smokers who were lost to follow-up
were younger (M = 38.3, SD = 14.4) than smokers who were followed up (M = 42.3,
SD = 14.3; t = -9.88, p < 0.001).
Respondents were recruited using probability sampling methods with fixed
line telephone numbers selected at random from the population of each country.
The Netherlands sample differed in that most respondents were surveyed using web
interviewing (n = 1,668 of baseline sample of 2,072) instead of telephone interviewing
(Nagelhout et al., 2010). The Dutch web sample was drawn from a large probability-
based database with respondents who had indicated their willingness to participate
in research on a regular basis. Dutch telephone and web respondents did not differ
by age, gender, and number of cigarettes per day. However, web respondents
were less educated (χ2 = 23.74, p < 0.001), and smoked their first cigarette of the
day later than telephone respondents (t = -3.75, p < 0.001). Therefore, univariate
analyses were carried out separately for the Dutch telephone and web respondents
and interviewing mode was added as predictor variable in multivariate analyses.
Follow-up rates were considerably higher for the Netherlands web survey (80.1%)
than the Netherlands telephone survey (73.7%) and the telephone surveys in the
other countries (Ireland 71.8%, France 71.0%, Germany 66.1%).
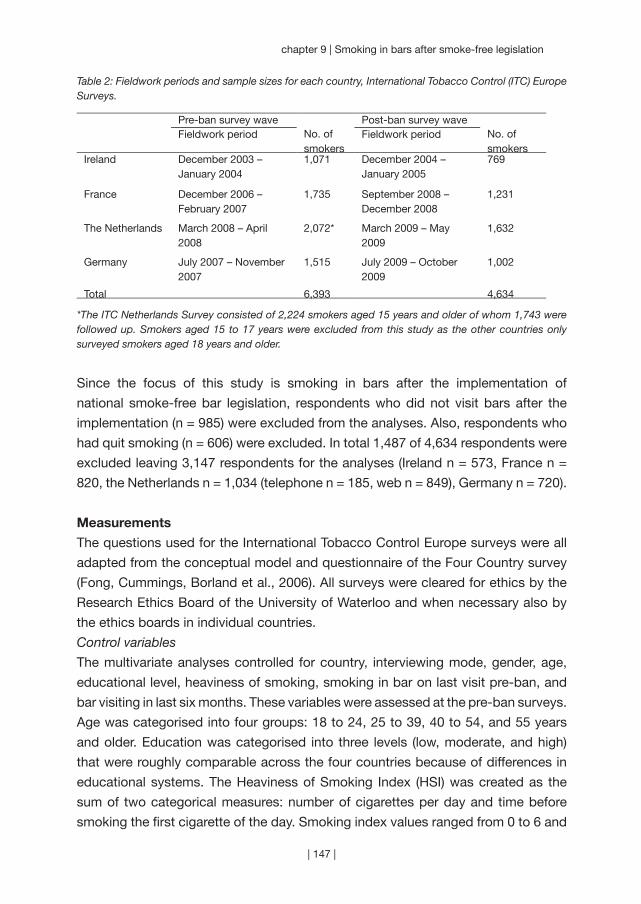
| 147 |
chapter 9 | Smoking in bars after smoke-free legislation
Table 2: Fieldwork periods and sample sizes for each country, International Tobacco Control (ITC) Europe Surveys.
Pre-ban survey wave Post-ban survey waveFieldwork period No. of
smokersFieldwork period No. of
smokersIreland December 2003 –
January 20041,071 December 2004 –
January 2005769
France December 2006 – February 2007
1,735 September 2008 – December 2008
1,231
The Netherlands March 2008 – April 2008
2,072* March 2009 – May 2009
1,632
Germany July 2007 – November 2007
1,515 July 2009 – October 2009
1,002
Total 6,393 4,634
*The ITC Netherlands Survey consisted of 2,224 smokers aged 15 years and older of whom 1,743 were followed up. Smokers aged 15 to 17 years were excluded from this study as the other countries only surveyed smokers aged 18 years and older.
Since the focus of this study is smoking in bars after the implementation of
national smoke-free bar legislation, respondents who did not visit bars after the
implementation (n = 985) were excluded from the analyses. Also, respondents who
had quit smoking (n = 606) were excluded. In total 1,487 of 4,634 respondents were
excluded leaving 3,147 respondents for the analyses (Ireland n = 573, France n =
820, the Netherlands n = 1,034 (telephone n = 185, web n = 849), Germany n = 720).
Measurements
The questions used for the International Tobacco Control Europe surveys were all
adapted from the conceptual model and questionnaire of the Four Country survey
(Fong, Cummings, Borland et al., 2006). All surveys were cleared for ethics by the
Research Ethics Board of the University of Waterloo and when necessary also by
the ethics boards in individual countries.
Control variables
The multivariate analyses controlled for country, interviewing mode, gender, age,
educational level, heaviness of smoking, smoking in bar on last visit pre-ban, and
bar visiting in last six months. These variables were assessed at the pre-ban surveys.
Age was categorised into four groups: 18 to 24, 25 to 39, 40 to 54, and 55 years
and older. Education was categorised into three levels (low, moderate, and high)
that were roughly comparable across the four countries because of differences in
educational systems. The Heaviness of Smoking Index (HSI) was created as the
sum of two categorical measures: number of cigarettes per day and time before
smoking the first cigarette of the day. Smoking index values ranged from 0 to 6 and
| 148 |
are positively associated with nicotine dependence (Heatherton et al., 1989). Bar
visiting was assessed using the question “In the last 6 months, how often have you
visited a drinking establishment such as a bar or pub?”
Policy-specific variables
Support for a bar smoking ban was assessed at the pre-ban surveys using the
question “Do you think smoking should be allowed in all indoor areas, allowed in
some indoor areas, or not allowed indoors at all at drinking establishments (bars and
pubs)?”. This question was used as indicator of support for smoke-free legislation
in several other studies (Borland, Yong, Siahpush et al., 2006; Fong, Hyland et al.,
2006; Li et al., 2010; Yong et al., 2010). SHS harm awareness was assessed at the
pre-ban surveys using the question “In the last month, how often, if at all, did you
think about the harm your smoking might be doing to other people?” This question
was also used in previous studies (Borland, Yong, Siahpush et al., 2006; Yong et
al., 2010).
Psychosocial mediators
Smokers’ attitudes towards smoking were assessed at the pre-ban surveys using
the question “What is your overall opinion of smoking?” This question was used
in previous research as predictor of smoking cessation (Hyland, Borland et al.,
2006). In line with previous research (Brown et al., 2009; Hammond et al., 2006),
perceived societal approval of smoking was assessed at the pre-ban surveys using
the statement “Society disapproves of smoking”.
Outcome variable
Smoking in bars was assessed at the pre- and post-ban surveys using the question
“Did you smoke at all at the pub or bar during your last visit, either inside or outside?”
Respondents who answered “yes” were asked whether they smoked inside the bar,
outside or both. Respondents who answered that they smoked inside or both inside
and outside were categorised as “smoked inside the bar on last visit”.
Analyses
To examine the prevalence of smoking in bars pre- and post-ban (research question
1), proportions of smokers reporting smoking in bars pre- and post-ban were
presented for each country separately. Chi-square tests were conducted to assess
differences in country proportions and to assess difference from pre- to post-ban.
All analyses have been weighted by age and gender to be representative of the adult
smoker population within each country. More details on the weighting procedure
can be found in Thompson et al. (2006).
Predictors of smoking in bars post-ban (research question 2) were
assessed using multivariate regression mediation analyses using SPSS macros and
| 149 |
chapter 9 | Smoking in bars after smoke-free legislation
guidelines developed by Preacher & Hayes (2004), that were adjusted to allow for a
binary outcome (Preacher & Hayes, 2010). Sobel tests were calculated to estimate
the strength and significance of mediation effects. In addition, multivariate logistic
regression analysis was employed with smoking in bars post-ban as dependent
variable. Independent variables were the above mentioned control variables, policy-
specific variables, and psychosocial mediators.
Differences between countries (research question 3) in predictors of
smoking in bars post-ban were assessed by adding country interactions to the
multivariate logistic regression analysis predicting smoking in bars post-ban. As
Germany was the country with the highest level of smoking in bars post-ban, this
country was chosen as reference for comparison with Ireland, France, and the
Netherlands. Added interactions were country by: support for a bar smoking ban,
SHS harm awareness, smokers’ attitudes towards smoking, and perceived societal
approval of smoking.
Differences between SES groups (research question 4) were assessed by
adding educational level interactions to the multivariate logistic regression analysis
predicting smoking in bars post-ban. These analyses were done separately for each
country. Added interactions were educational level by: support for a bar smoking
ban, SHS harm awareness, smokers’ attitudes towards smoking, and perceived
societal approval of smoking. Educational level was used as indicator of SES,
because it contained considerably fewer missing values (n = 14) than income (n =
363).
RESULTS
Prevalence of smoking in bars
As can be seen in Table 3, the prevalence of smoking in bars was around 90 percent
in all countries pre-ban. Smoking in bars decreased significantly from pre-ban to
post-ban in each country (Ireland χ2 = 954.91, p < 0.001; France χ2 = 1,039.10, p <
0.001; Netherlands χ2 = 606.55, p < 0.001; Germany χ2 = 299.85, p < 0.001). The
post-ban percentage of smoking in bars significantly differed between countries
(χ2 = 566.49, p < 0.001) and was lowest in France (2.7%), followed by Ireland
(3.3%), the Netherlands (34.0%; telephone survey 44.8%, web survey 31.6%), and
Germany (43.6%).
Predictors of smoking in bars
There were significant between-country differences in the predictor variables, except
for gender of respondents (Table 3). Smokers from Ireland and France were younger
and less educated than smokers from the Netherlands and Germany. Smokers in
| 150 |
France were the least heavy smokers and smokers in Ireland were the heaviest
smokers. Smokers from Ireland were the most frequent bar visitors and smokers
from the Netherlands the least frequent. Smokers from Ireland and France more
often supported smoke-free bars, more often thought about the harm of smoking
to others, more often thought negative of smoking, and more often thought that
society disapproves of smoking than smokers in Germany and the Netherlands.
The multiple regression mediation analyses showed that both the policy-
specific variables and the psychosocial mediators significantly predicted smoking
in bars post-ban (Figure 1). Sobel tests showed that the inclusion of smokers’
attitudes towards smoking as mediator significantly decreased the influence of
support for the ban (z = 2.29, p = 0.022) and SHS harm awareness (z = 2.53, p
= 0.012) on smoking in bars post-ban. Also, the inclusion of perceived societal
approval of smoking as mediator significantly decreased the influence of support
for the ban (z = 2.61, p = 0.009) and SHS harm awareness (z = 3.68, p < 0.001) on
smoking in bars post-ban. Since the influence of the policy-specific variables on
smoking in bars post-ban was still significant after controlling for the psychosocial
mediators, we can conclude that there is partial mediation. Mediation analyses by
country did not show significant mediation effects, indicating that the mediation
effects are small.
A multivariate logistic regression analysis showed that country was the
most important predictor of prevalence of smoking in bars post-ban. Smokers
from the Netherlands and Germany were more likely to smoke in bars post-ban
than smokers from Ireland and France (OR Ireland = 0.03, 95% CI = 0.02-0.05; OR
France = 0.03, 95% CI = 0.02-0.05; OR the Netherlands = 0.96, 95% CI = 0.65-
1.43; Germany is the reference category). Furthermore, there was more smoking
in bars post-ban by telephone respondents (versus web respondents from the
Netherlands), male smokers, younger smokers, less educated smokers, heavier
smokers, smokers who smoked in bars pre-ban, and smokers who visited bars
more often (data not shown). More support for the ban and very often thinking
about the harm of smoking to others was negatively associated with smoking in
bars post-ban (Table 4). Moreover, a negative opinion of smoking was significantly
associated with a smaller likelihood of smoking in bars post-ban.
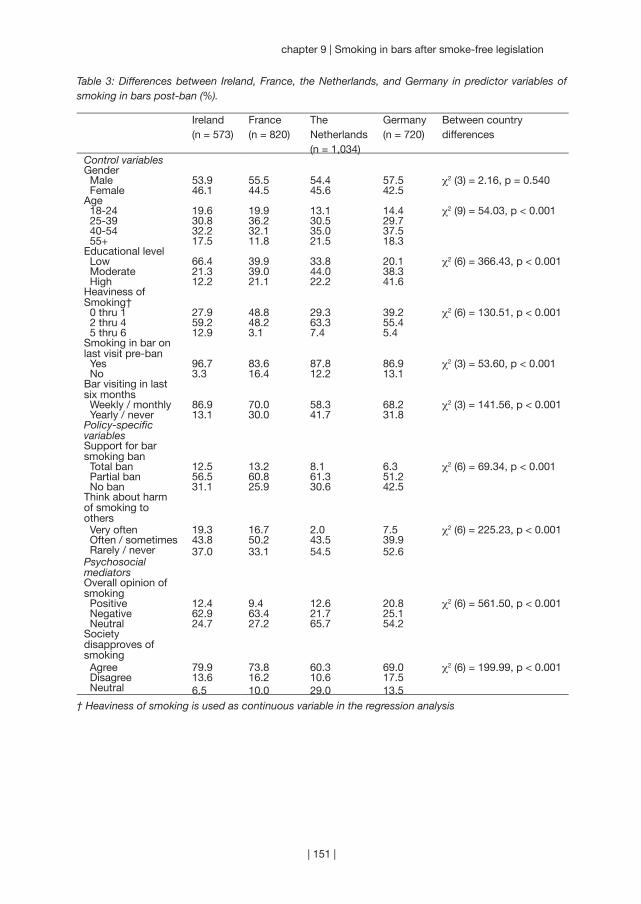
| 151 |
chapter 9 | Smoking in bars after smoke-free legislation
Table 3: Differences between Ireland, France, the Netherlands, and Germany in predictor variables of smoking in bars post-ban (%).
Ireland(n = 573)
France(n = 820)
The Netherlands(n = 1,034)
Germany(n = 720)
Between country differences
Control variablesGender Male 53.9 55.5 54.4 57.5 χ2 (3) = 2.16, p = 0.540 Female 46.1 44.5 45.6 42.5Age 18-24 19.6 19.9 13.1 14.4 χ2 (9) = 54.03, p < 0.001 25-39 30.8 36.2 30.5 29.7 40-54 32.2 32.1 35.0 37.5 55+ 17.5 11.8 21.5 18.3Educational level Low 66.4 39.9 33.8 20.1 χ2 (6) = 366.43, p < 0.001 Moderate 21.3 39.0 44.0 38.3 High 12.2 21.1 22.2 41.6Heaviness of Smoking† 0 thru 1 27.9 48.8 29.3 39.2 χ2 (6) = 130.51, p < 0.001 2 thru 4 59.2 48.2 63.3 55.4 5 thru 6 12.9 3.1 7.4 5.4Smoking in bar on last visit pre-ban Yes 96.7 83.6 87.8 86.9 χ2 (3) = 53.60, p < 0.001 No 3.3 16.4 12.2 13.1Bar visiting in last six months Weekly / monthly 86.9 70.0 58.3 68.2 χ2 (3) = 141.56, p < 0.001 Yearly / never 13.1 30.0 41.7 31.8Policy-specific variablesSupport for bar smoking ban Total ban 12.5 13.2 8.1 6.3 χ2 (6) = 69.34, p < 0.001 Partial ban 56.5 60.8 61.3 51.2 No ban 31.1 25.9 30.6 42.5Think about harm of smoking to others Very often 19.3 16.7 2.0 7.5 χ2 (6) = 225.23, p < 0.001 Often / sometimes 43.8 50.2 43.5 39.9 Rarely / never 37.0 33.1 54.5 52.6Psychosocial mediatorsOverall opinion of smoking Positive 12.4 9.4 12.6 20.8 χ2 (6) = 561.50, p < 0.001 Negative 62.9 63.4 21.7 25.1 Neutral 24.7 27.2 65.7 54.2Society disapproves of smoking Agree 79.9 73.8 60.3 69.0 χ2 (6) = 199.99, p < 0.001 Disagree 13.6 16.2 10.6 17.5 Neutral 6.5 10.0 29.0 13.5
† Heaviness of smoking is used as continuous variable in the regression analysis
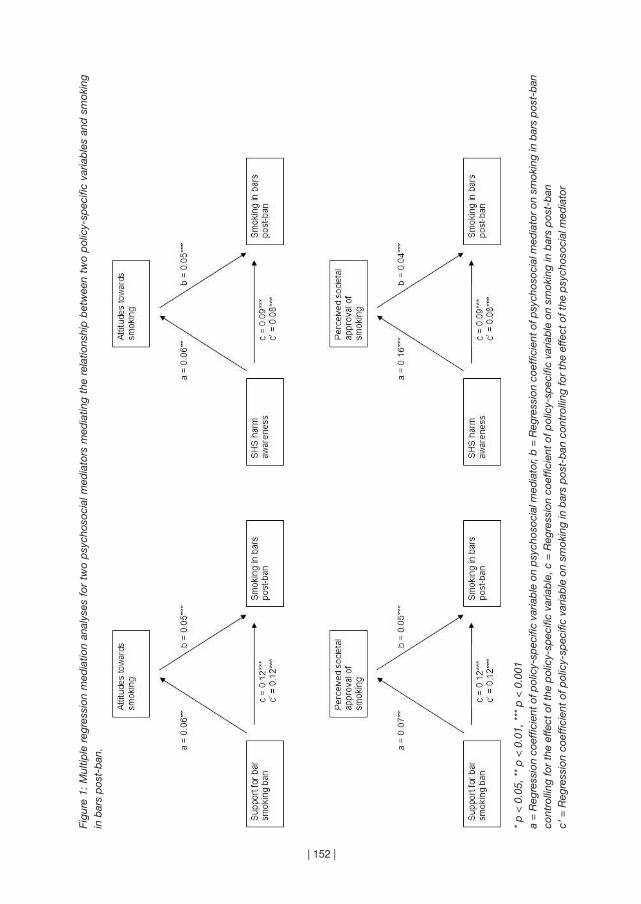
| 152 |
Figu
re 1
: M
ultip
le r
egre
ssio
n m
edia
tion
anal
yses
for
tw
o p
sych
osoc
ial m
edia
tors
med
iatin
g th
e re
latio
nshi
p b
etw
een
two
pol
icy-
spec
ific
varia
ble
s an
d s
mok
ing
in b
ars
pos
t-b
an.
* p
< 0
.05,
**
p <
0.0
1, *
** p
< 0
.001
a =
Reg
ress
ion
coef
ficie
nt o
f pol
icy-
spec
ific
varia
ble
on
psy
chos
ocia
l med
iato
r, b
= R
egre
ssio
n co
effic
ient
of p
sych
osoc
ial m
edia
tor
on s
mok
ing
in b
ars
pos
t-b
an
cont
rolli
ng fo
r th
e ef
fect
of t
he p
olic
y-sp
ecifi
c va
riab
le, c
= R
egre
ssio
n co
effic
ient
of p
olic
y-sp
ecifi
c va
riab
le o
n sm
okin
g in
bar
s p
ost-
ban
c’ =
Reg
ress
ion
coef
ficie
nt o
f pol
icy-
spec
ific
varia
ble
on
smok
ing
in b
ars
pos
t-b
an c
ontr
ollin
g fo
r th
e ef
fect
of t
he p
sych
osoc
ial m
edia
tor

| 153 |
chapter 9 | Smoking in bars after smoke-free legislation
Tab
le 4
: Mul
tivar
iate
logi
stic
regr
essi
on a
naly
ses
of p
red
icto
rs o
f sm
okin
g in
bar
s p
ost-
ban
for
all c
ount
ries
toge
ther
and
sep
arat
ely
for
each
cou
ntry
(1 =
sm
oked
in
sid
e th
e b
ar o
n la
st v
isit,
0 =
did
not
sm
oke
insi
de
the
bar
on
last
vis
it).
All
coun
trie
s (n
= 2
,422
)Ire
land
(n =
489
)Fr
ance
(n =
707
)Th
e N
ethe
rland
s (n
= 7
02)
Ger
man
y (n
= 5
24)
Ad
just
ed†
OR
(95%
CI)
Ad
just
ed O
R (9
5% C
I)A
dju
sted
OR
(95%
CI)
Ad
just
ed O
R (9
5% C
I)A
dju
sted
OR
(95%
CI)
Pol
icy-
spec
ific
varia
ble
sS
upp
ort
for
bar
sm
okin
g b
an T
otal
ban
0.44
(0.2
6-0.
75)*
*1.
56 (0
.23-
10.6
8)0.
27 (0
.02-
3.03
)0.
67 (0
.34-
1.35
)0.
19 (0
.07-
0.53
)**
Par
tial b
an0.
72 (0
.58-
0.91
)**
1.30
(0.4
2-3.
97)
0.58
(0.1
8-1.
89)
0.84
(0.6
1-1.
17)
0.53
(0.3
6-0.
77)*
** N
o b
an1.
001.
001.
001.
001.
00Th
ink
abou
t ha
rm o
f sm
okin
g to
oth
ers
Ver
y of
ten
0.42
(0.2
3-0.
77)*
*0.
25 (0
.03-
2.39
)0.
35 (0
.07-
1.77
)0.
29 (0
.07-
1.24
)0.
50 (0
.21-
1.17
) O
ften
/ s
omet
imes
1.01
(0.8
0-1.
26)
1.36
(0.4
7-3.
95)
0.71
(0.2
2-2.
32)
0.94
(0.6
9-1.
29)
1.16
(0.7
9-1.
72)
Rar
ely
/ ne
ver
1.00
1.00
1.00
1.00
1.00
Psy
chos
ocia
l m
edia
tors
Ove
rall
opin
ion
of
smok
ing
Pos
itive
1.01
(0.7
5-1.
36)
4.61
(0.7
6-27
.92)
19.8
0 (1
.96-
199.
84)*
0.78
(0.5
0-1.
21)
1.17
(0.7
4-1.
85)
Neg
ativ
e0.
70 (0
.54-
0.93
)*2.
73 (0
.63-
11.9
3)8.
94 (1
.13-
70.5
7)*
0.50
(0.3
3-0.
77)*
*0.
70 (0
.45-
1.11
) N
eutr
al1.
001.
001.
001.
001.
00S
ocie
ty d
isap
pro
ves
of s
mok
ing
Agr
ee0.
97 (0
.74-
1.27
)0.
37 (0
.06-
2.43
)0.
30 (0
.09-
1.04
)1.
11 (0
.79-
1.56
)1.
23 (0
.73-
2.07
) D
isag
ree
1.31
(0.9
1-1.
90)
1.89
(0.2
7-13
.50)
0.37
(0.0
7-1.
89)
1.17
(0.6
9-2.
00)
1.78
(0.9
4-3.
40)
Neu
tral
1.00
1.00
1.00
1.00
1.00
Nag
elke
rke
R2
0.40
0.16
0.28
0.14
0.27
* p
< 0
.05,
**
p <
0.0
1, *
** p
< 0
.001
† A
dju
sted
for t
he v
aria
ble
s in
the
tab
le a
nd th
e co
ntro
l var
iab
les:
cou
ntry
, int
ervi
ewin
g m
ode,
gen
der
, age
gro
up, e
duc
atio
nal l
evel
, hea
vine
ss o
f sm
okin
g, s
mok
ing
in b
ar o
n la
st v
isit
pre
-ban
, and
bar
vis
iting
in la
st s
ix m
onth
s.
| 154 |
Differences between countries
Table 4 shows the multivariate logistic regression analysis for all countries together
and the analyses separately for each country. Country interaction analyses with
Germany as reference showed that support for the ban was a stronger predictor in
Germany than in Ireland and the Netherlands (the interaction with France was not
significant). There were also interactions found between attitudes towards smoking
and perceived societal approval of smoking in France compared to Germany.
However, probably due to few French smokers smoking in bars post-ban, the main
effects were either not significant or had a very large confidence interval, suggesting
that these results may not be reliable.
Differences between SES groups
There were significant interactions between educational level and the extent to which
the policy-specific variables and the psychosocial mediators predicted smoking in
bars post-ban in the Netherlands and Germany. Highly educated smokers from the
Netherlands who were supportive of a partial ban were less likely to smoke in bars
post-ban (OR highly educated = 0.53, 95% CI = 0.26-1.08). Moderately educated
smokers from the Netherlands who often or sometimes thought about the harm of
smoking to others were less likely to smoke in bars (OR moderately educated =
0.54, 95% CI = 0.34-0.88). Societal approval of smoking was a stronger predictor
of smoking in bars among highly educated smokers (OR highly educated = 2.87,
95% CI = 1.01-8.18). Low and moderately educated smokers from Germany who
very often thought about the harm of smoking to others were borderline significantly
less likely to smoke in bars (OR low educated = 0.14, 95% CI = 0.02-1.15; OR
moderately educated = 0.23, 95% CI = 0.05-1.11).
DISCUSSION
Smoking was highly prevalent in bars in Ireland, France, the Netherlands and Germany
before these countries implemented national-level smoke-free bar legislation. While
the partial legislation in the Netherlands and Germany was effective in reducing
smoking in bars, the level of effectiveness was much lower than that achieved in
Ireland and France. Many bar workers and patrons in the Netherlands and Germany
are still exposed to SHS, whereas the comprehensive legislation in Ireland and
France almost completely eliminated smoking in bars. Since there is no risk-free
minimal level of exposure to SHS (U.S. Department of Health and Human Services,
2006; World Health Organization, 2007b), no countries should settle with less than
eliminating smoking in all indoor public places. The Netherlands and Germany
should, therefore, aim to further reduce smoking in bars.
| 155 |
chapter 9 | Smoking in bars after smoke-free legislation
This study showed that ‘country’ was the most important predictor of prevalence of
smoking in bars post-ban, with smokers from the Netherlands and Germany more
likely to smoke in bars post-ban than smokers from Ireland and France. The weaker
smoke-free bar legislation in the Netherlands and Germany compared to Ireland and
France (see Table 1) is the most plausible explanation of this finding. The Netherlands
and Germany both allowed smoking in bars but not in other workplaces for a period
of four years. In this period, the hospitality industry was expected to reduce smoking
by means of self-regulation. Both countries eventually banned smoking in bars, but
allowed smoking in designated smoking rooms and in small bars. In the Netherlands
and some German states, violations of the legislation were not fined in the first
months after the implementation of the legislation. Since the exceptions and the
moderate level of enforcement probably causes the higher levels of smoking in bars
post-ban, we recommend countries to implement smoke-free legislation without
exceptions and to enforce the legislation heavily. This corresponds with guidelines
and recommendations of the World Health Organization (World Health Organization,
2007a, b) and the European Commission (European Commission, 2007).
In this study, we identified individual smokers’ predictors of smoking in bars
post-ban. Smokers who were more supportive of the ban, were more aware of the
harm of SHS, and who had negative opinions of smoking were less likely to smoke
in bars post-ban. There was more support for the ban, SHS harm awareness,
negative opinions of smoking, and societal disapproval of smoking in Ireland and
France than in the Netherlands and Germany. These predictors can possibly be
positively influenced by educational campaigns that clearly explain that the smoke-
free legislation is implemented to protect people against harm from exposure to
SHS (European Commission, 2007; Smoke Free Partnership, 2006; World Health
Organization, 2007a, b). In Ireland and France several health organisations argued
in favour of the legislation in the media, and educational campaigns highlighted the
fact that the legislation was intended to protect people against SHS exposure. In the
Netherlands and Germany there was less media advocacy from health organisations,
and the educational campaign in the Netherlands only communicated the date of
the implementation of the legislation and did not explain the health rationale for
the legislation. In Germany, there was no national implementation campaign at all.
However, since we did not directly study exposure to educational campaigns, we
cannot be certain that campaigns would have increased SHS harm awareness and
support for the ban. More research is needed to study this further.
According to the ITC Conceptual Model, each tobacco control policy
ultimately has an influence on behaviour by influencing policy-specific variables,
which in turn influence psychosocial mediators, which influence policy-relevant
| 156 |
outcome behaviours (Fong, Cummings, Borland et al., 2006). Our study showed
that smokers’ attitudes towards smoking and perceived societal approval of
smoking were partial mediators of the relationship between support for the ban
and SHS harm awareness on smoking in bars post-ban. Support for the ban and
SHS harm awareness also had a direct influence on smoking in bars post-ban. This
suggests that increasing support for the ban and SHS harm awareness can lead to
less smoking in bars post-ban, even when attitudes and norms about smoking are
not affected.
There were some differences between countries in the predictors of smoking
in bars post-ban. Greater support for the ban was a stronger predictor in Germany.
As the German smoke-free law allows smoking rooms as well as smoking in small
bars, smokers from Germany have more options regarding bars than smokers from
Ireland, France, and the Netherlands. German smokers can either go to a smoke-
free bar, to a bar with a smoking room or to a smoking bar, and this decision would
likely influence their smoking behaviour during the time spent at the bar. Assuming
that support for the ban reflects preferences regarding smoke-free bar legislation,
German smokers supporting smoke-free bars would be more likely to go to smoke-
free bars and thus be less likely to smoke in bars.
Smokers with a low educational level were more likely than smokers with
a high educational level to smoke in bars post-ban. The predictors of smoking
in bars post-ban were also different between smokers from different educational
levels. In Germany and the Netherlands, SHS harm awareness was a stronger
predictor among less educated smokers. This suggests that smoking in bars post-
ban can be decreased among lower SES smokers by communicating about the
harm of smoking to others. This is especially urgent for the Netherlands, where
only 1 percent of low educated smokers thinks very often about the harm of their
smoking to others (compared to 19% of Irish, 17% of French, and 9% of German
low educated smokers).
Limitations
The primary strength of the ITC Project is that findings in one country can be compared
with findings in another country (Fong, Cummings, Borland et al., 2006). In a perfect
world, the ITC Europe surveys used in this study would have been conducted
in parallel, while using exactly the same questions and methods. Unfortunately,
practical issues prevented us from doing so. The survey months and years and
the time intervals between waves and between the ban and post-ban waves were
different between countries, there were demographic differences between countries
and the interviewing methods were different for the ITC Netherlands survey.
| 157 |
chapter 9 | Smoking in bars after smoke-free legislation
Although we recommend standardisation of the methods between countries for
future research, we expect the influence of these inconsistencies on the pattern of
results of the study to be only minor.
Another issue is that it might be perceived as socially undesirable to smoke
in bars when there is legislation that bans smoking. Therefore, the point estimates
of smoking in bars post-ban presented in this study could be an underestimation
of the actual figures. Fortunately, we not only asked about whether smokers have
smoked themselves in a bar post-ban, but also about whether they have seen other
people smoking. These figures are indeed slightly higher, but show a corresponding
pattern: Ireland self = 3%, others = 5%, France self = 3%, others = 4%, Netherlands
self = 34%, others = 36%, Germany self = 44%, others = 50%.
Furthermore, younger smokers had lower follow-up rates. Since younger
smokers were more likely to smoke in bars post-ban, this could have led to an
underestimation of the point estimates of smoking in bars post-ban.
Conclusion
In Ireland and France, comprehensive smoke-free legislation almost completely
eliminated smoking in bars post-ban. In contrast, the partial legislation in the
Netherlands and Germany was much less successful, although this legislation did
reduce smoking in bars. Smokers who were more supportive of the ban, were more
aware of the harm of SHS, and who had negative opinions of smoking were less likely
to smoke in bars post-ban. The results indicate the need for strong comprehensive
smoke-free legislation without exceptions. This should be accompanied by
educational campaigns in which the public health rationale for the legislation is
clearly explained.

“Identifying the mechanisms through which
tobacco control policies operate will provide tools
for reducing the harms of tobacco use that could
be employed even in the absence of changes in
policies, or to increase the effectiveness of policies
that are being implemented.” (Geoffrey Fong)
| 158 |
Chapter 10
~~~
Explaining the effect of smoke-free legislation on
cessation
Published as:
Nagelhout, G. E., De Vries, H., Fong, G. T., Candel, M. J. J. M.,
Thrasher, J. F., Van den Putte, B., Thompson, M. E., Cummings, K. M.,
& Willemsen, M. C. Pathways of change explaining the effect of smoke-
free legislation on smoking cessation in the Netherlands. An application
of the International Tobacco Control (ITC) Conceptual Model. Nicotine
& Tobacco Research. Published Online First: 5 April 2012.
| 159 |

| 160 |
This study aims to test the pathways of change from individual exposure
to smoke-free legislation on smoking cessation, as hypothesised in
the International Tobacco Control (ITC) Conceptual Model. A nationally
representative sample of Dutch smokers aged 15 years and older was
surveyed during four consecutive annual surveys. Of the 1,820 baseline
smokers, 1,012 participated in the fourth survey. Structural Equation
Modelling was employed to test a model of the effects of individual
exposure to smoke-free legislation through policy-specific variables
(support for smoke-free legislation and awareness of the harm of (second-
hand) smoking) and psychosocial mediators (attitudes, subjective norm,
self-efficacy, and intention to quit) on quit attempts and quit success.
The effect of individual exposure to smoke-free legislation on smoking
cessation was mediated by one pathway via support for smoke-free
legislation, attitudes about quitting, and intention to quit smoking.
Exposure to smoke-free legislation also influenced awareness of the harm
of (second-hand) smoking, which in turn influenced the subjective norm
about quitting. However, only attitudes about quitting were significantly
associated with intention to quit smoking, whereas subjective norm and
self-efficacy for quitting were not. Intention to quit predicted quit attempts
and quit success, and self-efficacy for quitting predicted quit success.
Our findings support the ITC Conceptual Model which hypothesised that
policies influence smoking cessation through policy-specific variables
and psychosocial mediators. Smoke-free legislation may increase
smoking cessation provided that it succeeds in influencing support for
the legislation.
AB
STR
AC
T

| 161 |
chapter 10 | Explaining the effect of smoke-free legislation on cessation
INTRODUCTION
Tobacco smoke pollution (TSP or second-hand smoke) can cause death, disease,
and disabilities in non-smokers (World Health Organization, 2003). TSP accounts
for about 600,000 deaths a year among non-smokers (Öberg, Jaakkola, Woodward,
Peruga, & Prüss-Ustün, 2011). To protect non-smokers from this risk, many countries
have implemented smoke-free legislation that bans smoking in indoor workplaces
and public places. A review on smoke-free legislation reported that some studies
found a positive effect on smoking cessation, whereas other studies did not find
this effect (Callinan et al., 2010). A recent study using data from 21 jurisdictions
(countries, states, and provinces) that implemented smoke-free legislation in public
places found evidence of a decrease in smoking prevalence in eight jurisdictions but
no change in the other 13 (Bajoga, Lewis, McNeill, & Szatkowski, 2011). Knowledge
about the pathways of change explaining the effect of smoke-free legislation on
smoking cessation may help in understanding why smoke-free legislation increases
smoking cessation in some circumstances and not in others.
The International Tobacco Control (ITC) Conceptual Model is a model
that explicitly describes the pathways of change from tobacco control policies to
smoking cessation (Fong, Cummings, Borland et al., 2006). According to the ITC
Conceptual Model, tobacco control policies influence individuals by first influencing
factors that are most proximal (conceptually closest) or most specifically related
to the policy itself. These factors are called policy-specific variables and include
variables like warning label salience, perceived costs of cigarettes, and support
for smoke-free legislation. Policy-specific variables in turn influence psychosocial
mediators. Psychosocial mediators in the ITC Conceptual Model have been taken
from various social cognitive models. These models assume that behaviour is
the result of intentions and intentions in turn, are the result of three main types of
factors: attitudes, subjective norms, and self-efficacy (e.g. Ajzen, 1991; De Vries &
Mudde, 1998). Finally, changes in psychosocial mediators are expected to influence
policy-relevant outcomes, such as quit attempts and quit success.
To date, no published studies have reported on a test of the full causal chain
explaining the effect of individual exposure to smoke-free legislation on smoking
cessation (see Figure 1). Most studies have focused on the effects of implementing
smoke-free legislation on support for smoke-free legislation and awareness of the
harm of (second-hand) smoking (policy-specific variables). These studies mainly
found that exposure to smoke-free legislation increases support for smoke-free
legislation without examining how such support translates into changes in smoking
behaviour (Borland, Yong, Siahpush et al., 2006; Brown et al., 2009; Fong, Hyland
et al., 2006; Hyland, Higbee et al., 2009; Mons et al., 2012; Thrasher et al., 2009;

| 162 |
Thrasher, Pérez-Hernández et al., 2010; Thrasher, Swayampakala et al., 2010).
Some studies have also found associations of exposure to smoke-free legislation
with awareness of the harm of smoking and second-hand smoking (Hyland, Higbee
et al., 2009; Thrasher, Pérez-Hernández et al., 2010), while other studies have shown
that support for smoke-free legislation is associated with awareness of the harm of
second-hand smoking (Borland, Yong, Siahpush et al., 2006; Mons et al., 2012).
Some studies have examined the effects of support for smoke-free legislation on
attitudes, subjective norms, and self-efficacy (psychosocial mediators). It was
found that support for smoke-free legislation was associated with attitudes (Macy
et al., 2012; Nagelhout, Mons et al., 2011; Thrasher, Besley, & González, 2010) and
subjective norms (Brown et al., 2009; Macy et al., 2012; Nagelhout, Mons et al.,
2011; Thrasher et al., 2009) about smoking and quitting. These in turn increased
intentions to quit smoking (Brown et al., 2009; Macy et al., 2012), but effects on
smoking cessation were not studied.
For the current study, a nationally representative sample of smokers
participating in the ITC Netherlands Survey was surveyed at four consecutive years
before and after the implementation of smoke-free hospitality industry legislation in
July 2008. Although the implementation of smoke-free legislation went relatively well
in restaurants, there were considerable problems with the implementation in bars
(Mons et al., 2012; Nagelhout, Mons et al., 2011). High levels of non-compliance
and low levels of societal and political support eventually led to a partial reversal
of the smoke-free legislation in small, owner-run bars at the end of 2010. Possibly
due to the problems with bars, the smoke-free hospitality industry legislation had
only a small impact on smoking cessation, without significantly reducing smoking
prevalence (Nagelhout, Willemsen et al., 2011).
The aim of the current study was to apply the ITC Conceptual Model on
pathways of change explaining the effect of individual exposure to smoke-free
legislation on smoking cessation. Based on the ITC Conceptual Model and previous
literature, we hypothesise that smoke-free legislation influences smoking cessation
by first increasing support and harm awareness (policy-specific variables) and in turn
increasing attitudes, subjective norms, and self-efficacy for quitting (psychosocial
mediators).
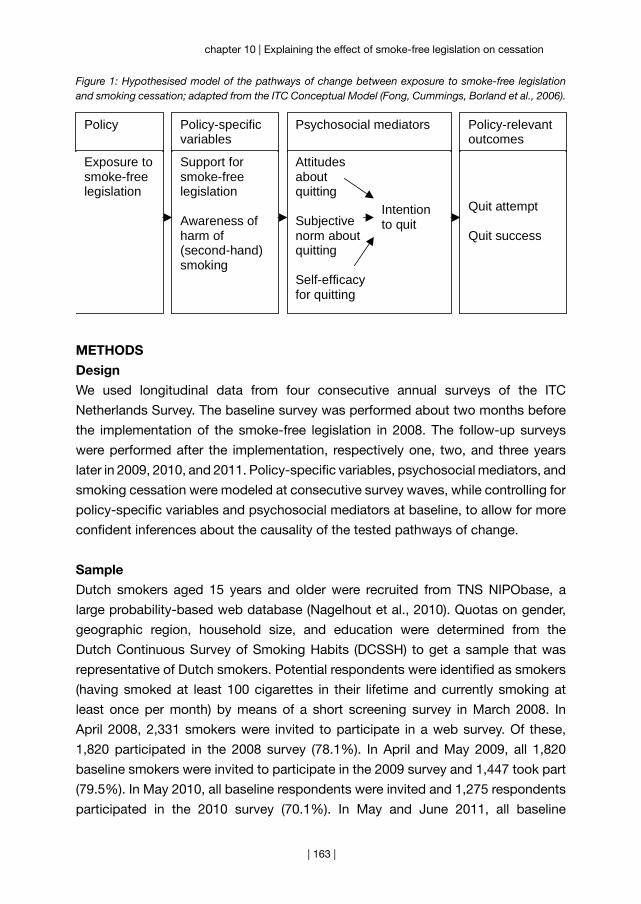
| 163 |
chapter 10 | Explaining the effect of smoke-free legislation on cessation
Figure 1: Hypothesised model of the pathways of change between exposure to smoke-free legislation and smoking cessation; adapted from the ITC Conceptual Model (Fong, Cummings, Borland et al., 2006).
Policy-specificvariables
Psychosocial mediators Policy-relevantoutcomes
Policy
Quit attempt
Quit success
Exposure tosmoke-freelegislation
Support forsmoke-freelegislation
Awareness ofharm of(second-hand)smoking
Attitudesaboutquitting
Subjectivenorm aboutquitting
Self-efficacyfor quitting
Intentionto quit
METHODS
Design
We used longitudinal data from four consecutive annual surveys of the ITC
Netherlands Survey. The baseline survey was performed about two months before
the implementation of the smoke-free legislation in 2008. The follow-up surveys
were performed after the implementation, respectively one, two, and three years
later in 2009, 2010, and 2011. Policy-specific variables, psychosocial mediators, and
smoking cessation were modeled at consecutive survey waves, while controlling for
policy-specific variables and psychosocial mediators at baseline, to allow for more
confident inferences about the causality of the tested pathways of change.
Sample
Dutch smokers aged 15 years and older were recruited from TNS NIPObase, a
large probability-based web database (Nagelhout et al., 2010). Quotas on gender,
geographic region, household size, and education were determined from the
Dutch Continuous Survey of Smoking Habits (DCSSH) to get a sample that was
representative of Dutch smokers. Potential respondents were identified as smokers
(having smoked at least 100 cigarettes in their lifetime and currently smoking at
least once per month) by means of a short screening survey in March 2008. In
April 2008, 2,331 smokers were invited to participate in a web survey. Of these,
1,820 participated in the 2008 survey (78.1%). In April and May 2009, all 1,820
baseline smokers were invited to participate in the 2009 survey and 1,447 took part
(79.5%). In May 2010, all baseline respondents were invited and 1,275 respondents
participated in the 2010 survey (70.1%). In May and June 2011, all baseline
| 164 |
respondents were invited and 1,012 respondents participated in the 2011 survey
(55.6%). The respondents received compensation for their participation in each
survey by earning points for every answered question, as is standard procedure in
the TNS NIPObase web panel. The points could be exchanged for money, which
ranged between 5 and 7 Euros for each survey.
Measurements
Control variables (2008)
Control variables were gender, age group, educational level, heaviness of smoking,
smoking status, and attempts to quit smoking in the last year. These variables
were assessed at the 2008 survey. Age was categorised as 15 to 24, 25 to 39,
40 to 54, and 55 years and older. Education was categorised in three levels: low
(primary education and lower pre-vocational secondary education), moderate
(middle pre-vocational secondary education and secondary vocational education),
and high (senior general secondary education, (pre-)university education and higher
professional education). The Heaviness of Smoking Index (HSI) was created as the
sum of two categorised measures: number of cigarettes per day and time before
smoking the first cigarette of the day (Heatherton et al., 1989). HSI values ranged
from 0 to 6 and were positively associated with nicotine dependence. Smoking
status was categorised as daily smoker versus occasional smoker. Attempts to
quit smoking were categorised as attempted to quit in the last year versus did not
attempt to quit in the last year.
Individual exposure (2009)
Not all individuals were exposed to the smoke-free legislation, because not all
hospitality industry venues complied with the legislation and not all individuals
visited hospitality industry venues. Individual exposure to smoke-free legislation
was assessed using the questions “Which of the following best describes the rules
about smoking in bars where you live?” and “Which of the following best describes
the rules about smoking in restaurants where you live?” Response categories were
“No rules or restriction” (0), “Smoking is allowed only in some indoor areas” (1), and
“Smoking is not allowed in any indoor area” (2). Respondents who had not visited
bars or restaurants or did not know the rules about smoking were placed in the
category “no rules or restrictions”. The two questions were also used in previous
research to assess exposure to smoking restrictions (Hammond et al., 2006).
Policy-specific variables (2008, 2009)
Consistent with previous research (Nagelhout, Van den Putte et al., 2012), support
for smoke-free legislation was assessed using the questions “Do you support or
oppose a complete Dutch smoking ban in bars?” and “Do you support or oppose a
| 165 |
chapter 10 | Explaining the effect of smoke-free legislation on cessation
complete Dutch smoking ban in restaurants?” Response categories were “Strongly
oppose” (1), “Oppose” (2), “Support” (3), and “Strongly support” (4). Cronbach’s
Alpha was 0.72.
Awareness of the harm of (second-hand) smoking was measured with two
questions “In the last month, how often, if at all, did you think about the harm your
smoking might be doing to you?” and “In the last month, how often, if at all, did you
think about the harm your smoking might be doing to other people?” (Nagelhout,
Van den Putte et al., 2012). Response categories were “Never” (1), “Rarely” (2),
“Sometimes” (3), “Often” (4), and “Very often” (5). Cronbach’s Alpha was 0.67.
Psychosocial mediators (2008, 2010)
Attitudes about quitting were assessed using the question “If you quit smoking
within the next 6 months, this would be…” Respondents could answer on three
5-point scales whether they thought this would be wise or unwise, pleasant or
unpleasant, and positive or negative (Van den Putte, Yzer, Brunsting, & Willemsen,
2005). Cronbach’s Alpha was 0.87.
Subjective norm about quitting was measured with the question “How do
you think that most of the people who are important to you would feel about your
quitting smoking within the next 6 months?” (Van den Putte, Yzer, & Brunsting,
2005). Response categories were “Strongly disapprove” (1), “Disapprove” (2),
“Neutral” (3), “Approve” (4), “Strongly approve” (5).
Self-efficacy for quitting was measured using the questions “Suppose you
want to quit smoking within the next 6 months, will you be able to resist smoking
when: ..you just woke up?”, “..you have experienced something annoying?”, “..you
are having a cup of coffee or tea?”, “..you are drinking alcohol?”, “..you are offered
a cigarette?” (Hoving, Mudde, & De Vries, 2006). Response categories were “I
will certainly not be able” (1), “I will probably not be able” (2), “Maybe I will be
able, maybe not” (3), “I will probably be able” (4), and “I will certainly be able” (5).
Cronbach’s Alpha was 0.88.
Intention to quit was assessed with a single question: “Are you planning
to quit smoking: ..within the next month?” (4), “..within the next 6 months?” (3),
“..sometime in the future, beyond 6 months” (2), “..or are you not planning to quit?”
(1) (De Vries, Mudde, Dijkstra, & Willemsen, 1998).
Policy-relevant outcomes (2011)
Whether respondents had attempted to quit smoking was measured with the
question: “Have you made any attempts to stop smoking since the last survey?”
(Hyland, Borland et al., 2006).
Quit success was assessed by asking respondents who had attempted to
quit whether they were back to smoking or still stopped. Respondents who where
| 166 |
still stopped, or who were back to smoking, but reporting smoking less than once
a month, were defined as successful quitters. Respondents who did not attempt
to quit, or who were back to smoking more than once a month, were defined as
smokers (Hyland, Borland et al., 2006).
Ethics
The ITC Netherlands surveys received ethics clearance from the Research Ethics
Board of the University of Waterloo and the Central Committee on Research
Involving Human Subjects in the Netherlands.
Analyses
Attrition analyses, sample characteristics, and correlation analyses were performed
with SPSS version 17.0. For the correlation analyses, all variables were treated as
continuous variables.
Structural Equation Modelling was performed using Mplus version 5.21
(Muthén & Muthén, 2007), while employing weighted least square parameter
estimates. Model fit was assessed using the Comparative Fit Index (CFI), the Tucker-
Lewis-Index (TLI), and the Root-Mean-Square Error of Approximation (RMSEA). For
a satisfactory model fit, the CFI and TLI should be above 0.90, and the RMSEA
should be under 0.05 (Hox & Bechger, 1998). All respondents who participated in
the 2008 and 2011 survey (n = 1,012) were included in the analyses. Respondents
who had quit smoking successfully before the 2011 survey were not asked the
questions about psychosocial mediators at the 2010 survey and smoking cessation
at the 2011 survey. These respondents could be included in the model because
Mplus can use all available information from all observed (including incomplete)
cases.4 All analyses were weighted by age and gender to be representative of the
smoker population in the Netherlands.
We tested a model of the effects of individual exposure to smoke-free
legislation in 2009 on quit attempts and quit success in 2011 through policy-
specific variables in 2009 and psychosocial mediators in 2010. We controlled for
the above mentioned control variables in 2008 and the policy-specific variables
and psychosocial mediators, all as measured in 2008. Exposure to smoke-free
legislation, support for smoke-free legislation, harm awareness, attitudes about
quitting, and self-efficacy for quitting were entered as latent constructs and
measured by the indicators as defined in the measurements section. Subjective
4 Additional analyses with only complete cases who responded to all four surveys and did not quit successfully before the 2011 survey (n = 766) resulted in a similar model in which all paths that were significant in the reported model remained significant.
| 167 |
chapter 10 | Explaining the effect of smoke-free legislation on cessation
norm about quitting, intention to quit, quit attempt, quit success, and the control
variables were measured with single items and were thus observed variables.
Support for smoke-free legislation, intention to quit, quit attempt, and quit success
were treated as categorical variables, because they had non-normal distributions.
All other variables had approximately normal distributions and were treated as
continuous variables.
Within the above described model, we tested the significance of the indirect
paths of exposure to smoke-free legislation via all policy-specific variables and
psychosocial mediators to quit attempts and quit success. In a separate model, we
added direct paths from exposure to smoke-free legislation on quit attempts and
quit success to test for full mediation.
RESULTS
Attrition analyses
Of the 1,820 baseline respondents, 1,012 (55.6%) participated in the 2011 survey.
Respondents who participated in the 2011 survey were significantly older (mean
age = 39.3, SD = 15.3) than respondents who did not participate in the 2011 survey
(mean age = 33.9, SD = 15.2) (t = -7.5, p < 0.001). Furthermore, respondents who
participated in the 2011 survey were significantly more likely to be male (χ2 = 8.8, p =
0.003), lower educated (χ2 = 9.1, p = 0.011), and more likely to be a heavier smoker
(t = -2.4, p = 0.017) than respondents who did not participate in the 2011 survey.
Respondents who participated in the 2011 survey and who did not participate in the
2011 survey did not differ on support for smoke-free legislation, harm awareness,
attitudes about quitting, subjective norm about quitting, and intention to quit
smoking in 2008. Respondents who participated in the 2011 survey did have slightly
less self-efficacy for quitting (t = 2.3, p = 0.023).
Sample characteristics
Sample characteristics are shown in Table 1. Most respondents were daily smoker at
baseline. About 23% of respondents reported at the 2008 survey to have attempted
to quit smoking in the previous year. Respondents were mostly not supportive of
smoke-free legislation and not much aware of the harm of (second-hand) smoking.
Most respondents intended to quit smoking sometime in the future. More than one-
third of respondents reported at the 2011 survey to have attempted to quit smoking
in the previous year and almost one fifth quit smoking successfully.
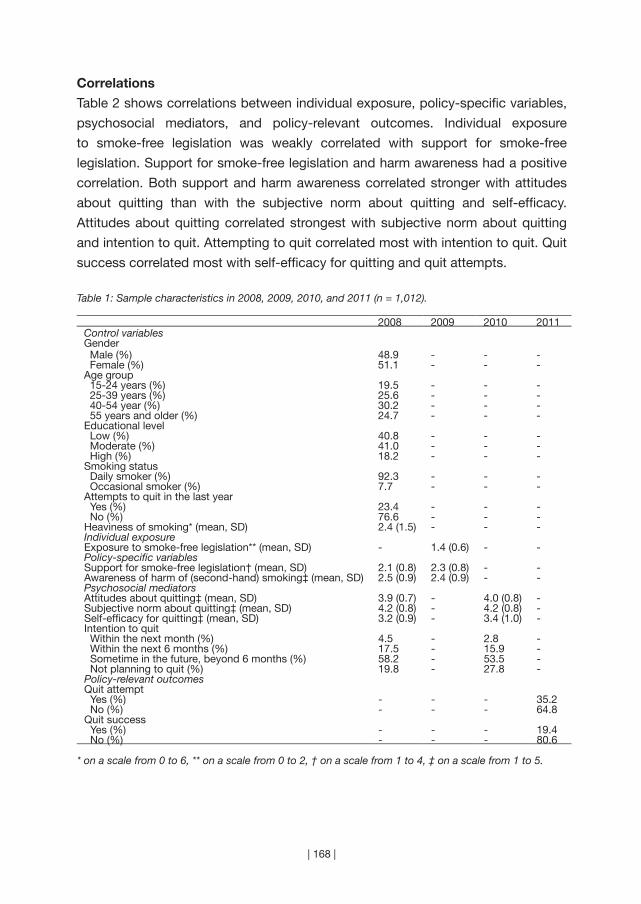
| 168 |
Correlations
Table 2 shows correlations between individual exposure, policy-specific variables,
psychosocial mediators, and policy-relevant outcomes. Individual exposure
to smoke-free legislation was weakly correlated with support for smoke-free
legislation. Support for smoke-free legislation and harm awareness had a positive
correlation. Both support and harm awareness correlated stronger with attitudes
about quitting than with the subjective norm about quitting and self-efficacy.
Attitudes about quitting correlated strongest with subjective norm about quitting
and intention to quit. Attempting to quit correlated most with intention to quit. Quit
success correlated most with self-efficacy for quitting and quit attempts.
Table 1: Sample characteristics in 2008, 2009, 2010, and 2011 (n = 1,012).
2008 2009 2010 2011Control variablesGender Male (%) 48.9 - - - Female (%) 51.1 - - -Age group 15-24 years (%) 19.5 - - - 25-39 years (%) 25.6 - - - 40-54 year (%) 30.2 - - - 55 years and older (%) 24.7 - - -Educational level Low (%) 40.8 - - - Moderate (%) 41.0 - - - High (%) 18.2 - - -Smoking status Daily smoker (%) 92.3 - - - Occasional smoker (%) 7.7 - - -Attempts to quit in the last year Yes (%) 23.4 - - - No (%) 76.6 - - -Heaviness of smoking* (mean, SD) 2.4 (1.5) - - -Individual exposureExposure to smoke-free legislation** (mean, SD) - 1.4 (0.6) - -Policy-specific variablesSupport for smoke-free legislation† (mean, SD) 2.1 (0.8) 2.3 (0.8) - -Awareness of harm of (second-hand) smoking‡ (mean, SD) 2.5 (0.9) 2.4 (0.9) - -Psychosocial mediatorsAttitudes about quitting‡ (mean, SD) 3.9 (0.7) - 4.0 (0.8) -Subjective norm about quitting‡ (mean, SD) 4.2 (0.8) - 4.2 (0.8) -Self-efficacy for quitting‡ (mean, SD) 3.2 (0.9) - 3.4 (1.0) -Intention to quit Within the next month (%) 4.5 - 2.8 - Within the next 6 months (%) 17.5 - 15.9 - Sometime in the future, beyond 6 months (%) 58.2 - 53.5 - Not planning to quit (%) 19.8 - 27.8 -Policy-relevant outcomesQuit attempt Yes (%) - - - 35.2 No (%) - - - 64.8Quit success Yes (%) - - - 19.4 No (%) - - - 80.6
* on a scale from 0 to 6, ** on a scale from 0 to 2, † on a scale from 1 to 4, ‡ on a scale from 1 to 5.
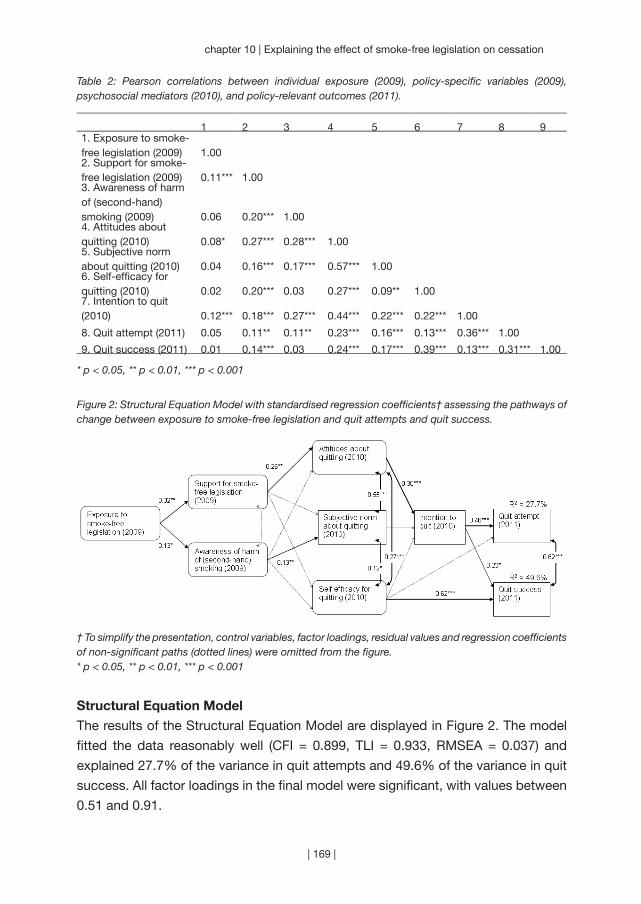
| 169 |
chapter 10 | Explaining the effect of smoke-free legislation on cessation
Table 2: Pearson correlations between individual exposure (2009), policy-specific variables (2009), psychosocial mediators (2010), and policy-relevant outcomes (2011).
1 2 3 4 5 6 7 8 91. Exposure to smoke-free legislation (2009) 1.002. Support for smoke-free legislation (2009) 0.11*** 1.003. Awareness of harm of (second-hand) smoking (2009) 0.06 0.20*** 1.004. Attitudes about quitting (2010) 0.08* 0.27*** 0.28*** 1.005. Subjective norm about quitting (2010) 0.04 0.16*** 0.17*** 0.57*** 1.006. Self-efficacy for quitting (2010) 0.02 0.20*** 0.03 0.27*** 0.09** 1.007. Intention to quit (2010) 0.12*** 0.18*** 0.27*** 0.44*** 0.22*** 0.22*** 1.00
8. Quit attempt (2011) 0.05 0.11** 0.11** 0.23*** 0.16*** 0.13*** 0.36*** 1.00
9. Quit success (2011) 0.01 0.14*** 0.03 0.24*** 0.17*** 0.39*** 0.13*** 0.31*** 1.00
* p < 0.05, ** p < 0.01, *** p < 0.001
Figure 2: Structural Equation Model with standardised regression coefficients† assessing the pathways of change between exposure to smoke-free legislation and quit attempts and quit success.
† To simplify the presentation, control variables, factor loadings, residual values and regression coefficients of non-significant paths (dotted lines) were omitted from the figure.* p < 0.05, ** p < 0.01, *** p < 0.001
Structural Equation Model
The results of the Structural Equation Model are displayed in Figure 2. The model
fitted the data reasonably well (CFI = 0.899, TLI = 0.933, RMSEA = 0.037) and
explained 27.7% of the variance in quit attempts and 49.6% of the variance in quit
success. All factor loadings in the final model were significant, with values between
0.51 and 0.91.

| 170 |
As can be seen in Figure 2, exposure to smoke-free legislation was associated
with more support for smoke-free legislation (β = 0.32, p = 0.007) and more harm
awareness (β = 0.13, p = 0.034). More support for smoke-free legislation predicted
positive attitudes about quitting (β = 0.26, p = 0.004), while more harm awareness
predicted a stronger subjective norm about quitting (β = 0.13, p = 0.023). Positive
attitudes about quitting were associated with more intention to quit smoking (β =
0.30, p < 0.001), while subjective norm about quitting (β = 0.03, p = 0.572) and
self-efficacy for quitting (β = 0.05, p = 0.347) were not significantly associated with
intention to quit after controlling for the other predictors in the model. Intention to
quit predicted quit attempts (β = 0.46, p < 0.001) and quit success (β = 0.23, p =
0.023) and self-efficacy for quitting predicted quit success (β = 0.62, p < 0.001).
Tests of indirect and direct paths
Within the model in Figure 2, we tested the significance of the indirect paths of
exposure to smoke-free legislation via all policy-specific variables and psychosocial
mediators to quit attempts and quit success. There was a borderline significant
indirect path from exposure to smoke-free legislation on quit attempts via support,
attitudes, and intention (β = 0.01, p = 0.059).
In a separate model (not shown), we tested for full mediation by adding
direct paths from exposure to smoke-free legislation on quit attempts and quit
success. Direct paths from exposure to smoke-free legislation to quit attempts (β
= -0.05, p = 0.495) and quit success (β = 0.06, p = 0.447) were non-significant,
suggesting full mediation.
DISCUSSION
The analyses presented in this paper, involving longitudinal data from four
survey waves across three years, represent the most extensive test so far of the
mediational pathways between policy and behaviour that are presented in the ITC
Conceptual Model (Fong, Cummings, Borland et al., 2006). We found support for
the ITC Conceptual Model which hypothesised that policies influence smoking
cessation through policy-specific variables and psychosocial mediators. The effect
of smoke-free legislation on smoking cessation was mediated by one pathway via
support for smoke-free legislation, attitudes about quitting, and intention to quit
smoking. Smoke-free legislation also influenced the subjective norm about quitting
by creating more awareness of the harm of (second-hand) smoking. Our findings
are largely in line with earlier studies that have tested parts of the causal chain
from exposure to smoke-free legislation on smoking cessation. Consistent with
earlier studies, we found that support for smoke-free legislation and attitudes about
| 171 |
chapter 10 | Explaining the effect of smoke-free legislation on cessation
quitting were crucial factors in increasing intention to quit smoking (Brown et al.,
2009; Macy et al., 2012).
In our model, only attitudes about smoking were significantly associated
with intention to quit smoking, whereas subjective norm and self-efficacy for
quitting were not after controlling for the other predictors in the model. This is
not in line with predictions of social cognitive models (Ajzen, 1991; De Vries &
Mudde, 1998), although a meta-analysis (Armitage & Conner, 2001) did find that
subjective norms were a weaker predictor of intentions than attitudes and self-
efficacy. This meta-analysis also showed that multiple-item measures of subjective
norms were a stronger predictor of intentions than single-item measures, which
may explain our results. Although this was also found in an earlier study (Bledsoe,
2006), it is unclear why self-efficacy was not significantly associated with intention
after controlling for the other predictors in the model. A meta-analysis showed that
attitudes, subjective norms, self-efficacy, and intention explain 27% of the variance
in behaviour (Armitage & Conner, 2001). Our explained variance was similar for quit
attempts (28%), but much higher for quit success (50%). This may be caused by
the strong direct effect from self-efficacy on quit success, which is consistent with
predictions of social cognitive models. Consistent with earlier studies (Borland et
al., 2010; Hyland, Borland et al., 2006; Zhou et al., 2009), intention to quit was a
stronger predictor of quit attempts than of quit success.
Earlier studies that examined the direct effects of smoke-free legislation on
smoking behaviour found positive effects in some jurisdictions and not in others
(Bajoga et al., 2011; Callinan et al., 2010). Earlier ITC studies have also found
inconsistent evidence of an effect of smoke-free legislation on smoking cessation
(Cooper et al., 2010; Fong, Hyland et al., 2006; Hyland, Hassan et al., 2009;
Nagelhout, De Vries, Boudreau et al., 2012). The current study sheds some light on
psychosocial factors that mediate the effects of smoke-free legislation on smoking
cessation, that is, if the legislation is not supported by smokers and smokers do not
change their attitudes about quitting no effects on cessation are to be expected.
However, behavioural factors like implementing voluntary smoking bans in homes
and cars and complying with smoke-free legislation might also explain why
smoke-free legislation stimulates smoking cessation in some individuals and not
in others. Moreover, implementation characteristics of the smoke-free legislation
may influence whether smoke-free legislation increases smoking cessation. It
is, for example, reported that support for smoke-free legislation increases more
after the implementation of comprehensive than after the implementation of
partial smoke-free legislation (Mons et al., 2012; Thrasher, Swayampakala et al.,
2010). Comprehensive smoke-free legislation may therefore lead to more smoking

| 172 |
cessation than partial legislation. Also, smoke-free legislation that is implemented
with accompanying media attention may lead to more support and harm awareness
(Thrasher et al., 2011; Villalobos et al., 2010). The Dutch smoke-free hospitality
industry legislation was not comprehensive and was accompanied by unsupportive
media attention and an implementation campaign that did not emphasise the harm
of (second-hand) smoking (Nagelhout, Van den Putte et al., 2012). More research
is needed on the relations between psychosocial factors, behavioural factors, and
implementation characteristics, and how they account for smoke-free legislation
effects on smoking cessation.
This study has some important strengths. It is the first study to examine the
full causal chain explaining the effect of individual exposure to smoke-free legislation
on smoking cessation. The longitudinal nature of the study with four survey waves
and a relatively large sample of smokers allows for more confident inferences about
the causality of the tested pathways of change. However, there are several limitations
that deserve to be acknowledged. First, we were only able to retain half of the
baseline respondents over four survey waves which could introduce selection bias
into the inferences from this study. Respondents lost to follow-up were more likely
to be younger, female, higher educated, less heavy smokers, and had slightly more
self-efficacy for quitting. Therefore, our results may not be fully generalisable to the
broader population of Dutch smokers. Furthermore, because we used self-reported
measures we could not objectively determine exposure to smoke-free legislation
and smoking cessation. People may have been exposed to smoke-free legislation
without remembering this at the time of the survey. Also, exposure may take place
without actually visiting the hospitality industry, for example by media attention. The
main aim of our modelling strategy, using four waves, was to infer causality of the
hypothesised relationships in the ITC Conceptual Model. This has the drawback of
being unable to account for short-term effects of smoke-free legislation on smoking
cessation. Because modeled effects on policy-specific variables, psychosocial
mediators, and smoking cessation are spread over the course of several years, the
found total effect may be smaller than the actual total effect, which suggests that
our results are conservative.
Our results may not be fully generalisable to other countries because of
differences in smoke-free legislation. Because the smoke-free legislation in Germany
is comparable to the Netherlands (Nagelhout, Mons et al., 2011), we expect that the
results are generalisable to Germany. However, the results may not be generalisable
to countries where smoke-free legislation is more comprehensive, which may lead
to stronger effects than found in our study. For example, in Ireland and England
stronger effects on smoking cessation were found after implementation of a more
| 173 |
chapter 10 | Explaining the effect of smoke-free legislation on cessation
comprehensive ban (Nagelhout, De Vries, Boudreau et al., 2012).
Our findings have important implications for smoke-free policy
implementation and development of accompanying media campaigns. Our study
shows that support for smoke-free legislation and attitudes about quitting are crucial
factors in increasing intention to quit smoking after the implementation of smoke-
free legislation. This suggests that the countries where smoke-free legislation
had a positive effect on smoking cessation are the countries where support for
the legislation and attitudes about quitting increased the most. Although more
(ecological) research is needed to examine this hypothesis, anecdotal evidence from
Ireland (Currie & Clancy, 2010) and Greece (Tamvakas & Amos, 2010) has already
pointed out that support for the legislation is an important factor in the success of
smoke-free legislation. Therefore, countries should actively aim to increase support
for the legislation and attitudes about quitting, for example through accompanying
media campaigns and media advocacy.

| 174 |
Part 3
~~~
Unintended consequences of smoke-free legislation
| 175 |

“An hour a day in a room with a smoker is
nearly a hundred times more likely to cause lung
cancer in a non-smoker than 20 years spent in a
building containing asbestos.” (Sir Richard Doll)
| 176 |
Chapter 11
~~~
Smoke-free legislation and smoking in smokers’ homes
Published as:
Mons, U., Nagelhout, G. E., Allwright, S., Guignard, R., Van den Putte,
B., Willemsen, M. C., Fong, G. T., Brenner, H., Pötschke-Langer, M.,
& Breitling, L. P. Impact of national smoke-free legislation on home
smoking bans: Findings from the International Tobacco Control (ITC)
Policy Evaluation Project Europe Surveys. Tobacco Control. Published
Online First: 13 February 2012.
| 177 |
| 178 |
The aim of this study was to measure changes in prevalence and
predictors of home smoking bans (HSB) among smokers in four European
countries after the implementation of national smoke-free legislation. We
used two waves of the International Tobacco Control Policy Evaluation
Project (ITC Project) Europe Surveys, which is a prospective panel study.
Pre- and post-legislation data was used from Ireland, France, Germany,
and the Netherlands. Two pre-legislation waves from UK were used as
control. 4,634 respondents from the intervention countries and 1,080 from
the control country completed both baseline and follow-up, and were
included in the present analyses. Multiple logistic regression models to
identify predictors of having or of adopting a total HSB, and Generalised
Estimating Equation (GEE) models to compare patterns of change after
implementation of smoke-free legislation to a control country without
such legislation. Most smokers had at least partial smoking restrictions
in their home, but the proportions varied significantly between countries.
After implementation of national smoke-free legislation, the proportion
of smokers with a total HSB increased significantly in all four countries.
Among continuing smokers the number of cigarettes smoked per day
either remained stable or decreased significantly. Multiple logistic
regression models indicated that having a young child in the household
and supporting smoking bans in bars were important correlates of
having a pre-legislation HSB. Prospective predictors of imposing a HSB
between survey waves were planning to quit smoking, supporting a total
smoking ban in bars, and the birth of a child. GEE models indicated that
the change in total HSB in the intervention countries was greater than
in the control country. The findings suggest that smoke-free legislation
does not lead to more smoking in smokers’ homes. On the contrary, our
findings demonstrate that smoke-free legislation may stimulate smokers
to establish total smoking bans in their homes.
AB
STR
AC
T
| 179 |
chapter 11 | Smoke-free legislation and smoking in smokers’ homes
INTRODUCTION
For children, exposure to secondhand smoke (SHS) is an important health risk. SHS
impairs their respiratory system and can cause severe and chronic diseases such as
asthma and bronchitis (Cheraghi & Salvi, 2009; Royal College of Physicians, 2010).
Especially in early childhood, the home environment is usually the main source of
exposure to SHS (Akhtar, Haw, Currie, Zachary, & Currie, 2009). But while workplace
and public smoking bans have been proven to be successful in reducing exposure
to SHS in public areas (Callinan et al., 2010), private homes cannot be directly
targeted by measures such as smoke-free legislation. They might nevertheless be
indirectly affected.
Two competing hypotheses regarding possible influences of public smoking
bans on smoking at home have been put forward (Borland, Yong, Cummings et al.,
2006). According to the displacement hypothesis or ‘last refuge model’, smoking
bans in public places would lead to more smoking in the home and hence to
increased SHS exposure of non-smoking family members and children. Under
this hypothesis, an increase in SHS-related diseases would be expected as an
unintended detrimental consequence of smoke-free legislation. The social diffusion
hypothesis, in contrast, suggests that more restrictive rules regarding smoking in
public places would increase the likelihood of householders imposing voluntary
home smoking restrictions.
Whereas two empirical studies from the US and from Hong Kong support
the displacement hypothesis (Adda & Cornaglia, 2010; Ho et al., 2010), recent
studies from Scotland, Wales, Ireland, and New Zealand evaluating the effects of
smoke-free legislation found no increase in exposure to SHS in non-smoking family
members and children due to displacement of smoking into the private home, and
no increase of smoking at home (Akhtar, Currie, Currie, & Haw, 2007; Akhtar et al.,
2009; Edwards et al., 2009; Edwards et al., 2008; Fong, Hyland et al., 2006; Haw &
Gruer, 2007; Holliday, Moore, & Moore, 2009; Hyland, Hassan et al., 2009; Hyland
et al., 2008; Jarvis, Sims, Gilmore, & Mindell, 2012). Of these studies, only two are
based on longitudinal data (Fong, Hyland et al., 2006; Hyland et al., 2008).
The recent implementation of pertinent legislation in several European
countries provides an unprecedented opportunity to examine this topic in a broader
European setting in order to allow better informed decisions by policymakers. Unique
prospective data from the Europe Surveys of the International Tobacco Control
Policy Evaluation Project (ITC Project) were analysed, based on representative
surveys in Ireland, France, Germany, and the Netherlands conducted shortly before
and after the implementation of smoke-free legislation. We examined the numbers
of cigarettes smoked at home, and prevalence and predictors of home smoking

| 180 |
bans (HSB) before and after implementation of smoke-free legislation. Additionally,
the pattern of change in the rate of HSB in these countries was compared to pre-
legislation data from the United Kingdom (UK) as a control country.
METHODS
Study design and study participants
The ITC Europe Surveys are part of the ITC Project (www.itcproject.org), which
is committed to evaluating the psychosocial and behavioural effects of tobacco
control policies throughout the world. All ITC surveys are based on the same
conceptual framework and methods and use standardised survey questionnaires
(Fong, Cummings, Borland et al., 2006; Thompson et al., 2006).
The ITC Europe Surveys are conducted with probability samples of smokers
aged 18 years and older, with smokers being defined as having smoked at least
100 cigarettes in their lifetime and currently smoking at least once per month. In
Ireland, France and Germany, respondents were recruited and questioned using
random digit dialling (RDD) and computer-assisted telephone interviews (CATI)
only. In the Netherlands, the sample consisted of a small RDD CATI sample and
a larger computer-assisted web interview sample (CAWI). The CAWI sample was
drawn from a large probability-based database with potential respondents who
had been recruited by phone or mail and who had indicated their willingness to
participate in research on a regular basis. Whereas the two Dutch samples showed
small differences in socio-demographics and smoking behaviour (Nagelhout et al.,
2010), there were no significant differences with regard to HSB prevalence at pre-
legislation (χ2 = 4.46, p = 0.11) or post-legislation (χ2 = 1.77, p = 0.41); the samples
were thus pooled for the analyses.
Respondents were first interviewed before implementation of the national
smoke-free legislation (pre-legislation surveys). The fieldwork of the post-legislation
measurements started about 8 months after implementation of the hospitality
sector smoke-free legislation in Ireland, France and the Netherlands (Figure 1).
As the starting date of the smoke-free legislation in Germany varied from state to
state, the time gap between introduction of the state legislation and post-legislation
survey varied from 12 to 23 months.
The analyses presented here were based on the longitudinal samples, i.e.
only on those respondents who had been surveyed both pre- and post-legislation.
Of 6,393 smokers interviewed pre-legislation, 4,634 (72.5%) could be followed up
after the implementation of the smoke-free legislation. Country-specific follow-up
rates varied between 66 and 79 percent (Figure 1). For some analyses, sample sizes
were smaller due to missing values for some covariates.
| 181 |
chapter 11 | Smoke-free legislation and smoking in smokers’ homes
In order to address the question of causality, we employed a quasi-experimental
design in additional analyses. We chose UK as a control country, the only other
European country in the ITC Project and the only one for which several pre-legislation
waves are available. In the UK, Scotland introduced a comprehensive smoking ban
in March 2006, Wales and Northern Ireland followed in April 2007, and England
enacted its ban in July 2007. In order to have a pre-legislation observation period as
comparable as possible to the pre- to post-legislation period in the other countries,
we used waves 4 (October 2005 – January 2006) and 5 (October 2006 – February
2007) of the ITC UK survey, but excluded Scotland from the analyses, because they
implemented their smoke-free legislation between these two waves. From 1,581
smoking non-Scotland respondents of ITC UK wave 4, 1,080 could be followed up
at wave 5 and were used for the analyses (follow-up rate: 68.3%).
In order to assess the potential effect of attrition bias, non-responder
analyses were conducted by estimating logistic regression models with the full
baseline samples, and with being lost to follow-up as dependent variable, and
with home smoking restrictions and all covariates as independent variables. In the
intervention countries, these analyses yielded higher odds of being lost to follow-
up in younger age groups (age 18-24 versus age 55+: OR = 1.79, 95% CI = 1.43-
2.24; age 25-39 versus age 55+: OR = 1.54, 95% CI = 1.26-1.88) and lower odds
in married respondents (OR = 0.68, 95% CI = 0.60-0.78). In the control country UK,
younger age groups also had comparably higher odds of being lost to follow-up
(age 18-24 versus age 55+: OR = 2.39, 95% CI = 1.41-4.03; age 25-39 versus age
55+: OR = 1.46, 95% CI = 1.02-2.10). Additionally, higher odds were found among
UK respondents with children aged 6 to 12 (OR = 1.48, 95% CI = 1.05-2.07) and with
children aged 13 to 17 (OR = 1.74, 95% CI = 1.21-2.50), compared to respondents
without children in the household. Furthermore, country-specific non-responder
analyses showed that French respondents with home smoking restrictions pre-
legislation were less likely to be lost to follow-up (total HSB versus no restrictions:
OR = 0.56, 95% CI = 0.38-0.81; partial restrictions versus no restrictions: OR = 0.57,
95% CI = 0.42-0.77).

| 182 |
Figu
re 1
: Fie
ldw
ork
per
iod
s, s
amp
le s
izes
and
follo
w-u
p r
ates
of I
TC s
urve
ys, a
nd im
ple
men
tatio
n d
ates
and
cha
ract
eris
atio
n of
sm
oke-
free
legi
slat
ion.
| 183 |
chapter 11 | Smoke-free legislation and smoking in smokers’ homes
Measures and outcomes
The study included relevant socio-demographic variables, such as gender, age,
marital status, education and the age of children living in the household. A binary
variable referring to the birth of a child between the two survey waves was derived
by using pre- and post-legislation information about the age of children living in the
respondent’s household. Because the Irish survey did not ask about children in the
household at the first post-legislation survey, this item of information was derived
from the second post-legislation survey (fieldwork period: February – March 2006,
i.e. 14 months after the first post-legislation survey).
Smoking-related questions of particular relevance to the present analyses
were cigarette consumption, the Heaviness of Smoking Index (HSI) (Heatherton et
al., 1989), intention to quit smoking, and support for a bar smoking ban. The amount
of cigarettes smoked at home was obtained with asking “When you are spending
an evening at home, about how many cigarettes do you smoke inside your home
during the evening?”, and was used as a continuous variable. Unfortunately, this
measure was not available for Ireland and UK. The frequency of bar visits was
used to assess to what extent respondents would be affected by the smoke-free
policy. Awareness of the harm of SHS was measured by reported agreement with
the statement “Cigarette smoke is dangerous to non-smokers”. For Ireland, the
comparably phrased statement “Your cigarette smoke is dangerous to those around
you” was used.
The rules for smoking at home were assessed by asking, “Which of the
following statements best describes smoking inside your home (inside the home,
not on the balcony or terrace)?” Response choices in France, Germany and the
Netherlands were: “Smoking is allowed anywhere inside your home”, “Smoking is
allowed in some rooms inside your home”, “Smoking is never allowed anywhere
inside your home”, and “Smoking is not allowed inside your home except under
special circumstances”. In Ireland and the UK the response choices were slightly
different: “Smoking is allowed anywhere inside your home”, “Smoking is never
allowed anywhere inside your home”, and “Something in between”. For the bivariate
analyses these statements were translated into three categories: total home smoking
ban (HSB), partial restrictions, and no restrictions. For the multivariate analyses
on having or adopting a HSB, a binary variable was constructed. The statement
“Smoking is never allowed anywhere inside your home” qualified as having a HSB.
Those respondents reporting having partial or no home smoking restrictions were
regarded as having no HSB.
| 184 |
Statistical analyses
Percentages reported for country-specific estimates of home smoking restrictions
and arithmetic means of cigarette consumption were weighted by age and sex to
each country’s resident smoking population of the year of the respective survey.
To assess whether changes in home smoking restrictions were due to smoking
cessation between survey waves, the percentages were also reported for continuing
smokers. McNemar-Bowker-tests of symmetry were used to test for changes
in prevalence of home smoking restrictions. Paired t-tests were used to test for
changes in mean cigarette consumption.
In order to identify factors associated with the presence or adoption of HSB
in smokers, multiple logistic regression models were computed. For predictors of
a HSB at the time of the pre-legislation survey, reporting a HSB at this survey was
the dependent variable. For predictors of adopting a HSB, reporting a HSB at the
post-legislation survey was the dependent variable, while the sample was restricted
to those who had not implemented a HSB at the pre-legislation survey. Except for
‘newborn child’, all predictor variables refer to the pre-legislation measurement.
To test whether patterns of changes in HSB prevalence from pre- to post-
legislation in the four countries examined differed from the control country (UK)
in a comparable period of time, Generalised Estimating Equations (GEE) models
(Hanley et al., 2003; Zeger & Liang, 1986) predicting the presence of a HSB
(binomial distribution; logit link function; exchangeable correlation structure) were
computed separately for Ireland, France, Germany, and the Netherlands, each time
including UK as control. The models were adjusted for socio-demographic time-
invariant covariates reported at baseline (age, gender, education, country) as well
as for socio-demographic time-varying covariates reported at each measurement
(wave, age of youngest child in the household, marital status). The inclusion of
country x wave-interaction allowed us to test whether the change in the presence of
HSB over time significantly differed from the change in the UK as the no-legislation
control country.
The statistical package SAS 9.2 was used for all analyses.
RESULTS
Prevalence of home smoking restrictions
Most smokers had at least partial smoking restrictions in their home at the pre-
legislation survey (Table 1). The proportion of smokers with no home smoking
restrictions was lowest in Germany and in France; and both countries accordingly
also had the highest proportion of smokers with a total HSB. By the post-legislation
measurement, there was an increase in the proportion of total HSB in all four countries
| 185 |
chapter 11 | Smoke-free legislation and smoking in smokers’ homes
among the baseline smokers and a decrease in the proportion with no smoking
restrictions. The relative increases of total HSB were 22% in the control country UK.
In the intervention countries, it was 25% in Ireland, 17% in France, 38% in Germany,
and 28% in the Netherlands. The changes in the proportions followed a similar
pattern in the intervention countries when analysing only continuing smokers, albeit
with somewhat smaller relative increases, suggesting that these changes were not
merely a surrogate for smoking cessation occurring between the survey waves. The
changes in proportions between the time points were statistically significant (p <
0.05) in each country when analysing all baseline smokers, and in all countries but
UK after restriction to continuing smokers. For UK, this suggests that the observed
changes in home smoking restrictions in the overall sample mainly occurred among
smokers who quit between the survey waves.
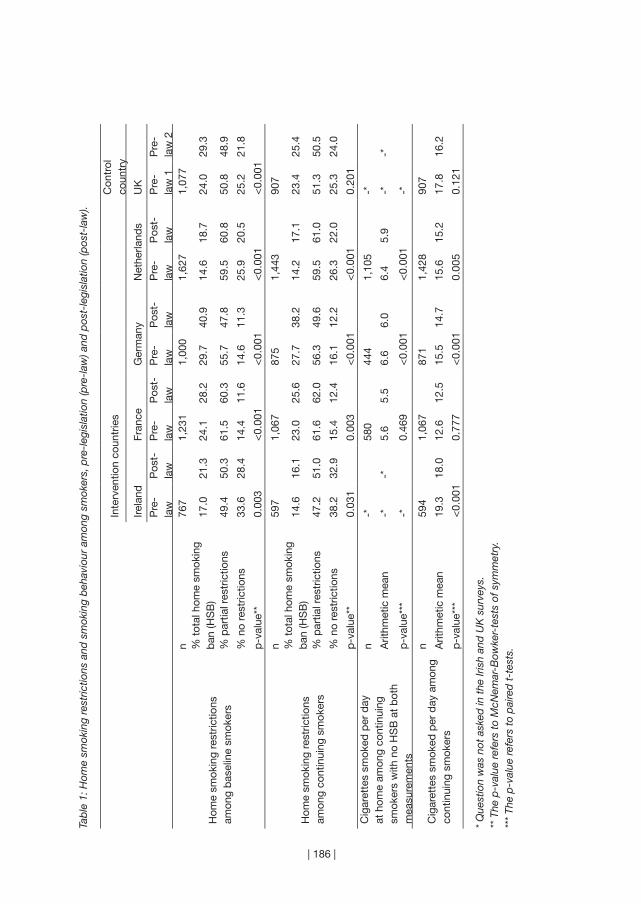
| 186 |
Tab
le 1
: Hom
e sm
okin
g re
stric
tions
and
sm
okin
g b
ehav
iour
am
ong
smok
ers,
pre
-leg
isla
tion
(pre
-law
) and
pos
t-le
gisl
atio
n (p
ost-
law
).
Inte
rven
tion
coun
trie
sC
ontr
ol
coun
try
Irela
ndFr
ance
Ger
man
yN
ethe
rland
sU
K
P
re-
law
Pos
t-la
wP
re-
law
Pos
t-la
wP
re-
law
Pos
t-la
wP
re-
law
Pos
t-la
wP
re-
law
1P
re-
law
2
Hom
e sm
okin
g re
stric
tions
am
ong
bas
elin
e sm
oker
s
n76
71,
231
1,00
01,
627
1,07
7%
tot
al h
ome
smok
ing
ban
(HS
B)
17.0
21.3
24.1
28.2
29.7
40.9
14.6
18.7
24.0
29.3
% p
artia
l res
tric
tions
49.4
50.3
61.5
60.3
55.7
47.8
59.5
60.8
50.8
48.9
% n
o re
stric
tions
33.6
28.4
14.4
11.6
14.6
11.3
25.9
20.5
25.2
21.8
p-v
alue
**0.
003
<0.
001
<0.
001
<0.
001
<0.
001
Hom
e sm
okin
g re
stric
tions
am
ong
cont
inui
ng s
mok
ers
n59
71,
067
875
1,44
390
7%
tot
al h
ome
smok
ing
ban
(HS
B)
14.6
16.1
23.0
25.6
27.7
38.2
14.2
17.1
23.4
25.4
% p
artia
l res
tric
tions
47.2
51.0
61.6
62.0
56.3
49.6
59.5
61.0
51.3
50.5
% n
o re
stric
tions
38.2
32.9
15.4
12.4
16.1
12.2
26.3
22.0
25.3
24.0
p-v
alue
**0.
031
0.00
3<
0.00
1<
0.00
10.
201
Cig
aret
tes
smok
ed p
er d
ay
at h
ome
amon
g co
ntin
uing
sm
oker
s w
ith n
o H
SB
at
bot
h m
easu
rem
ents
n-*
580
444
1,10
5-*
Arit
hmet
ic m
ean
-*-*
5.6
5.5
6.6
6.0
6.4
5.9
-*-*
p-v
alue
***
-*0.
469
<0.
001
<0.
001
-*
Cig
aret
tes
smok
ed p
er d
ay a
mon
g co
ntin
uing
sm
oker
s
n59
41,
067
871
1,42
890
7
Arit
hmet
ic m
ean
19.3
18.0
12.6
12.5
15.5
14.7
15.6
15.2
17.8
16.2
p-v
alue
***
<0.
001
0.77
7<
0.00
10.
005
0.12
1
* Q
uest
ion
was
not
ask
ed in
the
Iris
h an
d U
K s
urve
ys.
** T
he p
-val
ue r
efer
s to
McN
emar
-Bow
ker-
test
s of
sym
met
ry.
***
The
p-v
alue
ref
ers
to p
aire
d t
-tes
ts.
| 187 |
chapter 11 | Smoke-free legislation and smoking in smokers’ homes
Changes in smoking at home
In order to test whether displacement took place among continuing smokers, we
also tested for changes in cigarette consumption (Table 1). Among continuing
smokers with no HSB at both time points, the average number of cigarettes smoked
at home decreased significantly in Germany (0.60, 0.31-0.88) and the Netherlands
(0.52, 0.34-0.69). Cigarette consumption per day decreased significantly (p < 0.05)
in Ireland (mean decrease in cigarettes: 1.29, 95% CI: 0.67-1.91), Germany (0.79,
0.45-1.13) and the Netherlands (0.39, 0.12-0.65).
Predictors of home smoking bans
Smokers who were male, younger, or married were more likely to report having
a HSB at the pre-legislation survey (Table 2), and also smokers supporting a bar
smoking ban, and those strongly agreeing that cigarette smoke is dangerous to
others were more likely to report having a HSB. The presence of young children in
the household was a strong predictor of HSB with a pronounced dose-response
relationship with age of child: the younger the child, the greater the likelihood of
having a HSB. Heaviness of smoking was inversely related to having a HSB. At
pre-legislation, HSBs were significantly less likely among smokers from France, the
Netherlands and Ireland than among smokers from Germany.
The prospective predictors of having adopted a HSB at the post-legislation
survey (in subjects who did not have a HSB pre-legislation) were generally similar
to the predictors of having a HSB at the pre-legislation survey (Table 2). Exceptions
were the increased odds of newly adopting a HSB at the post-legislation survey
among smokers who had reported at the pre-legislation survey an intention to quit
within 1 or 6 months. Although the age of the youngest child at baseline was not
related to the adoption of a HSB, the birth of a child between waves was a strong
predictor.
When the analysis of newly adopting a HSB was restricted to continuing
smokers in order to rule out HSB adoption purely being a consequence of smoking
cessation, the patterns were generally the same (Table 2). However, in this model
only, smokers visiting bars on a monthly basis were significantly more likely to adopt
a HSB than those rarely visiting bars.

| 188 |
Tab
le 2
: Cor
rela
tes
of h
avin
g a
hom
e-sm
okin
g b
an (H
SB
) at t
he p
re-l
egis
latio
n su
rvey
and
pro
spec
tive
pre
dic
tors
* of
ad
optin
g a
HS
B b
etw
een
the
pre
- an
d p
ost-
legi
slat
ion
surv
ey, m
ultip
le lo
gist
ic r
egre
ssio
n an
alys
es. Hav
ing
a H
SB
at
the
pre
-leg
isla
tion
surv
ey
amon
g b
asel
ine
smok
ers
Ad
optin
g a
HS
B b
etw
een
pre
- an
d p
ost-
legi
slat
ion
surv
ey a
mon
g b
asel
ine
smok
ers
with
no
HS
B a
t b
asel
ine
Ad
optin
g a
HS
B b
etw
een
pre
- an
d p
ost-
legi
slat
ion
amon
g co
ntin
uing
sm
oker
s w
ith n
o H
SB
at
bas
elin
e
n =
446
1, e
vent
s =
929
n =
352
8, e
vent
s =
446
n =
307
2, e
vent
s =
322
%A
dju
sted
OR
(9
5% C
I)%
Ad
just
ed O
R
(95%
CI)
%A
dju
sted
OR
(9
5% C
I)
Gen
der
Mal
e24
.51.
78 (1
.51-
2.10
)15
.31.
66 (1
.34-
2.05
)12
.71.
60 (1
.25-
2.05
)
Fem
ale
17.4
1.00
10.4
1.00
8.6
1.00
Age
18-2
427
.42.
90 (2
.08-
4.03
)14
.11.
47 (0
.96-
2.25
)11
.91.
83 (1
.11-
3.02
)
25-3
926
.71.
74 (1
.30-
2.31
)16
.81.
57 (1
.11-
2.21
)14
.31.
79 (1
.19-
2.71
)
40-5
417
.51.
26 (0
.96-
1.66
)10
.20.
95 (0
.69-
1.31
)8.
71.
11 (0
.76-
1.63
)
55+
12.8
1.00
10.5
1.00
7.7
1.00
Ed
ucat
ion
Low
17.5
0.97
(0.7
8-1.
21)
11.3
1.04
(0.7
7-1.
39)
8.7
0.88
(0.6
3-1.
25)
Mod
erat
e22
.21.
03 (0
.84-
1.26
)12
.91.
07 (0
.81-
1.41
)11
.11.
02 (0
.74-
1.39
)
Hig
h24
.11.
0014
.61.
0012
.81.
00
Mar
ital s
tatu
sM
arrie
d22
.91.
43 (1
.19-
1.73
)13
.31.
38 (1
.08-
1.77
)11
.31.
53 (1
.14-
2.03
)
Not
mar
ried
19.0
1.00
12.1
1.00
9.9
1.00
Age
of y
oung
est
child
in
hou
seho
ld
<1
46.8
3.92
(2.5
4-6.
07)
19.0
0.99
(0.4
7-2.
05)
16.0
1.00
(0.4
3-2.
30)
1-5
39.4
3.06
(2.3
8-3.
93)
17.5
1.11
(0.7
6-1.
61)
16.7
1.39
(0.9
1-2.
12)
6-12
25.2
1.77
(1.3
9-2.
25)
13.4
1.05
(0.7
6-1.
46)
11.5
1.11
(0.7
6-1.
62)
13-1
717
.91.
12 (0
.84-
1.49
)11
.11.
01 (0
.70-
1.47
)9.
51.
07 (0
.70-
1.64
)
No
child
ren<
1816
.01.
0012
.01.
009.
51.
00
New
bor
n ch
ildN
ewb
orn
child
--
51.6
6.60
(3.8
3-11
.37)
46.9
6.72
(3.6
3-12
.45)
No
new
bor
n ch
ild-
-11
.91.
009.
91.
00H
eavi
ness
of s
mok
ing*
*In
dex
0.
72 (0
.68-
0.76
)
0.86
(0.8
0-0.
92)
0.
87 (0
.80-
0.95
)
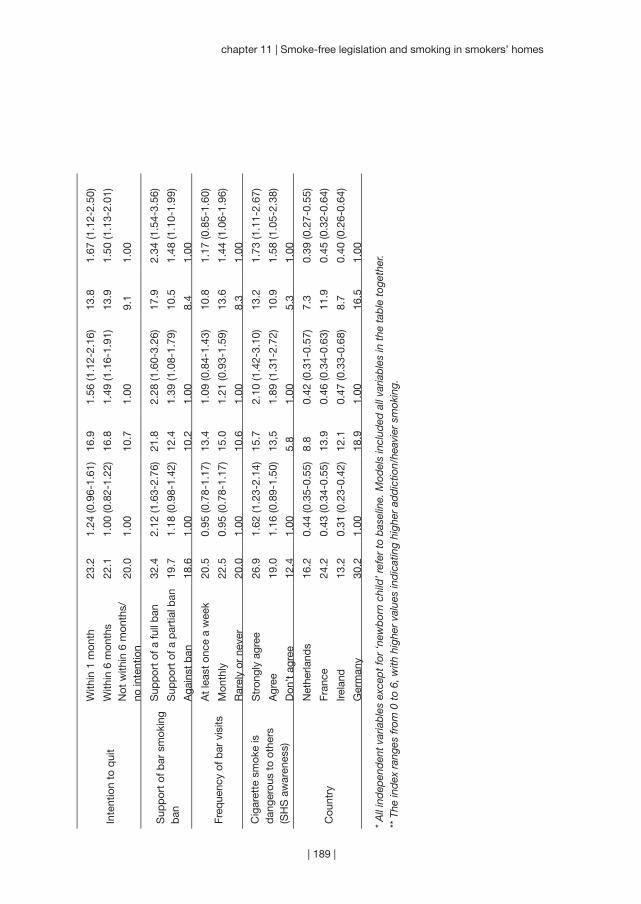
| 189 |
chapter 11 | Smoke-free legislation and smoking in smokers’ homes
Inte
ntio
n to
qui
t
With
in 1
mon
th23
.21.
24 (0
.96-
1.61
)16
.91.
56 (1
.12-
2.16
)13
.81.
67 (1
.12-
2.50
)
With
in 6
mon
ths
22.1
1.00
(0.8
2-1.
22)
16.8
1.49
(1.1
6-1.
91)
13.9
1.50
(1.1
3-2.
01)
Not
with
in 6
mon
ths/
no
inte
ntio
n20
.01.
0010
.71.
009.
11.
00
Sup
por
t of
bar
sm
okin
g b
an
Sup
por
t of
a fu
ll b
an32
.42.
12 (1
.63-
2.76
)21
.82.
28 (1
.60-
3.26
)17
.92.
34 (1
.54-
3.56
)
Sup
por
t of
a p
artia
l ban
19.7
1.18
(0.9
8-1.
42)
12.4
1.39
(1.0
8-1.
79)
10.5
1.48
(1.1
0-1.
99)
Aga
inst
ban
18.6
1.00
10.2
1.00
8.4
1.00
Freq
uenc
y of
bar
vis
itsA
t le
ast
once
a w
eek
20.5
0.95
(0.7
8-1.
17)
13.4
1.09
(0.8
4-1.
43)
10.8
1.17
(0.8
5-1.
60)
Mon
thly
22.5
0.95
(0.7
8-1.
17)
15.0
1.21
(0.9
3-1.
59)
13.6
1.44
(1.0
6-1.
96)
Rar
ely
or n
ever
20.0
1.00
10.6
1.00
8.3
1.00
Cig
aret
te s
mok
e is
d
ange
rous
to
othe
rs(S
HS
aw
aren
ess)
Str
ongl
y ag
ree
26.9
1.62
(1.2
3-2.
14)
15.7
2.10
(1.4
2-3.
10)
13.2
1.73
(1.1
1-2.
67)
Agr
ee19
.01.
16 (0
.89-
1.50
)13
,51.
89 (1
.31-
2.72
)10
.91.
58 (1
.05-
2.38
)
Don
’t ag
ree
12.4
1.00
5.8
1.00
5.3
1.00
Cou
ntry
Net
herla
nds
16.2
0.44
(0.3
5-0.
55)
8.8
0.42
(0.3
1-0.
57)
7.3
0.39
(0.2
7-0.
55)
Fran
ce24
.20.
43 (0
.34-
0.55
)13
.90.
46 (0
.34-
0.63
)11
.90.
45 (0
.32-
0.64
)
Irela
nd13
.20.
31 (0
.23-
0.42
)12
.10.
47 (0
.33-
0.68
)8.
70.
40 (0
.26-
0.64
)
Ger
man
y30
.21.
0018
.91.
0016
.51.
00
* A
ll in
dep
end
ent
varia
ble
s ex
cep
t fo
r ‘n
ewb
orn
child
’ ref
er t
o b
asel
ine.
Mod
els
incl
uded
all
varia
ble
s in
the
tab
le t
oget
her.
** T
he in
dex
ran
ges
from
0 t
o 6,
with
hig
her
valu
es in
dic
atin
g hi
gher
ad
dic
tion/
heav
ier
smok
ing.

| 190 |
Pattern of change over time and in comparison to control country
Table 3 summarises the results of the GEE models comparing the intervention
countries with the control country, separately for baseline smokers and for
continuing smokers. The results for baseline smokers indicate that there was a
significant increase in HSB prevalence from baseline to follow-up in all countries, i.e.
in countries which introduced smoke-free legislation in the meantime as well as in
the control country (UK). The increase was smaller in the control country compared
to each of the four intervention countries. Nevertheless, the wave x country-
interaction was only significant in the model comparing Germany to UK, indicating
that the HSB prevalence increased to a significantly greater extent than it did in the
control country.
In the models restricted to continuing smokers, the increase of HSB over
time was significant in Germany, France, and the Netherlands, but not in Ireland
nor in the control country. In Germany and France, the increase of HSB over time
was statistically significantly greater than in the control country (as measured by the
country x wave-interaction).

| 191 |
chapter 11 | Smoke-free legislation and smoking in smokers’ homes
Table 3: Results of GEE modelsa estimating the change in HSB prevalence for baseline smokers and for continuing smokers.
Presence of HSB among baseline smokers
Presence of HSB among continuing smokers
OR (95% CI) OR (95% CI)
Ireland vs. UK
follow-up vs. baseline Ireland UKIreland x wave-interaction
1.53 (1.24-1.90)1.29 (1.11-1.50)1.19 (0.92-1.54)
1.26 (0.97-1.65)1.07 (0.91-1.26)1.16 (0.86-1.61)
France vs. UK
follow-up vs. baseline France UKFrance x wave-interaction
1.53 (1.32-1.78)1.29 (1.11-1.49)1.17 (0.96-1.47)
1.40 (1.18-1.66)1.07 (0.91-1.26)1.31 (1.04-1.66)
Germany vs. UK
follow-up vs. baseline Germany UKGermany x wave-interaction
1.61 (1.42-1.81)1.29 (1.11-1.50)1.25 (1.03-1.51)
1.55 (1.37-1.76)1.07 (0.91-1.26)1.45 (1.17-1.79)
Netherlands vs. UK
follow-up vs. baseline Netherlands UKNetherlands x wave-interaction
1.34 (1.20-1.51)1.29 (1.11-1.50)1.05 (0.86-1.27)
1.22 (1.08-1.38)1.07 (0.90-1.26)1.15 (0.93-1.42)
a Models adjusted for socio-demographic time-invariant covariates (age, gender, education, country) and for time-varying covariates (age of youngest child in the household, marital status, wave), and included country x wave-interaction terms. The odds ratios reported for each country estimate the change in HSB prevalence odds between the two waves. The interaction odds ratios are the ratios of these estimates and were used to assess if the change in the respective intervention country was statistically significantly different from the change in the no-legislation control country (UK w/o Scotland). In this table, an interaction OR > 1 indicates that the change was greater in the intervention country compared to the control country.
| 192 |
DISCUSSION
This large prospective dataset with pre- and post-smoke-free legislation observations
from four European countries provided us with a uniquely comprehensive
opportunity to assess effects of smoke-free legislation on home smoking in Europe.
No evidence of displacement of smoking into the home after the implementation
of national smoke-free legislation could be found. In all four countries, irrespective
of the smoke-free legislation being comprehensive or allowing exceptions, the
proportions of smokers having no or only partial home smoking restrictions either
remained stable or even decreased, whereas the proportions of smokers with total
home smoking bans increased. Among continuing smokers, the average number of
cigarettes smoked per day decreased in three of the four countries examined, and
there also was no rise in the average number of cigarettes smoked at home.
Regarding causality, it is important to assess whether the smoke-free
legislation itself facilitated the adoption of home smoking bans, as the growth in
the prevalence of home smoking bans could also be the manifestation of secular
trends. GEE analyses comparing the patterns of change in the four countries
which implemented smoke-free legislation with a control country without smoke-
free legislation at both time-points (UK) yielded some evidence that the increase in
HSB prevalence could at least be partially attributable to the smoke-free legislation.
Especially for continuing smokers the results indicated a significant (or borderline
significant) increase in HSB among continuing smokers in Ireland, Germany, France,
and the Netherlands, while there was no significant increase in HSB in the UK.
Although the difference in patterns of change was significant only in the models
comparing Germany to UK and France to UK, this is an important finding as it
suggests the possibility of a causal link between the implementation of a national
smoke-free legislation and imposition of individual home smoking restrictions
among continuing smokers.
Furthermore, we found that positive attitudes towards smoking bans in bars
were a significant prospective predictor of having adopted a HSB between pre- and
post-legislation survey waves. This supports the social diffusion hypothesis and is
suggestive of a causal relationship between smoking-related norms and attitudes
and the adoption of a HSB. It is also known that the introduction of public smoking
bans usually leads to an increase in support for such measures (Edwards et al.,
2008; Rayens et al., 2007; Tang et al., 2003). Given the positive association between
policy support and HSB observed in the present study, the prevalence of HSB may
be expected to increase further in the future.
We also found that male, younger, married smokers, smokers with a young
(or with a newborn) child in the household and smokers with a high awareness of
| 193 |
chapter 11 | Smoke-free legislation and smoking in smokers’ homes
the dangerous potential of SHS were more likely to have or to adopt a HSB. The
gender effect could be an effect of household composition, which we could not
control for as this variable was not recorded in all country surveys. Borland et al.
reported that in their analyses, household composition accounted for the gender
effect as male smokers were more likely to live in a home with non-smokers (Borland,
Yong, Cummings et al., 2006). Previous cross-sectional studies (Borland, Mullins,
Trotter, & White, 1999; Ouedraogo, Turcotte, Ashley, Brewster, & Ferrence, 2009;
Pizacani et al., 2003), and a study analyzing ITC survey data from Australia, Canada,
United Kingdom, and United States (Borland, Yong, Cummings et al., 2006), already
showed that having a young child is one of the most important correlates of home
smoking restrictions. In addition to this, our study found that also the birth of a child
is a strong prospective predictor of adopting a HSB.
Some limitations need to be considered when interpreting our results.
Due to different implementation dates of the national smoke-free legislation, the
four country surveys were conducted in different years. The follow-up time and
the time between implementation of the smoking ban and the post-legislation
survey also varied between the countries, which probably affects the comparability
of the relative increases in HSB prevalence. Such effects might explain why the
comprehensiveness of the legislation seems to be unrelated to the extent of the
policy effect in terms of an increase in HSB prevalence. In particular, that the relative
increases in HSB prevalence is strongest in Germany could be partly due to the
longer time between pre- and post-legislation measurements compared to the other
countries, whereas the lower prevalence of home smoking restrictions in Ireland
could partly be attributed to the surveys having been conducted about four years
earlier than in the other countries. However, as additional single-country analyses
of predictors of HSB yielded similar and consistent results (data not shown), it
is unlikely that country differences in the study design would have distorted the
findings from the multivariate analyses.
Between 21 and 34 percent of respondents were lost to attrition between
pre- and post-legislation surveys. The non-responder analysis suggests only limited
potential bias in the estimates of the multivariate analyses. The lower odds of being
lost to follow-up among French respondents with pre-legislation home smoking
restrictions might however lead to overestimated prevalence estimates for France.
UK (without Scotland) was chosen as a control country to give an estimate
for the secular trend in HSB, and comparable baseline HSB prevalence implied that
it was an appropriate choice for this purpose. In line with the diffusion hypothesis,
it is nevertheless possible that the publicity around the plans for the enactment
of the smoke-free legislation in UK has led to a steeper increase than would

| 194 |
have been expected with the secular trend alone, which might have resulted in
an overestimation of the secular trend. However, a similar effect could have led
to a pre-legislation increase in the intervention countries already before the pre-
legislation measurements, which might have resulted in an underestimation of the
policy effect in these countries. It thus appears quite possible that such effects
might have lead to our estimates being altogether conservative.
We relied solely on self-reported information in this study, and our findings
may be subject to social desirability bias. A study using data from a large household
survey furthermore found inconsistencies in reports about strict HSB especially
in multi-person households with smokers (Mumford, Levy, & Romano, 2004).
Recording more detailed information about the household composition and its
members and biochemical validation would be an asset for any future study.
Regardless of the limitations outlined above, this study is characterised by
several strengths. The surveys were based on large national probability samples from
four European countries using standardised survey questions and a prospective
study design. They were conducted at pre- and post-smoke-free legislation time-
points and thus exploited a historically unique situation. The prospective design,
with replications across four countries, and with explicit analytic comparisons with
a country in which smoke-free legislation had not yet been implemented, offers
greater opportunities to examine alternatives to causality than cross-sectional
studies. The greater internal validity accompanying the prospective design has
been noted as a distinct advantage in evaluating the impact of tobacco control
policies (International Agency for Research on Cancer, 2009b). Our findings also
were consistent with results from ITC studies conducted elsewhere (Borland, Yong,
Cummings et al., 2006), which suggests a broad generalisability of the findings for
Western industrial nations.
Future research should be aimed at elucidating the mechanisms of
how public smoking bans influence household smoking rules. Our study and
some previous evidence support the social diffusion hypothesis, but the precise
interrelations between smoke-free legislation, smoking-related norms and imposing
household smoking bans have yet to be clarified. Additional ITC survey waves will
provide an important resource in this regard.
Opponents of workplace or public smoking bans have argued that these
policies – albeit intended to protect non-smokers from tobacco smoke – could
lead to displacement of smoking into the home and hence even increase the SHS
exposure of non-smoking family members and, most importantly, children. On
the contrary, our findings strongly support the premise that smoke-free legislation
does not lead to more smoking in smokers’ homes. The data suggest rather that

| 195 |
chapter 11 | Smoke-free legislation and smoking in smokers’ homes
smoke-free legislation may stimulate smokers to establish total smoking bans in
their homes. Policymakers in Europe and around the world thus do not need to
fear an increase in SHS exposure among children as an unintended detrimental
consequence of smoke-free legislation. In fact, converging evidence supports the
notion that smoke-free legislation will lead to further benefits in reducing the harms
of SHS beyond the limits of the legislation.

“In the last half century the cigarette has been transformed.
The fragrant has become foul. . . . An emblem of attraction
has become repulsive. A mark of sociability has become
deviant. A public behaviour is now virtually private. Not
only has the meaning of the cigarette been transformed but
even more the meaning of the smoker (who) has become a
pariah . . . the object of scorn and hostility.” (Allan Brandt)
| 196 |
Chapter 12
~~~
Smoke-free legislation and stigmatisation of smokers
Accepted as:
Nagelhout, G. E., Willemsen, M. C., Gebhardt, W. A., Van den Putte,
B., Hichman, S. C., Crone, M. R., Fong, G. T., Van der Heiden, S., &
De Vries, H. Does smoke-free legislation and smoking outside bars
increase feelings of stigmatisation among smokers? Findings from the
International Tobacco Control (ITC) Netherlands Survey. Health & Place.
| 197 |
| 198 |
This study examined whether smokers’ perceived level of stigmatisation
changed after the implementation of smoke-free hospitality industry
legislation and whether smokers who smoked outside bars reported
more perceived stigmatisation. Longitudinal data from the International
Tobacco Control (ITC) Netherlands Survey was used, involving a nationally
representative sample of 1,447 smokers aged 15 years and older. Whether
smoke-free legislation increases smokers’ perceived stigmatisation
depends on how smokers feel about smoking outside. The level of perceived
stigmatisation did not change after the implementation of smoke-free
hospitality industry legislation in the Netherlands, possibly because most
Dutch smokers do not feel negatively judged when smoking outside.
AB
STR
AC
T

| 199 |
chapter 12 | Smoke-free legislation and stigmatisation of smokers
INTRODUCTION
Smoke-free legislation protects non-smokers from tobacco smoke pollution
(also known as second-hand smoke) in public places. A possible unintended
consequence of smoke-free legislation is that continuing smokers may experience
increased feelings of stigmatisation. They may feel that not only their cigarette
smoke is banned from public places, but that they are themselves banned and may
thus think that others perceive smokers negatively.
Stigmatisation occurs “when elements of labelling, stereotyping,
separating, status loss, and discrimination co-occur in a power situation that allows
these processes to unfold” (Link & Phelan, 2001). Because smoke-free legislation
physically separates smokers from non-smokers by requiring smokers to smoke
outside, it has been suggested that smoke-free legislation may increase feelings of
stigmatisation (Gottlieb et al., 1992). Several qualitative studies that asked smokers
whether they felt more stigmatised after the implementation of smoke-free legislation
in workplaces and public places, found that smoke-free legislation indeed increased
feelings of stigmatisation (Gottlieb et al., 1992; Hargreaves et al., 2010; Poland,
1998; Ritchie, Amos, & Martin, 2010a, b; Thompson, Pearce, & Barnett, 2007). In
these studies, smokers report that they feel ‘like a leper’ (Ritchie, Amos, & Martin,
2010a), ‘an outcast’ (Thompson, Pearce, & Barnett, 2007), or ‘ashamed’ (Baha &
Le Faou, 2010) when they have to go outside to smoke. To our knowledge, only
one quantitative study examined the association between exposure to smoke-free
legislation and stigmatisation and this study found no association among smokers
in New York City (Stuber et al., 2008).
In the current study, we used longitudinal data from two survey waves of
the International Tobacco Control (ITC) Netherlands Survey. Smoke-free hospitality
industry legislation was implemented in the Netherlands between these two survey
waves, in July 2008. The implementation of the legislation was not comprehensive
(smoking rooms were allowed) and there were high levels of non-compliance
among bars (Nagelhout, Mons et al., 2011). We examined whether smokers’
level of perceived stigmatisation changed after the implementation of smoke-free
hospitality industry legislation, and whether smokers who smoked outside bars had
stronger perceptions of stigmatisation. Also, we examined associations between
perceived stigmatisation with feelings of shame, being judged, and being proud
when smoking outside hospitality establishments after the smoke-free legislation.
Finally, differences between smokers with low, moderate, and high education were
investigated, because persons with lower socioeconomic status may be more
vulnerable to the negative effects of stigmatisation (Major & O’Brien, 2005).
| 200 |
METHODS
Sample
Dutch smokers aged 15 years and older were recruited from a probability-based
web database (Nagelhout et al., 2010). Potential respondents were identified as
smokers (having smoked at least 100 cigarettes in their lifetime and currently
smoking at least once per month) by means of a short screening survey in March
2008. In April 2008, 2,331 smokers were invited to participate in a web survey. Of
these smokers, 1,820 participated in the first survey (78.1%). In April and May 2009
all 1,820 smokers of the baseline survey were recontacted for the follow-up survey
and 1,447 took part (79.5%).
Measurements
Control variables were gender, age group, and heaviness of smoking in the 2008
survey. Age was categorised as 15 to 24, 25 to 39, 40 to 54, and 55 years and older.
The Heaviness of Smoking Index (HSI) was created as the sum of two categorical
measures: cigarettes per day and time before smoking the first cigarette of the
day (Heatherton et al., 1989). HSI values ranged from 0 to 6 and are positively
associated with nicotine dependence. Education was measured at the 2008 survey
and categorised in three levels: low, moderate, and high.
Smoking outside bars was measured at the 2009 survey by asking continuing
smokers who reported visiting a bar since the implementation of the smoke-free
hospitality industry legislation in July 2008, whether they had smoked outside the
bar at their last visit. Smokers who did not visit bars after the implementation of
smoke-free hospitality industry legislation were categorised as not having smoked
outside bars. We also controlled for bar visiting.
Feelings when smoking outside were measured at the 2009 survey by asking
respondents how they feel when they are smoking outside the hospitality industry.
Three statements about feeling negatively judged, ashamed, or proud were used,
e.g. “You are ashamed if others see you smoking”. Respondents could answer on a
five-point Likert scale whether they agreed or disagreed with these statements.
Perceived stigmatisation of smokers was measured in both survey waves
by asking respondents how they thought most Dutch people perceive smokers
nowadays (Goldstein, 1991; Stuber et al., 2008). Respondents were asked to
indicate on seven-point Likert bipolar scales whether they thought most people
perceive smokers as nice versus not nice, strong versus weak, free versus not
free, pathetic versus not pathetic, and persevering versus not persevering. A factor
analysis showed that these items loaded on one factor, with factor loadings between
0.39 and 0.82. A mean score of these items (Cronbach’s Alpha = 0.72) was used
| 201 |
chapter 12 | Smoke-free legislation and stigmatisation of smokers
as a measure of perceived stigmatisation that ranged from 1 (nice, strong, free, not
pathetic, persevering) to 7 (not nice, weak, not free, pathetic, not persevering).
Ethics
The ITC Netherlands surveys were cleared for ethics by the Research Ethics Board
of the University of Waterloo and the Central Committee on Research Involving
Human Subjects in the Netherlands.
Analyses
All analyses were performed with SPSS version 17.0 and were weighted by age
and gender to be representative of the smoker population in the Netherlands. More
details on the weighting procedure can be found elsewhere (ITC Project, 2009b).
Differences between respondents with low, moderate, and high educational level
were tested with Chi-square tests and ANOVA F-tests.
Multivariate linear mixed model analysis was performed to assess whether
the level of perceived stigmatisation changed between before (2008) and after
(2009) the implementation of smoke-free hospitality industry legislation. This
technique extends multivariate linear regression to longitudinal analyses of repeated
measures. The two individual perceived stigmatisation scale scores were taken as
dependent variable and survey wave was designated as the repeated measure
variable, while controlling for gender, age group, educational level, and heaviness
of smoking. Interactions of educational level with survey wave were added to the
model to examine whether the change in perceived stigmatisation between 2008
and 2009 was the same for respondents from all educational levels.
Multivariate linear regression analysis was performed to determine whether
smoking outside bars and feelings when smoking outside hospitality establishments
predicted a change in perceived stigmatisation between 2008 and 2009. The
dependent variable was the stigmatisation scale in 2009. The independent variables
were gender, age group, educational level, heaviness of smoking, visited bars,
smoking outside bars, feels ashamed when smoking outside, feels negatively judged
when smoking outside, feels proud when smoking outside, and stigmatisation in
2008. Interactions of educational level with smoking outside bars and with feelings
when smoking outside were added to the regression analysis to examine whether
there were educational differences in the possible effect of smoking outside bars
and feelings when smoking outside on perceived stigmatisation.
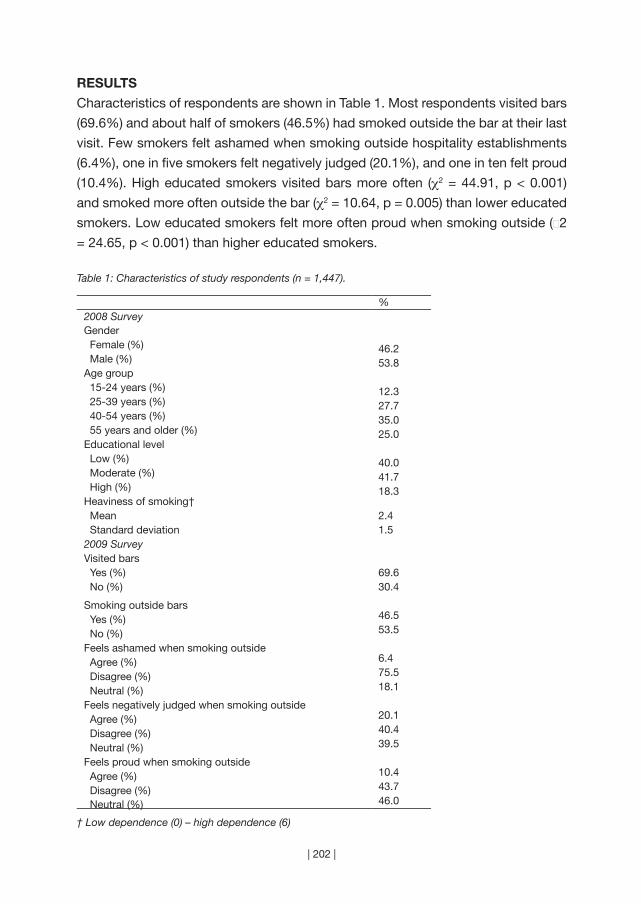
| 202 |
RESULTS
Characteristics of respondents are shown in Table 1. Most respondents visited bars
(69.6%) and about half of smokers (46.5%) had smoked outside the bar at their last
visit. Few smokers felt ashamed when smoking outside hospitality establishments
(6.4%), one in five smokers felt negatively judged (20.1%), and one in ten felt proud
(10.4%). High educated smokers visited bars more often (χ2 = 44.91, p < 0.001)
and smoked more often outside the bar (χ2 = 10.64, p = 0.005) than lower educated
smokers. Low educated smokers felt more often proud when smoking outside (χ2
= 24.65, p < 0.001) than higher educated smokers.
Table 1: Characteristics of study respondents (n = 1,447).
%2008 SurveyGender Female (%) 46.2 Male (%) 53.8Age group 15-24 years (%) 12.3 25-39 years (%) 27.7 40-54 years (%) 35.0 55 years and older (%) 25.0Educational level Low (%) 40.0 Moderate (%) 41.7 High (%) 18.3Heaviness of smoking† Mean 2.4 Standard deviation 1.52009 SurveyVisited bars Yes (%) 69.6 No (%) 30.4
Smoking outside bars Yes (%) 46.5
No (%) 53.5
Feels ashamed when smoking outside Agree (%) 6.4
Disagree (%) 75.5
Neutral (%) 18.1
Feels negatively judged when smoking outside Agree (%) 20.1
Disagree (%) 40.4
Neutral (%) 39.5
Feels proud when smoking outside Agree (%) 10.4
Disagree (%) 43.7
Neutral (%) 46.0
† Low dependence (0) – high dependence (6)
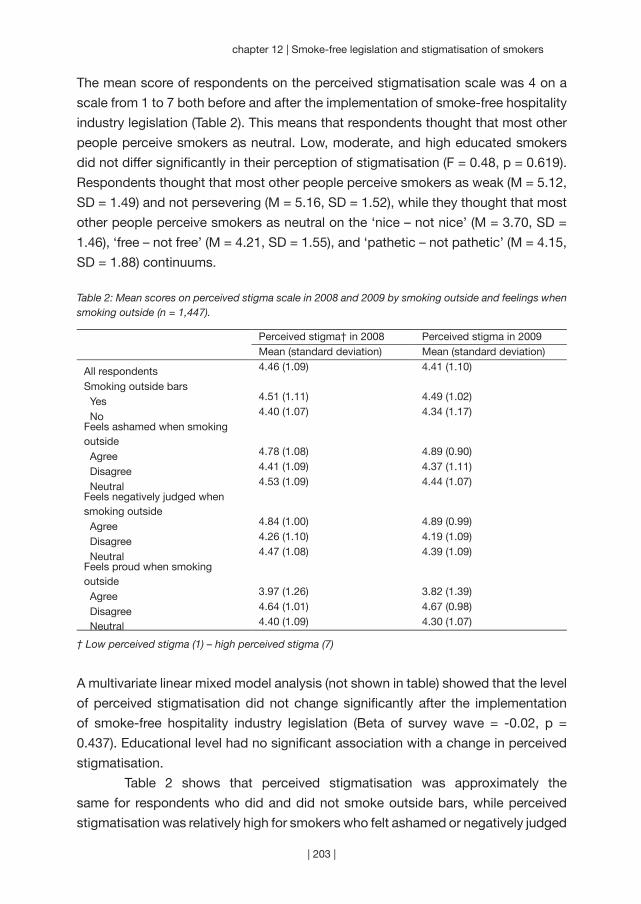
| 203 |
chapter 12 | Smoke-free legislation and stigmatisation of smokers
The mean score of respondents on the perceived stigmatisation scale was 4 on a
scale from 1 to 7 both before and after the implementation of smoke-free hospitality
industry legislation (Table 2). This means that respondents thought that most other
people perceive smokers as neutral. Low, moderate, and high educated smokers
did not differ significantly in their perception of stigmatisation (F = 0.48, p = 0.619).
Respondents thought that most other people perceive smokers as weak (M = 5.12,
SD = 1.49) and not persevering (M = 5.16, SD = 1.52), while they thought that most
other people perceive smokers as neutral on the ‘nice – not nice’ (M = 3.70, SD =
1.46), ‘free – not free’ (M = 4.21, SD = 1.55), and ‘pathetic – not pathetic’ (M = 4.15,
SD = 1.88) continuums.
Table 2: Mean scores on perceived stigma scale in 2008 and 2009 by smoking outside and feelings when smoking outside (n = 1,447).
Perceived stigma† in 2008 Perceived stigma in 2009Mean (standard deviation) Mean (standard deviation)
All respondents 4.46 (1.09) 4.41 (1.10)
Smoking outside bars Yes 4.51 (1.11) 4.49 (1.02)
No 4.40 (1.07) 4.34 (1.17)Feels ashamed when smoking outside Agree 4.78 (1.08) 4.89 (0.90)
Disagree 4.41 (1.09) 4.37 (1.11)
Neutral 4.53 (1.09) 4.44 (1.07)Feels negatively judged when smoking outside Agree 4.84 (1.00) 4.89 (0.99)
Disagree 4.26 (1.10) 4.19 (1.09)
Neutral 4.47 (1.08) 4.39 (1.09)Feels proud when smoking outside Agree 3.97 (1.26) 3.82 (1.39)
Disagree 4.64 (1.01) 4.67 (0.98)
Neutral 4.40 (1.09) 4.30 (1.07)
† Low perceived stigma (1) – high perceived stigma (7)
A multivariate linear mixed model analysis (not shown in table) showed that the level
of perceived stigmatisation did not change significantly after the implementation
of smoke-free hospitality industry legislation (Beta of survey wave = -0.02, p =
0.437). Educational level had no significant association with a change in perceived
stigmatisation.
Table 2 shows that perceived stigmatisation was approximately the
same for respondents who did and did not smoke outside bars, while perceived
stigmatisation was relatively high for smokers who felt ashamed or negatively judged

| 204 |
when smoking outside hospitality establishments. Also, perceived stigmatisation
was relatively low for smokers who felt proud when smoking outside. A multivariate
linear regression analysis (Table 3) confirmed that smoking outside bars in 2009
was not associated with perceived stigmatisation (Beta = 0.02, p = 0.613). However,
feelings of being negatively judged when smoking outside were associated with
an increase in perceived stigmatisation (Beta = 0.11, p < 0.001), while feelings of
being proud when smoking outside were associated with a decrease in perceived
stigmatisation (Beta = -0.08, p = 0.001). There were no significant interactions of
smoking outside bars or feelings when smoking outside with educational level (not
shown in table).
Table 3: Multivariate linear regression analysis predicting perceived stigmatisation in 2009 (n = 1,264).
Beta (95% CI)Gender Female 0.00 (-0.05 to 0.05) Male 0.00Age group 15-24 years 0.04 (-0.02 to 0.13) 25-39 years 0.08 (0.02 to 0.15)** 40-54 years 0.08 (0.02 to 0.14)** 55 years and older 0.00Educational level Low -0.07 (-0.14 to 0.00)* Moderate -0.03 (-0.10 to 0.03) High 0.00Heaviness of smoking -0.03 (-0.08 to 0.02)Visited bars
Yes 0.02 (-0.04 to 0.08)No 0.00
Smoking outside barsYes 0.02 (-0.05 to 0.08)No 0.00
Feels ashamed when smoking outside Agree 0.02 (-0.03 to 0.08) Disagree 0.05 (-0.01 to 0.11) Neutral 0.00Feels negatively judged when smoking outside Agree 0.11 (0.06 to 0.17)*** Disagree -0.07 (-0.13 to -0.02)* Neutral 0.00Feels proud when smoking outside Agree -0.08 (-0.14 to -0.03)** Disagree 0.08 (0.03 to 0.14)** Neutral 0.00Stigmatisation in 2008 0.42 (0.39 to 0.49)***
* p < 0.05** p < 0.01*** p < 0.001
| 205 |
chapter 12 | Smoke-free legislation and stigmatisation of smokers
DISCUSSION
In our study, increased feelings of stigmatisation were found only among smokers
who felt negatively judged by passers-by when smoking outside hospitality
establishments. However, in the Netherlands, most smokers did not feel negatively
judged when smoking outside. This explains why we found that the overall level
of perceived stigmatisation did not change after the implementation of smoke-
free hospitality industry legislation and that smoking outside bars did not increase
feelings of stigmatisation.
Earlier research (Stuber et al., 2008) found that lower educated smokers
perceive lower levels of stigmatisation than higher educated smokers. In the
current study, we did not find significant differences in perceived stigmatisation
between educational levels. There are, however, concerns that lower educated
smokers internalise the stigmatised identity more than higher educated smokers
(Farrimond & Joffe, 2006). This means that lower educated smokers may not only
think that most other people perceive smokers as weak and not persevering, but
they may also come to see themselves as weak and not persevering because they
smoke. This may cause them to continue smoking despite high levels of perceived
stigmatisation (Farrimond & Joffe, 2006).
Our results suggest that smoke-free hospitality industry legislation may
increase stigmatisation in countries where smokers feel negatively judged when
smoking outside. Our study focused on smoking outside hospitality establishments
after the implementation of smoke-free hospitality industry legislation, and findings
may not generalise to effects of smoking outside workplaces. Also, specific
characteristics of the Dutch legislation may have influenced the results.
A limitation of our study was that our measure of perceived stigmatisation
may not capture the entire experience of smoker related stigmatisation. Although
other studies have also measured perceived stigmatisation by asking respondents
how they thought most others perceive smokers (Goldstein, 1991; Stuber et al.,
2008), a study on HIV related stigma showed that this is only one dimension of
perceived stigmatisation and that stigmatisation also includes personalised stigma,
disclosure concerns, and a negative self-image (Berger, Ferrans, & Lashley, 2001).
As argued by others (Ritchie et al., 2010a), we believe that policymakers
should continue implementing smoke-free legislation despite possible unintended
consequences such as stigmatisation. However, policymakers also have the moral
responsibility to support individuals who experience negative consequences of smoke-
free legislation (Bayer, 2008). When these individuals are supported, the known benefits
of smoke-free legislation for non-smokers and smokers who want to quit smoking will
by far outweigh the possible unintended consequences for continuing smokers.

“Health inequities exist because the wrong
policies are in place.” (Margarat Chan)
| 206 |
Chapter 13
~~~
Widening socioeconomic inequalities in smoking
Published as:
Nagelhout, G. E., De Korte-de Boer, D., Kunst, A. E., Van der Meer, R.
M., De Vries, H., Van Gelder, B. M., & Willemsen, M. C. (2012). Trends
in socioeconomic inequalities in smoking prevalence, consumption,
initiation, and cessation between 2001 and 2008 in the Netherlands.
Findings from a national population survey. BMC Public Health, 12, 303.
| 207 |
| 208 |
Widening of socioeconomic status (SES) inequalities in smoking
prevalence has occurred in several Western countries from the mid
1970’s onwards. However, little is known about a widening of SES
inequalities in smoking consumption, initiation and cessation. Repeated
cross-sectional population surveys from 2001 to 2008 (n ≈ 18,000 per
year) were used to examine changes in smoking prevalence, smoking
consumption (number of cigarettes per day), initiation ratios (ratio of ever
smokers to all respondents), and quit ratios (ratio of former smokers to
ever smokers) in the Netherlands. Educational level and income level were
used as indicators of SES and results were reported separately for men
and women. Lower educated respondents were significantly more likely to
be smokers, smoked more cigarettes per day, had higher initiation ratios,
and had lower quit ratios than higher educated respondents. Income
inequalities were smaller than educational inequalities and were not all
significant, but were in the same direction as educational inequalities.
Among women, educational inequalities widened significantly between
2001 and 2008 for smoking prevalence, smoking initiation, and smoking
cessation. Among low educated women, smoking prevalence remained
stable between 2001 and 2008 because both the initiation and quit ratio
increased significantly. Among moderate and high educated women,
smoking prevalence decreased significantly because initiation ratios
remained constant, while quit ratios increased significantly. Among men,
educational inequalities widened significantly between 2001 and 2008 for
smoking consumption only. While inequalities in smoking prevalence were
stable among Dutch men, they increased among women, due to widening
inequalities in both smoking cessation and initiation. Both components
should be addressed in equity-oriented tobacco control policies.
AB
STR
AC
T
| 209 |
chapter 13 | Widening socioeconomic inequalities in smoking
BACKGROUND
Nowadays, mortality rates tend to be higher among lower socioeconomic status
(SES) groups in most Western countries (Blais, Hamel, & Rinfret, 2012; Mackenbach
et al., 2003; Saydah & Lochner, 2010). The higher prevalence of smoking in individuals
from lower SES groups is the single most important cause of socioeconomic
differences in mortality (Strand & Tverdal, 2004; Stringhini et al., 2010). The smoking
epidemic model describes the trends of smoking prevalence and smoking-
attributable mortality in populations over time (Lopez et al., 1994). In the first stage
of the smoking epidemic, smoking prevalence and smoking-attributable mortality is
low and rising. In the second stage, smoking prevalence among men rises rapidly,
while smoking among women lags behind. Smoking prevalence rates are similar
among different SES groups or may be higher among high SES groups. In the third
stage, male prevalence declines and female prevalence remains stable. There is a
rapid rise in smoking-attributable mortality among men. In the fourth stage of the
smoking epidemic, smoking prevalence declines for both men and women and there
is a rapid rise in smoking-attributable mortality among women. Smoking prevalence
is higher among lower SES groups in this stage and a widening of SES inequalities
in smoking prevalence may occur. A widening of SES inequalities in smoking has
been found for several Western countries from the mid 1970’s onwards, for example
in most U.S. states (Harper & Lynch, 2007; Pierce, Fiore, Novotny, Hatziandreu, &
Davis, 1989), Canada (Smith, Frank, & Mustard, 2009), Australia (Bennett, 1995;
White, Hill, Siahpush, & Bobevski, 2003), New Zealand (Hill, Blakely, Fawcett, &
Howden-Chapman, 2005), and most European countries (Daponte-Codina, Bolívar-
Muñoz, Ocaña-Riola, Toro-Cárdenas, & Mayoral-Cortés, 2009; Giskes et al., 2005;
Osler et al., 2000; Rasmussen, Due, Damsgaard, & Holstein, 2009).
Studies that examined trends in SES differences in smoking focused mostly
on differences in smoking prevalence (Schaap & Kunst, 2009), i.e. the proportion
of smokers in a population. These studies provide no information about how SES
differences in smoking prevalence originate, because the smoking prevalence in
a population is determined both by smoking initiation and by smoking cessation.
The few studies that have examined trends in SES inequalities in both smoking
initiation and cessation found mixed results (Federico, Costa, & Kunst, 2007;
Pierce et al., 1989). One study found that widening SES inequalities in cessation
are mostly responsible for widening SES differences in smoking prevalence (Pierce
et al., 1989), while the other study found that inequalities in initiation are a more
important explanation (Federico, Costa, & Kunst, 2007). Knowledge about trends
in SES inequalities in initiation and cessation can potentially help to better inform
future tobacco control interventions (Gilman, Abrams, & Buka, 2003). Furthermore,
| 210 |
it is important to examine SES differences in smoking consumption levels, as
consumption levels have been found to relate in a dose-response manner to the
risks and severity of many smoking-related diseases (U.S. Department of Health
and Human Services, 2010). Therefore, information about trends in SES differences
in smoking consumption, smoking initiation, and smoking cessation is required
(Schaap & Kunst, 2009).
In the current study, trends in SES differences in four smoking-related
outcomes are examined for the Netherlands for the period 2001 to 2008. In this period,
several tobacco control policies were implemented that could have influenced SES
differences in smoking. In 2002, text warning labels for cigarette packages were
implemented and a tobacco advertising ban was implemented (Nagelhout, Levy
et al., 2012). In 2003, a youth access law was implemented (Nagelhout, Levy et
al., 2012). In 2004, smoke-free workplace legislation was implemented, which was
extended in 2008 so as to include the hospitality industry (Nagelhout, Willemsen et
al., 2011). Tax increases were implemented in 2001, 2004, and 2008 and intensive
national mass media smoking cessation campaigns ran in 2003, 2004, and 2008
(Nagelhout, Willemsen et al., 2011).
We aim to answer the following research questions: 1) Were there SES
differences in smoking prevalence, smoking consumption, smoking initiation, and
smoking cessation in the Netherlands in 2001 and 2008? and 2) Did these SES
differences change in the period 2001 to 2008? These research questions are
answered for both men and women.
METHODS
Sample
Data were obtained from the Dutch Continuous Survey of Smoking Habits
(DCSSH). This is a cross-sectional population survey of respondents aged 15 years
and older that is used to monitor smoking habits of the Dutch population, using
weekly measurements. The DCSSH is conducted by market research company
TNS NIPO for the Dutch expert centre on tobacco control (STIVORO). Respondents
for the DCSSH were selected from TNS NIPObase, a database containing more
than 140,000 potential respondents who participate in internet-based research on
a regular basis. TNS NIPObase panel members are recruited actively by TNS NIPO
using telephone and mail.
For the present study, DCSSH data from 2001 until 2008 were used. The
questionnaire was sent to a stratified random sample of potential respondents by
e-mail. Respondents completed the questionnaire at their own computer using
software from TNS NIPO. Approximately 18,000 respondents participated in the
| 211 |
chapter 13 | Widening socioeconomic inequalities in smoking
survey each year, totaling 144,733 respondents in the period 2001 to 2008. The
respondents were representative of the Dutch population of 15 years and older
after applying weights for gender, age, educational level, working hours, geographic
region, urbanisation, and household size. Response data were weighted on the
basis of stratum weights. Each respondent was provided a weight by TNS NIPO
with DIANA software, using an iterative process until there was little deviation
between the weighted data and the target strata.
The Central Committee on Research Involving Human Subjects in the
Netherlands requires no ethical approval for non-medical survey research.
Questionnaire
The DCSSH questionnaire assessed demographic characteristics, smoking
behaviour and use of smoking cessation aids and contained sections on tobacco
control policies and campaigns. For the current study, we used questions about
SES indicators, smoking status, smoking consumption, age, and gender.
Although educational level is seen as a key indicator of SES (Huisman,
Kunst, & Mackenbach, 2005a; Schaap & Kunst, 2009), it has been recommended
to include other indicators as well to account for other dimensions of SES that
have shown to be independently related to smoking (Schaap & Kunst, 2009). We,
therefore, used both educational level and income level as indicators of SES. We
categorised educational level into three groups: low (primary education and lower
pre-vocational secondary education), moderate (middle pre-vocational secondary
education and secondary vocational education) and high (senior general secondary
education, (pre-)university education and higher professional education). Gross
yearly household income level was also categorised into three equal sized groups:
low (less than 28,500 Euro = < 25,600 GBP), moderate (between 28,500 and 45,000
Euro = 25,600 - 40,430 GBP), and high (more than 45,000 Euro = > 40,430 GBP).
In line with earlier studies (Nagelhout, Willemsen et al., 2011; Willemsen et
al., 2002), current smoking status was assessed by asking ‘do you (ever) smoke
or do you not smoke at all?’. Respondents who answered that they smoke were
defined as current smokers. Respondents who answered that they do not smoke
were asked: ‘have you smoked in the past?’. Respondents who answered that they
had smoked in the past were defined as former smokers and respondents who
answered that they had not smoked in the past were defined as never smokers.
Smoking prevalence was defined as the proportion of all respondents who were
current smokers (current smokers / all respondents * 100). In the regression analyses,
smoking prevalence was treated as a binary outcome.
| 212 |
Following recommendations from Schaap and Kunst (Schaap & Kunst, 2009),
smoking initiation and cessation were examined by calculating initiation ratios and
quit ratios. Initiation ratio was defined as the ratio of all respondents who were ever
smokers (current + former smokers / all respondents). Quit ratio was defined as the
ratio of ever smokers who were former smokers (former smokers / current + former
smokers). In the regression analyses, initiation and quit ratios were treated as binary
outcomes.
Smoking consumption was measured by asking current smokers how
many cigarettes (factory made and/or roll-your-own) they smoked on average per
day. In the regression analyses, smoking consumption was treated as a continuous
outcome.
Furthermore, age and gender were assessed. Age was categorised into
four groups: 15-24 years, 25-39 years, 40-54 years, and 55 years and older.
Analyses
SES differences in smoking-related outcomes (research question 1) were examined
by logistic regression analyses (for smoking prevalence, initiation, and cessation)
and linear regression analyses (for smoking consumption). Dependent variables
were smoking prevalence, smoking consumption, smoking initiation, and smoking
cessation. Independent variables were educational level and income level (in
separate analyses). Regression analyses were controlled for age group and reported
separately for men and women in 2001 and 2008. Respondents who did not report
their educational level (n = 665, 0.5%) were excluded from the analyses with
educational level. Respondents who did not report their income level (n = 30,661,
21.2%) were excluded from the analyses with income level. Respondents who did
not report their income level were significantly more likely to have a low educational
level (χ2 (2) = 413.08, p < 0.001), to be younger (F (1) = 238.40, p < 0.001), and to be
a current smoker (χ2 (1) = 61.52, p < 0.001).
SES differences in trends in smoking-related outcomes (research question
2) were examined with the regression analyses described above for the survey
years 2001 and 2008 taken together and with a dichotomous ‘trends’ variable (0 for
2001 and 1 for 2008) and the interaction between ‘trends’ and educational/income
level (separate analyses per SES indicator) as independent variables. Regression
analyses were controlled for age group and reported separately for men and
women. Educational level and income level were treated as continuous variables in
the interaction analyses so as to limit the number of interaction terms. In all other
analyses, they were treated as categorical variables with high educational level
and income level being the reference categories. Significant interactions between
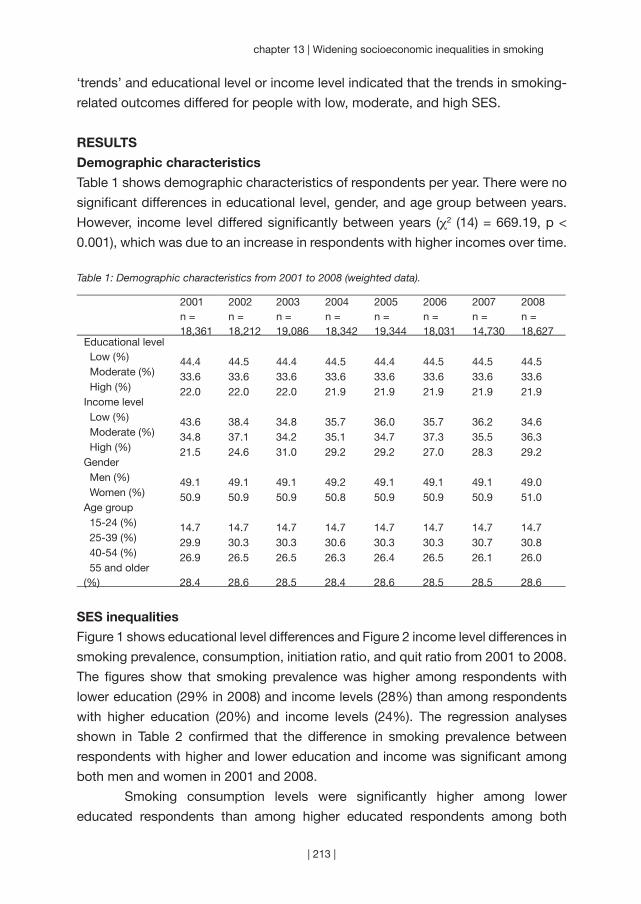
| 213 |
chapter 13 | Widening socioeconomic inequalities in smoking
‘trends’ and educational level or income level indicated that the trends in smoking-
related outcomes differed for people with low, moderate, and high SES.
RESULTS
Demographic characteristics
Table 1 shows demographic characteristics of respondents per year. There were no
significant differences in educational level, gender, and age group between years.
However, income level differed significantly between years (χ2 (14) = 669.19, p <
0.001), which was due to an increase in respondents with higher incomes over time.
Table 1: Demographic characteristics from 2001 to 2008 (weighted data).
2001n = 18,361
2002n = 18,212
2003n = 19,086
2004n = 18,342
2005n = 19,344
2006n = 18,031
2007n = 14,730
2008n = 18,627
Educational level Low (%) 44.4 44.5 44.4 44.5 44.4 44.5 44.5 44.5 Moderate (%) 33.6 33.6 33.6 33.6 33.6 33.6 33.6 33.6 High (%) 22.0 22.0 22.0 21.9 21.9 21.9 21.9 21.9Income level Low (%) 43.6 38.4 34.8 35.7 36.0 35.7 36.2 34.6 Moderate (%) 34.8 37.1 34.2 35.1 34.7 37.3 35.5 36.3 High (%) 21.5 24.6 31.0 29.2 29.2 27.0 28.3 29.2Gender Men (%) 49.1 49.1 49.1 49.2 49.1 49.1 49.1 49.0 Women (%) 50.9 50.9 50.9 50.8 50.9 50.9 50.9 51.0Age group 15-24 (%) 14.7 14.7 14.7 14.7 14.7 14.7 14.7 14.7 25-39 (%) 29.9 30.3 30.3 30.6 30.3 30.3 30.7 30.8 40-54 (%) 26.9 26.5 26.5 26.3 26.4 26.5 26.1 26.0 55 and older (%) 28.4 28.6 28.5 28.4 28.6 28.5 28.5 28.6
SES inequalities
Figure 1 shows educational level differences and Figure 2 income level differences in
smoking prevalence, consumption, initiation ratio, and quit ratio from 2001 to 2008.
The figures show that smoking prevalence was higher among respondents with
lower education (29% in 2008) and income levels (28%) than among respondents
with higher education (20%) and income levels (24%). The regression analyses
shown in Table 2 confirmed that the difference in smoking prevalence between
respondents with higher and lower education and income was significant among
both men and women in 2001 and 2008.
Smoking consumption levels were significantly higher among lower
educated respondents than among higher educated respondents among both
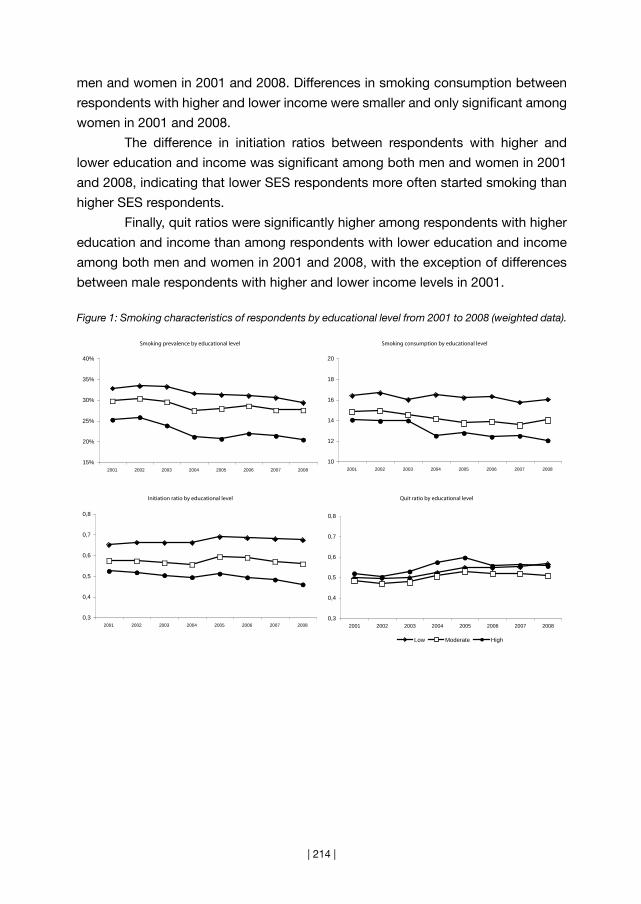
| 214 |
men and women in 2001 and 2008. Differences in smoking consumption between
respondents with higher and lower income were smaller and only significant among
women in 2001 and 2008.
The difference in initiation ratios between respondents with higher and
lower education and income was significant among both men and women in 2001
and 2008, indicating that lower SES respondents more often started smoking than
higher SES respondents.
Finally, quit ratios were significantly higher among respondents with higher
education and income than among respondents with lower education and income
among both men and women in 2001 and 2008, with the exception of differences
between male respondents with higher and lower income levels in 2001.
Figure 1: Smoking characteristics of respondents by educational level from 2001 to 2008 (weighted data).
Smoking prevalence by educational level
15%
20%
25%
30%
35%
40%
2001 2002 2003 2004 2005 2006 2007 2008
Smoking consumption by educational level
10
12
14
16
18
20
2001 2002 2003 2004 2005 2006 2007 2008
Initiation ratio by educational level
0,3
0,4
0,5
0,6
0,7
0,8
2001 2002 2003 2004 2005 2006 2007 2008
Quit ratio by educational level
0,3
0,4
0,5
0,6
0,7
0,8
2001 2002 2003 2004 2005 2006 2007 2008
Low Moderate High

| 215 |
chapter 13 | Widening socioeconomic inequalities in smoking
Figure 2: Smoking characteristics of respondents by income level from 2001 to 2008 (weighted data).
Smoking prevalence by income level
15%
20%
25%
30%
35%
40%
2001 2002 2003 2004 2005 2006 2007 2008
Smoking consumption by income level
10
12
14
16
18
20
2001 2002 2003 2004 2005 2006 2007 2008
Initiation ratio by income level
0,3
0,4
0,5
0,6
0,7
0,8
2001 2002 2003 2004 2005 2006 2007 2008
Quit ratio by income level
0,3
0,4
0,5
0,6
0,7
0,8
2001 2002 2003 2004 2005 2006 2007 2008
Low Moderate High

| 216 |
Table 2: Regression analyses† in which educational level and income level predicted four smoking-related outcomes.
Men Women2001 2008 2001 2008
Smoking prevalenceEducational level* Low 1.75 (1.55 to 1.97) 1.84 (1.62 to 2.09) 1.79 (1.56 to 2.06) 2.26 (1.96 to 2.62) Moderate 1.32 (1.17 to 1.49) 1.44 (1.27 to 1.64) 1.25 (1.09 to 1.44) 1.62 (1.41 to 1.87) High 1.00 1.00 1.00 1.00Income level Low 1.33 (1.17 to 1.51) 1.49 (1.31 to 1.70) 1.52 (1.33 to 1.74 1.83 (1.58 to 2.10) Moderate 1.13 (0.99 to 1.28) 1.11 (0.98 to 1.25) 1.12 (0.97 to 1.30) 1.39 (1.20 to 1.60) High 1.00 1.00 1.00 1.00Smoking consumptionEducational level Low 0.11 (0.06 to 0.17) 0.17 (0.11 to 0.23) 0.11 (0.05 to 0.17) 0.20 (0.13 to 0.26) Moderate 0.07 (0.02 to 0.13) 0.07 (0.01 to 0.13) 0.01 (-0.05 to 0.07) 0.12 (0.06 to 0.18) High 0.00 0.00 0.00 0.00Income level Low 0.06 (0.00 to 0.11) 0.00 (-0.06 to 0.06) 0.12 (0.06 to 0.17) 0.15 (0.08 to 0.20) Moderate 0.05 (-0.01 to 0.11) -0.01 (-0.06 to 0.04) 0.06 (0.00 to 0.12) 0.08 (0.02 to 0.14) High 0.00 0.00 0.00 0.00Initiation ratioEducational level Low 1.87 (1.66 to 2.10) 2.24 (1.99 (2.52) 1.41 (1.25 to 1.59) 1.73 (1.53 to 1.95) Moderate 1.43 (1.27 to 1.61) 1.47 (1.30 to 1.65) 1.19 (1.05 to 1.34) 1.45 (1.29 to 1.63) High 1.00 1.00 1.00 1.00Income level Low 1.32 (1.16 to 1.51) 1.51 (1.32 to 1.73) 1.25 (1.11 to 1.41) 1.32 (1.17 to 1.49) Moderate 1.14 (1.00 to 1.30) 1.27 (1.13 to 1.43) 1.01 (0.89 to 1.14) 1.21 (1.08 to 1.37) High 1.00 1.00 1.00 1.00Quit ratioEducational level Low 0.81 (0.70 to 0.94) 0.84 (0.71 to 0.98) 0.69 (0.58 to 0.82) 0.56 (0.47 to 0.67) Moderate 0.95 (0.81 to 1.11) 0.83 (0.70 to 0.98) 0.92 (0.77 to 1.10) 0.73 (0.61 to 0.87) High 1.00 1.00 1.00 1.00Income level Low 0.86 (0.74 to 1.01) 0.76 (0.64 to 0.89) 0.72 (0.61 to 0.85) 0.56 (0.47 to 0.66) Moderate 0.96 (0.82 to 1.13) 1.05 (0.91 to 1.22) 0.88 (0.74 to 1.05) 0.78 (0.66 to 0.92) High 1.00 1.00 1.00 1.00
† Odds Ratios and 95% confidence intervals are given for smoking prevalence, initiation ratio, and quit ratio, Betas and 95% confidence intervals for smoking consumption. All regression coefficients were adjusted for age group. Regression coefficients in italics were non-significant.* Educational level and income level were entered as independent variables in separate analyses.
Changes in SES inequalities
Among women, educational differences changed significantly between 2001 and
2008 for smoking prevalence, smoking initiation, and smoking cessation (Table 3).
Regression analyses stratified by educational level showed that smoking prevalence
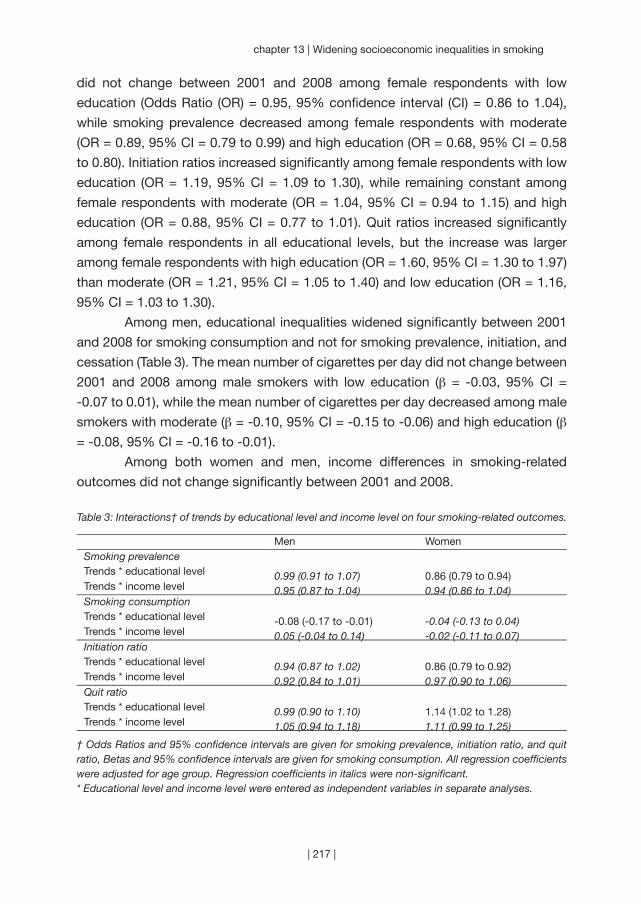
| 217 |
chapter 13 | Widening socioeconomic inequalities in smoking
did not change between 2001 and 2008 among female respondents with low
education (Odds Ratio (OR) = 0.95, 95% confidence interval (CI) = 0.86 to 1.04),
while smoking prevalence decreased among female respondents with moderate
(OR = 0.89, 95% CI = 0.79 to 0.99) and high education (OR = 0.68, 95% CI = 0.58
to 0.80). Initiation ratios increased significantly among female respondents with low
education (OR = 1.19, 95% CI = 1.09 to 1.30), while remaining constant among
female respondents with moderate (OR = 1.04, 95% CI = 0.94 to 1.15) and high
education (OR = 0.88, 95% CI = 0.77 to 1.01). Quit ratios increased significantly
among female respondents in all educational levels, but the increase was larger
among female respondents with high education (OR = 1.60, 95% CI = 1.30 to 1.97)
than moderate (OR = 1.21, 95% CI = 1.05 to 1.40) and low education (OR = 1.16,
95% CI = 1.03 to 1.30).
Among men, educational inequalities widened significantly between 2001
and 2008 for smoking consumption and not for smoking prevalence, initiation, and
cessation (Table 3). The mean number of cigarettes per day did not change between
2001 and 2008 among male smokers with low education (β = -0.03, 95% CI =
-0.07 to 0.01), while the mean number of cigarettes per day decreased among male
smokers with moderate (β = -0.10, 95% CI = -0.15 to -0.06) and high education (β
= -0.08, 95% CI = -0.16 to -0.01).
Among both women and men, income differences in smoking-related
outcomes did not change significantly between 2001 and 2008.
Table 3: Interactions† of trends by educational level and income level on four smoking-related outcomes.
Men WomenSmoking prevalenceTrends * educational level 0.99 (0.91 to 1.07) 0.86 (0.79 to 0.94)Trends * income level 0.95 (0.87 to 1.04) 0.94 (0.86 to 1.04)Smoking consumptionTrends * educational level -0.08 (-0.17 to -0.01) -0.04 (-0.13 to 0.04)Trends * income level 0.05 (-0.04 to 0.14) -0.02 (-0.11 to 0.07)Initiation ratioTrends * educational level 0.94 (0.87 to 1.02) 0.86 (0.79 to 0.92)Trends * income level 0.92 (0.84 to 1.01) 0.97 (0.90 to 1.06)Quit ratioTrends * educational level 0.99 (0.90 to 1.10) 1.14 (1.02 to 1.28)Trends * income level 1.05 (0.94 to 1.18) 1.11 (0.99 to 1.25)
† Odds Ratios and 95% confidence intervals are given for smoking prevalence, initiation ratio, and quit ratio, Betas and 95% confidence intervals are given for smoking consumption. All regression coefficients were adjusted for age group. Regression coefficients in italics were non-significant.* Educational level and income level were entered as independent variables in separate analyses.
| 218 |
DISCUSSION
We examined changes in socioeconomic inequalities in smoking prevalence,
smoking consumption, smoking initiation, and smoking cessation between 2001
and 2008 in the Netherlands. In line with previous studies (Bennett, 1995; Daponte-
Codina et al., 2009; Giskes et al., 2005; Harper & Lynch, 2007; Hill et al., 2005;
Osler et al., 2000; Pierce et al., 1989; Rasmussen et al., 2009; Smith et al., 2009;
White et al., 2003), we found that respondents with lower education and income
were more likely to be smokers than respondents with higher education and income
in 2001 and 2008. Socioeconomic inequalities in smoking consumption, smoking
initiation, and smoking cessation are less well documented than inequalities in
smoking prevalence (Schaap & Kunst, 2009). We found that respondents with lower
education smoked more cigarettes per day, had higher initiation ratios, and had lower
quit ratios than respondents with higher education in 2001 and 2008. Therefore, it
is important that tobacco control programs focus on decreasing smoking initiation
and consumption and increasing smoking cessation among the lower educated. It
seems that focusing only on either initiation or cessation is insufficient.
In this study, we found evidence that SES inequalities in smoking widened
between 2001 and 2008 in the Netherlands, but this widening was not the same
for women and men and it depended on which SES and smoking indicator was
used. Among women, educational inequalities widened significantly for smoking
prevalence, smoking initiation, and smoking cessation. Among men, educational
inequalities widened significantly for smoking consumption. The widening pattern
in smoking, initiation, and quitting among low educated women is especially
worrying. In this group, smoking prevalence remained stable between 2001 and
2008 because both the initiation and quit ratio increased slightly. Among moderate
and high educated women smoking prevalence decreased because initiation ratios
remained constant, while quit ratios increased considerably. Other studies have also
found that in countries in later stages of the smoking epidemic, SES inequalities in
smoking prevalence are stable among men, while they are widening among women
(Bennett, 1995; Giskes et al., 2005). Also, it was found earlier that SES inequalities in
smoking consumption are stable among women and widening among men (Giskes
et al., 2005).
According to the literature, advertising bans, smoking bans in workplaces,
reimbursement of smoking cessation therapies, and increased tobacco taxes have
the potential to reduce SES differences in smoking (Giskes et al., 2007). During
our study period, smoke-free workplace legislation (2004), smoke-free hospitality
industry legislation (2008), and tobacco tax increases (2001, 2004, and 2008) were
implemented in the Netherlands. From our data, it looks like there was a change in

| 219 |
chapter 13 | Widening socioeconomic inequalities in smoking
SES inequalities in smoking prevalence and consumption between 2003 and 2004,
when the smoke-free workplace legislation was implemented together with a tax
increase. However, the SES inequalities seem to be widening instead of narrowing.
An earlier study also showed that the workplace smoking ban in the Netherlands has
increased SES differences in smoking cessation (Nagelhout, Willemsen et al., 2011).
An explanation could be that the smoke-free legislation was not comprehensive: the
hospitality industry was exempted (until 2008) and designated smoking rooms were
allowed.
Our study had some important strengths. We used very large, representative
samples of the Dutch population over a period of eight years. Therefore, changes in
SES differences over time could be detected and generalised to the Dutch population.
Also, we examined both educational level and income level differences in four
smoking-related outcomes, including smoking initiation and cessation for both men
and women. Our study thus provides a more detailed picture of SES differences in
smoking than most studies. This study also had some limitations. First of all, we relied
on self-reported smoking status. Since there can be differences in underreporting
of smoking between SES groups, this could have influenced our results. Second,
income levels were unknown for 21% of respondents. These respondents were
excluded from the analyses and this may have introduced selection bias. However,
since we also used another SES indicator (educational level) with only a few missing
values resulting in comparable findings, we expect that the missing income data
did not bias our results. Furthermore, we used initiation and quit ratios to estimate
population level smoking initiation and cessation. These ratios may not be sensitive
enough to reflect short-term changes in smoking initiation and cessation. However,
initiation and quit ratios are suitable for understanding long-term population trends
(Schaap & Kunst, 2009).
Conclusion
This study exemplifies that inequalities in smoking prevalence among women and
smoking consumption among men may widen in the fourth stage of the smoking
epidemic. Although our study provides some insight in trends in SES differences
in smoking in populations, more research is needed to find ways to successfully
address these differences. While inequalities in smoking prevalence were stable
among Dutch men, they increased among women, due to widening inequalities
in both smoking cessation and initiation. Therefore, both components should be
addressed in equity-oriented tobacco control policies.

“To tackle the high prevalence of smoking among
disadvantaged groups, tobacco control mechanisms
must not be viewed in isolation but rather as part of
a comprehensive strategy to reduce smoking.”
(Rosemary Hiscock)
| 220 |
Chapter 14
~~~
Inequalities in cessation after three tobacco control policies
Resubmitted as:
Nagelhout, G. E., Crone, M. R., Van den Putte, B., Willemsen, M. C.,
Fong, G. T., & De Vries, H. Age and educational inequalities in smoking
cessation due to three population level tobacco control interventions.
Findings from the International Tobacco Control (ITC) Netherlands Survey.
| 221 |
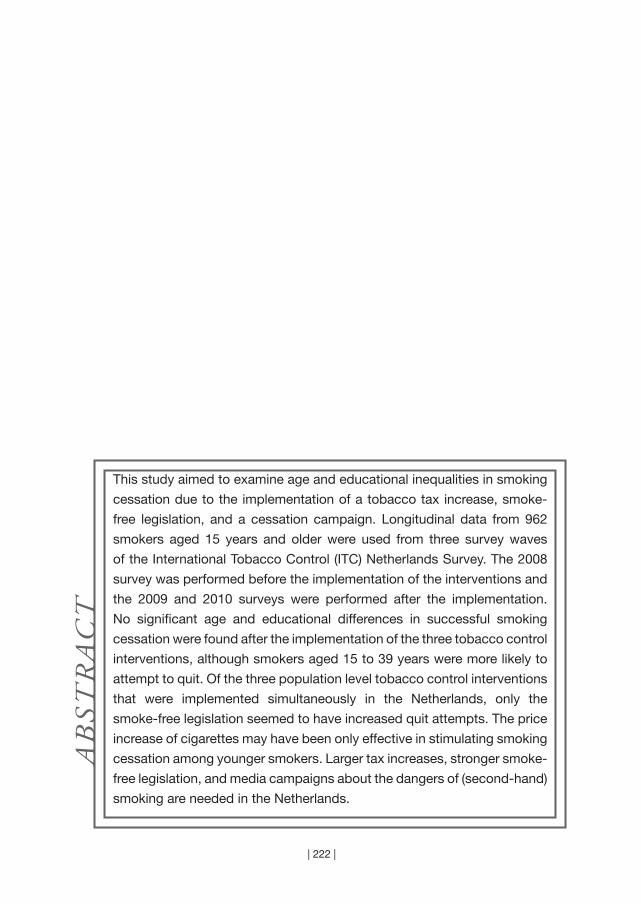
| 222 |
This study aimed to examine age and educational inequalities in smoking
cessation due to the implementation of a tobacco tax increase, smoke-
free legislation, and a cessation campaign. Longitudinal data from 962
smokers aged 15 years and older were used from three survey waves
of the International Tobacco Control (ITC) Netherlands Survey. The 2008
survey was performed before the implementation of the interventions and
the 2009 and 2010 surveys were performed after the implementation.
No significant age and educational differences in successful smoking
cessation were found after the implementation of the three tobacco control
interventions, although smokers aged 15 to 39 years were more likely to
attempt to quit. Of the three population level tobacco control interventions
that were implemented simultaneously in the Netherlands, only the
smoke-free legislation seemed to have increased quit attempts. The price
increase of cigarettes may have been only effective in stimulating smoking
cessation among younger smokers. Larger tax increases, stronger smoke-
free legislation, and media campaigns about the dangers of (second-hand)
smoking are needed in the Netherlands.
AB
STR
AC
T
| 223 |
chapter 14 | Inequalities in cessation after three tobacco control policies
INTRODUCTION
The World Health Organization has introduced the MPOWER package, consisting
of six effective population level tobacco control interventions (World Health
Organization, 2008a). Three of these, tobacco tax increases, smoke-free legislation,
and cessation campaigns, are thought to be most effective (Levy et al., 2004; Levy
et al., 2005). Ideally, these interventions should not only be effective in reducing
overall smoking rates, but also in decreasing smoking-related disparities. People
with lower educational levels are more likely to become smokers and to become
heavily addicted smokers (Huisman et al., 2005b; Siahpush et al., 2006). Previous
research suggests that tax increases may have larger effects among smokers with
lower educational levels (Chaloupka, Straif, & Leon, 2011; Thomas et al., 2008)
and that smoke-free legislation and cessation campaigns may have larger effects
among smokers with higher educational levels (Niederdeppe et al., 2008; Thomas
et al., 2008).
It is also preferred that population-level tobacco control interventions have
equal or greater effects among young smokers, to prevent them from becoming
established smokers (Huisman et al., 2005b). Tax increases on tobacco are known
for their larger effects on young people (Chaloupka et al., 2011; Levy et al., 2004;
World Health Organization, 2003), presumably because young people have lower
incomes (Chaloupka et al., 1996). Potential differential effects of smoke-free
legislation and cessation campaigns on young people are less well documented
(Levy et al., 2004; Thomas et al., 2008).
Evidence about the differential effects of population-level tobacco control
interventions generally comes from studies examining the effects of only one
intervention (Levy et al., 2005), while the implementation of only one population-
level tobacco control intervention at a time is rare (Chapman, 1993). Therefore, it is
unclear whether differential effects of interventions across studies are really due to
the differential strength of that particular intervention or to the presence of concurrent
interventions whose impact was not explicitly considered in the evaluation.
In our study, we examine the differential effects of three tobacco control
interventions: a tobacco tax increase, smoke-free hospitality industry legislation,
and a mass media smoking cessation campaign. These three interventions were
implemented during the same time period in the Netherlands in 2008, providing
a large opportunity to substantially decrease smoking prevalence and increase
smoking cessation. However, smoking prevalence did not decrease significantly
(Nagelhout, Willemsen et al., 2011) and the combination of the three interventions
increased quit attempts only slightly from 24% in 2007 to 26% in 2008 (Nagelhout,
Willemsen et al., 2011). By using a longitudinal cohort study and classifying people
| 224 |
according to their exposure to each of the three interventions, we attempt to
disentangle the differential effects of the interventions.
In the Netherlands, tobacco taxes were increased by €0.25 for a pack
of 20 cigarettes and by €0.31 for a 50 gram pouch of rolling tobacco from July
2008. This resulted in a mean price increase of 8%, which reached the consumer
in November 2008. Smoke-free hospitality industry legislation was implemented in
July 2008. Workplaces were already smoke-free from January 2004. The smoke-
free hospitality industry legislation did not succeed in making all hospitality venues
totally smoke-free due to weak legislation and problems with compliance (Gonzalez
& Glantz, 2011; Nagelhout, Mons et al., 2011). From April 2008 until January 2009,
a mass media smoking cessation campaign ‘There is a quitter in every smoker’ ran
on television, radio, print, and internet. This campaign was designed to stimulate
smokers to quit smoking and had a special focus on smokers with low to moderate
educational levels aged 20 to 50 years.
In the current study, we examine whether there were age or educational
inequalities in smoking cessation after the implementation of the three interventions
(research question 1), in exposure to the three interventions (research question 2),
and in the effects of the three interventions on smoking cessation (research question 3).
METHODS
Design
The tobacco tax increase, smoke-free hospitality industry legislation, and the
cessation campaign were all implemented on a national level in the Netherlands
between April 2008 and January 2009. Longitudinal data from smokers from
three survey waves of the International Tobacco Control (ITC) Netherlands Survey
were used to evaluate the effects of the three interventions. The 2008 survey
was performed before and the 2009 and 2010 surveys were performed after the
implementation of the three interventions. The 2008 and 2009 surveys were used to
assess exposure to the interventions and the 2010 survey was used to assess the
effects of exposure on smoking cessation.
Sample
Dutch smokers aged 15 years and older were recruited from a probability-based
web database (Nagelhout et al., 2010). Potential respondents were identified as
smokers (having smoked at least 100 cigarettes in their lifetime and currently
smoking at least once per month) by means of a short screening survey in March
2008. In April 2008, 2,331 smokers were requested to participate in a web survey.
Of these smokers, 1,820 participated in the first survey (78.1%). In April and May

| 225 |
chapter 14 | Inequalities in cessation after three tobacco control policies
2009 all 1,820 smokers of the baseline survey were recontacted for the second
survey and 1,447 took part (79.5%). In May 2010 all baseline respondents were
again recontacted and 1,275 respondents participated in the third survey (70.1%).
The analyses for this paper were restricted to respondents who participated
in all three survey waves (n = 1,176). Furthermore, respondents were excluded who
had quit smoking between the 2008 and 2009 survey (n = 128). This enabled us to
estimate the effects of exposure to the interventions between the 2008 and 2009
survey on smoking cessation between the 2009 and 2010 survey. Of the remaining
1,048 respondents 962 answered all questions that were used in the current study
and were used in the analyses. These respondents (n = 962) were older (t = 4.83, p
< 0.001), had higher scores on the Heaviness of Smoking Index (t = 2.81, p = 0.005),
and had less often the intention to quit smoking within the next 6 months (χ2 = 8.18,
p = 0.004) at the 2008 survey than respondents who did not answer all questions
used in this study or did not participate in the 2010 survey (n = 858).
Measurements
Control variables
Control variables were gender, age group, educational level, heaviness of smoking,
and intention to quit smoking. These variables were assessed at the 2008 survey. Age
was categorised as 15 to 24, 25 to 39, 40 to 54, and 55 years and older. Education
was categorised in three levels: low (primary education and lower pre-vocational
secondary education), moderate (middle pre-vocational secondary education and
secondary vocational education), and high (senior general secondary education,
(pre-)university education and higher professional education). The Heaviness
of Smoking Index (HSI) was created as the sum of two categorical measures:
number of cigarettes per day and time before smoking the first cigarette of the
day (Heatherton et al., 1989). HSI values ranged from 0 to 6 and are positively
associated with nicotine dependence. Intention to quit smoking was categorised as
intending to quit within 6 months and not intending to quit within 6 months.
Exposure to tobacco control interventions
A tobacco tax increase will affect only those smokers who pay more for their
cigarettes after the tax increase. Therefore, respondents were asked during the
2008 and 2009 survey how much they paid for their cigarettes at their last purchase.
Following previous studies (Ross, Blecher, Yan, & Hyland, 2011), the increase in
reported prices between the 2008 and 2009 survey was used as an indicator of
exposure to the price increase. Next, this variable was categorised into four levels:
no price increase including price decreases (0), an increase in price of 1 to 2 cents
per cigarette (1), 3 to 4 cents per cigarette (2), and 5 cents per cigarette or more (3).
| 226 |
Not all smokers were exposed to the smoke-free hospitality industry legislation,
because not all hospitality industry venues complied with the legislation and
because not all smokers frequented hospitality industry venues. Therefore, we used
both rules about smoking in bars (Cooper et al., 2010; Hammond et al., 2006) and
frequency of visiting bars (Cooper et al., 2010; Nagelhout, Willemsen et al., 2011) at
the 2009 survey as a measure for exposure to smoke-free legislation. The following
questions were used: “Which of the following best describes the rules about
smoking in drinking establishments such as bars or pubs where you live?” (“no rules
or restrictions”, “smoking is allowed only in some indoor areas”, or “smoking is not
allowed in any indoor area”) and “Since the smoking ban in the hospitality industry
(July 2008), how often have you visited a drinking establishment such as a bar
or pub where you live?” (“never”, “yearly”, “monthly”, or “weekly”). One exposure
variable was created by multiplying the answers on the two questions, ranging from
0 (no rules or restrictions about smoking in drinking establishments and/or never
visited drinking establishments since the ban) to 6 (smoking is not allowed in any
indoor area in drinking establishments and weekly visited drinking establishments
since the ban).
Recall of exposure to the cessation campaign was assessed at the 2009
survey by showing respondents pictures and texts from the campaigns. Smokers
were asked how often they had seen the television commercial, the radio commercial,
the poster, and how often they had seen anything on the internet from the ‘There
is a quitter in every smoker’ campaign. Response categories were “never” (0),
“rarely” (1), “sometimes” (2), and “often” (3). One exposure variable was created by
computing a mean score of exposure to the four different parts of the campaign for
every respondent.
Smoking cessation
Smoking cessation was assessed during the 2010 survey. Quit attempts were
assessed by asking respondents: “Have you made any attempts to stop smoking
since the last survey?”
Smokers who attempted to quit smoking since the last survey and who had
not smoked in the past seven days at the 2010 survey were defined as successful
quitters (seven-day point prevalence abstinence).
Ethics
The surveys were cleared for ethics by the Research Ethics Board of the University
of Waterloo and the Central Committee on Research Involving Human Subjects in
the Netherlands.
| 227 |
chapter 14 | Inequalities in cessation after three tobacco control policies
Analyses
Age and educational inequalities in quit attempts and successful smoking cessation
(research question 1) were examined with Chi-square tests. Age and educational
inequalities in exposure to the interventions (research question 2) were examined
with ANOVA F-tests. Exposure to the interventions was approximately normally
distributed.
Age and educational inequalities in the effects of the three interventions
(research question 3) were examined by performing logistic regression analyses
(both bivariate and multivariate) predicting quit attempts and successful smoking
cessation at the 2010 survey. Independent variables were the above mentioned
control variables and exposure to the price increase, the smoke-free legislation,
and the cessation campaign. Interactions of exposure to the interventions with age
and education were simultaneously added to these regression analyses to examine
whether there were age or educational inequalities in the effects of the interventions
on smoking cessation. Simple slope analysis was conducted to decompose a
significant interaction term (Aiken & West, 1991). In the simple slopes analysis, low,
moderate, and high values for each factor corresponded to one standard deviation
(SD) below the mean, the mean, and one SD above the mean, respectively.
All analyses were weighted by age and gender to be representative of the
adult smoker population in the Netherlands. More details on the weighting procedure
can be found in Thompson et al. (2006).
RESULTS
Inequalities in cessation
Of the study sample, 281 out of 962 respondents (29.3%) had tried to quit smoking
between the 2009 and 2010 survey (Table 1). At the 2010 survey, 86 out of 962
respondents (8.9%) had successfully quit smoking. Table 1 shows that there were
no significant age or educational inequalities in successful smoking cessation.
Smokers aged 15 to 39 years were more likely to attempt to quit smoking.
Inequalities in exposure
Most respondents were exposed to at least one of the three population-level
tobacco control interventions. 82.4% reported having paid more for their cigarettes
in the 2009 survey than in the 2008 survey, 65.6% reported having visited a
drinking establishment that had some form of smoking restriction, and 83.1%
reported having experienced one or more parts of the campaign. Table 1 shows
that smokers aged 15 to 24 years were more exposed to the smoke-free legislation,
while smokers aged 25 to 39 years were more exposed to the cessation campaign.
| 228 |
Higher educated smokers were more exposed to the price increase and the smoke-
free legislation.
Inequalities in effects on cessation
As can be seen in Table 2, exposure to the smoke-free legislation and to the
cessation campaign had a significant positive association with attempting to quit
smoking in the bivariate analyses, but not with successful smoking cessation. In
the multivariate analyses, only the association between exposure to the smoke-free
legislation with attempting to quit smoking remained significant (Odds Ratio (OR) =
1.11, 95% confidence interval (CI) = 1.01 to 1.22, p = 0.029).
In additional analyses (not shown in table), interactions of exposure to the
interventions with age and education were added. The interaction between age and
exposure to the price increase on successful smoking cessation was significant (OR
= 0.99, 95% CI = 0.97 to 1.00, p = 0.046). Decomposing this interaction by means
of simple slopes analysis showed that exposure to the price increase only predicted
successful smoking cessation among young respondents (Beta = 0.10, 95% CI =
0.01 to 0.18, p = 0.035) and not among older respondents (Figure 1).
There were no significant interaction effects of age with the other two
interventions (not shown in tables). Also, there were no significant interaction effects
of education with any of the interventions.
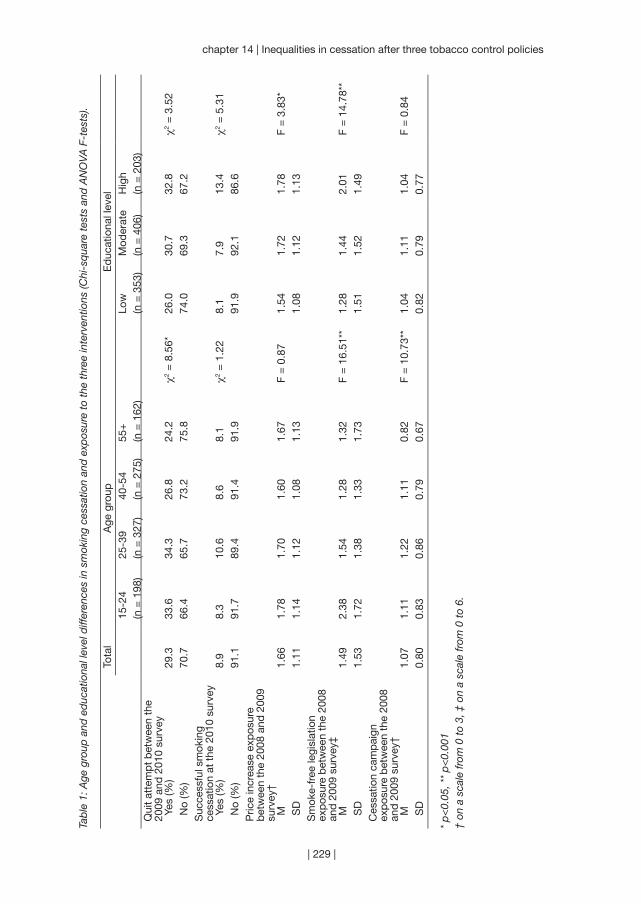
| 229 |
chapter 14 | Inequalities in cessation after three tobacco control policies
Tab
le 1
: Age
gro
up a
nd e
duc
atio
nal l
evel
diff
eren
ces
in s
mok
ing
cess
atio
n an
d e
xpos
ure
to t
he t
hree
inte
rven
tions
(Chi
-sq
uare
tes
ts a
nd A
NO
VA F
-tes
ts).
Tota
lA
ge g
roup
Ed
ucat
iona
l lev
el15
-24
(n =
198
)25
-39
(n =
327
)40
-54
(n =
275
)55
+(n
= 1
62)
Low
(n =
353
)M
oder
ate
(n =
406
)H
igh
(n =
203
)Q
uit
atte
mp
t b
etw
een
the
2009
and
201
0 su
rvey
Yes
(%)
29.3
33.6
34.3
26.8
24.2
χ2 =
8.5
6*26
.030
.732
.8χ2
= 3
.52
No
(%)
70.7
66.4
65.7
73.2
75.8
74.0
69.3
67.2
Suc
cess
ful s
mok
ing
cess
atio
n at
the
201
0 su
rvey
Yes
(%)
8.9
8.3
10.6
8.6
8.1
χ2 =
1.2
28.
17.
913
.4χ2
= 5
.31
No
(%)
91.1
91.7
89.4
91.4
91.9
91.9
92.1
86.6
Pric
e in
crea
se e
xpos
ure
bet
wee
n th
e 20
08 a
nd 2
009
surv
ey†
M1.
661.
781.
701.
601.
67F
= 0
.87
1.54
1.72
1.78
F =
3.8
3* S
D1.
111.
141.
121.
081.
131.
081.
121.
13S
mok
e-fr
ee le
gisl
atio
n ex
pos
ure
bet
wee
n th
e 20
08
and
200
9 su
rvey
‡ M
1.49
2.38
1.54
1.28
1.32
F =
16.
51**
1.28
1.44
2.01
F =
14.
78**
SD
1.53
1.72
1.38
1.33
1.73
1.51
1.52
1.49
Ces
satio
n ca
mp
aign
ex
pos
ure
bet
wee
n th
e 20
08
and
200
9 su
rvey
† M
1.07
1.11
1.22
1.11
0.82
F =
10.
73**
1.04
1.11
1.04
F =
0.8
4 S
D0.
800.
830.
860.
790.
670.
820.
790.
77
* p
<0.
05, *
* p
<0.
001
† on
a s
cale
from
0 t
o 3,
‡ o
n a
scal
e fr
om 0
to
6.
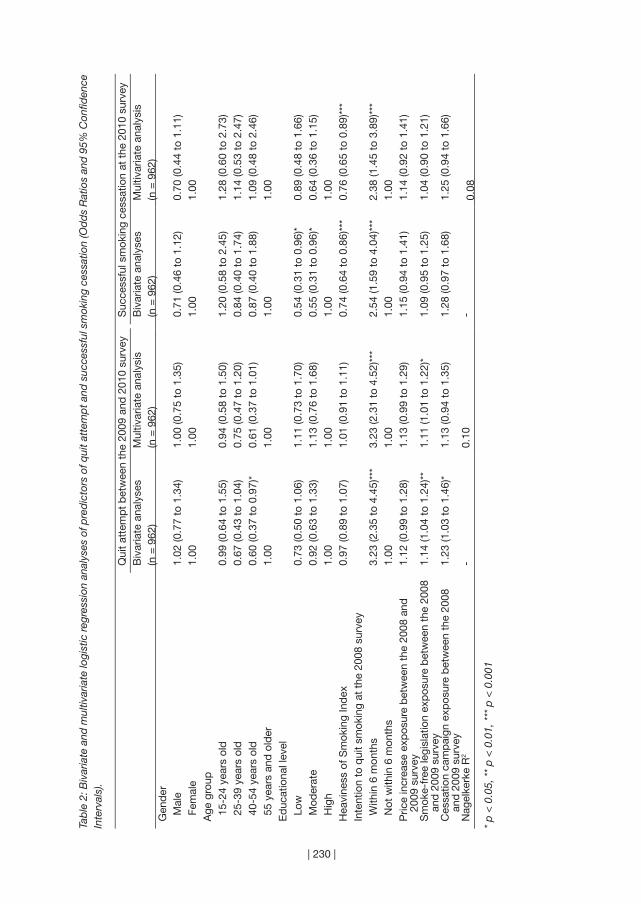
| 230 |
Tab
le 2
: Biv
aria
te a
nd m
ultiv
aria
te lo
gist
ic re
gres
sion
ana
lyse
s of
pre
dic
tors
of q
uit a
ttem
pt a
nd s
ucce
ssfu
l sm
okin
g ce
ssat
ion
(Od
ds
Rat
ios
and
95%
Con
fiden
ce
Inte
rval
s).
Qui
t at
tem
pt
bet
wee
n th
e 20
09 a
nd 2
010
surv
eyS
ucce
ssfu
l sm
okin
g ce
ssat
ion
at t
he 2
010
surv
eyB
ivar
iate
ana
lyse
s(n
= 9
62)
Mul
tivar
iate
ana
lysi
s(n
= 9
62)
Biv
aria
te a
naly
ses
(n =
962
)M
ultiv
aria
te a
naly
sis
(n =
962
)G
end
er M
ale
1.02
(0.7
7 to
1.3
4)1.
00 (0
.75
to 1
.35)
0.71
(0.4
6 to
1.1
2)0.
70 (0
.44
to 1
.11)
Fem
ale
1.00
1.00
1.00
1.00
Age
gro
up 1
5-24
yea
rs o
ld0.
99 (0
.64
to 1
.55)
0.94
(0.5
8 to
1.5
0)1.
20 (0
.58
to 2
.45)
1.28
(0.6
0 to
2.7
3) 2
5-39
yea
rs o
ld0.
67 (0
.43
to 1
.04)
0.75
(0.4
7 to
1.2
0)0.
84 (0
.40
to 1
.74)
1.14
(0.5
3 to
2.4
7) 4
0-54
yea
rs o
ld0.
60 (0
.37
to 0
.97)
*0.
61 (0
.37
to 1
.01)
0.87
(0.4
0 to
1.8
8)1.
09 (0
.48
to 2
.46)
55
year
s an
d o
lder
1.00
1.00
1.00
1.00
Ed
ucat
iona
l lev
el L
ow0.
73 (0
.50
to 1
.06)
1.11
(0.7
3 to
1.7
0)0.
54 (0
.31
to 0
.96)
*0.
89 (0
.48
to 1
.66)
Mod
erat
e0.
92 (0
.63
to 1
.33)
1.13
(0.7
6 to
1.6
8)0.
55 (0
.31
to 0
.96)
*0.
64 (0
.36
to 1
.15)
Hig
h1.
001.
001.
001.
00H
eavi
ness
of S
mok
ing
Ind
ex0.
97 (0
.89
to 1
.07)
1.01
(0.9
1 to
1.1
1)0.
74 (0
.64
to 0
.86)
***
0.76
(0.6
5 to
0.8
9)**
*In
tent
ion
to q
uit
smok
ing
at t
he 2
008
surv
ey W
ithin
6 m
onth
s3.
23 (2
.35
to 4
.45)
***
3.23
(2.3
1 to
4.5
2)**
*2.
54 (1
.59
to 4
.04)
***
2.38
(1.4
5 to
3.8
9)**
* N
ot w
ithin
6 m
onth
s1.
001.
001.
001.
00P
rice
incr
ease
exp
osur
e b
etw
een
the
2008
and
20
09 s
urve
y1.
12 (0
.99
to 1
.28)
1.13
(0.9
9 to
1.2
9)1.
15 (0
.94
to 1
.41)
1.14
(0.9
2 to
1.4
1)
Sm
oke-
free
legi
slat
ion
exp
osur
e b
etw
een
the
2008
an
d 2
009
surv
ey1.
14 (1
.04
to 1
.24)
**1.
11 (1
.01
to 1
.22)
*1.
09 (0
.95
to 1
.25)
1.04
(0.9
0 to
1.2
1)
Ces
satio
n ca
mp
aign
exp
osur
e b
etw
een
the
2008
an
d 2
009
surv
ey1.
23 (1
.03
to 1
.46)
*1.
13 (0
.94
to 1
.35)
1.28
(0.9
7 to
1.6
8)1.
25 (0
.94
to 1
.66)
Nag
elke
rke
R2
-0.
10-
0.08
* p
< 0
.05,
**
p <
0.0
1, *
** p
< 0
.001
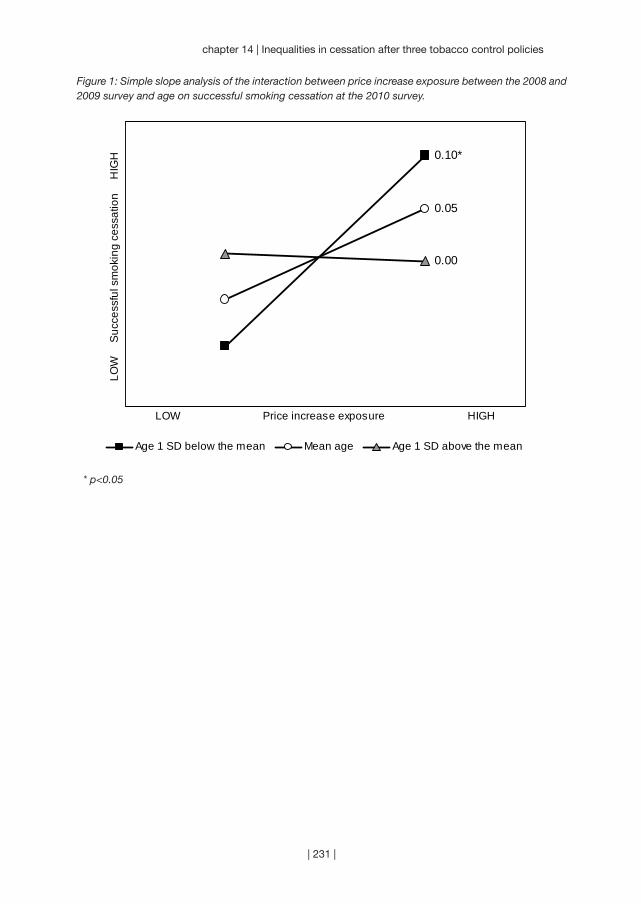
| 231 |
chapter 14 | Inequalities in cessation after three tobacco control policies
Figure 1: Simple slope analysis of the interaction between price increase exposure between the 2008 and 2009 survey and age on successful smoking cessation at the 2010 survey.
* p<0.05
0.10*
0.05
0.00
LOW Price increase exposure HIGH
LOW
S
ucce
ssfu
l sm
okin
g ce
ssat
ion
H
IGH
Age 1 SD below the mean Mean age Age 1 SD above the mean
| 232 |
DISCUSSION
In this study, we examined age and educational inequalities in smoking cessation
after three population-level tobacco control interventions: a tobacco tax increase,
smoke-free hospitality industry legislation, and a mass media cessation campaign.
These three interventions were implemented during the same time period in the
Netherlands in 2008. We found that only the smoke-free legislation seemed to
have had a small effect on attempting to quit smoking among the whole group of
smokers. The price increase may have been only effective in increasing successful
smoking cessation among younger smokers. However, there were no overall age or
educational differences in successful smoking cessation after the implementation
of the three interventions.
We did not find significant effects of the price increase on smoking cessation
for the whole group of smokers. This was probably caused by the fact that prices
increased by only 8%. Prices should rise substantial to increase smoking cessation
(World Health Organization, 2010). Consistent with earlier findings (Chaloupka et al.,
2011; Levy et al., 2004; World Health Organization, 2003), our findings suggest that
the price increase was only effective in stimulating successful smoking cessation
among younger smokers.
We found a small effect of the smoke-free hospitality industry legislation on
quit attempts, but not on successful smoking cessation. This is consistent with a
previous study that showed that quit attempts increased slightly in the Netherlands
after the implementation of the three interventions, but smoking prevalence did
not decrease significantly (Nagelhout, Willemsen et al., 2011). This previous study
could not disentangle which of the three interventions caused this increase in
quit attempts. In the current study, we controlled for the other two interventions,
which strengthens conclusions that the found effect of exposure to the smoke-free
legislation can actually be ascribed to this intervention. A possible explanation for
the small size of the effect is that the legislation was weak, not well implemented,
and that there were considerable problems with compliance (Gonzalez & Glantz,
2011; Nagelhout, Mons et al., 2011). Another recent study showed that compared to
two countries with comprehensive and well-enforced smoke-free legislation, Ireland
and England, there were less quit attempts and there was less quit success in the
Netherlands after the implementation (Nagelhout, De Vries, Boudreau et al., 2012).
The Dutch cessation campaign focused on smokers with low to moderate
educational levels. However, we found no educational inequalities in exposure to the
cessation campaign. The campaign did not succeed in reaching low to moderate
educated smokers more than high educated smokers. But it may be considered an
achievement that smokers from different educational levels were reached equally,
| 233 |
chapter 14 | Inequalities in cessation after three tobacco control policies
because previous research found that cessation campaigns have a larger reach among
smokers with higher educational levels (Niederdeppe et al., 2008; Thomas et al.,
2008). Furthermore, smokers aged 25 to 39 years old were more often exposed to the
campaign, which matches the focus of the campaign on smokers aged 20 to 50 years.
The strength of our study is that we compared the effects of three tobacco
control interventions that were implemented during the same time period using
three survey waves of a longitudinal cohort study. This study design allowed us to
classify people according to their exposure to each of the three interventions, so
we could disentangle the effects of the three interventions on smoking cessation.
However, there were also some limitations. Our design with three survey waves
has the drawback of being unable to account for short-term effects on smoking
cessation and our results may therefore be conservative. The fact that we did not
have a control region in the Netherlands where the three interventions were not
implemented is a limitation of this study. Also, exposure to the interventions cannot
be measured objectively by using self-report. Smokers who report that they have
not seen or heard anything from the smoking cessation campaign, may have seen
something from the campaign without remembering this at the time of the survey.
Also, we used self-reported smoking cessation without biochemical validation.
Finally, almost half of the sample was either lost to follow-up or did not answer all
questions that were used in the current study. These respondents were younger,
less addicted, and had more intention to quit smoking. Therefore, our results may
not be fully generalisable to the broader population of Dutch smokers.
Our study has important implications for population-level tobacco control
interventions. Based on our findings, we recommend increasing tobacco taxes at a
higher rate such that there is a much larger resulting increase in price. Although raising
taxes is widely recognised as the most potent tobacco control intervention (Glynn,
Seffrin, Brawley, Grey, & Ross, 2010; Levy et al., 2005), it is known from previous
studies that in order for tax hikes to lead to substantial increases in cessation, the
resulting price increase must also be substantial (World Health Organization, 2010).
We also recommend implementing strong, comprehensive smoke-free legislation,
because this protects non-smokers and may maximise quitting behaviour (Callinan
et al., 2010; Nagelhout, De Vries, Boudreau et al., 2012). An accompanying media
campaign should explain that smoke-free legislation is implemented to protect non-
smokers from exposure to second-hand smoke instead of only stimulating smoking
cessation (European Commission, 2007; World Health Organization, 2007b). This
is especially important in the Netherlands, were smokers are less knowledgeable
or concerned about the harms of smoking and second-hand smoke than in other
countries (Arnott et al., 2011).

“While research can play a role in policy debates,
political considerations will often trump best evidence.”
(Kenneth Warner)
| 234 |

Chapter 15
~~~
Discussion
| 235 |
| 236 |
Introduction
The studies in this thesis focused on the impact of smoke-free legislation on
smoking. Smoke-free legislation is a key policy under the World Health Organization
(WHO) Framework Convention on Tobacco Control (FCTC). The FCTC is the first
international public health treaty and has currently been ratified by more than 170
countries around the world. The International Tobacco Control Policy Evaluation
Project (ITC Project) was specifically designed to evaluate the impact of FCTC
policies. The founding researchers realised that the treaty provided a unique
opportunity to evaluate the impact of tobacco control policies worldwide. ITC is
the first-ever international cohort survey of tobacco use and is currently conducted
in 20 countries. It is unique in its use of individual longitudinal cohort data within a
quasi-experimental design. In this thesis, data from the ITC Project were used to
evaluate the impact of smoke-free legislation in the Netherlands. The Netherlands
is an interesting case study for smoke-free legislation because the emergence of
smoke-free hospitality industry legislation was more controversial and problematic
there than in many other countries.
The ITC Netherlands Survey was initiated in 2008 to evaluate the impact of
Dutch FCTC policies. The following FCTC policies were implemented immediately
after the first wave of the ITC Netherlands Survey in 2008: smoke-free hospitality
industry legislation with an accompanying implementation campaign, a mass media
smoking cessation campaign, and a small tax increase. The impact of all these policies
are evaluated in this thesis, but the focus is on the impact of smoke-free hospitality
industry legislation. The studies were grouped into three parts: 1) population impact
of smoke-free legislation on smoking, 2) individual pathways of change after smoke-
free legislation, and 3) unintended consequences of smoke-free legislation.
In this chapter, we will discuss the main findings of our studies in relation to
recent findings described in the international literature. Methodological limitations
of the studies in this thesis will be discussed, as well as priorities for future research
and recommendations for tobacco control policy.
Overview of main findings
Before the results of the studies are discussed separately, a short overview of the
main findings is given. These findings are graphically displayed in Figure 1. The
studies in this thesis focused mostly on the impact of smoke-free legislation on
attempts to quit smoking. We found that support for smoke-free legislation was
an important mediator of the relationship between smoke-free legislation and
quit attempts. When smoke-free legislation succeeds in substantially increasing
quit attempts, the legislation can cause a decrease in smoking prevalence. This
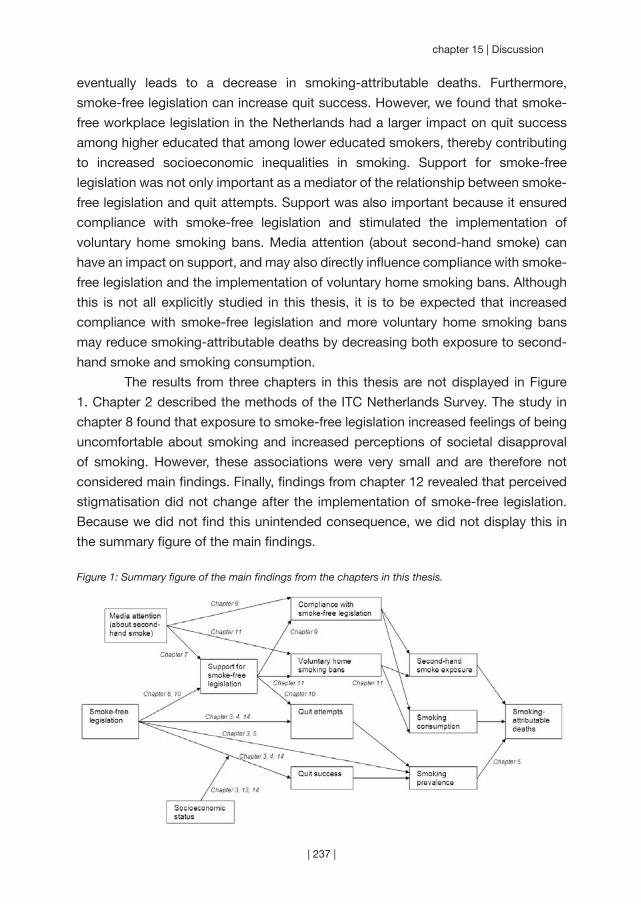
| 237 |
chapter 15 | Discussion
eventually leads to a decrease in smoking-attributable deaths. Furthermore,
smoke-free legislation can increase quit success. However, we found that smoke-
free workplace legislation in the Netherlands had a larger impact on quit success
among higher educated that among lower educated smokers, thereby contributing
to increased socioeconomic inequalities in smoking. Support for smoke-free
legislation was not only important as a mediator of the relationship between smoke-
free legislation and quit attempts. Support was also important because it ensured
compliance with smoke-free legislation and stimulated the implementation of
voluntary home smoking bans. Media attention (about second-hand smoke) can
have an impact on support, and may also directly influence compliance with smoke-
free legislation and the implementation of voluntary home smoking bans. Although
this is not all explicitly studied in this thesis, it is to be expected that increased
compliance with smoke-free legislation and more voluntary home smoking bans
may reduce smoking-attributable deaths by decreasing both exposure to second-
hand smoke and smoking consumption.
The results from three chapters in this thesis are not displayed in Figure
1. Chapter 2 described the methods of the ITC Netherlands Survey. The study in
chapter 8 found that exposure to smoke-free legislation increased feelings of being
uncomfortable about smoking and increased perceptions of societal disapproval
of smoking. However, these associations were very small and are therefore not
considered main findings. Finally, findings from chapter 12 revealed that perceived
stigmatisation did not change after the implementation of smoke-free legislation.
Because we did not find this unintended consequence, we did not display this in
the summary figure of the main findings.
Figure 1: Summary figure of the main findings from the chapters in this thesis.
| 238 |
Population impact of smoke-free legislation on smoking
The main goal of smoke-free legislation is to protect non-smokers by reducing
exposure to second-hand smoke. However, the largest impact on smoking-
attributable deaths may not come from the effects of smoke-free legislation on
reduced exposure to second-hand smoke, but from its effects on reduced smoking
consumption and reduced smoking prevalence (see Figure 1). The first part of this
thesis focused on the population impact of smoke-free legislation on smoking
cessation and smoking prevalence. Relatively few studies had addressed whether
the population impact of smoke-free legislation on smoking was the same for
smoke-free workplace legislation and hospitality industry legislation, whether the
impact was the same for comprehensive and partial legislation, and how the impact
of smoke-free legislation compared to the impact of other tobacco control policies.
Moreover, few studies had examined the impact of national smoke-free legislation
on smoking. The studies in the first part of this thesis were conducted to fill these
gaps in the literature.
Findings from chapters 3, 4, and 5 demonstrated that national smoke-free
legislation can have a population impact by reducing smoking prevalence, stimulating
smoking cessation, and reducing smoking-attributable deaths. Furthermore, the
findings suggested that the impact of smoke-free legislation on smoking prevalence
and cessation was larger when it was implemented in all workplaces instead of
only hospitality industry venues (chapter 3). Also, the impact on smoking cessation
may be larger when the smoke-free legislation was comprehensive instead of
partial (chapter 4). Extending partial smoke-free legislation to all public places and
workplaces with full enforcement and publicity can substantially reduce smoking
prevalence and smoking-attributable deaths (chapter 5). We found that the impact
of comprehensive smoke-free legislation on reducing future smoking-attributable
deaths ranked as the third most effective tobacco control policy, after increasing
tobacco taxes and implementing cessation treatment policies (chapter 5).
A recent systematic review of the impact of smoke-free legislation reported
that some studies found a positive effect on smoking cessation, whereas other
studies did not (Callinan et al., 2010). Also, a study using data from 21 jurisdictions
(countries, states, and provinces) that implemented smoke-free legislation found
evidence of a decrease in smoking prevalence in eight jurisdictions but no change
in the other 13 (Bajoga et al., 2011). This may suggest that smoke-free legislation
has an impact on smoking cessation, but only under certain circumstances. Two of
these circumstances were explicitly studied in this thesis: the scope of the legislation
(workplace or hospitality industry) and the comprehensiveness of the legislation.
We found that partial smoke-free workplace legislation in the Netherlands and
| 239 |
chapter 15 | Discussion
comprehensive smoke-free workplace legislation in Ireland and England was more
effective in increasing smoking cessation than partial smoke-free hospitality industry
legislation in the Netherlands (chapters 3 and 4). The smoke-free hospitality industry
legislation in the Netherlands only had a small impact on quit attempts, without
significantly reducing smoking prevalence (chapter 3). It is unknown whether the
smaller impact of smoke-free hospitality industry legislation in the Netherlands is
due to its limited scope, to the fact that the legislation is not comprehensive (allowing
smoking rooms and other exceptions), or to both. Additionally, the impact may have
been larger in Ireland and England due to better enforcement, more publicity, and
other policies already in place or implemented at the same time.
A study involving multiple countries that have different types of smoke-free
legislation is needed to disentangle the factors determining the impact of smoke-
free legislation on smoking. At minimum, a two-by-two design of four countries
would be needed to disentangle the two factors scope of the legislation and
comprehensiveness. Yet if factors like enforcement and other policies or campaigns
are also taken into account such a study may become practically unfeasible.
Simulation studies, like the one described in chapter 5, can be an alternative research
strategy to answer these questions. Simulation studies combine information
from different kinds of empirical studies and provide a useful tool for examining
the effects of smoke-free legislation while controlling for secular trends, scope of
the legislation, comprehensiveness, enforcement, publicity, and other policies or
campaigns already in place or implemented at the same time (Levy et al., 2006).
However, the reliability of simulation models is always limited by the quality of the
empirical data that is used for model construction and validation. Therefore, more
empirical studies are needed comparing countries with different types of smoke-
free legislation.
In conclusion, we found that national smoke-free legislation can reduce
smoking prevalence, stimulate smoking cessation, and reduce smoking-attributable
deaths. The impact is likely to be larger when the legislation is implemented in
all workplaces, when it is comprehensive, and when there is full enforcement and
publicity.
Individual pathways of change after smoke-free legislation
It is not only important to know whether policies have an impact on tobacco
consumption; it is also important to understand how this process occurs. The
ITC Conceptual Model (Fong et al., 2006) describes the individual pathways of
change from tobacco control policies to smoking cessation. Before the start of the
ITC Netherlands Survey, no published studies had tested the entire causal chain
| 240 |
hypothesised in the ITC Conceptual Model. Therefore, it was unknown through
which policy-specific variables and psychosocial mediators the individual impact
of smoke-free legislation on smoking cessation occurred. This was examined in the
studies in the second part of this thesis.
The studies in chapters 6 and 7 determined relevant policy-specific
variables, the factors that are most proximal to the policy itself. It was found that
comprehensive smoke-free legislation was associated with an increase in support
for smoke-free legislation that was above the secular trend (chapter 6). Furthermore,
awareness of the harm of second-hand smoking was a predictor of greater support
for smoke-free legislation. The study in chapter 7 described the newspaper
coverage about smoke-free hospitality industry legislation in the Netherlands. Most
newspaper coverage was negative towards the smoke-free legislation and focused
on economic aspects rather than health aspects. Exposure to this coverage had a
small negative effect on support for smoke-free legislation, while exposure to the
implementation campaign had a small positive effect on awareness of the harm
of second-hand smoking. In sum, we found in chapters 6 and 7 that smoke-free
legislation and accompanying media attention can have an influence on two policy-
specific variables: support for smoke-free legislation and awareness of the harm of
second-hand smoking.
In chapters 8 and 9 the role of psychosocial mediators was established.
Chapter 8 focused on the social acceptability of smoking. Small associations
between awareness of warning labels, anti-tobacco information, and smoke-
free legislation and the social acceptability of smoking were found. Exposure to
smoke-free legislation increased feelings of being uncomfortable about smoking
and increased perceptions of societal disapproval of smoking. However, the small
associations suggest that smoke-free legislation may only have an impact on
the social acceptability of smoking on the long term and/or the population level.
Chapter 9 examined predictors of smoking in bars after the implementation of
smoke-free legislation in Europe. Smokers who were more supportive of smoke-
free legislation and who were more aware of the harm of second-hand smoke
were less likely to smoke in bars after the implementation. Attitudes and social
norms about smoking partly mediated the relationship between support and harm
awareness and smoking in bars post-ban. Concluding, the studies in chapters 8 and
9 found that exposure to smoke-free legislation, support for smoke-free legislation,
and awareness of the harm of second-hand smoking can influence attitudes and
social norms (psychosocial mediators) and compliance with smoke-free legislation
(behavioural mediator).
| 241 |
chapter 15 | Discussion
Chapter 10 tested the entire causal chain from individual exposure to smoke-free
legislation through policy-specific variables and psychosocial mediators on smoking
cessation. The effect of individual exposure to smoke-free legislation on smoking
cessation was mediated by one pathway via support for smoke-free legislation,
attitudes about quitting, and intention to quit smoking. Exposure to smoke-free
legislation also influenced awareness of the harm of (second-hand) smoking, which
in turn influenced the subjective norm about quitting. However, only attitudes
about quitting were significantly associated with intention to quit smoking, whereas
subjective norm and self-efficacy for quitting were not.
These studies point to the importance of support for smoke-free legislation
in ensuring compliance with smoke-free legislation and in changing psychosocial
determinants of smoking cessation. Other recent studies have also concluded that
support for smoke-free legislation is an important mediator in the effect of smoke-
free legislation on intention to quit smoking (Brown et al., 2009; Macy et al., 2012).
This may be caused by the fact that smokers first experience smoke-free legislation
and come to appreciate it. Later, these changed perceptions about smoke-free
legislation may have an impact on how they think about smoking and quitting. This
may motivate them to quit smoking. It may be that for countries where smoke-free
legislation had a positive effect on smoking cessation, support for the legislation
also increased most or was highest. Anecdotal evidence from Ireland (Currie &
Clancy, 2010) and Greece (Tamvakas & Amos, 2010) suggests that support for the
legislation can be an important factor in explaining whether smoke-free legislation
succeeds in reducing exposure to second-hand smoke.
In conclusion, we found that support for smoke-free legislation increased
after the implementation when the legislation was comprehensive and/or when
media attention was positive. Sufficient support is important, because it can
contribute to increased levels of compliance with smoke-free legislation as well as
increased smoking cessation.
Unintended consequences of smoke-free legislation
Most research has focused on the intended effects of smoke-free legislation: reduced
exposure to second-hand smoke and increased smoking cessation. However,
smoke-free legislation can also have unintended consequences. An important
concern is that smoke-free legislation might lead to a displacement of smoking into
private venues, thereby increasing second-hand smoke exposure among children.
Another possible unintended consequence is increased stigmatisation of smokers.
Furthermore, tobacco control policies sometimes have larger effects on smokers
with a higher socioeconomic status (SES), thereby increasing socioeconomic
| 242 |
inequalities (Niederdeppe et al., 2008; Thomas et al., 2008). Part three of this thesis
examined possible unintended consequences of smoke-free legislation on smoking
in the home, on stigmatisation of smokers, and on socioeconomic inequalities in
smoking.
Findings from chapter 11 demonstrated that smoke-free hospitality industry
legislation did not lead to more smoking in smokers’ homes. In fact, smoke-free
legislation seemed to reduce the number of cigarettes smoked per day and seemed
to stimulate smokers to establish voluntary smoking bans in their homes. Smokers
with young children, smokers who were supportive of smoke-free legislation, and
who were planning to quit smoking were particularly likely to implement a voluntary
home smoking ban. Consistent with our findings, a recent systematic review
concluded that exposure to second-hand smoke does not increase in homes after
the implementation of smoke-free legislation (Callinan et al., 2010).
Chapter 12 described that whether smoke-free legislation increased
smokers’ perceived stigmatisation depended on how smokers felt about smoking
outside. Increased feelings of stigmatisation were found only among smokers who
felt negatively judged by passers-by when smoking outside. The level of perceived
stigmatisation did not change after the implementation of smoke-free hospitality
industry legislation in the Netherlands, possibly because most Dutch smokers did
not feel negatively judged when smoking outside. However, it is unclear whether
our results are generalisable to other countries that implemented comprehensive
smoke-free legislation in both workplaces and the hospitality industry at the same
time. Evidence from other recent studies is inconsistent (Hargreaves et al., 2010;
Ritchie, Amos, & Martin, 2010a; Stuber et al., 2008). Therefore, more research is
warranted.
In the Netherlands, there is a widening of educational inequalities in smoking
(chapter 13). While smoking prevalence remained stable among low educated
women between 2001 (29%) and 2008 (26%), there was a significant decrease in
smoking prevalence among high educated women in the same period (from 23%
to 17%). Similarly, smoking consumption remained stable among low educated
men, while there was a decrease in smoking consumption among high educated
men. There are concerns that tobacco control policies contributed to this widening
of socioeconomic inequalities by having larger effects on smokers with a higher
SES. Our findings revealed that the smoke-free hospitality industry legislation in the
Netherlands did not have differential effects on lower or higher educated people
(chapters 3 and 14). However, the smoke-free workplace legislation did have
differential effects, with more effects on smoking cessation among higher educated
smokers than among lower educated smokers (chapters 3 and 13). A possible
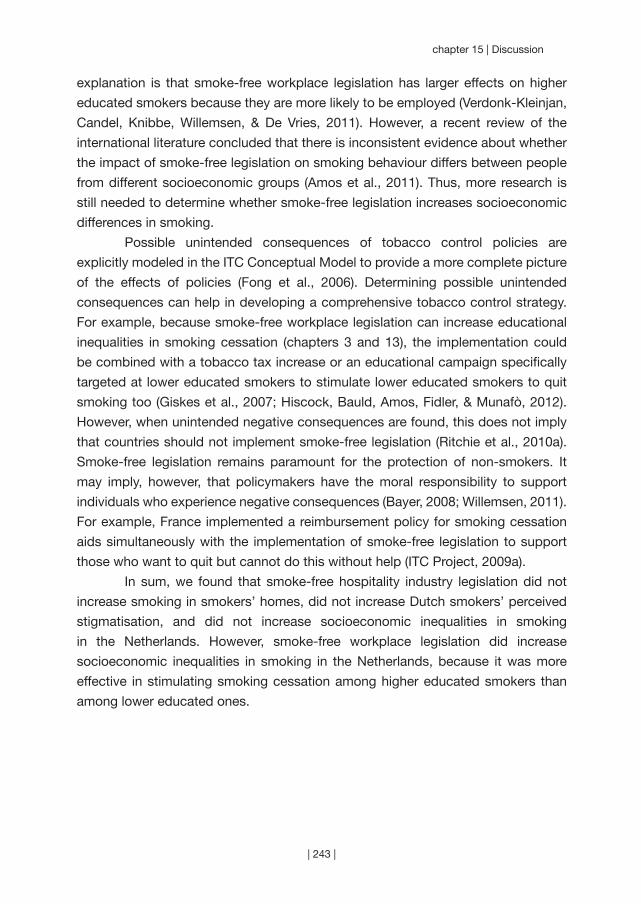
| 243 |
chapter 15 | Discussion
explanation is that smoke-free workplace legislation has larger effects on higher
educated smokers because they are more likely to be employed (Verdonk-Kleinjan,
Candel, Knibbe, Willemsen, & De Vries, 2011). However, a recent review of the
international literature concluded that there is inconsistent evidence about whether
the impact of smoke-free legislation on smoking behaviour differs between people
from different socioeconomic groups (Amos et al., 2011). Thus, more research is
still needed to determine whether smoke-free legislation increases socioeconomic
differences in smoking.
Possible unintended consequences of tobacco control policies are
explicitly modeled in the ITC Conceptual Model to provide a more complete picture
of the effects of policies (Fong et al., 2006). Determining possible unintended
consequences can help in developing a comprehensive tobacco control strategy.
For example, because smoke-free workplace legislation can increase educational
inequalities in smoking cessation (chapters 3 and 13), the implementation could
be combined with a tobacco tax increase or an educational campaign specifically
targeted at lower educated smokers to stimulate lower educated smokers to quit
smoking too (Giskes et al., 2007; Hiscock, Bauld, Amos, Fidler, & Munafò, 2012).
However, when unintended negative consequences are found, this does not imply
that countries should not implement smoke-free legislation (Ritchie et al., 2010a).
Smoke-free legislation remains paramount for the protection of non-smokers. It
may imply, however, that policymakers have the moral responsibility to support
individuals who experience negative consequences (Bayer, 2008; Willemsen, 2011).
For example, France implemented a reimbursement policy for smoking cessation
aids simultaneously with the implementation of smoke-free legislation to support
those who want to quit but cannot do this without help (ITC Project, 2009a).
In sum, we found that smoke-free hospitality industry legislation did not
increase smoking in smokers’ homes, did not increase Dutch smokers’ perceived
stigmatisation, and did not increase socioeconomic inequalities in smoking
in the Netherlands. However, smoke-free workplace legislation did increase
socioeconomic inequalities in smoking in the Netherlands, because it was more
effective in stimulating smoking cessation among higher educated smokers than
among lower educated ones.

| 244 |
Conceptual model of individual impact of smoke-free legislation on smoking
cessation
Based on the findings from this thesis and on the ITC Conceptual Model (Fong et
al., 2006), we developed a model of the individual impact of smoke-free legislation
on smoking cessation (Figure 2). Smoke-free legislation is often accompanied by
media attention, and both have the potential to increase support for smoke-free
legislation and awareness of the harm of (second-hand) smoking. Increases in
support and harm awareness result in more favourable attitudes and social norms
about quitting. These attitudes and social norms can in turn increase intention to
quit and smoking cessation. Support and harm awareness, as well as attitudes and
social norms about quitting, also influence compliance with smoke-free legislation
and whether people implement voluntary smoking bans, for example in their home.
These behavioural mediators may also increase intention to quit and smoking
cessation.
The ITC Conceptual Model does not specify which policy-specific and
psychosocial mediators can be expected to mediate the impact of policies on
behaviour separately for each tobacco control policy. Our model applied the ITC
Conceptual Model on smoke-free legislation in order to determine which policy-
specific variables and psychosocial mediators were important in explaining the
impact of smoke-free legislation on smoking cessation (chapter 10). It is important
that such mediational models are also applied to other policies, such as tax
increases, tobacco advertising bans, and health warnings on cigarette packages.
This can help future theory building concerning the working mechanisms of these
policies.
In our model, we added the category of behavioural mediators to the ITC
Conceptual Model, consisting of two intermediate behaviours that relate to the
implementation of smoke-free legislation: complying with smoke-free legislation
(chapter 9) and implementing voluntary smoking bans (chapter 11). Some smokers
may not immediately intend to quit smoking after they change their attitudes about
smoke-free legislation and quitting. These smokers may first perform intermediate
behaviours such as complying with smoke-free legislation and implementing
voluntary smoking bans in their home, which may ultimately cause them to intend
to quit smoking and attempt to quit. Future research should not only examine
psychosocial mediators, but should also take behavioural mediators into account.
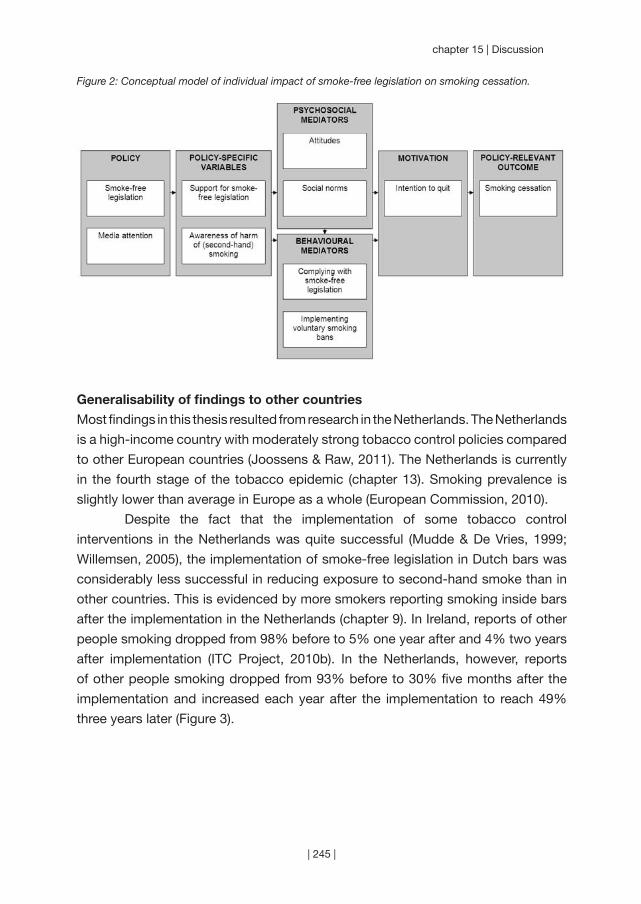
| 245 |
chapter 15 | Discussion
Figure 2: Conceptual model of individual impact of smoke-free legislation on smoking cessation.
Generalisability of findings to other countries
Most findings in this thesis resulted from research in the Netherlands. The Netherlands
is a high-income country with moderately strong tobacco control policies compared
to other European countries (Joossens & Raw, 2011). The Netherlands is currently
in the fourth stage of the tobacco epidemic (chapter 13). Smoking prevalence is
slightly lower than average in Europe as a whole (European Commission, 2010).
Despite the fact that the implementation of some tobacco control
interventions in the Netherlands was quite successful (Mudde & De Vries, 1999;
Willemsen, 2005), the implementation of smoke-free legislation in Dutch bars was
considerably less successful in reducing exposure to second-hand smoke than in
other countries. This is evidenced by more smokers reporting smoking inside bars
after the implementation in the Netherlands (chapter 9). In Ireland, reports of other
people smoking dropped from 98% before to 5% one year after and 4% two years
after implementation (ITC Project, 2010b). In the Netherlands, however, reports
of other people smoking dropped from 93% before to 30% five months after the
implementation and increased each year after the implementation to reach 49%
three years later (Figure 3).
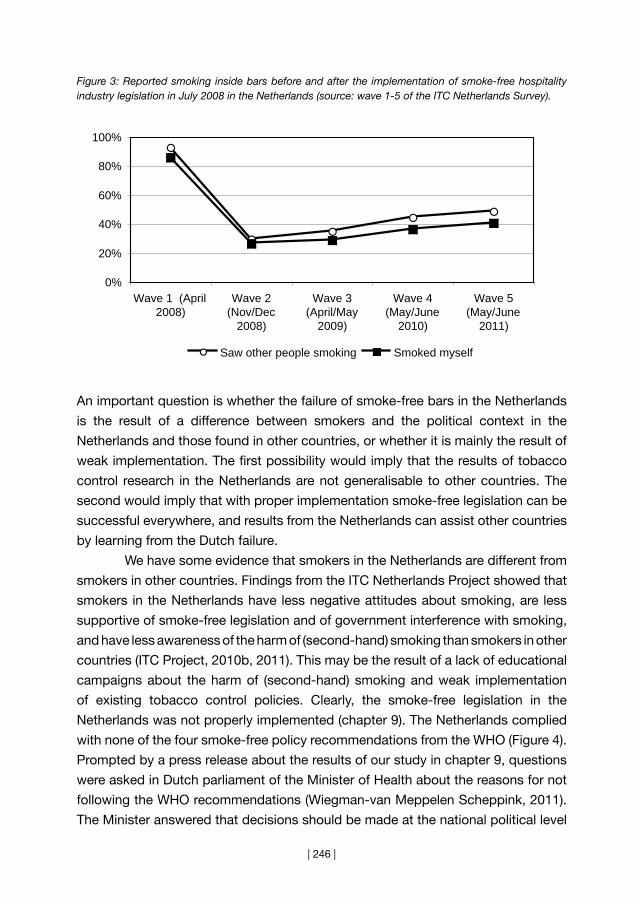
| 246 |
Figure 3: Reported smoking inside bars before and after the implementation of smoke-free hospitality industry legislation in July 2008 in the Netherlands (source: wave 1-5 of the ITC Netherlands Survey).
An important question is whether the failure of smoke-free bars in the Netherlands
is the result of a difference between smokers and the political context in the
Netherlands and those found in other countries, or whether it is mainly the result of
weak implementation. The first possibility would imply that the results of tobacco
control research in the Netherlands are not generalisable to other countries. The
second would imply that with proper implementation smoke-free legislation can be
successful everywhere, and results from the Netherlands can assist other countries
by learning from the Dutch failure.
We have some evidence that smokers in the Netherlands are different from
smokers in other countries. Findings from the ITC Netherlands Project showed that
smokers in the Netherlands have less negative attitudes about smoking, are less
supportive of smoke-free legislation and of government interference with smoking,
and have less awareness of the harm of (second-hand) smoking than smokers in other
countries (ITC Project, 2010b, 2011). This may be the result of a lack of educational
campaigns about the harm of (second-hand) smoking and weak implementation
of existing tobacco control policies. Clearly, the smoke-free legislation in the
Netherlands was not properly implemented (chapter 9). The Netherlands complied
with none of the four smoke-free policy recommendations from the WHO (Figure 4).
Prompted by a press release about the results of our study in chapter 9, questions
were asked in Dutch parliament of the Minister of Health about the reasons for not
following the WHO recommendations (Wiegman-van Meppelen Scheppink, 2011).
The Minister answered that decisions should be made at the national political level
0%
20%
40%
60%
80%
100%
Wave 1 (April2008)
Wave 2(Nov/Dec
2008)
Wave 3(April/May
2009)
Wave 4(May/June
2010)
Wave 5(May/June
2011)
Saw other people smoking Smoked myself
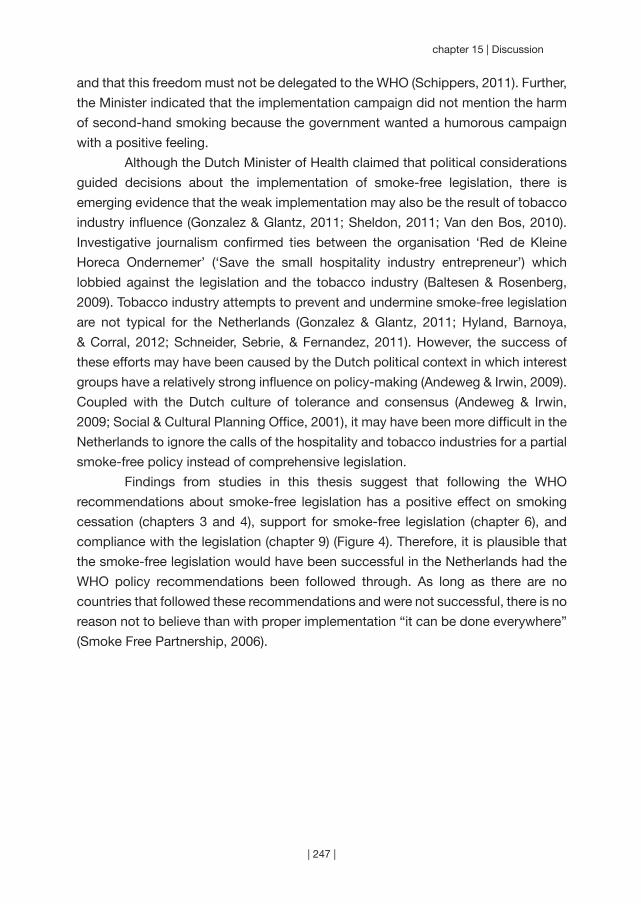
| 247 |
chapter 15 | Discussion
and that this freedom must not be delegated to the WHO (Schippers, 2011). Further,
the Minister indicated that the implementation campaign did not mention the harm
of second-hand smoking because the government wanted a humorous campaign
with a positive feeling.
Although the Dutch Minister of Health claimed that political considerations
guided decisions about the implementation of smoke-free legislation, there is
emerging evidence that the weak implementation may also be the result of tobacco
industry influence (Gonzalez & Glantz, 2011; Sheldon, 2011; Van den Bos, 2010).
Investigative journalism confirmed ties between the organisation ‘Red de Kleine
Horeca Ondernemer’ (‘Save the small hospitality industry entrepreneur’) which
lobbied against the legislation and the tobacco industry (Baltesen & Rosenberg,
2009). Tobacco industry attempts to prevent and undermine smoke-free legislation
are not typical for the Netherlands (Gonzalez & Glantz, 2011; Hyland, Barnoya,
& Corral, 2012; Schneider, Sebrie, & Fernandez, 2011). However, the success of
these efforts may have been caused by the Dutch political context in which interest
groups have a relatively strong influence on policy-making (Andeweg & Irwin, 2009).
Coupled with the Dutch culture of tolerance and consensus (Andeweg & Irwin,
2009; Social & Cultural Planning Office, 2001), it may have been more difficult in the
Netherlands to ignore the calls of the hospitality and tobacco industries for a partial
smoke-free policy instead of comprehensive legislation.
Findings from studies in this thesis suggest that following the WHO
recommendations about smoke-free legislation has a positive effect on smoking
cessation (chapters 3 and 4), support for smoke-free legislation (chapter 6), and
compliance with the legislation (chapter 9) (Figure 4). Therefore, it is plausible that
the smoke-free legislation would have been successful in the Netherlands had the
WHO policy recommendations been followed through. As long as there are no
countries that followed these recommendations and were not successful, there is no
reason not to believe than with proper implementation “it can be done everywhere”
(Smoke Free Partnership, 2006).
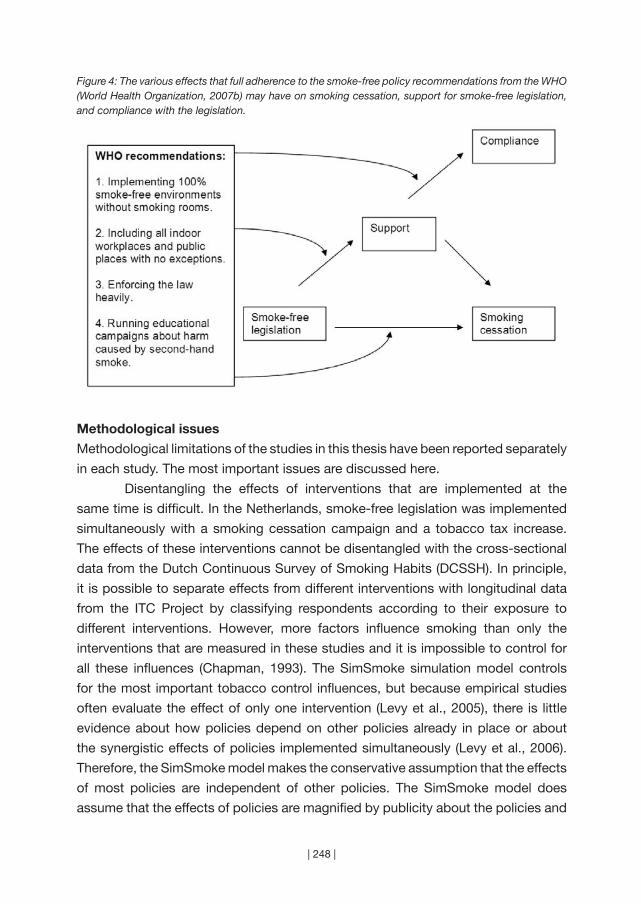
| 248 |
Figure 4: The various effects that full adherence to the smoke-free policy recommendations from the WHO (World Health Organization, 2007b) may have on smoking cessation, support for smoke-free legislation, and compliance with the legislation.
Methodological issues
Methodological limitations of the studies in this thesis have been reported separately
in each study. The most important issues are discussed here.
Disentangling the effects of interventions that are implemented at the
same time is difficult. In the Netherlands, smoke-free legislation was implemented
simultaneously with a smoking cessation campaign and a tobacco tax increase.
The effects of these interventions cannot be disentangled with the cross-sectional
data from the Dutch Continuous Survey of Smoking Habits (DCSSH). In principle,
it is possible to separate effects from different interventions with longitudinal data
from the ITC Project by classifying respondents according to their exposure to
different interventions. However, more factors influence smoking than only the
interventions that are measured in these studies and it is impossible to control for
all these influences (Chapman, 1993). The SimSmoke simulation model controls
for the most important tobacco control influences, but because empirical studies
often evaluate the effect of only one intervention (Levy et al., 2005), there is little
evidence about how policies depend on other policies already in place or about
the synergistic effects of policies implemented simultaneously (Levy et al., 2006).
Therefore, the SimSmoke model makes the conservative assumption that the effects
of most policies are independent of other policies. The SimSmoke model does
assume that the effects of policies are magnified by publicity about the policies and

| 249 |
chapter 15 | Discussion
media campaigns (U.S. Department of Health and Human Services, 2000), but more
empirical studies are needed that explicitly take publicity and media campaigns into
account when evaluating the effects of policies.
Second, it is important to take secular trends into account when examining
smoking behaviour. The ITC surveys in the Netherlands, Germany, France, and
Ireland only had one survey wave before the implementation of smoke-free legislation
and could therefore not control for secular trends in the same country. The studies
in chapters 4, 6, and 11 used a control country as an attempt to control for secular
trends, but secular trends may have been different in that country. Also, different
survey months and years between countries and different time intervals between
survey waves and between the implementation of smoke-free legislation and post-
ban waves complicate comparisons of trends across countries. Although we could
take secular trends into account using data from the DCSSH study, a change in
the sampling strategy of the survey from 2009 prevented us from examining long-
term trends after the implementation of smoke-free hospitality industry legislation in
2008.
The ITC Project measures many aspects of smoking and tobacco control.
All FCTC policies are examined by using several policy-specific questions per
policy in the ITC Surveys. The downside is that the surveys become very lengthy
and compromises have to be made with respect to the number of items used to
measure one concept. For example, social acceptability of smoking was measured
with three items, while it was clear that each item measured a very different aspect
of the social acceptability of smoking (chapter 8). Also, ITC researchers in different
countries make different choices about which items to include in their ITC Surveys.
Therefore, we could not always include every country in our analyses when we
wanted to compare specific items. Moreover, we could not always include every
potentially relevant item when we wanted to compare specific countries.
Each study in this thesis was based on survey research that used self-
reported measures. Self-reported measures are sometimes biased because of
social desirability and recall problems (Adams, Soumerai, Lomas, & Ross-Degnan,
1999). For example, smoking inside bars and homes can be considered socially
undesirable, which may cause underreporting. Also, exposure to smoke-free
legislation and campaigns may not always be remembered at the time of the survey.
Although this may cause underreporting of exposure to smoke-free legislation, it will
probably not affect results about the impact of exposure to smoke-free legislation
on smoking cessation and the pathways of change.
Finally, in the ITC Netherlands Survey we were only able to retain half of the
baseline respondents in wave 5 of the survey which could introduce selection bias
| 250 |
into the inferences from the survey. Respondents lost to follow-up were more likely
to be younger, female, more highly educated, and less heavy smokers. Therefore,
results from follow-up waves may not be fully generalisable to the broader population
of Dutch smokers. This is handled by the ITC methodology of replenishing the
sample after attrition to ensure a generalisable sample with a constant sample size
across waves (Thompson et al., 2006).
Research priorities
Both the Population Model of Tobacco Control (Willemsen, 2011) and the ITC
Conceptual Model (Fong et al., 2006) assume that social norms are an important
mediator of the effect of tobacco control policies on smoking cessation. However,
only a few studies have empirically tested this mediating role of social norms. The
studies in chapters 8 and 10 have begun to explore this research area, but further
research is warranted. Findings from chapter 8 demonstrate that there are different
aspects to the social norms or social acceptability of smoking. Future research
should attempt to measure these aspects separately with validated measures and
further determine the role of social norms and denormalisation in reducing smoking
in the population. The study in chapter 10 is the first to examine the full causal chain
from individual exposure to tobacco control policy through policy-specific variables
and psychosocial mediators (like social norms) on smoking cessation. The role of
social norms in the full causal chain from exposure to policies on smoking cessation
should also be explored for policies other than smoke-free legislation. Furthermore,
social norms should not only be studied on the individual level, but also on the
macro level. For example, the relatively tolerant attitude in the Netherlands towards
smokers may have its roots in the broader socio-cultural and political environment.
Ecological studies that examine these macro-level determinants may provide
insights into the possible consequences of including a denormalisation strategy in
the national tobacco control strategy in the Netherlands.
As socioeconomic inequalities in smoking are widening (chapter 13), it is
important to find effective ways to prevent low SES groups from initiating smoking
and to stimulate low SES smokers to quit smoking. Tobacco tax increases are
the only tobacco control policy which we know with sufficient certainty to be
more effective among low SES groups (Amos et al., 2011; Chaloupka, Straif, &
Leon; Thomas et al., 2008). Only a small amount of studies about the impact of
tobacco control interventions have examined socioeconomic differences, and most
examined individual-level cessation support rather than population-level tobacco
control interventions (Amos et al., 2011). More research is therefore needed on the
differential effectiveness of various tobacco control policies. Research should focus
| 251 |
chapter 15 | Discussion
not only on educational inequalities (as was primarily the case in this thesis), but
also on income inequalities (Schaap & Kunst, 2009). Furthermore, tobacco control
policies’ effects on socioeconomic inequalities in smoking should be studied in
different countries and cultural contexts to assist policymakers in prioritising which
policies should be implemented in their country. Such research can also assist in
developing effective new interventions for low SES groups. For example, it has been
suggested that media campaigns specifically targeted at low SES groups can be
effective in reducing socioeconomic inequalities, and that a tobacco control strategy
that uses a combination of interventions is likely to be most effective (Hiscock,
Bauld, Amos, Fidler, & Munafò, 2012). More specifically, it has been proposed that
media campaigns should contain emotionally evocative and personal stories to
reduce socioeconomic inequalities in smoking (Durkin, Biener, & Wakefield, 2009).
More research is needed to test these assumptions.
The total impact of implementing several tobacco control policies
simultaneously is probably greater than the sum of the impact of implementing
each policy separately. However, few studies have examined synergies between
tobacco control policies (Levy et al., 2006). An example of synergy is the fact
that publicity and campaigns about policies are expected to magnify the effect of
policies. Chapter 7 has begun to explore the effects of publicity and campaigns
about the smoke-free hospitality industry legislation in the Netherlands. Publicity
and campaigns are expected to contribute to the success of smoke-free legislation,
but the effects of publicity and campaigns are rarely evaluated in such a way
that they can be separated from the effects of the legislation (Kosir & Gutierrez,
2009; Thrasher et al., 2011). More knowledge about synergies from publicity and
campaigns with tobacco control policies can be very important for tobacco control
advocates. Tobacco control advocates often have little direct influence on policy
implementation, but they can advocate for policy change by using the media
(Dorfman, 2003). Also, evidence about synergies between various tobacco control
policies can be important for policymakers who want to develop a comprehensive
tobacco control strategy.
Policy recommendations
Support for smoke-free legislation among smokers is a crucial factor in ensuring
compliance with smoke-free legislation, in stimulating the implementation of
voluntary home smoking bans and in changing psychosocial determinants of
smoking cessation. Therefore, policymakers should plan upfront how to ensure that
smokers are more supportive of smoke-free legislation. Because media attention
can both help and hinder in creating support for smoke-free legislation and the
| 252 |
tobacco industry will also attempt to win over public opinion, a coordinated media
advocacy strategy is needed (Crosbie, Sebrié, & Glantz; Currie & Clancy, 2010;
Fahy et al., 2009). The timing of the implementation of smoke-free legislation is
also important. If few smokers support smoke-free legislation it is likely to fail. As
Kagan and Skolnick comment: “Like surfers, legislators and corporate officials
who wish to change everyday social norms must wait for signs of a rising wave
of cultural support, catching it at just the right time. Legislate too soon and they
will be swamped by the swells of public resistance. Legislate too late and they
will be irrelevant. Legislate at the right moment and an emerging cultural norm still
tentatively struggling for authority . . . acquires much greater social force.” (Kagan
& Skolnick, 1993).
Countries without smoke-free legislation in public places and workplaces
should implement smoke-free legislation according to the recommendations from
the WHO (World Health Organization, 2007b): 100% smoke-free legislation without
smoking rooms, without exceptions, with adequate enforcement, and with a
campaign that educates the public about the harms of second-hand smoke. Ireland
implemented national comprehensive smoke-free legislation in all workplaces in
one legislative action without exceptions for the hospitality industry. Despite the
Irish ‘pub culture’, compliance rates were excellent and a large majority of the Irish
population supported the legislation (Allwright, 2004). At the end of 2008, 80% of the
Irish population supported smoke-free bars, whereas in the Netherlands only 44%
of the population was supportive of smoke-free bars (European Commission, 2009).
Countries that currently have partial smoke-free legislation should
acknowledge that the policy is not effectively protecting non-smokers from second-
hand smoke and should announce the implementation of new comprehensive smoke-
free legislation. Spain is an example of a country that implemented comprehensive
smoke-free legislation as recommended by the WHO (Fernández & Nebot, 2011)
after policy makers recognised that the partial smoke-free legislation that was in
place was not working (López et al., 2011). The partial smoke-free legislation in
Germany was based on the old ‘Spanish model’ that was, according to the tobacco
industry, working well for everyone (Schneider, Sebrie, & Fernandez, 2011). In turn,
the Dutch exemption for small bars is based on the ‘German model’ (VVD-CDA,
2010). However, the new ‘Spanish model’ and the example of the German federal
state, Bavaria, which implemented comprehensive smoke-free legislation despite
the weak national law demonstrate that partial smoke-free legislation is not working
and should be strengthened. The Netherlands should follow the examples of Spain
and Bavaria and implement comprehensive smoke-free legislation. If it can be done
elsewhere, it can be done everywhere.

| 253 |

| 254 |

References
~~~
| 255 |
| 256 |
ReferencesAdams, A., Soumerai, S., Lomas, J., & Ross-Degnan, D. (1999). Evidence of self-report bias in assessing
adherence to guidelines. International Journal for Quality in Health Care, 11, 187-192.
Adda, J., & Cornaglia, F. (2010). The effect of bans and taxes on passive smoking. American Economic
Journal: Applied Economics, 2, 1-32.
Ahmad, S. (2005). Increasing excise taxes on cigarettes in California: A dynamic simulation of health and
economic impacts. Preventive Medicine, 41, 276-283.
Ahmad, S., & Billimek, J. (2005). Estimating the health impacts of tobacco harm reduction policies: A
simulation modeling approach. Risk Analysis, 25, 801-812.
Aiken, L., & West, S. (1991). Multiple Regression: Testing and Interpreting Interactions. Newbury Park,
CA: Sage Publications.
Ajzen, I. (1991). The Theory of Planned Behavior. Organizational Behavior Human Decision Processes,
50, 179-211.
Akhtar, P. C., Haw, S. J., Currie, D. B., Zachary, R., & Currie, C. E. (2009). Smoking restrictions in the
home and secondhand smoke exposure among primary schoolchildren before and after
introduction of the Scottish smoke-free legislation. Tobacco Control, 18, 409-415.
Alamar, B., & Glantz, S. A. (2006). Effect of increased social unacceptability of cigarette smoking on
reduction in cigarette consumption. American Journal of Public Health, 96, 1359-1363.
Albers, A. B., Siegel, M., Cheng, D. M., Biener, L., & Rigotti, N. A. (2004). Relation between local restaurant
smoking regulations and attitudes towards the prevalence and social acceptability of smoking:
A study of youths and adults who eat out predominantly at restaurants in their town. Tobacco
Control, 13, 347-355.
Alesci, N. L., Forster, J. L., & Blaine, T. (2003). Smoking visibility, perceived acceptability, and frequency
in various locations among youth and adults. Preventive Medicine, 36, 272-281.
Allwright, S. (2004). Republic of Ireland’s indoor workplace smoking ban. British Journal of General
Practice, 54, 811-812.
American Cancer Society (2003). Tobacco control strategy planning guide #1. Strategy planning for
tobacco control advocacy. American Cancer Society & International Union Against Cancer.
Amos, A., Bauld, L., Clifford, D., Fidler, J., Hill, S., Hiscock, R. et al. (2011). Tobacco control, inequalities
in health and action at the local level in England. York: Public Health Research Consortium.
Andeweg, R. B., & Irwin, G. A. (2009). Governance and politics of the Netherlands. Houndmills,
Basingstoke, Hampshire: Palgrave Macmillan.
Andreou, G., Gourgoulianis, K., & Galantomos, I. (2010). The “language” of the unsuccessful anti-smoking
campaign in Greece: Examples from Greek newspaper headlines. Preventive Medicine, 51,
336-337.
Armitage, C. J., & Conner, M. (2001). Efficacy of the Theory of Planned Behaviour: A meta-analytic
review. British Journal of Social Psychology, 40, 471-499.
Arnott, D., Berteletti, F., Britton, J., Cardone, A., Clancy, L., Craig, L. et al. (2011). Can the Dutch
government really be abandoning smokers to their fate? The Lancet, 379(9811), 121-122.
Baha, M., & Le Faou, A. L. (2010). Smokers’ reasons for quitting in an anti-smoking social context. Public
Health, 124, 225-231.
Bajoga, U., Lewis, S., McNeill, A., & Szatkowski, L. (2011). Does the introduction of comprehensive
smokefree legislation lead to a decrease in population smoking prevalence? Addiction, 106,
| 257 |
| References
1346-1354.
Baltesen, F., & Rosenberg, E. (2009). Tabakssector betaalt verzet rookverbod [Big tobacco pays Dutch
opposition to smoking ban]. NRC Handelsblad, p. 1.
Bandura, A. (1986). Social foundations of thought and action: A Social Cognitive Theory. New York:
Prentice Hall.
Bauld, L. (2011). The impact of smokefree legislation in England: Evidence review. Bath: University of
Bath.
Bayer, R. (2008). Stigma and the ethics of public health: Not can we but should we. Social Science &
Medicine, 67, 463-472.
Bell, K., McCullough, L., Salmon, A., & Bell, J. (2010). ‘Every space is claimed’: Smokers’ experiences of
tobacco denormalisation. Sociology of Health & Illness, 32, 914-929.
Bennett, S. (1995). Cardiovascular risk factors in Australia: Trends in socioeconomic inequalities. Journal
of Epidemiology and Community Health, 49, 363-372.
Berger, B. E., Ferrans, C. E., & Lashley, F. R. (2001). Measuring stigma in people with HIV: Psychometric
assessment of the HIV stigma scale. Research in Nursing & Health, 24, 518-529.
Bettcher, D., & Subramaniam, C. (2001). The necessity of global tobacco regulations. JAMA, 286, 2737.
Blake, K. D., Viswanath, K., Blendon, R. J., & Vallone, D. (2010). The role of tobacco-specific media
exposure, knowledge, and smoking status on selected attitudes toward tobacco control.
Nicotine & Tobacco Research, 12, 117-126.
Bledsoe, L. K. (2006). Smoking cessation: An application of Theory of Planned Behavior to understanding
progress through stages of change. Addictive Behaviors, 31, 1271-1276.
Borland, R., Yong, H.-H., Cummings, K. M., Hyland, A., Anderson, S., & Fong, G. T. (2006). Determinants
and consequences of smoke-free homes: Findings from the International Tobacco Control
(ITC) Four Country Survey. Tobacco Control, 15(Suppl 3), 42-50.
Borland, R., Yong, H.-H., Siahpush, M., Hyland, A., Campbell, S., Hastings, G. et al. (2006). Support for
and reported compliance with smoke-free restaurants and bars by smokers in four countries:
Findings from the International Tobacco Control (ITC) Four Country Survey. Tobacco Control,
15(Suppl 3), 34-41.
Braverman, M. T., Aaro, L. E., Bontempo, D. E., & Hetland, J. (2010). Bar and restaurant workers’ attitudes
towards Norway’s comprehensive smoking ban: A growth curve analysis. Tobacco Control, 19,
240-247.
Braverman, M. T., Aaro, L. E., & Hetland, J. (2008). Changes in smoking among restaurant and bar
employees following Norway’s comprehensive smoking ban. Health Promotion International,
23, 5-15.
Brooks, D., & Mucci, L. (2001). Support for smoke-free restaurants among Massachusetts adults, 1992-
1999. American Journal of Public Health, 91, 300-303.
Brown, A., Moodie, C., & Hastings, G. (2009). A longitudinal study of policy effect (smoke-free legislation)
on smoking norms: ITC Scotland/United Kingdom. Nicotine & Tobacco Research, 11,
924-932.
Brownson, R. C., Eriksen, M. P., Davis, R. M., & Warner, K. E. (1997). Environmental tobacco smoke:
Health effects and policies to reduce exposure. Annual Review of Public Health, 18, 163-185.
California Department of Health Services (1998). A model for change: The California experience in
tobacco control. California: California Department of Health Services / Tobacco Control Section.
Callinan, J. E., Clarke, A., Doherty, K., & Kelleher, C. (2010). Legislative smoking bans for reducing
| 258 |
secondhand smoke exposure, smoking prevalence and tobacco consumption. Cochrane
Database of Systematic Reviews, Issue 4.
Capannesi, M., Boshuizen, H. C., Willemsen, M. C., & Van Houwelingen, H. C. (2009). How to obtain
long term projections for smoking behaviour: A case study in the Dutch population.
Computational and Mathemethical Methods in Medicine, 10, 155-164.
Chaloupka, F. J., Grossman, M., Pacula, R., Wechsler, H., Saffer, H., Tauras, J. et al. (1996). Price, tobacco
control policies and youth smoking. ImpacTeen Reports Paper Series. Chicago: University of
Illinois.
Chaloupka, F. J., Straif, K., & Leon, M. E. (2011). Effectiveness of tax and price policies in tobacco
control. Tobacco Control, 20, 235-238.
Chan, S. S. C., Wong, D. C. N., Fong, D. Y. T., Leung, A. Y. M., Mak, Y.-W., Lam, D. O. B. et al. (2009).
Short-term impact of new smoke-free legislation on the utilization of a quitline in Hong Kong.
Nicotine & Tobacco Research, 11, 356-361.
Chandola, T., Head, J., & Bartley, M. (2004). Socio-demographic predictors of quitting smoking: How
important are household factors? Addiction, 99, 770-777.
Chandra, S., & Chaloupka, F. J. (2003). Seasonality in cigarette sales: Patterns and implications for
tobacco control. Tobacco Control, 12, 105-107.
Chapman, S. (1993). Unravelling gossamer with boxing gloves: Problems in explaining the decline in
smoking. BMJ, 307(6901), 429-432.
Chapman, S., Borland, R., Scollo, M., Brownson, R. C., Dominello, A., & Woodward, S. (1999). The
impact of smoke-free workplaces on declining cigarette consumption in Australia and the
United States. American Journal of Public Health, 89, 1018-1023.
Chapman, S., & Freeman, B. (2008). Markers of the denormalisation of smoking and the tobacco industry.
Tobacco Control, 17, 25-31.
Cheraghi, M., & Salvi, S. (2009). Environmental tobacco smoke (ETS) and respiratory health in children.
European Journal of Pediatrics, 168, 897-905.
Christakis, N. A., & Fowler, J. H. (2008). The collective dynamics of smoking in a large social network. The
New England Journal of Medicine, 358, 2249-2258.
Cilcote, S. (1985). Public Smoking: The Problem (SDC Introduction). Tobacco Institute, Bates Range
TIMN0014552/4597. http://legacy.library.ucsf.edu/tid/yai76b00 (Accessed 14 Sep 2011).
Clegg-Smith, K., Siebel, C., Pham, L., Cho, J., Singer, R. F., Chaloupka, F. J. et al. (2008). News on
tobacco and public attitudes towards smokefree air policies in the United States. Health
Policy, 86, 42-52.
Cooper, J., Borland, R., Yong, H. H., & Hyland, A. (2010). Compliance and support for bans on smoking
in licensed venues in Australia: Findings from the International Tobacco Control Four-Country
Survey. Australian and New Zealand Journal of Public Health, 34, 379-385.
Currie, L. M., & Clancy, L. (2010). The road to smoke-free legislation in Ireland. Addiction, 106, 15-24.
De Vries, H., & Mudde, A. N. (1998). Predicting stage transitions for smoking cessation applying the
attitude-social influence-efficacy model. Psychology & Health, 13, 369-385.
De Vries, H., Mudde, A. N., Dijkstra, A., & Willemsen, M. C. (1998). Differential beliefs, perceived social
influences, and self-efficacy expectations among smokers in various motivational phases.
Preventive Medicine, 27, 681-689.
Doll, R., & Hill, B. (1950). Smoking and carcinoma of the lung: Preliminary report. British Medical Journal,
2(4682), 739-748.

| 259 |
| References
Doll, R., Peto, R., Boreham, J., & Sutherland, I. (2004). Mortality in relation to smoking: 50 years’
observations on male British doctors. BMJ, 328, 1519.
Dorfman, L. (2003). Studying the news on public health: How content analysis supports media advocacy.
American Journal of Health Behavior, 27(Suppl 3), 217-226.
Dunlop, S. M., & Romer, D. (2010). Relation between newspaper coverage of ‘light’ cigarette litigation
and beliefs about ‘lights’ among American adolescents and young adults: The impact on risk
perceptions and quitting intentions. Tobacco Control, 19, 267-273.
Durkin, S. J., Biener, L., & Wakefield, M. A. (2009). Effects of different types of antismoking ads on
reducing disparities in smoking cessation among socioeconomic subgroups. American
Journal of Public Health, 99, 2217-2223.
Eadie, D., Heim, D., MacAskill, S., Ross, A., Hastings, G., & Davies, J. (2008). A qualitative analysis of
compliance with smoke-free legislation in community bars in Scotland: Implications for public
health. Addiction, 103, 1019-1026.
Edwards, R., Thomson, G., Wilson, N., Waa, A., Bullen, C., O’Dea, D. et al. (2008). After the smoke has
cleared: Evaluation of the impact of a new national smoke-free law in New Zealand. Tobacco
Control, 17, e2.
Elton, P. J., & Campbell, P. (2008). Smoking prevalence in a north-west town following the introduction of
Smoke-free England. Journal of Public Health, 30, 415-420.
ENSP (2009). European trends towards smoke-free provisions. Brussels: European Network for Smoking
Prevention.
Eriksen, M. P., & Gottlieb, N. H. (1998). A review of the health impact of smoking control at the workplace.
American Journal of Health Promotion, 13, 83-104.
Etter, J.-F., & Perneger, T. V. (2001). A comparison of cigarette smokers recruited through the Internet or
by mail. International Journal of Epidemiology, 30, 521-525.
European Commission (2007). Green paper. Towards a Europe free from tobacco smoke: Policy options
at EU level. Brussels: European Commission.
European Commission (2009). Survey on tobacco: Analytical report. Eurobarometer #253. Hungary: The
Gallup Organisation.
European Commission (2010). Tobacco. Eurobarometer #332. Brussels: TNS Opinion & Social.
Ezzati, M., & Lopez, A. D. (2003). Estimates of global mortality attributable to smoking in 2000. Lancet,
362, 847-852.
Fahy, D., Trench, B., & Clancy, L. (2009). Communicating contentious health policy: Lessons from
Ireland’s workplace smoking ban. Health Promotion Practice. Published Online First: 8 October
2009.
Farkas, A. J., Gilpin, E. A., Distefan, J. M., & Pierce, J. P. (1999). The effects of household and workplace
smoking restrictions on quitting behaviours. Tobacco Control, 8, 261-265.
Farrelly, M., Pechacek, T., & Chaloupka, F. (2003). The impact of tobacco control program expenditures
on aggregate cigarette sales: 1981-2000. Journal of Health Economics, 22, 843-849.
Farrelly, M. C., Evans, W. N., & Sfekas, A. E. S. (1999). The impact of workplace smoking bans: Results
from a national survey. Tobacco Control, 8, 272-277.
Farrimond, H. R., & Joffe, H. (2006). Pollution, peril and poverty: A British study of the stigmatization of
smokers. Journal of Community & Applied Social Psychology, 16, 481-491.
Federico, B., Costa, G., & Kunst, A. E. (2007). Educational inequalities in initiation, cessation, and
prevalence of smoking among 3 Italian birth cohorts. American Journal of Public Health, 97,
| 260 |
838-845.
Fernández, E., Fu, M., Pascual, J. A., Lopéz, M. J., Pérez-Ríos, M., Schiaffino, A. et al. (2009). Impact
of the Spanish smoking law on exposure to second-hand smoke and respiratory health in
hospitality workers: A cohort study. PLoS ONE, 4, e4244.
Fernández, E., & Nebot, M. (2011). Spain: Beyond the ‘Spanish model’ to a total ban. Tobacco Control,
20, 6-7.
Ferrante, D., Linetzky, B., Virgolini, M., Schoj, V., & Apelberg, B. (2011). Reduction in hospital admissions
for acute coronary syndrome after the successful implementation of 100% smoke-free
legislation in Argentina: A comparison with partial smoking restrictions. Tobacco Control.
Published Online First: 20 May 2011.
Fichtenberg, C. M., & Glantz, S. A. (2002). Effect of smoke-free workplaces on smoking behaviour:
Systematic review. BMJ, 325(7357), 188.
Fong, G. T., Cummings, K. M., & Shopland, D. R. (2006). Building the evidence base for effective tobacco
control policies: The International Tobacco Control Policy Evaluation Project (the ITC Project).
Tobacco Control, 15(Suppl 3), 1-2.
Fong, G. T., Cummings, M., Borland, R., Hastings, G., Hyland, A., Giovino, G. et al. (2006). The
conceptual framework of the International Tobacco Control (ITC) Policy Evaluation Project.
Tobacco Control, 15(Suppl 3), 3-11.
Fong, G. T., Hyland, A., Borland, R., Hammond, D., Hastings, G., McNeill, A. et al. (2006). Reductions
in tobacco smoke pollution and increases in support for smoke-free public places following
the implementation of comprehensive smoke-free workplace legislation in the Republic of
Ireland: Findings from the ITC Ireland/UK Survey. Tobacco Control, 15(Suppl 3), 51-58.
Fowkes, F. J. I., Stewart, M. C. W., Fowkes, F. G. R., Amos, A., & Price, J. F. (2008). Scottish smoke-free
legislation and trends in smoking cessation. Addiction, 103, 1888-1895.
Galán, I., Mata, N., Estrada, C., Díez-Gañán, L., Velázquez, L., Zorrilla, B. et al. (2007). Impact of the
«Tobacco control law» on exposure to environmental tobacco smoke in Spain. BMC Public
Health, 7, 224.
Galeone, D., Laurendi, G., Vasselli, S., Spizzichino, L., D’Argenio, P., & Greco, D. (2006). Preliminary
effects of Italy’s ban on smoking in enclosed public places. Tobacco Control, 15, 143.
Gallus, S., Zuccaro, P., Colombo, P., Apolone, G., Pacifici, R., Garattini, S. et al. (2007). Smoking in Italy
2005-2006: Effects of a comprehensive national tobacco regulation. Preventive Medicine, 45,
198-201.
German Constitutional Court (2008). Decision of the First Senate from July 30th 2008. Karlsruhe: German
Constitutional Court.
Gilman, S. E., Abrams, D. B., & Buka, S. L. (2003). Socioeconomic status over the life course and stages
of cigarette use: Initiation, regular use, and cessation. Journal of Epidemiology and Community
Health, 57, 802-808.
Giskes, K., Kunst, A. E., Ariza, C., Benach, J., Borrell, C., Helmert, U. et al. (2007). Applying an equity
lens to tobacco-control policies and their uptake in six Western-European countries.
Journal of Public Health Policy, 28, 261-280.
Giskes, K., Kunst, A. E., Benach, J., Borrell, C., Costa, G., Dahl, E. et al. (2005). Trends in smoking
behaviour between 1985 and 2000 in nine European countries by education. Journal of
Epidemiology and Community Health, 59, 395-401.
Gleich, F., Mons, U., & Pötschke-Langer, M. (2011). Air contamination due to smoking in German
| 261 |
| References
restaurants, bars, and other venues - Before and after the implementation of a partial smoking
ban. Nicotine & Tobacco Research, 13, 1155-1160.
Goffman, E. (1974). Frame analysis: An essay on the organization of experience. New York: Harper
University Press.
Goldstein, J. (1991). The stigmatization of smokers: An empirical investigation. Journal of Drug Education,
21, 167-182.
Gonzalez, M., & Glantz, S. A. (2011). Failure of policy regarding smokefree bars in the Netherlands.
European Journal of Public Health. Published Online First: 5 December 2011.
Gottlieb, N. H., Lovato, C. Y., Weinstein, R., Green, L. W., & Eriksen, M. P. (1992). The implementation of
a restrictive worksite smoking policy in a large decentralized organization. Health Education &
Behavior, 19, 77-100.
Hackshaw, L., McEwen, A., West, R., & Bauld, L. (2010). Quit attempts in response to smoke-free
legislation in England. Tobacco Control, 19, 160-164.
Hahn, E. J., Rayens, M. K., Butler, K. M., Zhang, M., Durbin, E., & Steinke, D. (2008). Smoke-free laws
and adult smoking prevalence. Preventive Medicine, 47, 206-209.
Hamilton, W. L., Biener, L., & Brennan, R. T. (2008). Do local tobacco regulations influence perceived
smoking norms? Evidence from adult and youth surveys in Massachusetts. Health Education
Research, 23, 709-722.
Hammond, D. (2011). Health warning messages on tobacco products: A review. Tobacco Control, 20,
327-337.
Hammond, D., Fong, G. T., Zanna, M. P., Thrasher, J. F., & Borland, R. (2006). Tobacco denormalization
and industry beliefs among smokers from four countries. American Journal of Preventive
Medicine, 31, 225-232.
Hanley, J. A., Negassa, A., Edwardes, M. D., & Forrester, J. E. (2003). Statistical analysis of correlated
data using Generalized Estimating Equations: An orientation. American Journal of Epidemiology,
157, 364-375.
Hardin, J. W., & Hilbe, J. M. (2003). Generalized Estimating Equations. Boca Raton, FL: Chapman & Hall/
CRC.
Harper, S., & Lynch, J. (2007). Trends in socioeconomic inequalities in adult health behaviors among U.S.
states, 1990–2004. Public Health Reports, 122, 177-189.
Harris, J. K., Shelton, S. C., Moreland-Russell, S., & Luke, D. A. (2010). Tobacco coverage in print media:
The use of timing and themes by tobacco control supporters and opposition before a failed
tobacco tax initiative. Tobacco Control, 19, 37-43.
Haw, S. J., & Gruer, L. (2007). Changes in exposure of adult non-smokers to secondhand smoke after
implementation of smoke-free legislation in Scotland: National cross sectional survey. BMJ,
335, 549-552.
Heatherton, T. F., Kozlowski, L. T., Frecker, R. C., Rickert, W., & Robinson, J. (1989). Measuring the
heaviness of smoking: Using self-reported time to the first cigarette of the day and number of
cigarettes smoked per day. British Journal of Addiction, 84, 791-800.
Heironimus, J. (1992). Impact of workplace restrictions on consumption and incidence (memo to Louis
Suwarna). Philip Morris, Bates Range 2045447779/7806. http://legacy.library.ucsf.edu/tid/
ytw44e00 (Accessed 14 Sep 2011).
Hill, S. E., Blakely, T. A., Fawcett, J. M., & Howden-Chapman, P. (2005). Could mainstream anti-smoking
programs increase inequalities in tobacco use? New Zealand data from 1981-96. Australian
| 262 |
and New Zealand Journal of Public Health, 29, 279-284.
Hirayama, T. (1981). Non-smoking wives of heavy smokers have a higher risk of lung cancer: A study
from Japan. British Medical Journal, 282(6259), 183-185.
Hiscock, R., Bauld, L., Amos, A., Fidler, J. A., & Munafò, M. (2012). Socioeconomic status and smoking:
A review. Annals of the New York Academy of Sciences, 1248, 107-123.
Hitchman, S. C., Mons, U., Nagelhout, G. E., Guignard, R., Mcneill, A., Willemsen, M. C. et al. (2011).
Effectiveness of the European Union text-only cigarette health warnings: Findings from four
countries. European Journal of Public Health. Published Online First: 15 September 2011.
Ho, S. Y., Wang, M. P., Lo, W. S., Mak, K. K., Lai, H. K., Thomas, G. N. et al. (2010). Comprehensive
smoke-free legislation and displacement of smoking into the homes of young children in Hong
Kong. Tobacco Control, 19, 129-133.
Homer, J. B., & Hirsch, G. B. (2006). System dynamics modeling for public health: Background and
opportunities. American Journal of Public Health, 96, 452-458.
Hoogenveen, R. T., Van Baal, P. H., Boshuizen, H. C., & Feenstra, T. L. (2008). Dynamic effects of smoking
cessation on disease incidence, mortality and quality of life: The role of time since cessation.
Cost Effectiveness and Resource Allocation, 6, 1.
Hopkins, D. P., Briss, P. A., Ricard, C. J., Husten, C. G., Carande-Kulis, V. G., Fielding, J. E. et al. (2001).
Reviews of evidence regarding interventions to reduce tobacco use and exposure to
environmental tobacco smoke. American Journal of Preventive Medicine, 20(Suppl 1), 16-66.
Hosking, W., Borland, R., Yong, H.-H., Fong, G., Zanna, M., Laux, F. et al. (2009). The effects of smoking
norms and attitudes on quitting intentions in Malaysia, Thailand and four Western nations: A
cross-cultural comparison. Psychology and Health, 24, 95-107.
Hoving, E., Mudde, A., & De Vries, H. (2006). Smoking and the Phi-pattern; predictors of transitions
through the stages of change. Health Education Research, 21(3), 305-314.
Howell, F. (2004). Ireland’s workplaces, going smoke free. BMJ, 328, 847-848.
Howell, F., & Allwright, S. (2005). Smoke-free public places in Ireland: How was it achieved and what
has been learnt? In Royal College of Physicians Tobacco Advisory Group (Ed.), Going smoke-
free. The medical case for clean air in the home, at work and in public places. (pp. 185-196).
London: Royal College of Physicians.
Hox, J. J., & Bechger, T. M. (1998). An introduction to Structural Equation Modeling. Family Science
Review, 11, 354-373.
Hu, T. W., Sung, H. Y., & Keeler, T. E. (1995a). Reducing cigarette consumption in California: Tobacco
taxes vs an anti-smoking media campaign. American Journal of Public Health, 85, 1218-1222.
Hu, T. W., Sung, H. Y., & Keeler, T. E. (1995b). The state antismoking campaign and the industry response:
The effects of advertising on cigarette consumption in California. The American Economic
Review, 85, 85-90.
Hublet, A., Schmid, H., Clays, E., Godeau, E., Gabhainn, S. N., Joossens, L. et al. (2009). Association
between tobacco control policies and smoking behaviour among adolescents in 29 European
countries. Addiction, 104, 1918-1926.
Huisman, M., Kunst, A. E., & Mackenbach, J. P. (2005a). Educational inequalities in smoking among men
and women aged 16 years and older in 11 European countries. Tobacco Control, 14, 106-113.
Huisman, M., Kunst, A. E., & Mackenbach, J. P. (2005b). Inequalities in the prevalence of smoking in the
European Union: Comparing education and income. Preventive Medicine, 40, 756-764.
Hyland, A., Borland, R., Li, Q., Yong, H.-H., McNeill, A., Fong, G. T. et al. (2006). Individual-level predictors
| 263 |
| References
of cessation behaviours among participants in the International Tobacco Control (ITC) Four
Country Survey. Tobacco Control, 15(Suppl 3), 83-94.
Hyland, A., Hassan, L. M., Higbee, C., Boudreau, C., Fong, G. T., Borland, R. et al. (2009). The impact
of smokefree legislation in Scotland: Results from the Scottish ITC Scotland/UK longitudinal
surveys. European Journal of Public Health, 19, 198-205.
Hyland, A., Higbee, C., Borland, R., Travers, M., Hastings, G., Fong, G. T. et al. (2009). Attitudes and
beliefs about secondhand smoke and smoke-free policies in four countries: Findings from the
International Tobacco Control Four Country Survey. Nicotine & Tobacco Research, 11,
642-649.
Hyland, A., Li, Q., Bauer, J., Giovino, G., Bauer, U., & Cummings, K. (2006). State and community
tobacco-control programs and smoking-cessation rates among adult smokers: What can we
learn from the COMMIT intervention cohort? American Journal of Health Promotion, 20,
272-281.
International Agency for Research on Cancer (2004). IARC monographs on the evaluation of carciongenic
risks to humans, vol. 83: Tobacco smoke and involuntary smoking. Lyon: World Health
Organization, International Agency for Research on Cancer.
International Agency for Research on Cancer (2009a). IARC handbooks of cancer prevention, tobacco
control, vol. 13: Evaluating the effectiveness of smoke-free policies. Geneva: WHO Press.
International Agency for Research on Cancer (2009b). IARC handbooks of cancer prevention, tobacco
control, vol. 12: Methods for evaluating tobacco control policies. Geneva: WHO Press.
ITC Project (2009a). ITC France National Report. Waterloo, Paris: University of Waterloo, Institut national
de prévention et d’éducation pour la santé (INPES), Institut national du cancer (INCa), and
Observatoire francais des drogues et des toxicomanies (OFDT).
ITC Project (2009b). ITC Netherlands Survey Waves 1-3 (2008-2009) Technical Report. Waterloo, Ontario,
Canada.
ITC Project (2010a). ITC Germany National Report. Waterloo, Heidelberg: University of Waterloo, German
Cancer Research Center.
ITC Project (2010b). ITC Netherlands National Report. Waterloo, The Hague: University of Waterloo,
STIVORO.
ITC Project (2011). ITC Netherlands Survey. Report on smokers’ awareness of the health risks of smoking
and exposure to second-hand smoke. Waterloo: University of Waterloo.
Jaccard, J. (2001). Interaction effects in logistic regression. Sage university paper series on quantitative
applications in the social sciences, series no. 07-135. Thousand Oaks, CA: Sage.
Janz, N., & Becker, M. (1984). The Health Belief Model: A decade later. Health Education Quarterly, 11,
1-47.
Jha, P., & Chaloupka, F. (1999). Curbing the epidemic: Government and the economics of tobacco
control. Washington, DC: World Bank.
Joossens, L., & Raw, M. (2007). Progress in tobacco control in 30 European countries, 2005 to 2007.
Bern: Swiss Cancer League.
Joossens, L., & Raw, M. (2011). The Tobacco Control Scale 2010 in Europe. Paper presented at the fifth
European Conference on Tobacco or Health, Amsterdam, the Netherlands.
Kagan, R. A., & Skolnick, J. H. (1993). Banning smoking: Compliance without enforcement. In R. L. Rabin
& S. D. Sugarman (Eds.), Smoking policy: Law, politics & culture (pp. 69-94). New York: Oxford
University Press.
| 264 |
Kluger, R. (1996). Ashes to ashes: America’s hundred-year cigarette war, the public health, and the
unabashed triumph of Philip Morris. New York: Alfred A. Knopf.
Kosir, M., & Gutierrez, K. (2009). Lessons learned globally: Secondhand smoke mass media campaigns.
Saint Paul, Minnesota, United States: Global Dialogue for Effective Stop Smoking Campaigns.
Krasnegor, N. A. (1979). Cigarette smoking as a dependence process. Rockville, Maryland: U.S.
Department of Health, Eduction, and Welfare, Public Health Service, Alcohol, Drug Abuse, and
Mental Health Administration, National Institute on Drug Abuse.
Kunst, A., Giskes, K., & Mackenbach, J. (2004). Socio-economic inequalities in smoking in the European
Union. Applying an equity lens to tobacco control policies. Rotterdam: Erasmus Medical
Center Rotterdam.
Larsson, M., Boethius, G., Axelsson, S., & Montgomery, S. M. (2008). Exposure to environmental tobacco
smoke and health effects among hospitality workers in Sweden - before and after the
implementation of a smoke-free law. Scandinavian Journal of Work, Environment & Health, 34,
267-277.
Lavack, A. M. (1999). De-normalization of tobacco in Canada. Social Marketing Quarterly, 5, 82-85.
Lee, J. T., Glantz, S. A., & Millett, C. (2011). Effect of smoke-free legislation on adult smoking behaviour
in England in the 18 Months following implementation. PLoS ONE, 6(6), e20933.
Lemstra, M., Neudorf, C., & Opondo, J. (2008). Implications of a public smoking ban. Canadian Journal
of Public Health, 99, 62-65.
Lennox, A. (1992). Determinants of outcome in smoking cessation. British Journal of General Practice,
42, 247-252.
Levin, M., Goldstein, H., & Gerhardt, P. (1950). Cancer and tobacco smoking. JAMA, 143, 336-338.
Levy, D., Blackman, K., Currie, L., Clancy, L., & Willemsen, M. (2011). The Netherlands SimSmoke:
The effect of tobacco control policies on smoking prevalence and tobacco attributable deaths
in the Netherlands. Soon available at www.PPACTE.eu.
Levy, D. T., Bauer, J., Ross, H., & Powell, L. (2007). The role of public policies in reducing smoking
prevalence and deaths caused by smoking in Arizona: Results from the Arizona tobacco policy
simulation model. Journal of Public Health Management and Practice, 13, 59-67.
Levy, D. T., Bauer, J. E., & Lee, H.-R. (2006). Simulation modeling and tobacco control: Creating more
robust public health policies. American Journal of Public Health, 96, 494-498.
Levy, D. T., Benjakul, S., Ross, H., & Ritthiphakdee, B. (2008). The role of tobacco control policies in
reducing smoking and deaths in a middle income nation: Results from the Thailand SimSmoke
simulation model. Tobacco Control, 17, 53-59.
Levy, D. T., Chaloupka, F., & Gitchell, J. (2004). The effects of tobacco control policies on smoking rates:
A tobacco control scorecard. Journal of Public Health Management and Practice, 10, 338-353.
Levy, D. T., Chaloupka, F., Gitchell, J., Mendez, D., & Warner, K. E. (2002). The use of simulation models
for the surveillance, justification and understanding of tobacco control policies. Health Care
Management Science, 5, 113-120.
Levy, D. T., Cho, S., Kim, Y.-M., Park, S., Suh, M.-K., & Kam, S. (2010). An evaluation of the impact of
tobacco control policies in Korea using the SimSmoke model: The unknown success story.
American Journal of Public Health, 100, 1267-1273.
Levy, D. T., & Friend, K. B. (2003). The effects of clean indoor air laws: What do we know and what do we
need to know? Health Education Research, 18, 592-609.
Levy, D. T., Hyland, A., Higbee, C., Remer, L., & Compton, C. (2007). The role of public policies in
| 265 |
| References
reducing smoking prevalence in California: Results from the California tobacco policy
simulation model. Health Policy, 82, 153-166.
Levy, D. T., Nikolayev, L., & Mumford, E. (2005). Recent trends in smoking and the role of public policies:
Results from the SimSmoke tobacco control policy simulation model. Addiction, 100,
1526-1536.
Levy, D. T., Tworek, C., Hahn, E., & Davis, R. (2008). The Kentucky SimSmoke tobacco policy simulation
model: Reaching healthy people 2010 goals through policy change. Southern Medical Journal,
101, 503-507.
Lewis, S. A., Haw, S. J., & McNeill, A. (2008). The impact of the 2006 Scottish smoke-free legislation on
sales of nicotine replacement therapy. Nicotine & Tobacco Research, 10, 1789-1792.
Li, X., Li, Q., Dong, L., Sun, B., Chen, J., Yuan, J. et al. (2010). Risk factors associated with smoking
behavior in recreational venues: Findings from the International Tobacco Control (ITC) China
Survey. Tobacco Control, 19(Suppl 2), 30-39.
Liang, K. Y., & Zeger, S. L. (1986). Longitudinal data using Generalized Linear Models. Biometrika, 73,
13-22.
Ling, P. M., & Glantz, S. A. (2002). Nicotine addiction, young adults, and smoke-free bars. Drug and
Alcohol Review, 21, 101-104.
Link, B. G., & Phelan, J. C. (2001). Conceptualizing stigma. Annual Review of Sociology, 27, 363-385.
Longo, D. R., Johnson, J. C., Kruse, R. L., Brownson, R. C., & Hewett, J. E. (2001). A prospective
investigation of the impact of smoking bans on tobacco cessation and relapse. Tobacco
Control, 10, 267-272.
Lopez, A. D., Collishaw, N. E., & Piha, T. (1994). A descriptive model of the cigarette epidemic in
developed countries. Tobacco Control, 3, 242-247.
López, M. J., Nebot, M., Schiaffino, A., Pérez-Ríos, M., Fu, M., Ariza, C. et al. (2011). Two-year impact
of the Spanish smoking law on exposure to secondhand smoke: Evidence of the failure of the
‘Spanish model’. Tobacco Control. Published Online First: June 9 2011.
Lund, K. E. (2006). The introduction of smoke-free hospitality venues in Norway. Impact on revenues,
frequency of patronage, satisfaction and compliance (vol. 2). Oslo: The Norwegian Institute for
Alcohol and Drugs Research.
Macy, J. T., Middlestadt, S. E., Seo, D.-C., Kolbe, L. J., & Jay, S. J. (2012). Applying the Theory of
Planned Behavior to explore the relation between smoke-free air laws and quitting intentions.
Health Education & Behavior, 39, 27-34.
Magzamen, S., Charlesworth, A., & Glantz, S. A. (2001). Print media coverage of California’s smokefree
bar law. Tobacco Control, 10, 154-160.
Magzamen, S., & Glantz, S. (2001). The new battleground: California’s experience with smoke-free bars.
American Journal of Public Health, 91, 245-252.
Major, B., & O’Brien, L. T. (2005). The social psychology of stigma. Annual Review of Psychology, 56,
393-421.
Mamudu, H. M., Hammond, R., & Glantz, S. (2008). Tobacco industry attempts to counter the World
Bank report curbing the epidemic and obstruct the WHO Framework Convention on Tobacco
Control. Social Science & Medicine, 67, 1690-1699.
Martínez-Sánchez, J. M., Fernández, E., Fu, M., Gallus, S., Martínez, C., Sureda, X. et al. (2010). Smoking
behaviour, involuntary smoking, attitudes towards smoke-free legislations, and tobacco
control activities in the European Union. PLoS ONE, 5, e13881.
| 266 |
McNabb, J., & Hearns, N. (2005). The smoking ban in hospitality: A cross-border perspective from
Ireland. International Journal of Contemporary Hospitality Management, 17, 191-190.
McNicholas, W. T. (2004). Controlling passive smoking through legislation in Ireland: An attack on civil
liberty or good public health policy? European Respiratory Journal, 24, 337-338.
Mendez, D., & Warner, K. E. (2004). Adult cigarette smoking prevalence: Declining as expected (not as
desired). American Journal of Public Health, 94, 251-252.
Mendez, D., Warner, K. E., & Courant, P. N. (1998). Has smoking cessation ceased? Expected trends in
the prevalence of smoking in the United States. American Journal of Epidemiology, 148,
249-258.
Moher, M., Hey, K., & Lancaster, T. (2005). Workplace interventions for smoking cessation. Cochrane
Database of Systematic Reviews, Issue 2, CD003440.
Momperousse, D., Delnevo, C. D., & Lewis, M. J. (2007). Exploring the seasonality of cigarette-smoking
behaviour. Tobacco Control, 16, 69-70.
Mons, U., Nagelhout, G. E., Guignard, R., McNeill, A., Van den Putte, B., Willemsen, M. C. et al. (2012).
Comprehensive smoke-free policies attract more support from smokers in Europe than partial
policies. European Journal of Public Health, 22(Suppl 1), 10-16.
Moskowitz, J., Lin, Z., & Hudes, E. (2000). The impact of workplace smoking ordinances in California on
smoking cessation. American Journal of Public Health, 90, 757-761.
Mullally, B. J., Greiner, B. A., Allwright, S., Paul, G., & Perry, I. J. (2009). The effect of the Irish smoke-free
workplace legislation on smoking among bar workers. European Journal of Public Health, 19,
206-211.
Mumford, E. A., Levy, D. T., & Romano, E. O. (2004). Home smoking restrictions: Problems in classification.
American Journal of Preventive Medicine, 27, 126-131.
Muthén, L. K., & Muthén, B. O. (2007). Mplus user’s guide. Los Angeles: Muthén & Muthén.
Nagelhout, G. E., De Vries, H., Boudreau, C., Allwright, S., McNeill, A., Van den Putte, B. et al. (2012).
Comparative impact of smoke-free legislation on smoking cessation in three European
countries. European Journal of Public Health, 22(Suppl 1), 4-9.
Nagelhout, G. E., De Vries, H., Fong, G. T., Candel, M. J. J. M., Thrasher, J. F., Van den Putte, B. et al.
(2012). Pathways of change explaining the effect of smoke-free legislation on smoking
cessation in the Netherlands. An application of the International Tobacco Control Conceptual
Model. Nicotine & Tobacco Research. Published Online First: 5 April 2012.
Nagelhout, G. E., Levy, D. T., Blackman, K., Currie, L., Clancy, L., & Willemsen, M. C. (2012). The effect
of tobacco control policies on smoking prevalence and smoking-attributable deaths. Findings
from the Netherlands SimSmoke Tobacco Control Policy Simulation Model. Addiction, 107,
407-416.
Nagelhout, G. E., Mons, U., Allwright, S., Guignard, R., Beck, F., Fong, G. T. et al. (2011). Prevalence
and predictors of smoking in “smoke-free” bars. Findings from the International Tobacco
Control (ITC) Europe Surveys. Social Science & Medicine, 72, 1643-1651.
Nagelhout, G. E., Van den Putte, B., De Vries, H., Crone, M., Fong, G. T., & Willemsen, M. C. (2012).
The influence of newspaper coverage and a media campaign on smokers’ support for smoke-
free bars and restaurants and on secondhand smoke harm awareness: Findings from the
International Tobacco Control (ITC) Netherlands Survey. Tobacco Control, 21, 24-29.
Nagelhout, G. E., Willemsen, M. C., & De Vries, H. (2011). The population impact of a workplace smoking
ban and a hospitality industry smoking ban on smoking behaviour. Findings from a national
| 267 |
| References
population survey. Addiction, 106, 816-823.
Nagelhout, G. E., Willemsen, M. C., Thompson, M. E., Fong, G. T., Van den Putte, B., & De Vries, H.
(2010). Is web interviewing a good alternative to telephone interviewing? Findings from the
International Tobacco Control (ITC) Netherlands Survey. BMC Public Health, 10, 351.
Naiman, A., Glazier, R., & Moineddin, R. (2011). Is there an impact of public smoking bans on self-
reported smoking status and exposure to secondhand smoke? BMC Public Health, 11, 146.
National Cancer Institute (2006). Evaluating ASSIST: A Blueprint for Understanding State-level Tobacco
Control. Tobacco Control Monograph No. 17. Bethesda, MD: U.S. Department of Health and
Human Services, National Institutes of Health, National Cancer Institute.
National Cancer Institute (2008). The role of the media in promoting and reducing tobacco use. Tobacco
Control Monograph No. 19. Bethesda, MD: U.S. Department of Health and Human Services,
National Institutes of Health, National Cancer Institute.
Niederdeppe, J., Kuang, X., Crock, B., & Skelton, A. (2008). Media campaigns to promote smoking
cessation among socioeconomically disadvantaged populations: What do we know, what do
we need to learn, and what should we do now? Social Science & Medicine, 67, 1343-1355.
Öberg, M., Jaakkola, M. S., Woodward, A., Peruga, A., & Prüss-Ustün, A. (2011). Worldwide burden of
disease from exposure to second-hand smoke: A retrospective analysis of data from 192
countries. The Lancet, 377(9760), 139-146.
Office of Tobacco Control (2010). Ireland: Current trends in cigarette smoking. Retrieved May 23, 2011
from http://www.otc.ie/research.asp.
Osypuk, T. L., & Acevedo-Garcia, D. (2010). Support for smoke-free policies: A nationwide analysis of
immigrants, US-born, and other demographic groups, 1995-2002. American Journal of Public
Health, 100, 171-181.
Palmersheim, K. A., Remington, P. L., & Gundersen, D. F. (2006). The impact of a smoke-free ordinance
on the health and attitudes of bartenders. Madison, USA: Tobacco Surveillance and Evaluation
Program, University of Wisconsin Comprehensive Center.
Peto, R., Lopez, A. D., Boreham, J., Health, C., & Thun, M. (1992). Mortality from tobacco in developed
countries: Indirect estimation from national vital statistics. Lancet, 339, 1269-1278.
Pierce, J. P., Fiore, M. C., Novotny, T. E., Hatziandreu, E. J., & Davis, R. M. (1989). Trends in cigarette
smoking in the United States. Educational differences are increasing. JAMA: The Journal of
the American Medical Association, 261, 56-60.
Preacher, K. J., & Hayes, A. F. (2004). SPSS and SAS procedures for estimating indirect effects in simple
mediation models. Behavior Research Methods, Instruments, & Computers, 36, 717-731.
Preacher, K. J., & Hayes, A. F. (2010). SPSS Sobel macro syntax reference. Retrieved January 13, 2011
from http://www.comm.ohio-state.edu/ahayes/SPSS%20programs/Sobel%20syntax.pdf.
Public Health Service (1979). Healthy people: Surgeon General’s report on health promotion and disease
prevention. Washington, DC: US Department of Health, Education and Welfare.
Pursell, L., Allwright, S., O’Donovan, D., Paul, G., Kelly, A., Mullally, B. J. et al. (2007). Before and after
study of bar workers’ perceptions of the impact of smoke-free workplace legislation in the
Republic of Ireland. BMC Public Health, 7, 131.
Rayens, M. K., Hahn, E. J., Langley, R. E., Hedgecock, S., Butler, K. M., & Greathouse-Maggio, L. (2007).
Public opinion and smoke-free laws. Policy Politics Nursing Practice, 8, 262-270.
Reda, A. A., Kaper, J., Fikretler, H., Severens, J. L., & Schayck, C. P. v. (2009). Healthcare financing
systems for increasing the use of tobacco dependence treatment. Cochrane Database of
| 268 |
Systematic Reviews 2009, Issue 2, CD004305.
Ritchie, D., Amos, A., & Martin, C. (2010a). “But it just has that sort of feel about it, a leper” - Stigma,
smoke-free legislation and public health. Nicotine & Tobacco Research, 12, 622-629.
Ritchie, D., Amos, A., & Martin, C. (2010b). Public places after smoke-free--A qualitative exploration of
the changes in smoking behaviour. Health & Place, 16, 461-469.
Ross, H., Blecher, E., Yan, L., & Hyland, A. (2011). Do cigarette prices motivate smokers to quit? New
evidence from the ITC survey. Addiction, 106, 609-619.
Royal College of Physicians (2010). Passive smoking and children: A report by the Tobacco Advisory
Group of the Royal College of Physicians. London: Royal College of Physicians.
Schaap, M. M., & Kunst, A. E. (2009). Monitoring of socio-economic inequalities in smoking: Learning
from the experiences of recent scientific studies. Public Health, 123, 103-109.
Schaap, M. M., Kunst, A. E., Leinsalu, M., Regidor, E., Ekholm, O., Dzurova, D. et al. (2008). Effect
of nationwide tobacco control policies on smoking cessation in high and low educated groups
in 18 European countries. Tobacco Control, 17, 248-255.
Schippers, E. I. (2011). Kamervragen betere uitleg rookvrije horeca [Parliamentary questions about a
better explanation about smoke-free hospitality industry legislation]. The Hague: Ministry of
Health.
Schneider, N., Sebrie, E., & Fernandez, E. (2011). The so-called “Spanish model” - Tobacco industry
strategies and its impact in Europe and Latin America. BMC Public Health, 11, 907.
Sheldon, T. (2010). Netherlands is told to get tough on smokers as cancer mortality stagnates. BMJ,
340, c3309.
Sheldon, T. (2011). Dutch health minister is quizzed about “intensive” contact with tobacco industry.
BMJ, 343, d7137.
Siahpush, M., McNeill, A., Borland, R., & Fong, G. T. (2006). Socioeconomic variations in nicotine
dependence, self-efficacy, and intention to quit across four countries: Findings from the
International Tobacco Control (ITC) Four Country Survey. Tobacco Control, 15(Suppl 3), 71-75.
Siegel, M., & Skeer, M. (2003). Exposure to secondhand smoke and excess lung cancer mortality risk
among workers in the “5 B’s”: Bars, bowling alleys, billiard halls, betting establishments, and
bingo parlours. Tobacco Control, 12, 333-338.
Smith, P., Frank, J., & Mustard, C. (2009). Trends in educational inequalities in smoking and physical
activity in Canada: 1974-2005. Journal of Epidemiology and Community Health, 63, 317-323.
Smoke Free Partnership (2006). Lifting the smokescreen. 10 reasons for a smoke free Europe. Brussels:
European Respiratory Society Brussels Office.
Social & Cultural Planning Office (2001). The Netherlands in a European perspective. Social & cultural
report 2000. The Hague: Social & Cultural Planning Office.
Steering Committee of the National Strategy to Reduce Tobacco Use in Canada (1999). New directions
for tobacco control in Canada: A national strategy. Ottawa: Health Canada.
Stuber, J., Galea, S., & Link, B. G. (2008). Smoking and the emergence of a stigmatized social status.
Social Science & Medicine, 67, 420-430.
Szatkowski, L., Coleman, T., McNeill, A., & Lewis, S. (2011). The impact of the introduction of smokefree
legislation on prescribing of stop-smoking medications in England. Addiction, 106,
1827-1834.
Tamvakas, I., & Amos, A. (2010). ‘These things don’t happen in Greece’: A qualitative study of Greek
young people’s attitudes to smoking, secondhand smoke and the smokefree legislation.
| 269 |
| References
Health Education Research, 25, 955-964.
Tang, H., Cowling, D. W., Lloyd, J. C., Rogers, T., Koumjian, K. L., Stevens, C. M. et al. (2003). Changes
of attitudes and patronage behaviors in response to a smoke-free bar law. American Journal
of Public Health, 93, 611-617.
Tang, H., Cowling, D. W., Stevens, C. M., & Lloyd, J. C. (2004). Changes of knowledge, attitudes, beliefs,
and preference of bar owner and staff in response to a smoke-free bar law. Tobacco Control,
13, 87-89.
Tengs, T. O., Osgood, N. D., & Chen, L. L. (2001). The cost-effectiveness of intensive national school-
based anti-tobacco education: Results from the Tobacco Policy Model. Preventive Medicine,
33, 558-570.
The American Association for Public Opinion Research (2009). Standard definitions: Final dispositions of
case codes and outcome rates for surveys. Deerfield, Illinois: AAPOR.
Thomas, S., Fayter, D., Misso, K., Ogilvie, D., Petticrew, M., Sowden, A. et al. (2008). Population tobacco
control interventions and their effects on social inequalities in smoking: Systematic review.
Tobacco Control, 17, 230-237.
Thompson, L., Pearce, J., & Barnett, J. R. (2007). Moralising geographies: Stigma, smoking islands and
responsible subjects. Area, 39, 508-517.
Thompson, M. E., Fong, G. T., Hammond, D., Boudreau, C., Driezen, P., Hyland, A. et al. (2006). Methods
of the International Tobacco Control (ITC) Four Country Survey. Tobacco Control, 15(Suppl 3),
12-18.
Thrasher, J. F., Besley, J. C., & González, W. (2010). Perceived justice and popular support for public
health laws: A case study around comprehensive smoke-free legislation in Mexico City. Social
Science & Medicine, 70, 787-793.
Thrasher, J. F., Boado, M., Sebrié, E. M., & Bianco, E. (2009). Smoke-free policies and the social
acceptability of smoking in Uruguay and Mexico: Findings from the International Tobacco
Control Policy Evaluation Project. Nicotine & Tobacco Research, 11, 591-599.
Thrasher, J. F., Huang, L., Pérez-Hernández, R., Niederdeppe, J., Arillo-Santillán, E., & Alday, J. (2011).
Evaluation of a social marketing campaign to support Mexico City’s comprehensive smoke-
free law. American Journal of Public Health, 101, 328-335.
Thrasher, J. F., Pérez-Hernández, R., Swayampakala, K., Arillo-Santillán, E., & Bottai, M. (2010). Policy
support, norms, and secondhand smoke exposure before and after implementation of a
comprehensive smoke-free law in Mexico City. American Journal of Public Health, 100,
1789-1798.
Thrasher, J. F., Swayampakala, K., Arillo-Santillán, E., Sebrié, E., Walsemann, K. M., & Bottai, M. (2010).
Differential impact of local and federal smoke-free legislation in Mexico: A longitudinal study
among adult smokers. Salud Pública de México, 52(Suppl 2), 244-253.
Thun, M., Myers, D. G., Day-Lally, C., Namboodiri, N. M., Calle, E. E., Flanders, W. D. et al. (1997). Age
and the exposure-response relationships between cigarette smoking and premature death
in Cancer Prevention Study II. In National Cancer Institute (Ed.), Changes in cigarette related
disease risks and their implication for prevention and control. Smoking and tobacco control
monograph 8, NIH publication no. 97-4213 (pp. 383-475). Bethesda, MD: National Cancer
Institute.
Tichenor, P. J., Donohue, G. A., & Olien, C. N. (1970). Mass media flow and differential growth in
knowledge. Public Opinion Quarterly, 34, 159-170.

| 270 |
Trotter, L., Wakefield, M., & Borland, R. (2002). Socially cued smoking in bars, nightclubs, and gaming
venues: a case for introducing smoke-free policies. Tobacco Control, 11, 300-304.
U.S. Department of Health and Human Services (1986). The health consequences of involuntary smoking:
A report of the Surgeon General. Rockville, Maryland: U.S. Department of Health and Human
Services, Center for Disease Control and Prevention, National Center for Chronic Disease
Prevention and Health Promotion, Office on Smoking and Health.
U.S. Department of Health and Human Services (2000). Reducing tobacco use: A report of the Surgeon
General. Atlanta, Georgia: U.S. Department of Health and Human Services, Centers for
Disease Control and Prevention, National Center for Chronic Disease Prevention and Health
Promotion, Office on Smoking and Health.
U.S. Department of Health and Human Services (2006). The health consequences of involuntary exposure
to tobacco smoke: A report of the Surgeon General. Atlanta, GA: U.S. Department of Health
and Human Services, Centers for Disease Control and Prevention, Coordinating Center for
Health Promotion, National Center for Chronic Disease Prevention and Health Promotion,
Office on Smoking and Health.
U.S. Department of Health and Human Services (2010). How tobacco smoke causes disease: The biology
and behavioral basis for smoking-attributable disease: A report of the Surgeon General Atlanta,
GA: U.S. Department of Health and Human Services, Centers for Disease Control and
Prevention, National Center for Chronic Disease Prevention and Health Promotion, Office on
Smoking and Health.
U.S. Department of Health Education and Welfare (1964). Smoking and health: Report of the Advisory
Committee to the Surgeon General of the Public Health Service. Washington, DC: U.S. Public
Health Service.
Van den Bos, A. (2010). From controversy to courtesy: Tobacco industry’s tactics to prevent workplace
smoking restrictions in the Netherlands [Master’s thesis]. Amsterdam: Vu University
Amsterdam.
Van den Putte, B., Yzer, M. C., & Brunsting, S. (2005). Social influences on smoking cessation: A
comparison of the effect of six social influence variables. Preventive Medicine, 41, 186-193.
Van den Putte, B., Yzer, M. C., Brunsting, S., & Willemsen, M. C. (2005). Sociale invloeden op stoppen
met roken [social influences on smoking cessation]. Tijdschrift voor Communicatiewetenschap,
33, 262-272.
Van Genugten, M. L., Hoogenveen, R. T., Mulder, I., Smit, H. A., Jansen, J., & De Hollander, A. E. (2003).
Future burden and costs of smoking-related disease in the Netherlands: A dynamic modeling
approach. Value in Health, 6, 494-499.
Verdonk-Kleinjan, W. M. I., Candel, M. J. J. M., Knibbe, R. A., Willemsen, M. C., & De Vries, H. (2011).
Effects of a workplace-smoking ban in combination with tax increases on smoking in the
Dutch population. Nicotine & Tobacco Research, 13, 412-418.
Verdonk-Kleinjan, W. M. I., Knibbe, R. A., Tan, F. E. S., Willemsen, M. C., de Groot, H. N., & De Vries, H.
(2009). Does the workplace-smoking ban eliminate differences in risk for environmental
tobacco smoke exposure at work? Health Policy, 92, 197-202.
VVD-CDA (2010). Vrijheid en verantwoordelijkheid. Regeerakkoord VVD-CDA [Freedom and responsibility.
Coalition agreement VVD-CDA]. The Hague: VVD, CDA.
VWA (2010). Inventarisatie naleefniveau rookvrije horeca winter 2009/2010 [Inventarisation level of
compliance smoke-free hospitality industry legislation winter 2009/2010]. Voedsel en Waren
| 271 |
| References
Autoriteit & Intraval.
Wakefield, M., & Chaloupka, F. (2000). Effectiveness of comprehensive tobacco control programmes in
reducing teenage smoking in the USA. Tobacco Control, 9, 177-186.
Wakefield, M., Roberts, L., & Owen, N. (1996). Trends in prevalence and acceptance of workplace
smoking bans among indoor workers in South Australia. Tobacco Control, 5, 205-208.
Warren, C. W., Lee, J., Lea, V., Goding, A., O’Hara, B., Carlberg, M. et al. (2009). Evolution of the Global
Tobacco Surveillance System (GTSS) 1998-2008. Global Health Promotion, 16(Suppl 2), 4-37.
White, J., & Froeb, H. (1980). Small-airways dysfunction in nonsmokers chronically exposed to tobacco
smoke. New England Journal of Medicine, 302, 720-723.
White, V., Hill, D., Siahpush, M., & Bobevski, I. (2003). How has the prevalence of cigarette smoking
changed among Australian adults? Trends in smoking prevalence between 1980 and 2001.
Tobacco Control, 12(Suppl 2), 67-74.
Wiegman-van Meppelen Scheppink (2011). Vragen van het lid Wiegman-van Meppelen Scheppink
(ChristenUnie) aan de minister van Volksgezondheid Welzijn en Sport over betere uitleg van de
overheid over rookvrije horeca [Questions from parliament member Wiegman-van Meppelen
Scheppink (ChristenUnie) to the Minister of Health about a better explanation from the
government about smoke-free hospitality industry legislation]. The Hague: ChristenUnie.
Willems, P., Brown, M., Van Ossenbruggen, R., & Vonk, T. (2006). The effects of panel recruitment and
management on research results. Dutch online panel study NOPVO. Barcelona: ESOMAR.
Willemsen, M. C. (2011). Roken in Nederland. De keerzijde van tolerantie. Oratie [Smoking in the
Netherlands. The downside of tolerance. Inaugural lecture]. Maastricht: Maastricht University.
Willemsen, M. C., Hoogenveen, R. T., & Van der Lucht, F. (2002). New smokers and quitters. Transitions
in smoking status in a national population. European Journal of Public Health, 12, 136-138.
Wilson, N., Thomson, G., Grigg, M., & Afzal, R. (2005). New smoke-free environments legislation
stimulates calls to a national Quitline. Tobacco Control, 14, 287-288.
World Bank (2003). Tobacco control at a glance. Washington, DC: World Bank.
World Health Organization (1998). Guidelines for controlling and monitoring the tobacco epidemic.
Geneva: World Health Organization.
World Health Organization (2003). WHO Framework Convention on Tobacco Control. Geneva: World
Health Organization.
World Health Organization (2007a). Guidelines on protection from exposure to tobacco smoke. Geneva:
World Health Organization.
World Health Organization (2007b). Protection from exposure to second-hand tobacco smoke. Policy
recommendations. Geneva: World Health Organization.
World Health Organization (2008a). Report on the global tobacco epidemic, 2008: the MPOWER
package. Geneva: World Health Organization.
World Health Organization (2008b). Tobacco industry interference with tobacco control. Geneva: World
Health Organization.
World Health Organization (2010). WHO Technical manual on tobacco tax administration. Geneva: World
Health Organization.
World Health Organization, Health and Welfare Canada, & Canadian Public Health Association (1986).
Ottawa charter for health promotion. Canadian Journal of Public Health, 77, 425-430.
Yong, H.-H., Foong, K., Borland, R., Omar, M., Hamann, S., Sirirassamee, B. et al. (2010). Support for
and reported compliance among smokers with smoke-free policies in air-conditioned

| 272 |
hospitality venues in Malaysia and Thailand: Findings from the International Tobacco Control
Southeast Asia Survey. Asia-Pacific Journal of Public Health, 22, 98-109.
Zeger, S. L., & Liang, K. Y. (1986). Longitudinal data analysis for discrete and continuous outcomes.
Biometrics, 42, 121-130.
Zhang, X., Cowling, D. W., & Tang, H. (2010). The impact of social norm change strategies on smokers’
quitting behaviours. Tobacco Control, 19(Suppl 1), 51-55.

| 273 |

| 274 |

Summary
~~~
| 275 |
| 276 |
SummaryExposure to tobacco smoke from others (second-hand smoking) is dangerous for
non-smokers. To protect them from these risks, many countries have implemented
smoke-free legislation that bans smoking in indoor workplaces and public places.
We examined the impact of smoke-free legislation on smokers instead of non-
smokers in this thesis. The expectation is that the largest public health gain from
smoke-free legislation comes from the effect on smokers. This effect can set a
flywheel in motion that eventually causes smoking to reduce further and further. This
thesis mainly focused on the impact of the implementation of smoke-free hospitality
industry legislation in the Netherlands in July 2008.
It was unknown in 2008 whether smoke-free legislation in the hospitality
industry had a similar impact on the population as smoke-free legislation in
workplaces. We also did not know enough about differences in impact between
comprehensive and partial smoke-free legislation and between smoke-free
legislation and other tobacco control policies. Furthermore, it was unclear how
smoke-free legislation influenced smoking cessation. Finally, more research
was needed on unintended consequences of smoke-free legislation on smoking
in smokers’ homes, perceived stigmatisation of smokers, and socioeconomic
inequalities in smoking.
For this thesis, we mostly used data from the International Tobacco Control
Policy Evaluation Project (ITC Project). ITC is an international survey study among
smokers and is currently conducted in 20 countries. The methods of the ITC
Netherlands Project are described in chapter 2.
Part 1: What is the impact of smoke-free legislation on smoking?
Findings from chapters 3, 4, and 5 demonstrated that national smoke-free legislation
can reduce smoking prevalence, stimulate smoking cessation, and reduce
smoking-attributable deaths. Furthermore, the findings suggested that the impact
of smoke-free legislation on smoking prevalence and cessation was larger when
it was implemented in all workplaces instead of only hospitality industry venues
(chapter 3). Also, the impact on smoking cessation may be larger when the smoke-
free legislation was comprehensive instead of partial (chapter 4). Extending partial
smoke-free legislation to all public places and workplaces can substantially reduce
smoking prevalence and smoking-attributable deaths provided that there is full
enforcement and publicity (chapter 5). We found that the impact of comprehensive
smoke-free legislation on reducing future smoking-attributable deaths ranked as
the third most effective tobacco control policy in the Netherlands, after increasing
tobacco taxes and implementing cessation treatment policies (chapter 5).
| 277 |
| Summary
Part 2: How do the individual pathways of change after smoke-free legislation
look like?
According to the ITC Conceptual Model, tobacco control policy can have an
impact on smoking cessation through certain individual pathways of change. First,
the policy influences opinions and thoughts that are strongly related to the policy
(policy-specific variables). These opinions and thoughts then influence more general
psychological factors that are less related with the policy and more with smoking
cessation (psychosocial mediators). Finally, these psychosocial mediators can have
an influence on actual smoking cessation.
In the studies in chapters 6 and 7 we determined relevant policy-specific
variables of smoke-free legislation. It was found that there was a larger increase in
support for smoke-free legislation among smokers than normal in countries that
implemented comprehensive smoke-free legislation (chapter 6). Smokers who
were more aware of the harm of second-hand smoking were more often supportive
of smoke-free legislation. The study in chapter 7 described the newspaper
coverage about smoke-free hospitality industry legislation in the Netherlands. Most
newspaper coverage was negative towards the smoke-free legislation and focused
on economic aspects rather than health aspects. Exposure to this coverage had a
small negative effect on support for smoke-free legislation, while exposure to the
implementation campaign had a small positive effect on awareness of the harm of
second-hand smoking.
The studies in chapters 8 and 9 focused on the impact of smoke-free
legislation on psychosocial mediators. In chapter 8 we examined the impact on the
social acceptability of smoking. Exposure to smoke-free legislation was associated
with increased feelings of being uncomfortable about smoking and increased
perceptions of societal disapproval of smoking. However, these associations were
small, which suggests that smoke-free legislation may only have an impact on the
long term and on the population level. In chapter 9 we described which smokers
smoked inside bars after the implementation of smoke-free legislation. Smokers
who were more supportive of smoke-free legislation and who were more aware
of the harm of second-hand smoke were less likely to smoke in bars after the
implementation. Smokers in the Netherlands and Germany, countries with partial
smoke-free legislation, smoked more often inside bars after the implementation of
smoke-free legislation than smokers in Ireland and France, where the implementation
of smoke-free legislation was comprehensive.
In chapter 10 we tested the entire causal chain from individual exposure
to smoke-free legislation on smoking cessation, through policy-specific variables
and psychosocial mediators. The effect of individual exposure to smoke-free
| 278 |
legislation on smoking cessation could be explained by an effect on support for
smoke-free legislation (policy-specific variable), and an impact of this on attitudes
about quitting and intention to quit smoking (psychosocial mediators). Exposure to
smoke-free legislation also created more awareness of the harm of (second-hand)
smoking (policy-specific variable), which in turn increased positive social norms
about quitting (psychosocial mediator).
Part 3: Are there unintended consequences of smoke-free legislation?
It was demonstrated in chapter 11 that smoke-free hospitality industry legislation
did not lead to more smoking in smokers’ homes. In fact, smoke-free legislation
seemed to reduce the number of cigarettes smoked per day and seemed to
stimulate smokers to establish voluntary smoking bans in their homes. In chapter
12 we described that whether smoke-free legislation increased smokers’ perceived
stigmatisation depended on how smokers felt about smoking outside. Feelings of
stigmatisation did not increase after the implementation of smoke-free hospitality
industry legislation in the Netherlands, possibly because most Dutch smokers did
not feel negatively judged when smoking outside. Finally, we found that there is a
widening of educational inequalities in smoking in the Netherlands (chapter 13). We
did not find that the implementation of smoke-free hospitality industry legislation
contributed to this (chapters 3 and 14). However, the smoke-free workplace
legislation did have larger effects on smoking cessation among higher educated
smokers than among lower educated smokers (chapters 3 and 13).
What can we conclude from this?
In this thesis we found that smoke-free legislation can reduce smoking prevalence,
stimulate smoking cessation, and reduce smoking-attributable deaths. Support
for smoke-free legislation among smokers proved to be very important, because
support contributes to more compliance with the legislation, because support can
lead to more smoking cessation by influencing attitudes and intentions to quit
smoking, and because support for smoke-free legislation stimulates smokers to
establish voluntary home smoking bans. Smoke-free legislation did not lead to
more smoking in smokers’ homes and the smoke-free hospitality industry legislation
in the Netherlands did not lead to an increase in feelings of stigmatization. Only
the smoke-free workplace legislation and not the smoke-free hospitality industry
legislation increased socioeconomic differences in smoking.
Based on the findings from this thesis and on the ITC Conceptual Model,
we developed a model of the individual impact of smoke-free legislation on smoking
cessation (chapter 15). Smoke-free legislation is often accompanied by media

| 279 |
| Summary
attention and both have the potential to increase support for smoke-free legislation
and awareness of the harm of (second-hand) smoking. Increases in support and
harm awareness result in more favourable attitudes and social norms about quitting.
These attitudes and social norms can in turn increase intention to quit and smoking
cessation. Support and harm awareness, as well as attitudes and social norms
about quitting, also influence compliance with smoke-free legislation and whether
people implement voluntary smoking bans in their home. Compliance with smoke-
free legislation and voluntarily implementing home smoking bans may also increase
intention to quit and smoking cessation.
The World Health Organization recommends implementing 100% smoke-
free environments without smoking rooms and exceptions, to enforce the law
heavily, and to run an educational campaign about the harm caused by second-
hand smoke. Several studies in this thesis found evidence that it is important to
follow these recommendations. It seems that following these recommendation
has a positive effect on smoking cessation (chapters 3 and 4), support for smoke-
free legislation (chapter 6), and compliance with the legislation (chapter 9). The
Netherlands did not follow any of these recommendations, which is the most likely
cause of less smoking cessation after the implementation in the Netherlands than
in other countries, a lower increase in support for smoke-free legislation, and more
smoking inside bars. It is plausible that the smoke-free legislation would have
been successful in the Netherlands when the World Health Organization policy
recommendations had been followed through. As long as there are no countries
that followed these recommendations and were not successful, we can assume
that with proper implementation it can succeed everywhere. “It has been done
elsewhere, it can be done everywhere”.
What should be studied further?
Future research should further determine the role of social norms and denormalisation
in reducing smoking in the population. More research is also needed on the differential
effectiveness of various tobacco control policies on different socioeconomic
groups. Finally, it is important to study synergies between tobacco control policies
and publicity about this.
Which recommendations do we have for practice?
Policymakers in countries that do not have smoke-free legislation should plan
upfront how they are going to ensure that enough smokers are supportive of
smoke-free legislation. A coordinated media advocacy strategy is therefore
needed. These countries should implement smoke-free legislation according to the

| 280 |
recommendations from the World Health Organization (100% smoke-free legislation
without smoking rooms, without exceptions, with adequate enforcement, and with
an educational campaign about the harms of second-hand smoke).
The Netherlands and other countries that still have partial legislation should
acknowledge that the policy is not effectively protecting non-smokers from second-
hand smoke and are advised to implement comprehensive smoke-free legislation.
The Netherlands should reverse the exemption for small bars without employees,
should ban smoking rooms, should enforce the law more heavily, and should run
an educational campaign which explains that smoke-free legislation is necessary to
protect non-smokers from the harm of second-hand smoke.

| 281 |

| 282 |

Samenvatting
~~~
| 283 |
| 284 |
SamenvattingBlootstelling aan tabaksrook van anderen (meeroken) is gevaarlijk voor niet-rokers.
Om hen hiertegen te beschermen, voeren veel landen rookverboden in voor
werkplekken en openbare gebouwen. In dit proefschrift is gekeken naar het effect
van rookverboden op rokers in plaats van niet-rokers. De verwachting is namelijk
dat de grootste gezondheidswinst door rookverboden ontstaat door het effect op
rokers. Dit effect kan een vliegwiel in beweging brengen dat er uiteindelijk voor zorgt
dat roken steeds verder teruggedrongen wordt in de samenleving. In dit proefschrift
is vooral onderzoek gedaan naar het effect van de invoering van de rookvrije horeca
in Nederland in juli 2008.
Het was in 2008 nog onbekend of rookverboden in de horeca een
vergelijkbare invloed hadden op de populatie als rookverboden op de werkplek. Ook
wisten we onvoldoende over de verschillen in effect tussen volledige en gedeeltelijke
rookverboden en tussen rookverboden en ander tabaksontmoedigingsbeleid.
Verder was nog onduidelijk hoe rookverboden stoppen met roken beïnvloeden.
Ten slotte was meer onderzoek nodig naar mogelijke ongewenste effecten van
rookverboden op roken in het eigen huis, gevoelens van stigmatisering onder rokers
en op sociaaleconomische verschillen in roken.
In dit proefschrift is voornamelijk gebruik gemaakt van data uit het
International Tobacco Control Policy Evaluation Project (ITC project). ITC is een
internationaal vragenlijstonderzoek onder rokers en wordt momenteel uitgevoerd in
20 landen. De methode van het ITC Nederland project is beschreven in hoofdstuk 2.
Deel 1: Wat is het effect van rookverboden op roken?
Resultaten uit hoofdstuk 3, 4 en 5 lieten zien dat landelijke rookverboden het
percentage rokers kunnen doen dalen, stoppen met roken kunnen stimuleren en
het aantal aan roken gerelateerde sterfgevallen (tabaksdoden) kunnen reduceren.
Verder wezen de resultaten erop dat het effect van rookverboden groter is als een
rookverbod op alle werkplekken wordt ingevoerd in plaats van alleen in de horeca
(hoofdstuk 3). Ook leek het erop dat het effect van volledige rookverboden groter
was dan het effect van gedeeltelijke rookverboden (hoofdstuk 4). Het uitbreiden van
een gedeeltelijk rookverbod naar alle openbare gebouwen en werkplekken kan het
percentage rokers en het aantal tabaksdoden sterk doen dalen, mits er sprake is
van volledige handhaving en voldoende publiciteit over het verbod (hoofdstuk 5).
De meest effectieve maatregelen om het aantal tabaksdoden terug te dringen in
Nederland zijn het verhogen van de tabaksaccijns en het invoeren van beleid voor
stoppen-met-rokenbehandeling, gevolgd door volledige rookverboden (hoofdstuk 5).
| 285 |
| Samenvatting
Deel 2: Hoe zien de individuele paden van verandering na rookverboden eruit?
Volgens het conceptuele model van ITC kan tabaksontmoedigingsbeleid een effect
hebben op stoppen met roken via bepaalde individuele paden van verandering.
Eerst beïnvloed het beleid meningen en gedachten die sterk met het beleid te maken
hebben (beleidsspecifieke variabelen). Deze meningen en gedachten beïnvloeden
vervolgens algemenere psychologische factoren die minder met het beleid zelf en
meer met stoppen met roken te maken hebben (psychosociale mediatoren). Ten
slotte kunnen deze psychosociale mediatoren een invloed hebben op daadwerkelijk
stoppen met roken.
In de studies in hoofdstuk 6 en 7 onderzochten we beleidsspecifieke
variabelen van rookverboden. Gevonden werd dat er een grotere stijging dan
normaal in draagvlak voor rookverboden onder rokers was in landen die een
volledig rookverbod invoerden (hoofdstuk 6). Rokers die zich meer bewust waren
van de schade van meeroken waren vaker voorstander van rookverboden. In
hoofdstuk 7 werd de krantenberichtgeving over de rookvrije horeca in Nederland
beschreven. De berichtgeving was overwegend negatief over het rookverbod en
ging voornamelijk in op economische aspecten in plaats van gezondheidsaspecten.
Blootstelling aan deze berichtgeving had een klein negatief effect op draagvlak voor
rookverboden, terwijl blootstelling aan de implementatiecampagne van de overheid
een klein positief effect had op bewustzijn van de schade van meeroken.
De studies in hoofdstuk 8 en 9 waren vooral gericht op het effect van
rookverboden op psychosociale mediatoren. In hoofdstuk 8 onderzochten we het
effect op de sociale acceptatie van roken. Blootstelling aan rookverboden ging samen
met het zich ongemakkelijk voelen over roken en meer denken dat de samenleving
het roken afkeurt. Deze associaties waren echter klein, wat doet vermoeden dat
het effect van rookverboden op de sociale acceptatie van roken vooral op de
lange termijn en op het populatieniveau optreedt. In hoofdstuk 9 beschreven we
welke rokers binnen in cafés rookten na de invoering van rookverboden. Rokers
die voorstander waren van rookverboden en die zich meer bewust waren van de
gevaren van meeroken waren minder geneigd om te roken binnen in cafés na de
invoering van een rookverbod. Rokers in Nederland en Duitsland, landen met een
gedeeltelijk rookverbod, rookten vaker binnen in cafés na de invoering van het
rookverbod dan rokers in Ierland en Frankrijk, waar het rookverbod volledig was
ingevoerd.
In hoofdstuk 10 onderzochten we de totale oorzakelijke keten van individuele
blootstelling aan rookverboden op stoppen met roken, via beleidsspecifieke
variabelen en psychosociale mediatoren. Het effect van individuele blootstelling
aan rookverboden op stoppen met roken kon verklaard worden door een effect
| 286 |
van rookverboden op draagvlak voor rookverboden (beleidsspecifieke variabele) en
vervolgens een effect daarvan op attitudes over stoppen met roken en intenties om
te stoppen (psychosociale mediatoren). Blootstelling aan rookverboden zorgde ook
voor meer bewustzijn van de schade van (mee)roken (beleidsspecifieke variabele),
wat zorgde voor positievere sociale normen over stoppen met roken (psychosociale
mediator).
Deel 3: Zijn er ongewenste effecten van rookverboden?
In hoofdstuk 11 werd aangetoond dat rookvrije horeca wetgeving niet leidt tot meer
roken in het eigen huis. Het leek er zelfs op dat rookverboden zorgden voor een
daling in het aantal gerookte sigaretten per dag en een rookverbod leek rokers
te stimuleren om hun huis vrijwillig rookvrij te maken. In hoofdstuk 12 lieten we
zien dat een eventueel effect van rookverboden op gevoelens van stigmatisering
afhing van hoe rokers zich voelen over buiten roken. Gevoelens van stigmatisering
namen niet toe na de invoering van de rookvrije horeca in Nederland. Nederlandse
rokers voelen zich dan ook meestal niet negatief beoordeeld als ze buiten roken.
Ten slotte vonden we dat de sociaaleconomische verschillen in roken steeds meer
toenamen in Nederland (hoofdstuk 13). Het leek er niet op dat de invoering van de
rookvrije horeca hieraan heeft bijgedragen (hoofdstuk 3 en 14). Echter, de invoering
van de rookvrije werkplek had wel een groter effect op stoppen met roken onder
hoogopgeleiden dan onder lager opgeleiden (hoofdstuk 3 en 13).
Wat kunnen we hieruit concluderen?
In dit proefschrift vonden we dat rookverboden het percentage rokers kunnen doen
dalen, stoppen met roken kunnen stimuleren en zodoende het aantal tabaksdoden
kunnen reduceren. Draagvlak voor rookverboden onder rokers bleek erg belangrijk
te zijn, omdat draagvlak zorgt voor meer naleving van het verbod, omdat het door het
beïnvloeden van attitudes en intenties om te stoppen met roken kan leiden tot meer
stoppogingen en omdat het stimuleert om het eigen huis vrijwillig rookvrij te maken.
Rookverboden zorgden niet voor meer roken in het eigen huis en in Nederland heeft
de rookvrije horeca niet geleid tot een toename in gevoelens van stigmatisering.
Alleen de rookvrije werkplek en niet de rookvrije horeca heeft in Nederland geleid
tot een vergroting van de sociaaleconomische verschillen in roken.
Op basis van de bevindingen in dit proefschrift en het conceptuele model van
ITC hebben we een model ontwikkeld dat het individuele effect van rookverboden
op stoppen met roken beschrijft (hoofdstuk 15). Rookverboden gaan vaak samen
met media-aandacht en beide hebben de potentie om te zorgen voor meer
draagvlak voor rookverboden en meer bewustzijn over de schade van (mee)roken.
| 287 |
| Samenvatting
Meer draagvlak en bewustzijn van schade kunnen leiden tot positievere attitudes
en sociale normen over stoppen met roken. Deze attitudes en normen kunnen
vervolgens leiden tot meer intentie om te stoppen met roken en meer stoppogingen.
Zowel draagvlak en bewustzijn van schade als attitudes en sociale normen over
stoppen met roken kunnen beïnvloeden of rokers het rookverbod naleven en of ze
hun eigen huis vrijwillig rookvrij maken. Naleving van het rookverbod en het vrijwillig
invoeren van thuisrookverboden kunnen ook leiden tot een hogere stopintentie en
meer stoppen met roken.
De Wereldgezondheidsorganisatie beveelt aan om rookverboden 100%
in te voeren zonder rookruimtes en uitzonderingen, om te zorgen voor goede
handhaving en om een voorlichtingscampagne te voeren over de schade van
meeroken. Verschillende studies in dit proefschrift hebben aanwijzingen gevonden
dat het belangrijk is om deze aanbevelingen te volgen. Het lijkt erop dat het volgen
van deze aanbevelingen een positief effect heeft op stoppen met roken (hoofdstuk
3 en 4), draagvlak voor rookverboden (hoofdstuk 6) en naleving van het rookverbod
(hoofdstuk 9). Nederland heeft geen van deze aanbevelingen opgevolgd, wat de
meest waarschijnlijke oorzaak is voor het feit dat er na de invoering minder gestopt
werd met roken dan in andere landen, dat het draagvlak voor rookverboden minder
steeg en dat er meer gerookt werd binnen in cafés. Het is aannemelijk dat het
rookverbod in Nederland succesvol was geweest als de aanbevelingen van de
Wereldgezondheidsorganisatie waren gevolgd. Zolang er geen landen zijn die deze
aanbevelingen volgen en niet succesvol zijn, kunnen we ervan uitgaan dat het met
een goede invoeringsstrategie overal kan lukken. “It has been done elsewhere, it
can be done everywhere”.
Wat moet er verder nog onderzocht worden?
Toekomstig onderzoek zou meer inzicht moeten geven in de rol van sociale normen
en denormalisatie in het terugdringen van roken in de populatie. Ook is meer
onderzoek nodig naar de effecten van verschillend tabaksontmoedigingsbeleid op
sociaaleconomische verschillen in roken. Ten slotte is het belangrijk om onderzoek
te doen naar de synergie tussen tabaksontmoedigingsbeleid en publiciteit hierover.
Welke aanbevelingen doen we voor de praktijk?
Beleidsmakers in landen die nog geen rookverbod hebben ingevoerd, moeten vóór
tot invoering van rookverboden wordt overgegaan, nadenken over hoe ze draagvlak
voor rookverboden onder rokers kunnen realiseren. Daarvoor is een gecoördineerde
mediastrategie nodig. Deze landen zouden rookverboden in moeten voeren volgens
de aanbevelingen van de Wereldgezondheidsorganisatie (100% rookvrij zonder

| 288 |
rookruimtes en uitzonderingen, goede handhaving en een voorlichtingscampagne
over de schade van meeroken).
Nederland en andere landen die nog een gedeeltelijk rookverbod hebben,
moeten onderkennen dat dit beleid niet effectief is in het beschermen van niet-rokers
tegen de schade van meeroken en worden geadviseerd een volledig rookverbod
in te voeren. Nederland zou de uitzondering voor kleine cafés zonder personeel
moeten terugdraaien, rookruimtes moeten verbieden, beter moeten handhaven en
alsnog een voorlichtingscampagne moeten voeren waarin wordt uitgelegd dat een
rookverbod noodzakelijk is om niet-rokers te beschermen tegen de schade van
meeroken.

| 289 |

| 290 |

Dankwoord
~~~
| 291 |
| 292 |
DankwoordHet schrijven van dit proefschrift heb ik zeker niet alleen gedaan. Daarom wil ik
iedereen bedanken die hieraan heeft bijgedragen. Als eerste wil ik mijn promotoren,
Marc en Hein, bedanken. Marc, dankjewel voor de vele uren die je gestoken hebt in
mijn begeleiding, het brainstormen over de implicaties van mijn bevindingen en het
becommentariëren van alle artikelen. Ik denk dat ik heel veel geluk heb gehad met
een promotor waar ik altijd bij binnen kan lopen en die heel geïnteresseerd is en zeer
deskundig op mijn onderzoeksterrein. Ook bedankt voor de gezelligheid tijdens
onze tripjes naar Ierland, Engeland en (de jungle van) Singapore. Hein, dankjewel
voor je opbouwende kritieken en goede adviezen. Het is fijn om een promotor te
hebben die geroutineerd is in het begeleiden van promovendi en je vanaf de eerste
dag dwingt te kijken naar het grote geheel van het proefschrift en de planning die
daarbij hoort. Ik wil jullie beiden ook bedanken voor jullie geduld toen bleek dat het
schrijven van de inleiding en discussie van mijn proefschrift me minder makkelijk
afging dan het schrijven van artikelen.
Ook wil ik natuurlijk de andere twee leden van het ‘ITC Netherlands team’, Bas en
Matty, bedanken voor hun bijdrages. Bas, dankjewel voor je bijdrages aan bijna
alle artikelen in mijn proefschrift. Je co-auteurschap is altijd zeer verdiend en je
commentaren bijzonder nuttig (ook al is het vaak ook even slikken hoe kritisch
je bent). Ik wil je vooral bedanken voor je enthousiasme en begeleiding bij ons
‘krantenproject’. Ook wil ik je bedanken voor alle tijd die je in ITC steekt. Super dat
je elk jaar de gehele vragenlijst doorloopt om mij te helpen met testen. Matty, ook
jou wil ik bedanken voor je bijdrage aan ITC en mijn proefschrift. Ik heb het erg leuk
gevonden om samen te puzzelen op de analyses van ons ‘jongerenartikel’ (van
Structural Equation Modelling, naar Growth Modelling, naar uiteindelijk ‘gewoon’
regressie analyses). Ik hoop dat we in de toekomst samen kunnen blijven werken
op onderzoek naar meeroken en Rookvrij Opgroeien.
My PhD project would not have been possible without the help of the ITC team at the
University of Waterloo in Canada. Many of you have worked on ITC Netherlands and
helped us with project management, survey development, research coordination,
data cleaning, and statistical analyses. In particular, I want to thank Geoff and
Lorraine. Geoff, thanks very much for critically revising my papers, coming up with
ideas for survey questions, and for your inspiring leadership on the project. It is
unbelievable that with all the work that you do, you still make the time to fly to
the Netherlands to talk to our national media and help us in our battle to save
tobacco control in the Netherlands. Lorraine, thanks for your terrific work on the ITC

| 293 |
| Dankwoord
Netherlands National Report and Health Risk Report. I dare to say that these reports
have been more important for tobacco control in the Netherlands than any of the
scientific papers in my thesis. Also, many thanks for making me feel so welcome on
the project and helping me with so many things. As a young researcher, it is great to
be part of the ITC Project and immediately having a large international network and
seeing lots of familiar faces at your first conferences. Finally, I want to thank you for
the opportunity of being involved in ITC journal supplements and ITC conference
symposia. Thank you, Lorraine, for organising many of these events and getting us
involved.
ITC has also brought me new friends. In one of the first conference calls with Canada,
Geoff told us that there was a PhD student in Germany, Ute, who was “also young,
ambitious, and fun”. And he was right! Later on, a PhD student from Canada, Sara,
became ITC Europe Student Project Manager. Ute and Sara, thanks for the nice
company during the conferences in Ireland, England, Amsterdam, and Singapore. I
hope we will meet many more times in the future, but anyway, we will keep in touch
through Facebook. Of course, I also owe you thanks for working together on some
interesting papers. It’s great that we never had any problems, although Ute and I
were both doing a PhD Project on the same topic and with the same data.
Furthermore, I had the privilege of being involved in another international study:
SimSmoke. Many thanks, David, for giving me the opportunity to work with the
model that you developed and to write a paper about it. And thank you for your
enthusiasm whenever we use SimSmoke Netherlands for national media advocacy
purposes. I hope to work with you and with the SimSmoke model more often in the
future.
Obviously, none of the papers in my PhD thesis were written by me alone. Many
thanks to all my co-authors (in alphabetical order): Ann, Anton, Bas, Boukje,
Christian, David, Dianne, Els, Eva, François, Geoff, Hein, Hermann, Jim, Kenneth,
Laura, Luke, Lutz, Marc, Martina, Mary, Math, Matty, Mike, Regina, Romain, Sander,
Sara, Shane, Ute, and Winnie. Ann, thanks for organising a journal supplement and
conference symposia for ITC Europe and involving us in these efforts. Christian
and Math, your help with some complex statistical modelling is much appreciated.
Shane, thanks for proofreading the introduction of my thesis.
Een ontzettend leuk onderdeel van het promoveren, vond ik het begeleiden van
twee masterstudenten. Els en Mariëtte, bedankt voor jullie inzet, enthousiasme

| 294 |
en gezelligheid. Ik ben erg trots dat er uit beide projecten een mooi artikel is
voortgekomen (hoofdstuk 8 en 12 uit dit proefschrift). Ik heb het volste vertrouwen
dat we beide artikelen binnenkort in een wetenschappelijk tijdschrift geplaatst
krijgen.
Ik wil graag mijn (ex-)collega’s bij STIVORO bedanken voor de prettige werksfeer
en gezelligheid. In het bijzonder Dagmar en Annegré, die beiden begonnen als
kamergenoten en al snel lunchwandelmaatjes werden, later vriendinnen zijn geworden
en nu mijn paranimfen zijn. Natuurlijk ben ik jullie ook dank verschuldigd voor jullie
bijdrage aan mijn proefschrift: het lezen en coderen van 1.068 artikelen over de
rookvrije horeca! Dagmar, dankjewel voor het kritisch lezen en becommentariëren van
de inleiding van mijn proefschrift. Verder wil ik Dewi bedanken voor het zijn van een
hele leuke baas, voor de wijze adviezen tijdens voortgangsgesprekken en voor het
leesbaarder maken van de Nederlandse samenvatting van mijn proefschrift. Graag
wil ik ook mijn mede-promovendi bij STIVORO, Regina en Frederieke, bedanken
voor de steun na een afgewezen artikel, de felicitaties bij een geaccepteerd artikel
en natuurlijk voor jullie gezelligheid als (ex-)kamergenoten. Frederieke, dankjewel
voor het becommentariëren van de inleiding van mijn proefschrift. Ten slotte wil ik
Lies, Grieto en Fleur bedanken voor het vertalen van mijn onderzoeksbevindingen
naar de pers en politiek.
Natuurlijk wil ik ook mijn (ex-)collega’s bij de Universiteit Maastricht bedanken, ook
al ben ik daar niet erg vaak te vinden. Ik wil iedereen van de PhD lunch meetings
hartelijk bedanken voor het kritisch lezen en bespreken van de artikelen in hoofdstuk
2, 3, 7 en 10 van mijn proefschrift. Ik heb daar enorm veel van geleerd! Ik wil Roy
bedanken voor het bieden van een plek, een theemok en een gezellig praatje als ik
een keer geen vertraging had met de trein en daardoor te vroeg in Maastricht was.
Eline, Nicola, Daniel, Iman en Carolien, bedankt voor de gezelligheid tijdens het
congres in Turkije.
Tijdens mijn promotieproject had ik de luxe dat ik het werven van respondenten, het
programmeren van vragenlijsten en het uitvoeren van het veldwerk niet zelf hoefde
te doen, maar dat dit uitgevoerd werd door TNS NIPO. Hanneke, Yvette, Noortje,
Danielle, Anneloes en Kevin: bedankt voor jullie inzet en interesse in het onderzoek.
Dit proefschrift was niet mogelijk geweest zonder de subsidiegevers: ZonMw (voor
ITC Nederland), het Ministerie van VWS (voor het COR) en de Europese Commissie
| 295 |
| Dankwoord
(voor SimSmoke). Ook zijn subsidies verleend door de Amsterdam School of
Communication Research ASCoR en STIVORO voor de inhoudsanalyse van de
krantenberichtgeving over de rookvrije horeca. En niet te vergeten: een subsidie
van maar liefst 2 Singapore dollars van Bas voor het WCToH-congres. Bedankt!
Ten slotte wil ik vrienden, familie en Jaap bedanken voor de afleiding en ontspanning
die ook erg hard nodig zijn tussen het schrijven van het proefschrift door. Mama,
dankjewel voor je hulp bij het leesbaarder maken van de Nederlandse samenvatting
van mijn proefschrift. Roos, dankjewel voor de prachtige vormgeving van mijn
proefschrift. Jaap, dankjewel dat je me meestal hebt ‘gedwongen’ om thuis te
ontspannen en leuke dingen (met jou) te doen, maar dat je me ook af en toe m’n
gang hebt laten gaan als dat nodig was.

| 296 |

Curriculum Vitae
~~~
| 297 |
| 298 |
Curriculum Vitae Gera Nagelhout was born on January 30, 1985, in Hattem, the Netherlands.
After having graduated from secondary school in 2003, she started studying
Communications at Radboud University Nijmegen. Her goal was to learn about
commercial communication and public relations. However, after a project on organ
donation in her first year, she became more interested in health communication than
in commercial communication. During her time in Nijmegen, she also participated
in a multidisciplinary extracurricular Honours Program, where she learned about
evolution, literature, nutrition, and religion. Although she secretly thought that
statistics were fun, Gera thought research was not something she wanted to do
after graduation. Therefore, she went to the University of Twente in Enschede for
a master in Applied Communications with the specialisation Health Promotion and
Government Communication. Her master thesis was about smoking cessation
counselling by oncologists and physician assistants, which was commissioned by
the knowledge centre for the implementation of the clinical guideline on tobacco
addiction. This knowledge centre was a collaboration between the Dutch expert
centre on tobacco control STIVORO in The Hague and the Radboud University
Nijmegen’s Scientific Institute for Quality of Healthcare (IQ Healthcare). After
receiving her MSc degree in August 2007, she worked on a research project at IQ
Healthcare in which she evaluated a quality improvement program for mental health
care and addiction care. In 2007, she also started working at STIVORO one day a
week, where she wrote Dutch reports on trends in smoking in the Netherlands. Gera
then realised that research was what she wanted to do after all and started her PhD
project in May 2008, employed at the department of Health Promotion of Maastricht
University (CAPHRI), but working from the office of STIVORO in The Hague. Gera
will continue her work on the impact of tobacco control policies on smoking as a
post-doctoral researcher at Maastricht University and STIVORO.
Publications in this thesis
Nagelhout, G. E., Willemsen, M. C., Thompson, M. E., Fong, G. T., Van den Putte,
B. & De Vries, H. (2010). Is web interviewing a good alternative to telephone
interviewing? Findings from the International Tobacco Control (ITC)
Netherlands Survey. BMC Public Health, 10, 351.
Nagelhout, G. E., Willemsen, M. C., & De Vries, H. (2011). The population impact
of smoke-free workplace and hospitality industry legislation on smoking
behaviour. Findings from a national population survey. Addiction, 106,
816-823.
Nagelhout, G. E., De Vries, H., Allwright, S., McNeill, A., Van den Putte, B., Boudreau,
| 299 |
| Curriculum Vitae
C., Fong, G. T. & Willemsen, M. C. (2012). Comparative impact of smoke-
free legislation on smoking cessation in three European countries. European
Journal of Public Health, 22(Suppl 1), 4-9.
Nagelhout, G. E., Levy, D. T., Blackman, K., Currie, L., Clancy, L., & Willemsen,
M. C. (2012). The effect of tobacco control policies on smoking prevalence
and smoking-attributable deaths. Findings from the Netherlands SimSmoke
Tobacco Control Policy Simulation Model. Addiction, 107, 407-416.
Mons, U., Nagelhout, G. E., Guignard, R., McNeill, A., Van den Putte, B., Willemsen,
M. C., Brenner, H., Pötschke-Langer & M., Breitling, L. P. (2012).
Comprehensive smoke-free policies attract more support from smokers in
Europe than partial policies. European Journal of Public Health,
22(Suppl 1), 10-16.
Nagelhout, G. E., Van den Putte, B., De Vries, H., Crone, M., Fong, G. T., & Willemsen,
M. C. (2012). The influence of newspaper coverage and a media campaign
on smokers’ support for smoke-free bars and restaurants and on second-
hand smoke harm awareness. Findings from the International Tobacco
Control (ITC) Netherlands Survey. Tobacco Control, 21, 24-29.
Rennen, E., Nagelhout, G. E., Van den Putte, B., Janssen, E., Mons, U., Guignard,
R., Beck, F., De Vries, H., Thrasher, J. F., & Willemsen, M. C. The effects
of tobacco control policy awareness on smoking cessation by reducing the
social acceptability of smoking. Findings from the International Tobacco
Control (ITC) Europe Surveys. Submitted.
Nagelhout, G. E., Mons, U., Allwright, S., Guignard, R., Beck, F., Fong, G. T., De
Vries, H., & Willemsen, M. C. (2011). Prevalence and predictors of smoking
in “smoke-free” bars. Findings from the International Tobacco Control (ITC)
Europe Surveys. Social Science & Medicine, 72, 1643-1651.
Nagelhout, G. E., De Vries, H., Fong, G. T., Candel, M. J. J. M., Thrasher, J. F., Van
den Putte, B., Thompson, M. E., Cummings, K. M., & Willemsen, M. C.
Pathways of change explaining the effect of smoke-free legislation on
smoking cessation in the Netherlands. An application of the International
Tobacco Control (ITC) Conceptual Model. Nicotine & Tobacco Research.
Published Online First: 5 April 2012.
Mons, U., Nagelhout, G. E., Allwright, S., Guignard, R., Van den Putte, B.,
Willemsen, M. C., Fong, G. T., Brenner, H., Pötschke-Langer & M., Breitling,
L. P. Impact of national smoke-free legislation on home smoking bans:
Findings from the International Tobacco Control (ITC) Policy Evaluation
Project Europe Surveys. Tobacco Control. Published Online First: 13
February 2012.

| 300 |
Nagelhout, G. E., Willemsen, M. C., Gebhardt, W. A., Van den Putte, B., Hichman,
S. C., Crone, M. R., Fong, G. T., Van der Heiden, S., & De Vries, H. Does
smoke-free legislation and smoking outside bars increase feelings of
stigmatisation among smokers? Findings from the International Tobacco
Control (ITC) Netherlands Survey. Accepted for publication in Health & Place.
Nagelhout, G. E., De Korte-de Boer, D., Kunst, A. E., Van der Meer, R. M., De
Vries, H., Van Gelder, B. M., & Willemsen, M. C. (2012). Trends in
socioeconomic inequalities in smoking prevalence, consumption, initiation,
and cessation between 2001 and 2008 in the Netherlands. Findings from a
national population survey. BMC Public Health, 12, 303.
Nagelhout, G. E., Crone, M. R., Van den Putte, B., Willemsen, M. C., Fong, G. T.,
& De Vries, H. Age and educational inequalities in smoking cessation after
three population level tobacco control interventions. Findings from the
International Tobacco Control (ITC) Netherlands Survey. Resubmitted.
Other international publications
Van der Heiden, S., Gebhardt, W.A., Willemsen, M. C., Nagelhout, G. E. & Dijkstra,
A. Behavioral and psychological responses of lower educated smokers to
smoke-free legislation in Dutch hospitality venues. Accepted for publication
in Psychology & Health.
Willems, R. A., Willemsen, M. C., Nagelhout, G. E., & De Vries, H. Understanding
smokers’ motivations to use evidence-based smoking cessation aids.
Nicotine & Tobacco Research. Published Online First: 9 May 2012.
Hitchman, S. C., Guignard, R., Nagelhout, G. E., Mons, U., Beck, F., Van den Putte,
B., Crone, M., De Vries, R., Hyland, A., & Fong, G. T. (2012). Predictors
of car smoking rules among smokers in France, Germany and the
Netherlands. European Journal of Public Health, 22(Suppl 1), 17-22.
Hitchman, S. C., Mons, U., Nagelhout, G. E., Guignard, R., Mcneill, A., Willemsen,
M. C., Driezen, P., Wilquin, J.-L., Beck, F., Du-Roscöat, E., Pötschke-Langer,
M., Hammond, D., & Fong, G. T. Effectiveness of the European Union
text-only cigarette health warnings: Findings from four countries. European
Journal of Public Health. Published Online First: 15 September 2011.
Nagelhout, G. E. & Fong, G. T. (2011). Netherlands: Plan to cut all health education
(News Analysis). Tobacco Control, 20, 253-254.
Other national publications
Nagelhout, G. E., Willemsen, M. C., & De Vries, H. (2012). Een écht rookvrije horeca
is ook mogelijk in Nederland. Tijdschrift voor Gezondheidswetenschappen,
| 301 |
| Curriculum Vitae
90, 344-346.
Nagelhout, G. E., Van den Putte, B., De Vries, H., & Willemsen, M. C. (2011).
Krantenberichtgeving over het rookverbod in de horeca: Een inhoudsanalyse.
Tijdschrift voor Communicatiewetenschap, 39, 4-16.
Nagelhout, G. E., Willemsen, M. C., Van den Putte, B., Crone, M., Segaar, D. & De
Vries, H. (2011). Campagnes over schade van roken zijn absoluut
noodzakelijk. Tijdschrift voor Gezondheidswetenschappen, 89, 258-260.
Nagelhout, G. E., Van den Burg, I., Muller, D. S. C. M., Adriaanse, M. C., &
Crone, M. R. (2011). Rookvrij Opgroeien. Voorlichting over meeroken door
de Jeugdgezondheidszorg. Tijdschrift voor Jeugdgezondheidszorg, 43,
58-60.
Crone, M. R., Nagelhout, G. E., Van den Burg, I., & Hirasing, H. A. (2010). Meeroken
door kinderen in Nederland sinds 1996 sterk gedaald. Nederlands Tijdschrift
voor Geneeskunde, 154, A1658.