Embed Size (px)
Citation preview
Broman-Fulks, J. J., Hill, R. W., & Green, B. A. (2008). Is perfectionism categorical or dimensional? A taxometric analysis. Journal of Personality Assessment, 90(5): 481-490. (Sep/Oct 2008) Published by Taylor & Francis (ISSN: 1532-7752). DOI: 10.1080/00223890802248802
Is Perfectionism Categorical or Dimensional? A Taxometric Analysis Joshua J. Broman-Fulks, Robert W. Hill, and Bradley A. Green
ABSTRACT
Considerable debate exists within the perfectionism literature regarding whether perfectionism is most accurately conceptualized as a dimensional or categorical construct. Specifically, some researchers have viewed perfectionism as a continuous construct, with extreme scores being associated with negative psychological outcomes (e.g., obsessive–compulsive disorder, eating disorders, etc.). In contrast, others have argued that two distinct forms of perfectionism exist (i.e., adaptive vs. maladaptive perfectionism) that are associated with both positive and negative outcomes. The purpose of this study was to examine the latent structure of perfectionism using taxometric procedures to determine whether perfectionism is most accurately conceptualized as taxonic (categorical) or dimensional (continuous). We applied four taxometric procedures (maximum eigen value [Waller & Meehl, 1998], maximum covariance [Meehl & Yonce, 1996], mean above minus below a cut [Meehl & Yonce, 1994], and latent-mode factor analysis [Waller & Meehl, 1998]) to perfectionism data collected from 2 large nonclinical samples. Results provided convergent evidence for a dimensional conceptualization of perfectionism across samples, perfectionism measures, and statistical procedures. We discuss the implications of these findings for the theory, assessment, and investigation of perfectionism are discussed.
The concept of perfectionism has been challenging to define, and the theoretical formulation and measurement of the phenomenon has evolved substantially over the past 20 to 30 years (see Flett & Hewitt, 2002, for a review). Historically, the predominant view has been that perfectionism represents a dimensional construct, implying that individuals vary in degree of perfectionism (e.g., Burns, 1980; Hollender, 1978; Stober & Otto, 2006). Individuals with higher levels of perfectionism have been often described as setting high standards and being overly self-critical of their performance (e.g., Frost, Marten, Lahart, & Rosenblate, 1990), thus making them more susceptible to a variety of negative psychological phenomena. Consistent with this perspective, much of the early perfectionism research has focused on investigating the relation between high levels of perfectionism and various forms of psychopathology including depression, eating disorders, social anxiety, phobias, obsessive– compulsive disorder (OCD), somatic complaints (see Shafran& Mansell, 2001, and Hewitt & Flett, 2002, for reviews), as well as other psychological vulnerabilities to distress (Flett, Hewitt, Blankstein, & Gray, 1998; Hewitt & Flett, 2002). However, accumulating evidence appears to suggest that perfectionism is not exclusively associated with negative correlates and consequences as was once assumed. Rather, research has linked perfectionism with a variety of positive outcomes as well (for a summary, see Stober & Otto, 2006) including the achievement of high standards, the attainment of various rewards for achieving those standards, and higher aptitude test performance (Stober & Kersting, 2007). The discovery that perfectionism is associated with both positive and negative characteristics has generated controversy within the literature regarding the latent structure of perfectionism. Specifically, two basic approaches to conceptualizing the structure of perfectionism have emerged, which can be labeled as dimensional versus categorical models. The dimensional approach views perfectionism as a continuous variable, suggesting that one or more dimensions of perfectionism exist along which all individuals can be located. In other words, individuals are discriminated based on the degree of perfectionism rather than type. In contrast, the categorical approach maintains that two distinct forms of perfectionism exist and should be distinguished (e.g., positive vs. negative perfectionism or adaptive vs. maladaptive; e.g., see Enns & Cox, 2002, and Stober & Otto, 2006, for reviews). According to the categorical perspective, “negative perfectionists” set unrealistically high goals and are driven by a fear of failure, whereas “positive perfectionists” set realistic goals and aremotivated by positive reinforcement such as self-satisfaction and heightened self-esteem (Frost et al., 1990; Hamachek, 1978; Terry-Short, Owens, Slade, & Dewey, 1995). Potential support
for the categorical model has come from several sources. For example, cluster analysis has purportedly identified two “natural groupings” of perfectionists, which have been used by some researchers to categorize students into groups according to “adaptive” versus “maladaptive” features (Parker, 1997; Rice & Mirzadeh, 2000). In addition, some proponents of the categorical model of perfectionism have cited factor analytic research, which has indicated that a two-factor model is a better fit for perfectionism data than a unitary model (e.g., Bieling, Israeli, & Antony, 2004; Frost, Heimberg, Holt, Mattia, & Neubauer, 1993; Hill et al., 2004; Stumpf & Parker, 2000), as providing support for the typological conceptualization of perfectionism. However, it should be noted that factor analysis is notspecifically designed to evaluate the categorical versus continuous latent structure of phenomena, and cluster analysis will often create clusters whether they are meaningful or not, in effect forcing structure on the data (that may or may not occur naturally). Despite the limited evidence for a categorical model, many researchers have begun to treat perfectionism as though it were a categorical construct. For example, several measures of perfectionism have been developed to distinguish between positive and negative perfectionists (e.g., Almost Perfect Scales–Revised [APS–R]; Slaney, Rice, Mobley, Trippi, & Ashby, 2001; Positive and Negative Perfectionism Scale [PNP]; Terry-Short et al., 1995). In addition, many other investigators have used composites of existing perfectionism scales to assess adaptive (healthy) versus maladaptive (unhealthy) perfectionism (for a summary, see Enns & Cox, 2002). Thus, considerable debate has arisen regarding whether perfectionism is most accurately depicted as a dimensional or categorical construct. One recent review of the literature documented that 15 perfectionism studies had used a “dimensional” approach, whereas 20 others employed a “groups”-based approach (Stober & Otto, 2006). Flett and Hewitt (2002) observed that until the dimensional versus categorical nature of perfectionism has been resolved, the interpretation of differences in perfectionism cannot be readily interpreted as “qualitative rather than quantitative in nature” (p. 19).Whether perfectionism consists of one more dimensions or two distinct forms is an empirical question, one that must be addressed, as it has important implications for the theory, measurement, and investigation of perfectionism. Taxometrics refers to a set of statistical procedures designed to discern the latent structure of phenomena using multiple indicators of the construct of interest. In contrast with other classification techniques, such as cluster analysis methods, taxometric procedures are designed to expose naturally occurring patterns in the data (Meehl, 1992; J. Ruscio&Ruscio, 2000). In addition, taxometric methodology does not rely on traditional statistical
significance testing, instead requiring that several independent procedures (i.e., consistency tests) provide convergent evidence either in support or against the existence of a taxon (i.e., a naturally occurring class). Taxometric procedures have a long history in the literature (e.g., Meehl, 1973) and have recently gained in popularity, as their utility has become increasingly recognized. Researchers have successfully used taxometric procedures to examine the latent structure of various psychological phenomena including schizotypy (e.g., Korfine & Lenzenweger, 1995), posttraumatic stress reactions (Broman-Fulks et al., 2006; A. M. Ruscio, Ruscio, & Keane, 2002), Jungian personality preferences (Arnau, Green, Rosen, Gleaves, & Melancon, 2003), bulimia nervosa (Gleaves, Lowe, Snow, Green,&Murphy-Eberez, 2000), and depression (e.g., J. Ruscio & Ruscio, 2000). However, researchers have yet to apply taxometric procedures to the investigation of the latent structure of perfectionism. Determining the latent structure of perfectionism, or any other construct of scientific interest, is important for several reasons (Meehl, 1992). First, the psychometric strategy behind the construction of assessment instruments is different when one is attempting to assign individuals to a category versus when one is trying to pinpoint an individual’s location on a dimension. In the case of a dimensional variable, the goal of assessment measures is to disperse scores broadly and to discriminate effectively in all areas of the dimension. In contrast, test construction for a taxonic or categorical variable would aim to sort individuals into groups while maximizing valid classifications. Currently, numerous perfectionism measures exist, some of which are designed to classify individuals as positive or negative perfectionists (e.g., APS–R; Slaney et al., 2001; PNP; Terry-Short et al., 1995), whereas others provide a more continuous measurement of perfectionism (e.g., Multidimensional Perfectionism Scales; Frost et al., 1990; Hewitt & Flett, 1991; Perfectionism Inventory; Hill et al., 2004). Thus, taxometric procedures may help to resolve some of the controversy regarding the most appropriate measurement techniques for assessing perfectionism. Second, research aimed at identifying themost effective diagnostic and treatment methods is enhanced when the underlying structure of the targeted pathology is known. Although perfectionism is not a diagnosable psychiatric condition according to the Diagnostic and Statistical Manual of Mental Disorder (4th ed.; American Psychiatric Association, 1994), research has indicated that perfectionism plays an integral role in the development and treatment of various other psychological conditions including OCD, eating disorders, and depression. For example, perfectionism has been shown to impede the successful treatment of depression regardless of the treatment method employed (Blatt, Quinlan, Pilkonis, & Shea, 1995). Despite the wealth of research demonstrating an association between perfectionism and psychopathology, relatively little systematic research has been conducted on the treatment of perfectionism (Ferguson &
Rodway, 1994; Shafran & Mansell, 2001). Thus, knowing the latent structure of perfectionism may help to guide the creation and evaluation of treatment methods. Finally, knowing the latent structure of perfectionism will help to inform etiological research. Taxonic, or categorical, latent structure is generally suggestive of a discrete etiological source such as a particular gene, nervous system disorder, environmental stressor, or specific interaction of such variables. In contrast, dimensional structure implies that the phenomenon is multiply determined and has an additive or graded etiology. Although many experts have asserted that perfectionism is a product of children’s interactions with perfectionistic and demanding parents (e.g., Frost, Lahart, & Rosenblate, 1991), relatively little systematic research is available regarding the causes of perfectionism. Thus, knowing the latent structure of perfectionism will help to guide the focus and improve the efficiency of etiological perfectionism research. The purpose of this study was to empirically examine the nature of the boundary between normal (positive) and maladaptive (negative) perfectionism and to determine whether perfectionism is most accurately conceptualized as a continuous or categorical construct. To this end, and consistent with taxometric methodology that necessitates the use of multiple consistency tests, we applied four taxometric procedures to data collected from two large, nonclinical samples using three common measures of perfectionism. METHOD Participants Participants consisted of two large samples of undergraduate psychology students who completed three measures of perfectionism. The first sample of participants completed the Multidimensional Perfectionism Scale (MPS–F) developed by Frost et al. (1990) and the Perfectionism Inventory (PI; Hill et al., 2004), and consisted of 616 undergraduate students (M = 18.9 years; 62% female, 29% male, 9% missing gender data; 95% White, 5% African American or other race). Another 816 undergraduate students (M age = 19.0 years; 68 % female, 25 % male, 7% missing gender data; 94% White, 6% African American or other race) completed the Hewitt and Flett (1991) MPS–HF. These sample sizes well exceed the minimum sample size of 300 recommended by Meehl (1995) for conducting taxometric analyses. All participants received course credit for their participation.
Measures We selected the following measures of perfectionism for use in this research based on their (a) popularity in the perfectionism literature, (b) well-documented psychometric properties, (c) ability to evaluate the full spectrum of perfectionism characteristics, and (d) demonstrated ability to assess both adaptive and maladaptive aspects of perfectionism (e.g., Frost et al., 1993; Hill et al., 2004). MPS–F. Frost et al.’s (1990) MPS–F consists of 35 items (using a 5-point rating scale ranging from 1 [Strongly Disagree] to 5 [Strongly Agree]) that comprise six subscales:ConcernOver Mistakes, Personal Standards, Parental Expectations, Parental Criticism, Doubts Over Actions, and Organization. Frost et al. (1995) reported adequate internal consistency for the MPS–F, with coefficient alphas ranging from .77 to .93. The internal consistency of the MPS–F data used in this study was good (Cronbach’s α = .92), with subscale alphas ranging from .78 (Doubts Over Actions) to .94 (Organization). Support for the convergent and discriminant validity of the MPS–F has come from numerous studies that have demonstrated the relation between the MPS–F subscales and diverse personality constructs and behaviors (e.g., Frost et al., 1990; Frost et al., 1995). MPS–HF. Hewitt and Flett’s (1991) MPS–HF consists of 45 items (using a 7-point rating scale ranging from 1 [Strongly Disagree] to 7 [Strongly Agree]) that comprise three 15-item subscales: Self-Oriented Perfectionism, Other-Oriented Perfectionism, and Socially-Prescribed Perfectionism. Previous research has demonstrated that theMPS–HF has adequate internal consistency, with coefficient alphas ranging from .79 to .89 (Hewitt & Flett, 1991). The internal consistency of the MPS–HF data used in this research was consistent with previous reports (Cronbach’s α = .87), with subscale alphas ranging between .68 (Other-Oriented Perfectionism) and .84 (Self-Oriented Perfectionism). The construct and criterion-related validity of the MPS–HF has been established via numerous studies that have examined the associations between the MPS–HF and MPS–F subscales as well as varied other behavioral and personality constructs (e.g., Hewitt & Flett, 1991; Hewitt, Flett, Turnbull- Donovan, & Mikail, 1991). PI. Hill et al.’s (2004) PI consists of 59 items (using a 5-point rating scale ranging from 1 [Strongly Disagree] to 5 [Strongly Agree]) that comprise eight subscales: Striving for Excellence, Organization, Planfulness, High Standards for Others, Concern Over Mistakes, Need for Approval, Rumination, and Perceived Parental Pressure. The PI data utilized in this study demonstrated high overall internal consistency (Cronbach’s α = .95), with subscale alpha coefficients ranging from .83 (High Standards for Others) to .91 (Orderliness), which is consistent
with previous reports (e.g., Hill et al., 2004). The PI has good convergent validity with other measures of perfectionism such as theMPS–HF and MPS–F and with related constructs that are not included in these scales (Hill et al., 2004). Data Analytic Strategy Taxometric methods do not rely on traditional statistical significance testing. Rather, a multiple hurdles, consistency testing approach is generally recommended (Meehl, 1995; Waller & Meehl, 1998). Specifically, if a taxon exists, the results of multiple independent taxometric procedures would be expected to converge on a taxonic finding. Following this recommendation, in thus study, we used four independent taxometric procedures—maximum Eigenvalue (MAXEIG; Waller & Meehl, 1998), maximum covariance (MAXCOV; Meehl & Yonce, 1996), mean above minus below a cut (MAMBAC; Meehl & Yonce, 1994), and latent-mode factor analysis (LMode; Waller & Meehl, 1998) —to analyze the latent structure of perfectionism as measured by three well-established measures of perfectionism: the MPS–F,MPS–HF, and PI. To ensure accurate plot ratings, we asked two experienced taxometricians to independently rate each of the plots generated by the taxometric procedures. We also provide the raters with comparison plots generated from simulated taxonic and dimensional data with similar distributional characteristics (e.g., skew, kurtosis, N, etc.) to the empirical data.We encouraged raters to compare the empirical data plots with simulated taxonic and dimensional plots and to use these comparisons as an additional source of information in making their decision about the shape of the empirical data plots. The raters were in perfect agreement in their plot ratings (100%). We obtained the computer programs used to perform the taxometric analyses from J. Ruscio (2006). In addition to analyzing the empirical data, these programs can also be used to simultaneously create simulated taxonic and dimensional data plots (refer to J. Ruscio, Ruscio, & Meron, 2007, for a detailed description of these simulation programs). Simulated dimensional data are created using an iterative procedure that matches the distributions of all indicators including their skew, kurtosis, and discrete values. In contrast, simulated taxonic data sets are generated by employing a fallible criterion variable denoting the putative class membership of each case to isolate taxon and complement distributions. The same iterative procedure is then employed to create simulated taxon and complement distributions, which are merged to produce the simulated data set for the taxonic case. In this study, we sorted cases into putative taxon and nontaxon membership using Bayes’ Theorem in the MAXEIG and MAXCOV programs, the grand mean, base-rate
estimate in MAMBAC, and the nearest mode in L-Mode. Following is a brief explanation of the mathematical rationale behind each taxometric procedure used in this study. MAXEIG. MAXEIG(Waller&Meehl, 1998) is amultivariate extension of the often used MAXCOV procedure (Meehl & Yonce, 1996). MAXEIG extracts one input indicator, calculates the eigenvalues from all remaining indicators across successive intervals of the input indicator, and plots these values. If the variable under investigation is taxonic, data typically yield plots with a distinctive peak. In contrast, dimensional data tend to produce relatively flat plots, with minor fluctuations around a mean eigenvalue. In comparison with theMAXCOV procedure, MAXEIG generates a greater number of response points, which can potentially enhance interpretability of plot shapes (A. M. Ruscio, Ruscio, & Keane, 2002).
MAXCOV. The MAXCOV (Meehl & Yonce, 1996) procedure functions by examining the patterns of covariance among two indicators across successive, nonoverlapping intervals of a third indicator. When the resulting function is plotted, taxonic variables will produce a peak at the interval that contains the largest mixture of taxon and nontaxon groups (i.e., the hitmax). In contrast, if the variable is nontaxonic, the graphs will remain relatively flat due to relatively stable covariance across the distribution of scores. MAMBAC. TheMAMBAC (Meehl & Yonce, 1994) procedure operates on the assumption that when two discrete groups exist (i.e., taxon and nontaxon groups), valid indicators of group membership will demonstratemean differences between groups. However, within groups, correlations should be minimal.When mean differences on one indicator are plotted as a function of successive cuts on another indicator, taxonic constructs tend to produce plots with a distinct peak. In contrast, dimensional constructs generally produce dish-shaped MAMBAC plots. L-Mode. The L-mode (Waller & Meehl, 1998) procedure functions by conducting a factor analysis on the proposed indicators. When the distribution of scores on the first principal factor is plotted, taxonic constructs tend to produce a bimodal distribution of factor scores. In contrast, the factor scores of dimensional variables tend to be unimodally distributed. Indicator Selection Prior to conducting the taxometric analyses, we created indicators for each of the perfectionism measures. As noted previously, the MPS–F evaluates six dimensions of perfectionism, the MPS–HF three dimensions, and the PI eight dimensions, with each instrument assessing both adaptive and maladaptive
domains of perfectionism. Accordingly, we selected three sets of indicators representing the six MPS–F, three MPS–HF, and eight PI subscale scores. We selected these indicators to ensure adequate coverage of the perfectionism construct and to provide a sufficient range of response options to meet statistical utility for taxometric analyses (Schmidt, Kotov,&Joiner, 2004;Waller & Meehl, 1998). We examined nuisance, or within-group, correlations to ensure that valid interpretation of taxometric curves was possible. In general, indicators should be selected to be correlated within the full sample but to have minimal correlations within the proposed taxon and complement groups. As noted previously, we sorted cases into putative taxon and nontaxon groups using Bayes’ Theorem in theMAXEIG and MAXCOV programs, the grand mean base rate estimate in MAMBAC, and the nearest mode in L-Mode. Examination of the nuisance correlations among the MPS-F indicators revealed low within-group correlations (.10 and .11 for the taxon and complement groups, respectively) and a higher correlation within the full sample (.34). Correlations among the MPS–HF indicators revealed a similar pattern, with within taxon group correlations of .09, nontaxon group correlations of .13, and a total sample correlation of .44. The PI indicators also demonstrated the desirable pattern of nuisance covariance (taxon group = .16, nontaxon group = .15, and total sample=.39). Thus, these correlation patterns are well within the tolerable range for taxometric procedures (Meehl & Yonce, 1994). Given these within-group and total sample correlations, estimates of the validity of the selected indicators can be obtained. Previous research has suggested that indicator validities of 1 SD or greater are sufficient for taxometric research (e.g., Meehl & Golden, 1982). Results revealed an average degree of separation of 1.26 SD for the MPS–F indicators, 1.56 SD for the MPS–HF indicators, and 1.30 SD for the PI indicators.[1] We also examined the distributions of the summed indicators. The MPS–F, MPS–HF, and PI indicators demonstrated negligible skew. Specifically, the average indicator skew was .05 for the MPS–F indicators, .09 for the MPS–HF indicators, and .29 for the PI indicators. Similarly, kurtosis was low, averaging .55 for the MPS–F, .39 for the MPS–HF, and .23 for the PI, respectively. Thus, based on the large sample sizes, low nuisance correlations, adequate validities, and minimal skew or kurtosis, we deemed the indicators created for this study appropriate for taxometric analysis.
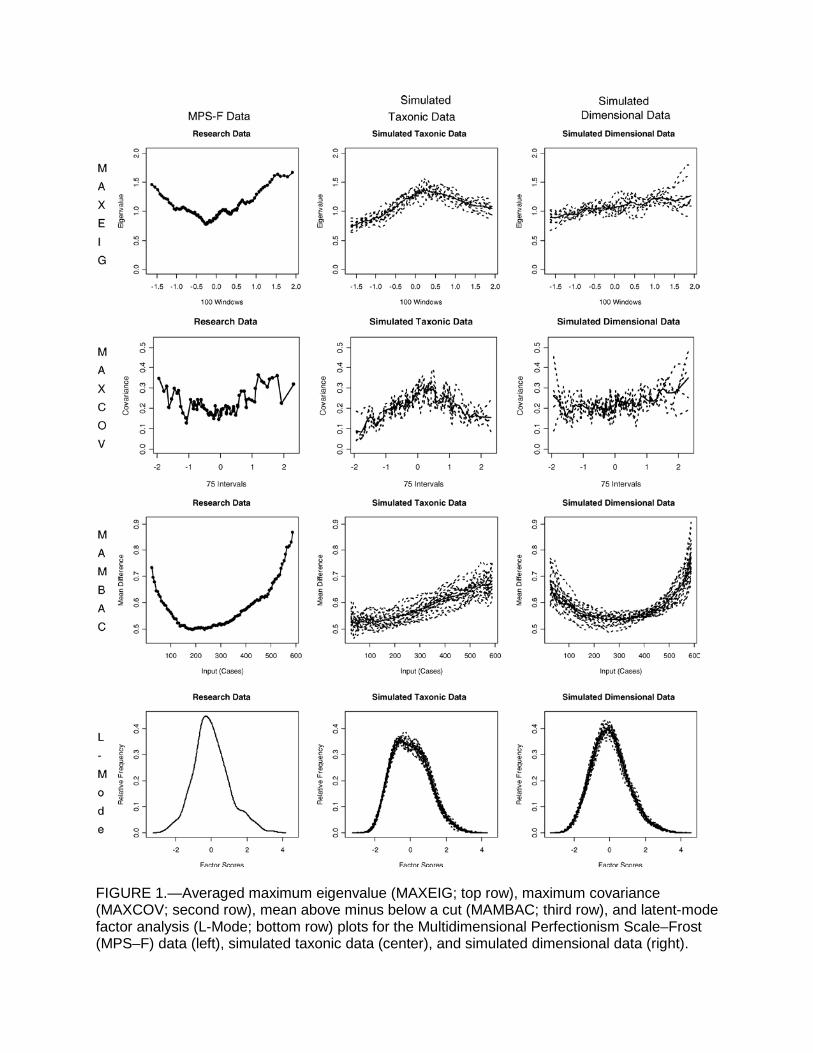
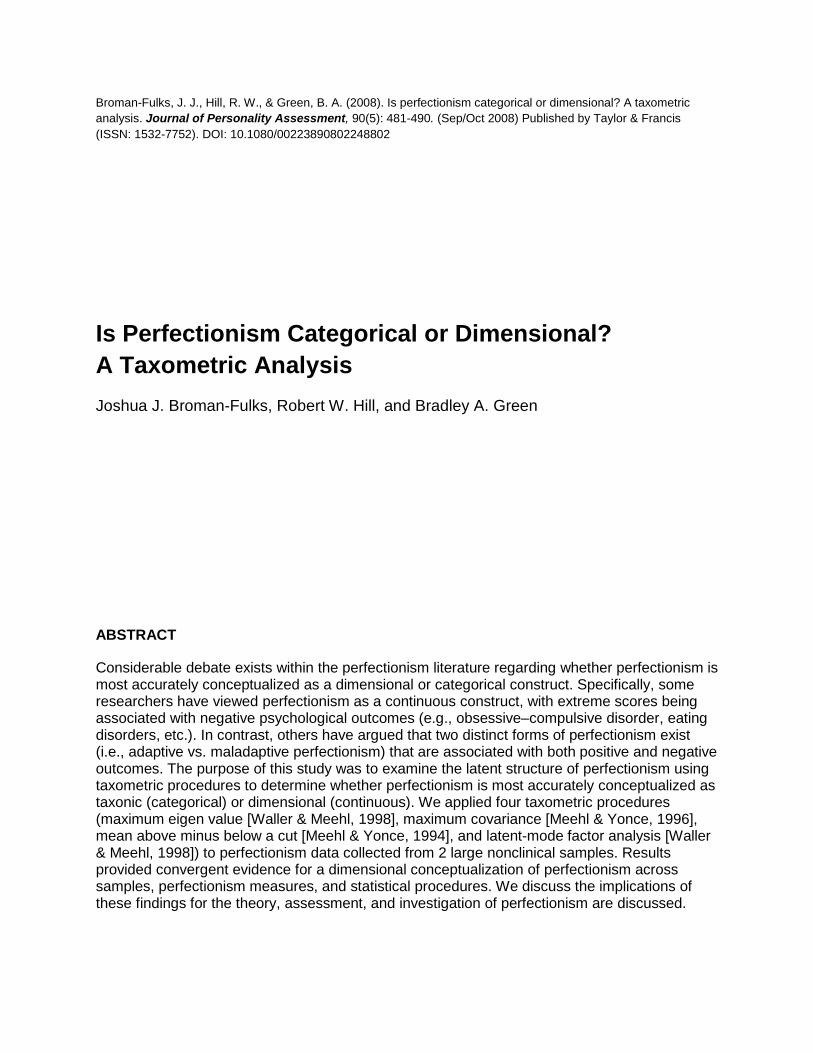
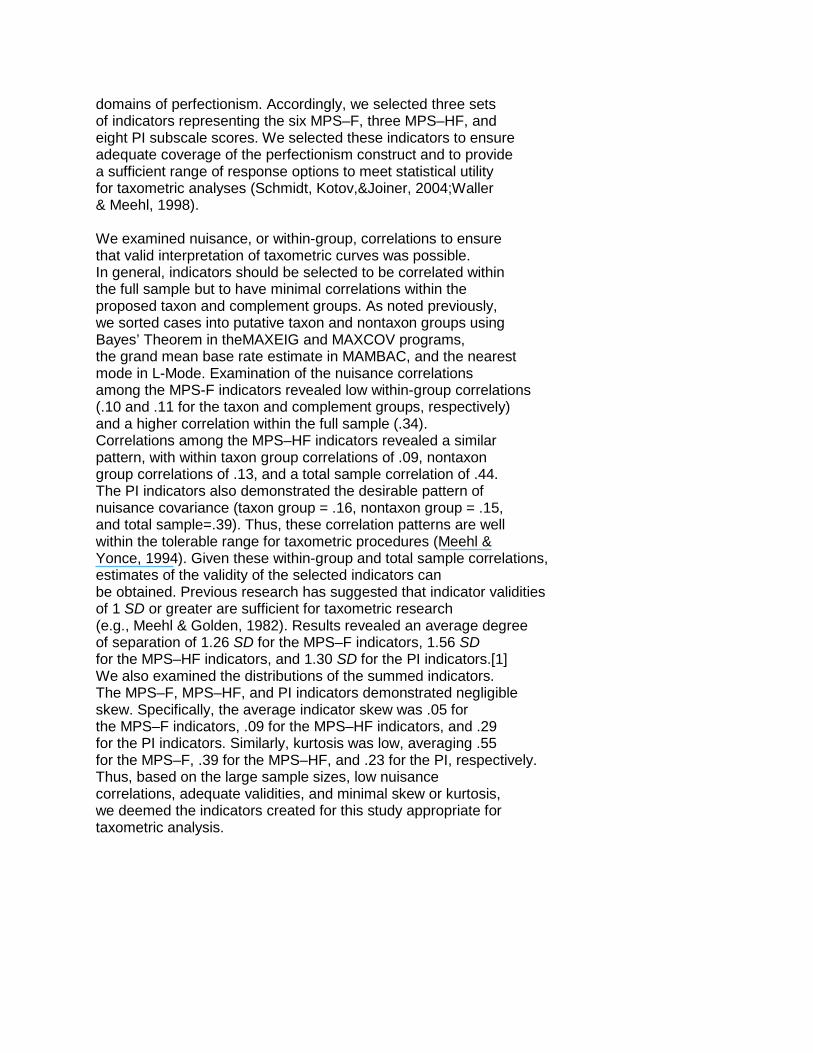
FIGURE 1.—Averaged maximum eigenvalue (MAXEIG; top row), maximum covariance (MAXCOV; second row), mean above minus below a cut (MAMBAC; third row), and latent-mode factor analysis (L-Mode; bottom row) plots for the Multidimensional Perfectionism Scale–Frost (MPS–F) data (left), simulated taxonic data (center), and simulated dimensional data (right).
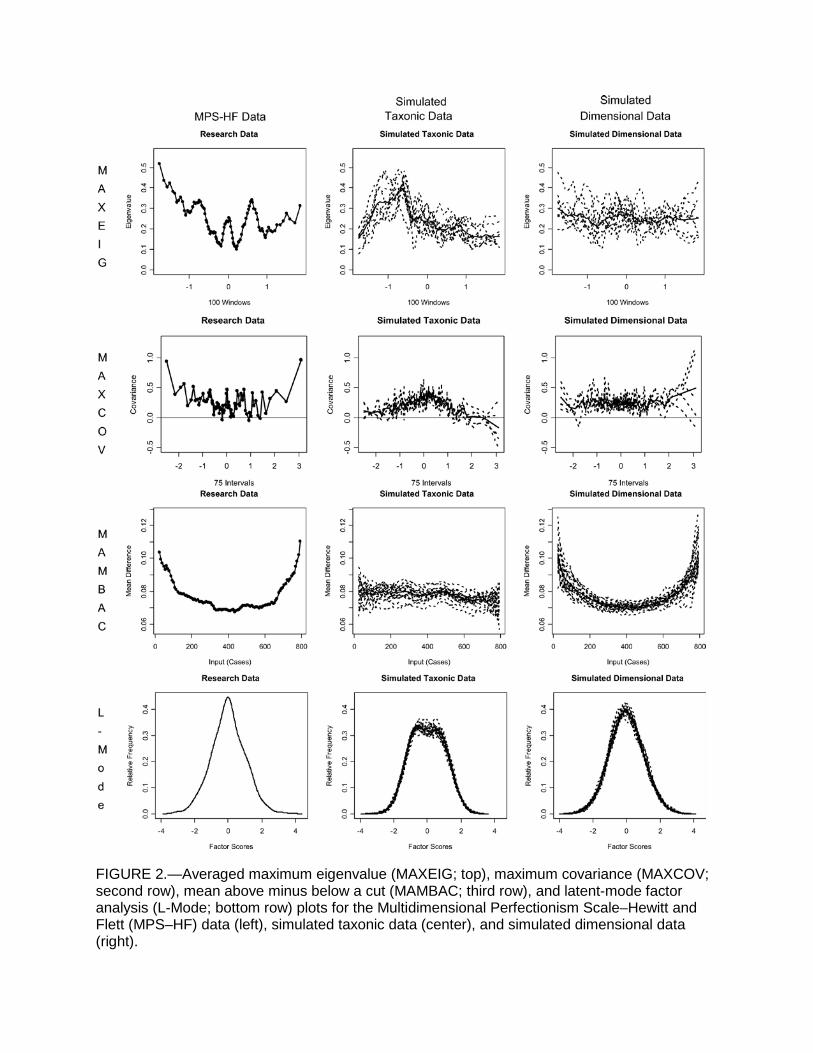
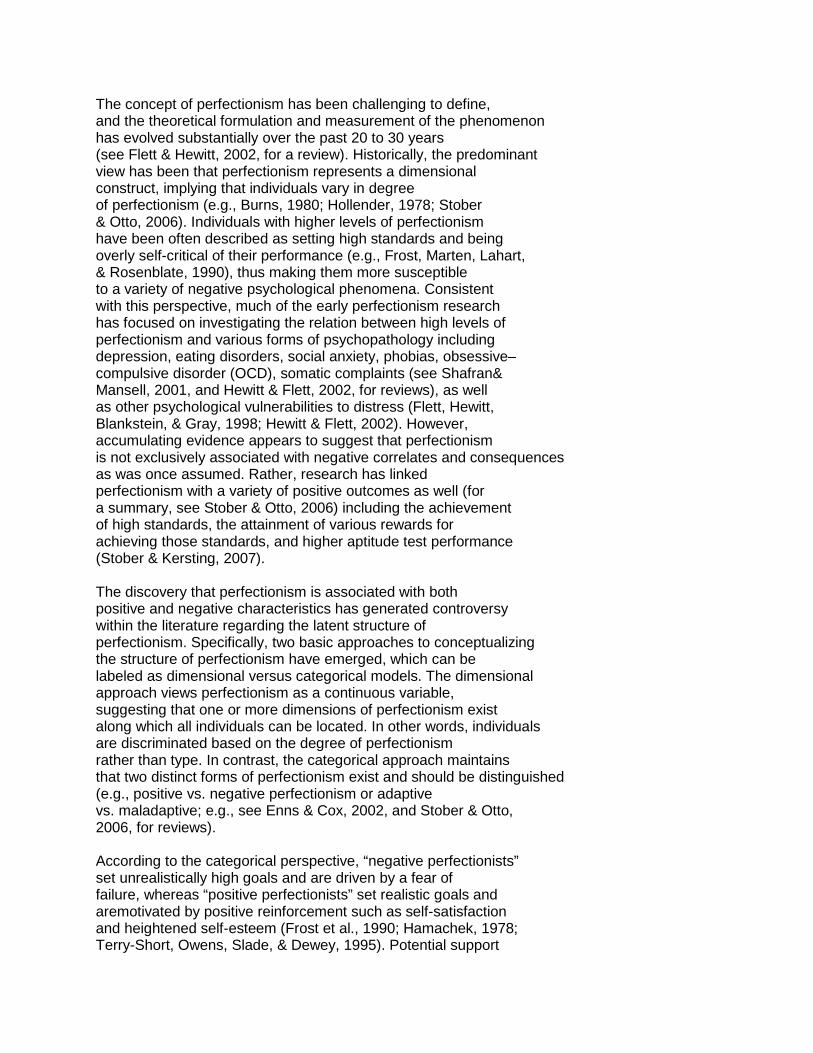
FIGURE 2.—Averaged maximum eigenvalue (MAXEIG; top), maximum covariance (MAXCOV; second row), mean above minus below a cut (MAMBAC; third row), and latent-mode factor analysis (L-Mode; bottom row) plots for the Multidimensional Perfectionism Scale–Hewitt and Flett (MPS–HF) data (left), simulated taxonic data (center), and simulated dimensional data (right).
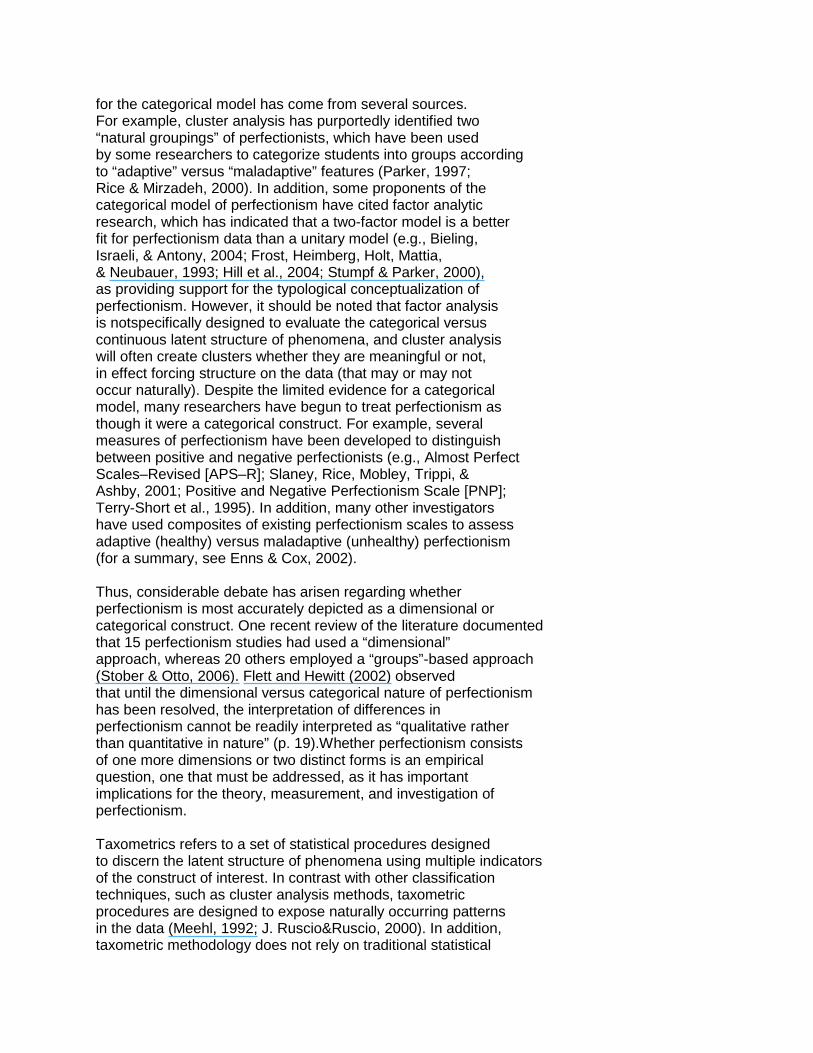
FIGURE 3.—Averaged maximum eigenvalue (MAXEIG; top), maximum covariance (MAXCOV; second row), mean above minus below a cut (MAMBAC; third row), and latent-mode factor analysis (L-Mode; bottom row) plots for the Perfectionism Inventory data (left), simulated taxonic data (center), and simulated dimensional data (right).
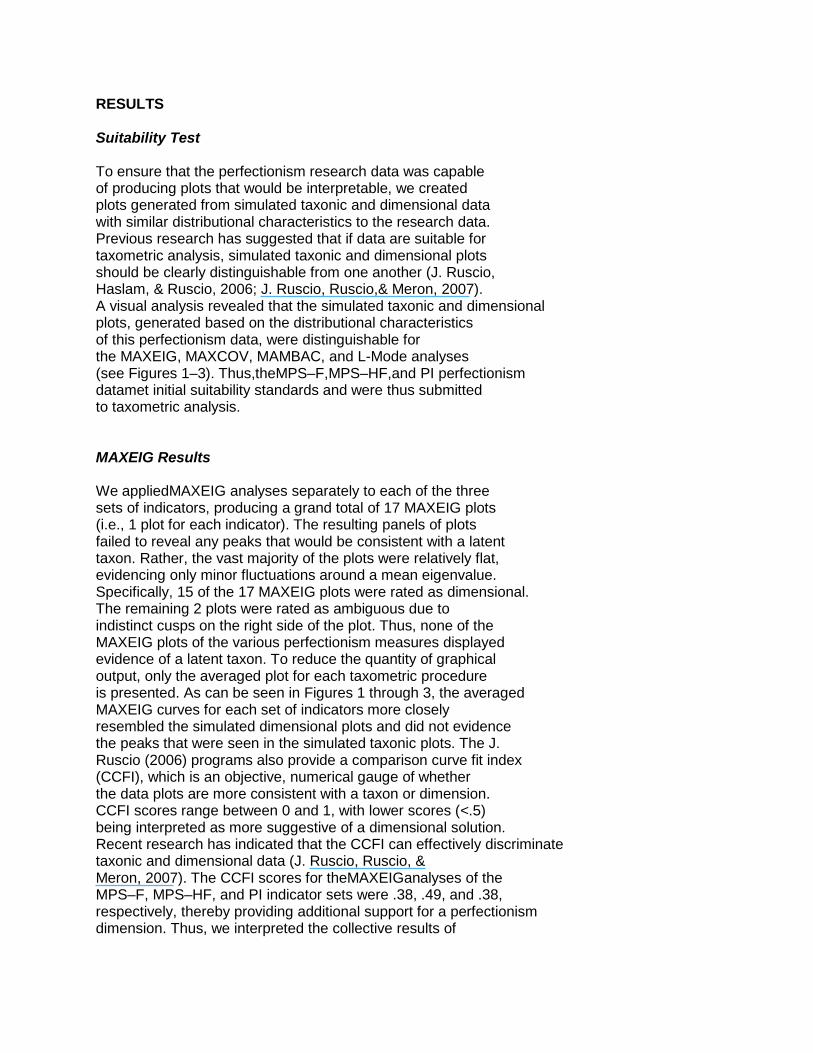
RESULTS Suitability Test To ensure that the perfectionism research data was capable of producing plots that would be interpretable, we created plots generated from simulated taxonic and dimensional data with similar distributional characteristics to the research data. Previous research has suggested that if data are suitable for taxometric analysis, simulated taxonic and dimensional plots should be clearly distinguishable from one another (J. Ruscio, Haslam, & Ruscio, 2006; J. Ruscio, Ruscio,& Meron, 2007). A visual analysis revealed that the simulated taxonic and dimensional plots, generated based on the distributional characteristics of this perfectionism data, were distinguishable for the MAXEIG, MAXCOV, MAMBAC, and L-Mode analyses (see Figures 1–3). Thus,theMPS–F,MPS–HF,and PI perfectionism datamet initial suitability standards and were thus submitted to taxometric analysis. MAXEIG Results We appliedMAXEIG analyses separately to each of the three sets of indicators, producing a grand total of 17 MAXEIG plots (i.e., 1 plot for each indicator). The resulting panels of plots failed to reveal any peaks that would be consistent with a latent taxon. Rather, the vast majority of the plots were relatively flat, evidencing only minor fluctuations around a mean eigenvalue. Specifically, 15 of the 17 MAXEIG plots were rated as dimensional. The remaining 2 plots were rated as ambiguous due to indistinct cusps on the right side of the plot. Thus, none of the MAXEIG plots of the various perfectionism measures displayed evidence of a latent taxon. To reduce the quantity of graphical output, only the averaged plot for each taxometric procedure is presented. As can be seen in Figures 1 through 3, the averaged MAXEIG curves for each set of indicators more closely resembled the simulated dimensional plots and did not evidence the peaks that were seen in the simulated taxonic plots. The J. Ruscio (2006) programs also provide a comparison curve fit index (CCFI), which is an objective, numerical gauge of whether the data plots are more consistent with a taxon or dimension. CCFI scores range between 0 and 1, with lower scores (<.5) being interpreted as more suggestive of a dimensional solution. Recent research has indicated that the CCFI can effectively discriminate taxonic and dimensional data (J. Ruscio, Ruscio, & Meron, 2007). The CCFI scores for theMAXEIGanalyses of the MPS–F, MPS–HF, and PI indicator sets were .38, .49, and .38, respectively, thereby providing additional support for a perfectionism dimension. Thus, we interpreted the collective results of
the MAXEIG analyses as providing support for a dimensional solution for perfectionism. MAXCOV Results Taxometric procedures do not operate according to traditional significance testing. Rather, they rely on replication of findings across independent procedures to ensure accuracy of results (Meehl, 1995). Thus, even though the results of the MAXEIG analyses were supportive of a dimensional structure, we conducted MAXCOV analyses on each of the indicator sets as an additional measure of consistency. MAXCOV produced a grand total of 231 plots, not one of which was clearly peaked. Rather, the vast majority of the MAXCOV plots were relatively flat, providing further evidence of dimensionality. Furthermore, the MAXCOV curves were similar to the simulated dimensional plots and did not contain any peaks that were noted in the simulated taxonic plots (refer to Figures 1–3). The CCFI scores derived from the MAXCOV analyses were .34, .40, and .38 for the MPS–F, MPS–HF, and PI data, respectively. Thus, the results of MAXCOV were consistent with those of MAXIEG in suggesting that perfectionism represents a dimensional construct. MAMBAC Results The MAMBAC procedure served as a third consistency test and generated a grand total of 92 plots, none of which evidenced a peak that would be characteristic of a taxon. Rather, all of the plots were bowl-shaped or relatively flat. As can be seen in Figures 1 through 3, the averaged MAMBAC curves closely resembled those generated by the simulated dimensional data and were inconsistent with the taxonic simulations. The MAMBAC CCFI scores for the MPS–F, MPS–HF, and PI indicator sets were .39, .19, and .36, respectively. Thus, MAMBAC provided further evidence that perfectionism is dimensional at the latent level. L-Mode Results We conducted L-Mode analyses as a final measure of consistency. In contrast to MAXEIG, MAXCOV, and MAMBAC, L-Mode only generates a single plot per indicator set. Thus, separate L-Mode analyses of theMPS–F,MPS–HF, and PI indicator sets generated a grand total of three distributions. Results of the L-Mode procedure clearly favored a dimensional solution. Specifically, all three of the L-Mode plots demonstrated unimodal distributions, which were nearly identical to the simulated dimensional plots and in sharp contrast to the simulated
taxonic plots, which evidenced bimodal distributions. Refer to Figures 1 through 3 for the L-Mode curves generated from the three sets of indicators along with simulated dimensional and taxonic plots for comparison. Thus, the L-Mode results complement the findings of MAXEIG, MAXCOV, and MAMBAC, which taken together provide consistent and convergent evidence that perfectionism is most accurately represented as a latent dimensional construct.
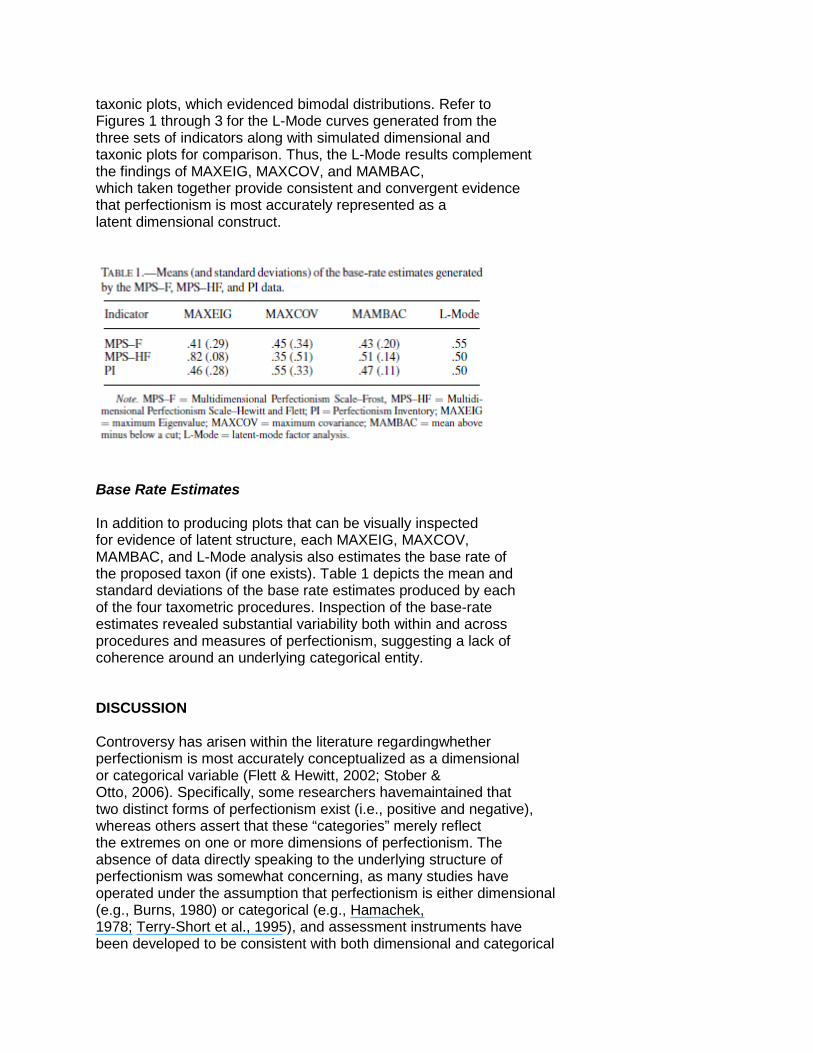
Base Rate Estimates In addition to producing plots that can be visually inspected for evidence of latent structure, each MAXEIG, MAXCOV, MAMBAC, and L-Mode analysis also estimates the base rate of the proposed taxon (if one exists). Table 1 depicts the mean and standard deviations of the base rate estimates produced by each of the four taxometric procedures. Inspection of the base-rate estimates revealed substantial variability both within and across procedures and measures of perfectionism, suggesting a lack of coherence around an underlying categorical entity. DISCUSSION Controversy has arisen within the literature regardingwhether perfectionism is most accurately conceptualized as a dimensional or categorical variable (Flett & Hewitt, 2002; Stober & Otto, 2006). Specifically, some researchers havemaintained that two distinct forms of perfectionism exist (i.e., positive and negative), whereas others assert that these “categories” merely reflect the extremes on one or more dimensions of perfectionism. The absence of data directly speaking to the underlying structure of perfectionism was somewhat concerning, as many studies have operated under the assumption that perfectionism is either dimensional (e.g., Burns, 1980) or categorical (e.g., Hamachek, 1978; Terry-Short et al., 1995), and assessment instruments have been developed to be consistent with both dimensional and categorical
latent structures. Thus, in this study,we sought to address the paucity of research in this area by empirically investigating the latent structure of perfectionism by applying a series of taxometric procedures to data from two large, nonclinical samples assessed using three commonly used perfectionism measures. Results across analytic procedures, samples, and assessment measures converged in support of a latent perfectionism dimension. Thus, it appears that the heterogeneity in perfectionism is best conceptualized as reflecting quantitative rather than qualitative differences among individuals (Gibb, Alloy, Abramson, Beevers, &Miller, 2004). In other words, individual differences in perfectionism are reflective of a difference in degree rather than type of perfectionism experienced. These taxometric findings have important implications for the investigation and assessment of perfectionism. First, a dimensional solution indicates that the use of continuous measures focused on evaluating the full range of perfectionism will maximize statistical power and minimize information loss. Thus, although measures such as the Positive and Negative Perfectionism Scale (Terry-Short et al., 1995) may provide useful information and help to determine where along the continuum of perfectionism specific individuals or groups fall, researchers should exercise caution when attempting to use such measures to classify individuals as either positive perfectionists or negative perfectionists given the apparent dimensional latent structure of perfectionism. Any such dichotomization of a dimensional variable represents an arbitrary cut point and is likely to result in an unnecessary loss of potentially important information. Furthermore, the use of statistical procedures that demand the division of continuous data (e.g., analysis of variance) appear less appropriate for perfectionism investigations. Rather, researchers are encouraged to assess the full spectrum of perfectionism and the use of parametric statistical procedures, such as multiple regression, that do not necessitate artificial dichotomization. Dimensional results also provide information regarding the etiology of perfectionism. Specifically, a dimensional solution suggests that additive and graded etiological models are most appropriate for perfectionism rather than models that suggest a specific all-or-none genetic factor or a single environmental variable (Haslam, 1997). Thus, it is likely that various environmentrelated and person-specific factors are important in predicting the onset and maintenance of perfectionism. Etiological research should focus on uncovering the specific biopsychosocial factors, and the interactions or combinations of these factors, that lead to high levels of perfectionism. This knowledge would in turn help to inform clinical decision making, enabling clinicians to specifically and systematically address these factors in the assessment and treatment of disorders in which perfectionism has
been implicated (e.g., OCD, eating disorders, personality disorders, etc.). This research possessed a number of strengths that enhance confidence in the dimensional findings, including the use of multiple measures of perfectionism, relatively large sample sizes, and multiple taxometric procedures, which allowed for an evaluation of the degree to which these results would replicate. However, this research was also limited in several ways, which should be taken into consideration when drawing inferences based on these findings. For example, the ability to detect a latent taxon is heavily influenced by the indicators used to find it (Widiger, 2001). Although the indicators were derived from empirically informed studies of the psychometric properties of the respective perfectionism measures, it is possible that the dimensional results were partially attributable to the indicators chosen. Similarly, another potential limitation of this research was the use of measures not specifically designed to classify perfectionistic individuals. Although the measures from which the indicatorswere derived are some of the most commonly used perfectionism measures in the literature and include subscales designed to assess both the positive and negative dimensions of perfectionism, none of these measures were created with the intention of classifying individuals as either positive perfectionists or negative perfectionists. Thus, future investigations may benefit from replication of these findings with alternative measures of perfectionism, including those assessment instruments that were specifically designed to categorize individuals. Another potential limitation of this study was the exclusive use of undergraduate samples, which may limit the generalizability of the taxometric findings. Specifically, one could argue that the dimensional findings were due to the use of nonclinical samples whose perfectionism levels were not excessively high. However, the range of scores for participants on each of the measures was quite broad and included scores that would be considered extreme. Furthermore, the combined rates of psychopathology known to be associated with perfectionism, including depression, eating disorders, and OCD, are not rare among undergraduate populations. Thus, it is unlikely that the use of nonclinical undergraduate samples impaired our ability to detect a taxon. Furthermore, it is also important to examine the latent structure of perfectionism in nonclinical samples to determine which approach (categorical vs. dimensional) is appropriate for assessing individuals who may be at risk for developing associated forms of psychopathology and related problems. Had a taxon been detected, the taxometric procedures would have also provided researchers with estimates of the base rate of perfectionism among nonclinical populations. It will be beneficial for future research to determine the extent to which these findings generalize to clinical samples.
NOTES 1. One PI and one MPS–F indicator did not meet theminimum validity criteria (1 SD).We dropped these indicators and reran taxometric analyses. However, the exclusion of these indicators did not noticeably change plot shapes or the overall interpretability of findings. Thus, to reduce confusion and ease interpretability of findings, all figures and tables include all of the original PI and MPS–F indicators. REFERENCES American Psychiatric Association. (1994). Diagnostic and statistical manual of mental disorders (4th ed.). Washington, DC: Author. Arnau, R. C., Green, B. A., Rosen, D. H., Gleaves, D. H., & Melancon, J. G. (2003). Are Jungian preferences really categorical?: An empirical investigation using taxometric analysis. Personality and Individual Differences, 34, 233–251. Bieling, P. J., Israeli, A. L., & Antony, M. M. (2004). Is perfectionism good, bad, or both? Examining models of the perfectionism construct. Personality and Individual Differences, 36, 1373–1385. Blatt, S. J., Quinlan, D. M., Pilkonis, P. A., & Shea, M. T. (1995). Impact of perfectionism and need for approval on the brief treatment of depression: The National Institute of Mental Health Treatment of Depression Collaborative Research Program revisited. Journal of Consulting and Clinical Psychology, 63, 125–132. Broman-Fulks, J. J., Ruggiero, K. J., Kilpatrick, D. G., Resnick, H. S., Green, B. A., & Saunders, B. E. (2006). Taxometric investigation of posttraumatic stress disorder: Data from two nationally representative samples. Behavior Therapy, 37, 364–380. Burns, D. D. (1980, November). The perfectionist’s script for self-defeat. Psychology Today, 70–76. Enns, M.W., & Cox, B. J. (2002). The nature and assessment of perfectionism: A critical analysis. In G. L. Flett&P. L. Hewitt (Eds.), Perfectionism: Theory, research and treatment (pp. 33–62). Washington, DC: American Psychological Association Press. Ferguson, K. L., & Rodway, G. R. (1994). Cognitive behavioral treatment of perfectionism: Initial evaluation studies. Research on Social Work Practice, 4, 283–308.
Flett, G. L. & Hewitt, P. L. (2002). Perfectionism and maladjustment: An overview of the theoretical, definitional, and treatment issues. In G. L. Flett & P. L. Hewitt (Eds.), Perfectionism: Theory, research and practice (pp. 5–31). Washington, DC: American Psychological Association Press. Flett, G. L., Hewitt, P. L., Blankstein, K. R., & Gray, L. (1998). Psychological distress and the frequency of perfectionistic thinking. Journal of Personality and Social Psychology, 75, 1363–1381. Frost, R. O., Heimberg, R. G., Holt, C. S., Mattia, J. I., & Neubauer, A. L. (1993). A comparison of two measures of perfectionism. Personality and Individual Differences, 14, 119–126. Frost, R. O., Lahart, C. M., & Rosenblate, R. (1991). The dimensions of perfectionism: A study of daughters and their parents. Cognitive Therapy and Research, 15, 469–489. Frost, R. O., Marten, P., Lahart, C., & Rosenblate, R. (1990). The dimensions of perfectionism. Cognitive Therapy and Research, 14, 449–468. Frost, R. O., Turcotte, T. A., Heimberg, R. G., Mattia, J. I., Holt, C. S., & Hope, D. A. (1995). Reactions to mistakes among subjects high and low in perfectionistic concern over mistakes. Cognitive Therapy and Research, 19, 195–205. Gibb, B. E., Alloy, L. B., Abramson, L. Y., Beevers, C. G., & Miller, I. W. (2004). Cognitive vulnerability to depression: A taxometric analysis. Journal of Abnormal Psychology, 113, 81–89. Gleaves, D. H., Lowe, M. R., Snow, A. C., Green, B. A., & Murphy-Eberez, K. P. (2000). Continuity and discontinuity models of bulimia nervosa: A taxometric investigation. Journal of Abnormal Psychology, 109, 56–68. Hamachek,D.E. (1978). Psychodynamics of normal and neurotic perfectionism. Psychology: A Journal of Human Behavior, 15, 27–33. Haslam, N. (1997). Evidence that male sexual orientation is a matter of degree. Journal of Personality and Social Psychology, 73, 862–870. Hewitt, P. L., & Flett, G. L. (1991). Perfection in the self and social contexts: Conceptualization, assessment, and association with psychopathology. Journal of Personality and Social Psychology, 60, 456–470. Hewitt, P. L., & Flett, G. L. (2002). Perfectionism and stress processes in psychopathology. In G. L. Flett & P. L. Hewitt (Eds.), Perfectionism: Theory, research and practice (pp. 255–284). Washington, DC: American Psychological Association Press. Hewitt, P. L., Flett, G. L., Turnbull-Donovan, W., & Mikail, S. F. (1991). The Multidimensional Perfectionism Scale: Reliability, validity, and psychometric properties in psychiatric samples. Psychological Assessment, 3, 464–468.
Hill, R. W., Huelsman, T. J., Furr, R. M., Kibler, J., Vicente, B., & Kennedy, C. (2004). A new measure of perfectionism: The Perfectionism Inventory. Journal of Personality Assessment, 82, 80–91. Hollender, M. H. (1978). Perfectionism, a neglected personality trait. Journal of Clinical Psychiatry, 39, 384. Korfine, L., & Lenzenweger, M. F. (1995). The taxonicity of schizotypy: A replication. Journal of Abnormal Psychology, 104, 26–31. Meehl, P. E. (1973). MAXCOV-HITMAX: A taxonomic search method for loose genetic syndromes. In Psychodiagnosis: Selected papers (pp. 200– 224). Minneapolis: University of Minnesota Press. Meehl, P. E. (1992). Factors and taxa, traits and types, differences of degree and differences in kind. Journal of Personality, 60, 117–174. Meehl, P. E. (1995) Bootstraps taxometrics: Solving the classification problem in psychopathology. American Psychologist, 50, 266–275. Meehl, P. E.,&Golden, R. R. (1982). Taxometric methods. In: J. N. Butcher&P. C. Kendall (Eds.), The handbook of research methods in clinical psychology (pp. 127–181). New York: Wiley. Meehl, P. E., & Yonce, L. J. (1994). Taxometric analysis: I. Detecting taxonicity with two quantitative indicators using means above and below a sliding cut (MAMBAC procedure). Psychological Reports, 74, 1059–1274. Meehl, P. E., & Yonce, L. J. (1996). Taxometric analysis: II. Detecting taxonicity using covariance of two quantitative indicators in successive intervals of a third indicator (MAXCOV procedure). Psychological Reports, 78, 1091–1227. Parker, W. D. (1997). An empirical typology of perfectionism in academically talented children. American Educational Research Journal, 34, 545–562. Rice, K.G., & Mirzadeh, S. A. (2000). Perfectionism, attachment, and adjustment. Journal of Counseling Psychology, 47, 238–250. Ruscio, A. M., Ruscio, J., & Keane, T. M. (2002). The latent structure of posttraumatic stress disorder: A taxometric investigation of reactions to extreme stress. Journal of Abnormal Psychology, 111, 290–301. Ruscio, J. (2006). Documentation of program code to perform taxometric analyses and simulate comparison data in the R language. Retrieved November 1, 2006, from http://www.taxometricmethod.com. Ruscio, J., Haslam, N., & Ruscio, A. M. (2006).Introduction to the taxometric method: A practical guide. Mahwah, NJ: Lawrence Erlbaum Associates.
Ruscio, J., & Ruscio, A. M. (2000). Informing the continuity controversy: A taxometric analysis of depression. Journal of Abnormal Psychology, 109, 473–487. Ruscio, J., Ruscio, A. M., & Meron, M. (2007). Applying the bootstrap to taxometric analysis: Generating empirical sampling distributions to help interpret results. Multivariate Behavioral Research, 44, 349–386. Schmidt, N. B., Kotov, R., & Joiner, T. E. (2004). Taxometrics: Toward a new diagnostic scheme for psychopathology. Washington, DC: American Psychological Association. Shafran, R., & Mansell, W. (2001). Perfectionism and psychopathology: A review of research and treatment. Clinical Psychology Review, 21, 879–906. Slaney, R. B., Rice, K. G., Mobley, M., Trippi, J., & Ashby, J. S. (2001). The revised Almost Perfect Scale. Measurement and Evaluation in Counseling and Development, 34, 130–146. Stober, J.,&Otto,K. (2006). Positive conceptions of perfectionism:Approaches, evidence, challenges. Personality and Social Psychology Review, 10, 295– 319. Stober, J., & Kersting, M. (2007). Perfectionism and aptitude test performance: Testees who strive for perfection achieve better test results. Personality and Individual Differences, 42, 1093–1103. Stumpf, H., & Parker, W. (2000). A hierarchical structural analysis of perfectionism and its relation to other personality characteristics. Personality and Individual Differences, 28, 837–852. Terry-Short, L. A., Owens, R. G., Slade, P. D., & Dewey, M. E. (1995). Positive and negative perfectionism. Personality and Individual Differences, 18, 663– 666. Waller, N. G., & Meehl, P. E. (1998). Multivariate taxometric procedures: Distinguishing types from continua. Newberry Park, CA: Sage. Widiger, T. A. (2001). What can be learned from taxometric analyses? Clinical Psychology: Science and Practice, 8, 528–533.


