Embed Size (px)
Citation preview
1
Bharat Petroleum Corporation Limited
December 2021
Investor Presentation
2
2Disclaimer
No information contained herein has been verified for truthfulness completeness, accuracy, reliability or otherwise whatsoever by anyone. While the Company will use reasonable efforts
to provide reliable information through this presentation, no representation or warranty (express or implied) of any nature is made nor is any responsibility or liability of any kind
accepted by the Company or its directors or employees, with respect to the truthfulness, completeness, accuracy or reliability or otherwise whatsoever of any information, projection,
representation or warranty (expressed or implied) or omissions in this presentation. Neither the Company nor anyone else accepts any liability whatsoever for any loss, howsoever,
arising from use or reliance on this presentation or its contents or otherwise arising in connection therewith.
This presentation may not be used, reproduced, copied, published, distributed, shared, transmitted or disseminated in any manner. This presentation is for information purposes only
and does not constitute an offer, invitation, solicitation or advertisement in any jurisdiction with respect to the purchase or sale of any security of BPCL and no part or all of it shall form
the basis of or be relied upon in connection with any contract, investment decision or commitment whatsoever.
The information in this presentation is subject to change without notice, its accuracy is not guaranteed, it may be incomplete or condensed and it may not contain all material
information concerning the Company. We do not have any obligation to, and do not intend to, update or otherwise revise any statements reflecting circumstances arising after the date
of this presentation or to reflect the occurrence of underlying events, even if the underlying assumptions do not come to fruition.

3
1 2 3
Corporate Overview
Table of Contents
Business Overview Industry Overview
Page 4 Page 9 Page 29
4
1. Corporate Overview
5
394
3rd
1.2 Lakh
Cr
114
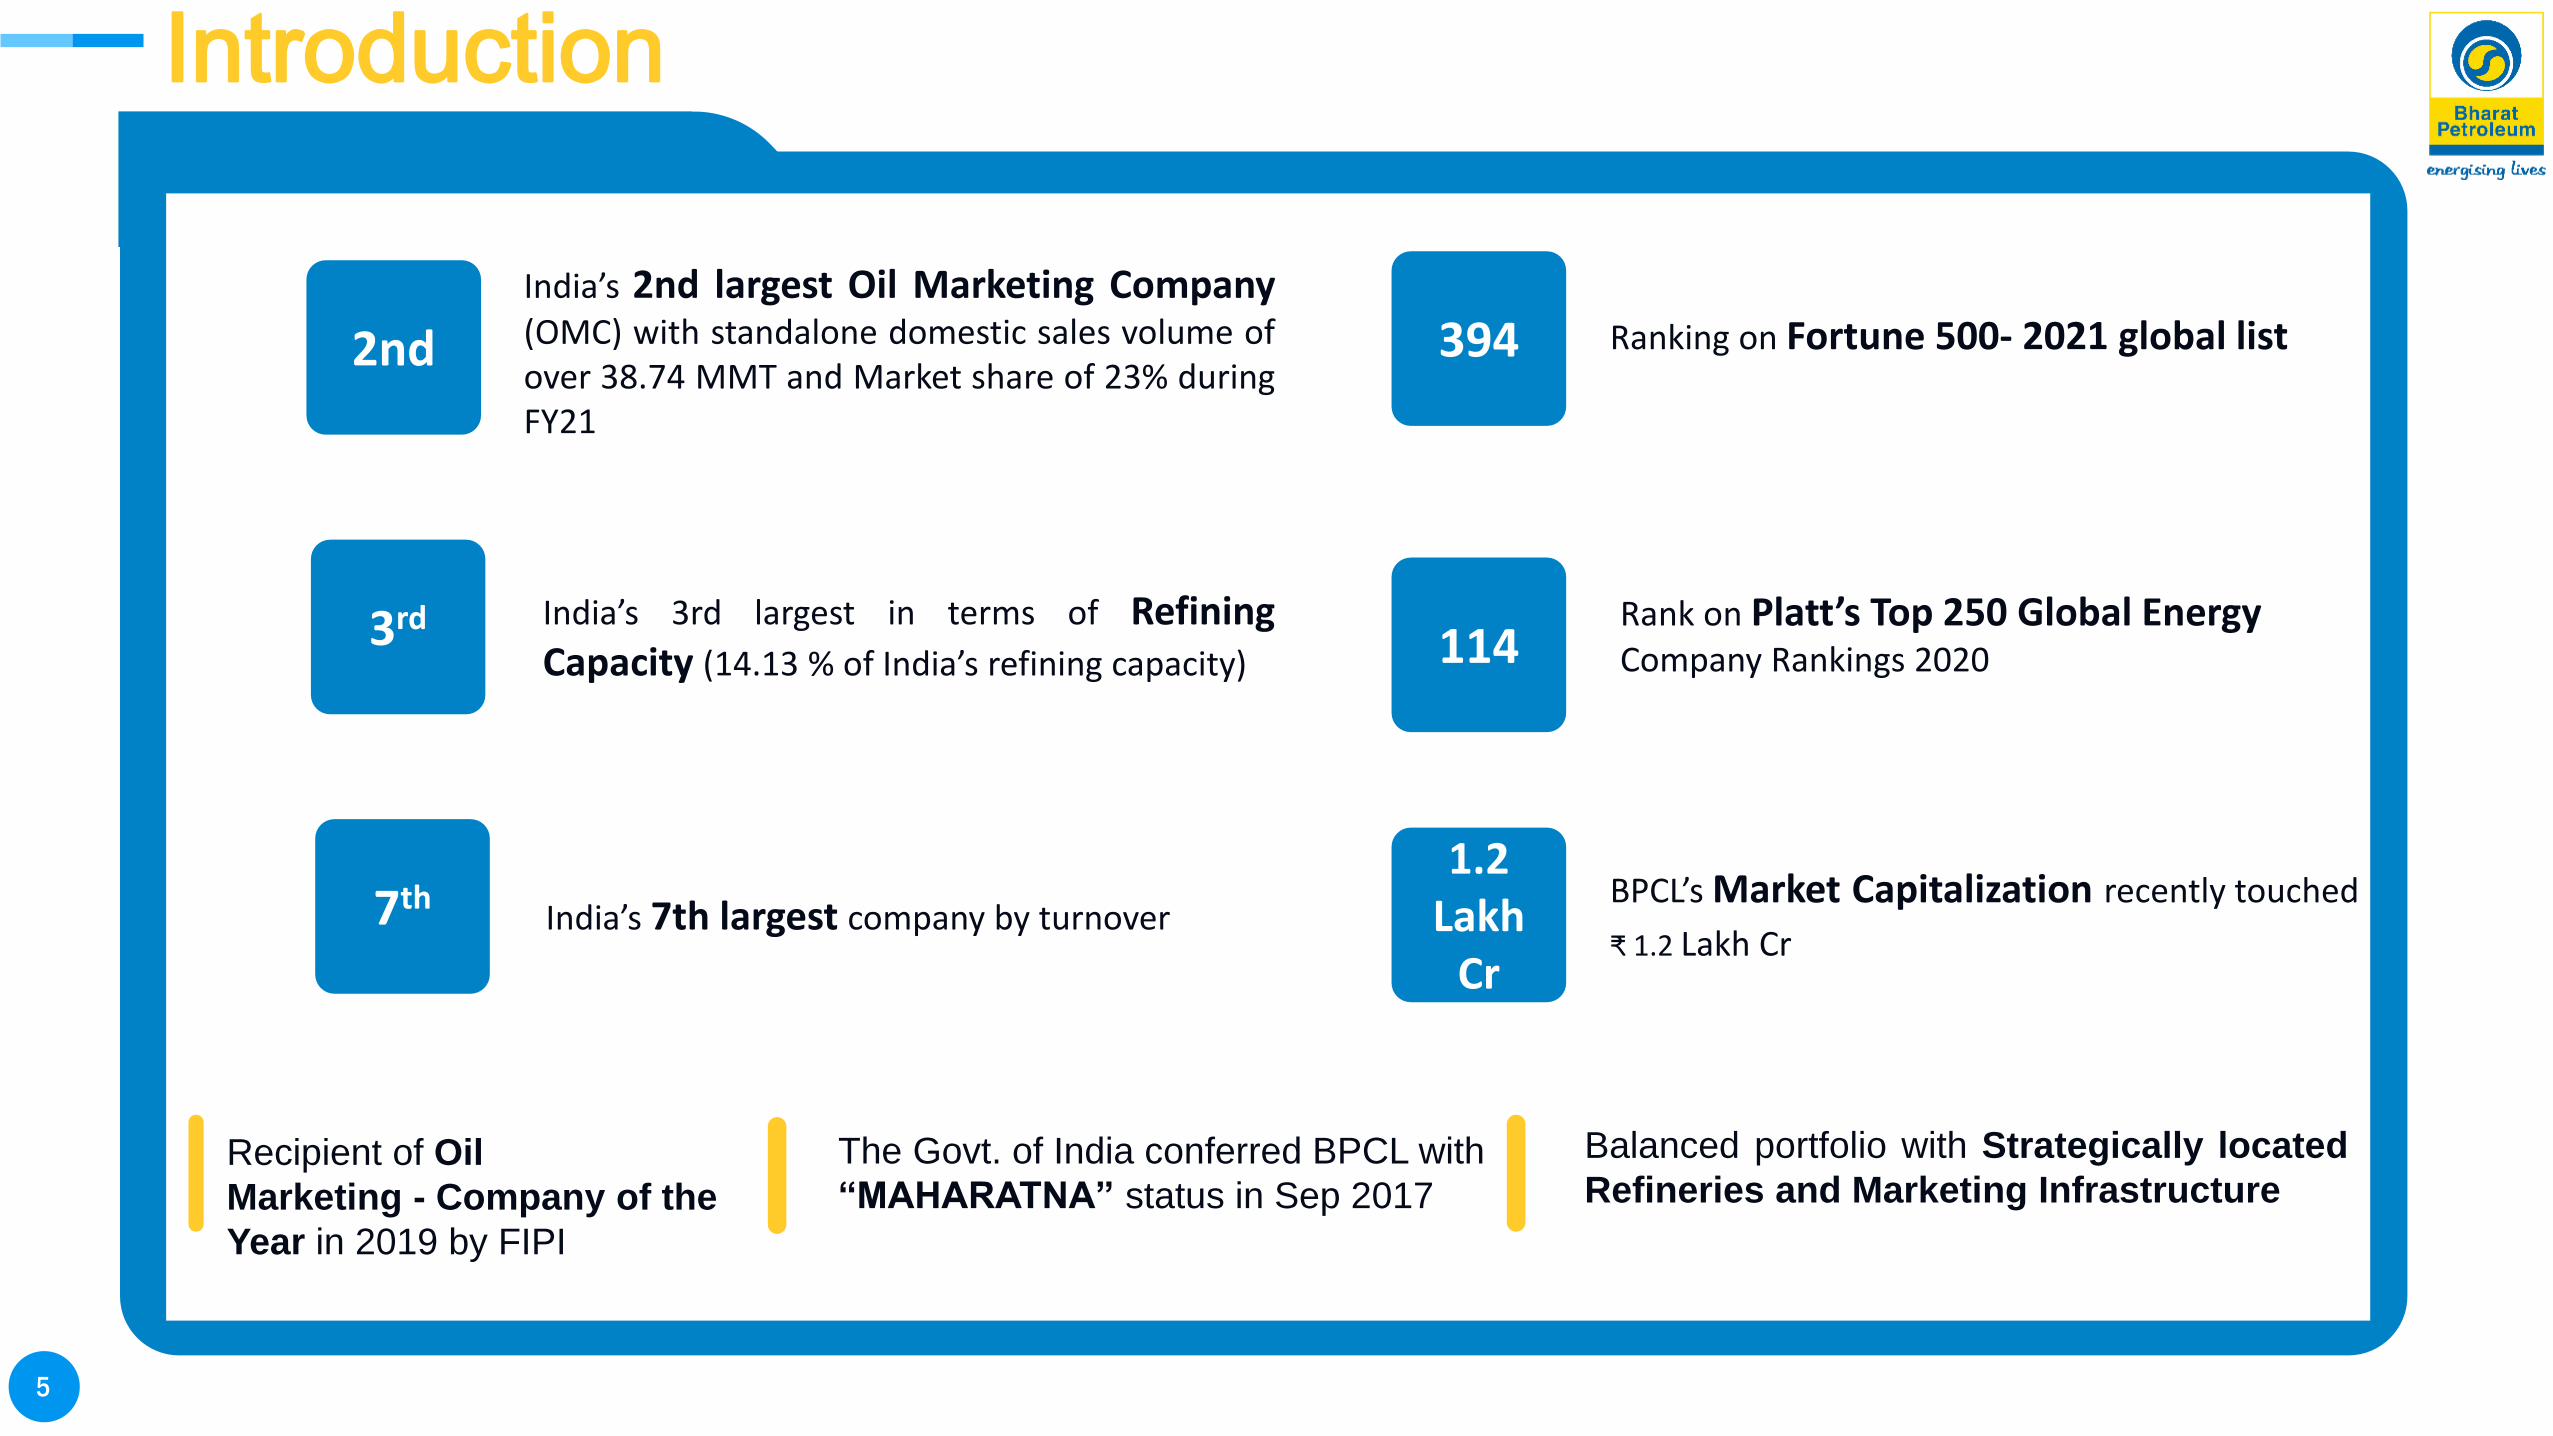
7thIndia’s 7th largest company by turnover
BPCL’s Market Capitalization recently touched
₹ 1.2 Lakh Cr
Ranking on Fortune 500- 2021 global list
Rank on Platt’s Top 250 Global Energy Company Rankings 2020
India’s 3rd largest in terms of RefiningCapacity (14.13 % of India’s refining capacity)
Introduction
Recipient of Oil
Marketing - Company of the
Year in 2019 by FIPI
Balanced portfolio with Strategically located
Refineries and Marketing InfrastructureThe Govt. of India conferred BPCL with
“MAHARATNA” status in Sep 2017
2nd
India’s 2nd largest Oil Marketing Company(OMC) with standalone domestic sales volume ofover 38.74 MMT and Market share of 23% duringFY21

6
BPCL 5 Year Key Physical Indicators
REFINING CAPACITY
(MMT)
MARKET SALES (MMT) Market Capitalization
(INR billion)
Market Capitalization figures as on period end
India’s Leading Oil and Gas Company with presence across the Hydrocarbon Value Chain
37.68
41.21
43.07 43.10
38.74
FY17 FY18 FY19 FY20 FY21
927.25
833.65
685.05
928.33
836.14
FY18 FY19 FY20 FY21 Q3FY22
36.50
38.30 38.30 38.30
35.30
FY18 FY19 FY20 FY21 FY22
7
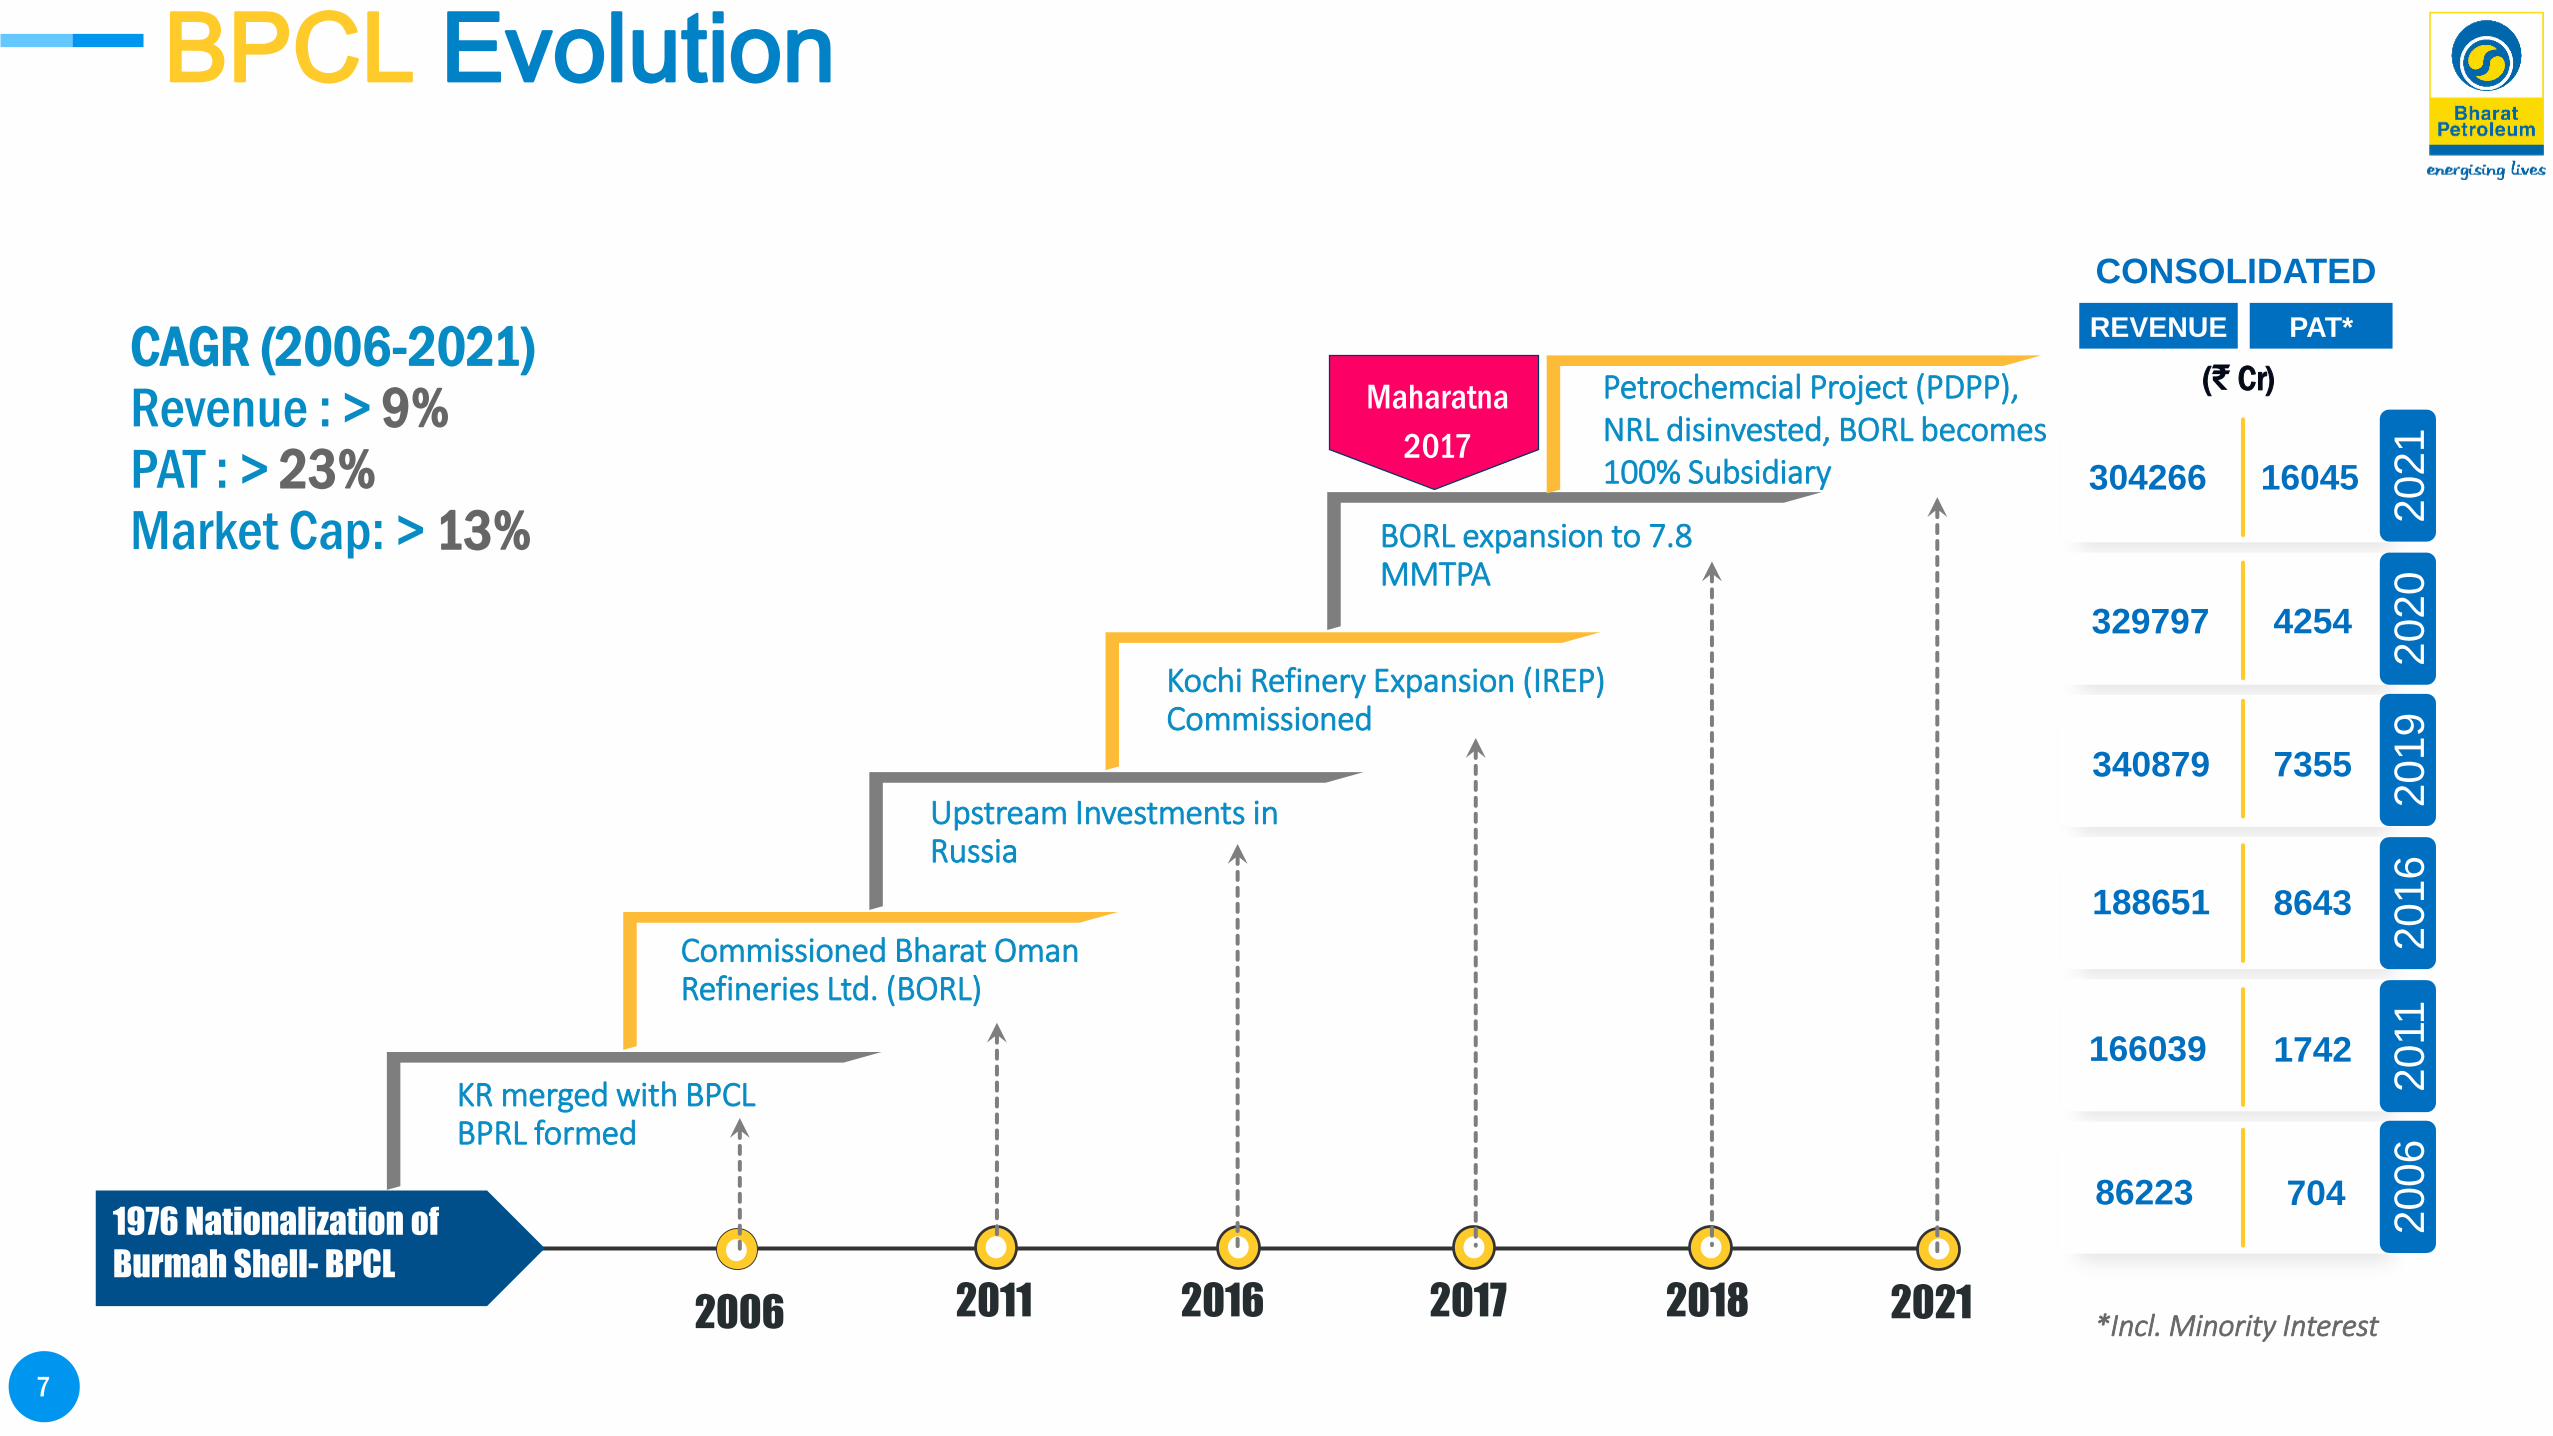
Journey of last 15 years
KR merged with BPCL BPRL formed
1976 Nationalization of
Burmah Shell- BPCL
2006 2016 2017 20182011 2021
2021
2020
2019
2016
2011
2006
REVENUE PAT*
(₹ Cr)
86223 704
166039 1742
188651 8643
340879 7355
329797 4254
304266 16045
Commissioned Bharat Oman Refineries Ltd. (BORL)
Kochi Refinery Expansion (IREP) Commissioned
BORL expansion to 7.8 MMTPA
Petrochemcial Project (PDPP),NRL disinvested, BORL becomes 100% Subsidiary
CAGR (2006-2021)Revenue : > 9%PAT : > 23%Market Cap: > 13%
Upstream Investments in Russia
Maharatna
2017
*Incl. Minority Interest
CONSOLIDATED
BPCL Evolution
8
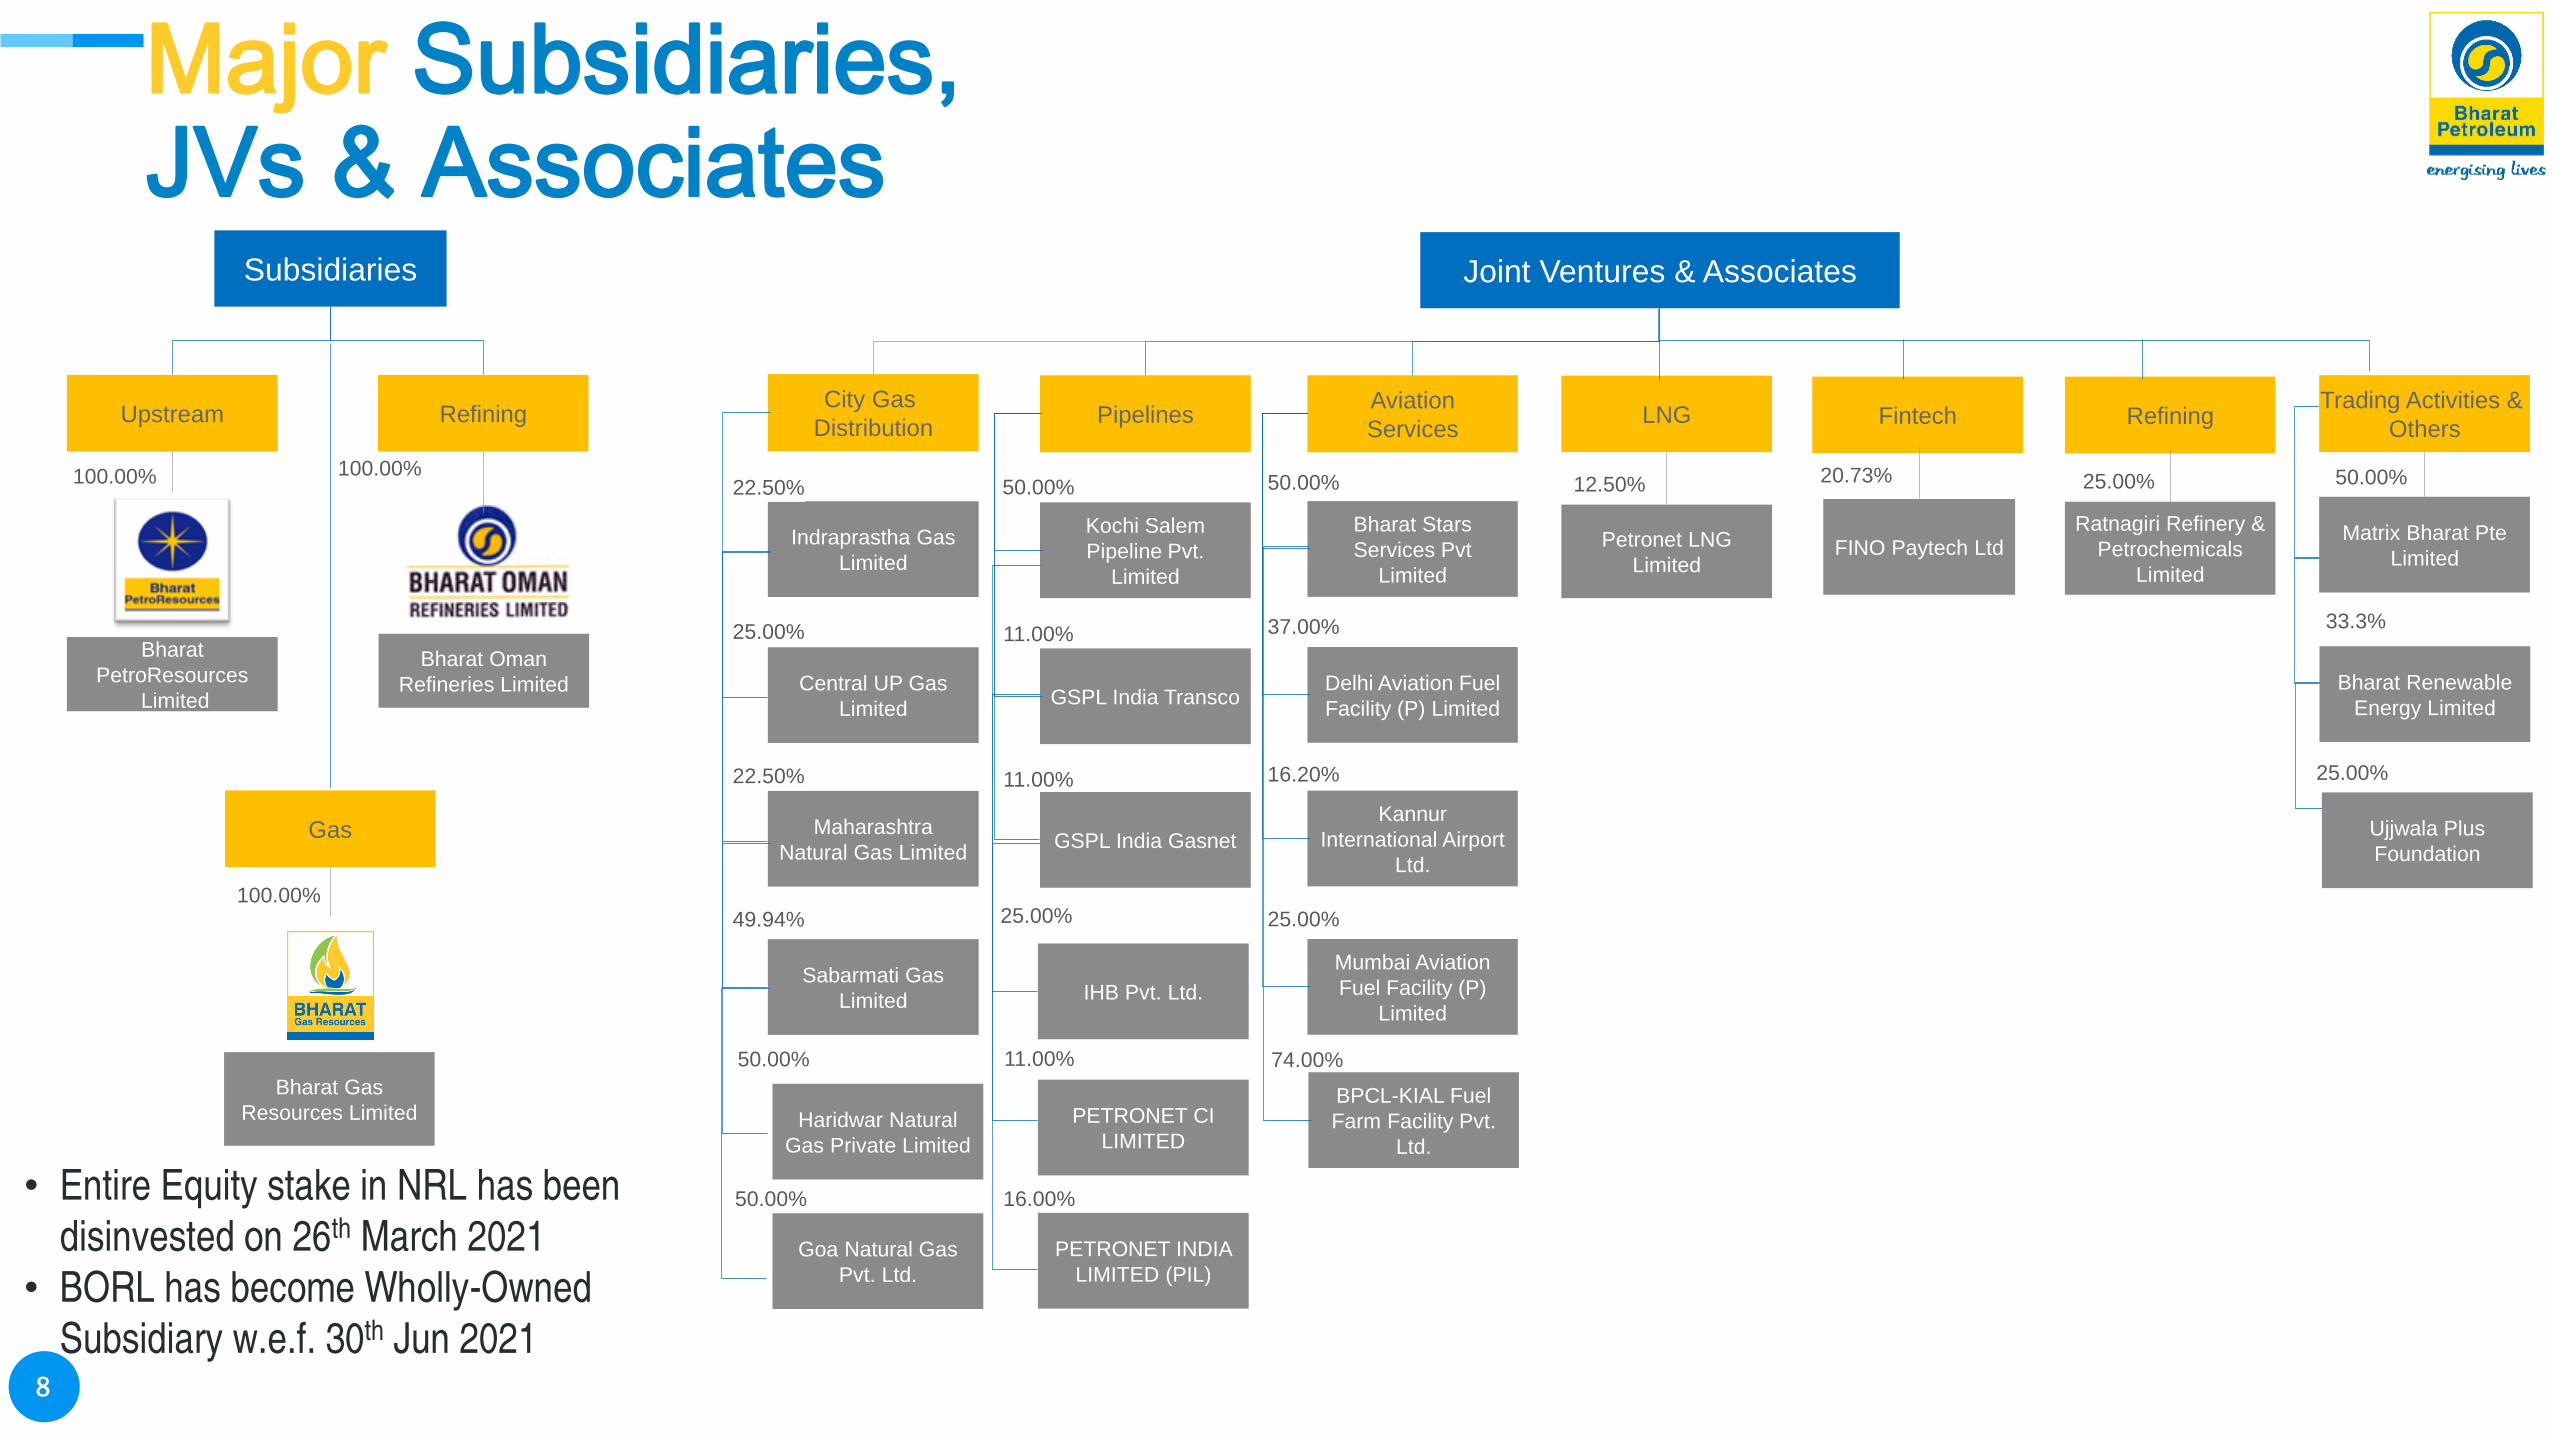
Subsidiaries Joint Ventures & Associates
Upstream Refining LNGCity Gas
Distribution
Bharat
PetroResources
Limited
PipelinesAviation
Services
Indraprastha Gas
Limited
Central UP Gas
Limited
Maharashtra
Natural Gas Limited
Sabarmati Gas
Limited
100.00%
Petronet LNG
Limited
Kochi Salem
Pipeline Pvt.
Limited
Bharat Stars
Services Pvt
Limited
Delhi Aviation Fuel
Facility (P) Limited
100.00%22.50%
22.50%
49.94%
50.00% 50.00%
Trading Activities &
Others
Matrix Bharat Pte
Limited
12.50% 50.00%
GSPL India Transco
GSPL India Gasnet
Kannur
International Airport
Ltd.
16.20%
11.00%
11.00%
Mumbai Aviation
Fuel Facility (P)
Limited
25.00%
25.00% 37.00%
Haridwar Natural
Gas Private Limited
50.00%
Goa Natural Gas
Pvt. Ltd.
50.00%
Fintech
FINO Paytech Ltd
Gas
Bharat Gas
Resources Limited
100.00%
74.00%
20.73%
BPCL-KIAL Fuel
Farm Facility Pvt.
Ltd.
IHB Pvt. Ltd.
25.00%
Bharat Oman
Refineries Limited
• Entire Equity stake in NRL has been
disinvested on 26th March 2021
• BORL has become Wholly-Owned
Subsidiary w.e.f. 30th Jun 2021
Major Subsidiaries, JVs & Associates
Refining
Ratnagiri Refinery &
Petrochemicals
Limited
25.00%
PETRONET CI
LIMITED
11.00%
PETRONET INDIA
LIMITED (PIL)
16.00%
Bharat Renewable
Energy Limited
Ujjwala Plus
Foundation
33.3%
25.00%
Major Subsidiaries, JVs & Associates
9
2. Business Overview

10
6 CountriesRussia, Brazil, Mozambique, UAE,
Indonesia, India
19 Blocks +15 Global PartnersTotal, ENI, ONGC, Rosneft, Mitsui, OIL,
BP, ADNOC, Petrobras etc.
Strategically located
82 Retail
Depots
937 kmVadinar-Bina Crude oil pipeline
35.30 MMTRefining Capacity
SBMat Vadinar and Kochi
2597 Km Specific & Multi
Product Pipeline Network
21.35 MMTPA Design
capacity of Pipeline Network
Marketing
Infrastructure
Distribution
Network
Pipeline
Network
Refining
Infrastructure
Upstream
Presence
Refining
Storage
Distribution
Marketing
Refining
E&P
Along with Equity Stake
in 2 Russian Entities
54 LPG
Bottling Plants
57 Aviation
Service Stations
4 Lube
blending plants
38 Geographical
Areas incl. JVs
3 Refineries
~19,668 Retail Outlets ~6,191 LPG Distributors
Up
str
ea
mM
ids
tre
am
&
Do
wn
str
ea
m
Asset Portfolio
STRATEGIC BUSINESS
UNITS 9 Subsidiaries & JV 26 EMPLOYEES 8,733
11
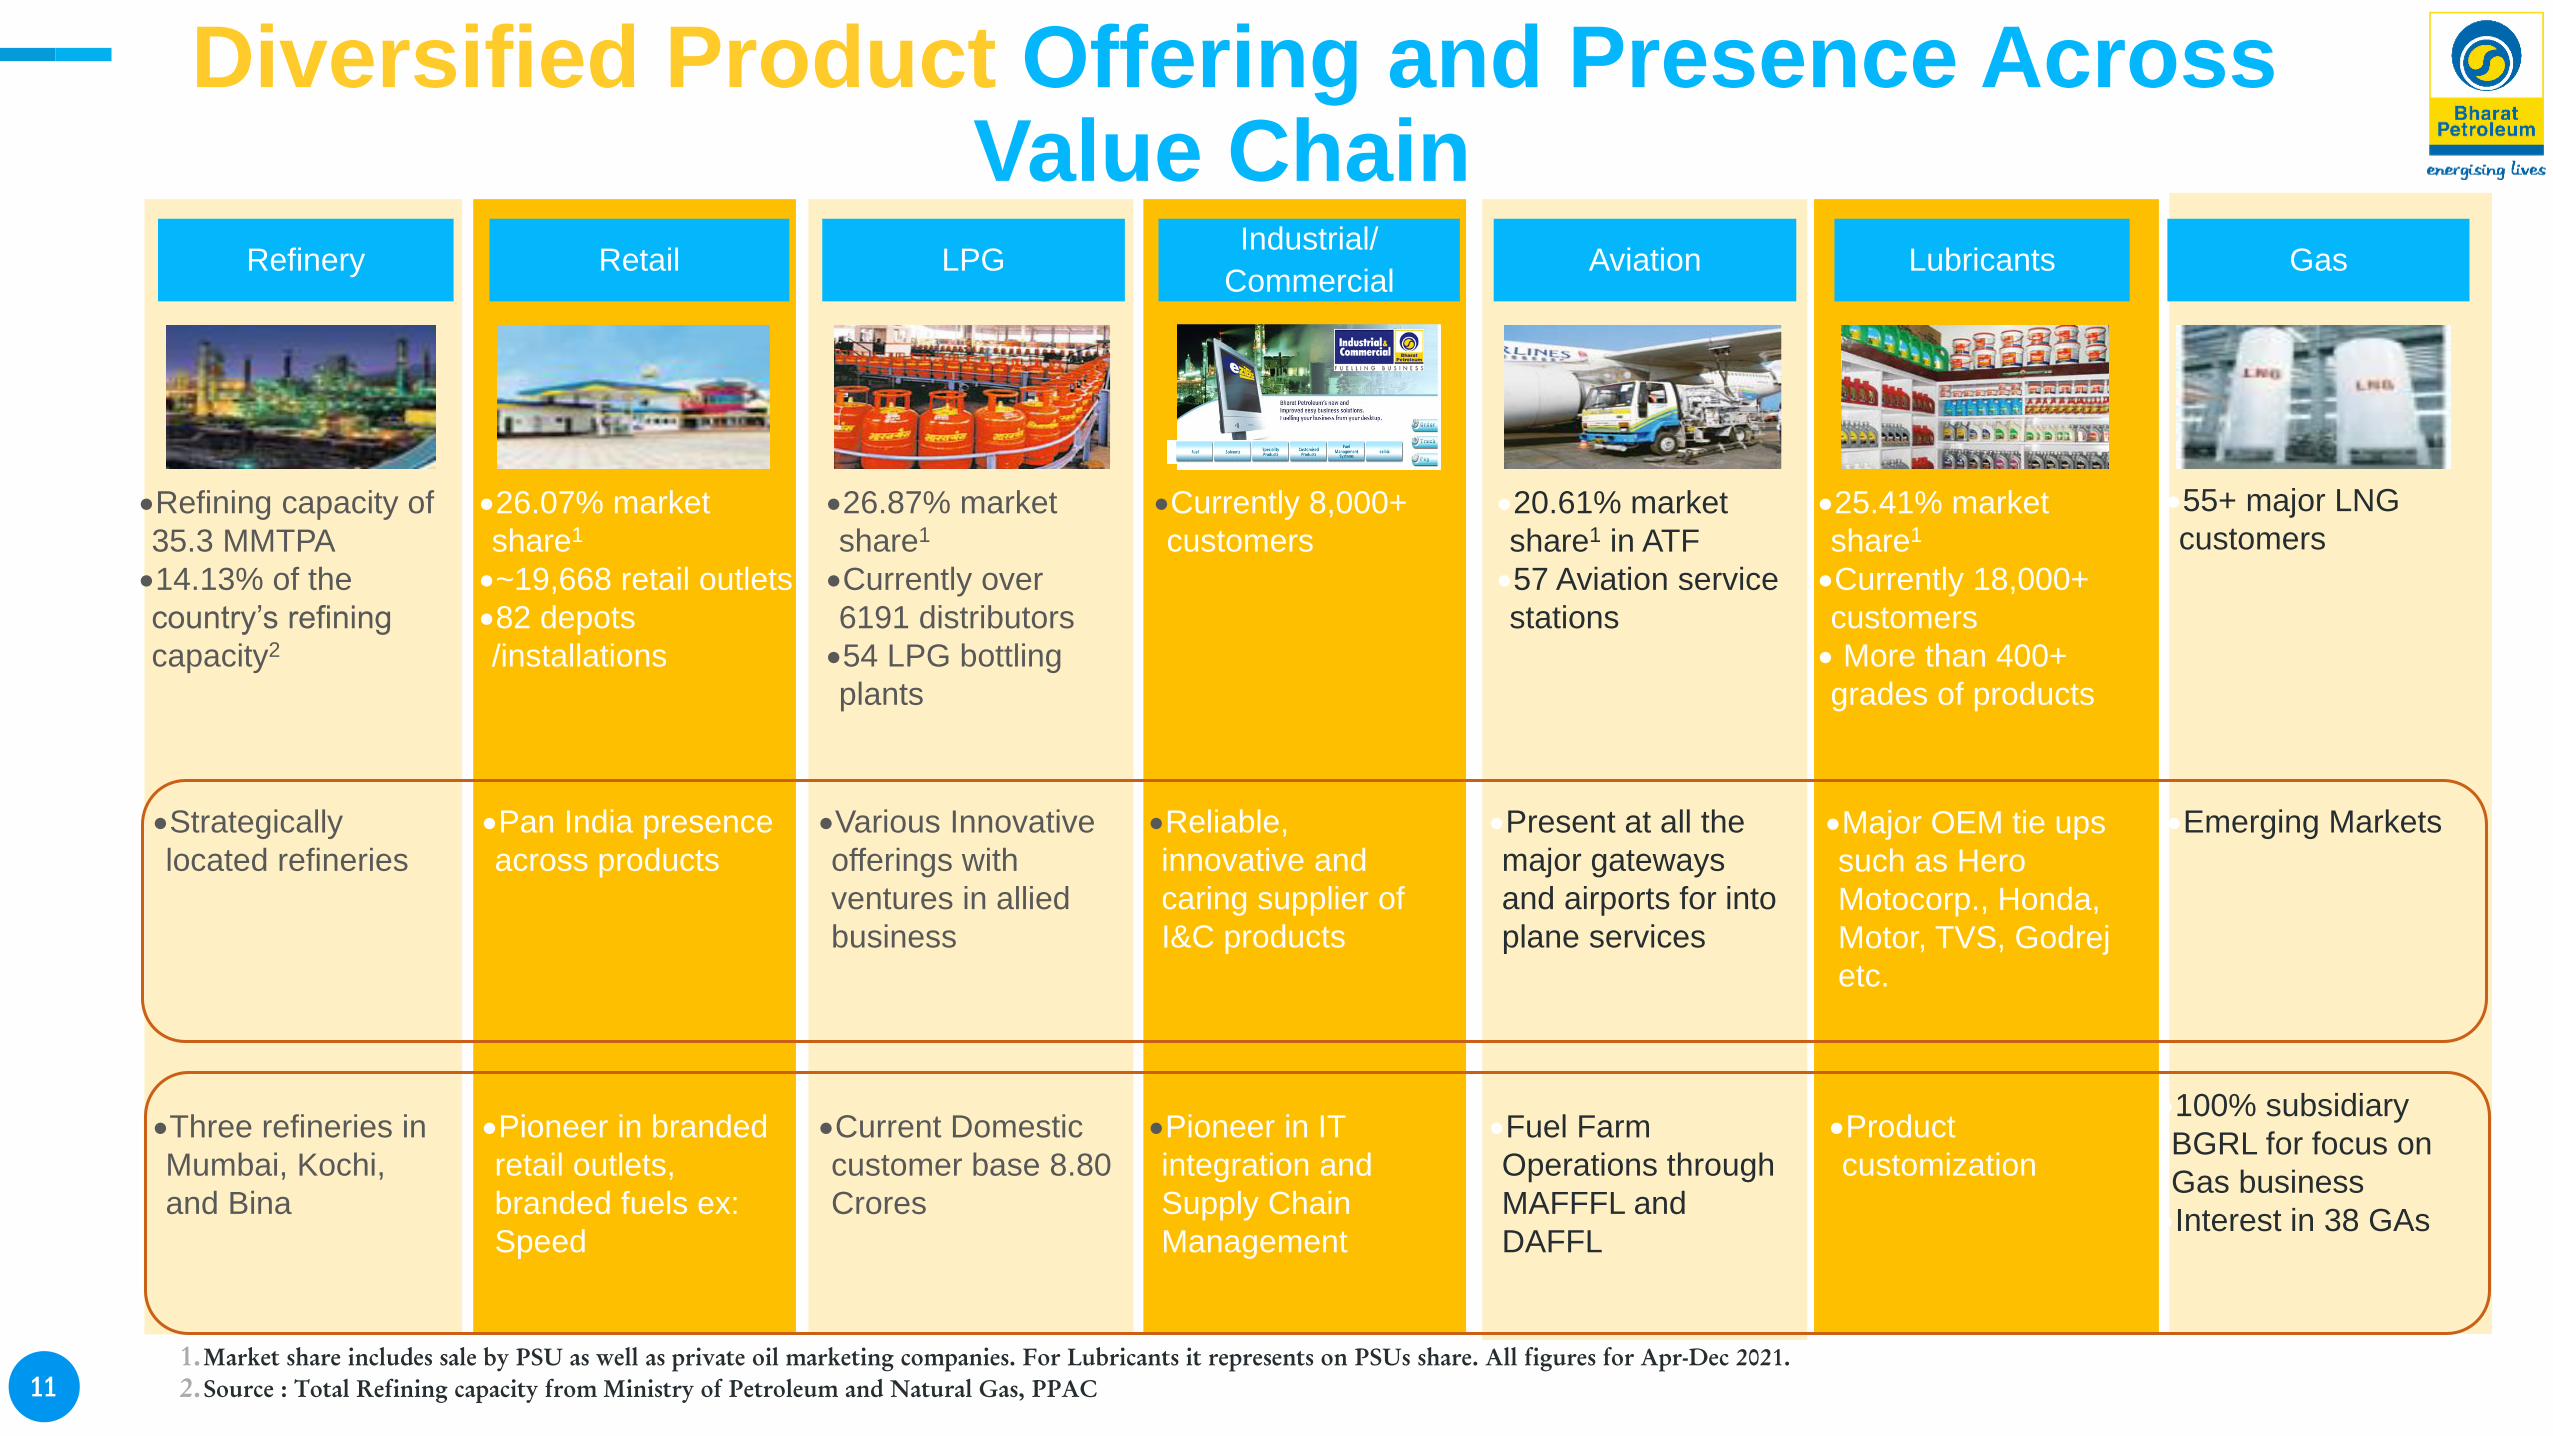
Diversified Product Offering and Presence Across Value Chain
Retail
26.07% market
share1
~19,668 retail outlets
82 depots
/installations
Pan India presence
across products
Pioneer in branded
retail outlets,
branded fuels ex:
Speed
Industrial/
Commercial
Currently 8,000+
customers
Reliable,
innovative and
caring supplier of
I&C products
Pioneer in IT
integration and
Supply Chain
Management
Lubricants
25.41% market
share1
Currently 18,000+
customers
More than 400+
grades of products
Major OEM tie ups
such as Hero
Motocorp., Honda,
Motor, TVS, Godrej
etc.
Product
customization
LPG
26.87% market
share1
Currently over
6191 distributors
54 LPG bottling
plants
Various Innovative
offerings with
ventures in allied
business
Current Domestic
customer base 8.80
Crores
Aviation
20.61% market
share1 in ATF
57 Aviation service
stations
Present at all the
major gateways
and airports for into
plane services
Fuel Farm
Operations through
MAFFFL and
DAFFL
AviationRefinery
Refining capacity of
35.3 MMTPA
14.13% of the
country’s refining
capacity2
Strategically
located refineries
Three refineries in
Mumbai, Kochi,
and Bina
Gas
55+ major LNG
customers
Emerging Markets
100% subsidiary
BGRL for focus on
Gas business
Interest in 38 GAs
1.Market share includes sale by PSU as well as private oil marketing companies. For Lubricants it represents on PSUs share. All figures for Apr-Dec 2021.
2.Source : Total Refining capacity from Ministry of Petroleum and Natural Gas, PPAC
12
Refining Coverage
Kochi Refinery
Mumbai Refinery
BORL
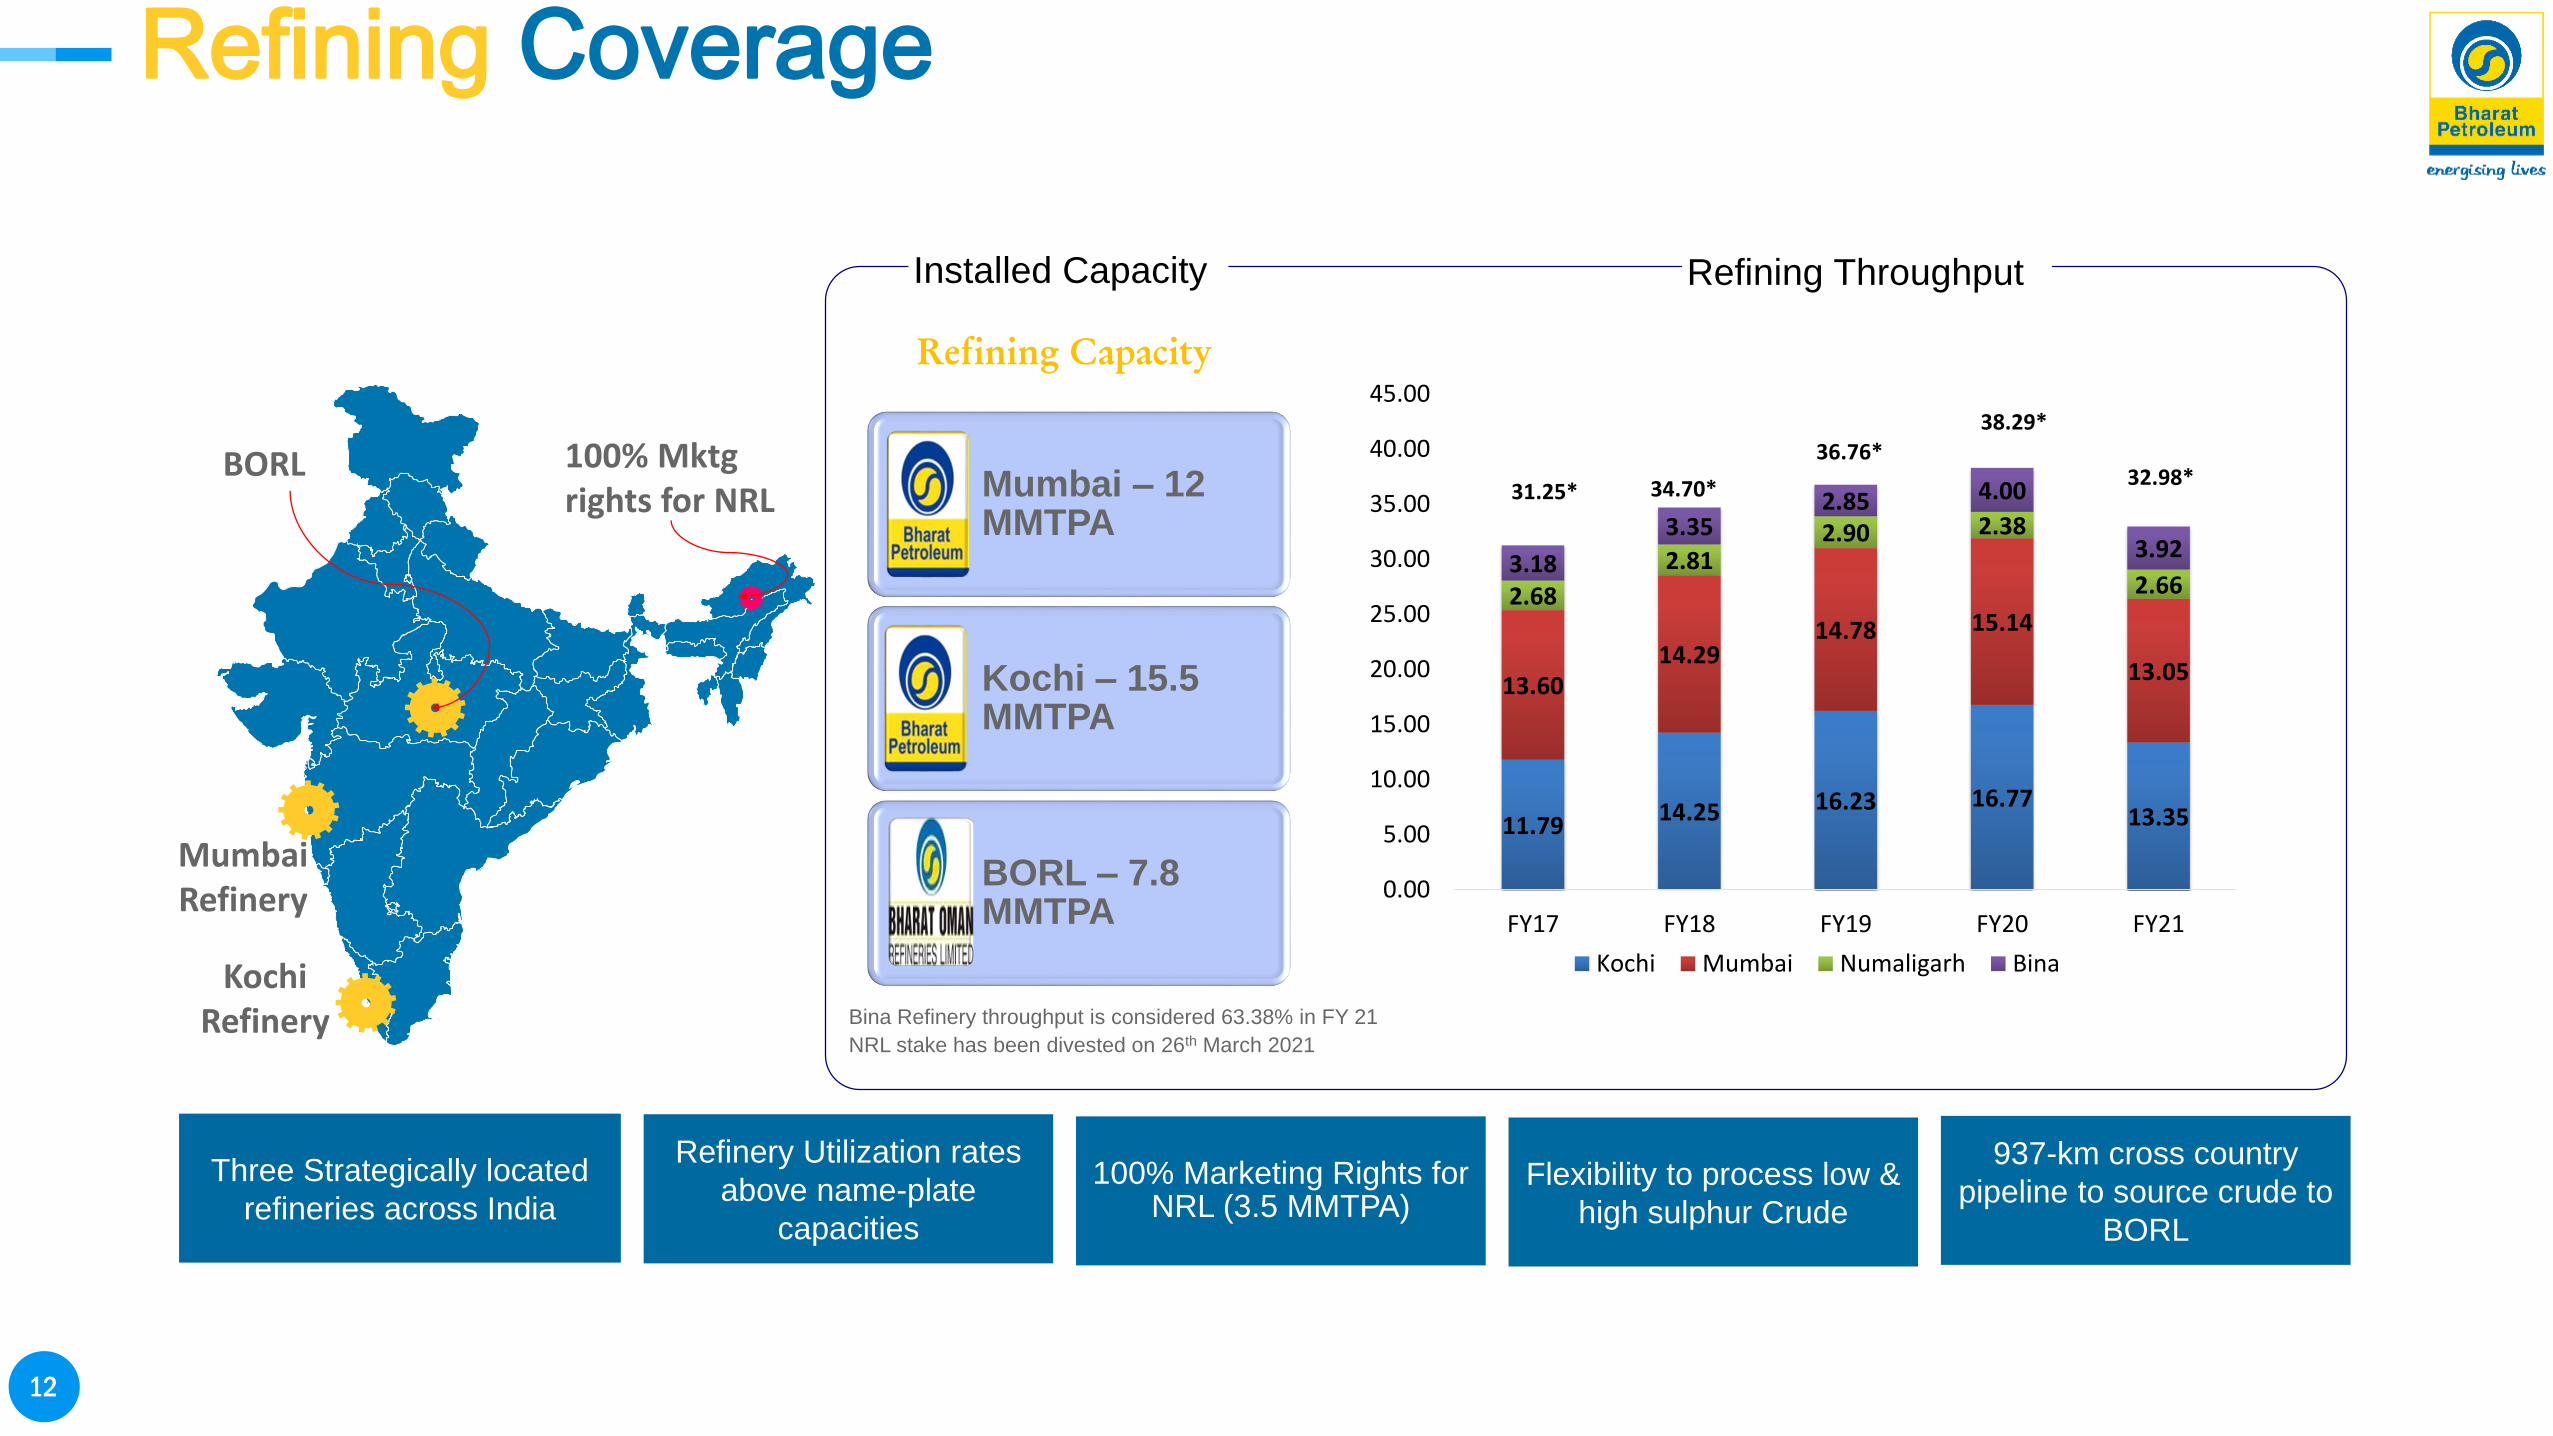
Installed Capacity
Mumbai – 12 MMTPA
BORL – 7.8 MMTPA
Kochi – 15.5 MMTPA
Refining Throughput
Refining Capacity
Bina Refinery throughput is considered 63.38% in FY 21
NRL stake has been divested on 26th March 2021
Three Strategically located
refineries across India
Refinery Utilization rates
above name-plate
capacities
937-km cross country
pipeline to source crude to
BORL
Flexibility to process low &
high sulphur Crude
100% Marketing Rights for NRL (3.5 MMTPA)
31.25* 34.70*
36.76*38.29*
11.7914.25 16.23 16.77
13.35
13.6014.29
14.78 15.14
13.05
2.68
2.812.90 2.38
2.663.18
3.352.85 4.00
3.92
0.00
5.00
10.00
15.00
20.00
25.00
30.00
35.00
40.00
45.00
FY17 FY18 FY19 FY20 FY21
Kochi Mumbai Numaligarh Bina
32.98*100% Mktgrights for NRL
13
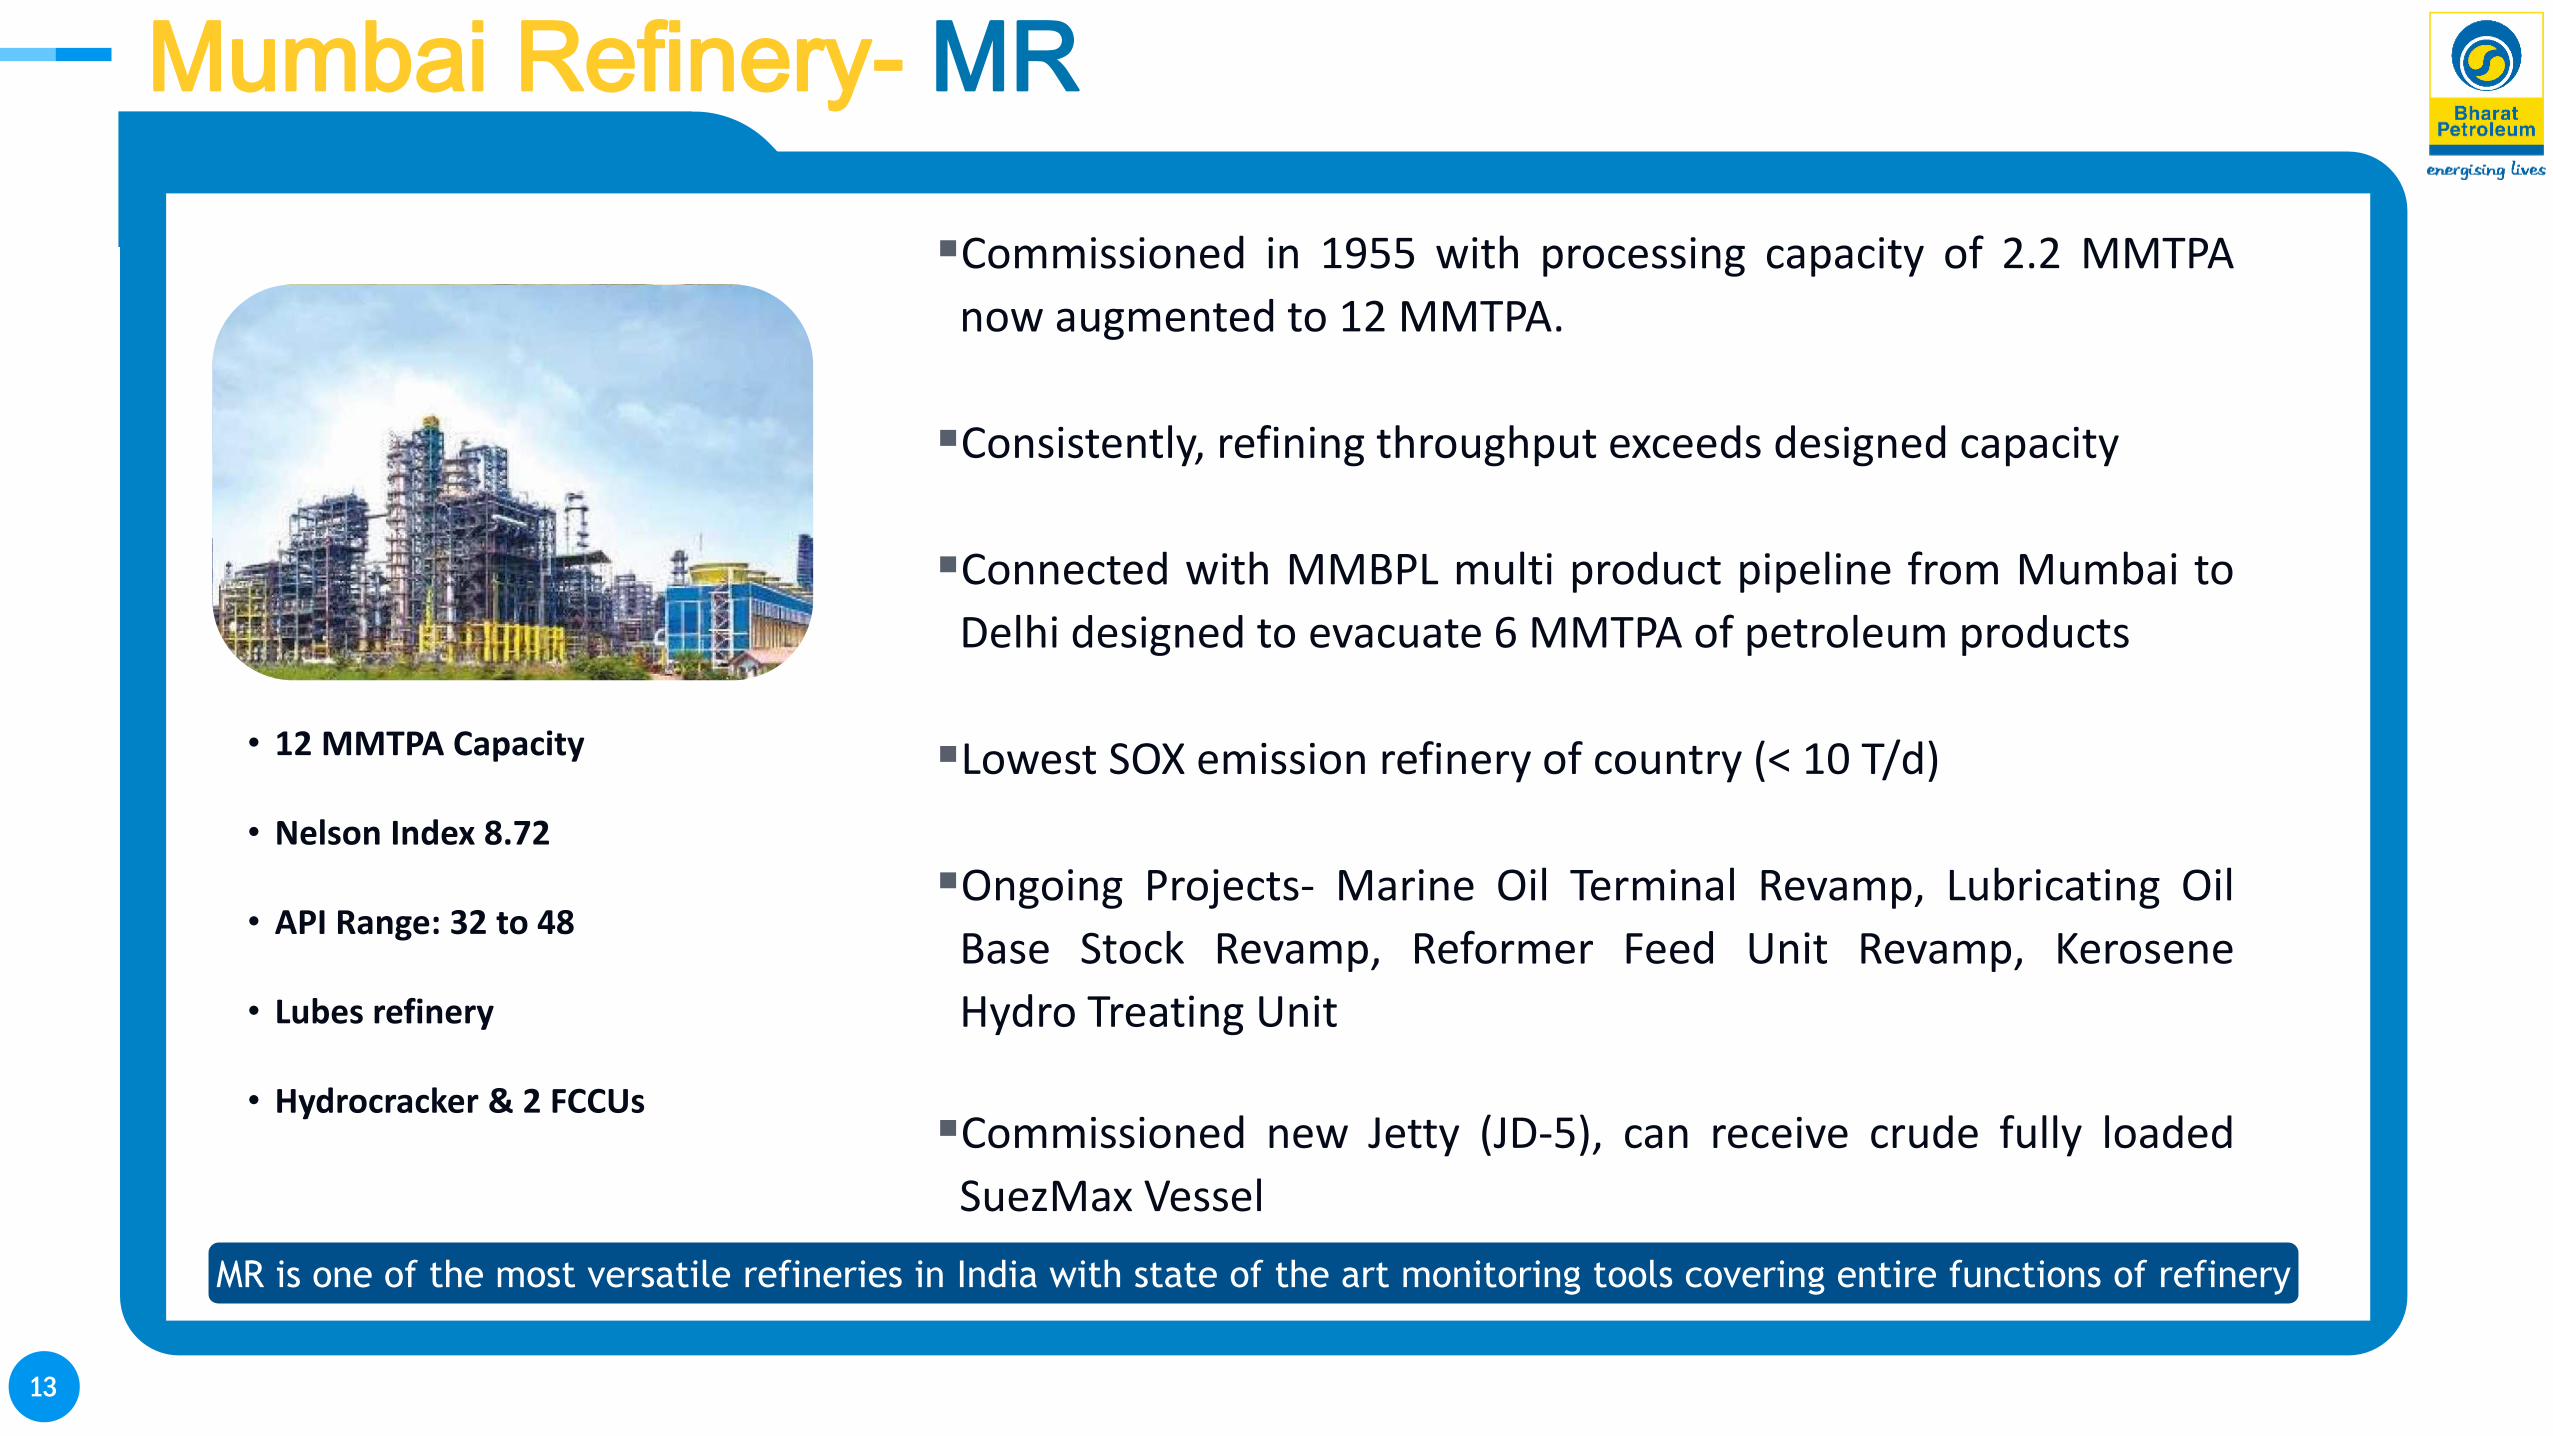
Mumbai Refinery- MR
Commissioned in 1955 with processing capacity of 2.2 MMTPA
now augmented to 12 MMTPA.
Consistently, refining throughput exceeds designed capacity
Connected with MMBPL multi product pipeline from Mumbai to
Delhi designed to evacuate 6 MMTPA of petroleum products
Lowest SOX emission refinery of country (< 10 T/d)
Ongoing Projects- Marine Oil Terminal Revamp, Lubricating Oil
Base Stock Revamp, Reformer Feed Unit Revamp, Kerosene
Hydro Treating Unit
Commissioned new Jetty (JD-5), can receive crude fully loaded
SuezMax Vessel
• 12 MMTPA Capacity
• Nelson Index 8.72
• API Range: 32 to 48
• Lubes refinery
• Hydrocracker & 2 FCCUs
MR is one of the most versatile refineries in India with state of the art monitoring tools covering entire functions of refinery
14
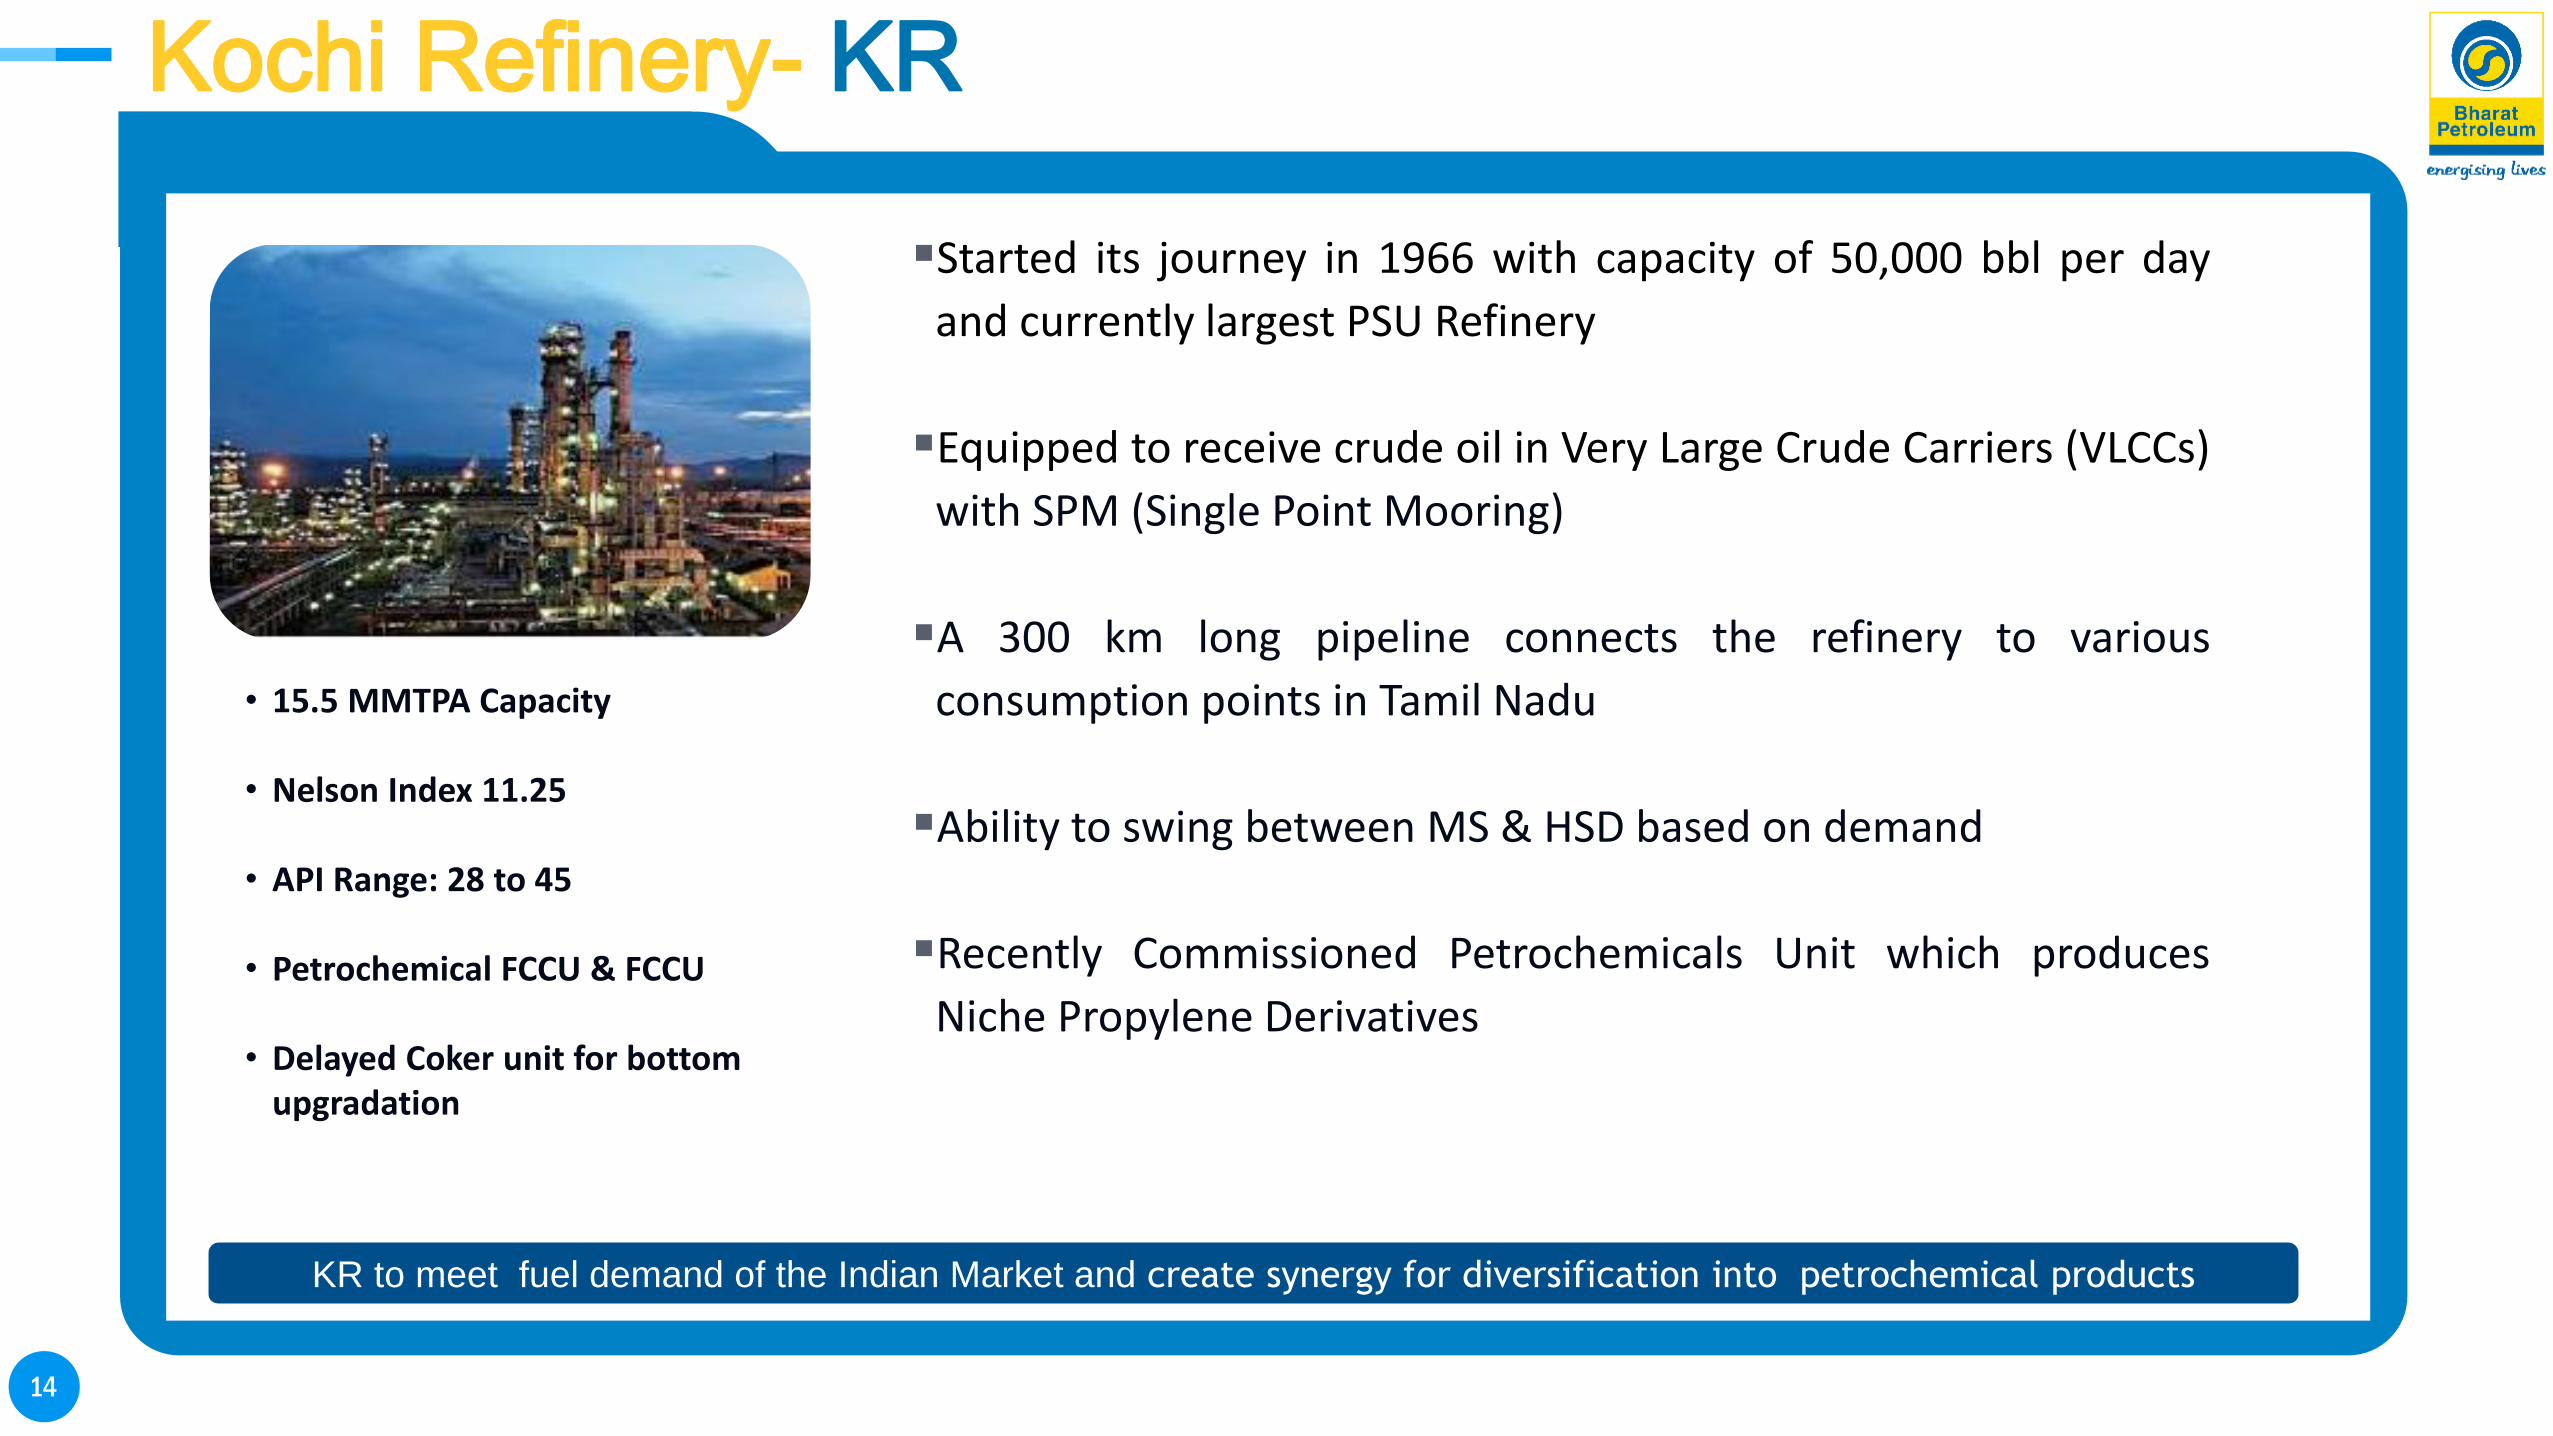
Kochi Refinery- KR
Started its journey in 1966 with capacity of 50,000 bbl per day
and currently largest PSU Refinery
Equipped to receive crude oil in Very Large Crude Carriers (VLCCs)
with SPM (Single Point Mooring)
A 300 km long pipeline connects the refinery to various
consumption points in Tamil Nadu
Ability to swing between MS & HSD based on demand
Recently Commissioned Petrochemicals Unit which produces
Niche Propylene Derivatives
• 15.5 MMTPA Capacity
• Nelson Index 11.25
• API Range: 28 to 45
• Petrochemical FCCU & FCCU
• Delayed Coker unit for bottom upgradation
KR to meet fuel demand of the Indian Market and create synergy for diversification into petrochemical products
15
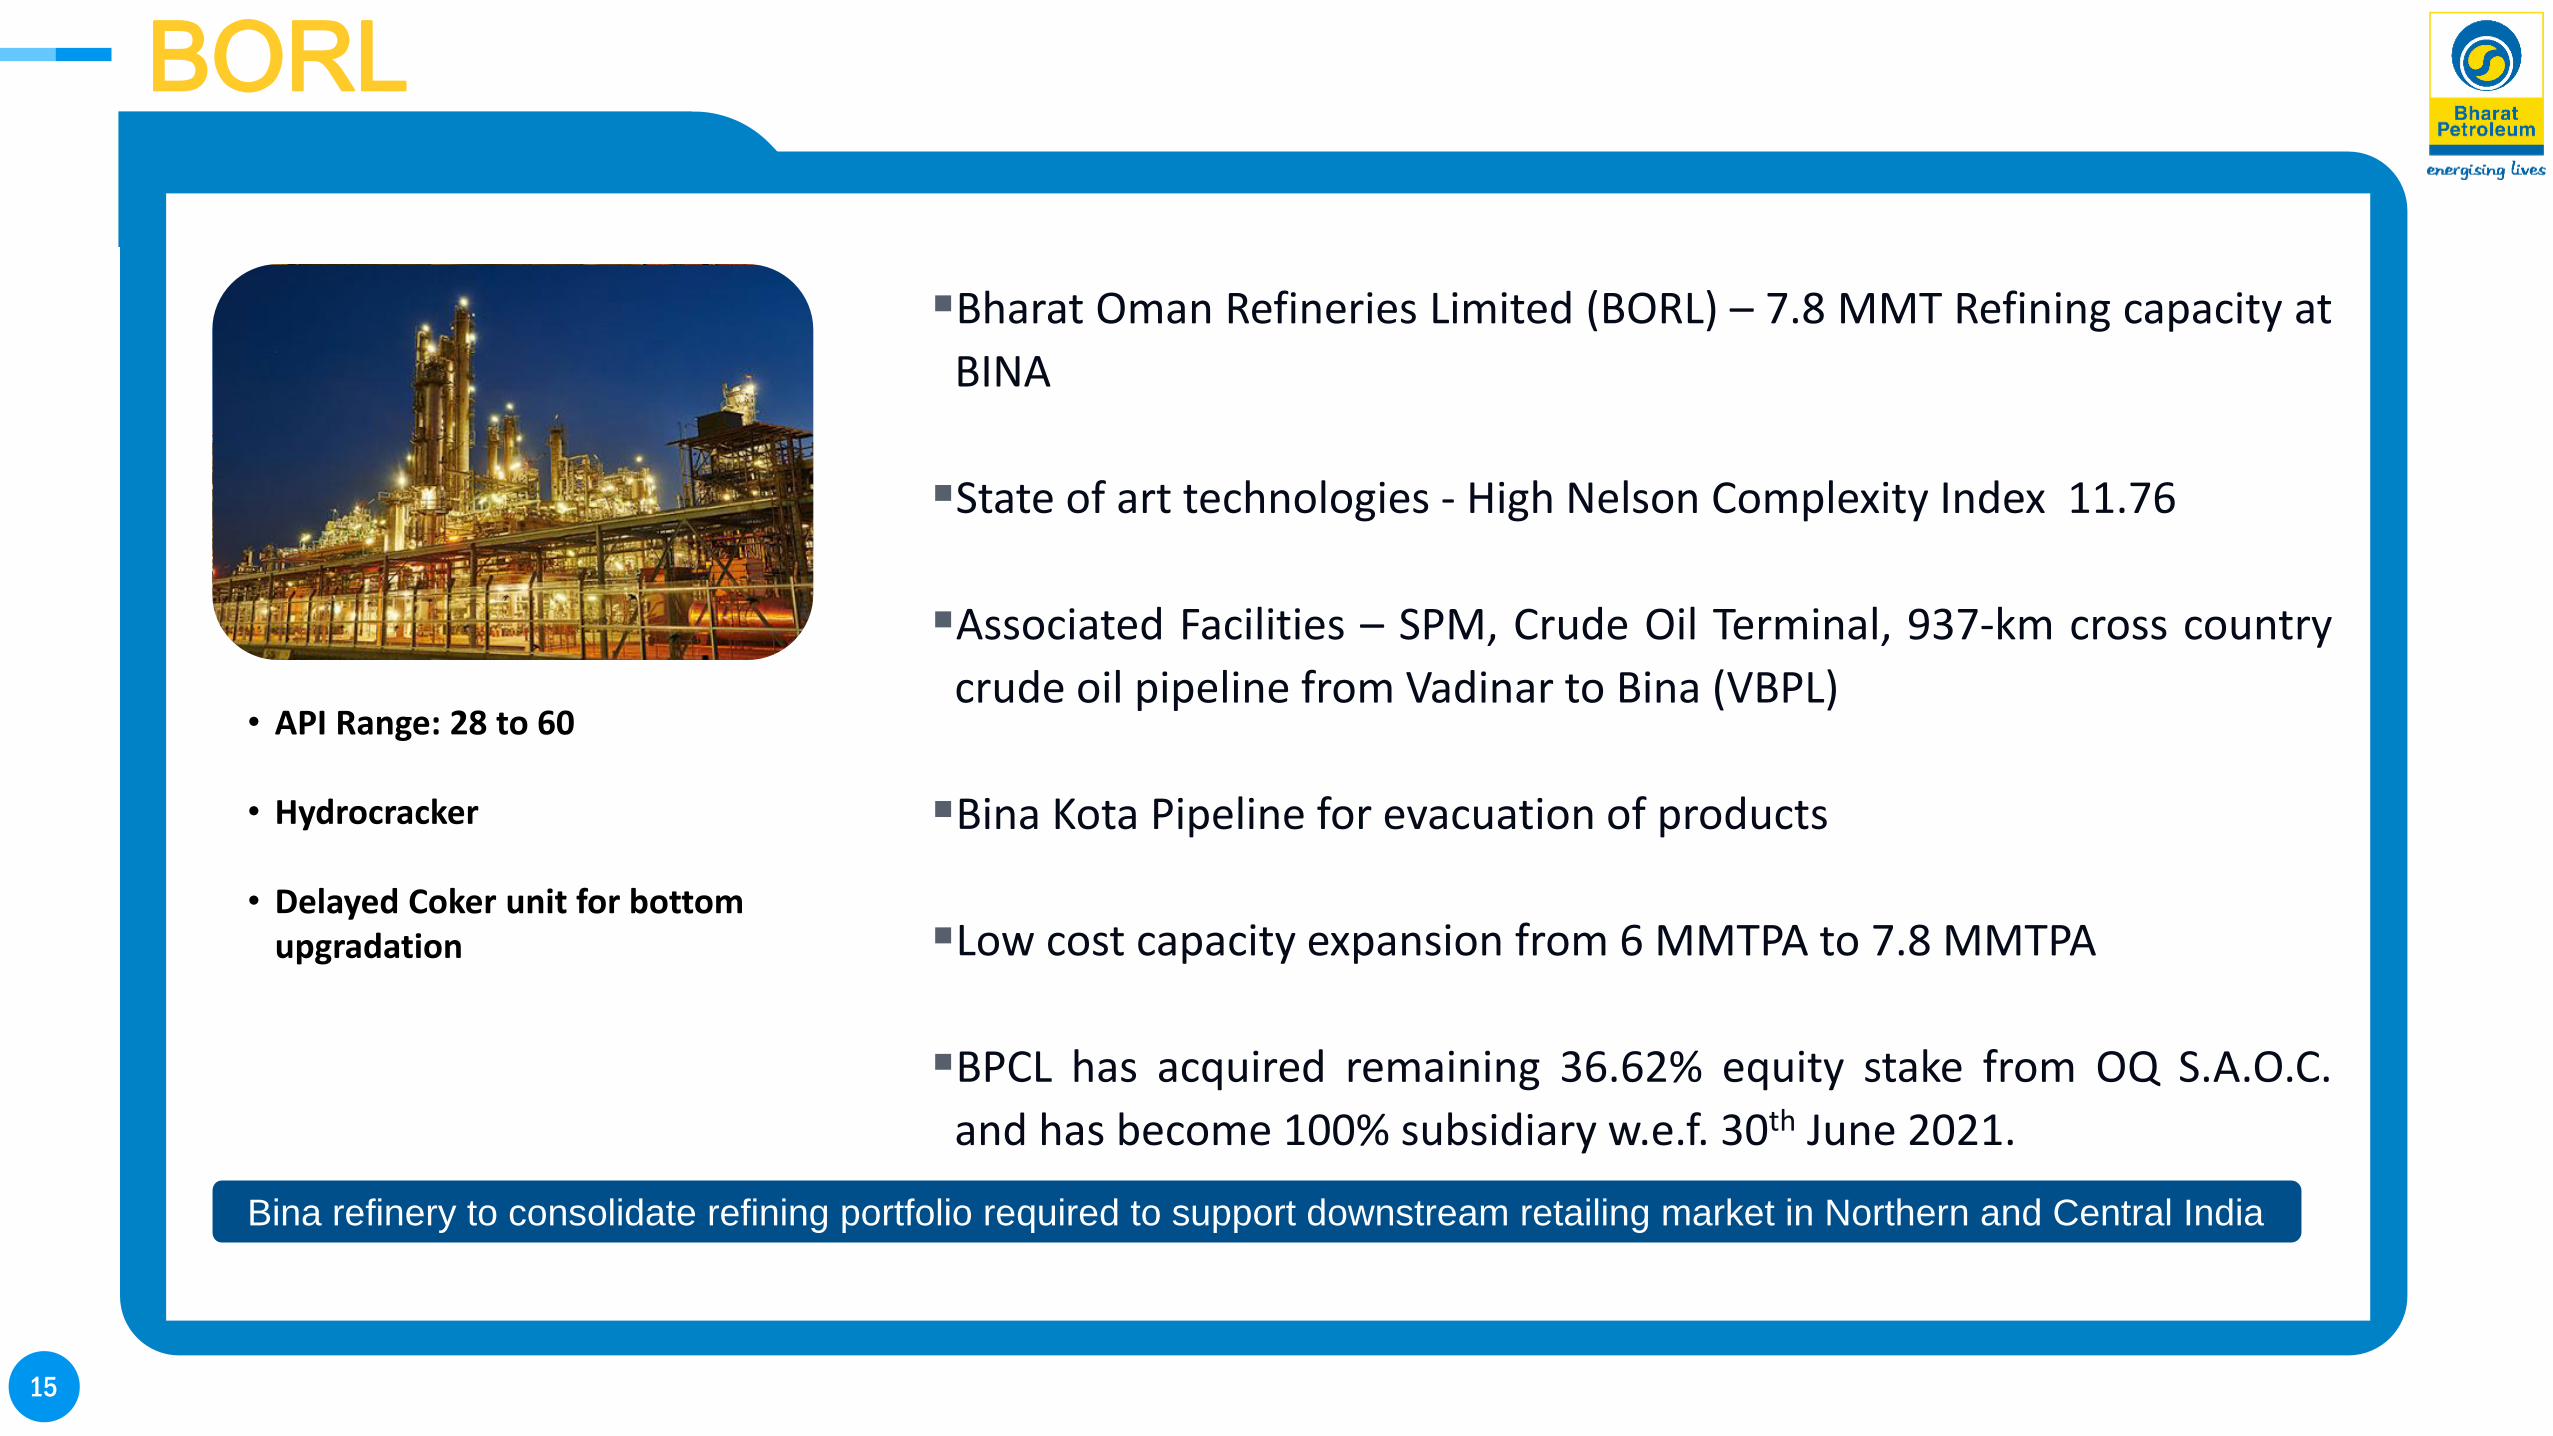
BORL
Bharat Oman Refineries Limited (BORL) – 7.8 MMT Refining capacity at
BINA
State of art technologies - High Nelson Complexity Index 11.76
Associated Facilities – SPM, Crude Oil Terminal, 937-km cross country
crude oil pipeline from Vadinar to Bina (VBPL)
Bina Kota Pipeline for evacuation of products
Low cost capacity expansion from 6 MMTPA to 7.8 MMTPA
BPCL has acquired remaining 36.62% equity stake from OQ S.A.O.C.
and has become 100% subsidiary w.e.f. 30th June 2021.
• API Range: 28 to 60
• Hydrocracker
• Delayed Coker unit for bottom upgradation
Bina refinery to consolidate refining portfolio required to support downstream retailing market in Northern and Central India
16
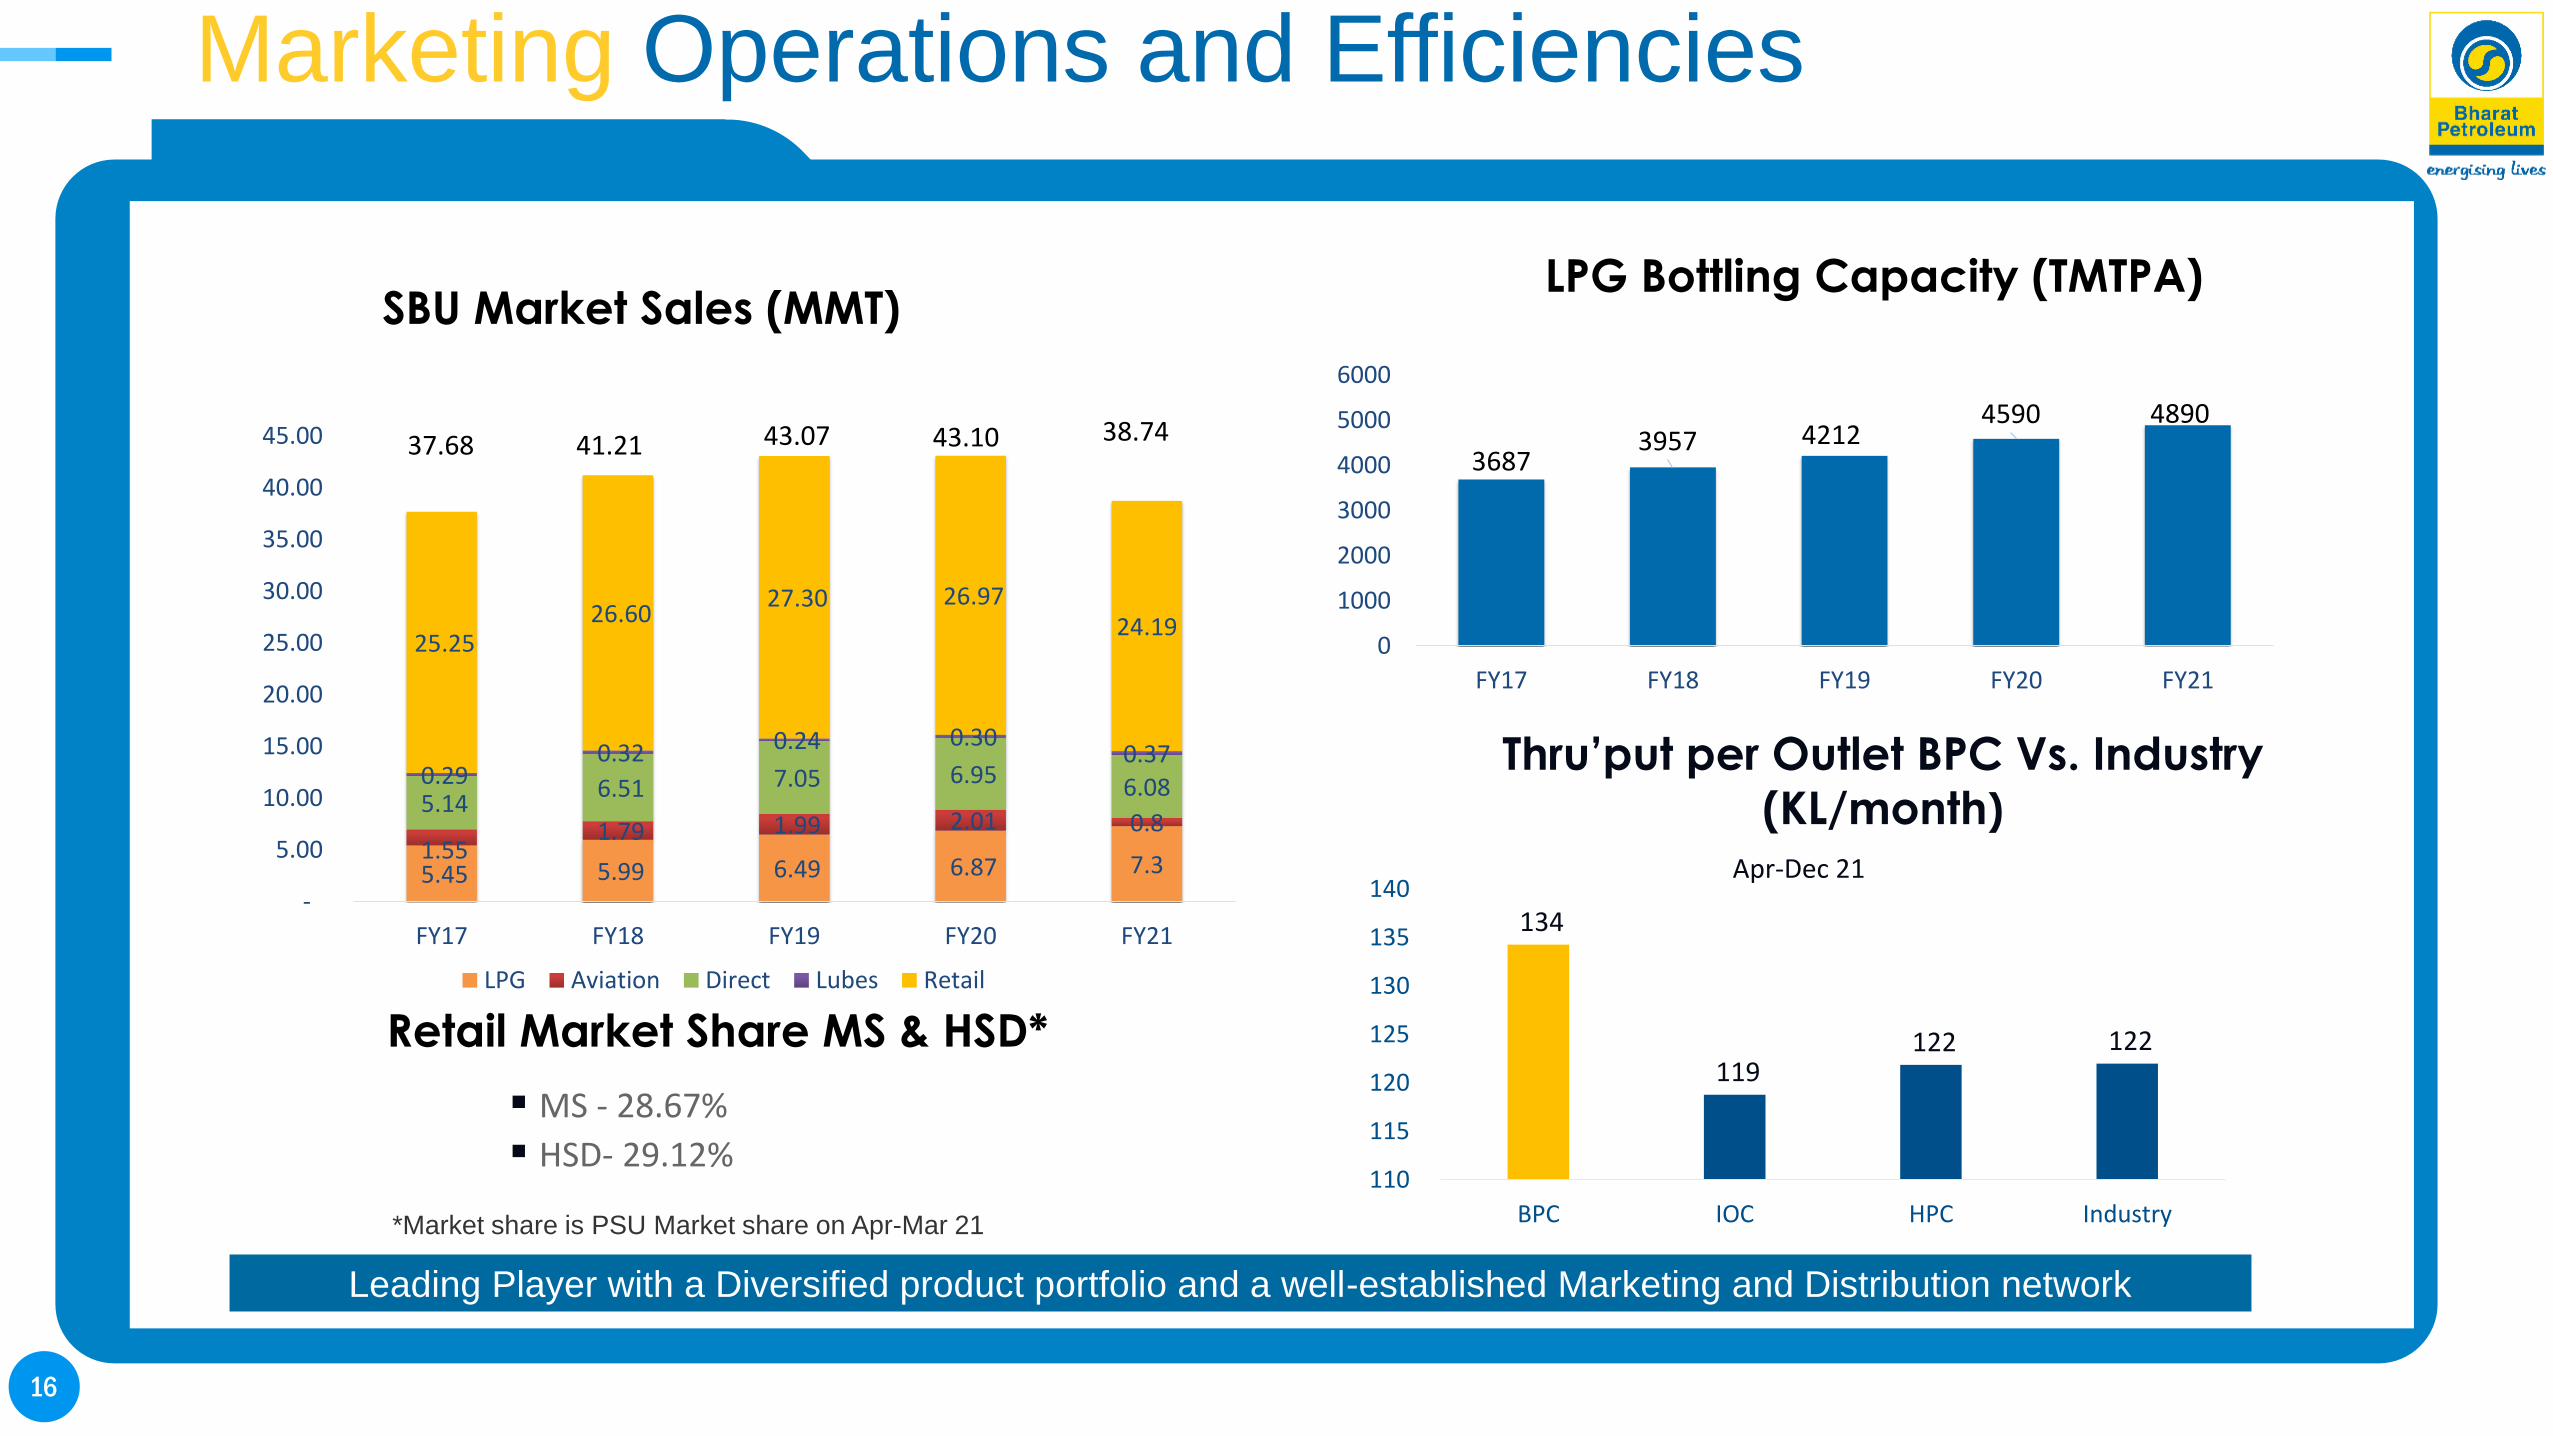
Marketing Operations and Efficiencies
SBU Market Sales (MMT)
Leading Player with a Diversified product portfolio and a well-established Marketing and Distribution network
Retail Market Share MS & HSD*
MS - 28.67%
HSD- 29.12%
*Market share is PSU Market share on Apr-Mar 21
37.68 41.21
LPG Bottling Capacity (TMTPA)
Thru’put per Outlet BPC Vs. Industry
(KL/month)
43.07
5.45 5.99 6.49 6.87 7.31.55
1.79 1.99 2.01 0.85.14
6.51 7.05 6.95 6.080.29 0.32 0.24 0.30
0.37
25.25 26.60
27.30 26.97 24.19
-
5.00
10.00
15.00
20.00
25.00
30.00
35.00
40.00
45.00
FY17 FY18 FY19 FY20 FY21
LPG Aviation Direct Lubes Retail
43.103687
3957 42124590 4890
0
1000
2000
3000
4000
5000
6000
FY17 FY18 FY19 FY20 FY21
38.74
134
119 122 122
110
115
120
125
130
135
140
BPC IOC HPC Industry
Apr-Dec 21
17
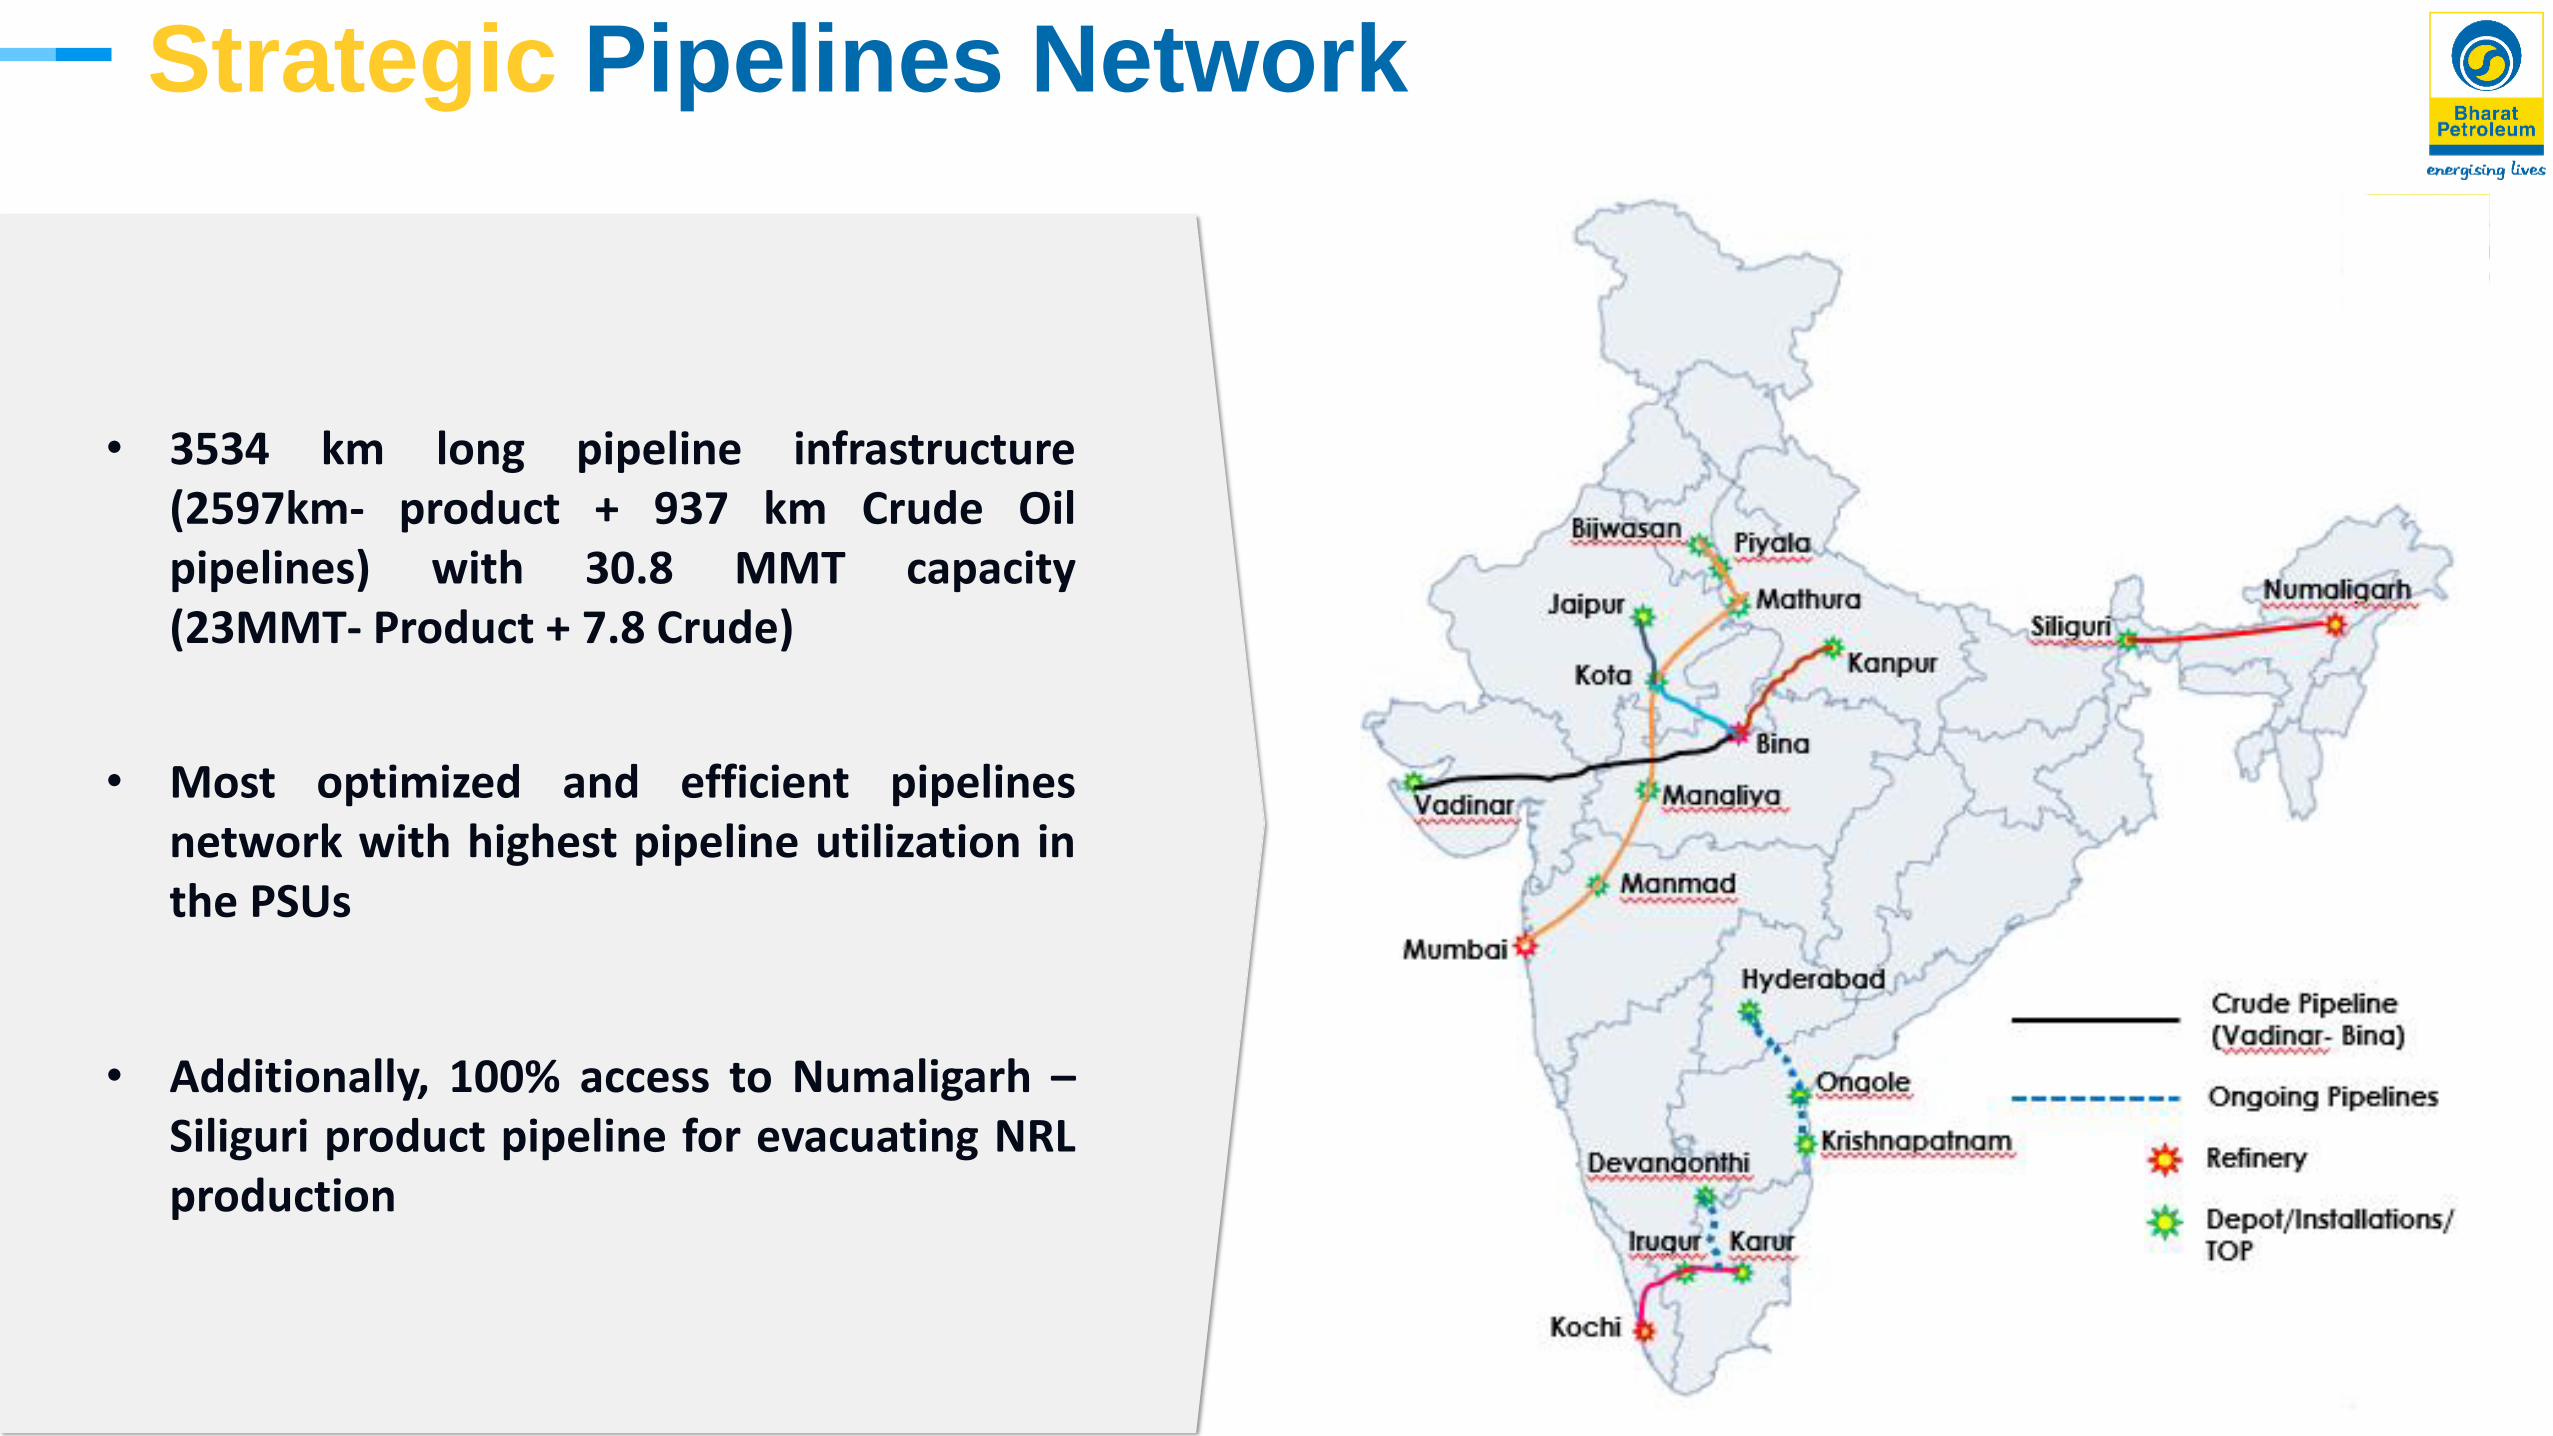
Strategic Pipelines Network
• Most optimized and efficient pipelinesnetwork with highest pipeline utilization inthe PSUs
• 3534 km long pipeline infrastructure(2597km- product + 937 km Crude Oilpipelines) with 30.8 MMT capacity(23MMT- Product + 7.8 Crude)
• Additionally, 100% access to Numaligarh –Siliguri product pipeline for evacuating NRLproduction
18
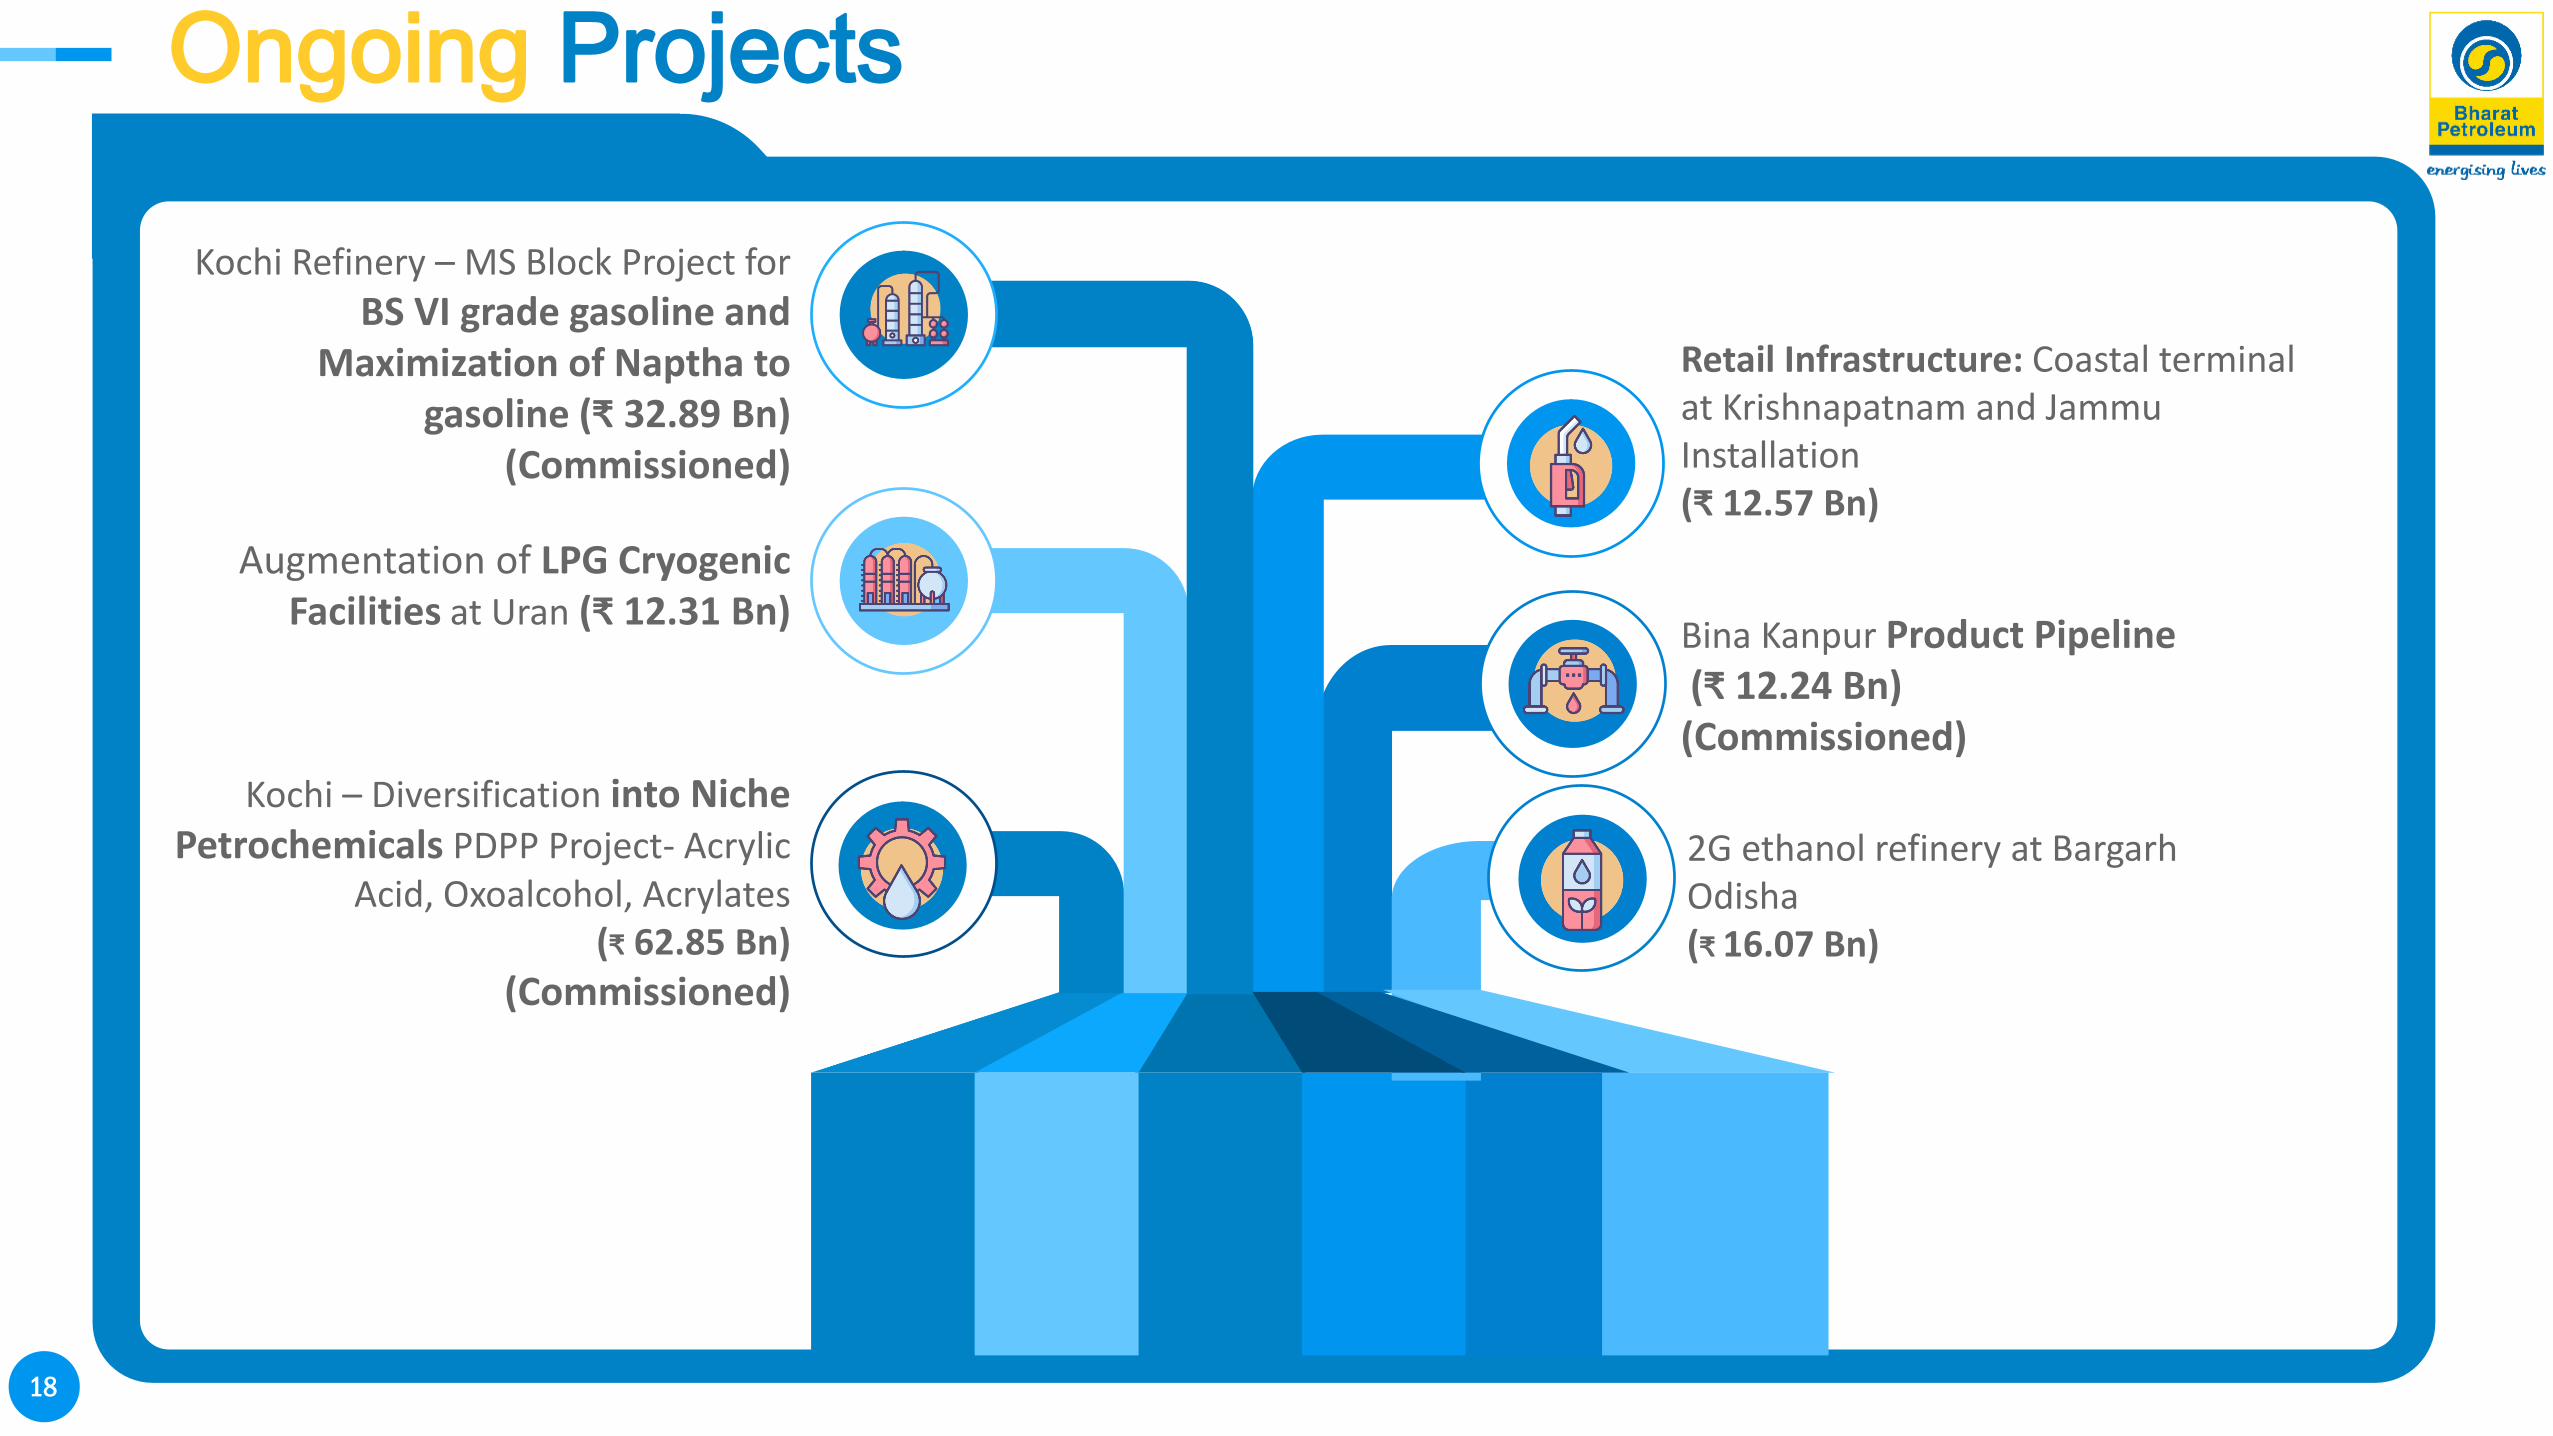
Retail Infrastructure: Coastal terminal at Krishnapatnam and Jammu Installation(₹ 12.57 Bn)
Kochi – Diversification into Niche Petrochemicals PDPP Project- Acrylic
Acid, Oxoalcohol, Acrylates (₹ 62.85 Bn)
(Commissioned)
Kochi Refinery – MS Block Project for
BS VI grade gasoline and Maximization of Naptha to
gasoline (₹ 32.89 Bn) (Commissioned)
Bina Kanpur Product Pipeline(₹ 12.24 Bn)(Commissioned)
Ongoing Projects
Augmentation of LPG Cryogenic Facilities at Uran (₹ 12.31 Bn)
2G ethanol refinery at BargarhOdisha(₹ 16.07 Bn)

19
Investments in Mozambique – FID sanctioned. Project Financing agreement signed.
Expansion of marketing infrastructure across all business verticals
Marketing Infrastructure & other facilities at Rasayani near Mumbai
Cross country LPG pipeline from Kandla to Gorakhpur through a JV
Petrochemical Project at Kochi
BPCL has been awarded 11 GAs in 9th round and 2 GAs in 10th round of bidding
Upcoming Projects
UPSTREAM
INVESTMENTS IN GAS
MARKETING INFRASTRUCTURE
PIPELINES
RASAYANI
PETROCHEMICALS
Capex expenditure of INR 93.46 Bn in Apr-Dec 22 (Incl. investment in Subsidiaries/JVs)
20
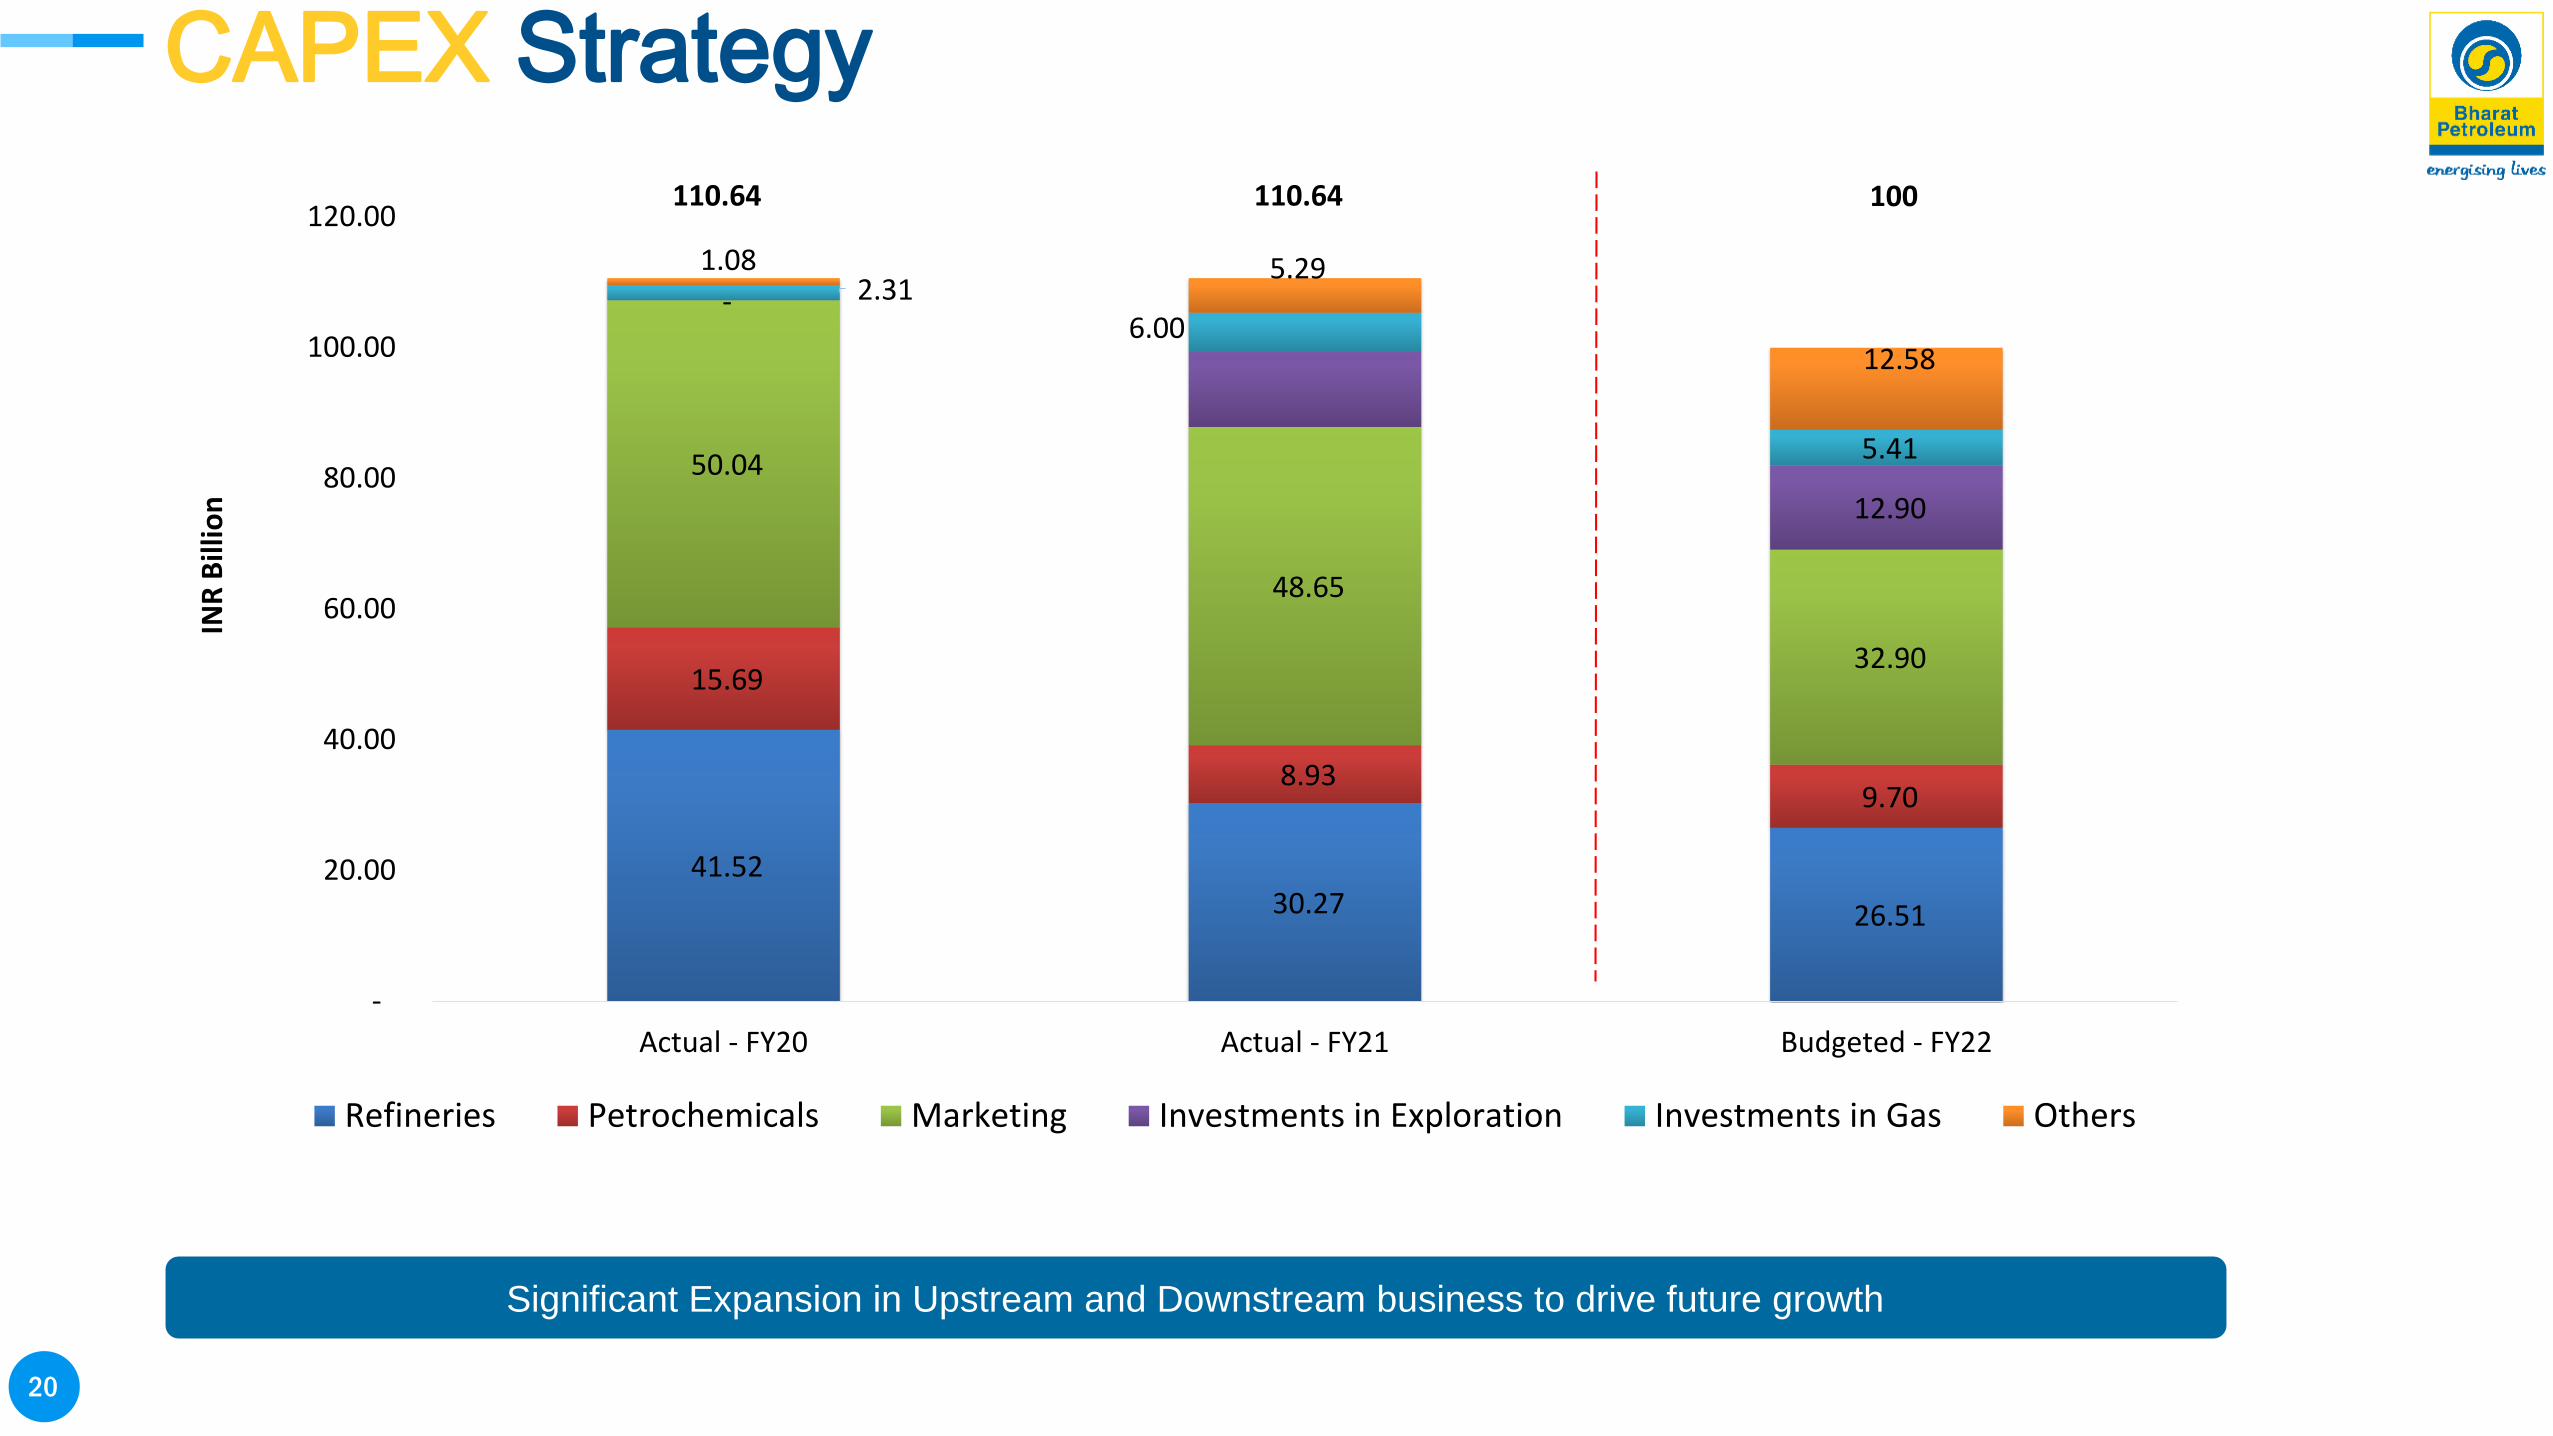
41.52 30.27 26.51
15.69
8.93 9.70
50.04
48.65
32.90
-
12.90
2.31 6.00
5.41
1.08 5.29
12.58
-
20.00
40.00
60.00
80.00
100.00
120.00
Actual - FY20 Actual - FY21 Budgeted - FY22
INR
Bill
ion
Refineries Petrochemicals Marketing Investments in Exploration Investments in Gas Others
BPCL EvolutionCAPEX Strategy
Significant Expansion in Upstream and Downstream business to drive future growth
110.64 100110.64
21
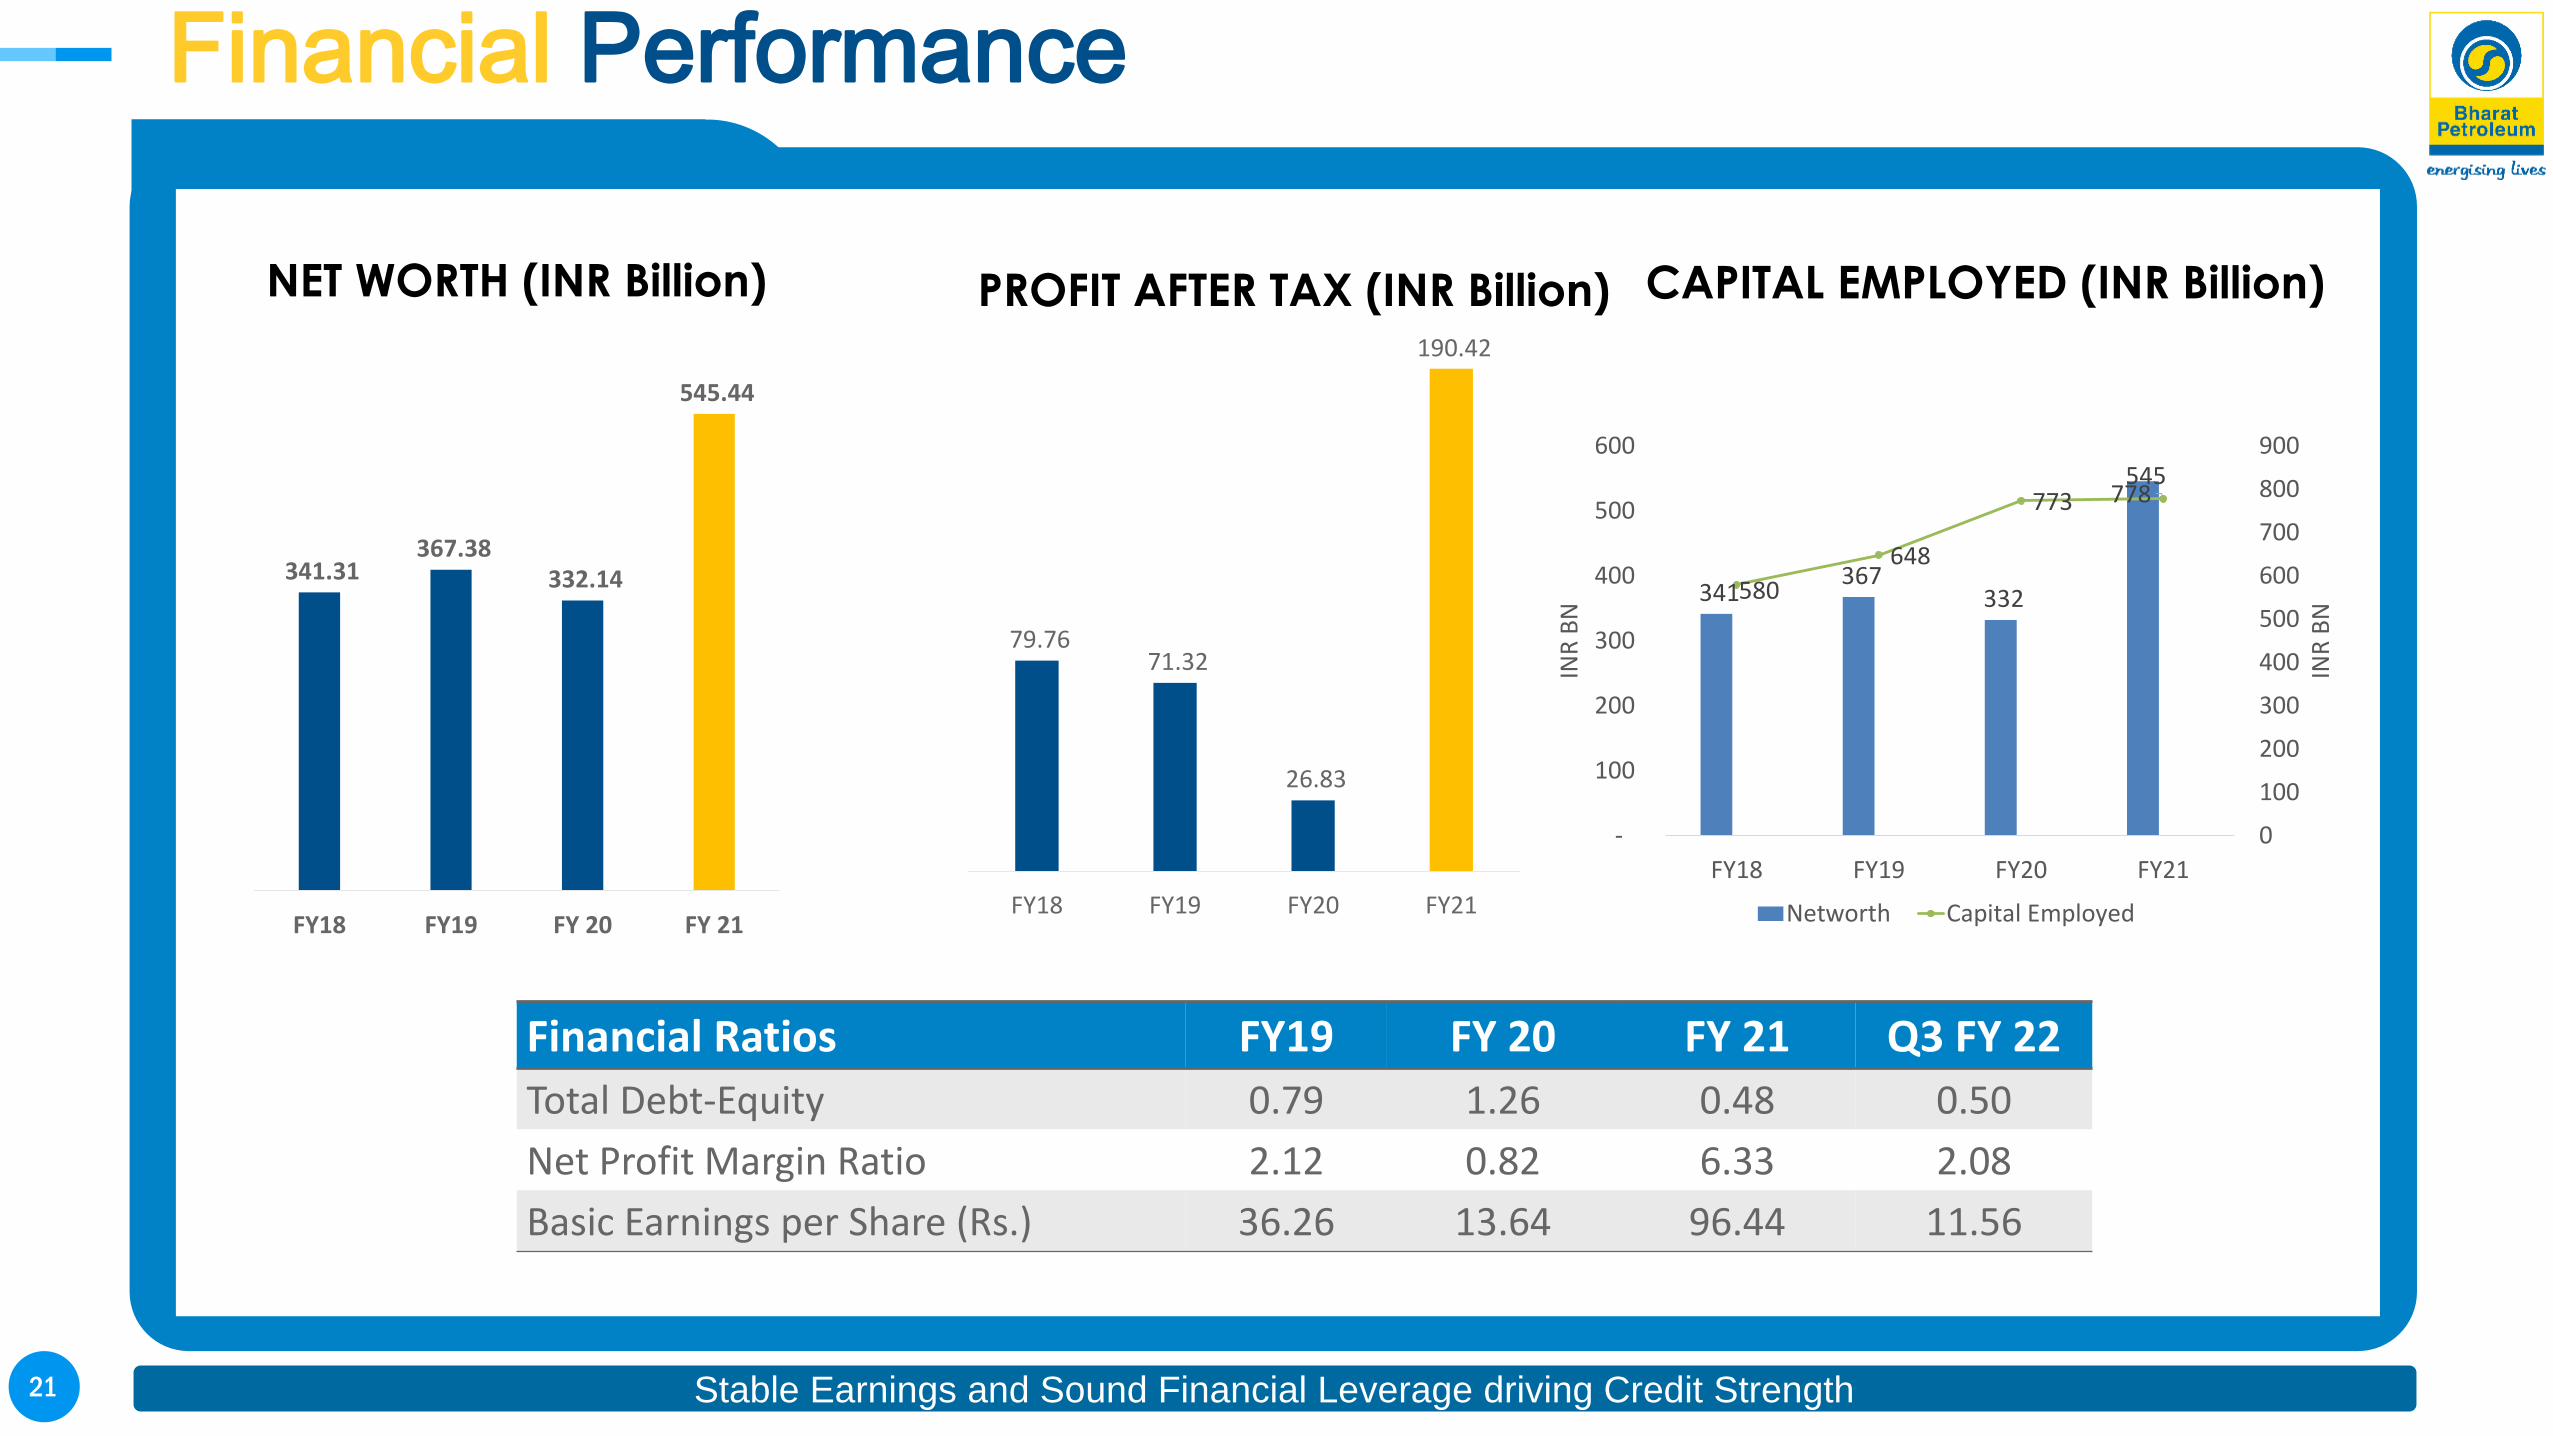
Financial Performance
NET WORTH (INR Billion) PROFIT AFTER TAX (INR Billion) CAPITAL EMPLOYED (INR Billion)
Financial Ratios FY19 FY 20 FY 21 Q3 FY 22
Total Debt-Equity 0.79 1.26 0.48 0.50
Net Profit Margin Ratio 2.12 0.82 6.33 2.08
Basic Earnings per Share (Rs.) 36.26 13.64 96.44 11.56
Stable Earnings and Sound Financial Leverage driving Credit Strength
341 367
332
545
580
648
773 778
0
100
200
300
400
500
600
700
800
900
-
100
200
300
400
500
600
FY18 FY19 FY20 FY21
INR
BN
INR
BN
Networth Capital Employed
341.31 367.38
332.14
545.44
FY18 FY19 FY 20 FY 21
79.76 71.32
26.83
190.42
FY18 FY19 FY20 FY21
22
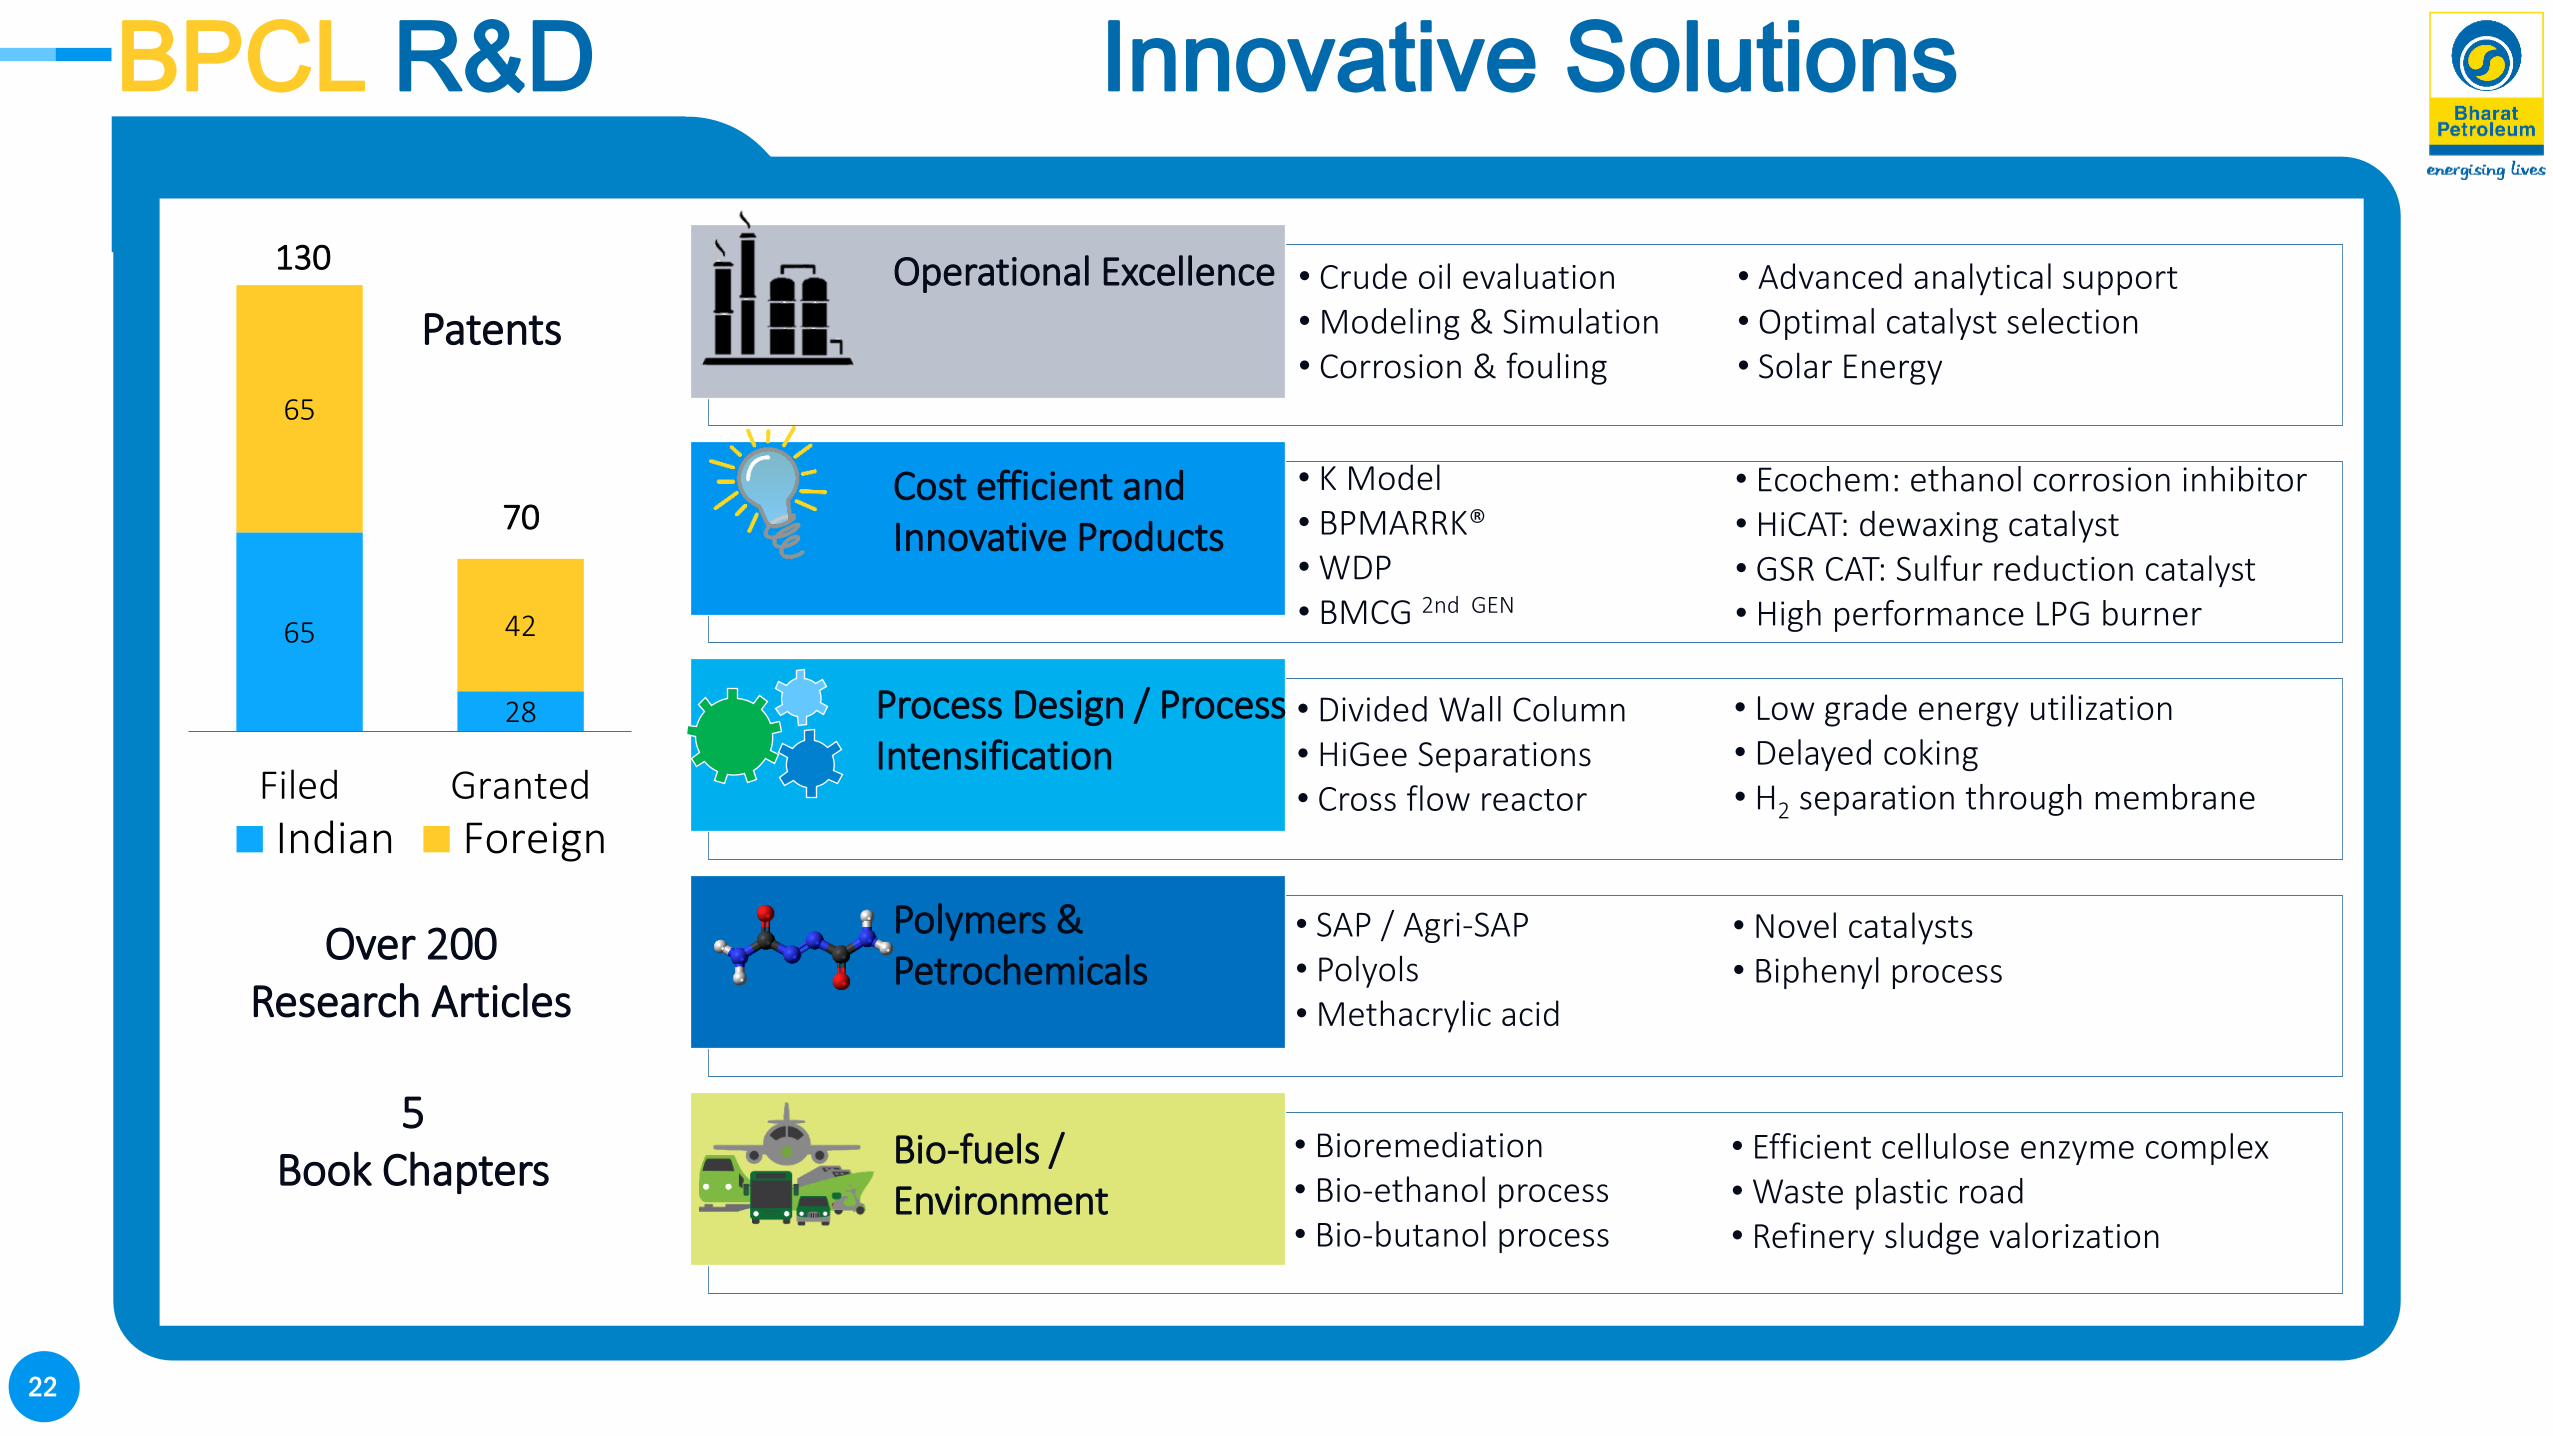
BPCL R&D Innovative Solutions
Operational Excellence
Process Design / Process Intensification
Polymers & Petrochemicals
Cost efficient and Innovative Products
Bio-fuels / Environment
• K Model• BPMARRK®• WDP• BMCG 2nd GEN
• Ecochem: ethanol corrosion inhibitor• HiCAT: dewaxing catalyst• GSR CAT: Sulfur reduction catalyst• High performance LPG burner
• Crude oil evaluation• Modeling & Simulation• Corrosion & fouling
• Advanced analytical support• Optimal catalyst selection• Solar Energy
• Divided Wall Column• HiGee Separations• Cross flow reactor
• Low grade energy utilization• Delayed coking• H2 separation through membrane
• SAP / Agri-SAP• Polyols• Methacrylic acid
• Novel catalysts• Biphenyl process
• Bioremediation• Bio-ethanol process• Bio-butanol process
• Efficient cellulose enzyme complex• Waste plastic road• Refinery sludge valorization
65
28
65
42
Filed Granted
Indian Foreign
130
70
Patents
Over 200Research Articles
5Book Chapters
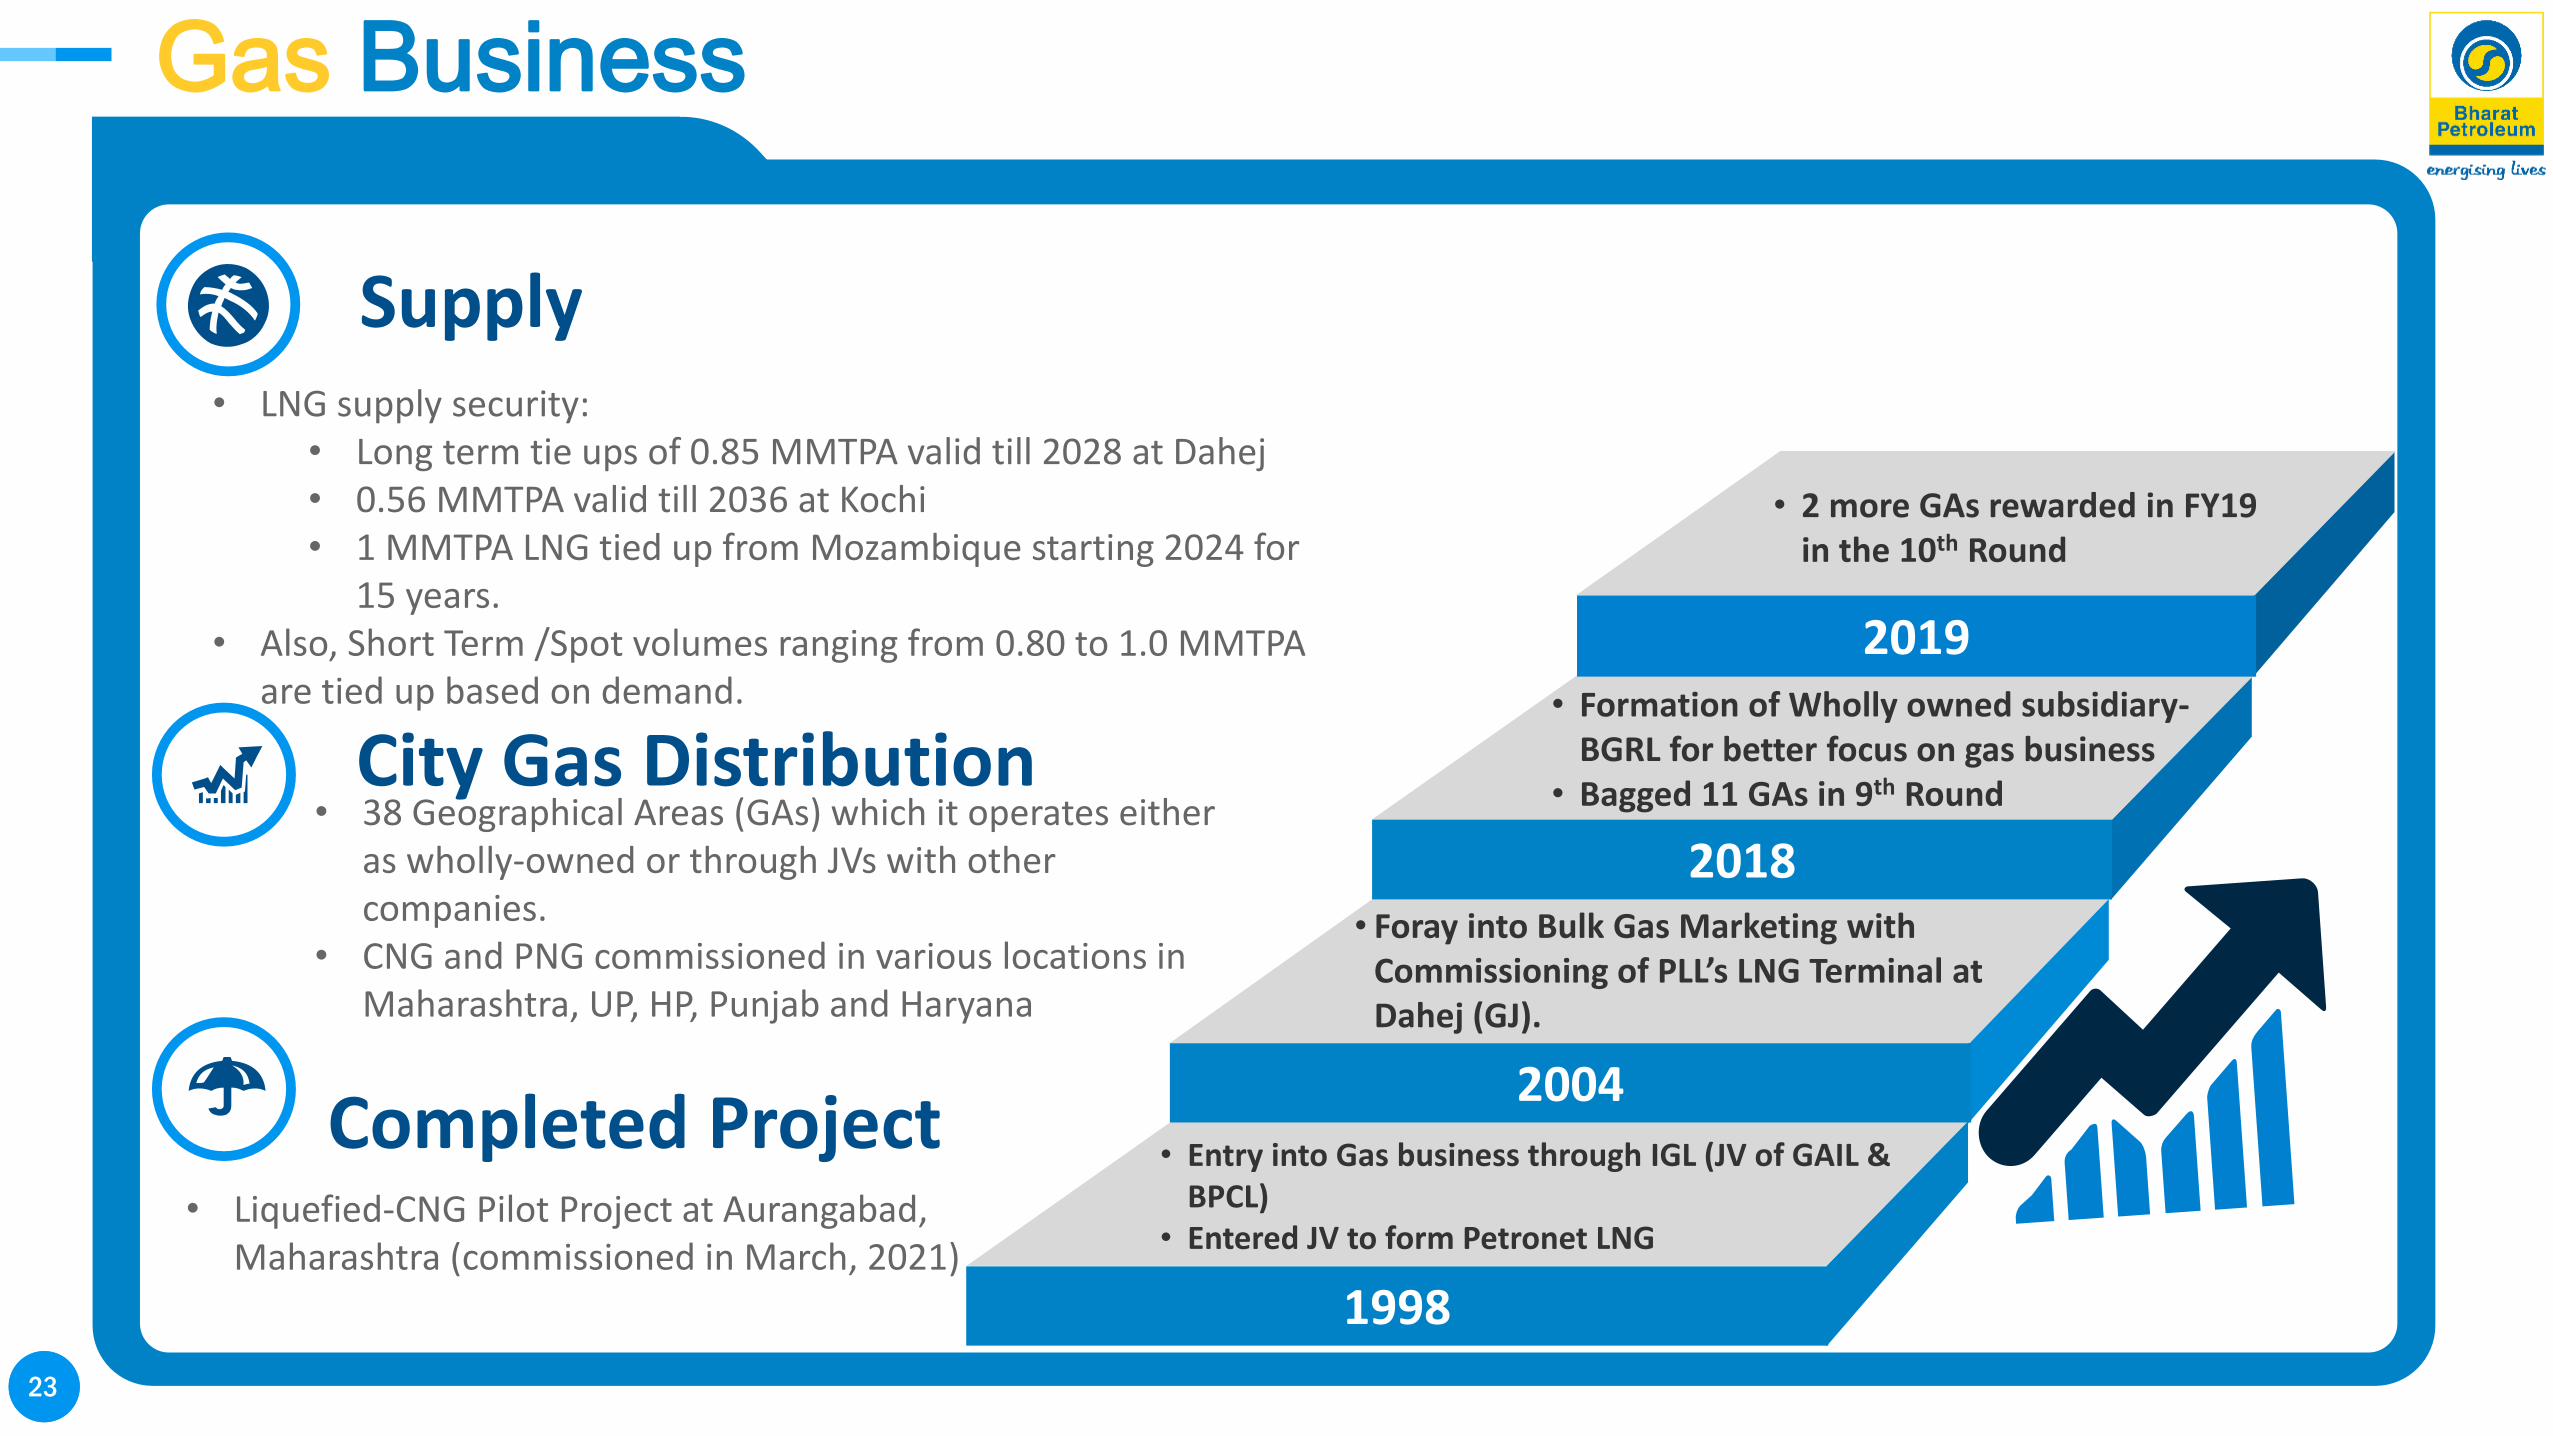
2323
1998
• Entry into Gas business through IGL (JV of GAIL & BPCL)
• Entered JV to form Petronet LNG
2004
• Foray into Bulk Gas Marketing with Commissioning of PLL’s LNG Terminal at Dahej (GJ).
2018
• Formation of Wholly owned subsidiary-BGRL for better focus on gas business
• Bagged 11 GAs in 9th Round
2019
• 2 more GAs rewarded in FY19 in the 10th Round
Supply• LNG supply security:
• Long term tie ups of 0.85 MMTPA valid till 2028 at Dahej• 0.56 MMTPA valid till 2036 at Kochi• 1 MMTPA LNG tied up from Mozambique starting 2024 for
15 years.• Also, Short Term /Spot volumes ranging from 0.80 to 1.0 MMTPA
are tied up based on demand.
City Gas Distribution• 38 Geographical Areas (GAs) which it operates either
as wholly-owned or through JVs with other companies.
• CNG and PNG commissioned in various locations in Maharashtra, UP, HP, Punjab and Haryana
Gas Business
• Liquefied-CNG Pilot Project at Aurangabad, Maharashtra (commissioned in March, 2021)
Completed Project

24
BPCL EvolutionBPRL’s Upstream Story over the years… Story over the years…….
Formation of E&P setup in BPCL
Formation
of BPRL
Brazil
& Mozambique
acquisition
Indonesia
entry
2003
2006
2008
2010
2009
2012
2013
2016
Shale gas
entry Australia
Lead
operator
Schedule B
2017
Russian
Acquisition
Declaration of
Commerciality
approved in
Operatorship
block
2018
Entry in Lower
Zakum
2019
Overseas
Onshore
Operatorship
– Abu Dhabi

25
Upstream - Global Spread
2.5 MMToE eqv. production Presence in 4 continents, 6 countries
India
4 Cauvery Basin*
1 Rajasthan Basin
3 Cambay Basin**
2 Assam-Arakan
UAE1 Lower Zakum
1 Onshore 1
Brazil
2 BM-SEAL-11
1 BM-C-30
2 BM-POT-16
Mozambique 1 Area 1
Indonesia 1 Nunukan
Russia2 TYNGD2 Vankorneft
Production
Development
Exploration / Appraisal
BPCL pursues its Upstream Business through its wholly owned Subsidiary Company –Bharat Petroresources Limited
* 1 block in in Cauvery Basin is in Production, the rest arein Exploration / Development / under relinquishment** 1 block in Cambay Basin in in Development, the rest isin Exploration / under relinquishment
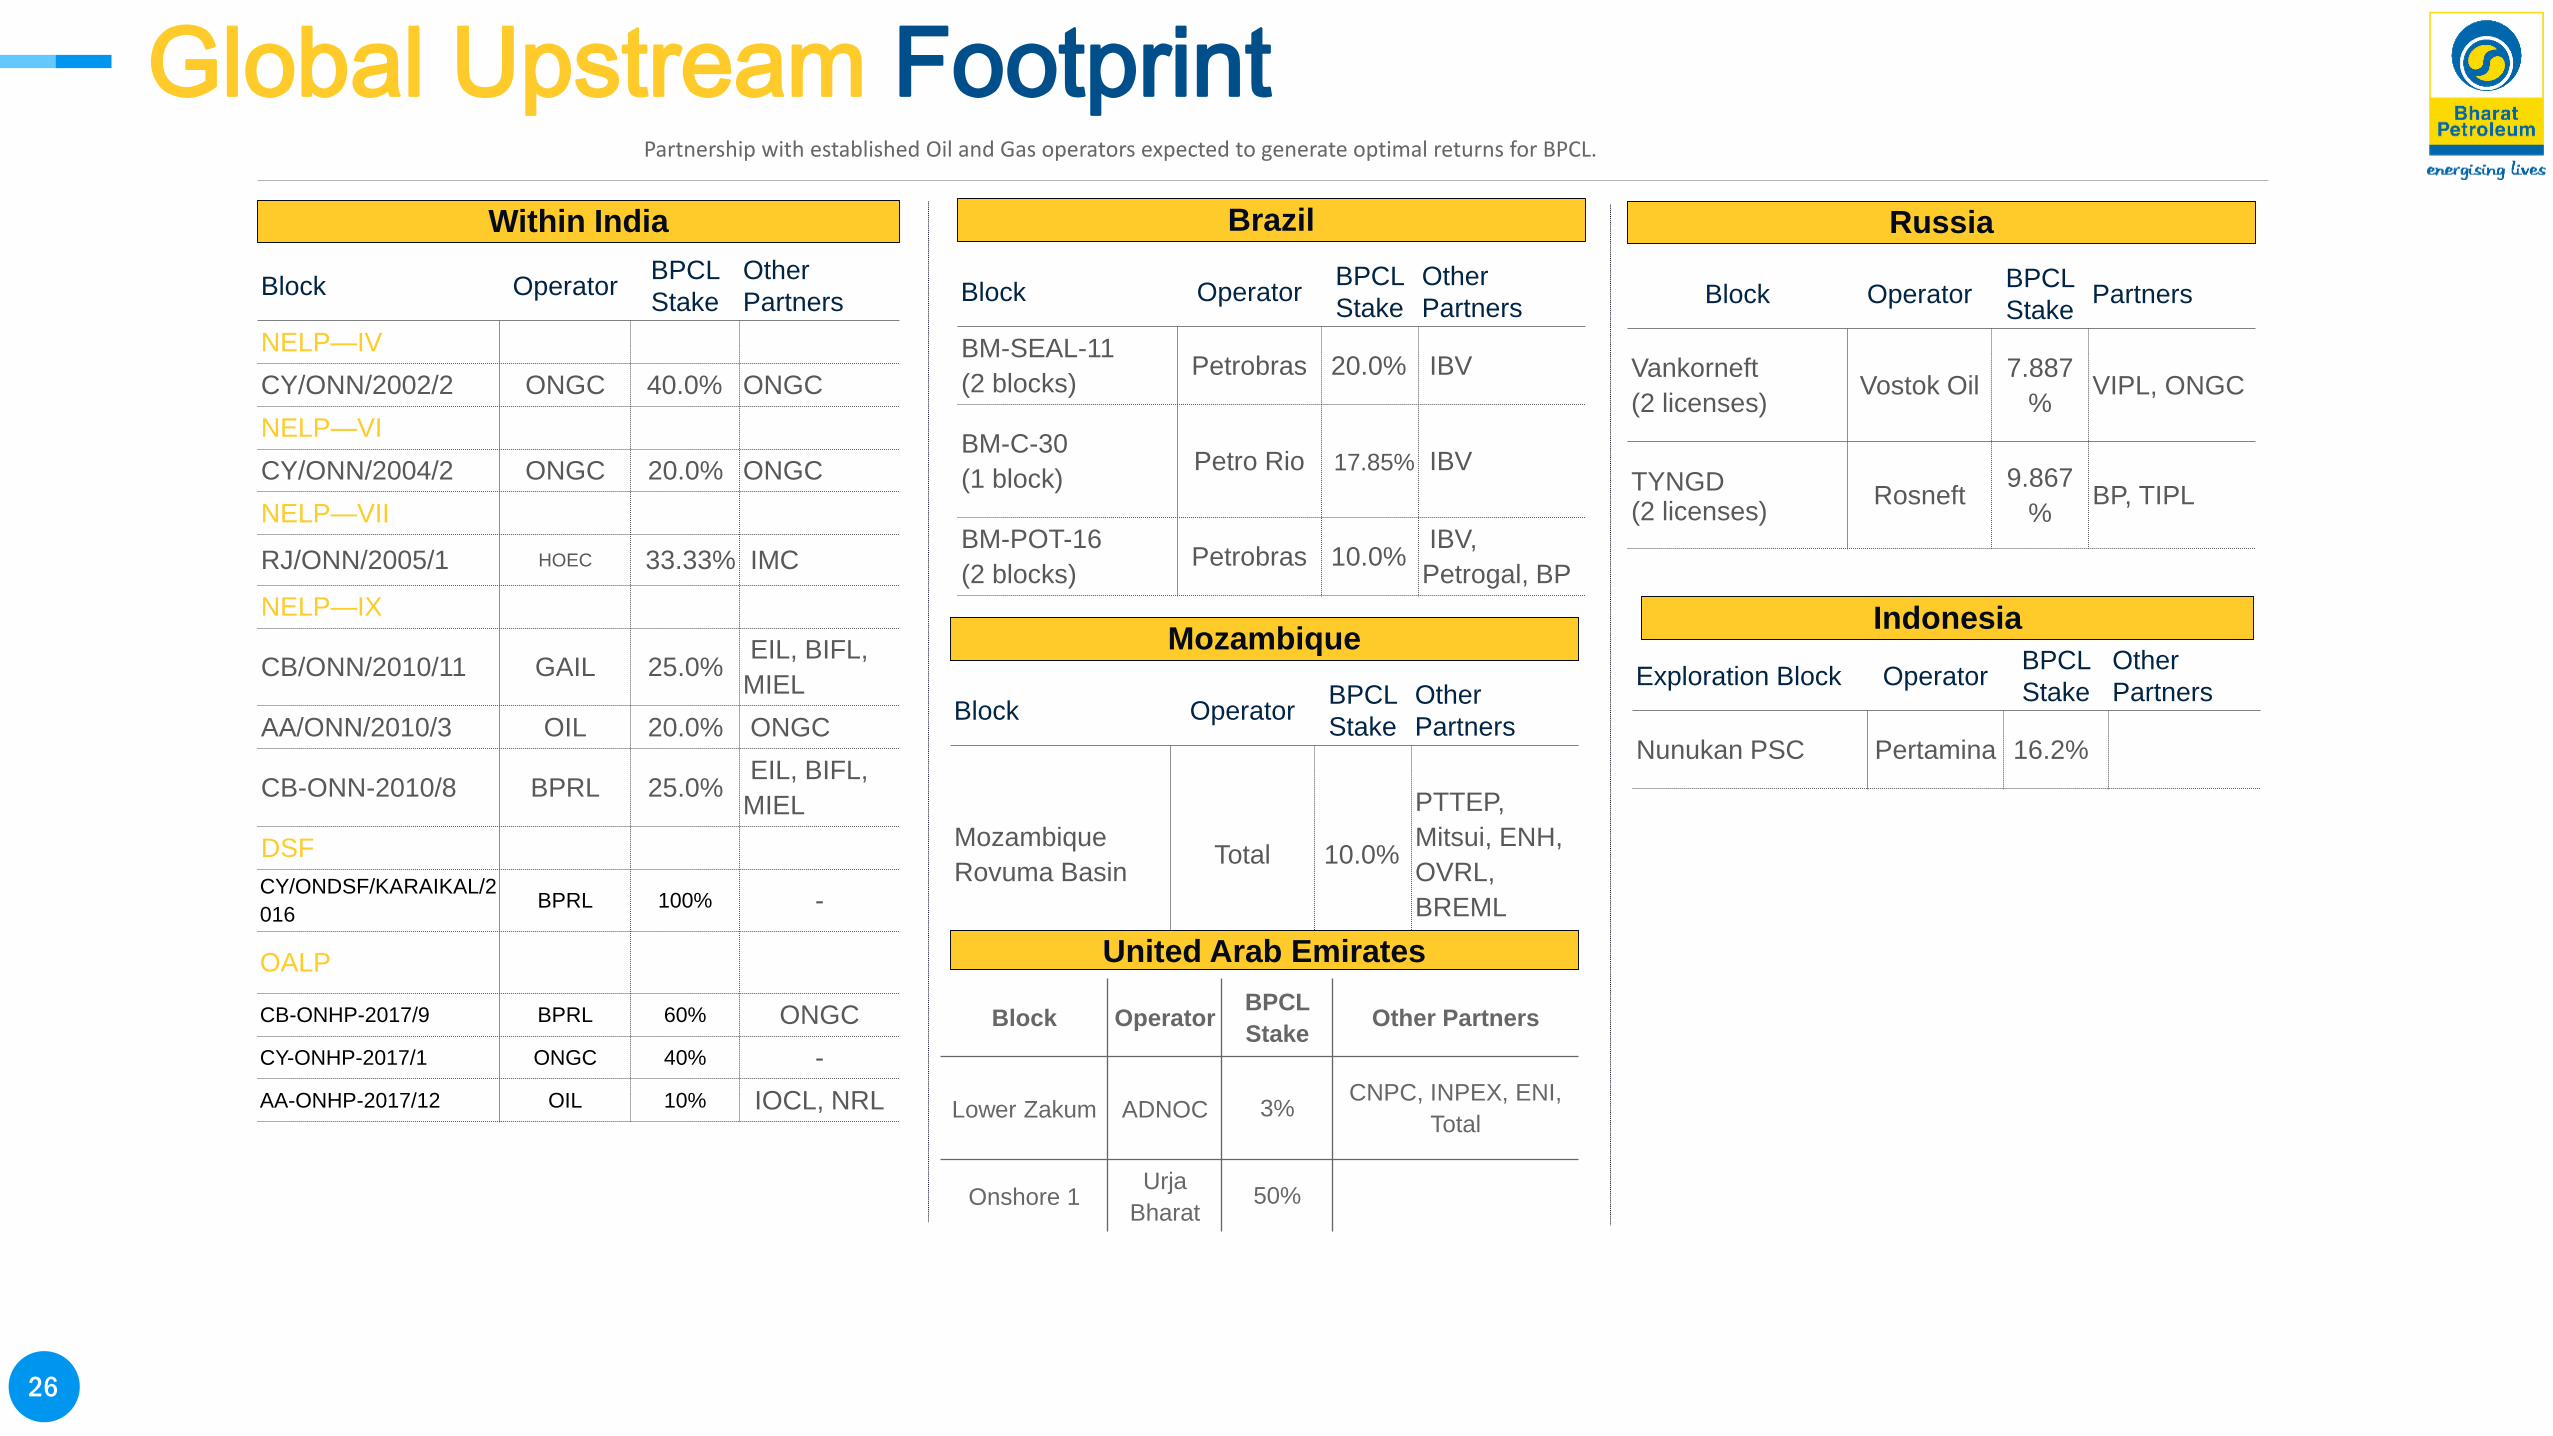
26
Within India
Indonesia
Block OperatorBPCL
Stake
Other
Partners
NELP—IV
CY/ONN/2002/2 ONGC 40.0% ONGC
NELP—VI
CY/ONN/2004/2 ONGC 20.0% ONGC
NELP—VII
RJ/ONN/2005/1 HOEC 33.33% IMC
NELP—IX
CB/ONN/2010/11 GAIL 25.0%EIL, BIFL,
MIEL
AA/ONN/2010/3 OIL 20.0% ONGC
CB-ONN-2010/8 BPRL 25.0%EIL, BIFL,
MIEL
DSF
CY/ONDSF/KARAIKAL/2
016BPRL 100% -
OALP
CB-ONHP-2017/9 BPRL 60% ONGC
CY-ONHP-2017/1 ONGC 40% -
AA-ONHP-2017/12 OIL 10% IOCL, NRL
Exploration Block OperatorBPCL
Stake
Other
Partners
Nunukan PSC Pertamina 16.2%
Brazil
Block OperatorBPCL
Stake
Other
Partners
BM-SEAL-11
(2 blocks)Petrobras 20.0% IBV
BM-C-30
(1 block)Petro Rio 17.85% IBV
BM-POT-16
(2 blocks)Petrobras 10.0%
IBV,
Petrogal, BP
Mozambique
Block OperatorBPCL
Stake
Other
Partners
Mozambique
Rovuma BasinTotal 10.0%
PTTEP,
Mitsui, ENH,
OVRL,
BREML
Russia
Block OperatorBPCL
StakePartners
Vankorneft
(2 licenses)Vostok Oil
7.887
%VIPL, ONGC
TYNGD(2 licenses)
Rosneft9.867
%BP, TIPL
United Arab Emirates
Block OperatorBPCL
StakeOther Partners
Lower Zakum ADNOC 3%CNPC, INPEX, ENI,
Total
Onshore 1Urja
Bharat50%
Global Upstream FootprintPartnership with established Oil and Gas operators expected to generate optimal returns for BPCL.
27
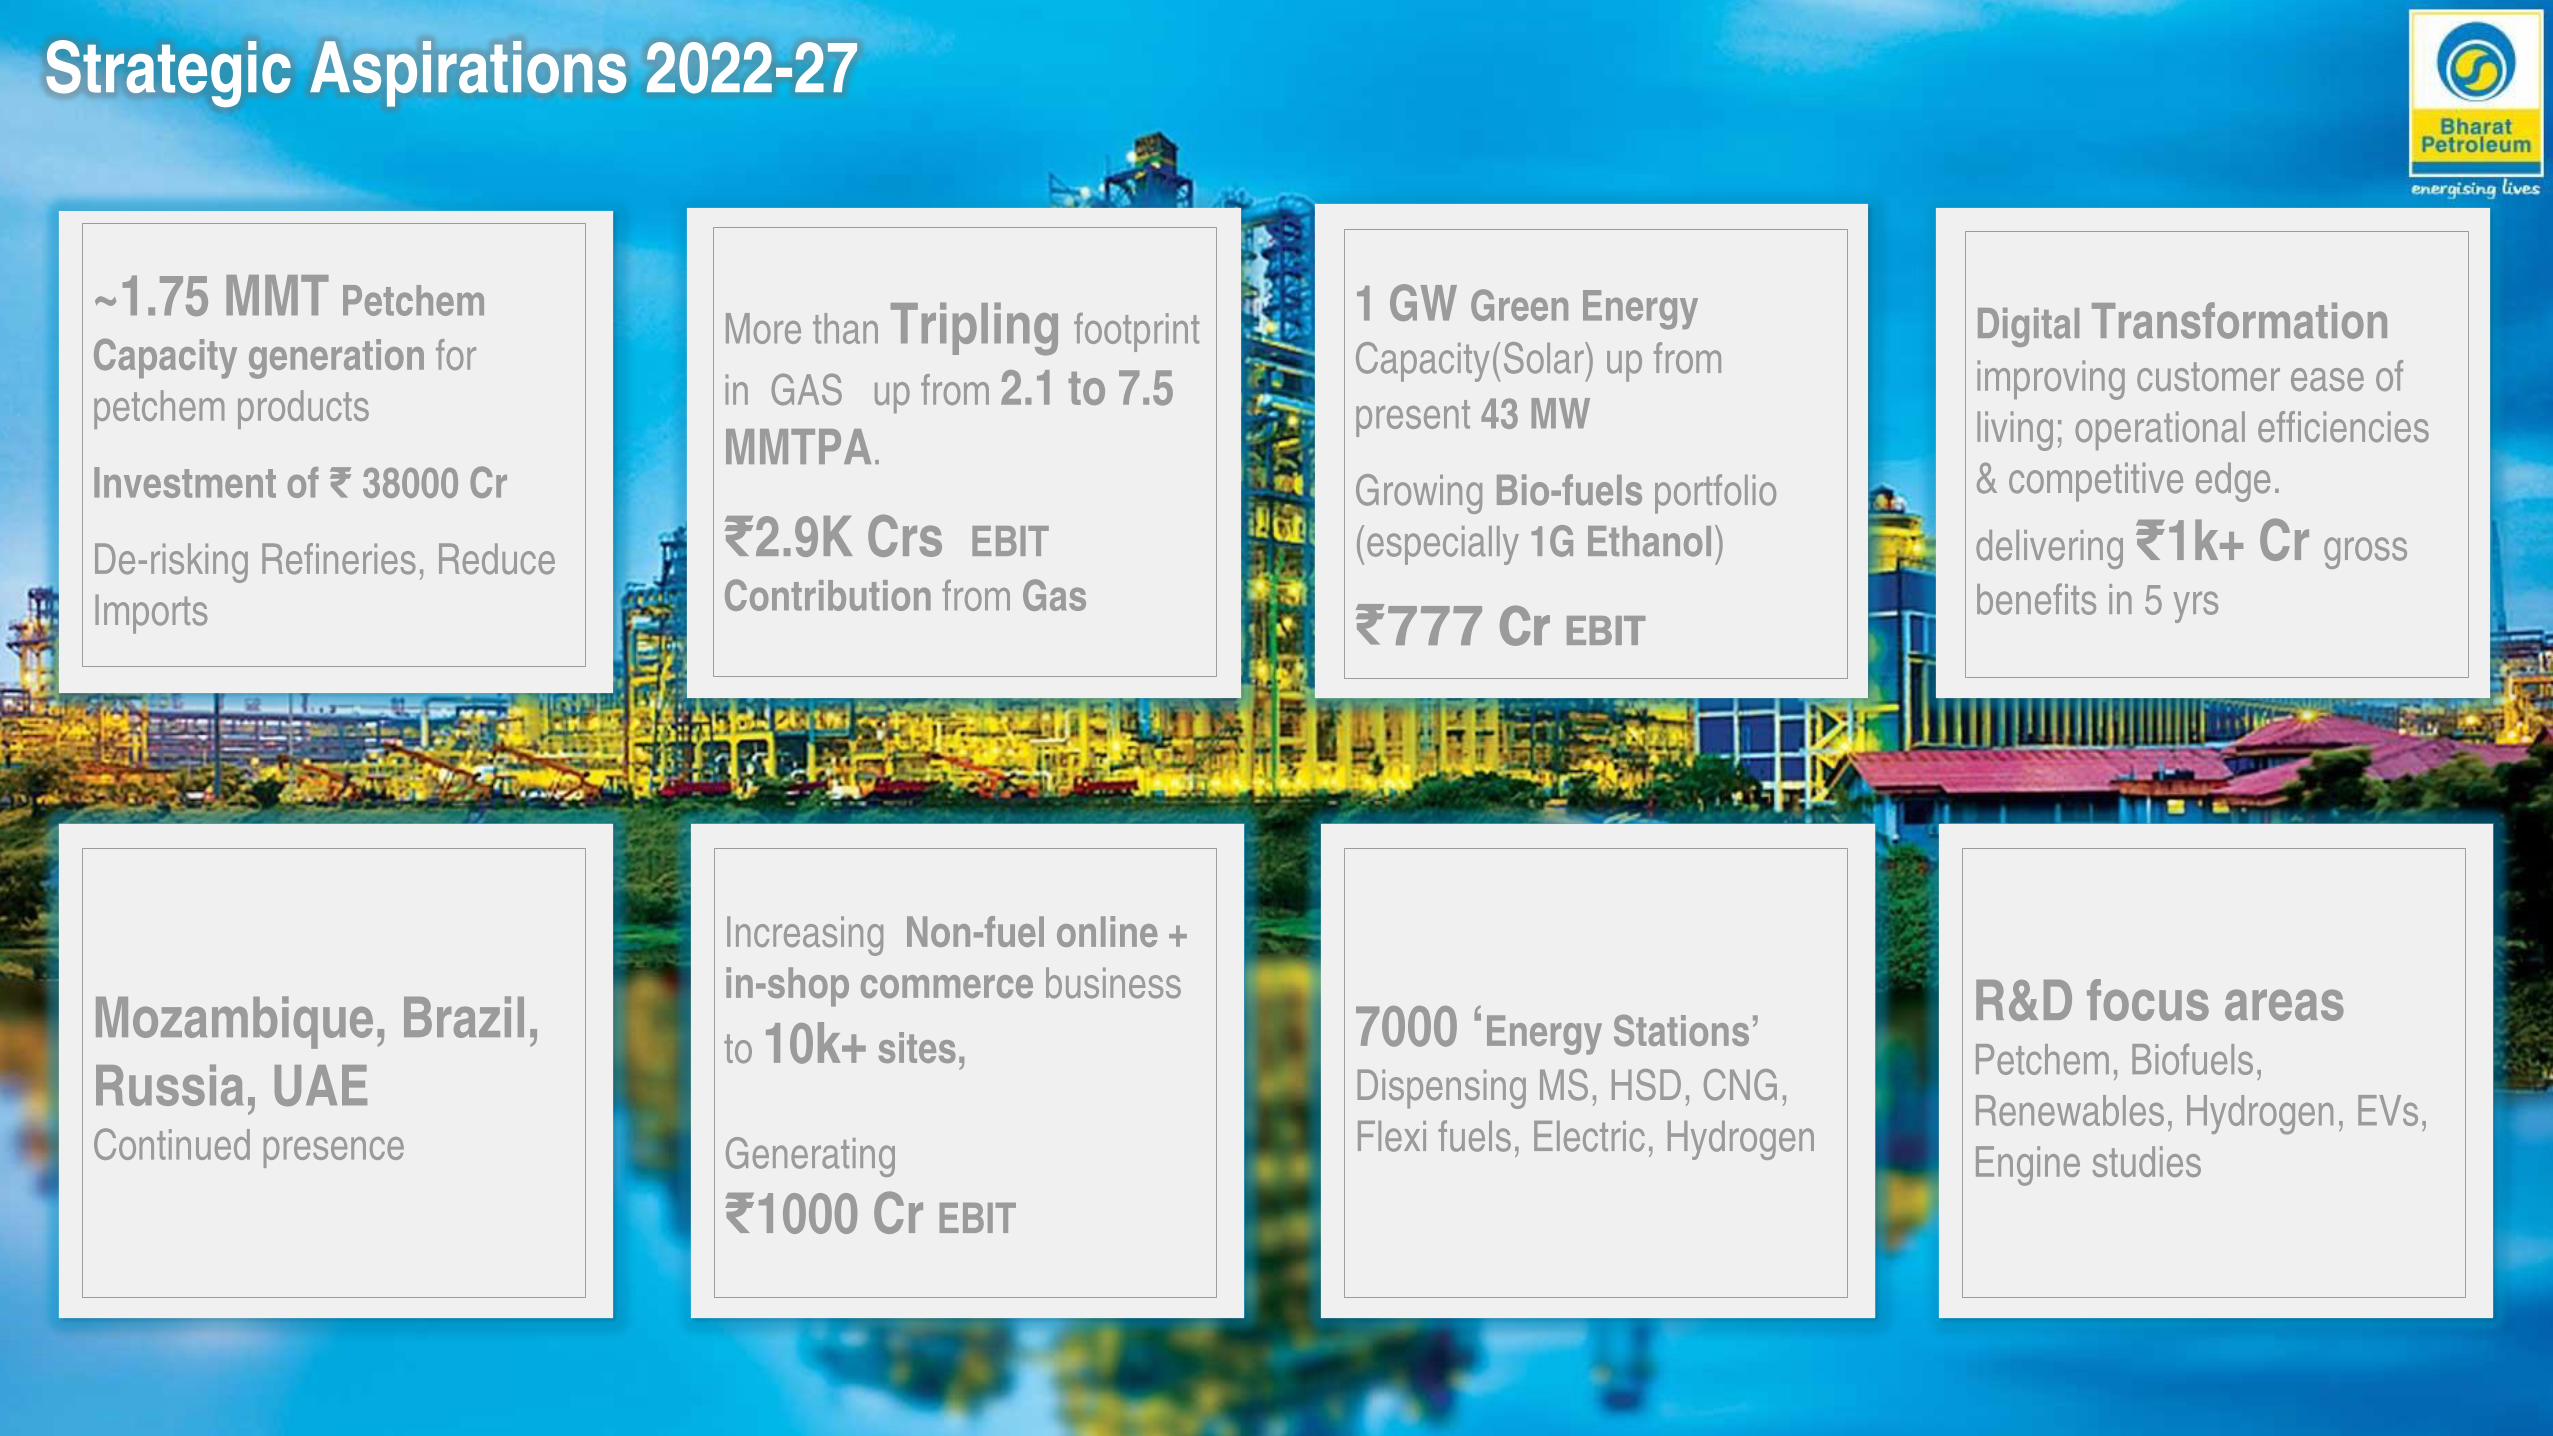
~1.75 MMT Petchem
Capacity generation for
petchem products
Investment of ₹ 38000 Cr
De-risking Refineries, Reduce
Imports
Increasing Non-fuel online +
in-shop commerce business
to 10k+ sites,
Generating
₹1000 Cr EBIT
1 GW Green Energy
Capacity(Solar) up from
present 43 MW
Growing Bio-fuels portfolio
(especially 1G Ethanol)
₹777 Cr EBIT
More than Tripling footprint
in GAS up from 2.1 to 7.5
MMTPA.
₹2.9K Crs EBIT
Contribution from Gas
Strategic Aspirations 2022-27
Digital Transformation improving customer ease of
living; operational efficiencies
& competitive edge.
delivering ₹1k+ Cr gross
benefits in 5 yrs
Mozambique, Brazil,
Russia, UAEContinued presence
7000 ‘Energy Stations’
Dispensing MS, HSD, CNG,
Flexi fuels, Electric, Hydrogen
R&D focus areasPetchem, Biofuels,
Renewables, Hydrogen, EVs,
Engine studies
28
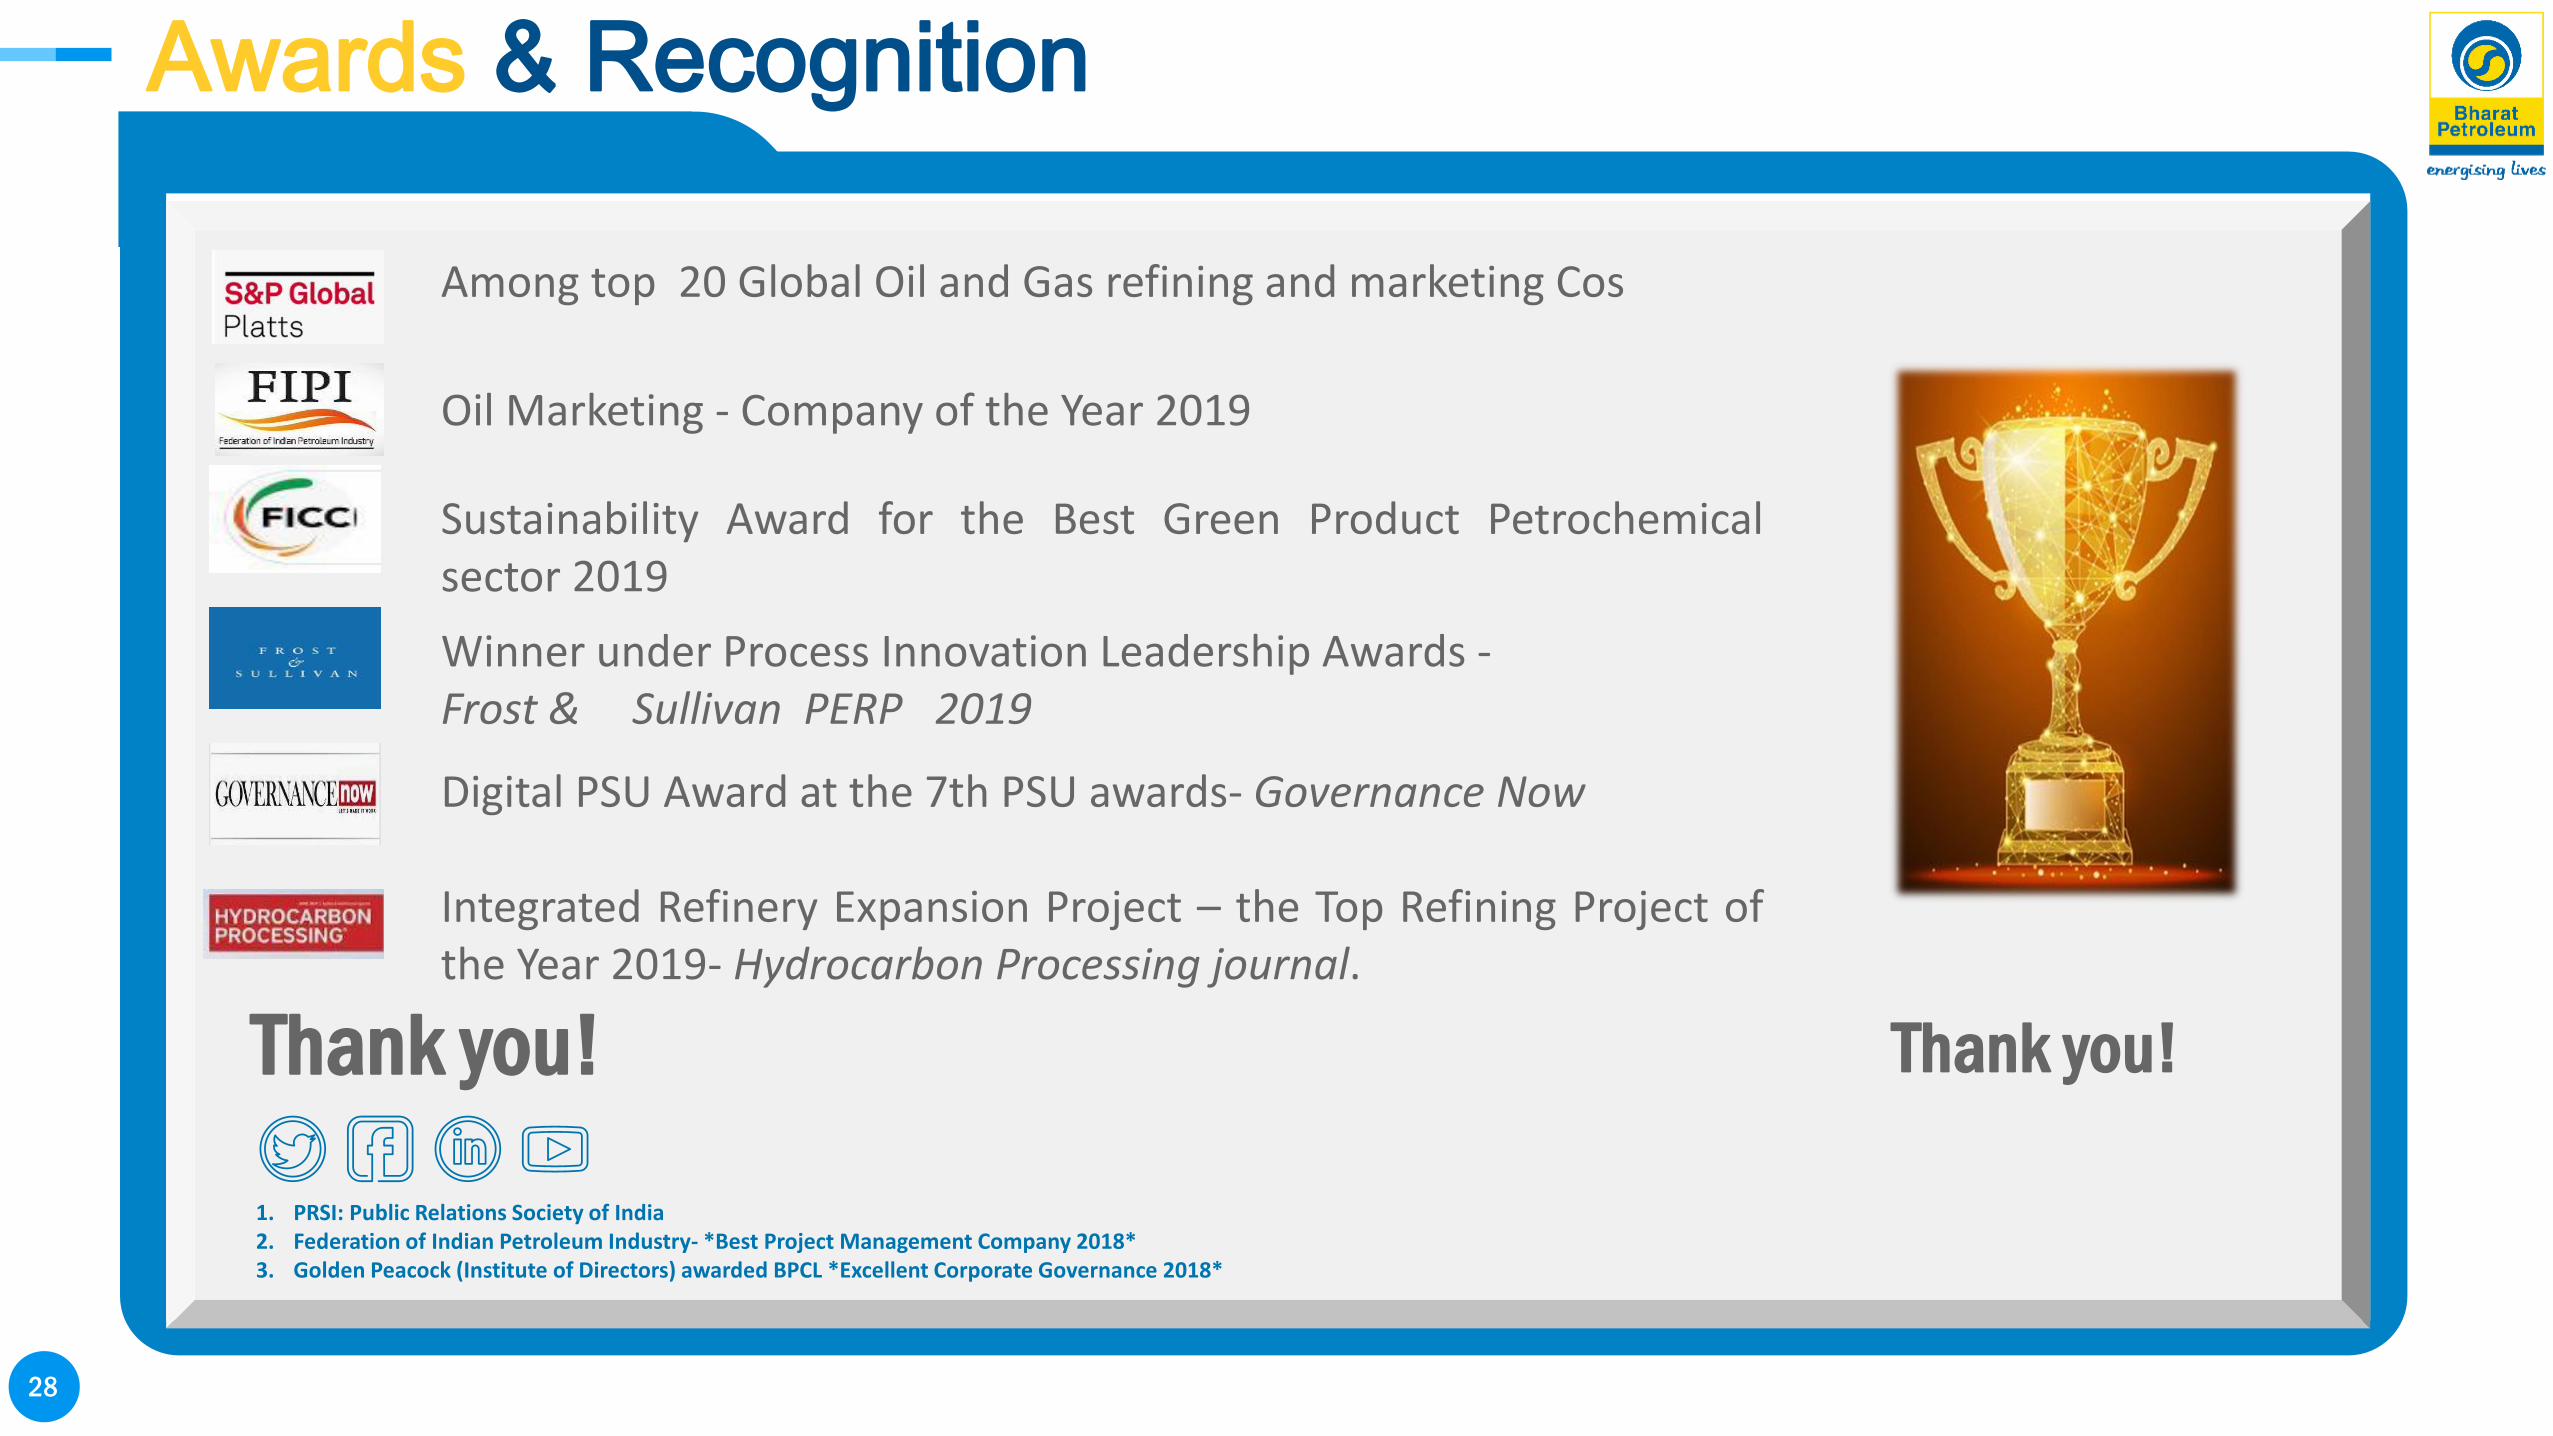
Awards & Recognition
BS VI & IMO Compliant Refinery
Flexibility to process low & high sulphur Crude
Consistently, refining throughput exceeds designed capacity
Ongoing Projects- PDPP, MSBP, Polyols, HTPL
GRM of $5.6/bbl during FY 20 and $9.8/bbl during FY19
1. PRSI: Public Relations Society of India2. Federation of Indian Petroleum Industry- *Best Project Management Company 2018*3. Golden Peacock (Institute of Directors) awarded BPCL *Excellent Corporate Governance 2018*
Thank you!
Among top 20 Global Oil and Gas refining and marketing Cos
Oil Marketing - Company of the Year 2019
Sustainability Award for the Best Green Product Petrochemicalsector 2019
Winner under Process Innovation Leadership Awards -Frost & Sullivan PERP 2019
Digital PSU Award at the 7th PSU awards- Governance Now
Integrated Refinery Expansion Project – the Top Refining Project ofthe Year 2019- Hydrocarbon Processing journal.
Thank you!
29
3. Industry Overview
30
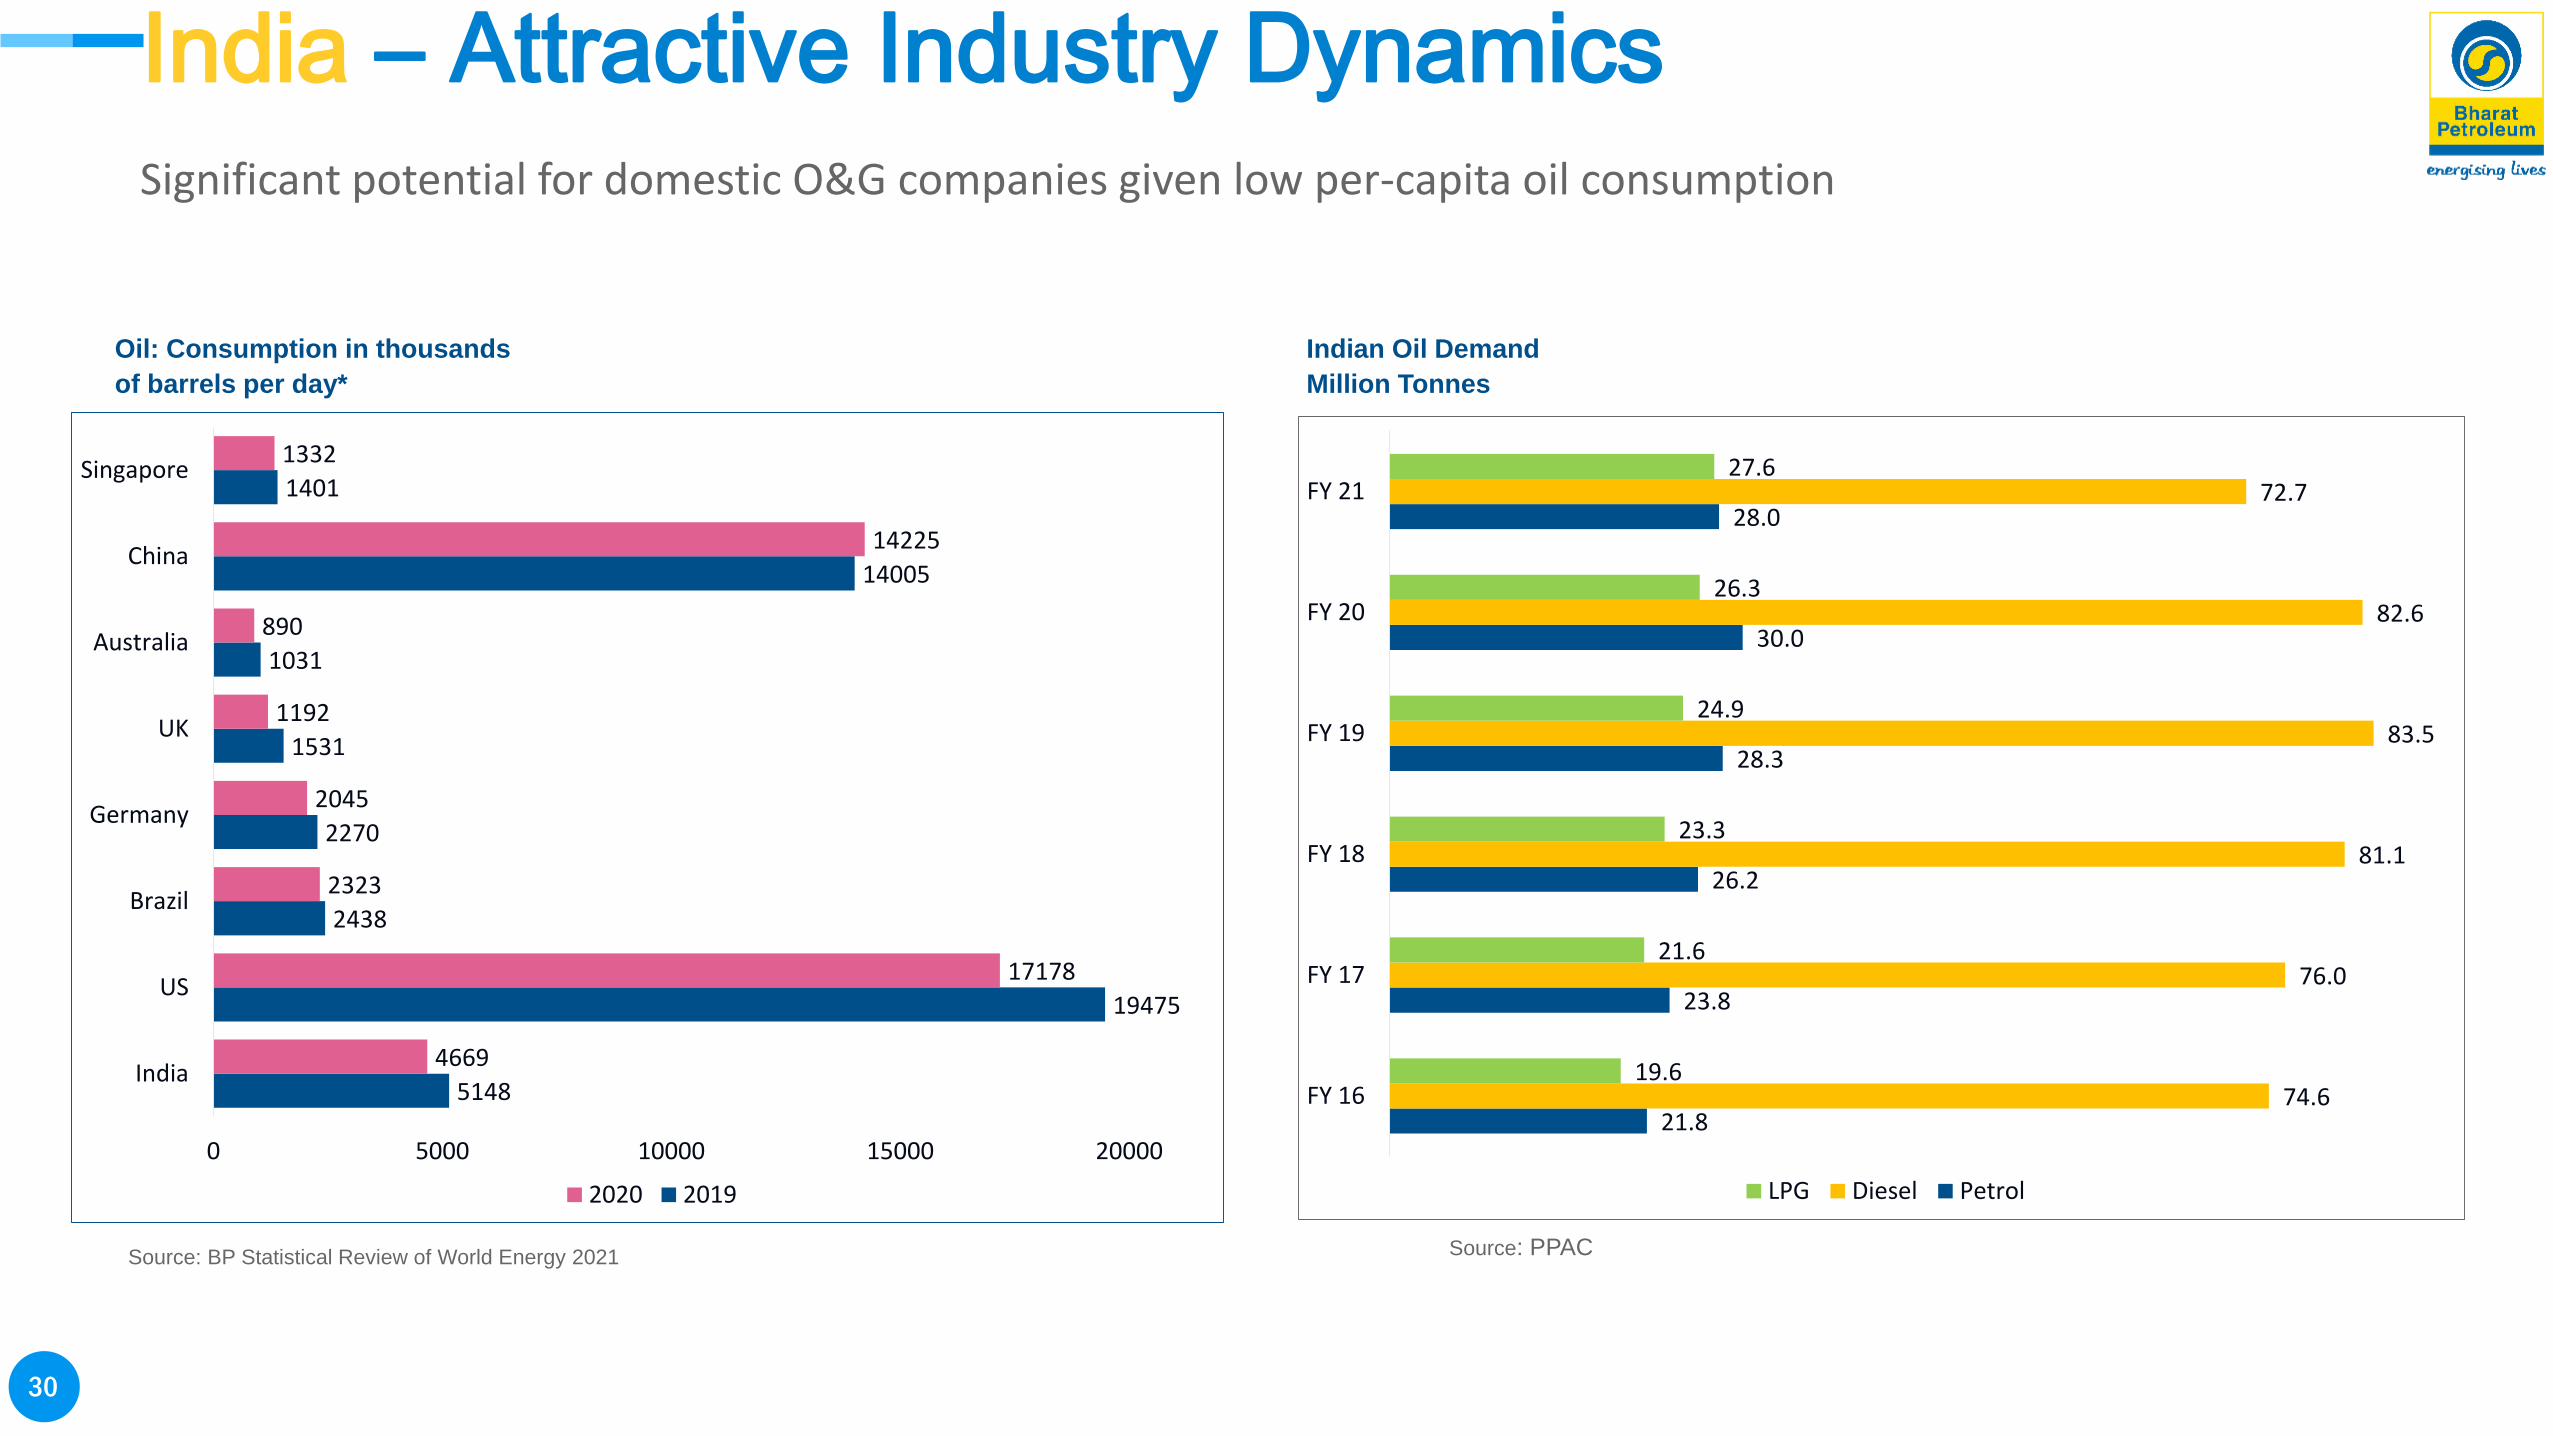
BPCL EvolutionIndia – Attractive Industry Dynamics
Significant potential for domestic O&G companies given low per-capita oil consumption
Oil: Consumption in thousands
of barrels per day*
Indian Oil Demand
Million Tonnes
Source: BP Statistical Review of World Energy 2021 Source: PPAC
21.8
23.8
26.2
28.3
30.0
28.0
74.6
76.0
81.1
83.5
82.6
72.7
19.6
21.6
23.3
24.9
26.3
27.6
FY 16
FY 17
FY 18
FY 19
FY 20
FY 21
LPG Diesel Petrol
5148
19475
2438
2270
1531
1031
14005
1401
4669
17178
2323
2045
1192
890
14225
1332
0 5000 10000 15000 20000
India
US
Brazil
Germany
UK
Australia
China
Singapore
2020 2019
31
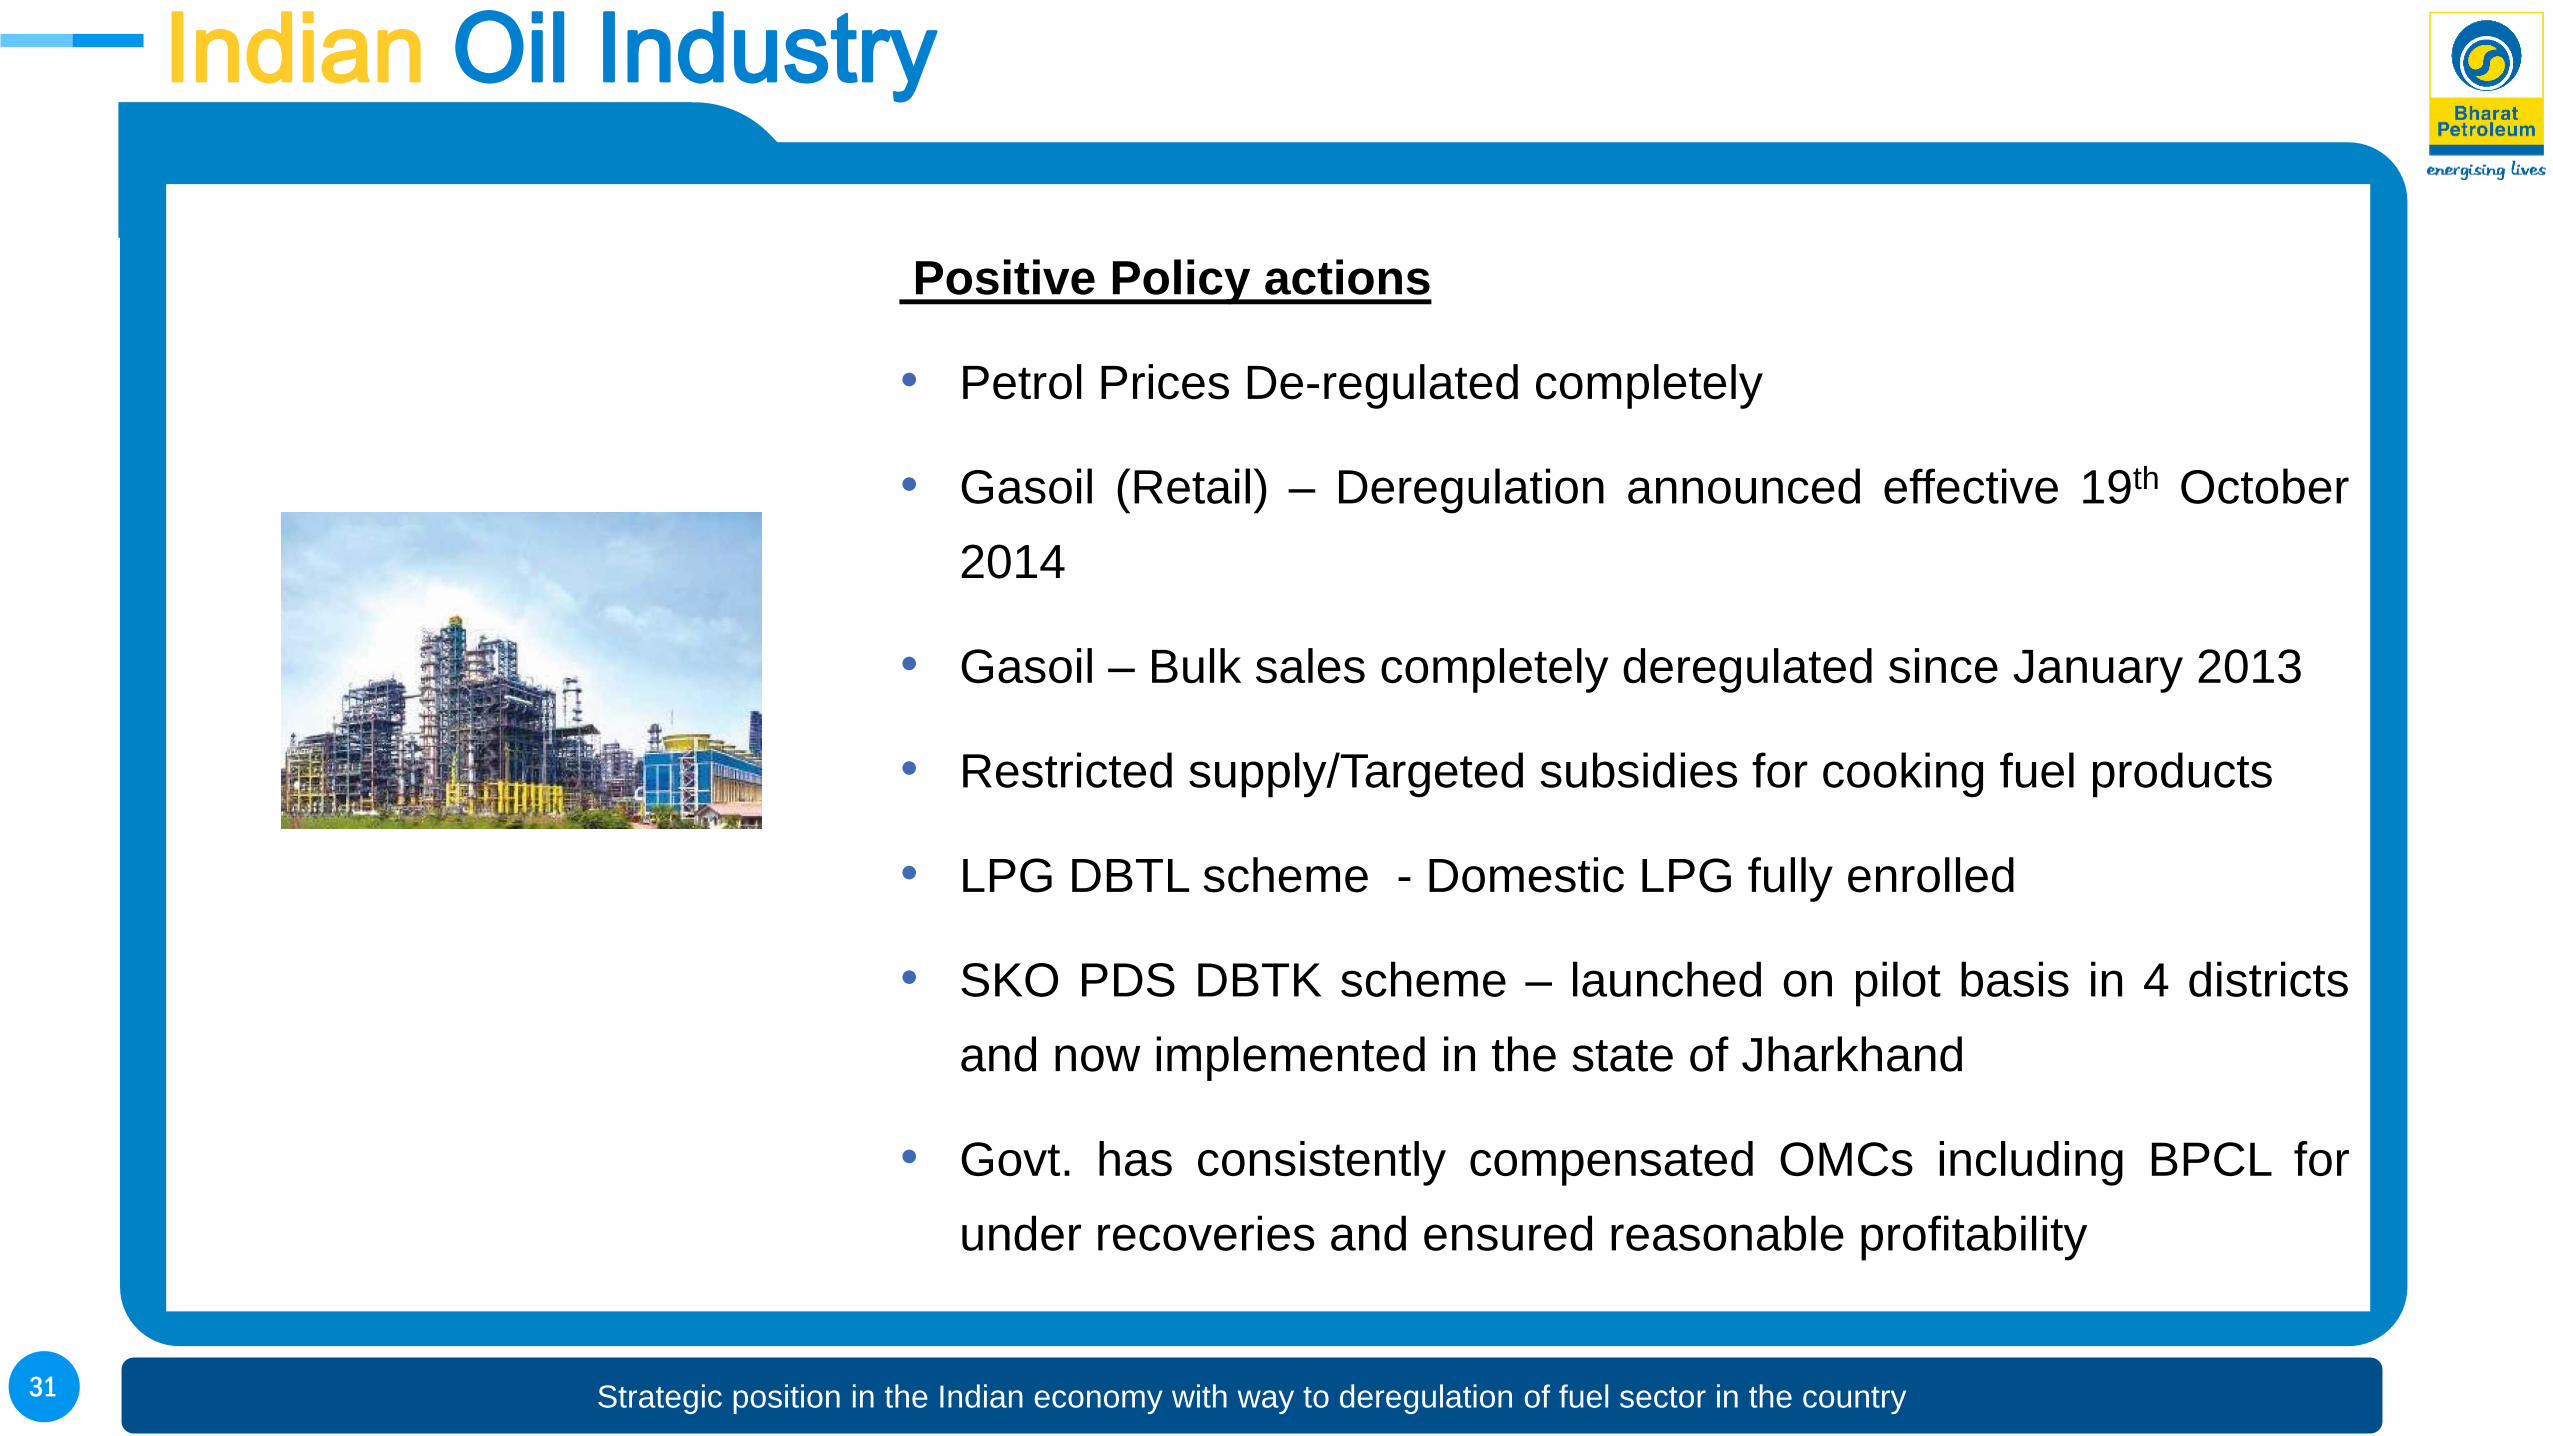
BPCL EvolutionIndian Oil Industry
Strategic position in the Indian economy with way to deregulation of fuel sector in the country
Positive Policy actions
• Petrol Prices De-regulated completely
• Gasoil (Retail) – Deregulation announced effective 19th October
2014
• Gasoil – Bulk sales completely deregulated since January 2013
• Restricted supply/Targeted subsidies for cooking fuel products
• LPG DBTL scheme - Domestic LPG fully enrolled
• SKO PDS DBTK scheme – launched on pilot basis in 4 districts
and now implemented in the state of Jharkhand
• Govt. has consistently compensated OMCs including BPCL for
under recoveries and ensured reasonable profitability
32
BPCL Evolution
Thank You