Embed Size (px)
Citation preview
Investigating the Transport Mechanism of PM2.5 Pollution duringJanuary 2014 in Wuhan, Central China
Miaomiao LU1,2,6 , Xiao TANG*1,3 , Zifa WANG1,3,6 , Lin WU1 , Xueshun CHEN1 , Shengwen LIANG4 ,Hui ZHOU5 , Huangjian WU1,6 , Ke HU4 , Longjiao SHEN4 , Jia YU4 , and Jiang ZHU1,6
1State Key Laboratory of Atmospheric Boundary Layer Physics and Atmospheric Chemistry,
Institute of Atmospheric Physics, Chinese Academy of Sciences, Beijing 100029, China2State Environmental Protection Key Laboratory of Urban Ambient Air Particulate Matter Pollution Prevention and Control,
College of Environmental Science and Engineering, Nankai University, Tianjin 300350, China3Center for Excellence in Regional Atmospheric Environment, Institute of Urban Environment,
Chinese Academy of Sciences, Xiamen 361021, China4Wuhan Environmental Monitoring Center, Wuhan 430015, China
5Hunan Meteorological Observatory, Changsha 410118, China6University of Chinese Academy of Sciences, Beijing 100049, China
(Received 8 December 2018; revised 19 June 2019; accepted 25 June 2019)
ABSTRACT
Severe haze pollution that occurred in January 2014 in Wuhan was investigated. The factors leading to Wuhan’s PM2.5
pollution and the characteristics and formation mechanism were found to be significantly different from other megacities,like Beijing. Both the growth rates and decline rates of PM2.5 concentrations in Wuhan were lower than those in Beijing,but the monthly PM2.5 value was approximately twice that in Beijing. Furthermore, the sharp increases of PM2.5
concentrations were often accompanied by strong winds. A high-precision modeling system with an online source-taggedmethod was established to explore the formation mechanism of five haze episodes. The long-range transport of the pollutedair masses from the North China Plain (NCP) was the main factor leading to the sharp increases of PM2.5 concentrations inWuhan, which contributed 53.4% of the monthly PM2.5 concentrations and 38.5% of polluted days. Furthermore, thechange in meteorological conditions such as weakened winds and stable weather conditions led to the accumulation of airpollutants in Wuhan after the long-range transport. The contribution from Wuhan and surrounding cities to the PM2.5
concentrations was determined to be 67.4% during this period. Under the complex regional transport of pollutants fromsurrounding cities, the NCP, East China, and South China, the five episodes resulted in 30 haze days in Wuhan. Thefindings reveal important roles played by transregional and intercity transport in haze formation in Wuhan.
Key words: haze pollution, regional transport, Wuhan, North China Plain, source-tagged method
Citation: Lu, M. M., and Coauthors, 2019: Investigating the transport mechanism of PM2.5 pollution during January 2014in Wuhan, Central China. Adv. Atmos. Sci., 36(11), 1217−1234, https://doi.org/10.1007/s00376-019-8260-5.
Article Highlights:
• The formation mechanism of haze episodes in Wuhan during January 2014 was investigated.• A high-precision modeling system with an online source-tagged method was employed.• The sharp increase in the PM2.5 concentrations in Wuhan were triggered by long-range transport from the North ChinaPlain region.
1. Introduction
In China, rapid industrialization and urbanization havegiven rise to frequent and persistent haze pollution across pop-
ulated and prosperous regions (Xin et al., 2016). The haze pol-lution found in China is the result of several factors such asindustrial and urban pollutant sources, diverse topographiesand weather patterns (Wang et al., 2018b), and complex re-gional transport of pollutants (Wang et al., 2018a; Chen etal., 2019). The development of air pollution control policiesdemands a clear and thorough understanding of the region-
* Corresponding author: Xiao TANG
Email: [email protected]
ADVANCES IN ATMOSPHERIC SCIENCES, VOL. 36, NOVEMBER 2019, 1217–1234 • Original Paper •
© The Author(s) 2019. This article is published with open access at link.springer.com.
al haze formation mechanism. In this study, we investig-ated the formation of a haze episode in Wuhan over thecourse of 30 days. Wuhan is the largest city in CentralChina and is situated at a crossroads where air pollutantsfrom many neighboring and surrounding city clusters con-verge. For this reason, Wuhan’s geographic location hasemerged as a key region for probing regional air pollutionchallenges in China.
Wuhan is home to approximately 10 million inhabit-ants and has suffered from increasingly frequent haze pollu-tion events in recent years. Based on one year of observa-tions from March 2013 to February 2014 and data from theChinese National Ambient Air Quality Standard, the num-ber of days with a daily average PM2.5 concentration above75 μg m−3 reached 193. This ranked Wuhan in fourth placeamong 31 provincial capital cities (Wang et al., 2014a). Infact, Wuhan’s annual average PM2.5 concentration of 92 μgm−3 is higher than that of Beijing (87 μg m−3), Shanghai (56μg m−3), and Guangzhou (52 μg m−3) (Wang et al., 2014a).In particular, during the winter season, polluted days ac-count for 90% of all days (Wang et al., 2014a). During themonth of January 2013, the number of haze days was 25 inBeijing, while it was 30 in Wuhan during the same period(Zheng et al., 2015b). Persistently high concentrations of par-ticulate matter (PM) are extremely harmful to human health.According to Chen et al. (2013), long-term exposure to ambi-ent PM concentrations of approximately 184 μg m−3 can re-duce life expectancy by more than three years in northernChina. The number of premature adult mortalities due to ex-cessive PM2.5 concentrations across China in 2013 was estim-ated to be greater than one million in total (Liu et al., 2016).Therefore, there is an urgent need to mitigate PM pollutionin Wuhan and Central China.
To date, source apportionment studies for Wuhan havemainly been based on PM composition observations thatcan distinguish between sources from different sectors ofactivities or different types of fossil fuels (Cheng et al.,2012; Gong et al., 2015; Huang et al., 2015; Zhang et al.,2015; Lyu et al., 2016). Very few studies, however, have in-vestigated the role of regional transport in the haze forma-tion mechanism in Wuhan. For instance, Lu et al. (2017) em-ployed a chemical transport model to quantify the contribu-tion of regional transport to two pollution episodes in Octo-ber 2014 and highlighted the complexity of the haze forma-tion mechanism in Wuhan. However, further investigationson the source–reception relationship of Wuhan areneeded—especially for haze episodes during the winter sea-son.
Here, we examine an unprecedented long period of per-sistent pollution over Wuhan that took place in January2014, and compare the relationship between the haze epis-odes and meteorological conditions in Wuhan with Beijing.Moreover, the influence of transboundary transport from theNorth China Plain (NCP), East China(EastC), and SouthChina (SouthC)(definitions in section 2.2) was assessed to in-vestigate the transport mechanism during this case inWuhan. We used a high-resolution modeling system with an
online source-tagged method validated by PM2.5 observa-tions from 117 cities in Central and East China to performthe source apportionment of air pollution over Wuhan. It isthe hope that regions with the highest contribution toWuhan’s haze pollution are identified and are followed upby mitigation efforts. In addition, the clarification of pollu-tion formation processes over the Wuhan area may help to es-tablish a relationship of haze episodes between Wuhan andits surrounding city clusters and establish a holistic view ofthe joint evolution of pollutants across Central and EastChina. This is so that the integrated assessment and future de-velopment of polices can better cope with compound air pollu-tion problems in China. Section 2 describes the methodsand data used in this study. The observational features andformation mechanism of the haze episode are investigatedin section 3. Section 4 provides conclusions and discussion.
2. Methods and data
2.1. Model description and simulation design
The Nested Air Quality Prediction Model System(NAQPMS), a 3D and multiscale air quality model from theInstitute of Atmospheric Physics, Chinese Academy of Sci-ences, was employed to simulate the haze episode over Cent-ral and East China in January 2014 (Wang et al., 2006). Themodel can simulate physical processes (including horizont-al and vertical advection and diffusion, dry and wet depos-ition) and chemical processes (including gaseous, aqueousand heterogeneous phase chemistry) of air pollutants withvarious modules (Li et al., 2007).
The advection process and the dry deposition velocitywere calculated referring to the algorithm of Walcek andAleksic (1998) and a scheme of Wesely (1989), respect-ively. The RADM mechanism (Chang et al., 1987) was em-bedded into NAQPMS to address the wet deposition pro-cesses and aqueous phase chemistry. The gas chemistry mod-ule included 134 reactions with 71 species based on the “car-bon-bond mechanism Z” (Zaveri and Peters, 1999). The sixsecondary organic aerosols were contained in NAQPMSwith the methods and formation rates from Pandis et al.(1992) and Odum et al. (1997). Based on the results from pre-vious studies, heterogeneous phase chemistry does play a sig-nificant part in the production of secondary inorganic aero-sols during China’s winter season (Zheng et al., 2015a;Chen et al., 2016). The finding from Li et al. (2012) indic-ated that 28 heterogeneous chemical interactions on the sur-face of black carbon (BC), sulfate, dust, and sea saltparticles were implemented in NAQPMS. In addition, ver-sion 3.6.1 of the Weather Research and Forecasting (WRF)model provided hourly meteorological data for simulatingair pollutants in NAQPMS. The setup of the WRF model, in-cluding the model domains and their horizontal resolutions,was consistent with that in NAQPMS. Each domain con-tains 27 vertical levels stretched from the surface to 50 hPa.MODIS land-use data were used for the WRF modeling.The WRF physical parameterization schemes employed in
1218 A MONTH-LASTING HAZE EPISODE IN WUHAN VOLUME 36
this study included the Purdue Lin scheme (Lin et al., 1983;Rutledge and Hobbs, 1984) for the microphysical processes,the Grell-3 scheme for the cumulus parameterization, the God-dard shortwave radiation scheme (Chou and Suarez, 1994),the Rapid Radiative Transfer Model scheme for longwave ra-diation, the Noah land surface model, and the Yonsei Uni-versity (YSU) planetary boundary layer scheme. The simula-tion period was from 0000 UTC 25 December 2013 to 0000UTC 1 February 2014, and the first 24 hours were used as aspin-up period in a two-day simulation. NCEP-FNL dataprovided the initial and boundary conditions of the WRF mod-el with a resolution of 1° × 1°. As shown in Fig. 1, three nes-ted domains were set in WRF and NAQPMS, with horizont-al resolutions of 27, 9 and 3 km, respectively. The mother do-main covered Central and East China, the inner domaincovered an area in Hubei and its nearby provinces, and do-main 3 included Wuhan and surrounding cities in HubeiProvince. The simulation of air pollutants was conductedfrom 25 December 2013 to 31 January 2014 with a spin-upperiod during the first seven days. The lateral boundary condi-tions for the first domain in NAQPMS was the monthly aver-age data obtained by the global chemistry transport modelMOZART-v2. They were kept constant during the simula-tion period and the boundary data in the nested domainswere provided by their parent domains.
For analysis in section 3.2, the calculation of the atmo-spheric planetary boundary layer height (PBLH) in the YSU
RB RB
scheme of the WRF model is given. The PBLH is definedas the lowest height at which the overall Richardson num-ber ( ) is less than the critical value of zero. The isdefined as follows:
RB =g∆θvk∆zk
θvk
[(∆Uk
)2+
(∆Vk
)2] , (1)
θvk ∆Uk
∆Vk
∆θvk ∆zk
where represents the mean potential temperature; and are the differences between the kth layer and the low-est layer; and are the differences of potential temper-ature and vertical distance, respectively; and g is the gravita-tional acceleration.
2.2. Source apportionment method
An online source-tagged algorithm (Li et al., 2008; Luet al., 2017; Wu et al., 2017), similar to the ComprehensiveAir Quality Model with Extensions/Particulate Source Appor-tionment Technology (Wagstrom et al., 2008), was em-ployed to quantify the contributions of predefined source re-gions to the concentrations of air pollutants in Wuhan. Theapportionments during the physical and aerosol chemistry cal-culations were separately calculated during the simulation.The method suffered a lower error compared to the tradition-al sensitivity method with the turning on/off of the emis-sions of the source-tagged regions due to the high nonlinear-ity of the chemical transport model. This method has beenused in many previous studies to assess the influence of re-gional transport on the PM, ozone, and other gaseous spe-cies over different regions or cities (Wu et al., 2011; Li etal., 2013; Wang et al., 2014b; Li et al., 2016).
Fs
In this method, the gaseous species and PM were as-sumed to be mixed well in each grid cell, and sharing thesame loss coefficients during the outflow, chemical destruc-tion, and dry and wet deposition. The secondary aerosolswere simplified by connecting them directly to their corres-ponding precursors. Therefore, the fraction of each species( ) was calculated as follows: (
dFs
dt
)i=
(Er,i
)emisr+
(Pr,i
)adv+conv+diff +
(Cr,i
)chem , (2)
(Er,i
)emisr
(Cr,i
)chem
(Pr,i
)adv+conv+diff
S i
where r and i are the tagged region and the index of the mod-el cell, and and represent the productionduring the emission process and the chemical reactions ofthe tagged regions (r) in the ith grid cell. The emission isequal to zero if the ith grid is not included in the tagged emis-sion region. is the flow flux of the speciesfrom the tagged region (r) originating from advection, conven-tion, and diffusion, and represents the total concentra-tions of the species in the ith grid. Moreover, the high speedof chemical reactions among active precursors such as NOx
SO2, and volatile organic compounds (VOCs), form second-ary species including sulfate, nitrate, and secondary organicaerosol, that could be calculated during the chemical pro-cesses to reduce errors due to nonlinearity. More al-
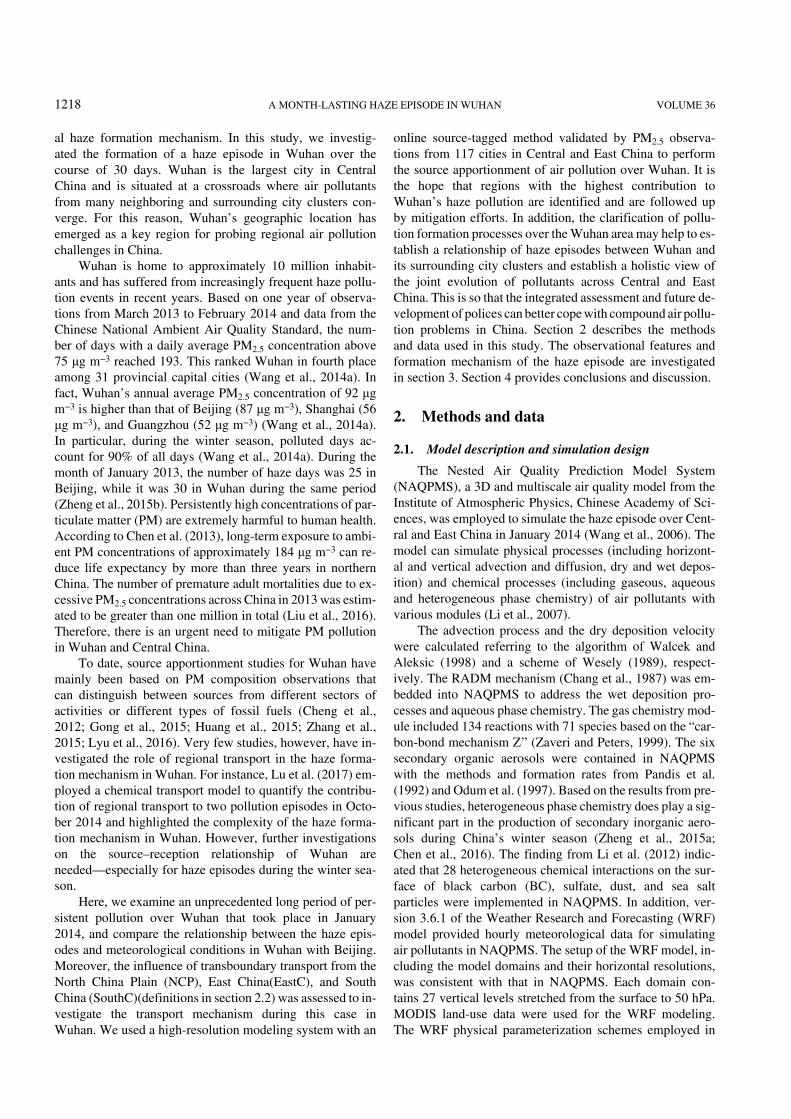
Fig. 1. Configuration of the three model domains and sixtagged emission source regions. The North China Plain (NCP)includes Beijing, Tianjin, Hebei, Shandong and Henanprovinces; East China (EastC) includes Shanghai, Jiangsu,Zhejiang and Anhui provinces; and South China (SouthC)includes Guangdong, Hunan and Jiangxi provinces. The eightcities surrounding Wuhan (AdjCity) include Ezhou, Xianning,Huanggang, Huangshi, Xiaogan, Xiantao, Tianmen, andQianjiang. The locations of the four meteorological stations(blue stars) and sixteen PM2.5 level observation cities (blackdots) are: 1-Beijing, 2-Tianjin, 3-Shijiazhuang, 4-Jinan, 5-Zhengzhou, 6-Wuhan, 7-Changsha, 8-Nanchang, 9-Hefei, 10-Nanjing, 11-Shanghai, 12-Hangzhou, 13-Guangzhou, 14-Chengdu, 15-Xi’an and 16-Taiyuan.
NOVEMBER 2019 LU ET AL. 1219

gorithms can be referred to in Wu et al. (2017) and Lu et al.(2017).
To quantify the regional contributions to the PM2.5 con-centrations in Wuhan, we marked six emission source re-gions based on the administrative divisions shown in Fig. 1.The tagged source regions were: Wuhan and the eightnearby cities of Ezhou, Xianning, Huanggang, Huangshi,Xiaogan, Xiantao, Tianmen and Qianjiang; the NCP region,including Beijing–Tianjin–Hebei and the provinces of Shan-dong and Henan; EastC including the provinces of Shang-hai, Jiangsu, Zhejiang and Anhui; SouthC including theprovinces of Guangdong, Hunan and Jiangxi; and otherareas, referred to simply as “others”.
2.3. Emission data
The anthropogenic emission data for NAQPMS wasprovided by version 2.1 of the Regional Emission Invent-ory in ASia (REAS) from Japan, covering East, Central,Southeast and South Asia with a spatial resolution of 0.25°× 0.25° (approximately 30 × 25 km) and a temporal resolu-tion of one month (Ohara et al., 2007). The emissionsources with the base years of 2000–08 included fuel combus-tion sources like heavy industry, power plants, transporta-tion, and other activities of this kind, industrial emissions, ag-ricultural activities such as fertilizer application and live-stock, fugitive emissions, solvent use, and so on. The REASemissions inventory is reported in detail in Kurokawa et al.(2013) and has been widely applied in numerical studies (Liet al., 2012; Zhong et al., 2014). For this case study of Janu-ary 2014, a big obstacle was that the emissions inventoryfor the base year of 2014 was not available, while the emis-sions over China changed very rapidly due to the rapid urban-ization, industrial development, and emission control meas-ures. In order to reduce the uncertainty induced by thechanges of regional emissions between 2008 and 2014, weemployed the inverse method developed by Tang et al.(2013) and surface observations to update the regional emis-sions inventory for CO, SO2 and NOx. Figure S1 in Electron-ic Supplementary Material compares the CO simulations us-ing the original and the inversed CO emissions inventory.The modeling errors of the precursors were greatly reduced,which could in turn reduce the uncertainties of the air pollut-ant transport modeling and improve the accuracy of thesource apportionment results. Moreover, considering the signi-ficant impact of biomass burning across China (Ding et al.,2016), the daily fire emissions with 1-km resolution fromthe Fire Inventory from NCAR (FINNv1), including agricul-tural fires, wildfires, and prescribed burning(https://www2.acom.ucar.edu/modeling/finnfire-inventory-ncar), were incorporated into the modeling. Additionally,the anthropogenic emissions containing PM2.5, PM10, CO,SO2, NOx, NO, BC, organic carbon (OC) and VOCs were up-dated in Wuhan using the local emissions inventory fromthe Wuhan Research Academy of Environmental Sciencesand Peking University. The base year of the inventory is2014 and the horizontal resolution is 3 km. The main anthro-pogenic sectors included fossil-fuel combustion, transporta-
tion, agriculture, dust, biomass burning, solvent use, powerplants, and other activities of this nature. The point sources,such as power plants, were coordinated based on their loca-tions, while the areal sources and line sources were pro-cessed and gridded at a 3 km × 3 km resolution using mapsof the total populations, road networks and soil properties.
2.4. Measurement data
Routine meteorological data in Wuhan and three otherprovincial cities (Beijing, Hefei, and Changsha) from theChina Meteorological Administration were used to validatethe WRF model and analyze the characteristics of the meteor-ological conditions in January 2014. The hourly observa-tions, including 2-m temperature, 2-m relative humidity(RH), 10-m wind speed (WS) and wind direction (WD),were used. The hourly observed PM2.5 concentrations inWuhan and 116 other cities were provided by the Wuhan En-vironmental Monitoring Center and the China National Envir-onmental Monitoring Center, respectively. The locations ofall observation stations are shown in Fig. 1. The data fromthese observation stations were used for validatingNAQPMS and investigating the characteristics of the hazeepisode at both urban and regional scales.
3. Results and discussion
3.1. Model validation
To assess the performance of the WRF model for the met-eorological simulations, the simulated surface temperature,RH, WD, and WS were compared with the observed data. Ta-ble 1 and Fig. S2 present the statistics of the model perform-ance in Wuhan and other cities like Beijing, Hefei and Chang-sha. Overall, the WRF model was able to reproduce themain characteristics of the four meteorological variables inthese four cities. The simulated temperatures at 2 m wereclose to the observations, with correlation coefficients (r) of0.75–0.91 and average mean biases (MB) of approximately−1.8 to 1.4°C. The variations of RH were also reproducedby the model with r values of approximately 0.72–0.84, ex-cept for more underestimation of RH in SouthC than thatover the NCP. RH is a diagnostic quantity rather than an out-put of the model and is inferred based on the simulated tem-perature, surface pressure, and water vapor mixing ratio. Assuggested by Yang and Duan (2016), one possible reasonfor the underestimation of RH in the WRF model is due tothe overestimation of the surface temperature under insignific-ant change in water vapor pressure. WRF overestimated thesurface temperature, with mean biases from 0.5°C to 1.4°C,in southern cities of China. The correlations between the simu-lated WSs and the observations, with r values ranging from0.32 to 0.71, were relatively lower than those of temperat-ure and RH, which might be related to the difficulty in simu-lating the weak atmospheric circulation at the urban scale.The WRF model was able to reproduce the evolution of thewinds in these cities, especially for the period with prevail-ing strong winds.
1220 A MONTH-LASTING HAZE EPISODE IN WUHAN VOLUME 36
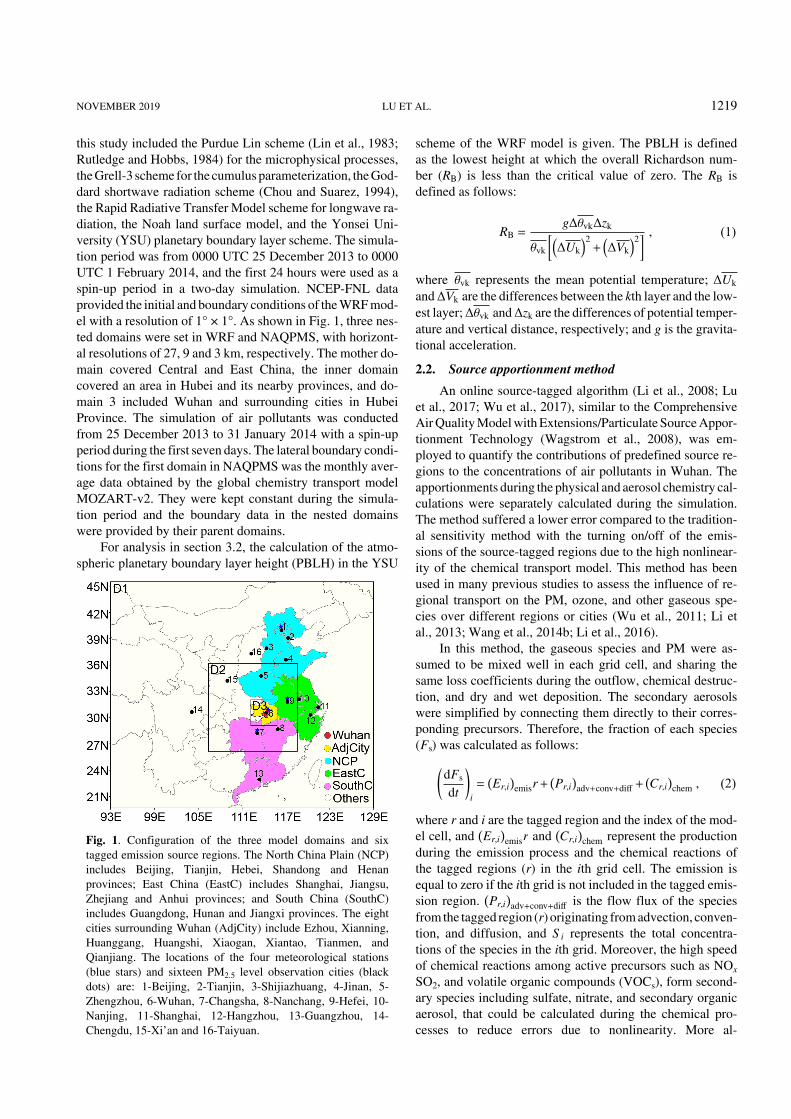
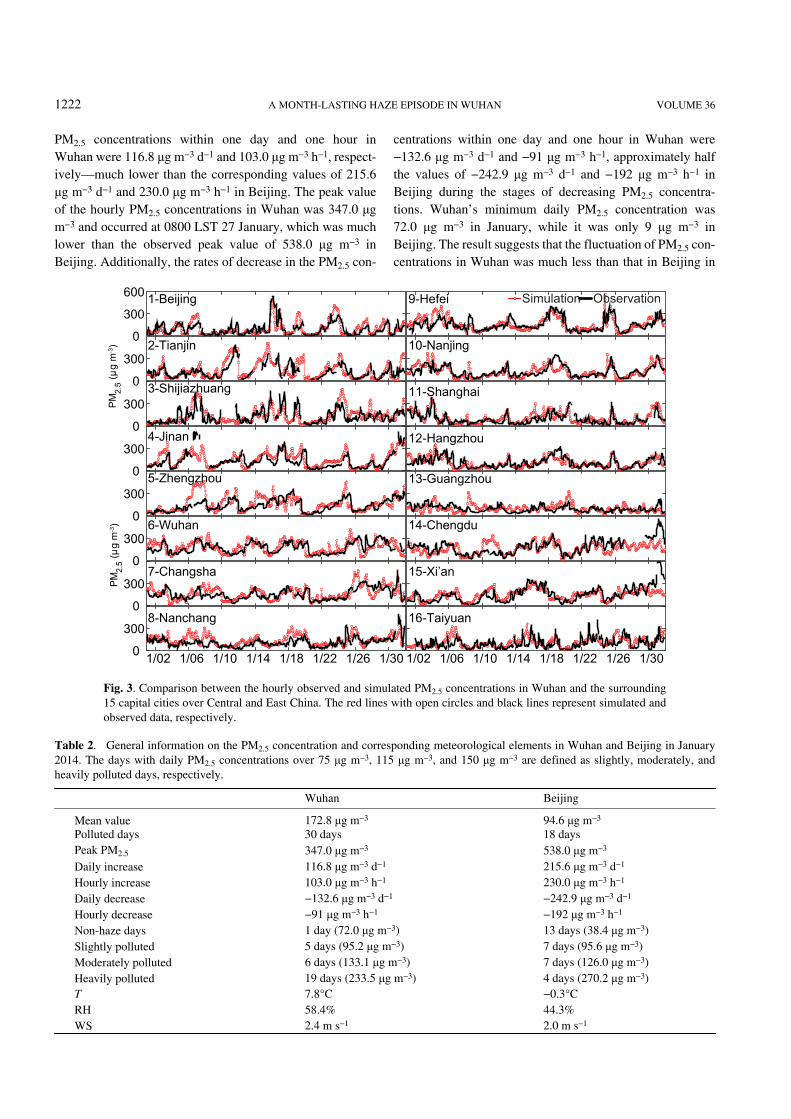
Figure 2 displays the simulated monthly average concen-trations of PM2.5 over Central and East China and the ob-served PM2.5 concentrations in 117 cities during January2014. As shown by the observations and simulations, PM2.5
values over 150 μg m−3 were mainly distributed across thesouth of the NCP region, Central China, north of SouthC,and the Sichuan Basin. The average PM2.5 concentrations inJanuary 2014 over the typical cities in the SouthC region(e.g., Changsha, Nanchang, Guangzhou), at 93.1 μg m−3 to153.9 μg m−3, were relatively higher than those over the typic-al cities in the NCP region (e.g., Beijing, Tianjin,Shijiazhuang, Jinan, Zhengzhou), at 93.5 μg m−3 to 138.4μg m−3. The model showed good performance for the mag-nitude and spatial distribution of PM2.5 concentrations overCentral and East China. Figure 3 compares the hourly simu-lated and observed PM2.5 concentrations in Wuhan and the15 provincial capital cities, with corresponding statistical para-meters shown in Table S1. The simulated PM2.5 values wereconsistent with observations in most cities, with r values ofapproximately 0.48–0.73 and MBs within ±20 μg m−3, spe-cifically for periods with sharp increases and decreases ofthe PM2.5 concentrations over the NCP, including Beijing,Tianjin, Shijiazhuang, Jinan, and Zhengzhou, as well asEast China, including Shanghai, Hangzhou, and Nanjing.The mean fraction biases (MFBs) of −10.5% to 22.6% andmean fraction errors (MFEs) of 31.6%–54.2% in all citiesalso suggest a good performance of NAQPMS, based on a pre-vious study of the evaluation of PM simulation with chemic-al transport models (Boylan and Russell, 2006). Therefore,the high-precision simulated data of the PM2.5 concentra-tions served as a good basis for analyzing the variations inthe spatiotemporal distributions of the PM2.5 pollution andquantifying the impacts of regional transport to the haze form-ation in Wuhan.
3.2. Overall characteristics of meteorological conditionsand haze episodes in Wuhan
Wuhan experienced a persistent haze pollution periodfor nearly the entire month of January 2014, which was signi-
ficantly longer than that in Beijing with 18 polluted days. Adetailed comparison of several statistics of the PM2.5 concen-trations and the corresponding meteorological variables ob-served in Wuhan and Beijing during this period is shown inTable 2. The number of severely polluted days with a dailyPM2.5 average ≥150 μg m−3 was 19, which was far morethan that of Beijing at 4 days. The monthly average PM2.5 con-centration reached 172.8 μg m−3 in Wuhan—almost twiceas much as the 94.6 μg m−3 found in Beijing during January2014, and much higher than the 121.0 μg m−3 also reportedin Beijing during January 2013 (Zheng et al., 2015b). Theseresults suggest that the haze pollution in Wuhan was farworse and persisted for a longer period compared to Beijingduring January 2014.
In view of the temporal variation in the PM2.5 values inFig. 4, the daily values showed cyclic variations lasting ap-proximately 4–10 days in Wuhan and approximately 3–7days in Beijing. During the processes of accumulationamong pollutants, the maximum rates of increase in the
Table 1. Statistical parameters of the three simulated and observed meteorological parameters [temperature (T), relative humidity (RH),and wind speed (WS)] in Wuhan, Changsha, Hefei and Beijing in January 2014. The definitions of the abbreviations MO, MM, MB, r,MFB and MFE are given (Table S1 in Electronic Supplementary Material).
Site Factors MO MM MB r MFB(%) MFE (%)
Wuhan T (°C) 7.7 9.1 1.4 0.84 18.4 26.7RH (%) 58.3 46.2 −12.1 0.77 −20.7 25.4WS (m s−1) 2.4 3.3 0.9 0.33 34.2 53.2
Changsha T (°C) 8.6 9.1 0.5 0.85 4.4 32.4RH (%) 62.2 50.8 −11.4 0.84 −20.7 25.2WS (m s−1) 2.4 3.0 0.6 0.63 26.0 45.3
Hefei T (°C) 5.5 6.1 0.6 0.91 −15.6 17.4RH (%) 68.3 56.3 −12 0.80 −18.2 24.7WS (m s−1) 1.9 3.2 1.3 0.71 58.3 62.4
Beijing T (°C) −0.3 −2.1 −1.8 0.75 63.3 −55.8RH (%) 44.3 40.8 −3.5 0.72 −0.8 31.6WS (m s−1) 2.0 2.9 0.8 0.32 36.3 59.6
96E 102E 108E 114E 120E 126E
45N
39N
33N
27N
21N
24N
30N
36N
42N
35
50
75130
250
150
μg m-3
Fig. 2. The monthly mean concentrations of simulated PM2.5 (background color) and the observed values of 117 cities (solidcircles) in the first modeling domain in January 2014.
NOVEMBER 2019 LU ET AL. 1221
PM2.5 concentrations within one day and one hour inWuhan were 116.8 μg m−3 d−1 and 103.0 μg m−3 h−1, respect-ively—much lower than the corresponding values of 215.6μg m−3 d−1 and 230.0 μg m−3 h−1 in Beijing. The peak valueof the hourly PM2.5 concentrations in Wuhan was 347.0 μgm−3 and occurred at 0800 LST 27 January, which was muchlower than the observed peak value of 538.0 μg m−3 inBeijing. Additionally, the rates of decrease in the PM2.5 con-
centrations within one day and one hour in Wuhan were−132.6 μg m−3 d−1 and −91 μg m−3 h−1, approximately halfthe values of −242.9 μg m−3 d−1 and −192 μg m−3 h−1 inBeijing during the stages of decreasing PM2.5 concentra-tions. Wuhan’s minimum daily PM2.5 concentration was72.0 μg m−3 in January, while it was only 9 μg m−3 inBeijing. The result suggests that the fluctuation of PM2.5 con-centrations in Wuhan was much less than that in Beijing in
Table 2. General information on the PM2.5 concentration and corresponding meteorological elements in Wuhan and Beijing in January2014. The days with daily PM2.5 concentrations over 75 μg m−3, 115 μg m−3, and 150 μg m−3 are defined as slightly, moderately, andheavily polluted days, respectively.
Wuhan Beijing
Mean value 172.8 μg m−3 94.6 μg m−3
Polluted days 30 days 18 daysPeak PM2.5 347.0 μg m−3 538.0 μg m−3
Daily increase 116.8 μg m−3 d−1 215.6 μg m−3 d−1
Hourly increase 103.0 μg m−3 h−1 230.0 μg m−3 h−1
Daily decrease −132.6 μg m−3 d−1 −242.9 μg m−3 d−1
Hourly decrease −91 μg m−3 h−1 −192 μg m−3 h−1
Non-haze days 1 day (72.0 μg m−3) 13 days (38.4 μg m−3)Slightly polluted 5 days (95.2 μg m−3) 7 days (95.6 μg m−3)Moderately polluted 6 days (133.1 μg m−3) 7 days (126.0 μg m−3)Heavily polluted 19 days (233.5 μg m−3) 4 days (270.2 μg m−3)T 7.8°C −0.3°CRH 58.4% 44.3%WS 2.4 m s−1 2.0 m s−1
0
300
600 simulation observationSimulation Observation
0
300
PM
2.5
(µg
m-3
)
0
300
0
300
1-Beijing
2-Tianjin
3-Shijiazhuang
4-Jinan
9-Hefei
10-Nanjing
11-Shanghai
12-Hangzhou
0
300
0
300
0
300
1/02 1/06 1/10 1/14 1/18 1/22 1/26 1/300
300
1/02 1/06 1/10 1/14 1/18 1/22 1/26 1/30
5-Zhengzhou
6-Wuhan
7-Changsha
8-Nanchang
13-Guangzhou
14-Chengdu
15-Xi’an
16-Taiyuan
PM
2.5
(µg
m-3
)
Fig. 3. Comparison between the hourly observed and simulated PM2.5 concentrations in Wuhan and the surrounding15 capital cities over Central and East China. The red lines with open circles and black lines represent simulated andobserved data, respectively.
1222 A MONTH-LASTING HAZE EPISODE IN WUHAN VOLUME 36
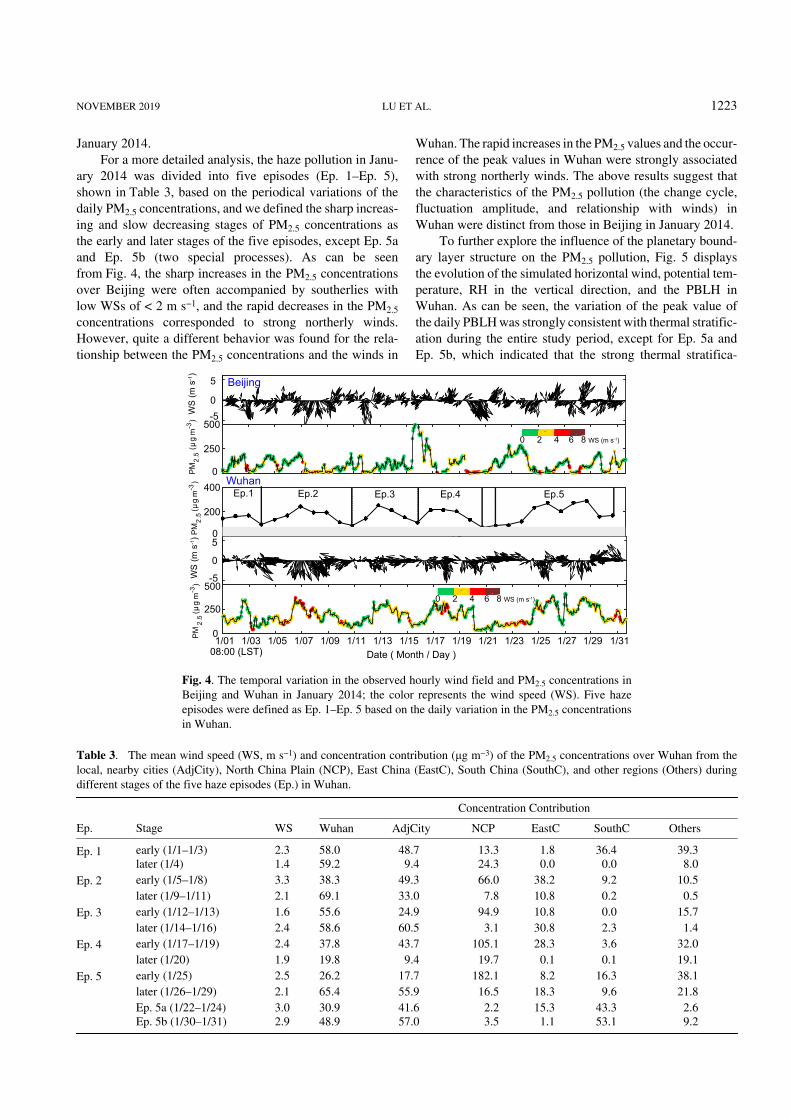
January 2014.For a more detailed analysis, the haze pollution in Janu-
ary 2014 was divided into five episodes (Ep. 1–Ep. 5),shown in Table 3, based on the periodical variations of thedaily PM2.5 concentrations, and we defined the sharp increas-ing and slow decreasing stages of PM2.5 concentrations asthe early and later stages of the five episodes, except Ep. 5aand Ep. 5b (two special processes). As can be seenfrom Fig. 4, the sharp increases in the PM2.5 concentrationsover Beijing were often accompanied by southerlies withlow WSs of < 2 m s−1, and the rapid decreases in the PM2.5
concentrations corresponded to strong northerly winds.However, quite a different behavior was found for the rela-tionship between the PM2.5 concentrations and the winds in
Wuhan. The rapid increases in the PM2.5 values and the occur-rence of the peak values in Wuhan were strongly associatedwith strong northerly winds. The above results suggest thatthe characteristics of the PM2.5 pollution (the change cycle,fluctuation amplitude, and relationship with winds) inWuhan were distinct from those in Beijing in January 2014.
To further explore the influence of the planetary bound-ary layer structure on the PM2.5 pollution, Fig. 5 displaysthe evolution of the simulated horizontal wind, potential tem-perature, RH in the vertical direction, and the PBLH inWuhan. As can be seen, the variation of the peak value ofthe daily PBLH was strongly consistent with thermal stratific-ation during the entire study period, except for Ep. 5a andEp. 5b, which indicated that the strong thermal stratifica-
Table 3. The mean wind speed (WS, m s−1) and concentration contribution (μg m−3) of the PM2.5 concentrations over Wuhan from thelocal, nearby cities (AdjCity), North China Plain (NCP), East China (EastC), South China (SouthC), and other regions (Others) duringdifferent stages of the five haze episodes (Ep.) in Wuhan.
Concentration Contribution
Ep. Stage WS Wuhan AdjCity NCP EastC SouthC Others
Ep. 1 early (1/1–1/3) 2.3 58.0 48.7 13.3 1.8 36.4 39.3later (1/4) 1.4 59.2 9.4 24.3 0.0 0.0 8.0
Ep. 2 early (1/5–1/8) 3.3 38.3 49.3 66.0 38.2 9.2 10.5later (1/9–1/11) 2.1 69.1 33.0 7.8 10.8 0.2 0.5
Ep. 3 early (1/12–1/13) 1.6 55.6 24.9 94.9 10.8 0.0 15.7later (1/14–1/16) 2.4 58.6 60.5 3.1 30.8 2.3 1.4
Ep. 4 early (1/17–1/19) 2.4 37.8 43.7 105.1 28.3 3.6 32.0later (1/20) 1.9 19.8 9.4 19.7 0.1 0.1 19.1
Ep. 5 early (1/25) 2.5 26.2 17.7 182.1 8.2 16.3 38.1later (1/26–1/29) 2.1 65.4 55.9 16.5 18.3 9.6 21.8Ep. 5a (1/22–1/24) 3.0 30.9 41.6 2.2 15.3 43.3 2.6Ep. 5b (1/30–1/31) 2.9 48.9 57.0 3.5 1.1 53.1 9.2
0
200
400
-5
0
5
1/01 1/03 1/05 1/07 1/09 1/11 1/13 1/15 1/17 1/19 1/21 1/23 1/25 1/27 1/29 1/310
250
500
WS
(m s
-1)
-50
5
PM
2.5
(µ
g m
-3 )
0
250
500WS (m s-1) 0 2 4 6 8
Beijing
Wuhan Ep.1 Ep.2 Ep.3 Ep.4 Ep.5
75 µg m -3
Date ( Month / Day )08:00 (LST)
PM
2.5
(µg
m-3 )
WS
(m s
-1)
PM
2.5
(µg
m-3 )
WS (m s-1) 0 2 4 6 8
Fig. 4. The temporal variation in the observed hourly wind field and PM2.5 concentrations inBeijing and Wuhan in January 2014; the color represents the wind speed (WS). Five hazeepisodes were defined as Ep. 1–Ep. 5 based on the daily variation in the PM2.5 concentrationsin Wuhan.
NOVEMBER 2019 LU ET AL. 1223
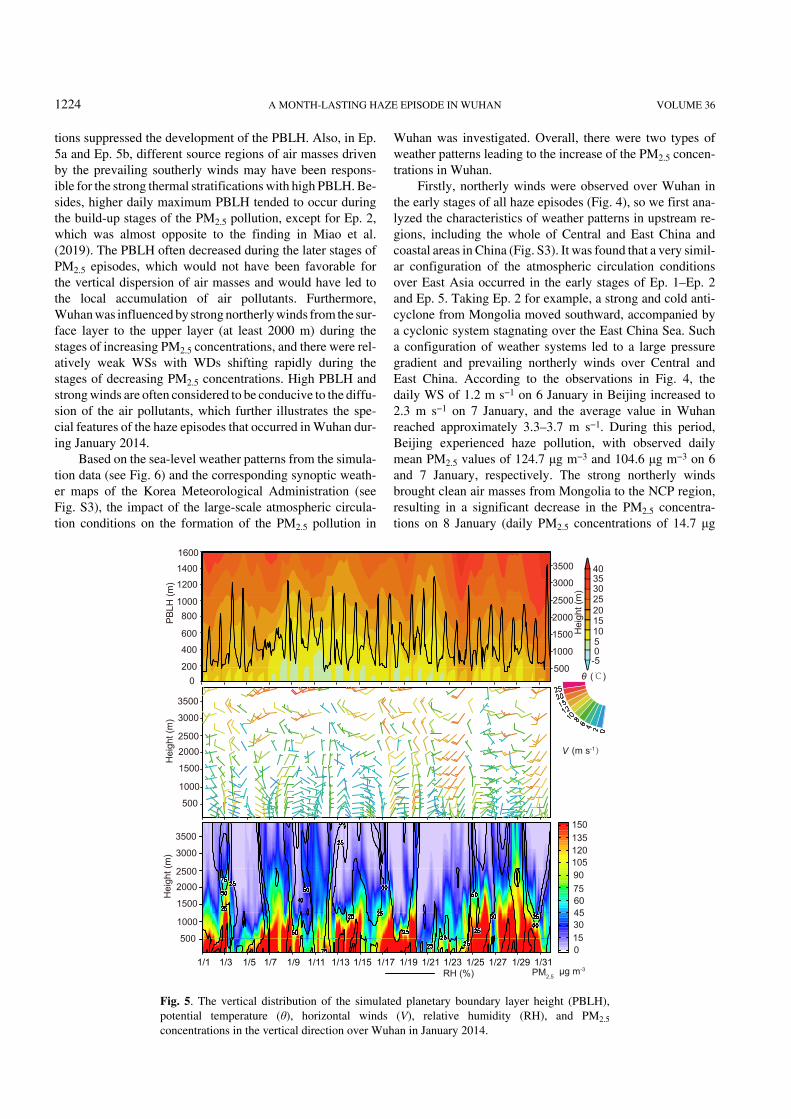
tions suppressed the development of the PBLH. Also, in Ep.5a and Ep. 5b, different source regions of air masses drivenby the prevailing southerly winds may have been respons-ible for the strong thermal stratifications with high PBLH. Be-sides, higher daily maximum PBLH tended to occur duringthe build-up stages of the PM2.5 pollution, except for Ep. 2,which was almost opposite to the finding in Miao et al.(2019). The PBLH often decreased during the later stages ofPM2.5 episodes, which would not have been favorable forthe vertical dispersion of air masses and would have led tothe local accumulation of air pollutants. Furthermore,Wuhan was influenced by strong northerly winds from the sur-face layer to the upper layer (at least 2000 m) during thestages of increasing PM2.5 concentrations, and there were rel-atively weak WSs with WDs shifting rapidly during thestages of decreasing PM2.5 concentrations. High PBLH andstrong winds are often considered to be conducive to the diffu-sion of the air pollutants, which further illustrates the spe-cial features of the haze episodes that occurred in Wuhan dur-ing January 2014.
Based on the sea-level weather patterns from the simula-tion data (see Fig. 6) and the corresponding synoptic weath-er maps of the Korea Meteorological Administration (seeFig. S3), the impact of the large-scale atmospheric circula-tion conditions on the formation of the PM2.5 pollution in
Wuhan was investigated. Overall, there were two types ofweather patterns leading to the increase of the PM2.5 concen-trations in Wuhan.
Firstly, northerly winds were observed over Wuhan inthe early stages of all haze episodes (Fig. 4), so we first ana-lyzed the characteristics of weather patterns in upstream re-gions, including the whole of Central and East China andcoastal areas in China (Fig. S3). It was found that a very simil-ar configuration of the atmospheric circulation conditionsover East Asia occurred in the early stages of Ep. 1–Ep. 2and Ep. 5. Taking Ep. 2 for example, a strong and cold anti-cyclone from Mongolia moved southward, accompanied bya cyclonic system stagnating over the East China Sea. Sucha configuration of weather systems led to a large pressuregradient and prevailing northerly winds over Central andEast China. According to the observations in Fig. 4, thedaily WS of 1.2 m s−1 on 6 January in Beijing increased to2.3 m s−1 on 7 January, and the average value in Wuhanreached approximately 3.3–3.7 m s−1. During this period,Beijing experienced haze pollution, with observed dailymean PM2.5 values of 124.7 μg m−3 and 104.6 μg m−3 on 6and 7 January, respectively. The strong northerly windsbrought clean air masses from Mongolia to the NCP region,resulting in a significant decrease in the PM2.5 concentra-tions on 8 January (daily PM2.5 concentrations of 14.7 μg
500
1000
1500
20002500
3000
3500
Hei
ght (
m)
V
PB
LH (m
)
0200
400
600
8001000
1200
1400
1600
500
1000
1500
2000
2500
3000
3500
-5051015202530
4035
θ
500
1000
1500
20002500
3000
3500
Hei
ght (
m)
0153045607590105
135120
150
RH (%) PM2.5 μg m-3
1/1 1/5 1/11 1/17 1/21 1/25 1/311/3 1/7 1/9 1/13 1/15 1/19 1/23 1/27 1/29
Hei
ght (
m)
(m s-1)
(℃)
Fig. 5. The vertical distribution of the simulated planetary boundary layer height (PBLH),potential temperature (θ), horizontal winds (V), relative humidity (RH), and PM2.5
concentrations in the vertical direction over Wuhan in January 2014.
1224 A MONTH-LASTING HAZE EPISODE IN WUHAN VOLUME 36

Wuhan Wuhan
Wuhan Wuhan
Wuhan
40N
35N
30N
25N
100E 105E 110E 115E 120E 100E 105E 110E 115E 120E
40N
35N
30N
25N
40N
35N
30N
25N
40N
35N
30N
25N
100E 105E 110E 115E 120E 100E 105E 110E 115E 120E
100E 105E 110E 115E 120E
40N
35N
30N
25N
(b) Ep.2-21:00 LST 7 January(a) Ep.1-15:00 LST 2 January
(d) Ep.4-22:00 LST 16 January(c) Ep.3-14:00 LST 12 January
(e) Ep.5-19:00 LST 24 January
H H
HH
H
L
L
L
L
L
H
Fig. 6. The simulated sea-level weather patterns and wind fields at (a) 1500 LST 2 January 2014 (Ep. 1), (b) 2100LST 7 January 2014 (Ep. 2), (c) 1400 LST 12 January 2014 (Ep. 3), (d) 2200 LST 16 January 2014 (Ep. 4), and(e) 1900 LST 24 January 2014 (Ep. 5).
NOVEMBER 2019 LU ET AL. 1225
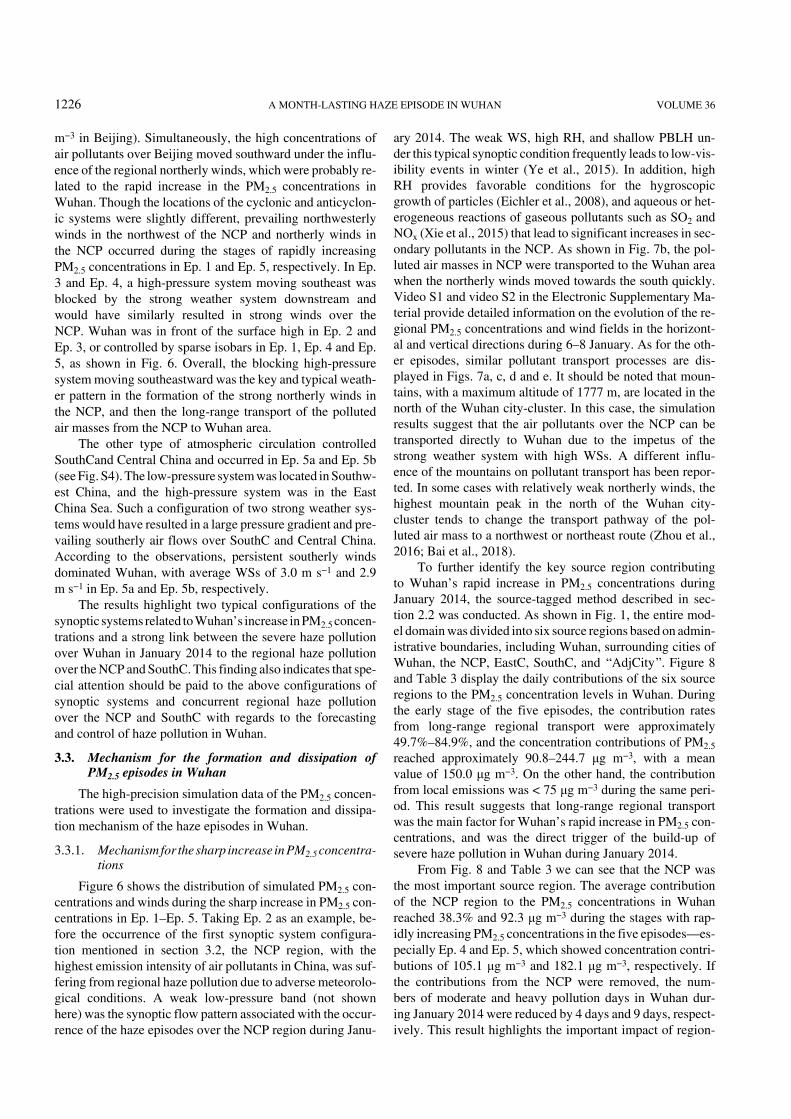
m−3 in Beijing). Simultaneously, the high concentrations ofair pollutants over Beijing moved southward under the influ-ence of the regional northerly winds, which were probably re-lated to the rapid increase in the PM2.5 concentrations inWuhan. Though the locations of the cyclonic and anticyclon-ic systems were slightly different, prevailing northwesterlywinds in the northwest of the NCP and northerly winds inthe NCP occurred during the stages of rapidly increasingPM2.5 concentrations in Ep. 1 and Ep. 5, respectively. In Ep.3 and Ep. 4, a high-pressure system moving southeast wasblocked by the strong weather system downstream andwould have similarly resulted in strong winds over theNCP. Wuhan was in front of the surface high in Ep. 2 andEp. 3, or controlled by sparse isobars in Ep. 1, Ep. 4 and Ep.5, as shown in Fig. 6. Overall, the blocking high-pressuresystem moving southeastward was the key and typical weath-er pattern in the formation of the strong northerly winds inthe NCP, and then the long-range transport of the pollutedair masses from the NCP to Wuhan area.
The other type of atmospheric circulation controlledSouthCand Central China and occurred in Ep. 5a and Ep. 5b(see Fig. S4). The low-pressure system was located in Southw-est China, and the high-pressure system was in the EastChina Sea. Such a configuration of two strong weather sys-tems would have resulted in a large pressure gradient and pre-vailing southerly air flows over SouthC and Central China.According to the observations, persistent southerly windsdominated Wuhan, with average WSs of 3.0 m s−1 and 2.9m s−1 in Ep. 5a and Ep. 5b, respectively.
The results highlight two typical configurations of thesynoptic systems related to Wuhan’s increase in PM2.5 concen-trations and a strong link between the severe haze pollutionover Wuhan in January 2014 to the regional haze pollutionover the NCP and SouthC. This finding also indicates that spe-cial attention should be paid to the above configurations ofsynoptic systems and concurrent regional haze pollutionover the NCP and SouthC with regards to the forecastingand control of haze pollution in Wuhan.
3.3. Mechanism for the formation and dissipation ofPM2.5 episodes in Wuhan
The high-precision simulation data of the PM2.5 concen-trations were used to investigate the formation and dissipa-tion mechanism of the haze episodes in Wuhan.
3.3.1. Mechanism for the sharp increase in PM2.5 concentra-tions
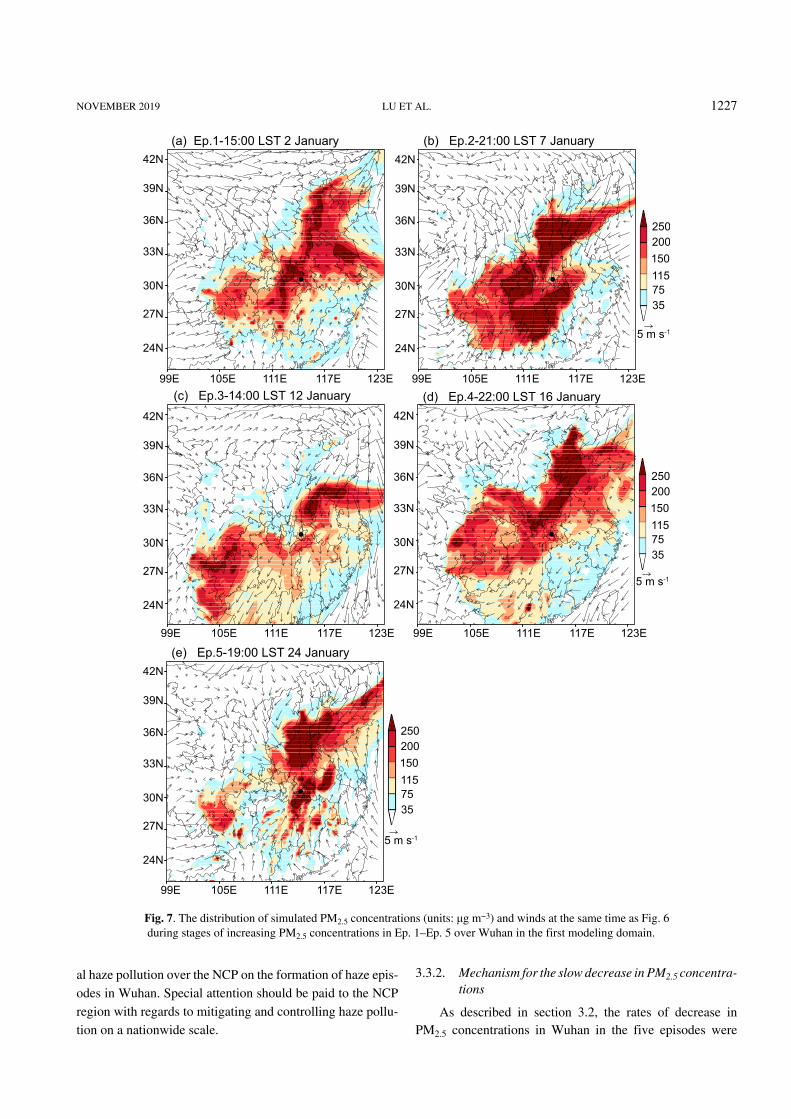
Figure 6 shows the distribution of simulated PM2.5 con-centrations and winds during the sharp increase in PM2.5 con-centrations in Ep. 1–Ep. 5. Taking Ep. 2 as an example, be-fore the occurrence of the first synoptic system configura-tion mentioned in section 3.2, the NCP region, with thehighest emission intensity of air pollutants in China, was suf-fering from regional haze pollution due to adverse meteorolo-gical conditions. A weak low-pressure band (not shownhere) was the synoptic flow pattern associated with the occur-rence of the haze episodes over the NCP region during Janu-
ary 2014. The weak WS, high RH, and shallow PBLH un-der this typical synoptic condition frequently leads to low-vis-ibility events in winter (Ye et al., 2015). In addition, highRH provides favorable conditions for the hygroscopicgrowth of particles (Eichler et al., 2008), and aqueous or het-erogeneous reactions of gaseous pollutants such as SO2 andNOx (Xie et al., 2015) that lead to significant increases in sec-ondary pollutants in the NCP. As shown in Fig. 7b, the pol-luted air masses in NCP were transported to the Wuhan areawhen the northerly winds moved towards the south quickly.Video S1 and video S2 in the Electronic Supplementary Ma-terial provide detailed information on the evolution of the re-gional PM2.5 concentrations and wind fields in the horizont-al and vertical directions during 6–8 January. As for the oth-er episodes, similar pollutant transport processes are dis-played in Figs. 7a, c, d and e. It should be noted that moun-tains, with a maximum altitude of 1777 m, are located in thenorth of the Wuhan city-cluster. In this case, the simulationresults suggest that the air pollutants over the NCP can betransported directly to Wuhan due to the impetus of thestrong weather system with high WSs. A different influ-ence of the mountains on pollutant transport has been repor-ted. In some cases with relatively weak northerly winds, thehighest mountain peak in the north of the Wuhan city-cluster tends to change the transport pathway of the pol-luted air mass to a northwest or northeast route (Zhou et al.,2016; Bai et al., 2018).
To further identify the key source region contributingto Wuhan’s rapid increase in PM2.5 concentrations duringJanuary 2014, the source-tagged method described in sec-tion 2.2 was conducted. As shown in Fig. 1, the entire mod-el domain was divided into six source regions based on admin-istrative boundaries, including Wuhan, surrounding cities ofWuhan, the NCP, EastC, SouthC, and “AdjCity”. Figure 8and Table 3 display the daily contributions of the six sourceregions to the PM2.5 concentration levels in Wuhan. Duringthe early stage of the five episodes, the contribution ratesfrom long-range regional transport were approximately49.7%–84.9%, and the concentration contributions of PM2.5
reached approximately 90.8–244.7 μg m−3, with a meanvalue of 150.0 μg m−3. On the other hand, the contributionfrom local emissions was < 75 μg m−3 during the same peri-od. This result suggests that long-range regional transportwas the main factor for Wuhan’s rapid increase in PM2.5 con-centrations, and was the direct trigger of the build-up ofsevere haze pollution in Wuhan during January 2014.
From Fig. 8 and Table 3 we can see that the NCP wasthe most important source region. The average contributionof the NCP region to the PM2.5 concentrations in Wuhanreached 38.3% and 92.3 μg m−3 during the stages with rap-idly increasing PM2.5 concentrations in the five episodes—es-pecially Ep. 4 and Ep. 5, which showed concentration contri-butions of 105.1 μg m−3 and 182.1 μg m−3, respectively. Ifthe contributions from the NCP were removed, the num-bers of moderate and heavy pollution days in Wuhan dur-ing January 2014 were reduced by 4 days and 9 days, respect-ively. This result highlights the important impact of region-
1226 A MONTH-LASTING HAZE EPISODE IN WUHAN VOLUME 36
al haze pollution over the NCP on the formation of haze epis-odes in Wuhan. Special attention should be paid to the NCPregion with regards to mitigating and controlling haze pollu-tion on a nationwide scale.
3.3.2. Mechanism for the slow decrease in PM2.5 concentra-tions
As described in section 3.2, the rates of decrease inPM2.5 concentrations in Wuhan in the five episodes were
(b) Ep.2-21:00 LST 7 January(a) Ep.1-15:00 LST 2 January
(e) Ep.5-19:00 LST 24 January
3575115150200250
99E 105E 111E 117E 123E 99E 105E 111E 117E 123E
24N
27N
30N
33N
36N
39N
42N
24N
27N
30N
33N
36N
39N
42N
24N
27N
30N
33N
36N
39N
42N
24N
27N
30N
33N
36N
39N
42N
3575115150200250
3575115150200250
99E 105E 111E 117E 123E 99E 105E 111E 117E 123E
99E 105E 111E 117E 123E
24N
27N
30N
33N
36N
39N
42N
5 m s-1
5 m s-1
5 m s-1
(d) Ep.4-22:00 LST 16 January(c) Ep.3-14:00 LST 12 January
Fig. 7. The distribution of simulated PM2.5 concentrations (units: μg m−3) and winds at the same time as Fig. 6 during stages of increasing PM2.5 concentrations in Ep. 1–Ep. 5 over Wuhan in the first modeling domain.
NOVEMBER 2019 LU ET AL. 1227
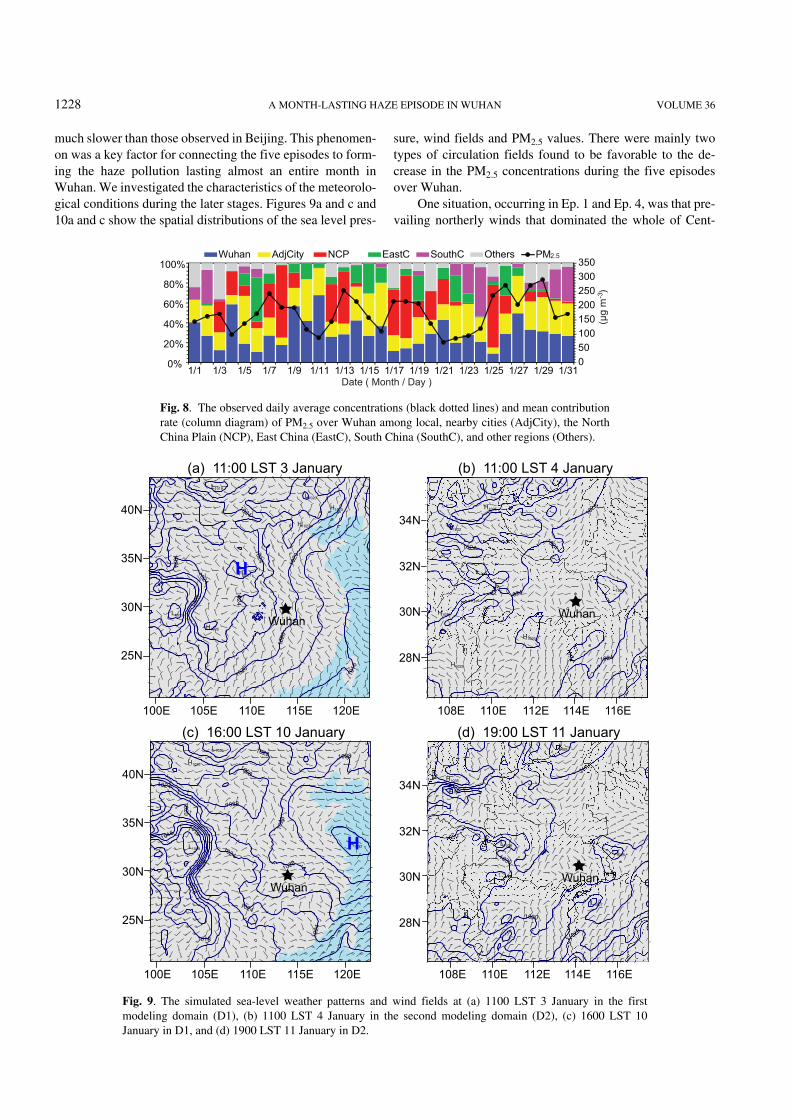
much slower than those observed in Beijing. This phenomen-on was a key factor for connecting the five episodes to form-ing the haze pollution lasting almost an entire month inWuhan. We investigated the characteristics of the meteorolo-gical conditions during the later stages. Figures 9a and c and10a and c show the spatial distributions of the sea level pres-
sure, wind fields and PM2.5 values. There were mainly twotypes of circulation fields found to be favorable to the de-crease in the PM2.5 concentrations during the five episodesover Wuhan.
One situation, occurring in Ep. 1 and Ep. 4, was that pre-vailing northerly winds that dominated the whole of Cent-
(μg
m )
050100150200250300350
0%
20%
40%
60%
80%
100%
1/1 1/3 1/5 1/7 1/9 1/11 1/13 1/15 1/17 1/19 1/21 1/23 1/25 1/27 1/29 1/31
Wuhan AdjCity NCP EastC SouthC Others PM
Date ( Month / Day )
2.5
-3
Fig. 8. The observed daily average concentrations (black dotted lines) and mean contributionrate (column diagram) of PM2.5 over Wuhan among local, nearby cities (AdjCity), the NorthChina Plain (NCP), East China (EastC), South China (SouthC), and other regions (Others).
(a) 11:00 LST 3 January (b) 11:00 LST 4 January
(c) 16:00 LST 10 January (d) 19:00 LST 11 January
40N
35N
30N
25N
40N
35N
30N
25N
34N
32N
30N
28N
34N
32N
30N
28N
100E 105E 110E 115E 120E 108E 110E 112E 114E 116E
100E 105E 110E 115E 120E 108E 110E 112E 114E 116E
Wuhan Wuhan
WuhanWuhan
H
H
Fig. 9. The simulated sea-level weather patterns and wind fields at (a) 1100 LST 3 January in the firstmodeling domain (D1), (b) 1100 LST 4 January in the second modeling domain (D2), (c) 1600 LST 10January in D1, and (d) 1900 LST 11 January in D2.
1228 A MONTH-LASTING HAZE EPISODE IN WUHAN VOLUME 36
ral and East China with a strong high-pressure system fromSiberia and Mongolia area moving southeastward. With thedry and clean air toward Wuhan, air pollutants dispersedpartly. Ye et al. (2015) found that this typical atmospheric cir-culation reduces pollutant concentrations effectively overBeijing at the leading edge of the northerly cold advectionin wintertime. Figure 4 also shows a similar situation inwhich the hourly PM2.5 concentrations in Beijing experi-enced a sharp decrease from 205 μg m−3 to 18 μg m−3 with-in 8 h and remained at values lower than 20 μg m−3 underthe influence of northerly winds with daily WSs of approxim-ately 2.3–3.5 m s−1 on 7 and 8 January. The second situ-ation, occurring in Ep. 2, Ep. 3 and Ep. 5, was that a high-pressure system stagnated over eastern coastal areas ofChina and resultant regional easterly winds were conduciveto removing the particle concentrations in Wuhan. Thissecond typical situation is tightly linked to the mitigation ofair pollution in EastC under the control of clean maritime air-streams (Shu et al., 2017). However, these two strong circula-
tion fields did not lead to the expected decrease in Wuhan’sPM2.5 concentrations.
The main reason for the ineffectiveness of the twostrong atmospheric conditions in removing pollutants fromWuhan was the city’s geographic limitations—specifically,the city being located in the center of regional haze pollu-tion covering large areas of China (Fig. 2). When the cleanair brought by the strong atmospheric circulation systemwas close to Wuhan, the circulation system often changed.As shown in Fig. 9, Wuhan was in front of the surface highon 3 January and was behind the offshore high-pressure sys-tem on 10 January, and then controlled by sparse isobars inthe following days. The transitions of weather patterns werealso found in the other episodes. Therefore, winds shiftedfrom a northerly direction to a weak northeasterly one inEp. 1, to a weak northeasterly one in Ep. 4, and to a weaksoutherly one in Ep. 5, respectively shown in Fig. 10 andFig. S5. Additionally, prevailing easterly winds that werealso carrying clean air weakened in Ep. 2 and Ep. 3. The res-
(a) D1: Ep.1 3 January (b) D2: Ep.1 4 January
(c) D1: Ep.2 10 January (d) D2: Ep.2 11 January
3575115150200250
3575115150200250
5 m s-1
5 m s-1
28N
30N
32N
34N
28N
30N
32N
34N
24N
27N
30N
33N
36N
39N
42N
24N
27N
30N
33N
36N
39N
42N
108E 110E 112E 114E 116E99E 105E 111E 117E 123E
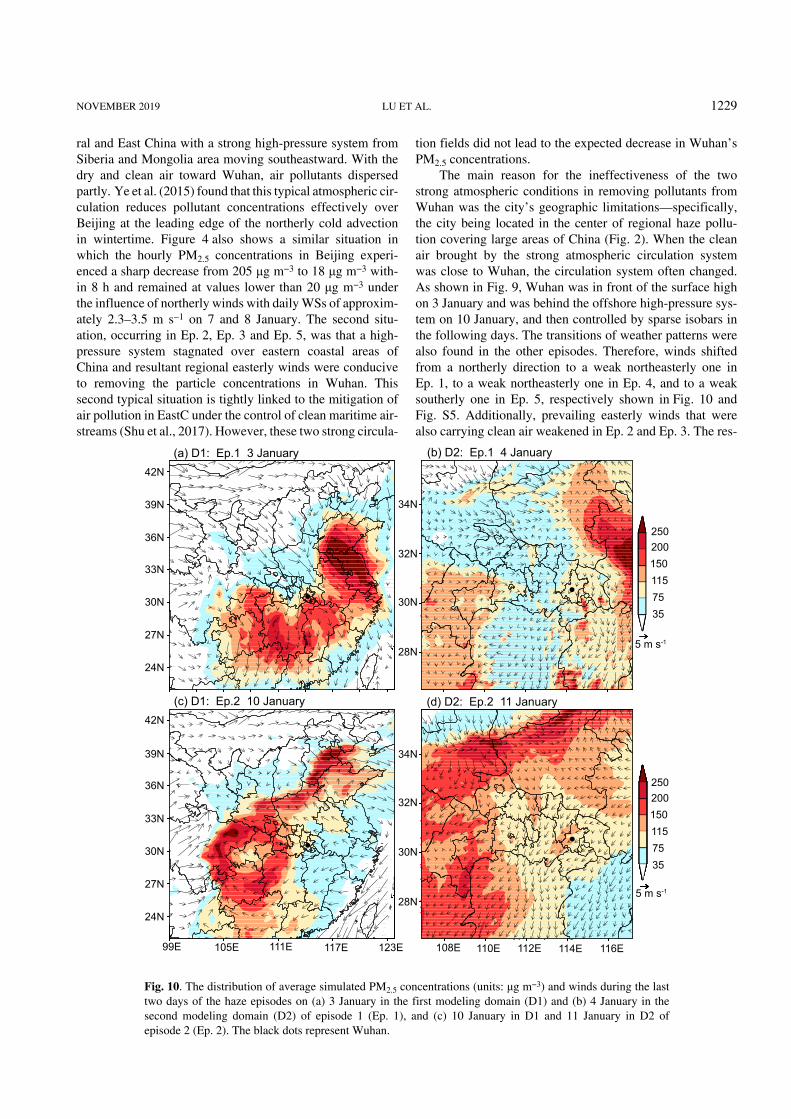
Fig. 10. The distribution of average simulated PM2.5 concentrations (units: μg m−3) and winds during the lasttwo days of the haze episodes on (a) 3 January in the first modeling domain (D1) and (b) 4 January in thesecond modeling domain (D2) of episode 1 (Ep. 1), and (c) 10 January in D1 and 11 January in D2 ofepisode 2 (Ep. 2). The black dots represent Wuhan.
NOVEMBER 2019 LU ET AL. 1229
ults suggest that the change in the circulation system led tothe end of the prevailing northerly winds and sea winds. Bycomparison, the high PM2.5 concentrations in Beijing couldbe eliminated immediately by the strong northerly windsdue to its location at the edge of the regional haze (see Fig.2) and lasted shorter (3–7 days) than that (4–10 days) inWuhan. On the other hand, the variations of the PM2.5 concen-trations of the two cities were strongly related under the influ-ences of cold air from Siberia. From Fig. 5, the WS gradu-ally decreased in the later stages of the episodes from theground to a height of approximately 1.5 km, and the WDsshifted rapidly on the last day of the episodes on 4, 11, 16,21 and 29 January. Referring to Ep. 2 as an example, the evol-ution of the PM2.5 pollution under weak winds is shown inVideo S1 and Video S2. The stable weather conditions andweak winds were responsible for the accumulation of air pol-lutants and the maintenance of high PM2.5 concentrations inWuhan during the later stages of the episodes. This wouldhave been another key factor for the 30 haze days seen inWuhan, as well as the long-range regional transport duringthe early stages of the episodes.
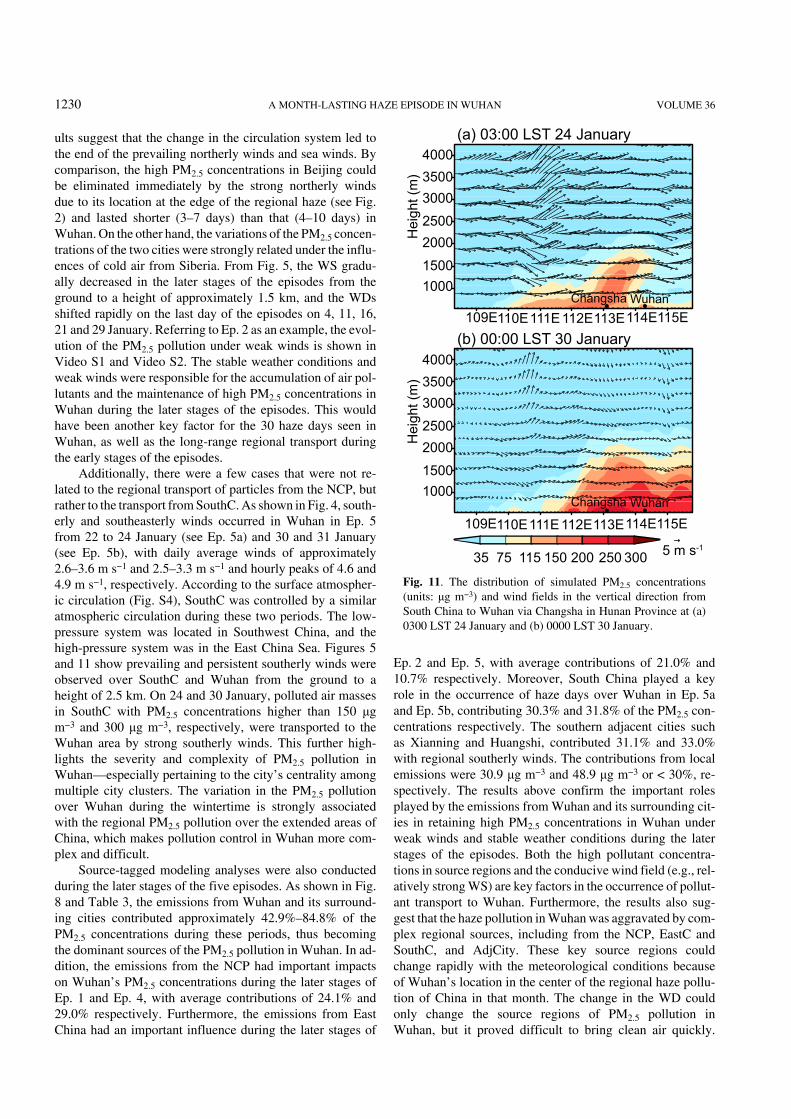
Additionally, there were a few cases that were not re-lated to the regional transport of particles from the NCP, butrather to the transport from SouthC. As shown in Fig. 4, south-erly and southeasterly winds occurred in Wuhan in Ep. 5from 22 to 24 January (see Ep. 5a) and 30 and 31 January(see Ep. 5b), with daily average winds of approximately2.6–3.6 m s−1 and 2.5–3.3 m s−1 and hourly peaks of 4.6 and4.9 m s−1, respectively. According to the surface atmospher-ic circulation (Fig. S4), SouthC was controlled by a similaratmospheric circulation during these two periods. The low-pressure system was located in Southwest China, and thehigh-pressure system was in the East China Sea. Figures 5and 11 show prevailing and persistent southerly winds wereobserved over SouthC and Wuhan from the ground to aheight of 2.5 km. On 24 and 30 January, polluted air massesin SouthC with PM2.5 concentrations higher than 150 μgm−3 and 300 μg m−3, respectively, were transported to theWuhan area by strong southerly winds. This further high-lights the severity and complexity of PM2.5 pollution inWuhan—especially pertaining to the city’s centrality amongmultiple city clusters. The variation in the PM2.5 pollutionover Wuhan during the wintertime is strongly associatedwith the regional PM2.5 pollution over the extended areas ofChina, which makes pollution control in Wuhan more com-plex and difficult.
Source-tagged modeling analyses were also conductedduring the later stages of the five episodes. As shown in Fig.8 and Table 3, the emissions from Wuhan and its surround-ing cities contributed approximately 42.9%–84.8% of thePM2.5 concentrations during these periods, thus becomingthe dominant sources of the PM2.5 pollution in Wuhan. In ad-dition, the emissions from the NCP had important impactson Wuhan’s PM2.5 concentrations during the later stages ofEp. 1 and Ep. 4, with average contributions of 24.1% and29.0% respectively. Furthermore, the emissions from EastChina had an important influence during the later stages of
Ep. 2 and Ep. 5, with average contributions of 21.0% and10.7% respectively. Moreover, South China played a keyrole in the occurrence of haze days over Wuhan in Ep. 5aand Ep. 5b, contributing 30.3% and 31.8% of the PM2.5 con-centrations respectively. The southern adjacent cities suchas Xianning and Huangshi, contributed 31.1% and 33.0%with regional southerly winds. The contributions from localemissions were 30.9 μg m−3 and 48.9 μg m−3 or < 30%, re-spectively. The results above confirm the important rolesplayed by the emissions from Wuhan and its surrounding cit-ies in retaining high PM2.5 concentrations in Wuhan underweak winds and stable weather conditions during the laterstages of the episodes. Both the high pollutant concentra-tions in source regions and the conducive wind field (e.g., rel-atively strong WS) are key factors in the occurrence of pollut-ant transport to Wuhan. Furthermore, the results also sug-gest that the haze pollution in Wuhan was aggravated by com-plex regional sources, including from the NCP, EastC andSouthC, and AdjCity. These key source regions couldchange rapidly with the meteorological conditions becauseof Wuhan’s location in the center of the regional haze pollu-tion of China in that month. The change in the WD couldonly change the source regions of PM2.5 pollution inWuhan, but it proved difficult to bring clean air quickly.
5 m s-1
(a) 03:00 LST 24 January
(b) 00:00 LST 30 January
Hei
ght (
m)
Changsha Wuhan
115E113E109E110E111E112E
10001500
20002500300035004000
35 75 115 150 200 250 300
114E
115E113E109E110E111E112E 114EChangsha Wuhan
Hei
ght (
m)
10001500
20002500300035004000
Fig. 11. The distribution of simulated PM2.5 concentrations(units: μg m−3) and wind fields in the vertical direction fromSouth China to Wuhan via Changsha in Hunan Province at (a)0300 LST 24 January and (b) 0000 LST 30 January.
1230 A MONTH-LASTING HAZE EPISODE IN WUHAN VOLUME 36
Therefore, pollution control in Wuhan is a more complex is-sue compared to other regions, which raises concerns forrolling out effective national pollution control policies consid-ering China’s diverse geography and regional climates.
4. Conclusions and discussion
In January 2014, Wuhan experienced severe haze pollu-tion lasting for one month with 19 heavily polluted days.We examined the specific characteristics of the PM2.5 pollu-tion in Wuhan and compared them to the megacity ofBeijing. The rapid growth in the PM2.5 concentrations oc-curred frequently under the influence of strong northerlywinds, and the increase and decrease in the PM2.5 concentra-tions in Wuhan were much slower. In this study, a chemicaltransport model (NAQPMS) with an online source-taggedmethod was employed to investigate the impact of regionaltransport on the formation of the severe haze episode, com-bined with surface observations of the PM2.5 concentrationsand meteorological variables. The main findings are as fol-lows:
(1) During the early stages of the five episodes, with arapid increase in the PM2.5 concentrations, Wuhan, CentralChina and East China were dominated by strong northerlywinds under a very similar synoptic system configuration.The strong northerly winds drove the polluted air massespast the NCP region to move further southward, leading tosharp increases in PM2.5 concentrations in Wuhan. Thelong-range transport was the main trigger for the formationof severe haze pollution during these stages, with contribu-tions to the PM2.5 concentrations in Wuhan of approxim-ately 49.7%–84.9%. The NCP was the key source region,with contributions of approximately 10.6%–63.0%.
(2) During the later stages of the five episodes, two atmo-spheric circulation conditions were favorable to the decreas-ing PM2.5 concentrations in Wuhan, but they did not lead tothe expected decrease in PM2.5 concentrations to a healthylevel like in Beijing. This was because Wuhan and Beijingwere respectively located in the center and at the edge ofwhere the regional haze pollution in Central and East Chinaconverged. Such a distribution of the regional haze made itdifficult for the haze episodes in Wuhan to be dispersed byclean winds, and made them last longer than those inBeijing. Meanwhile, when the clean air brought by a strongsynoptic system was close to Wuhan, the circulation sys-tem often changed and led to weakened winds and stable met-eorological conditions over Central China. Therefore, the loc-al accumulation of air pollutants over Wuhan and complex re-gional transport from surrounding cities, the NCP, EastCand SouthC occurred, which connected five episodes toform haze pollution of 30 days in January over Wuhan.
The results of this study highlight the special characterist-ics of the haze episodes in Wuhan during January 2014 andthe strong relationship between the formation of PM2.5 pollu-tion and regional transport from the NCP, EastC, SouthC,and AdjCity during the wintertime. It implies that applying in-
terventions for pollution control in Wuhan is very complic-ated and raises challenges for national pollution controlpolicies in China, as they must consider the environmental re-lations and geography. Further investigation of the air pollut-ant transport relationship between these regions would be use-ful for revealing the causes and formation of such extendedhaze pollution in China as shown in Fig. 2. In addition, con-sidering the important role played by the emissions from theNCP in the build-up of the haze episodes in Wuhan, itwould be important to see whether air quality improvementin the NCP (http://www.mee.gov.cn/gkml/hbb/bgth/201801/t20180110_429453.htm) would be helpful in reducing the fre-quency and severity of winter haze pollution in Wuhan.
In this study, some uncertainties—mainly from the meth-ods employed—should be discussed. Firstly, the NAQPMSversion without meteorology–aerosol feedback was used tosimulate the pollution process over Wuhan in January 2014,which basically reproduced the spatial and temporal distribu-tion of PM2.5 concentrations in 16 major capital cities acrossthe country (see section 3.1 for more analysis). However, aer-osol–meteorology interactions can change aerosol concentra-tions via physical mechanisms such as altering radiationbudgets or cloud microphysical processes (Chen et al.,2014; Zhang et al., 2018), which may bring some uncertain-ties for the simulation results of the air quality model. Re-search by Zhang et al. (2018) showed that the enhancementof PM2.5 concentrations due to aerosol–radiation interac-tions was about 8.9 μg m−3 (6.9%) in January 2014, whilethe impact of cloud microphysics was very small. Numeric-al models with aerosol–meteorology interactions would re-quire more thought in future research, which may reduce er-rors caused by the mechanism. In addition, the onlinesource-tagged method employed in this study was con-sidered as an efficient method for a range of source apportion-ment studies and has been widely used to quantify the region-al contribution of PM, ozone, or other pollutants to a particu-lar area. Compared to the traditional sensitivity method,such as the turning on/off of emissions, this method can effect-ively reduce errors caused by the nonlinearity of variouschemical reactions among pollutants (He et al., 2008; Li etal., 2010). Moreover, online source apportionment has a relat-ively low computational cost because it can track the contribu-tion of multiple source locations in one simulation.However, all molecules of a particular species have thesame probability of reacting at a given time and location inthe algorithm (Wagstrom et al., 2008). For example, SO2 emit-ted by power plants reacts identically to SO2 emitted by oil-refining facilities at a given time and grid. Such a hypothes-is may give rise to a certain level of error in the calculation,which needs to be addressed in future studies.
Acknowledgments. The authors express their utmost gratit-ude to the NCAR for providing important biomass burning emis-sions data (FINNv1). We also thank Professor Shaodong XIE, Pek-ing University, and Zhichao ZHU and Peipei QIU, Wuhan Re-search Academy of Environmental Sciences, for providing
NOVEMBER 2019 LU ET AL. 1231
Wuhan’s 2014 emissions data. This study was supported by the Na-tional Key R&D Program (Grant Nos. 2017YFC0212603 and2017YFC0212604), the Chinese Academy of Sciences Strategic Pri-ority Research Program (Grant No. XDA19040201), and the Nation-al Natural Science Foundation of China (Grant Nos. 41575128 and41620104008).
Open Access This article is distributed under the terms of theCreative Commons Attribution License which permits any use, dis-tribution, and reproduction in any medium, provided the original au-thor(s) and the source are credited.
Electronic supplementary material: Supplementary materialis available in the online version of this article at https://doi.org/10.1007/s00376-019-8260-5.
REFERENCES
Bai, Y. Q., H. X. Qi, T. L. Zhao, H. Yang, L. Liu, and C. G. Cui,2018: Analysis of meteorological conditions and diurnal vari-ation characteristics of PM2.5 heavy pollution episodes in thewinter of 2015 in Hubei province. Acta Meteorologica Sin-ica, 76(5), 803−815, https://doi.org/10.11676/qxxb2018.029. (in Chinese with English abstract)
Boylan, J. W., and A. G. Russell, 2006: PM and light extinctionmodel performance metrics, goals, and criteria for three-di-mensional air quality models. Atmos. Environ., 40(26),4946−4959, https://doi.org/10.1016/j.atmosenv.2005.09.087.
Chang, J. S., R. A. Brost, I. S. A. Isaksen, S. Madronich, P.Middleton, W. R. Stockwell, and C. J. Walcek, 1987: Athree-dimensional Eulerian acid deposition model: Physicalconcepts and formulation. J. Geophys. Res., 92(D12),14681−14700, https://doi.org/10.1029/JD092iD12p14681.
Chen, D., Z. Q. Liu, J. Fast, and J. Ban, 2016: Simulations ofsulfate-nitrate-ammonium (SNA) aerosols during the ex-treme haze events over northern China in October 2014. Atmo-spheric Chemistry and Physics, 16, 10707−10724,https://doi.org/10.5194/acp-16-10707-2016.
Chen, Q., L. F. Sheng, Y. Gao, Y. C. Miao, S. F. Hai, S. H. Gao,and Y. Gao, 2019: The effects of the trans-regional trans-port of PM2.5 on a heavy haze event in the Pearl River deltain January 2015. Atmosphere, 10, 237, https://doi.org/10.3390/atmos10050237.
Chen, S. Y., J. P. Huang, Y. Qian, and J. M. Ge, 2014: Effectsof aerosols on autumn precipitation over Mid-EasternChina. Journal of Tropical Meteorology, 20(3), 242−250, ht-tps://doi.org/10.16555/j.1006-8775.2014.03.007.
Chen, Y. Y., A. Ebenstein, M. Greenstone, and H. B. Li, 2013:Evidence on the impact of sustained exposure to air pollu-tion on life expectancy from China's Huai River policy. Pro-ceedings of the National Academy of Sciences of the UnitedStates of America, 110(32), 12936−12941, https://doi.org/10.1073/pnas.1300018110.
Cheng, H. R., Z. W. Wang, J. L. Feng, H. L. Chen, F. Zhang,and J. Liu, 2012: Carbonaceous species composition andsource apportionment of PM2.5 in urban atmosphere ofWuhan. Ecology and Environmental Sciences, 21(9), 1574−1579, https://doi.org/10.3969/j.issn.1674-5906.2012.09.011.(in Chinese with English abstract)
Chou, M. D., and M. J. Suarez, 1994: An efficient thermal in-frared radiation parameterization for use in general circula-
tion models. NASA Tech. Memo 104606, 85 pp.
Ding, X., Q. F. He, R. Q. Shen, Q. Q. Yu, Y. Q. Zhang, J. Y. Xin,T. X. Wen, and X. M. Wang, 2016: Spatial and seasonal vari-ations of isoprene secondary organic aerosol in China: Signi-ficant impact of biomass burning during winter. Sci. Rep., 6,20411, https://doi.org/10.1038/srep20411.
Eichler, H., and Coauthors, 2008: Hygroscopic properties and ex-tinction of aerosol particles at ambient relative humidity insouth-eastern China. Atmos. Environ., 42, 6321−6334,https://doi.org/10.1016/j.atmosenv.2008.05.007.
Gong, W., T. H. Zhang, Z. M. Zhu, Y. Y. Ma, X. Ma, and W.Wang, 2015: Characteristics of PM1.0, PM2.5, and PM10, andtheir relation to black carbon in Wuhan, Central China. Atmo-sphere, 6(9), 1377−1387, https://doi.org/10.3390/atmos6091377.
He, Y. J., I. Uno, Z. F. Wang, P. Pochanart, J. Li, and H.Akimoto, 2008: Significant impact of the east asia monsoonon ozone seasonal behavior in the boundary layer of easternChina and the west pacific region. Atmospheric Chemistryand Physics, 8, 7543−7555, https://doi.org/10.5194/acp-8-7543-2008.
Huang, Y. L., C. Liu, K. F. Zeng, L. Ding, and S. G. Cheng,2015: Spatio-temporal distribution of PM2.5 in Wuhan andits relationship with meteorological conditionsin, 2013-2014. Ecology and Environmental Sciences, 24(8),1330−1335, https://doi.org/10.16258/j.cnki.1674-5906.2015.08.011. (in Chinese with English abstract)
Kurokawa, J., T. Ohara, T. Morikawa, S. Hanayama, G. Jans-sens-Maenhout, T. Fukui, K. Kawashima, and H. Akimoto,2013: Emissions of air pollutants and greenhouse gases overAsian regions during 2000−2008: Regional emission invent-ory in Asia (REAS) version 2. Atmospheric Chemistry andPhysics, 13(21), 11 019−11 058, https://doi.org/10.5194/acp-13-11019-2013.
Li, J., Z. F. Wang, H. Akimoto, C. Gao, P. Pochanart, and X. Q.Wang, 2007: Modeling study of ozone seasonal cycle inlower troposphere over east Asia. J. Geophys. Res., 112,D22S25, https://doi.org/10.1029/2006JD008209.
Li, J., and Coauthors, 2008: Near-ground ozone source attribu-tions and outflow in central eastern China during MTX2006.Atmospheric Chemistry and Physics, 8(24), 7335−7351, ht-tps://doi.org/10.5194/acp-8-7335-2008.
Li, J., Z. F. Wang, and Q. Z. Wu, 2010: A Study of the quantitat-ive diagnosis for the regional transport of tropospheric O3 con-centrations. Climatic and Environmental Research, 15,529−540, https://doi.org/10.3878/j.issn.1006-9585.2010.05.01. (in Chinese with English abstract)
Li, J., Z. Wang, G. Zhuang, G. Luo, Y. Sun, and Q. Wang, 2012:Mixing of Asian mineral dust with anthropogenic pollutantsover East Asia: A model case study of a super-duststorm inMarch 2010. Atmospheric Chemistry and Physics, 12(16),7591−7607, https://doi.org/10.5194/acp-12-7591-2012.
Li, J., and Coauthors, 2013: Assessing the effects of trans-bound-ary aerosol transport between various city clusters on region-al haze episodes in spring over East China. Tellus B, 65(1),20052, https://doi.org/10.3402/tellusb.v65i0.20052.
Li, J., and Coauthors, 2016: Modeling study of surface ozonesource-receptor relationships in East Asia. Atmospheric Re-search, 167, 77−88, https://doi.org/10.1016/j.atmosres.2015.07.010.
Lin, Y. L., R. D. Farley, and H. D. Orville, 1983: Bulk parameteriz-ation of the snow field in a cloud model. J. Climate Appl. Met-
1232 A MONTH-LASTING HAZE EPISODE IN WUHAN VOLUME 36
eor., 22, 1065−1092, https://doi.org/10.1175/1520-0450(1983)022<1065:BPOTSF>2.0.CO;2.
Liu, J., Y. Q. Han, X. Tang, J. Zhu, and T. Zhu, 2016: Estimat-ing adult mortality attributable to PM2.5 exposure in Chinawith assimilated PM2.5 concentrations based on a ground mon-itoring network. Science of the Total Environment, 568,1253−1262, https://doi.org/10.1016/j.scitotenv.2016.05.165.
Lu, M. M., and Coauthors, 2017: Source tagging modeling studyof heavy haze episodes under complex regional transport pro-cesses over Wuhan megacity, Central China. EnvironmentalPollution, 231, 612−621, https://doi.org/10.1016/j.envpol.2017.08.046.
Lyu, X. P., N. Chen, H. Guo, L. W. Zeng, W. H. Zhang, F. Shen,J. H. Quan, and N. Wang, 2016: Chemical characteristicsand causes of airborne particulate pollution in warm sea-sons in Wuhan, Central China. Atmospheric Chemistry andPhysics, 16(16), 10671−10687, https://doi.org/10.5194/acp-16-10671-2016.
Miao, Y. C., and S. H. Liu, 2019: Linkages between aerosol pollu-tion and planetary boundary layer structure in China. Sci-ence of the Total Environment, 650, 288−296, https://doi.org/10.1016/j.scitotenv.2018.09.032.
Odum, J. R., T. P. W. Jungkamp, R. J. Griffin, R. C. Flagan, andJ. H. Seinfeld, 1997: The atmospheric aerosol-forming poten-tial of whole gasoline vapor. Science, 276(5309), 96−99, ht-tps://doi.org/10.1126/science.276.5309.96.
Ohara, T., H. Akimoto, J. Kurokawa, N. Horii, K. Yamaji, X.Yan, and T. Hayasaka, 2007: An Asian emission inventoryof anthropogenic emission sources for the period 1980-2020.Atmospheric Chemistry and Physics, 7(16), 4419−4444, ht-tps://doi.org/10.5194/acp-7-4419-2007.
Pandis, S. N., R. A. Harley, G. R. Cass, and J. H. Seinfeld, 1992:Secondary organic aerosol formation and transport. Atmo-spheric Environment. Part A. General Topics, 26(13),2269−2282, https://doi.org/10.1016/0960-1686(92)90358-R.
Rutledge, S. A., and P. V. Hobbs, 1984: The mesoscale and micro-scale structure and organization of clouds and precipitationin midlatitude cyclones. XII: A diagnostic modeling study ofprecipitation development in narrow cold-frontal rainbands.J. Atmos. Sci., 20, 2949−2972, https://doi.org/10.1175/1520-0469(1984)041<2949:TMAMSA>2.0.CO;2.
Shu, L., M. Xie, D. Gao, T. J. Wang, D. X. Fang, Q. Liu, A. N.Huang, and L. W. Peng, 2017: Regional severe particle pollu-tion and its association with synoptic weather patterns in theYangtze River Delta region, China. Atmospheric Chemistryand Physics, 17(21), 12871−12891, https://doi.org/10.5194/acp-17-12871-2017.
Tang, X., and Coauthors, 2013: Inversion of CO emissions overBeijing and its surrounding areas with ensemble Kalman fil-ter. Atmos. Environ., 81, 676−686, https://doi.org/10.1016/j.atmosenv.2013.08.051.
Wagstrom, K. M., S. N. Pandis, G. Yarwood, G. M. Wilson, andR. E. Morris, 2008: Development and application of a compu-tationally efficient particulate matter apportionment al-gorithm in a three-dimensional chemical transport model. At-mos. Environ., 42(22), 5650−5659, https://doi.org/10.1016/j.atmosenv.2008.03.012.
Walcek, C. J., and N. M. Aleksic, 1998: A simple but accuratemass conservative, peak-preserving, mixing ratio bounded ad-vection algorithm with FORTRAN code. Atmos. Environ.,32(22), 3863−3880, https://doi.org/10.1016/S1352-2310(98)
00099-5.
Wang, N., Z. H. Ling, X. J. Deng, T. Deng, X. P. Lyu, T. Y. Li, X.R. Gao, and X. Chen, 2018a: Source contributions to PM2.5
under unfavorable weather conditions in Guangzhou City,China. Adv. Atmos. Sci., 35(9), 1145−1159, https://doi.org/10.1007/s00376-018-7212-9.
Wang, X. Y., R. E. Dickinson, L. Y. Su, C. L. Zhou, and K. C.Wang, 2018b: PM2.5 Pollution in China and how it has beenexacerbated by terrain and meteorological conditions. Bull.Amer. Meteor. Soc., 99(1), 105−119, https://doi.org/10.1175/BAMS-D-16-0301.1.
Wang, Y. G., Q. Ying, J. L. Hu, and H. L. Zhang, 2014a: Spatialand temporal variations of six criteria air pollutants in 31 pro-vincial capital cities in China during 2013−2014. Environ-ment International, 73, 413−422, https://doi.org/10.1016/j.en-vint.2014.08.016.
Wang, Z. F., F. Y. Xie, X. Q. Wang, J. L. An, and J. Zhu, 2006:Development and application of nested air quality Predic-tion modeling system. Chinese Journal of Atmospheric Sci-ences, 30, 778−790, https://doi.org/10.3878/j.issn.1006-9895.2006.05.07. (in Chinese with English abstract)
Wang, Z. F., and Coauthors, 2014b: Modeling study of regionalsevere hazes over mid-eastern China in January 2013 and itsimplications on pollution prevention and control. ScienceChina Earth Sciences, 57(1), 3−13, https://doi.org/10.1007/s11430-013-4793-0.
Wesely, M. L., 1989: Parameterization of surface resistances togaseous dry deposition in regional-scale numerical models.Atmos. Environ., 23(6), 1293−1304, https://doi.org/10.1016/0004-6981(89)90153-4.
Wu, J. B., and Coauthors, 2017: Development of an on-line source-tagged model for sulfate, nitrate and ammonium: A model-ing study for highly polluted periods in Shanghai, China.Environmental Pollution, 221, 168−179, https://doi.org/10.1016/j.envpol.2016.11.061.
Wu, Q. Z., Z. F. Wang, A. Gbaguidi, C. Gao, L. N. Li, and W.Wang, 2011: A numerical study of contributions to air pollu-tion in Beijing during CAREBeijing-2006. Atmospheric Chem-istry and Physics, 11(12), 5997−6011, https://doi.org/10.5194/acp-11-5997-2011.
Xie, Y. N., and Coauthors, 2015: Enhanced sulfate formation bynitrogen dioxide: Implications from in situ observations atthe SORPES station. J. Geophys. Res., 120, 12679−12694, ht-tps://doi.org/10.1002/2015JD023607.
Xin, J. Y., and Coauthors, 2016: The observation-based relation-ships between PM2.5 and AOD over China. J. Geophys. Res.,121(18), 10701−10716, https://doi.org/10.1002/2015JD024655.
Yang, J. H., and K. Q. Duan, 2016: Effects of initial drivers andland use on WRF modeling for near-surface fields and atmo-spheric boundary layer over the northeastern Tibetan Plat-eau. Advances in Meteorology, 2016, 7849249, https://doi.org/10.1155/2016/7849249.
Ye, X. X., Y. Song, X. H. Cai, and H. S. Zhang, 2015: Study onthe synoptic flow patterns and boundary layer process of thesevere haze events over the North China Plain in January2013. Atmos. Environ., 124, 129−145, https://doi.org/10.1016/j.atmosenv.2015.06.011.
Zaveri, R. A., and L. K. Peters, 1999: A new lumped structure pho-tochemical mechanism for large-scale applications. J. Geo-phys. Res., 104(D23), 30387−30415, https://doi.org/10.1029/
NOVEMBER 2019 LU ET AL. 1233
1999JD900876.
Zhang, F., Z. W. Wang, H. R. Cheng, X. P. Lv, W. Gong, X. M.Wang, and G. Zhang, 2015: Seasonal variations and chemic-al characteristics of PM2.5 in Wuhan, Central China. Scienceof the Total Environment, 518−519, 97−105, https://doi.org/10.1016/j.scitotenv.2015.02.054.
Zhang, X., Q. Zhang, C. P. Hong, Y. X. Zheng, G. N. Geng, D.Tong, Y. X. Zhang, and X. Y. Zhang, 2018: Enhancement ofPM2.5 concentrations by aerosol-meteorology interactionsover China. J. Geophys. Res., 123, 1179−1194, https://doi.org/10.1002/2017JD027524.
Zheng, B., and Coauthors, 2015a: Heterogeneous chemistry: Amechanism missing in current models to explain secondary in-organic aerosol formation during the January 2013 haze epis-ode in North China. Atmospheric Chemistry and Physics,15, 2031−2049, https://doi.org/10.5194/acp-15-2031-2015.
Zheng, G. J., and Coauthors, 2015b: Exploring the severe winterhaze in Beijing: The impact of synoptic weather, regionaltransport and heterogeneous reactions. Atmospheric Chem-istry and Physics, 15(6), 2969−2983, https://doi.org/10.5194/acp-15-2969-2015.
Zhong, M., E. Saikawa, V. Naik, L. W. Horowitz, M. Takigawa,and Y. Zhao, 2014: WRF-chem simulation of air quality inChina: Sensitivity analyses of PM concentrations to emis-sions, atmospheric transport, and secondary organic aerosolformation. American Geophysical Union, Fall Meeting, Amer-ican Geophysical Union, A13C-3187.
Zhou, Y., Y. Y. Yue, L. Li, M. Liu, and T. Zhou, 2016: Analysisof a serious haze event resulting from crop residue burningin central eastern Hubei. Climatic and Environmental Re-search, 21(2), 141−152, https://doi.org/10.3878/j.issn.1006-9585.2015.15109. (in Chinese with English abstract)
1234 A MONTH-LASTING HAZE EPISODE IN WUHAN VOLUME 36


