Embed Size (px)
Citation preview
Strategic Management JournalStrat. Mgmt. J., 34: 978–998 (2013)
Published online EarlyView 21 March 2013 in Wiley Online Library (wileyonlinelibrary.com) DOI: 10.1002/smj.2057
Received 21 March 2011 ; Final revision received 16 June 2012
INTRA-INDUSTRY DIVERSIFICATION AND FIRMPERFORMANCE
TALLI ZAHAVI and DOVEV LAVIE*Faculty of Industrial Engineering and Management, Technion—Israel Institute ofTechnology, Haifa, Israel
We study how intra-industry product diversity affects firm performance by analyzing theimplications of expanding a firm’s product line within its core business. We conjecture thatincreases in product diversity initially undermine performance because of negative transfereffects but then improve it due to economies of scope. We further theorize that this U-shapedeffect of product diversity becomes more pronounced as the firm increases the intensity of itstechnology investment, yet is likely to be attenuated by the firm’s accumulated experience withintra-industry diversification. Data on 156 U.S.-based software firms operating from 1990 to2001 furnish support for these conjectures. Our study advances emerging research on intra-industry diversification by underscoring some of its contingent performance effects. Copyright 2013 John Wiley & Sons, Ltd.
INTRODUCTION
Strategy research has extensively studied diver-sification to new businesses. Nevertheless, littleis known about the performance implications ofdiversifying to related product lines within indus-try boundaries, that is, intra-industry diversifi-cation. Prior research has concentrated on largediversified firms even though focused firms arecommon in many industries, and most firms havea single business when initiating operations. Infact, intra-industry diversification is more preva-lent than inter-industry diversification and can beconsidered a natural precursor to it. Despite thefact that a firm’s decision to diversify its productportfolio within its current business is a highly rel-evant managerial concern, it has received limitedscholarly attention.
Keywords: product diversification; product diversity; per-formance; economies of scope; negative transfer*Correspondence to: Dovev Lavie, Faculty of Industrial Engi-neering and Management, Technion—Israel Institute of Tech-nology, Haifa 32000, Israel. E-mail: [email protected]
Copyright 2013 John Wiley & Sons, Ltd.
Considering mostly the benefits of diversify-ing into related product markets, prior researchon intra-industry diversification has not fullyacknowledged fundamental differences betweenintra- and inter-industry diversification. It has the-orized about the benefits of product diversity incertain industries yet revealed inconsistent findings(Li and Greenwood, 2004; Stern and Henderson,2004; Tanriverdi and Lee, 2008). We shed newlight on this phenomenon by claiming that intra-and inter-industry diversification are fundamen-tally different. On the one hand, firms that diversifyto product lines within their industry boundariesare unlikely to experience diseconomies of scopeand organizational challenges typical of unrelateddiversification. On the other hand, such firmsmay experience learning impediments and limitsto economies of scope at low levels of productdiversity. Prior diversification research has treatedfocused firms as a homogenous group, whichobscures these nuances. Nevertheless, diversify-ing a firm’s product line within a given businessinvolves distinct challenges compared to diversi-fying across businesses. By discussing limits to
Intra-industry Diversification 979
economies of scope and elaborating on the role ofnegative transfer of learned behavior, we advancediversification research and demonstrate that the-ory and findings relating to inter-industry diversi-fication cannot be bluntly applied to the study ofintra-industry diversification.
Counter to conventional wisdom that firm per-formance improves with related diversification as aresult of economies of scope (Farjoun, 1998; Nay-yar and Kazanjian, 1993; Panzar and Willig, 1981),we claim that such economies reach a boundarycondition at a low level of intra-industry productdiversity. At that level, the overlapping functional-ity of products offers limited complementary valueto customers, thus limiting the benefits of sharingresources across related products. The ability togain from product relatedness is also compromisedby negative transfer effects. The notion of neg-ative transfer suggests that learned behavior cangenerate negative consequences when a practice isapplied with no adjustments in a context that isslightly different from the context in which learn-ing originally occurred (Finkelstein and Haleblian,2002; Novick, 1988). In turn, at a high level ofintra-industry product diversity, products are suffi-ciently distinctive to generate economies of scopeand mitigate negative transfer effects. Thus, firmperformance is likely to decline with increases inintra-industry product diversity up to a thresholdlevel beyond which it is likely to improve. We fur-ther examine how relevant organizational charac-teristics, namely technology intensity and accumu-lated diversification experience, shape this effect.Specifically, we expect the U-shaped performanceeffect of product diversity to become pronouncedwhen a firm increases its technology intensity andattenuated as it gains diversification experience.We test our hypotheses with a sample of 156 publicfirms operating in the U.S. prepackaged softwareindustry between 1990 and 2001.
We advance strategy research by elucidating theperformance effects of intra-industry diversifica-tion and uncovering contingencies that can assistin realizing the benefits arising from expanding afirm’s product line within its industry. We counterprior research that has underscored the benefits ofrelated diversification (e.g., Mayer and Whitting-ton, 2003) by highlighting some boundary condi-tions to economies of scope and revealing hownegative transfer can undermine performance whenproducts in the firm’s core business are closelyrelated. Only when managers acknowledge the
subtle differences across related products can theyovercome this impediment and fully realize theeconomies of scope ascribed to product diversity.Furthermore, while investing in unique technolo-gies can enhance economies of scope, it can alsolimit the firm’s ability to mitigate negative trans-fer. In turn, the firm’s prior experience is usefulfor overcoming negative transfer but can limit thefirm’s gains from economies of scope. Thus, wefurther advance research on intra-industry diver-sification by revealing its contingent performanceimplications.
THEORY AND HYPOTHESES
Inter-industry diversification refers to expansioninto additional businesses new to the firm (Berry,1975; Chandler, 1962; Hitt, Hoskisson, and Kim,1997; Rumelt, 1974). Diversification pertains tothe process of initiating new businesses, whereasthe static notion of diversity refers to the spreadof a firm’s businesses at a certain time (Grant,Jammine, and Thomas, 1988; Ramanujam andVaradarajan, 1989). Following Rumelt (1974),scholars distinguish focused firms from firmswith dominant businesses, related businesses andunrelated businesses. Business relatedness refers tothe extent to which the firm’s businesses draw onsimilar skills or resources (Robins and Wiersema,1995; Rumelt, 1982; Tanriverdi and Venkatraman,2005), common technologies, or shared customers(Davis et al . 1992; Pitts and Hopkins, 1982).
The performance effect of inter-industry diver-sification has been studied extensively. Despitesome mixed evidence, most scholars advocatean inverted U-shaped relationship between inter-industry business diversity and firm performance(Geringer, Tallman, and Olsen, 2000; Grant et al .,1988; Palepu, 1985; Tallman and Li, 1996). Asimilar pattern characterizes the effect of businessrelatedness on firm performance (e.g., Harrison,Hall, and Nargundkar, 1993; Palich, Cardinal, andMiller, 2000). Research on inter-industry diversifi-cation considers focused firms that operate singlebusinesses as a coherent group without accountingfor variance in their product diversity.
Intra-industry diversification entails a firm’spresence in more than one market niche or productline within a single industry (Li and Greenwood,2004; Stern and Henderson, 2004). Some scholarsassume that, given its limited diversification, such
Copyright 2013 John Wiley & Sons, Ltd. Strat. Mgmt. J., 34: 978–998 (2013)DOI: 10.1002/smj
980 T. Zahavi and D. Lavie
a firm resembles firms that engage in relatedinter-industry diversification (Tanriverdi and Lee,2008) whose performance improves with increasesin product diversity. However, the evidence ismixed, with some studies revealing negativeor insignificant effects of intra-industry productdiversity (Li and Greenwood, 2004; Stern andHenderson, 2004; Tanriverdi and Lee, 2008).
Only a handful of studies have examined theperformance implications of intra-industry productdiversity, defined as the degree of variation in afirm’s portfolio of related products in a particularindustry. One study found no significant associ-ation between intra-industry diversity and returnon assets (Li and Greenwood, 2004). Another hasreported mixed findings, showing that a softwarefirm’s platform scope is negatively associated withits market share, while its product market scope ispositively related to its sales growth (Tanriverdiand Lee, 2008). Another study revealed perfor-mance improvement following the introduction ofnew products, yet reported performance declineresulting from the introduction of existing prod-ucts on new platforms (Cottrell and Nault, 2004).Whereas one study indicated that expansion ofa firm’s primary product line is negatively asso-ciated with firm survival (Stern and Henderson,2004), another study reported that diversifying intorelated market niches increases return on assets(Li and Greenwood, 2004). This mixed evidencemay reflect discrepancies across alternative out-come measures or some latent contingencies.
Few studies have considered the contingent per-formance effects of intra-industry diversity. Sternand Henderson (2004) found that a firm’s likeli-hood of failure depends on the interplay betweenthe firm’s primary product-line diversity and theaggregated number of new products introduced bythe firm’s competitors. These findings demonstratethe role of competitive pressures but offer lim-ited insight into the performance implications ofintra-industry diversity. Partially addressing thisconcern, Tanriverdi and Lee (2008) showed thata combination of platform relatedness and prod-uct market relatedness positively affects a firm’ssales growth and market share, while indepen-dently these forms of relatedness generate neg-ative effects. Overall, the emerging research onintra-industry product diversity has assumed thatthe implications of such diversity are consistentwith those of inter-industry diversity, but generatedmixed findings.
The scant research on intra-industry diversifica-tion has not fully explained how focused firms canbenefit from expanding product diversity withina particular industry. We seek to advance thisresearch by examining both the positive and nega-tive implications of product diversity, underscoringthe corresponding roles of economies of scope andnegative transfer. We further advance a contin-gency perspective by studying how the implica-tions of intra-industry product diversity vary withthe firm’s technology intensity and diversificationexperience.
The benefits of intra-industry diversification
Diversification research has traditionally under-scored the benefits of economies of scope that canbe obtained by sharing resources across productmarkets (Farjoun, 1998; Gary, 2005; Miller, 2006;Nayyar and Kazanjian, 1993; Panzar and Willig,1981). Resource sharing takes various forms, suchas having a sales team sell complementary prod-ucts, involving engineers in the development ofrelated products (Gary, 2005), or using accu-mulated knowledge of another business (Nay-yar, 1993; Tanriverdi and Venkatraman, 2005).Such sharing enables the firm to exploit under-utilized resources and generate synergies (Guptaand Govindarajan, 1986), which reduce produc-tion costs or increase product value. Related inter-industry diversification generates economies ofscope due to enhanced opportunities for sharingresources (e.g., Jones and Hill, 1988; Rumelt,1974, 1982) that can be used in one market andthen redeployed in another (Helfat and Eisenhardt,2004).1
Intra-industry diversification can also generateeconomies of scope by offering opportunities forresource redeployment across related product mar-kets. For example, a firm can leverage its famil-iarity with customer needs to increase productquality when introducing related products to thesame market (Tanriverdi and Lee, 2008). Hence,resources can be redeployed when different prod-ucts share similar input factors or customers (Liand Greenwood, 2004).
1 Studies of inter-industry diversification show limits toeconomies of scope at high levels of diversity because of theneed to oversee operations across a wide range of unrelated busi-nesses. Such performance decline is inapplicable at high levels ofintra-industry diversity since the firm still offers related productsin that range.
Copyright 2013 John Wiley & Sons, Ltd. Strat. Mgmt. J., 34: 978–998 (2013)DOI: 10.1002/smj
Intra-industry Diversification 981
Although intra-industry diversification enablesresource redeployment, economies of scope varywith the extent of product diversity. At lowintra-industry product diversity the benefits fromeconomies of scope are limited. Even thoughthe same employees, technologies, or marketingresources can be deployed across closely relatedproducts, these products offer overlapping func-tionality. Such redundancy limits the comple-mentary value of related products to customers.Attempts to differentiate closely related productsor direct them to different market niches mayrequire investments of nonfungible resources intechnology development and marketing, which canoffset economies of scope. Customers may refrainfrom buying related products that offer limited dis-tinctive functionality or may purchase them at theexpense of the firm’s other products. For example,a software firm that offers desktop applications forfile backup and archiving is unlikely to gain scopeeconomies when introducing online storage anddata backup services that partially substitute for itsdesktop products. Hence, a firm may fail to gainfrom complementarity or encounter cannibaliza-tion when newly introduced products resemble itsexisting products (Cottrell and Nault, 2004; Naultand Vandenbosch, 1996).
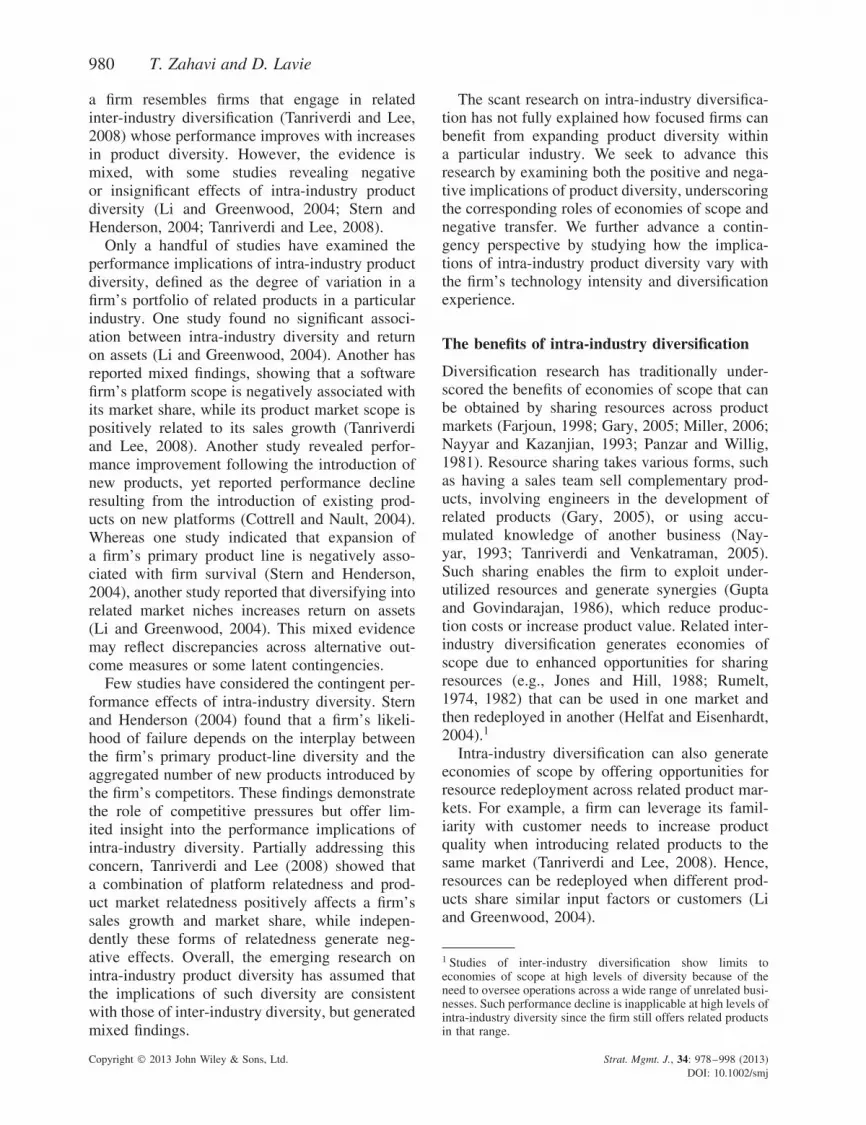
In turn, the more extensive the diversity ofrelated products offered by the firm within itsindustry boundaries the more opportunities it hasfor deploying resources across these products(Jones and Hill, 1988) and the more likely theseproducts are to offer complementary value tocustomers. As the level of intra-industry prod-uct diversity increases, economies of scope areexpected to increase at an increasing rate (Jonesand Hill, 1988). Such a pattern is ascribed toresource redeployment and increased availabilityof opportunities for effective sharing of resources.Specifically, when a firm diversifies into a dis-tinctive yet related product category, it can deploysimilar personnel, R&D, and marketing assets aswell as benefit from increased complementarity ofits related products. Indeed, products belonging tothe same product line are typically developed inthe same location by the same team or by teamsthat maintain frequent face-to-face communicationand leverage the same technologies (Stern andHenderson, 2004), thus supporting economies ofscope. Increases in intra-industry product diver-sity create opportunities for exercising economiesof scope across an increasing range of related
Intra-industrydiversity
Economiesof scope
Figure 1. Economies of scope and intra-industrydiversity
products, which can enhance firm performance.For example, in the computer workstation industry,multiple product offerings improve organizationalviability (Sorenson, 2000).
In sum, economies of scope are restricted ata low level of intra-industry product diversity(Jones and Hill, 1988) given limited opportunitiesfor leveraging the firm’s resources in distinctivemarket niches. Yet, as intra-industry productdiversity increases, the firm can more effectivelyleverage product relatedness and meet variouscustomer preferences. Consequently, the benefitsof economies of scope increase at an increasingrate (see Figure 1).2
Liabilities of intra-industry diversification
Whereas economies of scope entail productivedeployment of resources across related products,negative transfer leads to inappropriate deploy-ment of nonfungible resources that are suitablefor supporting one product but not the other. Thenotion of negative transfer originated in the learn-ing literature, which focuses on the retrieval andreuse of knowledge (Levitt and March, 1988).When confronted with a task that is similar to afamiliar task, individuals rely on analogical rea-soning and follow proven practices for perform-ing that task. Yet negative transfer of learnedbehavior can occur when the tasks are in factdistinct, so that irrelevant knowledge might bewrongly applied, yielding poor results (Novick,1988). The negative transfer effect has been inves-tigated in various organizational contexts (Farjounand Lai, 1997), such as the study of mergers
2 This pattern is fully consistent with the lower bound of thecurvilinear effect of inter-industry product diversity reported byJones and Hill (1988). Yet, for intra-industry diversification wedo not expect eventual decline in economies of scope at the upperbound since the firm does not expand to unrelated businesses.
Copyright 2013 John Wiley & Sons, Ltd. Strat. Mgmt. J., 34: 978–998 (2013)DOI: 10.1002/smj

982 T. Zahavi and D. Lavie
and acquisitions (Finkelstein and Haleblian, 2002;Haleblian and Finkelstein, 1999), internationalexpansion (O’Grady and Lane, 1996), and allianceportfolios (Lavie and Miller, 2008). It has notbeen empirically investigated by prior research ondiversification, which was mostly concerned withinter-industry diversification, wherein the firm’sbusinesses are sufficiently distinctive so that man-agers are unlikely to make unwarranted analo-gies across businesses. Moreover, most diversifiedfirms adopt a multi-divisional organizational struc-ture (Chandler, 1962), so that different managerswith industry-specific expertise are responsible forthe firm’s operations in different businesses. Insuch organization, cross-business learning is lim-ited and negative transfer effects are unlikely.
We suggest that the negative transfer effecttranspires in intra-industry diversification, sincemanagers may fail to recognize subtle yet crit-ical differences across the firm’s closely relatedproducts, especially when developed by the samebusiness unit. For example, since its inception in1986, software firm PlanetCAD has focused onintroducing computer-aided design/manufacturing(CAD/CAM) and related graphics products. In1999 the firm launched 3dmodelserver.com—aweb-based application for manufacturing simu-lation and sharing of CAD designs. Althoughits functionality was similar to its prior soft-ware products, this was PlanetCAD’s first attemptto introduce a product based on the internetplatform, which required its managers to adoptdifferent practices. Customers were expected tosubmit models for translation on the 3dmod-elserver.com website and pay fees based on theirmodels’ sizes. Unfortunately, PlanetCAD encoun-tered many challenges with the introduction of thisproduct, which did not live up to expectations.
Believing that a product should be managedaccording to practices that have been developedfor related products, managers may inappropri-ately apply existing resources and routines withoutintroducing minor modifications entailed by themarginally different features of related products.Instead of learning the unique setting and under-standing the required changes, managers naturallyresort to familiar practices that may not be appli-cable in the new context. In addition, the use ofestablished practices can result in the illusion ofcontrol and overconfidence in the firm’s ability,which may prompt managers to evaluate superfi-cially emerging situations and their consequences
(Jemison and Sitkin, 1986). Thus, negative transfermay impair performance. Although the negativetransfer effect is less likely in inter-industry diver-sification where differences across businesses aresubstantial and easily recognizable, it becomescommon in intra-industry diversification, whererelated products offer somewhat similar function-ality but differ in some other meaningful aspects.Negative transfer of learned behavior can thusundermine performance as the firm diversifieswithin its industry.
The negative transfer effect is expected to mani-fest mostly at a low level of intra-industry productdiversity, where differences across related productsare subtle and latent, so that managers are morelikely to disregard them. At that range of productdiversity, a firm may fail to learn the unique fea-tures and requirements typical of related products.The firm may blindly apply resources that havebeen assigned to support its core products ratherthan develop unique capabilities for meeting a newproduct’s development needs and market require-ments. Existing resources such as personnel, tech-nologies, and marketing techniques are likely tobe deployed without the minor adjustments nec-essary to meet the corresponding requirements.Consequently, the firm may encounter organiza-tional challenges and operational impediments incarrying out intra-industry diversification at a lowlevel of product diversity.
As the level of intra-industry product diver-sity increases, the distinct nature of related prod-ucts becomes apparent. The more diverse theseproducts, the more observable are their differ-ences. At a high level of product diversity, man-agers can more easily realize the distinct featuresof diverse products, make necessary adjustments,and learn how to overcome problems of misap-plied resources and practices (Farjoun and Lai,1997; Novick, 1988). Thus, as the level of intra-industry product diversity increases, the firm islikely to avoid successfully some of the liabili-ties of negative transfer. When product diversityis extensive, negative transfer becomes unlikelygiven that related products are easily distinguish-able and managers can effectively apply relevantresources across products. Thus, the liabilities ofnegative transfer are expected to accumulate ata decreasing rate with increases in intra-industryproduct diversity (see Figure 2).
Copyright 2013 John Wiley & Sons, Ltd. Strat. Mgmt. J., 34: 978–998 (2013)DOI: 10.1002/smj
Intra-industry Diversification 983
Intra-industrydiversity
Negativetransfer
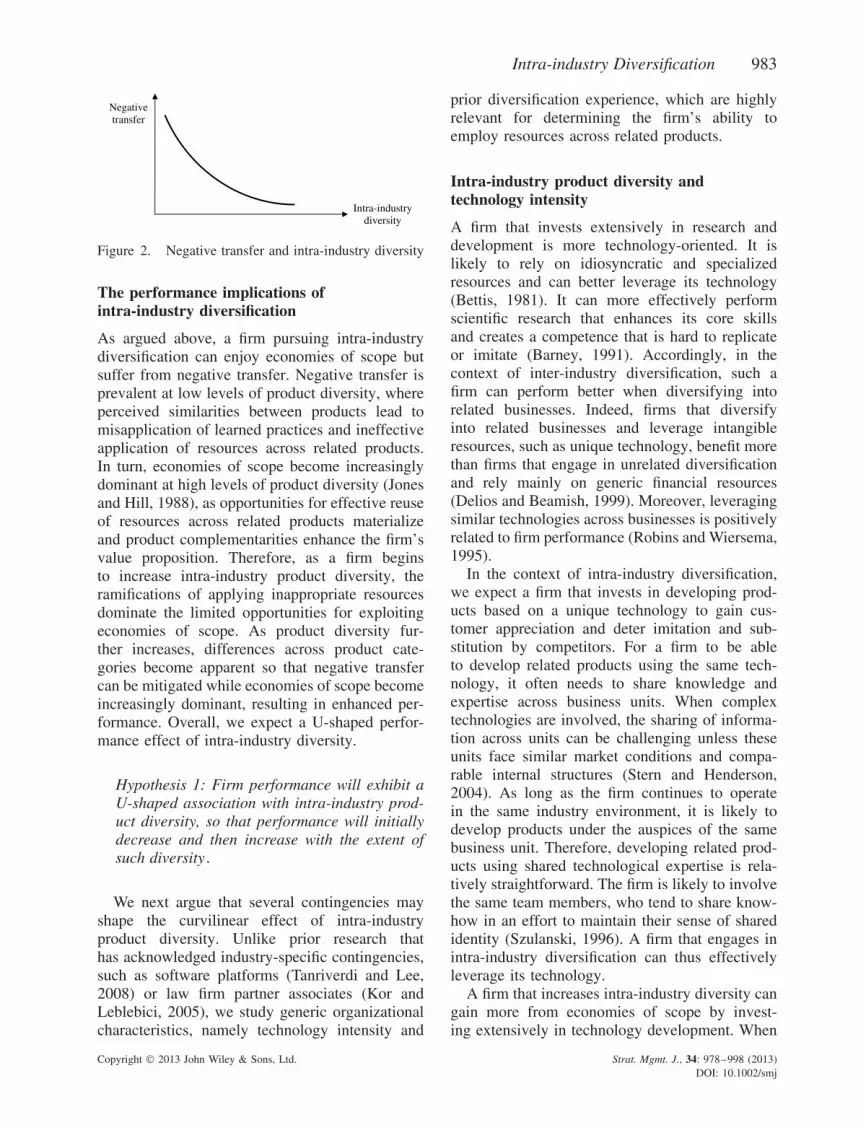
Figure 2. Negative transfer and intra-industry diversity
The performance implications ofintra-industry diversification
As argued above, a firm pursuing intra-industrydiversification can enjoy economies of scope butsuffer from negative transfer. Negative transfer isprevalent at low levels of product diversity, whereperceived similarities between products lead tomisapplication of learned practices and ineffectiveapplication of resources across related products.In turn, economies of scope become increasinglydominant at high levels of product diversity (Jonesand Hill, 1988), as opportunities for effective reuseof resources across related products materializeand product complementarities enhance the firm’svalue proposition. Therefore, as a firm beginsto increase intra-industry product diversity, theramifications of applying inappropriate resourcesdominate the limited opportunities for exploitingeconomies of scope. As product diversity fur-ther increases, differences across product cate-gories become apparent so that negative transfercan be mitigated while economies of scope becomeincreasingly dominant, resulting in enhanced per-formance. Overall, we expect a U-shaped perfor-mance effect of intra-industry diversity.
Hypothesis 1: Firm performance will exhibit aU-shaped association with intra-industry prod-uct diversity, so that performance will initiallydecrease and then increase with the extent ofsuch diversity .
We next argue that several contingencies mayshape the curvilinear effect of intra-industryproduct diversity. Unlike prior research thathas acknowledged industry-specific contingencies,such as software platforms (Tanriverdi and Lee,2008) or law firm partner associates (Kor andLeblebici, 2005), we study generic organizationalcharacteristics, namely technology intensity and
prior diversification experience, which are highlyrelevant for determining the firm’s ability toemploy resources across related products.
Intra-industry product diversity andtechnology intensity
A firm that invests extensively in research anddevelopment is more technology-oriented. It islikely to rely on idiosyncratic and specializedresources and can better leverage its technology(Bettis, 1981). It can more effectively performscientific research that enhances its core skillsand creates a competence that is hard to replicateor imitate (Barney, 1991). Accordingly, in thecontext of inter-industry diversification, such afirm can perform better when diversifying intorelated businesses. Indeed, firms that diversifyinto related businesses and leverage intangibleresources, such as unique technology, benefit morethan firms that engage in unrelated diversificationand rely mainly on generic financial resources(Delios and Beamish, 1999). Moreover, leveragingsimilar technologies across businesses is positivelyrelated to firm performance (Robins and Wiersema,1995).
In the context of intra-industry diversification,we expect a firm that invests in developing prod-ucts based on a unique technology to gain cus-tomer appreciation and deter imitation and sub-stitution by competitors. For a firm to be ableto develop related products using the same tech-nology, it often needs to share knowledge andexpertise across business units. When complextechnologies are involved, the sharing of informa-tion across units can be challenging unless theseunits face similar market conditions and compa-rable internal structures (Stern and Henderson,2004). As long as the firm continues to operatein the same industry environment, it is likely todevelop products under the auspices of the samebusiness unit. Therefore, developing related prod-ucts using shared technological expertise is rela-tively straightforward. The firm is likely to involvethe same team members, who tend to share know-how in an effort to maintain their sense of sharedidentity (Szulanski, 1996). A firm that engages inintra-industry diversification can thus effectivelyleverage its technology.
A firm that increases intra-industry diversity cangain more from economies of scope by invest-ing extensively in technology development. When
Copyright 2013 John Wiley & Sons, Ltd. Strat. Mgmt. J., 34: 978–998 (2013)DOI: 10.1002/smj
984 T. Zahavi and D. Lavie
the firm’s products incorporate highly intensiveand complex technologies, the firm can moreeffectively maintain idiosyncrasy, social complex-ity, and causal ambiguity (Dierickx and Cool,1989). Hence, the firm’s operations and its prod-uct portfolio are considered unique from the cus-tomers’ standpoint and more difficult to imitate bycompetitors. The firm’s investment in technologyenables it to benefit more from related productsthat furnish opportunities for sharing and leverag-ing complementary resources. In addition, at lowlevels of product diversity in which economies ofscope are limited, extensive investment in tech-nology becomes exorbitant, since the firm can-not spread technology development costs acrossa broad range of related products. As the firmincreases product diversity, its ability to spreadits investments in technology across a range ofrelated products contributes to economies of scope,which in turn increase its returns on these invest-ments. Consequently, when a firm invests exten-sively in technology development the economiesof scope made available by increased productdiversity accumulate at a faster rate.
Intensive investment in technology can bothmagnify economies of scope and also increasethe risk of negative transfer. Managers in a firmwith high technology intensity are more likelyto assume erroneously that related products aresimilar as well as encounter challenges whenattempting to introduce necessary technologicaladjustments. First, the firm’s investment in highlyintensive and unique technology constrains itsability to recognize the need for technologicalchanges that divert its attention away from itsestablished technological trajectory (Burgelman,1994). A firm with high technology intensity isthus more likely to fall into the propinquity trap,since it engages in local search for nearby solutions(Ahuja and Lampert, 2001). Local search is gen-erally desirable when engaging in related productdevelopment; yet as the firm increases its productdiversity, managers may not recognize dissimi-larities across related products and fail to identifyrelevant technological solutions to increasinglydistinctive problems. Thus, attempts to leverageinvestments in technology constrain the firm’sability to identify the need for adjustments whendiversifying to closely related product categories.
Besides increasing the likelihood of negativetransfer, intensive technology development islikely to increase the magnitude of negative
transfer effects. When a firm invests intensely in aspecialized set of resources to support its technol-ogy, it becomes more vulnerable to failures dueto strict application of its technology in relatedproducts. Its investments in skills, knowledge, andtechnical systems may not be aligned with thoseneeded for related products. Such investments cancreate core rigidities that undermine performance(Rawley, 2010). Moreover, when a firm investsin a specific set of assets, it is likely to incur sunkcosts that limit its ability to exercise flexibility(Lieberman and Montgomery, 1988). Since thefirm’s technology is likely to be more specializedand necessitate adaptation, this may intensifythe negative transfer effect that occurs when thefirm applies its core technology across relatedproducts. Failure to recognize subtle differencesacross product categories is likely to increase mis-application costs because the firm’s technology islikely to be unique and less robust. Consequently,when the firm invests extensively in technologyand avoids commonly available yet less noveltechnologies, the negative transfer effect increasesat a faster rate with product diversity. Still, whenthe firm begins to realize that its technologycannot be bluntly applied across related productcategories, its superior technical skills can enableit to adjust its technology effectively, thus miti-gating the costs of negative transfer at high levelsof product diversity.
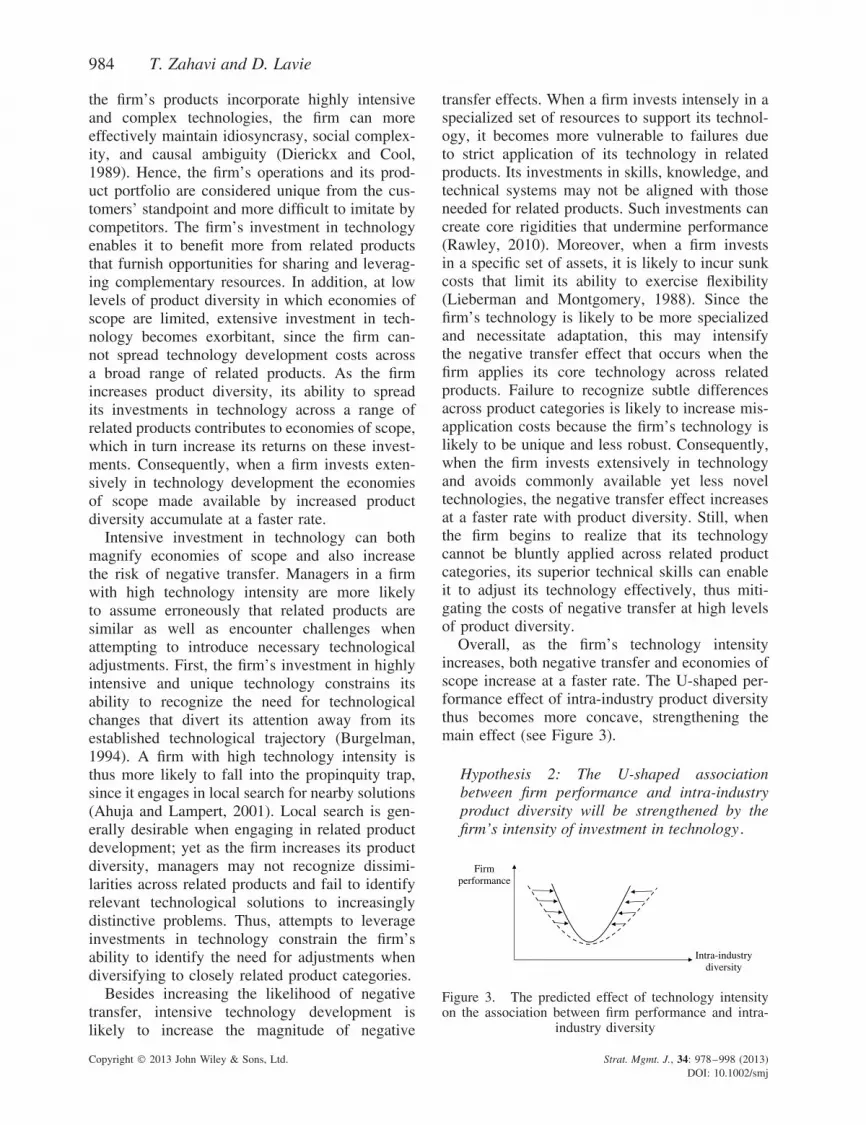
Overall, as the firm’s technology intensityincreases, both negative transfer and economies ofscope increase at a faster rate. The U-shaped per-formance effect of intra-industry product diversitythus becomes more concave, strengthening themain effect (see Figure 3).
Hypothesis 2: The U-shaped associationbetween firm performance and intra-industryproduct diversity will be strengthened by thefirm’s intensity of investment in technology .
Intra-industrydiversity
Firmperformance
Figure 3. The predicted effect of technology intensityon the association between firm performance and intra-
industry diversity
Copyright 2013 John Wiley & Sons, Ltd. Strat. Mgmt. J., 34: 978–998 (2013)DOI: 10.1002/smj

Intra-industry Diversification 985
Intra-industry product diversity and priordiversification experience
The performance effect of intra-industry productdiversity may depend on a firm’s prior experi-ence with intra-industry diversification. Such expe-rience supports learning that enriches practices andknowledge that in turn enables the firm to avoidorganizational liabilities (Levinthal and March,1993). The firm’s managers can leverage diver-sification experience to recognize subtle dissimi-larities across related products and mitigate nega-tive transfer effects. However, prior diversificationefforts can also exhaust prospective diversificationopportunities and limit economies of scope.
As previously argued, intra-industry productdiversity generates economies of scope. Indeed,prior research has noted that customers in tech-nology markets appreciate a variety of productsoffered by a single vendor (Cottrell and Nault,2004). Nevertheless, a firm tends to diversify intoproduct markets where it can apply its existingtechnological resources (Silverman, 1999). There-fore, prior intra-industry diversification experiencelimits the firm’s opportunities for extractingeconomies of scope when entering new productmarkets. Such experience suggests that the firmhas already leveraged relevant economies of scopein prior diversification initiatives, and thus mayhave exhausted opportunities for benefiting fromsuch economies. In this sense, the firm facesdiseconomies associated with products introducedto market niches in which competitive pressureand other market conditions offset potentialsynergies (Dixon, 1994). Limits to economies ofscope can also emanate from market resistanceto complexity, price schemes for product bundles,and challenging coordination within the firm (Cot-trell and Nault, 2004), which intensify as the firmexhausts diversification opportunities. Hence, asthe firm accumulates intra-industry diversificationexperience, remaining diversification opportunitiesgenerate limited benefits of economies of scope.
In addition, diversification experience limitseconomies of scope by prompting resourceoveruse. The value of resources diminishes whenthe firm relies on its accumulated knowledge whilecompetitors introduce innovations (Markides andWilliamson, 1994). Indeed, limits to economies ofscope are often ascribed to the firm’s broadeningproduct portfolio, which becomes increasinglycostly to maintain and less valuable as the range of
related products in the market increases (Sorenson,2000). Therefore, experience with intra-industrydiversification limits the benefits of economies ofscope associated with increased product diversity.
Although intra-industry diversification expe-rience can constrain economies of scope, it canalso mitigate the effects of negative transfer. Priorexperience facilitates ‘learning by doing’ (Nelsonand Winter, 1982) that leads to productivity gains.It enables the firm to accumulate knowledge thathelps it form and refine organizational routines(Zollo and Singh, 2004). As the firm gainsexperience, it can incrementally adjust its reactionto similar tasks while absorbing feedback on pastdecisions (Pennings, Barkema, and Douma, 1994).Hence, a firm that has accumulated substantialintra-industry diversification experience is moreattuned to subtle differences across related prod-ucts and can more easily avoid negative transfer oflearned behavior by relying on a more substantialstock of accumulated knowledge. As the firm gainsintra-industry diversification experience, it is lesslikely to suffer from negative transfer and morelikely to recognize the need for customization. Itcan more effectively make necessary adjustmentsbased on its experience and thus reduce the prob-ability of failure. Consequently, the performancedecrease associated with product diversity isattenuated. Overall, as the firm’s diversificationexperience increases, the effects of both negativetransfer and economies of scope increase atslower rates with increases in product diversity, sothat the U-shaped performance effect of productdiversity becomes more convex (see Figure 4).
Hypothesis 3: The U-shaped associationbetween firm performance and intra-industryproduct diversity will be attenuated by thefirm’s prior diversification experience.
Intra-industrydiversity
Firmperformance
Figure 4. The predicted effect of diversification expe-rience on the association between firm performance and
intra-industry diversity
Copyright 2013 John Wiley & Sons, Ltd. Strat. Mgmt. J., 34: 978–998 (2013)DOI: 10.1002/smj
986 T. Zahavi and D. Lavie
RESEARCH METHODS
Research setting and sample
We performed a pooled time-series analysisof U.S.-based firms operating in the prepack-aged software industry (Standard IndustryClassification—SIC 7372) between 1990 and2001, with some historical data traced backto 1985. This industry is suitable for analysisbecause most software firms are focused anddiversify within their industry. This industry isdynamic, with emerging technologies drivingfirms’ expansion to various product markets. Inaddition, this industry features a high proportionof publicly traded firms, ensuring the accessibilityof financial information and reducing potentialsize- and age-related biases (Lavie, 2007). Ourdata are representative, since the worldwidesoftware industry is dominated by U.S.-basedfirms (Rudy, 2000). Apparently, much of theresearch on intra-industry diversification has beenconducted in the software industry (e.g., Stern andHenderson, 2004; Tanriverdi and Lee, 2008), sothat this setting supports comparison to relevantprior research. Our initial sample included all 243publicly traded U.S.-based firms that operatedin SIC 7372, were active in 2001, and had atleast five records in Compustat during the timeframe of the study. The final sample included 156firms after excluding large firms that are likely toengage in inter-industry diversification.3,4
Data collection
We relied on archival data that included financialinformation on the sampled firms and pressannouncements of product introductions. Annualfinancial data on firms’ total assets, revenues,employees, long-term debt, cash, R&D expenses,and net income were extracted from Compustat.
3 Eighty-seven percent of the firms in our final sample had onlyone primary four-digit SIC code, seven percent had a two-digitSIC code, and six percent had a three-digit SIC code, indicatinglimited inter-industry diversification.4 On average, a firm had $16.76 million in cash (median = $4.82million), made $55.30 million in sales (median = $21.90 mil-lion), employed 446 employees (median = 173 employees), andspent $9.73 million on R&D (median = $4.60 million). It main-tained $73.37 million in assets (median = $25 million) andreached a −49 percent return on assets (median = −9%) anda $346.50 million market value (median = $76 million). It hadbeen in business for 17 years (median = 16 years) and released3.55 software products annually (median = 2 products).
Data on common shares outstanding and stockprices were available from the Compustat-CRSPdatabase. Product data were gathered from pressannouncements of new product introductionsfrom 1985 to 2001. A total of 16,027 relevantpress releases were obtained from the LexisNexisdatabase and Thompson’s Dialog New ProductAnnouncements database.
To measure intra-industry product diversity, weclassified each prepackaged software product torelevant functional categories based on a typologythat was developed with the help of industryexperts. This typology was preferred to prevalenttaxonomies such as the SIC or North Amer-ican Industry Classification System (NAICS),taxonomies developed by International DataCorporation (IDC), the Software and InformationIndustry Association (SIIA), or the NPD Group.5
Our typology is the most comprehensive, offeringa hierarchical structure of 463 product functions.In the classification process, every press releasewas independently reviewed by two trainedcoders with extensive industry experience and wasassigned the relevant functions. The pre-traininginter-rater reliability was 84.57 percent, withdisagreements resolved via deliberation. Besidesits functionality, for each product we coded: thedate of product introduction, the product’s name,whether it was a new product or a version ofa previously introduced product, whether it wasreleased on a new platform, whether the producttargeted a particular vertical market, and whetherit served as a software package consisting ofseveral standalone applications. Coders wereencouraged to validate any inconclusive or incon-sistent information by seeking additional pressreleases or tracking product information in EdgarSEC filings, the Business and Company ResourceCenter database, and firms’ websites.
In total, between 1985 and 2001, the 156 firmsintroduced 6,362 software products, of which3,293 were classified as new products and theremaining 3,069 were versions of existing prod-ucts. In total, the software products incorporated
5 The SIC and NAICS systems offer overly crude categorization.In turn, SIIA and NPD have limited scope since they focus eitheron business applications or consumer products. Finally, the IDCtaxonomy (e.g., Cottrell and Nault, 2004; Stern and Henderson,2004) relies on time-variant classification which does not enableconsistent categorization of historical product functions. In turn,our product typology reflects the state of the software industryin 2001 after accounting for the emergence of new categoriesand their convergence over time.
Copyright 2013 John Wiley & Sons, Ltd. Strat. Mgmt. J., 34: 978–998 (2013)DOI: 10.1002/smj
Intra-industry Diversification 987
12,060 product functions covering 51 distinct mar-ket segments. A software product was assumed tobe available in the market for three years since theintroduction of its most recent version. To accountfor the lifecycle of each product, we replicatedrecords of product functions over this periodstarting with the year of product introduction. Theresulting 31,193 records were transformed by pool-ing the data across all product functions introducedby each firm in a given year. The pooled databaseincluded 2,080 firm-year observations, but thefinal database was restricted to 972 observationsin the first-stage analysis and 857 observationsin the second-stage analysis after accounting formissing values6 and excluding historical recordscorresponding to the years 1985–1989.
Dependent variable—firm performance
Following prior research on intra-industry diver-sification in the software industry (e.g., Tanriverdiand Lee, 2008), we adopt sales growth as ameasure of firm performance. This performancemeasure has been generally used in prior diver-sification research (e.g., Palich et al ., 2000;Ramanujam and Varadarajan, 1989), and it isespecially relevant to software firms, which reachprofitability only at a relatively late stage oftheir lifecycle. In fact, industry analysts oftenrely on sales growth when valuing softwarefirms (Cusumano, 2004). Unlike slowly adjustingaccounting-based performance measures, salesgrowth is an immediate measure of diversificationperformance (Stuart, 2000). Robustness tests usingalternative performance measures, such as returnon assets, generated consistent results. In line withprior research (e.g., Podolny, Stuart, and Hannan,1996; Stuart, 2000), for each firm i at year t , salesgrowth was measured using a logarithmic powerfunction: ln(Salesi,t + 1) =αln(Salesi,t) + π’xi,t + ei,t.This model yields unbiased and efficient estimatesunder the linearity, homoscedasticity, and inde-pendence assumptions of OLS regression (Stuart,2000). All independent variables and controls(denoted by xi,t) were lagged by one year relativeto the dependent variable.
6 Missing values occurred because of the lag structure of the dataand because financial information was available mostly startingthe year in which firms went public. In addition, some firms didnot report information such as R&D investment to the extentthat it was not required by SEC regulations.
Independent variables—intra-industryproduct diversity
Traditional measures of inter-industry diversityrely on the SIC system and are weighted by firms’sales in various industry segments (Chakrabarti,Singh, and Mahmood, 2007; Farjoun, 1998;Geringer et al ., 2000; Palepu, 1985). A morerefined system is needed when studying intra-industry diversity within an industry segment.7
We rely on a typology of prepackaged softwareproducts with three hierarchical levels of productcategories: 4 application classes (personal applica-tions, system infrastructure, vertical applications,and business applications), 55 market segments(second level), and 463 product functions (thirdlevel). The weights are based on counts of prod-ucts offering a particular function or classified toa certain market segment. Two commonly useddiversity measures served as independent vari-ables: the Herfindahl index (Nguyen, Seror, andDevinney, 1990; Stimpert and Duhaime, 1997)and the Concentric index (Davis and Thomas,1993; Montgomery and Wernerfelt, 1988; Robinsand Wiersema, 2003). These measures are appro-priate for studying the implications of economiesof scope and negative transfer.
The Herfindahl diversity measure was cal-culated using the formula (Montgomery, 1982,
1985): DiversityH,it = 1 −∑
j M 2ijt(∑
j Mijt
)2 where M ijt
is the proportion of active products of firm i inmarket segment j in year t , that is, the numberof products that the firm has in a particularmarket segment divided by the total number ofproducts it has in all market segments in a givenyear. The main advantage of this measure isits ability to capture the relative importance ofmarket segments by considering the proportionof products introduced in each segment. TheHerfindahl diversity measure was calculated atthe second level of the product typology.
7 Conceptually, the distinction between intra- and inter-industrydiversification is straightforward since the former involvesexpanding a firm’s product line within a given business whereasthe latter entails diversifying across distinctive businesses.Empirically, there is the question of determining the industryboundaries of a business. Because research on inter-industrydiversification has often relied on the hierarchical SIC system(Pitts and Hopkins, 1982) but has rarely considered industriesat a more refined level than the four-digit SIC code (Brice andWinter, 2009), intra-industry diversification can be empiricallydefined as expansion to related product lines within the samefour-digit SIC code.
Copyright 2013 John Wiley & Sons, Ltd. Strat. Mgmt. J., 34: 978–998 (2013)DOI: 10.1002/smj
988 T. Zahavi and D. Lavie
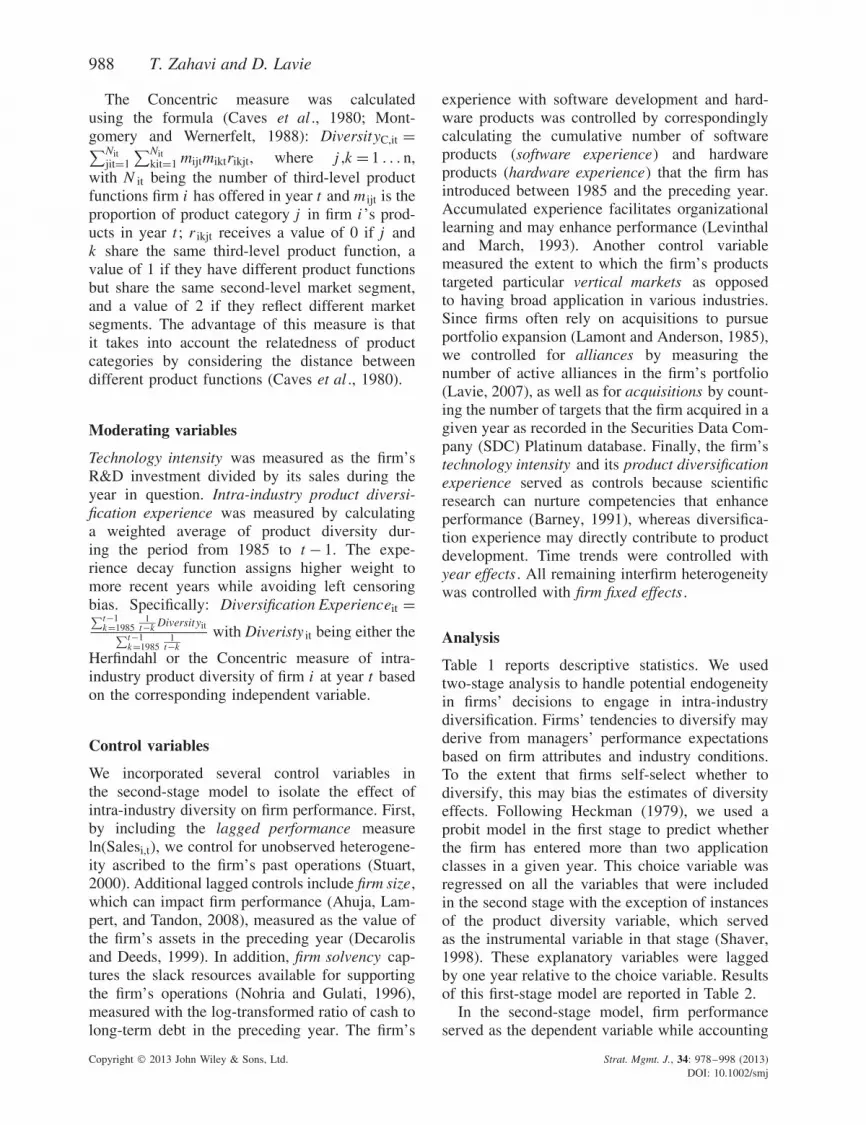
The Concentric measure was calculatedusing the formula (Caves et al ., 1980; Mont-gomery and Wernerfelt, 1988): DiversityC,it =∑Nit
jit=1
∑Nitkit=1 mijtmiktrikjt, where j ,k = 1 . . . n,
with N it being the number of third-level productfunctions firm i has offered in year t and m ijt is theproportion of product category j in firm i ’s prod-ucts in year t ; r ikjt receives a value of 0 if j andk share the same third-level product function, avalue of 1 if they have different product functionsbut share the same second-level market segment,and a value of 2 if they reflect different marketsegments. The advantage of this measure is thatit takes into account the relatedness of productcategories by considering the distance betweendifferent product functions (Caves et al ., 1980).
Moderating variables
Technology intensity was measured as the firm’sR&D investment divided by its sales during theyear in question. Intra-industry product diversi-fication experience was measured by calculatinga weighted average of product diversity dur-ing the period from 1985 to t − 1. The expe-rience decay function assigns higher weight tomore recent years while avoiding left censoringbias. Specifically: Diversification Experienceit =∑t−1
k=19851
t−k Diversityit∑t−1k=1985
1t−k
with Diveristy it being either the
Herfindahl or the Concentric measure of intra-industry product diversity of firm i at year t basedon the corresponding independent variable.
Control variables
We incorporated several control variables inthe second-stage model to isolate the effect ofintra-industry diversity on firm performance. First,by including the lagged performance measureln(Salesi,t), we control for unobserved heterogene-ity ascribed to the firm’s past operations (Stuart,2000). Additional lagged controls include firm size,which can impact firm performance (Ahuja, Lam-pert, and Tandon, 2008), measured as the value ofthe firm’s assets in the preceding year (Decarolisand Deeds, 1999). In addition, firm solvency cap-tures the slack resources available for supportingthe firm’s operations (Nohria and Gulati, 1996),measured with the log-transformed ratio of cash tolong-term debt in the preceding year. The firm’s
experience with software development and hard-ware products was controlled by correspondinglycalculating the cumulative number of softwareproducts (software experience) and hardwareproducts (hardware experience) that the firm hasintroduced between 1985 and the preceding year.Accumulated experience facilitates organizationallearning and may enhance performance (Levinthaland March, 1993). Another control variablemeasured the extent to which the firm’s productstargeted particular vertical markets as opposedto having broad application in various industries.Since firms often rely on acquisitions to pursueportfolio expansion (Lamont and Anderson, 1985),we controlled for alliances by measuring thenumber of active alliances in the firm’s portfolio(Lavie, 2007), as well as for acquisitions by count-ing the number of targets that the firm acquired in agiven year as recorded in the Securities Data Com-pany (SDC) Platinum database. Finally, the firm’stechnology intensity and its product diversificationexperience served as controls because scientificresearch can nurture competencies that enhanceperformance (Barney, 1991), whereas diversifica-tion experience may directly contribute to productdevelopment. Time trends were controlled withyear effects . All remaining interfirm heterogeneitywas controlled with firm fixed effects .
Analysis
Table 1 reports descriptive statistics. We usedtwo-stage analysis to handle potential endogeneityin firms’ decisions to engage in intra-industrydiversification. Firms’ tendencies to diversify mayderive from managers’ performance expectationsbased on firm attributes and industry conditions.To the extent that firms self-select whether todiversify, this may bias the estimates of diversityeffects. Following Heckman (1979), we used aprobit model in the first stage to predict whetherthe firm has entered more than two applicationclasses in a given year. This choice variable wasregressed on all the variables that were includedin the second stage with the exception of instancesof the product diversity variable, which servedas the instrumental variable in that stage (Shaver,1998). These explanatory variables were laggedby one year relative to the choice variable. Resultsof this first-stage model are reported in Table 2.
In the second-stage model, firm performanceserved as the dependent variable while accounting
Copyright 2013 John Wiley & Sons, Ltd. Strat. Mgmt. J., 34: 978–998 (2013)DOI: 10.1002/smj

Intra-industry Diversification 989
Tabl
e1.
Des
crip
tive
stat
istic
san
dpa
irw
ise
corr
elat
ions
for
sam
pled
firm
s
Var
iabl
eN
Mea
nS.
D.
12
34
56
78
910
1112
1314
15
1.L
nsa
les t
−111
093.
034
1.78
32.
Ln
sale
s t10
782.
907
1.90
20.
854**
*
3.Fi
rmsi
zet
1266
73.3
724
6.45
0.35
5***
0.35
1***
4.So
lven
cyt
1264
4.84
84.
198
0.10
3***
0.11
4***
−0.0
305.
Soft
war
eex
peri
ence
t
1694
14.2
920
.81
0.34
0***
0.36
7***
0.34
6***
0.14
0***
6.H
ardw
are
expe
rien
cet
1694
1.19
15.
253
−0.0
37−0
.012
−0.0
360.
061*
0.01
9
7.A
cqui
sitio
nst
1694
0.22
00.
801
0.21
0***
0.19
4***
−0.0
69*
0.00
80.
138**
*0.
004
8.A
llian
ces t
1694
8.47
912
.678
0.27
7***
0.28
7***
0.39
4***
0.20
7***
0.48
2***
0.00
50.
123**
*
9.V
ertic
alm
arke
t t13
921.
938
4.56
20.
143**
*0.
145**
*0.
055†
−0.0
120.
037
−0.0
96**
*0.
120**
*−0
.060
*
10.λ
Her
finda
hlt
1041
0.23
90.
171
0.13
5***
0.13
4***
0.04
10.
161**
*0.
229**
*−0
.138
***
0.10
6***
0.06
9*0.
391**
*
11.λ
conc
entr
ict
1041
0.23
90.
148
0.18
3***
0.17
90.
052†
0.18
6***
0.26
6***
−0.1
61**
*0.
141**
*0.
085**
0.45
5***
0.95
9***
12.
Her
finda
hldi
vers
ityt
1392
0.38
70.
289
0.02
90.
051
0.03
30.
086**
0.24
4***
−0.0
51†
0.01
50.
205**
*0.
127**
*0.
582**
*0.
501**
*
13.
Con
cent
ric
dive
rsity
t
1392
0.97
60.
559
0.11
5***
0.13
4***
0.07
5*0.
081**
0.32
5***
−0.0
50†
0.06
2*0.
254**
*0.
151**
*0.
548**
*0.
527**
*0.
930**
*
14.
Tech
nolo
gyin
tens
ityt
1160
0.74
48.
572
−0.1
22**
*−0
.195
***
−0.0
100.
042
−0.0
250.
071†
0.01
90.
001
−0.0
160.
003
−0.0
020.
044
0.02
8
15.
Her
finda
hldi
vers
ifica
tion
expe
rien
cet
1354
0.25
20.
220
0.07
6*0.
102**
0.04
8−0
.004
0.40
0***
−0.0
65*
−0.0
440.
173**
*0.
065*
0.76
9***
0.67
6***
0.76
1***
0.73
4***
0.00
5
16.
Con
cent
ric
dive
rsifi
catio
nex
peri
ence
t
1354
0.63
30.
462
0.16
0***
0.19
0***
0.07
2*−0
.016
0.49
0***
−0.0
55*
−0.0
060.
209**
*0.
073**
0.70
8***
0.69
6***
0.67
2***
0.74
1***
−0.0
120.
947**
*
Sign
ifica
nce
leve
ls:
†p
<0.
1,*p
<0.
05,
**p
<0.
01,
***p
<0.
001.
Copyright 2013 John Wiley & Sons, Ltd. Strat. Mgmt. J., 34: 978–998 (2013)DOI: 10.1002/smj
990 T. Zahavi and D. Lavie
for self-selection by controlling for the predictedvalues from the first-stage model (Lambda).The second-stage models were implementedusing cross-section time-series regressions withfirm fixed effects. Fixed effects models controlfor unobserved heterogeneity in the form oftime-invariant variables. Their inclusion suggeststhat the reported models explain within-firmvariation in performance over time. In addition,the analysis of panel data raises concernsabout serial correlation of errors within cross-sections, which may deflate standard errors andinflate significance levels. Autocorrelation wastreated by incorporating first-order autoregres-sive errors, assuming their correlation acrossadjacent years. Thus, the tested models took theform: ln(Salesi,t + 1) =αln(Salesi,t) + π ’ xi,t + u i +εi,t, where εi,t = ρεi,t−1 + µi,t and −1 <ρ < 1 ,u i represents the firm fixed effects, and ρ is theautoregressive AR(1) parameter. These modelswere estimated using maximum likelihood esti-mators, with missing values subject to listwisedeletion. The results are reported in Tables 3 and4, in which Model 1 is the baseline model thatincludes the control variables. Model 2 introducesthe linear term of diversity, while Model 3 addsits quadratic term in order to test Hypothesis 1.Models 4 and 5 introduce the interactions withtechnology intensity and product diversificationexperience to test hypotheses 2 and 3.8 Theeffects are evaluated with log likelihood ratiotests, comparing models to the baseline model.
RESULTS
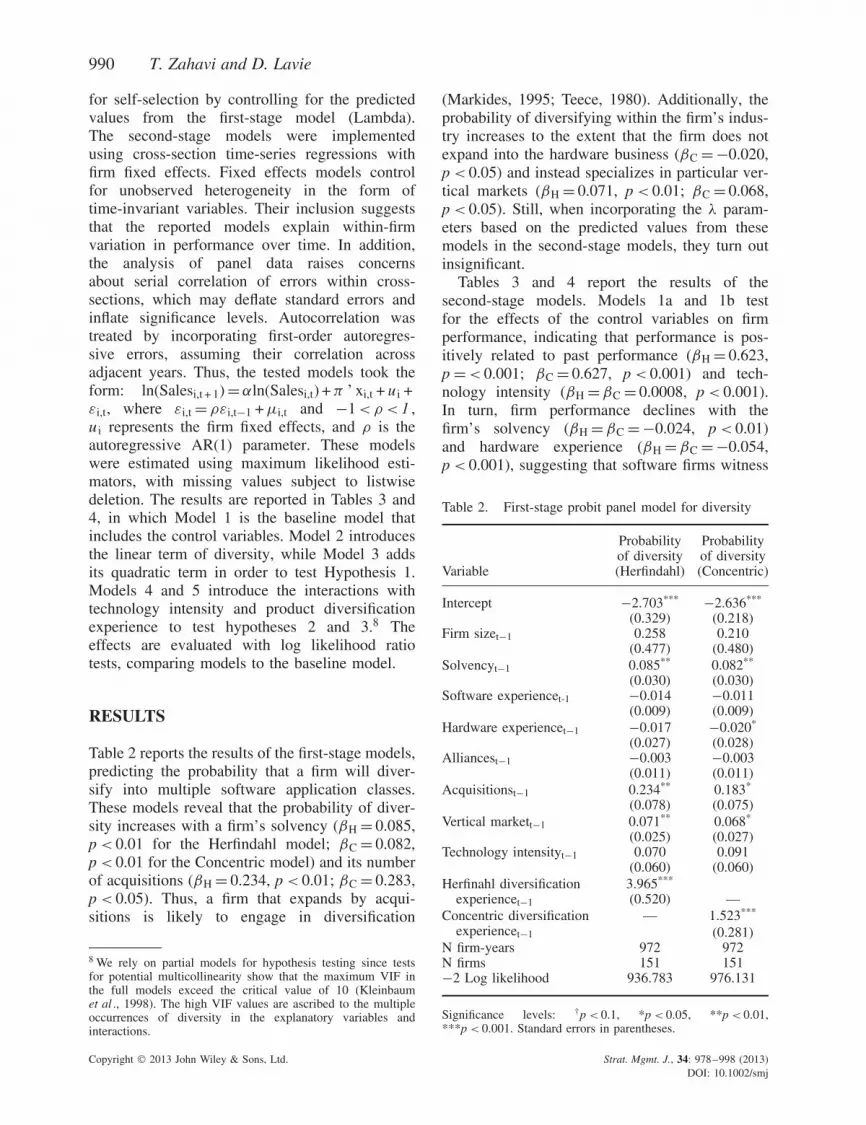
Table 2 reports the results of the first-stage models,predicting the probability that a firm will diver-sify into multiple software application classes.These models reveal that the probability of diver-sity increases with a firm’s solvency (βH = 0.085,p < 0.01 for the Herfindahl model; βC = 0.082,p < 0.01 for the Concentric model) and its numberof acquisitions (βH = 0.234, p < 0.01; βC = 0.283,p < 0.05). Thus, a firm that expands by acqui-sitions is likely to engage in diversification
8 We rely on partial models for hypothesis testing since testsfor potential multicollinearity show that the maximum VIF inthe full models exceed the critical value of 10 (Kleinbaumet al ., 1998). The high VIF values are ascribed to the multipleoccurrences of diversity in the explanatory variables andinteractions.
(Markides, 1995; Teece, 1980). Additionally, theprobability of diversifying within the firm’s indus-try increases to the extent that the firm does notexpand into the hardware business (βC =−0.020,p < 0.05) and instead specializes in particular ver-tical markets (βH = 0.071, p < 0.01; βC = 0.068,p < 0.05). Still, when incorporating the λ param-eters based on the predicted values from thesemodels in the second-stage models, they turn outinsignificant.
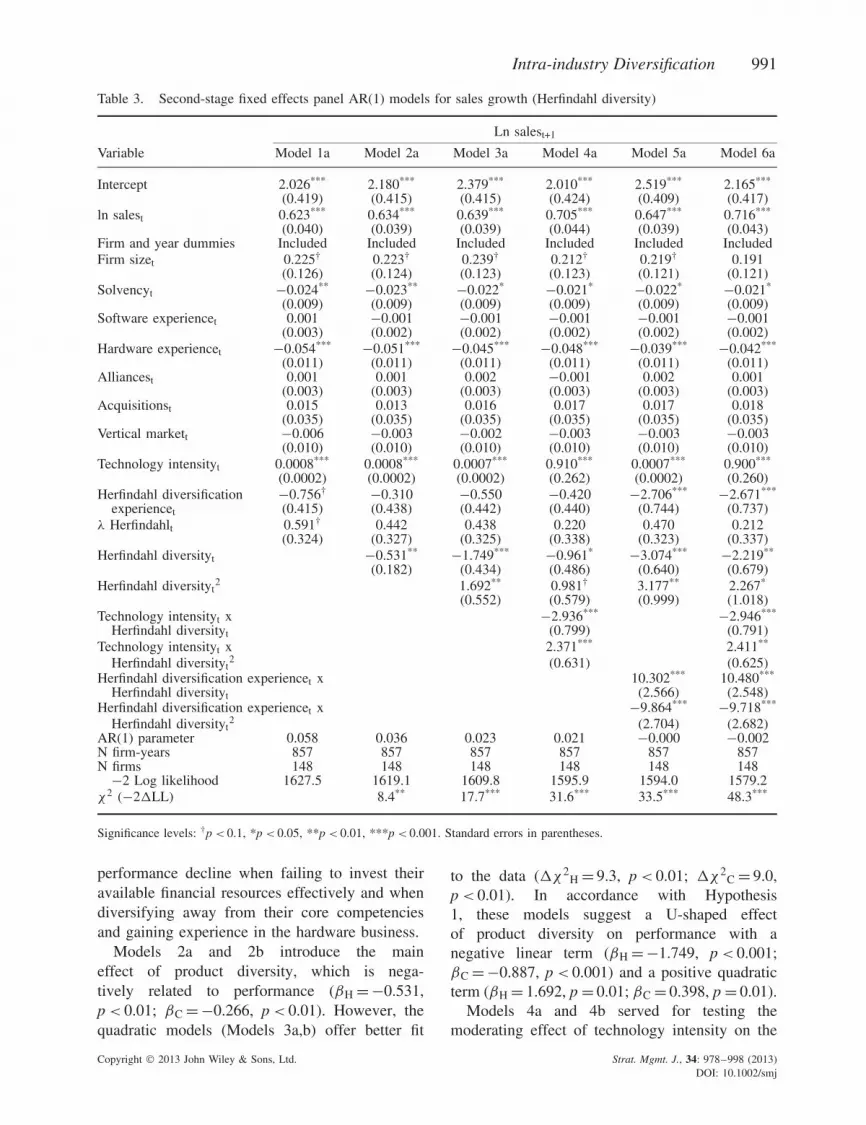
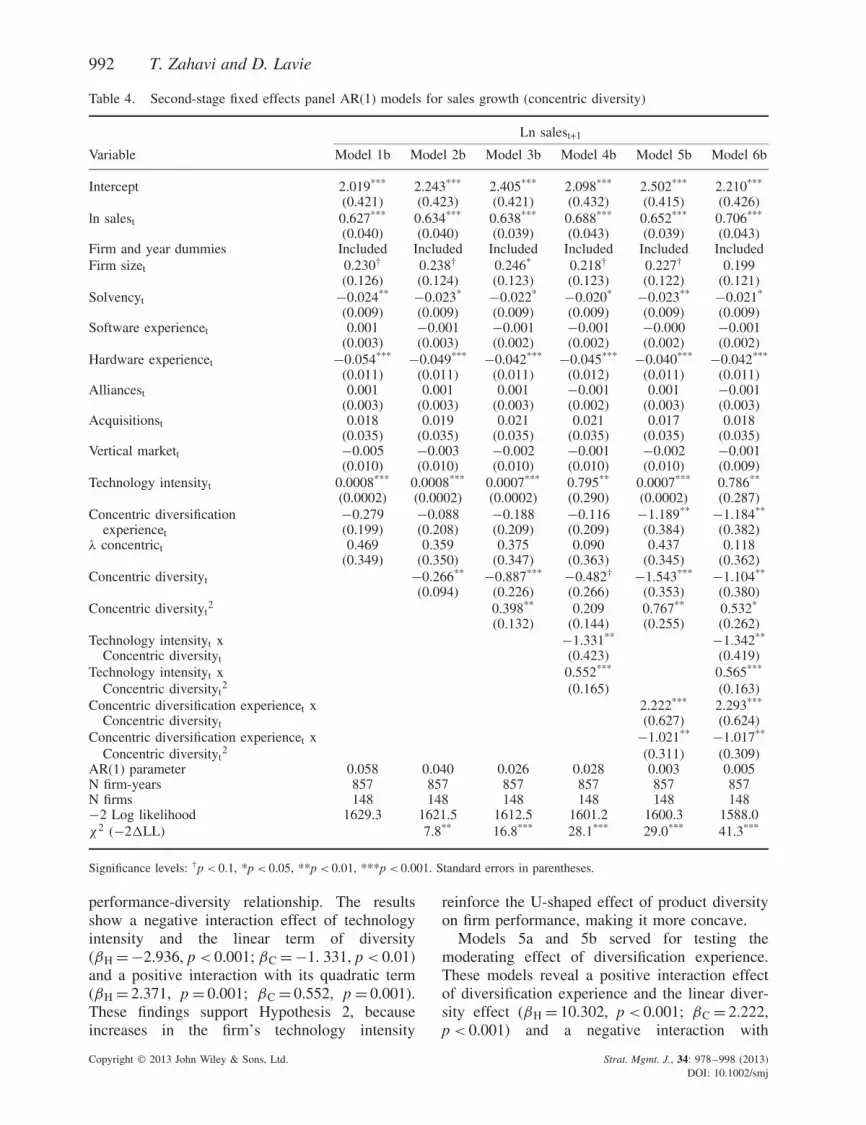
Tables 3 and 4 report the results of thesecond-stage models. Models 1a and 1b testfor the effects of the control variables on firmperformance, indicating that performance is pos-itively related to past performance (βH = 0.623,p =< 0.001; βC = 0.627, p < 0.001) and tech-nology intensity (βH = βC = 0.0008, p < 0.001).In turn, firm performance declines with thefirm’s solvency (βH =βC =−0.024, p < 0.01)and hardware experience (βH = βC =−0.054,p < 0.001), suggesting that software firms witness
Table 2. First-stage probit panel model for diversity
Variable
Probabilityof diversity(Herfindahl)
Probabilityof diversity(Concentric)
Intercept −2.703*** −2.636***
(0.329) (0.218)Firm sizet−1 0.258 0.210
(0.477) (0.480)Solvencyt−1 0.085** 0.082**
(0.030) (0.030)Software experiencet-1 −0.014 −0.011
(0.009) (0.009)Hardware experiencet−1 −0.017 −0.020*
(0.027) (0.028)Alliancest−1 −0.003 −0.003
(0.011) (0.011)Acquisitionst−1 0.234** 0.183*
(0.078) (0.075)Vertical markett−1 0.071** 0.068*
(0.025) (0.027)Technology intensityt−1 0.070 0.091
(0.060) (0.060)Herfinahl diversification
experiencet−1
3.965***
(0.520) —Concentric diversification
experiencet−1
— 1.523***
(0.281)N firm-years 972 972N firms 151 151−2 Log likelihood 936.783 976.131
Significance levels: †p < 0.1, *p < 0.05, **p < 0.01,***p < 0.001. Standard errors in parentheses.
Copyright 2013 John Wiley & Sons, Ltd. Strat. Mgmt. J., 34: 978–998 (2013)DOI: 10.1002/smj
Intra-industry Diversification 991
Table 3. Second-stage fixed effects panel AR(1) models for sales growth (Herfindahl diversity)
Ln salest+1
Variable Model 1a Model 2a Model 3a Model 4a Model 5a Model 6a
Intercept 2.026*** 2.180*** 2.379*** 2.010*** 2.519*** 2.165***
(0.419) (0.415) (0.415) (0.424) (0.409) (0.417)ln salest 0.623*** 0.634*** 0.639*** 0.705*** 0.647*** 0.716***
(0.040) (0.039) (0.039) (0.044) (0.039) (0.043)Firm and year dummies Included Included Included Included Included IncludedFirm sizet 0.225† 0.223† 0.239† 0.212† 0.219† 0.191
(0.126) (0.124) (0.123) (0.123) (0.121) (0.121)Solvencyt −0.024** −0.023** −0.022* −0.021* −0.022* −0.021*
(0.009) (0.009) (0.009) (0.009) (0.009) (0.009)Software experiencet 0.001 −0.001 −0.001 −0.001 −0.001 −0.001
(0.003) (0.002) (0.002) (0.002) (0.002) (0.002)Hardware experiencet −0.054*** −0.051*** −0.045*** −0.048*** −0.039*** −0.042***
(0.011) (0.011) (0.011) (0.011) (0.011) (0.011)Alliancest 0.001 0.001 0.002 −0.001 0.002 0.001
(0.003) (0.003) (0.003) (0.003) (0.003) (0.003)Acquisitionst 0.015 0.013 0.016 0.017 0.017 0.018
(0.035) (0.035) (0.035) (0.035) (0.035) (0.035)Vertical markett −0.006 −0.003 −0.002 −0.003 −0.003 −0.003
(0.010) (0.010) (0.010) (0.010) (0.010) (0.010)Technology intensityt 0.0008*** 0.0008*** 0.0007*** 0.910*** 0.0007*** 0.900***
(0.0002) (0.0002) (0.0002) (0.262) (0.0002) (0.260)Herfindahl diversification −0.756† −0.310 −0.550 −0.420 −2.706*** −2.671***
experiencet (0.415) (0.438) (0.442) (0.440) (0.744) (0.737)λ Herfindahlt 0.591† 0.442 0.438 0.220 0.470 0.212
(0.324) (0.327) (0.325) (0.338) (0.323) (0.337)Herfindahl diversityt −0.531** −1.749*** −0.961* −3.074*** −2.219**
(0.182) (0.434) (0.486) (0.640) (0.679)Herfindahl diversityt
2 1.692** 0.981† 3.177** 2.267*
(0.552) (0.579) (0.999) (1.018)Technology intensityt x −2.936*** −2.946***
Herfindahl diversityt (0.799) (0.791)Technology intensityt x 2.371*** 2.411**
Herfindahl diversityt2 (0.631) (0.625)
Herfindahl diversification experiencet x 10.302*** 10.480***
Herfindahl diversityt (2.566) (2.548)Herfindahl diversification experiencet x −9.864*** −9.718***
Herfindahl diversityt2 (2.704) (2.682)
AR(1) parameter 0.058 0.036 0.023 0.021 −0.000 −0.002N firm-years 857 857 857 857 857 857N firms 148 148 148 148 148 148
−2 Log likelihood 1627.5 1619.1 1609.8 1595.9 1594.0 1579.2χ2 (−2�LL) 8.4** 17.7*** 31.6*** 33.5*** 48.3***
Significance levels: †p < 0.1, *p < 0.05, **p < 0.01, ***p < 0.001. Standard errors in parentheses.
performance decline when failing to invest theiravailable financial resources effectively and whendiversifying away from their core competenciesand gaining experience in the hardware business.
Models 2a and 2b introduce the maineffect of product diversity, which is nega-tively related to performance (βH =−0.531,p < 0.01; βC =−0.266, p < 0.01). However, thequadratic models (Models 3a,b) offer better fit
to the data (�χ2H = 9.3, p < 0.01; �χ2
C = 9.0,p < 0.01). In accordance with Hypothesis1, these models suggest a U-shaped effectof product diversity on performance with anegative linear term (βH = −1.749, p < 0.001;βC =−0.887, p < 0.001) and a positive quadraticterm (βH = 1.692, p = 0.01; βC = 0.398, p = 0.01).
Models 4a and 4b served for testing themoderating effect of technology intensity on the
Copyright 2013 John Wiley & Sons, Ltd. Strat. Mgmt. J., 34: 978–998 (2013)DOI: 10.1002/smj
992 T. Zahavi and D. Lavie
Table 4. Second-stage fixed effects panel AR(1) models for sales growth (concentric diversity)
Ln salest+1
Variable Model 1b Model 2b Model 3b Model 4b Model 5b Model 6b
Intercept 2.019*** 2.243*** 2.405*** 2.098*** 2.502*** 2.210***
(0.421) (0.423) (0.421) (0.432) (0.415) (0.426)ln salest 0.627*** 0.634*** 0.638*** 0.688*** 0.652*** 0.706***
(0.040) (0.040) (0.039) (0.043) (0.039) (0.043)Firm and year dummies Included Included Included Included Included IncludedFirm sizet 0.230† 0.238† 0.246* 0.218† 0.227† 0.199
(0.126) (0.124) (0.123) (0.123) (0.122) (0.121)Solvencyt −0.024** −0.023* −0.022* −0.020* −0.023** −0.021*
(0.009) (0.009) (0.009) (0.009) (0.009) (0.009)Software experiencet 0.001 −0.001 −0.001 −0.001 −0.000 −0.001
(0.003) (0.003) (0.002) (0.002) (0.002) (0.002)Hardware experiencet −0.054*** −0.049*** −0.042*** −0.045*** −0.040*** −0.042***
(0.011) (0.011) (0.011) (0.012) (0.011) (0.011)Alliancest 0.001 0.001 0.001 −0.001 0.001 −0.001
(0.003) (0.003) (0.003) (0.002) (0.003) (0.003)Acquisitionst 0.018 0.019 0.021 0.021 0.017 0.018
(0.035) (0.035) (0.035) (0.035) (0.035) (0.035)Vertical markett −0.005 −0.003 −0.002 −0.001 −0.002 −0.001
(0.010) (0.010) (0.010) (0.010) (0.010) (0.009)Technology intensityt 0.0008*** 0.0008*** 0.0007*** 0.795** 0.0007*** 0.786**
(0.0002) (0.0002) (0.0002) (0.290) (0.0002) (0.287)Concentric diversification −0.279 −0.088 −0.188 −0.116 −1.189** −1.184**
experiencet (0.199) (0.208) (0.209) (0.209) (0.384) (0.382)λ concentrict 0.469 0.359 0.375 0.090 0.437 0.118
(0.349) (0.350) (0.347) (0.363) (0.345) (0.362)Concentric diversityt −0.266** −0.887*** −0.482† −1.543*** −1.104**
(0.094) (0.226) (0.266) (0.353) (0.380)Concentric diversityt
2 0.398** 0.209 0.767** 0.532*
(0.132) (0.144) (0.255) (0.262)Technology intensityt x −1.331** −1.342**
Concentric diversityt (0.423) (0.419)Technology intensityt x 0.552*** 0.565***
Concentric diversityt2 (0.165) (0.163)
Concentric diversification experiencet x 2.222*** 2.293***
Concentric diversityt (0.627) (0.624)Concentric diversification experiencet x −1.021** −1.017**
Concentric diversityt2 (0.311) (0.309)
AR(1) parameter 0.058 0.040 0.026 0.028 0.003 0.005N firm-years 857 857 857 857 857 857N firms 148 148 148 148 148 148−2 Log likelihood 1629.3 1621.5 1612.5 1601.2 1600.3 1588.0χ2 (−2�LL) 7.8** 16.8*** 28.1*** 29.0*** 41.3***
Significance levels: †p < 0.1, *p < 0.05, **p < 0.01, ***p < 0.001. Standard errors in parentheses.
performance-diversity relationship. The resultsshow a negative interaction effect of technologyintensity and the linear term of diversity(βH = −2.936, p < 0.001; βC =−1. 331, p < 0.01)and a positive interaction with its quadratic term(βH = 2.371, p = 0.001; βC = 0.552, p = 0.001).These findings support Hypothesis 2, becauseincreases in the firm’s technology intensity
reinforce the U-shaped effect of product diversityon firm performance, making it more concave.
Models 5a and 5b served for testing themoderating effect of diversification experience.These models reveal a positive interaction effectof diversification experience and the linear diver-sity effect (βH = 10.302, p < 0.001; βC = 2.222,p < 0.001) and a negative interaction with
Copyright 2013 John Wiley & Sons, Ltd. Strat. Mgmt. J., 34: 978–998 (2013)DOI: 10.1002/smj
Intra-industry Diversification 993
Firm
per
form
ance
Technology intensityProduct diversit
y
(Herfindahl)
Firm
per
form
ance
Technology intensityProduct diversit
y
(Concentric)
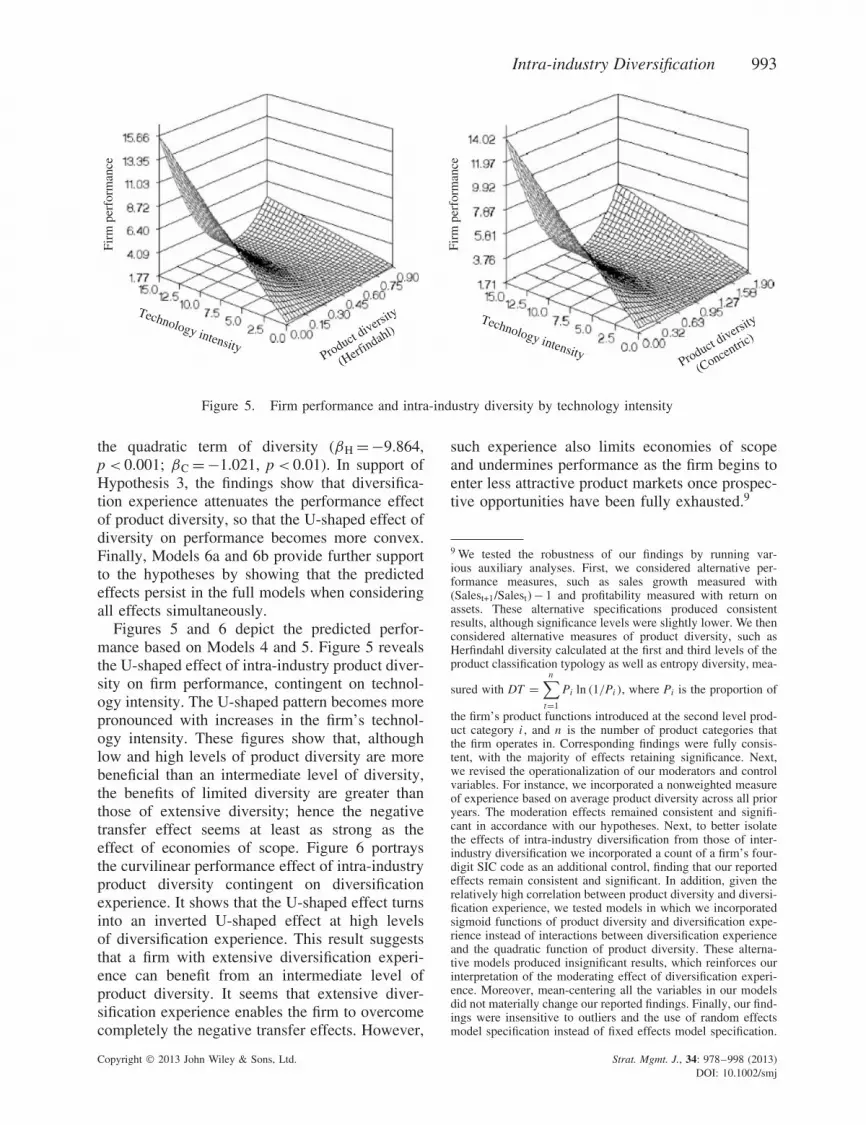
Figure 5. Firm performance and intra-industry diversity by technology intensity
the quadratic term of diversity (βH =−9.864,p < 0.001; βC = −1.021, p < 0.01). In support ofHypothesis 3, the findings show that diversifica-tion experience attenuates the performance effectof product diversity, so that the U-shaped effect ofdiversity on performance becomes more convex.Finally, Models 6a and 6b provide further supportto the hypotheses by showing that the predictedeffects persist in the full models when consideringall effects simultaneously.
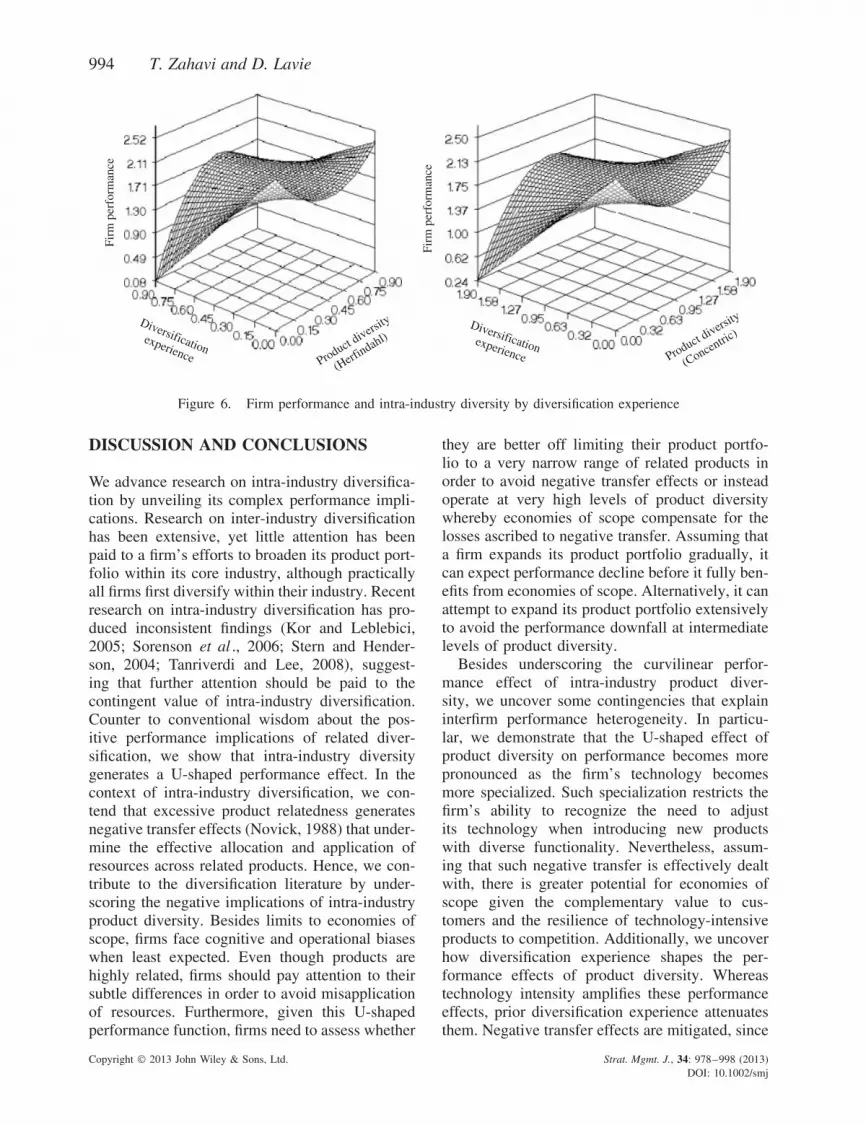
Figures 5 and 6 depict the predicted perfor-mance based on Models 4 and 5. Figure 5 revealsthe U-shaped effect of intra-industry product diver-sity on firm performance, contingent on technol-ogy intensity. The U-shaped pattern becomes morepronounced with increases in the firm’s technol-ogy intensity. These figures show that, althoughlow and high levels of product diversity are morebeneficial than an intermediate level of diversity,the benefits of limited diversity are greater thanthose of extensive diversity; hence the negativetransfer effect seems at least as strong as theeffect of economies of scope. Figure 6 portraysthe curvilinear performance effect of intra-industryproduct diversity contingent on diversificationexperience. It shows that the U-shaped effect turnsinto an inverted U-shaped effect at high levelsof diversification experience. This result suggeststhat a firm with extensive diversification experi-ence can benefit from an intermediate level ofproduct diversity. It seems that extensive diver-sification experience enables the firm to overcomecompletely the negative transfer effects. However,
such experience also limits economies of scopeand undermines performance as the firm begins toenter less attractive product markets once prospec-tive opportunities have been fully exhausted.9
9 We tested the robustness of our findings by running var-ious auxiliary analyses. First, we considered alternative per-formance measures, such as sales growth measured with(Salest+1/Salest) − 1 and profitability measured with return onassets. These alternative specifications produced consistentresults, although significance levels were slightly lower. We thenconsidered alternative measures of product diversity, such asHerfindahl diversity calculated at the first and third levels of theproduct classification typology as well as entropy diversity, mea-
sured with DT =n∑
t=1
Pi ln (1/Pi ), where Pi is the proportion of
the firm’s product functions introduced at the second level prod-uct category i , and n is the number of product categories thatthe firm operates in. Corresponding findings were fully consis-tent, with the majority of effects retaining significance. Next,we revised the operationalization of our moderators and controlvariables. For instance, we incorporated a nonweighted measureof experience based on average product diversity across all prioryears. The moderation effects remained consistent and signifi-cant in accordance with our hypotheses. Next, to better isolatethe effects of intra-industry diversification from those of inter-industry diversification we incorporated a count of a firm’s four-digit SIC code as an additional control, finding that our reportedeffects remain consistent and significant. In addition, given therelatively high correlation between product diversity and diversi-fication experience, we tested models in which we incorporatedsigmoid functions of product diversity and diversification expe-rience instead of interactions between diversification experienceand the quadratic function of product diversity. These alterna-tive models produced insignificant results, which reinforces ourinterpretation of the moderating effect of diversification experi-ence. Moreover, mean-centering all the variables in our modelsdid not materially change our reported findings. Finally, our find-ings were insensitive to outliers and the use of random effectsmodel specification instead of fixed effects model specification.
Copyright 2013 John Wiley & Sons, Ltd. Strat. Mgmt. J., 34: 978–998 (2013)DOI: 10.1002/smj
994 T. Zahavi and D. Lavie
Firm
per
form
ance
Diversificationexperience Product diversit
y
(Herfindahl)
Firm
per
form
ance
Diversificationexperience Product diversity
(Concentric)
Figure 6. Firm performance and intra-industry diversity by diversification experience
DISCUSSION AND CONCLUSIONS
We advance research on intra-industry diversifica-tion by unveiling its complex performance impli-cations. Research on inter-industry diversificationhas been extensive, yet little attention has beenpaid to a firm’s efforts to broaden its product port-folio within its core industry, although practicallyall firms first diversify within their industry. Recentresearch on intra-industry diversification has pro-duced inconsistent findings (Kor and Leblebici,2005; Sorenson et al ., 2006; Stern and Hender-son, 2004; Tanriverdi and Lee, 2008), suggest-ing that further attention should be paid to thecontingent value of intra-industry diversification.Counter to conventional wisdom about the pos-itive performance implications of related diver-sification, we show that intra-industry diversitygenerates a U-shaped performance effect. In thecontext of intra-industry diversification, we con-tend that excessive product relatedness generatesnegative transfer effects (Novick, 1988) that under-mine the effective allocation and application ofresources across related products. Hence, we con-tribute to the diversification literature by under-scoring the negative implications of intra-industryproduct diversity. Besides limits to economies ofscope, firms face cognitive and operational biaseswhen least expected. Even though products arehighly related, firms should pay attention to theirsubtle differences in order to avoid misapplicationof resources. Furthermore, given this U-shapedperformance function, firms need to assess whether
they are better off limiting their product portfo-lio to a very narrow range of related products inorder to avoid negative transfer effects or insteadoperate at very high levels of product diversitywhereby economies of scope compensate for thelosses ascribed to negative transfer. Assuming thata firm expands its product portfolio gradually, itcan expect performance decline before it fully ben-efits from economies of scope. Alternatively, it canattempt to expand its product portfolio extensivelyto avoid the performance downfall at intermediatelevels of product diversity.
Besides underscoring the curvilinear perfor-mance effect of intra-industry product diver-sity, we uncover some contingencies that explaininterfirm performance heterogeneity. In particu-lar, we demonstrate that the U-shaped effect ofproduct diversity on performance becomes morepronounced as the firm’s technology becomesmore specialized. Such specialization restricts thefirm’s ability to recognize the need to adjustits technology when introducing new productswith diverse functionality. Nevertheless, assum-ing that such negative transfer is effectively dealtwith, there is greater potential for economies ofscope given the complementary value to cus-tomers and the resilience of technology-intensiveproducts to competition. Additionally, we uncoverhow diversification experience shapes the per-formance effects of product diversity. Whereastechnology intensity amplifies these performanceeffects, prior diversification experience attenuatesthem. Negative transfer effects are mitigated, since
Copyright 2013 John Wiley & Sons, Ltd. Strat. Mgmt. J., 34: 978–998 (2013)DOI: 10.1002/smj

Intra-industry Diversification 995
an experienced firm can discern subtle differencesacross related products and leverage its extensiveknowledge base. In turn, economies of scope arelimited, since the firm has already exhausted itsdiversification opportunities. In fact, our findingssuggest a reversal of the U-shaped pattern at highlevels of experience, implying that, as the firmgains experience, it should seek intermediate lev-els of diversity, which are typically undesirable forinexperienced firms.
In conclusion, managers should consider notonly the benefits of diversification but also thechallenges associated with expanding the productportfolio within their firm’s industry boundariessince leveraging resources across related productmarkets can be dysfunctional if done improperly.Managers should also consider the pace of entryinto new product markets. Unless the firm hasaccumulated sufficient diversification experience,gradual expansion to related product markets(Cottrell and Nault, 2004) may turn out to beineffective. To overcome this hurdle managersmay pursue multiple and simultaneous productintroductions or, alternatively, diversify outside thefirm’s core industry into related industries wherenegative transfer is inapplicable and economiesof scope persist (Bettis, 1981; Hoskisson, 1987;Markides and Williamson, 1994; Palepu, 1985).Nevertheless, such strategies entail advancedlearning skills and substantial investments in prod-uct development and marketing and may increasethe risk of failed product introductions. Prior diver-sification experience can also mitigate negativetransfer effects, but it limits the firm’s opportuni-ties for leveraging economies of scope and cross-product synergies within its industry boundaries.
In line with prior research (Stern and Hen-derson, 2004; Tanriverdi and Lee, 2008), wehave studied the software industry and thusunderscore contingencies that have particular valuein technology-intensive industries. Scholars mayexamine the contingent value of intra-industrydiversification in other industries. We believe thatour findings would hold in various industries giventhat economies of scope and negative transfer arefundamental mechanisms. Nevertheless, our theorymay reach boundary conditions when managerscan recognize subtle differences between relatedproducts and when customers value such differ-ences. For instance, specialty products tailor-madeby experts per detailed customer specificationsmay gain from economies of scope and may not
be subject to negative transfer at low levels ofintra-industry diversity. Moreover, whereas tech-nology intensity is more relevant in the softwareindustry, in other industries other complementaryassets, such as distribution channels, may shape thefirm’s ability to leverage economies of scope andovercome negative transfer. In addition, by study-ing intra-industry diversification in various coun-tries, scholars may identify national characteristicsthat further account for performance heterogeneityamong firms that pursue such diversification.
Additionally, future research may account forvarious product characteristics such as applicationplatforms (Tanriverdi and Lee, 2008) and com-petitors’ product portfolios (Li and Greenwood,2004; Stern and Henderson, 2004) as well asfor distinctive organizational characteristics suchas culture, brand equity, and operating skills. Itmay also be worthwhile to develop more refinedmeasures of a firm’s technology policy, sincetechnology intensity serves only as a proxy fora firm’s investment in technology, which may bedirected toward either exploration or exploitation.Moreover, it may be interesting to consider per-formance differences across firms with differentdiversification rates or sequences, since somefirms diversify more slowly than others or enterrelated product categories as opposed to unrelatedones. Additionally, future research may attemptto measure directly the mechanisms of economiesof scope and negative transfer, although sucheffort may require more refined data that canbe collected via surveys but cannot effectivelysupport longitudinal analysis. Finally, futureresearch may integrate the effect of intra-industrydiversity (a U-shaped pattern) with that of inter-industry diversity (an inverted U-shaped pattern),which may generate an overall S-shaped effectas the firm increases product diversity beyond itsindustry boundaries. Paving the way for futureresearch, our study advances understanding of anunderstudied phenomenon by departing from priorresearch that has mostly emphasized the merits ofintra-industry diversification and by uncoveringits contingent performance implications.
ACKNOWLEDGEMENTS
We appreciate the feedback received from MosheFarjoun, Niron Hashai and Ithai Stern. Thispaper was presented at the fourth Israel Strategy
Copyright 2013 John Wiley & Sons, Ltd. Strat. Mgmt. J., 34: 978–998 (2013)DOI: 10.1002/smj
996 T. Zahavi and D. Lavie
Conference in Haifa, 2010, and the Academyof Management Meeting in San Antonio, 2011.We appreciate the research assistance of DanielAlon, Yaron Amir, Sumit Chougule, Avi Kasz-tan, Archana Sastry, Uriel Stettner, Alex Takatch,and Leonid Tsytrinbaum. We also thank the indus-try experts who assisted in developing the soft-ware product typology: Carliss Y. Baldwin, ChrisForman, Richard V. Heiman, Fred Hoch, Ken-neth L. Kraemer, Scott Latham, Miriam Shiran,Arnon Sturm, David Thomas, and Dan Vesset. Weacknowledge the financial support of the Tech-nion’s R&D Institute and the Elson/Shapiro Fam-ilies Research Fund.
REFERENCES
Ahuja G, Lampert CM. 2001. Entrepreneurship in thelarge corporation: a longitudinal study of how estab-lished firms create breakthrough inventions. StrategicManagement Journal 22(6–7): 521–543.
Ahuja G, Lampert CM, Tandon V. 2008. Chapter 1:Moving beyond Schumpeter: management researchon the determinants of technological innovation.Academy of Management Annals 2: 1–98.
Barney J. 1991. Firm resources and sustained competitiveadvantage. Journal of Management 17(1): 99–120.
Berry CH. 1975. Corporate Growth and Diversification .Princeton University Press: Princeton, NJ.
Bettis RA. 1981. Performance differences in relatedand unrelated diversified firms. Strategic ManagementJournal 2(4): 379–393.
Brice DJ, Winter SG. 2009. A general interindus-try relatedness index. Management Science 55(9):1570–1585.
Burgelman RA. 1994. Fading memories: a process theoryof strategic business exit in dynamic environments.Administrative Science Quarterly 39(1): 24–56.
Caves RE, Porter ME, Spence AM, Scott JT. 1980.Competition in the Open Economy: A Model Applied toCanada . Harvard University Press: Cambridge, MA.
Chakrabarti A, Singh K, Mahmood I. 2007. Diversifica-tion and performance: evidence from East Asian firms.Strategic Management Journal 28(2): 101–120.
Chandler AD. 1962. Strategy and Structure. MIT Press:Cambridge, MA.
Cottrell T, Nault BR. 2004. Product variety and firmsurvival in the microcomputer software industry.Strategic Management Journal 25(10): 1005–1025.
Cusumano MA. 2004. The Business of Software: WhatEvery Manager, Programmer, and Entrepreneur MustKnow to Thrive and Survive in Good Times and Bad .Reed Elsevier: New York.
Davis PS, Robinson RB, Pearce JA, Park SH. 1992.Business unit relatedness and performance: a look atthe pulp and paper industry. Strategic ManagementJournal 13(5): 349–361.
Davis R, Thomas LG. 1993. Direct estimation of synergy:a new approach to the diversity-performance debate.Management Science 39(11): 1334–1346.
Decarolis DM, Deeds DL. 1999. The impact of stocksand flows of organizational knowledge on firm perfor-mance: an empirical investigation of the biotechnol-ogy industry. Strategic Management Journal 20(10):953–968.
Delios A, Beamish PW. 1999. Ownership strategyof Japanese firms: transactional, institutional, andexperience influences. Strategic Management Journal20(10): 915–933.
Dierickx I, Cool K. 1989. Asset stock accumulation andsustainability of competitive advantage. ManagementScience 35(12): 1504–1511.
Dixon HD. 1994. Inefficient diversification in multi-market oligopoly with diseconomies of scope. Eco-nomica 61(242): 213–219.
Farjoun M. 1998. The independent and joint effectsof the skill and physical bases of relatedness indiversification. Strategic Management Journal 19(7):611–630.
Farjoun M, Lai L. 1997. Similarity judgments in strategyformulation: role, process, and implications. StrategicManagement Journal 18(4): 255–273.
Finkelstein S, Haleblian J. 2002. Understanding acquisi-tion performance: the role of transfer effects. Organi-zation Science 13(1): 36–47.
Gary MS. 2005. Implementation strategy and perfor-mance outcomes in related diversification. StrategicManagement Journal 26(7): 643–664.
Geringer JM, Tallman S, Olsen DM. 2000. Product andinternational diversification among Japanese multina-tional firms. Strategic Management Journal 21(1):51–80.
Grant RM, Jammine AP, Thomas H. 1988. Diversity,diversification, and profitability among British man-ufacturing companies, 1972–1984. Academy of Man-agement Journal 31(4): 771–801.
Gupta AK, Govindarajan V. 1986. Resource sharingamong SBUs: strategic antecedents and administrativeimplications. Academy of Management Journal 29(4):695–714.
Haleblian J, Finkelstein S. 1999. The influence oforganizational acquisition experience on acquisitionperformance: a behavioral learning perspective.Administrative Science Quarterly 44(1): 29–56.
Harrison JS, Hall EH, Nargundkar R. 1993. Resourceallocation as an outcropping of strategic consistency:performance implications. Academy of ManagementJournal 36(5): 1026–1051.
Heckman JJ. 1979. Sample selection bias as a specifica-tion error. Econometrica 47(1): 153–161.
Helfat CE, Eisenhardt KM. 2004. Inter-temporaleconomies of scope, organizational modularity, andthe dynamics of diversification. Strategic ManagementJournal 25(13): 1217–1232.
Hitt MA, Hoskisson RE, Kim H. 1997. Internationaldiversification: effects on innovation and firm perfor-mance in product-diversified firms. Academy of Man-agement Journal 40(4): 767–798.
Copyright 2013 John Wiley & Sons, Ltd. Strat. Mgmt. J., 34: 978–998 (2013)DOI: 10.1002/smj
Intra-industry Diversification 997
Hoskisson RE. 1987. Multidivisional structure and per-formance: the contingency of diversification strategy.Academy of Management Journal 30(4): 625–644.
Jemison DB, Sitkin SB. 1986. Corporate acquisitions: aprocess perspective. Academy of Management Review11(1): 145–163.
Jones GR, Hill CWL. 1988. Transaction cost analysisof strategy-structure choice. Strategic ManagementJournal 9(2): 159–172.
Kleinbaum DG, Lawrence LK, Muller KE, NizamA. 1998. Applied Regression Analysis and OtherMultivariable Methods (3rd edn). Brooks/Cole: PacificGrove, CA.
Kor YY, Leblebici H. 2005. How do interdependen-cies among human-capital deployment, development,and diversification strategies affect firms’ financialperformance? Strategic Management Journal 26(10):967–985.
Lamont BT, Anderson CR. 1985. Mode of corporatediversification and economic performance. Academyof Management Journal 28(4): 926–934.
Lavie D. 2007. Alliance portfolios and firm performance:a study of value creation and appropriation in the U.S.software industry. Strategic Management Journal 28:1187–1212.
Lavie D, Miller SR. 2008. Alliance portfolio internation-alization and firm performance. Organization Science19(4): 623–646.
Levinthal DA, March JG. 1993. The myopia of learning.Strategic Management Journal 14: 95–112.
Levitt B, March JG. 1988. Organizational learning.Annual Review of Sociology 14: 319–340.
Li SX, Greenwood R. 2004. The effect of within-industrydiversification on firm performance: synergy creation,multi-market contact and market structuration. Strate-gic Management Journal 25(12): 1131–1153.
Lieberman MB, Montgomery DB. 1988. First-moveradvantages. Strategic Management Journal 9: 41–58.
Markides CC. 1995. Diversification, restructuring andeconomic performance. Strategic Management Jour-nal 16(2): 101–118.
Markides CC, Williamson PJ. 1994. Related diversifica-tion, core competencies and corporate performance.Strategic Management Journal 15: 149–165.
Mayer M, Whittington R. 2003. Diversification in con-text: a cross-national and cross-temporal extension.Strategic Management Journal 24(8): 773–781.
Miller DJ. 2006. Technological diversity, related diversi-fication and firm performance. Strategic ManagementJournal 27(7): 601–619.
Montgomery CA. 1982. The measurement of firm diver-sification: some new empirical evidence. Academy ofManagement Journal 25(2): 299–307.
Montgomery CA. 1985. Product-market diversificationand market power. Strategic Management Journal28(4): 789–798.
Montgomery CA, Wernerfelt B. 1988. Diversification,Ricardian rents, and Tobin’s q. Rand Journal ofEconomics 19(4): 623–632.
Nault BR, Vandenbosch MB. 1996. Eating your ownlunch: protection through preemption. OrganizationScience 7(3): 342–358.
Nayyar PR. 1993. Performance effects of informationasymmetry and economies of scope in diversifiedservice firms. Academy of Management Journal 36(1):28–57.
Nayyar PR, Kazanjian RK. 1993. Organizing to attainpotential benefits from information asymmetries andeconomies of scope in related diversified firms.Academy of Management Review 18(4): 735–759.
Nelson R, Winter S. 1982. An Evolutionary Theory ofEconomic Change. Harvard University Press: Cam-bridge, MA.
Nguyen TH, Seror A, Devinney TM. 1990. Diversifi-cation strategy and performance in Canadian manu-facturing firms. Strategic Management Journal 11(5):411–418.
Nohria N, Gulati R. 1996. Is slack good or bad forinnovation? Academy of Management Journal 39(5):1245–1264.
Novick LR. 1988. Analogical transfer, problem similarity,and expertise. Journal of Experimental Psychology.Learning, Memory, and Cognition 14(3): 510–520.
O’Grady S, Lane HW. 1996. The psychic distanceparadox. Journal of International Business Studies27(2): 309–333.
Palepu K. 1985. Diversification strategy, profit perfor-mance and the entropy measure. Strategic Manage-ment Journal 6(3): 239–255.
Palich LE, Cardinal LB, Miller CC. 2000. Curvilinearityin the diversification-performance linkage: an exam-ination of over three decades of research. StrategicManagement Journal 21(2): 155–174.
Panzar JC, Willig RD. 1981. Economies of scope.American Economic Review 71(2): 268–272.
Pennings JM, Barkema H, Douma S. 1994. Organiza-tional learning and diversification. Academy of Man-agement Journal 37(3): 608–640.
Pitts RA, Hopkins HD. 1982. Firm diversity: conceptu-alization and measurement. Academy of ManagementReview 7(4): 620–629.
Podolny JM, Stuart TE, Hannan MT. 1996. Networks,knowledge, and niches: competition in the worldwidesemiconductor industry, 1984–1991. American Jour-nal of Sociology 102(3): 659–689.
Ramanujam V, Varadarajan P. 1989. Research on corpo-rate diversification: a synthesis. Strategic ManagementJournal 10(6): 523–551.
Rawley E. 2010. Diversification, coordination costs,and organizational rigidity: evidence from microdata.Strategic Management Journal 31(8): 873–891.
Robins J, Wiersema MF. 1995. A resource-basedapproach to the multibusiness firm: empirical analysisof portfolio interrelationships and corporate financialperformance. Strategic Management Journal 16(4):277–299.
Robins JA, Wiersema MF. 2003. The measurement ofcorporate portfolio strategy: analysis of the contentvalidity of related diversification indexes. StrategicManagement Journal 24(1): 39–59.
Rudy J. 2000. Standard and Poor’s IndustrySurveys—Computers: Software. McGraw-Hill,New York.
Copyright 2013 John Wiley & Sons, Ltd. Strat. Mgmt. J., 34: 978–998 (2013)DOI: 10.1002/smj

998 T. Zahavi and D. Lavie
Rumelt RP. 1974. Strategy, Structure, and EconomicPerformance. Division of Research, Harvard BusinessSchool: Boston, MA.
Rumelt RP. 1982. Diversification strategy and profitabil-ity. Strategic Management Journal 3(4): 359–369.
Shaver MJ. 1998. Accounting for endogeneity whenassessing strategy performance: does entry modechoice affect FDI survival? Management Science44(4): 571–585.
Silverman BS. 1999. Technological resources and thedirection of corporate diversification: toward an inte-gration of the resource-based view and transaction costeconomics. Management Science 45(8): 1109–1124.
Sorenson O. 2000. Letting the market work for you: anevolutionary perspective on product strategy. StrategicManagement Journal 21(5): 577–592.
Sorenson O, McEvily S, Ren CR, Roy R. 2006. Nichewidth revisited: organizational scope, behavior andperformance. Strategic Management Journal 27(10):915–936.
Stern I, Henderson AD. 2004. Within-business diversi-fication in technology-intensive industries. StrategicManagement Journal 25(5): 487–505.
Stimpert JL, Duhaime IM. 1997. In the eyes of thebeholder: conceptualizations of relatedness held bythe managers of large diversified firms. StrategicManagement Journal 18(2): 111–125.
Stuart TE. 2000. Interorganizational alliances and the per-formance of firms: a study of growth and innovationrates in a high-technology industry. Strategic Manage-ment Journal 21(8): 791–811.
Szulanski G. 1996. Exploring internal stickiness: imped-iments to the transfer of best practice within the firm.Strategic Management Journal 17: 27–43.
Tallman S, Li J. 1996. Effects of international diversityand product diversity on the performance of multina-tional firms. Academy of Management Journal 39(1):179–196.
Tanriverdi H, Lee C-H. 2008. Within-industry diversifi-cation and firm performance in the presence of net-work externalities: evidence from the software indus-try. Academy of Management Journal 51(2): 381–397.
Tanriverdi H, Venkatraman N. 2005. Knowledge relat-edness and the performance of multibusiness firms.Strategic Management Journal 26(2): 97–119.
Teece DJ. 1980. Economies of scope and the scopeof the enterprise. Journal of Economic Behavior andOrganization 1(3): 223–247.
Zollo M, Singh H. 2004. Deliberate learning in corporateacquisitions: post-acquisition strategies and integrationcapability in U.S. bank mergers. Strategic Manage-ment Journal 25(13): 1233–1256.
Copyright 2013 John Wiley & Sons, Ltd. Strat. Mgmt. J., 34: 978–998 (2013)DOI: 10.1002/smj