Embed Size (px)
Citation preview
Interval HSV: Extracting Ink Annotations
John C. Femiani Anshuman Razdan
Arizona State University
Polytechnic Campus, 7001 E. Williams Field Rd.
Bldg. 140, Mesa, AZ 85212, USA
Abstract
The HSV color space is an intuitive way to reasonabout color, but the nonlinear relationship to RGB co-ordinates complicates histogram analysis of colors inHSV. We present novel Interval-HSV formulas to iden-tify a range in HSV for each RGB interval. We showthe usefulness by introducing a parameter-free and com-pletely automatic technique to extract both colored andblack ink annotations from faded backgrounds such asdigitized aerial photographs, maps, or printed-text doc-uments. We discuss the characteristics of ink mixingin the HSV color space and discover a single feature,the upper limit of the saturation-interval, to extract inkeven when it is achromatic. We form robust Interval-HV histograms in order to identify the number and col-ors of inks in the image.
1. Introduction
Paper documents may be photocopied, faxed, re-viewed, folded, or marked with hand drawn annota-tions. For example reviewers may mark correctionsonto a physical copy of a journal paper, or plannersmay circle important regions of an aerial photograph.Unfortunately, annotations make it very di�cult to runimage processing routines on the images when they arelater digitized. We believe that existing document pro-cessing methods have the potential to improve theiraccuracy at recognizing text in images if annotationsdrawn in ink are �rst extracted to a separate image sothat they can be analyzed individually.
This paper is motivated by issues we faced whileusing color histograms in hue, saturation, and value(HSV ) to identify common types of ink used for an-notation. We considered alternative color spaces suchas CIELAB or YUV, but chose to analyze colors using
HSV because we interpret our input colors as RGBre�ectances and HSV has special invariance proper-ties with respect to our ink mixing model (section 3).Furthermore, the input RGB indices �ll a color-cubewhich the HSV hexcone was designed to �t perfectly.The fundamental problem is that uniform RGB digi-tization errors are not uniform after mapping to HSVcoordinates. This can cause gaps in histograms as il-listrated in Fig. 1. To address this we present a newinterval approach to using HSV that not only leads toa simple, intuitive, robust, and fast density estimationapproach using simple histograms, but it also reveals apowerful new attribute, the saturation upper limit, thatcan discriminate both chromatic and achromatic inksfrom background colors in many images. The utilityof interval HSV is demonstrated with a simple his-togram based image segmentation that is more appro-priate than state of the art techniques for color imagesegmentation such as mean shift [1] and other similarmethods when applied to the problem of ink annota-tion segmentation. This low level color based approachprovides a language agnostic and a fast method to sep-arate handwriting, stamps, decorations, and other arti-facts from faded document images, so optical characterrecognition (OCR) techniques can be applied to a sin-gle ink-layer (presumably, of machine-print).
Intervals in HSV are used to overcome numericalissues which have complicated histogram analysis [2,3, 4, 5]. We make the following contributions:
1. We discover a new feature, the saturation-intervalupper limit, that illustrates the merit in treatingdiscrete colors as intervals by reducing the com-plexity of extracting both chromatic and achro-matic inks.
2. We present a robust way to compute joint HSVor just HV histograms. This allows individual
1
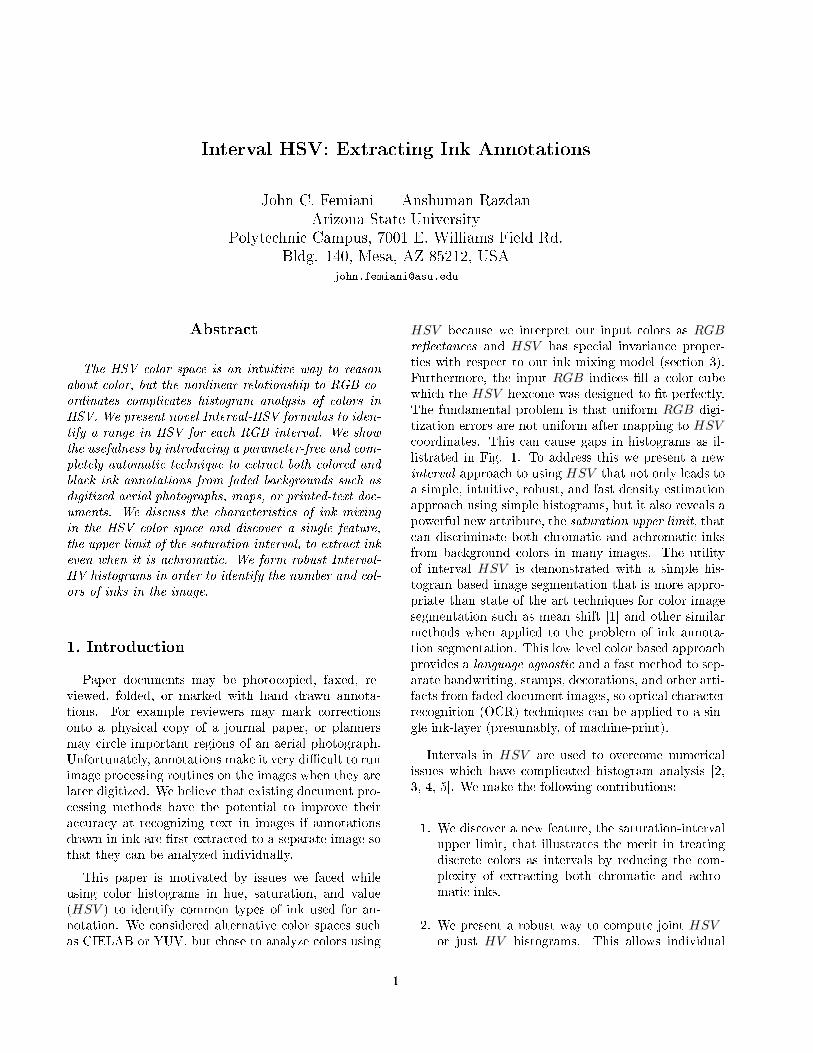
(a) (b) (c) (d) (e)Figure 1. Histograms of an image with �ve pens, including one black, are shown. In each the vertical axis is hue and thehorizontal is value. (a) was computed with interval arithmetic, (b) was computed without. Both were low-pass �ltered andthresholded to form (d) and (e). (c) is a zoomed view of the portion of (b) within the red rectangle. Observe that (e) hassplit the black pen into several disconnected regions.
inks to be identi�ed using connected decision re-gions of the histogram.
3. We employ decisions which are based predomi-nantly on color at each pixel rather than structure[6, 7] and we do not require complex or iterativefeature space clustering techniques [8, 9, 10].
1.1. Problem
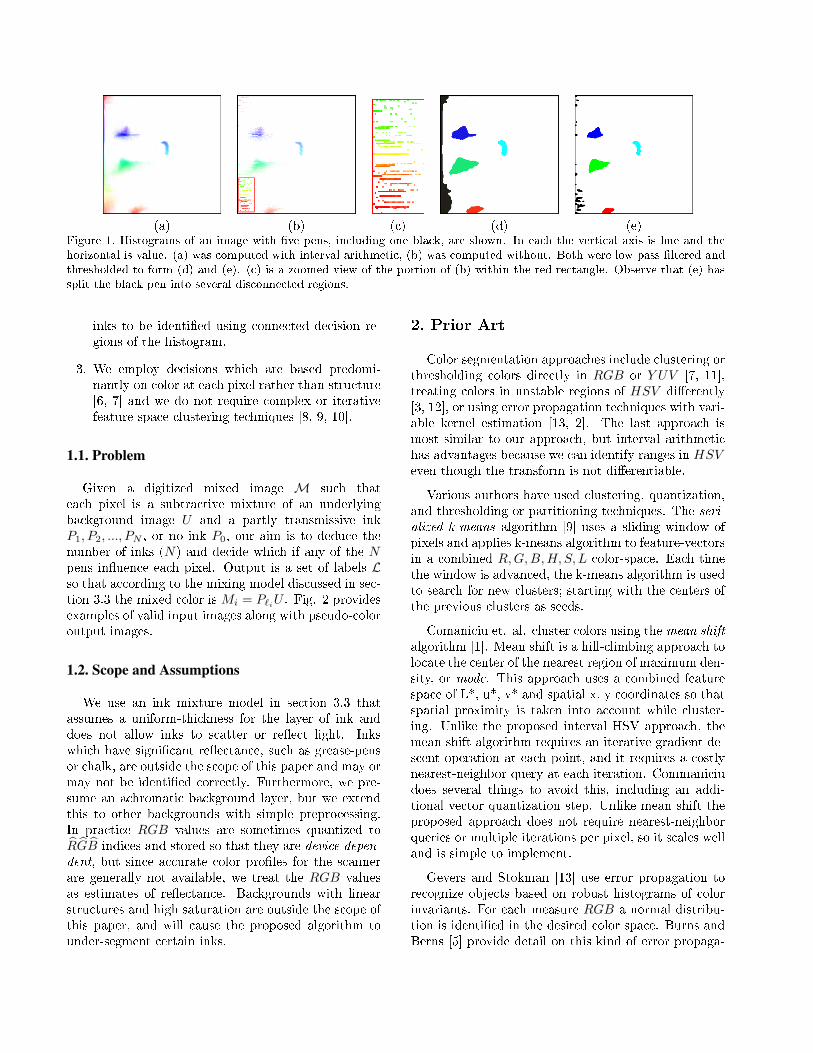
Given a digitized mixed image M such thateach pixel is a subtractive mixture of an underlyingbackground image U and a partly transmissive inkP1, P2, ..., PN , or no ink P0, our aim is to deduce thenumber of inks (N) and decide which if any of the Npens in�uence each pixel. Output is a set of labels Lso that according to the mixing model discussed in sec-tion 3.3 the mixed color is Mi = P`iU . Fig. 2 providesexamples of valid input images along with pseudo-coloroutput images.
1.2. Scope and Assumptions
We use an ink mixture model in section 3.3 thatassumes a uniform-thickness for the layer of ink anddoes not allow inks to scatter or re�ect light. Inkswhich have signi�cant re�ectance, such as grease-pensor chalk, are outside the scope of this paper and may ormay not be identi�ed correctly. Furthermore, we pre-sume an achromatic background layer, but we extendthis to other backgrounds with simple preprocessing.In practice RGB values are sometimes quantized toRGB indices and stored so that they are device depen-dent, but since accurate color pro�les for the scannerare generally not available, we treat the RGB valuesas estimates of re�ectance. Backgrounds with linearstructures and high saturation are outside the scope ofthis paper, and will cause the proposed algorithm tounder-segment certain inks.
2. Prior Art
Color segmentation approaches include clustering orthresholding colors directly in RGB or Y UV [7, 11],treating colors in unstable regions of HSV di�erently[3, 12], or using error propagation techniques with vari-able kernel estimation [13, 2]. The last approach ismost similar to our approach, but interval arithmetichas advantages because we can identify ranges in HSVeven though the transform is not di�erentiable.
Various authors have used clustering, quantization,and thresholding or partitioning techniques. The seri-alized k-means algorithm [9] uses a sliding window ofpixels and applies k-means algorithm to feature-vectorsin a combined R,G,B,H, S, L color-space. Each timethe window is advanced, the k-means algorithm is usedto search for new clusters; starting with the centers ofthe previous clusters as seeds.
Comaniciu et. al. cluster colors using the mean shiftalgorithm [1]. Mean shift is a hill-climbing approach tolocate the center of the nearest region of maximum den-sity, or mode. This approach uses a combined featurespace of L*, u*, v* and spatial x, y coordinates so thatspatial proximity is taken into account while cluster-ing. Unlike the proposed interval HSV approach, themean shift algorithm requires an iterative gradient de-scent operation at each point, and it requires a costlynearest-neighbor query at each iteration. Commaniciudoes several things to avoid this, including an addi-tional vector quantization step. Unlike mean shift theproposed approach does not require nearest-neighborqueries or multiple iterations per pixel, so it scales welland is simple to implement.
Gevers and Stokman [13] use error propagation torecognize objects based on robust histograms of colorinvariants. For each measure RGB a normal distribu-tion is identi�ed in the desired color space. Burns andBerns [5] provide detail on this kind of error propaga-
(a) (b) (c) (d)Figure 2. Examples of the input (a,c) and pseudocolored output (b,d) that one can expect from the proposed method. Thecolors in (b,d) are the mean colors of the pens in (a,b) with contrast adjusted to increase visibility. Image (a) is an annotatedaerial photo of Phoenix, Arizona (printed onto transparency, obtained from www.usgs.gov), and (b) is an annotated revisionof this paper.
tion analysis; but it requires di�erentiable transformfunctions, and the mapping to HSV is de�ned piece-wise with the derivatives that are not continuous. Theproposed approach overcomes this limitation using in-terval arithmetic, which allows us to precisely track therange in terms of hard limits so we can threshold onShi (section 3.3).
3. Method
Our approach has the following major steps:
1. Preprocess the image in order to reduce the sat-uration of large, homogeneous areas of color thatare not likely to contain annotations while keepingthe inked areas saturated.
2. Form a histogram of saturation interval upper-limits.
3. Form a 2D value × hue (HV ) histogram of anno-tated pixels using interval arithmetic to cope withsingularities, and threshold the histogram at 1% ofthe highest peak. Each connected region in HV istreated as a distinct ink.
4. Label regions of the image based on pixel HSVrepresentations. Morphological operations recoverpixels otherwise missed in the HV histogram.
The proposed method is simple because it can be im-plemented using arrays for histograms, and does notneed complex spatial indexing techniques or nearest-neighbor algorithms in order to estimate a probability
density function or �nd its modes. The approach isalmost parameter free; the only parameters controllingthe results are the 1% threshold used in step 3, andpossibly the �lter-size used for preprocessing in step 1(section 3.1).
3.1. Preprocessing
Documents are subject to various processes whichmay desaturate and brighten, the images. The pro-posed segmentation technique works best when inkmarks are darker or more saturated than the back-ground image, but this is not always the case. To allowour method to work on these images, we start by ad-justing the brightness before processing by looking forthe darkest pixel in the image and subtracting its valuefrom all other pixels.
Sometimes the fading e�ect is not isotropic in theRGB coordinates, causing the image to have a tintede�ect. Some images, while faded, still have low fre-quency variation in chroma. In our implementationwe pre-process these images by rescaling RGB coordi-nates so that below a certain frequency the image isunsaturated. Let F be a low-pass �lter applied to theoriginal imageM. Then the preprocessed imageM′ isthe result of
M′ =M× Value(M∗ F )M∗ F
where the multiplication operator (×) is done ele-ment by element, and the Value(·) function returns thearithmetic mean of R, G, and B. In our experiments we
use a box �lter with a square window of 4×σ+1, whereσ is a rough estimate of the expected pen thickness atthe image's resolution.
3.2. Computing HSV from RGB
In this section we provide the formulas to transformdiscretized RGB indices into an interval of HSV in-dices. The well known transformation from RGB toHSV [14]works for real values, but in practice ourcolors are not real numbers. Instead they are quan-tized to indices that are positive scaled integers witha scale of L, where rounding truncates so that R =min (L− 1, bRLc) and L is 256 for images with 8 bitchannels. This mapping transforms half-open intervalsto quantization indices. The error added by quantiza-tion causes signi�cant problems when mapping thesecolors to HSV because division by small numbers isinvolved. The problem is particularly evident with un-saturated colors and dark colors such as those producedby a black or brown pen.
In order to base our decisions on histograms usingHSV coordinates in sections 3.3 and 3.4 we must solvethis issue with discretization. Fig. 1 shows the kind ofproblem we can expect if errors are not addressed.
The quantization operation RGB 7→ RGB is not in-vertible, but its preimage1 is a set of half-open intervals
[R], [G], [B] of the form [R] = [Rlo, Rhi) =[RL ,
R+1L
).
We �nd intervals [H], [S], [V ] using interval arithmeticto adapt the standard formulas [14], and we deal explic-itly with regions where the mapping RGB 7→ HSV isunde�ned by setting them to the entire range of [0, 1] .Intervals [Max] and [Min] are set to one of [R], [G], [B]depending on which of R, G, B is the maximum or min-imum.
In interval HSV, the value interval is
[V ] = [Max] =
[Max
L,Max+ 1
L
)(1)
We divide by [Max] to �nd [S], but division by aninterval which crosses 0 is unde�ned so we replace [S]by [0, 1] whenever [Max] includes 0.
[S] =
{[0, 1] Max = 0(Max−Min−1
Max+1, Max−Min+1
Max
)else.
(2)
1In this context we are talking about the preimage or image
of a function, not a digital image or picture.
The hue interval [H] involves another interval called[D] where
[D] =1L
(Max− Min− 1, Max− Min+ 1
)When we divide by [D], if [D] crosses 0 the result isforced to [0, 1]
[H] =
[0, 1] if Dlo ≤ 0(G−B−16LDhi
, G−B+16LDlo
)else if Max = R(
B−R−16LDhi
, B−R+16LDlo
)+ 1
3 else if Max = G(R−G−16LDhi
, R−G+16LDlo
)+ 2
3 else.
3.3. Thresholding the Saturation
According to the Kubelka Munk theory of re-�ectance an ink with no re�ectance and uniform thick-ness alters a background color according to the familiarformula for subtractive color mixing M = PU whereM is the re�ectance in the mixed image before quan-tization, P is re�ectance of a pen's ink on a whitebackground, and U is the re�ectance of the underlyingmaterial. In this section we introduce a theorem thatjusti�es the use of Shi to separate ink from a grayscalebackground.
Lemma 3.1. The value of a color mixed with a sub-tractive ink is always less than or equal to the value ofthe achromatic background (Value(M) ≤ Value(U)).
Proof. Since P is a re�ectance it is constrained to theinterval [0, 1] and Max(PU) ≤Max(U).
Lemma 3.2. If an achromatic background U > 0 thenthe saturation of a mixed color is equal to the satura-tion of the pen used to mark it, S(M) = S(P ), and isinvariant with respect to the intensity of the achromaticbackground material.
Proof. Since U is a nonzero re�ectance it is constrainedto the interval (0, 1], and U has equal R,G, and Bbecause it is achromatic. Therefore
S(M) =Max(M)−Min(M)
Max(M)
=Max(P )U −Min(P )U
Max(P )U= S(P )
Lemma 3.3. If an achromatic background U > 0 thenthe hue of a mixed color is equal to the hue of the penused to mark it, H(M) = H(P ), and is invariant withrespect to the intensity of the achromatic backgroundmaterial.
Proof. Although H is piecewise de�ned, for each casethe hue H is always a constant plus a fraction witha linear combination of R,G,B in the numerator anddenominator. The ratios are invariant to U because itis a common factor and the constant part of equationfor hue depends only on which of R,G,B is maximaland is therefore invariant to multiplication by a positiveconstant U .
De�nition 3.4. A pair of inks Pi and Pj are separa-
ble based on color space coordinate X by a threshold τif the domain of X can be partitioned into two disjointintervals [Xi] and [Xj ] with a common bound at τ andM = PiU if and only if X(M) ∈ [Xi] and M = PjU ifand only if X(M) ∈ [Xj ].
We o�er the following theorem for achromatic inks.
Theorem 3.5. If achromatic inks Pi and Pj are sep-arable based on Vlo, then they are separable based onShi.
Proof. Any achromatic ink satis�es Max = Min byde�nition, so Shi = 1
Vloaccording to equations (2) and
(1) . Therefore for any τ , if Vlo <1τ then it follows
that Shi > τ .
The most important pen to identify is the 100%transparent background-pen P0 because it occupies themajority of the pixels. Theorem 3.5 suggests thatwe identify a threshold τ so we can decide that penP0 in�uences all colors where Shi < τ is true. Wechoose Otsu's threshold selection technique to identifya threshold τ using a histogram of discretized Shi. Fig.3(b) shows results on images with chromatic and achro-matic inks. Note that it is often successful even for theblack pen. We improve further on this result by regiongrowing in section 4.
3.4. Grouping by Hue and Value
Section 3.3 identi�ed colors that were unmixed (i.e.mixed with P0). In this section we use interval HSV
to form a 2D joint value and hue histogram and distin-guish between the remaining pens. If inks are designedso that a human can distinguish between them, then itis very unlikely that two di�erent pens will have similarhue and value. Eliminating the colors that are rare inany pen (e.g. less than 1% of the most frequent color)
leaves remaining colors in connected regions of the HVplane that can be attributed to a single pen.
Consider two joint HV -histograms g and h. Let gi,jbe the measured number of colors that are not in thebackground, with i = H and j = V . Let hi,j count theexpected number if we assume colors are uniformly dis-tributed in the discrete interval [H] = bHloc ... dHhie,which includes i. In the h formulation each color Mcontributes equally to each histogram bin in the inter-vals [H] and [V ]. The di�erence between these twohistograms is evident in Fig.1. Notice that h shouldhave only a few well de�ned peaks corresponding tothe colors of the inks used in the image. Without in-terval arithmetic these peaks are divided into manydisconnected pieces. This is undesirable because con-nected component labeling can not be applied to thehistogram in order to count the number of pens.
We expect it to be rare but not impossible that penscan produce the same colors, so we threshold h by0.01×max(hi,j)and then label connected componentsto identify N decision regions R1,R2, . . . ,RN for Npens so that we decide M = PkU if the projection ofM onto the HV plane intersects Rk. When we �ndconnected components we take care to recognize thatthe H axis is cyclic. Fig. 1(c) shows the identi�ed com-ponents colored according to the average color (withthe average computed in RGB).
4. Generating Output
Output is a corresponding raster of labels L suchthat each Mx,y = P`x,y
U . In this section we describehow a simple iterative region growing technique is usedto set the labels. Our region growing process startswith a seed labeling L0 and iteratively changes labels toproduce a sequence L1,L2, . . .L∞ = L . Notationallywe use Lk for the label set after k iterations.
We start by de�ning the seed labels L0 so that `0x,y =i if theHV projection of Mx,y is inRi . For each pen Pi,we de�ne the expected mixed color as the average colorof the mixed pixels in region Ri. In each subsequentiteration Lk+1, unmarked pixels are given the samelabel as their most similar adjacent pixel in the imageaccording to Lk, with similarity measured using the
scan_0013
usgs_
0001_F
usgs_
0000_A
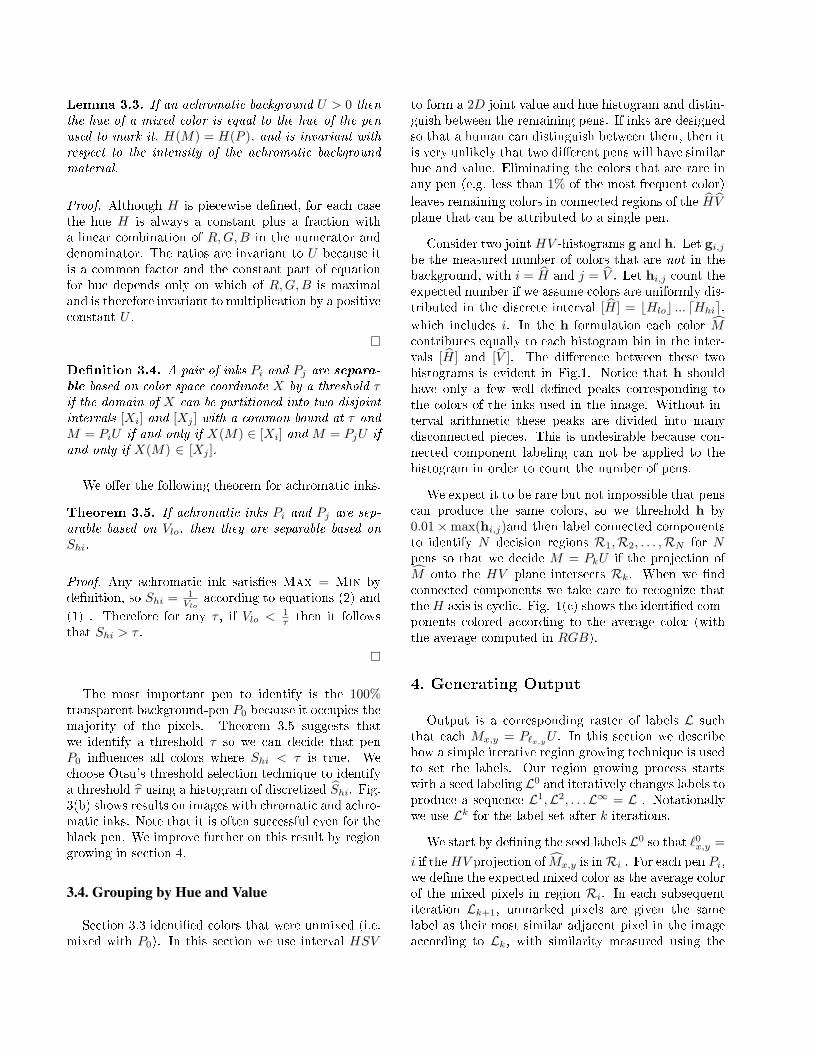
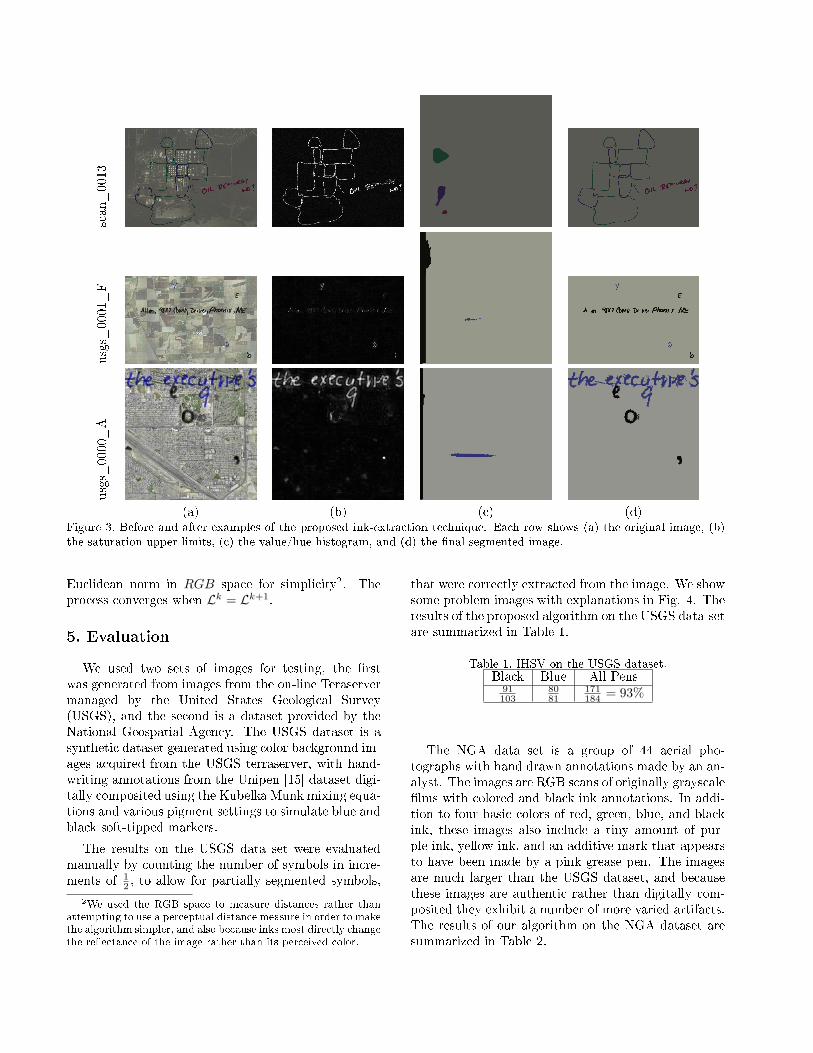
(a) (b) (c) (d)Figure 3. Before and after examples of the proposed ink-extraction technique. Each row shows (a) the original image, (b)the saturation upper limits, (c) the value/hue histogram, and (d) the �nal segmented image.
Euclidean norm in RGB space for simplicity2. Theprocess converges when Lk = Lk+1.
5. Evaluation
We used two sets of images for testing, the �rstwas generated from images from the on-line Teraservermanaged by the United States Geological Survey(USGS), and the second is a dataset provided by theNational Geospatial Agency. The USGS dataset is asynthetic dataset generated using color background im-ages acquired from the USGS terraserver, with hand-writing annotations from the Unipen [15] dataset digi-tally composited using the Kubelka Munk mixing equa-tions and various pigment settings to simulate blue andblack soft-tipped markers.
The results on the USGS data set were evaluatedmanually by counting the number of symbols in incre-ments of 1
2 , to allow for partially segmented symbols,
2We used the RGB space to measure distances rather than
attempting to use a perceptual distance measure in order to make
the algorithm simpler, and also because inks most directly change
the re�ectance of the image rather than its perceived color.
that were correctly extracted from the image. We showsome problem images with explanations in Fig. 4. Theresults of the proposed algorithm on the USGS data-setare summarized in Table 1.
Table 1. IHSV on the USGS dataset.Black Blue All Pens
91103
8081
171184 = 93%
The NGA data set is a group of 44 aerial pho-tographs with hand drawn annotations made by an an-alyst. The images are RGB scans of originally grayscale�lms with colored and black ink annotations. In addi-tion to four basic colors of red, green, blue, and blackink, these images also include a tiny amount of pur-ple ink, yellow ink, and an additive mark that appearsto have been made by a pink grease pen. The imagesare much larger than the USGS dataset, and becausethese images are authentic rather than digitally com-posited they exhibit a number of more varied artifacts.The results of our algorithm on the NGA dataset aresummarized in Table 2.
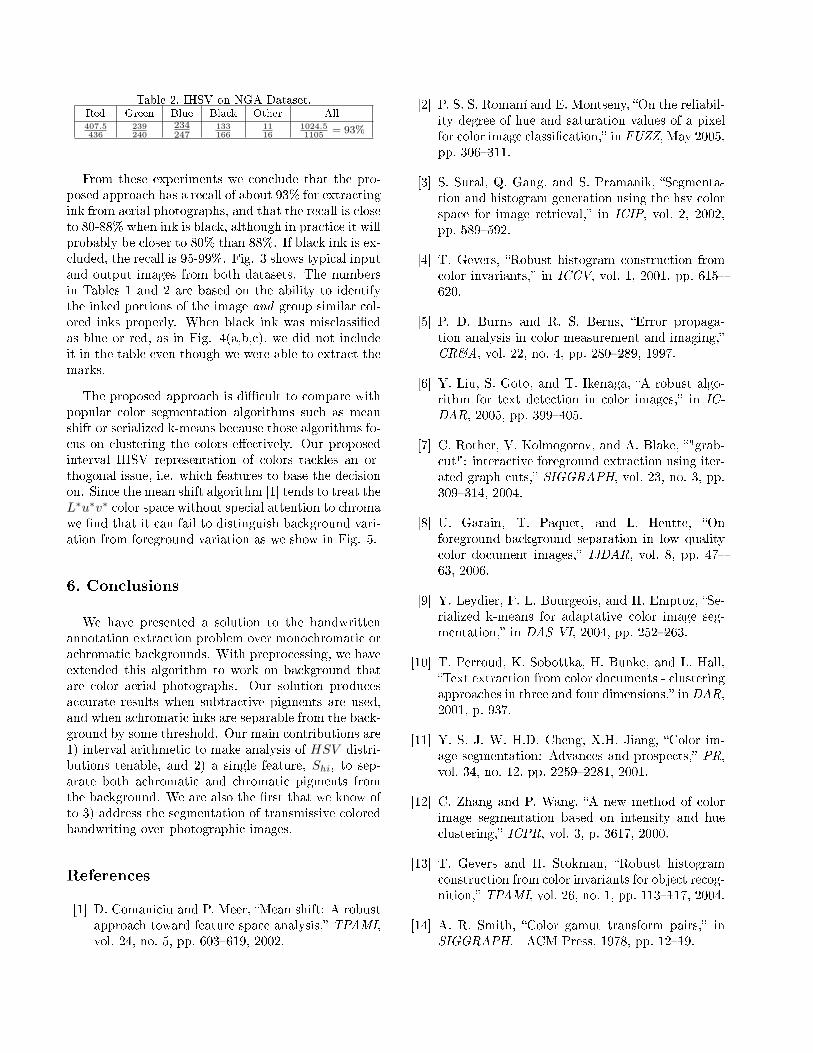
Table 2. IHSV on NGA Dataset.Red Green Blue Black Other All407.5436
239240
234247
133166
1116
1024.51105
= 93%
From these experiments we conclude that the pro-posed approach has a recall of about 93% for extractingink from aerial photographs, and that the recall is closeto 80-88% when ink is black, although in practice it willprobably be closer to 80% than 88%. If black ink is ex-cluded, the recall is 95-99%. Fig. 3 shows typical inputand output images from both datasets. The numbersin Tables 1 and 2 are based on the ability to identifythe inked portions of the image and group similar col-ored inks properly. When black ink was misclassi�edas blue or red, as in Fig. 4(a,b,c), we did not includeit in the table even though we were able to extract themarks.
The proposed approach is di�cult to compare withpopular color segmentation algorithms such as meanshift or serialized k-means because those algorithms fo-cus on clustering the colors e�ectively. Our proposedinterval IHSV representation of colors tackles an or-thogonal issue, i.e. which features to base the decisionon. Since the mean shift algorithm [1] tends to treat theL∗u∗v∗ color space without special attention to chromawe �nd that it can fail to distinguish background vari-ation from foreground variation as we show in Fig. 5.
6. Conclusions
We have presented a solution to the handwrittenannotation extraction problem over monochromatic orachromatic backgrounds. With preprocessing, we haveextended this algorithm to work on background thatare color aerial photographs. Our solution producesaccurate results when subtractive pigments are used,and when achromatic inks are separable from the back-ground by some threshold. Our main contributions are1) interval arithmetic to make analysis of HSV distri-butions tenable, and 2) a single feature, Shi, to sep-arate both achromatic and chromatic pigments fromthe background. We are also the �rst that we know ofto 3) address the segmentation of transmissive coloredhandwriting over photographic images.
References
[1] D. Comaniciu and P. Meer, �Mean shift: A robustapproach toward feature space analysis,� TPAMI,vol. 24, no. 5, pp. 603�619, 2002.
[2] P. S. S. Romaní and E. Montseny, �On the reliabil-ity degree of hue and saturation values of a pixelfor color image classi�cation,� in FUZZ, May 2005,pp. 306�311.
[3] S. Sural, Q. Gang, and S. Pramanik, �Segmenta-tion and histogram generation using the hsv colorspace for image retrieval,� in ICIP, vol. 2, 2002,pp. 589�592.
[4] T. Gevers, �Robust histogram construction fromcolor invariants,� in ICCV, vol. 1, 2001, pp. 615�620.
[5] P. D. Burns and R. S. Berns, �Error propaga-tion analysis in color measurement and imaging,�CR&A, vol. 22, no. 4, pp. 280�289, 1997.
[6] Y. Liu, S. Goto, and T. Ikenaga, �A robust algo-rithm for text detection in color images,� in IC-DAR, 2005, pp. 399�405.
[7] C. Rother, V. Kolmogorov, and A. Blake, �"grab-cut": interactive foreground extraction using iter-ated graph cuts,� SIGGRAPH, vol. 23, no. 3, pp.309�314, 2004.
[8] U. Garain, T. Paquet, and L. Heutte, �Onforeground-background separation in low qualitycolor document images,� IJDAR, vol. 8, pp. 47�63, 2006.
[9] Y. Leydier, F. L. Bourgeois, and H. Emptoz, �Se-rialized k-means for adaptative color image seg-mentation,� in DAS VI, 2004, pp. 252�263.
[10] T. Perroud, K. Sobottka, H. Bunke, and L. Hall,�Text extraction from color documents - clusteringapproaches in three and four dimensions,� in DAR,2001, p. 937.
[11] Y. S. J. W. H.D. Cheng, X.H. Jiang, �Color im-age segmentation: Advances and prospects,� PR,vol. 34, no. 12, pp. 2259�2281, 2001.
[12] C. Zhang and P. Wang, �A new method of colorimage segmentation based on intensity and hueclustering,� ICPR, vol. 3, p. 3617, 2000.
[13] T. Gevers and H. Stokman, �Robust histogramconstruction from color invariants for object recog-nition,� TPAMI, vol. 26, no. 1, pp. 113�117, 2004.
[14] A. R. Smith, �Color gamut transform pairs,� inSIGGRAPH. ACM Press, 1978, pp. 12�19.
(a) (b) (c)
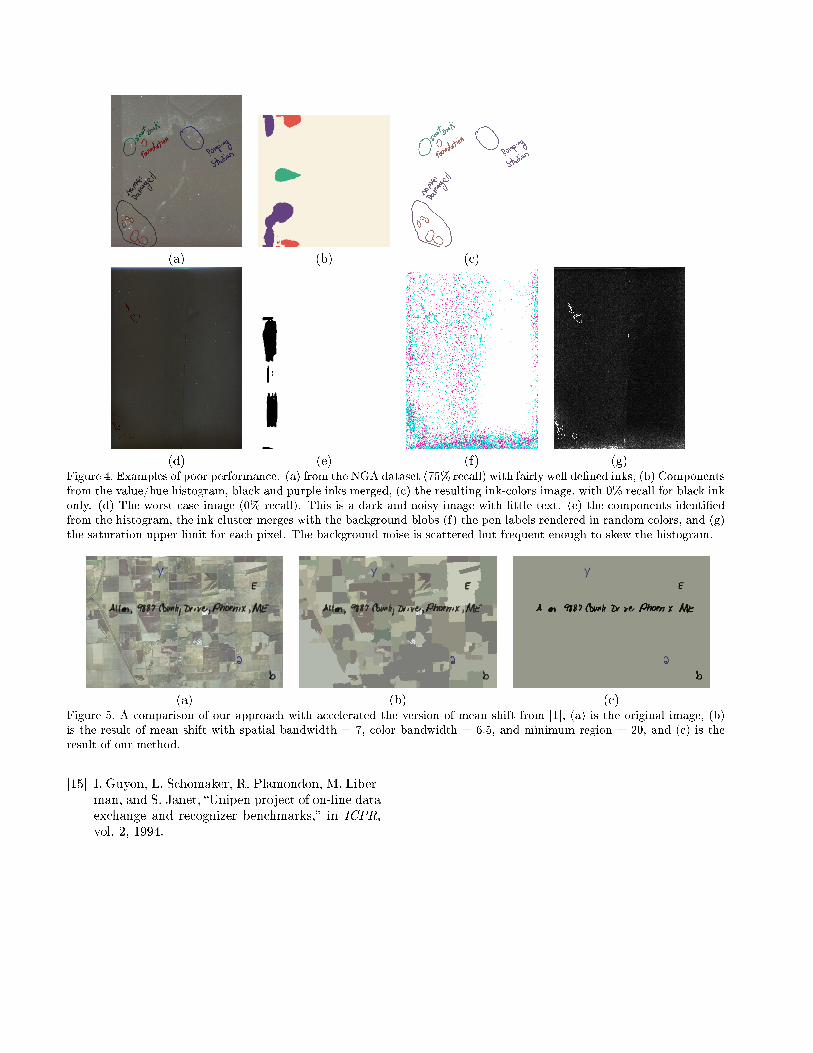
(d) (e) (f) (g)Figure 4. Examples of poor performance. (a) from the NGA dataset (75% recall) with fairly well de�ned inks, (b) Componentsfrom the value/hue histogram, black and purple inks merged, (c) the resulting ink-colors image, with 0% recall for black inkonly. (d) The worst case image (0% recall). This is a dark and noisy image with little text. (e) the components identi�edfrom the histogram, the ink cluster merges with the background blobs (f) the pen-labels rendered in random colors, and (g)the saturation upper limit for each pixel. The background noise is scattered but frequent enough to skew the histogram.
(a) (b) (c)Figure 5. A comparison of our approach with accelerated the version of mean shift from [1], (a) is the original image, (b)is the result of mean shift with spatial bandwidth = 7, color bandwidth = 6.5, and minimum region = 20, and (c) is theresult of our method.
[15] I. Guyon, L. Schomaker, R. Plamondon, M. Liber-man, and S. Janet, �Unipen project of on-line dataexchange and recognizer benchmarks,� in ICPR,vol. 2, 1994.


