Embed Size (px)
Citation preview
International Indian Ocean
Expedition
Collected reprints IV Published upon the recommendation of the Scientific Committee on Oceanic Research (SCOR) and the Intergovernmental Océanographie Commission (IOC)
Unesco
•<¿sc£>
^ K C H »
International Indian Ocean Expedition. Collected reprints IV
i
Copyright in each paper reprinted in this collected edition remains in the possession of each author and publisher, from w h o m permission to reproduce has been obtained.
Collected edition published in 19o7 by the United Nations Educational, Scientific and Cultural Organization, Place de Fontenoy, Paris 7 e
Printed by Les Presses Saint-Augustin, Bruges.
NS .66 /D .37 /4A Printed in Belgium
Preface
The fourth volume of collected reprints of the International Indian Ocean Expedition comprises reprints received by Unesco during the second half of 1966. The papers presented in the volume are roughly grouped into five major parts :
I. Marine biology; II. Marine chemistry;
III. Physical oceanography; IV. Marine geology and geophysics ;
V . Papers presented by title or an abstract only. As was indicated previously, this classification is only a very approximate one which is accepted here simply for convenience
of presentation. S o m e papers of biological importance are included in Part III, "Physical oceanography" since they treat environmental processes, although with application to biological ones. Everyone knows also h o w difficult it is to separate a chemical description of the environment from a physical one.
It is planned, therefore, to complete eventually the series of volumes of collected reprints with an index volume which will contain both the n a m e and the subject indexes.
The fifth volume of the series will be compiled by the middle of 1967.
V
List of reprints
Collected reprints of the IIOE
Part I. Marine biology
205. W O O D , E . J. F. Check list of dinoflagellates recorded from the Indian Ocean. Commonwealth of Australia, CSIRO, Division of Fisheries and Oceanography, 1963, (Report no. 28) 3
206. D U R A I R A T N A M , M . Studies on the seasonal cycle of sea surface temperatures, salinities and phytoplankton in Puttalam Lagoon, Dutch Bay and Portugal Bay along the west coast of Ceylon. Bull. fish. res. Sin., Ceylon, vol. 16, no. 1, 1963, p. 9-24 63
207. SAIJO, Yatsuka ; K A W A S H I M A , Takuji. Primary production in the Antarctic Ocean. J. oceanogr. Soc. Japan, vol. 19, no. 4, 1964, p. 190-196 80
208. SAIJO, Yatsuka. Size distribution of photosynthesizing* phytoplankton in the Indian Ocean. J. oceanogr. Soc. Japan, vol. 19, no. 4, 1964, p. 187-189 87
209. G R U A , Paul. Premières données sur les biomasses de l'herbier à Macrocystis pyrifera de la Baie du Morbihan (Archipel Kerguelen). La terre et la vie, no. 2, 1964, p. 215-220 . . 91
210. G R U A , Paul. Plongées • aux Iles Saint-Paul et Nouvelle Amsterdam. Plongées en eaux froides. In : R . Carrick (éd.), Biologie antarctique. Paris, Hermann, 1964, p. 279-282 . . 99
211. G R U A , Paul. Le cycle sexuel et l'évolution des soies ovigères des femelles de Jasus Paulensis (Palinuridae). In : R . Carrick (éd.), Biologie antarctique. Paris, Hermann, 1964, p. 471-480 103
212. G R U A , Paul. Océanographie biologique. Sur la structure des peuplements de Macrocystis pyrifera (L). C. Ag. observés en plongée à Kerguelon et Crozet. C.R. Acad. Se. Paris, vol. 259, groupe 11, 1964, p. 1541-1543 113
213. D E L É P I N E , R . ; G R U A , P. La végétation infra-littorale de la Baie du Morbihan (Kerguelan). Bull. Soc. Phycol. de France, no. 10, 1964, p. 14 116
214. K I R S T E N E R , Ernst. Ptychodera flava (Enteropneusta) von Tanikely, Madagaskar. Zoologischer Anzeiger (Leipzig), Bd. 175, Heft 4-6, 1965, S. 371-377 .117
215. C R O C E , N . Delia ; H O L T H U I S , L. B . Swarming of Charybdis (Goniohellenus) edwardsi Leene & Buitendijk in the Indian Ocean (Crustacea Decapoda, Portunidae). Boll. Mus. 1st. Biol. Univ. Genova, vol. XXXIII , no. 199, 1964-1965, p. 33-38 125
216. SAIJO, Yatsuka ; T A K E S U E , Kaoru. Further studies on the size distribution of photosynthesizing phytoplankton in the Indian Ocean. J. oceanogr. Soc. Japan, vol. 20, no. 6, 1965, p. 264-271 132
217. D U R A I R A T N A M , M . Some planktonic diatoms from the Indian Ocean. Bull. fish. res. Stn., Ceylon, vol. 17, no. 2, 1964, p. 159-168 141
218. R O B E R T S O N , Robert. Coelenterate-associated prosobranch gastropods. Annual reports for 1965 of the American Malac-ological Union, p. 6-8 152
219. C U T L E R , Edward B . Sipunculids of Madagascar. Océanographie, vol. Ill, no. 2, 1965, p. 51-63 (Cahiers O R S T R O M ) 155
220. H U M E S , Arthur G . ; H o , Ju-Shey. N e w species of the genus Anthessius (copepoda, cyclopoida) associated with mollusks in Madagascar. Océanographie, vol. Ill, no. 2,1965, p. 79-113 (Cahiers O R S T R O M ) 169
221. H U M E S , Arthur G . New species of Hemicychps (copepoda, cyclopoida) from Madagascar. Bull. Mus. comp. Zool., vol. 134, no. 6, 1965, p. 159-259 205
222. M E A D , Giles W . ; De F A L L A , J. E . New oceanic cheilodipterid fishes from the Indian Ocean. Bull. Mus. comp. Zool., vol. 134, no. 7, 1965, p. 261-274 307
223. K I R S T E U E R , Ernst. Über das Vorkommen von Nemertinen in einem tropischen Korallenriff ; 4. Hoplonemertini monos-tilifera. Zool. Jb. Syst., Bd. 92, 1965, S. 289-326 - . . .321
VII
224. D E C K E R , A . de. Observations on the ecology and distribution of copepoda in the marine plankton of South Africa. Cape T o w n , Republic of South Africa, Department of Commerce and Industries, Division of Sea Fisheries, 1964, 33 p. (Investigational report no. 49) 359
225. D E C K E R , A . de ; M O M B E C K , F . J. A preliminary report on
the planktonic copepoda. Cape T o w n , Republic of South Africa, Department of Commerce and Industries, Division of Sea Fisheries, 1964, 41 p. (Investigational report no. 51). . 391
226. G R I N D L E Y , J. R . ; P E N R I T H , M . J. Notes on the bathypelagic
fauna of the seas around South Africa. Zoológica Africana, vol. 1, no. 2, 1965, p. 275-295 435
227. M E A D , Giles W . ; R U B I N O F F , Ira. Avocettinops yanoi, a new nemichthyid eel from the southern Indian Ocean. Breviora (Museum of Comparative Zoology), no. 241, 1966, 6 p. . . 457
228. M U L L I N , Michael M . Selective feeding by calanoid copepods from the Indian Ocean. In : H . Barnes (éd.), Some contemporary studies in marine science. London. Allen & Unwin Ltd., 1966, p . 545-554 463
229. E O r O P O B , B . I \ ; E O P , H , O B C K H H , O . K . ; B H H O r P A -¿ ÍOB, M . E . EnoreoxHMHH OHeammecKoro ruiaHKTOHa. PacnpeflejieHHe HeKOTopwx xHiwmiecKHX KOMnoHeHTOB ruiaHKTOHa B H H ^ H H C K O M OKeaue. OneanoAoiun, T . V I , Bfein. 2, 1966, d p . 314-325 474
BOCOROV, B. G. ; BORDOVSKIJ, O. K . ; VINOGRADOV, M . E.
Biogeochemistry of the oceanic plankton. The distribution of some chemical components of the plankton of the Indian Ocean. Okeanologia, vol. VI , no. 2, 1966, p. 314-325. . . 4 7 4
Part III. Physical oceanography
236. H A M O N , B . V . Geostrophic currents in the south-eastern Indian Ocean. Aust. J. mar. freshw. Res., vol. 16, 1965, p. 255-271 591
237. S O U R N I A , Alain. Mesure de l'absorption de l'ultraviolet dans les eaux côtières de Nossi-Bé (Madagascar). Bull. Insl. océanogr. Monaco, vol. 65, no. 1,348, 1965, 12 p 609
238. S W A L L O W , J. C . The Somali current. Some observations made aboard R . R . S . Discovery during August 1964. Mar. Obs., London, July 1965, p. 125-130 621
239. R O C H F O R D , D . J. Distribution of Banda Intermediate water in the Indian Ocean. Aust. J. mar. freshw. Res., vol. 17, 1966, p. 61-76 627
240. R A M A G E , C . S. The summer atmospheric circulation over the Arabian Sea. J. atmosph. Sci., vol. 23, no. 2, 1966, p. 144-150 643
241. V I S S E R , G . A . ; V A N N I E K E R K , M . M . Ocean currents and
water masses at 1,000, 1,500 and 3,000 metres in the southwest Indian Ocean. Cape Town, Republic of South Africa, Department of Commerce and Industries, Division of Sea Fisheries, 1965, 46 p. (Investigational report no. 52). . . 651
242. O R R E N , M . J. Hydrology of the south-west Indian Ocean. Cape T o w n , Republic of South Africa, Department of Commerce and Industries, Division of Sea Fisheries, 1966, 35 p. (Investigational report no. 55) 697
230. H U M E S , Arthur G . Pseudanthessius procurrens n.sp., a cyclopoid copepod associated with a cidarid echinoid in Madagascar. Breviora (Museum of Comparative Zoology), no. 246, 1966, 14 p 487
Part II. Marine chemistry
231. S U B B A R A O , D . V . The measurement of total carbon dioxide in dilute tropical waters. Aust. J. mar. freshw. Res., vol. 16, 1965, p. 273-280 503
232. T H O M M E R E T , Jean ; T H O M M E R E T , Yolande ; G A L L I O T , Jean.
Teneur en radiocarbone des eaux profondes et superficielles du nord de l'océan Indien (mer d ' O m a n ) . Bull. Insl. océanogr. Monaco, vol. 65, no. 1,347, 1965, 8 p. (IAEA, Radioactivity in the sea. Publication no. 18) 511
233. F R A G A , F . Distribution of particulate and dissolved nitrogen in the western Indian Ocean. Deep-sea Res., vol. 13, 1966, p. 413-425 519
234. R O C H F O R D , D . J. Source regions of oxygen maxima in intermediate depths of the Arabian Sea. Aust. J. mar. freshw. Res., vol. 17, 1966, p. 1-30 533
235. M O S T E R T , S. A . Distribution of inorganic phosphate and dissolved oxygen in the south-west Indian Ocean. Cape Town, Republic of South Africa, Department of Commerce and Industries, Division of Sea Fisheries, 1966, 23 p. (Investigational report no. 54) 563
Part IV. Marine geology and geophysics
243. L A F O N D , E . C . Andhra, Mahadevan and Krishna submarine canyons and other features of the continental slope off the east coast of India. J. Indian geophys. Un., vol. 1, no. 1, 1964, p. 25-32 739
244. A L L A N , T . D . ; C H A R N O C K , H . ; M O R E L L I , C. Magnetic,
gravity and depth surveys in the Mediterranean and Red Sea. Nature, Lond., vol. 204, no. 4,965,1964, p. 1245-1248 . 751
245. K A H A E B , B . <t>. ; M A P O B A , H . A . EaTHMeTpimec-Kaa KapTa CeBepHOH «acm HHflmícKoro OKeaHa. Otcea-HOJiozuuecKue uccjieaoeauun, Ns 13, 1964, crp. 157-162. 759
K A N A E V , V . F . ; M A R O V A , N . A . Bathymétrie chart of the
northern part of the Indian Ocean. Okeanol. issled., no. 13, 1964, p. 157-162 759
246. K A H A E B , B . <£>. H H # H H C K H H oKeaH. HoBan reorpa-4>ntiecKaH Kapia. OKeauo/iozuH, T . V , B t m . 4 , 1965, crp. 760-762 768
K A N A E V , V . F . The Indian Ocean. A new geographical m a p . Okeanologia, vol. V , no. 4, 1965, p. 760-762 . . . 7 6 8
247. D A VIES, D . ; F R A N C I S , T . J. G . The crustal structure of the
Seychelles Bank. Deep-sea Res., vol. II, 1964, p. 921-927 . 773
248. F R A N C I S , T . J. G . ; S H O R , G . G . Seismic refraction measurements in the north-west Indian Ocean. J. geophys. Res., vol. 71, no. 2, 1966, p. 427-449 781
VIII
249. ENGEL, C. G. ; FISHER, R. L. ; E N G E L , A. E. G. Igneous
rocks of the Indian Ocean floor. Science, vol. 150, no. 3,696, 1965, p. 605-610 805
250. E E 3 P y K 0 B ; n . JÏ.TRPLDIOB, A . %..; ^EPHBIIIIE-B A , B . H . ITeTporpartpHH H aôcojiioTHbiH B03pacT 6e-3anbTOB co jsfia. HHflHHCKoro OKeaHa. Oneanojiozun, T. VI, Btm. 2, 1966, erp. 261-266 811
BEZRUKOV, P. L. ; K R Y L O V , A. Ya. ; CHERNYSHEVA, V. I.
Petrography and the absolute age of the Indian Ocean floor basalts. Okeanologia, vol. VI , no. 2, 1966, p. 261-266 . . 811
251. r O P B Y H O B A , 3 . H . PacnpeaejieHae rJiHHHCTbix M H H e -pajioB B oca^Kax HumriicKoro OKeaHa. OKeaHOjiotun, T . V I , Bbin. 2 , 1966, crp. 267-275 817
G O R B U N O V A , Z . N . Distribution of clay minerals in the sediments of the Indian Ocean. Okeanologia, vol. VI , no. 2, 1966, p. 267-275 817
252. B I R C H , F . S. ; H A L U N E N Jr., A . J. Heat-flow measurements
in the Atlantic Ocean, Indian Ocean, Mediterranean Sea and Red Sea. J. geophys. Res., vol. 71, no. 2, 1966, p. 583-586 . 827
253. BowiN, C . O . ; V O G T , P . R . Magnetic lineation between Carlsberg Ridge and Seychelles Bank, Indian Ocean. J. geophys. Res., vol. 71, no. 10, 1966, p. 2625-2630 . . . 8 3 1
254. S C H O T T , W . ; S T A C K E L B E R G , U . von. Über rezente Sedimen
tation im Indischen Ozean, ihre Bedeutung fur die Ent-stehung kohlenwasserstoffhaltiger Sedimente. Erdôl und Kohle-Erdgas-Petrochemie, 18 Jahrgang, Nr. 12, 1965, S. 945-950 837
255. B U N G E N S T O C K , H . ; C L O S S , H . ; H I N Z , K . Seismische
Untersuchungen im nôrdlichen Teil des Arabischen Meeres
(Golf von O m a n ) . Erdol und Kohle-Erdgas-Petrochemie, 19 Jahrgang, Nr. 4 , 1966, S. 237-243 843
Part V. Papers presented by title or an abstract only
256-259. Israel South Red Sea Expedition, 1962. Reports nos. 1-4. Haifa, Department of Fisheries, Sea Fisheries Research Station, 1964. (Bulletin no. 35). [Titles only] . . 853
256. O R E N , O . H . Hydrography of Dahlak Archipelago (Red Sea) 257. G O R E A U , T . O n the prédation of coral by the spiny starfish
Acanthaster Planci (L.) in the southern Red Sea 258. S T O C K , J. H . Report on the Pycnogonida of the Israel South
Red Sea Expedition 259. H O O F I E N , J. H . ; Y A R O N , Z . A collection of reptiles from
the Dahlak Archipelago
260-267. Israel South Red Sea Expedition, 1962. Reports nos. 5-12. Haifa, Department of Fisheries, Sea Fisheries Research Station, 1965. (Bulletin no. 38). [Titles only] . . 854
260. H A R R I S O N , David L . Remarks on some trident leaf-nosed bats (Genus Asellia Gray, 1838) obtained by the Israel South Red Sea Expedition, 1962
261. C O S T A , Michael. Andrégamasus N . Gen., a new genus of mesostigmatic mites associated with terrestrial hermit crabs
262. D A Y , J. H . Some polychaeta from the Israel South Red Sea Expedition, 1962
263. S T O C K , J. H . ; N I J S S E N , H . Eriopisa Longiramus N . S p . , a
new subterranean amphipod from a Red Sea island 264. W A I N W R ' I G H T , Stephen A . Reef communities visited by the
Israel South Red Sea Expedition, 1962. 265. N I R , Yaacov ; R O G E R S , Allen S. Entedebir Island—Dahlak
Archipelago 266. K O H N , Alan J. Conus (mollusca, gastropoda) collected by
the Israel South Red Sea Expedition, 1962, with notes on collections from the Gulf of Aqaba and the Sinai Peninsula
267. STEINITZ, H . Comments on geographical names on the expedition's m a p
268-272. Israel South Red Sea Expedition, 1962, Reports nos. 13-17. Haifa, Department of Fisheries, Sea Fisheries Research Station, 1965. (Bulletin no. 40). [Titles only] . . 855
268. L E V I , Claude. Spongiaires récoltés par l'Expédition Israélienne dans le Sud de la Mer Rouge en 1962
269. V E R S E V E L D T , J. Report on the Octocorallia (Stolonifera and Alcyonacea) of the Israel South Red Sea Expedition 1962, with notes on other collections from the Red Sea
270. H U M E S , A . G . ; S T O C K , J. H . Three new species of Anthessius
(Copepoda, Cyclopoida, Myicolidae) associated with Tridacna from the Red Sea and Madagascar
271. S C H I L D E R , F . A . Cypraeidae
272. S T E P H E N , A . C . Echiura and Sipuncula from the Israel South Red Sea Expedition
273. Records of océanographie works in Japan. General report of the participation of Japan in the International Indian Ocean Expedition. Vol 8, no. 2 (new series February 1966). Published by the Science Council of Japan [Title only] 856
274-286. A discussion concerning the floor of the Northwest Indian Ocean, organized by M . N . Hill. Phil. Trans. Roy. Soc, Series A , vol. 259, no. 1,099, 1966 857
274. Preface 858 275. H E E Z E N , B . C . ; T H A R P , Marie. Physiography of the Indian
Ocean [Abstract] 860 276. L A U G H T O N , A . S. The Gulf of Aden [Abstract] . . . . 8 6 0 277. M A T T H E W S , D . H . The O w e n fracture zone and the northern
end of the Carlsberg Ridge [Abstract] 861 278. B A R K E R , P . F . A reconnaissance survey of the Murray Ridge
[Abstract] 861 279. C A N N , J. R . ; V I N E , F . J. A n area on the crest of the
Carlsberg Ridge : petrology and magnetic survey [Abstract] 862 280. B U N C E , Elizabeth T . ; B O W I N , C . O . ; C H A S E , R . L . Prelimi-
mary results of the 1964 cruise of R . V . Chain to the Indian Ocean [Abstract] 862
281. M A T T H E W S , D . H . ; D A V I E S , D . Geophysical studies of the
Seychelles Bank [Abstract] . 863 282. F R A N C I S , T . J. G . ; D A V I E S , D . ; H I L L , M . N . Crustal
structure between Kenya and the Seychelles [Abstract] . 863
283. H E R Z E N , R . P . von ; V A C Q U I E R , V . Heat flow and magnetic
profiles on the mid-Indian Ocean Ridge [Abstract] . . . 864 284. S C L A T E R , J. G . Heat flow in the north-west Indian Ocean
and Red Sea [Abstract] 864 285. L E W I S , M . S. ; T A Y L O R , J. D . Marine sediments and bottom
communities of the Seychelles [Abstract] 865 286. E V A N S , G . The recent sedimentary faciès of the Persian Gulf
region [Abstract] 865
IX
287. B E R G E R , J. Infraciliary morphology of a little-known echinophilous hymenostome ciliate from Indo-West Pacific. Second International Conference on Protozoology. London, August 1965. (Excerpta Medica International Congress series no. 91) [Abstract] 866
288. M C D O W E L L , S. A preliminary report on the Tintinnida of the Indian Ocean from the collections of Cruise 2 of the Anton Bruun, June to August 1963. Second International Conference on Protozoology. London, August 1965. (Excerpta Medica International Congress series no. 91) [Abstract]. . 867
X
Part I Marine biology
C O M M O N W E A L T H ^g^asaagg¡jfc r OF AUSTRALIA
Commonwealth Scientific and Industrial Research Organization
Division of Fisheries and Oceanography
REPORT 28
CHECK-LIST OF DINOFLAGELLATES
RECORDED FROM THE INDIAN OCEAN
By E . J. F. Wood
Marine Biological Laboratory Cronulla, Sydney
1963
Collected reprints of the International Indian Ocean Expedition, vol. IV, contribution no. 205 3
CHECK-LIST OF DINOFUGELIATES RECORDED FROM THE INDIAN OCEAN
By E.J.F. Wood
INTRODUCTION
Because of the international interest in the Indian Ocean as an object of study by oceanographers from various countries of the world, it seemed opportune to scan previous work which has been carried out in the region. Fhytoplankton studies have been considerable, and because many of the papers are not easy of access, a check-list of previous records from the Indian Ocean region has been prepared. It is hoped that this check-list will prove useful to phytoplanktologists working on dinoflagellates collected from the Indian Ocean region during the SCOR-UNESCO project in the Indian Ocean (1959-1965).
Genus AMHÍIDINITJM
Amphidinium extensum Wulff, 1916
Matzenauer, 1933; Indian Ocean
A. globosum Schroeder, 1911
Matzenauer, 1933J Indian Ocean
A. turbo Kofoid, 1922
Matzenauer, 1933; Indian Ocean
Genus AMFHISOLENIA
Amphisolenia bidentata Schroeder, 1900
Ostenfeld and Schmidt, 1901 ; Red Sea, Gulf of Aden Schroeder, 1906; Red Sea, G. of Aden, Arabian Sea,
Indian Ocean to Sumatra Karsten, 1907; East African Coast,- Indian Ocean Ostenfeld, 1915; Boeton Strait Matzenauer, 1933; Indian Ocean Subrahmanyan, 1958; Arabian Sea Wood, 1962; Indian Ocean, Java Seas, Timor Sea, Arafura Sea
When citing this report abbreviate as follows: C.S.I.R.O. Aust. Div. Fish. Oceanogr. Rep. No. 28
1305
5
- 2 -
Amphisolenia bifurcata Murray and Whitting, 1899
Karsten, 1907; Indian Ocean
A. brevicauda Kofdd, 1907
Wood, 1962; Indian Ocean
A. claviceps Refold, 1907
Wood, 1962j Indian Ocean
A. elongata Kofoid and Skogsberg, 1928
Subrahmanyan, 1958j Arabian Sea
A. globifera Stein, 1883
Cleve, 1901; Malaya Cleve, 1903; Red Sea, Arabian Sea Wood, .1962; Indian Ocean
A. inflata Murray and Whitting, 1899
Cleve, 1903; Arabian Sea Schroeder, 1906; G. of Aden, Indian Ocean to Sumatra
A. leramermanni Kofoid, 1907
Matzenauer, 1933; Indian Ocean Wood, 1962; Indian Ocean
A. palaeotheroides Kofoid, 1907
Wood, 1962; Indian Ocean
A. palmata Stein, 1883
Cleve, 1900, 1901; Red Sea, Arabian Sea, Indian Ocean Cleve, 1903; Red Sea, Arabian Sea, G. of Aden Schroeder, 1906; G. of Aden, Arabian Sea Karsten, 1907; Indian Ocean
A. rectangulata Kofoid, 1907
Wood, 1962; Indian Ocean
- 3 -
Amphisolenia schauinslandi Lemmermann, 1899
Ostenfeld and Schmidt, 1901,- G. of ¿den Schroeder, 1906; Indian Ocean Matzenauer, 1933; G. of Aden, Indian Ocean Ballantine, 1961j Zanzibar Wood, 1962; Indian Ocean
A. schroederi Kofoid, 1907
Wood, 1962; Indian Ocean
A. thrinax Schlltt, 1895
Ostenfeld and Schmidt, 1901; Arabian Sea Cleve, 1901; Arabian Sea Schroeder, 1906; Arabian Sea, Indian Ocean Matzenauer, 1933; Indian Ocean Wood, 1962; Indian Ocean
Genus BLEPHAROCYSTA
Blepharocvsta paulseni Schiller, 1937
Wood, 1962; Indian Ocean
B. splendor maris Ehrenberg, 1873
Ostenfeld and Schmidt, 1901; G. of Aden Schroeder, 1906; Red Sea, G. of Aden Wood, 19625 Indian Ocean
Genus CENTR0DINIUM
Centrodinium eminens Bohm, 1933
Wood, 1962; Indian 0cean(N.E.)
0. intermedium Pavillard, 1930
Wood, 1962; Indian Ocean (N.E.)
7
- 4 -
Genus CERATIUM
Ceratium arcticum (Ehr.) Cleve, 1901 .
Wood, 1961| Indian Ocean
C. arietinum Cleve, 1900b} South Indian Ocean
Cleve, 1901; Arabian Sea, Indian Ocean Schroeder, 1906," Indian Ocean Karsten, 1907; Indian Ocean Matzenauer, 1933? Indian Ocean Steemann Nielsen, 1939j Indian Ocean Wood, 1954; Cape Inscription, Western Australia
C. axiale Kofoid, 1907
Steemann Nielsen, 1939; Indian Ocean Wood, 1954; West of King I.
C. azorlcum Cleve, 1900b; South Indian Ocean
Cleve, 1901, 1903; Indian Ocean, Arabian Sea Schroeder, 1906; Red Sea, Arabian Sea, Colombo-Sumatra Karsten, 1907; Indian Ocean Czapek, 1909; Indian Ocean Steemann Nielsen, 1939; Indian Ocean Wood, 1954; south and west coasts of Australia, Indian
Ocean
C. belone Cleve, 1900
Cleve, 1901; Indian Ocean Schroeder, 1906; Red Sea, G. of Aden, Arabian Sea Karsten, 1907; Indian Ocean Steemann Nielsen, 1939; Indian Ocean Wood, 1962; Indian 0c6an
C. bigelowi Kofoid, 1907
Steemann Nielsen, 1939; Indian Ocean Wood, 1962; Indian Ocean
C. brachyceros Daday, 1907; tropical lakes of Africa and Asia
Schroeder, 1914; East Africa
8
- 5 -
Ceratium breve (Ostenfeld and Schmidt) Schroeder, 1906
Ostenfeld and Schmidt, 1901 (as C. tripos v. breve); Red and Arabian Seas
Schroeder, 1906; Arabian Sea Karsten, 1907 (as C. tripos azoricum): Indian Ocean Ostenfeld, 1915; Boeton Strait Steemann Nielsen, 1939? Indian Ocean Subrahmanyan, 1958; Arabian Sea Wood, 1962; eastern Indian Ocean Ballantine, 1961; Zanzibar
C. bucephalum (Cleve) Cleve, 1901
Cleve, 1901, 1903 (as C. heterocamptum Jorg.); Arabian Sea, south Indian Ocean
Ostenfeld and Schmidt, 1901 (as C. heterocamptum): G. of Aden
Schroeder, 1906; Arabian Sea Subrahmanyan, 1958; Arabian Sea Wood, 1962; Indian Ocean
C..buceros Zacharias, 1905
v. tenue (Ost. and Schmidt) Jftrg., 1911
Ostenfeld and Schmidt, 1901 (as C. tenue n. sp.)î ï*ed Sea Steemann Nielsen, 1939 (as C. tenue); Indian Ocean Wood, 1954; west and south Australia: 1960; Indian Ocean Subrahmanyan, 1958; Arabian Sea
v. molle (Kofoid) Jorgensen, 1911
Schroeder, 1906 (as C. undulatum); Indian Ocean Karsten, 1907 (as C. tripos inversum. and C. tripos
buceros) Indian Ocean Steemann Nielsen, 1939 (as G. molle): Indian Ocean Wood, 195-45 0» Inscription to C. Leeuwin: 1962; Indian
Ocean
C. candelabrum (Ehr.) Stein, 1883
Ostenfeld and Schmidt, 1901; Red Sea, G. of Aden Cleve, 1901, 1903; Red Sea, G. of Aden, Arabian Sea,
Indian Ocean, Malaya Schroeder, 1906; Red Sea, G. of Aden, Arabian Sea, Indian
Ocean, Singapore, Sunda Sea Ostenfeld, 1915; Boeton Str. Steemann Nielsen, 1939; Indian Ocean Subrahmanyan, 1958; Arabian Sea Ballantine, 1961; Zanzibar
9
- 6 -
Ceratium candelabrum (contd)
f. depressum Pouchet, 1883
Karsten, 1907; south Indian Ocean Steemann Nielsen, 1939» Indian Ocean Wood, 1954; southern Australia, Bass Strait to Albany:
1962; Indian Ocean Subrahmanyan, 1958; Arabian Sea
C. carriense Gourret, 1883 (and vars.)
Cleve, 1900, 1901, 1903 (as C. volans); Red Sea, G. of Aden, Arabian Sea, Malaya
Ostenfeld and Schmidt, 1901 (as C. volans. G. patentis-simum); Red Sea
Schroeder, 1906 (as C. cevlonicum. n. sp., C. elegans. C. patentissimum); Fremantle Harbour, G. of Aden, Indian Ocean
Karsten, 1907 (as G. tripos volans, etc.)J Indian Ocean Steemann Nielsen, 1939; Indian Ocean Wood, 1955; west and south coasts of Australia:
1962; Indian Ocean Subrahmanyan, 1958; Arabian Sea
G. cephalotum (Lemm.) Jttrg., 1911
Schroeder, 1906 (as C. gravidum v. hydrocephala): Ceylon to Sumatra
Karsten, 1907; Indian Ocean Steemann Nielsen, 1939; Indian Ocean Wood, 1962; Indian Ocean
C. concilians Jorg., 1920
Karsten, 1909; Indian Ocean Steemann Nielsen 1939; Indian Ocean Wood, 1954-, 1962; west of Bass Str., Indian Ocean
• C « contortum (Gourret) Cleve, 1900a; Arabian Sea, Red Sea, Indian Ocean
Ostenfeld and Schmidt, 1901; Red Sea, G. of Aden Cleve, 1901, 1903; Red Sea, G. of Aden, Arabian Sea,
Indian Ocean Schroeder, 1906 (as C. subcontortum): Arabian Sea,
Fremantle, Indian Ocean, Singapore Karsten, 1907; Indian Ocean Czapek, 1909 (as C. arcuatum f. contortum): Indian Ocean Steemann Nielsen, 1939; Indian Ocean Wood, 1962; Indian Ocean
10
- 7 -
Ceratium contrarium (Gourret) Pav., 1905
Clave-, 1900a, 1901 (as n. nafîp/njf\vm|n)'l; Red Sea, Indian Ocean, Malaya
Schroeder, 1906; Indian Ocean east of Colombo Karsten, 1907 (as C. tripos f1ap^lliferum v. undulata) ;
Indian Ocean Ostenfeld, 1915 (as C. inflexum): Boeton Str. Steemann Nielsen, 1939» Indian Ocean Wood, 1954 (as C trichoceros v. contrarium); 1962;
Indian Ocean
0. curvicome v. Daday, 1888
Cleve, 1901, 1903; Red Sea, G. of Aden, Arabian Sea
C. declinatum Karsten, 1907 (and as C. tripos heterooamptum); Indian Ocean
Steemann Nielsen, 1939; Indian Ocean Subrahmanyan, 1958; Arabian Sea Wood, 1962; Indian Ocean
C. deflexum (Kofoid) Jorgensen, 1911
Schroeder, 1906 (as C. recurvatum); east of Ceylon Ostenfeld, 1915; Boeton Str. Steemann Nielsen, 1939; Indian Ocean Wood, 1962; Indian Ocean
C» dens Ostenfeld and Schmidt, 1901; Red Sea, Arabian Sea
Cleve, 1903; Red Sea, Arabian Sea Schroeder, 1906; Red Sea, G. of Aden, Indian Ocean Karsten, 1907; Indian Ocean Ostenfeld, 1915; Boeton Str. Steemann Nielsen, 1939; Indian Ocean Subrahmanyan, 1958; Arabian Sea Wood, 1962; Indian Ocean
C. digitatum Schtitt, 1895
Karsten, 1907; Indian Ocean Steemann Nielsen, 1939; Indian Ocean Wood, 1962; Indian Ocean
11
- 8 -
Oeratium euarcuatum Jorg., 1920
Schroeder, 1906 (as C. inflexua (Gour.) Schr.); Indian Ocean
Karsten, 1907; Indian Ocean Steemann Nielsen, 1939; Indian Ocean Wood, 1962; Indian Ocean
C. extensum (Gourret) Gleve, 1901
Cleve, 1901, 1903; Red Sea, Arabian Sea, Malaya Ostenfeld and Schmidt, 1901 (as C. fusus v. extensa) :
Red Sea, G. of Aden Schroeder, 1906; Arabian Sea, G. of Aden, Singapore,
Sunda Sea Ostenfeld, 1915? Boeton Str. Steemann Nielsen, 1939; Indian Ocean Wood, 1954-, 1962; west of Bass Str., Indian Ocean, west
of Australia
f, strictum
Ostenfald 1915; Boeton Str. Wood, 1954, 1962; Indian Ocean
0. falcatiforme Jftrg. 1920
Karsten, 1907; Indian Ocean Steemann Nielsen, 19395 Indian Ocean Wood, 1954, 1962; Indian Ocean
C . falcatara (Kofoid) Jcrg., 1920
Cleve, 1900a (as C. pennatum); Arabian Sea, Indian Ocean, Red Sea
Karsten, 1907 (as C« pennataun f. f alcatuaO ; Indian Ocean Steemann Nielsen, 1939; Indian Ocean Wood, 1954; 1962; west of Bass Str., Indian Ocean Ballantine, 1961; Zanzibar
C. filicorne Steemann Nielsen, 1934
Steemann Nielsen, 1939; Indian Ocean
C. furca (Ehr.) Clap, and Lach.
Schroeder, 1906; Red Sea, G. of Aden east to Sunda Sea
12
- 9 -
Ceratium furca (contd)
v. eugrammum (Ehr.) Jferg., 1911
Steemann Nielsen, 1939; Indian Ocean Subrahmanyan, 1958; Arabian Sea Wood, 1954; Swan R. to Kangaroo I* Ballantine, 1961; Zanzibar
v. hflT-ffh-i (Jftrg.) Schiller, 1911
Ostenfeld and Schmidt, 1901; Red Sea, G. of M e n eleve, 1901, 1903; Red Sea, G. of Aden, Arabian Sea,
Malaya Schroeder, 1906j N.E. Indian Ocean Czapek, 1909; Indian Ocean Ostenfeld, 1915; Boeton Str. Steemann Nielsen, 1939; Indian Ocean Wood, 1954» 1962; Bass Strait, Southern and Indian
Oceans
C. fusus (Ehr.) Dujardin, 1841
Cleve,1900 a,b,1901; Indian Ocean, Red Sea Ostenfeld and Schmidt, 1901; Red Sea, G. of Aden Schroeder, 1906; Red Sea, G. of Aden, Arabian Sea,
N.E. Indian Ocean Karsten, 1907; Indian Ocean Czapek, 1909; Indian Ocean Ostenfeld, 1915; Boeton Str. Steemann Nielsen, 1939; Indian Ocean Wood, 1954; south and west coasts of Australia:
1962; Indian Ocean Subrahmanyan, 1954; Arabian Sea Ballantine, 1961; Zanzibar
r.T pwfl^mim Kofoid, 1907
Schroeder, 1906 (as C. hundhauseni); Indian Ocean Karsten, 1907 (as C. tripos macroceros v. tenuissima);
Indian Ocean Ostenfeld, 1915; Boeton Str. Wood, 1954» 1962; south and west coasts of Australia,
Indian Ocean Subrahmanyan, 1958 (as C. macroceros v. jggüicjaS) i
Arabian Sea
C. eeniculatum (Lemm.) Cleve, 1901
Karsten, 1907; Indian Ocean Steemann Nielsen, 1939; Indian Ocean Wood, 1962; Indian Ocean
13
- 10 -
Ceratium gibberum Gourret, 1883
Ostenfeld and Schmidt, 1901 (as C. curvicorne Daday) Clevej Red Sea
Cleve, 1901, 1903j Red Sea, G. of Aden, Arabian Sea Schroeder, 1906j Indian Ocean, Fremantle Harbour Karsten, 1907; Indian Ocean Ostenfeld, 1915; Boston Str. Steemann Nielsen, 1939; Indian Ocean Subrahmanyan, 1958; Arabian Sea Wood, 1962; Indian Ocean
0. gravidum Gourret, 1883
Ostenfeld and Schmidt, 1901 j G. of Aden, Red Sea Cleve, 1901, 1903; Red Sea, Arabian Sea, Indian Ocean Schroeder, .1906; Red Sea, G. of Aden, Arabian Sea,
Indian Ocean Karsten, 1907; Indian Ocean Steemann Nielsen, 1939; Indian Ocean Wood, 1954; west of Bass Strait. 1962; Indian Ocean
C. hexacanthum Gourret, 1883
Ostenfeld and Schmidt, 1901; Red Sea, G. of Aden Cleve, 1901, 1903 (as Cf reticulatum (Pouchet));
Red Sea, Arabian Sea, Indian Ocean, Malaya Schroeder, 1906 (as C. reticulatum): Indian Ocean Karsten, 1907; Indian Ocean Ostenfeld, 1915 (as C. reticulatum); Boeton Str. Steemann Niels«n, 1939; Indian Ocean Wood, 1954, 1962; Indian Ocean to Bass Str.
0. hirundinellA (O.F.M.) Bergh, 1882
West, 1907; Victoria Nyanza Ostenfeld, 1909, Tanganyika Woloszynska, 1912; Java Schroeder, 1914; East Africa Wood, 1954; Swan River, West Australia
C. horiddum Gran, 1902
Subrahmanyan, 1958; Arabian Sea Wood, 1962; Indian Ocean
C. humile Jorg., 1911
Steemann Nielsen, 1939; Indian Ocean Subrahmanyan, 1958; Arabian Sea Wood, 1962; Indian Ocean
14
- 11 -
Ceratium incisum (Karsten) J5rg. 1911
Schroeder, 1906; Red Sea Karsten, 1907; Indian Ocean Steemann Nielsen, 1939; Indian Ocean Wood, 1962; Indian Ocean
C. inflatum (Kofoid) Jttrg. 1911
Schroeder, 1906; N.E. Indian Ocean Steemann Nielsen, 1939; Indian Ocean Subrahmanyan, 1958; Arabian Sea Wood, 1962; Indian Ocean
C. karsteni Pav., 1907
Ostenfeld and Schmidt, 1901 (as 0« tripos v. arçuata); Red Sea, G. of Aden
Oleve, 1901, 1903 (as G. arcuatum Gourret); Red Sea, G. of Aden, Arabian Sea
Schroeder, 1906 (as 0. arcuatum); Red Sea, G. of Aden, Arabian Sea, Indian Ocean
Karsten, 1907 (as C. tripos schranki); Indian Ocean Czapek, 1909 (as C. arcuatum); Indian Ocean Steemann Nielsen, 1939; Indian Ocean Wood, 1954, 1962; Indian Ocean ¿¡ubrahmanyan, 1958; Arabian Sea Ballantine, 1961; Zanzibar
C. kofoidi Jorg., 1911
Karsten, 1907; Indian Ocean Steemann Nielsen, 1939; Indian Ocean Wood, 1962; Indian Ocean
C. limulus Gourret, 1883
Ostenfeld and Schmidt, 1901; Arabian Sea Cleve, 1901, 1903; Red Sea, Malaya Schroeder, 1906; Arabian Sea Karsten, 1907; Indian Ocean Steemann Nielsen, 1939; Indian Ocean Wood, 1954, 1962; Southern and Indian Oceans
0. lineatum (Ehr.) Cleve, 1899
Cleve 1900a,b (probably in part = C. pentagonum): South Indian Ocean, Red Sea, Arabian Sea, Malaya
15
- 12 -
Ceratium lineatum (contd)
Schroeder, 1906 (= C. pentagonum)i Red Sea, G. of Aden, Arabian Sea
Wood, 1954-, 1960; Subantarctic Convergence, central Indian Ocean
C« longinum Karsten, 1906
Schiller, 1937; Indian Ocean
C. longipes (Bailey) Gran, 1902
Subrahmanyan, 1958; Arabian Sea
C. longirostrum Gourret, 1883
Ostenfeld, 1915; Boeton Str. Steemann Nielsen, 1939; Indian, Ocean Subrahmanyan, 1958; Arabian Sea Wood, 1962; Indian Ocean
C. longissimum (Schroeder) Kofoid, I907
Steemann Nielsen, 1939; Indian Ocean
C. lunula Schimper, 1900
Karsten, 1907; Indian Ocean Czapek, 1909; Indian Ocean Steemann Nielsen, 1939; Indian Ocean Wood, 1954-» 1962; Southern and Indian Oceans Subrahmanyan, 1958; Arabian Sea
C. macroceros (Ehr.) Cleve, 1900
Ostenfeld and Schmidt, 1901 (as C. macroceras); Red Sea, G. of Aden
Cleve, 1901, 1903; Red Sea, G. of Aden, Arabian Sea, Indian Ocean, Malaya
Schroeder, 1906; Red Sea, G. of Aden, Arabian Sea, Singapore, Fremantle
Karsten, 1907; Indian Ocean Czapek, 1909; Indian Ocean Steemann Nielsen, 1939; Indian Ocean Subrahmanyan, 1958; Arabian Sea Wood, 1962; Indian Océan Ballantine, 1961; Zanzibar
16
- 13 -
Ceratium massil.iense (Gourret) Jftrg., 1911
Schroeder, 1906 (as G. aeauatorlale): Singapore, Red Sea, G. of Aden
Karsten, 1907 (as C. tripos longipes v. cristata, C. tripos flagelliferum v. erassa etc.)» Indian Ocean
Ostenfeld, 19155 Boeton Str. Steemann Nielsen, 1939; Indian Ocean Subrahmanyan, 1958; Arabian Sea Wood, 1962; Indian Ocean
v. macroceroides (Karst.) Jftrg. 1911
Wood, 1954; Great Australian Bight, coastal waters of west Australia south of Shark Bay (characteristic): 1962; Indian Ocean
Subrahmanyan, 1958; Arabian Sea
C. minutum J&rg., 1920
Schroeder, 1906; Fremantle Wood, 1954> 1962; central and S.E. Indian Ocean, south
west coast of Australia
C. okamurai Schroeder, 1906; Indian Ocean, Arabian Sea
C. paradoxides Cleve, 1900
Schroeder, 1906; Arabian. Sea Steemann Nielsen, 1939; Indian Ocean
C. pavillardi Jftrg., 1911
Steemann Nielsen, 1939; Indian Ocean Wood, 1954» 1962; Southern and Indian Oceans
C. pentagonum Gourret, 1883
Cleve, 1900a (as C. lineatum v. robusta Cl.); south Indian Ocean
Ostenfeld and Schmidt, 1901 (as C. lineatum and v. robusta); Red Sea, G. of Aden
Cleve, 1903 (as C. lineatum v. longiseta Ost. and Sch.); Red Sea, Arabian Sea
Schroeder, 1906; Indian Ocean Karsten, 1907; Indian Ocean Steemann Nielsen, 1939 (as C. subrobustum): Indian Ocean Wood, 1954, 1962; Heard I., Antarctic, Southern and
Indian Oceans Ballantine, 1961 (f. teñera); Zanzibar
17
- 1 4 -
Ceratium platycorne v. .Daday, 1888
Cleve, 1903; Arabian Sea Karsten, 1907; Indian Ocean Steemann Nielsen, 1939; Indian Ocean Wood, 1954; west of Bass Str.
C. porrectum Karsten, 1907; Seychelles
Wood, 1962; Indian Ocean
C. praelongum (Lemm.) Kofoid, 1907
Ostenfeld and Schmidt, 1901 (as C. gravidum v. praelongum); Red Sea, Arabian Sea
Steemann Nielsen, 1939; Indian Ocean Wood, 1962; Indian Ocean
C. pulchellum Schroeder, 1906; Arabian Sea.
Karsten, 1907; Indian Ocean Czapek, 1909; Indian Ocean Wood, 1962; Indian Ocean (including C. eupulchellum)
v. semipulchellum Jttrg. 1920
Steemann Nielsen, 1939 (as C. semipulchellum); Indian Ocean
Subrahmanyan, 1958; Arabian Sea Wood, 1962; Indian Ocean-Ballantine, 1961; Zanzibar
v. eupulchellum Jttrg. 1920
Steemann Nielsen, 1939 (as C. pulchellum); Indian Ocean Wood, 1962; Indian Ocean
G. ranipes Cleve, 1900, 1903; Arabian Sea, Malaya
Schroeder, 1906; G. of Aden Karsten, 1907; Indian Ocean Steemann Nielsen, 1939; Indian Ocean Wood, 1954; S.W. Australia; 1962; Indian Ocean
0. refleicum Gleve 1900
Ostenfeld and Schmidt, 1901; Red Sea, G. of Aden Gleve, 1903; Red Sea Schroeder, Í906; N.E. Indian Ocean Karsten, 1907; Indian Ocean Steemann Nielsen, 1939; Indian Ocean Wood, 1962; Indian Ocean
18
- 15 -
Ceratium schmldti Jorg., 1911
Ostenfeld, 1915; Boeton Str. Bohm, 1931» Indian Ocean Steemann Nielsen, 1939; Indian Ocean Subrahmanyan, 1958; Arabian Sea Wood, 1962; Indian Ocean
C. scapiforme Kofoid, 1907 (probably = C. falcatum Jorg.)
Steemann Nielsen, 1939; Indian Ocean
C. schroeteri Schroeder, 1906; Arabian Sea
Wood, 1962; Indian Ocean
G. setaceum Jorg., 1911
Ostenfeld and Schmidt, 1901 (as fl. I nñatiim v. longiseta); Red Sea, G. of Aden
Schroeder, 1906; east Indian Ocean Steemann Nielsen, 1939; Indian Ocean Subrahmanyan, 1958; Arabian Sea Wood, 1962; Indian Ocean
C. symmetricum Pav., 1905
Karsten, 1907; Indian Ocean Steemann Nielsen, 1939; Indian Ocean Wood, 1954-, 1962; Port Fairy to Albany, Indian Ocean
C. teres Kofoid, 1907
Steemann Nielsen, 1939; Indian Ocean Wood, 1954-, 1962; Southern Ocean, Indian Ocean Subrahmanyan, 1958; Arabian Sea
C. trichoceros (Ehr.) Kofoid, 1907
Cleve, 1900a, 1903 (as C. flagelliferum); Indian Ocean, Red Sea, Arabian Sea
Ostenfeld and Schmidt, 1901 (as C. flagelliferum): Red Sea Schroeder, 1906 (as C. flagelliferum); Red Sea to Singapore Karsten, 1907 (as G. tripos flagelliferum); Indian Ocean Steemann Nielsen, 1939; Indian Ocean Wood, 1954, 1962; Southern and Indian Oceans Subrahmanyan, 1958; Arabian Sea Ballantine, 1961; Zanzibar
19
- 16 -
Ceratium tripos (O.F. Millier) Nitzsch, 1817
Schroeder, 1906; Arabian Sea Karsten, 1907; Indian Ocean Czapek, 1909; Indian Ocean Steemann Nielsen, 1939; Indian Ocean Subrahmanyan, 1958; Arabian Sea Wood, 1954, 1962; Indian Ocean
C. vultur Cleve, 1900a; Red Sea, Indian Ocean
Cleve, 1900b, 1903 (as C. robusturn Ost. and Sch.); Red Sea, Arabian Sea, Malaya
Ostenfeld and Schmidt, 1901 (as C. robustum); Red Sea Schroeder, 1906; Red Sea, Arabian Sea, G. of Aden,
Indian Ocean Karsten, 1907 (as C. tripos robustum); Indian Ocean Ostenfeld, 1915; Boeton Str. Steemann Nielsen, 1939; Indian Ocean Wood, 1962; Indian Ocean
v. sumatranum (Karst.); Steemann Nielsen, 1934
Ostenfeld and Schmidt (as C» vultur); Red Sea Schroeder, 1906; Indian Ocean Karsten, 1907 (as C. tripos vultur and v. sumatranum);
Indian Ocean Ostenfeld, 1915 (as C. sumatranum); Boeton Str. Steemann Nielsen, 1939; Indian Ocean Wood, 1954; Southern and Indian Oceans Subrahmanyan, 1958; Arabian Sea Ballantine, 1961; Zanzibar
Genus CERATOCORYS
Ceratocorys armata (Schütt) Kofoid, 1910
Ostenfeld and Schmidt, 1901; Red Sea, G. of Aden Schroeder, 1906 (as Goniaulax fimbriatum); Indian Ocean Matzenauer, 1933; Indian Ocean Wood, 1962; Indian Ocean
C. bipes (Cleve) Kofoid, 1910
Cleve, 1903 (as Goniodoma bipes); Red Sea, Arabian Sea Karsten, 1907 (as C. asvmmetrica); Indian Ocean Wood, 1962; Indian Ocean
20
- 17 -
Ceratocorys gouretti Paulsen, 1930
Ostenfeld and Schmidt, 1901 (as C. .iourdani); Red Sea, G. of Aden
Matzenauer, 1933 (as C. .iourdani); Indian Ocean Wood, 1954; west cf Bass Str.: 1962, Indian Ocean
C. hirsuta Matzenauer, 1933; Indian Ocean
C. hórrida Stein, 1S83
Ostenfeld and Schmidt, 1901; Red Sea, G. of Aden Cleve, 1901, 1903; Red-Sea, G. of Aden, Malaya,
Indian Ocean Schroeder, 1906j Red Sea, G. of Aden, Arabian Sea,
Indian Ocean Karsten, 1907 (as v. africana); Indian Ocean Ostenfeld, 1915; Boeton Str. Matzenauer, 1933; Indian Ocean Wood, 195A> 1962; Southern and Indian Oceans Subrahmanyan, 1958; Arabian Sea Ballantine, 1961; Zanzibar
Genus CITHARISTES
Cithaxistes apsteini Schtltt, 1895
Wood, 1962; Indian Ocean
Genus CLADOPYXIS
Cladopyxis brachiolata Stein, 1883
Ostenfeld and Schmidt, 1901 ; G. of Aden Cleve, 1901; Indian Ocean Schroeder, 1906; G. of Aden, Indian Ocean
Genus CONGRUENTIDIUM
Congruentidiufti compressum Abë, 1927
Matzenauer, 1933; Indian Ocean
21
- 18 -
Genus DESMOCAPSA
Desmocapsa 3p
Subrahmanyan, 1958j- Arabian Sea
Genus DINOFHÏSIS
Dinophysis acuminata Clap, and Lach., 1859
Wood, 1954; Swan River, W. Australia Subrahmanyan, 1958; Arabian Sea
D. acuta Ehr.. 1839
Wood, 1954-5 south-west coast of Australia
D. árctica Mereschowsky, 1879
Wood, 1954; Heard I., Antarctic
D. antárctica Balech, 1957; Adelie Land
D. caudata Saville Kent, 1881
Cleve, 1900a, 1901; South Indian Ocean, Arabian Sea, Indian Ocean
Ostenfeld and Schmidt, 1901 (as D. homunculus): Arabian Sea
Schroeder, 1906 (and as D. homunculus): Arabian Sea Karsten, 1907; Indian Ocean Czapek, 1909 (as D. homunculus); Indian Ocean Matzenauer, 1933; Indian Ocean Wood, 1954; west and south coasts of Australia:
1962; Indian Ocean Subrahmanyan, 1958; Arabian Sea Ballantine, 1961; Zanzibar
D. diegensis Kofoid, 1907
Ostenfeld, 1915; Boeton Str.
D. exigua Kofoid and Skogsberg, 1928
Wood, 1962; Indian Ocean
22
- 19 -
Dinophvsis fortii' Pav., 1923
Matzenauer, 19335 Indian Ocean Wood, 1954-, 1962; southern Tasmania, Southern Ocean,
Indian Ocean
D, hastata Stein, 1883
Ostenfeld and Schmidt, 1901; G of Aden, Red Sea Cleve, 1901, 1903; Red Sea, Arabian Sea, G. of Aden,
Indian Ocean Karsten, 1907; Indian Ocean Matzenauer, 1933; Indian Ocean Wood, 1962; Indian Ocean
D. hvalina Wood, 1962; Indian Ocean
Dt nn'lpf! Cleve, 1900a; Red Sea
Ostenfeld and Schmidt, 1901 (and as D. michaelis) ; Red Sea Cleve, 1901, 1903; Red Sea, Arabian Sea, Malaya Lemmermann, 1901; East Indies Schroeder, 1906; Red Sea, Arabian Sea, G. of Aden,
Indian Ocean, Singapore Czapek, 1909; Indian Ocean Ostenfeld, 1915; Boeton Str. Matzenauer, 1933; Indian Ocean Subrahmanyan, 1958; Arabian Sea Wood, 1962; Java Seas, northern Australia Ballantine, 1961; Zanzibar
D. nias Karsten, 1907; Indian Ocean
D. ovum Schtttt, 1895
Ostenfeld and Schmidt, 1901; Aden Karsten, 1907; Indian Ocean Wood, 1954-5 Swan R., Antarctic; 1962, Indian Ocean Subrahmanyan, 1958; Arabian Sea
D. parva Schiller, 1929
Wood, 1962; Indian Ocean
D. punctata Jorg., 1923
Matzenauer, 1933; Indian Ocean
D. rotundata Karsten, 1907 = Phalacroma rotundatum q.v.
23
- 20 -
Dinophysis sacculus Stein, 1883
Wood, 1954; Tasmania, Albany, W. Australia
D. schroederi Pav., 1909
Wood, 1962; Indian Ocean
D. sohuetti Mar. and Whit., 1899
Cleve, 1901J Indian Ocean Karsten, 1907; Indian Ocean Wood, 1962; Indian Ocean
D. sphaerica Stein (em. Kof. and Skogs., 1928)
Cleve, 1900a, 1900b, 1903 (as D. vanhoffeni): South Indian Ocean, Red Sea
Ostenfeld and Schmidt, 1901; Red Sea, G. of Aden Matzenauer, 1933; Indian Ocean Wood, 1954; Swan R., Antarctic: 1962; Indian Ocean
D. tripos Gourret, 1883
Ostenfeld and Schmidt, 1901 (as D. homunculus v. tripos): Red Sea
Cleve, 1903; Red Sea, G. of Aden, Arabian Sea Ostenfeld, 1915 (as D. pedunculata): Boeton Str. Wood, 1954; South Australia
D. truncata Cleve, 1900b; South Africa, South Indian Ocean
Wood, 1954; Subantarctic, Tasmania
D. tuberculatg. Mangin, 1912
Wood, 1954; Antarctic Balech, 1958; Adelie Land
D. uracantha Stein, 1883
Ostenfeld and Schmidt, 1901; G. of Aden Cleve, 1903; Red Sea Schroeder, 1906; Indian Ocean Karsten, 1907; Indian Ocean Matzenauer, 1933; Indian Ocean Wood, 1962; Indian Ocean
24
- 21 -
Genus DIPLOPSALIS
Diplopsalis lenticula Bergh 1882
Cleve, 1900a, 1900b, 1901, 1903; South Indian Ocean, Red Sea, G. of Aden, Arabian Sea, Malaya, Indian Ocean
Ostenfeld and Schmidt, 1901; Red Sea, G. of Aden Schroeder, 1906; Red Sea, G. of Aden, Indian Ocean,
Arabian Sea Karsten, 1907; Indian Ocean Czapek, 19095 Indian Ocean Ostenfeld, 1915 (as Peridinium asvmmetricum); Boeton Str. Wood, 1954-, 1962; Antarctic, northern Australia, Indian
Ocean Ballantine, 1961 (as Peridiniopsis asymmetrica); Zanzibar
D. minor Paulsen 1907
Matzenauer, 1933 (as Peridinium asymmetricum) ; Indian Ocean
Subrahmanyan, 1958 (as Glenodinium lenticula v. asymmetrica); Arabian Sea
Wood, 1954-» 1962; Antarctic, Indian Ocean Balech, 1958 (as Diplopeltopsis); Adelie Land
D. pilula Ostenfeld, 1908
Subrahmanyan, 1958 (as Glenodinium); Arabian Sea
D. orbicularis (Paulsen) Lebour, 1922
Matzenauer, 1933; Indian Ocean Wood, 1954-5 Antarctic, northern Australia
D. rotundata Lebour, 1922
Wood, 1954; Swan R., Antarctic
D. saecularis Mur. and Whit., 1899
Ostenfeld and Schmidt, 1901; Red Sea, G. of Aden Schroeder, 1906; Red Sea, G. of Jlden, Arabian Sea
Genus EXÜVIAELLA
Eaeuviaella báltica Lohmann', 1908
Wood, 1962; Indian Ocean
- 22 -
Exuviaella compressa (Bailey) Ost., 1903
Cleve, 1900b, 1901, 1903; Red Sea, G. of Aden, Indian Ocean, Malaya
Ostenfeld and Schmidt, 1901 ; Red Sea, G. of Aden Schroeder, 1906; Red Sea, G. of Aden, Fremantle
Harbour, Indian Ocean Matzenauer, 1933; Indian Ocean Wood, 1954-1 Fremantle Harbour: 1962; Indian Ocean Subrahmanyan, 195S; Arabian Sea
E. lenticulata Matzenauer, 1933» Indian Ocean
E. marina Cienkowski, 1881
Wood, 1962; Indian Ocean
E. mediterránea Schiller, 1928
Wood, 1962; Indian Ocean
E. oblonga Schiller, 1928
Matzenauer, 1933; Red Sea, G. of Aden
Genus GLENODINIOESIS
(yiftnori-ifTiopsis pretiosa Lindemann, 1931; Sumatra
Genus GLENODINIUM
Glenodinium cinctum Ehr. (dubious form)
West, 1909; ïan Yean reservoir, Victoria
G. elpatiewskvi (Ost.) Lemm. 1910
Lemm., 1910; Malaya: 1931 (as Pexid njLum) ; Indonesia
G. lindemanni Lefevre, 1932; Madagascar
G. penardi Lemm., 1900
Schroeder, 1914- (as Peridiniuni); East Africa
26
-23-
Glenodinium penardiforme (Lind.) Schiller, 1937
Lindemann, 1931 (as Peridinium): Indonesia
G. pulviscuius (Ehr.) Stein, 1883
West, 1907; Tanganyika
G. pygmaeum (Lind.) Schiller, 1937
•Lindemann, 1931 (as Peridinium): Indonesia
G. auadridens Stein 1883
West, 1907 (as Peridiniopsis cunningtoni); Tanganyika
Woloszynska, 1912 (as P. treubi Wol. and P. wild-manni Wol.) Java
Schroeder, 1914- (as Peridiniopsis cunningtoni); Tanganyika
Lindemann, 1931 (as Peridinium and as P. wildemanni); Indonesia
Lefevre, 1932; Asia
G. viguieri (Lefevre) Schiller, 1937; Madagascar
Genus G0NIAÜIAX
Goniaulax alaskenais Kofoid, 1911
Wood, 1954» 1962; Antarctic, Indian Ocean
G. apiculata (Penard) Entz, 1904
Wood, 1962; Indian Ocean
G. birostris Stein, 1883
Karsten, 1907; Indian Ocean Matzenauer, 1933; Indian Ocean Wood, 1954-, 1962; off Port Fairy, Indian Ocean Ballantine, 1961; Zanzibar
G. coniuncta Wood, 1954-
Ballantine, 1961; Zanzibar
27
- 2 4 -
Goniaulax diegensis Kofoid, 1911
Wood, 1954» 1962; Swan R ., west New Guinea, Indian Ocean Subrahmanyan, 1958; Arabian Sea
G. digitale (Pouchet) Kofoid, 1911
Wood, 1954, 1962; Swan R., Indian Ocean
G. fragjlia (Schütt) Kofoid, 1911
Wood, 1962} Indian Ocean
G. glvptorhynchus Mur. and Whit., 1899
Wood, 1962; Indian Ocean
G. highlevi Mur. and Whit., 1899
Cl6ve, 1901; Indian Ocean
r'i hYfl1iiiiT,fl Ostenfeld and Schmidt, 1901; G. of Aden
Matzenauer, 1933; Indian Ocean Wood, 1962; Indian Ocean
rTl jn-mmri Mur. and Whit. 1899
Schroeder, 1906; Red Sea (probably does not = Ceratocorys gouretti as Schiller, 1937, suggests)
G. kofoidi Pavillard, 1909
Wood, 1954; south of Port Fairy: 1962; Indian Ocean
G. longispina Lebour, 1925
Matzenauer, 1933; Indian Ocean
G. milneri (Mur. and Whit.) Kof., 1911
Wood, 1962; Indian Ocean
G. minima Matzenauer, 1933; Indian Ocean
Wood, 1954; Indian Ocean, south-west of Albanyr 1962; Indian Ocean
28
- 25 -
Goniaulax monacantha Pavillard, 1916
Wood, 1962; Indian Ocean
G. orientalis Lindemann, 1924
Matzenauer, 1933| Indian Ocean
G. oralis Schiller, 1937
Matzenauer, 1933 (as G. ovata); Indian Ocean
G. pacifica Kofoid, 1907
Karsten, 1907 (as Steiniella cornuta): Indian Ocean Wood, 1954; Southern Ocean, Port Fairy? 1962, Indian
Ocean
G. polvedra Stein, 1883
Matzenauer, 1933; Indian Ocean Wood, 1962; Indian Ocean
G. polygramma Stein, 1883
Ostenfeld and Schmidt, 1901; Red Sea, G. of Aden Cleve, 1901, 1903; Red Sea, Arabian Sea, Indian Ocean Matzenauer, 1933; Indian Ocean Ostenfeld, 1915; Boeton Str. Wood, 1954; south of Port Fairy: 1962; Indian Ocean Ballantine, 1961; Zanzibar
G. scrippsae Kofoid, 1911
Wood, 1954, 1962; Swan R., Indian Ocean Subrahmanyan, 1958; Arabian Sea
G. sphaeriodea Kofoid, 1911
Matzenauer, 1933; Indian Ocean
G. spinifera (Clap., and Lach.) Diesing, 1866
Schroeder, 1906 (.as Ceratocorva) ; Indian Ocean Karsten, 1907; Indian Ocean Matzenauer, 1933; Indian Ocean Wood, 1954; Antarctic Convergence; 1962; Indian Ocean Ballantine, 1961; Zanzibar
29
- 26 -
Goniaulax turbynei Mur. and Whit., 1899
Schroeder, 1906; Indian Ocean Matzenauer, 1933; Indian Ocean Wood, 1954» 1962; Swan R., Indian Ocean
Genus GONIODOMA
Goniodoma polyedricum (Pouchet) Jbrg., 1899
Cleve, 1900b, 1901, 1903 (as G. acuminattim) ; Red Sea, Malaya, Indian Ocean
Ostenfeld and Schmidt, 1901 (as G» acuminatum); Red Sea, G. of Aden
Schroeder, 1906j Red Sea, G. of Aden Matzenauer, 1933; Indian Ocean Wood, 1962; Indian Ocean BaUantine, 1961; Zanzibar
G. sphaericum Mur. and Whit., 1899
Ostenfeld and Schmidt, 1899; G. of Aden, Red Sea Matzenauer, 1933; Indian Ocean Wood, 1954; west of Bass Str.
Genus GYMNASTER
Gymnaster pentasterias Schütt, 1895
Cleve, 1900 > 1901; south Indian Ocean
Genus GYMNODINIUM
Gvmtiodinium bogoriense Klebs.. 1912; Java
G. chuckwani Ballantine, 1961; Zanzibar
G. diploconus Schütt, 1895
Balech, 1958; Adelie Land
G. fusus Schütt, 1895
Karsten, 1907; Indian Ocean
30
- 27 -
Gymnodinium galaeiforme Matzenaúer, 1933» üed See
Wood, 1962; Indian Ocean
G. gelbum Kofoid, 1931
Subrahmanyan, 1958; Arabian Sea
G. marinum Savilie Kent, 1882
Subrahmanyan, 1958; Arabian Sea Wood, 1962» Indian Ocean
G. mirabile Penard, 1891
Subrahmanyan, 1958; Arabian Sea
G. simplex (Lohmann) Kofoid and Swezy, 1921
Wood, 1962; Indian Ocean
G» splendens Lebour, 1925
Subrahmanyan, 1958; Arabian Sea
G. uberrimum (AUmann) Kofoid and Swezy, 1921
Subrahmanyan, 1958; Arabian Sea
G. variable Herdman, 1924
Subrahmanyan, 1958; Arabian Sea
Genus GYRODINIUM
Gyrodinium aureum Conrad, 1926
Subrahmanyan, 1958; Arabian Sea
G. oitrinum Kofoid, 1931
Subrahmanyan, 1958; Arabian Sea
G. fusiforme Kofoid and Swezy, 1921
Subrahmanyan, 1958; Arabian Sea
31
- 28 -
GyrodinJi i™ •] j^py^ i fa-ra Lehour, 1925
Subrahmanyan, 1958; Arabian Sea
G. obtusum (Schtltt) Kofoid and Swezy, 1921
Subrahmanyan, 1958; Arabian Sea
G. pepo (Schütt) Kofoid and Swezy, 1921
Subrahmanyan, 1958; Arabian Sea
G. pingue (Schütt) Kofoid and Swezy, 1921
Subrahmanyan, 1958; Arabian Sea
G. spirale (Bergh) Kofoid and Swezy, 1921
Subrahmanyan, 1958; Arabian Sea
Genus HAPLODINIUM
Haplodinium antjoliense Klebs, 1912; Java
Haplodinium spp. Subrahmanyan, 1958; Arabian Sea
Genus HEMIDINIUM
Hemidinium nasutum Stein, 1883
Wood, 1954; Swan R.
Genus HETERODINIUM
Heterodinium assymetricum Kofoid and Adamson, 1933
Wood, 1954-; Southern Ocean west of Bass Str.
H. australe Wood, 1962; Indian Ocean
H. blackmani (Mur. and Whit.) Kofoid, 1906
Schroeder, 1906; N.E. Indian Ocean Karsten, 1907; Indian Ocean
32
- 29 -
Heterodinium dispar Kofoid and Adamson, 1933
Wood, 1962; Indian Ocean
H. doma (Mur. and Whit.) Kofoid, 1906
Wood, 1954, 1962; Southern Ocean west of Bass Str., Indian Ocean
H. rlgdeni Kofoid, 1906
Karsten, 1907; Indian Ocean Wood, 1962; Indian Ocean
H. aerippsi Kofoid. 1906
Wood, 1954» Southern Ocean west of Bass Str. : 1962; Indian Ocean
Genus HISTIONEIS
B sftioneis caminus Bohm in Schiller, 1933; Indian Ocean
H. cerasus Bohm in Schiller, 1933; Indian 0c«an Wood, 1962; Indian Ocean
H. oostata Kofoid and Michener, 1911
Wood, 1962; Indian Ocean
H. dolon Mur. and Whit., 1899
Karsten, 1907; Indian Ocean Wood, 1962; Indian Ocean
H. eloneata Kofoid and Michener, 1911
Schiller, 1933; Indian Ocean Wood, 1962; Indian Ocean
H. fragills Bohm in Schiller, 1933; Indian Ocean
H. gubernans Schtttt, 1895
Schtttt, 1896; Indian Ocean
H. helenae Mur. and Whit, 1899
Wood, 1962; Indian Ocean
33
- 30 -
Histioneis hyalina Kofoid and Michener, 1911
Schiller, 1933J Indian Ocean Wood, 1962; Indian Ocean
H. inclinata Kofoid and Michener, 1911
Wood, 1962; Indian Ocean
H. longicollis Kofoid, 1907
Wood, 1962; Indian Ocean
H. milneri Mur. and Whit., 1899
Wood, 1962; Indian Ocean
H. mitchellana Mur. and Whit., 1899
Schroeder, 1906; Indian Ocean
H. panaria Kofoid and Skogsberg, 1928
Wood, 1962; Indian Ocean
H. pietschmanni Bohm in Schiller, 1933; lidian Ocean
H. remora Stein, 1883
Cleve, 1901; Arabian Sea, Indian Ocean Wood, 1962; Indian Ocean
H. schilleri Bohm in Schiller', 1933; Indian Ocean
H. tubifera Bohm in Schiller, 1933; Indian Ocean
Wood, 1962; Indian Ocean
H. variabilis Schiller, 1933
Wood, 1962; Indian Ocean
Genus LISSODINIUM
yftsofftnlum schilleri Matzenauer, 1933; Indian Ocean
34
- 31 -
Genus MASSARTIA
Massartia glauca (Lebour) Schiller, 1933
Subrahmanyan, 195S; Arabian Sea
Genus MELANODINIUM
Melanodinium nigricans Schiller, 1937
Wood, 1962; Indian Ocean
Genus NOCTILUCA
Noctiluca miliaris Suriray, 1816
Prasad, 1958; Indian Ocean, coast of India Subrahmanyan, 1958; Arabian Sea
Genus ORNITHOCERCUS
Ornithocercus cristatus Matzenauer, 1933; Indian Ocean
0. geniculatus Dangeard, 1927
Wood, 1962; Indian Ocean
0. heteroporus Kofoid, 1907
Matzenauer, 1933; Indian Ocean
0. magnificus St6in, 1883
Cleve, 1900a, 1901, 1903 (as Histioneis magnifica): Red Sea, Arabian Sea, Indian Ocean, Malaya
Ostenfeld and Schmidt, 1901; Red Sea, G. of Aden Schroeder, 1906; Red Sea, G. of Aden, Arabian Sea,
Indian Ocean, Fremantle Harbour Karsten, 1907; Indian Ocean Ostenfeld, 1915; Boeton Str. Matzenauer, 1933; Indian Ocean Wood, 1954, 1962; Southern and Indian Oceans Subrahmanyan, 1958; Arabian Sea Ballantine, 1961; Zanzibar
35
- 3 2 -
•Ornlthocercus auadratus Schütt, 1900
Ostenfeld and Schmidt, 1901; Red Sea, G. of Aden Cleve, 1903; Red Sea, Arabian Sea Schroeder, 1906; Arabian Sea, Indian Ocean Karsten, 1907; Indian Ocean Matzenauer, 1933; Indian Ocean Wood, 1954-, 1962; Southern and Indian Oceans
0. solendidua Schütt, 1895
Schroeder, 1906; N.E. Indian Ocean Karsten, 1907; Indian Ocean Matzenauer, 1933; Indian Ocean Wood, 1962; Indian Ocean
0. steini Schütt, 1895
Ostenfeld, 1915; Boeton Str. Matzenauer, 1933; Indian Ocean Wood, 1962; Indian Ocean
0. thurni (Schmidt) Kof. and Skogsb., 1928
Matzenauer, 1933; Indian Ocean Wood, 1962; Indian Ocean Ballantine, 1961; Zanzibar
Genus 0XÏRRHIS
Oxyrrhis marina Dujardin 1841
Subrahmanyan, 1958; Arabian Sea
Genus 0XÏT0XUM
Oxvtoxum caudatum Schiller, 1937
Wood, 1962; Indian Ocean
n. f-ha^engeroides Kofoid, 1907
Wood, 1962; Indian Ocean
36
- 33 -
Oxytoxum compres sum Kofoid, 1907
Wood, 1962; Indian Ocean
0. constrictum Stein, 1883
Ostenfeld and Schmidt, 1901; Bed Sea Cleve, 1903; Arabian Sea Schroeder,' 1906; Arabian Sea Wood, 1962; Indian Ocean
0. coronatum Schiller, 1937
Wood, 1962; Indian Ocean
0. curvaturn Kofoid, 1911
Wood, 1962; Indian Ocean
0. diploconus Stein, 1883
Cleve, 1903; Arabian Sea Karsten, 1907; Indian Ocean Wood, 1962; Indian Ocean
0. elegans Pavillard, 1910
Matzenauer, 1933; Indian Ocean Wood, 1962; Indian Ocean
0. gladiolus Stein 1883
Ostenfeld and Schmidt, 1901; Red Sea Schroeder, 1906; Arabian Sea, Indian Ocean
0. milneri Mur. and Whit., 1899
Ostenfeld and Schmidt, 1901; Red Sea, G. of Aden Schroeder, 1906; N.E. Indian Ocean Karsten, 1907; Indian Ocean Wood, 1962; Indian Ocean
0. mitra (Stein) Schroeder, 1906; Arabian Sea
Wood, 1962; Indian Ocean
0. parvum Schiller, 1937
Wood, 1962; Indian Ocean
37
- 34-
Oxvtoxmn reticulatum (Stein) Seh.ti.tt, 1896
Wood, 1962; Indian Ocean
0. sceptrum Stein, 1883
Cleve, 1901j Arabian Sea, Indian Ocean Schroeder, 1906; Arabian Sea Wood, 1962; Indian Ocean
0. scolopax Stein, 1883
Cleve, 1900a,b, 1901; south Indian Ocean, Arabian Sea, Red Sea
Ostenfeld and Schmidt, 1901; Red Sea, G. of Aden Schroeder, 1906; Arabian Sea, G. of Aden, Indian-Ocean,
Fremantle Karsten, 1907; Indian Ocean Wood, 1962; Indian Ocean
0. sphaeroideum Stein, 1883
Cleve, 1900b; Indian Ocean Ostenfeld and Schmidt, 1901; Red Sea Wood, 1962; Indian Ocean
0. subulatum Kofold, 1907
Wood, 1962; Indian Ocean
0, tessellatum Stein, 1883
Cleve, 1901, 1903; Red Sea, Arabian Sea Ostenfeld and Schmidt, 1901; Red Sea; G. of iden Schroeder, 1906; Arabian Sea Matzenauer, 1933; Indian- Ocean Wood, 1962; Indian Ocean
0. turbo Kofold, 1907
Wood, 1962; Indian Ocean
0. variabile Schiller, 1937
Wood, 1962; Indian Ocean
38
- 35 -
Genus PACHÏDINIUM
Pachydinium indician Matzenauer, 1933; Indian Ocean
Genus PARAHISTIONEIS
Parahistioneis acuta Bohin in Schiller, 19335 Indian Ocean
P. crateriformis (Stein) Kofoid, 1907
Gleve, 1901 (as Histioneis); Red Sea, G. of Aden Ostenfeld and Schmidt, 1901 (as Histioneis). Red Sea,
G. of Aden
P. rotundata Kofoid and Michener, 1911
Subrahmanyan, 1953; Arabian Sea
Genus PERIDINIUM
Peridinium abei Paulsen, 1930
Matzenauer, 1933 (as P. biconicum Abe); Indian Ocean Wood, 1954; Swan R.
P. achromaticum Levander, 1902
Matzenauer, 1933; Indian Ocean
P. adeliense Baleen 1958; Adelie Land
P. adense Matzenauer, 1933; G. of Aden
P. affine Balech, 1958; Adelie Land (= P. pallidum)
P. africanoides Dangeard, 1927 (= P. steini)
Matzenauer, 1933; Indian Ocean
P. africanum Lemm., 1907; Madagascar, Malaya
West, 1907; Tanganyika Schroeder, 1914; East Africa Lindemann, 1931 (as P. ornamentosum); Java
39
- 3 6 -
Peridinium amolum Matzenauer, 1933» Indian Ocean
P. ampulliforme Wood, 1954; Swan R.
P. antarcticum Schimper 1907 (= P. depressum)
Balech, 1958; Adelie Land
P. applanatum Mangin, 1914-
Balech, 1958; Adelie Land
P. archiovatum Balech, 1957
Balech, 1958; Adelie Land
P. avellana (Meunier) Lebour, 1925
Wood, 1954, 1962; Antarctic, Indian Ocean
P. baliense Lindemann, 1931; Malaya, Bali
P. berolinense Lemm., 1910
West, 1907; Tanganyika (doubtful)
P. biconicum Dangeard, 1927
Matzenauer, 1933; Indian Ocean
P. brachypus Schiller, 1937; Sumatra
P. breve Paulsen, 1907
Matzenauer, 1933; Indian Ocean Wood, 1954; Antarctic, Heard I.
P. brevipes Paulsen, 1908
Wood, 1954; Antarctic, Heard I.
P. brochi Kofoid and Swezy, 1921
Subrahmanyan, 1958; Arabian Sea Wood, 1962; Indian Ocean
f. inflatum Okamura, 1912
Matzenauer, 1933; Indian Ocean Subrahmanyan, 1958; Arabian Sea
40
- 37 -
PeridinJTiTTi huila Meunier, 1910
Subrahmanyan, 1958; Arabian Sea
P. centenniale (Play) Lefevre, 1932
Lindemann, 1931; Indonesia Lefevre, 1932; Malaya
P. cerasus Paulsen, 1907
Matzenauer, 1933? Indian Ocean Wood, 1962; Indian Ocean
P» charcoti Balech, 1958; Adelie Land
P. cinctum (O.F.M. ) Ehr., 1838; Asia
Woloszynska, 1912; Java Schiller, 1914 fas P. westi); East Africa Lindemann, 1931; East Indies
v. tuberosum Meunier, 1919; Madagascar
P. claudicans Paulsen, 1907
Karsten, 1907; Indian Ocean Matzenauer, 1933; Indian Ocean Wood, 1954; Southern Ocean, Swan R.: 1962; Indian Ocean Subrahmanyan, 1958; Arabian Sea
P. colombense Matzenauer, 1933; Colombo Harbour
P. conicum (Gran) Ostenfeld and Schmidt, 1901; Red Sea, G. of Aden
Ostenfeld, 1915; Boeton Str. Matzenauer, 1933; Indian Ocean Wood, 1954; Southern Ocean, Heard I. Subrahmanyan, 1958; Arabian Sea
f. concava Matzenauer, 1933; Indian Ocean f. euardafuiana Matz., 1933; Indian Ocean
P. coniooides Paulsen, 1905
Wood, 1954; Albany, Antarctic, Heard I Subrahmanyan, 1958; Arabian Sea
P. crassines Kofoid, 1907
Karsten, 1907; Indian Ocean Ostenfeld, 1915; Boeton Str.
41
- 3S-
Peridinium crassipes (contd)
Matzenauer, 1933 (as f. asymmetrical; Indian Ocean Wood, 1954; west coast of Australia, Heard I., Antarctic:
1962j Indian Ocean Subrahmanyan, 1958; Arabian Sea
P. curtipes Jftrgensen, 1913
Karsten, 19075 Indian Ocean Matzenauer, 1933 (and as f. asymmetrical : Indian Ocean Wood, 1954; Antarctic, Heard I.
P. curtum Balech, 1958; Adelie Land
P. curvipes Ostenfeld, 1906
Wood, 1954; Antarctic
P. decipiens' Jorgensen, 1899
Matzenauer, 1933; Indian Ocean Wood, 1954; Antarctic
P. depressum Bailey, 1855
Karsten, 1907; Indian Ocean Ostenfeld, 1915; Boeton Str. Matzenauer, 1933 (and f. antárctica) : Indian Ocem Wood, 1954, 1962; Antarctic, Heard I., Indian and
Southern Ocesns Subranmanyan, 1958; Arabian Ser Brllcntine, 1961; Zonzibcr
P. diabolus Cleve, 1900a ; Red Ser
Cleve, 1900b, 1901, 1903; South Indian Ocean, G. of Aden, Arabian Ser, Indian Ocean, Malayo
Ostenfeld and Schmidt, 1901; G. of Aden Schroeder, 1906; east Indian Ocean Karsten, 1907 (as P. longipes); Indian Ocean Mrtzenauer, 1933; Indian Ocean Wood, 1954> 1962; Antarctic,. Heard I., Indian Ocean
P. divergens Ehr., 1840
Cleve, 1900a, 1903; Red Sea, Arabian Sea, Indian Ocean Ostenfeld and Schmidt, 1901; Red Sea, G. of Aden Schroeder, 1906; G. of Aden to Malaya, Fremantle Karsten, 1907; Indian Ocean
42
- 39 -
Peridlnium divereens (contd)
Ostenfeld, 1915; Boeton Str. Matzenauer, 1933 (*s P. -cutipes): Indian Ocean Wood, 1954, 1962; Albany, South Australia, Indian Ocean Subrahmanyrn, 1958; Arabian Se?
P. elegons Cleve, 1900a; Red Se?
Cleve, 1901, 1903; Red Sea, G. of Aden, Arabian Sea, Mr: laya
Ostenfeld and Schmidt, 1901; Red Sea, G. of Aden Schroeder, 1906; Red S6a to Mslaya Matzenauer, 1933 (and f. granulata); Indian Ocean Wood, 1962; Indian Ocean
P. excentricum Paulsen, 1907
Matzenauer, 1933; Malacca Str. Subrahmonyan, 1958; Arabian Sea Wood, 1962; Indian Ocean
P. fatulipes Kofoid", 1907
Matzenauer, 1933 (and as P. tumidum Okam.); Indian Ocean Wood, 1962; Indian Ocean
P. gatunense
v. madagosc?rense Lefevre., 1927; Madagascar
P. gibbosum Matzenauer, 1933; Indian Ocean
P. globulus Stein, 1883
Cleve, 1900a, 1901, 1903; Red Sen, G. of Aden to Malayo Ostenfeld and Schmidt, 1901; Red Sea, G. of Aden Schroeder, 1906; Red Sea to Malsyr, Fremrntle Karsten, 1907; Indian Ocean Matzenauer, 1933 (and as P. sphaeroides): Indian Ocean Wood, 1954, 1962; Port Fairy to Fremantle Harbour,
Indian Ocean Subrahmonyan, 1958; Arabian Sea
P. grande Kofoid, 1907
Karsten, 1907; Indian Ocean Czapek, 1909; Indian Ocean
43
- 40 -
Feridinlum gronde (contd)
Ostenfeld, 1915; Boeton Str. Matzenauer, 1933; Indien Ocean Wood, 1954, 1962; Great Australian Bight, Indian Oceon Subrahmanyan, 1954-5 Arabian Seo
P. grani Ostenfeld, 1906
Matzenauer, 1933; Indian Ocecn Subrahmanyan, 1958; Arabian Sea Wood, 1954, 1962; Heard I., Indian Ocean
P. gutwinskyi Woloszynska 1912; Java, Madagascar
Lindemann, 1931; Indonesia
P, heteracanthum Dangeard, 1927
Matzenauer, 1933; Indian Ocean
P. heteroconicum Matzenauer, 1933; Indian Ocean
P. hirobis Abé, 1927
Wood, 1962; Indian Ocean
P. humile Schiller, 1937
Matzenauer, 1933 (as P. decipiens); Indian Ocean Subrahmanyan, 1958; Arabian Sea
P. hyalinum Meunier, 1910
Subrahmanyan, 1958; Arabian Sea
P. inconspicuum Lindemann, 1931; Me lays
I'ioloszynske, 1912, 1932 (as P. parvulum and P. steinmanni); Malaya
P. keyense Nygaard, 1926; Malaya
P. leonis Pavillard, 1916
Matzenauer, 1933; Indian Ocean Subrahmanyan, 1958; Arabian Sea Wood, 1962; Indian Ocean
- 41 -
Peridinium levanderi Abe, 1927
Matzenauer, 1933» Indian Ocean
P. marchicum Lemm. 1906
Woloszynska, 1912; Java
P. marielebourae Paulsen, 1930
Schiller, 1937; Indian Ocean
P. mediochre Balech, 1958; Adelie Land
P. minutum Kofoid, 1907
Subrahmanyan, 1958; Arabian Sea
P. mite Pavillard, 1916
Karsten, 1907; Indian Ocean Matzenauer, 1933; Indian Ocean Wood, 1954; Antarctic, Heard I.
P. monacanthum Brock, 1910
Wood, 1962; Indian Ocean
P. murravi Kofoid, 1907
Matzenauer, 1933; Indian Ocean Wood, 1954» 1962; Albany, Indian Ocean Subrahmanyan, 1958; Arabian Sea
P. nipponicum Ab¿, 1927
Matzenauer, 1933; Indian Ocean Wood, 1962; Indian Ocean
P. nux Schiller, 1937; Indian Ocean
P. obesum Matzenauer, 1933 (cf. P. heteracanthunOi Indian Ocean
P. oblongum (Aurivillius) Cleve, 1900
Ostenfeld, 1915; Boeton Str. Matzenauer, 1933; Indian Ocean Wood, 1954, 1962; Albany, Heard I., Indian Ocean
45
- 42 -
Peridinium obovatum Wood, 1954» Antarctic
P. obtusum Karsten, 1906
Subrahmanyan, 1958 (? = P. marielebourae); Arabian Sea
P. oceanicum Vanhoffen, 1897
Cleve, 1900a,b, 1901, 1903; Red Sea, G. of Aden to Malaya, south Indian Ocean
Ostenfeld and Schmidt, 1901; Red Sea, G. of Aden Schroedsr, 1906; Arabian Sea, G. of Aden, Red Sea Karsten, 1907; Indian Ocean Ostenfeld, 1915; Boeton Str. Matzenauer, 1933; Indian Ocean Wood, 1954; Victoria to Albany, Indian Ocean: 1962;
Indian Ocean Subrahmanyan, 1958; Arabian Sea Ballantine, 1961; Zanzibar
P. okamurai Abe, 1927
Wood, 1962; Indian Ocean
P. orientale Matzenauer, 1933; Indian Ocean
P. ovatum (Pouchet) Schtitt, 1895
Matzenauer, 1933; Indian Ocean Wood, 1954? Heard I. Subrahmanyan, 1958 (as P. globulus v. oyattun): Arabian Sea
P. oviforme Dangeard, 1937
Matzenauer, 1933; Indian Ocean
P. •pallidum Ostenfeld, 1899
Balech, 1958 (as P. affine); Adelle Land Wood, 1962; Indian Ocean
P. parvicollum Balech, 1957
Balech, 1958; Adelie Land
P. nedunculatum Schlitt, 1895
Cleve, 1900a,b, 1901; Indian Ocean, Malaya Ostenfeld and Schmidt, 1901; Red Sea, G. of Aden
46
- 43 -
Peridinium pedunculatum (contd)
Schroeder, 1906; Red Sea to Singapore, Fremantle Matzenauer, 1933 (as P. pellucidum); Indian Ocean Wood, 1954-, 1962; Albany, Indian Ocean Subrahmanyan, 1958; Arabian Sea
P. pellucidum (Bergh).Schutt, 1883
Cleve, 1900b; south Indian Ocean Ostenfeld and Schmidt, 1901; Red Sea, G. of Aden Ostenfeld, 1915; Boeton Str. Matzenauer, 19335 Indian Ocean Wood, 1954: 1962; Indian Ocean
P. pentagonum Gran, 1902
Karsten, 1907; Indian Ocean Ostenfeld, 1915; Boeton Str. Matzenauer, 1933; Indian Ocean Wood, 1954-5 Victoria, Swan R., North Australia:
1962; Indian Ocean Subrahmanyan, 1958; Arabian Sea
v. latissima Kofoid, 1907
Ostenfeld, 1915; Boeton Str. Matzenauer, 1933; Indian Ocean Wood, 1954; Swan R. Ballantine, 1961; Zanzibar
P. perrieri Faure Fremiet, 1909; Indian Ocean
P. persicum Schiller, 1937
Bohm, 1931 (as P. schilleri): Persian Gulf
P. pietschmanni Bohm, 1931; Persian Gulf
P, pyriforme Paulsen, 1904
Ostenfeld, 1915; Boeton Str Wood, 1954; Heard I.
P. playfairi Lindemann, 1931; Malaya, Bali
P. pseudoantarcticum Balech, 1937
47
- a -Perldinium punctulatum Paulsen, 1908
Matzenauer, 1933; Indian Ocean Wood, 1954; Israelite Bay, Albany, Heard I. Ballantine, 1961; Zanzibar
P. pyriforme Paulsen, 1907
Matzenauer, 1933j Indian Ocean Wood, 1954-5 Heard I., Antarctic, Indian Ocean Balech, 1958; Adelie Land
P. guadratum Matzenauer, 1933; Indian Ocean
P. guarnerense Schroeder, 1910; Indian Ocean
Ostenfeld, 1915; Boeton Str. Matzenauer, 1933 (as P. subpyriforme Dang.); Indian Ocean Wood, 1954; Swan R., Northern Australia Subrahmanyan, 19*58 (as P. globulus v. auarnerense) :
Arabian.Sea
P. raciborskii Woloszynska, 1912, Java
P. remoturn Karsten 1907; Indian Ocean
Matzenauer, 1933; Indian Ocean
P. retiferum Matzenauer, 1933; Indian Ocean
P. rosaceum Balech, 1957
Balech, 1958; Adelie Land
P. roseum Paulsen, 1929
Wood, 1954, 1962; Swan R., Indian Ocean
P. sanguineum Carter, 1858
Saville Kent, 1880; Bombay
P. sinaicum Matzenauer, 1933; Red Sea
Subrahmanyan, 1958; Arabian Sea
P. solidicorne Mangin, 1926
Matzenauer, 1933; Indian Ocean Wood, 1962; Indian Ocean
- AIS -
Peridinium somma Matzenauer, 1933? Indian Ocean
P. sp? Subrahmanyan, 1958; Arabian Sea
P. sphaericum Okamura, 1912
Matzenauer, 1933 (v. gracilis as P. sphaeroidea Abe); Indian Ocean
Ballantine, 1961; Zanzibar
P. steini Jorgensen, 1899
Cleve, 1900a,b, 1901, 1903; Red Sea to Malaya, south Indian Ocean
Ostenfeld and Schmidt, 1901; Red Sea, G. of Aden Schroeder, 1906; Red Sea to Singapore Karsten, 1907; Indian Ocean Ostenfeld, 1915; Boeton Str. Matzenauer, 1933; Indian Ocean Wood, 1954» 1962; Fremantle, Geraldton, Indian Ocean,
Antarctic convergence Subrahmanyan, 1958; Arabian Sea Ballantine, 1961; Zanzibar
P. subinerme Paulsen, 1904
Matzenauer, 1933 (as P. asvmmetrica); Indian Ocean Wood, 1954, 1962; Victoria, Albany, Antarctic convergence,
Indian Ocean Subrahmanyan, 1958; Arabian Sea
P. tenuissimum Kofoid, 1907
Karsten, 1907; Indian Ocean Matzenauer, 1933; Indian Ocean Wood, 1962; Indian Ocean
P. thorianum Paulsen, 1905
Matzenauer, 1933; Indian Ocean Subrahmanyan, 1958; Arabian Sea Wood, 1962; Indian Ocean
P. treubi Woloszynska (v. Glenodinium ouadridens Stein)
49
- 46 -
Peridinium tristvlum Stein, 1883
Ostenfeld and Schmidt, 1901; Red Sea, G. of Aden Matzenauer, 1933» Indian Ocean
f. ovata Schroeder, 1906; Indian Ocean, Fremantle Harbour
P. trochoideum (Stein) Lemra., 1910
Subrahmanyan, 1958 (as Glenodinium); Arabian Sea
P. turbinatum Mangin, 1926
Wood, 1954-» Heard I., Antarctic Balech, 1958; Adelie Land (= P. inaequale Peters)
P. umbonatum Stein. 1883
Woloszynska, 1912; Java Lindemann, 1931 (as P. ambiguum, Qlenodinium guildfordense.
and G. geminum); Java
P. variegatum Peters, 1928
Wood, 1954-» 1962; Antarctic, Indian Ocean Balech, 1958, Adelie Land
P. ventricum Abé, 1927
Wood, 1962; Indian Ocean
P. venusturn Matzenauer, 1933; Indian Ocean
Subrahmanyan, 1958; Arabian Sea Ballantine, 1961; Zanzibar
P. volzi Lemm., 1905; Madagascar, Africa
West, 1909; Yan Yean, Victoria Lindemann, 1931; Indonesia
v. botanicum Lindemann, 1909? Malayo
f. sinurtum (Lindemann) Lefevre, 1932
Lindemann, 1931 (?s P. sinuatum): Malaya
P. wildemani Woloszynska, 1912 (v. Glenodinium quadridens Stein)
50
- 4 7 -
p ? r 1 ^ n ^ m i^V*i Huitfeld-Kaas, 1900
Lindemann, 1931? Indonesia
Genus PHALACROMA
Fhalacroma acutum (Schûtt) Pav., 1916
Matzenauer, 1933| Indian Ocean Wood, 1962; Indian Ocean
P. areus Stein, 1883
Ostenfeld and Schmidt, 1901; Red Sea, G. of Aden Cleve, 1901; Arabian Sea, Indian Ocean Schroeder, 1906; Red Sea, Arabian Sea Matzenauer, 1933; Indian Ocean Wood, 1954; vest of Bass Str.
P. clrcumsutum Karsten, 1907; Indian Ocean
Matzenauer, 1933J Indian Ocean Ballantine, 1961; Zanzibar
P. cuneus Schütt, 1895
Cleve, 1901, 1903; Arabian Sea, Indian Ocean Ostenfeld and Schmidt, 1901; G. of Aden Schroeder, 1906 (as P. blackmani); Arabian Sea,
Fremantle, Indian Ocean Karsten, 1907; Indian Ocean Matzenauer, 1933; Indian Ocean Wood, 1962; Indian Ocean
P. dolichoptervgium Mur. andWhit., 1899
Cleve, 1901; Indian Ocean Matzenauer, 1933; Indian Ocean Subrahmanyan, 1958; Arabian Sea
P» doryphorum Stein, 1883
Cleve, 1900, 1903; Red Sea, Arabian See, Indian Ocean Ostenfeld and Schmidt, 1901; Red Sea, G. of Aden Schroeder, 1906; G. of Aden, Arabian See, Indian Ocean Wood, 1962; Indian Ocean
51
-48 -
Phalacroma fayus Kof. and Mich., 1911
Matzenauer, 1933» Indian Ocean Wood, 1962; Indian Ocean
P. hindmarchi Mur. and Whit., 1899
Wood, 1962; Indian Ocean
P. irreguiare Lebour, 1926
Wood, 1954-5 south coast of Australia
P. .iourdani Gourret, 1883
Cleve, 1901, 1903; Red Sea, G. of Aden, Arabian Sea, Indian Ocean
P. latevelatum Kof. and Skogsb., 1928
Matzenauer, 1933; Indian Ocean
P. lens Kof. and Skogs., 1928
Wood, 1954; Swan R.
P. mawsoni Wood, 1954; Antarctic convergence
P. mitra Schütt, 1895
Ostenfeld and Schmidt, 1901; Red Sea, G. of Aden Schroeder, 1906; Arabian Sea, east Indian Ocean Wood, 1962; Indian Ocean
P. operculatun Stein, 1883
Cleve, 1901, 1903; Red Sea, G. of Aden, Arabian Sea, Indian Ocean
Schroeder, 1906; Arabian Sea, N.E. Indian Ocean Karsten, 1907; Indian Ocean Wood, 1962; Indian Ocean
P. ovum Schütt, 1895
Wood, 1954, 1962; Swan R., Indian Ocean
52
- 49 -
Phalacroma parvulum (Schütt) Jorgensen, 1923
Ostenfeld and Schmidt, 1901 (as P. porodictvum v. parvulum); G. of Aden
Matzenauer, 1933; Indian Ocean Wood, 1962; Indian Ocean
P. porodictvum Stein, 1883
Ostenfeld and Schmidt, 1901; Red Sea, G. of Aden Schroeder, 1906 (as P. porodictum); Arabian Sea Ostenfeld, 1915; Boeton Str. Matzenauer, 1933; Indian Ocean
P. porosum (Kof. and Mich.) Kof. and Skogs., 1928
Wood, 1954-; Antarctic
P. pulchellum Lebour, 1925
Wood, 1954; Antarctic convergence south of C. Leeuwin
P. rapa Stein, 1883
Cleve, 1901, 1903; Arabian Sea, Indian Ocean Ostenfeld and Schmidt, 1901? G. of Aden Matzenauer, 1933; Indian Ocean, Red See Wood, 1962; Indian Ocean
P. rotundatum (Clap, and Lach.) Kof. and Mich., 1911
Karsten, 1907 (as Dinophvsis rotundatum); Indian Ocean Matzenauer, 1933; G. of Aden, Indian Ocean Subrahmanyan, 195£; Arabian Sea
P. rudgei Mur. and Whit., 1899
Schroeder, 1906; Indian Ocean Wood, 1962; Indian Ocean
P. striatum Kofoid, 1907
Wood, 1962; Indian Ocean
P. vastum Schroeder, 1906; G. of 'den, Arabian Sea
53
- 50 -
Genus PODOLAMPAS
Podolampas bines Stein, 1883
Cleve, 1901, 1903; Red Sea, G. of Aden, Arabian Sea, Indian Ocean, Malaya
Ostenfeld and Schmidt, 1901; Red Sea, G. of Aden Schroeder, 1906; Red Sea, Arabian Sea, Indian Ocean Ostenfeld, 1915; Boeton Str. Matzenauer, 1933; Indian* Ocean Subrahmanyan, 1958$ Arabian Sea Wood, 1962; Indian Ocean Ballantine, 1961; Zanzibar
f. reticulata (Kofoid) Schiller, 1937
Matzenauer, 1933 (as P. reticulata Kof.), Indian Ocean Wood, 19¿2; Indian Ocean
P. elegans Schütt, 1895
Schroeder, 1906; Red Sea, G. of Aden, Arabian Sea Matzenauer, 1933; Indian Ocean Wood, 1962; Indian Ocean
P. palmipes Stein, 1883
Cleve, 1900a, 1903; Red Seo, G. of Aden, Arabian Sea Ostenfeld and Schmidt, 1901; Red Sea, G. of Aden Schroeder, 1906; Red Sea to Sunda Sec Matzenauer, 1933; Indian Ocean Subrahmanyan, 1958; Arabian Sea Wood, 1962; Indian Ocean
P. spinifer Okamurai 1912
Wood, 1962; Indian Ocean
Genus PCLYKRIKOS
Polykrikos schwartzi Butschli, 1873
Subrahmanyan, 1958; Arabian Sea
54
- 51 -
Genus PRONOCTILUCA
Pronoctiluca pelagrin Fabre-Domergue, 1889
Wood, 1962; Indian Ocean
P. spjnifera (Lohmann) Schiller, 1933
Wood, 1962; Indian Ocean
Genus PROROCENTRUM
Prorocentrum arcuatum Issel, 1928
Matzenauer, 1933 (as P. gibbosum Schiller); Indian Ocean Wood, 1962; Indian Ocean
P. dentatum Stein, 1883
Wood, 1954, 1962; Swan R., Indian Ocean
P. maximum Schiller, 1931
Matzenauer, 1933; Indian Ocean
P. gracile Schütt, 1895
Ostenfeld and Schmidt, 1901; Red Sea Schroeder, 1906; Arabian Sea, Indian Ocean
P. micans Ehr.. 1833
Ostenfeld end Schmidt, 1901; Red Sea, G. of Aden Cleve, 1903; Arabian Sea Schroeder, 1906; G. of Aden, Red Sea, Arabian Ser Ostenfeld, 1915; Boeton Str. Matzenauer; 1933; Indian 0c6an Wood, 1954-, 1962; Swan R., Indian Ocean Subrahmanyan, 1958; Arabian Sea
P. Tm-mrrmn) Schiller, 1933
Wood, 1962; Indian Ocean
P. rostratum Stein, 1883
Wood, 1962; Indian Ocean
55
- 52 -
Prorocentrum scutellum Schroeder, 19015 India
P. sigmoides Bohm, 1931
Subrahmanyan, 1958; Arabian Sea
P. spinulosum Karsten, 1907; Indian Ocean
Genus PR0T0CERATIUM
Protoceratium areolatum Kofoid, 1907
Matzenauer, 1933; Indian Ocean Wood, 1962; Indian Ocean
P. reticulatum (Clap, and Lach.) Butschli, 1885
Ostenfeld and Schmidt, 1901; Red Sea, G. of Aden Matzenauer, 1933; Indian Ocean
Genus PTÏCH0DISCUS
Ptychodiscus carinatus Kofoid, 1907
Matzenauer, 1933; Indian Ocean
P. inflatus Pavillard, 1916
Matzenauer, 1933; Indian Ocean
Genus PSEUD0PHALACR0MA
Pseudophalacroma nasutum (Stein) J5rg., 1923
Karsten, 1907; Indian Ocean Matzenauer, 1933; Indian Ocean
Genus PTROCYSTIS
Pyrocystis elegans Pav., 1931
Matzenauer, 1933; Indian Ocean Wood, 1962; Indian Ocean
56
- 53 -
Pyrocvstis ellipsoïdes (Hackel) Lemm., 1890
Matzenauer, 1933; Indian Ocean
P. fusiformis Murrey, 1885
Ostenfeld and Schmidt, 1901; Red Sea, G. of Aden Cleve, 1901; Indian Ocean, Malaya Karsten, 1907; Indian Ocean Matzenauer, 1933; Indian Ocean Subrahmanyan, 1958; Arabian Sea Wood, 1962; Indian Ocean
P. hamulus Cleve, 1900
Cleve, 1901, 1903; Indian Ocean, Malaya, Red Sea Ostenfeld and Schmidt, 1901; G. of Aden Schroeder, 1906; Indian Ocean Karsten, 1907; Indian Ocean Matzenauer, 1933; Indian Ocean Wocd, 1962; Indian Ocean
f. semicircularis Kofoid, 1907
Matzenauer, 1933; Indian Ocean Wood, 1962; Indian Ocean
P. lanceolata Schrory"--?,1900
Karsten, 1907; Indian Ocean Matzenauer, 1933; Indian Ocean
P. lunula Schutt, 1896
Ostenfeld and Schmidt, 1901; Red Sea, G. of Aden Cleve, 1901; Arabian Sea, Indian Ocean Schroeder, 1906; Indian Ocean Karsten, 1907; Indian Ocean Wood, 1962; Indian Ocean
P. micans Schroeder, 1906; Red Sea
PT minima Matzenauer, 1933; Indian Ocean
P. obtusa Pav., 1931
Matzenauer, 1933; Indian Ocean
57
- 54 -
Pyrocystis pseudonoctiluca W. Thompson, 1876
Cleve, 1900a,b, 1901, 1903, Red Sea, G. of Aden, Arabian Sea, Malaya, Indian Ocean
Ostenfeld and Schmidt, 1901; Red Sea,- G. of Aden Karsten, 1907; Indian Ocean Matzenauer, 1933? Indian Ocean Wood, 1954> 1962; Indian and Southern Oceans Subrahmanyan, 1958; Arabian Sea
P. rhomboides Matzenauer, 1933; Indian Ocean
P. robusta Kofoid, 1907
Matzenauer, 1933; Indian Ocean Karsten, 1907; Indian Ocean Wood, 1962, Indian Ocean Bailantine, 1961; Zanzibar
Genus PYR0DINIUM
Pvrodinium schilleri (Matz.) Schiller, 1937
Matzenauer, 1933 (as Goniaulax): Red Sea, Persian Gulf
Genus PÏROPHACUS
PvTophacus horologicum Stein, 1883
Cleve, 1900a,b, 1901, 1903; Red Sea, Indian Ocean, Malaya Ostenfeld and Schmidt, 1901; Red Sea, G. of Aden Schroeder, 1906; Red Sea to Sunda Sea Ostenfeld, 1915; Boeton Str. Matzenauer, 1933; Indian Ocean Wood, 1954, 1962; Bass Strait to Indian Ocean Subrahmanyan, 1958 (and v. steini): Arabian Sea Ballantine, 1961; Zanzibar
Genus SPHAERODINIUM
Sphaerodinium javanicum Woloszynska, 1930; Java
S. spp. Subrahmanyan, 1958; Arabian Sea
58
- 55 -
Genus SPIRAULAX
Spiraulax iolliffei (Mur. and Whit.) Kofoid, 1911
Cleve, 1903 (as Goniaulax); Red Sea, Arabian Sea Schroeder, 1906 (as Goniaulax); Indian Ocean Matzenauer, 1933; Indian Ocean Wood, 1962: Indian Ocean
BIBLIOGRAPHY
This bibliography contains the papers consulted in preparing the check-list, and does not include species references which are available elsewhere.
BALECH, E. (1957).- Dinoflagelles et tintinnides de la terre Adelie (Secteur française Antarctique). Vie et Milieu 8: 382-408. * —-
BALEGH, E. (1958).- Plancton de la compana Antarctica Argentina. Phvsis J¿: 75-108.
BALLANTINE, Dorothy (1961).- Gymnodinium chuckwanii n. sp. and other marine dinoflagallates collected in the vicinity of Zanzibar, J. Protosool. S: 217-228.
BOHM, A. (1931).- Zur Verbreitung einige Peridinium. Arch. Protisjtenk. 21' 498.
CLEVE, P.T. (1900a).- Plankton from the Red Sea. Ofv. Kongl. Sv. Vet-Akad Forh. ¿7(9).
CLEVE, P.T. (1900b).- Plankton from the South Atlantic and South Indian Oceans Ofv. Kongl. Sv. Vet-Akad Forh. 57(9).
CLEVE, P.T. (1901).- Plankton from the Indian Ocean and the Malay Archipelago. Ofv. Kongl. Sv. Vet-Akad Forh. ¿5.(5)
CLEVE, P.T. (1903).- Report on plankton collected by Mr Thorild Wulff during a voyag'' to and from Bombay. Ark. Zool. ¿: 329-391.
C.S.I.R.O. Aust. (1962).- Oceanic observations in the Indian Ocean in 1959- H.M.A.S.. Diamantina Cruises Dml/59, Dm2/59. C.S.I.R.O. Aust. Oceanogr. Cruise Rep. J,.
C.S.I.R.O. Aust. (1962).- Oceanic observations in the Indian Ocean in 19Ó0. H.M.A.S. Diamantina Cruise Dml/60. C.S.I.R.O. Aust. Oceanogr. Cruise Rep. 2.
60
- 2 -
C.S.I.R.O. Aust. (1962).- Oceanic observations in the Indian Ocean in 1960. H.M.A.S. Diamantina Cruise Dm2/60. C.S.I.R.O. Aust. Oceanoer. Cruise Rep. ¿ (in press).
CZAPEK, F. (1909)*- Zur Kenntnis der Phytoplanktons im Indischen Ozean. Sitz. Akad. Wiss. Wien. 118; 231-239.
KARSTEN, G. (1907).- Das Indische Fhytoplankton. Wiss. Erg. Deutsch. Tiefsee EXP. VALDIVIA. 2; 221-34-8.
LEMMERMANN, E. (1899).- Ergebnis einer Reise nach dem Pacific Planktonalgen. Abh. Naturw. Ver. Bremen J6; 298-313-
LEMMERMANN, E. (1910).- Klasse Peridiniales. Algen in Krypto-gamenflora der Mark Brandenberg und angrenzender Gebiete, 3: 563-712.
LINDEMANN, E. (1931).- Die Peridineen der Deutsch Limnol. Sunda Exp. nach Sumatra, Java u. Bali Arch. Hydrobiol. Suppl. Bd 8, 691.
MATZENAUER, G. (1933).- Die Dinoflagellaten des Indischen Ozeans. Bot. Arch. 2£: 437-510
OSTENFELD, C.H. (1915).- A list of phytoplankton from the Boston Strait. Dansk Bot. Ark. J(4)Î 1-18.
OSTENFELD, C.H. and SCHMIDT, J. (1901).- Plankton fra det Rbde Hav og Adenbugten. Vidensk. Medd. Naturh. Foren. Kjobenhavns No. 141.
SCHILLER, J. (1933/1937).- Dinoflagellatae (Peridineae). In Rabenhorsts Kryptogamen-flora. 1,0(3) ° 1-580.
SCHROEDER, B. (1906).- Beitrage zur Kenntnis der Phytoplanktons warmer meere. Vierteliahr naturf. Ges. Zurich. Q 319-377.
SCHROEDER, B. (1914-).- Zellpflanzen Ostafrikas. Hedwigia 5g: 183-208.
61
- 3 -
STEEMANN-NIELSEN, E. (1939).- De Ceratien des Indisches Ozeans und ser Ostasiatischen GewBsser. Dana Rept. ¿T.; 1-33-
SUBRAHMANYAN, R. (1958).- Phytoplankton organisms of the Arabian Sea off the west coast of India. J. Ind. Bot Soc. 2£Î 435-441
VEST, G.S.' (1907).- Report on freshwater algoe of the Third Tanganyika Expedition conducted by Dr W.A. Cunnington. J. Linn. Soc. (Bot.) ¿8; 81-197.
WEST, G.S. (1909).- The algae of Yan Yecn reservoir. J. Linn. Soc. (Bot.) ¿9_: 1_88-
WOLOSZYNSKA, J. (1912).- Das Phytoplankton einiger javanischer Seen. Beruch. Sawa-Plankton. Bull. Int. Acad. Sci. Cracovie (B)s 649-704.
WOLOSZYNSKA, J. (1930).- Beitrag zur Kenntnis des Phytoplanktons tropischen Seen. Arch. Hydrobiol. 5(1-2): 159-169-
WOOD, E.J.F. (1954).- Dinoflagellates in the Australian region. Aust. J. Mar. Freshw. Res. 5_: 171-351.
WOOD, E.J.F. (1962).- Phytoplankton in Report of H.M.A.S. Diamantina Cruises Dml/59, Dm2/59. See C.S.I.R.O. Aust. (1962).
WOOD, E.J.F. (1962).- Phytoplankton in Report of H.M.A.S. Diamantina Cruise Dml/60. See O.S.I.R.O. Aust. (1962).
WOOD, E.J.F. (1962).- Phytoplankton in Report of H.M.A.S. Diamantina Cruise Dm2/60. See O.S.I.R.O. Aust. (1962).
62
Reprinted from Bull. fish. res. Stn., Ceylon, vol. 16, no. 1, 1963, p. 9-24.
Studies on the Seasonal Cycle of Sea Surface Temperatures, Salinities and Phytoplankton in Puttalam Lagoon,
Dutch Bay and Portugal Bay along the
West Coast of Ceylon
M . DTTBAIBATNAM
Department of Fisheries, Colombo 3, Ceylon
Introduction A study of the sea surface temperatures, salinities and phytoplankton was carried out at Puttalam lagoon, which is the largest Jagoon in Ceylon and in the adjacent bays, Dutch Bay and Portugal Bay, for one year from June, 1960 to M a y , 1961. Lagoon fishing is carried out throughout the year, but most of the fishing is done during the South West Monsoon, as the sea outside is too rough for small vallams, theppams and orus to go out fishing. Surface temperatures and salinities for the Bay of Bengal have been reported by Sewell (1925), Das (1954) and Jayaraman (1954). They have made detailed studies for specific nearshore locations along the Indian coasts. La Fond (1954, 1957) had shown the relation of these data to the water masses and circulation. La Fond (1958) had also described the seasonal cycle of sea surface temperatures and salinities along the East Coast of India. Studies on the plankton of the inshore waters off Mandapam were made by Prasad (1954, 1956). Studies on plankton were also made by Chacko (1950), Ganapathi and Murthy (1953 and 1955), Ganapathy and Rao (1953), and Menon (1945).
However, no work on marine plankton had been described for Ceylon waters. It was thought worthwhile to study the seasonal cycle of sea surface temperatures, salinities and phytoplankton and their effect on fisheries production in these areas, as phytoplankton forms the food of zooplankton and the food of fishes directly or indirectly.
Material and Methods Surface plankton hauls were made with Kitahara's surface plankton net with an over all length of 120 cms. and diameter of 30 cms. The mesh is in conformity with the International Standard N o . 13 and with the Japanese standard X X 13. Plankton hauls were made once a month from the departmental motor launches the " Seer ", " Kelawalla ", and " Halmessa ". The speed of the boat was kept constant during the tow which was confined to 15 minutes. The plankton collected was transferred into clean bottles and preserved in 4 % formalin. Temperature readings of surface water were made on the dates of collection. Salinities were obtained by determining chlorinity by Knudsen's method and reading salinity values directly from Knudsen's table. Quantitative estimations were made by counting under a binocular microscope the plankton contained in 1 c.c. samples. Different symbols were used to denote the comparative abundance of the différant diatoms, dinoflagellates and Cyanophyceae.
Sea surface temperature The mean monthly surface temperatures at Puttalam lagoon vary from 27.6° C to 30.8° C . The peak temperatures were in April, M a y and June and the lowest found were in November, December
Collected reprints of the International Indian Ocean Expedition, vol. IV, contribution no. 206 63
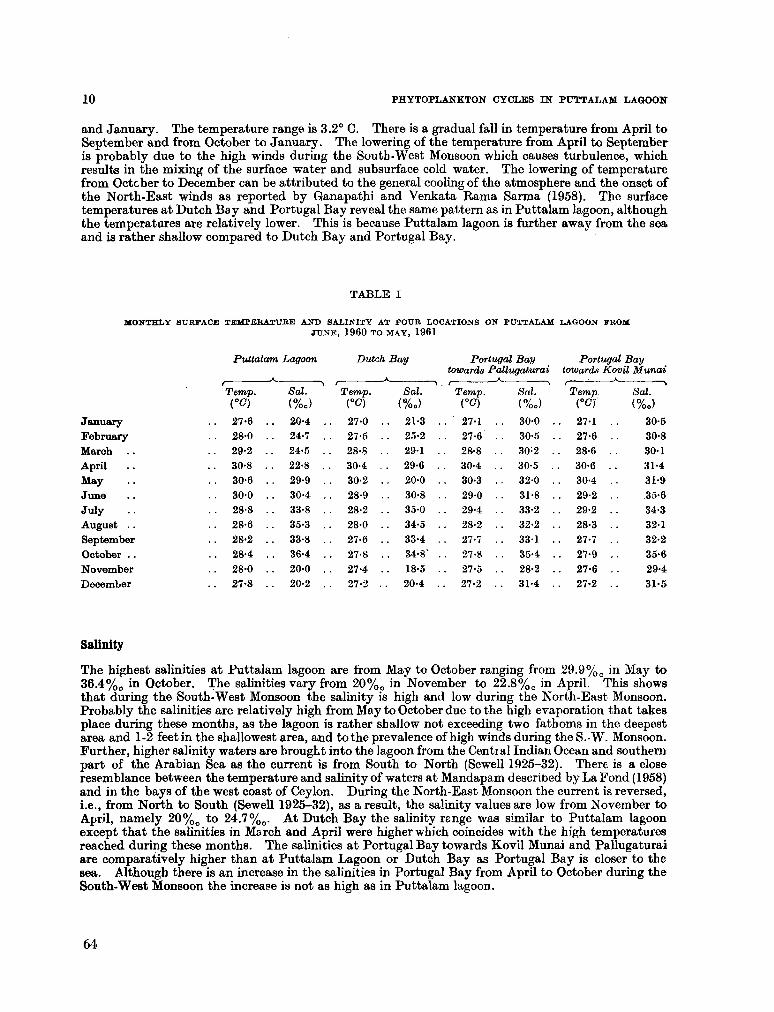
10 PHYTOPLANKTON CYCLES IN PUTTALAM LAGOON
and January. The temperature range is 3.2° C . There is a gradual fall in temperature from April to September and from October to January. The lowering of the temperature from April to September is probably due to the high winds during the South-West Monsoon which causes turbulence, which results in the mixing of the surface water and subsurface cold water. The lowering of temperature from October to December can be attributed to the general cooling of the atmosphere and the onset of the North-East winds as reported by Ganapathi and Venkata R a m a Sarma (1958). The surface temperatures at Dutch Bay and Portugal Bay reveal the same pattern as in Puttalam lagoon, although the temperatures are relatively lower. This is because Puttalam lagoon is further away from the sea and is rather shallow compared to Dutch Bay and Portugal Bay.
TABLE I
M O N T H L Y SURFACE TEMPERATURE A N D SALINITY AT FOUR LOCATIONS O N PUTTALAM LAGOON FROM JUNE, 1960 TO MAY, 1961
January
February
March
April
May June
July
August . .
September
October . .
November
December
Puttalam Lagoon
A
Temp. Sal. CO) (%„)
27-6 .
28-0 .
29-2 .
30-8 .
30-6 .
30-0 .
28-8 .
. 28-6 .
28-2 .
. 28-4 .
. 28-0 .
27-8 .
. 20-4 .
24-7 .
. 24-5 .
. 22-8 .
29-9 .
. 30-4 .
. 33-8 .
35-3 .
33-8 .
. 36-4 .
20-0 .
. 20-2 .
Dutch Bay
A
Temp. Sal. CO) (%.) 27-0 . . 21-3 .
27-5 . . 25-2
. 28-8 . . 29-1
. 30-4 . . 29-6 .
30-2 . . 20-0 .
28-9 . . 30-8 .
28-2 . . 35-0 .
. 28-0 . . 34-5 .
27-6 . . 33-4 .
. 27-8 . . 34-8' .
27-4 . . 18-5 .
27-2 . . 20-4 .
Portugal Bay towards Pallugaturai , *- .
Temp. Sal. CO) (%„) 27-1
27-6 .
28-8 .
30-4 .
30-3 .
29-0 .
29-4 .
28-2 .
27-7
27-8
27-5 .
27-2 .
30-0 .
. 30-5 .
30 ;2 .
. 30-5 .
32'0 .
31-8 .
33-2 .
32-2 .
331 .
. 35-4 .
. 28-2 .
31-4 .
Portugal Bay towards Kovil Munai
Temp. Sal.
CO) (%„) 27-1 . . 30-5
27-6 . . 30-8
28-6 . . 30-1
30-6 . . 31-4
30-4 . . 31-9
29-2 . . 35-6
29-2 . . 34-3
28-3 . . 32-1
27-7 . . 32-2
27-9 . . 35-6
27-6 . . 29-4
27-2 . . 31-5
Salinity
The highest salinities at Puttalam lagoon are from M a y to October ranging from 29.9%0 in M a y to 36.4%0 in October. The salinities vary from 20% o in November to 22.8%0 in April. This shows that during the South-West Monsoon the salinity is high and low during the North-East Monsoon. Probably the salinities are relatively high from M a y to October due to the high evaporation that takes place during these months, as the lagoon is rather shallow not exceeding two fathoms in the deepest area and 1-2 feet in the shallowest area, and to the prevalence of high winds during the S . - W . Monsoon. Further, higher salinity waters are brought into the lagoon from the Central Indian Ocean and southern part of the Arabian Sea as the current is from South to North (Sewell 1925-32). There is a close resemblance between the temperature and salinity of waters at Mandapam described by La Fond (1958) and in the bays of the west coast of Ceylon. During the North-East Monsoon the current is reversed, i.e., from North to South (Sewell 1925-32), as a result, the salinity values are low from November to April, namely 20% o to 24.7%0. At Dutch Bay the salinity renge was similar to Puttalam lagoon except that the salinities in March and April were higher which coincides with the high temperatures reached during these months. The salinities at Portugal Bay towards Kovil Munai and Pallugaturai are comparatively higher than at Puttalam Lagoon or Dutch Bay as Portugal Bay is closer to the sea. Although there is an increase in the salinities in Portugal Bay from April to October during the South-West Monsoon the increase is not as high as in Puttalam lagoon.
64
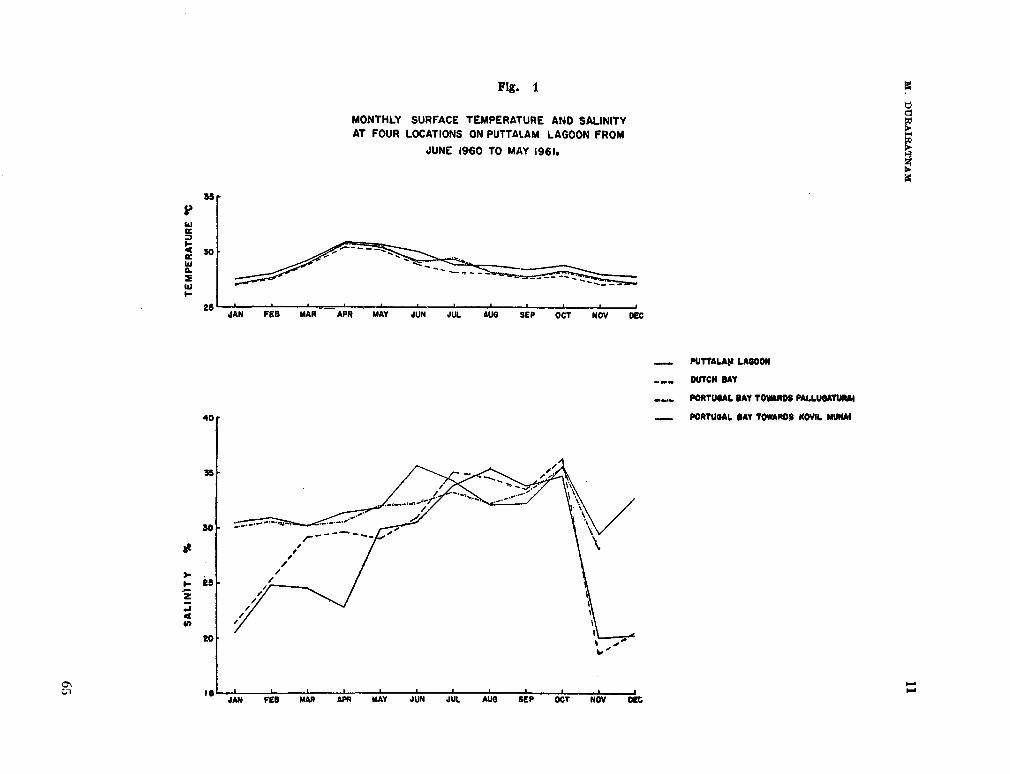
M.
DU
UA
IKA
TN
AM
11
1
*
¡S
J •«-
kl _
«
oc S
-
o <
>•
*•=
o
I-o «0 0>
to —
*
Ul
12 z o
II' ce o
5 X
I-
_
Z "*
O
(-
z <
3. S
-I
-i
5*
8 J
Í S
? g
g i I s
I ! ! !
s s
3
. 3U
njL
VU
3dW
3J.
L" §
8 S
S
%
A
lN
IlVS
65
12 PHYTOPLANKTON CYCLES IN FUTTALAM LAGOON
Plankton
There were sudden fluctuations in the distribution of phytoplankton but no definite conclusions can be drawn due to the short period of observation. The distribution of phytoplankton including Dinophyceae and Cyanophyceae is shown in tables 2, 3, 4 and 5. There are more than one phytoplankton m a x i m u m in a year. At Puttalam lagoon blooms of Thalassiosira subtilis occurred in N o v e m ber, Bhizosolenia alata in February, Rhizosolenia imblricata in March and M a y , Chaetoceros lascinosus in February, ThaUassionema nitzschioides and Thallassiothrix Frauenfeldii in M a y . At Dutch B a y blooms of Coscinodiscus gigas occurred in June, Sceletonema costatum in August, Bacteriastrum varions in July, Chaetoceros diversus in October, Rhizosolenia imbricata in February, Rhizosolenia alata in March, Biddulphia mobilensis in M a y , Thallassiothrix frauenfeldii July to September, Rhaphoneis discoides in September, Asterionella japónica M a y and in October, ThaUassionema nitzschioides in April and M a y . Blooms at Portugal B a y towards Kovil Munai were identical with those of Dutch Bay . Blooms at Portugal B a y towards Pallugaturai were mostly ¡denied, but blooms of Chaetoceros pervianus occurred in October, and Thalassiosira subtilis in November.
In all the 4 regions the bulk of phytoplankton occurred from M a y to September during the South-West Monsoon and is the cumulative effect of several species. For example the bulk of phytoplankton in M a y was composed of Thalassiosira decipens, Thalassiosira subtilis, Coscinodiscus gigas, Rhizosolenia imbricata, Rhizosolenia alata, Rhizosolenia styliformis, Bacteriastrum varians, Chaetoceros lorenzianus, Chaetoceros pervianus, Biddulphia sinensis, Biddulphia putchella, Rhaphoneis discoides, Thallasionema nitzschoides, Thallassiothrix longissima, Thallassiothrix frauenfeldii and Gyrosigma balticum. There were two outburts of diatoms in June and in October. The June outburst consisted of several species, the dominant ones being Sceletonema costatum, Coscinodiscus gigas, Rhizosolenia styliformis, Rhizosolenia alata, Biddulphia sinensis, ThaUassionema nitzschioides, Thallassiothrix frauenfeldii and Asterionella japónica. The October outburst consisted of several species of Chaetoceros, Chaetoceros lorenzianus, Chaetoceros pervianus, Chaetoceros lascinosus, Chaetoceros diversus, Thallassiothrix frauenfeldii, Asterionella japónica, Rhizosolenia imbricata, Rhizosolenia alata and Rhizosolenia styliformis.
Sudden outbursts of a single species were c o m m o n especially Thallassiothrix frauenfeldii, Chaetoceros species and Rhizosolenia species. The distribution of diatoms at Puttalam lagoon is different from the other three localities. The relative abundance of plankton was small and the number of species of diatoms m u c h less. This m a y be attributed to the fact that it is further away from the sea and lacks nutrient salts. In the other three areas the rivers Kal Aru and Pomparippu Aru empty and bring in nutrient salts.
Four species of Dinophyceae were found in these areas and their relative abundance is shown in the tables 2-5.
Trichodesmium erythraeum a blue green algae belonging to the Cyanophyceae was found in plenty in January, February, March and November. Davanesan (1942) states that Trichodesmium found off Krusadai in abundance forms a favourite item in the food of the Indian sprat (Sardinella gibbosa) and the mullet (Mugil waigiensis). During the year June, 1960 to M a y , 1961 the months in which sprats were caught in large quantities were January, February, March and November. This seems to correspond with the relative abundance of Trichodesmium erythraeum during these months.
F r o m the fisheries statistics available for this period the best fishing months were from M a y to September which corresponded to the peak months for phytoplankton. But no conclusions can be derived as there is more intensive fishing during these months of the S . - W . Monsoon in these protected regions due to the sea being too rough for distant fishing.
66
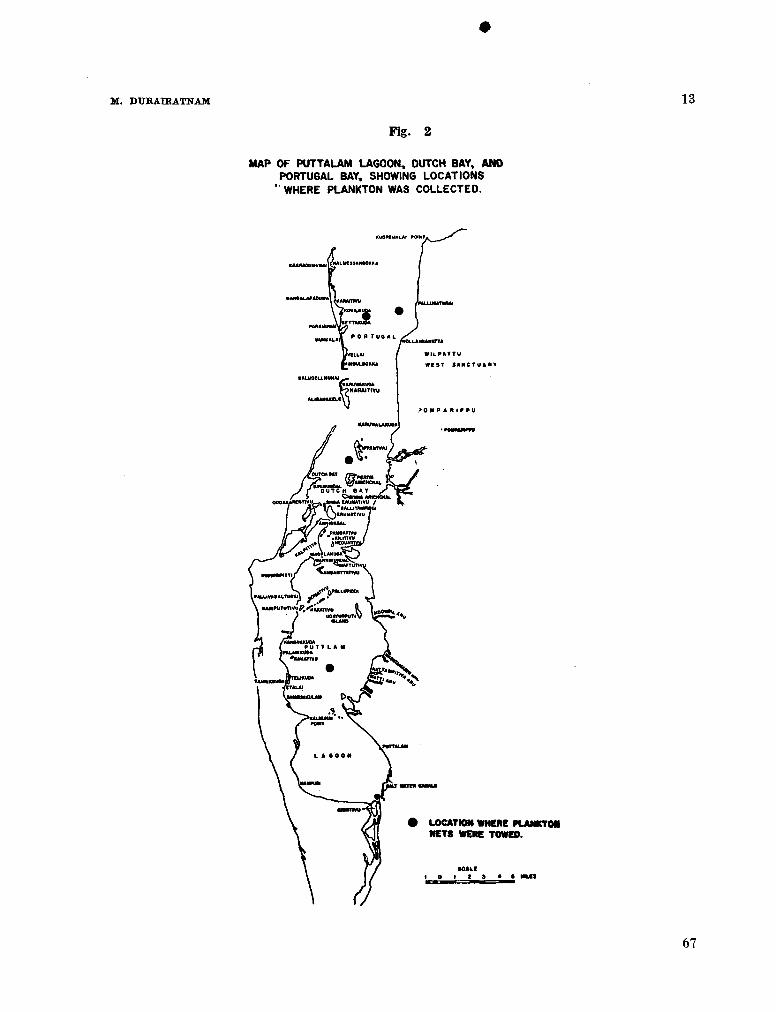
M . DURAIBATNAM 13
Fig. 2
MAP OF PUTTALAM LAGOON, DUTCH BAY, ANO PORTUGAL BAY, SHOWING LOCATIONS
'WHERE PLANKTON WAS COLLECTED.
«UOftEUALM POINT.
IOLLAHRAIMTTA
WlLPATTU
W C 9 T SANCTUAftV
• LOCATION WHERE PLANKTON NETS WERE TOWED.
67
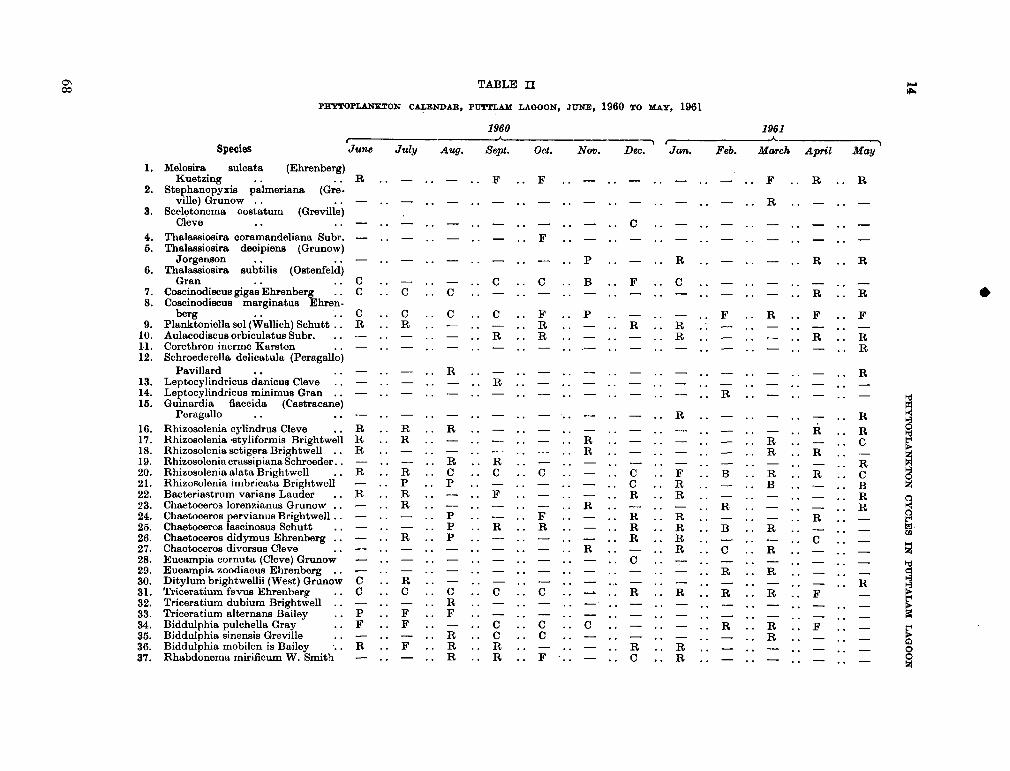
PHYTOPLANKTON CYCLES IN PUTTALAM LAGOON
| P
Í I
I I
s
Is
& I
ss
s I I
titiüIrtü
Mtitilllllltó
lllllll
I ti
I I
I ti
Iti * I s
I III
1-
sls
ls
llls
lo
lllU
llh
lll
<|
fe
S
II I
lltilll
III llt
itilt
imlllt
iltilt
iltillt
itill
I I
I II
I I I
h I I I
I I M
lllllm
lls
ln
lo
ls
ls
lls
lll
I I
I I
I PÍ o
l IS
S I
III S
ll
ll
fc
SS
lS
SS
Sl
ll
sl
ll
IS
S
lo
i I fe
I Is
I I III
I I I I lo
oS
IS
SS lo
I Iti II I
ISO
I I
I PM n
I PH I I I
III I
Is
s I I I Is
I I Is I I I 1
I I o I I
I
h I
I ^
lo
i feS
S
I III
I I I I lo
I I IhS I I I I lo
I loo lh
JB- h
i II
lo
lo
ls
l IS
l I
I I ISo Ih
I IS I I I I lo
I lo
oS
S
J
I I
II I
lo
ol
ll
sll
IS
II
SO
PH
II
PH
PH
PH
II
II
OS
IX
JS
SS
3 I
I II
I lo
os
ll
III Is
sllS
PH
SS
llslllS
olfe
felfe
l
s I
I I
I o
o o
sll
III I
SS
SI
SI
SI
II
IM
IO
OI
PM
ÜJ
S
""" :I
:IÎ:I
: :â
:j ::â
'•'• :î:
:1 :i
:* : :~
: : :* :l
| a 1
ill
I' |
1 .
a8
ja5 1 ñ
s?
Ll
«
|
i s t
il i fm
ÎI i jjj
4ih
k¡tii m
il* .**
S-
1
5.
w
IS
S
" 0? g-
»S
P. =8 _ lia
i ¡S aO
-çjS §
Èr-S
-Sl-S
-S-S
^5
^ ^
œ5
- 5
3Ü
iS
S-g
If 3 e
-as g
oü c
íTsi-2
• â
¡ ÎJ » il lin ir
mm
îirM*m
m«.*ii
^ -I -I • !:§.•§ -«l-lliS
g -S
|^ •||glm
g§
l|§ls
ü-ss
«s
ia
« -
S."
* • |g
••§ -
ai -6
.1*5
"°
e:Í "
lS8
,-sáJ
ig.g
S|B
5Í
!3H
.i¡1
11
- gg«S
§§ ¿
Ib Il
5S
ÍS3
«H
rf**Í8-&
*'^S
.-3-
d-B2
°§
.2.2
3.2
=5 '-
5 5
~ o
S ¿
= s
|-3
» «
^ »
^^
| ï ï g S
fe.S
.Í*.3
.3.2
J¿
X „
.3
©
°3 ©
°
>
3 m
bo
a H
H H
fcí)*
^ O
dc
Tü
üh
ía
»c
fl!a
o[n
)tc
vO
QO
Oû
Cf5
fi
iS
M'i
'2'3
'Ti
3M
j^|o
.âa
^a
ol8
-0|-3
§-S
Pt fr^
S* 2
3 2
2 3
3 8.3
J J
jj §
§ £
-g -g -g S
S 3
.3
S
ta
oo
HH
H
O
O P
H«
!ÜK
JI-IO
S
SS
SS
Sm
oo
OO
OK
WflB
BH
SfflP
QS
i-H
©4
C
O
^IO
C
O
t> 0
0
OS
O^
HC
N
rt^
îlO
CO
I>C
»0
50
^c
Nc
O^
*IC
CO
l>c
Oo
aO
Fjc
irt^
l£5
cO
l>
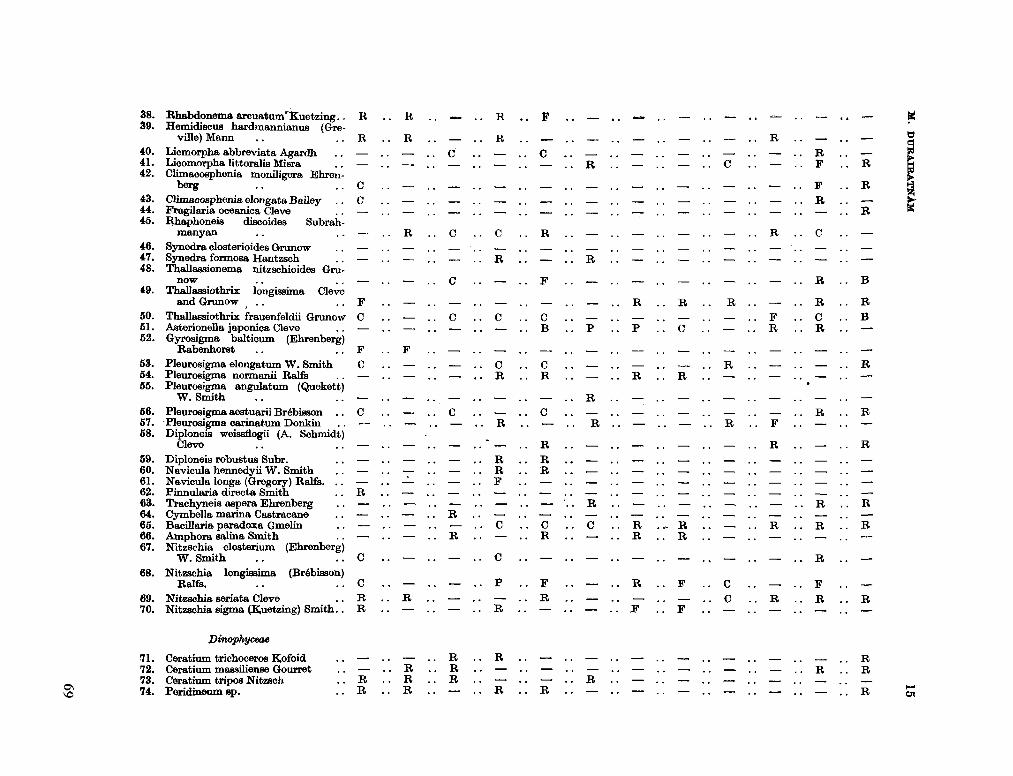
M.
DU
EA
IEA
TN
AM
I I |
s s
I
s M
| m
« «
I I «
I |
«l
sl
ll
ls
ls
l I
I « I
! I
Sf
tf
ct
fl
ol
lS
So
S I
II I S
I |
I I I U | t
í [ tí ft S
I
I tí
I I I I I tí I
I
I
I fetó I
I I I I
h s
I I I I I I
sI
I
I « I
I I
I©
II
I I
II I
« I I
I « I
li
s
I I I I I I I I I
I
o o
I
! I
ll
II
I
II
I
I
«
lo
li
s
IN
I I I
II I
IPSA I
ft U
1 I I I
I M
I I I
I s
| h
I I
s I I I
I I I |
| I |s
s I
A
I
*
I l
is
II
I
Ms
I
II
PW
II
IS
I«
II
M|
S|
OI
I
II
I
ft lo
i I
II
S I I
ft
I o
n
I o
S
lo
i S
SS
I I I
|o
S
I ft
S I
* «
I I
ll
lo
ls
l l
oi
|o
S|
|S
| fit
ífc
I I I
O I
O
PM
IS
I lo
i I
II o
il
o
lo
i I
II
lo
i lllllls
ls
l I
N
s tí
M I
I I s I I
I
II I
* I I
II
I I
I Ml I I I I
I
I tí I
tí tí o o
ft
o ft
o o
| | t
í I I I I
o
o S
S
.la
N
Is
II os es
g s §
sis
•Ü
'G ©
111 3 S g
g
+2
(fi H
s a
o .
•g g a •
3 S.«
•api*
tur
§ 8 Ji
: : ; : "SB :
i ¿
SI
|
'"S S »
sa ° .a - 8.1 °6
ti ilis
oo œ
O
~H
<N
«•#
«!
ot-«
os
o i-* N
m
TU >a
es
r-oo
«
OH
C«
N«
IO
O^
OO
OJ
O
com
•* Tji•*
•*'*•*
•*•<* •w
•*
io io
«s
laio
io
IOIO
U
ici<
s<
o<
ee
»e
<s
o
to
«oc-
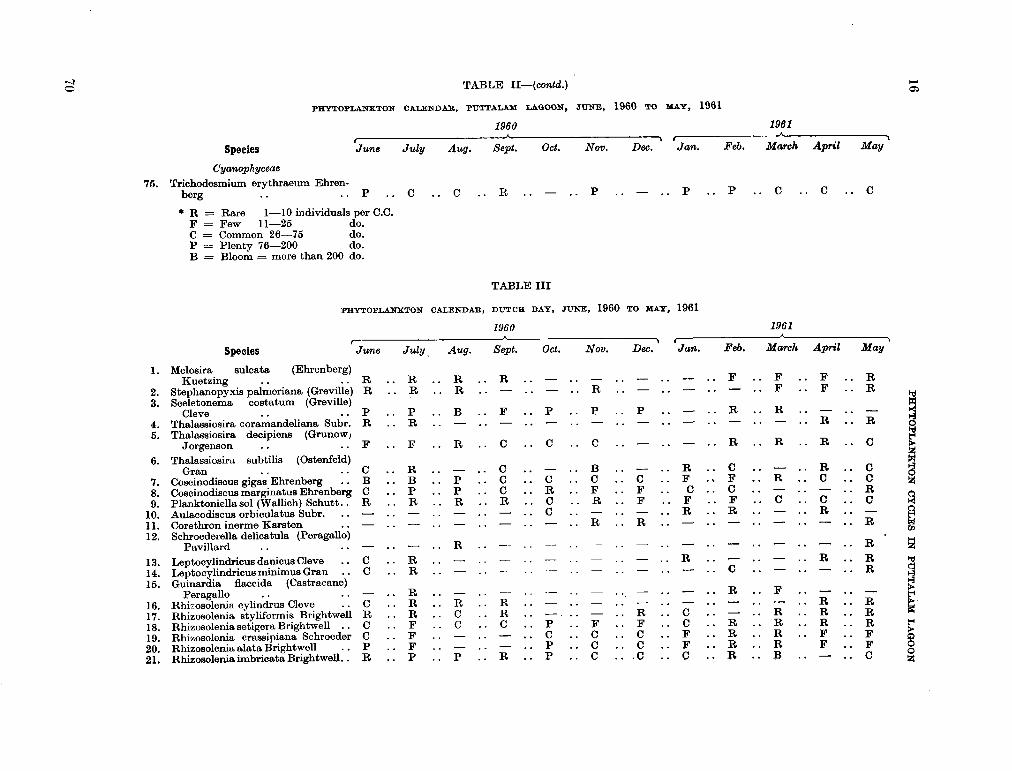
16
PHYTOPLANXTON CYCLES IN PUTTALAM LAGOON
i o PH
^ títí
I tí
o
oo
tíoltí
tí títí
Itítítífefe
o
3 fe
fe
| tí
«
PÍO
I o tí
títítífefe
e fe
fe
tf |
«
| « | O
fe
| p3 tí
pí pfl pe).
| fe
I
tí I
tí O
feO
^tí
| |
|o
tílltítítítí
tífe°fc
tí I I tí
üü
hh
o
o
O
to
%
0 o 0 a a < in
3 A
»
S
•«
!
<i
OS
*1
•K
O «
fr «5
ri, 3 J
¿P
.*
tí
o
3 «5
S
.? 1
8, w
5^
8-s o
p-l
a
•
fe rythrae g
i •a
.
richo berg
O
o 05
• •
• •
¡ü, o o o
o
13 *Ü 'tí
'tí
3 °
-5 <M
in di vi
75
e than
O
1Q
O
h
H
(M
1 d
O
1 IS
IS
» s
ss
1 g
S g
§
Il II II II II
tífeo
fetí
PH
Ofe
fc I tí
tífeO
OO
tí PL, 1
o fflo
fetí
I ps
ho
oo
PH
O
O tíO
O
I I
I ! P
HO
PH
PH
j| tí
I fe
I
O
OO
Otí
títíü
| I tí
,3 títí
pq |
tí I
PH
PH
PS
tí fiO
Ü
*s títí-
Pntí
fe
tífflPn
tí títí títítífe
fefe
Pn
títí P
ntí
fe
Offlü
tí |
DO
1 O
tíOU
Pn
tí
^ • -
34
Sa
o
S
T*
OÜ
ï_
«* 'tí ÊMS o
m
fi « •il
J 8 g S
U*
O O
•ií! o
ot.
o o s
-^ -^
tí
<D c 3
H
HI-lO
_ ce
o3
•2
'S'S
'tí ^
0
©
ID m
4)
o»
bp'o 'o "o 'o 'o 'o 03
00
00
09
00
09
CO
h
O
O
O
O
O
O
©
N
N
N
N
M
6j
^ "ÍT
,3 ',3 j3 13
"P£3
t- oo
a
o i-i
N
C3 T
* U3
?D t-
00
C5 ©
^
H
70
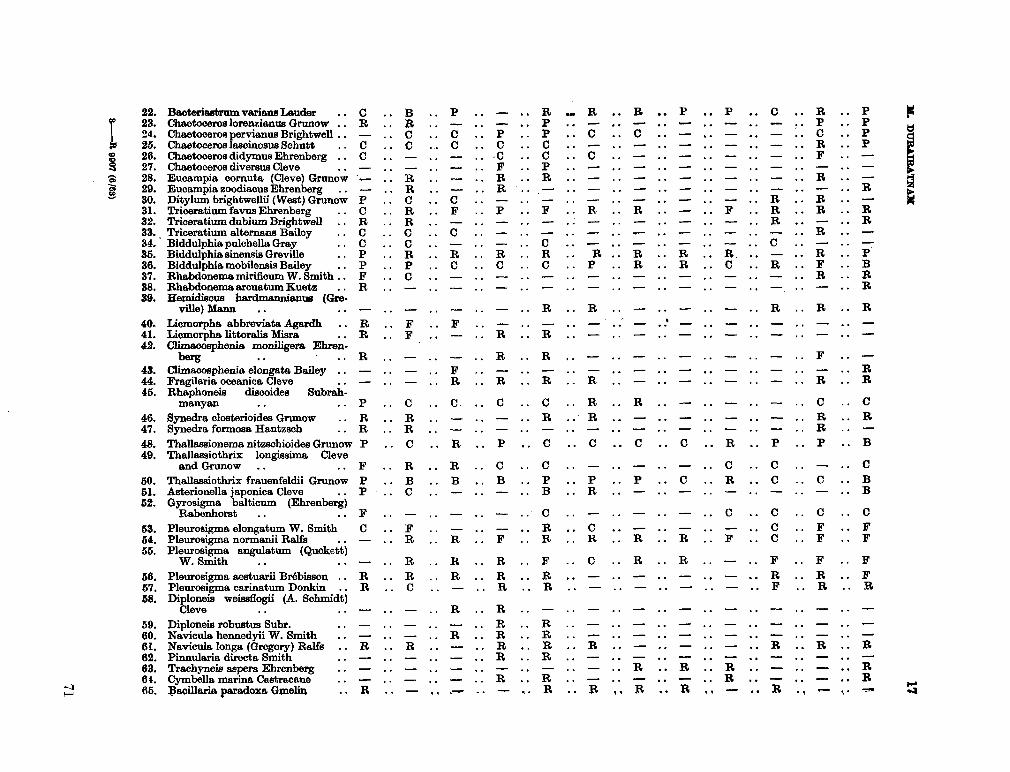
H.
DU
BXEBA
TNA
M
17
PMPMPHPM I I I «
Ititi I IfcmrtP
S t
i I I
U
n; o
Kl
n u
nn
u^
h ^
h^ I I
Itf l«
« F
PíP
Mo
eífe IP
; IPÍP
Í Ic
e IK
PH
PÍ I «
II fe
I « O
rt«
PH l
oi o
fefe fe
«ti I I I «
I I I I
o I I
I I I I
Itititi lo
Itó I I
ti I I III I I I
PH O
O I
O O
O fe
«I* I M
ti I I
Itf
* ! I
I I I I I I fe I I
I «O I I
III III I I I ti O ti ! O I fe
III I I I I
Itfrt I
ml I I I M
I I I
11
I «P
i I I III
Ml I
I I o
lo
i I | M
A
I I
U
ll
lt
fl
«
ti
I O 1 I I I I I t
i I |. I titi I I
I
II I
II
tillo
1*
1 | | t
i ti M
I I
I I I t
i I «
PS
IO
IO
II
II
PS
II
I^
PH
II
PÍ
II
I Iti ti tí I O
I
P<
« I o
í o
il I I It
i I I It
i
5 : : : : : : : : : : : : : : : : : :
: : : : : :
: :
: : : : :
: : :
:
::
::
::
::
ti^P
HO
oP
utilIfello
tioll
ti
I ti ti Ití
ot
il
o
oh
» o
titi fe
titi Ititititiltiti
llho
ofe
titilpn
llltioll
| |p
5 p?
| pq o
life
offll
I Ife
tititi
p; «
««
« Iti I
P< I oo I I
I I o
fe I o I t
ío I I I fc I I ft tí
ollt
i titil
I It
i titil
tí I tí I I I I I
MtiO
O I Ititio
titiOO
tiPn
O I
I
fcfe III
ü
S«
0 p
Sfflü
I fe
ti ti «
O I I |t
i I I I I
Otilo
olJ
IpH
OtiO
OP
Lip
Hfe
ti It
iti
till
fe
tit
i P
H
fePn
pH
feo
l lt
iti
I
Mtilllti
..
..
..
tí- • b
»
••
•<
•
^ (D
.
>
• --*-
•
• *
-» t
•
• •—
• •
*ii*s s
»! s
i.,
«a H
-t 1 s «
Is I §
all
*$
M
SiiiJlîlH
tatliïll fil tu
1 ¡l 1 ft $
MM
I § § i § i J5|. Ill-i-ii g 1
il til fil g «
i! IH
11&Í.1Í i,i.a
i-s
jí 15 i IIiIiilliiig
ílflIl^ir
Li^
liiiiis ¡.s
il us
- lili iiíliil
8|||j|§
§.'s
,|||ális
||l^ ill-
8 J
eja
g
.&il
3 Jlk
* J
JJ
^ 1
-2*°
JS
JJ
-SE
JJ
mS
eS
So
BW
QS
SS
nm
ffltitiW
,5^
5 S
fiti
«¡OQ
EU
H
&<
a PM
PHFH
PHPH
Q
PÍZ
Í^P
HB
O»
<N
«'*'io
<o
i>o
oo
20
'-<c
J«
'*ii5¿
t^Q
¿o
>
cSi-H
cj «
•* «j <s i~
oç o>
© ** «i
eô •* ici «o i>
ce o
»O
i-îeiiô
-*io
MN
ciiÑeíiN
miN
coco
TO
CT
meo
coco
eoec
•* •* •* •*•*•*
-"*•>* i -i
us m us
us us us us us us
me
tc
ee
oc
. 9007 (6/63)
71
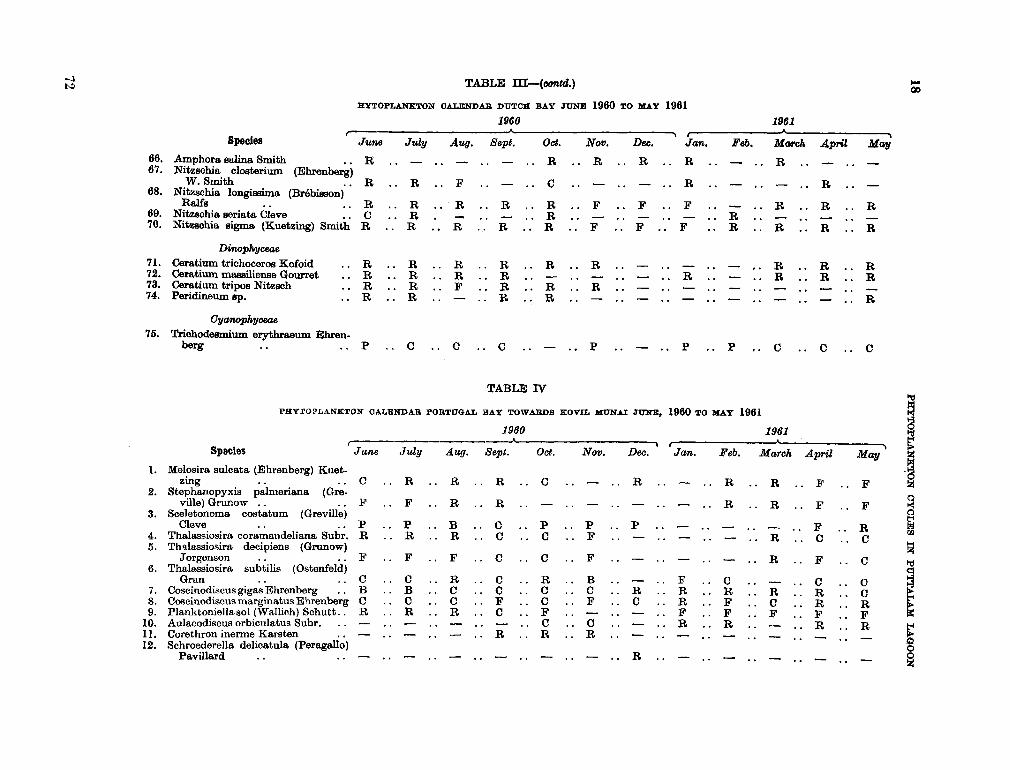
18
PHYTOPLANETON CYCLES HT PÜTTALAM LAGOON
3 I
I « l«
«
« l«
<-<} I
«
« |
«
«P
i
¡H «
I «
l«
««
[««
o E4 O
«O
o
»
1
S
T *
M
H
"-•S tf
tf &
« I
fc
I pe,
o ^
| «
I I s
4 a.
fc Ife
| M
o
««
«
« 1«
« î«
« l«
«
l««
««
««
««
h
«
««
g
««
««
^
K «
fio
p»
«
««
«
o
o
o
d d
d
c8
3^
Os * Í "s
09
«o
o
OU
«É
<«
S
«
«
|«
«
|«ofc
3
£ «
«
| I |
o«h
fc«
! I
I fe
««fe
tf
«
1 I
l«o I
I
PHPL, Ü
, Wofe
1 0
«
Aid
O
«
OO
fcü
«
§, «
«
oo
o
oofro
l«
=5
«
«
p3« ^
B
oo
B
«
«
fe, &
« fe
o
pq
o«
o i*<
ft«
fe
o
pq
o«
3 O
M
~
s 2
S
• & •
* fe
-S
-a 5
o
« g
>>? CL "
3 <S
-a
S I
111 .S- -*3
o 3
c3 «-t
o3
ta
S
bj
.3
O •
-
ï m 2
.° C .2 'm
P
'in
r*
m
bü to a
43 g^ g
H
H
C 3
'Sb 6 g g
3 3.S
3
» »-2 g
Hi? 8=9 .5 .S ^A °
'o
"o
q _
*
s s .s 3
bo o u
«fe £
9
^3 .
S'Ü
3.3
£•§
1 ID
I*
O
i
J3fc
O C
i
«O O
«oes
2?
I>C
0 0
10
HN
72
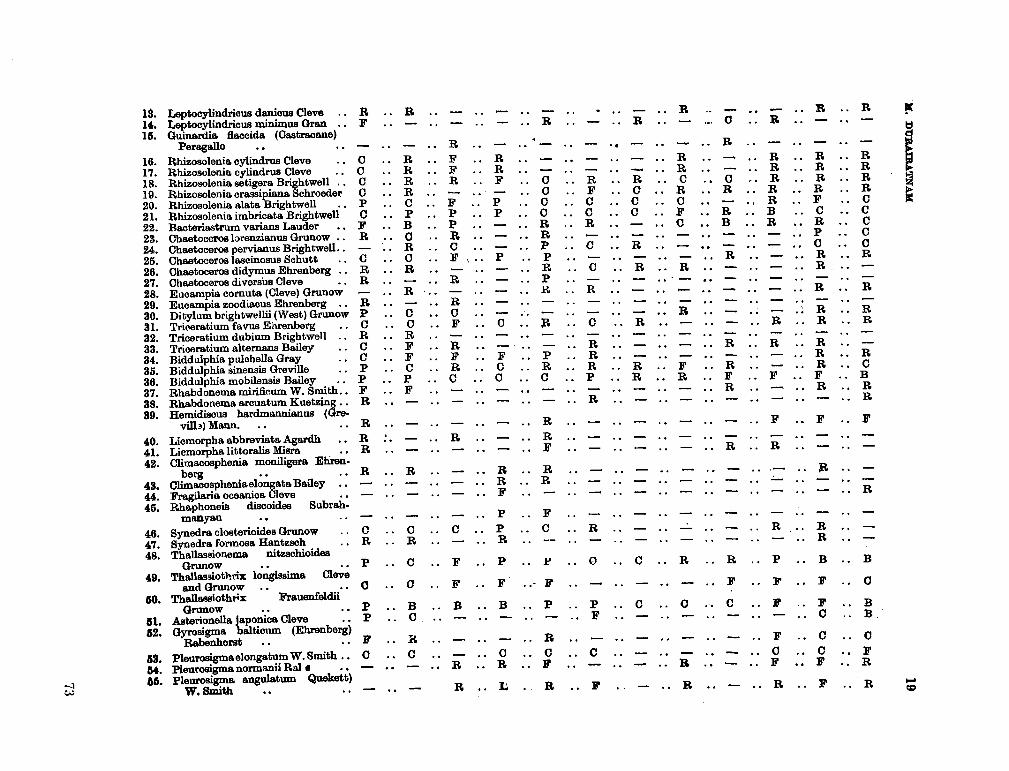
il. DU
BA
HtA
TN
AM
19
I m
mm
Pio
uc
>o
om
I I Pi Itftf
I ItíOpqP
ítfi fe
I
I ti «
o
mm
o fe
m «
« I
| BtiK
tffeO
Pta
ottK
I Pi
Pi |
P5P
5P5tfrtM
P»
lo
«
I lop
? |p
3M
PS
«P
iOp
îOfe
O
JtíOoo
Pîfe
oo
m
1*1
11
11« 11
p. |m
|
o I»
I Pi
oo
oo
sm
fe^
Pife
Pî
PiP
ife I PUPH
1 I Ife
I I I
«P
i l«
«P
ifeP
S I fe
I I
*
« les
I lh I I
i*
« iP
ifem
«III
I feci
I* I I Imp;!
I I
O IP
nP
îrtfc 1(4
PÍ. 1 IP
HP
ÜO
M
«
«P
R
Spfi
mm
m fe
NO o
oh fe
ml
PH
fe fe
I fe
O
ÜI *
m fe- o
I 1
I
I I m
lo
i I Irt «
O I
O
« I
o
! fe
*
1 o I fc
ft o ¡
i( fe
fe
I
P5 Ofe
Pi
|o | Ife
oo II
MI
«P
ifr fe
fe
rt fe
fe
w
I I o
«
3
m fefe« jpcfefertofe IPÍ Imofe
ipïfemo
PÜ
o I fe
fe m
m «
ti I | m
mm
moPH
mom
om 1 m
lo^
mfefeohfe
m
OK
O
D
mo
m
o
pîfe
i oü
oo
mo
fem
I ornm lP
Sfeom
oofefefePH
PÎ m
pi PÎ
DP
H fe
O
fe
fe
fe
O
î :g : : JÜ5 M
¡1
I'M :
i S|
•S-2 S
J-S*
3
.S .S «s
|
isa
s
8-9--3fe 111 fflQ
Q
11] O ai o5 S
T. a
, l %
m
'• '•
• S
3IÍ9
6
2 »i-=i
666 1 1.3.3-° 3
Ilill - s ¿S Tj
d o
B »
"S S o. -l a a g ||.a
.a.a
ll3 •2-2 a
o. a. 8 o .2 g S
-g-g
-g-o
-o^
•S'C 33 !5 3 ¿s 5 s
H H m m
m PÎ m
M
2á2
¿S
S3-á
33ááS
£K
SS
e3S
S¿
SS
&8*
73
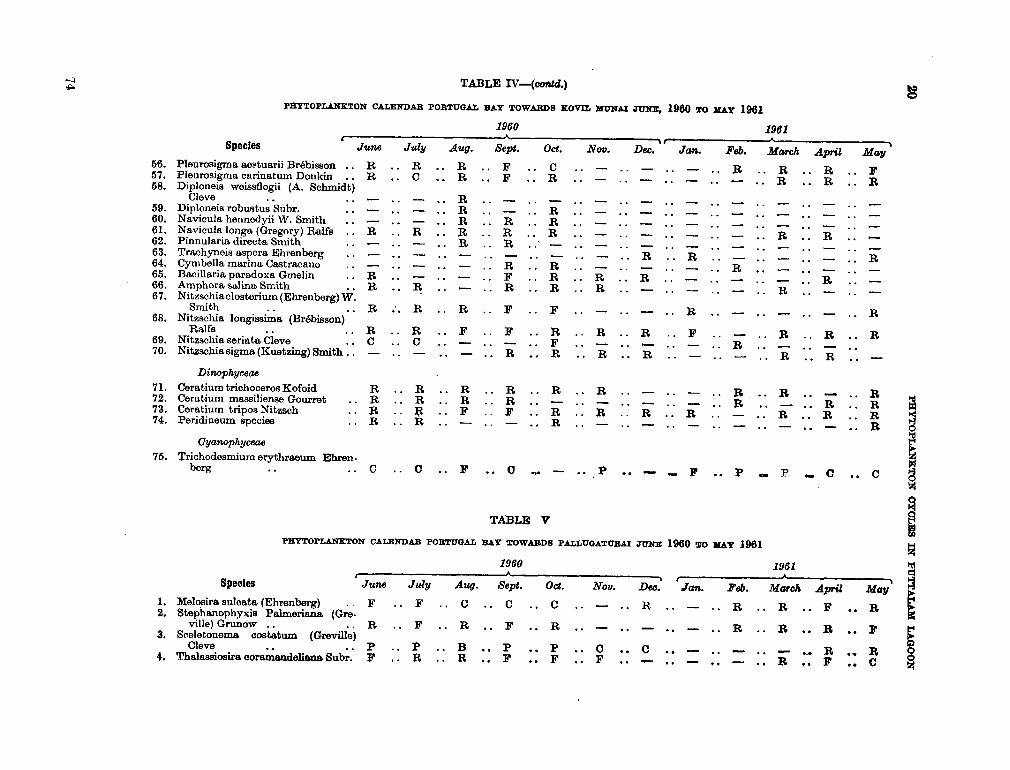
PHY
TOPLA
NK
TOST
OY
ÓLES IN
PTTTTALAM LA
GO
ON
fcfi
i I S
«
X fifi
1 a.
CO
!«
«
I «i
|l
l I I I I l
«l I
«
h
Í M
P5p
5rt I
fi&fi
PL
, fe I P
i
I"
fifi «
fif
ifif
i I I I 1
tí
hi
? «o
1
I «P
i 1 1
kl
1 Is
1 l!
!«
P3
Il fifi
«
«o
1
«o
1
* -
^
8»
S«
o
o c
>
i
í- O
O
SE
ft
-I '§
«
. Œ...
g CO
s c
« S
*• J2.S <s .2
es os "C " c
3*3
•§
0.2
.25
t» o
0
,0
« g-S
S
PO
CO ;q
0
S P 2
-O
H0
«g
a
S
es o >» |
S.-g'S IS
w
R e
-a o
s * «
o
X £
2 a
:.§
g/3 <D «3
•S a-l'a a H
i
ls
S¿?
OT
o S:
•Sfi 1
0
3
.9
•s
*
•c S
S §>
te
S
3 2 o o
« en
•+
3 +
3
fif
ifif
i
«|p
3 It
ffi
«|
«
«l«
l«
I «fi I
I I I l«
Ifi I
I «
l«
M
tó
I I I I I I M
l«S
I « I«
« IS
3' o
fi
Itífifi I Ifififi fc
«
&,
«
fi Ififi
Pn
fih
PÍtó
fL,
Pîfifi-fi
fif
ifif
i
Si. irai
g ¡z¡ ¡z; £
S O
H
-3 £
jz¡ 5
£
I* E B
Si
.§ s
3 a
a
Ci lu
i Ô
Ô&
© ! I
A4
h
•Mají
*•*
1 fi ;
fc ft :
fi
fio
• •
• • «fe
o «
fi Ifi
¡S
fi fi
I I
| o
tí
fcfc
s
O
O
¿ :
i I J if" 5>
3
I "i 2 M
S
s
e ta
a>
o M
jjîjlj O
lOH
IMM
Tj'IO
tDt*
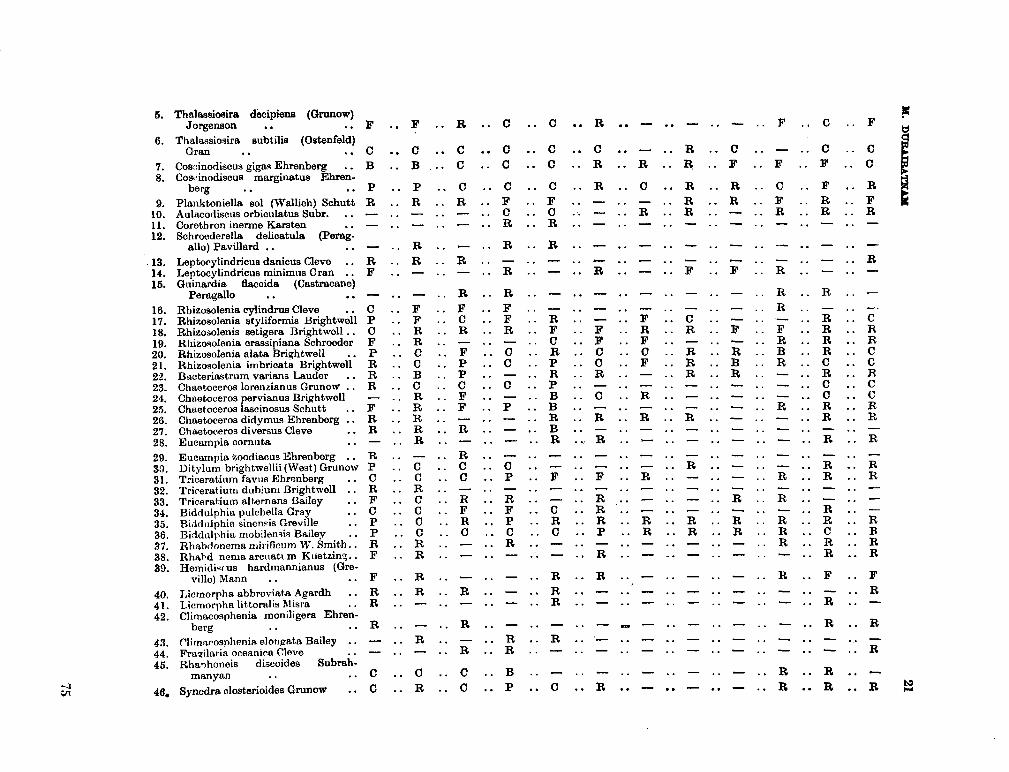
M.
DU
BAIEA
TNA
M
21
© o rt ft«
I I rt I
urtrto
orto
ortrt
I rt Irtrt
tíKA
A ft
M
«
«
o o
fe ft
rtr
t I 1
II Pi ¡«
««
«o
rtoo
rtrtlrt | «P
S I I «P
3UP
ÎP3
ft l«
«
II «
tf
ft I Pc
o ftr
t pq
« A
íftrtrtrt I I le
í Itf
|«
l««
P5 I
«
« rt
I D
hM
ll
lift I
I lftl«fflrtl I I I I I I I I Irtlrtrtll
Ml M
l II
I «
A A
rttf I
lift I I O
* l«P5« I I I A
I I I « I I I I «
« I I
IN
III
II
I I pq o
[rt | I
II I
IftrtftOft I |K
Irt 1 I I 1« 1 I l«« I I
1 I I
II
I M
:
: :
: : : :
: : :
:
::
::
::
::
::
::
::
::
::
::
::
: :' : :
6 :
:
: :
« O
K K
ill lis
I
I Iftftootí I o |« Irt lift Irtrtrtft Irt « I I
II
I Is
• •
o o
o o
puort
rt
I I
I Irtfto
rtPH
rtftHP
Qtím
rt I Ift I lo
rto II
« r
trt I
rt 1
lo
o o
o O
ho
rt
rt
Irt rtf
tftr
tloolo
lftlll
I oft I «
ftftort
I I II
Irttí «
ft
rt
o o o rt 1
I
Irtl
«fto
rtlf
tftP
no
ftf
tlrtlr
too
lrtf
trto
ll Irtl
rt
l« o
o
ft-
o m
ft r
t I 1
rt «
I I ftftrtrto
onortrtrtrttí lo
orto
oo
op
srt
« «
I 1 «
I o «
ft o
m
PH «
I I
I r
tft 1
ofto
ftftrtrtrt Ifttírt
I «fto
rtftoftftrtft
ft
«« r
t I I
o o
> • 2
O
,©
. tí
^
==• o
'I
2- -§
3
«"d
es
I =2
.'8 * •§
ja s
o es
.2
O h
tí
(B
3 '
•S CO iJ
2\3
•SP
1111 0 S §
1 2 J
•2 .9
bo
g
'Si
m
œ
S 3
o o
w 2
•5 -3
§
§£
? 'S
'V ©
a
M
-O
O O
O
O
•al •T3
lüll
til lÜ
li !í
•c-c
"D -O
C C
1!
TT
íl 1
III 1
£=
3-3
S
II
I (Q .*>» fe
O OT
(VI «3 *
C
» "2 S **
3 Ç j
â T
^•a
&'i*
•S ^ -r¡ 2
+» £
/ m
35
o
os
c3 o3
en o
3 aj
'S '5 'S'S'S ©
o ©
© ©
"o
"o "
o'o
'c
m
m m
cfi a)
O O
O O
O
M £
N N
_N
'£ '5 3 '-3 '-a
rtrtrtrtrt ©
§•«
§
*•
3
^
ffl «O
—
t-J £0
; *
~ 3
'*~ > e
o¡,j
"E 'C
N
.Û
03
C
a
> ©
© 60
I-I •s
il*
a ° g s
• Ss • •
. o • •
a © ©
llli,'i*fl*
5 ®
w
BÍÜ
14
¡ .2 ?
m
•si»
o .2
u
X
L.
O
O ©
4¿
•=
© s
rtmo
m
m co
tn
O
O O
O
h
h h
t<
©
© ©
oí
o o o
o
o o o
o
4
¿
^
«3
-
P
© o
© ©
es
¡B o3
es
-C s
i J3 -c
üü
üü
,_ © 'tí
bO
03 CO
§¿
H a S
a » S
""
"S
BS
cscsee .= .3 .2 le 3
3
V)
*J
-t-:
CL- C
ü.
c3 ç3
ç3 —- «-J
—
t- ti
t. 3 s S
©
© ©
XI T
) T3
-¿ *- .Sí .£; .£¡ -o
T3 ^
3
•—
*
•
•
-
—•
- —
=3
^
S 3
c3 '
HQ
HH
HP
3CÛ
M
HH
H
i-H i-i
i-I i-H
^
H i-H
(-H
C4 C
M C
4 C<l G
4 &4 9
4 C
l 94
C
4 CO «
C
O C
O C
O C
O C
O «
C
O C
O
T* ^
-^
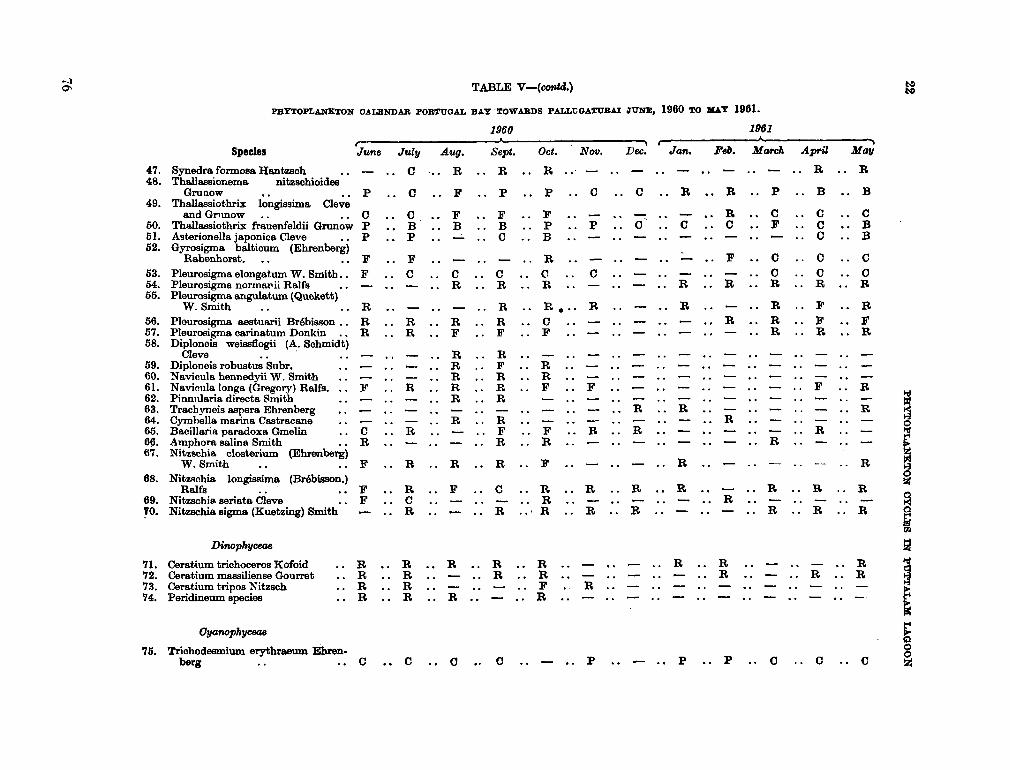
22
PH
YT
OÏL
AN
KT
ON
C
YC
LE
S IN
PTTTTA
LAM
LA
GO
ON
a s o
CO
o
| S
fl
oo
o o o
fi fe fe
pî
^
fi Ifi I I I
«
g U
l« I ! tf l
«
ft o
hl
oo
«
P5«pj
||
X
•
>$ |
«
PÍO
I h
|«
I fi
§ |
«
lo I
,1 I tf fi I I
M
o lo
J
I O
|P
4 |
I o
I « I I
II
« I
tí Ití
I I
Ifil
I fi
fill
tí Ifi
«
£ «
P
H fe
fep
q A
vfi
tí O
fe
Ififip
q
|«
tí fc
fe
tío
I o
tí
tí fih
tíf
etít
ítí
r «
fc fe
«
otí
fife fifitififi
•f o
o
offlp
n
h o
I I
títí «
« Ifi
fi ifi
. fc
rt fe
«
fifi
tífetí
tí o
Ití
tí 1 I
tí fell
fil «
fiofi
títí
tí
títí
tí fe
11
« I
««
&«
títí I I
tí I Ití
títítítí
fifififi
â3
-S
o
í fi! C fl C
1.2
.3 5
-s -s -ss h
b t>
g
666(5
O
-H
N
10
0
10
«O t- 00
"O lO
«5 O
iO^
CM
CO
-^-O
tO-t»
U
3C
PC
OC
OC
DC
0Œ
CD
C0
8S.
76
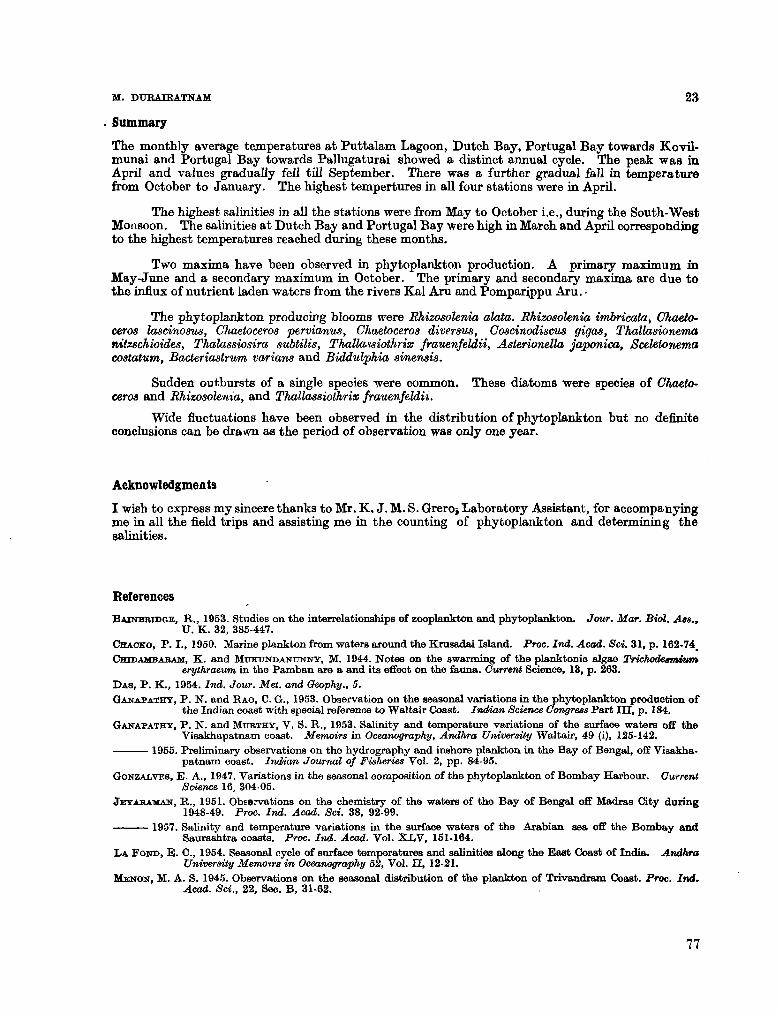
M . DTJRAIRATNAM 23
Summary
The monthly average temperatures at Puttalam Lagoon, Dutch Bay, Portugal Bay towards Kovil-munai and Portugal Bay towards Pallugaturai showed a distinct annual cycle. The peak was in April and values gradually fell till September. There was a further gradual fall in temperature from October to January. The highest tempertures in all four stations were in April.
The highest salinities in all the stations were from M a y to October i.e., during the South-West Monsoon. The salinities at Dutch Bay and Portugal Bay were high in March and April corresponding to the highest temperatures reached during these months.
T w o maxima have been observed in phytoplankton production. A primary m a x i m u m in May-June and a secondary m a x i m u m in October. The primary and secondary maxima are due to the influx of nutrient laden waters from the rivers Kal Aru and Pomparippu Aru. -
The phytoplankton producing blooms were Rhizosolenia alata. Rhizosolenia imbricata, Chaeto-ceros lascinosus, Chaetoceros pervianus, Chaetoceros diverses, Coscinodiscus gigas, Thallasionema nitzschioides, Thaktssiosira subtilis, ThaUatsiothrix frauenfeldii, Asterionella japónica, Scelelonema costatum, Bacteriastrum various and Biddulphia sinensis.
Sudden outbursts of a single species were c o m m o n . These diatoms were species of Chaetoceros and Rhizosolenia, and Thallassiothrix frauenfeldii.
Wide fluctuations have been observed in the distribution of phytoplankton but no definite conclusions can be drawn as the period of observation was only one year.
Acknowledgments
I wish to express m y sincere thanks to M r . K . J. M . S. Grero¡ Laboratory Assistant, for accompanying m e in all the field trips and assisting m e in the counting of phytoplankton and determining the salinities.
References
B A T N B B I D G E , R . , 1953. Studies on the interrelationships of zooplankton and, phytoplankton. Jour. Mar. Biol. Ass., U . K . 32, 385-447.
C H A C K O , P . I., 1950. Marine plankton from waters around the Krusadai Island. Proc. Ind. Acad. Sci. 31, p. 162-74,
C H I D A M B A R A M , K . and M U K U K D A N T T N N Y , M . 1944. Notes on the swarming of the planktonie algae Trichodesmium erythraeum in the Pamban are a and its effect on the fauna. Current Science, 13, p. 263.
D A S , P . K . , 1954. Ind. Jour. Met. and Oeophy., 5.
G A N A P A T H Y , P . N . and B A O , C. G . , 1953. Observation on the seasonal variations in the phytoplankton production of the Indian coast with special reference to Waltair Coast. Indian Science Congress Part III, p. 184.
G A N A P A T H Y , P . N . and M T J R T H Y , V . S. R . , 1953. Salinity and temperature variations of the surface waters off the Visakhapatnam coast. Memoirs in Oceanography, Andhra University Waltair, 49 (i), 125-142.
1955. Preliminary observations on the hydrography and inshore plankton in the Bay of Bengal, off Visakhapatnam coast. Indian Journal of Fisheries Vol. 2, pp. 84-95.
G O N Z A L V E S , E . A . , 1947. Variations in the seasonal composition of the phytoplankton of Bombay Harbour. Current Science 16, 304-05.
J K Y A B A M A N , R . , 1951. Observations on the chemistry of the waters of the Bay of Bengal off Madras City during 1948-49. Proc. Ind. Acad. Sci. 38, 92-99.
1957. Salinity and temperature variations in the surface waters of the Arabian sea off the Bombay and Saurashtra coasts. Proc. Ind. Acad. Vol. X L V , 151-164.
L A F O N D , E . C , 1954. Seasonal cycle of surface temperatures and salinities along the East Coast of India. Andhra University Memoirs in Oceanography 52, Vol. II, 12-21.
M E N O N , M . A . S. 1945. Observations on the seasonal distribution of the plankton of Trivandram Coast. Proc. Ind. Acad. Sci., 22, Sec. B , 31-62.
77
24 PHYTOPLANKTON OYOLBS IN PUTTAT.AM LAGOON
P R A S A D , R . R . , 1954. The characteristics of marina plankton at an inshore station in the Gulf of Mannar near ' Mandapam, Indian Journal of Fisheries I, 1-36.
1956. Further studies on the plankton of the inshore waters off Mandapam, Indian Journal of Fisheries 3, 1-42.
P R A S A D , R . R . and R A M A O K A T T O R A N N A I B , 1960. Observations on the distribution and occurrenoe of diatoms in the inshore waters of the Gulf of Mannar and Palk Bay, Indian Journal of Fisheries, Vol. 7, 49-68.
R A M A C H A N D R A N N A I R , P. V. , 1959. The marine plankton diatoms of Trivandram coast. Bull Bes. Inst. Univ. Kerala ser. C, 1-63.
S B W E L L , R . B . , S, 1937. Oceans round India. From " an outline of the Field Sciences of India " Ind. Soi. Conor. Assn. 17-41.
1955. A study of the Sea Coast of Southern Arabia, Proc. Linn. Soe. Land. (Session 1952-53) Part H . S U B R A M A N Y A N , R . , 1946. A systematic account of the marine plankton diatoms of the-Madras Coast, Proc. Ind.
Acad. Sci. Vol. X X I V , 85-197. 1958. Ecological studies of the marine phytoplankton of the West Coast of India. Mem. Ind. Bot. Soe., 1.
145-151. 1959. Studies on the phytoplankton of the West Coast of India. Proc. Ind. Acad. Sci. 50B, 113-187.
78
Reprinted from J. oceanogr. Soc. Japan, vol. 19, no. 4, 1964, p. 22.28.
Primary Production in the Antarctic Ocean*
Yatsuka S A I J O * * and Takuji K A W A S H I M A * * *
Abstract: Studies on primary production were made in the Antarctic Ocean, between 40°W and 100CE, during December 1961 to February 1962. At ten stations, cblorophyll-a and photo-synthetic rate were determined for sample waters from surface as well as the depth of Secchi disk reading, and at other 35 stations only chlorophyll-a in surface water was determined. At most of the stations the chlorophyll-a contents were very low (/'. e. 0.02 to 0.22 m g / ' m ' ) except at a few stations where higher values, (/. e. 0.3-0.6 g / m ' ) were obtained. T h e photosynthetic rates determined by " C technique under the optimum light ranged from 0.06 to 0.8Q m g C / m 1 / hr, and the mean value of photosynthesis per unit amount of chlorophyll was 1.22 m g C / m g chl./hr. T h e daily primary production beneath a unit surface, calculated from the above results and light data were ranged from 0.01 to 015 g C / m V d a y . After consideration about the high concentration of nutrients in the sample waters and rather plenty incident radiation during this period, it was concluded that such low values of primary production in the Antarctic Ocean might be caused by the near freezing water temperature and deep mixing layer in that area.
1. Introduction
In the study of primary production in the
sea, the Antarctic Ocean might be one of the
most interesting field because of its character
istic environmental conditions, such as long
day- or night-time, low water temperature
and high concentration of inorganic nutrients.
Valuable observations have been reported on
the species and quantitative distribution of
plankton in this ocean, however, only a few
results have yet appeared in the available
publications concerning the phytoplankton
production by recently developed U C and
chlorophyll techniques.
During the Antarctic summer of 1958-59,
B U R K H O L D E R and SlEBURTH (1961) made the
studies on chlorophyll-a content in waters
along the western coast of the Antarctic
Peninsula on the Argentine Hydrographie ship
" Chiriguano " and icebreaker " San Martin."
In January-March 1959, D Y S O N (IGY Oceano
graphy Report, N o . 4, 1961) made the measure
ments on primary production by 1 4 C technique
and plant pigment determination in the area
•Received Oct. 4, 1963 ** Water Research Laboratory, Faculty of Science,
Nagoya University **== Institute of Chemistry. Faculty of Science,
Nagoya University
between 110° • and 160° E until 66339' S on
board Australian ship " Magga Dan." But
studied area by these researches are quite
limited and insufficient to know the general
feature of primary production in that ocean.
From December 1961 to February 1962, during
the cruise of " Umitaka-maru " (the trainning
and research ship of Tokyo University of
Fisheries) one of the authors, K A W A S H I M A
had an opportunity to collect the samples for
primary production in the Antarctic Ocean
while his work on chemical analysis of sea
water. The measurement of 1 4 C activity and
chlorophyll-a analysis on filtered samples were
made at senior author's laboratory.
2 . A r e a studied a n d m e t h o d
T h e studied area w a s between 40 D W and
100°E, mainly the region so-called Atlantic-
Indian Antarctic basin which covers about one
third of the sea surrounding Antarctica. A t
ten stations, the sample waters were collected
with a plastic V a n D o r n sampler from surface
and the depth of Secchi disk reading. F o r
measuring chlorophyll-a content, normally five
liter samples from each depth were filtered
with M e m b r a n e N o . 1 filters, then treated
with steam for about 30 seconds and kept in a
desiccator at dark place. H a v i n g been brought
80 Collected reprints of the International Indian Ocean Expedition, vol. IV, contribution no. 207
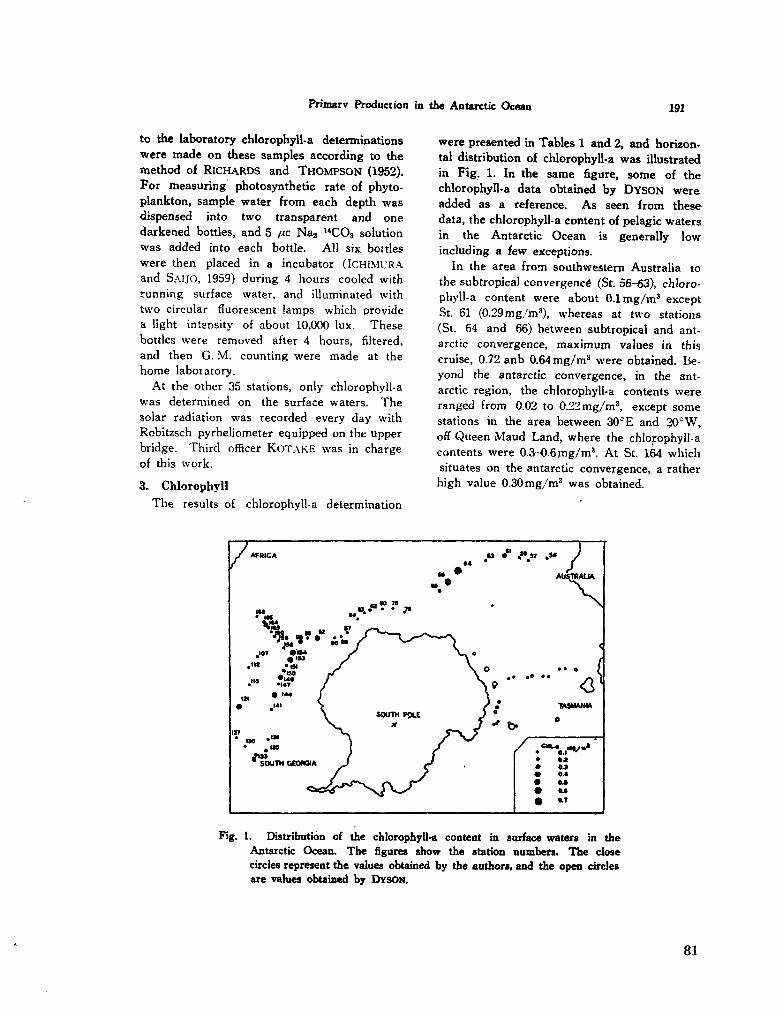
Primary Production in the Antarctic Ocean 191
to the laboratory chlorophyll-a determinations were m a d e on these samples according to the method of RICHARDS and T H O M P S O N (1952). For measuring photosynthetic rate of phyto-plankton, sample water from each depth was dispensed into two transparent and one darkened bottles, and 5 /¿c N a 2
l 4 C 0 3 solution was added into each bottle. All six bottles were then placed in a incubator (ICHIML'RA and S A I J O , 1959) during 4 hours cooled with running surface water, and illuminated with two circular fluorescent lamps which provide a light intensity of about 10,000 lux. These bottles were removed after 4 hours, filtered, and then G . M . counting were m a d e at the h o m e laboiatcry.
At the other 35 stations, only chlorophyll-a was determined on the surface waters. T h e solar radiation was recorded every day with Robitzsch pyrheliometer equipped on the upper bridge. Third officer K o T A K E was in charge of this work.
3. Chlorophyll
T h e results of chlorophyll-a determination
were presented in Tables 1 and 2, and horizontal distribution of chlorophyll-a was illustrated in Fig. 1. In the same figure, some of the chlorophyll-a data obtained by D Y S O N were added as a reference. A s seen from these data, the chlorophyll-a content of pelagic waters in the Antarctic Ocean is generally low including a few exceptions.
In the area from southwestern Australia to the subtropical convergence (St. 56-63), chlorophyll-a content were about 0.1 m g / m 3 except St. 61 (0 .29mg/m 3 ) , whereas at two stations (St. 64 and 66) between subtropical and antarctic convergence, m a x i m u m values in this cruise, 0.72 anb 0.64 m g / m 3 were obtained. Beyond the antarctic convergence, in the antarctic region, the chlorophyll-a contents were ranged from 0.02 to 0.22 m g / m 3 , except some stations in the area between 30 = E and 2 0 ° W , off Queen M a u d Land, where the chlorophyll-a contents were 0 . 3 - 0 . 6 m g / m 3 . At St. 164 which situates on the antarctic convergence, a rather high value 0.30 m g / m 3 was obtained.
/ AFRICA
IM • MS
JOT ma* .it* /%,
• B O
• .'" X.
flM * SOUTH GEORGIA
M . " '
•7
SOUTH P O U
X
w
•
« •" ¡» .4 •
•
•
\ — 0
\ ° \ 9
\ O
J ' f>
/
w
AUSTRALIA
\
<
• • 0 S
TASMANIA
0
. c ~- - . -v -»
1 ••
••••
0J OJ 04 0.S M O.T
Fig. 1. Distribution of the chlorophyll-a content in surface waters in the Antarctic Ocean. The figures show the station numbers. The close circles represent the values obtained by the authors, and the open circles are values obtained by DYSON.
81
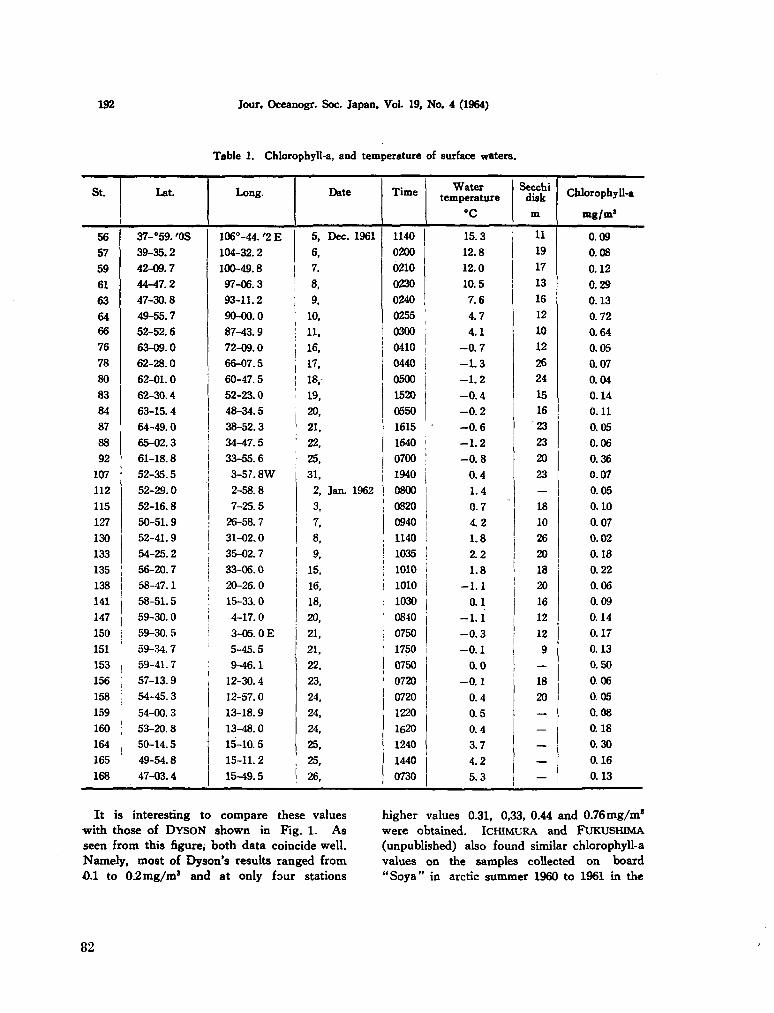
192 Jour. Oceanogr. Soc. Japan, Vol. 19, No. 4 (1964)
Table 1. Chlorophyll-a, and temperature of surface waters.
St.
56
57
59
61
63
64 66
76
78
80
83
84
87
88
92
107
112
115
127
130
133
135
138
141
147
150
151
153
156
158
159
160
164
165
168
Ut.
37-"59. 'OS
39-35.2
42-09.7
44-47.2
47-30.8
49-55.7
52-52.6
63-09.0
62-28.0
62-01.0
62-30.4
63-15.4
64-49.0
65-02.3
61-18.8
52-35.5
52-29.0
52-16.8
50-51.9
52-41.9
54-25.2
56-20.7
58-47.1
58-51.5
59-30.0
59-30. 5
59-34.7
59-41.7
57-13.9
54-45. 3
54-00. 3
53-20.8
50-14.5
49-54.8
47-03.4
Long.
106°-44. '2 E
104-32.2
100-49.8
97-06.3
93-11.2
90-00.0
87-43.9
72-09.0
66-07.5
60-47.5
52-23.0
48-34.5
38-52.3
34-47.5
33-55.6
3-57.8W
2-58.8
7-25.5
26-58.7
31-02.0
35-02.7
33-06.0
20-26.0
15-33.0
4-17.0
3-05.0 E
5-45.5
9-46.1
12-30.4
12-57.0
13-18.9
13-48.0
15-10. 5
15-11. 2
15-49.5
Date
5, Dec. 1961
6,
7.
8,
9,
10,
11. 16,
17,
18.
19,
20,
21,
22,
25,
31,
2, Jan. 1962
3,
7,
8,
9,
15,
16,
18,
20,
21,
21,
22,
23,
24,
24,
24,
25,
25,
26,
Time
1140
0200
0210
0230
0240
0255
0300
0410
0440
0500
1520
0550
1615
1640
0700
1940
0800
0820
0940
1140
1035
1010
1010
1030
0840
0750
1750
0750
0720
0720
1220
1620
1240
1440
0730
Water temperature
°C
15.3
12.8
12.0
10.5
7.6
47
4.1
-0.7
-1.3
-1.2
-0.4
-0.2
-0.6
-1.2
-0.8
0.4
1.4
0.7
4.2
1.8
2.2
1.8
-1.1
0.1
-1.1
-0.3
-0.1
0.0
-0.1
0.4
0.5
0.4
3.7
4.2
5.3
Secchi disk
m
11
19
17
13
16
12
10
12
26
24
15
16
23
23
20
23
—
18
10
26
20
18
20
16
12
12
9
—
18
20
—
—
—
—
—
Chlorophyll-a
mg/m*
0.09
0.08
0.12
0.29
0.13
0.72
0.64
0.05
0.07
0.04
0.14
0.11
0.05
0.06
0.36
0.07
0.05
0.10
0.07
0.02
0.18
0.22
0.06
0.09
0.14
0.17
0.13
0.50
0.06
0.05
0.08
0.18
0.30
0.16
0.13
It is interesting to compare these values •with those of D Y S O N shown in Fig. 1. A s seen from this figure, both data coincide well. Namely, most of Dyson's results ranged from Û.1 to 0 ^ m g / m 3 and at only four stations
higher values 0.31, 0,33, 0.44 and 0.76 m g / m ' were obtained. ICHIMURA and F U K U S H I M A (unpublished) also found similar chlorophyll-a values on the samples collected on board "Soya" in arctic summer 1960 to 1961 in the
82
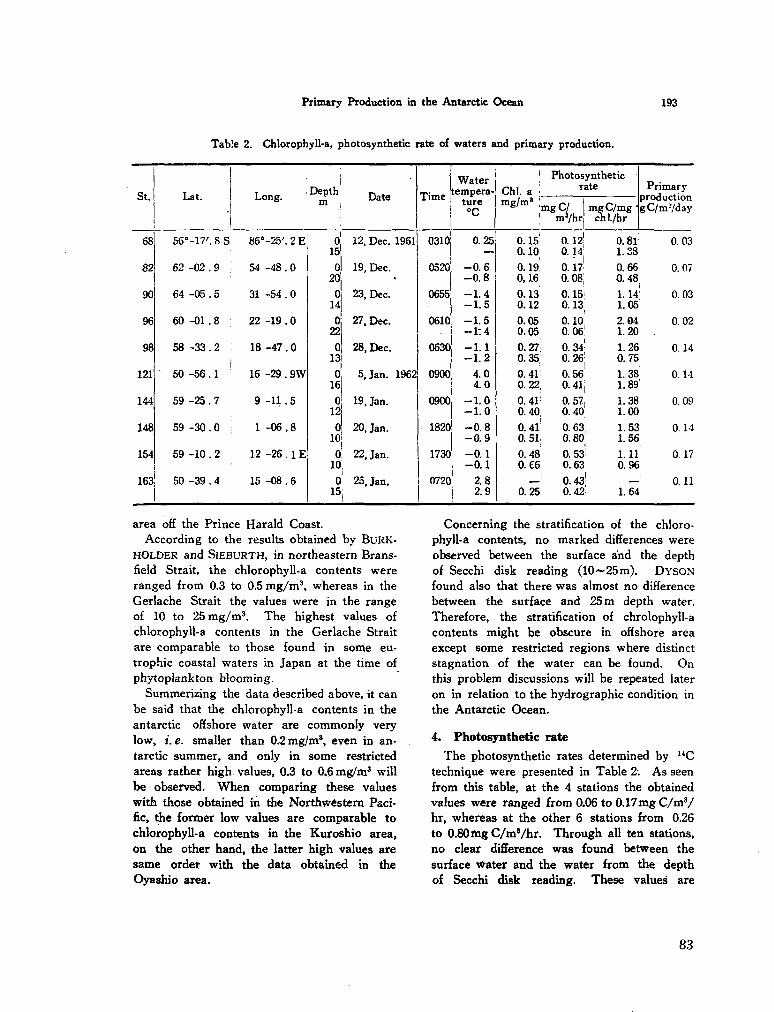
Primary Production in the Antarctic Ocean 193
Table 2. Chlorophyll-a, photosynthetic rate of waters and primary production.
St.
68
82
90
96
98
121
144
148
154
163
Lat.
56°-17'. S S
62 -02 .9
64 -05 . 5
60 -01 . 8
58 -33 . 2
~ 50 -56 .1
59 -25 . 7
59 -30 . 0
59 -10 . 2
50 -39 .4
Long.
86°-25'. 2 E
54 -48 . 0
31 -54 . 0
22 -19 . 0
18 - 4 7 . 0
16 -29 . 9 W
9 - 1 1 . 5
1 - 0 6 . 8
12 -26 .1 E
15 -08 . 6
Depth m
â 0
20
0 14
0 22
0 13
0 16
0 12
0 10
0 10
0 15
Date
12, Dec. 1961
19, Dec.
23, Dec.
27, Dec.
28, Dec.
5, Jan. 1962
19, Jan.
20, Jan.
22, Jan.
25, Jan.
T ime
0310
0520
0655
0610
0630
0900
0900
1820
1730
0720
Water tempera
ture °C
0.25
- 0 . 6 - 0 . 8
- 1 . 4 - 1 . 5
- 1 . 5 - 1 : 4
- 1 . 1 - 1 . 2
4 .0 4 . 0
- 1 . 0 - 1 . 0
- 0 . 8 - 0 . 9
- 0 . 1 - 0 . 1
2.8 j 2.9
1
Chi . a • m g / m 3 ;n
l
0.15 0.10
0.19 0,16
0.13 0.12
0.05 0.05 0.27Í 0.35; 0 .4L 0.22,
0.411
0.40 0.41 0. 51;' 0.48 0. £6
1
0.25
Photosynthetic rate
lgC/ m g C / m g m3 /hr chl./hr
0.12! 0.81 0.14! 1. 38 0.17 0. 66 0. 08; 0. 48
0.15; 1.14 0.13 1. 05 0.10! 2. 04 0. 06! 1. 20
0. 34! 1. 26 0. 26: 0. 75 0. 56 1. 38 0. 41; 1. 89
0. 57, 1. 38 0. 40' 1. 00
0.63, 1. 53 0.80 1. 56
j
0. 53 1.11 0.63 0. 96
0.43Í -0 .42 1. 64
Primary production g C / m 2 / d a y
0.03
0.07
0.03
0.02
0.14
0.14
0.09
0.14
0.17
0. H
area off the Prince Harald Coast.
According to the results obtained by B u R K -H O L D E R and SiEBURTH, in northeastern Brans-field Strait, the chlorophyll-a contents were ranged from 0.3 to 0.5 m g / m 3 , whereas in the Gerlache Strait the values were in the range of 10 to 25 m g / m 3 . The highest values of chlorophyll-a contents in the Gerlache Strait are comparable to those found in some eu-trophic coastal waters in Japan at the time of phytoplankton blooming.
Summerizing the data described above, it can be said that the chlorophyll-a contents in the antarctic offshore water are commonly very low, 1. e. smaller than 0.2 m g / m s , even in antarctic summer , and only in some restricted areas rather high values, 0.3 to 0.(5 m g / m 3 will be observed. W h e n comparing these values with those obtained in the Northwestern Pacific, the former low values are comparable to chlorophyll-a contents in the Kuroshio area, on the other hand, the latter high values are same order with the data obtained in the Oyashio area.
Concerning the stratification of the chlorophyll-a contents, no marked differences were observed between the surface and the depth of Secchi disk reading (10~25m). D Y S O N found also that there was almost no difference between the surface and 25 m depth water. Therefore, the stratification of chrolophyll-a contents might be obscure in offshore area except some restricted regions where distinct stagnation of the water can be found. O n this problem discussions will be repeated later on in relation to the hydrographie condition in the Antarctic Ocean.
4 . Photosynthetic rate
The photosynthetic rates determined by 1 4 C technique were presented in Table 2: A s seen from this table, at the 4 stations the obtained values were ranged from 0.06 to 0.17 m g C / m 3 / hr, whereas at the other 6 stations from 0.26 to 0.80 m g C / m '/hr. Through all ten stations, no clear difference was found between the surface water and the water from the depth of Secchi disk reading. These values are
83
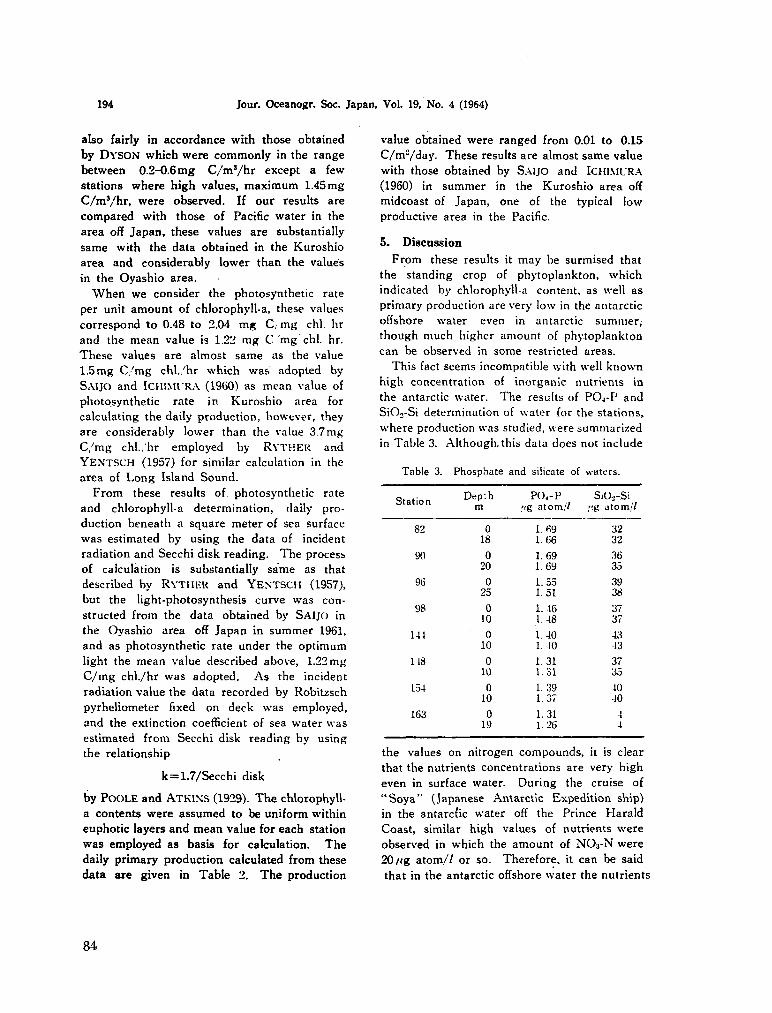
194 Jour. Oceanogr. Soc. Japan, Vol. 19, No. 4 (1964)
also fairly in accordance with those obtained
by D Y S O N which were commonly in the range
between 0.2-0.6 m g C / m 3 / h r except a few
stations where high values, m a x i m u m 1.45mg
C / m 3 / h r , were observed. If our results are
compared with those of Pacific water in the
area off Japan, these values are substantially
same with the data obtained in the Kuroshio
area and considerably lower than the values
in the Oyashio area.
W h e n w e consider the photosynthetic rate
per unit amount of chlorophyll-a, these values
correspond to 0.48 to 2.04 m g C , m g chl. hr
and the m e a n value is 1.22 m g C m g chl. hr.
These values are almost same as the value
1 . 5 m g C / m g chl./hr which was" adopted by
S A I J O and IcniMl'RA (1960) as m e a n value of
photosynthetic rate in Kuroshio area for
calculating the daily production, however, they
are considerably lower than the value 3 . 7 m g
C / m g chl./hr employed by R V T H E K and
Y E N T S C H (1957) for similar calculation in the
area of L o n g Island Sound.
F r o m these results of. photosynthetic rate
and chlorophyll-a determination, daily pro
duction beneath a square meter of sea surface
was estimated by using the data of incident
radiation and Secchi disk reading. T h e process
of calculation is substantially same as that
described by R Y T H E R and Y E N T S C H (1957),
but the light-photosynthesis curve was con
structed from the data obtained by SAIJO in
the Oyashio area off Japan in s u m m e r 1961,
and as photosynthetic rate under the optimum
light the m e a n value described above, 1.22 m g
C / m g chl./hr was adopted. A s the incident
radiation value the data recorded by Robitzsch
pyrheliometer fixed on deck was employed,
and the extinction coefficient of sea water was
estimated from Secchi disk reading by using
the relationship
k = 1.7/Secchi disk
by P O O L E and A T K I N S (1929). T h e chlorophyll-
a contents were assumed to be uniform within
euphotic layers and m e a n value for each station
was employed as basis for calculation. T h e
daily primary production calculated from these
data are given in Table 2. T h e production
value obtained were ranged from 0.01 to 0.15
C / m 2 / d a y . These results are almost same value
with those obtained by SAIJO and ICHIML'RA
(1960) in s u m m e r in the Kuroshio area off
midcoast of Japan, one of the typical low
productive area in the Pacific.
5. Discussion
F r o m these results it m a y be surmised that
the standing crop of phytoplankton, which
indicated by chlorophyll-a content, as well as
primary production are very low in the antarctic
offshore water even in antarctic s u m m e r ;
though m u c h higher amount of phytoplankton
can be observed in some restricted areas.
This fact seems incompatible with well k n o w n
high concentration of inorganic nutrients in
the antarctic water. The results of P 0 4 - P and
SiO.-Si determination of water for the stations,
where production was studied, were summarized
in Table 3. Although, this data does not include
Table 3. Phosphate and silicate of waters.
Station
82
90
96
98
111
148
154
163
Dep-.h m
0 18
0 20
0 25
0 10
0 10
0 10
0 10
0 19
P O , - P ,vg atom//
1.69 1.66
1.69 1.69
1. 55 1.51
1.46 1.48
1.40 1.40
1.31 1.31
1.39 1.37
1.31 1.26
SiO..-S¡ ,'!g atom/7
32 32
36 35
39 38
37 37
43 43
37 35
40 40
1 4
the values on nitrogen c o m p o u n d s , it is clear
that the nutrients concentrations are very high
even in surface water. D u r i n g the cruise of
" S o y a " (Japanese Antarctic Expedition ship)
in the antarctic water off the Prince Harald
Coast, similar high values of nutrients w e r e
observed in w h i c h the a m o u n t of N O 3 - N w e r e
20/(g a t o m / / or so. Therefore, it can b e said
that in the antarctic offshore water the nutrients
84
Primary Production in the Antarctic Ocean 195
condition will not usually become a limiting
factor for phytoplankton production.
As a next step to analyse the factors regulat
ing the primary production, it will be neces
sary to consider about the solar radiation in
the Antarctic Ocean. Kimball's table (1928)
on the distribution of incident radiation shows
that the average amount of radiation from
sun and sky at the location 60CS, 45C'W is in
the range from 0.204 to 0.221 g cal/cm2 min
from November to January, these values are
approximately same as those obtained at the
location 30°N, 6 7 - 7 7 ' W or 128-130 E in March
or September. If fact the solar radiation data,
recorded on "Umitaka-maru " during this
cruise, gave considerably high amount of radi
ation. The maximum radiation was 65 g cal/
cm-/hr, which corresponds to about 70.000 lux
as the intensity of illumination. The length
of daytime was also very long in comparison
with that of the region in temperate latitude.
These results show clearly the fact that at
water surface the incident radiation is sufficient
for photosynthetic activity of phytoplankton in
the Antarctic Ocean during a summer period.
It is well known fact that the photosynthetic
rate of phytoplankton generally decreases with
the lowering of water temperature. S.UJO and
S A K A M O T O (unpublished) found in some Japan
ese lakes in winter that the rate of photo
synthesis per unit amount of chlorophyll-a are
consistently low near the freezing temperature
regardless of their nutrient concentration. This
phenomena may be one of the important reason
for low photosynthetic rate and low primary
production in the antarctic water where high
nutrient contents were observed It will be
necessary to consider the problem of vertical
stability of the water as an another reason for
the low primary production in that area. In
high latitudes, the average plant cell does not
receive sufficient light to grow when the depth
of mixed layer is deeper than that of euphotic
layer and the phytoplankton production remains
at low level. This phenomena was discussed
precisely by S V E R D R I T (1953) and others as
the problem of so-called critical depth.
During the previous cruise of "Umitaka-
maru" in the Antarctic Ocean from December
1956 to January 1957, the immense phyto
plankton bloom was found only in the area
where marked change of <7t in a vertical
direction was observed. In this cruise there
was no such clear relation between the phyto
plankton standing crop and vertical difference
of <rt. However, it is quite probable that the
vertical mixing takes place easily even to the
much deeper layer than the depth of euphotic
layer because the surface water temperatures
were near the freezing point and the vertical
differences of <rt were generally very small in
the area studied.
From the results presented here, it can be
concluded that the chlorophyll-a a content and
primary production in the Antarctic offshore
water is generally very low in spite of its high
concentration of nutrients. As the reasons of
these low values two facts were considered.
The one is low photosynthetic rate of phy
toplankton caused by near freezing water
temperature, and the other is the insufficience
of submarine light for growing of phytoplank
ton as a result of the low stability of the
waters in the upper layer.
Acknowledgements
The cooperation given by the late Prof. T .
Kl'MAOORl, Captain K . O Z A W A , his officers and
crew, is gratefully acknowledged. Our heart
felt appreciation is extended to Dr. M . IsHlNO
of the Tokyo University of Fisheries, for his
kind permission to use data from his physical
and chemical observations. W e owe much to
Miss. J. B A N N O and M r . K . O o i Y A M A for their
assistance on radiation counting and pigment
analysis.
References
B U R K H O U D D R , P. R. and J. M . S I E B U R T H (1961):
Phytoplankton and chlorophyll in Gerlache and Bransfield Straits of Antarctica. Limnol. Ocea-nogr., 6, 45-52.
1CHIMURA. S. and Y . SAIJO (1959): Chlorophyll content and primary production of the Kuroshio off the southern midcoast of Japan. Bot. Mag. Tokyo, 72. 193-202.
IGY World Data Center A, Oceanography (1961): Production measurements in the world . ocean.
85
196 Jour. Oceanogr. Soc. Japan, Vol. 19, No . 4 (1964)
part II. I G Y Oceanography Report, N o . 4, 517-519.
KlMBALL, H . H . (1928): Amount of solar radiation that reaches the surface of the earth on the land and on the sea, and the method by which it is measured. M o n Weath. Rev., 56, 393-398.
P O O L E , H . H . and W . G . R . A T K I N S (1929): Photoelectric measurements of submarine illumination throughout the year. Jour. Mar. Biol. Assoc. U . K . , 16, 279-324.
R I C H A R D S , F . A . and T . G . T H O M P S O N (1952): The
estimation and characterization of plankton population by pigment analysis. II. A spectro
photometry method ror the estimation of plankton pigments. Jour. Mar . Res., 11, 156.
R Y T H E R , J . H . and C.S. Y E N T S C H (1957): The estimation of photoplankton production in the ocean from chlorophyll and light data. Limnol. Oceanogr., 2, 281-286.
S A I J O , Y . and S. ICHIMURA (1950): Primary production in the northwestern Pacific Ocean. Jour. Oceanogr. Soc. Jap., 16, 139-145.
S V E R D R U P , H . U . (1953): O n conditions for the vernal blooming of phytoplankton. Jour. Cons. Int. Explor. Mer, 18. 287-295.
86
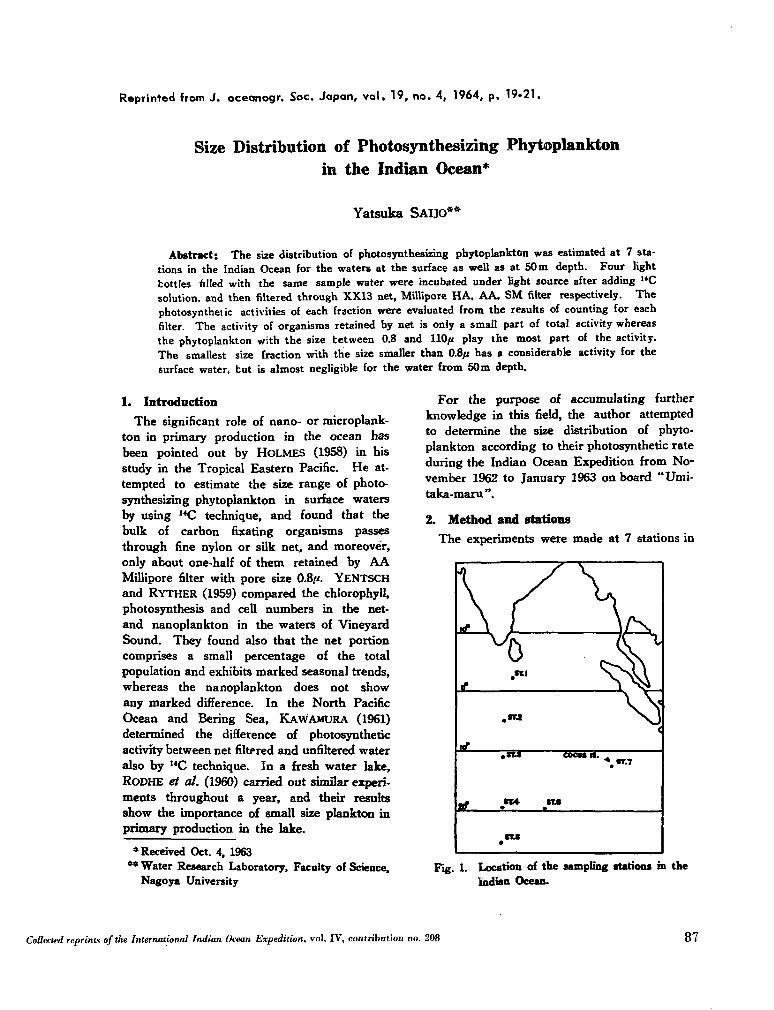
Reprinted from J. oceonogr. Soc. Japan, vol. 19, no. 4, 1964, p. 19-21.
Size Distribution of Photosynthesizing Phytoplankton in the Indian Ocean*
Yatsuka SAIJO**
Abstract; The size distribution of photosynthesizing phytoplankton was estimated at 7 stations in the Indian Ocean for the waters at the surface as well as at 50 m depth. Four light bottles filled with the same sample water were incubated under light source after adding U C solution, and then filtered through X X 1 3 net, Millipore H A , A A , S M filter respectively. The photosynthetic activities of each fraction were evaluated from the results of counting for each filter. The activity of organisms retained by net is only a small part of total activity whereas the phytoplankton with the size between 0.8 and 110ft play the most part of the activity. The smallest size fraction with the siie smaller than 0.8ft has a considerable activity for the surface water, but is almost negligible for the water from 50m depth.
1. Introduction
T h e significant role of nano- or microplank-ton in primary production in the ocean has been pointed out by H O L M E S (1958) in. his study in the Tropical Eastern Pacific. H e attempted to estimate the size range of photosynthesizing phytoplankton in surface waters by using M C technique, and found that the bulk of carbon fixating organisms passes through fine nylon or silk net, and moreover, only about one-half of them retained by A A Millipore filter with pore size O.S>. Y E N T S C H and R Y T H E R (1959) compared the chlorophyll, photosynthesis and cell numbers in the net-and nanoplankton in the waters of Vineyard Sound. They found also that the net portion comprises a small percentage of the total population and exhibits marked seasonal trends, whereas the nanoplankton does not show any marked difference. In the North Pacific Ocean and Bering Sea, K A W A M U R A (1961) determined the difference of photosynthetic activity between net filtpred and unaltered water also by U C technique. In a fresh water lake, R O D H E et al. (1960) carried out similar experiments throughout a year, and their results show the importance of small size plankton in primary production in the lake.
* Received Oct. 4, 1963 ** Water Research Laboratory, Faculty of Science,
Nagoya University
For the purpose of accumulating further knowledge in this field, the author attempted to determine the size distribution of phytoplankton according to their photosynthetic rate during the Indian Ocean Expedition from N o vember 1962 to January 1963 on board " U m i ta ka-maru".
2 . Method and stations
T h e experiments were m a d e at 7 stations in
\ if
f
if
*r
j v 0
. t t l
.Itl
.«ta
• M
•
RI
•
/
ST*
\
A x^ s \ Si
V X
coces ». „ \«r.7
\
L i
0 <
Fig. 1. Location of the sampling stations in the Indian Ocean.
Collected reprints of the International Indian Ocean Expedition, vol. IV, contribution no. 208 87
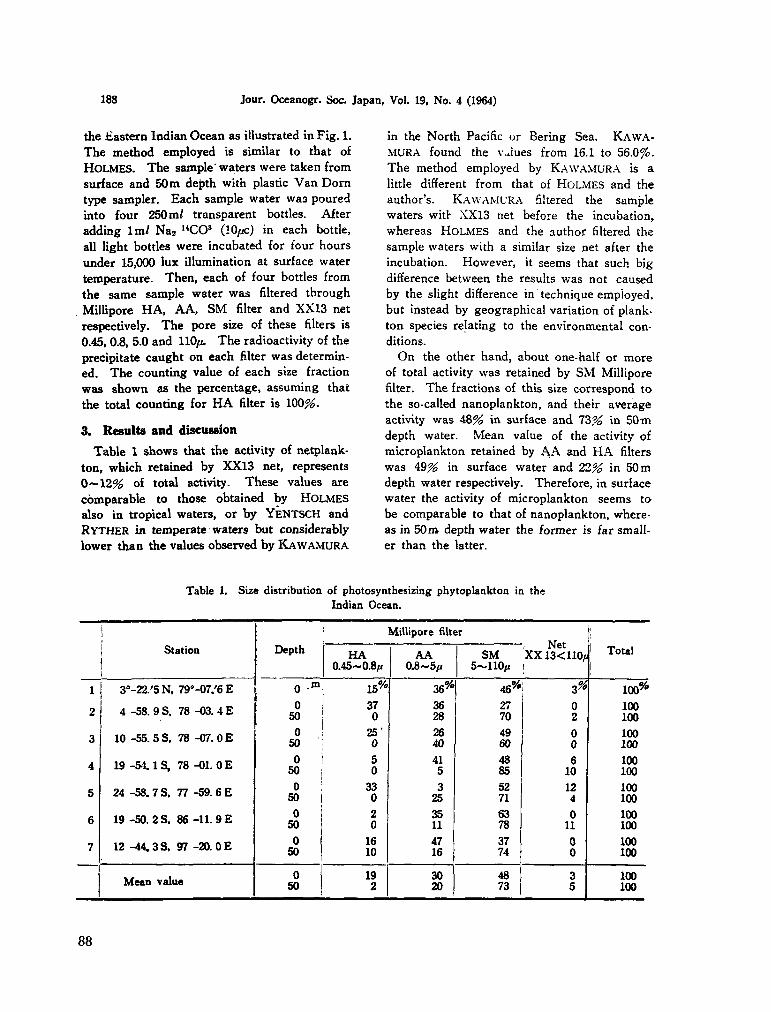
188 Jour. Oceanogr. Soc. Japan, Vol. 19, N o . 4 (1964)
the Eastern Indian Ocean as illustrated in Fig. 1.
The method employed is similar to that of
H O L M E S . T h e sample waters were taken from
surface and 50 m depth with plastic V a n Dorn
type sampler. Each sample water was poured
into four 250 m / transparent bottles. After
adding l m / N a 2 " C O 3 (lOftc) in each bottle,
all light bottles were incubated for four hours
under 15,000 lux illumination at surface water
temperature. Then , each of four bottles from
the same sample water was filtered through
Millipore H A , A A , S M filter and X X 1 3 net
respectively. T h e pore size of these filters is
0.45, 0.8, 5.0 and 110/t T h e radioactivity of the
precipitate caught on each filter was determin
ed. T h e counting value of each size fraction
was shown as the percentage, assuming that
the total counting for H A filter is 100%.
3 . Results and discussion
Table 1 shows that the activity of netplank-
ton, which retained by X X 1 3 net, represents
0 ~ 1 2 % of total activity. These values are
comparable to those obtained by H O L M E S
also in tropical waters, or by Y E N T S C H and
R Y T H E R in temperate waters but considerably
lower than the values observed by K A W A M U R A
in the North Pacific or Bering Sea. K A W A -
M U R A found the values from 16.1 to 56.0%.
T h e method employed by K A W A M U R A is a
little different from that of H O L M E S and the
author's. K A W A M U R A filtered the sample
waters with X X 1 3 net before the incubation,
whereas H O L M E S and the author filtered the
sample waters with a similar size net after the
incubation. However, it seems that such big
difference between the results was not caused
by the slight difference in technique employed,
but instead by geographical variation of plank
ton species relating to the environmental con
ditions.
O n the other hand, about one-half or more
of total activity was retained by S M Millipore
filter. T h e fractions of this size correspond to
the so-called nanoplankton, and their average
activity was 48% in surface and 73% in 5 0 m
depth water. M e a n value of the activity of
microplankton retained by A , A and H A filters
was 49% in surface water and 22% in 50 m
depth water respectively. Therefore, in surface
water the activity of microplankton seems to
be comparable to that of nanoplankton, where
as in 50 m depth water the former is far small
er than the latter.
Table 1. Size distribution of photosynthesizing phytoplankton in the Indian Ocean.
1
2
3
4
5
6
7
!
i Station
1 i
3°-22.'5N. 79--07/6E
4 -58. 9 S, 78 -03. 4 E
10 -55. 5 S, 78 -07. 0 E
19 -54. IS, 78 -01. 0 E
24 -58. 7 S. 77 -59. 6 E
19 -50. 2 S, 86 -11. 9 E
12 -44.3S, 97 -20. 0 E
Mean value
Depth
0 m
0 50
0 50
0 50
0 50
0 50
0 50
0 50
i
| HA 0.45~0.8,u
j 15%
1 37
° ! 25"
0
5 0
33 0
2 0
16 10
19 2
Millipore filter
AA 0.8~5//
36% 36 28
26 40
41 5
3 25
35 11
47 16
30 20
SM 5~110//
46% 27 70
49 60
48 85
52 71
63 78
37 74
48 73
Net X X 13<110/i
i
3* 0 2 0 0 6
10 12 4 0
11 0 0
3 5
1
I Total
100%
100 100
100 100
100 100
100 100
100 100
100 100
100 100
88
Size Distribution of Photosynthesizing Phytoplankton in the Indian Ocean 189
It is interesting that at five out of seven stations in surface waters the activity of organisms passed through A A filter plays 15 to 3 7 % of total activity. For same fraction, H O L M E S obtained the value 44.5, 8.4 and 51.9% in the surface waters. H e was in doubt to attribute all of high values to the carbon fixating activity of bacteria, and he attempted to explain it by protoplasmatic frangments released from fragile cells which ruptured on the filters surface. In the present study such phenomena also might be one of the reasons of high activity of small size fraction. But for final explanation further precise studies including the dark bottle experiments for each fraction and simultaneous microscopic inspection on board will be necessary.
It can be concluded that in the Indian Ocean, the significance of netplankton in photo-synthetic activity is generally very small, on the other hand the phytoplankton with the size between 0.8 and 90,u play the most part of the activity. T h e smallest size fraction retained by H A filter also has considerable activity for surface waters, but almost negligible for 50 m depth waters. F r o m these fact it m a y be said that the size of photosynthesizing phytoplankton in tropical water is smaller at the surface and larger in 50 m depth. This tendency coincides with m a n y results of micro
scopic study on the geographical distribution of plankton in the ocean. G E S S N E R (1960) described that the smaller phytoplankton in a fresh water lake have higher photosynthetic activity by unit amount than that of bigger organisms. Similar phenomena might be observed in the ocean in future studies in this field. Including such problem, the studies on size distribution of phytoplankton will give important basis for the explanation of primary-production in the oceans.
References
GESSNER, F. (1959): Hydrobotanik, II Stoffhaushak, Berlin, 619-621.
H O L M E S , R . W . (1658) • Size fractionation of photosynthesizing phytoplankton. Special Scientific Report-Fisheries, N o . 279, 69-71.
K A W A M U R A , T . (1960): The "Oshoro Maru" cruise 46 to the Bering Sea and North Pacific in June-August 1960, 11. Data on phytoplank.on photosynthetic activity. Data Rec. Oceanogr. Obs. Exp. Fish. Hokkaido Univ. N o . 5, 142-165
R O D H E , W . , R . A . VOLLENWEIDER and A . N A U W E R C K (1960): The primary production and standing crop of phytoplankton. Perspective in marine biology. California, 299-322.
YENTSCH, C . S. and J. H . RYTHER (1959): Relative significance of the net phytoplankton and nano-plankton in the waters of Vineyard Sound. Jour. Cons. Int. Explor. Mer, 24, (2), 231-238.
89
Reprinted from La terre et la vie, no. 2, 1964, p. 215-220.
PREMIERES DONNEES SUR LES BIOMASSES DE L'HERBIER
A MACROCYSTIS PYRIFERA DE LA BAIE DU MORBIHAN
(ARCHIPEL KERGUELEN) par Paul GRUA,
Station Biologique de Roscoff (Finistère)
A u cours d'un programme d'étude de biotopes marins infralittoraux, des plongées avec scaphandres autonomes se sont déroulées dans la Baie du Morbihan, dans l'archipel Kerguelen, du 23 décembre 1962 au 5 février 1963 ; un peu plus tôt, du 17 au 19 décembre, quelques plongées avaient eu lieu à l'Ile de la Possession dans l'Archipel de Crozet. Plus de cinquante heures ont été passées ainsi dans l'eau, entre la surface et 15 mètres de profondeur, au cours de 54 plongées (Grua, 1963). La Baie du M o r bihan est une vaste étendue abritée de 25 kilomètres sur 18, semée d'îles et de fjords dans sa moitié Ouest, et communiquant vers l'Est avec le large par la Passe Royale de 13 kilomètres de largeur. La transparence des eaux intérieures de la Baie est moindre que celle des rivages extérieurs. Des indications écologiques sont données dans Borojevic et Grua ; il paraît inutile de les reprendre ici.
Les limites supérieures et inférieures de fixation des Macrocystis varient suivant les lieux. Le facteur essentiel responsable de la distribution verticale a paru être l'éclai-rement du fond, lié à la transparence des eaux. Dans les stations visitées, ces limites sont à 1 m . et 12 m . sous la surface en eaux peu transparentes, tandis que dans les eaux plus claires ces limites sont déplacées vers la profondeur : à l'extérieur de la Passe (Ile Buchanan), le peuplement s'établit à 8 m . et descend bien au-dessous de 15 m . (Grua, 1964).
La détermination de l'étendue des herbiers ne peut être encore qu'imprécise. E n appliquant les résultats des observations relatives à la distribution verticale en fonc-
— 215 —
Collected reprints of the International Indian Ocean Expedition, vol. IV, contribution no. 209 9 1
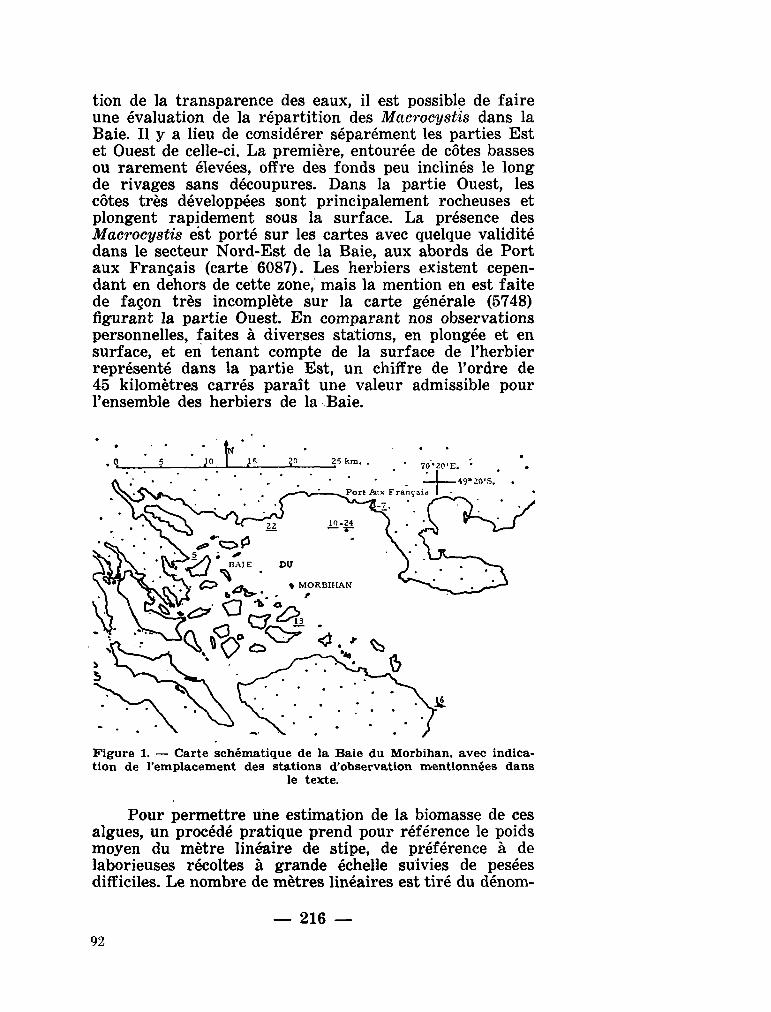
tion de la transparence des eaux, il est possible de faire une évaluation de la répartition des Macrocystis dans la Baie. Il y a lieu de considérer séparément les parties Est et Ouest de celle-ci. La première, entourée de côtes basses ou rarement élevées, offre des fonds peu inclinés le long de rivages sans découpures. Dans la partie Ouest, les côtes très développées sont principalement rocheuses et plongent rapidement sous la surface. La présence des Macrocystis est porté sur les cartes avec quelque validité dans le secteur Nord-Est de la Baie, aux abords de Port aux Français (carte 6087). Les herbiers existent cependant en dehors de cette zone, mais la mention en est faite de façon très incomplète sur la carte générale (5748) figurant la partie Ouest. E n comparant nos observations personnelles, faites à diverses stations, en plongée et en surface, et en tenant compte de la surface de l'herbier représenté dans la partie Est, un chiffre de l'ordre de 45 kilomètres carrés paraît une valeur admissible pour l'ensemble des herbiers de la Baie.
Figure 1. — Carte schématique de la Baie du Morbihan, avec indication de l'emplacement des stations d'observation mentionnées dans
le texte.
Pour permettre une estimation de la biomasse de ces algues, un procédé pratique prend pour référence le poids moyen du mètre linéaire de stipe, de préférence à de laborieuses récoltes à grande échelle suivies de pesées difficiles. Le nombre de mètres linéaires est tiré du dénom-
— 216 — 92
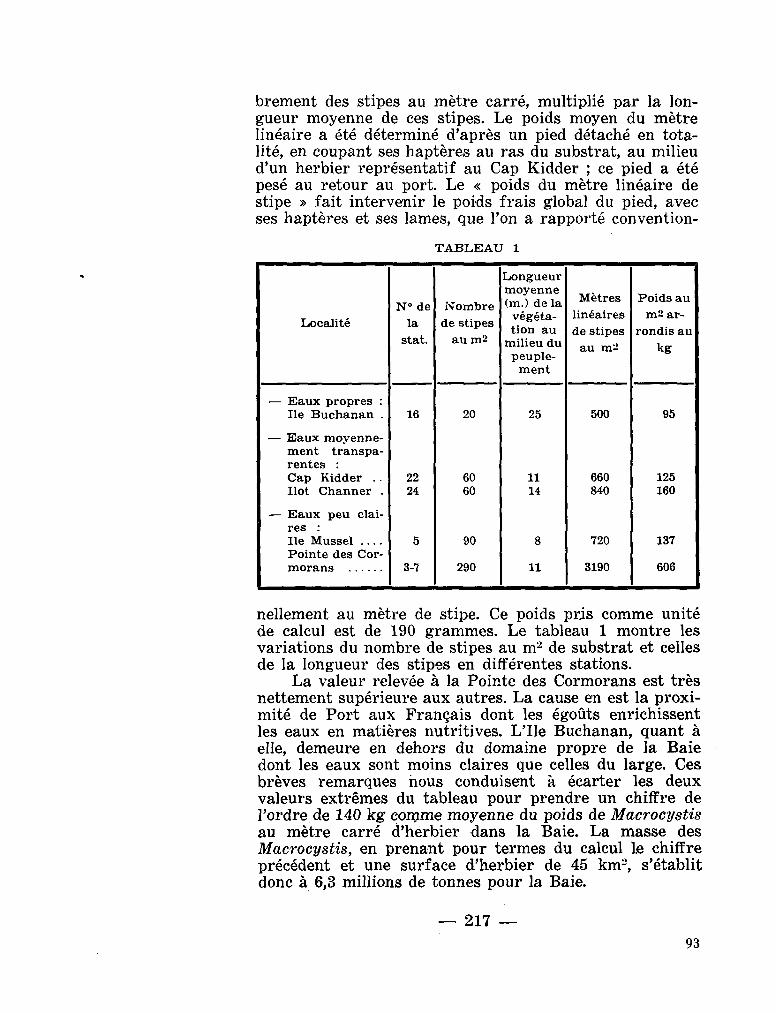
brement des stipes au mètre carré, multiplié par la longueur moyenne de ces stipes. Le poids moyen du mètre linéaire a été déterminé d'après un pied détaché en totalité, en coupant ses haptères au ras du substrat, au milieu d'un herbier représentatif au Cap Kidder ; ce pied a été pesé au retour au port. Le « poids du mètre linéaire de stipe » fait intervenir le poids frais global du pied, avec ses haptères et ses lames, que l'on a rapporté convention-
TABLEAU 1
Localité
— Eaux propres : Ile Buchanan .
— Eaux moyennement transparentes : Cap Kidder . . Ilot Channer .
— Eaux peu claires : Ile Mussel . . . . Pointe des Cormorans
N ° de
la
stat.
16
22 24
5
3-7
Nombre
de stipes
au m2
20
60 60
90
290
Longueur moyenne (m.) de la végétation au
milieu du peuple
ment
25
11 14
8
11
Mètres
linéaires
de stipes
au m -
500
660 840
720
3190
Poids au
m 2 ar
rondis au
kg
95
125 160
137
606
nellement au mètre de stipe. Ce poids pris c o m m e unité de calcul est de 190 grammes. Le tableau 1 montre les variations du nombre de stipes au m 2 de substrat et celles de la longueur des stipes en différentes stations.
La valeur relevée à la Pointe des Cormorans est très nettement supérieure aux autres. La cause en est la proximité de Port aux Français dont les égoûts enrichissent les eaux en matières nutritives. L'Ile Buchanan, quant à elle, demeure en dehors du domaine propre de la Baie dont les eaux sont moins claires que celles du large. Ces brèves remarques nous conduisent à écarter les deux valeurs extrêmes du tableau pour prendre un chiffre de l'ordre de 140 kg c o m m e moyenne du poids de Macrocystis au mètre carré d'herbier dans la Baie. La masse des Macrocystis, en prenant pour termes du calcul le chiffre précédent et une surface d'herbier de 45 k m 2 , s'établit donc à 6,3 millions de tonnes pour la Baie.
— 217 —
93
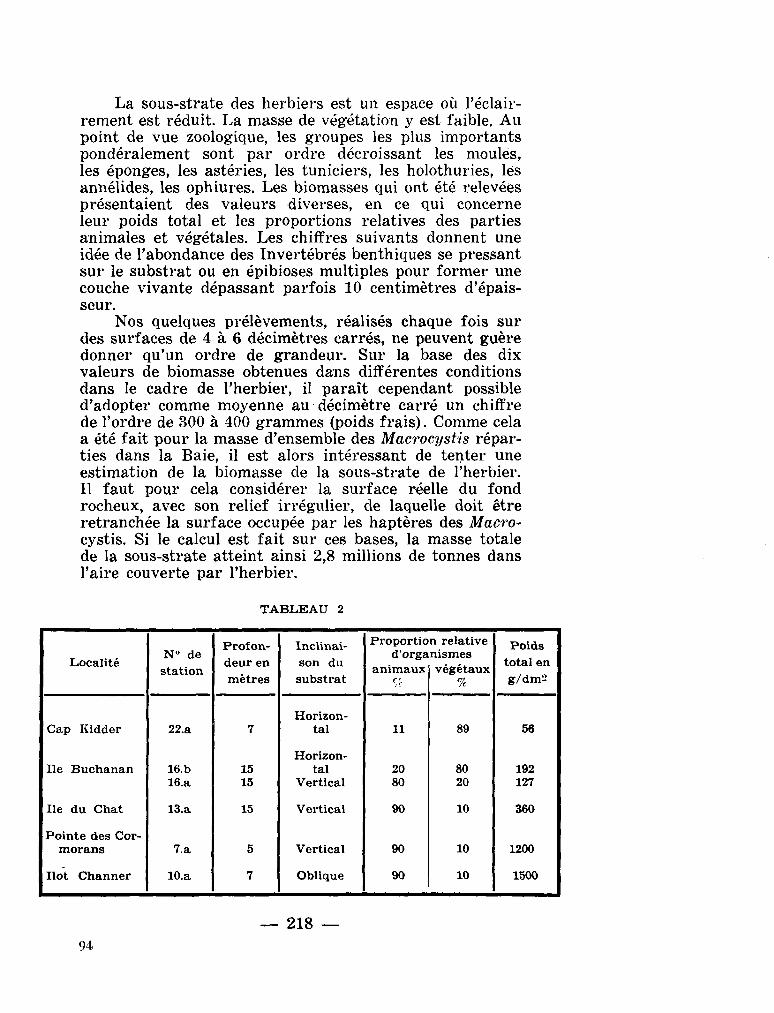
La sous-strate des herbiers est un espace où l'éclair-rement est réduit. La masse de végétation y est faible. A u point de vue zoologique, les groupes les plus importants pondéralement sont par ordre décroissant les moules, les éponges, les astéries, les tuniciers, les holothuries, lés annélides, les ophiures. Les biomasses qui ont été relevées présentaient des valeurs diverses, en ce qui concerne leur poids total et les proportions relatives des parties animales et végétales. Les chiffres suivants donnent une idée de l'abondance des Invertébrés benthiques se pressant sur le substrat ou en épibioses multiples pour former une couche vivante dépassant parfois 10 centimètres d'épaisseur.
Nos quelques prélèvements, réalisés chaque fois sur des surfaces de 4 à 6 décimètres carrés, ne peuvent guère donner qu'un ordre de grandeur. Sur la base des dix valeurs de biomasse obtenues dans différentes conditions dans le cadre de l'herbier, il paraît cependant possible d'adopter comme moyenne au décimètre carré un chiffre de l'ordre de 300 à 400 grammes (poids frais). C o m m e cela a été fait pour la masse d'ensemble des Macrocystis réparties dans la Baie, il est alors intéressant de tenter une estimation de la biomasse de la sous-strate de l'herbier. 11 faut pour cela considérer la surface réelle du fond rocheux, avec son relief irrégulier, de laquelle doit être retranchée la surface occupée par les haptères des Macrocystis. Si le calcul est fait sur ces bases, la masse totale de la sous-strate atteint ainsi 2,8 millions de tonnes dans l'aire couverte par l'herbier.
TABLEAU 2
Localité
Cap Kidder
Ile Buchanan
Ile du Chat
Pointe des Cormorans
Ilot Channer
N ° de station
22.a
16.b 16.a
13.a
7.a
10.a
Profondeur en mètres
7
15 15
15
5
7
Inclinaison du substrat
Horizontal
Horizontal
Vertical
Vertical
Vertical
Oblique
Proportio d'orga
animaux
11
20 80
90
90
90
n relative nismes végétaux
%
89
80 20
10
10
10
Poids total en g / d m 2
56
192 127
360
1200
1500
— 218 —
94
Envisagée après les formes sessiles ou sédentaires, la faune benthique mobile n'est représentée que par de très rares poissons. Alors que les fonds constitués de sédiments nourrissent une masse peu importante de poissons, l'herbier de Macrocystis peut sembler à priori le milieu propice à une concentration d'individus nombreux. Or, ce n'est pas du tout le cas. Durant une trentaine d'heures passées dans des zones à Macrocystis, une dizaine de poissons seulement ont été vus, appartenant aux genres Chaenichthys et Notothenia.
Les Vertébrés rencontrés dans la zone superficielle de l'herbier étaient des cormorans Phalacrocorax verrucosus, des manchots Aptenodytes patagónica et Pygoscelis papua, et, à petite distance de côtes basses, des éléphants de mer Mirounga leonina. Dans une zone à Macrocystis clairsemées sur un fond de 12 m . a été remarqué à l'Ile du Chat, un Hydrurga leptonyx (Léopard de mer), inhabituel à cette période de l'année, dont le comportement à notre égard a été circonspect — quoique investigateur au cours des trois quarts d'heure que dura notre confrontation. A l'Ile de la Possession (Crozet), au-dessus de fonds comparables, une troupe de quatre Orcinus orea a longé le rivage de la Baie du Navire alors que l'un de nous venait de reprendre pied sur le radeau. Ces Vertébrés à respiration aérienne ne sont que des hôtes occasionnels des secteurs où croissent les Macrocystis et leur présence constatée est mentionnée pour mémoire ici. L'évaluation de leur biomasse est hors de propos, et serait d'ailleurs illusoire du fait des déplacements au long cours qui poussent nombre d'entre eux à abandonner temporairement les lieux.
C O N C L U S I O N . — Les estimations de biomasses que nous avons tentées dans l'herbier de Macrocystis pyrifera de la Baie du Morbihan (Archipel des Kerguelen), étage bionomique défini comme un milieu précis, n'ont pu être accompagnées du calcul de l'erreur pouvant entacher les valeurs indiquées. Dans une étude plus large, la question abordée brièvement ici sera traitée de façon critique. Cependant les chiffres obtenus indiquent que les masses vivantes, animales et végétales, y atteignent des valeurs dépassant largement ce que l'on peut rencontrer dans les mers boréales tempérées pour lesquelles des estimations analogues ont été faites.
— 219 —
95
B I B L I O G R A P H I E
BoROJEViCj R . et G R U A , P . — Eponges calcaires de K E R G U E L E N , systématique et écologie. Arch. Zool. Exp. Gén. (sous presse).
G R U A , P . (1963). — Etude de biotopes marins infralittoraux, K E R -G U E L E N 1962-63. T.A.A.F., 23-24 ; 69-73. — (1964). — Sur la structure des peuplements de Macrocystia pyrifera (L.) C . Ag . observés en plongée à Kerguelen et Crozet. C. R. Acad. Se. Paris, 259 : 1541-1543.
Service Hydrographique de la Marine, P A R I S . Carte 5748. — Iles de K E R G U E L E N , 3e Ed., 1961. Carte 6087. — Baie du Morbihan. Partie Est. 3e Ed., 1961.
96
— 220 —
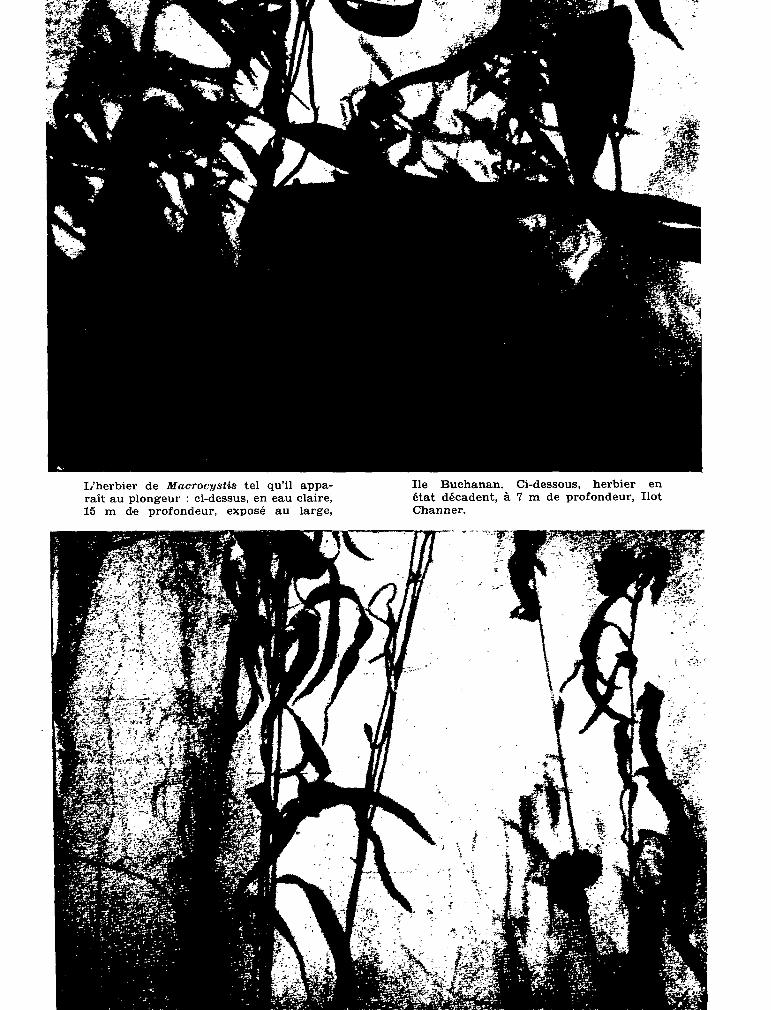
L'herbier de Macrocystis tel qu'il apparaît au plongeur : ci-dessus, en eau claire, 15 m de profondeur, exposé au large,
Ile Buchanan. Ci-dessous, herbier en état décadent, à 7 m de profondeur, Ilot Channer.
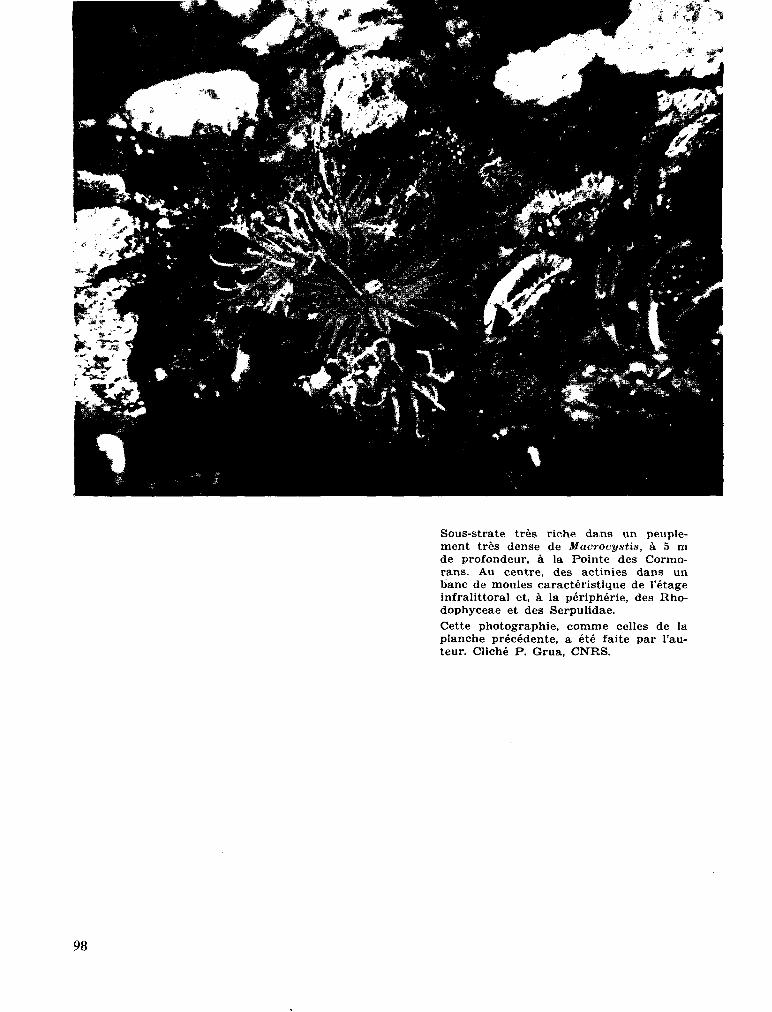
Sous-strate très riche dans un peuplement très dense de Macrocystis, à 5 m de profondeur, à la Pointe des Cormorans. Au centre, des actinies dans un banc de moules caractéristique de l'étage infralittoral et, à la périphérie, des Rho-dophyceae et des Serpulidae.
Cette photographie, comme celles de la planche précédente, a été faite par l'auteur. Cliché P. Grua, C N R S .
98
Reprinted from Biologie antarctique, Paris, 1964, p. 279-282.
PLONGÉES AUX ILES SAINT-PAUL ET NOUVELLE AMSTERDAM
PLONGÉES EN EAUX FROIDES
P. G R U A
Station Biologique de Roscoff, Finistère, France
The possibilities of research using diving techniques, and the precautions required, at these two French southern islands are examined. Local conditions of topography and hydrography and potential dangers are reviewed from the point of view of an underwater biologist and in the particular context of diving. Emphasis is placed on the importance, in unfamiliar waters, of knowing one's personal capacities, which depend on good physical and psychological condition as well as equipment. Work in cold water, although often less efficient, is nevertheless quite feasible with the equipment available and some practical advice is given on this subject.
Les plongées sous-marines présentent d'incontestables avantages par rapport aux méthodes conventionnelles d'investigation. Les dragages ont en effet l'inconvénient de détériorer et la faune et la flore sédentaires, de provoquer la fuite de la faune mobile, de mélanger les peuplements biologiques, sans m ê m e pouvoir permettre l'exploration des zones anfractueuses.
Tous ces inconvénients sont évités par les plongées qui donnent en outre au biologiste la possibilité d'observer et de photographier directement les c o m m u nautés biologiques et leur étagement.
Toutefois les plongées ne sont pas sans présenter quelques inconvénients. L a basse température de l'eau et le dépaysement provoquent une inhibition appréciable des facultés mentales. Aussi le plongeur doit-il avant de s'introduire dans l'eau, être assuré que son matériel est parfaitement au point. Ceci étant, son sentiment de sécurité et de confiance en lui-même sera d'autant moins altéré, s'il se trouve brusquement placé devant une situation imprévue.
A la faveur des plongées faites aux Iles Saint-Paul et Nouvelle Amsterdam au cours de l'été 1958-1959 (Grua, 1963a), dans les premiers mètres de la surface, nous préciserons ce que sont les conditions du travail sous-marin dans ces régions. Nous terminerons cette brève note par quelques indications sur le matériel qu'il convient d'utiliser en eaux très froides (Grua, 19636).
Collected reprints of the International Indian Ocean Expedition, vol. IV, contribution no. 210 99
280 PLONGÉES SOUS-MARINES
L A CÔTE ET LES FONDS
Les côtes de ces deux îles sont en général formées de falaises abruptes, à l'exception du rivage nord-est de la Nouvelle Amsterdam et de l'ouverture du cratère à Saint-Paul. E n conséquence, une embarcation à moteur, transportant le plongeur et son matériel, s'avère indispensable. O n peut, par ce moyen , s'approcher sans difficulté de la plupart des rivages, à l'exception toutefois des côtes ouest des deux îles, battues par une boule quasi-permanente.
Les fonds proches de la côte sont formés d'éboulis rocheux parsemés çà et là de petites étendues de sable. A u pied des falaises on peut trouver, à certains endroits, quelques grottes.
Les algues géantes, Macrocystis pyrifera, allant de 10 à 30 m de profondeur jusqu'à la surface, sont fréquentes, particulièrement sur les côtes orientées à l'Est. A u cours d'une récente campagne de plongées aux Iles de Kerguelen (1962-63) nous avons pu pénétrer sous leur couvert sans trop de difficulté.
C o m m e on le sait, l'Ile Saint-Paul est d'origine volcanique et les eaux de son cratère communiquent avec celles du large par un étroit goulet,, dont le fond est un seuil rocheux où la barre est très fréquente. O n peut atteindre aisément la zone des galets qui entoure le goulet et un plongeur équipé peut, avec quelques difficultés faire le tour du cratère. Cette île étant inhabitée en permanence il est nécessaire d'y établir au préalable un campement.
LA MER ET LE VENT
L'amplitude m a x i m u m des marées est de l'ordre de 1,80 m . Les courants, dont l'intensité et la direction sont très variables, sont assez fréquents à proximité de la côte. Le plongeur en scaphandre autonome doit donc en tenir compte pour éviter tout essoufflement superflu. Mais ces courants peuvent aussi provoquer la dérive de l'embarcation; pour assurer efficacement la sécurité du plongeur, cette dernière doit donc toujours être maintenue à l'endroit où les bulles d'air viennent crever à la surface. U n e corde d'appel reliant le plongeur au bateau, n'est toutefois pas souhaitable en raison de la présence des bancs de Macrocystis et du relief accidenté du fond.
L a température des eaux de surface varie entre 12,7° en septembre et 17,4°C en février à la Nouvelle Amsterdam et entre 12,3° et 16,8°C respectivement à l'Ile Saint-Paul (Météorologie Nationale, c o m m . pers.). A trente mètres de profondeur en janvier 1959, l'eau de l'Ile Saint-Paul était voisine de 14° celle de la Nouvelle Amsterdam de 18°C.
100
P. GRUA 281
E n hiver les tempêtes sont fréquentes et compliquent ou interdisent m ê m e totalement tout travail sous-marin. La période d'été est nettement plus favorable, mais il faut toujours se souvenir que le vent peut se lever, en toute saison, en deux ou trois heures. Toute embarcation évoluant sans secours éventuel doit donc tenir compte de ce laps de temps, notamment quand elle se trouve face à une côte hostile.
La transparence des eaux, plus agréable que nécessaire, procure néanmoins un sentiment subjectif de sécurité. Ces petites îles sont entourées par des eaux du large toujours propres et renouvelées. Ce n'est pas le cas pour le cratère de l'Ile Saint-Paul; la relative turbidité de ses eaux est due à la présence de nombreuses sources sous-marines d'eau chaude et de gaz qui sont libérées dans un milieu relativement confiné.
ASPECTS G É N É R A U X D E SÉCURITÉ
Les délais de transport vers un moyen de secours pouvant être assez longs, les plongées doivent être effectuées avec d'autant plus de prudence. E n effet, les incidents physiologiques ou les blessures prennent dans ces régions une importance plus grande que sur les côtes bien équipées de nos régions habitées. Si la station de la Nouvelle Amsterdam héberge en permanence un médecin susceptible d'intervenir, il n'y a rien par contre à l'Ile Saint-Paul.
Certains animaux représentent des dangers directs pour l 'homme immergé, tandis que d'autres peuvent simplement effrayer. Ce sont Orea gladiator, Isurus glaucus, Carcharodon sp., Squalus fernandinus, Thyrsites atun, Polyprion americanas, Mirounga leonina, Arctocephalus australis.
U n plongeur m ê m e expérimenté doit donc se garder de dépasser 10 mètres de profondeur; au-delà il est indispensable qu'il soit accompagné. Mais dans tous les cas un veilleur doit se tenir à proximité, que ce soit sur la côte ou dans l'embarcation, prêt à intervenir.
LES CONDITIONS D E TRAVAIL E N E A U X FROIDES
Les eaux de l'Océan Antarctique, limitées au Nord par la ligne de convergence, ont une température de surface variant selon les lieux et la saison entre — 2° et + 4° C , tandis que les températures moyennes de l'air restent voisines de 0° C pendant l'été.
Les glaces dérivantes ou fixées, la présence de banquettes côtières, les vents violents et subits peuvent sérieusement gêner les plongées. Ces dernières sont d'autant plus efficaces que le plongeur est mieux protégé du froid ambiant. Ceci implique donc le choix de vêtements isothermiques particulièrement adaptés au genre de travail à effectuer. U n e épaisseur de dix millimètres de néoprène
101
282 PLONGÉES SOUS-MARINES
mousse obtenue de préférence par la superposition de deux combinaisons bien ajustées, isole de façon pratique et confortable le plongeur évoluant entre la surface et une quinzaine de mètres de profondeur. Le vêtement étanche, avec les doublures nécessaires, quoique d'un emploi plus délicat, peut être préféré au-dessous de ce niveau pour les travaux statiques; ce vêtement une fois gonflé procure d'ailleurs un meilleur isolement au froid. U n e nouvelle combinaison en feuille de latex mince non doublée de tissu, d'une grande résistance aux accrocs, semble une beureuse innovation. Elle peut recouvrir la combinaison en néoprène et son élasticité diminue les inconvénients du placage en plongée. Ces enveloppes protectrices étant relativement épaisses il faut donc augmenter le lestage et le répartir de préférence sur les divers sanglages plutôt que d'utiliser une lourde ceinture.
L'étanchéité au niveau des poignets et du cou n'est pas encore résolue de façon satisfaisante. U n vêtement trop serré à ce niveau peut provoquer en effet des constrictions gênant la circulation sanguine, dont les effets sont rapidement ressentis en eaux très froides.
L a préhension manuelle doit rester précise pour les manipulations diverses et l'isolement avec des gants de néoprène est le meilleur compromis. O n peut limiter le refroidissement périphérique par l'emploi d'un révulsif provoquant une vaso-dilatation superficielle. Il est bon de consommer une préparation polyvitaminée aidant à conserver une bonne forme physique.
Pour éviter au plongeur de respirer un air tTop froid, il est préférable que les scaphandres soient tiédis à l'avance, et isolés dans une enveloppe de néoprène. Le détendeur à deux étages, avec valve située contre la bouche et tube unique, est également préférable.
Mentionnons accessoirement la récente sortie sur le marché du « Calypso-Phot », appareil photographique complet de format 24 X 36 étanche et de manipulation facile.
RÉFÉRENCES
F A N E , F. D . 1959. Skin diving in polar waters. Polar Rec, 9 : 433-5.
G R Ú A , P. 1963a. Plongées biologiques sous-marines aux îles St-Paul et Nouvelle Amsterdam.
C.N.F.R.A., Paris, 4 : 37-49.
C R U A , P. 19636. Lutte contre le froid et adaptation rapide aux conditions de plongée dans des
eaux froides. Kerguelen 1962-63. In Third Intern. Biometeor. Congr., Pau (sous presse).
N E U S H U L , M . 1961. Diving in Antarctic Waters. Polar Rec, 10 : 353-8.
102
Reprinted from Biologie antarctique, Paris, 1964, p. 471-480,
LE CYCLE SEXUEL ET L'ÉVOLUTION DES SOIES OVIGÈRES DES FEMELLES DE JASUS PAULENSIS (PALINURIDAE)
P. GRUA
Station Biologique, Roscoff, Finistère, France
The southern crayfish live in two separate populations around lies Saint-Paul and Nouvelle Amsterdam.
The annual sexual cycle, determined for the population of Nouvelle Amsterdam, is related to water temperature : egg-laying occurs in May and June and hatching takes place in August and September. At both islands, the ovigerous setae then become very variable in size, being damaged by the female taking off the empty egg-shells. The setae are renewed during the southern summer.
This phenomenon is being studied by an original biométrie method involving size ratios, the validity of which is discussed. Pilosity becomes complete again about March, owing to a moult distinct from the pre-breeding one. The populations at the two islands, and the various size-classes, differ in their detailed pattern.
L a biologie des langoustes australes, vivant autour des îles Saint-Paul et N o u velle Amsterdam, n'est connue que de façon très fragmentaire. Après une campagne d'été en 1958-59 à bord du navire langoustier congélateur S A P M E R , une première étude a contribué à la connaissance de l'écologie de cette espèce. L'objet de cette communication est de préciser le cycle annuel de J. paulensis Heller ; lors de la recherche de la taille de maturité précisée récemment (Grua, 1963), un phénomène estival particulier intéressant les soies ovigères a été étudié au m o y e n d'une méthode biométrique qui, à notre connaissance tout au moins, n'avait jamais été utilisée auparavant (*).
L E C Y C L E S E X U E L
La figure 1 exprime, par période de quinze jours, la proportion de femelles portant des œufs extérieurs fixés aux pléopodes par rapport au nombre total des
(*) Nous retiendrons avec L. B . Holthuis le nom de J. paulemis Heller 1862 pour la langouste australe française. Holthuis a en effet rejeté dernièrement J. latandii Lamk. t H . M . E d w 1837, employé jusqu'à maintenant par assimilation avec les langoustes du Cap.
Collected reprints of the International Indian Ocean Expedition, vol. IV, contribution no. 211 103
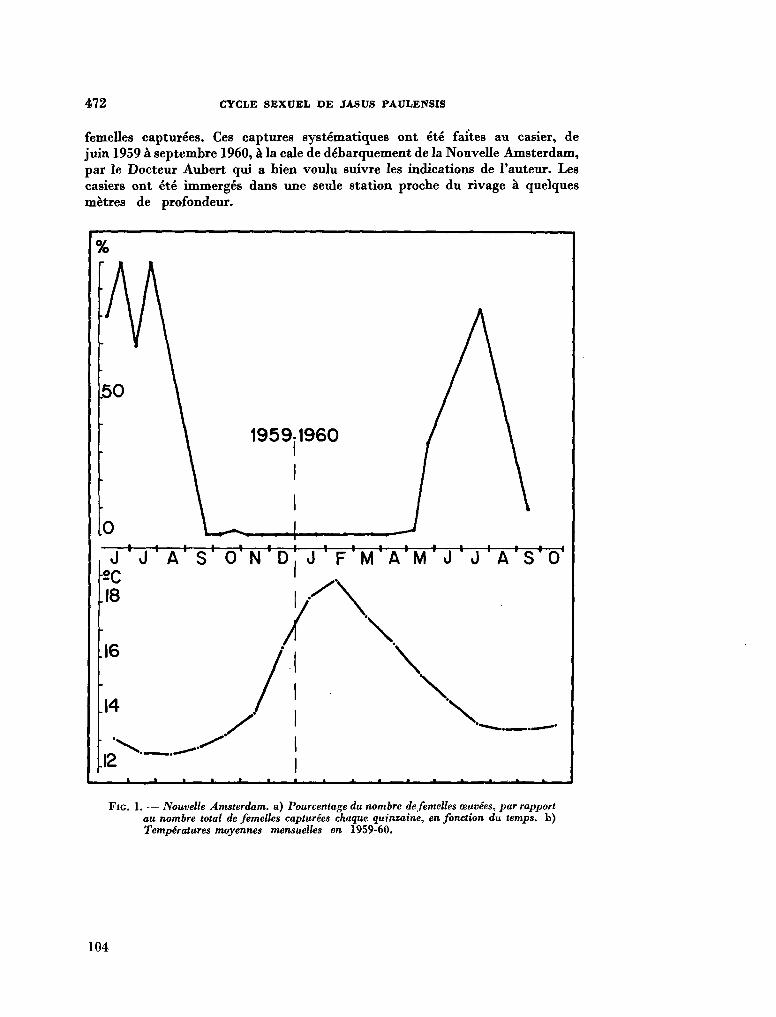
472 CYCLE SEXUEL DE JAS US PAULENSIS
femelles capturées. Ces captures systématiques ont été faites au casier, de juin 1959 à septembre 1960, à la cale de débarquement de la Nouvelle Amsterdam, par le Docteur Aubert qui a bien voulu suivre les indications de l'auteur. Les casiers ont été immergés dans une seule station proche du rivage à quelques mètres de profondeur.
1959-1960
J J A S O N D . J F M A M J J A S O .op I .18 • /
16
14
[2
/ \
\
\
. / \ .
• • i i i i i *
Fie 1. — Nouvelle Amsterdam, a) Pourcentage du nombre de femelles œuvées, par rapport au nombre total de femelles capturées chaque quinzaine, en fonction du temps, b) Températures moyennes mensuelles en 1959-60.
104
P. GRUA 473
Ces résultats ne rendent sans doute pas compte exactement du phénomène tel qu'il se produit dans l'ensemble des populations exploitées ; ces précisions sont cependant intéressantes car ce sont les seules dont nous disposons. Notons enfin que la température de l'eau a été relevée systématiquement au m ê m e endroit en 1959-60.
Nous avons pu déduire de ces observations que la ponte de l'année 1960 avait commencé à la fin du mois d'avril ou au début de mai, dans une eau dont la température atteignait 16°C environ. L'éclosion se produit dans la deuxième moitié de l'hiver, étalée sensiblement sur deux mois, tandis que la température de l'eau recommence à s'élever. A la fin du mois de septembre, les températures de l'eau étaient voisines de 13°C et les femelles ne portaient plus d'oeufs extérieurs. Les femelles sont donc dépourvues d'oeufs pendant sept à neuf mois, le milieu de cette période se situant au mois de janvier, un mois environ avant que la température, moyenne de l'eau atteigne sa valeur la plus élevée. La fréquence m a x i m u m du nombre des femelles œuvées a été observée vers le milieu de juillet, quelques semaines avant que l'eau atteigne sa température m i n i m u m .
LES SOIES OVIGÈRES EN ÉTÉ
A u cours de la campagne d'été 1958-1959 à bord du navire S A P M E R nous avons étudié la longueur et la densité de la pilosité de 1 720 langoustes femelles. Quand les femelles ne portent pas d'œufs extérieurs (après l'éclosion des larves à la fin de l'hiver) leurs soies sont de longueurs très inégales, selon que la taille des individus est plus ou moins grande, mais il existe aussi des différences entre deux spécimens de m ê m e taille. Les pléopodes paraissent partiellement épilés, et les soies sont irrégulièrement écourtées. L a proportion de femelles aux soies écourtées diminue pendant le déroulement de l'été austral. Cette epilation est probablement imputable aux femelles elles-mêmes qui détachent les coques d'œufs vides fixées aux soies par la sécrétion cémentaire avec la petite pince terminale de leur cinquième paire de péréiopodes. Cette toilette des pléopodes paraît responsable de l'amputation de très nombreuses soies.
MÉTHODE UTILISÉE
Pour rendre compte des divers états des soies, nous avons utilisé le rapport existant entre leur longueur et la largeur de l'article sétigère de l'endopodite, ce qui nous a permis d'indexer la pilosité individuelle à la taille de l'animal. E n effet une mesure millimétrique aurait pu donner le m ê m e chiffre pour deux états de pilosité de signification différente. L'établissement de ces notations a été rendue possible du fait de la grande largeur de l'article sétigère de Jasus (Boas, 1880; Holthuis, 1946).
105
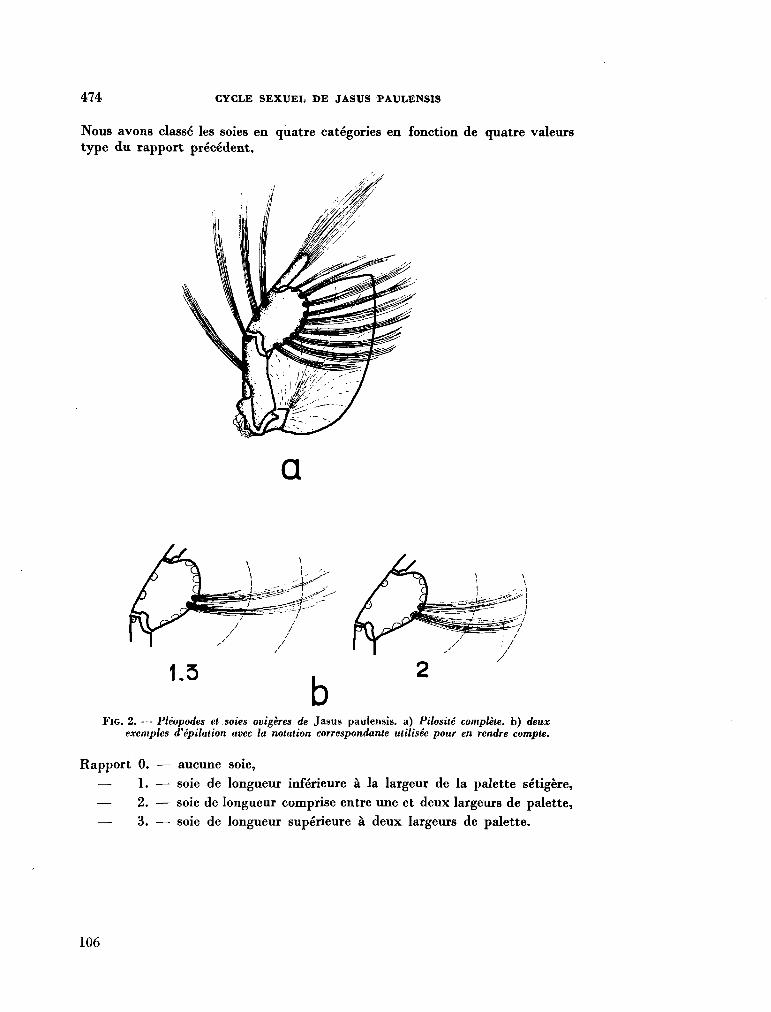
474 CYCLE SEXUEL DE JASUS PAXJLENSIS
Nous avons classé les soies en quatre catégories en fonction de quatre valeurs type du rapport précédent.
Rapport 0. — aucune soie,
— 1. — soie de longueur inférieure à la largeur de la palette sétigère,
— 2. — soie de longueur comprise entre une et deux largeurs de palette,
— 3. — soie de longueur supérieure à deux largeurs de palette.
106
P. GRUA 475
Il est exceptionnel que des soies atteignent trois largeurs de palette. Il faut remarquer par ailleurs qu'il existe souvent sur u n m ê m e pléopode, des soies de longueurs diverses. Dans un tel cas, nous avons relevé les valeurs extrêmes, celles des soies longues et celle des soies courtes. Dans nos calculs nous avons utilisé soit ces valeurs extrêmes, soit leur moyenne arithmétique. R e m a r quons aussi que sur un m ê m e animal l'ensemble des pléopodes présente très sensiblement le m ê m e aspect d'épilation ; par conséquent la notation appliquée à chacun d'entre eux rend compte de l'état de tous les pléopodes.
D e plus nous avons rangé l'ensemble des sujets étudiés en deux catégories fonction de la richesse et de la densité de l'ensemble de la pilosité : la catégorie I, qui correspond à une pilosité moyenne ou réduite, comprend la majorité des individus. La catégorie II, où les franges de soies sont très fournies, n'est guère observée que chez des sujets de grande taille.
L a combinaison réciproque de ces deux notations a été appliquée à toutes les langoustes, sans aucune difficulté. O n pourrait, faire des réserves sur ce m o d e de chiffrage soumis à un élément subjectif d'appréciation, mais nous avons pu constater que la variabilité de la longueur et de la densité des soies entre individus de m ê m e taille est très largement supérieure à la latitude d'estimation.
Chaque mensuration de pilosité a été prise en m ê m e temps que la longueur totale de l'animal (de l'extrémité de l'épine supra-orbitaire à l'extrémité du telson).
L'ensemble des animaux étudiés a permis d'établir deux mille deux cents notations de pilosité. Les chiffres obtenus rendent compte de la grande diversité présentée par les soies, que ce soit en fonction des tailles ou en fonction de la date des captures ; aussi a-t-il été nécessaire de les classer en plusieurs groupes. Les moyennes obtenues statistiquement donnent des courbes continues à évolution progressive. Par contre, à l'échelon individuel, chaque langouste étant soumise aux brusques étapes de croissance, l'évolution de ses soies ne peut être continue.
MISE E N ÉVIDENCE D U PHÉNOMÈNE
DISCUSSION
Avant toute interprétation il faut être certain que la codification adoptée et le rapport caractérisant les soies sont justifiées. E n d'autres termes, il s'agit de savoir si les variations de ce rapport dépendent effectivement de l'inégalité de longueurs de soies.
Définissons donc les variables entrant dans les graphiques. Elles se composent sous la forme suivante :
longueur de soie
largeur de l'article sétigère
x longueur totale de la femelle
107
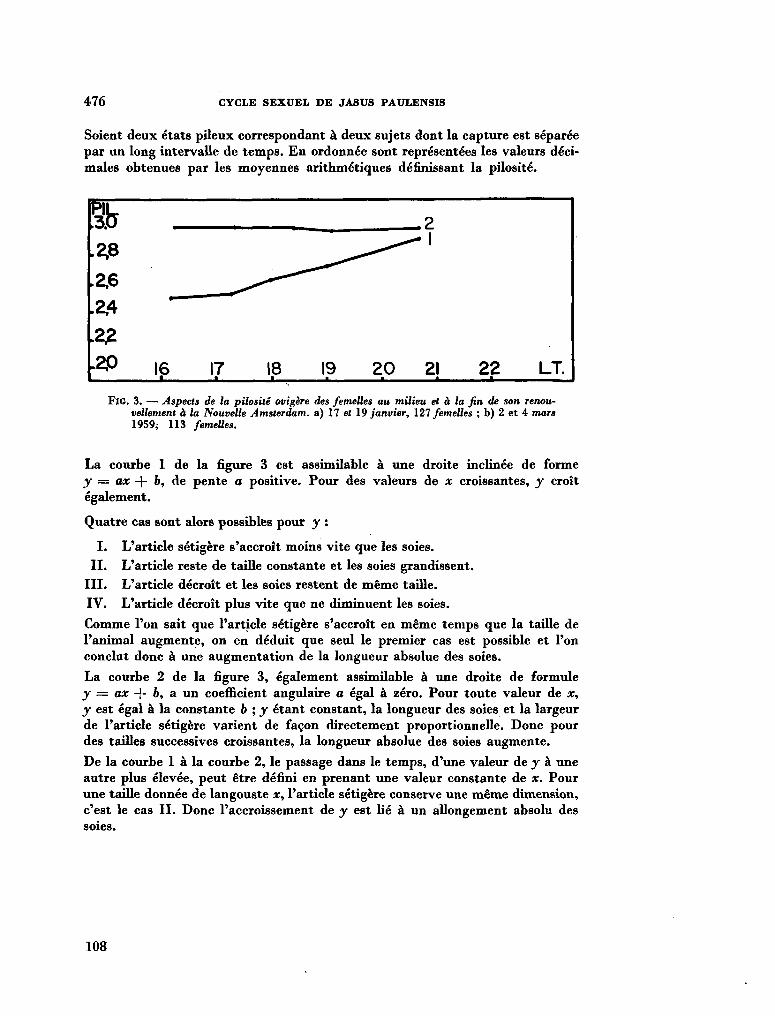
476 CYCLE SEXUEL DE JAS US PAULENSIS
Soient deux états pileux correspondant à deux sujets dont la capture est séparée par u n long intervalle de temps. E n ordonnée sont représentées les valeurs décimales obtenues par les moyennes arithmétiques définissant la pilosité.
.2,8
2.6
.2.4
.22
.2.0 16 17 •
18 19 20
.2 ^1
21
CM.
CM LT.
FlG. 3. — Aspects de la pilosité ovigère des femelles au milieu et à la fin de son renouvellement à la Nouvelle Amsterdam, a) 17 et 19 janvier, 127 femelles ; b) 2 et 4 mars 1959; 113 femelles.
L a courbe 1 de la figure 3 est assimilable à une droite inclinée de forme y = ax + b, de pente a positive. Pour des valeurs de x croissantes, y croît également.
Quatre cas sont alors possibles pour y :
I. L'article sétigère s'accroît moins vite que les soies.
II. L'article reste de taille constante et les soies grandissent.
III. L'article décroît et les soies restent de m ê m e taille.
IV. L'article décroît plus vite que ne diminuent les soies.
C o m m e l'on sait que l'article sétigère s'accroît en m ê m e temps que la taille de l'animal augmente, on en déduit que seul le premier cas est possible et l'on conclut donc à une augmentation de la longueur absolue des soies.
La courbe 2 de la figure 3, également assimilable à une droite de formule y = ax + b, a un coefficient angulaire a égal à zéro. Pour toute valeur de x, y est égal à la constante b ; y étant constant, la longueur des soies et la largeur de l'article sétigère varient de façon directement proportionnelle. Donc pour des tailles successives croissantes, la longueur absolue des soies augmente.
D e la courbe 1 à la courbe 2, le passage dans le temps, d'une valeur de y à une autre plus élevée, peut être défini en prenant une valeur constante de x. Pour une taille donnée de langouste x, l'article sétigère conserve une m ê m e dimension, c'est le cas II. Donc l'accroissement de y est lié à un allongement absolu des soies.
108
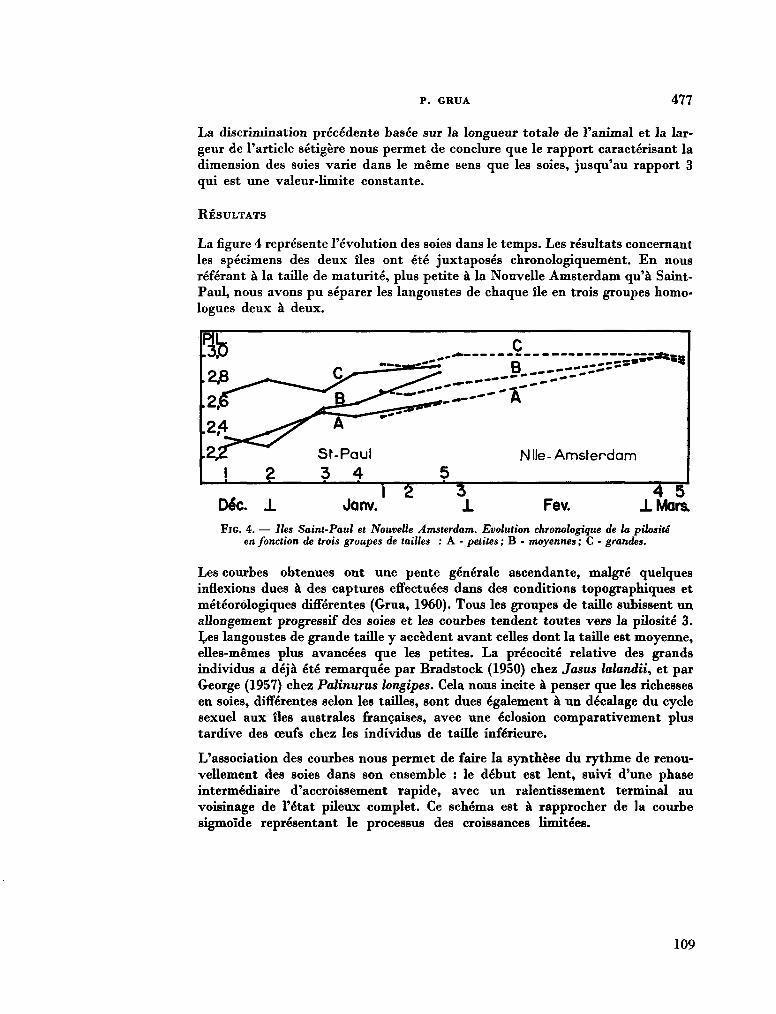
P. GRUA 477
L a discrimination précédente basée sur la longueur totale de l'animal et la largeur de l'article sétigère nous permet de conclure que le rapport caractérisant la dimension des soies varie dans le m ê m e sens que les soies, jusqu'au rapport 3 qui est une valeur-limite constante.
RÉSULTATS
La figure 4 représente l'évolution des soies dans le temps. Les résultats concernant les spécimens des deux îles ont été juxtaposés chronologiquement. E n nous référant à la taille de maturité, plus petite à la Nouvelle Amsterdam qu'à Saint-Paul, nous avons pu séparer les langoustes de chaque île en trois groupes h o m o logues deux à deux.
F i e 4. — Iles Saint-Paul et Nouvelle Amsterdam. Evolution chronologique de la pilosité en fonction de trois groupes de tailles : A - petites ; B - moyennes ; C - grandes.
Les courbes obtenues ont une pente générale ascendante, malgré quelques inflexions dues à des captures effectuées dans des conditions topographiques et météorologiques différentes (Crua, 1960). Tous les groupes de taille subissent un allongement progressif des soies et les courbes tendent toutes vers la pilosité 3. Les langoustes de grande taille y accèdent avant celles dont la taille est moyenne, elles-mêmes plus avancées que les petites. La précocité relative des grands individus a déjà été remarquée par Bradstock (1950) chez Jasus lalandii, et par George (1957) chez Palinurus longipes. Gela nous incite à penser que les richesses en soies, différentes selon les tailles, sont dues également à un décalage du cycle sexuel aux îles australes françaises, avec une eclosión comparativement plus tardive des œufs chez les individus de taille inférieure.
L'association des courbes nous permet de faire la synthèse du rythme de renouvellement des soies dans son ensemble : le début est lent, suivi d'une phase intermédiaire d'accroissement rapide, avec un ralentissement terminal au voisinage de l'état pileux complet. Ce schéma est à rapprocher de la courbe sigmoïde représentant le processus des croissances limitées.
109
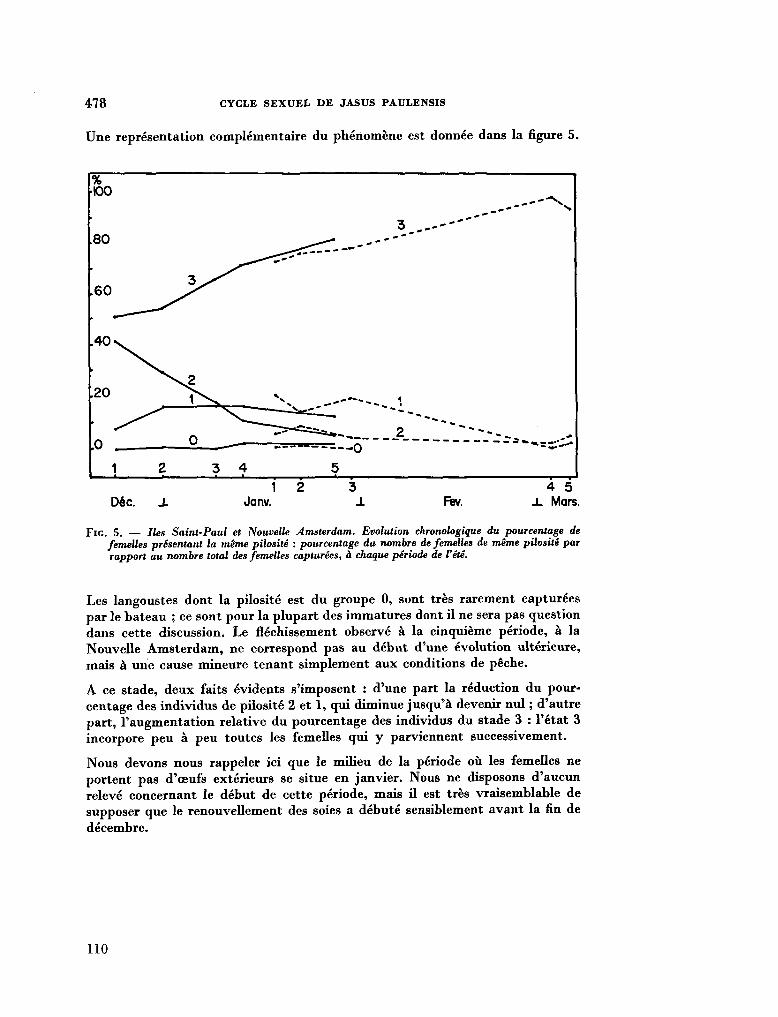
478 CYCLE SEXUEL D E JASUS PAULENSIS
U n e représentation complémentaire du phénomène est donnée dans la figure 5.
Dec.
%
•K>0
.80
.60
. 4 0 ^
.20
0
1 2
3 ,
v2
0
3 4
^ -• ^ "" ^ ••
• ~ ^ - i = s * * - _2_ _ _ _ /_V_v - — - U ~—~
5
Janv. Rsv. 4 5 Mars.
F I G . 5. — Iles Saint-Paul et Nouvelle Amsterdam. Evolution chronologique du pourcentage de femelles présentant la même pilosité : pourcentage du nombre de femelles de même pilosité par rapport au nombre total des femelles capturées, à chaque période de l'été.
Les langoustes dont la pilosité est du groupe 0, sont très rarement capturées par le bateau ; ce sont pour la plupart des immatures dont il ne sera pas question dans cette discussion. Le fléchissement observé à la cinquième période, à la Nouvelle Amsterdam, ne correspond pas au début d'une évolution ultérieure, mais à une cause mineure tenant simplement aux conditions de pêche.
A ce stade, deux faits évidents s'imposent : d'une part la réduction du pourcentage des individus de pilosité 2 et 1, qui diminue jusqu'à devenir nul ; d'autre part, l'augmentation relative du pourcentage des individus du stade 3 : l'état 3 incorpore peu à peu toutes les femelles qui y parviennent successivement.
Nous devons nous rappeler ici que le milieu de la période où les femelles ne portent pas d'ceufs extérieurs se situe en janvier. Nous ne disposons d'aucun relevé concernant le début de cette période, mais il est très vraisemblable de supposer que le renouvellement des soies a débuté sensiblement avant la fin de décembre.
110
P. GRUA 479
Les individus à pilosité très fournie 3-II, sont plus fréquents à l'Ile Saint-Paul qu'à la Nouvelle Amsterdam ; nous savons en effet que les grosses langoustes, celles dont les soies sont les plus riches, sont plus nombreuses dans la première des deux îles.
L'hypothèse retenue pour expliquer l'allongement des soies est celle de la m u e . D'ailleurs, l'examen des pléopodes épilés montre des soies tronquées, alors que les soies complètes ont une extrémité effilée. Les soies écourtées sont donc remplacées par d'autres, lors de l'exuviation, selon le processus décrit par Drach (1939).
La courbe 3 de la figure 5 est une courbe cumulative. Cette courbe est l'expression additive de la courbe normale de distribution de Gauss. L a distribution des date de la m u e , responsable du renouvellement des soies, doit être c o m m e la distribution des dates de ponte et d'éclosion dans le cycle sexuel. Le renouvellement des soies correspond donc naturellement, sous sa forme sigmoïde, à la sommation du nombre des mues dans la population.
Avant de conclure, un rapprochement doit être fait. lia richesse des soies d'un animal donné, c'est-à-dire, la longueur absolue de ses soies et leur abondance, est en relation directe avec sa taille. L'on sait par ailleurs depuis Herrick (1895) que la relation entre la fertUité et la taille chez les crustacés est donnée par la formule : E X K L 3 . Si d'une part la fertilité est proportionnelle à la taille de la femelle, et si d'autre part la pilosité est liée à cette m ê m e taille, la pilosité, autrement dit la capacité à porter les œufs produits, est en rapport avec la fertUité.
CONCLUSION
L'ensemble des résultats acquis nous permet d'établir le schéma du déroulement du cycle annuel et celui de l'évolution des soies. L a femelle immature accède à la maturité qui s'établit à la taille moyenne de 172-173 m m à Saint-Paul et de 167-168 m m à la Nouvelle Amsterdam ; elle acquiert, à ce stade, des soies ovigères. Dès lors son cycle sexuel se déroule c o m m e suit : fécondation puis ponte en mai et juin, incubation des œufs, eclosión des larves en août et septembre (à la Nouvelle Amsterdam), nettoyage actif des pléopodes pour les débarrasser des coques d'œufs vides avec amputation partielle des soies ovigères, m u e estivale pouvant intervenir au cours d'une période de 4 à 5 mois, s'achevant en mars et responsable du renouvellement des soies, enfin m u e précédant i m m é diatement la fécondation. Les grosses femelles sont généralement plus précoces que les petites.
Les soies redevenues complètes, de longueur supérieure à deux largeurs de la palette sétigère de l'endopodite, sont plus longues chez les gros individus que chez les petits. La longueur et la densité de la pilosité des pléopodes est en rapport avec la fertilité des femelles.
111
480 CYCLE S E X U E L D E JAS US PAULENSIS
R É F É R E N C E S
B O A S , J .E.V. 1880. Studier over decapodernes slaegtskasforhold. Vidensk. Selsk. Skr.,
1-2 i 23-210.
B R A D S T O C K , C.A. 1950. A study on the marine spiny crayfish Jasus lalandii (Milne-Edwards),
including accounts of autonomy and autospasy. Zool. Publ. Victoria Univ. Coll., 7 : 1-36.
D R A C H , P. 1939. Mue et cycle d'intermue chez les Crustacés Décapodes. Ann. Inst.
Océanogr. Monaco, 19 t 103-391.
G E O R G E , R . W . 1957. Continuous crayfishing tests: Pelsart group, Houtman Abrolhos, Western Australia. (Palinurus longipes.). C.S.I.R.O., Austral., J. Mar. Freshw. Res.,
8 i 476-490. C R U A, P. 1960. Les langoustes australes Jasus lalandii. Biologie, milieu, exploitation commer
ciale. T.A.A.F., n° 10 : 15-40. G R U A , P. 1963. Maturité, cycle sexuel, soies ovigères des langoustes australes femelles, Jasus
paulensis. Heller 1863. Etude statistique. C.N.F.R.A., n° 4 : 1-35.
H E L L E R , C. 1861-1862. Vorlaüfiger Bericht über die wahrend der Weltumsegelegung der K . Fregatte Novara gesammelten Crustaceen. Verhandl. Zool. Bot. Ges., 11 : 495-498 ;
12 : 519-528.
H E R R I C K , F . H . 1895. The ame'rican ¿obster : a study of its habits and development. Bull.
U.S. Fish. Commission, 15 : 1-52.
H O L T H U I S , L . B . 1946. The Decapoda Macrura of the Snellius Expedition. Temminckia,
7 : 1-178.
H O L T H U I S , L .B . 1963. Preliminary descriptions of some new species of Palinuridea (Crustacea, Decapoda, Macrura, Reptantia). Koninkl. Nederl. Akad. Wetenschappen, Proc., Ser. C. 66 : 54-60.
112
Reprinted from C . R . Acad. 5c. Paris, vol. 259, groupe II, 1964, p. 1541-1543.
OCÉANOGRAPHIE BIOLOGIQUE. — Sur la structure des peuplements de
Macrocystis pyrifera (L.) C. Ag. observés en plongée à Kerguelen et
Crozet. Note (*) de M . P A U L G R U A , présentée par M . Roger Heim.
La pénétration en scaphandre autonome dans l'épaisseur de ces herbiers a rendu possibles des précisions écologiques reliées à la transparence des eaux, concernant la configuration verticale, la densité et les limites bathymétriques de la végétation. Des constatations sur la faune sont rapportées.
Les observations ont porté, entre o et i5 m d'immersion, sur l'étage
infralittoral de terres situées au voisinage de la convergence antarctique
dont la localisation semble être à quelques degrés tout au plus au Sud
des îles étudiées ('). Après quelques plongées à l'île de la Possession, dans
l'archipel de Crozet, les autres se sont déroulées à Kerguelen, dans la baie
du Morbihan, vaste espace intérieur s'ouvrant sur une large passe en
.direction de l'Est. Les eaux fréquentées, au long des rivages côtiers ou
autour d'îlots, étaient de transparences diverses; les valeurs relevées au
disque de Secchi s'établissaient en moyenne entre 4 et 15 m . La température
fraîche (J) de ces eaux varie, pour la couche superficielle, entre les moyennes
mensuelles de 2 et 8,5°C, selon les lieux et les saisons.
Les pieds de Macrocystis, individualisâmes par leur bloc de haptères,
ne sont pas contigus et laissent entre eux des espaces variables de l'ordre
de o,5 à 1 m . Dans la partie centrale de l'herbier, les stipes issus de chaque
pied sont souvent nombreux, de quelques dizaines à plusieurs centaines,
s'élevant verticalement en un faisceau serré et plus ou moins tressé
sur lui-même. Dans le cas des pieds dont le nombre de stipes est limité
à quelques unités, l'espacement entre eux peut être inférieur aux valeurs
indiquées ci-dessus. La fixation des haptères, constituant parfois des
masses volumineuses, s'effectue sur des faces subhorizontales, le plus
souvent surélevées. Les faces horizontales des creux et les faces verticales
ne sont pas colonisées, à moins d'être occupées par l'extension des haptères
voisins. Le substrat n'est pas nécessairement de la roche en place, la végé
tation étant possible sur des blocs dont la stabilité est suffisante pour
résister à la turbulence des eaux^JEn eaux calmes, on peut observer c o m m e
base des galets isolés, entourés parlors de sédiment, ou des galets rapprochés
recouverts par la croissance progressive des haptères. Dans les zones
favorables à une végétation puissante,- celle-ci subsiste sur des roches
pesantes ou fixes.
Dans les eaux peu transparentes, rencontrées le plus souvent, la limite
supérieure d'implantation apparaît à 2 ou 3 m de profondeur. Cette fixation
peut se faire plus près de la surface, exceptionnellement jusqu'à la ceinture
de Durvillea antárctica (Cham.) Hariot, soit à la frange inférieure de
l'étage littoral. Ba tham (s), qui a relevé la présence de Macrocystis à un
niveau homologue dans les stations abritées de Nouvelle-Zélande, explique
le fait par la faible turbulence locale, élément directement accessible à
Collected reprints of the International Indian Ocean Expedition, vol. IV, contribution no. 212 113
( » )
un observateur de surface. Cette relation ne paraît pas généralisable, car elle porte sur un cas particulier de la limite supérieure du peuplement. L'éclairement reçu par le fond se révèle par contre un facteur limitatif essentiel de la distribution verticale ("). Le peuplement disparaît progressivement en s'espaçant aux environs de 12 m de profondeur. Entre ces limites, la végétation est dense, soit que l'espace compris entre les pieds soit réduit, soit que de nombreux pieds comptent une grande quantité de stipes serrés les uns contre les autres, formant alors des sortes de colonnes atteignant 3o c m de diamètre. Des pieds peu prolifiques se répartissent autour de ces fûts, mais cependant ils n'empêchent pas totalement la circulation entre eux. Dans la couche d'eau, d'une épaisseur voisine de 1 m compté au-dessous de la surface, la végétation forme une masse considérable de stipes et de lames dont certaines, enchevêtrées, s'étendent parallèlement à la surface au lieu de pendre obliquement vers le fond. Cela constitue un écran dense que des rais de lumière traversent difficilement par endroit. Il en résulte un espace ombragé au-dessous. Lorsque le couvert est très épais, les stipes ne portent que peu de lames dans leur portion inférieure. Par ailleurs, les lames sont ondulées, rappelant l'aspect des frondes de Laminaria saccharina, et cela d'autant plus que les eaux sont plus turbides.
Si l'on considère des eaux plus transparentes, soumises à l'influence du large, la limite supérieure de fixation des pieds a été constatée à 8 m de profondeur. Sur un fond de i5 m , le peuplement se manifeste en pleine puissance et se poursuit au-delà vers la profondeur. Il est connu que les Macrocystis se fixent sur des fonds plus importants, et les nombres de 3o ou 4° m sont couramment avancés ; nous verrons plus loin ce qu'il faut penser des limites bathymétriques. A la différence de ce qui a été remarqué en eaux peu claires, l'impression générale ressentie dans le corps du peuplement est celle donnée par une forêt plus claire, plus penetrable à la lumière, et dont le faîte, en surface, reste lâche. La végétation est moins serrée du fait que les pieds peuvent être moins rapprochés et que, d'autre part et surtout, le nombre des stipes issus de chacun d'eux se limite le plus souvent à quelques unités.
Tous les intermédiaires ont été rencontrés, entre les cas schématiques ci-dessus, depuis l'aspect d'une futaie portant sa frondaison au niveau supérieur, ne comptant que des troncs volumineux quoique peu élevés, jusqu'à celui d 'un champ de cannes à sucre démesurées, aux pieds peu serrés et au feuillage prospère, en passant par le bois taillis aux plants d'importance inégale et où tous les individus, bien verticaux, atteindraient cependant la couche de surface. Dans les cas extrêmes qui ont été observés, une estimation a donné les valeurs approchées suivantes, par mètre carré de fond situé dans le milieu d'herbiers bien établis : 5oo m linéaires de stipes en eaux claires et jusqu'à 3 000 m linéaires de stipes en eaux enrichies de matières organiques (3). Parfois ont été rencontrées des
114
( 3 ) clairières à peuplement détérioré, avec des pieds dont les stipes restants,
après avoir perdu la majorité des lames et des flotteurs pendaient en
guirlandes festonnantes entre la surface et le fond. Sur le substrat ne
subsistaient par place que les blocs de haptères morts enlacés de stipes
affaissés.
Les limites des peuplements imposent les remarques suivantes. A u voisi
nage de la limite extérieure des bancs, au-dessus des fonds dont le faible
éclairement est encore favorable à l'espèce, le peuplement se poursuit
en profondeur tandis que la hauteur de la végétation diminue. Le sommet
des plants s'éloigne progressivement de la surface, les pieds s'espacent,
et, pour chacun d'eux, décroît le nombre de stipes. O n ne peut, en consé
quence, déterminer l'étendue de l'herbier à Macrocystis par l'observation
des contours de celui-ci à la surface. D'ailleurs, sous l'effet de courants
qui inclinent les stipes, les limites visibles des bancs se rétrécissent. A la
limite opposée, du côté des éclairements importants, le peuplement typique
ne présente pas un éclaircissement symétrique : la bordure supérieure
s'érige en une lisière précise, surgissant du fond jusqu'à la surface.
U n fait inattendu est la rareté de la faune mobile dans cet herbier.
Durant une trentaine d'heures passées dans des zones à Macrocystis,
outre des incursions de manchots Aptenodytes patagónica Miller, Pygoscelis
papua (Forster), et de cormorans Phalacrocorax verrucosus Cabanis, une
dizaine de poissons ont été vus, encore n'était-ce que sur les marges des
bancs. Le nombre généralement faible de poissons vivant dans la Baie
n'est peut-être pas étranger à cette pauvreté constatée dans l'herbier;
celui-ci n'est pas le milieu d'élection favorable qu'on a pu supposer.
Les Macrocystis exercent-elles une influence à laquelle seraient sensibles
certains vertébrés ? Des extraits analysés de M. pyrifera californiennes
se sont révélés toxiques pour les souris (6). Des invertébrés peuvent se
nourrir de cette algue (') tandis que sous leur couvert d'autres viennent
chercher abri (8) et que des formes sessiles s'y développent en masses
considérables. Des mesures de biomasse animale ont donné des valeurs
s'élevant jusqu'à i ,5kg/dm' J ; les espèces constituantes, actuellement à
l'étude, sont surtout constituées par des synascidies, des moules et des
éponges. U n e collection de photographies en couleurs a été faite dans les herbiers.
(*) Séance du 17 août 1964. (') R . D E L É P I N E , C.N.F.R.A., 3, 1963, p. 25. ('-) P. G R U A , Third Intern. Biometeor. Congr., Pau, 1963, Pergamon Press, Oxford
(sous presse). (:l) Ë . J. B A T H A M , Trans. Roy. Soc. New Zealand, 84, 1956, p. 447. (») P. D R A C H , C. R. SOC. Biogéogr., 227, 1949, p. 46. (') Le mètre linéaire utilisé comme unité est le produit du nombre de stipes comptés
à 1 m au-dessus du fond, par la longueur moyenne de la végétation au lieu considéré. ('•) R . C. H A B E K O S T , M . F. IAN et W . H . B R U C E , J. Washington Acad. Se, 45, ig55,
p. loi. (') \V . J. N O R T H , Nature, 190, 1961, p. 1214. (8) P. G R U A , T. A. A. F., 10, i960, p. i5.
(Station Biologique de Roscoff, Finistère.)
115
Reprinted from Bull. Soc. Phycol. de France, no. 10, 1964, p< 14.
La végétation infra-littorale de la Baie du Morbihan IKerguelenl
par R. DELÊPINE et P. GRUA
Dans le cadre de l'étude de la flore algale des îles australes, l'un de nous avait déjà eu l'occasion de présenter ici m ê m e des photographies en coufleurs sur l'étagement de la végétation littorale. Lors d'une mission d'été en 1962-1963, P. G R U A a réalisé des photographies sous-marines au cours de plongées en scaphandre autonome, pour une étude des peuplements infra-littoraux jamais entreprise ainsi. Il a pu préciser certains points écologiques de cet étage qu'il expose ici au sujet de la végétation. Par ailleurs* des problèmes systématiques sont signalés ; les photographies suivantes illustrent ces points.
Le caractère fondamental de la végétation de l'étage littoral est la ceinture de Durvillea antárctica, qui indique la limite inférieure de l'étage médio-littoral. Les photos sous-marines laissent suggérer qu'une deuxième espèce {D. caepaestipes) est peut-être présente à Kerguelen et se situerait ÎIU sommet de l'étage infra-littoral. L'absence de données certaines sur la base de fixation nécessite d'autres investigations.
U n échantillonnage de la végétation infra-littorale, est ensuite montré : Delesseriacées, Iridaea, Ulva, Acrosiphonia et diverses Desmarestia de caractères écologiques différents. Une espèce de ces dernières peut former une strate caractéristique d'eaux calmes, notamment sous les Macrocystis dans des zones où celles-ci sont peu denses.
Les plongées ont permis de retrouver en place, dans l'herbier de Macrocystis à 15 mètres de profondeur, à l'Ilot Buchanan, une espèce de Lessonia qui n'y avait été localisée que par quelques fragments l'année précédente. Une autre localisation a été découverte à l'Ile du Chat à la m ê m e profondeur.
Enfin, la végétation caractéristique de cet étage infra-littoral est formée par Macrocystis pyrifera, dont les folioles portées par les grandes lanières flottent à la surface de l'eau, formant ainsi d'immenses herbiers dans la Baie du Morbihan (Kerguelen). Ces herbiers dessinent souvent- une ceinture très nette à quelque 10 ou 20 m de l'aplomb des côtes, correspondant à des thalles fixés au substrat à des profondeurs variant de quelques mètres à 25 m environ.
En outre, des prises de vue en 16 m m ont été effectuées ; ce film sur l'écologie infralittorale à Kerguelen, est en préparation.
• Laboratoire de Biologie végétale marine, Paris. • Station Biologique, Boscoff.
116 Collected reprints of the International Indian Ocean Expedition, vol. IV, contribution no. 213
Reprinted from Zoo/og/scher Anzeiger, Bd. 175, Heft 4-6, 1965, S. 371-377.
Aus dem Instituto Oceanógrafico Cumaná, Venezuela
Ptychodera flava (Enteropneusta) von Tanikely, Madagaskar
Ergebnisse der Osterreichischen Indo-Westpazifik-Expedition 1959/60
Teil X
Von
ERNST KIRSTEUER1
Mit 4 Abbildungen
(Eingegangen am 5. November 1964)
Das vorliegende Material wurde im Verlaufe der von der „Osterreichischen Indo-Westpazifik-Expedition 1959/60" durchgefiihrten faunistisch-ôkologischen Untersuchungen an madagassischen Korallenriffen gesammelt und beschrankt sich auf eine Art, Ptychodera flava Eschscholtz 1825. Es ist dies nicht nur die a m langsten bekannte und oftmals in derLiteratur erscheinende Enteropneusten-Species, sondern nach den gemachten Erfahrungen auch der im Bereich des In-dischen Ozeans (und pazifischen Raumes) weitest verbreitete Vertreter der Gruppe (Abb. 1). W e n n nun dieser an sich wohlbekannten Art noch eine weitere Studie gewidmet ist, so m ô g e dies damit begründet sein, daB es sich z u m einen u m einen fiir die marine Fauna Madagaskars neuen Reprasentanten handelt, z u m anderen aber eine Art zur Rede steht, die nach bisherigen Mitteilungen eine groBe Vielfalt an anatomisch-morphologischen Abweichungen aufweisen kann, welche ihren Niederschlag in der Beschreibung von nicht weniger als 15 Varie-tâten fand (PrjNNETT [1903] meldet allein sieben Varietâten der Art von den Malediven und Lakkadiven, R A O [1963] fünf weitere von der Insel Krusadai und deren naherer Umgebung) und vereinzelt auch zur Darstellung neuer Arten fiihrten, die erst durch die eingehenden Arbeiten von T R E W A V A S (1931) und H O R S T (1939) als mit Ptychodera flava identisch erkannt wurden.
Die Nachricht iiber einen tiergeographisch neuen Fund sollte demnach einer Wiedergabe der anatomischen Organisationsverhaltnisse nicht entbehren. Fiir letzteres stehen 14 in Bouin fixierte, vollstandige und gut erhaltene Individúen zur Verfiigung, welche auf der Madagaskar im N W unmittelbar vorge-lagerten Insel Tanikely ( M80I4"9'0,13°¿8-<í'S ) gesammelt wurden. Die Tiere be-fanden sich unter Steinen an der Oberilache eines Grobsandbodens in einem durchschnittlich 20 c m tiefen Fluttiimpel an der Ostseite der Insel.
Ptychodera flava E S C H S C H O L T Z 1825
Clamydothorax ceylonensis N A R A Y A N A R A O 1934
C . krusadiensis ders. 1934
Ptychodera flava H O R S T 1940
1 Dr. Ernst Kirsteuer, Museum of Natural Historv, Department of Living Invertebrates, CENTRAL P A R K W E S T at 79 St. N E W Y O R K , N . Y .
Collected reprints of the International Indian Ocean Expedition, vol. IV, contribution no. 214 117
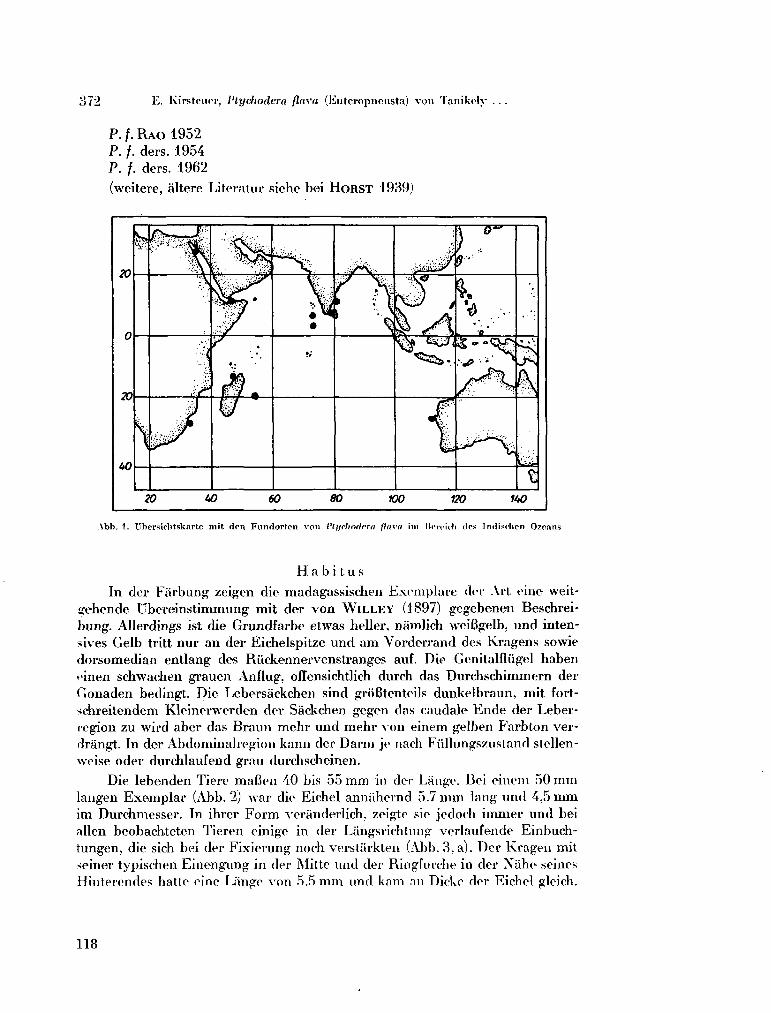
372 E . Kirstcnpi-, Ptychodera flava (Eutcropneusta) von Tnnikoly . . .
P. /. R A O 1952 P. f. ders. 1954 P. f. ders. 1962
(weitere, altere Literatur siehe bei H o R S T 1939)
A b b . 1. Ubersiohtskarte mit don Fundorten von Vtyclioflcrti flava im TÍOI-OÍCII dos Indisolicn Ozoans
H a b i t u s
In der Fiirbung zeigen die madagassischen Exemplare der .Vit eine weit-gehende übereinstimmung mit der von W i L L E Y (1897) gegebenen Beschrei-bung. Allerdings ist die Grundfarbe etwas heller, namlich weiBgelb, und intensives Gelb tritt nur an der Eichelspitze und a m Vorderrand des Kragens sowie dorsomedian entlang des Rückennervenstranges auf. Die Genilalílügel haben finen schwachen grauen Anflug, oft'ensichtlich durch das Durchschimmern der Gonaden bedingt. Die Lebersáckchen sind gróBtenteils dunkelbraun, mit fort-sehreitendem Klemcrwerden der Sackchen gegen das caudale Ende der Leber-region zu wird aber das Braun mehr und mehr von einem gelben Farbton ver-drangt. In der Abdominalregion kann der Darm je nach Fülhmgszustand stellen-weise oder durchlaufend grau durchscheinen.
Die lebenden Tiere mafien 40 bis 55 m m in der Lange. Bei einem 50 m m langen Exemplar (Abb. 2) war die Eichel anniihernd 5.7 m m lang und 4,5 m m im Durchmesser. In ihrer Form veranderlich, zeigte sie jedoch immer und bei alien beobachteten Tieren einige in der Lângsrichlung verlaufende Einbuch-tungen, die sich bei der Fixierung noch verstarkten (Abb. 3, a). Der Kragen mit seiner typischen Einengung in der Mitte und der Ringfurche in der Niihe seines Hinterendes batte eine Lange von 5.5 m m und kam an Dicke der Eichel gleich.
118
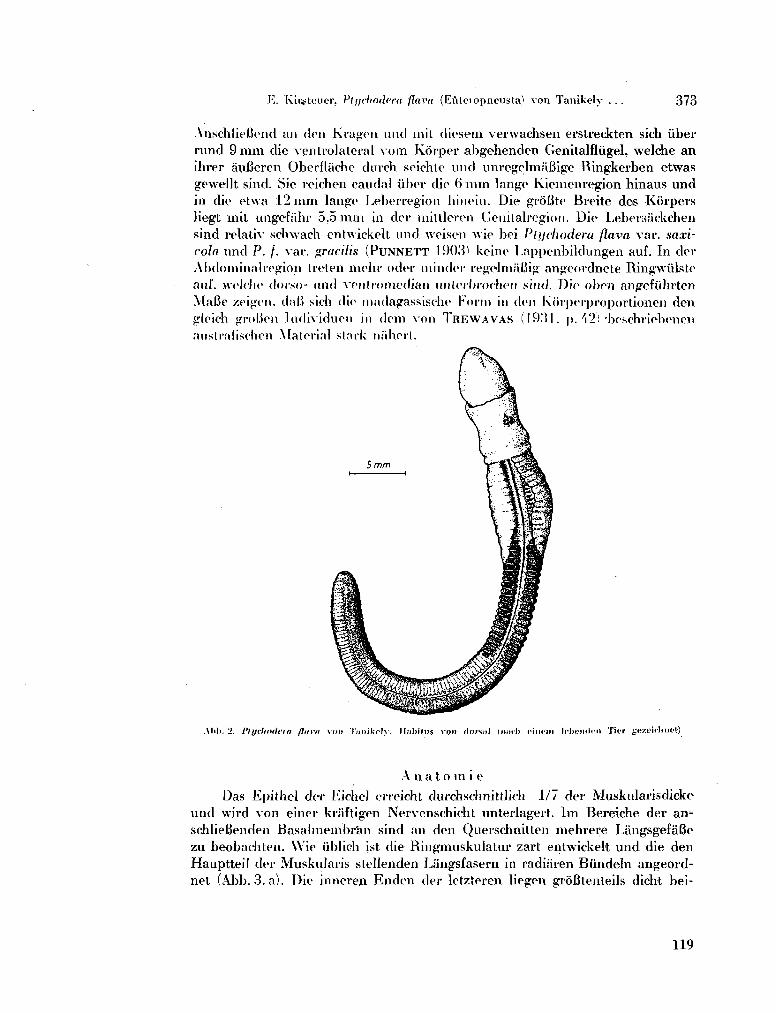
K . Kii* toner, Ptj/clmdera flava (ILùlciopneusta) von Tanikely . . . 373
Anschliefjond an den Kragen and mil diesem verwachsen erstreckten sich über rund 9 m m die ventrolateral v o m Korper abgehenden Genitalflügel. welche an Hirer ¿infieren Oberflache dnrch seiehte mid unregelmaBige Ringkerben etwas gewellt sind. Sie reichen caudal über die 6 m m lange Kiemenregion hinaus und in die etwa 12 m m lange Leberregion hinein. Die groBte Breite des Kôrpers liegt mit ungefahr 5.5 m m in der miltlereii (jenilalregion. Die Lebersackchen sind relativ schwach entwickelt und weisen wie bei Plijclwdera flava var. saxícola und P. f. var. gracilis (PuNNETT 19031 keinc l.appenbildungen auf. In dor Abdominalregion treten mohr oder minder regelmafiig angcordnete Ringwülsto auf. welche dorso- und ventromedial! untorbrocheii sind. Die oben angefiihrten M a B e zeigen. dab" sich dû1 madagassische Form in den Korperproportionen den gloich groUon lndividuen in deni von T R E W A V A S (1931. p. Vi) •boschriebonen australiselicn Material slack niilierl.
Alii). 2. Plychodt'ta flava voit Tanikcly. Habitus von dorsal (nach riiii'in Ichenilrn Tier gezeioliuct)
A uatoinie Das Epithel der Eichel crieicht durchschnittlich 1/7 der Muskularisdicke
und wird von einer kriiftigen Nervenschicht unterlagert. Im Bereiche der an^ schlieBenden Basalmembr'an sind an den Querschnitten mehrere LangsgefaBc zu beobachten. W i e iiblich ist die Ringmuskulatur zart entwickelt und die den Hauptteil der Muskularis stellenden Langsfasern in radiaren Bündeln angeord-net (Abb. 3. a). Die inneren Enden der letzteren liegen groBtenteils dicht bei-
119
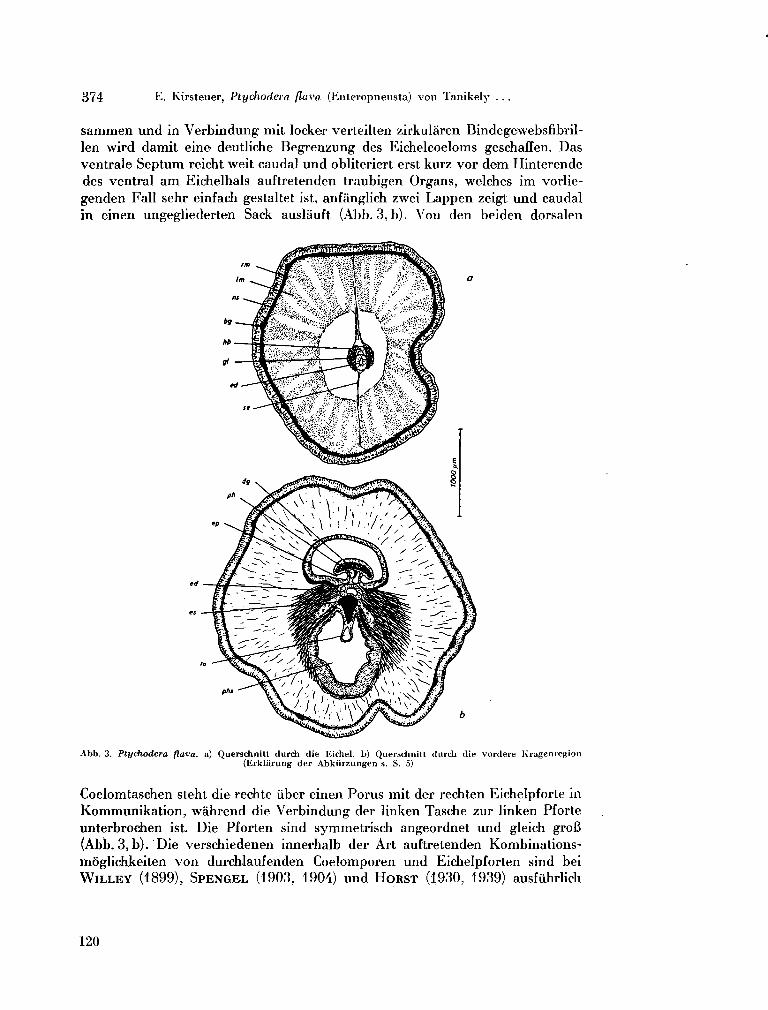
374 E . Kii'steuer, Ptychodeia flava (EnLeropneusta) von Tanikely . . .
s a m m e n und in Verbindung mit locker verteilten zirkuláren Bindegewebsfibril-len wird damit eine deutliche Begrenzung des Eichelcoeloms geschaiïen. Das ventrale Septum reicht weit caudal und obliteriert erst kurz vor d e m Hinterende des ventral a m Eichelhals auftretenden traubigen Organs, welches im vorlie-genden Fall sehr einfach gestaltet ist, anfanglich zwei Lappen zeigt und caudal in einen ungegliederten Sack auslauft (Abb. 3, b). Y o n den beiden dorsalen
Abb. 3. Ptychodera flava, a) Querschnilt durch die Eichel. b) Querschnitt durcb die vordere Kragenregion (Erklarung der Abkürzungen s. S. 5)
Coelomtaschen steht die rechte über einen Porus mit der rechten Eichelpforte in Kommunikation, wâhrend die Verbindung der linken Tasche zur linken Pforte unterbrochen ist. Die Pforten sind symmetrisch angeordnet und gleich groB (Abb. 3, b). Die verschiedenen innerhalb der Art auftretenden Kombinations-moglichkeiten von durchlaufenden Coelomporen und Eichelpforten sind bei W I L L E Y (1899), S P E N G E L (1903, 1904) und H O R S T (1930, 1939) ausfiihrlich
120
E . Kirsteuer, Ptychodera flava (Euteropiieusla) von Tanikely . . . 375
behandelt und kônnen an dieser Stelle übergangen werden. Die Herzblase endet terminal ein Stuck hinter der Eicheldarmspitze. Die den beiden Organen grôB-tenteils lateral aufliegenden Glomerulushàlften vereinigen sich dorsal im vor-deren Herzblasenbereich und umhiillen vollstandig das Vorderende des Eichel-darms. Letzterer besitzt ein durchgehendes und relativ weit terminal reichendes zentrales L u m e n von stark wechselndem Durchmesser, welches in der vorderen Eicheldarmhalfte stellenweise nur einen engen vertikalen Schlitz, darstellt. Der groBte Durchmesser des Kanals ais audi des Eicheldarmes selbst ist an jener Stelle zu beobachten, w o die durch ZusammenflieBen der beiden lateroventralen Blindsâcke gebildete ventromediane kurze Tasche mit d e m Hauptlumen in Ver-bindung tritt. Hinsichtlich des Eichelskeletts ist nur zu vermerken, daB der Kiel anfànglich trotz des kleinen traubigen Organs ventral eingebuchtet ist, und zwar so weit als das erwàhnte Organ zweilappig in Erscheinung tritt, in der Fort-setzung nach caudal aber dann ventral zugespitzt und im Querschnitt keil-formig ist (Abb. 3, b).
In der Kragenregion zeigt die Epidermis annahernd gleiche Dicke wie an der Eichel. Unterschiedlich ist nur die abwechselnde Folge von Zonen mit weni-ger Driisen und solchen w o diese dicht angelagert sind, wobei insgesamt, und wie bisher immer bei P. flava beobachtet, fiinf Zonen zu unterscheiden sind. Eine auBere Ringmuskulatur fehlt, und eine dünne Lángsmuskellage legt sich von innen her der Basalmembran direkt an. Die den Pharynx umschlieBende Muskulatur ist gut ausgebildet. Das Kragenmark mit seinem durchgehenden Zentralkanal ist zu Beginn im Querschnitt nierenformig, gegen die Kragenmitte wird es rund, und nur der Kanal behàlt seine urspriingliche Querschnittsform, und im caudalen Drittel des Làngsverlaufes tritt wieder eine ventrale Einbuch-tung des Neurochords auf, und der Kanal zeigt hier einen elliptischen Querschnitt. Bei der vorliegenden Form entsendet das Kragenmark nur eine Dorsal-vvurzel, deren Kanal auf den proximalen Abschnitt beschrànkt ist. Sie liegt etwas links auBerhalb der Mediansagittalen und zieht terminal ansteigend zur Epidermis, in die sie eindringt. Die Epidermis zeigt aber an dieser Stelle keine Invagination, wie sie etwa T R E W A V A S (1931) bei australischen Individúen der Art vorgefunden hat. Das dorsale Kragenseptum fângt erst etwas hinter der Dorsalwurzel an und erstreckt sich bis an das caudale Kragenende, wobei es im hinteren Teil stark gefaltet ist. Die iiberwiegend von Lángsmuskelfasern durch-setzten Perihaemalraume liegen d e m Kragenmark lateral und ventral auf und schlieBen sich mit ihren medianen W à n d e n , soweit es das RückengefaB zulaBt, dicht zusammen. Das ventrale Kragenseptum beginnt ein wenig friiher als das dorsale, ist aber unvollstândig und reicht nicht bis an die ventrale Kragenwand heran. Besonders a m Anfang, d. h. unmittelbar hinter d e m KragenringgefaB ist es sehr kurz und stellt nur eine das VentralgefáB haltende Falte dar. Die Kra-genpforten sind von dorsal her tief eingefaltet und miinden in die ersten Kie-mentaschen.
Die Kiemenregioh ist vergleichsweise kurz. V o n den beiden durch einen kraftigen Grenzwulst getrennten Darmabschnitten dieses Gebietes ist der Kie-mendarm der mit d e m grôBeren Volumen, selbst wenn m a n beriicksichtigt, daB
121
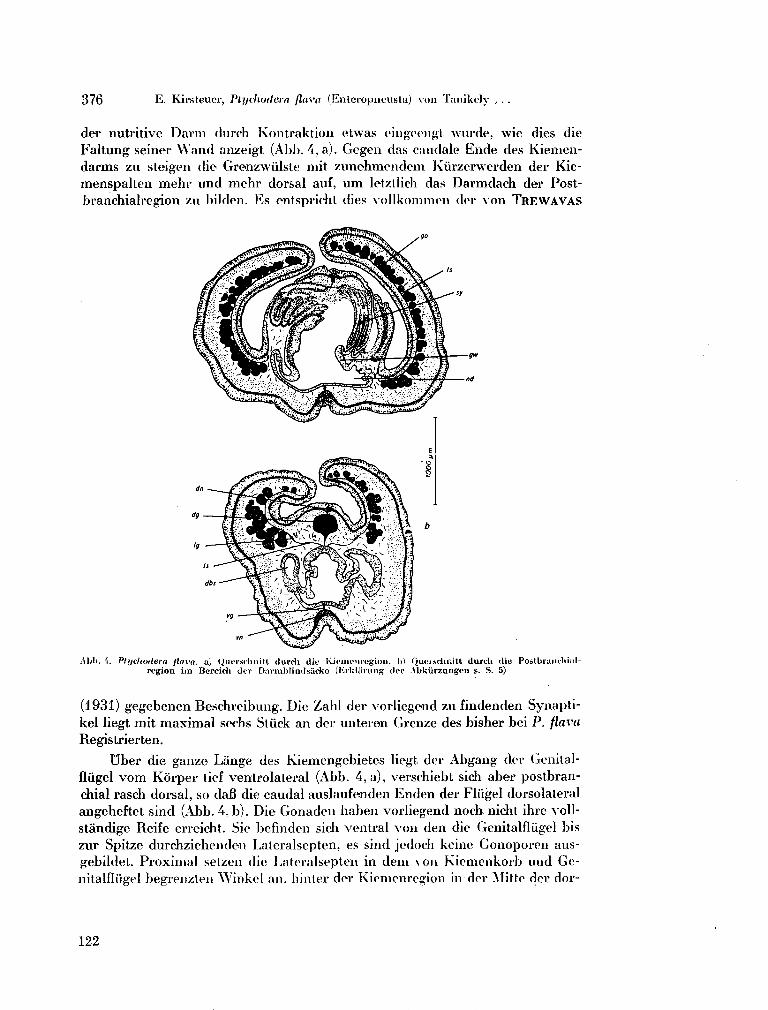
376 E . Kivs teuor, Ptychodera flava (Enteropneusla) von TanikeJy , . .
der nutritive Daini (lurch Kontraktion etwas oingeengt wurde, wie dies die Faltung seiner W a n d anzeigt (Abb. 4, a). Gegen das caudale Ënde des Kiemen-darms zu steigen die Grenzwiilste mit zunehmendem Kürzerwerden der Kie-menspalten mehr und mehr dorsal auf, u m letzllich das Darmdach der Post-branchialregion zu bilden. Es entsprlcht dies vollkommen dor von T R E W A V A S
Alii). \. Ptychodera flava, a) Quersclmitl durch die Kiemcuregion. b) Qucisclinitt durch die Postbram-liial-region im BcreioJi (lev Darmblindsackc (Erkliinmg der Abkurzungeii s. S. 5)
(1931) gegebenen Beschreibung. Die Zahl der vorliegend zu findenden Synapti-kel liegt mit maximal sechs Stuck an der unteren Gi'enze des bisher bei P . flava Registrierten.
Uber die ganze Lèinge des Kiemengebietes liegt der Abgang (1er Genilal-fliigel v o m Kôrper tief ventrolateral (Abb. 4, a), verschiebt sich aber postbranchial rasch dorsal, so daB die caudal auslaufenden Enden der Fliigel dorsolateral angeheftet sind (Abb. 4 , b). Die Gonaden haben vorliegend noch, nicht ihre voll-stándige Reife erreicht. Sie befinden sich ventral von den die Genitalflügel bis zur Spitze durchziehenden Lateralsepten, es sind jedoch keine Gonoporen aus-gebildet. Proximal setzen die Lateralsepten in d e m von Kiemenkorb und G e nitalflügel begrenzten Winkel an. hinter der Kiemenregion in der Mitte der dor-
122
E . Kirsteucr, Ptydiodera flava (Enteropneusta) von Tanikcly . . . 3 7 7
salen Darmwand und in der caudalen Genitalregion dorsolateral à m Darni. Die in der Postbranchialregion auftretenden lateralen Darmblindsacke (Abb. 4 , b . die durch ihre dorsale Verlôtung mit der D a r m w a n d zwei in das Darmlumen caudal hineinreichende Coelomblindsàcké bilden. entsprechen in Form- un<f Lageverhaltnissen ganz der von T R E W A V A S (1931. Fig. 2, p. 44) gegebenen Dai -stellung. Die bei d e m zur Diskussion stehenden Material in diesem Abschnitt stellenweise zu beobachtende enorme Erweiterung des dorsalen GefaBstammes (Abb. 4,b) ist vermutlich kontraktionsbedingt. Die terminal ungefàhr gleieb-zeitig mit der Leberregion bcginnenden beiden dorsolateralen Wimperstreifen des Darmes sind verhaltnismâBig seicht, die sie medianwárts abdeckepde Epi-thelleiste ist schmal. und es sind keine sehr ausgeprâgten, mit den Lebersâckchen alternierenden Vcrtiefungen der Wimperstreifen gegeben. W a s das Pygochord betrifït, so liegen die gleichen Verhâltnisse vor wie sie W l L L E Y (1899. p. 243) bc-schrieben hat.
E r k 1 ii r H n g der Abki i rzungci i
bg dbs dg dn ed ep es si SO gw hb 1g
Ulutgefaû Darmbliadsack DorsalgefàB Dorsalnerv Eicheldarm Eichclpfortc Eichelskelett Glomerulus Gonaden Grenzwulst Herzblasc
Latralgcfiili
Im h nd ns ph phv rm se sy to vg
va
Lângsmuskulalm-Latcralseplum uutritiver D a r m ¿Vervenschicht Perihacmalraum Pharynx Ringmuskulatur Eichelseptuni Synaptikel Iraubiges Organ VentralgefâB V e n train crv
S c h r i f t t u m H O R S T , C . J. V A N D E R : Observations on s o m e Enteropneusla. Papers from D r . T h . Morten-
sen's Pacific Expedition 1914—16. Vidensk. M é d d . fra Dansk naturh. Foren. 87 (1930) 1 3 5 - 2 0 0 .
— Hemichordata. In Bronns Klassen u n d Ordnungen des Tierrcichs 4 (1939). — The Enteropneusta from Invack Island, Delagoa Bav. Ann. S. Afric. M u s . 32 (1940 >
293-380. ^ARAYANARAO, C. : Enleropneusta of the Krusadai Island. Curr. Sci. 3 (1934). PuNNETT, R . C. : The Enteropneusta. In Fauna and Geography of the Maldive and Laccii-
dive Archipelagoes. 2 (J 903) 631-680. ' ' R A O , K . P . : Significance of variation in Ptydiodera flava. Evolution 6 (1952) 342—343. — Bionomics of Ptydiodera flava Eschscholtz. J. Madras Univ. 24 (1954). — Enteropneusta from the east coast of India, with a note on the probable course of distri
bution of Ptydiodera flava. Proc. Indian A c . Sci. 55 (1962) 2 2 4 - 2 3 2 . S P E N G E L , J. W . : N e u c Beitrage zur Kenntnis der Enteropneusten. I. Ptychodera flavo
Eschsch. von Laysan. Zool. Jb. Anat. 18 (1903) 2 7 1 - 3 2 6 . — Neue Beitrage zur Kenntnis der Enteropneusten. II. Ptydiodera flava von Funafuli
(Ellice-Gruppe). Zool. lb. Sysf. 20 (1904) 1-18. T R E W A V A S , E . : Enteropneusla. Great Barrier Reef Expedition 1928—29. Sci. Rep. 4 (1931
39-67. WlLLEY, A . : O n Ptydiodera flava Eschscholtz. Quart. J. Micr. Sci. 40 (1897) 165-183. — Enteropneusta from the South Pacific, with notes on Wes t Indian Species. Willey, A .
Zoological Results, Part 3 (1899) 223—334.
123
Reprinted from Boll. Mus. 1st. Biol. Univ. Genova, vol. XXXIII, 1964-65, no. 199, p. 33-38.
N . D E L L A C R O C E - L.B. H O L T H U I S *
Istituto di Zoología délia Università di Genova
* Rijksmuseum van Natuurlijke Historie, Leiden
Swarming of Cherybd/s (Gonr'ohel/enus ) edv/ardsi
Leene & Buirendijk in the Indian Ocean
(Crustacea Decepoda, Portunidae)
Swimming crabs of the family Portunidae as a rule are bottom
dwelling animals. A n exception is the only known species of the genus
PolybiuSy P. henslowi Leach, which has been observed in large groups
(often in hundreds or thousands of specimens) on the surface of the
sea at considerable distances from the shore (Clark, 1909, p. 287; Balss,
1955, pp. 1318-1319; Delia Croce, 1961, pp. 5-13, where older records
are cited).
The pelagic occurrence of this species evidently is a periodic
phenomenon; schools appear rather suddendly and disappear equally
abruptly. Whether this occurrence is connected with the reproductive
cycle, or is caused by the temporary presence of food in the upper layers
of the sea (Polybius often attacks sardines voraciously and is considered
a severe pest by sardine fishermen), is still an open question.
So far as is known to us, this swarming habit has not been observed
in other Portunidae. It seems therefore of interest to report here on
the observations of such swarms of the Portunid Charybdis (Goniohellenus)
edwardsi Leene & Buitendijk, 1949 made in the Indian Ocean during
cruise no. 8 of the R . / V . << Anton Bruun » of the National Science Found
ation, held under the auspices of the U . S . Biological Program for the
International Indian Ocean Expedition.
Collected reprints of the International Indian Ocean Expedition, vol. IV, contribution no. 215 125
34
During this expedition swimming crabs were spotted in surface
waters on three consecutive days and at three different stations:
Date Sta. Lat. Long. Temper. Salinity
1 November 1964 416 09° 45' • S - 43° 39' E 25,91<>C 35,108°/Oo
2 November 1964 417 07° 03' S - 42° 34' E 26,54°C 35,308°/Oo
3 November 1964 418 05° 14' S - 41° 40' E 26,30°C 35,393°/oo
The stations were located in the open sea at a distance of not less
than 120 miles from the nearest land (in the case of Sta. 416 the nearest
land were the Comore Islands, and in that of Sta. 418 the East African
coast). The area covered by these stations exceeds 240 miles in length
from South to North, and we may therefore assume that the area oc
cupied by these swimming crabs was very extensive. The crabs appeared
on 1 November after sunset, between 0700 and 0800 p . m . and were
very abundant. Fourteen males and 26 females (none ovigerous) were
collected. The size range of the measured males varied from 51 to 65
m m carapace breadth, and that of the females from 48 to 61 m m . O n
2 November the crabs appeared again in the evening, but were not so
numerous as the day before, while only few specimens were observed,
again after sunset, on 3 November.
Examination of the crabs showed them to belong to the species
Charybdis (Goniohellenus) edwardsi Leene & Buitendijk, 1949, a species,
the correct status of which was only recently ascertained. It was des
cribed and figured as early as 1861 by A . Milne Edwards (1861, p. 380,
pi. 34, fig. 4) and identified by him as Goniosoma truncatum (Fabricius,
1798) (= Charybdis truncata (Fabr.) ), but Leene & Buitendijk (1949,
p. 296, figs. 3, 4 c) showed that A . Milne Edwards's material was
different from Fabricius's species and represented an unnamed form
for which they proposed the new name Charybdis edwardsi. The des
criptions and figures provided by A . Milne Edwards and by Leene
& Buitendijk agree very well with our specimen, so that we are fully
convinced of their identity. Leene & Buitendijk described and figured
a male specimen from Malabar, west coast of India, which is now
selected to be the lectotype of the species. A . Milne Edwards's material
came also from the Malabar coast of India and furthermore from Port
Natal (= Durban, Natal, South Africa).
126
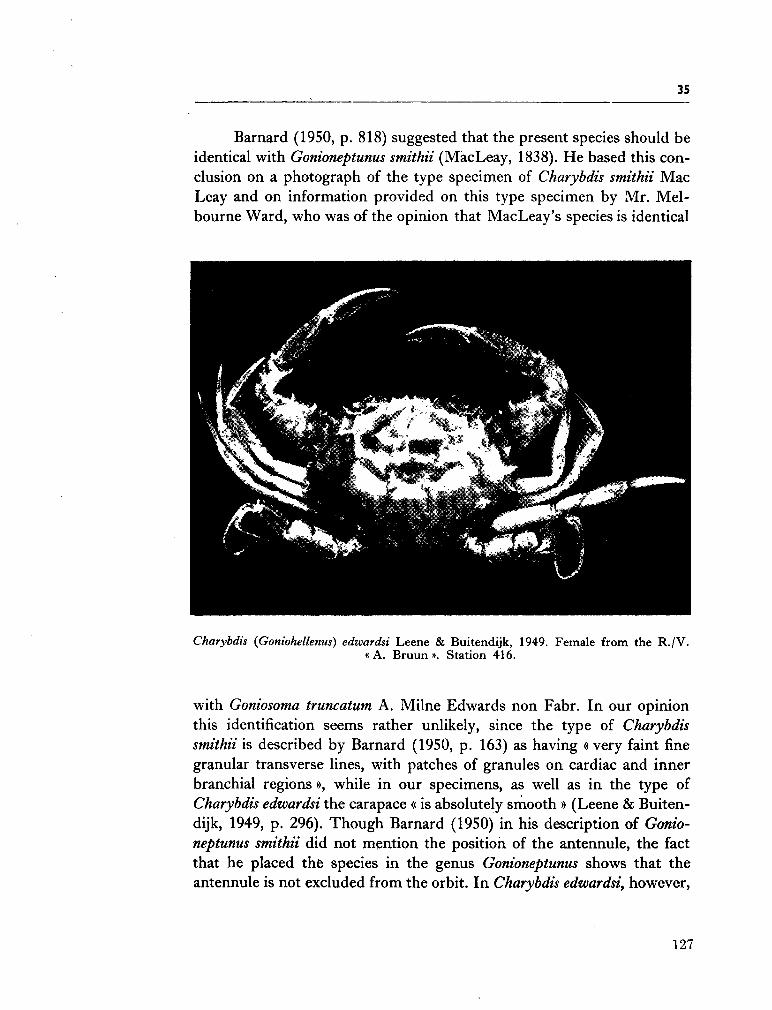
35
Barnard (1950, p. 818) suggested that the present species should be identical with Gonioneptunus smithii (MacLeay, 1838). H e based this conclusion on a photograph of the type specimen of Charybdis smithii M a c Leay and on information provided on this type specimen by M r . M e l bourne Ward , w h o was of the opinion that MacLeay's species is identical
Charybdis (Goniohellenus) edwardsi Leene & Buitendijk, 1949. Female from the R . / V . « A . Bruun ». Station 416.
with Goniosoma truncatum A . Milne Edwards non Fabr. In our opinion this identification seems rather unlikely, since the type of Charybdis
smithii is described by Barnard (1950, p . 163) as having « very faint fine granular transverse lines, with patches of granules on cardiac and inner branchial regions », while in our specimens, as well as in the type of Charybdis edwardsi the carapace « is absolutely smooth » (Leene & Buitendijk, 1949, p . 296). Though Barnard (1950) in his description of Gonio
neptunus smithii did not mention the position of the antennule, the fact that he placed the species in the genus Gonioneptunus shows that the antennule is not excluded from the orbit. In Charybdis edwardsi, however,
127
36
the antennule is definitely excluded from the orbit, as is shown by our
specimens and clearly indicated by Leene & Buitendijk. It is interesting
to note that Leene (1938, p. 16) mentioned that, again at the suggestion
of M r . Melbourne Ward, who had examined MacLeay's type, she con
sidered Charybdis stnithii MacLeay to be a synonym of Charybdis (Go-
nioneptunus) bimaculata (Miers), which in our opinion indeed seems far
more likely. It is not clear why Leene (1938, p. 126) did not include a
reference to C. smithii MacLeay, 1836, in her synonymy of C. bimaculata
(Miers, 1886), and why she did not substitute the former name for the
latter, as it has distinct priority.
It is of interest that the smooth and highly polished (though minut
ely shagreened) carapace of Charybdis edwardsi is one of the conspicuous
and most characteristic features of this species, which it has in common
with Polybius henslowi Leach.
So far nothing was known about the biology of Charybdis edwardsi.
The present observations of its pelagic occurrence in the open ocean,
and the fact that it forms swarms, therefore are of special interest.
W e may state that the only certain locality, from where the present
species has been reported before, is Malabar on the west coast of India.
The present records to some degree do extend the known range of the
species, which remains restricted to the western Indian Ocean. C.
edwardsi may possibly also occurs in Natal. It would be interesting
to know whether A . Milne Edwards's Durban specimen actually is
identical (*) with the present species or that it perhaps belongs to Go-
nioneptunus smithii (MacLeay), so that Ward indeed was correct in
identifying MacLeay's type with (part of) A . Milne Edwards's G.
truncatum. Only the examination of the Durban specimen can solve
this problem, while new records from that area would prove a more
wide pattern of distribution of the species.
ADDENDUM
W e received through the kindness of Dr. Isabella Gordon, British
M u s e u m (Natural History), London, the following extract from an entry
in the log book of M . V . « Herefordshire » made on a voyage from C o
lombo towards Aden:
(*) The figure of Goniosoma truncatum by A . Milne Edwards (1861) is based on a specimen « des mers de llInde », thus evidently on the Malabar specimen mentioned in his text. This figured specimen is unmistakably Charybdis edwardsi.
128
37
«21st October, 1963, between 0345 and 0400 G . M . T . in 10°
43' N , 59° 26' E . During this time observed a great number of crabs
(approximately 1 crab every 15 feet for 4 miles and stretching either side
of ship's course as far as could be seen by binoculars) floating on surface.
The crabs were dark reddish brown in colour, average size about 5
inches long and 2% inches wide, they appeared to be lying still until
disturbed by bow wave, when they were observed to paddle their legs.
Sea temperature 83°, sea smooth, no swell, calm, fine and clear ».
This phenomenon shows a remarkable resemblance to that observed
during the cruise of the R . / V . « Anton Bruun ». The colour of the animals
checks well with that of Charybdis edwardsi, while the measurements
could pertain to the animal with extended legs, the given width ther
should be the actual length and viceversa. Unfortunately no specimens
were taken by the « Herefordshire », and therefore the identity of the
species must remain uncertain. It is interesting to note that this obser
vation resembles those made at the « Anton Bruun » in that it is made (1)
in the extreme western part of the Indian Ocean, (2) in the autumn and
(3) at night.
LITERATURE
BALSS H . , 1955 - Decapoda. 10. Lieferung. In: H.G. Bronn, Klassen und Ordnungen des Tierreichs. Vol. 5, sect. 1, pt. 7, 10, 1285-1367.
B A R N A R D K . H . , 1950 - Descriptive catalogue of South African Decapod Crustacea. Ann. S. Afr. Mus., 38, 1-837.
C L A R K J., 1909 - Notes on Cornish Crustacea. Zoologist, S. 4, 13, 281-308.
D E L L A C R O C E N . , 1961 - Considerazioni su Polybius henslowi Leach {Crustacea Bra-chyura). Boll. Mus. 1st. Biol. Univ. Genova, 31, 5-13.
L E E N E J.E., 1938 - Brachygnatha: Portunidae. The Decapoda Brachyura of the Si-boga Expedition. VII. Siboga Exped. Mon., 39 (C 3), 1-156.
L E E N E J.E., BUITENDIJK A . M . , 1949 - Note on Charybdis ihlei nov. spec, Charybdis beauforti nov. spec, and Charybdis edwardsi nom. nov., from the collection of the British Museum (Natural History), London. Bijdr'. Dierk. Amsterdam, 28, 291-298.
M I L N E E D W A R D S A . , 1861 - Études zoologiques sur les Crustacés récents de la famille des Portuniens. Arch. Mus. Hist. nat. Paris, 10, 309-428.
129
38
R I A S S U N T O
Gli A . A . riportano alcune osservazioni biologiche e sistematiche su Charybdis edwardsi raccolto nel corso délia crociera n. 8 del R . / V . « A . Bruun » in occasione della Spedizione Internazionale nell'Oceano Indiano.
SUMMARY
T h e A . A . report some biological and systematic observations on Charybdis edwardsi collected on cruise no. 8 of the R . / V . « A . Bruun » during the International Indian Ocean Expedition.
130
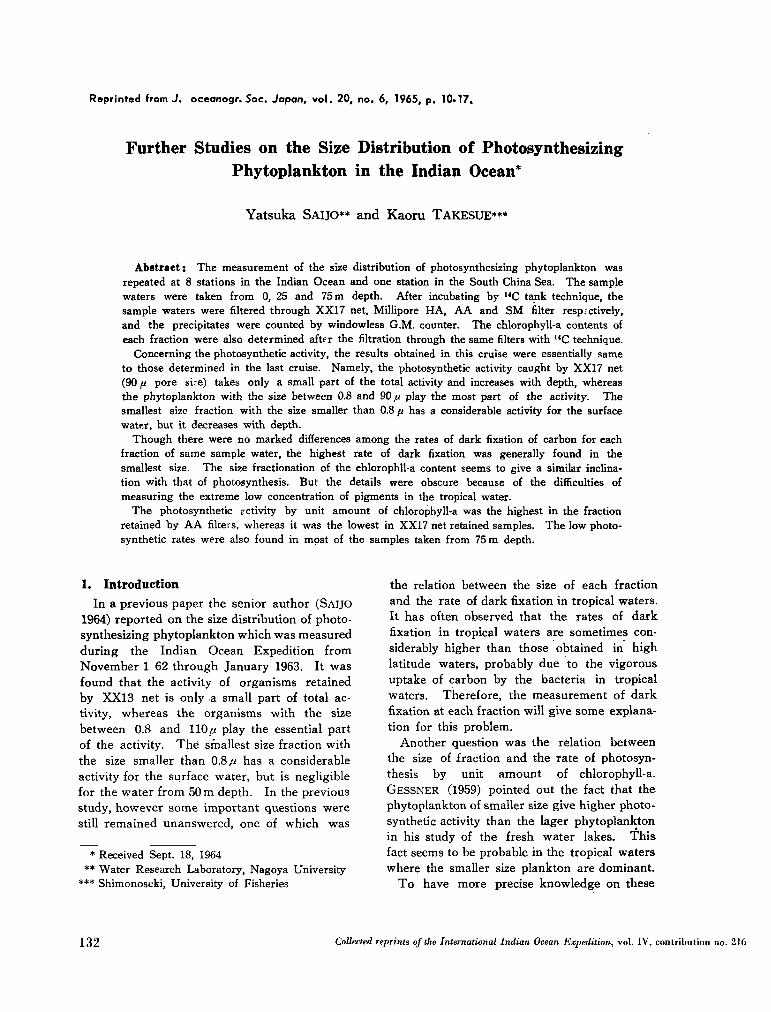
Reprinted from J. oceonogr. Soc. Japan, vol. 20, no. 6, 1965, p. 10-17.
Further Studies on the Size Distribution of Photosynthesizing Phytoplankton in the Indian Ocean*
Yatsuka SAIJO** and Kaoru TAKESUE***
Abstract: The measurement of the size distribution of photosynthesizing phytoplankton was
repeated at 8 stations in the Indian Ocean and one station in the South China Sea. The sample
waters were taken from 0, 25 and 75 m depth. After incubating by 1 4C tank technique, the
sample waters were filtered through XX17 net, Millipore H A , A A and S M filter resp;ctively,
and the precipitates were counted by windowless G . M . counter. The chlorophyll-a contents of
each fraction were also determined after the filtration through the same filters with H C technique.
Concerning the photosynthetic activity, the results obtained in this cruise were essentially same
to those determined in the last cruise. Namely, the photosynthetic activity caught by XX17 net
(90 ft pore sire) takes only a small part of the total activity and increases with depth, whereas
the phytoplankton with the size between 0.8 and 90 fi play the most part of the activity. The
smallest size fraction with the size smaller than 0.8 ¡i has a considerable activity for the surface
water, but it decreases with depth.
Though there were no marked differences among the rates of dark fixation of carbon for each
fraction of same sample water, the highest rate of dark fixation was generally found in the
smallest size. The size fractionation of the ehlorophll-a content seems to give a similar inclina
tion with that of photosynthesis. But the details were obscure because of the difficulties of
measuring the extreme low concentration of pigments in the tropical water.
The photosynthetic activity by unit amount of chlorophyll-a was the highest in the fraction
retained by A A filters, whereas it was the lowest in XX17 net retained samples. The low photo
synthetic rates were also found in most of the samples taken from 75 m depth.
1. Introduction
In a previous paper the senior author (SAIJO
1964) reported on the size distribution of photo
synthesizing phytoplankton which was measured
during the Indian Ocean Expedition from
November 1 62 through January 1963. It was
found that the activity of organisms retained
by X X 1 3 net is only a small part of total ac
tivity, whereas the organisms with the size
between 0.8 and HOjU play the essential part
of the activity. Thé smallest size fraction with
the size smaller than 0.8 n has a considerable
activity for the surface water, but is negligible
for the water from 50 m depth. In the previous
study, however some important questions were
still remained unanswered, one of which was
* Received Sept. 18, 1964
** Water Research Laboratory, Nagoya University
** Shimonoseki, University of Fisheries
the relation between the size of each fraction
and the rate of dark fixation in tropical waters.
It has often observed that the rates of dark
fixation in tropical waters are sometimes con
siderably higher than those obtained in high
latitude waters, probably due to the vigorous
uptake of carbon by the bacteria in tropical
waters. Therefore, the measurement of dark
fixation at each fraction will give some explana
tion for this problem.
Another question was the relation between
the size of fraction and the rate of photosyn
thesis by unit amount of chlorophyll-a.
GESSNER (1959) pointed out the fact that the
phytoplankton of smaller size give higher photo
synthetic activity than the lager phytoplankton
in his study of the fresh water lakes. This
fact seems to be probable in the tropical waters
where the smaller size plankton are dominant.
T o have more precise knowledge on these
132 Collected reprints of the International Indian Ocean Expedition, vol. IV, contribution no. 216
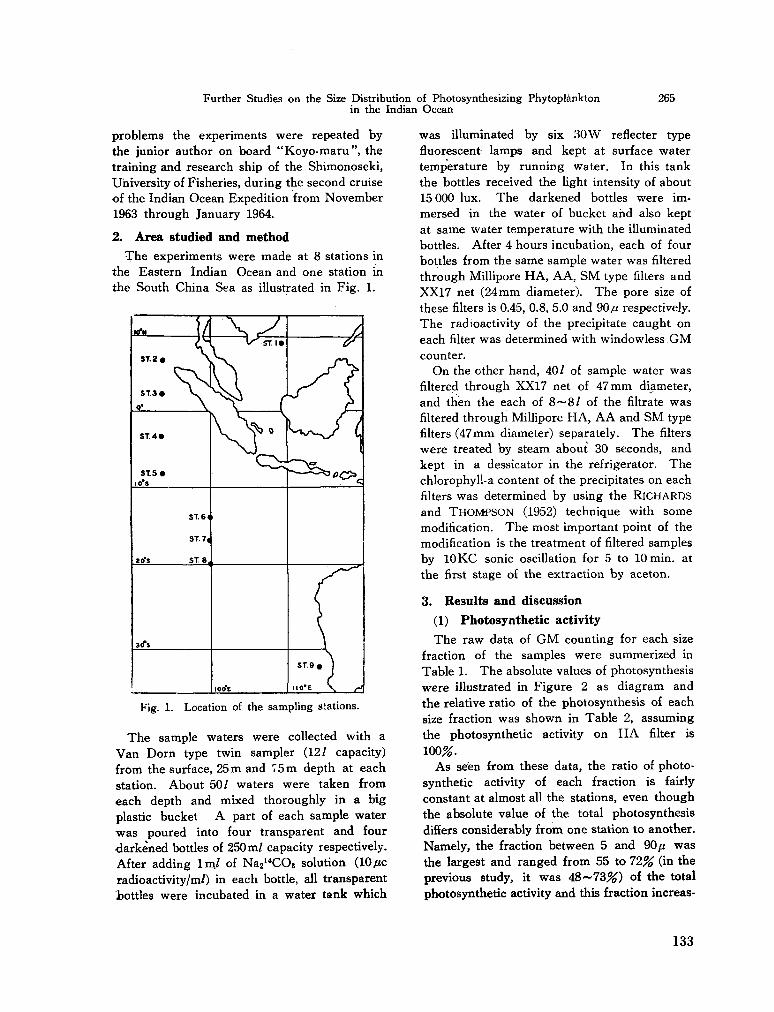
Further Studies on the Size Distribution of Photosynthesizing Phytoplànkton in the Indian Ocean
265
problems the experiments were repeated by
the junior author on board " K o y o - m a r u " , the
training and research ship of the Shimonoseki,
University of Fisheries, during the second cruise
of the Indian Ocean Expedition from November
1963 through January 1964.
2. Area studied and method
T h e experiments were m a d e at 8 stations in
the Eastern Indian Ocean and one station in
the South China Sea as illustrated in Fig. 1.
W N
ST. 2 *
{
S T . 3 *
0'
ST. 4 »
S T . 5 * IO*S
2ÍS
30*S
~j(
V
\ y I U ' - S t l »
K ^ \ \ V (
ST.6I
ST. 7 ,
ST. 8 ,
\ y c^
1
IOCTC
¿ <y
y> ^ i ¿_
h—^ooC?» <;
r ST.9 c J
no'E \ ri
Fig. 1. Location of the sampling stations.
T h e sample waters were collected with a
V a n Dorn type twin sampler (12/ capacity)
from the surface, 2 5 m and 7 5 m depth at each
station. About 50 / waters were taken from
each depth and mixed thoroughly in a big
plastic bucket A part of each sample water
w a s poured into four transparent and four
darkened bottles of 250 m / capacity respectively.
After adding l m / of N a 21 4 C 0 3 solution (10¿ic
radioactivity/m/) in each bottle, all transparent
hottles were incubated in a water tank which
was illuminated by six 3 0 W reflecter type
fluorescent lamps and kept at surface water
temperature by running water. In this tank
the bottles received the light intensity of about
15 000 lux. T h e darkened bottles were im
mersed in the water of bucket and also kept
at same water temperature with the illuminated
bottles. After 4 hours incubation, each of four
bottles from the same sample water was filtered
through Millipore H A , A A , S M type filters and
X X 1 7 net (24 m m diameter). T h e pore size of
these filters is 0.45, 0.8, 5.0 and 90p. respectively.
T h e radioactivity of the precipitate caught on
each filter was determined with windowless.GM
counter.
O n the other hand, 4 0 / of sample water was
filtered through X X 1 7 net of 47 m m diameter,
and then the each of 8 ~ 8 / of the filtrate was
filtered through Millipore H A , A A and S M type
filters ( 4 7 m m diameter) separately. T h e filters
were treated by steam about 30 seconds, and
kept in a dessicator in the refrigerator. T h e
chlorophyl!-a content of the precipitates on each
filters was determined by using the R I C H A R D S
and T H O M P S O N (1952) technique with some
modification. T h e most important point of the
modification is the treatment of filtered samples
by 10 K C sonic oscillation for 5 to 10 min. at
the first stage of the extraction by aceton.
3. Results and discussion
(1) Photosynthetic activity
T h e raw data of G M counting for each size
fraction of the samples were summerized in
Table 1. T h e absolute values of photosynthesis
were illustrated in Figure 2 as diagram and
the relative ratio of the photosynthesis of each
size fraction was shown in Table 2, assuming
the photosynthetic activity on H A filter is
100%. A s seen from these data, the ratio of photo
synthetic activity of each fraction is fairly
constant at almost all the stations, even though
the absolute value of the total photosynthesis
differs considerably from one station to another.
Namely, the fraction between 5 and 90 ft was
the largest and ranged from 55 to 7 2 % (in the
previous study, it was 48~73%) of the total
photosynthetic activity and this fraction increas-
133
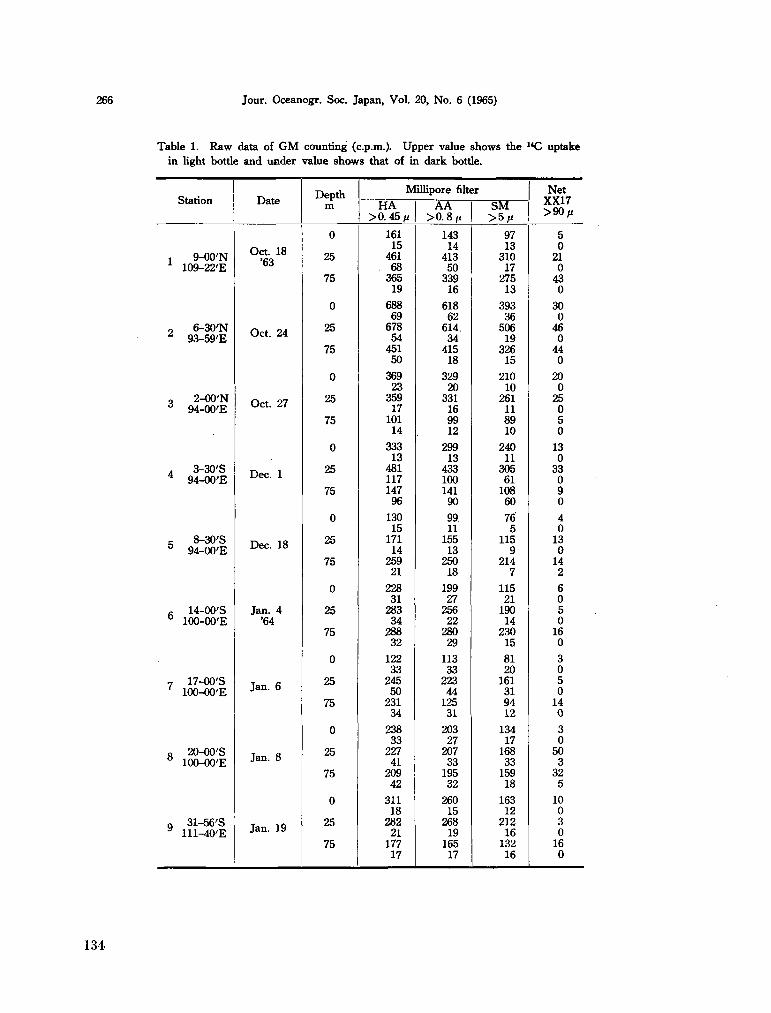
Jour. Oceanogr. Soc. Japan, Vol. 20, N o . 6 (1965)
Table 1. R a w data of G M counting (c.p.m.). Upper value shows the " C uptake in light bottle and under value shows that of in dark bottle.
Station
, 9-00'N 1 109-22'E
9 6-30'N ¿ 93-59'E
o 2-00'N 0 94-00'E
. 3-30'S 4 94-00'E
c 8-30'S D 94-00'E
R 14-00'S 0 100-00'E
7 17-00'S ' 100-00'E
R 20-00'S ° 100-00'E
Q 31-56'S 3 111-40'E
Date
Oct. 18 '63
Oct. 24
Oct. 27
Dec. 1
Dec. 18
Jan. 4 '64
Jan. 6
Jan. 8
Jan. 19
Depth m
0
25
75
0
25
75
0
25
75
0
25
75
0
25
75
0
25
75
0
25
75
0
25
75
0
25
75
Millipore filter
HA >0. 45 fi
161 15
461 68 365 19
688 69 678 54 451 50
369 23 359 17 101 14
333 13 481 117 147 96
130 15 171 14 259 21
228 31 283 34 288 32
122 33 245 50 231 34
238 33 227 41 209 42
311 18 282 21 177 17
AA >0.8p
143 14 413 50 339 16
618 62
614. 34 415 18
329 20 331 16 99 12
299 13 433 100 141 90
99 11 155 13 250 18
199 27 256 22 280 29
113 33 223 44 125 31
203 27 207 33 195 32
260 15 268 19 165 17
SM >5;Í
97 13 310 17 275 13
393 36 506 19 326 15
210 10 261 11 89 10
240 11
305 61 108 60
76 5
115 9
214 7
115 21 190 14 230 15
81 20 161 31 94 12
134 17 168 33 159 18
163 12 212 16 132 16
Net XX17 >90/z
5 0 21 0 43 0
30 0 46 0 44 0
20 0 25 0 5 0
13 0 33 0 9 0
4 0 13 0 14 2
6 0 5 0 16 0
3 0 5 0 14 0
3 0 50 3 32 5
10 0 3 0 16 0
134
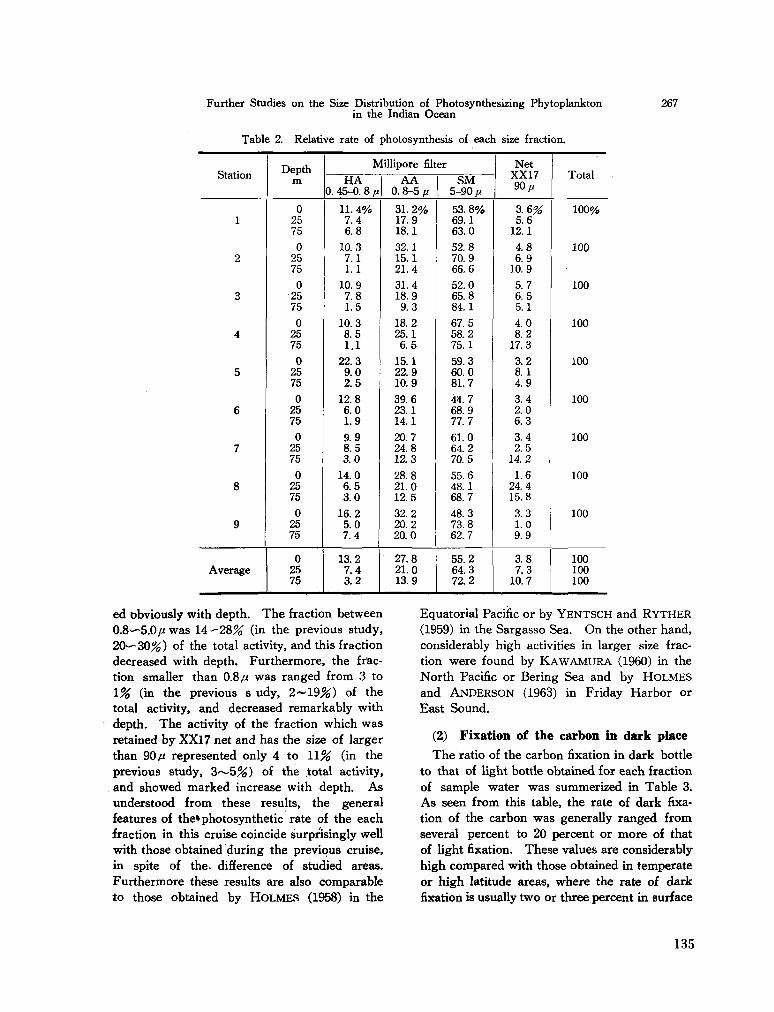
Further Studies on the Size Distribution of Photosynthesizing Phytoplankton in the Indian Ocean
Table 2. Relative rate of photosynthesis of each size fraction.
267
Station
1
2
3
4
5
6
7
8
9
Average
Depth m
0 25 75
0 25 75
0 25 75
0 25 75
0 25 75
0 25 75
0 25 75
0 25 75
0 25 75
0 25 75
Millipore filter
HA 0. 45-0. 8 fi
11. 4% 7.4 6.8
10.3 7.1 1.1
10.9 7.8 1.5
10.3 8.5 1.1
22.3 9.0 2 .5
12.8 6.0 1.9
9.9 8.5 3 . 0
14.0 6.5 3 .0
16.2 5.0 7 .4
13.2 7 .4 3 .2
AA 0. 8-5 ¡i
31. 2% 17.9 18.1 32.1 15.1 21 .4
31.4 18.9
9.3 18.2 25.1
6.5 15.1 22.9 10.9
39.6 23.1 14.1
20.7 24.8 12.3
28.8 21.0 12.5
32.2 20.2 20.0
27.8 21.0 13.9
SM 5-90 ft
53. 8% 69.1 63.0 52.8 70.9 66.6
52.0 65.8 84.1
67.5 58.2 75.1
59.3 60.0 81.7
44.7 68.9 77.7
61.0 64.2 70.5
55.6 48. 1 68.7
48.3 73.8 62.7
55 .2 64.3 72.2
Net XX17 90 ju
3.6% 5.6
12.1
4.8 6.9
10.9 5.7 6.5 5.1
4.0 8.2
17.3 3.2 8.1 4.9
3.4 2.0 6.3
3.4 2.5
14.2 1.6
24.4 15.8
3.3 1.0 9.9
3.8 7.3
10.7
Total
100%
100
100
100
100
100
100
100
100
100 100 100
ed obviously with depth. T h e fraction between 0.8—5.0 ft was 14--28% (in the previous study, 20—30%) of the total activity, and this fraction decreased with depth. Furthermore, the fraction smaller than 0.8 ¿< was ranged from 3 to \% (in the previous s udy, 2~Vè%) of the total activity, and decreased remarkably with depth. T h e activity of the fraction which was retained by X X 1 7 net and has the size of larger than 90¿Í represented only 4 to \\% (in the previous study, 3 ~ 5 % ) of the total activity, and showed marked increase with depth. A s understood from these results, the general features of the*photosynthetic rate of the each fraction in this cruise coincide surprisingly well with those obtained during the previous cruise, in spite of the. difference of studied areas. Furthermore these results are also comparable to those obtained by H O L M E S (1958) in the
Equatorial Pacific or by Y E N T S C H and R Y T H E R (1959) in the Sargasso Sea. O n the other hand, considerably high activities in larger size fraction were found by K A W A M U R A (1960) in the North Pacific or Bering Sea and by H O L M E S and A N D E R S O N (1963) in Friday Harbor or East Sound.
(2) Fixation of the carbon in dark place
T h e ratio of the carbon fixation in dark bottle to that of light bottle obtained for each fraction of sample water was summerized in Table 3. A s seen from this table, the rate of dark fixation of the carbon was generally ranged from several percent to 20 percent or more of that of light fixation. These values are considerably high compared with those obtained in temperate or high latitude areas, where the rate of dark fixation is usually two or three percent in surface
135
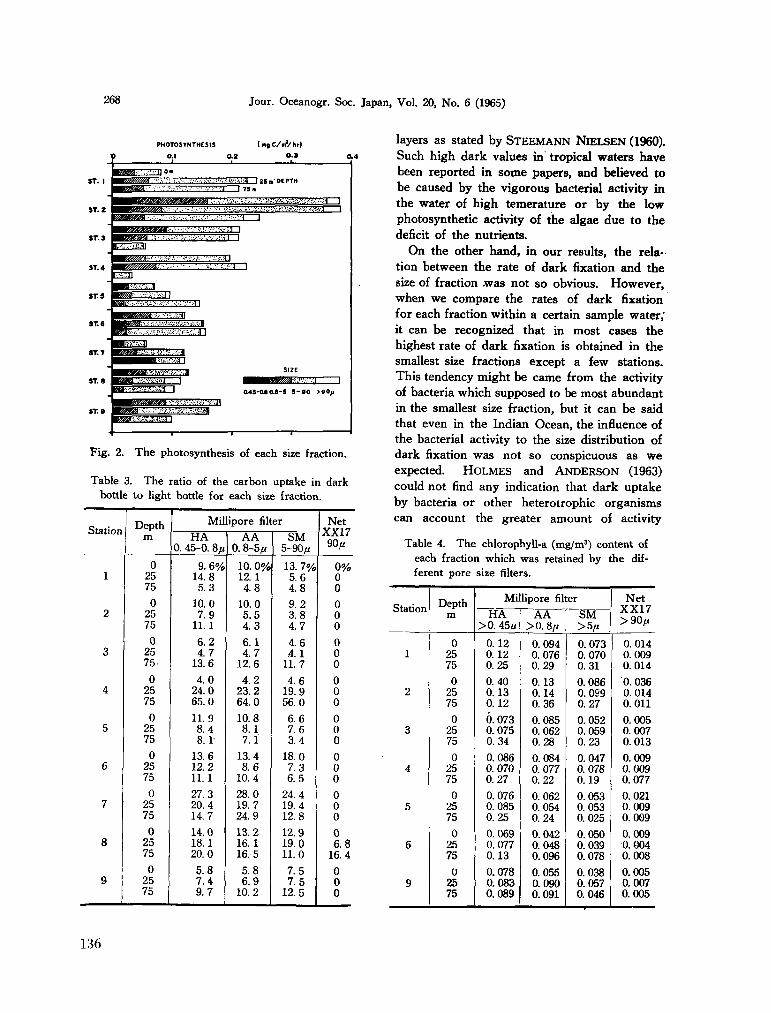
268 Jour. Oceanogr. Soc. Japan, Vol. 20, N o . 6 (1965)
PHOTOSYNTHESIS ( mj C/ni1/hr)
0.1 0.2 0.3
O43-0ÍO.S-S S - B O >tOp
Fig. 2. The photosynthesis of each size fraction.
Table 3. The ratio of the carbon uptake in dark bottle to light bottle for each size fraction.
Station
1
2
3
4
5
6
7
8
9
Depth m
0 25 75
0 25 75
0 25 75-
0 25 75
0 25 75
0 25 75
0 25 75
0 25 75
0 25 75
Mil HA
0. 45-0. 8//
9. 6% 14.8 5.3
10 .0 7 .9
11.1 6 . 2 4 . 7
13.6 4 . 0
24 .0 65 .0
11.9 8 .4 8.1'
13.6 12 .2 11.1
27.3 20 .4 14.7
14 .0 18.1 20 .0
5 .8 7 . 4 9 . 7
ipore filter
AA 0. 8-5//
10. 0% 12.1 4.8
10 .0 5 .5 4 . 3
6.1 4 . 7
12.6 4 . 2
2 3 . 2 64 .0
10.8 8.1 7.1
13.4 8 .6
10 .4 28 .0 19.7 24 .9
13 .2 16.1 16.5
5 .8 6 .9
10 .2
SM 5-90//
13. 7% 5.6 4.8
9.2 3.8 4.7
4.6 4.1
11.7 4.6
19.9 56.0
6.6 7.6 3.4
18.0 7.3 6.5
24.4 19.4 12.8
12.9 19.0 11.0
7.5 7.5
12.5
Net XX17 90//
0% 0 0 0 0 0 0 0 0 0 0 0 0 0 0 0 0 0 0 0 0 0 6 .8
16.4 0 0 0
layers as stated by S T E E M A N N NIELSEN (1960). Such high dark values in tropical waters have been reported in some papers, and believed to be caused by the vigorous bacterial activity in the water of high temerature or by the low photosynthetic activity of the algae due to the deficit of the nutrients.
O n the other hand, in our results, the relation between the rate of dark fixation and the size of fraction .was not so obvious. However , w h e n w e compare the rates of dark fixation for each fraction within a certain sample water,' it can be recognized that in most cases the highest rate of dark fixation is obtained in the smallest size fractions except a few stations. This tendency might be came from the activity of bacteria which supposed to be most abundant in the smallest size fraction, but it can be said that even in the Indian Ocean, the influence of the bacterial activity to the size distribution of dark fixation was not so conspicuous as w e expected. H O L M E S and A N D E R S O N (1963) could not find any indication that dark uptake by bacteria or other heterotrophic organisms can account the greater amount of activity
Table 4. The chlorophyll-a (mg/m 3) content of each fraction which was retained by the different pore size filters.
Station
1
2
3
4
5
6
9
Depth m
0 25 75
0 25 75
0 25 75
0 25 75
0 25 75
0 25 75
0 25 75
Millipore filter
HA > 0 . 45//
0 .12 0 .12 0.25
0 .40 0 .13 0 .12
0.073 0.075 0 .34
0.086 0.070 0 .27
0.076 0.085 0 .25
0.069 0.077 0.13
0.078 0.083 0.089
AA > 0 . 8//
0.094 0.076 0 .29
0.13 0 .14 0.36
0.085 0.062 0.28
0.084 0.077 0 .22
0.062 0.054 0 .24
0.042 0.048 0.096
0.055 0.090 0.091
SM >5/i
0.073 0.070 0.31
0.086 0.099 0.27
0.052 0.059 0.23
0.047 0.078 0.19
0.053 0.053 0.025
0.050 0.039 0.078
0.038 0.057 0.046
Net XX17 >90//
0.014 0.009 0.014
0. 036 0.014 0.011
0.005 0.007 0.013
0.009 0.009 0.077
0.021 0.009 0.009
0.009 0.004 0.008
0.005 0.007 0.005
136
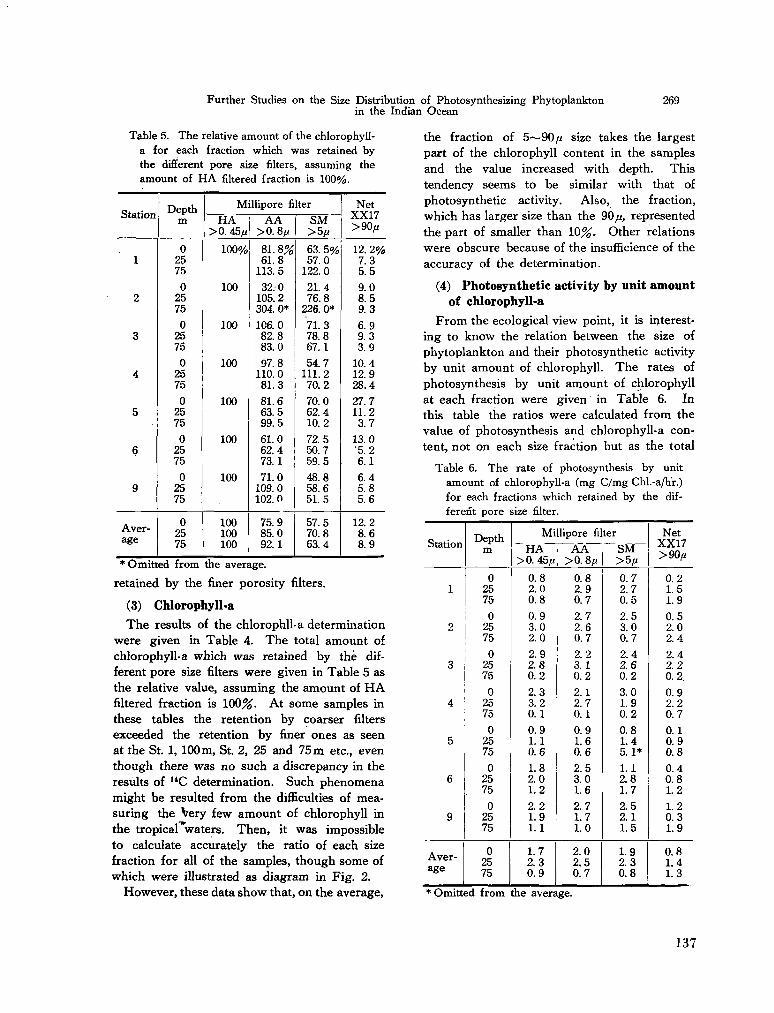
Further Studies on the Size Distribution of Photosynthesizing Phytoplankton in the Indian Ocean
269
Table 5. The relative amount of the chlorophyll-a for each fraction which was retained by the different pore size filters, assuming the amount of H A filtered fraction is 100%.
Station
1
2
3
4
5
6
9
Average
Depth m
0 25 75
0 25 75
0 25 75
0 25 75
0 25 75
0 25 75
0 25 75
0 25 75
Millipore filter
HA > 0 . 45ft
100%
100
100
100
100
100
100
100 100 100
AA >0.8fi
81.8% 61.8
113.5
32.0 105.2 304. 0*
106.0 82.8 83.0
97.8 110.0 81.3 81.6 63.5 99.5
61.0 62.4 73.1
71.0 109.0 102.0
75.9 85.0 92.1
SM >5/n
63.5% 57.0
122.0
21.4 76.8
226. 0* 71.3 78.8 67.1
54.7 111.2 70.2 70.0 62.4 10.2
72.5 50.7 59.5
48.8 58.6 51.5
57.5 70.8 63.4
Net XX17 >90/i
12. 2% 7.3 5.5
9.0 8.5 9.3
6.9 9.3 3.9
10.4 12.9 28.4
27.7 11.2 3.7
13.0 5.2 6.1
6.4 5.8 5.6
12.2 8.6 8.9
Omitted from the average.
retained by the finer porosity filters.
(3) Chlorophyll-a
T h e results of the chlorophll-a determination were given in Table 4 . T h e total amount of chlorophyll-a which was retained by thé different pore size filters were given in Table 5 as the relative value, assuming the amount of H A filtered fraction is 100%. A t s o m e samples in these tables the retention by coarser filters exceeded the retention by finer ones as seen at the St. 1, 100 m , St. 2 , 25 and 75 m etc., even though there was n o such a discrepancy in the results of 1 4 C determination. Such phenomena might be resulted from the difficulties of m e a suring the Very few amount of chlorophyll in the tropical waters. T h e n , it was impossible to calculate accurately the ratio of each size fraction for all of the samples, though some of which were illustrated as diagram in Fig. 2 .
However , these data s h o w that, on the average,
the fraction of 5—90,u size takes the largest part of the chlorophyll content in the samples and the value increased with depth. This tendency seems to be similar with that of photosynthetic activity. Also, the fraction, which has larger size than the 90fi, represented the part of smaller than 10%. Other relations were obscure because of the insufficience of the accuracy of the determination.
(4) Photosynthetic activity by unit a m o u n t of chlorophyll-a
F r o m the ecological view point, it is interesting to k n o w the relation between the size of phytoplankton and their photosynthetic activity by unit amount of chlorophyll. T h e rates of photosynthesis by unit amount of chlorophyll at each fraction were given in Table 6. In this table the ratios were calculated from the value of photosynthesis and chlorophyll-a content, not on each size fraction but as the total
Table 6. The rate of photosynthesis by unit amount of chlorophyll-a (mg C / m g Chl.-a/hr.) for each fractions which retained by the different pore size filter.
Station
1
2
3
4
5
6
9
Average
Depth m
0 25 75
0 25 75
0 25 75
0 25 75
0 25 75
0 25 75
0 25 75
0 25 75
Millipore filter
HA >0. 45^
0.8 2.0 0.8
0.9 3.0 2.0
2.9 2.8 0.2
2.3 3.2 0.1
0.9 1.1 0.6
1.8 2.0 1.2
2.2 1,9 1.1
1.7 2.3 0.9
AA > 0 . 8 / /
0.8 2.9 0 .7
2 .7 2.6 0.7
2.2 3.1 0 .2
2.1 2 .7 0.1
0.9 1.6 0.6
2.5 3.0 1.6
2.7 1.7 1.0
2.0 2.5 0 .7
SM >5;u
0.7 2.7 0.5
2.5 3.0 0.7
2.4 2.6 0.2
3.0 1.9 0.2
0.8 1.4 5.1*
1.1 2.8 1.7
2.5 2.1 1.5
1.9 2.3 0.8
Net XX17 >90/i
0.2 1.5 1.9
0.5 2.0 2.4
2.4 2.2 0.2
0.9 2.2 0.7
0.1 0.9 0.8
0.4 0.8 1.2
1.2 0.3 1.9
0.8 1.4 1.3
* Omitted from the average.
137
270 Jour. Oceanogr. Soc. Japan, Vol. 20, N o . 6 (1965)
a m o u n t retained on each pore size filters, i.e., the each value shows the total a m o u n t of the part which is larger than the pore size of the filters employed, because of the insufficience of the accuracy of the- chlorophyll-a determination in these samples.
E v e n though detailed discussions are impossible on each value, following facts can be recognized as the tendency of this table.
1) T h e photosynthetic activity by unit a m o u n t of chlorophyll w a s very low for the fraction of phytoplankton which were retained by X X 1 7 net (90 fj. pore size). But it is improbable fact that all of the phytoplankton retained by X X 1 7 net are composed of larger size phytoplankton which has low photosynthetic activity, and it seems m o r e plausible that most part of this fraction w a s formed by the floccuration of phytoplankton which nearly lost their activity. This p h e n o m e n a might be more conspicuous at the samples taken from deeper layer. In fact, the X X 1 7 fraction from 75 m depth showed the lowest activity except St. 6.
2) In general, the photosynthetic activity of the samples from the surface and 25 m depth gave rather high values of 2 ~ 3 m g C / m g chl./ hr. except the fraction retained by X X 1 7 net. T h e highest values were obtained in A A fraction, especially at 25 m depth. The somewhat smaller values in H A fraction might be caused by the fact that some part of this fraction were composed of protoplasmic fragments released from fragile cells which ruptured on the filter surface, as stated by H O L M E S (1959).
F r o m these results it can be said that as the tendency the phytoplankton of smaller size have higher photosynthetic activity than those of larger fractions, even though the difference is not so much . Here, it is noteworthy that these comparisons were made not among the values at each size fraction but among the total values retained on each pore size filter. Therefore, real differences of photosynthetic rate among each size fraction might be con-sidrably higher than those given in this table.
These results coincide fairly well with those obtained by G E S S N E R (1959) in a fresh water lake. In some Japanese lakes S A K A M O T O and S A I J O (unpublished) also found similar tendency
in the relation between the size of fraction and the photosynthetic rate by unit amount of chlorophyll, i.e., the higher photosynthetic rates were found in smaller size fraction.
4. Conclusion
From the results described above, it can be concluded as follows:
(1) T h e general features of the photosynthetic rate of the each size fraction in this cruise coincide very well with those obtained during the previous cruise. N a m e l y , the activity of the organisms retained by X X 1 7 net represents only small part of the total activity, on the other hand, the organisms having the size between 5 and 9 0 A play the largest part (55~ 72%) of the activity. T h e activity of the organisms in larger fractions increased with depth, whereas that of the smaller fractions s h o w n inverse relation to the depth.
(2) T h o u g h there were n o marked difference of the rate of dark fixation a m o n g the organisms in each fraction from the same sample, at most of the stations, the highest rate of dark fixation w a s found in the smallest size fraction.
(3) T h e size fraction of the chlorophyll-a content seems to give a similar inclination with that of photosynthesis, though it w a s not so clear as the case of photosynthesis, probably due to the difficulties of determinating such a low concentration of pigments in the tropical waters.
(4) T h e photosynthetic activity by unit amoun t of chlorophyll-a w a s the highest in the" fraction which w a s retained by A A filter (0.8 fx pore size), while the value w a s the lowest in X X 1 7 net filtered samples. T h e low photosynthetic activity w a s also found in most of the 75 m sample waters.
N o w , it can be expected that the studies on the size distribution of phytoplankton will give an important basis for the explanation of the geographical and seasonal variation of primary production in the oceans. F r o m this view point, we.should begin our future studies from the accumlation of the data in this direction, because our present knowledge concerned is quite limited to the resticted space and time.
138
Further Studies on the Size Distribution of Photosynthesizing Phytoplankton 271 in the Indian Ocean
A c k n o w l e d g e m e n t s
T h e cooperation given by Captain G . S A K U R A I
of " K o y o - m a r u " , his officers and crew, is
greatefully acknowledged.
References
G E S S N E R , F. (1959): Hydrobotanik, II Stoffhaushalt,
Berlin, 619-621.
HOLMES, R . W . (1958): Size fractionation of photo-
synthesizing phytoplankton. Special Scientific
Report-Fisheries, N o . 279, 69-71.
H O L M E S , R . W . and C. G. A N D E R S O N (1963): Size
fractionation of 14C-labelled natural phytoplankton
communities. Symposium on marine micro
biology, Charles C . Thomas Pub., Springfield.
K A W A M U R A , T . (1960): The "Oshoro M a r u " Cruise
46 to the Bering Sea and North Pacific in June-
August 1960, 11. Data Rec. Oceanogr. Obs.
Exp. Fish. Hokkaido Univ., N o . 5, 142-165.
S A I J O , Y . (1964): Size distribution of photosynthe
sizing phytoplankton in the Indian Ocean. Jour.
Oceanogr. Soc. Japan, 19, 187-189.
S T E E M A N N N I E L S E N , E . (1960): Dark fixation of
C 0 2 and measurements of organic productivity.
With remarks on chemo-synthesis. Physiologi
cal Plantarum, 13, 348-357.
Y E N T S C H , C . S. and J . H . R Y T H E R (1959): Relative
significance of the net phytoplankton and nano-
plankton in the waters of Vineyard Sound. Jour.
Cops. Int. Explor. Mer , 24 (2). 231-238.
139
Reprinted from Bull. fish. res. Stn„ Ceylon,.vol. 17, no. 2, 1964, p. 159-168.
Some Planktonic Diatoms from the Indian Ocean
By M . DUEAIBATNAM
(Fisheries Research Station, Colombo 3 Ceylon) Introduction
Collections of phytoplankton were m a d e by m e at various stations between latitude 5°S and 25°S and longitude 78° E and 101 ° E (Fig. 1) from December 1962 to January 1963 during a cruise of the research vessel " Umitaka M a r u " belonging to the Tokyo University of Fisheries. This vessel was engaged in work in connection with the 1.1 . O . E . T h e collections m a d e by m e from these stations were examined at the Fisheries Research Station, Colombo, for the various diatoms present and the findings are reported in this paper.
Some Stations covered by Umitaka Maru in connection with I.I.O.E.
29 .12 .62 Station 11 Latitude 4°-57 ' . 2"S Longitude 78°-49'. 6 " E 30 .12 .62 Station 12 Latitude 7°. 0 5 ' . 0"S Longitude 78°-04'. 0 " E 31 .12 .62 Station 13 Latitude 8°-52' .4"S Longitude 78°-03 ' .0"E
2 . 1.63 Station 15 Latitude 12°-55'. 9"S Longitude 78°-02'. 2 " E 3 . 1.63 Station 16 Latitude 15°-10'. 6"S Longitude 78°-03'. 8 " E
Some Stations where experimental tuna fishing was carried out from the Umitaka Maru
13 . 1.62 Station 1 Latitude 12°-46'S Longitude 97°-19 'E 15 . 1.63 Station 2 Latitude 10°-10'. 8"S Longitude 98°-41"E 16. 1.63 Station 3 Latitude 8°-15'.2*S Longitude 100°-04' .6"E
Stations covered in connection with the International Indian Ocean Expedition will be referred to as 1.1. 0 . E ; Stations covered for experimental tuna fishing will be referred to as T . G .
Material and Method
Horizontal hauls were m a d e at Stations 11-16 with thé following nets :— (1) Pocket high-speed sampler, 4*5 c m . dia., 30 c m . long metal cylinder, 2 c m . dia. m o u t h
opening with Japanese standard net N o . X X 13. (2) Marutoku net, 45 c m . diameter m o u t h ring, 90 c m . long with Japanese standard net
No. X X 13. Vertical hauls were m a d e at Stations 1-3 with a Hart closing net, 25 c m . dia. m o u t h ring, 30 c m . diameter trunk ring ; Japanese standard net N o . X X 13.
T h e plankton collected was poured into a plankton concentration net and transferred into glass bottles, preserved in 1 0 % formalin and examined in the laboratory.
Bacillariophyceae Order : Centrales Sub-order : Discoideae Family : Coscinodisceae Genus : Melosira Agardh
Melosira sulcata (Ehrenberg) Kuetzing
C u p p 1943, p . 40, fig. 2 , Orthosira marina Smith 1856, p . 59, pi. 53, fig. 338, Paralia sulcata (Ehrenberg) Gran 1908, p . 14, fig. 5, Lebour 1930, p . 28, fig. 9.
Collected reprints of the International Indian Ocean Expedition, vol. IV , contribution no. 141
160 SOME PLANKTONIC DIATOMS
Cells were found in long chains. Cells disc shaped thick walled 20-28 /x in diameter. Valves concave, areolate and punctate. Margin of valve with double rows of cells. Chromatophores numerous and disc shaped.
Station : T . G . 1, 2, 3.
Geographic distribution : Arctic Ocean, Indian Ocean, Atlantic and Pacific coasts of America, West Coast of France, Northern seas, Mediterranean Sea, Java Sea, Skaggerak.
Sub-family Sceletonemineae
Genus Skeletonema Greville
Skektonema costatum (Greville) Cleve
Cleve 1878, p. 18, Lebour 1930, p. 311, fig. 149, Cupp 1943, p. 43, fig. 6.
Melosira eostata Greville 1866, p. 77, pi. 8, figs. 3-6.
These were found in long straight chains, cells lens-shaped or cylindrical with rounded ends. Cells separated from each other by a long space and connected by straight marginal spines. Chro-matophores two, plate like, sometimes dissected. Diameter of cells 12-18 [i. Auxospores were observed.
Station : T . G . 1, 2, 3.
Geographic distribution : Generally neritic and widely distributed, Indian Ocean, English coasts, Baltic Sea, Arctic Sea, and Java Sea.
Genus Thalassiosira Cleve
Thalassiosira decipiens (Grunow) Jorgenson
Hustedt 1864, p. 322, fig. 168. Cupp . 1943, p. 48, fig. 10.
Coscinodiscus decipiens Grunow 1899, p. 532, pi. 34, fig. 905.
Cells disc-shaped, united in loose chains with long spaces between cells. Valves with minute spines along the border ; diameter 18 ¡x. Areolae in the valves larger in the centre than towards the periphery. Chromatophores small and numerous.
Station : T . G . 1, 2, 3.
Geographic distribution : Europe, Indian Ocean, Mediteranean Sea, Aral Sea, Caspian Sea.
Sub-family Coscinodiscineae
Genus Coscinodiscus Ehrenberg
ConscinodiscuA lineatus Grunow
Cupp. 1943, p. 53, fig. 15.
Cells disc-shaped 34-36 ¡x in diameter. Valve surface areolated. Areolae arranged in straight lines, those at the centre large* than those at the periphery, \alve margin radially striated, striae 12 in 10 /z ; marginal spinulae strong.
Station T . G . 1, 2.
Geographic distribution : Europe, Indian Ocean, Pacific coast of America» Campechi Bay , Florida. Vera Cruz, Java.
142
M . DURAIBATNAM 161
Coscinodiscus centralis Ehrenberg
Lebour 1930, p. 39, fig. 16 a-b, 17b, 18b., Cupp. 1943, p. 60, fig. 24. Disc-shaped cells of 162 ¡x. diameter. Valves with distinct rosette at the centre. Areolae 4
in 10 JU, near centre, 4-5 midway to margin and 5-6 near the margin. Valve margin radially striated, 6-8 striae in 10 )"•.
Station : 1.1. O . E . 15.
Geographic distribution : North Atlantic Ocean, Mediterranean Sea, Gulf of California, Florida, Algeria.
Coscinodiscus marginatum Ehrenberg
D e Toni, 1891-94, p. 1241, Allen and Cupp. 1935, p. 115, fig. 7, Cupp. 1943, 55, fig. 19 ; plate 1, fig. 3.
Cells with flat valves, diameter 35-128 ft. Valves with areolae 3 in 10 (i at centre becoming smaller towards margin, 5 in 10 ¡x. Central rosette absent. Border of valve striated.
Station : T . G . 2, 3. Geographic distribution : Sumatra, Indian Ocean, Singapore, Antarctic, Ceylon, Arabian Sea
and in all oceans.
Genus PlanhtonieUa Schutt Planktoniella sol (Wallich) Schutt
Lebour 1930, p. 50, pi. 1, fig. 5, Cupp. 1943, p. 63. Coscinodiscus sol Wallich, 1860, p. 38, figs. 1-2. Cells disc-shaped ; diameter of central disc 45 ¡i with wing 120 ¡x. Valve surface areolated ; areolae 5-7 in 10 /x at the centre of valve, 7-8 in the middle and
8-9 in the margin, wing like expansions present on cell margin. Station : T . G . 1, 2, 3. Geographic distribution : Widely distributed, c o m m o n in sub-tropical and tropical seas. R e d
Sea, Gulf of Aden, Arabian Sea, Indian Ocean, Antarctic, Arafura Sea. In Europe only in the Mediterranean region.
Genus Asteromphalus Ehrenberg Asteromphalus wyviUei Castracane
Castracane 1876, p. 134, PI. 5, fig. 6. Cells round ; diameter 72 ¡JL, with numerous small disc-shaped chromotophores. Segmenta
wedge-shaped, areolated. Station : T . G . 1, 2, 3. Geographic distribution : Indian Ocean.
Asteromphalus flabeUatus (Brebisson) Greville
Greville, 1859, p. 160, pi. 7, figs. 4, 5, 1891-94, D e Toni, p. 1414. Cells convex, valves sub-elliptical ; long axis 55-60 ¡J-, short axis 40-52 fi. Compartments finely
reticulated. Median ray straight or slightly curved. Border segments areolated. Station : T . G . 1, 2, 3. Geographic distribution: Mediterranean Sea, Campeche Bay, Java Sea, Peruvian guano»
North Sea, Indian Ocean.
143
162 SOME PLANKTONIC DIATOMS
Genus Oosskriella Schutt Oossleriella tropica Schutt
Schutt 1893, p. 20 ; Subrahmanyan 1946, p. 107, fig. 86.
Cells disciform, valves orbicular, diameter 180 to 190 ¡M. Valve border with a ring of hairs of equal length but of unequal thickness. Chromatophores numerous and disc-shaped.
Station : 1.1. 0 . E . 11; T . G . 1, 2, 3.
Geographic distribution : Mediterranean Sea, Indian Ocean.
Genus Actinocyclus Ehrenberg Actinocyclu8 ehrenbergii Ralfs
Pritchard 1861, p. 834; D e Toni 1891-94, p. 1177; Lebour 1930, p. 53 ; Subrahmanyan 1946 p. 109, figs. 82-92 and 96, Eupodiscus crassus Smith 1853, p. 24, PI. IV, fig. 41.
Cells disc-shaped, slightly convex 54 \i in diameter. Valve circular, pseudo-nodule very large, sub-marginal. Central area with scattered areolae. Valve magin finely striated.
Station : T . G . 1, 2, 3.
Géographie distribution : Atlantic and Pacific Coasts of America, North Sea, Norwegian and Danish Seas, Gulf of Finland Gulf of Bothnia, Baltic, Skaggerak, Aral and Caspian Seas, Black Sea, North Atlantic, Mediterranean, Peruvian guano.
Sub-order: Solenoideae Family : Solenieae Sub-family : Lauderiineae Genus : Corethron Castracane
Corethron hystrix Hensen
Hustedt 1930, p. 547, fig. 311 ; Cupp. 1943, p. 70. Corethron criophylum Castracane 1886, p. 85, pi. 21, figs. 12, 14 and 15 ; Lebour 1930, p. 80, fig. 24.
Cells with cylindrical mantle and valves arched hemispherically. Diameter 52 ft. Valve margin with a crown of slender spines. Spines of both valves pointed in the same direction. Chromatophores numerous, small and disc-shaped.
Station : T . G . 1,3.
Geographic distribution : Atlantic Ocean, Java Sea, Vancouver, California.
Sub-family Rhizosoleniinae Genera : Bhizosolenia Ehrenberg Rhizosolenia setigera Brightwell
Brightwell 1858, p. 95, pi. 5, fig. 7, D e Toni, 1891-94, p. 827, Lebour 1930, p. 98, fig. 70, Hustedt 1930, p. 588, fig. 336, Cupp. 1943, p. 88, fig. 40.
Cells cylindrical, diameter 38 /¿, length 512 / A , valves conical, slightly oblique. Apical process hollow for some distance and ending in a long spine. Chromatophores numerous, small and ellipsoidal.
Station : T . G . 1, 2. '
Geographic distribution : California, Vancouver, Java Sea, European Seas, B a y of Fundy.
144
M . DUBAIRATNAM 163
Rhizosolenia robusta N o r m a n
N o r m a n 1861, p. 866, pi. 8, fig. 42, Lebour 1930, p. 94, fig. 68, Cupp. 1943, p. 83, fig. 46. Cells cylindrical, valves convex or conical curved, 52-258 \i in diameter cells crescent-shaped
or S-shaped. Intercalary bands robust, collar shaped. Cell wall thin, membrane delicately punctuated, puncta in three lines self crossing system. Numerous chromatophoree lying along the wall.
Station : T . G . 2. Geographic distribution : European Seas, Pacific Coast of America.
Rhizosolenia alata Bright well
Brightwell 1858, p. 96, pi. 5, fig. 8, Lebour 1930, p. 88, fig. 60 ; Allen and Cupp 1935, p. 131, fig. 43 ; Cupp 1943, p. 90, fig. 52A.
Cells rod shaped, cylindrical, 7-24 /* in diameter and 658-980 ¡i in length. Valves conical ending in tube-like or curved oblique process. Depression at the base of tube into which the apical process of adjoining cell fits. Intercalary bands scalelike rhombic in two dorsiventral rows. Cell wall thin and finely striated. Chromatophores small and numerous.
Station- : 1.1. O . E . 11, 12, 13, 16. Geographic distribution : Java Sea, Indian Ocean, Red Sea, Gulf of Aden, Arabia, Malaya,
Antarctic, Madras, Boston Strait, America.
Rhizosolenia alata Brightwell forma gracülima (Cleve) Grunow
Allen and Cupp 1935, p. 131, fig. 44 ; Cupp 1943, p. 92, fig. 52B ; Subrahmanyan 1946, p. 121 Cells rod-shaped, straight 4-7 ¡J. in diameter. Station : T . G . 1, 2. Geographic distribution : Coastal form found in most, usually northern, seas.
Rhizosolenia alata Brightwell forma? indica (Peragallo) Ostenfeld
Allen and Cupp 1935, p. 131, fig. 45 ; Cupp 1943, p. 93. Cells m u c h broader than the type 15-110 /¿.. Calyptrae suddenly attenuated due to the greater
diameter of cell. Process very strikingly curved. Cell wall finely punctuated, puncta in quincunx., rows short and irregular.
Station : T . G . 1, 2, 3. Geographic distribution : In all w a r m seas, California.
Rhizosolenia styliformis Brightwell
Brightwell 1858, p. 95, PI. 5, fig. 5d ; D e Toni, 1891-94, p. 826 ; Hustedt 1930, p . 584, fig 335 ; Cupp. 1943, p. 87, fig. 46.
Cells cylindrical, diameter 54 /* and length 484 /x, valves obliquely pointed. Apical process long and hollow. Wing not distinct. Intercalary bands scale like in two rows, punctuate. Chromatophores round, small, and numerous.
Station : 1.1. 0 . E . 12,13, 16 ; T . G . 2, 3. Geographic distribution : European seas, Vancouver, California, West Indies, Antarctic, coast
of Barbardos, Java Sea.
145
164 SOME PLANKTOHIC DIATOM
Sub-order : Biddulphioideae
Family : Chaetocereae
Chaetoceros pervianus Brightwell
1856, p . 107, pi. 7, figs. 16-18 ; Allen and Cupp 1935, p. 137, fig. 57, Cupp 1943, p. 113. Cells usually single, sometimes forming short chains 15-35 fi broad. Valves dissimilar, the
upper rounded, the lower flat. Both with well developed valve mantles. Setae of upper valve originate near the centre, turn sharply and runs backwards in wide outwardly convex curves. Setae of lower valve originate near the margin, curve outwards and run parallel to the pervalvar axis. Setae strong, four sided, 3-5 ¡J. thick with strong spines ; striated 19-25 in 10 fi. Chromatophores numerous, small and disc-shaped, present in setae as well.
Station : I. I. O . E . 16 ; T . G . 2, 3. Geographic distribution : Atlantic and Pacific Oceans, Java Sea, Peruvian guano, Mediterranean
Sea, widely distributed in warmer seas.
Chaetoceros didymus var. protuberans (Lauder) Gran and Yendo
Allen and C u p p 1935, p. 139, fig. 62 ; Cupp 1943, p. 121 ; Chaetoceros protuberans Lauder, 1864, pi. 8, fig. 11.
Cells forming straight chains 15-36 LL wide with concave surface and with semicircular knob in the middle. Setae arising from the corners of the adjacent cells crossing at the base or further out. Terminal setae mostly thicker than others and strongly divergent. Chromatophores two in each cell pressed against the valve with a pyrenoid located in the protuberance.
Station : T . G . 2, 3. Geographic distribution : Mediterranean, warmer seas, California; Arctic and Atlantic Oceana
Peruvian guano, Europe.
Chaetoceros affinis Lauder
Lauder 1864, p . 78, pi. 8, fig. 5, Lebour 1930, p. 135, fig. 99 ; Allen and Cupp 1935, p. 140, fig. 66 ; Cupp 1943, p. 125.
Chains straight, 6-25 ¡x wide, apertures lanceolate and constricted in the middle. Celia oblong in broad girdle view. Setae delicate, terminal setae strongly divergent with spirally arranged spines; chromatophores one in each cell lying on broad side of girdle with single pyrenoid.
Station : T . G . 1, 2, 3. Geographic distribution : C o m m o n in all seas.
Chaetoceros diversus Cleve
Cleve 1873, p. 9, pi. 11, fig. 12 ; Allen and Cupp 1935, p. 142, fig. 71 ; Cupp 1943, p . 132, fig. 87, Short straight chains 10-12 ¡x broad. Valves flat or slightly raised at the centre. Apioal
axis 5-12 /A long. Apertures very small. Setae arise from 4 corners of cell. Setae thick, tubular and spinous, more or less curved or straight turning towards chain ends. Terminal setae thin and hair-like. Chromatophores are in each cell on girdle side.
Station : T . G . 1, 2, 3. Geographic distribution : Tropical and sub-tropical, North Sea, Mediterranean.
Chaetoceros coarctatus Lauder
Lauder 1864, p. 79, pi. 8, fig. 8 ; Lebour 1930, p. 119, Allen and Cupp 1935, p . 135, fig. 52 ; Cupp 1943, p. 107, fig. 62.
Cells cylindrical, elliptical in valve view. Apical axis 30-48 fi. in length. Cells united to form chains robust in appearance. Mantle with clear ring like furrow. Valve surface flat. Posterior
146
M . DURAUtATNAM 165
terminal setae shorter than others, strongly curved and heavily spined. Anterior terminal setae less robust, curved backwards and sparsely spined. Inner setae resembling the anterior ones. Chromatophores numerous and disc-shaped.
Station, : I .1. O . E . N o . 15. Géographie distribution : Tropical and sub-tropical seas, Mediterranean Sea.
Family Biddulphieae Sub-family Eucampineae Genus Eueampia Ehrenberg Eucampia zodiacus Ehrenberg
Ehrenberg 1840, p. 71, pi. 4. fig. 8. ; Lebour 1930, p. 187, fig. 147 ; Allen and Cupp, 1935, p. 143 ; Cupp 1943, p. 145; fig. 103.
Eucampia britannica. W . Smith 1856, p . 25, pi. 71, fig. 378 ; Eucampia groenlandica, Cleve 1896, p. 10, pi. 2, fig. 10.
Cells flattened, linear united in chains by two blunt processes. Chains spirally curved. Valves in surface view elliptical. Apical axis 20-60 /L¿. Apertures of variable size. Punctae 16-20 in 10 JM. Chromatophores numerous, small and highly refractive.
Station: T . G . 1 , 2 , 3 . Geographic distribution : North Sea, Skaggerak, Baltio Sea, English Channel, Mediterranean,
North Atlantic, California, Europe, Belgian Coast.
Genus Climacodium Grunow Olimacodium frauenfeldianum Grunow
Grunow 1867, p. 102, pi. la, fig. 24 ; D e Toni 1891-94, p. 986 ; Lebour 1930, p. 189, fig. 149a Allen and Cupp, 1935, p. 144, fig. 76 ; Cupp 1943, p. 147, fig. 10J.
Cells flat, forming ribbon-like chains. Length of apical axis 70-158 [i, pervalvar axis 12-20 /x. In valve view ceDs are linear-elliptical. Apertures large, oblong or almost at right angles and wider than the cell in pervalvar direction.
Station : 1.1. O . E . 11, 13 ; T . G . 1, 3. Geographic distribution : Mediterranean, Red Sea, California; Central America.
Order : Pennales Sub-order : Araphidineae Family : Fragilarioideae Sub-family : Fragilarieae,
Fragilariinae
Genus Fragilariae Lyngbye Fragilaria oceánica Cleve
Cleve 1873, p. 22, pi. 4, fig. 25 ; Lebour 1930, p. 193, fig. 153. Fragilaria árctica Grunow, Cleve and Grunow, p. 110, pi. 7, fig. 124. Cells in girdle view rectangular, forming compact ribbon-like chains ; valves lanceolate or
elliptical, with rounded ends 12-30 ¡i in length and 7-8 \L broad. Pseudoraphi, narrow and linear. /Station : T . G . 1. Geographic distribution : Norway, Denmark, Russia, Davis Strait, England and Gulf of Maine.
147
166 SOME PLAUKTONIC DIATOMS,
Grenus Synedra
Synedra formosa Hantzsch
Hustedt 1931-32, p . 233, fig. 720 ; Subrahmanyan 1946, p . 167, figs. 342, 343 and 348.
Ardiaaonia formosa (Hantzsch), D e Toni 1891-94, p. 675.
Valves linear with rounded ends, 135-300 [h long, 18-21 /u. broad. Cell wall porous, valves with three longitudinal ribs. Outer membrane areolate punctate. Double series of areolae lie between two ribs.
Station : T . G . 1.
Geographic distribution : Honduras, Vera Cruz, East Indian Archipelago, Europe.
Genus Thallassiothrix Cleve and Grunow
Thallassiothrix longissima Cleve and Grunow
Cleve ana Grunow 1880, p . 108 ; D e Toni 1891-94, p. 672 ; Lebour 1930, p . 199, fig. 159 ; Cupp 1943, p . 184, fig. 134.
Cells four sided, long and threadlike often more or less curved. Valves narrow and linear, ends slightly narrowed more in one end than the other. Length 0 • 5 to 4 m m . width 2 • 5V6 [X. Delicate spines present in the corner of the valves, more towards the centre than towards the ends or absent.
Station : I. I. O . E . 12, 13, 15 ; T . G . 1, 2, 3.
Geographic distribution : North Atlantic, Arctic Sea, Scotland, Belgium, Russia, Sweden, Norway, Germany, California and Antarctic, Denmark, Mediterranean.
Genus Pleurosigma W . Smith
Pleurosigma angulatum (Quekett) W . Smith
var strigosa ( W . Smith) Van Heurck
Van Heurck 1899, p. 251, pi. 6, fig. 261 ; D e Toni 1891-94, p. 233, Allen and Cupp 1935, p. 158, fig. 108 ; Pleurosigma " strigosum " W . Smith* p . 7, pi. 1, fig. 6.
Valves lanceolate, slightly sigmoid, 110 ¡J. long and 15 /A broad, raphe sigmoid, excentric at the ends. Oblique and transverse striae equidistant, 18-22 in 10 ¡A.
Station : T . G . 1.
Geographic distribution : England, Sicily, Italy, Finmark, Adriatic Sea, Mediterranean Baltic.
Nitzschia longissima (Brebisson) Ralfs
D e Toni 1891-94, p. 547 ; Allen'and Cupp 1935, p . 163, fig. 121, Allen and Cupp 1935, p . 163, fig. 121 ; Cupp 1943, p. 200, fig. 154.
Nitzschia birostrata W . Smith 1853, p . 42, pi. 14, fig. 119 ; Ceratoneis longissima (Brebisson) Ralfs, 1861, p. 783 ; Nitzschiella longissima (Brebisson) Rabenhorst, 1864, p . 164.
Cells 95-565 / A long and 3-6 ¡J. broad ; valves linear, lanceolate ; ends elongated into hair-like horns. Keel punctae, 8-14 in 10 ¡x. Chromatophores, two in the centre.
Station : T . G . 1, 2 , 3.
Geographic distribution : England, Denmark, France, Virgin Islands, N e w Jersey, Pacific Coast of America, Java Sea.
M . DUEAIRATNAM 167
Niteschia closterium (Ehrenberg) W . Smith
W . Smith 1853, p. 42, pi. 15 ; Lebour 1930, p . 212, fig. 176 ; Allen and Cupp 1935, p.163, fig. 122 ; Cupp 1943, p . 200, fig. 153.
Ceratoneis closterium Ralfs 1861, p. 783, pi. 12, fig. 59 ; Nitzschiella closterium (Ehrenberg) Rabenhorst 1864, p . 163.
Cells single, valves spindle-shaped or lanceolate in the middle, ends hair-like, slightly bent. T w o Chromatophores placed in the centre. Valves 25-150 ¡x in length, 3-7 ¡x broad.
Station : T . G . 1, 2, 3.
Geographic distribution : England, Scotland, Davis Strait, Norway, Sweden, Denmark, California, Java Sea.
Nitzschia seriata Cleve
Cleve 1883, p . 478, pi. 38, fig. 75 ; D e Toni 1891-94, p . 501 ; Lebour 1930, p. 213, fig. 178 ; Allen and Cupp 1935, p. 164, fig. 124 ; Cupp 1943, p . 201, fig. 155.
Cells spindle shaped, ends pointed or slightly rounded, united into stiff hair-like chains by the overlapping points of the cells. Length of valves 60-135 ¡x, width 3-5*8 \x. Striae 13-19 in 10 ¡x. Chromatophores 2 on each side of the central nucleus.
Station : T . G . 1, 2, 3.
Geographic distribution : Davis Strait, England, Scotland, Holland, Belgium, Germany, Sweden, Denmark, Atlantic and Pacific Coasts of America, Antarctic and Java Sea.
Navícula hennedyii W . Smith
W . Smith 1856, p. 93 ; D e Toni 1891-94, p. 103 ; Cleve 1894, p. 57 ; Subrahmanyan, p. 181, fig. 402.
Valves elliptical, 38-62 ¡x long, 21-36 ¡x wide. Lateral areas, narrow, linear, lanceolate or broad semilanceolate with parallel inner margins. Striae 12-15 in 10 JU..
Station : I. I. O . E . 16.
Geographic distribution : England, Belgium, Italy, Greenland, Spitzbergen, Finmark, Lusitania, Adriatic, North America, Ceylon.
Sub-family : Amphiproroideae
Genus Amphiprora Ehrenberg
Amphiprora gigantea Grunow, var. sulcata (O'meara) Cleve
Cleve 1894, p. 18 ; Allen and Cupp 1935, p . 160, fig. 113 : Cupp 1943, p . 198, fig. 151.
Amphiprora sulcata O'meara 1871, p . 22, pi. 3, fig. 3.
Cells strongly constricted, keel with hyaline margin broader towards the ends. Junction line curved like a bow. Cells 62-122 ¡x long. Striae of the valve curved and divergent from the central nodule. Striae in connecting zone 20-24 in 10 /¿..
Station: T . G . 1 ,2 ,3 .
Geographic distribution : Java Sea, California.
Acknowledgments
I wish to thank Dr . Sekine, President of the Tokyo University of Fisheries, and the Japanese Government for granting m e permission to join the research boat " Umitaka Maru " to enable m »
149
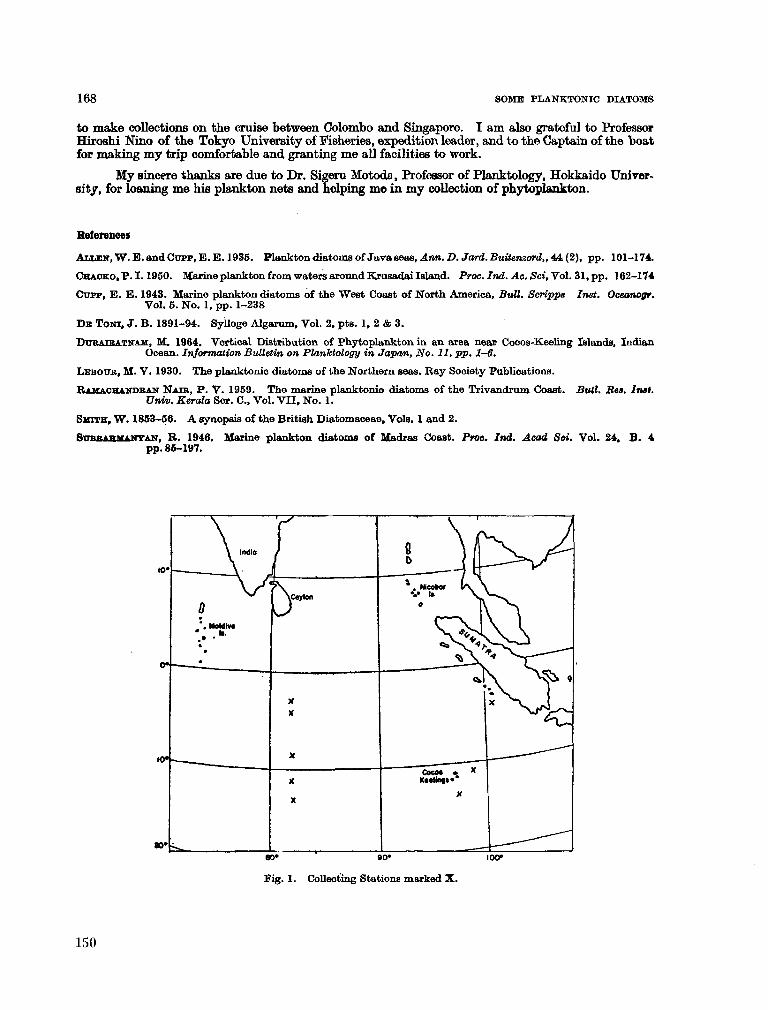
168 SOME PLANKTONIO DIATOMS
to m a k e collections on the cruise between Colombo and Singapore. I a m also grateful to Professor Hiroahi Nino of the Tokyo University of Fisheries, expedition leader, and to the Captain of the boat for making m y trip comfortable and granting m e all facilities to work.
M y sincere thanks are due to Dr . Sigeru Motoda, Professor of Planktology, Hokkaido University, for loaning m e his plankton nets and helping m e in m y collection of phytoplankton.
References
A L L E N , W . E . and Ctrpp.E.E. 1935. Plankton diatoms of Java seas, Ann. D. Jard. Buitenzord,, 44 (2), pp. 101-174.
C H A C K O . P . I . 1950. Marine plankton from waters around Krusadai Island. Proc. Ind. Ac. Sci, Vol. 31, pp. 162-174
C U F F , E . E . 1943. Marine plankton diatoms of the West Coast of North America, Bull. Scripps Inst. Oceanogr. Vol. 5. No. 1, pp. 1-238
D E T O O T , J. B . 1891-94. Sylloge Algarum, Vol. 2, pts. 1, 2 & 3.
D T T R A T B A T N A M , M . 1964. Vertical Distribution of Phytoplankton in an area near Cocos-Keeling Islands, Indian Ocean. Information Bulletin on Planktology in Japan, No. 11, pp. 1-6.
L E B O U B , M . V . 1930. The planktonio diatoms of the Northern seas. Bay Society Publications.
R A M A O H A N D R A N N A T R , P. V . 1959. The marine planktonio diatoms of the Trivandrum Coast. Bull. Bes. Inst. Univ. Kerala Ser. C , Vol. VII, No. 1.
S M I T H , W . 1853-56. A synopsis of the British Diatomaceae, Vols. 1 and 2.
S U B B A H M A N Y A N , B . 1946. Marine plankton diatoms of Madras Coast. Proc. Ind. Acad Soi. Vol. 24. B . 4 pp. 85-197.
80»
Fig. 1. Collecting Stations marked X .
150
Reprinted from Annual reports for 7965 of the American Malacological Union, p. 6-8.
COELENTERATE-ASSOCIATED P R O S O B R A N C H GASTROPODS.1 Robert Robertson, Academy of Natural Sciences of Philadelphia, Pennsylvania.
(Abstract)
Nematocysts presumably protect coelenterates from most animals which might otherwise feed on them. Nevertheless, there are animals in various groups which feed in whole or in part on the soft, nematocyst-bearing, living tissues. Many associates of hydroids, sea anemones, and corals feed on their hosts.
A m o n g the prosobranch gastropods, 21 genera in seven families are now known that include such associates:
A R C H I T E C T O N I C I D A E [= "Solariidae"] (Heliacus [- "Torinia"] with the zoanthids Palythoa and Zoanthus).
EPITONIIDAE [= "Scalidae"] (Alexania [= "Hafcea"], Epitonium, O palia, and Amaea with sea anemones, zoanthids, and stony corals).
J A N T H I N I D A E (Janthina with pleustonic siphonophores and sea anemones on Sargassum; Recluzia with Minyas, a pleustonic sea anemone).
l The field work in the Indian Ocean was supported by the National Science Foundation as a part of the U . S . Program in Biology, International Indian Ocean Expedition.
-6-
152 Collected reprints of the International Indian Ocean Expedition, vol. IV, contribution no. 218
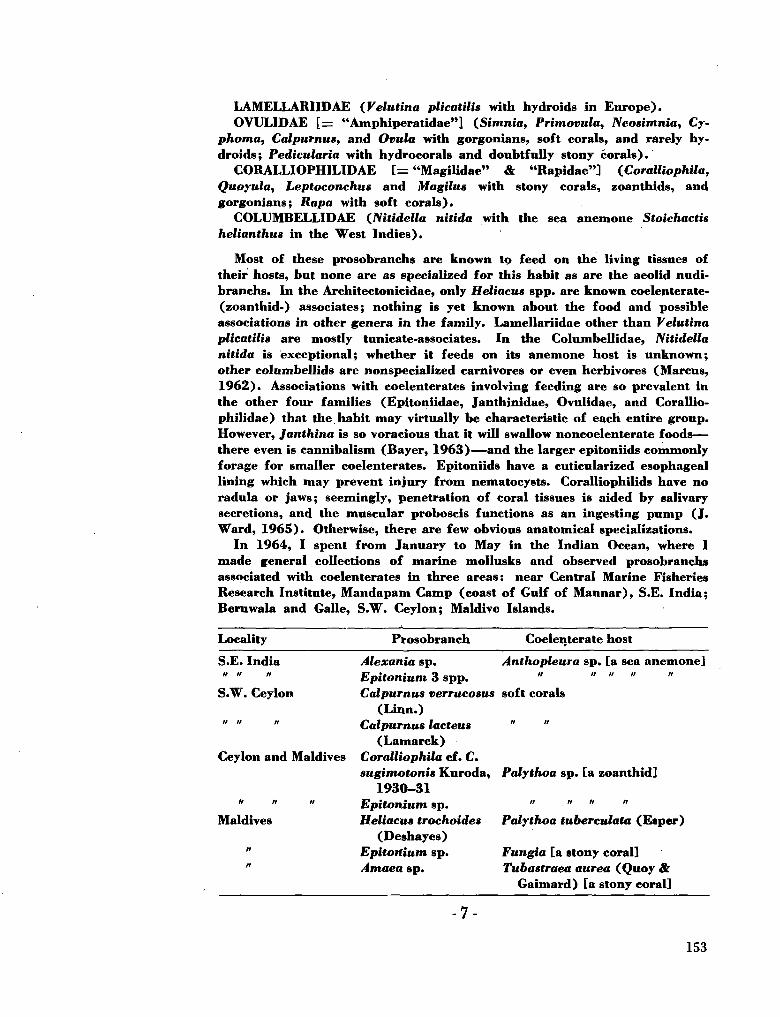
L A M E L L A R I I D A E {Velutina plicatilis with hydroids in Europe). O V U L I D A E [= "Amphiperatidae"] (Simnia, Primovula, Neosimnia, Cy-
phoma, Calpurnus, and Ovula with gorgonians, soft corals, and rarely hydroids ; Pedicularia with hydrocorals and doubtfully stony corals).
C O R A L L I O P H 1 L I D A E [= "Magilidae" & "Rapidae"] {CoralliophUa, Quoyula, Leptoconchus and Magilus with stony corals, zoanthids, and gorgonians; Rapa with soft corals).
C O L U M R E L L I D A E (Nitidella nitida with the sea anemone Stoichactis helianthus in the West Indies).
Most of these prosobranchs are known to feed on the living tissues of their hosts, but none are as specialized for this habit as are the aeolid nudi-branchs. In the Architectonicidae, only Heliacus spp. are known coelenterate-(zoanthid-) associates; nothing is yet known about the food and possible associations in other genera in the family. Lamellariidae other than Velutina plicatilis are mostly tunicate-associates. In the Columbellidae, Nitidella nitida is exceptional; whether it feeds on its anemone host is unknown; other columbellids are nonspecialized carnivores or even herbivores (Marcus, 1962). Associations with coelenterates involving feeding are so prevalent in the other four families (Epitoniidae, Janthinidae, Ovulidae, and Corallio-philidae) that the habit m a y virtually be characteristic of each entire group. However, Janthina is so voracious that it will swallow noncoelenterate foods— there even is cannibalism (Bayer, 1963)—and the larger epitoniids commonly forage for smaller coelenterates. Epitoniids have a cuticularized esophageal lining which may prevent injury from nematocysts. Coralliophilids have no radula or jaws; seemingly, penetration of coral tissues is aided by salivary secretions, and the muscular proboscis functions as an ingesting p u m p (J. Ward, 1965). Otherwise, there are few obvious anatomical specializations.
In 1964, I spent from January to May in the Indian Ocean, where I made general collections of marine mollusks and observed prosobranchs associated with coelenterates in three areas: near Central Marine Fisheries Research Institute, Mandapam C a m p (coast of Gulf of Mannar), S.E. India; Beruwala and Galle, S . W . Ceylon; Maldive Islands.
Locality Prosobranch Coelenterate host
S.E. India Anthopleura sp. [a sea anemone] u » »
S . W . Ceylon
Alexania sp. Epitonium 3 spp. Calpurnus verrucosus soft corals
(Linn.) " " " Calpurnus lacteus
(Lamarck) Ceylon and Maldives CoralliophUa cf. C.
sugimotonis Kuroda, Palythoa sp. [a zoanthid] 1930-31
" " " Epitonium sp. " " " Maldives Heliacus trochoides
(Deshayes) " Epitonium sp. " Amaea sp.
Palythoa tuberculata (Esper)
Fungia [a stony coral] Tubastraea aurea (Quoy &
Gaimard) [a stony coral]
7-
153
The Epitonium with Palythoa in Ceylon and the Maldives is the first epitoniid to be found with a zoanthid. The shell and body of the Maldivian Amaea was bright orange in life, and its coral host was similarly colored.
M u c h remains to be learned about coelenterate-associated prosobranchs ; for example: their taxonomy and zoogeography, their specificity and their methods of feeding without injury from nematocysts. Architectonicid, ovulid, and coralliophilid larvae occur in tropical plankton far from shallow-water benthic sources, so there are also interesting problems in larval ecology—especially the location of and settlement on appropriate hosts.
154
-8-
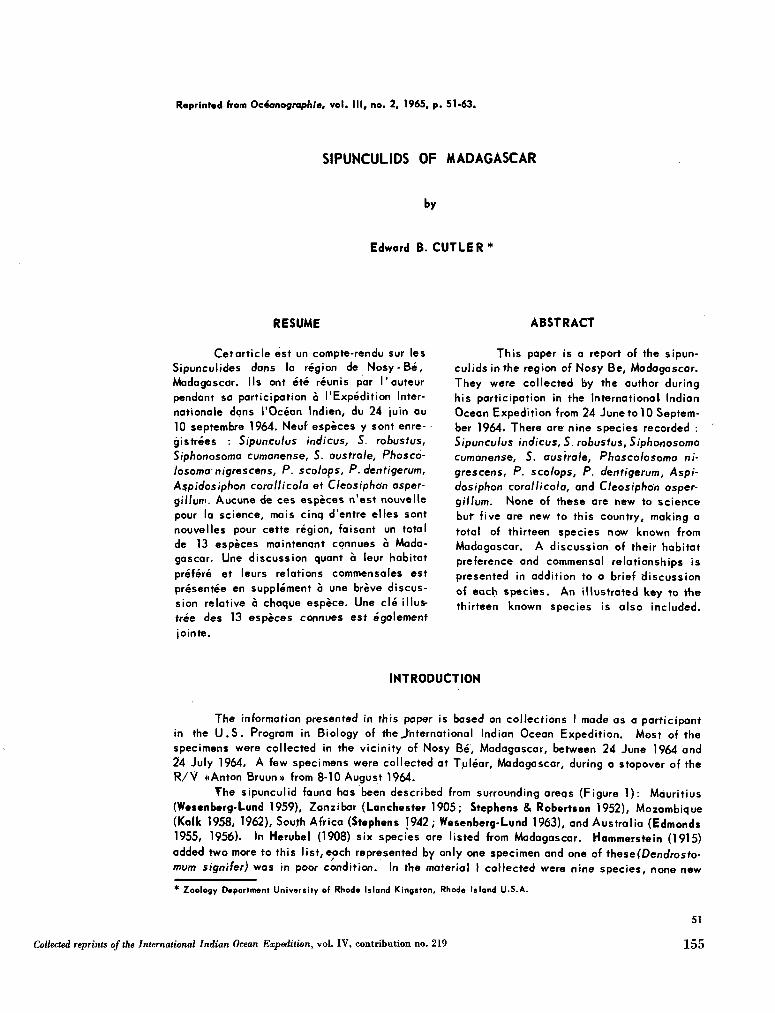
Reprinted from Océanographie, vol. Ill, no. 2, 1965, p. 51-63.
SIPUNCULIDS OF MADAGASCAR
by
Edward B. CUTLER*
RESUME ABSTRACT
Cetarticle est un compte-rendu sur les
Sipunculides dans la région de N o s y - B é ,
Madagascar. Ils ont été réunis par l'auteur
pendant sa participation à l'Expédition Inter
nationale dans l'Océan Indien, du 24 ¡uin au
10 septembre 1964. Neuf espèces y sont enre
gistrées : Sipunculus indicus, S. robustus,
Siphonosoma cumanense, S. australe, Phosco-
losoma nigrescens, P. scolops, P. dentigerum,
A$pidosiphon corallicola et Cleosiphon asper-
gillum. Aucune de ces espèces n'est nouvelle
pour la science, mais cinq d'entre elles sont
nouvelles pour cette région, faisant un total
de 13 espèces maintenant connues à Mada
gascar. Une discussion quant à leur habitat
préféré et leurs relations commensales est
présentée en supplément à une brève discus
sion relative à chaque espèce. Une clé illus
trée des 13 espèces connues est également
¡ointe.
This paper is a report of the sipun-
cuiids in the region of Nosy B e , Madagascar.
They were collected by the author during
his participation in the International Indian
Ocean Expedition from 24 June to 10 Septem
ber 1964. There are nine species recorded :
Sipunculus indicus, S. robustus, Siphonosoma
cumanense, S. australe, Phascolosoma ni
grescens, P. scolops, P. dentigerum, Aspi-
dosiphan corallicola, and Cleasiphtin asper-
gillum. None of these are new to science
buf five are new to this country, making a
total of thirteen species now known from
Madagascar. A discussion of their habitat
preference and commensal relationships is
presented in addition to a brief discussion
of each species. An illustrated key to the
thirteen known species is also included.
INTRODUCTION
The information presented in this paper is based on collections I made as a participant
in the U . S . Program in Biology of theJ'nternational Indian Ocean Expedition. Most of the
specimens were collected in the vicinity of Nosy Be, Madagascar, between 24 June 1964 and
24 July 1964. A few specimens were collected at T.uléar, Madagascar, during a stopover of the
R / V «Anton Bruun» from 8-10 August 1964.
The sipunculid fauna has been described from surrounding areqs (Figure 1): Mauritius
(Wesenberg-Lund 1959), Zanzibar (Lanchester 1905; Stephens & Robertson 1952), Mozambique
(Kalk 1958, 1962), South Africa (Stephens 1942; Wesenberg-Lund 1963), and Australia (Edmonds
1955, 1956). In Herubel (1908) six species are listed from Madagascar. Hammerstein (1915)
added two more to this list, each represented by only one specimen and one of these(DenaVosfo-
mum signifer) was in poor condition. In the material I collected were nine species, none new
* Zoology Department University of Rhode Island Kingston, Rhode Island U . S . A .
51
Collected reprints of the International Indian Ocean Expedition, vol. IV, contribution no. 219 155
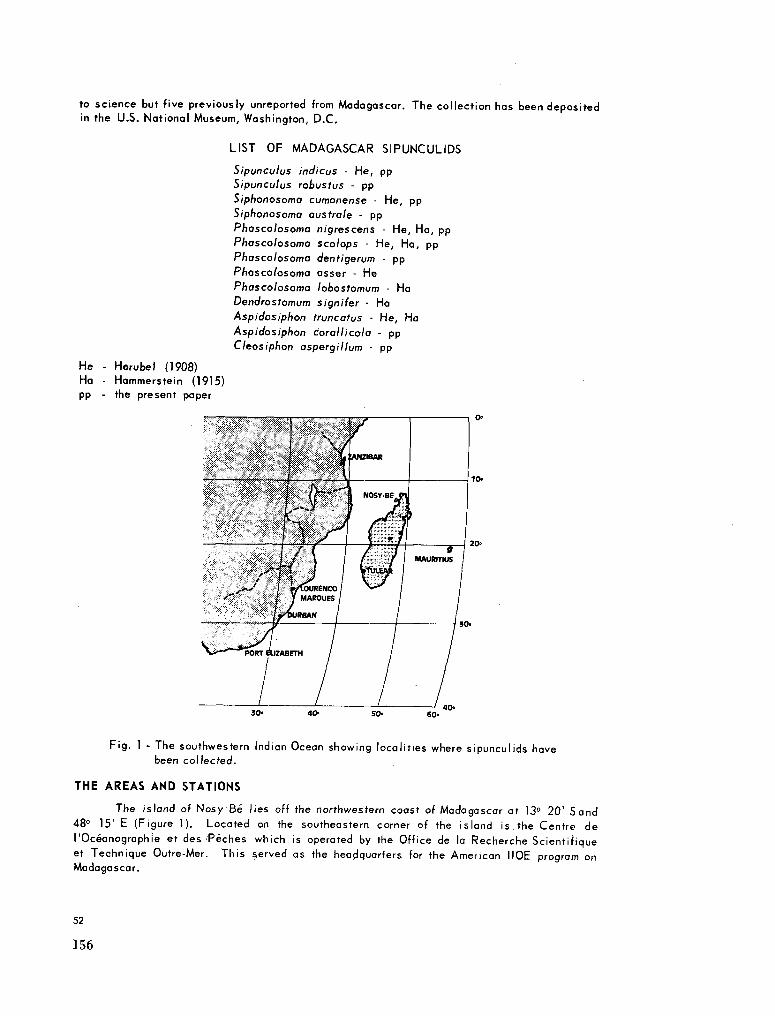
to science but five previously unreported from Madagascar. The collection has been deposited
in the U.S. National Museum, Washington, D . C .
LIST O F M A D A G A S C A R SIPUNCULIDS
SipunCulus indicus - He, pp
Sipunculus robustus - pp
Siphonosoma cumanense - He, pp
Siphonosoma australe • pp
Phascolosoma nigrescens - He, Ha, pp
Phascolosoma sco/ops - He, Ha, pp
Phascolosoma dentigerum - pp
Phasco/osoma asser - He
Phascolosoma lobostomum - Ha
Dendrostomum sign ¡fer - Ha
Aspidosiphon truncatus - He, Ha
Aspidosiphon corallicola - pp
Cleosiphon aspergí Hum - pp
He - Herubel (1908)
Ha - Hammerstein (1915)
pp - the present paper
Fig. 1 - The southwestern Indian Ocean showing localities where sipunculids have
been col lected.
THE AREAS AND STATIONS
The island of Nosy Bé lies off the northwestern coast of Madagascar at 13° 20' Sand
48° 15' E (Figure 1). Located on the southeastern corner of the island is.the Centre de
l'Océanographie et des Pêches which is operated by the Office de la Recherche Scientifique
et Technique Outre-Mer. This s,erved as the headquarters for the American IIOE program on
Madagascar.
52
156
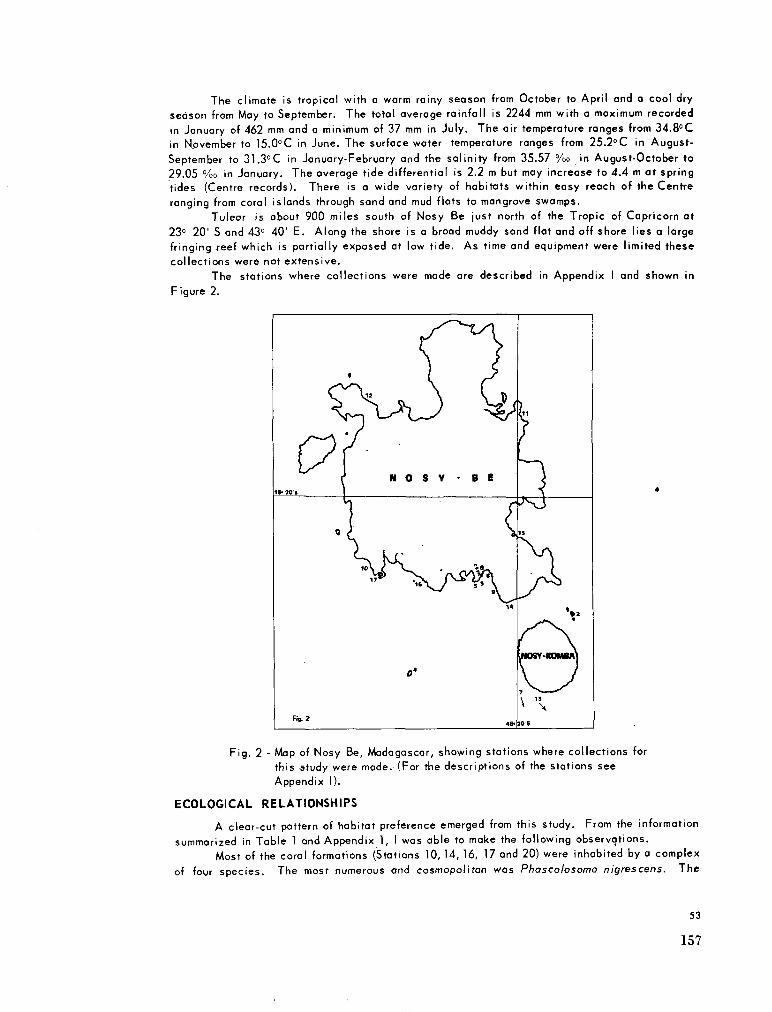
The climate is tropical with a warm rainy season from October to April and a cool dry
season from May to September. The total average rainfall is 2244 mm with a maximum recorded
in January of 462 m m and a minimum of 37 m m in July. The air temperature ranges from 34.8°C
in N.ovember to 15.0°C in June. The surface water temperature ranges from 25.2°C in August-
September to 31.3°C in January-February and the salinity from 35.57 %o in August-October to
29.05 %o in January. The average tide differential is 2.2 m but may increase to 4.4 m at spring
tides (Centre records). There is a wide variety of habitats within easy reach of the Centre
ranging from coral islands through sand and mud flats to mangrove swamps.
Tulear is about 900 miles south of Nosy Be just north of the Tropic of Capricorn at
23° 20' S and 43° 40' E. Along the shore is a broad muddy sand flat and off shore lies a large
fringing reef which is partially exposed at low tide. As time and equipment were limited these
collections were not extensive.
The stations where collections were made are described in Appendix I and shown in
Figure 2.
c 13*20't
fis. 2
•
0 /
V 2
io \
1 7 *
N O S
*ieÍS
0'
¥
-
• B E
".a
14
as*
in
15
20'E
Fig. 2 - Map of Nosy Be, Madagascar, showing stations where collections for
this study were made. (For the descriptions of the stations see
Appendix I).
ECOLOGICAL RELATIONSHIPS
A clear-cut pattern of habitat preference emerged from this study. From the information
summarized in Table I and Appendix l, I was able to make the following observations.
Most of the coral formations (Stations 10, 14, 16, 17 and 20) were inhabited by a complex
of four species. The most numerous and cosmopolitan was Phascolosomo nigrescens. The
53
157
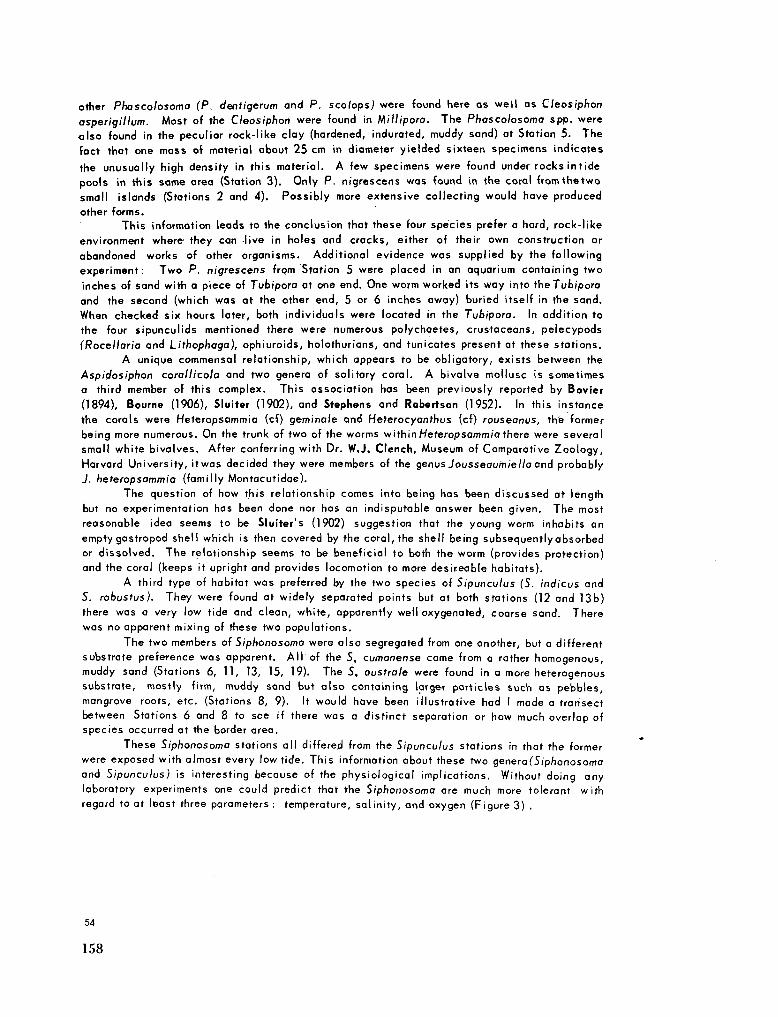
other Phascolosoma (P. dentigerum and P. scolops) were found here as well as Cleosiphon
asperigillvm. Most of the Cleosiphon were found in Millipora. The Phascolosoma spp. were
olso found in the peculiar rock-like clay (hardened, indurated, muddy sand) at Station 5. The
fact that one mass of material about 25 cm in diameter yielded sixteen specimens indicates
the unusually high density in this material. A few specimens were found under rocks intide
pools in this same area (Station 3). Only P. m'grescens was found in the coral fromthetwo
small islands (Stations 2 and 4). Possibly more extensive collecting would have produced
other forms.
This information leads to the conclusion that these four species prefer a hard, rock-like
environment where they can live in holes and cracks, either of their own construction or
abandoned works of other organisms. Additional evidence was supplied by the following
experiment: Two P. nigrescens from Station 5 were placed in an aquarium containing two
inches of sand with a piece of Tubipora at one end. One worm worked its way into the Tubipora
and the second (which was at the other end, 5 or 6 inches away) buried itself in the sand.
When checked six hours later, both individuals were located in the Tubipora. In addition to
the four sipunculids mentioned there were numerous polychaetes, crustaceans, pelecypods
(Rocellaria and Litbophaga), ophiuroids, holothurians, and tunicates present at these stations.
A unique commensal relationship, which appears to be obligatory, exists between the
Aspidosiphon corallicola and two genera of solitary coral. A bivalve mollusc is sometimes
a third member of this complex. This association has been previously reported by Bovier
(1894), Bourne (1906), Sluiter (1902), and Stephens and Robertson (1952). In this instance
the corals were Heteropsammia (cf) gemínale and Heterocyanthus (cf) rouseanus, thé former
being more numerous. On the trunk of two of the worms within Heteropsammia there were several
small white bivalves. After conferring with Dr. W.J . Clench, Museum of Comparative Zoology,
Harvard University, itwas decided they were members of the genusJousseaumiellaand probably
J. heteropsammia (familly Montacutidge).
The question of how this relationship comes into being has been discussed at length
but no experimentation has been done nor has an indisputable answer been given. The most
reasonable idea seems to be Sluiter's (1902) suggestion that the young worm inhabits an
empty gastropod shell which is then covered by the coral, the shell being subsequently absorbed
or dissolved. The relationship seems to be beneficial to both the worm (provides protection)
and the coral (keeps it upright and provides locomotion to more desireable habitats).
A third type of habitat was preferred by the two species of Sipunculus (S. indicus and
S. robustus). They were found at widely separated points but at both stations (12 and 13b)
there was a very low tide and clean, white, apparently well oxygenated, coarse sand. There
was no apparent mixing of these two populations.
The two members of Siphonosoma were also segregated from one another, but a different
substrate preference was apparent. All of the S, cumanense came from a rather homogenous,
muddy sand (Stations 6, 11, 13, 15, 19). The 5. australe were found in a more heterogenous
substrate, mostly firm, muddy sand but also containing larger particles such as pebbles,
mangrove roots, etc. (Stations 8, 9). It would have been illustrative had I made a transect
between Stations 6 and 8 to see if there was a distinct separation or how much overlap of
species occurred at the border area.
These Siphonosoma stations all differed from the Sipunculus stations in that the former
were exposed with almost every low tide. This information about these two genera(5/pnonosoma
and Sipunculus) is interesting because of the physiological implications. Without doing any
laboratory experiments one could predict that the Siphonosoma are much more tolerant with
regard to at least three parameters : temperature, salinity, and oxygen (Figure 3) .
54
158
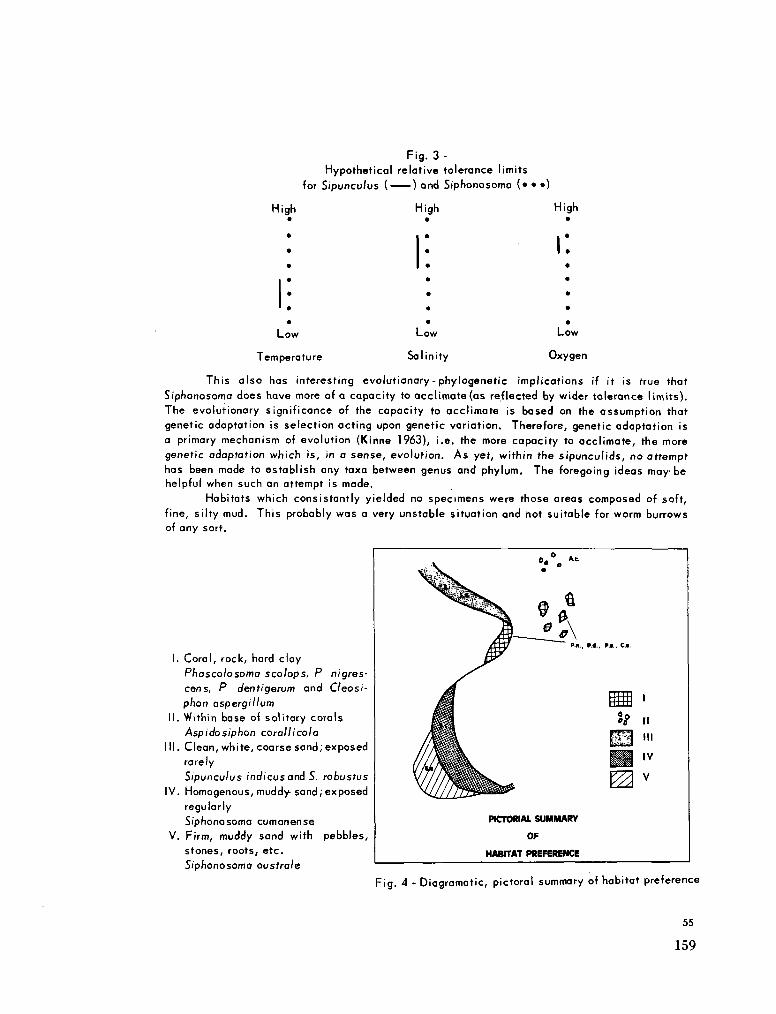
Fig. 3 -Hypothetical relative tolerance limits
for Stpunculus ( — ) and Siphonosoma (• • •)
High High High
L o w
Temperature
L o w
Salinity
L o w
Oxygen
This also has interesting evolutionary-phylogenetic implications if it is true that 5/pnonosoma does have more of a capacity to acclimate (as reflected by wider tolerance limits). The evolutionary significance of the capacity to acclimate is based on the assumption that genetic adaptation is selection acting upon genetic variation. Therefore, genetic adaptation is a primary mechanism of evolution (Kinne 1963), i.e. the more capacity to acclimate, the more genetic adaptation which is, in a sense, evolution. A s yet, within the sipunculids, no attempt has been made to establish any taxa between genus and phylum. The foregoing ideas m a y b e helpful when such an attempt is made .
Habitats which consistently yielded no specimens were those areas composed of soft, fine, silty m u d . This probably was a very unstable situation and not suitable for worm burrows of any sort.
I. Coral, rock, hard clay
Phascolosoma sco/ops, P nigres-cens, P dentigerum and C/eosi-phon aspergillum
II. Within base of solitary corals Aspidosiphon corallicola
I I I . Clean, white, coarse sand; exposed rarely Sipunculus ¡ndicusand S. robustus
IV. Homogenous, muddy-sand; exposed regularly S/phonosoma cumanense
V . Firm, muddy sand with pebbles, stones, roots, etc. S/phonosoma australe
P H . , P.4.. P.I.. C.a.
I
î? ri
PICTORIAL SUMMARY
OF
HABITAT PREFERENCE
Fig. 4 - Diagramatic, pictoral summary of habitat preference
55
159
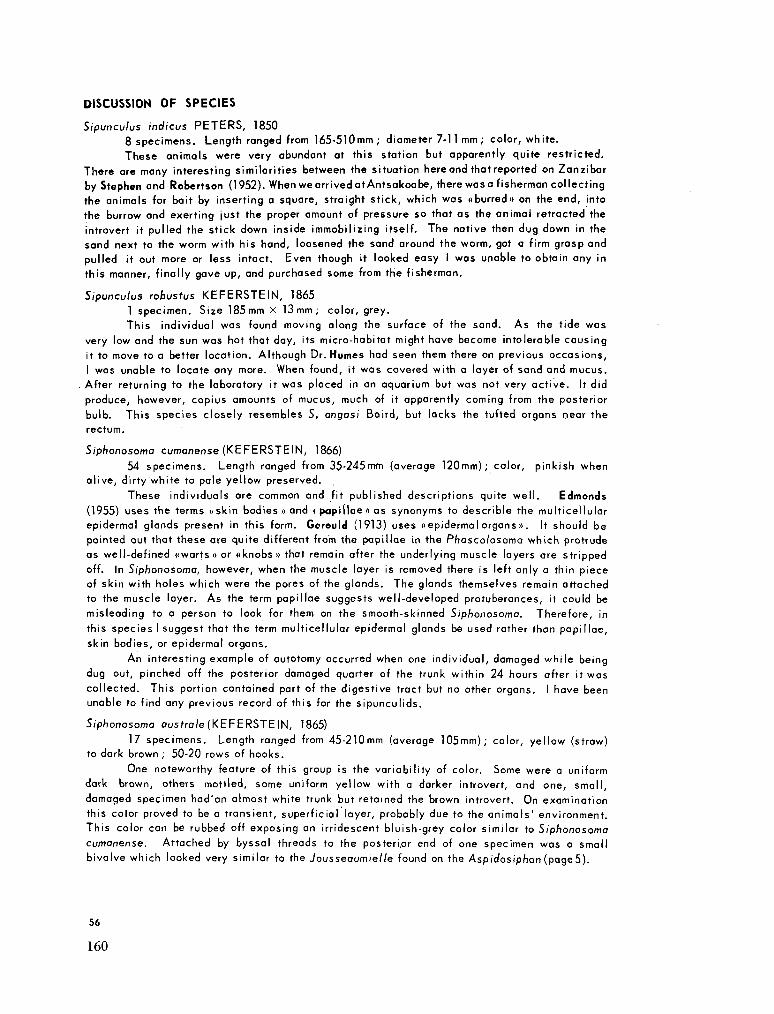
DISCUSSION OF SPECIES
Sipunculus ¡ndicus P E T E R S , 1850
8 specimens. Length ranged from 165-510mm ; diameter 7-11 m m ; color, white.
These animals were very abundant at this station but apparently quite restricted.
There are many interesting similarities between the situation here and that reported on Zanzibar
by Stephen and Robertson (1952). When we arrived at Antsakoabe, there wasa fisherman collecting
the animals for bait by inserting a square, straight stick, which was «burred» on the end, into
the burrow and exerting just the proper amount of pre6sure so that as the animal retracted the
introvert it pulled the stick down inside immobilizing itself. The native then dug down in the
sand next to the worm with his hand, loosened the sand around the worm, got a firm grasp and
pulled it out more or less intact. Even though it looked easy I was unable to obtain any in
this manner, finally gave up, and purchased some from the fisherman.
Sipunculus robustus KEFERSTEIN, 1865
1 specimen. Size 185mm X 13 m m ; color, grey.
This individual was found moving along the surface of the sand. As the tide was
very low and the sun was hot that day, its micro-habitat might have become intolerable causing
it to move to a better location. Although Dr. Humes had seen them there on previous occasions,
I was unable to locate any more. When found, it was covered with a layer of sand and mucus.
After returning to the laboratory it was placed in an aquarium but was not very active. It did
produce, however, copius amounts of mucus, much of it apparently coming from the posterior
bulb. This species closely resembles S. angasi Baird, but lacks the tufted organs pear the
rectum.
Siphonosoma cumanense (KEFERSTEIN, 1866)
54 specimens. Length ranged from 35-245mm (average 120mm); color, pinkish when
alive, dirty white to pale yellow preserved.
These individuals are common and fit published descriptions quite well. Edmonds
(1955) uses the terms «skin bodies» and * papillae» as synonyms to describle the multicellular
epidermal glands present in this form. Gerould (1913) uses «epidermal organs ». It should be
pointed out that these are quite different from the papillae in the Phascolosoma which protrude
as well-defined «warts» or «knobs» that remain after the underlying muscle layers are stripped
off. In Siphonosoma, however, when the muscle layer is removed there is left only a thin piece
of skin with holes which were the pores of the glands. The glands themselves remain attached
to the muscle layer. As the term papillae suggests well-developed protuberances, it could be
misleading to a person to look for them on the smooth-skinned Siphonosoma. Therefore, in
this species I suggest that the term multicellular epidermal glands be used rather than papillae,
skin bodies, or epidermal organs.
An interesting example of autotomy occurred when one individual, damaged while being
dug out, pinched off the posterior damaged quarter of the trunk within 24 hours after it was
collected. This portion contained part of the digestive tract but no other organs. I have been
unable to find any previous record of this for the sipunculids.
5/phonosoma australe (KEFERSTE IN, 1865)
17 specimens. Length ranged from 45-210mm (average 105mm); color, yellow (straw)
to dark brown; 50-20 rows of hooks.
One noteworthy feature of this group is the variability of color. Some were a uniform
dark brown, others mottled, some uniform yellow with a darker introvert, and one, small,
damaged specimen had'an almost white trunk but retained the brown introvert. On examination
this color proved to be a transient, superficial layer, probably due to the animals' environment.
This color can be rubbed off exposing an ¡rridescent bluish-grey color similar to Siphonosoma
cumanense. Attached by byssal threads to the posterior end of one specimen was a small
bivalve which looked very similar to the Jousseaumielle found on the Aspidosiphon (page5).
56
160
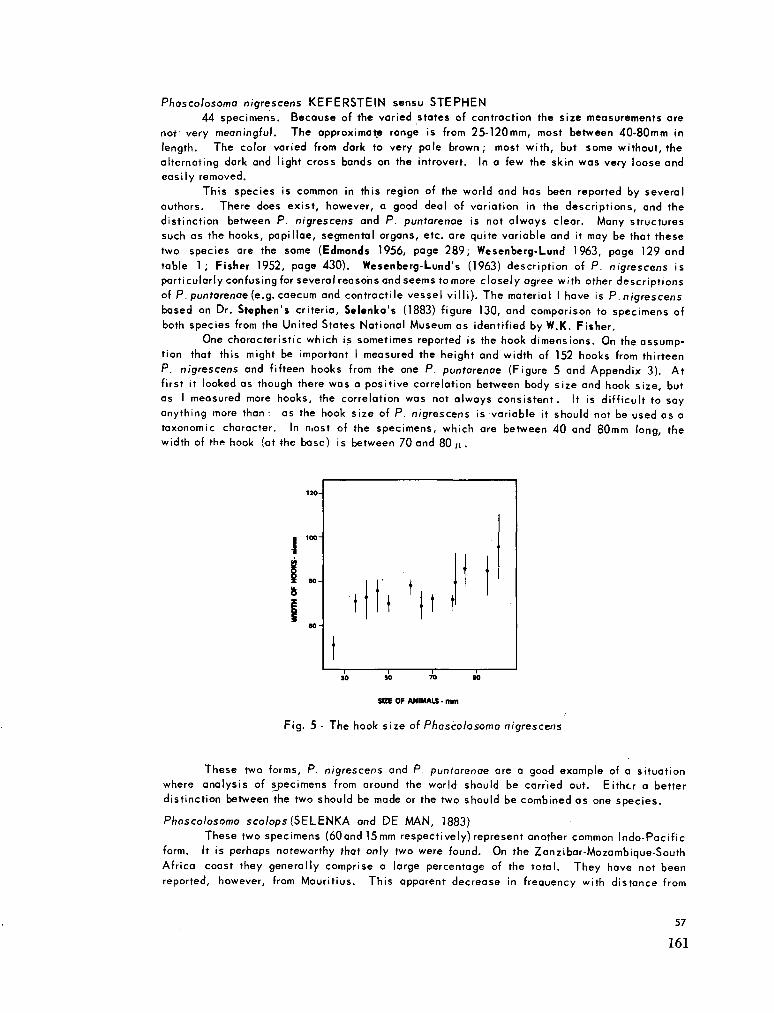
Phascolosoma nigrescens KEFERSTEIN sensu S T E P H E N
44 specimens. Because of the varied states of contraction the size measurements are
not very meaningful. The approximate range is from 25-120mm, most between 40-80mm in
length. The color varied from dark to very pale brown; most with, but some without, the
alternating dark and light cross bands on the introvert. In a few the skin was very loose and
easily removed.
This species is common in this region of the world and has been reported by several
authors. There does exist, however, a good deal of variation in the descriptions, and the
distinction between P. nigrescens and P. puntarenae is not always clear. Many structures
such as the hooks, papillae, segmental organs, etc. are quite variable and it may be that these
two species are the same (Edmonds 1956, page 289; Wesenberg-Lund 1963, page 129 and
table 1; Fisher 1952, page 430). Wesenberg-Lund's (1963) description of P. nigrescens is
particularly confusing for several reasons and seems to more closely agree with other descriptions
of P. puntarenae (e.g. caecum and contractile vessel villi). The material I have is P. nigrescens
based on Dr. Stephen's criteria, Selenka's (1883) figure 130, and comparison to specimens of
both species from the United States National Museum as identified by W . K . Fisher.
One characteristic which is sometimes reported is the hook dimensions. On the assump
tion that this might be important I measured the height and width of 152 hooks from thirteen
P. nigrescens and fifteen hooks from the one P. puntarenae (Figure 5 and Appendix 3). At
first it looked as though there was a positive correlation between body size and hook size, but
as I measured more hooks, the correlation was not always consistent. It is difficult to say
anything more than : as the hook size of P. nigrescens is variable it should not be used as a
taxonomic character. In most of the specimens, which are between 40 and 80mm long, the
width of the hook (at the base) is between 70 and 80 ¡i.
1
t
tV' i t t 1
<
n 1 r 50 70 90
SIZE OF ANIMALS • m m
Fig. 5 - The hook size of Phascolosoma nigrescens
These two forms, P. nigrescens and P. puntarenae are a good example of a situation
where analysis of specimens from around the world should be carried out. Either a better
distinction between the two should be made or the two should be combined as one species.
Phasco/osomo scolops (SELENKA and D E M A N , 1883)
These two specimens (60and 15mm respectively) represent another common Indo-Pacific
form. It is perhaps noteworthy that only two were found. On the Zanzibar-Mozambique-South
Africa coast they generally comprise a large percentage of the total. They have not been
reported, however, from Mauritius. This apparent decrease in frequency with distance from
57
161
the continent may be significant. This species, together with P. agassizi, P. japonicum and
others form another complex of Phasco/osoma with very similar hooks and the internal anatomy
exhibiting only minor differences. This species differs from P. agassizi by the absence of
a rectal caecum. The nature of the papillae platelets separates it from P. japonicum.
Phascolosoma den//gerum(SELENKA and D E M A N , 1883)
20 specimens. The trunks ranged in length from 20-52mm. The expanded introverts
were all at least half as long and some as long as the body. The largest individual was 77mm
overall. Most of these individuals had a very pale body with the tall, conical, preanal papillae
oriented posteriorly and the introvert showing the reddish - brown bands or blotches which
characterize this species.
Aspidosiphon corallicole SLUITER, 1902
11 specimens. I am indebted to Dr. M . Pichón for pointing these out to me in the bases
of the solitary corals. The anal shields fit Stephen's (1952) description very well. They are
dark red - brown and composed of longitudinal furrows next to the anus changing to rounded
granules anteriorly. The caudal shield is not deep red-brown, however, but a rather pale tan
becoming somewhat darker towards the center. The secondary tooth on the hook is quite
variable in size but usually present.
Cleosiphon aspergillum (QUATREFAGES 1865)
15 specimens. Most of these were an ivory color but a few were a rather dark brown.
These are unique animals with their white, compound, acorn-like cap or knob at the anterior
end of the trunk through which the introvert protrudes. The hooks differ slightlyfrom Edmonds
(1956, Figure 21) in that the secondary tooth is even niore strongly developed as in S'elenka
(1883) Figure 216. The size of the trunk ranged from 30-75mm. The average was 4 8 m m . These
were very difficult to obtain intact as they were most abundant in very hard Millipora.
KEY TO THE KNOWN SPECIES OF SIPUNCULIDS OF MADAGASCAR
1 a. Horny or calcareous shields absent from both ends of the trunk 2
1 b. Above shields present at one or both ends of trunk 10
2 a. Longitudinal muscles gathered into a number of bands 3
2 b. Longitudinal muscles form a continuous sheath 12
3 a. Skin divided into numerous rectangles or squares (Figure 6-1). 4
3 b. Skin not divided into rectangles or squares 5
4 a. 24-30 strong longitudinal muscle bands Sipunculus robustus
4 b. 41-43 weak longitudinal muscle bands Sipunculus indicus
5 a. Skin papi llae complex ; made up of numerous platelets (Figure 6-2 & 3) 6
5 b. Protruding and complex skin papillae absent 9
6 a. Hooks present on introvert 7
6 b. Introvert without hooks , Phasyolosoma asser
7 a. Clear streak of hook merged with basal, triangular clear space (Figure 6-4)
Phascolosoma nigrescens
7 b. Clear streak of hook separate from triangular clear space (Figure 6-5 & 6). . 8
8 a. Introvert with reddish bands and tall, conkal, preanal papillae oriented somewhat posteri
orly (Figure 6-7) ,__ Phascolosoma denfigerum
8 b. Papillae smaller and not as above Phascolosoma scolops
9 a. Introvert with hooks Siphonosoma australe
9 b. Introvert lacking hooks Siphonosoma cumanense
10 a. A white pineapple-like cap at the anterior end of trunk (Figure 6-8)
Cleosiphon asperigillum
10 b. Corrugated shields at both ends of trunk. The caudal shield is pale with radiating grooves
11
11 a. Grooves of anal shield run from ventral edge to margin . . . . . . . Aspidosiphon truncatus
58
162
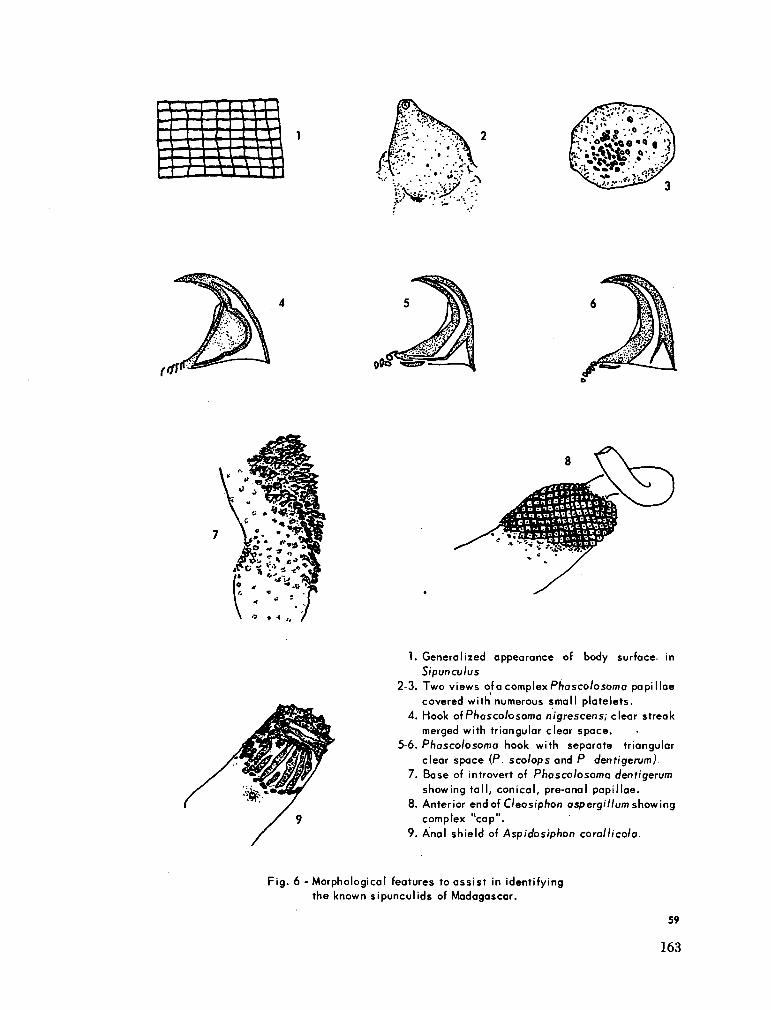
M W
• • « « • • t [•«. V
1. Generalized appearance of body surface, in
Sipunculus
2-3. T w o views of a complex Phascolosoma papillae
covered with numerous small platelets.
4. Hook of Phascolosoma nigrescens; clear streak
merged with triangular clear space.
5-6. Phascolosoma hook with separate triangular
clear space (P. scolops and P dentigerum).
7. Base of introvert of Phascolosoma dentigerum
showing tall, conical, pre-anal papillae.
8. Anterior end of Cleo siphon aspergillum showing t it n
complex cap . 9. Anal shield of Aspidosrphon coral I i col a.
Fig. 6 -Morphological features to assist in identifying
the known sipunculids of Madagascar.
59
163
11 b. Anal shield with two distinct areas; longitudinal grooves posteriorly, granules near
introvert (Figure 6-9) Aspidosiphon corailicola
12 a. Tentacles dendritic . Themiste signifer
(formerly Dendrostomum)
12 b. Tentacles filiform or digitiform; complicated hooks present. . . . : Fisherana ¡obostomum (formerly Phascolosoma)
ACKNOWLEDGMENTS
The author is especially indebted to the following: Dr. A . C Stephen, Royal Scottish
Museum, Edinburgh, for several kinds of assistance; the personnel at the C O P N , particularly
the director and Dr. M . Pichón for their cooperation and facilities; Dr. A . G . Humes, Boston
University, American lioson officer at Nosy Be, for his suggestions and help in collecting;
the National Science Foundation for financial support; and Dr. D.J. Zinn, University of Rhode
Island, for assistance in preparing the manuscript.
BIBLIOGRAPHY
B O U R N E , G . C . - 1906. On Jousseaumia in Report on the pearl oyster fisheries of the Gulf of
Manaar (Ceylon), edited by W . A . Herdman. The Royal Soc. London. Part 5 : 243-266, 3 pis.
1907. Note to correct the name Jousseaumia. Proc. Malacological Soc. London. 7- 260.
BOVIER. 1894. Un nouveau cas de commensalisme : association d'Aspidosiphon avec des
polypiers madreporaires et un Mollusque bivalve. C . R . Acad. Se. Paris CXIX : 95.
E D M O N D S , S.J.- 1955. Australian Sipunculoidea, I. The genera Sipunculus, Xenos/phon, and
S/phonosoma. Austral. J. Mar. and Freshwater Res. 6 : 82-97, 1 pi., 9 textfigs.
1956. Australian Sipunculoidea, II. The genera Phascolosoma Dendrostomum, Golfingia,
Aspidosiphon, and Cleosiphon. Austral. J. Mar. and Freshwater Res. 7 : 281-315, 3 pis.,
21 textfigs.
1961. On Sipunculus aeneus Baird (Sipunculoidea). Ann. and Mag. Nat. Hist. Ser. 13;
4 : 217.
FISHER, W . K . - 1952. The Sipunculid worms of California and Baja California. Proc. U . S .
Nat. Mus. 192: 371-450, 22 pis.
G E R O U L D , J.H.- 1913. The sipunculids of the eastern coast of North America. Proc. U . S.
Nat. Mus. 44 : 373-437, 5 pis., 16 figs.
G R U B E , E . and O E R S T E D , A . S . - 1859. Annulate Oerstediana. Vid. Medd. naturh. Foren.
Kjobenhavn for 1858.
H A M M E R S T E I N , 0 . - 1915. Gephyreen von Madagascar, gesammelt von W . Kaudern 1911-1912.
Arkiv for Zool. 9 (10): 1-3, 1 fig.
H E R U B E L , , , M . A . - 1908. Recherches sur les sipunculides. Mem.-Soc. Zool. France. 1907.
20 : 107-418, pis. 5-10.
K A L K , M . - 1958. The intertidal fauna of rocks at Inhaca Island, Mozambique. Ann. Natal Mus.
14: 189.
60
164
KEFERSTEIN, W . * 1865. Beitrage zur anatomischen und systematischen Kenntnis der Sipun-
culoiden. Zeitschr. f. wiss. Zool. 15 : 404-445.
KINNE, 0.- 1963. The effects of temperature and salinity on marine and brackish water animals.
I. Temperature. In Oceanography and Marine Biology, Vol. 1. H. Barnes, editor.
L A N C H E S T E R , W . E . - 1905. The marine fauna of Zanzibar and British East Africa from collec
tions made by C.Cross land in the years 1901 and 1902. Gephyrea. Proc. Zool.Soc. London.
L : 28-35, pi. 1.
M A C N A E , W . and K A L K , M.- 1962. The fauna and flora of sand flats at Inhaca Island, Mozam
bique. J. Animal Ecol. 31 (1): 93-128.
S E L E N K A , E . , D E M A N , I.G., and B U L O W , C - 1883. Die Sipunculiden, eine systematische
Monographic Semper, Reisen im Archipel, d. Philippinen 11. 4 : 1-131, 14 pis.
SLUITER, C.Ph.- 1902. Die Sipunculiden und Echiuriden. Siboga-Expedition X X V : 1-53.
S T E P H E N , A . C . - 1942. Notes on the Intertidal Sipunculids of Cape Province and Natal. Ann.
Natal Mus. 10: 245-256, 1 pi.
- and R O B E R T S O N , I.D.- 1952. A preliminary report on the Echiuridae and Sipunculidae of
Zanzibar. Proc. Royal Soc. Edinburgh. Sect. B 64 : 426-444, 1 chart, 1 pi.
W E S E N B E R G - L U N D , E.- 1959. Sipunculoidea and Echiuroidea from Mauritius. Vid. Medd.
Dsk. Naturhist. Foren. 121 : 55-73, 6 figs.
1963. South African sipunculids and echiuroids from coastal waters. Vid. Medd. Dsk.
Naturhist. Foren. 125: 101-146.
61
165
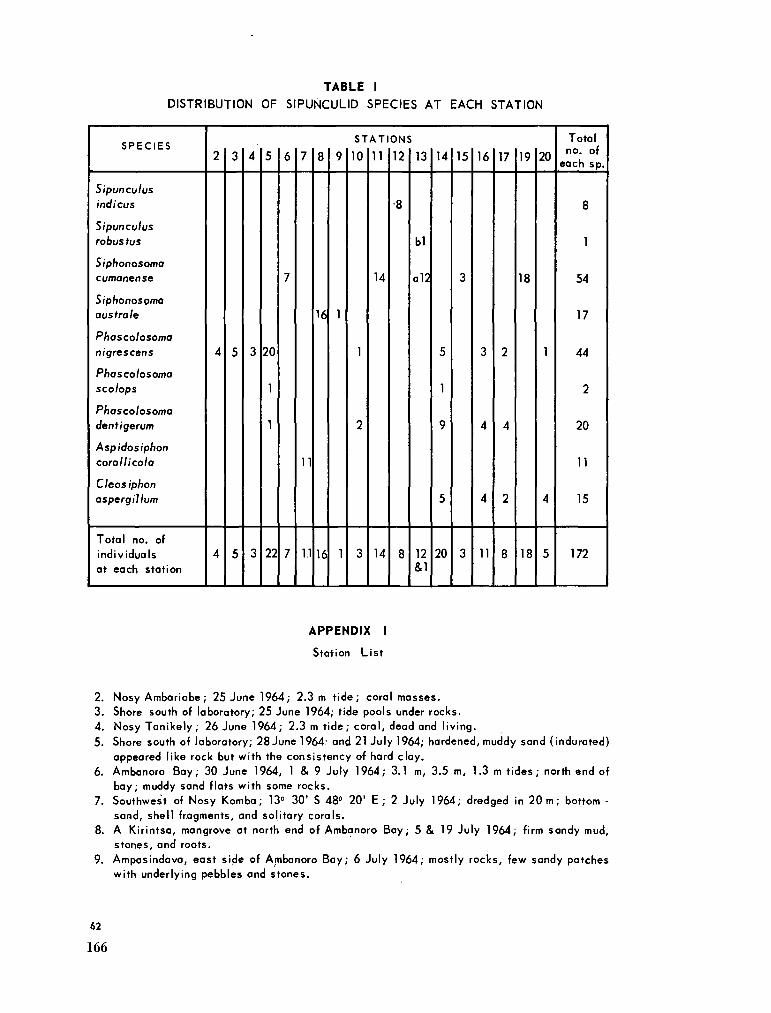
TABLE I
DISTRIBUTION OF SIPUÑCULID SPECIES AT EACH STATION
SPECIES
Sipunculus
indicus
Sipunculus
robus tus
Siphonosoma
cumanense
Siphonosoma
australe
Phascolosoma
nigrescens
Phascolosoma
scolops
Phascolosoma
dentigerum
Aspidosiphon
corallicola
Cleosiphon
aspergillum
Total no. of
individuals
at each station
2
4
4
3
5
5
4
3
3
5
20
1
1
22
6
7
7
7
11
11
8
16
16
9
1
1
ST
10
1
2
3
ATI
11
14
14
ON.
12
8
8
13
bl
al2
12 &1
14
5
1
9
5
20
15
3
3
16
3
4
4
11
17
2
4
2
8
19
18
18
20
1
4
5
Total no. of
each sp.
8
1
54
17
44
2
20
11
15
172
APPENDIX I
Station List
2. Nosy Ambariobe; 25 June 1964; 2.3 m tide; coral masses.
3. Shore south of laboratory; 25 June 1964; tide pools under rocks.
4. Nosy Tanikely ; 26 June 1964; 2.3 m tide ; coral, dead and living.
5. Shore south of laboratory; 28 June 1964: and 21 July 1964; hardened, muddy sand (indurated)
appeared like rock but with the consistency of hard clay.
6. Ambanoro Bay; 30 June 1964, 1 & 9 July 1964; 3.1 m, 3.5 m, 1.3 m tides; north end of
bay; muddy sand flats with some rocks.
7. Southwest of Nosy Komba ; 13° 30' S 48° 20' E ; 2 July 1964; dredged in 20 m ; bottom -
sand, shell fragments, and solitary corals.
8. A Kirintsa, mangrove at north end of Ambanoro Bay; 5 & 19 July 1964; firm sandy mud,
stones, and roots.
9. Ampasindava, east side of Ambanoro Bay; 6 July 1964; mostly rocks, few sandy patches
with underlying pebbles and stones.
62
166
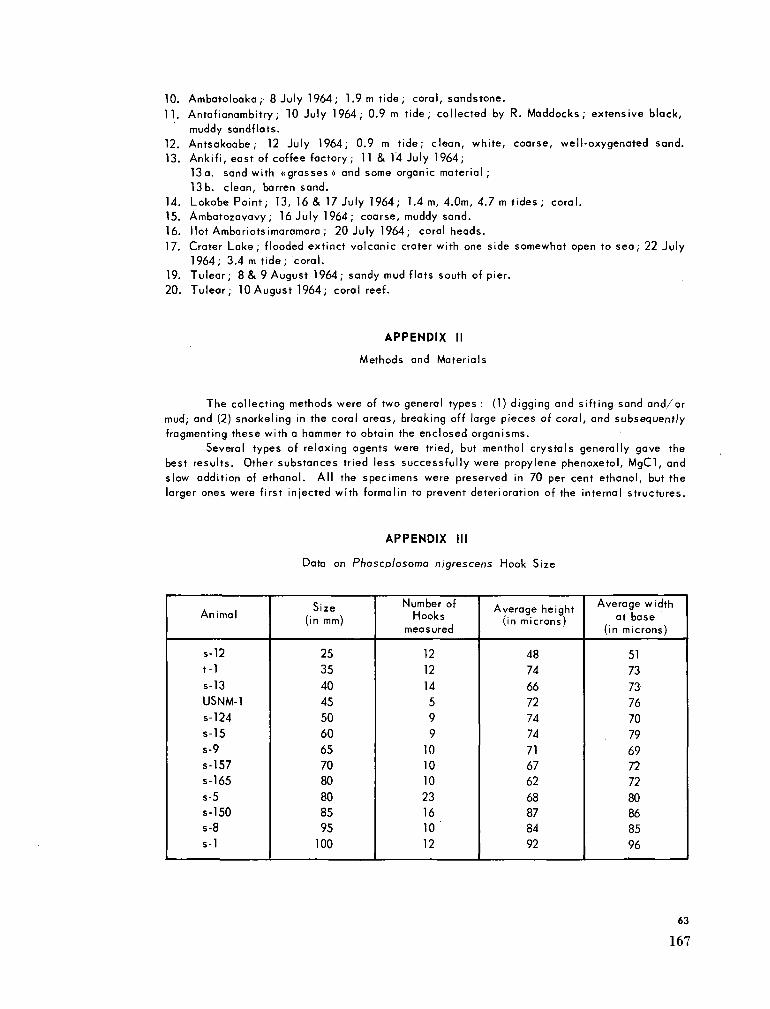
10. Ambatoloaka; 8 July 1964; 1.9m tide; coral, sandstone.
11. Antafianambitry ; 10 July 1964; 0.9 m tide; collected by R. Maddocks; extensive black,
muddy sandflats.
12. Antsakoabe; 12 July 1964; 0.9 m tide; clean, white, coarse, well-oxygenated sand.
13. Ankifi, east of coffee factory; 11 & 14 July 1964;
13a. sand with «grasses» and some organic material;
13 b. clean, barren sand.
14. Lokobe Point; 13, 16 & 17 July 1964 ; 1.4 m, 4.0m, 4.7 m tides ; coral.
15. Ambatozavavy ; 16 July 1964; coarse, muddy sand.
16. Hot Ambariotsimaramara ; 20 July 1964; coral heads.
17. Crater Lake; flooded extinct volcanic crater with one side somewhat open to sea; 22 July
1964; 3.4 m tide; coral.
19. Tulear; 8 & 9 August 1964 ; sandy mud flats south of pier.
20. Tulear; 10 August 1964; coral reef.
APPENDIX II
Methods and Materials
The collecting methods were of two general types : (1) digging and sifting sand and/or
mud; and (2) snorkeling in the coral areas, breaking off large pieces of coral, and subsequently
fragmenting these with a hammer to obtain the enclosed organisms.
Several types of relaxing agents were tried, but menthol crystals generally gave the
best results. Other substances tried less successfully were propylene phenoxetol, MgCl , and
slow addition of ethanol. All the specimens were preserved in 70 per cent ethanol, but the
larger ones were first injected with formalin to prevent deterioration of the internal structures.
APPENDIX III
Data on Phascplosoma nigrescens Hook Size
Animal
s-12 t-1 s-13
U S N M - 1
s-124
s-15 s-9 s-157
s-165
s-5 s-150 s-8 s-1
Size (in m m )
25 35 40 45 50 60 65 70 80 80 85 95
100
Number of Hooks
measured
12 12 14 5 9 9
10 10 10 23 16 10 12
Average height (in microns)
48 74 66 72 74 74 71 67 62 68 87 84 92
Average width at base
(in microns)
51 73 73 76 70 79 69 72 72 80 86 85 96
63
167
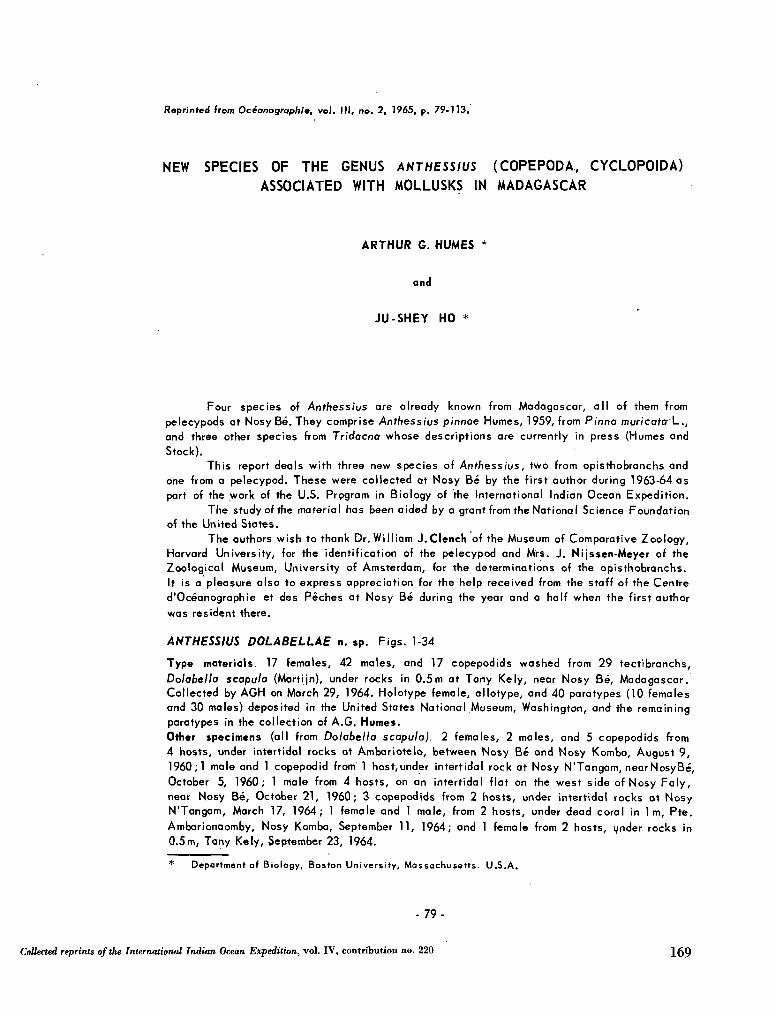
Reprinted from Océanographie, vol. Ill, no. 2, 1965, p. 79-113.
NEW SPECIES OF THE GENUS ANTHESSIUS (COPEPODA, CYCLOPOIDA) ASSOCIATED WITH MOLLUSKS IN MADAGASCAR
ARTHUR G. HUMES *
and
JU-SHEY HO *
Four species of Anthessius are already known from Madagascar, all of them from
pelecypods at Nosy Be. They comprise Anthessius pinnae Humes, 1959, from Pinna muricatcr'L.,
and three other species from Tridacna whose descriptions are currently in press (Humes and
Stock).
This report deals with three new species of Anthessius, two from opisthobranchs and
one from a pelecypod. These were collected at Nosy Bé by the first author during 1963-64 as
part of the work of the U.S. Program in Biology of the International Indian Ocean Expedition.
The study of the material has been aided by a grant from the National Science Foundation
of the United States.
The authors wish to thank Dr. William J.Clench of the Museum of Comparative Zoology,
Harvard University, for the identification of the pelecypod and Mrs. J. Nijssen-Meyer of the
Zoological Museum, University of Amsterdam, for the determinations of the opisthobranchs.
It is a pleasure also to express appreciation for the help received from the staff of the Centre
d'Océanographie et des Pêches at Nosy Bé during the year and a half when the first author
was resident there.
ANTHESSIUS DOLABELLAE n. sp. Figs. 1-34
Type materials. 17 females, 42 males, and 17 copepodids washed from 29 tectibranchs,
Dolabella scapula (Martijn), under rocks in 0.5m at Tany Kely, near Nosy Bé, Madagascar.
Collected by A G H on March 29, 1964. Holotype female, allotype, and 40 paratypes (10 females
and 30 males) deposited in the United States National Museum, Washington, and the remaining
paratypes in the collection of A . G . Humes.
Other specimens (all from Dolabella scapula). 2 females, 2 males, and 5 copepodids from
4 hosts, under intertidal rocks at Ambariotelo, between Nosy Bé and Nosy Komba, August 9,
1960 ; 1 male and 1 copepodid from 1 host,under intertidal rock at Nosy N'Tangam, nearNosyBé,
October 5, 1960; 1 male from 4 hosts, on an intertidal flat on the west side of Nosy Faly,
near Nosy Bé, October 21, 1960; 3 copepodids from 2 hosts, under intertidal rocks at Nosy
N'Tangam, March 17, 1964; 1 female and 1 male, from 2 hosts, under dead coral in 1 m , Pte.
Ambarionaomby, Nosy Komba, September 11, 1964; and 1 female from 2 hosts, under rocks in
0.5m, Tany Kely, September 23, 1964.
* Deportment of Biology, Boston University, Massachusetts. U . S . A .
- 7 9 -
Collected reprints of the International Indian Ocean Expedition, vol. IV, contribution no. 220 169
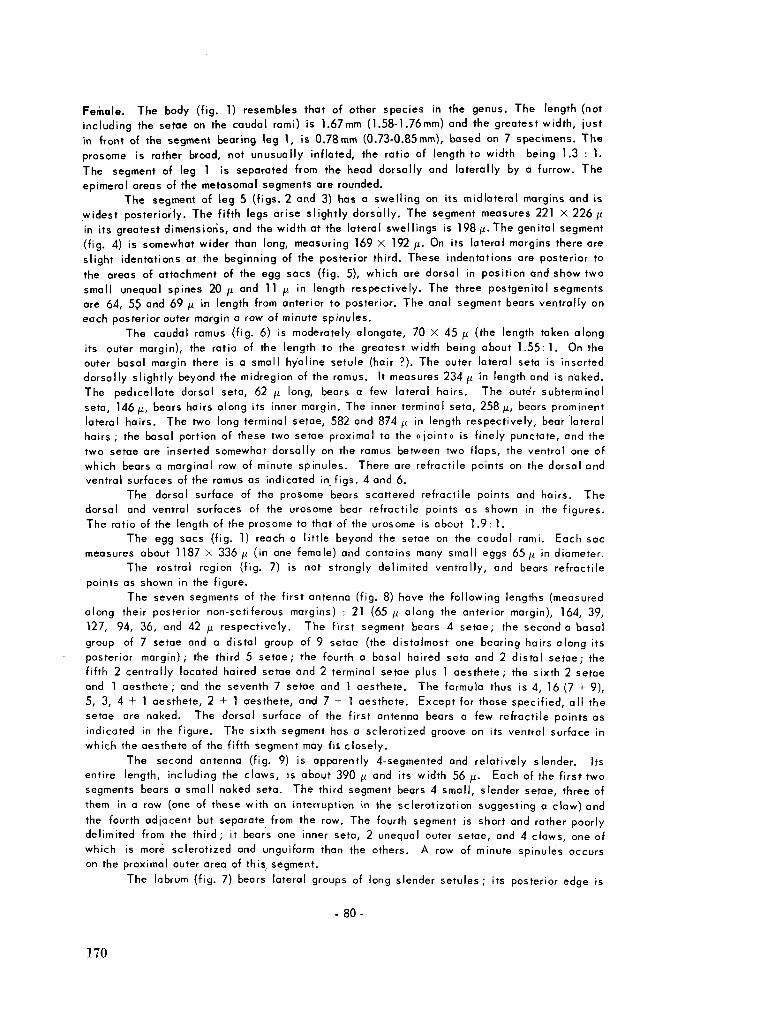
Female. The body (fig. 1) resembles that of other species in the genus. The length (not
including the setae on the caudal rami) is 1 .67mm (1.58-1.76mm) and the greatest width, ¡ust
in front of the segment bearing leg 1, is 0 . 7 8 m m (0.73-0.85mm), based on 7 specimens. The
prosome is rather broad, not unusually inflated, the ratio of length to width being 1.3 : 1.
The segment of leg 1 is separated from the head dorsally and laterally by a furrow. The
epimeral areas of the metasomal segments are rounded.
The segment of leg 5 (figs. 2 and 3) has a swelling on its midlateral margins and is
widest posteriorly. The fifth legs arise slightly dorsally. The segment measures 221 X 226 fi
in its greatest dimensions, and the width at the lateral swellings is 198/¿.The genital segment
(fig. 4) is somewhat wider than long, measuring 169 X 192 fi. On its lateral margins there are
slight ¡dentations at the beginning of the posterior third. These indentations are posterior to
the areas of attachment of the egg sacs (fig. 5), which are dorsal in position and show two
small unequal spines 20 fi and 1 1 fi in length respectively. The three postgenital segments
are 64, 55 and 69 fi in length from anterior to posterior. The anal segment bears ventrally on
each posterior outer margin a row of minute spinules.
The caudal ramus (fig. 6) is moderately elongate, 70 X 45 fi (the length taken along
its outer margin), the ratio of the length to the greatest width being about 1 .55 :1 . O n the
outer basal margin there is a small hyaline setule (hair ?). The outer lateral seta is inserted
dorsally slightly beyond the midregion of the ramus. It measures 234 ¡x in length and is naked.
The pedicellate dorsal seta, 62 ¡x long, bears a few lateral hairs. The outer subterminal
seta, 146 fi, bears hairs along its inner margin. The inner terminal seta, 258 fi, bears prominent
lateral hairs. The two long terminal setae, 582 and 874 ft in length respectively, bear lateral
hairs; the basal portion of these two setae proximal to the «joint» is finely punctate, and the
two setae are inserted somewhat dorsally on the ramus between two flaps, the ventral one of
which bears a marginal row of minute spinules. There are refractile points on the dorsal and
ventral surfaces of the ramus as indicated in figs. 4 and 6.
The dorsal surface of the prosome bears scattered refractile points and hairs. The
dorsal and ventral surfaces of the urosome bear refractile points as shown in the figures.
The ratio of the length of the prosome to that of the urosome is about 1 .9 :1 .
The egg sacs (fig. 1) reach a little beyond the setae on the caudal rami. Each sac
measures about 1187 X 336 fi (in one female) and contains many small eggs 65 fi in diameter.
The rostral region (fig. 7) is not strongly delimited ventrally, and bears refractile
points as shown in the figure.
The seven segments of the first antenna (fig. 8) have the following lengths (measured
along their posterior non-setiferous margins) : 21 (65 ¡j. along the anterior margin), 164, 39,
127, 94, 36, and 42 fj. respectively. The first segment bears 4 setae; the seconda basal
group of 7 setae and a distal group of 9 setae (the distalmost one bearing hairs along its
posterior margin); the third 5 setae; the fourth a basal haired seta and 2 distal setae; the
fifth 2 centrally located haired setae and 2 terminal setae plus 1 aesthete; the sixth 2 setae
and 1 aesthete; and the seventh 7 setae and 1 aesthete. The formula thus is 4 , 16 (7 + 9),
5, 3, 4 + 1 aesthete, 2 + 1 aesthete, and 7 + 1 aesthete. Except for those specified, all the
setae are naked. The dorsal surface of the first antenna bears a few refractile points as
indicated in the figure. The sixth segment has a sclerotized groove on its ventral surface in
which the aesthete of the fifth segment may fii closely.
The second antenna (fig. 9) is apparently 4-segmented and relatively slender. Its
entire length, including the claws, is about 390 fi and its width 56 fi. Each of the first two
segments bears a small naked seta. The third segment bears 4 small, slender setae, three of
them in a row (one of these with an interruption in the sclerotization suggesting a claw) and
the fourth adjacent but separate from the row. The fourth segment is short and rather poorly
delimited from the third; it bears one inner seta, 2 unequal outer setae, and 4 claws, one of
which is more sclerotized and unguiform than the others. A row of minute spinules occurs
on the proximal outer area of this, segment.
The labrum (fig. 7) bears lateral groups of long slender setules; its posterior edge is
- 8 0 -
170
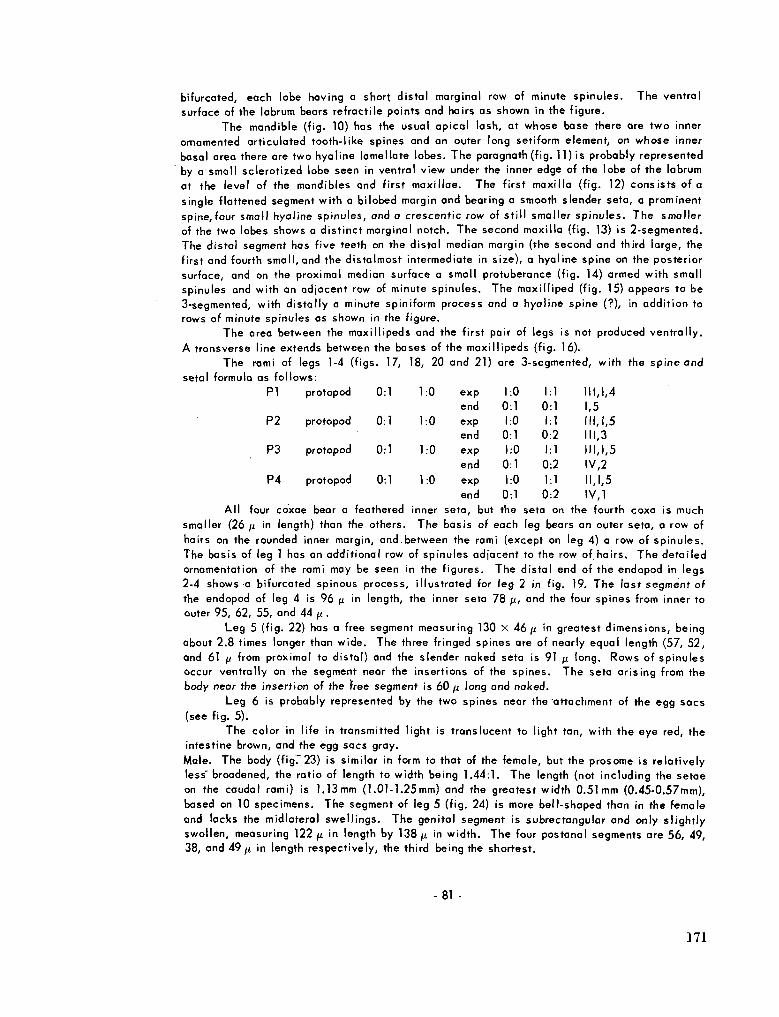
bifurcated, each lobe having a short distal marginal row of minute spinules. The ventral
surface of the labrum bears refractile points and hairs as shown in the figure.
The mandible (fig. 10) has the usual apical lash, at whose base there are two inner
ornamented articulated tooth-like spines and an outer long setiform element, on whose inner
basal area there are two hyaline lamellate lobes. The paragnath (fig. 11) is probably represented
by a small sclerotized lobe seen in ventral view under the inner edge of the lobe of the labrum
at the level of the mandibles and first maxillae. The first maxilla (fig. 12) consists of a
single flattened segment with a bilobed margin and bearing a smooth slender seta, a prominent
spine,four small hyaline spinules, and a crescentic row of still smaller spinules. The smaller
of the two lobes shows a distinct marginal notch. The second maxilla (fig. 13) is 2-segmented.
The distal segment has five teeth on the distal median margin (the second and third large, the
first and fourth small, and the distalmost intermediate in size), a hyaline spine on the posterior
surface, and on the proximal median surface a small protuberance (fig. 14) armed with small
spinules and with an adjacent row of minute spinules. The maxilliped (fig. 15) appears to be
3-segmented, with distally a minute spiniform process and a hyaline spine (?), in addition to
rows of minute spinules as shown in the figure.
The area between the maxillipeds and the first pair of legs is not produced ventrally.
A transverse line extends between the bases of the maxillipeds (fig. 16).
The rami of legs 1-4 (figs. 17, 18, 20 and 21) are 3-segmented, with the spine and
setal formulo as follows:
PI
P2
P3
P4
protopod
protopod
protopod
protopod
0:1
0:1
0:1
0:1
1:0
1:0
1:0
1:0
exp
end
exp end
exp
end
exp
end
1 0 1 0 1 0 1 0
0 1 0 1 0 1 0 1
1:1 0:1 1:1 0:2 1:1 0:2 1:1 0:2
111,1,4 1,5 111,1,5 111,3 111,1,5 IV,2
11,1,5 IV,1
All four coxoe bear a feathered inner seta, but the seta on the fourth coxa is much
smaller (26 fi in length) than the others. The basis of each leg bears an outer seta, a row of
hairs on the rounded inner margin, and.between the rami (except on leg 4) a row of spinules.
The basis of leg 1 has an additional row of spinules adjacent to the row of hairs. The detailed
ornamentation of the rami may be seen in the figures. The distal end of the endopod in legs
2-4 shows a bifurcated spinous process, illustrated for leg 2 in fig. 19. The last segment of
the endopod of leg 4 is 96 ¡j. in length, the inner seta 78 ¡i, and the four spines from inner to
outer 95, 62, 55, and 44 ¡JL .
Leg 5 (fig. 22) has a free segment measuring 130 X 46 ¡x in greatest dimensions, being
about 2.8 times longer than wide. The three fringed spines are of nearly equal length (57, 52,
and 61 ¡i from proximal to distal) and the slender naked seta is 91 ¡i long. Rows of spinules
occur ventrally on the segment near the insertions of the spines. The seta arising from the
body near the insertion of the free segment is 60 ¡i long and naked.
Leg 6 is probably represented by the two spines near the attachment of the egg sacs
(see fig. 5).
The color in life in transmitted light is translucent to light tan, with the eye red, the
intestine brown, and the egg sacs gray.
Male. The body (fig7 23) is similar in form to that of the female, but the prosome is relatively
less" broadened, the ratio of length to width being 1.44:1. The length (not including the setae
on the caudal rami) is 1.13mm (1.01-1.25mm) and the greatest width 0.51mm (0.45-0.57mm),
based on 10 specimens. The segment of leg 5 (fig. 24) is more bell-shaped than in the female
and lacks the midlateral swellings. The genital segment is subrectangular and only slightly
swollen, measuring 122 ¡i in length by 138 fi in width. The four postanal segments are 56, 49,
38, and 49 ¡x in length respectively, the third being the shortest.
81
171
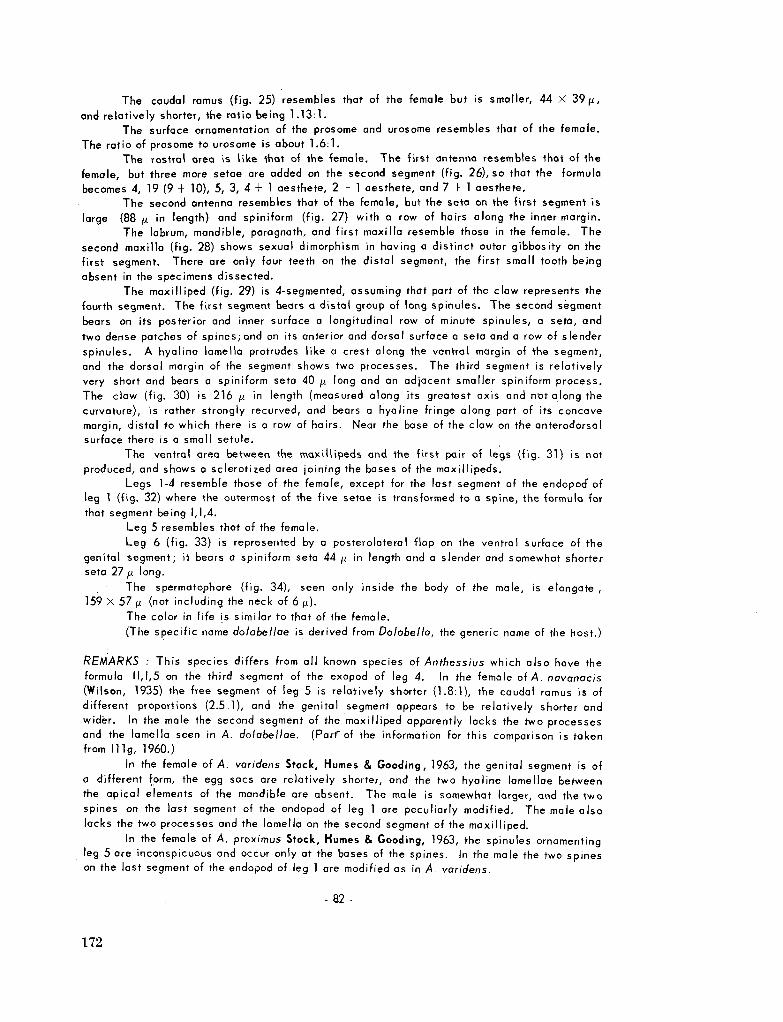
The caudal ramus (fig. 25) resembles that of the female but is smaller, 44 X 39 f¿,
and relatively shorter, the ratio being 1.13:1.
The surface ornamentation of the prosome and urosome resembles that of the female.
The ratio of prosome to urosome ¡S about 1.6:1.
The rostral area is like that of the female. The first antenna resembles that of the
female, but three more setae are added on the second segment (fig. 26), so that the formula
becomes 4, 19 (9 + 10), 5, 3, 4 + 1 aesthete, 2 + 1 aesthete, and 7 + 1 aesthete.
The second antenna resembles that of the female, but the seta on the first segment is
large (88 [i in length) and spiniform (fig. 27) with a row of hairs along the inner margin.
The labrum, mandible, paragnath, and first maxilla resemble those in the female. The
second maxilla (fig. 28) shows sexual dimorphism in having a distinct outer gibbosity on the
first segment. There are only four teeth on the distal segment, the first small tooth being
absent in the specimens dissected.
The maxilliped (fig. 29) is 4-segmented, assuming that part of the claw represents the
fourth segment. The first segment bears a distal group of long spinules. The second segment
bears on its posterior and inner surface a longitudinal row of minute spinules, a seta, and
two dense patches of spines; and on its anterior and dorsal surface a seta and a row of slender
spinules. A hyaline lamella protrudes like a crest along the ventral margin of the segment,
and the dorsal margin of the segment shows two processes. The third segment is relatively
very short and bears a spiniform seta 40 /i long and an adjacent smaller spiniform process.
The claw (fig. 30) is 216 ¡i in length (measured along its greatest axis and not along the
curvature), is rather strongly recurved, and bears a hyaline fringe along part of its concave
margin, distal to which there is a row of hairs. Near the base of the claw on the anterodorsal
surface there is a small setule.
The ventral area between the maxillipeds and the first pair of legs (fig. 31) is not
produced, and shows a sclerotized area joining the bases of the maxillipeds.
Legs 1-4 resemble those of the female, except for the last segment of the endopod of
leg 1 (fig. 32) where the outermost of the five setae is transformed to a spine, the formula for
that segment being 1,1,4.
Leg 5 resembles that of the female.
Leg 6 (fig. 33) is represented by a posterolateral flap on the ventral surface of the
genital segment; it bears a spiniform seta 44 ¡i in length and a slender and somewhat shorter
seta 27 jLi long.
The spermatophore (fig. 34), seen only inside the body of the male, is elongate ,
159 X 57 fi (not including the neck of 6 ft).
The color in life is similar to that of the female.
(The specific name dolabellae is derived from Dolabella, the generic name of the host.)
REMARKS : This species differs from all known species of Anthessius which also have the
formula 11,1,5 on the third segment of the exopod of leg 4. In the female of A. navanacis
(Wilson, 1935) the free segment of leg 5 is relatively shorter (1.8:1), the caudal ramus is of
different proportions (2.5.1), and the genital segment appears to be relatively shorter and
wider. In the male the second segment of the maxilliped apparently lacks the two processes
and the lamella seen in A. dolabellae. (Parf of the information for this comparison is taken
from II Ig, 1960.)
In the female of A . varidens Stock, H u m e s & Gooding,, 1963, the genital segment is of
a different form, the egg sacs are relatively shorter, and the two hyaline lamellae between
the apical elements of the mandible are absent. The male is somewhat larger, and the two
spines on the last segment of the endopod of leg 1 are peculiarly modified. The male also
lacks the two processes and the lamella on the second segment of the maxilliped.
In the female of A . proximus Stock, H u m e s & Gooding, 1963, the spinules ornamenting
leg 5 are inconspicuous and occur only at the bases of the spines. In the male the two spines
on the last segment of the endopod of leg 1 are modified as in A. varidens.
- 82 -
172
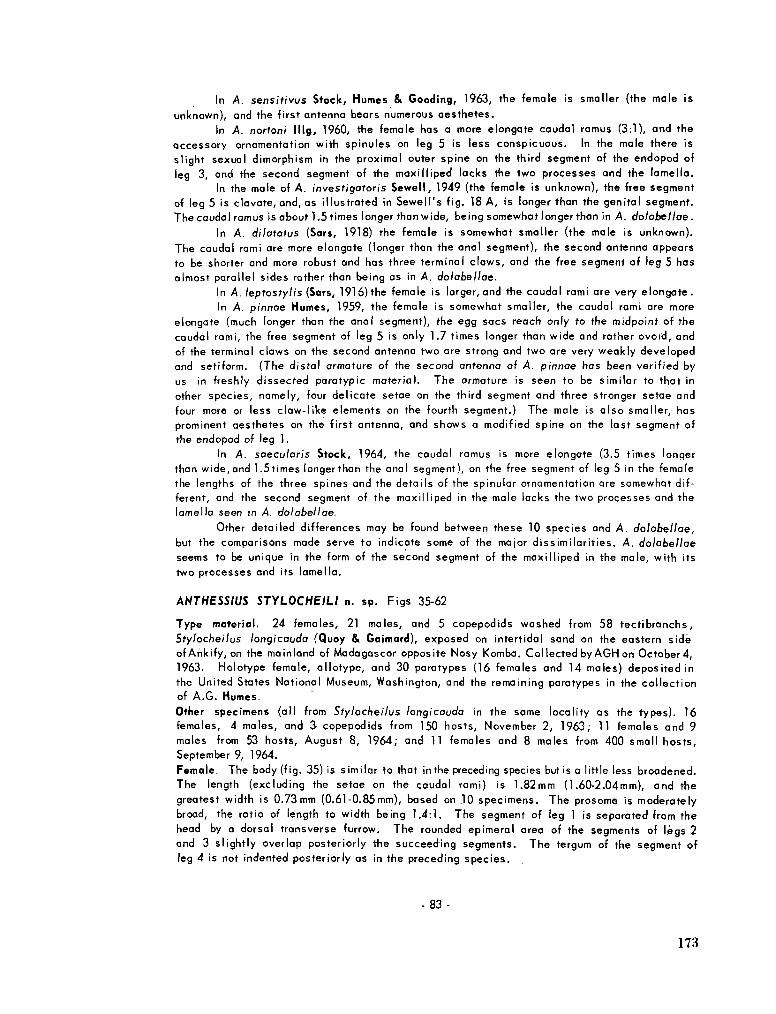
In A . sensitivus Stock, Humes & Gooding, 1963, the female is smaller (the male is
unknown), and the first antenna bears numerous aesthetes.
In A. nortoni lllg, 1960, the female has a more elongate caudal ramus (3:1), and the
accessory ornamentation with spinules on leg 5 is less conspicuous. In the male there is
slight sexual dimorphism in the proximal outer spine on the third segment of the endopod of
leg 3, and the second segment of the maxilliped lacks the two processes and the lamella.
In the male of A. investigatoris Se well, 1949 (the female is unknown), the free segment
of leg 5 is clávate, and, as illustrated in Sewell's fig. 18 A , is longer than the genital segment.
The caudal ramus is about 1.5 times longer than wide, being somewhat longer than in A . dolabellae.
In A. dilatatus (Sars, 1918) the female is somewhat smaller (the male is unknown).
The caudal rami are more elongate (longer than the anal segment), the second antenna appears
to be shorter and more robust and has three terminal claws, and the free segment of leg 5 has
almost parallel sides rather than being as in A . dolabellae.
In A. leptostylis (Sars, 1916)the female is larger, and the caudal rami are very elongate.
In A. pinnae Humes, 1959, the female is somewhat smaller, the caudal rami are more
elongate (much longer than the anal segment), the egg sacs reach only to the midpoint of the
caudal rami, the free segment of leg 5 is only 1.7 times longer than wide and rather ovoid, and
of the terminal claws on the second antenna two are strong and two are very weakly developed
and setiform. (The distal armature of the second antenna of A. pinnae has been verified by
us in freshly dissected paratypic material. The armature is seen to be similar to that in
other species, namely, four delicate setae on the third segment and three stronger setae and
four more or less claw-like elements on the fourth segment.) The male is also smaller, has
prominent aesthetes on the first antenna, and shows a modified spine on the last segment of
the endopod of leg 1.
In A . saecularis Stock, 1964, the caudal ramus is more elongate (3.5 times longer
than wide,and 1.5times longer than the anal segment), on the free segment of leg 5 in the female
the lengths of the three spines and the details of the spinular ornamentation are somewhat dif
ferent, and the second segment of the maxilliped in the male lacks the two processes and the
lamella seen in A. dolabellae.
Other detailed differences may be found between these 10 species and A . dolabellae,
but the comparisons made serve to indicate some of the major dissimilarities. A . dolabellae
seems to be unique in the form of the second segment of the maxilliped in the male, with its
two processes and its lamella.
ANTHESSIUS STYLOCHEILI n. sp. Figs 35-62
Type material. 24 females, 21 males, and 5 copepodids washed from 58 tectibranchs,
Stylocheilus longicauda (Quoy & Gaimard), exposed on intertidal sand on the eastern side
of Ankify, on the mainland of Madagascar opposite Nosy Komba. Collected by A G H on October4,
1963. Holotype female, allotype, and 30 paratypes (16 females and 14 males) deposited in
the United States National Museum, Washington, and the remaining paratypes in the collection
of A . G . Humes.
Other specimens (all from Stylocheilus longicauda in the same locality as the types). 16
females, 4 males, and 3 copepodids from 150 hosts, November 2, 1963; 11 females and 9
males from 53 hosts, August 8, 1964; and 11 females and 8 males from 400 small hosts,
September 9, 1964.
Female. The body (fig. 35) is similar to that in the preceding species but is a little less broadened.
The length (excluding the setae on the caudal rami) is 1.82mm (1.60-2.04mm), and the
greatest width is 0.73mm (0.61-0.85mm), based on .10 specimens. The prosome is moderately
broad, the ratio of length to width being 1.4:1. The segment of leg 1 is separated from the
head by a dorsal transverse furrow. The rounded epimeral area of the segments of legs 2
and 3 slightly overlap posteriorly the succeeding segments. The tergum of the segment of
leg 4 is not indented posteriorly as in the preceding species.
- 83 -
173
The segment of leg 5 (figs. 35 and 36) ¡s inserted under the tergum of the last prosomal
segment; here the segment has nearly parallel sides. The segment expands laterally behind
this point. Its dorsal posterior margin slightly overlaps the genital segment. O n the ventral
surface of the segment there are two crescentic lines. Between the segment of leg 5 and the
genital segment there is seen ventrally a short intersegmental sclerite. The genital segment
is wider than long, 205 X 300 / / . It is widest at its middle, where it is abruptly ¡dented and
constricted posteriorly. The areas of attachment of the egg sacs (fig. 37) are dorsal in position
just in front of the indentation, and have two small setae 13 ¡i and 9 ¡i in length. The three
postgenital segments are 117, 78 and 161 ¡i in length from anterior to posterior. The anal
segment bears on each outer posterior ventral margin a short row of minute spinules.
The caudal ramus (fig. 38) is elongate, about equal in length to the anal segment;
its greatest length is 180 ft, its length along the inner margin 156 ¡i, and its greatest width
61 fi, the ratio of length to width being about 2.8:1. The arrangement of the setae is similar
to that in the preceding species. The naked outer lateral seta, 55 ¡i in length, is inserted
somewhat dorsally about halfway on the outer margin. The short naked pedicellate dorsal
seta is 30 ^ long. The naked outer terminal seta is 66 f¿; the inner terminal seta is 108/ /
in length and bears lateral hairs. The two long median terminal setae, 140 and 247 ¡x in length
respectively, are less attenuated than usual and naked. The ramus is inserted dorsally on
the anal segment. The terminal setae are inserted somewhat dorsally and the distal ventral
margin of the ramus bears a row of minute spinules. There are refractile points and hairs on
the dorsal and ventral surfaces of the ramus as indicated in figs. 36 and 38.
The dorsal surface of the prosome and the dorsal and ventral surfaces of the urosome
bear scattered refractile points and hairs. The ratio of the length of the prosome to that of
the urosome is about 1.3:1.
The egg sacs extend to the end of the setae on the caudal rami. Each sac (fig. 39) is
about 896 X 325 n (in one female) and contains many small eggs 57 fi in diameter.
The rostral area is similar to that of A. dolabellae.
The seven segments of the first antenna (fig. 40) have the following lengths (measured
along their posterior non-setiferous margins): 24 (65 f¿ along the anterior margin), 162, 31 ,
81, 73, 20, and 21 ¡i respectively. The formula for the armature is the same as in the preceding
species. The setae are relatively shorter than in A. dolabellae and all are naked.
The second antenna resembles that of the preceding species, except that the second
segment is less slender.
The labrum resembles that of A . dolabellae, but the fine ornamentation of the two
lobes is rather different (fig. 41), with minute marginal spinules and a submarginal row of
larger hyaline spinules.
The mandible (fig. 42) resembles that of A. dolabellae, but the hyaline lobes at the
inner basal area of the setiform element are of a different form. The paragnaths are probably
represented by two small sclerotized lobes (fig.43) between the insertions of the first maxillae.
The first maxilla is like that of the preceding species. The second maxilla (fig. 44) resembles
in general form that of A. dolabellae, but the distal segment usually has six teeth, as in the
specimen illustrated. (The second maxilla on the opposite side of the same individual had
seven teeth as in fig. 45.) In other females there may be five teeth (fig. 46). The maxilliped
resembles that of A. dolabellae.
The area between the maxillipeds ond the first pair of legs (fig. 47) is produced
ventrally in a balloon-like swelling, which in lateral view of the animal is rather prominent.
A transverse line connects the bases of the maxillipeds.
The segmentation of the legs and the form of the intercoxal plates are in major respects
similar to the preceding species. The spine and setal formula is also similar except that for
the exopod of leg 4 the arrangement is 1,0; 1,1; 111,1,5. Leg 1 (fig. 48) shows only minor
differences from that of A . dolabellae. The last segment of the endopod of leg 2 (fig. 49)
shows a distal bifurcation (present also in leg 3). The exopod of leg 4 , with threeouter
spines on the last segment (instead of two as in A.xJolabellae), is illustratedinf ig.50.
- 8 4 -
174
Leg 5 (fig. 51) has a free segment measuring 117/i (the length along the inner margin)
X 41 n (the greatest width), the ratio being about 3:1. The three spines, each with smooth
lateral lamellae, are nearly equal in length (39, 36, and 42 ¡i from proximal to distal) and the
slender naked seta is 36 ¡i long. There are rows of spinules ventrally near the insertions of
the spines, but these rows tend to be shorter than in the preceding species. The seta arising
from the body near the insertion of the free segment is relatively short, only 28 ¡i in length.
Leg 6 is probably represented by the two setae near the attachment of the egg sacs
(see fig. 37).
The color in life in transmitted light is pale amber, nearly translucent, with the eye
red, the egg sacs opaque gray. A few females had a slight pink color.
Male. The body (fig. 52) has a general form similar to that of the female. The ratio of the
length of the prosome to its width is about 1.5:1. The length (without the setae on the caudal
rami) is 1.70mm (1.57-1.83 mm) and the greatest width 0.63mm (0.58-0.68mm), based on 10
specimens. The segment of leg 5 (figs. 52 and 53) is not inserted under the tergum of the
last prosomal segment as it is in the female. The genital segment is about as long as wide
(177 X 172 ¡i), with its sides very slightly swollen. The four postgenital segments are 99,
104, 72, and 130 ¡i in length respectively, the third being the shortest.
The caudal ramus (fig. 53) resembles that of the female, but is somewhat longer and
narrower, being a little longer than the anal segment. There is some variation in its length;
in one male the ramus was 156 X 44 ¡i (ratio of 3.54:1) and in another 143 X 41 ¡x (ratio of
3.49:1), in both cases the length being measured along the inner margin.
The surface ornamentation of the prosome and urosome is much like that of the female.
The ratio of prosome to urosome is 1.28:1.
The rostral area resembles that of the female.
The first antenna (fig. 54) resembles that of the female except for the addition of
four long aesthetes (three on segment 2 and one on segment 4), so that the formula becomes
4, 16 (7 + 2 aesthetes and 9 + 1 aesthete), 5, 3 + 1 aesthete, 4 + 1 aesthete, 2 + 1 aesthete,
and 7 + 1 aesthete.
The second antenna resembles that of the female, but the seta on the first segment
(fig. 55) is spiniform (44 ¿x in length) with a row of hairs along its inner margin.
The labrum, mandible, and paragnath are like those in the female. The first maxilla
also resembles that in the female except that the seta seems to be a little shorter than the
spine. The second maxilla (fig. 56) has a distinct outer gibbosity on the first segmentas in
the male of A. dolabellae. There are five teeth (three large and two small) on the distal
segment; the hyaline spine on that segment has a finely dentate lamella along the distal
margin (fig. 57).
The maxilliped (fig. 58) has 4 segments, assuming part of the claw to represent the
fourth segment. There is a pronounced, rather angular projection on the mid-inner margin-of
the first segment. The second segment is rather slender (lacking the ventral lamella and the
irregularities of the dorsal margin seen in the preceding species), and the row of slender
spinules on its anterior and dorsal surfaces is short. The seta on the third segment is rather
long and slender (68 ¡i in length). The arcuate claw is 242 f¿ in length (measured along its
greatest axis and not along its curvature). Otherwise the armature and ornamentation is
similar to that in the preceding species.
The ventral area between the maxillipeds and the first pair of legs (fig. 59) is less
produced than in the female. In preserved specimens the concave surfaces of the claws of
the maxillipeds often rest against the anterior part of the swollen area. A sclerotized line
joins the bases of the maxillipeds as in the female.
Legs 1-4 resemble those of the female, except for the last segment of the endopod of
leg 1 (fig. 60), where the outermost of the five setae is transformed to a spine as in the
preceding species. The formula for that segment is 1,1,4.
Leg 5 (fig. 61) is relatively longer and more slender than in the female, measuring
130 X 31 ÍÍ in greatest dimensions, with a ratio of about 4.2:1.
- 8 5 -
175
Leg 6 (fig. 62) consists of a posterolateral flap on the ventral surface of the genital
segment. This is extended posterolaterally into a subconical projection bearing a distal
seta 48 ¡x in length and a more proximal, smaller, and less sclerotized seta 21 ¡i long.
Spermatophores were not observed.
The color in life is similar to that in the female.
(The specific name sty'ocheili is derived from Stylocheilus, the generic name of the
host.)
REMARKS : A. stylocheili belongs to the group of species of Anthessius which have the
formula 111,1,5 on the third segment of the exopod of leg 4 . It thus should be compared with
each of the 17 species in this group. From these A. stylocheili may be distinguished on the
basis of a combination of three characters: the relatively short apical setae on the caudal
ramus (only about 1.4 times longer than the ramus), the abruptly indented genital segment
in the female, and the angular projection on the inner margin of the first segment of the
maxilliped in the male.
In addition, A. fitchi lllg, 1960, has a very different body form, is much larger, the
caudal rami in the female are elongate and about 2 times the length of the anal segment, and the
free segment of leg 5 is 2 times longer than wide and of a different form.
Each of the three species of Anthessius from Tridacna at Nosy Bé (Humes & Stock,
in press) have a marked lateral indentation of the cephalosóme near the level of the maxillipeds.
A. lighti lllg, 1960, and A. hawaiiensis (Wilson, 1921) are much larger.
In A. brevifurca Sewell, 1949, the caudal rami in the female are short, but little longer
than wide, and less than the length of the anal segment (the male is unknown).
In A . arenicola (Brady, 1872) and A teissieri Bocquet & Stock, 1958, the first antenna
has six segments, and the anal segment has two ventral rows of spines (arenicola) or spinules
(teissieri).
In A . minor Stock, 1959, the female is much smaller in size, and there are two ventral
rows of spines on the anal segment.
A. solecurti Delia Valle, 1880 (based on Stock, -1959) is larger; the female shows
two rows of spinules on the ventral surface of the anal segment, and the caudal rami are
3.5-4 times longer than wide.
A . oval ¡pes Stock, Humes & Gooding, 1963, is larger; the free segment of leg 5
is elliptical or oval in outline, less than two times as long as wide.
A . concinnus (A. Scott, 1909) is larger, has a more rounded prosome (in dorsal view),
and leg 5 is of a somewhat different outline.
In A . pleurobrancheae Delia Valle, 1880. the female is much larger, and the genital
segment is more elongate. The distal end of the second maxilla has more than 10 teeth.
A . pectinis Tanaka, 1961, ¡s much larger; the caudal rami are very elongate (in the
female 12 times longer than wide).
A . groenlandicus (Hansen, 1923) has in the female a shorter genital segment, of quite
different form than in A . stylocheili.
A . brevicauda (Leigh-Sharpe, 1934) has in the female a very short caudal ramus and
the fifth leg is irregularly elliptical, nearly 1.5 times longer than wide.
ANTHESSIUS DISTENSUS n sp. Figs. 63-88
Type material. 24 females, 44 males, and 11 copepodids from the mantle cavity of 1 9 pe lecypods,
Pteria macrpptera Lamarck, attached to coral in 6 m , east of Pte. Ambarionaomby, Nosy K o m b a ,
near Nosy Bé , Madagascar. Collected by A G H on September 21, 1964. Holotype female,
allotype, and 50 paratypes (15 females and 35 males) deposited in the United States National
Museum, Washington, and the remaining paratypes in the collection of A . G . H u m e s .
Other specimens (all from Pteria macroptera). 1 male from 1 host, in 2 m , west of Ambariote lo,
between Nosy Bé and Nosy Komba , August 24, V960 ; 2 females and 3 males from 1 host, in
- 8 6 -
176
2 0 m , Tany Kely, December 20, 1963; 13 females, 3 males, and 3 çopepodids from 3 hosts,
in 4 - 1 0 m , off Ampombilava, Nosy B é , December 21, 1963; 4 females, 13 males, and 13 çope
podids from 1 host, in 10m, Pte. Lokobe, Nosy B e , December 27, 1963; 9 females and 3
males from 4 hosts, in 7 m , Ambariotelo, August 18, 1964; 3 females and 1 male from 2 hosts,
¡n 3 m , east of Pte. Ambarionaomby, Nosy K o m b a , September 18, 1964; and 1 female and
4 males from 3 hosts, Ambariobe, between Nosy Bé and Nosy K o m b a , September 19, 1964.
Female. The body (fig. 63) has a form somewhat different from either of the two preceding
species. The length (not including the setae on the caudaTrami) is 1 . 5 2 m m (1.26-1.77mm)
ond the greatest width is 0.67 m m (0.55-0.79 m m ) , based on 10 specimens. The prosome in
dorsal view is elongate rather than suboval, the ratio of length of width being 1.6:1. The
segment bearing leg 1 is set off from the head by a dorsal transverse furrow. Theepimeral
areas of the segments bearing legs 2 and 3 are rather acute posteriorly.
The segment of leg 5 (figs. 64 and 65) is inserted slightly under the tergum of the
last prosomal segment. The sides of the segment are somewhat swollen in the anterior half
(the width here being 244 fi) but nearly parallel in the posterior half (203 ¡i). The length of
the segment is 155 /u. In ventral view there is a lightly sclerotized line between the bases
of the fifth legs. Between the segment of leg 5 and the genital segment a narrow intersegmental
sclerite may be seen on the ventral surface. The genital segment is longer than wide, 231 X 203 ¡x .
It is widest in its posterior half, at the level of the areas of attachment of the egg sacs.
Behind this area the segment is indented laterally and the sides are nearly parallel (the
width here being 138 ¡x). The egg sacs are attached dorsally, and each area of attachment
(fig. 66) shows two setae, one 29 ¡i in length and bent, the other. 7 ¡i, hyaline, and rather
obscure. The three postgenital segments are 65, 49, and 60¡i in length from anterior to posterior
(the last segment being measured along its outer margin rather than in the midline where the
length is 75 /z). Ventrally the posterior margins of the genital segment and the first two
postgenital segments bear a row of hyaline spinules; the anal segment bears a row of smaller
spinules near the insertion of each caudal ramus. Dorsally these margins are unornamented.
The caudal ramus (fig. 67) is nearly quadrate, about half as long as the anal segment.
Its greatest length (to the tip of the terminal flap) is 37 fi, and its width is 36 fi. Its length
along the outer margin is 27 ¡i, and along the inner margin 23 // . The ratio of the greatest
length to the width is about 1:1. The setae are arranged as in the preceding species. The
outer lateral seta, inserted somewhat dorsally, is 75 fi in length; the pedicellate dorsal seta
52 ¡i ; the outer terminal seta 114 fi ; the inner terminal seta 146 ¡x ; and the two long median
terminal setae 336 and 550 ¿¿ respectively. All the setae are naked except for the innermost
terminal one which bears slender spinules along the inner edge. The ramus is inserted on
the anal segment between slight dorsal and ventral flaps. The terminal setae are inserted
dorsally above a terminal ventral triangular flap which bears a submarginal row of spinules.
There are refractile points and hairs on the dorsal and ventral surfaces of the ramus as shown
in figs. 64 and 67.
The dorsal surface of the prosome and the dorsal and ventral surfaces of the urosome
bear scattered refractile points and hairs. The ratio of the length of the prosome to that of
the urosome is about 2.25:1.
The elongate egg sacs extend far beyond the end of the setae on the caudal rami.
Each sac (fig. 63) is about 1 175 X 225 fi (in one female) and contains many small eggs 75 fi
in diameter.
The rostral area (fig. 68) resembles in general aspects that in A. dolabellae and
A. stylocheili.
The seven segments of the first antenna (fig. 69) have the following lengths (measured
along their posterior non-setiferous margins): 18 (55 fi along the anterior margin), 146, 35 ,
61, 47, 22, and 21 ¡i respectively. The formula for the armature is the same as in the two
preceding species. All the setae are naked. The pattern of sclerotization between the second
and third segments (fig. 70) suggests another incomplete segment.
The second antenna (figs. 71 and 72) has the same armature as in the two preceding
- 87 -
177
species. The second segment showsofew rugosities on itspostero-inner surface and terminates
distally on its antero-inher surface in a small sclerotized process. On the third segment,
in addition to the four hyaline setae (the outermost more blunt than the others), there are
two rows of spinules as shown in fig. 71. Of the four terminal claws, two are strongly formed.,
one is short and weak, and the other is long and rather slender.
The two lobes of the labrum (fig. 73) are different from those in either of the two
preceding species. Each lobe is rather acute instead of being rounded and bears two smaller
hyaline lobes on the median margin.
The mandible (fig. 74) is in general similar to that of A. dolabellae and A. stylocheili,
but the two tooth-like inner spines at the base of the apical lash are more slender and have
long spinules rather than denticles, and the hyaline lobes adjacent to the base of the lash
resemble those of A. stylocheili more closely than those of A. dolabellae. The paragnaths
are probably represented by two small lobes seen in ventral view under the tips of the lobes
of the labrum (see fig. 73, indicated in dashed lines). The first maxilla (fig. 75) has the
same general armature and ornamentation as in the two preceding species, but the small inner
lobe has no notch and its two hyaline processes are unequal in size. The second maxilla
(fig. 76) differs considerably from that in A. dolabellae and A. stylocheili. The se.ond
segment bears on its proximal outer margin a small hyaline process (seta ?) preceded by a
minute prominence, and has on its posterior surface two very unequal setae, one long, spir'form,
and armed with spinules along one side, the other short (only about 1 / 4 the length of the
first), slender, and naked. The segment is extended distaily to form a long blade with a row
of 13-14 spines along the outer edge. The maxilliped (fig. 77) is highly modified. Its
segmentation is obscure, though there is a suggestion of division into four segments. The
area of the second segment is outwardly swollen, so that the appendage in posteroventral
view appears to be greatly inflated. The only ornamentation, aside from a few refractile
points, consists of a terminal hyaline process (seta ?) 6 y. long and an adjacent small spiniform
projection.
The area between the maxillipeds and the first pair of legs (fig. 78) is slightly swollen
ventrally, but less so than in A. stylocheili. A transverse line connects the bases of the
maxillipeds.
The segmentation of legs 1-4 (figs. 79, 80, 81, and 82) is like that in the two preceding
species, but the last two segments of the endopods are noticeably longer and slenderer. The
spine and setal formula is like that of A. stylocheili. On the basis of all four legs the spinules
near the insertion of the endopod are unusually prominent, and there is a minute hyaline
setule (?) near the outer end of the row of hairs on the rounded inner margin. The last segment
of the endopod of leg 4 is 70 in length, the outer seta 100 //, and the four spines from inner
to outer 76, 26, 27, and 24 ft.
Leg 5 (fig. 83) has a short free segment measuring 64 X 48 ¡i in greatest dimensions,
the ratio being about 1.33:1. This segment is attached ventrally on the body. The three
prominent fringed spines are of about equal length (33 fi); their narrow hyaline fringes are
dentate along the edge, with' the tips of the fringes projecting near the extremities of the
spines so as to produce a trifid appearance. The naked seta is 56 ¡i in length. The segment
is ornamented with a row of strong spinules along the inner margin and other similar spinules
submarginal ly on the dorsal outer area. The'seta arising from the body near the insertion of
the free segment is about 80 fi long and naked.
Leg 6 is probably represented by the two setae near the attachment of the egg sacs
(see fig. 66),
The color in life in transmitted light is translucent to light tan, with the eye red,
the ovary dark gray, and the egg sacs gray.
Male. The body (fig. 84) resembles that of the female, though the cephalosome is somewhat
more rounded. The length (not counting the setae on the caudal rami) is 0.91 m m (0.84-0.98mm)
and the greatest width is 0.42 m m (0.37-0.47 mm), -based on 10 specimens. The ratio of the
length of the prosome to its width is about 1.5:1. The segment bearing leg 5 (fig. 85) is
- 8 8 -
178
shaped differently from that in the female, being narrowed anteriorly (109 (i wide) and
expanded posteriorly (164 y. wide); its length is 78 t. The genital segment is wider than
long (86 X 143 /z), being slightly swollen in front of the sixth legs. The four postgenital
segments are 47, 40, 30, and 39 ¡t in length from anterior to posterior (the last segment being
measured along its outer margin rather than in the midline where its length is 43 ¡i ). The
posterior ventral margin of the genital segment is unornamented, but those margins of the
postgenital segments have rows of hyaline spinules as in the female. Dorsally such spinules
are absent.
The caudal ramus, its greatest dimensions being 30 X 29 ¡i, is much like that of the
female.
The surface ornamentation of the prosome and urosóme is similar to that in the female.
The ratio of the length of the prosome to that of the urosome is about 2.4:1.
The rostral area, first antenna, second antenna, labrum, mandible, paragnath, first
maxilla, and second maxilla resemble those of the female.
The maxilliped (fig. 86) has 4 segments, assuming part of the claw to represent the
fourth segment. The first segment is rather elongate and bears a distal group of long spinules.
The slender second segment shows rugosities or folds in the sclerotization of its outer margin
and the row of minute spinules seen in the two preceding species is here apparently absent.
The seta on the third segment is 47 p in length. The gently arcuate claw is 200 fi long
(measured along its greatest axis and not along its curvature). Otherwise the armature and
ornamentation is similar to that in A. dolobellae and A. stylocheili.
The ventral area between the maxillipeds and the first pair of legs (fig. 87) is not
much produced. The line between the bases of the maxillipeds is somewhat better sclerotized
than in the female.
Legs 1-4 resemble those of the female, except that, as in A. dolobellae and A. stylocheili,
the outermost of the five setae on the last segment of the endopod of leg 1 is transformed to
a spine, thus creating the formula of 1,1,4 for that segment.
Leg 5 resembles that of the female.
Leg 6 (fig. 88) consists of a posterolateral flap on the ventral surface of the genital
segment. This flap is slightly produced posterolateral where it bears a spiniform process
and a distal seta 33 ¡j. in length, with nearby another seta 43 p, long.
Spermatophores were not observed.
Several pairs of males and females in.amplexus were seen. In these the claws of
the maxillipeds were placed around the lateroventral areas of the segment of leg 5, and the
surfaces of the second segments of the maxillipeds (those bearing the patches of spinules)
were pressed against the dorsolateral areas of this segment.
The color in life resembles that of the female.
(The specific name distensus, from Latin, distendere, to stretch out, to become swollen,
alludes to the tumid form of the maxilliped in the female.)
REMARKS : A. distensus belongs to the group of species of Anthessius having the formula
111,1,5 on the third segment of the exopod of leg 4. It may be distinguished from most of the
species of this group by the swollen nature of the maxilliped in the female. In the following
species the maxilliped is of the usual elongate and rather slender type: A. pleurobrancheae
Delia Valle, 1880, A. concinnus ( A . Scott, 1909), A . solecurti Delia Valle, 1880, A.arenicola
(Brady, 1872), A . hawaiiensis (Wilson, 1921), A . brevifurca Sewell, 1949, A . teissieri Bocquet
& Stock, 1958, A . minor Stock, 1959, A . fitchi lllg, 1960, A . lighti lllg, 1960, A . ova//pes
Stock, Humes & Gooding, 1963, and the three species of Anthessius from Tridacno at Nosy Bé
(Humes & Stock, in press). In A. brevicauda (Leigh-Sharpe, 1934) the maxillipeds in the
female were described by Leigh-Sharpe as having enormous bases, but Stock's (1964)redescrip-
tion based on pdratypic material shows the maxilliped to be of the usual more or less slender
form. In A. groenlandicus (Hansen, 1923) the form of the maxilliped in the female is not
- 8 9 -
described of figured, but this species has a much more elongate caudal ramus and fewer
teeth on the end of the second maxilla than in A. distensus.
In only one species of this group does the maxilliped of the female approach the
swollen condition seen in A. distensus. In the large A. pectinis Tanaka, 1961, the second
segment articulates with the following segment almost at a right angle, and the whole appendage
is less tumid than in the species from Madagascar. The caudal rami of this Japanese species
are very long (12 times longer than wide).
REMARKS ON THE GENUS ANTHESSIUS
The genus Anthessius is a rather large, fairly homogeneous group. Its species are
often recognized on the basis of rather subtle differences. During the last five years (starting
with 1960) the fairly complete descriptions of fifteen new species have been published. This
equals the number of all previously described species since 1880 when Delia Valle erected
the genus.
Twenty-four species of Anthessius are known to be associated with mollusks, either
with gastropods (12 species) or with pelecypods (12 species). The remaining six species
have been recovered from weed-wiashings, plankton, or dredged material, but is seems likely
that they too may actually be associated with mollusks.
Among the species known from mollusks there seem to be no obvious morphological
characters which might serve to distinguish those from gastropods from those from pelecypods.
Although the genus may readily be divided into two groups on the basis of the formula of the
last segment of the exopod of leg 4 (for example, in the key provided by Stock, Humes 8>
Gooding, 1963), this division does not reflect host preferences. Thus, of those with the
formula 11,1,5, two are known from pelecypods, four from tectibranchs, and two from other
gastropods, and of those with 111,1,5 ten are known from pelecypods, three from nudibranchs,
two from tectibranchs, and one from another gastropod. Other characters, such as the dentition
of the second maxilla and the form of the caudal ramus, do not appear to be correlated with
host preferences. The three species from Tridacna soon to be described by Humes and Stock
(in press) show, however, a surprisingly similar faciès, especially in the form of the lateral
areas of the cepha losóme.
180
- 9 0 -
REFERENCES
B O C Q U E T , C . and STOCK, J.H.- 1958, Copépodes parasites d'invertébrés des côtes de la
Manche. III. Sur deux espèces, jusqu'ici confondues, du genre Anthessius ; description
d'/Wness/us teissieri, n. sp. Arch. Zool. exp. gén., 95 (2) : 99-112.
B R A D Y , G .S . - 1872, Contributions to the study of the Entomostraca. VII. A list of the non
parasitic marine Copepoda of the north-east coast of England. Ann. Mag. Nat. Hist.,
(4) 10:1-17.
D E L L A V A L L E , A . - 1880, Sui Coriceidi parassiti, e suM'anatomia del gen. Lichomùlgus.
Atti R. Acad. Lincei 1879-1880, (3) 5: 107-124.
H A N S E N , H.J.- 1923, Crustacea Copepoda. II. Copepoda parasita and hemiparasita. Danish
Ingolf-Exped., 3:1-92.
H U M E S , A . G . - 1959, Copépodes parasites de mollusques à Madagascar. Mém. Inst. Sci.
Madagascar, 1958, sér. F, 2:285-342.
H U M E S , A . G . and S T O C K , J.H.- (in press). Three new species of Anthessius (Copepoda,
Cyclopoida, Myicolidae) associated with Tridacna from the Red Sea and Madagascar.
ILLG, P.L.- I960, Marine copepods of the genus Anthessius from the northeastern Pacific
Ocean. Pacific Science, 14 (4):337-372.
LEIGH-SHARPE, W . H . - 1934, The Copepoda of the Siboga Expedition. II. Commensal and
parasitic Copepoda. Siboga Exped. 29b, pp. 1-40.
SARS, G . O . - 1916, Liste systématique des Cyclopoidés, Harpacticoidés et Monstrilloidés
recueillis pendant les campagnes de S.A.S. le Prince Albert de Monaco avec descriptions
et figures des espèces nouvelles. Bull. Inst» Océan. Monaco, n° 233, pp. 1-15.
SARS, G . O . - 1918, An account of the Crustáceo of Norway with short descriptions and figures
of all the species. Vol. 6, Copepoda, Cyclopoida, parts 13 and 14, Lichomolgidae
(concluded), Oncae/dae, Corycaeic/ae, Ergos/'i/dae, Clausiidae, Eunicicolidae, Supplement,
pp. 173-225. Bergen Museum, Bergen.
S C O T T , A . - 1909, The Copepoda of the Siboga Expedition. I. Free-swimming, littoral and
semi-parasitic Copepoda. Siboga Exped. 29a, pp. 1-323.
S E W E L L , R .B .S . - 1949, The littoral and semi-parasitic Cyclopoida, the Monstrilloida and
Notodelphyoida. John Murray Exped. 1933-34, Sci. Repts., 9 (2):17-199.
S T O C K , J.H.- 1959, Copepoda associated with Neapolitan Mollusca. Pubbl. Staz. Zool. Napoli,
31:43-58.
STOCK, J.H.- 1964, Sur deux espèces ¿'Anthessius (Copepoda) des Indes Orientales. Zoolo-
gische Mededelingen, vol.39, Festbundel H . Boschma, pp. 111-124.
- 91 -
181
S T O C K , J .H , H U M E S , A . G . and G O O D I N G , R . U . - 1963, Copepoda associated with West Indian
invertebrates. III. The genus Anthessius (Cyclopoida, Myicolidae). Studies on the Fauna
of Curaçao and other Caribbean Islands, 17 (73):1-37.
T A N A K A , 0 . - 1961, On cope pod s associated with marine pelecypods in Kyushu. Jour. Fac.
Agrie. Kyushu Univ., 11 (3):249-278.
WILSON, C . B . - 1921, New species and a new genus of parasitic copepods. Proc. U .S . Nat.
Mus. , 59 (2354):1-17.
WILSON, C . B . - 1935, Parasitic copepods from the Pacific Coast. Amer. Midi. Nat.,
16 (5):776-797.
*
* *
EXPLANATION OF THE FIGURES
All the figures have been drawn with the aid of a camera lucida. The letter after
the explanation of each figure refers to the scale at which the figure was drawn.
182
- 9 2 -
P L A N C H E S
183
Fig. 1-7 - Anfhessius dolabellae n. sp., female
1 - Body, dorsal (A)
2 - Segment of leg 5, dorsal (B)
3 - Segment of leg 5, ventral (B)
4 - Genital and postgenital segments, ventral (C)
5 - Area of attachment of egg sac, dorsal (D)
6 - Caudal ramus, dorsal (D)
7 - Rostral area and labrum, ventral (B)
- 9 4 -
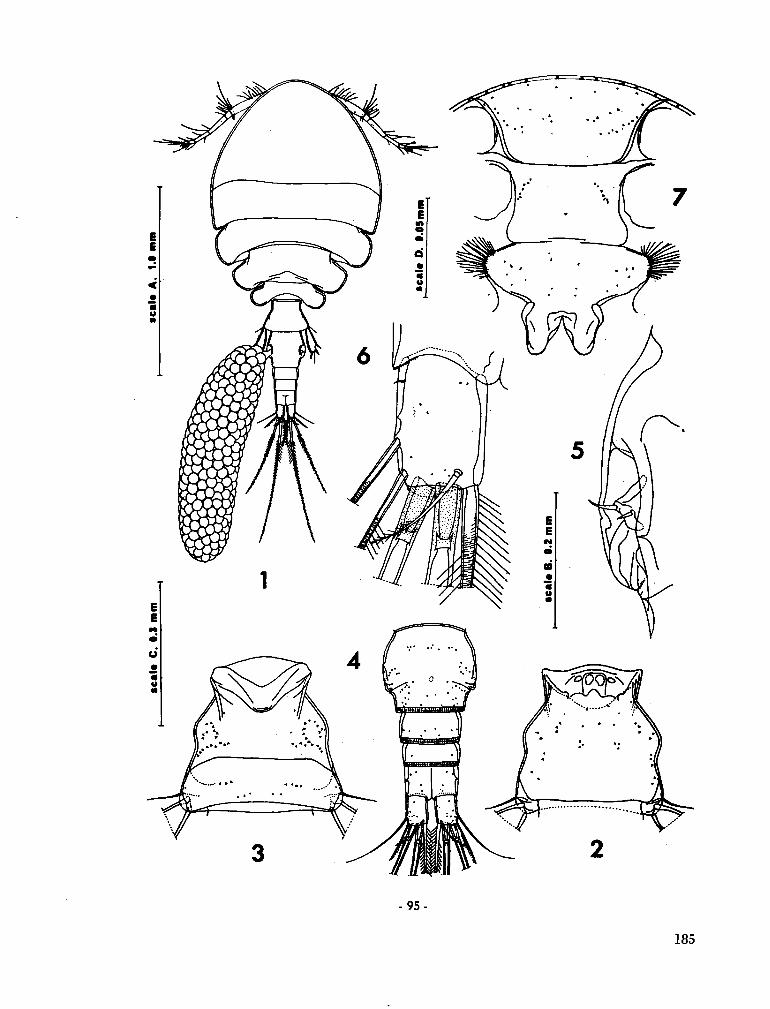
- 9 5 -
185
Fig. 8-17 - Anthessius dolabellae n. sp., female (continued)
8 - First antenna, dorsal (B)
9 - Second antenna, anterior (B)
10 - Mandible (D)
11 - Paragnath below edge of labrum, ventral (E)
12 - First maxilla, anterior (D)
13 - Second maxilla, posterior (F)
14 - Process on second segment of second maxilla, posterior (E)
15 - Maxilliped, anterior (F)
16 - Area between maxillipeds and leg 1, ventral (C)
17 - Leg 1, anterior (B)
186
- 9 6 -
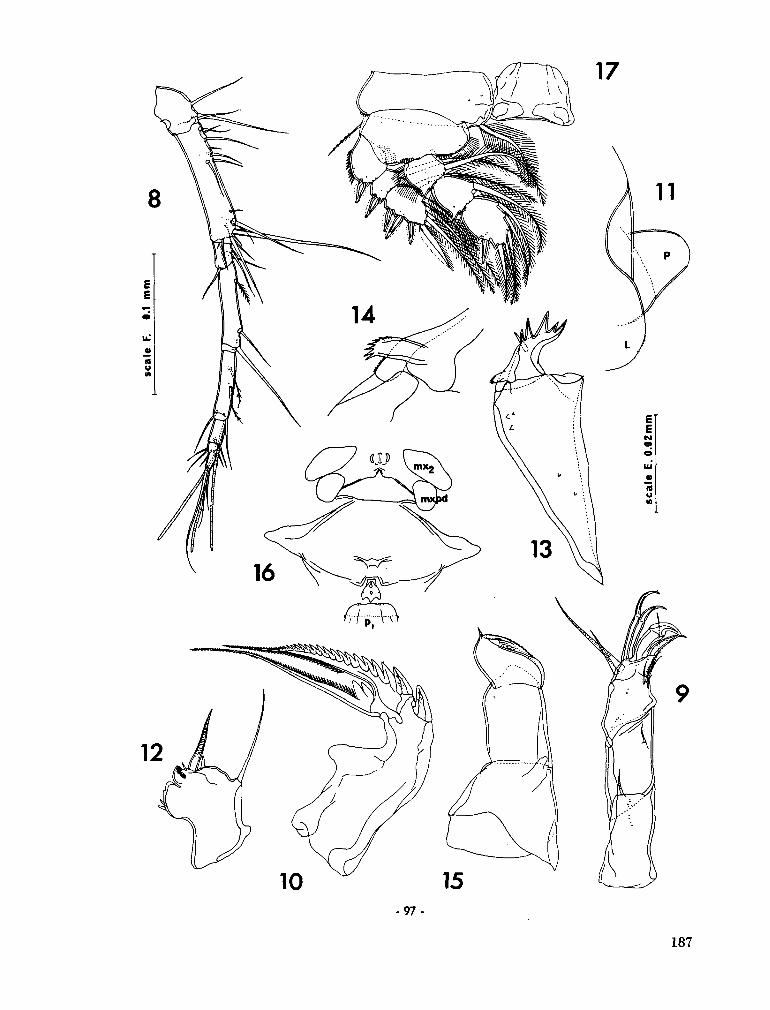
97
187
Fig. 18-22 - Anthessius dolabellae n. sp., female (continued)
18 - Leg 2, anterior (B)
19 - Tip of endopod of leg 2, anterior (G)
20 - Leg 3, anterior (B)
21 - Leg 4, anterior (6)
22 - Leg 5, ventral (F)
Fig. 23-24 - Anthessius dolabellae n. sp., male
23 - Body, dorsal (A)
24 - Urosome, ventral (C)
- 9 8 -
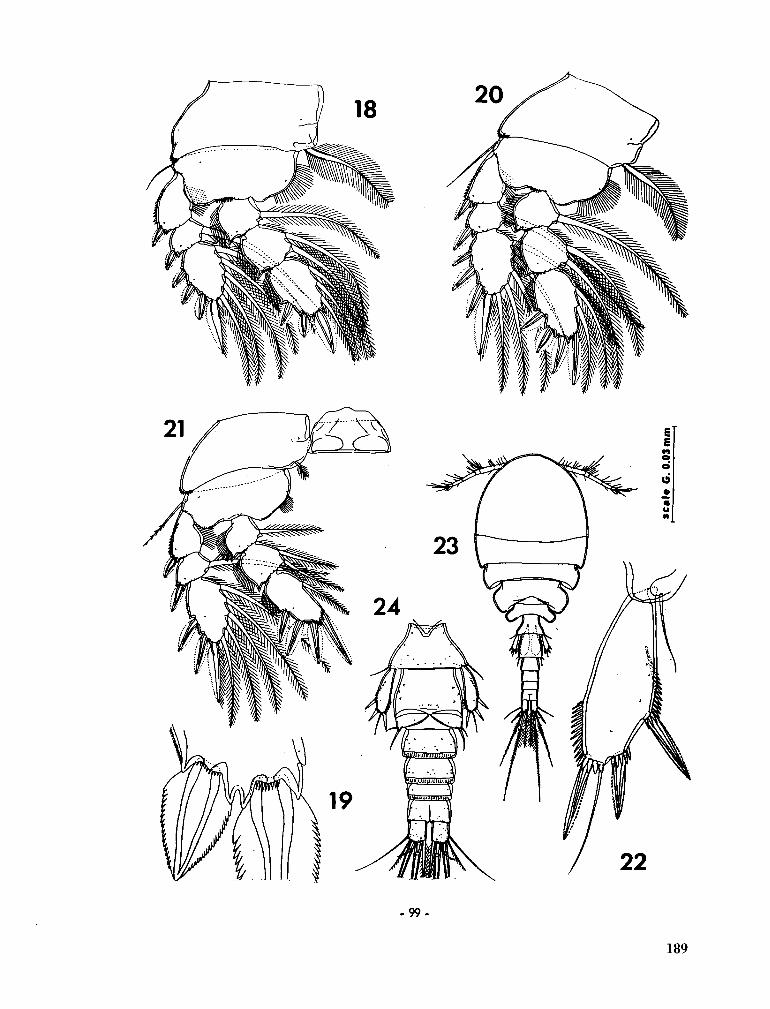
- 9 9 -
189
Fig. 25-34 - Anthessius dolabellae n. sp., male (continued)
25 - Caudal ramus, ventral (D)
26 - Second segment of first antenna, ventral (H)
27 - Second segment of second antenna, anterior (F)
28 - Second maxilla, posterior (F)
29 - Maxilliped, posterior and inner (F)
30 - Claw of maxilliped, posterior (F)
31 - Area between maxillipeds and leg 1, ventral (C)
32 - Third segment of endopod of leg 1, anterior (F)
33 - Leg 6, ventral (D)
34 - Spermatophore inside body of male (H)
- 100-
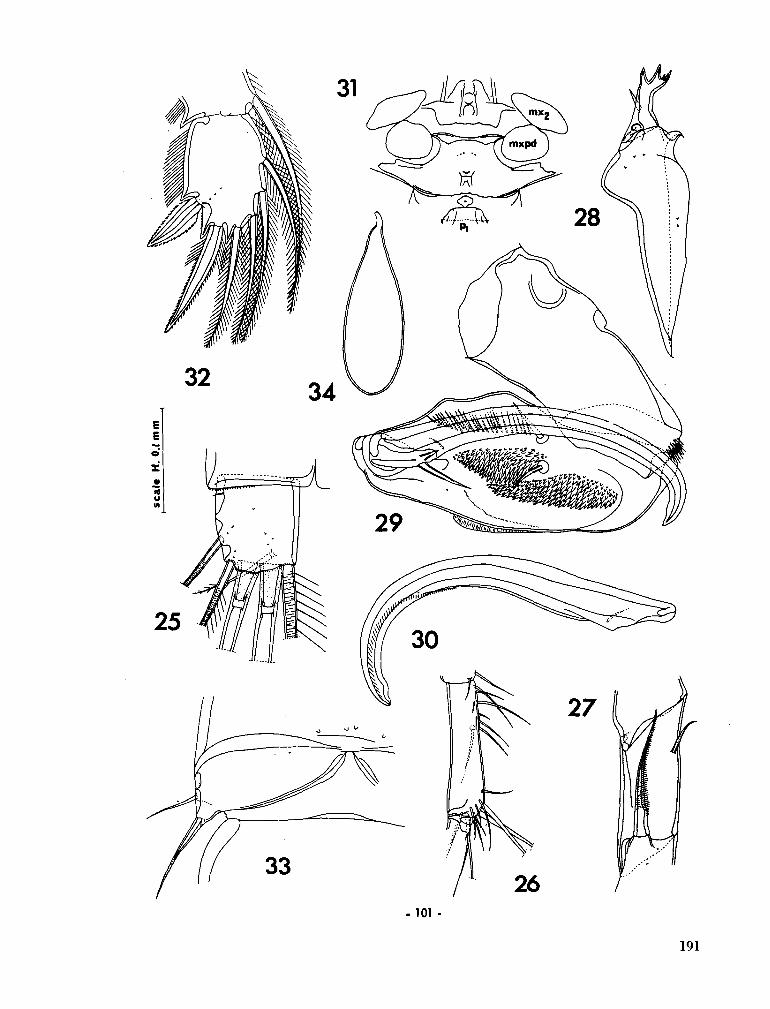
101
191
Fig. 35-46 - Anthessius stylocheili n. sp., female
35 - Body, dorsal (A)
36 - Urosome, ventral (I)
37 - Area of attachment of egg sac, dorsal (D)
38 - Caudal ramus, dorsal (B)
39 - Egg sac (A)
40 - First antenna, ventral (B)
41 - Tip of labrum, ventral (F)
42 - Detail of mandible (G)
43 - Paragnaths, ventral (H)
44 - Second maxilla, anterior (F)
45 - Tip of second maxilla, same individual as in fig. 44 but opposite side, anterior (D)
46 - Tip of second maxilla, anterior (D).
- 102 -
192
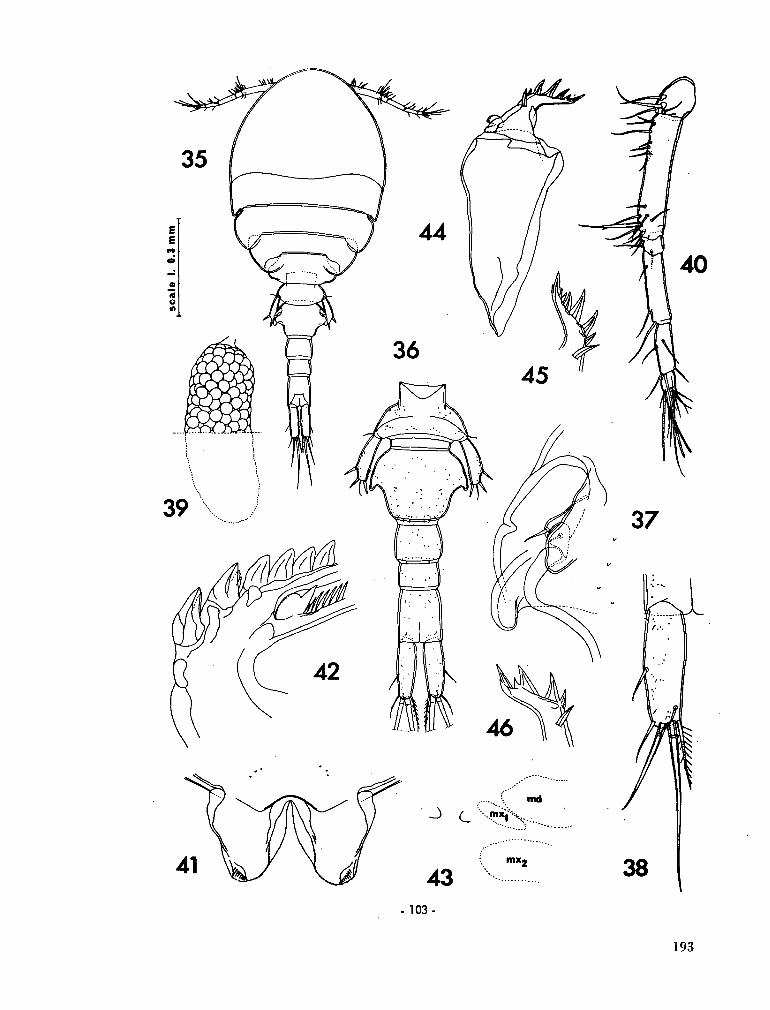
193
Fig. 47-51 - Anthessius stylocheili n. sp., female (continued)
47 - Area between maxillipeds and leg 1, ventral (C)
48 - Leg 1, anterior (B)
49 - Tip of endopod'of leg 2, anterior (G)
50 - Exopod of leg 4, posterior (B)
51 - Leg 5, ventral (F)
Fig. 52-57 - Anthessius stylocheili n. sp., male
52 - Body, dorsal (A)
53 - Urosome, dorsal (I)
54 - First antenna, ventral (B)
55 - Second segment of second antenna, anterior (F)
56 - Second maxilla, posterior (H)
57 - Hyaline spine on second segment of second maxilla, anterior (E)
- 104-
194
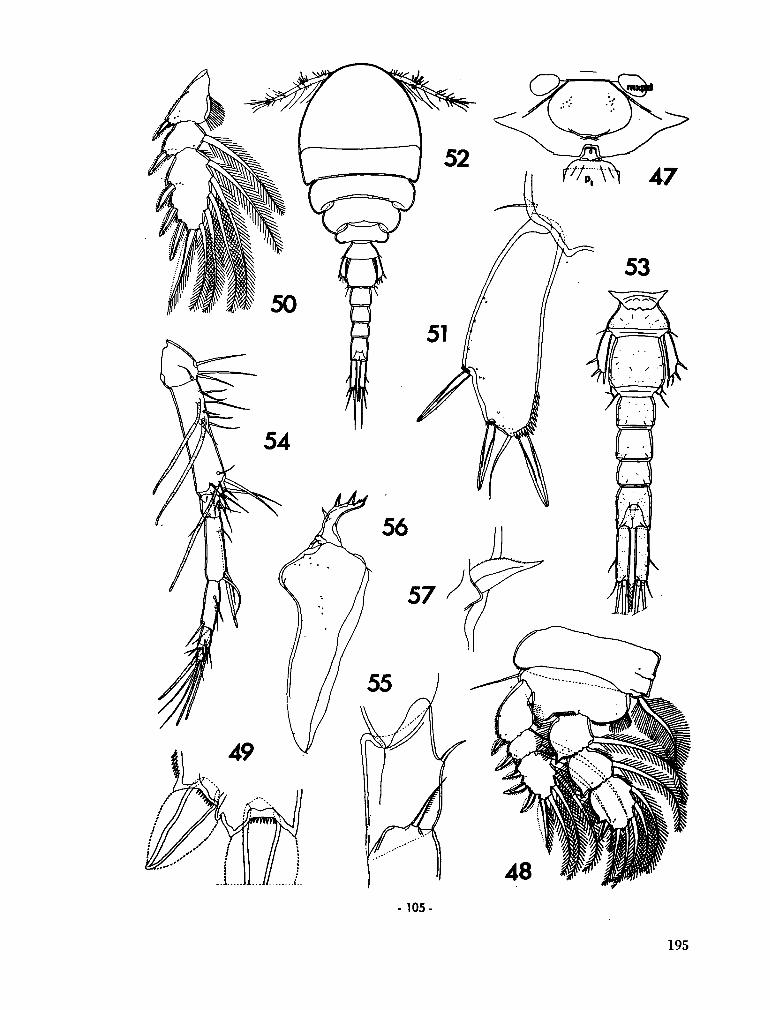
105
195
Fig. 58-62 - Anthessius stylocheili n. sp., male (continued)
58 - Maxilliped, posterior and inner (H)
59 - Area between maxillipeds and leg 1, ventral (C)
60 - Tip of last segment of endopod of leg 1, anterior (F)
61 - Leg 5, ventral (F)
62 - Leg 6, ventral (D)
Fig. 63-64 - Anthessius distensus n. sp., female
63 - Body, dorsol (A)
64 - Urosome, dorsal (C)
- 106 -
196
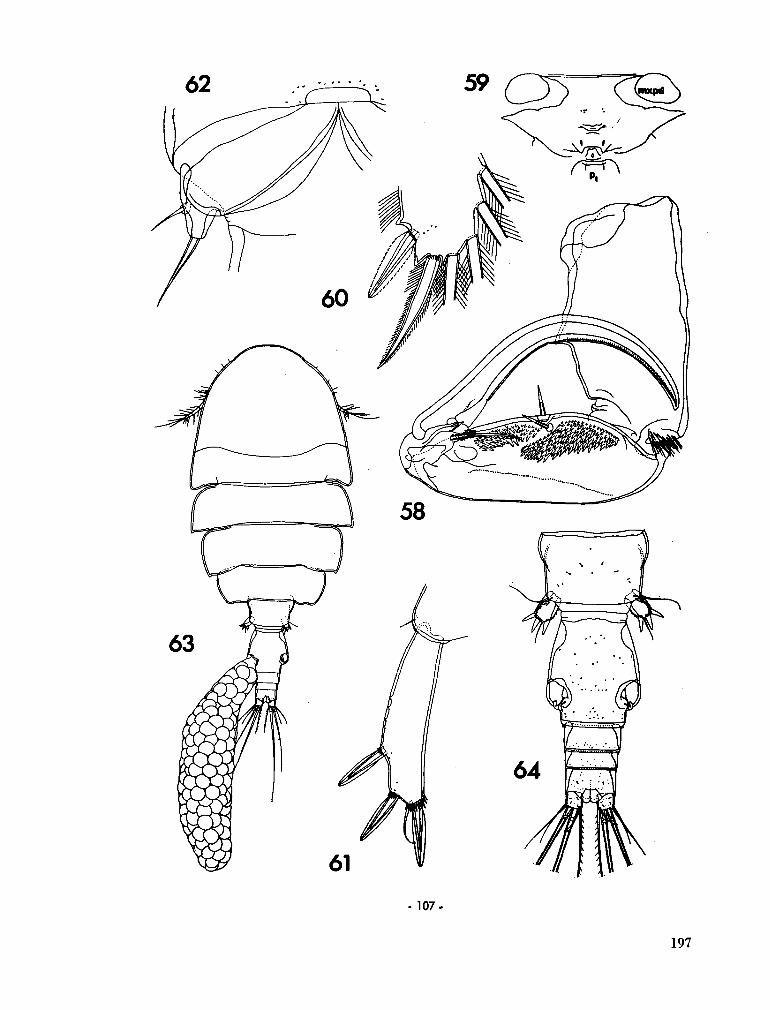
- 107
197
Fig. 65-73 -
65 -
66 -
67 -
68 -
69 -
70 -
71 -
72 -
73 -
Anthessius disten su s n. sp., female (continued)
Urosome, ventral (C)
Area of attachment of egg sac, dorsal (D)
Caudal ramus, ventral (G)
Rostral area, ventral (B)
First antenna, ventral (B)
Third segment of first antenna, ventral (G)
Second antenna, posterior (H)
Second antenna, anterior -(H)
Labrum, with paragnaths indicated by dashed lines, ventral (H)
198
- 108-
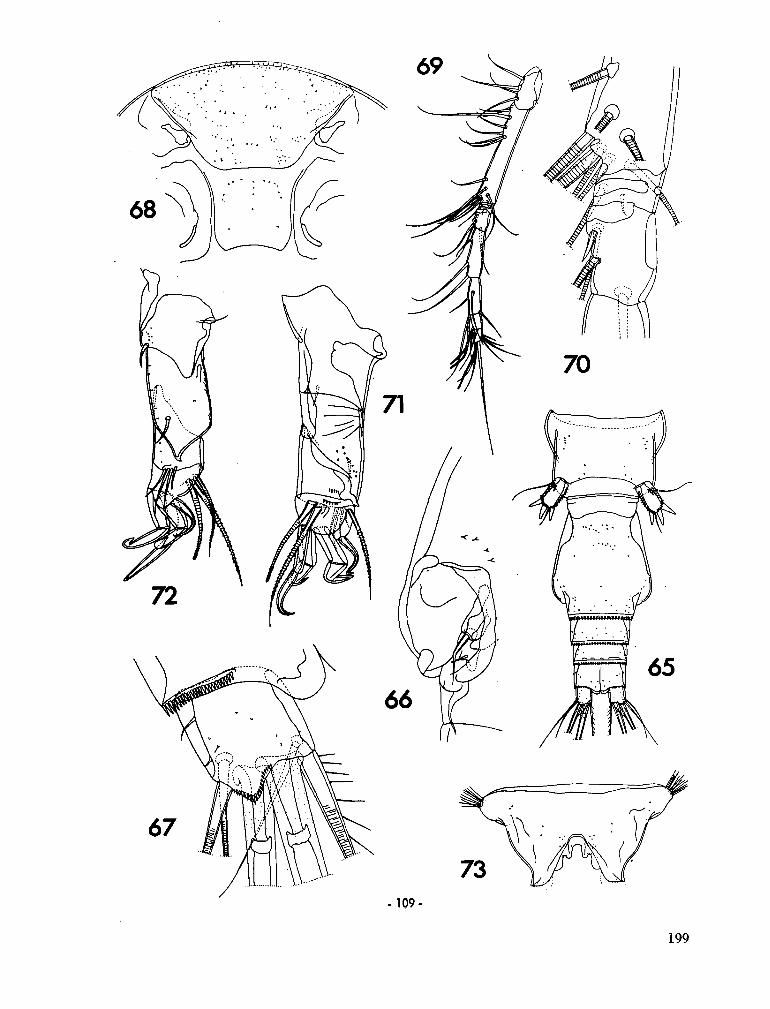
199
Fig. 74-81 - Anthessius distensus n. sp., female (continued)
74 -
75 -
76 -
77 -
78 -
79 -
80 -
81 -
Mandible (D)
First maxilla tD)
Second maxilla, anterior (D)
Maxilliped, posteroventral (D)
Area between maxillipeds and leg 1,
Leg 1, anterior (B)
Leg 2, anterior (B)
Leg 3, anterior (B)-
ventral (C)
- 110 -
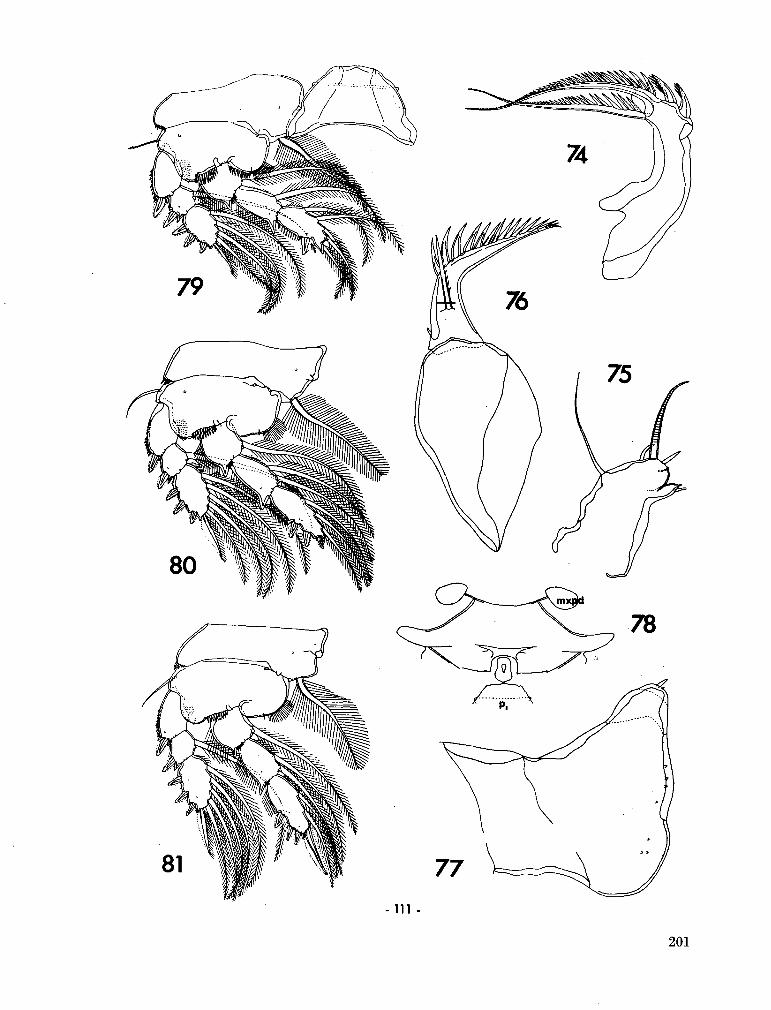
201
Fig. 82-83 - Anthessius distensus n. sp., female (continued)
82 - Leg 4, anterior (B)
83 - Leg 5, dorsal (D)
Fig. 84-88 - Anthessius distensus n. sp., male
84 - Body, dorsal (I)
85 - Urosome, ventral (B)
86 - Maxilliped, posterior and inner (F)
87 - Area between maxillipeds and leg 1, ventral (B)
88 - Leg 6, ventral (D)
202
- 112 -
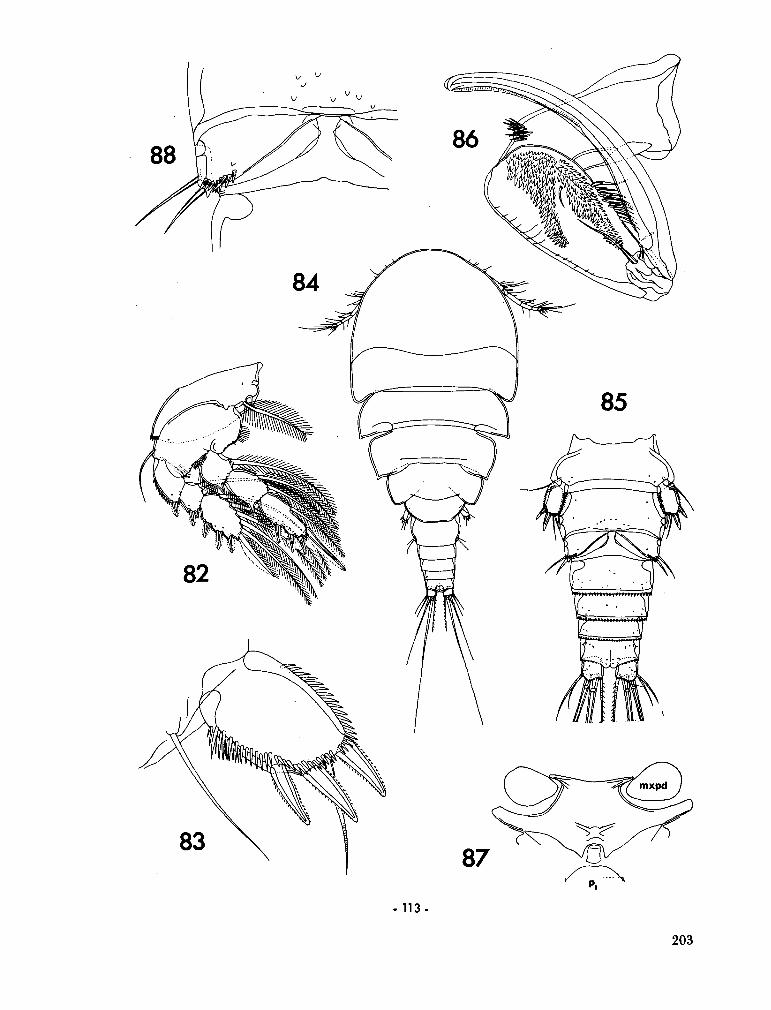
- 113-
203
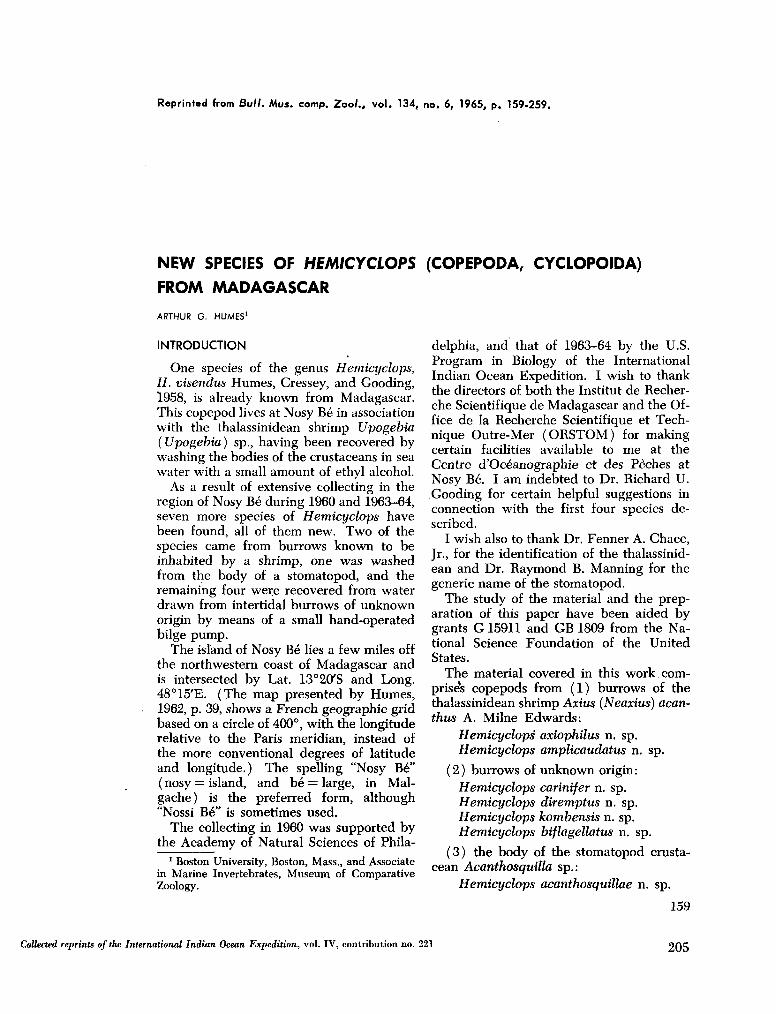
Reprinted from Bull. Mus. camp. Zoo/ . , vol. 134, no. 6, 1965, p. 159-259.
NEW SPECIES OF HEMICYCLOPS
FROM MADAGASCAR
ARTHUR G. HUMES1
INTRODUCTION
O n e species of the genus Hemicyclops, H. visendus H u m e s , Cressey, and Gooding, 1958, is already known from Madagascar. This copepod lives at Nosy Bé in association with the thalassinidean shrimp Upogebia (Upogebia) sp., having been recovered by washing the bodies of the crustaceans in sea water with a small amount of ethyl alcohol.
As a result of extensive collecting in the region of Nosy Bé during 1960 and 1963-64, seven more species of Hemicyclops have been found, all of them new. T w o of the species came from burrows known to be inhabited by a shrimp, one was washed from the body of a stomatopod, and the remaining four were recovered from water drawn from intertidal burrows of unknown origin by means of a small hand-operated bilge p u m p .
The island of Nosy Bé lies a few miles off the northwestern coast of Madagascar and is intersected by Lat. 13°20'S and Long. 48°15'E. (The m a p presented by H u m e s , 1962, p. 39, shows a French geographic grid based on a circle of 400°, with the longitude relative to the Paris meridian, instead of the more conventional degrees of latitude and longitude.) The spelling "Nosy Bé" ( nosy = island, and bé = large, in Malgache) is the preferred form, although "Nossi B é " is sometimes used.
The collecting in 1960 was supported by the Academy of Natural Sciences of Phila-
1 Boston University, Boston, Mass., and Associate in Marine Invertebrates, M u s e u m of Comparative Zoology.
(COPEPODA, CYCLOPOIDA)
delphia, and that of 1963-64 by the U . S . Program in Biology of the International Indian Ocean Expedition. I wish to thank the directors of both the Institut de Recherche Scientifique de Madagascar and the Office de la Recherche Scientifique et Technique Outre-Mer ( O R S T O M ) for making certain facilities available to m e at the Centre d'Océanographie et des Pèches at Nosy Bé. I a m indebted to Dr. Richard U . Gooding for certain helpful suggestions in connection with the first four species described.
I wish also to thank Dr. Fenner A . Chace, Jr., for the identification of the thalassinidean and Dr. Raymond B . Manning for the generic n a m e of the stomatopod.
The study of the material and the preparation of this paper have been aided by grants G 15911 and G B 1809 from the N a tional Science Foundation of the United States.
The material covered in this work comprises copepods from (1) burrows of the thalassinidean shrimp Axius (Neaxius) acanthus A . Milne Edwards:
Hemicyclops axiophilus n. sp. Hemicyclops amplicaudatus n. sp.
(2) burrows of unknown origin: Hemicyclops carinifer n. sp. Hemicyclops diremptus n. sp. Hemicyclops kombensis n. sp. Hemicyclops biflagellatus n. sp.
(3) the body of the stomatopod crustacean Acanthosquilla sp.:
Hemicyclops acanthosquillae n. sp.
159
Collected reprints of the International Indian Ocean Expedition, vol. IV, contribution no. 221 205
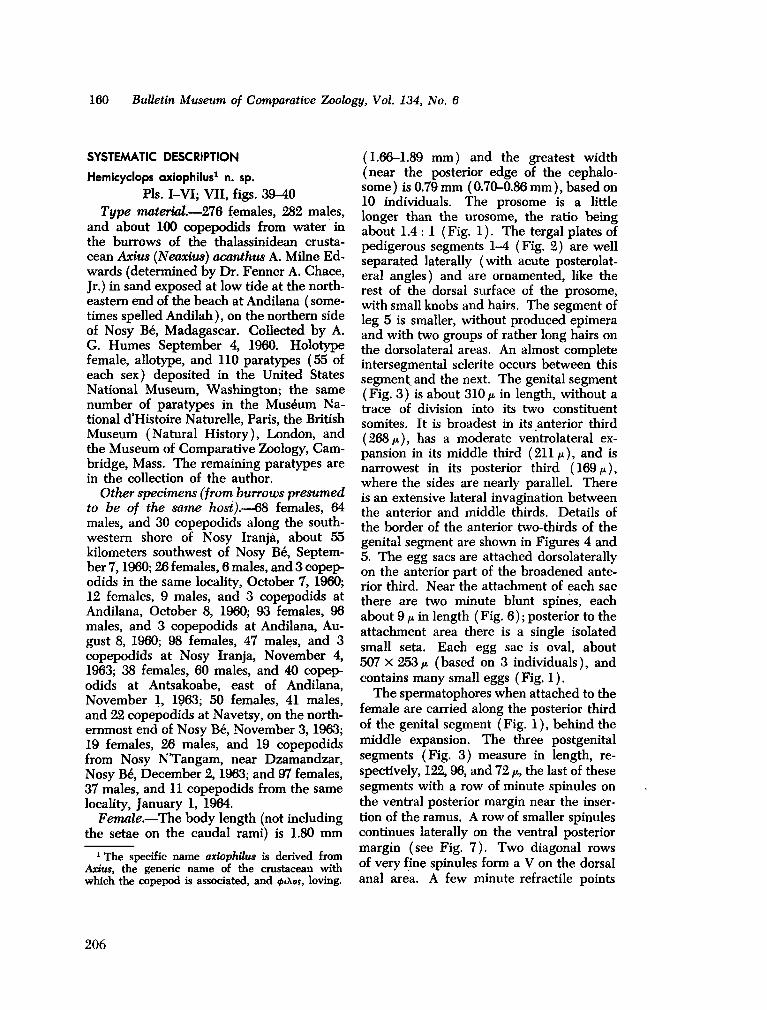
160 Bulletin Museum of Comparative Zoology, Vol. 134, No. 6
SYSTEMATIC DESCRIPTION
Hemicyclops axiophilus1 n. sp.
Pis. I-VI; VII, figs. 39-40 Type material.—276 females, 282 males,
and about 100 copepodids from water in the burrows of the thalassinidean crustacean Axius (Neaxius) acanthus A . Milne E d wards (determined by Dr . Fenner A . Chace, Jr.) in sand exposed at low tide at the northeastern end of the beach at Andilana ( sometimes spelled Andilah), on the northern side of Nosy Bé, Madagascar. Collected by A . G . H u m e s September 4, 1960. Holotype female, allotype, and 110 paratypes (55 of each sex) deposited in the United States National M u s e u m , Washington; the same number of paratypes in the M u s é u m N a tional d'Histoire Naturelle, Paris, the British M u s e u m (Natural History), London, and the M u s e u m of Comparative Zoology, C a m bridge, Mass. T h e remaining paratypes are in the collection of the author.
Other specimens (from burrows presumed to be of the same host).—68 females, 64 males, and 30 copepodids along the southwestern shore of Nosy Iranjà, about 55 kilometers southwest of Nosy Bé, September 7,1960; 26 females, 6 males, and 3 copepodids in the same locality, October 7, 1960; 12 females, 9 males, and 3 copepodids at Andilana, October 8, 1960; 93 females, 96 males, and 3 copepodids at Andilana, A u gust 8, I960; 98 females, 47 males, and 3 copepodids at Nosy Iranja, November 4, 1963; 38 females, 60 males, and 40 copepodids at Antsakoabe, east of Andilana, November 1, 1963; 50 females, 41 males, and 22 copepodids at Navetsy, on the northernmost end of Nosy Bé, November 3,1963; 19 females, 26 males, and 19 copepodids from Nosy N T a n g a m , near Dzamandzar, Nosy Bé, December 2,1963; and 97 females, 37 males, and 11 copepodids from the same locality, January 1, 1964.
Female.—The body length (not including the setae on the caudal rami) is 1.80 m m
1 The specific name axiophilus is derived from Axius, the generic name of the crustacean with which the copepod is associated, and 0iXo$, loving.
(1.66-1.89 m m ) and the greatest width (near the posterior edge of the cephalo-some ) is 0.79 m m ( 0.70-0.86 m m ), based on 10 individuals. The prosome is a little longer than the urosome, the ratio being about 1.4 : 1 ( Fig. 1 ). The tergal plates of pedigerous segments 1-4 (Fig. 2) are well separated laterally (with acute posterolateral angles) and are ornamented, like the rest of the dorsal surface of the prosome, with small knobs and hairs. The segment of leg 5 is smaller, without produced epimera and with two groups of rather long hairs on the dorsolateral areas. A n almost complete intersegmental sclerite occurs between this segment, and the next. The genital segment (Fig. 3) is about 310¡J. in length, without a trace of division into its two constituent somites. It is broadest in its anterior third (268/t), has a moderate ventrolateral expansion in its middle third (211 /x), and is narrowest in its posterior third (169/a), where the sides are nearly parallel. There is an extensive lateral invagination between the anterior and middle thirds. Details of the border of the anterior two-thirds of the genital segment are shown in Figures 4 and 5. T h e egg sacs are attached dorsolaterally on the anterior part of the broadened anterior third. Near the attachment of each sac there are two minute blunt spines, each about 9 /i in length ( Fig. 6) ; posterior to the attachment area there is a single isolated small seta. Each egg sac is oval, about 507 X 253 JU, (based on 3 individuals), and contains m a n y small eggs ( Fig. 1 ).
T h e spermatophores w h e n attached to the female are carried along the posterior third of the genital segment (Fig. 1), behind the middle expansion. The three postgenital segments (Fig. 3) measure in length, respectively, 122, 96, and 72 the last of these segments with a row of minute spinules on the ventral posterior margin near the insertion of the ramus. A row of smaller spinules continues laterally on the ventral posterior margin (see Fig. 7 ) . T w o diagonal rows of very fine spinules form a V on the dorsal anal area. A few minute refractile points
206
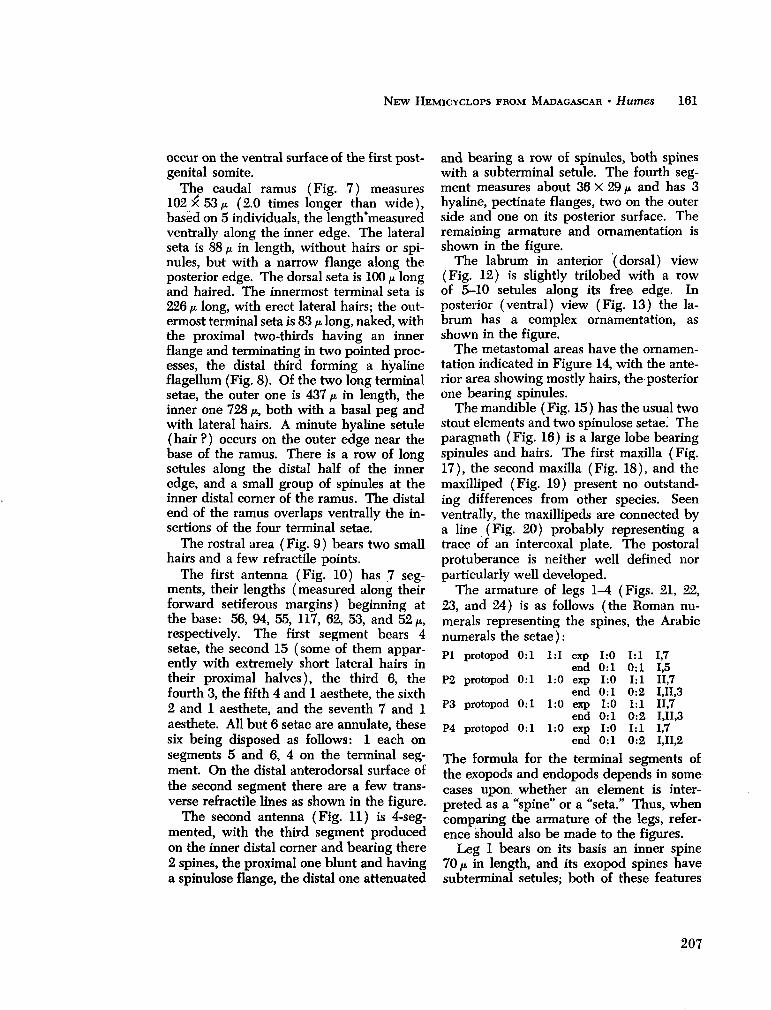
N E W HEMICYCLOPS F R O M MADAGASCAR • Humes 161
occur on the ventral surface of the first post-genital somite.
The caudal ramus (Fig. 7) measures 1 0 2 x 5 3 / * (2.0 times longer than wide), based on 5 individuals, the length'measured ventrally along the inner edge. The lateral seta is 88 /i in length, without hairs or spi-nules, but with a narrow flange along the posterior edge. The dorsal seta is 100 ¡x. long and haired. The innermost terminal seta is 226 p long, with erect lateral hairs; the outermost terminal seta is 83 /* long, naked, with the proximal two-thirds having an inner flange and terminating in two pointed processes, the distal third forming a hyaline flagellum (Fig. 8). Of the two long terminal setae, the outer one is 437 ¡J. in length, the inner one 728 /*, both with a basal peg and with lateral hairs. A minute hyaline setule (hair ?) occurs on the outer edge near the base of the ramus. There is a row of long setules along the distal half of the inner edge, and a small group of spinules at the inner distal corner of the ramus. T h e distal end of the ramus overlaps ventrally the insertions of the four terminal setae.
The rostral area ( Fig. 9 ) bears two small hairs and a few refractile points.
The first antenna (Fig. 10) has 7 segments, their lengths (measured along their forward setiferous margins) beginning at the base: 56, 94, 55, 117, 62, 53, and 52 ,*, respectively. The first segment bears 4 setae, the second 15 (some of them apparently with extremely short lateral hairs in their proximal halves), the third 6, the fourth 3, the fifth 4 and 1 aesthete, the sixth 2 and 1 aesthete, and the seventh 7 and 1 aesthete. All but 6 setae are annulate, these six being disposed as follows: 1 each on segments 5 and 6, 4 on the terminal segment. O n the distal anterodorsal surface of the second segment there are a few transverse refractile lines as shown in the figure.
The second antenna (Fig. 11) is 4-seg-mented, with the third segment produced on the inner distal corner and bearing there 2 spines, the proximal one blunt and having a spinulose flange, the distal one attenuated
and bearing a row of spinules, both spines with a subterminal setule. The fourth segment measures about 36 X 29 ¡x and has 3 hyaline, pectinate flanges, two on the outer side and one on its posterior surface. The remaining armature and ornamentation is shown in the figure.
The labrum in anterior (dorsal) view (Fig. 12) is slightly trilobed with a row of 5-10 setules along its free edge. In posterior (ventral) view (Fig. 13) the labrum has a complex ornamentation, as shown in the figure.
T h e metastomal areas have the ornamentation indicated in Figure 14, with the anterior area showing mostly hairs, the posterior one bearing spinules.
The mandible (Fig. 15) has the usual two stout elements and two spinulose setae. The paragnath (Fig. 16) is a large lobe bearing spinules and hairs. The first maxilla (Fig. 17), the second maxilla (Fig. 18), and the maxilliped (Fig. 19) present no outstanding differences from other species. Seen ventrally, the maxillipeds are connected by a line (Fig. 20) probably representing a trace of an intercoxal plate. The postoral protuberance is neither well defined nor particularly well developed.
The armature of legs 1-4 (Figs. 21, 22, 23, and 24) is as follows (the R o m a n numerals representing the spines, the Arabic numerals the setae):
PI protopod 0:1 1:1 exp 1:0 1:1 1,7 end 0:1 0:1 1,5
P2 protopod 0:1 1:0 exp 1:0 1:1 11,7 end 0:1 0:2 1,11,3
P3 protopod 0:1 1:0 exp 1:0 1:1 11,7 end 0:1 0:2 1,11,3
P4 protopod 0:1 1:0 exp 1:0 1:1 1,7 end 0:1 0:2 1,11,2
T h e formula for the terminal segments of the exopods and endopods depends in some cases upon whether an element is interpreted as a "spine" or a "seta." Thus, w h e n comparing the armature of the legs, reference should also be m a d e to the figures.
Leg 1 bears on its basis an inner spine 70/i in length, and its exopod spines have subterminal setules; both of these features
207
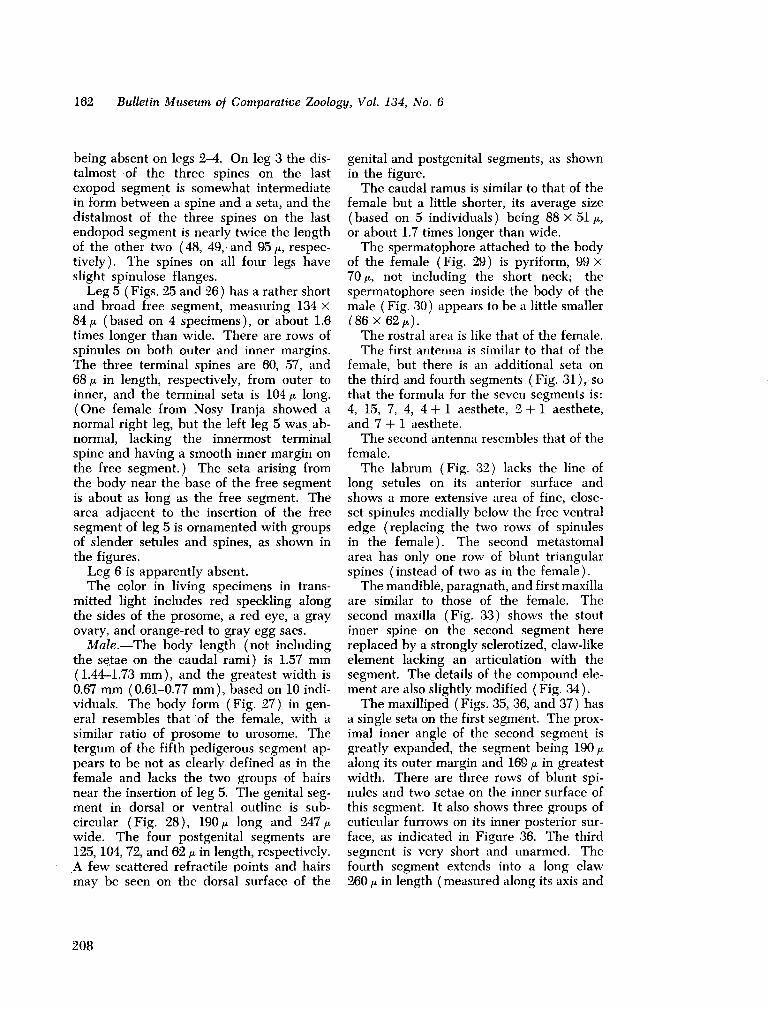
162 Bulletin Museum of Comparative Zoology, Vol. 134, No. 6
being absent on legs 1-A. O n leg 3 the dis-talmost of the three spines on the last exopod segment is somewhat intermediate in form between a spine and a seta, and the distalmost of the three spines on the last endopod segment is nearly twice the length of the other two (48, 49,-and 95/x, respectively). The spines on all four legs have slight spinulose flanges.
Leg 5 ( Figs. 25 and 26 ) has a rather short and broad free segment, measuring 134 X 84 ft. (based on 4 specimens), or about 1.6 times longer than wide. There are rows of spinules on both outer and inner margins. The three terminal spines are 60, 57, and 68 fi in length, respectively, from outer to inner, and the terminal seta is 104 ¡x long. (One female from Nosy Iranja showed a normal right leg, but the left leg 5 was abnormal, lacking the innermost terminal spine and having a smooth inner margin on the free segment.) The seta arising from the body near the base of the free segment is about as long as the free segment. The area adjacent to the insertion of the free segment of leg 5 is ornamented with groups of slender setules and spines, as shown in the figures.
Leg 6 is apparently absent. The color in living specimens in trans
mitted light includes red speckling along the sides of the prosome, a red eye, a gray ovary, and orange-red to gray egg sacs.
Male.—The body length (not including the se,tae on the caudal rami) is 1.57 m m (1.44-1.73 m m ) , and the greatest width is 0.67 m m (0.61-0.77 m m ) , based on 10 individuals. The body form (Fig. 27) in general resembles that of the female, with a similar ratio of prosome to urosome. The tergum of the fifth pedigerous segment appears to be not as clearly defined as in the female and lacks the two groups of hairs near the insertion of leg 5. The genital segment in dorsal or ventral outline is sub-circular (Fig. 28), 190/i. long and 247 ¿i wide. The four postgenital segments are 125,104,72, and 62 ¡i in length, respectively. A few scattered refractile points and hairs may be seen on the dorsal surface of the
genital and postgenital segments, as shown in the figure.
The caudal ramus is similar to that of the female but a little shorter, its average size ( based on 5 individuals ) being 88 X 51 ¡x, or about 1.7 times longer than wide.
The spermatophore attached to the body of the female (Fig. 29) is pyriform, 99 X 70 fx., not including the short neck; the spermatophore seen inside the body of the male (Fig. 30) appears to be a little smaller Í86X62/*).
The rostral area is like that of the female. The first antenna is similar to that of the
female, but there is an additional seta on the third and fourth segments ( Fig. 31 ), so that the formula for the seven segments is: 4, 15, 7, 4, 4 + 1 aesthete, 2 + 1 aesthete, and 7 + 1 aesthete.
The second antenna resembles that of the female.
The labrum (Fig. 32) lacks the line of long setules on its anterior surface and shows a more extensive area of fine, close-set spinules medially below the free ventral edge (replacing the two rows of spinules in the female). The second metastomal area has only one row of blunt triangular spines (instead of two as in the female).
The mandible, paragnath, and first maxilla are similar to those of the female. The second maxilla (Fig. 33) shows the stout inner spine on the second segment here replaced by a strongly sclerotized, claw-like element lacking an articulation with the segment. The details of the compound element are also slightly modified ( Fig. 34 ).
The maxilliped (Figs. 35, 36, and 37) has a single seta on the first segment. The proximal inner angle of the second segment is greatly expanded, the segment being 190/* along its outer margin and 169 ¡x in greatest width. There are three rows of blunt spinules and two setae on the inner surface of this segment. It also shows three groups of cuticular furrows on its inner posterior surface, as indicated in Figure 36. The third segment is very short and unarmed. The fourth segment extends into a long claw 260 fi in length ( measured along its axis and
208
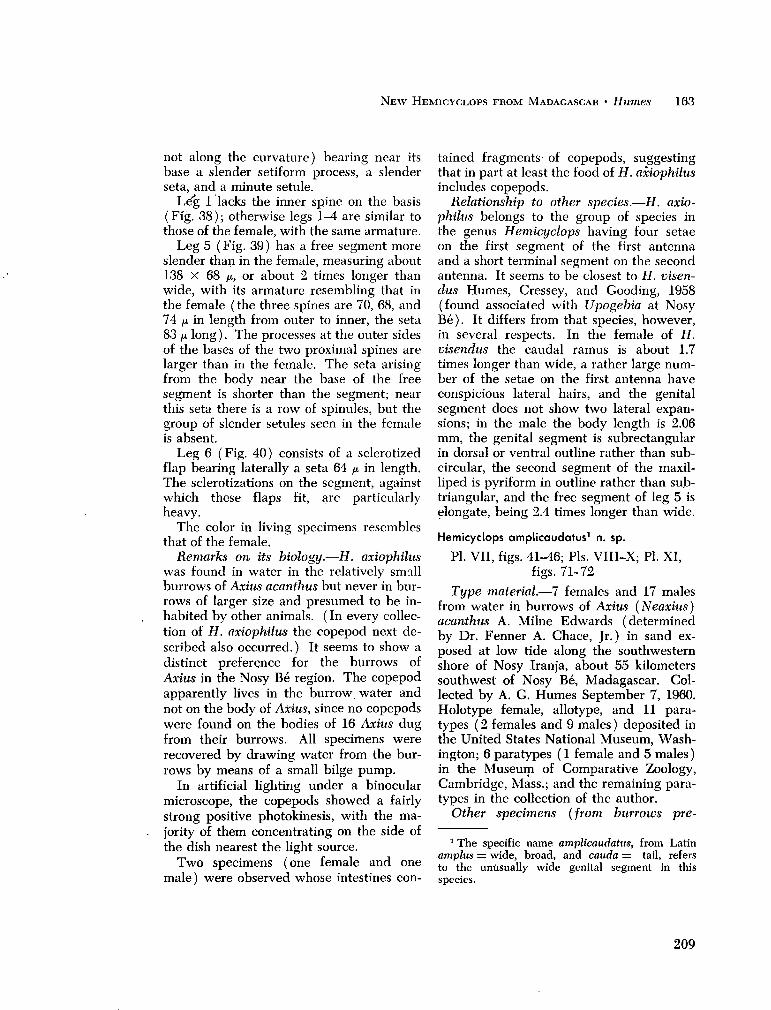
N E W HEMICYCLOPS F R O M MADAGASCAR • Humes 163
not along the curvature) bearing near its base a slender setiform process, a slender seta, and a minute setule.
Leg 1 lacks the inner spine on the basis ( Fig. 38 ) ; otherwise legs 1-4 are similar to those of the female, with the same armature.
Leg 5 ( Fig. 39 ) has a free segment more slender than in the female, measuring about 138 X 68 fi, or about 2 times longer than wide, with its armature resembling that in the female ( the three spines are 70, 68, and 74 ¡j. in length from outer to inner, the seta 83 ¡x. long ). The processes at the outer sides of the bases of the two proximal spines are larger than in the female. The seta arising from the body near the base of the free segment is shorter than the segment; near this seta there is a row of spinules, but the group of slender setules seen in the female is absent.
Leg 6 (Fig. 40) consists of a sclerotized flap bearing laterally a seta 64 /J. in length. The sclerotizations on the segment, against which these flaps fit, are particularly heavy.
The color in living specimens resembles that of the female.
Remarks on its biology.—H. axiophilus was found in water in the relatively small burrows of Axius acanthus but never in burrows of larger size and presumed to be inhabited by other animals. (In every collection of H. axiophilus the copepod next described also occurred.) It seems to show a distinct preference for the burrows of Axius in the Nosy Bé region. The copepod apparently lives in the burrow, water and not on the body of Axius, since no copepods were found on the bodies of 16 Axius dug from their burrows. All specimens were recovered by drawing water from the burrows by means of a small bilge p u m p .
In artificial lighting under a binocular microscope, the copepods showed a fairly strong positive photokinesis, with the m a jority of them concentrating on the side of the dish nearest the light source.
T w o specimens (one female and one male) were observed whose intestines con
tained fragments- of copepods, suggesting that in part at least the food of H. axiophilus includes copepods.
Relationship to other species.—H. axiophilus belongs to the group of species in the genus Hemicyclops having four setae on the first segment of the first antenna and a short terminal segment on the second antenna. It seems to be closest to H. visen-dus H u m e s , Cressey, and Gooding, 1958 (found associated with Upogebia at Nosy B é ) . It differs from that species, however, in several respects. In the female of H. visendus the caudal ramus is about 1.7 times longer than wide, a rather large n u m ber of the setae on the first antenna have conspicious lateral hairs, and the genital segment does not show two lateral expansions; in the male the body length is 2.06 m m , the genital segment is subrectangular in dorsal or ventral outline rather than sub-circular, the second segment of the maxil-liped is pyriform in outline rather than sub-triangular, and the free segment of leg 5 is elongate, being 2.4 times longer than wide.
Hemicyclops amplicaudatus1 n. sp.
PI. VII, figs. 41-46; Pis. VIII-X; PI. XI , figs. 71-72
Type material.—7 females and 17 males from water in burrows of Axius (Neaxius) acanthus A . Milne Edwards (determined by Dr . Fenner A . Chace, Jr. ) in sand exposed at low tide along the southwestern shore of Nosy Iranja, about 55 kilometers southwest of Nosy Bé, Madagascar. Collected by A . G . H u m e s September 7, 1960. Holotype female, allotype, and 11 para-types ( 2 females and 9 males ) deposited in the United States National M u s e u m , W a s h ington; 6 paratypes ( 1 female and 5 males ) in the M u s e u m of Comparative Zoology, Cambridge, Mass.; and the remaining paratypes in the collection of the author.
Other specimens (from burrows pre-
1 The specific name amplicaudatus, from Latin amplus = wide, broad, and cauda = tail, refers to the unusually wide genital segment in this species.
209
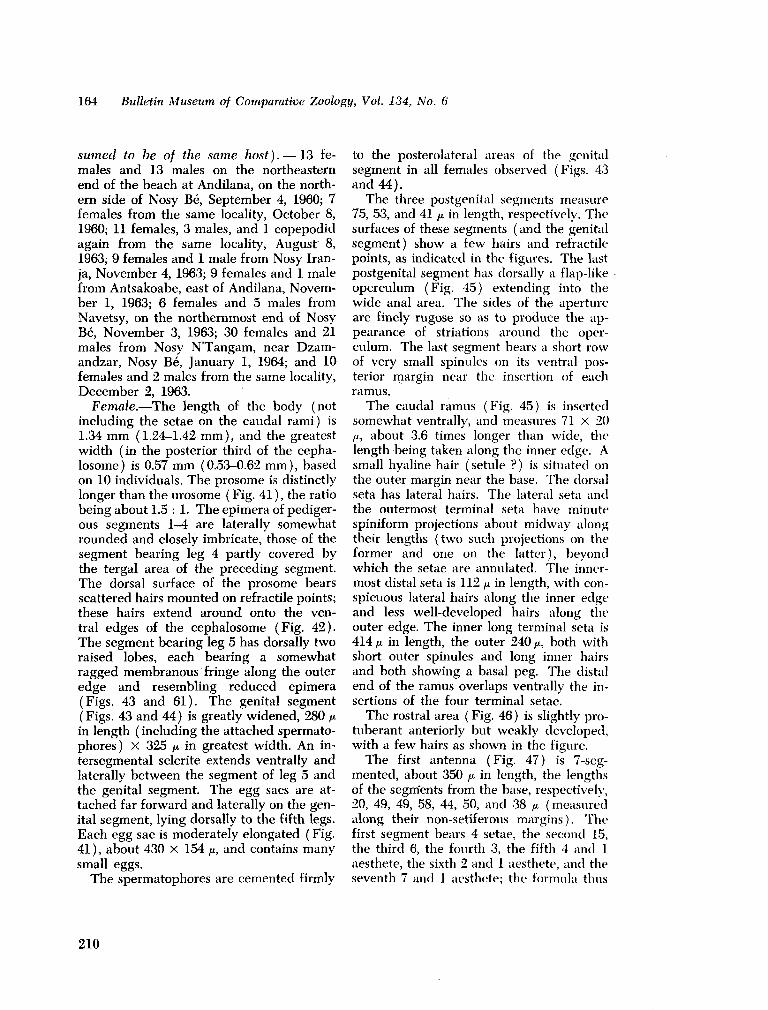
164 Bulletin Museum of Comparative Zoology, Vol. 134, No. 6
sumed to be of the same host). — 1 3 females and 13 males on the northeastern end of the beach at Andilana, on the northern side of Nosy Bé, September 4, 1960; 7 females from the same locality, October 8, 1960; 11 females, 3 males, and 1 copepodid again from the same locality, August 8, 1963; 9 females and 1 male from Nosy Iran-ja, November 4, 1963; 9 females and 1 male from Antsakoabe, east of Andilana, N o v e m ber 1, 1963; 6 females and 5 males from Navetsy, on the northernmost end of Nosy Bé, November 3, 1963; 30 females and 21 males from Nosy N T a n g a m , near D z a m -andzar, Nosy Bé, January 1, 1964; and 10 females and 2 males from the same locality, December 2, 1963.
Female.—The length of the body (not including the setae on the caudal rami) is 1.34 m m (1.24-1.42 m m ) , and the greatest width (in the posterior third of the cepha-losome ) is 0.57 m m ( 0.53-0.62 m m ), based on 10 individuals. The prosome is distinctly longer than the urosome ( Fig. 41 ), the ratio being about 1.5 : 1. The epimera of pediger-ous segments 1-4 are laterally somewhat rounded and closely imbricate, those of the segment bearing leg 4 partly covered by the tergal area of the preceding segment. The dorsal surface of the prosome bears scattered hairs mounted on refractile points; these hairs extend around onto the ventral edges of the cephalosome (Fig. 42). The segment bearing leg 5 has dorsally two raised lobes, each bearing a somewhat ragged membranous fringe along the outer edge and resembling reduced epimera (Figs. 43 and 61). The genital segment ( Figs. 43 and 44) is greatly widened, 280 fi in length ( including the attached spermato-phores) X 325 ¡x in greatest width. A n intersegmental sclerite extends ventrally and laterally between the segment of leg 5 and the genital segment. The egg sacs are attached far forward and laterally on the genital segment, lying dorsally to the fifth legs. Each egg sac is moderately elongated ( Fig. 41), about 430 X 154 fx, and contains m a n y small eggs.
The spermatophores are cemented firmly
to the posterolateral areas of the genital segment in all females observed (Figs. 43 and 44).
The three postgenital segments measure 75, 53, and 41 ¡x in length, respectively. The surfaces of these segments ( and the genital segment) show a few hairs and refractile points, as indicated in the figures. The last postgenital segment has dorsally a flap-like operculum (Fig. 45) extending into the wide anal area. The sides of the aperture are finely rugose so as to produce the appearance of striations around the operculum. The last segment bears a short row of very small spinules on its ventral posterior margin near the insertion of each ramus.
The caudal ramus (Fig. 45) is inserted somewhat ventrally, and measures 71 X 20 ¡J., about 3.6 times longer than wide, the length being taken along the inner edge. A small hyaline hair (setule ?) is situated on the outer margin near the base. The dorsal seta has lateral hairs. The lateral seta and the outermost terminal seta have minute spiniform projections about midway along their lengths (two such projections on the former and one on the latter), beyond which the setae are annulated. The innermost distal seta is 112 ¡x in length, with conspicuous lateral hairs along the inner edge and less well-developed hairs along the outer edge. The inner long terminal seta is 414 ¡x in length, the outer 240 ¿u, both with short outer spinules and long inner hairs and both showing a basal peg. The distal end of the ramus overlaps ventrally the insertions of the four terminal setae.
The rostral area ( Fig. 46 ) is slightly protuberant anteriorly but weakly developed, with a few hairs as shown in the figure.
The first antenna (Fig. 47) is 7-seg-mented, about 350 ¡J. in length, the lengths of the segments from the base, respectively, 20, 49, 49, 58, 44, 50, and 38 ¡x (measured along their non-setiferous margins). The first segment bears 4 setae, the second 15, the third 6, the fourth 3, the fifth 4 and 1 aesthete, the sixth 2 and 1 aesthete, and the seventh 7 and 1 aesthete; the formula thus
210
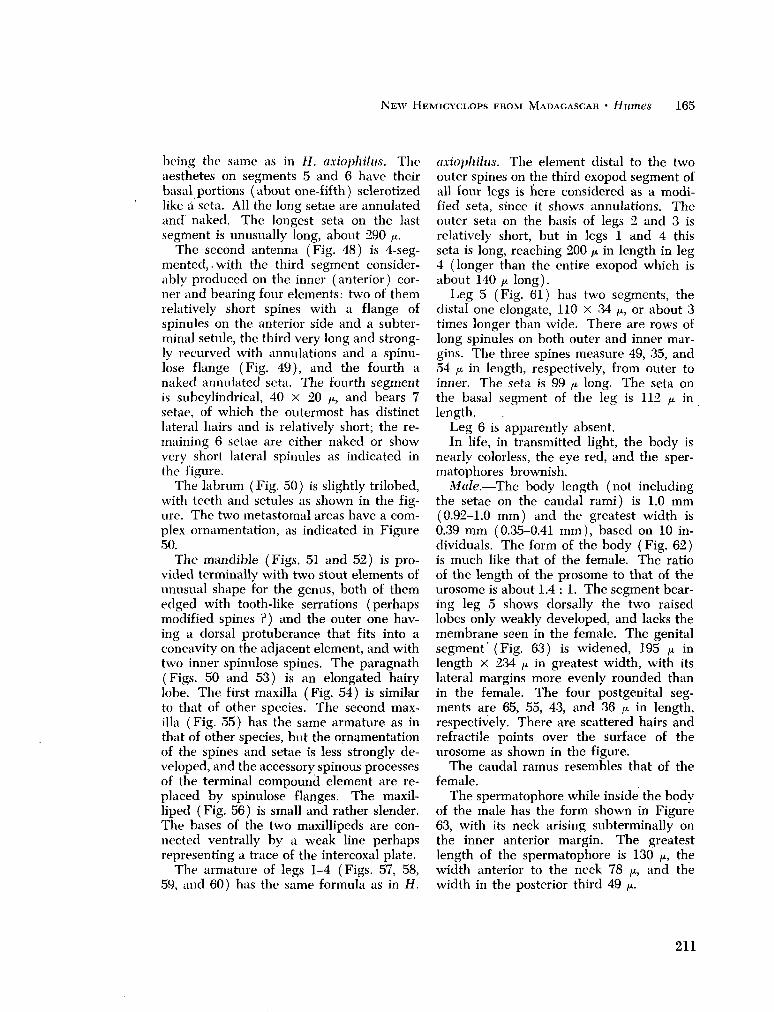
N E W HEMICYCLOPS FROM MADAGASCAR • Humes 165
being the same as in H. axiophitus. The aesthetes on segments 5 and 6 have their basal portions (about one-fifth) sclerotized like á seta. All the long setae are annulated and naked. The longest seta on the last segïnent is unusually long, about 290 ¡x.
The second antenna (Fig. 48) is 4-seg-mented,. with the third segment considerably produced on the inner (anterior) corner and bearing four elements: two of them relatively short spines with a flange of spinules on the anterior side and a subterminal setule, the third very long and strongly recurved with annulations and a spinu-lose flange (Fig. 49), and the fourth a naked annulated seta. The fourth segment is subcylindrical, 40 X 20 n, and bears 7 setae, of which the outermost has distinct lateral hairs and is relatively short; the remaining 6 setae are either naked or show very short lateral spinules as indicated in the figure.
The labrum (Fig. 50) is slightly trilobed, with teeth and setules as shown in the figure. The two metastomal areas have a complex ornamentation, as indicated in Figure 50.
The mandible (Figs. 51 and 52) is provided terminally with two stout elements of unusual shape for the genus, both of them edged with tooth-like serrations (perhaps modified spines ?) and the outer one having a dorsal protuberance that fits into a concavity on the adjacent element, and with two inner spinulose spines. The paragnath (Figs. 50 and 53) is an elongated hairy lobe. The first maxilla (Fig. 54) is similar to that of other species. The second maxilla (Fig. 55) has the same armature as in that of other species, but the ornamentation of the spines and setae is less strongly developed, and the accessory spinous processes of the terminal compound element are replaced by spinulose flanges. The maxil-liped ( Fig. 56 ) is small and rather slender. The bases of the two maxillipeds are connected ventrally by a weak line perhaps representing a trace of the intercoxal plate.
The armature of legs 1-4 (Figs. 57, 58, 59, and 60) has the same formula as in H.
axiophilus. The element distal to the two outer spines on the third exopod segment of all four legs is here considered as a modified seta, since it shows annulations. The outer seta on the basis of legs 2 and 3 is relatively short, but in legs 1 and 4 this seta is long, reaching 200 fx in length in leg 4 (longer than the entire exopod which is about 140 ¡x long).
Leg 5 (Fig. 61) has two segments, the distal one elongate, 110 X .34 ¡x, or about 3 times longer than wide. There are rows of long spinules on both outer and inner margins. The three spines measure 49, 35, and 54 fji in length, respectively, from outer to inner. The seta is 99 ¡x long. The seta on the basal segment of the leg is 112 ¡x in length.
Leg 6 is apparently absent. In life, in transmitted light, the body is
nearly colorless, the eye red, and the sper-matophores brownish.
Male.—The body length (not including the setae on the caudal rami) is 1.0 m m (0.92-1.0 m m ) and the greatest width is 0.39 m m (0.35-0.41 m m ) , based on 10 individuals. The form of the body (Fig. 62) is much like that of the female. The ratio of the length of the prosome to that of the urosome is about 1.4 : 1. The segment bearing leg 5 shows dorsally the two raised lobes only weakly developed, and lacks the membrane seen in the female. The genital segment (Fig. 63) is widened, 195 ¡x in length X 234 ¡x in greatest width, with its lateral margins more evenly rounded than in the female. The four postgenital segments are 65, 55, 43, and 36 ¡x in length, respectively. There are scattered hairs and refractile points over the surface of the urosome as shown in the figure.
The caudal ramus resembles that of the female.
The spermatophore while inside the body of the male has the form shown in Figure 63, with its neck arising subterminally on the inner anterior margin. The greatest length of the spermatophore is 130 ¡x, the width anterior to the neck 78 ¡x, and the width in the posterior third 49 ¡x.
211
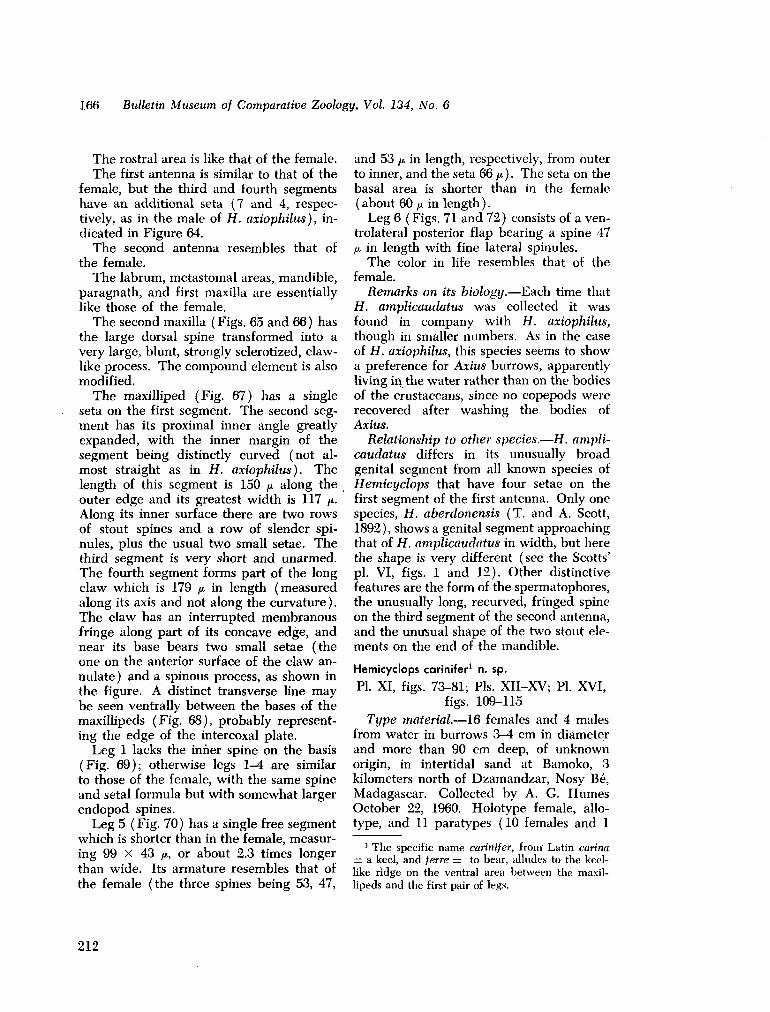
166 Bulletin Museum of Comparative Zoology, Vol. 134, No. 6
The rostral area is like that of the female. The first antenna is similar to that of the
female, but the third and fourth segments have an additional seta (7 and 4, respectively, as in the male of H. axiophilus), indicated in Figure 64.
The second antenna resembles that of the female.
The labrum, metastomal areas, mandible, paragnath, and first maxilla are essentially like those of the female.
The second maxilla (Figs. 65 and 66) has the large dorsal spine transformed into a very large, blunt, strongly sclerotized, clawlike process. The compound element is also modified.
The maxilliped (Fig. 67) has a single seta on the first segment. The second segment has its proximal inner angle greatly expanded, with the inner margin of the segment being distinctly curved (not almost straight as in H. axiophilus). The length of this segment is 150 ii along the outer edge and its greatest width is 117 /¿. Along its inner surface there are two rows of stout spines and a row of slender spi-nules, plus the usual two small setae. The third segment is very short and unarmed. The fourth segment forms part of the long claw which is 179 /x in length (measured along its axis and not along the curvature). The claw has an interrupted membranous fringe along part of its concave edge, and near its base bears two small setae (the one on the anterior surface of the claw annulate ) and a spinous process, as shown in the figure. A distinct transverse line m a y be seen ventrally between the bases of the maxillipeds (Fig. 68), probably representing the edge of the intercoxal plate.
Leg 1 lacks the inner spine on the basis (Fig. 69); otherwise legs 1-4 are similar to those of the female, with the same spine and setal formula but with somewhat larger endopod spines.
Leg 5 (Fig. 70) has a single free segment which is shorter than in the female, measuring 99 X 43 /x, or about 2.3 times longer than wide. Its armature resembles that of the female (the three spines being 53, 47,
and 53 ¡x in length, respectively, from outer to inner, and the seta 66 ii). The seta on the basal area is shorter than in the female ( about 60 ¡x in length ) .
Leg 6 ( Figs. 71 and 72) consists of a ventrolateral posterior flap bearing a spine 47 yu. in length with fine lateral spinules.
The color in life resembles that of the female.
Remarks on its biology.—Each time that H. amplicaudatus was collected it was found in company with H. axiophilus, though in smaller numbers. As in the case of H. axiophilus, this species seems to show a preference for Axius burrows, apparently living in the water rather than on the bodies of the crustaceans, since no copepods were recovered after washing the bodies of Axius.
Relationship to other species.—H. amplicaudatus differs in its unusually broad genital segment from all known species of Hemicyclops that have four setae on the first segment of the first antenna. Only one species, H. aherdonensis (T. and A . Scott, 1892), shows a genital segment approaching that of H. amplicaudatus in width, but here the shape is very different (see the Scotts' pi. VI, figs. 1 and 12). Other distinctive features are the form of the spermatophores, the unusually long, recurved, fringed spine on the third segment of the second antenna, and the unirsual shape of the two stout elements on the end of the mandible.
Hemicyclops carinifer1 n. sp.
PI. XI , figs. 73-81; Pis. X I I - X V ; PI. X V I ,
figs. 109-115
Type material.—16 females and 4 males from water in burrows 3-4 c m in diameter and more than 90 c m deep, of unknown origin, in intertidal sand at Bamoko, 3 kilometers north of Dzamandzar, Nosy Bé, Madagascar. Collected by A . G . H u m e s October 22, 1960. Holotype female, allotype, and 11 paratypes (10 females and 1
1 T h e specific n a m e carinifer, from Latin carina = a keel, and ferre = to bear, alludes to the keellike ridge on the ventral area between the maxillipeds and the first pair of legs.
212
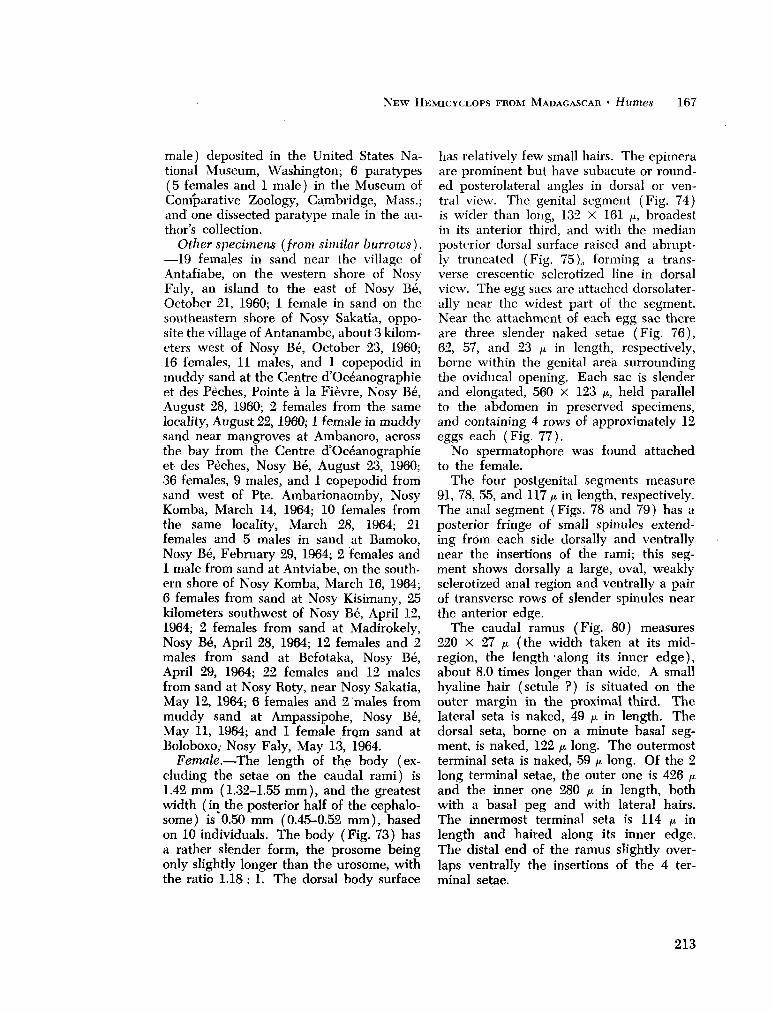
N E W H E M I C Y C L O P S F R O M M A D A G A S C A R • Humes 167
male) deposited in the United States National Museum, Washington; 6 para types (5 females and 1 male) in the Museum of Comparative Zoology, Cambridge, Mass.; and one dissected paratype male in the author's collection.
Other specimens (from similar burrows). —19 females in sand near the village of Antafiabe, on the western shore of Nosy Faly, an island to the east of Nosy Bé, October 21, 1960; 1 female in sand on the southeastern shore of Nosy Sakatia, opposite the village of Antanambe, about 3 kilometers west of Nosy Bé, October 23, 1960; 16 females, 11 males, and 1 copepodid in m u d d y sand at the Centre d'Océanographie et des Pêches, Pointe à la Fièvre, Nosy Bé, August 28, 1960; 2 females from the same locality, August 22,1960; 1 female in m u d d y sand near mangroves at Ambanoro, across the bay from the Centre d'Océanographie et des Pêches, Nosy Bé, August 23, 1960; 36 females, 9 males, and 1 copepodid from sand west of Pte. Ambarionaomby, Nosy K o m b a , March 14, 1964; 10 females from the same locality, March 28, 1964; 21 females and 5 males in sand at Bamoko , Nosy Bé, February 29, 1964; 2 females and 1 male from sand at Antviabe, on the southern shore of Nosy K o m b a , March 16, 1964; 6 females from sand at Nosy Kisimany, 25 kilometers southwest of Nosy Bé, April 12, 1964; 2 females from sand at Madirokely, Nosy Bé, April 28, 1964; 12 females and 2 males from sand at Befotaka, Nosy Bé, April 29, 1964; 22 females and 12 males from sand at Nosy Roty, near Nosy Sakatia, M a y 12, 1964; 6 females and 2 males from m u d d y sand at Ampassipohe, Nosy Bé, M a y 11, 1964; and 1 female from sand at Boloboxo, Nosy Faly, M a y 13, Í964.
Female.—The length of the body (excluding the setae on the caudal rami) is 1.42 m m (1.32-1.55 m m ) , and the greatest width ( in the posterior half of the cephalo-some) is 0.50 m m (0.45-0.52 m m ) , based on 10 individuals. The body (Fig. 73) has a rather slender form, the prosome being only slightly longer than the urosome, with the ratio 1.18 : 1. The dorsal body surface
has relatively few small hairs. The epimera are prominent but have subacute or rounded posterolateral angles in dorsal or ventral view. The genital segment (Fig. 74) is wider than long, 132 X 161 /u, broadest in its anterior third, and with the median posterior dorsal surface raised and abruptly truncated (Fig. 75)., forming a transverse crescentic sclerotized line in dorsal view. The egg sacs are attached dorsolater-ally near the widest part of the segment. Near the attachment of each egg sac there are three slender naked setae (Fig. 76), 62, 57, and 23 ¡x in length, respectively, borne within the genital area surrounding the oviducal opening. Each sac is slender and elongated, 560 X 123 ¡i, held parallel to the abdomen in preserved specimens, and containing 4 rows of approximately 12 eggs each (Fig. 77).
N o spermatophore was found attached to the female.
The four postgenital segments measure 91, 78, 55, and 117 ¡x in length, respectively. The anal segment (Figs. 78 and 79) has a posterior fringe of small spinules extending from each side dorsally and ventrally near the insertions of the rami; this segment shows dorsally a large, oval, weakly sclerotized anal region and ventrally a pair of transverse rows of slender spinules near the anterior edge.
The caudal ramus (Fig. 80) measures 220 X 27 /j. (the width taken at its mid-region, the length'along its inner edge), about 8.0 times longer than wide. A small hyaline hair (setule ?) is situated on the outer margin in the proximal third. The lateral seta is naked, 49 ¡J. in length. The dorsal seta, borne on a minute basal segment, is naked, 122 /* long. The outermost terminal seta is naked, 59 /* long. Of the 2 long terminal setae, the outer one is 426 ju, and the inner one 280 /x in length, both with a basal peg and with lateral hairs. The innermost terminal seta is 114 ^ in length and haired along its inner edge. The distal end of the ramus slightly overlaps ventrally the insertions of the 4 terminal setae.
213
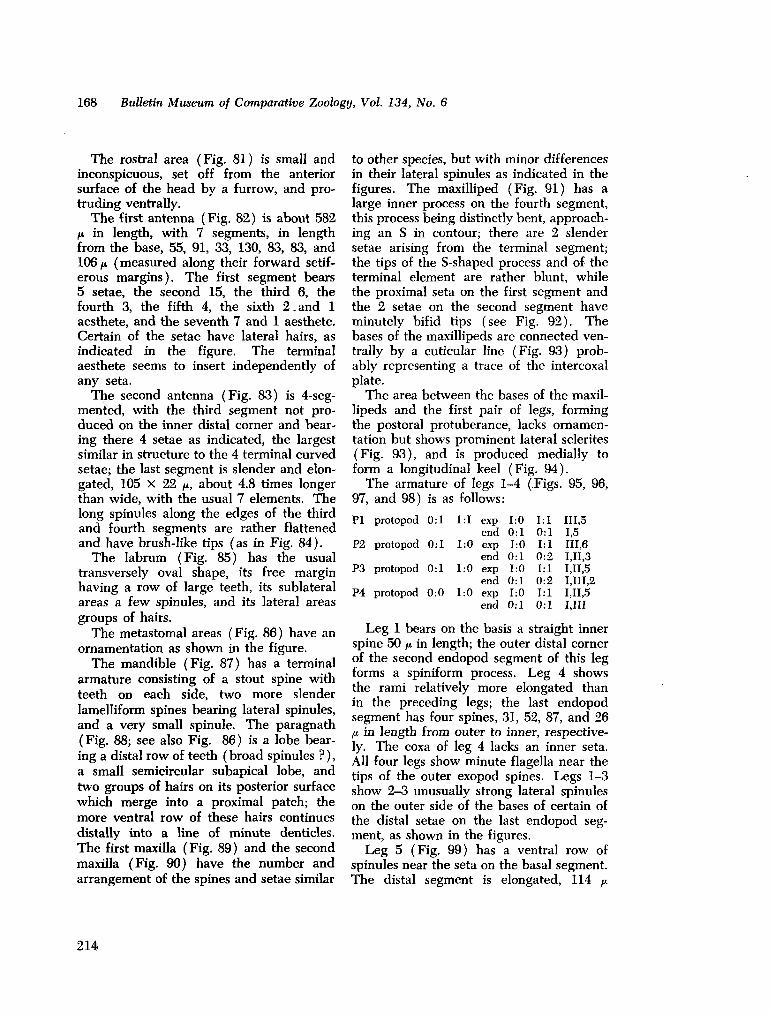
168 Bulletin Museum of Comparative Zoology, Vol. 134, No. 6
The rostral area (Fig. 81) is small and inconspicuous, set off from the anterior surface of the head by a furrow, and protruding ventrally.
T h e first antenna (Fig. 82) is about 582 m in length, with 7 segments, in length from the base, 55, 91, 33, 130, 83, 83, and 106 JU. (measured along their forward setif-erous margins). The first segment bears 5 setae, the second 15, the third 6, the fourth 3, the fifth 4, the sixth 2 .and 1 aesthete, and the seventh 7 and 1 aesthete. Certain of the setae have lateral hairs, as indicated in the figure. The terminal aesthete seems to insert independently of any seta.
The second antenna (Fig. 83) is 4-seg-mented, with the third segment not produced on the inner distal corner and bearing there 4 setae as indicated, the largest similar in structure to the 4 terminal curved setae; the last segment is slender and elongated, 105 X 22 ¡x, about 4.8 times longer than wide, with the usual 7 elements. The long spinules along the edges of the third and fourth segments are rather flattened and have brush-like tips (as in Fig. 84).
T h e labrum (Fig. 85) has the usual transversely oval shape, its free margin having a row of large teeth, its sublateral areas a few spinules, and its lateral areas groups of hairs.
The metastomal areas (Fig. 86) have an ornamentation as shown in the figure.
The mandible (Fig. 87) has a terminal armature consisting of a stout spine with teeth on each side, two more slender lamelliform spines bearing lateral spinules, and a very small spinule. The paragnath (Fig. 88; see also Fig. 86) is a lobe bearing a distal row of teeth (broad spinules ?), a small semicircular subapical lobe, and two groups of hairs on its posterior surface which merge into a proximal patch; the more ventral row of these hairs continues distally into a line of minute denticles. The first maxilla ( Fig. 89 ) and the second maxilla (Fig. 90) have the number and arrangement of the spines and setae similar
to other species, but with minor differences in their lateral spinules as indicated in the figures. The maxilliped (Fig. 91) has a large inner process on the fourth segment, this process being distinctly bent, approaching an S in contour; there are 2 slender setae arising from the terminal segment; the tips of the S-shaped process and of the terminal element are rather blunt, while the proximal seta on the first segment and the 2 setae on the second segment have minutely bifid tips (see Fig. 92). The bases of the maxillipeds are connected ventrally by a cuticular line (Fig. 93) probably representing a trace of the intercoxal plate.
The area between the bases of the maxillipeds and the first pair of legs, forming the postoral protuberance, lacks ornamentation but shows prominent lateral sclerites (Fig. 93), and is produced medially to form a longitudinal keel (Fig. 94).
The armature of legs 1-4 (Figs. 95, 96, 97, and 98) is as follows:
PI protopod 0:1 1:1 exp 1:0 1:1 111,5 end 0:1 0:1 1,5
P2 protopod 0:1 1:0 exp 1:0 1:1 111,6 end 0:1 0:2 1,11,3
P3 protopod 0:1 1:0 exp 1:0 1:1 1,11,5 end 0:1 0:2 1,111,2
P4 protopod 0:0 1:0 exp 1:0 1:1 1,11,5 end 0:1 0:1 I,IH
Leg 1 bears on the basis a straight inner spine 50 JU. in length; the outer distal corner of the second endopod segment of this leg forms a spiniform process. Leg 4 shows the rami relatively more elongated than in the preceding legs; the last endopod segment has four spines, 31, 52, 87, and 26 fi in length from outer to inner, respectively. The coxa of leg 4 lacks an inner seta. All four legs show minute flagella near the tips of the outer exopod spines. Legs 1-3 show 2-3 unusually strong lateral spinules on the outer side of the bases of certain of the distal setae on the last endopod segment, as shown in the figures.
Leg 5 (Fig. 99) has a ventral row of spinules near the seta on the basal segment. The distal segment is elongated, 114 ¡J.
214
N E W HEMICYCLOPS FROM MADAGASCAR • Humes 169
along its inner edge; it is wider in its basal half (45 /i) than in its distal half (36 ^ ) , and deeply indented at the insertion of the lateral seta. There is an outer marginal row of spinules on the basal half, and a similar inner row of spinules along part of the margin of the distal half. The outer margin forms a blunt projection near the insertion of the marginal spine and also near the distal outer spine; there is a row of slender spinules ventrally on these projections. There is also a row of minute spinules ventrally near the insertion of the inner distal spine. The 3 spines and the seta measure 42, 42, 77, and 49 ¡x in length from outer to inner, respectively.
Leg 6 is apparently absent, but m a y be represented by the 3 setae near the egg sac attachments.
The color in living specimens, in transmitted light, is translucid, slightly amber or reddish brown, with reddish orange globules in the prosome, the ovary dark gray, the eye red, and the egg sacs reddish gray to orange.
Male.—The body length (not including the setae on the caudal rami) is 1.61 m m (1.57-1.66 m m ) and the greatest width is 0.55 m m (0.53-0.58 m m ) , based on 4 individuals. The ratio of the prosome to urosome is 1.35 : 1, with the prosome only slightly longer (Fig. 100) than in the female. The genital segment (Fig. 101) is nearly quadrate in dorsal or ventral view, measuring 156 X 151 p. The 4 postgenital segments have proportions similar to those of the female. The ornamentation of the anal segment is also like that in the female.
The caudal ramus is as in the female. Spermatophores were seen only inside
the genital segment of the male ( Fig. 101 ) . The rostral area resembles that of the
female. The first antenna is similar to that of the
female, but the third segment has 7 setae and the fourth 4 setae (see Fig. 102).
The second antenna is like that of the female.
T h e labium ( Fig. 103 ) has a row of slender spines along its free edge and a row of
additional, broad, scale-like denticles curving dorsally along the posteroventral face on either side. The metastomal areas are m u c h like those of the female, but the most posterior rows of spines are smaller (Fig. 104).
The mandible, paragnath, first maxilla, and second maxilla are similar to those of the female.
The maxilliped (Figs. 105 and 106) has 2 unequal setae on the first segment, the proximal seta with prominent lateral spinules, the distal one naked. The second segment is slender, 239 X 101 ¡x, with 2 rows of broad spinules and 2 annulated setae on its inner surface; one of these rows is interrupted by the bases of the setae, proximal to which the row becomes a series of blunt serrations and then a group of broad spinules. The third segment is short and unarmed. The fourth segment forms part of the claw, which is 260 ¡i in length (measured along its axis and not along the curvature), slightly sinuous in outline, and with a distinct flexure near its tip, where there is a small outer lamella and 2 rows of denticle-like ridges which decrease in size proximally. Near the base of the claw there m a y be seen a setiform process and 3 slender setae (the one nearest to the process recurved and unilaterally haired) (see Fig. 107).
The postoral area between the bases of the maxillipeds and the first pair of legs ( Fig. 108 ) is raised to form a ventral longitudinal keel (Fig. 109). This keel bears a row of serrations along its edge, a short transverse crescentic row of irregular serrations anteriorly, and laterally a few minute refractile points. Between the bases of the second maxillae there is a minute bifurcated sclerotization.
Legs 1-4 have the same number and arrangement of spines and setae as in the female. T h e inner spine on the basis of leg 1 (Fig. 110). is larger than in the female and slightly recurved, about 77 /a in length, with a transverse weakening in the sclerotization in its basal third, a row of minute refractile points, and a cluster of rather
215
170 Bulletin Museum of Comparative Zoology, Vol. 134, No. 6
blunt minute spinules near its tip (Fig. 111). The second endopod segment of leg 1 does not show a distal outer spiniform process as in the female. The middle spine on the outer side of the third exopod segment of leg 1 is relatively smaller than in the female. Leg 2 shows the 3 spines on the third endopod segment of different proportions than those of the female, their lengths from outer to inner being 38, 28, and 77 , the middle spine being distinctly shorter and more slender (Fig. 112). There is on this endopod only a single terminal spiniform process. (One male showed the distal margin of the third endopod segments of leg 3 with a single spiniform process between the 2 middle spines on one leg, and with a bifurcated process at this point on the opposite leg, as indicated in Fig. 113).
Leg 5 (Fig. 114) is similar to that of the female, but the row of spinules on the distal inner margin of the distal segment is shorter, and the processes near the bases of the 2 outermost spines are more acute than rounded.
Leg 6 (Fig. 115) consists of a small ventrolateral flap on whose extreme lateral portion a slender seta 34 ¡J. in length is borne on a slight prominence.
The color in living specimens resembles that of the female.
Remarks on its biology.—H. carinifer frequently occurred in the same burrows with the following species ( in 10 of 16 collections ).
Relationship to other species. — This copepod falls in the group of Hemicyclops species having five setae on the first segment of the first antenna, an elongated terminal segment on the second antenna, and elongated caudal rami. Four species attributable to this group (H. elongatus Wilson, 1937, H. adhaerens (Williams, 1907), H. subadhaerens Gooding, 1960, and H. arenicolae Gooding, 1960) have in the female a caudal ramus which is much shorter than in H. carinifer ( only a little more than 4 times longer than wide, or less). These species also appear ( as nearly as can be as
certained from the published descriptions) to lack two features of H. carinifer, namely, the projections near the insertions of the two outer spines on the distal segment of leg 5, and the keel on the ventral surface between the maxillipeds and the first legs.
Hemicyclops diremptus1 n. sp.
PI. XVI, figs. 116-117; Pis. XVII-XX; PI. XXI, figs. 147-152
Type material.—6 females and 5 males from burrows of unknown origin 3-4 cm in diameter and more than 90 cm deep in intertidal sand near the village of Anta-fiabe, on the western shore of Nosy Faly, an island to the east of Nosy Bé, Madagascar. Collected by A . G . Humes October 21, 1960. Holotype female, allotype, and 3 paratypes (2 females and 1 male) deposited in the United States National Museum, Washington; 2 paratypes (1 female and 1 male) in the Museum of Comparative Zoology, Cambridge, Mass.; and the remaining paratypes in the author's collection.
Other specimens ( from similar burrows ). —1 male from sandy mud in front of the Centre d'Océanographie et des Pèches, Nosy Bé, August 22, 1960; 8 females in sand west of Pte. Ambarionaomby, Nosy Komba, March 14, 1964; 2 females from the same locality, March 28, 1964; 1 male from sand north of Antafiabe, Nosy Faly, March 15, 1964; 5 females and 13 males from sand at Nosy Kisimany, April 12, 1964; 1 female and 2 males from sand at Madirokely, Nosy Bé, April 28, 1964; 176 females and 118 males from sand at Befo-taka, Nosy Bé, April 29, 1964; 77 females and 21 males from sand at Nosy Roty, near Nosy Sakatia, May 12, 1964; 15 females and 22 males from muddy sand at Ampas-sipohe, Nosy Bé, May 11, 1964; and 1 female and 2 males from sand at Boloboxo, Nosy Faly, May 13, 1964.
Female.—The length of the body (not including the setae on the caudal rami) is
1 The specific name diremptus, from Latin di-rempere = to separate, divide, alludes to the divided condition of the genital segment in the female.
216
N E W H E M I C Y C L O P S F R O M M A D A G A S C A R • Humes 171
1.90 m m (1.82-1.97 m m ) , and the greatest width ( in the posterior part of the cephalo-some) is 0.81 m m (0.76-0.87 m m ) , based on 6 individuals. The prosome is moderately broad and a little longer than the uro-sorrie, the ratio being about 1.37 : 1 (Fig. 116). In dorsal or ventral view the epimera are conspicuous and angulate. The segment bearing leg 5 is narrow in front and broadened posteriorly at the level of the legs, where it shows a dorsal transverse sclerotized ridge (probably a remnant of the epimeron of this segment). A n intersegmental sclerite occurs between the first two urosomal segments. The genital segment (Figs. 117, 118, and 119) is widened and divided transversely into an anterior portion bearing the attachments of the egg sacs and a slightly narrower posterior portion. The length of the genital segment is 195 ¡x, the anterior part being 117 X 273 ¡x and the posterior part 78 X 229 ¡x.
The egg sacs are attached dorsolateral on the anterior half of the genital segment between small dorsolateral and more extensive ventrolateral flanges (see Fig. 119). Each egg sac is about 560 X 200 ¡x, and contains numerous small eggs (Figs. 116 and 117).
The three postgenital segments measure respectively 114 X 178 ¡x, 62 X 133 ¡x, and 62 X 114 fi, the first segment being longer, wider, and more globose than the other two, which are somewhat more closely associated. The last segment has near the insertion of each caudal ramus a ventral transverse row of about four small spinules followed by a row of much smaller spinules (see Figs.'119, 120, and 121). The thinly sclerotized anal area occupies virtually the whole dorsal side of the anal segment. There is no anal plate, but the posterior edge of the preceding postgenital segment is modified ( see Fig. 121 ).
The dorsal surface of the prosome and the dorsal and ventral surfaces of the uro-some are covered with minute hairs, each arising from a refractile point.
The caudal ramus (Fig. 121) is elongated,
117 X 24 ¿u (the length measured along the inner edge and the width at the middle of the ramus ), nearly 5 times longer than wide. A small hyaline hair occurs on the basal outer margin and a few minute hairs are to be found on the ventral surface. The lateral seta is 47 ¡x in length and the outermost terminal seta is 65 ¡x, including the basal shaft and the distal flagelliform part. The dorsal seta is 91 ¡x long and bears only a few lateral hairs. The innermost terminal seta is 112 /x in length with an inner row of hairs. The inner long terminal seta is 728 ¡x and the outer one 437 )x in length, both with lateral spinules, these being at first widely spaced and long, then in the distal two-thirds of the setae short and closely spaced.
The rostral area ( Fig. 122 ) is very weakly developed.
The first antenna (Fig. 123) is about 400 fx long, 7-segmented, the segments, beginning at the base, 20, 55, 52, 88, 51, 55, and 47 ¡x in length ( measured along their non-setiferous margins). The formula for the armature is 4, 15, 6, 3, 4 + 1 aesthete, 2 + 1 aesthete, and 7 + 1 aesthete. Most of the setae are annulated with minute lateral hairs, but there are a few setae which are entire with longer lateral hairs (1 on the second segment, 2 on the fifth, 1 on the sixth, and 4 on the seventh).
The second antenna (Fig. 124) is 4-seg-mented, with the third segment produced on the inner distal corner where it bears four elements: proximally a small posterior seta, more distally a large and slightly sinuous spine, and distally two more slender and somewhat recurved spines with sub-terminal setules. The fourth segment is quadrate in flat view, 29 X 29 ¡x, and bears seven setae, the four long curved setae with their tips not as attenuated as the others, and the outermost of these seven setae lying across the bases of the others and having long lateral spinules.
The labrum (Fig. 125) is tilted forward, so that the ventral view shown in the figure is equivalent to posterior in other species.
217
172 Bulletin Museum of Comparative Zoology, Vol. 134, No. 6
The labrum is somewhat trilobed and has setules and teeth as shown in the figure; there is a curved row of long hyaline setules along the anteroventral margin. The meta-stomal areas have a complex ornamentation, as indicated in Figure 125.
The mandible (Fig. 126) has the usual two stout elements and two well-developed setae with lateral hairs. The paragnath (Figs. 125 and 127) is a stout hairy lobe. The first maxilla (Fig. 128) is similar in structure to that of other species; it has prominent lateral spinules on certain of the setae. The second maxilla (Fig. 129) is armed as in other species, the innermost spine on the second segment having long outer spinules. The maxilliped (Fig. 130) shows the two setae on the second segment with prominent lateral spinules, and the margin distal to these two setae bears a row of hairs. The last maxilliped segment (Fig. 131 ) bears two large setae ( spines ? ) ( one of them with about five very long slender spinules on its inner margin), four more slender setae, and a row of 4-5 slender hyaline setules on the outer side near the bases of the spines. The bases of the maxil-lipeds are connected by a ventral transverse line as indicated in Figure 125.
The postoral protuberance is poorly differentiated.
The armature of legs 1-4 (Figs. 132, 133, 134, and 135) is similar to that of H. axio-philus and H. amplicaudatus, although certain elements are difficult to classify as a "spine" or a "seta." In leg 1 the inner spine on the basis is 65 ft in length, its inner margin serrated and its outer margin with a row of short hairs; the margin of the basis medial to this spine is prominently rounded and smooth. In legs 2—4 this inner area of the basis has a broadly rounded margin and bears a row of short marginal setules and another row of hyaline spinules on its anterior surface. The ventral margin of the intercoxal plate of leg 1 bears on each side a row of hairs; in legs 2—4 this margin has on each side a patch of long spinules. The
outer margin of the coxa of leg 4 lacks the long hairs seen in the preceding three legs.
Leg 5 (Fig. 136) has a rather broad and short free segment (its greatest diagonal length from the outer proximal corner to the inner distal angle 143 ¡x, its length along the inner side 125 ix, its greatest width 105 tx ) . There are rows of spinules on the distal half of both the outer and inner margins. The three spines are 48, 63, and 50 ¡x in length, respectively, from outer to inner; the seta is very short, only 34 ¡x in length. A row of spinules occurs laterally on the basal area of the leg just anterior to the insertion of the free segment. The seta on the basal area is 68 ix long. Traces of a basal segment m a y be seen in the pattern of scle-rotization on the segment of leg 5; the fifth legs are joined ventrally by a strong ridge near the posterior edge of this segment.
Leg 6 is apparently absent. The color in living specimens, in trans
mitted light, is translucid, the eye red. Male.—The length of the body (not in
cluding the setae on the caudal rami) is 1.14 m m (1.04-1.28 m m ) and the width in the posterior part of the cephalosome is 0.48 m m (0.44-0.52 m m ) , based on 4 individuals. The ratio of the length of the prosome to that of the urosome is about 1.36 : 1 (Fig. 137). The epimera are prominent as in the female. The genital segment (Fig. 138) is undivided and subcircular in dorsal or ventral view, 143 ¡x long X 174 n wide. The spermatophore (seen only within the body of the male) is elongated (Fig. 139), 99 X 36 n including the neck of 13 ¡x.
The four postgenital segments are respectively 68, 60, 40, and 40 ¡x in length.
There are hairs and refractile points on both the urosome and prosome as in the female, but the general sclerotization seems to be stronger.
The caudal ramus (Fig. 140) is shorter than in the female, 55 ¡x ( the length along the inner edge) X 28 ¡x ( the greatest width ), or two times longer than wide. The setae are arranged as in the female.
218
N E W H E M I C Y C L O P S F R O M M A D A G A S C A R • Humes 173
The rostral area (Fig. 141) is a little better defined than in the female.
The first antenna is similar to that of the female, but the third segment has 7 setae and the fourth 4 setae (Fig. 142). The second antenna is like that of the female.
The labrum and the metastomal areas (Fig. 143) are generally like those of the female, but the long hyaline setules on the anteroventral margin of the labrum are absent, and the second metastomal area shows only a single row of broad tooth-like spines.
The mandible, paragnath, and first m a x illa are like those of the female. The second maxilla (Fig. 144) is similar to that of the female, but the spinules on the innermost spine of the second segment are m u c h less developed.
The maxilliped (Figs. 145 and 146) has a single long seta on the first segment. The second segment has its proximal inner angle greatly expanded, making the segment almost pyriform in outline. The length of this segment along the outer margin is 114 ¡x, its greatest length along the inner spinose margin is 143 ¡x, and the greatest width is 112 /x. There are three rows of stout, rather blunt spines along the inner margin, in addition to the usual two setae. The third segment is very short and unarmed. The fourth segment forms part of a long claw 148 ¡x in length ( measured along its axis and not along the curvature), bearing near its base a small seta on the posterior side, and a spinous process and a minute setule on the inner curvature. The transverse line on the ventral surface between the bases of the maxillipeds is weakly developed.
Leg 1 lacks the inner spine on the basis (Fig. 147). Otherwise the spine and setal formula of legs 1-4 is like that of the female. There is a slight sexual dimorphism in the last endopod segment of legs 2-4 (Figs. 148, 149, and 150), where the terminal spine-like processes are reduced and the sclerotization at the base of the two distal spines is stronger.
Leg 5 (Fig. 151) has a free segment
which is not as broad as in the female, m e a suring 85ja long (along the inner side) X 51 ¡x in greatest width. Its armature is like that of the female.
Leg 6 ( Fig. 152 ) consists of a ventral flap oh the posterior part of the genital segment. It bears .a stout spine 30 ¡x long with minute lateral spinules.
The color is like that of the female. Remarks on its biology.—H. diremptus
was often found in burrows along with H. carinifer (in 10 of 11 collections).
Relationship to other species.—H. diremptus belongs to the group of species with four setae on the basal segment of the first antenna, along with H. axiophilus and H. amplicaudatus. It differs from all other species in this group in having a distinctly divided genital segment in the female. In the original description of H. bacescui (Serban, 1956) the genital segment is described as double, and Stock (1959), w h o has restudied the species, mentions a trace of a suture on its dorsal surface. The division is m u c h weaker, however, than in H. diremptus. H. bacescui further differs from the n e w species in the form of the fifth legs and the caudal rami. H. indicus Sewell, 1949, shows lateral indentations on the female genital segment (see Sewell's fig. 1 6 A ) , but the segment is single. Although this species shows certain similarities to H. diremptus (for example, in the form of the fifth legs and in the armature of the second maxilla ) , it differs in the form of the caudal ramus, in the relative length of the second and third segments of the first antenna, and in the size of the body. The female of H. leggii (Thompson and Scott, 1903) is unknown, but the male differs from that of the n e w species in its body length, in the relative lengths of the first antennal segments, in the form of the innermost terminal spine on the second segment of the second maxilla, in the shape of the second segment of the maxilliped, and in the size of the caudal ramus. The fifth leg of H. leggii seems to resemble closely that of the n e w species.
219
174 Bulletin Museum of Comparative Zoology, Vol. 134, No. 6
Hemicyclops kombensis1 n. sp.
PI. X X I , figs. 153-154; Pis. X X I I - X X V I
Type material.—3 females and 2 males from water in burrows of unknown origin 3-4 c m in diameter and more than 90 c m deep in intertidal sand west of Pte. A m b a -rionaomby, Nosy K o m b a , near Nosy Be, Madagascar. Collected by A . G . H u m e s March 14, 1964. Holotype female, allotype, and one paratype female deposited in the United States National M u s e u m , Washington; the remaining female and male dissected and in the collection of the author.
Other specimens ( from similar burrows ) . —1 male from sand in front of the village of Antviabe, on the southern shore of Nosy K o m b a , March 16, 1964; 1 female and 1 male from sand at Madirokely, Nosy Be, April 28, 1964; and 1 female from sand at Nosy Roty, near Nosy Sakatia, M a y 12, 1964.
Female.—The length of the body (not including the setae on the caudal rami) is 2.27 m m (2.26-2.29 m m ) , and the greatest width is 0.83 m m (0.80-0.89 m m ) , based on 3 individuals. The prosome is moderately broad and only slightly longer than the urosome, the ratio being about 1.08 : 1 (Fig. 153). In dorsal or ventral view the epimera of the segments of legs 1-4 are conspicuous and angulate. The segment of the fifth legs shows a dorsal transverse sclerotized band, bearing a row of long slender spinules on each side (Fig. 154). A n intersegmental sclerite, best seen from the ventral side, occurs between the first two segments of the urosome. The genital segment (Figs. 154 and 155) is elongated, with the sides nearly parallel except for slight swellings near the attachments of the egg sacs, and shows dorsally in the middle of the segment a transverse internal scle-rocization. The segment measures 475 ¿i in le.igth; its width in the anterior one-fourth is 305 n and in the posterior half 27Í ¡x.
1 The specific name kombensis, a combination made from Nosy K o m b a and Latin -ensis = living in, refers to the island where this species was first found.
The egg sacs are attached ventrolateral^ far forward on the genital segment, between small dorsal and ventral flanges ( Fig. 155 ). Near the point of attachment there are two minute, rather obscure spiniform processes, each about 10 ¡x in length. Each egg sac is elongated oval, 633 X 249 ¡x, and contains numerous rather small eggs ( Fig. 156 ).
The three postgenital segments measure, respectively, 203 X 220,140 X 184, and 92 x 158 ¡x. The last segment is thus shorter and narrower than the preceding ones; there is no apparent anal operculum. Above and below the insertion of each caudal ramus there are slight flanges, the dorsal one smooth, the ventral one with an outer row of minute spinules and an inner row of larger spinules (Fig. 157).
The dorsal surface of the prosome and the dorsal and ventral surfaces of the urosome bear minute hairs and refractile points.
The caudal ramus (Fig. 157) is moderately elongated, 170 ¡x in length, 70 ¡x wide near the base, 62 /¿ at the middle, and 54 ¡x near the distal end; taking the width at the middle, the ramus is 2.74 times longer than wide. A small hyaline hair arises from the outer basal margin. The lateral seta is 68 ¡x in length and shows only a slight differentiation into a basal shaft and a distal flagel-lum. The outermost terminal seta is 117 ¡x long, including the basal shaft of 68 ¡x and the distal flagelliform part of 49 ¡x. The dorsal seta is 149 ¡x long and bears a few lateral hairs. The innermost terminal seta is 260 ¡x in length and bears lateral spinules, those along the inner side being longer and better developed. The inner long terminal seta is 948 ¡x and the outer one 588 fx in length, the middle region of both bearing short outer spinules and longer inner hairs (see Fig. 153). The -four terminal setae are inserted somewhat dorsally and the resulting ventral flange at the end of the ramus bears a row of minute spinules and a group of longer spinules on the inner angle. Along the distal third of the inner margin of the ramus there is a row of long slender spinules.
220
N E W H E M I C Y C L O P S F R O M M A D A G A S C A R • Humes 175
The rostral area (Fig. 158) is moderately well defined.
The first antenna (Fig. 159) is about 510 ^ long, 7-segmented, the segments, beginning at the base, 15, 74, 65, 110, 65, 73, and 56 /x in length (measured along their non-setif-erous margins). The formula for the armature is 4, .15, 6, 3, 4 + 1 aesthete, 2 + 1 aesthete, and 7 + 1 aesthete. Most of the setae are annulated and a few of those on the second segment show minute lateral hairs. There are, however, certain entire setae with long lateral hairs (one on the second segment, one on the fourth, 2 on the fifth, one on the sixth, and 4 on the seventh). The armature is thus very similar to that in H. diremptus. O n the distal anteroventral surface of the second segment there are a few transverse narrow refractile bars.
The second antenna (Fig. 160) is 4-seg-mented, with the third segment produced on the inner distal corner where it bears four elements: proximally a slender posterior seta, more distally a larger recurved annulated seta, and distally two slender spines bearing unilateral spinules and sub-terminal setules. T h e fourth segment is nearly quadrate in flat view, 35 ¡J. in length X 30 fx., and bears seven setae, the four long recurved annulated setae with their tips less attenuated than the others, and the seta lying posteriorly across the bases of the long setae having conspicuous lateral spinules (Fig. 161).
The labrum (Fig. 162) is tilted forward as in H. diremptus, and in a ventral and somewhat posterior view has a rather trilobée! appearance, with setules and teeth as shown in the figure. The metastomal areas have a complex ornamentation, as indicated in Figure 163.
The mandible (Fig. 164) has two stout elements and two well-developed setae with lateral hairs. The paragnath ( Fig. 165 ) is a moderately elongated lobe bearing hairs and a row of delicate hyaline spinules as indicated. The first maxilla (Fig. 166) is similar in structure to that of H. diremptus; the lateral setules on the outermost seta, however, are longer than in that species.
T h e second maxilla (Fig. 167) is in major respects similar to that of H. diremptus. The maxilliped (Fig. 168) has the same general form as in H. diremptus, but the two setae on the first segment are more slender, and the two setae on the second segment are relatively shorter; the last segment bears two large recurved setae (spines?), one of them with conspicuous lateral spinules ( four on one side and three on the other), and four slender setae. Be tween the bases of the maxillipeds there is a ventral transverse line as shown in Figure 169.
T h e area between the maxillipeds and the first pair of legs shows little differentiation.
The armature of legs 1-4 (Figs. 170-173) is similar to that of H. axiophilus, H. ampli-caudatus, and H. diremptus, but again certain elements are difficult to classify as a "spine" or a "seta." In leg 1 the inner spine on the basis is 97 ¡i in length, with both margins bearing a narrow, finely serrated fringe. The margin of the basis medial to this spine is rounded and smooth except for a small tooth-like process near the base of the spine. In legs 2-4 this inner area of the basis bears a row of slender marginal spinules and another row of larger hyaline spinules on its anterior surface. The ventral margin of the intercoxal plate of leg 1 bears on each side a row of long hairs, but in legs 2-4 these hairs are replaced by rather stout spinules. The outer margin of the coxa of leg 4 lacks the long spinules seen on legs 1-3, but a row of slender spinules occurs on the outer posterior margin. O n the last segment of the endopod of leg 4 the two inner elements are setiform, with long lateral hairs basally and short "lateral spinules in the distal two-thirds.
Leg 5 (Fig. 174) has a free segment which is shaped rather like a petal, narrow at the base but broadened distally; its greatest length is 180 p, its greatest width 98 ¡x, and its width basally 32 /*. There are rows of spinules on both outer and inner margins, those on the outer margin being longer than the others. The three spirtes are 65, 52, and 71 ¡x in length, respectively, from outer
221
176 Bulletin Museum of Comparative Zoology, Vol. 134, No. 6
to inner; the seta is 89 fx. long. R o w s of small spinules occur ventrally near the insertions of the three spines. The two outer spines are bilaterally fringed, but the inner spine is fringed outwardly and bears small spinules inwardly. The basal area of leg 5 shows a pattern of sclerotization which suggests a discrete segment; the seta is 110 ¡x long and lightly plumose distally. There is a row of small spinules adjacent to the seta.
Leg 6 is apparently absent. The color in living specimens in trans
mitted light is somewhat opaque to light amber, with reddish globules in the pro-some, the eye red, the egg sacs reddish brown.
Male.—The length of the body (without the setae on the caudal rami) is 2.09 m m (1.99-2.19 m m ) and the greatest width is 0.77 m m , based on 2 individuals. The ratio of the length of the prosome to that of the urosome (Fig. 175) is about the same as that in the female. The epimera of the segment bearing leg 4 are less angular than in the female. T h e genital segment (Fig. 176) measures 240x287/* , being wider than long, constricted anteriorly, with the posterolateral areas pointed. Spermato-phores were not seen in any of the males collected.
The four postgenital segments measure, • respectively, 221 X 205, 170 X 167, 124 X 148, and 82 X 140 /¿.
As in the female, the prosome and the urosome bear hairs and refractile points. The general sclerotization of the body is stronger than in the female (see Fig. 187 below).
The caudal ramus ( Fig. 177 ) is relatively shorter than in the female, 132 jx long, 58 ¡x wide basally, 54 n in the middle, and 46 ¡x distally; thus, taking the middle width, the ramus is about 2.4 times longer than wide. The armature of the ramus is like that of the female.
The rostral area is similar to that in the female.
The first antenna is generally like that of the female, but as in the previous species shows an additional seta on the third and
fourth segments, the formula being 4, 15, 7, 4, 4 + 1 aesthete, 2 + 1 aesthete, and 7 + 1 aesthete.
The second antenna is similar to that of the female.
The labrum ( Fig. 178 ) shows certain differences in details of the spinules and teeth. The number of large teeth at either side of the transverse row appears to be somewhat variable (see Figure 179 of these teeth in another male). There are two diagonal lines of very small refractile points (spinules ?) on each side of the ventral surface of the labrum. The metastomal areas ( Fig. 178) are ornamented as indicated in the figure. (In the specimen from which Figure 178 was drawn, the two groups of tooth-like spines on the left side, indicated by broken lines, were missing and presumably broken off.)
The mandible resembles that of the female, but the teeth on the largest element appear to be more pointed (see Fig. 180). The paragnath ( Fig. 181 ) is similar to that of the female, but has a protuberance on the inner margin, which in the female is regular. The first maxilla (Fig. 182) appears to be shorter and less slender than in the female, and, although the long spines and setae are m u c h like those in the opposite sex, there is an additional row of short spinules on the inner margin. The second maxilla (Fig. 183) shows the stout inner element on the second segment here replaced by a strongly sclerotized, rather blunt, claw-like element lacking an articulation with the segment.
The maxilliped (Fig. 184) has a single long seta on the first segment. The second segment has its proximal inner angle greatly expanded. The length of this segment along the outer margin is 224 ¡x, its greatest length from the distal end to the tip of the inner expansion is 260 ¡x, and its greatest width is 189^. There are three rows of fairly stout spines along the inner surface, in addition to the usual two setae. The third segment is very short and unarmed. The fourth segment forms part of a long recurved claw 270 ¡x in length ( measured along its axis and not along the curvature), bearing near its
222
N E W HEMICYCLOPS FROM MADAGASCAR • Humes 111
base a small seta on the posterior side, and a spinous process and a minute setule on the inner curvature. The ventral surface between" the bases of the maxillipeds (Fig. 185) does not show a transverse line. The region between the maxillipeds and the first pair of legs is unmodified as in the female.
Leg 1 lacks the inner spine on the basis (Fig. 186). Otherwise legs 1-4 have a spine and setal formula like that of the female. The sclerotization of the legs, illustrated in the endopod of leg 4 (Fig. 187), seems to be stronger than in the female. (This m a y be an individual difference, however, since only one male was dissected.)
Leg 5 (Fig. 188) has a free segment which is not broadened distally as in the female, its greatest dimensions being 173 X 73 fi. Its armature is like that of the female.
Leg 6 (Fig. 189) consists of a ventral flap on the posterior part of the genital segment, bearing a strong spine 51 ¿i in length. In dorsal view the sixth leg is completely hidden except for the tip of the spine.
The color in life is similar to that of the female.
Remarks on its biology.—H. kombensis was always found in burrows in company with other species of Hemicyclops, once with H. carinifer and three times with both / / . diremptus and H. carinifer.
Relationship to other species.—H. kombensis is included in the group of species having four setae on the basal segment of the first antenna. It m a y be compared only with the male of H. lefigii (Thompson and Scott, 1903 ), since the female of. that species remains unknown. The male of H. leggii, however, differs in having nearly quadrate caudal rami and in having two setae on the basal segment of the maxilliped. H. dila-tatus Shen and Bai, 1956, has a "squarish" genital segment in the female. H. australis Nicholls, 1944, has two setae on the basal segment of the male maxilliped and the caudal ramus is almost quadrate. H. indiens Sewell, 1949, has a genital segment which is very slightly wider than long and the caudal rami are but little longer than broad. In H.
purpureus Boeck, 1873, as figured by Sars (1917), the fifth leg in the female is not markedly expanded distally and the caudal rami are relatively shorter than in H. kombensis. H. thysanotus Wilson, 1935, shows lateral expansions in the anterior part of the genital segment and the form of the fifth leg is different from that in the species from Madagascar. In H. aberdonensis (T. and A . Scott, 1892) the genital segment is m u c h wider than long, and there are two setae on the basal segment of the male maxilliped. In H. thompsoni (Canu, 1888) the genital segment, though elongate, is expanded in its extreme anterior part. H. tamïlensis ( Thompson and Scott, 1903 ) has in the female broad lateral expansions on the genital segment, and short, almost quadrate caudal rami. In the female of H. bacescui ( Serban, 1956 ) the caudal rami are two times longer than wide, the inner spine on the basis of leg 1 is strongly denticulated ( Stock, 1959 ), and the lateral margins of the genital segment are not almost parallel as in H. kombensis. H. oisendus H u m e s , Cressey, and Gooding, 1958, shows in the female a genital segment somewhat resembling that of H. kombensis but which has a pair of dorsolateral ridges; the caudal ramus is only 1.7 times longer than wide; the third segment of the second antenna bears spinules and setae of a different form than in the species from Madagascar; and the free segment of the fifth leg is oval rather than petal-like in outline. The inner side of the second segment of the male maxilliped of H. visendus is broadly inflated rather than angularly produced as in H. kombensis.
Hemicyclops biflagellatus1 n. sp.
Pis. X X V I I - X X X I ; PI. X X X I I , figs. 221-222
Type material.—24 females and 6 males from water in burrows of unknown origin 3-4 c m in diameter and about 50 c m deep in intertidal m u d d y sand at Ampassipohe, on the southern shore of the bay of Ambato-
1 The specific name biflagellatus, a combination from Latin bis = twice and flagellum = a whip, refers to the two setiform processes on the segment of leg 5 in the female.
223
178 Bulletin Museum of Comparative Zoology, Vol. 134, No. 6
zavavy, Nosy Bé, Madagascar. Collected by A . G . H u m e s M a y Ú , 1964. Holotype female, allotype, and 22 paratypes (19 females and 3 males ) deposited in the United States National M u s e u m , Washington; one paratypic female in the M u s e u m of C o m parative Zoology, Cambridge, Mass.; and the remaining paratypes in the author's collection.
Female.—The length of the body (excluding the setae on the caudal rami) is 1.63 m m (1.51-1.80 m m ) and the greatest width (in the cephalosome, although in some specimens the segment of leg 2 m a y be expanded laterally so that its width is slightly greater) is 0.56 m m (0.51-0.61 m m ) , based on 5 individuals. The prosome is not m u c h broadened, and somewhat longer than the uro-some, the ratio being about 1.46 : 1 (Fig. 190). In dorsal aspect the epimera of the segments of legs 1-4 are conspicuously angulate. The segment bearing the fifth legs has a posterior transverse ridge, and bears a pair of prominent posterolateral recurved setiform processes about 100 ¡x long, with delicate hyaline lateral hairs ( ? ) . These processes are perhaps true setae, but an articulation could not be established with certainty. A very narrow intersegmental sclerite, more evident in a ventral view, occurs between the first two segments of the urosome. The genital segment ( Fig. 191 ) is elongated, with two rounded lateral wings in its anterior fourth and with the sides of the posterior three-fourths sub-parallel and only very slightly swollen. A n extremely indistinct transverse indication of subdivision occurs internally near the middle of the segment in some specimens. The genital segment measures 294 /x in dorsal length; its width at the anterior lateral expansions is 270 fi, and in the posterior third 167 ii.
The egg sacs are attached dorsolaterally on the two expansions of the genital segment, the actual attachment being covered ' by a dorsal flange (Fig. 192). Near the point of attachment there are two strongly sclerotized spine-like processes each about 6/n in length. Each egg sac (Fig. 190) is
elongated, about 519 X 170 ¡x, and contains numerous small eggs.
The three postgenital segments measure, respectively, 122 X 143, 84 X 130, and 78 X 108 ¡x. There is no apparent anal operculum. The anal segment bears on its dorsal and ventral surfaces fine hairs, as indicated in the figure. The caudal rami are inserted dorsally and the posterior ventral border of the segment below each ramus bears an outer row of minute spinules and an inner submarginal row of prominent spinules ( the longest about 15¡x in length), as shown in Figure 193.
The dorsal surface of the prosome and the dorsal and ventral surfaces of the urosome bear minute hairs and refractile points.
The caudal ramus (Fig. 193) is moderately elongated, 100 ¡x in length, 41 ¡x wide just proximal to the lateral seta and 35/* wide distal to that seta. Taking the width as 41 fi, the ramus is 2.44 times longer than wide. A minute hyaline hair arises on the outer basal margin. The lateral seta (52/u. long ) and the outermost terminal seta ( 90 ¡x long) are both composed of a basal shaft and a distal flagelliform part. The dorsal seta is 200 fi long and bears a few lateral hairs. The innermost terminal seta is 227 ¡x in length and bears lateral spinules, those on the inner side being slightly better developed. The inner long terminal seta is 746 ¡x and the outer one 407 ¡x in length, both bearing lateral hairs ( see Fig. 190 ). The four terminal setae are inserted somewhat dor-sally and the resulting terminal ventral flange on the ramus bears a row of minute spinules. Along the inner margin of the ramus there is a row of very slender setules. Both the dorsal and ventral surfaces of the ramus bear scattered hyaline hairs.
The rostral region (Fig. 194) is well defined and bears a pair of setules and pairs of small hairs as indicated.
The first antenna (Fig. 195) is about 410 /x long, 7-segmented, the segments, beginning at the base, 15, 54, 49, 85, 58, 54, and 52ii in length (measured along their non-setiferous margins ) . The armature is 4, 15, 6, 3, 4 + 1 aesthete, 2 + 1 aesthete, and
224
N E W HEMICYCLOPS F R O M MADAGASCAR • Humes 179
7 + 1 aesthete ( the same formula as in H. axiophilus, H. amplicaudatus, H. diremptus, and fl. kombensis). A few of the setae on the,second segment show very short lateral hairs. O n the distal posteroventral surface of this segment there are a few short rows of minute refractile points. Certain setae bear long lateral hairs as in H. kombensis.
The second antenna (Fig. 196) is 4-seg-mented, with the third segment produced on the inner distal corner where it bears four elements: proximally a slender posterior seta, more distally a long recurved seta (which resembles the four long terminal recurved setae on the last segment), and distally two unequal recurved spines, both bearing subterminal setules and the longer one a row of prominent spinules. The fourth segment is nearly quadrate, 33 X 30 ¡i, and bears seven setae m u c h like those in H. kombensis.
The labrum (Fig. 197), in addition to ornamentation suggesting that in H. kombensis, shows a crescentic row of long hyaline setules, with the surface posterior to this row bearing conspicuous obtuse scales. The metastomal areas have a complex ornamentation, as shown in Figure 198.
The mandible (Fig. 199) has two stout elements and two well-developed setae with lateral hairs. The paragnath (Fig. 200) is a moderately elongated lobe bearing long hairs ( shorter at the tip ) and a row of small spinules as indicated. The first maxilla (Fig. 201) is in general similar to that of U. kombensis. The second maxilla (Fig. 202) also resembles in major features that of H. kombensis. The maxilliped (Fig. 203) is also m u c h like that of H. kombensis, but the second segment is relatively'longer and more slender, and the setae (including the two terminal claw-like setae) tend to be relatively longer. From near the base of the shorter claw-like seta there arises a seti-form process without clear articulation. Between the bases of the maxillipeds there is a conspicuous ventral transverse scleroti-zation as shown in Figure 198.
The area between the maxillipeds and the
first pair of legs is without conspicuous features.
The armature of legs 1-4 (Figs. 204, 205, 206, and 208) is as follows:
PI protopod 0:1 1:1 exp 1:0 1:1 "1,1,6 end 0:1 0:1 1,5
P2 protopod 0:1 1:0 exp 1:6 1:1 11,7 end 0:1 0:2 1,11,3
P3 protopod 0:1 1:0 exp 1:0 1:1 11,1,6 end 0:1 0:2 1,11,3
P4 protopod 0:1 1:0 exp 1:0 1:1 1,7 end 0:1 0:2 1,11,2
This formula is somewhat different from that of H. axiophilus, the third exopod segment of leg 1 having two spines and the same segment in leg 3 having three spines. In leg 1 the inner spine on the basis is 105 /x in length, with short lateral spinules and with a blunt tip. The margin of the basis medial to this spine is rounded and smooth except for a tooth-like process near the base of the spine. In legs 2-4 this inner area of the basis bears a row of marginal hairs and a group of slender hyaline spinules on its anterior surface. The ventral margin of the intercoxal plate of leg 1 bears on each side rows of long hairs, but in legs 2-4 these hairs are replaced by spinules. The outer margin of the coxa of leg 4 lacks the long spinules seen on legs 1-3, but a row of slender spinules occurs on the outer posterior margin. In leg 3 the distalmost spine on the last segment of the exopod is distinctly spine-like rather than almost setiform as in H. kombensis. (An abnormal second segment of the exopod of leg 3, with two outer spines instead of one, is shown in Fig. 207.) O n the last segment of the endopod of leg 4 the inner two elements are different from the outer three: the inner one being almost spine-like with lateral hairs basally and with a bilateral fringe of spinules in the distal three-fourths, the outer one being setiform with lateral hairs.
Leg 5 (Fig. 209) has a free segment which is somewhat constricted basally, broadened in the middle, and narrowed beyond the first outer spine. Its greatest length is 120 ii (91 ¡J. along the outer edge to the base of the first spine and 94 ii along
180 Bulletin Museum of Comparative Zoology, Vol. 134, No. 6
the inner edge), and its greatest width is 56 ¡x. The ratio of greatest length to width is 2.14 : 1. There are rows of prominent spinules on both outer and inner margins. The three spines are 63, 59, and 71 ¡x in length, respectively, from outer to inner. The first few inner lateral spinules on the innermost spine are unusually long. The outermost spine seems to lack outer spinules. The seta is 93 ¡x long and bears a few lateral hairs. The basal area of leg 5 suggests a discrete segment; it is armed with a plumose seta about 100 ¡x in length and a group of outer spinules.
Leg 6 is apparently absent. The color in living specimens, in trans
mitted light, is slightly opaque, with reddish orange globules in the prosome, the eye dark red, the ovary gray, the egg sacs dark reddish orange.
Male.—The length of the body (not including the setae on the caudal rami) is 1.34 m m (1.25-1.46 m m ) and the greatest width is 0.45 m m (0.41-0.50 m m ) , based on 5 individuals. The prosome is less expanded than in the female (Fig. 210). The ratio of the length of the prosome to that of the uro-some is about the same as that in the female. The segment of leg 5 lacks the two setiform processes seen in the female. The genital segment (Fig. 211) is wider than long, 148 X 178 fi, with gently rounded lateral margins.
The four postgenital segments measure, respectively, 108 X 103, 95 X 101, 62 X 98, and 54x89 fi.
As in the female, the prosome and uro-some bear hairs and refractile points.
The caudal ramus is similar to that of the female, but is relatively shorter, the greatest length being 80 ¡x, the width just proximal to the lateral seta 35 ¡x, and the width distal to that seta 31 ^. Taking the width as 35 ju., the ramus is 2.29 times longer than wide.
The spermatophore (Fig. 212), as seen attached to the female, is pyriform, 68 ¡x long ( including the slender neck of 6 ju,) and 40 ¡x wide.
The rostral area is like that of the female. The first antenna resembles that of the
female, but, as in previous species, has an additional seta on the third and fourth segments, so that the formula is 4, 15, 7, 4, 4 + 1 aesthete, 2 + 1 aesthete, and 7 + 1 aesthete.
The second antenna is similar to that of the female.
The labrum (Fig. 213) lacks the crescen-tic row of hyaline spinules, and the medial posteroventral surface has numerous scales and spinules, as shown in the figure. The metastomal areas (Fig. 214) are ornamented as indicated in the figure.
The mandible is like that in the female. The paragnath (Fig. 214) resembles that of the female, but seems to be somewhat more slender. The first maxilla is similar to that of the female. The second maxilla (Fig. 215) shows the stout inner element on the second segment here replaced by a strongly sclerotized, rather blunt, claw-like structure, sometimes pale yellowish in color, which lacks an articulation with the segment.
The maxilliped ( Fig. 216 ) has a single long seta on the first segment. The second segment has its proximal inner angle expanded and rounded; the length of this segment along the outer margin is 137 ¡x, its greatest length from the distal end to the tip of the inner expansion is 173 ja, and its greatest width is 115 ¡x. There are three rows of fairly stout spines along the inner margin, in addition to the usual two setae. The third segment is very short and unarmed. The fourth segment forms part of the long recurved claw 189 ¡i in length (measured along its axis and not along its curvature), bearing near its base on the posterior surface a small seta 18 ¡x long, and on its inner curvature a spinous process 25 ix long and a minute setule 5/u, long. The ventral surface of the cephalosome between the bases of the maxillipeds (Fig. 217) shows only an incomplete transverse line, instead of the readily visible scleroti-zation seen in the female.
Leg 1 lacks the inner spine on the basis (Fig. 218). Otherwise legs 1-4 show the same spine and setal formula as in the fe-
226
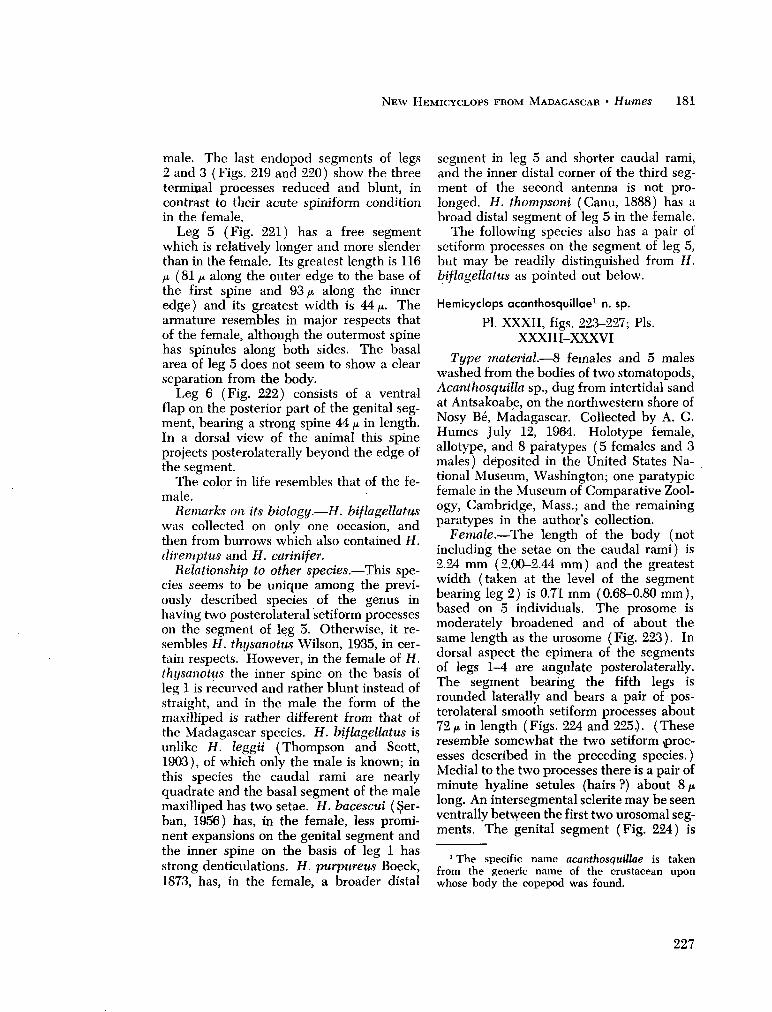
N E W H E M I C Y C L O P S F R O M M A D A G A S C A R • Humes 181
male. The last endopod segments of legs 2 and 3 (Figs. 219 and 220) show the three terminal processes reduced and blunt, in contrast to their acute spiniform condition in the female.
Leg 5 (Fig. 221) has a free segment which is relatively longer and more slender than in the female. Its greatest length is 116 ¡x. ( 81 ¡i along the outer edge to the base of the first spine and 93 ¡i along the inner edge ) and its greatest width is 44 ¡x,. The armature resembles in major respects that of the female, although the outermost spine has spinules along both sides. The basal area of leg 5 does not seem to show a clear separation from the body.
Leg 6 (Fig. 222) consists of a ventral flap on the posterior part of the genital segment, bearing a strong spine 44 ¡x in length. In a dorsal view of the animal this spine projects posterolaterally beyond the edge of the segment.
The color in life resembles that of the female.
Remarks on its biology.—H. biflagellatus was collected on only one occasion, and then from burrows which also contained H. cliremptus and H. carinifer.
Relationship to other species.—This species seems to be unique among the previously described species of the genus in having two posterolateral setiform processes on the segment of leg 5. Otherwise, it resembles H. thysanotus Wilson, 1935, in certain respects. However, in the female of H. thysanotus the inner spine on the basis of leg 1 is recurved and rather blunt instead of straight, and in the male the form of the maxilliped is rather different from that of the Madagascar species. H. biflagellatus is unlike H. leggii (Thompson and Scott, 1903), of which only the male is known; in this species the caudal rami are nearly quadrate and the basal segment of the male maxilliped has two setae. H. bacescui ( Ser-ban, 1956) has, in the female, less prominent expansions on the genital segment and the inner spine on the basis of leg 1 has strong denticulations. H. purpureus Boeck, 1873, has, in the female, a broader distal
segment in leg 5 and shorter caudal rami, and the inner distal corner of the third segment of the second antenna is not prolonged. H. thompsoni (Canu, 1888) has a broad distal segment of leg 5 in the female.
The following species also has a pair of setiform processes on the segment of leg 5, but may be readily distinguished from H. biflagellatus as pointed out below.
Hemicyclops acanthosquillae1 n. sp.
PI. XXXII, figs. 223-227; Pis. XXXIII-XXXVI
Type material.—8 females and 5 males washed from the bodies of two stomatopods, Acanthosquilla sp., dug from intertidal sand at Antsakoabe, on the northwestern shore of Nosy Be, Madagascar. Collected by A . G . Humes July 12, 1964. Holotype female, allotype, and 8 paratypes (5 females and 3 males) deposited in the United States National Museum, Washington; one paratypic female in the Museum of Comparative Zoology, Cambridge, Mass.; and the remaining paratypes in the author's collection.
Female.—The length of the body (not including the setae on the caudal rami) is 2.24 m m (2.00-2.44 m m ) and the greatest width (taken at the level of the segment bearing leg 2) is 0.71 m m (0.68-0.80 m m ) , based on 5 individuals. The prosome is moderately broadened and of about the same length as the urosome (Fig. 223). In dorsal aspect the epimera of the segments of legs 1-4 are angulate posterolaterally. The segment bearing the fifth legs is rounded laterally and bears a pair of posterolateral smooth setiform processes about 72 fi in length (Figs. 224 and 225.). (These resemble somewhat the two setiform processes described in the preceding species.) Medial to the two processes there is a pair of minute hyaline setules (hairs ?) about 8 ¡x long. An intersegmental sclerite may be seen ventrally between the first two urosomal segments. The genital segment (Fig. 224) is
1 The specific name acanthosquillae is taken from the generic name of the crustacean upon whose body the copepod was found.
227
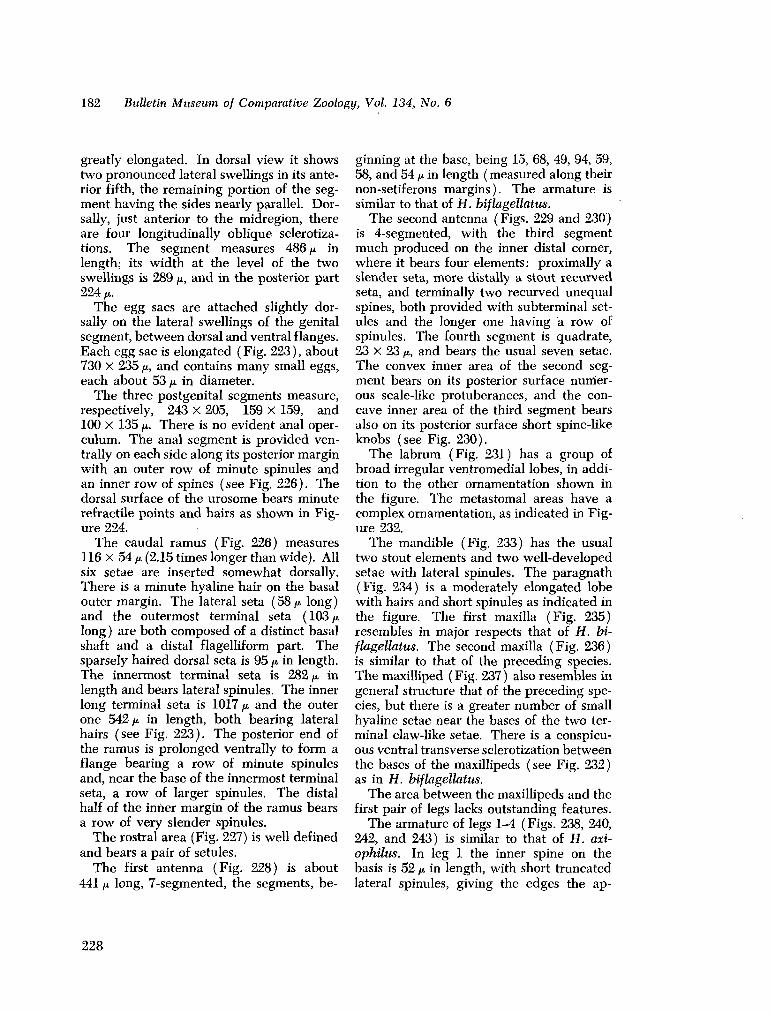
182 Bulletin Museum of Comparative Zoology, Vol. 134, No. 6
greatly elongated. In dorsal view it shows two pronounced lateral swellings in its anterior fifth, the remaining portion of the segment having the sides nearly parallel. Dor-sally, just anterior to the midregion, there are four longitudinally oblique sclerotiza-tions. The segment measures 486 ¡x in length; its width at the level of the two swellings is 289 ¡x, and in the posterior part 224 ^
The egg sacs are attached slightly dor-sally on the lateral swellings of the genital segment, between dorsal and ventral flanges. Each egg sac is elongated (Fig. 223), about 730 X 235 ¡x, and contains m a n y small eggs, each about 53 ¿<. in diameter.
The three postgenital segments measure, respectively, 243 X 205, 159 X 159, and 100 X 135 ¡i. There is no evident anal operculum. The anal segment is provided ven-trally on each side along its posterior margin with an outer row of minute spinules and an inner row of spines ( see Fig. 226 ) . The dorsal surface of the urosome bears minute refractile points and hairs as shown in Figure 224.
The caudal ramus (Fig. 226) measures 116 X 54 ^ (2.15 times longer than wide). All six setae are inserted somewhat dorsally. There is a minute hyaline hair on the basal outer margin. The lateral seta ( 58 ¡x long ) and the outermost terminal seta (103/i. long) are both composed of a distinct basal shaft and a distal flagelliform part. The sparsely haired dorsal seta is 95 //. in length. The innermost terminal seta is 282 ¡x in length and bears lateral spinules. The inner long terminal seta is 1017 ¡x and the outer one 542/x in length, both bearing lateral hairs (see Fig. 223). The posterior end of the ramus is prolonged ventrally to form a flange bearing a row of minute spinules and, near the base of the innermost terminal seta, a row of larger spinules. The distal half of the inner margin of the ramus bears a row of very slender spinules.
The rostral area (Fig. 227) is well defined and bears a pair of setules.
The first antenna (Fig. 228) is about 441 fx. long, 7-segmented, the segments, be
ginning at the base, being 15, 68, 49, 94, 59, 58, and 54 ¡x in length ( measured along their non-setiferous margins). The armature is similar to that of H. biflagellatus.
The second antenna (Figs. 229 and 230) is 4-segmented, with the third segment m u c h produced on the inner distal corner, where it bears four elements: proximally a slender seta, more distally a stout recurved seta, and terminally two recurved unequal spines, both provided with subterminal setules and the longer one having a row of spinules. The fourth segment is quadrate, 23 X 23 ¡x, and bears the usual seven setae. The convex inner area of the second segment bears on its posterior surface numerous scale-like protuberances, and the concave inner area of the third segment bears also on its posterior surface short spine-like knobs (see Fig. 230).
The labrum (Fig. 231) has a group of broad irregular ventromedial lobes, in addition to the other ornamentation shown in the figure. The metastomal areas have a complex ornamentation, as indicated in Figure 232.
The mandible (Fig. 233) has the usual two stout elements and two well-developed setae with lateral spinules. The paragnath (Fig. 234) is a moderately elongated lobe with hairs and short spinules as indicated in the figure. The first maxilla (Fig. 235) resembles in major respects that of H. biflagellatus. The second maxilla (Fig. 236) is similar to that of the preceding species. The maxilliped ( Fig. 237 ) also resembles in general structure that of the preceding species, but there is a greater number of small hyaline setae near the bases of the two terminal claw-like setae. There is a conspicuous ventral transverse sclerotization between the bases of the maxillipeds (see Fig. 232) as in H. biflagellatus.
The area between the maxillipeds and the first pair of legs lacks outstanding features.
The armature of legs 1-4 (Figs. 238, 240, 242, and 243) is similar to that of H. axi-ophilus. In leg 1 the inner spine on the basis is 52 ¡x in length, with short truncated lateral spinules, giving the edges the ap-
228
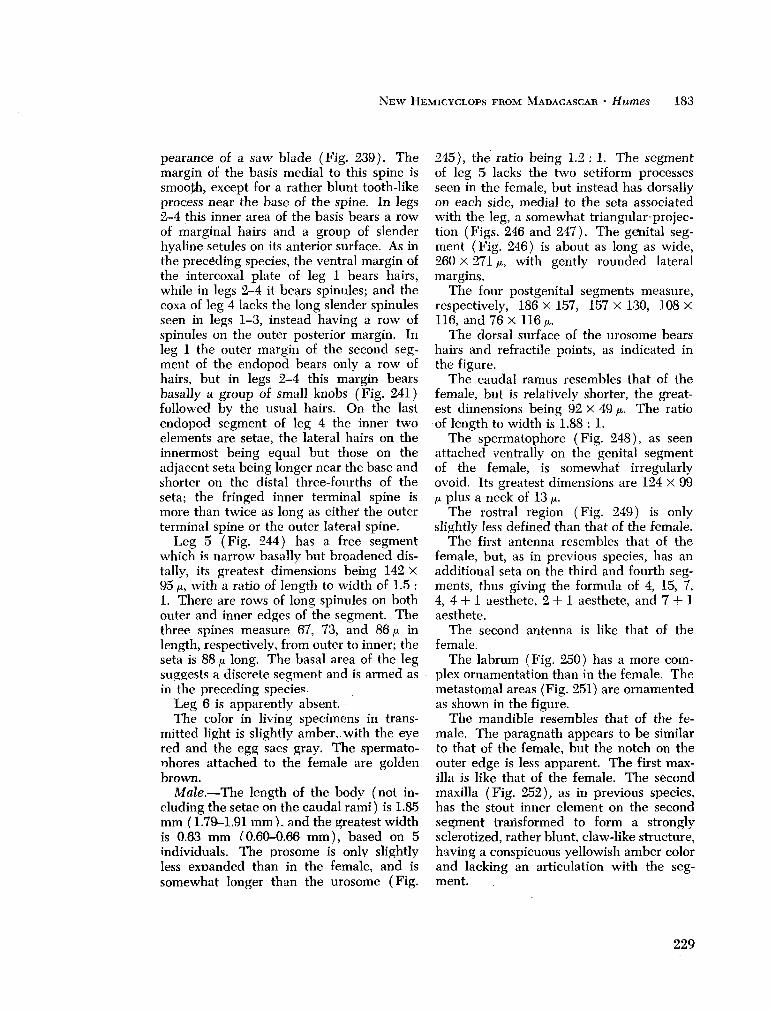
N E W H E M I C Y C L O P S F R O M M A D A G A S C A R • Humes 183
pearance of a saw blade (Fig. 239). The margin of the basis medial to this spine is smooth, except for a rather blunt tooth-like process near the base of the spine. In legs 2-4 this inner area of the basis bears a row of marginal hairs and a group of slender hyaline setules on its anterior surface. As in the preceding species, the ventral margin of the intercoxal plate of leg 1 bears hairs, while in legs 2-4 it bears spinules; and the coxa of leg 4 lacks the long slender spinules seen in legs 1-3, instead having a row of spinules on the outer posterior margin. In leg 1 the outer margin of the second segment of the endopod bears only a row of hairs, but in legs 2-4 this margin bears basally a group of small knobs (Fig. 241) followed by the usual hairs. O n the last endopod segment of leg 4 the inner two elements are setae, the lateral hairs on the innermost being equal but those on the adjacent seta being longer near the base and shorter on the distal three-fourths of the seta; the fringed inner terminal spine is more than twice as long as either the outer terminal spine or the outer lateral spine.
Leg 5 (Fig. 244) has a free segment which is narrow basally but broadened dis-tally, its greatest dimensions being 142 X 95 ¡x, with a ratio of length to width of 1.5 : 1. There are rows of long spinules on both outer and inner edges of the segment. The three spines measure 67, 73, and 86 ¡i in length, respectively, from outer to inner; the seta is 88 ¡j. long. The basal area of the leg suggests a discrete segment and is armed as in the preceding species.
Leg 6 is apparently absent. The color in living specimens in trans
mitted light is slightly amber,.with the eye red and the egg sacs gray. The spermato-r>hores attached to the female are golden brown.
Male.—The length of the body (not including the setae on the caudal rami) is 1.85 m m ( 1.79-1.91 m m ) . and the greatest width is 0.63 m m (0.60-0.66 m m ) , based on 5 individuals. The prosome is only slightly less exrjanded than in the female, and is somewhat longer than the urosome (Fig.
245), the ratio being 1.2 : 1. The segment of leg 5 lacks the two setiform processes seen in the female, but instead has dorsally on each side, medial to the seta associated with the leg, a somewhat triangular-projection (Figs. 246 and 247). The genital segment (Fig. 246) is about as long as wide, 260 x 271 fi, with gently rounded lateral margins.
The four postgenital segments measure, respectively, 186 X 157, 157 X 130, 108 X 116, and 76 x 116 ¡x,.
The dorsal surface of the urosome bears hairs and refractile points, as indicated in the figure.
The caudal ramus resembles that of the female, but is relatively shorter, the greatest dimensions being 92 X 49 p. The ratio of length to width is 1.88 : 1.
The spermatophore (Fig. 248), as seen attached ventrally on the genital segment of the female, is somewhat irregularly ovoid. Its greatest dimensions are 124 X 99 fi plus a neck of 13 ¡i.
The rostral region (Fig. 249) is only slightly less defined than that of the female.
The first antenna resembles that of the female, but, as in previous species, has an additional seta on the third and fourth segments, thus giving the formula of 4, 15, 7, 4, 4 + 1 aesthete, 2 + 1 aesthete, and 7 + 1 aesthete.
The second antenna is like that of the female.
The labrum (Fig. 250) has a more complex ornamentation than in the female. The metastomal areas (Fig. 251) are ornamented as shown in the figure.
The mandible resembles that of the female. The paragnath appears to be similar to that of the female, but the notch on the outer edge is less apparent. The first m a x illa is like that of the female. The second maxilla (Fig. 252), as in previous species, has the stout inner element on the second segment transformed to form a strongly sclerotized, rather blunt, claw-like structure, having a conspicuous yellowish amber color and lacking an articulation with the segment.
229
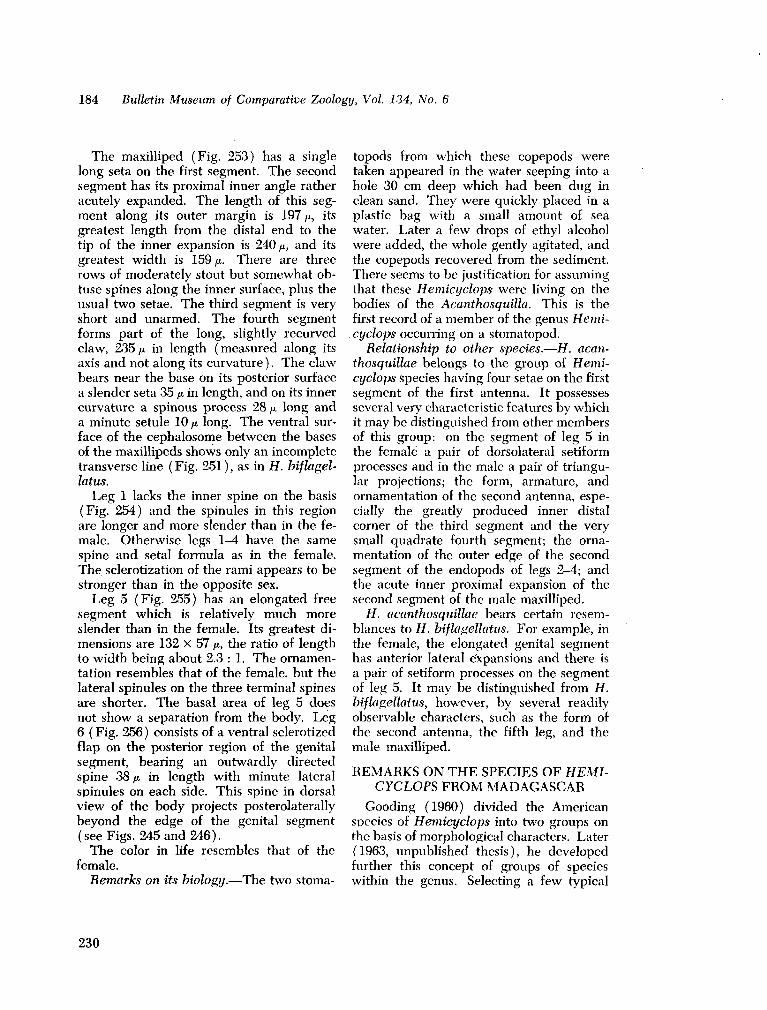
184 Bulletin Museum of Comparative Zoology, Vol. 134, No. 6
The maxilliped (Fig. 253) has a single long seta on the first segment. The second segment has its proximal inner angle rather acutely expanded. The length of this segment along its outer margin is 197 ¡a, its greatest length from the distal end to the tip of the inner expansion is 240 ¡i, and its greatest width is 159 ¡x. There are three rows of moderately stout but somewhat obtuse spines along the inner surface, plus the usual two setae. The third segment is very short and unarmed. The fourth segment forms part of the long, slightly recurved claw, 235yu, in length (measured along its axis and not along its curvature ) . The claw bears near the base on its posterior surface a slender seta 35 ¡x in length, and on its inner curvature a spinous process 28 ¡x. long and a minute setule 10 ¡i long. The ventral surface of the cephalosome between the bases of the maxillipeds shows only an incomplete transverse line ( Fig. 251 ) , as in H. biflagel-latus.
Leg 1 lacks the inner spine on the basis (Fig. 254) and the spinules in this region are longer and more slender than in the female. Otherwise legs 1-4 have the same spine and setal formula as in the female. The sclerotization of the rami appears to be stronger than in the opposite sex.
Leg 5 (Fig. 255) has an elongated free segment which is relatively m u c h more slender than in the female. Its greatest dimensions are 132 X 57 /x, the ratio of length to width being about 2.3 : 1. The ornamentation resembles that of the female, but the lateral spinules on the three terminal spines are shorter. The basal area of leg 5 does not show a separation from the body. Leg 6 ( Fig. 256 ) consists of a ventral sclerotized flap on the posterior region of the genital segment, bearing an outwardly directed spine 38 /* in length with minute lateral spinules on each side. This spine in dorsal view of the body projects posterolaterally beyond the edge of the genital segment (see Figs. 245 and 246).
The color in life resembles that of the female.
Remarks on its biology.—The two stoma-
topods from which these copepods were taken appeared in the water seeping into a hole 30 c m deep which had been dug in clean sand. They were quickly placed in a plastic bag with a small amount of sea water. Later a few drops of ethyl alcohol were added, the whole gently agitated, and the copepods recovered from the sediment. There seems to be justification for assuming that these Hemicyclops were living on the bodies of the Acanthosquilla. This is the first record of a m e m b e r of the genus Hemicyclops occurring on a stomatopod.
Relationship to other species.—H. acan-thosquiUae belongs to the group of Hemicyclops species having four setae on the first segment of the first antenna. It possesses several very characteristic features by which it m a y be distinguished from other members of this group: on the segment of leg 5 in the female a pair of dorsolateral setiform processes and in the male a pair of triangular projections; the form, armature, and ornamentation of the second antenna, especially the greatly produced inner distal corner of the third segment and the very small quadrate fourth segment; the ornamentation of the outer edge of the second segment of the endopods of legs 2-4; and the acute inner proximal expansion of the second segment of the male maxilliped.
H. acanthosquillae bears certain resemblances to H. biflagellatus. For example, in the female, the elongated genital segment has anterior lateral expansions and there is a pair of setiform processes on the segment of leg 5. It m a y be distinguished from H. biflagellatus, however, by several readily observable characters, such as the form of the second antenna, the fifth leg, and the male maxilliped.
R E M A R K S O N T H E SPECIES O F HEMICYCLOPS F R O M M A D A G A S C A R
Gooding (1960) divided the American species of Hemicyclops into two groups on the basis of morphological characters. Later (1963, unpublished thesis), he developed further this concept of groups of species within the genus. Selecting a few typical
230
N E W H E M I C Y C L O P S F R O M M A D A G A S C A R • Humes 185
characters, the eight known species from Madagascar (comprising the seven described above and H. visendus) may be placed in two groups ( corresponding to two of Gooding's):
1 ) those species with the urosome of the adult female having five segments, with four setae on the first segment of the first antenna, with a short terminal segment on the second antenna, and with a sexually dimorphic second maxilla, including:
H. axiophilus n. sp. H. amplicaudatus n. sp. H. diremptus n. sp. H. kombensis n. sp. H. biflagellatus n. sp. H. acanthosquillae n. sp. H. visendus Humes, Cressey,
and Gooding, 1958; 2) that species with the urosome of the
adult female having six segments, with five setae on the first segment of the first antenna, with an elongate terminal segment on the second antenna, and without sexvial dimorphism in the second maxilla:
H. carinifer n. sp.
THE GENUS HEMICYCLOPS IN THE INDIAN OCEAN
Five species of Hemicyclops have been reported from the Indian Ocean area: H. indiens Sewell, 1949, from Nankouri Harbour, Nicobar Islands, in weed-washings; H. leggii (Thompson and Scott, 1903) in washings from dredgings, sponges, in the Gulf of Manaar, Ceylon; H. intermedins Ummerkutty, 1962, from weed-washings in the Gulf of Manaar, southeastern coast of India; H. tamilensis (Thompson and Scott, 1903) in Muttuvaratu pearl oyster washings, Ceylon; and H. visendus Humes, Cressey, and Gooding, 1958, from Upogebia sp. at' Nosy Bé, Madagascar.
In addition, Pillai ( 1963 ) has reported Hemicyclops sp. from brackish water at Ashtamudi Lake, Quilon, Kerala State, India. The only specimen, a male, is 2.3 m m in length and belongs to the group of species having four setae on the first segment
of the first antenna. Its size alone distinguishes it from all six of the species in this group from Madagascar described above. The caudal ramus is nearly three times longer than wide ( in H. amplicaudatus it is 3.6 times, in H. axiophilus, H. diremptus, H. kombensis, H. biflagellatus, and H. acanthosquillae it is 2.4 times or less ). The male of H. kombensis appears to be closest to the Indian specimen, having a length of 2.09 m m and the caudal ramus being 2.4 times longer than wide. In the Indian form, however, the free segment of leg 5 is broader, the genital segment is not constricted anteriorly, and hairs occur along the entire inner border of the caudal ramus.
The question arises whether Pillai's specimen may be one of the five Indian Ocean species mentioned above. This male shows the fourth segment of the first antenna distinctly longer than the second (Pillai's fig. 49), while in H. indiens the reverse is true. The free segment of leg 5 is broadened and the second segment of the male maxilliped has its inner side rather angularly expanded proximally, while in H. visendus the free segment is elongate and the second segment of the maxilliped has its inner side broadly expanded. The caudal rami are nearly three times longer than wide and the first segment of the male maxilliped has one seta, while in H. leggii the caudal rami are nearly quadrate and the first segment of the maxilliped has two setae. The male of H. tamilensis is unknown, but the female of this Ceylonese species has nearly quadrate caudal rami, and it is perhaps safe to assume for the present that H. tamilensis and Pillai's single male are distinct.
Only the female of H. intermedins is known. It belongs to the group of Hemicyclops species having four setae on the first segment of the first antenna. It appears to be distinct from all six new species in this group described above. In these the caudal ramus is two or more times longer than wide, while in H. intermedins it is quadrate; the contour of the genital segment in dorsal view is different from that in H. intermedins; the inner distal corner of the third segment
231
186 Bulletin Museum of Comparative Zoology, Vol. 134, No. 6
of the second antenna is produced, while in H. intermedins this region is rounded; and the armature of the four legs is somewhat different than in H. intermedius, where, for example, the formula for the third exopod segment of the first leg is 111,1,4.
It is difficult to compare H. intermedius and Pillai's Hemicyclops sp., since the corresponding sexes are not known. These two copepods seem to be distinct, however, since in the male Hemicyclops sp. the caudal rami are nearly three times longer than wide, the inner distal corner of the third segment of the second antenna is produced, and the armature of the third exopod segment of the first leg is 1,7.
Twelve described species and one unnamed form of Hemicyclops are n o w known from the Indian Ocean area: H. indiens from the Nicobar Islands, H. leggii and H. tamilensis from Ceylon, H. intermedius and H. sp. from India, and H. axiophilus, H-amplicaudatus, H. carinifer, H. diremptus, H. kombensis, H. biflagellatus, H. acan-thosquillae, and H. visendus from M a d a gascar.
REFERENCES CITED B O E C K , A . 1873. Nye Slaegter og Arter 'af
Saltvands-Copepoder. Forh. Vid. Selsk. Christiana (1872) 14: 35-60.
C A N U , E . 1888. Les copépodes marins du Boulonnais III. Les Hersiliidae, famille nouvelle de copépodes commensaux. Bull. Sci. France Belgique 19: 402-432.
G O O D I N G , R. U . 1960. North and South American copepods of the genus Hemicyclops ( Cyclopoida-.Clausidiidae). Proc. U . S . Nat. Mus. 112(3434): 159-195.
. 1963 (unpublished). External morphology and classification of marine poecilostome copepods belonging to the families Clausidi-idae, Clausiidae, Nereicolidae, Eunicicolidae, Synaptiphilidae, Catiniidae, Anomopsyllidae, and Echiurophilidae. Ph.D. thesis, University of Washington, Seattle.
H U M E S , A . G . 1962. Eight new species of Xarifia (Copepoda, Cyclopoida), parasites of corals in Madagascar. Bull. Mus. Comp. Zool. 128 (2): 37-63.
H U M E S , A. G., R. F. CRESSEY, A N D R. U. GOODING.
1958. A new cyclopoid copepod, Hemicy
clops visendus, associated with Upogebia in Madagascar. J. Washington Acad. Sci. 48 (12): 398-405.
NICHOLLS, A. G . 1944. Littoral Copepoda from South Australia. (II) Calanoida, Cyclopoida, Notodelphyoida, Monstrilloida and Caligoida. Rec. South Australian Mus. 8(1): 1-62.
PILLAI, N . K. 1963. Copepods associated with South Indian invertebrates. Proc. Indian Acad. Sci. 58(section B , 4): 235-247.
SARS, G . O . 1917. Copepoda Cyclopoida. Clau-sidiidae, Lichomolgidae (part). An account of the Crustacea of Norway, etc. Vol. 6(11 & 12): 141-172. Bergen Museum, Bergen.
S C O T T , T. A N D A . SCOTT. 1892. O n new and
rare Crustacea from the east coast of Scotland. Ann. Sept. Nat. Hist. Soc. 3: 149-156.
S E H B A N , M . 1956. Pontocyclops bacescui n. g-, n. sp. ( Crustacea Copepoda ), ein neuer Cyclo-pide vom schwarzen Meere. Izdanija 1(7): 169-184.
S E W E L L , R. B. S. 1949. The littoral and semi-parasitic Cyclopoida, the Monstrilloida and the Notodelphyoida. John Murray Expedition 1933-34, Sci. Repts., Vol. 9(2): 17-199.
S H E N , C-j. A N D S. BAI . 1956. The marine Copepoda from the spawning ground of Pneuma-tophorus japonicus (Houttuyn) off Chefoo, China. Acta Zool. Sinica 8(2): 177-234.
STOCK, J. H . 1959. Copepoda associated with Neapolitan invertebrates. Pubbl. Staz. Zool. Napoli 31(1): 59-75.
T H O M P S O N , I. C . A N D A. SCOTT. 1903. Report on
the Copepoda collected by Professor Herdman, at Ceylon, in 1902. Rept. Gov. Ceylon Pearl Oyster Fish. Gulf of Manaar, Suppl. Rept. No. 7: 227-307.
U M M E R K U T T Y , A . N . P. 1962. Studies on Indian copepods 5. On eleven new species of marine cyclopoid copepods from the south-east coast of India. J. Mar. Biol. Ass. India, 1961, 3(1 & 2): 19-69.
W I L L I A M S , L. W . 1907. List of the Rhode Island Copepoda1, Phyllopoda, and Ostracoda, with new species of Copepoda. 37th Ann. Rept. C o m m . Inland Fish. Rhode Island ( Special Paper no. 30), pp. 69-79.
W I L S O N , C . B. 1935. Parasitic copepods from the Pacific Coast. Amer. Midland Nat. 16 (5): 776-797.
. 1937. Two new semi-parasitic copepods from the Peruvian coast. Parasitology 29 (2): 206-211.
(Received 25 January 1965.)
232
N E W HEMICYCLOPS F R O M MADAGASCAR • Humes 187
233
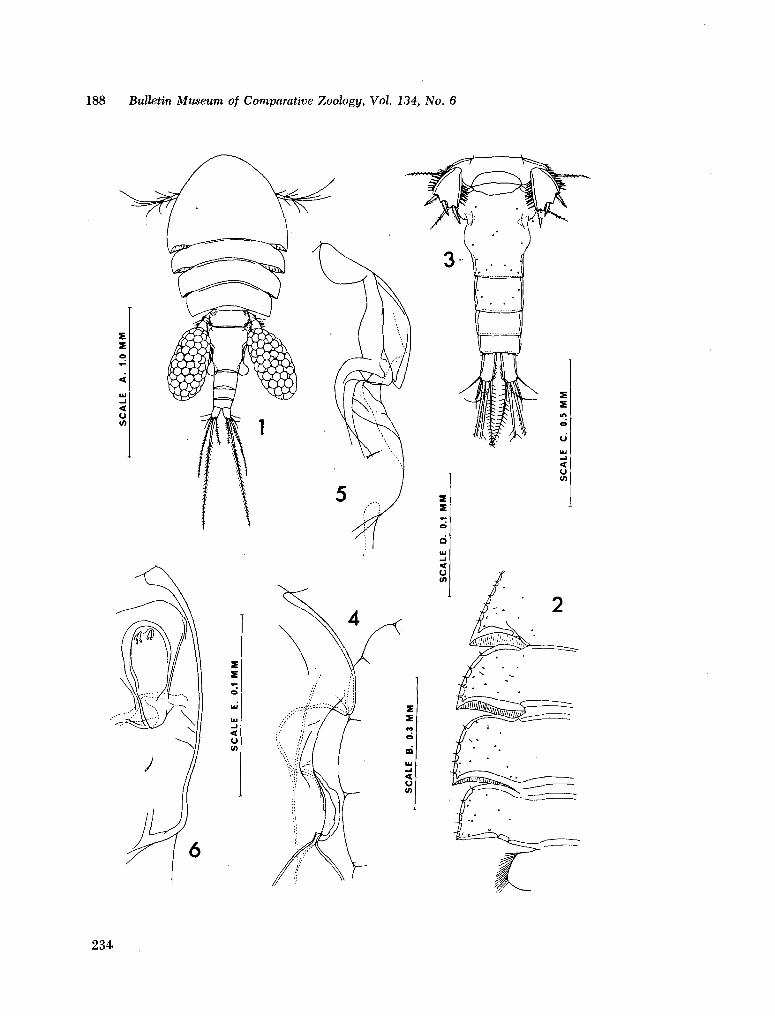
188 Bulletin Museum of Comparative Zoology, Vol. 134, No. 6
234
N E W HEMICYCLOPS F R O M MADAGASCAR • Humes 189
E X P L A N A T I O N O F FIGURES
All figures were drawn with the aid of a camera lucida. The letter after each figure refers to the scale at which it was
drawn.
Plate I
Hemicyclops axtophilus n. sp., female
Body, dorsal (A).
Edges of somites of legs 1-5, dorsal (B).
Urosome, ventral (C).
Part of edge of genital segment showing areas of attachment of egg sac and spermatophore, ventral (D).
Part of edge of genital segment, dorsal (D).
S a m e , lateral (E).
Fig. 1.
Fig. 2.
Fig. 3.
Fig. 4.
Fig. 5.
Fig. 6.
235
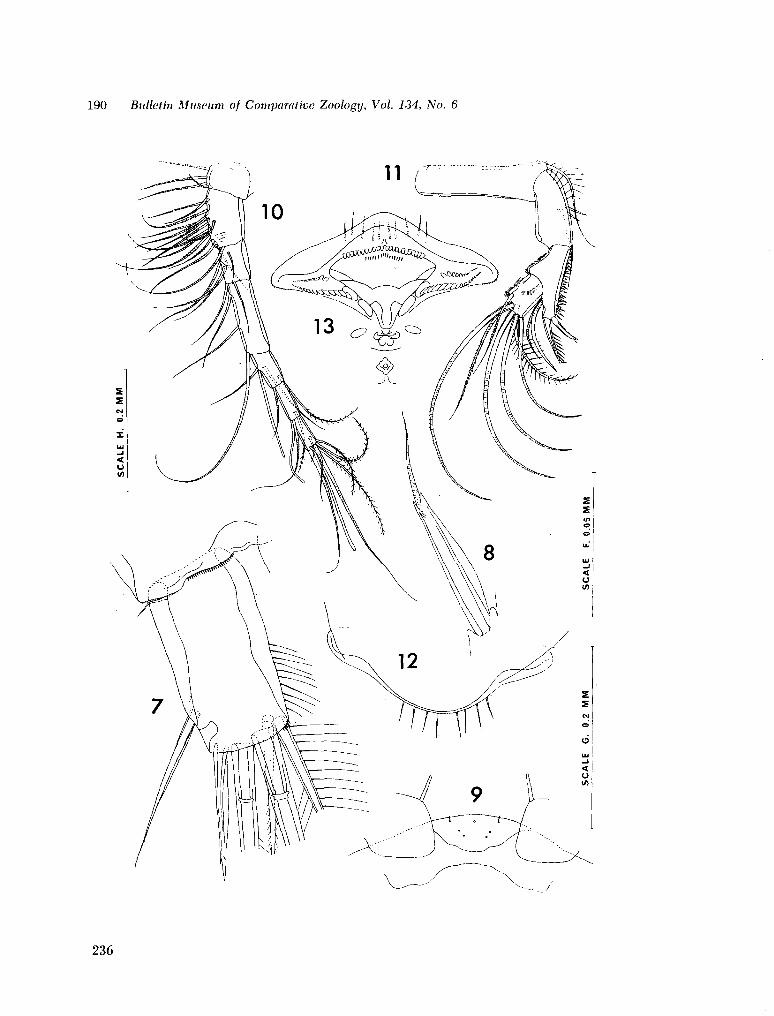
190 Bulletin Museum of Comparative Zoology, Vol. 134, No. 6
236
N E W HEMICYCLOPS FROM MADAGASCAR • Humes 191
Plate II
Hemicyc/ops axiophiius n. sp., female (continued)
7. Caudal ramus, ventral (E).
8. Outermost terminal seta on caudal ramus, dorsal (F).
9. Rostral area, ventral (G).
10. First antenna, anterodorsal (H).
11. Second antenna, anterior or ventral (G).
12. Edge of labrum, anterior and dorsal (E).
13. Posterior surface of labrum, pushed forward (E).
237
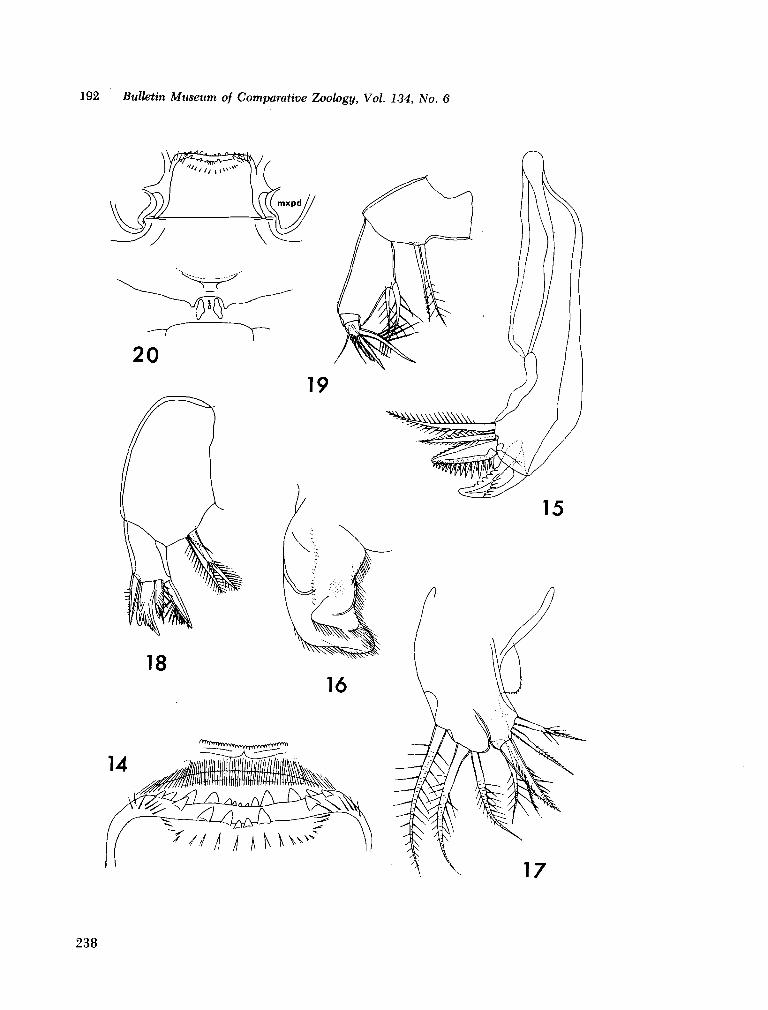
192 Bulletin Museum of Comparative Zoology, Vol. 134, No. 6
238

N E W HEMICYCLOPS F R O M MADAGASCAR • Humes 193
Plate III
Hemicyclops axiophiius n. sp., female (continued)
Fig. 14. Metastomal areas, ventral (E).
Fig. 15. Mandible, anterior and dorsal (E).
Fig. 16. Paragnath, anterior (E).
Fig. 17.. First maxilla, posterior (E).
Fig. 18. Second maxilla, posterior (G).
Fig. 19, Maxilliped, anterior or dorsal (G).
Fig. 20. Region between maxillipeds and leg 1, ventral (H).
239
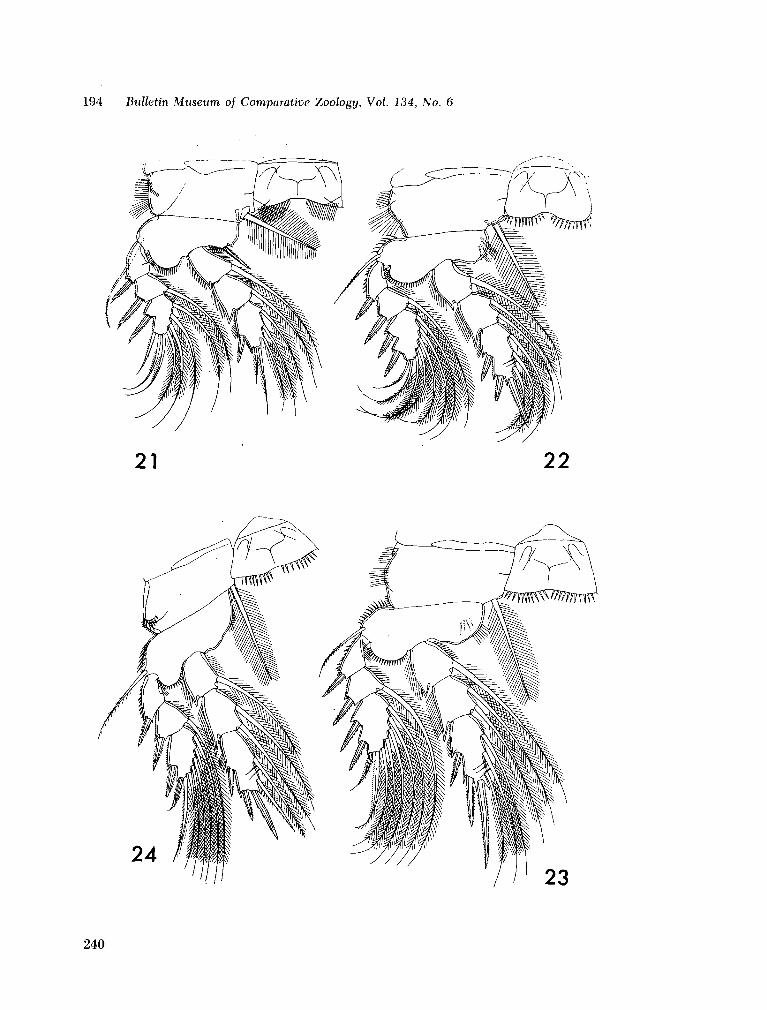
194 Bulletin Museum of Comparative Zoology, Vol. 134, No. 6
21 22
240
N E W HEMICYCLOPS FROM MADAGASCAR • Humes 195
Plate IV
Hemicyclops axtophilus n. sp., female (continued)
Fig. 21. Leg 1, anterior (H).
Fig. 22. Leg 2, posterior (H).
Fig. 23. Leg 3, posterior (H).
Fig. 24. ' Leg 4, posterior (HJ.
241
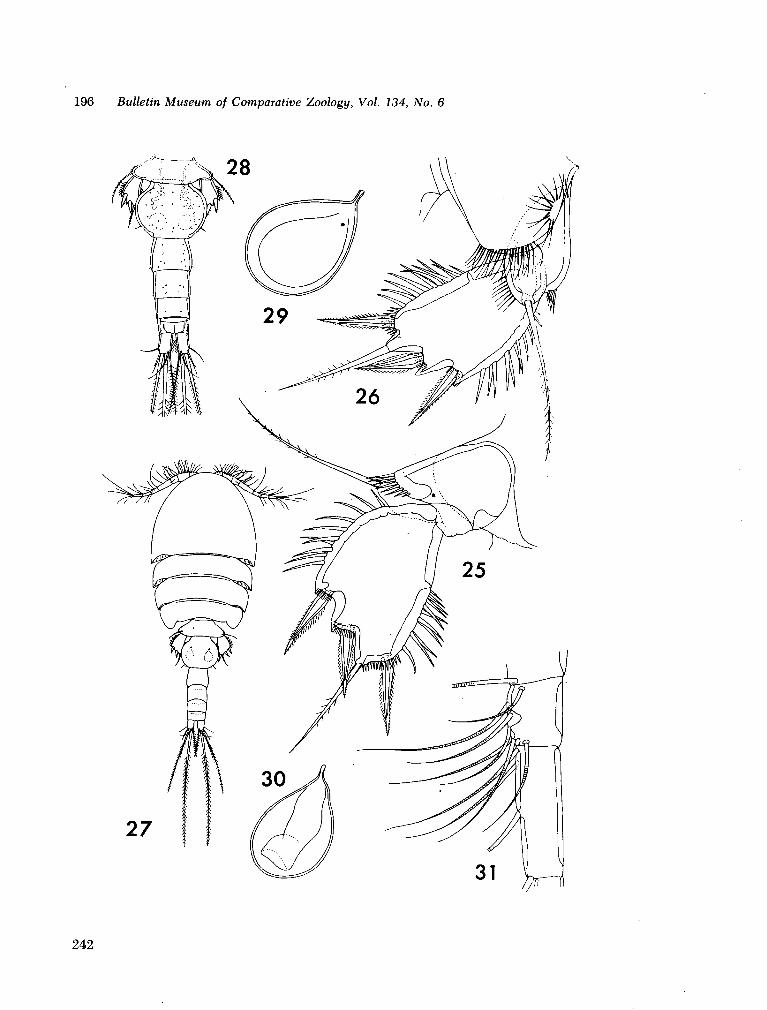
196 Bulletin Museum of Comparative Zoology, Vol. 134, No. 6
242
N E W HEMICYCLOPS F R O M MADAGASCAR • Humes 197
Plate V
Hemicyclops axiophilus n. sp., female (continued)
Fig. 25. Leg 5, ventral (D).
Fig. 26. Leg 5, dorsal |D ) .
Hemicyclops axiophilus n. sp.( male
Fig. 27. - Body, dorsal (A).
Fig. 28. Urosome, dorsal (C).
Fig. 29. Spermatophore attached to (emale (D).
Fig. 30. Spermatophore inside male (D).
Fig. 31. Segments 3 and 4 of first antenna, anterodorsal (D).
243
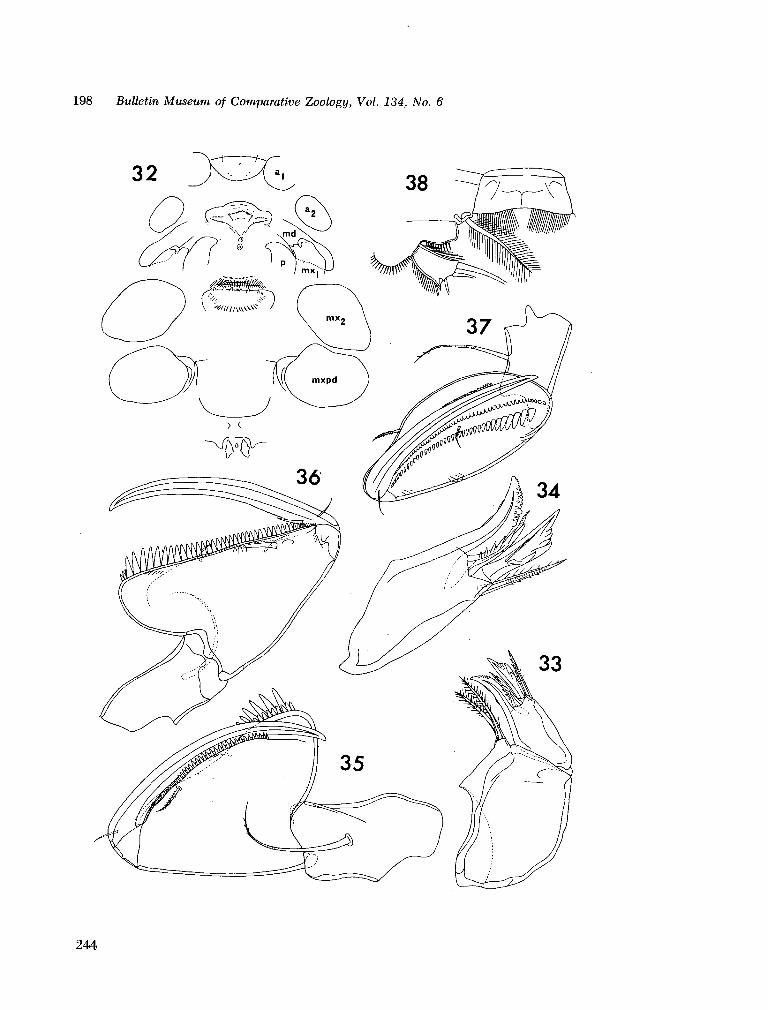
198 Bulletin Museum of Comparative Zoology, Vol. 134, No. 6
244
N E W HEMICYCLOPS FROM MADAGASCAR • Humes 199
Plate VI
Hemicyclops axiophilus n. sp., male (continued)
Fig. 32. Part of cephalosome, ventral (H).
Fig. 33. Second maxilla, posterior (G).
Fig. 34. Distal segment of second maxilla, posterior (EJ.
Fig. 35. Maxilliped, anterior (dorsal of large segment and claw) (G).
Fig. 36. Maxilliped, posterior (ventral of large segment and claw) (G).
Fig. 37. Maxilliped, inner surface (G).
Fig. 38. Detail of part of leg 1, posterior (H).
Abbreviations
ai, first antenna mxi, first maxilla
02, second antenna mx2, second maxilla
m d , mandible m x p d , maxilliped
p, paragnath pi, leg 1
245
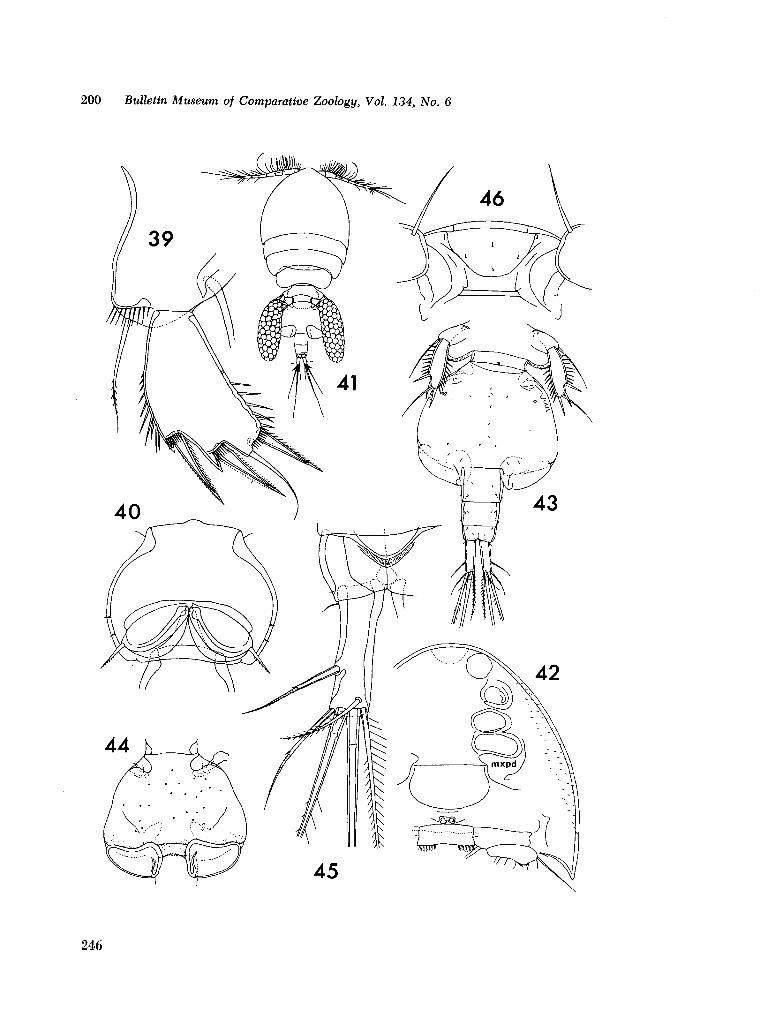
200 Bulletin Museum of Comparative Zoology, Vol. 134, No. 6
246
N E W HEMICYCLOPS F R O M MADAGASCAR • Humes 201
Plate VII
Hemicyclops axiophiius n. sp., male (continued)
Fig. 39. Leg 5, ventral (D).
Fig. 40. Genital segment showing leg 6, ventral (HJ.
Hemicyclops amplicaudatus n. sp., female
Fig. 41. Body, dorsal (A).
Fig. 42. Part of cephalosome, ventral (B).
Fig. 43. Urosome, ventral (B).
Fig. 44. Genital segment, dorsal (B).
Fig. 45. Caudal ramus and part of anal segment, dorsal (E).
Fig. 46. Rostral area, ventral (D).
247
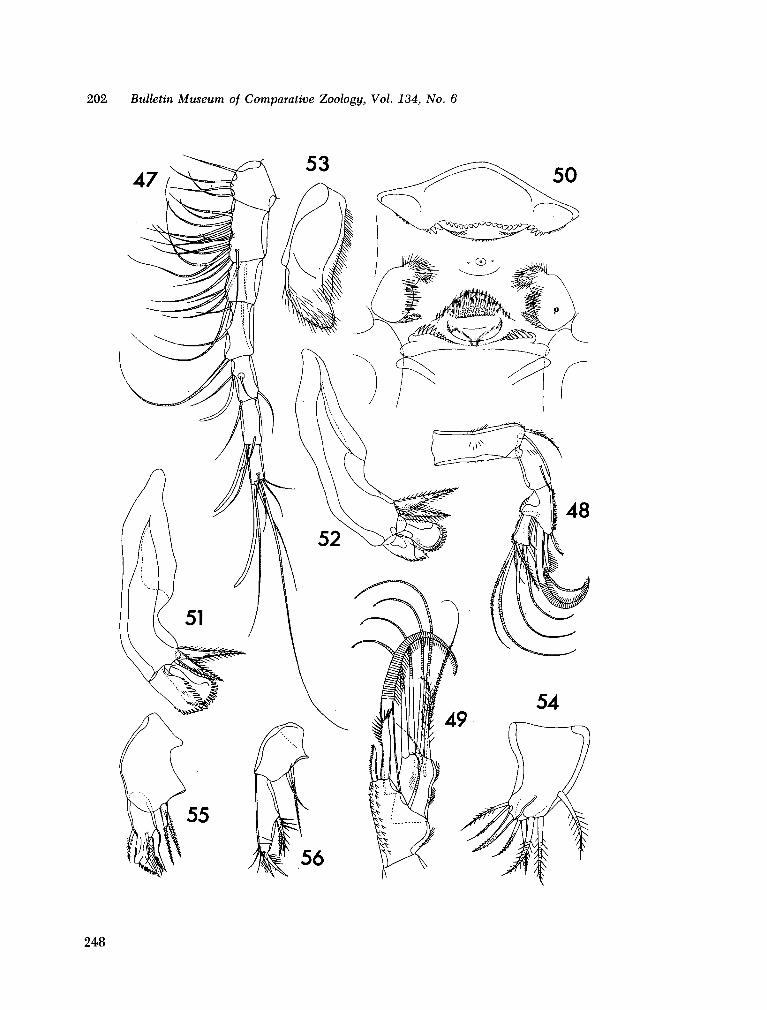
202 Bulletin Museum of Comparative Zoology, Vol. 134, No. 6
248

N E W HEMICYCLOPS F R O M MADAGASCAR • Humes 203
Plate VIII
Hemicyclops amplicaudatus n. sp., female (continued)
Fig. 47. First antenna, ventral (G).
Fig. 48. Second antenna, posterior (G).
Fig. 49. Last two. segments of second antenna, posterior (E).
Fig. 50. - Oral area, ventral (E).
Fig. 51. Mandible, ventral (E).
Fig. 52. Mandible, dorsal (E).
Fig. 53. Paragnath, ventral and posterior (F).
Fig. 54. First maxilla, posterior (G).
Fig. 55. Second maxilla, posterior (G).
Fig. 56. Maxilliped, posterior and slightly outer (G).
249
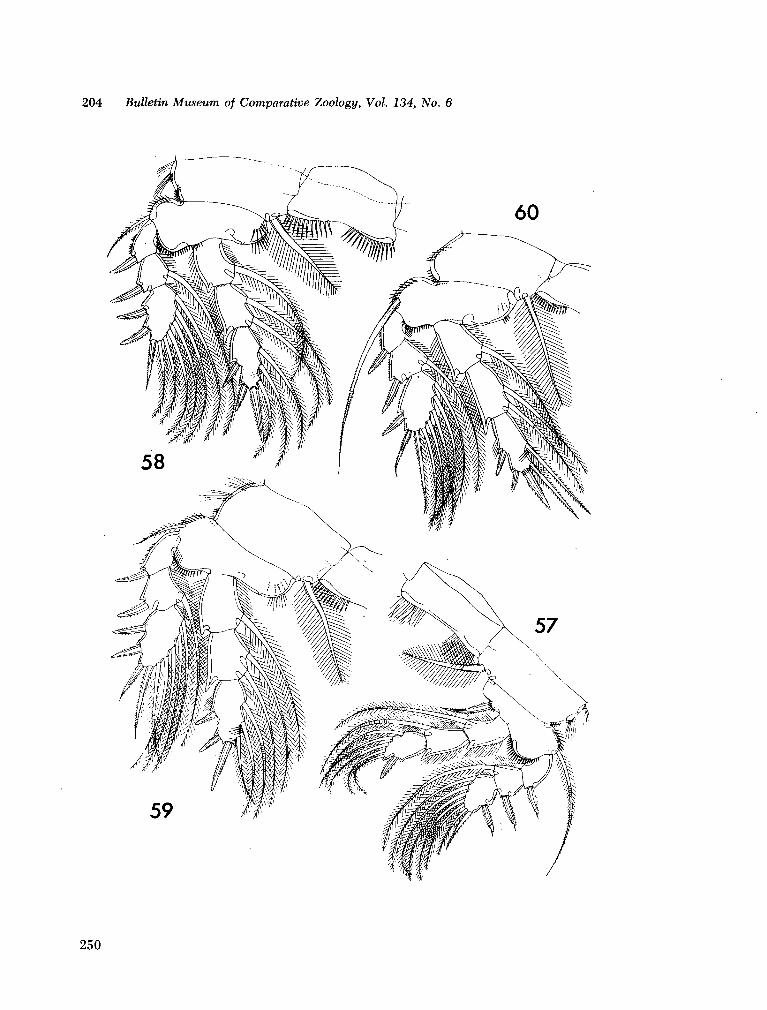
204 Bulletin Museum of Comparative Zoology, Vol. 134, No. 6
250

N E W HEMICYCLOPS F B O M MADAGASCAR • Humes 205
Plate IX
Hemicyclops amplicaudaius n. sp., female (continued)
Fig. 57. Leg 1, anterior (G).
Fig. 58. Leg 2, anterior (G).
Fig. 59. Leg 3, posterior (G).
Fig. 60.. Leg 4, posterior (G).
251
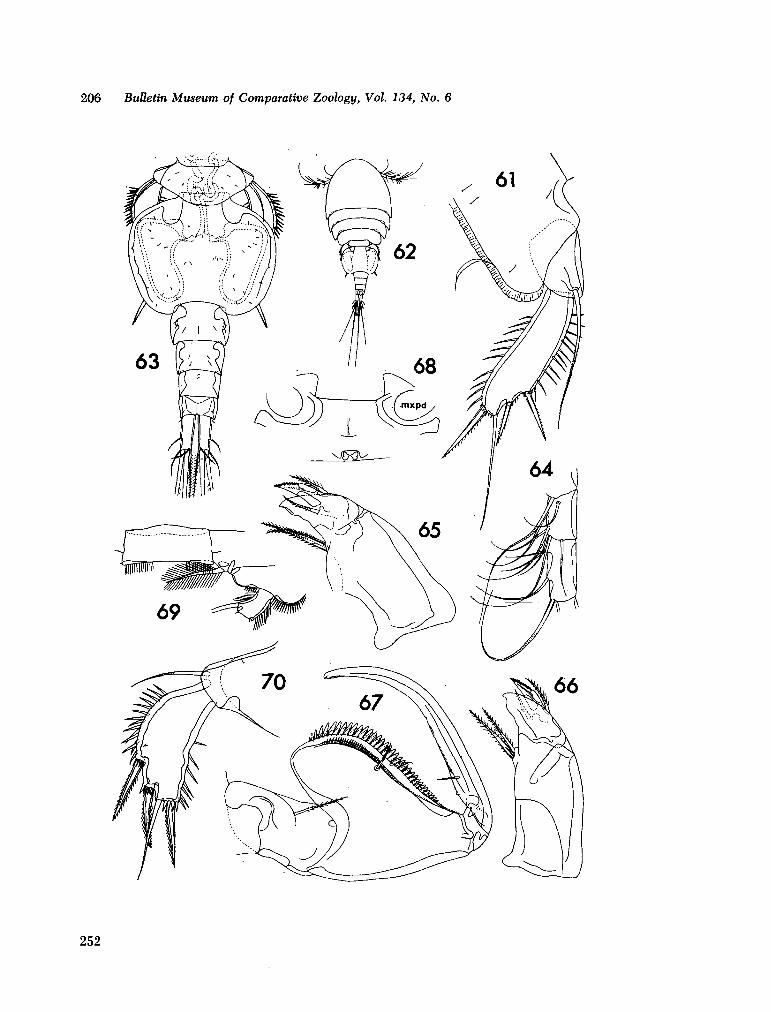
206 Bulletin Museum of Comparative Zoology, Vol. 134, No. 6
252
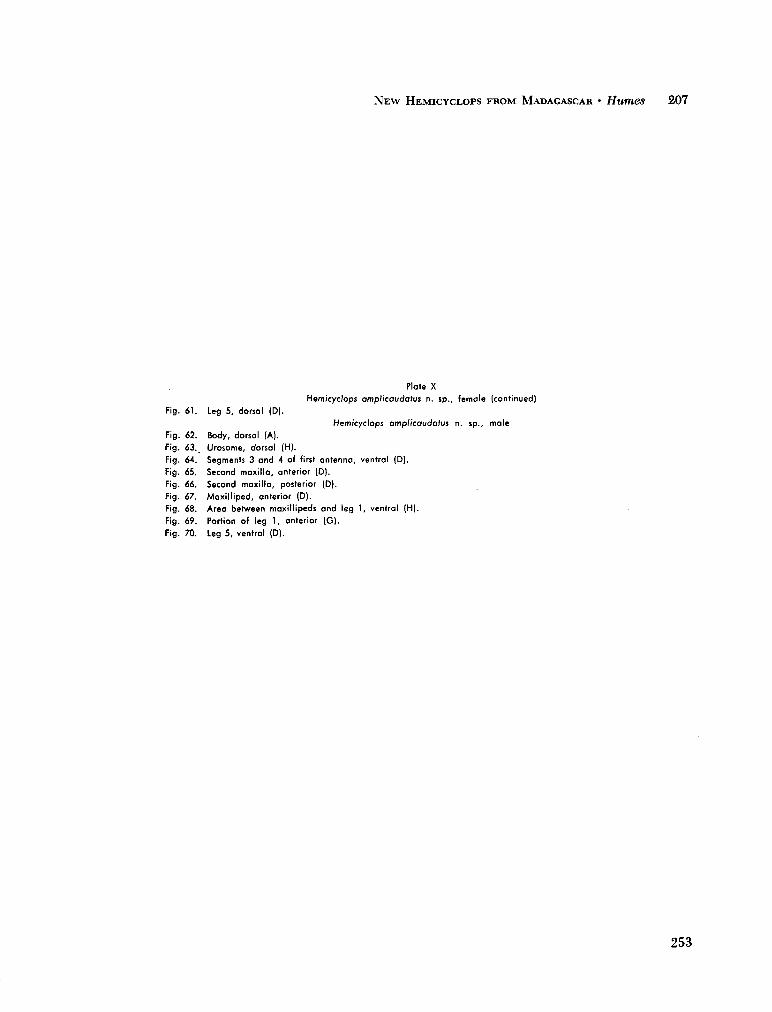
N E W HEMICYCLOPS F R O M MADAGASCAR • Humes 207
Plate X
Hem/cyc/ops amplicaudatus n. sp.( female (continued)
Fig. 61. Leg 5, dorsal (D).
Hem/cyc/ops amplicaudatus n. sp., male
Fig. 62. Body, dorsal (A).
Fig. 63.m Urosome, dorsal (H).
Fig. 64. Segments 3 and 4 of first antenna, ventral (D).
Fig. 65. Second maxilla, anterior (D).
Fig. 66. Second maxilla, posterior (D).
Fig. 67. Maxilliped, anterior (D).
Fig. 68. Area between maxilllpeds and leg 1, ventral (H).
Fig. 69. Portion of leg 1, anterior (G).
Fig. 70. Leg 5, ventral (D).
253
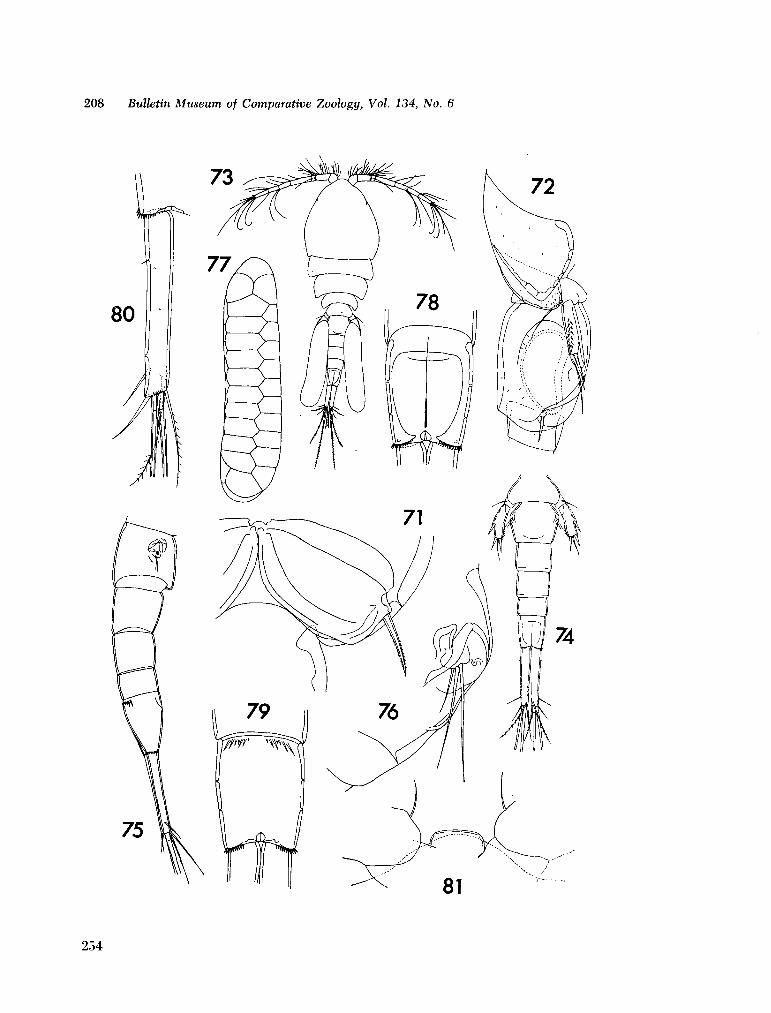
208 Bulletin Museum of Comparative Zoology, Vol. 134, No. 6
254
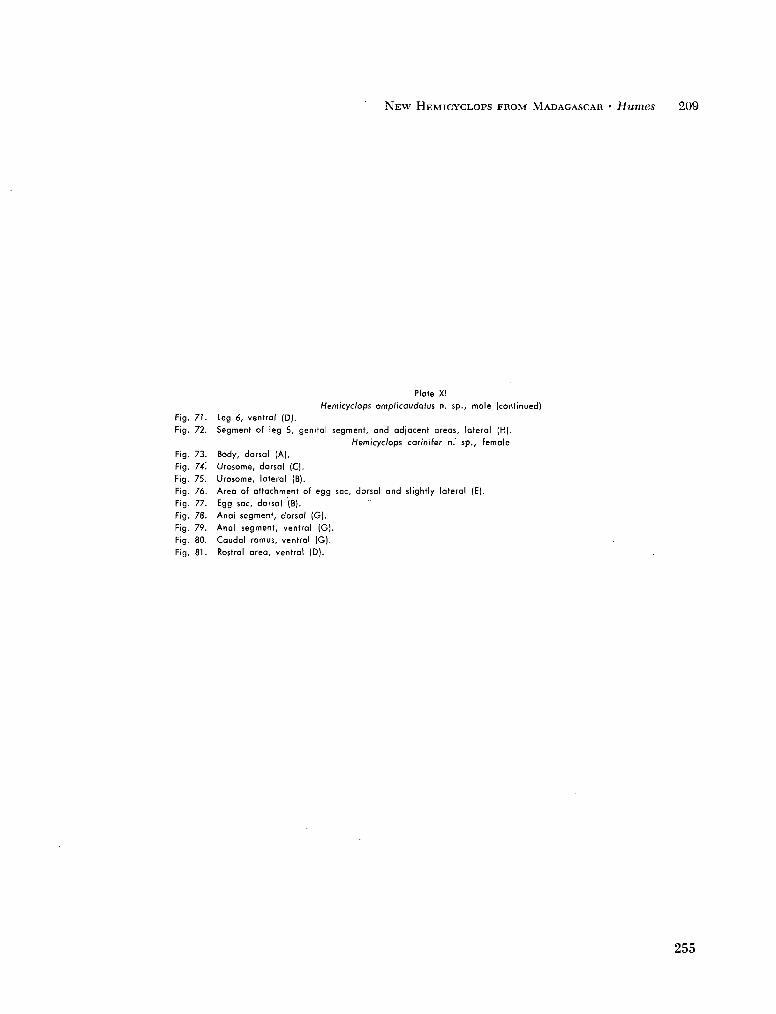
N E W HEMICYCLOPS F R O M MADAGASCAR • Humes 209
Plate XI
Hemicyclops amplicaudatus n. sp., male (continued}
Fig-
Fig.
Fig-
Fig.
Fig-
Fig-
Fig-
Fig-
Fig-
Fig-
Fig.
71.
72.
73.
74:
75.
76.
77.
78.
79.
80.
81.
Leg 6, ventral (D).
Segment of leg 5, genital segment, and adjacent areas, lateral (H).
Hemicyclops car'tniter n. sp., female
Body, dorsal (A).
Urosome, dorsal (C).
Urosome, lateral (B).
Area of attachment of egg sac, dorsal and slightly lateral (E).
Egg sac, dorsal (B).
Anal segment, dorsal (G).
Anal segment, ventral (G).
Caudal ramus, ventral (G).
Rostral area, ventral (D).
255
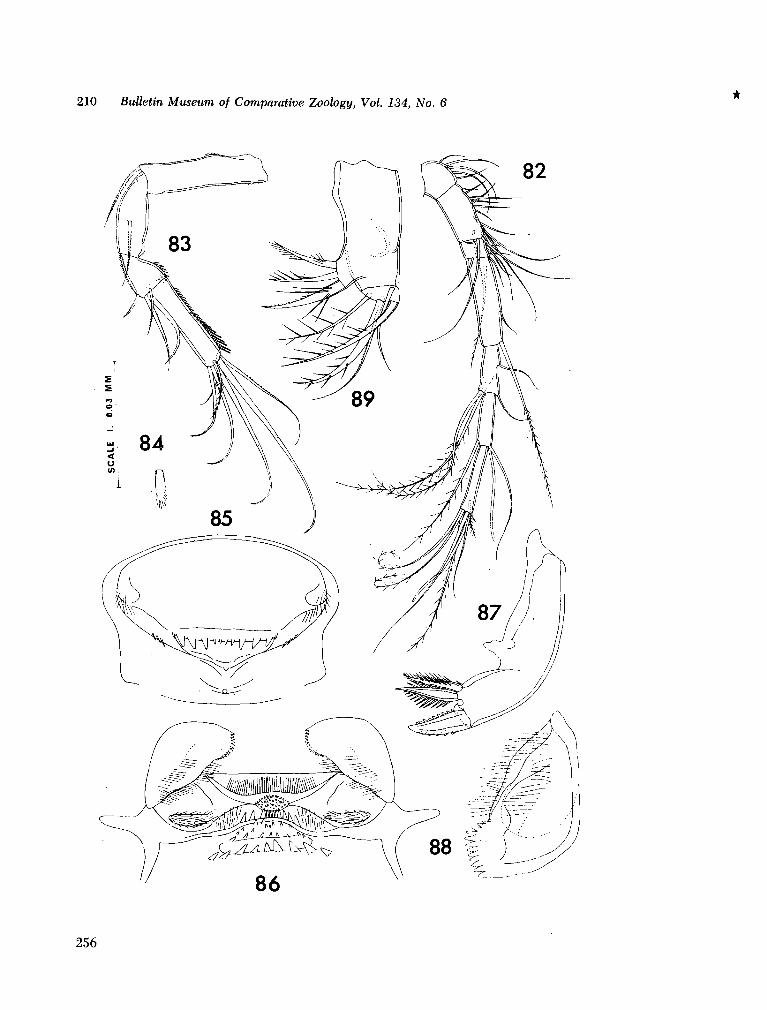
210 Bulletin Museum of Comparative Zoology, Vol. 134, No. 6
256

N E W HEMICYCLOPS F R O M MADAGASCAR • Humes 211
Plate Xtl
Hemicyclops carin'tfer n. sp., female (continued)
Fig. 82. First antenna, dorsal (H).
Fig. 83. Second antenna, posterior mesial (G).
Fig. 84. Seta on third segment of second antenna (I).
Fig. 85. Labrum, anterior and ventral (E).
Fig. 86: Metastomal areas and paragnaths, ventral (E).
Fig. 87. Mandible, posterior (E).
Fig. 88. Paragnath, ventral and posterior (F).
Fig. 89. First maxilla, posterior (E).
257
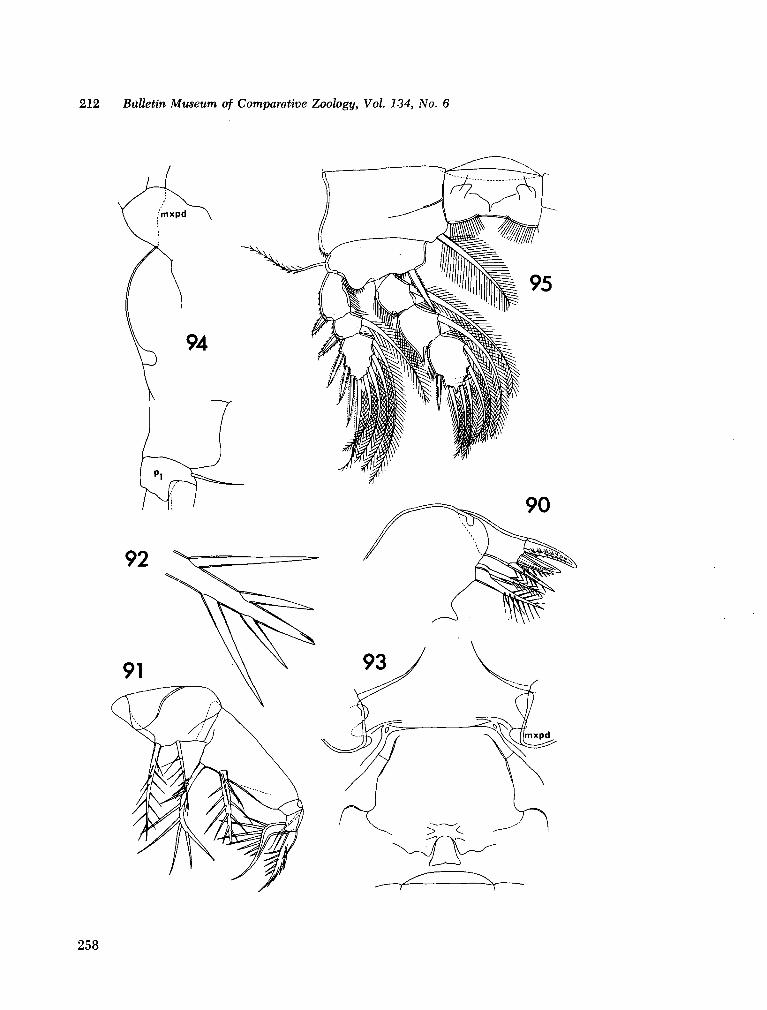
212 Bulletin Museum of Comparative Zoology, Vol. 134, No. 6
258

N E W HEMICYCLOPS FROM MADAGASCAR • Humes 213
Plate XIII
Hem/cyc/ops carinifer n. sp., female (continued)
Fig. 90. Second maxilla, posterior and dorsal (D).
Fig. 91. Maxilliped, dorsal | G ) .
Fig. 92. Terminal part of distal seta on second segment of maxilliped (I).
Fig. 93. Area between maxillipeds and leg 1, ventral (G).
Fig. 94. Area between maxillipeds and leg 1, lateral (G).
Fig. 95. Leg 1, anterior (G).
259
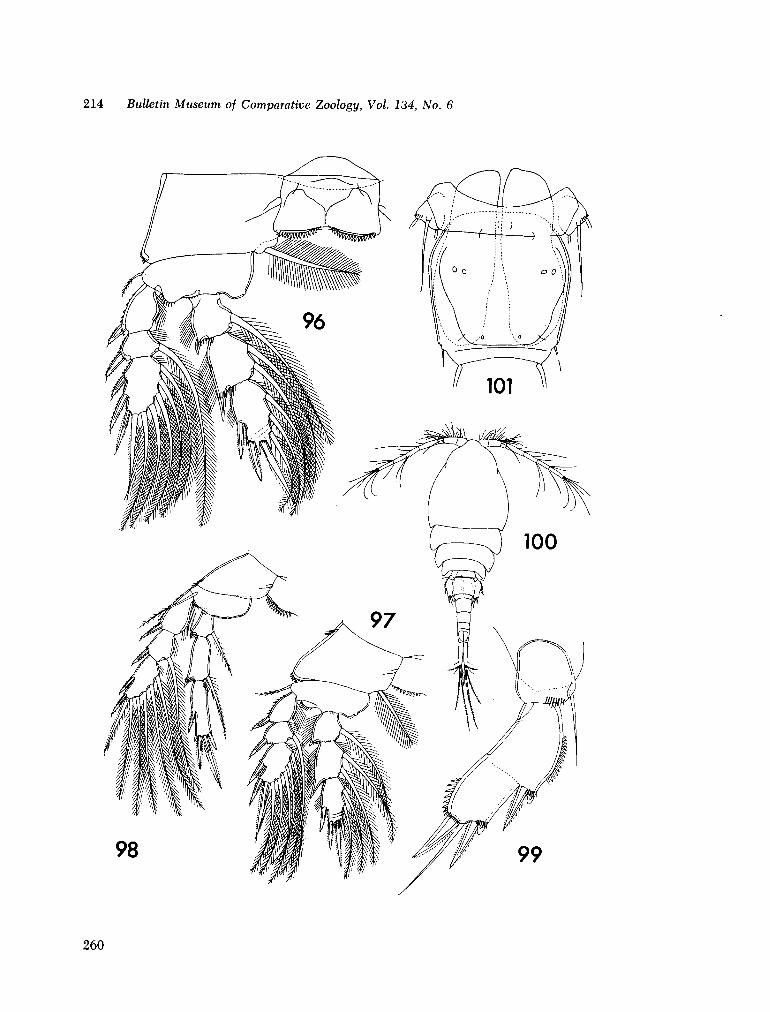
214 Bulletin Museum of Comparative Zoology, Vol. 134, No. 6
260

N E W HEMICYCLOPS FROM MADAGASCAR • Humes 215
Plate XIV
Hemicyclops cariniier n. sp., female (continu..
Fig. 96. Leg 2, anterior (G|.
Fig. 97. Leg 3, posterior (H).
Fig. 98. Leg 4, posterior (H).
Fig. 99. Leg 5, ventral and lateral (D|.
Hemicyclops carinifer n. sp., male
Fig. 100. Body, dorsal (A).
Fig. 101. Segment of leg 5 and genital segment, dorsal (G).
261
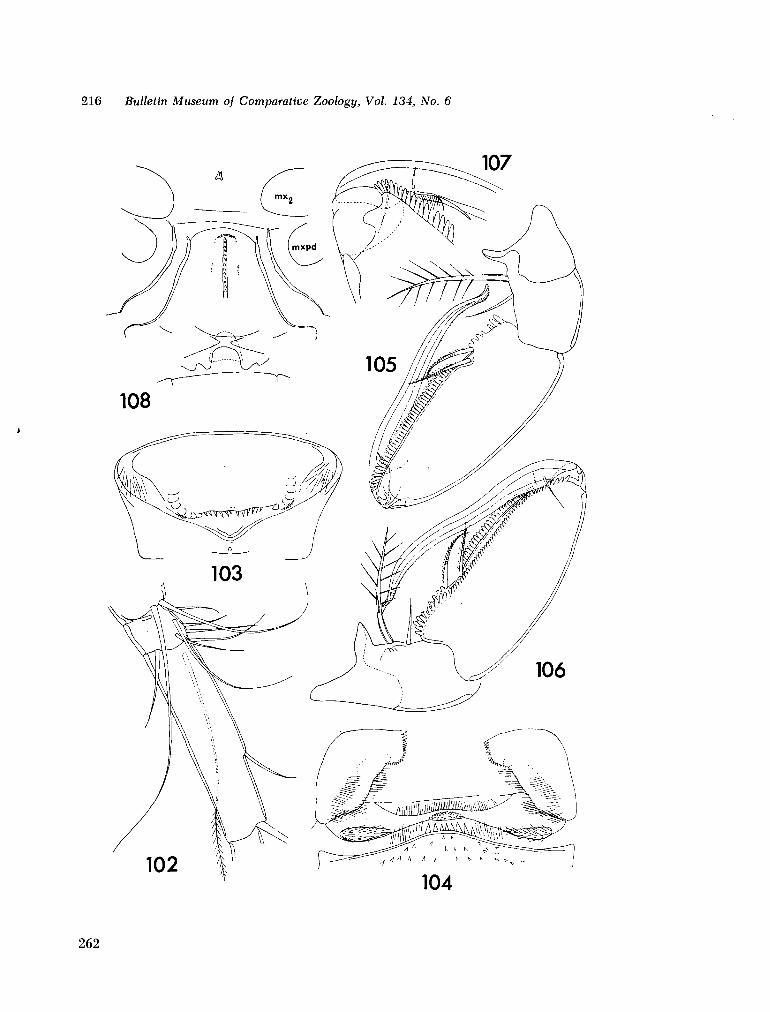
216 Bulletin Museum of Comparative Zoology, Vol. 134, No. 6
262
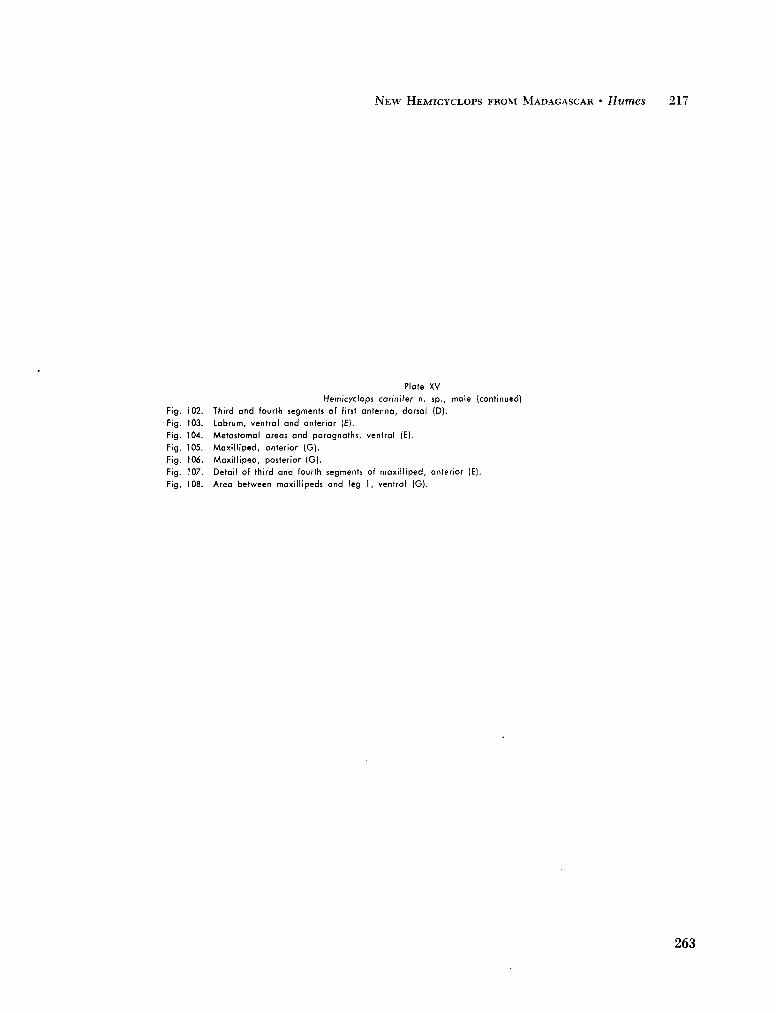
N E W HEMICYCLOPS FROM MADAGASCAR • Humes 217
Plate XV
Hemicyclops carinifer n. sp., male (continued)
102. Third and fourth segments of first antenna, dorsal (D).
103. Labrum, ventral and anterior (E).
104. Metastomal areas and paragnaths, ventral (E).
105. Maxilliped, anterior (GJ.
106. Maxilliped, posterior (G).
107. Detail of third and fourth segments of maxilliped, anterior (E).
108. Area between maxillipeds and leg 1, ventral (G).
263
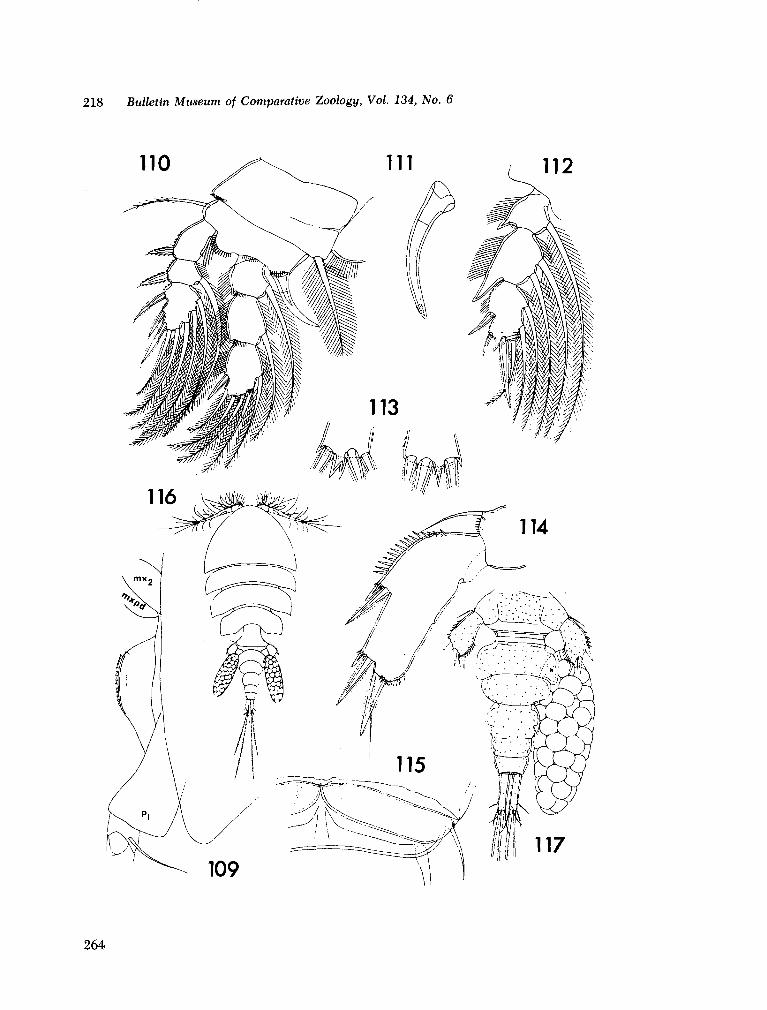
218 Bulletin Museum of Comparative Zoology, Vol. 134, No. 6
264
N E W HEMICYCLOPS F R O M MADAGASCAR • Humes 219
Plate XVI
Hemicyclops carinifer n. sp., male (continued)
Fig. 109. Area between maxillipeds and leg 1, lateral (G).
Fig. 110. Leg 1, anterior (G|.
Fig. 111. Inner spine on basis of leg 1, posterior (E).
Fig. 112. Endopod of leg 2, posterior (G).
Fig. 113. Distal margins of endopods in leg 3 of 1 male, posterior (E).
Fig. 114. Leg 5, dorsomesial (D).
Fig. 115. Leg 6, ventral (E).
Hemicyclops diremptus n. sp., female
Fig. 116. Body, dorsal (A).
Fig. 117. Urosome, ventral (C).
265
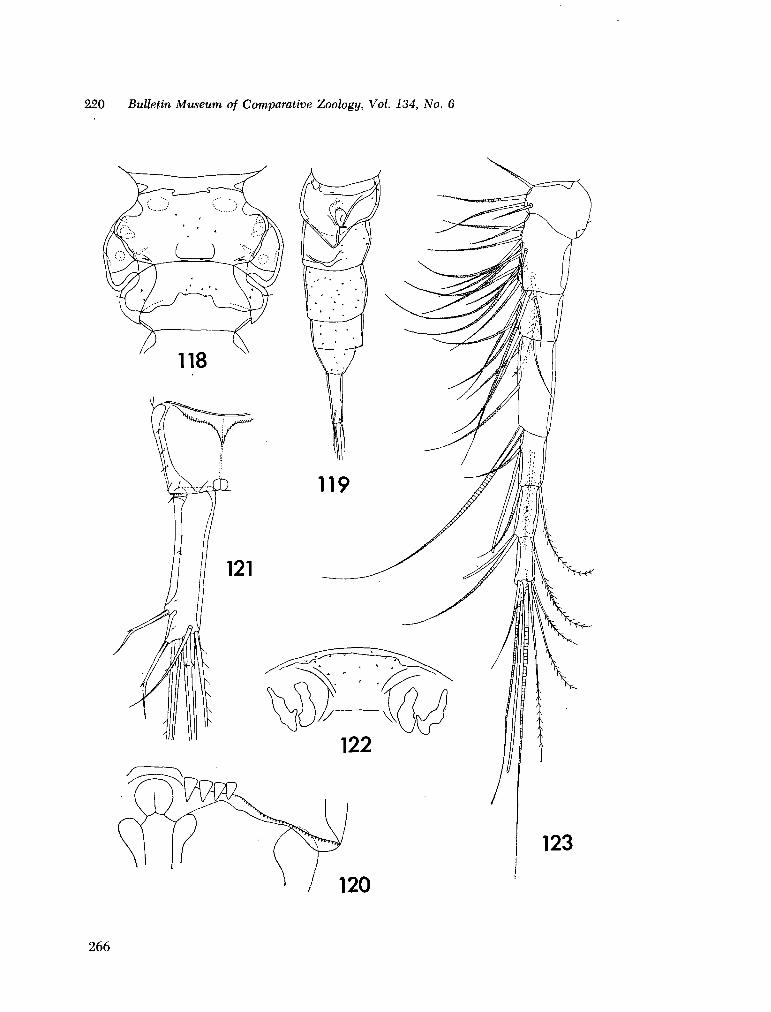
220 Bulletin Museum of Comparative Zoology, Vol. 134, No. 6
266
N E W HEMICYCLOPS F R O M MADAGASCAR • Humes 221
Plate XVII
Hemicyclops d/rempfus n. sp., female (continued)
Fig. 118. Genital segment, dorsal (H).
Fig. 119. Genital and postgenital segments, lateral (B).
Fig. 120. Area of insertion of a caudal ramus, ventral (I)
Fig. 121. Caudal ramus, dorsal (D).
Fig. 122. Rostral area, ventral (G).
Fig. 123. First antenna, ventral (G).
267
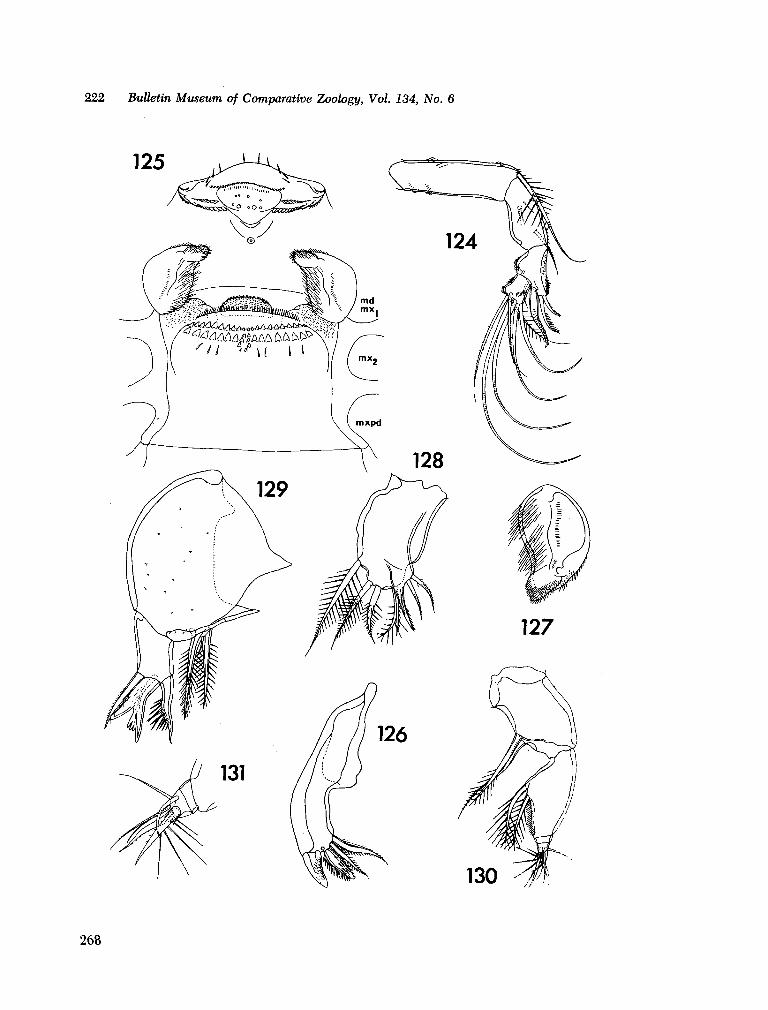
222 Bulletin Museum of Comparative Zoology, Vol. 134, No. 6
268

N E W HEMICYCLOPS FROM MADAGASCAR • Humes 223
Plate XVIII
Hemicyclops diremptus n. sp., female [continued) 124. Second antenna, anterior (G).
125. Oral area, ventral (D).
126. Mandible, posterior and ventral (D).
127. Paragnath, posterodorsal (E).
128. First maxilla, posterior (D).
129. Second maxilla, anterior (D).
130. Maxilliped, anterodorsal (G).
131. Tip of maxilliped, posteroventral (E).
269
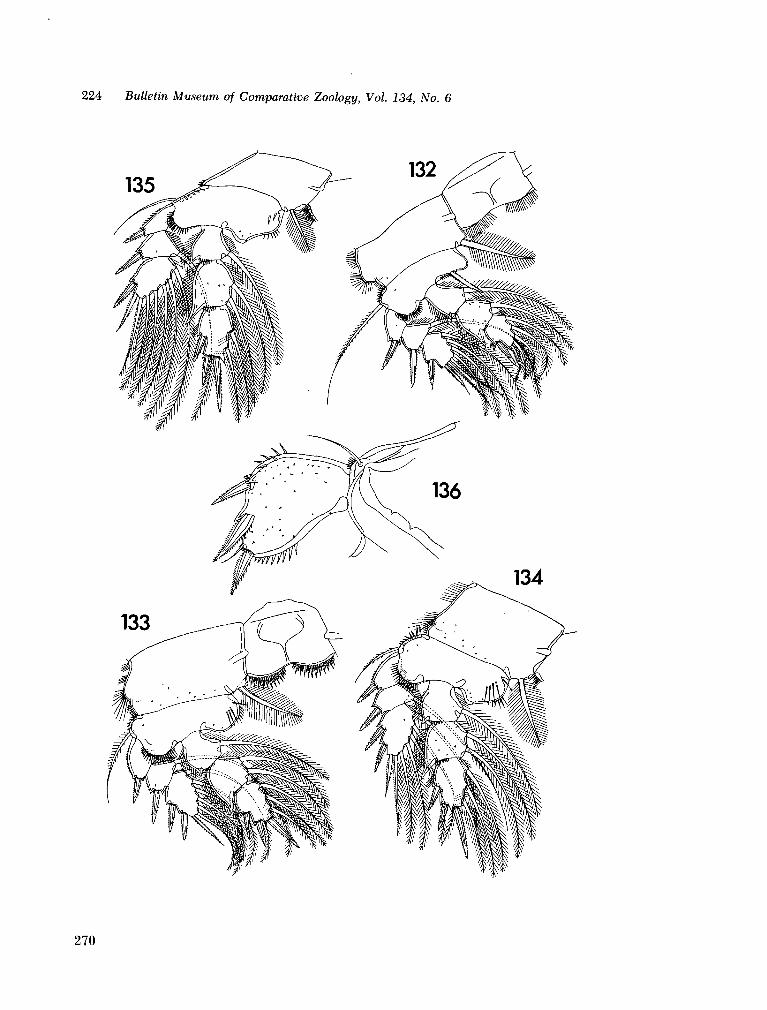
224 Bulletin Museum of Comparative Zoology, Vol. 134, No. 6
270
N E W HEMICYCLOPS F B O M MADAGASCAR • Humes 225
Plate XIX
Hemicyclops diremptus n. sp., female (continued)
Fig. 132. Leg 1, anterior (H).
Fig. 133. Leg 2, anterior (H).
Fig. 134. Leg 3, anterior (H).
Fig. 135. Leg 4 , anterior | H ) .
Fig. 136. Leg 5, dorsal (G].
271
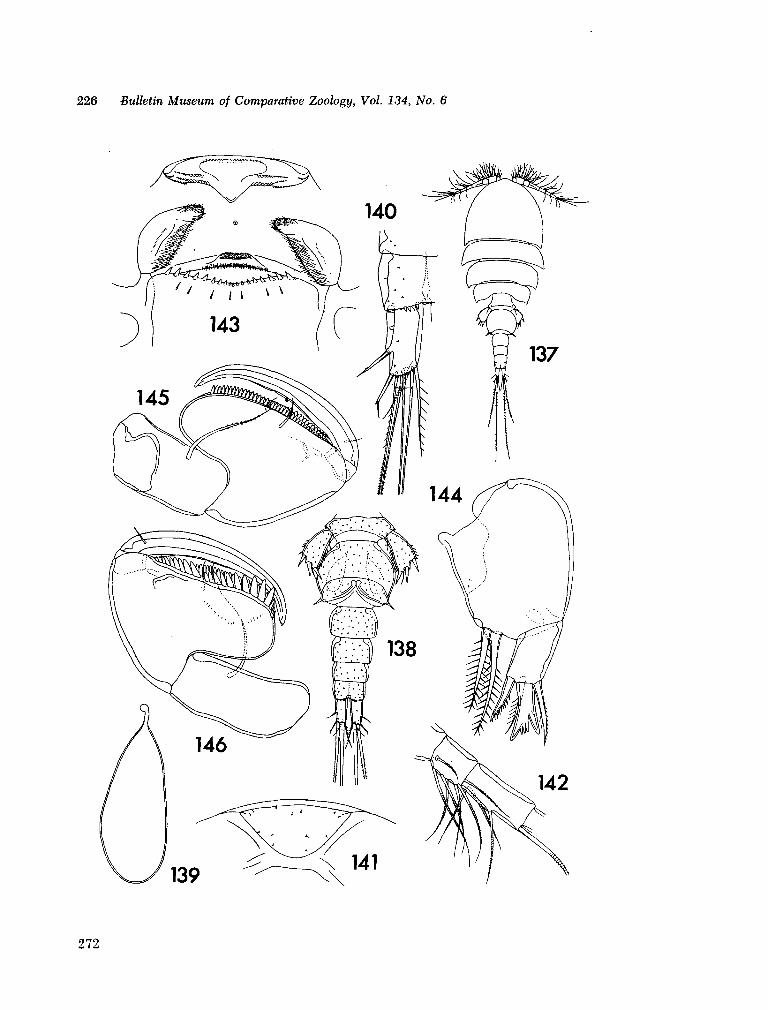
226 Bulletin Museum of Comparative Zoology, Vol. 134, No. 6
272

N E W HEMICYCLOPS F R O M MADAGASCAR • Humes 227
Plate XX
Hemicyclops diremptus n. sp., male 137. Body, dorsal (A).
138. Urosome, ventral (C).
139. Spermatophore from inside body of male |E).
140. Caudal ramus and part of anal segment, ventral |D) .
141. Rostral area, ventral (E).
142. Third and fourth segments of first antenna, ventral (D).
143. Oral area, ventral (E). 144. Second maxilla, anterior (E).
145. Maxilliped, anterior (D).
146. Maxilliped, posterior |D) .
273
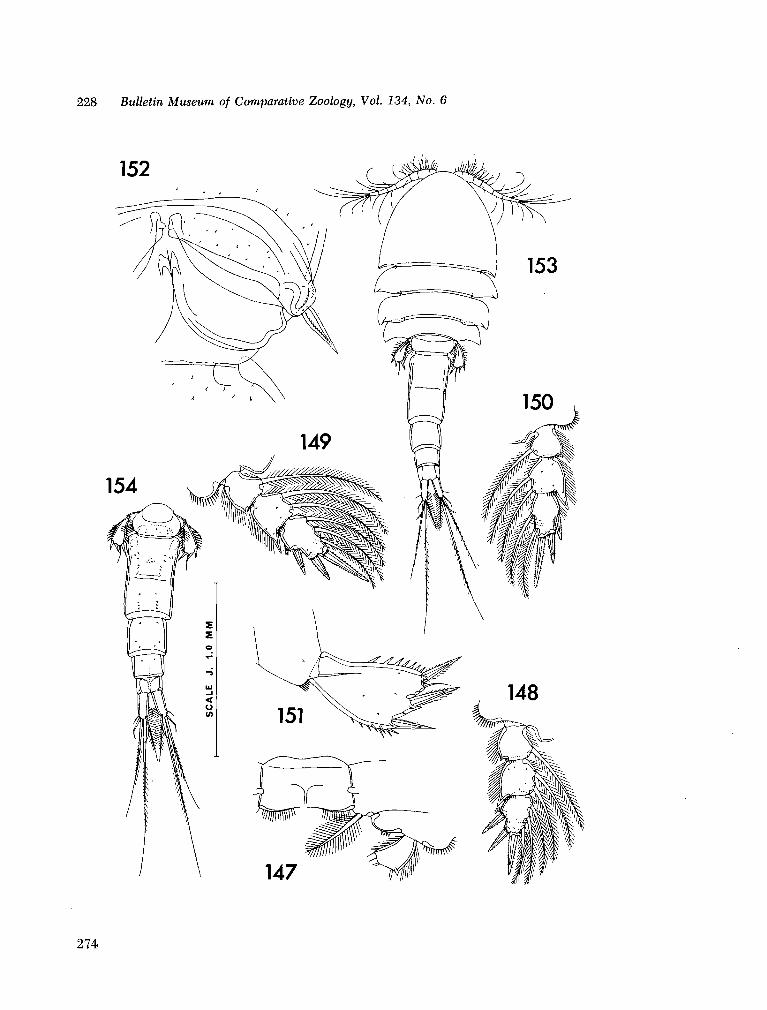
228 Bulletin Museum of Comparative Zoology, Vol. 134, No. 6
274
N E W - HEMICYCLOPS F R O M MADAGASCAR • Humes 229
Plate XXI
Hemicyclops d/rempfus n. sp., male (continued)
Fig. 147. Portion of leg 1, anterior (G).
Fig. 148. Endopod of leg 2, anterior (G).
Fig. 149. Endopod of leg 3, anterior (G).
Fig. 150. Endopod of leg 4, anterior (G).
Fig. 151. Leg 5, dorsal (D).
Fig. 152. Leg 6, ventral |E).
Hemicyclops kombensis n. sp., female
Fig. 153. Body, dorsal (A).
Fig. 154. Urosome, dorsal (J).
275
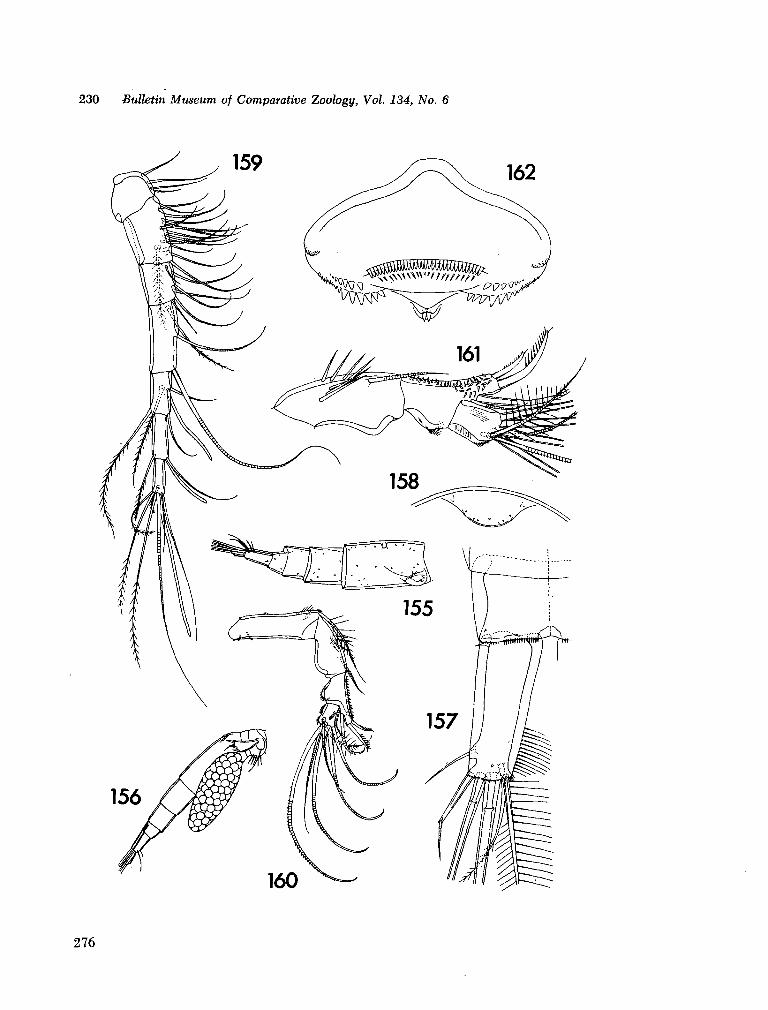
230 Bulletin Museum of Comparative Zoology, Vol. 134, No. 6
276
N E W HEMICYCLOPS F R O M MADAGASCAR • Humes 231
Plate XXII
Hemicyclops kombensis n. sp., female (continued)
Fig. 155. Genital and postgenital segments, nearly lateral (J).
Fig. 156. Egg sac attached to urosome, nearly lateral (A).
Fig. 157. Caudal ramus, ventral (G).
Fig. 158. Rostral area, ventral (G).
Fig. 159. First antenna, ventral (H).
Fig. 160. Second antenna, anterior (H).
Fig. 161. Last three segments of second antenna, posterior (D).
Fig. 162. Labrum, ventral and somewhat posterior (E).
277
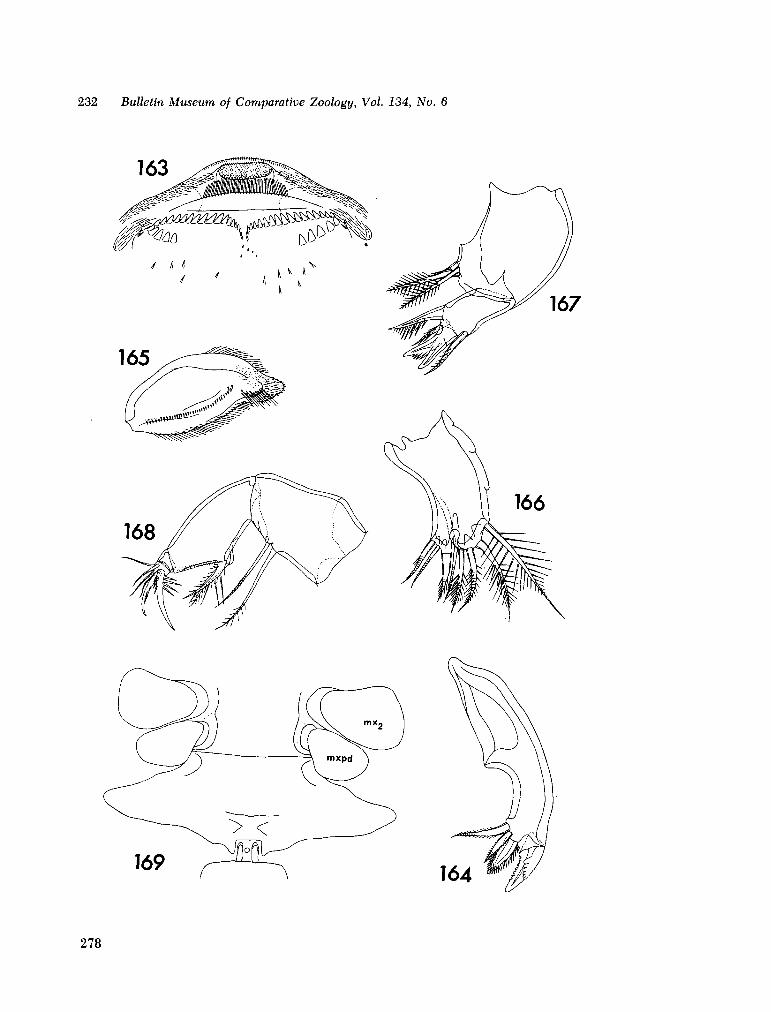
232 Bulletin Museum of Comparative Zoology, Vol. 134, No. 6
W P«^
278

N E W HEMICYCLOPS F R O M MADAGASCAR • Humes 233
Plate XXIII
Hemicyclops kombensis n. sp., female (continued)
Fig. 163. Metastomal areas, ventral (E).
Fig. 164. Mandible, anterior and dorsal (D).
Fig. 165. Paragnath, posterior and ventral (E).
Fig. 166. First maxilla, posterior (D).
Fig. 167. Second maxilla, anterior (G).
Fig. 168. Maxilliped, posterior and ventral (GJ.
Fig. 169. Region between maxillipeds and leg 1, ventral (H).
279
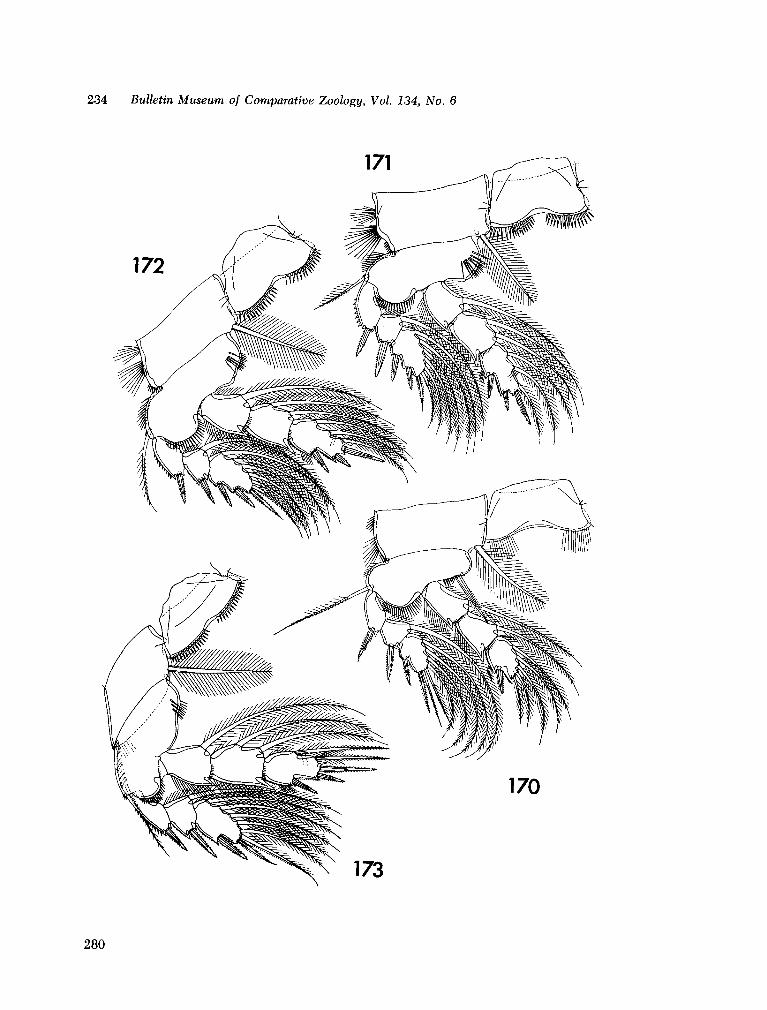
234 Bulletin Museum of Comparative Zoology, Vol. 134, No. 6
280
N E W HEMICYCLOPS F R O M MADAGASCAR • Humes 235
Plate XXIV
Hemicyclops kombensis n. sp., female (continued)
Fig. 170. Leg 1, anterior (H).
Fig. 171. Leg 2 , anterior (H).
Fig. 172. Leg 3, anterior (H).
Fig. 173. Leg 4, anterior (H).
281
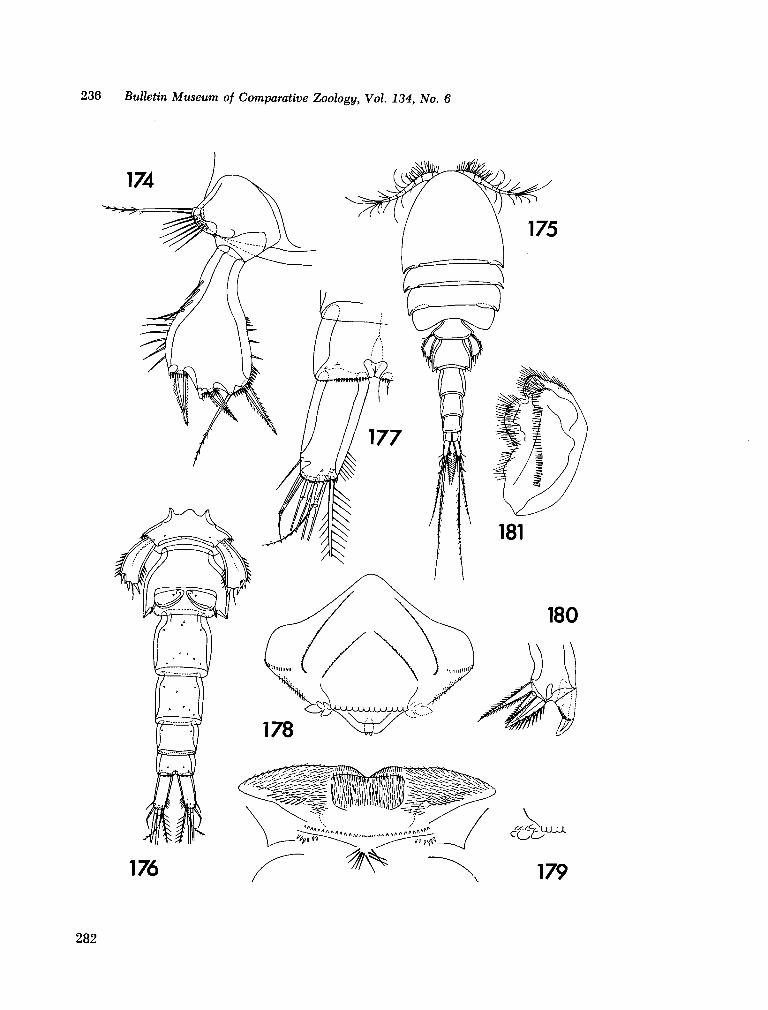
236 Bulletin Museum of Comparative Zoology, Vol. 134, No. 6
UJUUL
282
N E W HEMICYCLOPS F R O M MADAGASCAR • Humes 237
Fig. 174. Leg 5, ventral | G ) .
Plate XXV
Hemicyclops kombensis n. sp., female (continued)
Hemicyclops kombensis n. sp., male Fig. 175. Body, dorsal (A).
Fig. 176. Urosome, ventral (C).
Fig. 177. Caudal ramus and part of anal segment, ventral (G).
Fig. 178. Labrum and metastomal areas, ventral (E).
Fig. 179. Spines at corner of labrum, ventral (E).
Fig. 180. Tip of mandible, anterior (D).
Fig. 181. Paragnath, posterior and ventral (E).
283
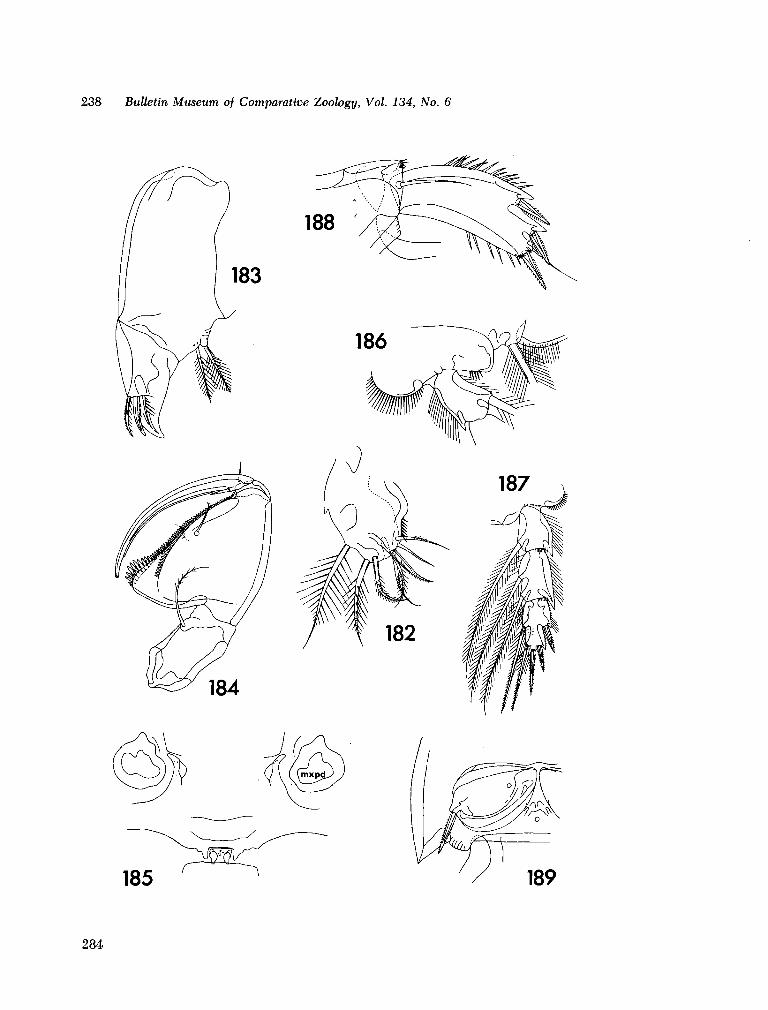
238 Bulletin Museum of Comparative Zoology, Vol. 134, No. 6
284

N E W HEMICYCLOPS F R O M MADAGASCAR • Humes 239
Plate XXVI
Hemicyclops kombensis n. sp.f male (continued)
Fig. 182. First maxilla, posterior (D).
Fig. 183. Second maxilla, anterior (G).
Fig. 184. Maxilliped, anterior (H).
Fig. 185. Region between maxillipeds and leg 1, ventral (H).
Fig. 186. Detail of leg 1, anterior (GJ.
Fig. 187. Endopod of leg 4 , anterior (H).
Fig. 188. Leg 5, dorsai (G).
Fig. 189. Leg 6, ventral (G).
285
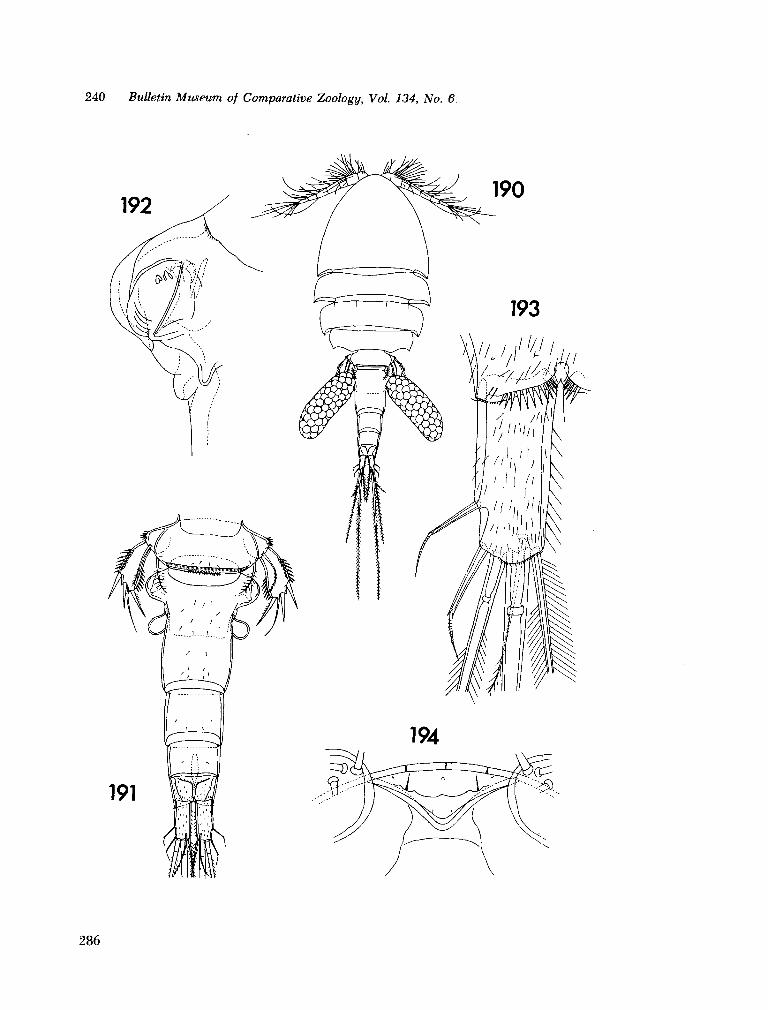
240 Bulletin Museum of Comparative Zoology, Vol. 134, No. 6
286
N E W HEMICYCLOPS F R O M MADAGASCAR • Humes 241
Fig. 190. Body, dorsal (J).
Fig. 191. Urosome, dorsal (B).
Fig. 192. Area of attachment of ej
Fig. 193. Caudal ramus, ventral (E
Fig. 194. Rostral area, ventral (E).
Plate XXVII
Hem/cyc/ops bithgellatus n. sp., female
sac, dorsal (E).
287
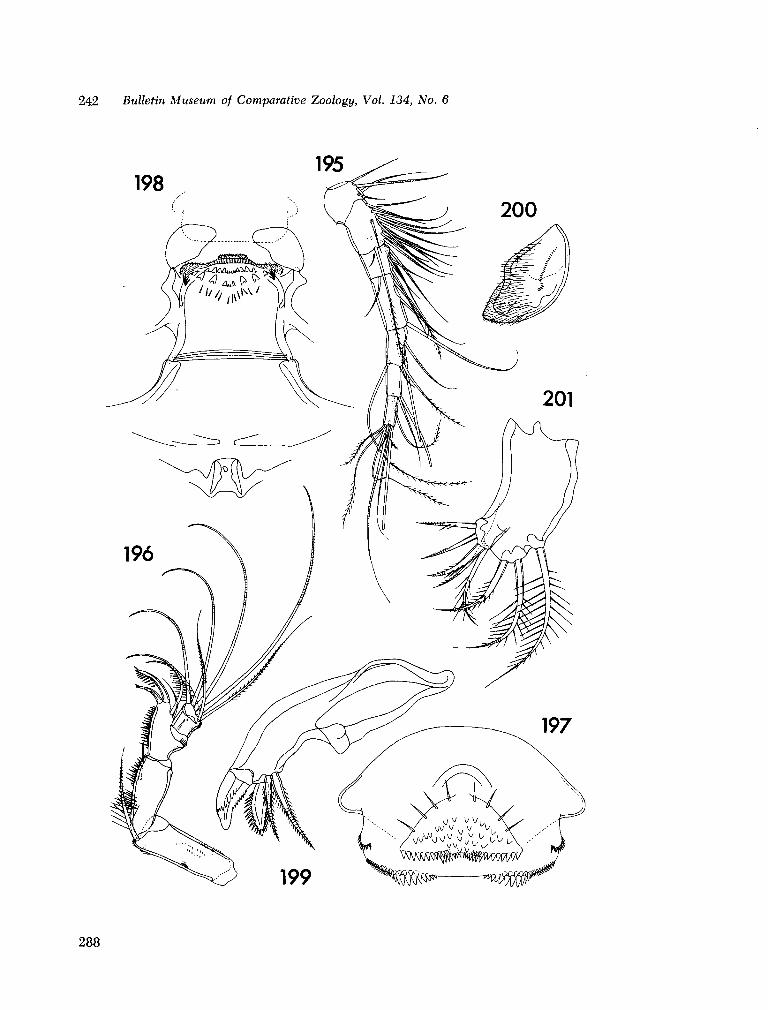
242 Bulletin Museum of Comparative Zoology, Vol. 134, No. 6
288
N E W HEMICYCLOPS FROM MADAGASCAR • Humes 243
Plate XXVIII
Hemicyclops biflagellatus n. sp., female (continued)
Fig. 195. First antenna, anterodorsal (HJ.
Fig. 196. Second antenna, anterior (G).
Fig. 197. Labrum, ventral (E).
Fig. 198. Metastomal areas and region between maxillipeds and leg 1 (with outline of labrum in dashed lines), ventral
(G).
Fig. 199. Mandible, anterior and dorsal (E).
Fig. 200. Paragnath, posterior (E).
Fig. 201. First maxilla, posterior (E).
289
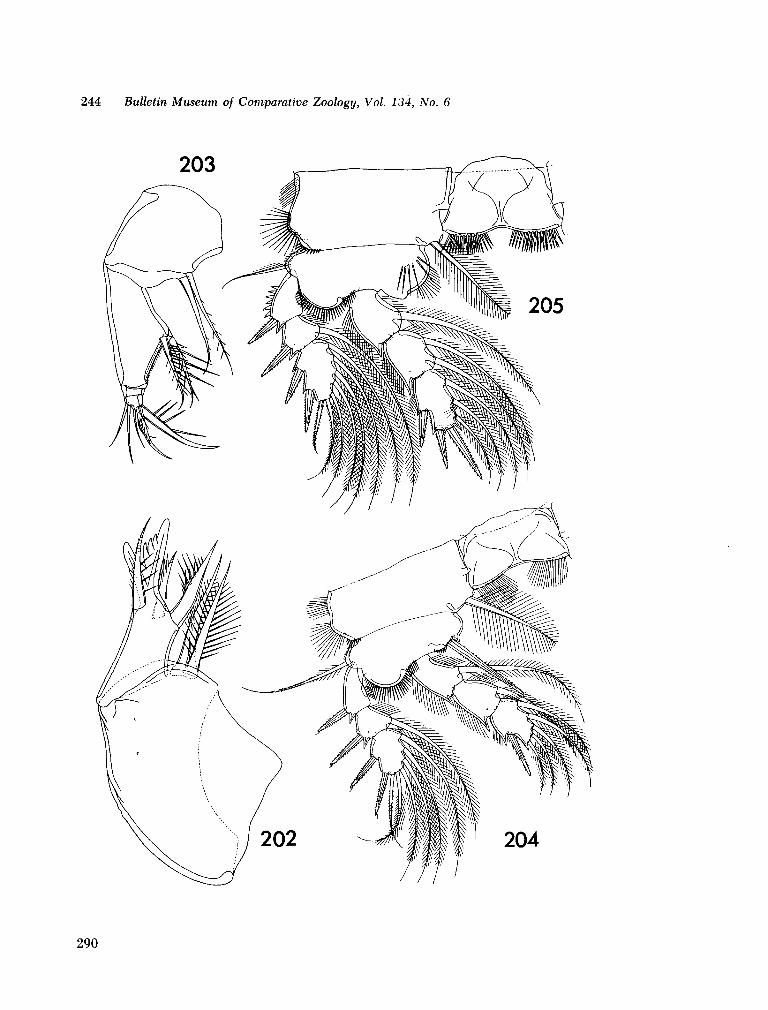
244 Bulletin Museum of Comparative Zoology, Vol. 134, No. 6
290
N E W HEMICYCLOPS F R O M MADAGASCAR • Humes 245
Plate XXIX
Hem/cyc/ops biflagellatus n. sp., female (continued)
Fig. 202. Second maxilla, anterior (EJ.
Fig. 203. Maxilliped, dorsal (D).
Fig. 204. Leg 1, anterior (G).
Fig. 205. Leg 2, anterior (G).
291
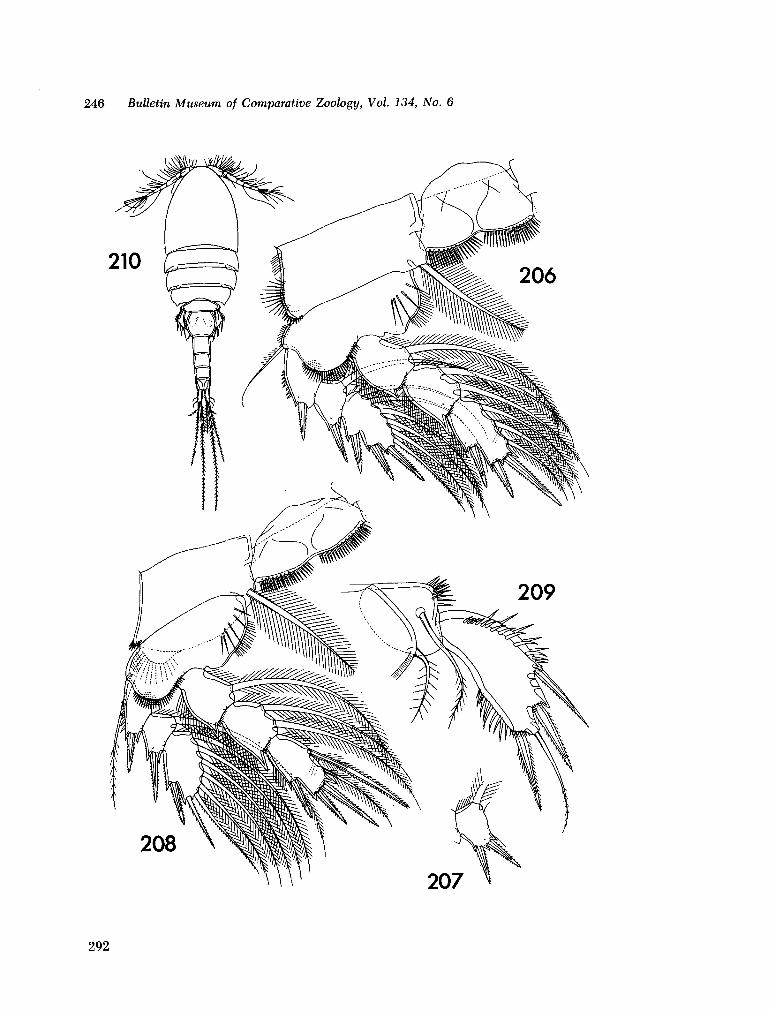
246 Bulletin Museum of Comparative Zoology, Vol. 134, No. 6
207
292
N E W HEMICYCLOPS F R O M MADAGASCAR • Humes 247
Piale XXX
Hemicyclops bitlagellatus n. sp., female (continued)
Fig. 206. Leg 3, anterior (G).
Fig. 207. Abnormal second segment of exopod of leg 3, anterior (GK
Fig. 208. Leg 4, anterior (G).
Fig. 209. Leg 5, dorsal (D).
Hemicyclops biflageltatus n. sp., male
Fig. 210. Body, dorsal (J).
293
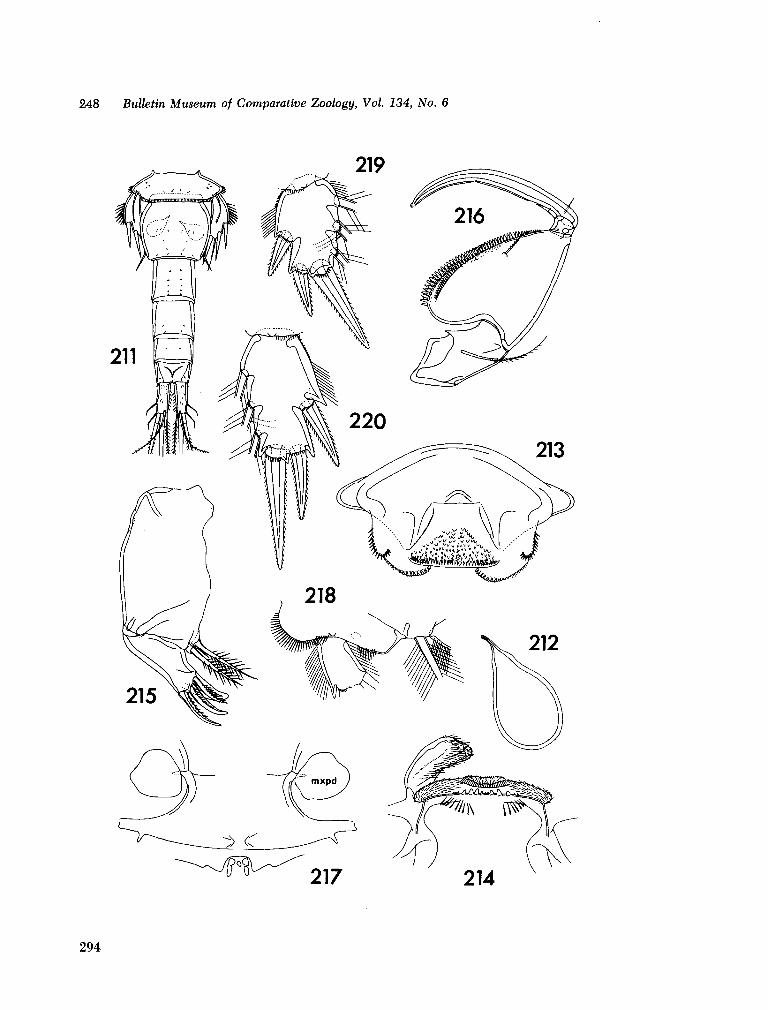
248 Bulletin Museum of Comparative Zoology, Vol. 134, No. 6
294
N E W HEMICYCLOPS F R O M MADAGASCAR • Humes 249
Plate XXXI
Hemicyclops biflagellolus n. sp., male (continued)
Fig. 211. Urosome, dorsal (B).
Fig. 212. Spermatophore attached to female, ventral (E).
Fig. 213. Labrum, ventral (E).
Fig. 214. Metastomal areas, with one paragnath in position, ventral (D).
Fig. 215. Second maxilla, anterior (D).
Fig. 216. Maxilliped, anterior (G).
Fig. 217. Region between maxillipeds and leg 1, ventral (G).
Fig. 218. Detail of leg 1, anterior (D).
Fig. 219. Last segment of endopod of leg 2, anterior (E).
Fig. 220. Last segment of endopod of leg 3, anterior (E).
295
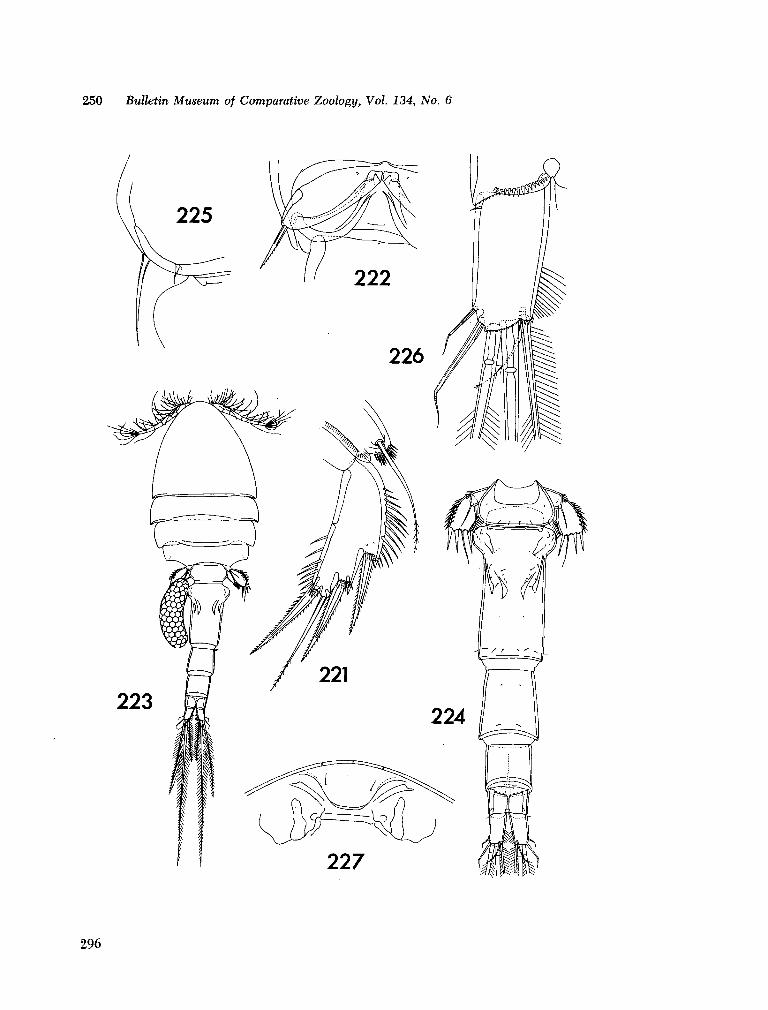
250 Bulletin Museum of Comparative Zoology, Vol. 134, No. 6
296
N E W HEMICYCLOPS F R O M MADAGASCAR • Humes 251
Fig.
Rg.
Fig.
Fig.
Fig-Fig-Fig.
221.
222.
223. 224.
225.
226.
227.
Plate XXXII
Hemicyclops biflagellatus n. sp., male (continued)
Leg 5, dorsal (DJ.
Leg 6, ventral (D).
Hemicyclops acanthosquillae n. sp., female
Body, dorsal (A).
Urosome, dorsal (C).
Portion of segment of leg 5 showing setiform process, dorsal (D).
Caudal ramus, ventral (D).
Rostral area, ventral (G).
297
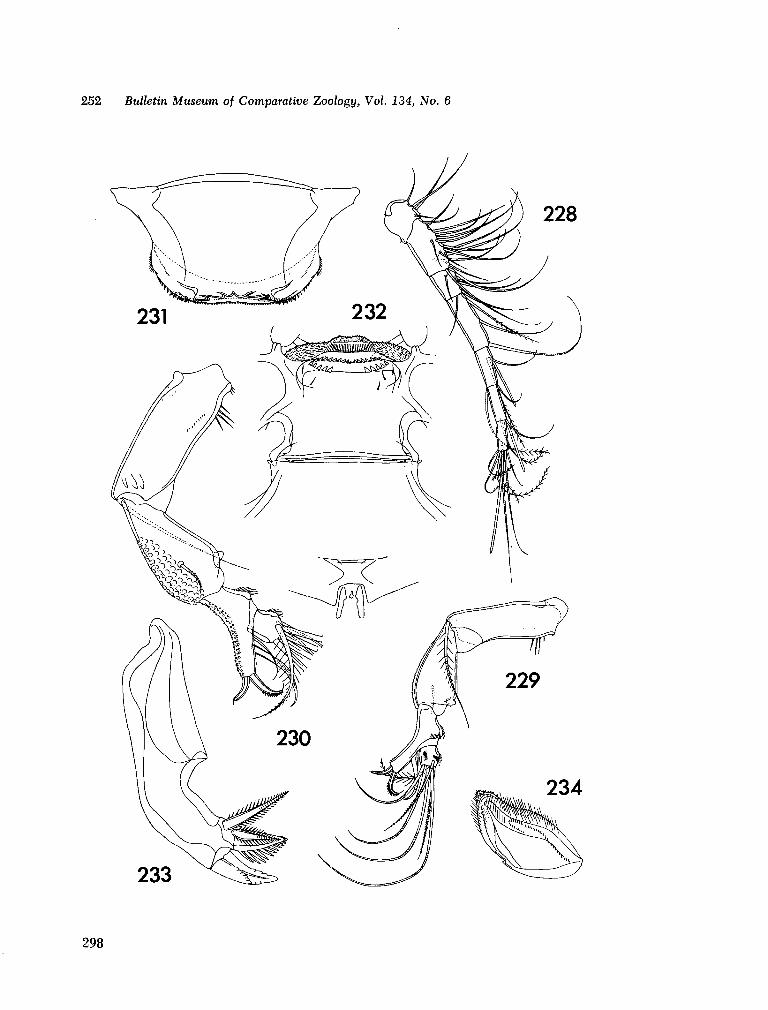
252 Bulletin Museum of Comparative Zoology, Vol. 134, No. 6
298
N E W HEMICYCLOPS F R O M MADAGASCAR • Humes 253
Plate XXXIII
Hemicyclops acanthosquHlae n. sp., female (continued)
Fig. 228. First antenna, anrerodorsal (H).
Fig. 229. Second antenna, anterior (G).
Fig. 230. Second antenna, posterior (D).
Fig. 231. Labrum, ventral (OJ.
Fig. 232. Metastomal areas and region between maxillipeds and leg 1, ventral (G).
Fig. 233. Mandible, anterior and dorsal (E).
Fig. 234. Paragnath, posterior and ventral (E).
299
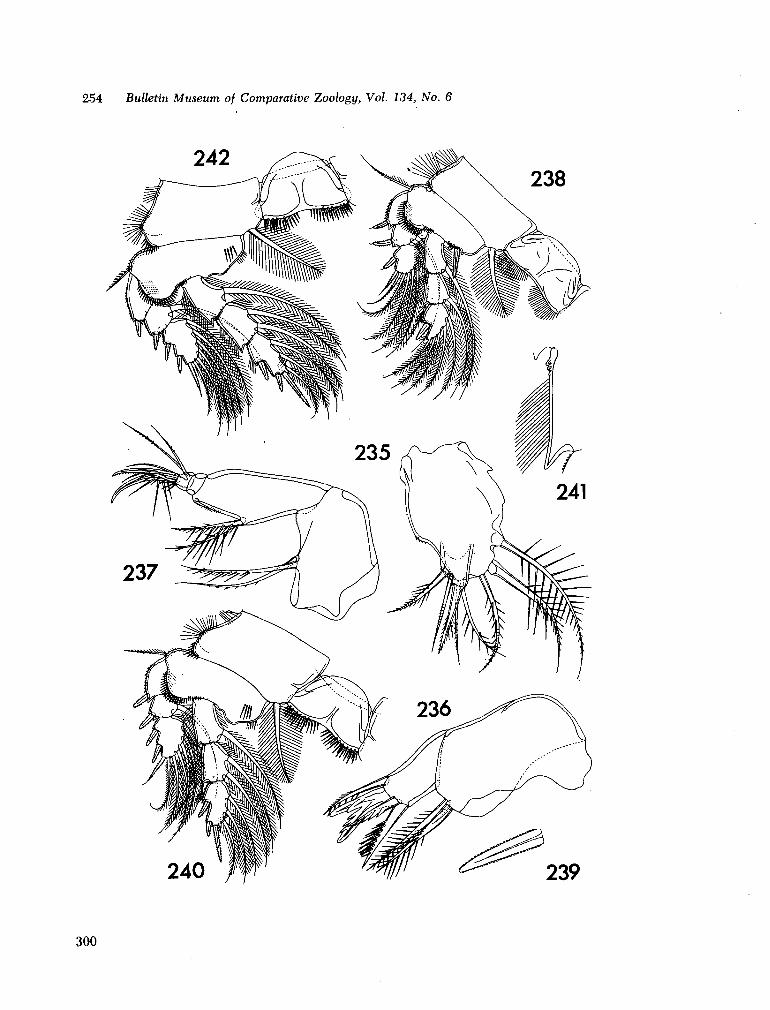
254 Bulletin Museum of Comparative Zoology, Vol. 134, No. 6
300
N E W HEMICYCLOPS FROM MADAGASCAR • Humes 255
Plate XXXIV
Hemicyclops acanthosquillae n. sp., female (continued)
Fig. 235. First maxilla, posterior (E).
Fig. 236. Second maxilla, posterior (D).
Fig. 237. Maxilliped, dorsal (D).
Fig. 238. Leg 1, anterior (H).
Fig. 239. Inner spine on basis of leg 1, anterior (E).
Fig. 240. Leg 2, anterior | H ) .
Fig. 241. Outer edge of second segment of endopod of leg 2, anterior (E).
Fig. 242. Leg 3, anterior (H).
301
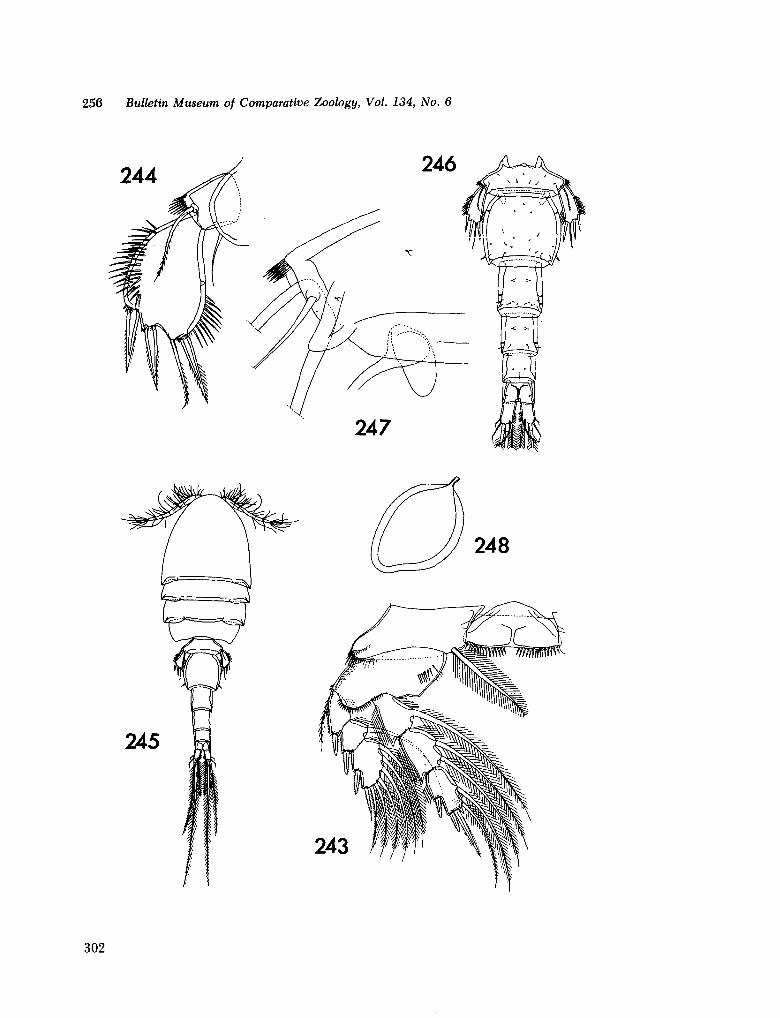
256 Bulletin Museum of Comparative Zoology, Vol. 134, No. 6
248
302
N E W HEMICYCLOPS FROM MADAGASCAR • Humes 257
Plate XXXV
Hemicyclops acanthosquillae n. sp., female (continued)
Fig. 243. Leg 4, anterior (H).
Fig. 244. Leg 5, dorsal (GJ.
Hemicyclops acanthosquillae n. sp., male
Fig. 245. Body, dorsal (A).
Fig. 246. Urosome, dorsal (C).
Fig. 247. Portion of segment of leg 5 showing projection, dorsal (E).
Fig. 248. Spermatophore (G).
303
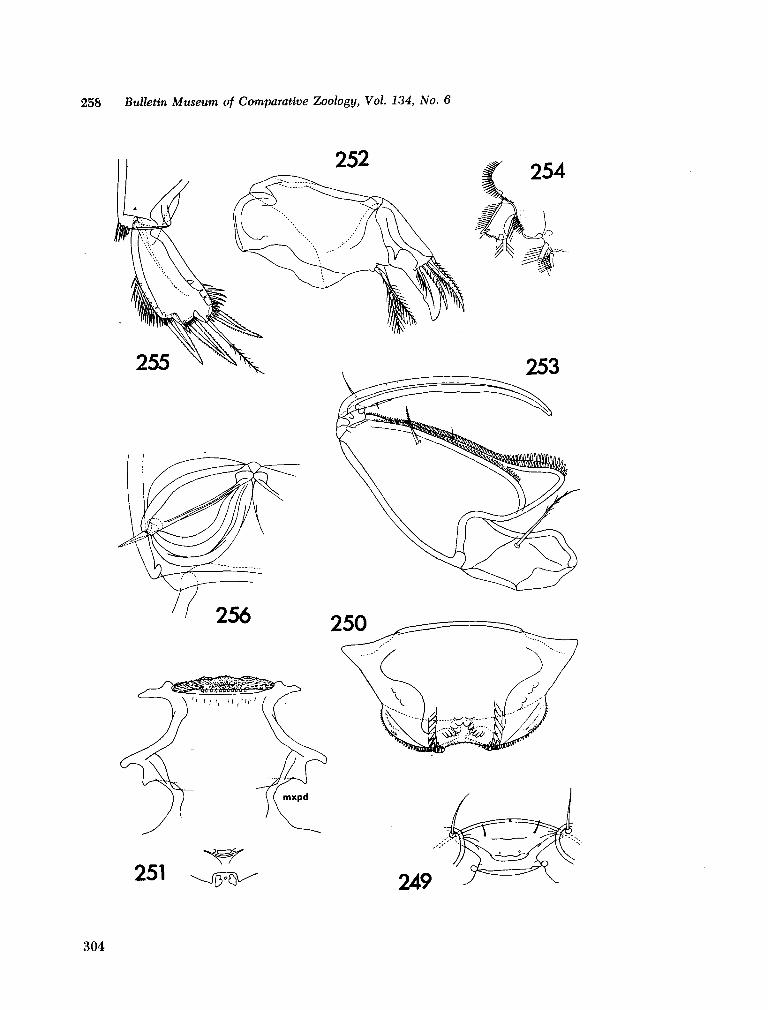
258 Bulletin Museum of Comparative Zoology, Vol. 134, No. 6
•^Jjy^
304

N E W HEMICYCLOPS FROM MADAGASCAR • Humes 259
Plate XXXVI
Hemicyclops acanlhosquillae n. sp., male-(continued)
249. Rostral area, ventral (G).
Labrum, ventral (D).
Metastomal areas and region between maxillipeds and leg 1, ventral (H).
Second maxilla, anterior (G).
Maxilliped, anterior (G).
Detail of leg 1, anterior (H).
Leg 5, ventral (G).
Fig. 256. Leg 6, ventral (G).
Rg-Fig-Fig-
Fig-
Fig-
Fig-
250. 251.
252.
253. 254.
255.
305
Reprinted from Bull. Mus. comp. Zoo/., vol. 134, no. 7, T965, p. 261-274,
NEW OCEANIC CHEILODIPTERID OCEAN
GILES W . M E A D and J. E. De FALLA
ABSTRACT
The collections m a d e in or adjacent to the Indian Ocean during voyages of R / V Anton Bruun and the "Monsoon" Expedition of Scripps Institution of Oceanography include six species of high-seas cheilodipterid fishes. T w o , Rosenblattia robusta and Flor-enciella lugubris, are described here as n e w genera and species; the other four, Howella brodiei, Bathysphyraenops simplex, Brink-mannella elongata, arid a second unidentified species of Brinkmannéüa are n e w records for the Indian Ocean. Included in the description of Rosenblattia robusta is material taken in the sub-Antarctic part of the Pacific Ocean during the Antarctic Research Program of the University of Southern California.
INTRODUCTION
In addition to the abundant mesopelagic malacopterygians such as myctophids and gonostomatids, midwater nets fished far from shore occasionally take spiny-rayed fishes which are related to coastal groups. W e are concerned here with one such group, the midwater segment of the per-comorph family Cheilodipteridae (Apogo-nidae), a family that is chiefly coastal, but that does contain a few off-shore species.
Although these fishes are customarily referred to the Cheilodipteridae, the family relationships have not properly been established. For example, N o r m a n (1957:242A)
FISHES FROM THE INDIAN
tentatively placed the genera Howella, Neoscombrops, Bathysphyraenops, and Apogonops in the serranid subfamily Ser-raninae. The problem is the recognition of those characters which are adaptations for mesopelagic life as distinct or partially distinct from those which reflect ancestry and relationship to an inshore family or subfamily. Various features found in these fishes, such as reduction or loss of color pattern, lack of countershading, occasional presence of terminal and horizontal antrorse teeth in the jaws, increased development of the lateral line, etc., are certainly characteristic of m a n y mesopelagic fishes of diverse relationships. Variability in other characters, such as number of anal spines, deciduous vs. adherent scales, presence or absence of opercular spines, and the extension of the lateral line onto the caudal fin, suggests that the group is not homogeneous. H o w ever, some of these features also m a y reflect the requirements of oceanic life as well as ancestry. A critical study of the family relationships is clearly in order, but cannot be attempted here.
The midwater species discussed below are so different from their coastal relatives that comparison is pointless. However, mindful of the possibility that these forms m a y represent the pelagic young or pre-juveniles of benthic cheilodipterids from the continental shelf and abyssal plain, various benthic genera ( e.g. Brephostoma Alcock, Synagrops Giinther, Epigonus Rafinesque, Neoscombrops Gilchrist, Paroncheitus
261
Collected reprints of the International Indian Ocean Expedition, vol. IV, contribution no. 222 307
262 Bulletin Museum of Comparative Zoology, Vol. 134, No. 7
Smith) were considered while arriving at the identifications which are given.
Only two oceanic cheilodipterids, Oxyo-don macrops Brauer 1906 and Hynnodus aiherinoides Gilbert, 1905 (Fourmanoir, 1957) have been previously reported from the Indian Ocean. Neither of these is represented in our collections.
The area with which w e are primarily concerned is the Indian Ocean. The type locality of Rosenblattia robusta lies in the southwestern Pacific, but the species was also caught in the Indian Ocean. In addition, w e have included in our description of this species a few specimens taken in the sub-Antarctic part of the Pacific Ocean. Our principal material was taken during Cruises III and VI of R / V Anton Bruun during the American Program in Biology, International Indian Ocean Expedition. Cruise III fished along the 60°E meridian from 12°N to 44°S, 13 August to 13 September, 1963. Cruise VI sampled waters along 65°E from 18°N to 41°S, 17 M a y to 4 July, 1964. Supplementing the Anton Bruun collections are several lots taken by Scripps Institution of Oceanography during its "Monsoon" Expedition to the Pacific and Indian Oceans, October, 1960 to March, 1961 (Clarke, 1963), and a few lots taken by the R / V Etianin during the Antarctic Research Program of the University of Southern California.
Both cruises of the Anton Bruun used a 10-foot Isaacs-Kidd Midwater Trawl; the Foxton Trousers (see Foxton, 1963), an opening-closing device designed to separate a shallow from a deep fraction of the trawl haul; and occasionally a time-depth recorder. Attempts to calibrate the Foxton Trousers by repeated lowerings of the instrument on the hydrographie wire showed that the depth at which the device triggered varied greatly. The device did separate the shallow from the deep part of the catch, but the actual depth of such separation was imprecise. Even limits of error of half or double the nominal depth of separation m a y be unrealistically narrow.
Our methods of counting and measuring are chiefly those of Hubbs and Lagler ( 1947 ). The tip of the snout is taken as the midpoint of the upper jaw, even though this point m a y not be terminal. The length of the head is taken from the tip of the snout to the most posterior edge of the gill flap exclusive of opercular spines. The number of scales between the first dorsal fin and the lateral line is counted along the oblique row beginning at the base of the second dorsal spine. This count includes the small scale at the base of the fin but excludes the lateral line scale. The count between the lateral line and anal fin is made on the oblique row terminating at the base of the first anal spine. This count also excludes the lateral line scale, and is somewhat variable due to the occasional presence of a half scale at either end of the row. The last soft dorsal and the last anal rays m a y or m a y not be divided to the base, but in either instance the ray is counted as one.
The following abbreviations are used: IIOE (International Indian Ocean Expedition), I K M T (Isaacs-Kidd Midwater Trawl), Ls.t. (local standard time), t.d.r. (time-depth recorder), s.l. (standard length), A N S P (Academy of Natural Sciences of Philadelphia), L A C M (Los Angeles County M u s e u m ) , M C Z (Museum of Comparative Zoology, Harvard University), SIO (Scripps Institution of Oceanography), U S C (University of Southern California), and U S N M ( United States National Museum).
W e are indebted to Basil G . Nafpaktitis for the illustrations, to E . A . Lachner and D . M . Cohen for review of the manuscript, and to Richard H . Rosenblatt, R . H . Gibbs, Jr., Jay M . Savage, and John R . Paxton for the loan of specimens. W e are particularly indebted to John H . Ryther of the W o o d s Hole Océanographie Institution, Scientific Director of the American Program in Biology, International Indian Ocean Expedid tion, and to the National Science Foundation for the organization of the field pro-
308
INDIAN O C E A N CHEILODIPTERIDS • Mead and De Falla 263
gram of which the Anton Bruun cruises were a part. This study was aided by Grant GF147 from the National Science Foundation to Harvard University, whose support is here gratefully acknowledged.
ROSENBLATTIA, NEW GENUS
Type species: Rosenblattia robusta new species. Gender of generic name: feminine.
Generic characters. Rosenblattia is distinguished from all other known oceanic cheilodipterid fishes by the more robust body and by the pair of caudal keels formed by the scales of the mid-lateral series of the caudal peduncle. The high number (ca. 52) of scales in the lateral line and the an-trorse teeth anteriorly in both jaws distinguish this genus from all others except Florenciella which is discussed below.
All scales strongly ctenoid; head almost completely covered, fins largely naked. Scales on body small and numerous; about four between base of dorsal fin and lateral line and about fifteen between lateral line and base of anal fin. Lateral line complete, ninterrupted, and continuing onto caudal
fii; 'he scales along the caudal peduncle particularly spinulose and V-shaped. Strong spines in vertical fins. Anal fin with two spines. Body raised and stiffened at origins of unpaired fins. Procurrent caudal fin rays stiff and spiny, their tips free. Eye large, a small aphakic space present. A few discrete simple spines along the upper edge of opérele; opérele and subopercle elsewhere serrated. Upper edge of orbit spiny when viewed from above. Teeth present on jaws, vomer, and palatines; some of anterior jaw teeth antrorse.
This genus is named in honor of Dr . Richard Rosenblatt of Scripps Institution of Oceanography, friend and fellow ichthyologist.
ROSENBLATTIA ROBUSTA, NEW SPECIES
Holotype. A n 84.8 m m s.l. specimen taken in the South Pacific by the Scripps Institution of Oceanography "Monsoon" Expedition; I K M T haul no. 17; 28 February
to 1 March, 1961; 2206 to 0250 hrs. l.s.t; 46° 53'S, 179°48'W to 46°42'S, 179°32'W; m a x i m u m calculated depth 1878 m , open net. SIO 61-45.
Paratypes. T w o , 94.4 and 48.8 m m s.l.; same data as holotype. M C Z and SIO, respectively.
One, 75.8 m m s.l.; R / V . Eltanin, U S C Antarctic Research Program, Cruise II; Sta. 882; 30 December 1963; 0805 to 1210 hrs. l.s.t.; S O L O ' S , 114°15'W to 55°52'S, 114° 2 2 ' W ; I K M T ; m a x i m u m depth of sampling 1737 m , open net. L A C M 10075.
One , 67.0 m m s.l.; R / V Eltanin, U S C Antarctic Research Program, Cruise 10; Sta. 846; 10 November 1963; 2315 to 0330 hrs. l.s.t.; 57°52'S, 74°43 'W to 57°27'S, 74°42'W; I K M T ; m a x i m u m depth of sampling 1829 m , open net. L A C M 10074.
One , 61.0 m m s.l.; R / V Eltanin, U S C Antarctic Research Program, Cruise 13; Sta. 1107; 24 M a y 1964; 0513 to 0855 hrs. l.s.t.; 57°59.6'S, 90°36.3'W to O S L O ' S , 90°46.9'W; I K M T ; m a x i m u m depth of sampling 713 m , open net. L A C M 10077.
O n e , 49.9 m m s.l.; R / V Eltanin, U S C Antarctic Research Program, Cruise 13; Sta. 1099; 22 M a y 1964; 1510 to 1845 hrs. l.s.t.; O O ^ ^ S , 89°09.3'W to 57°03.1'S, 88°54,3' W ; I K M T ; m a x i m u m depth of sampling 759 to 1207 m , open net. L A C M 10076.
One , 49.5 m m s.l.; R / V Eltanin, U S C Antarctic Research Program, Cruise 15; Sta. 1380; 17-18 November 1964; 2250 to 0250 hrs. l.s.t.; 54°01'S, 145°02'W to 53°53'S, 145°13'W; I K M T ; m a x i m u m depth of sampling 841 m , open net. L A C M 10078.
One , 49.0 m m s.l.; R / V Eltanin, U S C Antarctic Research Program, Cruise 6; Sta. 348; 4 December 1962; 1125 to 1445 hrs. l.s.t.; 54°40.1'S, 58°57.8rW to 55°05.8'S, 59°05.3' W ; I K M T ; m a x i m u m depth of sampling 896 m , open net. L A C M 10073.
One , 35.1 m m s.l.; "Monsoon" Expedition; I K M T haul no. 13; 13 January 1961; 0004 to 0457 hrs. l.s.t.; 49°26'30"S, 132° 18'24"E to 49°21'00"S, 132°39'24"E; maxim u m calculated depth 1878 m , open net. SIO 61-41.
309
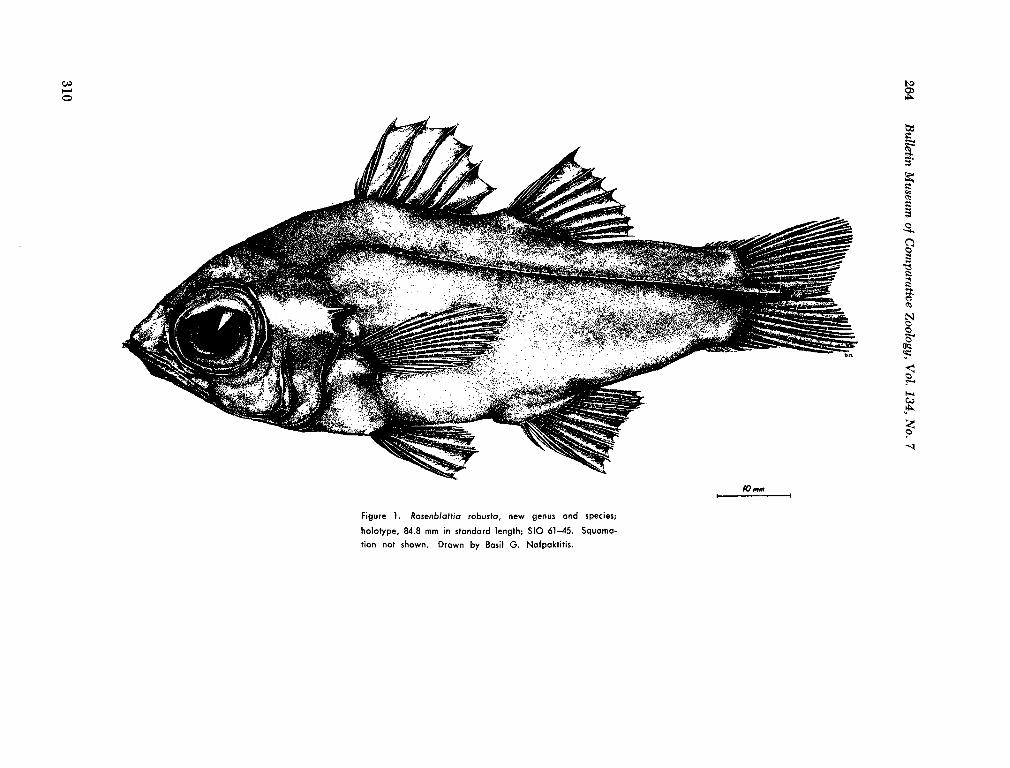
264
Bulle
tin M
useu
m o
f Co
mp
ara
tive Z
oo
log
y, V
ol. 1
34
, No.
7
u 0
3
-o
o
o
_o
2 sen o
ac
—
~o
o
~
o
c
O
—
E
E
CO
s s
m
.O
¡ o
O ¿ Ï
-§
310
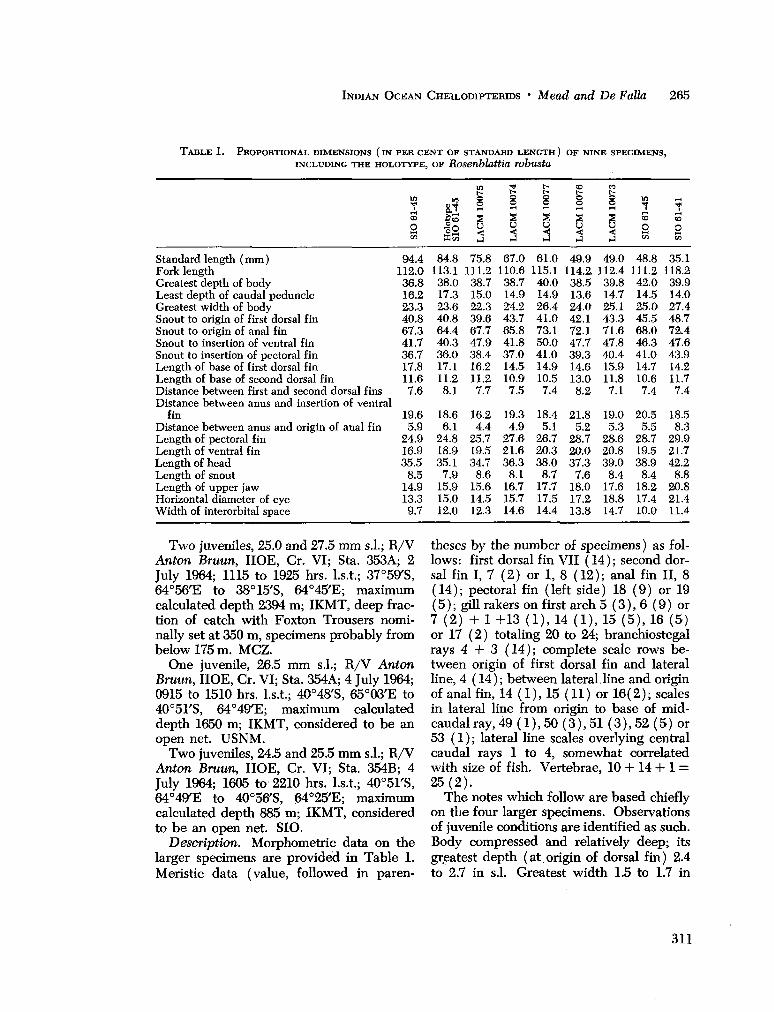
INDIAN O C E A N CHEILODIPTERIDS • Mead and De Falla 265
TABLE 1. PROPORTION AL DIMENSIONS (IN PER CENT OF STANDARD LENGTH) OF NINE SPECIMENS, INCLUDING THE HOLOTYPE, OF Rosenblattia robusta
Standard length ( m m ) Fork length Greatest depth of body Least depth of caudal peduncle Greatest width of body Snout to origin of first dorsal fin Snout to origin of anal fin Snout to insertion of ventral fin Snout to insertion of pectoral fin Length of base of first dorsal fin Length of base of second dorsal fin Distance between first and second dorsal fins Distance between anus and insertion of ventral
fin Distance between anus and origin of anal fin Length of pectoral fin Length of ventral fin Length of head Length of snout Length of upper jaw Horizontal diameter of eye Width of interorbital space
-45
CD
O Cfl
94.4 112.0
36.8 16.2 23.3 40.8 67.3 41.7 36.7 17.8 11.6 7.6
19.6 5.9
24.9 16.9 35.5 8.5
14.9 13.3
9.7
8.T £g 32 Km
84.8 113.1
38.0 17.3 23.6 40.8 64.4 40.3 36.0 17.1 11.2 8.1
18.6 6.1
24.8 18.9 35.1 7.9
15.9 15.0 12.0
100'
S < j
75.8 111.2
38.7 15.0 22.3 39.6 67.7 47.9 38.4 16.2 11.2
7.7
16.2 4.4
25.7 19.5 34.7 8.6
15.6 14.5 12.3
100
s u < J
67.0 110.6 38.7 14.9 24.2 43.7 65.8 41.8 37.0 14.5 10.9 7.5
19.3 4.9
27.6 21.6 36.3 8.1
16.7 15.7 14.6
100
s u < J
61.0 115.1 40.0 14.9 26.4 41.0 73.1 50.0 41.0 14.9 10.5
7.4
18.4 5.1
26.7 20.3 38.0 8.7
17.7 17.5 14.4
CO
100
S < J
49.9 114.2 38.5 13.6 24.0 42,1 72.1 47.7 39.3 14.6 13.0 8.2
21.8 5.2
28.7 20.0 37.3 7.6
18.0 17.2 13.8
100
S < j
49.0 112.4 39.8 14.7 25.1 43.3 71.6 47.8 40.4 15.9 11.8 7.1
19.0 5.3
28.6 20.8 39.0 8.4
17.6 18.8 14.7
-45
CD
O Cfl
48.8 111.2 42.0 14.5 25.0 45.5 68.0 46.3 41.0 14.7 10.6
7.4
20.5 5.5
28.7 19.5 38.9 8.4
18.2 17.4 10.0
-41
i-H
CD
2 «
35.1 118.2
39.9 14.0 27.4 48.7 72.4 47.6 43.9 14.2 11.7
7.4
18.5 8.3
29.9 21.7 42.2 8.8
20.8 21.4 11.4.
T w o juveniles, 25.0 and 27.5 m m s.l.; R / V Anton Bruun, IIOE, Cr. VI; Sta. 353A; 2 July 1964; 1115 to 1925 hrs. l.s.t.; WSffS, 64°56'E to 38°15'S, 64°45'E; maximum calculated depth 2394 m ; I K M T , deep fraction of catch with Foxton Trousers nominally set at 350 m , specimens probably from below 175 m . M C Z .
One juvenile, 26.5 m m s.l.; R / V Anton Bruun, IIOE, Cr. VI; Sta. 354A; 4 July 1964; 0915 to 1510 hrs. l.s.t.; 40°48'S, 65°03'E to 40°51'S, 64°49'E; m a x i m u m calculated depth 1650 m ; I K M T , considered to be an open net. U S N M .
T w o juveniles, 24.5 and 25.5 m m s.l.; R / V Anton Bruun, IIOE, Cr. VI; Sta. 354B; 4 July 1964; 1605 to 2210 hrs. l.s.t.; 40°51'S, 64°49'E to 40°56'S, 64°25'E; max imum calculated depth 885 m ; I K M T , considered to be an open net. SIO.
Description. Morphometric data on the larger specimens are provided in Table 1. Meristic data (value, followed in paren
theses by the number of specimens) as follows: first dorsal fin VII (14); second dorsal fin I, 7 (2) or 1, 8 (12); anal fin II, 8 (14); pectoral fin (left side) 18 (9) or 19 (5); gill rakers on first arch 5 (3), 6 (9) or 7 (2) + 1 +13 (1), 14 (1), 15 (5), 16 (5) or 17 (2) totaling 20 to 24; branchiostegal rays 4 + 3 (14); complete scale rows between origin of first dorsal fin and lateral line, 4 (14); between lateral line and origin of anal fin, 14 (1), 15 (11) or 16(2); scales in lateral line from origin to base of mid-caudal ray, 49 ( 1), 50 (3), 51 (3), 52 (5) or 53 (1); lateral line scales overlying central caudal rays 1 to 4, somewhat correlated with size of fish. Vertebrae, 10 + 14 + 1 = 25(2).
The notes which follow are based chiefly on the four larger specimens. Observations of juvenile conditions are identified as such. Body compressed and relatively deep; its greatest depth (at origin of dorsal fin) 2.4 to 2.7 in s.l. Greatest width 1.5 to 1.7 in
311
266 Bulletin Museum of Comparative Zoology, Vol. 134, No. 7
greatest depth. All of body and head, except for the tip of the snout anterior to the eye and the isthmus, covered by heavy, strongly ctenoid, adherent scales, the cteni of which continue onto the surface of the scale as tranverse ridges. Squamation on the body is complete in our smallest juvenile ( 24.5 m m s.l. ) , although the cteni and ridges are poorly developed and the scale coverings on the head and fins are incomplete. T h e lateral line is well developed. The lateral line scales are produced laterally to form a pair of mid-caudal keels, the beginnings of which are evident in juveniles. Aside from the single simple tranverse tube, the anterior scales of the lateral line are similar to their neighbors. T h e lateral line continues onto the proximal half of the caudal fin. Other fins are naked.
Distance between snout and origin of first dorsal fin 2.1 to 2.5 in s.l.; preanal distance 1.4 to 1.6 in s.l., preventral distance 2.0 to 2.5 in s.l., prepectoral distance 2.3 to 2.8 in s.l. Spines in fins strong and sharp. Those in first dorsal lie alternately to the right or left of center w h e n the fin is depressed. The second anal and ventral spines are as long or nearly as long as the succeeding soft rays. Pectoral fin set at about 45° with the horizontal, its length 1.4 in length of head. T h e anus is located about one-fourth of the distance from anal origin to the base of the ventral fin and is separated from the first anal spine by about four scales.
H e a d broad; interorbital slightly convex, 2.5 to 3.9 in length of head. Eye large, aphakic space small but prominent. Tiori-zontal diameter of eye 2.0 to 2.7 in length of head. Dorsal, and to a lesser extent posterior, edge of orbit spinulose, the spines small and nearly uniform in size. Preopercle with two free edges, the posterior spinulose, the anterior less so or completely without serrations. Opérele, especially its lower half, armed with small simple cteni. Three simple spines, the longest in the middle, present along the upper edge of the opérele.
Gill openings wide. Branchiostegal m e m branes attached to isthmus but not overlapping. Pseudobranchs present, formed of about 14 filaments. Gill rakers on first arch long and of the usual lath-like shape, those on successive arches reduced to spinulose knobs. Gill filaments notably few and short, those on the first arch no more than half the length of the gill rakers opposite them.
Teeth present on jaws, vomer, and palatines. Tongue toothless. Posterior end of maxillary but little expanded posteriorly and incompletely covered by the suborbitals. Premaxillaries separate and protractile. Each premaxillary bears one to three large antrorse teeth that lie in a horizontal plane and are excluded from the mouth w h e n it is closed. These, as well as the similar teeth at the tip of the lower jaw, are present in juveniles as well as in adults. Premaxillary with a row of minute teeth posterior to the anterior protruding series. Mandibular teeth similar, with antrorse fangs lateral to the median terminal bony boss followed posteriorly by a row of minute teeth. A transverse patch of small teeth present on the vomer, and an irregular band can be found on each palatine.
In alcohol, the adults are uniformly yellowish brown. All fins slightly dusky. Iris and linings of pharyngeal and abdominal cavities black. Juvenile coloration is far more striking. Pigmentation of the caudal part of the body appears last during development; and in young, shorter than 35 m m , the caudal peduncle and fin are completely colorless, while the more anterior part is dark brown or black. There is a darker broad vertical band at about the level of the second dorsal and anal fins, a narrower band through the rear part of the gill cover, and a dark patch on the body ventrally where the black peritoneum can be seen through the body wall. In these young the body coloration is not solid but formed of melanophores more or less closely spaced. W h e n newly caught, the 20-30 m m young showed a ventral reflective zone anterior
312
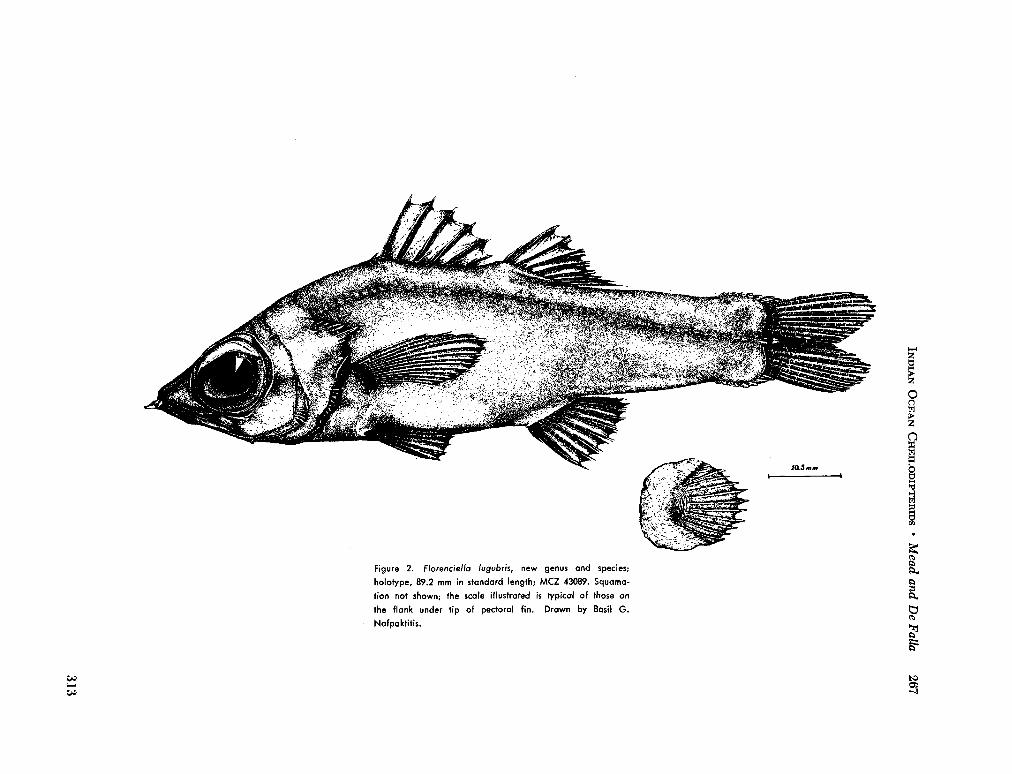
IND
IAN
OC
EA
N
CH
EIL
OD
IPT
ER
IDS • M
ead and De F
alla
267
o
Ü
•£ on
3
O
~
<•>
Ht
CN
0)
*-
a o
=
g
Hm
313
268 Bulletin Museum of Comparative Zoology, Vol. 134, No. 7
to the pelvic fins reminiscent of some luminescent systems reported in other cheilodipterid genera (e.g. Siphamia, Haneda, 1961), but no structural evidence has been found.
FLORENCIELLA, NEW GENUS
Type species: Florenciella lugubris n ew species. Gender of generic name: feminine.
Generic characters. This genus most closely resembles Rosenblattia, especially by the presence of relatively large antrorse teeth in the anterior parts of both jaws. However, it lacks the mid-lateral caudal keels of Rosenblattia and has a less deep body than that genus.
All scales strongly ctenoid. Head almost completely covered by scales; fins largely naked. Lateral line complete, uninterrupted, and extending onto the caudal fin. Mid-lateral scales of caudal peduncle differing from those adjacent to them only by the presence of a lateral line channel. About three rows of scales between base of dorsal fin and lateral line, about seventeen between lateral line and base of anal fin. Strong spines in vertical fins. T w o anal spines. Procurrent caudal spines stiff, spiny, and exposed. Eye large, aphakic space prominent. O n e prominent spine, simple or multifid, at upper end of gill flap which is flanked above and below by lesser spines. Subopercle and preopercle with feeble spines or serrations. Spines present along upper edge of orbit. Teeth present on jaws, palatines, and usually vomer.
FLORENCIELLA LUGUBRIS, NEW SPECtES
Holotype. A 89.2 m m s.l. specimen taken in the equatorial Indian Ocean by R / V Anton Bruun, IIOE, Cruise III; Sta. 6, coll. A E 1 3 B ; 21 August 1963; 0155 to 0440 hrs. l.s.t; 01°58'S, 60°06'E to 02°06'S, 60°02'E; m a x i m u m calculated depth 510 m (depth from t.d.r. 500 m ) ; I K M T , considered an open net collection. M C Z 43089.
Paratypes. Fifty-seven specimens, 22.7 to 97.0 m m s.l.; same data as holotype. Eight specimens in U S N M ; eight in SIO;
eight in A N S P ; three in Zoological M u s e u m , University of Copenhagen; remainder, including one cleared and stained individual, in MCZ.
O n e , 89.9 m m s.l.; R / V Anton Bruun, IIOE, Cr. Ill; Sta. 5, coll. A E 1 2 A ; 19 A u gust 1963; 2035 to 2350 hrs, l.s.t.; 01°23'N, 60°11'E to 01°22'N, 60°04'E; m a x i m u m calculated depth 750 m (maximum depth from t.d.r. 800 m ) ; shallow fraction of catch with Foxton Trousers set for ca. 275 m , specimen probably from above 550 m . M C Z .
Seven, 22.7 to 65.5 m m s.l.; R / V Anton Bruun, IIOE, Cr. Ill; Sta. 6, coll. A E 1 4 B ; 21 August 1963; 0445 to 1010 hrs. l.s.t.; 02°06'S, 60°02'E to 01°48'S, 59°50'E; maxim u m calculated depth 1600 m ; deep fraction of catch with Foxton Trousers set for ca. 275 m , specimens probably taken below 140 m . M C Z and USNM.
Two, 24.7 and 25.9 m m si; R/V Anton Bruun, IIOE, Cr. Ill; Sta. 7, coll. A E 1 5 D ; 23 August 1963; 0250 to 0610 hrs. l.s.t.; 05°03'S, 60olO-E to 04°52'S, 60°02'E; m a x i m u m calculated depth 685 m ; deep fraction of catch with Foxton Trousers set for ca. 150 m , probably taken below 75 m . MCZ.
One , 26.1 m m s.l.; R / V Anton Bruun, IIOE, Cr. Ill; Sta. 13, coll. A E 2 4 A ; 8 September 1963; 1055 to 1500 hrs. l.s.t.; 31°58'S, 59°45'E to 32°H'S , 59°30'E; m a x i m u m calculated depth 1360 jn ( depth from t.d.r. 1350 m ) ; deep fraction of catch with Foxton Trousers set for 275 m , probably taken below 110 m . Cleared and stained in M C Z .
One , 26.8 m m s.l.; R / V Anton Bruun, IIOE, Cr. VI; Sta. 336B; 27 M a y 1964; 0047 to 0530 hrs. l.s.t; 01°50'N, 65°06'E to 01° 37 'N, 65°07'E; m a x i m u m calculated depth 1250 m ; deep fraction of catch with Foxton Trousers set for 275 m , probably taken below 140 m . U S N M .
One, 26.0 m m s.l.; R / V Anton Bruun, IIOE, Cr. VI; Sta, 337A; 27 M a y 1964; 2130 to 0245 hrs. l.s.t.; 00°03'N, 65°00'E to 00° 14'S, 65°03'E; maximum calculated depth 525 m ; deep fraction of catch with Foxton
314
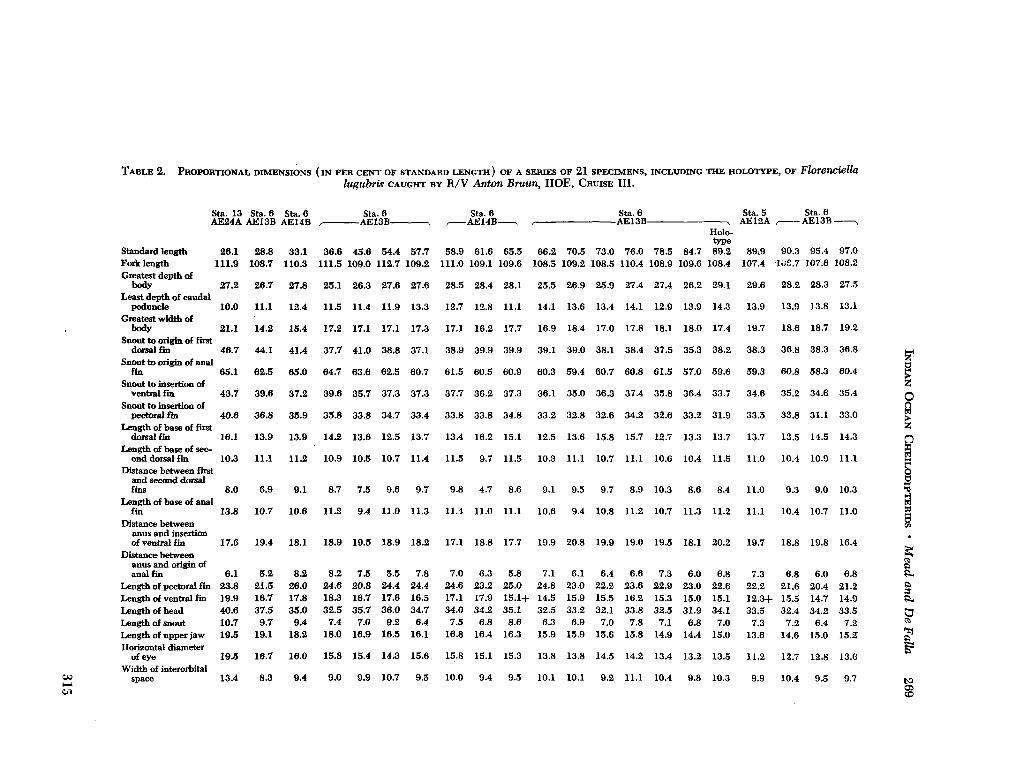
IND
IAN
OC
EA
N
CH
EIL
OD
IPT
EH
IDS • M
ead and De F
alla
269
có o
s ce
d
1 s s î W
£
u
CM
Sw
Ss S
< g fe
65
^ o
o"
3 "^ se
b
O
h-a
8 =
u D
o
fi-a
Q
O
I PH
•J-
n
m
IM
PH
P
H
co C
Ó
q
có co
!-<
P-í
CO
00 C
O*
CO
CO
lO
I*
i-H
lO
O
1 <*.
2 •*
o
CO
6 i-H
O
OS
CO
OS
q
iH
t-O
•*
o
-til
3 R
os
ce ¡¡¡•P
oo
o
£3
O
OS
MS
-^
W
CD
i-H
i-H
>3
•^
!-
•
o
CO
I-H
i-H
00
f-l
00 t-°
q
•*
00
OS
CO
P
H
t>
1>
i-H
IM
CO
i-H
rt
i-l
« t-*
IM
00
CO
CO
10 C
O
10 1
>
CO
•fll
00
CO
pH
00
CO
o
OS
C
O
I-l
OS
C
O
q
OS
C
O
q
OS
C
O
q
00
CO
I-I
CO
CO
O
S
ÎO
o
l>
lO
lO
•H
C
O
CO
©
CD
t>
d
CO
•*
OS
1
0
CO
d
CO
OS
d
CO
10
d
CO
lO
pH
C
O
t-d
CO
t~
CO
C
O
TP
d
CO
CO
10 C
O
•*
1>
C
O
CO
d
CO
o
10 C
O
rt
d
CO
CO
1^
C
O
IM
d
CO
t>
CO
CO
t- -
CO
q
CO
CM
CO
CO
CO
CM
C
O
IM
CO
CO
IM
CO
00 IM
C
O
IM
CO
CO
00
CO
CO
C
O
CO
CO
CO
CO
•*
CO
CO
1>
CO
CO
CO
t-IM
t>
10
00
10 I-l
CO
CO
lO
IM
I-l
I-l
10 !-l
IM
d
•*
CO
t-; CO
p-l
"S
3 Tt
d
i-i
">.
o
'i 3 t-d
i-H
^ i-H
« O
q
i-H
1>
os
q
3 Tf
3
•* CO
CO
00
CO
d
i-i
q
CO
t~
05
lO
d
rt O
S
CO
00
t-;
-
00
d
t~
d
«. 3 q
3 t-S « 3 q
2 Tf O
S
q
o
-1 3 q
p-i P
H
•*
PH
«í 3
^
CO
O
S
i-4
l>
i-H
IS
CM
i-l
i-i
CO
T|i
CD
F
H
CN
i-H
22 t-,
r-,
i>
•*" C
O
CO
CO
OS
sES
-H
ce
EQ
.C
O
I
CO
CO
O
00 t-
t-»
PH
00 00
CO
3
J 5
CO
i-l
i-H
oo
05 os
vi -^
©
C
O
i-H
i-l
1 a 3
I 3 3
00
d
0
d
00
d
CO
r-*
CO
d
0 d
CO
t>
CD
d
"t d
PH
d
PH
r-*
00 1Ô
CO
d
0 i>
(M
IM
•tf
d
IM
CD,
<M
IM
IM
CM
CD
C
M
IM
O
CO
•M
o>
ci
IM
CO
CO
IM
IM
IM-
IM
q
CO
IM
CO
IM
O
10 IM
CM
Û
CD
•<!<
°! i-H
I~
PH
q
2 * 2 'i 3 q
5 « S « CO
"?
5 q
2 « •*
+
3 q
t-1 t~
lO
CO
CO
IM
•* C
O
•V
OÍ
CO
iq
CO
CO
p^
•* C
O
q
CO
10 IM
C
O
CO
CO
C
O
PH
CM' C
O
CM
CO
C
O
10 IM
C
O
r_l
10 C
O
IM
•rp
CO
q
•v
IM
t
•fli
d
IM
»•
CO
1>
O
1>
00
d
PH
!*
•
00 1>
q
t-.*
OS
d
CO
d
CO
06
00
d
10 t~:
tM
10
q
lô
CO
•*
CO
CO
0 10
i-H
TJI
pH
OS
•
*
00 10
q
10 p
H
q
1Ô
i-*
œ
lô
PH
CO
d
pH
-
d
pH
CO
d
q
CO
P
H
•»
2 l>
3 « PH
*>.
S "I 2 Tf
3 <*.
i-H
« i-H
<*>.
3 q
3 q
IS
rt. 3 q
«?-
t'
d
10 O
)
Tf
d
q
d
CO
d
pH
CO
d
•*
d
pH
i-H
pH
IM
d
PH
d
PH
PH
d
pH
lO
œ
•*
d
0
d
oo
•*
10 N
-v
H
co
3 q
3 •*
d
<"1 3 q
2 i>
C
5 i-H
S q
S "?
2 q
2 1 5 * 2
t-10
iri
10 t»
CM
CO
CM
CO
CM
10
IM
•f
.3
00
d
CM
q
CM
O
CO
C
M
IO
PH
<
M
CO
P
H
CO
I-" P
H
» d
pH
CO
0
0 l-H
CO
I>
p
H
» d
pH
CO
O
d
CO
t-lô
CO
10 IM
0
0
0 10 C
O
10
CO
CO
IM
d
0 I>
•w
t>
•*
d
t-d
d
PH
•n
2 q
d
FH
q
2 « 2 1 2
10 P
H
q
PH
•*
10 p-l
X
in
O
d
PH
t>
d
PH
H
93 q
(O
b>
ir)
U5
-^
«j «
¿
6 o
©
os
cô
M
»-l "
^
1-1 T-l
FH
F
H
1 "S 1 11
lá'S
'S-S
'S-S
le
ti) ^
^
) 6
0 D
B
-g
1^
315
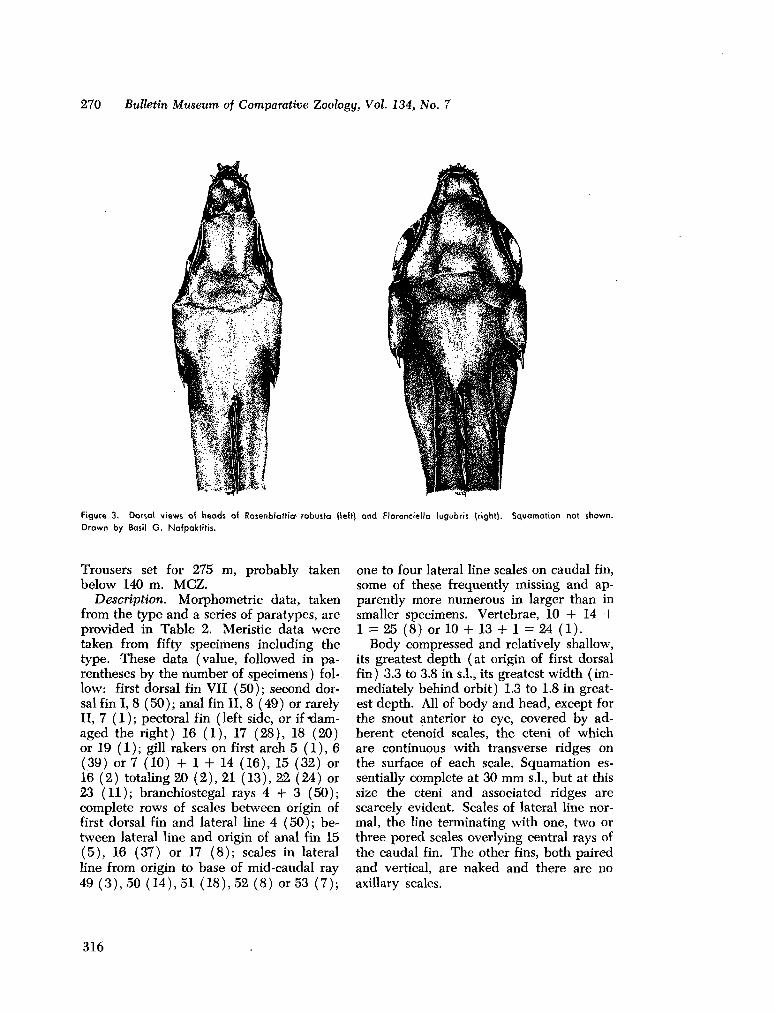
270 Bulletin Museum of Comparative Zoology, Vol. 134, No. 7
Figure 3 . Dorsal views of heads of Rosenblattio* robusta (left) and FJorenciello /.ugubr/s (right). Squamation not shown. Drawn by Basil G . Nafpaktitis.
Trousers set for 275 m , probably taken below 140 m . M C Z .
Description. Morphometric data, taken from the type and a series of paratypes, are provided in Table 2. Meristic data were taken from fifty specimens including the type. These data (value, followed in parentheses by the number of specimens ) follow: first dorsal fin VII (50); second dorsal fin I, 8 (50); anal fin II, 8 (49) or rarely II, 7 ( 1 ) ; pectoral fin ( left side, or if -damaged the right) 16 (1), 17 (28), 18 (20) or 19 ( 1 ) ; gill rakers on first arch 5 ( 1 ) , 6 (39) of 7 (10) + 1 + 14 (16), 15 (32) or 16 (2) totaling 20 (2), 21 (13), 22 (24) or 23 (11); branchiostegal rays 4 + 3 (50); complete rows of scales between origin of first dorsal fin and lateral line 4 (50); between lateral line and origin of anal fin 15 (5), 16 (37) or 17 (8); scales in lateral line from origin to base of mid-caudal ray 49 (3), 50 (14), 51 (18), 52 (8) or 53 (7);
one to four lateral line scales on caudal fin, some of these frequently missing and apparently more numerous in larger than in smaller specimens. Vertebrae, 10 + 14 + 1 = 25 (8) or 10 + 13 + 1 = 24 (1).
Body compressed and relatively shallow, its greatest depth (at origin of first dorsal fin ) 3.3 to 3.8 in s.L, its greatest width ( immediately behind orbit) 1.3 to 1.8 in greatest depth. All of body and head, except for the snout anterior to eye, covered by adherent ctenoid scales, the cteni of which are continuous with transverse ridges on the surface of each scale. Squamation essentially complete at 30 m m s.l., but at this size the cteni and associated ridges are scarcely evident. Scales of lateral line normal, the line terminating with one, two or three pored scales overlying central rays of the caudal fin. T h e other fins, both paired and vertical, are naked and there are no axillary scales.
316
I N D I A N O C E A N C H E I L O D I P T E R I D S • Mead and De Falla 271
Distance between snout and origin of first dorsal fin 2.2 to 2.8 in s.l.; preanal distance 1.5 to 1.8 in s.].; preventral 2.3 to 2.9 in s.l.; prepectoral 2.5 to 3.2 in s.l. Spines in fins strong, high and sharp, those in the first dorsal fin lying alternately on the right or left of center w h e n the fin is depressed. Dorsal and second anal spines about as long as the soft rays which follow them; spiny elements in the vertical fins longer than the soft. Base of pectoral fin set at about 45° angle with the horizontal, the fin relatively short and rounded, its length 1.4 to L 7 in length of head. Anus located about one-fourth of the w a y from origin of anal to insertion of ventral fins and separated from the first anal spine by about five scales. H e a d broad and bony, its greatest width 1.7 to 2.3 in length of head, its length 2.5 to 3.1 in s.l. Interorbital nearly flat, its least bony width 3.0 to 3.7 in length of head. E y e large, its horizontal diameter 2.1 to 3.0 in length of head. Pupil elliptical, aphakic space prominent. Dorsal and posterior edges of orbit spinulose, the supraorbital ridge terminating anteriorly in a broad, flat spine. Free edge of preopercle single, usually smooth, but occasionally ( especially in smaller individuals) bearing a few minute spines. A complex cluster of spines originate near the more posterior part of the opercular bone. T h e largest spine is the most posterior; it is usually simple in smaller specimens, but compound in the larger. Smaller and more or less simple spines lie above and below that at the angle of the operculum. Elsewhere the free edge of the gill cover is either smooth or weakly serrated.
Gill openings wide, the gill flaps and branchiostegal membranes meeting at the ventral midline but not overlapping. Pseudobranchs present, formed of about 14 filaments. Gill rakers on first arch of the usual lath-like shape and about half as long as diameter of eye. Gill filaments unusually short and few, those of first arch about two-thirds as long as the opposite rakers.
Symphysis of upper jaw toothless. O n
each side lateral to the midpoint is a patch of minute teeth and two or three conical, slightly recurved antrorse teeth. A single series of minute teeth is present on the more posterior biting edge of the pre-maxilla. T h e two or three conical antrorse canines on the mandible are followed by a row of small teeth. T h e vomer m a y bear a few minute, sharp teeth or be completely toothless. Palatines with teeth in a simple series or in a band. Tongue toothless.
In alcohol, the flanks are uniformly dusky, with more pigment along the margins of the scale pockets than elsewhere and with darker areas along the bases of the vertical fins. All fins are dark brown. T h e eye is dark, but elsewhere the head is similar in pigmentation to the body. Linings of mouth, pharynx, and abdominal cavity black. In young of about 35 m m s.l., the black linings of the body cavities are evident through the lighter dermal pigmentation, the black bases of the second dorsal and anal fins contrast in a more striking w a y with the pale flanks, the tip of the caudal is black, and there is a prominent dark vertical bar across the caudal peduncle in an area bounded by the upper and lower procurrent caudal rays.
HOWELLA BRODIEI OGILBY 1898
T h e three nominal species of Hotvella have never been critically compared. T h e type specimen of Hotvella brodiei was found on the beach at Lord H o w e Island near Australia. T h e type locality for the second species, H. sherborni (Norman, 1930, as Rhectogramma sherborni) lies in the eastern Atlantic off South Africa, ca. 34°S, 17°E. T h e third species, H. pommelas (Heller and Snodgrass, 1903, as Galeagra pammelas) was first taken at W e n m a n Island in the Galapagos group.
T h e type of H. pammelas (Heller and Snodgrass, 1903: pi. 4) and additional eastern Pacific material of this species from the collections of Scripps Institution of Oceanography show both an upper and a lower opercular spine to be complex. In
317
272 Bulletin Museum of Comparative Zoology, Vol. 134, No. 7
contrast, only the upper opercular spine is complex in specimens of Howella from the western Pacific and Atlantic. O n this basis alone, other morphometric data being similar, our Indian Ocean specimens, all of which have only an upper complex opercular spine, are referred here to H. brodiei, a species of which H. sherborni is tentatively considered conspecific. A critical and more detailed examination of the n o w considerable material from all oceans is obviously in order.
This genus is hitherto unknown from the Indian Ocean, the nearest records being the South African-Atlantic type locality of H. sherborni, the Australian type locality of H. brodiei, and a Philippine locality reported for the latter species by Herre and Herald (1951).
The Anton Bruun took specimens of H. brodiei at each of the following twelve stations:
One , 18.0 m m s.L; Cr. Ill; Sta. 2, coll. A E 6 E ; 15 August 1963; 0350 to 0715 hrs. l.s.t.; 10°09'N, 59°55'E to 10°00'N, 60o01'E; m a x i m u m calculated depth 560 m (depth from t.d.r. 520 m ) ; I K M T , deep fraction of catch with Foxton Trousers nominally set for 150 m , specimen probably taken below 75 m . M C Z .
One, 14.5 m m s.L; Cr. Ill; Sta. 3, coll. A E 8 B ; 16 August 1963; 1845 to 2213 hrs. l.s.t; 06°54'N, 59°55'E to 06°37'N, 59°57'E; maximum calculated depth 750 m ; I K M T , shallow fraction of catch with Foxton Trousers set for 150 m , probably taken above 300 m . M C Z .
One, 13.6 m m s.L; Cr. Ill; Sta. 5, .coll. AE12B; 19 August 1963; 2035 to 2350 hrs. l.s.t.; 01°23'N, 60°11'E to 01°22'N, 60°04'E; maximum calculated depth 750 m (depth from t.d.r. 800 m ) ; I K M T , shallow fraction of catch with Foxton Trousers set for 275 m , probably taken above 550 m . Zoological Museum, University of Copenhagen.
One, 65.0 m m s.L; Cr. Ill; Sta. 7, coll. A E 1 6 D ; 23 August 1963; 0625 to 1350 hrs. Ls.t.; 04°52'S, 60°02'E to 04°27'S, 59°55'E; maximum calculated depth 2030 m ; I K M T ,
deep fraction of catch with Foxton Trousers set at 275 m , probably caught below 140 m . M C Z .
One, 42.5 m m s.L; Cr. Ill; Sta. 16, coll. A E 3 0 B ; 12 September 1963; 1110 to 1710 hrs. Ls.t.; 40°53'S, 60°01'E to 41°07'S, 59°52'E; max imum calculated depth 2750 m ; I K M T , deep fraction of catch with Foxton Trousers set for 275 m , probably taken below 140 m . SIO.
One, 61.0 m m s.L; Cr. Ill; Sta. 16, coll. A E 3 1 B ; 12 September 1963; 1725 to 2105 hrs. Ls.t.; 41°07'S, 59°52'E to 41°07'S, 60°08'E; maximum calculated depth 635 m ; I K M T , deep fraction of catch with Foxton Trousers set for 150 m , probably from below 75 m . MCZ.
T w o , each 14.6 m m s.L; Cr. VI; Sta. 334A; 24 M a y 1964; 1912 to 2345 hrs. l.s.t; 06° 01 'N, 64°59'E to 05°48'N, 64°57'E; maxim u m calculated depth 700 m ; I K M T , deep fraction of catch with Foxton Trousers set for 275 m , probably taken below 140 m . MCZ.
One, 47.0 m m s.L; Cr. VI; Sta. 335 B ; 26 M a y 1964; 0100 to 0850 hrs. l.s.t.; 03°46'N, 65°05'E to 03°27'N, 65°07'E; max imum calculated depth 2575 m ; I K M T , deep fraction of catch with Foxton Trousers set for 275 m , probably taken below 140 m . USNM.
One, 15.5 m m s.L; Cr. VI; Sta. 337B; 28 M a y 1964; 0300 to 0930 hrs. l.s.t.; 00°14'S, 65°03'E to O O ^ S , 65°08'E; max imum calculated depth 2250 m ; I K M T , shallow fraction of catch with Foxton Trousers set for 275 m , probably taken above 550 m . USNM.
Three, 11.8 to 14.6 m m s.L; Cr. VI; Sta. 340B; 31 M a y 1964; 1945 to 0155 hrs. l.s.t; 05°55'S, 64°48'E to 06°08'S, 64°58'E; maximum calculated depth 746 m ; I K M T , shallow fraction of catch with Foxton Trousers set for 275 m , probably taken above 550 m . MCZ.
T w o , 11.1 and 11.9 m m s.L; Cr. VI; Sta. 341B; 1-2 June 1964; 2200 to 0300 hrs. l.s.t.; 07°56'S, 65°14'E to 07°57'S, 64°51'E; max-
318
INDIAN O C E A N CHEILODIPTERIDS • Mead and De Falla 273
i m u m calculated depth 504 m ; I K M T , considered an open net. M C Z .
Three, 10.2 to 12.4 m m s.l.; Cr. VI; Sta. 342A; 2 June 1964; 1755 to 2250 hrs. l.s.t.; 09°57'S, 64°55'E to l O W S , 64°19'E; maxi m u m calculated depth 580 m ; I K M T , deep fraction of catch with Foxton Trousers set for 200-250 m , probably taken below 125 m . MCZ.
BATHYSPHYRAENOPS PARR 1933
Bathysphyraenops, a monotypic genus, has been known only from the type series of B. simplex Parr 1933, which was taken off the Bahamas and adjacent islands, and from unpublished catches made elsewhere in the Atlantic and Pacific. Our Indian Ocean collection contains two specimens, 84.5 and 90.8 m m s.l., which w e have critically compared with the holotype of B. simplex ( Bingham Océanographie Lab. no. 2847). Meristic values, with the possible exception of the number of scale rows between the lateral line and origin of anal fin, are nearly identical, and differences in body proportions, armature, etc. are insignificant. These Indian Ocean B. simplex were taken at the following station:
R / V Anton Bruun, IIOE, Cr. Ill; Sta. 6, coll. A E 1 3 B ; 21 August 1963; 0155 to 0440 hrs. Ls.t.; 01°58'S, 60°06'E to 02°06'S, 60°02'E; max imum calculated depth 510 m (depth from t.d.r. 500 m ) ; I K M T , considered an open net. M C Z and U S N M .
BRINKMANNELLA PARR 1933
Included within the small group of oceanic cheilodipterids with single anal spines and unarmed opercular flaps are BrinkmanneUa elongata Parr, previously known only from midwaters off the Baham a Islands (Parr, 1933:26), and Brephos-toma carpenteri Alcock, an abyssal benthic species from the Bay of Bengal (Alcock, 1889:383). BrinkmanneUa elongata has deciduous scales and teeth in jaws, palatines, and vomer. Brephostoma carpenteri has adherent scales and a toothless mouth. In
other respects the two genera are suspiciously similar.
Our Indian Ocean material contains two lots of specimens within this group. The first is a single individual, 104.5 m m s.l., which is larger but otherwise identical to the Atlantic BrinkmanneUa elongata. It was taken as follows:
Scripps Institution of Oceanography "Monsoon" Expedition; I K M T haul no. 9; 19 December 1960; 0324 to 0829 hrs. l.s.t.; 33°19'18"S, 72°34'24"E to 33°38'06"S, 72° 31'00"E; max imum calculated depth 1878 m , open net. SIO 61-37.
The second lot contains four fishes, ca. 64-ca. 103 m m s.l., all in poor condition, which are meristically more similar to Brephostoma carpenteri than to BrinkmanneUa elongata but show the generic characters diagnostic of this latter genus: teeth in jaw, palatines, and vomer; deciduous scales; and an area of relatively light pigmentation on the flanks posterior to the anal fin. These are characters which possibly could change as a pelagic young assumes a benthic adult life. Therefore, pending further study, the identity of this lot is left open as "BrinkmanneUa sp." The series came from the following locality:
R / V Anton Bruun, IIOE, Cr. Ill; Sta. 6, coll. A E 1 3 B ; 21 August 1963; 0155 to 0440 hrs. l.s.t.; 01°58'S, 60°06'E to 02°06'S, 60° 02'E; m a x i m u m calculated depth 510 m (depth from t.d.r. 510 m ) ; I K M T , considered an open net. M C Z .
LITERATURE CITED
A L C O C K , A L F R E D . 1889. O n the bathybial fishes of the Bay of Bengal and neighbouring waters, obtained during the seasons 1885-1889. (Natural history notes from H . M . Investigator no. 13. ) Ann. Mag. Nat. Hist, ser. 6, vol. 4, pp. 376-399.
. 1890. On the bathybial fishes collected in the Bay of Bengal during the season 1889-1890. (Natural history notes from H . M . Investigator no. 16.) Ann. Mag. Nat. Hist., ser. 6, vol. 6, pp. 197-222.
B R A U E R , A U G U S T . 1906. Die Tiefsee-Fische I.
Systematischer Teil. Wiss. Ergeb. Deutschen
319
274 Bulletin Museum of Comparative Zoology, Vol. 134, No. 7
Tiefsee-Exped. auf dem Dampfer Valdivia
1898-99, vol. 15, 432 pp.
C L A B K E , W I L L I A M D . 1963. Field data for the
Isaacs-Kidd midwater trawl collections of
Scripps Institution of Oceanography, Univer
sity of California. Data Report, SIO Ref. 63-
29, 23 pp. + figs.
F O U H M A N O I R , P. 1957. Poissons téléostéens des
eaux malgaches du Canal de Mozambique.
M é m . Inst. Sci. Madagascar, Sér. F. Océanogr.,
vol. 1, pp. 1-316.
F O X T O K , P E T E R . 1963. A n automatic opening-
closing device for large plankton nets and
mid-water trawls. J. Mar. Biol. Ass. U . K . ,
vol. 43, pp. 295-308.
H A N E D A , Y A T A . 1961. Luminous organs of fish,
which emit light indirectly. Rec. Oceanogr.
Works Japan, vol. 7, no. 1, pp. 83-87.
HELLER, E D M U N D A N D ROBERT E V A N S SNODGRASS.
1903. Papers from the Hopkins Stanford Galapagos Expedition, 1898-1899. XV. New fishes. Proc. Washington Acad. Sci., vol. 5,
pp. 189-229.
H E R R E , ALBERT W . A N D E A R L S. H E R A L D . 1951.
Noteworthy additions to the Philippine fish
fauna with descriptions of a new genus and
species. Philippine J. Sci., vol. 79, no. 3, pp.
309-340.
H U B B S , C A R L L. A N D K A R L F. LAGLER. 1947.
Fishes of the Great Lakes Region. Cranbrook
Inst. Sci. Bull. no. 26, 186 pp.
N O R M A N , J. R. 1930. Oceanic fishes and flatfishes
collected in 1925-1927. Discovery Rep., vol.
2, pp. 261-370.
. 1957. A draft synopsis of the orders,
families and genera of recent fishes and fish
like vertebrates. 649 pp. Duplicated and dis
tributed by British Museum (Natural His
tory ).
O G I L B Y , J. D O U G L A S . 1898. Additions to the
fauna of Lord Howe Island. Proc. Linn. Soc.
N e w South Wales, vol. 23, pp. 730-745.
P A R R , A L B E R T E . 1933. Deepsea Berycomorphi
and Percomorphi from the waters around the
Bahama and Bermuda Islands. Bull. Bingham
Oceanogr. Coll., vol. 3, art. 6, 51 pp.
(Received 5 April 1965.)
320
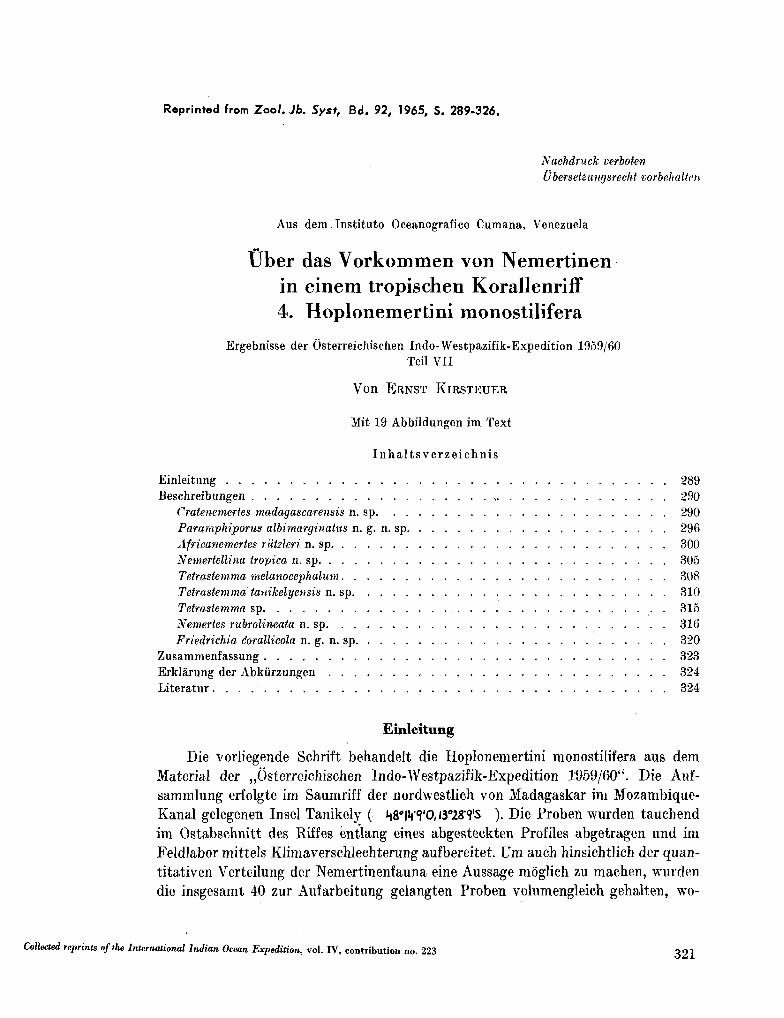
Reprinted from Zoo/ . Jb. Syst, Bd . 92, 1965, S. 289-326.
Nachdrnck verboten
Übersetzungsrecht vorbehalteii
Aus d e m . Instituto Oceanógrafico C u m a n a , Venezuela
Über das V o r k o m m e n von Nemertinen in einem tropischen Korallenriff 4. Hoplonemertini monostilifera
Ergebnisse der Osterreichischen Indo-Westpazifik-Expedition 1959/60 Teil VII
Von ERNST KIRSTEUER
Mit 19 Abbildungen im Text
Inhaltsverzeichnis
Einleitung 289 Beschreibungen , 290
Cratenemertes madagascarensis n. sp 290
Paramphiporus albimarginatus n. g. n. sp 296
Africanemertes riitzleri n . sp 300
Nemertellina tropica n. sp 305
Tetrastemma melanocephalum 308
Tetrastemma tanikelyensis n. sp 310
Tetrastemma sp 315 Nemertes rubrolineata n. sp 316
Friedrichia c'orallicola n. g. n. sp 320
Zusammenfassung 323
Erklàrung der Abkiirzungen 324
Literatur 324
Einleitung
Die vorliegende Schrift behandelt die Hoplonemertini monostilifera aus dem
Material der „Osterreichischen Indo-Westpazifik-Expedition 1959/60". Die Auf-
sammlung erfolgte im Saumriff der nordwestlich von Madagaskar im Mozambique-
Kanal gelegenen Insel Tanikely ( HS'mS'O,I3°28"9'S ). Die Proben wurden tauchend
im Ostabschnitt des Riffes entlang eines abgesteckten Profiles abgetragen und im
Feldlabor mittels Klirnaverschlechterung aufbereitet. U m auch hinsichtlich der quan-
titativen Verteilung der Nemertinenfauna eine Aussage moglich zu machen, wurden
die insgesamt 40 zur Aufarbeitung gelangten Proben volumengleich gehalten, w o -
Collected reprints of the International Indian Ocean Expedition, vol. IV, contribution no. 223 321
290 ERNST KIRSTEUER
bei eine Probe 3 Glaswannen zu je 30 Liter, gefiillt mit Substrat, entsprach. Die bei
der Untersuchung berücksichtigten Bestandsbildner waren: Seriatopora angulata
K I . U N Z I N G E R , Acropora pharaonis ( E D W A R D S & H A I M E ) , Acropora corymbosa (LA
M A R C K ) , Pontes nigrescens D A N A , Pontes iwayamaensis E G U C H I und Millepora te-
nella O R T M A N N , sowie eine dicke Rasen bildende Alge, deren Bestimmung noch aus-
stândig ist1). Die Nemertinen-Ausbeute der Expedition umfaBt 38 Arten mit zu-
sammen 488 Individúen. Auf die Hoplonemertini monistilifera entfallen 9 Arten,
von denen 8 nachfolgend dargestellt sind, wàhrend eine mit zwei Individúen ver-
tretene Tetrastemma-Species wegen des schlechten Erhaltungszustandes nicht weiter
determiniert werden konnte und nur kurz Erwàhnung findet.
Für Unterstützung und Fôrderung der im Rahmen der „Ôsterreichischen Ar-
beitsgemeinschaft für Meeresforschung" durchgeführten Expedition sei an dieser
Stelle Herrn Prof. Dr. W . M A R I N E L L I , Herrn Doz. Dr. R . R I E D L und Herrn Doz.
Dr. F. S T A R M U H I . N E R , I. Zoologisches Institut der Universitàt Wien, aufrichtig ge-
dankt. Die Feldarbeit auf Tanikely wurde durch Herrn Prof. Dr. J. M I L L O T , Herrn
Prof. Dr. R . P A U L I A N , Herrn Dr. A . CROSNIER, Herrn Dr. P. F O U R M A N O I R und Herrn
M . Bj0RNtnvr, Institut de Recherche Scientifique a Madagascar, Station Océano
graphique Nossi Bé, in dankenswerter Weise gefôrdert und erleichtert. Dank gebiihrt
audi Herrn Dr. F. B A L D A und Herrn Dr. R . C U R R A vom Instituto Oceanógrafico
Cumana, Venezuela, für gezeigtes Intéresse an der Bearbeitung des vorliegenden
Teñes. Für die Bestimmung der bestandsbildenden Madreporaria und Hydroidea
mochte ich Frau Dr. L . Rossi, Istituto e Museo di Zoología, Universita di Torino,
herzlichst danken.
Beschreibungen
Craienemertes F R I E D R I C H 1955
Im Genus Craienemertes wurden von F R I E D R I C H (1955) alie jene bis dahin unter
Amphiporus geführten Arten zusammengefaBt, bei welchen in der Rhynchocoelom-
wand eine Verflechtung der Muskulatur auftritt. Es sind dies Craienemertes amboien-
sis ( B U R G E R ) 1890, C. drepanophoroides (GRIFFIN) 1898, C. pacificus (COE) 1905,
C. occidentalis ( C O E ) 1905, C. punctatulus (COE) 1905 und C. bergendali ( G E R I N G )
1912. Hinzu kamen Craienemertes danae FRIEDRICH 1957 und C. pelagians K O R O T -
KEVITSCH 1961 sowie die in der Folge beschriebene Form
Craienemertes madagascarensis n. sp.
Habitus
Die aufgesammelten Exemplare der Art hatten eine Kôrperlànge von 5—7 m m
und erreichten eine maximale Breite von 1,5 m m . Im Leben wirkten die dorsoventral
1) D a in den Algenproben keine Hoplonemertini monostilifera auftraten, ist das Fehlen
einer Bestimmung ohne Bedeutung für die vorliegende Arbeit.
322
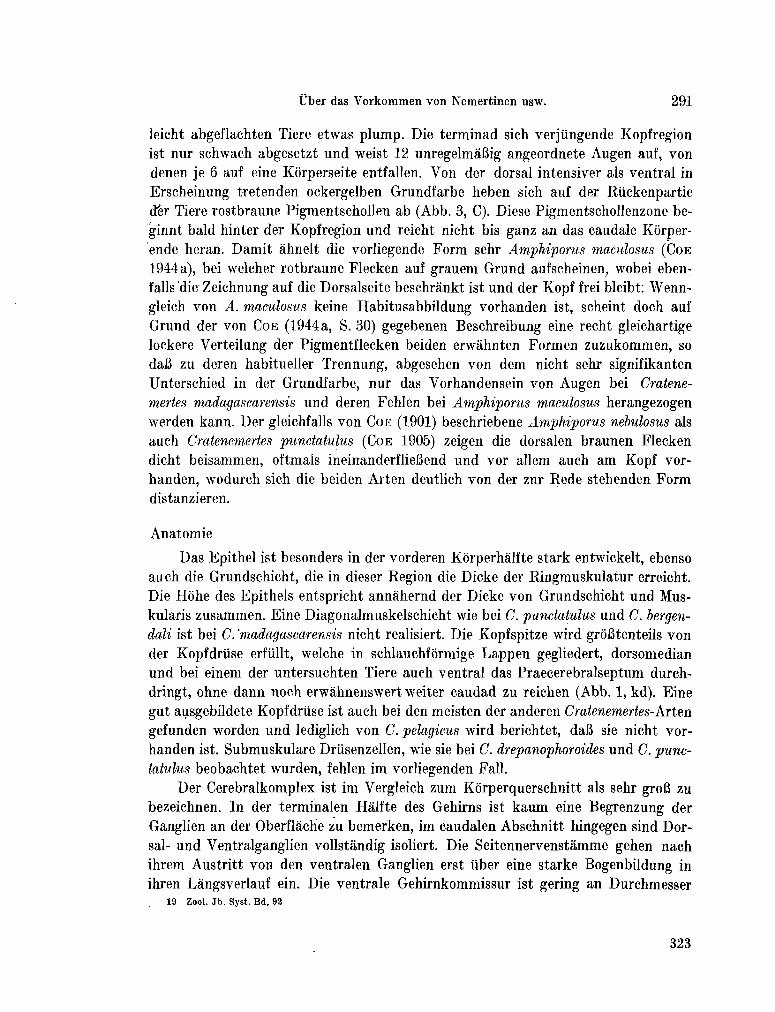
Über das Vorkommen von Nemertinen usw. 291
leicht abgeflachten Tiere etwas plump. Die terminad sich verjüngende Kopfregion
ist nur schwach abgesetzt und weist 12 unregelmáBig angeordnete Augen auf, von
denen je 6 auf eine Kórperseite entfallen. Von der dorsal intensiver ais ventral in
Erscheinung tretenden ockergelben Grundfarbe heben sich auf der Rückenpartie
der Tiere rostbraune Pigmentschollen ab (Abb. 3, C) . Diese Pigmentschollenzone be-
ginnt bald hinter der Kopfregion und reicht nicht bis ganz an das caudale Kôrper-
ende heran. Damit áhnelt die vorliegende Form sehr Amphiporus maculosus ( C O E
1944 a), bei welcher rotbraune Flecken auf grauem Grund aufscheinen, wobei eben-
falls die Zeichnung auf die Dorsalseite beschránkt ist und der Kopf frei bleibt W e n n -
gleich von A. maculosus keine Habitusabbildung vorhanden ist, scheint doch auf
Grund der von C O E (1944 a, S. 30) gegebenen Besehreibung eine recht gleichartige
lockere Verteilung der Pigmentflecken beiden erwáhnten Formen zuzukommen, so
daB zu deren habitueller Trennung, abgesehen von dem nicht sehr signifikanten
Unterschied in der Grundfarbe, nur das Vorhandensein von Augen bei Cratene-
mertes madagascarensis und deren Fehlen bei Amphiporus maculosus herangezogen
werden kann. Der gleichfalls von C O E (1901) beschriebene Amphiporus nebulosus ais
auch Cratenemertes punctatulus ( C O E 1905) zeigen die dorsalen braunen Flecken
dicht beisammen, oftmals ineinanderflieBend und vor allem auch a m Kopf vor
handen, wodurch sich die beiden Arten deutlich von der zur Rede stehenden Form
distanzieren.
Anatomie
Das Epithel ist besonders in der vorderen Korperhálfte stark entwickelt, ebenso
auch die Grundschicht, die in dieser Region die Dicke der Ringmuskulatur erreicht.
Die Hôhe des Epithels entspricht annahernd der Dicke von Grundschicht und M u s -
kularis zusammen. Eine Diagonalmuskelschicht wie bei C. punctatulus und C. bergen-
dali ist bei C. 'madagascarensis nicht realisiert. Die Kopfspitze wird groBtenteils von
der Kopfdrüse erfüllt, welche in schlauchformige Lappen gegliedert, dorsomedian
und bei einem der untersuchten Tiere auch ventral das Praecerebralseptum durch-
dringt, ohne dann noch erwáhnenswert weiter caudad zu reichen (Abb. 1, kd). Eine
gut ausgebildete Kopfdrüse ist auch bei den meisten der anderen Cratenemertes-Arten
gefunden worden und lediglich von C. pelagicus wird berichtet, daB sie nicht vor
handen ist. Submuskulare Driisenzellen, wie sie bei C. drepanophoroides und C. punc
tatulus beobachtet wurden, fehlen im vorliegenden Fall.
Der Cerebralkomplex ist im Vergleich zum Korperquerschnitt als sehr groB zu
bezeichnen. In der terminalen Halfte des Gehirns ist k a u m eine Begrenzung der
Ganglien an der Oberflache zu bemerken, im caudalen Abschnitt hingegen sind Dor
sal- und Ventralganglien vollstandig isoliert. Die Seitennervenstamme gehen nach
ihrem Austritt von den ventralen Ganglien erst über eine starke Bogenbildung in
ihren Langsverlauf ein. Die ventrale Gehirnkommissur ist gering an Durchmesser 19 Zool. Jb. Syst. Bd. 92
323
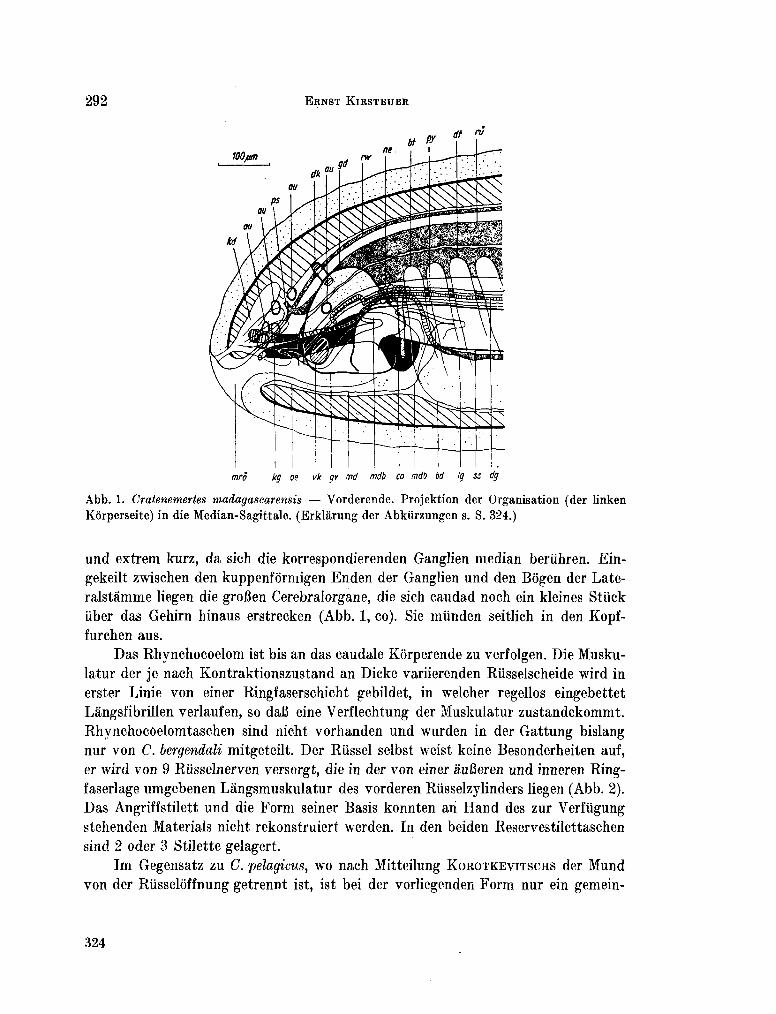
EKNST KIRSTEUER
mrô kg oe vk gv md mdt> co mdb bd Ig ss dg
A b b . 1. Cratenemertes madagascarensis — Vorderende. Projektion der Organisation (der linken
Kôrperseite) in die Median-Sagittale. (Erklârung der Abkiirzungen s. S. 324.)
unci extrem kurz, da sich die korrespondierenden Ganglien median beriihren. Ein-
gekeilt zwischen den kuppenformigen Enden der Ganglien und den Bogen der Late-
ralstàmme liegen die groBen Cerebralorgane, die sich caudad noch ein kleines Stuck
iiber das Gehirn binaus erstrecken (Abb. 1, co). Sie miinden seitlich in den Kopf-
furchen aus.
Das Rhynchocoelom ist bis an das caudale Kôrperende zu verfolgen. Die Musku-
latur der je nach Kontraktionszustand an Dicke variierenden Riisselscheide wird in
erster Linie von einer Ringfaserschicht gebildet, in welcher regellos eingebettet
Langsfibrillen verlaufen, so daB eine Verflechtung der Muskulatur zustandekommt.
Rhynchocoelomtaschen sind nicht vorhanden und wurden in der Gattung bislang
nur von C. bergendali mitgeteilt. Der Riissel selbst weist keine Besonderheiien auf,
er wird von 9 Riisselnerven versorgt, die in der von einer àuBeren und inn eren Ring-
faserlage umgebenen Lángsmuskulatur des vorderen Rüsselzylinders liegen (Abb. 2).
Das Angriffstilett und die Form seiner Basis konnten an H a n d des zur Verfügung
stehenden Materials nicht rekonstruiert werden. In den beiden Reservestilettaschen
sind 2 oder 3 Stilette gelagert.
I m Gegensatz zu C. pelagicus, w o nach Mitteilung K O R O T K E V I T S C H S der M u n d
von der Rüsseloffnung getrennt ist, ist bei der vorliegenden Form nur ein gemein-
324
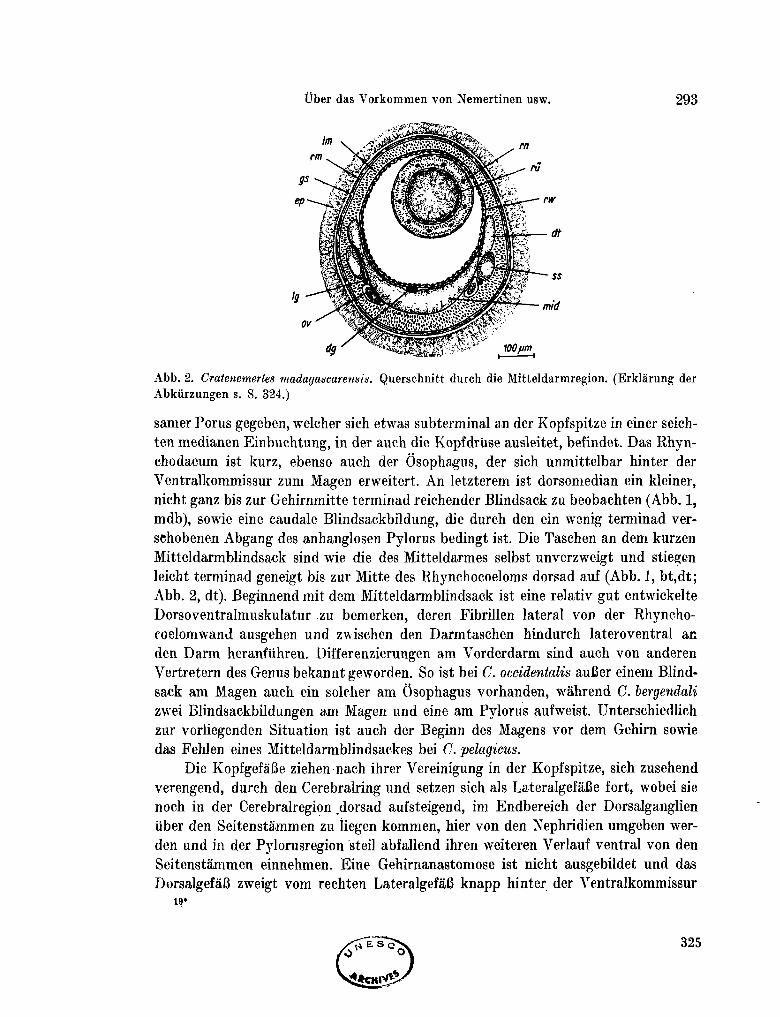
Uber das Vorkommen von Nemertinen usw. 293
Abb. 2. Cratenemertes Madagascar ens'is. Querschnitt durch die Mitteldarmregion. (Erklàrung der Abkürzungen s. S. 324.)
sanier Porus gegeben, welcher sich etwas subterminal an der Kopfspitze in einer seich-
ten medianen Einbuchtung, in der auch die Kopfdrüse ausleitet, befindet. Das Rhyn-
chodaeum ist kurz, ebenso auch der Ôsophagus, der sich unmittelbar hinter der
Ventralkommissur zum Magen erweitert. A n letzterem ist dorsomedian ein kleiner,
nicht ganz bis zur Gehirnmitte terminad reichender Blindsack zu beobachten (Abb. 1,
m d b ) , sowie eine caudale Blindsackbildung, die durch den ein wenig terminad ver-
schobenen Abgang des anhanglosen Pylorus bedingt ist. Die Taschen an dem kurzen
Mitteldarmblindsack sind wie die des Mitteldarmes selbst unverzweigt und stiegen
leicht terminad geneigt bis zur Mitte des Rhynchocoeloms dorsad auf (Abb. 1, bt,dt;
A b b . 2, dt). Beginnend mit dem Mitteldarmblindsack ist eine relativ gut entwickelte
Dorsoventralmuskulatur zu bemerken, deren Fibrillen lateral von der Rhyncho-
coelomwand ausgehen und zwischen den Darmtaschen hindurch lateroventral an
den D a r m heranführen. Differenzierungen a m Vorderdarm sind auch von anderen
Vertretern des Genus bekannt geworden. So ist bei C. occidentalis auBer einem Blind
sack a m Magen auch ein soldier a m Osophagus vorhanden, wàhrend C. bergendali
zwei Blindsackbildungen a m Magen und eine a m Pylorus aufweist. Unterschiedlich
zur vorliegenden Situation ist auch der Beginn des Magens vor dem Gehirn sowie
das Fehlen eines Mitteldarmblindsackes bei C. pelagicus.
Die Kopfgefà'Be ziehen nach ihrer Vereinigung in der Kopfspitze, sich zusehend
verengend, durch den Cerebralring und setzen sich ais LateralgefàCe fort, wobei sie
noch in der Cerebralregion ^dorsad aufsteigend, im Endbereich der Dorsalganglien
über den Seitenstámmen zu íiegen k o m m e n , hier von den Nephridien umgeben wer-
den und in der Pylorusregion steil abfallend ihren weiteren Verlauf ventral von den
Seitenstámmen einnehmen. Eine Gehirnanastomose ist nicht ausgebildet und das
DorsalgefaB zweigt v o m rechten LateralgefáB knapp hinter der Ventralkommissur 19»
294 ERNST KIRSTEL'ER
ab, dringt darauf in das Rhynchocoelom ein und tritt aus diesem mit Beginn des dor-
salen Magenblindsackes wieder aus. Sowohl die LateralgefàBe ais auch das Dorsal-
gefaB zeigen stellenweise Erweiterungen und Anschwellungen (Abb. 1, lg, dg).
Die Nephridien befinden sich über den Endkuppen der Dorsalganglien und off-
nen sich über je einen, die Seitenstamme lateral umgreifenden Ableitungskanal
lateroventral hinter den Ventralganglien nach auBen (Abb. 1, ne). Ein wesentlicher
Unterschied ergibt sich daraus nur zu C. pelagicv.s, bei welcher Form iiberhaupt kein
Nephridialapparat gefunden wurde ( K O R O T K E V I T S C H 1961, p. 1420).
Die untersuchten Tiere erwiesen sich als geschlechtsreife Weibchen, deren G o -
naden hauptsàchlich in der caudalen Kôrperhàlfte ventral von den Lateralnerven-
stàmmen angeordnet sind (Abb. 2, ov). Die Ausfuhrgànge der Ovarien sind nach
lateroventral gerichtet.
Verbreitung
Indo-westpazifischer R a u m : Madagascar (Tanikely) [Mozambique-Kanal].
Verteilung
Cratenemertes madagascarensis wurde ini Untersuchungsgebiet auf abgestorbenen,
stark ineinander verkeilten und von krustenbildenden Bryozoen bewachsenem Geast
von Acropora pharaonis mit einer F'requenz von 30 % bei einer Dominanz von 2,8 %
registriert. Ebenfalls totes Material (zum Teil abgebrochene und iibereinander ge-
schichtete Platten) von Acropora corymbosa erbrachte die Art mit 16,7% Fr. und
1,4 % D o . und auf Stocken von Seriatopora angulata (60 % Totmaterial in den Proben)
betrug die Fr. 11,2 % und D o . 1,5 % .
Paramphiporas n. g.
In seiner synoptischen Darstellung der Hoplonemertini monostilifera verweist
F R I E D R I C H (1955) mit Nachdruck auf die Heterogenitat der Gattung Amphipoms
und gliedert diese Sammelgattung durch Umstellung einer Reihe von Arten in neue
Genera auf. Eine weitere Anzahl von Arten, zum Teil hinsichtlich ihrer anatomischen
Verhàltnisse nicht geniigendbekannt, aber doch in dem einen oder anderen Merkmal
von Amphiporns sensu F R I E D R I C H abweichend, wird in Formengruppen zusammen-
gefafit. V o n diesen ist im vorliegendem Fall die Hastatus-Gruppe von Intéresse, da
deren Vertretcr Amphiporus hastatus, A. bioculatus, A. nebulosus und A. Icorschelti
àhnlich der hier zu beschreibenden Form eine Spaltung der Làngsfibrillenschicht in
der vorderen Korperwandmuskularis zeigen. Ansonsten ist diese Gruppe uneinheit-
lich, wie aus dem Fehlen eines Praecerebralseptums bei A. Icorschelti und der eigen-
tiimlichen Ausbildung des BlutgefàBsysterns bei letztgenannter Art und bei A. ha
status zu ersehen ist. Auch A. nebulosas dürfte entsprechend der Abbildung bei C O E
(1901, Taf. 11, Fig. 1) extracerebrale GefaBaste besitzen. Hinzu k o m m t , daB bei
326
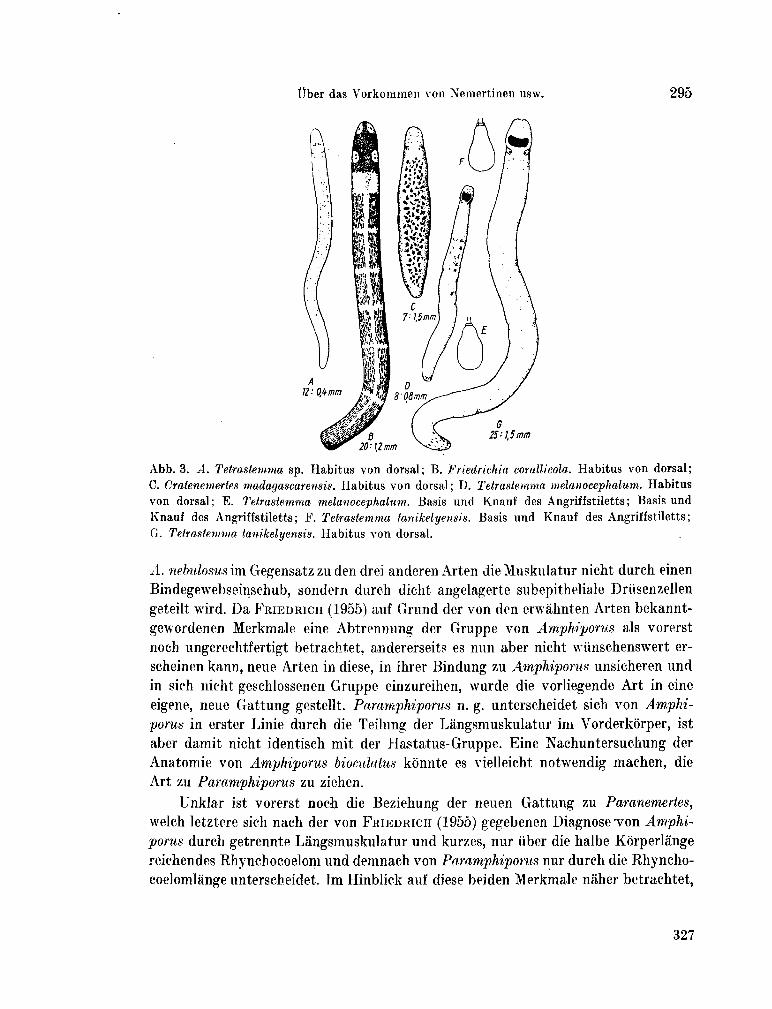
Über das V o r k o m m e n von Nemertinen usw. 295
Abb . 3. A. Tetrastemma sp. Habitus von dorsal; B . Friedrichia corallicola. Habitus von dorsal; C. Cratenemertes Madagascar ensis. Habitus von dorsal; D . Tetrastemma melanocephalum. Habitus von dorsal; E . Tetrastemma melanocephalum. Basis und Knauf des Angriffstiletts; Basis und Knauf des Angriffstiletts; F . Tetrastemma tanikelyensis. Basis und Knauf des Angriffstiletts; G . Tetrastemma tanikelyensis. Habitus von dorsal.
A. nebulosus im Gegensatz zu den drei anderen Arten die Muskulatur nicht durch einen
Bindegewebseinschub, sondern durch dicht angelagerte subepitheliale Driisenzellen
geteilt wird. D a F R I E D R I C H (1955) auf Grund der von den erwàhnten Arten bekannt-
gewordenen Merkmale eine Abtrennung der Gruppe von Amphiporus ais vorerst
noch ungereclitíertigt betrachtet, andererseits es nun aber nicht wünschenswert er-
scheinen kann, neue Arten in diese, in ihrer Bindung zu Amphiporus unsicheren und
in sich nicht geschlossenen Gruppe einzureihen, wurde die vorliegende Art in eine
eigene, neue Gattung gestellt. Paramphiporus n. g. unterscheidet sich von Amphi
porus in erster Linie durch die Teilung der Lángsmuskulatur im Vorderkórper, ist
aber damit nicht identisch mit der Hastatus-Gruppe. Eine Nachuntersuchung der
Anatomie von Amphiporus bionulatus kónnte es vielleicht notwendig machen, die
Art zu Paramphiporus zu ziehen.
Unklar ist vorerst noch die Beziehung der neuen Gattung zu Paranemertes,
welch letztere sich nach der von F R I E D R I C H (1955) gegebenen Diagnose'von Amphi
porus durch getrennte Lángsmuskulatur und kurzes, nur über die halbe Kórperlánge
reichendes Rhynchocoelom und demnach von Paramphiporus nur durch die Rhyncho-
coelomlánge unterscheidet. T m Hinblick auf diese beiden Merkmale náher betrachtet,
327
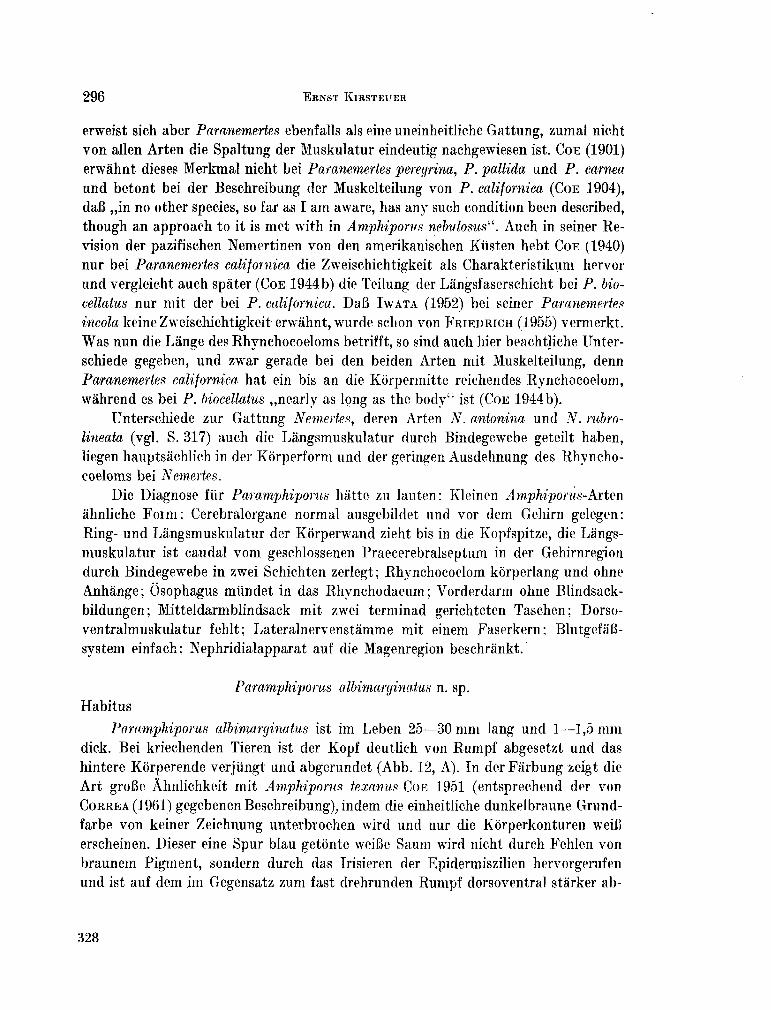
296 ERNST KIRSTEUER
erweist sich aber Paranemertes eberifalls ais eine uneinheitliche Gattung, zumal nicht
von alien Arten die Spaltung der Muskulatur eindeutig nachgewiesen ist. C O E (1901)
erwahnt dieses Merkmal nicht bei Paranemertes peregrina, P. pallida und P. carnea
und betont bei der Beschreibung der Muskelteilung von P. californica ( C O E 1904),
daB „in no other species, so far as I a m aware, has any such condition been described,
though an approach to it is met with in Amphiporus nebulosusu. Auch in seiner Re-
vision der pazifischen Nemertinen von den amerikanischen Kiisten hebt C O E (1940)
nur bei Paranemertes californica die Zweischichtigkeit als Charakteristikum hervor
und vergleicht auch spater ( C O E 1944b) die Teilung der Langsfaserschicht bei P. hio-
cellatus nur nut der bei P. californica. D a B I W A T A (1952) bei seiner Paranemertes
íncola keine Zweischichtigkeit erwâhnt, wurde schon von F R I E D R I C H (1955) vermerkt.
W a s nun die Lange des Rhynchocoeloms betrifft, so sind auch hier beachtjiche Unter-
schiede gegeben, und zwar gerade bei den beiden Arten mit Muskelteilung, denn
Paranemertes californica hat ein bis an die Korpermitte reichendes Rynchocoelom,
wàhrend es bei P. Mocellatus ,,nearly as long as the body" ist ( C O E 1944b).
Unterschiede zur Gattung Nemertes, deren Arten N. anionina und N. rubro-
lineata (vgl. S. 317) auch die Làngsmuskulatur durch Bindegewebe geteilt haben,
liegen hauptsâchlich in der Kôrperform und der geringen Ausdehnung des Rhyncho
coeloms bei Nemertes.
Die Diagnose für Paramphiporus hatte zu lauten: Kleinen Amphijwrus-Arten
almliche Form; Cerebralorgane normal ausgebildet und vor dem Gehirn gelegen:
Ring- und Làngsmuskulatur der Kôrperwand zieht bis in die Kopfspitze, die Làngs
muskulatur ist caudal v o m geschlossenen Praecerebralseptum in der Gehirnregion
durch Bindegewebe in zwei Schichten zerlegt; Rhynchocoelom korperlang und ohne
Anhánge; Osophagus miindet in das Rhynchodaeum ; Vorderdarm ohne Blindsack-
bildungen; Mitteldarmblindsack mit zwei terminad gerichteten Taschen; Dorso-
ventralmuskulatur fehlt; Lateralnervenstàmme mit einem Faserkern; BlutgefaB-
system einfach; Nephridialapparat auf die Magenregion beschrànkt.
Paramphiporus albimarginatus n. sp.
Habitus
Paramphiporus albimarginaius ist im Leben 25—30 m m lang und 1—1,5 m m
dick. Bei kriechenden Tieren ist der Kopf deutlich von R u m p f abgesetzt und das
hintere Kórperende verjüngt und abgerundet (Abb. 12, A ) . In der Farbung zeigt die
Art groBe Àhnlichkeit mit Amphiporus texanus C O E 1951 (entsprechend der von
C O R R E A (1961) gegebenen Beschreibung), indem die einheitliche dunkelbraune Grund-
farbe von keiner Zeichnung unterbrochen wird und nur die Korperkonturen weiB
erscheinen. Dieser eine Spur blau getonte weiBe Saum wird nicht durch Fehlen von
braunem Pigment, sondern durch das Insieren der Epidermiszilien hervorgerufen
und ist auf dem im Gegensatz zum fast drehrunden R u m p f dorsoventral starker ab-
328
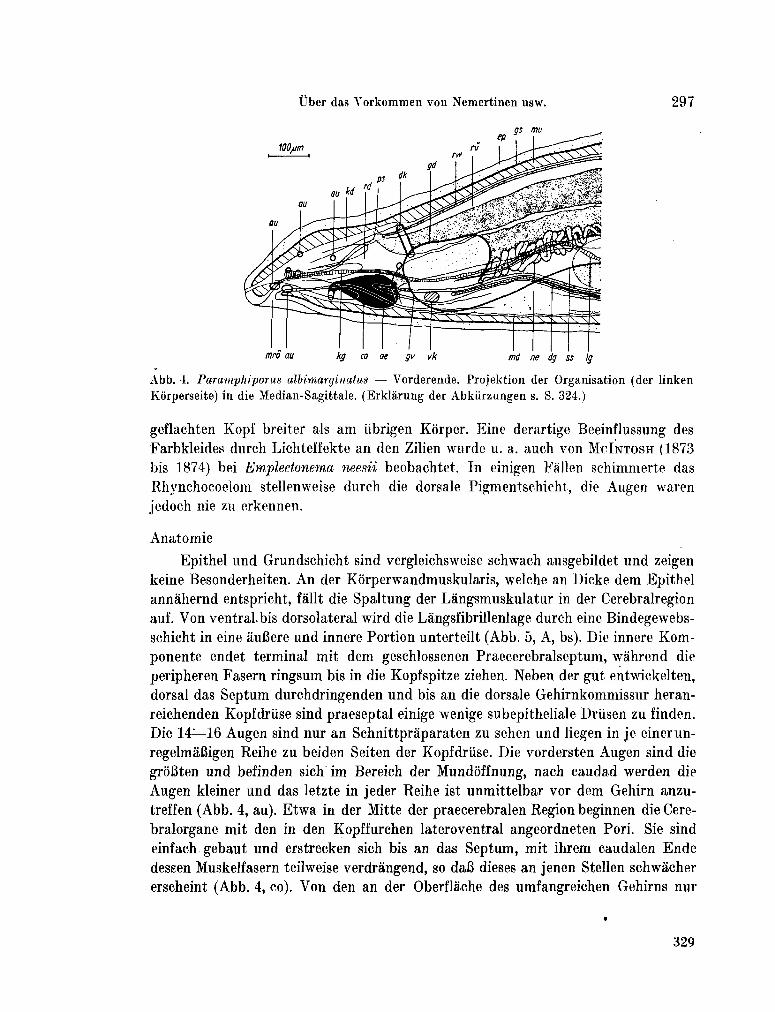
Über das V o r k o m m e n von Nemertinen usw.
gs mu
297
mro au co oe gv vk md ne dg ss Ig
A b b . 4. Paramphiporus albimarginatus — Vorderende. Projektion der Organisation (der linken
Kôrperseite) in die Median-Sagittale. (Erklàrung der Abkiirzungen s. S. 324.)
geflachten Kopí breiter ais a m übrigen Kórper. Eine derartige Beeinflussung des
Farbkleides durch Lichteffekte an den Zilien wurde u. a. auch von M C I N T O S H (1873
bis 1874) bei Emplectonema neesii beobachtet. In einigen Fallen schimmerte das
Rhynchocoelom stellenweise durch die dorsale Pigmentschieht, die Augen waren
jedoch nie zu erkennen.
Anatomie
Epithel und Grundschicht sind vergleichsweise schwach ausgebildet und zeigen
keine Besonderheiten. A n der Korperwandmuskularis, welche an Dicke dem Epithel
annáhernd entspricht, fàllt die Spaltung der Làngsmuskulatur in der Cerebralregion
auf. V o n ventralbis dorsolateral wird die Lángsfibrillenlage durch eine Bindegewebs-
schicht in eine àuBere und innere Portion unterteilt (Abb. 5, A , bs). Die innere K o m -
ponente endet terminal mit dem geschlossenen Praecerebralseptum, wahrend die
peripheren Fasern ringsum bis in die Kopfspitze ziehen. Neben der gut entwickelten,
dorsal das Septum durchdringenden und bis an die dorsale Gehirnkommissur heran-
reichenden Kopfdrüse sind praeseptal einige wenige subepitheliale Driisen zu finden.
Die 14—16 Augen sind nur an Schnittpràparaten zu sehen und liegen in je einerun-
regelmaBigen Eeihe zu beiden Seiten der Kopfdrüse. Die vordersten Augen sind die
groBten und befinden sich im Bereich der Mundóffnung, nach caudad werden die
Augen kleiner und das letzte in jeder Reihe ist unmittelbar vor dem Gehirn anzu-
treffen (Abb. 4, au). Etwa in der Mitte der praecerebralen Region beginnen die Cere-
bralorgane mit den in den Kopffurchen lateroventral angeordneten Pori. Sie sind
einfach gebaut und erstrecken sich bis an das Septum, mit ihrem caudalen Ende
dessen Muskelfasern teilweise verdràngend, so daB dieses an jenen Stellen schwàcher
erscheint (Abb. 4, co). Von den an der Oberflâche des umfangreichen Gehirns nur
329
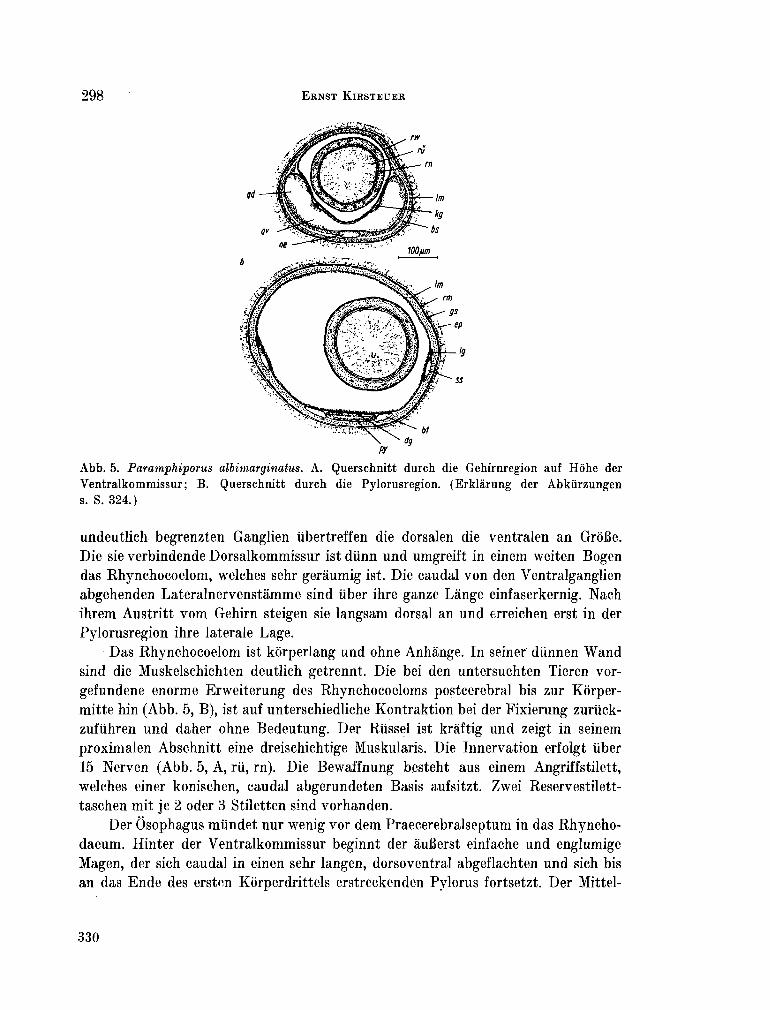
298 E R N S T K I R S T E U E B
Abb. 5. Paramphiporus albimarginatus. A . Querschnitt durch die Gehi'rnregion auf Hôhe der
Ventralkommissur; B . Querschnitt durch die Pylorusregion. (Erklárung der Abkiirzungen
s. S. 324.)
undeutlich begrenzten Ganglien iibertreffen die dorsalen die ventralen an Groiie.
Die sie verbindende Dorsalkommissur ist diinn und umgreift in einem weiten Bogen
das Rhynchocoelom, welches sehr geraumig ist. Die caudal von den Ventralganglien
abgehenden Lateralnervenstamme sind über ihre ganze Lánge einfaserkernig. Nach
ihrem Austritt v o m Gehirn steigen sie langsam dorsal an und erreichen erst in der
Pylorusregion ihre latérale Lage.
Das Rhynchocoelom ist kôrperlang und ohne Anhànge. In seiner diinnen W a n d
sind die Muskelschichten deutlich getrennt. Die bei den untersuchten Tieren vor-
gefundene enorme Erweiterung des Rhynchocoeloms postcerebral bis zur Korper-
mitte hin (Abb. 5, B ) , ist auf unterschiedliche Kontraktion bei der Fixierung zuriick-
zuführen ünd daher ohne Bedeutung. Der Riissel ist kràftig und zeigt in seinem
proximalen Abschnitt eine dreischichtige Muskularis. Die Innervation erfolgt über
15 Nerven (Abb. 5, A , rii, rn). Die Bewaffnung besteht aus einem Angriffstilett,
welches einer konischen, caudal abgerundeten Basis aufsitzt. Zwei Reservestilett-
taschen mit je 2 oder 3 Stiletten sind vorhanden.
Der Osophagus miindet nur wenig vor dem Praecerebralseptum in das Rhyncho-
daeum. Hinter der Ventralkommissur beginnt der auBerst einfache und englumige
Magen, der sich caudal in einen sehr langen, dorsoventral abgeflachten und sich bis
an das Ende des ersten Kórperdrittels erstreckenden Pylorus fortsetzt. Der Mittel-
330
Über das Vorkommen von Nemertinen usw. 299
darmblindsack ist mit einer Lange von rund 25 /u, bemerkenswert kurz und die beiden
von ihm abgehenden Blindsacktaschen reichen, neben dem Pylorus verlaufend, nur
über 240 ¡i terminad (Abb. 5, B , bt, py). Seichte, kaum über das dorsale Darmniveau
aufsteigende Mitteldarmtaschen treten erst in der caudalen Hálfte des Korpers auf.
Die sich über der Mund-Rüsseloffnung verbindenden KopfgefaBe sind nach
Durchlaufen des Gehirnringes ais LateralgefáBe weiter zu verfolgen. Das Dqrsal-
gefáB, welches keine Rhynchocoelombeziehung zeigt, nimmt seinen Abgang vom
rechten LateralgefaB.
' Die Exkretionsorgane liegen dorsolateral von den Seitennervenstammen und
reichen caudal bis in die Pylorusregion hinein. Terminal kommen sie bis an das Ge-
hirn heran, wo sie durch je einen, vor Eintritt in das Epithel leicht blasig erweiterten
Ableitungskanal lateral ausmünden (Abb. 4, ne). Die Gonaden sind bei den vor-
liegenden Exemplaren der Art nicht ausgebildet.
Verbreitung
Indo-westpazifischer R a u m : Madagaskar (Tanikely) [Mozambique-Kanal].
Verteilung
Mit 69 registrierten Individúen záhlt Paramphiporus albimarginatus zu den
háufigsten Arten im untersuchten Riffgebiet. Die Art schien in alien Proben von
Acropora pharaonis und Acropora corymbosa auf (jeweil 100% Frequenz), wobei sich
auf ersterer eine Dominanz von 21,8 % , auf letzterer von 23,9 % ergab. Auf Seriato-
pora angulata wurde die Art mit einer Frequenz von 77,8 % bei eine Dominanz von
15,6% vorgefunden.
Africanemertes S T I A S N Y - W I J N H O F F 1942
Die Gattung Africanemertes wurde von S T I A S N Y - W I J N H O F F für eine, selbst im
fixierten Zustand noch an Tetrastemma erinnernde Nemertine von der westafrika-
nischen Küste errichtet. Die aus der sehr sorgfaltigen Beschreibung der Typusart,
Africanemertes swakopmundi, ersichtlichen und von S T I A S N Y - W I J N H O F F (1942, p. 188)
zum Teil zur Gattungsdiagnose zusammengefaBten anatomischen Charakteristika
sind: Rhynchodaeum mündet in den Ôsophagus; vom Normalen abweichende Mus-
kulatur in der Kopfspitze (horizontale Muskelplatte und den Osophagus begleitende
Langsmuskulatur) ; geschlossenes Praecerebralseptum ; eigenartiger Ursprung der
Seitennervenstamme vom Gehirn; Cerebral organe in der Kopfspitze; Vorderteil des
Rüssels schwach und mit nur zweischichtiger Muskularis; Rüsselnerven bilden eine
zusammenhangende Schicht; Pylorus und Mitteldarmblindsack fehlen; zwei bis über
das Gehirn reichende Mitteldarmtaschen; LàngsgefàBe bilden Schlingen.
Neben Africanemertes swakopmundi, der bisher einzigen Art des Genus, kann
nun eine weitere Art gestellt werden, welche meinem Freund und Expeditions-
gefâhrten Dr. K L A U S R Ü T Z L E R gewidmet sei.
331
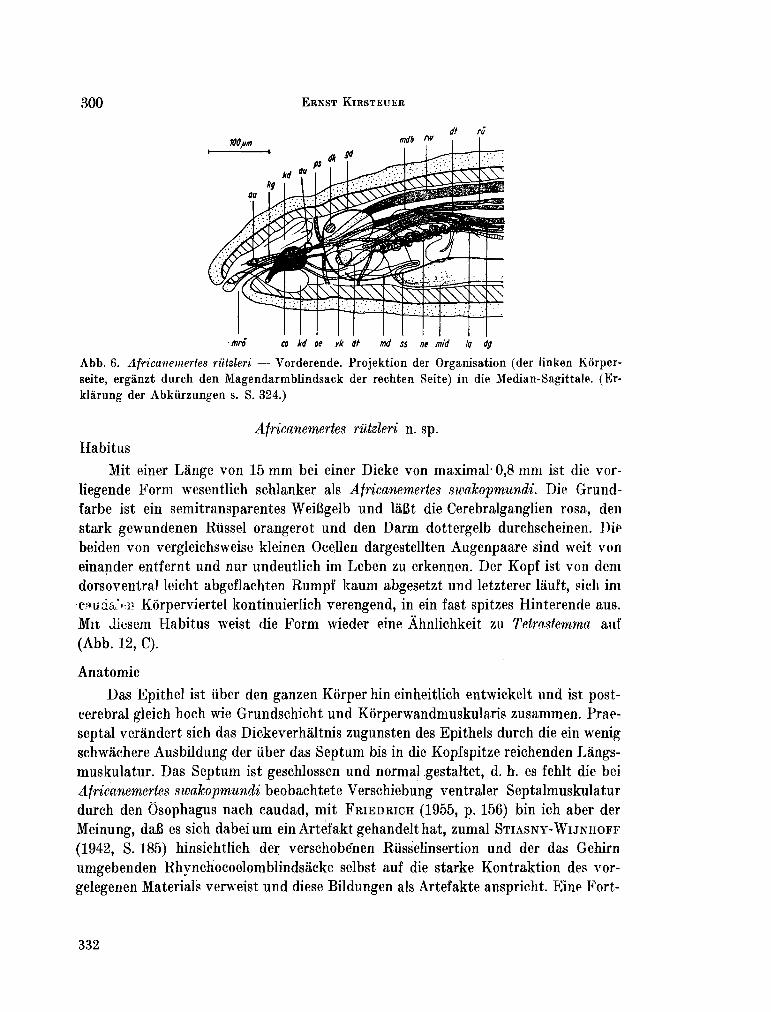
300 ERNST KIRSTEUER
dt ñ
mro co kd w vk dt md ss ne mid Iq dg
A b b . 6. Africanemertes riitzleri — Vorderende. Projektion der Organisation (der linken Kiirper-
seite, ergànzt durch den Magendarmblindsack der rechten Seite) in die Median-Sagittale. (Er-
klârung der Abkiirzungen s. S. 324.)
Africanemertes riitzleri n. sp.
Habitus
Mit einer Lange von 15 m m bei einer Dicke von maximal- 0,8 m m ist die vor-
liegende Form wesentlich schlanker als Africanemertes swakopmundi. Die Grund-
farbe ist ein semitransparentes WeiBgelb und làBt die Cerebralganglien rosa, den
stark gewundenen Riissel orangerot und den D a r m dottergelb durchscheinen. Die
beiden von vergleichsweise kleinen Ocellen dargestellten Augenpaare sind weit von
einander entfernt und nur undeutlich im Lebeh zu erkennen. Der Kopf ist von dem
dorsovenlral leicht abgeflachten R u m p f kaum abgesetzt und letzterer làuft, sich im
•CfluáaNí? Korperviertel kontinuierlich verengend, in ein fast spitzes Hinterende aus.
M n diesem Habitus weist die Form wieder eine Ahnlichkeit zu Teirastemma auf
(Abb. 12, C).
Anatomie
Das Epithel ist über den ganzen Kôrper hin einheitlich entwickelt und ist post-
cerebral gleich hoch wie Grundschicht und Kôrperwandmuskularis zusammen. Prae-
septal veràndert sich das Dickeverháltnis zugunsten des Epithels durch die ein wenig
schwàchere Ausbildung der über das Septum bis in die Kopfspitze reichenden Làngs-
muskulatur. Das Septum ist geschlossen und normal gestaltet, d. h. es fehlt die bei
Africanemertes swakopmundi beobachtete Verschiebung ventraler Septalmuskulatur
durch den Osophagus nach caudad, mit F R I E D R I C H (1955, p. 156) bin ich aber der
Meinung, daB es sich dabei u m ein Artefakt gehandelt hat, zumal S T I A S N Y - W I J N H O F F
(1942, S. 185) hinsichtlich der verschobenen Rüsselinsertion und der das Gehirn
umgebenden Rhynchocoelomblindsàcke selbst auf die starke Kontraktion des vor-
gelegenen Materials verweist und diese Bildungen als Artefakte anspricht. Eine Fort-
332
Über das Vorkommen von Nemertinen usw. 301
setzung des Sphincter rhynchodaei in Form einer Horizontalmuskulatur ist auch im
vorliegendem Fall realisiert, kann aber nicht wie bei A. swakopmundi ais Muskel-
platte bezeichnet werden, da die Faserzüge eher locker angeordnet sind. Die Kopf-
drüse nimmt den groGten Teil der Kopfspitze ein und bedingt das fast vollstandige
Fehlen von Parenchym in dieser Region. Sie ist in drei Lappen gegliedert, von denen
der dorsomediane bis dicht an das Septum heranreicht. Subepitheliale Drüsen sind
in der Kopfregion in geringer Anzahl vorhanden.
Die kleinen Cerebralorgane liegen vor dem Gehirn (Abb. 6, co). Sie sind einfach
gebaut und besitzen wie bei Africanemertes swakopmundi kein eigenes Neurilemma,
im Gegensatz zur Situation bei letztgenannter Art führt aber der Cerebralkanal nicht
vertikal aufsteigend direkt in das Organ, sondern weicht nach Durchdringen der
Kórperwand caudad ab und verlâuft annàhernd horizontal im Organ. Die A u s m ü n -
dung der Cerebralorgane erfolgt in den kurzen Kopffurchen, die gleich hinter der
Mund-Rüsselóffnung ventral beginnen und über lateral etwa zwei Drittel des Kórper-
umfanges bedecken.
Das Gehirn liegt dem Praecerebralseptum zum Teil direkt auf. In seiner termi-
nalen Hàlfte zeigt es nur geringe Oberflàchendifferenzierung und stellt im Quer-
schnitt einen geschlossenen Ring dar, da sich sowohl die Ventral- ais auchDorsal-
ganglien median berühren und die Lange der Kommissuren auf Nuil reduziert ist. Der
Cerebralkomplex ist im vorliegenden Fall gróBer ais bei Africanemertes sioakop-
mundd, in der inneren Struktur und mit dem Abgang der Seitennervenstamme
v o m Gehirn sind jedoch weitgehende Übereinstimmungen gegeben. Die Lateral-
nerven entstehen nach Abtrennung der Fasermasse von den Dorsalganglien und
Abbiegen nach lateral mehr minder zwischen den Dorsal- und Ventralganglien,
durch Kontraktion kónnen diese Lageverhaltnisse aber kleinen Veranderungen unter-
worfen sein (Abb. 7, A ) . Postcerebral steigen die einfaserkernigen Seitenstámme
leicht dorsad an, senken sich dann aber rasch wieder auf ein lateroventrales Niveau.
Das Rhynchocoelom erstreckt sich über vier Fünftel des Kórpers. Seine W a n d
ist in der vorderen Hàlfte auffallend dick, was vor allem durch eine starke Làngs-
muskulatur verursacht wird. Der Rüssel hingegen m u 6 ais bemerkenswert schwach
bezeichnet werden, besonders im ersten Abschnitt des proximalen Zylinders ist er
sehr eng und hat auBer dem Epithel nur eine dünne zweischichtige Muskularis (Abb. 7,
A , B , rü). Die Rüsselnerven bilden eine zusammenhàngende Schicht, und erst in der
mittleren Mitteldarmregion, w o der Rüssel durch das Auftreten einer dritten Muskel-
lage an Dicke zunimmt, sind stellenweise die Nerven ais Verdickungen zu erkennen.
Insgesamt wurden 11 Rüsselnerven gezáhlt. Die Basis des Angriffstiletts ist tropfen-
fôrmig und ungefáhr gleich lang wie die 20(i langen Reservestilette, welche zu je
zweien in den beiden Reservestilettaschen eingelagert sind.
Der 9,n die subterminal gelegene.Mundôffnung anschlieBende Vorderdarm ist in
Ôsophagus und Magen gegliedert. Wie bei Africanemertes swakopmundi ist kein
333
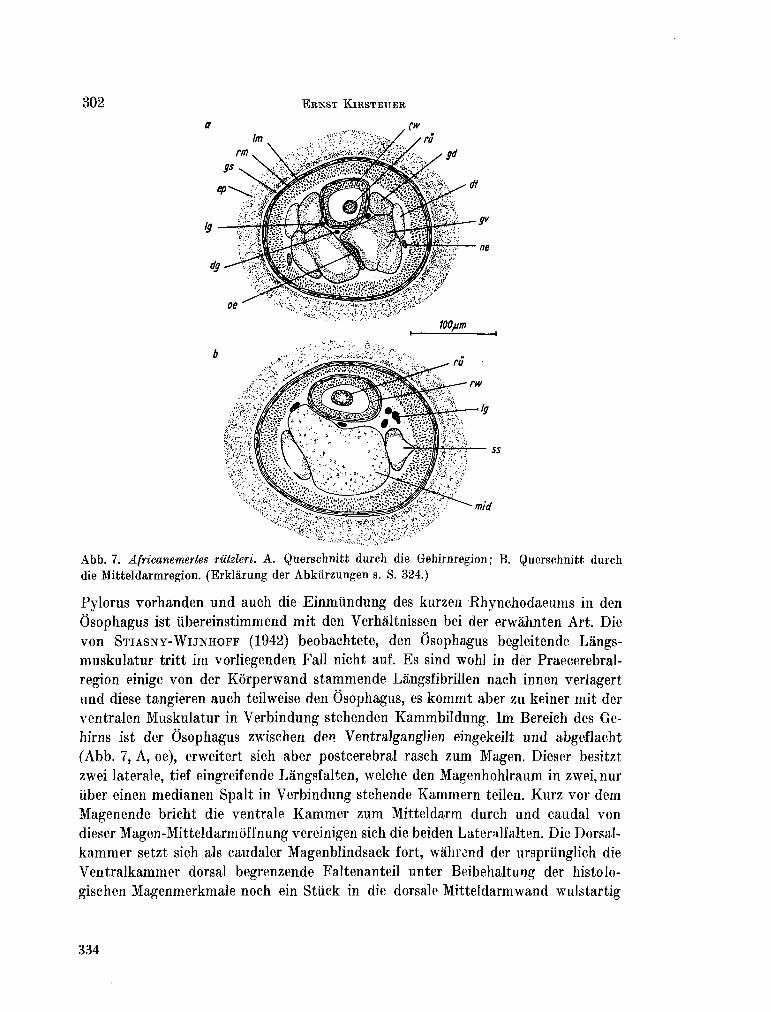
302 ERNST KIRSTEUER
100pm
A b b . 7. Africanemertes rützleri. A . Querschnitt durch die Gehiniregion; B . Querschnitt durch die Mitteldarmregion. (Erklàrung der Abkiirzungen s. S. 324.)
Pylorus vorhanden und auch die Einmiindung des kurzen Rhynchodaeums in den
Ôsophagus ist übereinstimmend mit den Verhàltnissen bei der erwahnten Art. Die
von S T I A S N Y - W I J N H O F F (1942) beobachtete, den Ôsophagus begleitende Langs-
muskulatur tritt ira vorliegenden Fall nicht auf. Es sind wohl in der Praecerebral-
region einige von der Kórperwand stammende Langsfibrillen nach innen verlagert
und diese tangieren auch teilweise den Osophagus, es k o m m t aber zu keiner mit der
ventralen Muskulatur in Verbindung stehenden Kammbildung. Im Bereich des Ge-
hirns ist der Ôsophagus zwischen den Ventralganglien eingekeilt und abgeflacht
(Abb. 7, A , oe), erweitert sich aber postcerebral rasch zum Magen. Dieser besitzt
zwei latérale, tief eingreifende Langsfalten, welche den Magenhohlraum in zwei,nur
iiber einen medianen Spalt in Verbindung stehende K a m m e r n teilen. Kurz vor dem
Magenende bricht die ventrale K a m m e r zum Mitteldarm durch und caudal von
dieser Magen-Mitteldarmóffnung vereinigen sich die beiden Lateralfalten. Die Dorsal-
k a m m e r setzt sich als caudaler Magenblindsack fort, wàhrend der urspriinglich die
Ventralkammer dorsal begrenzende Faltenanteil unter Beibehaltung der histolo-
gischen Magenmerkmale noch ein Stuck in die dorsale Mitteldarmwand wulstartig
334
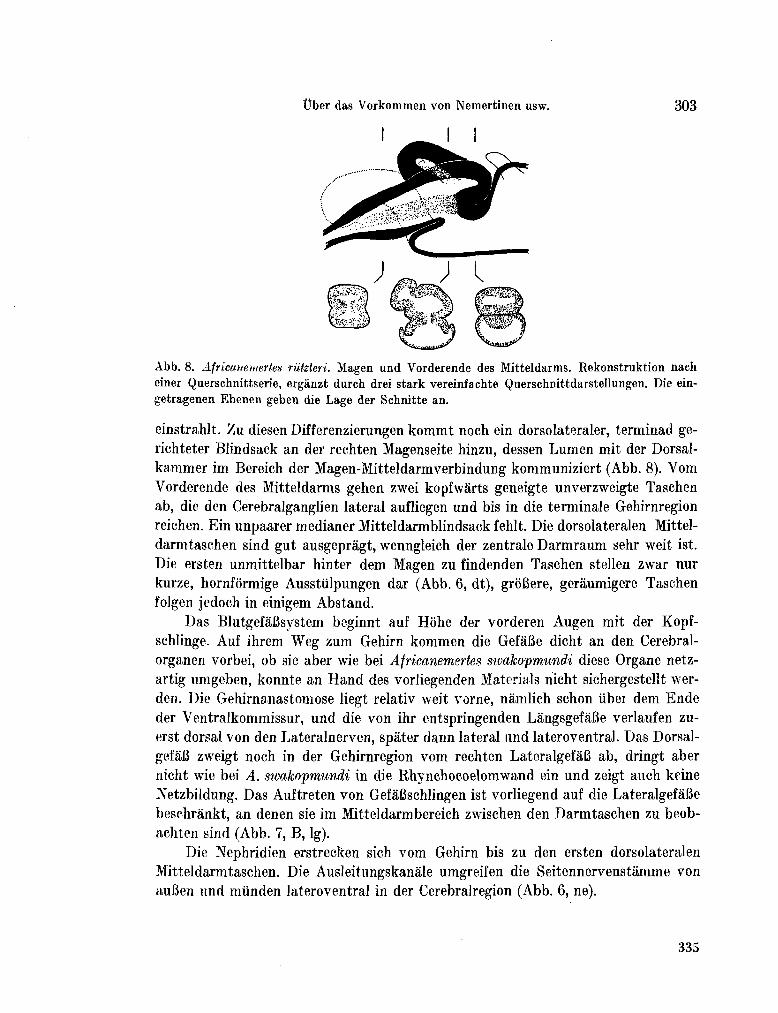
Über das Vorkommen von Nemertinen usw.
A b b . 8. Afrieanemertes rützleri. Magen und Vorderende des Mitteldarms. Rekonstruktion nach einer Querschnittserie, erganzt durch drei stark vereinfachte Querschnittdarstellungen. Die ein-getragenen Ebenen geben die Lage der Schnitte an.
einstrahlt. Zu diesen Differenzierungen k o m m t noch ein dorsolateraler, terminad ge-richteter Blindsack an der rechten Magenseite hinzu, dessen L u m e n mit der Dorsal-kammer im Bereich der Magen-Mitteldarmverbindung kommuniziert (Abb. 8). V o m Vorderende des Mitteldarms gehen zwei kopfwárts geneigte unverzweigte Taschen ab, die den Cerebralganglien lateral aufliegen und bis in die terminale Geliirnregion reichen. Ein unpaarer medianer Mitteldarmblindsack fehlt. Die dorsolateralen Mittel-darmtaschen sind gut ausgepràgt, wenngleich der zentrale Darmraum sehr weit ist. Die ersten unmittelbar hinter dem Magen zu findenden Taschen stellen zwar nur kurze, hornfórmige Ausstülpungen dar (Abb. 6, dt), grôBere, geraumigere Taschen folgen jedoch in einigem Abstand.
Das BlutgefaBsystem beginnt auf Hohe der vorderen Augen mit der Kopf-schlinge. Auf ihrem W e g zum Gehirn k o m m e n die GefáBe dicht an den Cerebral-organ en vorbei, ob sie aber wie bei Afrieanemertes sivakopmundi diese Organe netz-artig umgeben, konnte an Hand des vorliegenden Materials nicht sichergestellt wer-den. Die Gehirnanastomose liegt relativ weit vorne, námlich schon über dem Ende der Ventralkonimissur, und die von ihr entspringenden LângsgefàBe verlaufen zu-erst dorsal von den Lateralnerven, spater dann lateral und lateroventral. Das Dorsal-gefáB zweigt noch in der Gehirnregion v o m rechten LateralgefaB ab, dringt aber nicht wie bei A. swakopmundi in die Rhynchocoelomwand ein und zeigt auch keine Netzbildung. Das Auftreten von GefáBschlingen ist vorliegend auf die LateralgefàBe beschrànkt, an denen sie im Mitteldarmbereich zwischen den Darmtaschen zu beob-achten sind (Abb. 7, B , Ig).
Die Nephridien erstrecken sich v o m Gehirn bis zu den ersten dorsolateralen Mitteldarmtaschen. Die Ausleitungskanàle umgreifen die Seitennervenstàmme von auBen und münden lateroventral in der Cerebralregion (Abb. 6, ne).
335
304 ERNST KIRSTEUER
Die Gonaden sind iiber die beiden caudal en Korperdrittel verteilt und stellen
unregelmaBig aber durchweg dorsal von den Seitenstammen angeordnete Ovarien
dar, welche die Darmtaschen oft weitgehend verdrangen.
Auf Grund der angeführten Merkmale kann die zur Rede stehende Form in das
Genus Africanemertes eingereiht werden und unterscbeidet sich von der Typusart
A. swakopmundi durch folgende Gegebenheiten : Es sind nur vier Augen vorhanden ;
die Cerebralorgane liegen horizontal in der Kopfspitze ; die Riisselinnervation erfolgt
iiber 11 Nerven; es fehlen die bei A. swakopmundi den Ôsophagus begleitenden Làngs-
muskelkàmme, ebenso fehlt ein ventraler Magenblindsack, hingegen ist ein caudaler
und dorsolateral Blindsack a m Magen ausgebildet; die zumGehirn ziehenden Mittel-
darmtaschen sind unverzweigt; das DorsalgefaB zeigt keine Rhynchocoelombeziehung
und auch keine Tendenzen zu Netzbildungen.
Verbreitung
Indo-westpazifischer R a u m : Madagaskar (Tanikely) [Mozambique-Kanal].
Verteilung
Africanemertes riltzleri wurde nur auf Acropora pharaonts mit einer Frequenz
von 1 0 % bei einer Dominanz von 0 ,7% angetroffen und zàhlt damit zu den selten-
sten Arten im Untersuchungsgebiet.
Nemertellina F R I E D R I C H 1935
Die seit 1935 bekannt gewordenen drei Vertreter der Gattung, Nemertellina
oculata, N. canea und N. minuta sind kleine schlanke Formen, die durch den Besitz
von vier Augen einige Âhnlichkeit mit Tetrastemma-Arten zeigen. Als wichtigste
anatomische Gattungsmerkmale haben zu gelten die Lage der Cerebralorgane in der
Kopf spitze; das gesehlossene Praecerebralseptum ; das kurze, zwischen Korpermitte
und Beginn des letzten Kôrperdrittels endende Rhynchocoelom ; ein unpaarer taschen-
loser Mitteldarmblindsack ; die Einfaserkernigkeit der Lateralnervenstamme sowie
das nur bei dieser Gattung der Hoplonemertini bisher festgestellte Querseptum im
Bereich des caudalen Rhynchocoelomendes, gebildet durch Ringmuskelfasern der
Rhynchocoelomwand.
Die hier zu behandelnde Form war zufolge der inneren Organisationsverhalt-
nisse in keine andere Gattung einzureihen, kann aber auch nur mit einem gewissen
Vorbehalt Nemertellina zugeordnet werden, da sich das erwahnte Querseptum nicht
genau erkennen lafit, Leider ist das vorhandene Material auf ein Individuum be-
schrànkt, welches sich bei der Fixierung trotz ' vorangegangener Betàubung mit
Urethanum in zwei Teile autotornisierte. Der die Gonaden fiihrende hintere Korper-
halfte abtrennende Bruch erfolgte im Endbereich des Rhynchocoeloms, dort w o das
Septum zu erwarten ware. Wenngleich zu beiden Seiten der Bruchstelle einige den
336
Über das Vorkommen von Nemertinen usw. 305
Kôrper durchsetzende Ringmuskelfasern zu finden sind, ist es nun nachtràglich nicht
sicherzustellen, ob sie ais Reste des Septums angesprochen werden kónnen. Sollte
sich an H a n d von weiterem Material die vorliegende Form als einwandfrei zu Nemer
tellina gehorig erweisen (abgesehen von der Unsicherheit hinsichtlich des Septums
sprechen alie Merkmaledafür), so ware die Lage der Trennlinie eine Stütze fiir die von
F R I E D R I C H (1935 b, S. 322) geàuBerte Vermutung, wonach das Septum der Nemer-
tellina-Arten eine praeformierte Bruchstelle sein konnte.
Nemertellina tropica n. sp.
Habitus
Das Tier ist 3 m m lang und 0,3 m m dick. Die einheitliche weiBe, mit einem
schwachen gelblichen Ton versehene Grundfarbe des Kôrpers wird durch das Durch-
schimmern desgrauen Darmes und der hell organgegelben Ovarien unterbrochen. Eine
besondere Zeichung fehlt. Der Korper ist nur wenig dorsoventral abgeflacht, der
Kopf v o m R u m p f nicht abgesetzt und das Hinterende des Kôrpers stumpf abge-
rundet. Die vier Augen sind in einem Trapez angeordnet, die vorderen sind einander
naher als die hinteren und der Abstand der beiden Augenpaare zueinander ist wie bei
Nemertellina minuta relativ groB. Auffallend wàhrend der Lebendbeobachtung war
die unregelmâBige Oberflàche des Tieres, verursacht durch Epithelwiilste und Hôcker,
die auch beim Kriechen erhalten blieben (Abb. 12, B ) .
Anatomie
Das Kórperepithel übertrifft fast durchweg die Muskularis an Dicke. Die stellen-
weise auftretenden Wülste sind Überwachsungen, die im Quersclmitt (Abb. 10, ev)
ein annàhernd gleiches Bild ergeben wie bei Tetrastemma pinnatum ( I W A T A 1954a),
nur daB im vorliegendem Fall die Grundschicht nicht in diese Verdickungen ein-
strahlt. Beide Komponenten der Korperwandmuskulatur reichen bis in die Kopf-
spitze, die Lángsmuskulatur wird jedoch durch Abgabe von Faserzügen zur Bildung
des geschlossenen Praecerebralseptums etwas schwacher. In das Parenchym der
Kopfspitze eingesenkte Retraktoren sind vorhanden. Die Kopfdriise ist klein und be-
steht nur aus einem dorsomedianen Drüsenbündel, welches noch vor dem Praecere-
bralseptum endet (Abb. 9, kd). Die Cerebralorgane liegen vor dem Gehirn in der
Kopfspitze. Sie beginnen auf Hohe der vorderen Augen mit einem ventrolateral
Porus, welcher sich a m oberen Ende einer histologisch nicht als Kopffurche gekenn-
zeichneten Eintellung befindet. Das caudale Ende der Organe folgt bald nach dem
hinteren Augenpaar (Abb. 9, co).
Die Abgrenzung der Ganglien zueinander ist an der Oberflàche des Gehirns nicht
stark ausgeprágt. Dorsal- und Ventralganglien sind annàhernd gleich groB, die ven
trale Kommissur aber wesentlich kiirzer und dicker als die dorsale. Die caudal von
den Ventralganglien abgehenden Lateralnervenstámme führen nur einen Faserkern.
337
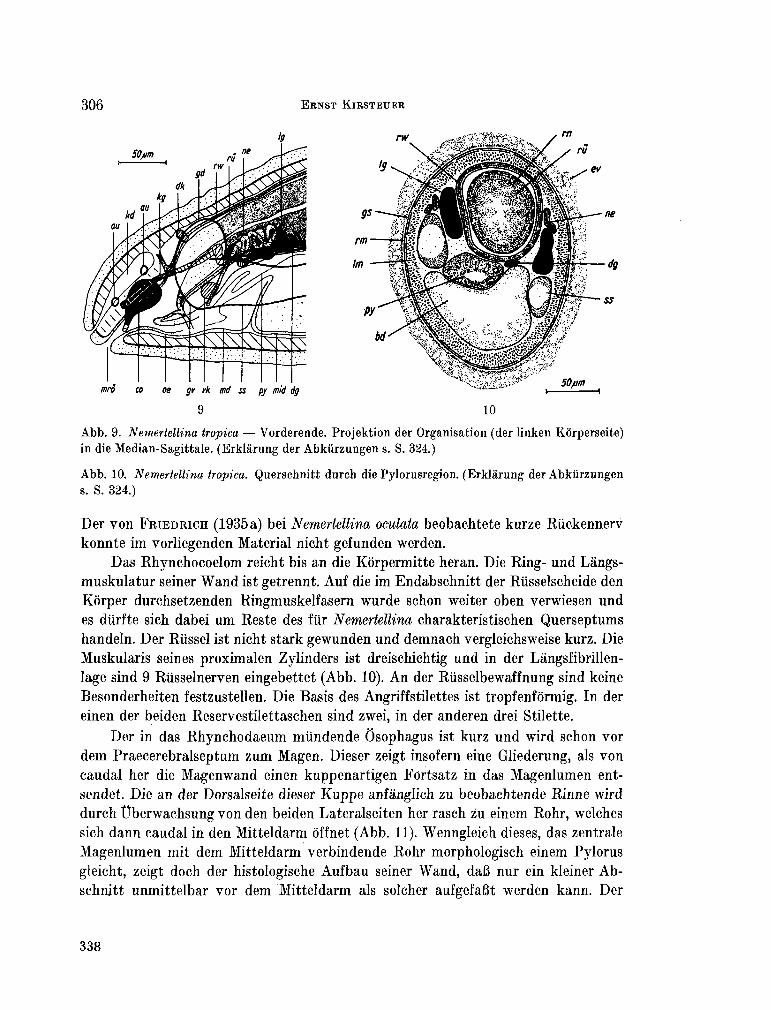
306 ERNST KIRSTEUER
• j • , . JVJUIII
mro co oe gv vk ma ss py mid dg ~ i 1
9 10
A b b . 9. Nemertellina tropica — Vorderende. Projektion der Organisation (der linken Kôrperseite)
in die Median-Sagittale. (Erklárung der Abkürzungen s. S. 324.)
A b b . 10. Nemertellina tropica. Querschnitt durch die Pylorusregion. (Erklárung der Abkürzungen s. S. 324.)
Der von F R I E D R I C H (1935a) bei Nemertellina oculata beobachtete kurze Rückennerv
konnte im vorliegenden Material nicht gefunden werden.
Das Rhynchocoelom reicht bis an die Korpermitte heran. Die Ring- und Langs-
muskulatur seiner W a n d ist getrennt. Auf die im Endabschnitt der Riisselscheide den
Korper durchsetzenden Ringmuskelfasern wurde schon weiter oben verwiesen und
es dürfte sich dabei u m Reste des für Nemertellina charakteristischen Querseptums
handeln. Der Rüssel ist nicht stark gewunden und demnach vergleichsweise kurz. Die
Muskularis seines proximalen Zylinders ist dreischichtig und in der Langsfibrillen-
lage sind 9 Rüsselnerven eingebettet (Abb. 10). A n der Riisselbewaffnung sind keine
Besonderheiten festzustellen. Die Basis des Angriffstilettes ist tropfenformig. In der
einen der beiden Reservestilettaschen sind zwei, in der anderen drei Stilette.
Der in das Rhynchodaeum miindende Osophagus ist kurz und wird schon vor
dem Praecerebralseptum zum Magen. Dieser zeigt insofern eine Gliederung, als von
caudal her die Magenwand einen kuppenartigen Fórtsatz in das Magenlumen ent-
sendet. Die an der Dorsalseite dieser Kuppe anfanglich zu beobachtende Rinne wird
durch Überwachsung von den beiden Lateralseiten her rasch zu einem Rohr, welches
sich dann caudal in den Mitteldarm ôffnet (Abb. 11). Wenngleich dieses, das zentrale
Magenlumen mit dem Mitteldarm verbindende Rohr morphologisch einem Pylorus
gleicht, zeigt doch der histologische Aufbau seiner W a n d , daB nur ein kleiner A b -
schnitt unmittelbar vor dem Mitteldarm als solcher aufgefaBt werden kann. Der
338

Über das V o r k o m m e n von Nemertinen usw. 307
Mitteldarm reicht nur wenig über die Pyloruseinmündung terminad (Abb. 9, m d )
und es sind keine Taschen an diesem kurzen Blindsack ausgebildet. Die nicht sehr
zahlreich auftretenden Taschen a m Mitteldarm sind seicht und liegen, sich k a u m über
die Seitennervenstámme dorsad erhebend, dem D a r m eng an.
Die beiden in der Nàhe des vorderen Augenpaares sich verbindenden Kopf-
gefáBe bilden keine Cerebralanastomose und setzen sich caudad ais LateralgefaBe
fort. Das nicht in die Rhynchocoelomwand eintretende DorsalgefáB zweigt v o m
linken LateralgefáB ab. Auffallend sind die starken Erweiterungen der SeitengefàBe
im Bereich zwischen ventraler Gehirnkommissur und Mitteldarmbeginn (Abb. 9, 10,
lg), w o auch der Exkretionsapparat gelegen ist, dessen Nephridialkanale stellenweise
die BlutgefàBe tangieren (Abb. 9, 10, ne).
Die Ovarien des geschlechtsreifen Tieres befinden sich in der caudalen Kôrper-
hàlfte und liegen nur dorsal von den Seitennerven.
11 12
A b b . 11. Nemertellina tropica. Magen und Mitteldarmblindsack. Rekonstruktion nach einer Quer-schnittserie, ergànzt durch zwei stark vereinfachte Querschnittdarstellungen. Die eingetragenen Ebenen geben die Lage der Schnitte an.
A b b . 12. A . Paramphiporus albimarginatus. Habitus von dorsal; B . Nemertellitm tropica. Habitus von dorsal; C . Africanemertes riitzleri. Habitus von dorsal; D . Nemeries rubrolineala. Habitus grôfitenteils von dorsal.
20 Zool. Jb. Syet. Bd. 92
339
308 ERNST KIRSTEUEK
Verbreitung
Indo-westpazifischer R a u m : Madagaskar (Tanikely) [Mozambique-Kanal].
Verteilung
Wàhrend der Aufsammlungen wurde Nemertellina tropica lediglich auf Acropora
pharaonis gefunden. Die sich fiir die Art ergebende Prequenz betragt 10%, die Domi-
nanz 0,7%.
Tetrastemma E H R E N B E R G 1831 (sensu FRIEDRICH 1955)
Áhnlich wie bei der Gattung Amphiporus wurde durch F R I E D R I C H (1955) auch
bei Tetrastemma mehr Klarheit durch Umstellung einiger Arten und Ausbau der Gat-
tungsdiagnose geschaffen. Es verblieben allerdings noch viele Arten im Genus, die
urspriinglich grôBtenteils nur auf Grund des Habitus eingereiht wurden und deren
unzureichend bekannt gewordene anatomische Gegebenheiten zur Zeit keine Ent-
scheidung über ihre systematische Stellung erlauben. Zu Tetrastemma sensu F R I E D
RICH gehoren kleine, schlanke, meist vieràugige Formen, deren anhangloses Rhyncho-
coelom korperlang ist, bei denen der Osophagus in das Rhynchodaeum miindet und
der Mitteldarmblindsack zwei terminad gerichtete Taschen besitzt. Weiter ist bei
Tetrastemma-Arten die Ring- und Langsmuskulatur bis in die Kopfspitze hinein aus-
gebildet und das Praecerebralspektrum geschlossen. Die Cerebralorgane liegen vor
oder in der Gehirnregion und die Seitennervenstamme sind einfaserkernig.
Tetrastemma melanocephalum ( J O H N S T O N )
T. m. VANSTONE & B E A U M O N T 1894 P. m. MONASTERO 1930
T. m. B E A U M O N T 1895 (part) P. melanocephala FRIEDRICH 1935b T. m. B U R G E R 1895 P. melanocephalum, ders. 1936 T. m. B E R G E N D A L 1903 Testrastemma m . G O N T C H A R O F F 1955 Prostoma m. B U R G E R 1904 T. m. B É N A R D 1960 P. m. W I J N H O F F 1912 T. m. K I R S T E U E R 1963
P. m. S O U T H E R N 1913
(Angaben altérer Literatur finden sieh bei B U R G E R 1895 und 1904.)
Habitus
Die beobachteten Tiere entsprechen in der Farbung jenen von W I J N H O F F (1912)
in der Umgebung von Plymouth aufgesammelten Individúen. Das Gelb der Dorsal-
seite zeigt einen zarten orangen Anflug und làBt teilweise den Rüssel, die Darm-
taschen und die Gonaden dunkel durchscheinen. Die Ventralseite als auch die Ran-
der des stark abgesetzten Kopfes sind weiBgelb. Der dunkelbraune Pigmentfleck am
Kopf stimmt in Form und Anordnung mit dem bei adriatischen Vertretern der Art
vorgefundenen überein ( K I R S T E U E R 1963). Er überlagert fast vollstandig das vordere
Augenpaar, reicht aber caudal nicht bis an die hinteren Augen heran. Vor dem Pig-
340
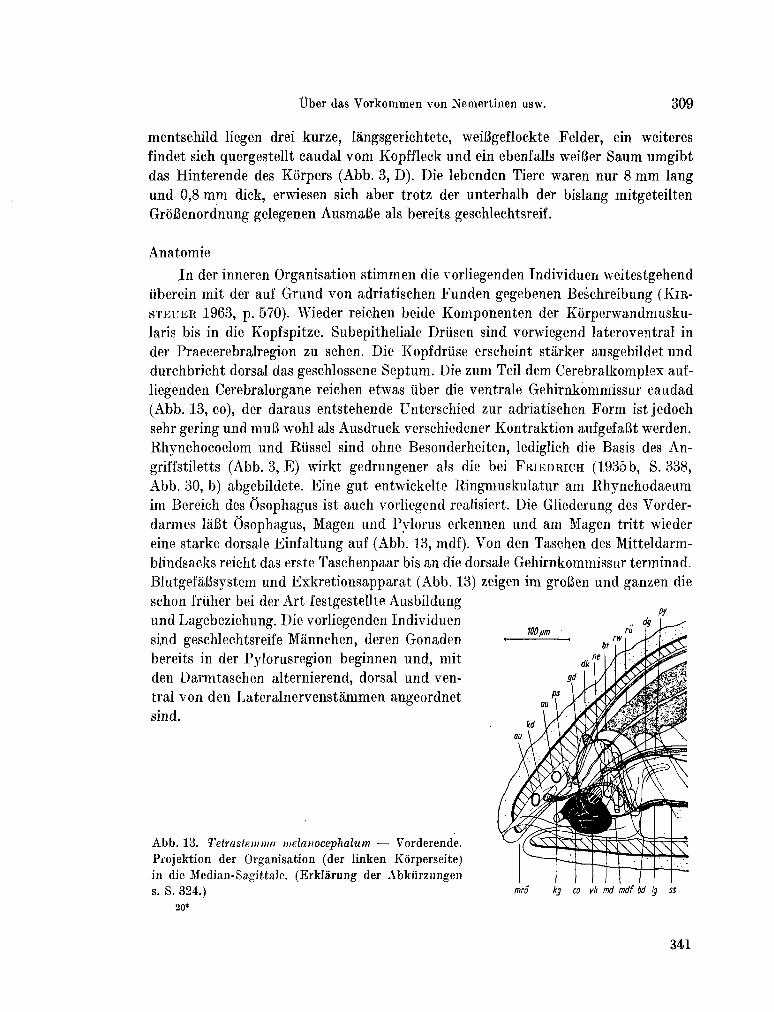
Über das Vorkommen von Nemertinen usw. 309
mentschild liegen drei kurze, langsgerichtete, weiBgeflockte Felder, ein weiteres
findet sich quergestellt caudal v o m Kopffleck und ein ebenfalls weiBer Saum umgibt
das Hinterende des Kórpers (Abb. 3, D ) . Die lebenden Tiere waren nur 8 m m lang
und 0,8 m m dick, erwiesen sich aber trotz der unterhalb der bislang mitgeteilten
GrôBenordnung gelegenen AusmaBe ais bereits geschlechtsreif.
Anatomie
In der inneren Organisation stimmen die vorliegenden Individúen weitestgehend
überein mit der auf Grund von adriatischen Funden gegebenen Beschreibung ( K I R -
S T E U E R 1963, p. 570). Wieder reichen beide Komponenten der Kôrperwandmusku-
laris bis in die Kopfspitze. Subepithelial Drüsen sind vorwiegend lateroventral in
der Praecerebralregion zu sehen. Die Kopfdrüse erscheint starker ausgebildet und
durchbricht dorsal das geschlossene Septum. Die zum Teil dem Cerebralkomplex auf-
liegenden Cerebralorgane reichen etwas über die ventrale Gehirnkommissur caudad
(Abb. 13, co), der daraus entstehende Unterschied zur adriatischen Form ist jedoch
sehr gering und m u B wohl als Ausdruck verschiedener Kontraktion aufgefaBt werden.
Rhynchocoelom und Riissel sind ohne Besonderheiten, lediglich die Basis des A n -
griffstiletts (Abb. 3, E ) wirkt gedrungener als die bei F R I E D R I C H (1935 b, S. 338,
A b b . 30, b) abgebildete. Fine gut entwickelte Ringmuskulatur a m Rhynchodaeum
im Bereich des Ôsophagus ist auch vorliegend realisiert. Die Gliederung des Vorder-
darmes làBt Osophagus, Magen und Pylorus erkennen und a m Magen tritt wieder
eine starke dorsale Einfaltung auf (Abb. 13, mdf). V o n den Taschen des Mitteldarm-
blindsacks reicht das erste Taschenpaar bis an die dorsale Gehirnkommissur terminad.
BlutgefâBsystem und Exkretionsapparat (Abb. 13) zeigen im groBen und ganzen die
schon friiher bei der Art festgestellte Ausbildung
und Lagebeziehung. Die vorliegenden Individúen
sind geschlechtsreife Mánnchen, deren Gonaden
bereits in der Pylorusregion beginnen und, mit
den Darmtaschen alternierend, dorsal und ven
tral von den Lateralnervenstámmen angeordnet
sind.
A b b . 13. Tetrastemma melanocephalum. — Vorderende. Projektion der Organisation (der linken Kôrperseite)
in die Median-Sagittaie. (Erklarung der Abkiirzungen
s. S. 324.)
20*
mn kg co yk md mdf bd Ig ss
341
310 ERNST KIRSTEUER
Verbreitung
Eine Zusammenstellung der bisher nur aus dem Atlantik und Mittelmeerraum
gemeldeten Fundorte ist bei K I R S T E U E R (1963, S. 571) gegeben. Zu ergànzen ist diese
Übersicht mit
Indo-westpazifiseher R a u m : Madagaskar (Tanikely) [Mozambique-Kanal].
Verteilung
Bislang wurde die Art vornehmlich in gezeitennahen Bereichen gefuhden, ihre
bathymetrische Verteilung ist jedoch bis zu 60 m Tiefe nachgewiesen. Bei der Sub-
stratwahl werden offensichtlich seichte Phytalbestànde wie Ulva, Cystoma und
Zostera bevorzugt. Ein Vorkommen auf Sand und zwischen Steinen ist nur zweimal
in der Literatur vermerkt.
Das Aufscheinen von Tetrastemma melanoeephalum auf Korallenstocken im
Untersuchungsgebiet schlieBt sich, was den Substratcharakter betrifft, an das Vor
k o m m e n der Art auf Corallina officinalis und Lithophyllum incrustans an, indem es
sich u m Besiedlung von durch Organismenverkalkung zustandegekommene feste
Lückenraumsysteme handelt. Auf Pontes nigrescens war die Ar.t mit einer Frequenz
von 5 0 % bei einer Dominanz von 7 ,7% vertreten. Auf Seriatopora angulata betrug
die Frequenz 11,1% und die Dominanz 0 ,7%.
Tetrastemma tanikelyensis n. sp.
Habitus
Die in den Probenprotokollen aufscheinenden Individúen dieser Art maBen
rund 25 m m in der Lange und maximal 1,5 m m in der Dicke. Der Korper wirkt etwas
gedrungen und ist dorsoventral leicht abgeflacht. Im Leben ist der Kopf deutlich
abgesetzt und bei kriechenden Tieren gewinnt m a n den Eindruck v o m Vorhanden-
sein zweier Kopffurchenpaare (Abb. 3, G ) , die Untersuchung der Schnittpráparate
ergibt jedoch nur einPaar Kopffurchen, welches dorsal zu den hinteren Augen zieht,
wahrend die andere beobachtete Einkerbung anscheinend eine den Kopf begrenzende
Faltenbildung darstellt, die bei der fixationsbedingten Kontraktion verloren geht
bzw. von weiteren auftretenden Falten nicht mehr unterscheidbar ist. Die sich von
der hellen orangegelben Grundfarbe abhebende Zeichnung beschrankt sich auf
einen dunkelbraunen Kopffleck, ein e m diesen vorgelagerten, nicht ganz terminad
reichenden weiBen Areal und locker verteilten ocker Schollen gegen das caudale
Kôrperende zu (Abb. 3, G ) . Von den inneren Organen schimmern die Cerebral-
ganglien rotlich und der Riissel stellenweise braun durch.
Die im vorliegendem Fall auftretende, die vorderen Augen überdeckende und
verbindende Pigmentbrücke macht es naheliegend, die Form mit jenen Arten des
Genus Tetrastemma in Beziehung zu bringen, bei denen àhnliche Pigmentanlage-
342
Über das Vorkommen von Nemertinen usw. 311
mngen gefunden wurden. Hierbei sind vor allem die sich habituell u m Tetrasternma
coronatum gruppierenden Arten Tetrasternma peltatum, T. melanocephalum, T. dia
dema und auch T. longissimum zu erwáhnen1). Eine vergleichende Betrachtung zeigt
wohl, daB UmriB und Lage des Kopffleckes nicht ganz mit der Situation bei den ge-
nannten Arten übereinstimmt, die auBerlichen Trennungsmerkmale aber keineswegs
markant sind und sich die Form leicht ais Varietát der einen oder anderen Species
auffassen lieBe. Nicht zuletzt wurde ja auch schon früher des ófteren versucht, einige
dieser Arten zu vereinigen ( J O U B I N 1890, 1894, E I C H E S 1893) und in neuerer Zeit
findet sich dieses Problem bei R I E D L (1959) und K I R S T E T J E R (1963) wieder aufge-
griffen, wobei gezeigt werden konnte, daB auf Grund von anatomischen Fakten die
Arten zu Recht bestehen. Es wird demnach auch für die zur Diskussion stehende
Form vorerst nur an Hand der inneren Organisation Klarheit hinsichtlich ihrer syste-
matischen Position zu erlangen sein. Neben den oben zitierten, hauptsachlich nord-
atlantischen und mediterranen Formen2) sind auch noch einige wenige indopazifische
Arten in den Vergleich einzuschlieBen, zumal aus tiergeographischen Erwagungen
eine Beziehung zur vorliegenden Form mit hôherer Wahrscheinlichkeit zu erwarten
ist. Es sind dies Tetrasternma verinigrum ( I W A T A 1954 a) mit deren Varietát T. v. var.
meridianum ( I W A T A 1954b), Formen, bei denen jedoch der Kopf nicht abgesetzt ist
und keine Kopffurchen auftreten, weiter Tetrasternma insolens ( I W A T A 1952) mit
zwei Paar Kopffurchen und Verdoppelung der hinteren Augen, Tetrasternma yamao-
kai ( I W A T A 1954 a) mit einem orangeroten Schild auf dem v o m R u m p f nicht abge-
setzten Kopf, der auch keine Kopffurchen zeigt, und Tetrasternma nigrifrons ( C O E
1904), von der bislang 7 Varietàten beschrieben wurden, wobei die von I W A T A (1954 a,
S. 30) gefundene T. n. var. punctata die meiste Âhnlichkeit mit der zu behandelnden
madagassischen Form zeigt. Die aus den Abbildungen bei C O E (1904) und I W A T A
(1954 a) ersichtliche enorme Variabilitátsbreite von Testrastemma nigrifrons macht
es unmóglich, dem Habitus in diesem R a h m e n eine artdifferenzialdiagnostische Be-
deutung beizumessen.
Anatomie
Das Epithel der Korperwand entspricht in seiner histologischen Struktur dem
bei Tetrasternma gemeiniglich vorgefundenen Typus und ist verglichen mit dem von
Testrastemma nigrifrons wesentlich schwàcher, da es durchschnittlich nur die Dicke
der Muskularis erreicht. Es liegt einer an Stárke der Ringfaserlage gleichkommenden
1) Tetrasternma nimbatum B U R G E R 1895, durch die braunrote Farbe des Rumpfes stark von der vorliegenden Form abweichend, aber doch auch eine schwarze Pigmentbinde zwischen den vorderen Augen aufweisend, kann hier nicht berücksichtigt werden, da die anatomischen Ge-gebenheiten ungenügend bekannt sind.
2) Nur für Testrastemma peltatum, T. coronatum und T. melanocephalum zeigen Einzel-funde ein Vorkommen auBerhalb des Hauptverbreitungsgebietes an.
343
312 ERNST KIRSTEUER
Grundschicht auf. Sowohl die Ring- als auch die Langsmuskelschicht reicht bis in
die Kopfspitze. Das von inneren Lagen der Làngsschicht gebildete Praecerebral-
septum ist geschlossen, wird aber von dorsalen Anteilen der groBen Kopfdriise durch-
drungen (Abb. 14, kd). Wie das Septum bei den erwàhnten indopazifischen Formen
gestaltet ist, lâBt sich nicht genau beurteilen, da es weder C O E noch I W A T A beschreibt,
allerdings vermerkt C O E (1904, S. 162) bei T. nigrifrons hinsichtlich des stark ent-
wickelten Kórperparenchyms, daB "this parenchyma extends forward into the head
in front of the brain", was aber vermutlich nur bei einem zumindest teilweise auf-
gelosten Septum moglich ware. Das in der Kopfregion auftretende Parenchym selbst,
bei den vorliegenden Individúen ist nur wenig vorhanden, bietet keine brauchbare
Vergleichsgrundlage, da es soweit angegeben, bei alien Tetrastemmen gefunden wurde,
die quantitativen Unterschiede v o m Ausbildungsgrad der Kopfdriise abhángig sind,
letzterer jedoch kein Artcharakteristikum darstellt. Wie Tetrastemma melanocephalum
und T. diadema hat die vorliegende Form subepitheliale Drüsen in der praecerebralen
Region. Die im Bereich des vorderen Augenpaares den Kopffleck hervorrufenden
dunkelbraunen Pigmentschollen sind subepithelial angeordnet und zeigen damit
gleiche Lageverhàltnisse wie bei T. coronatum und T. nigrifrons. Die Vierzahl der
Augen liefert keine Handhabe zur Artunterscheidung, da, abgesehen von dem U m -
stand, daB über die Verànderung der Augenzahl innerhalb einer Art wenig bekannt
ist, sowohl bei Tetrastemma insolens ( I W A T A 1952) ais auch gelegentlich bei Indivi
dúen von T. nigrifrons 6 Augen ausgebildet sind. Bei den sechsáugigen Tetrastemma
nigrifrons Exemplaren handelt es sich urn T. n. var. purpureum ( C O E 1904, Taf. 17,
Fig. 1), die nicht nur im Habitus T. insolens sehr àhnlich ist, sondern auch in alien
von I W A T A (1952) angefiihrten anatomischen Merkmalen mit dieser iibereinstimmt
und daher vorerst die Frage offen bleiben m u B , ob die beiden Formen nicht identisch
sind.
Die Cerebralorgane liegen grôBtenteils vor dem Septum. Sie beginnen latero-
ventral in den Kopffurchen und reichen mit ihrem caudalen Ende nocli etwas in die
Cerebralregion hinein (Abb. 14, co). Kleine Unterschiede ergeben sich daraus zu
Tetrastemma verinigrum, bei welcher sich die Cerebralorgane über die ganze Gehirn-
region erstrecken und. zu T. nigrifrons als auch T. insolens, w o sie in einer ihrem
eigenen Durchmesser gleichkommenden Distanz vor dem Gehirn liegen. Zu den
iibrigen in die Diskussion einbezogenen Arten sind die Abweichungen sehr gering
und ohne Bedeutung. Der Cerebralkomplex ist àhnlich dem von Tetrastemma diadema
wesentlich hoher als lang (Abb. 14, gd, gv) und làBt nach auBen hin keine Unter-
teilung in Ganglien erkennen. Die einfaserkernigen Seitennervenstàmme verlaufen
lateral im Korper.
Das von einer diinnen Ring- und Lángsmuskellage umscheidete Rhynchocoelom
reicht bis an das caudale Kôrperende heran. I m Gegensatz zu Tetrastemma peltatum,
T. melanocephalum sowie T. longissimum und in Übereinstimmung mit T. coronatum
344
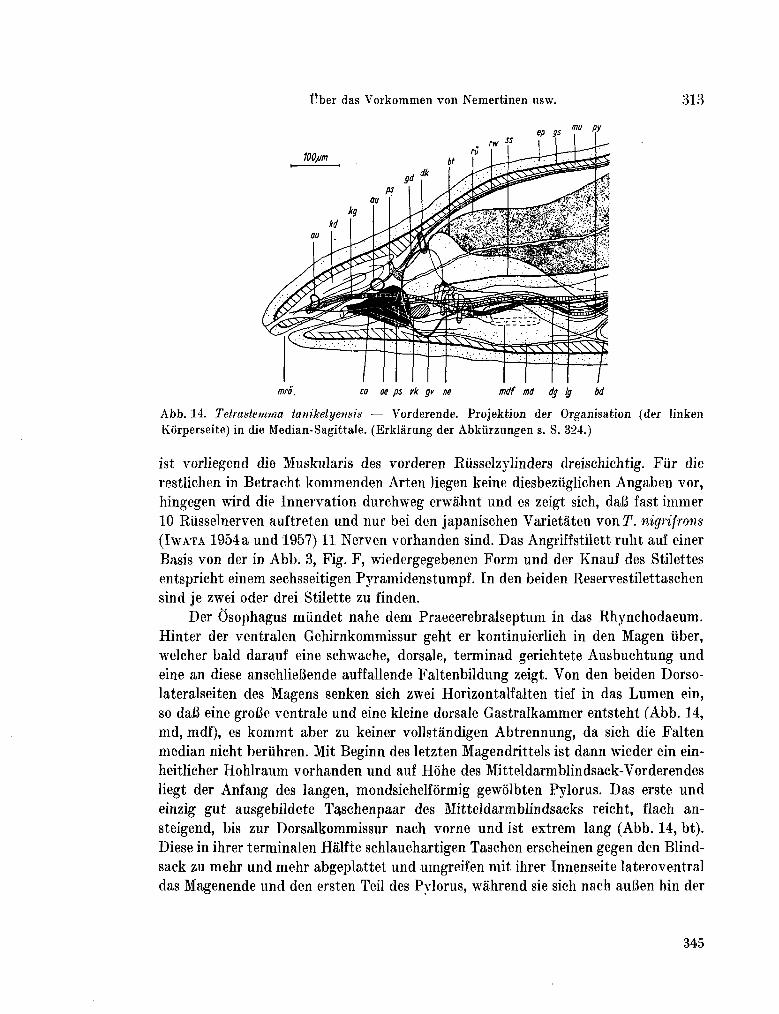
Über das Vorkommen von Nemertinen usw. 313
mrS. co oe ps vk gv ne mdf md dg l¡ M
Abb. 14. Tetrastemma tanikelyensis — Vorderende. Projektion der Organisation (der linken Kórperseite) in die Median-Sagittale. (Erklàrung der Abkürzungen s. S. 324.)
ist vorliegend die Muskularis des vorderen Rüsselzylinders dreischichtig. Für die
restlichen in Betracht kommenden Arten liegen keine diesbezüglichen Angaben vor,
hingegen wird die Innervation durchweg erwàhnt und es zeigt sich, daB fast immer
10 Riisselnerven auftreten und nur bei den japanischen Varietàten von T . nigrifrons
( I W A T A 1954 a und 1957) 11 Nerven vorhanden sind. Das Angriffstilett ruht auî einer
Basis von der in A b b . 3, Fig. F , wiedergegebenen Form und der Knauf des Stilettes
entspricht einem sechsseitigen Pyramidenstumpf. In den beiden Reservestilettaschen
sind je zwei oder drei Stilette zu finden.
Der Osophagus miindet nahe dem Praecerebralseptum in das Rhynchodaeum.
Hinter der ventralen Gehirnkommissur geht er kontinuierlich in den Magen über,
welcher bald darauf eine schwache, dorsale, terminad gerichtete Ausbuchtung und
eine an diese anschlieBende auffallende Faltenbildung zeigt. Von den beiden Dorso-
lateralseiten des Magens senken sich zwei Horizontalfalten tief in das L u m e n ein,
so daB eine groBe ventrale und eine kleine dorsale Gastralkammer entsteht (Abb. 14,
m d , mdf), es k o m m t aber zu keiner vollstàndigen Abtrennung, da sich die Falten
median nicht berühren. Mit Beginn des letzten Magendrittels ist dann wieder ein ein-
heitlicher Hohlraum vorhanden und auf Hôhe des Mitteldarmblindsack-Vorderendes
liegt der Anfang des langen, mondsichelformig gewolbten Pylorus. Das erste und
einzig gut ausgebildete Ta,schenpaar des Mitteldarmblindsacks reicht, flach an-
steigend, bis zur Dorsalkommissur nach vorne und ist extrem lang (Abb. 14, bt).
Diese in ihrer terminalen Hâlfte schlauchartigen Taschen erscheinen gegen den Blind-
sack zu mehr und mehr abgeplattet und umgreifen mit ihrer Innenseite lateroventral
das Magenende und den ersten Teil des Pylorus, wahrend sie sich nach aufien hin der
345
314 ERNST KIESTEUER
Kundung der Korperwand anpassen. Die nachfolgenden Blindsacktaschen stellen
nur seichte, k a u m bis zu den Seitennerven sieh erhebende Aussackungen dar und
erst a m Mitteldarm selbst ist ein Auftreten von norm alen, hôher aufsteigenden
Taschen zu beobachten. Damit liegen Verhaltnisse vor, die im Grundsatzlichen, i. e.
einem Mitteldarmblindsack mit Seitentaschen und zwei terminad gerichteten Ta
schen, mit den bisher innerhalb der Gattung gemachten Feststellungen überein-
stimmen, deren Analyse und graphische Wiedergabe jedoch ein v o m Gewohnten
stark abweichendes Bild liefern, welches nicht auf Kontraktion oder Darnifüllungs-
zustand zurückzuführen ist. Eine áhnliche Situation wurde auch bei Tetrastemma
signifer ( C O E 1904, S. 158) und T. fulvum ( K I R S T E U E R 1963, S. 582) gefunden, Unter-
schiede im Aufbau des Vorderdarms und des BlutgefàBsystems sowie in der Gesamt-
organisation schlieBen jedoch eine Identitât mit der vorliegenden Form aus. Zur A b -
grenzung gegen die aufgezàhlten Vergleichsarten sind die Differenzierungen a m
Vorder- und Mitteldarm gut verwertbar, wobei sich aus dieser Gruppe besonders
Tetrastemma nigrifrons var. bilineaium ( I W A T A 1957, S. 27) abhebt, da der Mittel
darmblindsack bis an das Gehirn heranreicht, weiter auch Teirastemmu- rerinigrum
( I W A T A 1954a, S. 32), bei welcher die kurzen vorderen Blindsacktaschen bis in die -
terminale Gehirnregion ziehen.
Das BlutgefàBsystem gliedert sich in die Kopischlinge und von dieser abgehende
LateralgefaBe sowie DorsalgefaB, welch letzteres nicht in das Rhynchocoelom ein-
dringt (Abb. 14). Mit diesen Eigenschaften sind weitere Merkmale zur Abgrenzung
gegeben, da bei Tetrastemma nigrifrons und T. diadema das DorsalgefáB Rhyncho-
cóelombeziehung zeigt, bei T. coronatum, T. melanocephalum und T. longissinmm
ebenfalls Eintritt in das Rhynchocoelom und auBerdem noch Abgang von einem der
beiden LateralgefaBe beobachtet wurde. Lediglich Tetrastemma peltatum weist in
diesem Punkt keine andersartige Ausbildung auf — fiir die restlichen indopazi-
l'ischen Formen fehlen leider Vergleichsmoglichkeiten.
Die relativ kleinen Exkretionsorgane liegen zwischen dem Gehirn und der er-
wahnten Magenfaltenbildung den Seitennerven lateral auf und miinden iiber je
einen Ableitungskanal lateroventral nach auBen. Akzesgorische Ableitungskanalchen,
wie sie bei einigen Individúen von Tetrastemma nigrifrons ( C O E 1904, S. 163) ge
funden wurden, sind vorliegend nicht ausgebildet.
Die Genitalregion der untersuchten weiblichen und mannlichen Exemplare be-
ginnt etwas nach dem ersten Korperdrittel. Die Ovarien liegen dorsal und ventral
von den Seitenstammen, die Testis nur dorsal von diesen und die Ausfuhrgange der
letzteren durchbrechen die Korperwand lateral bis zur Grundschicht, sind aber im
Epithelbereich nicht mehr zu sehen.
Verbreitung
Indo-westpazifischer R a u m : Madagaskar (Tanikely) [Mozambique-Kanal].
346
Über das Vorkommen von Nemertinen usw. 315
Verteilung
Die Aufsammhmgen ergaben für Tetrastemma tanikelyensis auf Aerófora corym-
bosa eine Frequenz von 33,3 % bei einer Dominanz von 11,3 % . Auf Seriatopora angu-
lata waren 11,1% Frequenz und 0 ,7% Dominanz festzustellen.
Tetrastemma sp.
Wie schon eingangs vermerkt wurde, befindet sich unter den aufgesammelten
Iloplonemertini monostilfera eine durch zwei Individúen reprásentierte Art, deren
genaue Bestimmung durch den schlechten Erhaltungszustand der konservierten
Tiere I eider nicht móglich ist. Die beiden vorliegenden Schnittserien lassen die Art
ais Vertreter des Genus Tetrastemma erkennen, gestatten aber keine ins Detail gehende
Beschreibung der anatomischen Verhaltnisse. D a nach AbschluB der systematischen
Bearbeitung de.s gesamten Nemertinenmaterials der Expedition eine allgemeine, zu-
sammenfassende Darstellung der Gruppe geplant ist, sei die Form der Vollstándig-
keit halber hier kurz erwàhnt.
Habitus
Die Tiere waren 10 und 12 m m lang und 0,3—0,4 m m dick. Die einheitliche
(¡nmdfarbe war ein milchiges, semitransparentes "WeiB, welches den D a r m dunkel-
grau durchschimmern lieB, wàhrend der Riissel nur stellenweise zu erkennen war.
Von den vier in einem Rechteck stehenden, kleinen Augen wurden die vorderen von
einem rotbraunen, dreieckigen Pigmentfleck iiberdeckt (Abb. 3, A ) .
Verbreitung
Tndo-westpazifischer R a u m : Madagaskar (Tanikely) [Mozambique-Kanal].
Verteilung
Die Form wurde auf Acroporapharaonis mit einer Frequenz von 1 0 % bei einer
Dominanz von nur 0 ,7% registiert. Fast gleiche Werte ergaben sich für das Vor
k o m m e n auf Seriatopora angidata mit einer Frequenz von 11,1% und einer D o m i
nanz von 0,7%.
Nemertes J O H N S T O N 1837
Die Gattung Nemertes wurde von F R I E D R I C H (1955) restituiert, und zwar für
Nemertes (Emplectonema) antonina Q U A T R E F A G E S , deren durch Bindegewebe ge-
teilte Langsmuskulatur in der Cerebralregion sie deutlich von den übrigen Emplec-
tonema-Arten distanziert. Von B R U N B E R G (1959) wurde diese Abtrennung nicht ak-
zeptiert, wird aber in der vorliegenden Schrift beibehalten, da sie den ersten kon-
kreten Schritt zur Klarung der Verhaltnisse in der als uneinheitlich zu betrachtenden
347
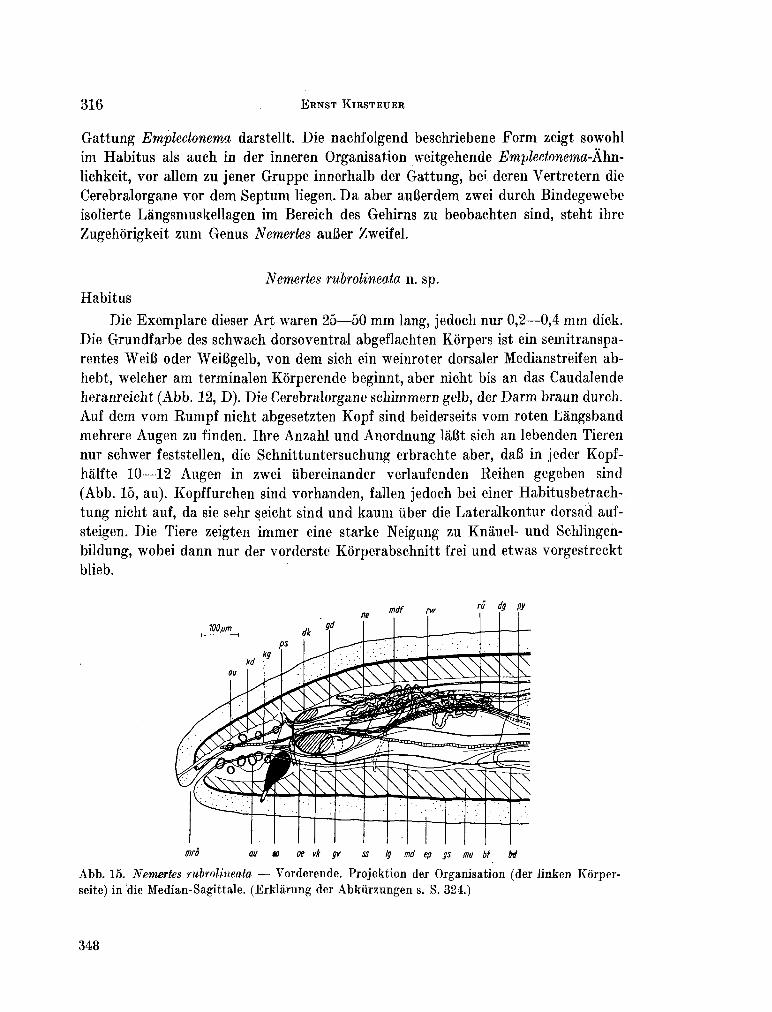
316 ERNST KIRSTEUER
Gattung Empledonema darstellt. Die nachfolgend beschriebene Form zeigt sowohl im Habitus als auch in der inneren Organisation weitgehende Emplectonema-Ahn-lichkeit, vor allem zu jener Gruppe innerhalb der Gattung, bei deren Vertretern die Cerebralorgane vor dem Septum liegen. D a aber auBerdem zwei durch Bindegewebe isolierte Làngsniuskellagen im Bereich des Gehirns zu beobachten sind, stent ihre Zugehôrigkeit zum Genus Nemertes auBer Zweifel.
Nemertes rubrolineata n. sp. Habitus
Die Exemplare dieser Art waren 25—50 m m lang, jedoch nur 0,2—0,4 m m dick. Die Grundfarbe des schwach dorsoventral abgeflachten Korpers ist ein semitransparentes WeiB oder Weifigelb, von dem sich ein weinroter dorsaler Medianstrëifen ab-hebt, welcher a m terminalen Kôrperende beginnt, aber nicht bis an das Caudalende heranreicht (Abb. 12, D ) . Die Cerebralorgane schimmern gelb, der D a r m braun durch. Auf dem v o m K u m p f nicht abgesetzten Kopf sind beiderseits v o m roten Lángsband mehrere Augen zu finden. Ihre Anzahl und Anordnung laBt sich an lebenden Tieren nur schwer feststellen, die Schnittuntersuchung erbrachte aber, daB in jeder Kopf-hálfte 10—12 Augen in zwei übereinander verlaufenden Reihen gegeben sind (Abb. 15, au). Kopffurchen sind vorhanden, fallen jedoch bei einer Habitusbetrach-tung nicht auf, da sie sehr seicht sind und kaum über die Lateralkontur dorsad auf-steigen. Die Tiere zeigten immer eine starke Neigung zu Knauel- und Schlingen-bildung, wobei dann nur der vorderstè Korperabschnitt frei und etwas vorgestreckt blieb.
mro au » oe vk gv ss Ig md ep gs mu bt M
A b b . 15. Nemertes rubrolineata — Vorderende. Projektion der Organisation (der linken Korper-seite) in die Median-Sagittale. (Erklàrung der Abkiirzungen s. S. 324.)
348
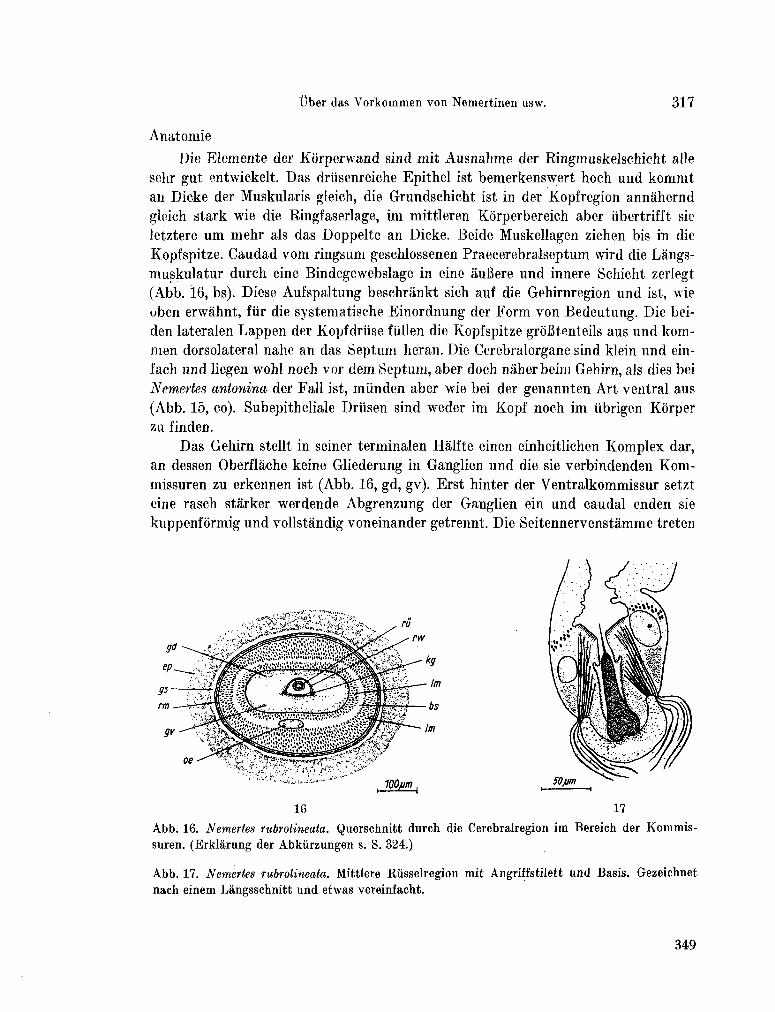
líber das Vorkommen von Nemertinen usw. 317
Anatomie
Die Elemente der Kôrperwand sind mit Ausnahme der Ringmuskelschicht aile
sehr gut entwickelt. Das driisenreiche Epithel ist bemerkenswert hoch und k o m m t
an Dicke der Muskularis gleich, die Grundschicht ist in der Kopfregion annahernd
gleich stark wie die Bingfaserlage, im mittleren Korperbereich aber übertrifft sie
letztere u m mehr als das Doppelte an Dicke. Beide Muskellagen Ziehen bis in die
Kopfspitze. Caudad v o m ringsum geschlossenen Praecerebralseptum vvird die Langs-
niuskulatur durch eine Bindegewebslage in eine áuBere und innere Schicht zerlegt
(Abb. 16, bs). Diese Aufspaltung beschrànkt sich auf die Gehirnregion und ist, wie
uben erwàhnt, fur die systematische Einordnung der Form von Bedeutung. Die bei-
den lateralen Lappen der Kopfdriise fiillen die Kopfspitze groBtenteils aus und k o m -
m e n dorsolateral nahe an das Septum heran. Die Cerebralorgane sind klein und ein-
fach und liegen wohl noch vor dem Septum, aber doch nâherbeiin Gehirn, als dies bei
Nemertes antonina der Fall ist, miinden aber wie bei der genannten Art ventral aus
(Abb. 15, co). Subepitheliale Driisen sind weder im Kopf noch im iibrigen Korper
zu finden.
Das Gehirn stellt in seiner terminalen Hàlfte einen einheitlichen Komplex dar,
an dessen Oberflàche keine Gliederung in Ganglien und die sie verbindenden K o m -
missuren zu erkennen ist (Abb. 16, gd, gv). Erst hinter der Ventralkommissur setzt
eine rasch starker werdende Abgrenzung der Ganglien ein und caudal enden sie
kuppenformig und vollstandig voneinander getrennt. Die Seitennervenstamme tretcn
A b b . 16. Nemertes rubrolineata. Querschnitt durch die Cerebralregion im Bereich der K o m m i s -suren. (Erklárung der Abkürzungert s. S. 324.)
A b b . 17. Nemertes rubrolineata. Mittlere Riisselregion mit Angriffstilett und Basis. Gezeichnet nach einem Langsschnitt und etwas vereinfacht.
349
318 ERNST KIRSTEUER
lateral von den Ventralganglien aus und nehnien über eine Bogenbildung ihren Làngs-
verlauf ein. Wie bei Nemertes antonina sind auch vorliegend die Cerebralkommissuren
auBerordentlich breit, die dorsalen Ganglien sind aber caudal nicht in zwei Zipfel
ausgezogen und es fehlen Ansehwellungen der Seitenstàmme im Bereich ihres Ur-
sprunges.
Das Rlrynchocoelom ist etwas langer ais ein Drittel des Kôrpers, endet abernoch
vor der Korpermitte. Seine W a n d ist durchlaufend sehr dünn und Ring- als auch
Làngsmuskulatur meist nur in einfaserigen Schichten vorhanden. Auch der Russe!
ist, vor allem in seinem vorderen Abschnitt, sehr schwach ausgebildet (Abb. 15,
16, rii). Die Muskularis des proximalen Riisselzylinders besteht aus einer Ring- und
einer Làngsfibrillenlage, die beide anfangs zart, gegen die Riisselmitte zu etwas an
Dicke zunehmen. Die Russe! nerven bilden eine einheitliche Schicht, die in der Làngs
muskulatur gelegen ist. Das Angriffstilett sitzt einer schlanken, birnenfôrmigen
Basis auf (Abb. 17), die der von Emplectonema gracilis ( C O R R E A 1955, Tafel 1, Fig. 2)
ahnlich ist. In den beiden Reservestilettaschen sind ein oder zwei Stilette eingelagert.
Der Vorderarm ist wie normal in Ôsophagus, Magen und Pylorus unterteilt.
Der sich in das Rhynchodaeum ôffnende Ôsophagus verlâuft in der Gehirnregion in
der die Làngsmuskulatur spaltenden Bindegewebeschicht und geht postcerebral in
einen faltenreichen Magen über. Dieser, im Querschnitt hufeisenformig, legt sich dem
Rhynchocoelom an (Abb. 15, mdf). Der Pylorus ist kurz, ebenso der Mitteldarm-
blindsack, der nur wenig den Pylorus an Lange übertrifft und zwei kleine terminad
gerichtete und lateroventral v o m Magen liegende Taschen entsendet (Abb. 15, bd, bt).
Wie der Magen umgreifen auch der Mitteldarmblindsack und der Mitteldarm mit
ihren weiten geraumigen Taschen das Rhynchocoelom an den Lateralseiten.
Das BlutgefaBsystem besteht aus den beiden KopfgefàBen, die sich nach Durch-
laufen des Gehirnringes als SeitengefàCe fortsetzen, und dem RiickengefaB, welches
v o m rechten LateralgefàB abzweigt und keine Rhynchocoelombeziehung zeigt
(Abb. 15).
Die Nephridien sind schon in der hinteren Gehirnregion zu linden und erstrecken
sich bis an den Mitteldarmblindsackbeginn caudad (Abb. 15, ne). Sie sind dorsal von
den Seitennervenstammen in dem zwischen Vorderdarm und Korperwand einge-
schobenen Bindegewebe gelagert. Ihre Ausmiindung erfolgt vermutlich bald nach
dem Gehirn lateroventral, mit Sicherheit konnte dies aber a m vorliegendem Material
nicht festgestellt werden.
Die bei einigen Individúen angetroffenen Ovarien sind ventral und dorsal von
den Lateralstàmmen angeordnet, wobei die vordersten noch in den Caudalbereich
des Rhynchocoeloms fallen.
Verbreitung
Indo-westpazifischer R a u m : Madagaskar (Tanikely) [Mozambique-Kanal].
350
Über das Vorkommen von Nemertinen usw. 319
Verteilung
Nemertes rubrolineata war eine im Untersuchungsgebiet relativ haufig auftretende
Form. Auf Acropora corymbosa schien sie mit einer Frequenz von 16,7% bei einer
Dominanz von 2,8% auf. Für das Vorkommen auf Seriatopora angulata ergab.sich
eine Frequenz von 33,3 % und eine Dominanz von 2,2 %, für Acropora pharaoniseine
Frequenz von 40% und Dominanz von 7%, wahrend auf Porites nigrescens'bO%
Frequenz und 15,4% Dominanz festgestellt wurden.
Friedrichia n. g.
Vorliegend ist eine Form, die zufolge ihrer inneren Organisation in keines der
bestehenden Genera der monostiliferen Hoplonemertinen eingereiht werden kann.
Auf Grund der Tetraneurie ergeben sich wohl Beziehungen zu einigen wenigen Gat-
tungen, bei kritischer Prüfung unter Heranziehen weiterer Merkmale erweisen sich
diese Bindungen aber nicht stark genug, u m eine Einordnung der Form zu rechtfer-
tigen. So zeigen sich Unterschiede zu Gononemertes B E R G E N D A L (1900) in der Lange
des Rhynchocoeloms und durch das Fehlen eines Stilettapparates und eines Ósopha-
gus sowie durch das Auftreten von terminad gerichteten Taschen am Mitteldarm-
blindsack und einer Diagonalmuskelschicht im Hautmuskelschlauch bei Gonone
mertes parasita, der einzigen Art des Genus. Bei Antarctonemertes F R I E D R I C H (1955)
hingegen sind es die groBen, nahe beim Gehirn gelegenen Cerebralorgane, das kórper-
lange Rhynchocoelom und Differenzierungen am Mitteldarmblindsack, welche die
Gattung für die zur Rede stehende Form nicht in Betracht kommen lassen. Es sei auch
darauf verwiesen, daB sich keine engere Beziehung zu der bislang ais Nemertopsis
actinophila B Ü R G E R (1904) geführten, jedoch wie FRIEDRICH (1955) mit Recht be-
tont, nicht zur Gattung Nemertopsis gehôrenden und 1958 in die Gattung Nemertop-
sella F R I E D R I C H gestellten Form abzeichnet, da bei dieser die Seitenstàmme nicht
über die ganze Lange zweifaserkernig sind und auch durch die direkte Einmündung
des Magens in das Rhynchodaeum und das kurze Rhynchocoelom eine sehr ab-
weichende Situation geschaffen ist. Die gróBte Annaherung zeigt sich zu dem Gat-
tungsdreieck Oersiedia —• Paroerstedia — Oerstediella. Die Übereinstimmungen liegen
in der Ausbildung und Anordnung der Cerebralorgane, Aufspaltung des Praecerebral-
septums in Fixatoren, Fehlen einer postcerebralen GefáBverbindung und weitest-
gehender Âhnlichkeit in der Kôrperform. Unterschiede zu Oerstedia sensu F R I E D R I C H
(1955) entstehen durch Vorhandensein eines Ôsophagus und Erstreckung der Lângs-
muskulatur bis in die Kopfspitze, der vollkommen taschenlose Mitteldarmblindsack
steht im Widerspruch mit den Diágnosen von alien drei oben genannten Genera,
ebenso die Tatsache, daB vorliegend das RückengefáB in das Rhynchocoelom ein-
dringt. Hinzu kommt, daB bei Oerstediella F R I E D R I C H (1955) der zweite Faserkern in
den Lateralnervenstámmen nicht über deren groBe Lange reicht.
351
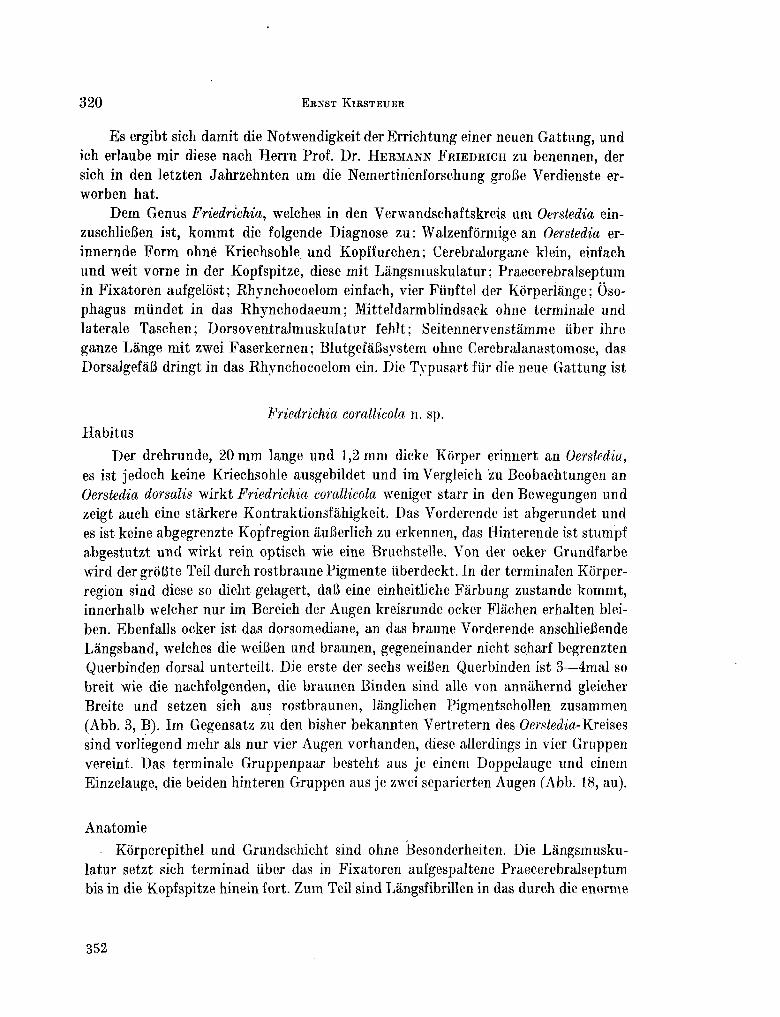
320 ERNST KIRSTEUER
Es ergibt sich damit die Notwendigkeit der Errichtung einer neuen Gattung, und
ich erlaube mir diese nach Herrn Prof. Dr . H E R M A N N F R I E D R I C H Z U benennen, der
sich in den letzten Jahrzehnten u m die Nemertinenforschung groBe Verdienste er-
worben hat.
D e m Genus Friedrichia, welches in den Verwandschaftskreis u m Oerstedio, ein-
zuschlieBen ist, k o m m t die folgende Diagnose zu: Walzenformige an Oerstedio, er-
innernde Form ohné Kriechsohle und Kopffurchen; Cerebralorgane klein, einfach
und weit vorne in der Kopfspitze, diese mit Lângsmuskulatur ; Praecerebralseptum
in Fixatoren aufgelost; Rhynchocoelom einfach, vier Fünftel der Kórperíánge; Óso-
phagus mündet in das Rhynchodaeum; Mitteldarmblindsack ohne terminale und
latérale Taschen; Dorsoventralmuskulatur fehlt; Seitennervenstamme über ihre
ganze Lange mit zwei Faserkernen ; BlutgefáBsystem ohne Cerebralanastomose, das
DorsalgefáB dringt in das Rhynchocoelom ein. Die Typusart für die neue Gattung ist
Friedrichia corallicola n. sp.
Habitus
Der drehrunde, 20 m m lange und 1,2 m m dicke Korper erinnert an Oerstedio,
es ist jedoch keine Kriechsohle ausgebildet und im Vergleich zu Beobachtungen an
Oerstedio dorsalis wirkt Friedrichia corallicola weniger starr in den Bewegungen und
zeigt auch eine stàrkere Kontraktionsfàhigkeit. Das Vorderende ist abgerundet und
es ist keine abgegrenzte Kopfregion auBerlich zu erkennen, das Hinterende ist stumpf
abgestutzt und wirkt rein optisch wie eine Bruchstelle. V o n der ocker Grundfarbe
wird der grôBte Teil durch rostbraune Pigmente überdeckt. In der terminalen Korper-
region sind diese so dicht gelagert, daB eine einheitliche Fàrbung zustande k o m m t ,
innerhalb welcher nur im Bereich der Augen kreisrunde ocker Flàchen erhalten blei-
ben. Ebenfalls ocker ist das dorsomediane, an das braune Vorderende anschliefiende
Langsband, welches die weiBen und braunen, gegeneinander nicht scharf begrenzten
Querbinden dorsal unterteilt. Die erste der sechs weiBen Querbinden ist 3—4mal so
breit wie die nachfolgenden, die braunen Binden sind aile von annahernd gleicher
Breite und setzen sich aus rostbraunen, lànglichen Pigmentschollen zusammen
(Abb. 3, B ) . I m Gegensatz zu den bisher bekannten Vertretern des Oerstedia-Kreises
sind vorliegend mehr als nur vier Augen vorhanden, diese allerdings in vier Gruppen
vereint. Das terminale Gruppenpaar besteht aus je einem Doppelauge und einem
Einzelauge, die beiden hinteren Gruppen aus je zwei separierten Augen (Abb. 18, au).
Anatomie
Korperepithel und Grundschicht sind ohne Besonderheiten. Die Lângsmusku
latur setzt sich terminad über das in Fixatoren aufgespaltene Praecerebralseptum
bis in die Kopfspitze hinein fort. Z u m Teil sind Lángsfibrillen in das durch die enorme
352
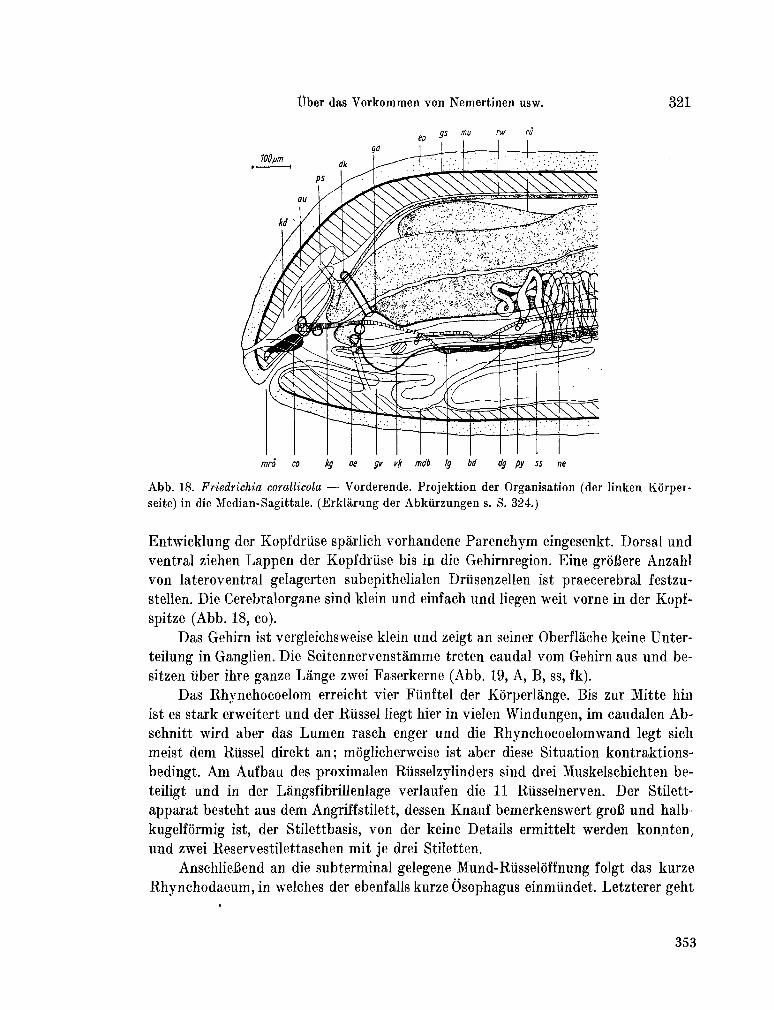
Über das Vorkommen von Nemertinen usw. 321
gs iïiu rw rû
mro co kg oe gv vh mdb Ig bd dg py ss ne
A b b . 18. Friedrichia corallicola — Vorderende. Projektion der Organisation (der linken Kôrper-seite) in die Median-Sagittale. (Erklàrung der Abkiirzungen s. S. 324.)
Entwicklung der Kopfdriise spàrlich vorhandene Parenchym eingesenkt. Dorsal und
ventral ziehen Lappen der Kopfdriise bis in die Gehirnregion. Eine grôBere Anzahl
von lateroventral gelagerten subepithelialen Driisenzellen ist praecerebral festzu-
stellen. Die Cerebralorgane sind klein und einfach und liegen weit vorne in der Kopf-
spitze (Abb. 18, co).
Das Gehirn ist vergleichsweise klein und zeigt an seiner Oberflâche keine Unter-
teilung in Ganglien. Die Seitennervenstàmme treten caudal v o m Gehirn aus und be-
sitzen über ihre ganze Lange zwei Faserkerne (Abb. 19, A , B , ss, fk).
Das Rhynchocoelom erreicht vier Fiinftel der Kôrperlânge. Bis zur Mitte hin
ist es stark erweitert und der Riissel liegt hier in vielen Windungen, im caudalen A b -
schnitt wird aber das L u m e n rasch enger und die Rhynchocoelomwand legt sich
meist d e m Riissel direkt an; môglicherweise ist aber diese Situation kontraktions-
bedingt. A m Aufbau des proximalen Riisselzylinders sind drei Muskelschichten be-
teiligt und in der Làngsfibrillenlage verlaufen die 11 Riisselnerven. Der Stilett-
apparat besteht aus d e m Angriffstilett, dessen Knauf bemerkenswert grofi und halb
kugelfôrmig ist, der Stilettbasis, von der keine Details ermittelt werden konnten,
und zwei Reservestilettaschen mit je drei Stiletten.
Anschliefîend an die subterminal gelegene Mund-Riisselôffnung folgt das kurze
Rhynchodaeum, in welches der ebenfalls kurze Osophagus einmiindet. Letzterer geht
353
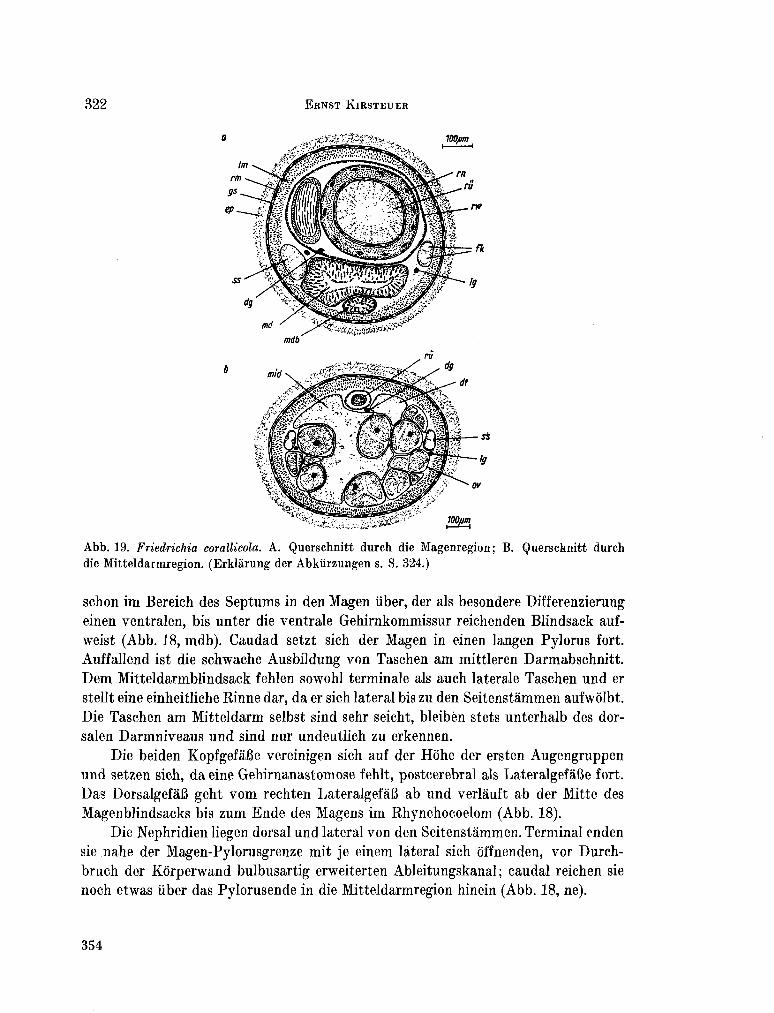
322 ERNST KIRSTEUER
A b b . 19. Friedrichia corallicola. A . Querschnitt durch die Magenregion; B . Querschnitt durch
die Mitteldarmregion. (Erklàrung der Abkiirzungen s. S. 324.)
schon im Bereich des Septums in den Magen über, der ais besondere Differenzierung einen ventralen, bis unter die ventrale Gehirnkommissur reichenden Blindsack auf-weist (Abb. 18, m d b ) . Caudad setzt sich der Magen in einen langen Pylorus fort. Auffallend ist die schwache Ausbildung von Taschen a m mittleren Darmabschnitt. D e m Mitteldarmblindsack fehlen sowohl terminale ais auch latérale Taschen und er stellt eine einheitliche Rinne dar, da er sich lateral bis zu den Seitenstàmmen aufwolbt. Die Taschen a m Mitteldarm selbst sind sehr seicht, bleibën stets unterhalb des dor-salen Darmniveaus und sind nur undeutlich zu erkennen.
Die beiden KopfgefaBe vereinigen sich auf der Hôhe der ersten Augengruppen und setzen sich, da eine Gehirnanastomose fehlt, postcerebral als LateralgefàBe fort. Das DorsalgefàB geht v o m rechten LateralgefâB ab und verlàuft ab der Mitte des Magenblindsacks bis z u m Ende des Magens im Rhynchocoelom (Abb. 18).
Die Nephridien liegen dorsal und lateral von den Seitenstàmmen. Terminal enden sie nahe der Magen-Pylorusgrenze mit je einem lateral sich ôffnenden, vor Durch-bruch der Korperwand bulbusartig erweiterten Ableitungskanal ; caudal reichen sie noch etwas über das Pylorusende in die Mitteldarmregion hinein (Abb. 18, ne).
354
Über das Vorkommen von Nemertinen usw. 323
Die Ovarien liegen rings u m den Darm angeordnet und sind bereits mit Beginn
des zweiíen Kórperdrittels zu beobachten.
Verbreitung
Indo-westpazifiseher R a u m : Madagaskar (Tanikely) [Mozambique-Kanal].
Verteilung
Friedriehia corallicola wurde auf Acropora corymbosa mit einer Frequenz von
16,7% bei einer Dominanz von 1,4% registriert.
Zusammenfassung
In der vorJiegenden Arbeit wurden die im Verlauf der „Üsterreichischen Indo-Westpazifik-
Expedition 1959/60" im Saumriff der Insel Tanikely aufgesammelten Hoplonemertini monostili-
fera behandelt. Das Material entstammt Proben von Seriatopora angulhta, Acropora pharaonis,
A. corymbosa, Porites nigrescens, P. iwayamaensis und Millepora tendía. Die anatomische Unter-
suchung ergab die Notwendigkeit der Errichtung von zwei neuen Genera, námlich Paramphi-
porus und Friedriehia. Die dargestellten Arten sind: Cratenemertes madagascarensis n. sp., Param-
phiporus albimarginatus n. sp., Africanemertes rützleri n. sp., Nemertellina tropica n. sp., Tetra-
stemma melanocephalum ( J O H N S T O N ) , Tetrastemma tanikelyensis n. sp., Nemertes rubrolineata
n. sp., Friedriehia corallicola n. sp. und eine nur kurz angeführte Tetrastemma sp. D a B von den
neun monostiliferen Hoplonemertinenarten sieben neu für die Wissenschaft sind, ist z u m einen
darauf zurückzuführen, daB von der Nemertinenfauna des Indischen Ozeans vergleichsweise w e -
nig bekannt ist, zum anderen ist es durch die Aufsammlungsmethode bedingt, da durch frei-
tauchendes Einholen des Probensubstrates und anschlieBender Aufbereitung der Proben mit
Hilfe der Klimaverschlechterung auch Klein- und Kleinstformen erfafit werden konnten. Die
quantitative Verteilung der Arten im Untersuchungsgebiet ist durch Prozentwerte ihrer Frequenz
und Dominanz ausgedrückt (vgl. R I E D L 1959 und K I R S T E U E R 1963).
21 Zool. Jb. Syst. Bd. 92
355
324 E R N S T K I R S T E U E R
Erklàrung der Abkürzungen
au bd bs bt CO
dg dk dt ep ev fk
gd gs gv kd
kg lg lm
Augen
Blinddarm
Bindegewebeschicht
Blinddarmtasche
Cerebralorgan
DorsalgefàB
Dorsalkommissur
Mitteldarmtas che
Epithel Epithelverdickung
Faserkern
Dorsalganglion
Grundschicht Ventralganglion
Kopfdriise
Kopfgefáfl
Lateralgefafi Làngsmuskulatur
md mdb mdf mid mrô mu ne oe ov ps
py rd rm rn rii rw ss vk
Magendarm
Magendarmblindsack
Magendarmfalte
Mitteldarm
Mund-Riisseloffnung Muskulatur
Nephridien
Osophagus
Ovar
Praecerebralseptum Pylorus
Rhynchodaeum
Ringmuskulatur
Rüsselnerven
Rüssel
Rhynchocoelomwand
S eitennervenstamm Ventralkommissur
Literatur
B E A U M O N T , W . (1895), Report on Nemertines observed at Port Erin, Isle of M a n . Trans. Biol.
Soc. Liverpool 9, 354—373.
B É N A R D , F . (1960), La faunule associée au Lithophyllum incrustans des cuvettes de la région de
Roscoff. Cahiers de Biologie Marine 1, 89—102.
B E R G E N D A L , D . (1900), Über ein Paar sehr eigentümliche nordische Nemertinen. Zool. Anz. 23,
313—328.
— (1903), Till kànnedomen o m de nordiska Nemertinerna. IV. Fôrteckning ôfver vid Sveriges
vestkust iakttagna Nemertiner. Arkiv Zool. 1, 85—156.
B R U N B E R G , L . (1959), Emplectonema bocki n. sp., a Hoplonemertean epizoic on Funiculina
quadrangularis ( P A L L A S ) . Vidensk. Medd. fra Dansk naturh. Foren. 119, 59—66.
B U R G E R , O . (1895), Fauna und Flora des Golfes von Neapel. Monographie 22. — (1904), Nemertini. Das Tierreich, Lief. 20.
C O E , W . (1901), Papers from the Harriman Alaska Expedition. X X . Nemerteans. Proc. Washington
Acad. Sci. 3, 1—84.
— (1904), Nemerteans, Part II. Harriman Alaska Series 11, 111—202.
— (1905), Nemerteans of the West and Northwest Coasts of America. Bull. Mus . C o m p . Zool.
Harvard 47, 1—318.
— (1940), Revision of the Nemertean Fauna of the Pacific Coasts of North, Central and northern
South America. Rep. Allan Hancock Exped. 1932—1938, 2, Nr. 13, 247—323.
— (1944a), Geographical distribution of the nemerteans of the Pacific Coasts of North America,
with desciptions of two new species. J. Washington Acad. Sci. 34, 27—32.
— (1944b), A new species of hoplonemertean (Paranemertes biocellatus) from the Gulf of Mexico.
J. Washington Acad. Sci. 34, 407—409.
356
Über das Vorkommen von Nemertinen usw. 325
— (1951), The nemertean faunas of the Gulf of Mexico and of southern Florida. Bull. mar. Sci. Gulf & Caribbean 1, 149—186.
O O R K B A , D . (1955), Os géneros Emplectonema STIMPSON e Nemertopsis B U R G E R (Hoplonemertini
monostilifera). Bol. Fac. Fil. Cien. Letr. Univ. Sao Paulo, Zoología 20, 67—78.
•— (1961), Nemerteans from Florida and Virgin Island. Bull. mar. Sci. Gulf & Caribbean 11,1—44.
FRIEDRICH, H . (1935a), Neue Hoplonemertinen der Kieler Bucht. Schr. Naturwiss. Ver. Schles-wig-Holstein 21, 10—19.
— (1935b), Studien zur Morphologie, Systematik und Okologie der Nemertinen der Kieler Bucht.
Arch. Naturgesch. Berlin, N . F. 4, 293—375.
— (1936), Nemertini. Grimpe und Wagler, Die Tierwelt der Nord- und Ostsee. Leipzig 4, 1—69.
— (1955), Beitráge zu einer Synopsis der Gattungen der Nemertini monostilifera nebst Bestim-
mungsschlüssel. Zschr. wiss. Zool. 158, 133—192.
— (1957), Beitráge zur Kenntnis der arktischen Hoplonemertinen. Vidensk. Medd. fra Dansk naturh. Foren. 119, 129—154.
— 1958), Nemertini. The Zoology of Iceland 2, Part 18, 1—24.
G E R I N G , G . (1912), Neue Nemertinen der schwedischen Westkiiste. Zool. Anz. 39, 520—523.
G O N T C H A R O F F , M . (1955), Inventaire de la Faune Marine de Roscoff. Trav. Stat. Biol. Roscoff,
Suppl 7, 1—15.
GRIFFIN, B . (1898), Description of some marine Nemerteans of Puget Sound and Alaska. Ann.
New York Acad. Sci. 11, 193—217.
I W A T A , F. (1952), Nemertini from the Coasts of Kyusyu. J. Fac. Sci. Hokkaido Univ. Ser. VI,
11, 126—148.
— (1954a), The Fauna of Akkeshi Bay. X X . Nemertini in Hokkaido. J. Fac. Sci. Hokkaido Univ.
Ser. VI, 12, 1—39.
— (1954b), Some Nemerteans from the Coasts of the Kii Peninsula. Publ. Seto Mar. Biol. Lab. 4,
33—42.
— (1957), Nemerteans from Sagami Bay. Publ. Akkeshi Mar. Biol. Stat. Nr. 7, 1—31.
JOUBIN, L. (1890), Recherches sur les Turbellariés des côtes de France. Arch. Zool. Exp. Ser. II,
8, 548—602.
— (1894), Les Némertiens. Faune française par R. Blanchard et J. de Guerne, Paris 1894,1—235.
K I R S T E U E R , E . (1963), Beitrag zur Kenntnis der Systematik und Anatomie der adriatischen
Nemertinen (Genera Tetrastemma, Oersledia, Oerslediella). Zool. Jb. Anat. 80, 555—616.
K O R O T K E V I T S C H , V . (1961), A new nemertean species and its position in the system. Zool. J. 40,
1416—1420.
M C I N T O S H , W . (1873), A Monograph of the British Annelids. Part I, The Nemerteans. Ray Soc. London 1873—1874.
M O N A S T E R O , S. (1930), I Nemertini della spiaggia di Palermo. Atti R. Ace. Sci. Palermo 16,1—23.
RICHES, P. (1893), A List of the Nemertines of Plymouth Sound. J. Mar. Biol. Ass. Plymouth,
N . S. 3, 1—39.
RIEDL, R. (1959), Das Vorkommen von Nemertinen in unterseeischen Hôhlen. Ergebnisse der Osterreichischen fyrrhenia-Expedition 1952. Teil X V . Pubbl. Staz. Zool. Napoli, Suppl. 30,
529—590. 21*
357
326 E R N S T K I R S T E U E R
S O U T H E R N , R. (1913), Nemertinea of Clare Island. Clare Island Survey Part 55. Dublin Proc.
Eoy. Irish Acad. 81, 1—20.
S T I A S N Y - W U N H O F F , G . (1942), Nemertinen der Westafrikanischen Kiiste. Zool. Jb. Syst. 75, 121—194.
V A N S T O N E , H . , and B E A U M O N T , W . (1894), Report upon the Nemertines found in the neighbour
hood of Port Erin, Isle of Man. Trans. Liverpool Biol. Soc. 8.
W I J N H O F F , G . (1912), List of Nemerteans collected in the neighbourhood of Plymouth from May
bis Sept. 1910. J. Mar. Biol. Ass. Plymouth 9, 407—434.
Anschrift des Verfassers: Dr. E R N S T KIRSTEUER, The American Museum of Natural History,
Department of Living Invertebrates, Central Park West at 79th Street, New York, N . J. (USA).
358
DEPARTMENT OF COMMERCE AND INDUSTRIES
DIVISION OF SEA FISHERIES
OBSERVATIONS ON THE ECOLOGY AND DISTRIBUTION OF COPEPODA
IN THE MARINE PLANKTON OF SOUTH AFRICA
BY
A. DE DECKER.
INVESTIGATIONAL REPORT No. 49
Issued by the Division of Sea Fisheries, Beach Road. Sea Point, Cape T o w n
REPUBLIC OF S O U T H AFRICA
Collected reprints of the International Indian Ocean Expedition, vol. IV, contribution no. 224 359
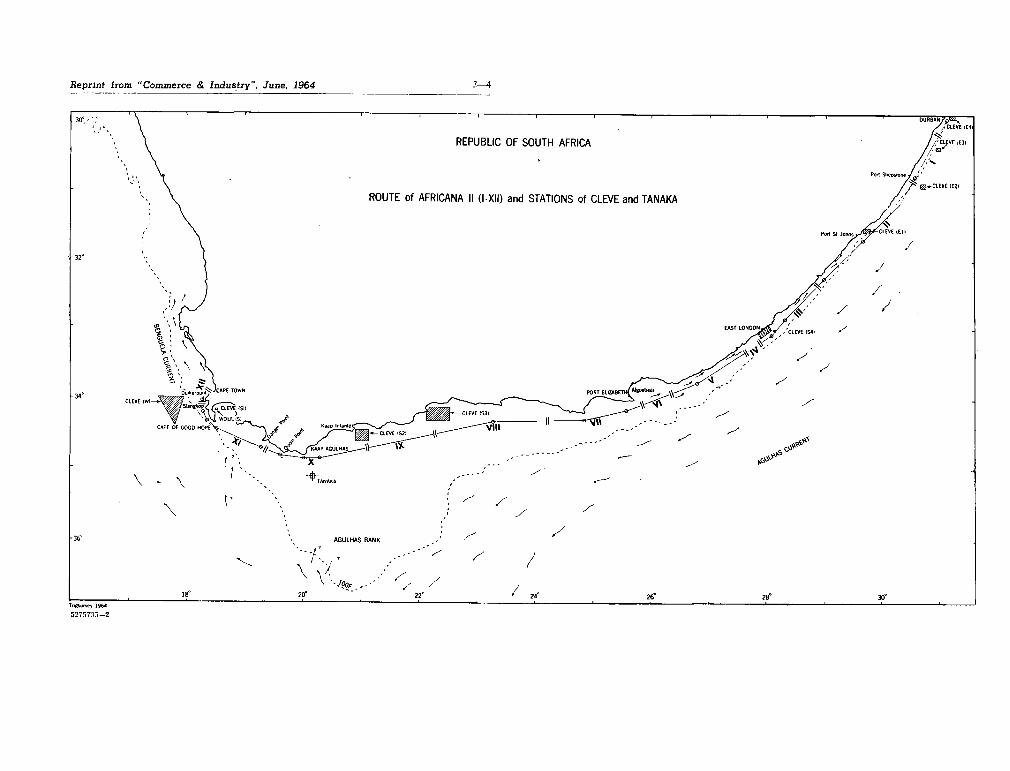
\
\ \
\ \ \
,' y
J
n
Bepriní horn "Commerce & Industry", June, 1964
Contents.
Page.
1. Summary 7
2. Introduction 7
3. Methods 8
4. Morphological and Hydrographie Conditions 9
5. Surface Temperature 9
6. Plankton Volumes 12
7. Distribution of Phytoplankton : 13
8. The Copepoda 14
9. Literature 32
361
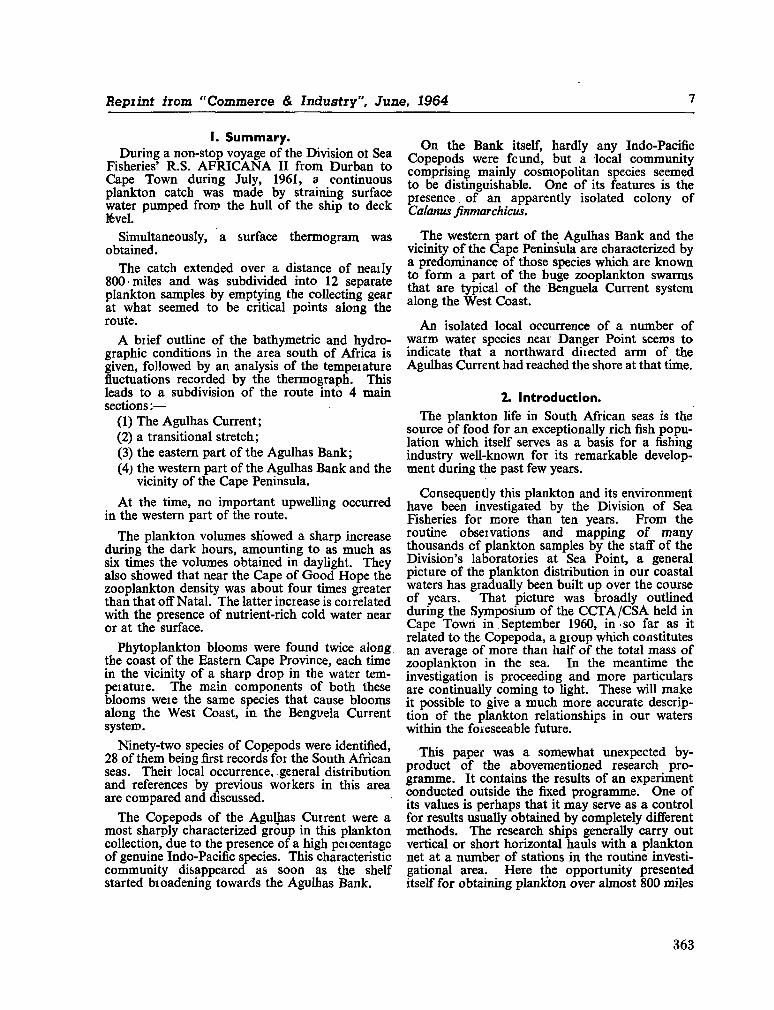
Bepiint from "Commerce & Industry", June, 1964 7
I. Summary. During a non-stop voyage of the Division oí Sea
Fisheries' R . S . A F R I C A N A II from Durban to Cape T o w n during July, 1961, a continuous plankton catch was m a d e by straining surface water pumped from the hull of the ship to deck level.
Simultaneously, a surface thermogram was obtained.
The catch extended over a distance of neaily 800 miles and was subdivided into 12 separate plankton samples by emptying the collecting gear at what seemed to be critical points along the route.
A biief outline of the bathymétrie and hydro-graphic conditions in the area south of Africa is given, followed by an analysis of the tempei ature fluctuations recorded by the thermograph. This leads to a subdivision of the route into 4 main sections:—
(1) The Agulhas Current; (2) a transitional stretch; (3) the eastern part of the Agulhas Bank ; (4; the western part of the Agulhas Bank and the
vicinity of the Cape Peninsula.
At the time, no important upwelling occurred in the western part of the route.
The plankton volumes showed a sharp increase during the dark hours, amounting to as m u c h as six times the volumes obtained in daylight. They also showed that near the Cape of G o o d H o p e the zooplankton density was about four times greater than that off Natal. The latter increase is coirelated with the presence of nutrient-rich cold water near or at the surface.
Phytoplankton blooms were found twice along the coast of the Eastern Cape Province, each time in the vicinity of a sharp drop in the water temperarme. The main components of both these blooms weie the same species that cause blooms along the West Coast, in the Benguela Current system.
Ninety-two species of Copepods were identified, 28 of them being first records for the South African seas. Their local occurrence, general distribution and references by previous workers in this area are compared and discussed.
The Copepods of the Agulhas Current were a most sharply characterized group in this plankton collection, due to the presence of a high percentage of genuine Indo-Pacific species. This characteristic community disappeared as soon as the shelf started bioadening towards the Agulhas Bank.
O n the Bank itself, hardly any Indo-Pacific Copepods were fcund, but a local community comprising mainly cosmopolitan species seemed to be distinguishable. O n e of its features is the presence of an apparently isolated colony of Calanus finmarchicus.
The western part of the Agulhas Bank and the vicinity of the Cape Peninsula are characterized by a predominance of those species which are k n o w n to form a part of the huge zooplankton swarms that are typical of the Benguela Current system along the West Coast.
A n isolated local occurrence of a number of w a r m water species near Danger Point seems to indicate that a northward diiected arm of the Agulhas Current had reached the shore at that time.
2. Introduction.
The plankton life in South African seas is the source of food for an exceptionally rich fish population which itself serves as a basis for a fishing industry well-known for its remarkable development during the past few years.
Consequently this plankton and its environment have been investigated by the Division of Sea Fisheries for more than ten years. F r o m the routine observations and mapping of m a n y thousands cf plankton samples by the staff of the Division's laboratories at Sea Point, a general picture of the plankton distribution in our coastal waters has gradually been built up over the course of years. That picture was broadly outlined during the Symposium of the C C T A / C S A held in Cape T o w n in September 1960, in so far as it related to the Copepoda, a group which constitutes an average of more than half of the total mass of zooplankton in the sea. In the meantime the investigation is proceeding and more particulars are continually coming to light. These will m a k e it possible to give a m u c h more accurate description of the plankton relationships in our waters within the foieseeable future.
This paper was a somewhat unexpected byproduct of the abovementioned research prog r a m m e . It contains the results of an experiment conducted outside the fixed programme. O n e of its values is perhaps that it m a y serve as a control for results usually obtained by completely different methods. The research ships generally carry out vertical or short horizontal hauls with a plankton net at a number of stations in the routine investigational area. Here the opportunity presented itself for obtaining plankton over almost 800 miles
363
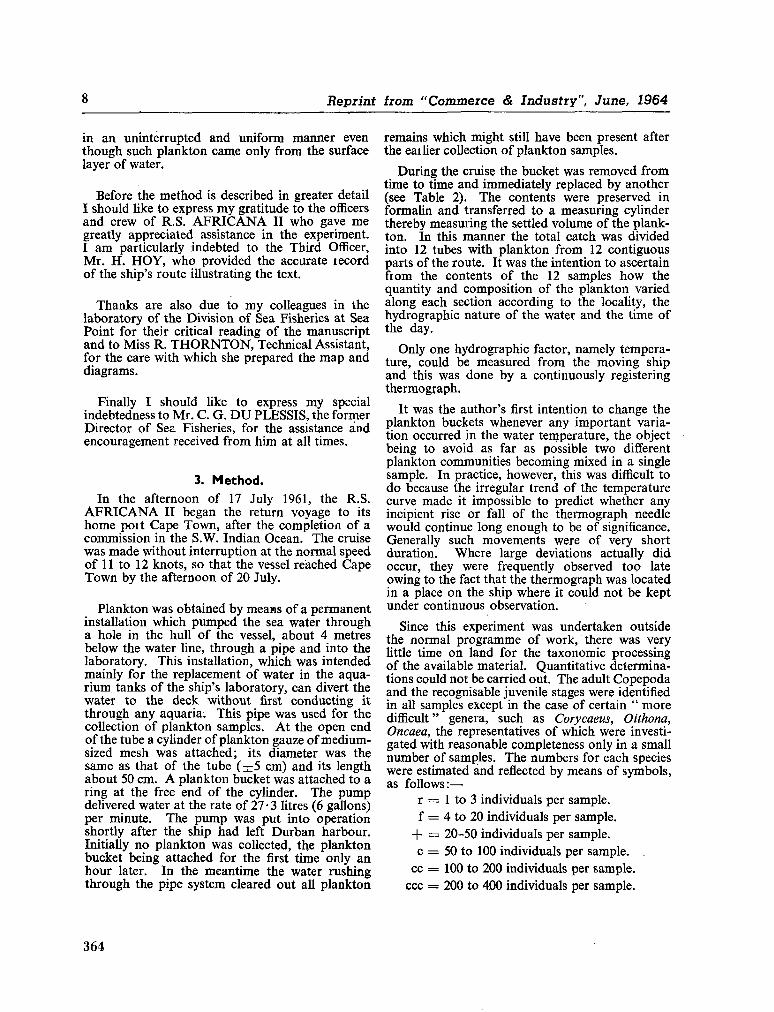
8 Repiint horn " C o m m e r c e & Industiy", June, 1964
in an uninterrupted and uniform manner even though such plankton came only from the surface layer of water.
Before the method is described in greater detail I should like to express m y gratitude to the officers and crew of R . S . A F R I C A N A II w h o gave m e greatly appreciated assistance in the experiment. I a m particularly indebted to the Third Officer, M r . H . H O Y , w h o provided the accurate record of the ship's route illustrating the text.
Thanks are also due to m y colleagues in the laboratory of the Division of Sea Fisheries at Sea Point for their critical reading of the manuscript and to Miss R . T H O R N T O N , Technical Assistant, for the care with which she prepared the m a p and diagrams.
Finally I should like to express m y special indebtedness to M r . C . G . D U PLESSIS, the former Director of Sea Fisheries, for the assistance and encouragement received from him at all times.
3. M e t h o d . In the afternoon of 17 July 1961, the R . S .
A F R I C A N A II began the return voyage to its h o m e port Cape T o w n , after the completion of a commission in the S . W . Indian Ocean. The cruise was m a d e without interruption at the normal speed of 11 to 12 knots, so that the vessel reached Cape T o w n by the afternoon of 20 July.
Plankton was obtained by means of a permanent installation which pumped the sea water through a hole in the hull of the vessel, about 4 metres below the water line, through a pipe and into the laboratory. This installation, which was intended mainly for the replacement of water in the aquarium tanks of the ship's laboratory, can divert the water to the deck without first conducting it through any aquaria. This pipe was used for the collection of plankton samples. At the open end of the tube a cylinder of plankton gauze of medium-sized mesh was attached; its diameter was the same as that of the tube ( ± 5 c m ) and its length about 50 c m . A plankton bucket was attached to a ring at the free end of the cylinder. The p u m p delivered water at the rate of 27 • 3 litres (6 gallons) per minute. The p u m p was put into operation shortly after the ship had left Durban harbour. Initially no plankton was collected, the plankton bucket being attached for the first time only an hour later. In the meantime the water rushing through the pipe system cleared out all plankton
remains which might still have been present after the eailier collection of plankton samples.
During the cruise the bucket was removed from time to time and immediately replaced by another (see Table 2). The contents were preserved in formalin and transferred to a measuring cylinder thereby measuring the settled volume of the plankton. In this manner the total catch was divided into 12 tubes with plankton from 12 contiguous parts of the route. It was the intention to ascertain from the contents of the 12 samples h o w the quantity and composition of the plankton varied along each section according to the locality, the hydrographie nature of the water and the time of the day.
Only one hydrographie factor, namely temperature, could be measured from the moving ship and this was done by a continuously registering thermograph.
It was the author's first intention to change the plankton buckets whenever any important variation occurred in the water temperature, the object being to avoid as far as possible two different plankton communities becoming mixed in a single sample. In practice, however, this was difficult to do because the irregular trend of the temperature curve made it impossible to predict whether any incipient rise or fall of the thermograph needle would continue long enough to be of significance. Generally such movements were of very short duration. Where large deviations actually did occur, they were frequently observed too late owing to the fact that the thermograph was located in a place on the ship where it could not be kept under continuous observation.
Since this experiment was undertaken outside the normal programme of work, there was very little time on land for the taxonomic processing of the available material. Quantitative determinations could not be carried out. The adult Copepoda and the recognisable juvenile stages were identified in all samples except in the case of certain " more difficult " genera, such as Corycaeus, Oithona, Oncaea, the representatives of which were investigated with reasonable completeness only in a small number of samples. The numbers for each species were estimated and reflected by means of symbols, as follows:—•
r = 1 to 3 individuals per sample, f = 4 to 20 individuals per sample.
+ = 20-50 individuals per sample, c = 50 to 100 individuals per sample,
cc = 100 to 200 individuals per sample, ccc = 200 to 400 individuals per sample.
364
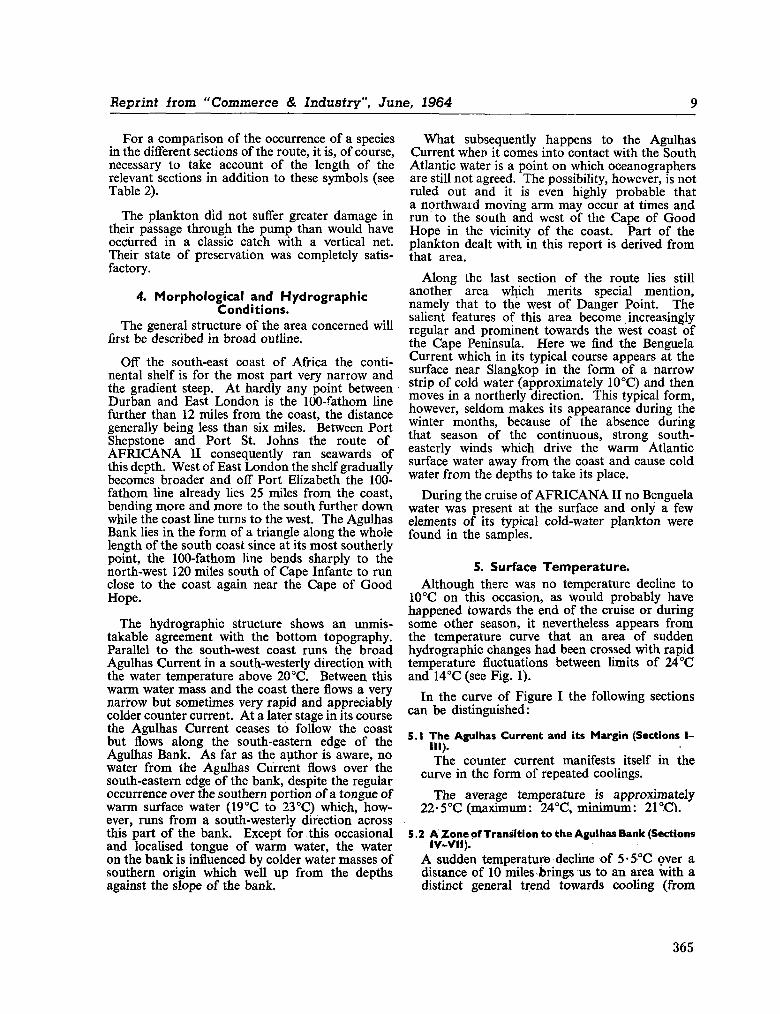
Reprint horn "Commerce & Industry", June, 1964 9
For a comparison of the occurrence of a species in the different sections of the route, it is, of course, necessary to take account of the length of the relevant sections in addition to these symbols (see Table 2).
The plankton did not suffer greater damage in their passage through the p u m p than would have occurred in a classic catch with a vertical net. Their state of preservation was completely satisfactory.
4. Morphological and Hydrographie Conditions.
The general structure of the area concerned will first be described in broad outline.
Off the south-east coast of Africa the continental shelf is for the most part very narrow and the gradient steep. At hardly any point between Durban and East London is the 100-fathom line further than 12 miles from the coast, the distance generally being less than six miles. Between Port Shepstone and Port St. Johns the route of A F R I C A N A II consequently ran seawards of this depth. West of East London the shelf gradually becomes broader and off Port Elizabeth the 100-fathom line already lies 25 miles from the coast, bending more and more to the south further down while the coast Une turns to the west. The Agulhas Bank lies in the form of a triangle along the whole length of the south coast since at its most southerly point, the 100-fathom line bends sharply to the north-west 120 miles south of Cape Infante to run close to the coast again near the Cape of G o o d Hope.
The hydrographie structure shows an unmistakable agreement with the bottom topography. Parallel to the south-west coast runs the broad Agulhas Current in a south-westerly direction with the water temperature above 20 °C. Between this warm water mass and the coast there flows a very narrow but sometimes very rapid and appreciably colder counter current. At a later stage in its course the Agulhas Current ceases to follow the coast but flows along the south-eastern edge of the Agulhas Bank. A s far as the author is aware, no water from the Agulhas Current flows over the south-eastern edge of the bank, despite the regular occurrence over the southern portion of a tongue of warm surface water (19°C to 23°C) which, however, runs from a south-westerly direction across this part of the bank. Except for this occasional and localised tongue of warm water, the water on the bank is influenced by colder water masses of southern origin which well up from the depths against the slope of the bank.
W h a t subsequently happens to the Agulhas Current when it comes into contact with the South Atlantic water is a point on which oceanographers are still not agreed. The possibility, however, is not ruled out and it is even highly probable that a northward moving arm m a y occur at times and run to the south and west of the Cape of Good Hope in the vicinity of the coast. Part of the plankton dealt with in this report is derived from that area.
Along the last section of the route lies still another area which merits special mention, namely that to the west of Danger Point. The salient features of this area become increasingly regular and prominent towards the west coast of the Cape Peninsula. Here we find the Benguela Current which in its typical course appears at the surface near Slangkop in the form of a narrow strip of cold water (approximately 10°C) and then moves in a northerly direction. This typical form, however, seldom makes its appearance during the winter months, because of the absence during that season of the continuous, strong southeasterly winds which drive the warm Atlantic surface water away from the coast and cause cold water from the depths to take its place.
During the cruise of A F R I C A N A II no Benguela water was present at the surface and only a few elements of its typical cold-water plankton were found in the samples.
5. Surface Temperature.
Although there was no temperature decline to 10°C on this occasion, as would probably have happened towards the end of the cruise or during some other season, it nevertheless appears from the temperature curve that an area of sudden hydrographie changes had been crossed with rapid temperature fluctuations between limits of 24°C and 14°C (see Fig. 1).
In the curve of Figure I the following sections can be distinguished:
5.1 The Agulhas Current and its Margin (Sections I-III). The counter current manifests itself in the
curve in the form of repeated coolings.
The average temperature is approximately 22• 5°C (maximum: 24°C, min imum: 2 1 ° 0 .
5.2 A Zone of Transition to the Agulhas Bank (Sections IV-VII).
A sudden temperature decline of 5-5°C over a distance of 10 miles brings us to an area with a distinct general trend towards cooling (from
365
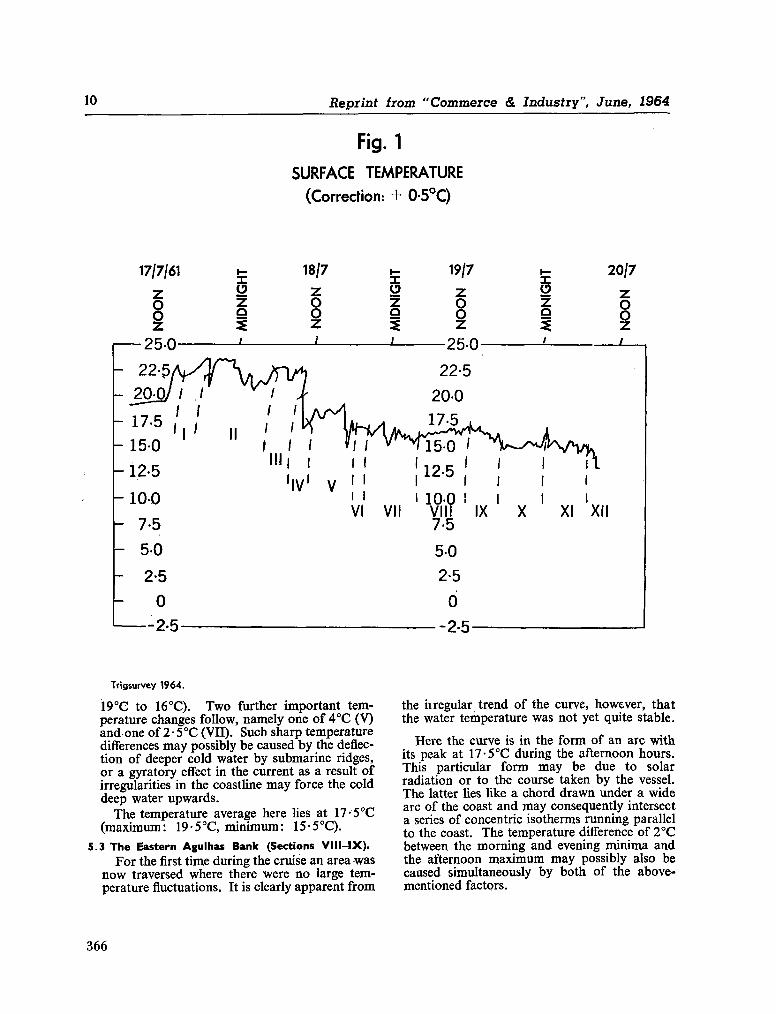
10 Reprint from "Commerce & Industry", June, 1964
Fig. 1
SURFACE TEMPERATURE (Correction: + 0-5°C)
Trigsurvey 1964.
19°C to 16°C). T w o further important temperature changes follow, namely one of 4°C (V) and one of 2-5°C (VII). Sucb sharp temperature differences m a y possibly be caused by the deflection of deeper cold water by submarine ridges, or a gyratory effect in the current as a result of irregularities in the coastline m a y force the cold deep water upwards.
The temperature average here lies at 17-5°C (maximum: 19-5°C, min imum: 15-5°C).
5.3 The Eastern Agulhas Bank (Sections VIII-IX). For the first time during the cruise an area was
n o w traversed where there were no large temperature fluctuations. It is clearly apparent from
the iiregular trend of the curve, however, that the water temperature was not yet quite stable.
Here the curve is in the form of an arc with its peak at 17-5°C during the afternoon hours. This particular form m a y be due to solar radiation or to the course taken by the vessel. The latter lies like a chord drawn under a wide arc of the coast and m a y consequently intersect a series of concentric isotherms running parallel to the coast. The temperature difference of 2°C between the morning and evening minima and the afternoon m a x i m u m m a y possibly also be caused simultaneously by both of the above-mentioned factors.
366
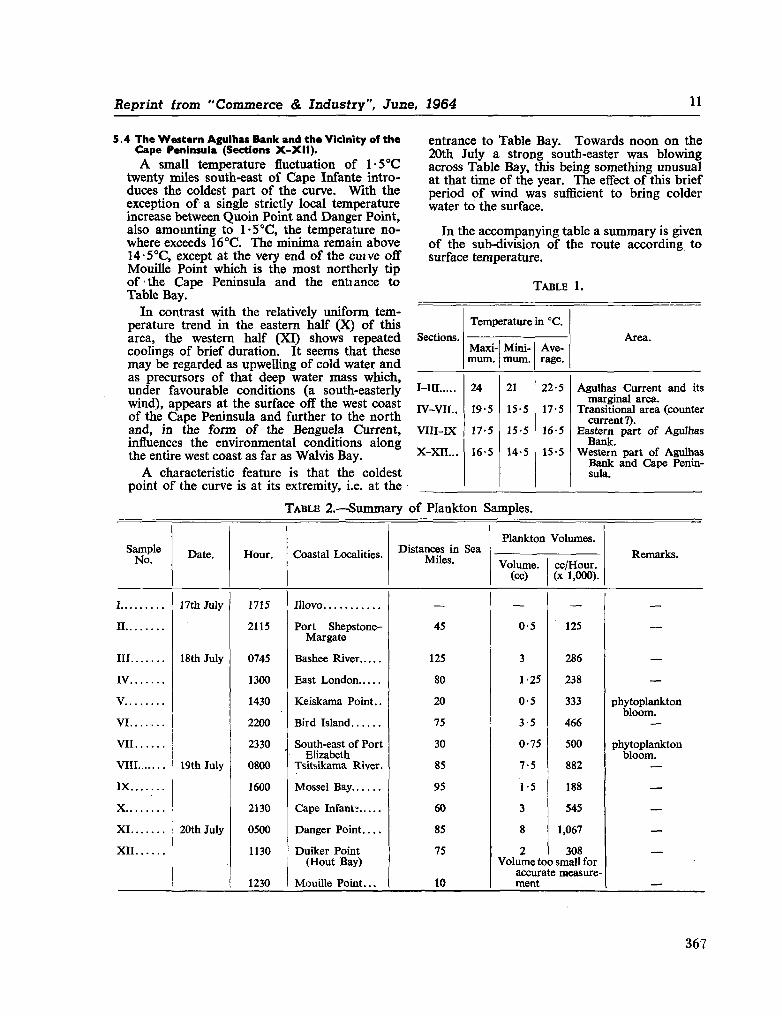
Repiint from "Commerce & Industry", June, 1964 11
5.4 The Western Agulhas Bank and the Vicinity of the Cape Peninsula (Sections X-XII).
A small temperature fluctuation of 1-5°C twenty miles south-east of Cape Infante introduces the coldest part of the curve. With the exception of a single strictly local temperature increase between Quoin Point and Danger Point, also amounting to 1-5°C, the temperature nowhere exceeds 16°C. The minima remain above 14-5°C, except at the very end of the curve off Mouille Point which is the most northerly tip of the Cape Peninsula and the entiance to Table Bay.
In contrast with the relatively uniform temperature trend in the eastern half (X) of this area, the western half (XI) shows repeated coolings of brief duration. It seems that these m a y be regarded as upwelling of cold water and as precursors of that deep water mass which, under favourable conditions (a south-easterly wind), appears at the surface off the west coast of the Cape Peninsula and further to the north and, in the form of the Benguela Current, influences the environmental conditions along the entire west coast as far as Walvis Bay.
A characteristic feature is that the coldest point of the curve is at its extremity, i.e. at the
entrance to Table Bay. Towards noon on the 20th July a strong south-easter was blowing across Table Bay, this being something unusual at that time of the year. The effect of this brief period of wind was sufficient to bring colder water to the surface.
In the accompanying table a summary is given of the sub-division of the route according to surface temperature.
TABLE 1.
Sections.
Temperature in °C.
Maxim u m .
Minim u m .
Average.
Area.
I-III
IV-VII..
VIII-IX
X - X I I . . .
24
19-5
17-5
16-5
21
15-5
15-5
14-5
22-5
17-5
16-5
15-5
Agulhas Current and its marginal area.
Transitional area (counter current?).
Eastern part of Agulhas Bank.
Western part of Agulhas Bank and Cape Peninsula.
T A B L E 2.—Summary of Plankton Samples.
Sample No. Date. Hour. Coastal Localities. Distances in Sea
Miles.
Plankton Volumes.
Volume, (cc)
cc/Hour. (x 1,000).
Remarks.
I
II...
III..
IV . .
V . . .
V I . .
VII.
VIII.
I X . .
X . . .
X I . .
XII.
17th July
18th July
19th July
20th July
1715
2115
0745
1300
1430
2200
2330
0800
1600
2130
0500
1130
1230
Illovo
Port Shepstone-Margate
Bashee River
East London
Keiskama Point..
Bird Island
South-east of Port Elizabeth
Tsitsikama River.
Mossel Bay
Cape Infant;
Danger Point
Duiker Point (Hout Bay)
Mouille Point...
45
125
80
20
75
30
85
95
60
85
75
10
0-5
3
1-25
0-5
3-5
0-75
7-5
1-5
3
8
125
286
238
333
466
500
882
188
545
1,067
308 Volume too small for
accurate measurement
phytoplankton bloom.
phytoplankton bloom.
367
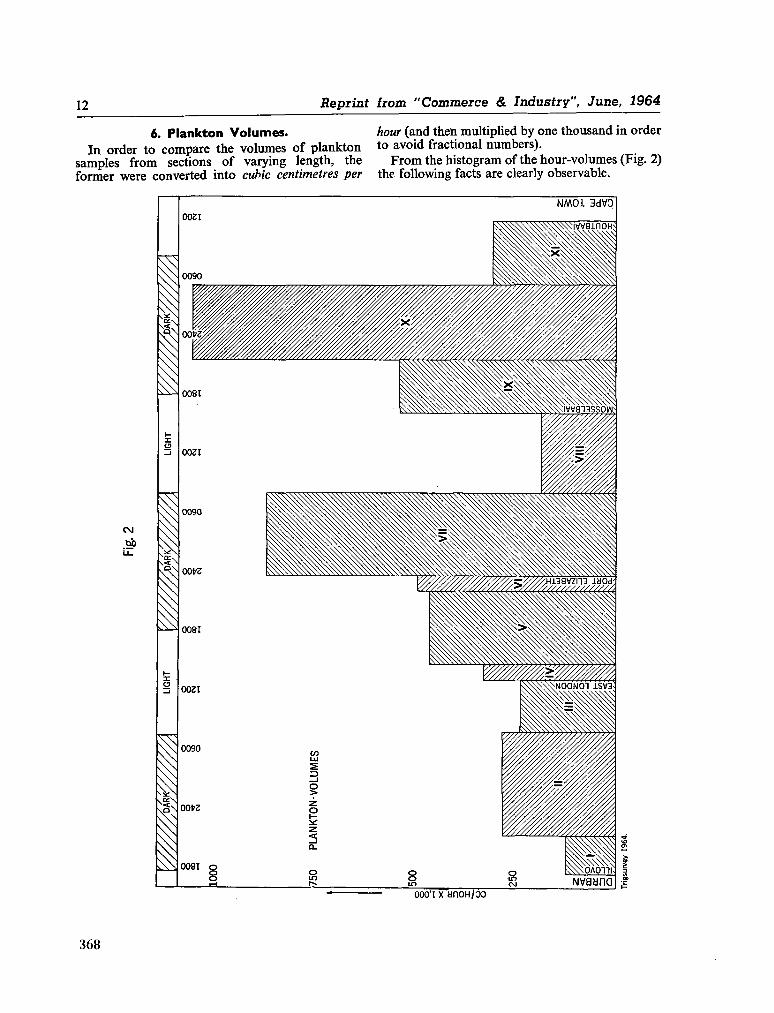
12 Reprint irom "Commerce & Industry", June, 1964
6. Plankton Volumes. In order to compare the volumes of plankton
samples from sections of varying length, the former were converted into cubic centimetres per
hour (and then multiplied by one thousand in order to avoid fractional numbers).
F r o m the histogram of the hour-volumes (Fig. 2) the following facts are clearly observable.
CM
bb
O N
NM01 3dV0 0021
0090
OOfrZ,
0081
00ZI
0090
OOfrS
0081
ooet
0090
OOfrZ
0081 o
s Nvaana ooo'i x anoH/oo
368

Reprint from "Commerce & Industry", June, 1964 13
6.1 Daily Fluctuations in Plankton Density near the Surface.
The three largest volumes were on each occasion obtained at night. The first night section (ID yielded twice as m u c h plankton as the preceding section (I), although the catching time for sample I lasted until the earliest hours of the night and the volume was consequently without any doubt increased by the nocturnal ascent of the plankton. During the second night (VII) four times more plankton, and during the third night (X) six times more plankton, were obtained than during the preceding daylight sections (III and VIII).
6.2 Increase in the Quantity of Plankton in a Westerly Direction with Declining Temperature.
This increase is already visible in the small volumes from the consecutive daylight periods. Section VIII yielded 50 per cent more than section I although the latter was favoured by ascending plankton during the late evening. The volume in section V is still larger, but is not comparable with the above-mentioned two volumes since a phytoplankton bloom was traversed here. Section X I , however, yielded 60 per cent more than section VIII.
The catches m a d e at night give an idea of the amount of plankton which sinks into deeper water during the day and which was consequently beyond the reach of the p u m p . A comparison of the three nocturnal catches shows that during the second night there was three times more plankton and during the third night almost four times more plankton than during the first.
The following comparison makes it clear that the temperature decline is not in itself the factor which causes the plankton to increase.
O n the final part of its cruise through the south-western part of the Indian Ocean between 6 and 15 July A F R I C A N A II m a d e observations at a number of océanographie stations lying in a straight line from 38 °S, 58 °E as far as 100 miles S.S.E. of Durban. Between the stations, where the whole of the day was generally spent in making observations, plankton was caught at night with the pumping apparatus described above. The surface temperatures lay between 15-5°C and 17-5°C in the south-eastern half of the section, and between 17-5°C and 20°C in the'north-western half. The average plankton volume per hour (xl,000) was 66 cc in the colder half and 138 cc in the wanner half. In both halves a short catch was also m a d e during the day and these yielded 28 cc and 38 cc (per hour x 1,000) respectively. These values from the open sea are only fractions of those obtained two days later in the appreciably warmer coastal waters south-west of Durban during the cruise to the Cape.
The increase in the plankton of the South African coastal area is undoubtedly caused by a large number of factors. O n e of these is the influence of the continental shelf with its greater complexity of communities than the open sea. Another very important factor in the area concerned is the influx of nutrients from the depths, cold water rising to the surface along the south coast. -The extent of this phenomenon becomes greater towards the west, the density of the plankton also increasing from east to west. In the plankton-deficient marine area in the S . W . Indian Ocean mentioned above, the 15°C isotherms lay "between 200 and 400 metres below the surface and the 10°C isotherms between 700 and 400 metres. Along the edge of the Agulhas bank a sharp thermocline regularly occurs and rises towards the north, the 10°C isotherm there being only at 100 metres depth.
7. Distribution of Phytoplankton. The main constituent of the plankton samples
was m a d e up of Crustacea, except in areas V and VII where the ship passed through dense masses of phytoplankton. This phytoplankton bloom was encountered in the same locality where the three large temperature declines occurred. It illustrates the effect of nutrient-rich deep water rising up and reaching the photic region. First there isa tremendous activation of algal growth (=primary production) on which the heterotrophic (animal) finks of the living community can then subsequently feed in abundance.
It was impossible to determine accurately the place of occurrence, the density and the extent of the phytoplankton patches because of the limitations of the apparatus. The question of their location in respect of the temperature minima must unfortunately remain unanswered.
I a m deeply indebted to Miss V . A . H I L L H O U S E of the Division of Sea Fisheries, for the readiness with which she undertook the identification of the algae from these two samples. In both cases their composition was very similar in so far as the predominating species are concerned, only the five diatom species which were most abundant in both samples being mentioned here, namely:—
Schrôderella sehroderi. Thalassionema nitzschioides. Thalassiosira rotula. Thalassiothrix longissima. Chaetoceros decipiens.
It is noteworthy that this algal community shows little relationship to that k n o w n from the sea area along the south east and south coasts of South Africa as a whole but it does indeed reflect a good agreement with that occurring in the cold Benguela waters along the west coast.
369
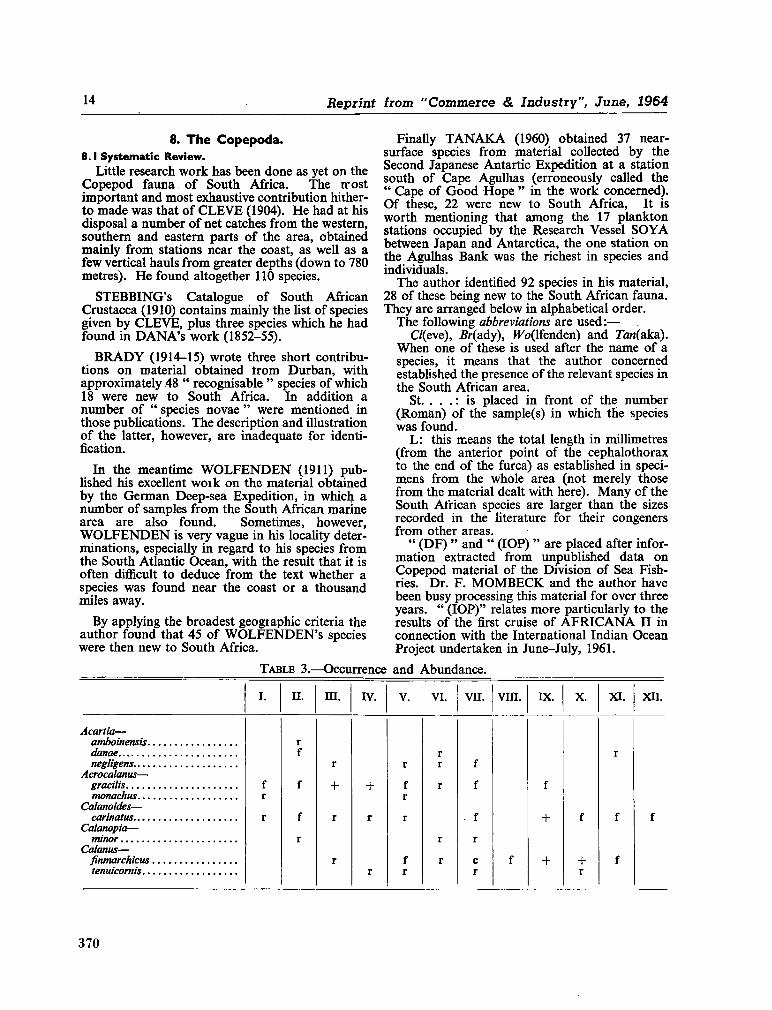
14 Repiint from "Commerce & Industry", June, 1964
8. T h e Copepoda. 8.1 Systematic Review.
Little research work has been done as yet on the Copepod fauna of South Africa. The trost important and most exhaustive contribution hitherto made was that of C L E V E (1904). H e had at his disposal a number of net catches from the western, southern and eastern parts of the area, obtained mainly from stations near the coast, as well as a few vertical hauls from greater depths (down to 780 metres). H e found altogether 110 species.
S T E B B I N G ' s Catalogue of South African Crustacea (1910) contains mainly the list of species given by C L E V E , plus three species which he had found in D A N A ' s work (1852-55).
B R A D Y (1914-15) wrote three short contributions on material obtained troro Durban, with approximately 48 " recognisable " species of which 18 were new to South Africa. In addition a number of " species novae " were mentioned in those publications. The description and illustration of the latter, however, are inadequate for identification.
In the meantime W O L F E N D E N (1911) published his excellent woik on the material obtained by the German Deep-sea Expedition, in which a number of samples from the South African marine area are also found. Sometimes, however, W O L F E N D E N is very vague in his locality determinations, especially in regard to his species from the South Atlantic Ocean, with the result that it is often difficult to deduce from the text whether a species was found near the coast or a thousand miles away.
By applying the broadest geographic criteria the author found that 45 of W O L F E N D E N ' s species were then new to South Africa.
Finally T A N A K A (1960) obtained 37 near-surface species from material collected by the Second Japanese Antartic Expedition at a station south of Cape Agulhas (erroneously called the " Cape of G o o d Hope " in the work concerned). O f these, 22 were new to South Africa, It is worth mentioning that among the 17 plankton stations occupied by the Research Vessel S O Y A between Japan and Antarctica, the one station on the Agulhas Bank was the richest in species and individuals.
The author identified 92 species in his material, 28 of these being new to the South African fauna. They are arranged below in alphabetical order.
The following abbreviations are used:— C/(eve), 5r(ady), Wo(lfenden) and Ta«(aka).
W h e n one of these is used after the name of a species, it means that the author concerned established the presence of the relevant species in the South African area.
St. . . . : is placed in front of the number (Roman) of the sample(s) in which the species was found.
L : this means the total length in millimetres (from the anterior point of the céphalothorax to the end of the furca) as established in specimens from the whole area (not merely those from the material dealt with here). M a n y cf the South African species are larger than the sizes recorded in the literature for their congeners from other areas.
" (DF) " and " (IOP) " are placed after information extracted from unpublished data on Copepod material of the Division of Sea Fish-ries. Dr . F . M O M B E C K and the author have been busy processing this material for over three years. " (IOP)" relates more particularly to the results of the first cruise of A F R I C A N A II in connection with the International Indian Ocean Project undertaken in June-July, 1961.
T A B L E 3.—Occurrence and Abundance.
H. m IV. vi. vu. vin. ix. x X I . XII.
Acartia— amboinensis. danae negligens....
Acrocalanus— gracilis monachus...
Calanoides— carinatus....
Calanopia— minor
Calamus— finmarchicus. tenuicornis..
f r r
r f
f
f
r
r
+
r
r
+
r
r
r
f r r
f r
r r
r
r
r
f
f
. f
r
c r
f
f
+
+
f
+ r
r
f
f
370
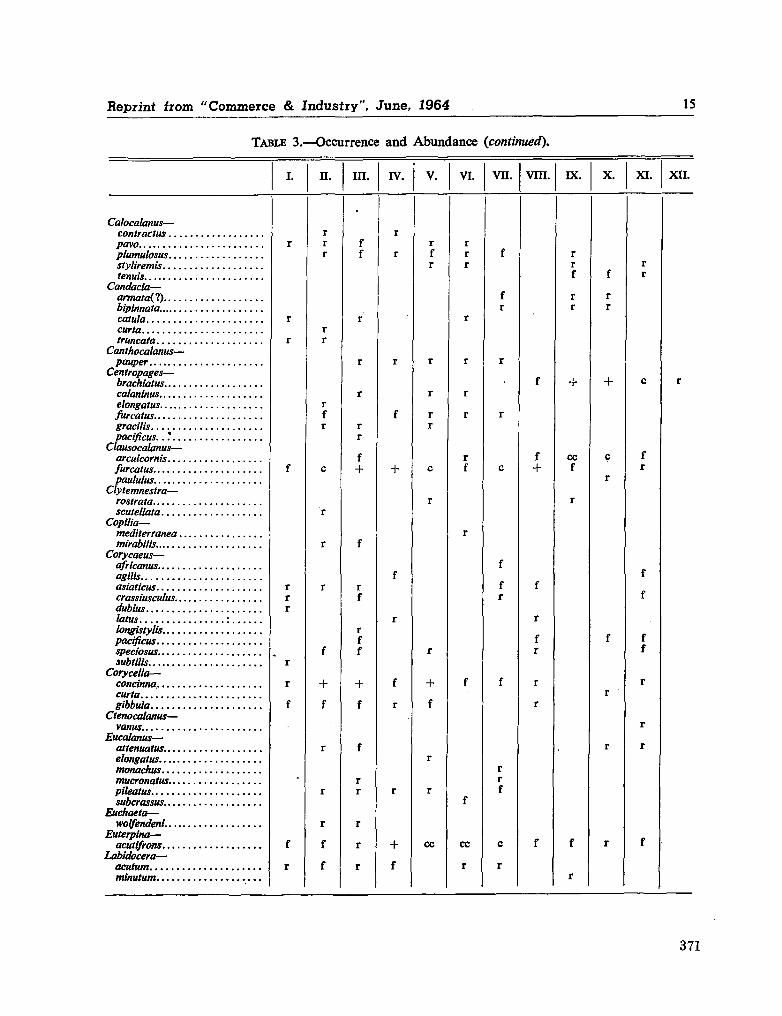
Reprint írom "Commerce & Industry", June, 1964 15
T A B L E 3.—Occurrence and Abundance (continued).
i. ii. in. iv. v. vi. VIL vra. ix. x. xi,
Calocalanus— contractus... pavo plumulosus... styliremis tenuis
Candada— armata(1) bipinnata catula curta truncata
Canthocalanus— pauper
Centropages— brachiatus.... calaninus elongatus furcatus gracilis pacificus.. .*..
Clausocalanus— arcuicornis... furcatus paululus
Clytemnestra— rostrata scutellata
Copilia— mediterránea. mirabilis.
Corycaeus— africanus agilis asiáticas crassiusculus.. dubius latus longistylis pacificus speciosus subtilis
Corycella— concinna,.... curta gibbula
Ctenocalanus— vanus
Eucalanus— attenuatus elongatus..... monachus.... mucronatus... pileatus subcrassus....
Euchaeta— y/olfendeni....
Euterpina— acutifirons....
Labidocera— acutum minutum
+ f
r r
f
+
+ f
+
+ f
+ f
cc cc
r
f
+
+
cc f
+
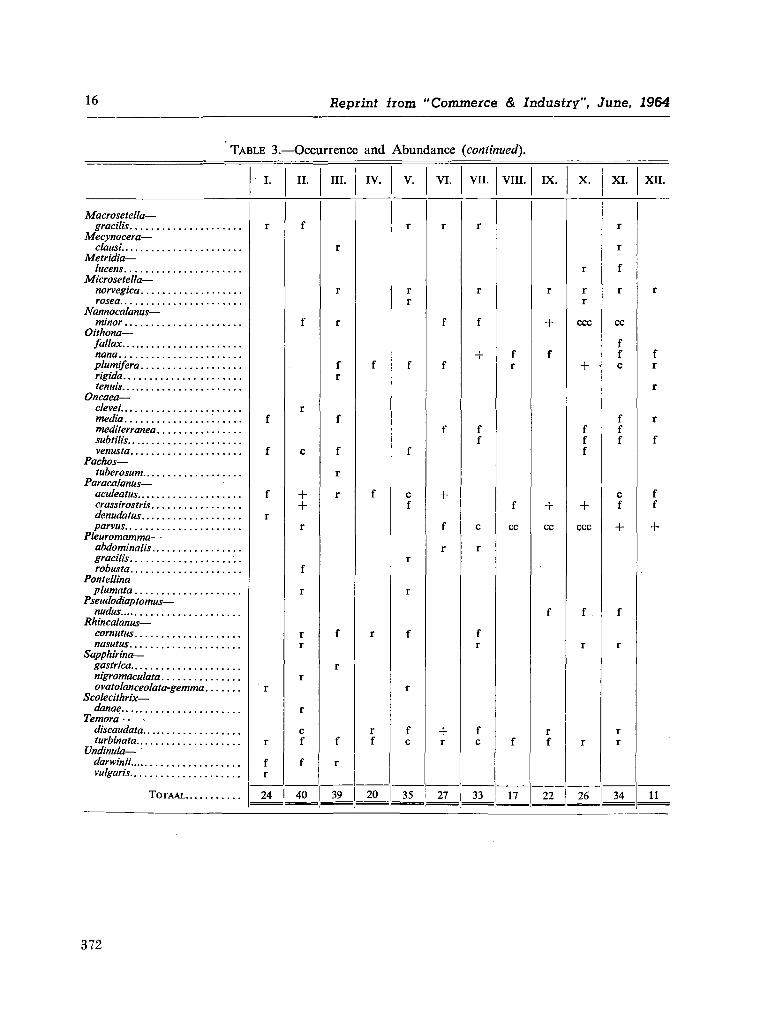
16 Reprint horn "Commezce & Industry", June, 1964
T A B L E 3.—Occurrence and Abundance (continued).
Macrosetella—
Mecynocera—
Metridia—
Microsetella—
Nannocalanus—
Oithona— fallax
Oncaea—
Pachos—
Paracalanus—•
Pleuromamma—
robusta Pontellina
Pseudodiaptomus—
Rhincalanus— cornutus
Sapphirina—
nigromaculata
Scolecithrix—
Temora—•
Undinula—
• I.
r
f
f
f
r
r
r
f r
24
II.
f
f
r
c
+ + r
f
r
r r
r
r
c f
f
40
III.
r
r
r
f r
f
f
r
r
f
r
f
r
39
IV.
f
f
r
r f
20
V.
r
r r
f
f
c f
r
r
f
r
f c
35
VI.
r
f
f
f
+
f
r
+ r
27
VII.
r
r
f
+
f f
c
r
f r
f c
33
VIII.
f r
f
cc
f
17
IX.
r
+
f
+ cc
f
r f
22
X.
r
r r
ccc
+ •
f f f
+ ccc
f
r
r
26
XI.
r
r
f
r
cc
f f c
f f f
c f
+
f
r
r r
34
XII.
r
f r
r
r
f
f f
+
11
372
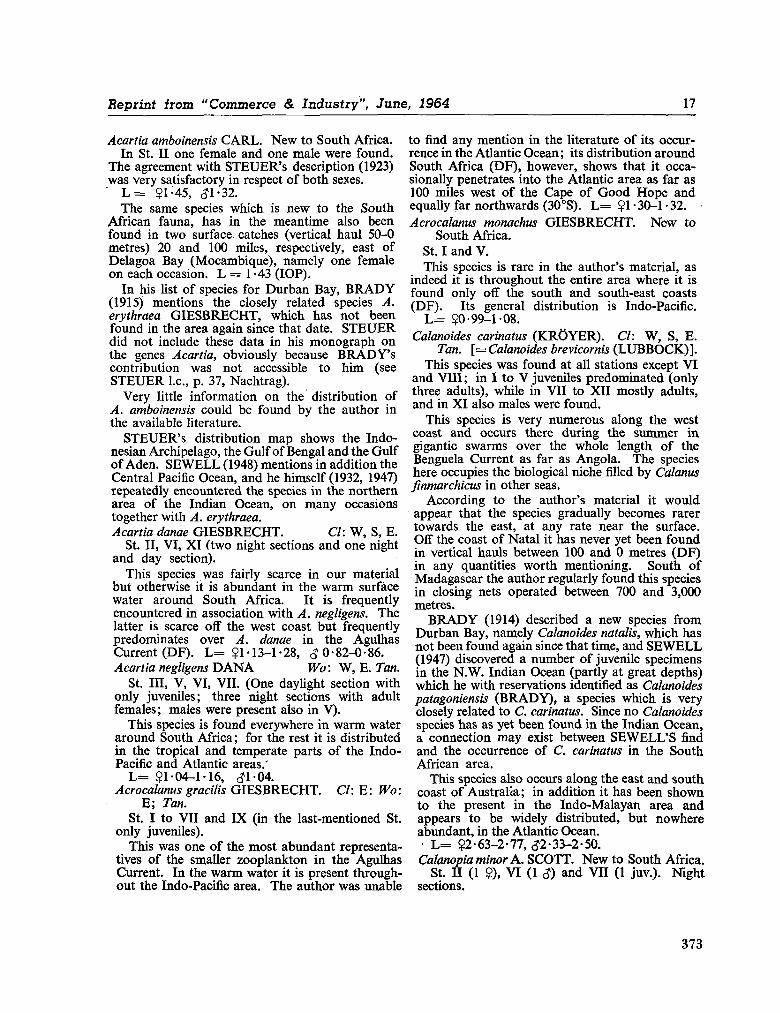
Reprint horn "Commerce & Industry", June, 1964 17
Acartia amboinensis C A R L . N e w to South Africa. In St. II one female and one male were found.
The agreement with S T E U E R ' s description (1923) was very satisfactory in respect of both sexes. ' L = $1-45, ¿1-32.
The same species which is new to the South African fauna, has in the meantime also been found in two surface, catches (vertical haul 50-0 metres) 20 and 100 miles, respectively, east of Delagoa Bay (Mocambique), namely one female on each occasion. L = 1-43 (IOP).
In his list of species for Durban Bay, B R A D Y (1915) mentions the closely related species A. erythraea G I E S B R E C H T , which has not been found in the area again since that date. S T E U E R did not include these data in his monograph on the genes Acartia, obviously because B R A D Y ' s contribution was not accessible to him (see S T E U E R L a , p. 37, Nachtrag).
Very little information on the distribution of A. amboinensis could be found by the author in the available literature.
S T E U E R ' s distribution m a p shows the Indonesian Archipelago, the Gulf of Bengal and the Gulf of Aden. S E W E L L (1948) mentions in addition the Central Pacific Ocean, and he himself (1932, 1947) repeatedly encountered the species in the northern area of the Indian Ocean, on many occasions together with A. erythraea. Acartia danae G I E S B R E C H T . Cl: W , S, E .
St. II, VI , X I (two night sections and one night and day section).
This species was fairly scarce in our material but otherwise it is abundant in the w a r m surface water around South Africa. It is frequently encountered in association with A. negligens. The latter is scarce off the west coast but frequently predominates over A. danae in the Agulhas Current (DF) . L = $1-13-1-28, <? 0-82-0-86. Acartia negligens D A N A Wo : W , E . Tan.
St. Ill, V , VI, VII. (One daylight section with only juveniles; three night sections with adult females; males were present also in V ) .
This species is found everywhere in w a r m water around South Africa; for the rest it is distributed in the tropical and temperate parts of the Indo-Pacific and Atlantic areas.'
L = $1-04-1-16, ¿1-04. Acrocalanus gracilis GIESBRECHT. Cl: E : Wo:
E; Tan. St. I to VII and IX (in the last-mentioned St.
only juveniles). This was one of the most abundant representa
tives of the smaller zooplankton in the Agulhas Current. In the warm water it is present throughout the Indo-Pacific area. The author was unable
to find any mention in the literature of its occurrence in the Atlantic Ocean ; its distribution around South Africa (DF) , however, shows that it occasionally penetrates into the Atlantic area as far as 100 miles west of the Cape of G o o d Hope and equally far northwards (30°S). L = $1-30-1-32. Acrocalanus monachus G I E S B R E C H T . N e w to
South Africa. St. I and V . This species is rare in the author's material, as
indeed it is throughout the entire area where it is found only off the south and south-east coasts (DF). Its general distribution is Indo-Pacific.
L = $0-99-1-08. Calanoides carinatus ( K R Ó Y E R ) . Cl: W , S, E .
Tan. [—Calanoides brevicornis ( L U B B O C K ) ] . This species was found at all stations except V I
and VIII; in I to V juveniles predominated (only three adults), while in VII to XII mostly adults, and in X I also males were found.
This species is very numerous along the west coast and occurs there during the summer in gigantic swarms over the whole length of the Benguela Current as far as Angola. The species here occupies the biological niche filled by Calanus finmarchicus in other seas,
According to the author's material it would appear that the species gradually becomes rarer towards the east, at any rate near the surface. Off the coast of Natal it has never yet been found in vertical hauls between 100 and 0 metres (DF) in any quantities worth mentioning. South of Madagascar the author regularly found this species in closing nets operated between 700 and 3,000 metres.
B R A D Y (1914) described a new species from Durban Bay, namely Calanoides natalis, which has not been found again since that time, and S E W E L L (1947) discovered a number of juvenile specimens in the N . W . Indian Ocean (partly at great depths) which he with reservations identified as Calanoides patagoniensis ( B R A D Y ) , a species which is very closely related to C. carinatus. Since no Calanoides species has as yet been found in the Indian Ocean, a connection m a y exist between S E W E L L ' S find and the occurrence of C. carinatus in the South African area.
This species also occurs along the east and south coast of Australia; in addition it has been shown to the present in the Indo-Malayan area and appears to be widely distributed, but nowhere abundant, in the Atlantic Ocean.
L = $2-63-2-77, ¿2-33-2-50. Calanopia minor A . S C O T T . N e w to South Africa.
St. II (1 $), VI (1 <?) and VII (1 juv.). Night sections.
373
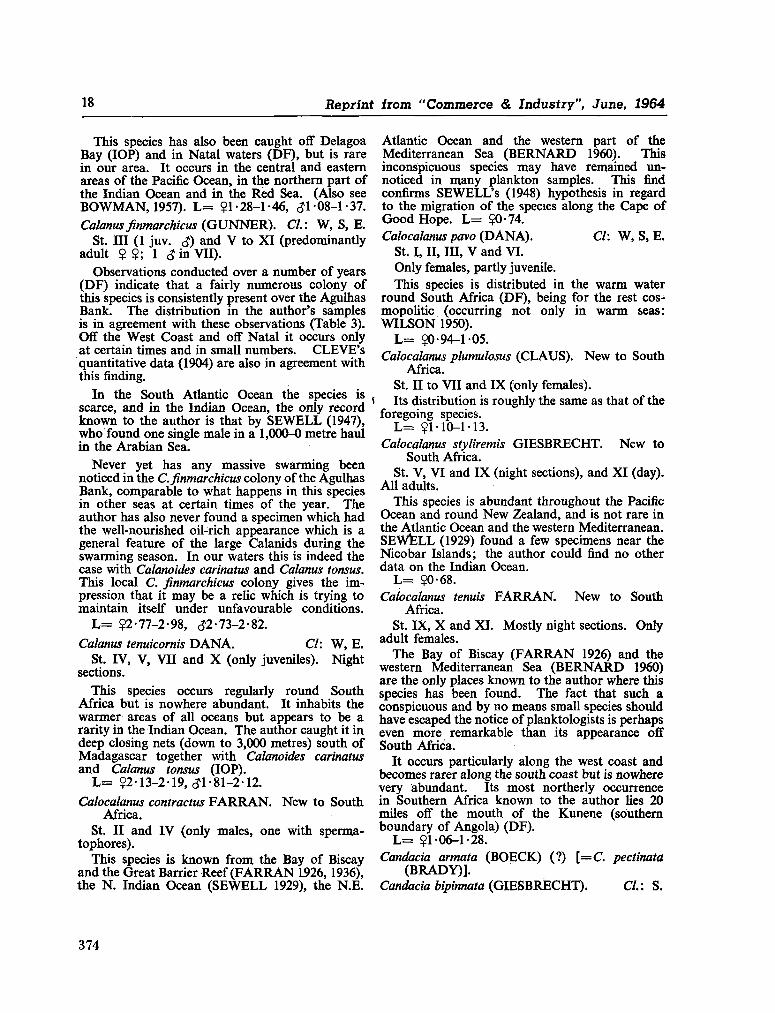
18 Reprint from " C o m m e r c e & Industry", June, 1964
This species has also been caught off Delagoa Bay (IOP) and in Natal waters (DF), but is rare in our area. It occurs in the central and eastern areas of the Pacific Ocean, in the northern part of the Indian Ocean and in the Red Sea. (Also see B O W M A N , 1957). L = $1-28-1-46, ¿1 08-1-37. Calanus finmarchicus ( G U N N E R ) . Cl: W , S, E .
St. Ill (1 juv. (?) and V to X I (predominantly adult $ $; 1 <? in VII).
Observations conducted over a number of years (DF) indicate that a fairly numerous colony of this species is consistently present over the Agulhas Bank. The distribution in the author's samples is in agreement with these observations (Table 3). Off the West Coast and off Natal it occurs only at certain times and in small numbers. C L E V E ' s quantitative data (1904) are also in agreement with this finding.
In the South Atlantic Ocean the species is scarce, and in the Indian Ocean, the only record known to the author is that by S E W E L L (1947), w h o found one single male in a 1,000-0 metre haul in the Arabian Sea.
Never yet has any massive swarming been noticed in the C. finmarchicus colony of the Agulhas Bank, comparable to what happens in this species in other seas at certain times of the year. The author has also never found a specimen which had the well-nourished oil-rich appearance which is a general feature of the large Calanids during the swarming season. In our waters this is indeed the case with Calanoides carinatus and Calanus tonsus. This local C. finmarchicus colony gives the impression that it m a y be a relic which is trying to maintain itself under unfavourable conditions.
L = $2-77-2-98, <?2- 73-2 -82.
Calanus tenuicornis D A N A . Cl: W , E . St. IV, V , VII and X (only juveniles). Night
sections. This species occurs regularly round South
Africa but is nowhere abundant. It inhabits the warmer areas of all oceans but appears to be a rarity in the Indian Ocean. The author caught it in deep closing nets (down to 3,000 metres) south of Madagascar together with Calanoides carinatus and Calanus tonsus (IOP).
L = $2-13-2-19, ¿1-81-2-12.
Calocalanus contractus F A R R A N . N e w to South Africa.
St. II and IV (only males, one with sperma-tophores).
This species is known from the Bay of Biscay and the Great Barrier Reef ( F A R R A N L926,1936), the N . Indian Ocean ( S E W E L L 1929), the N . E .
Atlantic Ocean and the western part of the Mediterranean Sea ( B E R N A R D I960). This inconspicuous species m a y have remained unnoticed in many plankton samples. This find confirms S E W E L L ' s (1948) hypothesis in regard to the migration of the species along the Cape of G o o d Hope. L = Ç0-74. Calocalanus pavo ( D A N A ) . Cl: W , S, E .
St. I, II, in, V and VI. Only females, partly juvenile. This species is distributed in the warm water
round South Africa (DF), being for the rest cos-mopolitic (occurring not only in warm seas: W I L S O N 1950).
L = $0-94-1-05. Calocalanus plumulosus ( C L A U S ) . N e w to South
Africa. St. II to VII and IX (only females). Its distribution is roughly the same as that of the
foregoing species. L = $1-10-1-13.
Calocalanus styliremis G I E S B R E C H T . N e w to South Africa.
St. V , VI and IX (night sections), and X I (day). All adults.
This species is abundant throughout the Pacific Ocean and round N e w Zealand, and is not rare in the Atlantic Ocean and the western Mediterranean. S E W E L L (1929) found a few specimens near the Nicobar Islands; the author could find no other data on the Indian Ocean.
L = $0-68. Calocalanus tenuis F A R R A N . N e w to South
Africa. St. IX, X and XI . Mostly night sections. Only
adult females. The Bay of Biscay ( F A R R A N 1926) and the
western Mediterranean Sea ( B E R N A R D 1960) are the only places known to the author where this species has been found. The fact that such a conspicuous and by no means small species should have escaped the notice of planktologists is perhaps even more remarkable than its appearance off South Africa.
It occurs particularly along the west coast and becomes rarer along the south coast but is nowhere very abundant. Its most northerly occurrence in Southern Africa known to the author lies 20 miles off the mouth of the Kunene (southern boundary of Angola) (DF).
L = $1-06-1-28. Candada armata ( B O E C K ) (?) [ = C . pectinata
(BRADY)]. Candada bipinnata ( G I E S B R E C H T ) . Cl: S.
374
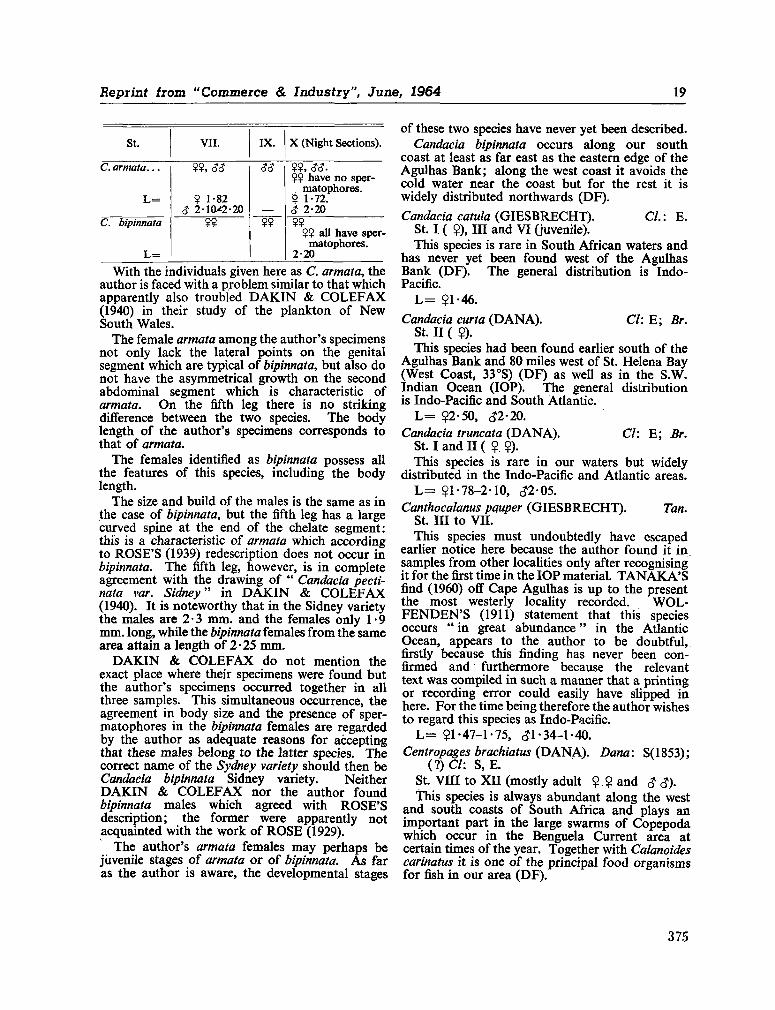
Repiint íiom " C o m m e r c e & industry", June, 1964 19
St.
C. armata...
L =
C. bipirmata
L =
VII.
99, S3
9 1-82 S 2-10¿2-20
99
IX.
cíe?
~99~
X (Night Sections).
99, 33. 99 have no sper-
matophores. 5 1-72. S 2-20 99
99 all have sper-matophores.
2-20
With the individuals given here as C. armata, the author is faced with a problem similar to that which apparently also troubled D A K I N & C O L E F A X (1940) in their study of the plankton of N e w South Wales.
The female armata among the author's specimens not only lack the lateral points on the genital segment which are typical of bipirmata, but also do not have the asymmetrical growth on the second abdominal segment which is characteristic of armata. O n the fifth leg there is no striking difference between the two species. The body length of the author's specimens corresponds to that of armata.
The females identified as bipirmata possess all the features of this species, including the body length.
The size and build of the males is the same as in the case of bipirmata, but the fifth leg has a large curved spine at the end of the chelate segment: this is a characteristic of armata which according to R O S E ' S (1939) redescription does not occur in bipirmata. The fifth leg, however, is in complete agreement with the drawing of " Candada pecti-nata var. Sidney" in D A K I N & C O L E F A X (1940). It is noteworthy that in the Sidney variety the males are 2-3 m m . and the females only 1-9 m m . long, while the bipinnata females from the same area attain a length of 2-25 m m .
D A K I N & C O L E F A X do not mention the exact place where their specimens were found but the author's specimens occurred together in all three samples. This simultaneous occurrence, the agreement in body size and the presence of sper-matophores in the bipinnata females are regarded by the author as adequate reasons for accepting that these males belong to the latter species. The correct name of the Sydney variety should then be Candada bipinnata Sidney variety. Neither D A K I N & C O L E F A X nor the author found bipinnata males which agreed with R O S E ' S description; the former were apparently not acquainted with the work of R O S E (1929).
The author's armata females m a y perhaps be juvenile stages of armata or of bipinnata. A s far as the author is aware, the developmental stages
of these two species have never yet been described. Candada bipinnata occurs along our south
coast at least as far east as the eastern edge of the Agulhas Bank; along the west coast it avoids the cold water near the coast but for the rest it is widely distributed northwards (DF).
Candada catula ( G I E S B R E C H T ) . CI. : E . St. I ( Ç), III and VI (juvenile). This species is rare in South African waters and
has never yet been found west of the Agulhas Bank (DF). The general distribution is Indo-Pacific.
L = $1-46.
Candada curta (DANA). Cl: E ; Br. St. II ( Ç). This species had been found earlier south of the
Agulhas Bank and 80 miles west of St. Helena Bay (West Coast, 33°S) (DF) as well as in the S . W . Indian Ocean (IOP). The general distribution is Indo-Pacific and South Atlantic.
L = Ç2-50, ¿2-20. Candada truncata ( D A N A ) . CI: E ; Br.
St. I and II ( $ ?). This species is rare in our waters but widely
distributed in the Indo-Pacific and Atlantic areas. L = Ç1-78-2-10, ¿2-05.
Canthocalanus pauper ( G I E S B R E C H T ) . Tan. St. Ill to VII. This species must undoubtedly have escaped
earlier notice here because the author found it in, samples from other localities only after recognising it for the first time in the IOP material. T A N A K A ' S find (1960) off Cape Agulhas is up to the present the most westerly locality recorded. W O L -F E N D E N ' S (1911) statement that this species occurs " in great abundance " in the Atlantic Ocean, appears to the author to be doubtful, firstly because this finding has never been confirmed and furthermore because the relevant text was compiled in such a manner that a printing or recording error could easily have slipped in here. For the time being therefore the author wishes to regard this species as Indo-Pacific.
L = Ç1-47-1-75, c?l'34-l-40. Centropages brachiatus ( D A N A ) . Dana: S(1853);
(?)C/: S, E . St. VIII to XII (mostly adult ? ? and ¿ <$). This species is always abundant along the west
and south coasts of South Africa and plays an important part in the large swarms of Copepoda which occur in the Benguela Current area at certain times of the year. Together with Calanoides carinatus it is one of the principal food organisms for fish in our area (DF).
375
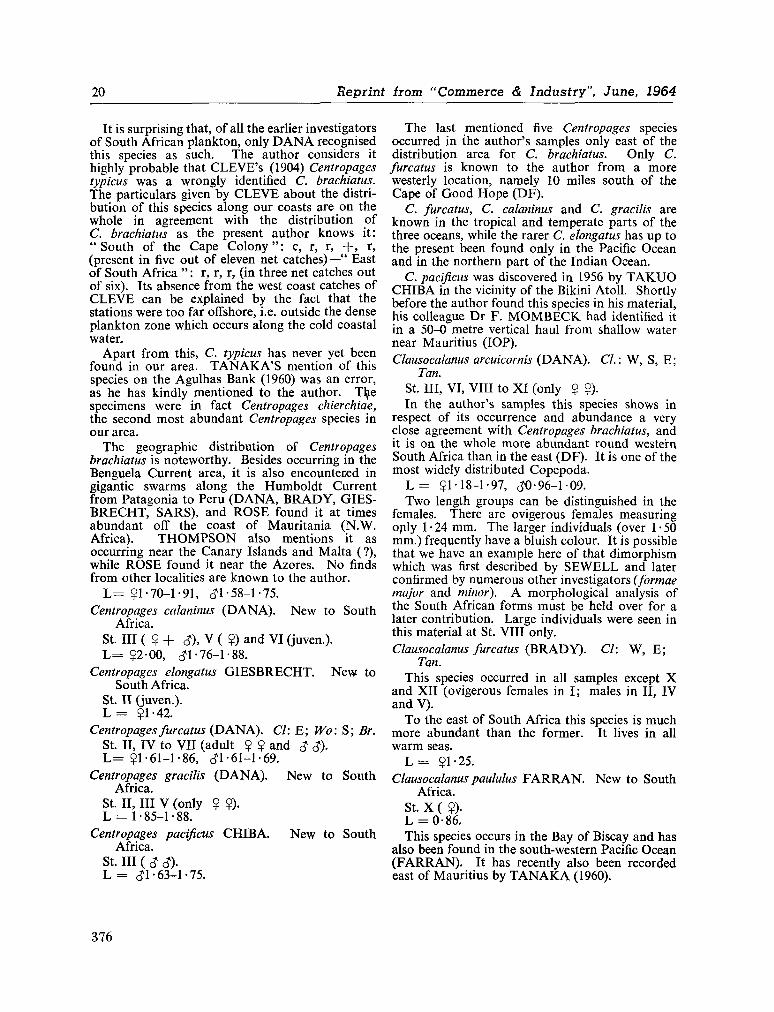
20 Reprint írom "Commerce & Industry", June, 1964
It is surprising that, of all the earlier investigators of South African plankton, only D A N A recognised this species as such. The author considers it highly probable that C L E V E ' s (1904) Centropages typicus was a wrongly identified C. brachiatus. The particulars given by C L E V E about the distribution of this species along our coasts are on the whole in agreement with the distribution of C. brachiatus as the present author knows it: "South of the Cape Colony" : c, r, r, + , r, (present in five out of eleven net catches)—" East of South Africa " : r, r, r, (in three net catches out of six). Its absence from the west coast catches of C L E V E can be explained by the fact that the stations were too far offshore, i.e. outside the dense plankton zone which occurs along the cold coastal water.
Apart from this, C. typicus has never yet been found in our area. T A N A K A ' S mention of this species on the Agulhas Bank (1960) was an error, as he has kindly mentioned to the author. The specimens were in fact Centropages chierchiae, the second most abundant Centropages species in our area.
The geographic distribution of Centropages brachiatus is noteworthy. Besides occurring in the Benguela Current area, it is also encountered in gigantic swarms along the Humboldt Current from Patagonia to Peru ( D A N A , B R A D Y , GIES-B R E C H T , S A R S ) , and R O S E found it at times abundant off the coast of Mauritania ( N . W . Africa). T H O M P S O N also mentions it as occurring near the Canary Islands and Malta (?), while R O S E found it near the Azores. N o finds from other localities are known to the author.
L = Çl-70-1-91, (J1-58-1-75. Centropages calaninus ( D A N A ) . N e w to South
Africa. St. Ill ( $ + <?), V ( ?) and VI (juven.). L = $2-00, ¿1- 76-1 -88.
Centropages elongatus G I E S B R E C H T . N e w to South Africa.
St. II (juven.). L = $1-42.
Centropages furcatus ( D A N A ) . CI: E ; W o : S ; Br. St. II, IV to VII (adult $ Ç and ¿ <J). L = Ç1-61-1-86, ¿1-61-1-69.
Centropages gracilis ( D A N A ) . N e w to South Africa.
St. II, III V (only $ ?). L = 1-85-1-88.
Centropages pacificus C H I B A . N e w to South Africa.
St. Ill ( ¿ <?). L = ¿1-63-1-75.
The last mentioned five Centropages species occurred in the author's samples only east of the distribution area for C . brachiatus. Only C . furcatus is k n o w n to the author from a more westerly location, namely 10 miles south of the Cape of Good Hope (DF).
C. furcatus, C. calaninus and C. gracilis are k n o w n in the tropical and temperate parts of the three oceans, while the rarer C. elongatus has up to the present been found only in the Pacific Ocean and in the northern part of the Indian Ocean.
C . pacificus was discovered in 1956 by T A K U O C H I B A in the vicinity of the Bikini Atoll. Shortly before the author found this species in his material, his colleague D r F . M O M B E C K had identified it in a 50-0 metre vertical haul from shallow water near Mauritius (IOP). Clausocalanus arcuicornis ( D A N A ) . CI. : W , S, E ;
Tan. St. Ill, VI , VIII to X I (only $ ?). In the author's samples this species shows in
respect of its occurrence and abundance a very close agreement with Centropages brachiatus, and it is on the whole more abundant round western South Africa than in the east (DF) . It is one of the most widely distributed Copepoda.
L = Ç M 8 - 1 - 9 7 , ¿0-96-1-09. T w o length groups can be distinguished in the
females. There are ovigerous females measuring only 1 • 24 m m . The larger individuals (over 1 • 50 m m . ) frequently have a bluish colour. It is possible that w e have an example here of that dimorphism which was first described by S E W E L L and later confirmed by numerous other investigators (formae major and minor). A morphological analysis of the South African forms must be held over for a later contribution. Large individuals were seen in this material at St. VIII only. Clausocalanus furcatus ( B R A D Y ) . Cl: W , E ;
Tan. This species occurred in all samples except X
and XII (ovigerous females in I; males in II, IV and V ) .
To the east of South Africa this species is much more abundant than the former. It lives in all warm seas.
L = $1-25. Clausocalanus paululus F A R R A N . N e w to South
Africa. St. X ( $). L=0-86. This species occurs in the Bay of Biscay and has
also been found in the south-western Pacific Ocean ( F A R R A N ) . It has recently also been recorded east of Mauritius by T A N A K A (1960).
376
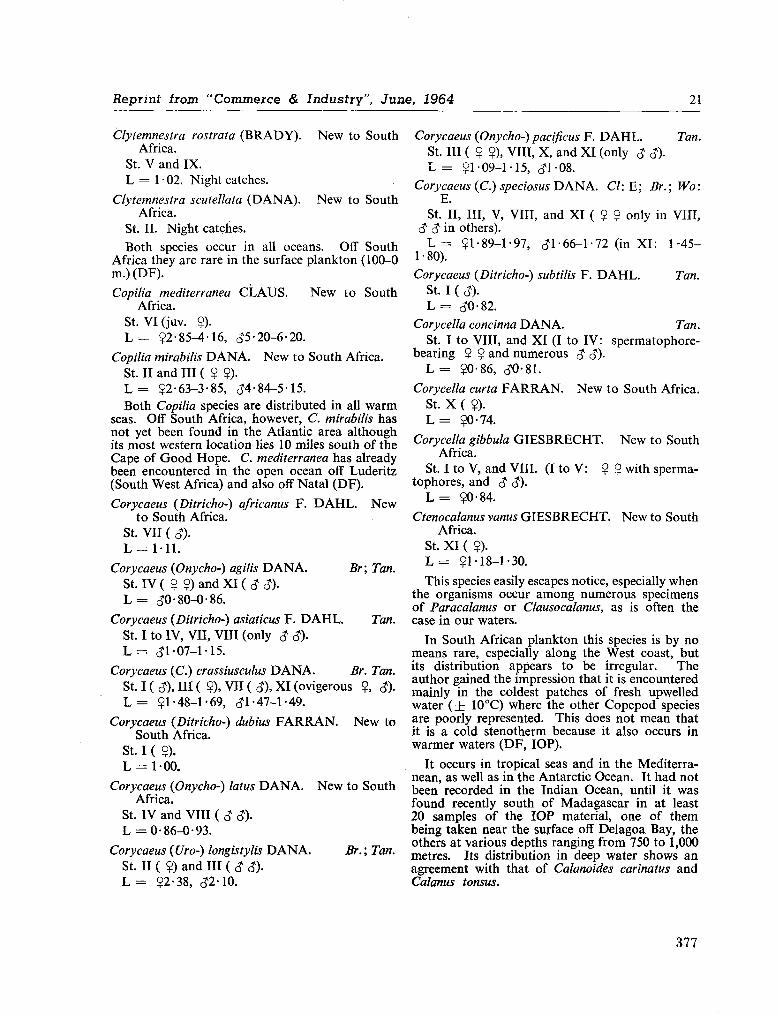
Reprint írom "Commerce & Industry", June, 1964 21
Clytemnestra rostrata ( B R A D Y ) . N e w to South Africa.
St. V and IX. L = 1 0 2 . Night catches.
Clytemnestra scutellata ( D A N A ) . N e w to South Africa.
St. II. Night catches.
Both species occur in all oceans. Off South Africa they are rare in the surface plankton (100-0 m . ) (DF).
Copilia mediterránea C L A U S . N e w to South Africa.
St. VI(juv. $). L = $2-85-4-16, ¿5-20-6-20.
Copilia mirabilis D A N A . N e w to South Africa. St. II and III ( $ ?). L = Ç2-63-3-85, ¿4-84-5-15. Both Copilia species are distributed in all w a r m
seas. Off South Africa, however, C. mirabilis has not yet been found in the Atlantic area although its most western location lies 10 miles south of the Cape of G o o d Hope . C. mediterránea has already been encountered in the open ocean off Luderitz (South West Africa) and also off Natal (DF).
Corycaeus (Ditricho-) africanus F . D A H L . N e w to South Africa.
St. VII ( ¿).
L = 1 1 1 .
Corycaeus (Onycho-) agilis D A N A . Br; Tan. St. IV ( ? $) and XI ( ¿ ¿). L = ¿0-80-0-86.
Corycaeus (Ditricho-) asiaticus F. D A H L . Tan. St. I to IV, VII, VIII (only ¿ ¿). L = ¿1-07-1-15.
Corycaeus (C.) crassiusculus D A N A . Br. Tan. St. I ( ¿), III ( ?), VII ( ¿), X I (ovigerous ?, ¿). L = Ç1-48-1-69, ¿1-47-1-49.
Corycaeus (Ditricho-) dubius F A R R A N . N e w to South Africa.
St. I ( Ç). L = 100.
Corycaeus (Onycho-) latus D A N A . N e w to South Africa.
St. IV and VIII ( ¿ ¿). L = 0 - 8 6 - 0 - 9 3 .
Corycaeus (Uro-) longistylis D A N A . Br. ; Tan. St. II ( $) and III ( ¿ ¿). L = Ç2-38, ¿2-10.
Corycaeus (Onycho-) pacificus F . D A H L . Tan. St. Ill ( $ ?), VIII, X , and X I (only ¿ ¿). L = $1 -09-1 -15, ¿108.
Corycaeus (C.) speciosus D A N A . CI: E ; Br.; W o : E .
St. II, III, V , VIII, and X I ( ? ? only in VIII, ¿ ¿ in others).
L = $1-89-1-97, ¿1-66-1-72 (in X I : 1-45-1-80).
Corycaeus (Ditricho-) subtilis F . D A H L . Tan. St. I ( ¿).
L = ¿0-82.
Cory celia concinna D A N A . Tan. St. I to VIII, and XI (I to IV: spermatophore-
bearing $ $ and numerous ¿ ¿). L = $0-86, ¿0-81.
Corycella curta F A R R A N . N e w to South Africa. St. X ( $). L = $0-74.
Corycella gibbula G I E S B R E C H T . N e w to South Africa.
St. I to V , and VIII. (I to V : $ ? with sperma-tophores, and ¿ ¿).
L = Ç0-84.
Ctenocalanus vanus G I E S B R E C H T . N e w to South Africa.
St. XI ( ?). L = Ç1-18-1-30.
This species easily escapes notice, especially when the organisms occur among numerous specimens of Paracalanus or Clausocalanus, as is often the case in our waters.
In South African plankton this species is by no means rare, especially along the West coast, but its distribution appears to be irregular. The author gained the impression that it is encountered mainly in the coldest patches of fresh upwelled water ( ± 10CC) where the other Copepod species are poorly represented. This does not mean that it is a cold stenotherm because it also occurs in warmer waters (DF, IOP).
It occurs in tropical seas and in the Mediterranean, as well as in the Antarctic Ocean. It had not been recorded in the Indian Ocean, until it was found recently south of Madagascar in at least 20 samples of the I O P material, one of them being taken near the surface off Delagoa Bay, the others at various depths ranging from 750 to 1,000 metres. Its distribution in deep water shows an agreement with that of Calanoides carinatus and Calanus tonsus.
377
22 Reprint from "Commerce & Industry", June, 1964
Eucalanus attenuatus ( D A N A ) . CI: E ; Wo: S, E ; Br.
St. II, III, X and X I (only juven.). L = $4-74-6-40, ¿5-76.
Eucalanus elongatus D A N A . CI. : E . St. V (juven.). L = $5-78-6-88, ¿4-4-4-54.
Eucalanus monachus G I E S B R E C H T . Cl: E . St. VII ( $).
Eucalanus mucronatus G I E S B R E C H T . Cl: E ; Tan.
St. Ill ( $) and VII (juven. $). L = $3-13.
Eucalanus pileatus G I E S B R E C H T . Cl: E . St. II to V and VII ( ? ? + ¿ c?). L = ?2-19-2-22.
Eucalanus subcrassus G I E S B R E C H T . C7. : E . St. VI (one $ + one ¿). ' L = $2-10-2-81. All of these Eucalanus species occur in the w a r m
and temperate areas of the three oceans. Off South Africa, E . attenuatus, E . elongatus, E . pileatus and E . subcrassus are fairly abundant (DF) . Euchaeta wolfendeni A . S C O T T . N e w to South Africa.
St. II (ovigerous and juvenile $ $) and III (juven.' $).
This species is Indo-Pacific. It has been found off Natal and Mocambique (DF, IOP).
L = $2-66-2-77. Euterpina acutifrons ( D A N A ) . Br. ; Tan
All samples, except XII, contained $ $, IV to VII ovigerous specimens, and VII also ¿ ¿ .
L = $0-58-0-82, ¿0-62-0-64. This species is present round South Africa and is
known in all seas. Its occurrence in the author's material points to a distribution similar to that "of Calanus finmarchicus, being more abundant on the Agulhas Bank. It is significant that on the whole voyage from Japan to Antarctica, the S O Y A found this species only here, 17 individuals occurring in one sample.
Labidocera acutum ( D A N A ) . CI: E ; Wo: E ; Br. St. I to IV, VI and VII (adult ? $ and ¿ ¿ in I
to III only, elsewhere juveniles). L = $3-02-3-35, ¿2-95-3-30. The above distribution is completely in agreement
with the general findings round South Africa (DF), as well as with the literature: the species is more abundant in the Indo-Pacific than in the Atlantic area [cf. W O L F E N D E N (1911), W I L S O N (1942)].
Labidocera minutum G I E S B R E C H T . N e w to South Africa.
St. IX ( $). L = 1-94-2-04. This species has hitherto been found in the
South African area only along the south and east coasts (DF) and for the rest only in the Indo-Pacific area ( G I E S B R E C H T , A . S C O T T , WILSON). Macrosetella gracilis ( D A N A ) . Wo: S ; Br; Tan.
St. I, II, V to VII ( ¿ ¿ here) and X I . L = $1-30-1-40. This species is distributed in the w a r m waters
round South Africa, mostly in small patches, but occasionally it occurs in swarms. It is more abundant in the Agulhas Current (DF) . The general distribution is cosmopolitic, including the Antarctic Ocean.
Mecynocera clausi I. C . T H O M P S O N . N e w to South Africa.
St. Ill and XI . L = 1-09-1-29. This species is cosmopolitic and is fairly abun
dant here and there round South Africa (DF). Metridia lucens B O E C K . CI: W , S.
St. X and XI. L = $2-24-2-92, ¿1-78-1-83. This species is one of our most important food
organisms for fish and plays a major role in many of the large plankton swarms in the Benguela Current area. It shows a preference for cold water and the densest swarms occur near the coldest patches of upwelling. Where w a r m Atlantic water lies near the surface along the west coast, this species can be found in deeper water or below the thermocline. It is also found regularly along the south coast in 100-0 metre vertical hauls, but swarms are rarer here than off the west coast (DF) .
Its general distribution includes not only the North and South Atlantic and Pacific areas but also areas near the Galapagos and Philippine Islands where it has been found in small numbers. The author was unable to find any data on the Indian Ocean in the literature, except for one laconic observation of S A R S (1925): " M e r Rouge ". In the area south of Madagascar this species has, however, been taken in five closing net catches at depths between 500 and 1,500 metres (IOP). Microsetella norvegica ( B O E C K ) . N e w to South
Africa. St. Ill, V , VII and IX to XII (only $). L = $0-40-0-56.
378
Repiint íiom "Commeice & Industry", June, 1964 23
Microsetella rosea ( D A N A ) . Tan. St. V and X . L = $0-79-0-93.
The distribution of these two species in our area compares well with that given by W I L S O N in the Carnegie plankton, I.e. norvegica more abundant in the Atlantic, rosea more abundant in the Indian (resp. Pacific) Ocean.
In the deep catches south of Madagascar both species show a certain agreement in their distribution with that of the calanids Calanoides carinatus and Calanus tonsus. M . norvegica, however, does not occur near the surface there, whereas rosea does (IOP).
Nannocalanus minor ( C L A U S ) . Cl: W , S, E . ; Tan. St. II, III, VI , VII, IX, X and X I . Night sections. L = $1-75-2-20, ¿1-67-1-84.
According to W I L S O N (1950), " this is one of the most widely distributed Calanids ". This statement is entirely pertinent in the South African area, since this species is absent only from a very narrow strip along the west coast where the temperature is too low. A t times it represents more than 50 per cent of the Copepoda found in a catch ( D F ) .
Oithonafallax F A R R A N . Tan. St. XI $ $.
Oithona nana G I E S B R E C H T . Cl: S ; Tan, St. VII to IX, X I and XII (mainly night sections).
L = Ç0-62.
This species is abundant round our coast, particularly in colder water.
Oithona plumífera B A I R D . CI: W , S, E ; Wo: W , E ; Br; Tan.
St : Present everywhere except I, II, VII and I X . L = $1-12-1 -39.
Oithona rígida G I E S B R E C H T . Cl.: E . St. Ill ( $). L = $0-90.
Oithona tenuis R O S E N D O R N . N e w to South Africa.
St. XII ( $). L = $1-27.
Oncaea clevei F R Ü C H T L . Tan. St. II (ovigerous Ç).
L = 0-68.
Oncaea media GIESBRECHT. Cl: W , E ; Tan. St. I, III, X I and XII ( $ $ everywhere, in III:
ovigerous $ $ + ¿ $). L = $0-62-0-97, $0-64-0-75.
Ocaea mediterránea ( C L A U S ) . Cl: W , S, E . St. V I , VII, X and X I (ovigerous $ $ every
where). L = $1-33.
Oncaea subtilis G I E S B R E C H T . Cl: S. St. VII, X , X I and XII (only $ $, ovigerous in
XI). L = $0-58-0-59.
Oncaea venusta PHILIPPI . CI: W , S, E ; Wo: E ; Br; Tan.
St. I, II, III, V , VIII and X (ovigerous $ $ in III).
L = $0-99-1-50 (mostly 1-42-1-46), ¿0-87 . M o s t of the Oncaea species are cosmopolitic in
w a r m and temperate areas. Pachos tuberosum ( G I E S B R E C H T ) . Cl: E ; Br. (?).
St. Ill ( <J). L = ¿2-58-2-63. In our area this species is found only off the
Natal coast where it occurs infrequently but nevertheless regularly. Hitherto only males were taken ( D F ) . Paracalanus acuieatus ( G I E S B R E C H T ) . Cl: S ;
Tan. St. I to VI, X I and XII ( ¿ ¿ in V and VI). This is a cosmopolitic species which in our area
avoids the proximity of cold patches of upwelled water near the coast but for the rest it is the commonest Paracalanus species round South Africa. Paracalanus crassirostris F . D A H L . / . typica
FRÜCHTL. Tan. St. II, V , VIII to XII. L = $0-57-0-66. In these specimens the anterior antennae extend
as far as the extremity of the furca, in agreement with T A N A K A ' S remarks (I960), whereas S E W E L L observes about his specimens from the Indian Seas : " The antenna reaches back only to the level of the posterior thoracic margin ".
In our area the species is abundant in the west ( D F ) . M A R Q U E S (1953) found the forma scotti F R U C H T L in all plankton samples from Angola and frequently in great abundance. Paracalanus denudatus S E W E L L . N e w to South
Africa. St. I ( $). L = 0-83.
379
24 Reprint horn "Commerce & Industry", June, 1964
Its presence has also been established from the South China Sea ( T A N A K A 1960) and the Great Barrier Reef ( F A R R A N 1936) right through the Northern Indian Ocean as far as the Arabian Sea ( S E W E L L 1947).
Paracalanus parvus (CLAUS). Cl: S; Br; Tan. St. II ( $), VI to XII ( $ ? + <? ¿). L = $0-90-0-95. This species takes the place of P. aculeatus
almost everywhere in the colder waters along our western and southern coasts where it m a y occur in large quantities (DF). It is cosmopolitic.
Pleuromamma abdominalis ( L U B B O C K ) . Cl: W , E; Wo: W , S; Br.
St. VI and VII ( $ $). Night section.
L = $2-77-3-60, ¿3-18-3-40.
Pleuromamma robusta (F. D A H L ) . Cl: W , E ' St. II ( $ + juv.). Night section.
Pleuromamma gracilis (CLAUS). Cl: W , S, E ; Wo: S.
St. V ( ? + juv. $). L = $2- 00-2 -25. All three of these Pleuromamma species are cos
mopolitic.
Pontellina plumata ( D A N A ) . Cl: E ; Br. St. Ill and V (juven.). L = $1-75-1-85, ¿1-43-1-58. This species is a warm-water cosmopolite which
is never abundant in our area but which occurs regularly in the w a r m waters off our coast; off Natal it is more numerous than elsewhere (DF).
Pseudodiaptomus nudus T A N A K A . Cl: S ; Tan-Sí. IX, X and X I (ovigerous $ $ , ¿ ¿ and
juveniles). L = $1-22-1-52 (mainly 1-42-1-48), ¿1-20-
1-29. T A N A K A (1960) discovered this species in
material from the Agulhas Bank and described it as being different from Ps. serricaudatus (T. S C O T T ) .
There can be no doubt that the organisms which were obtained from the same area and which C L E V E (1904) called Ps. serricaudatus, were really Ps. nudus.
This species occurs on the Agulhas Bank throughout the year and can at places be fairly numerous. Sometimes its area appears to extend westwards beyond the Cape of G o o d Hope, after which it turns to the north and appears as a narrow strip parallel to the west coast at least as far as 30°S. (DF). This distribution picture suggests water transport according to the same
pattern, possibly a northward sweeping arm of the Agulhas Current.
It is noteworthy that the author also repeatedly found this species off the Kunene River mouth (southern boundary of Angola). M A R Q U E S (1953, 1958) mentions the occurrence of Ps. serricaudatus off Angola, and her measurements agree more closely with T . S C O T T ' S (1894, as Heterocalanus serricaudatus) than with those of the author (DF).
The genus Pseudodiaptomus is well known for its numerous species, the majority of which are littoral forms with a limited distribution.
Rhincalanus cornutus D A N A . Cl: E ; Br. St. I ( $), II to V (juven.) and VII ( $). Adults in
night sections.
Rhincalanus nasutus G I E S B R E C H T . CI. : W , S, E . St. II, VII (adult $ $), and X and X I (juven.
$ $). Night sections. L = $3 • 60-4 • 52, ¿3 • 45-3 • 67. Although both Rhincalanus species are repre
sented in the waters round South Africa and in fact both live in the three great oceans, it is very clear from their distribution in our area that Rh. cornutus has a predilection for warmer water; its real habitat is the Agulhas Current since it is a rarity off the west coast. Rh. nasutus on the other hand, is abundant along the west coast, especially in the Benguela Current, and also over the Agulhas Bank (DF). Both species are present in the S . W . Indian Ocean, cornutus seldom being encountered deeper, and nasutus seldom higher, than the 500 m . level (IOP). This occurrence is in agreement with S E W E L L ' S diagram (1948, p. 366, Fig. 81) of the vertical distribution of the Rhincalanus species in the Indian Ocean.
Sapphirina gástrica G I E S B R E C H T . N e w to South Africa.
St. Ill ( ¿). L = 1-85.
Sapphirina nigromaculata C L A U S . Cl: E . St. II (ovigerous $ + juven.). L = $2-16-2-34, ¿1-81-2-57.
Sapphirina ovatotanceolata-gemma ( D A N A ) . CI: E ; Br; Tan.
St. II (juv. $ ) a n d V ( $). L = $2-22, ¿3-86. These Sapphirina species occur in all three
oceans. Scolecithrix danae (LUBBOCK). Cl: W . E ;
Wo: W ; Br. St. II (juv. $). L = $1-94-2-19, ¿2-05-2-39.
380
Reprint horn "Commerce & Industry", June, 1964 25
This is a cosmopolitic warm-water species which occurs regularly round South Africa but which is nowhere very abundant (DF). Temora cliscaudata G I E S B R E C H T . Cl: E .
St. II, IV to VII, IX and XI (Both sexes, with juveniles also in V)/
L = ÇI-73-2-05, ¿1-78-1-95. This is an !ndo-Pacific species, although
T H O M P S O N and A . S C O T T recorded it on one occasion in the Mediterranean. At times it is fairly abundant along bur south and east coasts; its most westerly point of occurrence hitherto recorded lies 10 miles south of the Cape of G o o d Hope (DF).
Temora turbinata ( D A N A ) . Br. (as T . africana); Tan.
Everywhere except in St. XII ( ¿ ¿ in VI and IX; juv. in I, IV, V and VIII).
L = 9(l-16)-l-34-l-45, ¿1-18-1-28. This species is more abundant in our area than
the foregoing and is also fairly numerous off the west coast—but never in the upwelled water (DF). It is a cosmopolite. Undinula danvinii ( L U B B O C K ) . Cl: E ; Br.
St. I to III ( ? Ç + ¿ ¿)-
L = Ç2-08-2-39, ¿1-97-2-30.
Undinula vulgaris ( D A N A ) . - Cl: E ; Br. St. I ( $). L = 52 -80-3 00, ¿2-47-2-60. Both Undinula species were frequently found
together in our nets. They are far more abundant in the eastern area but nevertheless not rare in the west. From their distribution pattern for the west coast, it is clearly apparent that they avoid the cold water. In winter when the upwelling is slightest, they m a y occur fom the Cape of G o o d Hope to far in the north (DF).
Both are cosmopolites. W I L S O N (1942) found vulgaris abundant in the Atlantic Ocean and darwinii more abundant in the Pacific Ocean. T A N A K A (1960) encountered vulgaris even in the Sub-Antarctic area (48 °S).
8.2 Discussion.
Before proceeding to draw conclusions from the above results, w e should first consider fhe following three sources of errors:—
1. Only a single plankton catch is discussed here and if taken in another season its composition might have been different.
II. Only surface plankton was collected (from a depth not exceeding 4 metres). Its composition could have been strongly influenced by the daily vertical migration of a number of
species. For this reason the absence of a species from certain parts of a section should not necessarily be regarded as a gap in its distribution because the organisms m a y possibly have retreated temporarily to deeper water under the influence of sunlight.
III. Our knowledge of the general distribution of the Copepoda is still very incomplete and partly uncertain. M a n y data from the literature upon which one is dependent for a bio-geographic assessment - of one's o w n findings will in course of time appear to be incomplete or sometimes even inaccurate as a result of incorrect identification.
In regard to points I and II, the following observations m a y be made :—
A d I. U p to a certain point the possible occurrence of seasonal changes m a y be tested against the results of earlier investigations in this area and against the unpublished data in the archives of the Division of Sea Fisheries at Sea Point. Within the framework of this short communication it is not possible to enter into details, but none of the above-mentioned sources of information is in flagrant conflict with the author's results. Only T A N A K A ' S (1960) data on the Agulhas Bank station on 1/12/57 will be briefly mentioned here because they were obtained in the opposite season and by a method very similar to the author's, namely by filtration of the cooling water of the ship's engines.
Of the 37 species obtained by T A N A K A at this station, 29 also occur in the author's list and of these 29 species c o m m o n to both investigators the author caught only nine in another part of the section. A m o n g these nine there were three Corycaeus species and one Oncaea, in other words, groups which, due to the author's method, have not correctly been reflected here (see " Method ", sixth paragraph, p. 8). The remaining five species were:—
Canthocalanus pauper (1 Ç, 2 ¿ ¿). Eucalanus mucronatus (1 juv.). Acrocalanus gracilis (5 2 2). Acartia negligens (3 2 $, 1 juv.). Sapphirina gemma (2 2 ?)•
Sapphirina gemma and Eucalanus mucronatus are isolated random catches of little significance. The presence of the other three species could possibly be
381
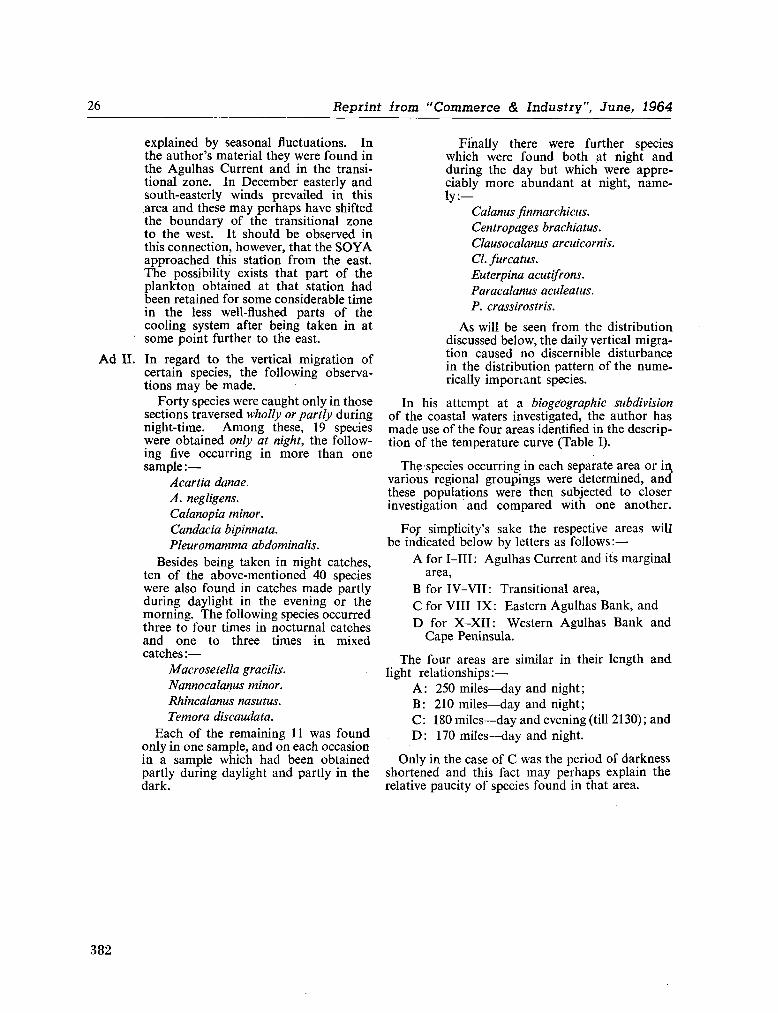
26 Reprint horn "Commerce & Industry", June, 1964
explained by seasonal fluctuations. In the author's material they were found in the Agulhas Current and in the transitional zone. In December easterly and south-easterly winds prevailed in this area and these m a y perhaps have shifted the boundary of the transitional zone to the west. It should be observed in this connection, however, that the S O Y A approached this station from the east. The possibility exists that part of the plankton obtained at that station had been retained for some considerable time in the less well-flushed parts of the cooling system after being taken in at some point further to the east.
A d II. In regard to the vertical migration of certain species, the following observations m a y be made .
Forty species were caught only in those sections traversed wholly or partly during night-time. A m o n g these, 19 species were obtained only at night, the following five occurring in more than one sample :—
Acartia danae. A. negligens. Calanopia minor. Candada bipinnata. Pleuromamma abdominalis.
Besides being taken in night catches, ten of the above-mentioned 40 species were also found in catches m a d e partly during daylight in the evening or the morning. The following species occurred three to four times in nocturnal catches and one to three times in mixed catches :—
Macrosetella gracilis. Nannocalanus minor. Rhincalanus nasutus. Temora discaudata.
Each of the remaining 11 was found only in one sample, and on each occasion in a sample which had been obtained partly during daylight and partly in the dark.
Finally there were further species which were found both at night and during the day but which were appreciably more abundant at night, n a m e -ly : -
Calanus finmarchicus. Centropages brachiatus. Clausocalanus arcuicornis. CI. furcatus. Euterpina acutifrons. Paracalanus aculeatus. P. crassirostris.
A s will be seen from the distribution discussed below, the daily vertical migration caused no discernible disturbance in the distribution pattern of the n u m e rically important species.
In his attempt at a biogéographic subdivision of the coastal waters investigated, the author has m a d e use of the four areas identified in the description of the temperature curve (Table I).
The species occurring in each separate area or in various regional groupings were determined, and" these populations were then subjected to closer investigation and compared with one another.
For simplicity's sake the respective areas will be indicated below by letters as follows:—
A for I—III : Agulhas Current and its marginal area,
B for IV-VII: Transitional area, C for VIII-IX: Eastern Agulhas Bank, and D for X - X I I : Western Agulhas Bank and
Cape Peninsula.
The four areas are similar in their length and light relationships:—
A : 250 miles—day and night; B : 210 miles—day and night; C : 180 miles—day and evening (till 2130) ; and D : 170 miles—day and night.
Only in the case of C was the period of darkness shortened and this fact m a y perhaps explain the relative paucity of species found in that area.
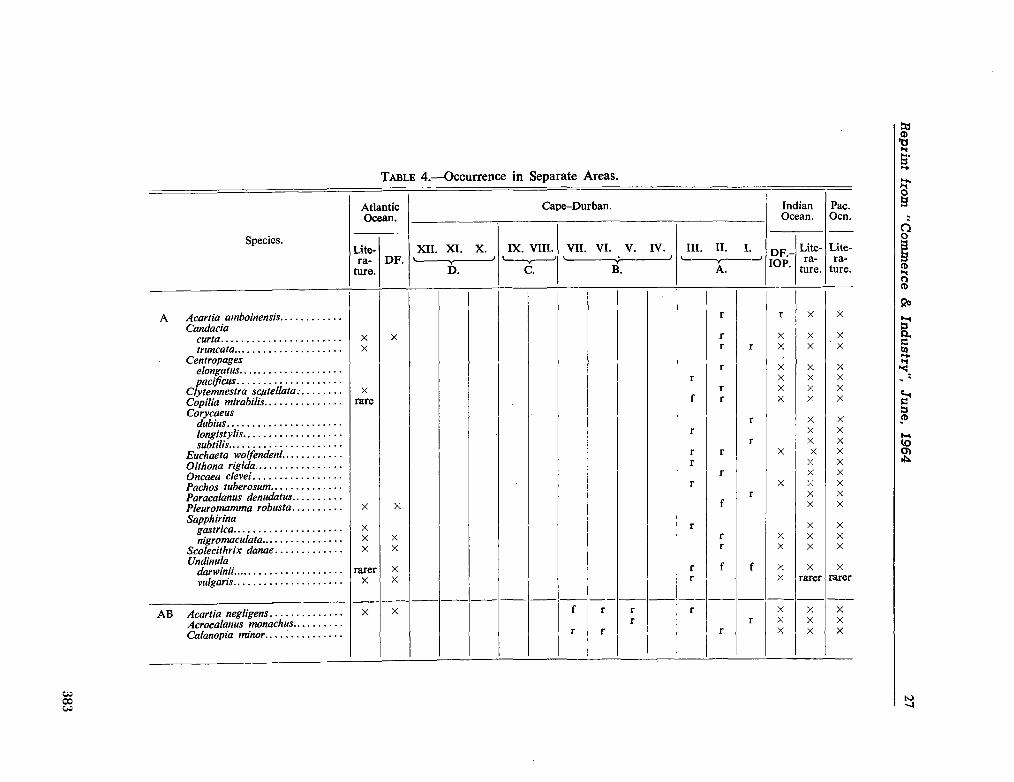
Rep
zint
íiom
. "Com
merce
& In
du
stry", June,
1964
27
() « c o euo
c
•o ¿3
H O
et
s of U
t
en
8 c 1>
ts 3 o
o S
3
3 Q
¿ o. Q
11
3°
3*i
â*i
P2
>
5 fPQ
>
X .1
X
H-4
X Vo
•m
X
XX
XXXX
XXXXXXXXX
XXX X S
X
XX
XXXX
XXXXXXXXX
XXX XS
XX
X
XX
X
XX
X
X
t-i IH
U
U
1-t
LH
t-
I- <
*-
U
h
h
t*
XX
X
XX
X
XX
X
X
Q.
CO
x x
xx
g:
I I lu
»
|s
ill •^
ota
«
il îs
«P
iilM II I PO <
383
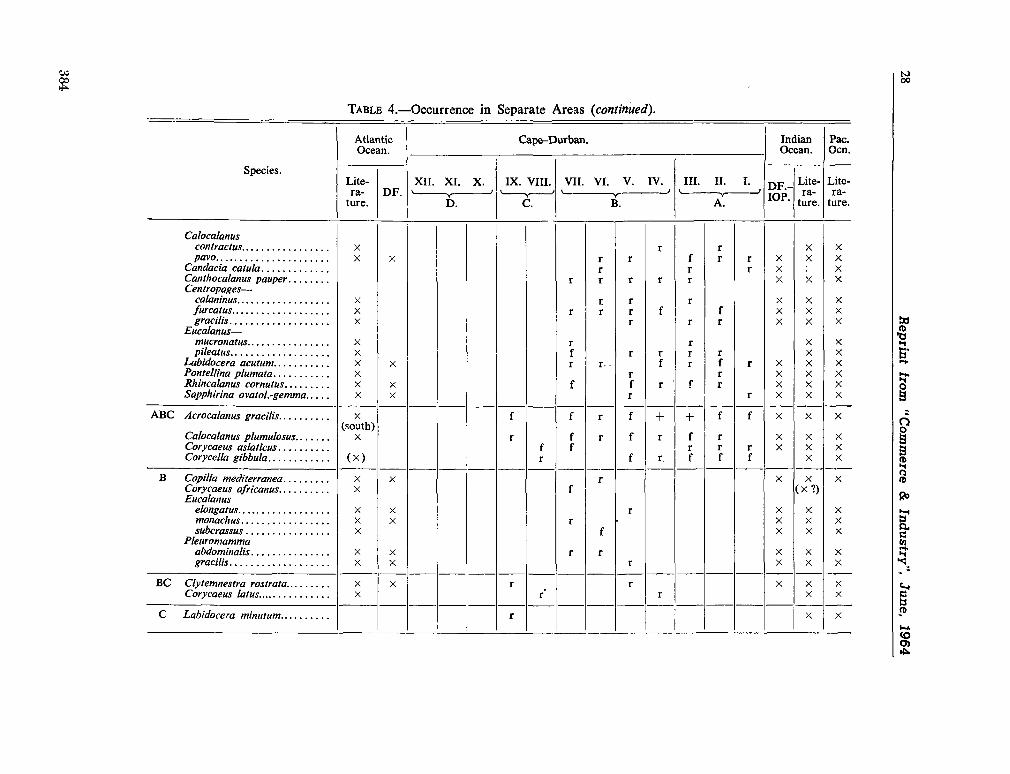
28
Reprin
t iro
m "
Com
merce
& In
du
stry"
, J
un
e, 1964
•5 «
sj
tal
& <D 1/5
O
tal
3 8 Q
01
1-1
CO
Si 8
IS
o
. ••S
c
ï<3
a*s a*i Ë
2
1 Cape-D
.1
h*
1
B [••<
III. -> >
•
«
> VII. IX. VIII.
•ü
-X
XII. XI.
•Q
Lite- 0 ra-ture.
XXXX
XXX
XXXXXX
XX
..
X
XX
X
XX
XX
XX
XX
X
XX
X
XX
XX
ta<
*-l
ta U
ta ta ta ta ta ta
ta<
*- IH
X
XX
X
x x
xx
X
XX
<** h
h
^
-f- **- ta
<l
-\- ta
ta
k Li
ta ta
1
tta tM
(»-
X
XX
X X
X
XX
X
XX
XX
X
I ! =0
S
111! ¡ïltlfîJ
l S
5 II S ?
^-~
5.5
=
3 5»
ooo
•«J M
x gx x
5 A 3!!
XX
X
XX
XX
X
XX
ta ta
X
XX
X
X
XX
X
XX
X
X
M il si
II"
Olil •s s 1
H6
«
X X
S-a
PS
oo
3
384
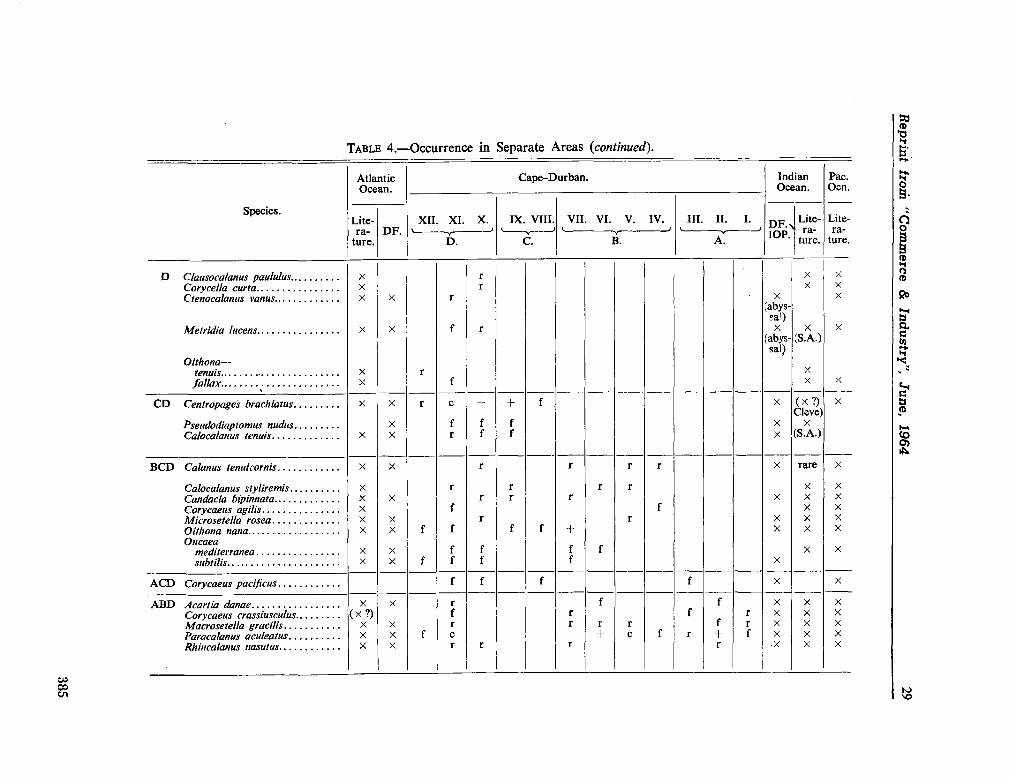
Reprin
t iio
m "
Com
merce
& In
du
stry"
, J
un
e, 1964
29
I!
.2 m
"2 8
So
1
J *
3
3 Sa
If III. II. I. VII. VI. V. IV. IX. VIII. XII. XI. X.
"«•
m
•u
•ci
Atlantic Ocean.
Litera
ture.
XX
X
x<
*às*
W
Ilia
xs X
XX
XX
X
X
J
1 1 M
+
+ X
XX
X
X X
X X
X
X
X X
X X
X
X
X X
n
+
X
X
XX
X
X
X
XX
XX
X
XX
X X
X X
X
xx
xx
x
XX
XX
X
*w -|- U
n +
X
XX
X
"3 c
. S ?: S
íí
ti 3
.S
«,0
l«
m. Ü
P
Hi
385
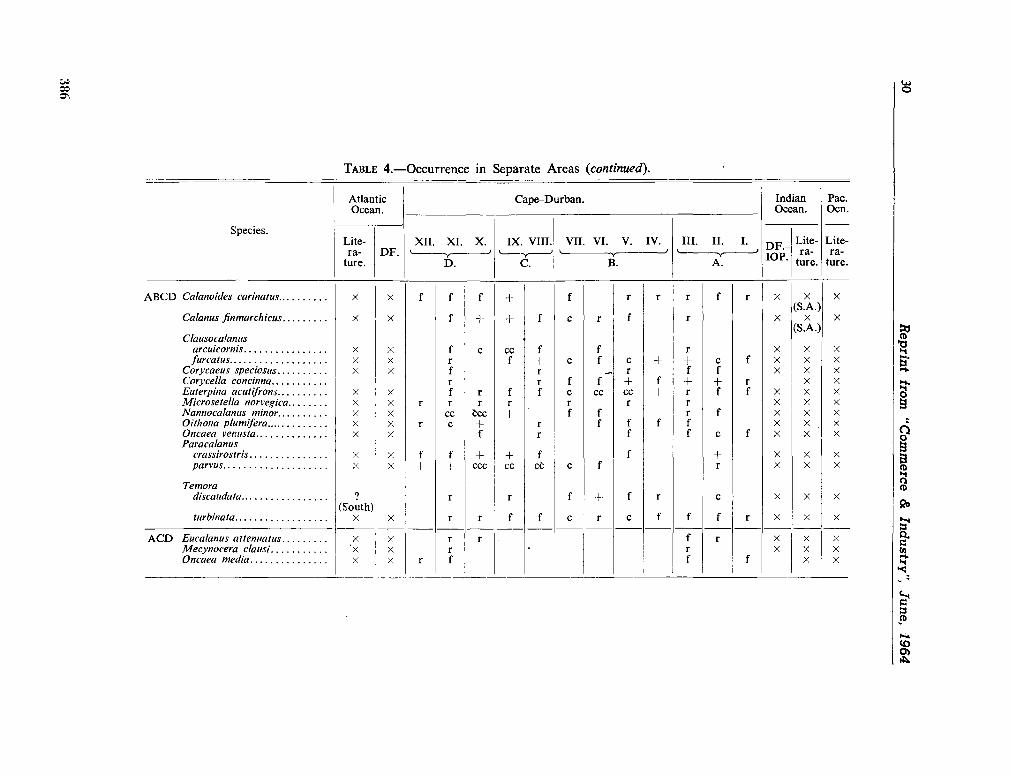
30
Rep
rin
t fr
om
"Co
mm
erc
e à
Industr
y",
June, 1
96
4
~<
3
«J
•S
*«
s o
«J
CU
o,
1/3
3 o O
W
11
SÔ
m
•ass ¿
ft Q
2
urban. Cape-D
P-¡
a
AI A IA IIA
IX. VIII. XII. XI. X.
•Sa
Atlan Ocea
'<
•ñ
-o
•Q
ÜH
Q
Lite-
ture.
o. 1/5
X X
XXXXXXXXX
XX
X X
X (S.A.)
X (S.A.)
x x
xx
xx
xx
xx
x
XX
X
XX
XX
X
X X
X X
X
X
X
X
XX
X
X X
<*
- I_
,<4
-H
O l*_ -j-**-r
**-
O
+^
(-i H
-1*-
1 +
U
U
. U t*- U
-
0 *-• +
o
^
**»*—
**-
+
*
O
*4
- O
L-**H
!H
-|
-)
H
h<
H
U,1
H *
*-•
-
+
+
K+
+!
+
(O
' '
O
t— í
n^
^^
t-
i^
O
t*
-+
>-.
t-
.^
-u
.
>-. kt
"*- +
XX
X
XX
XX
X
XX
xx
x
xx
xx
x
xx
^ 2
:
S -5
J lílfífi
I I ^=-~
ÍJÍ;JJ ¡i
S '
« &
g
a
VJ *
• c
* e
-S S
§
Q
U
<c
386
Reprint from "Commerce & Industry", June, 1964 31
In Table 4 the species are grouped according to their occurrence: A , B , C or D for only one area; A B , B C , C D ; A B C or B C D for 2 (or 3) adjacent areas, A B C D for all four areas, and A B D , A C D or A D for non-adjacent areas.
The various groupings in Table 4 can be summarised as follows from the point of view of species-content.
(a) Individual areas:—
Number of Species Found. Area.
Only there. Also elsewhere.
A B C D
21 7 1 6
42 48 28 34
The 21 A species were made up as follows:— 11 solely Indo-Pacific,
4 predominantly Indo-Pacific, and 6 cosmopolitic.
Amongst the seven B species there were:— 6 cosmopolites; 1 coastal species from W . Africa (F. D A H L ) ,
which possibly also occurs in the Indian Ocean ( S E W E L L 1947).
The six D species included:— 3 cosmopolites, 2 not previously found in the Indian Ocean,
and 1 not yet found in the Pacific Ocean.
The solitary C species is a rarity which has not yet been encountered outside the Indo-Pacific area.
(b) Adjacent areas.
Area. Number of Species Found.
Only there. Also elsewhere;
AB BC C D
16 2 3
65 59 44
The easterly part (AB) is still the richest in species although it is poorer than A . The predominantly Indo-Pacific character of A is already diminishing here and it will not reappear further to the west.
The 16 A B species contain only— 4 Indo-Pacific specimens as against 12 cos
mopolites.
Both B C species are cosmopolites, while the three C D species are bio-geographic curiosities (see " Systematic Review " above).
Further comparisons between areas do not reveal any important facts. A s a conclusion from the above findings, the author wishes to emphasise that in the A area a Copepoda community with a strong Indo-Pacific character, which w e will call the Agulhas Current community, was identified and that this community did not occur over the northern part of the Agulhas Bank in July, 1961. It had already disappeared from the coastal waters off East London. O n the strength of observations made on other occasions (DF) the author is of the opinion that this community seldom if ever extends beyond the eastern edge of the Agulhas Bank. Proof of this assertion, however, must be reserved for a later contribution.
(c) The whole section ( A B C D ) yielded 15 species which occurred in all four areas. It will clearly be seen from the table, however, that they are not uniformly distributed. In addition, their group includes those species which were most abundant in the author's material: 10 of the 15 species were marked with the abundance symbol c in at least one sample, this symbol having been given only twice outside this group.
A s eastern components the following are clearly distinguishable :—
Clausocalanus furcatus (warm-water cosmopolite),
Corycella concinna (Indo-Pacific), . Temora discaudata (Indo-Pacific).
In the south the following species were most abundant:—
Calanus finmarchicus, Euterpina acutifrons, Temora turbinata.
Together with Pseudodiaptomus nudus and Calo-calanus tenuis, the latter are so constant in their occurrence on the Agulhas Bank (DF) that the author feels tempted to regard this group of species as part of a plankton community peculiar to the Agulhas Bank.
The following species appear to be western components:—
Calanoides carinatus (represented in A B almost exclusively by juveniles),
Clausocalanus arcuicornis, Nannocalanus minor, Paracalanus crassirostris, Paracalanus parvus.
Together with Centropages brachiatus, Metridia lucens and perhaps also Ctenocalanus vanus, they occur in very great abundance along the whole
387
32 Reprint from "Commerce & Industry", June, 1964
west coast and are associated with the Benguela Current (DF) . Along the West Coast, the dispersion area of these species runs parallel to direction of the Benguela Current. Each of them seems to keep at an appropriate distance from the cold core, within the temperature limits that suits it. The author proposes to regard this group of species as members of the plankton community of the Benguela Current.
A striking feature in the case of the groups A B C D and A B D is the richness in species of sample X I . It contained 34 species, being surpassed in this respect only by samples II, III and V . It would be possible to regard at least 11 species in the author's material as southern and south-eastern warm-water inhabitants without further ado if they had not also cropped up in sample X I . They were the following:—
Acartia danae,
Calocalanus styliremis,
Cc ycaeus agilis,
Corycaeus crassiusculus,
Corycaeus speciosus,
Clausocalanus furcatus,
Corycella concinna,
Marrosetella gracilis,
Mecynocera clausi, Paracalanus aculeatus
Temora discaudata. Sample X also appears to share in this pheno
m e n o n because it contains six -pedes which are distribute in a manner similar to that of the foregoing and of which four also occur in X I : —
Corycaeus pacificus, Eucalanus attenuatus, Oncaea media, Oithona plumífera, Calanus tenuicornis,
Oncaea venusta. W h e n one recalls the sharp temperature increase
of 1-5°C which took place in a ten-mile strip on the boundary between sections X and X I , one cannot help feeling inclined to associate it with the local occurrence of so m a n y warm-water species, and it would appear that a tongue of w a r m water penetrated to a point near the coast in this locality. The presence of the following four Indo-Pacific species, namely—
Corycaeus crassiusculus, Corycaeus pacificus, Corycella concinna, Temora discaudata
gives an indication of the possible origin of this water; it could perhaps have been a northward moving off-shoot of the Agulhas Current.
9. Literature. Only the papers quoted in the text are mentioned here.
B E R N A R D , M . , 1958.—Révision des Calocalanus (Copépodes Calanoida) avec description d'un genre nouveau et de deux espèces nouvelles. Bull. SocrZool. France, T . LXXXIII . 15 pp.
1960.—Famille des Calocalanidae. Conseil Internet. Explor Mer. Zooplankton, Sheet 36 (First Revision), 5 PP.
B O W M A N , T H . E . , 1957.—A new species of Calanopia (Cope-poda Calanoida) from the Carribean Sea. Proc. U.S. Nat. Mus., 107, pp. 39-45.
B R A D Y , G . S., 1914.—On some pelagic Entomostraca collected by M r . J. Y . Gibson in Durban Bay. Ann. Durban Mus., Vol. 1, pp. 1-9..
1914.—On further pelagic Entomostraca collected by M r . J. Y . Gibson in Durban Bay. Ann. Durban Mus., Vol.: 1, pp. 25-28.
1915.—Notes on the pelagic Entomostraca of Durban Bay. Ann Durban Mus., Vol. 1, pp. 134-146.
C H I B A , T . , 1956.—Studies on the development and the systematics of Copepoda. Jnl. Shimonoseki College of Fisheries, Vol. 6, (1), 90 pp. (In Japanese with English summary).
C L E V E , P . T . , 1904.—The Plankton of the South African seas. I. Copepoda. Marine Investigations in South Africa, Vol. 3 (1905), pp. 177-210.
D A H L , M . , 1912.—Die Copepoden der Plankton-Expedition. I. Die Corycaeinen (mit Berücksichtigung aller bekannten Arten). Ergebn. Plankton-Exped. Humboldt Stiftung, II, f. 1, iv + 135 pp.
D A K I N , W . J. A N D C O L E F A X , A . N . , 1940.—The plankton of the Australian coastal waters off N e w South Wales, Part 1. Public University of Sidney, Department of Zoology, Monogr. 1, 215 pp.
D A N A , J. D . , 1852-55.—Crustacea. U . S . Exploring Expedition during the years 1838-42 under the command of Charles Wilkes; 13 (2); 1019-1262.
D E D E C K E R , A . , 1960. Communication provisoire sur la répartition des Copépodes planctoniques marins de l'Afrique du Sud. CCTA/CSA, LagosIBukavu: Colloque de biologie marine et de pêches maritimes sur les côtes orientales de l'Afrique. Le Cap, 12-17 Sept., 1960. 3 pp. (Roneoed).
F A R R A N , G . P. , 1926.—Biscayan plankton collected during a cruise of H . M . S . Research, 1900. Part X I V . The Copepoda. Jnl. Linnean Soc. London, Zoology, Part X X X V I , pp. 219-310.
1936.—Great Barrief Reef Expedition 1928-29. Scientific Reports, Vol. V (3), Copepoda. British Museum (Natural History), pp. 73-142.
F R Ü C H T L , F. , 1924.—Die Cladoceren und Copepodenfauna des Aru-Archipels. Arb. Zool. Instit. Univers. Innsbruck. II, pp. 25-136.
M A R Q U E S , E . , 1953.—Copépodes marinhos de Angola. I. Calanoida. Lisboa, Trabalhos da Missao de Biología Marítima, 5, pp. 85-126.
1957.—Copépodes dos mares de Angola. II. Ciclo-poida e Harpacticoida. Ibid, 20, pp. 131-150.
1958.—Copépodes marinhos de Angola. (2a Campanha 1952-53). Ibid., 24, pp. 197-222.
R O S E , M . , 1929.—Copépodes pélagiques, particulièrement de surface, provenant des campagnes scientifiques de S.A.S . le Prince Albert Ir de Monaco. Rés. camp, scientif. Monaco, 78, 132 pp.
388
Reprint from "Commerce & Industry", June, 1964 33
R O S E N D O R N , I., 1917.—Die Gattung Oithona. Wiss. Ergebn Deutschen Tiefsee-Expedit. 23 (1), 58 pp.
S C O T T , A . , 1909.—The Copepoda of the Siboga Expedition-Pt. I: Free-swimming, littoral and semi-parasitic Copepoda. Siboga Expedition Monograph 29 A, 323 pp.
S C O T T , T H . , 1894.—Report on the Entomostraca from the Gulf of Guinea. Trans. Linnean Soc. London, Second Series, Vol. 6, Zoology, pp. 1-16.
S E W E L L , R . B . S„ 1929^32.—The Copepoda of the Indian Seas. Calanoida. Calcutta, Memoirs Indian Mus., Vol. X , 407 pp.
1947.—The free-swimming planktonic Copepoda. Systematic Account. Sci. Repts. John Murray Exped. 1933-34. Vol. 8 (1), 303 pp.
1948.—The free-swimming planktonic Copepoda. Geographical Distribution. Ibid, pp. 317-592.
S T E B B I N G , T H . R . R . , 1910.—General Catalogue of South African Crustacea (Part V of 1 South African Crustacea for the Marine Investigations in South Africa). Annals South African Mus., 6 (4), pp. 281-593.
S T E U E R , A . , 1923.—Bausteine zu einer Monographie der Copepodengattung Acartia. Arb. Zool. Instit. Univ. Innsbruck, 1 (5).
T A N A K A , O . , 1960.—Biological Results of the Japanese Antarctic Expedition. 10. Pelagic Copepoda. Special Public. Seto Marine Biol. Labor, 95 pp.
W I L S O N , C . B . , 1942.—Copepods of the plankton gathered during the last cruise of the Carnegie. Washington Sci. Res. Cruise VII of the Carnegie 1928-29. Biology I, 237 pp.
1950.—Copepods gathered by the U . S . Fisheries Steamer Albatross from 1887 to 1909, chiefly in the Pacific. Smithsonian Instit. U.S. Nat. Mus. Bull 100, Vol. 14 (4), IX + 300 pp.
W O L F E N D E N , R . N . , 1911.—Die Marinen Copepoden der Deutschen Siidpolar Expedition 1901-03. II. Die pelagischen Copepoden der Westwinddrift und des südlichen Eismeeres. Deutsche Siidpolar Expedition, 12 (Zool. Vol. 4), pp. 181-380.
389
DEPARTMENT OF COMMERCE AND INDUSTRIES
DIVISION OF SEA FISHERIES
SOUTH AFRICAN CONTRIBUTION TO THE INTERNATIONAL INDIAN
OCEAN EXPEDITION:
(4) A Preliminary Report on the Planktonic Copepoda by A. DE DECKER & F. J. MÓMBECK.
INVESTIGATIONAL REPORT No. 51
Invest. Rep. Div. Sea Fish. South Africa. 51: 1—67
Issued by the Division of Sea Fisheries, Beach Road,
Sea Point, Cape Town, South Africa.
REPUBLIC OF SOUTH AFRICA
Collected reprints of the International Indian Ocean Expedition, vol. IV, contribution no. 225 391
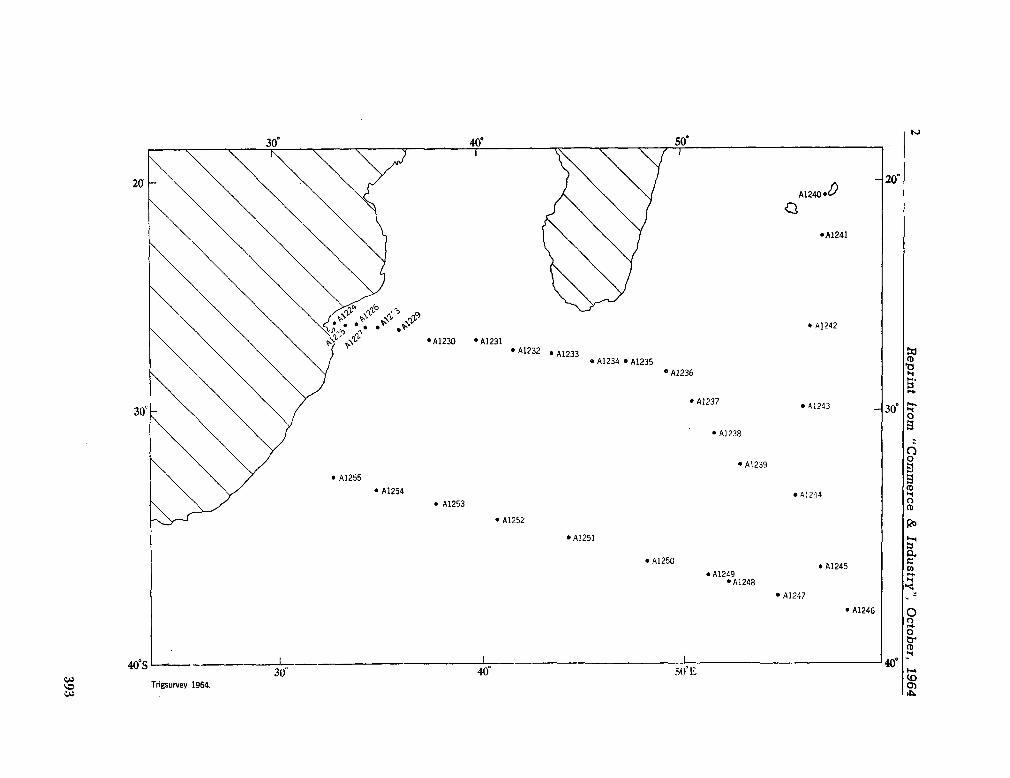
2
Rep
rin
t from
"C
om
merce
& In
dustry
", Octo
ber, 1
964
393
10 Reprint írom "Commerce & Industry", October, 1964
A PRELIMINARY REPORT ON THE PLANKTONIC COPEPODA by
A. DE DECKER and F. J. MOMBECK.
1. Abstract. S o m e 274 Copepod species were collected in the
South Western Indian Ocean during 1961. Sixty-five of these species appear to be new to the Indian Ocean. They have been grouped into local communities and appear to indicate certain océanographie phenomena. The bathypelagic Copepods are compared with those reported by S E W E L L and A . S C O T T from the Northern Indian Ocean and the Indonesian Archipelago, respectively.
2. Introduction. The area covered by the 1961 cruise of
A F R I C A N A II is situated in one of the least known parts of the Indian Ocean as far as zdo-piankton, and especially the copepod fauna are concerned.
The examination of the A F R I C A N A II material yielded 274 Copepod species, among which 65 appear to be new to the Indian Ocean. It seems unlikely that further and more thorough processing of the samples will greatly add to the number of species stated above. Nevertheless, such a variety found during a relatively short cruise shows that the diversity in this part of the ocean is quite c o m parable with that of other oceanic areas where more intensive sampling was carried out in the past over greater areas and for longer periods. S E W E L L ' s major papers (1929, 1932, 1947) on the Northern Indian Ocean make mention of a total of some 350 species found between Burma and East Africa. In samples taken by the Siboga Expedition in the Eastern Malay Archipelago, A . S C O T T (1909) identified 278 holoplanktonic species. Over 1,000 plankton samples collected by Prince A L B E R T I of Monaco during his long cruises through the Atlantic north of the Equator included 348 Copepod species, as identified by S A R S (1925) and R O S E (1929). Q B . W I L S O N (1942, 1950) found 281 species in the C A R N E G I E collections and 473 species in those made by the A L B A T R O S S , both vessels having worked numerous stations scattered all over the Pacific as well as in some parts of the Western Atlantic north and south of the Equator. In the case of the A L B A T R O S S , this was carried on for over twenty-two years.
The variety of the Copepod fauna in our samples, together with a few observations on the spatial distribution of certain of its components, justifies this short preliminary report. The area concerned is of special biogeographical interest as it lies on the border of the Indian Ocean where influences of the South Atlantic and the West Wind Drift may , at times, interfere with the dominant features provided by the Mozambique-Agulhas system and the South Equatorial Current.
3. Methods. The procedures followed at sea for catching
and preserving the plankton are described in the general narrative of this cruise (R. W . R A N D , pp. 4-9).
The information contained in this report was derived from—
(à) a routine general cataloguing of the entire contents of the N 70 V-samples ; and
(b) a detailed identification of all the Copepods found in the N 200-net used as a mid-water trawl.
Out of the 199 N 70 V-samples, 14 day-light hauls (viz. the 100-50 m . hauls at alternate stations) and 18 hauls taken in the dark in 100-0 m . are as yet unprocessed. The remaining 167 samples were examined under a binocular dissecting microscope and their general contents catalogued on special record sheets. Each species or higher taxonomic group was given a symbol to indicate its estimated abundance in the sample, as follows:—
r = 1 to 5 indiv. 1 = 50 to 100 indiv. f= 6 to 20 indiv. 2 = 1 0 0 to 200 indiv.
+ = 2 0 to 50 indiv. 3=200 to 400 indiv. The plankton of the N 200-samples was fully
sorted into groups and all Copepods were identified and counted. It m a y be of interest to note that the N 2 0 0 catches yielded a total of 115 Copepod species, of which 43 were new additions to our list; the remaining 72 were also found in the N 70-nets. One of the authors of this report (F. J. M . ) w h o has carried out all the taxonomic work on Copepods from the N 200-nets, will discuss his findings in greater detail in a separate paper.
394
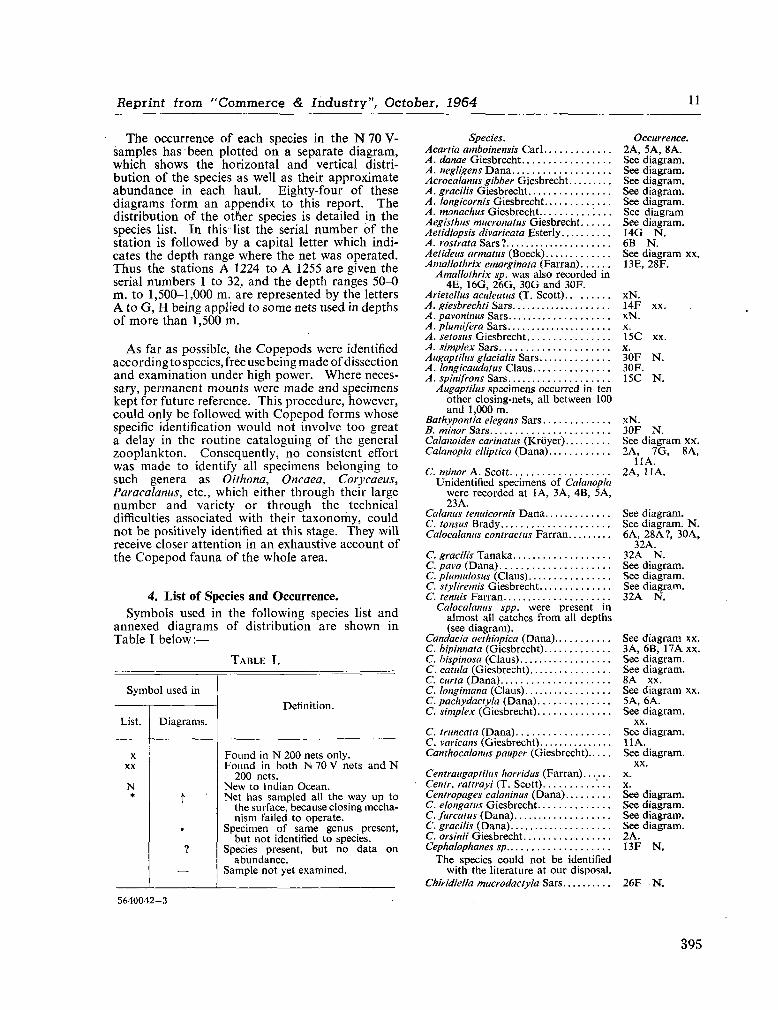
Reprint horn "Commerce & Industry", October, 1964 11
The occurrence of each species in the N 70 V -samples has been plotted on a separate diagram, which shows the horizontal and vertical distribution of the species as well as their approximate abundance in each haul. Eighty-four of these diagrams form an appendix to this report. The distribution of the other species is detailed in the species list. In this list the serial number of the station is followed by a capital letter which indicates the depth range where the net was operated. Thus the stations A 1224 to A 1255 are given the serial numbers 1 to 32, and the depth ranges 50-0 m . to 1,500-1,000 m . are represented by the letters A to G , H being applied to some nets used in depths of more than 1,500 m .
A s far as possible, the Copepods were identified according to species, free use being made of dissection and examination under high power. Where necessary, permanent mounts were m a d e and specimens kept for future reference. This procedure, however, could only be followed with Copepod forms whose specific identification would not involve too great a delay in the routine cataloguing of the general zooplankton. Consequently, no consistent effort was m a d e to identify all specimens belonging to such genera as Oithona, Oncaea, Corycaeus, Paracalanus, etc., which either through their large number and variety or through the technical difficulties associated with their taxonomy, could not be positively identified at this stage. They will receive closer attention in an exhaustive account of the Copepod fauna of the whole area.
4. List of Species and Occurrence. Symbols used in the following species list and
annexed diagrams of distribution are shown in Table I below :—
TABLE I.
Symbol used in
List.
X XX
N *
Diagrams.
t
•
Definition.
F o u n d in N 200 nets only. F o u n d in both N 70 V nets and N
200 nets. N e w to Indian Ocean. Net has sampled all the w a y up to
the surface, because closing mechanism failed to operate.
Specimen of same genus present, but not identified to species.
Species present, but no data on abundance.
Sample not yet examined.
Species. Occurrence. Acartia amboinensis Carl 2A, 5A, 8A. A . danae Giesbrecht See diagram. A . negligens D a n a See diagram. Acrocalanus gibber Giesbrecht See diagram. A . gracilis Giesbrecht See diagram. A . longicornis Giesbrecht See diagram. A . monachus Giesbrecht See diagram Aegisthus mucronatas Giesbrecht See diagram. Aetidlopsis divaricata Esterly 14G N . A . rostrata Sars? 6B N . Aetideus armatus (Boeck) See diagram xx. Amallothrix emarginata (Farran) 13E, 28F.
Amallothrix sp. was also recorded in 4E, 16G, 26G, 30G and 30F.
Arietellus aculeatus (T. Scott) xN. A . giesbrechti Sars 14F xx. A . pavoninus Sars xN. A. plumífera Sars x. A. setosus Giesbrecht 15C xx. A. simplex Sars x. Augaptilus glacialis Sars 30F N . A. longicaudatus Claus 30F. A . spinifrons Sars 15C N .
Augaptilus specimens occurred in ten other closing-nets, all between 100 and 1,000 m .
Bathypontia elegans Sars xN. B . minor Sars 30F N . Calanoides carinatus (Kroyer) See diagram xx. Calanopia elliptica (Dana) 2A, 7G, 8A,
11A. C. minor A . Scott 2A, 11 A .
Unidentified specimens of Calanopia were recorded at 1A, 3A, 4B, 5A, 23A.
Calanus tenuicornis D a n a See diagram. C. tonsus Brady See diagram. N . Calocalanus contractus Farran 6A, 28A?, 30A,
32A. C. gracilis Tanaka 32A N . C. pavo (Dana) See diagram. C. plumulosus (Claus) See diagram. C. styliremis Giesbrecht See diagram. C. tenuis Farran 32A N .
Calocalanus spp. were present in almost all catches from all depths (see diagram).
Candada aethiopica (Dana) See diagram xx. C. bipinnata (Giesbrecht) 3A, 6B, 17A xx. C. bispinosa (Claus) See diagram. C. catula (Giesbrecht) See diagram. C. curta (Dana) 8A xx. C. longimana (Claus) See diagram xx. C. pachydactyla (Dana) 5A, 6A. C. simplex (Giesbrecht) See diagram.
xx. C. trúncala (Dana) See diagram. C . varicans (Giesbrecht) 11 A . Canthocalanus pauper (Giesbrecht) See diagram.
xx. Centraugaptilus horridus (Farran) x. Centr. rattrayi (T. Scott) x. Centropages calaninus (Dana) See diagram. C. elongatus Giesbrecht See diagram. C . furcatus (Dana) See diagram, C. gracilis (Dana) See diagram. C. orsinii Giesbrecht 2 A . Cephalophanes sp 13F N . T h e species could not be identified with the literature at our disposal. Chiridiella macrodactyla Sars 26F N .
5640042-3
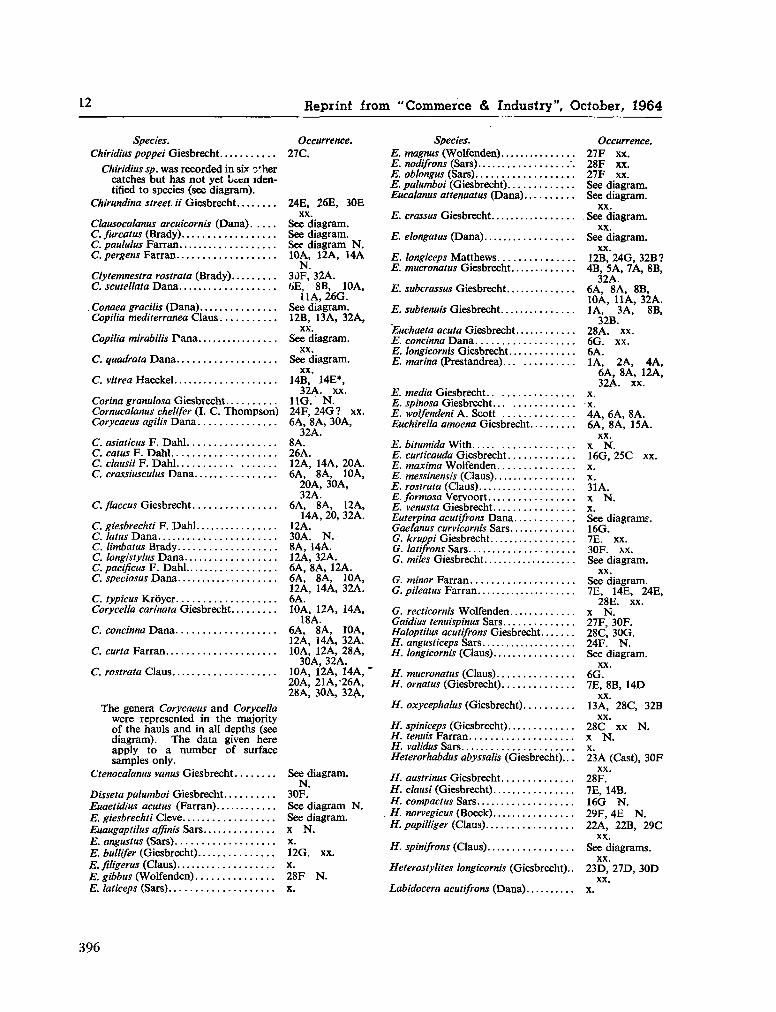
12 Reprint from "Commerce & Industry", October, 1964
Species. Occurrence. Chiridius poppei Giesbrecht 27C.
Chiridius sp. was recorded in six o'her catches but has not yet IMM identified to species (see diagram).
Chirundina street ii Giesbrecht 24E, 26E, 30E xx.
Ciausocalanus arcuicornis (Dana) See diagram. C. furcatus (Brady) See diagram. C. paululus Farran See diagram N . C. pergens Farran 10A, 12A, 14A
N . Clytemnestra rostrata (Brady) 30F, 32A. C. scutellata Dana 6E, 8B, 10A,
11 A , 26G. . Conaea gracilis (Dana) See diagram. Copilia mediterránea Claus 12B, 13A, 32A,
xx. Copilia mirabilis Dana See diagram.
xx. C. quadrata Dana See diagram.
xx. C. vitrea Haeckel 14B, 14E*,
32A. xx. Corina granulosa Giesbrecht 11G. N . Cornucalanus chelifer (I. C . Thompson) 24F, 2 4 G ? xx. Corycaeus agilis D a n a 6A, 8A, 30A,
32A. C. asiaticus F . Dahl 8A. C. catus F . Dahl 26A. C. clausii F . Dahl 12A, 14A, 20A. C. crassiusculus Dana 6A, 8A, 10A,
20A, 30A, 32A.
C. flaccus Giesbrecht 6A, 8A, 12A, 14A, 20, 32A.
C. giesbrechti F . Dahl 12A. C. latus Dana 30A. N . C. limbatus Brady 8A, 14A. C. longistylus Dana 12A, 32A. C. pacificas F . Dahl 6A, 8A, 12A. C. speciosus Dana 6A, 8A, 10A,
12A, 14A, 32A. C. typicus Krôyer 6A. Corycella carinata Giesbrecht 10A, 12A, 14A,
18A. C. concinna D a n a 6A, 8A, 10A,
12A, 14A, 32A. C. curta Farran 10A, 12A, 28A,
30A, 32A. C. rostrata Claus 10A, 12A, 14A, "
20A, 21A.-26A, 28A, 30A, 32A,
The genera Corycaeus and Corycella were represented in the majority of the hauls and in all depths (see diagram). The data given here apply to a number of surface samples only.
Ctenocalanus vanus Giesbrecht See diagram. N .
Disseta palumboi Giesbrecht 30F. Euaetidius acutus (Farran) See diagram N . E. giesbrechti Cleve See diagram. Euaugaptilus affinis Sars x N . E. angustus (Sars) x. E. bullifer (Giesbrecht) 12G. xx. E. filigerus (Claus) x. E. gibbus (Wolfenden) 28F N . E. laticeps (Sars) x.
Species. Occurrence. E. magnus (Wolfenden) 27F xx. E. nodifrons (Sars) '. 28F xx. E. oblongus (Sars) 27F xx. E. palumboi (Giesbrecht) See diagram. Eucalanus attenuatus (Dana) See diagram.
xx. E. crassus Giesbrecht See diagram.
xx. E. elongatus (Dana) See diagram.
XX.
E. longiceps Matthews 12B, 24G, 32B ? E. mucronatus Giesbrecht 4B, 5A, 7A, 8B,
32A. E. subcrassus Giesbrecht 6A, 8A, 8B,
10A, 11 A , 32A. E. subtenuis Giesbrecht 1A, 3A, 8B,
32B. Euchaeta acuta Giesbrecht 28A. xx. E. concinna Dana 6 G . xx. E. longicornis Giesbrecht 6A. E. marina (Prestandrea) 1A, 2A, 4A,
6A, 8A, 12A, 32A. xx.
E. media Giesbrecht x. E. spinosa Giesbrecht x. E. wolfendeni A . Scott 4A, 6A, 8A. Euchirella amoena Giesbrecht 6A, 8A, 15A.
xx. E. bitumida With x N . E. curticauda Giesbrecht 16G, 25C xx. E. maxima Wolfenden x. E. messinensis (Claus): x. E. rostrata (Claus) 31A. E. formosa Vervoort x N . E. venusta Giesbrecht x. Euterpina acutifrons Dana See diagram?. Gaelanus curvicornis Sars 16G. G. kruppi Giesbrecht 7E. xx. G. latifrons Sars 30F. xx. G. miles Giesbrecht See diagram.
xx. G. minor Farran See diagram. G. pileatus Farran 7E, 14E, 24E,
28E. xx. G. recticornis Wolfenden x N . Gaidius tenuispinus Sars 27F, 30F. Haloptilus acutifrons Giesbrecht 28C, 30G. H . angusticeps Sars 24F. N . H . longicornis (Claus) See diagram.
xx. H . mucronatus (Claus) 6G. H . ornatus (Giesbrecht) 7E, 8B, 14D
XX.
H . oxycephalus (Giesbrecht) 13A, 28C, 32B xx.
H . spiniceps (Giesbrecht) 28C xx N . H . tenuis Farran x N . H . validus Sars x. Heterorhabdus abyssalis (Giesbrecht)... 23A (Cast), 30F
xx. H . austrinus Giesbrecht 28F. H . clausi (Giesbrecht) 7E, 14B. H . compactus Sars 16G N .
. H . norvegicus (Boeck) 29F, 4E N . H . papilliger (Claus) 22A, 22B, 29C
xx. H . spinifrons (Claus) See diagrams. xx. Heterostylites longicornis (Giesbrecht).. 2 3 D , 2 7 D , 30D xx. Labidocera acutifrons (Dana) x.
396
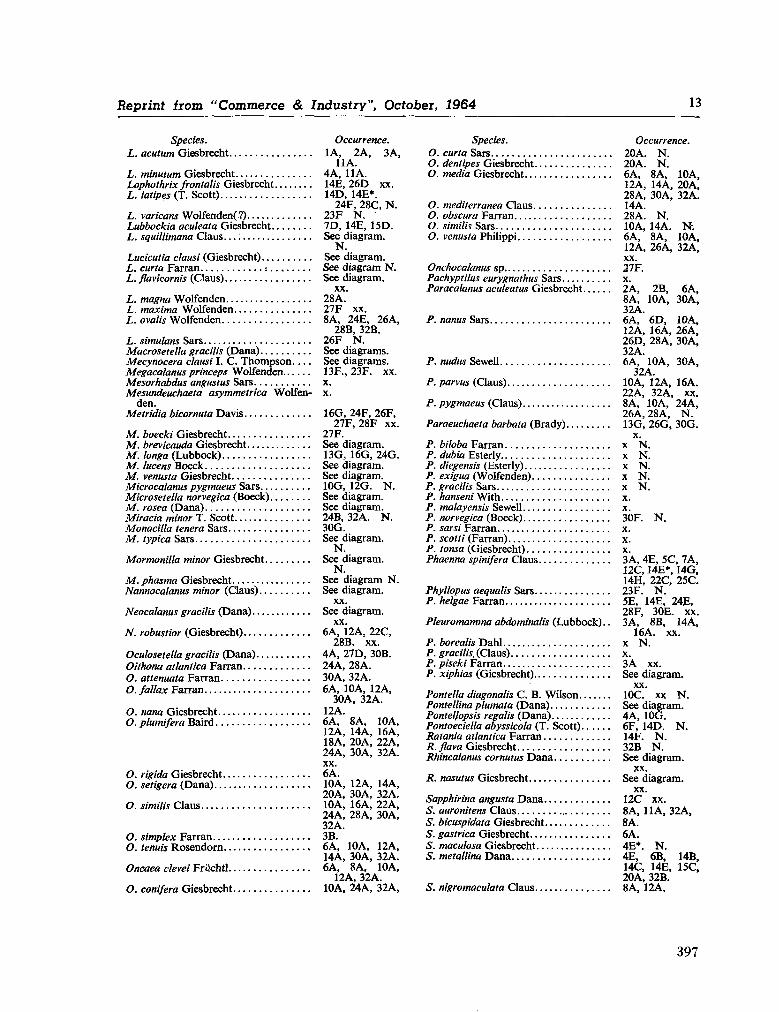
Repiint írom "Commerce & Industry", October, 1964 13
Species. Occurrence. L. acutum Giesbrecht 1A, 2A, 3A,
11A. L. minutum Giesbrecht 4A, 11 A . Lophothrix frontalis Giesbrecht 14E, 26D xx. L. latipes (T. Scott) 14D, 14E*.
24F, 28C, N . L. varicans Wolfenden(?) 23F N . Lubbockia aculeata Giesbrecht 7D, 14E, 15D. L. squillimana Claus... : See diagram.
N . Lucicutia clausi (Giesbrecht) See diagram. L. curta Farran : See diagram N . L. flavicornis (Claus) See diagram.
xx. L. magna Wolfenden 28A. L. maxima Wolfenden 27F xx. L. ovalis Wolfenden 8A, 24E, 26A,
28B, 32B. L. simulons Sars 26F N . Macrosetella gracilis (Dana) See diagrams. Mecynocera clausi I. C . Thompson See diagrams. Megacalanus princeps Wolfenden 13F., 23F. xx. Mesorhabdus angustus Sars x. Mesundeuchaeta asymmetrica Wolfen- x.
den. Metridia bicornuta Davis 16G, 24F, 26F,
27F, 28F xx. M . boecki Giesbrecht 27F. M . brevicauda Giesbrecht See diagram. M. longa (Lubbock) 13G, 16G, 24G. M . lucens Boeck See diagram. M . venusta Giesbrecht See diagram. Microcalanus pygmaeus Sars 10G, 12G. N . Microsetella norvegica (Boeck) See diagram. M . rosea (Dana) See diagram. Mirada minor T . Scott 24B, 32A. N . Monacillo teñera Sars 30G. M . typica Sars See diagram.
N . Mor monillo minor Giesbrecht See diagram.
N . M . phasma Giesbrecht See diagram N . Nannocalanus minor (Claus) See diagram.
xx. Neocalanus gracilis (Dana) See diagram.
xx. N. robustior (Giesbrecht) 6A, 12A, 22C,
28B. xx. Oculosetella gracilis (Dana) 4 A , 27D, 30B. Oithona atlántica Farran 24A, 28A. O . attenuata Farran 30A, 32A. O . fallax Farran 6A, 10A, 12A,
30A, 32A. O. nana Giesbrecht 12A. O . plumífera Baird 6A, 8A, 10A,
12A, 14A, 16A, 18A, 20A, 22A, 24A, 30A, 32A. xx.
O . rígida Giesbrecht 6A. O . setigera (Dana) 10A, 12A, 14A,
20A, 30A, 32A. O . similis Claus 10A, 16A, 22A,
24A, 28A, 30A, 32A.
O. simplex Farran 3B. O. tenuis Rosendorn 6A, 10A, 12A, 14A, 30A, 32A. Oncaea clevei Friichtl 6A, 8A, 10A, 12A 32A. O. conifera Giesbrecht 10A, 24A, 32A,
Species. Occurrence. O . curta Sars 20A. N . O . dentipes Giesbrecht 20A. N . O. media Giesbrecht 6A, 8A, 10A,
12A, 14A, 20A, 28A, 30A, 32A.
O . mediterránea Claus 14A. O . obscura Farran 28A. N . O . similis Sars 10A, 14A. N \ O . venusta Philippi 6A, 8A, 10A,
12A, 26A, 32A, xx.
Onchocalanus sp 27F. Pachyptilus eurygnathus Sars x. Paracalanus aculeatus Giesbrecht 2A, 2B, 6A,
8A, 10A, 30A, 32A.
P. nanus Sars 6A, 6D, 10A, 12A, 16A, 26A, 26D, 28A, 30A, 32A.
P. nudus Sewell 6A, 10A, 30A, 32A.
P. parvus (Claus) 10A, 12A, 16A. 22A, 32A, xx.
P. pygmaeus (Claus) 8A, 10A, 24A, 26A, 28A, N .
Paraeuchaeta barbata (Brady) 13G, 26G, 30G. x.
P. biloba Farran x N . P. dubia Esterly x N . P. diegensis (Esterly) x N . P. exigua (Wolfenden) x N . P. gracilis Sars x N . P. hanseni With x. P. malayensis Sewell x. P. norvegica (Boeck) 30F. N . P. sarsi Farran x. P. scotti (Farran) x. P. tonsa (Giesbrecht) x. Phaenna spinifera Claus 3A, 4E, 5C, 7A,
12C, 14E*, 14G, 14H, 22C, 25C.
Phyllopus aequalis Sars 23F. N . P. helgae Farran 5E, 14E, 24E,
28F, 30E. xx. Pleuromamma abdominalis (Lubbock).. 3 A , 8 B , 14A,
16A. xx. P. borealis Dahl x N . P. gracilis, (Claus) x. P. piseki Farran 3A xx. P. xiphias (Giesbrecht) See diagram.
xx. Pontella diagonalis C . B . Wilson IOC. xx N . Pontellina plumât a (Dana) See diagram. Pontellopsis regalis (Dana) 4A, 10G. Pontoeciella abyssicola (T. Scott) 6F, 14D. N . Ratania atlántica Farran ]4F. N . P. flava Giesbrecht 32B N . Rhincalanus cornutus D a n a See diagram.
xx. R . nasutus Giesbrecht See diagram.
xx. Sapphirina angusta D a n a 12C xx. S. auronitens Claus 8A, 11 A , 32A, S. bicuspidata Giesbrecht 8A. S. gástrica Giesbrecht 6A. S. maculosa Giesbrecht 4E*. N . S. metallina D a n a 4E, 6B, 14B, 14C, 14E, 15C, 20A, 32B. S. nigromaculata Claus 8A, 12A.
397
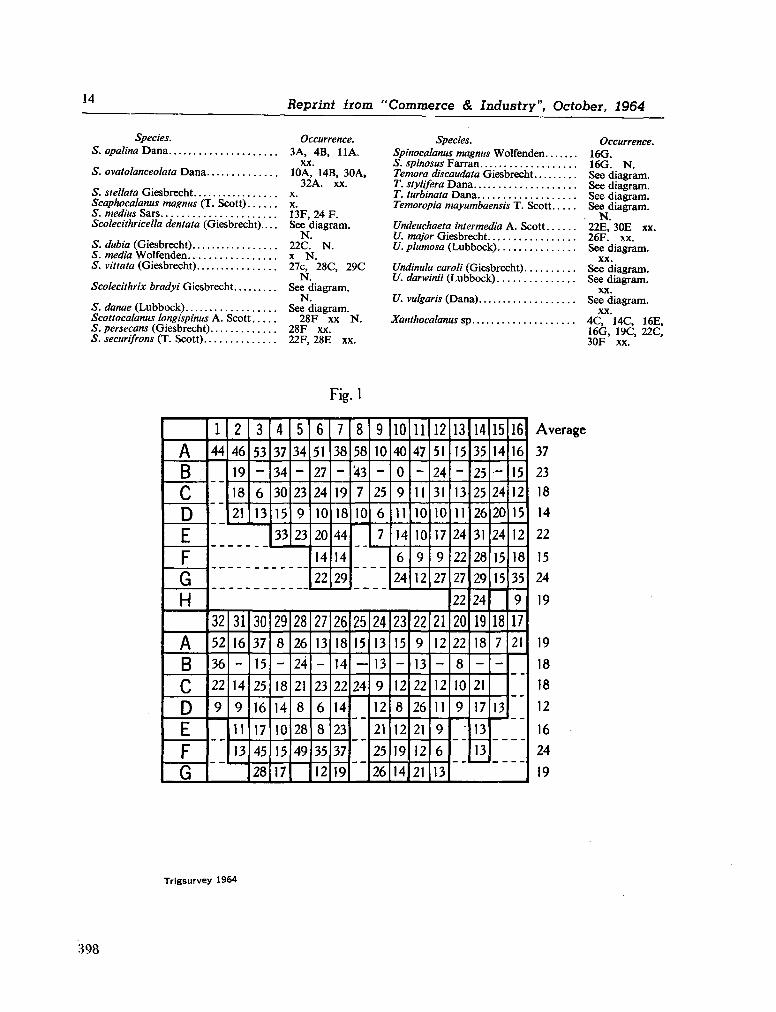
14 Reprint from "Commerce & Industry", October, 1964
Species. Occurrence. S. opalina D a n a 3A, 4B, 11A.
xx. S. ovatolanceolata Dana 10A, 14B, 30A,
32A. xx. S. stellata Giesbrecht x. Scaphocalanus magnus (T. Scott) x. S. médius Sars 13F, 24 F. Scolecithricella dentata (Giesbrecht) See diagram.
N . S. dubia (Giesbrecht) 22C. N . S. media Wolfenden x N . S. vit lata (Giesbrecht) 27c, 28C, 29C
N . Scolecithrix bradyi Giesbrecht See diagram.
N . S. danae (Lubbock) See diagram. Scottocalanus longispinus A . Scott 28F xx N . S. persecans (Giesbrecht) 28F xx. S. securifrons (T. Scott) 22F, 28E xx.
Species. Occurrence. Spinocalanus magnus Wolfenden 16G. S. spinosus Farran 16G. N . Temora discaudata Giesbrecht See diagram. T. stylifera Dana See diagram. T. turbinata Dana See diagram. Temoropia mayumbaensis T . Scott See diagram.
- N . Undeuchaeta intermedia A . Scott 22E, 30E xx. U. major Giesbrecht 26F. xx. U. plumosa (Lubbock) See diagram.
xx. Undinula caroli (Giesbrecht) See diagram. U. darwinii (Lubbock) See diagram.
xx. U. vulgaris (Dana) See diagram.
xx. JCanthocalanus sp 4C, 14C, 16E,
16G, 19C, 22C, 30F xx. Fig.l
A B C D E F G H
A B C D E F G
1 44
--
2 46
19 18
"¿T
3 53 -
6 13
4 37 34 30
15
33
5 34 -
23
9
23
32 52
36
22
9
--
31 16 -
14
9
11
13
30 37
15
25
16
17
45 28
29 8 -
18
14
10
15 17
28 26 24
21
8
28
49
6 51 27 24
10
20
14 22
7 38 -
19 18
44
14
29
21 13 -
23
6
8
35 12
26 18
14
22
14
23
37
19
8 58
43 7
10
9 10 -
25
6
7
25 15
24
• •
24 13
13
9
12
21
25
26
Toi 40 0
9 11
14
6 24
11 47 -
11 10
10
9
12
12 51
24 31 10
17
9
27
23 15 -
12
8
12
19 14
22 9
13
22
26
21
12
21
21 12 -
12
11
9
6
13
13 15 -
13 11
24
22
27
22
20 22 8
10
9
--
14 35
25 25 26
31
28
29
24
19 18 -
21
17
13
13
15 14 • -
24
m 24
15 15
18 7 -
13
16
16
15 12
15
12
18
35
9
17 21
--
Average
37
23
18
14
22
15
24
19
19
18
18
12
16
24
19
Trigsurvey 1964
Reprint from "Commerce & Industry", October, 1964 15
5. Discussion. Diversity distribution.
The total number of Copepod species found in each separate haul (=diversity) is recorded in Fig. 1. Although our taxonomic work is not complete, the present data already show two maxima: one in the surface layers along the northern line, the other in the deep hauls between 750 and 1,500 m . throughout the area. The occurrence of maxima in those levels has been observed on many occasions in all oceans, as S E W E L L (1948) has already emphasized.
In the greater part of the southern area, h o w ever, the surface water was marked by a paucity of species as well as by low plankton volumes. In fact, comparatively few adult copepods were found near the surface at most of the southern stations and the populations were composed of a very high percentage of early copepodid stages of small Calanoids and Oithona.
Distribution of certain species within the area. In more than 100 of our distribution diagrams
of individual species some sort of pattern is apparent. W h e n w e compare these patterns, it is possible to classify them into four groups, which could well correspond to four separate communities. By utilizing one diagram on which was plotted the occurrence of all the species which appear to fall into the same group (or supposed community), w e obtained the results shown in Figs. 2 to 5, where each dot represents the occurrence of one species of the group in a certain haul.
Table II shows that both groups C and D , occurring in deeper levels, contain a number of
species known to occur in the Atlantic and Pacific, but not previously found in the Indian Ocean. The number of these species appears to increase with depth. Furthermore, from Table II, the per cent occurrence of each of the four groups is uniformly high in that area to which w e hav« tentatively assigned it. This strengthens our supposition that the four groups correspond with real plankton communities.
The vertical distribution of the four groups closely agrees with that of the water masses as deduced from the hydrological data of the cruise ( O R R E N 1963):—
Mocambique and Agulhas Currents: Stat. 1-5, 0-500 m . . . Group A .
Surface and subsurface water: 0-200 m Group B .
Central water: • 200-600 m Group C .
Antarctic Intermediate water: 600-1, 300 m Group D .
Deep water: 1,400-3,000 m : As the nets seldom reached further down than the upper limit of the " Deep water ", it cannot be expected that a separate community (which might well occur here) would be distinguishable in our catches.
Again, the surface water at the southern line of stations did not yield any species falling within any of the four groups. This water mass seems to be inhabited by a few ubiquitous species only. The hydrological data here point towards a general sinking of the surface water ( O R R E N 1963), but w e can find no connection between this phenomenon and the dearth of surface plankton.
T A B L E II.
Group.
A B C D
N o . of
12 21 14 81
General distribution.
Atlantic.
10 15 14 75
Indian.
12 21 10 50
Pacific.
12 21 14 75
N o . of occurrences in our catches.
In/Outside group area.
52 10 166 37 107 41 491 83
Total.
62 203 148 574
Percentage occurrence in
group area.
84 82 72 85
399
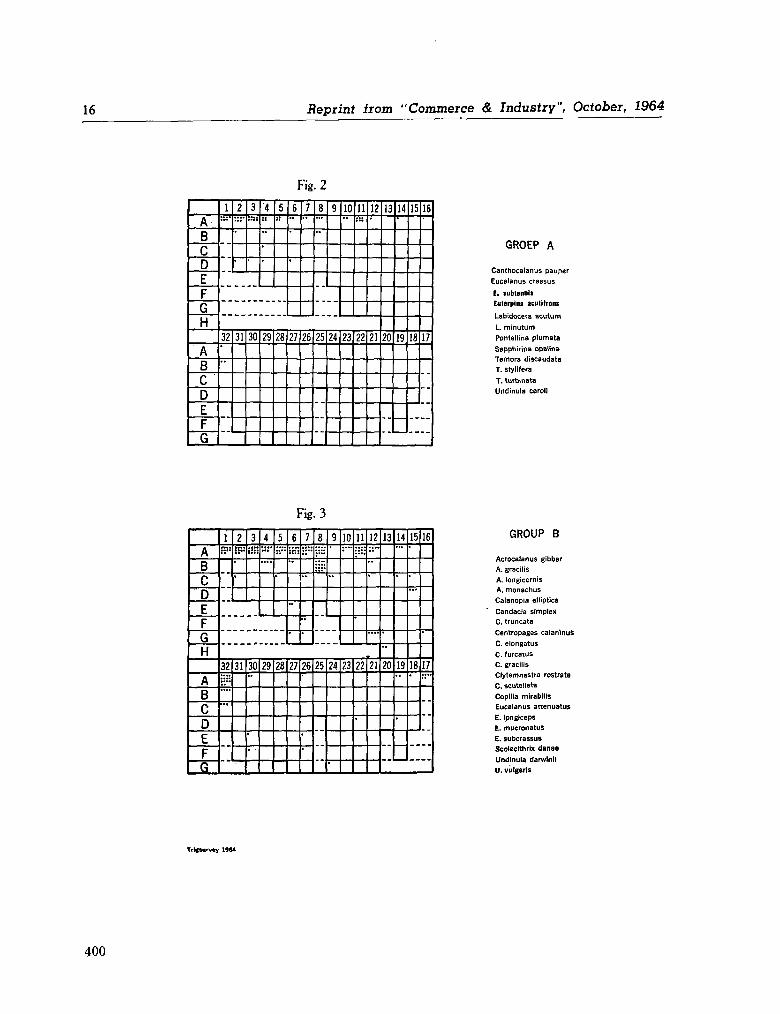
16 Reprint horn "Commerce & Industry", October, 1964
Fig. 2
A B C D E F G H
A B C D E F G
1 ::r
--
2 3 ' • ' • "
4 :: " •
5 Î:
32 "
—
31 30 29 28
6 *•
*
7 "
27 26
8 ...
9
25
-
24
10 '•
11 t¡:
12
23 22 21
13
20
--
14 "
19
15
18
16
17
--
GROEP A
Canthocalanus pauper
Eucalanus crassus
E. jubtenuli
Euterpina acutifront
Labtdocera acutum
L. minutum Pontellina plu mata
Sapphirina opalina Temora discauda ta T. stylifera
T . turbinata
Undinula caroll
Fig. 3
A B C D E F G H
A B C D E F G
Jj iï]
--
7 !•« ' '
3 ::::
4 ... ....
5 ::••
'
32 :::: .... •»•
--
31 30 *•
• • -
29 28
7 ;;;; "
"
"
7 ::"
••
" '
27 26
' *
8 ::::
9
25
.,_
24
10 •
11 12 ••
23 22 21
13
20
14
"
19
*
15
*
18 •
16
" ::••
GROUP B
Acrocalanus gibber
A . gracilis
A . longicornis
A. monachus
Calanopia elliptJca
Candacia simplex
C . truncata
Centre-pages calaninuS
C . elongatus
C.furcaxus
C . gracilis
Clytemnestra rostrata
C . scutellata
Copllia mirabilis
Eucalanus atténuât us
E. Ipngiceps
E. mucronatas
E. suberassus
Scolecithrix danae
Undinula darwinii
U . vulgaris
Trlgsun/ey 1964
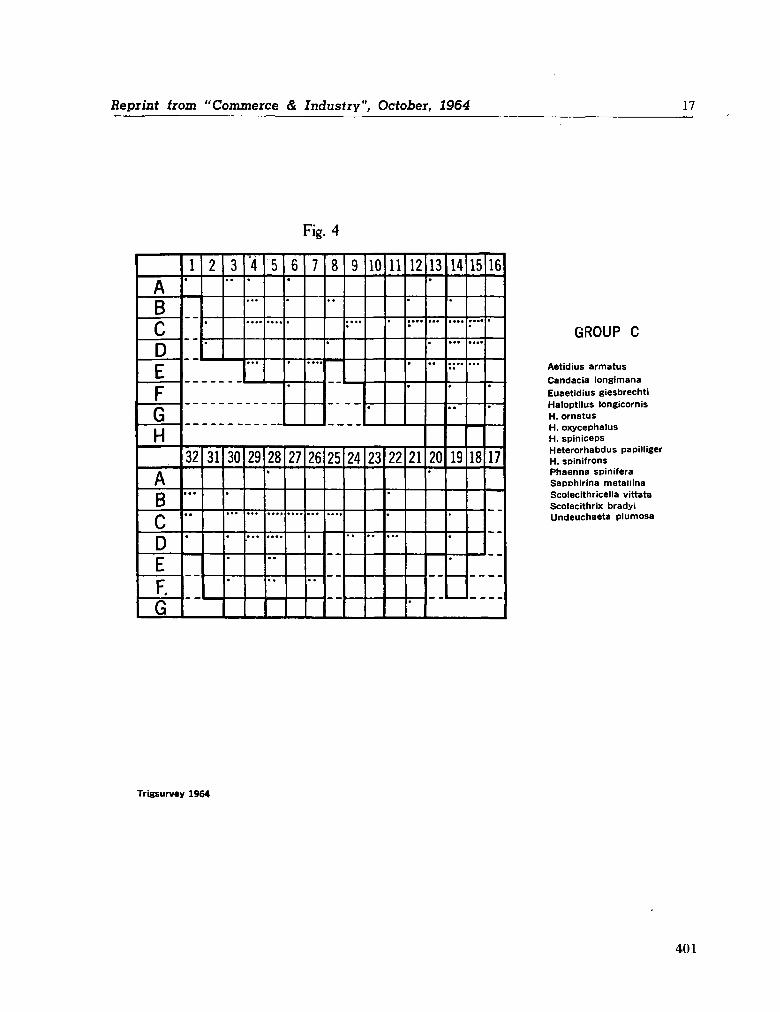
Reprint trom "Commerce & Industry", October, 1964 17
Fig. 4
A B C D E F G H
A B C D E F. G
l
- -
2
•
"
3 '"
4 ' ...
5
32
...
..
~~
31 30
•
'
29
•••
28 a
* • • •
"
6 '
•
7
27 26
8
•
9
• • • >
25
-
24
"ÎÔ1
•
11 12
•
23 22
" ...
21
13
•
"
20 '
- -
14
"
...
::••
»
• *
19
"
15
••••
...
18
16
'
17
- -
1
GROUP C
Aetidius armatus Candada longimana Euaetidius giesbrechti Haloptilus longicornis H . ornatus H . oxycephalic H . spiniceps Heterorhabdus papilliger H . spinifrons Phaenna spinifera SapDhirina metalilna Scolecithricella vittata Scolecithrix bradyi Undeuchaeta plumosa
Trigsurvey 1964
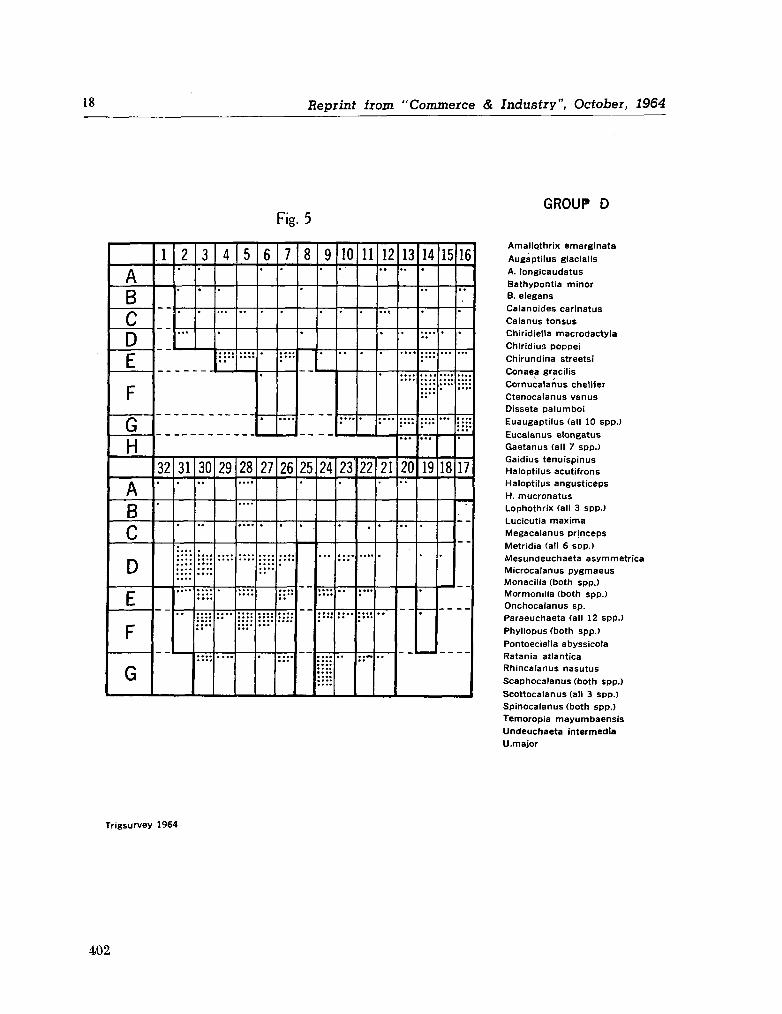
18 Reprint írom "Commerce & Industry", October, 1964
Fig. 5 GROUP D
A B C D E F
G H
A B C
D
E
F
G
l
- -
2
...
3
•
4
...
•
:;::
5
"*
32 •
- -
31 •
:... •• * *
....
30 •"
::::
::::
i::: : : • •
::::
29 28 • • • •
....
::::
• • *
6 •
7
:*::
27
'
::::
::::
26
'
•
•:•"
::::
:::•
8
•
9 •
25 *
- -
24
...
....
::::
lili •ir-
lO
'
•
11
"
12 " •
•
•
23 •
"
:::•
22
•
....
....
• • • • • • •
::~
21
•
13 • •
•
....
::::
20
- -
14 "
* ::••
::::
:::':'
::::
19
15
: -
18
•
16
..
•
::::
m 17
: :
Amallqthrix emarginata
Augaptilus glacialis
A. longicaudatus
Bathypontia minor B. elegans
Calanoi'des carinatus
Calanus tonsus
Chiridiella macrodactyla
Chiridius poppei
Chirundina streetsi
Conaea gracilis
Cornucalanus chelifer
Ctenocalanus vanus
Disseta palumboi
Euaugaptilus (ail 10 spp.)
Eucalanus elongatus
Gaetanus (ail 7 spp.)
Gaidius tenuispinus
Haloptilus acutifrons
Haloptilus angusticeps
H. mucronatus
Lophothrix (ail 3 spp.)
Lucicutia maxima
Megacalanus princeps
Metridia (ail 6 spp.)
Mesundeuchaeta asymmetrica
Microcalanus pygmaeus
Monacilla (both spp.)
Mormonilla (both spp.)
Onchocalanus sp.
Paraeuchaeta (ail 12 spp.)
Phyllopus (both spp.)
Pontoeciella abyssicola
Ratania atlántica
Rhincalanus nasutus
Scaphocalanus (both spp.)
Scottocalanus (ail 3 spp.)
Spinocalanus (both spp.)
Temoropia mayumbaensis
Undeuchaeta intermedia
U.major
Trigsurvey 1964
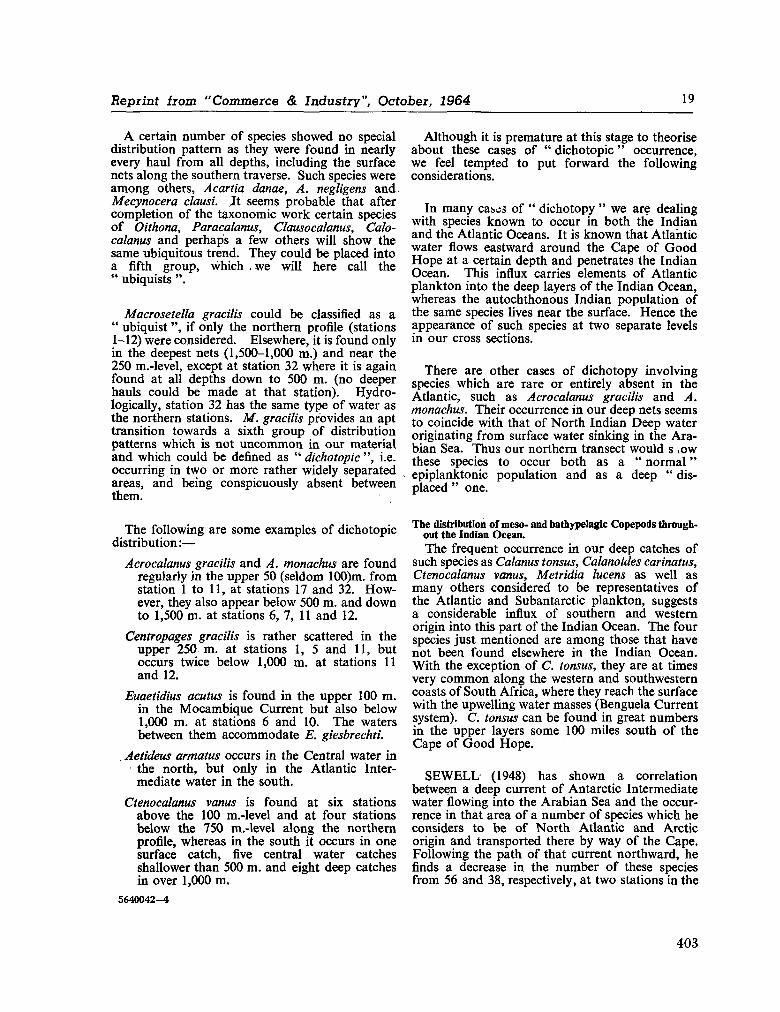
Reprint horn "Commerce & Industry", October, 1964 19
A certain number of species showed no special distribution pattern as they were found in nearly every haul from all depths, including the surface nets along the southern traverse. Such species were a m o n g others, Acartia danae, A . negligens and Mecynocera clausi. It seems probable that after completion of the taxonomic work certain species of Oithona, Paracalanus, Clausocalanus, Calo-calanus and perhaps a few others will show the same ubiquitous trend. They could be placed into a fifth group, which . w e will here call the " ubiquists ".
Macrosetella gracilis could be classified as a " ubiquist ", if only the northern profile (stations 1-12) were considered. Elsewhere, it is found only in the deepest nets (1,500-1,000 m . ) and near the 250 m.-level, except at station 32 where it is again found at all depths d o w n to 500 m . (no deeper hauls could be m a d e at that station). Hydro-logically, station 32 has the same type of water as the northern stations. M . gracilis provides an apt transition towards a sixth group of distribution patterns which is not u n c o m m o n in our material and which could be defined as " dichotopic ", i.e. occurring in two or more rather widely separated areas, and being conspicuously absent between them.
The following are some examples of dichotopic distribution:—
Acrocalanus gracilis and A . monachus are found regularly in the upper 50 (seldom 100)m. from station 1 to 11, at stations 17 and 32. H o w ever, they also appear below 500 m . and d o w n to 1,500 m . at stations 6, 7, 11 and 12.
Centropages gracilis is rather scattered in the upper 250 m . at stations 1, 5 and 11, but occurs twice below 1,000 m . at stations 11 and 12.
Euaeiidius acutus is found in the upper 100 m . in the Mocambique Current but also below 1,000 m . at stations 6 and 10. The waters between them accommodate E . giesbrechti.
Aetideus armatus occurs in the Central water in the north, but only in the Atlantic Intermediate water in the south.
Ctenocalanus vanus is found at six stations above the 100 m.-level and at four stations below the 750 m.-level along the northern profile, whereas in the south it occurs in one surface catch, five central water catches shallower than 500 m . and eight deep catches in over 1,000 m .
Although it is premature at this stage to theorise about these cases of " dichotopic " occurrence, w e feel tempted to put forward the following considerations.
In m a n y cases of " dichotopy " w e are dealing with species k n o w n to occur in both the Indian and the Atlantic Oceans. It is k n o w n that Atlantic water flows eastward around the Cape of G o o d H o p e at a certain depth and penetrates the Indian Ocean. This influx carries elements of Atlantic plankton into the deep layers of the Indian Ocean, whereas the autochthonous Indian population of the same species lives near the surface. Hence the appearance of such species at two separate levels in our cross sections.
There are other cases of dichotopy involving species which are rare or entirely absent in the Atlantic, such as Acrocalanus gracilis and A . monachus. Their occurrence in our deep nets seems to coincide with that of North Indian Deep water originating from surface water sinking in the Arabian Sea. Thus our northern transect would s , o w these species to occur both as a " normal " epiplanktonic population and as a deep " displaced " one.
The distribution of meso- and bathypelagic Copepods throughout the Indian Ocean. The frequent occurrence in our deep catches of
such species as Calanus tonsus, Calanoides carinatus, Ctenocalanus vanus, Metridia lucens as well as m a n y others considered to be representatives of the Atlantic and Subantarctic plankton, suggests a considerable influx of southern and western origin into this part of the Indian Ocean. The four species just mentioned are a m o n g those that have not been found elsewhere in the Indian Ocean. With the exception of C. tonsus, they are at times very c o m m o n along the western and southwestern coasts of South Africa, where they reach the surface with the upwelling water masses (Benguela Current system). C . tonsus can be found in great numbers in the upper layers some 100 miles south of the Cape of G o o d H o p e .
S E W E L L - (1948) has shown a correlation between a deep current of Antarctic Intermediate water flowing into the Arabian Sea and the occurrence in that area of a number of species which he considers to be of North Atlantic and Arctic origin and transported there by way of the Cape. Following the path of that current northward, he finds a decrease in the number of these species from 56 and 38, respectively, at two stations in the
5640042-4
403
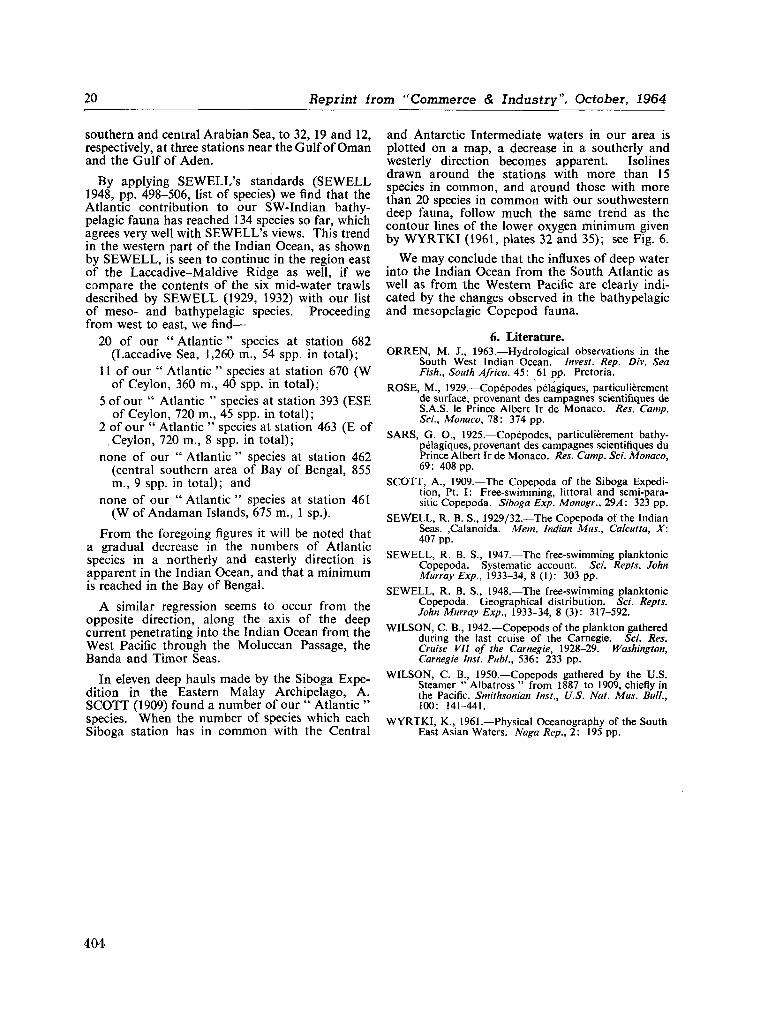
20 Reprint from "Commerce & Industry", October, 1964
southern and central Arabian Sea, to 32, 19 and 12, respectively, at three stations near the Gulf of O m a n and the Gulf of Aden.
By applying S E W E L L ' s standards ( S E W E L L 1948, pp. 498-506, list of species) we find that the Atlantic contribution to our SW-Indian bathy-pelagic fauna has reached 134 species so far, which agrees very well with S E W E L L ' s views. This trend in the western part of the Indian Ocean, as shown by S E W E L L , is seen to continue in the region east of the Laccadive-Maldive Ridge as well, if we compare the contents of the six mid-water trawls described by S E W E L L (1929, 1932) with our list of meso- and bathypelagic species. Proceeding from west to east, w e find—
20 of our " Atlantic " species at station 682 (Laccadive Sea, 1,260 m . , 54 spp. in total);
11 of our " Atlantic " species at station 670 ( W of Ceylon, 360 m . , 40 spp. in total);
5 of our " Atlantic " species at station 393 (ESE of Ceylon, 720 m . , 45 spp. in total);
2 of our " Atlantic " species at station 463 (E of Ceylon, 720 m . , 8 spp. in total);
none of our " Atlantic " species at station 462 (central southern area of Bay of Bengal, 855 m . , 9 spp. in total); and
none of our " Atlantic " species at station 461 ( W of A n d a m a n Islands, 675 m . , 1 sp.).
F rom the foregoing figures it will be noted that a gradual decrease in the numbers of Atlantic species in a northerly and easterly direction is apparent in the Indian Ocean, and that a minimum is reached in the Bay of Bengal.
A similar regression seems to occur from the opposite direction, along the axis of the deep current penetrating into the Indian Ocean from the West Pacific through the Moluccan Passage, the Banda and Timor Seas.
In eleven deep hauls made by the Siboga Expedition in the Eastern Malay Archipelago, A . S C O T T (1909) found a number of our " Atlantic " species. W h e n the number of species which each Siboga station has in c o m m o n with the Central
and Antarctic Intermediate waters in our area is plotted on a m a p , a decrease in a southerly and westerly direction becomes apparent. Isolines drawn around the stations with more than 15 species in c o m m o n , and around those with more than 20 species in c o m m o n with our southwestern deep fauna, follow much the same trend as the contour lines of the lower oxygen minimum given by W Y R T K I (1961, plates 32 and 35); see Fig. 6.
W e may conclude that the influxes of deep water into the Indian Ocean from the South Atlantic as well as from the Western Pacific are clearly indicated by the changes observed in the bathypelagic and mesopelagic Copepod fauna.
6. Literature. O R R E N , M . J., 1963.—Hydrological observations in the
South West Indian Ocean. Invest. Rep. Div. Sea Fish., South Africa. 45: 61 pp. Pretoria.
R O S E , M . , 1929.—Copépodes pélagiques, particulièrement de surface, provenant des campagnes scientifiques de S.A.S. le Prince Albert Ir de Monaco. Res. Camp. Sa'., Monaco, 78: 374 pp.
S A R S , G . O . , 1925.—Copépodes, particulièrement bathy-pélagiques, provenant des campagnes scientifiques du Prince Albert Ir de Monaco. Res. Camp. Sci. Monaco, 69: 408 pp.
S C O T T , A . , 1909.—The Copepoda of the Siboga Expedition, Pt. I: Free-swimming, littoral and semi-para-sitic Copepoda. Siboga Exp. Monogr., 29A: 323 pp.
S E W E L L , R . B . S., 1929/32.—The Copepoda of the Indian Seas. ,Calanoida. Mem. Indian Mus., Calcutta, X: 407 pp.
S E W E L L , R . B . S., 1947.—The free-swimming planktonic Copepoda. Systematic account. Sci. Repts. John Murray Exp., 1933-34, 8 (1): 303 pp.
S E W E L L , R . B . S., 1948.—The free-swimming planktonic Copepoda. Geographical distribution. Sci. Repts. John Murray Exp., 1933-34, 8 (3): 317-592.
W I L S O N , C . B . , 1942.—Copepods of the plankton gathered during the last cruise of the Carnegie. Sci. Res. Cruise VII of the Carnegie, 1928-29. Washington, Carnegie Inst. Publ., 536: 233 pp.
W I L S O N , C . B . , 1950.—Copepods gathered by the U . S . Steamer " Albatross " from 1887 to 1909, chiefly in the Pacific. Smithsonian Inst., U.S. Nat. Mus. Bull., 100: 141-441.
W Y R T K I , K . , 1961.—Physical Oceanography of the South East Asian Waters. Naga Rep., 2 : 195 pp.
404
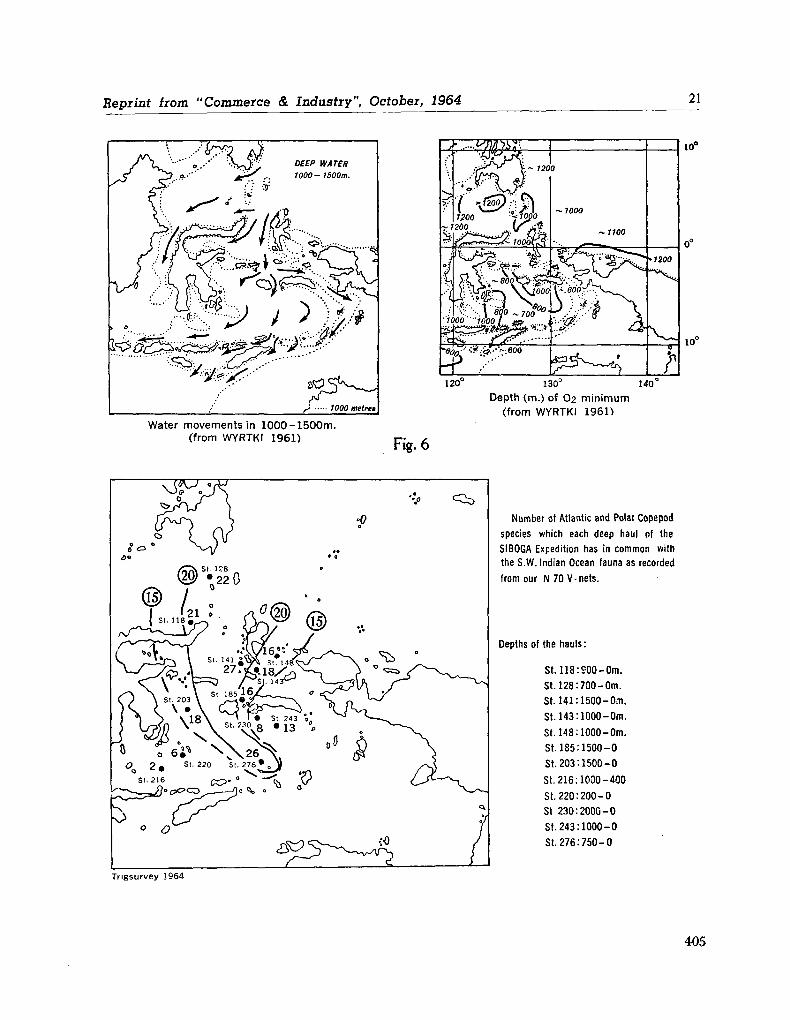
Reprint from "Commerce & Industry", October, 1964 21
DEEP WATER
1000-1500m.
1000 metres
Water movements in 1000 -1500m. (from WYRTKI 1961)
800 ^ _ .
•-. \ «?" - 700 7000 '1000 I j»
#;iF~600
120° 130° 140°
Depth (m.) of O2 minimum (from WYRTKI 1961)
Fig. 6
O 2 m St- 2 2 0 S'- 2 7 6 * t
s.. 216 K ? - . ° _ -% y
Ç^=^' C P C C D
o <9
o % o
¿fc?'
Number of Atlantic and Polar Copepod species which each deep haul of the SIBOGA Expedition has in c o m m o n with the S . W . Indian Ocean fauna as recorded from our N 70 V-nets.
Depths of the hauls:
St. 118
St. 128
St. 141
St. 143
St. 148
St. 185
St. 203
Si. 216
St. 220
St 230
St. 243
St. 276
900-
700-
1500
1000
1000
1500
1500
1000
200-
2000
1000
:750-
Om. Om. -Om.
-Om.
-Om. -0 -0
-400
0 -0 -0 0
Tngsurvey 1964
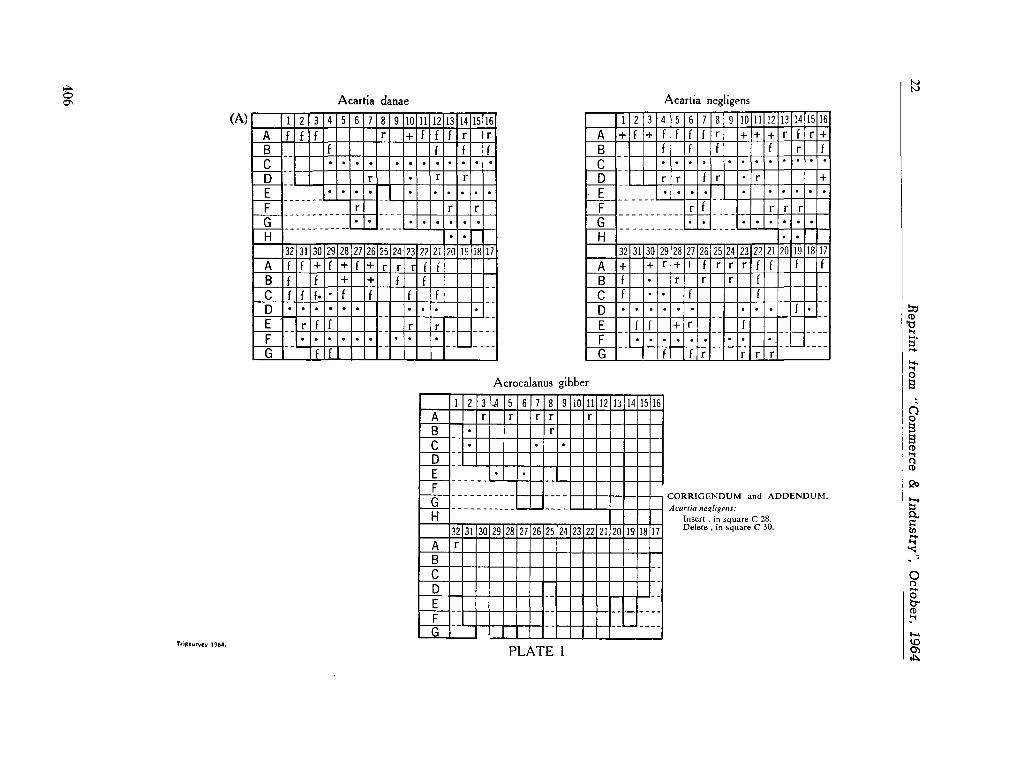
22
Reprin
t fro
m "
Com
merce
& In
du
stry"
, O
cto
ber,
1964
<-o
LO
-=J-
co
CN
J
^ O
CD
OO
r—*
<JD
LT>
*3-
m
CNJ
-
+
u
—
u
+
+
+
u
—
~-~-—
+
V-
+
< —
u
—
—
—
1-*
-.
+
u
• u
— u
u
I ', C
Q O
Q
• • • • •
LU
u
u.
u i
' —
U
Lu
• •
O
• •
X
^ OO
en
CD
C
NI
CN
I
CN
J
CN
I
CO
*3"
CN
J
LT
) C
NJ
to
CN
J
CN
J
OO
C
NJ
CN
J
O
CO
CO
CN
I C
O ^
^ M-
^ 1-
l_i
Ul
^ —
+
t_
+
+
<
¡ ¡
^7|
u
u.
Ui
.
M-
m
•—
^ • •
•-i-.
o
. >-• . •
i
i
i*.
• 1—
u
u
! !
!
o
U
+
—
^ 1
LÜ
Ü
_
U,
v-t-i
—
O
D
Q
Z u
Q
0
< c
CJ
s
3
Q
z IGE
tí
0
U
S
1
! s
"<¡ ^ o"
s 8 H
?»
.5-S
ert . lete.
1
•I
to
LT
)
*ST
CO
CN
J
;=; C
D
en
OO
1—
CO
HO
*3-
CO
CN
I
-,
u>
u.
*-h
>
l-*M
^ +
u.
<-<-,
«-(-•
"-t-l
<
«_
—
«-i—
*-*-.
u
i-• i-
1
1
1
1
CD O
1 . . . . . • • . . . DJ
U,
u, ' 1
u,
ü_
• •
O
~ • •
X
1^
OO
en
CD
C
NJ
CN
I
CN
I C
NJ
CO
C
NJ
CN
J
no
C
NJ
CN
I
CN
I
OO
C
NJ
co
C
NJ
CD
C
O
CO
CN
I C
O
•—
•—
L*
U,
U
+
—
+
<-b
*
+
—
—
<
1
1
~-,
•-I-.
+
+
El
<-
4_
CQ
—
\—
M-i
'-fc-
• ¿. —
•—
O
• • •
1
1
1
u
u
•
1 '
1
i p
1
O
»-—
u I
LU
Lu
—
—
O
<o
ur>
*=¡-
•TO
CN
J
^ CD
cr>
OO
l~
*.
to
uo r
CO
CN
I
—
U,
u
u
u,
u
<
U,
•
• . • 1
1
1
1
CQ 1
Q
• •
LÜ
' 1
1
u_ o
I
r—
OO
po
CD
C
sJ
CN
J
CN
I C
NJ
CO
C
NJ
CN
J
CN
J
CO
C
NJ
CN
J
OO
C
NI
CO
C
NJ
CD
C
O
CO
CN
J
CO
L-
<
¡
ÛÛ
O
i i
1
i
1
1
1
1
1
1
Q
i
i
LU
Ll_ es
LU
< 0.
406
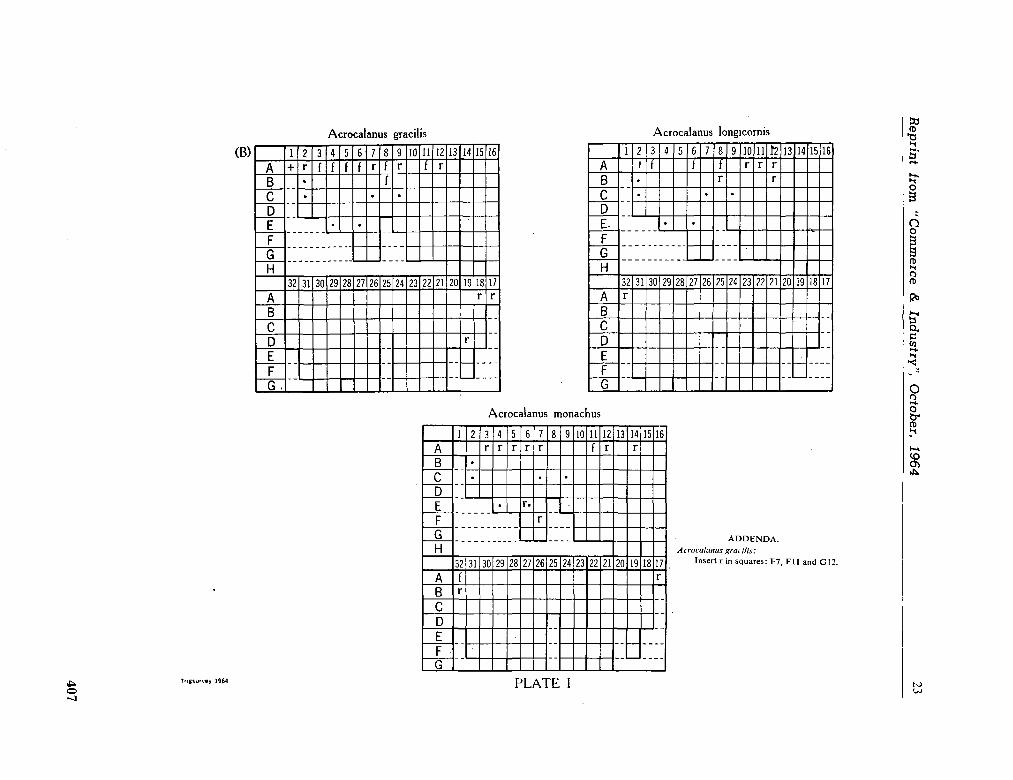
Rep
rin
t fro
m "C
om
merce
& In
dustr
y",
Octo
ber, 1
964
23
c o
o
Oil
Ü ocalanus
i-*
<
CO
LO
^r
co
« z;
en
CX
I
OO
r—*
co
LO
*3-
CQ
CM
-
U
u
u
u^-
i-t-i
-<
u
u .
. • • 1
1
1
1
m o
o
. . LU
i
1
t t
LL
C
S X
r
oo
en
CD
C
NJ
CNJ
CN
J C
XI
co
C
NJ
CN
I
CN
J
<o
C
NJ
CN
J
OO
C
NJ
en
C
NJ
CD
co
co
CN
J
m
U
<
i i
i i
m o
i i
•i i
i i
i
o
i
LU
Lu
o
<
Q
Z u
Q
a
<
¡2
1 & anus
ca Aero
(O
LO
^d-
co
CN
J
^ CD
en
oo
r*-CO
urs
-* co
Cv(
^
U
^ U
«-h
o
u
-U-
M-
^ «-U
+
<
«-•-i
•
• • • ¡
;
OÛ
o o
. . LU
; i
LL
CS
I
r^~
oo
en
CD
C
NJ
CNJ
CN
J C
NJ
co
C
NJ
CN
I
LO
C
NJ
CO
C
NJ
CN
J
OO
C
NJ
CO
C
NJ
O
co
co
CN
J
en
U
U
<
1
1
1
1
m o
-i 1 :
: 1
Q
1
1
LU
Lu
CD
rs-LO
*=T
CO
CNJ
^ CD
CD
OO
r*-co
LO
•=T
CO
CN
J
~
U
U.
^ u
u
u
u
u
<
•
. • • ;
;
00 o
o
u • LU
t i i
U
Lu
a
X
r.
oo
en
CD
C
NJ
CNJ
CN
J C
NJ
CO
C
NJ
CNJ
LO
C
NJ
CO
C
NJ
CNJ
OO
C
NJ
en
C
NI
CD
C
O
CO
CN
J C
D
u
^ <
1
(
u
CÛ
o
1
1
1
1
1
Q
i
LU L
u es
<
a.
CD
407
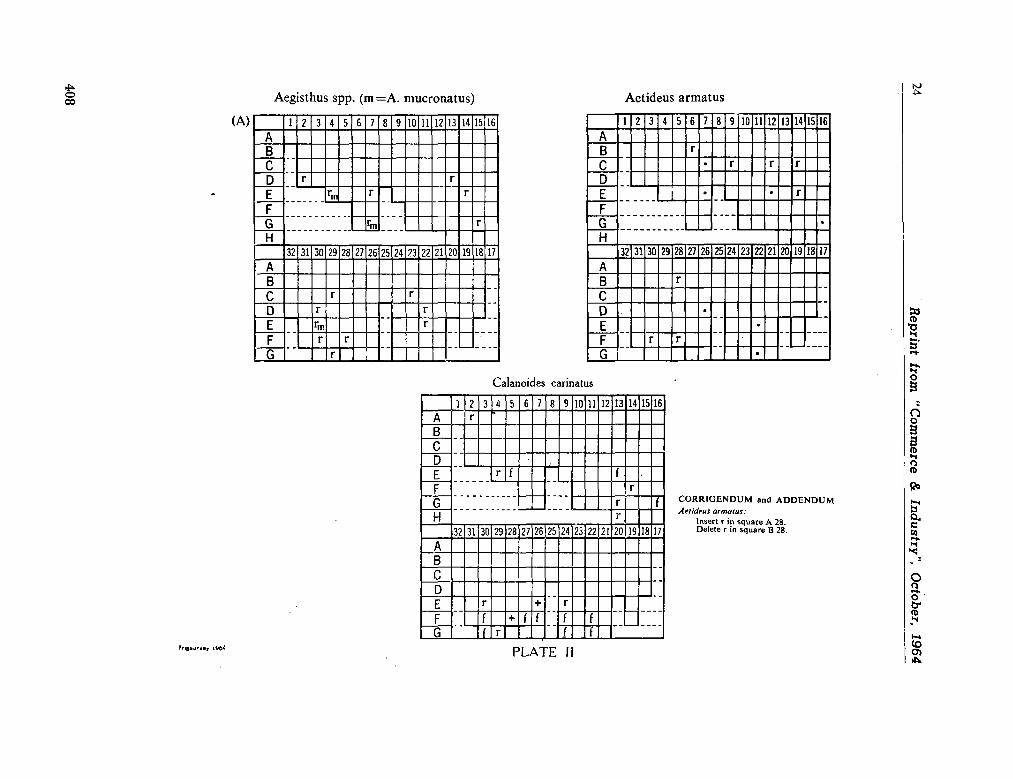
24
Reprin
t fro
m "
Com
merce
& In
du
stry"
, O
cto
ber,
1964
s
<
—
CO
CO
a-
CO
est
Zl
CD
CT»
OO
r-
CO
CO
>
CO
CN
J
-
<
u
ÛÛ
UH
L*
b*
•
1
1
o a
u
• • UJ
•
I i
i
Ll_
o i £
S
2
g
53
H
S3
S
W
S
a
a
a
S5
s s <
•
u
m o
—
•
*
1 LU
•
i
i
u
u
U_ o
C
O
o
3
O,
o. 3
60
_
CD
LO
í-
m
CS
J
zz
CD
o-»
OO
I-».
CO
en
*a-
CO
CS
J
-. <
u
u
1
1
m o
O
u
1-
¿
LU
u.
;
u_ J
o X
r-.
OO
on
CS
)
CS
I
es)
CS
J
co
C
SJ
CS
l
CS
I
CO
C
SJ
CS
I
OO
C
SI
CT
ï C
SI
CD
C
O
co
CS
I C
O
<
1
1
ÛG
u
u
O
u
t
1
i-
t
1
1
1
1
1
u
O ¿
J-
u
LU
Ll_
u.
O
D
Z U
Q
Q
<
0 I
£•-Z
1 Û
-
5 | S
"
CE
Í •
O
S
= Q
U
CO
ITÏ -C
O
CSJ
ZZ
C
D
o->
CO
r-
CO
kD
sa
co
CS
J
— U
<
i
m o
.
"
M-,
»-*-. î-
LU U
"•
**
u
J
1
1
Ll_
'-
o
X
^ OO
cr»
o
CS
I
CS
I
CS
I C
SI
tO
CS
I
CSJ
co
C
SJ
CO
C
SI
CS
I
CO
C
SJ
R
CD
C
O
CO
CS
I C
O <
1
m o
1
1
| 1
1
U
V4
-,
*-ta. >—
—
i
i
i
Q
+
u
w-,
•-Í-.
+
«-I-.
1
1
ÜJ
u
^
U- C
D
LU
H
< -1
eu
408
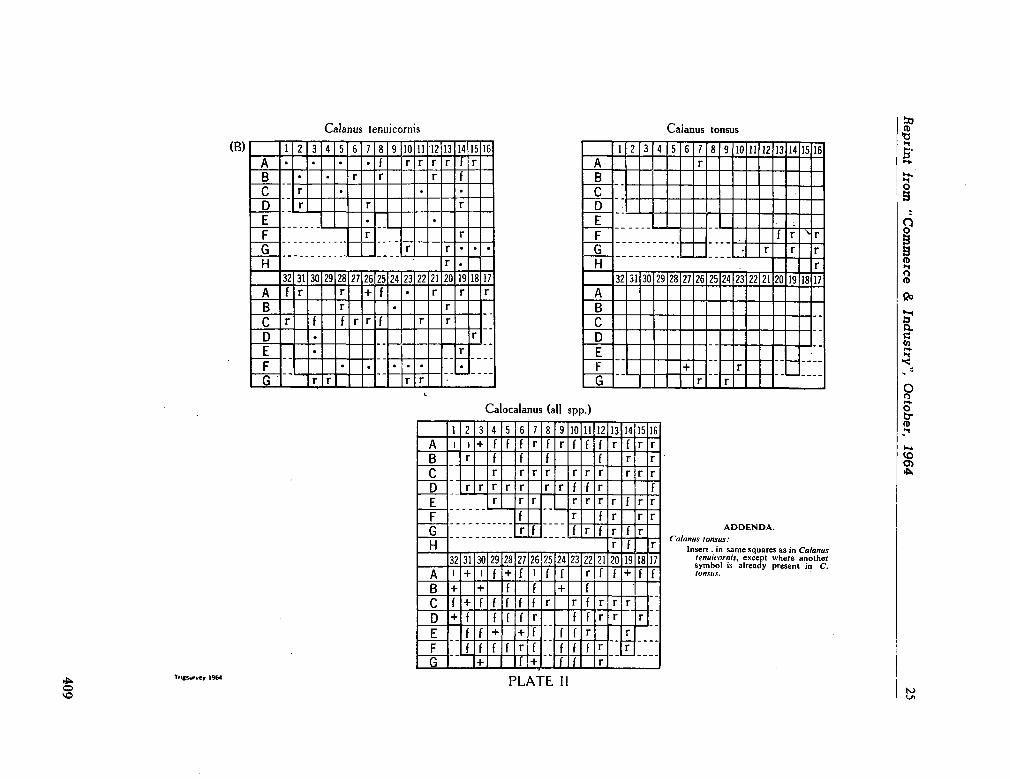
Reprin
t íro
m "
Com
merce
& In
du
stry"
, O
cto
ber, 1964
25
U
CO
IT)
s-
co
CM
ZZ
O
en
CO
r*.
CO
UO
*3-
CO
CSJ
-
u
<
CO
1 1
o
Q
•'
Lü
u
/ V-
V4
-I
u
u u
1 1
u_ a
1M
I
r-.
OO
o->
CSJ
CS
I
CS
J C
SJ
CO
C
SJ
^3
" C
sj
uo
C
SJ
CD
C
SJ
CSJ
OO
C
sj
Csl
CO
CO
CS
J C
O <
1 1
ÛQ
o
r i i i i u
i i i L* >
1
1 1
1 1
a
+
i 1
LjJ -
U
O
c
U
»
to
in r
CO
CSJ
~
o en
OO
r-—
cO
CO
"* C
O
CSI
-i
U
^ u.
u u u
—
• . . •
< —
u
u u . .
• • • u
u u u 1
1
CD Ü
O
• .
LU
u
• • • L.
U
i i
u
ÜL
. O
• u
X
r-.
OO
en
C3
CSJ
CSJ
CSJ
CSI
CO
C
SI
CSJ
UO
C
SJ
to C
SJ
(—
CSJ
OO
C
SJ en C
SJ
CO
CO
CSI
CO
u U.
L.
. w-
+
U U
v**.
<
• i
1 l
U • u
Dû
i-u
V—
.
U u
t-h*
V*
M
U.
O
u i
-1-• • • i
1
1 1
•
o
•
• •
i i
LU Ll_
U u
u u*
o
< Q
Z u
Q
0 < ¡ffll
CD
UO
*3-
CO
CSJ
~
O
en
OO
f-CO
HO
^J-
co
CSI
~
u u
<-!-« t-«-^. «—
IM
«-ta
.
u
**-*—
<
-l—
+ --<
u u
l-h«
—
—
<-h
«
u
CÛ
u. u L
.
u L-
u u u u u
o
<-t—
U
<-i—
*-»-. L
.
U
1_
1-
U J-L-
Q
u u
«-L-
u J-1»
IU
U.
U
Lu
L«
L-
l-
EJ
l_
U
^ u
—
u *+
*
1 1 1
**-l
Li_
w-
u
O
i»
VfcM
J-
X
r—.
OO
en
o CSÍ
CSJ
CSJ
CSJ
CO
C
SJ ^
3-C
SJ
CSJ
CO
C
SJ
CSI
OO
C
sj
cn C
SJ
CO
CO
CSJ
CO
—
l-t»
+ —
•—
. u
w
*-UM
-"-I-I
+ —
-+ -<
1 1
<-
M
+
<-
J-
.
—
+ +
CÛ
u
u*
u ^
b-
k*
h»
—
—
—
>*-—
+ —
o
u
u u
—
>—
1
-i- 1 1
u
—
— L
.
*-w *-i—
u
—
—
! !
! U
m
—
—
—
—
+ O
>—
+
+ <
•*•
V** —
u
—
V*
*
c^
w.
1 1
Lu LU + —
+
C3
."?
-3- >—
>
*- U
. U
. 1
-
<
0-
Cû
409

26 R
ep
rin
t íro
m "C
om
merce
& In
dustr
y",
Octo
ber, 1964
O
tJD
Ll">
*a-
co
CN
J
^ O
CD
OO
r-.
*£>
LO
*d-
CO
CM
-
u,
• u • «-• «-•
<-i-i
* u • • •
«-<
• • •
•
t 1
1
1
m o
Q
• LÜ • • •
l i
Lu • O
• • X
r-.
oo
CD
C
NJ
CX
I
CN
J
CM
oo
C
M
CN
J
CN
J
CN
J
CN
J
CO
C
NI
en
C
NI
CD
C
O
CO
CN
J
CO
. • • • 11
• U • u •
—
• u
<
• i
• i
• • • • m o
• • •
i | i i
• • i
i i
i i
i
• • •
o
1
LU U
.
•
a
o
> ta
a.
V)
3
G
JS <s u
_o a
O
UD
U-)
*a-
co
CN
J
^ CD
en
oo
t*-
UD
m -C
O
CN
J
-
U •
V*ri
• «•4—
i
• <-l~
i
• kri
• Ui
• • •-•
<
-. • •
•
1
1
1
1
m " 3 •
ÜJ
. • • ; t
U.
•
a
• •
i
r-*.
oo
CD
C
NJ
CN
J
CN
J
CN
J
CO
C
NI
*d-
CN
)
CN
J
to
CN
I
1
CN
J
CO
C
NJ
en
C
NJ
CD
C
O
CO
CN
J
CO
. u
Lri
• • • -• —
•
<-h
ri
• *>
hM
<
; ;
• • • •
m o
• • _•!
i 1
i
• • 1
I
I
1
1
1
• • • •
a
i i
UJ
U-
•
C3
<
Ü
Z UJ ADD
•a
rt
<
a
z m RIG COR
o
& anus
1
u <
K 19, F
w « uar C
f
.S ert. Ins
<
<
<
U 8
S S
•S
3.
s a
i-
alocalanus Delete
A 20,
U
remis
£ « ocaianus
ta )
<JD
UO
** C
O
CN
J
^ O
en
oo
r~~
.
<x>
LO
*<* C
O
CN
I
— • • • • l~
• ^-• * • • • * • <
• • • • 00
•
Í 1
O o
• LU • • • ' i i
Lu • (3
• • • I
r
oo
cr>
CD
C
NJ
CN
J
CN
J
CN
J
CO
C
NJ
CN
I
CN
J
CO
C
NJ
CN
J
OO
C
NI
cr> C
NI
CD
C
O
ro
CN
I C
O
u.
1-• u • -• *—
. <*.
<
1
1
• • • . . • CÛ
o
• • • • • • • • • • • Q
1
1
1
1
1
• • • 1
1
1
Lu LL. • • • C3
<
LU
410
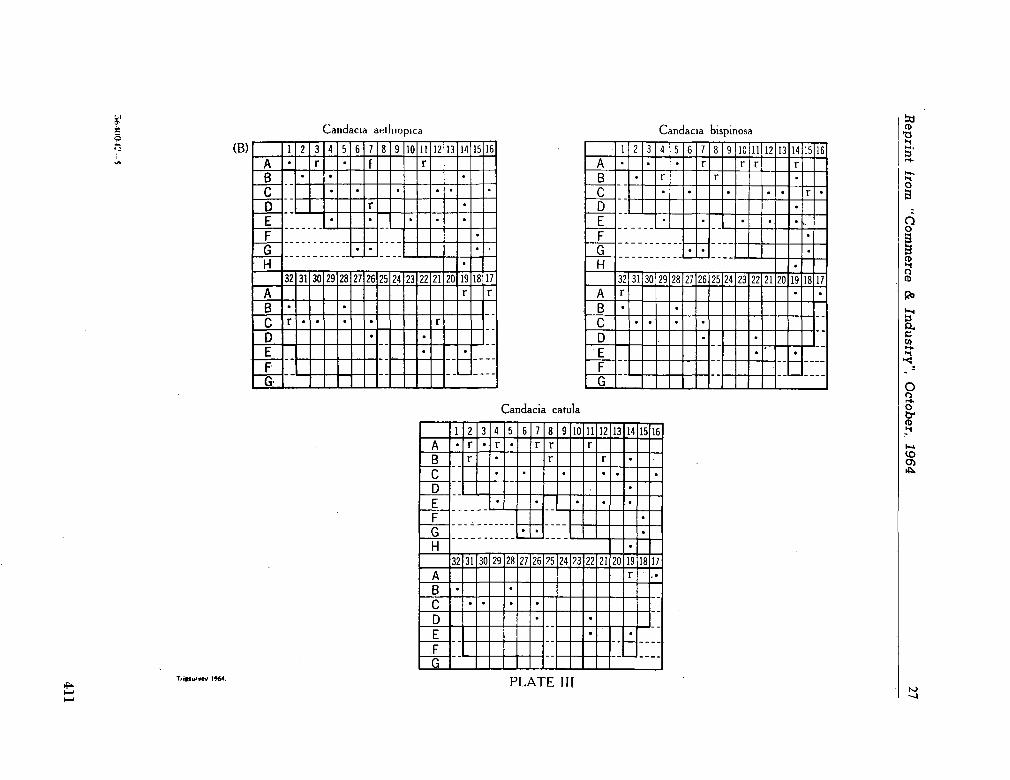
Bep
rin
t horn
"Com
merce
& In
dustr
y",
Octo
ber,,
1964 27
a
to
to a-
co
CSJ
H
o
en
OO
t~-
u?
LO
•=T
m
Csl
-
u
u
u
u • . •
<
• 1-
u. •
• u • • • • •
•
1 1
1 1
m O
a
• • • • LU
• •
1
i
Lu
• •
O
•
n:
r»-.
OO
CT>
Csl
CS
I
CS
I C
SJ
CO
C
SJ
CS
I
LO
C
SJ
to
CSJ
Csj
OO
c
si
CSJ
CD
m
ro
csi
CO
• • u
<
;
• • m • • • •
o
•
\ 1
•1 1
, •
"' : :
1
o
1
LU LU
O
J2 S
« -13
C
U
O
to
LO
*T
co
Csj
S
<=>
en
OO
r-tO
LT>
*«
•
PO
CSJ
-
w-
—
• u • <
• •
T1 . • • • • •
• u
i i
• i
00 OO
• • • . «
LU •
•
r r
LL. • •
a
•
-
r-.
OO
O")
O
CS
J
CS
I
CS
J C
SJ
CO
C
SJ
CSJ
uo
C
SJ
10
CS
J
r—«
C
SJ
OO
C
SI
est
CO
CO
CS
J C
O
u u
<
t 1
• . 00
J-• • • • w
o
• • o
1
•1 1 1
•
1 1
t 1
LU Li-
C*J
CO
LO
*!f
CO
CSJ
n
o
C7ï
OO
r—
co
LIT)
*3-
co
CS
J
— u.
J-I-• u • u •
<
•
.1-
Í-• u
m • • • • • • o
• a
. • • • •
."
• •
1
Ll_
• • O
•
X
s OO
O"»
C3
CSJ
CSJ
Csl
Csl
CO
C
SJ
CS
I
LT
Ï C
SI
to
CS
I
CSJ
OO
C
SJ
cr> C
SI
CO
CO
CS
I C
O
• u
<
1 1
• • GO • • • • o
•
1 1
•1 1 1
•
! !
! • o
1 1
ÜJ ± o
<
CL
CD
3Í.-M
O-4
2-5
411
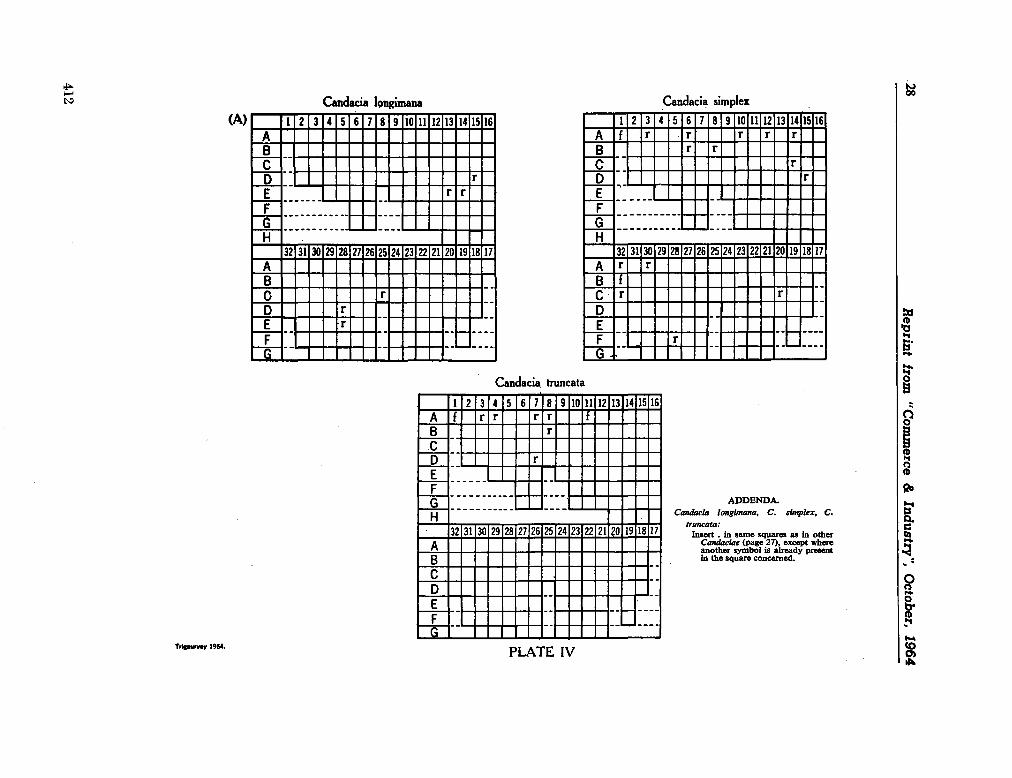
28
Reprin
t fro
m "
Com
merce
& In
du
stry"
, O
cto
ber,
1964
r r «o
to
s
CO
CM
H
O
OÍ
eo
r-»
to
u->
*
CO
CM
•H
U
Ui
1.
u
t*
••*•
<
h
la
œ
i»
tm
•
ü a
• LU
i
i
i
LLCS i S
s
2
S
S3
Ri
R S
a
s
s
R
s
55
Si ii
ii
<
*+M
m
b U
O — O
1
1
1
1 1 1
1
1
1
LU u
Ll_
r
O
Jl CO
en
*a-
CO
CM
•—•
m
S
en
oo
r**
CD
in
^
co
CM
^4 <
u
1
1
1
1
m o O
u
u
1
1
1 •
1
u. O X
r-»
eo
CJ>
s
CM
CM
CM
CO
CM
Si
in
CM
CO
CM
CM
eo
CM
a
es
en
CO
CM
PO < CÛ
t
1
U
O
l»
o
1
1
1
1
U
i
i
LU 1
a
B
u
^
s
2 s s sa
s
2
o»
eo
r*.
u>
u->
^
CO
CM
—
4a
U
u
u
kl
»~
<
h
m p
k.
O LU
É
i
i
LL. O i Ï5
2 2
a
53
Ri
S S S S
a
s
a
s s;
s < m ü
1
i
|
i
i
•
i
i
i
o LU
U. (3
Ou
412
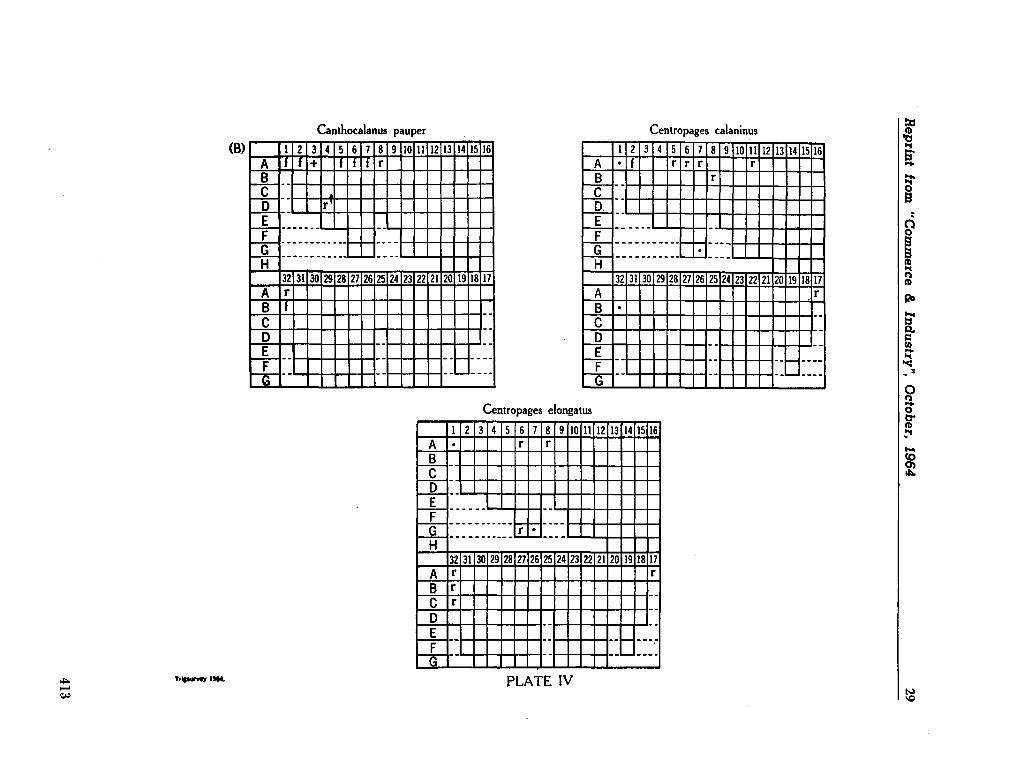
Reprin
t iro
m "
Com
merce
& In
du
stry'^
O
cto
ber,
1964
29
I B
3 u M
Q.
¿=
s
(0
m -C
O
CM
S
O
O)
oo
r-»
CO
in
-CO
CM
-
u
u.
u
u
*-•
<
u 1
1
1
1
m O
ci LL
l u. •
C3 X
r
oo
a»
to
CM
CM
CM
C
M
CM
CM
CN
I
CO
C
M
CM
oo
C
M
CT»
CM
CO
C
O
CO
CM
C
O ^ <
1
1
•
CQ Ü
a
i i
i
I i i
i
i
i
i
UJ
u_ a
luper
a.
3
Ü3 o
£ <0 «1
2
s
2
tí
S
2
C?»
CO
r-
CO
in
^ CO
CM
«
U
+
Uta
<
b
i
i
• i
CD Ü
O
LU
;
i o X
t>»
oo
en
CO
C
M
CM
CM
C
M
CO
C
M
CM
CM
<o
C
M
CM
CO
C
M
a
S?
CO
CM
C
O
U
<
i
t
1 i
OÙ
Ü o
1
1
1
1
1
1
1
UJ
U. (9
ô ^
(O
m
*»
CO
CM
~ O
o»
oo
r.
to
m -C
O
CM
— u
ta
•
<
CD u
p
UJ
i
i i
u_ • u
O
X
r-.
oo
a»
CO
C
M
CM
CM
C
M
CO
C
M
CM
to
CM
(0
C
M
CN
I
OO
C
NI
CM
CO
C
O
CO
CM
C
O
ta
ta
<
u
CO u
O —
o
, 1
1
LU
i
Ll_
C3
UÜ
H
<
Cu
413
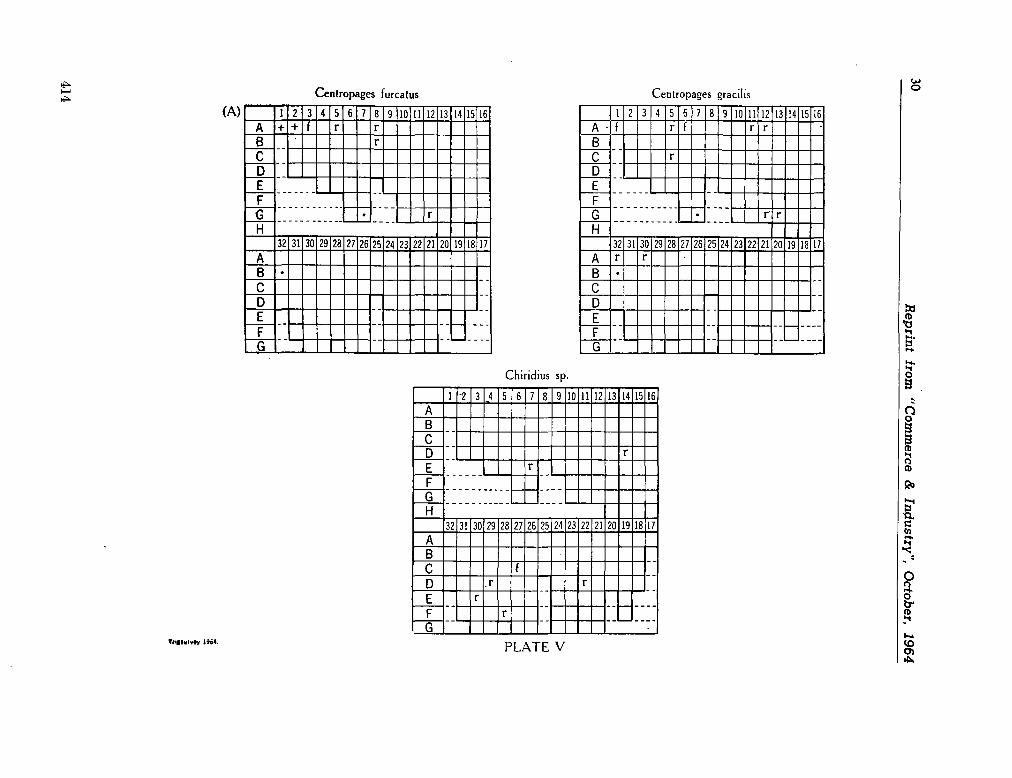
30 R
eprin
t tro
m "
Com
merce
& In
du
stry"
, O
cto
ber, 1964
tfi
u
as ages
a o
c
J
CO
LO
a-
co
CN
J
~ CD
0">
CO
P-.
co
uo
'=3-
co
CN
J
-
' u
u
—
u
—
<
u
¡ ¡
CO O
Q
LU
L*
l_
l i
U-
• '
O
X
r.
CO
CT»
CD
C
NJ
CN
J
CN
I C
NJ
CO
C
NJ
CN
J
LO
C
SJ
to
eg
CN
J
CO
C
NJ
CO
C
NJ
CD
C
O
CO
CN
J
CO
u
u
<
1 1
1 1
•
m o
i I
i i
i
a LU
Lu o
Vi urcat
en opage
? •i
CO
LO
^T
CO
CN
J
^ CD
en
oo
r—
CO
LO
«sj*
CO
CNJ
-
U
U
+ +
<
U
i i
i i
m p
a LU
-1
u
¡ 1
1 •
V X
r~
oo
Oí
CD
C
NJ
CN
l
CN
l C
NJ
CO
C
NJ
CN
J
tO
CN
J
cO
C
NJ
CN
J
ao
C
NJ
CN
J
S?
CO
CN
l C
O
<
t 1
•
m o
i
i i
i
i l
l
o
1
LU LU
o
75
U
CO
LO
•*J-
CO
CN
J
^ CD
CD
OO
r~~
co
LO
""•i
m j
— <
u
¡ ¡
CÜ
o O
u
LU
i 1
Lu a :r
i-».
oo
Crt
CD
C
NJ
CN
J
CN
J C
NJ
co
C
NJ
CN
J
LO
C
NJ
CO
C
NJ
CN
l
OO
C
Nl
cjn
CN
J
CD
C
O
CO
CN
J C
O <
1 1
m «
-L-
Ü
u
1 1 1 1 1
'
1 1
1
u
Q
u
U
1
LU Lu
C3
LU r-<
414
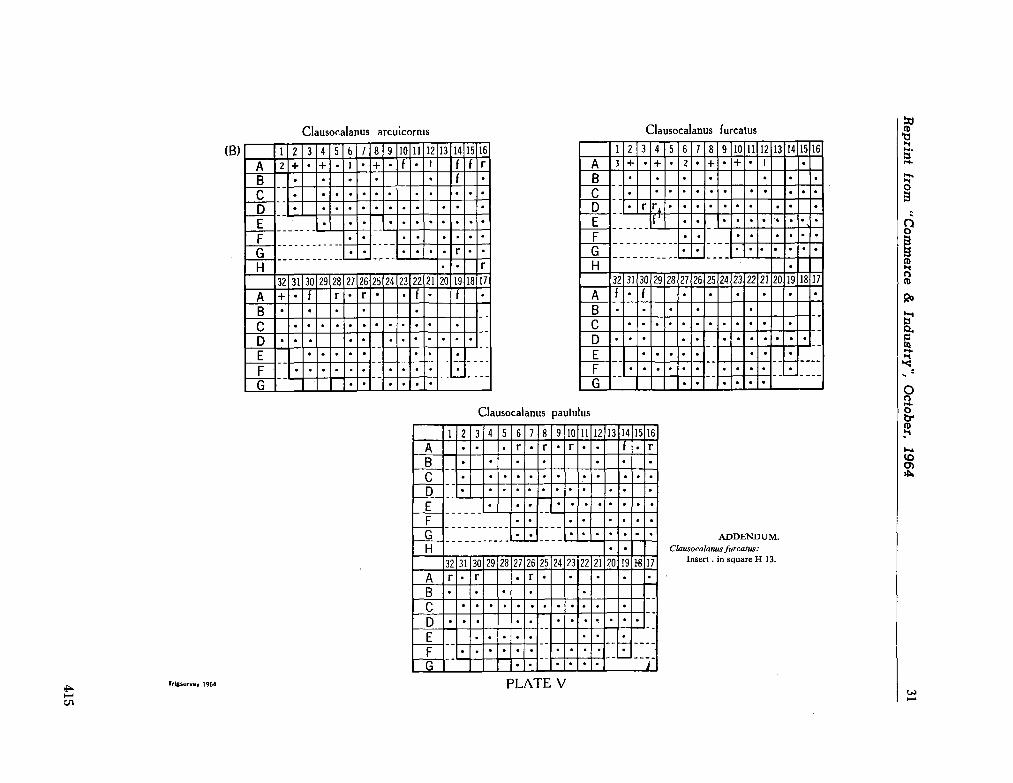
Reprin
t fro
m "
Com
merce
& In
du
stry"
, O
cto
ber,
1964
31
U
CO
IT»
** ro
CM
ZZ
C
D
O*
OO
r-
CO
in
•*
CO
CS
J
-
•
-• + • + . r*J
• + • +
r
<
• * •
_•_,
.
JJ
• .
• U
U •
i i
i i
m C
J Q
LU
• • !•_ • • • i
i
• •
Lu
• •
(D •
X
E;
OO
o>
CD
C
M
CM
CM
C
M
CM
CM
CM
to
CM
CM
OO
C
M
Cn
C
M
CD
C
O
ro
CM
c
o -•*•
<
.
• • . • •
m • o
• #
i
•I' 1 1
• • . • • •
' •
• 1
ii
i
• • •
Q
i
LU L
u • •
o
O
to
ID
*T
CO
CM
~ CD
o>
oo
"-*D
UT>
*d-
ro
CM
— L
*
**-V-h
*
-• <
-h*
• + • -• + . +
CM
<
<-t—
rr
• . • •
• :
;
CO Ü
1 •
LU
. . • • • •
• 1-• •
\ . • •
1 (3
u.
• X
£_; C
O
en
CD
C
M
CM
CM
C
M
ro
CM
CM
CM
tO
CM
CM
CO
C
M
en
C
M
CD
C
O
CO
CM
C
O
•
-• —
• • u • u
U-l
• +
<
1
1
i_»_
• • • •
m • ü
i
•1-
• • • • • •
i
I
i
• • •
o
•
LU
LU
• •
O
D
g w
Q
•¿S
Is
o
(A
3
JS
U
U3
u->
a-
CO
CS
I
^ CD
m
oo
r
t£»
ir)
*d-
en
C\J
— U
• • . U
• u • u . • •
<
. . • • . • • •
. • 1
1
1
1
1 O
O
• LU • • • . . .
i
• •
. .
Lu
• •
• .
O
X
r-»
se
en
CD
C
M
CM
CM
C
M
CO
C
M
•"=3-
CM
CM
to
CM
CN
J
OO
C
M
cr> C
M
CD
ro
CO
CV
J r
o
. • • • • U-•
L-r
• U
<
i i
l l
• • . • . 00 • O
' 1
1
•1-i • •
—
• • . • 1
1
1
1
1
1
• • •
Q
i
i
LU L
u . •
U
LU
H
<
0-
CQ
415
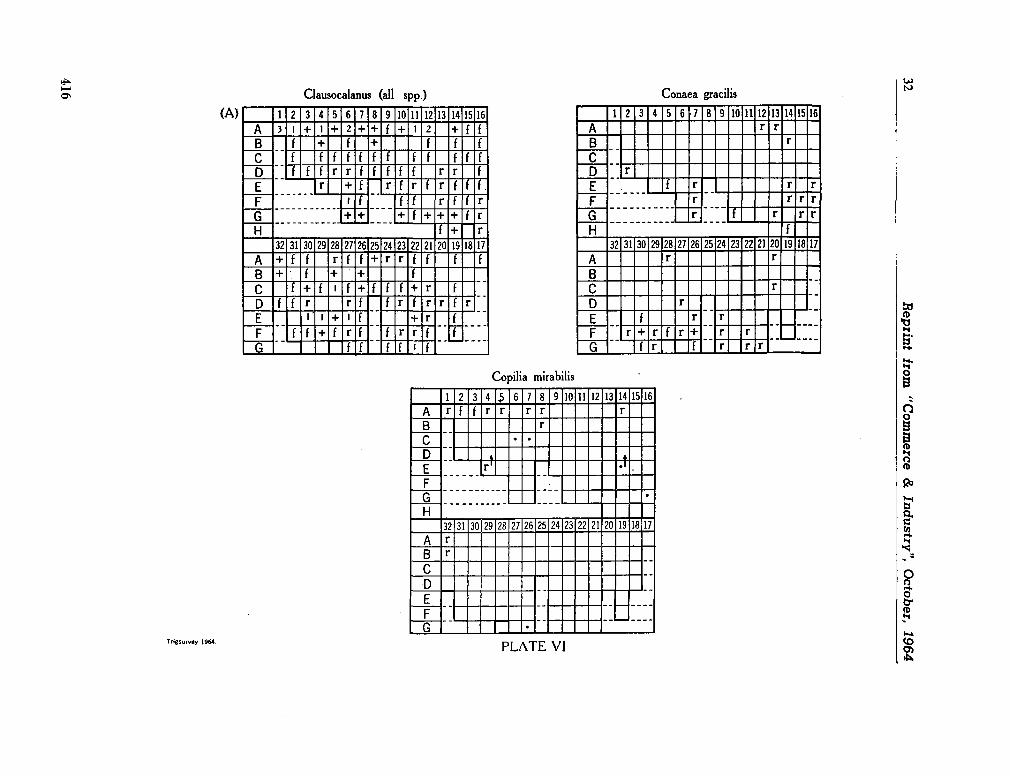
32
Rep
zint fro
m "
Com
merce
& In
dustry"
, Octo
ber,
1964
fc
c
o
O
CO
ir»
^ CO
CM
»—« O
CT
ï
CO
r»»
CO
LO
—f
CO
CM
»—
i
U
u
<
u
ÛÛ
u
i i
o o
11
u
1-
»•
*•
•
LÜ
k.
u.
u.
u.
u
u.
Ufc
H
1
1
1
u.
U. u
.
a —
-
5
2 23
S
c3
a
s
Si
»
S
R
gs
S3
8
£
íü u
u
<
1
CO u
.
O
i i
u
u
ta
ta
ta
ta
1
1
1
1
1
1
U.
O
u
Uta
+ ta
Uta
ta
+ u
1
1
LÜ
ü_ U
ta
ta
Uta
o
_2
CO
ITS
*3-
CO
CM
^
o
Oí
oo
r*.
CO
tn
** C
O
CM
-
Uta
Uta
+
r
-+ U
ta
+ + (N
+ -+ -(*>
<
Uta
.—
—
+
Uta
+
— v
~
Uta
<*.
Uta
Uta
Uta
—
.—
^-Uta
—
Uta
Uta
ta
U
Uta
Uta
Uta
Uta
Uta
ta
ta
Uta
Uta
-1
1
• i
m Ü
a
M_
«•h
t
t.
—
U
%4-*
u
—
+ 1-
ÜJ u
•
~.
•*. L
,
—
>*.
Ut
u.
+ + + U
ta
+ 1
1
«*. -1 + +
O
u
+ U
ta
X
P-.
OO
CT>
O
CS
J
CM
CM
CM
C
O
CM
CM
LI-Î
CM
CO
CM
CM
CO
CM
o-> CM
C
O
CO
CO
CM
CO
Uta
—
—
.*. u
la
+ U
ta
•->. u
—
«*. + <
• 1
1 1
Uta
+
+
Uta
+ m
—
u
+ U
ta
—
Uta
+ U
ta
-Uta
+ U
ta
O
ta
Uta
ta.
ta
Uta
ta
Uta
Uta
ta
U
Uta
Uta
o
1
-L.
1
11
+
Uta
p_ + --
Uta
ta
ta
Uta
—
-Uta
Uta
1
Uta
ta
Uta
+ U
ta
Uta
1 t
LÜ
Ü
_
Uta
Uta
O
2 »
- +
-
•0
O,
o
U
CO
LO
" C
O
CSJ
72
o
Oí
OO
I-—
CO
u-v
^3
-
CO
CM
— U
u
u,
ta
ta
Uta
w»_
u.
<
u.
m • •
i l
o a
«
~t-LLJ
.
1
1
L_
o X
r*.
oo
a->
CM
CM
CM
C
M
ro
CM
CM
in
CM
CO
C
M
CM
CO
C
M
CM
o
CO
CM
ro
1-
<
-1
i i
l i
ta
QÛ
O
i i 1
i i
i i
i i
i i
p
i i
LU l_l_
•
o
Lui
<
a.
416
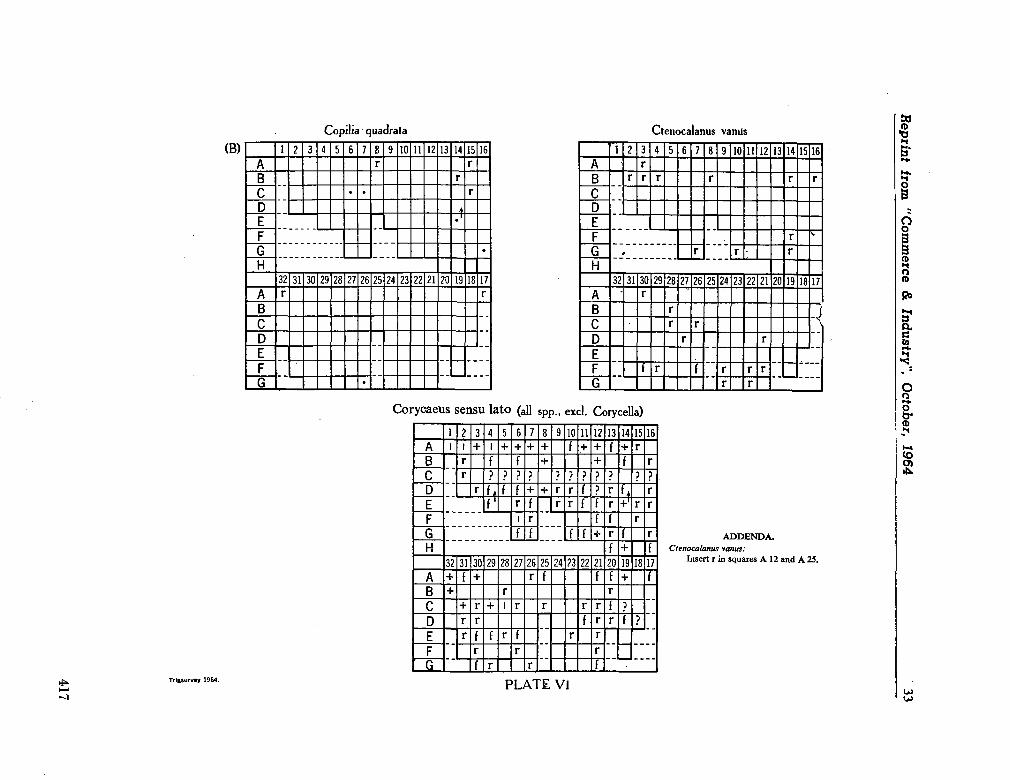
Rep
zint fro
m "
Com
merce
& in
dustry
",
Octo
ber,
19
64
33
o
•»
CO
LO
^ co
CM
zz
o
CT
»
OO
r—
co
LO
•*
CO
CM
-
u
<
u
u
I*
u
k*
u.
1
1
1
1
ÛÛ
o -
LU
>
u
u
u
, 1
1
ü.
k. «
o
X
1—
OO
en
o
CS
I
CM
CM
C
M
CO
C
NJ
CN
J
LO
C
M
CO
C
M
r-. C
M
OO
C
M
CM
CO
CO
CM
C
O
U
<
U
m
i
u
u
O
u
i i i •i 1
i i U
)
u
u
u
u
i i
i i
i i
i~
Q
"-*-u
U*
H
• i
LU
:_ o
a
^
Q.
O
co
LO
^ C
O
CM
z; o
CT>
oa
r--
co
LO
^ CO
CM
—
J-
L*
<
u
u • •
1
1
• 1
m Ü
O
• LU
•
i i i
U_ o
X
r-»
OO
en
CM
CM
CM
C
M
CO
C
M
CM
LO
C
M
(O
C
M
CM
OO
C
M
CM
CD
C
O
CO
CM
C
O —
U
<
1
1
1
1
CÛ
O
i 1
i i
i i
i i
i i
a
i i
LU
U-
•
C3
O
U
§ s «
IS
c
la) cel Cory excl. ï =S
v5
o
.si s sensu ycaeu
CD
LO
d-
co
CM
^ O
CT
ï
OO
P-*
CO
LO
-co
CM
_
U
+
«_
+
+
u.
+
+
+
+
-+
--<
u
.*
•
+
+
*-*m
<•
*•
u
r*..
~.
**v.
r*..
rv.
r*-.
~.
rv.
~.
~.
rv.
Ui
i-
Ub
a
U
r»-.
<•
*—
U
U
+
+
^ *-_
**r u
1
1
1
1
00 O
o —
U
i
+
u
*. ^ u
u
^ u
V4
—
LU
u
—
14
-I
u
.*. Lri
+
—
<-*-
1
u,
-—
L_ ->-t-fa
fl
CJ
—
+
<-fa
«
X
r-.
OO
CT
>
o
CM
CM
CM
C
M
CO
C
M
•3"
CM
LO
C
M
CO
C
M
CM
CO
C
M
CM
CO
CO
CM
C
O —
+
^ V*
H
—
U
+
«-+
<
U
Ui
+
CÛ
r*-.
<-
4M
U
u
u,
u
-+
L*
+
Ü
r»-.
—
u
u
—.
i i 1
u
u
U
•
u^
1
1
1
1
1
1
u
u
O
**
•
u
t-u*
<-••* U
u
u
1
1
LU
U_
U
U
**-
o
<
Ou
Cû
417
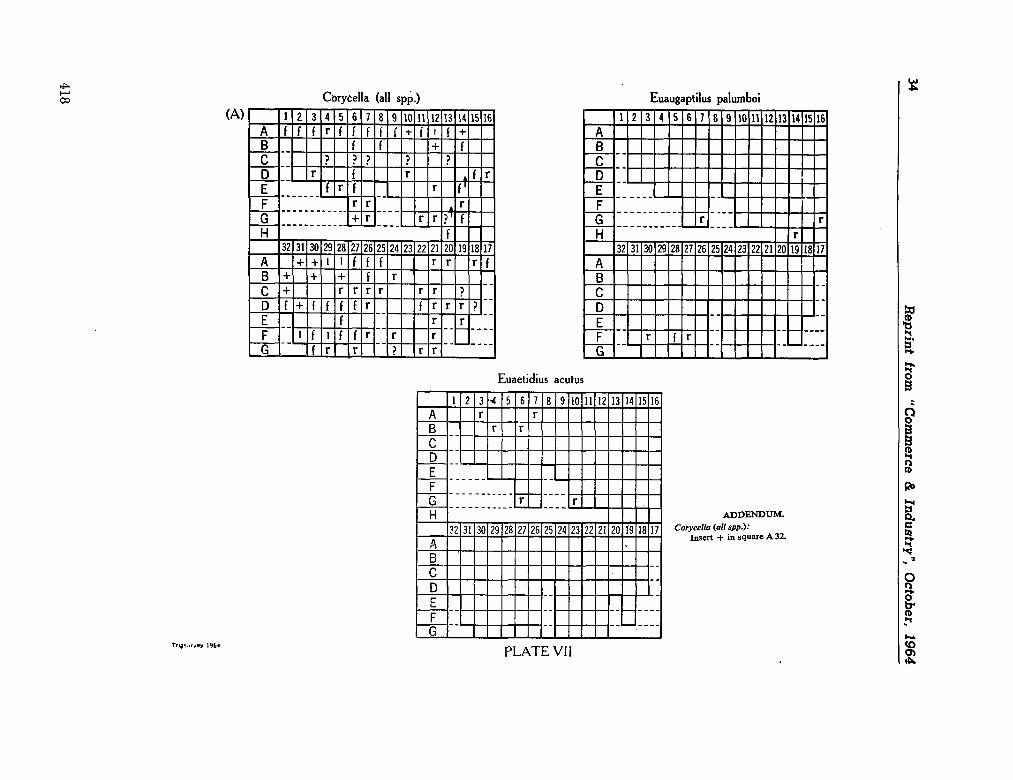
34
Repzin
t fro
m "
Com
merce
& In
du
stry"
, O
cto
ber,
1964
-1
S
2
t
CD
in
-CO
CS
J
-i
CD
en
oo
r*»
CO
i/)
* e
o
CN
I
»-H
<
CÛ
1
1
o a
LU
t-
1
1
Li_
u
O
L*
X
p**.
oo
cr>
CM
CM
CM
C
NI
CO
C
NI
CM
in
CM
C
O
CM
r--
CN
I
OO
C
NI
cn
CS
J
CO
ro
CN
I C
O <
1
00 o
l i
I i i
• i i
• « i
a
í-
—
t-
i l
LU L
l_ o
CO
in r
co
CV
J
~ O
en
oo
i—
CO
LO
* C
O
OJ
-
+
**. -—
+• *—
*—
^
u.
*-*-. U
.
**. v
*«
—
< >
-+
«.
— r*
..
fA.
r*-.
rw.
r*..
• • m
Ü
u
*-h.
i-
^,
u
Q
V4
M
U.
—
I.
^ LU u
^-r.
1*
t-
i i
i
u
u
Lu
1-
+
O
>*-
I
r-.
oo
CT»
CD
C
SJ
CN
I
CN
I C
NJ
CO
C
NI
CS
J
LO
C
NI
CO
C
NJ
CN
J
OO
C
M
CM
CD
C
O
CO
CM
C
O
^ U
i-1-
<-•—
•—
>---+
+
<
• .
,
1 •
i-
—
+
+
+
m
rv.
U
U-
»-l*
u
Ï-
+
O
rv.
l_
U>
l->
«_
Urn
M-
«—
V*
*
u-
+
—
O
1
1
i
1
H i
u
u
u
u.
u.
rv.
i
i
i
i
~-i u
<—
c*ri
-**. -i
LU
Ll_
J-
I-
M-
C5
O
§1 I 1
+ 11
LU
CD
LTi
*T
CO
CN
J
~ CD
CT>
CO
r-.
co
m
T
co
CM
—
U
ï-
<
1-
u-
1
1
1
1
CÛ
o
Q
LU
U
1
1
1
l_l_ U
a X
r-
oo
a>
CD
C
NI
CN
I
CN
I C
NI
ro
CN
I
^3
-C
NJ
CM
CO
C
NI
r-«.
CS
J
OO
C
NI
cn
CM
O
C
O
CO
CN
I
cn
<
i i
m o
i
i
1
i
i
i
i i
Q
i
i
LU
!_!_ CD
> LU
< ci
éis
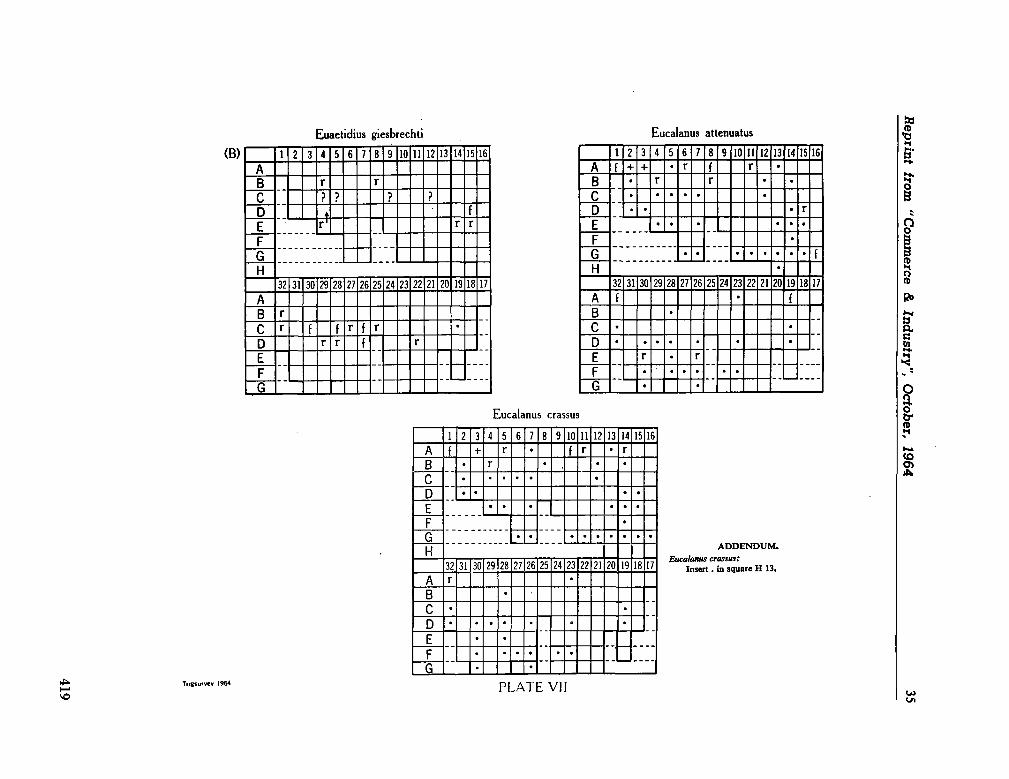
Repzin
t h
orn
"C
omm
erce &
Ind
ustry
",
Octo
ber,
1964
35
3 U
J
co
to
r
rn
CM
zz
C3
o»
oo
r-.
to
LT»
«* C
O
CM
-
• u
—
h*
• +
+
<-*
•
<
• • Í-
u •
m • • • • • •
Urn
* • • i
i
Ü o
••
• • • • •
LU
•
^-
i
t i
U_
• •
O
• X
r
oo
cr»
co
C
M
CM
CM
C
M
CO
C
M
CM
to
C
M
CO
C
M
1—
CM
OO
C
M
CO
C
M
CO
CO
CM
C
O
v~
•
*-<
1
1
•
m • •
ü
• •
i i • •
• i i
i
i i
• • • • •
a
u.
• u
• • • •
LU
U_
• •
o
hti giesbrec tn idi V
[,ï
(O
LO
-co
CM
^ CO
CJ>
oo
r-*.
CO
to
-CO
CM
-
<
Ut
u
rv.
rv.
fx
.
rv. «-
1
1
m Ü
o
b*
u-u
• LU
i
.
i a X
r-»
.
OO
CTï
CD
C
M
CM
CM
C
M
CO
C
M
^3
-C
M
CM
CO
C
M
1—
CM
OO
C
M
CD
C
M
CO
CO
CM
C
O <
1
1
1
1
Urn
CO «
I*
v~
u
^ -I-
o
u
i
1
\
1
1
«*.
L.
u
a
i
i
i
UJ
u_ o
2 r-
LU
CO
ITÎ
^ CO
C\J
~ O
en
oo
p-
.
CO
LO
** C
O
CM
—
U • u
«-• ^ +
«-
<
• • • u
•
. • . • . •
• • . • 1
1
m o
o
• • • • • •
LU
•
i
i
i
Lu
• •
O
X
1-^
OO
o~>
o
CM
CM
CM
C
M
CO
C
\J
CM
to
C
M
CD
C
M
CM
OO
C
M
CT
>
CM
CD
C
O
CO
CM
C
O
• u
<
1
1
1
1
• m • • o
• •
i
i
I i" i • •
i
i
i
i
i
i
• • • • • a
• •
• • • •
i
r
LU
U-
• •
C3 >
LU i-<
CQ
419
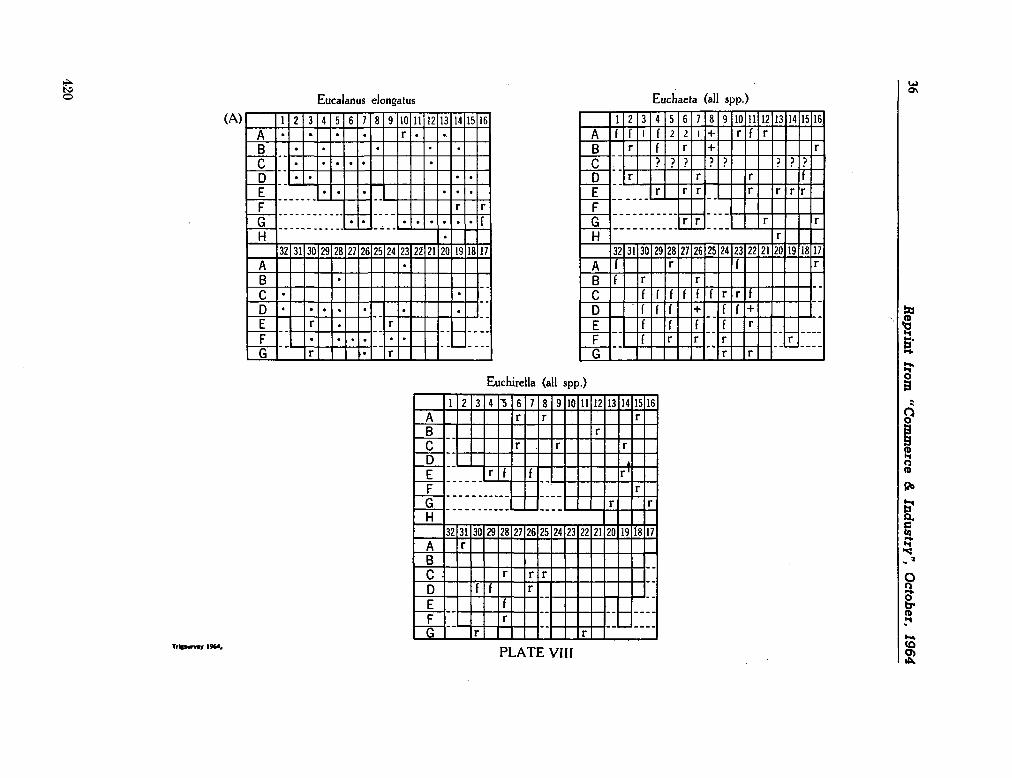
36
Rep
iint fro
m "
Com
merce
& In
du
stry"
, O
cto
ber,
1964
3
UJ
co
'
LO
*T
CO
CM
^ O
CT>
OO
r
10
U~>
*a-
CO
CM
— u
*
-b_
u
+
-<"M
CM
—
--*-—
<
u
+
b*
—
u
r^
..
n.
r\.
r*.
r»..
rx.
r*..
rv.
>>
*•
L.
L.
U
1
1
1
• 1
00 ü
Q
u
u.
u
u
u
L.
Ï-
ÜJ
u
1-
1
1
U_ u
Lri
=
u
I
p-«
OO
CT>
O
CM
CM
CM
C
M
CO
C
M
CM
ifi
CM
CO
C
M
CM
OO
C
M
CM
CO
CO
CM
C
O
u
*—
u
_ <
1
1
u
1«
^ m ^
h*
u
u
—
>—
v-
—
—
—
o +
—
—
1
t 1- 1 t
u
«*. u. u
u
>
1
J
1
1
1
+
—
—
>_
o
v~
<—.
— w
L.
«-*.
1
1
LU 1
o
3
UJ
CO
LTÏ -C
O
CM
Z! o
Oí
OO
p—
.
CD
ITS
-CO
CM
— * • u
?
• . 4 •
<
• • • • •
• . • • • •
• . • • 1
i
t t
m 1
o
• • . • • •
LU
U>
U-
^,
I
1
u_ • •
o
•
X
r*.
OO
CT>
O
CM
CM
CM
C
M
CO
C
M
CM
CM
CO
C
M
CM
OO
C
M
at
CM
C
D
CO
CO
CM
C
O
•
<
1
1
•
CO • •
Ü
• • u
1 I
• ' • • •
o
•
u
UJ
• • • • • •
u_ U
• u
o
-2
IE
u
3 U
J
CO
LO
«a-
CO
CM
^ O
CJ»
OO
r-
CO
f°
^ CO
CM
—
U
b.
u
<
1-
ÛÛ
t-
u
L-
i
1
ü o
'<-
**-
—
U>
ÜJ
u u
u
1
1
1
LL. a I
r».
OO
CT>
C3
CM
CM
CM
C
M
CO
C
M
CM
CM
CO
C
M
cg
OO
C
M
C7>
CM
C3
CO
CO
CM
C
O
U
< C
Û u
u
u
O
i
l
1
i
i
u
1
1
1
1
1
•
u
V-t-l
—
a <*.
1M
i
i
ÜJ
Lu
k.
C3
UJ
<
420
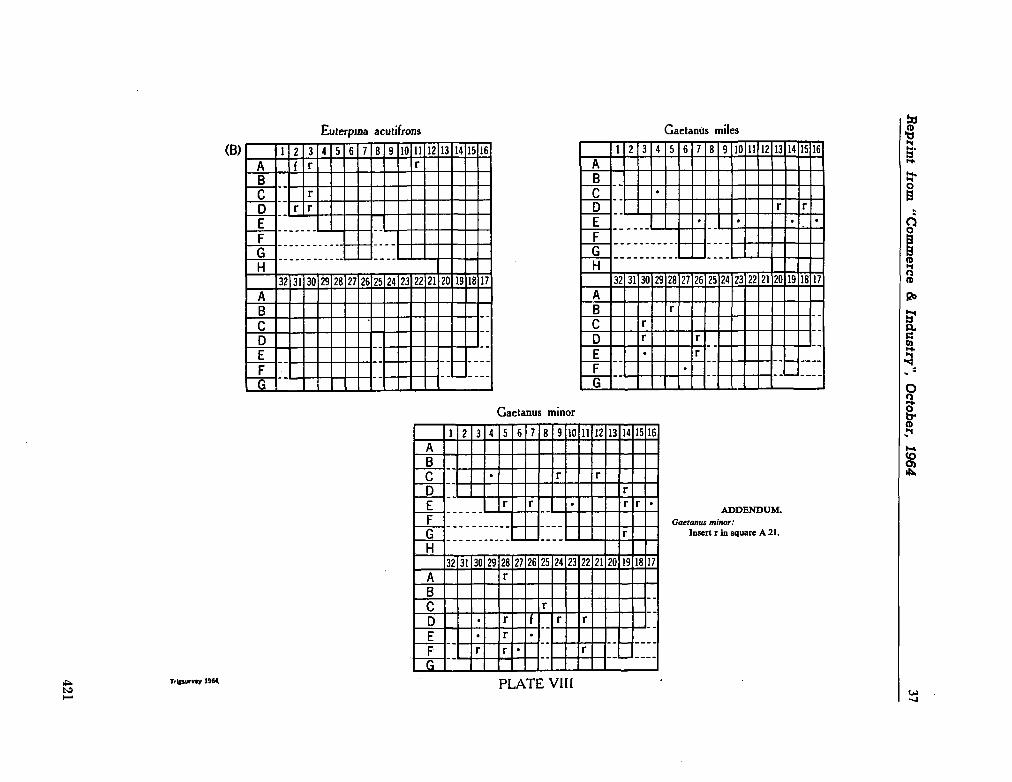
Reprin
t horn
"C
omm
erce &
industry
", O
cto
ber,
1964
37
a
CD
to
-CO
CM
zz
a
O*
oo
r-—
CO
lO
^ C
O
CM
i-
<£
•
L»
U
j i
i i
m o
a
. • • •
ÜJ
t 1
1
U_ O
X
ü
S
2
S
?:
s
s
s
s
s
S3
S
a
s
s; si <
i
u.
m L
*
o
• i
u-u-
û
t_
• -ÜJ
1
1
•
li_ o
] CO
LO
^ C
O
CM
ZZ
O
o-»
OO
r
to
in -co
CM
— U
U*
*+
.
<
u u
u
1
1
m O
o
ÜJ
1
1
1
1
LLCS I
r*.
oo
er»
CO
C
M
CM
«S
I C
M
CO
C
M
CM
LO
C
M
CO
C
M
CM
OO
C
M
CM
CO
C
O
CO
CM
C
O
<
1
1
t 1
CÛ
o o
i i
[ 1
1
I
1
1 i i
1
1
LU Ü
_ CJ
I § <
j
CO
in
** C
O
CM
zz
CO
o>
oo
r**
CO
LO
««a-
CO
CM
— <
m u
u . O
u
a
• u
u • %
m
U
LÜ
u
i i i
Li. a
I
r
OO
CT
»
CM
CM
CM
C
M
CO
C
M
CM
LO
C
M
CO
C
M
CM
OO
C
M
tT»
CM
CO
en
CO
CM
C
O
k*
<
i i
i i
GO u-
O
u
u
i i u
1
1
1
1
1
I
<-*
•
w •
a
. u •
. u
u
i i
LU L
L. C
3
UJ
<
Qu
CO.
421
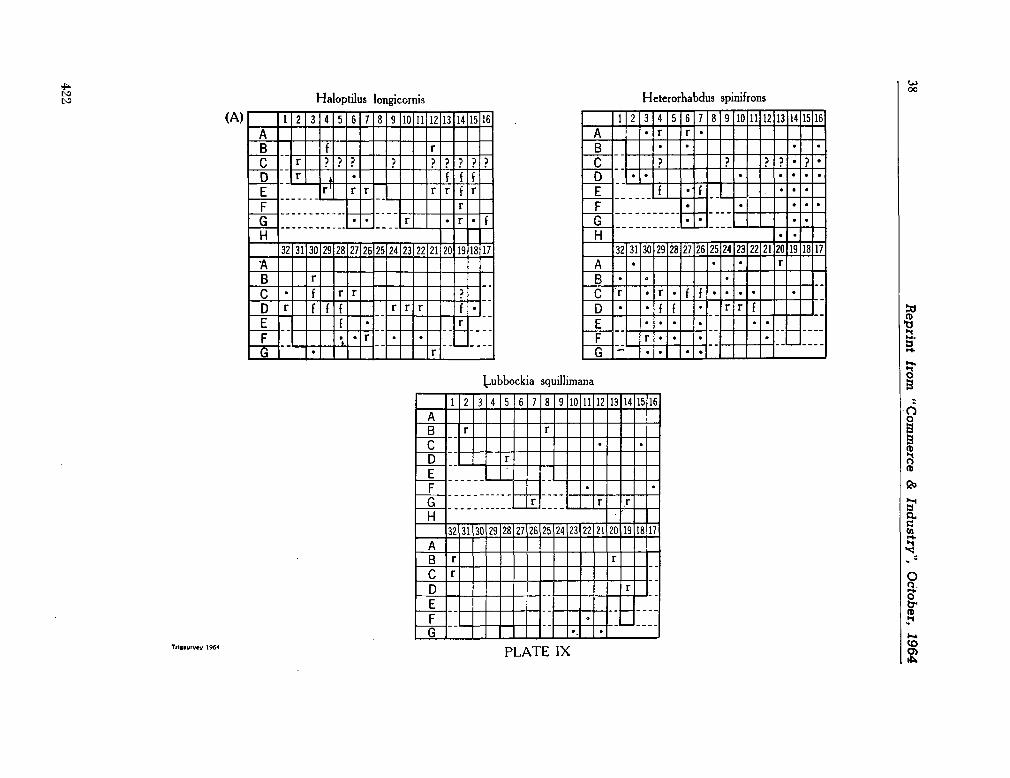
38
Repzin
t ízo
m "
Com
merce
& In
dustry"
, Octo
ber,
19
64
3 n
I x
CO
LT>
^s-
CO
CS
J
zz
O
en
CO
I-*
to
in
^3
"
CO
CS
J
-
• t-1~
•
<
• • •
• rv.
rv.
rv.
rv.
• • • • • 1
1
1
1
m o
Q
•
*-*
•
•
^ ÜJ
. • 1
1
•
u_ • •
C3 •
x
r.
CO
CT
>
C=>
C
NJ
CN
J
CS
l esj
CS
J
CS
J
in
CS
J
CO
C
Sl
CS
J
CO
C
Sl
en
CS
l
C3
C
O
CO
CS
l C
O
w*
• • •
<
1
1
• • •
m • • • • •
UM
• U • u
a **,
u.
u
i i 1
i i
• • •
I 1
1
1
1
I
«-
—
• •
O
• • •
• • u
i i
UJ
l
• • • y
a
!
CO
LO
•^
-
co
CS
J
zz
o
CO
CO
r—.
CO
LO
-CO
CS
J
-
<
I-
M-
rv.
rv.
rv.
rv.
rv.
rv.
rv.
rv.
rv.
U
»*. w
,
w.
•
u
1
1
1
1
m O
a
u.
«_
u
u
1-
>-
")-ÜJ
u
VJ—
1
• Ui
• u.
1
1
1
1
Li_ • •
a X
r-*
CO
CX
>
CS
l
CS
l
CS
J
CS
l
CO
C
SJ
CS
J
en
CS
J
CO
C
Sl
r—.
CS
l
CO
C
SJ
en
CS
J
o
CO
C
O
CS
l C
O «c
1
1
U:
CO
rv.
I-U
M—
•
Ü
• —
u
u
l-—
*-t-i
*-u.
1-
Û
t-•
—
LÜ
• • U • •-
LU
t-•
a
I IS
!
CO
LO
r
CO
CS
l
m
CD
CTi
CO
1—
CO
LO
^3
-
CO
CS
l
— <
1_
u-
• •
u
1
1
m o
O
ÜJ
• •
v
u.
i f
-
V-
a X
r—
CO
en
CS
l
CS
J
CS
l C
SJ
CO
C
SJ
*3
-C
SJ
CS
l
cO
C
Sl
1—
CS
l
CO
C
Sl
en
CS
J
o
co
CO
CV
J
CO
<
1
1
u
1-
m u-
o
U
1
1
1
1
1 «
• •
i i
i
o
1
1
LÜ -
C3 X <
a.
422
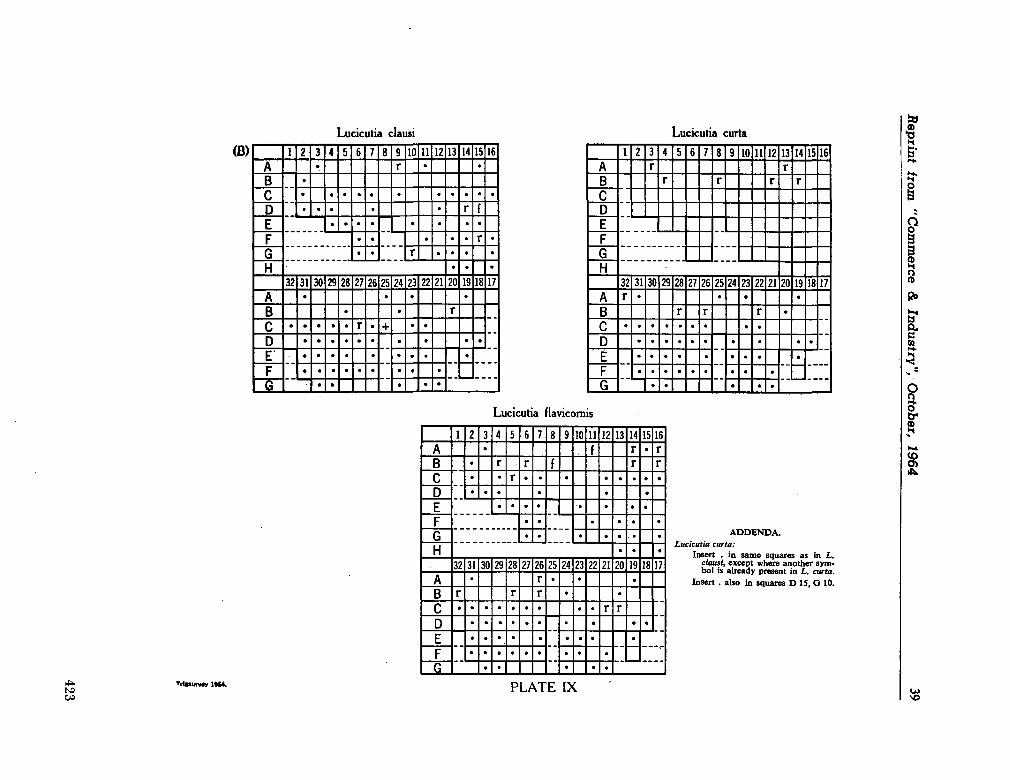
Reprin
t íro
m "
Com
merce
& In
du
stry"
, O
cto
ber,
1964 39
J
• s s 2
2¡
s s o»
eo
r«~
«o
*, ^ e*í
«sj
—
U
U
<
t.
u
u
u
CD
1
1
O
Û
LU
i i > i
ü_ O
X
r-»
oo
en
«3
»
CM
CM
CM
C
M
CO
C
M
CM
m
CM
C
D
CM
CM
OO
C
M
en
C
M
CD
C
O
CO
CM
C
O
• • • • U
<
i i
• U
u
u
• •
o
• • • • • • • •
Q
i
•1 i i
• • •
• • • •
i i
i i
• • • i i
LU U
_ a
u
.S
o
"3
3
4©
m -C
O
CM
~ C3
C7>
OO
r-«.
10
to
^* C
O
CM
~
• • u . <
•
• • . • • •
—
u • • • •
1
(
m 3
0
• • • • • • • •
1 • U
• • •
• • • •
u
1
l 1
•
LL.
•
CD • • •
I
r~*
00
en
0 CM
CM
CM
C
M
CO
C
M
CM
CM
CM
r-«. C
M
OO
C
M
en
C
M
0
CO
CO
CM
C
O
• • • •
<
1
1
1
1
u •
m
• • + •
1-
Ü
• • • • • • •
a —
• • • • • • • • •
•
•
LU 1
• • •
CD
I ÍHÍ
Si JSÎÎ
#1 s
"e o
•p
18
i
10
LO
a>
00
CM
¡U
0
en
00
r-«0
LO
^ CO
CM
«-H
J-• U
*+
•
•
<
u
u
—
u
11
•
m
• • • • • • • ï-• •
Ü
• • • • •
0
• • • ?
• • •
ÜJ
• • • •
• • • • • 1
1
1
•
U_
•
CD • • •
I
r**
00
en
CD
C
M
CM
CM
C
M
PO
C
M
CM
m
CM
C
O
CM
CM
OO
C
M
en
C
M
0 PO
PO
CM
C
O
• • • u •
<
• • 1-i->
1-
m
U
U • • • • • • •
O
• • • • —
, ' • • • •
• • • •
1
1
• 1
• 1
• • • •
0
• • • 1
1
LU
ILL
. CD
><
Lu
<
0-
423
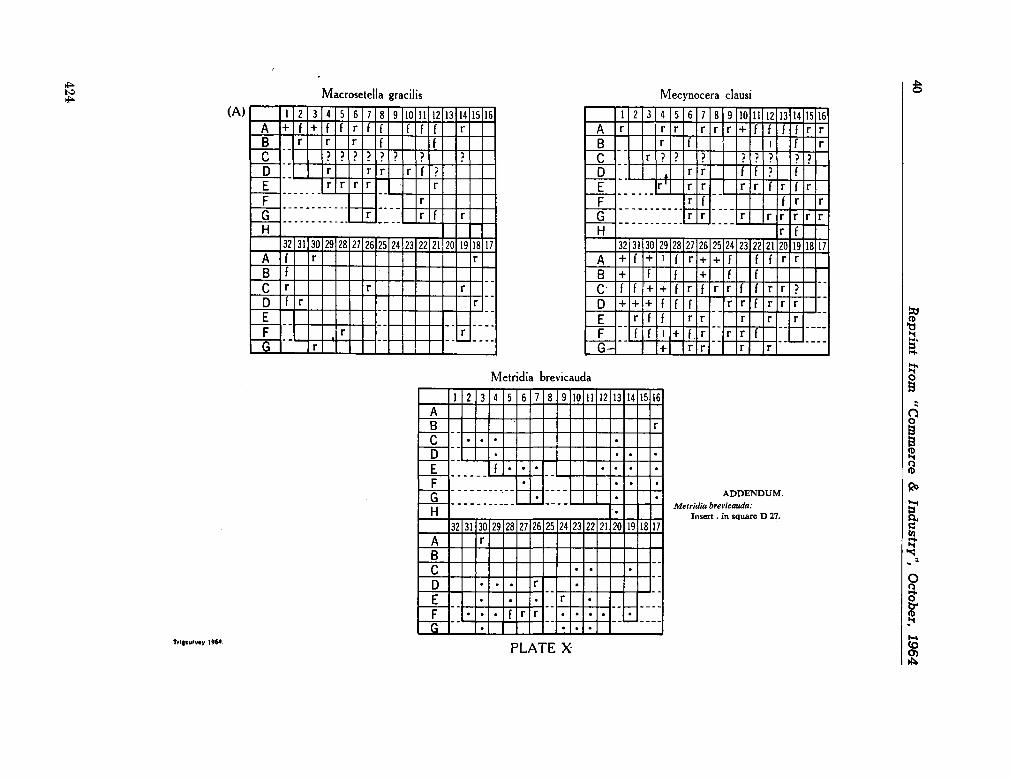
40
Reprin
t fro
m "
Com
merce
& In
du
stry"
, O
cto
ber,
1964
ID
IT)
"3-
co
CM
zz <=>
C
T»
OO
r.
to
LT>
*d-
m
CM
-
u
L.
-~ -—
—
*
-•
—
+ u u
u
u
t-u
<
u
WM
-.—
u
rv.
rv.
rv.
rv.
rv.
rv.
rv.
rv.
u. .*.
rv
.
«_ —
U
1_
1 1
1 1
m o O
u.
•-*» U
,
^ u
u.
u J-u-LÜ
u
k.
.— u>
u
u
u
u
u
1 1
_ L-
Ll_
b-
u.
:
<-4—
»-X s oo
CT
1
CM
CM
co C
M
•«3
-C
M
CM
<J
3 C
M
CM
CM
CO
CM
C
O
u.
Í-.
—
—
+ + U
-+ **. +
<
"-L-
+
—
+
m ,>..
u u-
*-fc«
u
u
<—
k.
+ + —
—
O
Ui
u
u
i-V-
) 1
-1 *-i_>
w-
1-
u
u,
u
• 1
1 1
1 1
*—
_-+ + +
o
u
u
V*
.
<-Í-
u
<—
+ -*-V*
.
1 1
LU Li_
Ï-L*
+
"! 3
& ce
"S
S
o
?
UD
tri
*3-
co
CM
zz <
=>
O
*
oo
r—.
<r>
u->
»
CO
CM
-
u
—
—
—
>-<-k
«
U
s*
.
v*_
+
—
+
<
v~
—
u
L.
t-
~.
rv.
rv*
rv.
rvi
rv.
rv.
rv.
rv.
v^
U
U
l-i
u-
' , •
" o
Û
u
u.
u
u
u
UJ
u
t-
^ u.
1
1
1
1
U_
u
o
I
r—
CO
CT»
CM
CM
CM
C
M
CO
C
M
CM
LT
) C
M
U3
CM
CM
OO
C
M
CT
ï C
M
CO
CO
CM
C
O
1-
L*
—
<
••fa
*
m
1
U
U-
lm
O
u,
u
' ' 1
u.
—
o
u,
1
1
UJ
U_
L*
o
1 R
Q
°
III r
i
<JD
LO
-co
CM
zz o
cr>
oo
r-»
U3
LT>
*d-
CO
CM
— <
U
m . • •
. • •
i
Ü
o
. • . . • * • —
"
• •
•
1
1
1
•
U-
•
O
X
P-.
oo
CT
»
O
CM
CM
CM
C
M
CO
C
M
CM
CM
U3
CM
CM
OO
C
M
CM
CO
CO
CM
C
O
1_
<
1
1
1
1
m
. • •
ü
•
L* • • •
a
•
1_ . • .
UJ
• • • * •
• • • r i
U
U
«—
• • •
LU
•
CD <
a.
424
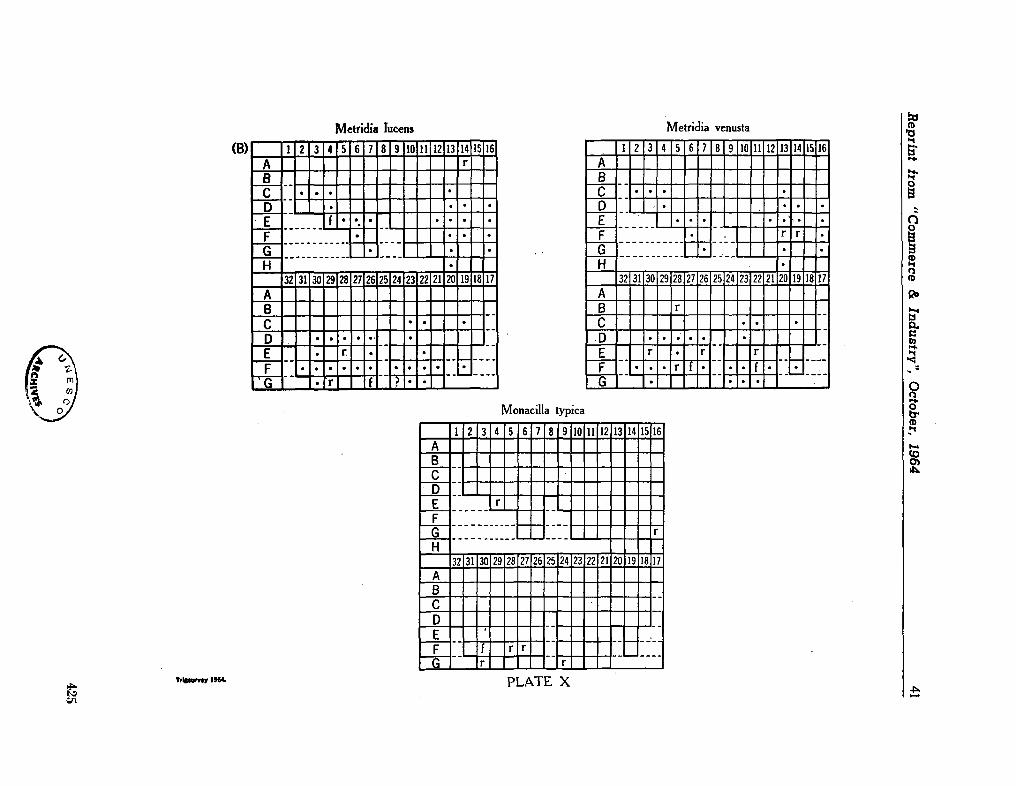
Reprin
t fro
m "
Com
merce
& In
du
stry"
, O
cto
ber,
1964
41
!
tO
Lit
^ co
CS
I
~ CD
o>
oo
r-*.
to
LO
•* C
O
CS
I
— <
00
• • • •
. • • •
i
i
o 1
. • • • • • .
LU
•
u
LH
• •
1
1
•
ü_ •
CD
•
I
r
oo
CX
>
CO
C
SI
CS
J
CS
J
CS
I
co
CS
I
CS
I
in
CS
I
CS
I
i—-
CS
I
CO
C
SI
CX
>
CS
I
co
CO
CO
CS
I C
O <
1
U.
CÛ
. • •
o
•
Û
• 1
1- 1 1
u
. V
*-
. •
• • • 1
1
1
1
IH
•
u.
• k
*M
V.
• • • 1
ÜJ
1 •
o
V
o
a
72 •«3
2
to
If)
*ar
CO
CS
I
Z!
CO
0>
oo
r-«.
to
tfi
^ CO
CM
^4
u
<
• • •
. • •
1
1
1
1
oo Ü
o
• • • • • " •
V*
.
ÜJ
•
Ll .
i
i
i
• u. •
CD X
r-.
oo
ex»
CO
C
SI
CS
J
CS
I C
SI
CO
C
SI
CS
I
CS
I
to
CS
I
CS
I
oo
C
SI
R
S?
CO
CS
I
CO
<
1
1
1
1
CD • • • o
•
o
i
1
1
l-l
1
1
1
LI
•
ui
•
1
1
LU LU
• • r*«
«*.
u •
CD
ica
& 18
1
S
2
(O
LO
-CO
CS
I
£2
CO
CT>
oo
r-.
CO
to
*T
CO
CS
I
~
<
1
1
1
1
CO o
Q
L*
LU
u
i
i i
U_ O
i
r-%
CO
cx>
CO
C
SI
CS
I
CS
I C
SI
CO
C
SI
cv
u-i
CM
to
C
SI
CS
I
oo
C
SI
CS
I
CO
C
O
CO
CS
I C
O <
! 1
00 Ü
1
1
u
: :
1
o -
U
U
*—
1
1
LU L
l_
u
CD X
u
i
J
0-425
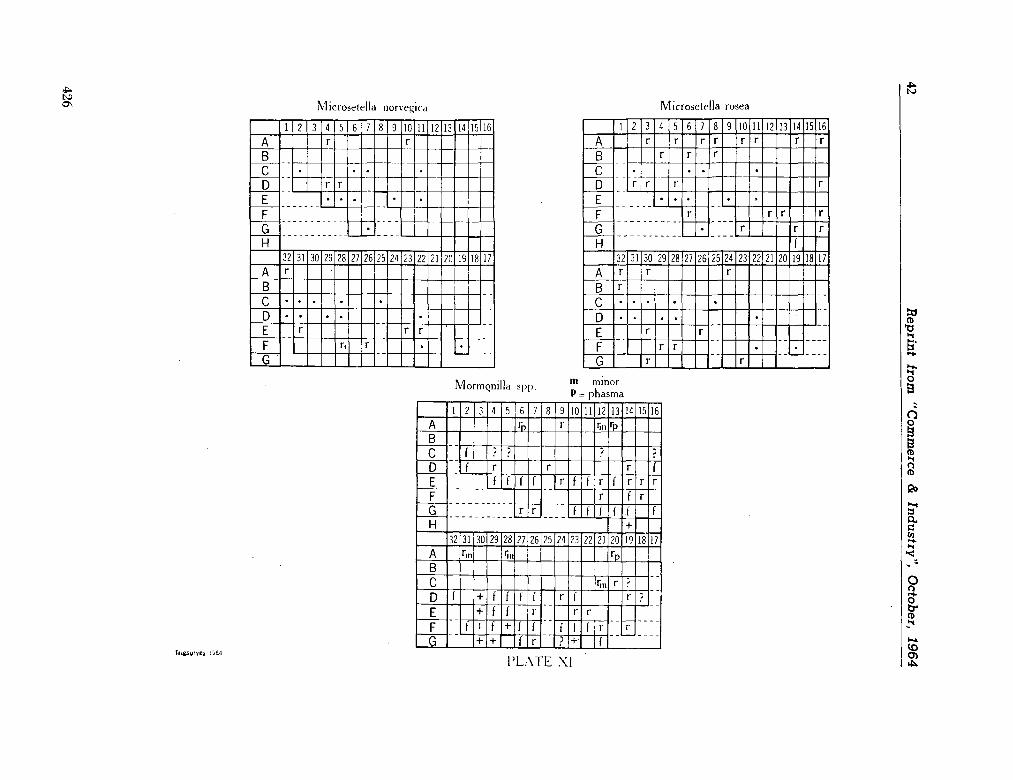
42
Rep
rin
t horn
"Com
merce
& In
dustr
y",
Octo
ber,
1964
to
LD
•<T
CO
CN
J
^ <o
en
oo
i—.
to
LO
r
m
CN
I
-
U.
L-
u
L-
1_
u
t-L-
<
V-
U
u.
• • • .
u.
i_
L.
L_
1
m o
Q
* • • • •
LU
U-
k-
i_
u
u
u.
i
,
U
Lu
•
e> <—
X
f-
oo
en
CD
C
NI
CN
I
CS
J
CN
J
en
C
NJ
CN
I
LO
C
NJ
tD
C
NJ
CN
J
OO
C
NJ
CD
C
NJ
CD
m
m
CN
J
co
U
U
U.
<
1
1
u
m
• • • • •
ü
•
1
|-• U
.
! !
!
• • • •
Q
U
u
u.
u
!
Lu U
_
i-
O
UD
Ln
2 m
CN
J
~ C
D
en
oo
-LJD
LO
«=>• C
O
CN
J
-
^ u
L-
<
• • . •
V-
U
'
ÛD
O
Q
• • • • •
LU
;
Li.
•
O
X
^ CO
CD
CD
C
Nj
CN
J
CN
J
CN
J
CO
C
NJ
CN
J
CN
J
CN
J
CN
J
OO
C
NJ
en
C
NJ
CD
ro
CN
J
co
U
<
; l
m
• • • . •
o
•
[
• ;
L-
U
•
^;
^ —
I
• • • •
-
U.
L_
c
LU L
t_ o
ninor lasma
~ a.
E a
,_
•
£•
_r0
Ë
o
LO
2
S
-f¡
" en
CD
CO
—
to
LJO
<=r
CO
CN
J
-
& i=
L«
i?
<
rv.
n.
"•
~.
— —
u
L-
U
—
1
1
OU
O
Q
¡_
u
u
—
V-
—
—
u
*—
—
—
—
Lu u
—
l-
—
-r
—
—
—
—
' ;
L.
u
U-
d
+
X
^ oo
en
CD
C
NJ
CN
J
CN
J
CN
J
CO
C
NJ
CN
J
LO
CN
J
(O
CN
J
CN
J
OO
C
NJ
en
C
NJ
CD
e
n
en
C
NJ
co
•5
kí
uT
<
1 '
OQ
Î^.
i—
¿
o
,N
.
k.
—
l-
¡ u.
I
u
1_
u
—
—
— —
+
~. !
! !
—
•^
—
--+
—
Q
L-
—
—
+ *—
_
+
—
-—
1
LU
1—
v-
+
+
Ll_
CD
y.
Lu f-
426
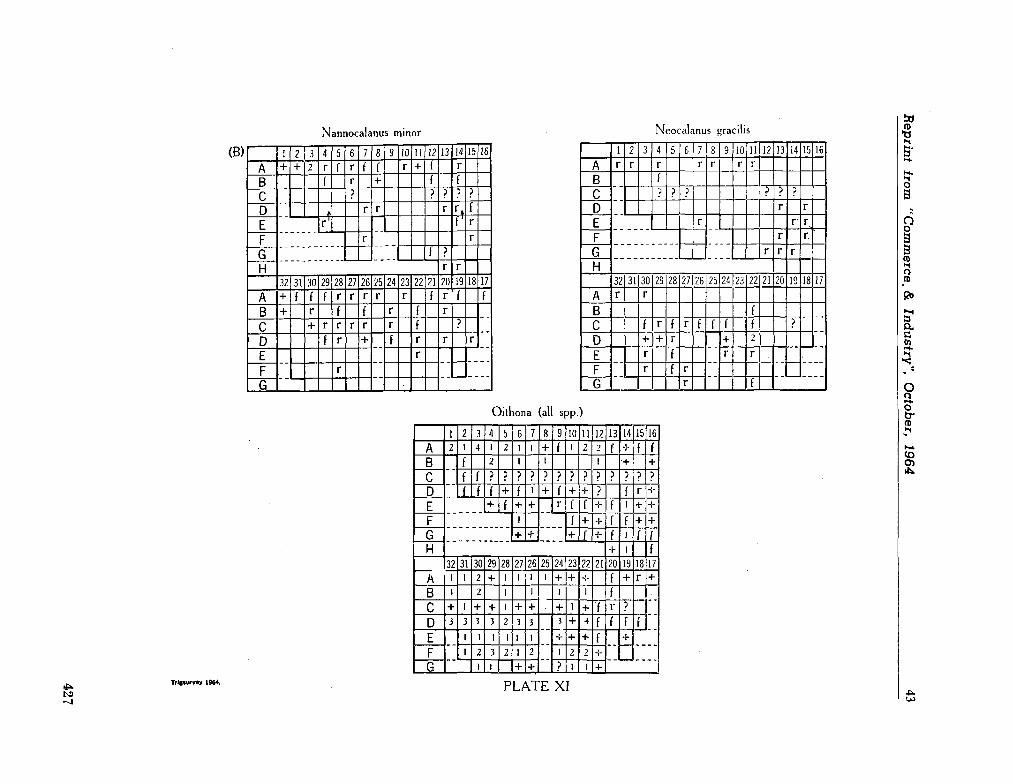
Repzin
t h
orn
"C
omm
erce. & In
du
stry"
, O
cto
ber,
1964
43
<x>
LT
)
*=r
co
CN
|
^ en
cr»
oo
r-*
en
un
-
co
CN
]
~
~ u
u
l_
¡~
u.
u
< ^
rv.
rv.
o,.
rv
.
rv
.
rv
.
U-
U
1
1
GÜ
a
Q
u.'
i-u-
LÜ
u
u
Lri
U
t-
1
_J U X
¡5
oo
CI
CD
C
NJ
CN
J
CN
I C
NI
CN
J
CN
J
CN
I
CD
C
NJ
1
CN
f
oo
C
NJ
CD
C
M
CZ
>
co
co
CN
I co
V-
b.
<
t f
i
i
r-QQ
rv.
—
—
—
—
u
—
u
v*.
O
rg
+
i
. i
I
u.
j-
—
! !
!
u,
+
+
a
>-4
—
!_
u
—
u
1
LU :_
u
CD
to
LC
I
«=r
m
CN
J
~ O
cr>
oo
r-—
<sD
LÍD
*=T
ro
CN
I
...
U
_ +
u
w-
w-
u
w.
1—
CM
+
+
< £-_
<*-+
u
— r
v.
rv
.
~.
rv
.
rv
.
i_
u
J-
U-•
«
! ;
ÛÛ
a Û
t-J—
LÜ
u ~
. •
^»
V-
U. a
u
1-
X
r--*
oo
CD
cz> C
NJ
CN
J
CN
J C
NI
CO
C
NJ
CN
I
un
C
NJ
CN
J
CN
J
OO
C
NI
CN
J
CZ
)
co
CN
J
en
—
—
u
—
u
u
L*
l*
1.
—
—
—
+
<
1
1
t t
U
_^
t-
V*
.
M-
u
+
ÛÛ
rv
.
w.
t-Ui
V-
L.
S-i
+
O
i_>
u
u
+
u
—
Q
1
1
1
t-
1
I
1
1
u
1
ÜJ
LL. O
8
to
LTi
-3"
CN
I
~ O
CD
OO
C--
to
LT
Ï
*=Ï-
m
CN
J
~
—
—
_j.
c-j
(N
--+
_ -rN
-f -CN
<
+
+
---(Ni
<-
r*..
o-.
rv.
rv.
rv.
rv.
rv.
rv.
rv.
rv.
rv.
rv.
<—
v¿—
T 1_
^
rv.
+
+
—
+
-—
+
—
—
—
1
1
CQ
O a
+
+
-+
—
—
u
+
+
—
+
ÜJ
_+_, +
^ -L
±\
— >—
-—
+
-+
1
r 1
-a. +
+
e> —
-X
[
oo
cr>
CN
J
CN
J C
NJ
CO
C
NJ
^3
-C
NJ
LO
C
NI
CN
J
CN
I
CO
C
NJ
cn
CN
J
CZ
>
CO
CO
CN
J C
O +
u.
+
-!-+
+
----+
rg
--r —
----CM
~
m ~
.
i**
+
-+
+
+
-+
+
-+
o
v-
•^
M_
,-+
w
• 1
1
+1
*-—
+
+
+
+
CM
ÍN
-
-i---rv
.
1
1
1
C"l
m
CM
m
»i
t+\
^
O
-—
----
CM
-(N
f»
ÍN
-1
1
LU
L
L-
+
+
--C3
(-<
-J
Ou
CO
427
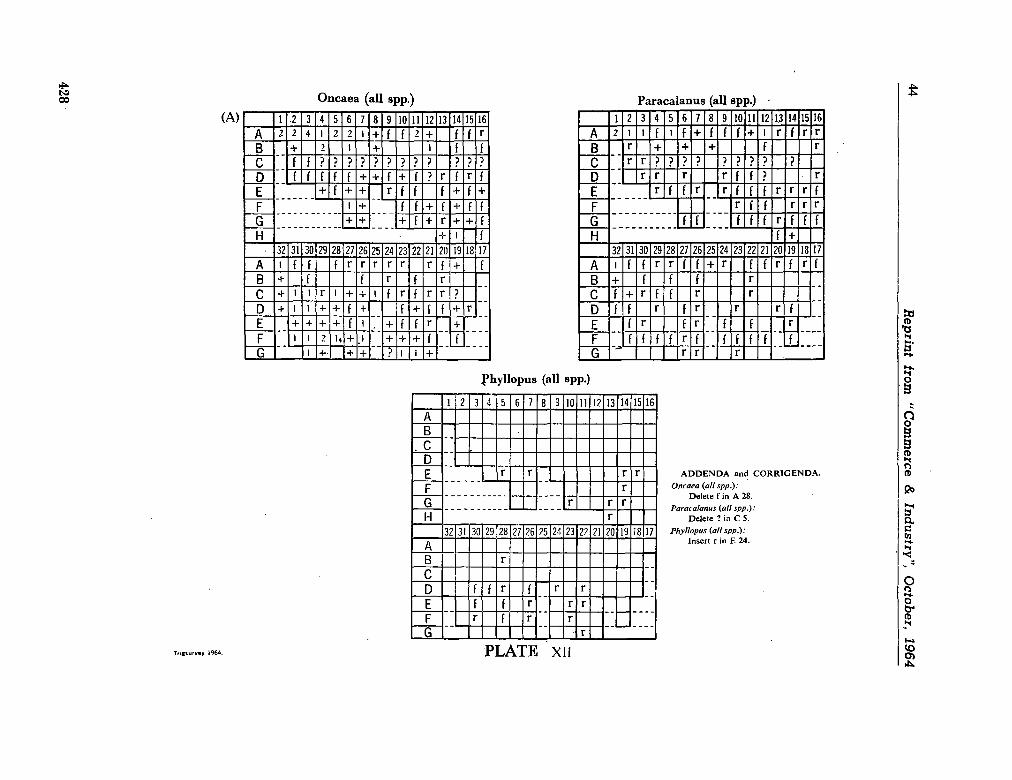
44
Rep
rint from
"C
omm
erce & In
du
stry"
, O
cto
ber,
1964 spp.)
S
•3*
3 Cfl
PL,
CO
LO
>
**>
CsJ
2 o
CT
ï
OO
r»-
to
u-ï
"3"
CO
CM
-
u
l«
—
u.
-+
—
•—
-~ +
—
-—
--i*J
*
u.
—
+
+ +
-
rv.
r*..
r*-.
r*..
r»..
r*.
r*.
•v
.
U
u
Ï-
r*..
—
«-U
-
k-Í-14
1 1
m O
Q
*-j-J-u
W-.
—
v*_
t-I~
»-V-
LÜ
V-
u.
u
'—
*-u.
*-
M
—
—
L»
•—
—
—
1
1 1
LL_ <—
O
+
—
X
r-»
oo
en
CD
C
SJ
CS
J
CS
J C
SJ
CO
C
SJ
CS
J
in
CS
J
co
C
SJ
oo
C
SJ
en
C
SJ
cz>
co
CO
CS
l C
O .*-U
,
<-fc
-
U
%*-
<*-u +
«-u
u
*-**. -<
1
U.
—
V4
—
—
+
CO u
l~
_ —
u.
+
—
O
w_
L*
u.
i
—'
—
u-
<-
4M
—
•-J—
W.
u,
> 1
1
1 1
1
L*
t-—
—
a
u.
u
v^
«—
u
t-ta.
—
-~ «.
1 1
LU
Ll-
Í-u,
» o
a, a, a
ca
cd u a
O
CO
LO
*d-
co
CS
J
Z!
CD
<T
>
OO
r-.
CO
LT»
*a-
CO
CS
J
—
V*
—
Cta
+
<N
<—
**. +
-rsi
CSJ
-•*
•
*N
(SI
< >—
1
-[+j
-<M
+
r»..
o-.
rv.
r*-.
r>-.
OA
r*.
rv.
o..
r»-.
r*..
r»..
—
— —
u
—
t.
r*..
—
+
—
+
+
—
V-iM
—
—
—
i i
ÛÛ
o a +
*-u
*
+
—
*-l—
»—
I-+
+
—
+
UJ —
<
-u-
+~l —
T
! 3
— —
+
+
u
+
—
+
i i
+
-U_ +
+
O
~ _ +
;
i—
oo
en
CD
C
st
CS
J
CS
J c
sj
CO
C
SJ
CS
J
LO
C
Sl
CO
C
SJ
CS
J
OO
est
en
C
SJ
CO
CO
CS
J C
O
-+
—
-L-
u
u
u
u
—
—
«--<
i i
u
zn u
—
—
+
m
r*..
U
1-
—
u
—
-+
+
-L*
--+
a
u
+
•—
—
+
w
1
+h
i
u d
—
+
1 1
-»-Í-U-
+
+
--+
Q
-—
+
+
+
+ —
+
+
+
+
--rv.
1
-+
^ rN
--i i
UJ
U.
+
+
+
-C3
<
a
z u O
S X 0 u 'A and
Q DEN
a
< 1 a (all %•
in A 28.
CM
1 Q all spp.) in C5.
"*-' v
ilanus elete
/—-
rJ Insert r
">.
s I -a
ft*
CO
to
^3-
CO
Cst
zx o C
T>
OO
1—
CO
LT
Î
—-T
CO
CSÍ
^H
<
1 1
CO o
Û
1-u>
)-u
-
u
U.
u.
u
; i
u. O
u
3:
r».
oo
en
CD
C
S)
CS)
CSl
CSJ
CO
C
Sl
CSJ
LT
) C
SJ C
O
CSJ
CSJ
oo C
SJ C
D
CSJ
CD
C
O
CO
CS
J C
O <
1 1
1 1
u
CO o
u.
u
<—
u
«. w
.
Q
"1
u
u.
L-
^
w_
Ut
u. u
i
u
^ u.
Ll_ CJ3
428
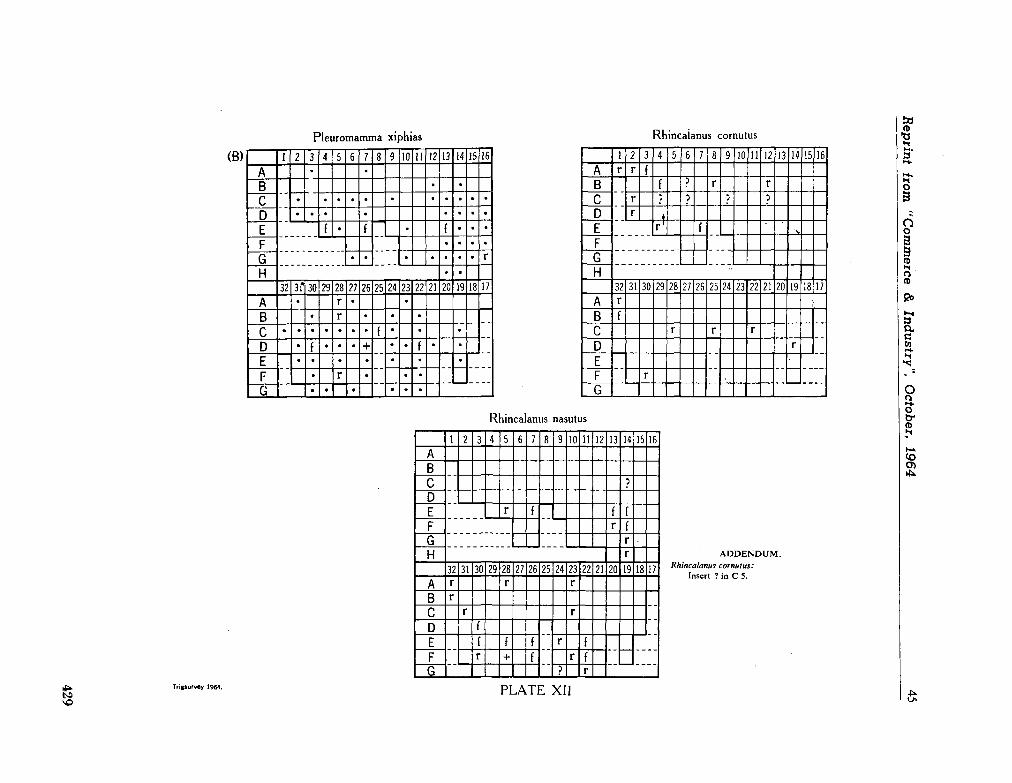
Rep
rin
t fro
m "C
om
merce
& In
dustr
y",
Octo
ber,
1964
45
G£
<x>
LO
«a-
tr>
CS
I
^ CD
CT>
CO
^ tO
uD
«* C
O
CM
~ **. U
t-
< ^ L
-
~.
—
r*.
rv
.
rv
.
rv
.
U
u
m O
Q
/
—
t_
ÜJ
,
Ll_
J O
X
^ CO
en
CD
C
SI
CS
I
CS
I C
s)
ro
CS
I
-=3-C
SJ
U-)
CS
I
UD
C
sj
CS
J
CO
csj
en
C
SI
CD
C
O
ro
Csl
ro
L-
<
1 1
^ 00
Í-u
u-
O
L.
i
i
. |
' i
i
Q
u.
;
LÜ Ü
_ o
S
CO xiphi mma Pleuro
to
un
•T
CO
esj
—
O
ey»
oo
i~-
<£>
ui
*3-
CO
CS
I
— • • <
•
• • • • • • • • •
• • • • • • :
;
CQ O
O
. <-•
*4
-
• —
LÜ
. •
u . • •
j 1
LU • • O
• I i
CO
CO
CD
Csj
CS
J C
S]
ro
CS
I
*d-
CS
I
Csl
CS
I
CS
i
CO
C
SI
CD
C
SI
CD
ro
CO
CS
I
ro
• • i-• <
i
i
• • • k*
• m • • • —
* • • • • • • o
• • «-i—
• •
• • • i
i
+ •
"^ • <-• o
• • • • LÜ • •
• • • i
i
• U • LL. • • •
C3
E
to
urs
ta
co
CS
I
s o
CX
>
CO
I—-
<-D
uo
•=r
CO
CS
I
— <
rv
.
1 1
CQ o
Q
—
—
—
u
LÜ —
u
L-
¡ ¡
Lu
o
u-
i
r-.
CO
CT»
CD
C
SI
csi
CS
I C
SI
ro
CS
I
CS
I
LO
CS
I
CS
I
CSJ
CO
C
SI
en
C
SI
CD
C
O
ro
csj
ro
U
1-,
u
<
1
1
1
1
I-CÛ
u
i-
O
¡ | 1
1
W-
j
u-
<-<— 1_
Ur
r*..
i
i i
'-M
O
•-*.
—
<-*
• ^ +
t~
1
1
LU
t_
l_ O
LU
<
00
429
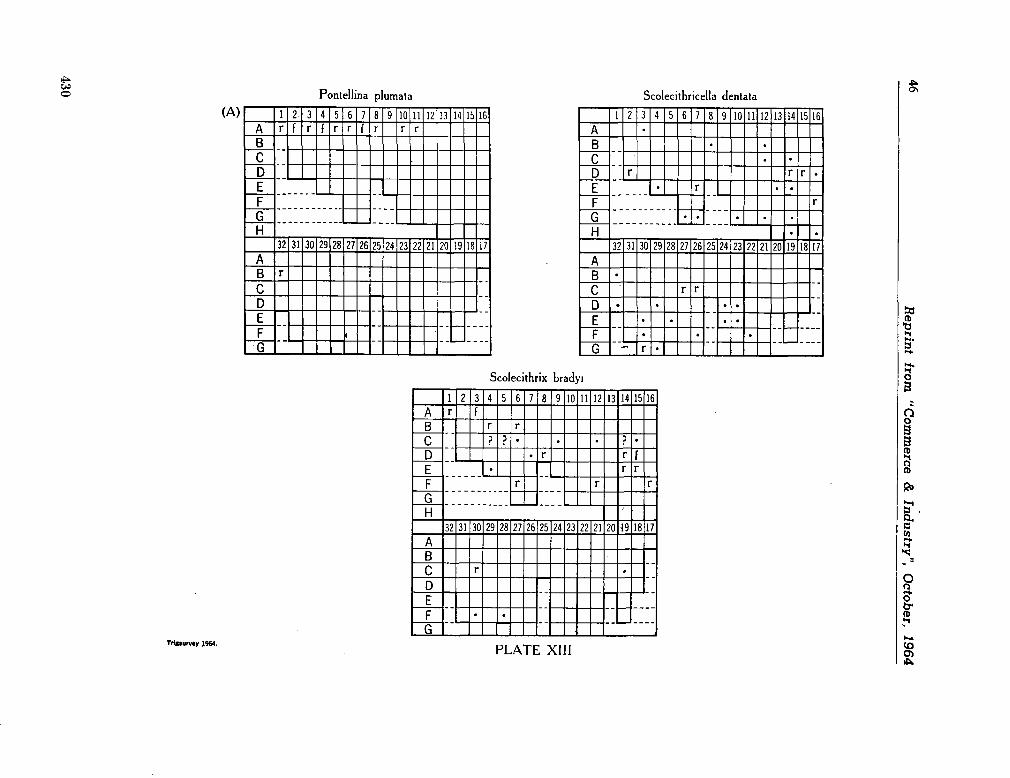
46
Reprin
t fro
m "
Com
merce
& In
du
stry"
, O
cto
ber,
1964
s
-a
sO
LO
s co
Csj
~ o
en
oo
f-
<-o
LO
«3"
CO
CS
J
-
•
<
• •
• •
• u
U
U
| |
m o
Q
• • L.
• LU
h.
• • • ) i
Lu
• •
O
• •
X
E:
oo
en
CSJ
CS
J
CS
J
Csj
CO
C
sl
«3-
CS
J
LO
C
SJ
to
OJ
oo
C
sl
CS
J
o
CO
CO
Csj
CO
<
;
• CO
U
u,
O
• •
i
I i i
• •
.
• 1
1
i
i
r
• •
a
• •
• •
i
LU L
u • u
,
t
O
tO
LO
«=
J-
CO
CN
J
~ C
D
en
oo
r.
tO
LO
*T
CO
Csl
-
u
L-
U
<—
L.
L-
«-U
**-b.
<
l
00 "
a
LU
i
i
i
LU
O
X
r*.
oo
en
CZ>
C
NI
CSJ
CS
J
CS
J
CO
C
sj
Csl
LO
C
SJ
to
CS
J
CS
J
OO
C
SJ
en
C
SJ
CO
CS
J
CO
<
1 t
u
00 a
! 1
1
o
1
_
1
1
ÜJ
ü_ o
f JB
•g rS
eci col
CO
to
io
«a-
co
CSJ
zz
O
en
oo
i—
to
LO
«=
í-
co
Csl
_ *—
u.
<
U
L.
. rv.
• • • rv.
r»-. —
u
u •
t 1
GQ o
s u
u-•
.
L-
t-
1
1
1
1
u
L¡_
o X
r-.
oo
en
C3
Csj
Csj
CS
J
Csj
ro
csj
«a
-C
sj
LO
C
SJ
Csj
csj
oo
C
SJ
en
C
sl
C3
CO
CO
Csj
ro <
1
1
1
1
m
• u
O
1
1
1
1
1
1
1
1
O
• .
1
1
LU
Ll_
o
X
üü
<
S
--
1
Ou
430
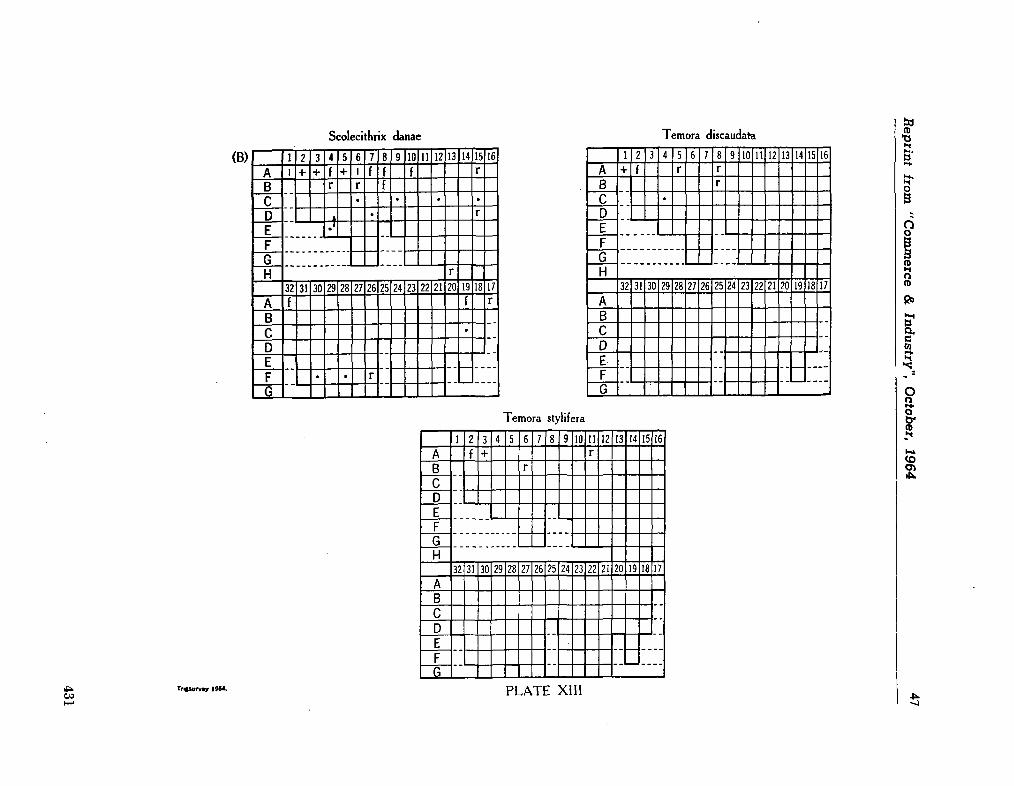
Jîep
rïni fro
m "
Com
merce
& In
du
stry"
, O
cto
ber,
1964
47
to
IT)
^ m
CS
J
^ CD
en
CO
r—.
to
LTÍ
^3
-
m
CS
J
— u
L-
—
+
<
k.
.
1 •
1 «
ÛÛ
O
O
UJ
— ' 1
1
Li. CD
-
I
I-*.
CO
en
O
CN
J
CS
J
CS
J
CM
CO
C
SJ
CS
J
IT
) C
SJ
UD
C
SJ
CS
J
oo
C
SJ
CS
J
CD
ro
ro
CS
J
ro <
Û
Û O
i
i
1
i
• i
i
i
i
i
û
i
i
LU L
l_ o
T3
X
O
O
Vi
S £ ^T
2 2i
—
2
o»
oo
1—,
CO
^ -CO
Csj
-
u _
—
V^
H
-+
—
+
+
-< U
a
U
*-
• • . .
u •
1
1
m
•
O
O LU
| | 1
U-|0
i-I
i—»
CO
en
CD
C
sj
Csj
CS
J
CS
J
ro
CS
J
^3
" C
SJ
CS
J
CS
J
Csj
OO
C
SJ
en
C
SJ
CD
ro
co
Cs
í ro
1-
V4
->
«_
<
' 1
1
1
OÙ
• Ü
i
i
1
1
1 1
1
1
1
1
o
i
i
U • •
1 1
LU
u. CD
styhlera
P.
P V
sD
U">
^3
-
CO
Psi
~ CD
en
oo
r—
«X>
WÏ
*a-
ro
Csj
-«
U
+
«•
*•
<
Í-
i
co O
O
Lu
i
i
i
LU
CD X
r-.
oo
en
CD
C
SJ
CN
I
CS
J
Csl
ro
CS
J
«3
-C
SJ
m
CS
J
CS
J
csj
OO
C
sj
en
C
Si
CD
ro
Csl
ro <
i
i
co o
l
1 | 1 t
t r
i
t i
i
Q
1 1
LU
U. CD
UJ
[-_j
CL.
cû
431
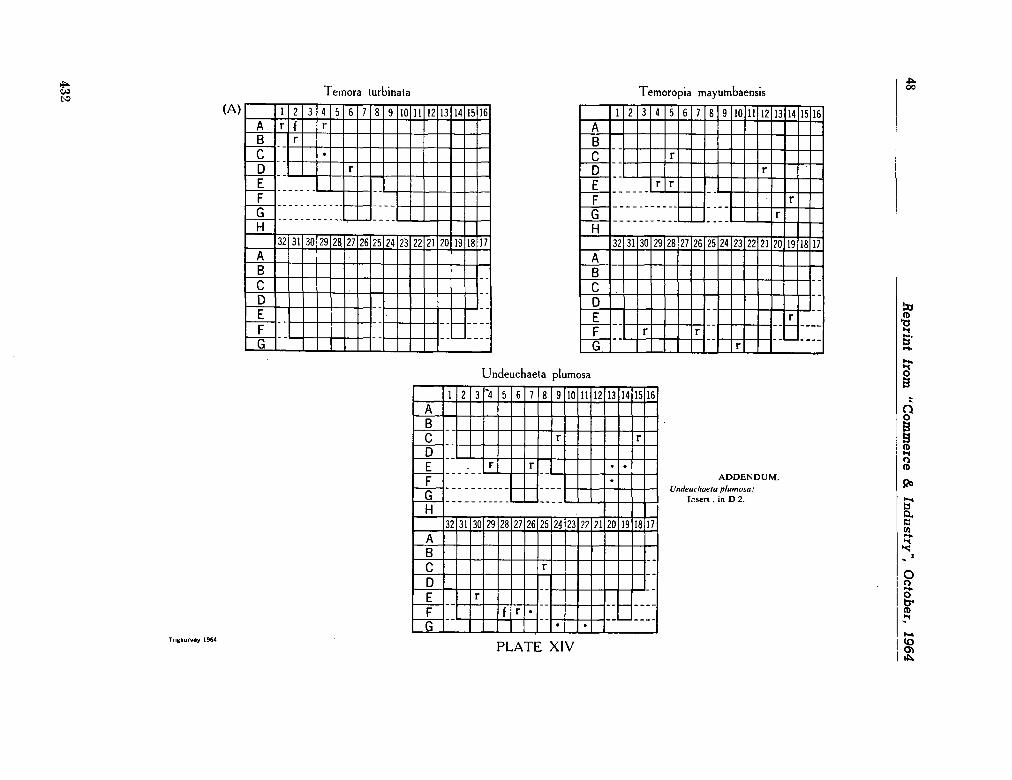
48
Reprin
t fro
m "
Com
merce
& In
du
stry"
, O
cto
ber,
1964
1 ID
LO
-CO
CN
J
Z! O
CT>
OO
r-«
to
LO
^3
-
m
CN
J
-
<
w.
i~
i
i
i
i
CO o
Q
L-
U
LÜ
u.
U.
1
1
LU
O
X
r.
OO
CD
CD
C
NJ
CN
l
CN
J
CN
J
ro
CS
J
CN
l
LO
C
NJ
tO
CS
J
CN
l
OO
C
NJ
CN
J
ro
CO
CN
J
ro <
i
i
• i
m o
1
1
I
t
-i 1
1
1
i
i u-
• i
i
o
II-
U.
1
1
LlJ
Ü_ o
1Q
°- .s
II
J 1)
to
LO
«a-
CO
CN
J
zz
o
CT>
OO
r-
to
LD
^ m
CN
J
-
u
^ u
<
1_
•
u
: ¡
m o
O
UJ
1
1
u_ CD
X
r—.
OO
CT>
o
CN
J
CN
J
CN
J
CN
J
.co
C
NJ
«a-
CN
J
LO
C
NJ
tD
CN
J
1—
C
NJ
otf
CN
J
en
C
NJ
CD
m
en
CN
J
CO
<
t •
m o
¡ 1
¡
Q
1
i
1
ÜJ
Ü
_ C3
-a
B
D
tO
to
*a-
co
CN
J
zz
o
en
OO
i~
~~
to
LO
r c
o
CN
J
— <
C
Û
u>
J-
1
1
o f
• • 1-
k.
LÜ
•
i
r
Lu
O
X
p—.
OO
cr>
CD
C
NJ
CN
J
CN
J
CN
J
CO
C
NJ
CN
J
LO
C
NJ
<x> C
NJ
CN
J
OO
C
NJ
CN
J
O
co
ro
CN
J
ro <
i
i
i
i
m u
O
i
i
I i 1
; ;
o
1-
• u
-
i
i
LÜ
L
U • • (3
>
X
LÜ
<
432
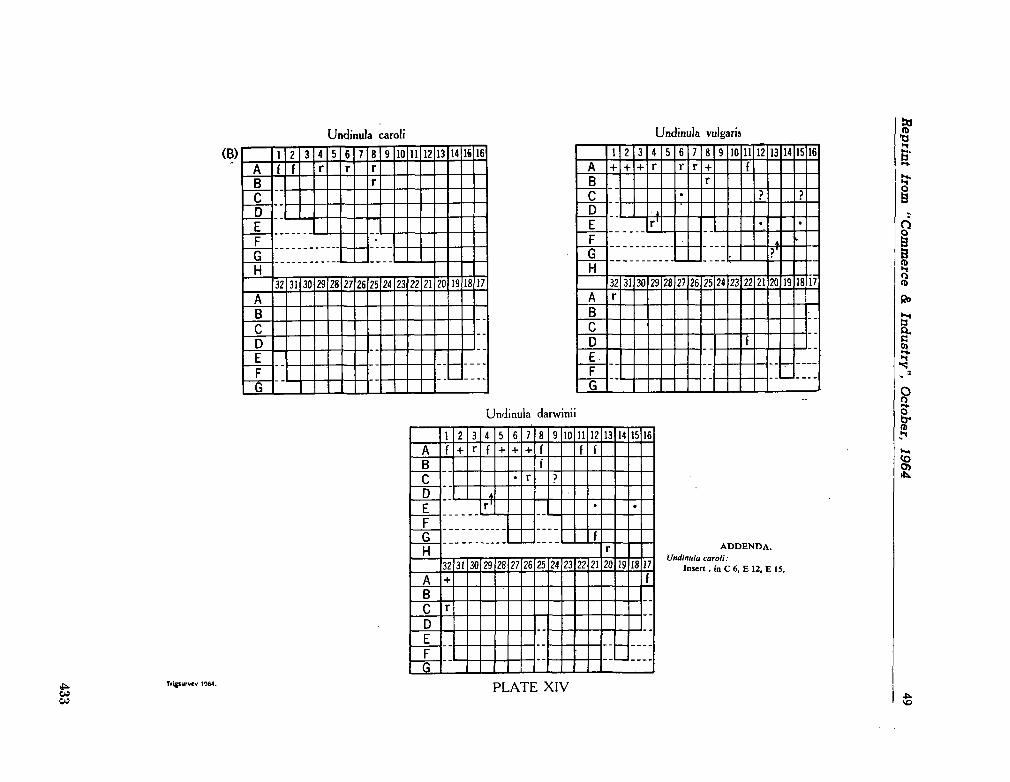
Reprin
t fro
m "
Com
merce
& In
du
stry"
, O
cto
ber,
1964
49
JS
r~
3
C
c
2 2
2 2
2
S
2
en
oo
r
to
IT)
* ro
CM
-
%*
•
+
u
-u
+
+
+
<
k»
rw.
r*..
•
1
1
1
1
m o
o
• •
"fc-
LÜ
r*.
i
i
i
U_ C
3 I
P^
.
CO
Ol
CD
C
M
CM
CN
J
CM
C
O
CN
J
CM
in
CM
«5
C
M
CM
CO
C
M
en
C
M
CD
C
O
in
CM
C
O
u
<
1
1
. 1
1
CO
o —
1
1
1- 1 1
• i i
i
i i
O
1
1
LU
ü_ o
a car Jndinul
CO
yp
^r
CO
CM
zz
o
o*
CO
r-
«o
\n -CO
CM
»—*
1M
u
u
**. n
-
<
u
1
1
CQ
Ü
Q
ÜJ
, 1
1
1
1
ü_ o
i
r-»
OO
cr>
CD
C
M
CM
CM
C
M
CO
C
M
a
CM
CM
CM
QO
C
M
cr» C
M
CO
CO
CM
C
O <
i
l
1
1
ÛÛ
O
i
1
1 I
i
o
1
LU
ü_ o
ü2
1'
*i
l£>
ut
**-CO
CM
H
CD
Cft
CO
1—
U3
LO
^ CO
CM
~
—
—
<_
+
+
+
—
I-+
i-b
*
< —
rv
.
U
•
1
1
1
1
CÛ
O ? • • u
LU
*—
i
i
i
l_l_ O
u
i
f*s.
oo
CT>
CD
C
M
CM
CM
C
M
CO
C
M
*3-
CM
IP
CM
«5
C
M
CM
CO
C
M
en
C
M
CD
C
O
CO
CM
C
O —
+
<
1
1
1
1
m u
ü
1
1
I i l
i
i i
i
i i
o
i
i
LU
Lu
e>
D
— ~
>
><
UJ
H
<
CL
ccr
433
Reprinted from Zoológica Africana, vol. 1, no. 2, 1965, p. 275-295.
NOTES ON THE BATHYPELAGIC FAUNA OF THE SEAS AROUND SOUTH AFRICA
J. R. GRINDLEY A N D M . J. PENRITH*
South African Museum, Cape Town
INTRODUCTION
The bathypelagic fauna of the sea m a y be regarded as comprising those pelagic animals which
dwell during daylight hours in the darkness of the mid-depths of the ocean, below the depth
to which visible light penetrates. At night most of these bathypelagic animals migrate vertically
upwards and some actually reach the surface. The present study was limited to animals obtained
with a mid-water trawl, with netting of half-inch stretched mesh size, fishing d o w n to a depth of
approximately 500 metres. The jarea covered included southern African coastal waters and the
South West Indian Ocean, as shown in Figure 1.
Until recently collecting in the bathypelagic zone was hampered by lack of. suitable
equipment. Available devices were based either on some sort of frame net, such as beam trawls
and scaled up plankton nets, or adaptations of otter trawls, where the shearing effect of doors
takes the place of the frame,, as in the case of the Petersen young fish trawl and Parr's (1934)
triangular trawl. Both types suffered from a number of disadvantages, the major ones being
that to maintain depth they had to be towed slowly. They required a great length of cable to
reach even moderate depths and, because of the slow speed of towing, they had to be large to
capture the faster swimming animals and were therefore extremely unwieldy.
The Isaac-Kidd mid-water trawl (Devereaux & Winsett 1953) developed at the Scripps
Institution of Oceanography, has to a large extent overcome m a n y of the faults of earlier types.
The diving action of the wide V-shaped steel depressor vane enables fast towing and the trawl
maintains its fishing depth within wide margins of speed. If the ship's speed is increased, the
additional drag on the cable tends to lift the net, but the depressing action of the vane also
increases. The vane used in the present programme was slightly modified to increase its
strength.
In 1960 the South African M u s e u m began a survey of the biology of tuna in South African
waters, including a study of their stomach contents. T o m a k e a reference collection of the
possible forage organisms of the tuna a ten ft. Isaacs-Kidd mid-water trawl was obtained.
This trawl proved so efficient for the collection of bathypelagic animals that its use was
continued after the end of the tuna survey and it is hoped to continue this programme further
to cover more intensively the seas around South Africa. Little work in this field had been
done in these seas apart from the early trawling surveys by the S.S. Pieter Faure (1897-1907)
and S.S. Pickle (1920-1929) and a few stations worked by the Danish D a n a expedition
(1928-1930).
The stations at which successful trawls have so far been made are shown on the chart
*Seconded from the Council for Scientific and Industrial Research, Océanographie Unit,
University of Cape T o w n .
275
Collected reprints of the International Indian Ocean Expedition, vol. IV, contribution no. 226 435
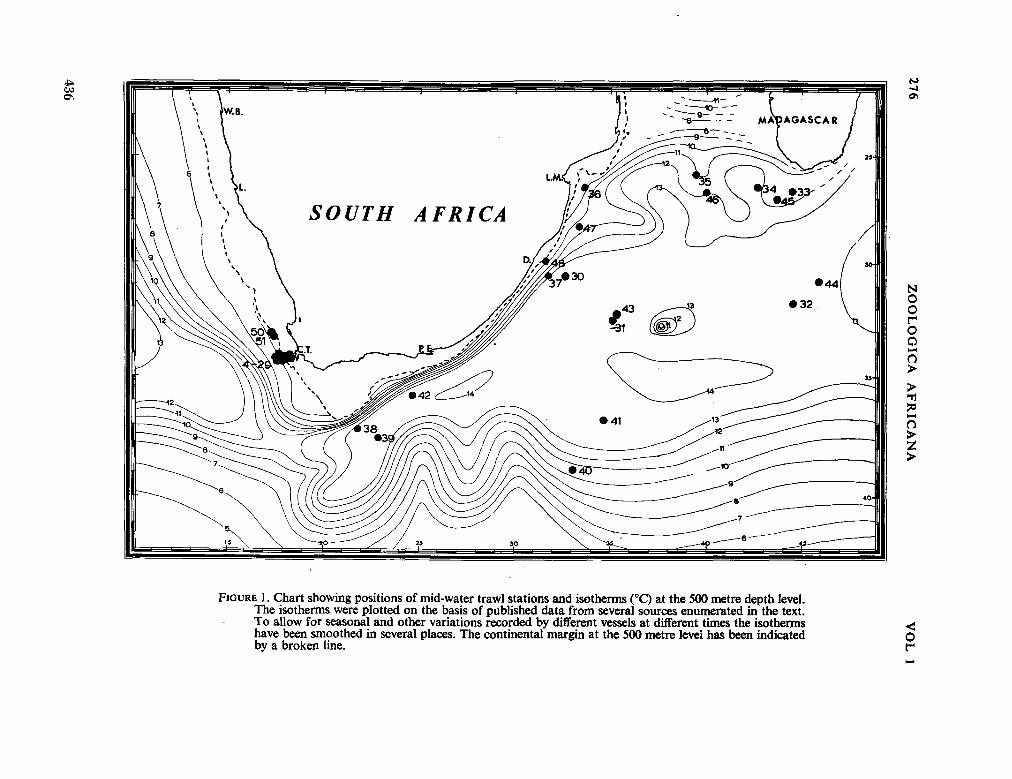
276 Z
OO
LÓ
GIC
A
AF
RIC
AN
A
VO
L l
™ 2
5 2
••°
R e
£ 3
S
n
2 2
.2H
rt 2
í¡ •
og
-Sg
111* .H
O
n r*
•«•S
—
.9
S
a^««
-|*aij
a o S s
g U
'« *
g (S
rtfl.O
cd
>,
436
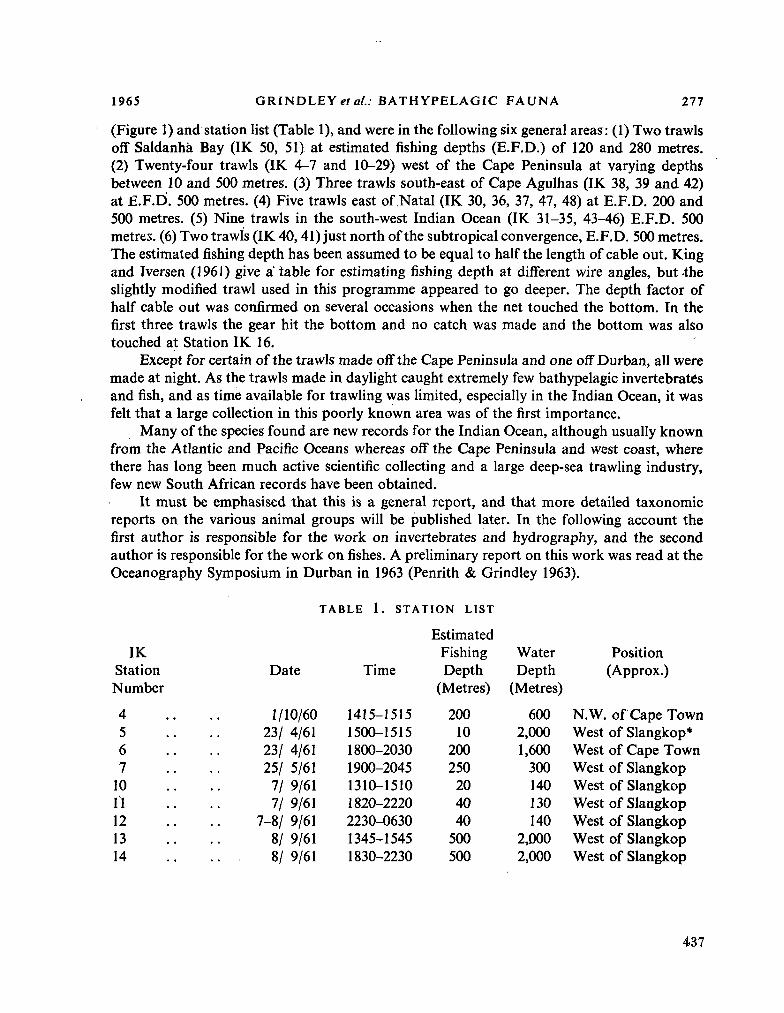
1965 GRINDLEYetfa/.: B A T H Y P E L A G I C F A U N A 277
(Figure 1) and station list (Table 1), and were in the following six general areas: (1) Two trawls off Saldanhà Bay (IK 50, 51) at estimated fishing depths (E.F.D.) of 120 and 280 metres. (2) Twenty-four trawls (IK 4-7 and 10-29) west of the Cape Peninsula at varying depths between 10 and 500 metres. (3) Three trawls south-east of Cape Agulhas (IK 38, 39 and 42) at E . F . D . 500 metres. (4) Five trawls east of Natal (IK 30, 36, 37, 47, 48) at E . F . D . 200 and 500 metres. (5) Nine trawls in the south-west Indian Ocean (IK 31-35, 43-46) E . F . D . 500 metres. (6) Two trawls (IK 40, 41) just north of the subtropical convergence, E . F . D . 500 metres. The estimated fishing depth has been assumed to be equal to half the length of cable out. King and Iversen (1961) give a table for estimating fishing depth at different wire angles, but the slightly modified trawl used in this programme appeared to go deeper. The depth factor of half cable out was confirmed on several occasions when the net touched the bottom. In the first three trawls the gear hit the bottom and no catch was made and the bottom was also touched at Station IK 16.
Except for certain of the trawls made off the Cape Peninsula and one off Durban, all were made at night. As the trawls made in daylight caught extremely few bathypelagic invertebrate's and fish, and as time available for trawling was limited, especially in the Indian Ocean, it was felt that a large collection in this poorly known area was of the first importance.
Many of the species found are new records for the Indian Ocean, although usually known from the Atlantic and Pacific Oceans whereas off the Cape Peninsula and west coast, where there has long been much active scientific collecting and a large deep-sea trawling industry, few new South African records have been obtained.
It must be emphasised that this is a general report, and that more detailed taxonomic reports on the various animal groups will be published later. In the following account the first author is responsible for the work on invertebrates and hydrography, and the second author is responsible for the work on fishes. A preliminary report on this work was read at the Oceanography Symposium in Durban in 1963 (Penrith & Grindley 1963).
TABLE 1. STATION LIST
IK Station Number
4 5 6 7
10 11 12 13 14
Date
1/10/60
23/ 4/61 23/ 4/61
25/ 5/61 7/ 9/61 7/ 9/61
7-8/ 9/61
8/ 9/61
. . 8/ 9/61
Time
1415-1515
1500-1515
1800-2030 1900-2045
1310-1510 1820-2220
2230-0630 1345-1545
1830-2230
Estimated Fishing Depth
(Metres)
200 10
200 250 20 40 40
500 500
Water
Depth (Metres)
600 2,000 1,600
300 140 130 140
2,000
2,000
Position (Approx.)
N . W . of Cape Town West of Slangkop*
West of Cape Town West of Slangkop
West of Slangkop West of Slangkop
West of Slangkop
West of Slangkop
West of Slangkop
437
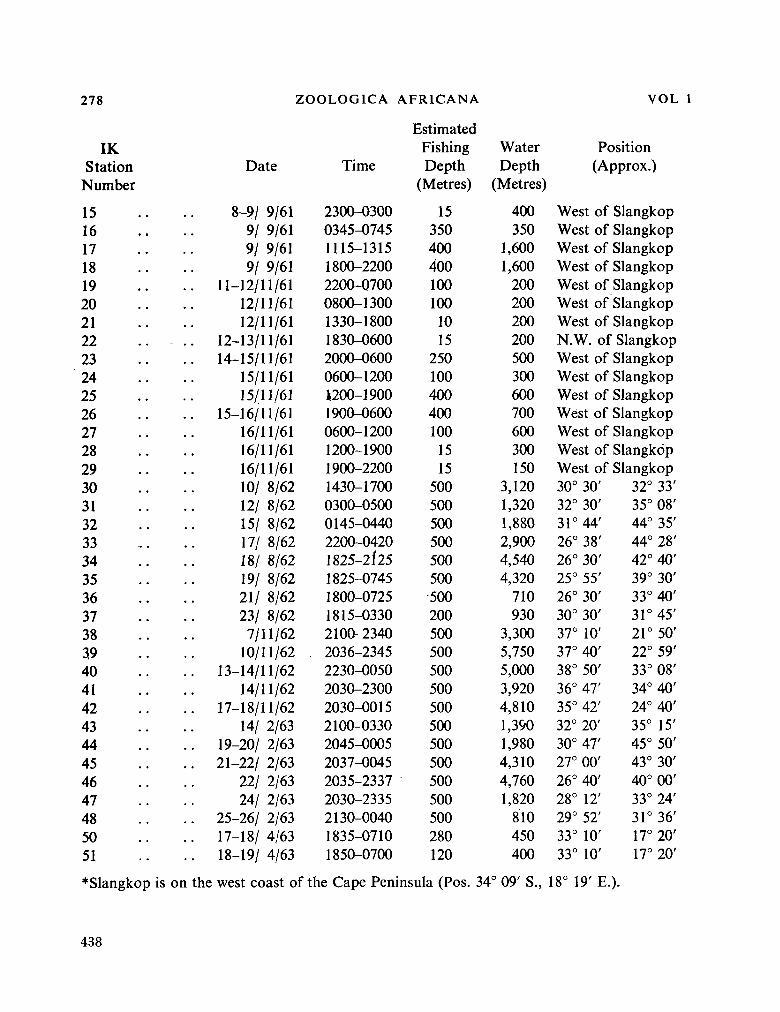
278 ZOOLÓGICA AFRICANA V O L l
IK Station
N u m b e r
15 16 17 18 19 20 21 22 . . . 23 24 25 26 27 28 29 30 31 32 33 34 35 36 37 38 39 40 41 42 43 44 45 46 47 48 50 51
Date
8-9/ 9/61 9/ 9/61 9/ 9/61 9/ 9/61
. 11-12/11/61 12/11/61 12/11/61
. 12-13/11/61
. 14-15/11/61 15/11/61 15/11/61
. 15-16/11/61 16/11/61 16/11/61 16/11/61 10/ 8/62 12/ 8/62 15/ 8/62 17/ 8/62 18/ 8/62 19/ 8/62 21/ 8/62 23/ 8/62
7/11/62 10/11/62
. 13-14/11/62 14/11/62
. 17-18/11/62 14/ 2/63
. 19-20/ 2/63
. 21-22/ 2/63 22/ 2/63 24/ 2/63
. 25-26/ 2/63
. 17-18/ 4/63
. 18-19/ 4/63
Time
2300-0300 0345-0745 1115-1315 1800-2200 2200-0700 0800-1300 1330-1800 1830-0600 2000-0600 0600-1200 Í200-1900 1900-0600 0600-1200 1200-1900 1900-2200 1430-1700 0300-0500 0145-0440 2200-0420 1825-2Í25 1825-0745 1800-0725 1815-0330 2100-2340
. 2036-2345 2230-0050 2030-2300 2030-0015 2100-0330 2045-0005 2037-0045 2035-2337 2030-2335 2130-0040 1835-0710 1850-0700
Estimated Fishing Depth
(Metres)
15 350 400 400 100 100 10 15
250 100 400 400 100 15 15
500 500 500 500 500 500 500 200 500 500 500 500 500 500 500 500 500 500 500 280 120
Water Depth
(Metres)
400 350
1,600 1,600
200 200 200 200 500 300 600 700 600 300 150
3,120 1,320 1,880 2,900 4,540 4,320
710 930
3,300 5,750 5,000 3,920 4,810 1,390 1,980 4,310 4,760 1,820
810 450 400
Position (Approx.)
West of Slangkop West of Slangkop West of Slangkop West of Slangkop West of Slangkop West of Slangkop West of Slangkop N . W . of Slangkop West of Slangkop West of Slangkop West of Slangkop West of Slangkop West of Slangkop West of Slangkop West of Slangkop 30° 30' 32° 30' 31° 44' 26° 38' 26° 30' 25° 55' 26° 30' 30° 30' 37° 10' 37° 40' 38° 50' 36° 47' 35° 42' 32° 20' 30° 47' 27° 00' 26° 40' 28° 12' 29° 52' 33° 10' 33° 10'
32° 33' 35° 08' 44° 35' 44° 28' 42° 40' 39° 30' 33° 40' 31° 45' 21° 50' 22° 59' 33° 08' 34° 40' 24° 40' 35° 15' 45° 50' 43° 30' 40° 00' 33° 24' 31° 36' 17° 20' 17° 20'
*Slangkop is on the west coast of the Cape Peninsula (Pos. 34° 09' S., 18° 19' E.).
438
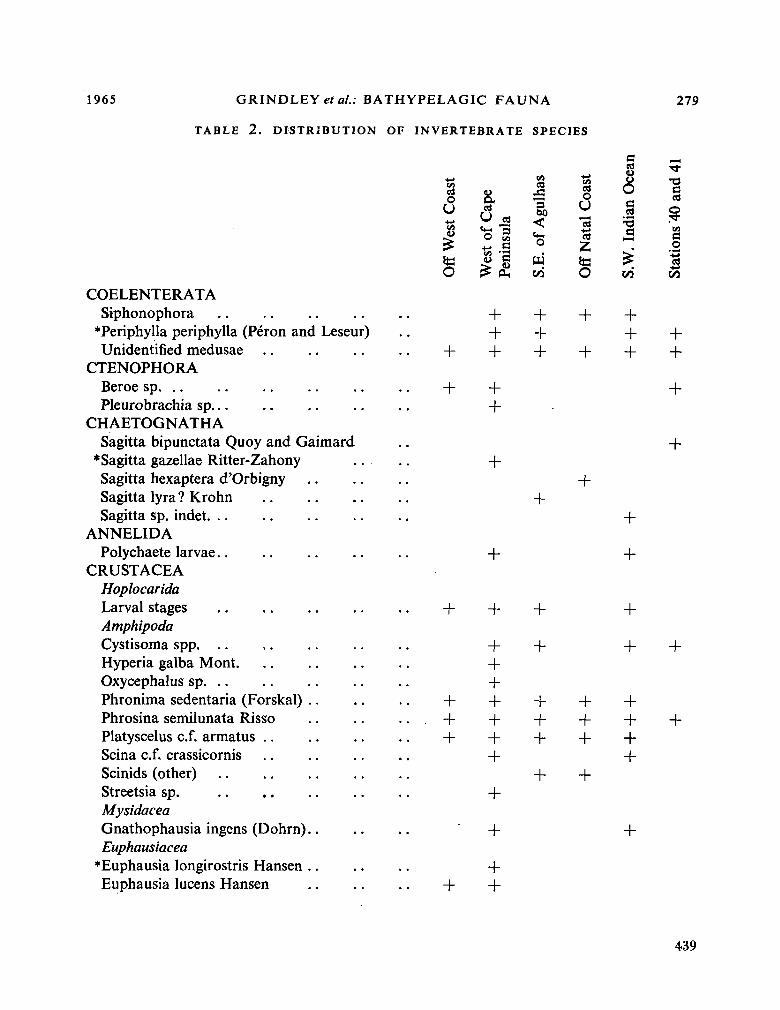
1965 G RINDLEY étal.: BATHYPELAGIC F A U N A
TABLE 2. DISTRIBUTION OF INVERTEBRATE SPECIES
279
COELENTERATA Siphonophora
*Periphylla periphylla (Péron and Leseur) Unidentified medusae
CTENOPHORA Beroe sp. . . Pleurobrachia sp
CHAETOGNATHA Sagitta bipunctata Q u o y and Gaimard
•Sagitta gazellae Ritter-Zahony Sagitta hexaptera d'Orbigny Sagitta lyra ? Krohn Sagitta sp. indet.
ANNELIDA Polychaete larvae
CRUSTACEA Hoplocarida Larval stages Amphipoda Cystisoma spp. Hyperia galba M o n t Oxycephalus sp Phronima sedentaria (Forskal) Phrosina semilunata Risso Platyscelus cf. armatus Scina cf. crassicornis Scinids (other) Streetsia sp. Mysidacea Gnathophausia ingens (Dohrn) Euphausiacea
•Euphausia longirostris Hansen Euphausia lucens Hansen
ast
Wes
t C
o
ta O
+
+
.
+
.
.
.
+ + +
,
.
.
.
.
+
u
¡t of
Cap
in
sula
(U C • ^ . il i
£ £
+ + +
+ +
+
+
+
+ + + + + + +
+
+
+ +
CO - E
of A
guí:
w </i
+ + +
+
+
+
+ + +
+
>ast
N
atal
Ce
ta O
+
+
+
+ + +
+
Oce
an
. In
dia
n
£ </>
+ + +
+
+
+
+
+ + + +
+
•o tí
ion
s 40
a
c4 •4-»
CO
+ +
+
+
+
+
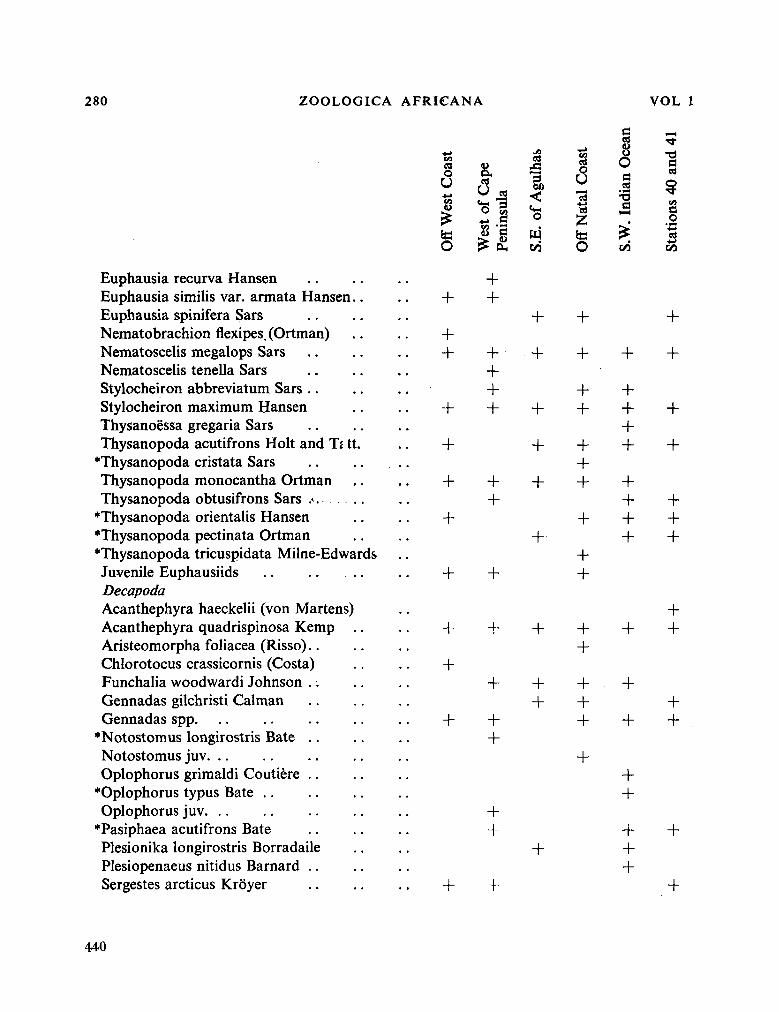
280 ZOOLÓGICA AFRICANA VOL l
Euphausia recurva Hansen Euphausia similis var. armata Hansen. Euphausia spinifera Sars Nematobrachion flexipes. (Ortman) Nematoscelis megalops Sars Nematoscelis tenella Sars Stylocheiron abbreviatum Sars . . Stylocheiron m a x i m u m Hansen Thysanoëssa gregaria Sars Thysanopoda acutifrons Holt and T Í tt.
•Thysanopoda cristata Sars Thysanopoda monocantha Ortman Thysanopoda obtusifrons Sars .<.
•Thysanopoda orientalis Hansen •Thysanopoda pectinata Ortman •Thysanopoda tricuspidata Milne-Edwards Juvenile Euphausiids Decapoda Acanthephyra haeckelii (von Martens) Acanthephyra quadrispinosa K e m p Aristeomorpha foliácea (Risso).. Chlorotocus crássicornis (Costa) Funchalia woodwardi Johnson Gennadas gilchristi Caiman Gennadas spp.
•Notostomus longirostris Bate Notostomus juv. Oplophorus grimaldi Coutière
•Oplophorus typus Bate . . Oplophorus juv.
•Pasiphaea acutifrons Bate Plesionika longirostris Borradaile Plesiopenaeus nitidus Barnard Sergestes arcticus Krôyer
ast
ff W
est
Co
O
+
+ +
+
+
+
+
+
+
+
+
4>
rest
of C
ap
min
sula
> OH
+ +
+ + + +
+ +
+
+
+
+ +
+ +
JS
«J
E.
of A
guli
tyj
+
- +
+
+
+
+
+
+ +
+
Í
if N
atal
Ce
O
+
+
+ +
+ + +
+
+ +
+ +
+ + +
+
c
Oce
a W
. In
dian
CO
+
+ + + +
+ + + +
+
+
+
+ +
+ + +
i—(
"tí
a
atio
ns 4
0 a
CO
+
+
+
+
+ + +
+ +
+ +
+
+ + +
440
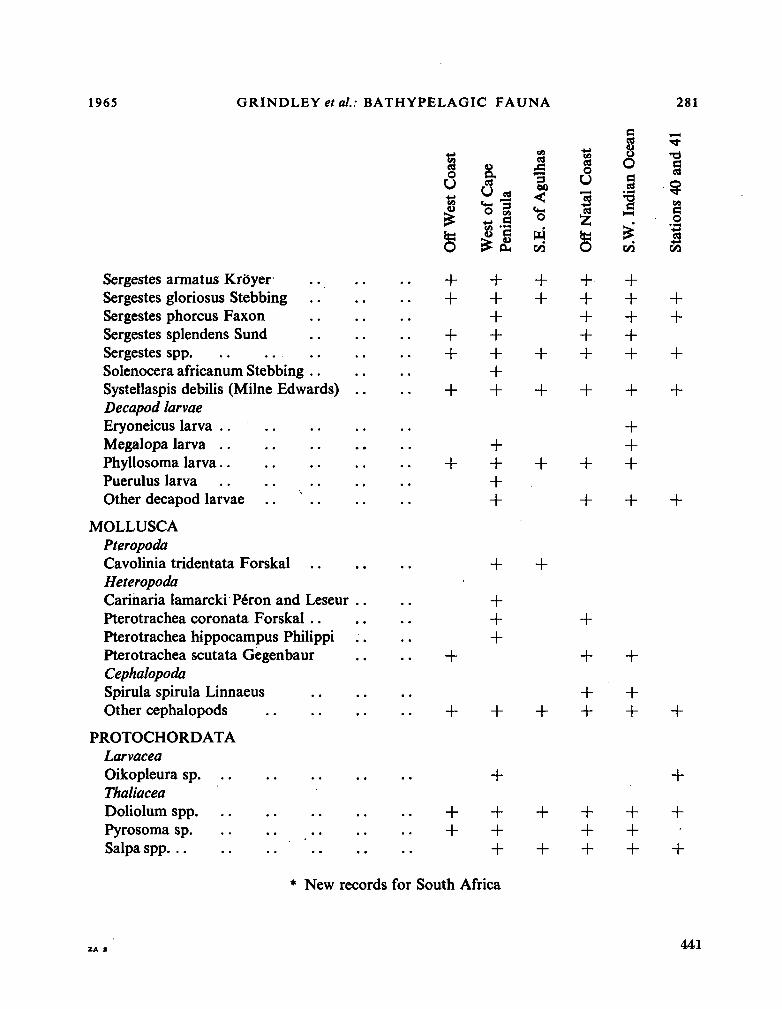
1965 GRINDLEYeía/.: BATHYPELAGIC F A U N A 281
Sergestes armât us Krbyer Sergestes gloriosus Stebbing . . . Sergestes phorcus Faxon Sergestes splendens Sund Sergestes spp Solenocera africanum Stebbing . . Systellaspis debilis (Milne Edwards) . Decapod larvae Eryoneicus larva . . Megalopa larva Phyllosoma larva Puerulus larva Other decapod larvae
•»-»
Wes
t C
oas
ta O
+ +
+ +
+
+ t
of C
ape
insu
la
<L> G
£ £ + + + + + + +
+ + + +
CO
of A
gulh
a
w t/3
+ +
+
+
+
-s
Nat
al C
oa
ta O
+ + + + +
+
+
+
cean
.
Indi
an
0
£ UÎ
+ + + + +
+
+ + +
+
•cl
ion
s 40
am
t3 &
+ +
+
+
+ MOLLUSCA
Pteropoda Cavolinia tridentata Forskal Heteropoda Carinaría lamarcki Péron and Leseur Pterotrachea coronata Forskal . . Pterotrachea hippocampus Philippi Pterotrachea scutata Gegenbaur Cephalopoda Spirula spirula Linnaeus Other cephalopods
PROTOCHORDATA Larvacea Oikopleura sp Thaliacea Doliolum spp. Pyrosoma sp Salpa spp
+
+ + +
+
+
+
+ +
+
+ +
+
+
+ + +
+
+
+
+ +
+ + +
+ +
+ + +
+
+
+
+ * N e w records for South Africa
441
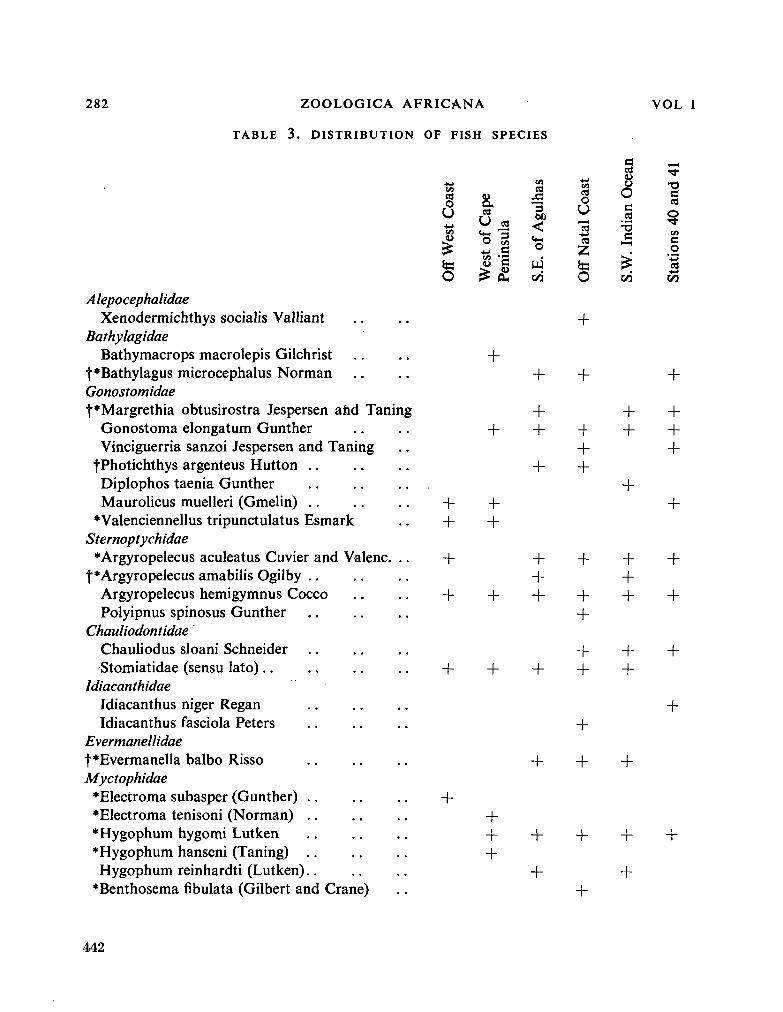
282 ZOOLÓGICA AFRICANA
TABLE 3. DISTRIBUTION OF FISH SPECIES
VOL 1
A lepocephalidae
Xenodermichthys socialis Valliant Bathylagidae
Bathymacrops macrolepis Gilchrist |*Bathylagus microcephalus Norman Gonostomidae
t*Margrethia obtusirostra Jespersen and Taning Gonostoma elongatum Gunther Vinciguerria sanzoi Jespersen and Taning
fPhotichthys argenteus Hutton Diplophos taenia Gunther Maurolicus muelleri (Gmelin)
•Valenciennellus tripunctulatus Esmark Sternoptychidae
*Argyropelecus aculeatus Cuvier and Valenc t*Argyropelecus amabilis Ogilby . .
Argyropelecus hemigymnus Coceo Polyipnus spinosus Gunther
Chauliodontidae Chauliodus sloani Schneider Stomiatidae (sensu lato)
Idiacanthidae Idiacanthus niger Regan Idi acanthus fasciola Peters
Evermanellidae f*Evermanella balbo Risso Myctophidae
•Electroma subasper (Gunther) . . *Electroma tenisoni (Norman) . . *Hygophum hygomi Lutken *Hygophum hanseni (Taning) . . Hygophum reinhardti (Lutken)..
•Benthosema fibulata (Gilbert and Crane)
+
V) CU
CU O
Wes
tC
ta O
4> a
st of
Ca
•5? £
insu
la
Pen
JB
. of
Agu
l
W co
+
CU
o
lu eU
fa O
+
+
a cU u o
o c cU
CO
e cU
S3 O
' • &
CU -4-»
CO
+
+ +
+
+
+
+
+
+ +
+
+
+ + +
+ +
+
+ + +
+
+
+
+
+ + +
+
+ +
+ +
+
+
+
+ +
+
+ + +
+ +
+
+
+
+ + +
+
+
+
+
+
+
+
442
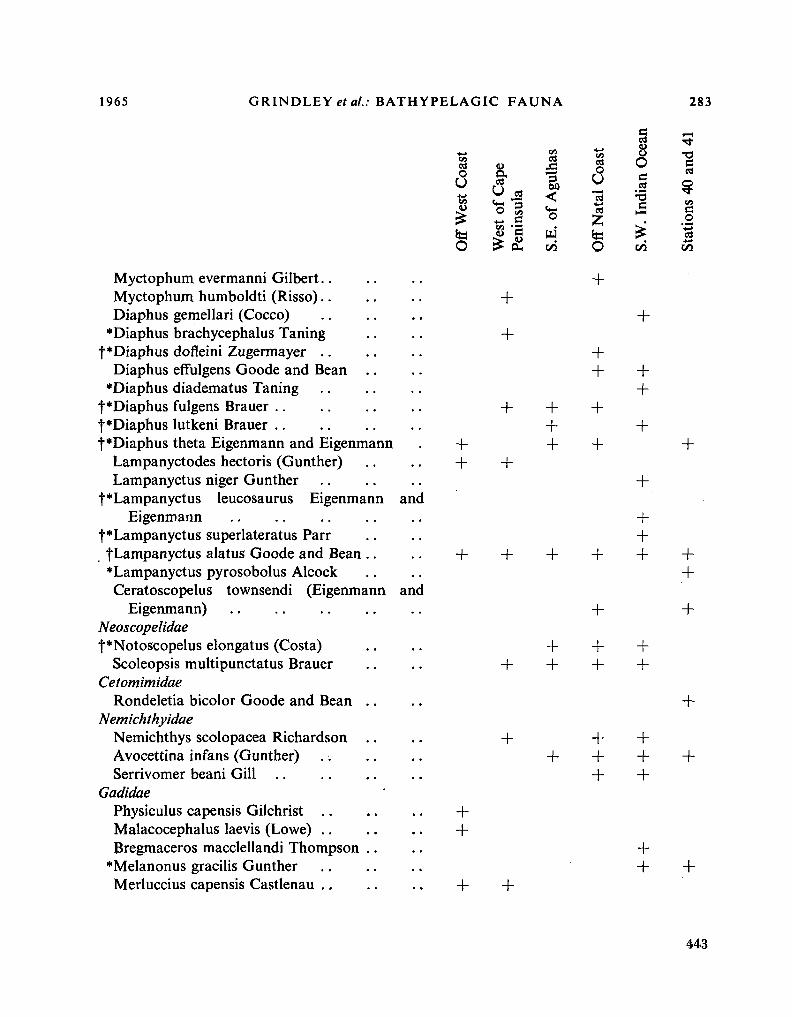
1965 GRINDLEYe/a/.: BATHYPELAGIC FAUNA 283
Myctophum evermanni Gilbert.. Myctophum humboldti (Risso) Diaphus gemellari (Coceo)
*Diaphus brachycephalus Taning t*Diaphus dofleini Zugermayer
Diaphus effulgens Goode and Bean •Diaphus diadematus Taning
t*Diaphus fulgens Brauer •¡••Diaphus lutkeni Brauer . . f*Diaphus theta Eigenmann and Eigenmann
Lampanyctodes hectoris (Gunther) Lampanyctus niger Gunther
t*Lampanyctus leucosaurus Eigenmann and Eigenmann
t* Lampanyctus superlateratus Parr fLampanyctus alatus Goode and Bean . . •Lampanyctus pyrosobolus Alcock Ceratoscopelus townsendi (Eigenmann and
Eigenmann) Neoscopelidae t*Notoscopelus elongatus (Costa)
Scoleopsis multipunctatus Brauer Cetomimidae
Rondeletia bicolor Goode and Bean . . Nemichthyidae
Nemichthys scolopacea Richardson . . Avocettina infans (Gunther) Serrivomer beani Gill
Gadidae Physiculus capensis Gilchrist Malacocephalus laevis (Lowe) Bregmaceros macclellandi Thompson . .
•Melanonus gracilis Gunther Merluccius capensis Castlenau . .
Wes
t C
oast
O
ff
+ +
t of
Cap
e in
sula
« (3
tu
+
+
of A
gulh
as
S.E.
+ + +
Nat
al C
oast
+
+
+
Off
+
+
CI
. In
dian
Oce
a
+
+ +
+
1-H
ions
40
and
4 St
at
+
+ + +
+ +
+ +
+
+
+
+ + +
+ +
+ +
+
+
+
+ +
+
+ +
+ + +
+ +
+ + +
+
+
+
443
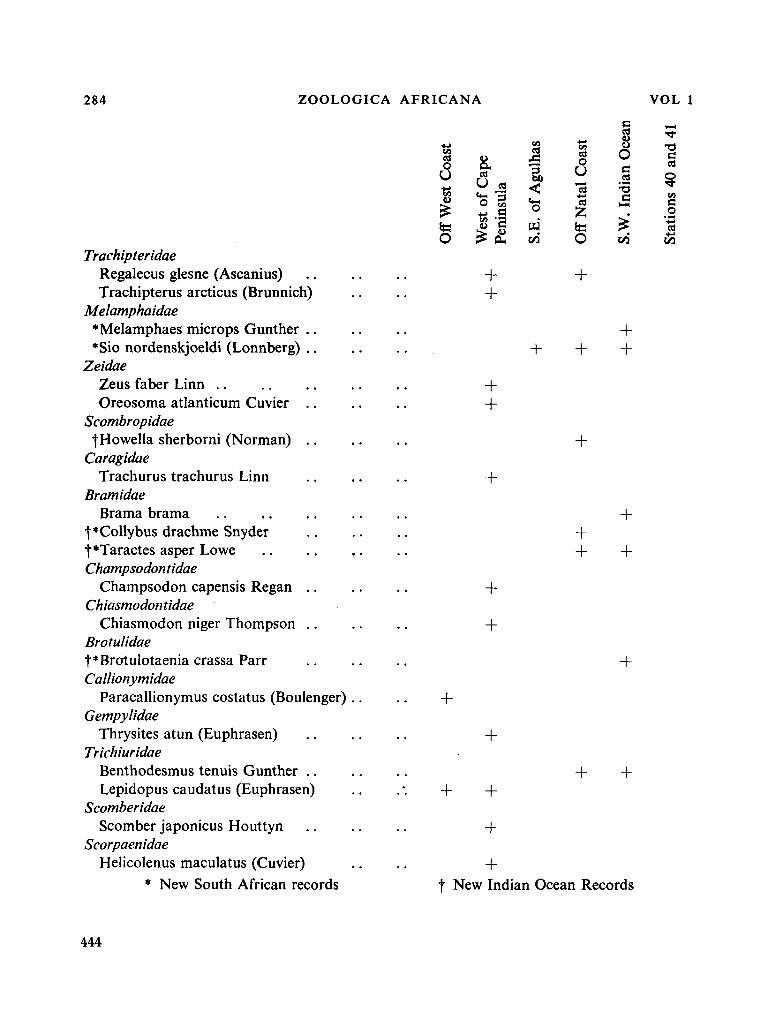
284 ZOOLÓGICA AFRICANA
Trachipteridae Regalecus glesne (Ascanius)
Trachipterus arcticus (Brunnich)
Melamphaidae •Melamphaes microps Gunther
*Sio nordenskjoeldi (Lonnberg)
Zeidae
Zeus faber Linn
Oreosoma atlanticum Cuvier
Scombropidae fHowella sherborni (Norman)
Caragidae
Trachurus trachurus Linn
Bramidae
Brama brama
f*Collybus drachme Snyder
t*Taractes asper Lowe
Champsodon tidae
Champsodon capensis Regan
Chiasmodontidae
Chiasmodon niger Thompson
Brotulidae
|*Brotulotaenia crassa Parr
Callionymidae
Paracallionymus costatus (Boulenger)
Gempylidae
Thrysites atún (Euphrasen)
Trichiuridae
Benthodesmus tenuis Gunther . .
Lepidopus caudatus (Euphrasen)
Scomberidae Scomber japonicus Houttyn
Seorpaenidae
Heücolenus maculatus (Cuvier)
* N e w South African records
V) a o
U t¡
te O
+
o O,
U es
Wes
t of
Pen
insu
+ +
Agulh
as
S.E
. of
al C
oast
O
ff N
at
+
di a
n O
ce
S.W
. In
+ +
f
+
+
+
+ +
+
+ +
+
+ +
+ +
+
+
+ +
+ t N e w Indian Ocean Records
444
196.5 GRINDLEYef a/.. BATHYPELAGIC FAUNA 285
SYSTEMATIC NOTES ON SPECIES
Lists of the species of invertebrates (Table 2) and fishes (Table 3) taken during this survey have been given above, but it must be emphasised that these are not complete lists. Detailed taxonomic reports on the major groups will be published separately.
A m o n g the Coelenterata was the characteristic bathypelagic medusa Periphylla periphylla (Péron and Leseur) which has been described under a number of different names throughout the world. K r a m p (1961) has, however, indicated that there is only a single species with an extensive synonymy. This is apparently the first record of this species from the South African region.
Sagitta gazellae is a species new to the South African list but the other Sagitta species are previously k n o w n from South Africa (Heydorn 1959).
The Amphipoda obtained were mostly not typical bathypelagic forms and m a y have been caught near the surface, but two species of the rare and interesting bathypelagic genus Cystisoma are represented.
S o m e of the specimens of Phronima sedentaria were in their transparent gelatinous "houses". Others, however, were found inside Pyrosoma colonies and there were a number of houses that were clearly the remains of Pyrosoma colonies that had the zooids missing to varying degrees, until they formed a normal smooth, gelatinous house. Phronima is normally reported to live in the tests of salps and doliolids.
The giant mysid Gnathophausia ingens (Dohrn) is a remarkable example of evolutionary convergence, resembling closely the bathypelagic prawns. It is large and red and has a long serrated rostrum like a bathypelagic prawn and it is m a n y times the size of a normal mysid. This genus has seven abdominal segments instead of six. Typical mysids have seven abdominal segments as embryos, of which the last two fuse, while in Gnathophausia they remain separate (Mantón 1928). The specific identification of the Gnathophausia specimens proved problematical as they showed a wide range of size and proportions, particularly in the length of the rostrum and carapace spines. The forms they appeared to resemble were regarded by Fage (1943) as synonymous and grouped under the n a m e ingens.
Various characters such as the lengths of the rostrum and carapace spines, and the numbers of teeth on the rostrum and antennal scale were compared graphically with total lengths. These morphometric data when plotted indicated that all our material could be regarded as a single species, G. ingens, and that the striking differences in appearance were merely due to allometric growth.
Amongst the Euphausiacea four species of Thysanopoda, (T. cristata, T. orientalis, T. pectinata and T. tricuspidata) as well as Euphausia longirostris appear to be new records for South Africa, although T. cristata is the only species not included in Boden's (1951) review which includes records from neighbouring regions.
The Decapoda have not yet all been identified and there appear to be some new records for South Africa in several genera. Earlier records of bathypelagic prawns obtained by trawling around South Africa are included in Barnard's (1950) monograph, while Lebour (1954) has discussed material from the Benguela current off South West Africa.
445
286 ZOOLÓGICA AFRICANA VOL l
Further work is required particularly on the species of the genus Sergestes. The Noto-
stomus obtained has been referred to N. longirostris Bate although the rostrum is relatively
shorter than in the small original specimen. The specimens of Plesionika obtained have been
referred to P. longirostris but the rostral teeth are rather more widely spaced than is normal
for the species. The erioneicus larva appears to be the form described as " K e m p V which is the
larva of Polycheles typhlops.
Most of the phyllosoma and puerulus larvae obtained off the west coast appeared to be
Jasus lalandii as described by Gilchrist (1916), whereas the phyllosomata obtained elsewhere
represented other genera and species.
The small squid Spirula spirula (Linnaeus) is generally regarded as rare throughout the
world although its characteristic spiral shell is found on beaches everywhere. It was, however,
found in large numbers in the southern Mozambique channel by the Dana expedition (Bruun
1943). This expedition also obtained a single juvenile specimen from south of Cape Point and
there is a specimen in the South African M u s e u m believed to be from Table Bay. During this
survey w e obtained live specimens of Spirula from three stations off Natal and in the South
West Indian Ocean.
Pelagic molluscs other than Cephalopoda included the pteropod Cavolinia tridentata and
four species of Heteropoda. O n e specimen of Pterotrachea coronata was exceptionally large,
measuring approximately 300 m m . in total length, which is larger than any known to Tesch
(1949).
The list of the fishes identified (Table 3) does not include Stomiatid fishes (sensu lato),
larval fishes, and some of the myctophid fishes, which still require study.
Schultz (1961) in his review of the hatchet fishes states that Argyropelecus hemigymnus is
confined to the Mediterranean and Atlantic while in the Indo-Pacific it is replaced by the
related A. intermedius, and he places A. hemigymnus recorded off South Africa by Gilchrist
(1913), Barnard (1925) and Smith (1949) in the synonomy of A. intermedius. Unfortunately no
Cape or Indian Ocean specimens of this fish were available to Schultz at the time. All specimens
found in this survey having a barbed dorsal blade, clearly fitted A. hemigymnus rather than
A. intermedius. Both seem to be very closely related and rather variable species. It was also
surprising that although large numbers of Argyropelecus species were taken, only one specimen
of the related genus Polyipnus was caught.
A single specimen of Brotulotaenia was found and has been assigned to B. crassa; the two
k n o w n species B. nigra Parr (1933) and B. crassa Parr (1934) are very similar, but the present
species seems to be closer to crassa. This catch is not only the first record of the genus outside
the Caribbean but is also believed to be only the fourth example of the genus ever found.
Bathylagus microcephalus was formerly only recorded from the South Atlantic. These
further records indicate that it is present in the southern Indian Ocean also.
Smith (1949) placed Lampanyctus alatus in the synonymy of L. pusillus although they can
be separated easily by the presence of a luminous organ at the adipose fin in alatus. All the
specimens recorded here were clearly alatus rather than pusillus. All examples in the collections
of the South African M u s e u m on which Barnard's (1925) records of alatus were based were
re-examined and found to be correctly identified as alatus.
446
1965 GRINDLEY etal: BATHYPELAGIC F A U N A 287
Included in the table are a few species taken off the Cape Peninsula which do not form part of the bathypelagic fauna, but are rather the juveniles of c o m m o n Cape fishes. It is presumed that they were caught while the net was being hauled. They are mostly the juveniles of the bottom-dwelling species Lepidopus caudatus, Merluccius capensis and Helicolenus maculatus, but other juveniles included Trachurus trachurus and Scomber japonicus.
O n e of the most unexpected results of the survey has been the complete absence of Cyclothone species. O f all bathypelagic fish genera this is considered to be the most abundant in number of individuals (Marshall 1954), yet apart from one doubtful and badly damaged specimen, no fish of this genus were found. Most Cyclothone are small, but the posterior end of the trawl was lined with half inch stretched mesh netting which captured m a n y other very small species of fishes.
HYDROGRAPHY OF THE ENVIRONMENT
Most specimens obtained in this survey were caught at night at a depth of about 500 metres, and it is well k n o w n that most bathypelagic animals migrate d o w n to a deeper level diurnally. To understand their distribution it is thus necessary to k n o w something of the hydrographie conditions in the seas around South Africa at a depth of 500 metres and perhaps a few hundred metres below this. Conditions at these depths differ greatly from surface conditions and data on their hydrography is limited and scattered in the literature. It has, however, been possible to obtain a picture of the hydrographie environment of this bathypelagic fauna by extracting data from the following published reports: Clowes and Deacon (1935), Dietrich (1935) Clowes (1950), Zoutendyk (1960), le Pichón (1960), Trotti and Welsh (1961), Fukase (1962), Kort (1962), Menaché (1963), Orren (1963), Zoutendyk (1963), Taft (1963), Darbyshire (1963), Darbyshire (1964), Shipley and Zoutendyk (1964), Station lists in the Discovery Reports, and Annual Reports of the Division of Sea Fisheries.
In the south-western part of the Indian Ocean there are three main water masses that concern us (Figure 2). In vertical sections Agulhas water, which, following the delimitations of Darbyshire (1964), m a y be regarded as water above the 17° C isotherm, extends d o w n to approximately 3C0 metres below the main stream of the Agulhas current. Further offshore, however, the Agulhas water does not extend d o w n so far, and near the coast it m a y be considerably less than 100 metres thick. The southern limit of the Agulhas water varies but the 17° C isotherm reaches the surface between about 35° and 40° south, where Fukase (1962) has described the "Agulhas Convergence".
Below the Agulhas water is the South Indian Central Water which m a y be regarded as extending d o w n from the 17° C isotherm to the 5° C isotherm. Salinities in this water mass lie between approximately 35-5°/0o and 34-5°/00, and there is an approximately linear temperature-salinity gradient within this range. It extends d o w n to about 1,300 metres in the open ocean but only to about 800 metres at the continental margin (Darbyshire 1964). The origin of this water mass is problematical, probably involving sinking at the subtropical convergence, northward drift, and mixing with adjoining water along its path (Orren 1963). In the south of
447
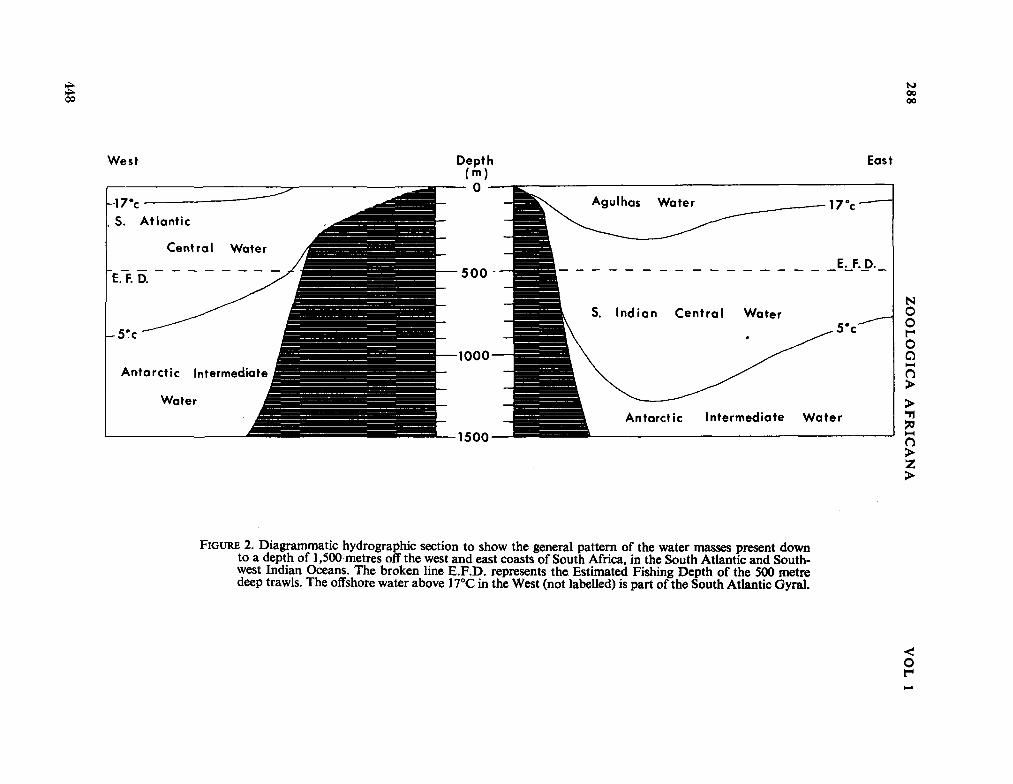
288
ZO
OL
ÓG
ICA
A
FR
ICA
NA
V
OL l
1
u
0 K
l_
\ <Ü
\
+- \
o \
£ )
V)
o
_c
3 /
O)
/ <
/
Q
uJ
UJ
\ • IO
>-
\ ®
\
o
\ £
w
\ 4>
£ \
o
>
* \
»
—
\ *
o
\ c
c \
«
\ U
\
u
an
tarct
—
/ c
-o
/ <
c
/
«/>
•WW
o g g
k
Su
r*
•••»
•i *> •£-
J3 •*
c §S
¿
2 o
2 -s
G
C4-1
J"*,
«o S
rg g g
;?
o -s Sis
'•S g S
g
.a-Ssl
p v
g
h
Ote
O *j
« o b
5
<- Í3-C
J-
.a8§°
l°s»
24= .3 "3
.2&
c2
M -. <-> o
. N
o$
8
448
1965 GRINDLEYefa/.: BATHYPELAGIC F A U N A 289
the region covered it lies closer to the surface and m a y extend d o w n to a depth of less than 700 metres. Under the Agulhas Current, Le Pichón (1960), Kort (1962) and Taft (1963) have suggested that the South Indian Central Water has a strong westward component and tends to follow the Agulhas water. In the north of the region covered the South Indian Central Water lies closer to the surface and the work of Menaché (1963) has shown that it extends steeply upwards to within about 150 metres of surface at the divergence at 24° S in the southern end of the Mozambique channel.
Under the South Indian Central Water lies the Antarctic Intermediate Water which m a y be regarded as being below 5° C and which is characterised by a marked salinity min imum. This water originates by sinking just north of the Antarctic Convergence, and drifts northwards under the South Indian Central Water, except under the Agulhas Current where it m a y also drift towards the south-west.
In the south-eastern Atlantic, west of the Cape, the same pattern of three water masses is present. The w a r m waters of the South Atlantic Gyral, which m a y also be delimited by the 17° C isotherm, are only found offshore and in the area concerned only extend d o w n about 100 metres.
The Central Water, here known as the South Atlantic Central Water, occupies the layer between about 100 and about 700 metres. Clowes (1950) showed that there was a well marked linear T - S relationship between 6° C , 34-4°/00 and 16° C , 35-5°/00 and that the same T - S characteristics were found in water along the west coast right up to the surface indicating upwelling of South Atlantic Central Water.
The Antarctic Intermediate Water delimited by the 5° C isotherm and characterised by the salinity m i n i m u m is usually below 700 metres but marked fluctuations occur. It m a y be below 1,000 metres, or as suggested by the data of Trotti and Welsh (1961), m a y come up to less than 300 metres over the shelf in August, 1959).
It is thus apparent that all the mid-water catches which were m a d e at a depth of about 500 metres were in Central Water (South Indian and South Atlantic). Shallower hauls m a d e near the coast would also have been in the same water mass owing to the tendency of the Central Water to approach the surface at the coast. Even during the hours of daylight when these bathypelagic animals m a y migrate downwards a few hundred metres they would in most areas remain within the Central Water.
Conditions within the Central Water mass vary considerably at any particular level in different parts of the area concerned. Using all the data available it was possible to get à picture of the temperature distribution at the 500 metre level over the region covered by this survey (Figure 1). The isotherms were plotted on the basis of published data from a number of sources enumerated above. T o allow for seasonal and other variations recorded by different vessels at different times the isotherms were smoothed in a few places. Periodic variations appear to occur particularly in the area south of the Cape Province (Darbyshire 1963), in the eddies in the northern and southern parts of the South West Indian Ocean (Darbyshire 1964), and in the extent of the upwelled water west of the Cape Peninsula (Trotti and Welsh, 1961), and further north (Hart and Currie 1960, Stander 1964). Over most of the South West Indian Ocean temperatures at the 500 metre level range between 12° and 14° G . Where the Antarctic Inter-
449
290 ZOOLÓGICA AFRICANA VOL l
mediate Water is not far below, temperatures at the 500 metre level are lower. In the south they m a y be as low as 8° C at 38° S. Near the east coast of South Africa the isotherms curve up sharply so that near the continental margin temperatures fall in places to 10°C and well below, particularly off the southern coast. The low temperature shown in Figure 1 at a point in the middle of the South West Indian Ocean (33° 02' S., 37° 35' E . ) is based on a single series of observations at Station N I O E - 1 0 2 (Shipley and Zoutendyk, 1964). This anomaly has not been found in any other data and it m a y not be a normal feature. Off the south-west Cape coast in the region of upwelling temperatures are even lower. The data of Trotti and Welsh (1961) for this area show considerable seasonal fluctuations in the temperature at the 500 metre level between 8° C and 5° C and occasional incursions of Antarctic Intermediate Water onto the shelf probably occur.
Regional differences in the bathypelagic fauna m a y be associated in some way with the variations of temperature at the 500 metre level described above. They might also be related to the depth of the Antarctic Intermediate Water, because m a n y bathypelagic animals are capable of making extensive vertical migrations, and where this lower water mass is closest, animals from it m a y be represented in catches.
NOTES ON DISTRIBUTION OF FISHES AND INVERTEBRATES
Several interesting features in the distribution of the invertebrates and fishes represented in these collections appear worthy of discussion although it would be premature to draw final conclusions.
Vertical distribution
Hauls m a d e during daylight were remarkably poor. N o prawns at all were obtained, only two euphausiids (and those at 500 metres) and few fish. Even at night most prawns and euphausiids appeared only in the deep hauls at 500 metres. Solenocera africanum was however obtained at night at only 100 metres and Funchalia woodwardi came up to only 20 metres at night. Amphipods, salps and medusae appeared in both day and night hauls but m a n y of these should perhaps be regarded as epipelagic, as should m a n y of the juvenile fishes.
Regional distribution
It has been shown above that the Central Water Mass extends throughout the region concerned so that m a n y species m a y be expected to occur throughout the region. In fact few species have so far heen found in all areas, but this m a y be due to differences in depth of the Central Water Mass in different parts of the region. M a n y species were not obtained in the warmer central area of the South West Indian Ocean (Figure 1), where they m a y occur deeper d o w n than 500 metres. Several species obtained only in the upwelled water off the Cape Peninsula and West Coast m a y also be more widely distributed at greater depths.
450
1965 GRINDLEYeía/..- BATHYPELAGIC F A U N A 291
Amongst the prawns most species were found in both the Atlantic and Indian Oceans. Five species (Plesiopenaeus nitidus, Aristeomorpha foliácea, Gennadas gilchristi, Acanthephyra haeckelii and Plesionika longirostris) were found only in the Indian Ocean samples while Solenocera africanum was only obtained from the Atlantic. Acanthephyra haeckelii only appeared in the extreme south (Station 40). The closely related form A. acanthitelsonis was recorded by Lebour (1954) in the Benguela Current off South West Africa. Sergestes arcticus also appeared in the extreme south and otherwise only in the cold upwelled water west of the Cape. Gnathophausia ingens appeared only in the colder regions, and it is interesting to note that Fage (1941) found that this species in the north Atlantic was limited to regions below a temperature of 10° C at 600 metres. (There are large areas above 13° C at this depth in the N . Atlantic also.)
M a n y fish also showed very wide ranges, and the scattered incidence of m a n y rarer species suggests that they are probably also widely if sparsely distributed. A distinct distribution pattern was however evident in the presence of vast numbers of Maurolicus muelleri and large numbers of Lampanyctodes hectoris in the cold water off the west coast and their almost complete absence in the Indian Ocean. Only one example of M . muelleri was found in the extreme south (IK 40). Inshore off the east coast it appeared that the place of M . muelleri was taken by Scoleopsis multipunctatus which was not found off the west coast and only once off the Cape Peninsula.
T w o specimens of Sagitta gazellae were obtained in the cold upwelled water west of the Cape Peninsula. David (1955) in his study of the distribution oí Sagitta gazellae found that it was limited to waters south of the region of the subtropical convergence. David (1955), however, did find specimens in some hauls just north of the subtropical convergence where subantarctic water was present below the surface. H e remarked that they might penetrate further north in deeper waters but regarded this as unlikely as a large number of hauls in areas further north had not revealed a single specimen. The present specimens thus represent a very interesting extension of the range of this characteristically antarctic and subantarctic species. The other Sagitta species appearing in Table 2 represent too few specimens to draw any conclusions as to their regional distribution.
Spirula spirula which is generally regarded as a tropical species was only found in the northern part of the region.
Amongst the amphipods Phrosina semilunata was found throughout the area and Phronima sedentaria and a species of Platyscelus appeared everywhere except in the extreme south.
O n e of the most striking distributional features was the great abundance of Euphausia similis var. armata off the west coast and its complete absence elsewhere. Numerically there were far more of this species than of all the other euphasiids together. It occurred associated with very large numbers of the fish Maurolicus muelleri. It would appear that this strikingly distinct population was related to the cold water upwelling and possibly to the presence of Antarctic Intermediate Water in this area. It is interesting that Nepgen (1957) in his study of the euphausiids of this same region west of the Cape found that Euphausia similis var. armata "did not occur in large numbers or often". It seems probable that this anomaly is due to his work being based mainly on shallower plankton hauls, taken mainly in daylight.
451
292 ZOOLÓGICA AFRICANA VOL l
Euphausia spinifera appeared at almost all of the southern stations in this survey and otherwise only inshore off Durban. This species is k n o w n to occur in waters north of the subtropical convergence while it is replaced by a closely related species E. longirostris south of the convergence (Boden 1951). The occurrence of E. spinifera off Durban is not surprising as the temperatures at the 500 metre level are m u c h lower close to the coast than in the regions offshore. E. spinifera occurred at most of the southerly stations while the prawns Sergestes arcticus and Acanthephyra haeckelii only appeared at the most southerly station (IK 40) and west of the Cape in the case of S. arcticus. In both these areas the Antarctic intermediate water is not far below 500 metres and they m a y have migrated up from this water. These prawns are larger and perhaps migrate further than Euphausia spinifera, which would probably be confined to the Central Water Mass. However more work is reauired before the apparent differences in distribution pattern can be explained.
It is interesting that Euphausia longirostris was obtained in the cold upwelled water west of the Cape Peninsula. Boden (1951) regarded it as characteristically subantarctic and reported that it was rarely encountered north of the subtropical convergence, and he did not find it in the Benguela Current off South West Africa either (Boden, 1955).
ACKNOWLEDGEMENTS
W e are grateful to D r . F. H . TalboJ w h o initiated this programme and m a d e it possible for the South African M u s e u m to carry it out; to Messrs. lrvin & Johnson Ltd., w h o provided the first Isaacs-Kidd trawls; and to the following for the use of ships: The South African Navy, S . A . S . Natal; Messrs. Irvin & Johnson Ltd., trawlers Cape Point, Illovo and Natalia; and the University of Cape T o w n , R . V . John D . Gilchrist. W e acknowledge the help of Mrs . M . - L . Penrith, Miss D . du Plessis and M r . B . Kensley in sorting and preliminary identification of some of the collections, Dr . G . W . M e a d of the M u s e u m of Comparative Zoology, Harvard, for the identification of the bramid fishes, M r s . S. Talbot of the University of Cape T o w n for checking the identification of Euphausiacea and M r . J. Stone of the University of Cape T o w n for identifying the Chaetognatha.
W e are indebted to the Council for Scientific and Industrial Research of South Africa w h o paid the salary and subsistence allowance for sea time for the second author, paid the salary of M r s . M . - L . Penrith as research assistant to the first author, and granted funds for the replacement of the mid-water trawl.
SUMMARY
The results of a mid-water trawling survey for bathypelagic fauna in the seas around South Africa and in the South West Indian Ocean is described.. The programme was carried out by the South African M u s e u m using a 10 ft'Isaacs-Kidd mid-water trawl d o w n to a depth of 500 m from several vessels. A station list gives details of the trawling stations and the species
452
1965 GRINDLEYef a/.: BATHYPELAGIC F A U N A 293
of invertebrates and fishes obtained are listed for six areas resulting from a grouping of these stations. M a n y species new to the South African fauna list and new to the Indian Ocean fauna list are recorded. Brief systematic notes have been included where necessary. The hydrography of the environment of the bathypelagic fauna at a depth of 500 m is discussed on the basis of data extracted from published reports and the temperature distribution at this level is described. Outstanding features of the distribution of species are discussed in relation to the hydrographie background. Distribution patterns appear to be related largely to the depth of the central water mass and some interesting records appear where this water upwells to near the surface. T w o species, Sagitta gazellae and Euphausia longirostris, previously regarded as characteristically sub-antarctic are recorded in the cold upwelled water west of the Cape.
REFERENCES
This list of references includes only papers referred to in the text, and does not include all taxonomic papers used in the course of the work. These will be cited separately in the taxo-nomic reports on different animal groups.
B A R N A R D , K. H . 1925-27. A monograph of the marine fishes of South Africa. Ann. S. Afr. Mus. 21:1-1065.
B A R N A R D , K . H . 1950. Descriptive catalogue of South African decapod crustácea (Crabs and Shrimps). Ann. S. Afr. Mus. 38: 1-837.
B O D E N , B . P. 1951. The Euphausiid crustaceans of southern African waters. Trans, roy. Soc. S. Afr. 34: 181-243.
B O D E N , B . p. 1955. Euphausiacea of the Benguela current. First Survey, R . R . S . "William Scoresby", March 1950. Discovery Rep. 82: 337-376.
B R U U N , A . 1943. The biology of Spirula spirula (Linn.). Dana Rep. 24: 1-46. C L O W E S , A . J. 1950. A n introduction to the hydrology of south African waters. Invest. Rep.
Fish mar. biol. Surv. S. Afr. 12: 1-42. C L O W E S , A . j. and D E A C O N , G . E . R . 1935. The deep water circulation of the Indian Ocean.
Nature, Lond. 136: 936-938. D A R B Y S H I R E , j. 1964. A hydrological investigation of the Agulhas Current area. Deep Sea Res.
11: 781-815. D A R B Y S H I R E , M . 1963. Computed currents off the Cape of G o o d Hope. Deep Sea Res. 10:
623-632. D A V I D , p. M . 1955. The distribution of Sagitta gazellae Ritter-Zahony. Discovery Rep. 27:
237-278. D E V E R E A U X , R . F. and W I N S E T T , R . C . 1953. Isaacs-Kidd midwater trawl, final report. Scripps
Inst. Oceanogr. Equipment Rept. 1: 1-21. D I E T R I C H , G. 1935. Aufbau und Dynamik des Südlichen Agulhasstromgebietes. Verôff. Inst.
Meeresk. Univ. Bed. (Ser. A) 27: 1-79. F A G E , L . 1943. Mysidacea, Lophogastrida—1. Dana Rep. 19: 1-52.
453
294 ZOOLÓGICA AFRICANA VOL l
FUKASE, s. 1962. Océanographie conditions of surface water between the south end of Africa
and Antarctica. Oceanogr. results, Japanese Antarct. Res. Exp. 15: 54-104. GILCHRIST, J. D . 1916. Larval and post-larval stages of Jasus lalandii (M.Ed.). J. Linn. Soc.
Lond.{Zool.) 33: 101-124. HART, j. H . and CURRIE , R. i. 1960. The Benguela current. Discovery Rep. 31: 123-298.
H E Y D O R N , A . E. F. 1959. The Chaetognatha off the west coast of the Union of South Africa.
Invest. Rep. Div. Fish, S. Afr. 36: 1-56. K I N G , J. E . and IVERSEN, R . T. 1962. Midwater trawling for forage organisms in the central
Pacific, 1951-1956. Fish. Bull. U.S. Fish Wildl. Ser. 62: 271-319.
K O R T , v. G . 1962. The Antarctic Ocean. Scientif. Amer. 207 (3): 113-128.
K R A M P , p. L. 1961. Synopsis of the Medusae of the world. J. mar. biol. Ass. U.K. 40: 1-469.
L E B O U R , M . V . 1954. The planktonic decapod crustácea and stomatopoda of the Benguela
current Part 1. First Survey, R . R . S . "William Scoresby", March 1950. Discovery Rep.
27: 219-234.
L E P I C H Ó N , x. 1960. The deep water circulation in the southwest Indian Ocean. J. Geophys. Res.
65:4061-4074.
M A N T Ó N , s. M . 1928. O n some points in the anatomy and habits of the lophogastrid crustácea.
Trans, roy. Soc. Edin. 56: 103-119. M A R S H A L L , N . B. 1954. Aspects of deep sea biology. London: Hutchinson.
MENACHÉ, M . 1963. Première campagne océanograe que du "Gommantant Robert Giraud"
dans le canal de Mozambique, 11 Octobre—28 Novembre 1957. Cahiers océanogr.
15: 224-285.
NEPGEN, c. s. de v. 1957. The Euphausiids of the west coast of South Africa. Invest. Rep. Div.
Fish., S. Afr. 28: 1-30. O R R E N , M . J. 1963. Hydrological observations is the South West Indian ocean. Invest. Rep.
Div. Sea Fish., S. Afr. 45: 1-61. P A R R , A . E . 1933. Deepsea Berycomorphi and Percomorphi from the waters around the
Bahama and Bermuda Islands. Bull. Binghum Oceanogr. Coll. 3 (6): 1-51.
P A R R , A . E . 1934. Report on the experimental use of a triangular trawl for bathypelagic collect
ing with an account of the fishes obtained and a revision of the family Cetomimidae.
Bull. Bingham. Oceanogr. Coll. 4 (6): 1-59L PENRITH, M . j. and GRiNDLEY, J. R . 1963. A preliminary report on the bathypelagic fauna of
South African seas. (Abstract only). S. Afr. Assoc. Adv. Sci., Congress Abstracts, 1963:
35-36.
SCHULTZ, L. P. 1961. Revision of the marine silver Hatchet Fishes (family Sternoptychidae).
Proc. U.S. nat. Mus. 112: 587-649. SHEARD, K. 1942. The genus Thysanopoda (Crustacea: Euphausiaea) Trans, roy. Soc. S. Austral.
66(1): 60-65.
SHIPLEY, A . M . and Z O U T E N D Y K , p. 1964. Hydrographie and plankton data collected in the
south west Indian Ocean during the S . C . O . R . International Indian Ocean Expedition,
1962-1963. Data Rep. Univ. Cape Town Oceanogr. Dep.2: 1-210. SMITH, J. L . B . 1949. The sea fishes of southern Africa. Cape Town: Central News Agency.
454
1965 GRINDLEYe/a/. : BATHYPELAGIC F A U N A 295
S T A N D E R , G . H . 1964. The Benguela current off South West Africa. Invest. Rep. S.W. Afr. mar. Res. Lab. 12: 1-43.
STATION LISTS : Ann. Rep. Div. Sea Fisheries, Cape T o w n . STATION LISTS: Discovery Reports, Cambridge. S U Z U K I , o. 1961. Mechanical analysis on the working behaviour of midwater trawl. Bull. Japan.
Soc. sci. Fish. 27: 903-907. T A F T , B . A . 1963. Distribution of salinity and dissolved oxygen on surfaces of uniform potential
specific volume in the south Atlantic, south Pacific and Indian Oceans. / . Mar. Res. 21 : 129-146.
T E S C H , J. J. 1949. Heteropoda. Dana Rep. 34: 1-53. T R O T T I , L . and W E L S H , J. G . 1961. Hydrographie and plankton observations made during
cruises on board the "John D . Gilchrist" 1959-1960. Publ. Univ. Cape Town Oceanogr. Dep. 2: 1-107.
Z O U T E N D Y K , p. I960. Hydrographie and plankton data collected in the Agulhas current during-I . G . Y . Publ. Univ. Cape Town Oceanogr. Dep. 1: 1-14, and Station lists.
Z O U T E N D Y K , P . 1963. Hydrographie and plankton data collected in the Agulhas current by R . V . "John D . Gilchrist" during July, 1959. Publ. Univ. Cape Town. Oceanogr. Dep. 7: 1-27.
A D D E N D U M
Since this paper was written a number of other publications have appeared which have some bearing on this work. A paper on towing characteristics of plankton-sampling gear by Aron, W . , Ahlstrom, E . H . , Bary B . M c K . , Bé, A . W . H . , and Clarke, W . D . (Limnol.Oceanogr.lO: 333-340, 1965) shows that the fishing depth of an Isaacs-Kidd midwater trawl is reduced considerably with increased towing speed. In the present work low towing speeds of the order of two knots were used. Alvarino, A . , in his review on chaetognaths (Oceanogr. Mar. Biol. Ann. Rev. 3: 115-194, 1965) records Sagitta gazellae north of the subtropical convergence in deep waters, reaching 21° S. in the Pacific and 36° S. in the Indian Ocean. D e Decker, A . and M o m b e c k , F . J. in their preliminary report on the planktonic Copepoda (invest. Rep. Div. Sea Fish. S.Afr. 51: 10-67, 1965) show clearly there are groups of species of Copepoda associated with the water masses at different levels in the south west Indian Ocean, and that species previously considered Atlantic or Sub-Antarctic occur frequently, as bathypelagic species in this region. The work of Visser, G . A . and van Niekerk, M . M . on ocean currents and water masses at 1,000, 1,500 and 3,000 metres in the south west Indian Ocean (Invest. Rep. Div. Sea. Fish. S. Afr. 52: 1-46, 1965) gives data for these deeper levels which m a y be compared with the conditions at 500 metres described in the present work.
455
B R E V I O R A Museman of Comparative Zoology
CAMBRIDGE, MASS. FEBRUARY 25, 1966 N U M B E R 241
AVOCETTINOPS YANOI, A N E W NEMICHTHYID EEL FROM THE SOUTHERN INDIAN OCEAN
By GILES W . MEAD and IRA RUBINOFF Museum of Comparative Zoology, Harvard University
The oceanic eels of the genus Avocettinops lack the prolonged jaws or snout typical of other snipe eels, although they do have fleshy anterior appendages; and they can be distinguished from all other apodal fishes by the complete absence of teeth, if not from their bizarre physiognomies alone. The number of known specimens is small: the type of A. schmidti (Roule and Bertin, 1924) ; a second specimen taken off Zanzibar during the "John Murray" expedition (Norman, 1939; the specimen rather casually christened Avocettinops normani by Bertin in 1947) ; a specimen collected from the Arcturus by William Beebe, N e w York Zoological Society, off N e w York and reported as A. schmidti by Bôhlke and Cliff (1956) (SU 47758) ; and the fish described below. Bohlke and Cliff (1956) also discussed in some detail the nomenclatorial and taxonomic entanglements generated by earlier authors, and reviewed the relationship of the genus to other snipe eels.
A V O C E T T I N O P S T A N O I , new species
Figure 1
Eolotype. — A specimen 620 m m long collected by R / V Anton Bruun during the International Indian Ocean Expedition, Cruise V I , Sta. 350 B , A P B label 7314; 27 June 1964; 28°05' S, 64°58' E to 28°28' S, 65°04' E ; depth of bottom 2200-4000 m ; 10-ft. Isaacs Kidd Midwater Trawl with catch dividing device nominally set to operate at 350 m ; deep fraction of catch the probable depth of capture between the max imum depth reached, 1750 m and 125 m . M C Z Catalog N o . 44404.
Collected reprints of the International Indian Ocean Expedition, vol. IV, contribution no. 227 457
2 BREVIORA N o . 241
Distinctive characters. — Avocettinops yanoi differs from its congeners in the position of the dorsal fin, which originates well in advance of the gill slit, and by the more anterior anal origin, the preanal distance being about 1.3 times the length of the head (cf. 2.0 or 2.1 in specimens hitherto described). The species has a correspondingly low number of preanal vertebrae (13 cf. 20 or more), and of lateral line pores between the temporal pore and that above the origin of the anal fin (13 cf. 18 or more).
Description. — Meristic data and measurements, which are expressed in per cent of head length to facilitate comparison with prior catches, are provided in Table 1.
Body about two-thirds as broad as deep anteriorly, becoming more compressed posteriorly. Head 12 in total length. Jaws coterminal and bearing fleshy protuberances anteriorly both of which were damaged during capture. Angle of gape under posterior edge of eye. Mouth without teeth but with minute denticles on skin overlying jaws and roof of mouth. Anterior nostril before center of orbit, the tube anteriorly directed. Posterior nostrils large deep pits, the posterior edges of which lie on à tangent with anteriormost points of orbits. Gill slits short (13 in length of head), ventrally directed, and placed below bases of pectoral fins. Eye circular, its diameter 7 in length of head. Acustico-lateralis system on head well developed (Fig. 1) , the pores large. The system includes series of lappets, which are presumably sensory, such as the vertical row behind and the horizontal series above and behind the eye. Similar lappets are interspersed at irregular intervals between pairs of pores in the lateral line along the flank. These lappets are not bilaterally symmetrical. The lateral line is continuous and complete.
Dorsal and anal fins originating far forward and nearly continuous around tip of tail. Predorsal distance 17 in total length, preanal 10 in length. Pectoral fin broad, short, and lying in a horizontal plane when expanded. Anus and iirogenital openings immediately anterior to origin of anal fin. The fish is completely black externally. Internally, the peritoneum, linings of mouth, and pharyngeal cavities are white. The coelom extends posteriorly far beyond the anus to about the midpoint of the total length. Most of this space is filled by the swollen, convoluted and apparently mature pair of gonads. These appear to be ovaries, although they are too decomposed for close study. The muscular stomach, which is placed anterior to the anus, is empty.
458
1966 N E W NEMICHTHYID EEL 3
The success of any trawling expedition is dependent in no small measure on those responsible for the maintenance and operation of the nets and associated equipment. Throughout the trawling activities which produced the collections of which this specimen is a part, M r . Shigeru Yano and his associate, Mr . C . P . Lee, devoted themselves to this equipment with ability, understanding, and scrupulous care; without these master fishermen these cruises-would have fallen short of their goals. With respect and professional admiration we take pleasure in naming this new eel in honor of Shigeru Yano, friend and fellow fisherman.
Remarks. — The identity of the nominal species of Avocet-tinops remains in doubt. The type of A. schmidti has been cleared in potassium hydroxide and stained with alizarine. Norman's ' ' J ohn Murray ' ' specimen from off Zanzibar lacks the tail, and has a fragmentary head which has also been cleared and stained, while the Atlantic individual discussed by Bohlke and Cliff is also fragmentary. Hence meaningful morphological comparison is impossible. A qualitative study of the latter specimen and the published accounts of the two others, in comparison with A. yanoi, suggests that the Zanzibar specimen is probably identical with A. schmidti, while the western North Atlantic specimen of Bohlke and Cliff probably represents a distinct and unnamed species.
This specimen was taken during the American Program in Biology, International Indian Ocean Expedition, a program financed by the National Science Foundation and under the general scientific direction of Dr. John H . Ryther of the Woods Hole Océanographie Institution. To the National Science Foundation, which has also financed the research of which this is a part through G F 147 with Harvard University, and to Dr. Ryther the authors express here their sincere appreciation.
459
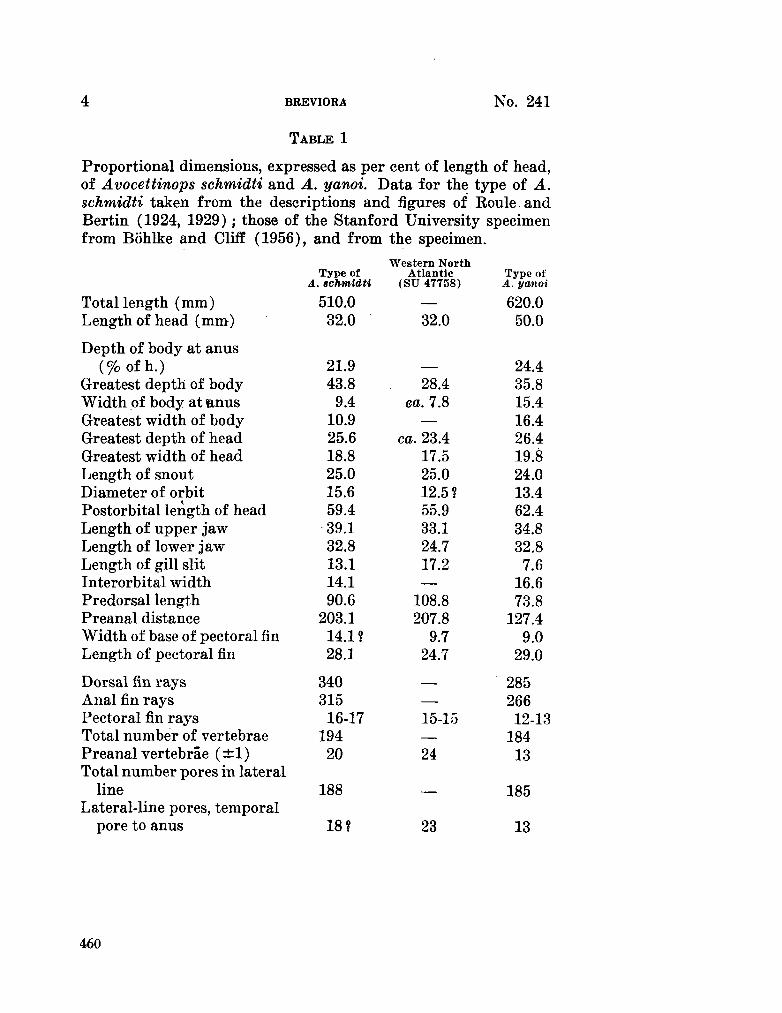
4 BBEVIORA No. 241
TABLE 1
Proportional dimensions, expressed as per cent of length of head, of Avocettinops schmidti and A. yanoi. Data for the type of A. schmidti taken from the descriptions and figures of Eoule and Bertin (1924, 1929) ; those of the Stanford University specimen from Bohlke and Cliff (1956), and from the specimen.
Total length ( m m ) Length of head ( m m )
Depth of body at anus (%ofh.)
Greatest depth of body Width of body at anus Greatest width of body Greatest depth of head Greatest width of head Length of snout Diameter of orbit Postorbital length of head Length of upper jaw Length of lower jaw Length of gill slit Interorbital width Predorsal length Preanal distance Width of base of pectoral fin Length of pectoral fin
Dorsal fin rays Anal fin rays Pectoral fin rays Total number of vertebrae Preanal vertebrae (±1) Total number pores in lateral
line 188 — 185 Lateral-line pores, temporal
pore to anus 18 ? 23 13
Type of A. schmidti
510.0 32.0
21.9 43.8 9.4
10.9 25.6 18.8 25.0 15.6 59.4 39.1 32.8 13.1 14.1 90.6
203.1 14.1? 28.1
340 315
16-17 194 20
Western North Atlantic
(SU 47758)
—
32.0
28.4 ea. 7.8
—
ca. 23.4 17.5 25.0 12.5? 55.9 33.1 24.7 17.2 —
108.8 207.8
9.7 24.7
—
—
15-15 —
24
Type of A. yanoi
620.0 50.0
24.4 35.8 15.4 16.4 26.4 19.8 24.0 13.4 62.4 34.8 32.8 7.6
16.6 73.8
127.4 9.0
29.0
285 266
12-13 184 13
460
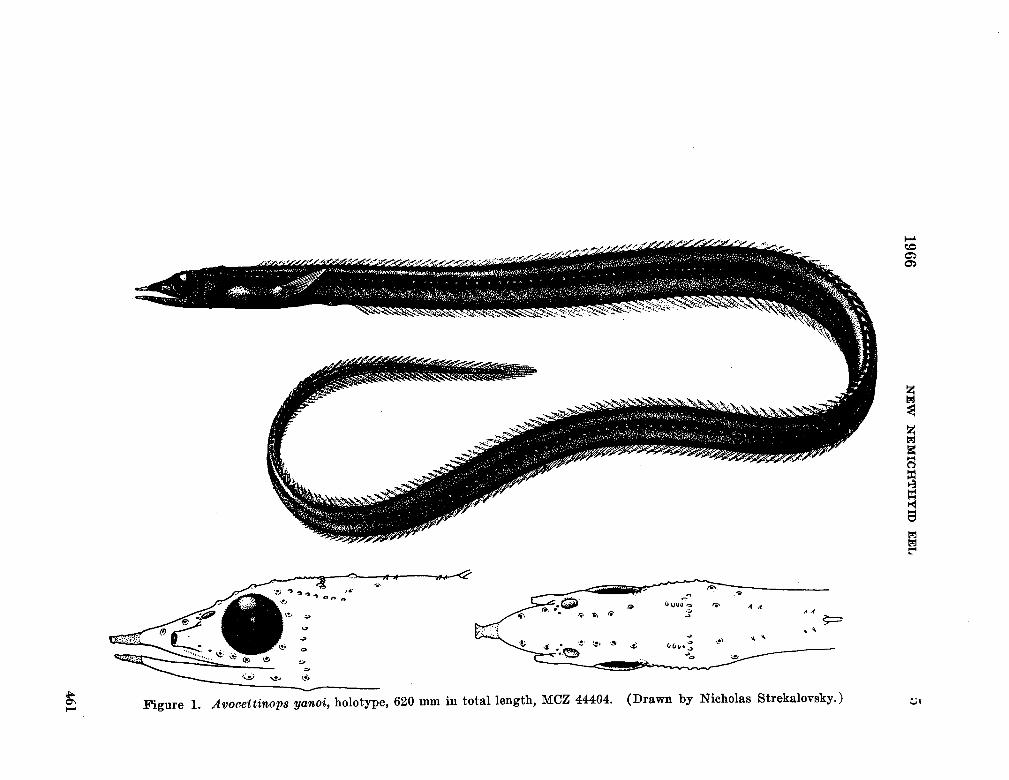
19G6
NE
W
NE
MIC
HT
HY
ID
EE
L
5
11
'cT1
*
) 1
Ti 0
í) »
<> O
> O
02 te
"o a ¡£ et t-,
A
o
ü 60
S
1 a a o oci 5©
S O
o S e ai
O
a tu
461
6 BBEVIOBA No. 241
L I T E R A T U R E CITED
BEETIN, L É O N
1947. Notules ichthyologiques. 1. — Compléments sur le genre Avocet-tinôps. Bull. Soc. Zool. France, 72:54-55.
B Ô H L K E , J A M E S E. , and F R A N K S. C M F F
1956. A discussion of the deep-sea eel genus Avocettinops, with notes on a newly discovered specimen. Copeia, 1956:95-99.
N O R M A N , J. R.
1939. Fishes. Sci. Rep. "John Murray" Expedition, 7(1) :116 pp. R O U L E , L O U I S , A N D L É O N B E R T I N
1924. Notice préliminaire sur la collection des nemichthydés recueillie par l'expédition du " D a n a , " (1921-1922), suivie de considérations sur la classification de cette section des poissons apodes. Bull. Mus . Nat. Hist. Natur., Paris, 30:61-67.
1929. Les poissons apodes appartenant au sous-ordre des Nemichthydi-formes. Rep. " D a n a " Exp., 1920-1922, N o . 4, 113 pp., 19 pis.
(Received 9 November 1965.)
462
Reprinted from Some contemporary studies in marine science, 1966, p. 545-554.
SELECTIVE FEEDING BY CALANOID COPEPODS PROM THE INDIAN OCEAN*
M I C H A E L M . MTTLLIN
Institute of Marine Resources, University of California at San Diego
Planktonic copepods form an important part of marine food webs, but the assignment of the various populations of an area to trophic levels is difficult because the feeding of most oceanic species has not been thoroughly studied. Where closely related species are sympatric in distribution and their populations are limited by food supply, a difference in selective feeding m a y provide the ecological distinctness which permits the populations to coexist.
The probable food of planktonic copepods has been deduced from the morphology of their mouthparts, by examining the contents of the guts of preserved animals, testing the feeding of living animals on one type of food at a time, or by measuring the feeding rate on various types of food in a mixture. All four methods were used in the present study, since each provides a different type of information.
A n abundance of fine setae on the second maxilla and other mouthparts and blunt, grinding mandibular teeth are generally thought to indicate a herbivorous food habit, while spined or grasping mouthparts and long, sharp mandibular teeth suggest that the copepod is a carnivore. This conclusion is supported by experimental studies (Anraku and Omori, 1963). A n examination of the mouthparts alone does not, however, tell what food the species eats, but only indicates what general type of food the species m a y be morphologically best adapted to eat. Analysis of the gut contents of preserved animals m a y tell what the animal had actually eaten just prior to capture, but the majority of animals generally have empty guts when examined, either because they had rapidly voided their gut contents or because they had not fed recently. Even when food is found in the gut, m a n y types of food organisms, such as the naked flagellates, leave no recognizable remains ; true rates of feeding cannot be estimated by this method or by examination of mouthparts.
Measurement of the feeding of a copepod on a single type of food determines to what extent the copepod will eat that food when no other food is available. Comparison between different foods in different experiments is difficult, however,
* Contribution N o . 1593 from the W o o d s Hole Océanographie Institution.
S
Collected reprints of the International Indian Ocean Expedition, vol. IV, contribution no. 228 463
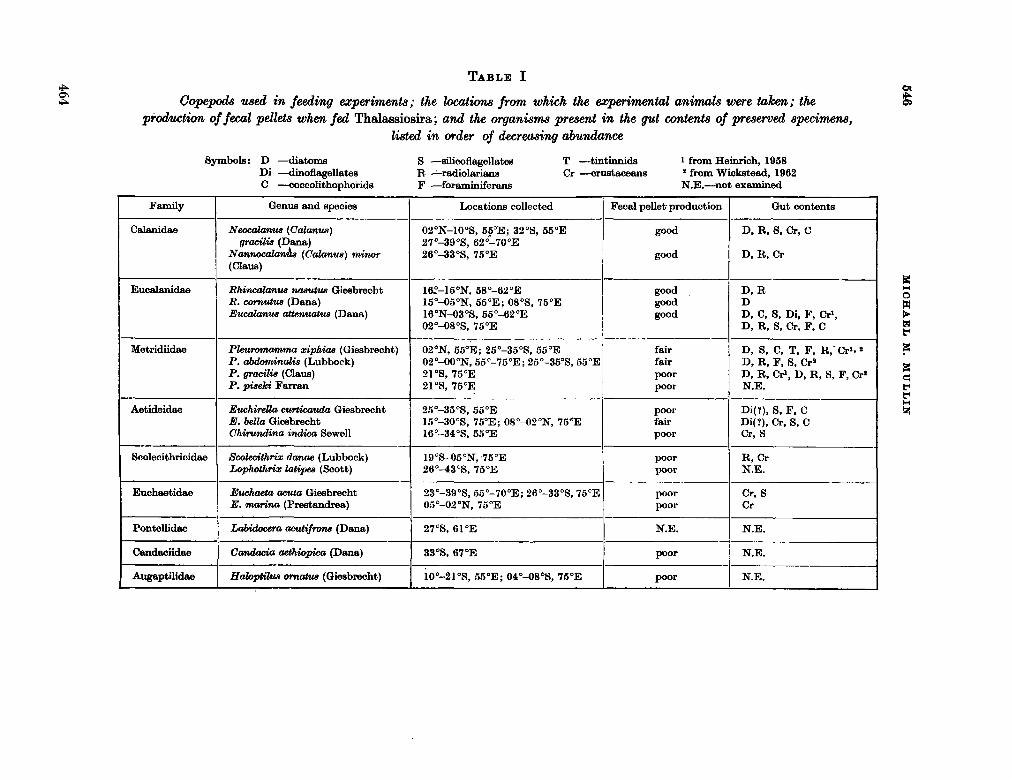
546 M
ICH
AE
L
M.
MU
LL
IN
•6 fc.
m
oa PS fe
111 fi 5
o
fe i.
P5
o
•o o &
73 O
H • r.
©
PS» 1
0 c^
io -
(O
l>
O
03 03
* o
o u>
CO
W
e .i
i i
fio fe* fe
00 <¡0
P5 O
(¡5
fif
lfif
l
•a -tí
-a
M
Ml
OC
02 a o
o <M
<N
CO
f «¿H
o
o ift
J?*
oo
IO "O
2»
>o >o .
£ ..
,os
S?!5S
,oo o
o i¿
o O
á O
O
O
SO O
»
<N
rt M
-i o
O O
fe
'«" "*
fe""*
o fe
¡5
oí PÍ Pí
H'
fifip
fc
h h
o i
3 3 2
Ci «S
P
. i
fe
° •?
SQ
Ü
» W
m
»
H
-a H
§°
2 £
^ o
^ ^
SÍ ? DD 00
o*
OU
fe» 00
Ô
.T~
30
S5Ô
o ¡a
o S
ag
P fc
HH
H
CO
CO
CO
.i .i
.i
o i
O
I
o. I
H
fc -
° ce
ií5 o
2?
•S §
•81
1* g o
J "S
II
fe fe
o o
o o
a a,
fe &
a
o oo"!z¡ o
o O
S <N
m
o
I I
fe o fe
fe o «O
00 o
fe
1¡ .2 §
<8
S
fe|6q 1 PH
¿ ll á
464
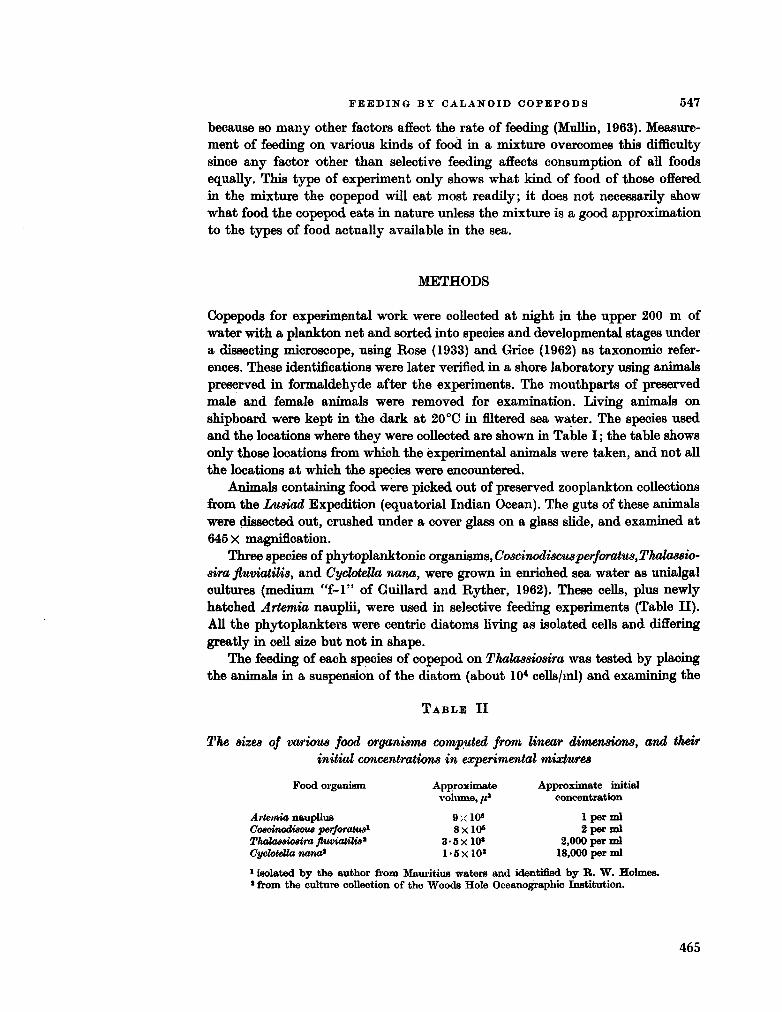
F E E D I N G B Y C A L A N O I D C O P E P O D S 547
because so m a n y other factors affect the rate of feeding (Mullin, 1963). Measurement of feeding on various kinds of food in a mixture overcomes this difficulty since any factor other than selective feeding affects consumption of all foods equally. This type of experiment only shows what kind of food of those offered in the mixture the copepod will eat most readily; it does not necessarily show what food the copepod eats in nature unless the mixture is a good approximation to the types of food actually available in the sea.
METHODS
Copepods for experimental work were collected at night in the upper 200 m of water with a plankton net and sorted into species and developmental stages under a dissecting microscope, using Rose (1933) and Grice (1962) as taxonomic references. These identifications were later verified in a shore laboratory using animals preserved in formaldehyde after the experiments. The mouthparts of preserved male and female animals were removed for examination. Living animals on shipboard were kept in the dark at 20 °C in filtered sea water. The species used and the locations where they were collected are shown in Table I ; the table shows only those locations from which the experimental animals were taken, and not all the locations at which the species were encountered.
Animals containing food were picked out of preserved zooplankton collections from the Lusiad Expedition (equatorial Indian Ocean). The guts of these animals were dissected out, crushed under a cover glass on a glass slide, and examined at 645 X magnification.
Three species of phytoplanktonic organisms,CoscinodÍ8Cusperforatus,Thalas8Ío-sira fluviatilis, and Cyclotella nana, were grown in enriched sea water as unialgal cultures (medium "f-1" of Guillard and Ryther, 1962). These cells, plus newly hatched Artemia nauplii, were used in selective feeding experiments (Table II). All the phytoplankters were centric diatoms living as isolated cells and differing greatly in cell size but not in shape.
The feeding of each species of copepod on Thalassiosira was tested by placing the animals in a suspension of the diatom (about 104 cells/ml) and examining the
T A B L E II
The sizes of various food organisms computed from linear dimensions, and their initial concentrations in experimental mixtures
F o o d organism Approximate Approximate initial vo lume, ft" concentration
Artemia nauplius 9x10* 1 per ml Coscinodiscus perforalua1 8 x 10s 2 per m l Thalassiosira fluviatilis* 3 • 5 x 10» 2,000 per m l Cyclotella nana* 1-5x10* 18,000 per ml 1 isolated b y the author from Mauritius waters a n d identified b y K . W . H o l m e s . * from the culture collection of the W o o d s Hole Océanographie Institution.
465
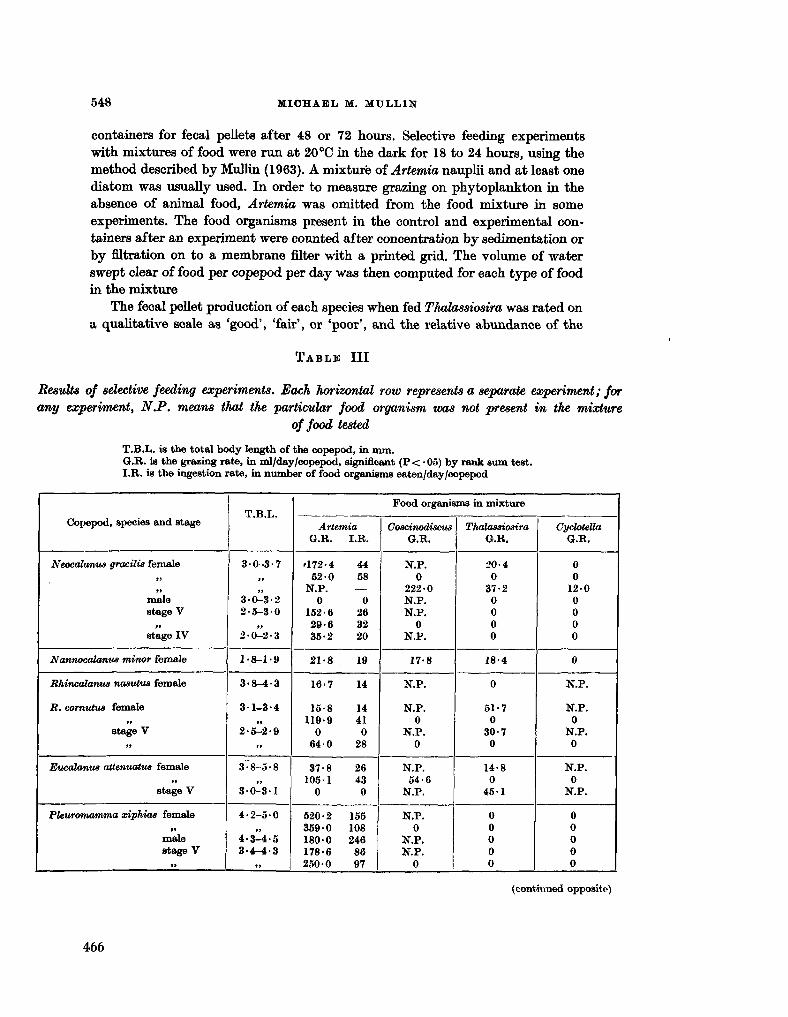
548 MICHAEL M. M U L L O
containers for fecal pellets after 48 or 72 hours. Selective feeding experiments with mixtures of food were run at 20 °C in the dark for 18 to 24 hours, using the method described by Mullin (1963). A mixture of Artemia nauplii and at least one diatom was usually used. In order to measure grazing on phytoplankton in the absence of animal food, Artemia was omitted from the food mixture in some experiments. The food organisms present in the control and experimental containers after an experiment were counted after concentration by sedimentation or by filtration on to a membrane filter with a printed grid. The volume of water swept clear of food per copepod per day was then computed for each type of food in the mixture
The fecal pellet production of each species when fed Thalassiosira was rated on a qualitative scale as 'good', 'fair', or 'poor', and the relative abundance of the
T A B L E III
Results of selective feeding experiments. Each horizontal row represents a separate experiment; for any experiment, N.P. means that the particular food organism was not present in the mixture
of food tested
T . B . L . is the total body length of the copepod, in m m . G . R . is the grazing rate, in ml/day/copepod, significant (P < • 05) by rank sum test. I.R. is the ingestion rate, in number of food organisms eaten/day/copepod
Copepod, species and stage
Neocalanus gracilis female », »»
male stage V
»» stage IV
Nannocalanw minor female
Rhincalanus nasutus female
B. cornuius female »,
stage V »»
Eucalanus attenuatus female »»
stage V
PUuromamma xiphias female »»
male stage V
»»
T . B . L .
3-0-3-7
30^3-2 2-5-3-0
2-0-2-3
1-8-1-9
3-8-4-3
3-1-3-4
2-5^2-9 ft
3~8-5-8
3 0 - 3 1
4-2-5-0
4-3^4-5 3-4-4-3
.. 1
Food organisms in mixture
Artemia G . R . I.R.
'172-4 44 62-0 58
N . P . — 0 0
152-6 26 29-6 32 35-2 20
21-8 19
16-7 14
15-8 14 119-9 41
0 0 64-0 28
37-8 26 105-1 43
0 0
520-2 155 359-0 108 180-0 246 178-6 86 250-0 97
Coacinodiscus G . R .
N . P . 0
222-0 N . P . N . P .
0 N . P .
17-8
N . P .
N . P . 0
N . P . 0
N . P . 54-6
N . P .
N . P . 0
N . P . N . P .
0
Thalassiosira G . R .
20-4 0
37-2 0 0 0 0
18-4
0
51-7 0
30-7 0
14-8 0
45-1
0 0 0 0 0
Cyclotella G . R .
0 0
12-0 0 0 0 0
0
N . P .
N . P . 0
N . P . 0
N . P . 0
N . P .
0 0 0 0 0
(continued opposite)
466
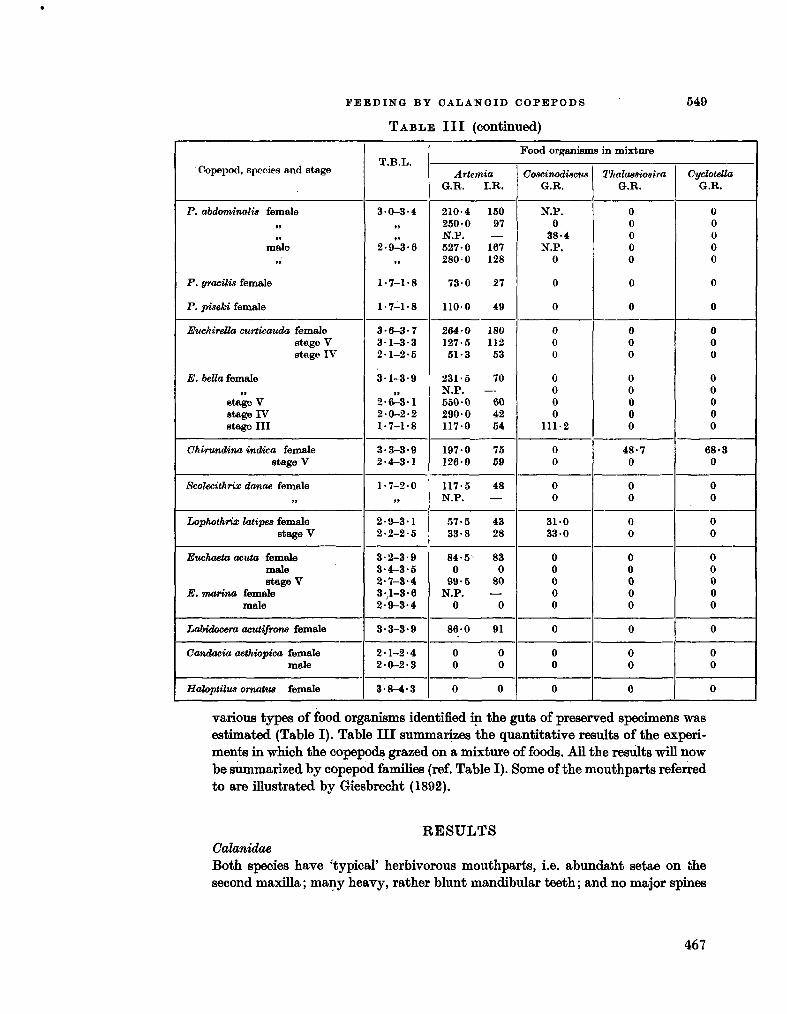
FEEDING BY CALANOID COPEPODS
T A B L E III (continued)
549
Copepod, species and stage
P. abdominalis female ff
male
P. gracilis female
P. piseki female
Euchireüa curticauda female stage V stage IV
E. bella female 99
stage V stage IV stage III
Chirundina indica female stage V
Scolecithrix danae female »!
Lophothrùt latipes female stage V
Euchaeta acuta female male stage V
E. marina female male
Labidocera acutifrona female
Candocia aethiopica female male
Haloptilus ornatus female
T . B . L .
3-0-3-4
2-9^3-6
1-7-1-8
1-7-1-8
3-6-3-7 3 1 - 3 - 3 2-1-2-5
3-1-3-9
2-6^3-1 2-0-2-2 1-7-1-8
3-3-3-9 2 - 4 - 3 1
1-7-2-0
2-9-3-1 2-2-2-5
3-2-3-9 3-4-3-5 2-7-3-4 3-,1-3-6 2-9-3-4
3-3-3-9
2-1-2-4 2-0-2-3
3-8-4-3
Food organisms in mixture
Artemia G . B . L B .
210-4 150 250-0 97 N.P . — 527-0 167 280-0 128
730 27
1100 49
2640 180 127-5 112 51-3 53
231-5 70 N . P . — 550-0 60 290-0 42 117-0 64
197-0 75 126-0 59
117-5 48 N . P . —
57-5 43 33-8 28
84-5 83 0 0
99-5 80 N . P . —
0 0
86-0 91
0 0 0 0
0 0
CoscinodUctis G . B .
N . P . 0
38-4 N . P .
0
0
0
0 0 0
0 0 0 0
111-2
0 0
0 0
3 1 0 3 3 0
0 0 0 0 0
0
0 0
0
Thalassiosira G . B .
0 0 0 0 0
0
0
0 0 0
0 0 0 0 0
48-7 0
0 0
0 0
0 0 0 0 0
0
0 0
0
CycloteUa G . B .
0 0 0 0 0
0
0
0 0 0
0 0 0 0 0
68-3 0
0 0
0 0
0 0 0 0 0
0
0 0
0
various types of food organisms identified in the guts of preserved specimens was estimated (Table I). Table III summarizes the quantitative results of the experiments in which the copepods grazed on a mixture of foods. All the results will now be summarized by copepod families (ref. Table I). Some of the mouthparts referred to are illustrated by Giesbrecht (1892).
RESULTS Calanidae Both species have 'typical' herbivorous mouthparts, i.e. abundant setae on the second maxilla ; m a n y heavy, rather blunt mandibular teeth ; and no major spines
467
550 M I C H A E L M . M U L L I N
or raptorial appendages. Diatom and radiolarian fragments constituted the major portion of the recognizable gut content*, although crustacean and other remains were also present. Similar gut contents are usually found in Calanus (see, Marshall, 1924; Beklemishev, 1054). Nannocalanits fed on both plant and animal food in the experiments. Neocalanus grazed Artemia almost exclusively in the food mixture, even the copepodid stage IV preferring Artemia to the diatoms. Neo-calanus thus exhibits more carnivorous tendencies than found in the genus Calanus, since although female Calanus finmarchicus grazes Artemia nauplii at higher rates than diatoms (Mullin, 1963), this preference is reversed in the copepodid stages IV and V (Anraku and Omori, 1963). The mandibular teeth of Neocalanus are somewhat sharper in appearance than those of Calanus. Female Neocalanus ate the diatoms readily in the absence of Artemia, showing a direct relationship between grazing rate and cell size as does Calanus (Harvey, 1937; Mullin, 1963).
Male Calanus have greatly reduced grazing rates compared to the females (Raymont and Gross, 1942 ; Mullin, 1963) and the mandibular blade and the second maxilla are reduced in size. Both these observations also apply to Neocalanus, where the reduction in male mouthparts is m u c h more pronounced. A s in Calanus, the male second antenna and mandibular palp are not reduced. These appendages are presumably necessary for normal swimming during the finding of potential mates.
Euealanidae
The mandibular teeth of Eucalanus are quite blunt and heavy ; those of Rhincala-nus are somewhat sharper. The other mouthparts also fit the herbivorous pattern, although the setae on the second maxillae are rather coarse. The gut contents suggest a basically herbivorous diet, although protozoans are equally abundant in the gut. Thalassiosira fluviatilis was eaten readily (see, Conover, 1960) and both Artemia nauplii and diatoms were eaten in the selective feeding experiments. Different experiments gave rather contradictory results.
Metrkliidae
The mandibular teeth are quite sharp, especially in Pleuromamma xiphias and P. abdominalis, but the other mouthparts are herbivorous. The gut contents include phytoplankton, protozoans, and crustaceans. Beklemishev (1954) reports similar gut contents for Metridia pacifica and M. ochotensis. Although some fecal pellets were produced when only the diatom Thalassiosira was provided as food, all species of Pleuromamma fed exclusively on Artemia when it was available. This is also true for female Metridia htcens and M. longa from the Gulf of Maine (Mullin, unpubl.). Very high grazing and ingestion rates were found, e.g. the ingestion rate of P. piseki is equivalent to a consumption of about twice its body volume per day. P. abdominalis grazed Coscinodiscus at low rates when Artemia was not present. Males fed just as voraciously as females, and no reduction in their mouthparts was noted.
468
FEEDING BY CALANOID OOPEPODS 551
Aetideidae
All three species have stout spines on the second maxilla and Chirundina has a raptorial maxilliped and sharp mandibular teeth. In Euchirella the mandibular blade is rather narrow and its teeth are heavy and rather blunt. Both species of Euchirella contained large numbers of what appeared to be fragments of armoured dinoflagellatesy while Chirundina contained abundant crustacean remains. There was little feeding on diatoms in the experiments, even in the absence of Artemia (see Conover, 1960, for E. rostrata). The apparent feeding by female Chirundina on the two small diatoms is difficult to interpret. All three species grazed Art&mia at high rates, even in the younger copepodid stages.
Scolecithricidae
Neither species has obviously carnivorous modifications of the mouthparts; in both, the mandibular blade is narrow, its teeth are not particularly sharp, and the second maxilla is rather stumpy and equipped with thread-like as well as stout setae. The gut contents of Scolecithrix suggest predominantly carnivorous feeding, although Wickstead (1962) reported diatoms and silicoflagellates as well as protozoans and crustaceans from the gut of Lophothrix frontalis. Scolecithrix did not feed on any of the diatoms used, although Lophothrix grazed Coscinodiscus at about the same rates as it did Artemia nauplii.
Euchaetidae
The enlarged raptorial second maxilla and maxilliped, both armed with heavy setae, and the edged cutting teeth of the mandible suggest predaceous feeding. Gut contents and feeding experiments supported this conclusion. Males of both species have virtually lost the mandibular blade and second maxilla, and did not feed during the experiments.
Pontellidae
The enlarged maxilla with its stout setae, the modified maxilliped, and the sharp mandibular teeth are suited for the selective prédation shown by Labidocera in the feeding experiments (see Anraku and Omori, 1963, for L. aestiva). N o reductions in male mouthparts were noted.
Candaciidae and Augaptilidae
Neither Candacia nor Haloptilus fed during the present experiments on either diatoms or Artemia. Both have stout spines on the first and second maxillae, the second maxilla of Candacia being highly modified for grasping prey. Both have a very slender mandibular blade terminating in two sharp points. Wickstead (1959) suggested that Candacia bradyi feeds on large animals such as Sagitta, grasping them with the second maxilla ( = first maxilliped) and piercing them with the pointed mandibular blade. It is tempting to suggest, by analogy, that Haloptilus feeds in the same w a y on animals larger than itself, although Haloptilus does not
469
552 M I C H A E L M . M Ü L L I N
look nearly so robust as Candada; however, opposed to this suggestion, is Heinrich's (1958) report of diatoms, radiolarians, foraminiferans, and tintinnids in the guts of three species of Haloptilus.
DISCUSSION
N o obligate herbivores were found ; all species tested fed on Artemia nauplii and contained animal protozoans in the guts. Rather than classifying copepods as herbivores or carnivores, it seems more useful to use terms such as particle grazers and predators, realizing that even these terms impose an artificial division on a continuum of types of feeding behaviour.
The particle grazers (the Calanidae and Eucalanidae) ingested Artemia and diatoms at high rates, although sometimes showing a marked preference for Artemia. The genus Acartia also seems to fit into this category (Lebour, 1922; Anraku and Omori, 1963). These copepods have no obvious morphological adaptations for capturing motile prey and apparently eat most types of available particles óf suitable size, such as diatoms and radiolarians, without regard to the taxonomic character of the particles. They feed, at least in part, by filtration, often removing larger particles preferentially. A n intermediate situation is exemplified by the Metridiidae, which never fed as readily on diatoms as on Artemia. However, the gut contents and mouthparts suggest that these copepods are basically particle grazers. LopJiothrix and Centropages (Lebour, 1922; Anraku and Omori, 1963) present a rather similar situation. In all the particle grazers, selective feeding on certain types of food is particularly marked when food is abundant, as in the feeding experiments, and probably involves behavioural mechanisms in addition to mechanical selection based on particle size. The extent to which the copepods 'search' for particular types of food and the mechanism permitting discrimination between food particles of similar size, such as Artemia nauplii and Coscinodiscus, are not known.
Most of the so-called predatory forms (the Aetideidae, Euchaetidae Pontellidae and probably Scolecithrix and the Candaciidae) are adapted to catch and hold motile animals, or at least to grasp large masses of food, and seldom capture small particles by filtration. Tortanus should be included here (Anraku and Omori, 1963). Prey is presumably detected by contact, but the mechanism of discrimination and selection of particular food requires further study (see, however, Horridge, this Volume, p . 395).
Available evidence suggests that less than one-fourth of the total particulate carbon in the surface waters of the Indian Ocean is in the form of particles larger than 30 //. (Mullin, 1965). The preference for large food particles shown by almost all copepods tested therefore provides indirect evidence as to the possible importance of micro-zooplankton and large aggregates of detritus in marine food webs. Estimation of the biomass and dynamics of production and utilization of these categories of organic matter is only beginning (Banse, 1962; Riley, 1963; Riley, Wangersky and V a n Hemert, 1964). Since feeding on detritus was not tested
470
F E E D I N G B Y C A L A N O I D C O P E P O D S 553
experimentally and cannot be readily distinguished from feeding on living organisms by examination of gut contents, this possibility cannot be further discussed.
Cases of rather specialized feeding by a particular genus, such as the utilization of dinoflagellates by Euchirella or the possible prédation by Candacia on large animals, are suggested by this study. In general, however, the particle grazers on the one hand and the predators on the other, seem to be rather unselective as to diet and opportunistic in what they ingest. Neither the analyses of gut contents nor the selective feeding experiments reveal significant differences in the food materials utilized by most of the different species within each category. Specializations in feeding behaviour sufficient by themselves to provide the ecological distinctness theoretically necessary for the coexistence of food-limited sym-patric populations thus have not been demonstrated by the present investigation.
S U M M A R Y
Selective feeding experiments were used to investigate the food preferences of 19 species of planktonic copepods, and the mouthparts and gut contents of these species were examined. All species consumed animal food at least as readily as phytoplankton, and several species ate only animal food. Most species could be tentatively classified as either particle grazers or predators, but there seems to be considerable overlap in the food preferences of different species.
A C K N O W L E D G M E N T S
The experiments reported here were carried out during Cruise 5 of the R . V . Anton Bruun as part of the International Indian Ocean Expedition ; the co-operation of the scientific staff on the vessel is gratefully acknowledged. Dr . A . Fleminger kindly provided preserved samples from the Lusiad Expedition and, together with D r J. D . H . Strickland, suggested improvements in the manuscript. The U . S . National Science Foundation provided funds for ship time and equipment through Grant N S F - G 2 0 9 5 2 and supported the investigator with a Postdoctoral Fellowship. The U . S . Atomic Energy Commission supported the investigator during the preparation of the manuscript through Contract N o . AT(ll-l)-34, Project 108.
R E F E R E N C E S
Anraku, M . and Omori, M . , 1963. Preliminary survey of the relationship between the feeding habit and the structure of the mouth-parts of marine copepods. Limnol. Oceanogr., Vol. 8, pp. 116-126.
Bause, K . , 1962. Net zooplankton and total zooplankton. Rapp. Cons. Explor. Mer, Vol. 153, pp. 211-215.
Beklemishev, K . V . , 1954. [The feeding of some abundant plankton copepods in Far-Eastern
seas.] Zool. Zhurn., Vol. 33, pp. 1210-1230, [Eng. trans.].
S*
471
554 MICHAEL M . MULLIN
Conover, B . J., 1960. The feeding behaviour and respiration of some marine planktonic Crustacea. Biol. Bull., Woods Hole, Vol. 119, pp. 399-415.
Gie8brecht, W . , 1892. Systematik und Faunistik der pelagischen Copepoden des Golfes von Neapel. Fauna und Flora oles Golfea von Neapel und der angrenz Meeres-abachnitte, Vol. 19, 831 pp.
Grice, G . D . , 1962. Calanoid copepods from equatorial waters of the Pacific Ocean. U.S. Fish. Bull., Vol. 61, N o . 186, pp. 171-246.
Guillard, B . B . L . and Byther, J. H . , 1962. Studies of marine planktonic diatoms. I. Cyclo-tella nana Hustedt, and Detonula confervacea (Cleve) Gran. Ganad. J. Microbiol., Vol. 8, pp. 229-239.
Harvey, H . W . , 1937. Note on selective feeding by Calanus. J. mar. biol. Aas. U.K., Vol. 22, pp. 97-100.
Heinrich, A . K . , 1958. [On the nutrition of marine copepods in the tropical region.] Dokl. Akod. Nauk S.S.S.R., Vol. 119, pp. 1028-1031, [Eng. trans.]
Lebour, M . V . , 1922. The food of plankton organisms. J. mar. biol. Ass. U.K., Vol. 12, pp. 644-677.
Marshall, S. M . , 1924. The food of Calanus finmarchicus during 1923. J. mar. biol. Aas. U.K., Vol. 13, pp. 473-479.
Mullin, M . M . , 1963. Some factors affecting the feeding of marine copepods of the genus Calanua. Limnol. Oceanogr., Vol". 8, pp. 239-250.
Mullin, M . M . , 1965. Size fractionation of particulate organic carbon in the surface waters of the western Indian Ocean. Limnol. Oceanogr., Vol. 10, pp. 495-462; 610-611.
Baymont, J. E . G . and Gross, F. , 1942. O n the feeding and breeding of Calanus finmarchicua under laboratory conditions. Proc. roy. Soc. Edinb., Vol. 61, pp. 267-287.
Biley, G . A . , 1963. Organic aggregates in sea water and the dynamics of their formation and utilization. Limnol. Oceanogr., Vol. 8, pp. 372-381.
Biley, G . A . , Wangersky, P . J. and Van Hemert, D . , 1964. Organic aggregates in tropical and subtropical surface waters of the North Atlantic Ocean. Limnol. Oceanogr., Vol. '9, pp. 546-550.
Bose, M . , 1933. Copépodos pélagiques. Faune de France, Vol. 26, Office Central de Faunistique, Paiis, 374 pp.
Wickstead, J. H . , 1959. A predatory copepod. J. anim. Ecol., Vol. 28, pp. 69-72. Wickstead, J. H . , 1962. Food and feeding in pelagic copepods. Proc. zool. Soc. Lond., Vol. 139,
pp. 545-555.
472
Reprinted from Okeanologla, vol. VI, no. 2, 1966, p. 314-325.
Y A K 550.42 : 517/475(267)
B. r. BOrOPOB, O. K. E O P A O B C K H H , M. E. B H H O r P A A O B
EHOTEOXUMMfl OKEAHHHECKOTO nJIAHKTOHA. PACnPEAEJIEHME HEKOTOPblX X H M H M E C K H X K O M n O H E H T O B
nJIAHKTOHA B H H A H H C K O M OKEAHE
HHCTUTIJT eco.ioeuu u paapaôoTKu eopio'tux ucKonaejnbix HHCTUTIJT oKeauoAoeuu A H CCCP
OcHODiian npoS/iema coupe.Meiinoii wopcKofi njiaiiKTOnojiorHH— H3ywe-inie aKOJiomiecKHx C M C T C M nejianiajiii. u p w S T O M ocaôemio cymecraeiiiio oueiiHTb noTOK sneprmi, luymeii Mepe3 S T H SKOciicTeMH, yepe3 H X T-patpime-CK)'K) CCTb.
CoBepiiieiiHo oneBHAiio, >ITO jyin Bbiflciienun nepeiioca siieprHH, ee KOII-
ueiiTpauHH H noTepb ira pa3Jin*iiifaix TpocpimecKHx ypoBiinx, HeAocraTomio iiMeTb cBe,aeiiH5i m n b K o o GiioMacce HJIII ,aa>Ke npoaynuHH ruiaincrona. RJÍÍI KO-nmecTBeKi!oii oueiiKii snepreTimecKoro 6a.nanea neo6xoflHMo .aeTajibiioe 3iianfie xHM'HiecKoro cocTaiia n/iaiiKTOiia n, npowjie Bcero, cooTiiomeHHn B neM ociiOBiibix XHMimecKiix KOMnoneiiTOB, TaiiHX, KaK yrjieBOAW, GejiKH, >Kiipbi, xapaKTepii3ypmnxc5i pa3JiHMiioii sneproeMKOCTbio. 3 T H KOMnoneirrbi c pasjiimnbiM 3nepreTHiiecKHM scpcpeKTOM M'oryt ycBaHBaTbcn H TpaiiopopMH-poBaTbcn opraiiH3MaMn.
O A H H H3 Ea>Kiiei'iujiix 3aKoiiOB ôiioaiiepreTiiKH saKJiiouaercn B T O M , «ITO Bee nocne;iyiomj:e inpeupameiiiin oprammecKoro BemecTBa, cra^ainnoro aBTO-TpoipiibiMH oprami3MaMn, ocymecTBJinioTcji 3K30TepMimecKHM nyTeM, T . e. c ocBooo>KAeiiHeM neKOToporo KOJiimecTBa siieprHH '. ripn S T O M na Ka>KAoñ no-cne,ayioineH eraAini npeBpameinin opranHMecKoe BemecTBO B ucno'M ôyaeT xapaKTepH30B3Tbca B-ce 6o\nee H H 3 K H M 3a>nacoM noTeifUHa^biiofi sHepinm no CpaBIieilIMO C 'K'CXOaHbTM.
H3MeH1HB0CTb 3KOCHCT6M B pa3^HllIIIbIX pafl'OHaX H KJIKMaTWiieCKTIX 30-
nax oxeaiia cny>Knt oain-iM ii3 OCIIOBIIMX MOMeiiTOB, orape;i,e.nHioiunx BCK> CiioJiornqecKyio 'CTpyKTypy OKeana. C S T O H TO*IKH apemi'a Mpe3BbiHaiino cy-mecTBenno BbincneuHe xnwniiecKoro coeraBa Been iwaccbi rmanKTOiia (Toia^bKoro. ruianKTOna), ii3Meiieniin ero B pa3nwx pafioiiax OKeana H BJlIIHIIIIfl BHeUIHHX — aOHOTIHieCKHX (paKTOpOB, C KOTOpblMH CBH3aHH 3TH
H3MCHCHHH.
HaKOiieu, O T xiiMimecKOro cocTaBa inJiaKioiia B 3naiiin'rejibiion CTenenH 33BHCHT ero pcjib KaK ocaj,Koo6pa30BaTejiH. KapôonaTiibie oca-flutH OTjiara-IOTCH B Tex paiioiiax, r,ne B njiaiiKTOiie npeoôjiaaaioT wRBOTiibie c ii3BecTK0-BiiCTbiMii paKOBiimaMii—niTepononbi H rjio6nrepnuibi. Oca'AKii c B U C O K I I M coaep>KanneM KpeMne3eMa xapaKTapnw AJIH pafioiiOB MaccoBoro pa3BHTiiii nejianiMecKnx aiiaTOiMOBbix BOAopoaneñ HJIH w e AJIH ôojibuinx r,ny6HH OKeana, i\ae cKejieTHbie ocTaTKH, cocTOîimne H3 KapóonaTa Ka^ibUHH, ne BicTipe-
1 Ba.TbTepc [29] yKa3UBaeT, M T O na iowAufi MOJib OKHC eiinoii rjiK)K03bi npH nepexoAe O T oAHoro nHmeBoro ypoBiin K we^yiomeMy TepjieTcn npHMepHo 275 KKOA.
314
474 Collected reprints of the International Indian Ocean Expedition, vol. IV, contribution no. 229
«iniOTcn, ftnaro.'iapji pacTiuipciiino » iieAoiiacbimeiiiibix C 0 2 niyoiiiiiibix BO'* AÍ1X. CyiHeCTlKMUIIiIM KOMII01IC1ITOM TaKHX OCaAKOB OÓblMHO OKa3bIBaiOTCH cKtYiCTbi paj,i:o.T5ip;n"i.
l-l:tyiiciii!CM xii.\ti!'iccKoro cocT;ma nJiai»KTOi;a 3amiMaJiiiCb Miianie Hccne-Aoi>.;nejin, H 13 nacTOHiii.ee iipc.Mn y>i<e iiaKoik'ien 3iiaMiiTeJibiibiH MaTepuaji, xa|KiKfcpii3y]omiiii KaK oT/uvibiibie an/ibi 11 uejiwe rpynnu > K H B O T H H X [6—7, 10, 12, 16, 2-1, 27 ii M U . .i'P-1, T;ÍK ii TOTajibiibii'i njiaiiKTOH pa3^iiinibix yua-CTKOii Mopei'i II iicKOTopux paiionoB OKeana [11, 13—15, 22, 25—27 H A P J . O.'inaKO Bonpoc oo ]I3.MCIIIIIIJIOCTII xitMime-CKOro cocraBa OKeamniecKHX njiaiiKTOinibix cooúmecTB n ero CBÍI3H C BiieiiiHHMH cpaKTopaMH Bee e m e ocTiiCTCH O A I I H M ii3 liaiiMenoe n3yiiemibix. To.nbKo B nocneAnne rojiu Hccne-AOiKHiiui üúumpiibix 'oKcaii'ii'iecKiix ;iKi)aTopiu"i, npe^npnnHTbie piiAOM cnpaii, •no3ao.nii.nn not'iofirn K noeraiioBKe noAoóiiux 3aAa<i.
Ocoocmio unipoKO paauepnyjiiicb iiccjieAOBamiii B3Becn noBepxnocTiioro CJIOÚ noAbi, B 3'iiaqnTe^biioi'i crenciin cocToameíi H3 MHKponjiaitKTOHa [17— 19]. Bbiji iiconeAOBan, B MacTiiocTii, cocTaB B3BecH B K O K H M X H uenTpajibHbix /pai'ioiiax-HiiA'HiicKoro oneana. 1< cowajieiinio, no onuoiuenHio K ôoviee Kpyn-noMy cenioMy 3oanjiaiiKTOiiy noAoôiibix na'ô^iOAenHH onejiano HecoH3MepH-M O MOIIbllie.
O n peA encime x<i:pnocTn nJiaiiKTOiia nipoBOAHJiacb Ha MapnAHOHajibiHbix pa3pc3ax wepe3 Tnxm'i n ATjiaimmecKiiii OKeaiibi [2—3], a TaioKe Ha He-CKOJibKHX C T a n m m x B Himin'ïcKOM H ATjianTHwecKOM oKeaHax [30].
B AajibueñiueM iicoieAOBamiH ÓHOXWMHHecKoro cocTaBa OKeaHH^eckoro njiaiiKToiia ôbijin pacuwpeiibi. Hei<oTopbiM pe3yjibTaTaiM S T H X HccneAOBaiHHft II nocBJimaeTcfl iiacTOHiuee cooúmeiiHe.
MATEPHAJI H METOflHKA
MaTepiiaji óbiji coôpaii B O BpeMH 31-ro peiica a/c «BHTH3b» B H H A H H -CKIII'I oKean ceTbio Tuna Arican c nAomaAbio BxoAnoro oTBepcTHa 0,5 M2 H C (pii.ibTpyiomiiM KoiiycoM H3 Menbimmioro ciiTa JVib 38 (pa3Mep «Men 0,18 MM). H a cTaimunx oCjiaBjiiiBajicn cjiofi 0—100 M. Tlojiynemibie npoóbi 6e3 (pHKca-miii c])iijibTpoBa^ncb, B3BeujiiBajincb, a 3aTeM BbicynmBajiHcb. B Aa^ibneñ-uieM B mix onpeAe^iijiocb coAepwa/ime KapóonaTa Ka^bUH», opraHHiecKoro yrjiepoAa H JIHIIHAOB.
Kap6onaTiiocTij o6pa3iiOB ii co,aepx<aiiwe opraiinyecKoro yr.nepo.ia onpefle^njiHCb no Kiionny. JXajicc KapConaTiibin C 0 2 nepeoiHTUBajiH na C a C 0 3 . ripu 3 T O M cncayeT HMCTI» c Biuy, M T O , X O T H CaCC>3 H H'BjiíieTca npeoôJiaflaiouiHM KOMnonciiTOM B cocTaoe Kapôo-iiaTuwx C K C / I Ë T O B njiaiuaomiux opraiiimioB, B iieKOTopux cjiywanx O H B aiiawHTe^bHoft CToncmi M O > K C T 3aMciu,aTi>csi M g C 0 3 . ycTaHOBineno, W T O C noBUiiieHHeM TeMnepaTypw o:cpy>Kaioiuei"t D O A W po.ib M g C O j B cocraBe KapCoiiaTHbix CKeJieTOB B03pacTaeT H , Ha-npuwep, y cpopaMinimpcp KOJie6/icTcn B 3aoHciiM0CTH O T TeMinepaTypw H weKOTOpbix ftpy-rn,\ tpaKTopoB O T 0,3 A Q 16% [23].
Cojep/Kaiivie jinniivtOB on'pes.enstjm nyTeiw SKCTpaKiuiH1 Ha annapaTe CoKCJieTa CMCCbio, cocTonmeû H3 70% beii3o.na, 15% aueîona H 15% MeTaiioJia.
JXJIH anajiH30B 6WJI ncnoAb30Baii MaTepiiaji, coó'pa'HHbiñ na 142 craH-miîix. B CBH3H c TeM, M T O KOJiniiecTBO nJiaHKTona, nojiyqae.Moe c O A H O H CTan-liiiii, Macro ôbijio HeAOCTaTomibiM AJin anajiHsa, T O CTanu'HH, cAe^amiwe B paiione co cxoAHbiMii ruiapojionmecKHMH ycjioBiijrMH H Ô A H Ï K H M TaKCOno-MII'ICCKIIM CCCTaBOM II KOJimiCCTBOM n^aiIKTOHa, OÔTjQAH'HnJI'irCb B IietÔOJlb-imie rpynnbi. OnpeACJieiiiie TanconoMiiwcoKoro cocTaBa, ÓHOMaccbi n^aiiK-Tona ii noACMCT MaccoBbix BIIAOB inpoBOAHAH. B npoSax, Koropue ôpajincb na K3>KAOI°I cTaiiUHH 'napajiAejibHO c npo6a'MH AJIH xHMH'MecKoro anaJiH3a2. Pe3jMbTaTH xHMH^ecKHx anaJiH30B npuBeAeHbi B TarôjiHue, rAe MaiepHaji no OTacnbiibiM cTaiiUHiiM oôijeAHiieii no ecTecTBemibiiw ÔHO-rHAipoJiorHuiecKHM
CBeACHiiH o cocTaBe n^anKTOiia npiiBeflenu B pn^e CTaTeû [4, 9, 21].
315
475
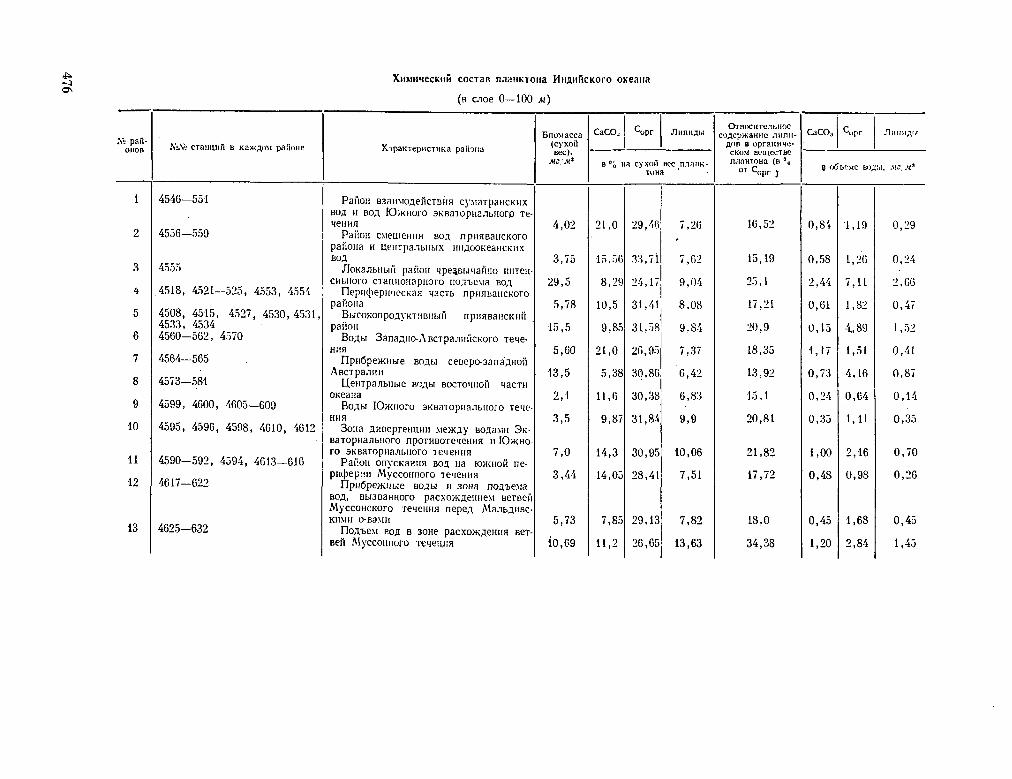
o
u
life IK
"'
-Ô
Vf
oî o
0
0
o
O
CO
I-
CI
_; „"
_r ^ _r
l~
CI
o
o
o
o
o
LO1
CO
O!
vn
_ ñ
ci
i
o
?, s 0
0
CI
«
—
to
00
o
C-l
82
OÍ
OÍ
o
00
oo
vr
eo
o o b.
o X u
5 S 2 IKT0
*J ^
c
^ 100 1
o
8
o o
i
oí"
o
00
CO
C
O
OS
1
~
00
CO
O
S
00
O
OS
—
•
o
Vf
íh\
o
CD
LO
LO
CO
o
co c~ L
O
•S
O»
2 H
5 Q
=
o
CO
r f-
^
5 re
E I
¿o
m t-{
_ o
5
a
ro
-; ro "^
2¡:c
en
il N
n
o
;
5 £
C
O
*~
" K
^
CU Jy
(ü fc
Ï
—
O
QJ I!" ' I
—
i (J
-ïl a
&
o
n
=
1
u.
o
u
m n
=
ro
CO
J3
M
O
CQ
a* C
L, t
OH
\O ro
H
=5 a
. s
a, H w
se
y=í
i
u. 3g
. £
c
^£
g 2
«I ro
1 re s
Set
CO H
ro
03 Ü
o
J
ra
v
r i"t
O.
s O
C
J
a «
a-K
Ü «I O
**
u
o
3
=
„ -r
3
5 !=•
re
O
" CJ
E =
s o.
S o £_»o
2 à
ü
5
51 Q
J —
SJ^
<
i ¿
i?
•n
Oí
vf
CO
lO
IO
V
f „
IO
Ol
1/5 1
Ol
IO
Vf ..
00
IO
Vf
„ 4530 4527 „
m*#
o
1—
in
vr »
r-íO
Jv
J
lOL
OC
Û
*tf *•<?
m
» »• 0
0
CO
O
O
C
C C
O
lOiO
lO
•^
-a1
-^
LO
C
O
IO 1
Vf
CD
L
O
Vf
00
IO 1
CO
lO
Vf
es
o 1
IO
o
CD
V
f
O
O
o
Vf „
en
os IO
V
f
O
CO
V
f
00
Ci
LO
V
f
CO
O
S
LO
V
f „ IO
O
S
LO
V
f
CD
1
CO
to
V
f ^ V
f O
L
O
Vf •>
O
l O
s L
O 1
o
oa
lO
V
f
Ol
Ol
CO
1
l~-co
Vf
CD
1
Vf
476
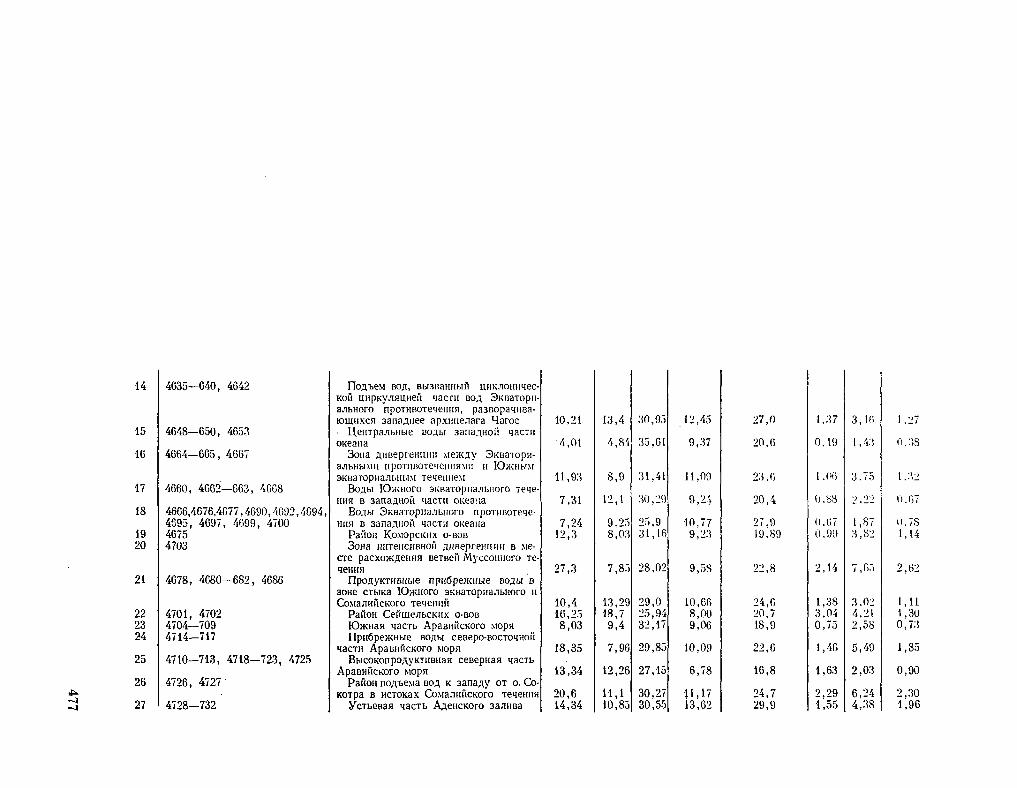
oto
C
O
OS
ri oc zo
CM
—
ro
C
M
irt
CO v
f C
M
h-
C2
—'
C
'TO
O
->
Vf
o
OL
^G
l v
fC
»
CM
C
M
CM
—
i C
M
CO
00
CO
t»
Gî
vf"
a>
C
M C
M
—
C5S
C
O
—
CO
IO
—
OS
CO
O
lO
-* ri
—
O
Oî
—
CM ro
o_
00
Ci
—
00
-M
CM
O
O
00~
—
00
—'
—'
CO
Vf
Ci
CC
co
o
co oo
vu
CO
' C
O
Vf
CO
C
O
O
vf
CM
—
o» o. r
a
=• o S
5
i- ~
° E ra
3" o
O
CO
"1
L
-
rr \¿ ex. C3
S5 ra
tu
: = s
H y
O
_ CU
•a
O
c
=1
r->>
CL,
a
o
•x. H
O
C
u
c
o
o
.a
cg s s 1
m _
I
•Il ïi . o
—
O)
?¡¡p
s - o
03
—
3 2
<u 2
£ 3.
C
L
flj
cu
S.
5 -
= -
cay çcn
2
* !
!
Vi p
K
CQ
„,2 5
ñ
CO
s—
CC
o
-ca
o
tsD
.n o
)
P Q
ó£
ó ü
U =
•
CL
» c
a
o
7 ca
&g
?s<
CQ
IS
I-
U
11
Su
o ?
S
- í
(5
** C
U i¿
l^¡£
2£
t<líl a
o s
-1
0
lea
ga
ira
co
o
Vf
465 -650, 4648-
CD
C
O
Vf -665, 4664-
vi
C3
O
V
?
c~r O
í O
C
S O
v
f I-
-vr o C5
. C
O C
3
Vf
C5
-C
O
Si
CO
V?
CM
0
0
CO
•Cf.
-
CO
ifj ira
C
O
o o
1— o
C
O
CI}
CD
t>
-
vf
vf
«a* vf
I 0
0
CM
1~
O
O
r- C
O
CM
C
M
l
O
—
—
1—
CO
vf
1-
t- 1
- vf
r~
-II
I -
I —
vf
vf
O
CD
00
O
O
•"* —
C
M C
M
W
l~
1-- t—
I—
1--
Vf
Vf
Vf
Vf
Vf
Vf
OS O
—
«
—
CM
C
M C
O V
f C
M C
M C
M
477
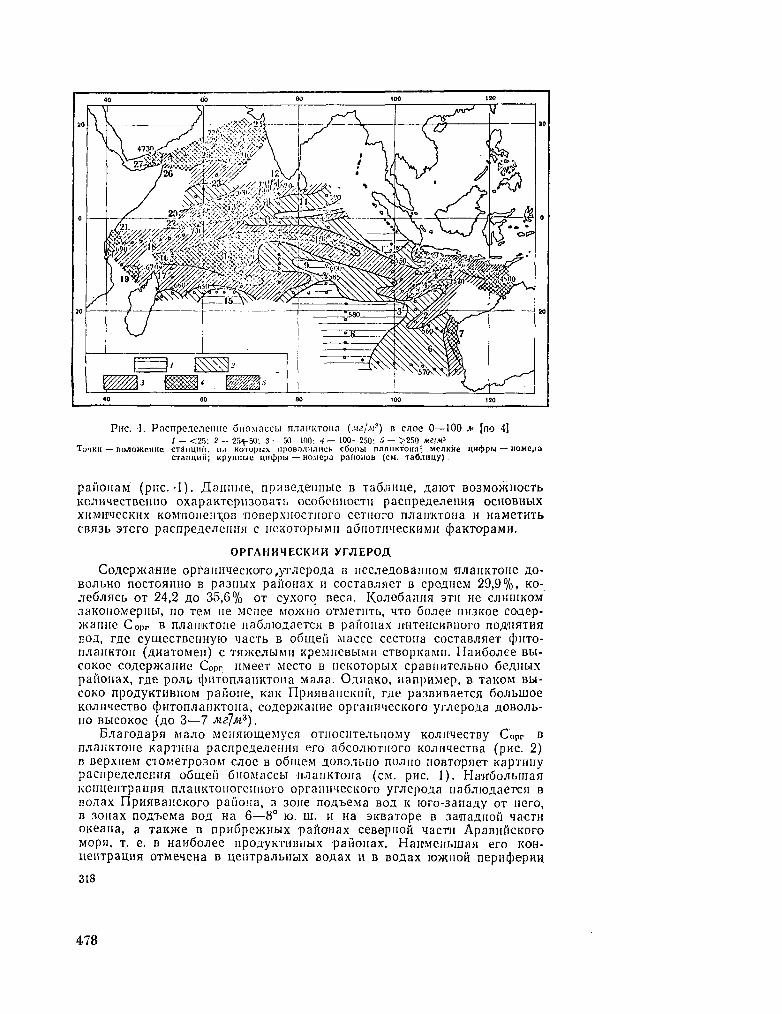
Pire. 1. PacnpcAe.icinic G I I O M . I C C U njiaiiKTOii.i (.m¡M~~) n cjioe 0—100 *. [no 4] / — <25; 2 — 25^-50; ,7 — 50-100: •/ — 100—250: 5 — >250 Me/M*
TLÎIJKII — noJiOKcitne CTaimmi. na KOTopux npono;iMJiiich c6opi>i nJiiUiKfoun; MeJiKÍie UH(t>pw — iioMepa CTanmni; Kpymiuc miippu — HOMcpa p.iiioiioB (CM. Taô^Huy)
paüouaM (pue.-1). Jlaimue, npHBeAeniiue B TaoVnme, aaioT B03Mo>i<HocTb Ko.iHMecTBeinio oxapaKTepii30BaTij OCOÔCMIIIOCTII pacnpeaejieiiHH O C H O B H M X XHM'ii'iecKHx KOMnoiien^oB noBepxnocTiioro ceTiioro n^aniKTOiia n naMeTHTb CBfi3b 3Tcro pacnpe,ae^cini5i c ncKOTopbiMii a5iiOTiflieci<iiMH cpaKTopaMH.
OPrAIIHMECKHH yrJIEPOfl
CoAep>i<aHne opraimiecKoro^ymepofla B ncaieflOBamioM TiJiaiiKTOiie RO-BOJibno nocTonnno B pa3iibix paiioiiax it cocTaBjiaeT B cpejueM 29,9%, K O -jieojincb OT 24,2 flo 35,6% O T cyxorq Beca. Ko/ieéaimn STII ne cniiuiKCM 3aKoiioMepiibi, no TeM ne Menee MO>KIIO oTMeniTb, H T O óojiee nn3Koe coaep-«ainie Copr B njiaiiiKTone naojiioaaeTcn B paiioiiax iniTeiicHBiioro nofliiHTHn noj, me cymecTBeii'nyio iiacrb B oôuxei'i Macee cecToiía cocTaejineT rj)iiTO-nJiailKTOH (AHaTOMeH) c THMCnblMH KpeMIieBMMH CTBOpiOMH. Han6<Wiee Bb[-coi<oe coAep>i<aiine C0Pr iiMeeT MecTo B neKOTopbix cpaBiiHTcnbiio oejiuux paiioiiax, r;ie pojib cpHToruiaiiKTOiia Ma^ia. O / u m K O , nanpHMep, B TauoM B H -C O K O npo^yKTiiBiioM paiione, Kan npuHBaiicKiiii, 171 e pa3BHBaeTC5i 6o;ibiLioe KO/iniiecTBo cpiiTon iaiiKTOiia, coAepjKaime opranniieci<oro yiviepofla flOBOJib-iio BbicoKoe ( A O 3—7 M¿JM3) .
B^aroaaipn Ma.no MeiiniomeMycii OTiiociiTcnbiioMy KOJiimecTBy Copr B njiaiiKTOiie KapTima pacnpe^e^iennn ero a6co,nioTiioro KOjimiecTBa (pue. 2) B BepxiieM d O M e T p o B O M enoe B oôme.M ^OBo.ibiio nojino noBTOpHeT Kapnniy pacnpeiie^er.im oômeii ôiioMaccw nviaiiKTona ( C M . pnc. 1). Han'ôo-nbuian KCiiueiiTpaunn n^aiiKTOiioreiuioro oprammecKoro yrjiepo^a iiaó ioaaeTCJi B no/tax npHHBaiiCKoro paiiona, B 3one noai>eMa Boa K ioro-3ana^y O T nero, B 3onax no;rbeMa noa na 6—8° IO. m . H na aicBaTope B sanation M a c ™ OKeaiia, a TaiOKe B npn6pe>Kiibix paftonax céBepnoñ wacrii ApaBniícKoro Mopii, T . e. B nanóo.nee npoayKTiiBiibix paiionax. HawMeiibiuaji ero K O H -neiiTpauHH OTMeiena B neiiTpaJibnax BOflax u B BOAax IOKIIOÍÍ nepwpepHH
318
478
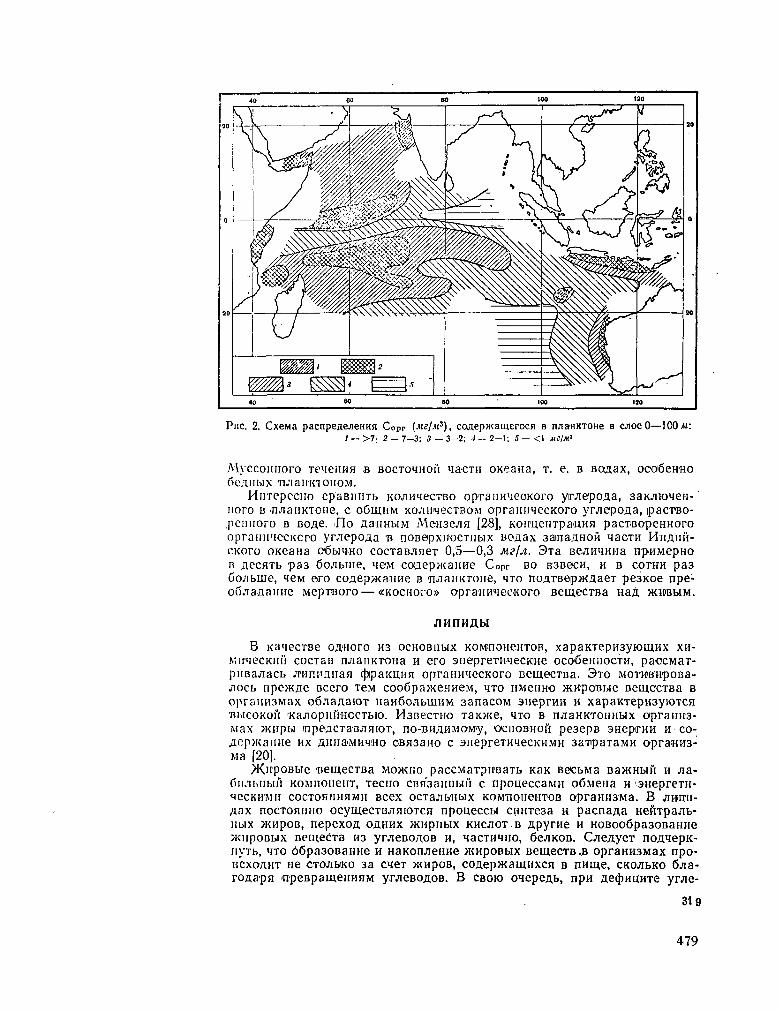
Pue. 2. Cxeiwa pacnpeaejieHHn Copr (MZ/M3), cojiep/KamerocH B njia«KTOne B cjioe 0—ICO AI: / — >7 : 2 — 7—3; S — 3—2; 4 — 2-1; 5 — <\ MSIM?
MyccoiiHoro Tenelína a B O C T O I H O H lacni OKeana, T . e. B BQ^ax, oco'ôeH'HO ÔCAHblX TUiaUIKIOIIOM.
HiiTepeciro cpaBiiiiTb KOjiimecTBO opraiiHHeoKoro yinnepoaa, 3aKJUOMen- ' îioro B in iaiiKTOiie, c oômiiM KO^ii|iiecTBOM oprammecKoro yrjiepoaa, pacrao-.pemioro B BOAe. H o aaiiHUM Men3&nn [28], KOiruenTpa'UHH pacTBOpeHHoro oprainmeCKcro yrjiepo^a 'B noBepxnocTiibix Bo^ax 3ainaanoH nacTH H H A H H -cKoro OKeana côbimno cocTaB-nneT 0,5—0,3 Me/A. 3îa BeJiHumia npHMepHO n AecaTb pa3 ôcuibiiie, new coaepwaime C0pr B O B'3BecH, H B C O T K H pa3 Combine, 4eM oro co.a,ep>KaHne B 'iLnaHKrone, M T O no^TBep*iiaeT pe3Koe npe-oG.ia-aaiiire MepTBoro— « K O C M O T O » opranH^ecworo BemeCTBa naà J K ' W B M M .
jiMnHAbi
B KaqecTBe oA'Horo H3 O C H O B I I U X KOMinoiienTOB, xapaKTepn3yiomHX X H -MipiecKiiH cocTaB n aiiKTOi-ia H ero aiiepreiwiecKHe ocoSeniiocTii, paocMaT-piiBa^acb jmmwian cppaïamn opraitmiecKoro BemecTna. 3 T O MOTWB'HpoBa-.noeb npc>K^e Bcero TeM cooûpajxenHeM, H T O miento wwpoBbie BemecTBa B oprann3Max oô^a^aiOT iiaHÔojibiunM 3anacoivi aneprHH H xapaKTepH3yiOTcn BbicoKofi «a^opniVi-iccTbio. H3BecTHO TaK>Ke, iTo B njiaHKTOHHbix opramra-Max >Kiipbi inpeacTaB.iíiiOT, no-BHAHMOiwy, OCIIOB-HOÜ pe3epB SHeprHH H co-^ep>i<aniie H X flinia'MHiHo OBfloano c anepreTH^ecKHMn 3aTipaTaMH opraiHH3-Ma [20].
>K"pOBbie nemecTBa MOJKIÎO paccMarpiiBaîb KaK BecbMa BawHbiii H Jia-CiLibiibiñ KOMnoiieitT, Tecno ciiii3aitiibii"t c npoueccaMii oôMeiia H sHepreTH-MccKHMii cocTonriHiiMH Bcex ocTa^biibix KOMnonenTOB QpraiiH3Ma. B jimmi-jiax nocTon.HHO ocyaiecTBjiniOTCfi npoueccw CHHTe3a H paenaaa HefiTpajib-iibix >KHpoB, nepexofl O A H H X jKupiibix K H C / I O T B fl.pyrne H HOBoo6pa30BanHe >KiipoBbix BemecTB H3 yivieBOAOB H , «lacTHino, ôejiKoo. CjicayeT noOTepK-nvTb, W T O o6pa30Banne H naKoruienHe >i<HpoBbix BemecTB.B opraHH3Max npo-KCxoflHT ne CTO^b'KO 3a c^eT >i<HpoB, co.nep>Kamnxcfi B nniue, CKOjibKo 6jia-roflapfi inpeBpameiiHHM yr^eBOfloB. B CBOK> onepeAb, npH aecpiiUHTe ynne-
319
479
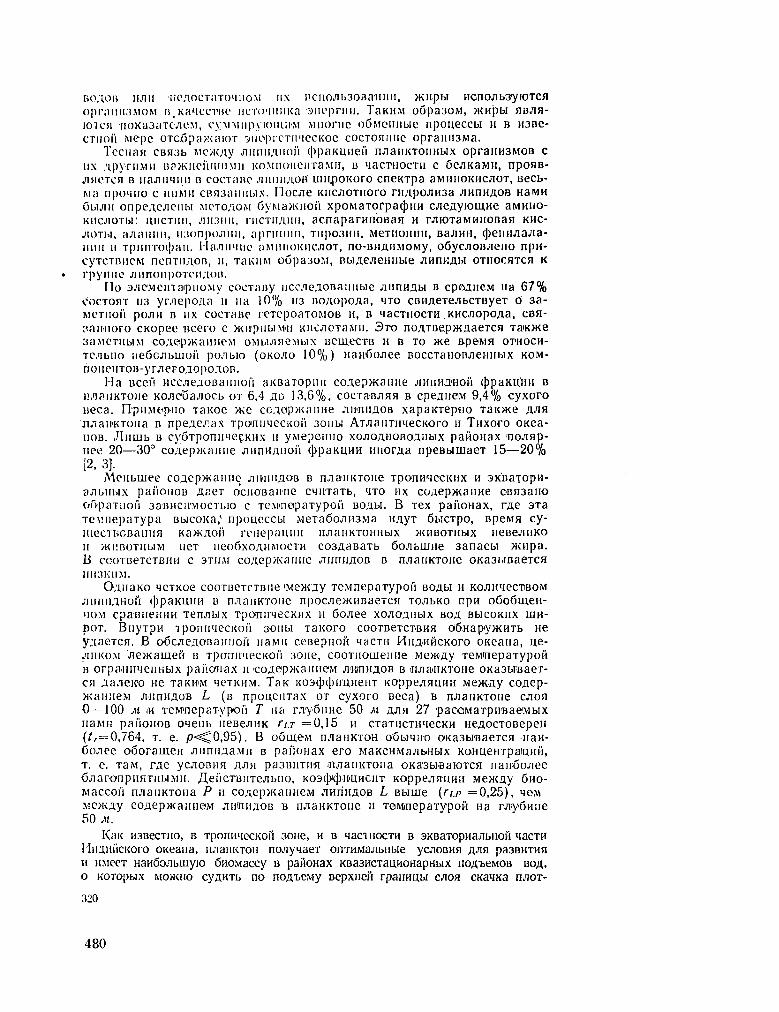
BO.Í.0H IIJ11I 'liCaOCTílTOMUOM MX l'Cn0flli3O3aiIIIH, >KIipbI HCn0^b3yK)TCíI
oprniiiKîMOM DKa^iccTuc iicTO'iiiiiKa aiii-prim. Tai<HM oópa30M, JKHpu HBJIH-JOI Cil •II0KÜ3£1TC^CM, 'Cy MMlipylOlUll'M MlIOniC OÔMC-Illlbie npOUeCCbl H B H 3 B C -
CTiiofi Mepe 0Toopa>!<aior siioprcTimccKoc cocTonime opraiiU3Ma. Tecuán CBSKib Mc>i<;iy Jiiirui/uiüí'i tppanmiefi n/iaiiKToniibix opraiiH3MOB c
nx /ipyniMii na/KiiciiiLiiiMii KOMnoneiiTaMii, B qacmocTH c 6e,nKaMii, nponB-jiHCTcn B iia.niiliiiii B cocîauc .niiriiiAon unijiOKoro cneicrpa aMimoKHcnoT, Becb-Ria npo'ino c niiMH cflîi3auiibix. Ilocne KiicnoTnoro rn/ipa/ima .mnHflOB H a M H ûbuni onpeAcneiibi M C T O A O M 6yMa>Kiioii xpoMaTOfpacpim cneAyiomne a M M i o -KiiciiOTbi: micTiiii, JIII3IUI, niCTiuiHii, acnaparmioBaii H rviiOTaMHHOBan K H C -jiOTbi, a^aiiiin, ii3onpojiiui, apriiiiim, Tiipo3nn, MeTiionmi, Bajimi, cpenn.na.ii a -iiiiii H TpiinToc|)an. IlaJiii'iiie aMiinowicnoT, no-BiiAHMOMy, oôycnoiuieno npii-cyTCTBncM nenTii/ioiî, n, TaKiiM oôpa30M, BbiAejiemibie J I M I K A M O T I I O C H T C H K
• rpyniic juinoii|)OToii;i«B. rio 3^c,McinaipiioMv cocTany iiccneAOBaniibie JiiinHAbi B cpaAneiw na 6 7 %
c'ocrojiT ii3 yr.aepojui 11 na 10% "3 BOAopoAa, M T O cBHAeT&nbCTByeT ci 3a-MCTiioi'i po.nn B nx cocTaae reTepoaTOMOB H , B MacTiiocTii .KHcnopoAa, CBÍI-íaiMioro CKopee «cero c >i<iipiibiMii KiicrcoTafoii. 3 T O noATBepwAaeTca TaK>Ke aaMCTiiHM co;iep>KamieM oMUJiiiCMbix BemecTB H B T O >Ke Bpeivm OTIIOCH-Tc/ibiio iieôcnbiuoii po.'ibio (OKOJIO 10%) nawóojiee BoccTanoB.neniibix K O M -rioiieiiTOB-yrvieECviopcaoB.
H a Been nccjieAOBaiinon ai<BaTopiin coAepwaime .minHAiiOH (ppaKUjm B n.iaiiKTone Kcwieoajiocb O T 6,4 A O 13,6%, cocTa'BjiHH B cpeaneM 9,4% cyxoro ñeca. npiiMep-iio Tai<oe >Ke cc-.icipwaime Jin<niiAOB xapaiCTepno TaK>Ke A - H H nriaii'KToiía B npeA&rax TpanimecKoii 3oiibi ATJianTimeCKOro H Tnxc*ro oxea-IIOB. .riiiiiib B cyÓTponimecKiix n yMepemio xanoAHOBccuibix paiionax >nojinp-nee 20—30° coAepwanne AnnHAHoii cppaKUHH iniorAa npeBbimaeT 15—20% [2, 3].
Meiibiuee coAepwanne jumunov B nJiaiiKTone TponimecKiix H SKBaTopn-a^biibix pai'ionoB AacT aciioBainie cqirraTb, I T O I U coAepwanne 0BH3ano oópaTiioi'i 3aBHCii'MOCTbio c TCMinoparypoii B O A M . B Tex paiionax, irte 3Ta TcvnepaTypa BbicoKa* uponeccbi MeTa6ojiH3Ma iiAyT óucrpo, BpeMH cy-mecTKOBainifi KawAoii renepaunn n-JianKTomibix J K H B O T H U X neBe/iiiKo H >Ki!BOTHbiM íieT I I C O Ó X O A M M O C T H co3AaBaTb 6o/ibuine 3anacbi miipa. B ccoTBeTCTBHH c 3THM coAepwanne .niiniiAOB B njiaiiKTone OKa3i-iBaeTCH 1IH3K1IM.
C X m a K o qciKoe cooTBCTCTBiie w e a u y TeMnepaT-ypoñ B O A W H Ko^imecTBOM JIHI1I1AHOH (ppaKmm B imaiiKTOiie npocne>XHBaeTCH m n b K o npn o ó o o m e H -iioM cpaoneKHH Tenjibix TponimecKnx H ôojiee xojiOAiibix B O A B U C O K I I X IIJH-Í)OT. BiryTpH iponiiHecKoii aoiibi Tai<oro cooTBeTCTBHH o6Hapy>KHTb lie y;iaeTcn. B otfeneAanaiiiioi'i iiaMii ceBepuoñ U Ü C T H HiiAHwcKoro oxeaiía, ue-JIIIKOM JTOKamefl B Tponii'iecKoii 3011e, cooTiiouieime Memay TeMinepaTypoi'i B orpa.nimeiiiibix paiionax n 'coAepwauiieM JimniiAOB B in/iaiiKTOiie OKa3HBaeT-C H Aa.Teifo ne TaKWM I C T K H M . Tai< K03(Jxpn'UHeHT Koppe^auHii Me>KAy coAep-waiiiieM JiiinHAOB L (B npoueiiTax O T cyxoro Beca) B n^ani<Tone CJIOH 0—100 M m TeiwnepaTypoii T na r,ny6nne 50 M A A H 27 paocMaTpHBaeMbix naMii pañoHOB oieiib iieBe^HK TLT = 0 , 1 5 H CTaracTimecKH HeAocTOBepeii (^=0,764, T . e. p - ^ 0 , 9 5 ) . B o ó m e M nAaiiKTOH oôbmiro 0Ka3biBaeTCH iian-Co^ee oôoramen irniiAaMii B paiionax ero MaKCHMaAbHbix KOHuenTpaimiñ, T . e. TaM, trie yc^oBim j\,¡\n pasBiiTiia iTijiaiiKTOiía oKa'3biBaioTca nanúojiee 6jiaronpiiíiT.iibiMH. üeiicTuiiTejibiio, KOScjycpimiieiiT Koppejinunii Me>i<Ay 6110-Maccoii n^aiiKTOiía P ii C0Aep>i<aiineM JIHÍÍHAOB L Bbiuie {r^p = 0 , 2 5 ) , H O M MOKA-y coAepjKaniieM AimiiAOB B n^aiiKTone H TeiHinepaTypoñ na rayonne 50 M .
Kan H3BecTH0, B TponnqccKoii 30ne, H B HaeinocTH B SKBaTopnajibiion «acTH 1 IjiAiiiicKoro OKeana, n^aiiKTOH nojiyqaeT onTHMajibiibie ycriOBHíi J\JIÍI pa3BHTHJi H îiMeeT Hanôojibuiyio 6no.viaccy B paiionax KBa3HCTau.HOHapHbix noA^eMOB B O A . o KOTopwx M O > K H O cyftHTb no noAi>eMy Bepxneñ rpannubi C A O H CKaMKa njiOT-
320
480
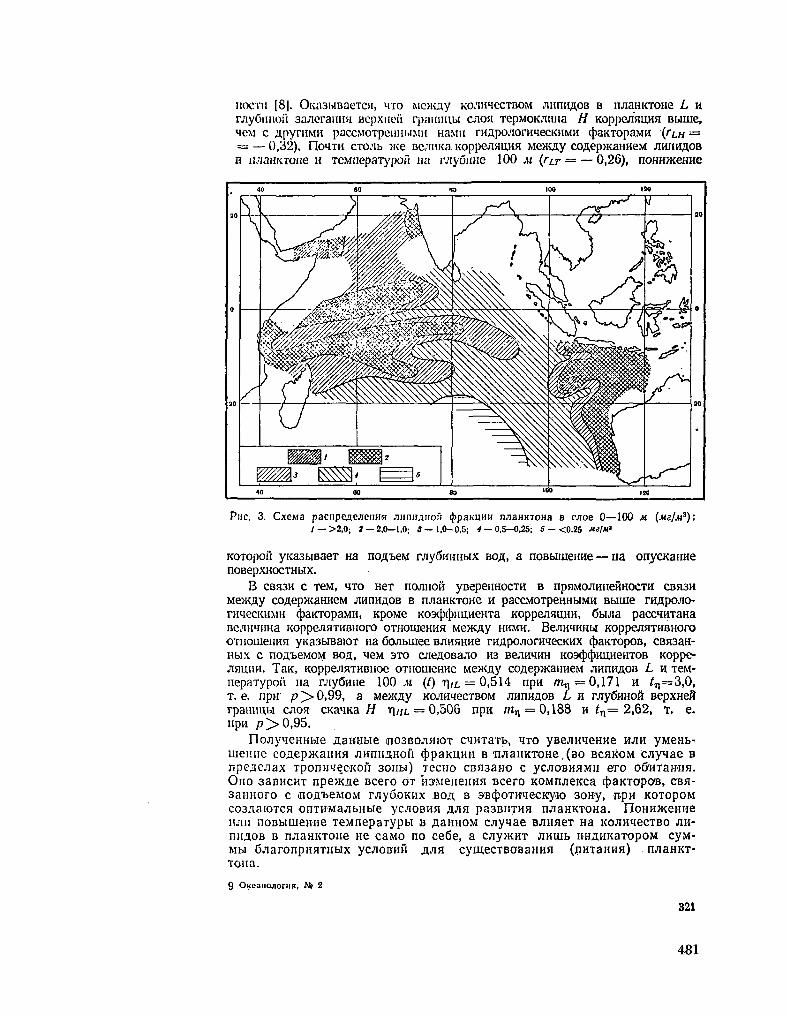
iiocTii [8]. OKa3MBaeTCH, uro M O K A Y KOIIHHCCTBOM JIUIIHAOB B njianicroiie L H rjiyCmioü 3aJicraimsi Bcpxiicii rpannuu CJIOH TepMOKJiHHa H KopponnuHH Bbiuie, HeM c ApyniMH paccMOTpemiiiiMH naMii rnApo.iorHiecKHMH cpaKTopaMH (rLH = — — 0,32). nouTH crarib >Ke Be/ini<a KoppeJinuHH M O K A Y coAepntaHHeM JIHHHAOB
B iuianKTOiie H TCMnepaTypoii na myóime 100 M (ru- = — 0,26), nOHH>KeHHe
Pue. 3. CxeMa pacnpejiejieiiHn jiiiniuiiofi (]>paKUHH ruiaiiKTOHa B cjioe 0—100 M (MZ¡M3): / —>2.0; 2 — 2,0—1.0; 3 — 1,0-0,5; 4 — 0,5—0,25; S — <0,25 M¿/M*
KOTopoiï yKa3biBaeT Ha noflteM rviyOHnnbix B O A , a noBbimemie — Ha onycKaHHe nOBepXHOCTHblX.
B CBH3H C TeM, 1TO HeT UOJIHOft yBepeHHOCTH B npHMOJIHHeñHOCTH CBH3H M O K A Y coAep>KaHHeM JIHIIHAOB B njiaHKTOHe H paccMOTpeHHHMH Bbime rHApo.no-rcmecKHMH (paKTopaMH, KpoMe KoacpcpnuHeHTa KoppenauHH, Obijia pacciHTaHa BGJlVWHHa KOppeJIHTHBHOrO OTHOUieffllH M O K A Y H H M H . BeJIHIHHbl KOppeJIHTHBHOrO OTiioLueiiHn yiva3biBaiOT Ha G a m m é e BJiHHHHe rHApenoraqecKHX cpaKTopoB, CBjraaH-Hbix c noA^eMOM B O A , ^eM S T O cJieAOBajio H3 BCJIHIHH KoacpcpHUHenTOB iroppe-JIHLUIH. Tai<, KoppejiHTHBHoe OTHomeHHe M O K A Y coAep>KaHHeM JinriHAOB L H TeM-nepaTypofi na nnyÔHHe 100 M (t) r|í£. = 0,514 npw m n = 0,171 H ¿,,=3,0, T . e. npn p > 0,99, a M O K A Y KojiHqecTBOM JHHIHAOB L H rjiyÓHHoñ BepxHeñ rpaimubi CJIOH CKamta H r\¡iL — 0,506 npu m , , = 0,188 H ín= 2,62, T . e. npH p > 0 , 9 5 .
nojiyqeHHbie Namibie mo3BOJTiiiOT CHHTarb, I T O yB&nuqeHHe HJIH yMeHb-meinie coAepjKaiiHH JIHTUIAHOÍI tppaKUHH B TuiaHKTOHe.(BO B C H K O M ejiyqae B npeAciax TponimçcKofi 30IIH) Tecuo cBH3ano c ycnoBHHMH ero oÔHTaniiH. O n o 3aBHCHT npe>Kfle Bcero O T ¡OMeneHun Bcero KOMiuieicca (paKTopoB, C B H -3aiiHoro c inoA^eMOM rJiyô.oKnx B O A B SBcpoTHqecKyio 30Hy, npH K O T O P O M co3AaiOTca onTHMajibHbie ycnoBHH AJin pa3BiiTHH n^aHKTOHa. rioHHJKeHue HJin noBbimenHe TeMnepaTypw B AannoM cnyqae BJinaeT Ha KOJIHHCCTBO JIH-miAOB B n^aHKTOHe ne caMO no ceôe, a c;iy>KHT JiHuib HHAHKaTopoM cyM-Mbi ôjiaronpiiHTHUx yc^OBHH JJJIH cymecTBOBaHHH (jiHTanHH) ruiaHKT-Toiia.
9 Oiteaiiojionift, Ni 2
321
481
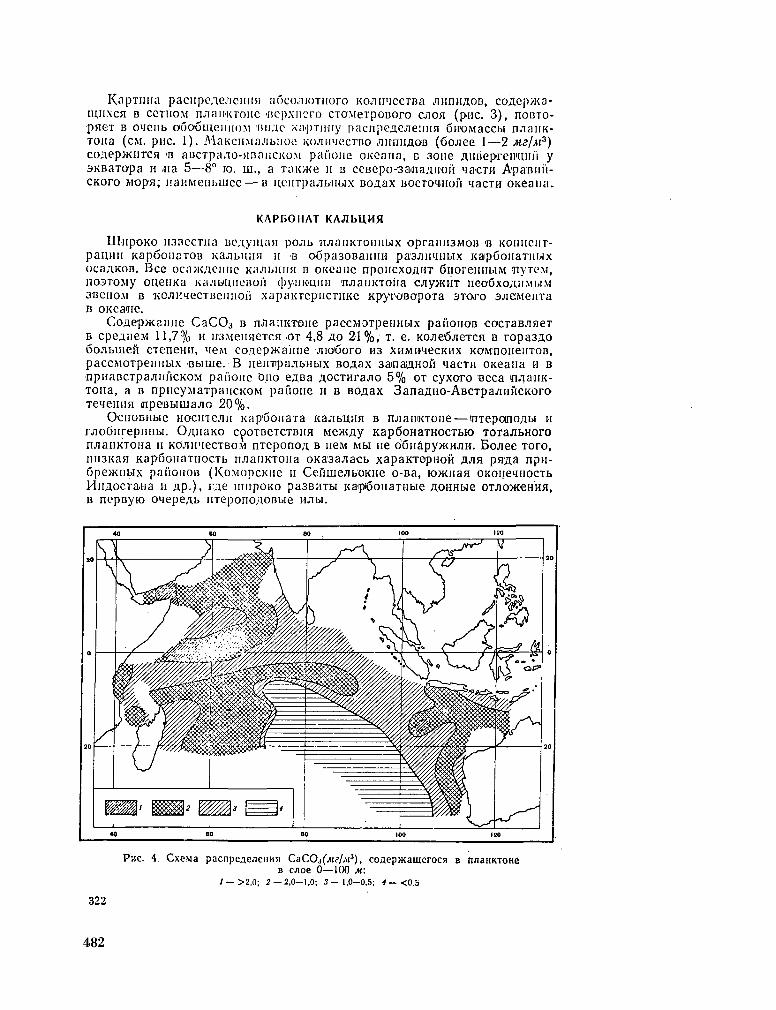
KapTiiiia paciipeAe.nciiitsi añcojiionioro KOJiii'iecTBa JIIUIHAOB, coAepwo-m-nxcn B ccTUOM njiaiiKToiic nepxnoro CTOMeTpoBoro OÎIOJI (pue. 3 ) , noisTO-psier B owciib oóoüiueiiiioM ' m u e Ka.pTnny pacnpe^ejiemín oiroiviaccbi miaiiK-Tona ( C M . piic. 1). MaKciiMaJibiioe Ko/imiecrao jiunuROB (Gojiee 1—2 MB/M3) coAepwiiTCH >a aBCTpa,/io-íinaiiCKOM pai'ione oKcaiia, B 3one zurnepreii'iuin y 3KBaT(jpa H iiia 5—8o io. m . , a Taione n B ceBepo-sanazuroii lacra ApaBiii'i-CKoro Müpíi; iiaiiMeiibUJee — B neiiTpajibiiux B O Z U X BOCTOHHOJ ' Í wacTH oneaiía.
K A P G O H A T KAJIbUHfl
lili i po K O ii3necTiia ucviyniíiH po;ib n^aiiKTomiux opraiui3Mou 'B K O H U C I I T -paumi icapóonaTOB Kajibiui» n B o ó p a s o B a m m pa3./iimiibix KaipGoiiaTiibix oca/iKon. 13ce oca>i<Acinic KaJibiuisi B oKcaue npoiicxo;iHT óiioremibiM U I V T C M , no3TOMy oneiiKa Ka.ibiuicBoii (pyiiKmni n.naiiKTOiia a n y * H T neoCxo;uiMi.iM 3Beiio.\i B KO^i:iecTBemioii xapaKTepiiCTiiKe KpyroBapoTa 3TO.ro 3Jie¡vieiiTa B oKeaiiie.
Co ,ep>Kaiiiie C a C 0 3 B nJiaiiKTOiie paccMOTpeiuibix pañonoB cocTaB.iJieT B cpe;uieiM 11,7% H ir3MeiiHCTCji..0T 4,8 AO 2 1 % , T . e. KOJieôJieTCfi B ropa3ao oo.Tbuieñ cTenemí, M C M co/iep>Kaiine jiidóoro H3 X H I M H W C K H X KoiunoneiiTOB, paccMOTpeKiibix Bbiiue.B ueimpajibiibix BOíiax 3ainaanoiï iiacTii OKeana H B npiiaBCTpa^iiiicKOM paiïoiie ono eAoa .nocTHra.no 5% O T cyxoro Beca n;iaiHK-Tona, a B npiicyMaTpaiicKOM paíioiie H B BOAax 3anafliio-ABCTpa^Hñci<oro TeweiHin npe'Bbiuia^o 2 0 % .
OciroBHbie Hocinejiii Kap'6onaTa Kajibnnn B n^ainKTOiie — iinepoinoAbí H nnoóiirepiiiibi. O A » 3 K O cpoTBeTCTBiiH Me>i<Ay KapóoHaTHOCTbio TOTajibHoro ruiaiiKToiia H K O V I H H C C T B O M nreponoa B neiw M M ne donâpywHJiH. Bo^ee Toro, iiii3KaH KapQoíiaTiiocTb nJiaiiKTOiía oKasajiacb xapaKTepiioft AJIH pwAa npii-6pe>Kiibix paiionoB (KoMopcKiie n Ce¡iiue.nbOKne o-Ba, rosnan OKonemiocTb H'iuocTana H zip.), me iunpoKO pa3BHTbi Kaip¡6onaTHbie AQHHbie OTJIO>K€H'HH, B ncpByio onepeAb nTeporiOAOBbie H A H .
40 GO 80 100 ISO
40 60 80 100 120
Pue. 4 Cxevia pacnpcacneiWH CaCOi(Me¡M3), coaepwamerocn B njiaHKTOHe B cjioe 0—100 M:
1 — >2,0; 2 — 2,0—1,0; 3 - 1 , 0 - 0 , 5 ; 4 — <0,5
322
482
1 liinsi K;!|"ITI:I;;I naó.no.'l.'iOTCíi JIpit cpauíicmiii pacnpcncneunn KapGonaT-noi'Tii iui<*niKTo:ia co cxoMoii Kü/iu'iccTiJcmioro pacnpca&ncimn r ioCiiropini, C(K'.T;IH.!IOIIIIOI"I 13cvi>ieno¡i [1]. ÜKaaajioch, M T O paiioiibi c iiairGoJice D H C O K O H KapóoiiaTiiocii.io iri.ri;i'iiKTOiia (IOKJKIÍI I U V C T L Apauni'iCKoro Mopa, tLpnn'Baii-c.Kiii'i H iipn;¡ncT]KMii]"iCKiii'[ paiioiibi) connaaaiOT c paí'ioiiaMH OTiioCHTejibiio HbR'OKoíi •mc./ieiiiiocTii ivioüiircpi'ii. B T O >KC B p e M H nan6oJiee úe iibic njiaiiK-Tonorciiiii.iM Kap'óoiiaTo.N! najibuiin ueirrpa^bHbie BOflbi TaioKe oócAneiibi H iviouiircpimaMii. Co3,T,acrcH iviicuaTJiciiiic, ' n o coaop>Kaimc KapiGonaTa Ka.nb-miH u Tporni'iecKOM n^aiiKToiic oiipcuvisicTca npe>K^e Bcero K O J I H M C C T B O M rjioóiircpini;
]i.'iaTo;iapH cpaiiiniTCvibiio Go;ibiwrM KOJieGaimíiM B coaepjKaiiHH C a C O í B n.'iaiiKTimc Kapuuia paonpo;uviciin>i ero a'GcojiiOTiibix 3iialieiiHÍi (pmc. 4) B MciibiBcü Mcpe, V I C M m m ;ipy.nix pacoMonpemiMx Bbiuie xoMnonenTOB, co-rJiacycTCH c KapTii'íioí'r pacn'pcicjieiiiiíi GnoMaccu njiaiiKTona (pnc. 1) .
ilaiióojicc EbicoKoe ccnep/Kamie 'luiaiiKToiioreinioro KapGonaTa KajibUHH' oKa:ia;iocb xapaKTep'Hbm ÍJIÍI soiibi „iiiBcprcimnii na sKBaTope B 3a'naaH0ñ; Macni oKeaiía H B Boaax y uxoaa n AJICIICKIIÍI 3ajiHB; HecKOJibKo Menbiuee — n Apa'imiickoM iwope, K B O C T O K Y O T Mazuiraciopa H Meatfly #¡BOÍI H A'Bcrpa-jineii (no ne B npiiópoKiibix Bo/iax). HaiiMeiibiuee coflep/Ka'iwe KapGonaTOB O T . M O M C I I O B ueiiTpajibiibix aoflax BOCTCHIIIOU <iacTn oi<eana H B BOflax H D J K H O -ro 3KBaTopnajibuoro Tcieinm K B O d O K y O T apxnnejiara Maroc.
HiiTepcciio npocjiefliiTb, Kai< oipa>KaeTCH pacnpeAejieiiHe x»MH>iecKHX KOMnonoiiTOB noBepxiiocTiioro n;iaiiKTOna na xapaKTepe iiaKon^enHH Tex w e BCincCTB B flOIIIIblX OTVlO/KCIIHilX.
K a K y>Kc roBop'iiJiocb, M O K n y paonpeflejieimeM iuiaiiKTOHorennoro i<ap-GonaTa KajibuiiH H pa.iMc'meiuic.M i<apóonaT¡ibix ocaaKOB ne naiGjuoflaeTCH i!CTnoii 3aiBi:cnMocTii. ITo-BiifliiuMOMy, pacTBopenne Ka;ibmiTa arpeccHBHHMH rJiyGimiibiMH BoaaMii B .npouecce ceflHMeiiTaunH, a TaK>Ke pa36aB.níiiom.ee BJiiiíMine Teppnreinioro n oGjioMOHHoro KapGonaTnoro MaTepnaJia B n¡pH-ópe»<noñ 30ne iiapymaioT ec.
B T O w e BpeMJi Meatfly 6iiTy<MHiio3HOCTbio flOHHbix oTjio^teHHH H paonpe-flcneinieM CiiOMaccw TuiaiiKTona o noBepxiiocmbix BOflax naiGjiioflaeTCH A O -CTaTO'ino «ieTKan, n p a M a n CB$i3b [5]. AiiaJiorHiiiaH CBfl3b npofl'BjiHeTCH H MOKfly pacnpeflejieinieM jiirniianoñ (ppawm-ni ruiaHKTOHa H 6jiTyMHH03HOCTbK> oca^KOB, ' m o noj,TBepH<aaeT nojioweniie o Beaymeíi pojrn ^HnHflOB injiaiHK-TOIIIIblX OpraHH3MOB B reiiepaUHH 6HTyiMHH03HbIX KOMInOUeHTOB flOHHblX OTJlOTKCHllff.
H a M C M a e T C H TaKHíe cooTBeTCTBiie 'MejKfly dOHJineM njiauKTOHHbix opra-HII3M0B H KOimeiiTpauíieii opraiumecKoro BemecTBa B flomnbix O T J I O J K C H H H X OTKpwTbix pai'ioiicB OKeaiía.
y,iiacTi:e pa3jinwHbix •njiaiiKTOiioremibix KOMnoHenToc B ocaflKoa6pa30-Bamiii ÍB O T K p b n o M OKeaiie B 3Ha,iiiiTejibiioii Mepe 3aBHcnT O T H X ycToñmiBO-CTII n o oTiiomeiíino K BHeiuiiHAi B03flei°fCT3iiírM. FIoaTOMy Tanne, oTHOCHTe^b-Ho CTaÔH^bHbie BemecTBa, Kan JiiinimnaH ^ p a K U H H , B ropasAO ôo^bmefi CTe-ncuii 3aneMeTJieBaiOT B oca.n,Kax oomyio KapTHwy cBoero paanpeaejienHH. B TiJiaiiKTone, W C M Go^ee Jia GiijibUbie KapCoiiaTbi.
JIHTEPATYPA
1. B c J i n c D a M . B . 1964. Pacnpe/ie.icime nJiaiiKTOimux ^)opaMHnntpep B Boaax n Ha Ane' HiiAinicKoro oKCiiiia. Tp. Hn-Ta OKeano^. A H C C C P , 68.
2. B o r o p o B . B . r. 1960. reorpa(j)iiMecKiic H3MeHemiH >KiipHOCTH n^aHKTOHá B OKeaHe. . U O K . 1 . All C C C P , 134, N°6.
3. B o r o p o B B . T. , B H H o r p a a o B M . E . 1960. Pacnpeaejiemie 6HOMaccw. 30onjiaHKTO-na B neiiTpa.ibHoi'i <iacTii Tiixoro oi<caiia. Tp. Bcec. rHapoOiio^. o-Ba, X .
9* 32Ï
483
4. 15 o r o |) o n B . T . , B n n o r p a ;i o n M . E . 1901. HcKOTopuc 'lepru pacnpeAC'iciiHH dnoMacVbi n.iaiiKTOiia n iionepxuocnibix iwuix HiiAin'iCKoro oncaiia 3 H M O M 1959/CO rr. Oi<eano¿i. IICCACA-, JVs 4.
5. li o p ; i o n c K H ii O . K . 1901. K xapaiucpiiCTiwc opraiimiecKoro BcmccTBa Aomibix O T -."iO/iicimii Tiixoro it IIii.iniicKoro oKcanon. B c6. CpeAa n nponeccu He(pTeo6pa30BannH. M J A . «Ilayua», M .
0. B ii II o r p a A o i) A . n . 1938. AIIMII ' ICCKMÜ cocîaB Mopcuoro MaiiKTona. T p . Bcec. H . - H . nii-xa pbidi. x-Ba n OKcanorp., VII.
7. B i i i i o r p a a o B A . II. 1939. XHMÍI ' ICCKIIÜ cocîaB nJiaiiKTOiia. T p . BiioreoxiiM. jia-flop., V .
8. B II II o r p n zio'n M . E . , B o p o H n n a II. M . , C y x a i i o a a H . H . 1901. npocTpaiicT-ncnnoe paciipcAcacuiie TpomiMccKoro u.iaiiKTOiia n ero CBÍI31> C ncKOTopuMii ocoGenuo-CTJIMU crpyioypi.1 B O A on<pi.irbix paiioiion oKcann. Oxcaiiojioriisi, 1, Bi.in. 2.
9. B n n o r p a A o u M . li., B o p o n n n a 11. M . 19152. IIci<OTopue 'icpTbi pacnpcACJicima 3ooiuiain<roiia ceocpnoii 'lacin lliumicKoro oneana. T p . Hn-Ta OKeaiioA. A M C C C P , 58.
10. B n n o r p a A o n n 3 . A . 1950. J\ iio.niamiio xiimii'iecKoro cocraHa KopMOBbix opraiM3-MOII n pufi Mepnoro Mopn . Tp . C m i c m . no I|III.IIIOJ¡. pi,if>, M .
11. B n n o r p a a n-B a 3 . A . 1957. liiiouiMii'iecKJiit cocrau n.'iaiii;io¡ia LIcpnoru Mopu. J\OKJ\. All C C C P , 116, JVs 4.
12. B n n o r p a A o B a 3 . A . 1900. K ii3yMeiiiuo GnoxiiMii'iecKoro cocTaBa aiiTapKTii'iecKiix >icpnorAa30K Euphausia supcrba Dana . JIOKJI. A H C C C P , 133, Nn 3.
13. B n n o r p a A o B 3 . A . 1901. O C O O C I I H O C T H GnoxiiMii'iecKoro cocTaBa n KajiopuiiiiocTh (|>iiTO- u 30on.ianiiTOiia ccnopo-sanaAiioii liacTM Mepnoro Mopn B 1955—1959 rr. yi yan. O A C C C K . (¡MOJÍ. cr. All Y C C P , nun. 3.
14. B M n o r p a A o B a 3 . A . 1901. HcKOTopuc GiioxiiMii'iecKiie acneKTbi cpauiiHTe.ibiioro iinyiciiiifi nAaiiKToiia Mepnoro, A3oiici<oro ii KaomiiicKoro Mopeii. OivcaiiojiorHsi, IV, Bblll. 2. \
15. K i i 3 e B C T T C p H . B . 1951. O KopwoBoi'i UCIIIIOCTII n.iaiiKTOiia OxoTCKoro n ilnoiiCKoro Mopeii. H 3 B . TnxooKcaiicK. ii.-II. nu-Ta pufiii. x-Ba n OKCaiiorp., 39.
10. Jl a il c K a H JI. B . , n m c n II II a T . H . 19G1. CoAepwainie 6eJiKa, « u p a , yrJieBOAOB ii 30-Jibi B HCKOTopbix MaccoiH.L\ n.iaiiKTOiiiibix BOAopoc/iHX Mepnoro M o p n , Bbipameiiiibix B Ky.TbTypax. Tp : CcBacT. Cmbn. C T . , 14.
17. Jl n c n u bi n A . n . 1959. HoBbic Aamibie o cocTa.Be w pacnpcAcncmiH' B3Boiiieinibix rcmi'CTB B Mopnx n oKcanax B CBSI3H C uonpocaMii reojioriiH. J\OK.J\. A H C C C P , 126, JVs 4 .
18. Ii n c n u. u n A . n . 1901. PacnpcACJieinie n cocîaB B3Beiiieinioro niaTepiiajia B mopnx n OKCanax. B c6. CoiipcMcmibie oca/uui Mopeii II OKcanoB. H 3 A . A H C C C P , M .
19. JIncHUbiii A . H . 1901. Pacnpeacicriiic n XIIMII'ICCKHÍ'I cocTau B 3 B C C H B no.iax H H A H H -CKoro OKoana. Pc3y.nbTaTi>i ncc.ic.i. no npoipaMM.e M I T . ÛKe£]io,ioi"iiH, IV, Bnin. 10.
20. rieTiina T . C . 1904. Cyro'iiibiii piiTM pacxoAa n iiaKon/icmisi >KHpa y Calanus helgo-landicus (Clans) B McpnoM Mope. JXOK.I. A H C C C P , 156, JVs 0.
21. C y x a ii o B a H . II. 1902. O IIIIAOBOM cocTane ii pacnpeAeJienmi (biiTonJiaiiKTona B ce-Bepnoii 'lacni HiiAiiiicKoro oncaiia. Tp. Hii-ia oi<eaiioJi. A H C C C P , 58.
22. U . x o M e Ji ii A 3 e O . Ii. 1958. K'óiioxiiMiniccKOMy cocTaBy nJiaHirroiia B O C T O ' H I O Ü >iacTH Mepnoro Mop». C o o C m . A H Tpy3. C C P , 21, A» 2.
23. C h a v e K . E . 1954. Aspects of the Biogeochemistry of Magnes ium. 1. Calcareaus m a rine organisms. J. Gcol., 62, N o 3.
21. F i s h e r L . R . 1902. The total lipid material in some species of marine zooplankton. Cons . Perm. Intern. Explor. M e r . Rap. et Proc-Verb., 153.
25. II a g m c i e r E . 1904. Z u m Gelialt an Sesión und Plankton im Indisched Ozean zwi-chen Australien und Indonésien. Kieler. Meercsiorsch., 20, H . 1.
20. H a r r i s E . , R i 1 e y G . A . 1950. Chemical composition of the plankton. Bull. Bingh a m Oceanogr. Coll., 15.
27. K r e y I. 1958. Chemical determinations of net plankton with special reference to equivalent albumin content. J. Marine Res., 17.
28. M e n z el D . W . 1904. Jhe distribution of dissolved organic carbon In the Western Indian Ocean. Deep-Sea Res., 11, N o 5.
29. W a l t e r s V . 1901. A contribution to the biology of the Giganturidae, with desceiption of a n e w genus and species. Bull. M u s e u m C o m p a r . Zool. Harv., 125, N o . 10.
30. W i m p c n n v R . S . 1941. Organic polarity, some ecological and physiological aspects. Quart. Rev. Biol., 16, N o . 4 .
riocTymuia B pcAaKmno 24.XII.1900 r.
484
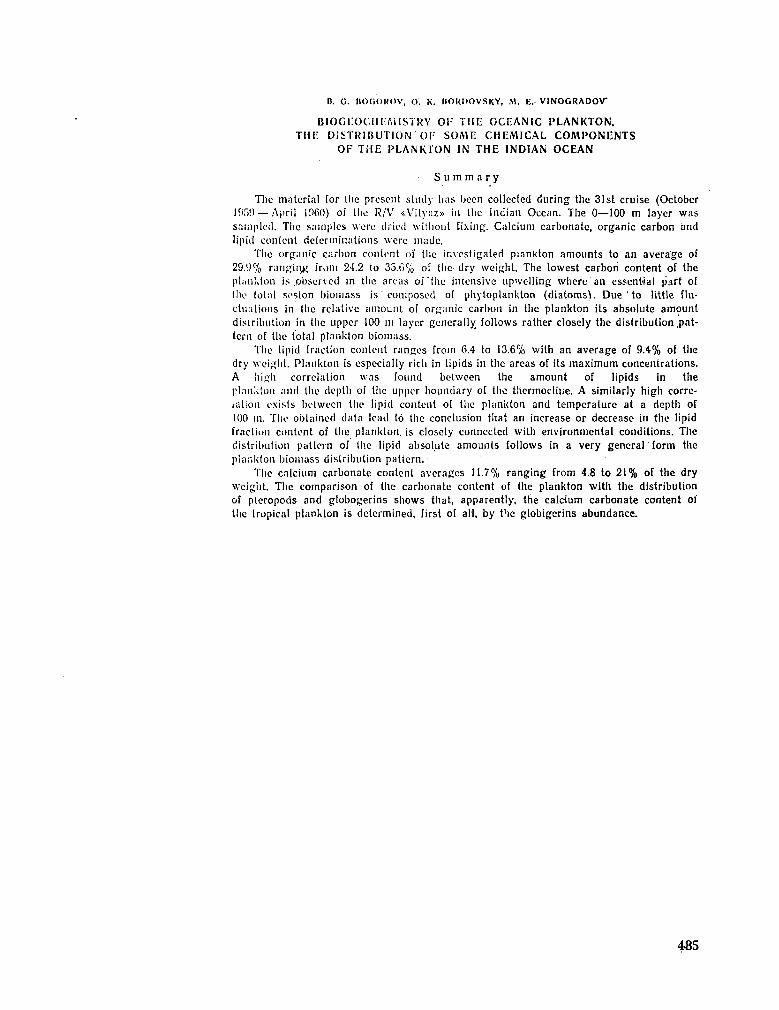
11. G. BOGOROV, O. K. IIOKPOVSKY, M. E. VINOGRADOV
BIOGEOCIIEMISTRY or THE OCEANIC PLANKTON. THF. DISTRIBUTION'0[" SOME CHEMICAL COMPONENTS
01- THE PLANKTON IN THE INDIAN OCEAN
S u m m a r y
TIic material for the present study lias been collected during the 31st cruise (October If)!)!) —April 1060) of Hie R / V «Vilyaz» in the Indian Ocean. The 0—100 m layer was sampled. The samples were dried without fixing. Calcium carbonate, organic carbon and lipid content determinations were made .
The organic carbon content of the investigated plankton amounts to an average of 29.9% ranging from 21.2 to 35.6% of the dry weight. The lowest carbori content of the plankton is .observed in the areas of'the intensive upwelling where an essential part of the tola! soslon biomass is composed of phytoplankton (diatoms). D u e ' to little fluctuations in the relative amount of organic carbon in the plankton its absolute amount distribution in the upper 100 m layer generally follows rather closely the distribution.pattern of the total plankton biomass.
The lipid fraction content ranges from 6.4 to 13.6% with an average of 9.4% of the dry weight. Plankton is especially rich in lipids in the areas of its m a x i m u m concentrations. A high correlation w a s found between the amount of lipids in the plankton and the depth of the upper boundary of the thermocliue. A similarly high correlation exists between the lipid content of the plankton and temperature at a depth of 100 in. The obtained data lead to the conclusion that an increase or decrease in the lipid fraction content of the plankton, is closely connected with environmental conditions. The distribution pattern of the lipid absolute amounts follows in a very generar form the plankton biomass distribution pattern.
The calcium carbonate content averages 11.7% ranging from 4.8 to 21% of the dry weight. The comparison of the carbonate content of the plankton with the distribution of pteropods and globogerins shows that, apparently, the calcium carbonate content of the tropical plankton is determined, first of all, by the globigerins abundance.
485
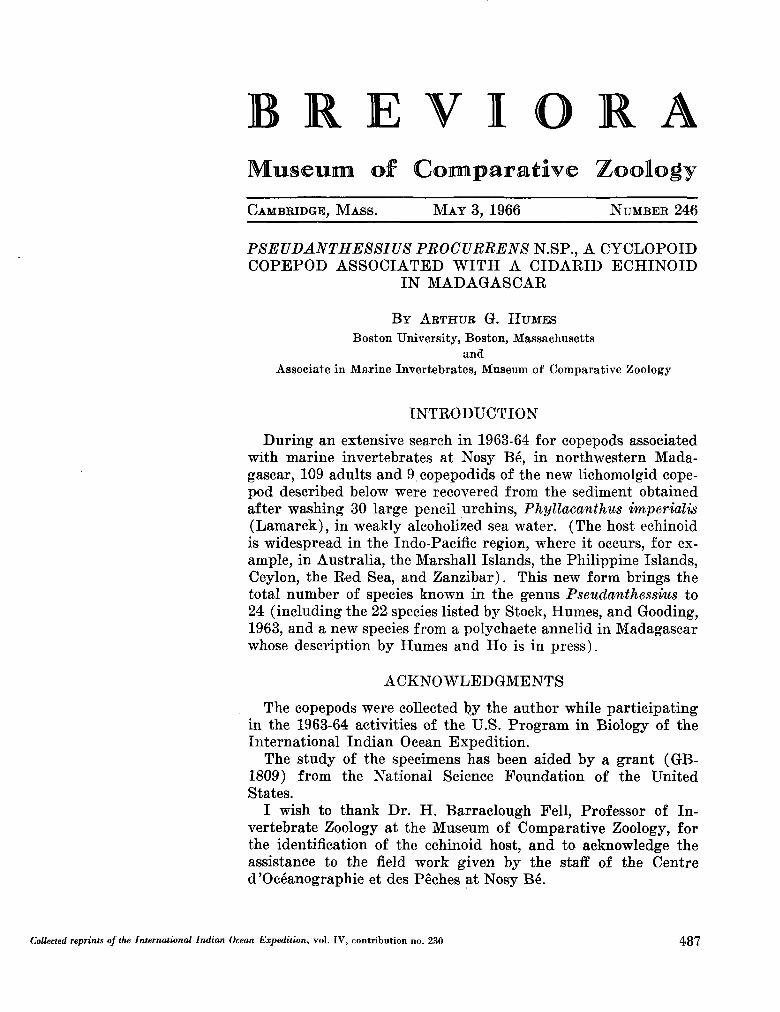
B R E V I O R A Museum of Comparative Zoology
CAMBRIDGE, MASS. M A Y 3, 1966 N U M B E R 246
PSEUDANTHESSIUS PROCURBENS N.SP., A CYCLOPOID COPEPOD ASSOCIATED WITH A CIDARID ECHINOID
IN MADAGASCAR
B Y ARTHUR G. H U M E S Boston University, Boston, Massachusetts
and
Associate in Marine Invertebrates, Museum of Comparative Zoology
INTRODUCTION
During an extensive search in 1963-64 for copepods associated with marine invertebrates at Nosy Bé, in northwestern M a d a gascar, 109 adults and 9 copepodids of the new lichomolgid cope-pod described below were recovered from the sediment obtained after washing 30 large pencil urchins, Phyllacanthus imperialis (Lamarck), in weakly alcoholized sea water. (The host echinoid is widespread in the Indo-Pacific region, where it occurs, for example, in Australia, the Marshall Islands, the Philippine Islands, Ceylon, the Red Sea, and Zanzibar). This new form brings the total number of species known in the genus Pseudanthessius to 24 (including the 22 species listed by Stock, H u m e s , and Gooding, 1963, and a new species from a polychaete annelid in Madagascar whose description by H u m e s and H o is in press).
ACKNOWLEDGMENTS
The copepods were collected by the author while participating in the 1963-64 activities of the U . S . Program in Biology of the International Indian Ocean Expedition.
The study of the specimens has been aided by a grant ( G B -1809) from the National Science Foundation of the United States.
I wish to thank Dr . H . Barraclough Fell, Professor of Invertebrate Zoology at the M u s e u m of Comparative Zoology, for the identification of the echinoid host, and to acknowledge the assistance to the field work given by the staff of the Centre d'Océanographie et des Pêches at Nosy Bé .
Collected reprints of the International Indian Ocean Expedition, vol. IV, contribution no. 230 487
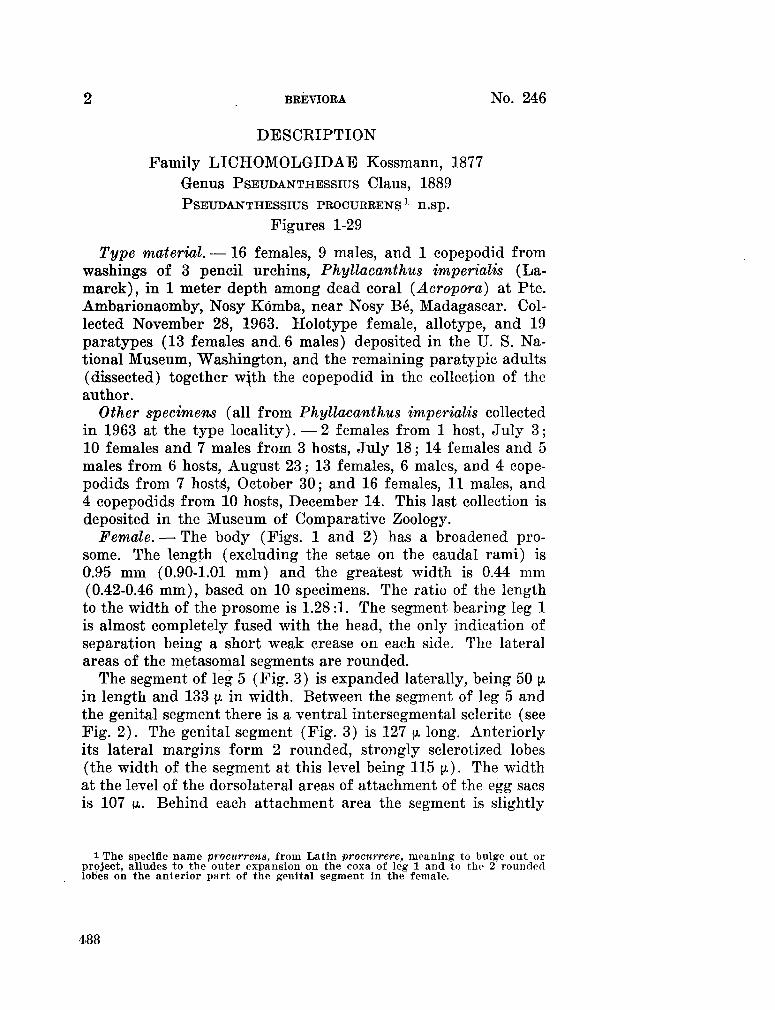
2 BBEVIORA No. 246
DESCRIPTION
Family L I C H O M O L G I D A E Kossmann, 1877 Genus PSEUDANTHESSIUS Claus, 1889 PSEUDANTHESSIUS PROCURRENS X n.Sp.
Figures 1-29
Type material. —16 females, 9 males, and 1 copepodid from washings of 3 pencil urchins, Phyllacanthus imperialis (Lamarck), in 1 meter depth among dead coral (Acropora) at Pte. Ambarionaomby, Nosy Kómba, near Nosy Bé, Madagascar. Collected November 28, 1963. Holotype female, allotype, and 19 paratypes (13 females and. 6 males) deposited in the U . S. National Museum, Washington, and the remaining paratypic adults (dissected) together w^th the copepodid in the collection of the author.
Other specimens (all from Phyllacanthus imperialis collected in 1963 at the type locality). — 2 females from 1 host, July 3 ; 10 females and 7 males from 3 hosts, July 18 ; 14 females and 5 males from 6 hosts, August 23 ; 13 females, 6 males, and 4 cope-podids from 7 hostá, October 30; and 16 females, 11 males, and 4 copepodids from 10 hosts, December 14. This last collection is deposited in the Museum of Comparative Zoology.
Female. — The body (Figs. 1 and 2) has a broadened pro-some. The length (excluding the setae on the caudal rami) is 0.95 m m (0.90-1.01 m m ) and the greatest width is 0.44 m m (0.42-0.46 m m ) , based on 10 specimens. The ratio of the length to the width of the prosome is 1.28:1. The segment bearing leg 1 is almost completely fused with the head, the only indication of separation being a short weak crease on each side. The lateral areas of the metasomal segments are rounded.
The segment of leg 5 (Fig. 3) is expanded laterally, being 50 [A in length and 133 ¡A in width. Between the segment of leg 5 and the genital segment there is a ventral intersegmental sclerite (see Fig. 2). The genital segment (Fig. 3) is 127 \i long. Anteriorly its lateral margins form 2 rounded, strongly sclerotized lobes (the width of the segment at this level being 115 ¡A). The width at the level of the dorsolateral areas of attachment of the egg sacs is 107 w.. Behind each attachment area the segment is slightly
1 The specific name procurrens, from Latin procurrere, meaning to bulge out or project, alludes to the outer expansion on the coxa of leg 1 and to the 2 rounded lobes on the anterior part of the genital segment in the female.
488
1966 N E W COPEPOD FROM AN ECHINOID 3
constricted with nearly parallel margins (the width in this region being 86 [x)v Each egg sac attachment area (Fig. 4) bears anteriorly a slender, slightly haired seta (21 \i long) and just posterior to it a short naked seta (6.5 y. long) composed of an expanded sclerotized basal portion and a slender hyaline distal part. Medial to the latter seta there are 2 small spinelike processes. The three postgenital segments are 44 x 81, 39 x 75, and 65 x 72 ¡J. from anterior to posterior. The anal segment bears on each side on its distal margin a dorsal and ventral row of spinules.
The caudal ramus (Fig. 5) is elongated, with a terminal ventral expansion whose margin bears a row of spinules. The length along the inner side of the ramus to the end of the expansion is 114 [A, along the outer side 104 ji, and the width at the level of the outer seta is 24 \x.. The ratio of length to width is about 4.5:1. The outer seta, inserted 70 ¡JL from the base of the ramus, is naked and 56 [x in length. The pedicellate dorsal seta is 33 [i and slightly haired. The outermost terminal seta (100 JJ.) and the innermost terminal seta (72 [A) are haired. The 2 long median terminal setae are 177 and 250 ¡jt. in length respectively and haired. A minute lateral setule is borne on the outer basal margin of the ramus. The dorsal and ventral surfaces of the ramus bear a few refractile points.
The dorsal surface of the prosome and the dorsal and ventral surfaces of the urosome bear minute setules and refractile points. In addition, the outer ventral areas of the head carry a sub-marginal row of refractile points (Fig. 6) . The ratio of the length of the prosome to that of the urosome is 1.53 :1.
The egg sacs (Fig. 1) are moderately elongated, often rather pointed posteriorly, and contain numerous eggs. In one female the egg sacs measured 385 x 220 ¡A, with each egg about 57-60 ¡A in diameter.
The rostral area (Fig. 7) is moderately well developed. Between this area and. the front of the labral region there is a slight protrusion on the ventral surface of the head.
The first antenna (Fig. 8) is 7-segmented, with the lengths of the segments (measured along their posterior non-setiferous margins) 24 (39 p along the anterior margin), 103, 21, 39, 33, 20, and 17 [x respectively. The formula for the armature is 4, 13, 6, 3, 4 -f- 1 aesthete, 2 + 1 aesthete, and 7 + 1 aesthete. All the setae are naked.
The second antenna (Fig. 9) is 4-segmented, with the last segment elongated (69 ¡JL along the shorter ventral margin, 93 ¡x along
489
4 BREVIORA N o . 246
the dorsal margin, and 19 [x in width). Each of the first two segments bears a small ventral seta, the third segment bears 4 slender setae (one of them very small), and the last segment bears 2 unequal slender recurved claws (47 and 25 JJL respectively along their axes) and 5 setae, one of them very long (99 [A). The extremity of the last segment is swollen, so that the 2 claws insert at one side rather than directly on the tip of the segment. All the setae are naked.
The labrum (Fig. 10) consists of 2 diverging, pointed lobes with their medial edges straight and finely dentate, both arising from a large, conspicuous, sclerotized area which projects (Fig. 2) from the ventral surface of the head. O n the posterior wall of the labrum, in front of the mouth area, there is a pair of small sclerotized lobes. The surface of the labrum lacks fine ornamentation. ^
The mandible (Fig. 11) has on the concave side of the blade an oblique row of spinules followed distally by a spinelike process lying parallel to the blade and evidently not articulated with it. The convex side of the blade bears a fringe of graduated spinuli-form structures without definite articulations. The paragnath (Fig. 12), lying medial to the base of the first maxilla (as in Fig. 16), is a rounded lobe bearing a small sclerotized outer process, a small postero-inner knob, and a posterior group of hairs. The first maxilla (Fig. 13) is a single segment bearing 4 naked elements, comprising terminally 2 obtuse subequal spines (10 and 8 ¡x long) and a shorter pointed spine (5 [/.) and sub-terminally a naked hyaline seta (11 [).). The second maxilla (Fig. 14) is 2-segmented. The first segment is unarmed but has a small sclerotized protuberance on its expanded margin. The second segment is produced to form a long bilaterally spinulose lash; the dorsal surface bears a proximal seta 29 ¡JI in length (bearing lateral spinules along one edge) and a distal row of 3-5 spinules. The maxilliped (Fig. 15) is 3-segmented. There are 2 naked setae on the second segment. The terminal segment bears proximally a spine with unilateral spinules, a hyaline naked setule, and near the base of the latter a minute setule ; the segment is produced to form an attenuated spinelike structure with a row of long spinules along one side and a row of minute spinules near the opposite margin.
The postoral area (Fig. 16) shows between the paragnaths a shield-shaped area which projects ventrally to form a low median process. Posterior to the sclerotization which almost joins the
490
1966 N E W COPEPOD FROM AN ECHINOID 5
bases of the maxillipeds, the ventral surface of the cephalosome protrudes slightly (best seen in a lateral view, as in Fig. 2 ) .
Legs 1-4 (Figs. 17, 18, 19, and 20) have trimerous rami except for the endopod of leg 4 which is unimerous. The armature of the legs is as follows (the E o m a n numerals indicating spines, the Arabic numerals setae) :
PI
P 2
P3
P 4
protopod
protopod
protopod
protopod
0-1;
0-1;
0-1;
0-1;
1-0
1-0
1-0
1-0
exp end exp end exp end exp end
1-0 0-1 1-0 0-1 1-0, 0-1 1-0, II
I-l; ; 0-1;
I-l; 0-2; I-l; 0-2;
I-l;
111,1,4 1,2,3 111,1,5 1,11,3 111,1,5 1,11,2 11,1,5
The inner seta on the coxa of legs 1-3 is long and plumose, but in leg 4 this seta is minute (7 ¡A long) and naked. In the first 3 legs the inner margin of the basis bears a short row of hairs, but in leg 4 these hairs are lacking. The outer coxal margin of leg 1 is expanded to form a prominent lobe (Fig. 17) ; in legs 2 and 3 this expansion is m u c h less prominent and in leg 4 it is apparently absent. The tips of the outer spines on the exopods are slightly recurved posteriorly and the more proximal ones have minute terminal flagella. The 3 spines on the last segment of the endopod of leg 2 are 14, 10, and 13 [x in length from proximal to distal, with the middle one having a short terminal flagellum. In leg 4 the exopod is longer than in any of the preceding legs. The endopod measures 53 x 16, ¡J. and has nearly païallel margins without a constriction or notch. It bears a row of hairs on its outer proximal third and an anterior row of small spinules near the insertions of the 2 divergent terminal spines (the outer 18 IJL long with a minute flagellum, the inner 37 j/. long with a more strongly spinulose flange along the outer side than along the inner side).
Leg 5 (Fig. 21) consists of a strong spine (33 \L long) and an adjacent seta (21 ¡JI), together with a dorsal seta (22 ¡x), ornamented as in the figure. External to the spine and seta there is a row of minute blunt spinules at the apex of the segment. Although, as in other species of Pseudanthessius, there is no free segment of leg 5, it is likely that the spine and its adjacent seta correspond to the terminal armature in other lichomolgids.
Leg 6 is probably represented by the 2 setae near the attachment of each egg sac (see Fig. 4 ) .
491
6 BREVIORA N o . 246
The color in life in transmitted light is translucid, the eye red, the intestine black, the ovary gray, the egg sacs opaque gray. (Although in specimens preserved in 70 per cent ethyl alcohol the color is an opaque grayish brown, the color changes quickly to a bright red when the copepods are placed in lactic acid.)
Male. — The body (Figs. 22 and 23) has a much narrower prosome than in the female, but otherwise resembles that sex in general form. The length (not including the setae on the caudal rami) is 0.76 m m (0J3-0.78 m m ) and the greatest width is 0.27 m m (0.25-0.28 m m ) , based on 10 specimens (including the allotype, 8 paratypes, and 1 specimen from Pte. Ambarionaomby on October 30). The ratio of length to width of the prosome is 1.57:1.
The segment of leg 5 is similar to that of the female, and measures 31 x 94 ¡j.. The genital segment (Fig. 24) is nearly as long as wide, 104 x 110 \¡., and in dorsal view has a subspherical outline. In lateral view (Fig. 25) the anteroventral part of the segment projects noticeably. There is no intersegmental selerite between the segment of leg 5 and the genital segment. The 4 postgenital segments are 39 x 52, 32 x 51, 30 x 50, and 43 x 53 i* from anterior to posterior.
The caudal ramus resembles that of the female, but is a little shorter, the inner length being 78 ¡JL, the outer length 73 ¡A, the width 23 [A, andrthe ratio of length to width 3.26:1.
The surfaces of the prosome and urosome bear minute setules as in the female. The ratio of the length of the prosome to that of the urosome is 1.31:1.
The rostral area, first antenna, second antenna, labrum, mandible, paragnath, and first maxilla are like those in the female. The second maxilla also resembles that of the female, but lacks the small sclerotized protuberance on the expanded margin of the basal segment. The maxilliped (Fig. 26) is much elongated, slender, and 4-segmented (assuming that the fourth segment is represented by the proximal part of the claw). Its entire length including the claw is about 300 ¡x. The first segment is unarmed. The second bears 2 unequal inner setae and 2 rows of hairs, one along the inner margin distal to the setae and another starting on the proximal inner margin and passing obliquely to the distal posterior surface of the segment. The very short third segment is unarmed. The terminal recurved claw, 135 \¡. in length along its axis, bears a conspicuous terminal lamella. The slightly crenated fringe along its concave margin is interrupted about midway. Near the base of the claw on its posterior surface there is a seta
492
1966 N E W COPEPOD PROM A N ECHINOID 7
42 ¡A long with minute lateral spinules, and on its anterior surface there are 2 small naked setules, one 10 jt, the other 4 y. long.
Thte postoral area is like that of the female. Legs 1-4 resemble those of the female except that the last seg
ment of the endopod of leg 1 is more elongated (Fig. 27), and the terminal segment of the endopod of leg 2 is more elongated, and its 3 spines are longer (24, 22, and 25 [¿ from proximal to distal), as seen in Figure 28.
Leg 5 is similar to that of the female. Leg 6 (Fig. 29) consists of a postero ventral flap on the genital
segment. Beyond the rim of the segment the leg projects conspicuously (see Fig. 24) as a large, pointed, ventral sclerotized process dorsal to which there is a shorter rounded process bearing 2 naked setae 22 and 24 \L in length.
The spermatophore, seen only inside the body of the male (Fig. 24), is oval, about 72 x 45 ¡JL, with a short neck.
The color in life in transmitted light resembles that of the female.
KELATIONSHIP TO O T H E R SPECIES IN T H E G E N U S
Twelve species of Pseudanthessius may be readily distinguished from P. procurrens in that they lack the prominent outer expansion on the coxa of leg 1 and do not bear the two rounded sclerotized lobes on the anterior part of the genital segment in the female. These species are : P . aestheticus Stock, Humes, and Gooding, 1963, P . concinnus Thompson and A . Scott, 1903, P . deficiens Stock, Humes, and Gooding, 1963, P . dubius G. 0 . Sars, 1918, P . graciloides Sewell, 1949, P . luculentus Humes and Cressey, 1961, P . mucronatus Gurney, 1927, P . nemertophi-lus Gallien, 1935, P . notabilis Humes and Cressey, 1961, P . pec-tinifer Stock, Humes, and Gooding, 1963, P . tortuosus Stock, Humes, and Gooding, 1963, and a new species (Humes and Ho , in press) from a polychaete annelid in Madagascar.
Eight other species may be separated from P . procurrens in that they lack the two lobes on the anterior part of the genital segment in the female and have a different armature on the last segment of the second antenna. (Unfortunately, in the original descriptions of these species, definite information on the condition of the outer coxal margin of leg 1 was not given.) These species are: P . gracilis Claus, 1889, P . lotus Illg, 1950, P . ob-scurus A . Scott, 1909, P . sauvagei Canu, 1892, P . spinifer Lind-berg 1945, P . tenuis Nicholls, 1944, P . thorelli (Brady, 1880), and P . weberi A . Scott, 1909.
493
8 BREVIORA N o . 246
Three species remain to be compared with P. procurrens : P. liber sensu Sewell, 1949, P. liber (Brady, 1880), and P. assimilis G . 0 . Sars, 1917. The species referred to as P. liber (Brady and Robertson) by Sewell (1949) is probably a new and unnamed species of the genus (see H u m e s and Cressey, 1961, pp. 80-81). It differs from P. procurrens chiefly in the presence of two long elements (aesthetes ?) on the basal segment of the first antenna, in the inwardly curving terminal spine on the last segment of the exopod of legs 2-4, and in the notch on the outer margin of the endopod of leg 4. N o information was given for this form regarding the nature of the genital segment in the female, and the condition of the outer coxal margin of leg 1 is not clearly shown in Sewell's text figure 32 D .
P. liber (Brady, 1880)2 lacks the two lobes on the anterior part of the genital segment of the female, has a caudal ramus about twic^ as long as wide, and has a different armature on the last segment of the second antenna. Brady did not mention an outer coxal expansion on leg 1, but Sars (1917) both mentioned and figured such an expansion in specimens taken in Norway. The expansion illustrated on Sars' plate X C I V is, however, less pronounced than in P. procurrens. The armature for the last segment of the endopod of leg 3 in the female is, according to Sars, 1,11,3, instead of 1,11,2 as in the Madagascan species.
P. assimilis G. 0 . Sars, 1917, is said by Sars to be closely allied to P. liber (Brady, 1880). Like the latter species it lacks the two lobes on the genital segment of the female and has an armature on the last segment of the second antenna unlike that of P. procurrens. Sars stated that the legs are "almost exactly as in P. liber," implying that there is a similar outer coxal expansion on leg 1.
Judging from the available information, P. procurrens appears to be near both P. liber (Brady, 1880) and P. assimilis G. 0 . Sars, 1917, resembling them in having an outer coxal expansion on leg 1, but differing in having two lobes on the anterior part of the genital segment in the female and in having a different armature on the last segment of the second antenna.
SUMMARY
The new species Pseudanthessius procurrens is associated with the cidarid echinoid Phyllacanthus imperialis (Lamarck) in the
2 Nut Itrady and Robertson, 1870. See Stock. Humes, and Gooding, 1963, p. 10, footnote.
494
1966 N E W COPEPOD FROM A N ECHINOID 9
region of Nosy Bé, northwestern Madagascar. Within the genus
the copepod m a y be recognized by the conspicuous expansion on
the outer coxal area of leg 1 and by the two rounded lateral lobes
on the anterior part of the genital segment in the female. The
species nearest to Jthe new form appear to be P . liber (Brady,
1880) and P. assimilis G . 0 . Sars, 1917. Although the host
echinoderm is widely distributed in the Indo-Pacific area, the
new copepod associated with it is known at present only from the
type locality in Madagascar.
REFERENCES CITED
B R A D Y , G. S.
1880. A monograph of the free and semi-parasitic Copepoda of the
British Islands. Kay Society, London, 3:1-83.
B R A D Y , G. S. A N D D . ROBERTSON
1876. Report on dredging off the coast of Durham and North York
shire in 1874. Sept. British Ass. Adv. Sci. (Bristol), 45: 185-
199.
C A N U , E .
1892. Les Copépodes du. Boulonnais, morphologie, embryologie, taxono-
mie. Trav. Lab. Zool. mar. Wimereux-Ambleteuse (Pas-de-
Calais), 6:1-354.
C N A C S , C.
1889. Uber neue oder wenig bekannte halbparasitische Copepoden,
insbesondere der Lichomolgiden- und Ascomyzontiden-Gruppe.
Arb. Zool. Inst. Univ. Wien, 8(3) :327-370.
GAIJLIKN, L.
1935. Pseudanthessius nemertophilus nov. sp., copépode commensal de
Linens longissimus Sowerby. Bull. Soc. Zool. France, 60:451-459. Gl'RNEY, R.
1927. Zoological results of the Cambridge expedition to the Suez Canal,
1924, XXXIII . Report on the Crustacea:—Copepoda (littoral
and semi-parasitic). Trans. Zool. Soc. London, 22(4) :451-477.
111;AJES, A . G . A N D R . F . C R E S S E Y
1961. Deux nouvelles espèces de Pseudanthessius (Copepoda, Cyclo-
poida) parasites des oursins à Madagascar. M é m . Inst. Sci.
Madagascar, sér. F , 1959, 3:67-82.
H U M E S , A . G . A N D J.-S. H O
In pre.-s. N e w cyclopoid copepods associated with polychaete annelids in
Madagascar. Bull. Mus. Comp. Zool.
ILLG, P .
1950. A new copepod, Pseudanthessius latus (Cyclopoida:Lichomolgi-
dae) commensal with a marine flatworm. Jour. Washington
Acad. Sci., 40 (4): 129-133.
495
10 BREVIORA No. 246
LiNDBÈRG, K .
1945. U n nouveau copépode poecilostome de l'Inde de la famille des
Lichomolgidae ; Pseudanthessius spinifer, n. sp. Bull. Soc. Zool.
France, 70:81-84. JNICHOLLS, A . G .
1944. Littoral copepods from South Australia (II). Calanoida, Cyclo-
poida, Notodelphyoida, Monstrilloida and Caligoida. Eec. So.
Austr. Mus., 8(1): 1-62.
SAHS, G. O .
1917. A n account of the Crustacea of Norway with short descriptions
and figures of all the species. Vol. 6, Copepoda, Cyclopoida, pts.
11 and 12, Glausidiidae, Lichomolgidae (part), pp. 141-172.
Bergen Museum, Bergen.
1918. A n account of the Crustacea of Norway with short descriptions
and figures of all the species. Vol. 6, Copepoda, Cyclopoida, pts.
13 and 14, Lichomolgidae (concluded), Oncaeidae, Corycaeidae,
Ergasilidae, Clausiidae, Eunicicolidae, Supplement, pp. 173-225.
Bergen Museum, Bergen. SCOTT, A .
1909. The Copepoda of the Siboga Expedition. Part I. Free-swim-' ming, littoral and semi-parasitic Copepoda. Siboga Exped., 29a: 1-323.
S E W E L L , B . B . S.
1949. The littoral and semi-parasitic Cyclopoida, the Monstrilloida and
Notodelphyoida. John Murray Exped. 1933-34, Sci. Eepts.,
9(2):17-199.
STOCK, J. H . , A . G. H U M E S , A N D E. U . GOODING
1963. Copepoda associated with West Indian invertebrates IV. The genera Octopicola, Pseudanthessius and Meomicola (Cyclopoida,
Lichomolgidae). Studies Fauna Curaçao and other Caribbean
Is., 18(77) :l-74.
T H O M P S O N , I. C. A N D A. SCOTT
1903. Eeport on the Copepoda collected by Professor Herdman at Cey
lon in 1902. Eept. Govt. Ceylon Pearl Oyster Fish. Gulf of
Manaar, pt. I, Suppl. Eept. No . 7:227-307.
(Beceived December 10, 1965.)
EXPLANATION OF T H E FIGURES
All the figures have been drawn with the aid of a camera lucida. The let
ter after the explanation of each figure refers to the scale at which the figure
was drawn.
Abbreviations : ai = first antenna, m d = mandible, p = paragnath, mxi =
first maxilla, mx2 = second maxilla, mxpd = maxilliped, pi = leg 1.
496
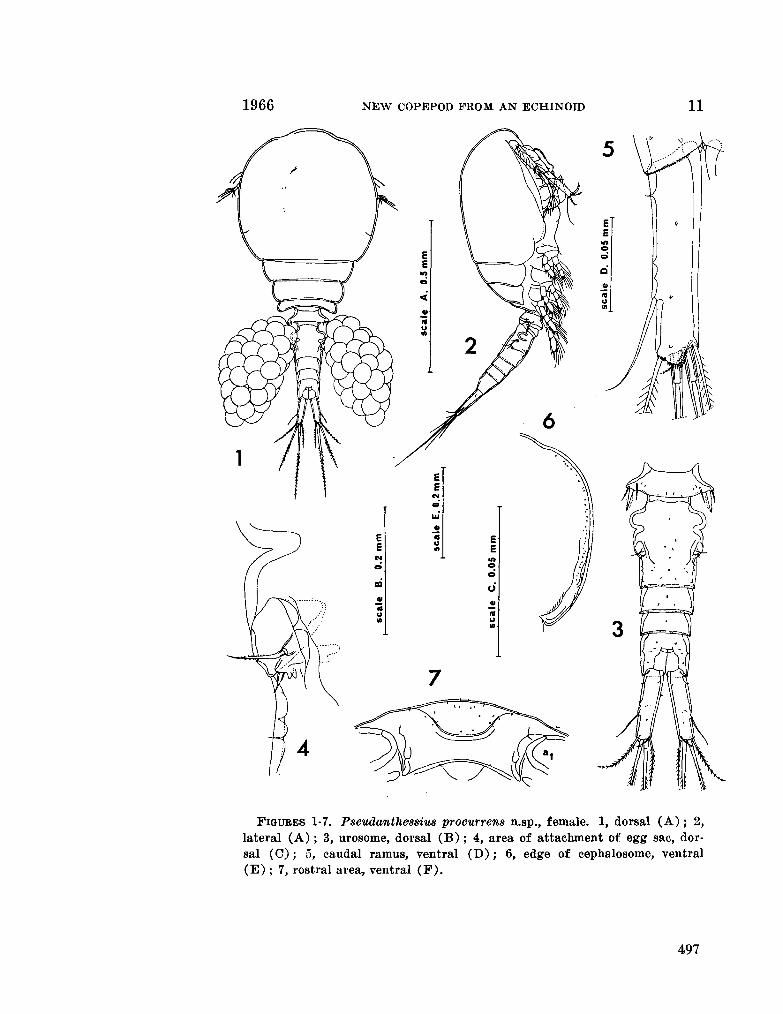
1966 N E W COPEPOD F R O M A N ECHINOID 11
F I G U R E S 1-7. Pseudanthessius procurrens n.sp., female. 1, dorsal (A) ; 2, lateral (A) ; 3, urosome, dorsal (B) ; 4, area of attachment of egg sac, dorsal (C) ; ¿5, caudal ramus, ventral (D) ; 6, edge of cephalosome, ventral (E) ; 7, rostral area, ventral (F).
497
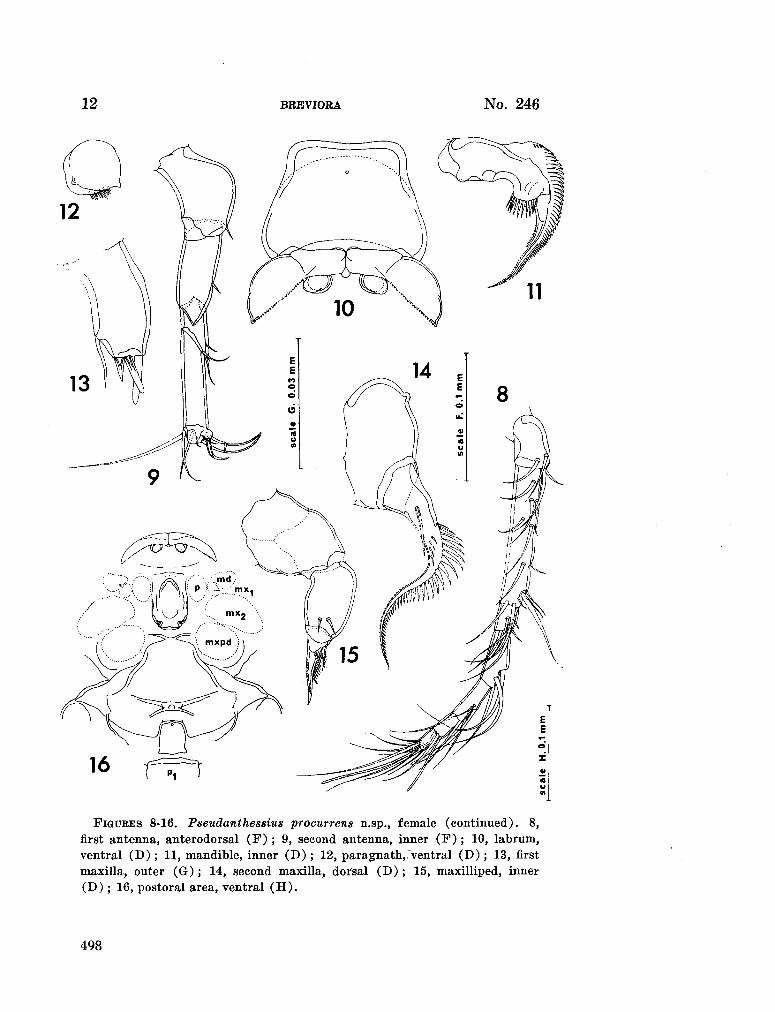
12 BBEVIOBA N o . 246
F I G U R E S 8-16. Pseudanthessius procurrens n.sp., female (continued). 8,
first antenna, anterodorsal (F) ; 9, second antenna, inner (F) ; 10, labrum,
ventral (D) ; 11, mandible, inner (D) ; 12, para gnath,. ventral (D) ; 13, first
maxilla, outer (G) ; 14, second maxilla, dorsal (D) ; 15, maxilliped, inner
(D) ; 16, postoral area, ventral (H) .
498
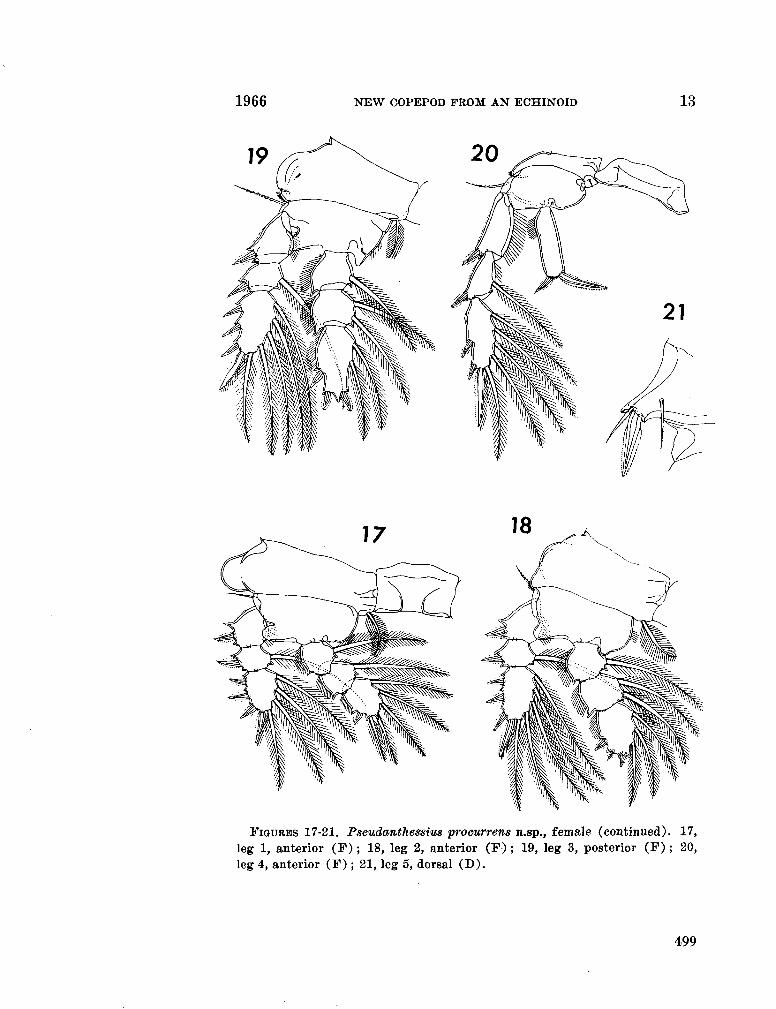
1966 N E W COPEPOD F R O M A N ECHINOID 13
F I G U R E S 17-21. Pseudanthessius procurrens n.sp., female (continued). 17, leg 1, anterior (F) ; 18, leg 2, anterior (F) ; 19, leg 3, posterior (F) ; 20, leg 4, anterior (F) ; 21, leg 5, dorsal (D) .
499
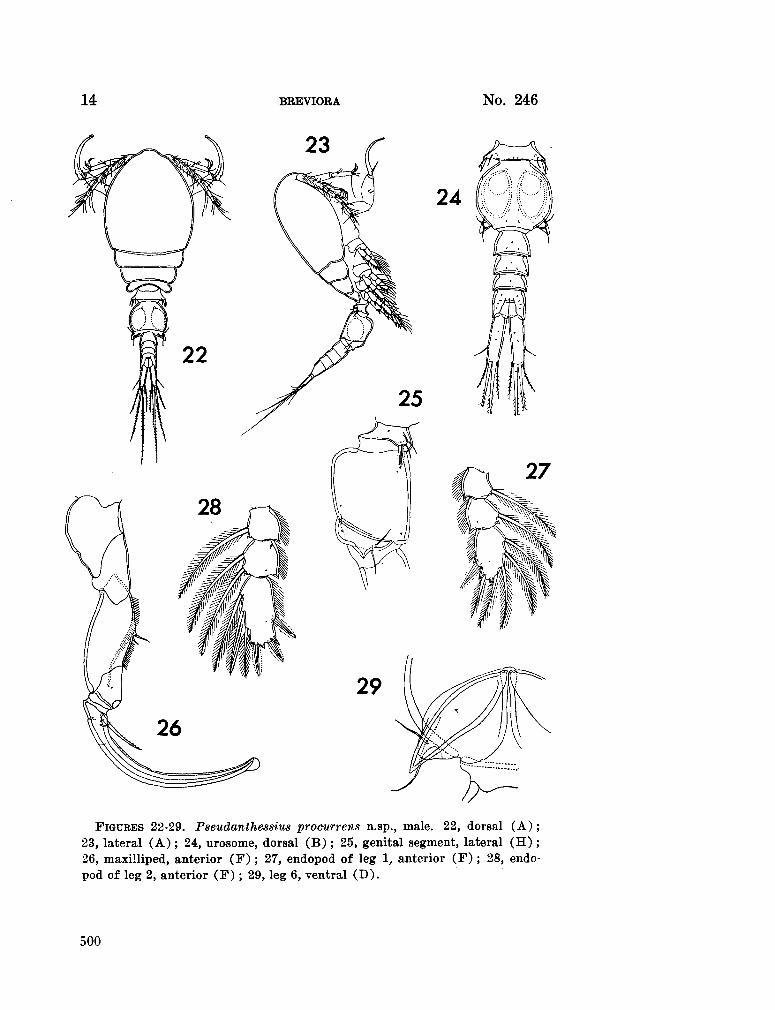
14 BREVIORA No. 246
F I G U R E S 22-29. Pseudanthessius proourrens n.sp., male. 22, dorsal (A) ; 23, lateral (A) ; 24, urosome, dorsal (B) ; 25, genital segment, lateral (H) ; 26, maxilliped, anterior (F) ; 27, endopod of leg 1, anterior (F) ; 28, endo-pod of leg 2, anterior (F) ; 29, leg 6, ventral (D) .
500
Part II Marine chemistry
Reprinted from Aust. J. mar. freshw. Res., vol. 16, 1965, p. 273-280.
THE MEASUREMENT OF TOTAL CARBON DIOXIDE IN DILUTE TROPICAL WATERS
By D . V. SUBBA R A O *
[Manuscript received November 16, 1964]
Summary
A shipboard conductivity technique to measure the total carbon dioxide in dilute tropical water is described. The standard error of a single determination in the range 40-100 m g C0 2 /1 is 6-0 mg/l. There were 41-102 m g C O a / l in waters of the Gulf of Thailand. In these waters, primary production determined with the usually assumed value of 90 m g C O a / l gave errors ranging from 11 to 120% for the individual depth samples and from 6 to 92 % for column values as compared to the values obtained using the measured C 0 2 concentration.
I. I N T R O D U C T I O N
The concentration of total C 0 2 in oceanic water has been found to vary between 85 and 103 mg/l (Clarke 1954; Rotschi, Angot, and Legand 1959). Based on the constancy of C 0 2 / p H and COa/salinity (%0) relationships, Buch (1951) presented tables to determine the total C 0 2 in seawater. In studies on oceanic primary production employing the radiocarbon method it is sufficient to assume avalué of 90 m g C0 2 /1 . However, in dilute tropical waters such as those in the present study, owing probably to C a C 0 3 precipitation, the C O z / p H and C02/salinity (%0) relationships do not remain constant, and the total C 0 2 cannot be interpolated from Buch's tables. Therefore there is need for a suitable shipboard method for the direct determination of total C 0 2 in dilute tropical waters.
In the present study a modified conductivity method based essentially on the method given by Milbiirn and Beadle (1960) is employed. The C 0 2 is removed by acidification of the sample and absorbed by a standard volume of N a O H , whose change in conductance is measured. This method was used in conjunction with studies on primary production in the Gulf of Thailand.
II. M E T H O D S
The apparatus (Fig. 1) is made from Pyrex glass and is mounted against a plywood board. The details of the temperature-compensated conductivity bridge are given by Dal Pont and Newell (1963).
Before each series of measurements the apparatus is flushed for 30 min with COa-free air without introducing samples or N a O H . By this procedure the blank is reduced to 0-5 m g C0 2 /1 .
* Division of Fisheries and Oceanography, C S I R O , Cronulla, N . S . W . (Reprint N o . 568.)
Collected reprints of the International Indian Ocean Expedition, vol. IV, contribution no. 231 503
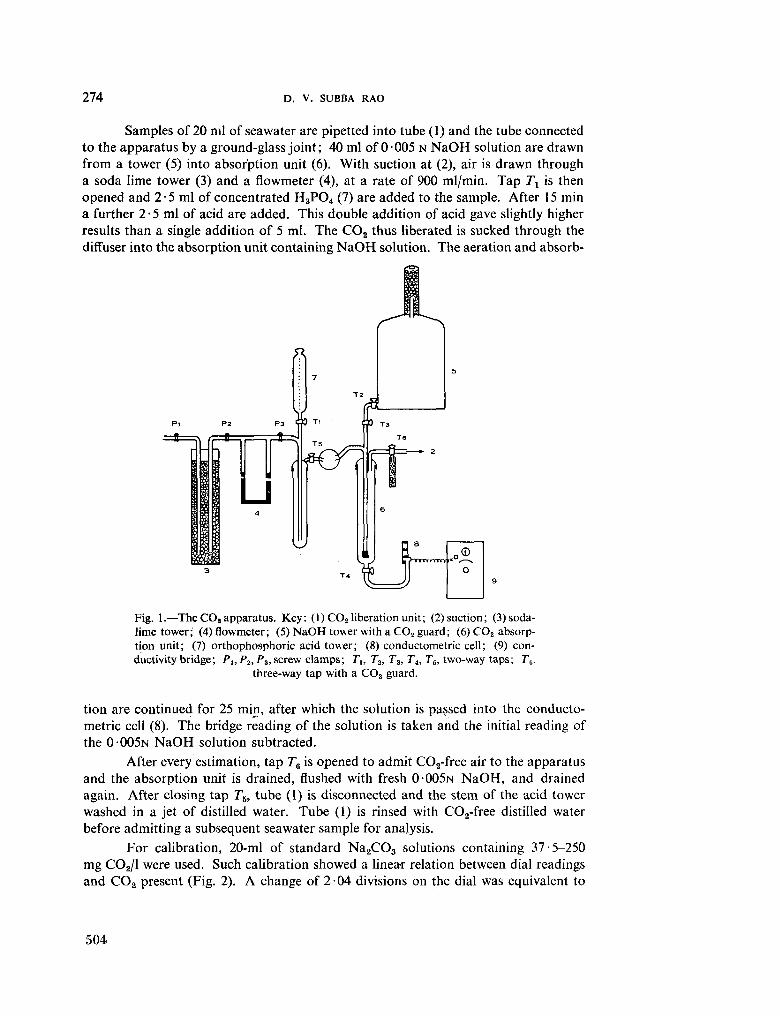
274 D. V. SUBBA RAO
Samples of 20 nil of seawater are pipetted into tube (1) and the tube connected to the apparatus by a ground-glass joint; 40 ml of 0-005 N N a O H solution are drawn from a tower (5) into absorption unit (6). With suction at (2), air is drawn through a soda lime tower (3) and a flowmeter (4), at a rate of 900 ml/min. Tap 7 \ is then opened and 2-5 ml of concentrated H 3 P 0 4 (7) are added to the sample. After 15 min a further 2 • 5 ml of acid are added. This double addition of acid gave slightly higher results than a single addition of 5 ml. The C 0 2 thus liberated is sucked through the diffuser into the absorption unit containing N a O H solution. The aeration and absorb-
Fig. 1.—The C O a apparatus. Key: (1) C 0 2 liberation unit; (2) suction; (3) soda-lime tower; (4) flowmeter; (5) N a O H tower with a C 0 2 guard; (6) C 0 2 absorption unit; (7) orthophosphoric acid tower; (8) conductometric cell; (9) conductivity bridge; Pu P2, P3, screw clamps; Tu T%, T3, Tt, T5, two-way taps; Te.
three-way tap with a C 0 2 guard.
tion are continued for 25 min, after which the solution is passed into the conductometric cell (8). The bridge reading of the solution is taken and the initial reading of the 0 0 0 5 N N a O H solution subtracted.
After every estimation, tap T6 is opened to admit C02-free air to the apparatus and the absorption unit is drained, flushed with fresh 0 0 0 5 N N a O H , and drained again. After closing tap Ts, tube (1) is disconnected and the stem of the acid tower washed in a jet of distilled water. Tube (1) is rinsed with C02-free distilled water before admitting a subsequent seawater sample for analysis.
For calibration, 20-ml of standard N a 2 C 0 3 solutions containing 37-5-250 m g C0 2 /1 were used. Such calibration showed a linear relation between dial readings and C 0 2 present (Fig. 2). A change of 2 04 divisions on the dial was equivalent to
504
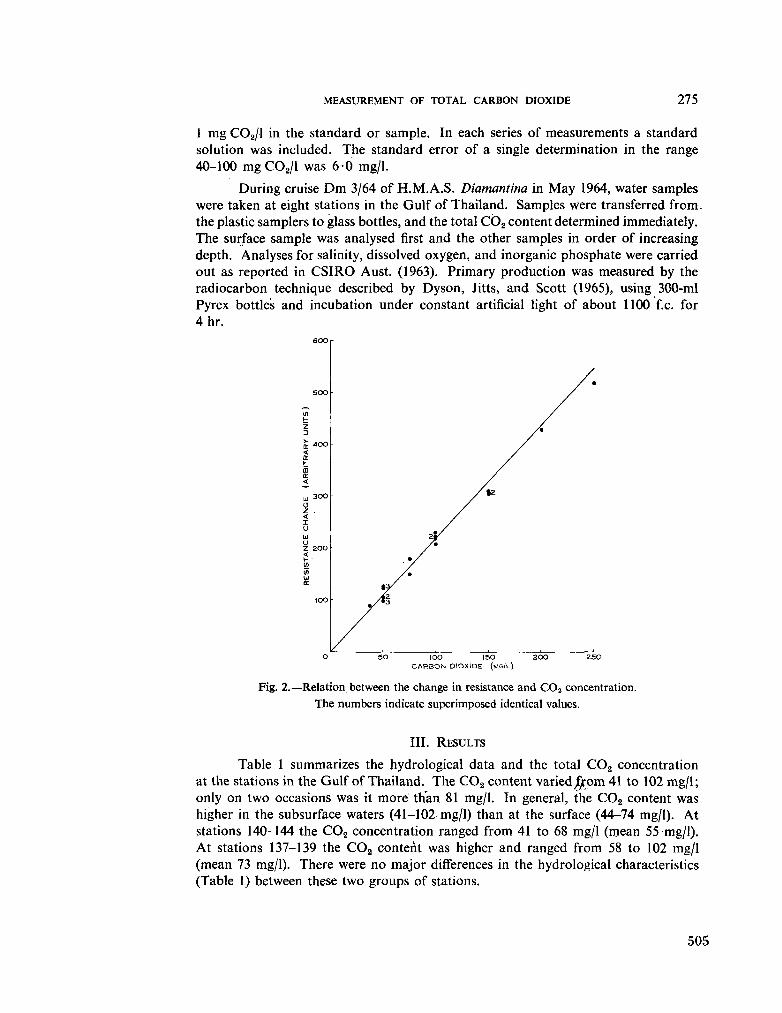
MEASUREMENT OF TOTAL CARBON DIOXIDE 275
1 m g C02 /1 in the standard or sample. In each series of measurements a standard solution was included. The standard error of a single determination in the range 40-100 m g C 0 2 / l was 6-0 mg/l.
During cruise D m 3/64 of H . M . A . S . Diamantina in M a y 1964, water samples were taken at eight stations in the Gulf of Thailand. Samples were transferred from, the plastic samplers to glass bottles, and the total C Ó 2 content determined immediately. The surface sample was analysed first and the other samples in order of increasing depth. Analyses for salinity, dissolved oxygen, and inorganic phosphate were carried out as reported in C S 1 R O Aust. (1963). Primary production was measured by the radiocarbon technique described by Dyson, Jitts, and Scott (1965), using 300-ml Pyrex bottles and incubation under constant artificial light of about 1100 f.c. for 4hr.
60O
SOO
(/) H Z D
S 400
< a. y-m a. <_ U 300 O z . < I u UJ u Z 200 < 1- " in in UJ (£
lOO
-
-
*z •/3
• / /.
ZV /%
/\12
/ m
/*
lOO 150 C A R B O N DIOXIDE (MG/L)
Fig. 2.—Relation between the change in resistance and C 0 2 concentration.
The numbers indicate superimposed identical values.
III. R E S U L T S
Table 1 summarizes the hydrological data and the total C 0 2 concentration at the stations in the Gulf of Thailand. The C 0 2 content varied Ijrom 41 to 102 mg/l ; only on two occasions was it more than 81 mg/l. In general, the C 0 2 content was higher in the subsurface waters (41-102 mg/l) than at the surface (44-74 mg/l). At stations 140-144 the C O a concentration ranged from 41 to 68 mg/l (mean 55 mg/l). At stations 137-139 the C O a content was higher and ranged from 58 to 102 mg/l (mean 73 mg/l). There were no major differences in the hydrological characteristics (Table 1) between these two groups of stations.
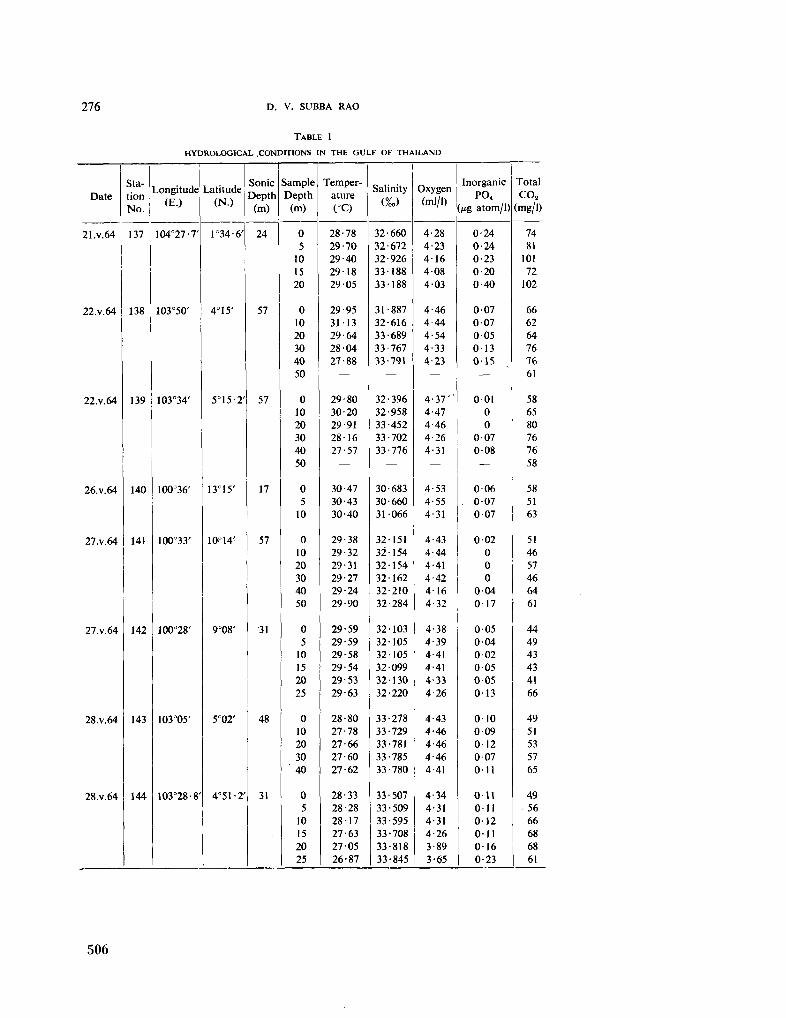
276 D . V. SUBBA RAO
TABLE 1
HYDROLOOICAL .CONDITIONS IN THE GULF OF THAILAND
Date
21.V.64
22.V.64
22.V.64
26.V.64
27.V.64
27.V.64
28.V.64
28.V.64
Station No.
137
138
139
140
141
142
143
144
Longitude (E.)
104°27-7'
103°50'
103°34'
100°36'
100°33'
100°28'
103°05'
103°28-8'
Latitude (N.)
l°34-6'
4°15'
5°15-2'
13°15'
10°14'
9°08'
5°02'
4°51-2'
Sonic Depth
(m)
24
57
57
17
57
31
48
31
Sample Depth
(m)
0 5
10 15 20
0 10 20 30 40 50
0 10 20 30 40 50
0 5
10
0 10 20 30 40 50
0 5
10 15 20 25
0 10 20 30 40
0 5
10 15 20 25
Temperature (°C)
28-78 29-70 29-40 29 18 29 05
29-95 3113 29-64 28 04 27-88
—
29-80 30-20 29-91 28-16 27-57
—
30-47 30-43 30-40
29-38 29-32 29-31 29-27 29-24 29-90
29-59 29-59 29-58 29-54 29-53 29-63
28-80 27-78 27-66 27-60 27-62
28-33 28-28 2817 27-63 27 05 26-87
i
Salinity
(%o)
32-660 32-672 32-926 33188 33188
31-887 32-616 33-689 33-767 33-791
—
32-396 32-958 33-452 33-702 33-776
—
30-683 30-660 31 066
32151 32-154 32-154 32-162 32-210 32-284
32-103 32-105 32-105 32-099 32-130 32-220
33-278 33-729 33-781 33-785 33-780
33-507 33-509 33-595 33-708 33-818 33-845
Oxygen (ml/1)
4-28 4-23 416 408 403
4-46 4-44 4-54 4-33 4-23
—
4-37' ' 4-47 4-46 4-26 4-31
—
4-53 4-55 4-31
4-43 4-44 4-41 4-42 416 4-32
4-38 4-39 4-41 4-41 4-33 4-26
4-43 4-46 4-46 4-46 4-41
4-34 4-31 4-31 4-26 3-89 3-65
Inorganic P O 4
(/¿g atom/l)
0-24 0-24 0-23 0-20 0-40
007 007 005 013 015
—
001 0 0
007 008 —
006 007 007
002 0 0 0
004 017
005 004 002 005 005 0-13
0 10 009 0 12 007 011
011 011 012 011 016 0-23
Total
co2 (mg/1)
74 81
101 72
102
66 62 64 76 76 61
58 65 80 76 76 58
58 51 63
51 46 57 46 64 61
44 49 43 43 4! 66
49 51 53 57 65
49 56 66 68 68 61
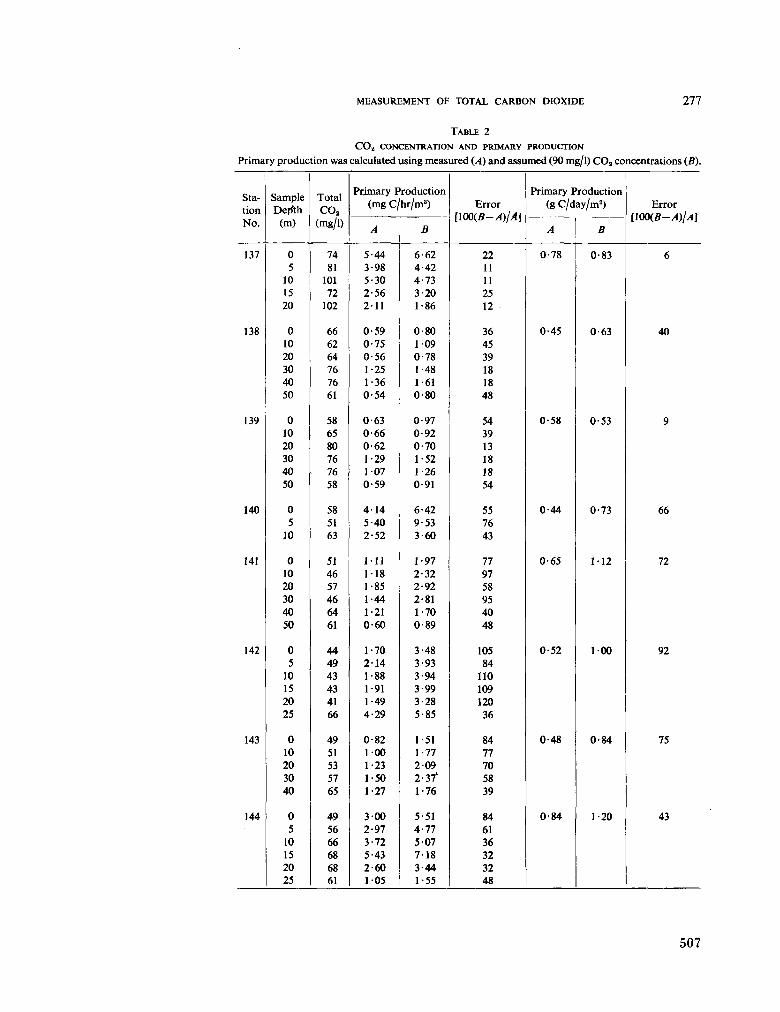
M E A S U R E M E N T OF TOTAL C A R B O N DIOXIDE 277
T A B L E 2
C O ¡ ¡ C O N C E N T R A T I O N A N D P R I M A R Y P R O D U C T I O N
Primary production was calculated using measured (A) and assumed (90 mg/l) C O a concentrations (B).
Sta-tion No.
137
138
139
140
141
142
143
144
Sample Dejfth
(m)
0 5
10 15 20
0 10 20 30 40 50
0 10 20 30 40 50
0 5
10
0 10 20 30 40 50
0 5
10 15 20 25
0 10 20 30 40
0 5
10 15 20 25
Total
co2 (mg/1)
74 81
101 72
102
66 62 64 76 76 61
58 65 80 76 76 58
58 51 63
51 46 57 46 64 61
44 49 43 43 41 66
49 51 53 57 65
49 56 66 68 68 61
Primary Production (mg C/hr /m 3 )
A
5-44 3-98 5-30 2-56 2-11
0-59 0-75 0-56 1-25 1-36 0-54
0-63 0-66 0-62 1-29 107 0-59
414 5-40 2-52
111 118 1-85 1-44 1-21 0-60
1-70 2-14 1-88 1-91 1-49 4-29
0-82 100 1-23 1-50 1-27
300 2-97 3-72 5-43 2-60 105
B
6-62 4-42 4-73 3-20 1-86
0-80 109 0-78 1-48 1-61 0-80
0-97 0-92 0-70 1-52 1-26 0-91
6-42 9-53 3-60
1-97 2-32 2-92 2-81 1-70 0-89
3-48 3-93 3-94 3-99 3-28 5-85
1 -51 1-77 209 2-371
1-76
5-51 4-77 507 7-18 3-44 1-55
Error [100(B-/f)/4]
22 11 11 25 12
36 45 39 18 18 48
54 39 13 18 18 54
55 76 43
77 97 58 95 40 48
105 84
110 109 120 36
84 77 70 58 39
84 61 36 32 32 48
Primary Production (g C/day/m 2 )
A
0-78
0-45
0-58
0-44
0-65
0-52
0-48
0-84
B
0-83
0-63
0-53
0-73
1-12
100
0-84
1-20
Error [100(B-/l)/.4]
6
40
9
66
72
92
75
43
507
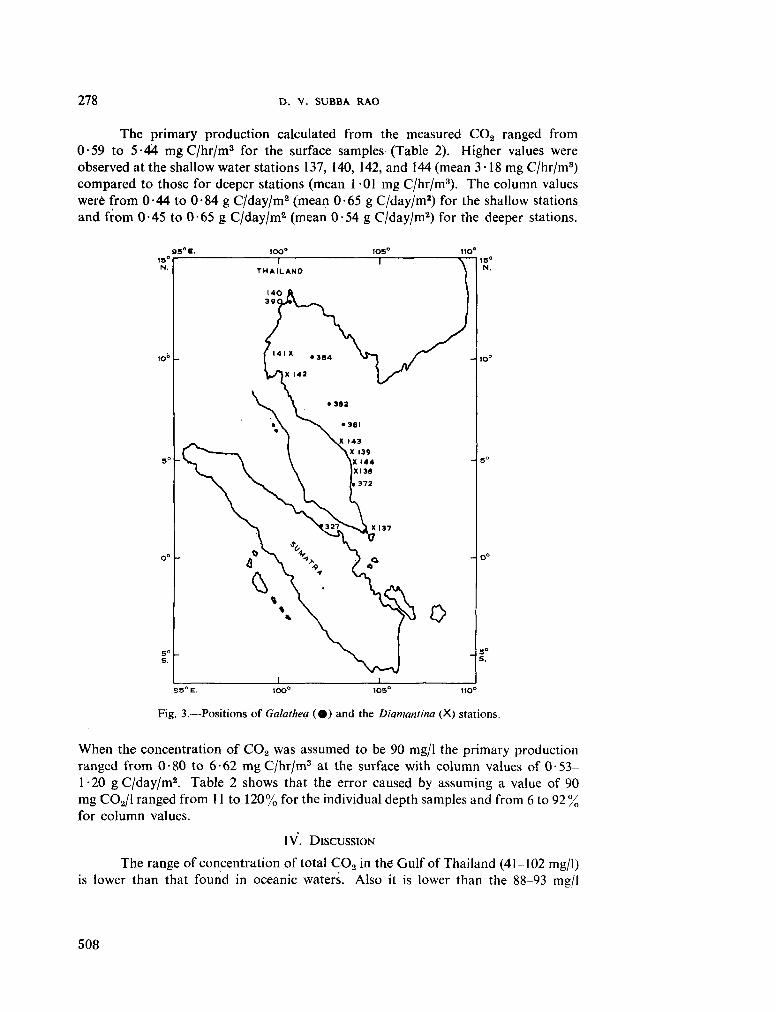
278 D . V. SUBBA RAO
The primary production calculated from the measured C 0 2 ranged from 0-59 to 5-44 m g C/hr /m 3 for the surface samples (Table 2). Higher values were observed at the shallow water stations 137, 140, 142, and 144 (mean 3 • 18 m g C/hr/m3) compared to those for deeper stations (mean 1 01 m g C/hr/m3). The column values were from 0-44 to 0-84 g C/day/m 2 (mean 0-65 g C/day/m2) for the shallow stations and from 0-45 to 0-65 g C/day/m 2 (mean 0-54 g C/day/m2) for the deeper stations.
I i i I S5°E. IOO° 105° 110°
Fig. 3.—Positions of Galathea (•) and the Diamantina (X) stations.
W h e n the concentration of C 0 2 was assumed to be 90 mg/1 the primary production ranged from 0-80 to 6-62 m g C/hr/m 3 at the surface with column values of 0-53-1 -20 g C/day/m2 . Table 2 shows that the error caused by assuming a value of 90 m g C02 /1 ranged from 11 to 120% for the individual depth samples and from 6 to 92 % for column values.
IV. DISCUSSION
The range of concentration of total C 0 2 in the Gulf of Thailand (41-102 mg/1) is lower than that found in oceanic waters. Also it is lower than the 88-93 mg/1
508
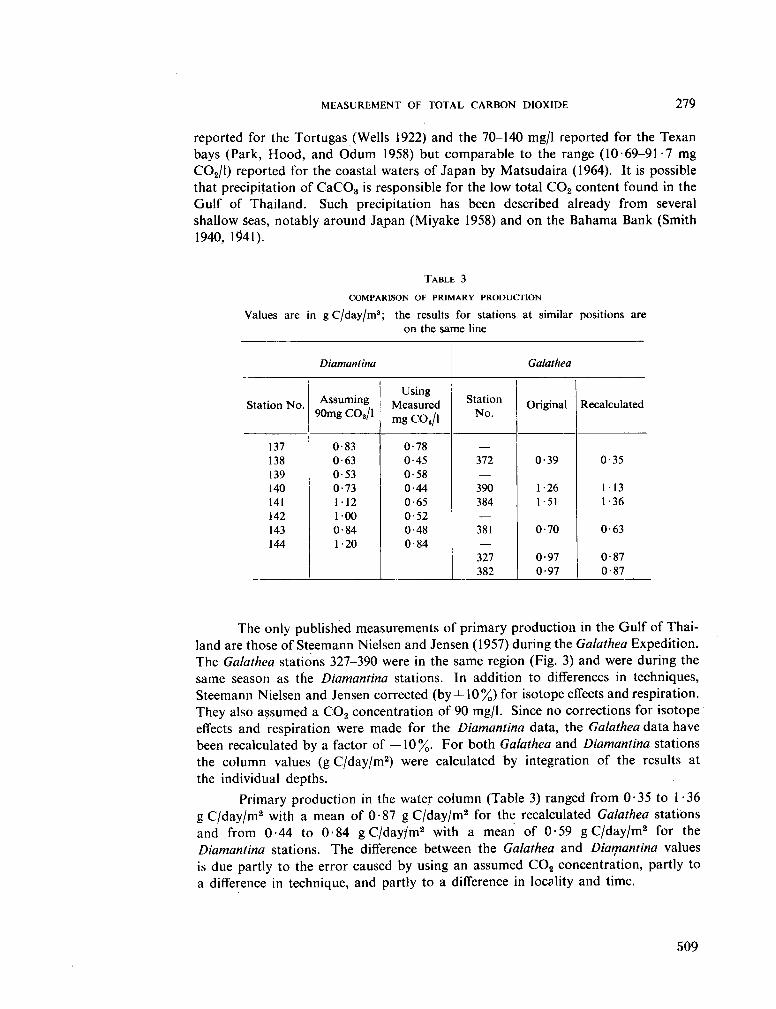
MEASUREMENT OF TOTAL CARBON DIOXIDE 279
reported for the Tortugas (Wells 1922) and the 70-140 mg/1 reported for the Texan bays (Park, Hood , and O d u m 1958) but comparable to the range (10-69-91 -7 m g C02 /1) reported for the coastal waters of Japan by Matsudaira (1964). It is possible that precipitation of C a C 0 3 is responsible for the low total C 0 2 content found in the Gulf of Thailand. Such precipitation has been described already from several shallow Seas, notably around Japan (Miyake 1958) and on the Bahama Bank (Smith 1940, 1041).
T A B L E 3
COMPARISON OF PRIMARY PRODUCTION
Values are in gC/day/m3; the results for stations at similar positions are on the same line
Diamantina
Station N o .
137 138 139 140 141 142 143 144
Assuming 90mg C02/1
0-83 0-63 0-53 0-73 112 100 0-84 1-20
Using Measured m g C02/1
0-78 0-45 0-58 0-44 0-65 0-52 0-48 0-84
Galathea
Station No.
372
390 384
381
327 382
Original
0-39
1-26 1 -51
0-70
0-97 0-97
Recalculated
0-35
113 1-36
0-63
0-87 0-87
The only published measurements of primary production in the Gulf of Thailand are those of Steemann Nielsen and Jensen (1957) during the Galathea Expedition. The Galathea stations 327-390 were in the same region (Fig. 3) and were during the same season as the Diamantina stations. In addition to differences in techniques, Steemann Nielsen and Jensen corrected (by+10%) for isotope effects and respiration. They also assumed a C 0 2 concentration of 90 mg/1. Since no corrections for isotope effects and respiration were made for the Diamantina data, the Galathea data have been recalculated by a factor of —10%. For both Galathea and Diamantina stations the column values (g C/day /m 2 ) were calculated by integration of the results at the individual depths.
Primary production in the water column (Table 3) ranged from 0-35 to 1-36 g C / d a y / m 2 with a mean of 0-87 g C / d a y / m 2 for the recalculated Galathea stations and from 0-44 to 0-84 g C / d a y / m 2 with a mean of 0-59 g C / d a y / m 2 for the Diamantina stations. The difference between the Galathea and Diamantina values is due partly to the error caused by using an assumed C O a concentration, partly to a difference in technique, and partly to a difference in locality and time.
509
280 D. V. SUBBA RAO
V. REFERENCES •
B U C H , K . (1951).—Das Kohlensàure gleichgewichtssystem im Meerwasser. Havsforsklnst. Skr., Helsingf. 151: 1-16.
C S I R O A U S T . (1963).—Oceanographical observations in the Indian Ocean in 1961. H . M . A . S . Diamantina. Cruise D m 2 / 6 1 . CSIRO Aust. Oceanogr. Cruise Rep. 9.
C L A R K E , G . L . (1954).—"Elements of Ecology." p. 534. (John Wiley & Sons: N e w York.) D A L P O N T , G . , and N E W E L L , B . (1963).—Suspended organic matter in the Tasman Sea. Aust. J. Mar.
Freshw. Res. 14: 155-65. D Y S O N , N . , JITTS, H . R . , and S C O T T , B . D . (1965).—Techniques for measuring oceanic primary pro
duction using radioactive carbon. C S I R O Aust. Div. Fish. Oceanogr. Tech. Pap. N o . 18. M A T S U D A I R A , Y . (1964).—Cooperative studies on primary productivity in the coastal waters of
Japan 1962-63. Inform. Bull. Planktol. Japan 11: 24-73. M I L B U R N , T . R . , and B E A D L E , L . C . (1960).—The determination of total carbon dioxide in water.
J. Exp. Biol. 37: 444-60. M I Y A K E , Y . (1958).—A study of the organic productivity and solubility product of C a C O a in the
ocean by means of radiocarbon C-14. Int. Conf. Radioisotopes in Sci. Res. Vol. 4, pp. 651-7. P A R K , K . , H O O D , D . W . , and O D U M , T . H . (1958).—Diurnal p H variations in Texan bays and its
application to primary production estimation. Pubis Univ. Texas Inst. Mar. Sci. 5: 47-64. R O T S C H I , H . , A N G O T , M . , and L E G A N D , M . (1959).—ORSOM III. Résultats de la croisière "Boussole"
2ème partie: Chimie, Productivité et Zooplancton. O . R . S . T . O . M . ¿ I . F . p . , Rapp. Se. N o . 13, p. 81.
S M I T H , C . L . (1940).—The Great Bahama Bank. II. Calcium carbonate precipitation. J. Mar. Res. 3: 171-89.
S M I T H , C . L . (1941).—The solubility of calcium carbonate in tropical sea water. J. Mar. Biol. Ass. U.K. 25: 235^12.
S T E E M A N N N I E L S E N , E . , and J E N S E ^ , A . E . (1957).—Primary oceanic production, the autotrophic production of organic matter in the oceans. Galathea Rep. 1: 47-135.
W E L L S , R . G . (1922).—Carbon dioxide content of sea water at Tortugas. Pap. Dep. Mar. Biol, Carnegie Instn. Wash. 18: 89-93.
510
Reprinted from Bull. Inst, océanogr., Monaco, vol. 65, no. 1,347, 1965.
Teneur en radiocarbone des eaux profondes
et superficielles du nord de l'océan Indien
(mer d ' O m a n )
par
Jean THOMMERET, Yolande THOMMERET et Jean GALLIOT
Laboratoire de radioactivité appliquée, Centre scientifique de Monaco
(Manuscrit reçu le 4 octobre 1965)
Collected reprints of the International Indian Ocean Expedition, vol. IV, contribution no. 232 511
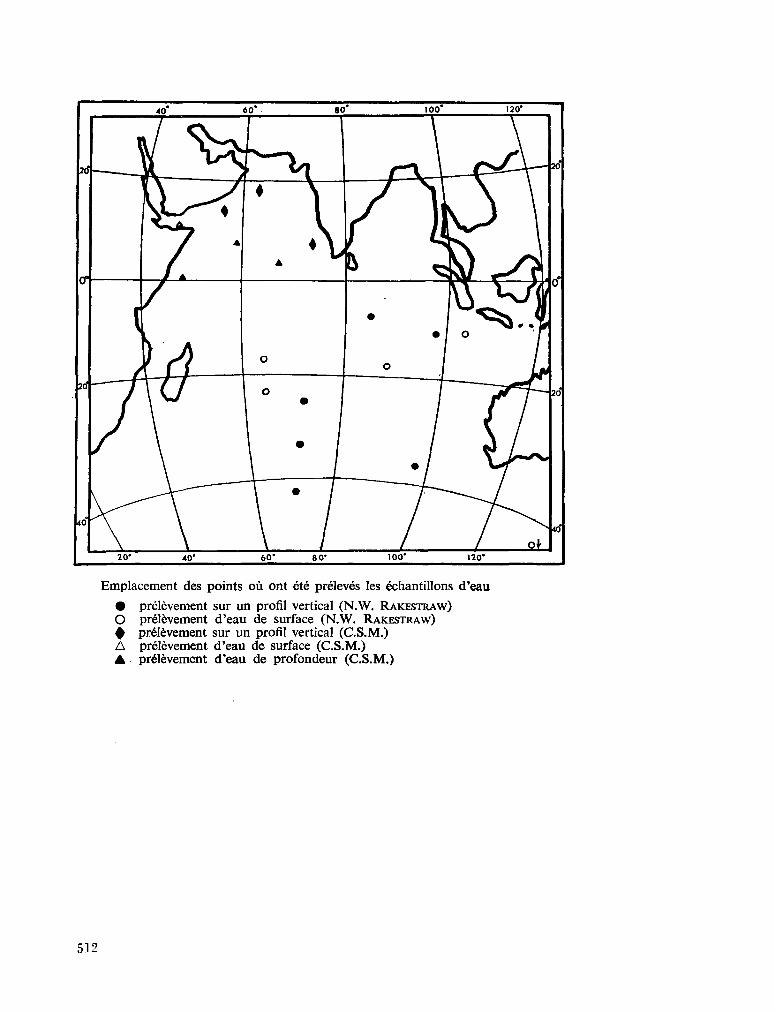
Emplacement des points où ont été prélevés les échantillons d'eau
• prélèvement sur un profil vertical ( N . W . R A K E S T R A W ) O prélèvement d'eau de surface ( N . W . R A K E S T R A W ) t prélèvement sur un profil vertical (C.S .M.) A prélèvement d'eau de surface (C .S .M. ) A prélèvement d'eau de profondeur (C .S .M. )
512
— 3 —
Introduction
L'étude des mouvements des masses d'eaux océaniques au moyen de l'analyse de la teneur en isotope 14 du carbone provenant des carbonates dissous dans les eaux de mer, a été traitée par plusieurs auteurs qui ont utilisé diverses méthodes d'extraction du gaz carbonique marin [2, 3, 4, 6, 10].
A u cours de l'Expédition internationale de l'océan Indien de la Woods Hole Océanographie Institution sur VAtlantis II (cruise 8) pendant l'été 1963, nous avons effectué une série de 10 prélèvements d'eau de mer de surface et de profondeur (2 400 à 4 500 m ) dans le secteur nord de l'océan Indien : golfe d'Aden et mer d ' O m a n , aux latitudes comprises entre 0 et 20° nord.
Les résultats des mesures de radiocarbone de ces échantillons d'eau de mer nous ont permis de les comparer à ceux qui ont été obtenus par B I E N , R A K E S T R A W et S U E S S en 1960 dans le secteur sud de l'océan Indien entre les latitudes 10° et 40° sud [2].
Techniques et Mesures
Les prélèvements exécutés à l'aide d'une bouteille d'acier de 100 litres construite à l'Université de Gôteborg, Institut océanographique, ont été traités immédiatement à bord de VAtlantis II par J. G A L L I O T en utilisant sans modification la méthode mise au point par F O N S E L I Ù S et O S T L U N D [6]. Le gaz carbonique dissous dans l'eau de mer sous forme de bicarbonates ou d'ions carbonate, déplacé par de l'acide sulfurique concentré, sous courant d'azote, est fixé sur une solution de soude 2 N décarbonatée. Les opérations terminales — transformation en carbonate de baryum, régénération et purification du gaz carbonique — et les mesures de l'activité du carbone 14 ont été effectuées au laboratoire suivant les techniques que nous utilisons habituellement [11].
Résultats
La mesure de l'activité en carbone 14 permet de déduire la valeur
s c H = A é c h -~ As*;^ °'95 x i ooo A * . X 0,95
Aéch. : activité de l'échantillon, A s t . : activité du standard N . B . S .
Selon les conventions du Lamont, geological observatory, la valeur A est obtenue en appliquant la formule de B R O E C K E R [5].
A = S C 1 * — (2 S Ci3 + 50) (1 + 0,001 S C " ) Nous avons calculé les âges correspondants aux valeurs de A
d'après la formule donnée par O S T L U N D , B O W M A N et R U S N A K de Ylnsti-tute of marine science, Université de Miami [9]
— T i/2 T 1 000 + A A g e = -TZT L n 1000 + A D
où A 0 est égal à — 50 pour les échantillons dérivant leur carbone de l'eau de mer et T ^ = 5 568 ans.
(1347)
513
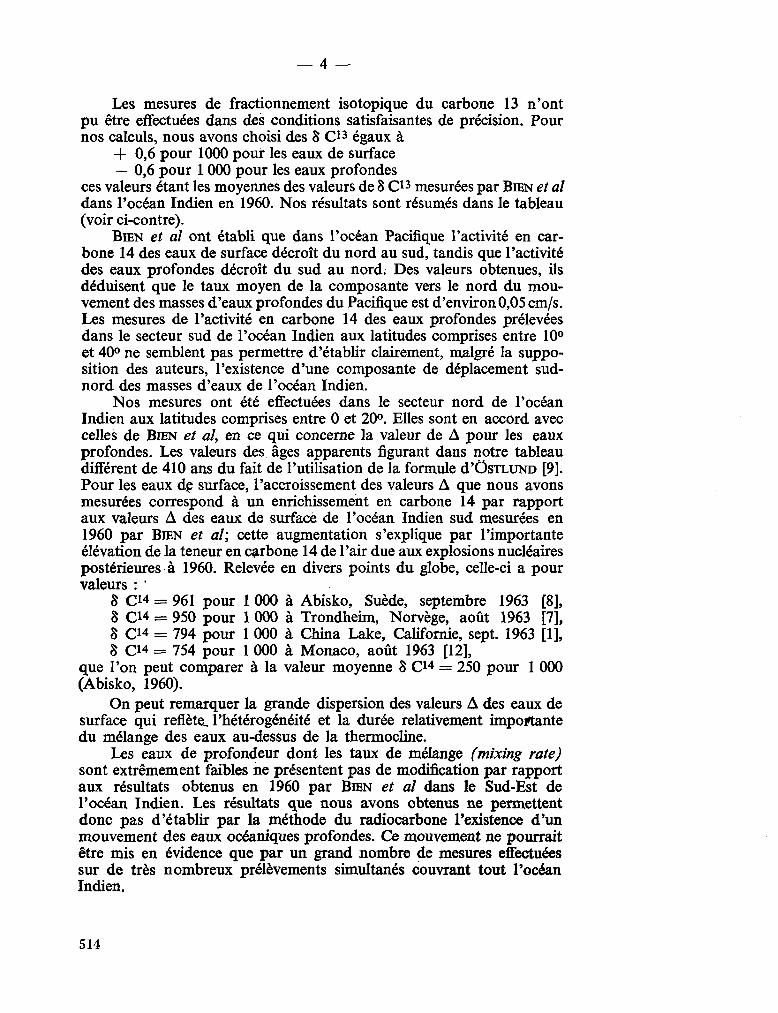
— 4 —
Les mesures de fractionnement isotopique du carbone 13 n'ont pu être effectuées dans des conditions satisfaisantes de précision. Pour nos calculs, nous avons choisi des 8 C 1 3 égaux à
+ 0,6 pour 1000 pour les eaux de surface — 0,6 pour 1 000 pour les eaux profondes
ces valeurs étant les moyennes des valeurs de 8 C 1 3 mesurées par B I E N et al dans l'océan Indien en 1960. Nos résultats sont résumés dans le tableau (voir ci-contre).
B I E N et al ont établi que dans l'océan Pacifique l'activité en carbone 14 des eaux de surface décroît du nord au sud, tandis que l'activité des eaux profondes décroît du sud au nord. Des valeurs obtenues, ils déduisent que le taux moyen de la composante vers le nord du m o u vement des masses d'eaux profondes du Pacifique est d'environ 0,05 cm/s. Les mesures de l'activité en carbone 14 des eaux profondes prélevées dans le secteur sud de l'océan Indien aux latitudes comprises entre 10° et 40° ne semblent pas permettre d'établir clairement, malgré la supposition des auteurs, l'existence d'une composante de déplacement sud-nord des masses d'eaux de l'océan Indien.
N o s mesures ont été effectuées dans le secteur nord de l'océan Indien aux latitudes comprises entre 0 et 20°. Elles sont en accord avec celles de B I E N et al, en ce qui concerne la valeur de A pour les eaux profondes. Les valeurs des âges apparents figurant dans notre tableau différent de 410 ans du fait de l'utilisation de la formule d ' O s T L U N D [9]. Pour les eaux de surface, l'accroissement des valeurs A que nous avons mesurées correspond à un enrichissement en carbone 14 par rapport aux valeurs A des eaux de surface de l'océan Indien sud mesurées en 1960 par B I E N et al; cette augmentation s'explique par l'importante élévation de la teneur en carbone 14 de l'air due aux explosions nucléaires postérieures à 1960. Relevée en divers points du globe, celle-ci a pour valeurs :
8 Ci4 = 961 pour 1 000 à Abisko, Suède, septembre 1963 [8], 8 Ci4 = 950 pour 1 000 à Trondheim, Norvège, août 1963 [7], 8 C " = 794 pour 1 000 à China Lake, Californie, sept. 1963 [1], 8 Ci4 = 754 pour 1 000 à M o n a c o , août 1963 [12],
que l'on peut comparer à la valeur moyenne 8 C 1 4 = 250 pour 1 000 (Abisko, 1960).
O n peut remarquer la grande dispersion des valeurs A des eaux de surface qui reflète, l'hétérogénéité et la durée relativement importante du mélange des eaux au-dessus de la thermocline.
Les eaux de profondeur dont les taux de mélange (mixing rate) sont extrêmement faibles ne présentent pas de modification par rapport aux résultats obtenus en 1960 par B I E N et al dans le Sud-Est de l'océan Indien. Les résultats que nous avons obtenus ne permettent donc pas d'établir par la méthode du radiocàrbone l'existence d'un mouvement des eaux océaniques profondes. C e mouvement ne pourrait être mis en évidence que par un grand nombre de mesures effectuées sur de très nombreux prélèvements simultanés couvrant tout l'océan Indien.
514
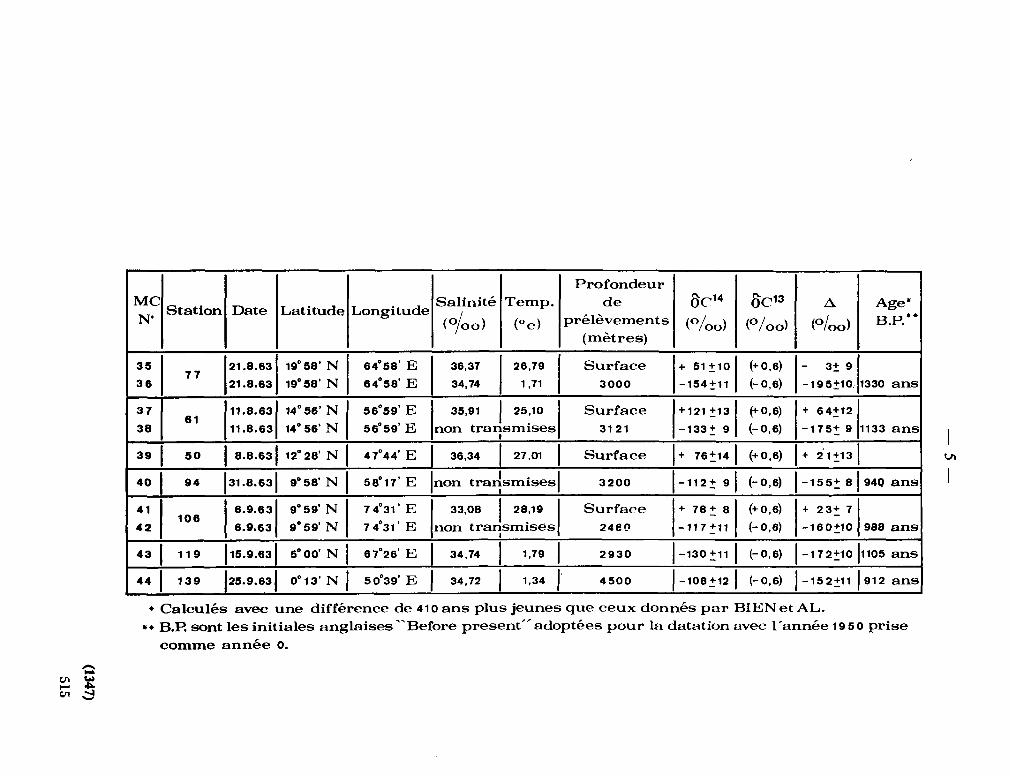
+
to *.
< m
^_ 0
0 -2
0 >__
n
o
o ^
¿O
o.
? 0
¿o o
3 Cl
ai
u
i/i
Profond de
rélèvem (mètres
a
. ft
.-S
0
<D Z
,
C ^
-H
0
(S
0
CO
w
d)
3 W
OC
e 0 J 0>
2 CO
Û)
es
0 s 0
w es
•w
ce
CD
fi es
O
o
co
^
0)
6
+i
+i
n
«
0)
i i
(0
(0
o
o
,+, J,
O
i-^
" T
™
+ 1
+1
i- •
<*
IO
10
^ +
1
O)
u o
3
*»
CC
0)
,-
CM
r~
* co
r-10
*
co «
o
H H
CO
C
O
IO
10
V
°* (0
0
z z
co co
in
io
0)
at
co
«
10
«9
co co
,- ,_
CM
CM
t»
r»
IO 10
CO
CO
cc
fl C3 CO
CO
1—
^ CM
0)
^ + 1
+
1
* IO
(0
t-
+
1
(0
(0
o
o
£, J
,
co a
>
Y~
+ 1
+1
«-
CO
CM
CO
i~
*—
+
1
(1) u
CB
** fr.
t-
3 "
CO
CO
o &
ïi
[fi
» 'S
CM
g
CD
fies
r-
U
0)
**
IO
-i
w S C H
W
en 0
) 10
10
o
o
<0 C
O
10
IO
2 Z
(0
C
O
10
IO
* *
CO C
O
10
to
CO C
O
T»
V-
*••
T™
^ (0
N
CO
CO
C
O
(0
+ 1
T
*
CM
+
(0
o
,£,
* i—
+ 1
(0
t»
+
1) Ü
CD U
3 CO
,_ q
CM
* CO
10
CO
a •
*
*• o
•*
z co
CM
CM
CO
CO
co
CO
o
10
0>
CO
ffi
c C3 o
* o>
CO
+ 1
IO
10
1
(0
o
J
0)
+ 1
CM
^ ^ 1
O
o
CM
CO
(ft <D
(fi
a fies
u
I H
f-^ "»
IO
Z co
IO
0)
CO
CO
co
^ CO
<* 0»
o
*
CD
fi CS
co
CO
o>
h-
O
+ 1
+
1
CO
O
CM
CO
+
1
10
(0
o
o
-±- ~L
CO
r-1—
+ 1
+
1
co r*-
r»
i-T
»
+
i
0)
«¡3 <o
h
*
3 "
CO
(fi 0
) <1)
N Ë C
fi_
CS
CO
U
o
«
"I H
W
1~
1—
CO
C
O
V %
* f-
l>-
z z
a> 0
) IO
IO
o> o>
CO C
O
co to
0)
01
to
to
CO
o
1"
»- «
*
<*
(fi fi CS
IO
o
^ o
+1
CM
t-1
to
o
J
,_ ^ + 1
o
CO
T"
1
o
CO
0)
CM
0)
* t~ CO
H
10
CM
o CO
z o
o
IO
CO
CO
0)
10 "
0)
^ v-
CO
^
(fi fi CS
CM
v
—
0>
+ 1
CM
IO
1
to
o
CM
»
+ 1
CO
o
v
—
1
o
o
IO
* * CO
CM
c
CO
H
0)
CO
o
10
z CO
^ o
CO
to
0)
IO
CM
0>
CO
r-^ *
(1347)
515
— 6 —
E n examinant les résultats des trois stations où des prélèvements d'eau de surface et de profondeur ont été effectués sur un profil vertical, nous constatons que la différence entre la valeur moyenne A entre eau de surface et eau profonde est sensiblement égale à 200 pour 1 000, qui correspondrait à une différence d'âge d'environ 1 400 ans, mais c o m m e pratiquement la teneur en carbone 14 des eaux de surface est en constante évolution, par suite du transfert du carbone 14 atmosphérique aux réservoirs de surface, il est difficile d'attribuer une signification à cet âge.
Remerciements
N o u s remercions le D r R . M I L L E R de la Woods Hole Océanographie Institution, qui a permis à J. G A L L I O T de participer aux travaux des équipes scientifiques, les officiers et l'équipage de 1'Atlantis II pour l'aide apportée dans les prélèvements des échantillons d'eau de mer ainsi que le Professeur I. H E L A , directeur du laboratoire de radioactivité marine de l'Agence internationale de l'énergie atomique à M o n a c o pour le prêt de la bouteille de prélèvements d'eau.
Résumé
Dix mesures de concentration en carbone 14 d'échantillons d'eaux de surface et de profondeur du Nord de l'océan Indien (mer d ' O m a n ) prélevés en août et septembre 1963 pendant l'Expédition internationale de l'océan Indien (Atlantis II), ont confirmé les résultats obtenus par B I E N , R A K E S T R A W et S U E S S en 1960 dans le m ê m e océan (partie sud-est). Le mélange des eaux de surface, au-dessus de la thermocline, prend plusieurs années et n'affecte qu'une mince couche superficielle de la mer. U n e augmentation sensible de la teneur en carbone 14 a été observée en 1963 pour les eaux de surface.
Il n 'y a aucune différence significative d'âge entre les eaux profondes du Sud-Est et celles d u Nord-Ouest de l'océan Indien. L'emploi de la méthode du radiocarbone semble impuissante à assigner aux masses d'eaux profondes un mouvement vers le nord, d'après le m ê m e critère que B I E N , R A K E S T R A W et S U E S S ont utilisé pour les eaux profondes du Pacifique pour lesquelles ils ont estimé une composante de vitesse vers le nord de 0,05 cm/s en considérant la différence d'âge de 400 ans, mesurée par le radiocarbone entre 40° S et 40° N .
Summary
Ten carbon 14 concentration measurements of surface and deep sea water samples of the north Indian ocean (Arabian sea), collected in August and September 1963, during the International Indian Ocean Expedition (Atlantis II), have confirmed the results obtained by B I E N ,
R A K E S T R A W and S U E S S in 1960 in the same ocean (south-east part).
516
— 7 —
The mixing of surface water, above the thermocline, takes several years and affects only a thin surface layer of the sea. A marked increase in the carbone 14 amount of surface waters has been observed in 1963.
There is no significant difference of age between deep waters from water masses, using the same criteria as B I E N , R A K E S T R A W ans S U E S S have taken for the deep waters of the Pacific for which they calculated a northward speed component of 0,05 cm/sec, on the consideration of the 400 years difference of age measured by the radiocarbon, between 40° S and 40° N .
CoflepacaHHe paflHoyraepofla B rjiy6HHHWx H HOBepxHocrawx Boflax ceBepHOH nacra HuzmiíCKoro oKeaHa / OMaHCKHH 3ajiHB/
3KaH T O M M E P 3 , HojiaHfla T O M M E P 3 H 3KaH TAJIJIHO
KpaTKoe coaepacaHHe
flecHTb npo6 KOHueHTpauHH yraepoaa 14 B noBepxHOCTHbix H rjiyÔHHHbix o6pa3uax CeBepHoñ nacra HHzuiiiCKoro OiceaHa / OisiaHC-KHÍÍ 3ajiHB /, B3HTHX B aBrycTe H ceHTHÔpe 1963 rofla B O BpeMS MeayryHapoflHoií 3Kcne,zmuHH B H H A H H C K H H OKeaHa / Atlantis 11/, noflTBep^HjiH aaHHbie, nojiyneHHbie B I E N ' O M , R A K E S T R A W ' O M H S U E S S ' O M B 1960 rosy B T O M ace oiceaHe / B K W O - B O C T O H H O H HacTH/. CMeniHBaHHe noBepxHOCTHbix B O H , Bbime TepMHiecKoro ypoBHà, 3aHHMaeT HecKOjibKo JieT H KacaeTca TOJibKO TOHKoro CJIOH MopcKOH noBepxHOCTH3HaHHTejibHoe yBejiHHeHHe coflepxcaHHH yrjie-pozia 14 Haôjiionajiocb ÂJIH noBepxHOCTHbix B O A B 1963 rozry.
Meayry rjry6HHHbiMH BOflaMH K)roB-ocToiHOH H CeBepHo-3ana,mioH nacreñ UHflHucicoro OKeaHa He cymecTByeT 3HawrejibHOH pa3HHH,bi B B03pacTe. rioBHflHMOMy, npHMeHeHae paflHoyrjiepcimoro cnoco6a He MoaceT 3acTaBHTb nryÔHHHbie B O A M nepeMemaTbca K ceBepy Ha T O M ace ocHOBaHHH, Ha KOTopoM B I E N , R A K E S T R A W H S U E S S npHMeHHJiH ero B T H X O M OKeaHe B rjry6HHHbix BOflax, jvm KOTopbix H M H onpeaejigjiacb cocTaBHan C K O P O C T H A J M nepeflBHaceHra K ceBepy B 0,05 CM/ceK, npHHHMaa B O BHHMamie pa3Hmry B03pacTa B 400 JieT, H3MepeHHyio c noMonn>K> pa,zmoyrjiepo,aa Meayry 40° ROacHoii H 40° CeBepHOH IHHpOTH.
Addendum
Page 7, entre les quatrième et cinquième lignes, veuillez ajouter :
Page 7, between the fourth and fifth lines, please add :
« (from) south - east and those from north - west of the Indian
ocean. The radiocarbon method seems unable to reveal a north
ward movement in deep (water) ».
517
— 8 —
Bibliographie
B E R G E R (R.), F E R G U S S O N (G.J.) & L I B B Y (W.F. ) , 1965. — U C L A radiocarbon dates IV. Radiocarbon, 7, pp. 336-371.
B I E N (G.S.), R A K E S T R A W ( N . W . ) & S U E S S (H.E.), 1963. — Radiocarbon dating of deep water of the Pacific and Indian oceans, in : Radioactive dating, pp. 159-172. — Vienna, International atomic energy agency [Bull. Inst, océanogr. Monaco, 61, n° 1278, 16 p.]
B R O E C K E R (W.S.), T U C E K (C.S.) & O L S O N (E.A.), 1959. — Radiocarbon analysis of oceanic CO2. Int. J. appl. Radiât, hot., 7, pp. 1-18.
B R O E C K E R (W.S.), G E R A R D (R.), E W I N G (M.) & H E E Z E N (B.C.), 1960. — Natural radiocarbon in the Atlantic Ocean. / . geophys. Res., 65, 9, pp. 2903-2931.
B R O E C K E R (W.S.) & O L S O N (E.A.), 1961. — Lamont radiocarbon measurements VIII. Radiocarbon, 3, pp. 176-204.
FONSELIUS (S.) & O S T L U N D (G.), 1959. — Natural radiocarbon measurements on surface water from the North Atlantic and the Arctic sea. Tellus, 11, 1, pp. 77-82.
N Y D A L (R.), 1963. — Increase in radiocarbon from the most recent series of thermonuclear tests. Nature, Lond., 200,
n° 4903, pp. 212-214.
OLSSON (I.U.) & K A R L E N (I.), 1965. — Uppsala radiocarbon
measurements VI. Radiocarbon, 7, pp. 331-335.
O S T L U N D (H.G.), B O W M A N (A.L.) & R U S N A K (G.A.), 1965. — Miami natural radiocarbon corrections I-III. Radiocarbon, 7, pp. 153-155.
R A F T E R (T.A.) & FERGUSSON (G.J.), 1957. — Recent increase in the C14 content of the atmosphere, biosphere and surface waters of the oceans. N.Z. J. Sci. Tech. (B), 38, pp. 871-883.
T H O M M E R E T (J.) & R A P A I R E (J.L.), 1964. — Monaco radiocarbon measurements I. Radiocarbon, 6, pp. 194-196.
T H O M M E R E T (J.) & T H O M M E R E T (Y.). — Monaco radiocarbon measurements II. Radiocarbon (à paraître).
Reprinted from Deep-sea Res., vol. 13, 1966, p. 413-425.
Distribution of particulate and dissolved nitrogen in the
Western Indian Ocean*
F. FRAGAt
(Received 12 November 1965)
Abstract—Determinations were made of particulate and dissolved organic nitrogen in the waters of the western Indian Ocean from 20°S to 25°N. The vertical distribution of particulate nitrogen had a max imum at ten meters and a very clear diurnal variation extending down to 340 m . During the night the nitrogen increased from 0 to 60 m and decreased from 60 to 340 m . It is supposed that this is due to zooplankton migration.
The vertical distribution of the dissolved organic nitrogen had a peak at 20 m and another very large one between 100-170 m .
The relationships were studied between dissolved nitrogen, dissolved organic carbon, particulate nitrogen, and also particulate carbon and phosphorus, chlorophyll and the fixation of carbon-14.
The distribution of organic nitrogen is shown for a north-south section and fo,r sections perpendicular to the Arabian coast.
I N T R O D U C T I O N
T H E INVESTIGATIONS reported here are part of a general survey of the Indian Ocean 1963-1964. The samples were taken aboard the Océanographie vessel Anton Bruun of the U . S . National Science Foundation on its Cruise 4-A, September to November 1963, from Mauritius to Bombay (Fig. 1). Further details may be found in Bulletin N o . 5, U . S . Program in Biology, I.I.O.E. and the Final Cruise Report ( W O O D S H O L E OCEANOGRAPHIC INSTITUTION, 1964; 1965).
The distribution of dissolved organic nitrogen and of suspended particulate nitrogen were studied. T h e two fractions were separated by filtration with a fiberglass filter (" G e l m a n A " ) . T h e particulate matter consisted of detritus, bacteria, phyto-and zooplankton of a size larger than 13 /x. " Dissolved organic nitrogen " included particulate matter of less than 13 p. H e n c e the pore-size must be especially considered w h e n comparing these with results published elsewhere.
This is a preliminary paper outlining the vertical distribution of organic nitrogen. T h e basic data has already been distributed rather widely ( W O O D S H O L E O C E A N O -G R A P H I C I N S T I T U T I O N , 1965). T h e final analysis of the data must await publication of other océanographie data.
Vertical distribution of organic nitrogen
T o obtain the average vertical distribution of dissolved and particulate organic nitrogen (Tables 1 and 2), the average value at each standard depth interval w a s calculated for all the stations studied. These intervals were not always the s a m e
*Part of the work was supported by the U . S . National Science Foundation through participation in the United States Biological Program of the International Indian Ocean Expedition,
flnstituto de Investigaciones Pesqueras, Vigo, Spain.
413
Collected reprints of the International Indian Ocean Expedition, vol. IV, contribution no. 233 519
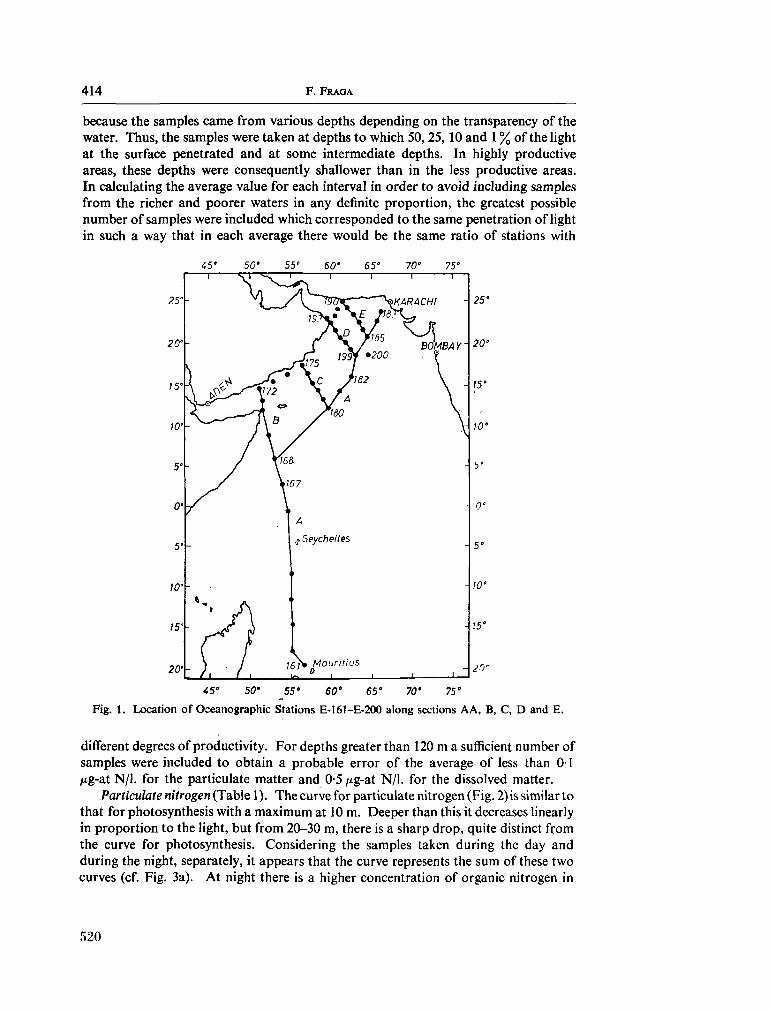
414 F. F R A G A
because the samples came from various depths depending on the transparency of the water. Thus, the samples were taken at depths to which 50, 25,10 and 1 % of the light at the surface penetrated and at some intermediate depths. In highly productive areas, these depths were consequently shallower than in the less productive areas. In calculating the average value for each interval in order to avoid including samples from the richer and poorer waters in any definite proportion, the greatest possible number of samples were included which corresponded to the same penetration of light in such a way that in each average there would be the same ratio of stations with
45° 50° 55' 60' 65' 70° 75°
Fig. 1. Location of Océanographie Stations E-161-E-200 along sections A A , B , C , D and E .
different degrees of productivity. For depths greater than 120 m a sufficient number of samples were included to obtain a probable error of the average of less than 0:1 /¿g-at N / 1 , for the particulate matter and 0-5 /¿g-at N / 1 , for the dissolved matter.
Particulate nitrogen (Table 1). The curve for particulate nitrogen (Fig. 2)issimilarto that for photosynthesis with a m a x i m u m at 10 m . Deeper than this it decreases linearly in proportion to the light, but from 20-30 m , there is a sharp drop, quite distinct from the curve for photosynthesis. Considering the samples taken during the day and during the night, separately, it appears that the curve represents the sum of these two curves (cf. Fig. 3a). At night there is a higher concentration of organic nitrogen in
520
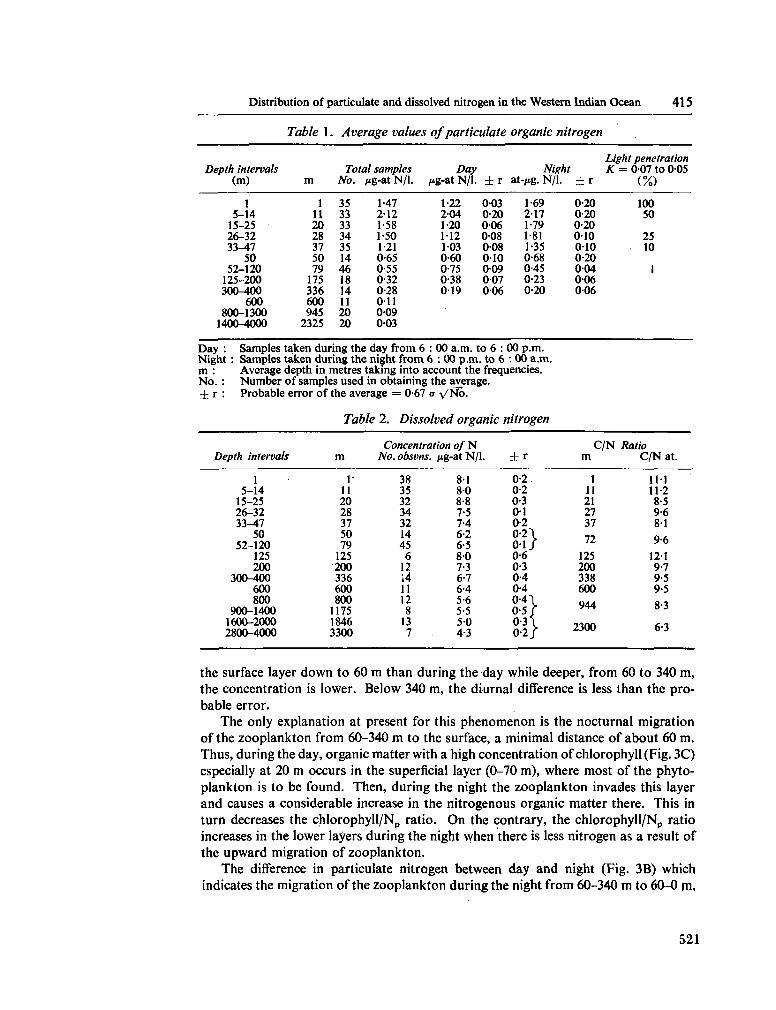
Distribution of particulate and dissolved nitrogen in the Western Indian Ocean 4 1 5
Table 1. Average values
Depth intervals (m)
1 5-14
15-25 26-32 33^*7
50 52-120
125-200 300-400
600 800-1300
1400-4000
Total samples m No.
1 35 11 33 20 33 28 34 37 35 50 14 79 46
175 18 336 14 600 11 945 20
2325 20
/tg-at N / 1 , j
147 2-12 1-58 1-50 1-21 0-65 0-55 0-32 0-28 011 009 003
Day : Samples taken during the day from 6 : Night : Samples taken during the night from (
of particulate organic nitrogen
Day ng-at N / 1 .
1-22 204 1-20 112 103 0-60 0-75 0-38 019
: 00 a . m . 1 > : 00 p . m
±r 003 0-20 006 008 008 010 009 007 006
to 6 : .to 6
Night at-/ig. N / 1 .
1-69 217 1-79 1-81 1-35 0-68 045 0-23 0-20
00 p . m . : 00 a . m .
m : Average depth in metres taking into account the frequencies. N o . : Number of samples used [ in obtaining the average. ± r : Probable error of the average = 0-67 <
Depth intervals
1 5-14
15-25 26-32 33-47
50 52-120
125 200
300-400 600 800
900-1400 1600-2000 2800-4000
ÍIVNO.
Table 2. Dissolved organic nitrogen
m 1-
11 20 28 37 50 79
125 200 336 600 800
1175 1846 3300
Concentration of N No. obsvns.
38 35 32 34 32 14 45 6
12 14 11 12 8
13 7
. ¿ig-atN/1.
81 80 8-8 7-5 74 6-2 6-5 80 7-3 6-7 64 5-6 5-5 5 0 4-3
±r 0-2 0-2 0-3 01 0-2 0-2 \ 0 1 / 0-6 0-3 04 04 0 4 \ 0-5/ 0-3 \ 0 - 2 /
,±r
0-20 0-20 0-20 010 010 0-20 004 006 006
Light penetration K = 007 to 005
(%)
100 50
25 10
1
C / N Ratio m
1 11 21 27 37 72
125 200 338 600 944
2300
C / N at.
Ill 11-2 8-5 9-6 81 9-6
121 9-7 9-5 9-5 8-3
6-3
the surface layer d o w n to 60 m than during the day while deeper, from 60 to 340 m , the concentration is lower. Below 340 m , the diurnal difference is less than the probable error.
The only explanation at present for this phenomenon is the nocturnal migration of the zooplankton from 60-340 m to the surface, a minimal distance of about 60 m . Thus, during the day, organic matter with a high concentration of chlorophyll (Fig. 3C) especially at 20 m occurs in the superficial layer (0-70 m ) , where most of the phyto-plankton is to be found. Then, during the night the zooplankton invades this layer and causes a considerable increase in the nitrogenous organic matter there. This in turn decreases the chlorophyll/Np ratio. O n the contrary, the chlorophyll/Np ratio increases in the lower layers during the night when there is less nitrogen as a result of the upward migration of zooplankton.
The difference in particulate nitrogen between day and night (Fig. 3B) which indicates the migration of the zooplankton during the night from 60-340 m to 60-0 m ,
521
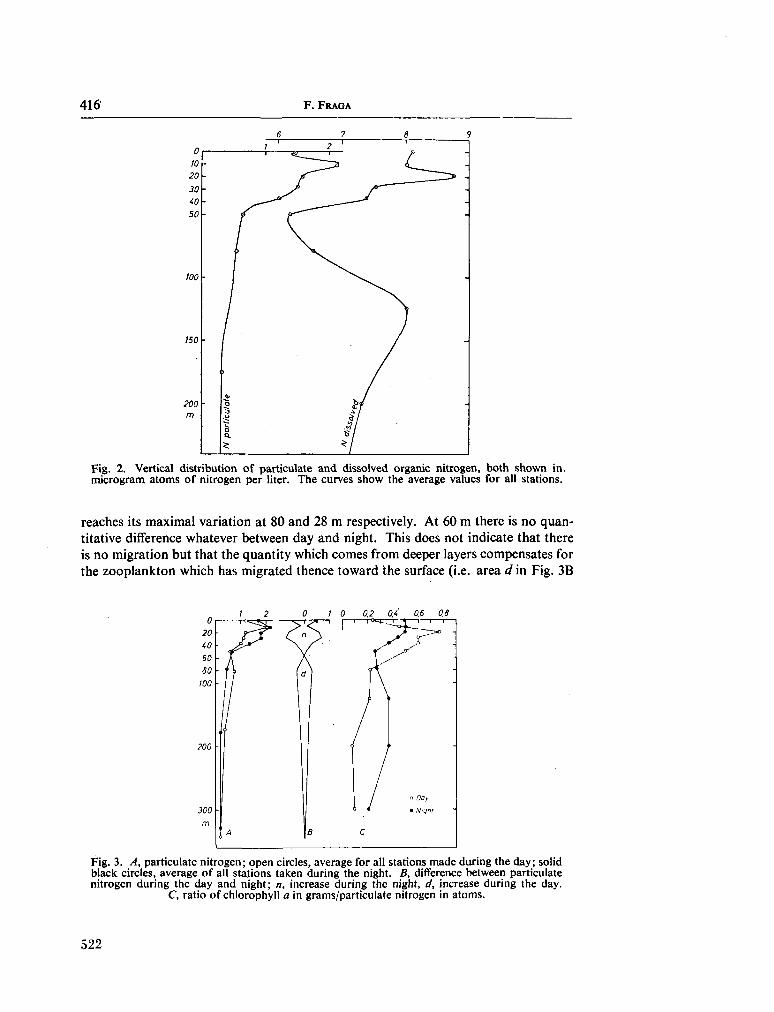
416 F. FRAGA
10 20 30 (0 50
100
150
200 m
. -
¡
• I
N
par
ticu
late
6 i
7 2 ' 1
s 1 s
_ ^^6 -
--
-
-
-
Fig. 2. Vertical distribution of particulate and dissolved organic nitrogen, both shown in. microgram atoms of nitrogen per liter. The curves show the average values for all stations.
reaches its maximal variation at 80 and 28 m respectively. At 60 m there is no quantitative difference whatever between day and night. This does not indicate that there is no migration but that the quantity which comes from deeper layers compensates for the zooplankton which has migrated thence toward the surface (i.e. area d in Fig. 3B
1 0 0.2 0.4 OS 0,8
Fig. 3. A , particulate nitrogen; open circles, average for all stations m a d e during the day; solid black circles, average of all stations taken during the night. B, difference between particulate nitrogen during the day and night; n, increase during the night, d, increase during the day.
C , ratio of chlorophyll a in grams/particulate nitrogen in atoms.
522
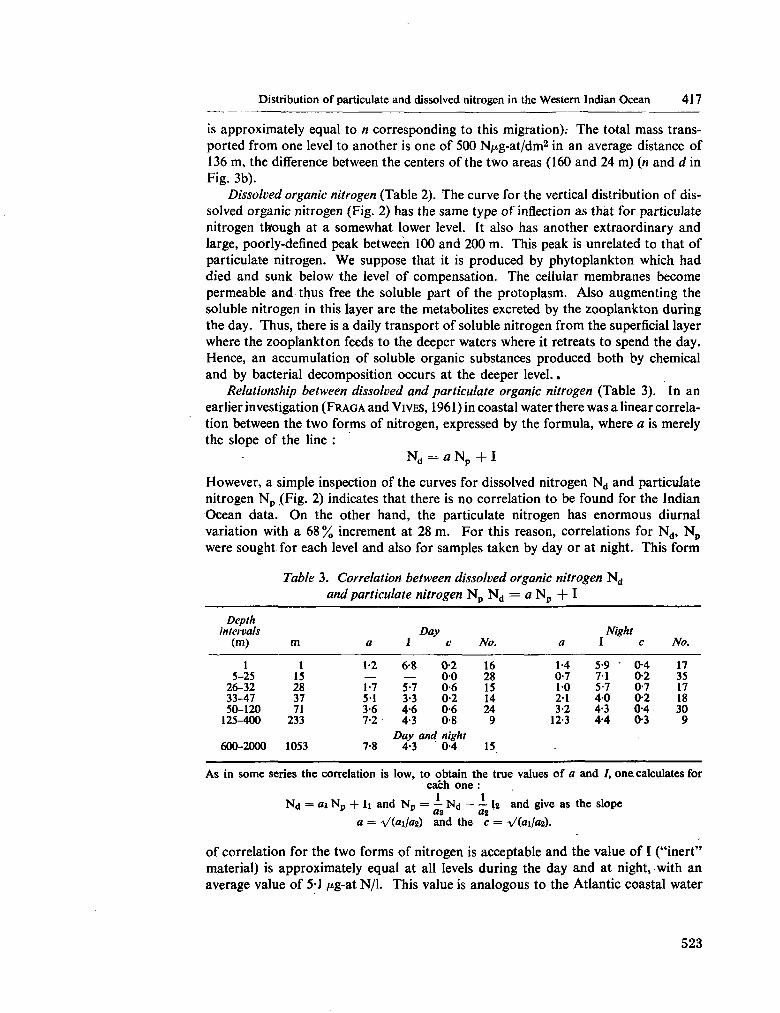
Distribution of particulate and dissolved nitrogen in the Western Indian Ocean 417
is approximately equal to n corresponding to this migration).- The total mass transported from one level to another is one of 500 N/xg-at/dm2 in an average distance of 136 m , the difference between the centers of the two areas (160 and 24 m ) (« and d in Fig. 3b).
Dissolved organic nitrogen (Table 2). The curve for the vertical distribution of dissolved organic nitrogen (Fig. 2) has the same type of inflection as that for particulate nitrogen though at a somewhat lower level. It also has another extraordinary and large, poorly-defined peak between 100 and 200 m . This peak is unrelated to that of particulate nitrogen. W e suppose that it is produced by phytoplankton which had died and sunk below the level of compensation. The cellular membranes become permeable and thus free the soluble part of the protoplasm. Also augmenting the soluble nitrogen in this layer are the metabolites excreted by the zooplankton during the day. Thus, there is a daily transport of soluble nitrogen from the superficial layer where the zooplankton feeds to the deeper waters where it retreats to spend the day. Hence, an accumulation of soluble organic substances produced both by chemical and by bacterial decomposition occurs at the deeper level..
Relationship between dissolved and particulate organic nitrogen (Table 3). In an earlier investigation ( F R A G A and V I V E S , 1961) in coastal water there was a linear correlation between the two forms of nitrogen, expressed by the formula, where a is merely the slope of the line :
N d = a N p + I
However, a simple inspection of the curves for dissolved nitrogen N d and particulate nitrogen N p (Fig. 2) indicates that there is no correlation to be found for the Indian Ocean data. O n the other hand, the particulate nitrogen has enormous diurnal variation with a 68 % increment at 28 m . For this reason, correlations for N d , N p
were sought for each level and also for samples taken by day or at night. This form
Table 3. Correlation between dissolved organic nitrogen N d
and particulate nitrogen N p N d = a N p + I
Depth intervals
(m)
1 5-25
26-32 33-47 50-120
125-400
600-2000
m
1 15 28 37 71
233
1053
a
1-2 — 1-7 51 3-6 7-2
7-8
Day 1
6-8 — 5-7 3-3 4-6 4-3
Day and 4-3
c
0-2 00 0-6 0-2 0-6 0-8 night 0-4
No.
16 28 15 14 24 9
15
a
1-4 0-7 10 21 3-2
12-3
Night I
5-9 • 71 5-7 40 4-3 4-4
c
0-4 0-2 0-7 0-2 0-4 0-3
No.
17 35 17 18 30 9
As in some series the correlation is low, to obtain the true values of a and /, one. calculates for each one :
N d = «i N „ + h and N „ = — N d h and give as the slope r az Û2 '
a = V(«i/«2) and the c = V(ai/«2).
of correlation for the two forms of nitrogen is acceptable and the value of I ("inert" material) is approximately equal at all levels during the day and at night, with an average value of 5-J Mg-at N / 1 . This value is analogous to the Atlantic coastal water
523
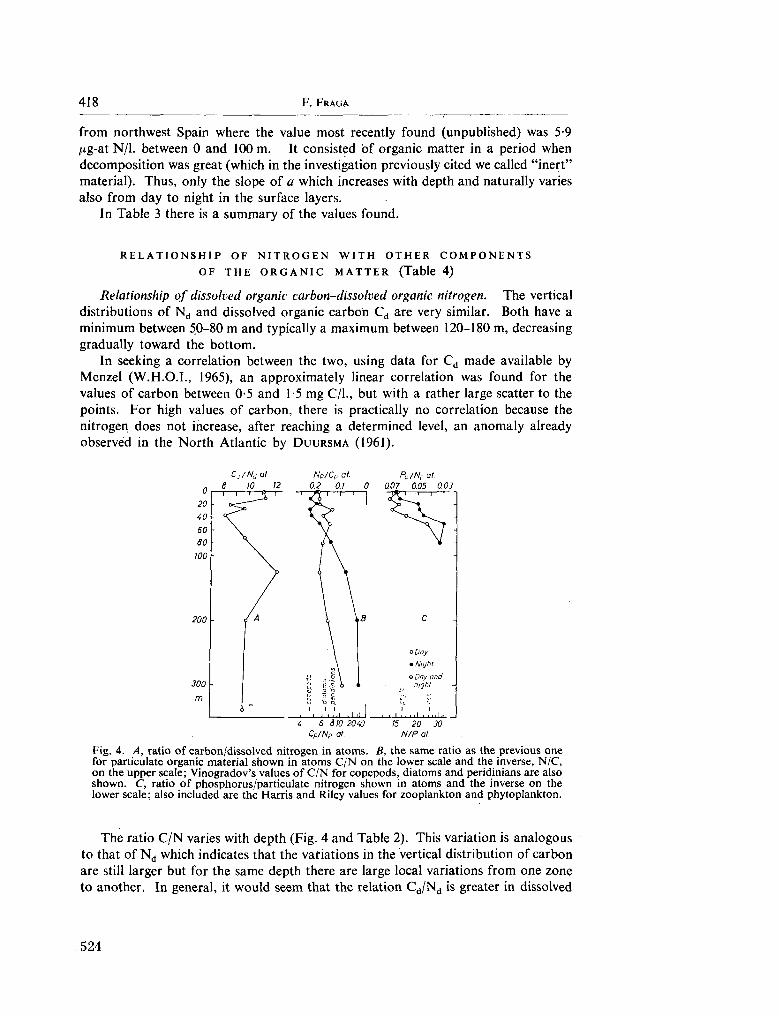
418 F. FRAGA
from northwest Spain where the value most recently found (unpublished) was 5-9 /¿g-at N / 1 , between 0 and 100 m . It consisted of organic matter in a period when decomposition was great (which in the investigation previously cited w e called "inert" material). Thus, only the slope of a which increases with depth and naturally varies also from day to night in the surface layers.
In Table 3 there is a summary of the values found.
RELATIONSHIP OF NITROGEN WITH OTHER COMPONENTS OF THE ORGANIC MATTER (Table 4)
Relationship of dissolved organic carbon-dissolved organic nitrogen. The vertical distributions of N d and dissolved organic carbon C d are very similar. Both have a min imum between 50-80 m and typically a m a x i m u m between 120-180 m , decreasing gradually toward the bottom.
In seeking a correlation between the two, using data for C d made available by Menzel ( W . H . O . T . , 1965), an approximately linear correlation was found for the values of carbon between 0-5 and 1-5 m g C/l., but with a rather large scatter to the points. For high values of carbon, there is practically no correlation because the nitrogen does not increase, after reaching a determined level, an anomaly already observed in the North Atlantic by D U U R S M A (1961).
Cj/Ndal Np/C,j at. Pp/Nrat.
8 10 12 0,2 0.1 0 0.07 0.05 0,03
_i I ' ' ' • ' i I ll I ' • I i i i • ! . • . 1 1 j .
A 6 810 20W 15 20 30
CP/Np at. N/P at.
Fig. 4 . A, ratio of carbon/dissolved nitrogen in atoms. B, the same ratio as the previous one for particulate organic material shown in atoms C / N on the lower scale and the inverse, N / C , on the upper scale; Vinogradov's values of C / N for copepods, diatoms and peridinians are also shown. C, ratio of phosphorus/particulate nitrogen shown in atoms and the inverse on the lower scale; also included are the Harris and Riley values for zooplankton and phytoplankton.
The ratio C / N varies with depth (Fig. 4 and Table 2). This variation is analogous to that of N d which indicates that the variations in the vertical distribution of carbon are still larger but for the same depth there are large local variations from one zone to another, In general, it would seem that the relation C d / N d is greater in dissolved
524
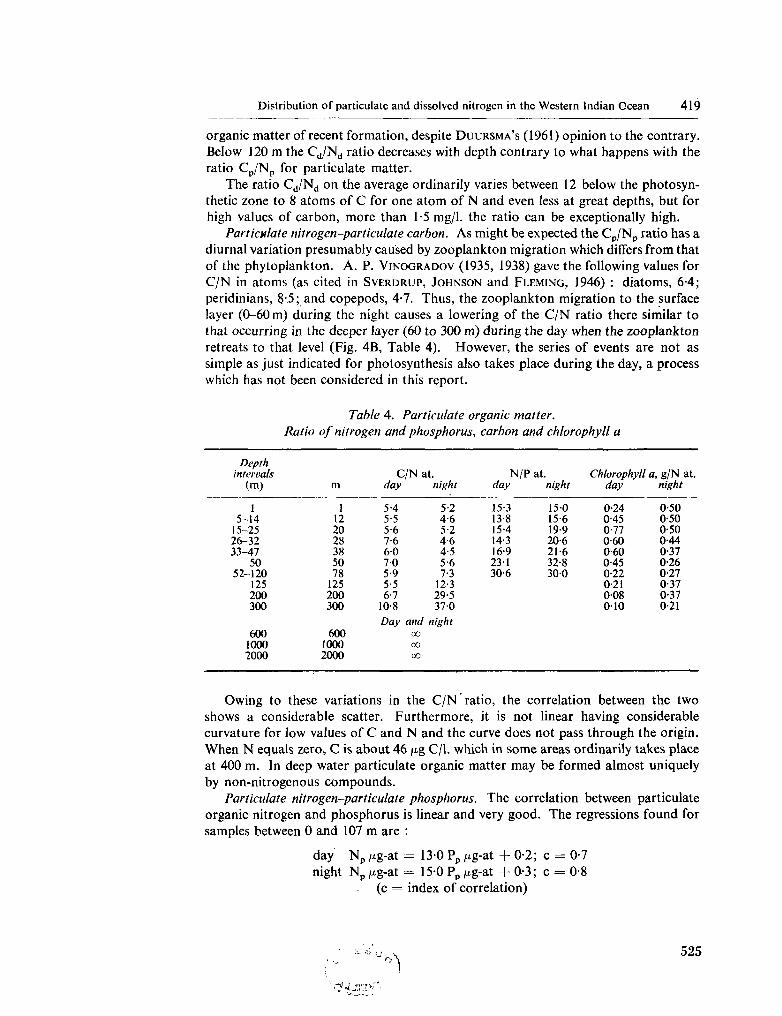
Distribution of particulate and dissolved nitrogen in the Western Indian Ocean 419
organic matter of recent formation, despite D U U R S M A ' S (1961) opinion to the contrary. Below 120 m the C d / N d ratio decreases with depth contrary to what happens with the ratio C p / N p for particulate matter.
The ratio C d / N d on the average ordinarily varies between 12 below the photosyn-thetic zone to 8 atoms of C for one atom of N and even less at great depths, but for high values of carbon, more than 1-5 mg/1. the ratio can be exceptionally high. ,
Particulate nitrogen-particulate carbon. As might be expected the C p / N p ratio has a diurnal variation presumably caused by zooplankton migration which differs from that of the phytoplankton. A . P . V I N O G R A D O V (1935, 1938) gave the following values for C / N in atoms (as cited in S V E R D R U P , J O H N S O N and F L E M I N G , 1946) : diatoms, 6-4;
peridinians, 8-5; and copepods, 4-7. Thus, the zooplankton migration to the surface layer (0-60 m ) during the night causes a lowering of the C / N ratio there similar to that occurring in the deeper layer (60 to 300 m ) during the day when the zooplankton retreats to that level (Fig. 4 B , Table 4). However, the series of events are not as simple as just indicated for photosynthesis also takes place during the day, a process which has not been considered in this report.
Table 4. Particulate organic matter. Ratio of nitrogen and phosphorus, carbon and chlorophyll a
Depth intervals C / N at. N / P at. Chlorophyll a, g / N at.
(m)
1 5-14
15-25 26-32 33-47
50 52-120
125 200 300
600 1000 2000
m
1 12 20 28 38 50 78
125 200 300
600 1000 2000
day night
5-4 5-2 5-5 4-6 5-6 5-2 7-6 4-6 6 0 4-5 7 0 5-6 5-9 7'3 5-5 12-3 6-7 29-5
10-8 3 7 0
Day and night co co CO
day
15-3 13 8 15-4 14-3 16-9 23-1 30-6
night
150 15 6 19-9 20-6 21-6 32-8 300
day
0-24 0-45 0-77 0-60 0-60 0-45 0-22 0-21 008 010
night
0-50 0-50 0-50 0-44 0-37 0-26 027 0-37 0-37 0-21
Owing to these variations in the C / N ratio, the correlation between the two shows a considerable scatter. Furthermore, it is not linear having considerable curvature for low values of C and N and the curve does not pass through the origin. W h e n N equals zero, C is about 46 /xg C/l. which in some areas ordinarily takes place at 400 m . In deep water particulate organic matter m a y be formed almost uniquely by non-nitrogenous compounds.
Particulate nitrogen-particulate phosphorus. The correlation between particulate organic nitrogen and phosphorus is linear and very good. The regressions found for samples between 0 and 107 m are :
day N p ¿xg-at = 13-0 P p /ug-at + 0-2; c = 0-7 night N p /¿g-at = 15-0 P p ¿tg-at + 0-3; c = 0-8
(c = index of correlation)
.„. ''" ""J ° o \ 525
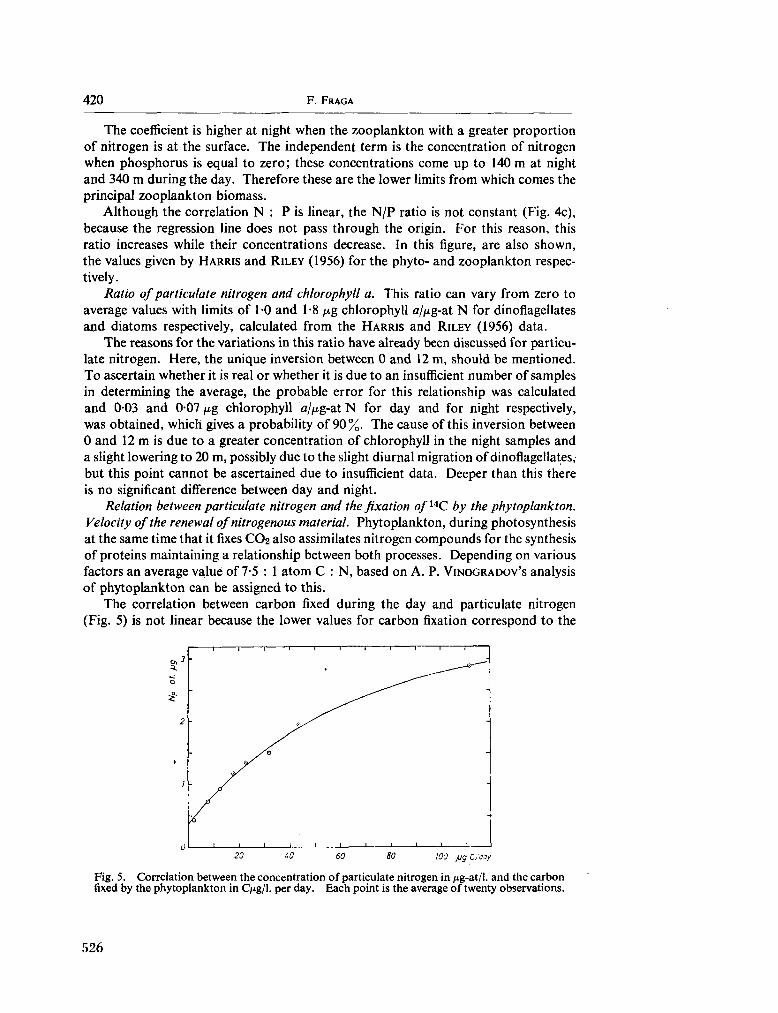
420 F. FRAGA
The coefficient is higher at night when the zooplankton with a greater proportion of nitrogen is at the surface. The independent term is the concentration of nitrogen when phosphorus is equal to zero; these concentrations come up to 140 m at night and 340 m during the day. Therefore these are the lower limits from which comes the principal zooplankton biomass.
Although the correlation N : P is linear, the N / P ratio is not constant (Fig. 4c), because the regression line does not pass through the origin. For this reason, this ratio increases while their concentrations decrease. In this figure, are also shown, the values given by H A R R I S and R I L E Y (1956) for the phyto- and zooplankton respectively.
Ratio of particulate nitrogen and chlorophyll a. This ratio can vary from zero to average values with limits of 1-0 and 1-8 .g chlorophyll a//¿g-at N for dinoflagellates and diatoms respectively, calculated from the H A R R I S and R I L E Y (1956) data.
The reasons for the variations in this ratio have already been discussed for particulate nitrogen. Here, the unique inversion between 0 and 12 m , should be mentioned. T o ascertain whether it is real or whether it is due to an insufficient number of samples in determining the average, the probable error for this relationship was calculated and 0-03 and 0-07 /¿g chlorophyll a/jug-at N for day and for night respectively, was obtained, which gives a probability of 90%. The cause of this inversion between 0 and 12 m is due to a greater concentration of chlorophyll in the night samples and a slight lowering to 20 m , possibly due to the slight diurnal migration of dinoflagellates, but this point cannot be ascertained due to insufficient data. Deeper than this there is no significant difference between day and night.
Relation between particulate nitrogen and the fixation ofuC by the phytoplankton. Velocity of the renewal of nitrogenous material. Phytoplankton, during photosynthesis at the same time that it fixes C O 2 also assimilates nitrogen compounds for the synthesis of proteins maintaining a relationship between both processes. Depending on various factors an average valué of 7-5 : 1 atom C : N , based on A . P. V I N O G R A D O V ' S analysis of phytoplankton can be assigned to this.
The correlation between carbon fixed during the day and particulate nitrogen (Fig. 5) is not linear because the lower values for carbon fixation correspond to the
1 1 1 1 1 1 1— 1 1 1 r
' 1 1 1 1 1 1 1 1 1 1
20 40 60 SO W0 /ug C/day
Fig. 5. Correlation between the concentration of particulate nitrogen in /¿g-at/l. and the carbon fixed by the phytoplankton in Qig/1. per day. Each point is the average of twenty observations.
526
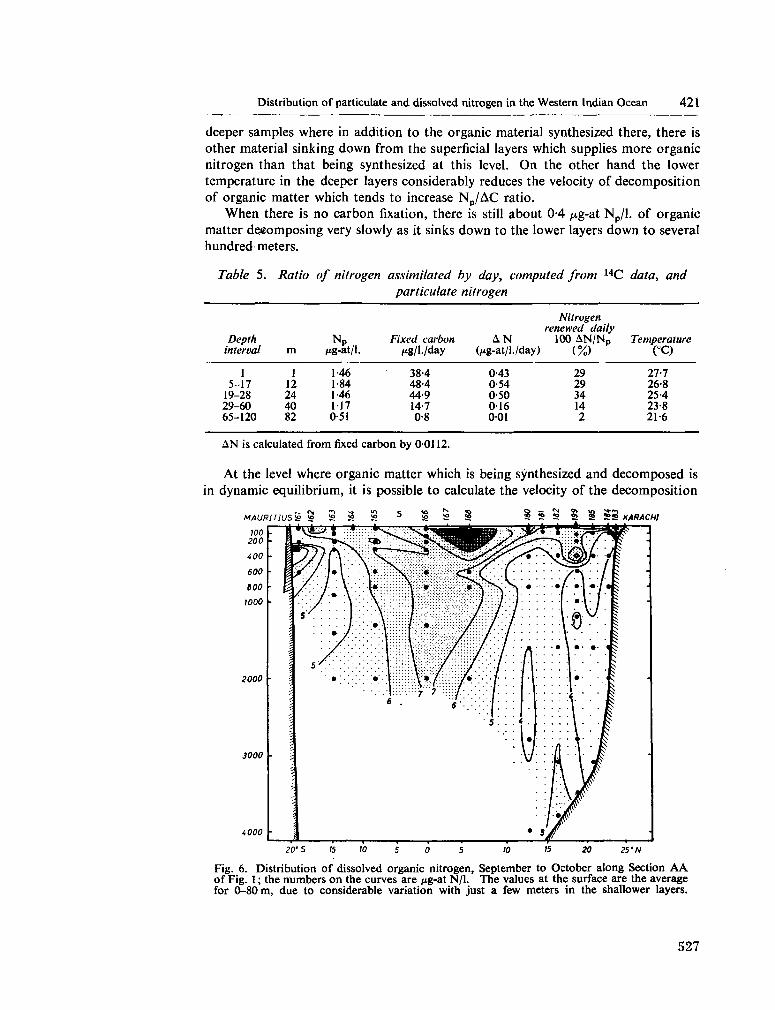
Distribution of particulate and dissolved nitrogen in the Western Indian Ocean 421
deeper samples where in addition to the organic material synthesized there, there is other material sinking d o w n from the superficial layers which supplies m o r e organic nitrogen than that being synthesized at this level. O n the other hand the lower temperature in the deeper layers considerably reduces the velocity of decomposition of organic matter which tends to increase N P / A C ratio.
W h e n there is no carbon fixation, there is still about 0-4 /¿g-at N p / 1 . of organic matter decomposing very slowly as it sinks d o w n to the lower layers d o w n to several hundred meters.
Table 5. Ratio of nitrogen assimilated by day, computed from 1 4 C data, and particulate nitrogen
Depth interval
1 5 - 1 7
19-28 2 9 - 6 0 6 5 - 1 2 0
m
1 12 24 40 82
N p /¿g-at/l.
1-46 1-84 1-46 117 0-51
Fixed carbon /ig/l./day
38-4 48-4 44-9 14-7 0-8
A N (itg-at/l./day)
0-43 0-54 0-50 016 001
Nitrogen renewed daily
100 A N / N P (%)
29 29 34 14 2
Temperature (°C)
27-7 26-8 25-4 23-8 21-6
A N is calculated from fixed carbon by 0-0112.
At the level where organic matter which is being synthesized and decomposed is in dynamic equilibrium, it is possible to calculate the velocity of the decomposition
MAURiriUSS S ¡S ¡S ¡S a !S ¡S S S S S 2 S S S KARACHI
Fig. 6. Distribution of dissolved organic nitrogen, September to October along Section A A of Fig. 1 ; the numbers on the curves are ftg-at N/1. The values at the surface are the average for 0-80 m , due to considerable variation with just a few meters in the shallower layers.
527
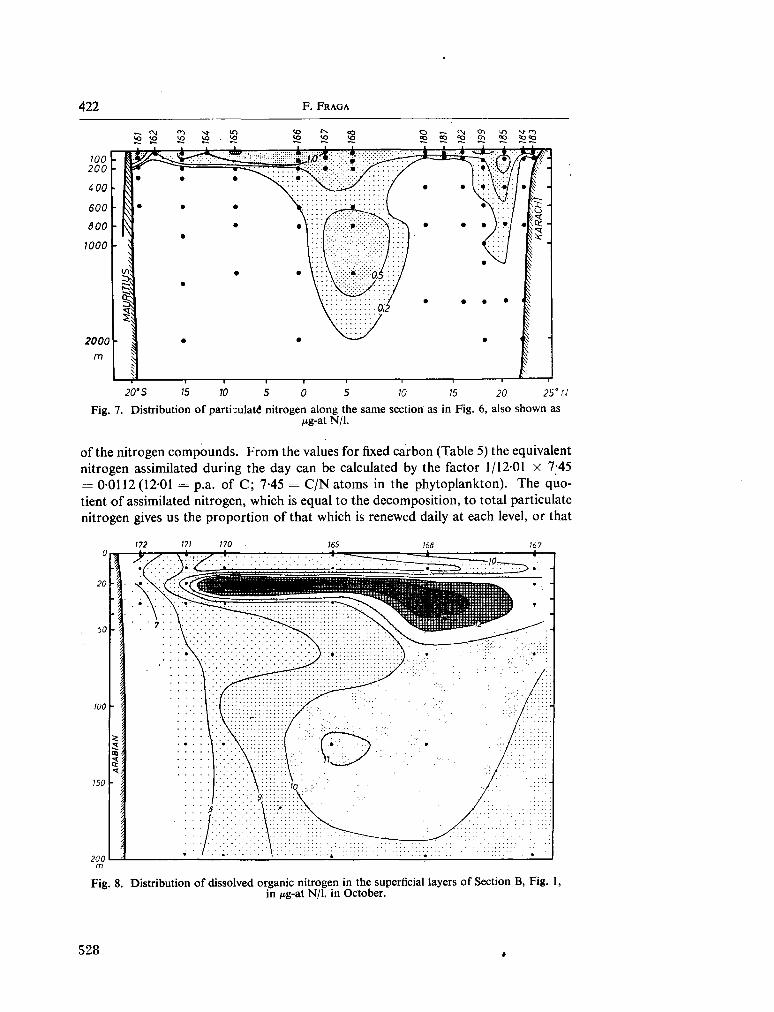
422 F. FRAGA
• 1 " I 1 1 1 1 1 1 1 r
20'S 15 10 5 0 5 10 15 20 25° ! J
Fig. 7. Distribution of particulate nitrogen along the same section as in Fig. 6, also shown as ¿ig-at N / 1 .
of the nitrogen compounds. F r o m the values for fixed carbon (Table 5) the equivalent nitrogen assimilated during the day can be calculated by the factor 1/1201 X 7-45 = 0-0112(12-01 = p.a. of C ; 7-45 = C / N atoms in the phytoplankton). The quotient of assimilated nitrogen, which is equal to the decomposition, to total particulate nitrogen gives us the proportion of that which is renewed daily at each level, or that
172 m HO 169 168 167
Fig. 8. Distribution of dissolved organic nitrogen in the superficial layers of Section B , Fig. 1, in /xg-at N / 1 , in October.
528 à
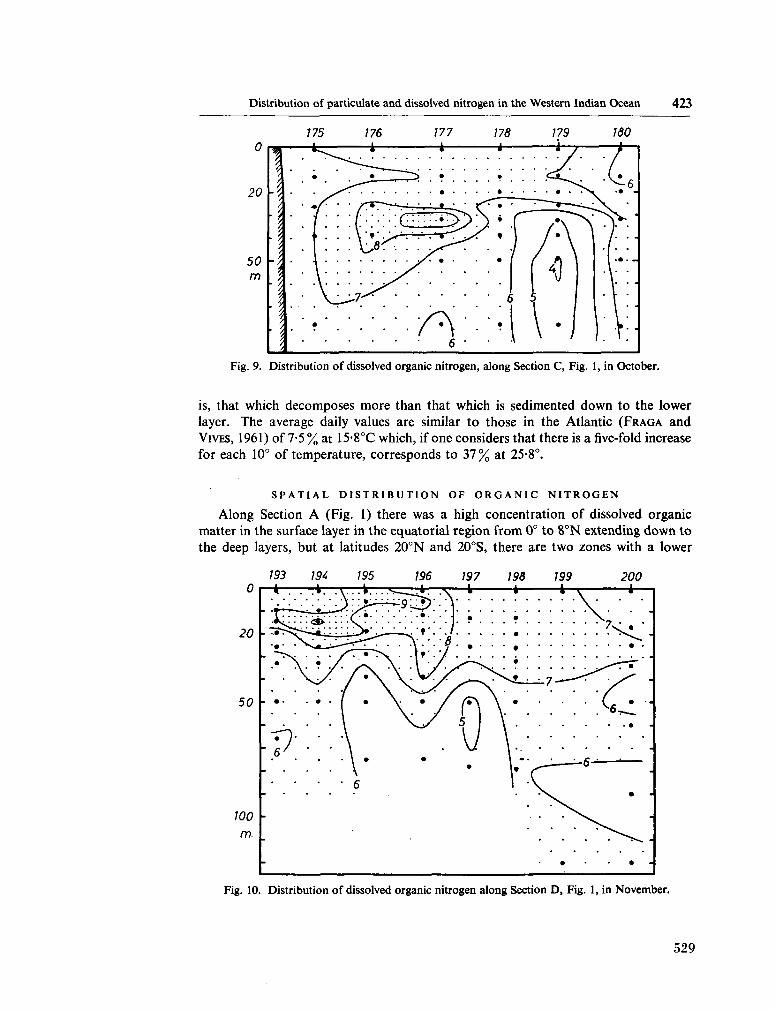
Distribution of particulate and dissolved nitrogen in the Western Indian Ocean 423
Fig. 9. Distribution of dissolved organic nitrogen, along Section C , Fig. 1, in October.
is, that which decomposes more than that which is sedimented d o w n to the lower layer. T h e average daily values are similar to those in the Atlantic ( F R A G A and V I V E S , 1961) of 7-5% at 15-8°C which, if one considers that there is a five-fold increase for each 10° of temperature, corresponds to 3 7 % at 25-8°.
SPATIAL DISTRIBUTION OF ORGANIC NITROGEN
Along Section A (Fig. 1) there was a high concentration of dissolved organic matter in the surface layer in the equatorial region from 0° to 8 ° N extending d o w n to the deep layers, but at latitudes 20°N and 20°S, there are two zones with a lower
Fig. 10. Distribution of dissolved organic nitrogen along Section D , Fig. 1, in November.
529
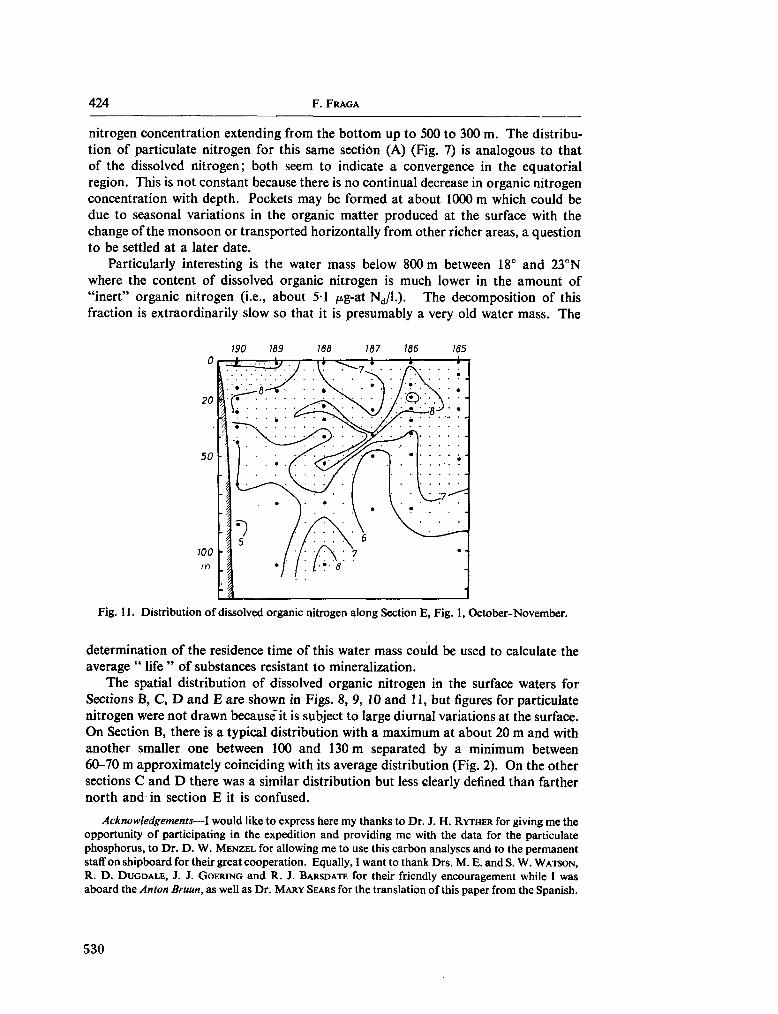
424 F. FRAGA
nitrogen concentration extending from the bottom up to 500 to 300 m . The distribution of particulate nitrogen for this same section (A) (Fig. 7) is analogous to that of the dissolved nitrogen; both seem to indicate a convergence in the equatorial region. This is not constant because there is no continual decrease in organic nitrogen concentration with depth. Pockets m a y be formed at about 1000 m which could be due to seasonal variations in the organic matter produced at the surface with the change of the monsoon or transported horizontally from other richer areas, a question to be settled at a later date.
Particularly interesting is the water mass below 800 m between 18° and 23°N where the content of dissolved organic nitrogen is m u c h lower in the amount of "inert" organic nitrogen (i.e., about 51 ¿¿g-at N d /1 . ) . The decomposition of this fraction is extraordinarily slow so that it is presumably a very old water mass. The
190 189 188 167 186 ¡85
Fig. 11. Distribution of dissolved organic nitrogen along Section E , Fig. 1, October-November.
determination of the residence time of this water mass could be used to calculate the average " life " of substances resistant to mineralization.
The spatial distribution of dissolved organic nitrogen in the surface waters for Sections B , C , D and E are shown in Figs. 8, 9, 10 and 11, but figures for particulate nitrogen were not drawn because'it is subject to large diurnal variations at the surface. O n Section B , there is a typical distribution with a m a x i m u m at about 20 m and with another smaller one between 100 and 130 m separated by a m i n i m u m between 60-70 m approximately coinciding with its average distribution (Fig. 2). O n the other sections C and D there was a similar distribution but less clearly defined than farther north and in section E it is confused.
Acknowledgements—I would like to express here m y thanks to Dr. J. H . R A T H E R for giving m e the opportunity of participating in the expedition and providing m e with the data for the particulate phosphorus, to Dr. D . W . M E N Z E L for allowing m e to use this carbon analyses and to the permanent staff on shipboard for their great cooperation. Equally, I want to thank Drs. M . E . and S. W . W A T S O N , R . D . D U G D A L E , J. J. G O E R I N G and R . J. B A R S D A T E for their friendly encouragement while I was aboard the Anton Bruun, as well as Dr . M A R Y S E A R S for the translation of this paper from the Spanish.
530
Distribution of particulate and dissolved nitrogen in the Western Indian Ocean 425
REFERENCES
D U U R S M A E . K . (1961) Dissolved organic carbon, nitrogen and phosphorus in the sea. Netherlands J. Sea Res. 1, pp. 1-148.
F R A G A F. y VIVES F. (1961) La descomposición de la materia orgánica nitrogenada en el mar. Inv. Pesq. 19, pp. 65-79.
H A R R I S E . and G . A . R I L E Y (1956) Chemical composition of the plankton. Bull. Bingham Ocean. Coll. 25, 135-323.
S V E R D R U P H . U . , M . W . J O H N S O N and R . H . F L E M I N G (1946). The Oceans. Prentice-Hall, N e w York, 1087 pp.
W O O D S H O L E O C E A N O G R A P H I C INSTITUTION (1964). Narrative Report : Anton Bruun cruise 4-A. News Bull., U . S . Program Biol., Int. Indian Ocean Exped., N o . 5, 15 pp., 11 figs. (Unpublished manuscript).
W O O D S H O L E O C E A N O G R A P H I C INSTITUTION (1965) Final Cruise Report, Anton Bruun cruises 4 A and 4B, Oceanographic data, bathythermograph positions, stations lists for biological collections. U . S . Program in Biology, Int. Indian Ocean Exped., unnumbered pp. (Unpublished manuscript).
531
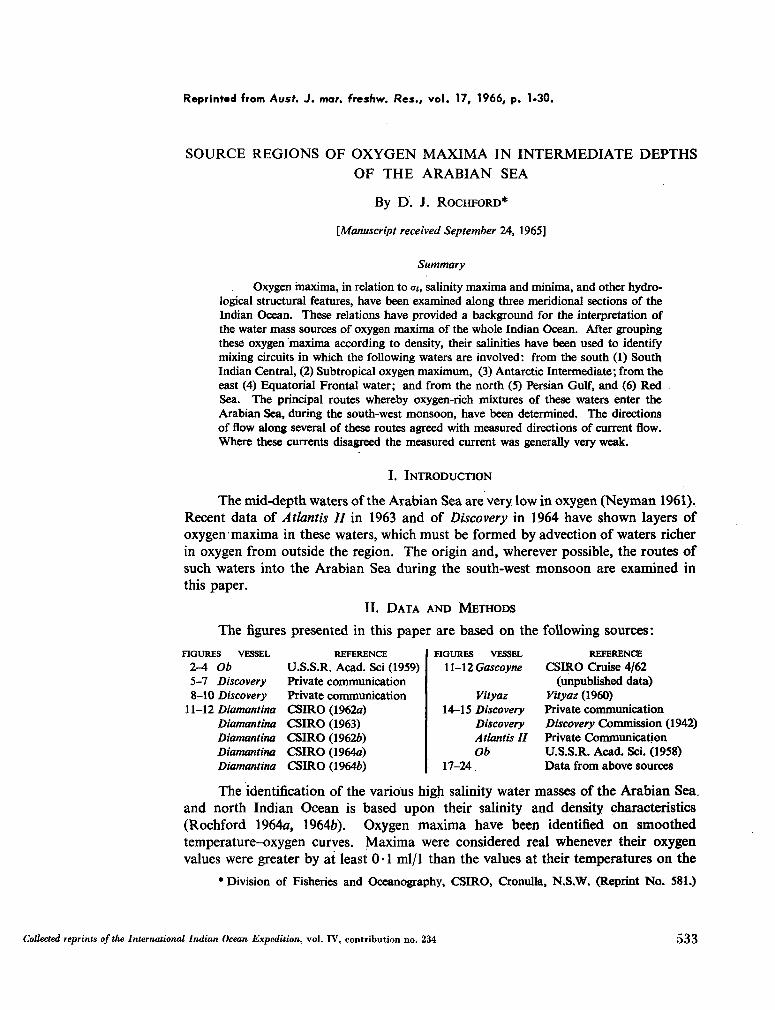
Reprinted from Aust. J. mar. freshw. Res., vol. 17, 1966, p. 1-30.
SOURCE REGIONS OF OXYGEN MAXIMA IN INTERMEDIATE DEPTHS OF THE ARABIAN SEA
By D. J. ROCHFORD*
[Manuscript received September 24, 1965]
Summary
Oxygen maxima, in relation to at, salinity maxima and minima, and other hydro-logical structural features, have been examined along three meridional sections of the Indian Ocean. These relations have provided a background for the interpretation of the water mass sources of oxygen maxima of the whole Indian Ocean. After grouping these oxygen maxima according to density, their salinities have been used to identify mixing circuits in which the following waters are involved: from the south (1) South Indian Central, (2) Subtropical oxygen m a x i m u m , (3) Antarctic Intermediate; from the east (4) Equatorial Frontal water; and from the north (5) Persian Gulf, and (6) Red Sea. The principal routes whereby oxygen-rich mixtures of these waters enter the Arabian Sea, during the south-west monsoon, have been determined. The directions of flow along several of these routes agreed with measured directions of current flow. Where these currents disagreed the measured current was generally very weak.
I. I N T R O D U C T I O N
The mid-depth waters of the Arabian Sea are very low in oxygen (Neyman 1961). Recent data of Atlantis II in 1963 and of Discovery in 1964 have shown layers of oxygen maxima in these waters, which must be formed by advection of waters richer in oxygen from outside the region. The origin and, wherever possible, the routes of such waters into the Arabian Sea during the south-west monsoon are examined in this paper.
II. D A T A A N D M E T H O D S
The figures presented in this paper are based on the following sources:
FIGURES VESSEL
2-4 Ob 5-7 Discovery 8-10 Discovery
11-12 Diamantina Diamantina Diamantina Diamantina Diamantina
REFERENCE
U . S . S . R . Acad. Sci (1959) Private communication Private communication C S I R O (1962a) C S I R O (1963) C S I R O (19626) C S I R O (1964a) C S I R O (19646)
FIGURES VESSEL
11-12 Gascoyne
Vityaz 14-15 Discovery
Discovery Atlantis II Ob
17-24.
REFERENCE
C S I R O Cruise 4/62 (unpublished data)
Vityaz (1960) Private communication Discovery Commission (1942) Private Communication U . S . S . R . Acad. Sci. (1958) Data from above sources
The identification of the various high salinity water masses of the Arabian Sea. and north Indian Ocean is based upon their salinity and density characteristics (Rochford 1964a," 19646). Oxygen maxima have been identified on smoothed temperature-oxygen curves. Maxima were considered real whenever their oxygen values were greater by at least 0-1 ml/1 than the values at their temperatures on the
* Division of Fisheries and Oceanography, C S I R O , Cronulla, N . S . W . (Reprint N o . 581.)
Collected reprints of the International Indian Ocean Expedition, vol. IV, contribution no. 234 533
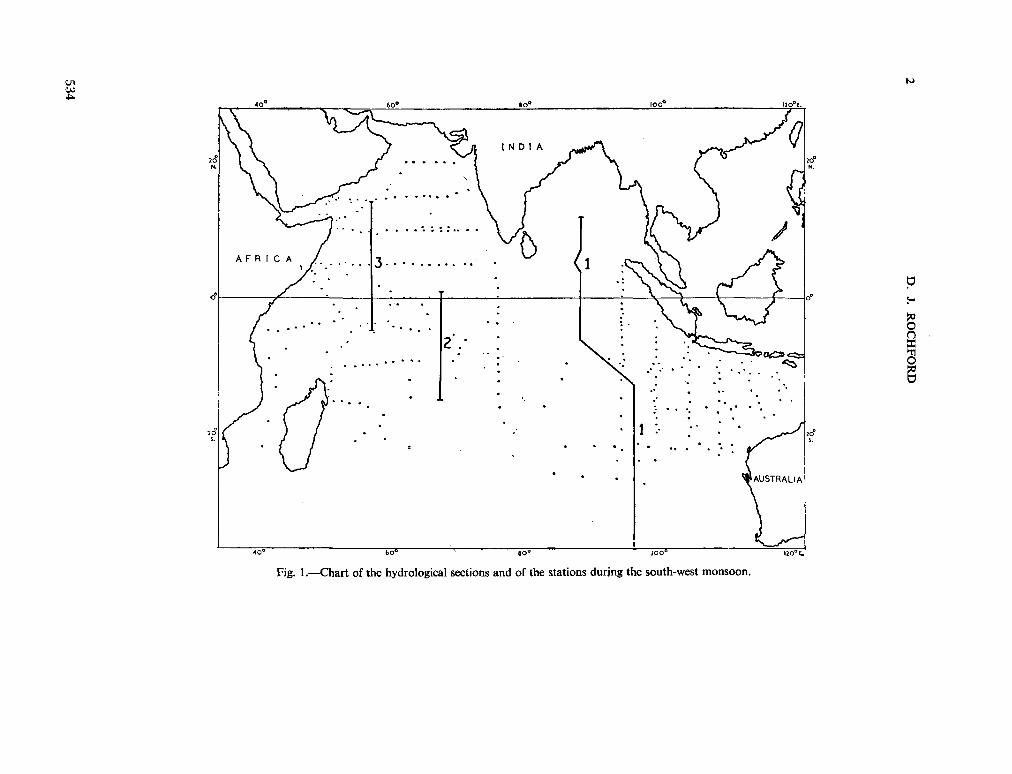
2
D. J. R
OC
HFO
RD
534
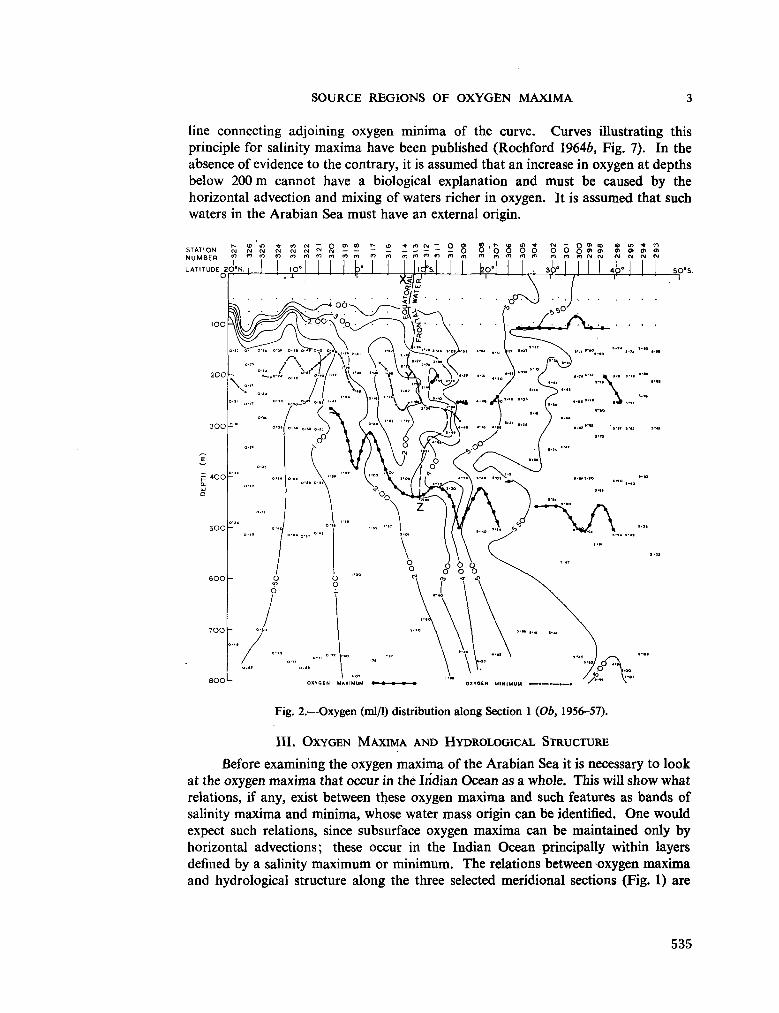
SOURCE REGIONS OF OXYGEN MAXIMA 3
line connecting adjoining oxygen minima of the curve. Curves illustrating this principle for salinity maxima have been published (Rochford 19646, Fig. 7). In the absence of evidence to the contrary, it is assumed that an increase in oxygen at depths below 200 m cannot have a biological explanation and must be caused by the horizontal advection and mixing of waters richer in oxygen. It is assumed that such waters in the Arabian Sea must have an external origin.
Fig. 2.—Oxygen (ml/1) distribution along Section 1 {Ob, 1956-57).
III. O X Y G E N M A X I M A A N D H Y D R O L O G I C A L S T R U C T U R E
Before examining the oxygen maxima of the Arabian Sea it is necessary to look at the oxygen maxima that occur in thé Indian Ocean as a whole. This will show what relations, if any, exist between these oxygen maxima and such features as bands of salinity maxima and minima, whose water mass origin can be identified. One would expect such relations, since subsurface oxygen maxima can be maintained only by horizontal advections; these occur in the Indian Ocean principally within layers defined by a salinity m a x i m u m or minimum. The relations between oxygen maxima and hydrological structure along the three selected meridional sections (Fig. 1) are
535
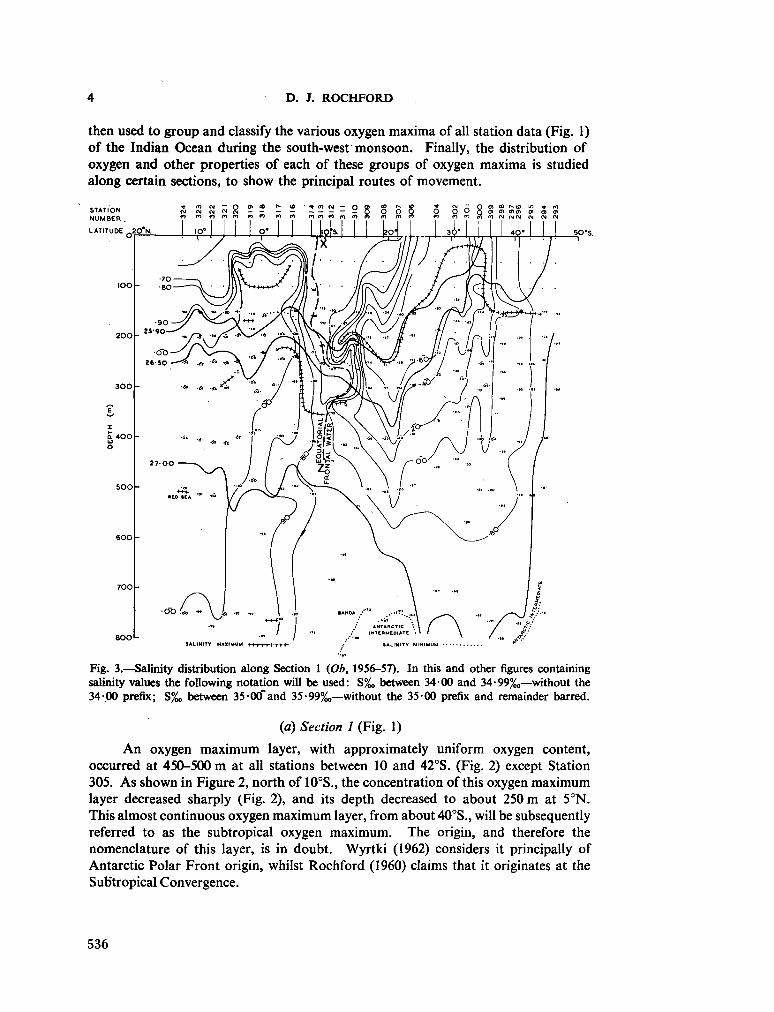
4 D. J. ROCHFORD
then used to group and classify the various oxygen maxima of all station data (Fig. 1) of the Indian Ocean during the south-west monsoon. Finally, the distribution of oxygen and other properties of each of these groups of oxygen maxima is studied along certain sections, to show the principal routes of movement.
Fig. 3.—Salinity distribution along Section 1 (Ob, 1956-57). In this and other figures containing salinity values the following notation will be used: S%o between 34 00 and 34-99%,,—without the 34-00 prefix; S%„ between 35-00" and 35 • 99%„—without the 3 5 0 0 prefix and remainder barred.
(a) Section 1 (Fig. 1)
A n oxygen m a x i m u m layer, with approximately uniform oxygen content, occurred at 450-500 m at all stations between 10 and 42°S. (Fig. 2) except Station 305. A s shown in Figure 2, north of 10°S., the concentration of this oxygen m a x i m u m layer decreased sharply (Fig. 2), and its depth decreased to about 250 m at 5°N. This almost continuous oxygen m a x i m u m layer, from about 40°S., will be subsequently referred to as the subtropical oxygen m a x i m u m . The origin, and therefore the nomenclature of this layer, is in doubt. Wyrtki (1962) considers it principally of Antarctic Polar Front origin, whilst Rochford (1960) claims that it originates at the Subtropical Convergence.
536
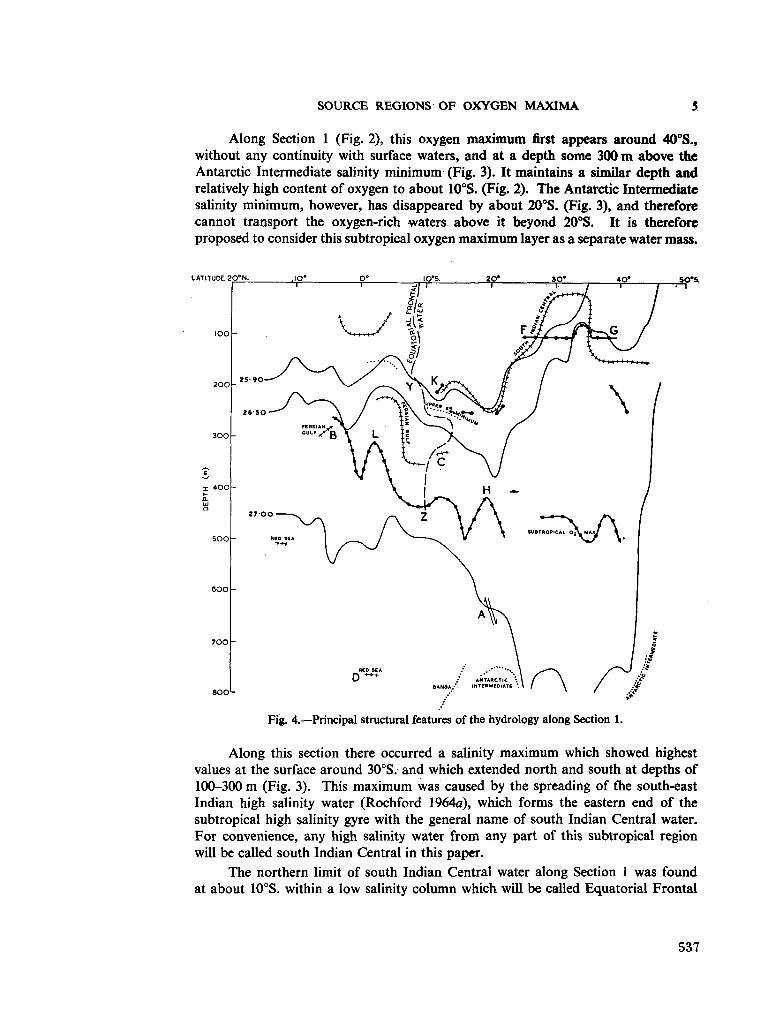
SOURCE REGIONS OF OXYGEN MAXIMA 5
Along Section 1 (Fig. 2), this oxygen m a x i m u m first appears around 40°S., without any continuity with surface waters, and at a depth some 300 m above the Antarctic Intermediate salinity min imum (Fig. 3). It maintains a similar depth and relatively high content of oxygen to about 10°S. (Fig. 2). The Antarctic Intermediate salinity min imum, however, has disappeared by about 20°S. (Fig. 3), and therefore cannot transport the oxygen-rich waters above it beyond 20°S. It is therefore proposed to consider this subtropical oxygen m a x i m u m layer as a separate water mass.
Fig. 4.—Principal structural features of the hydrology along Section 1.
Along this section there occurred a salinity m a x i m u m which showed highest values at the surface around 30°S. and which extended north and south at depths of 100-300 m (Fig. 3). This m a x i m u m was caused by the spreading of fhe south-east Indian high salinity water (Rochford 1964a), which forms the eastern end of the subtropical high salinity gyre with the general name of south Indian Central water. For convenience, any high salinity water from any part of this subtropical region will be called south Indian Central in this paper.
The northern limit of south Indian Central water along Section 1 was found at about 10°S. within a low salinity column which will be called Equatorial Frontal
537
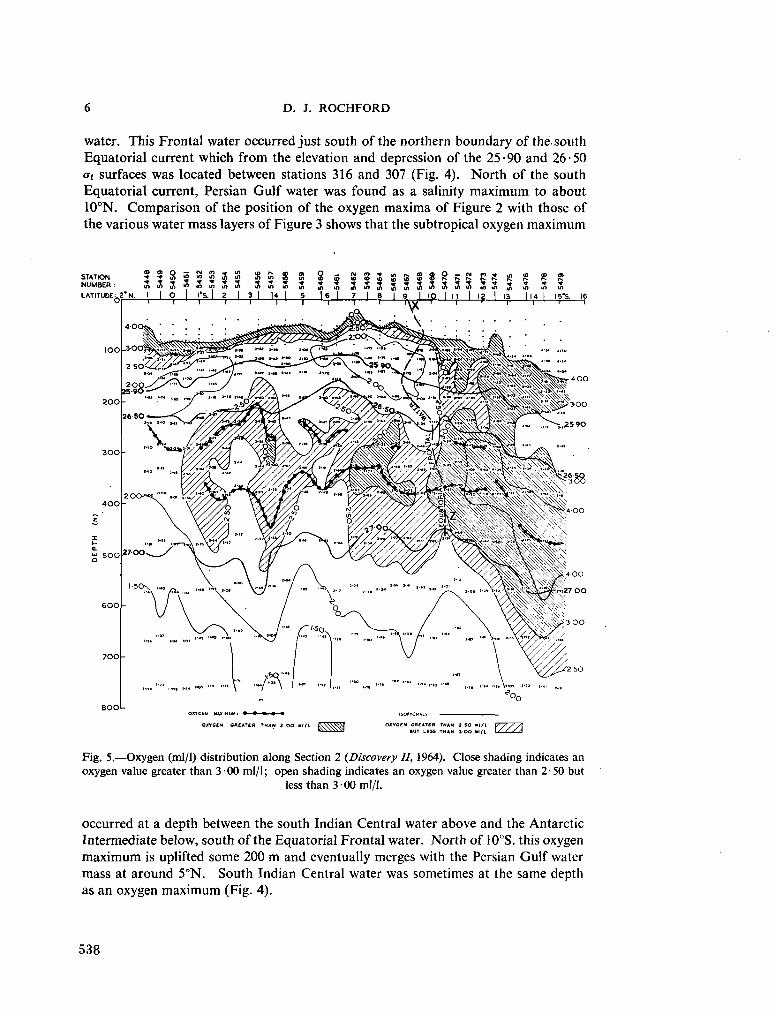
6 D . J. ROCHFORD
water. This Frontal water occurred just south of the northern boundary of the south Equatorial current which from the elevation and depression of the 25 • 90 and 26 • 50 at surfaces was located between stations 316 and 307 (Fig. 4). North of the south Equatorial current, Persian Gulf water was found as a salinity m a x i m u m to about 10°N. Comparison of the position of the oxygen maxima of Figure 2 with those of the various water mass layers of Figure 3 shows that the subtropical oxygen m a x i m u m
OXTCEN MAXIMUM: • H • • • ISO'YCNAIS -
OXYGEN GREATER T H A N 3 O O al/L I N ^ S S S OXYGEN GREATER THAN 2 SO Bl/l V / / A * " V V V S T 8 U T (.ESS THAN J OO min \ / / / A
Fig. 5.—Oxygen (ml/1) distribution along Section 2 (Discovery II, 1964). Close shading indicates an oxygen value greater than 3 00 ml/1; open shading indicates an oxygen value greater than 2-50 but
less than 3 00 ml/1.
occurred at a depth between the south Indian Central water above and the Antarctic Intermediate below, south of the Equatorial Frontal water. North of 10°S. this oxygen m a x i m u m is uplifted some 200 m and eventually merges with the Persian Gulf water mass at around 5°N. South Indian Central water was sometimes at the same depth as an oxygen m a x i m u m (Fig. 4).
538
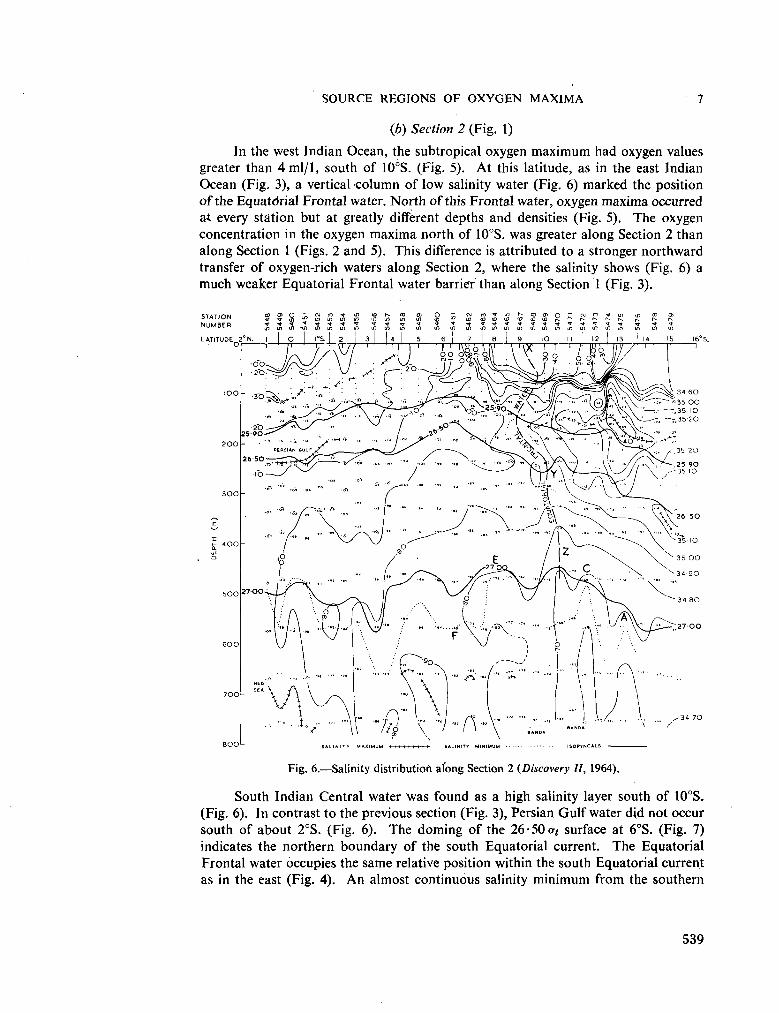
SOURCE REGIONS OF OXYGEN MAXIMA 7
(Jb) Section 2 (Fig. 1)
In the west Indian Ocean, the subtropical oxygen m a x i m u m had oxygen values greater than 4 ml/1, south of 10°S. (Fig. 5). At this latitude, as in the east Indian Ocean (Fig. 3), a vertical column of low salinity water (Fig. 6) marked the position of the Equatorial Frontal water. North of this Frontal water, oxygen max ima occurred a* every station but at greatly different depths and densities (Fig. 5). The oxygen concentration in the oxygen max ima north of 10°S. was greater along Section 2 than along Section 1 (Figs. 2 and 5). This difference is attributed to a stronger northward transfer of oxygen-rich waters along Section 2, where the salinity shows (Fig. 6) a m u c h weaker Equatorial Frontal water barrier than along Section 1 (Fig. 3).
Fig. 6.—Salinity distribution afong Section 2 (Discovery II, 1964).
South Indian Central water was found as a high salinity layer south of 10°S. (Fig. 6). In contrast to the previous section (Fig. 3), Persian Gulf water did not occur south of about 2°S. (Fig. 6). The doming of the 26 • 50 at surface at 6°S. (Fig. 7) indicates the northern boundary of the south Equatorial current. The Equatorial Frontal water occupies the same relative position within the south Equatorial current as in the east (Fig. 4). A n almost continuous salinity m i n i m u m from the southern
539
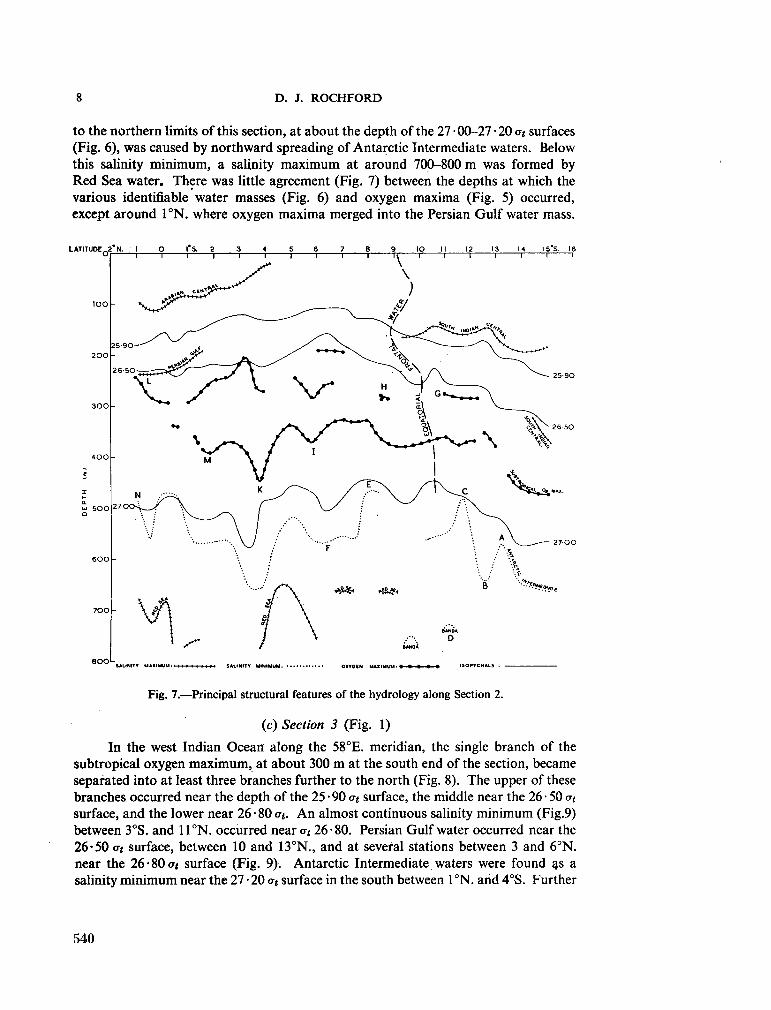
8 D. J. ROCHFORD
to the northern limits of this section, at about the depth of the 27-00-27-20 at surfaces (Fig. 6), was caused by northward spreading of Antarctic Intermediate waters. Below this salinity m i n i m u m , a salinity m a x i m u m at around 700-800 m was formed by Red Sea water. There was little agreement (Fig. 7) between the depths at which the various identifiable water masses (Fig. 6) and oxygen maxima (Fig. 5) occurred, except around 1°N. where oxygen maxima merged into the Persian Gulf water mass.
SALINITY MAXIMUM. SALINITY MINIMUM OXYGEN MAXIMUM: 1 « • » • ISOPYCNALS :
Fig. 7.—Principal structural features of the hydrology along Section 2.
(c) Section 3 (Fig. 1)
In the west Indian Ocean along the 58°E. meridian, the single branch of the subtropical oxygen m a x i m u m , at about 300 m at the south end of the section, became separated into at least three branches further to the north (Fig. 8). The upper of these branches occurred near the depth of the 25 • 90 at surface, the middle near the 26 • 50 at
surface, and the lower near 26 • 80 at. A n almost continuous salinity m i n i m u m (Fig.9) between 3°S. and 11°N. occurred near at 26 • 80. Persian Gulf water occurred near the 26-50 at surface, between 10 and 13°N., and at several stations between 3 and 6°N. near the 2 6 - 8 0 ^ surface (Fig. 9). Antarctic Intermediate waters were found as a salinity m i n i m u m near the 27 • 20 at surface in the south between 1 °N. and 4°S. Further
540
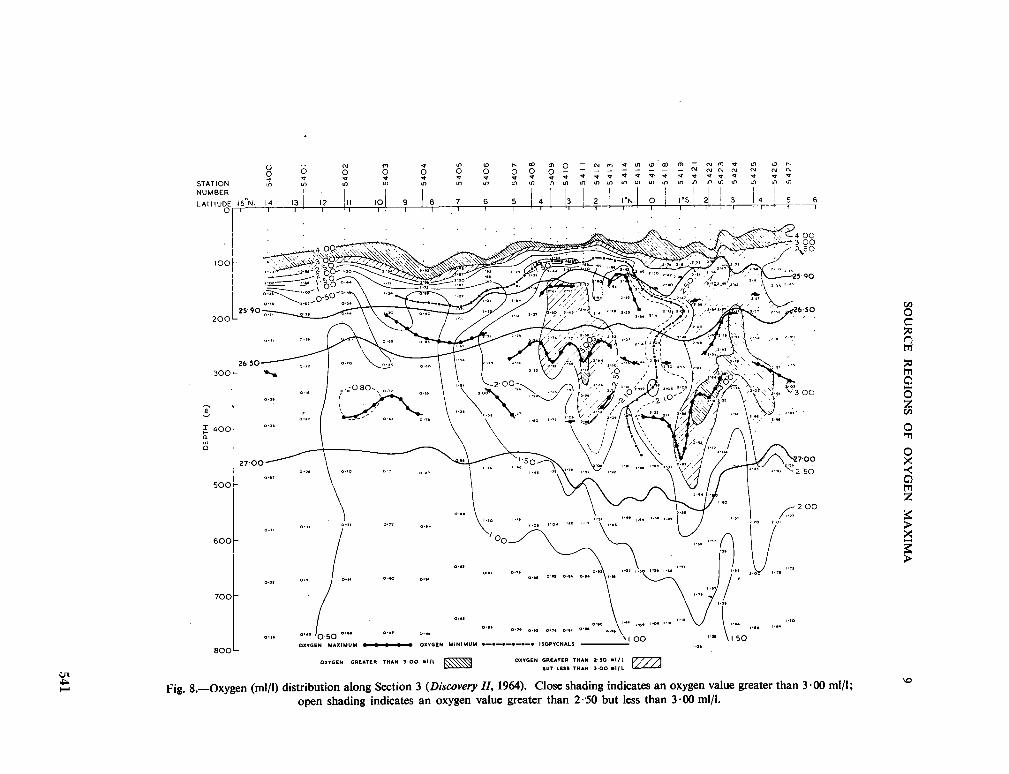
SOU
RC
E R
EG
ION
S O
F O
XY
GEN
M
AX
IMA
9
z oc
go
U)Z
J
O
o
(«0 H
idia
I O
f>
H 11
a i 1 ! 1
1 .i s è
o •
1 °
I I z K
K
UJ E
ñ
? ï
0 °
I A X I
SEN
•s
3 ;
°S
° lî
scover; xygen
W
C
m
«
"5 <8 0
T3 t«
£ 6
0 ""•
C
60 S
-S
"3 -3 S •« O
(A
3 S
¡s 0
I
541
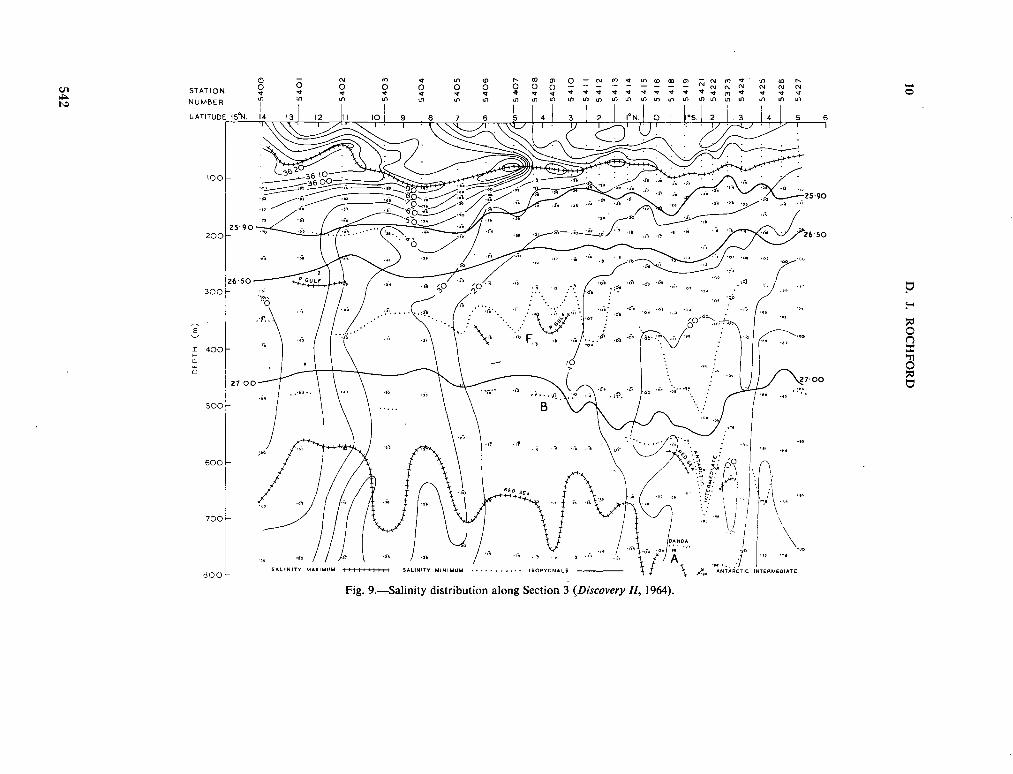
10
D. J. R
OC
HFO
RD
§
CO
! •a
C/5
0\
542
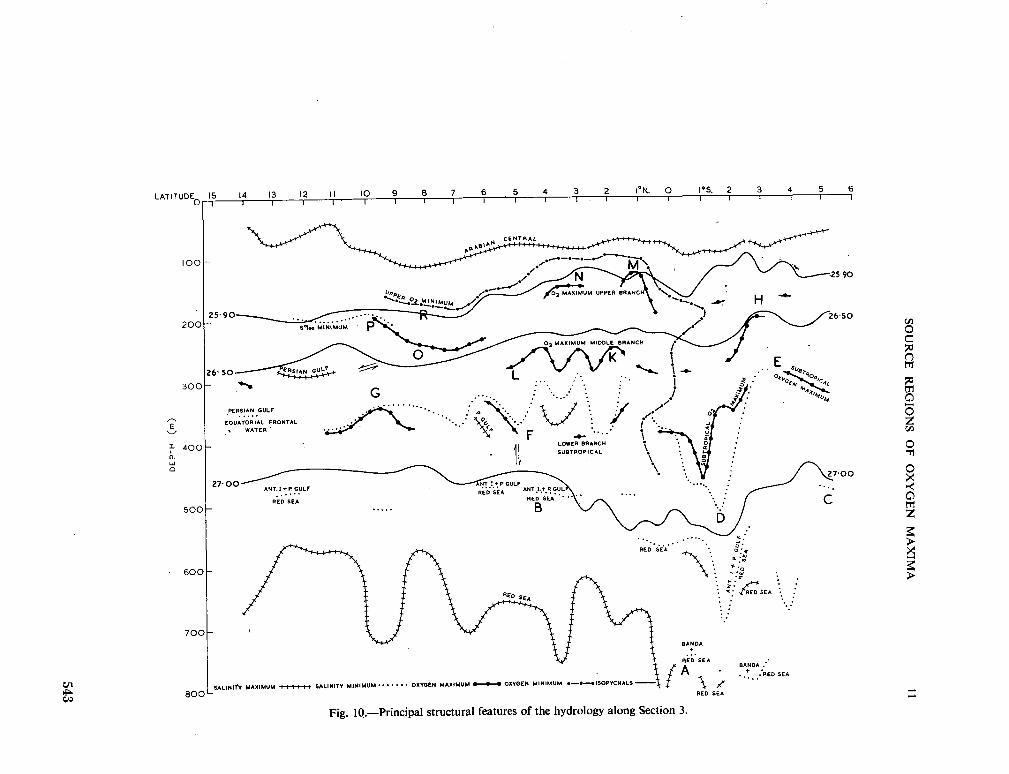
SOU
RC
E
RE
GIO
NS
OF
OX
YG
EN
M
AX
IMA
11
• \ £ •/>
r a.
'•
•<
***** j-t-H
*"*
"
1 m
z 0. (ISO i • i '
1
ci c o +3
8 V
> 60 c _o °ñ í¿ _o "o iM •a cu
a 1?
543
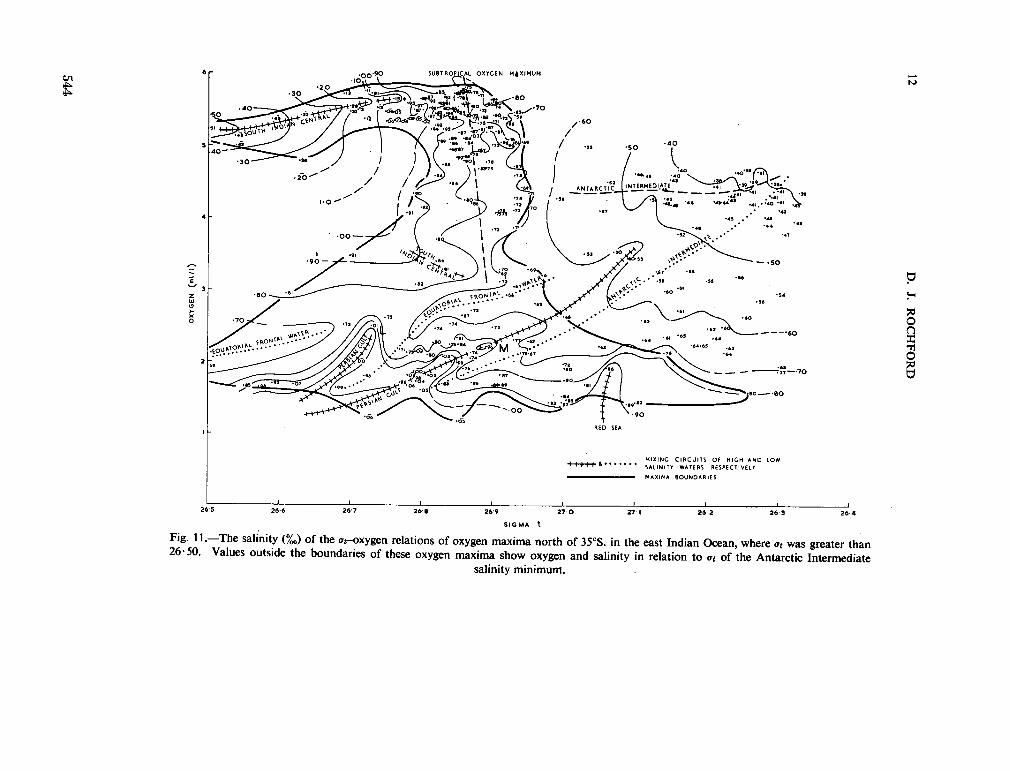
12
D. J. R
OC
HFO
RD
544
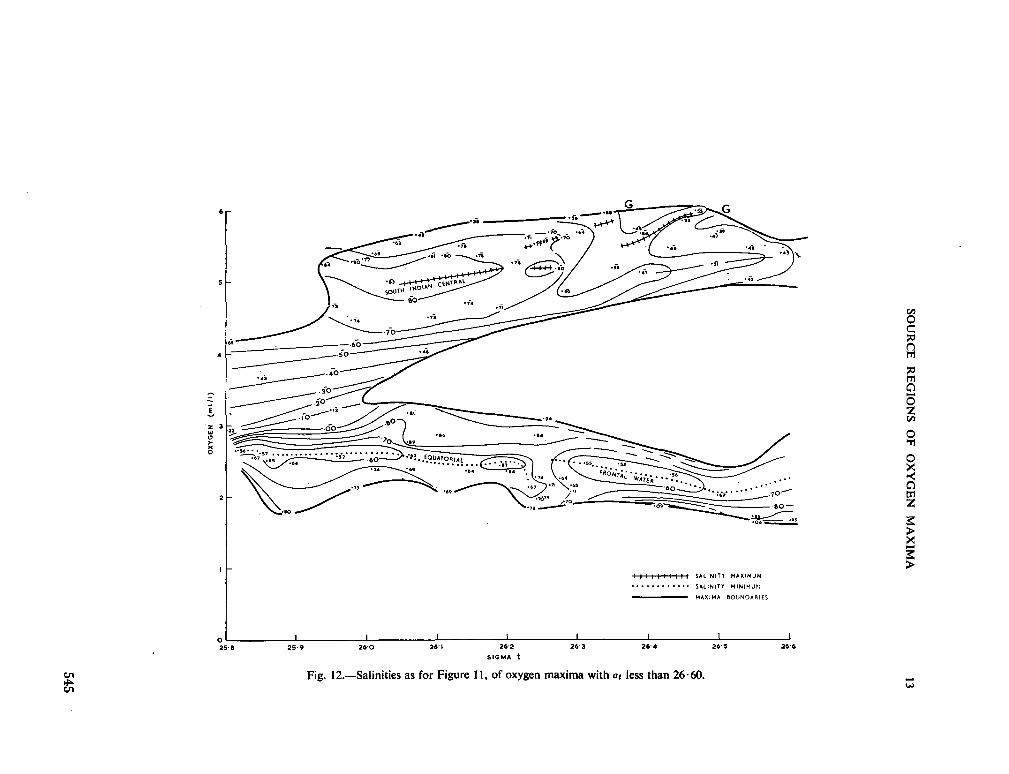
SOU
RC
E R
EG
ION
S O
F O
XY
GE
N
MA
XIM
A
13
0/l>
")
N33A
XO
545
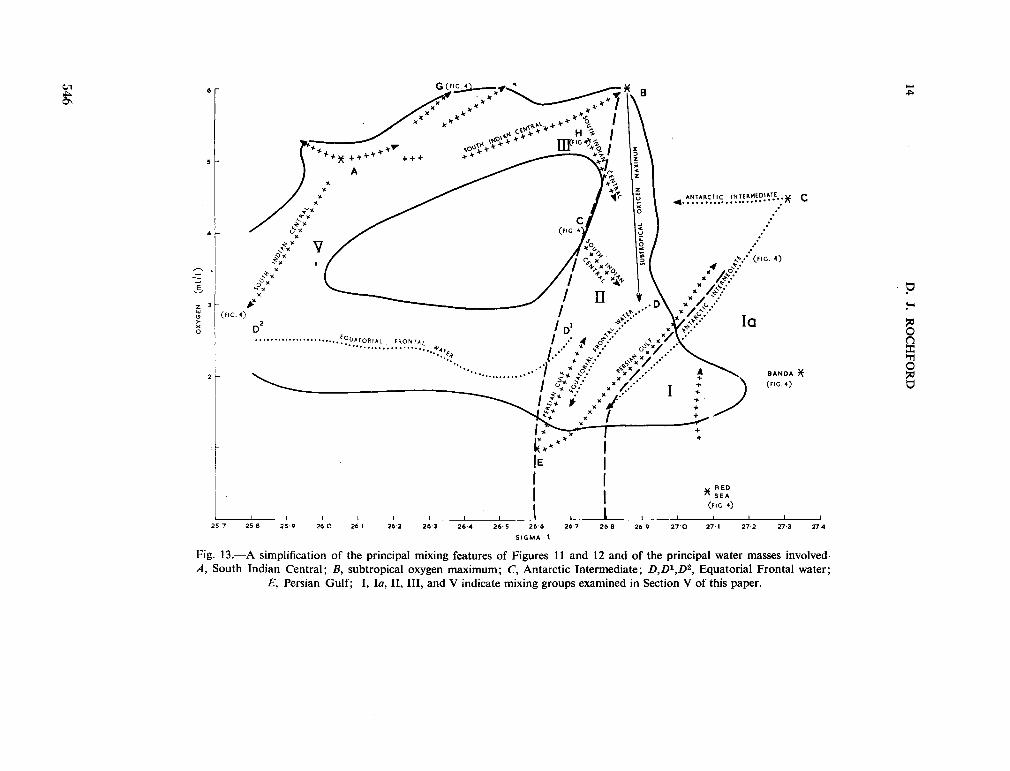
14
D. J. R
OC
HFO
RD
(l/lw)
N30A
XO
546
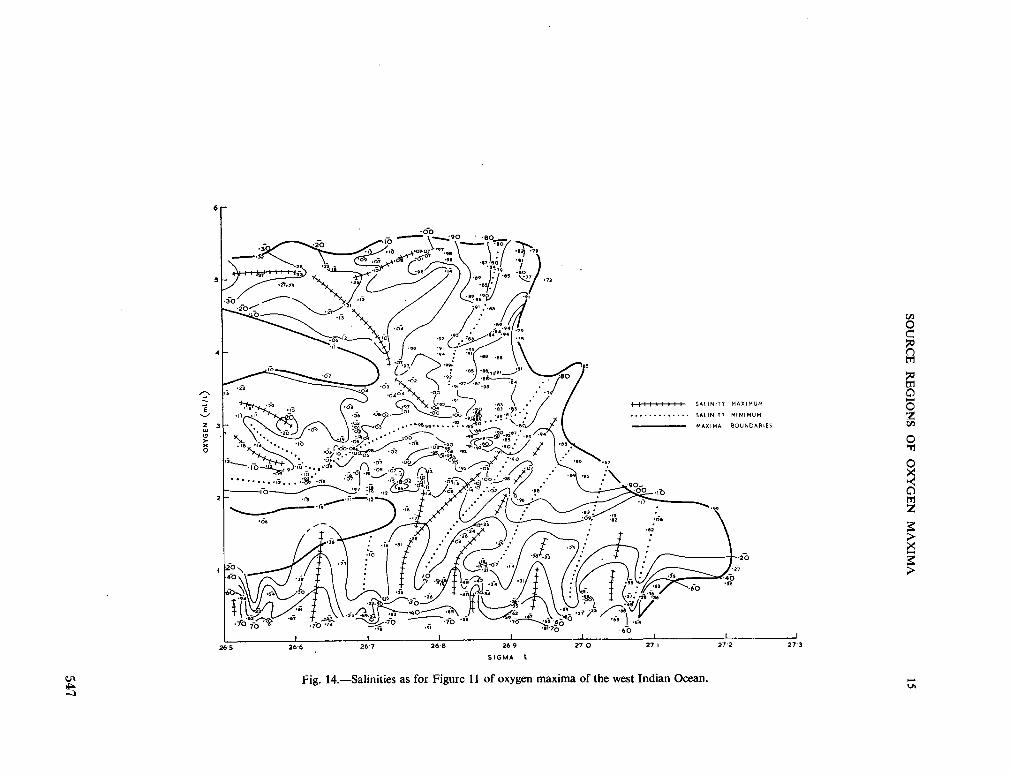
SOU
RC
E R
EG
ION
S O
F O
XY
GE
N
MA
XIM
A
15
(l/lw)
N3S
A.X
O
547
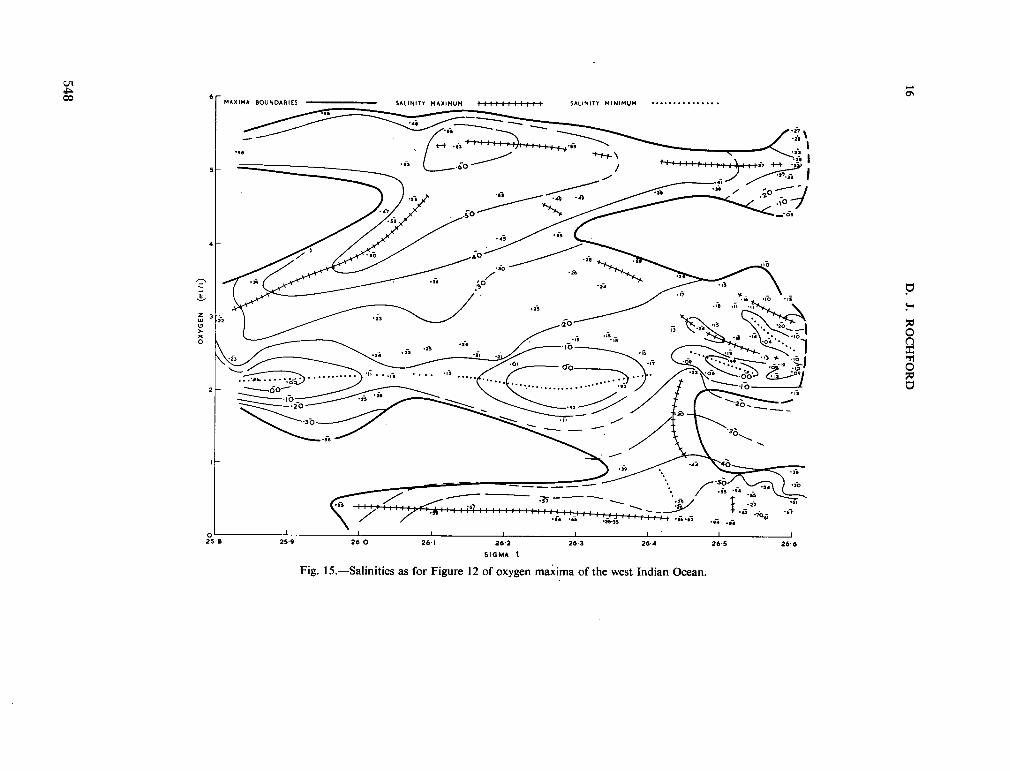
16 D
. J.
RO
CH
FOR
D
(l/lw)
N33A
XO
548
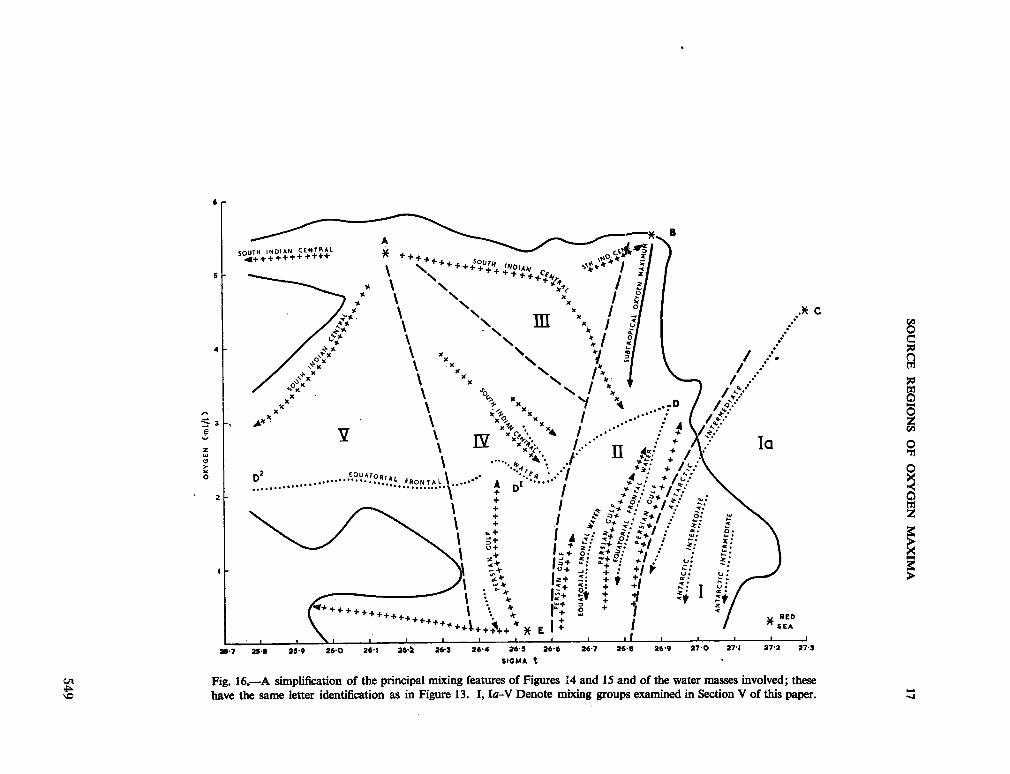
SOU
RC
E R
EGIO
NS O
F O
XY
GEN
M
AX
IMA
17
o
*:
;"%
r
^to S "
7b
••
••
•.
..
..
^ JN
OU
J iv
mo
Tv
no
j
- i
Fjj
î/tl bJ
X
.' \¿ X
J-."
**•
A0
* •
». * * I
.*V
:-
"*+ + + + + + + + + + V
,i
.-Ȓ ji
f^ d
îna
H
""
•• +
2
-"8 (l/l<
U)
N3S
A.X
O
549
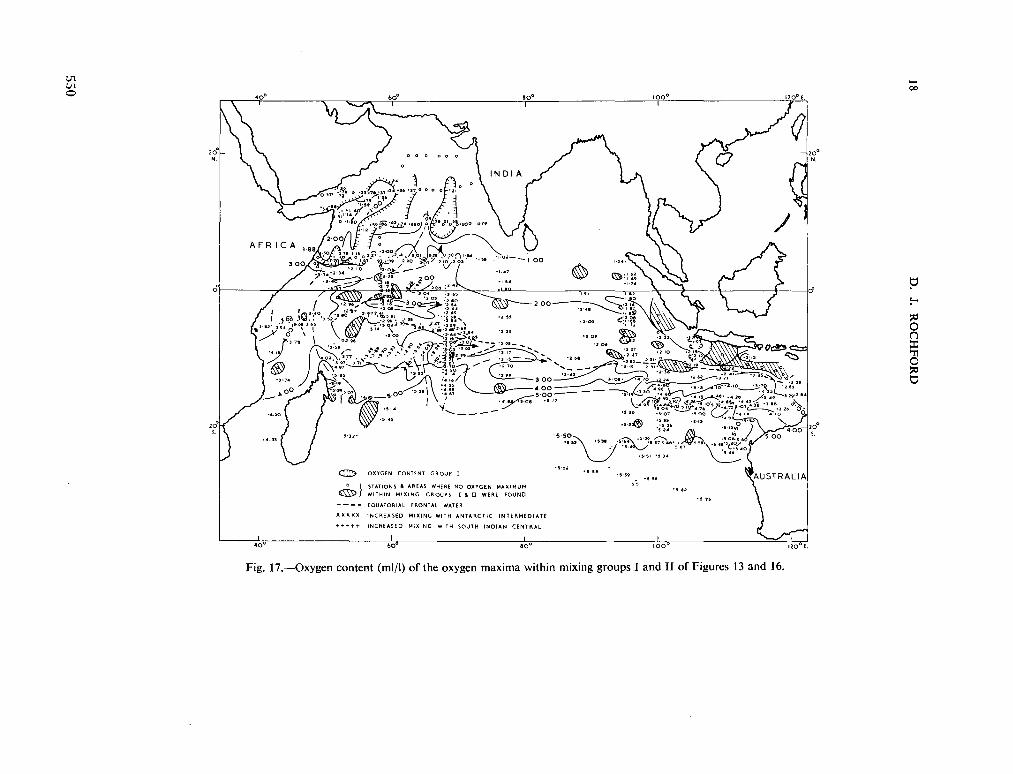
18
D. J. R
OC
HFO
RD
550
S O U R C E REGIONS O F O X Y G E N M A X I M A 19
to the north, however, only isolated regions of such water, with at values more than 27-00, were encountered (Fig. 9). A continuous layer of Red Sea water at between 600-800 m occurred northward from the equator (Fig. 9). The depth of the lower branch of the subtropical oxygen m a x i m u m coincided quite often with that of the salinity minimum around 2 6 - 8 0 ^ (Fig. 10). The other branches of this oxygen max imum did not, however, show any affinity with the salinity structure, except near 10°N., where the upper branch merged into a salinity minimum.
IV. W A T E R MASSES ASSOCIATED W I T H THE O X Y G E N M A X I M A OF T H E INDIAN O C E A N
Figures 2—10 show that north of the Equatorial Frontal water and extending into the Arabian Sea, a number of oxygen maxima occurred at different at values. In some cases these maxima were associated with a salinity maximum or minimum. The origin of waters forming these oxygen m a x i m a was determined, therefore, by the use of both at (for the initial separation into groups) and salinity (for the water mass identification within these groups). This was done by (1) plotting the oxygen concentration of all oxygen m a x i m a of the Indian Ocean (Fig. 1) against their at (e.g. Fig. 11); (2) superimposing upon the position of each oxygen m a x i m u m of such a diagram (e.g. Fig. 11), the salinity of the oxygen m a x i m u m . These salinity values were then contoured to show bands or areas of high or low salinity, whose water mass source was identified by use of Figures 2-10. For convenience the oxygen m a x i m a of the Indian Ocean were divided into an eastern group (east of 80°E.) and a western group. These groups were further subdivided into oxygen m a x i m a with at less than 26 • 50 and those with at greater than 26 • 50.
(a) Eastern
In the east Indian Ocean (Figs. 11 and 12), two sources of well-oxygenated water, the south Indian Central (mean at 26-10, Fig. 12) and the Subtropical oxygen m a x i m u m (mean at 26-85, Fig. 11), spread towards the equator and mixed almost isentropically with the upper and lower parts of the Equatorial Frontal water (Figs. 11 and 12). This mixing provides the source of the oxygen m a x i m a at various at values within the column of Equatorial Frontal water. North of this Frontal water, oxygen max ima are mostly found within mixtures of Persian Gulf and Equatorial Frontal water (L and M , Figs. 4 and 11), or Persian Gulf and Antarctic Intermediate water (Fig. 11). At at values greater than 27-00, a small number of oxygen m a x i m a was formed by the mixing of R e d Sea and Antarctic Intermediate waters. Oxygen max ima formed by the mixing of Antarctic Intermediate and Persian Gulf waters did not occur below at 26-80 (Fig. 11). This agrees with the limit of 26-90, previously determined (Rochford 1963), for Antarctic Intermediate water in this eastern region. T o facilitate comparison with the western Indian Ocean, the principal mixing circuits (based upon salinity) of Figures 11 and 12 were combined into a single simplified diagram (Fig. 13).
(b) Western
Figures 14 and 15 show that the salinity-oxygen-<j« relations of oxygen m a x i m a in the west Indian Ocean. Figure 16 summarizes the principal mixing circuits. Comparison of Figures 13 and 16 shows that, whereas mixing of south Indian Central
551
20 D. J. ROCHFORD
and Equatorial Frontal waters at at values around 25 • 80 arid 26 • 80 occur throughout, mixing of these waters at around at 26-60 was a feature of the west Indian Ocean only. Oxygen maxima within a at range of 26-00-26-60, and oxygen 3-4 ml/1 were therefore found only in the west Indian Ocean. These maxima formed the middle branch of the oxygen maxima of Section 3 (Fig. 10). The shallow oxygen maxima of both the east and west Indian Oceans (Figs. 13 and 16), however, were formed by the mixing of south Indian Central and Equatorial Frontal waters in both cases. North of the Equatorial Frontal water in the west Indian Ocean, semi-isentropic mixing of Persian Gulf and this Frontal water occurred around ot 26-40-26-50 (Fig. 16). In the Arabian Sea mixing of Persian Gulf and Red Sea water masses formed a series of waters with at values between those of the two parent water masses. These mixed so-called Persian Gulf waters spread southward (according to the salinity contours, see Fig. 14) and mixed with a northward movement of Equatorial Frontal water on about the same at surfaces (Fig. 16). At<Ti values greater than 26-90, however, the Equatorial Frontal water was not present and Antarctic Intermediate water became the source of the low salinity water contributing oxygen to the Arabian Sea (Fig. 16). This Antarctic Intermediate water, mixed with Persian Gulf water above and.Red Sea water below. Along Section 3 this Intermediate water formed the almost continuous salinity min imum extending northward to 6°N. and beyond (Fig. 10).
V. MIXING TRANSPORT OF OXYGEN FROM THE SOUTH TO THE NORTH INDIAN OCEAN
Figures 13 and 16 show that oxygen maxima with at values less than 26-90 in the Indian Ocean north of the Equatorial Frontal waters are formed by a spreading northward of Frontal waters richer in oxygen, and by their near-isentropic mixing with a southward-spreading Persian Gulf or mixtures of Persian Gulf and Red Sea water masses. The upper layers of these Equatorial Frontal waters receive oxygen by near-isentropic mixing with south Indian Central at at 25-80 (east Indian Ocean), and at at values of 25-80 and 26-50 (west Indian Ocean). The deep layers of these Frontal waters receive oxygen by isentropic mixing with waters of the subtropical oxygen m a x i m u m . At at values greater than 26 • 90, oxygen maxima in the Arabian Sea are formed by the spreading northward and mixing of Antarctic Intermediate waters with the Red Sea water mass below and the Persian Gulf water mass above. Oxygen maxima formed by the advection of these various waters into the north Indian Ocean and Arabian Sea have been divided into Groups 1-V (Figs. 13 and 16), centred about these principal mixing circuits. The geographic distribution of oxygen maxima from mixing groups 1, II and IV shows the location of the waters involved (Part V ) , and of their probable movements (Part VI).
(a) Group I (Figs. 13 and 16)
Oxygen maxima of this mixing group occurred east of the Somali coast along a strip running north-east from 5 to 15°N. near the mouth of the Gulf of Aden, and towards the west coast of India between lOand 15°N.(Fig. 17). In general these maxim a had greater salinities (Fig. 18), and occurred at greater depths (Fig. 19) than maxima of mixing Group II adjoining them. In the east Indian Ocean, only a small number of oxygen maxima of mixing Group 1 (Fig. 13) was found south of Java and west of Sumatra. Oxygen values within this mixing group off the Somali coast decreased
552
S O U R C E REGIONS O F O X Y G E N M A X I M A 21
northward. Those in the east Indian Ocean decreased westward (Fig. 17). These changes in oxygen concentration in conjunction with a general increase in salinity in the same direction (Fig. 18) indicate that the oxygen maxima of Group I are formed by a northward movement of Antarctic Intermediate water into the north Arabian Sea, and by a north-westward movement in the east Indian Ocean towards the equator. However, the exceptionally high oxygen and low salinity values of this oxygen m a x i m u m at one station close to fhe central Arabian coast can be caused only by a stronger and more direct movement of Antarctic Intermediate water into the Gulf of Aden than Figure 18 shows during the south-west monsoon. During the northeast monsoon,, surface currents move Arabian Sea water into the gulf and^it is probable that intensification of the movement of Antarctic Intermediate water in the same direction occurs during this season. (See also Part VI of this paper.)
(b) Group II (Figs. 13 and 16)
T h e oxygen content of these m a x i m a w a s greater, north of about 15°S., in the west than in the east Indian Ocean (Fig. 17). A tongue of waters with relatively high oxygen m a x i m u m values w a s found along the Somali coast and to the north-east towards the central Arabian coast (Fig. 17). Salinities within this oxygen-rich tongue were relatively low (Fig. 18), because of the accumulation of Equatorial Frontal water. L o w e r salinity values of oxygen m a x i m a along the south-west coast of India (Fig. 18), on the other hand, were found in waters of low oxygen and are of a different mixing origin. Salinities of G r o u p 11 (Fig. 13) show a fairly wide but clearly defined zone of Equatorial Frontal waters in the east Indian Ocean , which can be, traced with little change in salinity or latitudinal position to about 85°E. Wes t of this longitude the zone of m i n i m u m salinity, characteristic of these Equatorial Frontal waters, increases in salinity, narrows and finally bifurcates into a number of branches which terminate around 50°E. However , low salinities within the oxygen m a x i m a of G r o u p II (Fig. 16), at isolated stations along the Somali coast (Fig. 18), indicate that a northward m o v e m e n t of these Frontal waters must occur.
T h e depths of the oxygen m a x i m a of G r o u p II (Figs. 13 and 16) generally decreased northward (Fig. 19) except along the zone of Equatorial Frontal water, where the oxygen m a x i m a were found at a greater depth than immediately north or south. This increase in depth of the oxygen m a x i m u m in the vicinity of a zone of Equatorial Frontal water occurred just to the south (Station 5456, Fig. 7) or just to the north (Station 5421, Fig. 10) of regions where a m a x i m u m vertical separation of the 26-50 and 2 7 - O O C T Í surfaces occurred. This separation indicates a zonal flow in these regions between these two at surfaces. This deepening of the oxygen m a x i m u m is thought, therefore, to be caused by intensified zonal flow of Equatorial Frontal waters.
(c) Group /K(Figs . 13 and 16)
Oxygen m a x i m a of this mixing group occurred between 10°S. and 10°N. w h e n west of 60°E., but between 0 and 10°S. only, from 60°E. to 80°E. (Fig. 20). M a x i m a of this mixing group were absent from the east Indian Ocean . T h e oxygen content (Fig. 20), together with the salinity (Fig. 21) of these m a x i m a , identified regions in which south Indian Central, Equatorial Frontal water and Persian Gulf water pre-
553
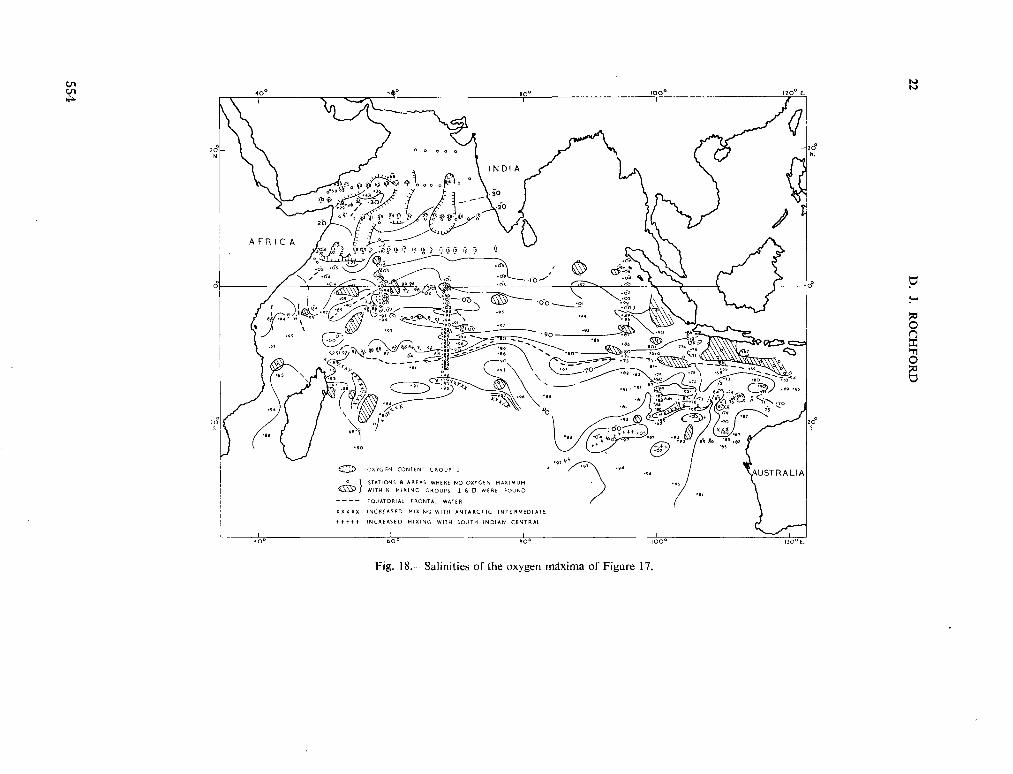
22
D. J. R
OC
HFO
RD
5>
'Q^
554
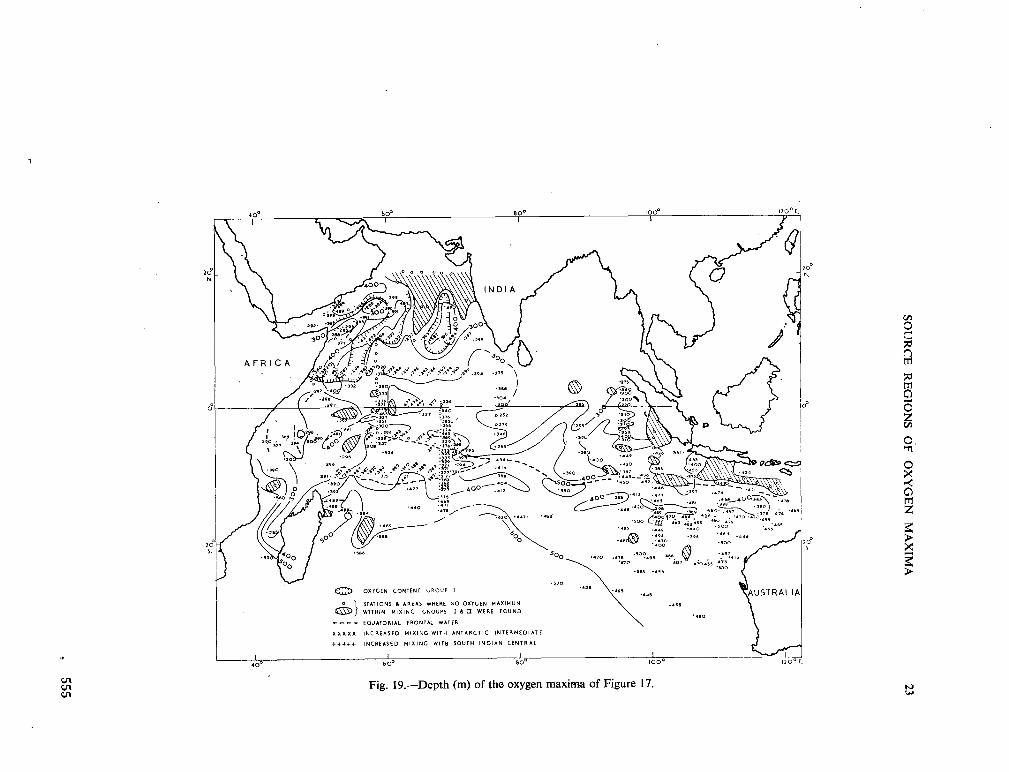
SOU
RC
E R
EG
ION
S O
F O
XY
GEN
M
AX
IMA
23
, 555
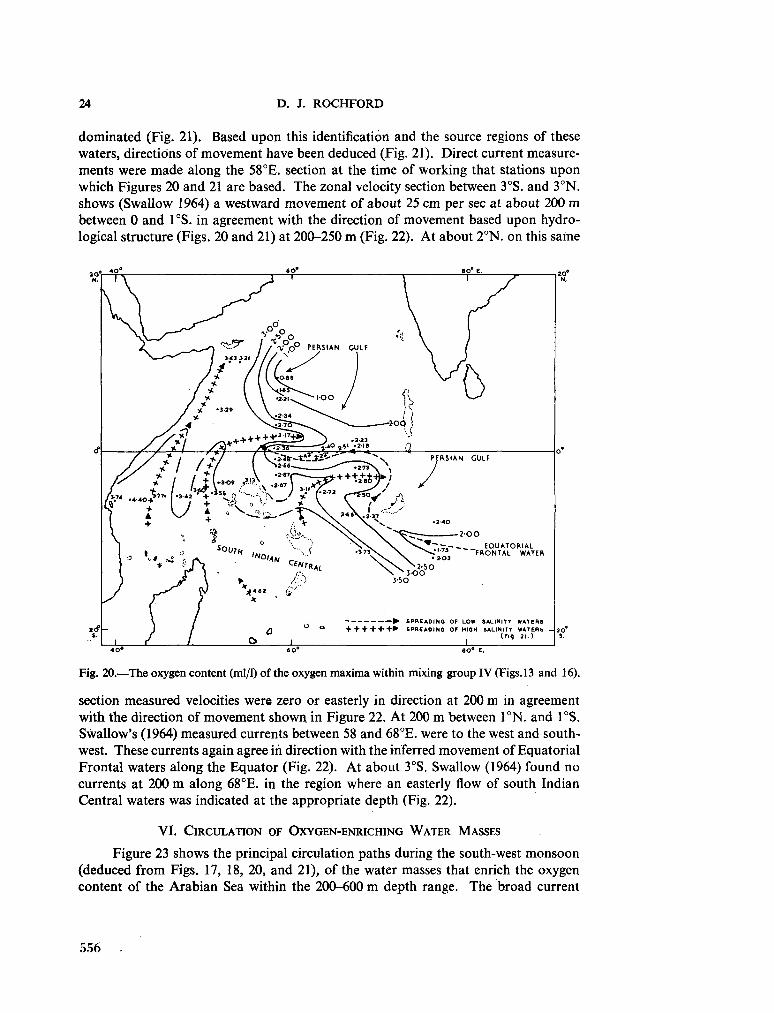
24 D . J. ROCHFORD
dominated (Fig. 21). Based upon this identification and the source regions of these waters, directions of movement have been deduced (Fig. 21). Direct current measurements were made along the 58°E. section at the time of working that stations upon which Figures 20 and 21 are based. The zonal velocity section between 3°S. and 3°N. shows (Swallow 1964) a westward movement of about 25 c m per sec at about 200 m between 0 and 1 °S. in agreement with the direction of movement based upon hydro-logical structure (Figs. 20 and 21) at 200-250 m (Fig. 22). At about 2°N. on this same
Fig. 20.—The oxygen content (ml/1) of the oxygen maxima within mixing group IV (Figs. 13 and 16).
section measured velocities were zero or easterly in direction at 200 m in agreement with the direction of movement shown in Figure 22. At 200 m between 1°N. and 1°S. Swallow's (1964) measured currents between 58 and 68°E. were to the west and southwest. These currents again agree in direction with the inferred movement of Equatorial Frontal waters along the Equator (Fig. 22). At about 3°S. Swallow (1964) found no currents at 200 m along 68°E. in the region where an easterly flow of south Indian Central waters was indicated at the appropriate depth (Fig. 22).
VI. C I R C U L A T I O N O F O X Y G E N - E N R I C H I N G W A T E R M A S S E S
Figure 23 shows the principal circulation paths during the south-west monsoon (deduced from Figs. 17, 18, 20, and 21), of the water masses that enrich the oxygen content of the Arabian Sea within the 200-600 m depth range. The broad current
556
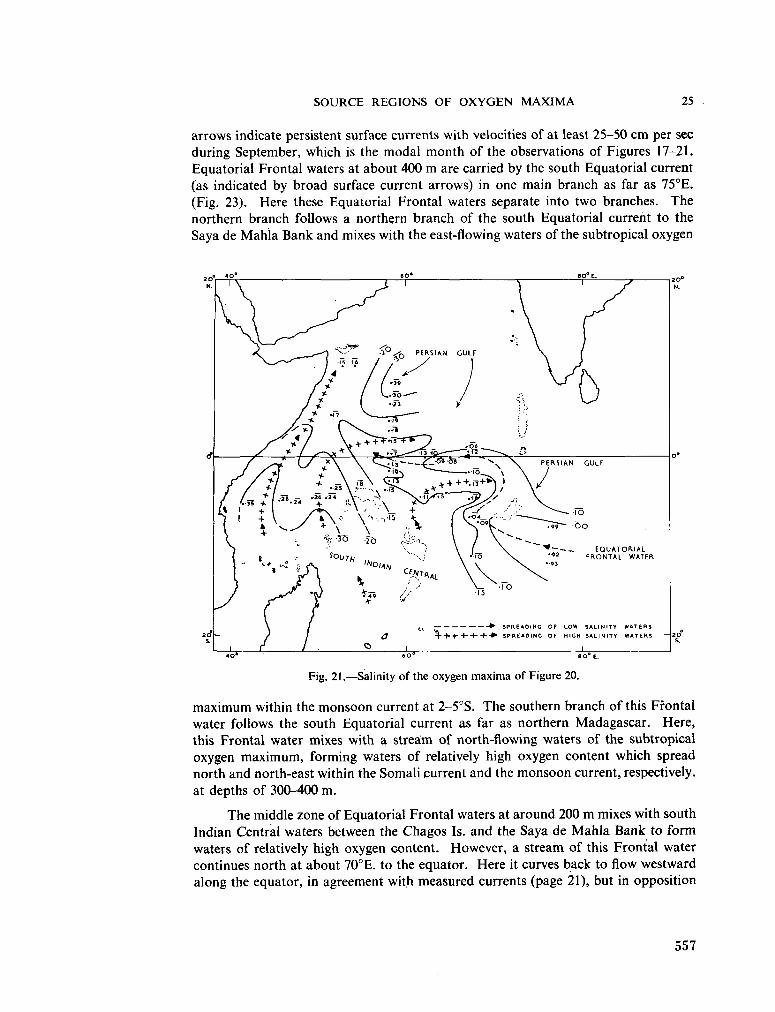
SOURCE REGIONS OF OXYGEN MAXIMA 25
arrows indicate persistent surface currents with velocities of at least 25-50 c m per sec during September, which is the modal month of the observations of Figures 17-21. Equatorial Frontal waters at about 400 m are carried by the south Equatorial current (as indicated by broad surface current arrows) in one main branch as far as 75°E. (Fig. 23). Here these Equatorial Frontal waters separate into two branches. The northern branch follows a northern branch of the south Equatorial current to the Saya de Mahla Bank and mixes with the east-flowing waters of the subtropical oxygen
Fig. 21.—Salinity of the oxygen maxima of Figure 20.
m a x i m u m within the monsoon current at 2-5°S. The southern branch of this Frontal water follows the south Equatorial current as far as northern Madagascar. Here, this Frontal water mixes with a stream of north-flowing waters of the subtropical oxygen m a x i m u m , forming waters of relatively high oxygen content which spread north and north-east within the Somali current and the monsoon current, respectively, at depths of 300-400 m .
The middle zone of Equatorial Frontal waters at around 200 m mixes with south Indian Central waters between the Chagos Is. and the Saya de Mahla Bank to form waters of relatively high oxygen content. However, a stream of this Frontal water continues north at about 70°E. to the equator. Here it curves back to flow westward along the equator, in agreement with measured currents (page 21), but in opposition
557
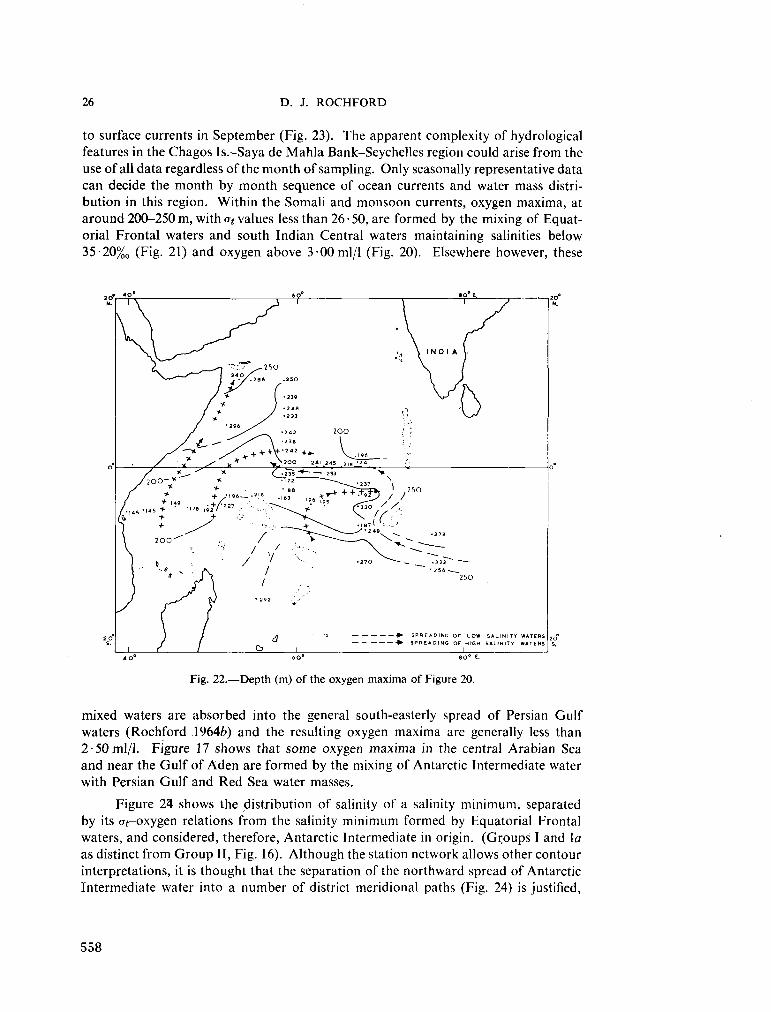
26 D. J. ROCHFORD
to surface currents in September (Fig. 23). The apparent complexity of hydrological features in the Chagos Ts.-Saya de Mahla Bank-Seychelles region could arise from the use of all data regardless of the month of sampling. Only seasonally representative data can decide the month by month sequence of ocean currents and water mass distribution in this region. Within the Somali and monsoon currents, oxygen maxima, at around 200-250 m , with at values less than 26 • 50, are formed by the mixing of Equatorial Frontal waters and south Indian Central waters maintaining salinities below 35-20%0 (Fig. 21) and oxygen above 3 00 ml/1 (Fig. 20). Elsewhere however, these
Fig. 22.—Depth (m) of the oxygen maxima of Figure 20.
mixed waters are absorbed into the general south-easterly spread of Persian Gulf waters (Rochford 1964¿>) and the resulting oxygen maxima are generally less than 2 -50 ml/1. Figure 17 shows that some oxygen maxima in the central Arabian Sea and near the Gulf of Aden are formed by the mixing of Antarctic Intermediate water with Persian Gulf and Red Sea water masses.
Figure 24 shows the distribution of salinity of a salinity minimum, separated by its CTi-oxygen relations from the salinity minimum formed by Equatorial Frontal waters, and considered, therefore, Antarctic Intermediate in origin. (Groups I and \a as distinct from Group II, Fig. 16). Although the station network allows other contour interpretations, it is thought that the separation of the northward spread of Antarctic Intermediate water into a number of district meridional paths (Fig. 24) is justified,
558
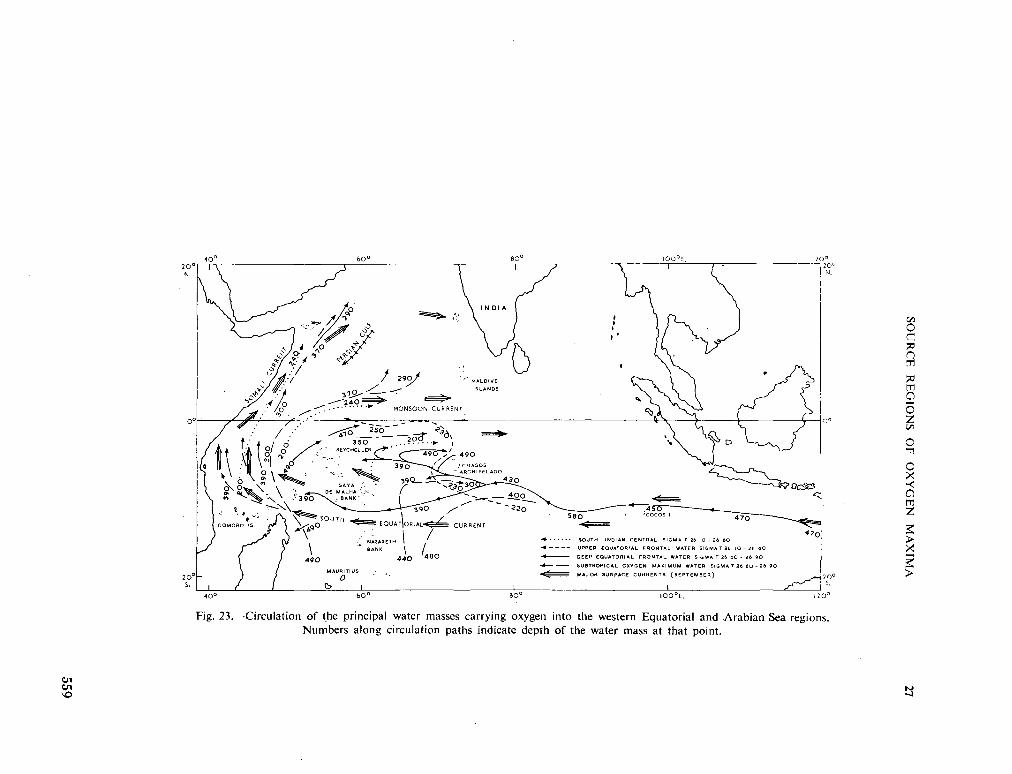
SOU
RC
E
RE
GIO
NS
OF
OX
YG
EN
MA
XIM
A
27
o
UZ
.5 +-
559
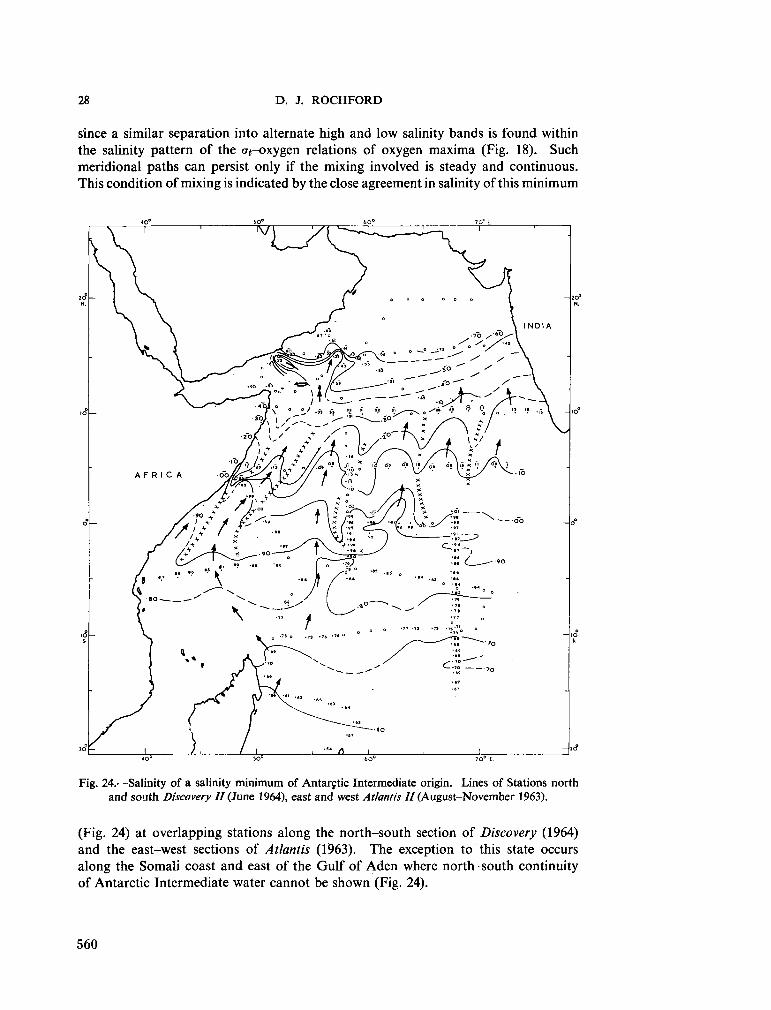
28 D. J. ROCHFORD
since a similar separation into alternate high and low salinity bands is found within the salinity pattern of the c7(-oxygen relations of oxygen m a x i m a (Fig. 18). Such meridional paths can persist only if the mixing involved is steady and continuous. This condition of mixing is indicated by the close agreement in salinity of this m i n i m u m
40° 50° _ ^ $°1 7Q° E.
Fig. 24.-—Salinity of a salinity min imum of Antarctic Intermediate origin. Lines of Stations north and south Discovery II (June 1964), east and west Atlantis II (August-November 1963).
(Fig. 24) at overlapping stations along the north-south section of Discovery (1964) and the east-west sections of Atlantis (1963). The exception to this state occurs along the Somali coast and east of the Gulf of A d e n where north-south continuity of Antarctic Intermediate water cannot be shown (Fig. 24).
560
SOURCE REGIONS OF OXYGEN MAXIMA 29
VII. CONCLUSIONS
(1) Three water masses from the south Indian Ocean and one from the east Indian Ocean are the external sources of oxygen-rich water of the Arabian Sea (200-600 m ) during the south-west monsoon.
(2) Subtropical oxygen m a x i m u m water spreads northward on about the 26 -85 at surface, with little change in oxygen, to about 10°S. near the northern side of the west-flowing south Equatorial current. In the east Indian Ocean, waters of this subtropical oxygen m a x i m u m are absorbed into ihis current, but in the west Indian Ocean, streams of this water spread to the equator and beyond.
(3) South Indian Central water spreads northward along several at surfaces. In the east Indian Ocean most of this spreading occurs within a at band 25-70-26-10 and terminates around 10°S. In the west Indian Ocean, however, spreading northward additionally occurs within a at band 26 • 10 -26-50, carrying south Indian Central waters to the equator and beyond.
(4) Antarctic Intermediate low salinity water spreads northward within a at band 26 • 90-27 • 30, moving beneath the south Equatorial current and then between Persian Gulf above and Red Sea water below, to about 15°N. off the Arabian coast.
(5) Equatorial Frontal water occurs as a vertical band of low salinity water within the south Equatorial current at about 10°S. This water maintains about the same oxygen content throughout the Indian Ocean by a balance of mixing between it and the south Indian Central and subtropical oxygen m a x i m u m waters from the south and the Persian Gulf, and other waters of low oxygen content from the north. Streams of this Equatorial Frontal water mix with Persian Gulf water and form oxygen m a x i m a in the central Arabian Sea, within a 26 • 50-26 • 90 at band.
VIII. REFERENCES
A C A D E M Y O F SCIENCES, U . S . S . R . (1958).—I.G.Y. Reports of the complex Antarctic Expedition of the Academy of Sciences of the U . S . S . R . Hydrological, hydrochemical, geological, and biological studies. Research Ship Ob, 1955-56. (Hydro-Meteorological Publishing House: Leningrad.)
A C A D E M Y O F SCIENCES, U . S . S . R . (1959).—I.G.Y. Reports Second Océanographie Expedition R . V . 06(1956-57). (Publishing House of Marine Transport: Leningrad.)
A N O N . (I960).—Data from Vityaz Cruise 31, 1959-60, on file at I . G . Y . World Data Centre B, Moscow, U . S . S . R .
C S I R O A U S T . (1962a).—Oceanographical observations in the Indian Ocean in 1959, H . M . A . S . Diamantina, Cruise D m 2/59. CSIRO Aust. Oceanogr. Cruise Rep. 1.
C S I R O A U S T . (19626).—Oceanographical observations in the Indian Ocean in 1960. H . M . A . S . Diamantina, Cruise D m 3/60. CSIRO Aust. Oceanogr. Cruise Rep. 4.
C S I R O A U S T . (1963).—Oceanographical observations in the Indian Ocean in 1960. H . M . A . S . Diamantina, Cruise D m 2/60. CSIRO Aust. Oceanogr. Cruise Rep. 3.
C S I R O A U S T . (1964a).—Oceanographical observations in the Indian Ocean in 1961. H . M . A . S . Diamantina, Cruise D m 3/61. CSIRO Aust. Oceanogr. Cruise Rep. 11.
C S I R O A U S T . (19646).—Oceanographical observations in the Indian Ocean in 1962. H . M . A . S . Diamantina, Cruise D m 2/62. CSIRO Aust. Oceanogr. Cruise Rep. 15.
561
30 D . J. ROCHFORD
D E U T S C H E S H Y D R O G R A P H I S C H E S INSTITUT (1960).—Monatskarten für den Indischen Ozean. Deutsches Hydrographisches Institut Hamburg Nr. 2422.
' D I S C O V E R Y ' C O M M I T T E E (1942).—Station List 1933-35. XXII, pp. 3-196. (Cambridge.) N E Y M A N , V . G . (1961).—Factors controlling the oxygen minimum in the subsurface waters of the
Arabian Sea. Oceanological Research Articles, I .G .Y. Program (Oceanology), Acad. Sci. U.S .S .R . , Moscow, Vol. 4, pp. 62-5.
R O C H F O R D , D . J. (1960).—The intermediate depth waters of the Tasman and Coral Seas. II. The 26-80<T( surface, Aust. J. Mar. Freshw. Res. 11: 148-65.
R O C H F O R D , D . J. (1961).—Hydrology of the Indian Ocean. I. The water masses in intermediate depths of the south-east Indian Ocean. Aust. J. Mar. Freshw. Res. 12: 129-49.
R O C H F O R D , D . J. (1963).—Mixing trajectories of intermediate depth waters of the south-east Indian Ocean as determined by a salinity frequency method. Aust. J. Mar. Freshw. Res. 14: 1-23.
R O C H F O R D , D . J. (1964a).—Hydrology of the Indian Ocean. III. Water masses of the upper 500 m of the south-east Indian Ocean. Aust. J. Mar. Freshw. Res. 15: 25-55.
R O C H F O R D , D . J. (19646).—Salinity maxima in the upper 1000 m of the north Indian Ocean. Aust. J. Mar. Freshw. Res. 15: 1-24.
S W A L L O W , J. C . (1964).—Equatorial undercurrent in the western Indian Ocean. Nature, Lond. 204 (4957): 436-7.
W Y R T K I , K . (1962).—The subsurface water masses in the western South Pacific Ocean. Aust. J. Mar. Freshw. Res. 13: 18-47.
562
\MJf «MM
REPUBLIC OF SOUTH AFRICA
DEPARTMENT OF COMMERCE AND INDUSTRIES
DIVISION OF SEA FISHERIES
INVESTIGATIONAL REPORT
No. 54
DISTRIBUTION OF INORGANIC PHOSPHATE
AND DISSOLVED OXYGEN
IN THE SOUTH WEST INDIAN OCEAN
by S. A. MOSTERT
Collected reprints of the International Indian Ocean Expedition, vol. IV , contribution no. 235 563
CONTENTS
PAGE
1. ABSTRACT 1
2. INTRODUCTION 1
3. METHODS 1
4. DISCUSSION 1
5. ACKNOWLEDGMENTS 5
6. LITERATURE CITED •. 5
564
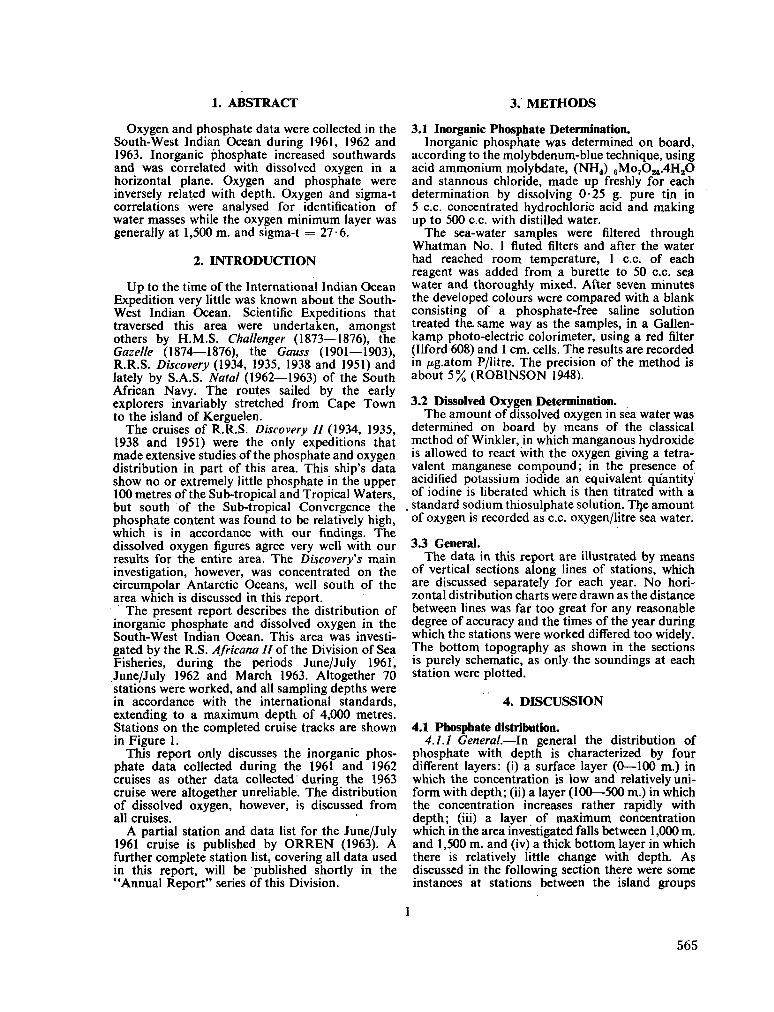
1. ABSTRACT
Oxygen and phosphate data were collected in the South-West Indian Ocean during 1961, 1962 and 1963. Inorganic phosphate increased southwards and was correlated with dissolved oxygen in a horizontal plane. Oxygen and phosphate were inversely related with depth. Oxygen and sigma-t correlations were analysed for identification of water masses while the oxygen min imum layer was generally at 1,500 m . and sigma-t = 27-6.
2. INTRODUCTION
U p to the time of the International Indian Ocean Expedition very little was known about the Southwest Indian Ocean. Scientific Expeditions that traversed this area were undertaken, amongst others by H . M . S . Challenger (1873—1876), the Gazelle (1874—1876), the Gauss (1901—1903), R . R . S . Discovery (1934, 1935, 1938 and 1951) and lately by S . A . S . Natal (1962—1963) of the South African Navy. The routes sailed by the early explorers invariably stretched from Cape T o w n to the island of Kerguelen.
The cruises of R . R . S . Discovery II (1934, 1935, 1938 and 1951) were the only expeditions that made extensive studies of the phosphate and oxygen distribution in part of this area. This ship's data show no or extremely little phosphate in the upper 100 metres of the Sub-tropical and Tropical Waters, but south of the Sub-tropical Convergence the phosphate content was found to be relatively high, which is in accordance with our findings. The dissolved oxygen figures agree very well with our results for the entire area. The Discovery's main investigation, however, was concentrated on the circumpolar Antarctic Oceans, well south of the area which is discussed in this report.
The present report describes the distribution of inorganic phosphate and dissolved oxygen in the South-West Indian Ocean. This area was investigated by the R . S . Africana II of the Division of Sea Fisheries, during the periods June/July 1961, June/July 1962 and March 1963. Altogether 70 stations were worked, and all sampling depths were in accordance with the international standards, extending to a m a x i m u m depth of 4,000 metres. Stations on the completed cruise tracks are shown in Figure 1.
This report only discusses the inorganic phosphate data collected during the 1961 and 1962 cruises as other data collected during the 1963 cruise were altogether unreliable. The distribution of dissolved oxygen, however, is discussed from all cruises.
A partial station and data list for the June/July 1961 cruise is published by O R R E N (1963). A further complete station list, covering all data used in this report, will be published shortly in the "Annual Report" series of this Division.
3. METHODS
3.1 Inorganic Phosphate Determination. Inorganic phosphate was determined on board,
according to the molybdenum-blue technique, using acid a m m o n i u m molybdate, ( N H 4 ) 6 M o 7 0 2 4 . 4 H 2 0 and stannous chloride, made up freshly for each determination by dissolving 0-25 g. pure tin in 5 c.c. concentrated hydrochloric acid and making up to 500 c.c. with distilled water.
The sea-water samples were filtered through W h a t m a n N o . 1 fluted filters and after the water had reached room temperature, 1 c.c. of each reagent was added from a burette to 50 c.c. sea water and thoroughly mixed. After seven minutes the developed colours were compared with a blank consisting of a phosphate-free saline solution treated the. same way as the samples, in a Gallen-k a m p photo-electric colorimeter, using a red filter (Uford 608) and 1 c m . cells. The results are recorded in /ig.atom P/litre. The precision of the method is about 5% ( R O B I N S O N 1948).
3.2 Dissolved Oxygen Determination. The amount of dissolved oxygen in sea water was
determined on board by means of the classical method of Winkler, in which manganous hydroxide is allowed to react with the oxygen giving a tetra-valent manganese compound; in the presence of acidified potassium iodide an equivalent quantity of iodine is liberated which is then titrated with a
. standard sodium thiosulphate solution. The amount of oxygen is recorded as c.c. oxygen/litre sea water.
3.3 General. The data in this report are illustrated by means
of vertical sections along lines of stations, which are discussed separately for each year. N o horizontal distribution charts were drawn as the distance between lines was far too great for any reasonable degree of accuracy and the times of the year during which the stations were worked differed too widely. The bottom topography as shown in the sections is purely schematic, as only the soundings at each station were plotted.
4. D I S C U S S I O N
4.1 Phosphate distribution. 4.1.1 General.—In general the distribution of
phosphate with depth is characterized by four different layers: (i) a surface layer (0—100 m . ) in which the concentration is low and relatively uniform with depth; (ii) a layer (100—500 m . ) in which the concentration increases rather rapidly with depth; (iii) a layer of m a x i m u m concentration which in the area investigated falls between 1,000 m . and 1,500 m . and (iv) a thick bottom layer in which there is relatively little change with depth. As discussed in the following section there were some instances at stations between the island groups
565
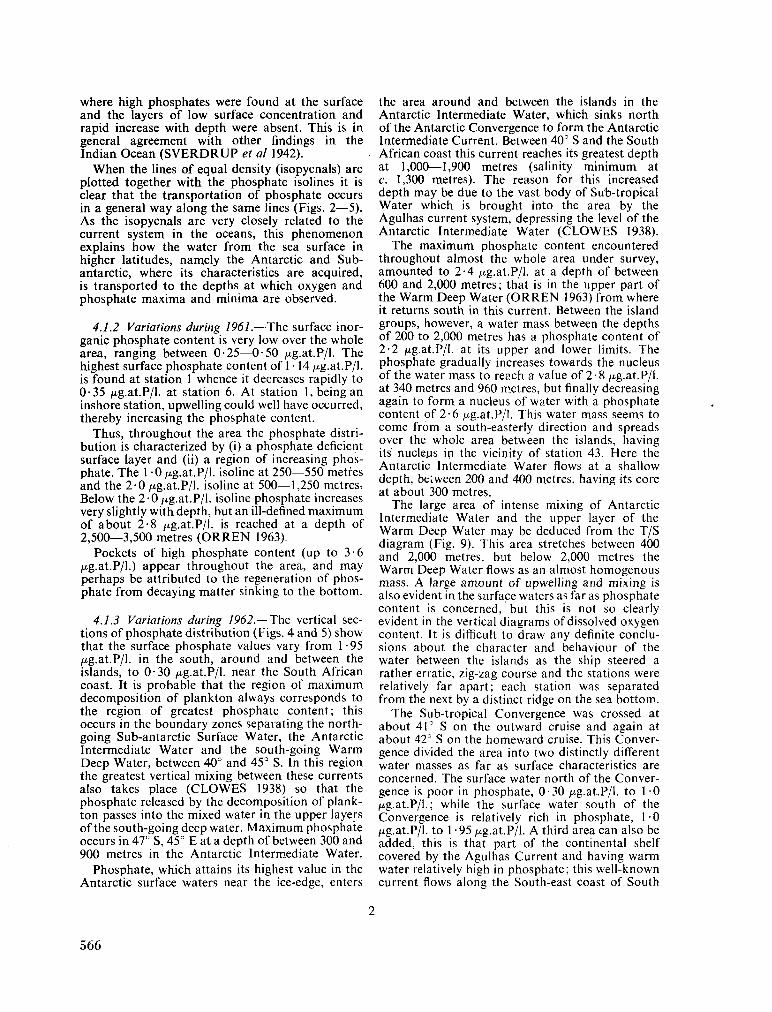
where high phosphates were found at the surface and the layers of low surface concentration and rapid increase with depth were absent. This is in general agreement with other findings in the Indian Ocean ( S V E R D R U P et al 1942).
W h e n the lines of equal density (isopycnals) are plotted together with the phosphate isolines it is clear that the transportation of phosphate occurs in a general way along the same lines (Figs. 2—5). A s the isopycnals are very closely related to the current system in the oceans, this phenomenon explains h o w the water from the sea surface in higher latitudes, namely the Antarctic and Sub-antarctic, where its characteristics are acquired, is transported to the depths at which oxygen and phosphate maxima and minima are observed.
4.1.2 Variations during 1961.—The surface inorganic phosphate content is very low over the whole area, ranging between 0-25—0-50 /xg.at.P/1. The highest surface phosphate content of 1 • 14 /xg.at.P/1. is found at station 1 whence it decreases rapidly to 0-35 /xg.at.P/1. at station 6. At station 1, being an inshore station, upwelling could well have occurred, thereby increasing the phosphate content.
Thus, throughout the area the phosphate distribution is characterized by (i) a phosphate deficient surface layer and (ii) a region of increasing phosphate. The 1 -0 /xg.at.P/1. isoline at 250—550 metres and the 2 -0 /xg.at.P/1. isoline at 500—1,250 metres, Below the 2-0 /xg.at.P/1. isoline phosphate increases very slightly with depth, but an ill-defined m a x i m u m of about 2-8 /xg.at.P/1. is reached at a depth of 2,500—3,500 metres ( O R R E N 1963).
Pockets of high phosphate content (up to 3-6 /xg.at.P/1.) appear throughout the area, and m a y perhaps be attributed to the regeneration of phosphate from decaying matter sinking to the bottom.
4.1.3 Variations during 1962.—The vertical sections of phosphate distribution (Figs. 4 and 5) show that the surface phosphate values vary from 1-95 /xg.at.P/1. in the south, around and between the islands, to 0-30 /xg.at.P/1. near the South African coast. It is probable that the region of m a x i m u m decomposition of plankton always corresponds to the region of greatest phosphate content; this occurs in the boundary zones separating the north-going Sub-antarctic Surface Water, the Antarctic Intermediate Water and the south-going W a r m Deep Water, between 40° and 45° S. In this region the greatest vertical mixing between these currents also takes place ( C L O W E S 1938) so that the phosphate released by the decomposition of plankton passes into the mixed water in the upper layers of the south-going deep water. M a x i m u m phosphate occurs in 47° S, 45° E at a depth of between 300 and 900 metres in the Antarctic Intermediate Water.
Phosphate, which attains its highest value in the Antarctic surface waters near the ice-edge, enters
the area around and between the islands in the Antarctic Intermediate Water, which sinks north of the Antarctic Convergence to form the Antarctic Intermediate Current. Between 40° S and the South African coast this current reaches its greatest depth at 1,000—1,900 metres (salinity m i n i m u m at c. 1,300 metres). The reason for this increased depth m a y be due to the vast body of Sub-tropical Water which is brought into the area by the Agulhas current system, depressing the level of the Antarctic Intermediate Water ( C L O W E S 1938).
The m a x i m u m phosphate content encountered throughout almost the whole area under survey, amounted to 2-4 /xg.at.P/1. at a depth of between 600 and 2,000 metres; that is in the upper part of the W a r m Deep Water ( O R R E N 1963) from where it returns south in this current. Between the island groups, however, a water mass between the depths of 200 to 2,000 metres has a phosphate content of 2-2 /xg.at.P/1. at its upper and lower limits. The phosphate gradually increases towards the nucleus of the water mass to reach a value of 2 • 8 /xg.at.P/1. at 340 metres and 960 metres, but finally decreasing again to form a nucleus of water with a phosphate content of 2-6 /xg.at.P/1. This water mass seems to come from a south-easterly direction and spreads over the whole area between the islands, having its nucle.us in the vicinity of station 43. Here the Antarctic Intermediate Water flows at a shallow depth, between 200 and 400 metres, having its core at about 300 metres.
The large area of intense mixing of Antarctic Intermediate Water and the upper layer of the W a r m Deep Water m a y be deduced from the T / S diagram (Fig. 9). This area stretches between 400 and 2,000 metres, but below 2,000 metres the W a r m Deep Water flows as an almost homogenous mass. A large amount of upwelling and mixing is also evident in the surface waters as far as phosphate content is concerned, but this is not so clearly evident in the vertical diagrams of dissolved oxygen content. It is difficult to draw any definite conclusions about the character and behaviour of the water between the islands as the ship steered a rather erratic, zig-zag course and the stations were relatively far apart; each station was separated from the next by a distinct ridge on the sea bottom.
The Sub-tropical Convergence was crossed at about 41° S on the outward cruise and again at about 42° S on the homeward cruise. This Convergence divided the area into two distinctly different water masses as far as surface characteristics are concerned. The surface water north of the Convergence is poor in phosphate, 0-30 /xg.at.P/1. to 1 -0 /xg.at.P/1.; while the surface water south of the Convergence is relatively rich in phosphate, 1-0 /xg.at.P/1. to 1 -95 /xg.at.P/1. A third area can also be added, this is that part of the continental shelf covered by the Agulhas Current and having w a r m water relatively high in phosphate; this well-known current flows along the South-east coast of South
566
Africa and can be traced as far south as Cape Agulhas.
At the Convergence the colder Sub-antarctic Water rapidly descends to a depth of about 600 to 1,200 metres. This water is known to be richer in phosphate than the Sub-tropical surface water and a phosphate m a x i m u m is encountered at an average depth of about 1,000—1,200 metres. Below this there is a slight decrease towards the bottom, the phosphate content reaching a secondary m a x i m u m at the bottom again (Fig. 5).
The sudden depression of phosphate content between stations' 48 and 49 m a y tentatively be attributed to the presence of the eddy found in that area ( O R R E N 1965, in press).
Unfortunately the distribution of inorganic phosphate in the area covered by the same ship during March 1963 cannot be discussed because m a n y of the phosphate determinations appear to be at fault.
Summarising, it can be said that the inorganic phosphate content of surface waters gradually increases along the lines of stations stretching from the African continent to the Sub-antarctic island groups of Prince Edward and Crozet.
The concentration of inorganic phosphate is correlated in a general way with the distribution of density.
4.2 Oxygen Distribution. 4.2.1 Generalized Oxygen/ Density (Sigma-t)
Relationship.—The whole area investigated can be divided into three distinct regions according to the surface characteristics of the water, namely (i) Tropical area; (ii) Sub-tropical area and (iii) Sub-antarctic area. These three regions can be identified clearly from the oxygen/sigma-t scatter diagrams (Figs. 6 and 7).
Tropical and Sub-tropical surface water have more or less the same characteristics, being relatively poor in dissolved oxygen and not very dense (sigma-t = c. 24-0); but below the surface these water masses are very different. Oxygen of the Tropical water reaches a m i n i m u m (4-0 c.c./l.) at about 75 metres but then increases with depth to c. 5-3 c.c./l. at a depth of 500 metres in Indian Central Water (Fig. 6). The Sub-tropical water has no sub-surface oxygen m i n i m u m , but oxygen content increases steadily with depth to the core of Indian Central Water, from 5-0 c.c./l. at the surface to 5-7 c.c./l. at 400 metres (Fig. 6) which in both cases is a m a x i m u m oxygen content. This demonstrates that the core of the Indian Central Water is slightly shallower in Sub-tropical than in Tropical waters (Fig. 8).
In Sub-antarctic Water there is no noticeable m i n i m u m or m a x i m u m from the surface downwards (Fig. 8). The oxygen content decreases rapidly with depth (from 7-4 c.c./l. to 4-8 c.c./l. at a depth of c. 700 metres) and shows a very small change with sigma-t (26-7—27-4).
The m i n i m u m oxygen content in all cases lies at an average depth of 1,500 metres on the sigma-t = 27-6 surface which is the boundary between Antarctic Intermediate and W a r m Deep Waters according to the temperature/salinity characteristics of Indian Ocean Water (Fig. 9).
O n comparing the three water masses, the m i n i m u m oxygen layer is found to be richest in dissolved oxygen in Sub-antarctic regions (4-1 c.c./l. as compared with 3-4—4-0 c.c./l. in the Sub-tropics) although the m i n i m u m layer is found at similar depths (1,500 metres and sigma-t = 26-7) throughout.
Below the m i n i m u m layer, the W a r m Deep Water, of slightly higher oxygen content for a higher sigma-t value, has m u c h the same oxygen content throughout, and the oxygen content increases downward almost to the bottom where a slight decrease again appears.
4.2.2 The Oxygen Minimum.—The presence of the oxygen m i n i m u m layer in the oceans has been investigated by several investigators. Darbyshire, using data obtained by R . S . Africana II during June/July 1962, could find very little evidence, if any, of the presence of such a layer in the Indian Ocean ( D A R B Y S H I R E 1964). However, w e found that there is indeed an oxygen m i n i m u m layer present at the sigma-t = 27-6 surface, and this layer was detected throughout the whole area irrespective of the time of the cruises (Figs. 6 and 7). This sigma-t = 27-6 layer actually coincides with the boundary area between the Antarctic Intermediate and the W a r m Deep Water and in fact was found everywhere at an average depth of 1,500 m . This can be seen in the T / S diagram of Figure 9 (Compare O R R E N 1963, Fig. 11). It was proposed by C L O W E S and D E A C O N (1935) that this upper stratum of the W a r m Deep Water is a continuation of the North Indian Deep Water which sank off the coastal region of the Arabian Sea and neighbouring gulfs, particularly the Red Sea.
F r o m the vertical distribution of oxygen (Fig. 13) it is suggested that the W a r m Deep stratum of about 2,000 metres, at least in the southern section of the whole-area investigated, has its source in an eastward current of Atlantic Deep Water (VISSER and V A N N I E K E R K 1965). "At station 58 the oxygen m i n i m u m lies at a depth of approximately 1,900 metres (sigma-t = 27-6). This significant depression of the oxygen m i n i m u m is caused by the huge mass of water from the Agulhas Current pushing southwards and being joined by the West W i n d Drift thereby forcing the Antarctic Intermediate Water to a greater depth. The Return Agulhas Current and the West W i n d Drift are clearly illustrated by V I S S E R and V A N N I E -K E R K ' s (op. cit. 1965) horizontal current distribution charts.
In the northwestern section of our area the lowest oxygen content of 3 • 26 c.c./l. is recorded at a depth
567
of 1,600 metres at station 7. This very poorly oxygenated water seems to be a continuation of the North Indian Deep Water, as suggested by C L O W E S and D E A C O N (op. cit.).
4.2.3 Oxygen Variation during 1961.—From station 1 near Lourenço Marques, where the dissolved oxygen content is relatively low (probably due to the presence of w a r m (±24° C ) and highly saline (S%0 = c. 35-4%o) tropical water streaming southward d o w n the coast), to station 8, the oxygen content increases very slightly (4-67—4-73 c.c./l.) and the water is all of tropical origin (cf. O R R E N 1963). F r o m station 9 eastwards the increase becomes more noticeable over the whole area, and a m a x i m u m surface oxygen content of 5-70 c.c./l. occurred at station 26 in the easternmost part of the area investigated. In the extreme north around Mauritius, the surface oxygen is also low (4-75 c.c./l.) and the water is again of tropical origin. The rest of the area is covered by cooler sub-tropical water, the oxygen content being uniformly higher in the south of the area than in the north.
Summarising, w e see that in tropical waters (Stations 2—8) the oxygen concentration attains a sub-surface min imum at a depth of ± 7 5 metres (3-5—4-3 c.c./l.) and again a m a x i m u m (4-6—50 c.c./l.) at a depth of ±500 metres in Indian Ocean Central Water with sigma-t = 26-6. The minimum oxygen concentration lies at the sigma-t = 27-6 surface with a value of 3-5 c.c./l. and at a depth of c. 1,500 metres.
4.2.4 Oxygen Variation during 7962.—Dissolved oxygen is distributed very evenly over the entire area, and as the oxygen content is directly related to the temperature of the water, oxygen variations can be closely correlated with temperature changes throughout the area (Figs. 10—12).
Water with an oxygen content of 5 c.c./l., flowing at a depth of between 600 to 800 metres between the islands (800 metres deep at Marion Island), rises slowly towards the north to reach the surface near the South African coast outside Port Elizabeth. At station 48 this water suddenly sinks from about 400 metres to 800 metres, only to rise again at station 49 to 200 metres at which depth-it remains until it reaches the coast. This sudden change in depth at station 48 can be attributed to an eddy found in the vicinity ( O R R E N 1965 in press).
In brief, w e find that in the sub-tropical region the dissolved oxygen content of the surface water is higher than that of the tropical regions (5-5 c.c./l. as compared with 4-8 c.c./l.) and the oxygen content decreases gradually with depth to a depth of 500 metres (sigma-t = 26-6, 5 0 c.c./l.) and then rapidly to a min imum of 4 0 c.c./l. at a depth of 1,500 metres at the sigma-t = 27-6 surface.
At the Sub-tropical Convergence colder water with an oxygen content of 6 0 c.c./l. is encountered
at the surface. This water appears to sink gradually southwards and can be traced between the islands at depths varying from 300 to 400 metres, but rising again to the surface between stations 46 and 47, where the Convergence was crossed once again.
Water with a surface oxygen content of 7 • 0 c.c./l. is encountered for the first time in the vicinity of Marion Island from where it sinks slightly and flows from 20 to 100 metres depth between the islands returning to the surface at the Convergence, encountered on the line of stations 44—50 (Fig. 12). The apparent effect of the oxygen isolines sinking in a southward direction is illusory and is no doubt brought about by the temperature which decreases southwards. In this way more oxygen can dissolve in the surface water to give a southward oxygen increase in the surface layer, causing the isolines to- sink deeper.
Oxygen is more or less evenly distributed through-uui the area, decreasing from the surface to the bottom except at station 36 where a secondary m a x i m u m of 5-0 c.c./l. lies at a depth of 1,800 to 2,200 metres. This seems to be an area where the lower layers of the Antarctic Intermediate Water mix with the upper layers of the W a r m Deep Water. The core of the W a r m Deep Water is at a depth greater than 2,500 metres. The depth of the core of the Antarctic Intermediate Water, however, varies considerably.
4.2.5 Oxygen Variation 1963.—The dissolved oxygen content of the surface water increases from 5-4 c.c./l. near the continent (36° 30' S) to 7-1 c.c./l. at about 47° S (Fig. 13). The 5-0 c.c./l. isoline sinks from near the surface at station 56 to 500 metres at station 60 then rises to 50 metres again at station 61 from where it sinks once more to 950 metres at station 62 to stay at that level throughout the remaining stations. The depth of the minimum oxygen concentration (4-4 c.c./l.) varies considerably before station 61 (from 1,100 to 2,000 metres) but subsequently remains at a more or less constant depth of about 1,500 metres. A marked minimum of 4 0 c.c./l. is seen at station 58 between depths of 1,500 and 1,900 metres and is again very marked at station 61 between depths of 400 and 1,100 metres.
From the vertical oxygen distribution section (Fig. 13) it is very clear that strong upwelling occurs at station 61 from depths of more than 2,000 metres. This area of upwelling is in the immediate vicinity of the Sub-tropical Convergence and the upwelling is most probably caused by an eddy. This eddy is clearly shown in the horizontal current distribution charts of V I S S E R and V A N N I E K E R K (1965).
The sigma-t/oxygen correlation chart (Fig. 14) shows that the large pocket of poorly oxygenated water between 400 and 1,100 metres at station 61 consists of Antarctic Intermediate Water brought
568
near the surface by the upwelling caused by this eddy.
At station 60, however, Sub-antarctic Surface Water with relatively high oxygen content was found, at the surface, mixed with Indian Central Water (that is, Sub-tropical Surface Water with low oxygen content) giving an oxygen value of 6-5 c.c./l. (Fig. 14). This phenomenon is clearly caused by the abovementioned eddy which also lies in the region of the Sub-tropical Convergence. The surface water at station 61 is of pure subtropical origin. Station 63, on the other hand, had the characteristics of Sub-antarctic Water (Fig. 14).
F r o m station 61 southwards the oxygen content of the surface water steadily increases as the temperature decreases. A sudden drop in temperature from 17-32° C to 10-79° C between stations 61 and 62 is accompanied by an increase in dissolved oxygen from 5-5 to 7-1 c.c./l. This is a clear indication that the Sub-tropical Convergence was crossed in this area in the vicinity of 43° S.
In general then, the dissolved oxygen content of the water in Sub-antarctic regions south of the Sub-tropical Convergence is m u c h higher (7-0 c.c./l.) than in either the tropical or sub-tropical regions. The decrease with depth is rapid over a relatively small sigma-t range to a m i n i m u m of 4-3 c.c./l. at a depth of ±1 ,500 metres, which is again the sigma-t = 27-6 surface.
A definite linear relationship (Figs. 15 and 16) exists between the concentrations of dissolved oxygen and inorganic phosphates on a horizontal plane, i.e. the variations in phosphate concentrations are directly proportional to the oxygen concentrations ( R I L E Y 1951). The correlation coefficient (/•) was calculated by the linear least square regression method and it was found that r = 0 • 94 for surface water and 0 • 92 for water at the 100 metre level. Although oxygen and phosphate are directly related on a horizontal plane, they seem to be inversely related with depth (Fig. 17).
4.2.6 Oxygen Saturation of Surface Water.—The percentage oxygen saturation of the sea water has been calculated and illustrated (Fig. 18) for the surface waters of the whole area. Although the water is 100% saturated at station 44 and super-saturated at stations 53 and 55, it was found later that a plankton bloom was present in the surface waters in these areas. The phosphate concentration was accordingly relatively low here. The high percentage of oxygen saturation can be ascribed, to the photosynthetic process of the phytoplankton. Similar reasoning applies to the vicinity of station 36 where the surface water is also super-saturated with oxygen. For the calculation of the solubility of oxygen in sea water at different temperatures and chlorinities a nomograph published by T U L L Y (1949) was used.
4.2.7 The Whole Area.—Over the whole area investigated during the three consecutive years, the surface oxygen content increases southwards. North of the Sub-trópical Convergence the southward increase is slight and the Sub-tropical Surface water is very uniform in oxygen content varying very little from 4-80 c.c./l. in the north to 5-80 c.c./l. in the south, that is, in the Convergence area. At the Convergence with its colder water, however, the increase in oxygen content is relatively large (from 5 • 80—7 • 00 c.c./l.) over a very short distance. The Convergence was in the vicinity of 42° S ± 1 ° . South of this Convergence the dissolved oxygen content is uniformly high again, being over 7-0 c.c./l. and reaching a m a x i m u m of 7-30 c.c./l. near the two island groups of Prince Edward and Crozet.
5. ACKNOWLEDGEMENTS
I a m indebted to the Director of Sea Fisheries, M r . B . v. D . de Jager, M r . M . J. Orren and other staff members of the Division of Sea Fisheries for their critical reading of this report and for their m a n y useful suggestions.
Finally I must also thank m y colleagues and the officers and crew of Africana II for their help in.the collection and processing of the data on which this report is based.
6. LITERATURE CITED
B A R N E S , H . , 1959.—Apparatus and Methods of Oceanography (.Chemical). G . Allen and Unwin : 341 pp. London.
C L O W E S , A . J. and G . E . R . D E A C O N , 1935.—The Deep-water circulation of the Indian Ocean. Nature, 136: 936.
C L O W E S , A . J., 1938.—Phosphate and Silicate in the Southern Ocean. Discovery Rep., 19: 3—120.
C L O W E S , A . J., 1950.—An Introduction to the Hydrology of South African Waters. Invest. Rep. Fish. Mar. Biol. Surv.,S.Afr. 12: 1—29.
D A R B Y S H I R E , J., 1964.—A Hydrological investigation of the Agulhas Current area. Deep Sea Res., 11 (5): 781—815.
H A R V E Y , H . W . , 1928.—Biological chemistry and Physics of sea water. Cambridge Univ. Press: Cambridge.
J A Y A R A M A N , R . , 1959.—The vertical distribution of dissolved Oxygen in the deeper waters of the Arabian Sea in the neighbourhood of the Laccarides during the summer of 1959.7. Mar. Biol. Assoc, India, 1 (2): 206—211.
O R R E N , M . J., 1963.—Hydrological observations in the South West Indian Ocean. Invest. Rep. Div. Sea Fish., S. Afr., 45: 1—61.
O R R E N , M . J., 1965.—Hydrology of the South West Indian Ocean. Invest. Rep. Div. Sea Fish. S. Afr. 55: in press.
R E D F I E L D , A . C , 1942.—The processes determining the concentration of oxygen and phosphate and other organic derivatives within the depths of the Atlantic Ocean. Pap. Phys. Oceanogr. and Met., W o o d s Hole, 9(2): 1—22.
1 569
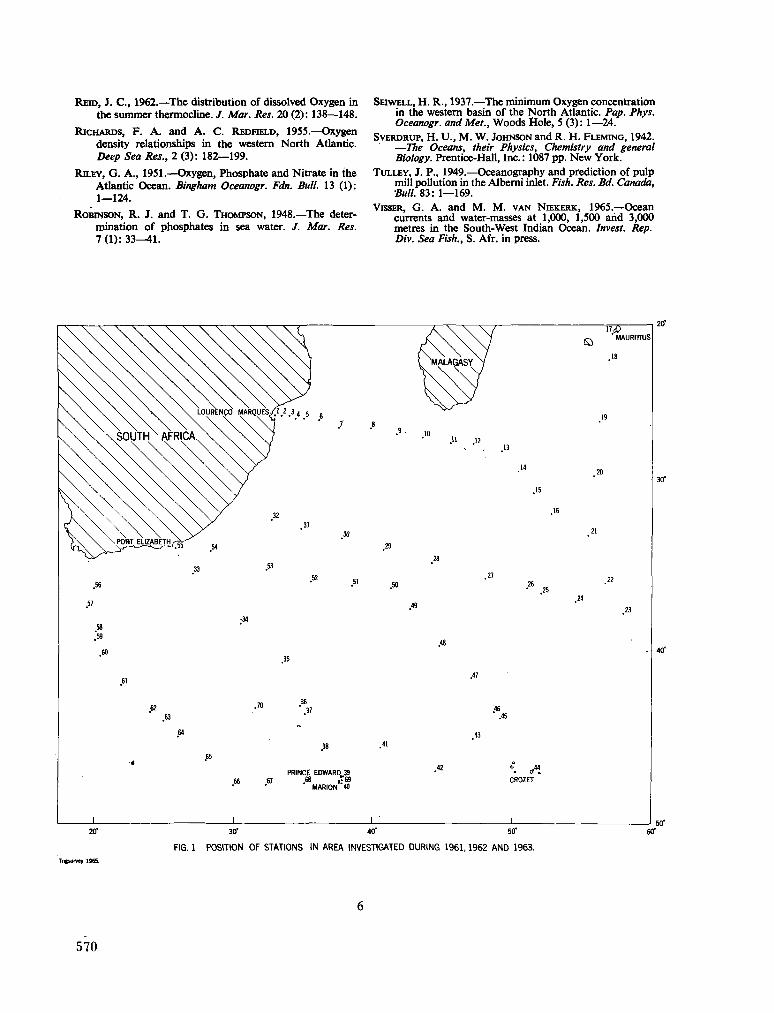
REÍD, J. C , 1962.—The distribution of dissolved Oxygen in the summer thermocline. / . Mar. Res. 20 (2): 138—148.
RICHARDS, F. A . and A . C. REDFIELD, 1955.—Oxygen density relationships in the western North Atlantic. Deep Sea Res., 2 (3): 182—199.
RILEY, G . A. , 1951.—Oxygen, Phosphate and Nitrate in the Atlantic Ocean. Bingham Oceanogr. Fdn. Bull. 13 (1): 1—124.
R O B I N S O N , R . J. and T . G . T H O M P S O N , 1948.—The deter
mination of phosphates in sea water. / . Mar. Res. 7 (1): 3 3 ^ 1 .
S E I W E L L , H . R . , 1937.—The minimum Oxygen concentration in the western basin of the North Atlantic. Pap. Phys. Oceanogr. and Met., W o o d s Hole, 5 (3): 1—24.
SVERDRUP, H . U . , M . W . JOHNSON and R. H . FLEMING, 1942. —The Oceans, their Physics, Chemistry and general Biology. Prentice-Hall, Inc.: 1087 pp. N e w York.
T U L L E Y , J. P. , 1949.—Oceanography and prediction of pulp mill pollution in the Alberni inlet. Fish. Res. Bd. Canada, Bull. 83: 1—169.
VISSER, G . A . and M . M . V A N N I E K E R K , 1965,—Ocean currents and water-masses at 1,000, 1,500 arid 3,000 metres in the South-West Indian Ocean. Invest. Rep. Div. Sea Fish., S. Afr. in press.
.56
.57
58
.'w .6"
1
\ \ \ \ \ L0URENÇ0 MARQUES/Tz .3 4 5 6
\ \. W W W \ \1 ' .7 S0UTHX AFRICA \ \ \ / \ \ /
WWW/ 32 \ W W \ / ' -31 \ \ \ \ >s 30
\P0WJUZABÈ™/-^5'^
33 -53
.52 #51
;34
.35
.61
7ii 36
« •7° ' 37 .63
64
.38 65
•4
PRINCE E D W A R D J 9 66 67 .68 « 6 9
MARION 40
1
8 .9
.29
.50
1
I MALAGASY}
10 .11 .12
.28
.49
.48
.47
.13
.14
.15
.16
27 26 • .25
46 .45
<T 44
CR02ET
1
17 a? £ , MAURITIUS
.18
.19
.20
.21
.22
.21 .23
2tf 30" 40" 50'
FIG. 1 POSITION OF STATIONS ¡N AREA INVESTIGATED DURING 1961,1962 AND 1963.
6tf
570
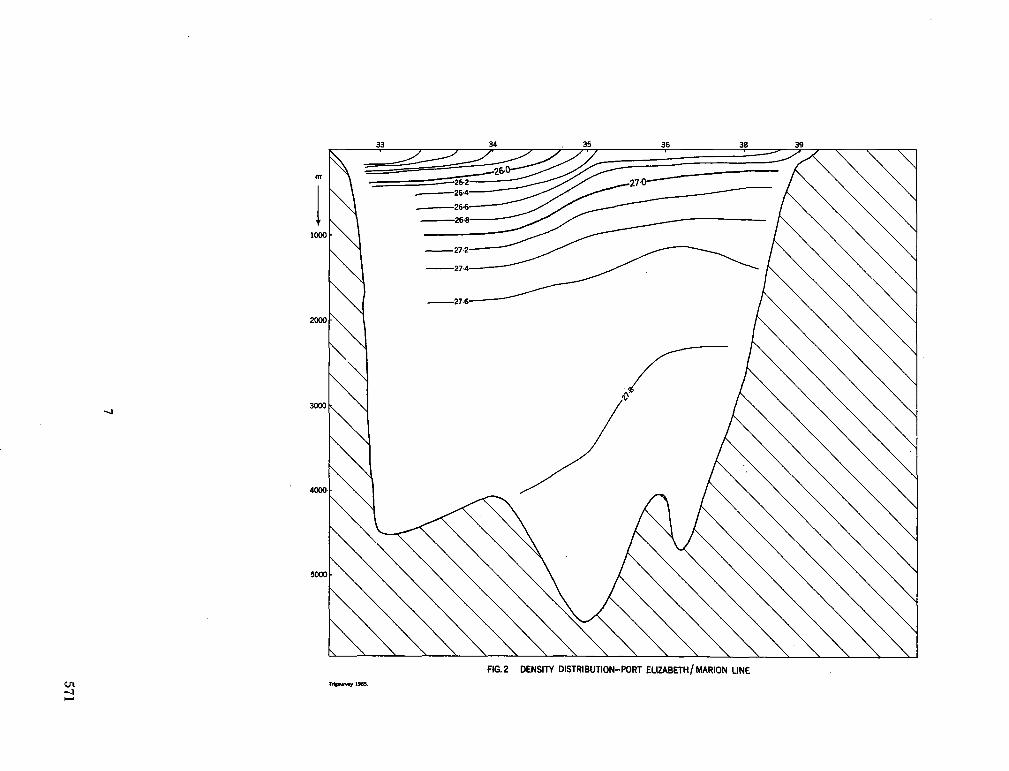
7
571
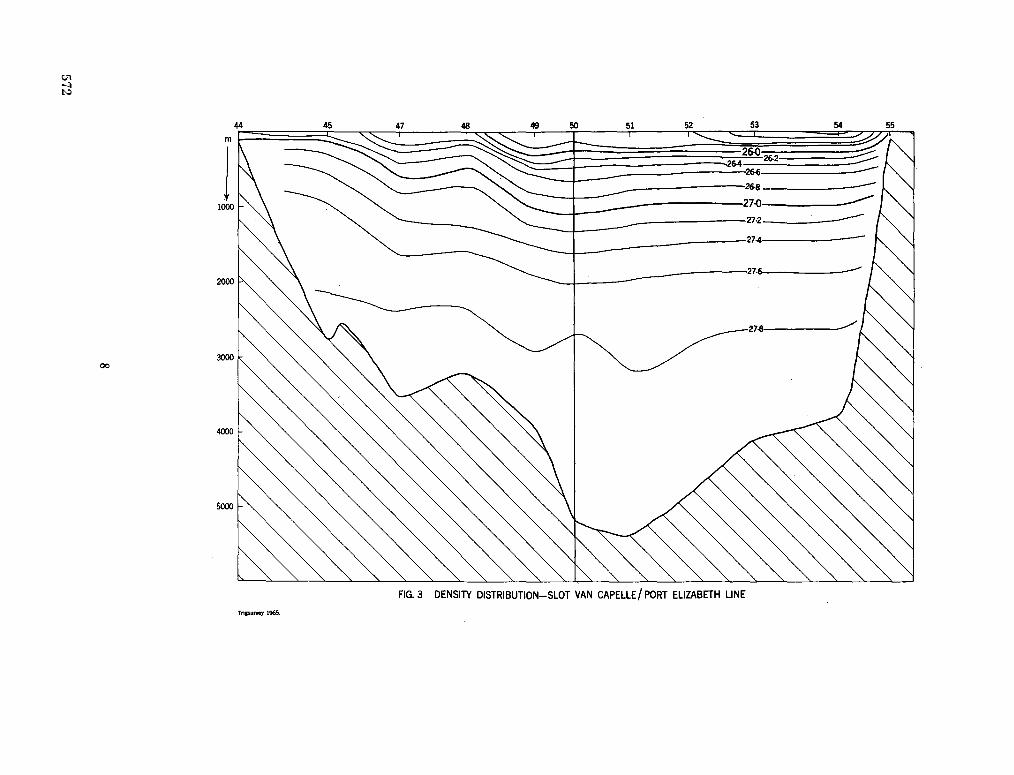
572
8
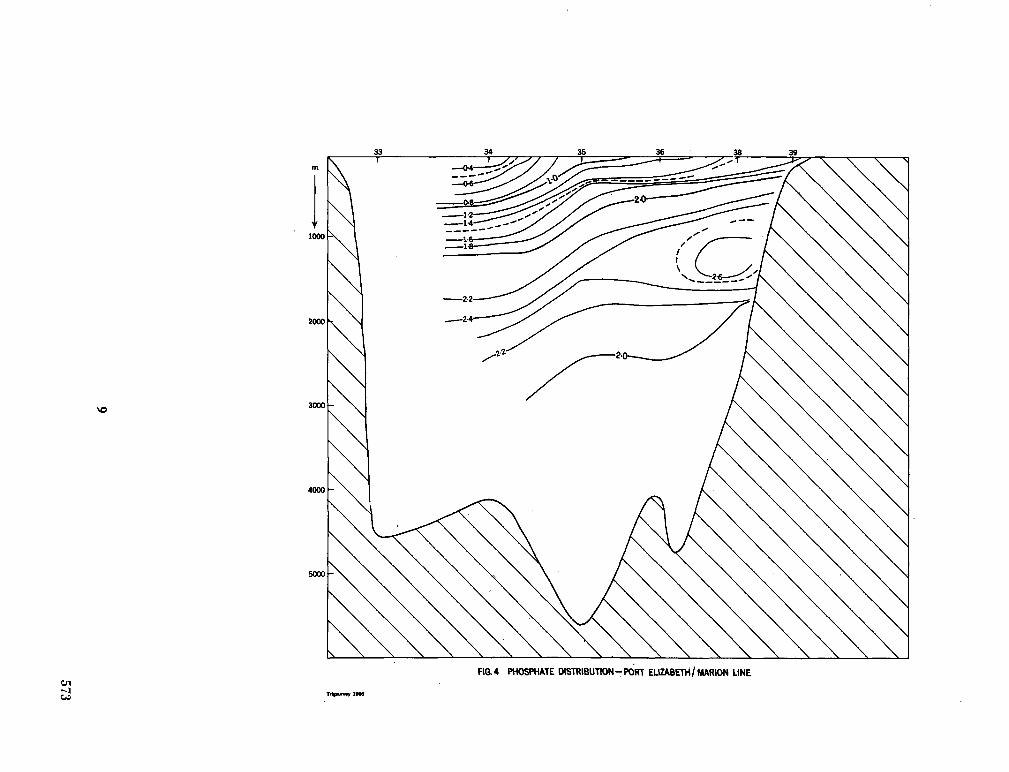
9
573
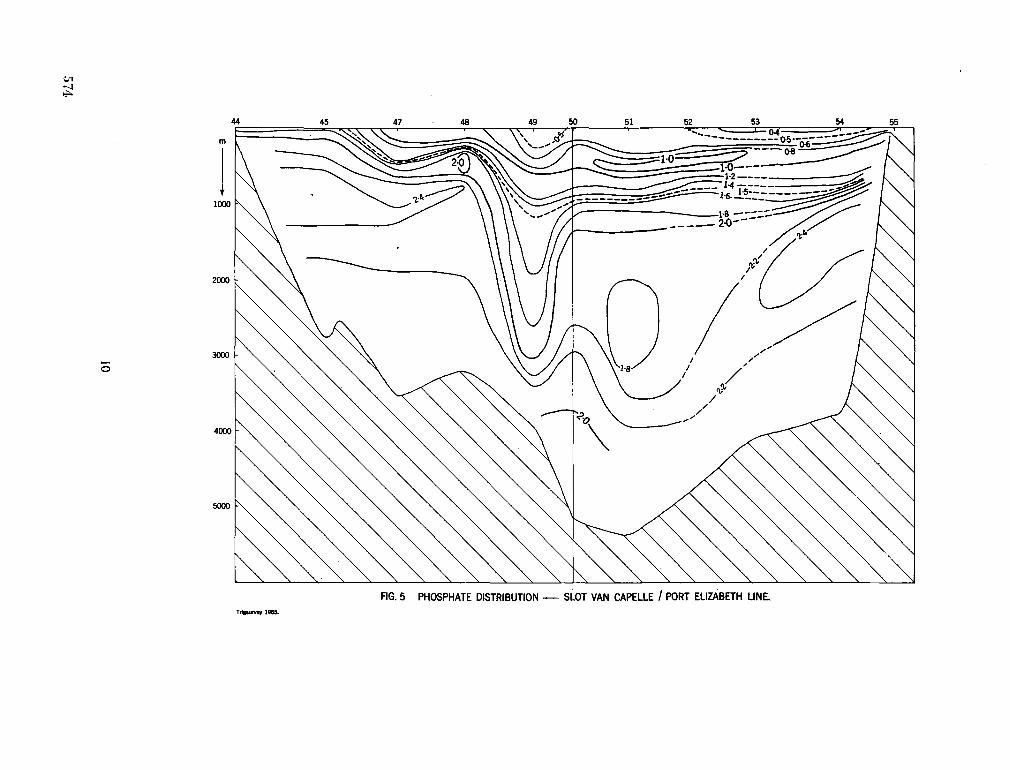
UJ
CD
Si
s 5
§ 3
m
S2
o.
</}
O
574
10
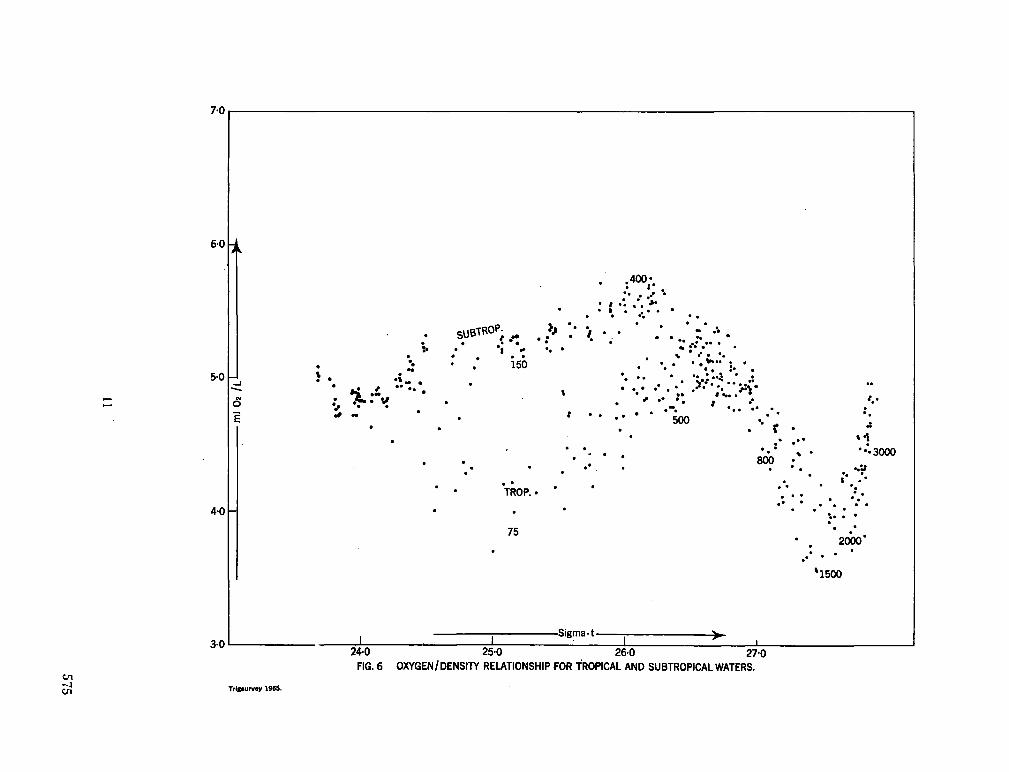
s m
-, ••§'
•s
.. .
• : «
y. J
'
. *
•*...•
3-.
0-
O
. ce
.A .••:
Ht
-jl/
'0 im
-
o
o
o
E.
M
ce
i
Q.
O ce i-C
D
I 1
1
I O
C
3
O
11
575
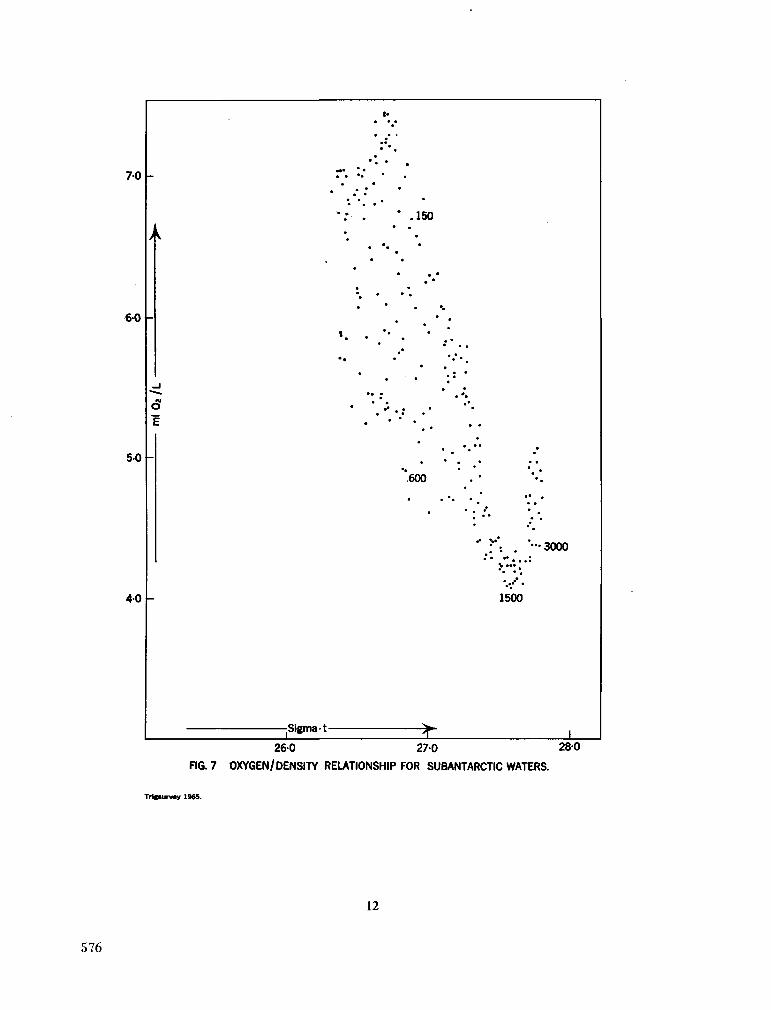
260 270 280
FIG. 7 OXYGEN/DENSITY RELATIONSHIP FOR SUBANTARCTIC WATERS.
Trtgsunwy 1965.
576
12
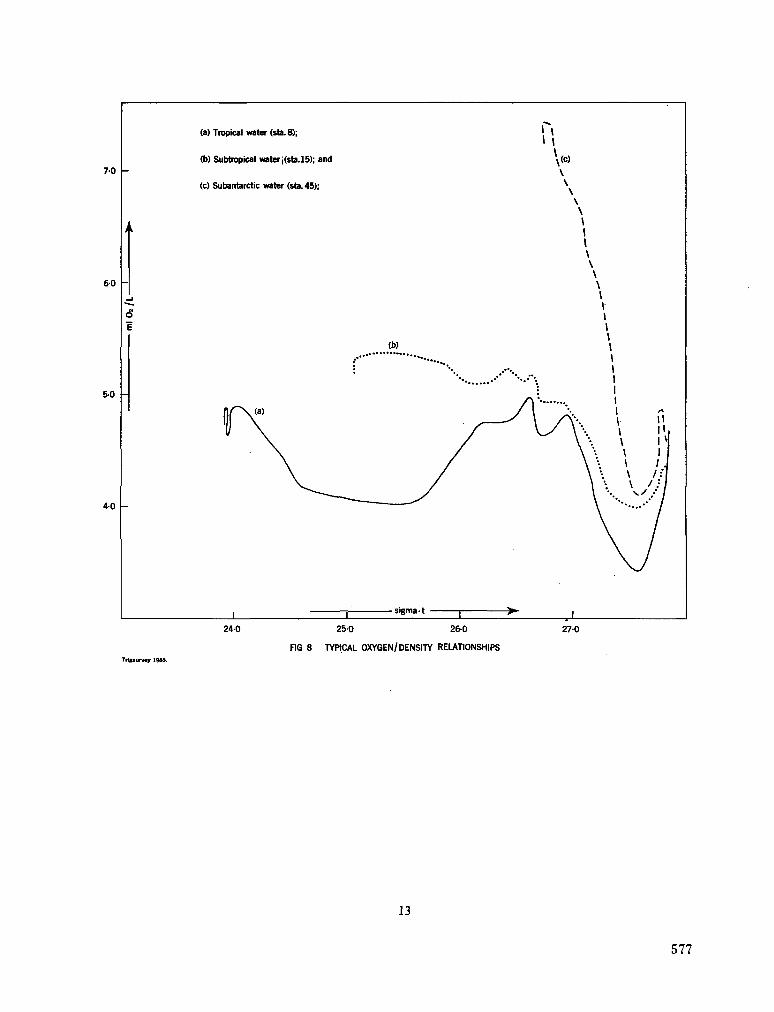
70 -
(a) Tropical water (sta.8);
(b) Subtropical water ¡(sta.15); and
(c) Subantarctic water (sta. 45);
60
o
I
5-0
40
X • sigma -t
240 250 260
FIG 8 TYPICAL OXYGEN/DENSITY RELATIONSHIPS
270
13
577
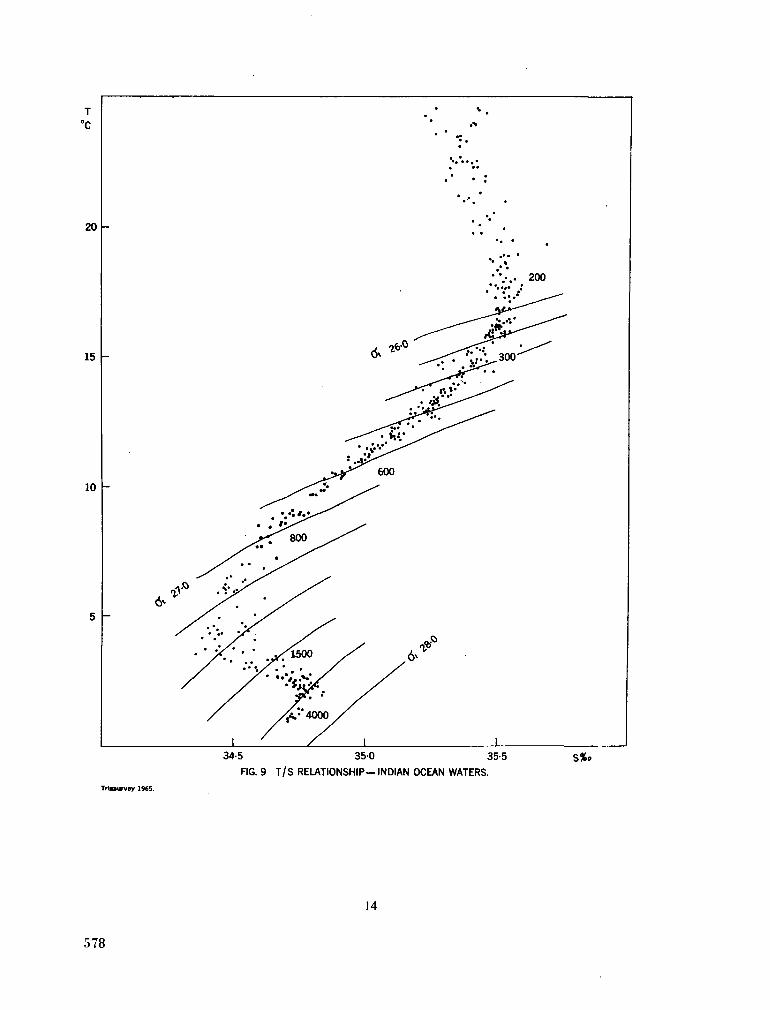
34-5 350 35-5
FIG. 9 T / S RELATIONSHIP—INDIAN OCEAN WATERS. S%o
Trlgsurvey 1965.
578
14
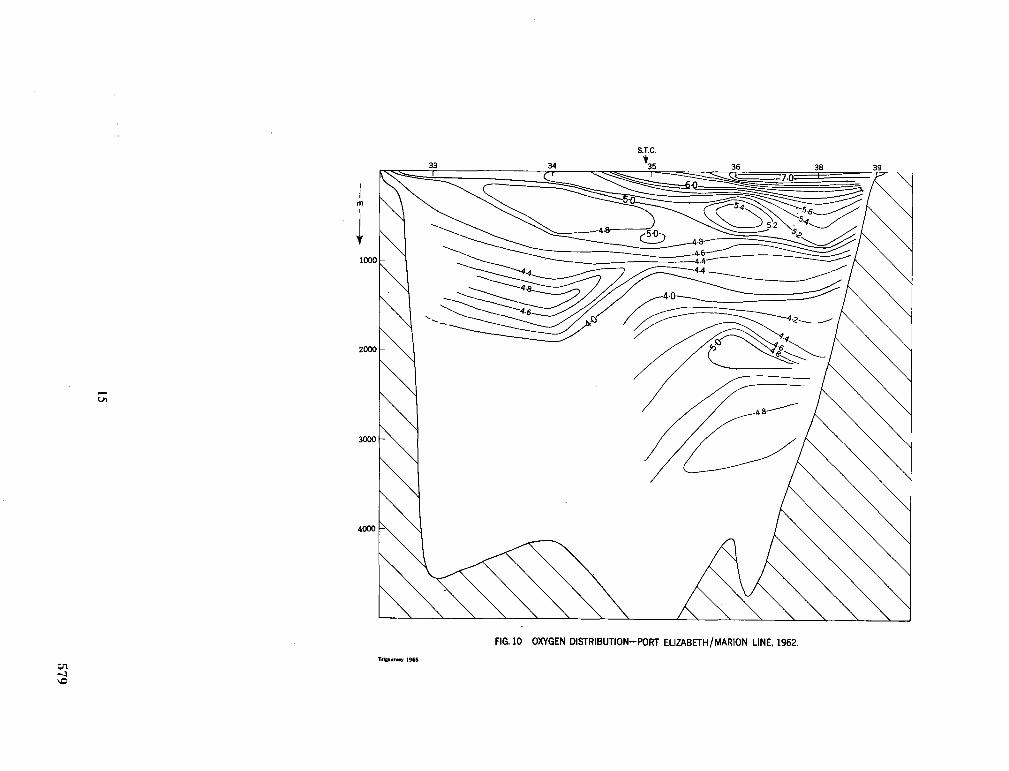
15
579
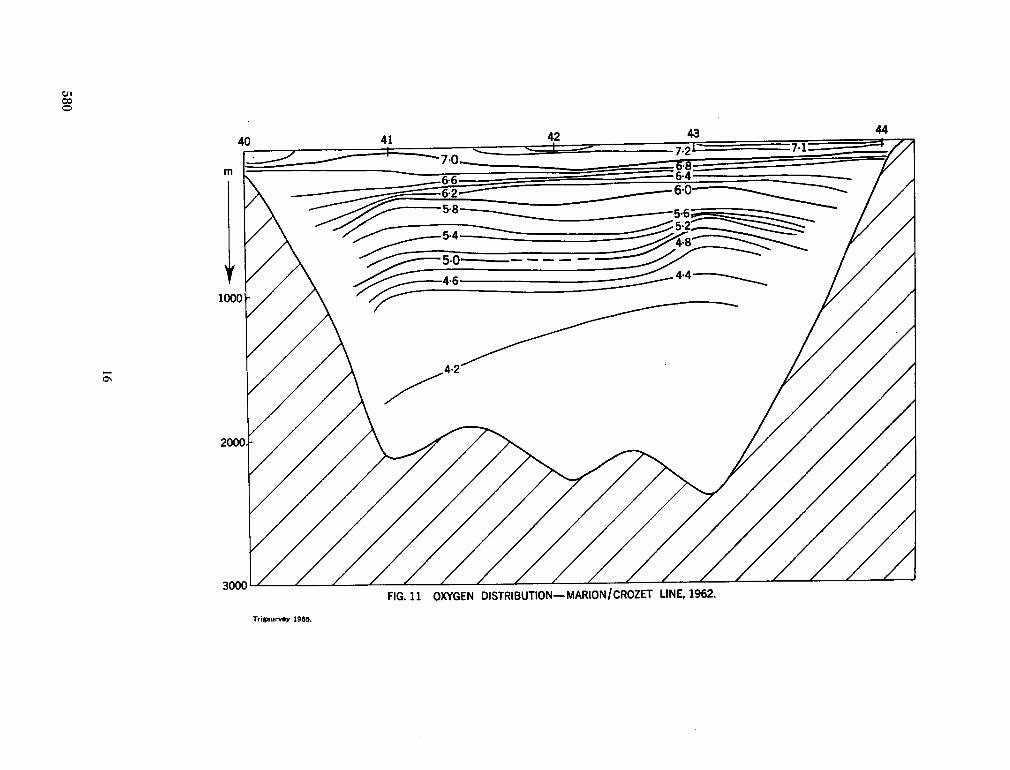
580
16
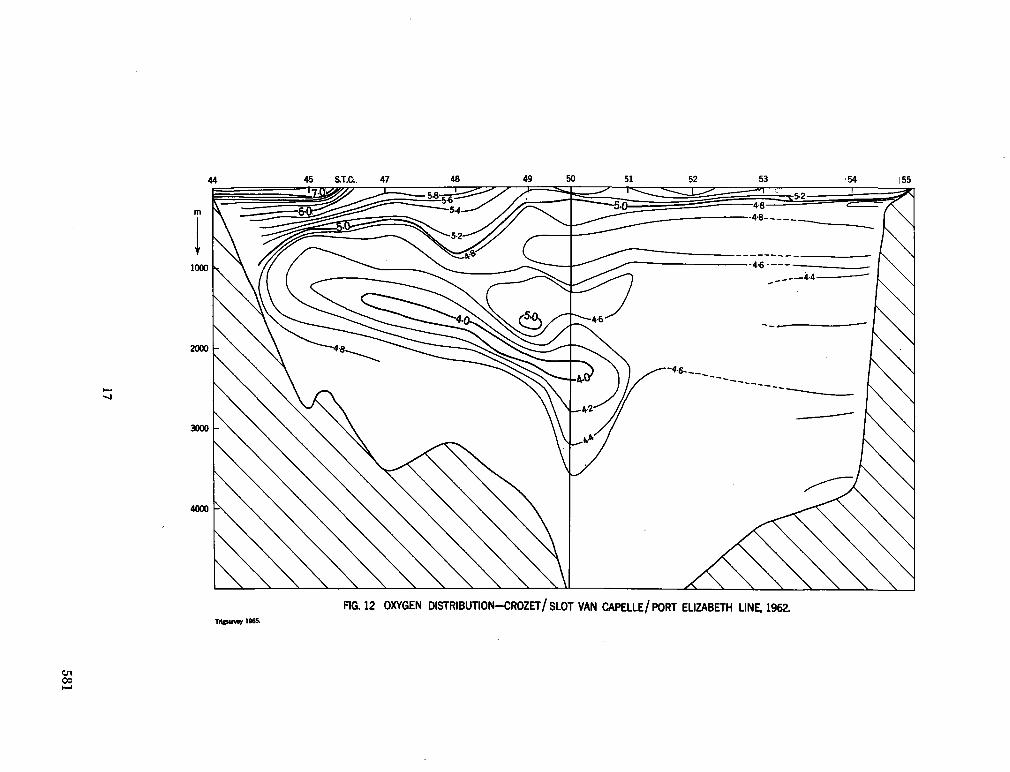
X
ti m
¡S ce
2
Q.
5 $
§ 3
ce o 3
m
ce o P
ë
17
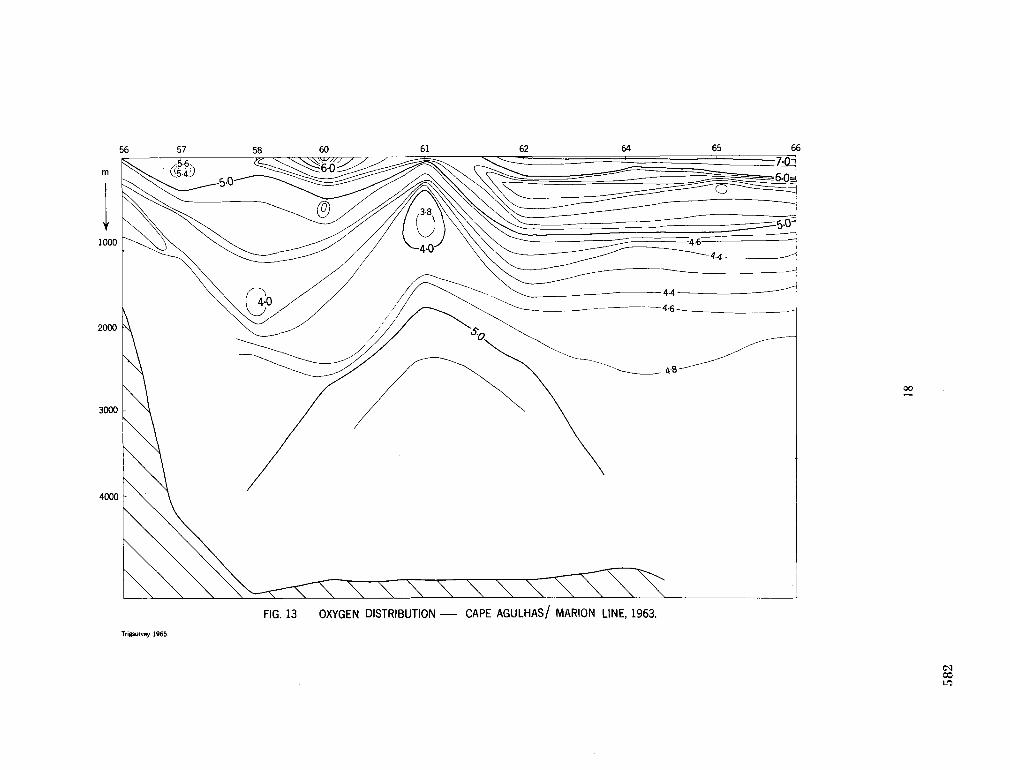
582
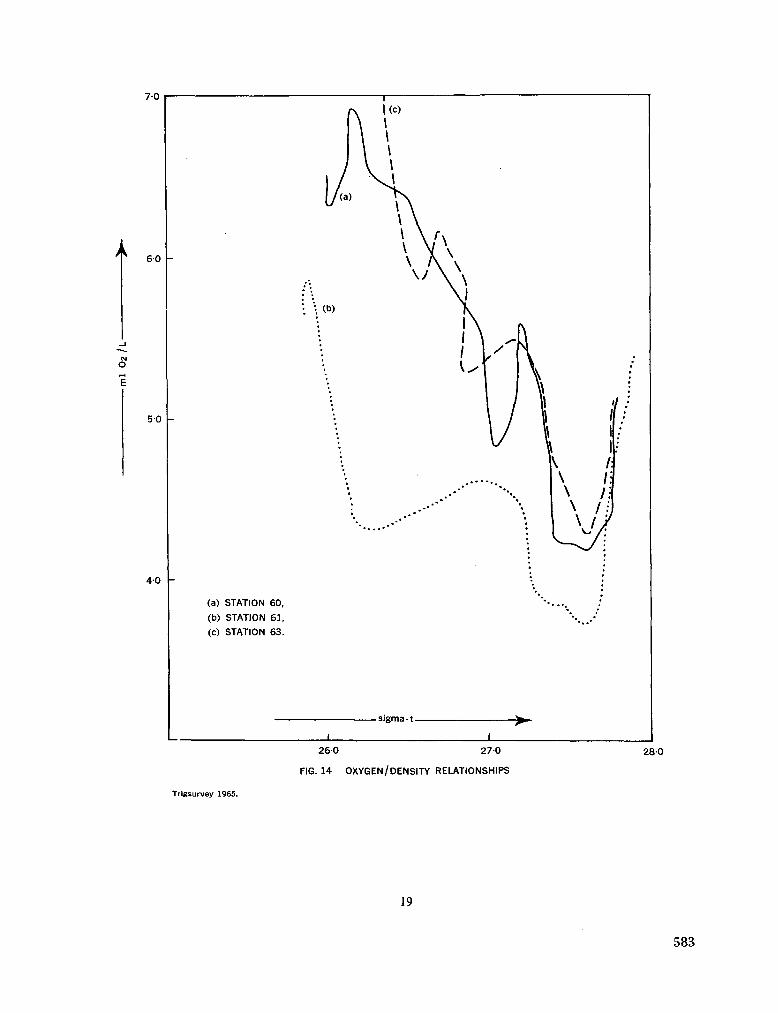
70
60
O
E
40
(a) STATION 60,
(b) STATION 61 ,
(c) STATION 63.
- sigma-t
260 270
FIG. 14 OXYGEN/DENSITY RELATIONSHIPS
280
Trigsurvey 1965.
19
583
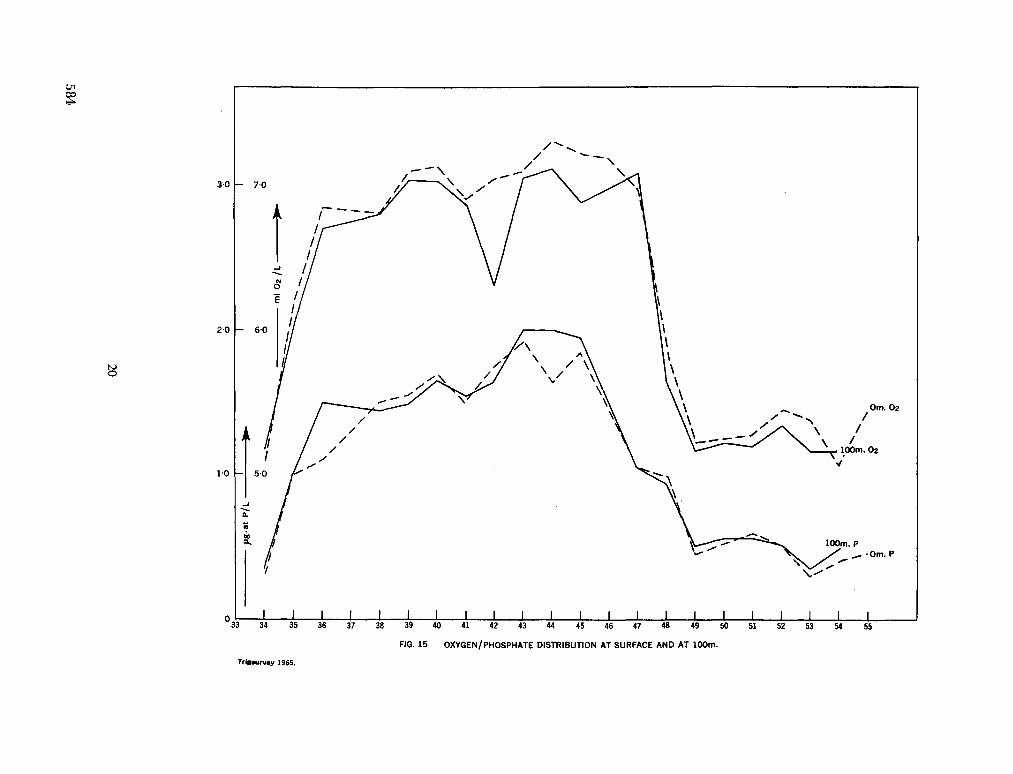
E
S
< a z < ce V
)
<
z g
<
x
o
X
CD >
X
o
584
20
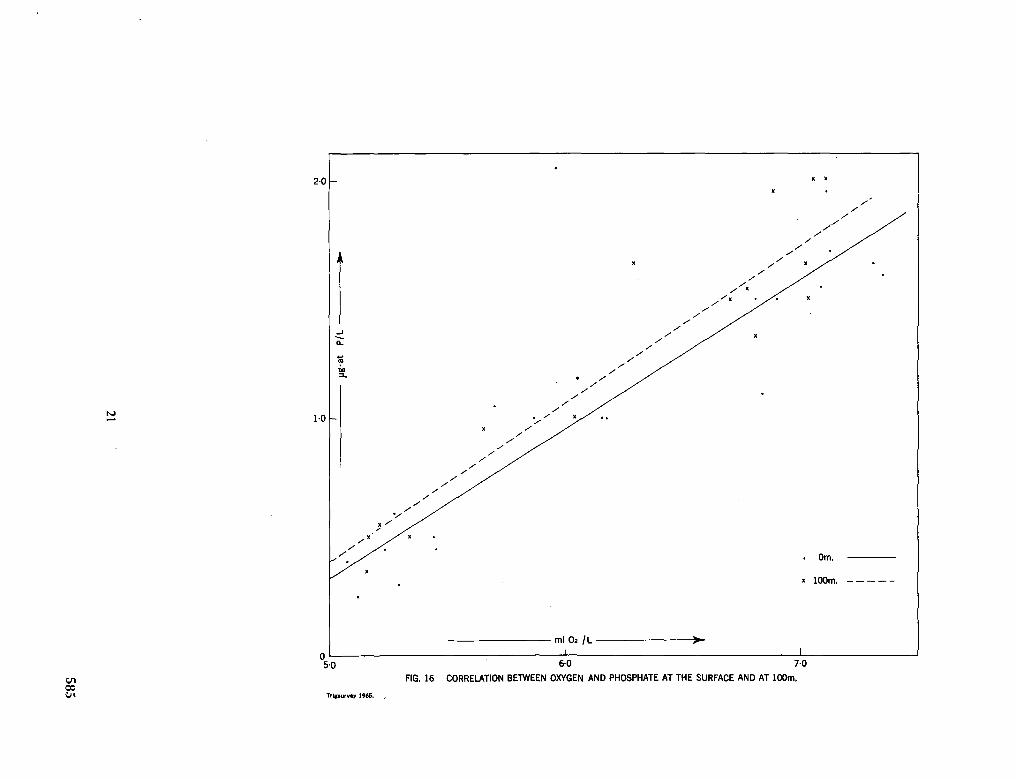
21
585
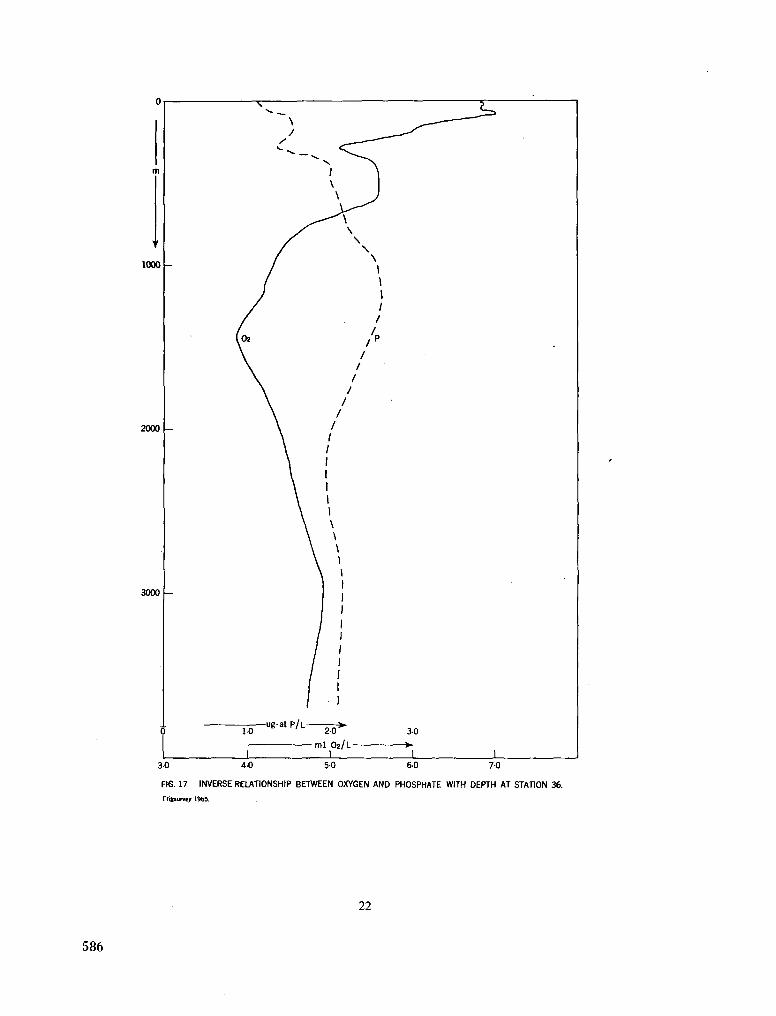
30 40 50 60 70
FtS. 17 INVERSE RELATIONSHIP BETWEEN OXYGEN AND PHOSPHATE WITH DEPTH AT STATION 36.
rrigsurvey 1965.
22
586
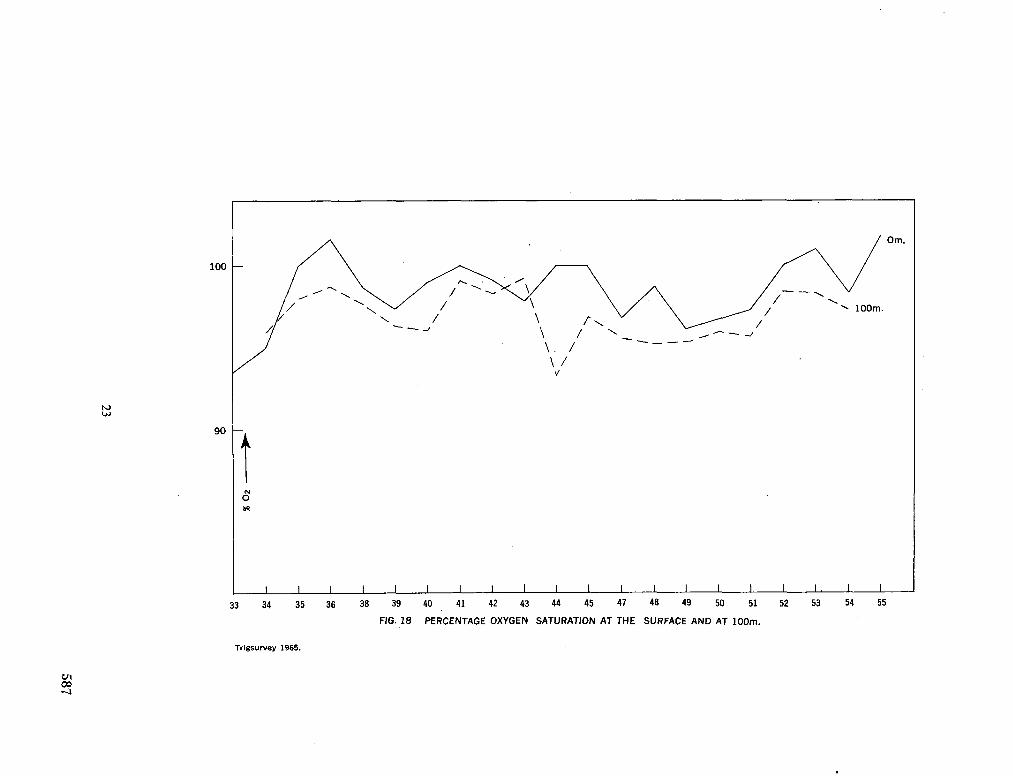
E
O
E
o
v.
O
—
*" H
/ /
X
/ 1 1
,
1
\ \
W
/) ' 1 (
i \
\ \
\
/ /
y / '
/ ( \
. \
, /
\ K
\ \
) \ \ \ i
>
/ /
/ 1 / 1
/
^
\K
Z
Q %
-
»-t
o
m -0
0
E
8 •-* <
Q
Z <
LU
O
<
U
.
ce 3
<0
2
O
I-«t
CE I-< </J
O >-X
o
UJ
O
<
- ^
z o
ce
§ a:
oo
O
O
O
Oí
23
587
Part III Physical oceanography
Reprinted from Aust. J. mar. freshw. Res., vol. 16, 1965, p. 255-271.
GEOSTROPHIC CURRENTS IN THE SOUTH-EASTERN INDIAN OCEAN
By B. V. H A M O N *
[Manuscript received March 10, 1965]
Summary
Dynamic topographies and geostrophic currents in the upper 1750 m are presented for several cruises between 1960 and 1963. The mean zonal surface circulation is shown to consist of the south equatorial current, 9-14 S., and a weak easterly current between 14 and 32 S. F rom 0 to 9"S., and again from 32 to 4 5 S . , the mean dynamic height anomalies are independent of latitude, so that mean geostrophic zonal currents are negligible in these latitudes. Changes in dynamic height of the surface relative to 300 decibars within 2-4 weeks are shown for five "seasonal biological cruises", along 110 E . The significance of these changes in interpreting the dynamics of the region is discussed. Cyclonic and anticyclonic eddies appear occasionally off Fremantle, but no seasonal pattern was found. Cyclonic eddies south of Java are postulated, mainly during the south-east monsoon. A bathythermograph section across the equator on 95 E . is included ; it shows no evidence of the equatorial undercurrent.
I. I N T R O D U C T I O N
This paper presents dynamic topographies and geostrophic currents in the upper 1750 m of the south-eastern Indian Ocean. Data obtained by Australian ships between 1960 and 1963 are used (CSIRO Aust. 1963a, 19636, 1963c, 1964a, 1964ft, 1964c, 1965a, 1965ft, 1965c, 1965*7, 1965c, 1965/; 1965g-). Data from three earlier cruises of the Australian océanographie frigate H . M . A . S . Diamantina in 1959 and 1960 ( D m 2/59, 1/60, and 2/60) have already been interpreted by Wyrtki (1962a).
II. C A L C U L A T I O N O F D Y N A M I C H E I G H T A N O M A L I E S
Anomalies of dynamic height were computed first for observed depths, using standard methods. Anomalies of dynamic height for standard depths were then computed by linear interpolation.
Following Wyrtki (1962a), a reference level of 1750 decibars was chosen for all cruises except D m 3/61, and the anomalies of dynamic height computed relative to this reference level. Where the m a x i m u m sampling depth was less than the depth of the reference level, but greater than 1000 m , dynamic height anomalies were extrapolated, using data from adjacent stations. This extrapolation should not introduce appreciable errors in geostrophic currents or dynamic topographies above 700 in.
The results for each cruise have been presented separately, except in one case ( D m 2/62 and G 4/62) when two ships were operating simultaneously in the one area.
Since the geostrophic currents in tropical regions often vary rapidly with depth in the upper few hundred metres (Wyrtki 1962a), it was decided to present topo-
* Division of Fisheries and Oceanography, C S I R O , Cronulla, N . S . W . (Reprint N o . 574.)
Collected reprints of the International Indian Ocean Expedition, vol. IV, contribution no. 236 591
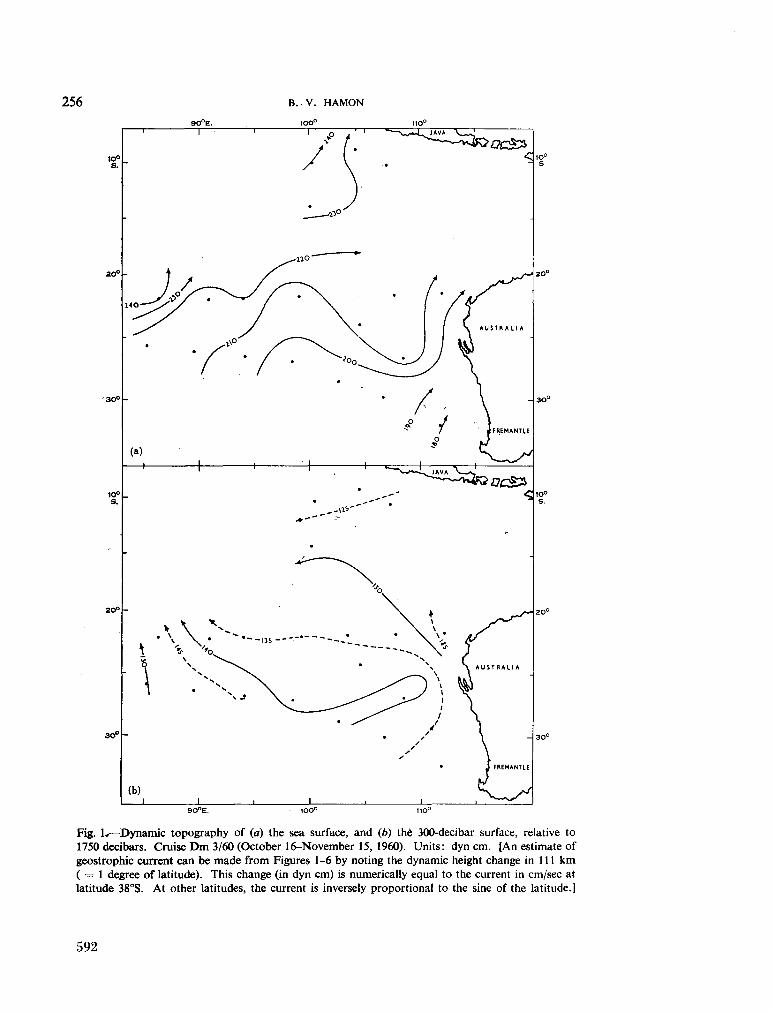
256 B..V. HAMON
90°E.
1 : 1IO°
10° s.
"30°
-•0°'
WC&2 10°
io° s.
3<J°
(b)
Fig. 1*—Dynamic topography of (a) the sea surface, and (¿>) the 300-decibar surface, relative to 1750 decibars. Cruise D m 3/60 (October 16-November 15, 1960). Units: dyn c m . [An estimate of geostrophic current can be m a d e from Figures 1-6 by noting the dynamic height change in 111 k m ( = 1 degree of latitude). This change (in dyn c m ) is numerically equal to the current in cm/sec at latitude 38°S. At other latitudes, the current is inversely proportional to the sine of the latitude.]
592
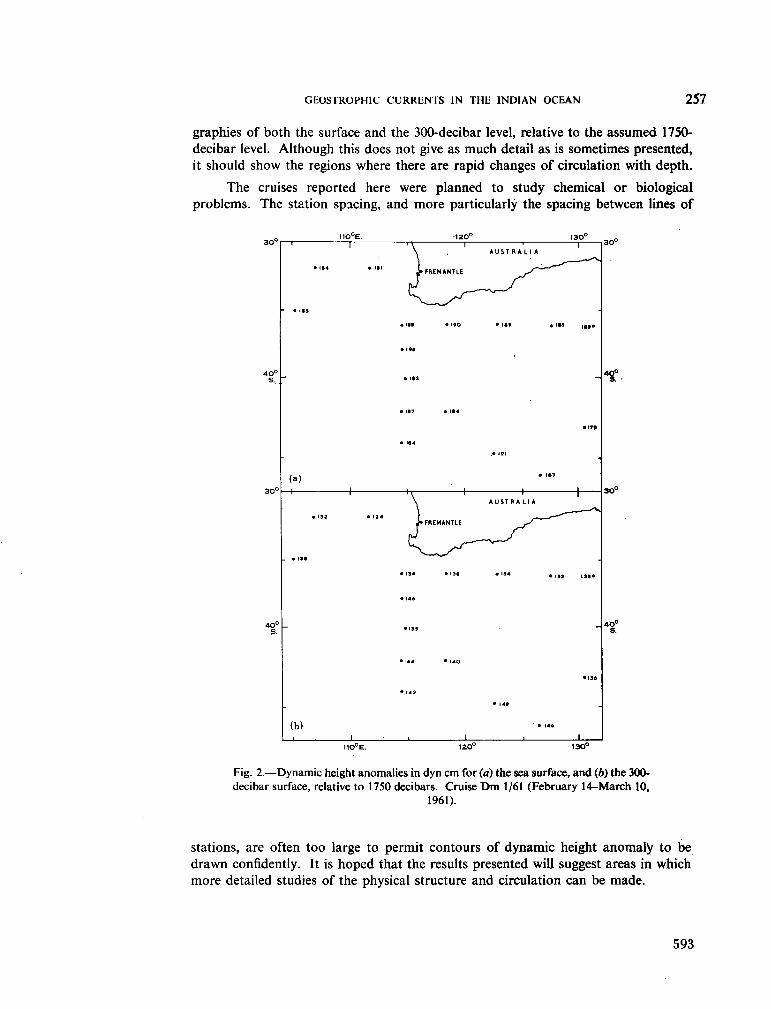
GEOSTROPH1C CURRENTS IN THE INDIAN OCEAN 257
graphies of both the surface and the 300-decibar level, relative to the assumed 1750-decibar level. Although this does not give as m u c h detail as is sometimes presented, it should show the regions where there are rapid changes of circulation with depth.
The cruises reported here were planned to study chemical or biological problems. The station spacing, and more particularly the spacing between lines of
30°
40° S.
30°
40°
s.
1
• IS4
- • its
(a) .
• 133
. • I3t
(b)
HO°E.
I
j 1
1
• m
• 134
1 I
• IIS
• 106
• 117
• 164
.
• 134
• 146
•135
• 1 4 4
• 142
120°
1
FREMANTIE
• 190
• 1*4
1 1
FREMANTLE
• 131
• I40
1
A U S T R A l l A
• ! •» «l«S
. • 191
• IS7
I 1
A U S T R A LIA
* l 3 4 • isa
• I4«
' • 146
1
130°
1
• • # •
• ITf
| 1
I3t*
•136
1
40°
s.
HO°E. 120° 130°
Fig. 2.—Dynamic height anomalies in dyn c m for (a) the sea surface, and (b) the 300-decibar surface, relative to 1750 decibars. Cruise D m 1/61 (February 14-March 10,
1961).
stations, are often too large to permit contours of dynamic height anomaly to be drawn confidently. It is hoped that the results presented will suggest areas in which more detailed studies of the physical structure and circulation can be m a d e .
593
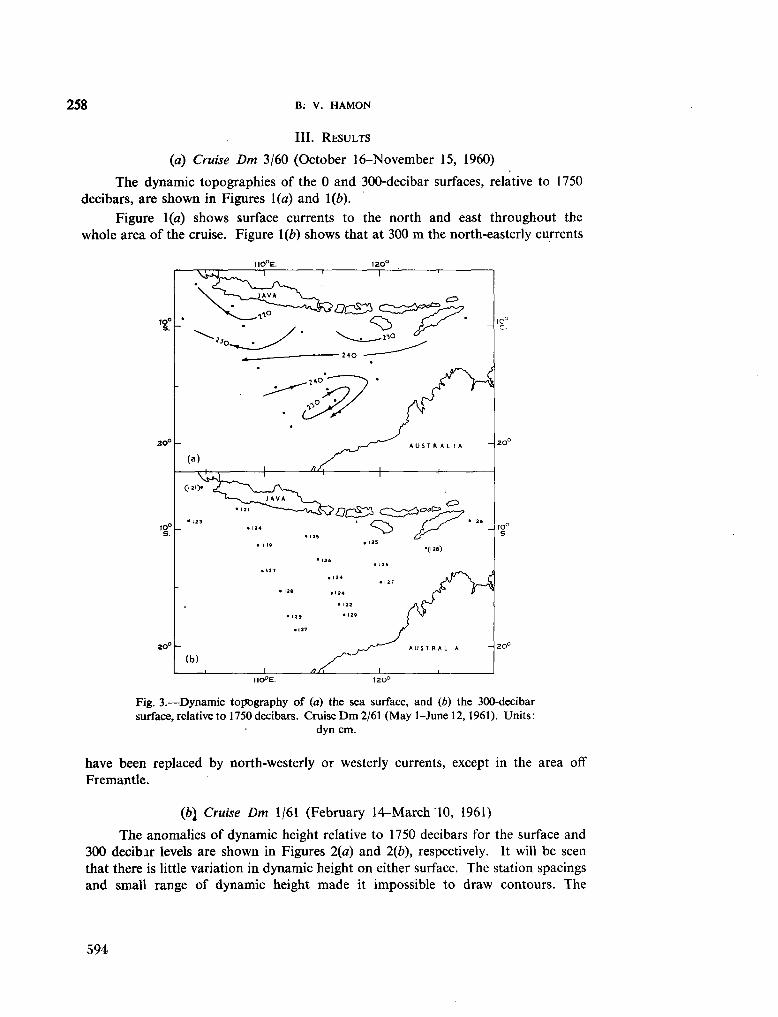
258 B. V. HAMON
III. R E S U L T S
(a) Cruise Dm 3/60 (October 16-November 15, 1960)
The dynamic topographies of the 0 and 300-decibar surfaces, relative to 1750 decibars, are shown in Figures 1(a) and 1(e).
Figure 1(a) shows surface currents to the north and east throughout the whole area of the cruise. Figure 1(6) shows that at 300 m the north-easterly currents
110°E. 120°
Fig. 3.—Dynamic topography of (a) the sea surface, and (¿>) the 300-decibar surface, relative to 1750 decibars. Cruise D m 2/61 (May 1-June 12,1961). Units :
dyn c m .
have been replaced by north-westerly or westerly currents, except in the area off Fremantle.
(b) Cruise Dm 1/61 (February 14-March 10, 1961)
The anomalies of dynamic height relative to 1750 decibars for the surface and 300 decibar levels are shown in Figures 2(a) and 2(b), respectively. It will be seen that there is little variation in dynamic height on either surface. The station spacings and small range of dynamic height made it impossible to draw contours. The
594
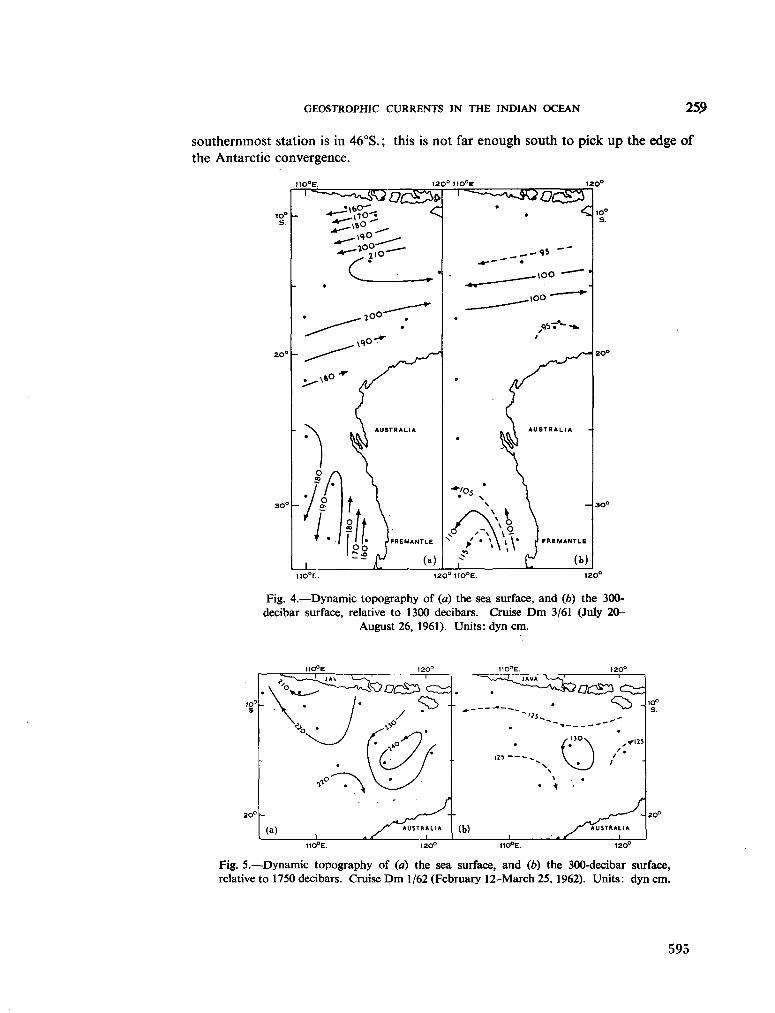
GEOSTROPHIC CURRENTS IN THE INDIAN OCEAN 259
southernmost station is in 46°S. ; this is not far enough south to pick up the edge of
the Antarctic convergence.
IIO°E. 120° no°e 120°
|10°F. I20°110°E. I20°
Fig. 4.—Dynamic topography of (a) the sea surface, and (6) the 300-decibar surface, relative to 1300 decibars. Cruise D m 3/61 (July 20-
August 26, 1961). Units: dyn cm.
HO°E I20° 11Q°E. 120°
Fig. 5.—Dynamic topography of (a) the sea surface, and (¿») the 300-decibar surface, relative to 1750 decibars. Cruise D m 1/62 (February 12-March 25, 1962). Units: dyn c m .
595
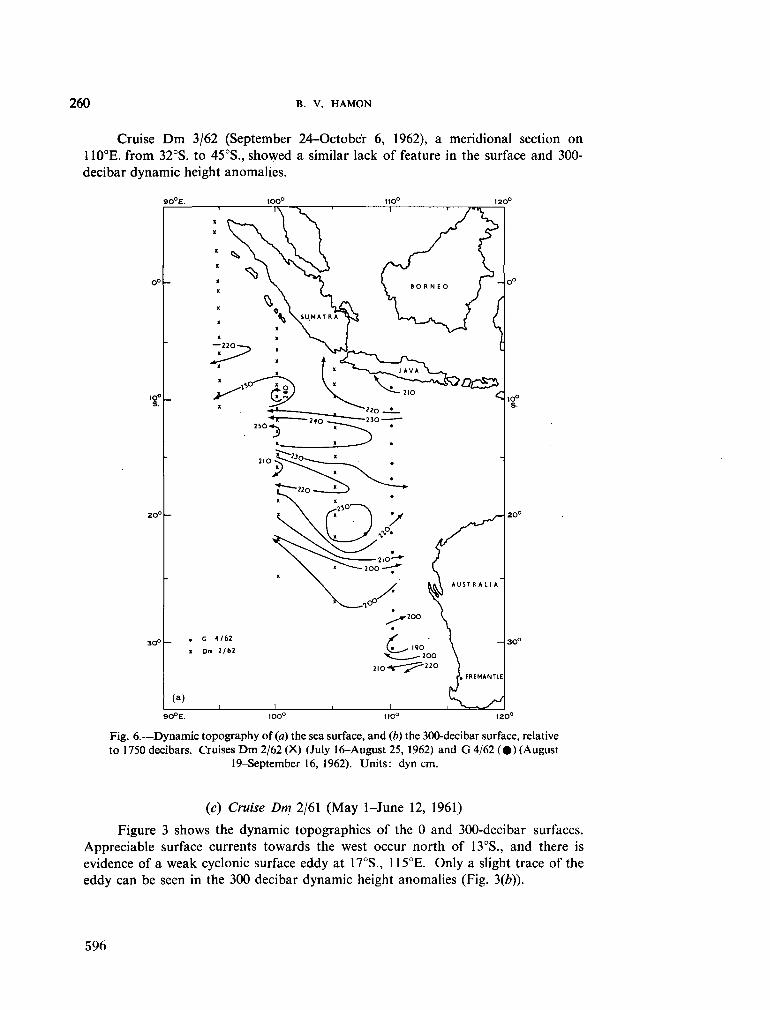
260 B. V. HAMON
Cruise D m 3/62 (September 24-October 6, 1962), a meridional section on 110°E. from 32°S. to 45°S., showed a similar lack of feature in the surface and 300-decibar dynamic height anomalies.
90°E.
20°
. G 4/62
1 Dm 2/62
(a)
Fig. 6.—Dynamic topography of (a) the sea surface, and (b) the 300-decibar surface, relative to 1750 decibars. Cruises D m 2/62 (X) (July 16-August 25, 1962) and G 4/62 (•) (August
19-September 16, 1962). Units: dyn cm.
(c) Cruise Dm 2/61 (May 1-June 12, 1961)
Figure 3 shows the dynamic topographies of the 0 and 300-decibar surfaces. Appreciable surface currents towards the west occur north of 13°S., and there is evidence of a weak cyclonic surface eddy at 17°S., 115°E. Only a slight trace of the eddy can be seen in the 300 decibar dynamic height anomalies (Fig. 3(e)).
596
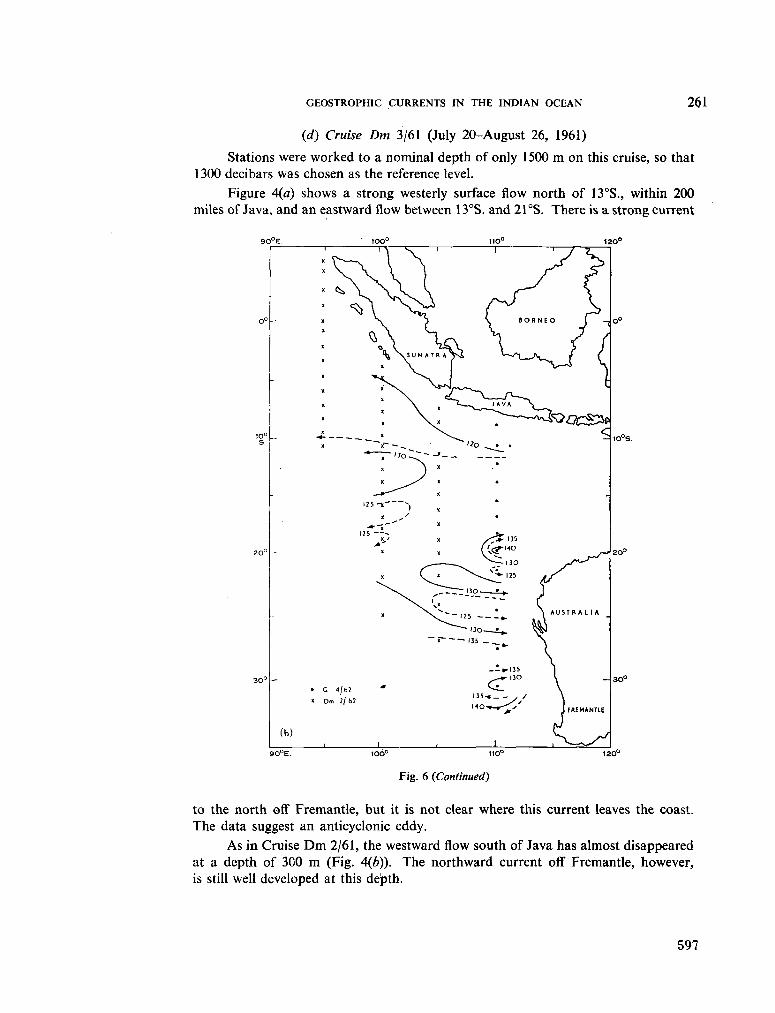
GEOSTROPHIC CURRENTS IN THE INDIAN OCEAN 261
(d) Cruise D m 3/61 (July 20-August 26, 1961)
Stations were worked to a nominal depth of only 1500 m on this cruise, so that 1300 decibars was chosen as the reference level.
Figure 4(a) shows a strong westerly surface flow north of 13°S., within 200 miles of Java, and an eastward flow between 13°S. and 21 °S. There is a strong current
90°E.
10° S.
C 4/62
Dm 2/ 62
(b)
Fig. 6 (Continued)
to the north ©ff Fremantle, but it is not clear where this current leaves the coast. The data suggest an anticyclonic eddy.
As in Cruise D m 2/61, the westward flow south of Java has almost disappeared at a depth of 300 m (Fig. 4(6)). The northward current off Fremantle, however, is still well developed at this depth.
597
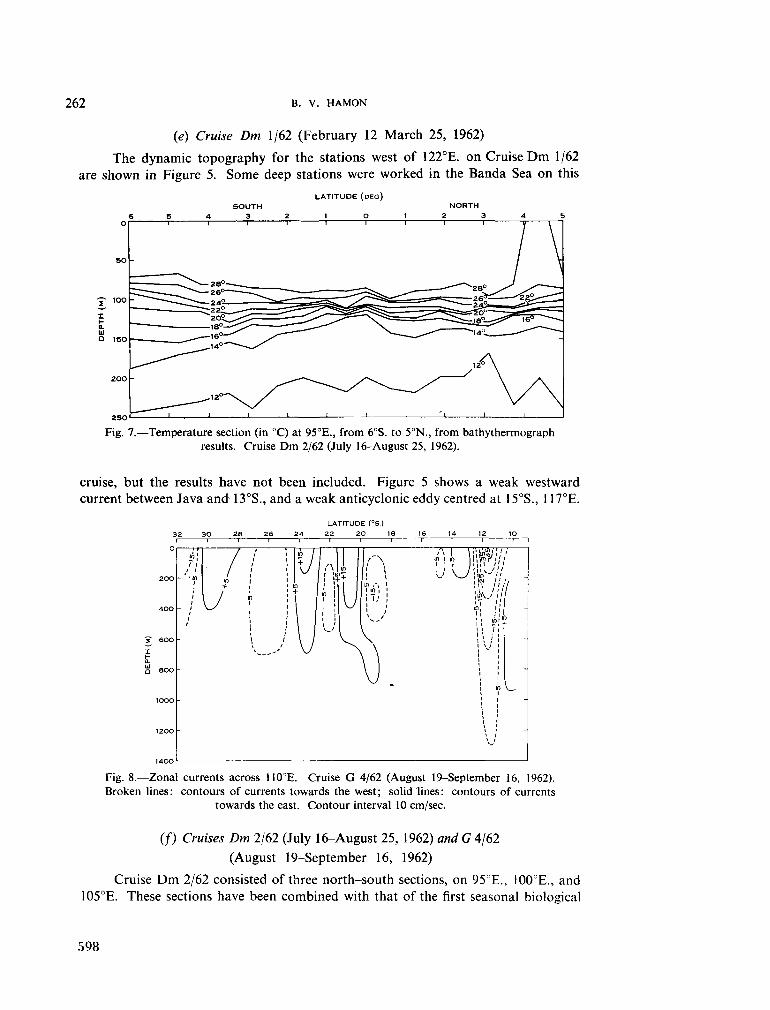
262 B. V. HAMON
(e) Cruise Dm 1/62 (February 12-March 25, 1962)
The dynamic topography for the stations west of 122°E. on Cruise D m 1/62 are shown in Figure 5. Some deep stations were worked in the Banda Sea on this
LATITUDE ( D E G )
Fig. 7.—Temperature section (in °C) at 95°E., from 6°S. to 5°N., from bathythermograph results. Cruise D m 2/62 (July 16-August 25, 1962).
cruise, but the results have not been included. Figure 5 shows a weak westward current between Java and 13°S., and a weak anticyclonic eddy centred at 15°S., 117°E.
LATITUDE (°S.)
2 0 0
4 0 0
600
B O O
O O O
200
T i
•in 1
i
i
1 V)
/ \J
t > »
1 • 1 ¡
m ¡
i i i t i i
' ' \ l
V ) -
i l
! ï ? i
+15
"-' \
I V
1 /' S 1 ' i
' 1
lin / - , i M m i •
\J y
\ \
V J .
A 1 m i m i i +
w¡¡¡ / tin "
; KM " ' ,
\kjl>
? ' r'1
1 - ! in
il H?! + i > (i
i \ ¡ '
i ¡ i • i i
i i i in L i i
» i
i i i i
-
'
~
-
Fig. 8.—Zonal currents across 1!0GE. Cruise G 4/62 (August 19-September 16, 1962). Broken lines: contours of currents towards the west; solid lines: contours of currents
towards the east. Contour interval 10 cm/sec.
(/) Cruises Dm 2/62 (July 16-August 25, 1962) and G 4/62
(August 19-September 16, 1962)
Cruise D m 2/62 consisted of three north-south sections, on 95°E., 100°E., and 105°E. These sections have been combined with that of the first seasonal biological
598
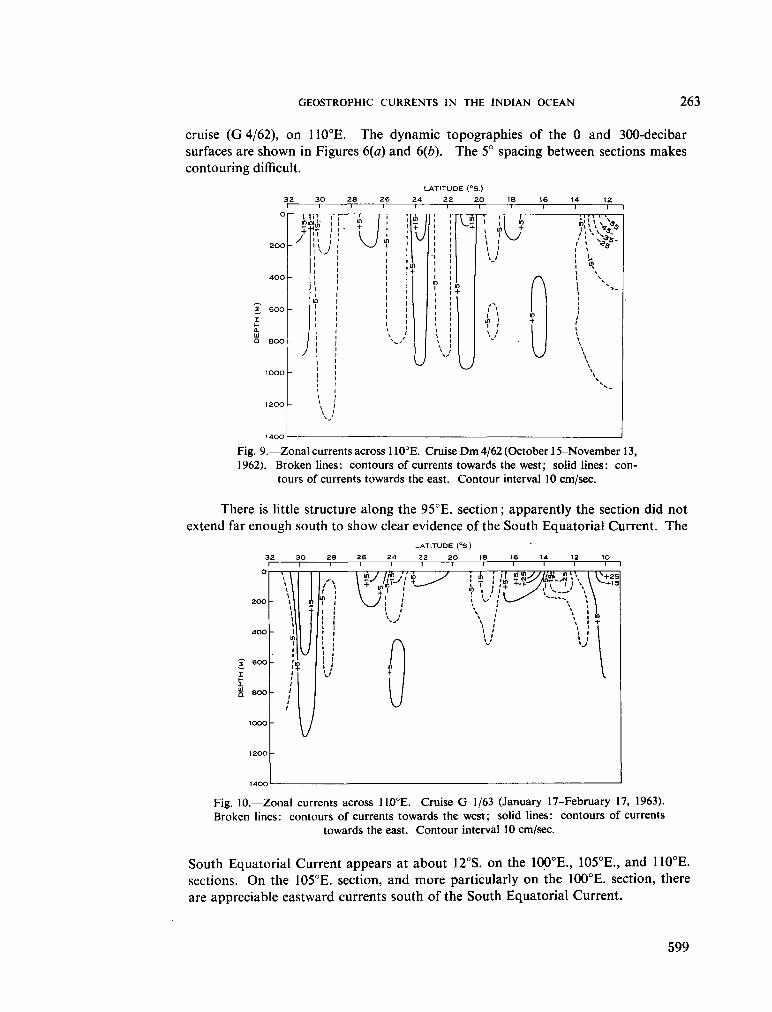
GEOSTROPH1C CURRENTS IN THE INDIAN OCEAN 263
cruise (G 4/62), on 110°E. The dynamic topographies of the 0 and 300-decibar surfaces are shown in Figures 6(a) and 6(e). The 5° spacing between sections makes contouring difficult.
LATITUDE (°S.)
24 22 20
Fig. 9.—Zonal currents across 110°E. Cruise D m 4/62 (October 15-November 13, 1962). Broken lines: contours of currents towards the west ; solid lines: con
tours of currents towards the east. Contour interval 10 cm/sec.
There is little structure along the 95°E. section; apparently the section did not extend far enough south to show clear evidence of the South Equatorial Current. The
LATITUDE (°S.)
Fig. 10.—Zonal currents across 110°E. Cruise G 1/63 (January 17-February 17, 1963). Broken lines: contours of currents towards the west; solid lines: contours of currents
towards the east. Contour interval 10 cm/sec.
South Equatorial Current appears at about 12°S. on the 100°E., 105°E., and 110°E. sections. O n the 105°E. section, and more particularly on the 100°E. section, there are appreciable eastward currents south of the South Equatorial Current.
599
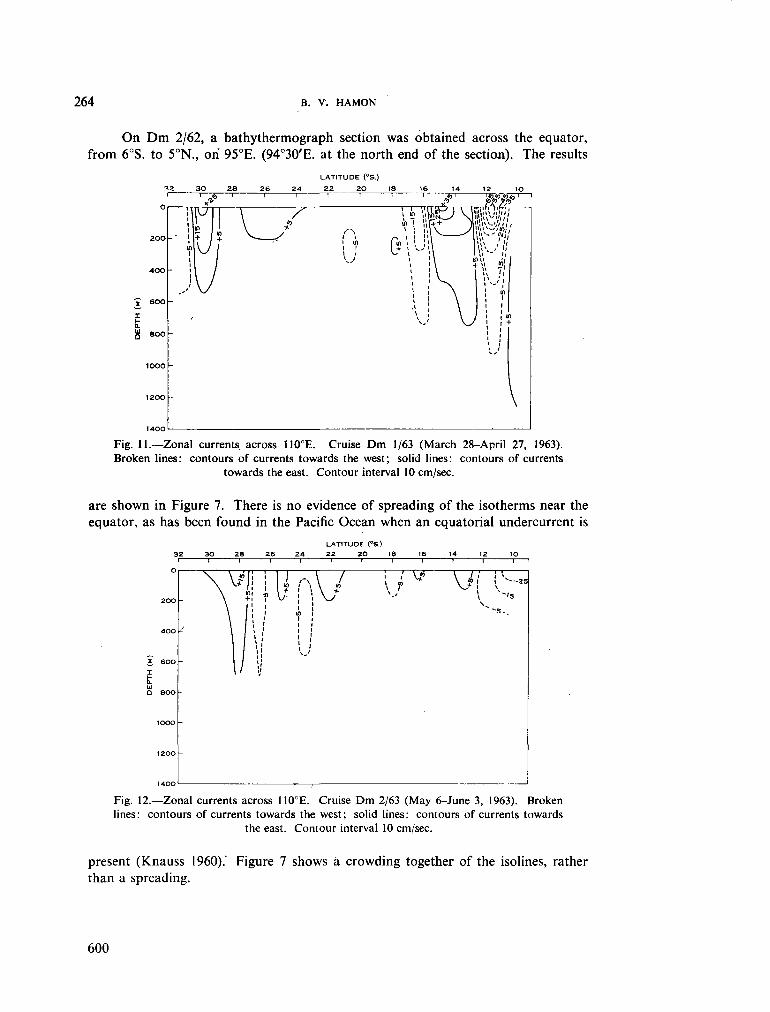
264 B. V. HAMON
O n D m 2/62, a bathythermograph section was obtained across the equator, from 6°S. to 5°N., on 95°E. (94°30'E. at the north end of the section). The results
LATITUDE (°S.)
22 20
Fig. 11.—Zonal currents across 110°E. Cruise D m 1/63 (March 28-April 27, 1963). Broken lines: contours of currents towards the west ; solid lines: contours of currents
towards the east. Contour interval 10 cm/sec.
are shown in Figure 7. There is no evidence of spreading of the isotherms near the equator, as has been found in the Pacific Ocean when an equatorial undercurrent is
LATITUDE. (°S.) 32 30 28 26 24 22 20 18 16 14 12 10
O
2 0 0
4 0 0
6 0 0
8 0 0
lOOO
1200
-
/
~
-
\ in t
\ + l
\ W I II
i
to y i
in
v-
y \ r
i i i
Fig. 12.—Zonal currents across 110°E. Cruise D m 2/63 (May 6-June 3, 1963). Broken lines: contours of currents towards the west; solid lines: contours of currents towards
the east. Contour interval 10 cm/sec.
present (Knauss I960).' than a spreading.
Figure 7 shows à crowding together of the isolines, rather
600
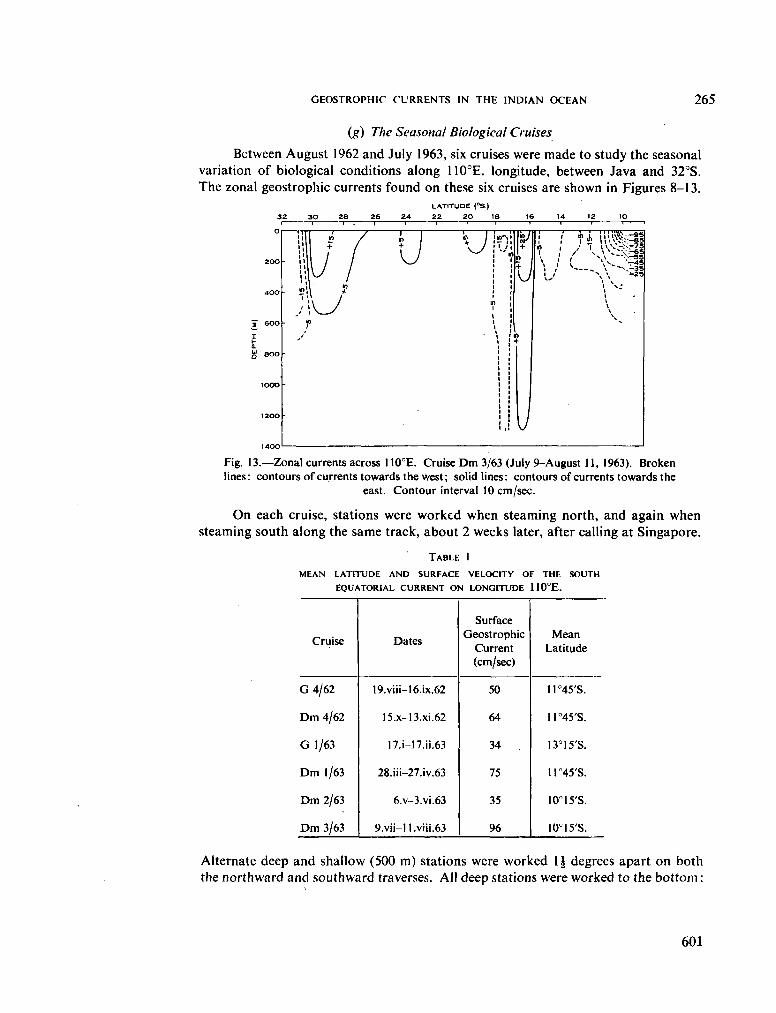
GEOSTROPHIC CURRENTS IN THE INDIAN OCEAN 265
(g) The Seasonal Biological Cruises
Between August 1962 and July 1963, six cruises were made to study the seasonal variation of biological conditions along 110°E. longitude, between Java and 32°S. The zonal geostrophic currents found on these six cruises are shown in Figures 8-13.
LATITUDE (°S.)
22 20
200
400
6 0 0
eoo
IO0O
1200
V /
-
-
•
u ;> - ii 01'
1 /1 +
1 +
t to I J +
u
\J s^a v^
Fig. 13.—Zonal currents across 110°E. Cruise D m 3/63 (July 9-August 11, 1963). Broken lines: contours of currents towards the west; solid lines: contours of currents towards the
east. Contour interval 10 cm/sec.
O n each cruise, stations were worked when steaming north, and again when steaming south along the same track, about 2 weeks later, after calling at Singapore.
T A B L E I
MEAN LATITUDE AND SURFACE VELOCITY OF THE SOUTH EQUATORIAL CURRENT ON LONGITUDE 110°E.
Cruise
G 4/62
D m 4/62
G 1/63
D m 1/63
D m 2/63
D m 3/63
Dates
19.viii-16.ix.62
15.x-13.xi.62
17.i-17.ii.63
28.iii-27.iv.63
6.v-3.vi.63
9.VÜ-I l.viii.63
Surface Geostrophic
Current (cm/sec)
50
64
34
75
35
96
M e a n Latitude
11°45'S.
1I°45'S.
13°15'S.
11°45'S.
I0"I5'S.
I0°15'S.
Alternate deep and shallow (500 m ) stations were worked 1¿ degrees apart on both the northward and southward traverses. All deep stations were worked to the bottom :
601
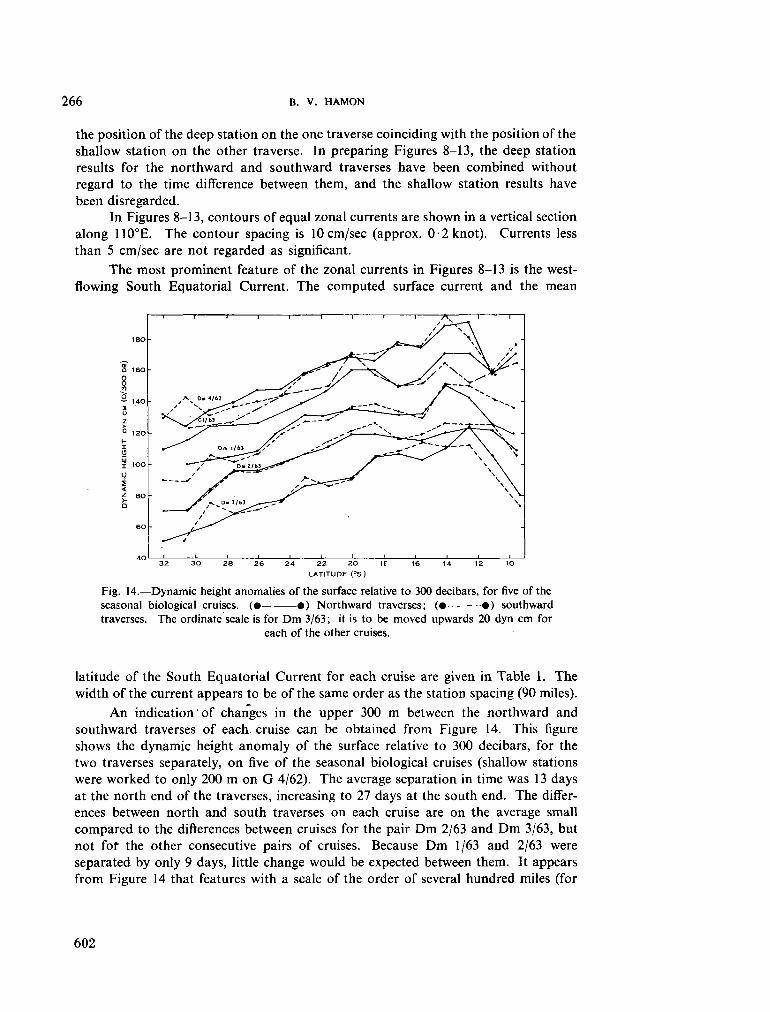
266 B. V. HAMON
the position of the deep station on the one traverse coinciding with the position of the shallow station on the other traverse. In preparing Figures 8-13, the deep station results for the northward and southward traverses have been combined without regard to the time difference between them, and the shallow station results have been disregarded.
In Figures 8-13, contours of equal zonal currents are shown in a vertical section along 110°E. The contour spacing is 10 cm/sec (approx. 0-2 knot). Currents less than 5 cm/sec are not regarded as significant.
The most prominent feature of the zonal currents in Figures 8-13 is the west-flowing South Equatorial Current. The computed surface current and the m e a n
4 Q I 1 I 1 1 I I 1 I I I I 1—
32 30 28 26 24 22 20 If 16 14 12 10 LATITUDE: (°S.)
Fig. 14.—Dynamic height anomalies of the surface relative to 300 decibars, for five of the seasonal biological cruises. (• • ) Northward traverses; (• • ) southward traverses. The ordinate scale is for D m 3/63 ; it is to be moved upwards 20 dyn c m for
each of the other cruises.
latitude of the South Equatorial Current for each cruise are given in Table 1. The width of the current appears to be of the same order as the station spacing (90 miles).
A n indication of changes in the upper 300 m between the northward and southward traverses of each cruise can be obtained from Figure 14. This figure shows the dynamic height anomaly of the surface relative to 300 decibars, for the two traverses separately, on five of the seasonal biological cruises (shallow stations were worked to only 200 m on G 4/62). The average separation in time was 13 days at the north end of the traverses, increasing to 27 days at the south end. The differences between north and south traverses on each cruise are on the average small compared to the differences between cruises for the pair D m 2/63 and D m 3/63, but not fof the other consecutive pairs of cruises. Because D m 1/63 and 2/63 were separated by only 9 days, little change would be expected between them. It appears from Figure 14 that features with a scale of the order of several hundred miles (for
602
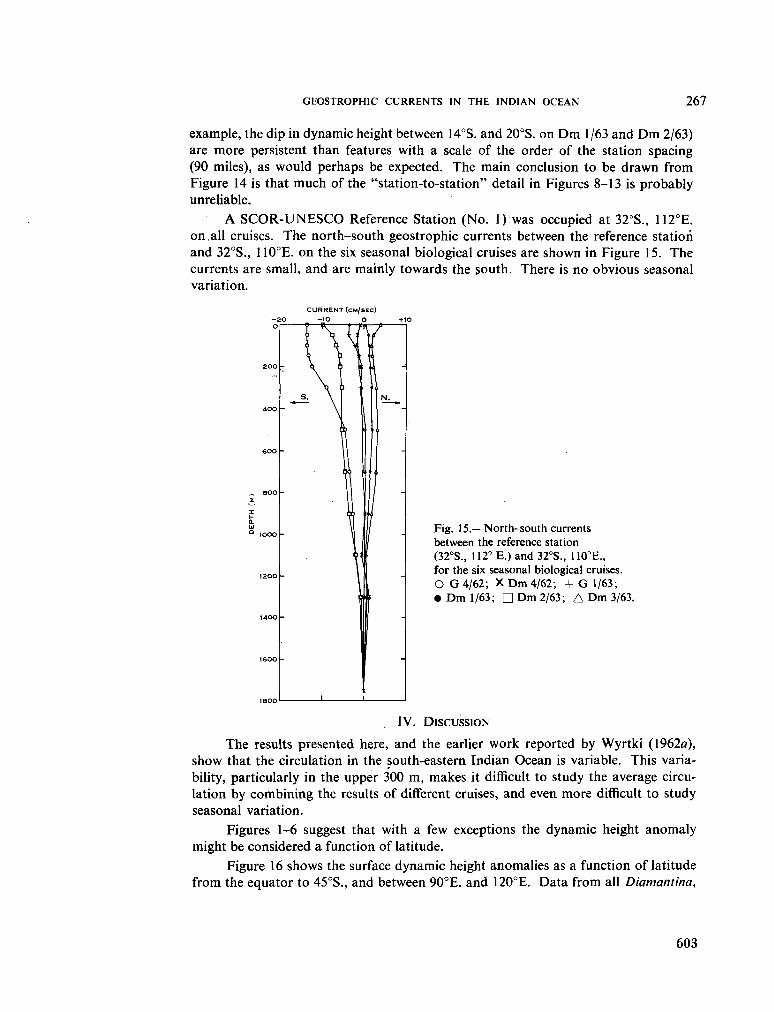
GEOSTROPH1C CURRENTS IN THE INDIAN OCEAN 267
example, the dip in dynamic height between 14°S. and 20°S. on D m 1/63 and D m 2/63) are more persistent than features with a scale of the order of the station spacing (90 miles), as would perhaps be expected. The main conclusion to be drawn from Figure 14 is that m u c h of the "station-to-station" detail in Figures 8-13 is probably unreliable.
A S C O R - U N E S C O Reference Station (No. 1) was occupied at 32°S., 112°E. on,all cruises. The north-south geostrophic currents between the reference station and 32°S., 110°E. on the six seasonal biological cruises are shown in Figure 15. The currents are small, and are mainly towards the south. There is no obvious seasonal variation.
CURRENT (CM/SEC)
Fig. 15.—North-south currents between the reference station (32°S., 112° E. ) and 32°S., U 0 ° E . , for the six seasonal biological cruises. O G 4/62; X D m 4/62; + G 1/63; • D m 1/63; • D m 2/63; A D m 3/63.
IV. D I S C U S S I O N
The results presented here, and the earlier work reported by Wyrtki (1962a), show that the circulation in the south-eastern Indian Ocean is variable. This variability, particularly in the upper 300 m , makes it difficult to study the average circulation by combining the results of different cruises, and even more difficult to study seasonal variation.
Figures 1-6 suggest that with a few exceptions the dynamic height anomaly might be considered a function of latitude.
Figure 16 shows the surface dynamic height anomalies as a function of latitude from the equator to 45°S., and between 90CE. and 120CE. Data from all Diamantina,
603
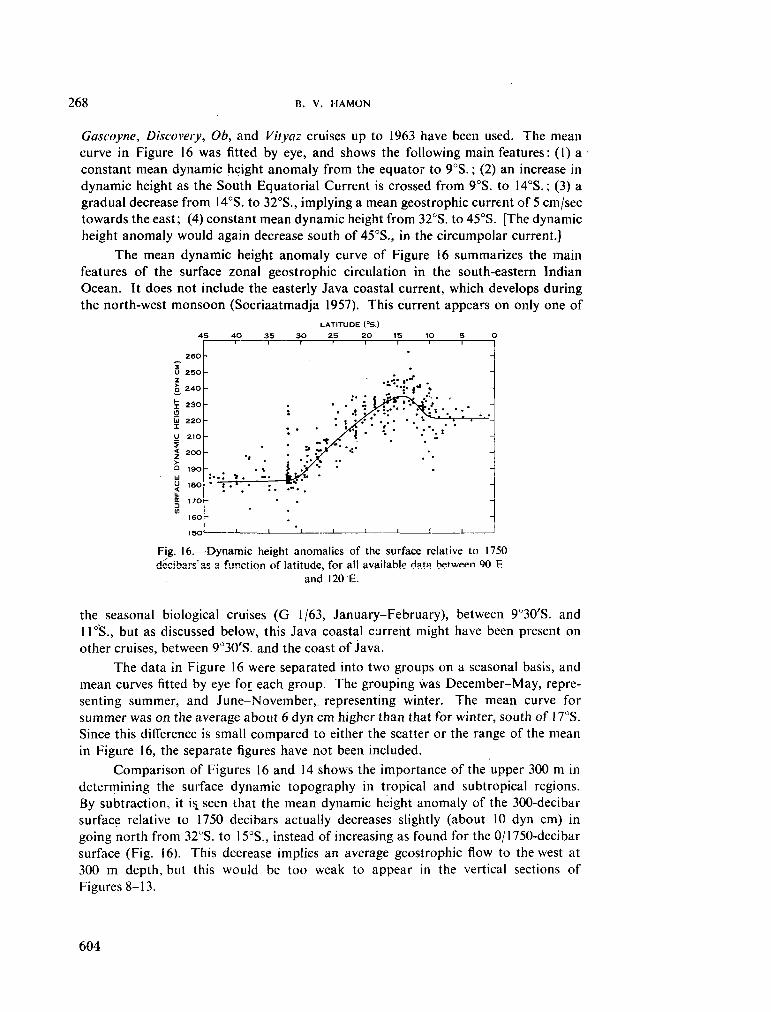
268 B. V. MAMÓN
Gascoyne, Discovery, Ob, and Vityaz cruises up to 1963 have been used. The mean curve in Figure 16 was fitted by eye, and shows the following main features: (1) a constant mean dynamic height anomaly from the equator to 9°S. ; (2) an increase in dynamic height as the South Equatorial Current is crossed from 9°S. to 14°S. ; (3) a gradual decrease from 14°S. to 32°S., implying a mean geostrophic current of 5 cm/sec towards the east; (4) constant mean dynamic height from 32°S. to 45CS. [The dynamic height anomaly would again decrease south of 45°S., in the circumpolar current.]
The m e a n dynamic height anomaly curve of Figure 16 summarizes the main features of the surface zonal geostrophic circulation in the south-eastern Indian Ocean. It does not include the easterly Java coastal current, which develops during the north-west monsoon (Soeriaatmadja 1957). This current appears on only one of
LATITUDE (°S.)
45 40 35 30 25 20 15 lO 5 O
260
U 250 Z O 240
£ 230 O ¡ü 220 I O 210 < 200
> Q 190 UJ
y mo < u. S- I70 in
ieo ISO
Fig. 16.—Dynamic height anomalies of the surface relative to 1750 dccibars'as 3 function of latitude for all available data between 90 E .
and 120 E .
the seasonal biological cruises (G 1/63, January-February), between 9Ü30'S. and 11 °S., but as discussed below, this Java coastal current might have been present on other cruises, between 9°30'S. and the coast of Java.
The data in Figure 16 were separated into two groups on a seasonal basis, and mean curves fitted by eye for each group. The grouping was D e c e m b e r - M a y , representing summer, and June-November, representing winter. The mean curve for s u m m e r was on the average about 6 dyn c m higher than that for winter, south of 17°S. Since this difference is small compared to either the scatter or the range of the mean in Figure 16, the separate figures have not been included.
Comparison of Figures 16 and 14 shows the importance of the upper 300 m in determining the surface dynamic topography in tropical and subtropical regions. By subtraction, it is„ seen that the mean dynamic height anomaly of the 300-decibar surface relative to 1750 decibars actually decreases slightly (about 10 dyn c m ) in going north from 32°S. to 15°S., instead of increasing as found for the O/1750-decibar surface (Fig. 16). This decrease implies an average geostrophic flow to the west at 300 m depth, but this would be too weak to appear in the vertical sections of Figures 8-13.
i r
-----_ *l
• \ :..: ->. -" Ï • " • '
' '
( I
. • * • • •
•* *»x ' • *• JC i .y- •• fcJsv* • •"• .
' 1 1
1
:• * . ; • y
»>^
A-•<•
•i."-'
1 . S * s??. * :•* '('•
i
.-• . £•-*. . TNJVV
. \i : ". • *• f • »— '
* .* "*. :
• • .
i
-
--
# i .
• -_ _ -
-
604
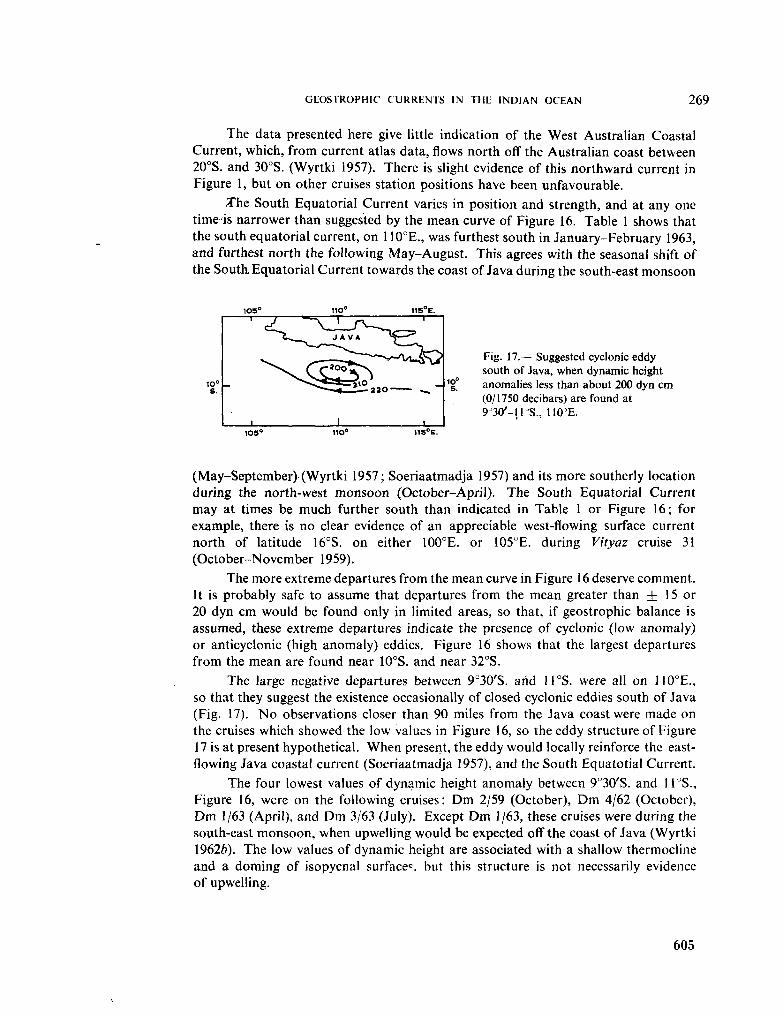
GLOSTROPHIC CURRENTS IN THE INDIAN OCEAN 269
The data presented here give little indication of the West Australian Coastal Current, which, from current atlas data, flows north off the Australian coast between 20°S. and 30°S. (Wyrtki 1957). There is slight evidence of this northward current in Figure 1, but on other cruises station positions have been unfavourable.
The South Equatorial Current varies in position and strength, and at any one timéis narrower than suggested by the mean curve of Figure 16. Table 1 shows that the south equatorial current, on 110°E., was furthest south in January-February 1963, and furthest north the following May-August . This agrees with the seasonal shift of the South. Equatorial Current towards the coast of Java during the south-east monsoon
10S° 110° 115°E.
Fig. 17.— Suggested cyclonic eddy south of Java, when dynamic height anomalies less than about 200 dyn c m (0/1750 decibars) are found at 9°30'-lloS., U 0 3 E .
IOS" HO° 115°E.
(May-September) (Wyrtki 1957; Soeriaatmadja 1957) and its more southerly location during the north-west monsoon (October-April). The South Equatorial Current m a y at times be m u c h further south than indicated in Table 1 or Figure 16; for example, there is no clear evidence of an appreciable west-flowing surface current north of latitude 16°S. on either 100°E. or 105°E. during Vityaz cruise 31 (October-November 1959).
The more extreme departures from the mean curve in Figure 16 deserve comment. It is probably safe to assume that departures from the mean greater than ± 15 or 20 dyn c m would be found only in limited areas, so that, if geostrophic balance is assumed, these extreme departures indicate the presence of cyclonic (low anomaly) or anticyclonic (high anomaly) eddies. Figure 16 shows that the largest departures from the mean are found near 10°S. and near 32°S.
The large negative departures between 9°30'S. and 11°S. were all on 110°E., so that they suggest the existence occasionally of closed cyclonic eddies south of Java (Fig. 17). N o observations closer than 90 miles from the Java coast were made on the cruises which showed the low values in Figure 16, so the eddy structure of Figure 17 is at present hypothetical. W h e n present, the eddy would locally reinforce the east-flowing Java coastal current (Soeriaatmadja 1957), and the South Equatotial Current.
The four lowest values of dynamic height anomaly between 9°30'S. and 11°S., Figure 16, were on the following cruises: D m 2/59 (October), D m 4/62 (October), D m 1/63 (April), and D m 3/63 (July). Except D m 1/63, these cruises were during the south-east monsoon, when upwelling would be expected off the coast of Java (Wyrtki 1962Z>). The low values of dynamic height are associated with a shallow thermocline and a doming of isopycnal surface , but this structure is not necessarily evidence of upwelling.
10°
s.
1 d
1
" ^ - ^ I T ^ vSr* ^C^fcr¿o>
^--»* 1— 220 ^ .
1
605
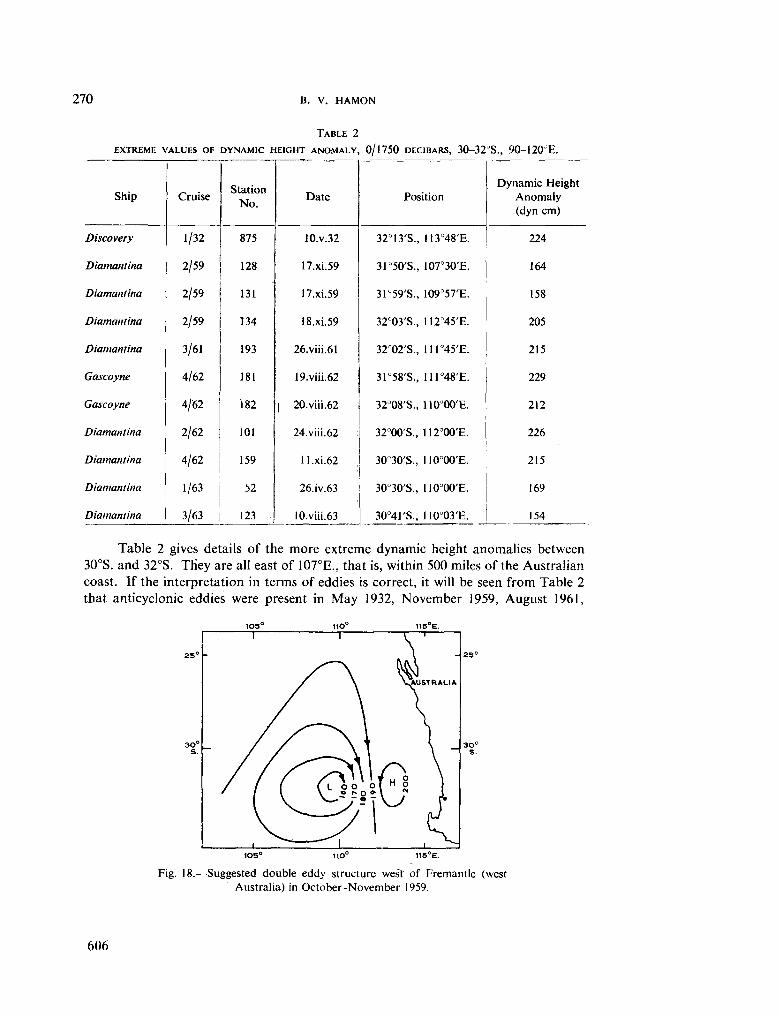
270 B. V. HAMON
TABLE 2
EXTREME VALUES OF DYNAMIC HEIGHT ANOMALY, 0/1750 DECIBARS, 30-32"S., 90-120JE.
Ship
Discovery
Diamantina
Diamantina
Diamantina
Diamantina
Gascoyne
Gascoyne
Diamantina
Diamantina
Diamantina
Diamantina
Cruise
1/32
2/59
2/59
2/59
3/61
4/62
4/62
2/62
4/62
1/63
3/63
Station No.
875
128
131
134
193
181
182
101
159
52
123
Date
lO.v.32
17.xi.59
17.xi.59
18.xi.59
26.viii.61
19.viii.62
1 20.viii.62
24.viii.62
ll.xi.62
26.iv.63
10.viii.63
Position
32°13'S.
31°50'S.
31°59'S.
32°03'S.
32°02'S.
31°58'S.
32°08'S.
32°00'S.
30°30'S.,
30°30'S.,
30°41'S.,
I13°48'E.
107°30'E.
109°57'E.
112°45'E.
111°45'E.
lll048'E.
110°00'E.
112°00'E.
I10°00'E.
1I0°00'E.
110°03'E.
D y n a m i c Height A n o m a l y (dyn cm)
224
164
158
205
215
229
212
226
215
169
154
Table 2 gives details of the more extreme dynamic height anomalies between 30°S. and 32°S. They are all east of 107°E., that is, within 500 miles of the Australian coast. If the interpretation in terms of eddies is correct, it will be seen from Table 2 that anticyclonic eddies were present in M a y 1932, November 1959, August 1961,
1Q5° 1lO° 115°E.
Fig. 18.—Suggested double eddy structure west of Fremantle (west Australia) in October-November 1959.
606
GEOSTROPHIC CURRENTS IN THE INDIAN OCEAN 271
August 1962, and November 1962. Cyclonic eddies were present in November 1959, April 1963, and August 1963. N o seasonal pattern is apparent. With this interpretation, a double eddy system may have been present off Fremantle in November 1959, as sketched in Figure 18.
The highest dynamic height anomaly in Figure 16, 263 dyn c m , was at 14°S., 110°E., and has been discussed by Wyrtki (1962a). This eddy moved or weakened rapidly, as it does not appear in the results of Vityaz cruise 39, 1 month later. It was not present the following year (Fig. 1 ; cruise D m 3/60).
It should be emphasized that strong eddies, of the type discussed above, seem to be rare, particularly off Fremantle. For example, the reference station at 32°S., 112°E., was occupied 12 times between 1960 and 1963, but dynamic height anomalies greater than 200 dyn c m were observed only twice, and no value lower than 179 dyn c m was found. The four low values south of Java on 110°E. appeared in a total of 10 cruises that sampled the area, and there is evidence of another low value on 113°E. on cruise D m ,3/61 (Fig. 4).
V . R E F E R E N C E S
CSIRO A U S T . (1963a).—Oceanographical observations in the Indian Ocean in 1960. H . M . A . S . Diamantina, Cruise D m 3/60. CSIRO Aust. Oceanogr. Cruise Rep. 4.
CSIRO A U S T . (19636).—Oceanographical observations in the Indian Ocean in 1961. H . M . A . S . Diamantina, Cruise D m 1/61. CSIRO Aust. Oceanogr. Cruise Rep. 7
CSIRO A U S T . (1963C).—Oceanographical observations in the Indian Ocean in 1961. H . M . A . S . Diamantina, Cruise D m 2/61. CSIRO Aust. Oceanogr. Cruise Rep. 9.
CSIRO A U S T . (1964a).—Oceanographical observations in the Indian Ocean in 1961. H . M . A . S . Diamantina, Cruise D m 3/61. CSIRO Aust. Oceanogr. Cruise Rep. 11.
CSIRO A U S T . (19646).—Oceanographical observations in the Indian Ocean in 1962. H . M . A . S . Diamantina, Cruise D m l/62. CSIRO Aust. Oceanogr. Cruise Rep. 14.
CSIRO A U S T . (1964C).—Oceanographical observations in the Indian Ocean in 1962. H . M . A . S . Diamantina, Cruise D m 2/62. CSIRO Aust. Oceanogr. Cruise Rep. 15.
CSIRO A U S T . (1965a).—Oceanographical observations in the Indian Ocean in 1962. H . M . A . S . Gascoyne, Cruise G 4/62. CSIRO Aust. Oceanogr. Cruise Rep. 17 (In press.)
CSIRO A U S T . (19656).—Oceanographical observations in the Indian Ocean in 1962. H . M . A . S . Diamantina, Cruise D m 3/62. CSIRO Aust. Oceanogr. Cruise Rep. 18 (In press.)
CSIRO A U S T . (1965c).—Oceanographical observations in the Indian Ocean in 1962. H . M . A . S . Diamantina, Cruise D m 4/62. CSIRO Aust. Oceanogr. Cruise Rep. 20 (In press.)
CSIRO A U S T . (1965d).—Oceanographical observations in the Indian Ocean in 1963. H . M . A . S . Gascoyne, Cruise G 1/63. CSIRO Aust. Oceanogr. Cruise Rep. 21 (In press.)
CSIRO A U S T . (1965e).—Oceanographical observations in the Indian Ocean in 1963. H . M . A . S . Diamantina, Cruise D m 1/63. CSIRO Aust. Oceanogr. Cruise Rep. 23 (In press.)
CSIRO A U S T . (1965/).—Oceanographical observations in the Indian Ocean in 1963. H . M . A . S . Diamantina, Cruise D m 2/63. CSIRO Aust. Oceanogr. Cruise Rep. 24 (In press.)
CSIRO A U S T . (1965#).—Oceanographical observations in the Indian Ocean in 1963. H . M . A . S . Diamantina, Cruise D m 3/63. CSIRO Aust. Oceanogr. Cruise Rep. 25 (In press.)
K N A U S S , J. A . (1960).—Measurements of the Cromwell Current. Deep Sea Res. 6: 265-86. SOERIAATMADJA, R . E. (1957).—The coastal current south of Java. Mar. Res. Indonesia 3: 41-55. W Y R T K I , K . (1957).—Die Zirkulation an der Oberflâche der siidostasiatischen Gewàsser. Dt.
Hydrog. Z. 10: 1-13. W Y R T K I , K . (1962a).—Geopotential topographies and associated circulation in the south-eastern
Indian Ocean. Aust. J. Mar. Freshw. Res. 13: 1-17. W Y R T K I , K . (19626).—The upwelling in the region between Java and Australia during the south-east
monsoon. Aust. J. Mar. Freshw. Res. 13: 217-25.
607
Reprinted from Bull. Inst, océanogr. Monaco, vol. 65, no. 1,348, 1965.
Mesure de l'absorption de l'ultraviolet
dans les eaux côtières de Nossi-Bé
(Madagascar)
par
Alain S O U R N I A
Laboratoire des pêches outre-mer, Muséum national d'histoire naturelle, Paris
(Manuscrit reçu le 2 avril 1965)
Collected reprints of the International Indian Ocean Expedition, vol. IV, contribution no. 237 609
Le problème de la pénétration des rayons ultraviolets dans la mer peut être abordé de deux façons : tout d'abord, on peut étudier in situ les modalités de la propagation du rayonnement et rechercher les variations qualitatives et quantitatives de la composition du spectre en fonction de la profondeur et des conditions du milieu.
O n peut aussi mesurer l'absorption de l'ultraviolet par un échantillon d'eau de mer dans le but de caractériser la composition de celui-ci. L'absorption résulte en effet de la présence des différents constituants : eau pure, particules en suspension, sels minéraux et substances organiques. C'est ce second aspect que nous aborderons ici, en nous attachant particulièrement au rôle des matières organiques.
Les données que nous allons présenter concernent principalement la baie d ' A m b a n o r o , à Nossi-Bé, et s'inscrivent dans l'étude générale du phytoplancton et de la production primaire de cette région [ S O U R N I A ,
1965]*.
Historique
T S U K A M O T O [1927] a mesuré l'absorption de l'eau de mer à Roscoff, dans l'ultraviolet lointain; il remarque que l'extinction, croissant vers les courtes longueurs d'onde dans l'intervalle étudié (2 336 à 2 123 Á ) , est supérieure à celle de l'eau distillée, et attribue exclusivement cette différence aux sels dissous, à tort. H U L B U R T [1928] compare la pénétration de l'ultraviolet dans l'eau de mer, l'eau pure, et diverses solutions de sels dont il définit quantitativement le rôle. Les recherches de C L A R K E
et J A M E S [1939], bien que n'intéressant que le spectre visible et le proche ultraviolet, montrent le rôle des particules en suspension vers les courtes longueurs d'onde. J O S E P H [1949, 1950] dans la Baltique et pour le proche ultraviolet, J E R L O V [1950, 1951, 1953] dans les divers océans et jusqu'à 310 xa.li, ont mesuré la pénétration des radiations in situ : celle-ci croît vers les courtes longueurs d'onde; elle est notablement supérieure dans les eaux littorales et les eaux à forte productivité, et fournit une intéressante caractéristique des masses d'eaux. Elle traduit essentiellement la présence de la substance jaune de K A L L E [1937, 1949, 1961]. L E N O B L E
[1956, a, b, c," d] a mesuré l'absorption de l'ultraviolet en différents points des côtes françaises et recherché, à la suite de H U L B U R T , les coefficients d'absorption des divers sels. C H A N U [1959] voit lui aussi dans la substance jaune l'origine de la différence entre l'absorption de l'eau de mer naturelle et celle de l'eau de mer artificielle, et isole cette substance en utilisant la technique développée par S H A P I R O pour
* N o u s remercions vivement l'Office de la recherche scientifique et technique Outre-Mer de nous avoir accueilli au Centre d'océanographie et des pêches de Nossi-Bé pour y effectuer ces recherches.
610
— 3 —
les eaux lacustres. Enfin A R M S T R O N G et B O A L C H [1961 a, b], ont confirmé ces données, étudié dans la M a n c h e les variations locales et saisonnières et recherché la nature des substances en cause.
Méthodologie
Nous/avons suivi dans ses grandes lignes la méthode d ' A R M S T R O N G et B O A L C H [1961 a] et utilisé un spectrophotomètre B e c k m a n D U avec des cuves de quartz de 10 c m .
Les prélèvements à la mer se font au moyen de bouteilles non métalliques du type V a n D o r m . Dans le but d'éliminer les particules en suspension, on filtre les échantillons sur membrane Millipore H A (porosité : 0,45 [x). Les mesures spectrophotométriques se font le plus tôt possible après le prélèvement; cependant les échantillons une fois filtrés conservent une absorption constante pendant plusieurs heures.
Mesure de référence : A R M S T R O N G et B O A L C H mesurent l'absorption de l'échantillon d'eau de mer par rapport à l'air, considérant cette référence c o m m e plus sûre qu'une eau distillée dont on ignore exactement le degré de pureté. Les valeurs obtenues dans ces conditions représentent non seulement l'absorption des sels minéraux et des matières organiques, mais aussi celle de l'eau pure, ainsi que la réflexion sur,les parois de la cuve. Il est préférable d'éliminer ces deux derniers effets en utilisant c o m m e référence une eau déminéralisée et bidistillée préparée à l'abri des poussières de l'air. O n prend de plus la précaution d'étalonner les deux cuves en comparant leurs spectres d'absorption de l'eau distillée; le facteur de correction qu'on en déduit est généralement négligeable. Finalement, l'absorption mesurée ne dépend plus que des teneurs en sels minéraux et matières organiques et la précision de la méthode se trouve notablement accrue.
Il serait également intéressant d'utiliser c o m m e référence l'eau de mer artificielle; cependant, les impuretés des sels du commerce rendent ces mesures assez aléatoires.
Longueurs d'onde : Vers les plus courtes longueurs d'onde, à partir de 220 m\i, l'absorption devient très élevée et rend les mesures imprécises. Elle devient par ailleurs très faible dans le proche ultraviolet. Aussi limitera-t-on les mesures à l'intervalle 220-350 ou 220-400 m¡x.
Le problème du choix des longueurs d'onde caractéristiques, qui n'est pas sans rappeler celui des> pigments phytoplanctoniques, est à résoudre en trois étapes :
1. Réalisation du spectre complet de nombreux échantillons d'origines diverses, mesuré par intervalles de 5 ou 10 m\i, ou mieux, obtenu de façon continue au m o y e n d'un spectrophotomètre enregistreur.
2. Choix de quelques longueurs d'onde caractéristiques pour les mesures de routine.
3. Identification chimique des différentes substances en cause.
(1348)
611
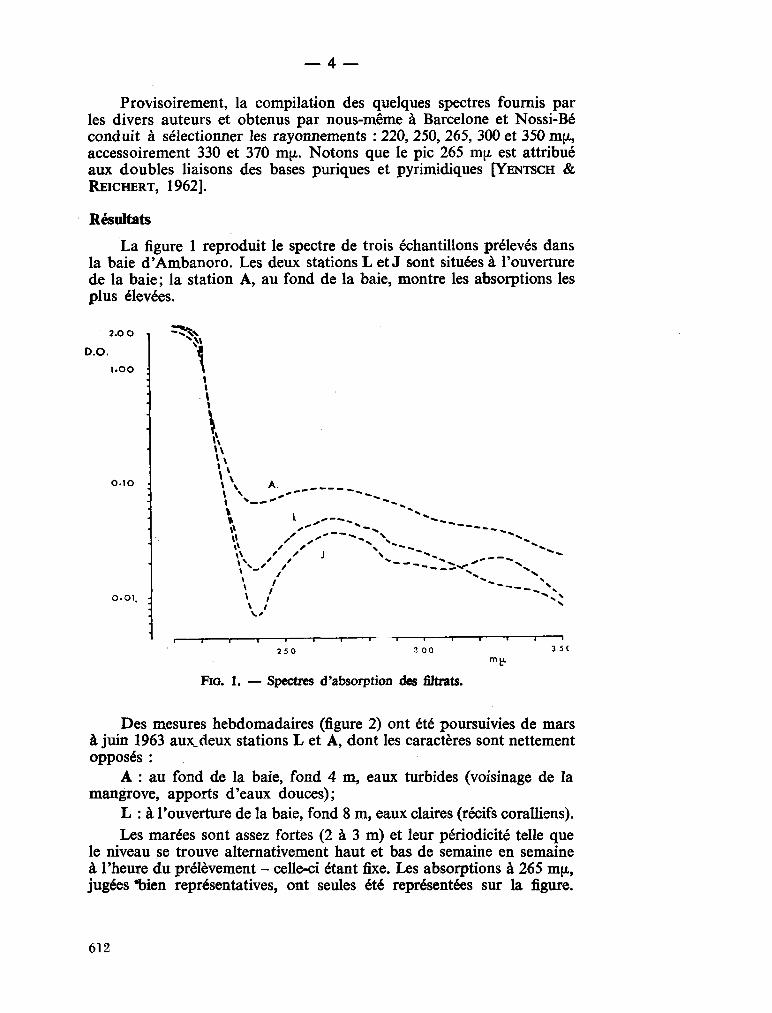
— 4 —
Provisoirement, la compilation des quelques spectres fournis par les divers auteurs et obtenus par nous-même à Barcelone et Nossi-Bé conduit à sélectionner les rayonnements : 220, 250, 265, 300 et 350 my., accessoirement 330 et 370 my.. Notons que le pic 265 my. est attribué aux doubles liaisons des bases puriques et pyrimidiques [ Y E N T S C H & R E I C H E R T , 1962].
Résultats
L a figure 1 reproduit le spectre de trois échantillons prélevés dans la baie d ' A m b a n o r o . Les deux stations L et J sont situées à l'ouverture de la baie; la station A , au fond de la baie, montre les absorptions les plus élevées.
( 1 1 1 1 T 1 1 1 1 ~1 1 I I I
250 3 00 35C
Fio. 1. — Spectres d'absorption des filtrats.
Des mesures hebdomadaires (figure 2) ont été poursuivies de mars à juin 1963 aux_deux stations L et A , dont les caractères sont nettement opposés :
A : au fond de la baie, fond 4 m , eaux turbides (voisinage de la mangrove, apports d'eaux douces);
L : à l'ouverture de la baie, fond 8 m , eaux claires (récifs coralliens).
Les marées sont assez fortes (2 à 3 m ) et leur périodicité telle que le niveau se trouve alternativement haut et bas de semaine en semaine à l'heure du prélèvement - celle-ci étant fixe. Les absorptions à 265 my., jugées *bien représentatives, ont seules été représentées sur la figure.
612
2.0 0
D.O.
l.OO 1
o.to
*
\ \\ ' ' J \ v.' /
L
o.oi. \ /
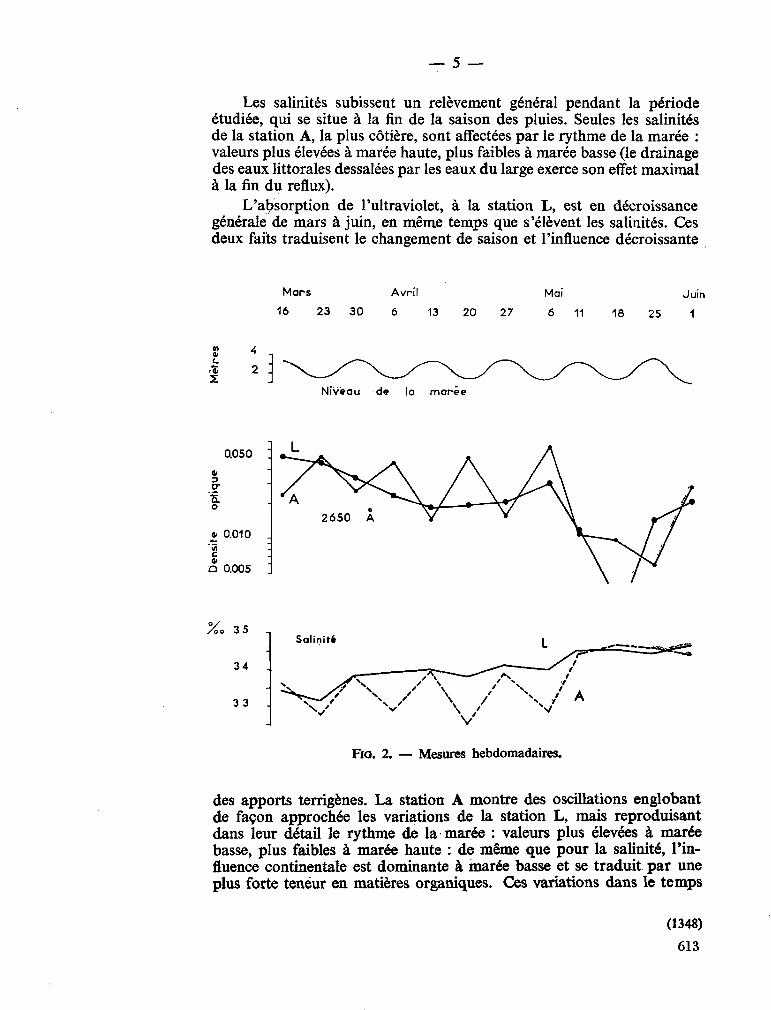
— 5 —
Les salinités subissent un relèvement général pendant la période étudiée, qui se situe à la fin de la saison des pluies. Seules les salinités de la station A , la plus côtière, sont affectées par le rythme de la marée : valeurs plus élevées à marée haute, plus faibles à marée basse (le drainage des eaux littorales dessalées par les eaux du large exerce son effet maximal à la fin du reflux).
L'absorption de l'ultraviolet, à la station L , est en décroissance générale de mars à juin, en m ê m e temps que s'élèvent les salinités. Ces deux faits traduisent le changement de saison et l'influence décroissante
Mars Avril Mai Juin
16 23 30 6 13 20 27 6 11 18 25 1
Niveau de la marée
Fio. 2. — Mesures hebdomadaires.
des apports terrigènes. L a station A montre des oscillations englobant de façon approchée les variations de la station L , mais reproduisant dans leur détail le rythme de la marée : valeurs plus élevées à marée basse, plus faibles à marée haute : de m ê m e que pour la salinité, l'influence continentale est dominante à marée basse et se traduit par une plus forte teneur en matières organiques. Ces variations dans le temps
m
2 2 .
(1348)
613
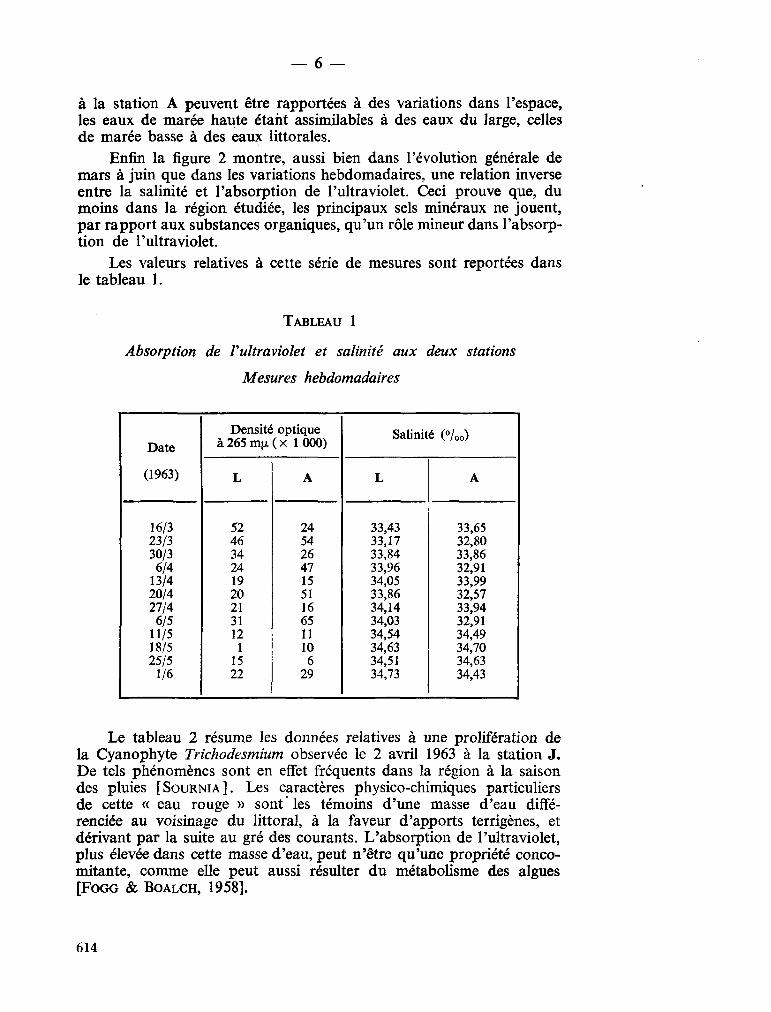
— 6 —
à la station A peuvent être rapportées à des variations dans l'espace, les eaux de marée haute étant assimilables à des eaux du large, celles de marée basse à des eaux littorales.
Enfin la figure 2 montre, aussi bien dans l'évolution générale de mars à juin que dans les variations hebdomadaires, une relation inverse entre la salinité et l'absorption de l'ultraviolet. Ceci prouve que, du moins dans la région étudiée, les principaux sels minéraux ne jouent, par rapport aux substances organiques, qu 'un rôle mineur dans l'absorption de l'ultraviolet.
Les valeurs relatives à cette série de mesures sont reportées dans le tableau 1.
TABLEAU 1
Absorption de l'ultraviolet et salinité aux deux stations
Mesures hebdomadaires
Date
(1963)
16/3 23/3 30/3
6/4 13/4 20/4 27/4 6/5
11/5 18/5 25/5
1/6
Densité optique a265m¡¿(x 1000)
L
52 46 34 24 19 20 21 31 12 1
15 22
A
24 54 26 47 15 51 16 65 11 10
6 29
Salinité (°/00)
L
33,43 33,17 33,84 33,96 34,05 33,86 34,14 34,03 34,54 34,63 34,51 34,73
A
33,65 32,80 33,86 32,91 33,99 32,57 33,94 32,91 34,49 34,70 34,63 34,43
Le tableau 2 résume les données relatives à une prolifération de la Cyanophyte Trichodesmium observée le 2 avril 1963 à la station J. D e tels phénomènes sont en effet fréquents dans la région à la saison des pluies [ S O U R N I A ] . Les caractères physico-chimiques particuliers de cette « eau rouge » sont' les témoins d'une masse d'eau différenciée au voisinage du littoral, à la faveur d'apports terrigènes, et dérivant par la suite au gré des courants. L'absorption de l'ultraviolet, plus élevée dans cette masse d'eau, peut n'être qu'une propriété concomitante, c o m m e elle peut aussi résulter d u métabolisme des algues [FOGG & BOALCH, 1958].
614
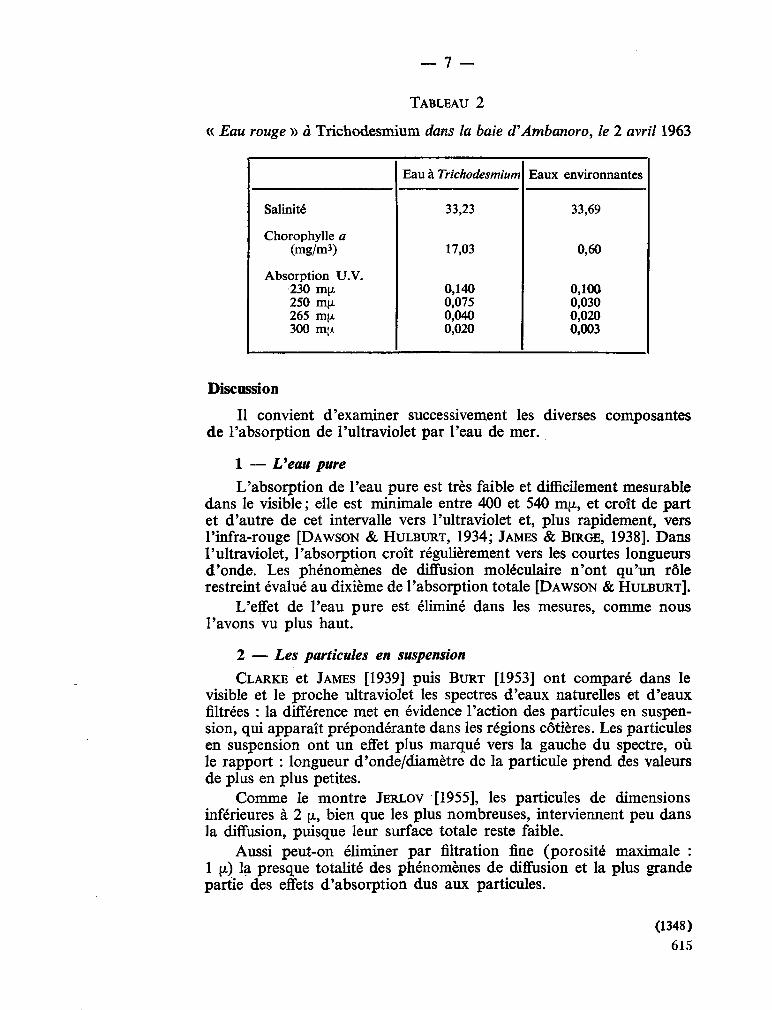
— 7 —
TABLEAU 2
« Eau rouge » à Trichodesmium dans la baie d'Ambanoro, le 2 avril 1963
Salinité
Chorophylle a (mg/m3)
Absorption U . V . 230 my. 250 m[z 265 my. 300 m¡x
Eau à Trichodesmium
33,23
17,03
0,140 0,075 0,040 0,020
Eaux environnantes
33,69
0,60
0,100 0,030 0,020 0,003
Discussion
Il convient d'examiner successivement les diverses composantes de l'absorption de l'ultraviolet par l'eau de mer.
1 — Veau pure
L'absorption de l'eau pure est très faible et difficilement mesurable dans le visible ; elle est minimale entre 400 et 540 VO.\L, et croît de part et d'autre de cet intervalle vers l'ultraviolet et, plus rapidement, vers l'infra-rouge [ D A W S O N & H U L B U R T , 1934; J A M E S & B I R G E , 1938]. Dans l'ultraviolet, l'absorption croît régulièrement vers les courtes longueurs d'onde. Les phénomènes de diffusion moléculaire n'ont qu'un rôle restreint évalué au dixième de l'absorption totale [ D A W S O N «fe H U L B U R T ] .
L'effet de l'eau pure est éliminé dans les mesures, c o m m e nous l'avons vu plus haut.
2 — Les particules en suspension
C L A R K E et J A M E S [1939] puis B U R T [1953] ont comparé dans le visible et le proche ultraviolet les spectres d'eaux naturelles et d'eaux filtrées : la différence met en évidence l'action des particules en suspension, qui apparaît prépondérante dans les régions côtières. Les particules en suspension ont un effet plus marqué vers la gauche du spectre, où le rapport : longueur d'onde/diamètre de la particule prend des valeurs de plus en plus petites.
C o m m e le montre J E R L O V [1955], les particules de dimensions inférieures à 2 \x, bien que les plus nombreuses, interviennent peu dans la diffusion, puisque leur surface totale reste faible.
Aussi peut-on éliminer par filtration fine (porosité maximale : 1 [A) la presque totalité des phénomènes de diffusion et la plus grande partie des effets d'absorption dus aux particules.
(1348) 615
— 8 —
3 — Les sels minéraux Certains auteurs, ont attribué aux sels minéraux l'exclusivité de
l'absorption de l'ultraviolet, d'autres les ont au contraire totalement négligés. Les résultats sont par ailleurs souvent contradictoires.
O n ne note pas de différence significative entre l'absorption de l'eau pure et celle de l'eau de mer artificielle dans le spectre visible [ C L A R K E & J A M E S , 1939]. L'absorption devient manifeste dans l'ultraviolet et croît vers les courtes longueurs d'onde. Elle se décompose, selon H U L B U R T [1928], de la façon suivante : de 340 à 300 m.[x, C a S 0 4 représente la moitié de l'absorption totale, H 2 O le quart, les divers sels l'autre quart. D e 300 à 250 m\i, M g CI2, C a S O 4 et H 2 O en représentent chacun le tiers, les autres sels n'ayant qu'une importance minime. Selon L E N O -B L E [1956 c, d] aucun sel n'a de bande spécifique dans l'ultraviolet (les mesures de cet auteur couvrent l'intervalle 250-400 m\î) : les coefficients d'absorption croissent vers la gauche du spectre, et l'importance de chaque sel est surtout fonction de sa concentration. L'ensemble des sels selon L E N O B L E ajoute une absorption équivalente à la moitié ou au quart de celle^de l'eau pure. Pour l'eau de la Manche , A R M S T R O N G et B O A L C H [1961 a] attribuent aux sels minéraux la moitié de l'absorption mesurée, pour les longueurs d'onde inférieures à 240 m¡x.
U n e mention particulière doit être faite concernant les nitrates, en raison de leur forte absorption aux environs de 200 m.[i, qui a donné heu à diverses techniques de dosage dont la plus récente est celle d ' A R M S T R O N G [1963].
4 — Les matières organiques L'absorption d'une eau de mer filtrée est notablement supérieure
à celle de l'eau de mer artificielle [ C H A N U , 1959; A R M S T R O N G & B O A L C H ,
1961 a]. L a différence est à attribuer à une substance ou un groupe de substances essentiellement organiques, dissoutes ou colloïdales, et dont la nature exacte est encore mal connue.
Distinction entre matières organiques et particules en suspension : Elle est loin d'être aisée. J A M E S et B I R G E [1938], C L A R K E et J A M E S
[1939] appelent « suspensoids » l'ensemble des particules retenues sur filtre Berkefeld V , et « colors » les substances du filtrat. Cependant ils admettent que, d'une part, les « suspensoids » les plus fins passent à travers le filtre, de l'autre, qu'une partie des « colors » est associée aux particules. L a distinction est donc dans ce cas tout à fait arbitraire. Y E N T S C H [1962] et divers auteurs admettent également qu'une fonction de la substance colorée se trouve sous forme figurée ou liée à des particules suspendues.
Il faut donc penser que la filtration, nécessaire pour éliminer les suspensions, retient une partie de la matière organique qui échappera ainsi aux mesures.
Essais d'identification U n certain nombre de substances organiques ont été mises en évi
dence sur les extraits et les filtrats d'eau de mer. Il convient peut-être
616
— 9 —
mieux de dire qu 'un certain nombre de propriétés ont été mises en évidence, car, dans leur ensemble, les données demeurent fragmentaires, et les analogies entre les divers composés décrits assez confuses.
N o u s avons personnellement testé la présence de matières organiques dans nos filtrats de la façon suivante : dans une série d'échantillons (diverses cultures et eaux naturelles), nous avons simultanément mesurp le taux d'oxydation (permanganate de potassium en milieu basique) et l'absorption de l'ultraviolet. Les densités optiques sont directement proportionnelles aux volumes de permanganate c o n s o m m é par l'oxydation.
L a substance colorée à laquelle il est le plus souvent fait allusion est la «substance jaune» ou Gelbstoff de K A L L E [1937, 1949, 1961], qui absorbe fortement les radiations violettes, mais n 'a pas été étudiée par cet auteur aux longueurs d'onde inférieures à 387 m{x. Il s'agit d 'un mélange de diverses matières organiques, colorées d u jaune clair au brun foncé, se trouvant à l'état dissous dans toutes les eaux naturelles, mais considérablement mieux représentées dans les régions côtières. L a substance jaune est souvent comparée, d u moins quant à sa fonction, aux acides humiques des sols.
Il faut en rapprocher les substances appelées « colors » par J A M E S et B I R G E [1938], définies c o m m e des produits de décomposition organique, dissous ou colloïdaux ; à la différence des « suspensoids », leur absorption est sélective dans le proche ultraviolet et leur présence caractéristique des eaux côtières.
S H A P I R O [1957] a donné pour l'eau des lacs une technique d'extraction de la matière jaune (evaporation sous vide et extraction par l'acétate d'éthyle), technique étendue par C H A N U à l'eau de mer : la « substance jaune » obtenue par C H A N U [1959] est reconnue de nature organique, non volatile, et présente un m a x i m u m d'absorption à 250 m(x.
D a n s des cultures d'Ectocarpus, F O G G et B O A L C H [1958] ont mis en évidence un produit extracellulaire azoté comportant un pic d'absorption à 260 m¡x, ainsi qu ' un autre composé, soluble dans l'éther et que son m a x i m u m d'absorption à 400 m¡x rapproche de la Gelbstoff.
Enfin une fraction volatile a été isolée par A R M S T R O N G et B O A L C H
[I960]; elle est en partie seulement organique et joue un rôle restreint (5 p . cent) dans l'absorption de l'ultraviolet.
Conclusions
1. L'absorption de l'ultraviolet par l'eau de mer , mesurée selon la technique décrite ci-dessus, est principalement due à la présence des matières organiques, et, pour une plus faible part, aux sels minéraux. L'effet des particules en suspension est en grande partie écarté.
2 . L a nature exacte des matières organiques en cause, et le rôle des « substances jaunes », restent à préciser, ainsi que la part de certains sels.
3. Cette méthode, simple et rapide, fournit en m ê m e temps une caractéristique des masses d'eau et une évaluation des matières orga-
(1348)
617
— 10 —
nisues qui demeurent, à l'heure actuelle, mal connues et difficilement dosables par voie chimique.
4 . L'étude d'une région côtière tropicale a, par ce moyen, mis en évidence les variations locales et saisonnières, l'abondance des matières organiques au voisinage de la mangrove et l'influence de la marée.
Résumé
L'absorption de l'ultraviolet par l'eau de mer est étudiée ici en tant que résultante des absorptions des divers constituants : eau pure, particules en suspension, sels minéraux et matières organiques dissoutes. La méthode. spectrophotométrique utilisée élimine les deux premiers effets et fournit une estimation des matières organiques. La nature exacte et le rôle de ces dernières substances restent à préciser. Les variations locales et saisonnières, ainsi que le rôle de la marée, sont étudiés dans une baie tropicale.
S u m m a r y
Ultra-violet absorption by coastal waters of Nossi-Bé (Madagascar)
The absorption of ultra-violet light by sea-water is discussed here as the result of the absorption of its four components : pure water, suspended matter, inorganic salts and dissolved organic matter. A spectrophotometric method is used, which eliminates the effects of both pure water and suspended matter, and provides an estimation of organic matter. The exact nature and effects of the latter remain to be determined. Local, seasonal and tidal changes in a tropical bay are studied.
Zusammenfassung
Die Messungen der ultravioletten Absorption in den Strandzonen-gewâssern von Nossi-Bé (Madagascar)
Die Absorption der ultravioletten Strahlen durch das Meerwasser wird hier ais Ergebnis der Absorption der verschiedenen Bestandteile studiert : reines Wasser, suspendierte Teilchen, Mineralsalzen und gelôste organische Stoffe. Die angewandte spektrophotometrische Méthode schaltet die beiden ersten Effekte aus, und liefert eine Abs -chátzüng der organische Stoffe. Die exakte Natur und die Rolle dieser beiden Substanzen bleiben zu erwàgen. Die lokalen und in die Jahreszeit passenden Variazionen sowie die Wirkung der Flut sind in einer tropis-chen Bucht studiert.
618
— 11 —
H3MepeHHe aôcopôuim yjibTpa-ibnojieTOBbix jryqeii B npnôpeacHbix
Boaax HoccH-B3/Ma«aracKap/
AJI3H C y P H M A
KpaTKoe co«ep»caHHe
A6cop6iiHH MopcKoii BOfloîi yjii>Tpa-4)HOJieTOBbix Jiynen H3yieHa 3^ecb, KaK npoH3BOflHaa aôcopôuim pasjiHHHbix cocTaBHbix nacreñ: HHCTOÎÎ BOflbl, IUiaBaiOfflHX HaCTHIi, MHHepajIbHblX COJieH H paCTBO-
peHHbix opraHHnecKHX BemecTB. npHMeHeHHbiii cneKTpo<boTOMe-TpHiecKHH cnoco6 yaajiaeT ppa nepBbix BJ IHHHHH H flaeT B03MoacHOCTb on;eHHTb opraHHHecKHe BemecTBa. OcraeTca yTOHHHTb HCTHHHyio npnpo^y H pojib S T H X noaneflirax BemecTB. MecTHbie H ce30HHbie H3-MeHeHHa, KaK H pojib MopcKoro npnjiHBa H OTJiHBa, H3yneHbi B Tpo-nHHecKoii 6yxTe.
Bibliographie
A R M S T R O N G (F.A.J.), 1963. — Determination of nitrate in water by ultraviolet spectrophotometry. Analyt. Chem., 35, 9, pp. 1292-1294.
A R M S T R O N G (F.A.J.) & B O A L C H (G.T.) , 1960. — Volatile organic matter in algal culture media and sea water. Nature, Lond., 185, n° 4715, pp. 761-762.
A R M S T R O N G (F.A.J.) & B O A L C H (G.T.) , 1961 a. — The ultra-violet absorption of sea water. / . mar. biol. Ass. U.K., 41, 3, pp. 591-597.
A R M S T R O N G (F.A.J.) & B O A L C H (G.T.) , 19616. — Ultra-violet absorption of sea water. Nature, Lond., 192, n° 4805, pp. 858-859.
B U R T ( W . V . ) , 1953. — Extinction of light by filter passing matter in Chesapeake Bay waters. Science, 118, pp. 386-387.
B U R T ( W . V . ) , 1955. — Interpretation of spectrophotometer readings on Chesapeake Bay waters. / . Mar. Res., 14, 1, pp. 33-46.
C H A N U (J.), 1959. — Extraction de la substance jaune dans les eaux côtières. Rev. Opt. (théor. instrum.), 38, 12, pp. 569-572.
C L A R K E (G.L.) & J A M E S (H .R . ) , 1939. — Laboratory analysis of the selective absorption of light by sea water. / . opt. Soc. Amer., 29, pp. 43-55.
D A W S O N (L.H.) & H U L B U R T (E.O.), 1934. — The absorption of ultraviolet light by water. J. opt. Soc. Amer., 24, pp. 175-177.
T ^ O G G ^ ( G . E , ) & B O A L C H (G.T.) , 1958. — Extracellular products in pure cultures of a brown alga. Nature, Lond., 181, n° 4611, pp. 789-790.
H U L B U R T (E.O.), 1928. — The penetration ol ultraviolet light into pure water and sea water. J. opt. Soc. Amer., 17, 1, pp. 15-22.
J A M E S ( H . R . ) & B I R G E (E.A.), 1938. — A laboratory study of the absorption of light by lake waters. Trans. Wis. Acad. Sci. Arts Lett., 31, pp. 1-154.
(1348) 619
- 12 —
J E R L O V (N .G . ) , 1950. — Ultra-violet radiation in the sea. Nature, Lond., 166, n« 4211, pp. 111-112.
J E R L O V (N .G . ) , 1951. — Optical studies of ocean waters. Rep. Swed. Deep-Sea Exped., 3, 1, pp. 1-59.
J E R L O V (N .G. ) , 1953. — Influence of suspended and dissolved matter in the transparency of sea water. Tellus, 5, 1, pp. 59-65.
J E R L O V (N .G . ) , 1955. — The particulate matter in the sea as determined by means of the Tyndall meter. Tellus, 7, 2, pp. 218-225.
J O S E P H (J.), 1949. — Durchsichtigkeitsmessungen im Meere im ultra-violetten Spektralbereich. Dtsch. hydrogr. Z . , 2, 5, pp. 212-218.
J O S E P H (J.), 1950. — Durchsichtigkeitsregistrierungen als ozeanogra-phische Untersuchungsmethode. Dtsch. hydrogr. Z . , 3, 1/2, pp. 69-77.
K A L L E (K.), 1937. — Meereskundliche chemische Untersuchungen mit Hilfe des ZeiBschen Pulfrich-Photometers. VI. Mitteilung. Die Bestimmung des Nitrits und des « Gelbstoífs ». Ann. Hydrogr. Berl, 65, 6, pp. 276-282.
K A L L E (K.), 1949. — Fluoreszenz und Gelbstoff im Bottnischen und Finnischen Meerbusen. Dtsch. hydrogr. Z . , 2, 4, pp. 117-124.
K A L L E (K.), 1961. — What do we know about the « Gelbstoff»? Monogr. Un. géod. int, 10 [Symposium on radiant energy in the sea, ed. by N . G . J E R L O V ] , pp. 59-62.
L E N O B L E (J.), 1956 a. — Sur la pénétration du rayonnement ultraviolet dans les eaux méditerranéennes. C. R. Acad. Sci., Paris, 243, 22, pp. 1781-1783.
L E N O B L E (J.), 1956 b. — Étude de la pénétration du rayonnement ultraviolet dans les eaux côtières de Bretagne. Ann. Géophys., 12, 3, pp. 225-227.
L E N O B L E (J.), 1956 c. — Absorption du rayonnement ultraviolet par les ions présents dans la mer. Rev. Opt. (théor. instrum.), 35, 10, pp. 526-531.
L E N O B L E (J.), 1956 d. — Sur le rôle des principaux sels dans l'absorption ultraviolette de l'eau de mer. C. R. Acad. Sci., Paris, 242, 6, pp. 806-808.
S H A P I R O (J.), 1957. — Chemical and biological studies on the yellow organic acids of lake water. Limnol. & Oceanogr., 2, 3, pp. 161-179.
S O U R N I A (A.), 1965. — Phytoplancton et production primaire dans une baie de Nossi-Bé (Madagascar). C. R. Acad. Sci., Paris, 261, 11, pp, 2245-2248.
T S U K A M O T O (K.), 1927. — Transparence de l'eau de mer pour l'ultraviolet lointain. C. R. Acad. Sci., Paris, 184, 4, pp. 221-223.
Y E N T S C H (C.S.), 1962. — Measurement of visible light absorption by particulate matter in the Ocean. Limnol. & Oceanogr., 7, 2, pp. 207-217.
Y E N T S C H (C!"S.) & R E I C H E R T (C.A.), 1962. — The interrelationship between water-soluble yellow substance and chloroplastic pigments in marine algae. Bot. mar., 3, 3/4, pp. 65-74.
620
Reprinted from Mar. Obs . , London, July 1965, p. 125-130.
The Somali Current S O M E OBSERVATIONS M A D E A B O A R D R.R.S. "DISCOVERY"
DURING AUGUST 1964 By J. C. S W A L L O W , P H . D .
(National Institute of Oceanography)
Although well known as one of the fastest currents to be found in the open sea, the Somali* current has until recently received relatively little attention from oceanographers.
Like the Gulf Stream and the Kuro Shio, it is a 'western-boundary current', a consequence mainly of the distribution of wind stress over the whole of the Indian Ocean, and not just driven by the local winds in its o w n area. Unlike the other western-boundary currents though, this one runs right across the equator (if the East African coast current is included as well), and it undergoes a seasonal reversal of direction.
Because of these unique features, one might hope that a study of the Somali current would lead to a better understanding of the mechanism of ocean currents in general, and h o w they respond to changes in wind stress, as well as being a necessary part of the exploration of the Indian Ocean.
Besides its significance for dynamical oceanography, the Somali current is important in relation to the biology of the Indian Ocean and, perhaps, its fisheries, since it appears to be connected with the upwelling of cold waier off the northern part of the east coast of Somalia, near Ras Hafun. This upwelling water is rich in the chemical nutrients needed for the growth of plankton, and can have a great effect on the biological productivity of the sea.
In the course of the International Indian Ocean Expedition there have been opportunities for research ships to make observations on this neglected current. T h e work described here was done during August 1964—a month when under the influence of the south-west Monsoon, the Somali current is setting strongly to the northward—in co-operation with the U . S . research vessel Argo, operated by the University of California. Compared to the intensive surveys carried out in the Gulf Stream and other more accessible currents, this two-ship survey lasting little more than a month can only be regarded as a reconnaissance, and as yet only part of the results collected by the two ships have been worked up and compiled together. Nevertheless, they represent the most detailed survey yet made of the Somali current, and some features of interest in the results can already be pointed out.
T h e observations made by the two ships comprised mainly water-sampling, current-measuring by various different means, and plankton-sampling with vertical nets. Tracks were chosen to cross the current working from south to north in irregular zig-zags, interlaced to give the best coverage of the area in the available time. After meeting in M o m b a s a to discuss final details of the programme, the two ships worked independently, though in daily radio contact, coming within sight of each other only once during the cruise when they met off Ras Mabber to transfer equipment and data. This account will be confined to Discovery's share of the work, but first some explanation of the kind of observations made would perhaps be appropriate.
Water-sampling provides the basic means of identifying the water masses being transported by the current. It also makes possible the calculation of relative
* T h e Somali current is the n a m e given nowadays by oceanographers to that portion of the East African coast current which is north of the equator, alongside the east coast of Somalia, and which reverses its direction during the north-east monsoon. In the Indian Ocean Current Atlas1 and in Hydrographie Office publications (e.g., the Africa Pilot, Vol. 3) the whole of this current is termed the East African coast current.
+ 125
Collected reprints of the International Indian Ocean Expedition, vol. IV, contribution no. 238 621
geostrophic currents, since the distribution of density in the water, and hence pressure, can be calculated from measurements of temperature and salinity of the water at different depths.
These indirect calculations of currents are similar to the m u c h more familiar process of estimating winds from the spacing of the isobars on a weather m a p , but they suffer from the disadvantage that only differences of current, from one level to another, can be calculated. O n these sections across the Somali current, Discovery occupied water-sampling stations at io-mile intervals close to the coast, opening out the spacing gradually to about 50 miles at the offshore ends of the longer sections. Samples were collected from about 30 depths between surface and bottom at typical deep stations, though at some stations sampling was limited to the upper 1,200 metres, with 22 sampling depths. Temperature and salinity were measured at all sampling depths, dissolved oxygen, phosphate, nitrate and silicate were measured in the upper layers and at selected depths in the deep water.
Current measurements were m a d e by various means. At each water-sampling station, current shear was measured in the near-surface layers, using a pair of direct-reading current meters. O n e meter was streamed at a constant depth of 10 metres while the other was lowered and read at 10-metre intervals down to 200-metres depth. At stations where radar fixing was possible, whether on the coast or on an anchored buoy, the ship's movement over the ground could be determined and combined with the current-meter readings to give true currents. At other stations, the current-shear profiles were fitted to surface currents deduced in the usual way from dead-reckoning and celestial navigation. Fortunately the weather was reasonably clear.
Surface currents were also measured by the electromagnetic method, in which a cable carrying a pair of electrodes is towed astern of the ship. T h e voltage between the electrodes depends on the rate at which the cable is cutting the vertical c o m ponent of the earth's magnetic field, and is a measure of the component of surface current across the ship's track. T h e component along the track is obtained by altering course at right angles for a few minutes, then returning to the original line. Unfortunately, the magnetic equator passes through the region where the Somali current becomes strongest, and the vertical component of the earth's magnetic field was too small for satisfactory working of the method north of 4°N.
For measuring deep water-movements, at depths of 1,000 metres and below, neutrally-buoyant floats were used. These consist of sealed aluminium tubes, loaded so as to sink to a pre-determined depth, where they have the same density as the surrounding water, but a lower compressibility so that they do not sink deeper. They carry small sound transmitters by means of which they can be located, as they drift freely with the deep current. Such deep-current measurements are slow and laborious to make, they need to extend over at least half a day, preferably more, and call for continuous accurate knowledge of the ship's position which, in that area, could only be obtained by radar fixing on the coast or on an anchored buoy. Consequently, only a few such measurements were made, but they are very useful as an indication of the speed and variability of deep-water movements, and as a guide in choosing a reference level for geostrophic calculations of currents.
Biological sampling consisted of vertical hauls with a closing net for zooplankton, through standard depth-intervals between 1,000 metres and the surface, measurements of chlorophyll and fine-mesh net hauls in the upper 100 metres of water, and surface tows with a net designed to sample only the top few centimetres of water.
Bathythermograph observations were m a d e every half-hour on passage between stations, and sea surface temperature was recorded continuously. A n account of the meteorological equipment and observations has already been published.2
Discovery's observations of the East African coast current began in late July, with a section of 9 stations extending from 300 miles offshore in towards the coast, on the way from Cape A m b e r towards M o m b a s a . At the offshore stations, surface currents were weak (less than J kt) and directed mainly in towards the coast.
126
622
Within 120 miles of the coast, the northward component of current increased, reaching i kt at 60 miles offshore, the m a x i m u m current observed being 2-7 kt only 20 miles from the coast. Closer in, there was a slight decrease. T h e current-shear measurements showed generally weak flow at 200 metres depth, most of the shear being within the thermocline below the w a r m surface-water. A buoy was anchored at the station 60 miles offshore, and a neutrally-buoyant float at 1,200 metres depth (only 200 metres off the bottom) moved north-east at nearly 0-4 kt. Although that m a y seem a weak current compared to those found at the surface, it is more than twice the average speed found at similar depths earlier in the cruise, and m a y imply substantial transport of deep water, below the main surface current. Unfortunately time did not permit any more deep-current measurements on that section. Approaching the coast, biological sampling with vertical nets was intensified, as plankton volumes increased from the usual low oceanic values.
Leaving M o m b a s a on 2nd August, the Discovery made a quick passage along the coast as far as I°N, with a favourable wind and increasing surface current. At the first station, within 10 miles of the coast, combined current-meter observations and radar fixes indicated a surface current of 4-2 kt, decreasing with depth to about half-value at 100 metres. Working south-eastwards across the current, four more stations were occupied in a short section out to 60 miles from the coast. T h e current was narrow, decreasing to 2 kt at the surface at 23 miles offshore, though still running north-eastwards, parallel to the coast. Farther out along the section it decreased to about 1 kt and turned more northward. T h e current-shear at the two inshore stations was too strong for more than one wire to be used over the side at a time. Usually in the Discovery it had been possible to do water-sampling, current-meter observations, and vertical net hauls simultaneously but with each wire straying differently in the strong current, according to the depth and drag of the gear being used, each kind of observation had to be made separately, and the vessel manoeuvred to keep the single wire as near vertical as possible.
A second short section was then worked at 3 ° N , where a 2-2-kt current was found in shallow water 8 miles offshore, but at 15 miles off, in deep water, the current was 4-7 kt, decreasing with depth to less than a knot at 200 metres. Farther out the current decreased, but not so sharply as in the first section; it was still 3 kt at 50 miles off. There were no signs of upwelling of cold water near the coast, on these short sections near the equator.
Next, a longer line of 10 stations, eastwards from the coast at 4 | °N, was begun. T w o sections made by the U . S . research vessel Atlantis II in 1963 had indicated a weak, broad countercurrent outside the main Somali current, and this was again observed by the Discovery. At the first station of this longer section, 5 miles from the coast, there was again a relatively weak current, but 10 miles farther out the current was running at 6 kt, to the northward with 4 kt of shear between surface and 100 metres depth. It was difficult working with even one wire over the side in the strong current, and only by rapid manoeuvring could anything like a vertical net haul be achieved. T h e water bottles sometimes failed to close properly, due to the drag of the current, and some casts had to be repeated several times. Despite the slow progress along the section, a full series of observations were made, with water sampling to the bottom and to 1,200 metres depth at alternate stations. T h e surface current decreased to 3 kt at 60 miles offshore, and was below 1 kt at 140 miles off. A buoy was anchored at that station, and a deep current of 0-4 kt towards the southeast, at 1,000 metres depth, was observed. Beyond 200 miles from the coast, a weak surface countercurrent, towards the south, was found.
Returning on a north-westward course, the Discovery soon came back into the main current, which exceeded 1 kt at 160 miles from the coast, and 2 kt at 100 miles. Further increase in current made it uneconomic to maintain the northwestward course of the section, and the later stations fall on a line running almost due north. T h e strongest surface current encountered was 6-9 kt, 22 miles offshore near 8°N, where the current was already beginning to turn away from the coast.
127
623
A s would be expected in crossing a current from right to left, north of the equator, the depth of the near-surface isotherms had decreased steadily along the section, and within 20 miles of the coast the thermocline came to the surface, with a rapid decrease in surface temperature and current. Temperatures as low as i3-2°c (55'8°F) were found close inshore a little farther north, and as expected the cold water was relatively rich in nutrients. There was little evidence of plankton growth, however, in the coldest water, in fact the most obvious biological feature of that area was the number of dead fish seen on the surface, most probably killed by a sudden invasion of cold water. Discovery then worked north along the coast to Ras Hafun, and m a d e another section north-eastwards towards Socotra. Surface temperatures remained below 20°c (68CF) out to 100 miles offshore, and currents in the cold water were relatively weak and variable, but predominantly northward. Returning from south of Socotra towards Cape Guardafui, w a r m water spreading from the Gulf of Aden was found on the surface, with the cold water moving northward below it. Only at these stations in the northern part of the cold-water area were abundant quantities of plankton found, with large numbers of larval fish. Remarkably few birds were seen, though they are usually abundant in upwelling areas.
After a brief visit to Aden , Discovery returned to the cold-water area to make further chemical and biological studies in the upwelling water. Seven station positions were chosen where it was hoped to find successive stages in the growth of plankton, and some further deep current measurements were made .
So far, there had been no measurements of deep currents under the strongest part of the surface current, although two observations, both showing only weak motion at 1,000 metres, had been m a d e farther offshore during the last long section. Since the strongest current observed had been just within radar range of the coast, it was possible to keep track of neutrally-buoyant floats there without .attempting to anchor a reference buoy (the buoys and moorings available were unsuitable for more than a 3-kt current, 100 metres thick). T h e surface current was found to be 6 kt on this second visit, and a weak southward movement was observed at 1,000 metres depth.
T h e ship then headed northward in a series of zig-zags, making half-hourly bathythermograph observations to delineate the boundary of the cold-water area, and the edge .of the current, which turned more markedly eastward before reaching I O ° N . A surface current measurement was m a d e near 53°E, well out of radar range of the coast, by putting out a drogue attached to a buoy and tracking it relative to an acoustic marker laid on the sea floor. T h e surface current was 4-7 kt, slightly south of east. Soon after recovering the drogue and setting course northwards, the thermograph showed the expected drop in temperature on leaving the current, but this was followed quickly by a sharp rise, of 7°c (I3°F), and next morning's stars indicated a north-westward set.
T h e cold water seemed to be drawn out into a narrow filament near 9 |°N 54°E, with opposing currents in the w a r m water on either side. T h e Argo noticed what was probably an extension of this feature, in the form of a less marked brief temperature drop in a. north-south section on 55°E. Discovery's observation was m a d e on 3rd September, in the dark, and shortage of time prevented further investigation of this strange situation. T w o days later, however, the m . v . Border Pele passed through the same area, fortunately in daylight. T h e Master, Captain E . L . Lloyd, reported sighting a continuous line of breakers running N W - S E . Passing through the disturbance, the ship's head was deflected in a manner consistent with the suspected strong current-shear, and a drop in sea surface temperature was observed.*
T w o more stations in the northern part of the cold-water area completed Discovery's work on the Somali current. In all, 61 stations had been occupied, and nearly 1,000 bathythermograph observations m a d e . T h e work of checking thermo-
* I a m indebted to Lieut.-Cdr. L . B . Philpott for passing on this report from the Border Pele.3
128
624
meter corrections, sorting plankton samplesandidentifyingthem,correctingcurrent-meter readings and compiling the data into a usable form, is continuing, and the results will be published elsewhere as they become available. F r o m the current measurements, it seems clear that there is a great increase in volume transport of the current, above the 200-metre level, once it has crossed the equator, and the extra water comes partly from below 200 metres and is partly drawn in from the eastern side of the current. T h e inflow from the side is most marked at a depth of about 150 metres, near the bottom of the w a r m surface layer and the top of the thermocline on'the oceanic side of the current. T h e surface water, which by geostrophic calculation should follow the same course, seems to be held off by the factional effect of the local wind. O n e is tempted to speculate whether this m a y stabilize the transport against variations in local winds, or whether perhaps the transport of the current m a y even be greater when the local wind is weaker.
A s an aid in planning the Somali current work, charts of the winds and sea surface temperatures in the area were prepared on a larger scale than is used in M . O . 519,4
from information kindly m a d e available by the Meteorological Office. All the accumulated ship's reports from that area, for the months of July and- August, were plotted, and the logs of ships reporting abnormally low temperatures were consulted. This information is essential in estimating to what extent the océanographie observations, limited to very few years, m a y be representative of average conditions. T h e winds in August 1964, although strong enough, were somewhat weaker than had been expected. Abnormally low temperatures were found by the Discovery in the cold-water area, though these were generally close inshore and might not have been observed by ships on passage. T h e Naval Weather Service is cooperating in further study of surface temperatures in this area.
T h e upwelling of cold water near 8 C N seems clearly to be related to the speed of the current and the increasing slope of the isotherms as the water moves northward from the equator. If the current had been weaker, it could have travelled farther north before the thermocline came to the surface, but when that has happened the current cannot continue north at the same speed and its only course is to turn east. T h e filament of cold water going south-eastwards, with opposing currents on either side, is a more puzzling feature, with some resemblance to an almost closed-off meander.
A n y further reports of its occurrence, in 1964 or in other years, would be most welcome.
There are two practical points concerning the Discovery's observations which it m a y be appropriate to mention here. First, in cases where radar fixing was not available, and surface currents were calculated from dead reckoning and celestial fixes, the biggest uncertainty was in estimating leeway on passage, and its variation with the relative bearing of the wind. (Movement through the water on station was measured by the shallow current-meter, which was read at 5-minute intervals throughout each station.)
T h e second point concerns surface temperatures in the cold-water area. Temperatures observed with the bucket thermometer were systematically higher than those recorded on the thermograph, the discrepancy being greater at lower surface temperatures (or at larger air-sea temperature differences), and reaching o-6°c (i'i°F) in extreme cases. Evidently the heat-exchange between w a r m air and cold sea was affecting only a thin layer of surface water and not reaching the thermograph sensor, which is sited well forward (not in the engine-room intake) at a depth of approximately 4 metres. At water-sampling stations in that area, it was noted that the thermometers on the shallowest bottle, at a nominal depth of 1 metre, showed temperatures intermediate between the bucket and the- thermograph. This is mentioned here as an example of one way in which apparently genuine differences between bucket and intake temperatures could occur.
In conclusion, m a y I take this opportunity of expressing m y thanks to all those concerned with collecting and processing the ships' observations that w e have used,
129
and are using, in studying this area. M a y I also thank all those involved in the work, "of the R . R . S . Discovery, in particular Captain R . H . A . Davies, for his consistently helpful understanding in difficult conditions, and M r . G . L . Swanson, Chief Officer, for his care in taking star sights.
REFERENCES
i. London, Meteorological Office. Indian Ocean Currents, (M.O.392), 2nd edn. London, 1939 (reprinted 1963).
2. Cox, W . J. Meteorological Observations aboard R . R . S . "Discovery". Mar. Obs., London, 35» !965, p. 21.
3 .m.v . Border Pele. Marine Observers' Log, disturbed water. Mar. Obs., London, 35, 1965, p. 113.
4. London, Meteorological Office. Monthly Meteorological Charts of the Indian Ocean, (M.O.519). London, 1949 (reprinted 1959).
Printed in England for Her Majesty's Stationery Office by William Clowes and Sons, Ltd., London and Beccles
626
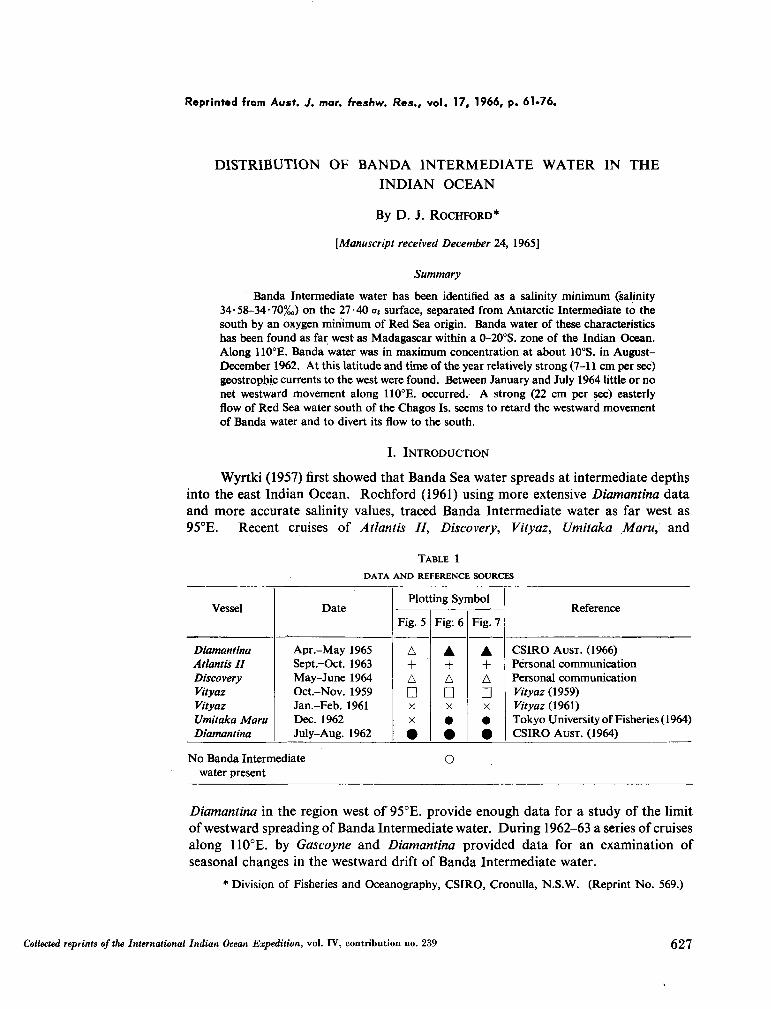
Reprinted from Aust. J. mar. freshw. Res., vol. 17, 1966, p. 61-76.
DISTRIBUTION OF BANDA INTERMEDIATE WATER IN THE INDIAN OCEAN
By D. J. ROCHFORD*
[Manuscript received December 24, 1965]
Summary
Banda Intermediate water has been identified as a salinity minimum (salinity 34-58-34-70%,,) on the 27-40 ot surface, separated from Antarctic Intermediate to the south by an oxygen min imum of Red Sea origin. Banda water of these characteristics has been found as far west as Madagascar within a 0-20°$. zone of the Indian Ocean. Along 110°E. Banda water was in m a x i m u m concentration at about 10°S. in August-December 1962. At this latitude and time of the year relatively strong (7-11 c m per sec) geostrophic currents to the west were found. Between January and July 1964 little or no net westward movement along 110°E. occurred. A strong (22 c m per sec) easterly flow of Red Sea water south of the Chagos Is. seems to retard the westward movement of Banda water and to divert its flow to the south.
I. I N T R O D U C T I O N
Wyrtki (1957) first showed that Banda Sea water spreads at intermediate depths into the east Indian Ocean. Rochford (1961) using more extensive Diamantina data and more accurate salinity values, traced Banda Intermediate water as far west as 95°E. Recent cruises of Atlantis II, Discovery, Vityaz, Umitaka Maru, and
T A B L E 1
D A T A A N D R E F E R E N C E S O U R C E S
Vessel
Diamantina Atlantis II Discovery Vityaz Vityaz Umitaka Maru Diamantina
Date
A p r . - M a y 1965 Sept.-Oct. 1963 May-June 1964 Oct.-Nov. 1959 Jan.-Feb. 1961 Dec. 1962 July-Aug. 1962
Plotting Symbol
Fig. 5
A + A D X X
•
Fig: 6
A + A
D X
• •
Fig. 7
A + A D X
• •
Reference
C S I R O A U S T . (1966) Personal communication Personal communication Vityaz (1959) Vityaz (1961) Tokyo University of Fisheries (1964) C S I R O A U S T . (1964)
N o Banda Intermediate O water present
Diamantina in the region west of 95°E. provide enough data for a study of the limit of westward spreading of Banda Intermediate water. During 1962-63 a series of cruises along 110°E. by Gascoyne and Diamantina provided data for an examination of seasonal changes in the westward drift of Banda Intermediate water.
* Division of Fisheries and Oceanography, C S I R O , Cronulla, N . S . W . (Reprint N o . 569.)
Collected reprints of the International Indian Ocean Expedition, vol. IV, contribution no. 239 627
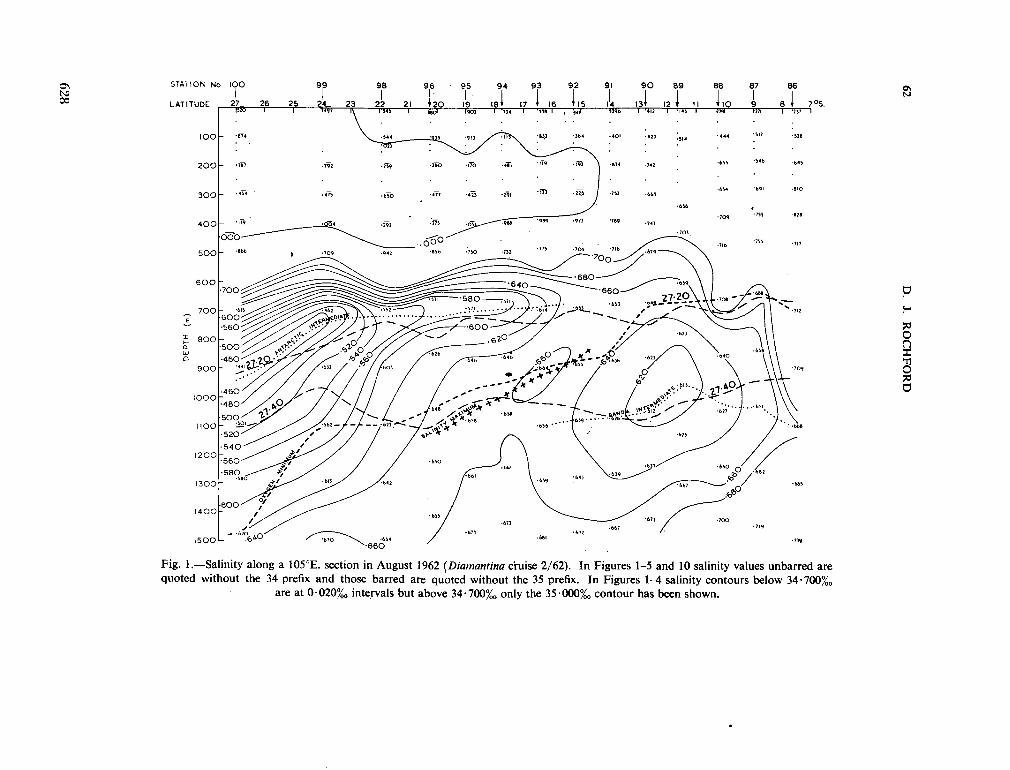
62
D. J. R
OC
HFO
RD
z o
rf
LJ
O
t-
O
q
0 o
CM
O
O
ro
o
o
*•
o
o
ul
0 o
(D
o
o
r
( «0
0 o
00
Hld
3Q
0 0 en
O
0 O
0 o
-o
o
c\j
O
o
tn
0 O
^
0 o
m
7Î
•SP § UH
O"
628
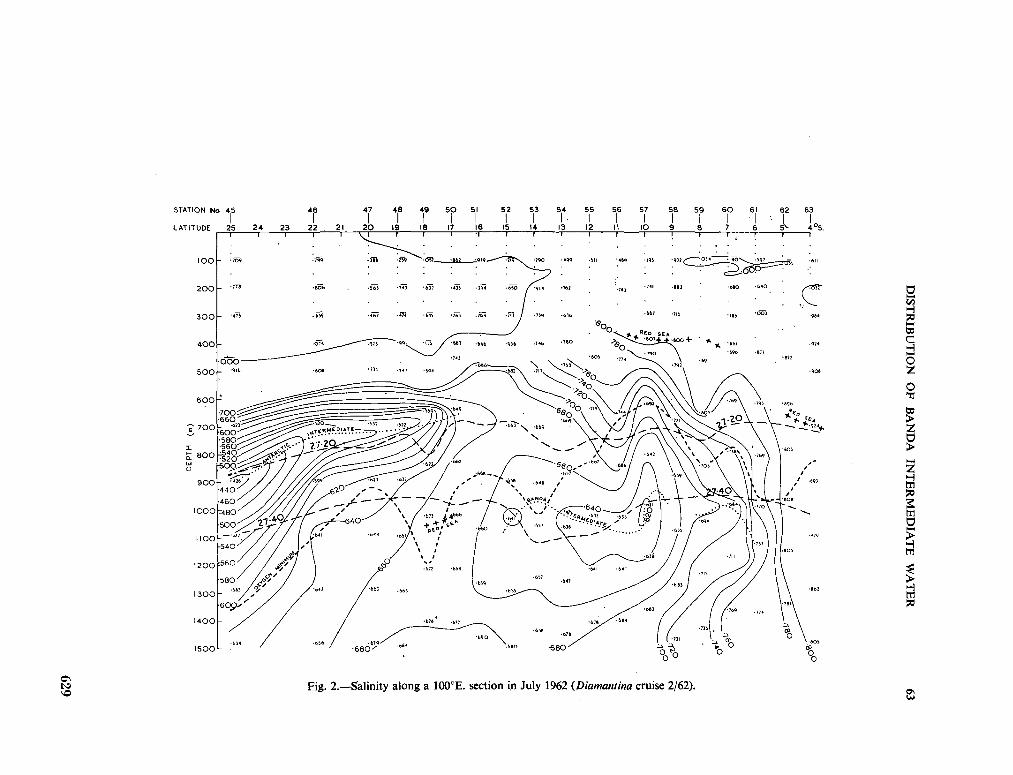
DIST
RIB
UT
ION
OF
BA
ND
A
INT
ER
ME
DIA
TE
W
ATER
63
r) 8 C
O
u
ni CS
60
n
o 00
O
n
o
0 OJ
O
O
en
O
o
o
0 lí)
o
o-
<0
.
o
o
("0
O
0 oo
Hld
SQ
o
o
<T
t
o
O
O
0 O
~
O
o
rsj
O
O
(0
O
O
n
O
o
m
629
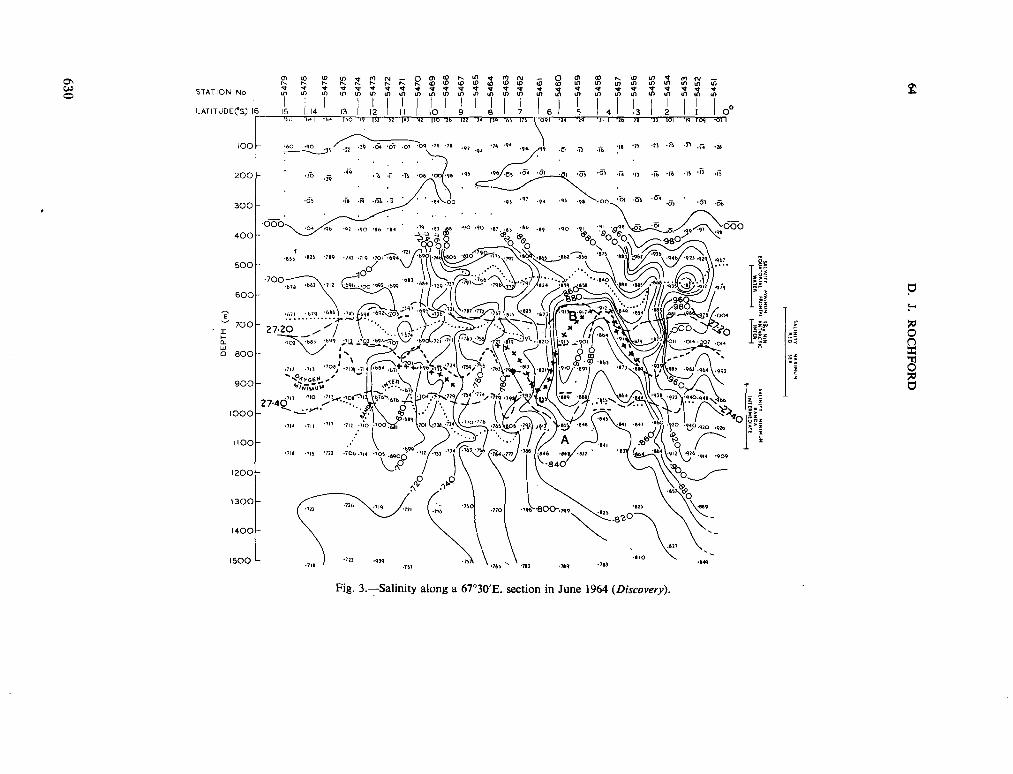
64 D
. J. R
OC
HFO
RD
SA
LIN
ITT
M
INIM
UM
i%
0 M
IN
EQ
UA
TO
RIA
L
FRO
NTA
L
AN
TA
RC
TIC
W
AT
ER
, ,
INTtR
.
SA
LIN
ITY
M
INIM
UM
B
AN
DA
.
INT
ER
ME
DIA
TE
&
CT
N
8 3
©
1
(4 t/5
£
C"0
H
ld3
Q
630
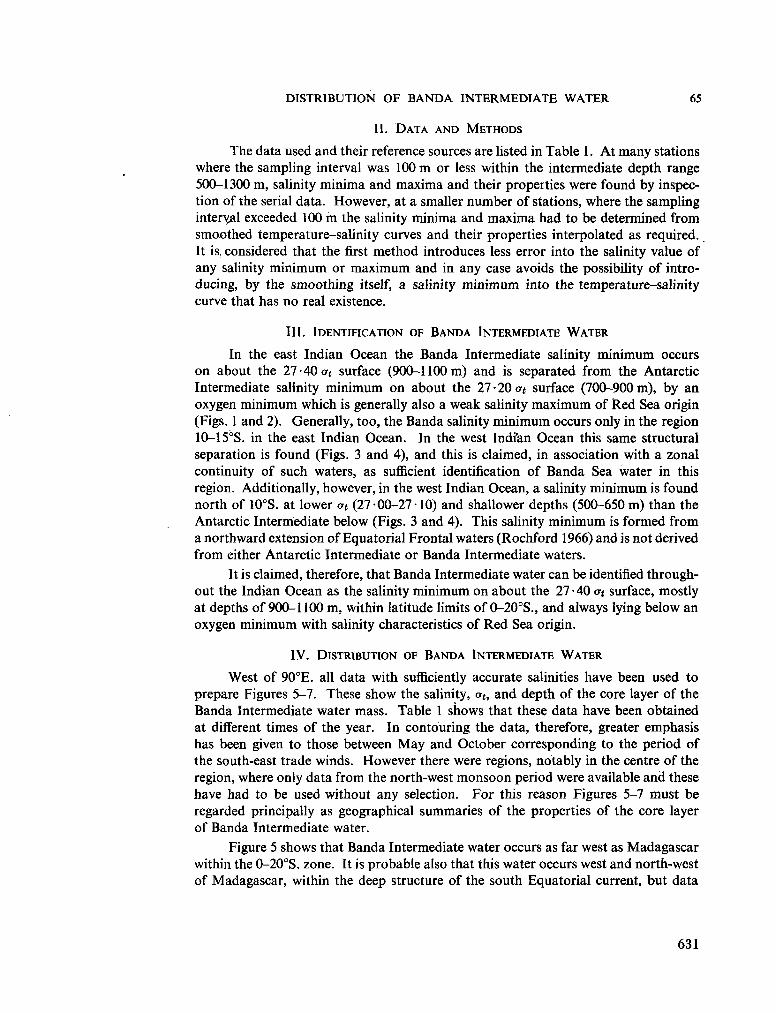
DISTRIBUTION OF BANDA INTERMEDIATE WATER 65
II. DATA AND METHODS
The data used and their reference sources are listed in Table 1. At m a n y stations where the sampling interval was 100 m or less within the intermediate depth range 500-1300 m , salinity minima and maxima and their properties were found by inspection of the serial data. However, at a smaller number of stations, where the sampling internal exceeded 100 m the salinity minima and maxima had to be determined from smoothed temperature-salinity curves and their properties interpolated as required. It is considered that the first method introduces less error into the salinity value of any salinity m i n i m u m or m a x i m u m and in any case avoids the possibility of introducing, by the smoothing itself, a salinity m i n i m u m into the temperature-salinity curve that has no real existence.
III. I D E N T I F I C A T I O N O F B A N D A I N T E R M E D I A T E W A T E R
In the east Indian Ocean the Banda Intermediate salinity m i n i m u m occurs on about the 27-40CTÍ surface (900-1100 m ) and is separated from the Antarctic Intermediate salinity m i n i m u m on about the 27- 20 at surface (700-900 m ) , by an oxygen m i n i m u m which is generally also a weak salinity m a x i m u m of Red Sea origin (Figs. 1 and 2). Generally, too, the Banda salinity m i n i m u m occurs only in the region 10—15°S. in the east Indian Ocean. In the west Indfan Ocean this same structural separation is found (Figs. 3 and 4), and this is claimed, in association with a zonal continuity of such waters, as sufficient identification of Banda Sea water in this region. Additionally, however, in the west Indian Ocean, a salinity m i n i m u m is found north of 10°S. at lower ot (27-00-27-10) and shallower depths (500-650 m ) than the Antarctic Intermediate below (Figs. 3 and 4). This salinity m i n i m u m is formed from a northward extension of Equatorial Frontal waters (Rochford 1966) and is not derived from either Antarctic Intermediate or Banda Intermediate waters.
It is claimed, therefore, that Banda Intermediate water can be identified throughout the Indian Ocean as the salinity m i n i m u m on about the 27 • 40 at surface, mostly at depths of 900-1100 m , within latitude limits of 0-20°S., and always lying below an oxygen m i n i m u m with salinity characteristics of Red Sea origin.
IV. D I S T R I B U T I O N O F B A N D A I N T E R M E D I A T E W A T E R
West of 90°E. all data with sufficiently accurate salinities have been used to prepare Figures 5-7. These show the salinity, ot, and depth of the core layer of the Banda Intermediate water mass. Table 1 shows that these data have been obtained at different times of the year. In contouring the data, therefore, greater emphasis has been given to those between M a y and October corresponding to the period of the south-east trade winds. However there were regions, notably in the centre of the region, where only data from the north-west monsoon period were available and these have had to be used without any selection. For this reason Figures 5-7 must be regarded principally as geographical summaries of the properties of the core layer of Banda Intermediate water.
Figure 5 shows that Banda Intermediate water occurs as far west as Madagascar within the 0-20°S. zone. It is probable also that this water occurs west and north-west of Madagascar, within the deep structure of the south Equatorial current, but data
631
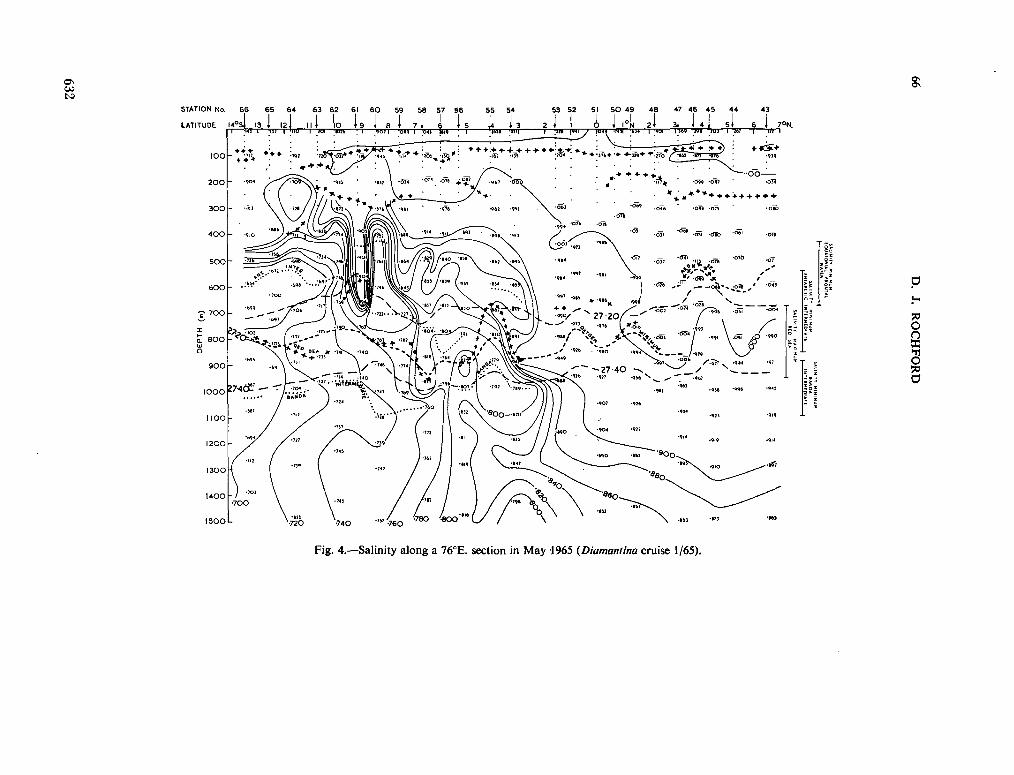
66
D. J. R
OC
HFO
RD
1
2 Ç a
.o
o
W c
o
I
60
o
o
o
o
o
o
0
0
ID
Hid
3a
o
o
a>
O
O
O
O
O
-
0
o
o
o
0
0
o
o
tn
632
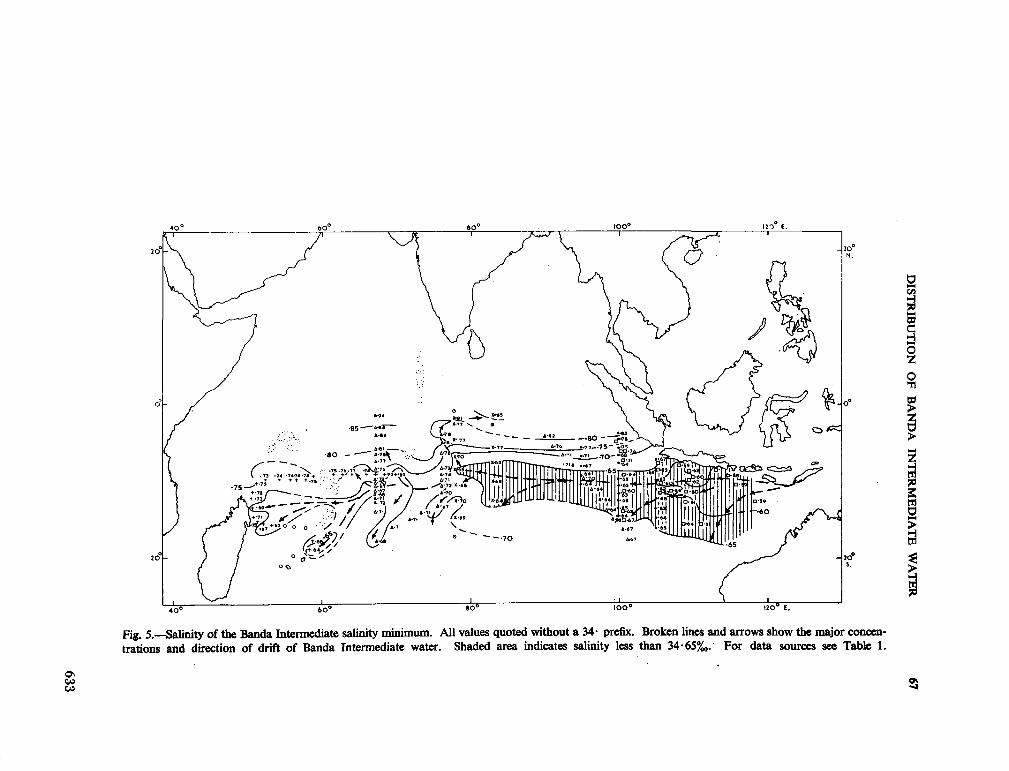
DIST
RIB
UT
ION
OF
BA
ND
A
INT
ER
ME
DIA
TE
WA
TER
67
q -*
(2
£ S
ja 1-° £
S "i
q
S m
m 5
II
If II 1* C
T3
a s •a
s ci
*o
li
r m
©
<o g
•*"i b
¿s
633
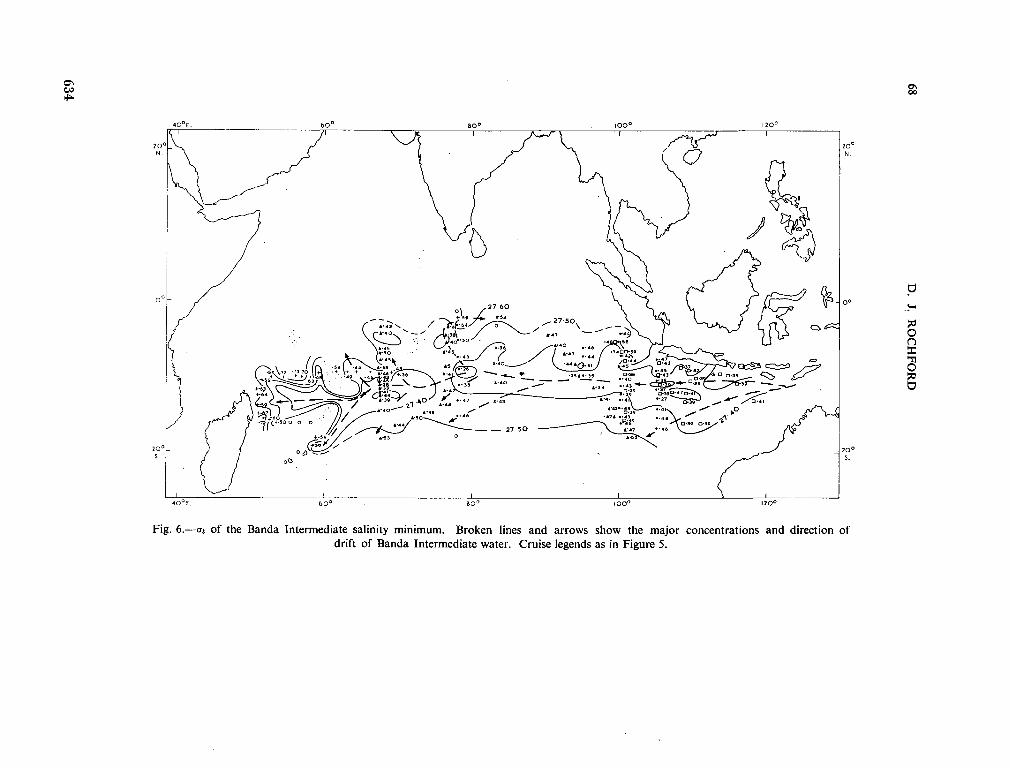
68
D. J. R
OC
HFO
RD
~^T
T
634
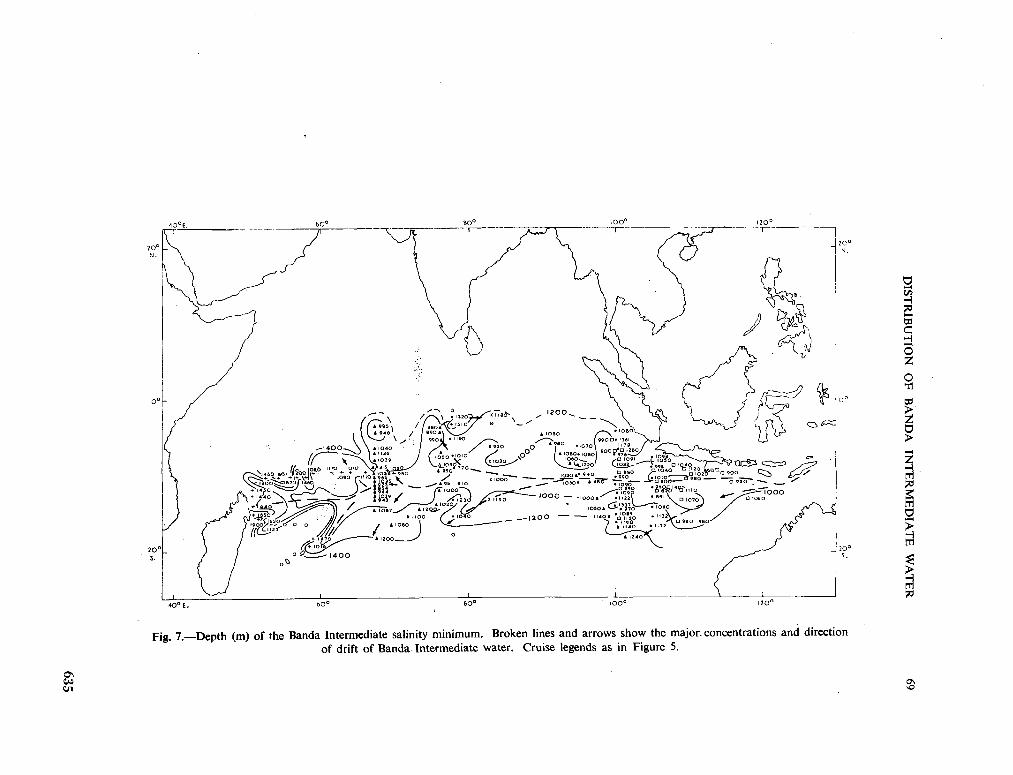
DIST
RIB
UT
ION
OF
BA
ND
A
INT
ER
ME
DIA
TE
W
ATER
69
635
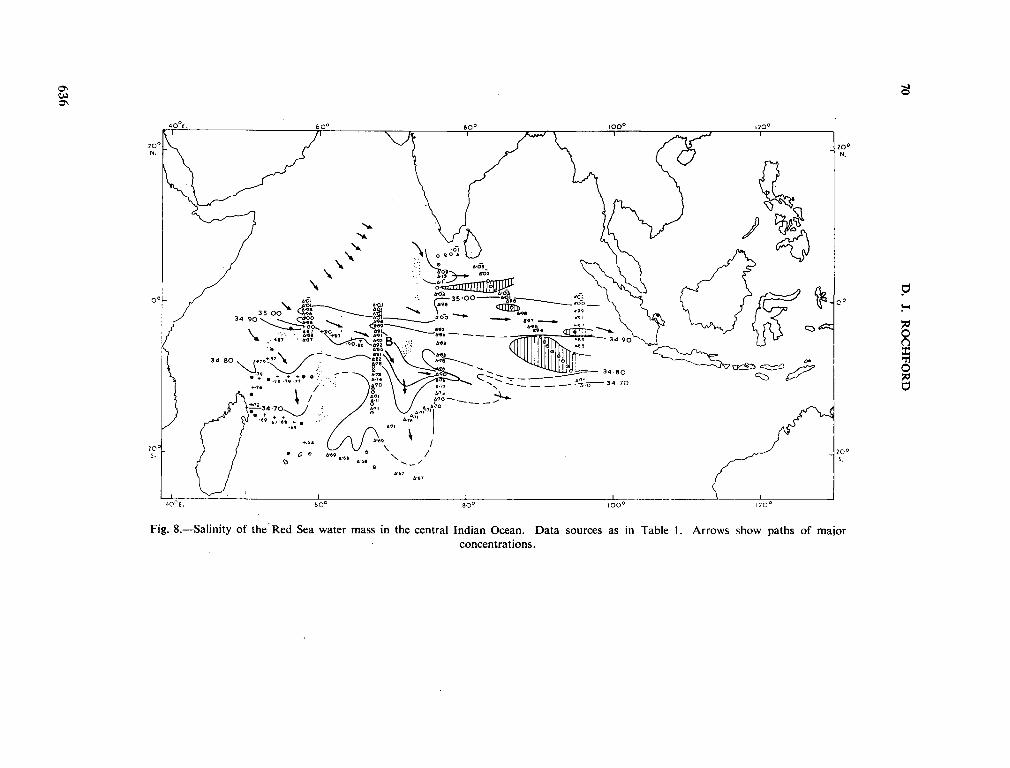
70
D. J. R
OC
HFO
RD
636
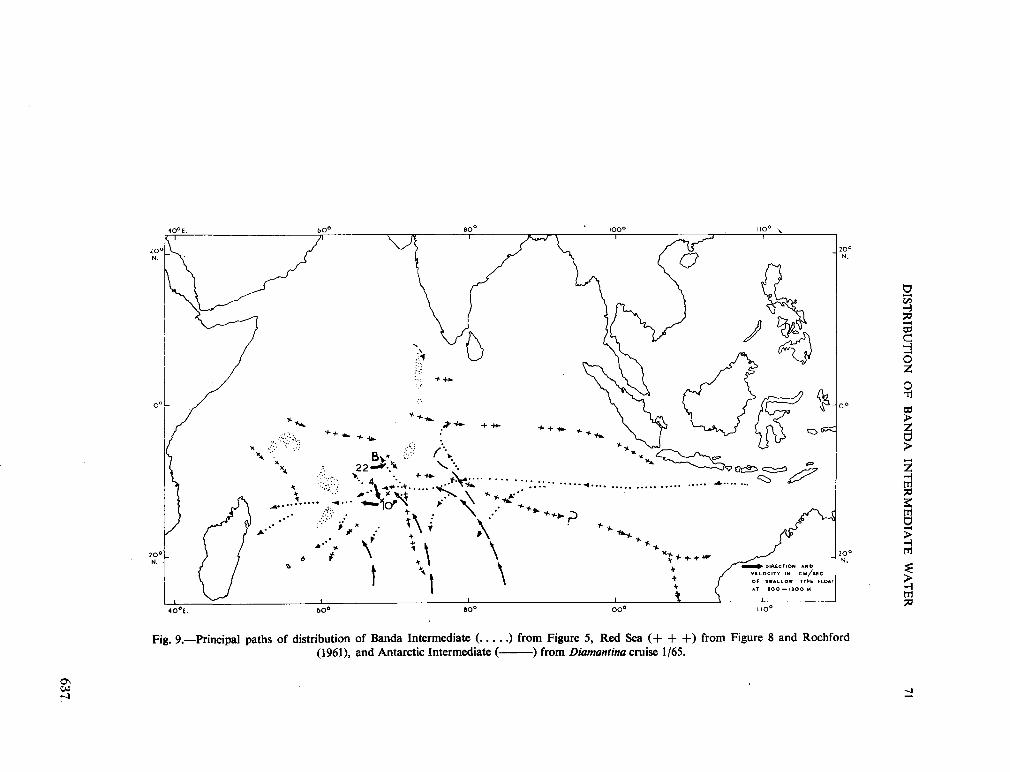
DIST
RIB
UT
ION
OF
BA
ND
A
INT
ER
ME
DIA
TE
W
ATER
71
637
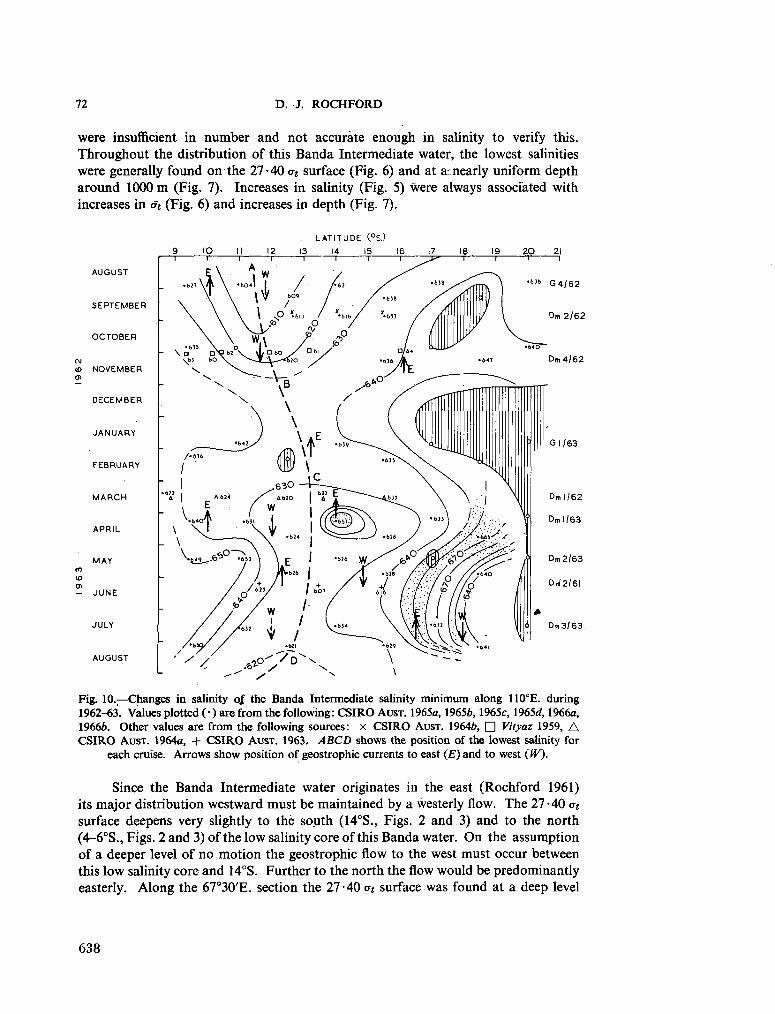
72 D. J. ROCHFORD
were insufficient in number and not accurate enough in salinity to verify this. Throughout the distribution of this Banda Intermediate water, the lowest salinities were generally found on the 27-40 at surface (Fig. 6) and at amearly uniform depth around 1000 m (Fig. 7). Increases in salinity (Fig. 5) were always associated with increases in <J( (Fig. 6) and increases in depth (Fig. 7).
AUGUST
SEPTEMBER
OCTOBER
co NOVEMBER 01
DECEMBER
JANUARY
FEBRUARY
M A R C H
APRIL
MAY co ID 01
- JUNE
JULY
AUGUST
LATITUDE C°S.)
13 14 15 16
Dm3/63-
Fig. 10.—Changes in salinity of the Banda Intermediate salinity minimum along 110°E. during 1962-63. Values plotted (• ) are from the following: C S I R O A U S T . 1965a, 19656,1965c, 1965a", 1966a, 19666. Other values are from the following sources: x C S I R O A U S T . 19646, • Vityaz 1959, A C S I R O A U S T . 1964a, + C S I R O A U S T . 1963. ABCD shows the position of the lowest salinity for
each cruise. Arrows show position of geostrophic currents to east (£) and to west (W).
Since the Banda Intermediate water originates in the east (Rochford 1961) its major distribution westward must be maintained by a westerly flow. The 27 -40 at
surface deepens very slightly to the south (14°S., Figs. 2 and 3) and to the north (4-6°S., Figs. 2 and 3) of the low salinity core of this Banda water. O n the assumption of a deeper level of no motion the geostrophic flow to the west must occur between this low salinity core and 14°S. Further to the north the flow would be predominantly easterly. Along the 67°30'E. section the 27-40 ot surface was found at a deep level
638
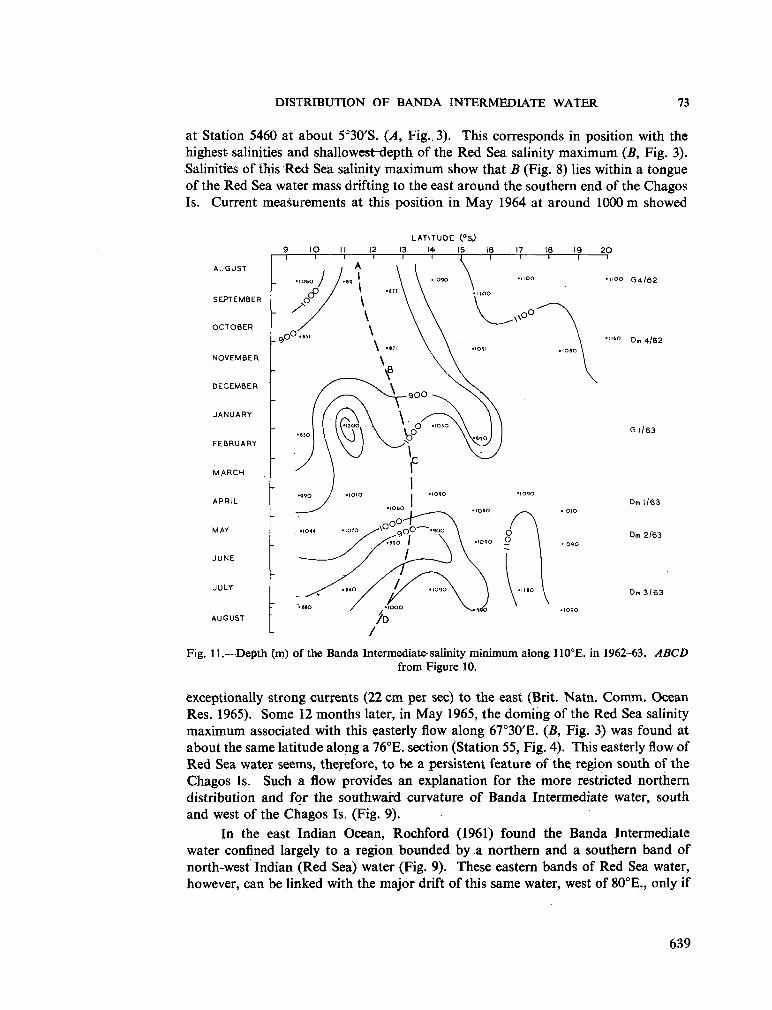
DISTRIBUTION OF BANDA INTERMEDIATE WATER 73
at Station 5460 at about 5°30'S. (A, Fig., 3). This corresponds in position with the highest salinities and shallowest-depth of the Red Sea salinity m a x i m u m (B, Fig. 3). Salinities of this Red Sea salinity m a x i m u m show that B (Fig. 8) lies within a tongue of the Red Sea water mass drifting to the east around the southern end of the Chagos Is. Current measurements at this position in M a y 1964 at around 1000 m showed
LATITUDE (°Sj
9 IO II 12 13 14 IS 16 17 18 19 20
AUGUST
SEPTEMBER
OCTOBER
NOVEMBER
DECEMBER
JANUARY
FEBRUARY
MARCH
APRIL
MAY
JUNE
JULY
AUGUST
Fig. 11.—Dejjth (m) of the Banda Intermediate-salinity minimum along 110°E. in 1962-63. ABCD from Figure 10.
exceptionally strong currents (22 c m per sec) to the east (Brit. Natn. C o m m . Ocean Res. 1965). S o m e 12 months later, in M a y 1965, the doming of the Red Sea salinity m a x i m u m associated with this easterly flow along 67°30'E. (B, Fig. 3) was found at about the same latitude along a 76°E. section (Station 55, Fig. 4). This easterly flow of Red Sea water seems, therefore, to be a persistent feature of the region south of the Chagos Is. Such a flow provides an explanation for the more restricted northern distribution and for the southward curvature of Banda Intermediate water, south and west of the Chagos Is. (Fig. 9).
In the east Indian Ocean, Rochford (1961) found the Banda Intermediate water confined largely to a region bounded by a northern and a southern band of north-west Indian (Red Sea) water (Fig. 9). These eastern bands of Red Sea water, however, can be linked with the major drift of this same water, west of 80°E., only if
639
0 0 G 4/62
, t 0 Dm 4/62
G 1/63
Dm 1/63
Dm 2/63
D m 3 / 6 3
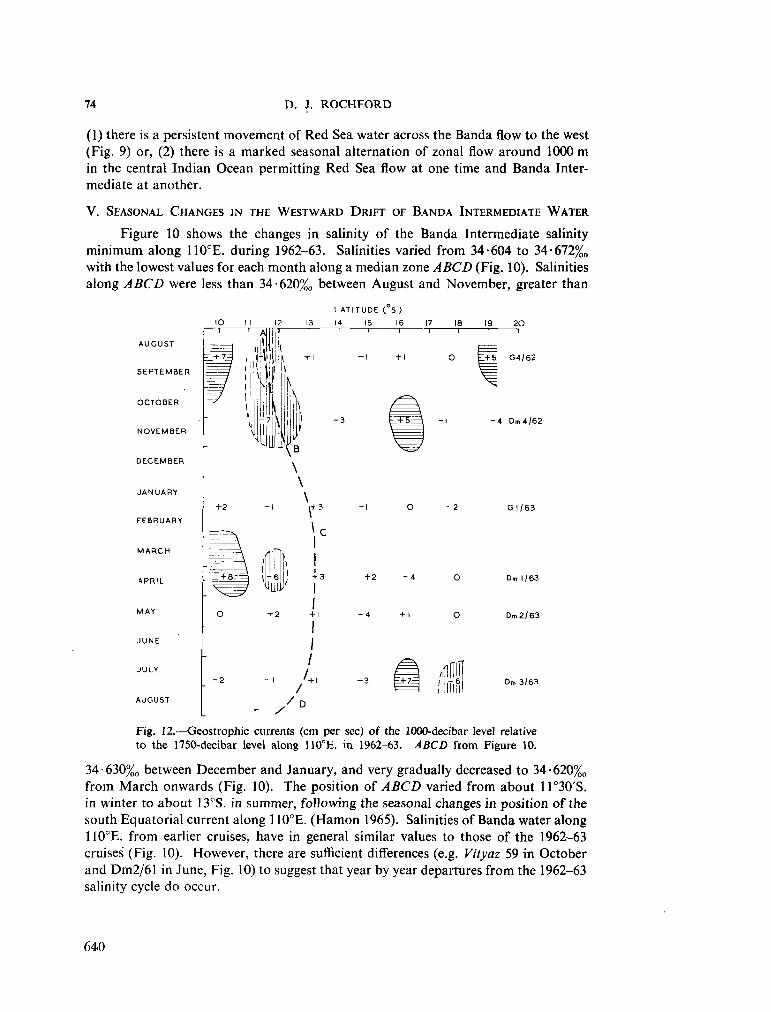
74 D. J. ROCHFORD
(1) there is a persistent movement of Red Sea water across the Banda flow to the west (Fig. 9) or, (2) there is a marked seasonal alternation of zonal flow around 1000 m in the central Indian Ocean permitting Red Sea flow at one time and Banda Intermediate at another.
V. SEASONAL C H A N G E S IN THE W E S T W A R D DRIFT OF B A N D A INTERMEDIATE W A T E R
Figure 10 shows the changes in salinity of the Banda Intermediate salinity minimum along 110°E. during 1962-63. Salinities varied from 34-604 to 34-672%0
with the lowest values for each month along a median zone ABCD (Fig. 10). Salinities along ABCD were less than 34-620%o between August and November, greater than
LATITUDE (°S.)
IP II 12 13 14 15 16 17 18 19 20
SEPTEMBER
OCTOBER
NOVEMBER
DECEMBER
JUNE
~1 1 1 I r
L+S G4/62
-4 Dm4/62
+ 2 +1
/
/
/
/ D Mil
G 1/63
Dm 1/63
Dm2/63
Dm 3/63
Fig. 12.—Geostrophic currents (cm per sec) of the 1000-decibar level relative to the 1750-decibar level along 110°E. in 1962-63. ABCD from Figure 10.
34 • 630%o between December and January, and very gradually decreased to 34 • 620%o
from March onwards (Fig. 10). The position oí ABCD varied from about 11°30'S. in winter to about 13°S. in summer, following the seasonal changes in position of the south Equatorial current along 110°E. (Hamon 1965). Salinities of Banda water along U 0 ° E . from earlier cruises, have in general similar values to those of the 1962-63 cruises (Fig. 10). However, there are sufficient differences (e.g. Vityaz 59 in October and D m 2 / 6 1 in June, Fig. 10) to suggest that year by year departures from the 1962-63 salinity cycle do occur.
640
DISTRIBUTION OF BANDA INTERMEDIATE WATER 75
Geostrophic currents ( H a m o n 1965) at 1000 m , the average depth of Banda water along 110°E. (Fig. 11), were for the most part so weak (less than 5 c m per sec) as to be considered not significantly different from zero (Fig. 12). In August-December, however, the region of m a x i m u m concentration of Banda water (AB, Fig. 12) was found within a region of relatively strong (7-11 c m per sec) westward movement. In August some of this westward transport would have been absorbed into the east-flowing current around 10°S., but despite this, there would have been a net transport to the west beyond 110°E. during August-December. At other times of the year geostrophic currents along BCD, the zone of m a x i m u m concentration of Banda water, were virtually absent or directed eastwards (Fig. 12). Stronger westerly currents to the north of BCD in March-April and to the south of BCD in July (Fig. 12) were always matched by an adjacent easterly current of about the same strength. However, these easterly currents always had m u c h higher core layer salinities than their adjoining westerly counterpart, showing that these currents are to some extent independently maintained. There could be some transport of Banda water westward in January-July but the amount involved is likely to be quite small. The strong easterly flow of high salinity Red Sea water south of the Chagos Is. (Fig. 9) was measured in June. It is thought likely that this easterly flow propagates eastwards and generates the easterly currents at 110°È. in the period March-July (Fig. 12). If this is the case, the weakening of westward transport of Banda water across 110°E. in March-July might not be caused by any seasonal diminution of flow out of the Banda Sea itself, but by its seasonal absorption into an increased eastward flow of Red Sea water. The southward diversions of Banda water, shown by the salinity distribution (Fig. 9), under these circumstances could be the resultant path of such waters when the opposing Red Sea flow intensifies.
VI. C O N C L U S I O N S
(1) Banda Intermediate water has been identified as a salinity m i n i m u m on about the 2 7 - 4 0 C T Í surface, below an oxygen m i n i m u m of Red Sea origin, throughout most of the 0-20°S. zone of the Indian Ocean.
(2) Lowest salinities within this zone occur around 10°S., where the depth is everywhere around 1000 m and the at is nearly uniform at 27-40.
(3) The slope of the 27-40<TÍ surface indicates that westward movement of Banda water occurs only south of 10°S.
(4) North of 10°S., Banda water is absorbed into an easterly movement of Red Sea water.
(5) During 1962-63 the salinity of Banda water along 110°E. varied not only with latitude (lowest values always between 11—13°S.) but also with time (lowest values overall in August-November; highest values overall in December-January).
(6) Geostrophic currents associated with Banda water along 110°E. were generally less than 5 c m per sec. The strongest westerly currents (7-11 c m per sec) between 11-13°S. were found in August-December. At other times of the year westerly currents between 11-13°S. were either absent or matched by almost equally strong currents to the east.
641
76 D. J. ROCHFORD
(7) The strong (22 c m per sec) easterly flow of Red Sea water south of the Chagos
Is., measured in June 1964, is thought to divert Banda water southward as well as
retard its westward transport.
VII. R E F E R E N C E S
A N O N . (1959).—Data from Vityaz Cruise 31, 1959-60, on file at I .G .Y. World Data Centre B, Moscow, U . S . S . R .
A N O N . (1961).—Data from Vityaz Cruise 33, 1961, on file at I .G.Y. World Data Centre B, Moscow, U . S . S . R .
BRITISH N A T I O N A L C O M M I T T E E O N O C E A N I C R E S E A R C H (1965).—I.I.O.E. R . R . S . Discovery Cruise 3 Report, p. 14. (Royal Society: London.)
C S I R O A U S T . (1963).—Oceanographical observations in the Indian Ocean in 1961. H . M . A . S . Diamantina, Cruise Dm2/61 . CSIRO Aust. Oceanogr. Cruise Rep. 9.
C S I R O A U S T . (1964a).—Oceanographical observations in the Indian Ocean in 1962. H . M . A . S . Diamantina, Cruise Dml /62 . CSIRO Aust. Oceanogr. Cruise Rep. 14.
C S I R O A U S T . (19646).—Oceanographical observations in the Indian Ocean in 1962. H . M . A . S . Diamantina, Cruise D m 2 / 6 2 . CSIRO Aust. Oceanogr. Cruise Rep. 15.
C S I R O A U S T . (1965a).—Oceanographical observations in the Indian Ocean in 1963. H . M . A . S . Gascoyne, Cruise Gl/63. CSIRO Aust. Oceanogr. Cruise Rep. 21.
C S I R O A U S T . (19656).—Oceanographical observations in the Indian Ocean in 1963. H . M . A . S . Diamantina, Cruise Dml/63 . CSIRO Aust. Oceanogr. Cruise Rep. 23.
C S I R O A U S T . (1965c).—Oceanographical observations in the Indian Ocean in 1963. H . M . A . S . Diamantina, Cruise D m 2 / 6 3 . CSIRO Aust. Oceanogr. Cruise Rep. 24.
C S I R O A U S T . (1965d).—Oceanographical observations in the Indian Ocean in 1963. H . M . A . S . Diamantina, Cruise D m 3 / 6 3 . CSIRO Aust. Oceanogr. Cruise Rep. 25.
C S I R O A U S T . (1966a).—Oceanographical observations in the Indian Ocean in 1962. H . M . A . S . Gascoyne, Cruise G4/62. CSIRO Aust. Oceanogr. Cruise Rep. 17.
C S I R O A U S T . (19666).—Oceanographical observations in the Indian Ocean in 1962. H . M . A . S . Diamantina, Cruise D m 4 / 6 2 . CSIRO Aust. Oceanogr. Cruise Rep. 20.
H A M O N , B . V . (1965).—Relative currents in the south-eastern Indian Ocean. Aust. J. Mar. Freshw. Res. 16: 255-71.
R O C H F O R D , D . J. (1961).—Hydrology of the Indian Ocean. I. The water masses in intermediate depths of the south-east Indian Ocean. Aust. J. Mar. Freshw. Res. 12: 129-49.
R O C H F O R D , D . J. (1966).—Source regions of oxygen maxima in intermediate depths of the Arabian Sea. Aust. J. Mar. Freshw. Res. 17: 1-30.
T O K Y O U N I V E R S I T Y O F FISHERIES (1964).—Physical and chemical data. I.I.O.E. Reps. Umitaka Maru (1962-63).
W Y R T K I , K . (1957).—The water exchange between the Pacific and the Indian Ocean in relation to upwelling processes. Proc. 9th Pacif. Sci. Congr. 16: 61-6.
642
Reprinted from J. armosph. Se/., vol. 23, no. 2, 1966, p. 144-150.
The Summer Atmospheric Circulation over the Arabian Sea
C. S. R A M A G E
University of Hawaii Honolulu
Collected reprints of the International Indian Ocean Expedition, vol. IV, contribution no. 240 643
144 J O U R N A L OF T H E A T M O S P H E R I C SCIENCES VOLUME 23
The Summer Atmospheric Circulation over the Arabian Sea1
C. S. RAMAGE
University of Hawaii, Honolulu
(Manuscript received 23 September 1965)
ABSTRACT
The summer heat low system extending from Somalia across southeast Arabia to northwest India is the most extensive and intense on earth. Although it develops in the normal w a y over desert regions in response to the sun's zenithal march, it is maintained and intensified through the summer by subsidence of air originally lifted and warmed by the release of latent heat in monsoon rain systems to the east and south. T h e subsidence not only dominates West Pakistan, Arabia, and Somalia, but severely restricts low cloud formation over the central and western Arabian Sea.
T h e heat low exports cyclonic vorticity in the middle and upper troposphere to the northern Arabian Sea. W h e n a deep layer of moist air is present over the eastern part of this area, subtropical cyclogenesis occurs, producing a burst of west Indian monsoon rains. This in turn, by increasing subsidence above the heat low, intensifies the heat low and its associated low-level monsoon circulation. W h e n the supply of moist air is cut off, the subtropical cyclone fills, the heat low weakens, and a break takes place in the monsoon rains. With renewal of the moisture supply, the sequence is repeated.
1. Introduction
During the International Indian Ocean Expedition oceanographers have concentrated more on studying the western Arabian Sea than any other part of the Indian Ocean. The reason is not hard to find since nowhere else is the difference between summer and winter monsoons so sharp—strong southwesterly winds with vigorous coastal upwelling in summer and moderate to fresh northeasterly winds and near-uniform sea surface temperatures in winter. So far the summer monsoon has been probed more extensively than the winter monsoon and since several of the research vessels made regular radiosonde ascents and U . S. Weather Bureau and W o o d s Hole Océanographie Institution research aircraft m a d e drop soundings in the summers of 1963 and 1964, a detailed study of the summer atmospheric circulation over the western Arabian Sea appears to be feasible.
T o prepare for this study, I attempt to construct in this paper a climatological framework interrelating gross features of the norrnal distributions of pressure, temperature, winds, and weather over the Arabian Sea and its littoral.
For surface climatology I have relied on the atlas published by the Royal Netherlands Meteorological Institute (1952) and for upper climatology on R a m a n and Dixit (1964), Frost and Stephenson (1965), and on observations from research vessels and aircraft.
Traditionally, meteorologists have linked the Arabian Sea summer monsoon circulation with a heat low system
1 Contribution N o . 128 of the Hawaii Institute of Geophysics. This paper was presented at the Symposium on Meteorological Results of the International Indian Ocean Expedition, 22-26 July 1965, B o m b a y , India.
over Arabia, West Pakistan, and northern India. Thé heat low, developing during M a y , establishes the low-level monsoon wind regime a full month before heavy monsoon rains set in over western India south of the heat low. B y mid-July, the low is deepest, the southwest monsoon is strongest, and the west Indian rains are heaviest, while all diminish through August and September. As long ago as 1887, W . L . Dallas questioned how a heat low dependent for its existence on hot sun and clear skies can persist once clouds and rain develop. Surface charts for the Arabian Sea show winds converging into the West Pakistan heat low. Surface relative humidities are high and the air is rising. W h y then does the low remain cloud-free and intense while rain falls well to the south? This question and the related question—Why does so little rain fall over the western Arabian Sea?—will be discussed in the remainder of this presentation.
2. Undisturbed heat low circulation
The surface southwesterly winds of the heat low circulation force cold water to upwell along the coast of Somalia and Arabia. The cold water, by modifying the temperature and hence the pressure distribution of the overlying air, produces two pronounced effects; a persistent wind speed m a x i m u m offshore from the zone of upwelling (Bunker, 1965) and deflection of inflow to flow parallel to the coast (Fig. 1). Consequently, with moist inflow over West Pakistan and little or none over Somalia and Arabia, w e should expect to find a rather weak moist heat low over West Pakistan with plentiful rain, a return current in the middle troposphere, evidence for some compensatory sinking
644
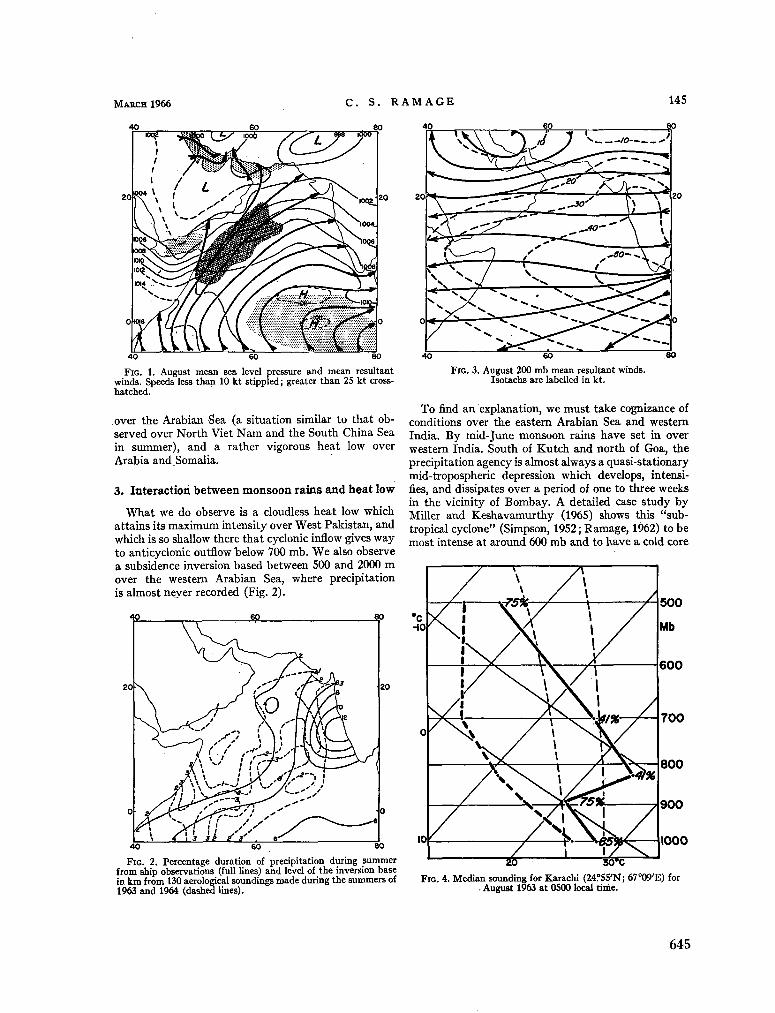
M A R C H 1966 C . S. R A M A G E 145
40 60 80
F I G . 1. August mean sea level pressure and mean resultant winds. Speeds less than 10 kt stippled; greater than 25 kt cross-hatched.
over the Arabian Sea (a situation similar to that observed over North Viet N a m and the South China Sea in summer), and a rather vigorous heat low over Arabia and Somalia.
3. Interaction between monsoon rains and heat low
W h a t w e do observe is a cloudless heat low which attains its m a x i m u m intensity over West Pakistan, and which is so shallow there that cyclonic inflow gives way to anticyclonic outflow below 700 m b . W e also observe a subsidence inversion based between 500 and 2000 m over the western Arabian Sea, where precipitation is almost never recorded (Fig. 2).
F I G . 2. Percentage duration of precipitation during summer from ship observations (full Unes) and level of the inversion base in k m from 130 aerological soundings made during the summers of 1963 and 1964 (dashed lines).
40 60 .80
F I G . 3. August 200 m b mean resultant winds. Isotachs are labelled in kt.
T o find an explanation, w e must take cognizance of conditions over the eastern Arabian Sea and western India. B y mid-June monsoon rains have set in over western India. South of Kutch and north of Goa, the precipitation agency is almost always a quasi-stationary mid-tropospheric depression which develops, intensifies, and dissipates over a period of one to three weeks in the vicinity of Bombay . A detailed case study by Miller and Keshavamurthy (1965) shows this "subtropical cyclone" (Simpson, 1952 ; Ramage, 1962) to be most intense at around 600 m b and to have a cold core
F I G . 4. Median sounding for Karachi (24°55'N; 67°09'E) for . August 1963 at 0500 local time.
645
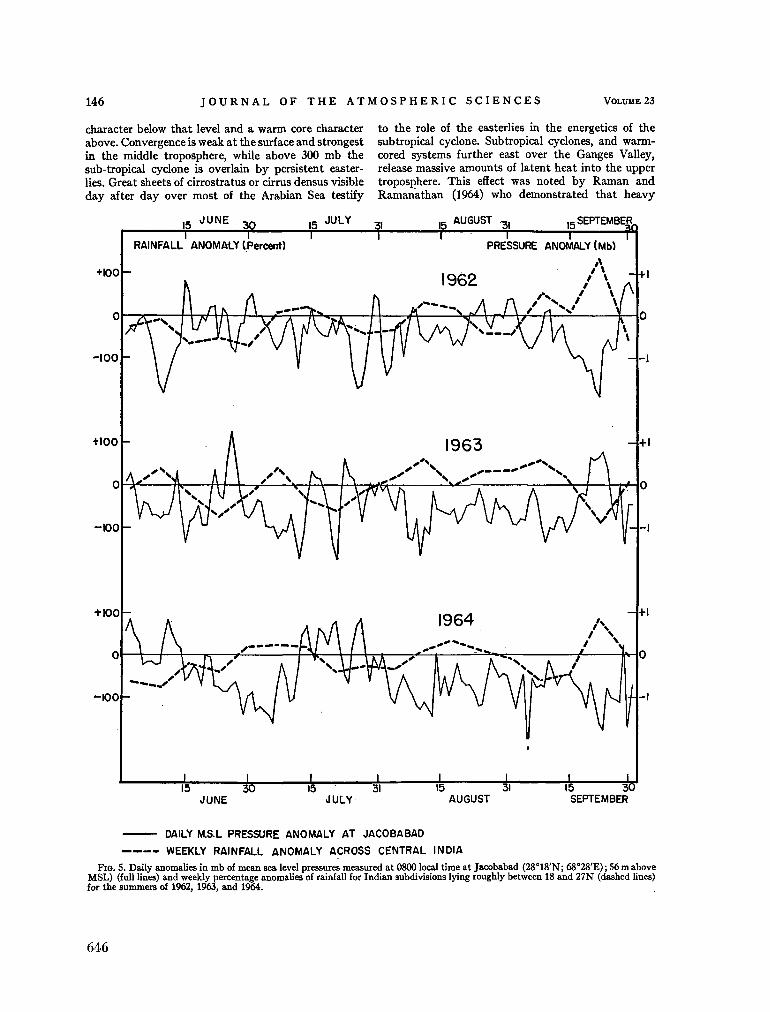
146 J O U R N A L O F T H E A T M O S P H E R I C S C I E N C E S V O L U M E 23
character below that level and a w a r m core character to the role of the easterlies in the energetics of the above. Convergence is weak at the surface and strongest subtropical cyclone. Subtropical cyclones, and w a r m -in the middle troposphere, while above 300 m b the cored systems further east over the Ganges Valley, sub-tropical cyclone is overlain by persistent easter- release massive amounts of latent heat into the upper lies. Great sheets of cirrostratus or cirrus densus visible troposphere. This effect w a s noted b y R a m a n and d a y after d a y over mos t of the Arabian Sea testify R a m a n a t h a n (1964) w h o demonstrated that heavy
15 J U N E 30 15 J U L Y 31 15 A U G U S T 31 is SEPTEMBER 1 1 1 T i—•- 1 1 r
RAINFALL ANOMALY (Percent) PRESSURE ANOMALY (Mb)
DAILY M.S.L PRESSURE ANOMALY AT JACOBABA0
WEEKLY RAINFALL ANOMALY ACROSS CENTRAL INDIA
F I G . 5. Daily anomalies in m b of mean sea level pressures measured at 0800 local time at Jacobabad (28°18'N; 68°28'E) ; 56 m above M S L ) (full lines) and weekly percentage anomalies of rainfall for Indian subdivisions lying roughly between 18 and 27N (dashed lines) for the summers of 1962, 1963, and 1964.
646
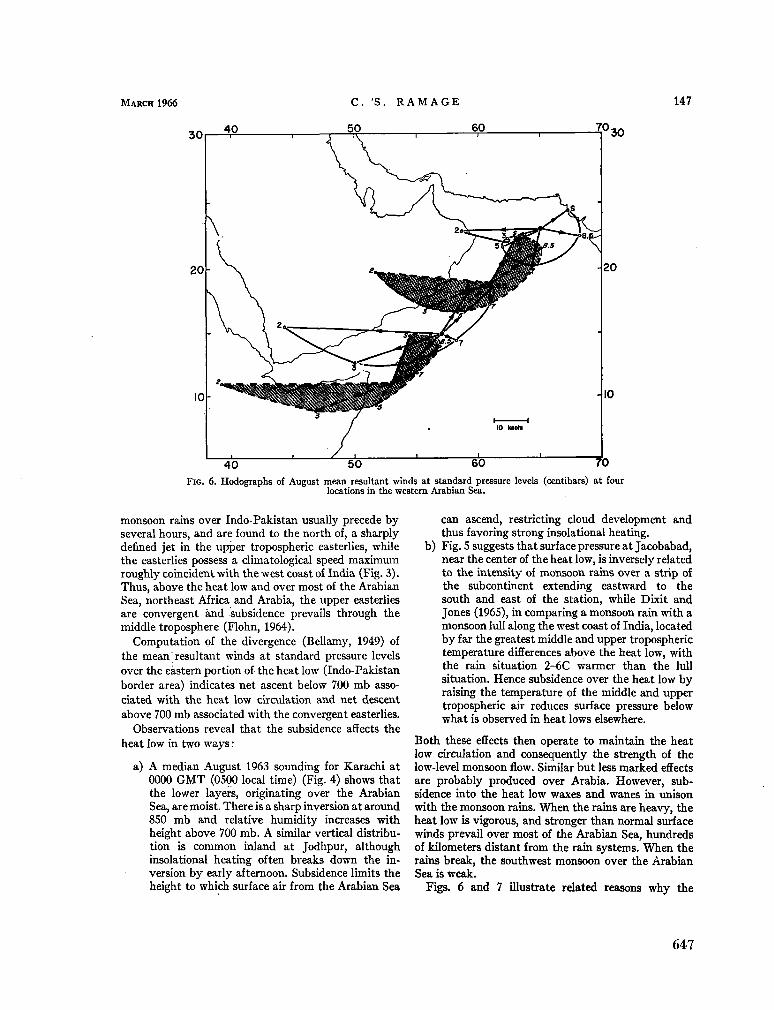
M A R C H 1966 C . ' S . R A M A G E 147
30
40 60 70 F I G . 6. Hodographs of August mean resultant winds at standard pressure levels (centibars) at four
locations in the western Arabian Sea.
monsoon rains over Indo-Pakistan usually precede by several hours, and are found to the north of, a sharply defined jet in the upper tropospheric easterlies, while the easterlies possess a climatological speed m a x i m u m roughly coincident with the west coast of India (Fig. 3). Thus, aboye the heat low and over most of the Arabian Sea, northeast Africa and Arabia, the upper easterlies are convergent and subsidence prevails through the middle troposphere (Flohn, 1964).
Computation of the divergence (Bellamy, 1949) of the mean resultant winds at standard pressure levels over the eastern portion of the heat low (Indo-Pakistan border area) indicates net ascent below 700 m b associated with the heat low circulation and net descent above 700 m b associated with the convergent easterlies.
Observations reveal that the subsidence affects the heat low in two ways :
a) A median August 1963 sounding for Karachi at 0000 G M T (0500 local time) (Fig. 4) shows that the lower layers, originating over the Arabian Sea, are moist. There is a sharp inversion at around 850 m b and relative humidity increases with height above 700 m b . A similar vertical distribution is c o m m o n inland at Jodhpur, although insolational heating often breaks down the inversion by early afternoon. Subsidence limits the height to which surface air from the Arabian Sea
can ascend, restricting cloud development and thus favoring strong insolational heating,
b) Fig. 5 suggests that surface pressure at Jacobabad, near the center of the heat low, is inversely related to the intensity of monsoon rains over a strip of the subcontinent extending eastward to the south and east of the station, while Dixit and Jones (1965), in comparing a monsoon rain with a monsoon lull along the west coast of India, located by far the greatest middle and upper tropospheric temperature differences above the heat low, with the rain situation 2 -6C warmer than the lull situation. Hence subsidence over the heat low by raising the temperature of the middle and upper tropospheric air reduces surface pressure below what is observed in heat lows elsewhere.
Both these effects then operate to maintain the heat low circulation and consequently the strength of the low-level monsoon flow. Similar but less marked effects are probably produced over Arabia. However, subsidence into the heat low waxes and wanes in unison with the monsoon rains. W h e n the rains are heavy, the heat low is vigorous, and stronger than normal surface winds prevail over most of the Arabian Sea, hundreds of kilometers distant from the rain systems. W h e n the rains break, the southwest monsoon over the Arabian Sea is weak.
Figs. 6 and 7 illustrate related reasons w h y the
647
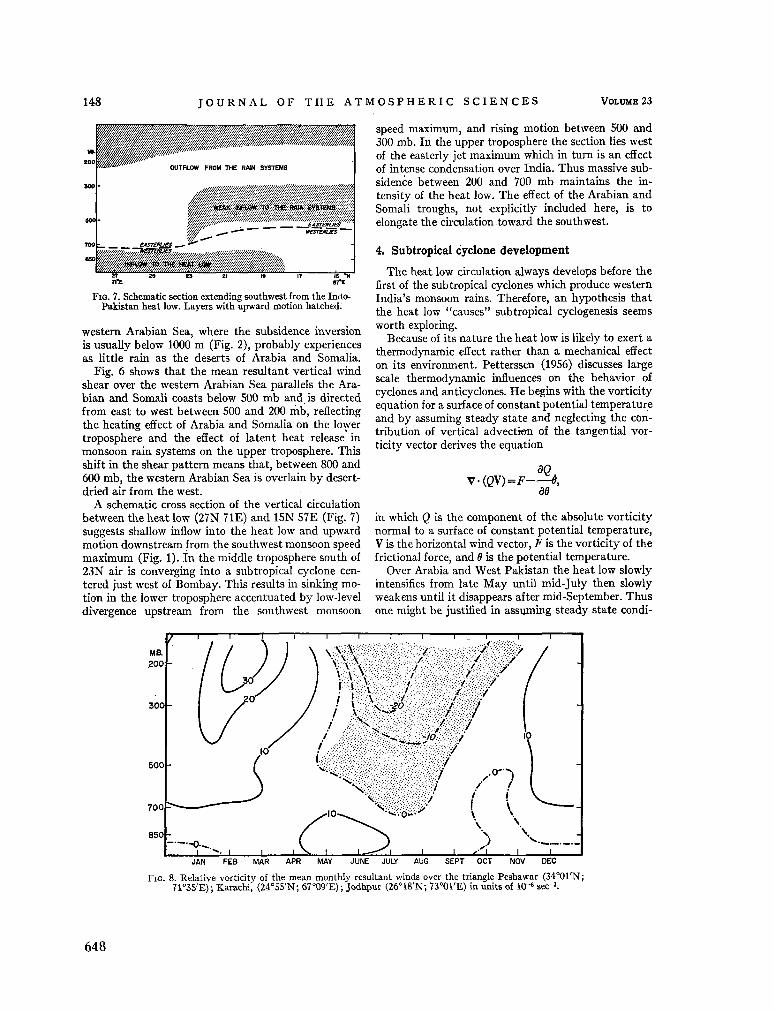
148 J O U R N A L OF T H E A T M O S P H E R I C S C I E N C E S VOLUME 23
F I G . 7. Schematic section extending southwest from the IndoPakistan heat low. Layers with upward motion hatched.
western Arabian Sea, where the subsidence inversion is usually below 1000 m (Fig. 2), probably experiences as little rain as the deserts of Arabia and Somalia.
Fig. 6 shows that the mean resultant vertical wind shear over the western Arabian Sea parallels the Arabian and Somali coasts below 500 m b and is directed from east to west between 500 and 200 m b , reflecting the heating effect of Arabia and Somalia on the lower troposphere and the effect of latent heat release in monsoon rain systems on the upper troposphere. This shift in the shear pattern means that, between 800 and 600 m b , the western Arabian Sea is overlain by desert-dried air from the west.
A schematic cross section of the vertical circulation between the heat low (27N 7 IE) and 15N 5 7 E (Fig. 7) suggests shallow inflow into the heat low and upward motion downstream from the southwest monsoon speed m a x i m u m (Fig. 1). In the middle troposphere south of 2 3 N air is converging into a subtropical cyclone centered just west of B o m b a y . This results in sinking m o tion in the lower troposphere accentuated by low-level divergence upstream from the southwest monsoon
speed m a x i m u m , and rising motion between 500 and 300 m b . In the upper troposphere the section lies west of the easterly jet m a x i m u m which in turn is an effect of intense condensation over India. Thus massive subsidence between 200 and 700 m b maintains the intensity of the heat low. The effect of the Arabian and Somali troughs, not explicitly included here, is to elongate the circulation toward the southwest.
4. Subtropical cyclone development
T h e heat low circulation always develops before the first of the subtropical cyclones which produce western India's monsoon rains. Therefore, an hypothesis that the heat low "causes" subtropical cyclogenesis seems worth exploring.
Because of its nature the heat low is likely to exert a thermodynamic effect rather than a mechanical effect on its environment. Petterssen (1956) discusses large scale thermodynamic influences on the behavior of cyclones and anticyclones. H e begins with the vorticity equation for a surface of constant potential temperature and by assuming steady state and neglecting the contribution of vertical advectwn of the tangential vorticity vector derives the equation
V - ( G V ) = F -ÔQ
de
in which Q is the component of the absolute vorticity normal to a surface of constant potential temperature, V is the horizontal wind vector, F is the vorticity of the frictional force, and 8 is the potential temperature.
Over Arabia and West Pakistan the heat low slowly intensifies from late M a y until mid-July then slowly weakens until it disappears after mid-September. Thus one might be justified in assuming steady state condi-
JAN FEB MAR APR MAY JUNE JULY AUG SEPT OCT NOV DEC
F I G . 8. Relative vorticity of the mean monthly resultant winds over the triangle Peshawar (34°01'N; 71°35'E); Karachi, (24°55'N; 67°09'E); Jodhpur (26°18'N; 73°01'E) in units of K T 6 sec"1.
648
M A R C H 1966 C . S. R A M A G E 149
tions and in exploring the implications of Petterssen's equation.
The term on the left measures the intensity of the vorticity source, i.e., the export per unit time of vor-ticity through the boundaries of a unit area in a surface of constant potential temperature. The export depends on F, the intensity of the heat or cold source, Ô, and the sign of dQ/dd which differs insignificantly from dQ/dZ.
In only one part of the heat low are m e a n resultant tropospheric winds available for computing vorticity, the triangle enclosed by the rawinsonde stations of Pehsawar, Jodhpur, and Karachi. Fig. 8 depicts the m e a n distribution through the year and through the troposphere of the relative vorticity computed by the Bellamy (1949) method for the triangle, whose centroid is located a't about 28N 7 IE, on the axis of the heat low.
If F and [—è(dQ/dd)~] have the same sign, the sign of the vorticity export is known. During summer over the heat low, 6 is always positive while in the stippled area of the diagram, F > 0 and (dQ/dd)<0. Fig. 8 shows that beginning in early June cyclonic vorticity is exported from the triangle in the middle and upper troposphere. If vorticity is similarly exported from Arabia then cyclonic vorticity accumulates over the northern Arabian Sea. A s long as the air remains dry development is unlikely but by mid-June moist air reaches the northeast Arabian Sea, usually from the south or east. Then buoyancy forces come into play, a subtropical cyclone develops, and the first burst of monsoon rains drenches the B o m b a y district. The subtropical cyclone through the agency of subsidence further intensifies the' heat low which then exports additional cyclonic vorticity to the middle and upper troposphere over the northern Arabian Sea. It m a y be no accident that the rains of western India set in (latitude for latitude) later than the rains of eastern India and B u r m a for the latter probably play a part in initiating the sharp increase in anticyclonic vorticity above the West Pakistan heat low in late M a y .
A s Miller and Keshavamurthy (1965) show, a subtropical cyclone lasts from one to three weeks, modifying its environment so as finally to reduce the supply of moist air to the circulation below the sustaining point. The cyclone fills, and a monsoon "break" ensues. Then when a new supply of moist air becomes available, subtropical cyclogenesis m a y once more occur in the favored location. 1 In a more general discussion, Pisharoty (1964) accounts for diminution of monsoon rains in terms of decreasing slope of isentropic surfaces resulting from the release of latent heat in the condensation process.
Fig. 8 shows that the depth of the layer of positive [F—è{dQ/dd)~\ over the heat low decreases rapidly through September. At the same time, 6 also decreases. B y mid-September, in most years, positive vorticity is no longer exported to the northern Arabian Sea and no further subtropical cyclogenesis occurs there. One consequence of the model, indicated by crudely quanti
tative computations, is that the Arabian Sea subsidence inversion m a y so limit the supply of moisture as to m a k e appreciably heavy monsoon rains over western India unlikely without significant incursions of deeply moist air from the Bay of Bengal across the peninsula. A burst of west Indian monsoon rains is usually preceded by increased depth of the moist layer to the east.
The worst west Indian summer drought in history occurred in 1899. Over northwest India both surface temperatures and pressures were above normal. Over the Arabian Sea surface winds were below normal. Intense insolation favored heat low development but the absence of subsidence above the heat low resulting in turn from the absence of rain systems to the south and east outweighed the effect of insolation. Presumably if "feedback" between rain systems and heat low is interrupted, export of mid-tropospheric cyclonic vorticity to the northern Arabian Sea is reduced, chances of subtropical cyclogenesis are lessened, the heat low remains relatively weak, and drought tightens its grip.
5. Concluding remarks
The foregoing discussion implies a symbiotic relationship between heat lows and subtropical cyclones. Because cold upwelling coastal waters keep Somalia and Arabia dry and hot throughout the summer, because a complex of desiccating influences are at work over West Pakistan, because topography concentrates mid-tropospheric cyclonic vorticity over the northern Arabian Sea, and because deep moist air can reach the region only from south or east, the relationship is strongly developed over West Pakistan and the northeast Arabian Sea.
However, rain-producing systems similar in character to subtropical cyclones have been observed south of the Saharan heat low (Gilchrist, 1960). In early summer, south of the thermal equator over the South China Sea and the Bay of Bengal, subtropical cyclones m a y also develop (Ramage, 1959, 1964), but as summer advances, warm-cored cyclones dominate these seas and moving inland displace the dry cloud-free air of the heat lows. Thus m a n y meteorologists maintain that the summer lows of North Viet N a m and the Ganges Valley are in reality only the statistical effects of stagnating, dissipating tropical storms (Palmer, 1951).
The summer regime over the Arabian Sea is a strange one whose character seems basically determined by the vast desert arc extending from northeast Africa to northwest India and by coastline orientation. T h e heat low develops over the deserts but then is maintained and protected by its offspring, upwelling along the west coast and subtropical cyclones in the northeast. The result is the most intense monsoon system on earth, gale force southwesterlies overlain by jet strength easterlies. Despite such vigor, no moving cyclone
649
150 J O U R N A L O F T H E A T M O S P H E R I C S C I E N C E S V O L U M E 23
system ever enters the region during s u m m e r . Tropical
hurricanes are u n k n o w n ( R a m a g e , 1959), while the
subtropical cyclones develop, intensify and fill in situ
equally as captive to orography as the heat low.
Acknowledgments. This w o r k forms part of an in
vestigation of the general atmospheric circulation of
the Indian Ocean region m a d e possible b y grant
G-22413 from the National Science Foundation.
REFERENCES
Bellamy, J. C , 1949: Objective calculations of divergence, vertical velocity, and vorticity. Bull. Amer. Meteor. Soc., 30, 45-49.
Bunker, A . F . , 1965 : Interaction of the summer monsoon air with the Arabian Sea (preliminary analysis). Paper presented at Symposium on Meteorological Results of the International Indian Ocean Expedition, Bombay, 22 July 1965.
Dallas, W . L . , 1887 : Memoir on the winds and monsoons of the Arabian Sea and north Indian Ocean. Calcutta, Supt. of Govt. Printing, India, 45 pp.
Dixit, C . M . , and D . R . Jones, 1965: A kinematic and dynamical study of active and weak monsoon conditions over India during June and July, 1964. International Meteorological Center, Bombay (prepub.) 28 pp. (Available from International Meteorological Center, Colaba Observatory, Bombay-5, India.)
Flohn, H . , 1964: Investigations on the tropical easterly jet. Bonner Meteor. Abhand., 4, 80 pp.
Frost, R . , and P . M . Stephenson, 1965: M e a n streamlines and isotachs at standard pressure levels over the Indian and west
Pacific Oceans and adjacent land areas. Geophys. Mem., 109, 24 pp.
Gilchrist, A . , 1960: Contour charts for July 1960 in the West African area. Tech. Notes, Brit. W. African Meteor. Services, 19,5 pp.
Miller, F . R . , and R . N . Keshavamurthy, 1965 : The Arabian Sea summer monsoon. Paper presented at Symposium on Meteorological Results of the. International Indian Ocean Expedition, Bombay, 2jS July 1965.
Palmer, C . E . , 1951: Tropical meteorology. Compendium of Meteorology, Boston, Amer. Meteor. Soc, p. 873.
Petterssen, S., 1956: Weather Analysis and Forecasting, Second Edition. Vol. I, Motion and motion systems, N e w York, McGraw-Hill, 428 pp.
Pisharoty, P . R . , 1964: Monsoon pulses. Proc. W M O Symposium on Tropical Meteorology, Rotorua, N e w Zealand, 373-379.
Ramage, C . S., 1959: Hurricane development. / . Meteor., 16, 227-237. , 1962: The subtropical cyclone. / . Geophys. Res., 67, 1401-1411. , 1964: Some preliminary research results from the International Meteorological Center. Proc. W M O Symposium on Tropical Meteorology, Rotorua, N e w Zealand, 403-408.
Raman , C . R . V . , and C . M . Dixit, 1964: Analyses of monthly mean resultant winds for standard pressure levels over the Indian Ocean and adjoining continental areas. Proc. W M O Symposium on Tropical Meteorology, Rotorua, N e w Zealand, 107-118. , and Y . Ramanathan, 1964: Interaction between lower and upper tropical tropospheres. Nature, 204, 31-35.
Royal Netherlands Meteorological Institute, 1952 : Indian Ocean Océanographie and Meteorological Data, Second Edition, 31 pp. and 24 charts.
Simpson, R . H . , 1952: Evolution of the kona storm, a subtropical cyclone. J. Meteor., 9, 24-35.
650
DEPARTMENT OF COMMERCE A N D INDUSTRIES
DIVISION OF SEA FISHERIES
OCEAN CURRENTS AND WATER MASSES AT 1,000, 1,500 AND 3,000
METRES IN THE SOUTH-WEST INDIAN OCEAN
BY
G. A. VISSER AND M . M . VAN NIEKERK
INVESTIGATIONAL REPORT No. 52
INVEST. REP. DIV. SEAFISH- S. AFR. 52: 1-46
Issued by the Division of Sea Fisheries, Beach Road, Sea Point, Cape Town
REPUBLIC OF S O U T H AFRICA
Collected reprints of the International Indian Ocean Expedition, vol. IV, contribution no. 241 651
Invest. Rep. N o . 52 of Division of Sea Fisheries 3
Contents. PAGE.
1. Summary 5
2. Introduction 5
3. Ocean Currents 7
3.1. Dynamic calculations, 3.2. Current directions at the 1,000 db surface. 3.3. Current directions at the 1,500 db surface. 3.4. Current directions at the 3,000 db surface. 3.5. Current velocities. 3.6. Influence of bottom topography.
4 . Influence of Salinity 18 4.1. Salinity and Water Masses at 1,000 metres. 4.2. Salinity and Water Masses at 1,500 metres. 4.3. Salinity and Water Masses at 3,000 metres.
5. Temperature Characteristics 22 5.1. Temperature and Water Masses at 1,000 metres.
5.2. Temperature and Water Masses at 1,500 metres. 5.3. Température and Water Masses at 3,000 metres.
6. Depth, Salinity and Temperature at the at = 27 • 20, 27 • 40 and 27 • 60 Surfaces 26
7. M e a n T / S Relationships. 29
8. Southward Protrusions and the Current South of Madagascar 30
9. M o v e m e n t of Atlantic Water in the South-West Indian Ocean 30
10. Acknowledgements 31
11. References. 32
Invest. Rep. N o . 52 of Division of Sea Fisheries 5
1. Summary. This report deals with data collected during the
three cruises of R . S . Africana!! undertaken in the South-West Indian Ocean during 1961, 1962 and 1963.
During these investigational cruises observations were made of the temperature, salinity, dissolved oxygen and inorganic phosphate of the waters at international sampling depths. The sigma-t values were calculated by means of temperature and salinity data' which were in turn used for dynamic calculations.
In the determination of current directions according to isobaths at the various sigma-t surfaces, use was m a d e of the principle that, if the surface of discontinuity has a downward gradient towards the left, the current will flow in the direction in which an observer is looking when standing between the two relevant stations ( S V E R D R U P et al. 1942).
If a comparison is m a d e between the current directions according to the dynamic topographical charts and the sigma-t charts, a very close agreement is observed. U p to the present research workers have made use mainly of identifying properties such as sigma-t, salinity and temperature for determining the direction of ocean currents and for identifying water masses on a theoretical basis.
According to the isobaths at the three selected sigma-t surfaces there is a possibility that water flows from an easterly direction over the M a d a gascar Ridge to the Agulhas Current, this flow being marked between stations 5 to 13 and 26 to 30. A s appears clearly from an analysis of the temperature and salinity, the water at great depths at the above-mentioned stations is mainly of Atlantic origin or otherwise of Indian Ocean origin. C o n sequently it is very probable that the isobaths indicate the actual path of water transportation. Apparently the current directions shown by the isodynamic lines are also confirmed. The trend of isohalines and isotherms at the various sigma-t surfaces further supports this conclusion.
In the area just to the south of Madagascar the current direccions, according to the sigma-t charts, confirm the supposition that water first moves south-eastwards, to flow over the Madagascar Ridge and curve north-westwards. Water gyrals, cyclonic or anticyclonic, as indicated by the dynamic topographic lines are confirmed by the isobaths, isotherms and isohalines at the sigma-t surfaces 27-20, 27-40 and 27-60.
Furthermore the isobaths on the sigma-t charts distinctly indicate that water flows from an easterly direction towards Madagascar. Part of this water is apparently deflected in a northerly direction along the east coast of Madagascar and the remainder moves around the southern tip of Madagascar.
In regard to the water masses of the area, it m a y be assumed with a large degree of certainty that Antarctic Intermediate Water, W a r m Deep Water (originating from the Atlantic Ocean and the Mozambique Channel) and Bottom Water form a large anticyclonic movement of water in this area. The intensive anticyclonic swirls are clearly observable around station 50 and in the region of the returning Agulhas Current around stations 57 and 60. The rapidly flowing Agulhas Current and the West Wind Drift m a y also be readily identified.
It would, therefore, appear that the method of dynamic calculations for the theoretical determination of relative ocean currents at great depths is valid and gives a good picture of the general current directions.
2. Introduction. In general the South-West Indian Ocean is an
area where little intensive research has been done on the deep water masses. Only a few stations have been completed during wide-spread cruises. A s a result of this deficiency earlier research workers for example, D I E T R I C H (1935) and C L O W E S (1950), could not achieve absolute finality in their findings. The three cruises of R . S . Africana II were spread over a relatively short period during which quite a large number (70) of stations were occupied. A s a result of the fairly stable nature of the deep water masses it appears that these data agree very well. Close agreement exists between the results obtained by the above-mentioned research workers, and those from data amassed during the voyage of R . S . Africana II.
For convenience when analysing the data, the stations were numbered from 1 to 70. These numbers are given first and then followed by the corresponding formal station numbers (Fig. 1). The data constitute only part of the hydrological particulars and additional information m a y be found in the complete station list under the formal station numbers as published in the " Annual Report " series of the Division of Sea Fisheries. Stations 1 to 32 (A 1,224 to A 1,255) south of Madagascar, were worked during 1961, while stations 33 to 55 (A 1,875 to A 1,897) from Port Elizabeth to the sub-antarctic islands were worked during 1962, and stations 56 to 70 (A 2,386 to A 2,400) from Cape Agulhas to Marion Island, during 1963.
655
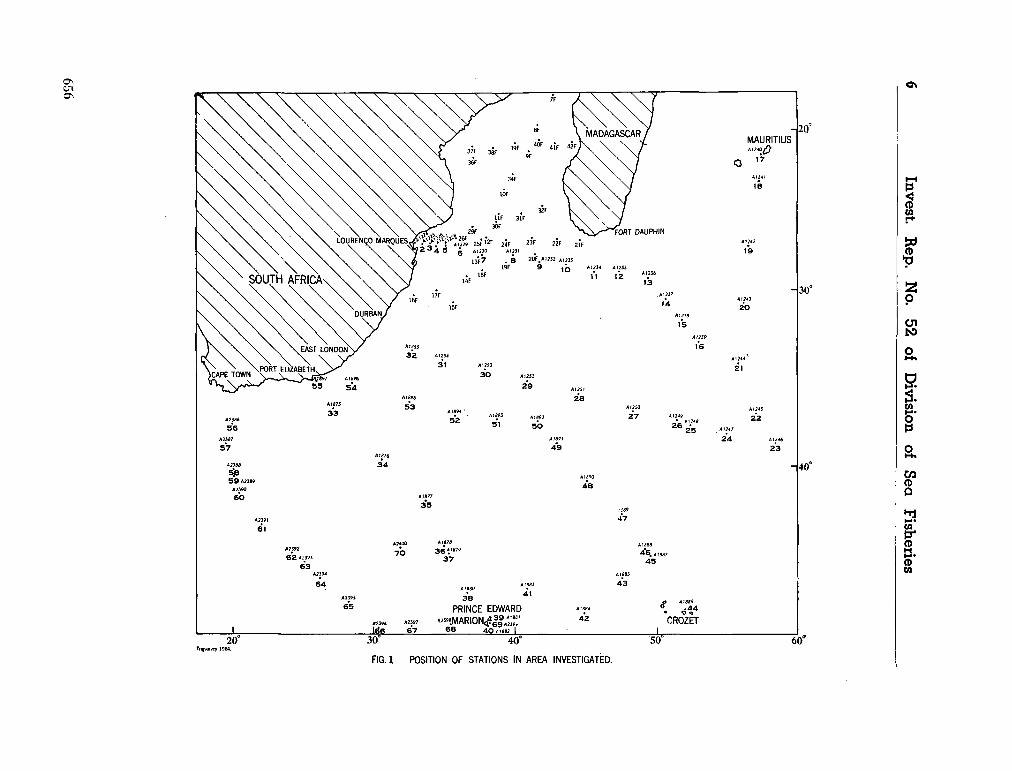
6 In
vest.
Rep
. No
. 52
of D
ivisio
n
of S
ea F
isheries
?*..
m
$,o>
¡I -II
>
in
5*5
-8
S-m
in*
?
3
<
O
O
z o
H;
CO
£
*fe £
656
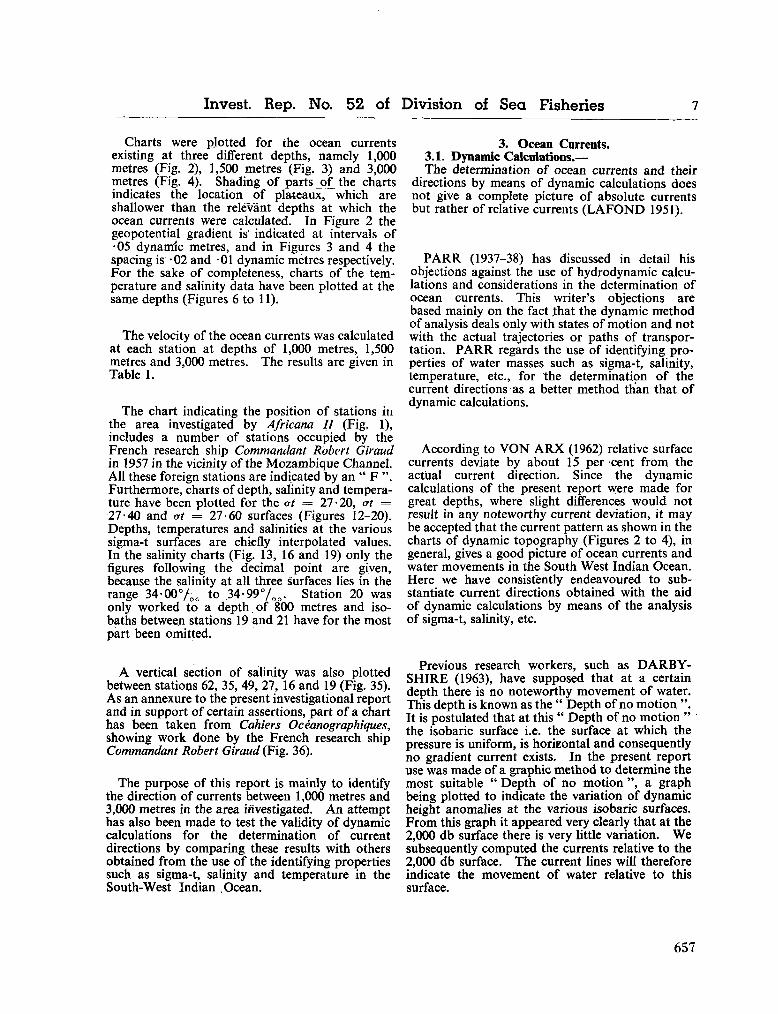
Invest. Rep. N o . 52 of Division of Sea Fisheries 7
Charts were plotted for the ocean currents existing at three different depths, namely 1,000 metres (Fig. 2), 1,500 metres (Fig. 3) and 3,000 metres (Fig. 4). Shading of parts c£ the charts indicates the location of plateaux, which are shallower than the relevant depths at which the ocean currents were calculated. In Figure 2 the geopotential gradient is indicated at intervals of •05 dynamic metres, and in Figures 3 and 4 the spacing is -02 and -01 dynamic mètres respectively. For the sake of completeness, charts of the temperature and salinity data have been plotted at the same depths (Figures 6 to 11).
The velocity of the ocean currents was calculated at each station at depths of 1,000 metres, 1,500 metres and 3,000 metres. The results are given in Table 1.
The chart indicating the position of stations in the area investigated by Africana II (Fig. 1), includes a number of stations occupied by the French research ship Commandant Robert Giraud in 1957 in the vicinity of the Mozambique Channel. All these foreign stations are indicated by an " F ". Furthermore, charts of depth, salinity and temperature have been plotted for the at = 27-20, at = 27-40 and at = 27-60 surfaces (Figures 12-20). Depths, temperatures and salinities at the various sigma-t surfaces are chiefly interpolated values. In the salinity charts (Fig. 13, 16 and 19) only the figures following the decimal point are given, because the salinity at all three surfaces lies in the range 34-00°/oc, to 3 4 - 9 9 % 0 . Station 20 was only worked to a depth of 800 metres and isobaths between stations 19 and 21 have for the most part been omitted.
A vertical section of salinity was also plotted between stations 62, 35, 49, 27, 16 and 19 (Fig. 35). A s an annexure to the present investigational report and in support of certain assertions, part of a chart has been taken from Cahiers Océanographiques, showing work done by the French research ship Commandant Robert Giraud (Fig. 36).
The purpose of this report is mainly to identify the direction of currents hetween 1,000 metres and 3,000 metres in the area investigated. A n attempt has also been m a d e to test the validity of dynamic calculations for the determination of current directions by comparing these results with others obtained from the use of the identifying properties such as sigma-t, salinity and temperature in the South-West Indian Ocean.
3. Ocean Currents. 3.1. Dynamic Calcinations.— The determination of ocean currents and their
directions by means of dynamic calculations does not give a complete picture of absolute currents but rather of relative currents ( L A F O N D 1951).
P A R R (1937-38) has discussed in detail his objections against the use of hydrodynamic calculations and considerations in the determination of ocean currents. This writer's objections are based mainly on the fact .that the dynamic method of analysis deals only with states of motion and not with the actual trajectories or paths of transportation. P A R R regards the use of identifying properties of water masses such as sigma-t, salinity, temperature, etc., for the determination of the current directions as a better method than that of dynamic calculations.
According to V O N A R X (1962) relative surface currents deviate by about 15 per cent from the actual current direction. Since the dynamic calculations of the present report were m a d e for great depths, where slight differences would not result in any noteworthy current deviation, it m a y be accepted that the current pattern as shown in the charts of dynamic topography (Figures 2 to 4), in general, gives a good picture of ocean currents and water movements in the South West Indian Ocean. Here w e have consistently endeavoured to substantiate current directions obtained with the aid of dynamic calculations by means of the analysis of sigma-t, salinity, etc.
Previous research workers, such as D A R B Y -S H I R E (1963), have supposed that at a certain depth there is no noteworthy movement of water. This depth is known as the " Depth of no motion ". It is postulated that at this " Depth of no motion " the isobaric surface i.e. the surface at which the pressure is uniform, is horizontal and consequently no gradient current exists. In the present report use was m a d e of a graphic method to determine the most suitable " Depth of no motion ", a graph being plotted to indicate the variation of dynamic height anomalies at the various isobaric surfaces. F r o m this graph it appeared very clearly that at the 2,000 db surface there is very little variation. W e subsequently computed the currents relative to the 2,000 db surface. The current lines will therefore indicate the movement of water relative to this surface.
657
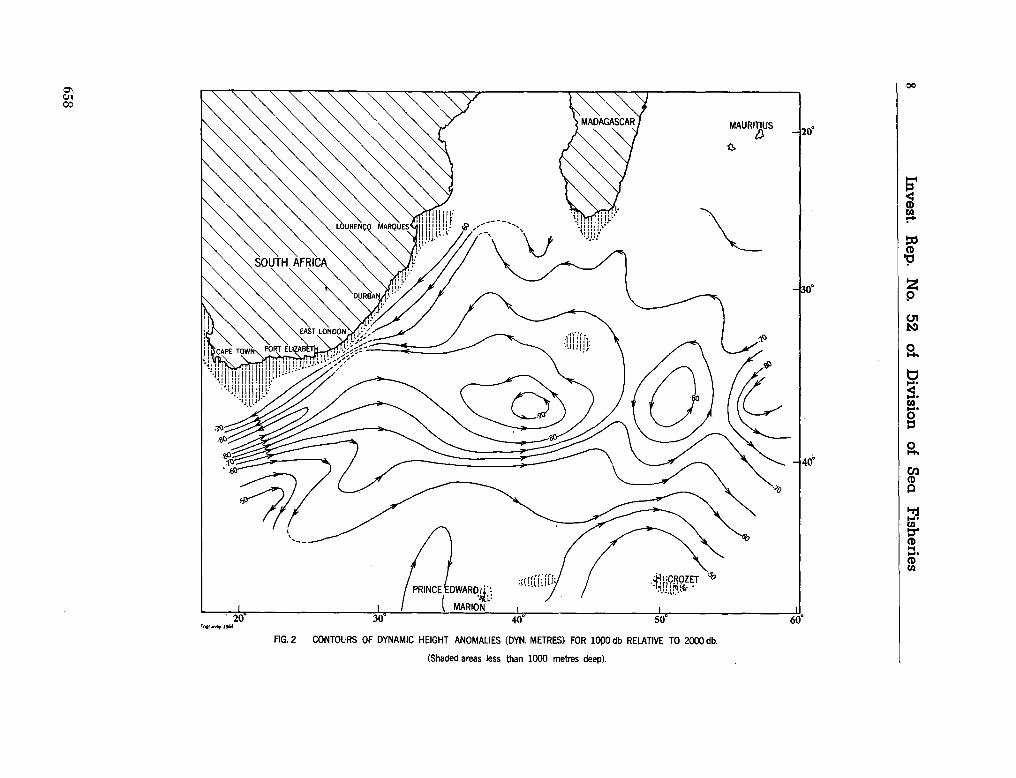
8 In
vest.
Re
p. N
o. 5
2
of D
ivisio
n
of S
ea
Fish
eries
658
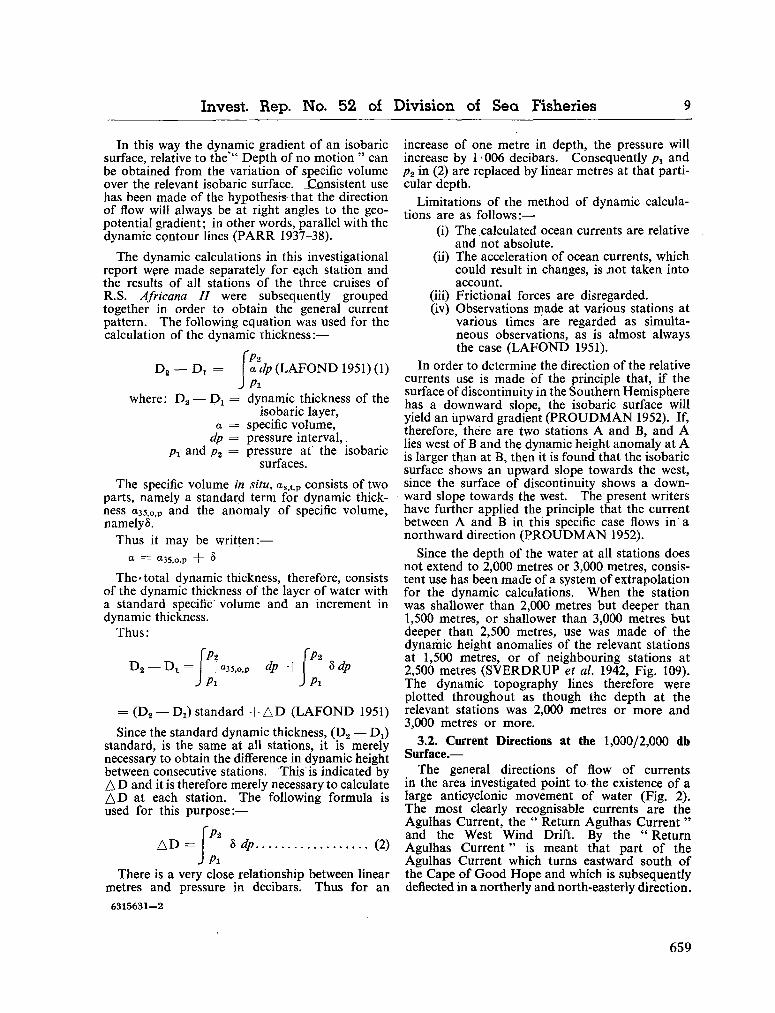
Invest. Rep. No. 52 of Division of Sea Fisheries 9
In this way the dynamic gradient of an isobaric surface, relative to the*" Depth of no motion " can be obtained from the variation of specific volume over the relevant isobaric surface. JZonsistent use has been made of the hypothesis that the direction of flow will always be at right angles to the geo-potential gradient; in other words, parallel with the dynamic contour lines ( P A R R 1937-38).
The dynamic calculations in this investigational report wçre made separately for each station and the results of all stations of the three cruises of R . S . Africana II were subsequently grouped together in order to obtain the general current pattern. The following equation was used for the calculation of the dynamic thickness :—
D 2 — D x = a dp ( L A F O N D 1951) (1) J Pi
where : D 2 — Pi = dynamic thickness of the isobaric layer,
a = specific volume, dp = pressure interval,.
Pi and p2 = pressure at the isobaric surfaces.
The specific volume in situ, aM,p consists of two parts, namely a standard term for dynamic thickness a35,o,p and the anomaly of specific volume, namelyS.
Thus it m a y be written:— a = a35,0,p + S
The'total dynamic thickness, therefore, consists of the dynamic thickness of the layer of water with a standard specific volume and an increment in dynamic thickness.
Thus:
D 2 — D v
Pi a35,o,p dp
Pi
P* S dp
Pi
= (D2 — D O standard + A D ( L A F O N D 1951)
Since the standard dynamic thickness, (D2 — D t ) standard, is the same at all stations, it is merely necessary to obtain the difference in dynamic height between consecutive stations. This is indicated by A D and it is therefore merely necessary to calculate A D at each station. The following formula is used for this purpose:—
A D = P%
8 dp. (2) Pi
There is a very close relationship between linear metres and pressure in decibars. Thus for an
6315631-2
increase of one metre in depth, the pressure will increase by 1 • 006 decibars. Consequently px and Pi in (2) are replaced by linear metres at that particular depth.
Limitations of the method of dynamic calculations are as follows:—
(i) The calculated ocean currents are relative and not absolute,
(ii) The acceleration of ocean currents, which could result in changes, is not taken into account,
(iii) Frictional forces are disregarded, (iv) Observations made at various stations at
various times are regarded as simultaneous observations, as is almost always the case ( L A F O N D 1951).
In order to determine the direction of the relative currents use is made of the principle that, if the surface of discontinuity in the Southern Hemisphere has a downward slope, the isobaric surface will yield an upward gradient ( P R O U D M A N 1952). If, therefore, there are two stations A and B , and A lies west of B and the dynamic height anomaly at A is larger than at B , then it is found that the isobaric surface shows an upward slope towards the west, since the surface of discontinuity shows a d o w n ward slope towards the west. The present writers have further applied the principle that the current between A and B in this specific case flows in a northward direction ( P R O U D M A N 1952).
Since the depth of the water at all stations does not extend to 2,000 metres or 3,000 metres, consistent use has been made of a system of extrapolation for the dynamic calculations. W h e n the station was shallower than 2,000 metres but deeper than 1,500 metres, or shallower than 3,000 metres but deeper than 2,500 metres, use was made of the dynamic height anomalies of the relevant stations at 1,500 metres, or of neighbouring stations at 2,500 metres ( S V E R D R U P et al. 1942, Fig. 109). The dynamic topography lines therefore were plotted throughout as though the depth at the relevant stations was 2,000 metres or more and 3,000 metres or more.
3.2. Current Directions at the 1,000/2,000 db Surface.—
The general directions of flow of currents in the area investigated point to the existence of a large anticyclonic movement of water (Fig. 2). The most clearly recognisable currents are the Agulhas Current, the " Return Agulhas Current " and the West W i n d Drift. By the " Return Agulhas Current " is meant that part of the Agulhas Current which turns eastward south of the Cape of G o o d H o p e and which is subsequently deflected in a northerly and north-easterly direction.
659
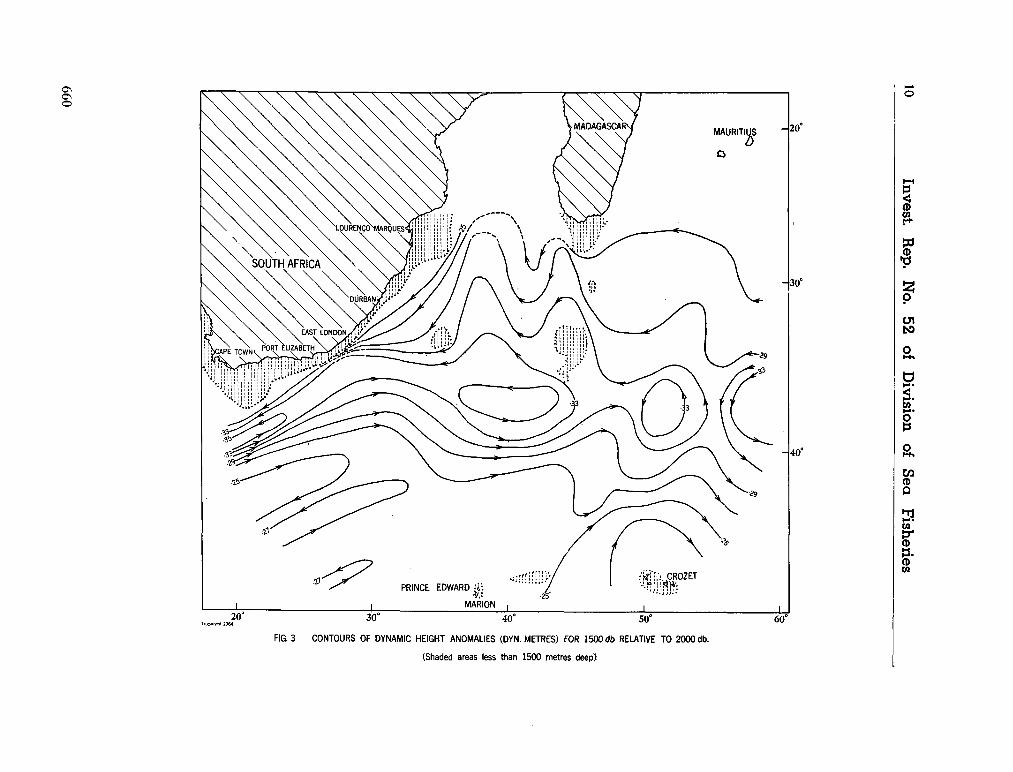
10 In
vest.
Re
p. N
o. 5
2
of D
ivisio
n
of S
ea
Fish
eries
660
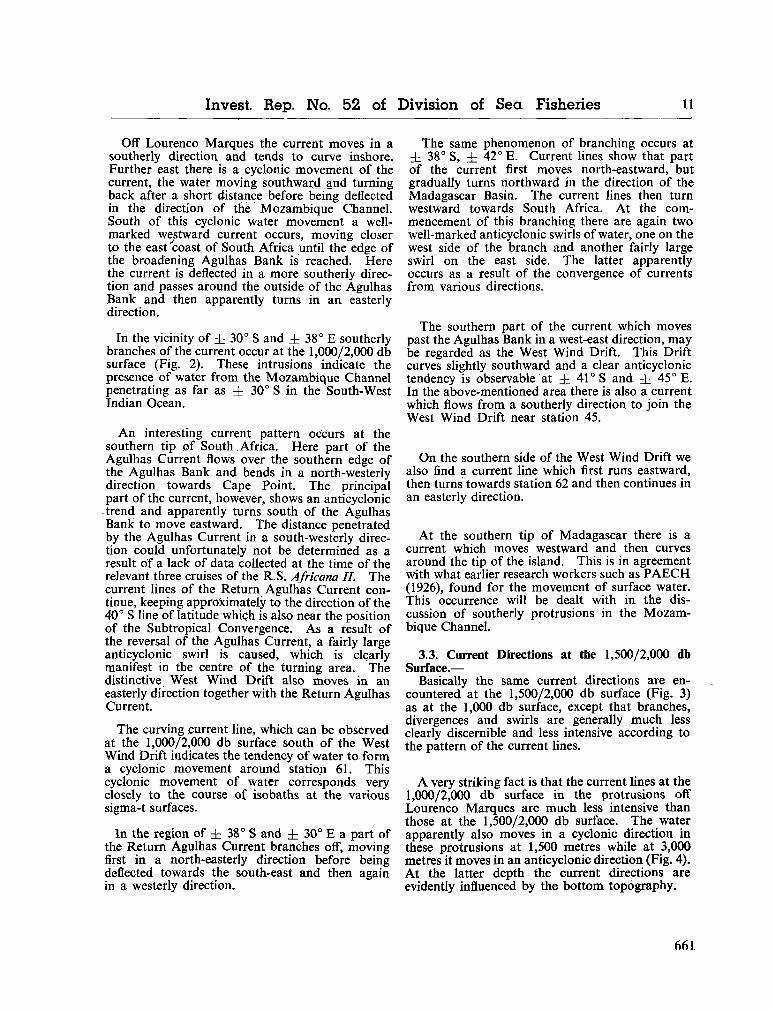
Invest. Rep. N o . 52 of Division of Sea Fisheries 11
Off Lourenco Marques the current moves in a southerly direction and tends to curve inshore. Further east there is a cyclonic movement of the current, the water moving southward ^ n d turning back after a short distance before being deflected in the direction of the Mozambique Channel. South of this cyclonic water movement a well-marked westward current occurs, moving closer to the east coast of South Africa until the edge of the broadening Agulhas Bank is reached. Here the current is deflected in a more southerly direction and passes around the outside of the Agulhas Bank and then apparently turns in an easterly direction.
In the vicinity of ± 30° S and ± 38° E southerly branches of the current occur at the 1,000/2,000 db surface (Fig. 2). These intrusions indicate the presence of water from the Mozambique Channel penetrating as far as ± 30° S in the South-West Indian Ocean.
A n interesting current pattern occurs at the southern tip of South Africa. Here part of the Agulhas Current flows over the southern edge of the Agulhas Bank and bends in a north-westerly direction towards Cape Point. The principal part of the current, however, shows an anticyclonic trend and apparently turns south of the Agulhas Bank to m o v e eastward. The distance penetrated by the Agulhas Current in a south-westerly direction could unfortunately not be determined as a result of a lack of data collected at the time of the relevant three cruises of the R . S . Africana II. The current lines of the Return Agulhas Current continue, keeping approximately to the direction of the 40° S line of latitude which is also near the position of the Subtropical Convergence. A s a result of the reversal of the Agulhas Current, a fairly large anticyclonic swirl is caused, which is clearly manifest in the centre of the turning area. The distinctive West W i n d Drift also moves in an easterly direction together with the Return Agulhas Current.
The curving current line, which can be observed at the 1,000/2,000 db surface south of the West W i n d Drift indicates the tendency of water to form a cyclonic movement around station 61. This cyclonic movement of water corresponds very closely to the course of isobaths at the various sigma-t surfaces.
In the region of ± 38° S and ± 30° E a part of the Return Agulhas Current branches off, moving first in a north-easterly direction before being deflected towards the south-east and then again in a westerly direction.
The same phenomenon of branching occurs at ± 38° S, ± 42° E . Current lines show that part of the current first moves north-eastward, but gradually turns northward in the direction of the Madagascar Basin. The current lines then turn westward towards South Africa. At the c o m mencement of this branching there are again two well-marked anticyclonic swirls of water, one on the west side of the branch and another fairly large swirl on the east side. The latter apparently occurs as a result of the convergence of currents from various directions.
The southern part of the current which moves past the Agulhas Bank in a west-east direction, m a y be regarded as the West W i n d Drift. This Drift curves slightly southward and a clear anticyclonic tendency is observable at ± 41° S and ± 45° E . In the above-mentioned area there is also a current which flows from a southerly direction to join the West Wind Drift near station 45.
O n the southern side of the West Wind Drift w e also find a current line which first runs eastward, then turns towards station 62 and then continues in an easterly direction.
At the southern tip of Madagascar there is a current which moves westward and then curves around the tip of the island. This is in agreement with what earlier research workers such as P A E C H (1926), found for the movement of surface water. This occurrence will be dealt with in the discussion of southerly protrusions in the M o z a m bique Channel.
3.3. Current Directions at the 1,500/2,000 db Surface.—
Basically the same current directions are encountered at the 1,500/2,000 db surface (Fig. 3) as at the 1,000 db surface, except that branches, divergences and swirls are generally m u c h less clearly discernible and less intensive according to the pattern of the current lines.
A very striking fact is that the current lines at the 1,000/2,000 db surface in the protrusions off Lourenco Marques are m u c h less intensive than those at the 1,500/2,000 db surface. The water apparently also moves in a cyclonic direction in these protrusions at 1,500 metres while at 3,000 metres it moves in an anticyclonic direction (Fig. 4). At the latter depth the current directions are evidently influenced by the bottom topography.
661
12
Invest.
Re
p. N
o. 5
2
of D
ivisio
n
of S
ea
Fish
eries
E
j.
662
Invest. Rep. N o . 52 of Division of Sea Fisheries 13
South-east of and opposite Durban the westward moving current tends to turn south and then to m o v e towards the east coast of South Africa again between stations 32 and 54.
O n the east side of the Madagascar Ridge the current lines indicate that at the 1,500/2,000 db surface around stations 21-23 there is a southward flowing cufrent, part of which moves in the direction of Madagascar and joins the current flowing westward, from the direction of station 19.
South-west of Madagascar in the vicinity of stations 8-10 well-defined southward current tendencies occur on the 1,500/2,000 db surface. The tendency of the current to turn back is apparently due to Atlantic water which has a northward component in the direction of the Mozambique Channel. '
The most prominent anticyclonic swirl noticeable at both the 1,000/2,000, db and 1,500/2,000 db surfaces is that found around station 50. In addition there are well-marked anticyclonic swirls around stations 62 and 65 at the deeper surface. The fact that the Agulhas Current tends to m o v e at an ever-decreasing rate around Cape Point towards the west coast of South Africa at the deeper surface m a y very clearly be observed.
In general, therefore, a part of the water moves south-ward along the east coast of South Africa, turns back in an easterly direction and then curves again in the direction of the Mozambique Channel, forming in this way a large anticyclonic water movement in the South-West Indian Ocean.
3.4. Current Directions at the 3,000/2,000 db Surface.—
The ocean currents as indicated by current directions at 3,000 metres, relative to the 2,000 db surface, are shown in Figure 4. Current lines have been plotted only where the area is deeper than 3,000 metres.
A n important characteristic of ocean currents at this depth is that in general they flow in opposite directions to those at 1,000 and 1,500 metre depths. There is, for example, a well-marked cyclonic swirl around station 50. F r o m a northerly direction there is also a tendency for the water from the Mozambique Channel to penetrate the Natal Basin and cause an anticyclonic move'ment of the current. In the same way, between stations 32 and 54 there is also a perceptible anticyclonic swirl, part of which apparently branches off and forms the deeper part of the Agulhas Current. According to the distribution of the current lines, it appears that the water between stations 6 and 31 flows over the shallow part, including the M o z a m bique Terrace and is then deflected by the southward-stretching Agulhas bank.
Other distinct anticyclonic swirls are perceptible around stations 36 and 61. According to the course of the current line between stations 66 and 67, the current flows north-eastward and turns back in the Natal Deep in the direction of station 65. The cyclonic swirl around station 50 is apparently due to the southward movement of water from the Mozambique Channel and the northward-moving water from the direction of stations 66 and 67.
O n the eastern side of the Madagascar Ridge there is a westward movement of water, which later changes into a north-eastward current. Around station 68 there is a current line which gives a slight indication of a cyclonic movement of water.
3.5. Current Velocities.—
The velocities of ocean currents in the area are given in Table I. These velocities were calculated according to the basic formula :—
10(DA — D B )
V = . . . . (LAFOND 1951) L 2a>Sin. (p
Where V = Relative current velocity in c m . / sec. at right angles to the line joining the two stations.
D A — D B = Difference between dynamic height anomalies at stations A and B in dynamic metres.
L = Distance between stations in nautical miles,
aj = Angular velocity of the earth's rotation = 0-729 X 10"4
radians per sec. rp = Average latitude between sta
tions. This formula was reduced to the following:—
c (DA — D B ) n V = (LAFOND 1951).
L 1
where c = and is called 2cu Sin. q>. 10s
the current factor.
n = 53959 and is called the unit conversion factor, dependent on the units of the other variables.
F r o m Table I it is clear that even at relatively great depths there are relatively rapid currents between certain stations. At a depth of 1,000 metres, for example, velocities of 15-6 cm./sec. and 21-8 cm./sec. were obtained between stations 57 and 58, and 58 and 60. A t 1,500 metres there is a velocity of 7-0 cm./sec. between stations 58 and 60 A fairly high velocity of 10-5 cm./sec is also found
663
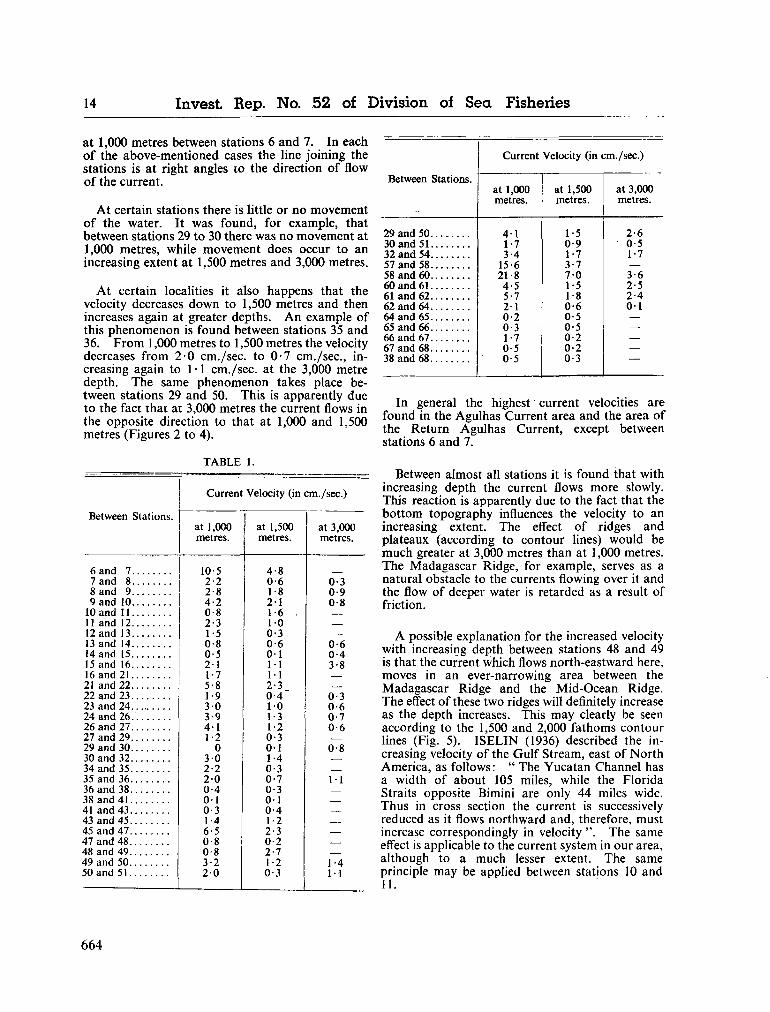
14 Invest. Rep. N o . 52 of Division of Sea Fisheries
at 1,000 metres between stations 6 and 7. In each of the above-mentioned cases the line joining the stations is at right angles to the direction of flow of the current.
At certain stations there is little or no movement of the water. It was found, for example, that between stations 29 to 30 there was no movement at 1,000 metres, while movement does occur to an increasing extent at 1,500 metres and 3,000 metres.
At certain localities it also happens that the velocity decreases d o w n to 1,500 metres and then increases again at greater depths. A n example of this phenomenon is found between stations 35 and 36. F r o m 1,000 metres to 1,500 metres the velocity decreases from 2-0 cm./sec. to 0-7 cm. / sec , increasing again to 1 • 1 cm./sec. at the 3,000 metre depth. The same phenomenon takes place between stations 29 and 50. This is apparently due to the fact that at 3,000 metres the current flows in the opposite direction to that at 1,000 and 1,500 metres (Figures 2 to 4).
TABLE 1.
Between Stations.
6 and 7 7 and 8 8 and 9 9 and 10
10 and 11 11 and 12 12 and 13 13 and 14 14and 15 15 and 16 16and21 21 and 22 22 and 23 23 and 24 24 and 26. 26 and 27 27 and 29 29 and 30 30 and 32 34 and 35 35 and 36 36 and 38 38 and 41 41 and 43 43 and 45 45 and 47 47 and 48 48 and 49 49 and 50 50 and 51
Current Velocity (in cm./sec.)
at 1,000 metres.
10-5 2-2 2-8 4-2 0-8 2-3 1-5 0-8 0-5 21 1-7 5-8 1-9 30 3-9 4-1 1-2
0 30 2-2 20 0-4 01 0-3 1-4 6-5 0-8 0-8 3-2 20
at 1,500 metres.
4-8 0-6 1-8 21 1-6 . 10 0-3 0-6 01 11 11 2-3 0-4 10 1-3 1-2 0-3 01 1-4 0-3 0-7 0-3 01 0-4 1-2 2-3 0-2 2-7 1-2 0-3
1 at 3,000 metres.
0-3 0-9 0-8
—
0-6 0-4 3-8
0-3 0-6 0-7 0-6
0-8
11
— 1-4 11
Between Stations.
29 and 50 30 and 51 32 and 54 57 and 58 58 and 60 60 and 61 61 and 62 62 and 64 64 and 65 65 and 66 66 and 67 67 and 68 38 and 68
Current Velocity (in cm./sec.)
at 1,000 metres.
4-1 1-7 3-4
15 6 21-8 4-5 5-7 21 0-2 0-3 1-7 0-5 0-5
at 1,500 metres.
1-5 0-9 1-7 3-7 70 1-5 1-8 0-6 0-5 0-5 0-2 0-2 0-3
at 3,000 metres.
2-6 0-5 1-7 — 3-6 2-5 2-4 01 — — — —
In general the highest current velocities are found in the Agulhas Current area and the area of the Return Agulhas Current, except between stations 6 and 7.
Between almost all stations it is found that with increasing depth the current flows more slowly. This reaction is apparently due to the fact that the bottom topography influences the velocity to an increasing extent. The effect of ridges and plateaux (according to contour lines) would be m u c h greater at 3,000 metres than at 1,000 metres. The Madagascar Ridge, for example, serves as a natural obstacle to the currents flowing over it and the flow of deeper water is retarded as a result of friction.
A possible explanation for the increased velocity with increasing depth between stations 48 and 49 is that the current which flows north-eastward here, moves in an ever-narrowing area between the Madagascar Ridge and the Mid-Ocean Ridge. The effect of these two ridges will definitely increase as the depth increases. This m a y clearly be seen according to the 1,500 and 2,000 fathoms contour lines (Fig. 5). ISELIN (1936) described the increasing velocity of the Gulf Stream, east of North America, as follows: " The Yucatan Channel has a width of about 105 miles, while the Florida Straits opposite Bimini are only 44 miles wide. Thus in cross section the current is successively reduced as it flows northward and, therefore, must increase correspondingly in velocity ". The same effect is applicable to the current system in our area, although to a much lesser extent. The same principle m a y be applied between stations 10 and 11.
664
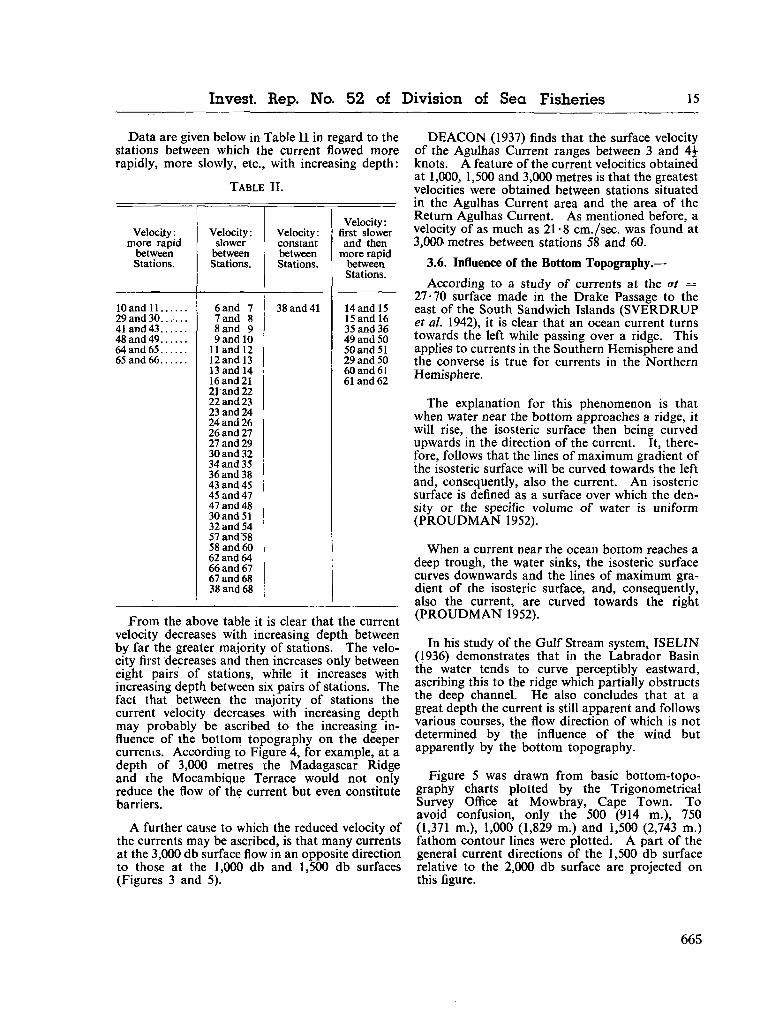
Invest. Rep. N o . 52 of Division of Sea Fisheries 15
Data are given below in Table II in regard to the stations between which the current flowed more rapidly, more slowly, etc., with increasing depth:
Velocity : more rapid
between Stations.
lOandll 29 and 3 0 . . . . . . 41and43 48 and 49 64 and 65
TABLE II.
Velocity : slower
between Stations.
6 and 7 7 and 8 8 and 9 9 and 10
11 and 12 12 and 13 13 and 14 16 and 21 21 and 22 22 and 23 23 and 24 24 and 26 26 and 27 27 and 29 30 and 32 34 and 35 36 and 38 43 and 45 45 and 47 47 and 48 30 and 51 32 and 54 57 and 58 58 and 60 62 and 64 66 and 67 67 and 68 38 and 68
Velocity: constant between Stations.
38 and 41
Velocity: first slower
and then more rapid
between Stations.
14 and 15 15 and 16 35 and 36 49 and 50 50 and 51 29 and 50 60 and 61 61 and 62
From the above table it is clear that the current velocity decreases with increasing depth between by far the greater majority of stations. The velocity first decreases and then increases only between eight pairs of stations, while it increases with increasing depth between six pairs of stations. The fact that between the majority of stations the current velocity decreases with increasing depth m a y probably be ascribed to the increasing influence of the bottom topography on the deeper currents. According to Figure 4 , for example, at a depth of 3,000 metres the Madagascar Ridge and the Mocambique Terrace would not only reduce the flow of the current but even constitute barriers.
A further cause to which the reduced velocity of the currents m a y be ascribed, is that m a n y currents at the 3,000 db surface flow in an opposite direction to those at the 1,000 db and 1,500 db surfaces (Figures 3 and 5).
D E A C O N (1937) finds that the surface velocity of the Agulhas Current ranges between 3 and 4 ^ knots. A feature of the current velocities obtained at 1,000, 1,500 and 3,000 metres is that the greatest velocities were obtained between stations situated in the Agulhas Current area and the area of the Return Agulhas Current. A s mentioned before, a velocity of as m u c h as 21-8 cm./sec. was found at 3,000> metres between stations 58 and 60.
3.6. Influence of the Bottom Topography.—
According to a study of currents at the at = 27-70 surface m a d e in the Drake Passage to the east of the South Sandwich Islands ( S V E R D R U P et al. 1942), it is clear that an ocean current turns towards the left while passing over a ridge. This applies to currents in the Southern Hemisphere and the converse is true for currents in the Northern Hemisphere.
The explanation for this phenomenon is that when water near the bottom approaches a ridge, it will rise, the isosteric surface then being curved upwards in the direction of the current. It, therefore, follows that the lines of m a x i m u m gradient of the isosteric surface will be curved towards the left and, consequently, also the current. A n isosteric surface is defined as a surface over which the density or the specific volume of water is uniform (PROUDMAN 1952).
W h e n a current near the ocean bottom reaches a deep trough, the water sinks, the isosteric surface curves downwards and the lines of m a x i m u m gradient of the isosteric surface, and, consequently, also the current, are curved towards the right (PROUDMAN 1952).
In his study of the Gulf Stream system, I S E L I N (1936) demonstrates that in the Labrador Basin the water tends to curve perceptibly eastward, ascribing this to the ridge which partially obstructs the deep channel. H e also concludes that at a great depth the current is still apparent and follows various courses, the flow direction of which is not determined by the influence of the wind but apparently by the bottom topography.
Figure 5 was drawn from basic bottom-topography charts plotted by the Trigonometrical Survey Office at M o w b r a y , Cape T o w n . T o avoid confusion, only the 500 (914 m . ) , 750 (1,371 m . ) , 1,000 (1,829 m . ) and 1,500 (2,743 m . ) fathom contour lines were plotted. A part of the general current directions of the 1,500 db surface relative to the 2,000 db surface are projected on this figure.
665
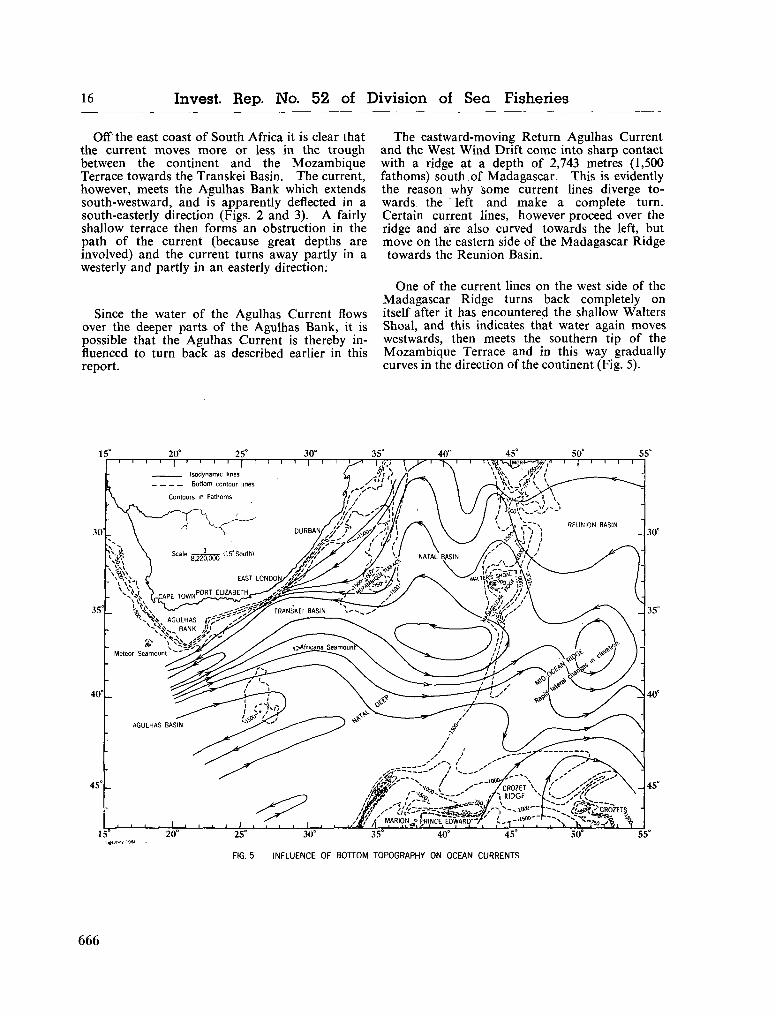
16 Invest. Rep. N o . 52 of Division of Sea Fisheries
Off the east coast of South Africa it is clear that the current moves more or less in the trough between the continent and the Mozambique Terrace towards the Transkei Basin. The current, however, meets the Agulhas Bank which extends south-westward, and is apparently deflected in a south-easterly direction (Figs. 2 and 3). A fairly shallow terrace then forms an obstruction in the path of the current (because great depths are involved) and the current turns away partly in a westerly and partly in an easterly direction:
Since the water of the Agulhas Current flows over the deeper parts of the Agulhas Bank, it is possible that the Agulhas Current is thereby influenced to turn back as described earlier in this report.
The eastward-moving Return Agulhas Current and the West W i n d Drift come into sharp contact with a ridge at a depth of 2,743 metres (1,500 fathoms) south of Madagascar. This is evidently the reason why some current lines diverge towards the left and m a k e a complete turn. Certain current lines, however proceed over the ridge and are also curved towards the left, but m o v e on the eastern side of the Madagascar Ridge towards the Reunion Basin.
O n e of the current lines on the west side of the Madagascar Ridge turns back completely on itself after it has encountered the shallow Walters Shoal, and this indicates that water again moves westwards, then meets the southern tip of the Mozambique Terrace and in this way gradually curves in the direction of the continent (Fig. 5).
Jif Í MARION _• PRINPF FÎ1WARD—/ C - . , — l í 0 0 r ^ ~"\^~>sii^/% %
25° 30° 35° 40° 45°
FIG. 5 INFLUENCE OF BOTTOM TOPOGRAPHY ON OCEAN CURRENTS
666
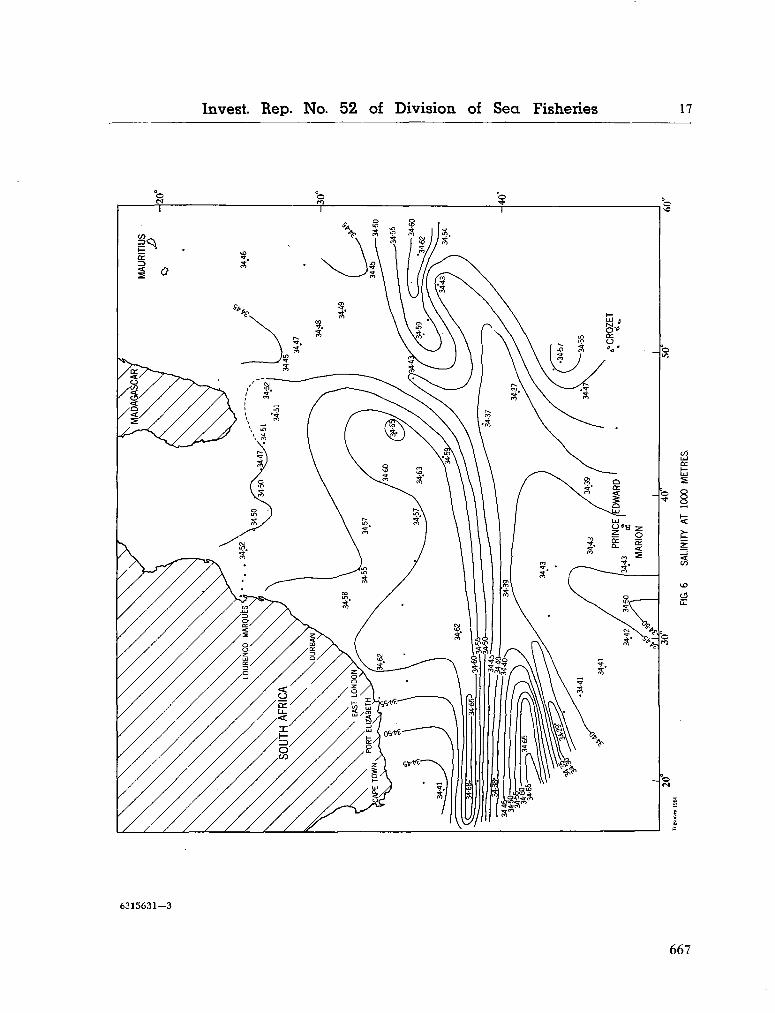
Invest. Rep. No. 52 of Division of Sea Fisheries 17
6315631—3
667
18 Invest. Rep. N o . 52 of Division of Sea Fisheries
The characteristic of currents in the Southern Hemisphere to turn to the left when passing over a ridge also explains further w h y water moving from the Mozambique Channel around the southern tip of Madagascar should be further deflected towards the left in a south-westerly direction. The water from the Return Agulhas Current and that from the Indian Ocean, which are evidently compressed between the shallow part at the southern tip of Madagascar and Walters' Shoal, apparently help to force this water back still further. Part of the water from the Mozambique Channel apparently moves (according to current lines at the 1,500/ 2,000 db surface) along the west side of the M a d a gascar Ridge in a southerly direction and is forced back as a result of the northward-moving Return Agulhas Current and flows back again in a northerly direction.
According to the contours of the Madagascar Ridge, the ocean first becomes deeper in a southerly direction and then shallows to Walters' Shoal. The deepest part is approximately due east of Durban. In this narrow part water from the Indian Ocean converges with Atlantic water and a measure of mixing is likely.
Another topographical feature which has a considerable effect on the ocean currents is the Mozambique Terrace. This shallow area apparently forces the Agulhas Current to move nearer to the continent.
According to Figure 4, it js clear that the bottom topography exercises a considerable influence at 3,000 metres, separating Atlantic Ocean water from Indian Ocean water.
At a depth of 1,000 metres the effect of the bottom topography on the current directions becomes less marked as is definitely evident from the current patterns at this depth (Fig. 2).
Over the whole area there is, therefore, adequate evidence that the bottom topography does, indeed, exercise an important influence over the deeper ocean currents.
4. Influence of Salinity.
4.1. Salinity and Water Masses at 1,000 Metres.— D E A C O N (1937) gives the following definition of
Antarctic Intermediate water:—
" The path taken by the intermediate current lies below the subsurface current and above the w a r m deep current and in longitudinal sections through each of the three main oceans it appears as a poorly saline layer between these highly saline waters ".
According to this quotation, it is possible that the Central Water ( S V E R D R U P et al. 1942) and Antartic Intermediate Water m a y be regarded as one water mass. S V E R D R U P , however, furnishes a better understanding of Antarctic Intermediate Water in the following way : " Below the Central Water the Antarctic Intermediate Water shows up by the characteristic salinity min imum . "
According to C L O W E S (1950), the salinity of Antarctic Intermediate Water ranges between 3 4 - 3 0 % o and 34-60°/o o , the depth of the nucleus varying between 1,000 metres and 1,500 metres in this area. C L O W E S also finds that Antarctic Intermediate Water follows the direction of the Agulhas Current and the Return Agulhas Current in that it flows northwards together with the Return Agulhas Current and is then carried back in the southern part of the Mozambique Channel together with the Agulhas Current.
In his investigational report of the first cruise of the R . S . Africana II during 1961, O R R E N (1963) found that the nucleus of the Antarctic Intermediate Water varied between 850 and 1,300 metres and the salinity between '34-40°/oo and 34-50°/oo in the north of the investigation area discussed in this report.
If the distribution of salinity values in general is considered, it appears that such values vary between ± 3 4 - 4 0 % o and ± 34-60°/oo (Fig. 6), except in a few cases where they are higher or lower than these two limits. O n the strength of these data it m a y therefore be said that, according to the salinity distribution, the water at a depth of 1,000 metres consists mainly of Antarctic Intermediate Water.
From a comparison of the results obtained during the cruises of the South African ship Africana II, and those of the French ship Commandant Robert Giraud during 1956, it appears that there is a fairly clear distinction between salinity values between 25° S and 27° S. In order to distinguish between stations worked by the Commandant Robert Giraud and R . S . Africana II, the stations of the former are indicated by an " F " after the station numbers, as has been mentioned above.
In the Mozambique Channel salinity values [stations 7F-11F and 31F-42F (Fig. 1)] were obtained which were mainly higher than 34-70°/oo at 1,000 metres. South of 27° S the salinities were for the most part lower than 34- 60°/o o . According to salinities it is therefore clear that there is a distinct separation between water in the Mozambique Channel and that in the South-West Indian Ocean (Cahiers Océanographiques—April, 1963).
668
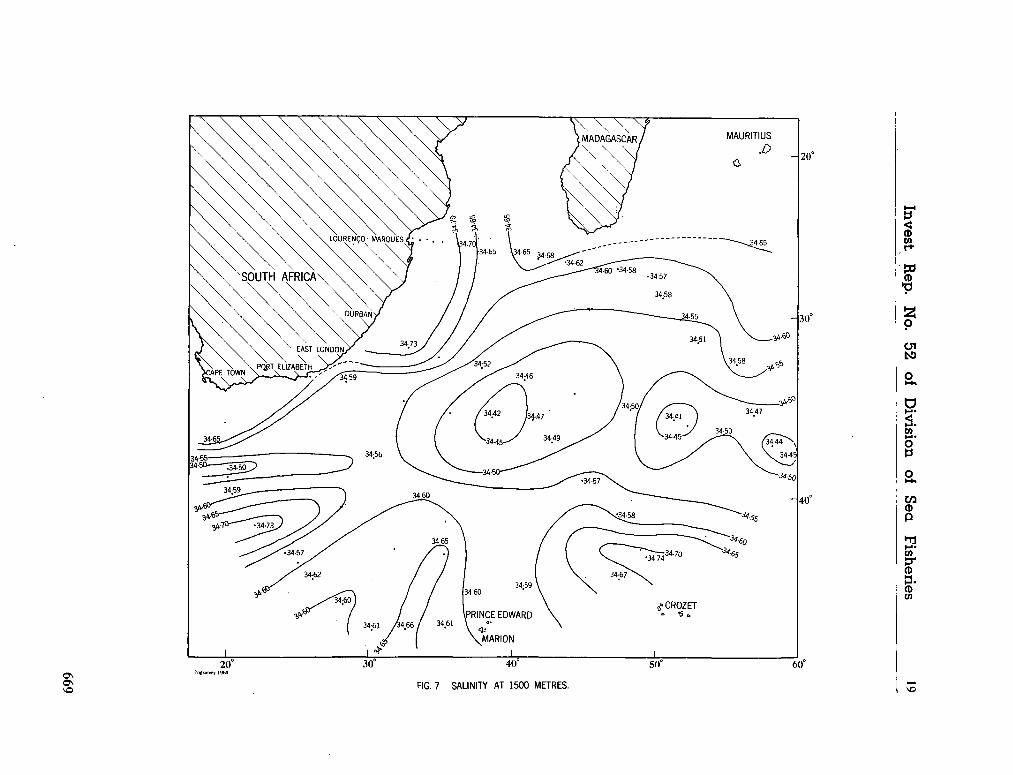
Invest.
Re
p. N
o. 5
2
of D
ivisio
n
of S
ea
Fish
eries 19
669
20 Invest. Rep. No . 52 of Division of Sea Fisheries
At stations 21F and 24F w e still find water with a salinity higher than 34-70°/o o . A salinity of 34-66°/00 at station 20F is also very close to the above-mentioned salinities. The salinities of stations 42F, 32F and 21F at 1,000 metres compare as follows :—
42F = 34-707o„; 32F = 3 4 - 6 6 % 0 ; 21F = 3 4 - 7 0 % o .
F r o m these data it appears, therefore, that the possibility exists at station 21F that water in the Mozambique Channel originates from the Indian Ocean moving around the southern tip of M a d a gascar.
If an imaginary line is drawn through stations 12, 29, 51 and 63, it is clear that, generally speaking, the salinities on the eastern side of this line are lower than those on the western side. Salinities in the Agulhas Current area fall mainly between 34- 50°/oo and 34-60°/oo and the values east of the imaginary line mainly between 34-40°/oo and 34- 50°/o o . The higher salinity on the west side of the line is apparently due to the more intensive mixing of Antarctic Intermediate Water with sub-surface water, this mixing possibly occuring in the rapidly flowing Agulhas Current. The phenomenon m a y also be ascribed to the Antarctic Intermediate Water which intermingles in the southern part of the M o z a m bique Channel with water of higher salinity origi-. nating from the Indian Ocean, and which is then carried further southwards with the Agulhas Current.
Salinities lower than 34-40°/oo a r e found at only
six stations, namely, 60, 62, 47, 48 41 and 35. The lowest value is found at station 62, namely 34-29°/0 0 , while the salinities at the other four stations were in the region of 34^40%o- T n e
low salinity at station 62 is apparently due to the sinking of sub-surface water of Sub-antarctic origin, According to the sigma-t surfaces (Figures 12, 15 and 18), the water at station 61 rises and this must necessarily result in the water at station 62 sinking
At station 22 a salinity of 34- 62°/ 0 0was obtained, this being strikingly higher than the surrounding salinities at stations 21 (34-450/00) and 23 (34-54°/00). This phenomenon is apparently due to the fact that water of Indian Ocean origin penetrates this area. This fact is emphasised by the current lines at the 1,000/2,000 db surface. The temperature is also considerably higher, namely, 8-34° C in contrast with temperatures of 5-82° C and 7-20° C at stations 21 and 23, respectively.
In the rest of the area salinities higher than 34-60°/oo were usually encountered in the vicinity of swirls in the current. Salinities of between ± 3 4 - 6 0 % o and 34-69°/00 were encountered at staiions 28, 29, 34, 50, 54, 58 and 61. It is apparent that here the possibility exists that Antarctic Intermediate Water might intermingle in these swirls with water masses of the sub-surface layer or the layers below 1,000 metres, and in this way be responsible for the higher salinities. O R R E N (1963) is of the same opinion. According to the dynamic height anomaly charts (Figures 2 to 4) and sigma-t charts (Figures 12, 15 and 18), this supposition is quite acceptable since swirls are distinctly shown around the above-mentioned stations on these charts.
According to the data obtained and the work of earlier workers, it is, therefore, obvious that, in regard to salinity, the water in the area investigated at the.depth of 1,000 metres answers.the requirements for identification as Antarctic Intermediate Water.
4.2. Salinity and Water Masses at 1,500 Metres.— Over the major part of the area investigated the
salinities at 1,500 metres (Fig. 7) lie between the limits of-34-41 % 0 and 34-62°/00 . The temperatures at the relevant stations varied between 2-50° C and 4-85° C . N o salinity was found lower than 34-41°/00 , but at a few stations salinities were obtained which were higher than 34-62°/00 , namely, at stations 6-9, 19, 32, 36, 43, 45, 57, 61 and 67. Out of 44 stations there were, consequently, only 12 stations with a salinity higher than 34-62°/00- The salinity was higher than 3 4 - 7 0 % o , only at stations 32, 45 and 61, but it was never higher than 34-74°/OCi. The salinities and temperatures, therefore, fall mainly within the salinity limits of Antarctic Intermediate Water (see discussion and quotations in section 4.1.) .
The high temperature of 4-85° C at station 50 m a y be due to the deeper penetration of warmer Antarctic Intermediate Water as a result of swirling. The salinity of 34-42°/00 bears out such a possibility. L o w temperatures are apparently due to the cold water in the vicinity of the Subtropical Convergence and the area southward thereof.
According to O R R E N (1963), North Indian Deep Water extends from 1,600 metres and deeper and lies between Antarctic Intermediate Water and the Atlantic Deep Water. C L O W E S (1950) asserts that W a r m Deep Water from the Arabian Sea
670
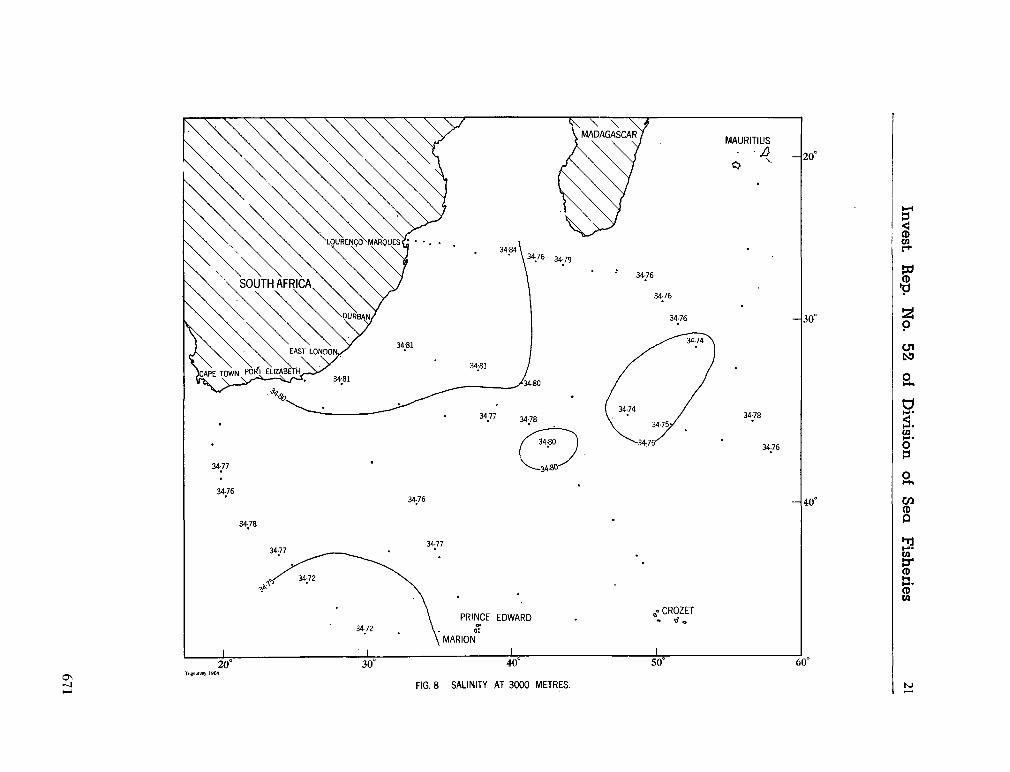
Invest.
Re
p. N
o. 5
2
of D
ivisio
n
of S
ea
Fish
eries 21
o
8 00
671
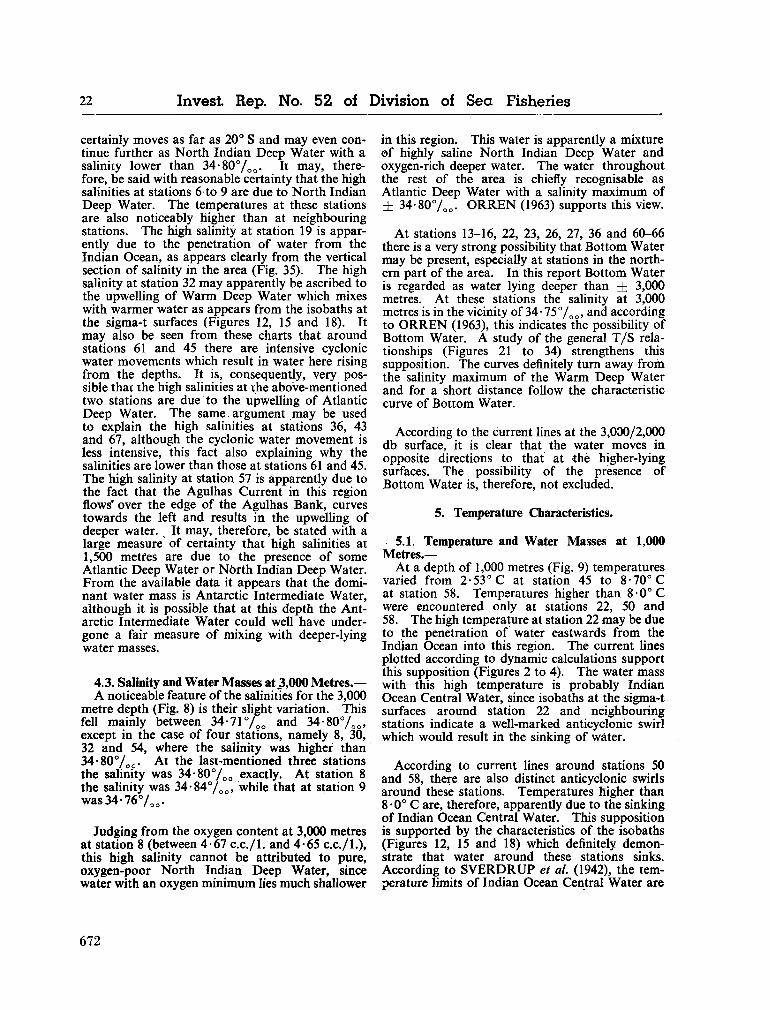
22 Invest. Rep. N o . 52 oí Division of Sea Fisheries
certainly moves as far as 20° S and m a y even continue further as North Indian Deep Water with a salinity lower than 34-80°/o o . It m a y , therefore, be said with reasonable certainty that the high salinities at stations 6 to 9 are due to North Indian Deep Water. The temperatures at these stations are also noticeably higher than at neighbouring stations. The high salinity at station 19 is apparently due to the penetration of water from the Indian Ocean, as appears clearly from the vertical section of salinity in the area (Fig. 35). The high salinity at station 32 m a y apparently be ascribed to the upwelling of W a r m Deep Water which mixes with warmer water as appears from the isobaths at the sigma-t surfaces (Figures 12, 15 and 18). It m a y also be seen from these charts that around stations 61 and 45 there are intensive cyclonic water movements which result in water here rising from the depths. It is, consequently, very possible that the high salinities at the above-mentioned two stations are due to the upwelling of Atlantic Deep Water. The same argument m a y be used to explain the high salinities at stations 36, 43 and 67, although the cyclonic water movement is less intensive, this fact also explaining w h y the salinities are lower than those at stations 61 and 45. The high salinity at station 57 is apparently due to the fact that the Agulhas Current in this region flows' over the edge of the Agulhas Bank, curves towards the left and results in the upwelling of deeper water. % It m a y , therefore, be stated with a large measure of certainty that high salinities at 1,500 metres are due to the presence of some Atlantic Deep Water or North Indian Deep Water. F r o m the available data it appears that the dominant water mass is Antarctic Intermediate Water, although it is possible that at this depth the Antarctic Intermediate Water could well have undergone a fair measure of mixing with deeper-lying water masses.
4.3. Salinity and Water Masses at 3,000 Metres.— A noticeable feature of the salinities for the 3,000
metre depth (Fig. 8) is their slight variation. This fell mainly between 34-71 °/0 0 and 3 4 - 8 0 % o , except in the case of four stations, namely 8, 30, 32 and 54, where the salinity was higher than 34-80°/o o . At the last-mentioned three stations the salinity was 34-80°/o o exactly. At station 8 the salinity was 34-84°/OCJ, while that at station 9 w a s 3 4 - 7 6 % 0 .
Judging from the oxygen content at 3,000 metres at station 8 (between 4-67 c.c./l. and 4-65 c.c./l.), this high salinity cannot be attributed to pure, oxygen-poor North Indian Deep Water, since water with an oxygen m i n i m u m lies m u c h shallower
in this region. This water is apparently a mixture of highly saline North Indian Deep Water and oxygen-rich deeper water. The water throughout the rest of the area is chiefly recognisable as Atlantic Deep Water with a salinity m a x i m u m of ± 34-80°/o o . O R R E N (1963) supports this view.
At stations 13-16, 22, 23, 26, 27, 36 and 60-66 there is a very strong possibility that Bottom Water m a y be present, especially at stations in the northern part of the area. In this report Bottom Water is regarded as water lying deeper than ± 3,000 metres. At these stations the salinity at 3,000 metres is in the vicinity of 34 • 75 % 0 > and according to O R R E N (1963), this indicates the possibility of Bottom Water. A study of the general T / S relationships (Figures 21 to 34) strengthens this supposition. The curves definitely turn away from the salinity m a x i m u m of the W a r m Deep Water and for a short distance follow the characteristic curve of Bottom Water.
According to the current lines at the 3,000/2,000 db surface, it is clear that the water moves in opposite directions to that at the higher-lying surfaces. The possibility of the presence of Bottom Water is, therefore, not excluded.
5. Temperature Characteristics.
5.1. Temperature and Water Masses at 1,000 Metres.—
At a depth of 1,000 metres (Fig. 9) temperatures varied from 2-53° C at station 45 to 8-70° C at station 58. Temperatures higher than 8 0° C were encountered only at stations 22, 50 and 58. The high temperature at station 22 m a y be due to the penetration of water eastwards from the Indian Ocean into this region. The current lines plotted according to dynamic calculations support this supposition (Figures 2 to 4). The water mass with this high temperature is probably Indian Ocean Central Water, since isobaths at the sigma-t surfaces around station 22 and neighbouring stations indicate a well-marked anticyclonic swirl which would result in the sinking of water.
According to current lines around stations 50 and 58, there are also distinct anticyclonic swirls around these stations. Temperatures higher than 8 -0° C are, therefore, apparently due to the sinking of Indian Ocean Central Water. This supposition is supported by the characteristics of the isobaths (Figures 12, 15 and 18) which definitely demonstrate that water around these stations sinks. According to S V E R D R U P et al. (1942), the temperature limits of Indian Ocean Central Water are
672
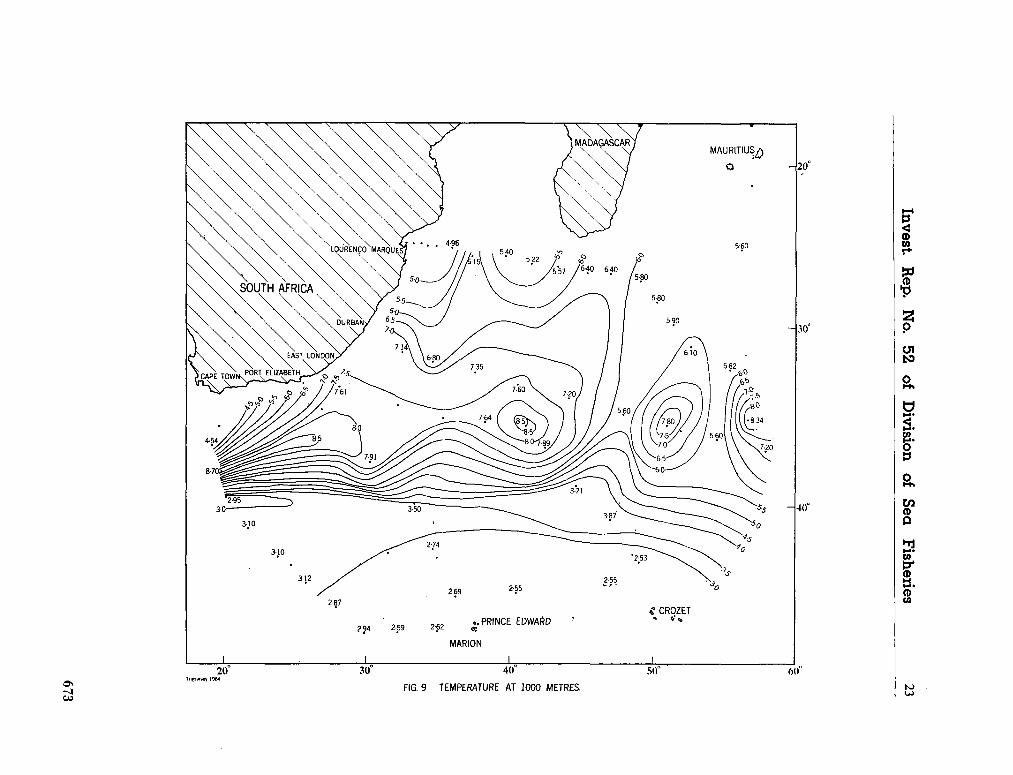
Invest.
Re
p. N
o. 5
2
of D
ivisio
n
of S
ea
Fish
eries 23
o
673
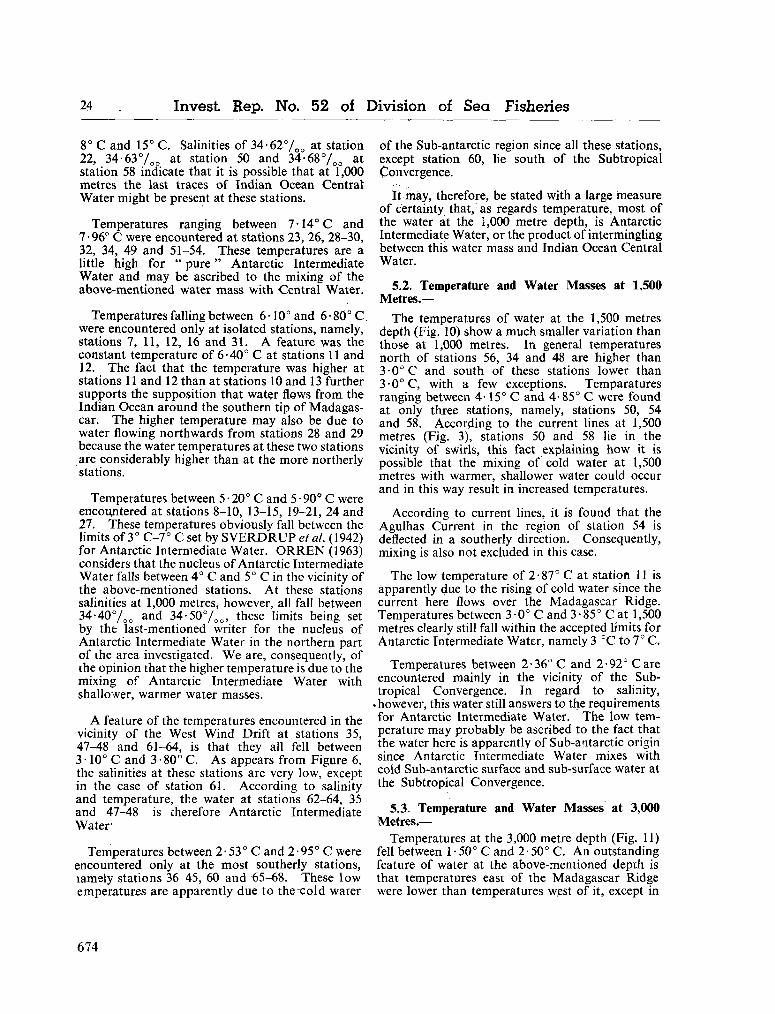
24 Invest. Rep. N o . 52 of Division of Sea Fisheries
8° C and 15° C . Salinities of 3 4 - 6 2 % 0 at station 22, 3 4 - 6 3 % 0 at station 50 and 3 4 - 6 8 % 0 at station 58 indicate that it is possible that at 1,000 metres the last traces of Indian Ocean Central Water might be present at these stations.
Temperatures ranging between 7 - 1 4 ° C and 7 • 96° C were encountered at stations 23, 26, 28-30, 32, 34, 49 and 51-54. These temperatures are a little high for " pure " Antarctic Intermediate Water and m a y be ascribed to the mixing of the above-mentioned water mass with Central Water.
Temperatures falling between 6-10° and 6•80° C were encountered only at isolated stations, namely, stations 7 , 11, 12, 16 and 31. A feature was the constant temperature of 6-40° C at stations 11 and 12. The fact that the temperature was higher at stations 11 and 12 than at stations 10 and 13 further supports the supposition that water flows from the Indian Ocean around the southern tip of Madagascar. The higher temperature m a y also be due to water flowing northwards from stations 28 and 29 because the water temperatures at these two stations are considerably higher than at the more northerly stations.
Temperatures between 5 • 20° C and 5 • 90° C were encountered at stations 8-10, 13-15, 19-21, 24 and 27. These temperatures obviously fall between the limits of 3° C - 7 ° C set by S V E R D R U P et al. (1942) for Antarctic Intermediate Water. O R R E N (1963) considers that the nucleus of Antarctic Intermediate Water falls between 4° C and 5° C in the vicinity of the above-mentioned stations. A t these stations salinities at 1,000 metres, however, all fall between 3 4 - 4 0 % o and 3 4 - 5 0 % o , these limits being set by the last-mentioned writer for the nucleus of Antarctic Intermediate Water in the northern part of the area investigated. W e are, consequently, of the opinion that the higher temperature is due to the mixing of Antarctic Intermediate Water with shallower, warmer water masses.
A feature of the temperatures encountered in the vicinity of the West W i n d Drift at stations 35, 47-48 and 61-64, is that they all fell between 3 • 10° C and 3 • 80° C . A s appears from Figure 6, the salinities at these stations are very low, except in the case of station 61. According to salinity and temperature, the water at stations 62-64, 35 and 47-48 is therefore Antarctic Intermediate Water-
Temperatures between 2-53° C and 2-95° C were encountered only at the most southerly stations, lamely stations 36-45, 60 and 65-68. These low emperatures are apparently due to the cold water
of the Sub-antarctic region since all these stations, except station 60, lie south of the Subtropical Convergence.
It m a y , therefore, be stated with a large measure of certainty that, as regards temperature, most of the water at the 1,000 metre depth, is Antarctic Intermediate Water, or the product of intermingling between this water mass and Indian Ocean Central Water.
5.2. Temperature and Water Masses at 1,500 Metres.—
The temperatures of water at the 1,500 metres depth (Fig. 10) show a m u c h smaller variation than those at 1,000 metres. In general temperatures north of stations 56, 34 and 48 are higher than 3 0° C and south of these stations lower than 3 0° C , with a few exceptions. Temparatures ranging between 4-15° C and 4-85° C were found at only three stations, namely, stations 50, 54 and 58. According to the current lines at 1,500 metres (Fig. 3), stations 50 and 58 lie in the vicinity of swirls, this fact explaining h o w it is possible that the mixing of cold water at 1,500 metres with warmer, shallower water could occur and in this way result in increased temperatures.
According to current lines, it is found that the Agulhas Current in the region of station 54 is deflected in a southerly direction. Consequently, mixing is also not excluded in this case.
The low temperature of 2-87° C at station 11 is apparently due to the rising of cold water since the current here flows over the Madagascar Ridge. Temperatures between 3 • 0° C and 3 • 85° C at 1,500 metres clearly still fall within the accepted limits for Antarctic Intermediate Water, namely 3 °C to 7° C .
Temperatures between 2-36° C and 2-92° Care encountered mainly in the vicinity of the Subtropical Convergence. In regard to salinity,
«however, this water still answers to the requirements for Antarctic Intermediate Water. T h e low temperature m a y probably be ascribed to the fact that the water here is apparently of Sub-antarctic origin since Antarctic Intermediate Water mixes with cold Sub-antarctic surface and sub-surface water at the Subtropical Convergence.
5.3. Temperature and Water Masses at 3,000 Metres.—
Temperatures at the 3,000 metre depth (Fig. 11) fell between 1 • 50° C and 2- 50° C . A n outstanding feature of water at the above-mentioned depth is that temperatures east of the Madagascar Ridge were lower than temperatures west of it, except in
674
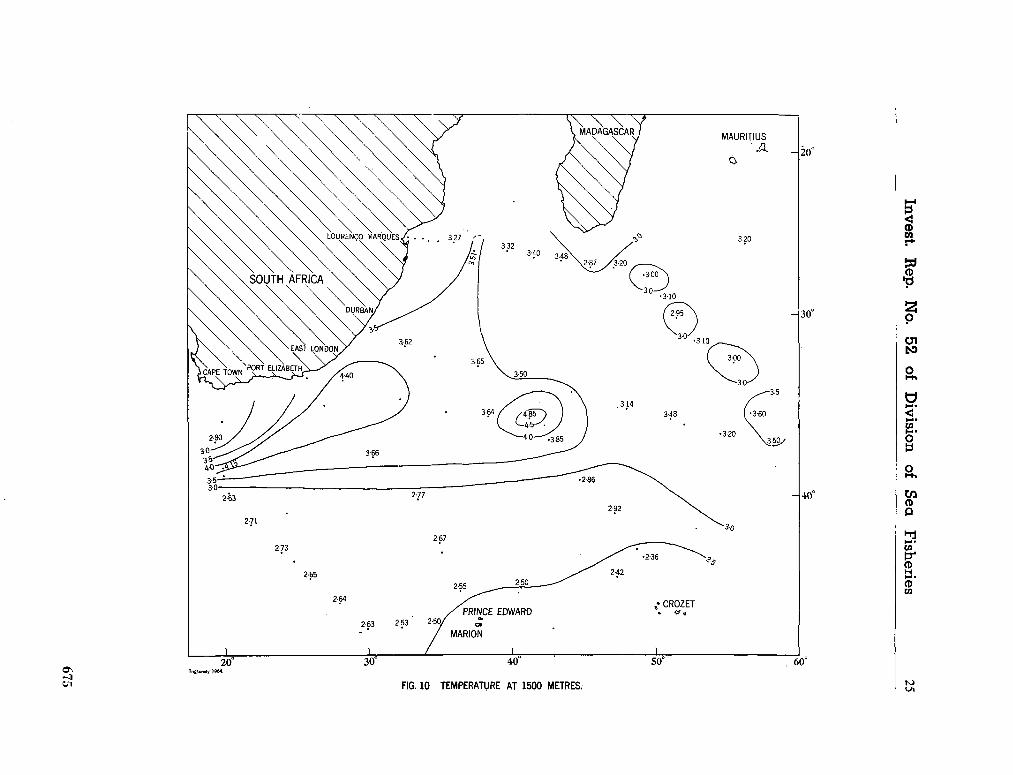
Invest.
Re
p. N
o. 5
2
of D
ivisio
n
of S
ea
Fish
eries 25
675
26 Invest. Rep. N o . 52 of Division of Sea Fisheries
the case of stations 36, 61 and 66. This phenomenon is substantiated by the distinct separation caused by the Madagascar Ridge in the deeper water. Throughout the larger part of the area the temperature falls between 2 0° C and 2-44° C . This "water is immediately recognisable (especially according to salinity distribution) as Atlantic Deep Water ( O R R E N 1963 and C L O W E S 1950).
The oxygen content at stations 13-16 was conspicuously lower than in the rest of the area and the salinity was more or less constant, namely ± 34-75°/co- It is possible, therefore, according to temperature and salinity, that Bottom Water is present at these stations. If, however, the oxygen content of the water is taken into account, it appears that it is possible that North Indian Deep Water has mixed with Atlantic Deep Water, this mixing being responsible for the low oxygen content.
6. Depth, Salinity and Temperature at the at = 27-20, 27-40 and 27-60 Surfaces.
According to S V E R D R U P et al. (1942), the distribution of the sigma-t surface will give a good picture of water transportation. Isohalines and isotherms will therefore be parallel to isobaths at a particular sigma-t level and will indicate the direction in which a current flows.
(a) The sigma-t = 27-20 surface.—
The depth, salinity and temperature of the at — 27-20 surface are shown in Figures 12 to 14. Isobaths for ever 50 metres, isohalires for every 0 - 0 5 % o and isotherms for every 0- 5° C have been plotted.
According to Figure 12, the depth of the at = 27-20 surface varies between 315 metres at station 45 and 1,305 metres at station 50. O n the northern side of the Sub-tropical Convergence the sigma-t surface lies for the most part at á depth of very close to 1,000 metres, and the isobaths will consequently give a good picture of ocean currents at 1,000 metres. A n intense crowding of isobaths was obtained between stations 56 and 58, to the north of the Sub-tropical Convergence and around station 61.
Anticyclonic swirls are clearly perceptible at stations 22, 50, 58 and 66. Cyclonic swirls are encountered at stations 9 and 61. A feature of these swirls is that the relevant sigma-t surface descends to a deeper level at anticyclonic swirls and rises in a cyclonic swirl. The sigma-t surface rises perceptibly between stations 54, 56 and 57 where the water meets the Agulhas Bank. According to bottom topography influences, this will
result in the current being deflected towards the left. This deflection will, therefore, be a further contributory factor in causing the Agulhas Current to turn back on itself. The swirl around station 58 is shown definitely not only by the isobaths but also by the course of isohalines and isotherms. The swirls indicated by the isobaths correspond closely to those demonstrated by the isodynamic lines (Fig. 2). The distribution, of isobaths over the relevant sigma-t surface distinctly shows the tendency of water to sink at the Subtropical Convergence.
Salinities at the at = 27-20 surface (Fig. 13) vary between 3 4 - 1 4 % 0 at station 42 and 3 4 - 6 1 % 0 at station 61. For the most part salinities north of the Subtropical Convergence are higher than those south of it. The high salinity of 34-61°/0 0 at station 61 is apparently due to the fact that the sigma-t surface here lies near to the surface at a depth where sub-surface water is present. This water has a higher salinity than the deeper water at ± 1,000 metres.
A n intensive crowding of isohalines around stations 58-60 clearly indicates that there is a marked swirl in this area. The isohalines follow more or less the course of computed ocean currents on this surface.
The temperature of the relevant sigma-t surface (Fig. 14) varies between 3-00° C at station 45 and 6-83° C at station 18. It is quite noticeable that the temperatures in the Agulhas Current area are m u c h higher than in the rest of the area. Temperatures south of the Subtropical Convergence are conspicuously lower than temperatures further north. Here, too, the isotherms follow more or less the course of the ocean currents.
F r o m the above data it can readily be seen that the sigma-t surface north of the Subtropical C o n vergence corresponds well with the isodynamic lines at the 1,000/2,000 db surface. The 1,050 metres isobath south of Madagascar shows the northward trend of the Return Agulhas current.
(b) The sigma-t = 27-40 surface.—
The pattern of isobaths, isohalines and isotherms at the at = 27-40 surface is shown in Figures 15 to 17. The spacing of the above values is exactly the same as in the case of the at = 27 • 20 surface.
According to Figure 15, the depth of the relevant sigma-t surface varies between 520 metres at station 61 and 1,600 metres at station 50. Noticeable anticyclonic swirls are perceptible around stations 26, 50 and 58 and cyclonic swirls around stations 9 and 61. At this surface it is again
676
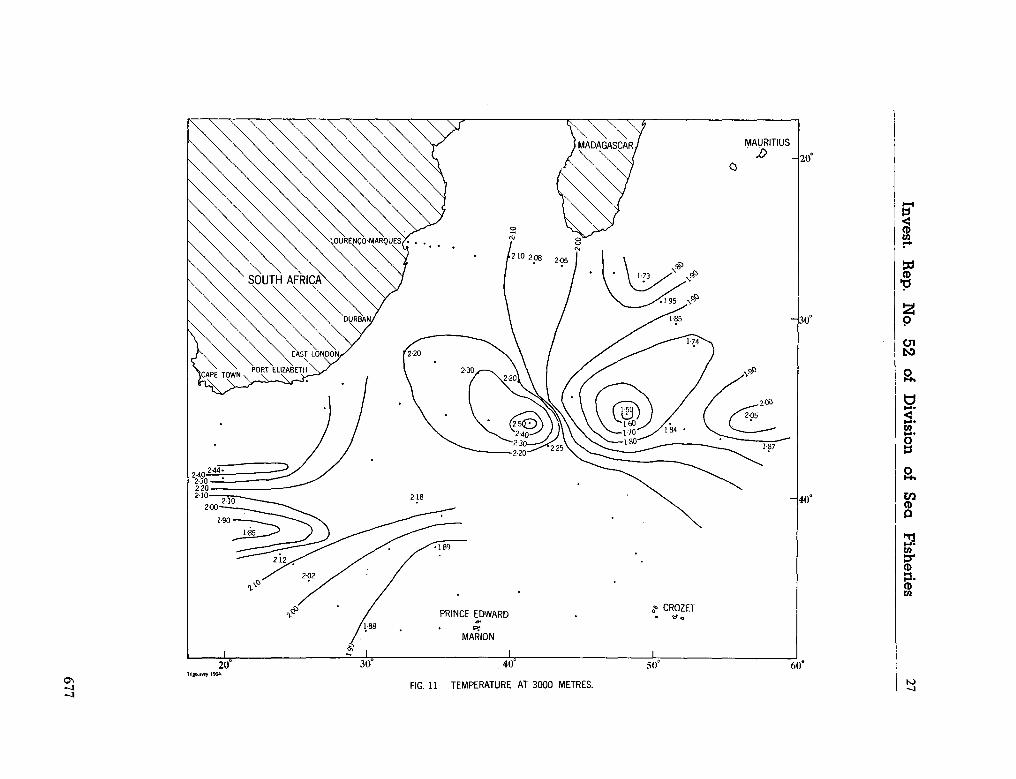
Invest.
Re
p. N
o. 5
2
of D
ivisio
n
of S
ea
Fish
eries 27
8 =3
5
677
28 Invest. Rep. N o . 52 of Division of Sea Fisheries
apparent that water of a certain density rises in cyclonic swirls and sinks in anticyclonic swirls. The intensive crowding of isobaths around stations 58 and 51 definitely indicates the presence of swirls. In the area of the Subtropical Convergence the isobaths are also very close together and show that the sigma-t surface sinks rapidly over a fairly short distance. This phenomenon is especially noticeable between stations 58 and 60 and between stations 45 and 47. The isobaths between stations 32 and 54 apparently run very close together between the coastline and station 54 and join the isobaths south of Port Elizabeth. In this case, too, the course of the isobaths shows the rising trend of the sigma-t surfaces at the Agulhas Bank. North of the Subtropical Convergence the course of the isobaths gives a fairly good picture of currents between ± 1,000 metres and ± 1,500 metres.
Salinities at the at = 27-40 surface (Fig. 16) vary between 3 4 - 3 2 % 0 at stations 41, 43 and 45 and 34-64°/0 0 at station 32. The highest salinities were encountered mainly in the Agulhas Current area and the lowest south of the Subtropical Convergence. A well-marked swirl of water is perceptible between stations 58 and 61 according to the isohalines. The closed isohaline around stations 49 and 50 gives an indication of the swirl around these stations which was obtained by means of dynamic calculations. The isohalines follow more or less the course of the dynamic topographic lines at the 1,000 db and 1,500 db surfaces, especially the 34-50°/DO and 34-45°/0 0 isohalines between stations 61 and 62. This isohaline pattern gives an indication that the isobaths over the Madagascar Ridge reflect a fairly reliable picture of actual water movements.
Temperatures at the at = 27 • 40 surface (Fig. 17) range from 2-55° C at station 45 to 5 0° C at station 32. A s above, temperatures south of the Subtropical Convergence are m u c h lower than temperatures in the northern part of-the area.
Just as was the case with the at = 27 • 20 surface, the highest temperature is encountered in the Agulhas Current area off the east coast of South Africa. In general the isotherms follow the same direction as the isohalines and give a sure indication that water from the Subtropical Convergence moves northwards. The course of the 4-0°C and 3-5° C isotherms between stations 61 and 62 further substantiates the course of the 3 4 - 5 0 % o and 34-45°/0 0 siohalines, as explained in the above paragraphs. It also further shows the tendency of water to flow from the Subtropical Convergence in a north-easterly direction over the Madagascar Ridge.
(c) The sigma-t = 27-60 surface.— The pattern of isobaths, isohalines and isotherms
at the at = 27 • 60 surface is presented in Figures 18 to 20. The spacing of the above-mentioned values are identical to the at = 27-20 and at = 27-40 surfaces.
According to Figure 18, the depth of the at = 27 • 60 surface varies between 953 metres at station 61 and 2,000 metres at station 50. This distribution of isobaths gives a good picture of the ocean currents and directions of flow between ± 1,500 and ± 2,000 metres. The intensive crowding of isobaths between stations 54 and 32, 57 and 60 and 45 and 47 indicates sinking of water over a relatively short distance. Around station 61 there is a perceptible upward motion of water. Other very clear features are the vertical movement of water over the edge of the Agulhas Bank and the deflection of the Agulhas Current in a southerly direction.
Anticyclonic swirls are perceptible around stations 9, 11, 26, 50 and 58, with the result that water with the same sigma-t value is found m u c h deeper here than at neighbouring stations. Cyclonic swirls of water m a y be seen around stations 36, 45 and 61. At these stations water with a sigma-t value of 27 • 60 moves closer to the surface.
The closely spaced isobaths between station 54 and the coastline indicate that water from the Agulhas Current strikes the coast from a northeasterly direction and is then deflected towards the south between Port Elizabeth and East London. The distribution of isobaths apparently also gives a good indication of the deflection of water towards the left when passing over a ridge, and this effect is especially noticeable over the Madagascar Ridge.
Another noticeable feature is the tendency to sink manifested by water at the Subtropical C o n vergence even at the depths indicated in Figure 18. Between stations 45 and 47, for example, the at = 27 • 60 surface sinks from 960 metres at station 45 to 1,630 metres at station 47.
In general the course of isobaths agrees closely with the current directions indicated by the dynamic topographic lines at the 1,500 db surface, except between the northern stations south of Madagascar. F r o m a consideration of the isohalines and isotherms, the course of the isodynamic lines appears to be more correct.
The salinity at the at = 27-60 surface (Fig. 19) varies between 34-52°/0 0 at station 36 and 34-75°/0 0 at station 50. A small number of isohalines could be plotted here to indicate that the
678
Invest. Rep. N o . 52 of Division of Sea Fisheries 29
salinity is fairly constant throughout this sigma-t surface. The isohaline of 34-60°/oo gives a good impression of the distribution of salinity over this surface. West of the above-mentioned isohaline the salinity lies mainly between 34-60°/oo and 3 4 - 7 0 % o and east of it between 3 4 - 5 0 % o and 34- 60°/o o . These few isohalines give a further indication- of the tendency of water of Atlantic origin to move in a north-easterly direction and thence to bring about a large anticyclonic movement in the South-West Indian Ocean.
Only a few isotherms could be plotted on the at = 27-60 surface (Fig. 20), showing that the temperature on this surface is fairly constant, varying from 2-47° C at station 43 to 3-62° C at station 32. The course of the 3 0° C isotherm gives an indication of the temperature variation over the relevant sigma-t surface in this area.
In conclusion, it further appears that all three sigma-t surfaces have an upward trend around station 32 and this is probably the reason for the high temperatures and salinities experienced here.
7. M e a n Temperature/Salinity Relationships.
Only mean T / S curves have been charted in this investigational report (Figures 21 to 34). In order to obtain them, all the curves for individual stations were drawn and from these curves the corresponding mean T / S curves were grouped. Approximate depths were also indicated on each general curve. Where depths of individual stations on the same curve differed greatly, approximate station depths are indicated separately.
All the mean curves have been charted in Figure 34. In this case only parts of the curves have been reproduced since only those at 1,000 metres and deeper are applicable to this report.
Sections of the curves giving a more or less linear T / S relationship are classified by S V E R -D R U P et al. (1942) as Central Water. The curved part with a distinct salinity min imum very obviously represents Antarctic Intermediate Water.
According to the general T / S curves, the 1,000 metre temperatures and salinities of only stations 22, 23, 26 and 58 lie clearly pn the linear parts of the curves. This probably demonstrates the presence of Central Water. Station 58 lies more or less in the centre of an intensive anticyclonic swirl between the Agulhas Current and Return Agulhas Current, and at this station there is apparently a sinking of Central Water which is encountered even at depths of 1,000 metres. It m a y , therefore, be accepted with a large measure of certainty that the high temperatures and salinities at the stations are brought about by Central Water.
With the exception of the above, the T / S curves at 1,000 metres depth have values between the limits of ± 4-5° C , ± 34-40°/oo and ± 8° C ± 3 4 - 6 0 % o north of the Subtropical C o n vergence. South of the Convergence these limits are ± 2-5° C , ± 34-50°/oo and ± 4° C , ± 34-30°/o o . At stations in the last-mentioned area there is occasional indication that the temperatures and salinities of water at 1,000 metres lie on that part of the curve which indicates W a r m Deep Water with a m a x i m u m salinity. The last-mentioned parts of the T / S curves lie in an almost horizontal direction with little variation in temperature but with a tendency towards a salinity maxim u m . This tendency is particularly noticeable at stations 38-45 and 60-68. The water at the 1,000 metre depth at these stations is, therefore, apparently already W a r m Deep Water of Atlantic origin.
In general the m e a n T / S curves show a tendency to m o v e from a m a x i m u m towards a min imum salinity and then again towards a m a x i m u m salinity. At stations 38-45 and 67-68 (Fig. 30) however, there is a noticeable tendency for the salinity to m o v e from a min imum at the surface to a m a x i m u m at ± 1,500 metres and deeper. The variation in temperature is generally small in comparison with that at stations north of the Subtropical Convergence. The curves of stations 38-45 and 67-68 confirm the opinion that water with a min imum salinity in the Sub-antarctic region sinks at the Subtropical Convergence (from ± 200 metres to ± 1,000 metres) and then, as Antarctic Intermediate Water, forms an anticyclonic circulation in the South-West Indian Ocean.
At a depth of 1,500 metres temperatures varied between ± 2.40°C and ± 4.30°C and salinities between ±34-45° / 0 0 and ± 34-70°/oo according to the T / S curves. At 1,500 metre depths the curves clearly show the presence of W a r m Deep Water of Atlantic and Indian Ocean origin. In the northern part of the area this section of the curve is not as distinctly separated from the part indicating Antarctic Intermediate Water as in the southern part of the area, and at station 58 (Fig. 31) the 1,500 metre water layer is still mainly Antarctic Intermediate Water. A s has already been m e n tioned, water sinks at this station in an eddy and Antarctic Intermediate Water, therefore, lies at greater depths here.
Most of the mean T / S curves show the presence of Bottom Water at 3,000 metres. The evidence for the presence of this water, however, is slight and
679
30 Invest. Rep. N o . 52 of Division of Sea Fisheries
Bottom Water can be identified with certainty at only a few stations. It is definitely present at stations 13-16 (Fig. 24) and 60-66 (Fig. 32) and at these stations temperatures were generally ± 2 0 ° C or less and the salinity ± 34-75°/0 0 . According to the bottom topography chart (Fig. 5), these stations lie in areas where the ocean is very deep, and the presence of Bottom Water is, therefore, likely.
According to the composite chart of mean T / S relationships (Fig. 34), it is apparent from the location of the curves that water at stations south of the Subtropical Convergence differs considerably (especially sub-surface water) from water at stations north of the Convergence. The curves of the northern stations show a close relationship and are well defined.
F r o m the above discussion it appears that at depths of 1,000 metres to 3,000 metres the principal water masses encountered, according to the T / S relationships, were Antarctic Intermediate Water, W a r m Deep Water and Bottom Water.
8. Southward Protrusions and the Current South of Madagascar.
According to the current pattern at the 0/1,000 db surface obtained during a cruise of the French research ship Commandant Robert Giraud during October-November, 1957 (Fig. 36), the M o z a m bique Current moves along the east coast of Africa and turns.back completely at ± 25° S, moving northwards off the coast of Madagascar. Where this current comes into contact with the east-west current south of Madagascar, there is a tendency for the latter current to penetrate far to the south. These observations are similar to the anticyclonic and cyclonic disturbances in the current pattern perceptible at the line between Lourenco Marques and the southern tip of Madagascar (Figures 2 to 4).
A noteworthy feature is the good agreement obtained between deep currents and surface currents (compare Figures 2, 3 and 36). Although the observations of R . S . Africana II and Commandant Robert Giraud were m a d e during different seasons, they nevertheless, show a close correspondence.
If the current directions according to the sigma-t surfaces (especially at = 27 • 60 and at — 27 • 20, Figures 12 and 18) are compared with current directions obtained with the aid of dynamic calculations in this area, it is clear that water in the
southern part of the Mozambique Channel moves southwards near Madagascar, causing large protrusions. Such a comparison also definitely shows that water moving from a north-easterly direction between stations 11 and 13, moves southwards between stations 9 and 11.
According to a vertical section of salinity made by M É N A C H É from Lourenco Marques to Port Dauphin (Cahiers Océanographiques, April, 1963), the water in this area, as indicated by the tongued structure of isohalines, tends to move westward towards the coast of Africa even at fairly great depths. Such characteristics of the current south of Madagascar further confirm the supposition that water from the Indian Ocean flows round the southern tip of Madagascar in a westerly direction at depths greater than 1,000 metres.
Charts drawn by P A E C H (1926) indicate that only during July is there a slight tendency forthe currents south of Madagascar to flow, even at the surface, in a north-esaterly direction. According to the directions shown, this phenomenon is not, however, observable in the deep water during this period of the year (Figures 2 to 4).
9. Movement of Atlantic Water in the South-West Indian Ocean.
A vertical section of salinity was drawn between stations 62, 35, 49, 27, 16 and 19 (Fig. 35), and an interesting pattern was obtained.
Between stations 62 and 35 it is clear that water coming from a southerly direction with a salinity of ± 3 4 - 3 0 % o to 3 4 - 7 0 % o sinks from the surface and sub-surface to depths of between ± 800 metres and =b7 1,350 metres. Between stations 35 and 49 there is marked sinking of water from the surface to i 800 metres as clearly shown by the isohalines 3 4 - 8 0 % o to 3 5 - 5 0 % o . According to the course of these isohalines, water which sank between stations 62 and 35, moves in a north-easterly direction as indicated by the tongued structure of the 34-30°/oo and 34-40°/o o isohalines, This water then apparently rises at station 19 where it meets water from the Indian Ocean moving in a south-westerly direction between stations 16 and 19. The water with a salinity of 34-30°/o o is apparently of Atlantic origin as demonstrated by the course of the isohalines. It m a y further be deduced from the course of the isohalines that Antarctic Intermediate Water constitutes the major part of the water south of the Subtropical C o n vergence, and is not only perceptible in sub-surface water but even extends to fairly great depths.
680
Invest. Rep. N o . 52 of Division of Sea Fisheries 31
The sinking of Atlantic water is completely understandable since the Subtropical Convergence is crossed between stations 62 and 35. During the 1963 cruise of R . S . Africana Il^tbe Subtropical Convergence was encountered between' stations 61 and 62 and again north-west of station 70.
At stations 49, 27, 16 and 19 it is clear that at depths shallower than ± 800 metres there is a sub-surface layer of water which apparently moves north-eastward and sinks to depths greater than ± 800 metres between stations 35 and 49. The salinity of this water ranges between ± 34-80°/oo and ± 35-50°/o o . The currents between the surface and ± 800 metres, therefore, evidently move in the same direction as the currents at a depth of ± 1,000 metres and deeper. The water masses very obviously originate from two different oceans, namely, the Atlantic Ocean and the Indian Ocean, and according to the dynamic current pattern it is very likely that Atlantic water flows into the South-West Indian Ocean since the trend of the isohalines distinctly indicates the same tend-dency as the current lines.
F rom a depth of ± 1,200 metres the course of the isohalines of 3 4 - 5 0 % o , 34-60°/oo and 3 4 - 7 0 % o is fairly uniform. At station 19 the first m e n tioned two isohalines show an upward tendency which might be due to the penetration here of water from the Indian Ocean since station 19 is situated in the deep Reunion Basin. The current lines in Figures 2 and 4 further support this supposition^
If the general T / S curves of stations 16 and 19 (Figures 24 and 25) are compared with those of surrounding stations, it appears that Antarctic Intermediate Water lies m u c h shallower at station 19 than at station 16. At depths greater than 1,000 metres, the T / S curve of station 19 shows a completely different tendency to that at station 16, and the two deep water masses which come into contact here are consequently of different origin.
According to L E P I C H Ó N (1960), the circulation of deep waver below 2,000 metres in the South-West Indian Ocean is determined chiefly by the influx of Atlantic Deep Water into this area. A s appears from charts published by the above-mentioned writer, there is a definite northwards movement of Atlantic water in the Natal Deep and the Natal Basin on the western side of the Madagascar Ridge. The Madagascar Ridge apparently forms an obstruction in the path of the Atlantic deep water, as shown by the current lines at the 3,000 db surface.
According to DE DECKER and M O M B E C K (1964), certain species of plankton were for the most part only encountered in fairly high concentrations at ± 1,000 metres and deeper in the vicinity of stations 16 and 27. For example, Calanus tonsus was encountered at a depth of ± 1,000 metres in high concentration at station 27. This species of plankton is indigenous to the area ¿ 100 miles south of Cape Point and even further south. A second example is Calanoides carinatus which is found in medium to fairly high concentration at a depth of ±1,000 metres in the vicinity of station 27. This species is found in high concentrations off the west coast of South Africa where upwelling of cold water occurs in the important fishing area.
D E D E C K E R and M O M B E C K (1964) state further that : " The frequent occurrence in our deep catches of such species as Calanus tonsus, Calanoides carinatus, Ctenocalanus vanus, Metridia lucens as well as many others considered to be representatives of the Atlantic and Subantarctic plankton, suggests a considerable influx of southern and western origin into this part of the Indian Ocean. The four species just mentioned are among those that had not been found elsewhere in the Indian Ocean. With the exception of C . tonsus they are at times very c o m m o n along the western and southwestern coasts of South Africa, where they reach the surface with the upwelling water masses (Ben-guela Current System). C . tonsus can be found in great numbers in the upper layers some 100 miles south of the Cape of-Good H o p e ".
That these species of plankton which are indigenous to the Atlantic water, occur at great depths in the Indian Ocean, is further evidence of the movement of Atlantic water in the deeper layers of the South-West Indian Ocean.
10. Acknowledgements.
The authors would like to take this opportunity of thanking the Director of Sea Fisheries for his guidance and interest in this investigational report.
W e would also like to express our appreciation to Messrs. M . J. Orren and S. A . Mostert of the Division of Sea Fisheries for their valuable assistance regarding the interpretation of data and the editing of the report.
W e would also like to thank M r . G . H . Stander of the Administration of South West Africa for his assistance and advice.
681
32 Invest. Rep. No. 52 of Division of Sea Fisheries
11. References
A R X , W . S. V O N , 1962.—Introduction to Physical Oceanography, 422 pp. Addison-Wesley Publishing Company, Inc., Massachusetts.
C L O W E S , A . J., 1950.—An introduction to the hydrology of South African waters. Invest. Rep. Fish, and Mar. Biol. Survey Div. S. Afr., 12: 42 pp. Pretoria.
D A R B Y S H I R E . M . , 1963.—Computed surface currents off the Cape of Good Hope. Deep-Sea Res., 10: 623-632.
D E A C O N , G . E . R . , 1937.—The Hydrology of the Southern Ocean. Discovery Rep., 15: 1-123. Cambridge.
D E D E C K E R , A . , A N D F . M O M B E C K , 1964.—South African contribution to the International Indian Ocean Expedition. Invest. Rep. Div. Sea Fish. S. Afr., 51: 49 pp. Pretoria.
D I E T R I C H , G . , 1935.—Aufbau und Dynamik des Südlichen Agulhas—stromgebietes. Veroff Inst. Meeresk. Univ. Berlin, 27: 79 pp. Berlin.
ISELIN, C . O ' D . , 1936.—A study of the circulation of the Western North Atlantic. Pap. phys. Oceanogr., 4 (4): 101 pp. Cambridge.
L A F O N D , E . C , 1951.—Processing Océanographie Data. H.O. Pub., 614: 114 pp. Washington.
L E P I C H Ó N , X . , 1960.—The Deep Water circulation in the Southwest Indian Ocean. J. geophys. Res., 65 (12): 4061^1074. Baltimore.
M É N A C H É , M . , 1963.—Première campagne océanographique du " Commandant Robert Giraud " en canal de Mozambique (11 Octobre-28 Novembre, 1957) Cahiers Océanographiques, 15 (4): 224-234. Paris.
O R R E N , M . J., 1963.—Hydrological observations in the South-West Indian Ocean. Invest. Rep. Div. Sea Fish. S. Afr., 45: 61 pp. Pretoria.
P A E C H , H . , 1926.—Die Oberflâchenstromungen im Mada-gaskar in ihrem Jârlichen Gang. Verôff. Inst. Meeresk. Univ. Berlin, 16: 37 pp. Berlin.
P A R R , A . E., . 1937-1938.—J. Mar. Res. 1 (2): 119-132.
P R O U D M A N , J., 1953.—Dynamical Oceanography. 409 pp. Methuen, London.
SVERDRUP, H . U. , JOHNSON, M . W . , AND R. H . FLEMING, 1942.—The Oceans, their Physics, Chemistry and General Biology, 1,087 pp. Prentice Hall, Inc., N e w York.
682
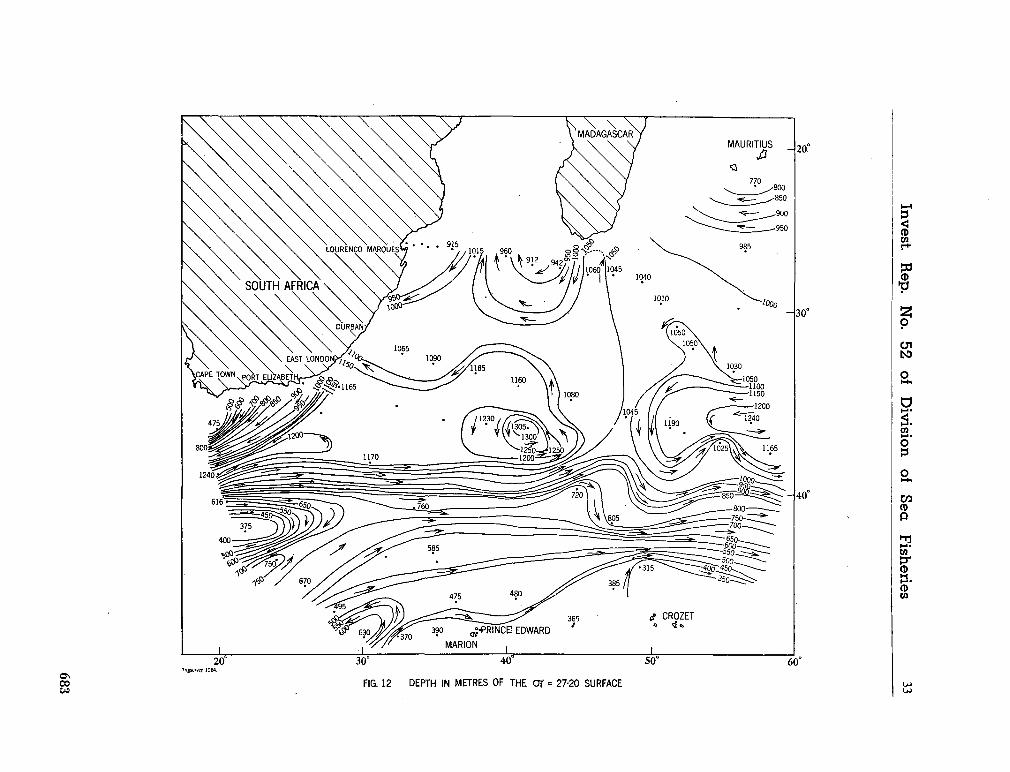
Invest.
Re
p. N
o. 5
2
of D
ivisio
n
of S
ea
Fish
eries 33
S
CE
O
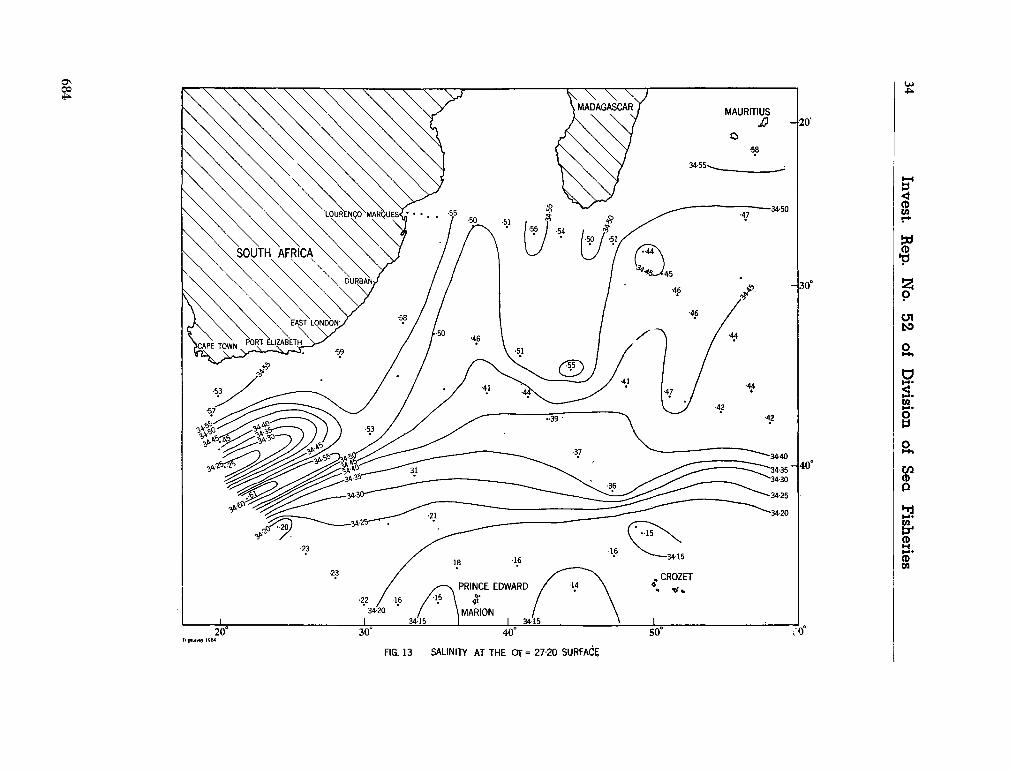
34 In
vest.
Re
p. N
o. 5
2
of D
ivisio
n
of S
ea
Fish
eries
684
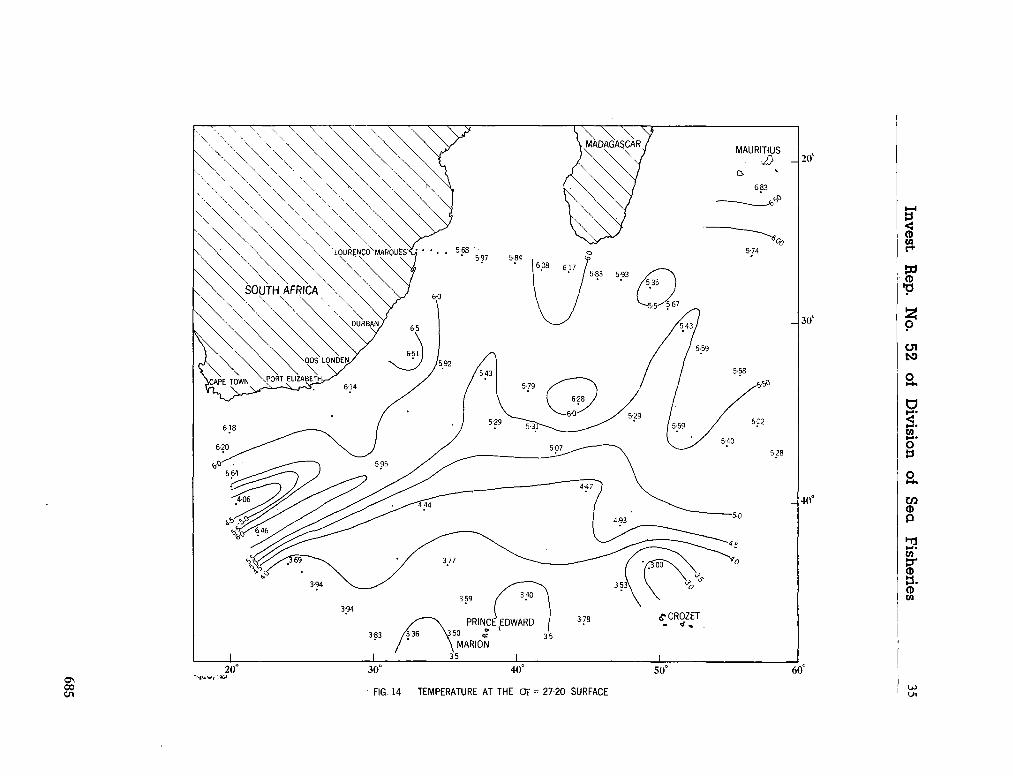
Invest.
Re
p. N
o. 5
2
of D
ivisio
n
of S
ea
Fish
eries 35
•_ &
685
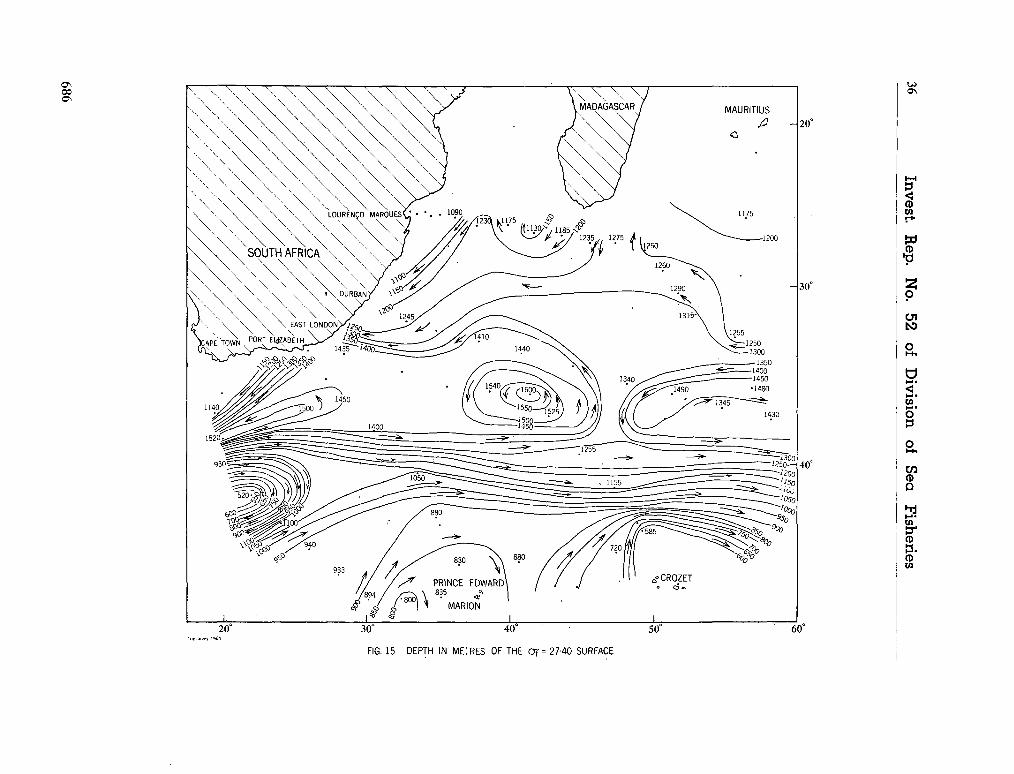
36
Invest.
Re
p. N
o. 5
2
of D
ivisio
n
of S
ea
Fish
eries
686
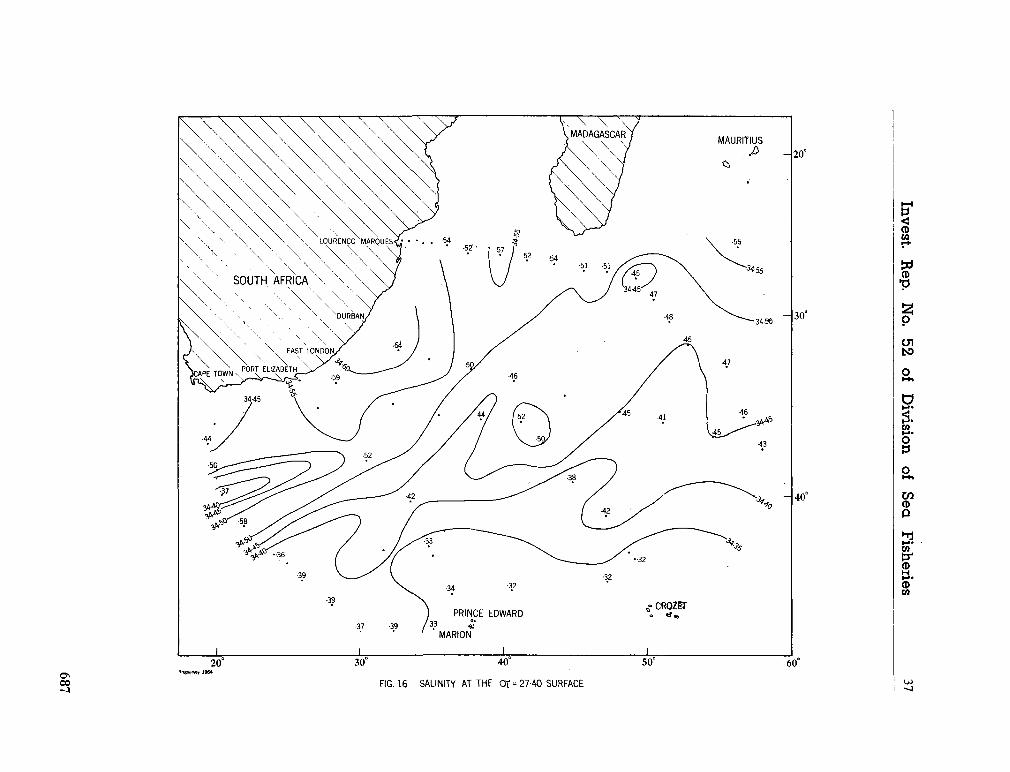
Invest.
Re
p. N
o. 5
2
of D
ivisio
n
of S
ea
Fish
eries 37
687
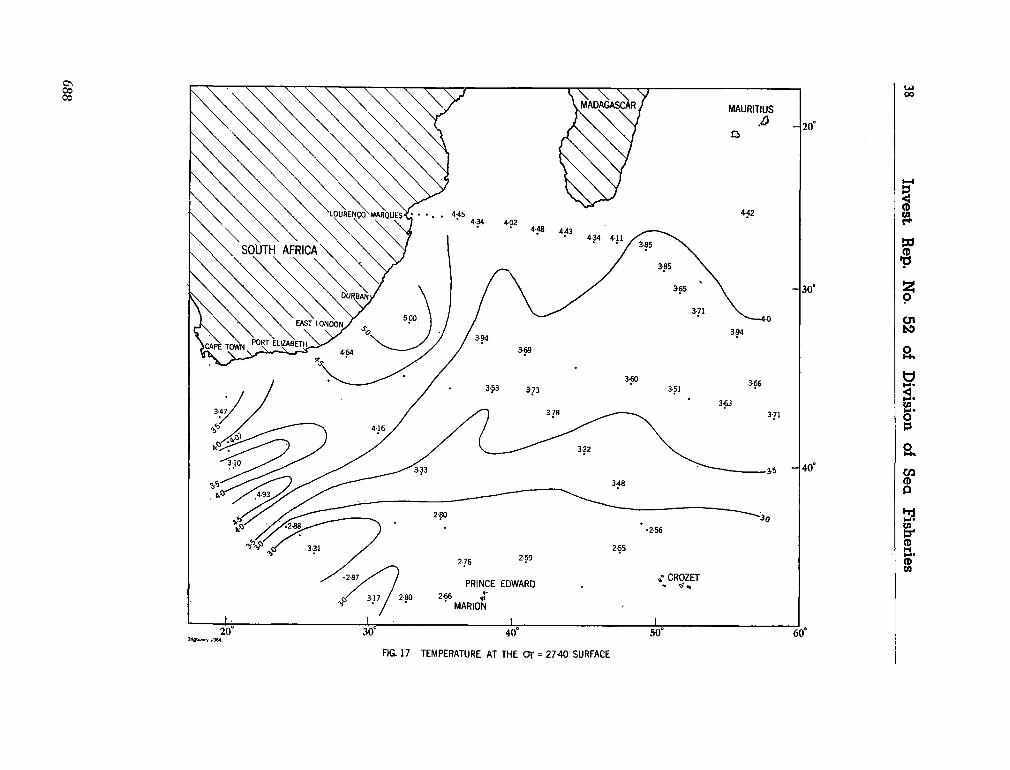
38 In
vest.
Re
p. N
o. 5
2
oí
Div
ision
of
Sea
Fish
eries
3
I—
<
688
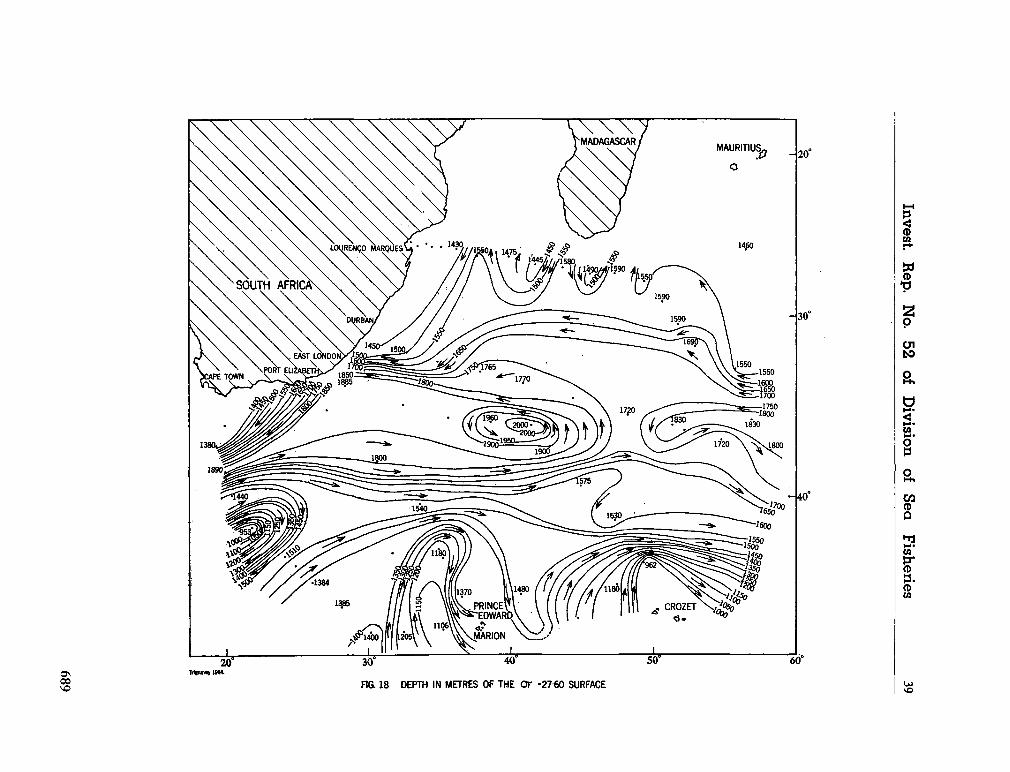
Invest.
Re
p. N
o. 5
2
of D
ivisio
n
of S
ea
Fish
eries 39
689
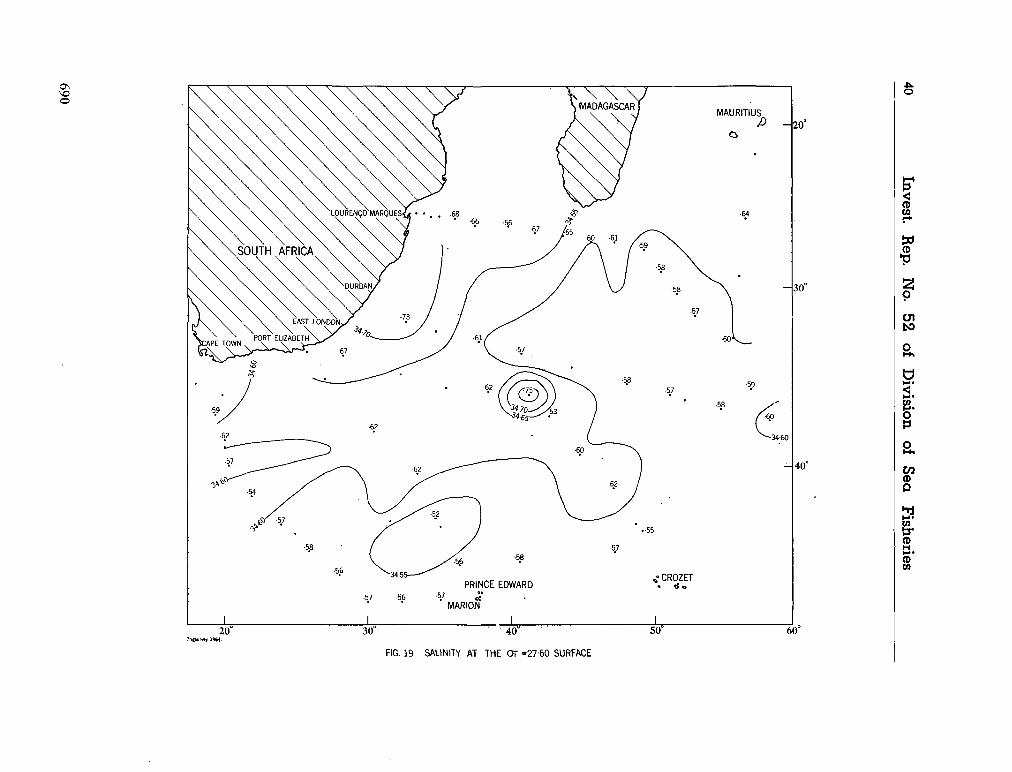
40
Invest.
Re
p. N
o. 5
2
of D
ivisio
n
of S
ea
Fish
eries
690
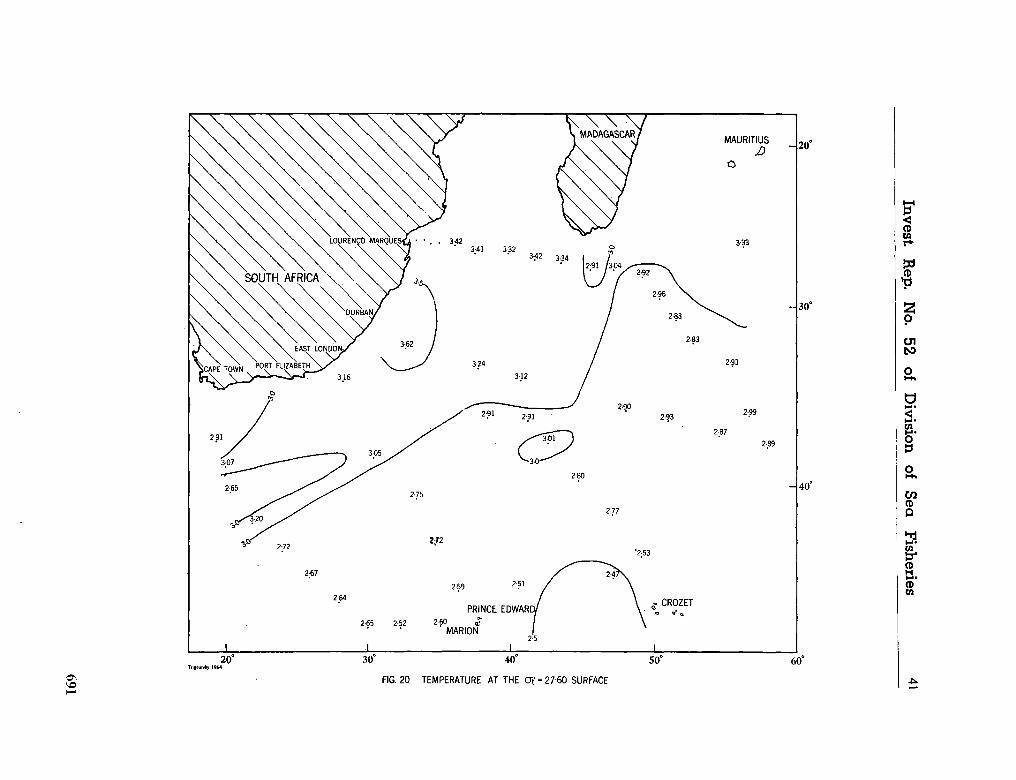
Invest.
Re
p. N
o. 5
2
of D
ivisio
n
of S
ea
Fish
eries 41
691
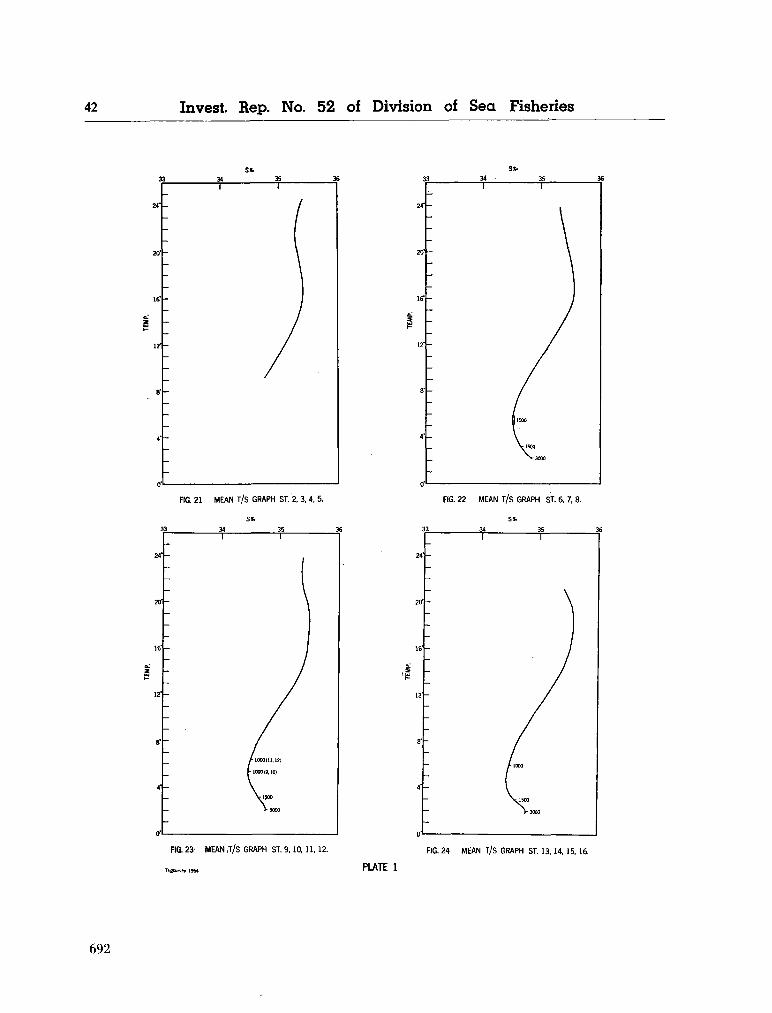
42 Invest. Rep. N o . 52 of Division of Sea Fisheries
FIG. 21 MEAN T/S GRAPH ST. 2, 3, 4, 5. FIG. 22 MEAN T/S GRAPH ST. 6, 7, 8.
s*.
FIG. 23- MEAN ,T/S GRAPH ST. 9, 10, 11, 12.
Tngsurvey 1964
FIG. 24 MEAN T/S GRAPH ST. 13, 14, 15. 16.
PLATE 1
692
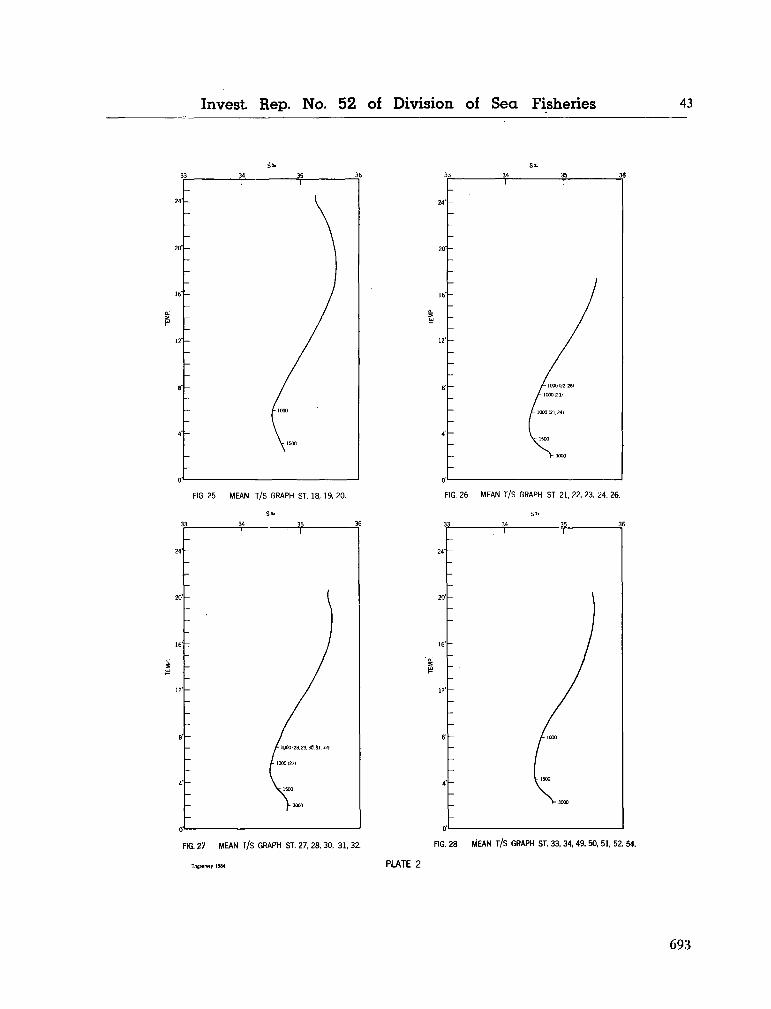
Invest. Rep. N o . 52 of Division of Sea Fisheries 43
FIG. 25 MEAN T/s GRAPH ST. 18, 19. 20.
35
FIG. 26 MEAN T/S GRAPH ST. 21, 22, 23, 24, 26.
FIG. 27 MEAN T/S GRAPH ST. 27, 28, 30, 31, 32.
Tfigsurwy 1964
FIG. 28 MEAN T/S GRAPH ST. 33, 34, 49, 50, 51, 52. 54.
PLATE 2
693
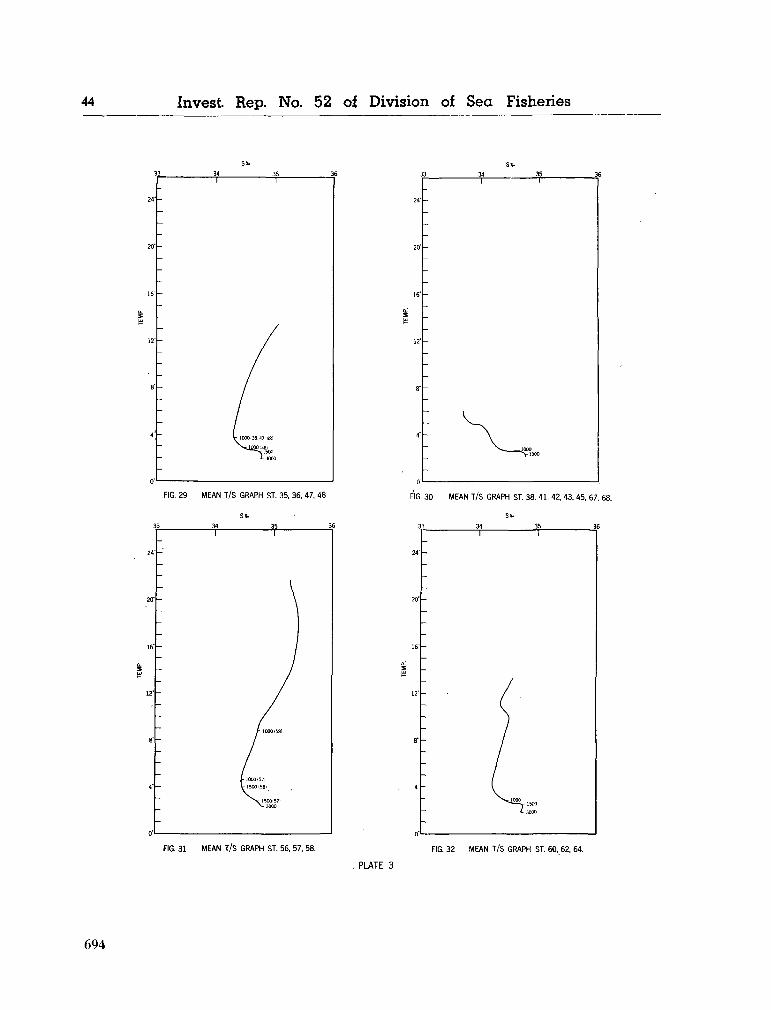
44 Invest. Rep. No. 52 of Division of Sea Fisheries
FIG. 29 MEAN T/S GRAPH ST. 35, 36, 47, 48. FIG. 30 MEAN T/S GRAPH ST. 38, 41, 42, 43, 45, 67, 68.
FIG. 31 MEAN T/S GRAPH ST. 56, 57. 58. FIG. 32 MEAN T/S GRAPH ST. 60, 62, 64.
PLATE 3
694
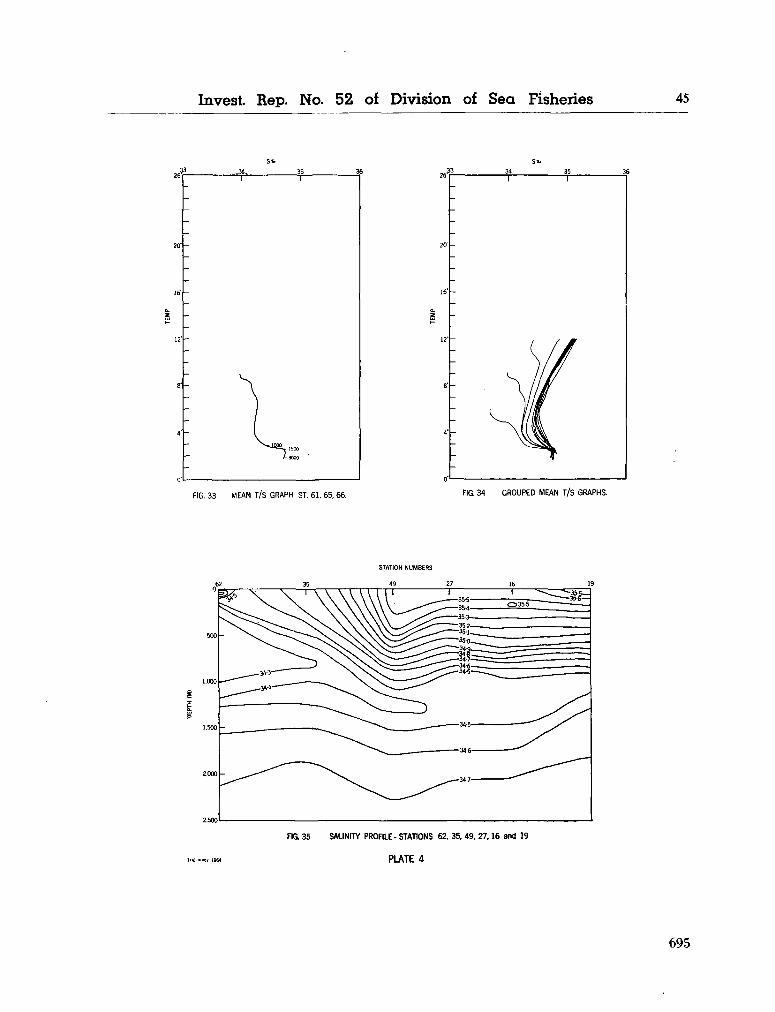
Invest. Rep. N o . 52 of Division of Sea Fisheries 45
FIG. 33 MEAN T/S GRAPH ST. 61, 65, 66. FIG. 34 GROUPED MEAN T/S GRAPHS.
STATION NUMBERS
Tn£;u,vey L964
FIG. 35 SALINITY PROFILE- STATIONS 62, 35, 49, 27,16 and 19
PLATE 4
695
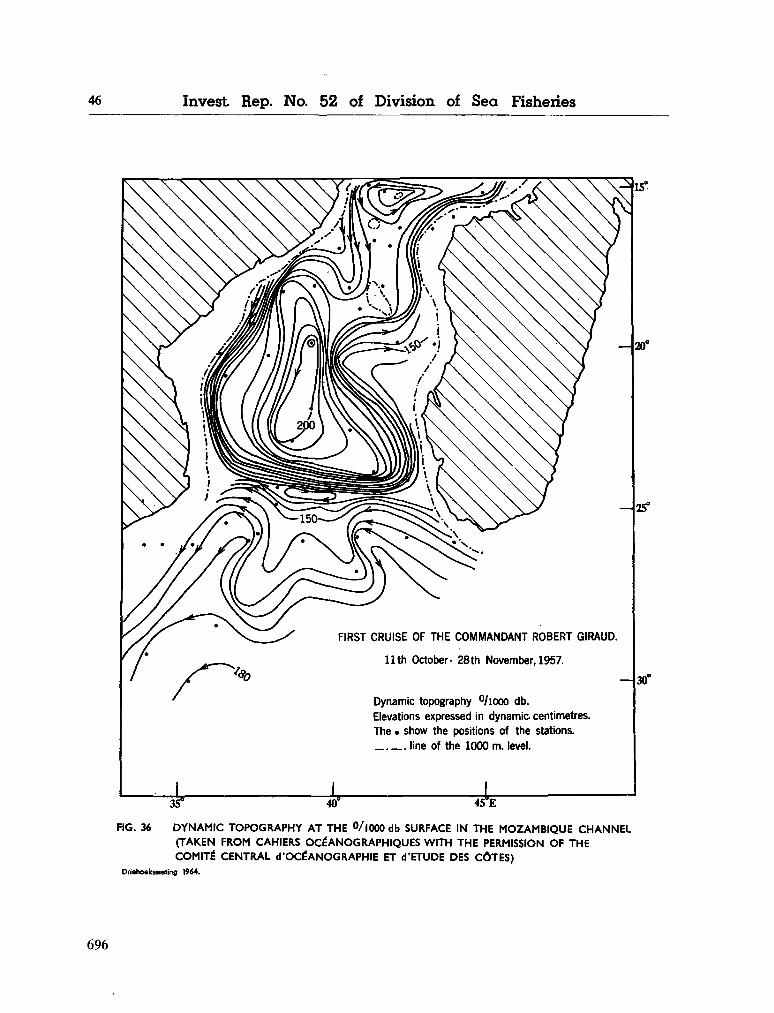
46 Invest. Rep. N o . 52 of Division of Sea Fisheries
FIG. 36 DYNAMIC TOPOGRAPHY AT THE <Vl000 db SURFACE IN THE MOZAMBIQUE CHANNEL (TAKEN FROM CAHIERS OCÉANOGRAPHIQUES WITH THE PERMISSION OF THE COMITÉ CENTRAL d'OCÉANOGRAPHIE ET d'ETUDE DES CÔTES)
Driehoeksmeting 1964.
-ja-J*
REPUBLIC OF SOUTH AFRICA
DEPARTMENT OF COMMERCE AND INDUSTRIES
DIVISION OF SEA FISHERIES INVESTIGATIONAL REPORT
No. 55
HYDROLOGY OF
THE SOUTH WEST INDIAN OCEAN
by M . J. ORREN
Collected reprints of the International Indian Ocean Expedition, vol. IV, contribution no. 242 697
CONTENTS
PAGE
1. ABSTRACT
2. INTRODUCTION
3. METHODS
3.1 Temperature and Salinity
3.2 Drift Measurements...
3.3 Miscellaneous
4. D I S C U S S I O N
4.1 General
4.2 Surface Water
4.3 Subsurface Water ...
4.4 Central Water
4.5 Antarctic Intermediate Water
4.6 Deep Water
5. ACKNOWLEDGEMENTS
6. LITERATURE CITED
3
11
13
15
17
19
19
669
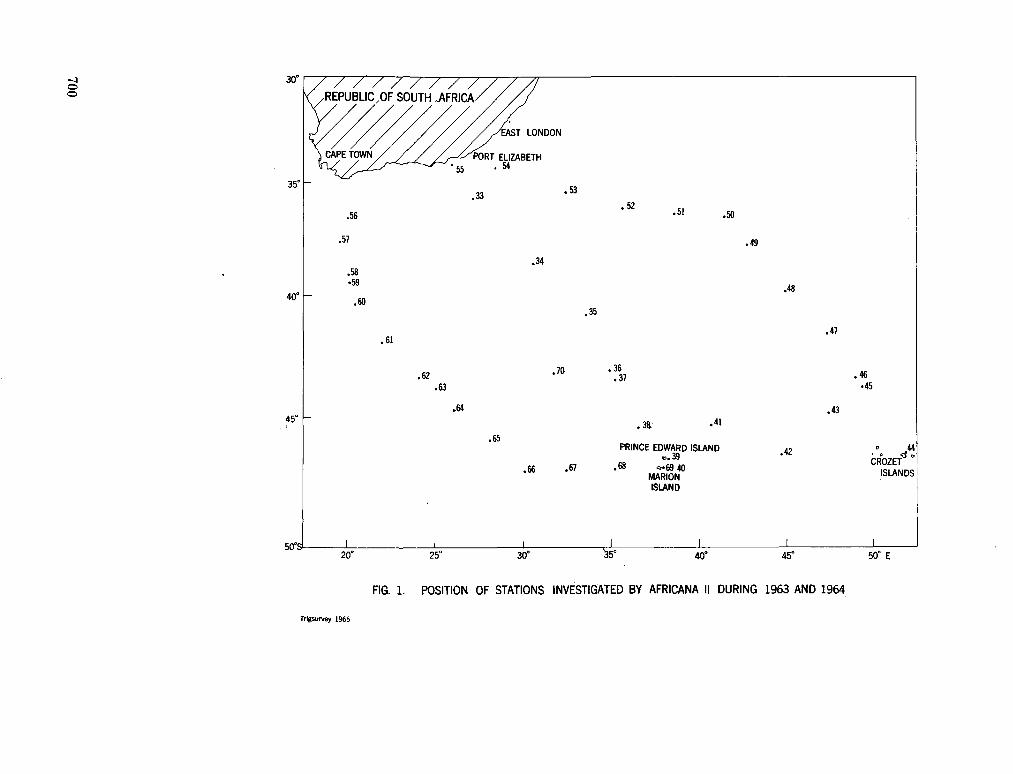
S'
o
z <
CO <£>
z ce O
S
ce <
.<
>
z to
z g
I 2
o
700
1. A B S T R A C T
During two cruises into an area of the Indian Ocean bounded by latitudes 34° S and 47° S and longitudes 20° Ë and 52° E , the sea water was sampled for temperature, salinity, oxygen and phosphate down to 4,000 m . Surface drift was obtained from navigational data. The_ Agulhas current varied from 50 to 100 miles in width and flowed at 2 to 4 knots. Little m o v e m e n t occurred in the Subtropical Water. T h e Subtropical Convergence was found to lie at 42° S ± 1 ° . The West W i n d Drift was only marked near the Crozets, where a northward thrust of Antarctic Surface Water appeared.
Subsurface currents were absent in the Subtropical Water, but were found in both the Agulhas Water and the Subantarctic Water. Possible sources of these currents are discussed. Central Water, originating from mixed Subtropical and Subantarctic Water, m o v e d northwards at depths of 200 to 800 m . T h e movements of Intermediate Water and the North Atlantic and North Indian D e e p Water masses are discussed.
2. INTRODUCTION
This report supplements Investigational Report 45 ( O R R E N 1963) and further describes the hydrological features of the South West Indian Ocean, using data obtained during two cruises by R . S . Africana II in 1962 and 1963 respectively. These cruises completed the field contribution of the Division of Sea Fisheries to the S C O R / U N E S C O International Indian Ocean Exploration programme.
The area covered by the cruises is shown in Figure 1. Stations 33 to 55 were completed in June/ July 1962, (Southern Winter) and the remainder in April 1963 (Southern A u t u m n ) . T h e 1963 cruise was curtailed due to an accident at Marion Island and no deep stations were done ón the return part of the cruise. The stations have been numbered consecutively and in chronological order and the numerals follow those used in Investigational Report 45 (op cit.).
A t each station the water column was sampled for temperature, salinity, dissolved oxygen and dissolved inorganic phosphate at the international depths to a m a x i m u m of 4,000 m . , while simultaneously extensive biological sampling was carried out. A t stations 37, 46, 59 and 63 only a surface sample was taken. T h e hydrological data .on which this report is based will be published separately at a later date.
For the purpose of graphical presentation of the data the stations were divided into five lines n a m e d as follows :
(a) T h e "Mar ion Line", i.e. stations 33—40. (b) T h e "Crozet Line", i.e. stations 40—44. (c) T h e "Slot Line", i.e. stations 44—50.
(d) The "Port Elizabeth Line", i.e. stations 50—55. (e) T h e "Agulhas Line", i.e. stations 56—69. Stations 39 ,40 ,44 and 69 were worked in shallow
water close to the islands. Vertical profiles of the hydrological variables have been constructed for each line and used for the deduction of water m o v e ments. T h e bathymétrie terminology used in this report follows that of S I M P S O N (1964).
3. METHODS
3.1 Temperature and Salinity. Samples for temperature and salinity determina
tion taken at the international depths down to 4,000m. were processed in the manner described by O R R E N (1963).
3.2 Drift Measurements. Surface currents were qualitatively estimated by
noting the navigational set between two accurate astronomical position sights. During extended periods of overcast skies accurate sights were not possible and in these circumstances the drift was calculated as an average over 24 hours or more . W i n d direction and velocity were noted at regular intervals during both cruises.
Figure 2 shows the current and wind vectors for the area and it m a y be noted that, in general, wind had little effect on the ship's drift w h e n under w a y . H a d this not been the case, the direction of the apparent surface current would have corresponded with the wind direction. Drifts observed on station with the ship stopped showed the latter tendency and consequently only drift measurements taken under w a y were included in the figure.
Although the surface drift thus arrived at is largely qualitative, it is felt that a fair picture of the actual movements m a y be obtained.
3.3 Miscellaneous. Continuous depth records were obtained
throughout the cruises with an Elac precision echo-sounder. Meteorological observations were m a d e at the start of each station as well as at the synoptic hours, and a distant-reading thermograph recorded surface temperature continuously.
4. D I S C U S S I O N
4.1 General. T h e surface water of the area m a y be divided into
three main water masses separated by m o r e or less marked frontal discontinuities. These water masses are:
(a) T h e Agulhas system, composed mainly of Indian Ocean Tropical Water mixed with Subtropical Water ;
(b) Subtropical Surface Water extending from the Tropical Convergence at 24° S ( O R R E N 1963) to the Subtropical Convergence at about 42° S ;
701
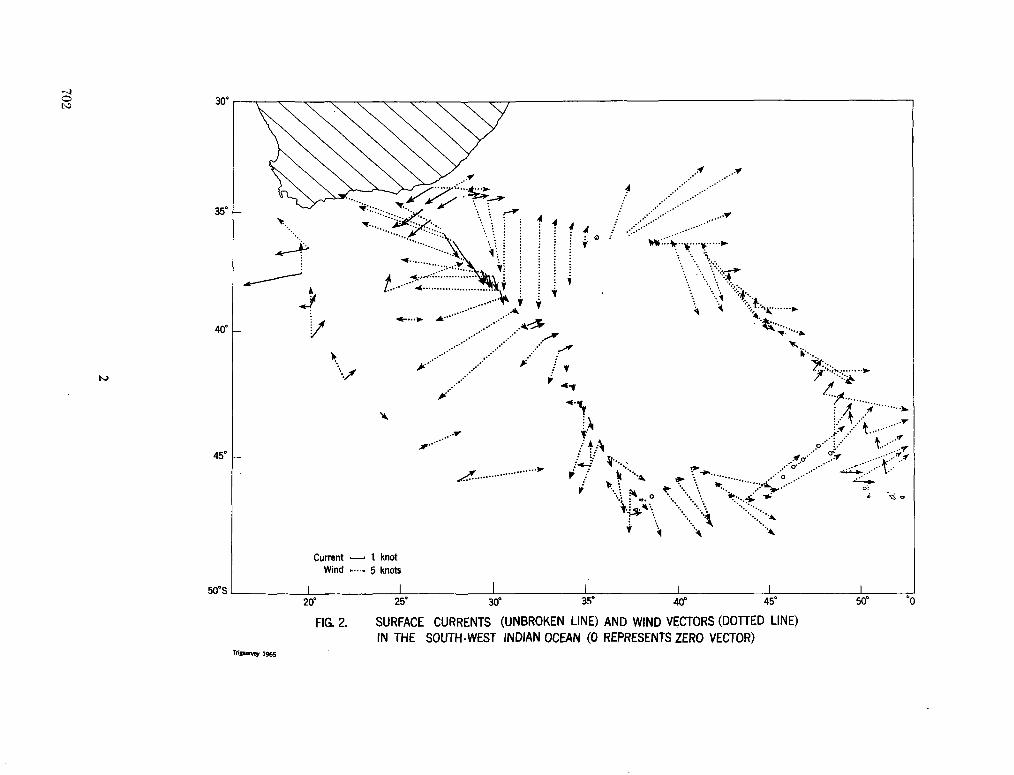
A y
A •:'*••.
-¿
'•. is"*
••>: V?
.#*
f tf
• t
• .•:?
'.•••:"T-*
f
\ \ \ K' ::>""...*
"•
•\
*
T...
5
^
' "
\ -
Ï •
' *
A
* *
• ^
••
-,
.
^ v
A
/ /
X
V **
y¿1
; '••
///XK
y ^
A! !
5. \ x
/
/ /
\\S
Ñf
••' /
H ='
'•••
///A^>h/ I*' t
A
/ /
/ A) * \ ••'
* ///A
^ /
^
' '
/ /
/\
•*
'
/ /
/ A
J
\ /
/ /
/)
•*
/ /
/ /
/\
.\ -*'*ï
••
•*
•
///j2A
\
'.. '*.
0. \\ V*
//
/w /
/•
"
/*
• A-'' o
<..
v-*3--..k •^ i. ; • \ •
Vi i •
---•-
s|
-
Ji
J 1
II ë
a
LU ^
^ O
o
P
o o
w LU
CO
>
oo
p
a:
CJ M
>Í2
9
z
II
£5
P> <*>
o o
CO LÜ O
LU
a: ^
35
CM
CD
§
702
2
(c) Subantarctic Surface Water stretching from the Subtropical Convergence to the Antarctic Convergence at c. 50° S.
Deeper down, the water masses can be further subdivided into the Subsurface, Central, Antarctic Intermediate, Deep and Bottom Waters. In the Northern part of the area all these water masses were present; southwards the Central-Water source was passed at the Subtropical^ Convergence, and here also marked changes occurred in the distribution of the other water masses. For example, Figure 3 ^shows typical T / S curves for the water masses oh either side of the Subtropical Convergence.
Figuré 4 was used to distinguish surface water masses. Surface values of all stations, with the addition of stations 1 to 32 (quoted in O R R E N 1963), are included in the surface T / S diagram. The boundary between Tropical and Subtropical masses was drawn at 23°C — the temperature of the Tropical Convergence—while the clustering of points was largely used to position the other limits. The large region between Subtropical and Subantarctic water is designated the "transition region", and the most likely position of the Subtropical Convergence (station 35) is entered as a dotted line.
The limits proposed by F U K A S E (1962) for the "Agulhas", "North Edge" and "Subantarctic" water masses have been entered as lines of dashes on Figure 4. Fukase's "Agulhas Water" limit of 19° C appears low for this region, and his Agulhas region covers a large number of points found in this investigation to be typical of Subtropical Water despite the fact that his values were taken in summer whereas the data used here for Figure 4 were collected largely in winter, when lower temperatures could be anticipated.
The "North Edge Water" limits agree more or less with the lower.part of the Subtropical Water and the upper part of what has been designated here as a "transition" region (Fig. 4).
Fukase's "Subantarctic Water" limits enclose water which is both warmer and more saline than was found in this investigation, and Fukase's results further agree with those of H O R I (1962). It appears that the difference is purely seasonal since the Africana II cruises described here were undertaken in autumn and winter (April 1963 and June/July 1962) whereas the Japanese researchers crossed the area in summer. The temperature variation from autumn to winter is further _ discussed in section 4.2.4 below. The T / S envelope produced by Hori for the area between Cape T o w n and Antarctica generally agrees well with Figure 4.
4.2 Surface Water. 4.2.1 The Agulhas System.—The Agulhas current
is a narrow, fast-flowing western boundary type current generally believed to originate in the south
ward moving part of the South Equatorial current, although recent studies by M E N A C H É (1961) show that the Moçambique current apparently returns to the north and does not form part of the Agulhas current. However, this phenomenon m a y be seasonal. The Agulhas region will be discussed only briefly here since other more detailed inshore surveys have been completed recently, for example D A R B Y S H I R E (1964).
From thermograph data, i.e. the rapid temperature change, the Agulhas current was encountered 10 to 20 miles off Port Elizabeth (Fig. 5) and extended about 100 miles off shore with temperatures of 21 to 23° C . O n the 20° E meridian the current lay about 150 miles south of Cape Agulhas and was about 50 miles wide. South of Plettenberg Bay (24° E) the Agulhas current was evident as a 90 mile wide strip of warm water with temperatures in excess of 23° C . Between the current and a cool (less than 17° C ) 50-mile wide strip of coastal water was a uniform layer of water moving westward at about two knots (probably a branch of Agulhas Water) which m a y later flow round the edge of the Agulhas Bank into the Atlantic.
Surface velocities in the current were generally high, namely two knots off Port Elizabeth and Plettenberg Bay and over four knots south of Cape Agulhas (See Fig. 2).
Station 57 (37¿° S, 20° E ) in the centre of the strong Agulhas flow in this area had a surface temperature and salinity which placed in it the Tropical Surface Water category, that is temperatures in excess of 23° C , and salinity ranging from 35-2 to 35-4°/00, as shown in Figure 4, in c o m m o n with stations from the Moçambique Channel and near Mauritius (compare stations 7 and 18 in O R R E N 1963). N o other station lay in the current core, but thermograph data indicated similar water throughout the Agulhas current in the study area. The T / S data from the Moçambique and Agulhas currents seem to indicate a c o m m o n origin in equatorial water, but further stations north of Lourenço Marques would be required for investigating whether the phenomenon observed by M E N A C H É (1961) was an isolated or seasonal disturbance.
F U K A S E (1962) considers the southern edge of the Agulhas current to be the "Agulhas Convergence" on the basis mainly of temperature measurement. This view is supported by D A R B Y S H I R E (1964), but this author admits the "Convergence" is not well marked, especially as regards salinity change. It is felt that the concept involves a rather unnecessary subdivision since the Agulhas current region is generally regarded as a separate hydro-logical entity and the edge of the Agulhas current m a y in fact perhaps be considered as a southward extension of the Tropical Convergence, especially since Tropical Water is present in the Agulhas current. If the concept of an "Agulhas Conver-
703
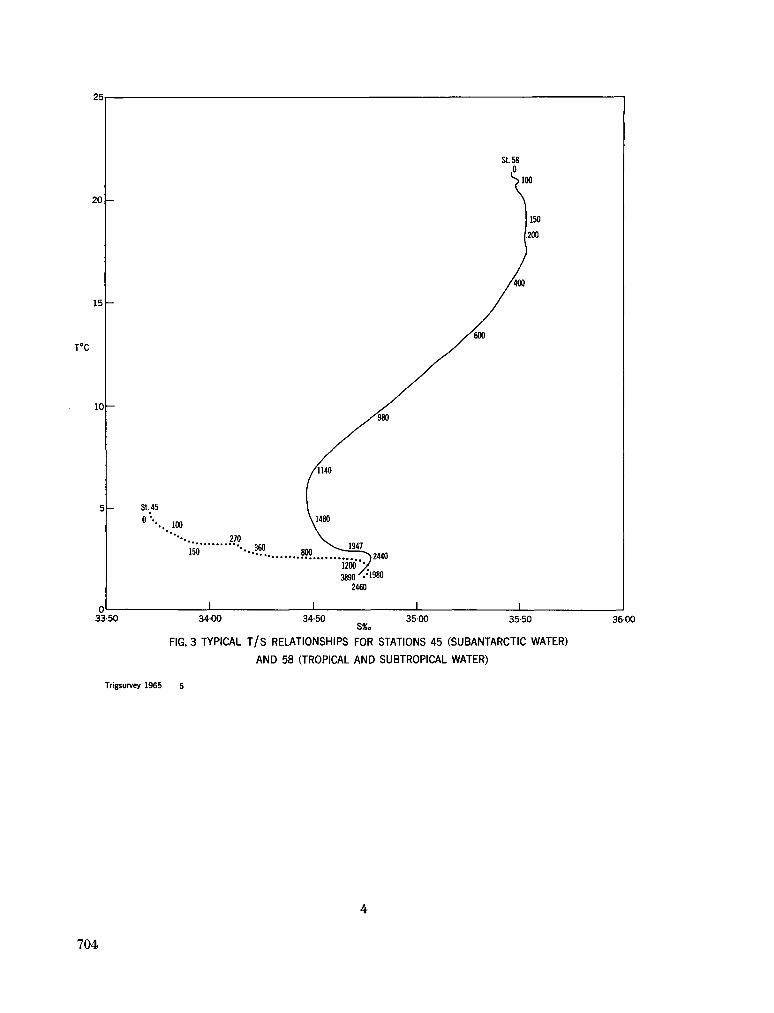
—
)-
)
SU5 o '•-.
_ 100
150
1
270 360
/1140
\ 1480
1
/ 9 8 0
^.1947
1200 y 3890 / . ;1980
2460
1
/m
St. 58
S loo
150
200
/m
1 33-50 3400 34-50 3500 35-50
S * .
FIG, 3 TYPICAL T / S RELATIONSHIPS FOR STATIONS 45 (SUBANTARCTIC WATER)
AND 58 (TROPICAL AND SUBTROPICAL WATER)
3600
Trigsurvey 1965 5
704
4
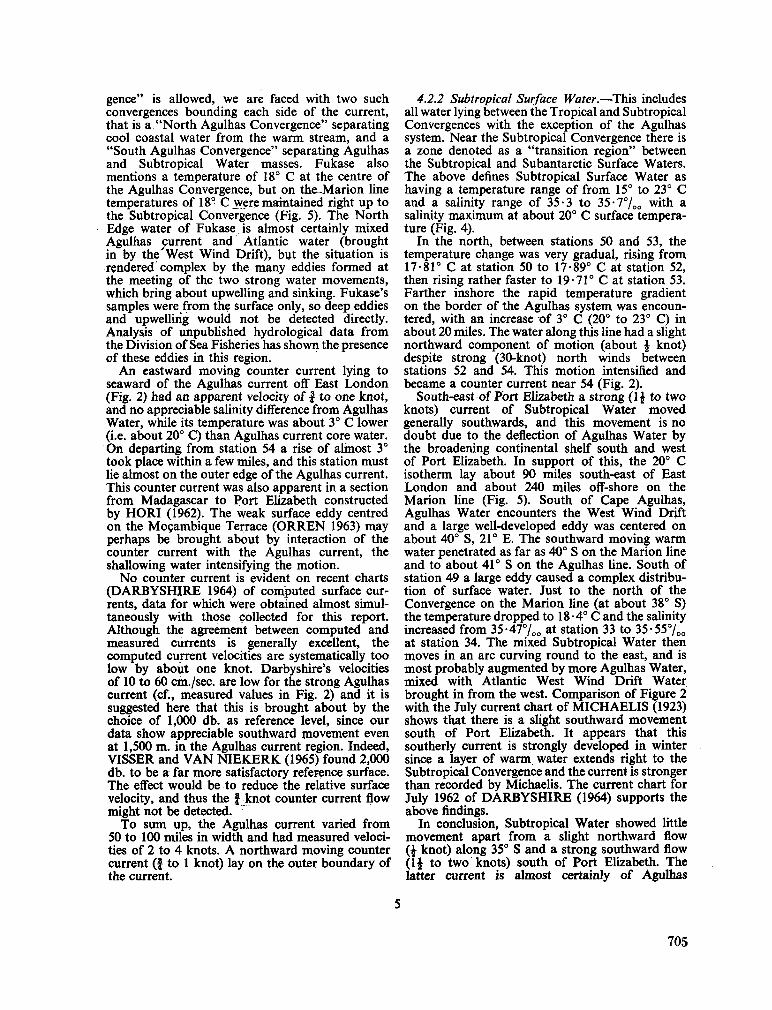
gence" is allowed, w e are faced with two such convergences bounding each side of the current, that is a "North Agulhas Convergence" separating cool coastal water from the w a r m stream, and a "South Agulhas Convergence" separating Agulhas and Subtropical Water masses. Fukase also mentions a temperature of 18° C at the centre of the Agulhas Convergence, but on the_Marion line temperatures of 18° C jwere maintained right up to the Subtropical Convergence (Fig. 5). The North Edge water of Fukase is almost certainly mixed Agulhas purrent and Atlantic water (brought in by the'West Wind Drift), but the situation is rendered complex by the m a n y eddies formed at the meeting of the two strong water movements, which bring about upwelling and sinking. Fukase's samples were from the surface only, so deep eddies and upwelling would not be detected directly. Analysis of unpublished hydrological data from the Division of Sea Fisheries has shown the presence of these eddies in this region.
A n eastward moving counter current lying to seaward of the Agulhas current off East London (Fig. 2) had an apparent velocity of f to one knot, and no appreciable salinity difference from Agulhas Water, while its temperature was about 3° C lower (i.e. about 20° C ) than Agulhas current core water. O n departing from station 54 a rise of almost 3° took place within a few miles, and this station must lie almost on the outer edge of the Agulhas current. This counter current was also apparent in a section from Madagascar to Port Elizabeth constructed by H O R I (1962). The weak surface eddy centred on the Moçambique Terrace ( O R R E N 1963) m a y perhaps be brought about by interaction of the counter current with the Agulhas current, the shallowing water intensifying the motion.
N o counter current is evident on recent charts ( D A R B Y S H I R E 1964) of computed surface currents, data for which were obtained almost simultaneously with those collected for this report. Although the agreement between computed and measured currents is generally excellent, the computed current velocities are systematically too low by about one knot. Darbyshire's velocities of 10 to 60 cm./sec. are low for the strong Agulhas current (cf., measured values in Fig. 2) and it is suggested here that this is brought about by the choice of 1,000 db. as reference level, since our data show appreciable southward movement even at 1,500 m . in the Agulhas current region. Indeed, V I S S E R and V A N N I E K E R K (1965) found 2,000 db. to be a far more satisfactory reference surface. The effect would be to reduce the relative surface velocity, and thus the J knot counter current flow might not be detected.
T o sum up, the Agulhas current varied from 50 to 100 miles in width and had measured velocities of 2 to 4 knots. A northward moving counter current (f to 1 knot) lay on the outer boundary of the current.
4.2.2 Subtropical Surface Water.—This includes all water lying between the Tropical and Subtropical Convergences with the exception of the Agulhas system. Near the Subtropical Convergence there is a zone denoted as a "transition region" between the Subtropical and Subantarctic Surface Waters. The above defines Subtropical Surface Water as having a temperature range of from 15° to 23° C and a salinity range of 35-3 to 35-7°/00 with a salinity m a x i m u m at about 20° C surface temperature (Fig. 4).
In the north, between stations 50 and 53, the temperature change was very gradual, rising from 17-81° C at station 50 to 17-89° C at station 52, then rising rather faster to 19-71° C at station 53. Farther inshore the rapid temperature gradient on the border of the Agulhas system was encountered, with an increase of 3° C (20° to 23° C ) in about 20 miles. The water along this line had a slight northward component of motion (about \ knot) despite strong (30-knot) north winds between stations 52 and 54. This motion intensified and became a counter current near 54 (Fig. 2).
South-east of Port Elizabeth a strong (1J to two knots) current of Subtropical Water moved generally southwards, and this movement is no doubt due to the deflection of Agulhas Water by the broadening continental shelf south and west of Port Elizabeth. In support of this, the 20° C isotherm lay about 90 miles south-east of East London and about 240 miles off-shore on the Marion line (Fig. 5). South of Cape Agulhas, Agulhas Water encounters the West Wind Drift and a large well-developed eddy was centered on about 40° S, 21° E . The southward moving w a r m water penetrated as far as 40° S on the Marion line and to about 41° S on the Agulhas line. South of station 49 a large eddy caused a complex distribution of surface water. Just to the north of the Convergence on the Marion line (at about 38° S) the temperature dropped to 18• 4° C and the salinity increased from 35-47°/00 at station 33 to 35-55°/00 at station 34. The mixed Subtropical Water then moves in an arc curving round to the east, and is most probably augmented by more Agulhas Water, mixed with Atlantic West W i n d Drift Water brought in from the west. Comparison of Figure 2 with the July current chart of M I C H A E L I S (1923) shows that there is a slight southward movement south of Port Elizabeth. It appears that this southerly current is strongly developed in winter since a layer of w a r m water extends right to the Subtropical Convergence and the current is stronger than recorded by Michaelis. The current chart for July 1962 of D A R B Y S H I R E (1964) supports the above findings.
In conclusion, Subtropical Water showed little movement apart from a slight northward flow (i knot) along 35° S and a strong southward flow (1| to two knots) south of Port Elizabeth. The latter current is almost certainly of Agulhas
705
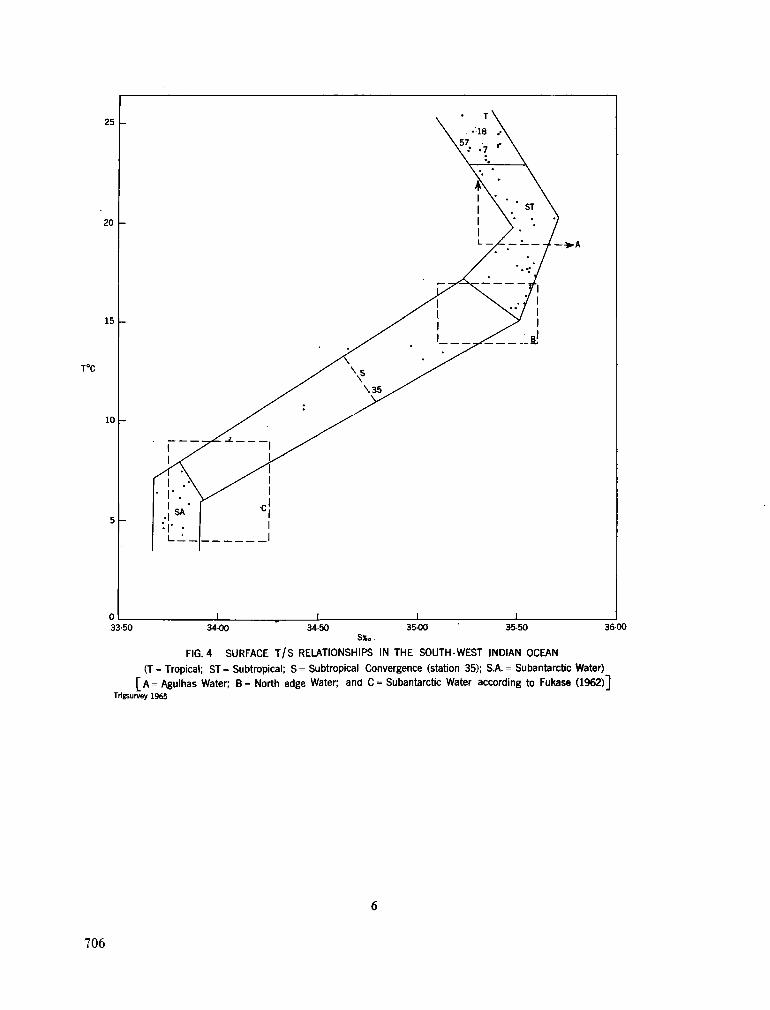
-
-
1
i A • r . N
> '
•r •
_^ii
i
•c
1
' i i i_
i
T \
• 18 X
X* \ 1 \ • . > 1 \ . ST i V •. 1 / • i Z. _ •
/ ' • • * /
\ / 1 S ? i
_^^_. . i i
1
'—>-A
33-50 3400 34-50 3500 35-50 36-00
S*„ FIG. 4 SURFACE T / S RELATIONSHIPS IN T H E S O U T H - W E S T INDIAN O C E A N
(T - Tropical; ST = Subtropical; S = Subtropical Convergence (station 35); S.A. = Subantarctic Water) [ A = Agulhas Water; B = North edge Water; and C = Subantarctic Water according to Fukase (1962)]
Trigsurvey 1965
706
6
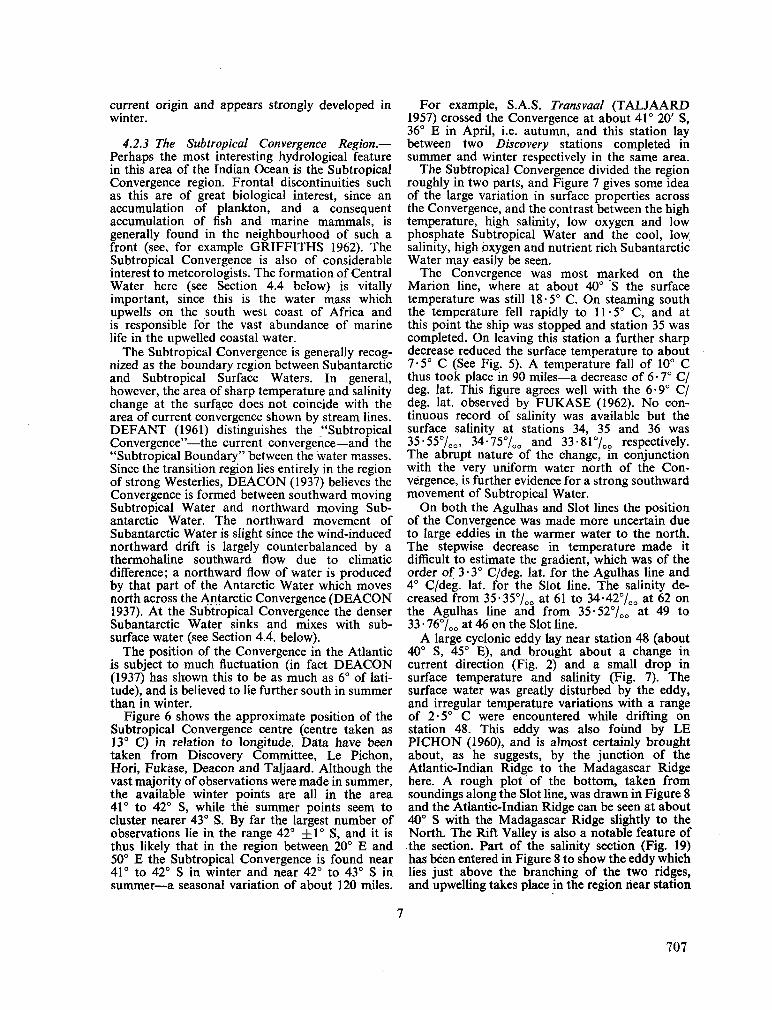
current origin and appears strongly developed in winter.
4.2.3 The Subtropical Convergence Region.— Perhaps the most interesting hydrological feature in this area of the Indian Ocean is the Subtropical Convergence region. Frontal discontinuities such as this are of great biological interest, since an accumulation of plankton, and a consequent accumulation of fish and marine m a m m a l s , is generally found in the neighbourhood of such a front (see. for example G R I F F I T H S 1962). The Subtropical Convergence is also of considerable interest to meteorologists. The formation of Central Water here (see Section 4.4 below) is vitally important, since this is the water mass which upwells on the south west coast of Africa and is responsible for the vast abundance of marine life in the upwelled coastal water.
The Subtropical Convergence is generally recognized as the boundary region between Subantarctic and Subtropical Surface Waters. In general, however, the area of sharp temperature and salinity change at the surface does not coincide with the area of current convergence shown by stream lines. D E F A N T (1961) distinguishes the "Subtropical Convergence"—the current convergence—and the "Subtropical Boundary" between the water masses. Since the transition region lies entirely in the region of strong Westerlies, D E A C O N (1937) believes the Convergence is formed between southward moving Subtropical Water and northward moving Subantarctic Water. The northward movement of Subantarctic Water is slight since the wind-induced northward drift is largely counterbalanced by a thermohaline southward flow due to climatic difference; a northward flow of water is produced by that part of the Antarctic Water which moves north across the Antarctic Convergence ( D E A C O N 1937). At the Subtropical Convergence the denser Subantarctic Water sinks and mixes with subsurface water (see Section 4.4. below).
The position of the Convergence in the Atlantic is subject to m u c h fluctuation (in fact D E A C O N (1937) has shown this to be as m u c h as 6° of latitude), and is believed to lie further south in summer than in winter.
Figure 6 shows the approximate position of the Subtropical Convergence centre (centre taken as 13° C ) in relation to longitude. Data have been taken from Discovery Committee, Le Pichón, H o n , Fukase, Deacon and Taljaard. Although the vast majority of observations were m a d e in summer, the available winter points are all in the area 41° to 42° S, while the summer points seem to cluster nearer 43° S. By far the largest number of observations lie in the range 42° ± 1 ° S, and it is thus likely that in the region between 20° E and 50° E the Subtropical Convergence is found near 41° to 42° S in winter and near 42° to 43° S in summer—a seasonal variation of about 120 miles.
For example, S . A . S . Transvaal ( T A L J A A R D 1957) crossed the Convergence at about 41° 20' S, 36° E in April, i.e. autumn, and this station lay between two Discovery stations completed in summer and winter respectively in the same area.
The Subtropical Convergence divided the region roughly in two parts, and Figure 7 gives some idea of the large variation in surface properties across the Convergence, and the contrast between the high temperature, high salinity, low oxygen and low phosphate Subtropical Water and the cool, low salinity, high oxygen and nutrient rich Subantarctic Water m a y easily be seen.
The Convergence was most marked on the Marion line, where at about 40° S the surface temperature was still 18-5° C . O n steaming south the temperature fell rapidly to 11-5° C , and at this point the ship was stopped and station 35 was completed. O n leaving this station a further sharp decrease reduced the surface temperature to about 7-5° C (See Fig. 5). A temperature fall of 10° C thus took place in 90 miles—a decrease of 6 • 7° C / deg. lat. This figure agrees well with the 6-9° C / deg. lat. observed by F U K A S E (1962). N o continuous record of salinity was available but the surface salinity at stations 34, 35 and 36 was 35-55%o. 34-75%o and 33-81%0 respectively. The abrupt nature of the change, in conjunction with the very uniform water north of the C o n vergence, is further evidence for a strong southward movement of Subtropical Water.
O n both the Agulhas and Slot lines the position of the Convergence was m a d e more uncertain due to large eddies in the warmer water to the north. The stepwise decrease in temperature m a d e it difficult to estimate the gradient, which was of the order of 3-3° C/deg. lat. for the Agulhas line and 4° C/deg. lat. for the Slot line. The salinity decreased from 35-35°/00 at 61 to 34-42°/00 at 62 on the Agulhas line and from 35-52°/00 at 49 to 33 • 76°/00 at 46 on the Slot line.
A large cyclonic eddy lay near station 48 (about 40° S, 45° E) , and brought about a change in current direction (Fig. 2) and a small drop in surface temperature and salinity (Fig. 7). The surface water was greatly disturbed by the eddy, and irregular temperature variations with a range of 2-5° C were encountered while drifting on station 48. This eddy was also found by L E P I C H Ó N (1960), and is almost certainly brought about, as he suggests, by the junction of the Atlantic-Indian Ridge to the Madagascar Ridge here. A rough plot of the bottom, taken from soundings along the Slot line, was drawn in Figure 8 and the Atlantic-Indian Ridge can be seen at about 40° S with the Madagascar Ridge slightly to the North. The Rift Valley is also a notable feature of the section. Part of the salinity section (Fig. 19) has been entered in Figure 8 to show the eddy which lies just above the branching of the two ridges, and upwelling takes place in the region near station
707
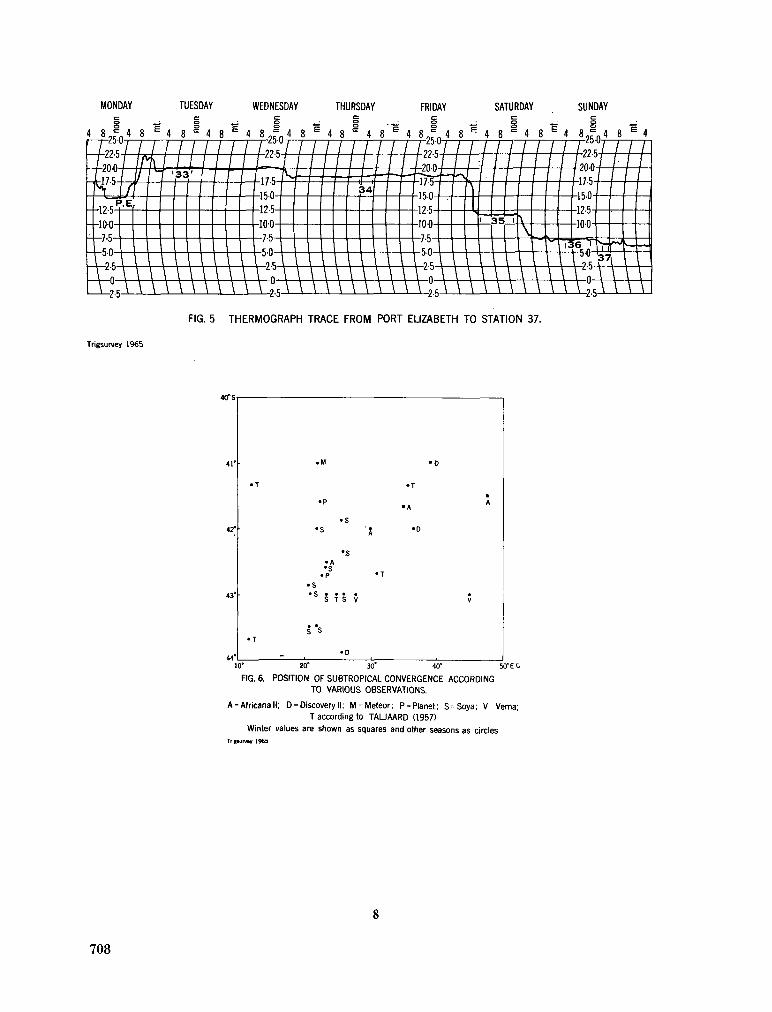
MONDAY TUESDAY WEDNESDAY THURSDAY FRIDAY SATURDAY SUNDAY
FIG. 5 T H E R M O G R A P H TRACE F R O M PORT ELIZABETH TO STATION 37.
Trigsurvey 1965
42°
43°
M - D
• T
• A
• S
• P
• A • S
• p «T
S S
10* 20° 30' 40" 50"EC
FIG. 6. POSITION O F S U B T R O P I C A L C O N V E R G E N C E A C C O R D I N G T O V A R I O U S O B S E R V A T I O N S .
A«Africanall; D = Discovery II; M - M e t e o r ; P = Planet; S - S o y a ; V V e m a ; T according to T A U A A R D (1957)
Winter values are shown as squares and other seasons as circles Tngsurvey 1965
708
8
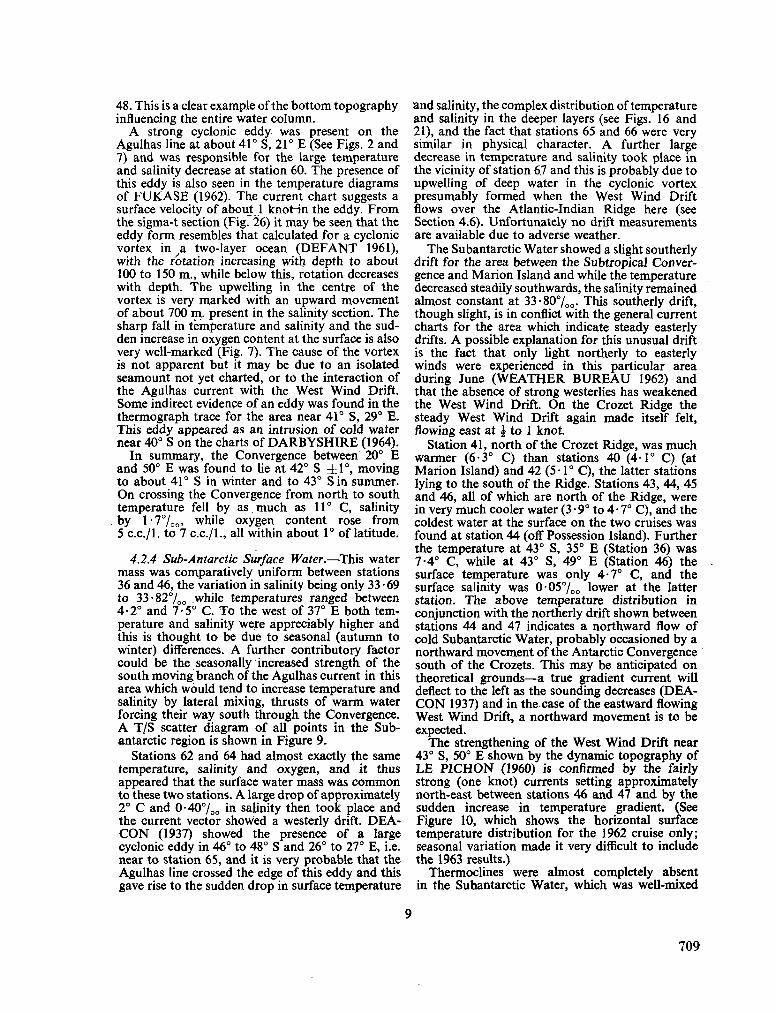
48. This is a clear example of the bottom topography influencing the entire water column.
A strong cyclonic eddy was present on the Agulhas line at about 41° S, 21° E (See Figs. 2 and 7) and was responsible for the large temperature and salinity decrease at station 60. The presence of this eddy is also seen in the temperature diagrams of F U K A S E (1962). The current chart suggests a surface velocity of about 1 knot4n the eddy. F r o m the sigma-t section (Fig. 26) it m a y be seen that the eddy form resembles that calculated for a cyclonic vortex in a two-layer ocean ( D E F A N T 1961), with the rotation increasing with depth to about 100 to 150 m . , while below this, rotation decreases with depth. The upwelling in the centre of the vortex is very marked with an upward movement of about 700 m . present in the salinity section. The sharp fall in temperature and salinity and the sudden increase in oxygen content at the surface is also very well-marked (Fig. 7). The cause of the vortex is not apparent but it m a y be due to an isolated seamount not yet charted, or to the interaction of the Agulhas current with the West Wind Drift. S o m e indirect evidence of an eddy was found in the thermograph trace for the area near 41° S, 29° E . This eddy appeared as an intrusion of cold water near 40° S on the charts of D A R B Y S H I R E (1964).
In summary, the Convergence between 20° E and 50° E was found to lie at 42° S ±1° , moving to about 41° S in winter and to 43° Sin summer. O n crossing the Convergence from north to south temperature fell by as m u c h as 11° C , salinity by l"77oo> wn'le oxygen content rose from 5 c.c./l. to 7 c.c./l., all within about 1° of latitude.
4.2.4 Sub-Antarctic Surface Water.—This water mass was comparatively uniform between stations 36 and 46, the variation in salinity being only 33 • 69 to 33-82%0 while temperatures ranged between 4-2° and 7-5° C . T o the west of 37° E both temperature and salinity were appreciably higher and this is thought to be due to seasonal (autumn to winter) differences. A further contributory factor could be the seasonally increased strength of the south moving, branch of the Agulhas current in this area which would tend to increase temperature and salinity by lateral mixing, thrusts of w a r m water forcing their way south through the Convergence. A T / S scatter diagram of all points in the Sub-antarctic region is shown in Figure 9.
Stations 62 and 64 had almost exactly the same temperature, salinity and oxygen, and it thus appeared that the surface water mass was c o m m o n to these two stations. A large drop of approximately 2° C and 0-40°/oo in salinity then took place and the current vector showed a westerly drift. D E A C O N (1937) showed the presence of a large cyclonic eddy in 46° to 48° S and 26° to 27° E , i.e. near to station 65, and it is very probable that the Agulhas line crossed the edge of this eddy and this gave rise to the sudden drop in surface temperature
and salinity, the complex distribution of temperature and salinity in the deeper layers (see Figs. 16 and 21), and the fact that stations 65 and 66 were very similar in physical character. A further large decrease in temperature and salinity took place in the vicinity of station 67 and this is probably due to upwelling of deep water in the cyclonic vortex presumably formed when the West Wind Drift flows over the Atlantic-Indian Ridge here (see Section 4.6). Unfortunately no drift measurements are available due to adverse weather.
The Subantarctic Water showed a slight southerly drift for the area between the Subtropical Convergence and Marion Island and while the temperature decreased steadily southwards, the salinity remained almost constant at 33-80%o. This southerly drift, though slight, is in conflict with the general current charts for the area which indicate steady easterly drifts. A possible explanation for this unusual drift is the fact that only light northerly to easterly winds were experienced in this particular area during June ( W E A T H E R B U R E A U 1962) and that the absence of strong westerlies has weakened the West Wind Drift. O n the Crozet Ridge the steady West Wind Drift again m a d e itself felt, flowing east at \ to 1 knot.
Station 41, north of the Crozet Ridge, was m u c h warmer (6-3° C ) than stations 40 (4-1° C ) (at Marion Island) and 42 (5 • 1 ° C ) , the latter stations lying to the south of the Ridge. Stations 43, 44, 45 and 46, all of which are north of the Ridge, were in very m u c h cooler water (3 • 9° to 4 • 7° C ) , and the coldest water at the surface on the two cruises was found at station 44 (off Possession Island). Further the temperature at 43° S, 35° E (Station 36) was 7-4° C , while at 43° S, 49° E (Station 46) the surface temperature was only 4-7° C , and the surface salinity was 0-05%o lower at the latter station. The above temperature distribution in conjunction with the northerly drift shown between stations 44 and 47 indicates a northward flow of cold Subantarctic Water, probably occasioned by a northward movement of the Antarctic Convergence south of the Crozets. This m a y be anticipated on theoretical grounds—a true gradient current will deflect to the left as the sounding decreases ( D E A C O N 1937) and in the case of the eastward flowing West Wind Drift, a northward movement is to be expected.
The strengthening of the West Wind Drift near 43° S, 50° E shown by the dynamic topography of L E P I C H Ó N (1960) is confirmed by the fairly strong (one knot) currents setting approximately north-east between stations 46 and 47 and by the sudden increase in temperature gradient. (See Figure 10, which shows the horizontal surface temperature distribution for the 1962 cruise only; seasonal variation made it very difficult to include the 1963 results.)
Thermoclines were almost completely absent in the Subantarctic Water, which was well-mixed
709
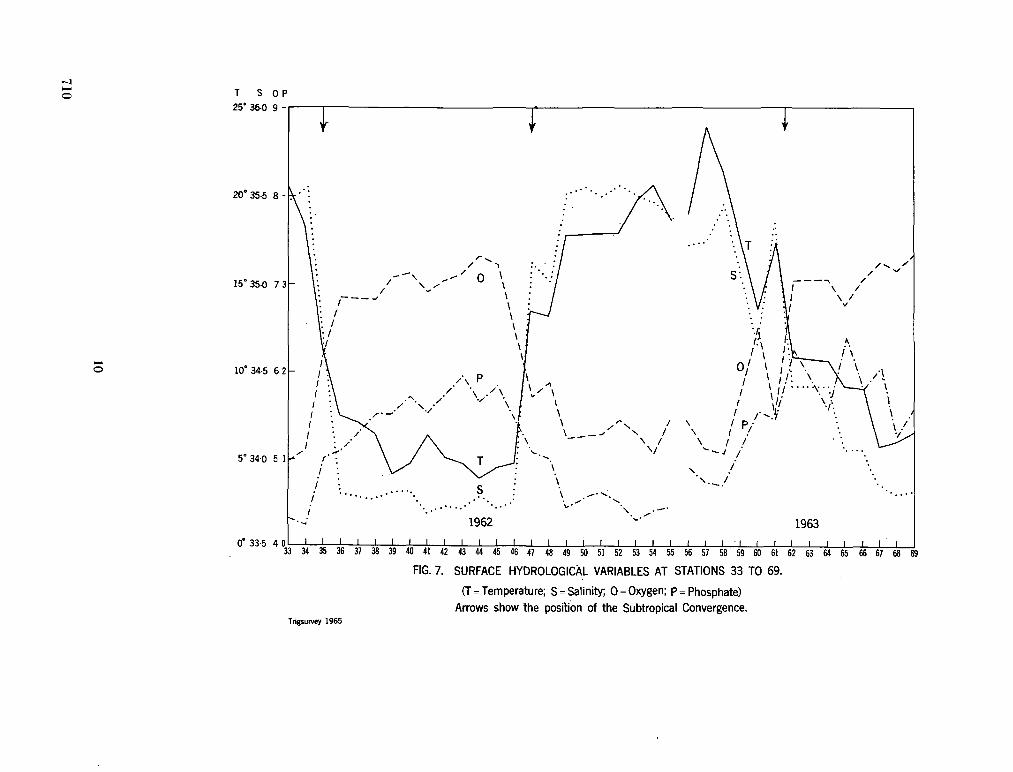
Hs
r?"v--.
o ~
~--.
/ /
Hs
g
LU
710
10
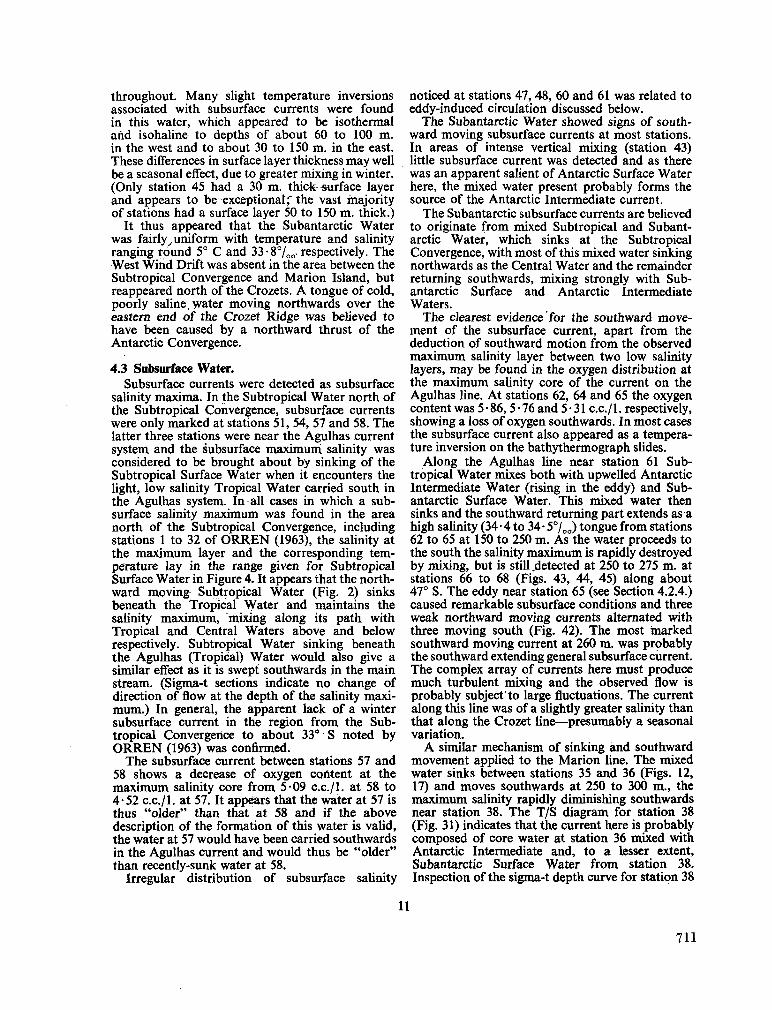
throughout. M a n y slight temperature inversions associated with subsurface currents were found in this water, which appeared to be isothermal and isohaline to depths of about 60 to 100 m . in the west and to about 30 to 150 m . in the east. These differences in surface layer thickness m a y well be a seasonal effect, due to greater mixing in winter. (Only station 45 had a 30 m . thick -surface layer and appears to be exceptional the vast majority of stations had a surface layer 50 to 150 m . thick.)
It thus appeared that the Subantarctic Water was fairly, uniform with temperature and salinity ranging round 5° C and 33 • 8°/00 respectively. The West W i n d Drift was absent in the area between the Subtropical Convergence and Marion Island, but reappeared north of the Crozets. A tongue of cold, poorly saline, water moving northwards over the eastern end of the Crozet Ridge was believed to have been caused by a northward thrust of the Antarctic Convergence.
4.3 Subsurface Water. Subsurface currents were detected as subsurface
salinity maxima. In the Subtropical Water north of the Subtropical Convergence, subsurface currents were only marked at stations 51, 54, 57 and 58. The latter three stations were near the Agulhas current system and the subsurface m a x i m u m salinity was considered to be brought about by sinking of the Subtropical Surface Water when it encounters the light, low salinity Tropical Water carried south in the Agulhas system. In all cases in which a subsurface salinity m a x i m u m was found in the area north of the Subtropical Convergence, including stations 1 to 32 of O R R E N (1963), the salinity at the m a x i m u m layer and the corresponding temperature lay in the range given for Subtropical Surface Water in Figure 4 . It appears that the northward moving Subtropical Water (Fig. 2) sinks beneath the Tropical Water and maintains the salinity m a x i m u m , mixing along its path with Tropical and Central Waters above and below respectively. Subtropical Water sinking beneath the Agulhas (Tropical) Water would also give a similar effect as it is swept southwards in the main stream. (Sigma-t sections indicate no change of direction of flow at the depth of the salinity maxim u m . ) In general, the apparent lack of a winter subsurface current in the region from the Subtropical Convergence to about 33° S noted by O R R E N (1963) was confirmed.
The subsurface current between stations 57 and 58 shows a decrease of oxygen content at the m a x i m u m salinity core from 5-09 c.c./l. at 58 to 4-52 c.c./l. at 57. It appears that the water at 57 is thus "older" than that at 58 and if the above description of the formation of this water is valid, the water at 57 would have been carried southwards in the Agulhas current and would thus be "older" than recently-sunk water at 58.
Irregular distribution of subsurface salinity
noticed at stations 47, 48, 60 and 61 was related to eddy-induced circulation discussed below.
The Subantarctic Water showed signs of southward moving subsurface currents at most stations. In areas of intense vertical mixing (station 43) little subsurface current was detected and as there was an apparent salient of Antarctic Surface Water here, the mixed water present probably forms the source of the Antarctic Intermediate current.
The Subantarctic subsurface currents are believed to originate from mixed Subtropical and Subantarctic Water, which sinks at the Subtropical Convergence, with most of this mixed water sinking northwards as the Central Water and the remainder returning southwards, mixing strongly with Subantarctic Surface and Antarctic Intermediate Waters.
The clearest evidence for the southward m o v e ment of the subsurface current, apart from the deduction of southward motion from the observed m a x i m u m salinity layer between two low salinity layers, m a y be found in the oxygen distribution at the m a x i m u m salinity core of the current on the Agulhas line. At stations 62, 64 and 65 the oxygen content was 5 • 86, 5 • 76 and 5-31 c.c./l. respectively, showing a loss of oxygen southwards. In most cases the subsurface current also appeared as a temperature inversion on the bathythermograph slides.
Along the Agulhas line near station 61 Subtropical Water mixes both with upwelled Antarctic Intermediate Water (rising in the eddy) and Subantarctic Surface Water. This mixed water then sinks and the southward returning part extends as a high salinity (34-4 to 34- 5°/00) tongue from stations 62 to 65 at 150 to 250 m . A s the water proceeds to the south the salinity m a x i m u m is rapidly destroyed by mixing, but is still .detected at 250 to 275 m . at stations 66 to 68 (Figs. 43, 44, 45) along about 47° S. The eddy near station 65 (see Section 4.2.4.) caused remarkable subsurface conditions and three weak northward moving currents alternated with three moving south (Fig. 42). The most marked southward moving current at 260 m . was probably the southward extending general subsurface current. The complex array of currents here must produce m u c h turbulent mixing and the observed flow is probably subject to large fluctuations. The current along this line was of a slightly greater salinity than that along the Crozet line—presumably a seasonal variation.
A similar mechanism of sinking and southward movement applied to the Marion line. The mixed water sinks between stations 35 and 36 (Figs. 12, 17) and moves southwards at 250 to 300 m . , the m a x i m u m salinity rapidly diminishing southwards near station 38. The T / S diagram for station 38 (Fig. 31) indicates that the current here is probably composed of core water at station 36 mixed with Antarctic Intermediate and, to a lesser extent, Subantarctic Surface Water from station 38. Inspection of the sigma-t depth curve for station 38
711
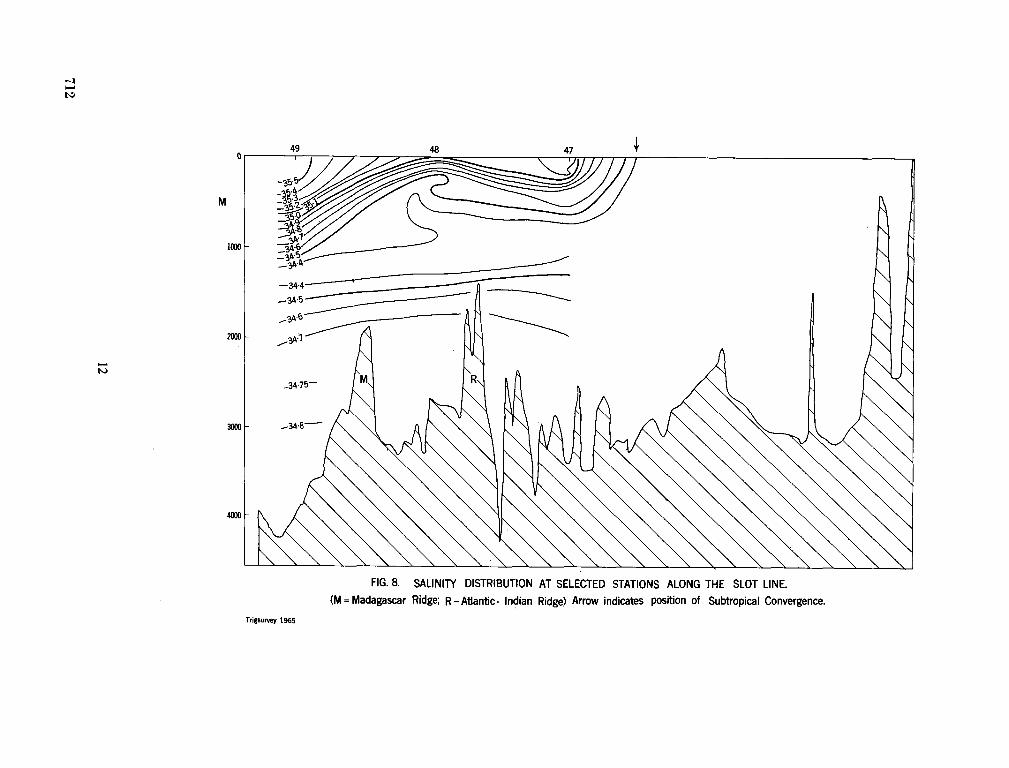
712
12
shows m a x i m u m vertical stability at about 150 m . , making mixing with, deeper layers easier than with the upper layers.
The Crozet Ridge forces the Deep Water nearer the surface along the Crozet line and brings about intensive mixing in the upper layers. Stations 41 and 42 (Figs. 32, 33) show the usual fairly weak subsurface current as observed alongthe Agulhas line (stations 66 to 68), but station 43 shows' almost no subsurface current. Here the Subsurface, Surface and Intermediate Water lose their identity and become one strongly mixed layer, which is probably, the source water of the Intermediate layer further north.
Between stations 45 and 49 across the Subtropical Convergence on the Slot line a most interesting celllike circulation is apparent. Station 45 shows the usual weak subsurface current at about 300 m . caused by the southward return of water sunk at the Convergence between stations 46 and 47. The mixed water which sinks at the Convergence moves north at about 340 m . to near station 48 where it mixes with Antarctic Intermediate Water, part returning south at 440 m . to the Convergence, where it mixes with the sinking water once more. The mixed Subtropical and upwelled Antarctic Intermediate Waters sink to form the Centra} Water north of station 48; This indicates that intense turbulent mixing must occur between the eddy and the Convergence due to the conflicting currents. A schematic outline of these processes is given in Figure 11.
A similar circulation m a y be seen on the Agulhas line with station 60 corresponding to station 49 in Figure 11 and 62 corresponding to 45. Station 61 would lie just to the south of station 48 in Figure 11. The intense turbulence at station 62 is probably caused by the close proximity of the Convergence. S o m e sinking water at station 60 apparently turns back at about 400 m . , but the remainder sinks northwards as Central Water.
The intense mixing to which the Antarctic Intermediate Water is subjected is no doubt responsible for the large increase in the core salinity (34-2°/00 to 34-5%0) in the Convergence region.
It was thus apparent that subsurface currents are absent in winter in the area between 34° S and 42° S in the Subtropical Water. The marked subsurface salinity maxima in the Agulhas Water were probably brought about by sinking of the denser Subtropical Water beneath the light Tropical Water. Well-developed southward moving subsurface currents were present in Subantarctic regions and probably originated in the mixing region of the Subtropical Convergence.
4.4 Central Water. The Central Water is found in the entire Sub
tropical region as a layer of linear T / S relation (Fig. 3) separating the Subsurface from the Inter
mediate layers, that is between about 300 m . and 800 m . This water mass is formed by the sinking and northward spreading of mixed Subtropical and Subantarctic Water masses in the Subtropical Convergence region. The centre of the water mass m a y be generally deduced to lie at 11° C , 35 -0°IOB (see Fig. 11 of O R R E N 1963). The oxygen content at this level varied from 4-62 to 5-20 c.c./l., most values lying in the range 4-9 to 5-2 c.c./l. Data for stations 1 to 32 have again been included. The low values of 4-6 to 4-9 c.c./l. were obtained in the Moçambique Channel and Reunion Basin areas where North Indian Deep Water, probably influences oxygen concentration.
Central Water below 300 m . has a general T / S line which lies wholly in the space enclosed by lines joining the Subantarctic (taken as 7°, 33-8% 0) , Antarctic Intermediate (taken as 3-5°, 34-1570 0 near the Subtropical Convergence), and Subtropical (15°, 35-5°/00) Water types, showing that these water masses are the most probable source waters.
The sinking and sluggish northward motion of the Central Water m a y be seen from Table I, showing the distribution of oxygen on sigma-t surfaces along the Agulhas and Slot Unes. T o o few stations were available for this purpose on the Marion Une. Although in all cases there is an initial decrease on moving northwards, the oxygen is fairly constant in the Central Water decreasing slightly northwards. Three of the four Africana II crossings of the Subtropical Convergence showed vortical disturbances to the north of the Convergence. Published sections ( D E A C O N 1957: Fig. 15 and sections 7 and 10) also show the presence of cyclonic eddies to the north of the Convergence, and it appears likely that the large eddies, mixing upwelled Intermediate Water with the upper layers, form the main source of the Central Water (see also DEFANT 1961).
The T / S diagram of station 57 (Fig. 38) shows an intrusion of a different water mass at about 600 m . The intrusion is also visible in the Agulhas line salinity section (Fig. 21). The temperature and salinity characters of the upper water mass agree with the general Indian Ocean Central Water but the lower mass (below 600 m . ) shows characteristics more in keeping with South Atlantic Central Water ( O R R E N 1963: Fig. 12). T o test the possibility of an eastward flow of South Atlantic Central Water around the Agulhas Bank the Central Waters of both Atlantic and Indian Oceans were compared with regard to oxygen content. The level chosen was that of the 3 5 % 0 isohaline as this lies at about 600 m . generally. A s mentioned above, the Indian Ocean oxygen range was 4 • 9 to 5 • 2 c.c./1. Oxygen values in South Central Water at 350/00 salinity were taken from Discovery stations D 673 to 679, D 1170 to 1175, and D 2042 to 2048, a total of 15 stations, and the measured range was from ± 4 - 3 to ± 4 - 8 c.c./l. It thus appears that
713
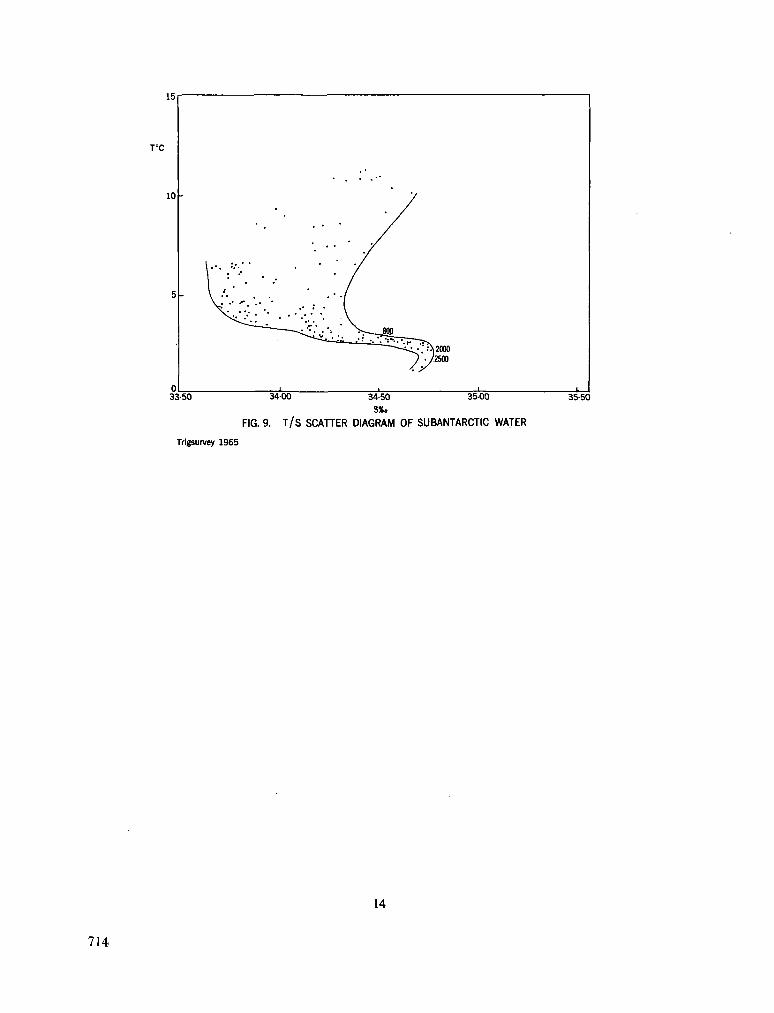
33-50 35-50
FIG. 9. T / S SCATTER DIAGRAM OF SUBANTARCTIC WATER
Trigsurvey 1965
714
14
South Atlantic Central Water has a lower oxygen content than South Indian Central Water. O n inspection of oxygen data for station 57 it was noted that a sudden decrease of ± 0 - 5 c.c./l. took place between 560 and 680 m . , oxygen values decreasing to 4-34 to 4-40 c.c./l. It is very likely therefore that an intruding current of South Atlantic Central Water flows east in this region. The eastward flow of Central Water shown by the sigma-t section (Fig. 26) cannot be positively identified as Indian or Atlantic Water by the above method as the oxygen content at 35 0°/oo was about 4-8 to 4"9 c.c./l.—intermediate between Atlantic and Indian Ocean values. The question n o w arises as to whether the Antarctic Intermediate Water here also has an eastward component in c o m m o n with the known eastward flow of Deep Water from the Atlantic to the Indian Ocean, and this will be considered below.
The Central Water thus originates from sinking of mixed Subtropical Water north of the Subtropical Convergence and moves northwards at 200—800 m . , mixing with high salinity subsurface water and low salinity Antarctic Intermediate Water along its path.
4.5 Antarctic Intermediate Water. Antarctic Intermediate Water, identified by its
min imum salinity core, was.found in the entire area studied and lay at 300 to 400 m . in the Subantarctic region, then sinking rapidly northwards to 900 to 1,300 m . north of the Convergence. In the Subtropical Region this water mass then rose slightly northwards, and part of the water appears to turn round and return southwards in the lower levels of the Agulhas current.
Along the Agulhas line from stations 56 to 58 the sigma-t section (Fig. 26) shows the water to have a strong south-westerly movement even at 2,000 m . The min imum salinity water in this region must accordingly be moving southwards and since it cannot originate in the Tropical or Subtropical regions, the water must be returning Antarctic Intermediate Water. Strong east-flowing water is present between 58 and 61 from the sigma-t sections and the high oxygen at the salinity min imum shows that this water is apparently flowing from the South Atlantic into the Indian Ocean. This flow could be traced by the progressive decrease of oxygen and increase of salinity at the salinity min imum (Table II). Since bad weather along the Marion and Port Elizabeth lines prevented deep sampling, and the sigma-t sections thus do not show m u c h detail of the deep movements, use was made of data collected by S . A . S . Natal during M a y and July, 1962 in the same area ( S H I P L E Y and Z O U T E N D Y K 1964). Their sigma-t sections both along the Marion and near the Port Elizabeth line ("Natal line B " ) (Figs. 27, 28) show three parallel zones of movement within the Antarctic Intermediate Water, namely (1) A strong south-westward flow in the inshore core
water, (2) A northward flowing counter current off shore of this, (3) A southward flowing current to seaward of (2). The eddy centred on the M o ç a m -bique Terrace just north of the "Natal line B " caused southward thrusts of core water near station N I O E 11, and this flow was probably strengthened by additional water turning back on encountering shallower depths.
In the Natal Deep and Natal Basin strong northerly flows were noted and it appears that this water turns round in the Moçambique Channel area and returns south again. S o m e evidence for this appears in the two separated "loops" of minim u m salinity along the Lourenco Marques line ( O R R E N 1963: Fig. 20) while the sections of M E N A C H É (1961 and 1963) show that Antarctic Intermediate Water rapidly loses its identity on encountering the North Indian Deep Water at about 24e S in the Moçambique Channel, indicating a m u c h weakened northward flow here. Table II shows the oxygen at the min imum salinity core, and Table III shows the northward increase in salinity and decrease in oxygen at the core along a section through stations 60, 35 and 48 and stations 29, II and 7 of the previous cruise ( O R R E N 1963). Southwestward flowing water at stations N I O E 78, 15 and 16, that is in the deeper layers of the Agulhas current, has a high salinity and low oxygen as would be expected if the water is returning south. Some southward movement occurs along the Marion line between N I O E 80 and 82 and it appears that the south-westward flow is reinforced by mixing with the northward moving Intermediate Water near Cape Agulhas, since the oxygen at stations 57 and 58 is rather higher and the salinity lower than expected, although these values differ markedly from the low salinity, high oxygen north-flowing current near station 60.
Some water from the strong flow in the Natal Basin (near station 50) appears to be deflected by the Atlantic-Indian Ridge and returns to some extent between 47 and 48 (Fig. 24) in the deeper layers of the eddy.
A n interesting point arising from the strong southwesterly flow of the Agulhas current min imum salinity layer is the fate of this current on encountering the vigorously northward flowing South Atlantic Antarctic Intermediate Water. It m a y be expected that large eddies would form and the resultant upwelling zones be rich in marine life. It will be of interest to see if further cruises in the South Atlantic show any signs of these eddy zones, and it is considered that the unpredictable currents and eddies south and west of Cape Point m a y well be caused by this encounter of two strong water masses at both surface and intermediate levels.
The above findings are in general agreement with the dynamic topography of the 1,000 db. surface put forward by V I S S E R and V A N N I E K E R K (1965), although this surface lies about 600 m . below the min imum salinity layer in the south and
715
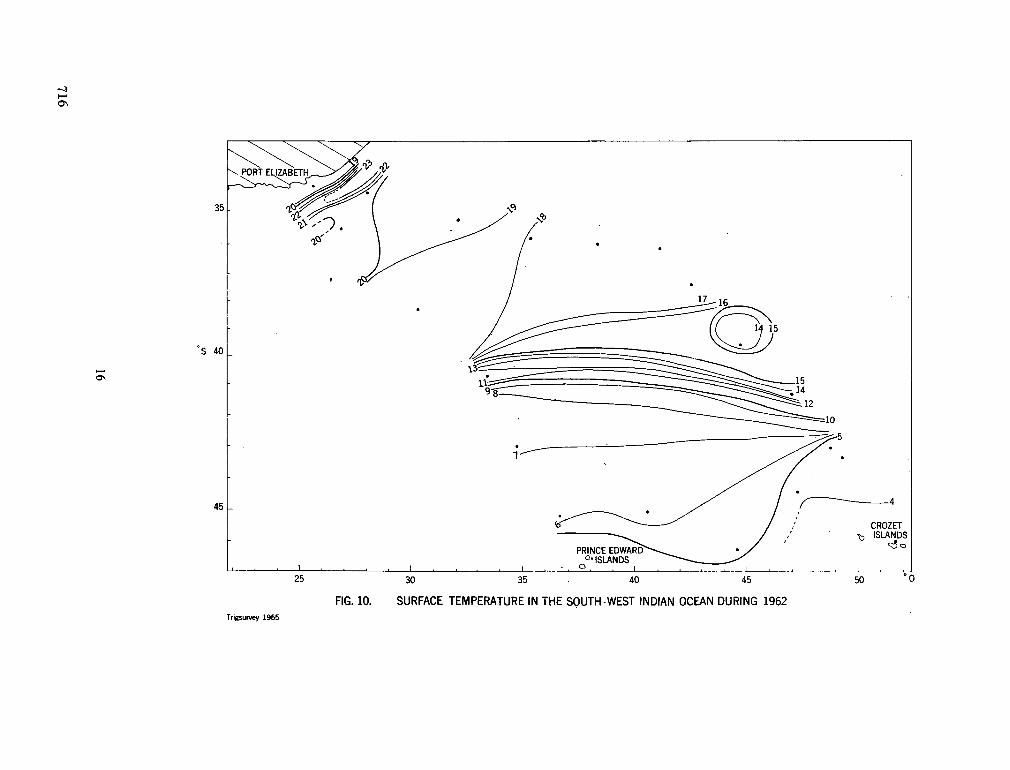
CM
C3
Z OH
O
o
o
<
o
o
CO
X
<
ce
o
ce
o i-H
d
16
716
about 300 m . above it in the north .These authors' choice of 2,000 db. as their reference level also introduces some further difficulty in interpretation since the sigma-t sections at 2,000 m . in this report show comparatively strong current movement at this level in m u c h of the area, especially in the Agulhas current system.
4.6 Deep Water. The generally sluggish flow and small variation
in conservative properties in the Deep Water raise difficulties in interpreting the flow of this water mass. The'discussion below must therefore be considered to be of a preliminary nature—further actual measurement of the deep layer movements is a requirement which should be borne in mind in future research cruises.
The Deep Water salinity m a x i m u m lay at 2,500 to 3,000 m . over the greater part of the area, and since relatively few samples deeper than 3,000 m . were obtained, the lack of observations further limits detailed conclusions.
The T / S diagrams for stations 66 and 68 show an intermediate salinity m i n i m u m in the Deep Water at depths of about 2,400 m . It is felt that this is due to upwelling of Antarctic Bottom Water on the Atlantic-Indian Ridge (sill depth about 2,000 m . ) and the upwelled water then mixes with the Deep Water and forms a low salinity layer.
F r o m the sigma-t sections (Fig. 22 to 26), a strong current of North Atlantic Deep Water of salinity near 34-80%o flows from the Atlantic to the Indian Ocean across the Agulhas line. This flow then apparently splits on meeting the Agulhas Plateau—one stream follows the coast just off the outer edge of the Agulhas current, while the other flows up the deep Natal Basin. A further flow of water appears to be deflected completely by the Agulhas Plateau and returns to the west near station 62.
The inshore flow is seen between N I O E 79 and N I O E 80 (Fig. 27). T o seaward of this there is a weaker return flow, which is perhaps water deflected from the main Natal Basin flow by the Mocambique Terrace and outlying ridges. The northward moving current in thé Natal Basin appears to be concentrated more to the eastern side (Fig. 25). It appears likely that the northward moving water meets North Indian Deep Water in the Mocambique Channel, mixes, and returns south in the western part of the region (LE P I C H Ó N I960). S o m e water apparently flows over the 2,800 m . sill joining the Natal and Reunion Basins near station 49 (Fig. 24) and further flow into the Reunion Basin m a y take place near station 10 ( O R R E N 1963 : Fig, 20). There is some indication that a limited return flow from the Reunion Basin into the Natal Basin takes place near station 50 (Fig. 24).
The flow of Deep Water in the Agulhas current itself cannot be easily elucidated. Only station N I O E 15 showed a southward movement in the
Deep Water under the Agulhas current and no other deep records are available for this region. The difficulties of working deep casts of sampling bottles in the strong surface current and inclement weather of the Agulhas current region are probably responsible for this. It is considered likely that the inshore stream of Deep Water is deflected by the M o c a m bique Terrace and returns south with some admixture of North Indian Deep Water, flowing in the channel between the Mocambique Terrace and the coast as a deep narrow southward moving current under the Agulhas current.
Further evidence for the above scheme of water movements m a y be gleaned from a study of the dissolved oxygen content at the salinity m a x i m u m (Table IV). All oxygen values along the Agulhas line are in excess of 4-7 c.c./l. with the important exception of station 57 (4-29 c.c./l.). The stations situated in the Natal Basin (35, 36, 49, 50 and 51 and also 8, 9, 10, 27, 29 and 30 of O R R E N 1963), with the exception of station 50, all have oxygen values greater than 4-6 c.c./l. L o w oxygen (less than 4-3 c.c./l.) was found at stations 47 and 50 and at N I O E II, 15, 69 and 72.
The general northward flow may be demonstrated by examining stations 61, 35 and 51, which lie approximately along the axis of the Natal Basin; the oxygen values at the m a x i m u m salinity level are 5-14, 4-68 and 4-62 c.c./l. respectively.
The low oxygen recorded at station 50, lying on the eastern edge of the Natal Basin, m a y perhaps be brought about by traces of poorly oxygenated North Indian Deep Water moving over the 2,800 m . sill from the Reunion Basin. L E P I C H Ó N (1960) has shown that Reunion Basin Deep Water has about 4-0 c.c./I. oxygen at the salinity m a x i m u m , and this compares favourably with the value of 4-12 c.c./l. at station 50.
The inshore work of S . A . S . Natal ( S H I P L E Y and Z O U T E N D Y K . 1964) yields an insight into near shore movements of the Deep Water. Figure 27 shows a section of sigma-t from N I O E 78 to N I O E 82, which line of stations was completed within a few weeks of the Africana cruise. Their line is essentially identical to the "Marion line" and stations 33 and 34 are marked on the section. Strong northward components of flow are evident at 2,000 to 3,000 m . from N I O E 79 to 80, and southward motion from N I O E 80 to 82. In agreement with this, the core oxygen at N I O E 79 (5-01 c.c./l.) is higher than for N I O E 80 or 82, the latter being 4-6 to 4-8 c.c./l. (Table IV). This low oxygen water m a y have been turned back by the Mocambique Terrace and is mixing with water flowing north near N I O E 79.
"Natal line B " data are plotted in Figure 28. This line extends 500 miles south-east of Port St. Johns. Stations N I O E 14 and 15 show southward flow at 2,000 m . under the Agulhas current with very low oxygen at N I O E 15. The low oxygen at station N I O E 11 is probably due to North Indian Deep Water penetrating southwards along the eastern
717
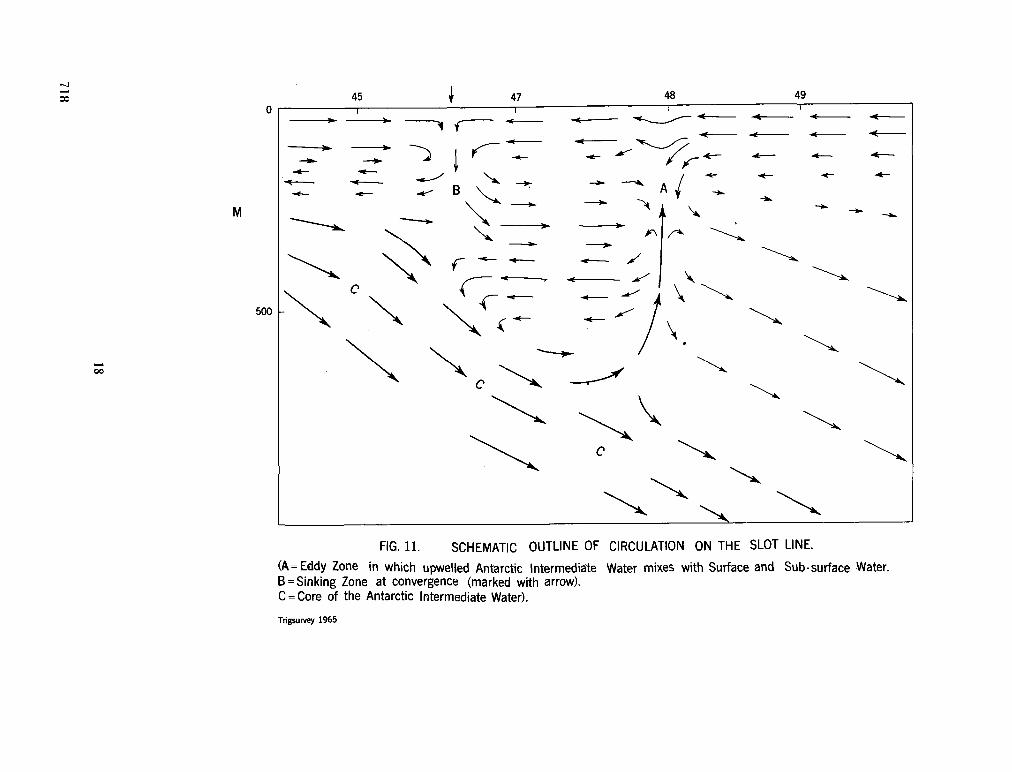
u
u
t v
• . .
Ml
* ^
/
•11* M
tl(|»w
/
/ /
11
,^/iN
: V
/
§ i
u ro 1=
3
en -Q
to
-o
c
«j
a> u t co
O
£
g
Z>
O
o:
o o
x
o
CO
C3
O)
X
I O
£
3
O
ë £.2
13 !M
M
M-
III f
" Il
U
»
5m
u í
718
18
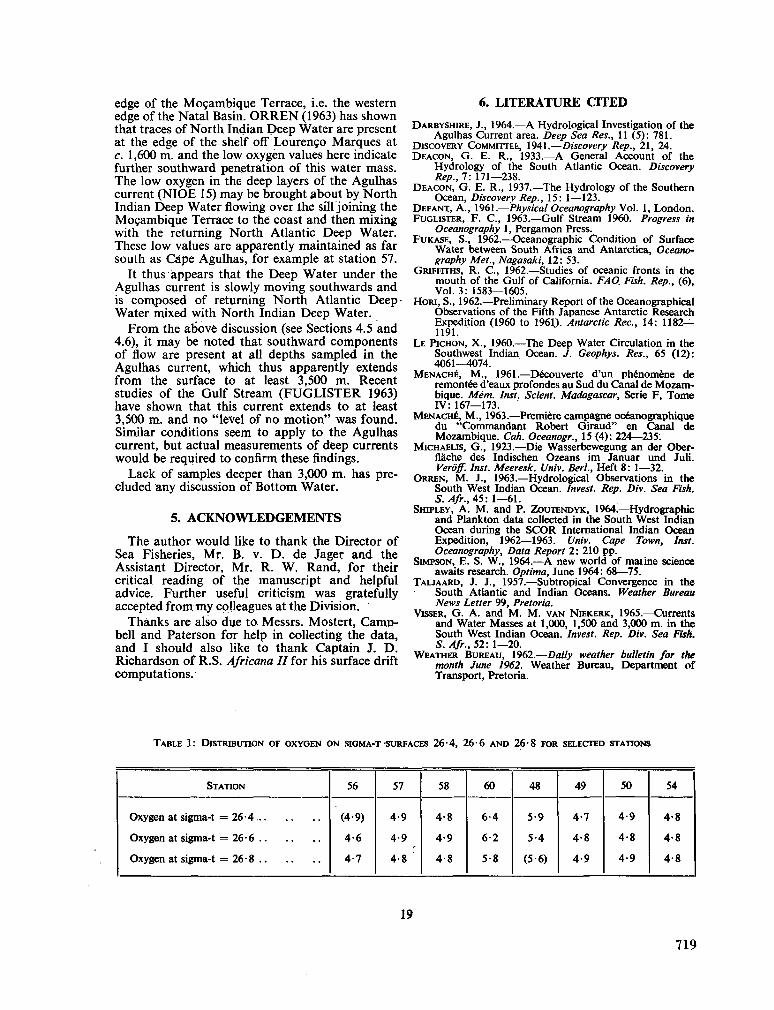
edge of the Moçambique Terrace, i.e. the western edge of the Natal Basin. O R R E N (1963) has shown that traces of North Indian Deep Water are present at the edge of the shelf off Lourenço Marques at c. 1,600 m . and the low oxygen values here indicate further southward penetration of this water mass. The low oxygen in the deep layers of the Agulhas current (NIOE 15) m a y be brought about by North Indian Deep Water flowing over the sill joining the Moçambique Terrace to the coast and then mixing with the returning North Atlantic Deep Water. These low values are apparently maintained as far south as Cape Agulhas, for example at station 57.
It thus appears that the Deep Water under the Agulhas current is slowly moving southwards and is composed of returning North Atlantic Deep-Water mixed with North Indian Deep Water.
From the above discussion (see Sections 4.5 and 4.6), it m a y be noted that southward components of flow are present at all depths sampled in the Agulhas current, which thus apparently extends from the surface to at least 3,500 m . Recent studies of the Gulf Stream ( F U G L I S T E R 1963) have shown that this current extends to at least 3,500 m . and no "level of no motion" was found. Similar conditions seem to apply to the Agulhas current, but actual measurements of deep currents would be required to confirm these findings.
Lack of samples deeper than 3,000 m . has precluded any discussion of Bottom Water.
5. ACKNOWLEDGEMENTS
The author would like to thank the Director of Sea Fisheries, M r . B . v. D . de Jager and the Assistant Director, M r . R . W . Rand, for their critical reading of the manuscript and helpful advice. Further useful criticism was gratefully accepted f rommy colleagues at the Division.
Thanks are also due to Messrs. Mostert, Camr> bell and Paterson for help in collecting the data, and I should also like to thank Captain J. D . Richardson of R . S . Africana II for his surface drift computations.
6. LITERATURE CITED
D A R B Y S H I R E , J., 1964.—A Hydrological Investigation of the Agulhas Current area. Deep Sea Res., 11 (5): 781.
D I S C O V E R Y C O M M I T T E E , 1941.—Discovery Rep., 21, 24. D E A C O N , G . E . R . , 1933.—A General Account of the
Hydrology of the South Atlantic Ocean. Discovery Rep., 7: 171—238.
D E A C O N , G . E . R . , 1937.—The Hydrology of the Southern Ocean, Discovery Rep., 15: 1—123.
D E F A N T , A . , 1961.—Physical Oceanography Vol. 1, London. F U G L I S T E R , F. C , 1963.—Gulf Stream 1960. Progress in
Oceanography 1, Pergamon Press. F U K A S E , S., 1962.—Océanographie Condition of Surface
Water between South Africa and Antarctica, Oceanography Met., Nagasaki, 12: 53.
GRIFFITHS, R . C , 1962.—Studies of oceanic fronts in the mouth of the Gulf of California. FAO. Fish. Rep., (6), Vol.3: 1583—1605.
H O R I , S., 1962.—Preliminary Report of the Oceanographical Observations of the Fifth Japanese Antarctic Research Expedition (1960 to 1961.)- Antarctic Rec, 14: 1182— 1191.
L E P I C H Ó N , X . , I960.—The Deep Water Circulation in the Southwest Indian Ocean. J. Geophys. Res., 65 (12): 4061-4074.
M E N A C H É , M . , 1961.—Découverte d'un phénomène de remontée d'eaux profondes au Sud du Canal de M o z a m bique. Mém. Inst. Scient. Madagascar, Serie F, T o m e IV: 167—173.
M E N A C H É , M . , 1963.—Première campagne océanographique du "Commandant Robert Giraud" en Canal de Mozambique. Cah. Oceanogr., 15 (4): 224—235:
M I C H A E U S , G . , 1923.—Die Wasserbewegung an der Ober-fláche des Indischen Ozeans im Januar und Juli. Veroff. Inst. Meeresk. Univ. Berl, Heft 8: 1—32.
O R R E N , M . J., 1963.—Hydrological Observations in the South West Indian Ocean. Invest. Rep. Div. Sea Fish. S.Afr., 45: 1—61.
SHIPLEY, A . M . and P. Z O U T E N D Y K , 1964.—Hydrographie and Plankton data collected in the South West Indian Ocean during the S C O R International Indian Ocean Expedition, 1962—1963. Univ. Cape Town, Inst. Oceanography, Data Report 2: 210 pp.
S I M P S O N , E . S. W . , 1964.—A new world of marine science awaits research. Optima, June 1964: 68—75.
T A L J A A R D , J. J., 1957.—Subtropical Convergence in the South Atlantic and Indian Oceans. Weather Bureau News Letter 99, Pretoria.
VISSER, G . A . and M . M . V A N N I E K E R K , 1965.—Currents and Water Masses at 1,000, 1,500 and 3,000 m . in the South West Indian Ocean. Invest. Rep. Div. Sea Fish. S. Afr., 52: 1—20.
W E A T H E R B U R E A U , 1962.—Daily weather bulletin for the month June 1962. Weather Bureau, Department of Transport, Pretoria.
T A B L E I: DISTRIBUTION O F O X Y G E N O N S I G M A - T - S U R F A C E S 26-4, 26-6 A N D 26-8 F O R SELECTED STATIONS
S T A T I O N
Oxygen at sigma-t = 26-6
56
(4-9)
4-6
4-7
57
4-9
4-9 r
4-8
58
4-8
4-9
4-8
60
6-4
6-2
5-8
48
5-9
5-4
(5-6)
49
4-7
4-8
4-9
50
4-9
4-8
4-9
54
4-8
4-8
4-8
19
719
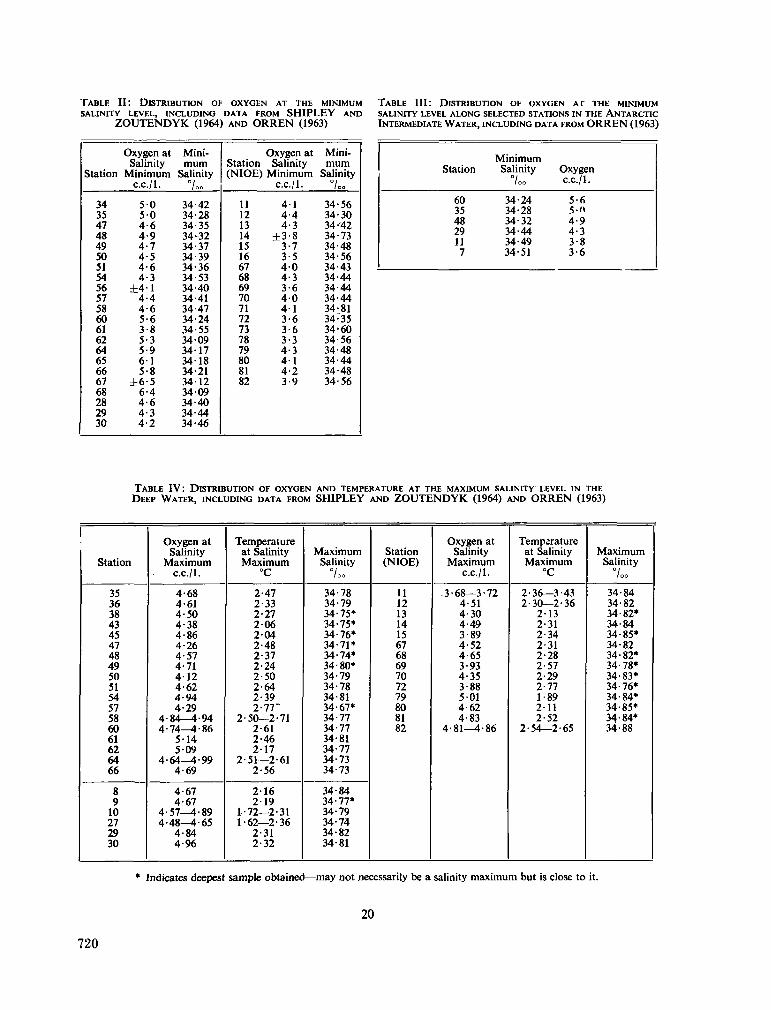
T A B L E II: DISTRIBUTION O F O X Y G E N A T T H E M I N I M U M T A B L E III: DISTRIBUTION O F O X Y G E N A T T H E M I N I M U M SALINITY LEVEL, INCLUDING DATA FROM S H I P L E Y AND SALINITY LEVEL ALONG SELECTED STATIONS IN THE ANTARCTIC
ZOUTENDYK (1964) AND ORREN (1963) INTERMEDIATE WATER, INCLUDING DATA FROM ORREN (1963)
Station
34 35 47 48 49 50 51 54 56 57 58 60 61 62 64 65 66 67 68 28 29 30
Oxygen at Salinity
M i n i m u m c.c./l.
50 50 4-6 4-9 4-7 4-5 4-6 4-3
±4-1 4-4 4-6 5-6 3-8 5-3 5-9 61 5-8
±6-5 6-4 4-6 4-3 4-2
Minimum
Salinity /oo
34-42 34-28 34-35 34-32 34-37 34-39 34-36 34-53 34-40 34-41 34-47 34-24 34-55 3409 34-17 34-18 34-21 3412 3409 34-40 34-44 34-46
Station Oxygen at
Salinity (NIOE) Minimum
11 12 13 14 15 16 67 68 69 70 71 72 73 78 79 80 81 82
c.c./l.
41 4-4 4-3
± 3 - 8 3-7 3-5 40 4-3 3-6 40 41 3-6 3-6 3-3 4-3 41 4-2 3-9
Minimum
Salinity "1
(00
34-56 34-30 34-42 34-73 34-48 34-56 34-43 34-44 34-44 34-44 34-81 34-35 34-60 34-56 34-48 34-44 34-48 34-56
Station
60 35 48 29 11 7
M i n i m u m Salinity
1 OO
34-24 34-28 34-32 34-44 34-49 34-51
Oxygen c.c/1.
5-6 5-0 4-9 4-3 3-8 3-6
TABLE IV : DISTRIBUTION OF OXYGEN AND TEMPERATURE AT THE MAXIMUM SALINITY LEVEL IN THE DEEP WATER, INCLUDING DATA FROM SHIPLEY AND ZOUTENDYK (1964) AND ORREN (1963)
1
Station
35 36 38 43 45 47 48 49 50 51 54 57 58 60 61 62 64 66
8 9
10 27 29 30
Oxygen at Salinity
Maximum c.c./l.
4-68 4-61 4 -50 4-38 4-86 4-26 4-57 4-71 4-12 4-62 4-94 4-29
4 -84 -^ -94 4 -74-^-86
514 509
4-64—4-99 4-69
4-67 4-67
4 -57-^-89 4-48—4-65
4-84 4-96
Temperature at Salinity M a x i m u m
°C
2-47 2-33 2-27 206 2-04 2-48 2-37 2-24 2-50 2-64 2-39 2-77"
2-50—2-71 2-61 2-46 2-17
2-51—2-61 2-56
216 219
1-72—2-31 1-62—2-36
2-31 2-32
M a x i m u m Salinity
1 O O
34-78 34-79 34-75* 34-75* 34-76* 34-71* 34-74* 34-80* 34-79 34-78 34-81 34-67* 34-77 34-77 34-81 34-77 34-73 34-73
34-84 34-77* 34-79 34-74 34-82 34-81
Station (NIOE)
11 12 13 14 15 67 68 69 70 72 79 80 81 82
Oxygen at Salinity
M a x i m u m c.c./l.
3-68—3-72 4-51 4-30 4-49 3-89 4-52 4-65 3-93 4-35 3-88 501 4-62 4-83
4-81—4-86
Temperature at Salinity Maximum
°C
2-36—3-43 2-30—2-36
213 2-31 2-34 2-31 2-28 2-57 2-29 2-77 1-89 211 2-52
2-54—2-65
M a x i m u m Salinity
7oo
34-84 34-82 34-82* 34-84 34-85* 34-82 34-82* 34-78* 34-83* 34-76* 34-84* 34-85* 34-84* 34-88
* Indicates deepest sample obtained—may not necessarily be a salinity m a x i m u m but is close to it.
20
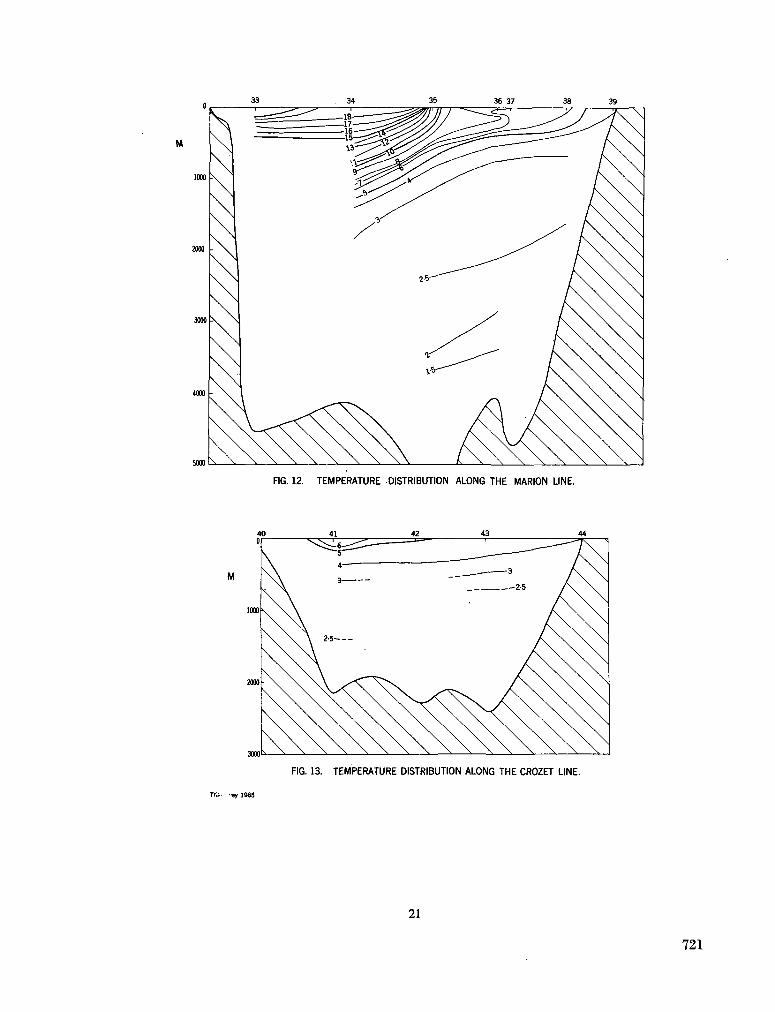
FIG. 12. TEMPERATURE DISTRIBUTION ALONG THE MARION LINE.
40 0
1000
2000
ma \ \
41
5
4—
A 2-5
AXV^
42 43
^ _ _ _ _ _ 3
-2-5
44
FIG. 13. TEMPERATURE DISTRIBUTION ALONG THE CROZET LINE.
Tr;i- -ey 1965
21
721
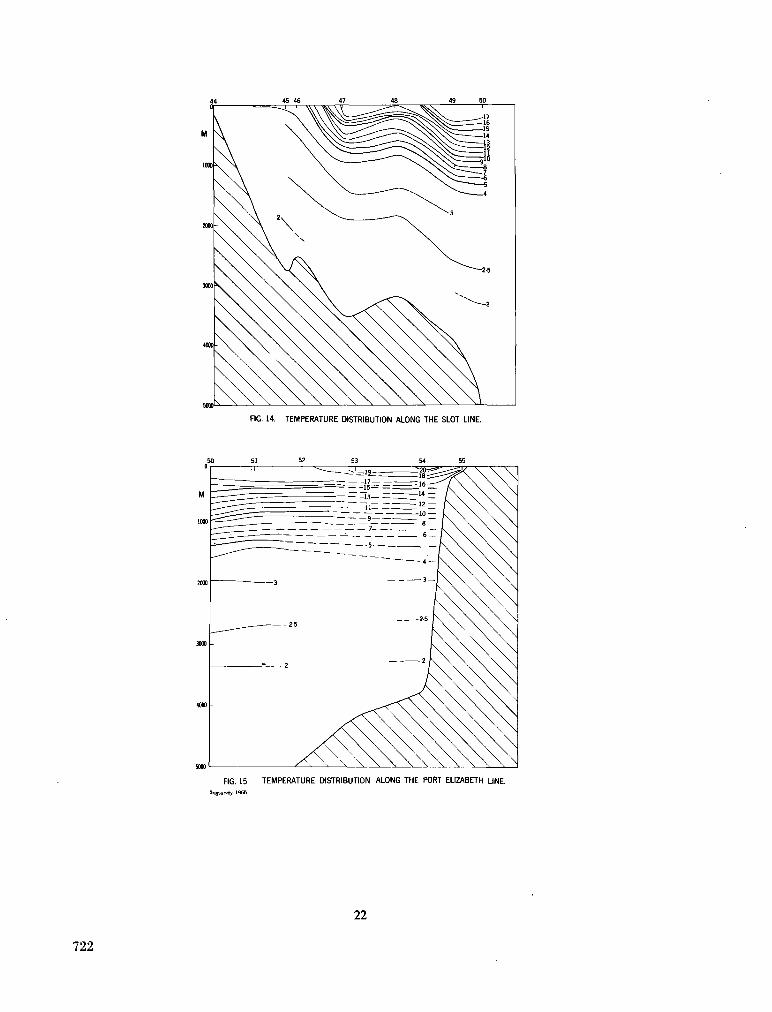
FIG. 15. TEMPERATURE DISTRIBUTION ALONG THE PORT ELIZABETH LINE. Trigsurvey 1965
722
22
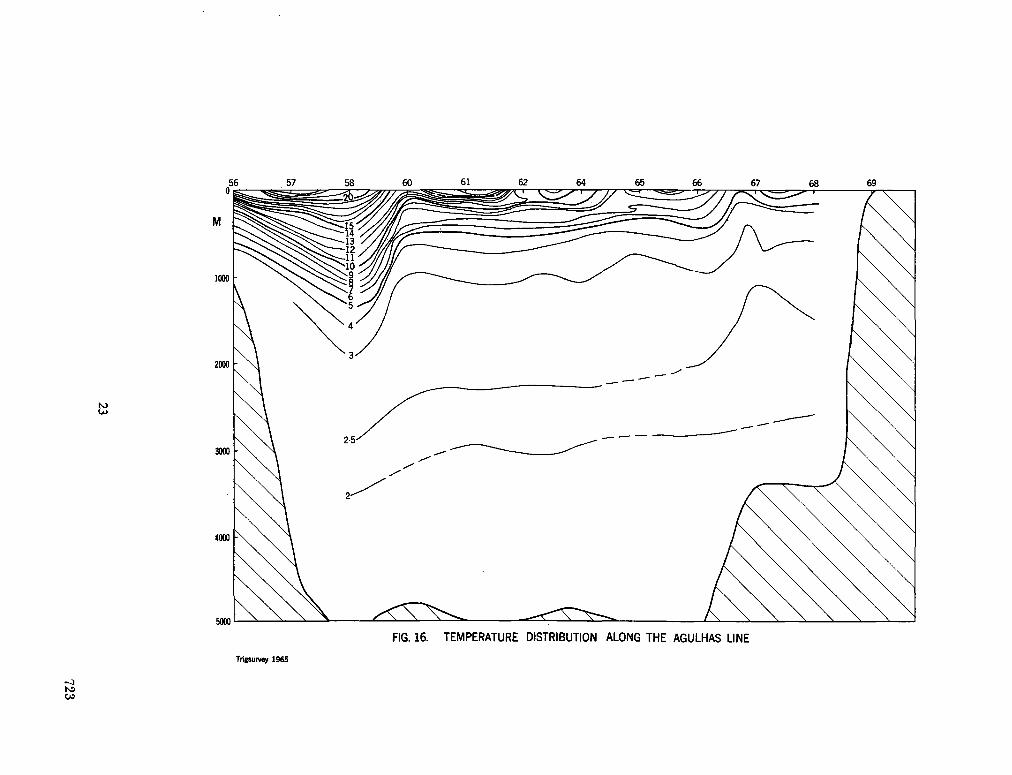
i
23
723
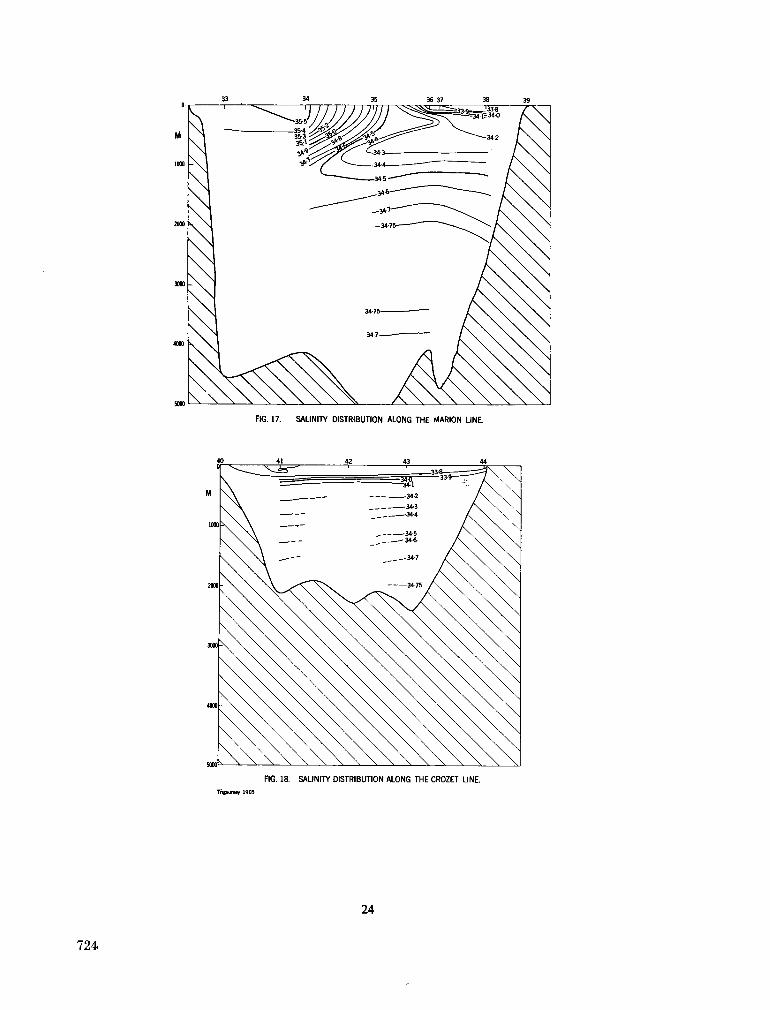
FIG. 17. SALINITY DISTRIBUTION ALONG THE NIARION LINE.
FIG. 18. SALINITY DISTRIBUTION ALONG THE CROZET LINE.
724
24
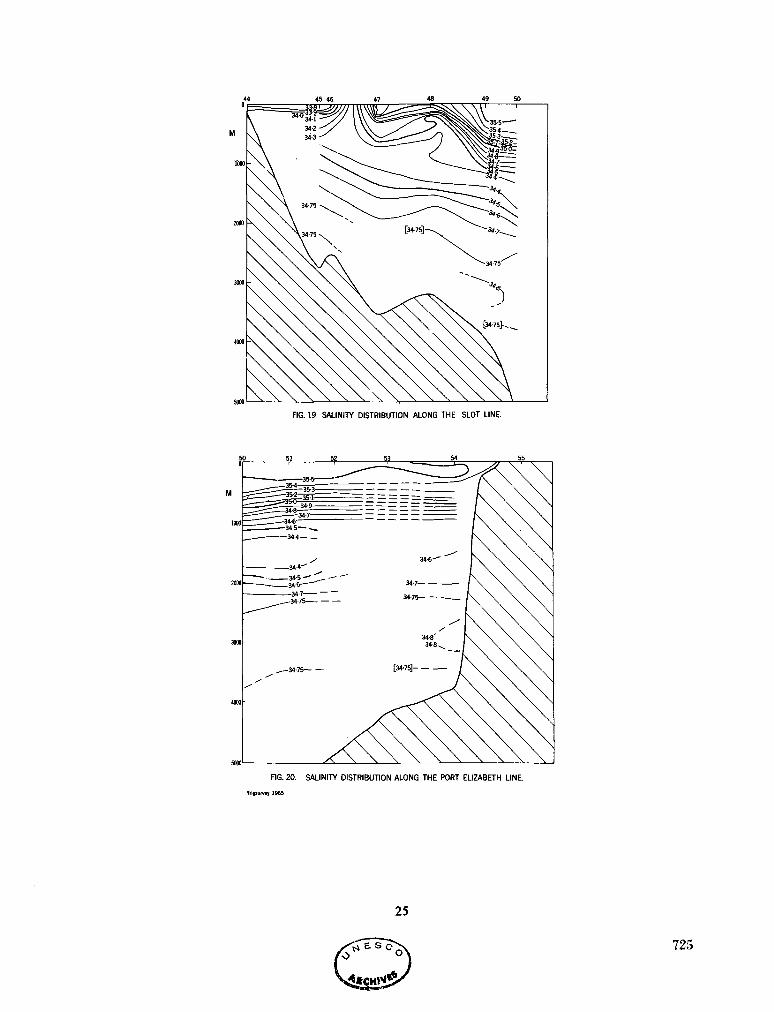
44 45 46 47 48 49 50
FIG. 19. SALINITY DISTRIBUTION ALONG THE SLOT LINE.
50 51 52 53 54 55_ 0
M
1000
2000
3000
4900
5000
FIG. 20. SALINITY DISTRIBUTION ALONG THE PORT ELIZABETH LINE. Trigsunwy 1965
25
725
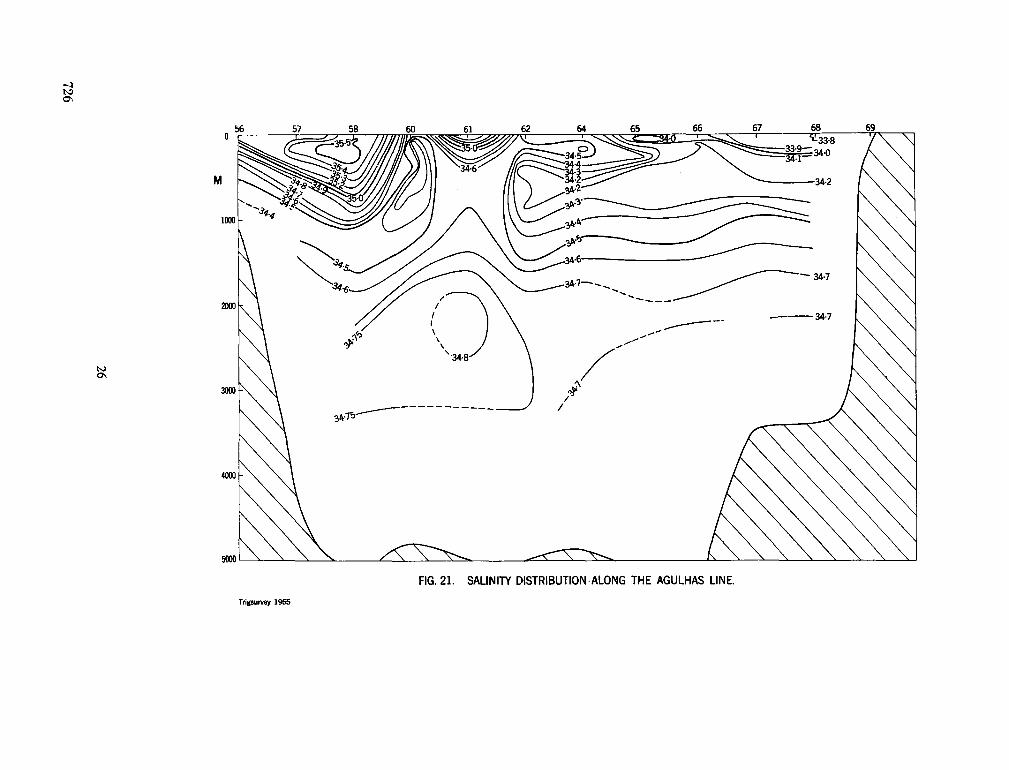
726
26
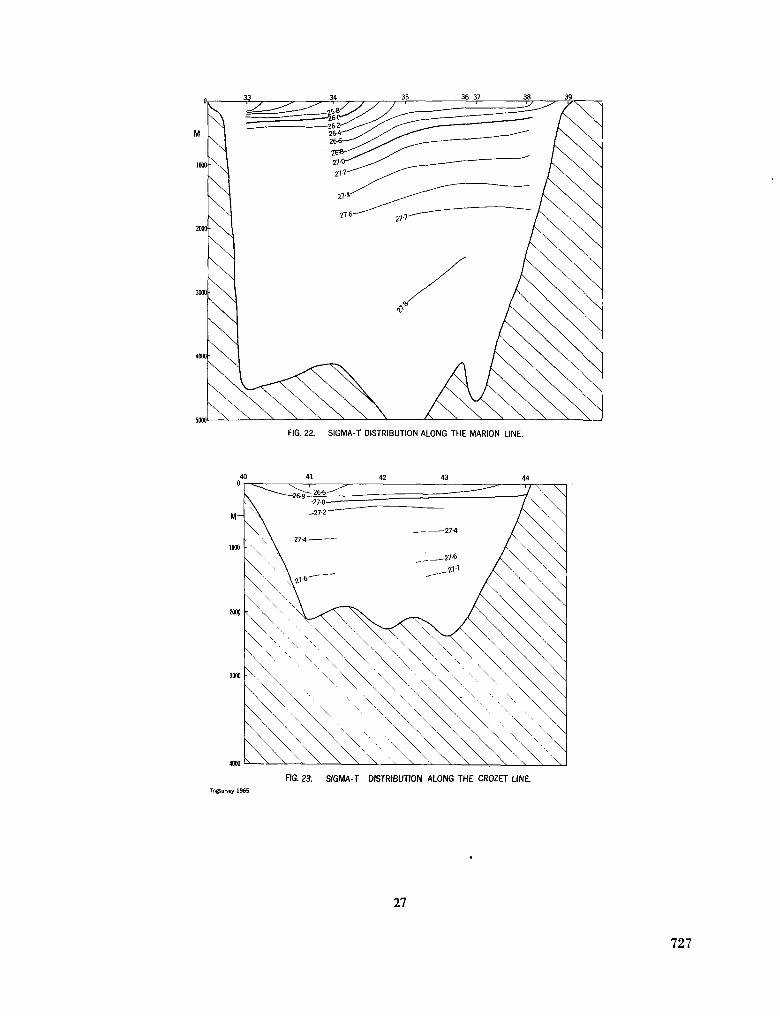
FIG. 22. SIGMA-T DISTRIBUTION ALONG THE MARION LINE.
FIG. 23. SIGMA-T DISTRIBUTION ALONG THE CROZET LINE.
27
727
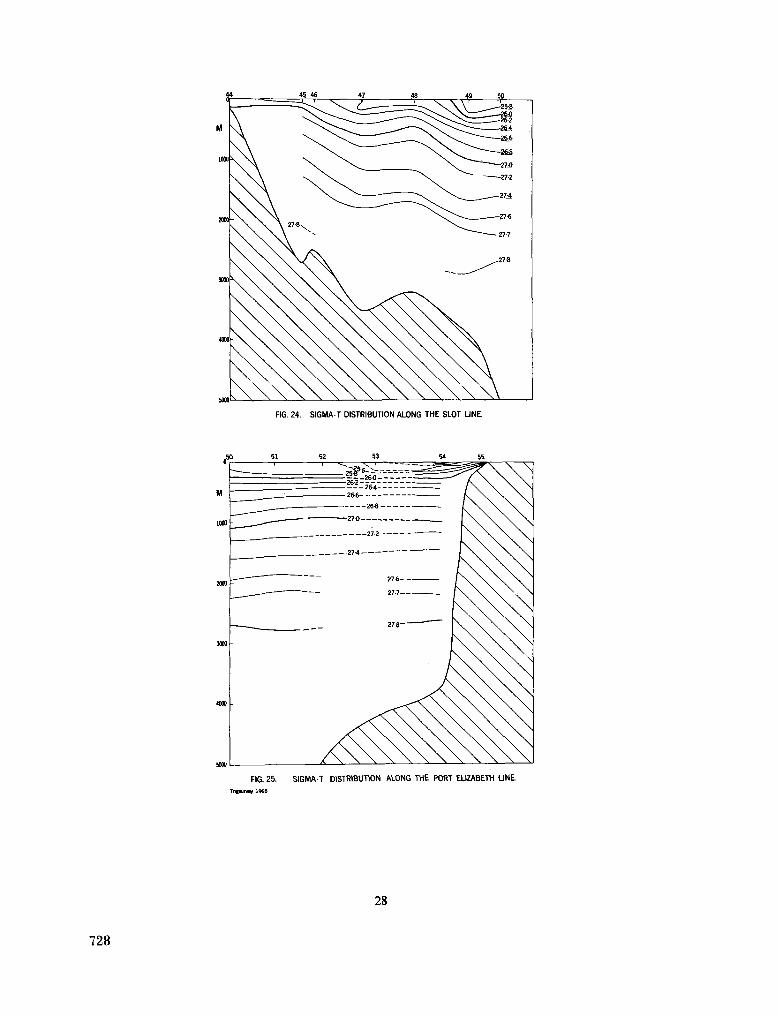
FIG. 24. SIGMAT DISTRIBUTION ALONG THE SLOT LINE.
FIG. 25. SIGMAT DISTRIBUTION ALONG THE PORT ELIZABETH LINE. Tngsurvey 1966
28
728
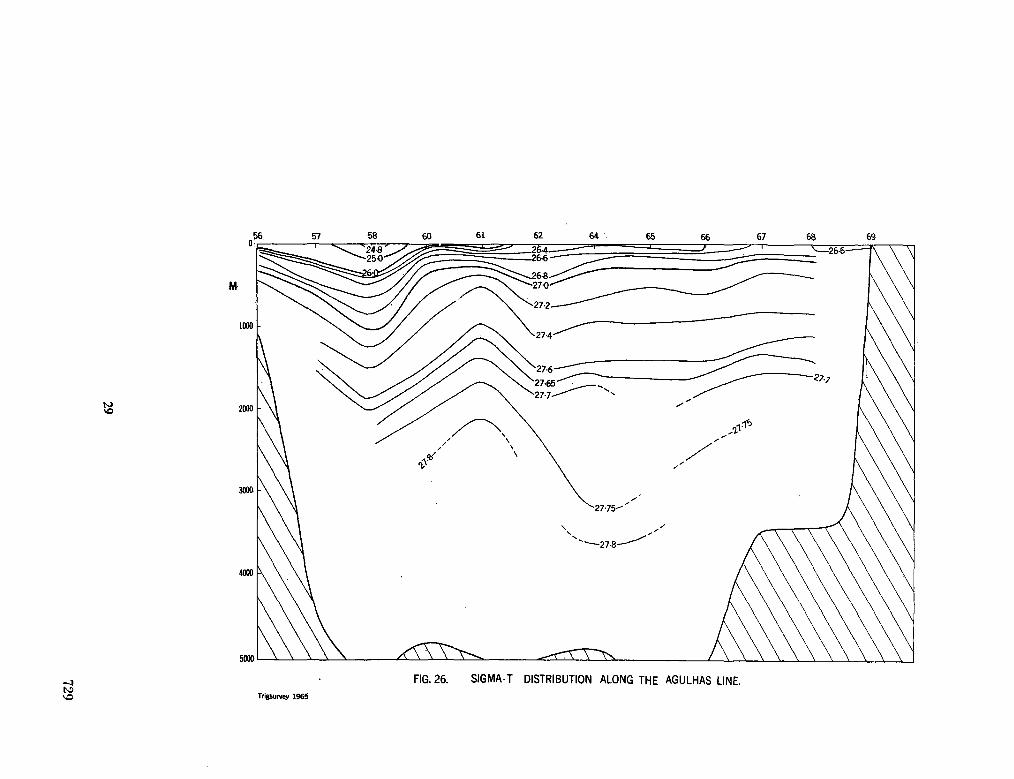
co
<
<
C3
z o
<
CQ
CO
eg
<J3
29
729
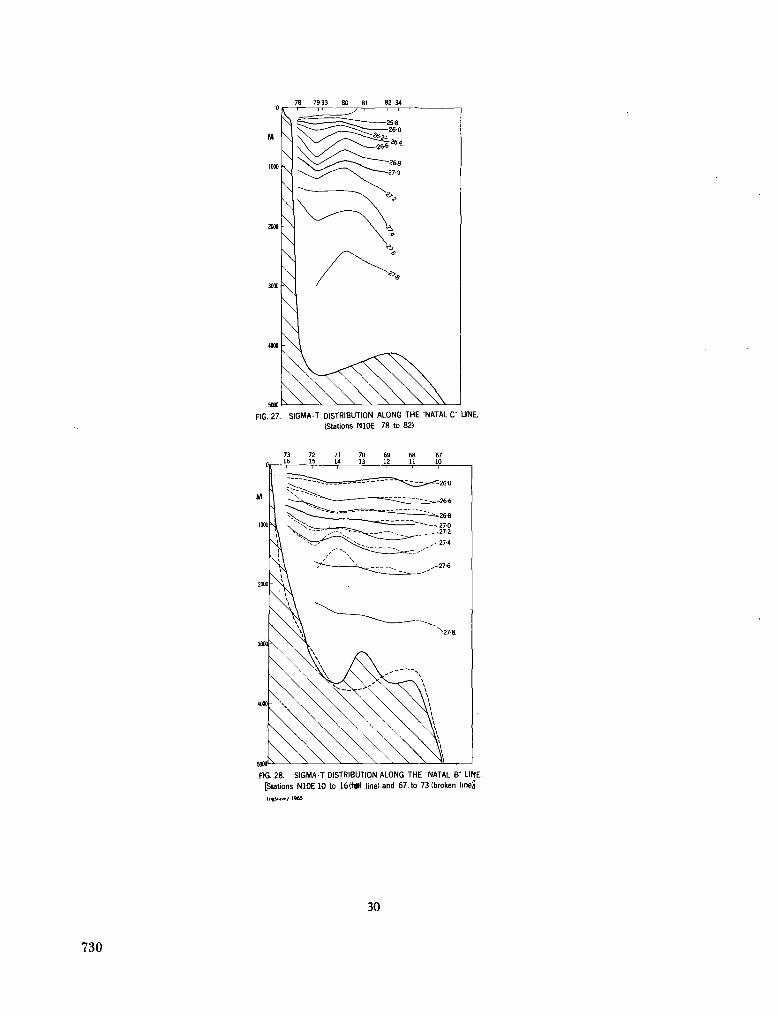
78 7933 80 81
FIG. 27. SIGMA-T DISTRIBUTION ALONG THE NATAL C LINE. (Stations N10E 78 to 82)
73 72 71 70 69 68 67 16 15 14 13 12 11 10
M
1000
2000
3000
4000
won
i
s
^r;
^
\
\
^ ^ a - - . . -^^r^-- ^v^j^^260 - s ^
^ ~ — _ T ^ " " =*»268 - ^ —^^ - - — ?7.n
"—' „ — v ~ ' - = * ^ - r - ^_ __—-27-2 ^çr^"' Nííc^. ,,27-4
i N 27a
Y "AN / \ \
\ \ \^ \ \ \^ \ \*
v \ W \ \ \ \ V \ \ \ \ \ \ \ y
^ v vvvv l FIG. 28. SIGMA-T DISTRIBUTION ALONG THE NATAL B LINE. [Stations N10E 10 to 16(f«H line) and 67. to 73 (broken line)] Tngsurvey 1965
730
30
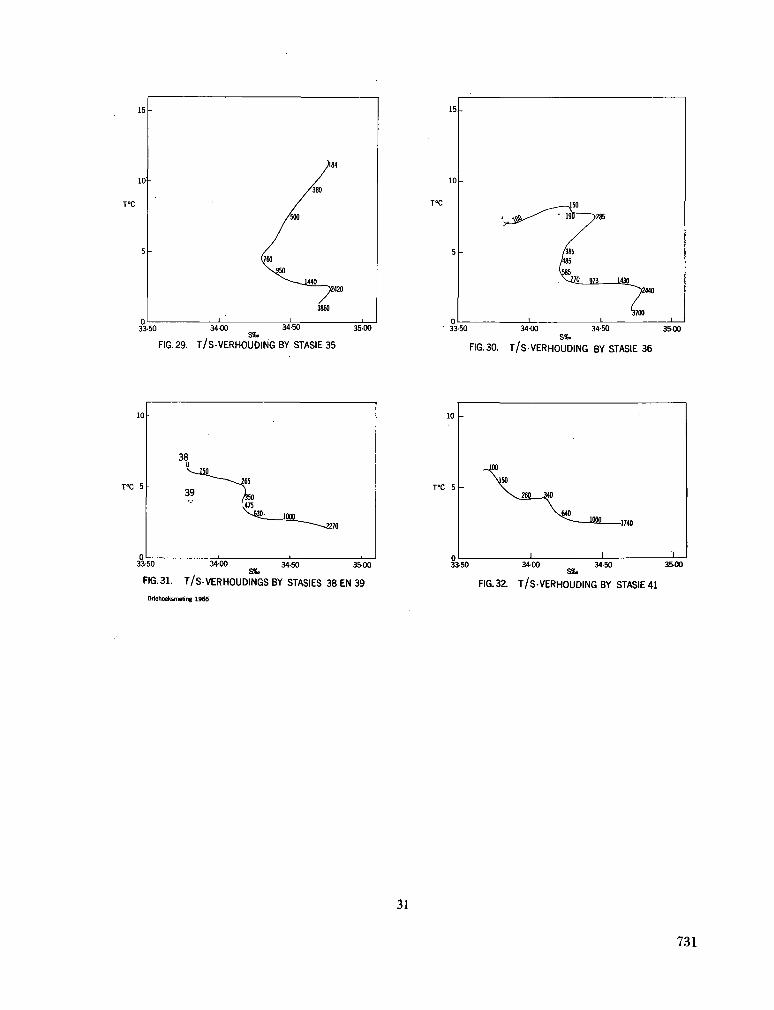
3350 3400 34-50 ; s*° FIG. 29. T /SVERHOUDING BY STASIE 35
3500
10
TX 5
n
38 0
39
150 - ^ 2 6 5
Aso U75
V630__ l f i 2 ! • 2270
33-50 3400 34-50 35-OC SX.
FIG.31. T/S-VERHOUDINGS BY STASIES 38 EN 39 Driehoeksmeting 1965
33-50 3400 S*.
34-50
FIG. 30. T /SVERHOUDING BY STASIE 36
T°C 5
FIG.32. T / S - V E R ' H O U D I N G BY STASIE41
31
731
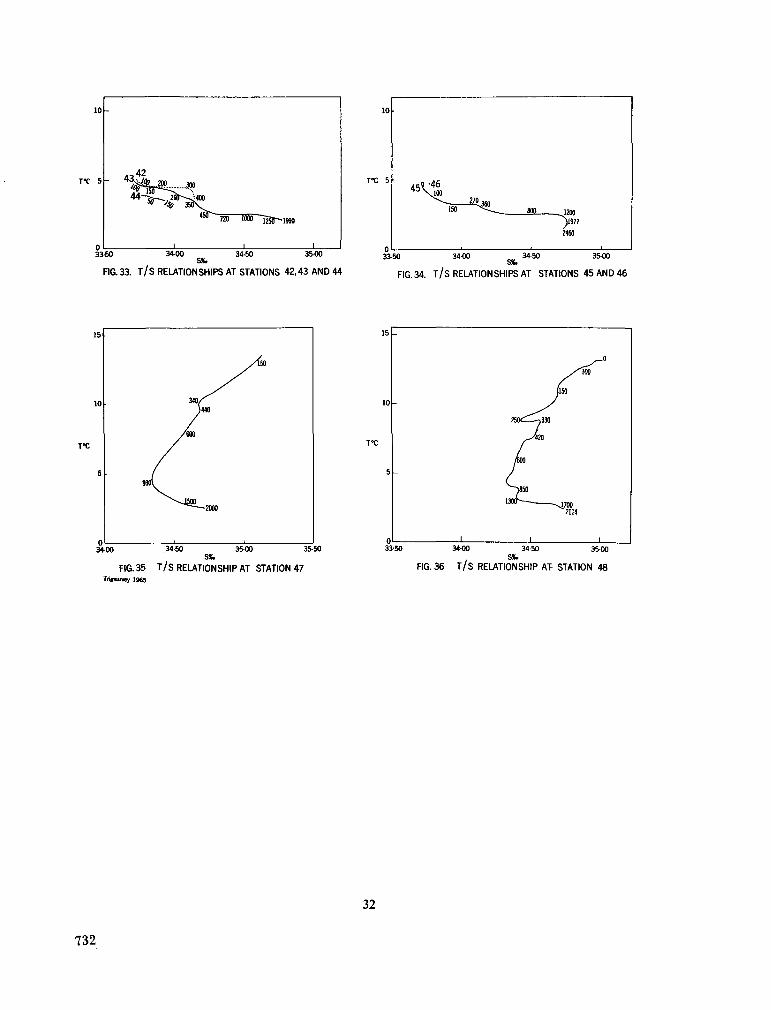
T°C 5
FIG.33. T / S RELATIONSHIPS AT STATIONS 42,43 AND 44
3 3 - 5 0
FIG.34. T / S RELATIONSHIPS AT STATIONS 45 AND 46
15
10
5
n
2SO£^330
1850 130ÍT .
1 1
(¡50
-vj.700 2114
_0
1 34-00 34-50 3500 3!
SX. FIG. 35 T / S RELATIONSHIP AT STATION 47
Trigsunny 1965
33-50 3400 34-50 35-00
FIG. 36 T / S RELATIONSHIP AT STATION 48
32
732
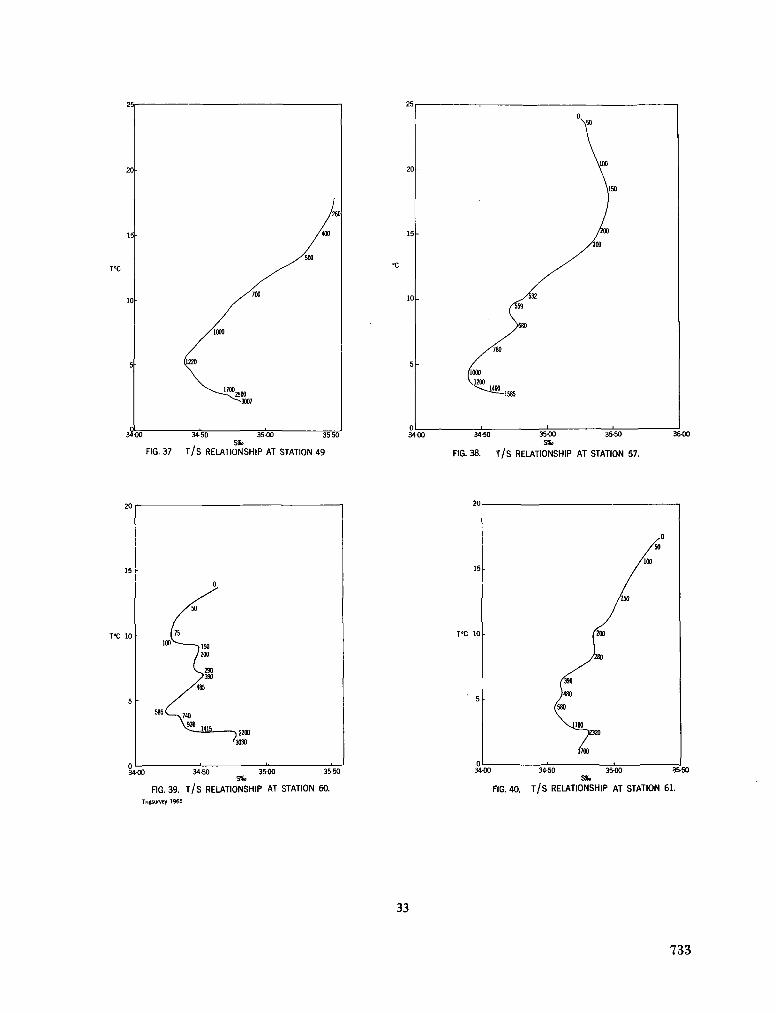
25
20
15
T"C
10
5
0
(¡220
/m
/ÎOOO
^--i^soo ^ 3 0 0 7
Sm
/ 2 6 0
/(00
FIG. 37 T / S RELATIONSHIP AT STATION 49 FIG. 38. T / S RELATIONSHIP AT STATION 57.
FIG. 39. T / S RELATIONSHIP AT STATION 60. Tngsurvey 1965
FIG. 40. T / S RELATIONSHIP AT STATION 61.
33
733
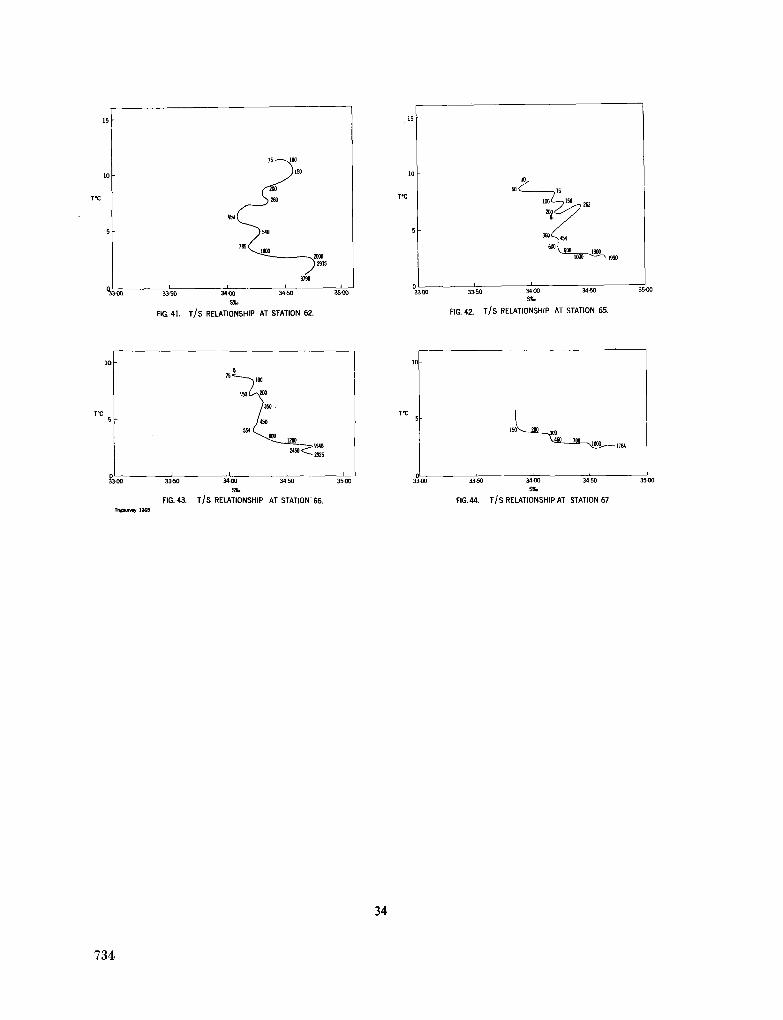
m j» ¡O» ' 1990
3400
Sí.
FIG. 41. T / S RELATIONSHIP AT STATION 62. FIG. 42. T / S RELATIONSHIP AT STATION 65.
3350 3400 3450 35-00
FIG. 43. T / S RELATIONSHIP AT STATION'66. FIG.44. T / S RELATIONSHIP AT STATION 67
34
734
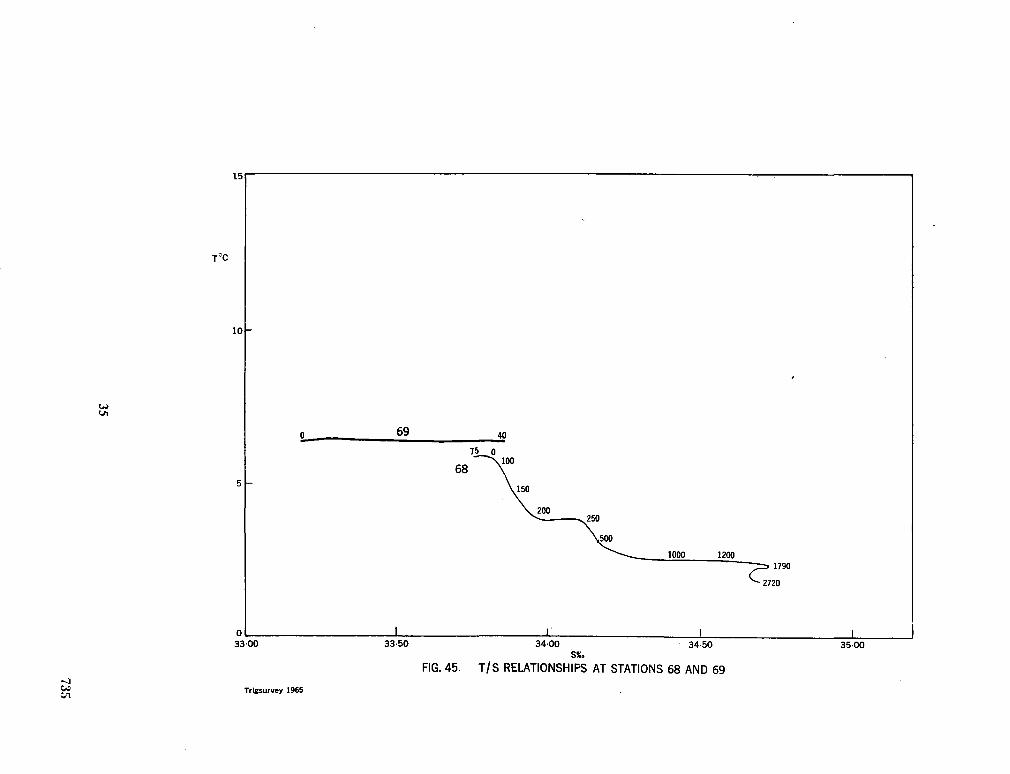
35
735
Part IV Marine geology and geophysics
Reprinted from J. Indian Geophys. Un., vol. 1, no. 1, 1964, p. 25-32.
A N D H R A , M A H A D E V A N , A N D KRISHNA SUBMARINE CANYONS A N D O T H E R FEATURES OF T H E
CONTINENTAL SLOPE OFF T H E EAST COAST OF INDIA
BY
E.C. L A F O N D
(U. S. Navy Electronics Laboratory, San Diego 52, California)
INTRODUCTION
Echo sounding profiles taken in the Indian Ocean off the central
east coast of India have disclosed several interesting sea-floor
topographic phenomena not yet discernible in the widely spaced
soundings shown in published navigational charts. These phenomena
consist of at least six submarine canyons that are cut into the
continental slope off the Andhra Coast.
The discovery of these submarine canyons was made possible
by the U . S. Program in Biology of the Indian Ocean Expedition.
In the course of Cruise One of this program, echo sounding profiles,
made by the writer from the research vessel A N T O N B R U U N ,
revealed the presence of six hitherto unknown canyons while the
expedition was conducting an integrated program of data collection
concerning the life cycle of marine organisms throughout the Bay of
Bengal. The ultimate goal of the over-all program is to' furnish
knowledge that will permit the development of marine resources for
use by the population of Southeast Asia. It includes marine
meteorology (the wind and radiant energy); physical oceanography
(water movement, especially upwelling); chemical oceanography
( nutrient distribution ) ; primary production ( initial plant life ) ;
plankton production (fish food); and h'arvestable organisms (fish,
prawns ).
Collected reprints of the International Indian Ocean Expedition, vol. IV, contribution no. 243 739
The sea-floor topographic data, which led to the discovery of the
six canyons, consisted of four profiles of the bottom off the east coast
of India. These were obtained by echo sounders from the A N T O N
B R U U N as it cruised between océanographie stations. The locations
of individual lines of sounding are shown in Fig. i as straight lines
marked A - B , C - D , E - F , and G - H , and additional details are given in
Table I.
The sounding lines were made as the ship cruised on a straight
course between stations at a speed of 10 to 12 knots. Although the general
topography of the Bay of Bengal will be analyzed separately, four short
sections across the Indian continental slope can be presented to show
the nature of the new submarine canyons, and the continental terrace,
that have been disclosed in this region of the world. The descriptions
of the bottom features begin with the most northerly section and
proceed to the south.
In addition to the measurement of sea-floor topography that
established the existence of these offshore underwater canyons of
India, Cruise O n e of the U . S . Program in Biology of the Indian
Ocean Expedition conducted several related programs. These included
the collection of all types of biological specimens for both museums
and taxometric studies. The exploration of the offshore sea-floor was
intended to supplement the active marine geological programs of
India.1 Although data from all phases of the expedition's general
program have not yet been completely analyzed, the success of the
enterprise is evident from a preliminary inspection. The final results
will be presented after particularized analysis by experts in the various
disciplines covered by the coordinated program.
The three largest canyons of the six revealed by the expedition
were given identifying names. Andhra Canyon was named after the
University at Waltair where modern Indian oceanography developed.
Mahadevan Canyon bears the name of the late Professor C . Mahadevan,
the internationally acclaimed Indian geologist and former Principal of
Andhra University. The name of the late Vice-Chancellor of Andhra
University, w h o was instrumental in providing facilities and inspiration
to Indian marine science, was given to Krishna Canyon. The three
26
740
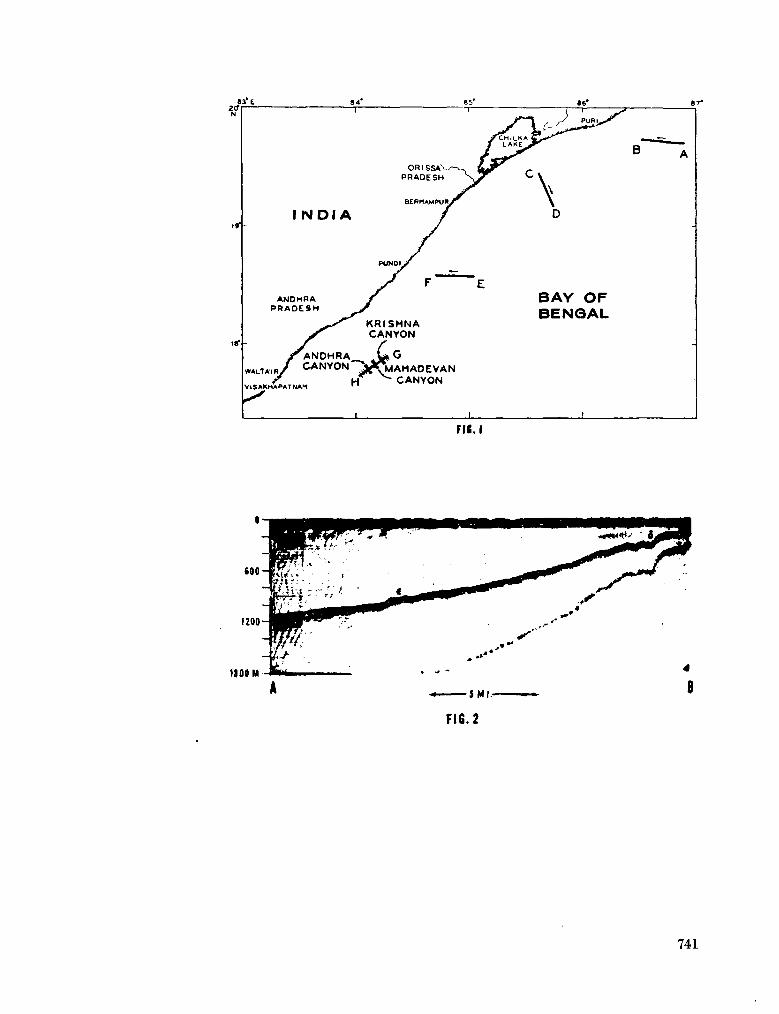
83° i 2tf|
84
—r~
OR I SSAV PRAOESH
I N D I A
ANDHRA PRADESH
KRISHNA CANYON
WALT A IR
VlSAKHAPATNAM
ANOHRA CANYON Ú .MAHAOEVAN
^-CANYON
J 86*
\
BAY OF BENGAL
j _
B
Fit. I
1200
flOOM
Í Ml . -
FIG.2
741
smaller canyons have not yet been named, and need additional
surveying to delineate their characteristics.
TABLE I
Location of Bathmetric Sections
Position
A B
C D E
F
G H
Date ( April 1963 )
23
23
24
11
Time' ( Local )
0600
0800
1830
2030
0505
0655
1940
2130
Lat. (N)
19^42.0'
19°43.9'
19^33.9'
19U0.2'
18°34.8'
18^35.9'
17154.0'
17^44.0'
Long. (E)
86^53.8'
86^31.5'
85^33.3'
85^44.8'
85302.3'
84^42.0'
84^16.2'
84^01.8'
Course ( True )
280°
154°
2 7 2 ,
234°
Speed ( Knots )
11
12
10
10
Section A - B
The first profile of the sea-floor runs up the continental slope
near the head of the Bay of Bengal (Fig. 2 ) . The bottom slope
between 1100 and 280 meters is relatively gentle and has a slightly
concave shape. The upper portion of the profile has minor irregulari
ties that give this slope a h u m m o c k y appearance which might be
associated with minor slumping or gravity creep of sediment down-
slope. The prominent rise (O with an elevation of 20 meters at a
depth of 850 meters, appears at the deepest boundary of the
h u m m o c k y topography. The slope is m u c h smoother below this depth
and probably represents a depositional surface.
At the major break in slope at the edge of the continental shelf,
a depth of 190 meters, the bottom steepens abruptly and is associated
with a slight depression. The sharp break in slope (8) at a depth of
190 meters forms a 100-meter nick point in the axial profile of the
slope. It is the only sudden drop in the section and is markedly
different from the topography usually associated with the base of the
break in slope at the continental shelf. A second depression is also
found about half a mile seaward and is also about 20 meters deep. The
27
742
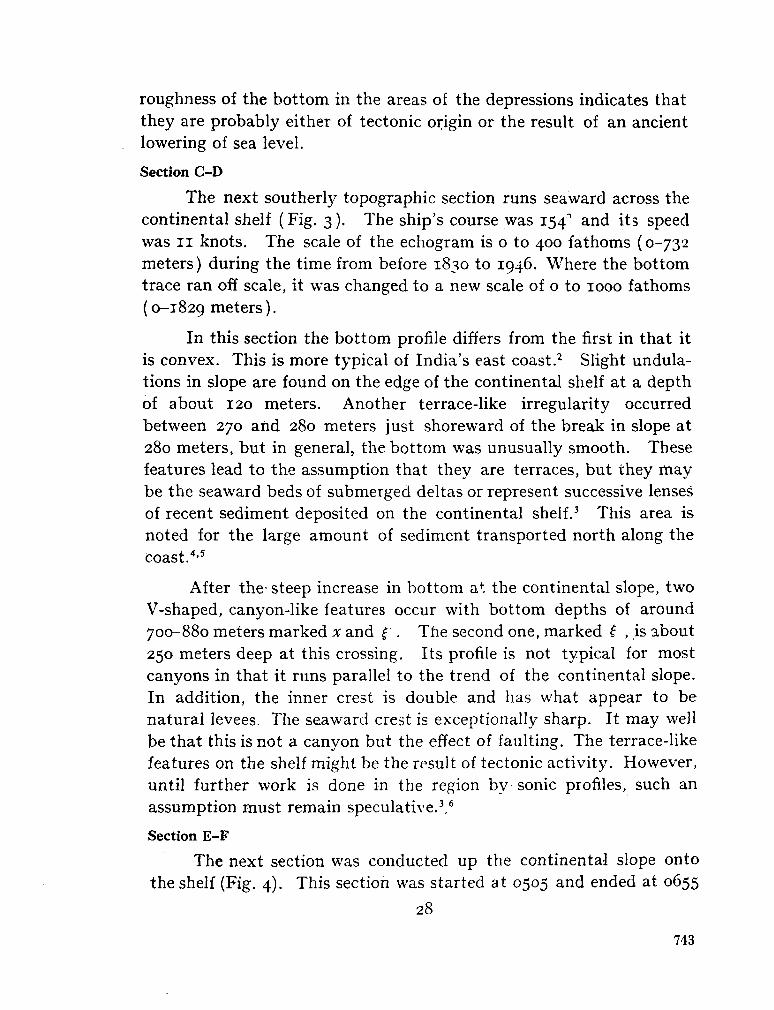
roughness of the bottom in the areas of the depressions indicates that
they are probably either of tectonic origin or the result of an ancient
lowering of sea level.
Section C - D
The next southerly topographic section runs seaward across the
continental shelf ( Fig. 3 ). The ship's course was 1541 and its speed
was 11 knots. The scale of the echogram is o to 400 fathoms (0-732
meters) during the time from before 1830 to 1946. Where the bottom
trace ran off scale, it was changed to a new scale of o to 1000 fathoms
(0-1829 meters).
In this section the bottom profile differs from the first in that it
is convex. This is more typical of India's east coast.2 Slight undula
tions in slope are found on the edge of the continental shelf at a depth
of about 120 meters. Another terrace-like irregularity occurred
between 270 and 280 meters just shoreward of the break in slope at
280 meters, but in general, the bottom was unusually smooth. These
features lead to the assumption that they are terraces, but they m a y
be the seaward beds of submerged deltas or represent successive lenses
of recent sediment deposited on the continental shelf.3 This area is
noted for the large amount of sediment transported north along the
coast.4,5
After the- steep increase in bottom at the continental slope, two
V-shaped, canyon-like features occur with bottom depths of around
700-880 meters marked x and f . The second one, marked £ , is about
250 meters deep at this crossing. Its profile is not typical for most
canyons in that it runs parallel to the trend of the continental slope.
In addition, the inner crest is double and has what appear to be
natural levees. The seaward crest is exceptionally sharp. It m a y well
be that this is not a canyon but the effect of faulting. The terrace-like
features on the shelf might be the result of tectonic activity. However,
until further work is done in the region by sonic profiles, such an
assumption must remain speculative.3,6
Section E - F
The next section was conducted up the continental slope onto
the shelf (Fig. 4). This section was started at 0505 and ended at 0655
28
743
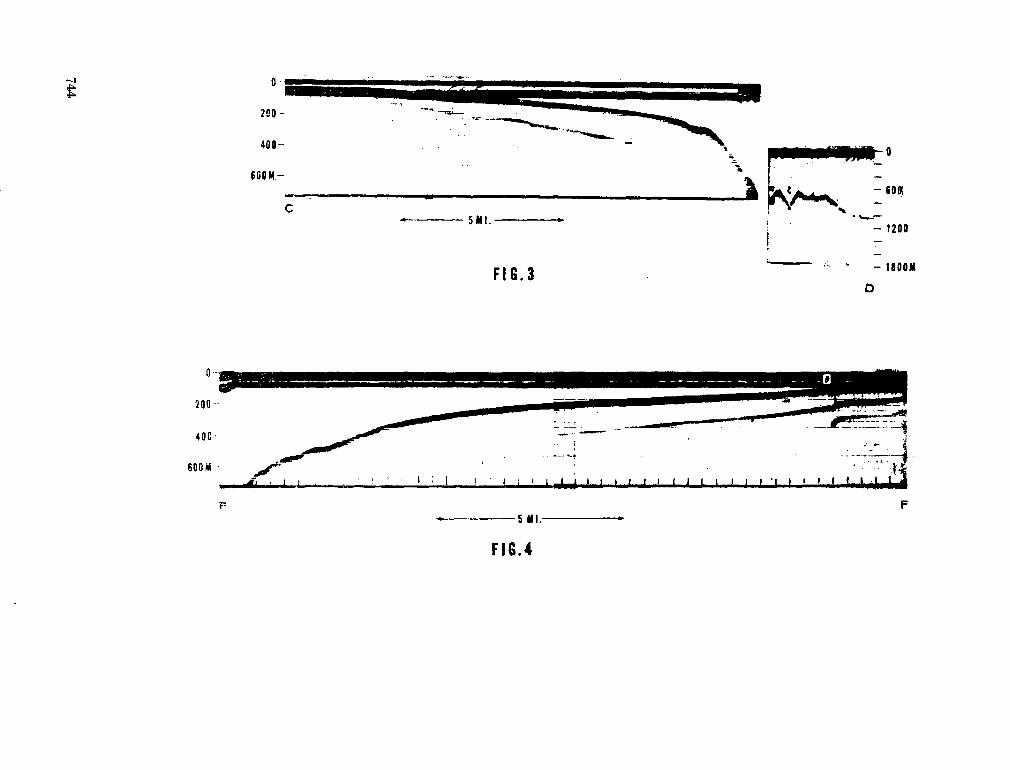
«M
eo
i i
i i,
i i
i i
n
i °
Í é^
Ê
'-""•T'V
ÏWB
"-
es
C0
O
\
744
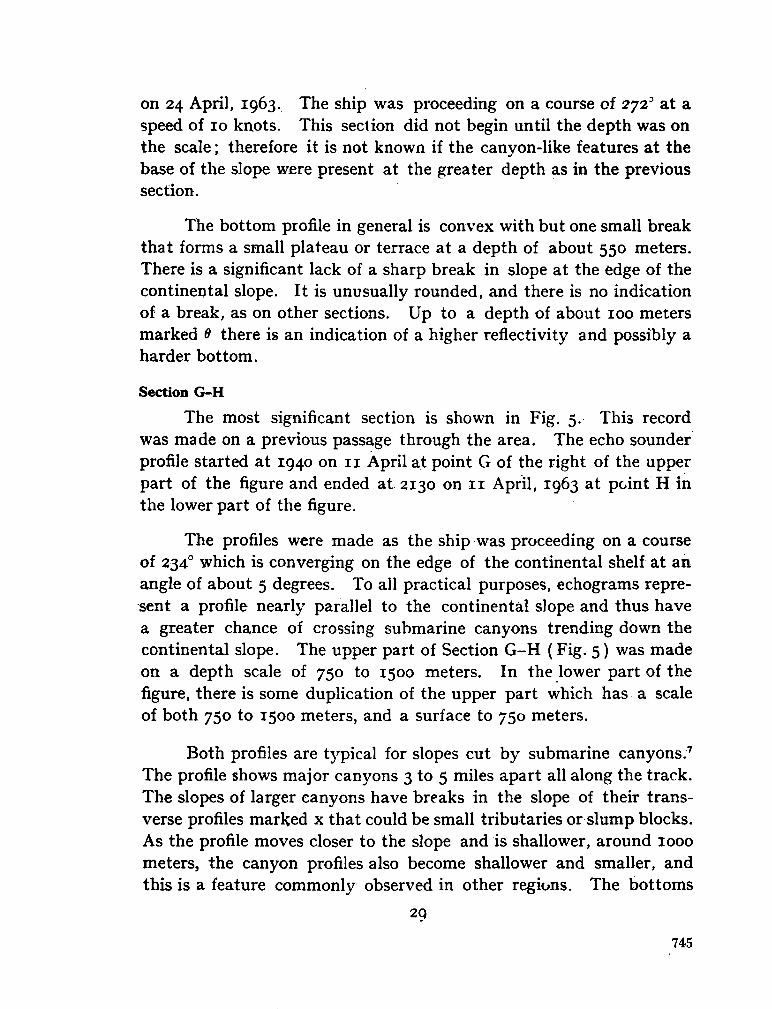
on 24 April, 1963. The ship was proceeding on a course of 272a at a speed of 10 knots. This section did not begin until the depth was on the scale ; therefore it is not known if the canyon-like features at the base of the slope were present at the greater depth as in the previous section.
The bottom profile in general is convex with but one small break that forms a small plateau or terrace at a depth of about 550 meters. There is a significant lack of a sharp break in slope at the edge of the continental slope. It is unusually rounded, and there is no indication of a break, as on other sections. U p to a depth of about 100 meters marked 0 there is an indication of a higher reflectivity and possibly a harder bottom.
Section G - H
The most significant section is shown in Fig. 5. This record was m a d e on a previous passage through the area. The echo sounder profile started at 1940 on 11 April at point G of the right of the upper part of the figure and ended at 2130 on 11 April, 1963 at point H in the lower part of the figure.
The profiles were m a d e as the ship was proceeding on a course of 234o which is converging on the edge of the continental shelf at an angle of about 5 degrees. To all practical purposes, echograms represent a profile nearly parallel to the continental slope and thus have a greater chance of crossing submarine canyons trending d o w n the continental slope. The upper part of Section G - H ( Fig. 5 ) was m a d e on a depth scale of 750 to 1500 meters. In the lower part of the figure, there is some duplication of the upper part which has a scale of both 750 to 1500 meters, and a surface to 750 meters.
Both profiles are typical for slopes cut by submarine canyons.7
The profile shows major canyons 3 to 5 miles apart all along the track. The slopes of larger canyons have breaks in the slope of their transverse profiles marked x that could be small tributaries or slump blocks. As the profile moves closer to the slope and is shallower, around 1000 meters, the canyon profiles also become shallower and smaller, and this is a feature commonly observed in other regions. The bottoms
29
745
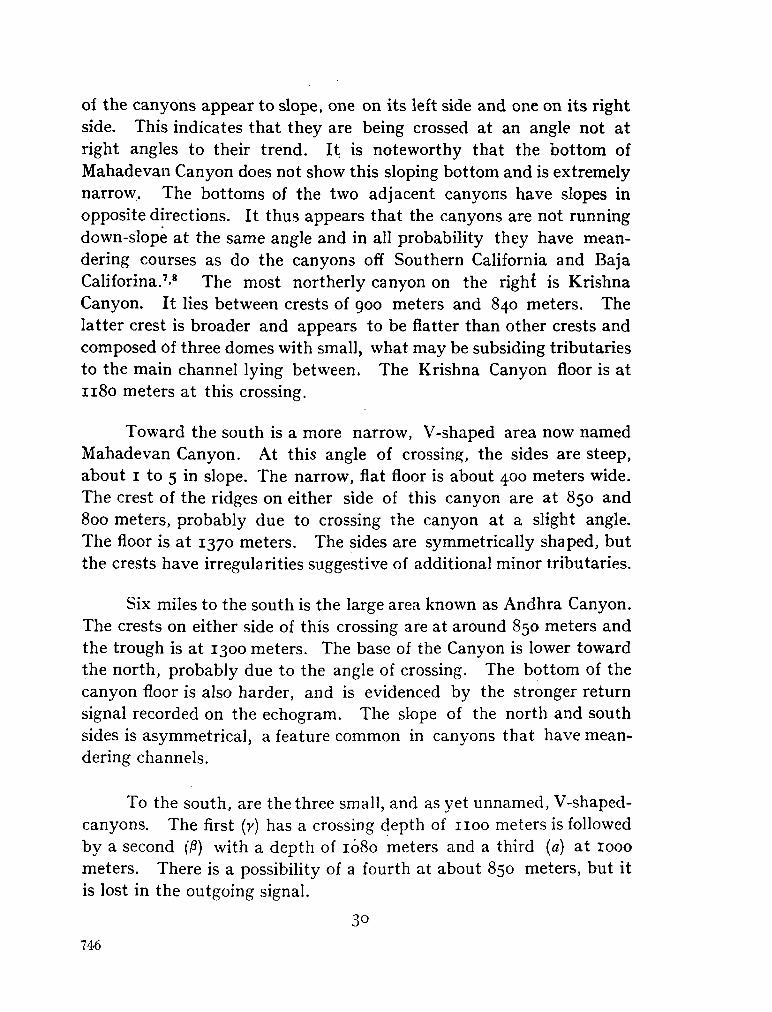
of the canyons appear to slope, one on its left side and one on its right
side. This indicates that they are being crossed at an angle not at
right angles to their trend. It is noteworthy that the bottom of
Mahadevan Canyon does not show this sloping bottom and is extremely
narrow. The bottoms of the two adjacent canyons have slopes in
opposite directions. It thus appears that the canyons are not running
down-slope at the same angle and in all probability they have mean
dering courses as do the canyons oñ Southern California and Baja
Calif orina.7-8 The most northerly canyon on the right is Krishna
Canyon. It lies between crests of 900 meters and 840 meters. The
latter crest is broader and appears to be flatter than other crests and
composed of three domes with small, what m a y be subsiding tributaries
to the main channel lying between. The Krishna Canyon floor is at
1180 meters at this crossing.
Toward the south is a more narrow, V-shaped area now named
Mahadevan Canyon. At this angle of crossing, the sides are steep,
about 1 to 5 in slope. The narrow, flat floor is about 400 meters wide.
The crest of the ridges on either side of this canyon are at 850 and
800 meters, probably due to crossing the canyon at a slight angle.
The floor is at 1370 meters. The sides are symmetrically shaped, but
the crests have irregularities suggestive of additional minor tributaries.
Six miles to the south is the large area known as Andhra Canyon.
The crests on either side of this crossing are at around 850 meters and
the trough is at 1300 meters. The base of the Canyon is lower toward
the north, probably due to the angle of crossing. The bottom of the
canyon floor is also harder, and is evidenced by the stronger return
signal recorded on the echogram. The slope of the north and south
sides is asymmetrical, a feature c o m m o n in canyons that have mean
dering channels.
To the south, are the three small, and as yet unnamed, V-shaped-
canyons. The first (y) has a crossing depth of 1100 meters is followed
by a second (P) with a depth of 1080 meters and a third (a) at 1000
meters. There is a possibility of a fourth at about 850 meters, but it
is lost in the outgoing signal.
30
746
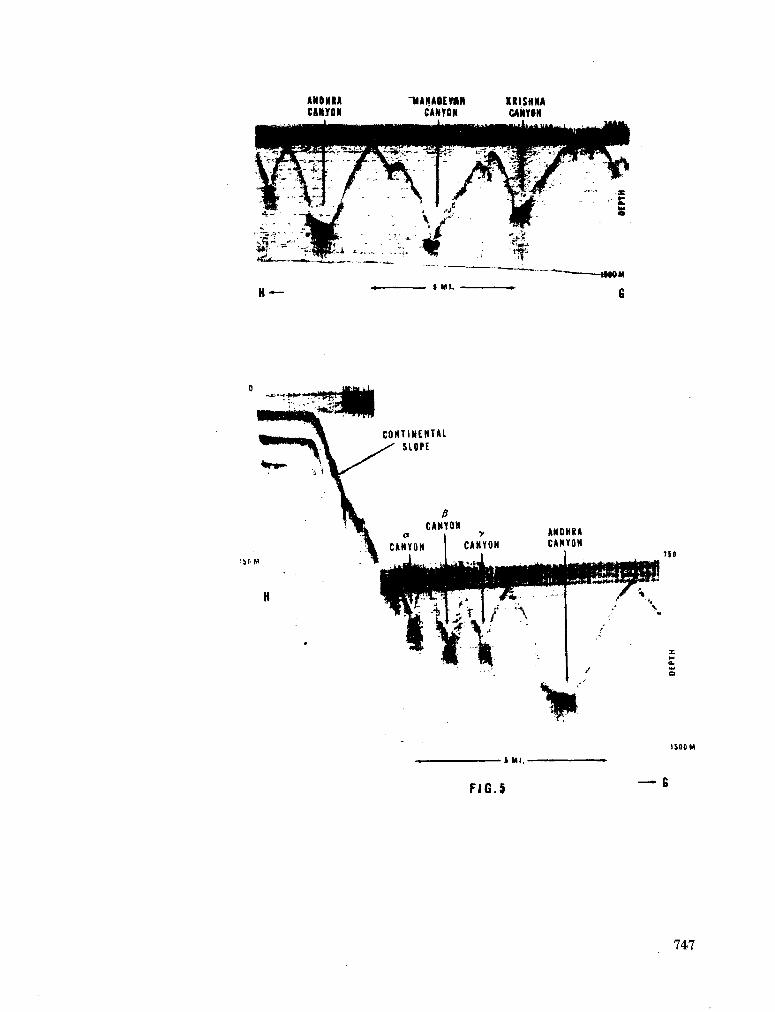
AMOHRA
CANYON T É A N A M W M
CAMYON KRISHNA CANYON
CONTINENTAL SLOPE
P CANYON
a i y
CANYON I CANYON
ANDHRA CANYON
S Ml.
FIG.5
1500 M
— G
747
The unique aspect of these multiple canyons is that they are
found at the base of the continental slope. The shape of all canyons
is similar and their crests are m u c h closer than is normal.
D I S C U S S I O N
The shape of the canyon walls shows the typical V-shaped profile
found in canyons cut into continental slopes. Their narrow bottoms
indicate that they are not being filled with sediment. It is not known
whether they extend up to the break in slope nor if they cut across
the shelf and intersect the longshore transport of nearshore sediments.
The soundings on published navigation charts are so widely spaced
that it is not possible to contour canyons with existing soundings. It
is known from the work of R . F . Dill off Baja California and Southern
California that canyons are often a focal point of fish concentrations.
The canyons of the east coast of India therefore deserve future
investigation to determine if such is also the case in the Indian Ocean.
A C K N O W L E D G M E N T
The author wishes to express appreciation to the U . S . Program
in Biology of the Indian Ocean Expeditions, which made possible the
opportunity to collect the sounding records. Thanks are also extended
to R . F . Dill and G . H . Curl for suggestions in the manuscript.
R E F E R E N C E S
I. LaFond, E. C. (1957) "Océanographie Studies in the Bay of Bengal." Proc. Indian Academy of Sciences, Vol. XLVI, pp. 1-46.
2. Rao, B . Kukkuteswara and E . C . LaFond (1954) "The Profile of the Continental Shelf off Visakhapatnam Coast." Andhra University Memoirs, Vol. 1, pp. 78-85.
3. Moore, D . G . (i960) "Acoustic Reflection Studies of the Continental Shelf and Slope off Southern California." Bull. Geol. Soc. America, Vol 71, pp. 1121-1136.
4. Rao, R . Prasad and C. Mahadevan (1958) "Evolution of Visakhapatnam Beach."
Andhra Univ. Memoirs, Vol. 2, pp.
33-47-5. Mahadevan, C . and R . Prasad Rio (1958) "Cause of the Growth and Sand Spit
North of Godavari Confluence." A n dhra Univ. Memoirs, Vol. 2, pp. 69-74.
31
748
6. Moore, D . G. and J. R. Curray (1963)
7. Shepard, F. P. (1963)
8. Shepard, F. P., and R. F. Dill (1964)
"Structural Framework of the Continental Terrace, Northwest Gulf of Mexico." Jour. Geophys. Res., Vol. 68, No. 6, pp. 1725-1747.
"Submarine Geology." Chapter XI, Harper and Row, New York, N . Y .
"Submarine Canyons," -Rand McNally Co., N . Y . (Manuscript).
32
749
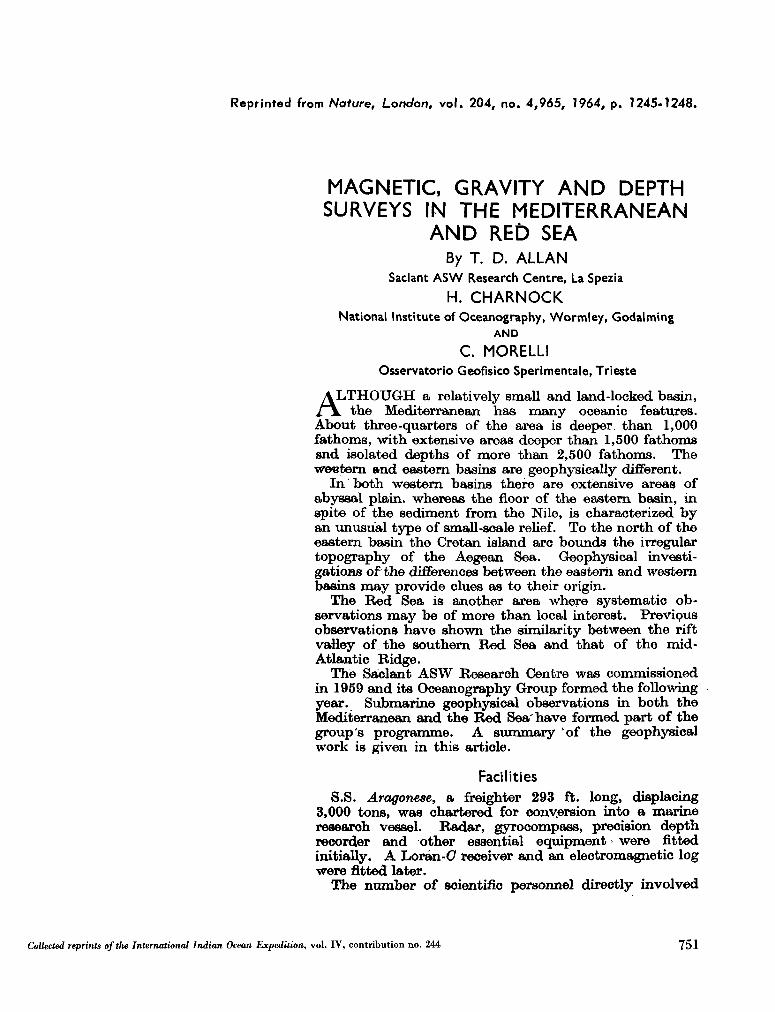
Reprinted from Nature, London, vol. 204, no. 4,965, 1964, p. 1245-1248.
MAGNETIC, GRAVITY AND DEPTH SURVEYS IN THE MEDITERRANEAN
AND RED SEA By T. D. ALLAN
Saclant A S W Research Centre, La Spezia
H. CHARNOCK National Institute of Oceanography, Wormley, Godalming
AND
C. MORELLI Osservatorio Geofísico Sperimentale, Trieste
AL T H O U G H a relatively small and land-locked basin, L the Mediterranean has many oceanic features.
About three-quarters of the area is deeper than 1,000 fathoms, with extensive areas deeper than 1,500 fathoms and isolated depths of more than 2,500 fathoms. The western and eastern basins are geophysically different.
In both western basins there are extensive areas of abyssal plain, whereas the floor of the eastern basin, in spite of the sediment from the Nile, is characterized by an unusual type of small-scale relief. To the north of the eastern basin the Cretan island arc bounds the irregular topography of the Aegean Sea. Geophysical investigations of the differences between the eastern and western basins m a y provide clues as to their origin.
The Red Sea is another area where systematic observations m a y be of more than local interest. Previous observations have shown the similarity between the rift valley of the southern Red Sea and that of the mid-Atlantic Ridge.
The Saclant A S W Research Centre was commissioned in 1959 and its Oceanography Group formed the following year. Submarine geophysical observations in both the Mediterranean and the Red Sea'have formed part of the group's programme. A summary 'of the geophysical work is given in this article.
Facilities
S.S. Aragone8e, a freighter 293 ft. long, displacing 3,000 tons, was chartered for conversion into a marine research vessel. Radar, gyrocompass, precision depth recorder and other essential equipment were fitted initially. A Lorán-<7 receiver and an electromagnetic log were fitted later.
The number of scientific personnel directly involved
Collected reprints of the International Indian Ocean Expedition, vol. IV, contribution no. 244 751
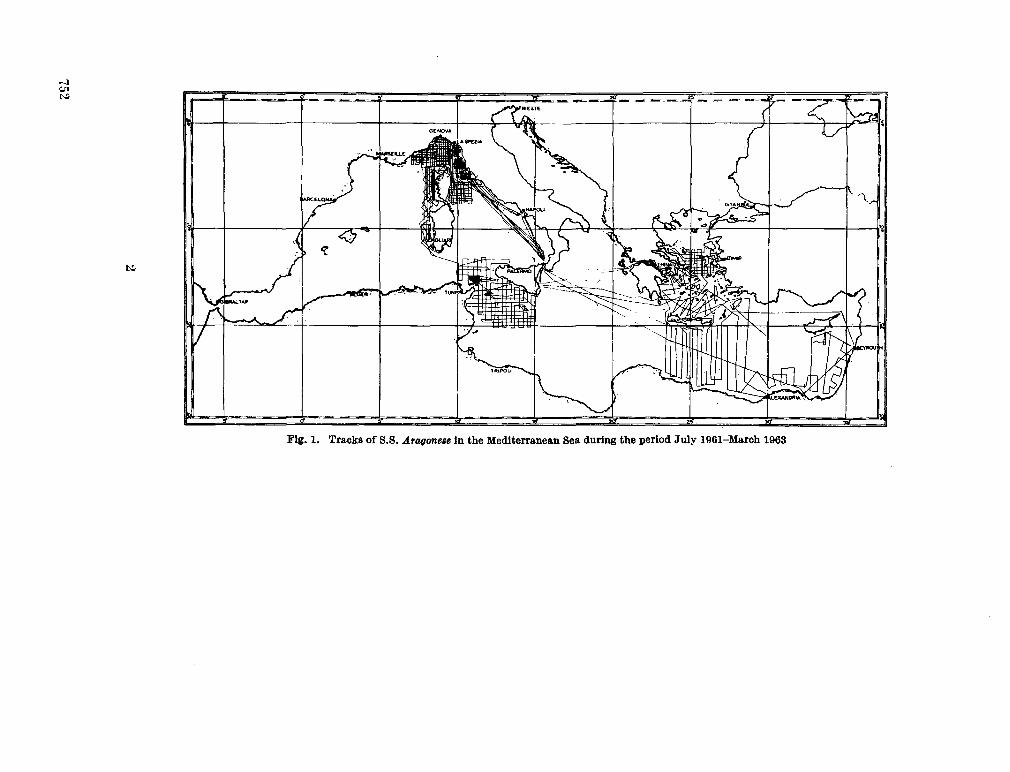
752
2
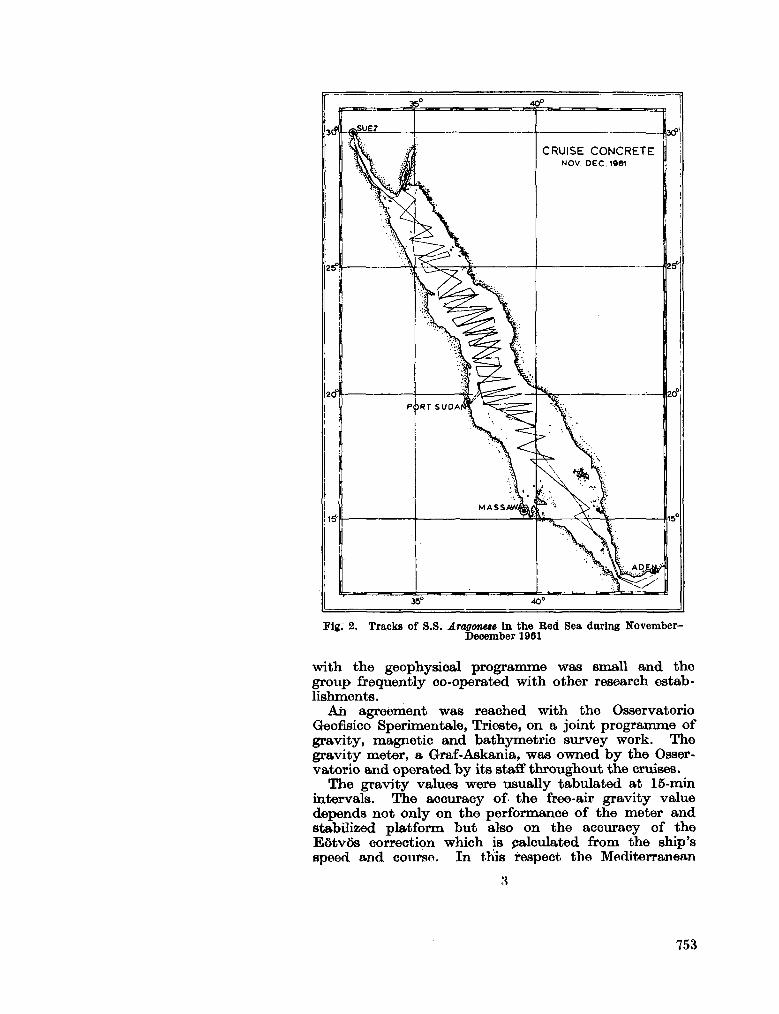
Fig: 2. Tracks of S.S. Aragonete in the Bed Sea during November-December 1961
with the geophysioal programme was small and the group frequently co-operated with other research establishments.
A n agreement was reached with the Osservatorio Geofísico Sperimentale, Trieste, on a joint programme of gravity, magnetic and bathymétrie survey work. The gravity meter, a Graf-Askania, was owned by the Osservatorio and operated by its staff throughout the cruises.
The gravity values were usually tabulated at 15-min intervals. The accuracy of the free-air gravity value depends not only on the performance of the meter and stabilized platform but also on the accuracy of the Eôtvôs correction which is palculated from the ship's speed and course. In this respect the Mediterranean
3
753
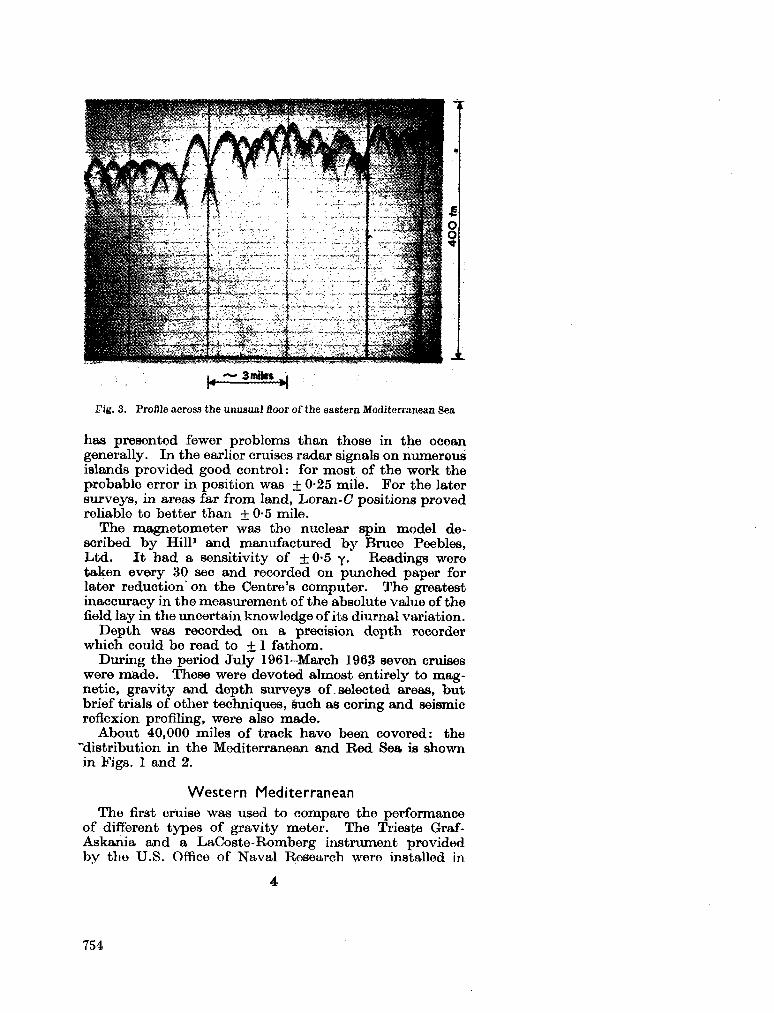
Fig. 3. Profile across the unusual floor of the eastern Mediterranean Sea
has presented fewer problems than those in the ocean generally. In the earlier cruises radar signals on numerous islands provided good control : for most of the work the probable error in position was ± 0-25 mile. For the later surveys, in areas far from land, Loran-C positions proved reliable to better than +0-5 mile.
The magnetometer was the nuclear spin model described by Hill1 and manufactured by Bruce Peebles, Ltd. It had a sensitivity of ± 0-5 y. Readings were taken every 30 sec and recorded on punched paper for later reduction on the Centre's computer. The greatest inaccuracy in the measurement of the absolute value of the field lay in the uncertain knowledge of its diurnal variation.
Depth was recorded on a precision depth recorder which could be read to + 1 fathom.
During the period July 1961-March 196,3 seven cruises were made. These were devoted almost entirely to magnetic, gravity and depth surveys of selected areas, but brief trials of other techniques, such as coring and seismic reflexion profiling, were also made.
About 40,000 miles of track have been covered: the "distribution in the Mediterranean and Red Sea is shown in Figs. 1 and 2.
Western Mediterranean The first cruise was used to compare the performance
of different types of gravity meter. The Trieste Graf-Askania and a LaCoste-Romberg instrument provided by the U . S . Office of Naval Research were installed in
4
754
the ship. Observations were made in three areas between La Spezia and Sicily where earlier bottom gravity readings2 provided a precise reference. Consequently, not only relative but absolute comparisons of the surface-ship meters were possible. In the area near La Spezia precise navigational control was achieved by using theodolites on nearshore hills.
The gravity meters agreed within 10 m.gal in calm conditions, but modifications to the LaCoste-Romberg were necessary to allow for the 'Browne' corrections in rougher weather. A n account of the comparisons has been published8.
Other cruises in the western basin have examined the continental slopes which border the Balearic and Tyrrhenian abyssal plains. These slopes are cut by submarine canyons resembling those found in other parts of the continental margin but which have been interpreted as former sub-aerial valleys.
Between Sicily and Malta the survey did not appear to change the existing conception of the geology of the area. There were large magnetic anomalies around volcanic islands such as Pantelleria and the negative Bouguer gravity anomaly known to exist in western Sicily was shown to change to a positive anomaly in the centre of the Strait.
Eastern Mediterranean In the eastern Mediterranean the islands of Crete,
Scarpanto and Rhodes appear to form an island arc structure with contrasting geophysical properties in the areas to the north and south of the arc. These areas have been extensively surveyed during three of our cruises. Dr. K . O . Emery took part in one of these, during which a relief map of the sea-floor was prepared from á study of the type of bottom, displayed on the echo-sounder.
Much of the sea-floor in the eastern basin is characterized by the type.of small-scale relief shown in Fig. 3. The lack of deposition appears to be caused by a series of trenches which borders the area and acts as a trap for sediment spreading from the Nile.
Perhaps the most interesting aspect of the eastern basin,, in spite of the lack of sedimented area, is the dullness of its magnetic field. Thus, apart from the latitudinal variation, there is no significant change of magnetic field between North Africa and Crete. This can be seen from Fig. 4, which shows a typical north-south profile of magnetic field, gravity and depth across the island arc. To the north there are several isolated magnetic anomalies, probably associated with vulcanism.
The gravity field is broadly similar to that associated with the island arcs of the major oceans. Generally negative in the southern part of the eastern basin, there
5
755
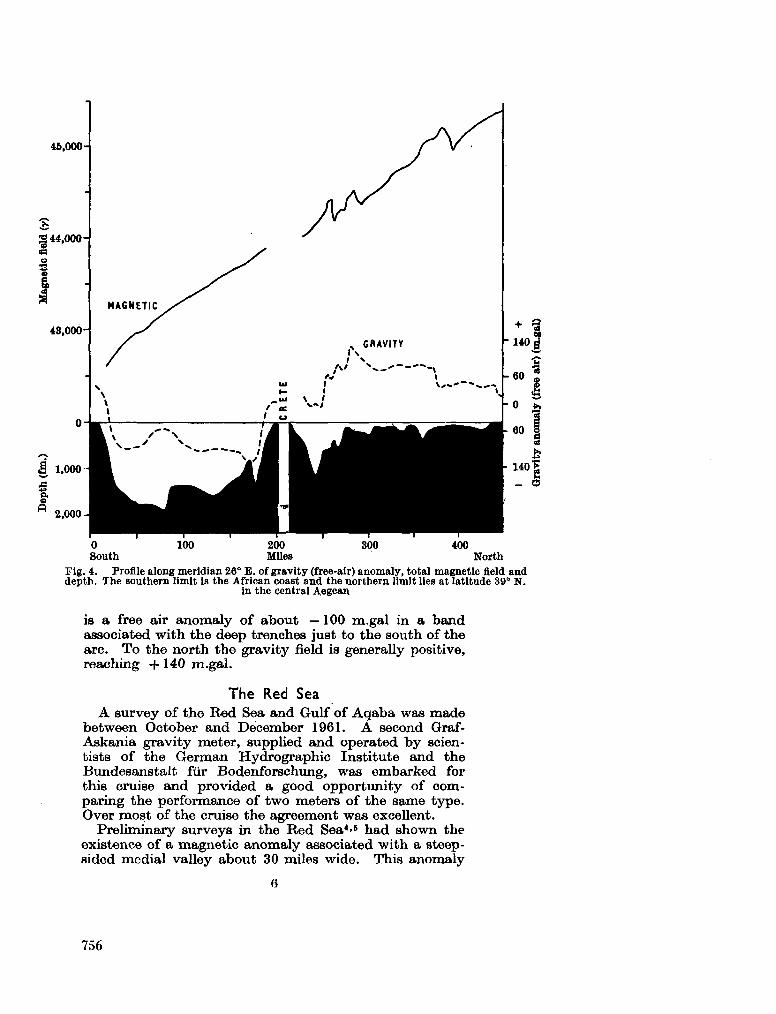
O 100 200 300 400 South M U e B North
Fig. 4. Profile along meridian 26° K . of gravity (free-air) anomaly, total magnetic field and depth. The southern limit is the African coast and the northern limit lies at latitude 39° N .
in the central Aegean
is a free air anomaly of about —100 m.gal in a band associated with the deep trenches just to the south of the arc. To the north the gravity field is generally positive, reaching +140 m.gal.
The Red Sea
A survey of the Red Sea and Gulf of Aqaba was made between October and December 1961. A second Graf-Askania gravity meter, supplied and operated by scientists of the German Hydrographie Institute and the Bundesanstalt fur Bodenforschung, was embarked for this cruise and provided a good opportunity of comparing the performance of two meters of the same type. Over most of the cruise the agreement was excellent.
Preliminary surveys in the Red Sea*-5 had shown the existence of a magnetic anomaly associated with a steep-sided medial valley about 30 miles wide. This anomaly
6
756
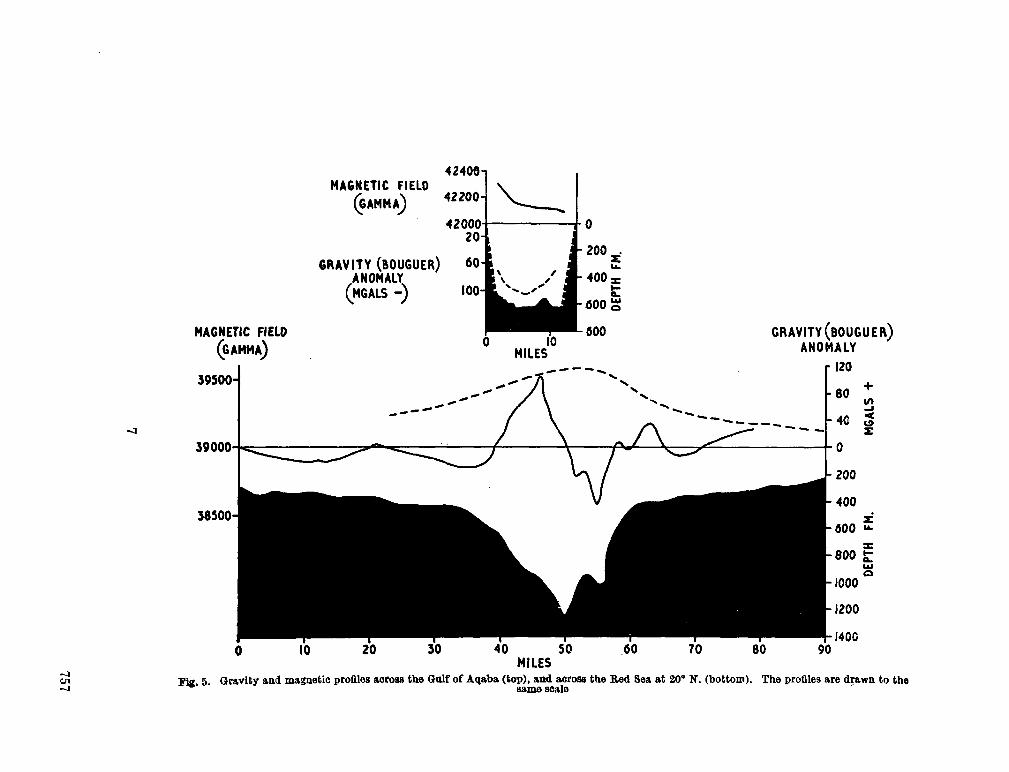
7
757
was studied in much more detail during the 1961 cruise. A total of fifty-four transverse crossings were made. Records from a typical crossing (20° N . ) are shown in Fig. 5.
A preliminary analysis of the results shows that the median valley, which is more fully developed in the south, is underlain by a considerable thickness of dense, mag» netic rock. The lateral extent of this material appears to be confined to the width of the valley.
At the northern end of the Red Sea the Gulf of Suez is shallow and dull both in its magnetic and gravity structure. The Gulf of Aqaba, however, provides an interesting contrast. The Aqaba rift is everywhere less than 15 miles wide and about 600 fathoms deep. It is flanked on both sides by steep mountains. There is a strongly negative gravity anomaly, reaching — 200 m.gal (free air) and —100 m.gal (Bouguer), while the magnetic field is featureless. The structure of the Gulf of Aqaba resembles that of the Gulf of Corinth; both may be thickly sedimented grabens.
The contrasting geophysical properties of the Gulf of Aqaba and the Red Sea, shown in Fig. 5, must be taken into account in any attempted interpretation of the origins of the Rift system.
W e thank Dr. E . T . Booth and Dr. J. M . Ide for their advice during their service as scientific director of the Saclant A S W Research Centre; and our colleagues, ashore and afloat, and the captain, officers and crew of S.S. Aragonese for their assistance.
• Hill, M . N . , Deep Sea Res., 5, 309 (1959). • Cianl,A.,Gantar,C.,andMorelli,C.,.BoB. Qeofisicateor. appl.,Z,A, 289(1960 * Allan, T . D . , Dehlinger, P . , Gantai, C . , Morelli, C . , Pisani, M . , and Harrison,
J. C , J. Qeophy*. Re»., 67, 5157 (1962). 4 Allan, T . D . , BoU. Geofisiea teor. appl., 6, 199 (1964). * Brake, C . L . , and Girdler, K . W . , Qeophy*. J., 8, 473 (1964).
Printed in Great Britain by. Fisher, Knight & C o . , Ltd., St. Albans.
758
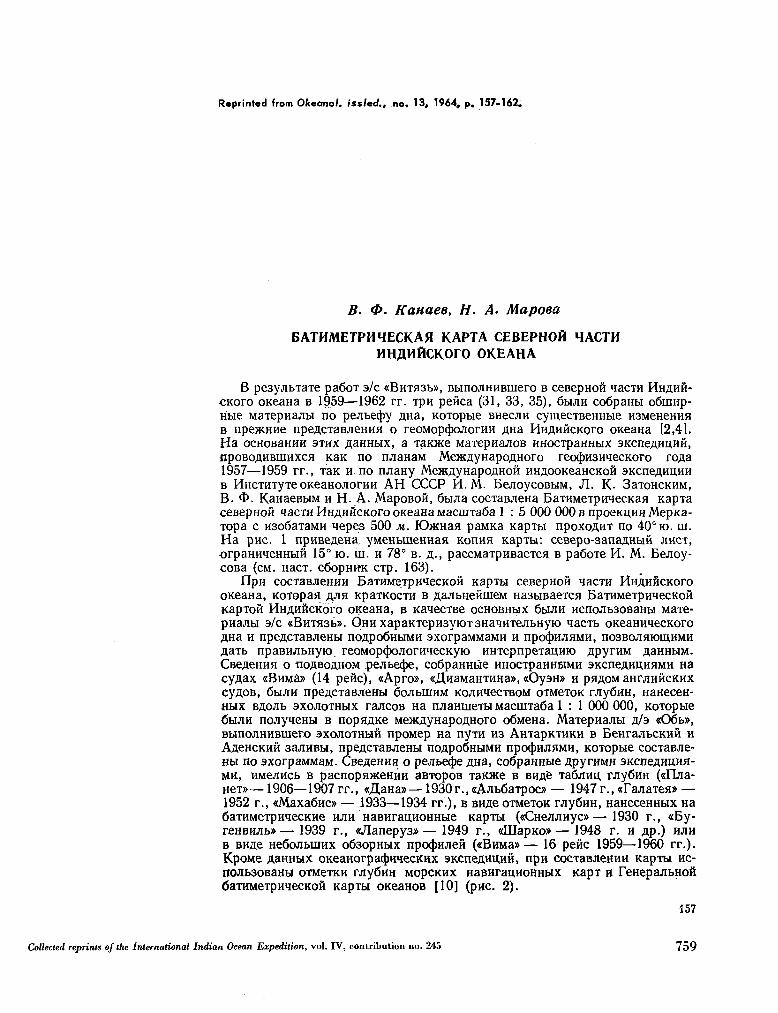
Reprinted from Okeanol. issled., no. 13, 1964, p. 157-162.
B- 0. Kanaee, H. A. Mapoea
EATHMETPHHECKAfl KAPTA CEBEPHOH HACTM MHAHftCKOrO OKEAHA
B pe3yjibTaTe paôoT a/c «BHTH3b», BbinoriHHBinero B ceBepHOH nacra H H A H H -cKoro oneaHa B 1959—1962 rr. TpH penca (31, 33, 35), 6UJIH coôpaHH oóiiiHp-ribie MaTepnajiH no pejibecpy AHa, KOTopue BHCCJIH cymecTBeHHbie H3MeHeHHH B npescHHe npeACTaBjieHHH o reoMoptpoiiorHH Ana HHAnncKoro oKeaHa [2,4]. H a OCHOBaHHH 9THX A 3 H H M X , a TaiOKe MaTepHaJIOB HHOCTpaHHblX SKCneAHUHH,
upoBOAHBUiHxcH KaK no njiaHaM MexAynapoAHoro reotpH3H"iecKoro roAa 1957—1959 rr., TaK H no njiaHy MejKAyHapoAHoñ HHAooKeaHCKoñ sKcneAHUHH B HHCTHTyTe OKeaHOJiorHH A H C C C P H . M . EejioycoBHM, Jl. K- 3aT0HCKHM, B . O . KaHaeBHM H H . A . MapoBoñ, 6biJia cocTaBJieHa BaTHMeTpnuecKaH KapTa ceBepHOH wacTH HHAHOCKoro OKeaHa Macmraoa 1 : 5 000 000 B npoeKUHH MepKa-TOpa c H3o6aTaMH Hepe3 500 M. KDjKHaa paMKa Kapra npoxoAHT no 40° 10. in. H a pnc. 1 npHBeAeHa. yMeHbineHHan Konnn KapTbi: ceBepo-3anaAHbiñ JIHCT, orpaHH'ieHHbiH 15° IO. m . H 78° B . A - , paccMaTpnBaeTCH B paôoTe H . M . Eejioy-coBa (CM. HacT. c6opH»K d p . 163).
npn cocTaBJieHHH BaTHMe.TpHiecKoñ KapTw ceBepHofi qacra HHAnñcKoro OKeaHa, KOTopaa AJIH KpaTKocTH B AaJibHeñineM Ha3biBaeTca BaTHMeTpnnecKon KapToñ HHAHHCKoro OKeaHa, B KaiecTBe O C H O B H H X 6HJIH ncnoJib30BaHbi MaTe-pnajibi a/c «BnTH3b». ÛHHxapaKTepH3yiOT3HaHHTejibHyio HacTb oKeaHH4ecKoro AHa H npeACTaBJieHbi noApoÔHbiMH axorpaMMaMH H npocpHJiHMH, no3BOJiHioiii,HMH AaTb npaBHJibHyio reoMoptpojiornqecKyio HHTepnpeTaunio ApyrnM AaHHHM. CBeAeHHH O Î10ABOAHOM peJIbeípe, COÓpaHHbie HHOCTpaHHBIMH SKCneAHUHHMH Ha
cyAax «BnMá» (14 peñe), «Apro», «ZtnaMaHTHHa», «OyaH» H P H A O M aHrjiniicKHX cyAOB, óbiJiH npeACTaBJieHbi O O J I M U H M KOJIKMCCTBOM O T M C T O K nnyOHH, HaHeceH-H H X BAOJib axo^oTHbix rajicoB Ha njiaHinera MacuiTaôa 1 : 1 000 000, KOTopwe <5HJIH noJiyqeHbi B nopaAKe MeacAyHapoAHoro oÓMeHa. MaTepHajiH A / 3 «06b», BbinojiHHBUiero S X O J I O T H H H npoMep. Ha nyra H3 AHTapKTHKH B BeHrajibCKHñ H AAeHCKHH 3ajiHBw, npeACTaBJieHH noApoÔHUMH npocpHJiHMH, KOTopbie cocTaBJie-H w no axorpaMMaM. CBeAeHHH o pejibecpe Ana, coópaHHbie ApyrHMH 3KcneAHUHH-M H , HMejIHCb B paCnOpHJKeHHH aBTOpOB TaKXe B BHAfe TaÓJIHU, TJiyÓHH («ÜJia-
HeT»—1906—1907rr., «AaHa»— 1930r.,«AJibôaTpoc» — 1947r.,«rajiaTea» — 1952 r., «MaxaÓHC» — .1933—1934 rr.), B B H A Ë O T M C T O K rjiy6HH, HaHeceHHbix Ha 6aTHMeTpHMecKHe HJIH HaBHrauHOHHHe Kapra («CHeJiJiHyc»—1930 r., «By-reHBH^ib»— 1939 r., «JIanepy3»— 1949 r., «lUapKo»— 1948 r. H Ap-) HJIH B BHAe HeôoJibiiiHX oÓ3opHbix npocpHjieñ («BHMa» — 16 peñe 1959—1960 rr.). KpoMe AaHHbix OKeaHorpaipHHecKHx 3KcneAHU.HH, npH cocTaBJieHHH KapTbi H C -IKWIb30BaHbI OTMeTKH TJiyÔHH MOpCKHX HaBHraUHOHHHX KapT H TeHepajIbHOH
6aTHMeTpHqecKoñ KapTH oKeaHOB [10] (pnc. 2).
157
Collected reprints of the International Indian Ocean Expedition, vol. IV, contribution no. 245 759
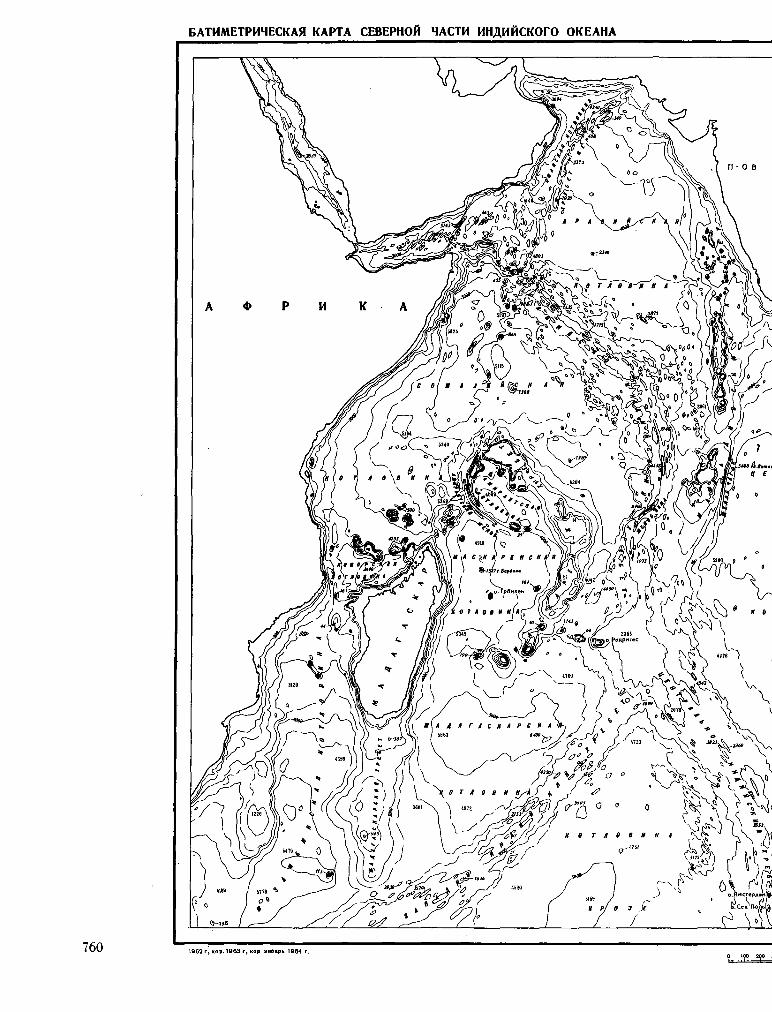
EATHMETPMHECKAfl KAPTA CEBEPHOfi HACTH MHAHftCKOrO OKEAHA
1962 r, KOp. 1963 r, KOp miBapb 1964 r. 0 too 200
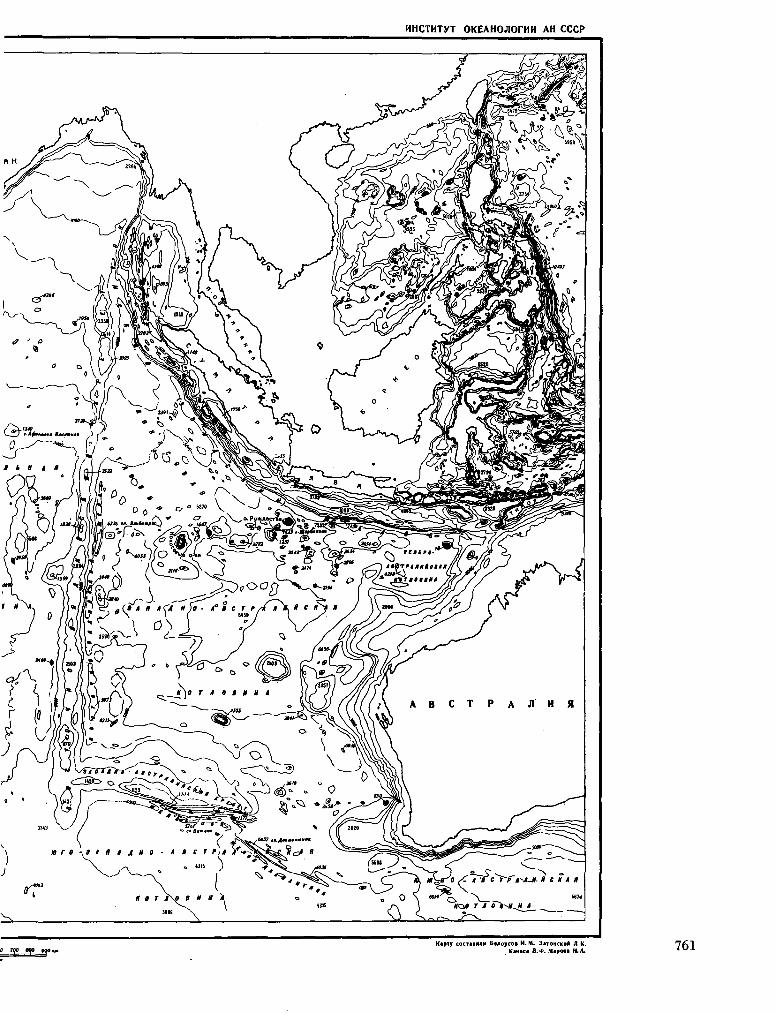
HHCTHTYT OKEAHOJIOrMH AH CCCP
ry> eoo gyoHw Kapry cocTaaKjm Bejoycot H . IW. 3aTOHCKHA JI K.
KaHaea B.4>. Mapoaa H . A .
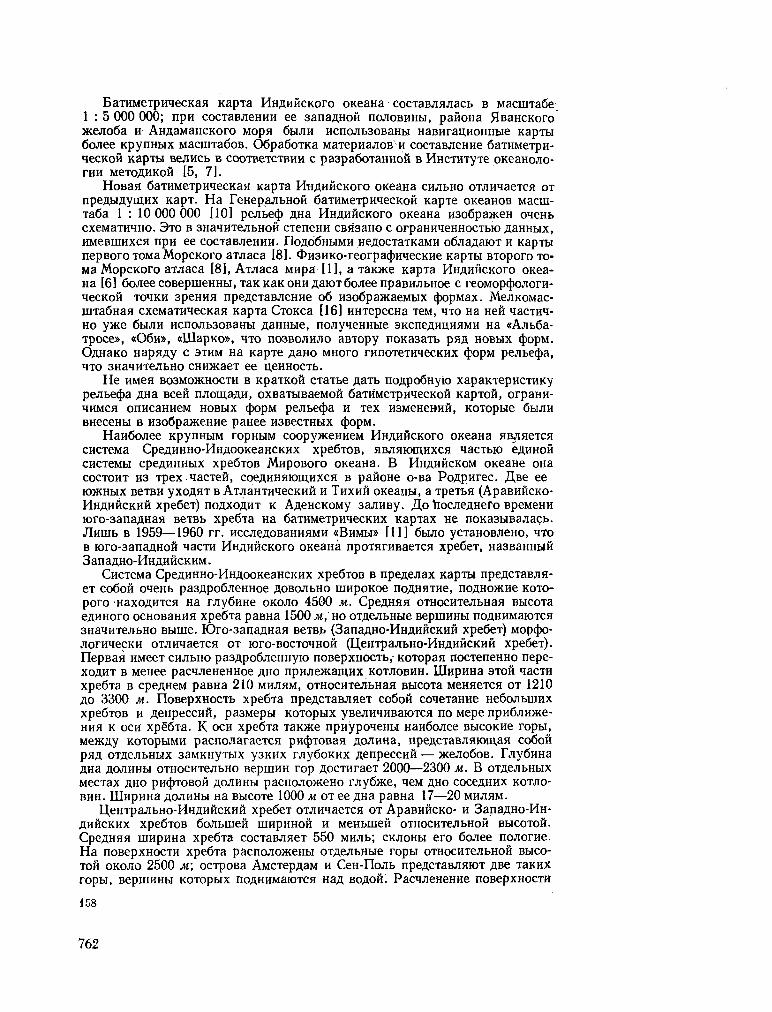
BaTHMeTpHHecKaa KapTa H H A H H C K O I X ) oneaHa cocTaBJiajiacb B MactuTaôe-1 : 5 000 000; npn cocTaBjieHHH ee 3anaAHoñ nojioBHHbi, pañoHa HsaHCKoro mejioôa H AHAaMaHCKoro Mopn 6buw HcnoJib30BaHbi HaBHrauHOHHbie KapTbi 6oJiee KpynHbix MaciiiTaóoB. 06pa6oTKa MaTepnajioB H cocTaBjieHHe óaraMeTpH-leCKOH KapTbi BeJIHCb B COOTBeTCTBHH C pa3pa60TaHHOÍÍ B HHCTHTyTe OKeaHOJlO-THH MeTOflHKOH [5, 7].
HoBaa 6aTHMeTpmiecKafl KapTa H H A H H C K O T O oneaHa CHJibHo oTJimaeTCH O T npeflbiflymHx KapT. H a TeHepanbHOH óaTHMeTpHHecKoií KapTe oKeaHOB Macm-Ta6a 1 : 10 000 000 [10] pejibeip AHa H H A H H C K O F O oneaHa H3o6pajKeH oneHb CXeMaTH^HO. 3 T O B 3HaqHTejIbHOH CTeneHH CBH3aHO C OrpaHHieHHOCTbK) AaHHblX, HMeBiiiHxcH npn ee cocTaBjieHHH. noAoÔHbiMH HeAocTaTKaMH oóJiaAaioT H KapTbi nepBoro TOMa MopcKoro aiviaca [8]. OH3HKo-reorpa<pHHecKHe KapTbi BToporo T O -Ma MopcKoro aTJiaca [8], ATJiaca MHpa [1], a TaioKe KapTa H H A H M C K O T O oKea-Ha [6] 6oJieecOBepmeHHbi,TaKKaKOHHAaioT6oJieenpaBHJibHoe c reoMopcpojiorH-MecKOH T O M K H 3peHHH npeACTaBJieHne 06 H3o6pa3KaeMbix (popinax. MejmoMac-uiTaÔHan cxeMaTHMecKan KapTa OroKca [16] HHTepecHa TeM, ^ T O Ha Heñ lacTHM-Ho yace ÔHJIH HcnoJib30BaHH AaHHbie, nojiyieHHbie SKcneAHUHHMH Ha «Ajibôa-Tpoce», « 0 6 H » , «UlapKo», M T O IIO3BOJIHJIO aBTopy noKa3aTb p»A H O B H X <jx>pM. O^HaKo HapaAy c S T H M Ha KapTe AaHo MHoro rHnoTeTH iecKHX (fcopM pejibeipa, qTO 3HaHHTejibHo CHHStaeT ee ueHHocTb.
H e HMeH B03MOJKHOCTH B KpaTKoft cTaTbe AaTb noApoÔHyio xapaKTepHCTHKy pejibetpa AHa Been njiomaAH, oxBaTbiBaeMoii oaTHMeTpH^ecKOH KapToñ, orpaHH-MHMCH onHCaHHeM HOBblX CpOpM peJIbetpa H Tex H3MeHeHHH, KOTOpbie 6bIJIH BHeceHbi B H3o6pa>KeHHe paHee n3BecTHbix (popM.
HanôoJiee KpynHbiM ropHHM coopyweHHeM H H A H H C K O T O oKeaHa HBJiHeTCH CHCTeMa CpeAHHHO-HHAOOKeaHCKHX XpêÔTOB, HBJIHK>IH,HXCH HaCTbK) eAHHOft CHcreMbi cpeAHHHbix xpeÔTOB MnpoBoro OKeaHa. B H H A H H C K O M OKeaHe oHa C O C T O H T H3 Tpex naereñ, coeAHHHiomHXCH B pañoHe o-Ba PoApnrec. ,H,Be ee KffiCHblX BeTBH yXOAHT B ATJiaHTHHeCKHH H T H X H H OKeaHbl, a TpeTbH (ApaBHHCKO-H H A H H C K H H xpeôeT) noAXOAHT K AAeHCKOMy 3ajiHBy. JXo riocjieAHero BpeMeHH roro-3anaAHaH BeTBb xpeÓTa Ha 6aTHMeTpmecKHx KapTax He noKa3biBajiacb. JlHUIb B 1959—1960 IT. HCCJieAOBaHHHMH « B H M H » [11] ÔbIJIO yCTaHOBJieHO, 1TO B K>ro-3anaAHoñ nacra H H A H H C K O F O OKeaHa npoTHTHBaeTCH xpefieT, Ha3BaHHbiñ 3anaAHo-HHAHHCKHM.
CncTeMa CpeAHHHo-HHAooKeaHCKHx xpeÔTOB B npeAejiax KapTbi npeACTaBjin-eT C060H o^eHb pa3Apo6jieHHoe AOBOJibHo uinpoKoe noAHHrae, noAHowne K O T O -poro HaxoAHTCH Ha rjiyÓHHe OKOJIO 4500 M. CpeAHHH oraocHTejibHaH BbicoTa eAHHoro ocHOBaHHH xpeÔTa paBHa 1500 M, H O oTAejibHbie BepuiHHbi noAHHMaioTCH 3HaMHTejibHo Bbime. K)ro-3anaAHaii BeTBb (3anaAHo-HHAHHCKHÜ xpeôeT) Mopcpo-jiorHwecKH oT^HiaeTCH O T roro-BocTOHHoñ (I^eHTpajibHo-HHAHHCKHH xpeèeT). nepBan HMeeT CHJibHO pa3Apo6jieHHyio noBepxHOCTb, KoTopaH nocTeneHHo nepe-X O A H T B MeHee pacq^eHeHHoe A H O npHJiestamnx KOTJIOBHH. IIInpHHa S T O H nacTH xpeÔTa B cpeAHeM paBHa 210 M H ^ H M , OTHocHTejibHaH BHCOTa MeHneTCH O T 1210 Ao 3300 M. noBepxHOCTb xpeôîa npeACTaBJineT co6oñ coneTaHHe HeóoJibiuHX xpeÔTOB H AenpeccHH, pa3MepH KOTopwx yBeAH4HBaK)TCH no Mepe npnójiHMce-H H H K O C H xpëÔTa. K O C H xpeÔTa Taoke npnypoqeHM HanóoJiee BbicoKHe ropw, Me>KAy KOTopHMH pacnoJiaraeTCH pH(pTOBaa AOJiHHa, npeACTaBJiHKMnan co6oii pflA OTAeJibHbix 3aMKHyTbix y3KHx r^yóoKHX AenpeccHH — xejioôoB. DiyÓHHa AHa AOJIHHbl OTHOCHTejIbHO BepiHHH Top AOCTHraeT 2000—2300 M. B OTAe^bHblX Mecrax A H O pn(pTOBOH AOJIHHW pacnoJioJKeHo myôJKe, qeM A H O C O C C A H H X KOTJIOB H H . IUnpHHa AOJiHHbi Ha B H C O T C 1000 M O T ee AHa paBHa 17—20 M H J I H M .
L[eHTpajibHo-HHAHHCKHH xpeóeT oTjiH^aeTCH O T ApaBHHCKo- H 3anaAHo-HH-AHHCKHX XpeÔTOB ÔOJIbUieÎI UIHpHHOH H MeHbllieH OTHOCHTeAbHOH BblCOTOH. CpeAHHH uiHpHHa xpeÔTa cocTaBJiHeT 550 MHJib; CKJIOHH ero ôojiee noJiorne. H a noBepxHocTH xpeÓTa pacnojioxeHbi OTAejibHwe ropw oTHocHTejibHOH B H C O -T O H OKOJIO 2500 M; ocTpoBa AMCTepAaM H CeH-üojib npeACTaBJiHiOT ABe TaKHX ropbl, BepUIHHbl KOTOpblX HOAHHMaiOTCH HaA BOAOH. PaCMJieHeHHe nOBepXHOCTH
158
762
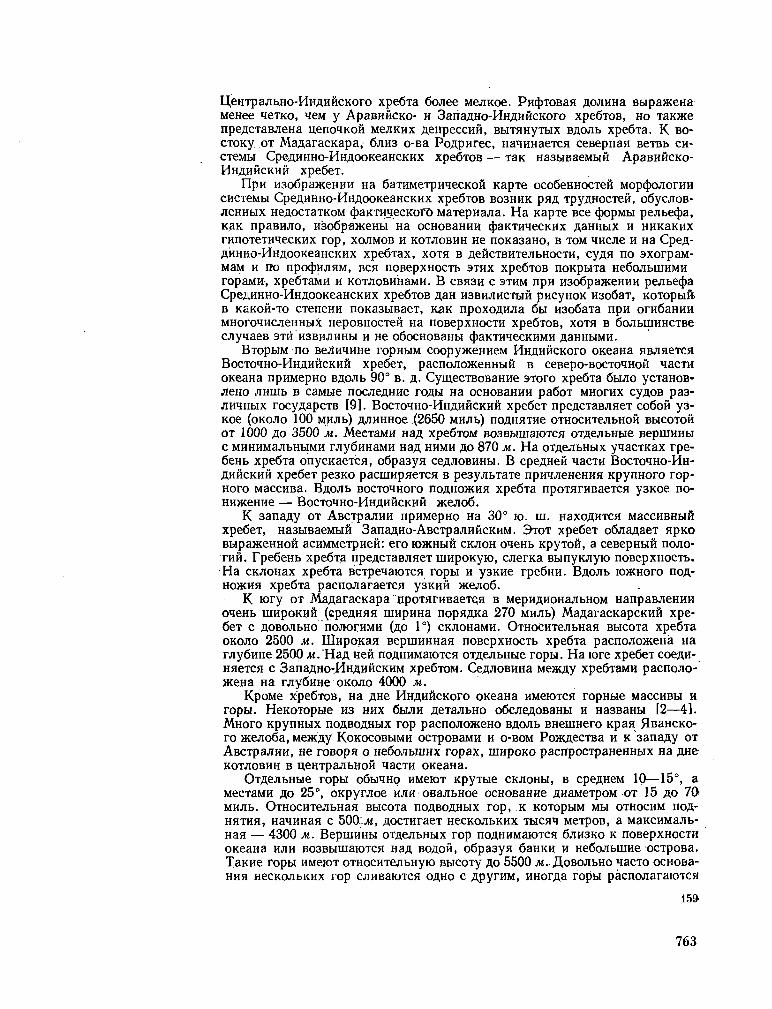
UeHTpajibHo-HHAHHCKoro xpeÔTa ôojiee MejiKoe. PntpTOBaa AOJiHHa Bbipaxena MeHee ieTKo, neu y ApaBHÔCKo- H 3anaAHo-HHAHñcKoro xpeÔTOB, H O TaKwe npeACTaBJieHa nenowoH MejiKHX aenpeccHñ, BbiTHHyrax BAOJib xpeÔTa. K B O -CTOKy OT Ma^aracKapa, 6JIH3 o-Ba PoApnrec, HaMHHaeTca ceBepHaa BeTBb C H -CTeMH CpeflHHHO-HHAOOKeaHCKHX XpeÔTOB — TaK Ha3bIBaeMbIH ApaBHHCKO-H H A H Í Í C K H H xpeôeT.
llpH H3o6paxeHHH Ha óaTHMeTpHqecKoñ KapTe ocoôeHHocTen MoptjxviorHH CHCTeMbI CpeAHHHO-HHAOOKeaHCKHX XpeÓTOB B03HHK pHA TpyflHOCTeÈ, OÔyCJIOB-jieHHbix HeAocTaTKOM (paRTH^ecKoro MaTepna.na. H a KapTe Bce cpopMbi pejibe^a, K.aK npaBHJIO, H30Ôpa5KeHbl Ha OCHOBaHHH (paKTHqeCKHX A3HHHX H HHKaKHX rHnoTeTHHecKHx rop, xojiMOB H KOTJIOBHH He noKa3aHo, B T O M «iHCJie H Ha CpeA-AHHHo-HHAooKeaHCKHx xpeôïax, X O T H B AeficTBHTejibHoc™, cyAH no axorpaM-MaM H ITO npOfpHJIHM, BCH nOBepXHOCTb 3THX XpeÔTOB nOKpbITa HeÔOJIbUlHMH ropaMH, xpeÔTaMH H K O T J I O B H H 3 M H . B C B H 3 H C S T H M npH H3o6paxeHHH pejibetpa CpeAHHHO-HHAOOKeaHCKHX XpeÓTOB AaH H3BHJIHCTHH pHCyHOK H30ÓaT, KOTOpbl» B KaKoñ-To CTeneHH noKa3biBaeT, KaK npoxoAHJia 6 H H3oôaTa npH ornôaHHH MHOrOMHCJieHHblX HepOBHOCTeft Ha nOBepXHOCTH XpeÔTOB, XOTH B ÔOJlblIIHHCTBe cjiyqaeB ara H3BHJIHHM H He oôocHOBaHbi (paKranecKHMH AaHHHMH.
BTopwM no BejînnnHe ropHHM coopyjKeHneM H H A H H C K O F O oKeaHa HBJineTCH B O C T O ^ H O - H H A H H C K H H xpeôeT, pacnoJiojKeHHbiñ B ceBepo-BocToiHoñ nacra OKeaHa npnMepHo BAOJib 90° B . A - CymecTBoBaHne 3Toro xpeÔTa ÔHJIO yeraHOB-jieHo jiHuib B caMbie nocjieAUne roAH Ha OCHOBaHHH paÔoT MHornx cyAOB pa3-J I H ^ H H X rocyAapcTB [9]. B O C T O I H O - H H A H H C K H H xpeôeT npeACTaBJineT coóoñ y3-KOe (OKOJIO 100 MHJIb) AflHHHOe (2650 MHJIb) nOAHHTHe OTHOCHTejIbHOH BbICOTOH OT 1000 Ao 3500 M. MecTaMH HaA xpeÔTOM B03BbimaioTCíi oTAejibHbie BepiuHHH c MHHHMajibHHMH TJiyÔHHaMH HaA HHMH A O 870 M. H a oTAejibHbix yiacTKax rpe-6eHb xpeÔTa onycKaeTCH, oôpa3ya ceAJioBHHbi. B cpeAHeñ nacra B O C T O M H O - H H -A H H C K H H xpeóeT pe3KO paciuHpHeTCH B pe3y ibTaTe npHiJieHeHHH KpynHoro rop-Horo MaccHBa. BAOJib BOCTOMHoro noAHOHíHH xpeÔTa npoTnrHBaeTCH y3Koe no-HHHceHHe — B O C T O M H O - H H A H H C K H H acejioô.
K 3anaAy O T ABcrpajinn npHMepHo Ha 30° 10. ui. HaxoAHTCH MaccHBHbiñ xpeôeT, Ha3HBaeMbiñ 3anaAHo-ABCTpajWHCKHM. 3 T O T xpeôeT oôjiaAaeT apKO BbipajKeHHoñ acHMMeTpneñ: ero K M K H M H CKJIOH oneHb KpyTofi, a ceBepHbifl no.no-
T H H . TpeôeHb xpeÔTa npeACTaBJineT ninpoKyio, cneraa BbinyKJiyio noBepxHOCTb. H a CKJioHax xpeÔTa BCTpeiaioTca ropw H y3KHe rpeÔHH. BAOJib lOJKHoro noA-H O J K H H xpeÔTa pacnoJiaraeTCH y3KHñ jKejioô.
K iory O T MaAaracKapa npoTflrnBaeTQH B MepnAnoHajibHoM HanpaBJieHHH oneHb uinpoKHH (cpeAHHH uiHpHHa nopHAKa 270 MHJib) MaAaracKapcKHH xpeôeT c AOBOJibHo noJiorHMH (AO 1°) CKJioHaMH. OTHoCHTejibHaH BbicoTa xpeÔTa OKOJIO 2500 M. IÜHpoKaH BepuiHHHaH noBepxHOCTb xpeÔTa pacnoJioweHà Ha rjiyÔHHe 2500 jw.'HaA Heft noAHHMaiOTCH oTAejibHbie ropu. H a lore xpeôeT coeAH-HfleTCH c 3anaAHo-HHAHHCKHM xpeÔTOïi. CeAJioBHHa MejKAy xpeôïaMH pacnojio-weHa Ha r^yÔHHe OKOJIO 4000 M.
KpoMe xpeÔTOB, Ha Ane HHAHHCKoro OKeaHa HMeioTCH ropHbie MaccnBbi H ropbi. HeKOTopwe H3 H H X ÔHJIH AeTajibHo oôcjieAOBaHH H Ha3BaHH [2—4]. MHoro KpynHHx noABOAHUx rop pacncwioweHo BAOJib BHeuiHero Kpan JlBaHCKo-ro xejioôa, MewAy K O K O C O B H M H ocTpoBaMH H O - B O M PoxAecTBa H K sanaAy O T ABCTpajiHH, He roBopH o HeóoJibiiiHX ropax, uinpoKO pacnpocTpaHeHHbix Ha AHe KOTJIOBHH B UeHTpaJIbHOH HaCTH OKeaHa.
OTAejibHbie ropu O Ô H M H Q HMeioT KpyTbie CKJIOHW, B cpeAHeM 10—15°, a MecTaMH A O 25°, oKpyrjioe HJIH osa^bHoe ocHOBaHHe AnaiweTpoM O T 15 A O 70= MHJIb. OTHOCHTejIbHaH BbICOTa nOABOAHWX Top, K KOTOpblM MbI OTHOCHM nOA" HHTHH, HaMHHaH C 500: »i, AOCTHraeT HeCKOJIbKHX TbICHM MeTpOB, a MaKCHMajIb-HaH — 4300 M. BepuiHHH oTAejibHbix rop noAHHMaioTCfl 6 ^ H 3 K O K noBepxHocra OKeaHa HJIH B03BbiuiaioTCH HaA B O A O H , oôpa3ya ôaHKH H HeÔojibuiHe ocTpoBa. TaKHe ropu HMeioT oTHocHTejibHyro BbicoTy A O 5500 M. JXoBOJihHO nacTo ocHoBa-H H H HecKOJibKHx rop cjiHBaioTCH OAHo c ApyrHM, HHorAa ropbi pàcnoJiaraioTCH
159
763
no npHMoñ JIHHHH. HanpHMep, MejKAy K O K O C O B H M H ocTpoBaMH H O - B O M PoxAe-CTBa HMeeTca ueno^Ka KpynHbix noABOAHbix rop, B03BbiuiaiomHXCH HaA iiinpo-KHM IKVIorHM BaJIOM.
BJIH3 no6epe»(bH 3anaAHoñ ABcrpajiHH pacnojiaraeTca HecKOJibKo KpynHbix nOAHHTHHAHa, Ha3bIBaeMbIX HaMH ropHMMHMaCCHBaMH.XÍBa H3HHX npHCOeAHHH-IOTCH K MaTepHKOBOMy cKjioHyi a ABa paciKwioxeHbi Ha AHe K O T J I O B H H M . MaccHB, pacncwioweHHbifl K ceBepy O T ceBepo-3anaAHoro Mbica ABCTpajiHH, npeACTaBjiaeT BHCTyn MaTepHKOBoro CKjioHa, KOTopbm Oenp6pnA5K Ha3HBaeT3KCMy [12]. Mac -C H B HaTypajiHCTa, HaxoAHmnflcH K 3anaAy O T oAHOHMCHHoro Mbica, TaKwe CJIH-BaeTCH c ocHoBaHHeM MaTepHKOBoro CKJioHa. B6JIH3H H O A H O J K H H MaTepHKOBoro CKJioHa ABCTpajiHH Ha uiHpoTe lOHtHoro TponHKa HaxoAHTcn ropHbifl MaccHB KlOBbe C HeCKOJIbKHMH BepUIHHaMH. OT nOAHOWHH MaTepHKOBoro CKJIOHa OH OTAejieH AOBOJibHo rjiyÔOKHM noHHweHHeM. CeBepo-3anaAHee HMeeTcn eiu,e O A H H ropHbifl MaccHB, HMeiomHH B njiaHe oKpyrjibie oqepTaHHH H njiocKyio BepuiHHy. 06men MepTOH Bcex nepeiHCJieHHbix ropHbix MaccHBOB HBJiaeTca 3Ha HTejibHa5i KpyTH3Ha CKJIOHOB H IÎJIOCKaH CJierKa BOJIHHCTaH BepiUHHHaH nOBepxHOCTb.
CHCTeMoñ ropHbix xpeÓTOB H BajioB BnaAHHa H H A H H C K O T C ) oKeaHa ACJIHTCH Ha pHA 6ojiee HJIH MeHee KpynHbix KOTJIOBHH. K iory O T H H A H H pacnojiaraeTca II,eHTpajibHa5i KOTjioBHHa, BKJiroiaroman BeHrajibCKHH 3ajiHB. H a BocTOKe 0Ha orpaHH^eHa B O C T O H H O - H H A H H C K H M xpeÔToM, a Ha lore H 3anaAe — UeHTpajib-HO-HHAHHCKHM H MajIbAHBCKHM XpeÓTaMH. K BOCTOKy OT BoCTOTHO-HHAHHCKOro xpeÓTa HaxoAHTCH HecKOJibKo KpynHbix KOTJIOBHH: KoKocoBaa, 3anaAHo-ABCT-pajiHHCKaa, CeBepo-ABCTpajinncKaH. 3 T H KOTJIOBHHM coeAHHHioTCH oAHa c Apy-roñ. K lory O T 3anaAHo-ÂBCTpaJiHHCKoro xpeÔTa pacnoJiaraeTCH K)ro-3anaAHo-ABCTpaJIHHCKaH KOTJIOBHHa. O T KDHtHO-ABCTpajIHHCKOH KOTJIOBHHbl OHa OTAejie-Ha HeBbicoKHM BajioM, B KOTopoM HMeeTca npoxoA, pacnojio*eHHbiH y caivioro nOAHOJKHH MaTepHKOBoro CKJIOHa ABCTpajiHH.
JXo BbiHBjieHHH 3anaAHO-HHAHHCKoro xpeÓTa K roro-BOCTOKy O T MaAaracKa-pa Ha KapTax oTMeqajiacb oojibiiian KOTJioBHHa, HHorAa Ha3HBaBuiaHCH II^HT-pajibHoñ [12]. CeBepHan qacTb S T O H K O T J I O B H H M , Ha3BaHHaa MaAaracKapcKofl, orpaHH^eHa Ha 3anaAe noAHîmieM o-Ba MaAaracKap H npoAOJiJKaiomHMCH O T Hero K lory MaAaracKapcKHM xpeÓTOM, Ha ioro-BocTOKe — 3anaAHo-HHAHnc-K H M xpeÓTOM, a Ha ceBepe — K » K H O H qacTbio MacKapeHCKoro xpeÔTa. JIHO K O T J I O B H H M , cyAH no npof HJiHM, BbipoBHeHO H pacnojioJKeHO Ha rJiyÔHHe HeMHo-ro 6oJiee 5000 M. lOxHan KOTJioBHHa — Kpo3e — HaxoAHTCH MexAy AByMH BeTBHMH CpeAHHHo-HHAOoKeaHCKHx xpeÔTOB, a Ha tore orpaHHHeHa noAHnraeM ocTpoBOB KeprejieH H Kpo3e.
Pa3JiH^Ha5i CTeneHb pacqjieHeHHocra AHa KOTJIOBHH H H A H H C K O F O OKeaHa nauiJia OTpaxeHHe B pncyHKe H3o6aT. TaM, i*Ae pa3BHTbi BbipoBHeHHbie npocTpaH-CTBa aKKyMyjiHTHBHbix paBHHH, HanpHMep B ceBepHon noJiOBHHe I eHTpajibHoft KOTJIOBHHH C BeHrajIbCKHM 3ajIHBOM H B KOKOCOBOH KOTJIOBHHe H306aTbI HMeiOT njiaBHbie H3rH6bi. HaoôopoT, B ueHTpaJibHbix qacTHX OKeaHa, rAe A H O KOTJIOBHH CHJibHo pacHJieHeHo, H3o6aTbi 6oJiee H3BHJiHCTbie.
B H H A H H C K O M oKeaHe HMeeTca O A H H KpaeBon rJiyóoKOBOAHbiñ scejioo—#BaH-C K H H , npoTHHyBHiHHCH BAOJib 3 O H A C K O H ocTpoBHofi Ayrn, BCjieACTBHe Mero ero npaBHJibHee 6biJio 6u Ha3biBaTb 3 O H A C K H M . H a ceBepe wejioô oKaHiHBaeTCH B BeHraJibCKOM 3aJiHBe npHMepHo Ha 18° c. HI. KDro-BocTO^Hoe OKOH^aHHe weJioôa pacnoJiomeHo npHMepHo Ha 123° B . A - B pañoHe o-Ba P O T H . FIpoAOJiweHHeM JlBaH-CKoro wejioôa K BOCTOKy HBjineTCH T H M O P C K H H mejioô. FlapajuiejibHo #BaH-CKOMyrJiyôoKOBOAHOMy Miejioôy BAOJib ocTpoBOB CyMaTpa, Hsa H 3anaAHoñ HacTH Majibix 3 O H A C K H X npoTnrHBaeTca CHCTeMa MexropHbix xejioooB: CHMajiypcKHH, MeHTaBeñ H BajiHHCKHH. O T flBaHCKoroxejioôa O H H oTAejieHH xpeÔTaMH MeHTa-»eft H BajiHHCKHM. BepuiHHbi nepBoro OKOJIO o-Ba CyMaTpa noAHHMaioTCH HaA BOAoñ, o6pa3yH uenoHKy HeooJibmnx O C T P O B O B ; BTopoñ xpeóeT noJiHocTbio CKpbiT noA BOAaMH OKeaHa. CeBepo-3anaAHoe oKOHMaHne CnMajiypcKoro )Kejio6a Mepe3 rjiy6oKHii npoAHB Mexjiy O - B O M CyMaTpa H noAHHTHeM HHKoôapcKHx
OCTpOBOB BXOAHT B KOTJIOBHHy AHAaMaHCKOTO MOpH.
160
764
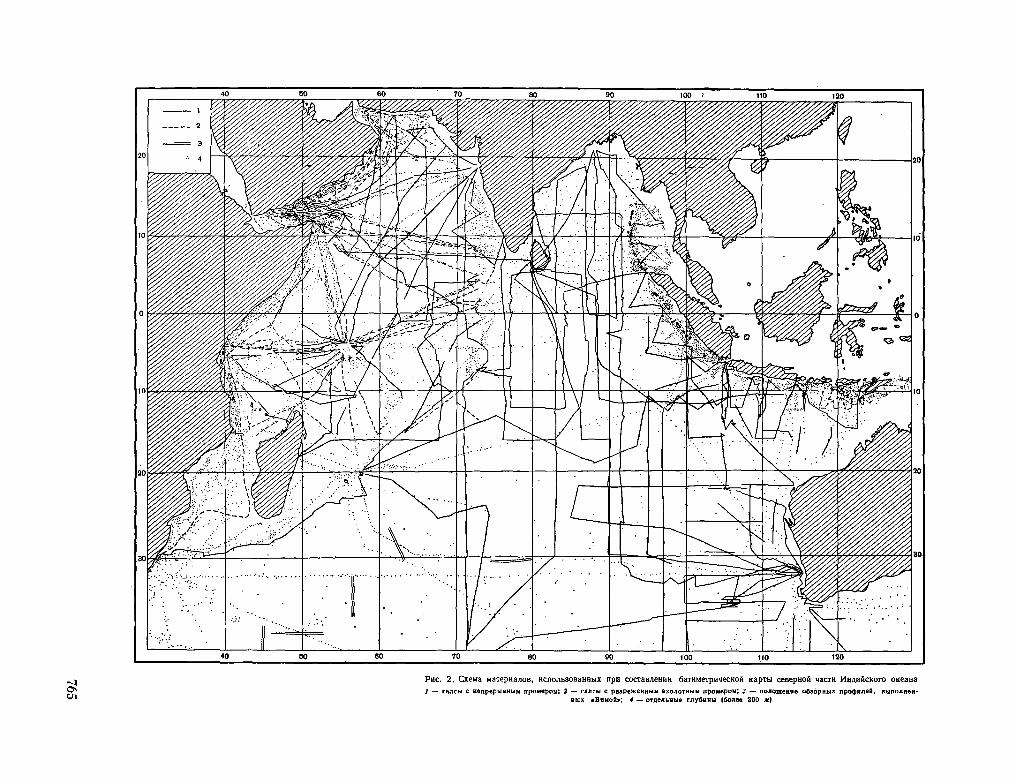
s s
o
Il II 1
¡l
1 ••
765
JlBaHCKHH iviyôoKOBQHHHH acejioó npeACTaBJiHeT HenpepbiBHyio y3Kyio flenpeCCHK) AJIHHOH OKOJIO 2900 MHJlb C HIHpOKHM (AO 20 MHJlb) njIOCKHM aKKy-MyjiHTHBHUM A H O M . HaHÔoJibmas r^yÓMHa >Kejio6apaBHa 7450^1. )Kejio6 HMeeT acHMMeTpHMHoe CTpoeHHe: KpyToñ H B H C O K H Í Í BHyTpeHHHH CKJIOH H ¿ojiee nojio-THH HH3KHÍÍ BHeiHHHH. BHyTpeHHHH CKJIOH JKeJIOÔa OTJIHMaeTCH CJIOJKHblM pejlb-etpoit: MecTaMH ero pacMJieHHioT rjiyôoKHe A O J I H H M H 6opo3AH, BCTpe^aiOTCH ycTynbi H CTyneHH. Kpyra3iia mraKHeH nacra BHyTpeHHero CKjioHa cocTaBjiaeT 4—7°. BHeuiHHH CKJIOH JÎBaHCKoro JKejioôa oôjiaAaeT 6oJiee npoCTWM peAbecpoM: jiHiub MecTaMH Ha HeM BCTpe^aioTCH HeôoJibuiHe CTyneHH H ycTynbi. BbicoTa BHeuiHero CKJioHa yBeJinraBaeTCH B HanpaBJieiïHH c ceBepo-3anaAa Ha roro-BO-CTOK OT 500 AO 2000 M.
C BHeuiHeñ CTopoHH 5lBaHCKoro acejiooa npoTHrHBaeTCH KpaeBoñ oKeaHHnec-KHÎi Ba/i, rtpeACTaBJiHioui,HH coóoñ pHA nojiornx noAHHTHH B M C O T O H 600—800 M, pa3AejieHHbix ceAJiOBHHaMH. H a A noBepxHocrao Bajía noAHHMaioTCH oTAejibHbie -T'opbi, no-BHAHMOMy, ByjiKaHHqecKoro npoHcxo)KAeHHH.MecTaMH Baji npçACTaB-jineT coóoñ CHJibHo paCTJieHeHHbiñ ropHbiñ xpeóeT.
B H H A H H C K O M OKeaHe H M C I O T C H HeôojibuiHe xejioóa, pacncwiojKeHHbie JIHÓO y noAHOXHH ropHbix xpeÓTOB, JIHÓO Ha AHe KOTJIOBHH. BAOJib B O C T O ^ H O T O noA-H O H C H H MaJibAHBCKoro xpeÓTa B pañoHe O C T P O B O B Maroc npoTHrHBaeTCH O A H O -HMeHHbiñ jKejioó, oÓHapy>KeHHbiñ B 33 pence « B H T H 3 H » [2]. B 35 pence « B H T H 3 H » ÔHJiH coôpaHH AonoJiHHTejibHbie CEeAeHHH no MopipoJiorHH SToro Htejioóa [9]. HaHÔoJibuiaH iviyÓHHa scejioóa paBHa 5408 M. J\HO Hcejioóa njiocKoe innpoKoe (AO 10 MHjib). BHyTpeHHHH CKJIOH Kpyqe (AO 20°) H Bbiuie, ueM BHeuiHHH. BAOJib 3anaAHoñ CTopoHbi HceJioóa npoTHrHBaeTCH y3KHH xpeÔTHK, a c B O C T O T H O H — iuHpoKHH Baji, HaA KOTOpbiM noAHHMaioTCH HeôojibuiHe ropbi.
B O C T O ^ H O - H H A H H C K H H «iejioô npoTHrHBaeTCH BAOJib BOCTOMHoro noAHOJKHH oAHOHMeHHoro xpeÔTa. )Kejio6 C O C T O H T H3 HecKOJibKHX qacTeñ, pa3AejieHHbix HeBbicoKHMH noporaMH. HanooJibuiafl rjiyÓHHa 6335 M [13] npnypoMeHa K ce-BepHon nacra scejioôa. IIInpHHa jKejioóa cocTaBJineT 10—20 MHAb, uinpHHa see njiocKoro aKKyMyjiHTHBHoro AHa AocTnraeT 15 MHjib. H a CKJioHax H AHe aœAooa MecTaMH noAHHMaioTCH xojiMH H ropa. KpyTH3Ha CKJIOHOB acejioôa AocTHraeT20°. C BHeuiHeH CTopoHbi aceAoôa B03BbimaiOTCH ropa H B03BbiuieHHOCTH, o6pa3yio-mjie cjiaóo Bbipa«eHHbiñ B pejibe<pe Baji.
BAOJib K»HCHoro CKJiOHa 3anaAHo-ABCTpaAHHCKoro xpeÓTa npoTHrHBaeTCH Hcejioó, KOTopbiñ 6MJI BnepBbie nepeceneH Ha A / S «06b», a 3aTeM noApoÔHo oôcjie-AOBaH B 35 peHce,«BHTH3H», nocjie Mero O H 6HJI Ha3BaH weJioôoM 0 6 H . HanôoAb-uiaa m y Ô H H a acejioôa 0 6 H coCTaBAHeT 5761 M.JIHO Htejioôa TaKsce nAocKoe, UIHpHHOH OKOJIO 7 MHJlb, CKJIOHbl KpyTbie — AO 15°. C lOHtHOH CTOpOHbl BAOJIb mejioóa T H H C T C H HeBbicoKHÍí Bají c oTAejibHbiMH ropaMH. BocTOMHee )Kejio6a 0 6 H H 3anaAHO-ABCTpaAHHCKoro xpeÔTa A H O K O T J I O B H H H CHJibHO pa3Apo6jieHO. 3AeCb HMeëTCH MHOrO HeÔOJIbHIHX KeAOÓOB — pa3JIOMOB, TOp H XOJIMOB.
K K)ry OT 3TOH 30HH ApoôjieHHH oKeaHH^ecKoro jiomaB cepeAKHeK)ro-3anaA-HO-ABCTpaJIHHCKOH KOTJIOBHHH HaXOAHTCH HteAOÔ ^.HaMaHTHHa, Ha3BaHHHH
B necTb aBCTpaAHHCKoro cyAHa, BnepBbie coo6ui,HBUiero o HajiHMHH B S T O M pañoHe óojibuiHX —• A O 6857 M — rjiyôHH 115]. 3 T O T JKeJioô npeACTaBJineT coóoñ cncTe-My H3 HecKOJibKHX HiejioôoB, HMeromHX F-o6pa3HbiH npo4)HJib, y3Koe A H O H KpyTbie CKJioHH. BAOJib KpaeB }KeAo6a npoTHrHBaioTca HeôoAbuine BaAM H H O A H H -MaioTCH oTAeJibHbie ropw.
Bce HeôojibuiHe HteJioôa H H A H H C K O F O OKeaHa o6jiaAatoî O6IH,HMH Mopipojiorn-necKHMH nepTaMH (HeôoJibman mupHHa, KpyTbie C K J I O H H , HajiHMHe BAOJib KpaeB BaJIOB H Top), KOTOptíe CBHAeTeAbCTByiOT O TOM, HTO OÔpa30BaHHe AaHHblX (¿OpM pejibe^a CBH3aHO c pa3JiOMaMH oKeaHH^ecKoro AOJKa, aHajiorHHHbiMH pa3JioMaM Tnxoro OKeaHa [14].
MHorne H3 noKa3aHHbix Ha BaraMeTpHiecKon KapTe H H A H H C K O T O OKeaHa cpopM noABOAHoro peAbecpa ÓMJIH oOHapyaceHbi B caMbie nocjieAHHe T O A H H He noABeprajiHCb AeTajibHoMy o6cjieAOBaHHK>. IloaTOMy npH AaJibHeñuiHX H C C A C A O -BaHHHX HX H306pa»íeHHe MOSíeT nOABeprHyTbCH H3MeHeHHK), MOryT nOHBHTbCH
11 OKeaHOJiorHiiecKHe Hccjie^oBaHHa JsTsf 13 \QA
766
TaK»e HOBbie (})opMfai pejibedpa, Tan KaK oóiiiHpHbie ynacTKH AHa HHAHftcKora oKeaHa ocTajiHCb eme njioxo HCCJieAOBaHHHMH. H o HecMonrpH Ha S T O , HOBaa KapTa no cpaBHeHHio c npewHHMH ôaTHMeTpimecKHMH KapTaMH HHAHHCKoro> OKeaHa, npeACTaBjmeT C O 6 O H 3HaiHT&flbHbiH mar BnepeA, noABOAfl HTor nepBO-My 3Tany paôoT MexAyHapoAHoñ HHAooKeaHCKoñ 3KcneAHii,HH, O C H O B H O Ü BKJiaA B KOTOpblH 6bIJI CAejiaH 3ÍC «BHTH3b».
A B S T R A C T
Based on investigations of the research vessels «Vityaz», «Ob», «Vyma», «Argo», «Diamantina», etc. a bathymétrie chart of the northern Indian Ocean (to 40°S) has been compiled at the Institute of Oceanology of the U S S R Academy of Sciences on a scale of 1 : 5 000 000. The article contains new data on the Indian Ocean bottom topography (except for its north-western part). The greatest geographical discovery was the finding of the East Indian Ridge stretching along 90° E from 10° N to 34° S. The East Indian Ridge and West Australian Ridge, and rises divide the north-eastern part of the ocean into a number of basins : Central with the Bay of Bengal, Cocos, West Australian, North Australian, South-West Australian. N e w data on the geomorphology of the Java (Sunda) trench are introduced. A description is also given of some new trou-ghes: Chagos, East Indian, O b , Diamantina. The morphology of the Mid Indian and West Australian ridges has been specified.
J I H T E P A T Y P A
1. ATJiac MHpa. M . TyTK, 1954. 2. B e 3 p y K o B II. JI. HccjieAOBaHHH HHflHÜCKOro OKeaHa B 33 pence,«BHTH3H».— Oxea-
HcwiorHH, 1961, Ne 4. ; 3. 5 e 3 p y K o B IL JL, 3 a T o H c K H fi Jl. K . , C e p r e e B H . B . Topa AcpaHacHsu
HHKHTHHa B H H A H H C K O M OKeaHe.— floKJi. A H CCCP, 1961. 139, JY° 1. 4. B e JI o y c o B H . M . 31 peñe «BHTH3H».— OKeaHOJiomH, 1961, Ne 2. 5. B y A a H O B a JI. JI., 3 a T O H C K H fi JI. K . , JI a p H H a H . H . , M a p o B a H . A. .
K Bonpocy o Mero/uiKe cocraBJieHHH 6aTHMeTpH*iecKHX KapT.— Tpyau H O A H , 1950, T . 44.. 6. HHAHÍÍCKHH OKeaH. MacurraÔ 1 : 10 000 000, AI., H P K 1 ! ryrK, 1956. 7. K a H a e B B . <t>., y p n a e B T. B . H3yieHHe noflBoflHoro pejn>e<pa B OKeaHorpa<pH-
MecKHX 3KcneflHiiHHX.— Tpyjjhi H O A H , I960, T . 44. 8. MopcKoâ aTJiac. H3fl. MopcKoro TeHepajibHoro urraóa, T . I, 1950; T . II, 1953. 9. B e 3 p y K O B n . JL, K a H a e B B . 4>. OçHOBHbie qepTU CTpoeHHH flHa ceBepo-BOcroi-
HOH nacTH HHflHftcKoro OKeaHa.— floiui. A H CCCP, 1963. 153, Ne 4. 10. Carte Générale Bathymétrique des Océans, Al 1 : 10 000 000. 3 éd. Bureau Hydrogr. In
ternat. Monaco, AIV-1938, A-III-1940; A'IV - 1938, A'III-1942. 11. E w i n g At., H e e z e n B . Continuity of Mid-Oceanic. Ridge and Rift Valley in the
Southwestern Indian Ocean confirmed.— Science, 1960, 131, Ne 3414. 12. F a i r b r i d ge JR. W . Some bathymétrie and geotectonic features of the eastern part
of the Indian Ocean.— Deep-sea Res., 1955, 2; p. 161. 13. K o c z y F. F. Echo Soundings.— Repts Swed. Deep-Sea Expedit., 1956, 4, N 3, fase. 2. 14. M e n a r d H . W . Deformation of the Northeastern Pacific Basin and West Coast North
America.— Bull. Geol. Soc. America, 1955, 66, N 9. 15. Oceanographicaí cruise report Ne 2. Oceanographical Observations in the Indian Ocean,
in 1960 H . M . A . S. «Diamantina», Cruise D M 1/60, Melbourne, 1962. 16. S.t o c k s T . Zur Bodengestalt des Indischen Okeans.— Erdkunde, 1960, 14, H . 3.
767
Reprinted from Okeanologia, vol. V , no. 4, 1965, p. 760-762.
HHAHHCKHfl OKEAH
HoBan reorpa$H<ieCKaii xapTa
B 1963—1964 rr. HayiHO-peAaKUHOHHafl KapTococTaBHTejibCKaa lacn. r J T K rocreoji-KOMa C G C P DbicnycTBJia cepwio cnpaBoinux (pn3HK>o-i-eorpa(pMecKHX KapT THxoro, Awian-THwecKoro H H H A H H C K O I - O oKeaHOB, a TaKjKe ceBepnoro H I O K H O T O nojiyiuapHH 3eMJiH. Bjia-roflapa 3T0My ceñíac HMeioTCH KapTH,' oxBaTHBaiomHe Becb MnpoBoii OKeaH, npimeM H3o6paweHHe noABOAHoro pejibecpa Ha H H X AaHO no eAHHofi MeTOAHKe H ocaoBaHo Ha «OBpeMeHHhix flaHHbix. 3 T O oôcTOHTeJibCTBO HMeeT fiojibiiioe 3HaHeHHe, TaK KaK pejibeip IHa HBJiaeTca BawHefiuiHM SJieineHTOM (pH3HKo-reorpa$HHecKOH cpeAbi, BJiHHiomHM Ha M H O -rne npoueccu, npoHcxoAHmHe B OKeaHe.
HeOÓXOflHMOCTb C03A8HHH HOBOH K a p T H H H A H H C K O T O OKeaHa B03HHKJla ftaBHO, riOTO-My H T O Bee paHee H3AaHHbie KapTH, ^awe caMbie HOBefliiiHe {29, 33], ocHOBhiBaJiHCb HCKJIIO-iHTeJibHo Hà CBeaeHHHX, noJiyieHHbix A O BTopoñ MHpoBOñ B O H H M . HoBHe aanHwe, coôpaH-Hue B nocjieBoeHHbie TOJSM H , ocoCeHHO, B TeieHHe MewAyHapoAHaro ireoipH3HHecKoro ro.ua 1957—1959 rr. fiojibiueñ sacTbio He HauiJiH OTpaweHHa Ha KapTax. flo SToro B neiaTH noaBHJiHCb JiHuib OTfleJibHbie HacTHbie paôoThi H cxeMaTHiecKHe CaTHiueTpHiecKHe H TèKTO-HHiecKHe Kap-rbi HHflHÜCKoro,OKeaHa H OTAeJibHbix ero lacieñ [12, 20, 21, 32].
B CBH3H c opraHH3au,Heñ MewAyHapoAHoii HHAooKeaHCKoñ SKcneAHiMH [4] H3yqeHHe peJibe<j>a ¡¡.«a HHAHÔCKoro OKeaHa CTa.no ocymecTBJisTbca B U I H P O K H X Macii)Ta6ax. Han6o-Jiee KpynHUñ s u a i B HayieHHe pejibecpa AHa OKeaHa B caMOM Haïajie paôoT S T O H 3Kcne-AHU.HH BHecJiH F.ccjieflOBaTeJibCKHe cy«a: «BHTH3b» ( C C C P ) , «BHMa» H «Apro» (ClIIA), «Oysff» H «ZlajipHMnji» (AHIVIHH) , «¿HaMaHTHHa» (ABcrpaJiHH).
HoBaa KapTa H H A H H C K O T O OKeaHa [17] raaaHa B KOHue 1963 r. ÛHa HMeeT MacuiTafr 1 : 15 000 000 H cocTaBJieHa B paBHOBeïiHKoô a3HMyTajibHoft npoeKUHH JlaM6epTa (peaaKTop KapTU E . M . IllypaH, pejibecp AHa OKeaHa OTpeAaKrapoBaH B . O . K a H a e B W M H H . A . M a p o B o ñ).
OcHOBHbiM coAepjKaHneM KapTbi ABJiHeTCH pejibecp «Ha OKeaHa H OKpyjKaroweñ cyuíH, noKa3aHHbiH npn noMOiiw H30JIHHHH (H3o6aT H H3ornnc) c nocJioftHofl OKpacKoft no cryne-. H H M BHCOT.H rjiyÔHH. OcHOBHue H30JIHHHH Ha KapTe AaHH iepe3 1000 M. JIJIH CoJiee noA-p O Ô H O H XapaKTepHCTHKH p a B H H H H H X npOCTpaHCTB npOBefleHbl flOnOJlHHTejlbHble H30JIHHHH: Ha cyme 200 H 500 M H Ha AHe 200, 3500, 4500, 5500 M. H3o63Ta 200 M B noAaBJiaromeM 6ojibiiiHKCTBe wiyqaeB xopouio noKa3hiBaeT nojioKeHHe Kpaa MaTepHKOBoô oTMeJiH, ocTajib-Hbie H3o6aTu HeoCxoflHMM AJIH nepeAaHH xapaKTepHux ocoôeHHocTen pejibecpa aiia oKeaHH-•leCKHX KOTJIOBHH.
O C H O B H W M H M a T e p H a ^ a M H , HCnOJIb30BaHHbIMH flJIH COCTaBJTeHHH HOBOH KapTbl H H £ H H -CKoro OKeaHa, HBH^HCb CaTHMeTpHiecKHe KapTH, Bbino^HeHHue B 1963 r. B HHCTHTyTe OKeaHOJiorHH A H C C C P (8] H B HHCTHTyTe reorpa4)HH A H C C C P . Pejibeip «Ha A w a H -raiecKoro H Taxoro OKeaHOB 6HJI B 3 H T C cooTBeTCTByiomnx paHee H3AaHHUx KapT [1, 24].
B ocHOBy ÔaTHMeTpHiecKOK KapTH HHCTHTyTa OKeaHOJiorHH A H C C C P , oxBaTUBaiomeft ceBepHyio <iacTb OKeama, ÓHJIH no^oweHbi MaTepaaJibi, coSpaHHbie B Tpex peflcax H H C «BnTH3b» B 1959—1962 rr. [2,3,7], a AJIH KapTH HHdTHTyra reorpa<pHH, oxBaTUBaromen K)3KHyio qacTb OKeaHa,— MaTepnaJibi, coôpaHHue B Tpex peftcax A / S «06b» B 1957—1960 rr. [13, Í4, 21].' Hcnojib30BaHHe MaTepHajiOB « B H T H 3 H » H « 0 6 H » , npeACTaBJieHHbix B BHAe npo-(pHAeft AHa [9—11, 22—23], a TaKJKe sxorpaMM, B T O M iHCJie H noAyneHHbix ea npeJiH3HOH-Hbix caMonHcu,ax [2, 18], no3BOJiHJio AOCTaTOiHO no^HO H npaBHJibHo H3o6pa3HTb na KapTe pejibeip AHa OKeaHa B iieJioM H ero lacTeñ, .a naKwe oTAeAbHbie KpynHbie (popMbi pejibecpa. BcJieflCTBue Toro, H T O paôoTaniH « B H T H 3 H » H « 0 6 H » Ôujia oxBaseHa ëojibiuaH qacTb HHAHftcKoro OKeaHa, coôpaHHbie MaTepmaJibi no3BOJiHJin 6ojiee npaBHJibHo HHTepnpeTHpoBaTb Apyrae CBeAeHHH o Ü O A B O A H O M peAbeípe, npeAC-naBJieHHwe ropa3AO MeHee AeTaAbHHMH AaH-HblMH B BHAe npOMepHblX njlaHUieTOB, M O p C K H X HaBltraHHOHHblX KapT, CnHCKOB irAyCHH H MejiKOMaciiiTaÓHbix npo(pHAeH.
ripoMepHue nJiaHiueTbi MacuiTa6a 1 : 1 000 000, nojiyieHHbie B nopaAKe MejKAyHapoa-Horo oôineHa, coAepscajiH O T M C T K H rjiyÔHH, HaHeceHHbie BJIOJII, npoMepHux rajicoB iepe3 1—2 MHJIH. H a iuiamueTax BpHTaHCKoro aAMHpajiTeñCTBa, oxBaTHBaiomHx ceBepo-3anaa-Hyio nacTb HHAHftcKoro OKeaHa, HaHeceHbi rjiyôHHbi, H3MepeHHbie HccJieAOBaTeJibCKHMH. cy-AaMH «Oy9H» B 1961—1963 rr., «flap/iHMnji» B 1963 r., H nonyTHue npoMepu ApyrHx cyAOB. H a aMepHKaHCKHX njiaHuieTax 6MJIH npeACTaBJieHM AaHHHe 14 H 16-ro peñcoB H / C «BHMa», KacaiomnecH MaBHbiM o6pa30M cpeAHHHO-oKeaHHiecKHX xpeÔTOB 3anaAHoft noAoBHHbi H H -A H H C K O T O OKeana H KpacHoro Mopa, a Taxate penca H / C «Apro» awcneAHUHH «MyccoH» 1960—1961 rr., npoxoAHBiueñ B BOCTOIHOÍÍ noJiOBHHe OKeaHa. ABCTpaAHñcKHe n^aHuieTU noKptJBajiH BOCTOHHyio nacTb OKeaHa, npHAexamyio K 3anaAHHM H ceBepHHM ÔeperaM ABCTpajiHH. H a H H X CMJIH HaHeceHH rJiy6HHu, H3MepeHHue H / C «flHaMaHTHHa» B 1959— 1960 rr.
KpoMe Toro ÔUJIK HcnoAMOBaHH AaHHbie o pejibeipe AHa, noJiyieHHue iuBeACKoñ Kpy-rocBeTHofl SKcneAHUHeH Ha cyAHe «AjibôaTpoc», npeACTaBAeHHue B BHAe cnHCKa rjiyÔHH, o63opHbix npoipHJien H (pOTorpaepHH xapaKTepHux yiacTKOB sxorpaMM [31]. npn n3o6pa>Ke-H H H B loro-aanaftHon qaCTH HHAHftcKoro OKeaHa ynacTKa CpeAHHHO-oKeaHHiecKoro xpeÔTa-. 6biAH HcnoAbaoBaHbi HeôoJibuiHe cxeMaTHiecKHe npoipHJiH [27], KOTopwe, oAHaKo, A O C H X nop HBAHH3TCH eAHHCTBeHHblM OnyÔJIHKOBaHHhIM HCTOIHHKOM, A a K J W H M HaHÓOJiee 6JIH3KOe K
AencTBHTeJibHoCTH npeACTaBAeHHe o MopipoJiorHH SToro xpeSTa. n p n cocTaBJieHHH KapTb»
760
768 Collected reprints of the International Indian Ocean Expedition, vol. IV, contribution no. 246
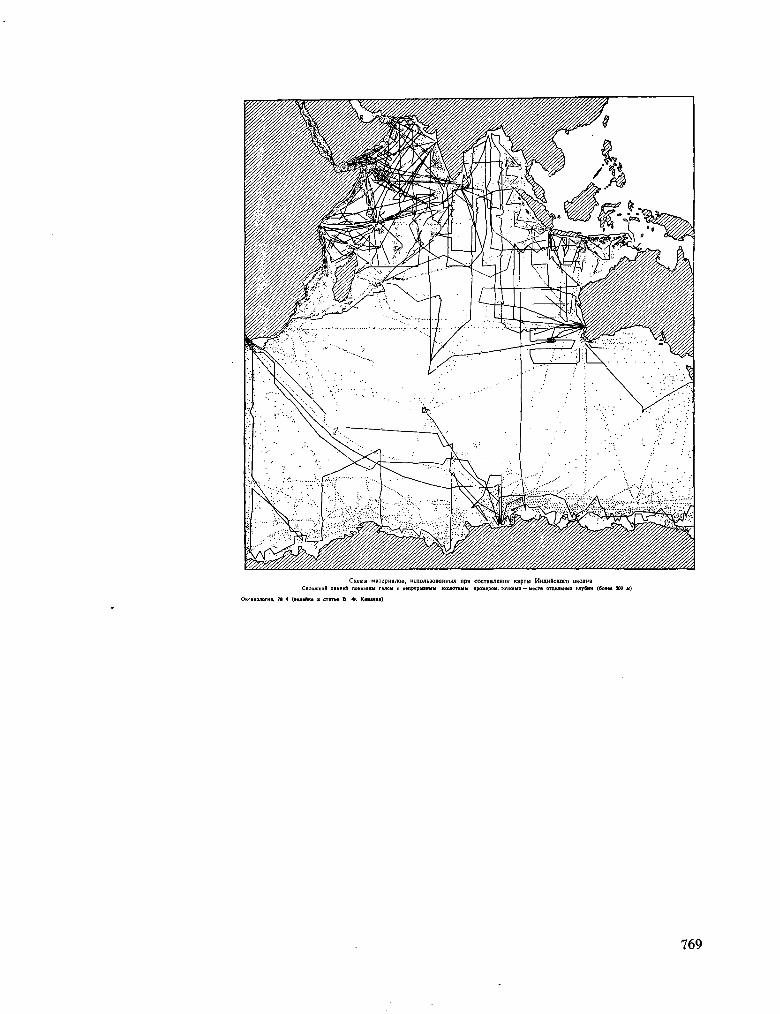
Cxejtia MaiepHavioa, m . n o n b 3 0 B a H H N x npH cocTaBJiemiH KapTU HwiHfiCKoro oxeana CruiouiHoft JiHMHefl nona3aHu rajicN c HenpepusHiiiá M H U I O T H U H npouepow. nrnxaira — uecTa crraejibtiux rjiy6an (Qonee 300 JI)
OüfflHcmorHB, M 4 (BHJieilKa H erarte B . * . KiHieaa)
769
Tanwe obiJiH HcnoJib30BaHH cooTBeTCTByiomHe JIHCTH TeHepajibHOH óaTHMeTpHqecKofi Kap-Tbi oKeaHOB [26], a TaKsce rjiyÓHHu c MopcKnx HaBHrauHOHHbix KapT pa3JiHiHbix rocyAapcTB.
HcnCWIb30BaHHe HOBblX AaHHblX n03BOJIHJIO COCTaBHTb KapTy, CymeCTBeHHO OTJIHlalO-myiocH OT paHee H3AaHHHx. 3 T O O T H O C H T C H KaK K coAepxaHHio KapTH, TaK H K MeTOAHKe ee cocraBJieHHa. n p n n3o6pajKeHHH noABOAHoro pejibeipa 6HJI Hcnojib30BaH MeTOA reoMop-cpoJiorHqecKOH HHTepnojiauHH [25]. KaK H3BecTHo [15, 19], npn noMomn H30JIHHHH (H3oninc H H3o6aT) Ha KapTax M O J K H O nepeAaBaTb He TOJibKo nJiaHOBOe pacnpeaeJieHHe pa3JiHiHbix BbICOT H TJIyÔHH, HO TaKJKe H MOpipOJIOrHleCKHe OCOÔeHHOCTH KaK OTAeJIbHblX <J)OpM, TaK H peJibeepa B neJioM. B C B H 3 H C S T H M npn H3o6pa«eHHH noABOAHoro pejibeipa pncyHOK H3o6aT Ha KapTe HHAHñcKoro OKeaHa MeHHJicn B 3 3 B H C H M O C T H O T xapaKTepa noABOAHoro pejibe<}>a. JXnn Toro, H T O 6 H HMeTb HarjiHAHoe npeACTaBJieHHe o KpyTMHe CKJIOHOB, ce^eHHe pejibeipa 6HJIO npHHHTO nocTOauHbiM H paBHbiM 1000 M. PncyHOK H3o6aT Ha ¡me OKeaHH^ecKHx K O T -JIOBHH MeHaeTCH B 3aBHCHM0CTH OT paCIJieHeHHOCTH AHa: B npeflejiax aKKyMyJIHTHBHblX paBHHH, pacnoJiOHceHHbix no nepnipepHH OKeaHOB y I T O A H O W H H MaTepHKOBbix CKJIOHOB, H30-6ara HMeiOT nJiaBHbie' oiepTaHHH, a B neHTpajibHoñ laCTH OKeaHa, r#e A H O CHJibno pacijie-neHO, HaoKjaTH AeJiaioT pe3KHe H3rw6bi. H a Opefl«H.HO-oKeaHH«ecKinx xpe&rax noAieipKH-BaeTC» JiHHeflHaa pacqjieHeHHOCTb H X noBepxHocTH H opneHTHpoBKa S T H X HepoBHocTeil BAOJib O C H xpeÔTa, a Ha «He KOTJIOBHH nofliepKHBaeTcn H30MeTpaiH0CTb noJioxHTejibHbix (popia pe/ibeça, B T O BpeMH KaK OTpHiiaTejibHbie (popuiu pejibeipa noKa3aHU O Ô H I H O 6ojiee HJIH MeHee BMTHHyTbiMH. H a MaTepHKOBbix CKJioHax B noaaBJiaiomeM ôojibuiHHCTBe onyqaeB noKa3aHo AOJIHHHOC paciJieHeHHe, Kpoine Tex yqacTKOB, rae CKJIOHH poBHbie.
npH CÓCTaBJieHHH KapTbl HHflHHCKOrO OKeaHa B CBH3H C nOHBJieHHeM CBeaeHHH O HOBMX KpynHbix (pop.Max pejibeipa H yTOiHeHHeM pa3MepoB H onepTaHHii MBecTHbix pâHee <popM noTpeóoBaJiocb BBecTH HOBue HJIH yToiHHTb npe>KHHe Ha3BaHHa. B Tex cjiyiaax, Koraa AJIH OAHOñ H TOH 5Ke IpOpMbl pejibeipa HCn0JIb30BajIHCb pa3Hbie Ha3BaHHH, BblÔHpajIOCb HaH-Cojiee yaaiHoe, Jiyiine Bcero OTpajKaiomee reorpaipH<iecKoe noJioweHHe ipopMbi: Mo3aMÔHK-CKaa KOTJiOBHHa, AMHpaHTCKHñ xpeôeT, weJioô Maroc H Ap. ECJIH M e sToro Hejib3H ÔHJIO ciieJiaTb, T O Ha3BaHne AaBaJiocb no HaHMeHOBaHHio cyAHa, o6Hapy>KHBinero HJIH Hccjie.no-BaBiuero AaHHyio ipopMy (wejioô 0 6 H ) , HJIH B qecTb BbiAaromnxcH yieHbix H HccJieAOBaTe-Jieñ (ropa Bap/lima, ropa A^iaHacHH HHKHTHHa).
HaHÔojiee cymecTBeHHHM H3MeHeHHeM B npeacTaBJieHHHx o peJibeipe flHa HHAHñcKoro OKeaHa siBHJiocb H3o6pa>KeHHe Ha KàpTe orpoMHoro BocToíHO-HHflHñcKoro xpeSTa AJIHHOH CuJiee 2700 MHJib [6, 18]. Cjie/iyeT OTMeTHTb, H T O ao nocjieOTero BpeMeHH BbicKa3HBaJiHCb npeanojioJKeHHü o cyinecTBOBaHHH B S T O M pañoHe xpe6Ta coBepiueHuo HHoro HanpaBJie-HHH [34]. BoCTOMHO-HHflHÔCKHM XpeÔTOM OrpOMHaH HHflHHCKO-ABCTpaJIHHCKaü KOTJiOBHHa pa3AeJieHa Hia flBe iacTH, npnqeM, ceBepHoe OKOHqaHHe B O C T O ^ H O U KOTJIOBHHH, oôocoÔJieH-HOe BaJIOM, npOTHHyBUIHMCH OT O. PoJKiieCTBa JO KOKOCOBHX O-BOB, Bbl/jeJieHO TaKJKe B KaiecTBe caMOCTOíiTeJibHOH KOTJIOBHHU. TaKHM o6pa30M, B ceBepo-BocTO^Hoñ qacTH H H ^ H H -CKoro OKeaHa ceüíac BbmejiaiOTCH cjieayiomHe KOTJIOBHHM: UehTpajibHaH c BeHrajibCKHM 3ajiHBOM, KoKocoBaa, 3anaAHO-ABCTpajiHñcKaH H CeBepo-ABCTpajiHftcKaH.
flpyrHM KpynHbiM OTKpbiTHeni ôbijio o6napyjKeHHe 3anafliio-HHflHHCKoro xpeÔTa [27]. BjiaroAapsi 3TOMy ÓHJIO flOKa3aHo, H T O CHCTeMa Cpe/iHHHbix xpeÓTOB MnpoBoro OKeaHa npeACTaBJiaeT eaHHoe ropHoe coopyweHHe npoTHjKeHHocTbio OKOJIO 40 000 MHJib. 3anaaHO-H H A H Ü C K H H xpeóeT pa3AeJiaeT óoJibinyio KOTJiOBHHy K roro-BOCTOKy O T Ma^aracKapa Ha ase — Ma/iaracKapcKyio H Kpo3e.
HoBbie jiaHHbie noKa3ajin, I T O BMecTO npeanojiaraBuieroca 03Hp6pH«meM [28] 3anaji-HO-ABCTpajiHñcKoro xpeÔTa K ceBepo-3anafly O T 3aJiHBa UUapK (ABCTpajiHH) pacnoJioxceHU OTfleJibHbie Kpymiue ropHue MaccHBbi. B C B H 3 H C S T H M Ha3BaHHe 3anaAH0-ABCTpajiH&CKHÍi xpeôeT 6bijio npeA-ioJKeHO AJIH MaccHBHoro noAHSTHsi AHa, pacnojioíKeHHoro 6JIH3 ABCTpa-JIHH (BAOJib 30° M . m:.) y IOJKHOH rpaHHiibi 3anaAHio-ABCTpajiHHCKoü KOTJIOBMHU.
H a H O B O H KapTe noHBHJiocb M H O T O HeBoAbuiHx >KeJio6oB-pa3JioMOB Ha jioxe H H A H Ü -CKoro OKeana, KOTopue CoJibineñ «acTbio npoTarHBaiOTCH BAOJib noAHOMHH xpeÔTOB {nte-jioôa: Maroc, 06b, B O C T O I H O - H H A H Ü C K H H , AMHpaHTCKHñ H AP-)- BcTpeiaioTCH wejioôa H B cepeAHHe - KOTJIOBHH (wejioó ZlnaMaHTHHa). H a KapTe noKa3aHo M H O T O noABOAHbix rop, OAHaKo jiHuib HeMHOrHe H3 H H X ôbiAH oôcjieAOBaHH AeTaJibHO [5, 16, 30, 35],
B. 0. Katia.ee
JIHTEPATyPA
1. A T J i a H T H U C K H H O K e a H (KapTa). 1963. M - 6 1:20000000. ry rK r rK C C C P , M .
2. B é 3 p y K O B n . Jl. 1961. HccjieAOBamiH HHAHñcKoro OKeaHa B 3 3 - M peñce s/c « B * TH3b». OKeaHOJiorHH, I, Bbin. .4. -
3. B e 3 p y K 0 B n . JI. 1963. MccjieAOBaHHH H H A H H C K O T O OKeaHa B 3 5 - M peñce s>/c « B H -TH3b». OKeaHOJiorHH, III, Bbin. 3.
4. B e a p y K O B n . Jl. 1963. HccjieAOBaHHH « B H T H 3 H » no nporpaniiue MeaiAyHapoAHoñ I>H-AOOKeaHCKOft SKcneAHUHH. BecTH. A H C C C P , Ni 8.
5. B e 3 p y K O B n . Jl., 3 a T O H C K H ñ Jl. K . , C e p r e e B H . B . 1961. Topa Aipamicna HHKHTHHa B H H A H H O K Q M OKeaHe. Z[OKJI. A H C C C P , 139, N» 1.
6. B e 3 p y K O B n . Jl., K a u a e B B . í>. 1963. OcHOBHbie lepTbi crpoeHHH Ana ceBepo-BOCTOHHOH qacTH H H A H H C K O T O OKeaHa. Jlpun. A H C C C P , 153, Ni 4.
7. B e J i o y c o B H . M . 1961. 31-ñ peñe « B H T H 3 H » . OKeaHOJiorna, I, Bbin. 2.
761
8. B e j i o y c o B H . M . , K a H a e B B . <!>., M a p o B a H . A . 1964. reoMopcpoaorHH aHa ce-BepHoft nacra HHflHftcKoro OKeaHa. A O K J I . A H C C C P , 155, (Ns 5.
9. ZUHHbie no peabdpy aHa, noJiyqeHHbie B 3 3 - M pence 3KcneaHu,HOHHoro cyaHa HHCTHTyTa OKeaHoaorHH A H C C C P «BnTH3b» B 1960—1961 rr. 1963. H3a . HH-Ta OKeaHOJi. A H CCCP, M .
10. HaHHbie no peabipy aHa, nojiyweHHHe B 1 - O M aHTapKTHiecKOM peace 3Kcnea>mHOHi>oro cyaHa «06b». 1960. Haa . HH-Ta OKeaHOJi. H HH-Ta reorp. A H C C C P , M .
11. ilaHHHe no pejibecpy aHa, nojiyieHHue B O 2 - M aHTapKraqecKOM pence aH3ejib3jieKTpoxoaa «06b». 1960. Haa . H H - T a OKeaHoa. H HH-Ta reorpacp™ A H C C O P , M .
12. X H B a r o A . B . 1960. ireoMoptpojiorHH H TeKTOHHKa ma K » K H O H qacTH HuauftcKoro OKeaHa. B K H . «MopcKaH reojionm». MescayHap. reoji. KOHrp., 21 ceccHH. Ü O K J I . C O B . reoji., M .
13. ?K H B a r o A . B . 1961L Moparae reoJioro-reoMop^anoTHiecKHe HCCJieaoBaHHH. Tp. C O B . aHTapKT. 3Kcnea., 19.
14. ) K n B a r o A . B . , J I H C H I I H H A . n . 1957. HoBbie aaHHbie o peju>e(pe aHa H ocaaKax Mopeñ B O C T O M H O H AHTapKTHKH. H 3 B . A H C C C P . Cep. reorp., N? 1.
15. 3 a p y u K a n H . n . 1958. Meroabi oocTaBJieHHH pejibe(pa Ha runcoMeTpmiecKHx KapTax. M .
16. 3 a T O H C K H H JI. K . 1964. HoBbie aaHHbie o peabetpe aHa HHAHñcKoro OKeaHa. Tp. HH-Ta oKeaHOJi. A H C C C P , 64.
17. HHaHHCKHñ OKeaH (KapTa). 1963. MacuiTa6 1:15 000 000. T X T K r r K C C C P , M . 18. K a H a e B B . <t>. 1964. TeoMopipOJiorHH aHa ceBepo-BOCTOiHoñ sacra HHanHCKOro OKea
Ha. B K H . «reoaorHH aHa OKeaHOB H Mopeñ». M e w a y H a p . reoji. KOHrp., 22 cecciiH. H O K J I . C O B . reoji., M .
19. J l e o H T b e B H . O . 1961. reorpacpHqecKHe O C H O B U KapTorpacpHpoBaHHH noaB^aHoro peabeipa Ha rnncOMeTpHqecKHx KapTax. ireoae3H3aaT, M .
20. J î e o H T b e B O . K . 1963. KpaTKHñ Kypc MopcKoñ reoJiorHH. H3a . M O C K . yH-ia. 21. J I H C H U U H A . n . , J K H B a r o A . B . 1958. Pejibecp aHa H ocaaKH K J K H O H lacra H H -
anHCKoro OKeaHa. H3B. A H C C C P . Cep. reorp., N° 2. 22. MaTepHajibi OKeaHoaorHHecKHx HccaeaoBaHHH. Pejibecp aHa. 31-ñ peñe sKcneaHUHOHHO-
ro cyana «BnTH3b», 1962. H3a- MescaiyBea. reoiJ>H3. KOMHîeTa npn ripe3HaHyMe A H CCCP, M .
23. MaTepHajibi OKeaHOJiorHiecKHx HccJieaoBaHHH. Pejibecp aHa. 3KcneaHunoiiHoe c y a m «06b» 1957/58 rr. 1964. H3a . MexayBea . reoepra. KOMHTeTa npn Hpe3HaHyMe A H C C C I M .
24. T H X H H OKeaH (KapTa). 1963. M - 6 1 : 25000 000. T y r K M r H O H C C C P , ' M . 25. Y a H H u e B T . B . , A r a n o B a T . B . H ap. 1963. HoBan earaMeTpHiecKasi KapTa T H X O -
ro OKea«a. C 6 . OKeaHoa. HCCJiea., Ws 9, X paaaea nporpaMMbi M I T . 26. Carte Genérale Bathymetrique des Oceans. 1938—1942. 3-me edition publee par le B i-
reau Hydrographique International, Monaco. 27. E w i n g M . , H e e z e n B . C . 1960. Continuity of Mid-oceanic ridge and rift valey
in southwestern Indian ocean confirmed. Science. 131. 28. F a i r b r i d g e R . W . 1955. Some bathymétrie and geotectonic features of the eastern
part of the Indian ocean. Deep-Sea Res., 2, N o 3. 29. Ocean Indien. Echelle 1 : 10 000 000. Institut Géographique National, Paris. 30. P a i s l e y J. T . K . 1955. Survey of a seapeak in the Mozambique channel. Deep-Sea
Res., 3, N o 2. 31. P e t t e r s s o n H . (Ed.) Reports of the Swedish Deep-Sea Expedition ¡947—1948. IV,
fase. II. Gôteborg. 32. S t o c k s Th. 1960. Zur Bodengestalt des Indischen Ozeans. Erdkunde, 14, H . 3. 33. The world. il960. Scale 1 : 63360 000. Atlas plate 2. National Geogr. Soc. The Natio
nal Geogr. M a g . 34. W i l s o n T . 1963. Hypothesis of earth's behaviour. Nature, 198, N o 4884. 35. W i s e m a n J., H a l l G . 1956. T w o recently discovered features on the floor of the
Indian ocean: Andrew tablemount and David seaknoll. Deep-Sea Res., 3, N o 4.
771
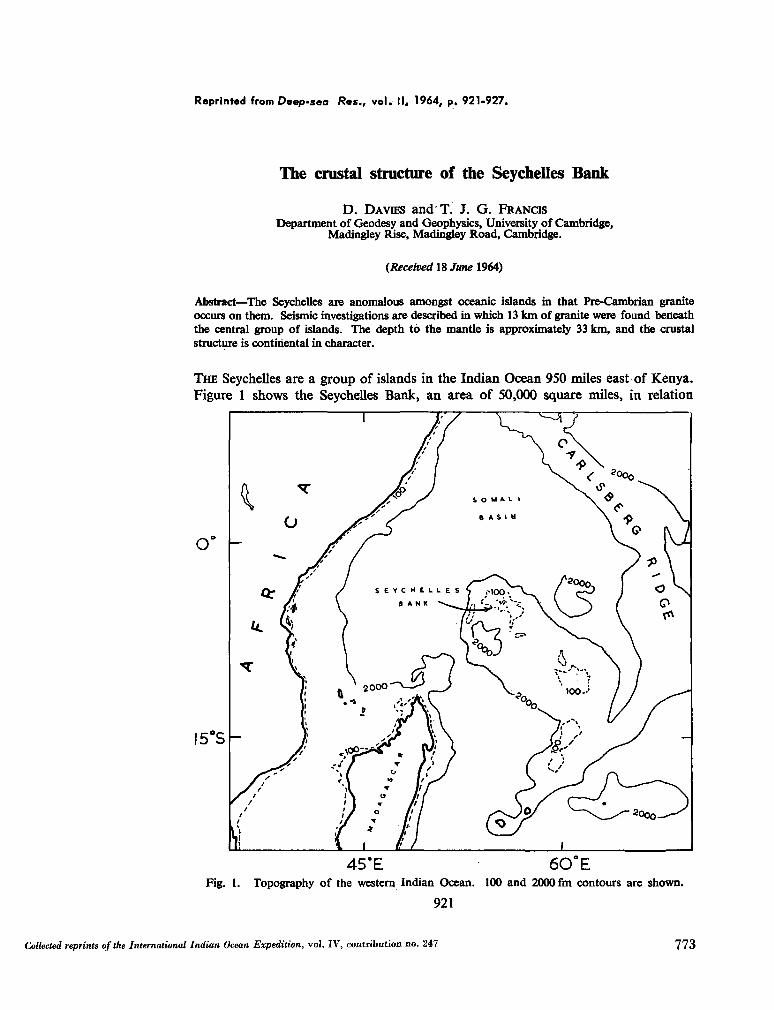
Reprinted from Deep-sea Res., vol. II, 1964, p. 921-927.
The crustal structure of the Seychelles Bank
D . DAVIES and T. J. G . FRANCIS
Department of Geodesy and Geophysics, University of Cambridge, Madingley Rise, Madingley Road, Cambridge.
{Received 18 June 1964)
Abstract—The Seychelles are anomalous amongst oceanic islands in that Pre-Cambrian granite occurs on them. Seismic investigations are described in which 13 k m of granite were found beneath the central group of islands. The depth to the mantle is approximately 33 k m , and the crustal structure is continental in character.
T H E Seychelles are a group of islands in the Indian Ocean 950 miles east of Kenya. Figure 1 shows the Seychelles Bank, an area of 50,000 square miles, in relation
O " -
I5°S-
45*E 60°E Fig. 1. Topography of the western Indian Ocean. 100 and 2000 fm contours are shown.
921
Collected reprints of the International Indian Ocean Expedition, vol. IV, contribution no. 247 773
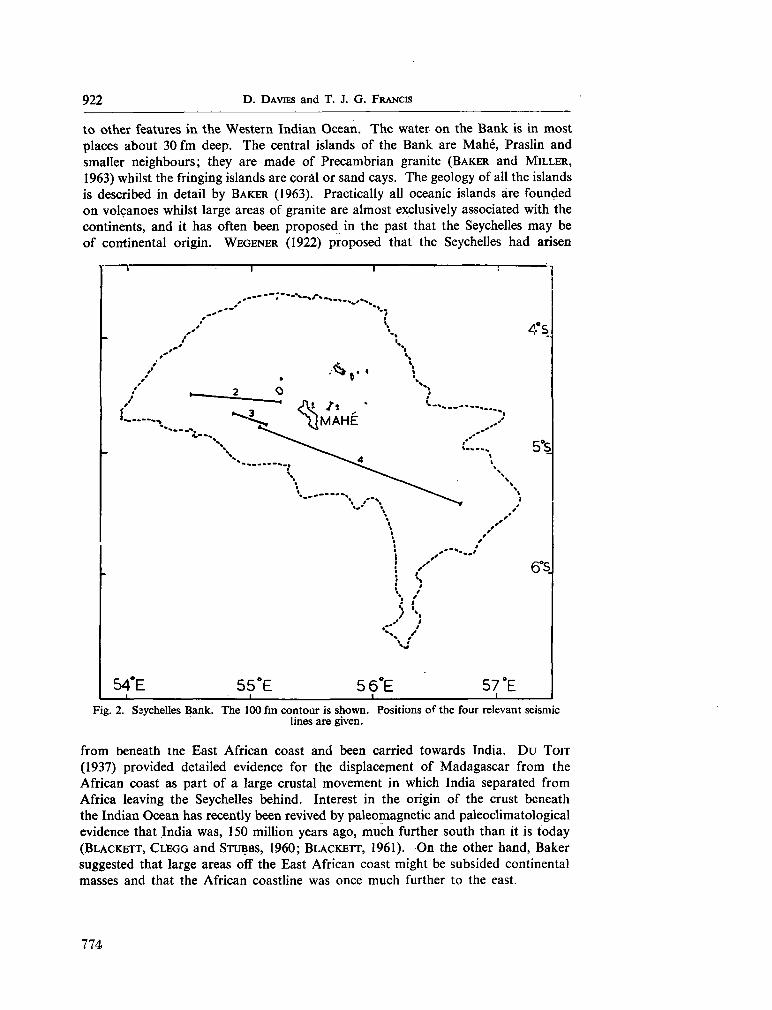
922 D - DAVIES and T. J. G . FRANCIS
to other features in the Western Indian Ocean. The water on the Bank is in most places about 30 fm deep. The central islands of the Bank are M a h é , Praslin and smaller neighbours; they are m a d e of Precambrian granite ( B A K E R and M I L L E R , 1963) whilst the fringing islands are coral or sand cays. The geology of all the islands is described in detail by B A K E R (1963). Practically all oceanic islands are founded on volcanoes whilst large areas of granite are almost exclusively associated with the continents, and it has often been proposed in the past that the Seychelles m a y be of continental origin. W E G E N E R (1922) proposed that the Seychelles had arisen
Fig. 2. Ssychelles Bank. The 100 fm contour is shown. Positions of the four relevant seismic lines are given.
from beneath tne East African coast and been carried towards India. D u T O I T (1937) provided detailed evidence for the displacement of Madagascar from the African coast as part of a large crustal movement in which India separated from Africa leaving the Seychelles behind. Interest in the origin of the crust beneath the Indian Ocean has recently been revived by paleomagnetic and paleoclimatological evidence that India was, 150 million years ago, m u c h further south than it is today ( B L A C K E T T , C L E G G and S T U B B S , 1960; B L A C K E T T , 1961). O n the other hand, Baker suggested that large areas off the East African coast might be subsided continental masses and that the African coastline was once m u c h further to the east.
774
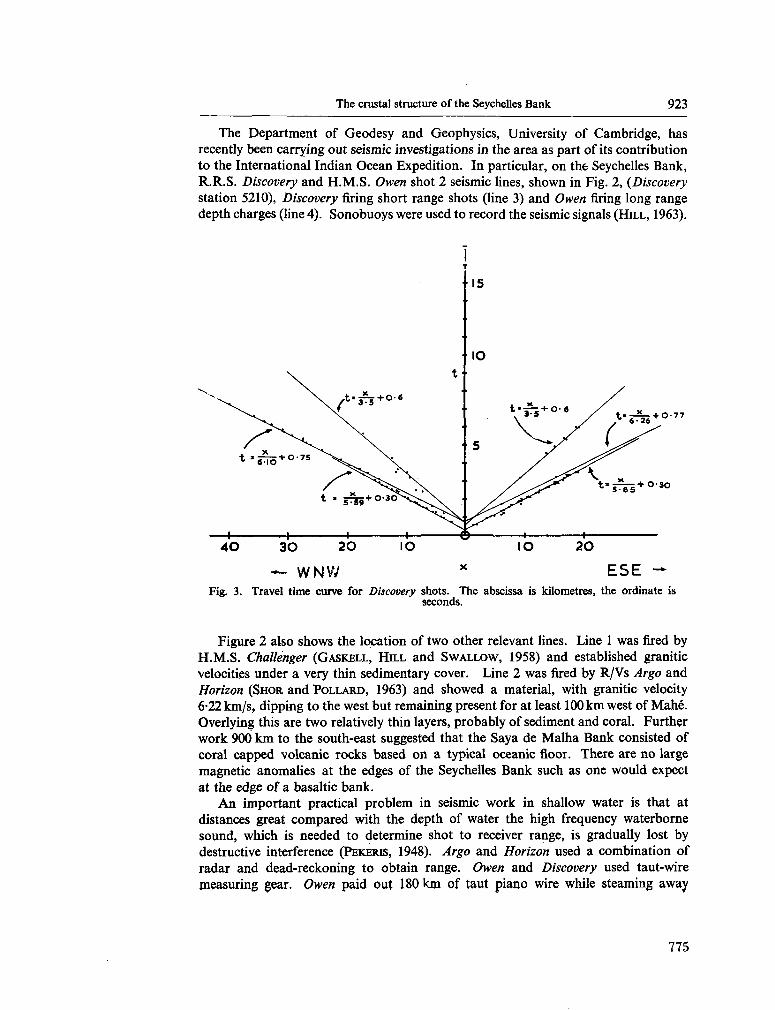
The crustal structure of the Seychelles Bank 923
The Department of Geodesy and Geophysics, University of Cambridge, has recently been carrying out seismic investigations in the area as part of its contribution to the International Indian Ocean Expedition. In particular, on the Seychelles Bank, R . R . S . Discovery and H . M . S . Owen shot 2 seismic lines, shown in Fig. 2, (Discovery station 5210), Discovery firing short range shots (line 3) and Owen firing long range depth charges (line 4). Sonobuoys were used to record the seismic signals ( H I L L , 1963).
40 30 20 IO IO 20
— W N W x ESE — Fig. 3. Travel time curve for Discovery shots. The abscissa is kilometres, the ordinate is
seconds.
Figure 2 also shows the location of two other relevant lines. Line 1 was fired by H . M . S . Challenger ( G A S K E L L , H I L L and S W A L L O W , 1958) and established granitic velocities under a very thin sedimentary cover. Line 2 was fired by R / V s Argo and Horizon ( S H O R and P O L L A R D , 1963) and showed a material, with granitic velocity 6-22 k m / s , dipping to the west but remaining present for at least 100 k m west of M a h é . Overlying this are two relatively thin layers, probably of sediment and coral. Further work 900 k m to the south-east suggested that the Saya de Malha Bank consisted of coral capped volcanic rocks based on a typical oceanic floor. There are no large magnetic anomalies at the edges of the Seychelles Bank such as one would expect at the edge of a basaltic bank.
A n important practical problem in seismic work in shallow water is that at distances great compared with the depth of water the high frequency waterborne sound, which is needed to determine shot to receiver range, is gradually lost by destructive interference (PEKERIS , 1948). Argo and Horizon used a combination of radar and dead-reckoning to obtain range. Owen and Discovery used taut-wire measuring gear. Owen paid out 180 k m of taut piano wire while steaming away
775
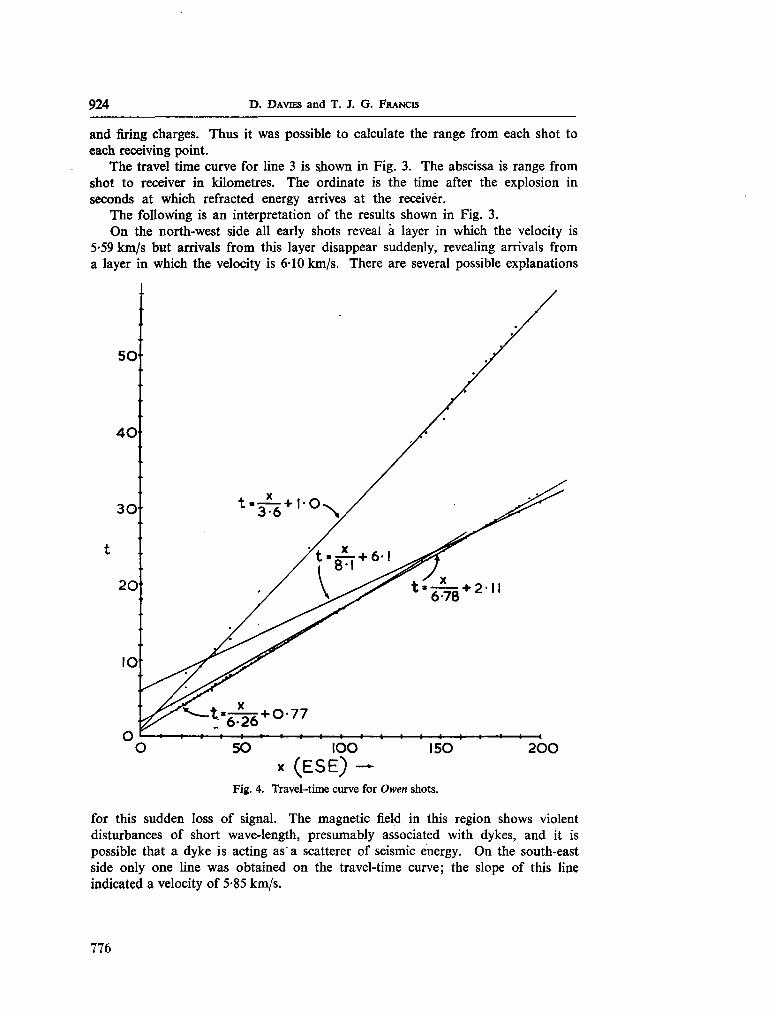
924 D. DAVŒS and T. J. G. FRANCIS
and firing charges. Thus it was possible to calculate the range from each shot to each receiving point.
T h e travel time curve for line 3 is shown in Fig. 3. The abscissa is range from shot to receiver in kilometres. T h e ordinate is the time after the explosion in seconds at which refracted energy arrives at the receiver.
T h e following is an interpretation of the results shown in Fig. 3. O n the north-west side all early shots reveal à layer in which the velocity is
5-59 k m / s but arrivals from this layer disappear suddenly, revealing arrivals from a layer in which the velocity is 6-10 k m / s . There are several possible explanations
O 50 IOO ISO 200 x (ESE) —
Fig. 4. Travel-time curve for Owen shots.
for this sudden loss of signal. The magnetic field in this region shows violent disturbances of short wave-length, presumably associated with dykes, and it is possible that a dyke is acting as a scatterer of seismic energy. O n the south-east side only one Une was obtained on the travel-time curve; the slope of this line indicated a velocity of 5-85 k m / s .
776
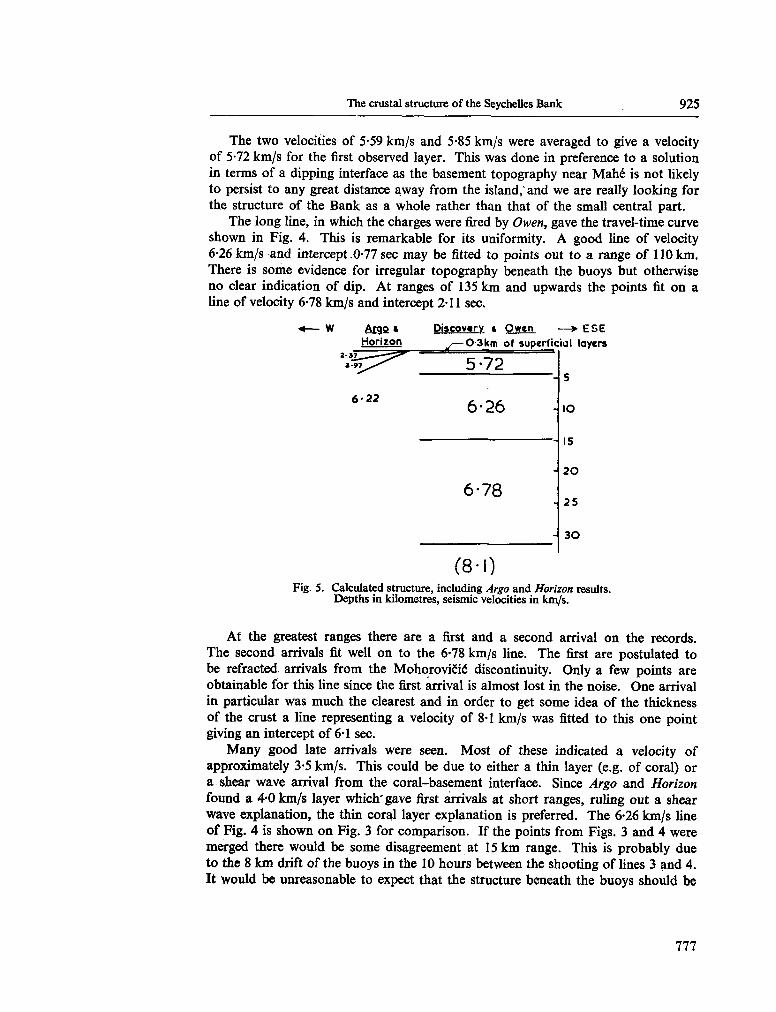
T h e crustal structure of the Seychelles B a n k 925
The two velocities of 5-59 k m / s and 5-85 k m / s were averaged to give a velocity of 5-72 k m / s for the first observed layer. This was done in preference to a solution in terms of a dipping interface as the basement topography near M a h é is not likely to persist to any great distance away from the island,'and w e are really looking for the structure of the Bank as a whole rather than that of the small central part.
The long line, in which the charges were fired by Owen, gave the travel-time curve shown in Fig. 4. This is remarkable for its uniformity. A good line of velocity 6-26 k m / s and intercept .0-77 sec m a y be fitted to points out to a range of 110 k m . There is some evidence for irregular topography beneath the buoys but otherwise no clear indication of dip. At ranges of 135 k m and upwards the points fit on a line of velocity 6-78 k m / s and intercept 2-11 sec.
<— W Ô£9Ô » Discovry t Owen —> E5E
Horizon y—Q-3km of superficial layers
S
IO
15
20
25
30
(8-1) Fig. 5. Calculated structure, including Argo and Horizon results.
Depths in kilometres, seismic velocities in k m / s .
At the greatest ranges there are a first and a second arrival on the records. The second arrivals fit well on to the 6-78 k m / s line. The first are postulated to be refracted arrivals from the Mohoroviéié discontinuity. Only a few points are obtainable for this line since the first arrival is almost lost in the noise. O n e arrival in particular was m u c h the clearest and in order to get some idea of the thickness of the crust a line representing a velocity of 8-1 k m / s was fitted to this one point giving an intercept of 6-1 sec.
M a n y good late arrivals were seen. Most of these indicated a velocity of approximately 3-5 k m / s . This could be due to either a thin layer (e.g. of coral) or a shear wave arrival from the coral-basement interface. Since Argo and Horizon found a 4-0 k m / s layer which' gave first arrivals at short ranges, ruling out a shear wave explanation, the thin coral layer explanation is preferred. The 6-26 k m / s line of Fig. 4 is shown on Fig. 3 for comparison. If the points from Figs. 3 and 4 were merged there would be some disagreement at 15 k m range. This is probably due to the 8 k m drift of the buoys in the 10 hours between the shooting of lines 3 and 4. It would be unreasonable to expect that the structure beneath the buoys should be
2"îZ-3-»7. 5-72
6-22 6-26
6-78
777
926 D . DAVIES and T. J. G. FRANCIS
identical 5 miles apart. Accordingly line 3 has been used for describing the shallow structure, and line 4 for the deep structure.
Figure 5 (which includes Argo and- Horizon results) shows an interpretation of the data on the basis of the above discussion. The interpretation is also given in Table 1. Less than 500 m of sediment and coral cover the first of two layers for which the seismic velocity suggests a granitic material. B I R C H (t960) showed that under a typical
Table 1. Calculated structure of Discovery Station 5210. Velocities bracketed have been assumed.
Layer Seismic velocity Thickness (km) (km/s)
Water 1-54 05 1 (20) and 3-5 -3 2 5-72 3-3 3 6-26 9-4 4 6-78 18-9 5 (81) -
continent the seismic velocity of granite would increase with depth from 5-3 k m / s at the surface to 6-25 k m / s at a depth of 10 k m . S T E I N H A R T and M E Y E R (1961) demonstrated that a travel-time curve based on Birch's velocity structure might well be interpreted as two layers with velocities 5-57 k m / s and 6-18 k m / s , the interface being 1 -9 k m deep. The similarity of these predictions to the results obtained by Discovery and Owen is striking and so although the structure is interpreted as two granitic-type layers for computational convenience, it is accepted that a velocity gradient could produce an almost identical travel-time curve. That Argo and Horizon observed just one layer of velocity 6-22 k m / s , near M a h é m a y be due to near surface topographic irregularities which could easily m a s k an effect which is in any event small.
Table 2. Seismic profiles in the vicinity of the Seychelles bank with determinations of the seismic velocity and depth of the basaltic layer.
Source
AH AH D D
Location
300 km ESE of Mahé 900 km SE of Mahé 350 km N E of Mahé 450 km W of Mahé
Velocity of basaltic material
Depth below ocean surface
6-77 k m / s 5 k m 6-81 k m / s 8 k m 6-86 k m / s 6-4 k m
N o obvious basaltic layer
Thickness
? h
4-7 k m
AH = Argo and Horizon station. D = Discovery station - preliminary result.
T h e 6*78 k m / s layer is of considerable interest. Table 2 lists seismic profiles in the vicinity and it is clear that the typically " basaltic " velocity of 6-8 k m / s is c o m m o n to the eastward. The complete lack of a clear 6-8 k m / s layer to the west is problematical and will be discussed in greater detail in conjunction with other Discovery and Owen seismic profiles at a later date. It seems possible that the 6-78 k m / s material beneath the Seychelles should be the same as the basaltic layer seen in the eastern vicinity. However, seismic arrivals from a layer with seismic
778
The crustal structure of the Seychelles Bank 927
velocity 6-78 k m / s on a continent would be termed P* and its upper boundary called the Conrad Discontinuity. The velocity of 6-78 k m / s and depth of approximately 13 k m agree well with continental determinations, of which m a n y are cited in Steinhart and Meyer (cop. cit.). Thus it is open to speculation that the sub-oceanic basaltic layer connects -directly with a thick sub-continental layer.
Little m a y be inferred from the depth of 33 k m to the Mohorovicic discontinuity as an assumed velocity of 8-1 k m / s has been used. A velocity of 7-7 k m / s for the material below the Mohoroviôié discontinuity would change the depth to 27 k m . There is considerable evidence for low mantle velocities to the west, m u c h less to the east. It is clear however that the depth is m u c h nearer to the continental range of values (30-40 k m ) than the oceanic range (8-15 k m ) .
The results obtained suggest that the Seychelles bank is a continental feature and that the horizontal extent of the " micro-continent " is at least 250 k m .
Acknowledgements—We thank the Director of the National Institute of Oceanography for providing the facilities on board R . R . S . Discovery, and the Hydrographer of the Navy for the use of H . M . S . Owen.
To the Captains, Officers and Crews of H . M . S . Owen and R . R . S . Discovery we are grateful for their splendid cooperation.
Dr. M . N . H I L L , F .R .S . , Principal Scientist on R . R . S . Discovery suggested the experiments and took an active part in all aspects of the work.
Dr. A . S. L A U G H T O N , M r . E . J. W . JONES and M r . R . B . W H T I M A R S H helped in many ways. This work was supported by O . N . R . Contract N o . N62558-3883 and D.S.I.R.
REFERENCES
B A K E R , B . H . (1963) Geology and Mineral Resources of the Seychelles Archipelago. Geol. Surv. Kenya, Memoir 3.
B A K E R B . H . and M I L L E R J. A . (1963) Geology and Geochronology of the Seychelles Islands. Nature 199, 346-348.
B I R C H F . (1960) Velocity of Compressional Waves in Rocks. / . Geophys. Res., 65,1083-1102. B L A C K E T T P . M . S. (1961) Comparison of ancient climates with the ancient latitudes deduced
from rock magnetic measurements. Proc. Roy. Soc. A , 263, 1-30. B L A C K E T T P . M . S. , C L E G G J. A . and S T U B B S P . H . S. (1960) A n analysis of rock magnetic
data. Proc. Roy. Soc. A , 256, 291-322. D u Torr A . L . (1937) Our Wandering Continents. Oliver and Boyd, Edinburgh, 366 pp. G A S K E L L T . F . , H I L L M . N . and S W A L L O W J. C . (1958) Seismic investigations m a d e by
H . M . S . Challenger 1950-53. Phil. Trans. Roy. Soc. A , 251, 23-83. H I L L M . N . (Ed.) (1963) Single-slip seismic refraction shooting. In The Sea, Chapt. 3,
Vol. 3, 963 pp . Interscience Publishers. P E K E R B C . L . (1948) Propagation of Explosive Sound in Shallow Water. Geol. Soc. Amer.
Mem., 21, 117 pp. S H O R G . G . J R . and P O L L A R D D . D . (1963) Seismic Investigations of Seychelles and Saya
de Malha Banks, Northwest Indian Ocean, Science, 142, 48-49. S T E I N H A R T J. S. and M E Y E R R . P . (1961) Explosion Studies of Continental Structure, Carnegie
Institution of Washington. W E G E N E R A . (1922) The Origin of Continents and Oceans. Methuen, London, 212 pp.
779
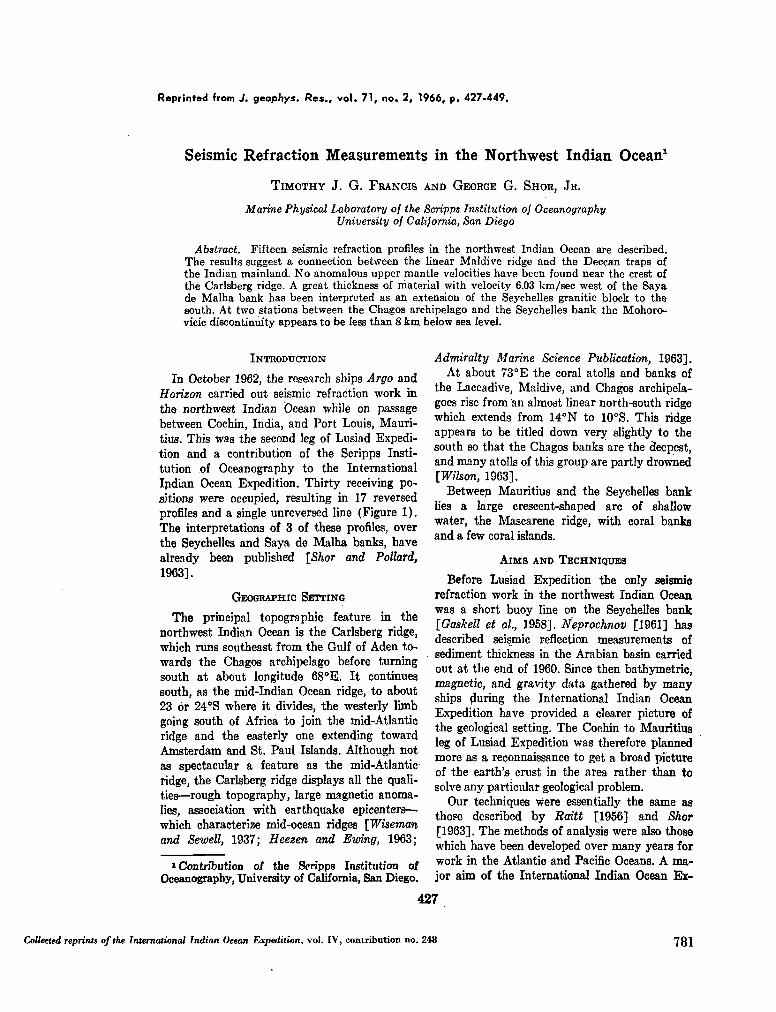
Reprinted (rom J. geophys. Res., vol. 71, no. 2, 1966, p. 427-449.
Seismic Refraction Measurements in the Northwest Indian Ocean1
TIMOTHY J. G. FRANCIS AND GEORGE G. SHOR, JR.
Marine Physical Laboratory of the Scripps Institution of Oceanography University of California, San Diego
Abstract. Fifteen seismic refraction profiles in the northwest Indian Ocean are described. The results suggest a connection between the linear Maldive ridge and the Deccan traps of the Indian mainland. N o anomalous upper mantle velocities have been found near the crest of the Carlsberg ridge. A great thickness of material with velocity 6.03 km/sec west of the Saya de Malha bank has been interpreted as an extension of the Seychelles granitic block to the south. At two stations between the Chagos archipelago and the Seychelles bank the Mohoro-vicic discontinuity appears to be less than 8 k m below sea level.
I N T R O D U C T I O N
In October 1962, the research ships Argo and Horizon carried out seismic refraction work in the northwest Indian Ocean while on passage between Cochin, India, and Port Louis, Mauritius. This was the second leg of Lusiad Expedition and a contribution of the Scripps Institution of Oceanography to the International Ipdian Ocean Expedition. Thirty receiving positions were occupied, resulting in 17 reversed profiles and a single unreversed line (Figure 1). The interpretations of 3 of these profiles, over the Seychelles and Saya de Malha banks, have already been published {Shor and Pollard, 1963].
G E O G R A P H I C S E T T I N G
T h e principal topographic feature in the northwest Indian Ocean is the Carlsberg ridge, which runs southeast from the Gulf of Aden towards the Chagos archipelago before turning south at about longitude 68°E. It continues south, as the mid-Indian Ocean ridge, to about 23 ór 24°S where it divides, the westerly limb going south of Africa to join the mid-Atlantic ridge and the easterly one extending toward Amsterdam and St. Paul Islands. Although not as spectacular a feature as the mid-Atlantic ridge, the Carlsberg ridge displays all the qualities —rough topography, large magnetic anomalies, association with earthquake epicenters— which characterize mid-ocean ridges [Wiseman and Sewell, 1937; Heezen and Ewing, 1963;
* Contribution of the Scripps Institution of Oceanography, University of California, San Diego.
Admiralty Marine Science Publication, 1963]. At about 73 °E the coral atolls and banks of
the Laccadive, Maldive, and Chagos archipelagoes rise from an almost linear north-south ridge which extends from 14°N to 10°S. This ridge appears to be titled down very slightly to the south so that the Chagos banks are the deepest, and m a n y atolls of this group are partly drowned [Wilson, 1963].
Betweep Mauritius and the Seychelles bank lies a large crescent-shaped arc of shallow water, the Mascarene ridge, with coral banks and a few coral islands.
A I M S A N D T E C H N I Q U E S
Before Lusiad Expedition the only seismic refraction work in the northwest Indian Ocean was a short buoy line on the Seychelles bank [Gaskell et al, 1958]. Neprochnov [1961] has described seismic reflection measurements of sediment thickness in the Arabian basin carried out at the end of 1960. Since then bathymétrie, magnetic, and gravity data gathered by m a n y ships during the International Indian Ocean Expedition have provided a clearer picture of the geological setting. The Cochin to Mauritius leg of Lusiad Expedition was therefore planned more as a reconnaissance to get a broad picture of the earth's crust in the area rather than to solve any particular geological problem.
Our techniques were essentially the same as those described by Raitt [1956] and Shor [1963]. The methods of analysis were also those which have been developed over m a n y years for work in the Atlantic and Pacific Oceans. A m a jor aim of the International Indian Ocean E x -
427
Collected reprints of the International Indian Ocean Expedition, vol. IV, contribution no. 248 781
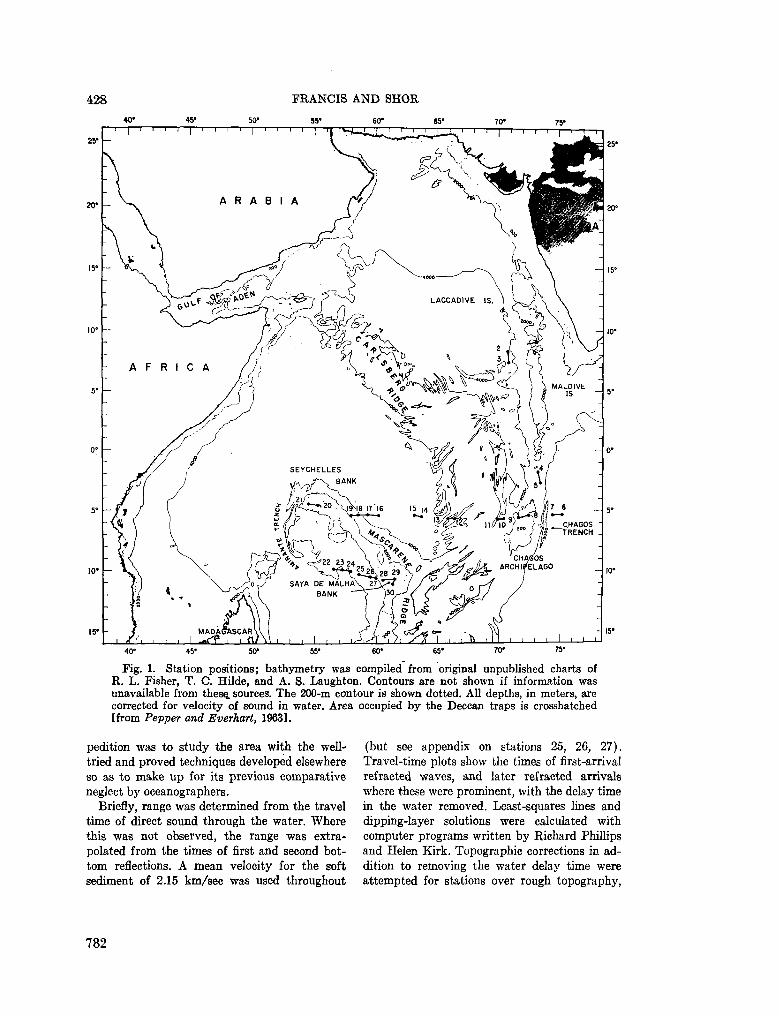
428
40' « •
FRANCIS AND SHOR
50" 55* 60* 65"
Fig. 1. Station positions; bathymetry was compiled from original unpublished charts of R . L . Fisher, T . C . Hilde, and A . S. Laughton. Contours are not shown if information was unavailable from these, sources. The 200-m contour is shown dotted. All depths, in meters, are corrected for velocity of sound in water. Area occupied by the Deccan traps is crosshatched [from Pepper and Everkart, 1963].
pedition was to study the area with the well-tried and proved techniques developed elsewhere so as to m a k e up for its previous comparative neglect by oceanographers.
Briefly, range was determined from the travel time of direct sound through the water. Where this was not observed, the range was extrapolated from the times of first and second bottom reflections. A mean velocity for the soft sediment of 2.15 km/sec was used throughout
(but see appendix on stations 25, 26, 27). Travel-time plots show the times of first-arrival refracted waves, and later refracted arrivals where these were prominent, with the delay time in the water removed. Least-squares lines and dipping-layer solutions were calculated with computer programs written by Richard Phillips and Helen Kirk. Topographic corrections in addition to removing the water delay time were attempted for stations over rough topography,
782
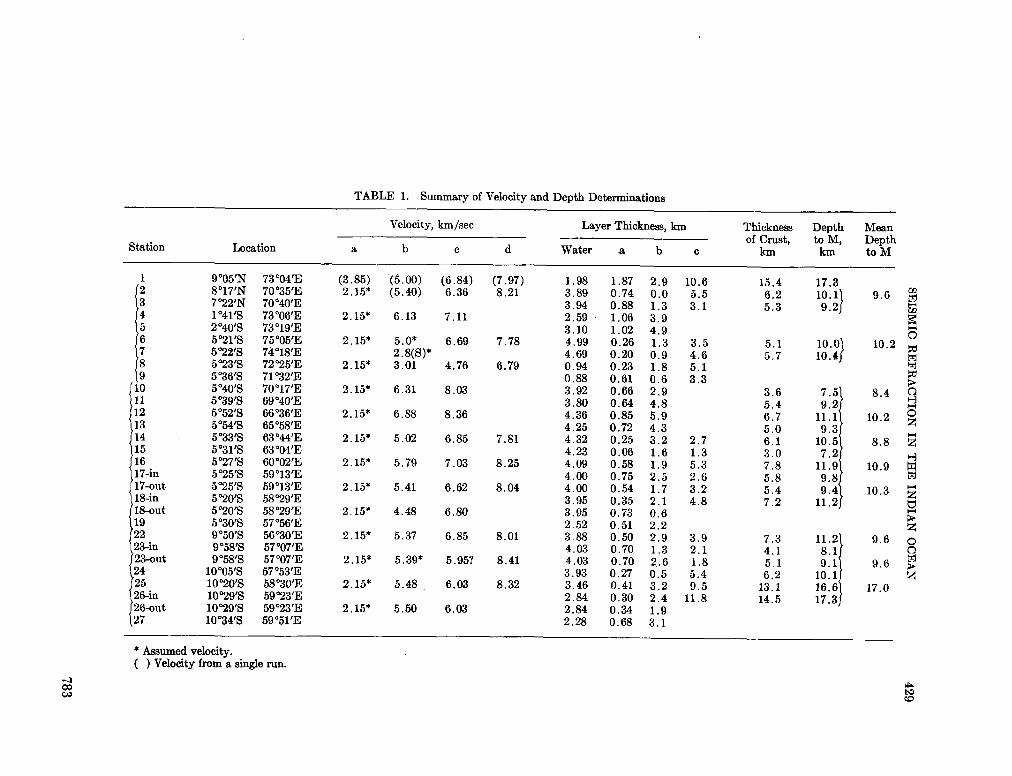
IÎ3
SEISM
IC R
EFR
AC
TIO
N IN
TH
E IN
DIA
N O
CEA
N
429
tO
OS
10.2
•*
00
IN
O
oo
oo
OS
o
CO
o
CD
OS
to
OS
o
f~
h-3
3H
fllO
NH
03
05
H
NH
HH
«5
C0
H
OO
QO
tO
N
n
A
«4-1
•* CM
CO
lOtB
iO
i-i t--
ID
^N
OH
OC
OO
O^
f)
MiO
tD
iO(O
MN
»0
»O
N
CO
>-*
'-, C
N i-H
"
5
fj T)i
"5 to
C
O Tji
a
3 H I?
CO
»0
^
H
ifl es H
co
CO
•*
' l£>
CO
t>
CO
CO
CO
<N
00
CN
>-l
lO IN
C
O
*
os i-* oo
wo o
o
0)O
c0
03
0S
MO
SÛ
O(0
0)Q
OO
>C
ON
tOO
S»
i5N
t-<tO
NO
iCO
tDiO
N^
OS
H
NO
rt
O}
*'
-l
OH
O«
T(
ii
o*
nH
HN
rt
C1
0D
fÍ
HN
'o
mN
Ht
O
t-^O
Oc
OC
NC
Oo
cO
t-íCO
" C
CN
OO
OO
fN
Nl
Ot
OI
'l
Ow
ot
Oû
Oi
fl
^m
co
HO
OO
^H
O^
oo
iO
Ot^
»C
NO
li3l>
WÎC
Ot>
-lC'^
^-t^
cN
'^C
OC
OÇ
O
•-
HO
Oi
-i
r-
iO
OO
OO
OO
OO
OO
OO
OO
OO
OO
oO
OO
O
OO
OS
^S
lO
Œc
S'i
io
oN
Ot
Bi
OM
MO
lO
Oi
oU
ÎN
OO
nM
M'O
f'f
W
OS
OO
OS
"i5
>-lO
S5
00
SO
OO
SO
OC
OC
NC
OC
NO
OO
OS
OS
iOO
OO
Oo
s'*O
OO
OlM
rtM
ra
Nn
^^
do
co
«^
i^'i<
'*^
^^
ÍMc
í!c)M
*^
lMn
Nc
iex
i
oo
Os
o
Tjl !
0
00
CO
f—
1
T-H
O
S to
«5
t~
CO
o
CO
CO
líO
oo
CO
o
CN
to
o
00
1—
1
o
oo
00
T-l
oo 95?
<N
co oo
8 to to
^^ '—
* v
rt
*
O
O
CO
*
'ÍÍ"-'
-H
OO
CN
Cs
^H
CO
t^
OS
OO
O
O"
* -H
O
OO
O
CO
0
0
O
t—
•*
Tf
CO
C
O
*ti it}
•uoiíO
to
lO
CN
CO
to
to
iO
"0
U
O M
* "ti
ȣ>
»0
O
—
'
^*
#*
**
**
*#
**
**
*
U0
iO
tí
0»
OH
0»
í0
tf
0i
O»
OH
Íi
O,
í0
u^
l£
3*
O
O0
I-
<I
-<
I-
<I
-I
I-
II
-I
I-
I~
HI
-I
IM
I-
II
-<
<-
II
-I
CO
IN
CQ
CN
NN
C^
C^
CN
NC
NC
Nt
NC
NC
N
a g
^Í
QÍ
bf
fi
WC
CW
Nf
-0
»«
)^
^Ñ
cO
MC
5f
fl
tb
bt
NM
Oc
i5
ct
)H
on
5o
HO
HN
MH
^n
io
4o
OH
rt
NN
«í
np
pi
i)
«N
si
io
o
oo
oo
oo
oo
oo
oo
oo
oo
oo
oo
oo
oo
oo
oo
mo
ora
co
io
^N
HO
OitB
in
Mm
oo
ie
so
oo
oN
to
t-tj^
oc
oo
io
s
t^t^
^t^
t^t^
t^t^
b-t^
tOtO
tOtO
tOtO
UO
iOiO
iOiO
iOu
OiiO
ic^
^u
Ou
o
o
1-4
•B o3
.a f .s §
.a f .a o
l<
NC
NC
Nc
N<
Nc
N<
N.(N
783
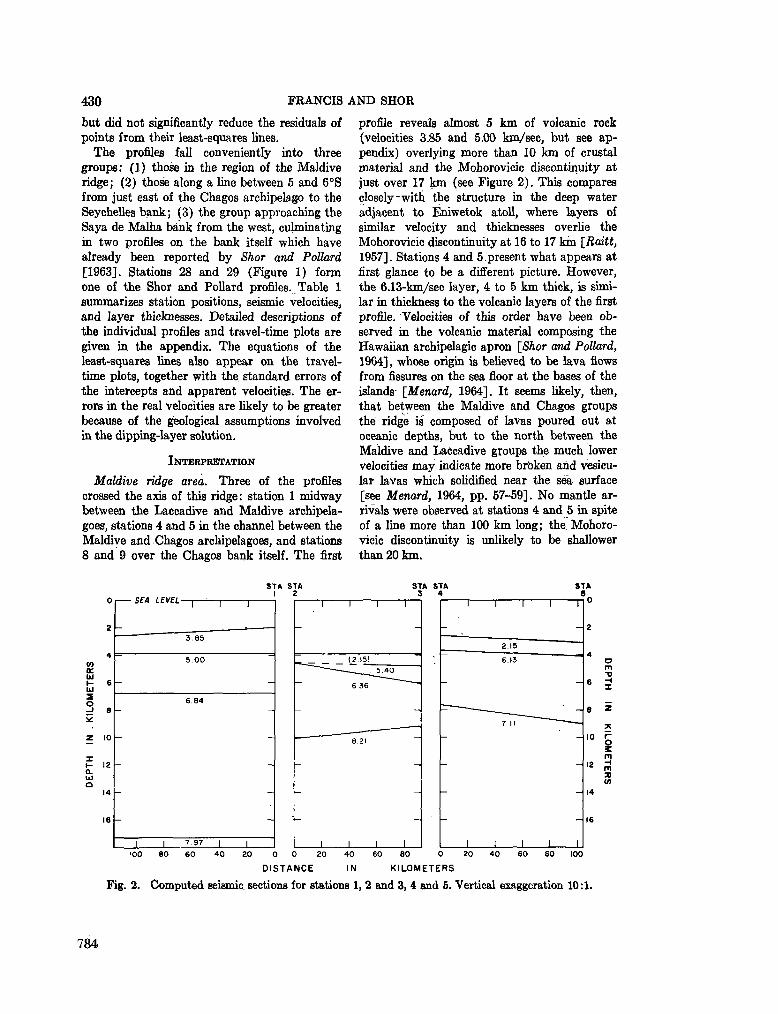
430 FRANCIS AND SHOR
but did not significantly reduce the residuals of points from their least-squares lines.
T h e profiles fall conveniently into three groups: (1) those in the region of the Maldive ridge; (2) those along a line between 5 and 6°S from just east of the Chagos archipelago to the Seychelles bank; (3) the group approaching the Saya de Malha bank from the west, culminating in two profiles on the bank itself which have already been reported by Shor and Pollard [1963]. Stations 28 and 29 (Figure 1) form one of the Shor and Pollard profiles. Table 1 summarizes station positions, seismic velocities, and layer thicknesses. Detailed descriptions of the individual profiles and travel-time plots are given in the appendix. The equations of the least-squares lines also appear on the travel-time plots, together with the standard errors of the intercepts and apparent velocities. The errors in the real velocities are likely to be greater because of the geological assumptions involved in the dipping-layer solution.
I N T E R P R E T A T I O N
Maldive ridge area. Three of the profiles crossed the axis of this ridge: station 1 midway between the Laccadive and Maldive archipelagoes, stations 4 and 5 in the channel between the Maldive and Chagos archipelagoes, and stations 8 and 9 over the Chagos bank itself. The first
profile reveals almost 5 k m of volcanic rock (velocities 3.85 and 5.00 km/sec, but see appendix) overlying more than 10 k m of crustal material and the Mohorovicic discontinuity at just over 17 k m (see Figure 2) . This compares closely with the structure in the deep water adjacent to Eniwetok atoll, where layers of similar velocity and thicknesses overlie the Mohorovicic discontinuity at 16 to 17 kin [Raitt, 1957]. Stations 4 and 5 present what appears at first glance to be a different picture. However, the 6.13-km/sec layer, 4 to 5 k m thick, is similar in thickness to the volcanic layers of the first profile. Velocities of this order have been observed in the volcanic material composing the Hawaiian archipelagic apron [Shor and Pollard, 1964], whose origin is believed to be lava flows from fissures on the sea floor at the bases of the islands [Menard, 1964]. It seems likely, then, that between the Maldive and Chagos groups the ridge is composed of lavas poured out at oceanic depths, but to the north between the Maldive and Laecadive groups the m u c h lower velocities m a y indicate more brbken and vesicular lavas which solidified near the sea surface [see Menard, 1964, pp. 57-59]. N o mantle arrivals weTe observed at stations 4 and 5 in spite of a line more than 100 k m long; the Mohorovicic discontinuity is unlikely to be shallower than 20 k m .
o
o
2
4
6
e
10
12
14
16
i SEA LEVEL—|—•-
3.85
5.00
6.84
-
1 1 7.97
1
1
1
-
-
-
-
-
-
1
STA STA I 2
STA STA 3 4
O m T> H X
r o z q m a </>
Fig.
'00 80 60 40 20 0 0 20 40 60 80 0 20 40 60 SO
DISTANCE IN KILOMETERS
2. Computed seismic, sections for stations 1, 2 and 3, 4 and 5. Vertical exaggeration 10:1.
784
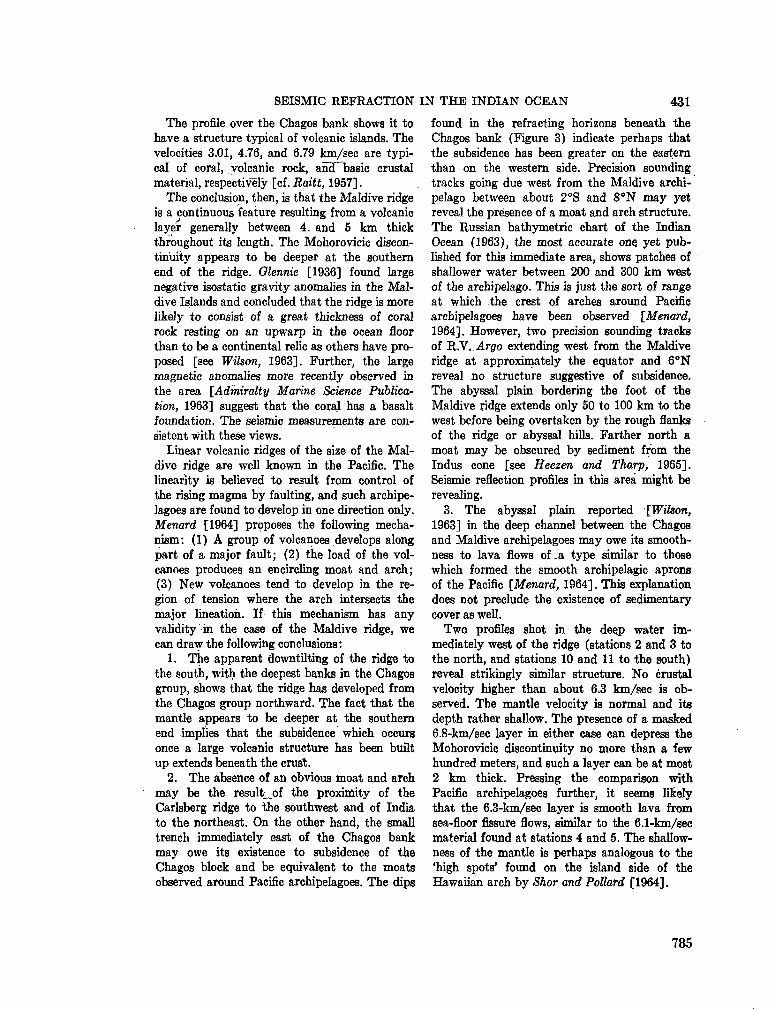
SEISMIC E E F R A C T I O N IN T H E INDIAN O C E A N 431 The profile over the Chagos bank shows it to
have a structure typical of volcanic islands. The velocities 3.01, 4.76, and 6.79 km/sec are typical of coral, volcanic rock, and-basic crustal material, respectively [cf. Raitt, 1957].
The conclusion, then, is that the Maldive ridge is a continuous feature resulting from a volcanic layer generally between 4. and 5 k m thick throughout its length. The Mohorovicie discontinuity appears to be deeper at the southern end of the ridge. Glennie [1936] found large negative isostatic gravity anomalies in the M a l dive Islands and concluded that the ridge is more likely to consist of a great thickness of coral rock resting on an upwarp in the ocean floor than to be a continental relic as others have proposed [see Wilson, 1963]. Further, the large magnetic anomalies more recently observed in the area [Admiralty Marine Science Publication, 1963] suggest that the coral has a basalt foundation. The seismic measurements are consistent with these views.
Linear volcanic ridges of the size of the M a l dive ridge are well known in the Pacific. The linearity is believed to result from control of the rising m a g m a by faulting, and such archipelagoes are found to develop in one direction only. Menard [1964] proposes the following mechanism: (1) A group of volcanoes develops along part of a major fault; (2) the load of the volcanoes produces an encircling moat and arch; (3) N e w volcanoes tend to develop in the region of tension where the arch intersects the major lineation. If this mechanism has any validity in the case of the Maldive ridge, w e can draw the following conclusions:
1. T h e apparent downtilting of the ridge to the south, with the deepest banks in the Chagos group, shows that the ridge has developed from the Chagos group northward. The fact that the mantle appears to be deeper at the southern end implies that the subsidence which occurs once a large volcanic structure has been built up extends beneath the crust.
2. The absence of an obvious moat and arch m a y be the result^of the proximity of the Carlsberg ridge to the southwest and of India to the northeast. O n the other hand, the small trench immediately east of the Chagos bank m a y owe its existence to subsidence of the Chagos block and be equivalent to the moats observed around Pacific archipelagoes. The dips
found in the refracting horizons beneath the Chagos bank (Figure 3) indicate perhaps that the subsidence has been greater on the eastern than on the western side. Precision sounding tracks going due west from the Maldive archipelago between about 2°S and 8 ° N m a y yet reveal the presence of a moat and arch structure. The Russian bathymétrie chart of the Indian Ocean (1963), the most accurate one. yet published for this immediate area, shows patches of shallower water between 200 and 300 k m west of the archipelago. This is just the sort of range at which the crest of arches around Pacific archipelagoes have been observed [Menard, 1964]. However, two precision sounding tracks of R . V . Argo extending west from the Maldive ridge at approximately the equator and 6 ° N reveal no structure suggestive of subsidence. The abyssal plain bordering the foot of the Maldive ridge extends only 50 to 100 k m to the west before being overtaken by the rough flanks of the ridge or abyssal hills. Farther north a moat m a y be obscured by sediment from the Indus cone [see Heezen and Tharp, 1965]. Seismic reflection profiles in this area might be revealing.
3. The abyssal plain reported [Wilson, 1963] in the deep channel between the Chagos and Maldive archipelagoes m a y owe its smoothness to lava flows of .a type similar to those which formed the smooth archipelagic aprons of the Pacific [Menard, 1964]. This explanation does not preclude the existence of sedimentary cover as well.
T w o profiles shot in the deep water immediately west of the ridge (stations 2 and 3 to the north, and stations 10 and 11 to the south) reveal strikingly similar structure. N o crustal velocity higher than about 6.3 km/sec is observed. The mantle velocity is normal and its depth rather shallow. The presence of a masked 6.8-km/sec layer in either case can depress the Mohorovicic discontinuity no more than a few hundred meters, and such a layer can be at most 2 k m thick. Pressing the comparison with Pacific archipelagoes further, it seems likely that the 6.3-km/sec layer is smooth lava from sea-floor fissure flows, similar to the 6.1-km/sec material found at stations 4 and 5. The shallowness of the mantle is perhaps analogous to the 'high spots' found on the island side of the Hawaiian arch by Shor and Pollard [1964].
785
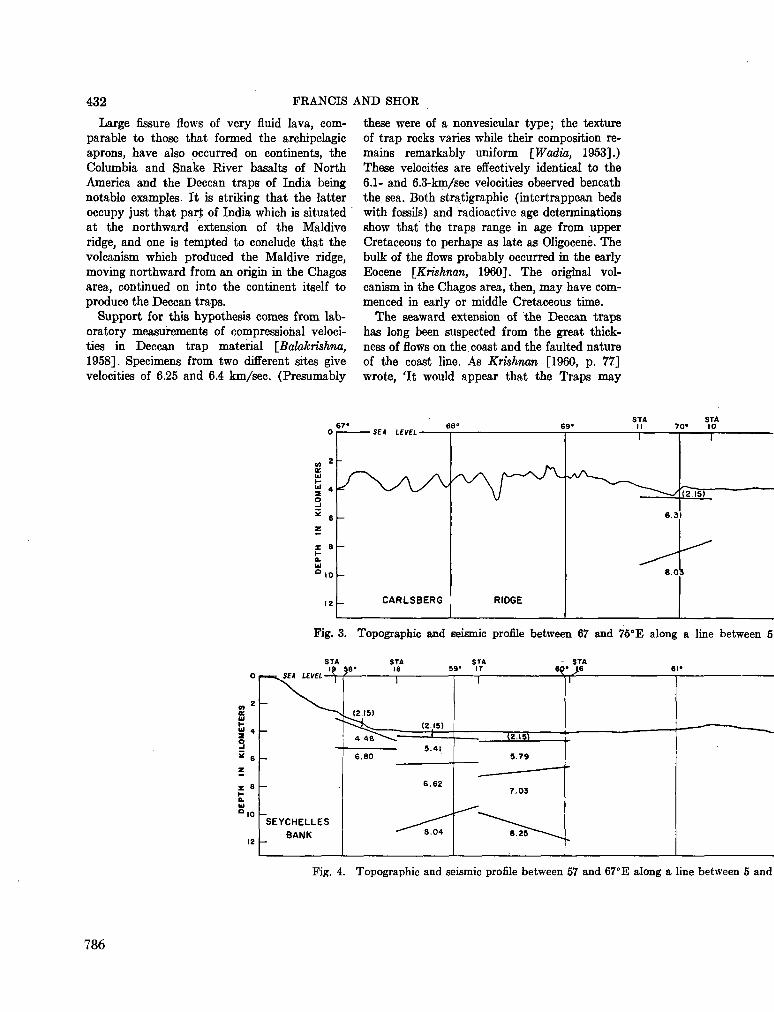
432 F R A N C I S A N D S H O R
Large fissure flows of very fluid lava, comparable to those that formed the archipelagic aprons, have also occurred on continents, the Columbia and Snake River basalts of North America and the Deccan traps of India being notable examples. It is striking that the latter occupy just that part of India which is situated at the northward extension of the Maldive ridge, and one is tempted to conclude that the volcanism which produced the Maldive ridge, moving northward from an origin in the Chagos area, continued on into the continent itself to produce the Deccan traps.
Support for this hypothesis comes from laboratory measurements of compressiohal velocities in Deccan trap material [Balakrishna, 1958]. Specimens from two different sites give velocities of 6.25 and 6.4 km/sec. (Presumably
these were of a nonvesicular type; the texture of trap rocks varies while their composition remains remarkably uniform [Wadia, 1953].) These velocities are effectively identical to the 6.1- and 6.3-km/sec velocities observed beneath the sea. Both stratigraphie (intertrappean beds with fossils) and radioactive age determinations show that the traps range in age from upper Cretaceous to perhaps as late as Oligocène. The bulk of the flows probably occurred in the early Eocene [Krishnan, I960]. The original volcanism in the Chagos area, then, m a y have commenced in early or middle Cretaceous time.
The seaward extension of the Deccan traps has long been suspected from the great thickness of flows on the.coast and the faulted nature of the coast line. As Krishnan [1960, p. 77] wrote, 'It would appear that the Traps m a y
I 8 -
STA H
STA 70» 10
(
_
-
SEA LCVU 1
CARLSBERG RI06E
| |
(2 IS)
6.31
8.03
Fig. 3. Topographic and seismic profile between 67 and 75°E along a line between 5
r
SEYCHELLES BANK
5.41
6.62
8.25
Fig. 4. Topographic and seismic profile between 57 and 67°E along a line between 5 and
786
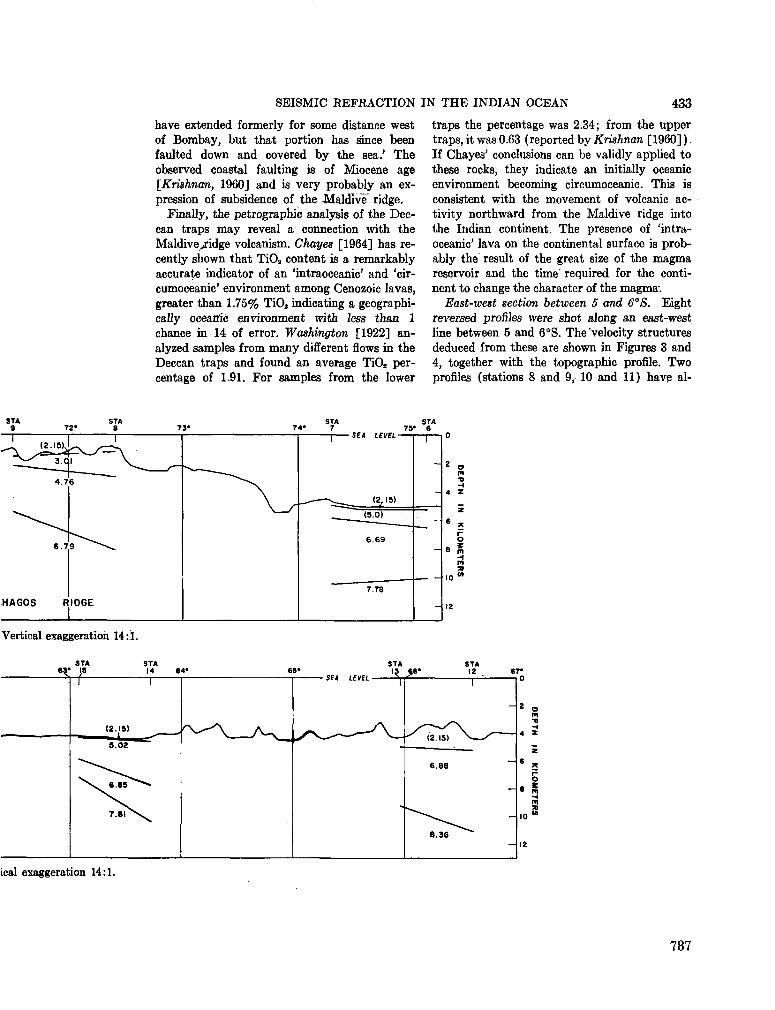
SEISMIC R E F R A C T I O N IN T H E I N D I A N O C E A N 433
have extended formerly for some distance west of Bombay, but that portion has since been faulted down and covered by the sea.' The observed coastal faulting is of Miocene age [Krishnan, 1960] and is very probably an expression of subsidence of the -MalcBvêf ridge.
Finally, the pétrographie analysis of the Dec-can traps m a y reveal a connection with the Maldive^ridge volcanism. Chayes [1964] has recently shown that TiOa content is a remarkably accurate indicator of an 'intraoceanic' and 'cir-cumoceanic' environment among Cenozoic lavas, greater than 1.75% Ti02 indicating a geographically oceanic environment with less than 1 chance in 14 of error. Washington [1922] analyzed samples from m a n y different flows in the Deccan traps and found an average TiO s percentage of 1.91. For samples from the lower
traps the percentage was 2.34; from the upper traps, it was 0.63 (reported by Krishnan [1960] ) . If Chayes' conclusions can be validly applied to these rocks, they indicate an initially oceanic environment becoming circumoceanic. This is consistent with the movement of volcanic activity northward from the Maldive ridge into the Indian continent. The presence of 'intraoceanic' lava on the continental surface is probably the result of the great size of the m a g m a reservoir and the time' required for the continent to change the character of the m a g m a - .
East-west section between 5 and 6°S. Eight reversed profiles were shot along an east-west line between 5 and 6°S. The velocity structures deduced from these are shown in Figures 3 and 4, together with the topographic profile. T w o profiles (stations 8 and 9, 10 and 11) have al-
Vertical exaggeration 14 j .
ical exaggeration 14:1.
787
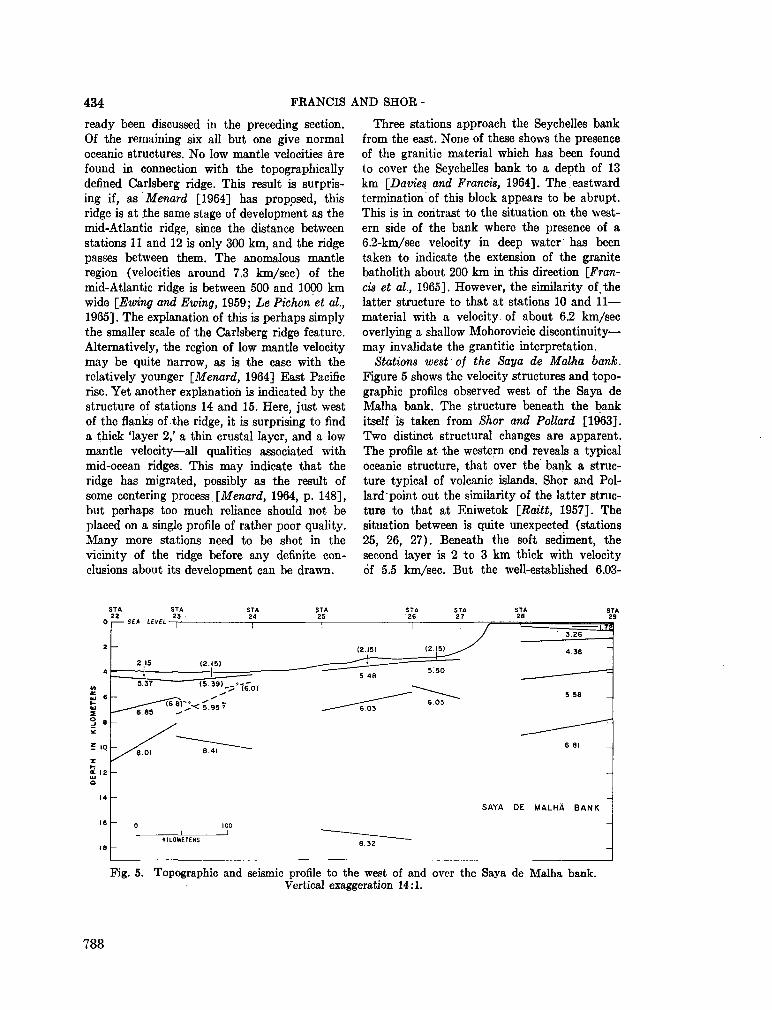
434 FEANCIS AND SHOE -
ready been discussed in the preceding section. Of the remaining six all but one give normal oceanic structures. N o low mantle velocities are found in connection with the topographically defined Carlsberg ridge. This result is surprising if, as Menard [1964] has proposed, this ridge is at the same stage of development as the mid-Atlantic ridge, since the distance between stations 11 and 12 is only 300 k m , and the ridge passes between them. T h e anomalous mantle region (velocities around 7.3 km/sec) of the mid-Atlantic ridge is between 500 and 1000 k m wide [Ewing and Ewing, 1959; Le Pichón et al., 1965]. T h e explanation of this is perhaps simply the smaller scale of the Carlsberg ridge feature. Alternatively, the region of low mantle velocity m a y be quite narrow, as is the case with the relatively younger [Menard, 1964] East Pacific rise. Yet another explanation is indicated by the structure of stations 14 and 15. Here, just west of the flanks of the ridge, it is surprising to find a thick 'layer 2 / a thin crustal layer, and a low mantle velocity—all qualities associated with mid-ocean ridges. This m a y indicate that the ridge has migrated, possibly as the result of some centering process {Menard, 1964, p. 148], but perhaps too m u c h reliance should not be placed on a single profile of rather poor quality. M a n y more stations need to be shot in the vicinity of the ridge before any definite conclusions about its development can be drawn.
Three stations approach the Seychelles bank from the east. None of these shows the presence of the granitic material which has been found to cover the Seychelles bank to a depth of 13 k m [Davies and Francis, 1964]. The eastward termination of this block appears to be abrupt. This is in contrast to the situation on the western side of the bank where the presence of a 6.2-km/sec velocity in deep water has been taken to indicate the extension of the granite batholith about 200 k m in this direction [Francis et al., 1965]. However, the similarity of the latter structure to that at stations 10 and 11— material with a velocity of about 6.2 km/sec overlying a shallow Mohorovicic discontinuity— m a y invalidate the grantitic interpretation.
Stations west of the Saya de Maüía bank. Figure 5 shows the velocity structures and topographic profiles observed west of the Saya de Malha bank. The structure beneath the bank itself is taken from Shor and Pollard [1963]. T w o distinct structural changes are apparent. The profile at the western end reveals a typical oceanic structure, that over the bank a structure typical of volcanic islands. Shor and Pollard point out the similarity of the latter structure to that at Eniwetok [Raitt, 1957]. The situation between is quite unexpected (stations 25, 26, 27). Beneath the soft sediment, the second layer is 2 to 3 k m thick with velocity of 5.5 km/sec. But the well-established 6.03-
STA STA 22 23
O i S£A LEVCL
SAYA DE MALHÀ BANK
Fig. 5. Topographic and seismic profile to the west of and over the Saya de Malha bank. Vertical exaggeration 14:1.
788
SEISMIC REFRACTION IN T H E INDIAN O C E A N 435
km/sec velocity is not observed beneath the bank, nor is a 6.8-km/sec crustal velocity observed at stations 25, 26, and 27. If the latter is masked, the crustal layer can be no shallower than 12 k m (see appendix). Four possible interpretations are (in order of preference) :
1. The 6.03-km/see velocity represents granitic material like that forming the Seychelles bank. Overlying it is volcanic material similar to thai which gives the 4.4- and 5.6-km/sec velocities beneath the Saya de Malha bank.
2. Both the 5.5- and 6.03-km/sec velocities represent granitic material, the two velocities resulting from the effect of pressure on the seismic velocity. T h e 5.72- and 6.26-km/sec velocities beneath the Seychelles bank were interpreted in this manner [Davies and Francis, 1964] following the demonstration by Steinhart and Meyer [1961] of the effect of a velocity gradient (deduced from laboratory measurements) on travel-time curves. T h e rather low velocities for the depths involved m a k e this interpretation less likely in this case. Also, w e might expect a closer correlation of dips (i.e., apparent velocities) between the 5.5- and 6.03-km/sec interfaces if both velocities were generated by a single continuous velocity gradient.
3. Since the 6.03-km/sec velocity is quite unlike anything else beneath the bank, it is also possible that the 5.5-km/sec velocity is unassociated with the 4.4- and 5.6-km/sec velocities. If the 6.03-km/sec material is indeed granitic like the Seychelles bank, the 5.5-km/sec velocity m a y represent a sedimentary formation associated with it, possibly a fairly hard limestone. The magnetic anomaly over the edge of the Saya de Malha bank should indicate whether the volcanic material ends abruptly here.
4. Both the 5.5- and 6.03-km/sec velocities represent basalt, the higher velocity being akin to the high second-layer velocities observed in the Maldive ridge area (stations 2 and 3, 4 and 5, 10 and 11). This interpretation is most unlikely. First, the travel-time plots are in c o m plete contrast, those for stations 25, 26, and 27 yielding a host of second arrivals. Second, the volcanic layer near the MaldiVe 'ridge is between 1 and 5 k m thick; the 6.03-km/sec layer here is at least 6 k m thick, and possibly as thick as 13 k m , as is the granitic layer of the Seychelles [Davies and Francis, 1964]. Third, where the high second-layer velocities are ob
served near the Maldive ridge the mantle is quite shallow; here at a similar distance from the shallow water it is 17 k m below sea level and perhaps as deep as 19 k m (see appendix).
In conclusion, then, granitic material similar to that forming the Seychelles bank appears to exist west of the Saya de Malha bank, in all probability part of the same block. If the westward limit of this material occurs between stations 23 and 24, as seems likely (see appendix), its east-west extent is about 250 k m — c o m p a rable in dimension to the Seychelles bank- B e tween these stations and the Seychelles the granitic material is probably confined by the Amirantes trench and the Mascarene ridge; to the south it m a y well continue as far as the Cargados Carajos shoals. M u c h of the Mascarene ridge seems to owe its existence to volcanism along the boundary of this continent-type mass. This does not necessarily imply that the eastern part of the continent of Africa once extended as far as the Mascarene ridge, as Baker and Miller [1963] have suggested. If the Seychelles bank owes its position as a continental block in mid-ocean to the rupture of India and Africa in the breakup of Gondwanaland [ D M Toit, 1937], elucidating the exact boundaries of this feature should help to identify its origin. T h e fact that the granitic material n o w appears to extend a considerable w a y south of the Seychelles bank itself makes the possibility of an original connection with northern Madagascar more likely.
COMPARISON W I T H O T H E R O C E A N S
Enough seismic refraction work has now been done in the northwest Indian Ocean to make a comparison with the earth's crust beneath other oceans worth while. Raitt and Shor [1959] have prepared histograms of velocities and thicknesses for the Pacific Ocean. In Figure 6 some of these are shown, together with similar histograms for the northwest Indian Ocean, the latter being prepared from the results of this paper and of Francis et al. [1965]. In the case of the Pacific Ocean, Raitt and Shor were interested in revealing the characteristics of 'typical' or 'average' oceanic structure and neglected the results from islands, trenches, ridges, and seamounts. For the Indian Ocean histograms, the only restriction has been to exclude the results from regions
789
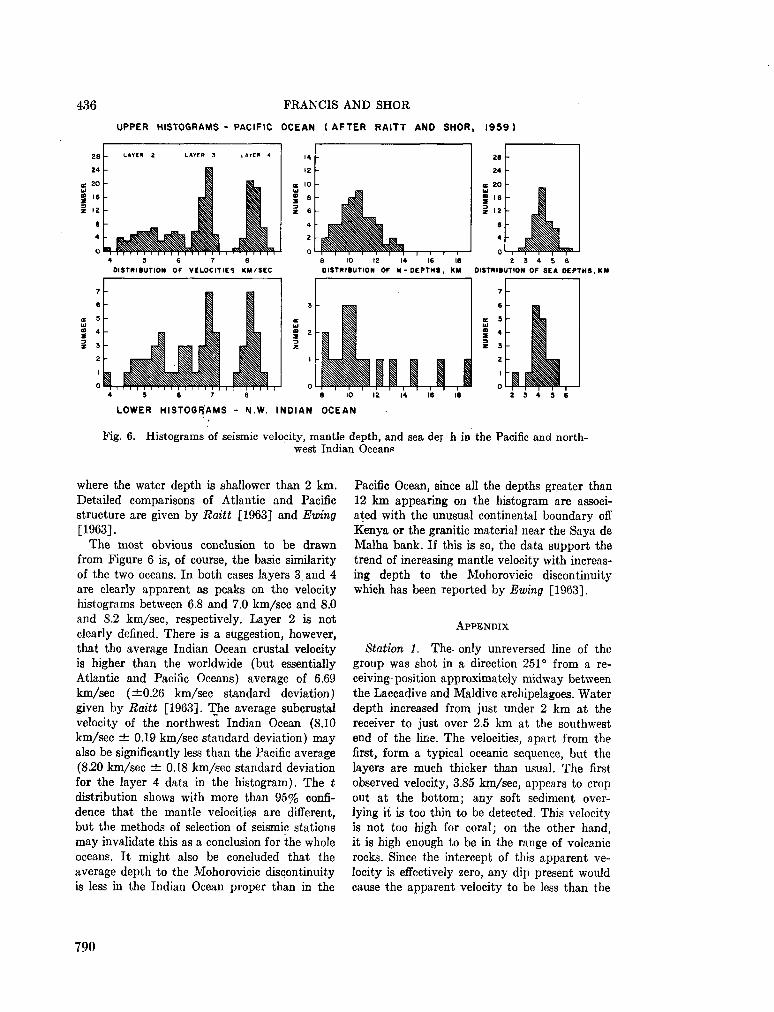
436 FRANCIS AND SHOR
UPPER HISTOGRAMS - PACIFIC OCEAN (AFTER RAITT AND SHOR, 1959)
28
24
20
16
12
a 4
0
--
LAYER 2 LAYER 3 LAYEfi 4
DISTRIBUTION OF VELOCITIES KM/SEC ia 2 Î 4 5
DISTRIBUTION OF M - D E P T H S , KM DISTRIBUTION OF SEA DEPTHS, KM
LOWER HISTOGRAMS - N.W. INDIAN OCEAN
Fig. 6. Histograms of seismic velocity, mantle depth, and sea der h in the Pacific and northwest Indian Oceans
where the water depth is shallower than 2 k m . Detailed comparisons of Atlantic and Pacific structure are given by Raitt [1963] and Ewing [1963].
The most obvious conclusion to be drawn from Figure 6 is, of course, the basic similarity of the two oceans. In both cases layers 3 and 4 are clearly apparent as peaks on the velocity histograms between 6.8 and 7.0 km/sec and 8.0 and 8.2 km/sec, respectively. Layer 2 is not clearly defined. There is a suggestion, however, that the average Indian Ocean crustal velocity is higher than the worldwide (but essentially Atlantic and Pacific Oceans) average of 6.69 km/sec (±0.26 km/sec standard deviation) given by Raitt [1963]. The average subcrustal velocity of the northwest Indian Ocean (8.10 km/sec ± 0.19 km/sec standard deviation) m a y also be significantly less than the Pacific average (8.20 km/sec ± 0.18 km/sec standard deviation for the layer 4 data in the histogram). The t distribution shows with more than 95% confidence that the mantle velocities are different, but the methods of selection of seismic stations m a y invalidate this as a conclusion for the whole oceans. It might also be concluded that the average depth to the Mohorovicic discontinuity is less in the Indian Ocean proper than in the
Pacific Ocean, since all the depths greater than 12 k m appearing on the histogram are associated with the unusual continental boundary off Kenya or the granitic material near the Saya de Malha bank. If this is so, the data support the trend of increasing mantle velocity with increasing depth to the Mohorovicic discontinuity which has been reported by Ewing [1963].
A P P E N D I X
Station 1. The- only unreversed line of the group was shot in a direction 251° from a receiving position approximately midway between the Laccadive and Maldive archipelagoes. Water depth increased from just under 2 k m at the receiver to just over 2.5 k m at the southwest end of the line. The velocities, apart from the first, form a typical oceanic sequence, but the layers are much thicker than usual. The first observed velocity, 3.85 km/sec, appears to crop out at the bottom; any soft sediment overlying it is too thin to be detected. This velocity is not too high for coral; on the other hand, it is high enough to be in the range of volcanic rocks. Since the intercept of this apparent velocity is effectively zero, any dip present would cause the apparent velocity to be less than the
790
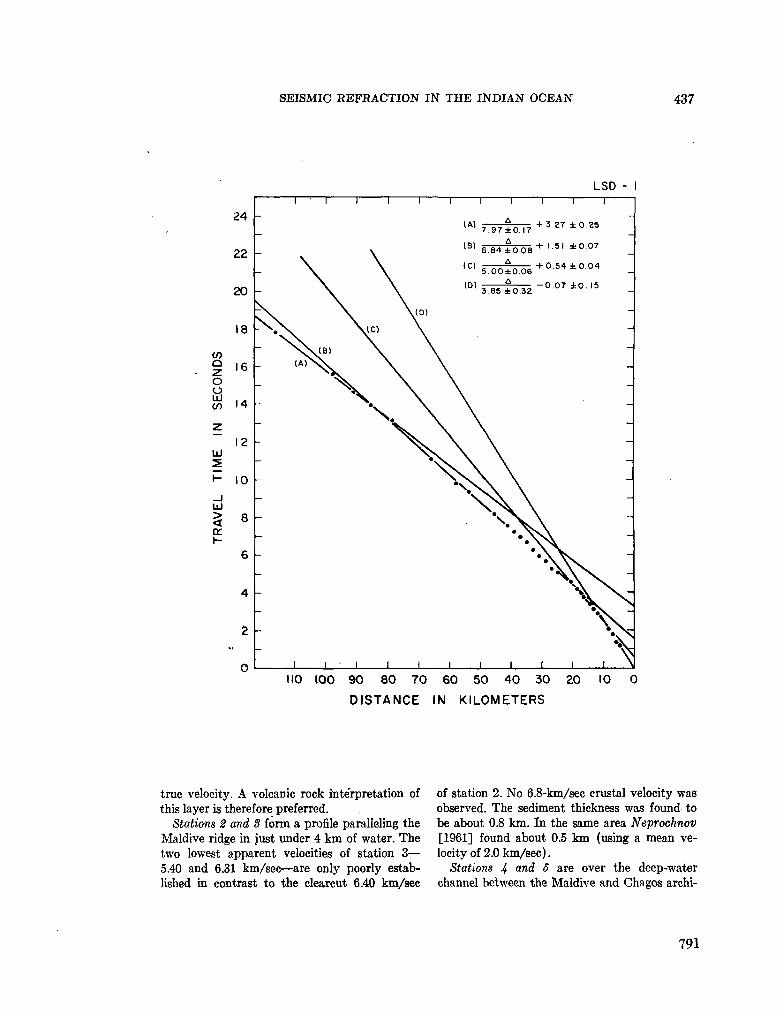
SEISMIC REFRACTION IN THE INDIAN OCEAN 437
LSD -
CO
o z o o UJ CO
UJ
_l UJ
HO 100 90 80 70 60 50 40 30 20 10 0
DISTANCE IN KILOMETERS
true velocity. A volcanic rock interprétation of this layer is therefore preferred.
Stations 2 and 3 form a profile paralleling the Maldive ridge in just under 4 k m of water. The two lowest apparent velocities of station 3— 5.40 and 6.31 km/sec—are only poorly established in contrast to the clearcut 6.40 km/sec
of station 2 . N o 6.8-km/sec crustal velocity was observed. The sediment thickness was found to be about 0.8 k m . In the same area Neprochnov [1961] found about 0.5 k m (using a mean velocity of 2.0 km/sec) .
Stations 4 and 5 are over the deep-water channel between the Maldive and Chagos archi-
791
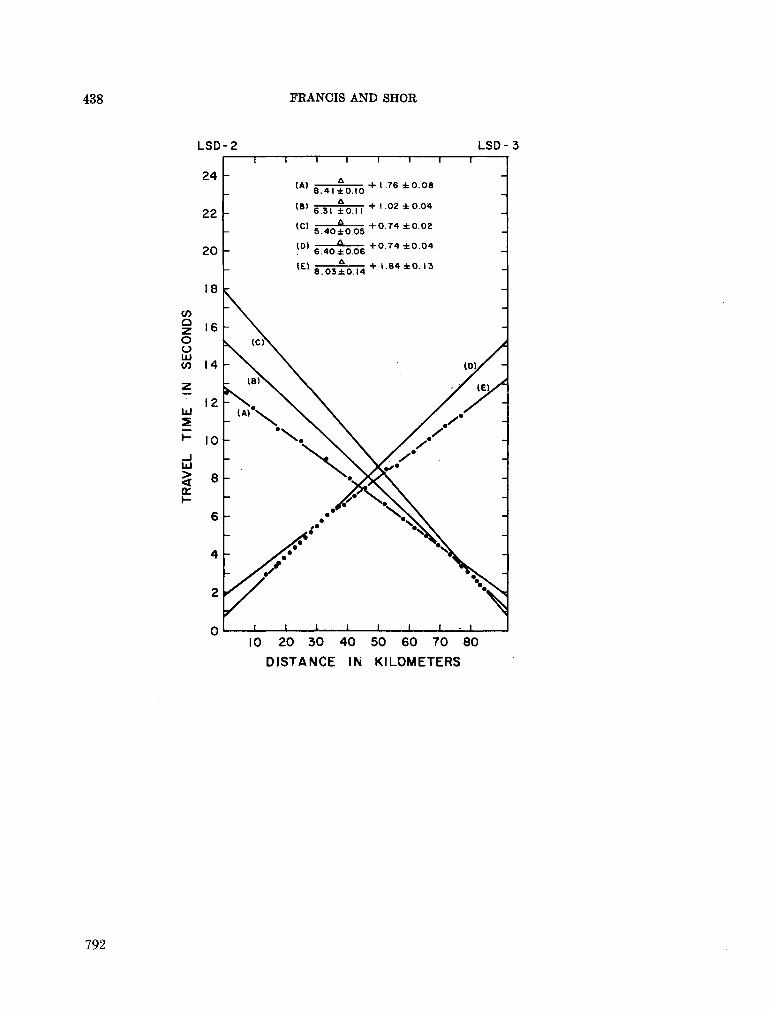
438 FRANCIS AND SHOR
LSD-
24
22
20
LSD-3 T ~
(A)
(B)
(C)
(D)
(El
8.4l±0.t0
6.31 ±0.1 I
5.40±0.05
6.40 ±0.06 A
8.03±0.I4
+ 1.76 ±0.08
+ 1.02 ±0.04
+ 0.74 ±0.02
+ 0.74 ±0.04
+ l.84±0. 13
to O z o o UJ
UJ
2
ce
10 20 30 40 50 60 70 80
DISTANCE IN KILOMETERS
792
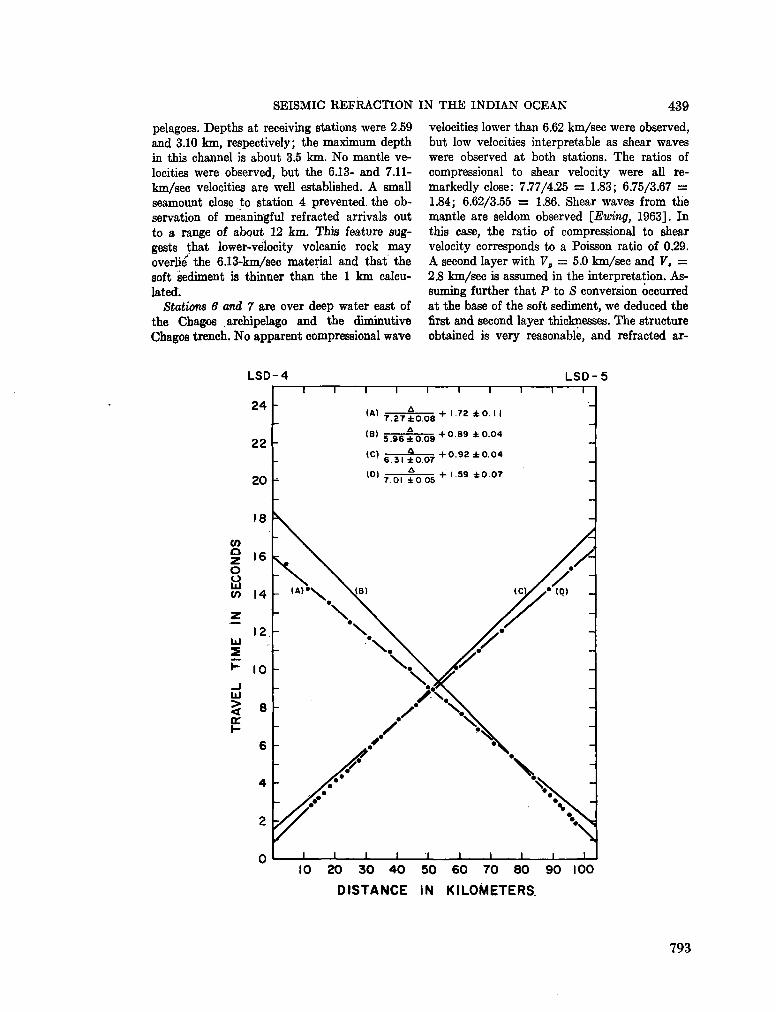
S E I S M I C R E F R A C T I O N IN T H E I N D I A N O C E A N 439
pelagoes. Depths at receiving stations were 2.59 and 3.10 k m , respectively; the m a x i m u m depth in this channel is about 3.5 k m . N o mantle velocities were observed, but the 6.13- and 7.11-km/sec velocities are well established. A small seamount close to station 4 prevented, the observation of meaningful refracted arrivals out to a range of about 12 k m . This feature suggests that lower-velocity volcanic rock m a y overlie the 6.13-km/sec material and that the soft sediment is thinner than the 1 k m calculated.
Stations 6 and 7 are over deep water east of the Chagos archipelago and the diminutive Chagos trench. N o apparent compressional wave
velocities lower than 6.62 km/sec were observed, but low velocities interpretable as shear waves were observed at both stations. The ratios of compressional to shear velocity were all re-markedly close: 7.77/4.25 = 1.83; 6.75/3.67 = 1.84; 6.62/3.55 = 1.86. Shear waves from the mantle are seldom observed [Ewing, 1963]. In this case, the ratio of compressional to shear velocity corresponds to a Poisson ratio of 0.29. A second layer with Vp = 5.0 km/sec and V. = 2.8 km/sec is assumed in the interpretation. Assuming further that P to S conversion occurred at the base of the soft sediment, w e deduced the first and second layer thicknesses. The structure obtained is very reasonable, and refracted ar-
LSD-4 LSD-5
CO
o z o £á (O
UJ
UJ
ce h-
24
22
20
18
16
14
12
10
8
6
4
2
n
1
-
O _ (A)»V
-
-
-
'/7
7
i — ^ 1" "i~
. . A (A) — 1 7\27±0.08 (ni A l D I 5.96 ±0.09
' 6.31 ±0.07
7.01 ±0.05
N^B)
. . . , ,
+ 1.72 ±0.1 1
1 f\ Q Q .A. f\ f\A T U . 0 3 X U.U*»
+ 1.59 ±0.07
¿r
/^x /
/ . ' •
s* m
. i i i i..
XX • X
*v
_ 1 1
1 •
# r
\
^
i
i
¿ •• (0)
•
1
. . . • J . . .
-
-
-
-
¿ ™
-
-
-
-
-
-
-
1 10 20 30 40 50 60 70 80 90 100
DISTANCE IN KILOMETERS.
793
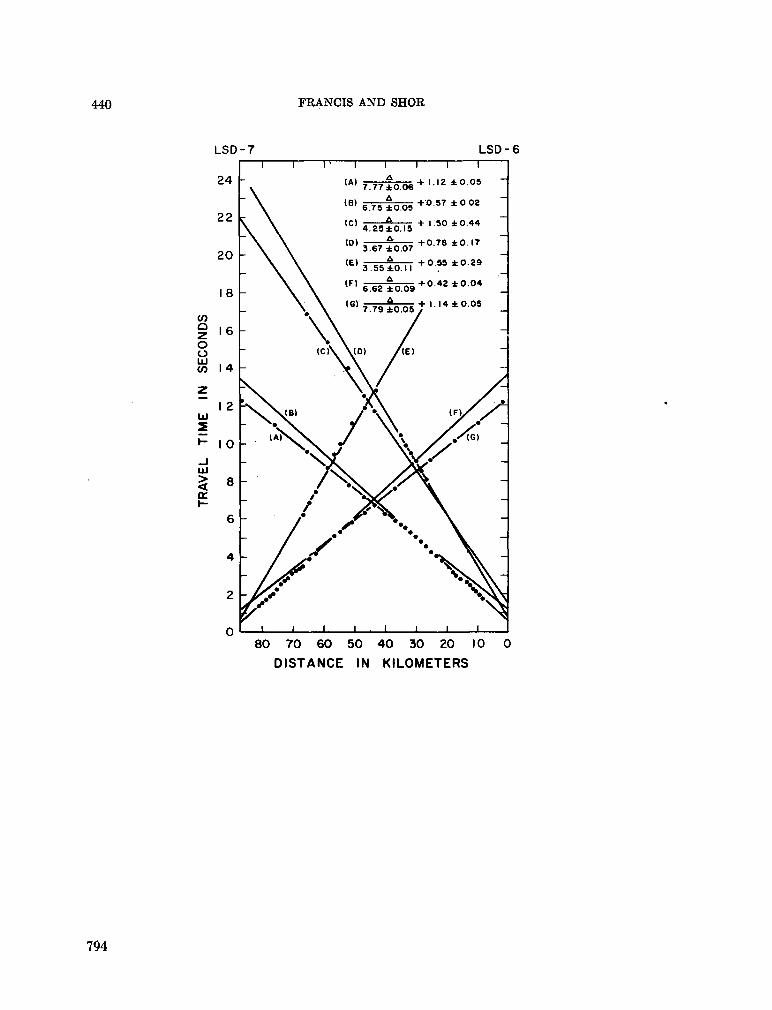
440 FRANCIS AND SHOR
80 70 60 50 40 30 20 10 0
DISTANCE IN KILOMETERS
794
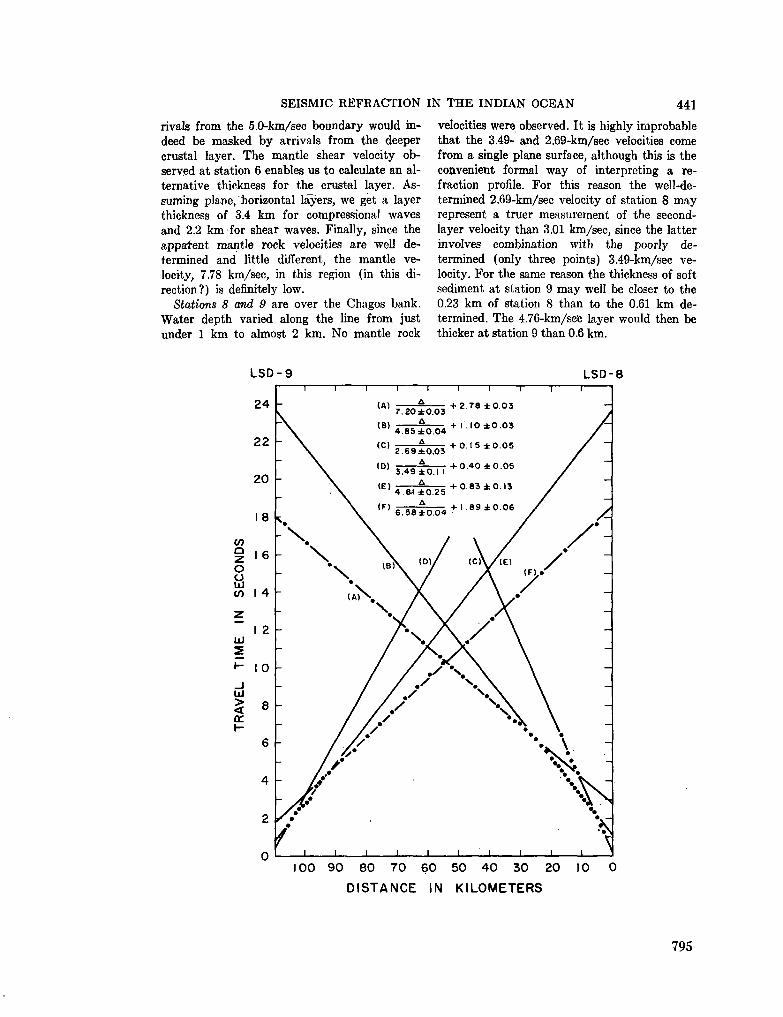
SEISMIC REFRACTION IN T H E INDIAN O C E A N 441
rivals from the 5.0-km/sec boundary would indeed be masked by arrivals from the deeper crustal layer. The mantle shear velocity observed at station 6 enables us to calculate an alternative thickness for the crustal layer. A s suming plane, horizontal layers, w e get a layer thickness of 3.4 k m for compressional waves and 2.2 k m for shear waves. Finally, since the apparent mantle rock velocities are well determined and little different, the mantle velocity, 7.78 km/sec, in this region (in this direction?) is definitely low.
Stations 8 and 9 are over the Chagos bank. Water depth varied along the line from just under 1 k m to almost 2 k m . N o mantle rock
velocities were observed. It is highly improbable that the 3.49- and 2.69-km/sec velocities come from a single plane surface, although this is the convenient formal w a y of interpreting a refraction profile. For this reason the well-determined 2.69-km/sec velocity of station 8 m a y represent a truer measurement of the second-layer velocity than 3.01 km/sec, since the latter involves combination with the poorly determined (only three points) 3.49-km/sec velocity. For the same reason the thickness of soft sediment at station 9 m a y well be closer to the 0.23 k m of station 8 than to the 0.61 k m determined. The 4.76-km/se'c layer would then be thicker at station 9 than 0.6 k m .
LSD-8
' I 1 I ' I L
100 90 80 70 60 50 40 30 20 10 0
DISTANCE IN KILOMETERS
795
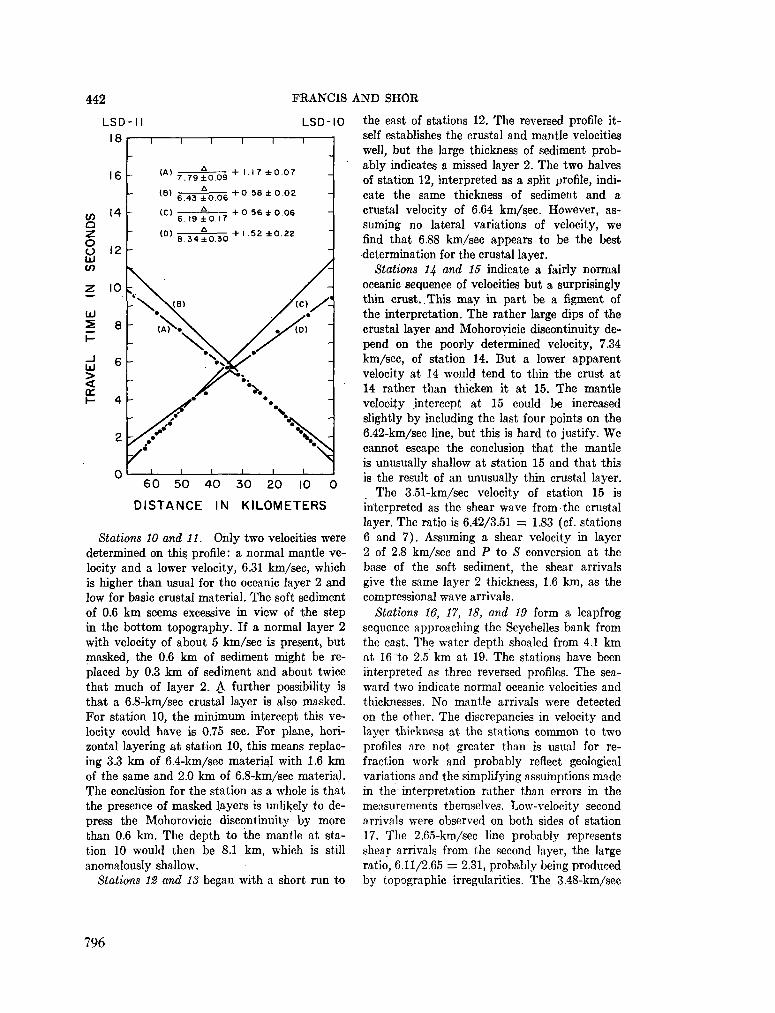
442 FRANCIS AND SHOR
LSD-II L S D - I O 18 i 1 1 1 1 1 1 1
60 50 40 30 20 10 0
DISTANCE IN KILOMETERS
Stations 10 and 11. Only two velocities were determined on this profile: a normal mantle velocity and a lower velocity, 6.31 km/sec, which is higher than usual for the oceanic layer 2 and low for basic crustal material. The soft sediment of 0.6 k m seems excessive in view of the step in the bottom topography. If a normal layer 2 with velocity of about 5 km/sec is present, but masked, the 0.6 k m of sediment might be replaced by 0.3 k m of sediment and about twice that m u c h of layer 2 . A further possibility is that a 6.8-km/sec crustal layer is also masked. For station 10, the m i n i m u m intercept this velocity could have is 0.75 sec. For plane, horizontal layering at station 10, this means replacing 3.3 k m of 6.4-km/sec material with 1.6 k m of the same and 2.0 k m of 6.8-km/sec material. The conclusion for the station as a whole is that the presence of masked layers is unlikely to depress the Mohorovicic discontinuity by more than 0.6 k m . The depth to the mantle at station 10 would then be 8.1 k m , which is still anomalously shallow.
Stations 12 and 13 began with a short run to
the east of stations 12. The reversed profile itself establishes the crustal and mantle velocities well, but the large thickness of sediment probably indicates a missed layer 2 . The two halves of station 12, interpreted as a split profile, indicate the same thickness of sediment and a crustal velocity of 6.64 km/sec. However, assuming no lateral variations of velocity, w e find that 6.88 km/sec appears to be the best determination for the crustal layer.
Stations H and 15 indicate a fairly normal oceanic sequence of velocities but a surprisingly thin crust.. This m a y in part be a figment of the interpretation. The rather large dips of the crustal layer and Mohorovicic discontinuity depend on the poorly determined velocity, 7.34 km/sec, of station 14. But a lower apparent velocity at 14 would tend to thin the crust at 14 rather than thicken it at 15. The mantle velocity .intercept at 15 could be increased slightly by including the last four points on the 6.42-km/sec line, but this is hard to justify. W e cannot escape the conclusion that the mantle is unusually shallow at station 15 and that this is the result of an unusually thin crustal layer.
The 3.51-km/sec velocity of station 15 is interpreted as the shear wave from the crustal layer. The ratio is 6.42/3.51 = 1.83 (cf. stations 6 and 7) . Assuming a shear velocity in layer 2 of 2.8 km/sec and P to S conversion at the base of the soft sediment, the shear arrivals give the same layer 2 thickness, 1.6 k m , as the compressional wave arrivals.
Stations 16, 17, 18, and 19 form a leapfrog sequence approaching the Seychelles bank from the east. The water depth shoaled from 4.1 k m at 16 to 2.5 k m at 19. The stations have been interpreted as three reversed profiles. The seaward two indicate normal oceanic velocities and thicknesses. N o mantle arrivals were detected on the other. The discrepancies in velocity and layer thickness at the stations c o m m o n to two profiles are not greater than is usual for refraction work and probably reflect geological variations and the simplifying assumptions made in the interpretation rather than errors in the measurements themselves. Low-velocity second arrivals were observed on both sides of station 17. The 2.65-km/sec line probably represents shear arrivals from the second layer, the large ratio, 6.11/2.65 = 2.31, probably being produced by topographic irregularities. The 3.48-km/sec
796
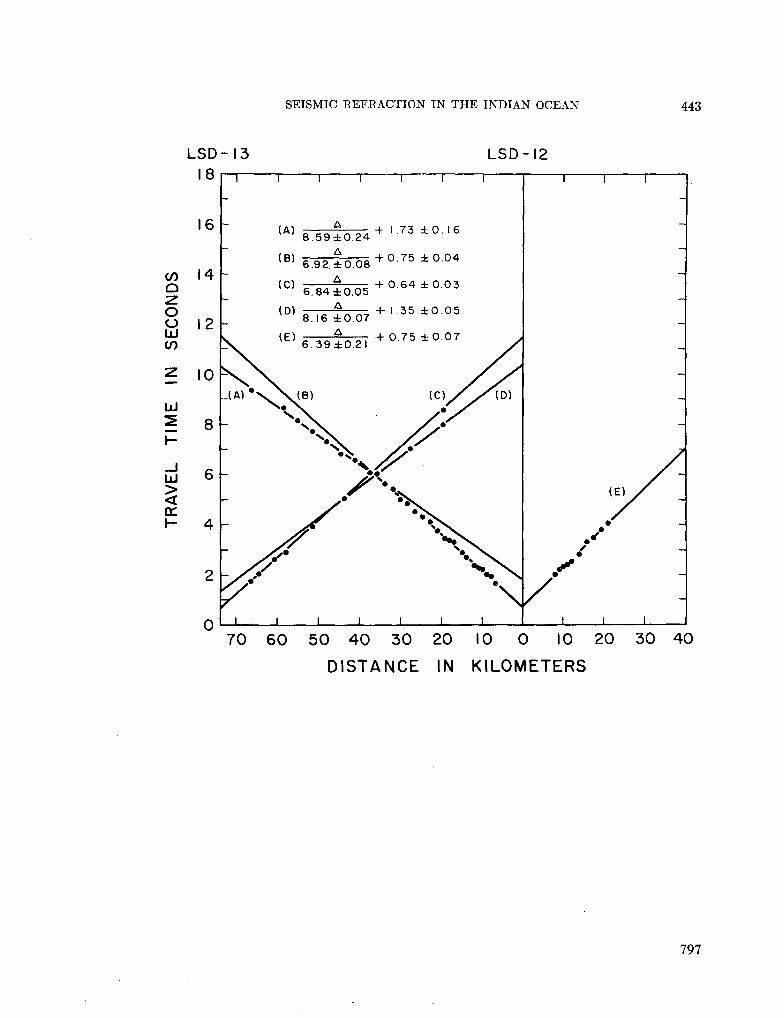
SEISMIC REFRACTION IN THE INDIAN OCEAN 443
70 60 50 40 30 20 10 0 10 20 30 40
DISTANCE IN KILOMETERS
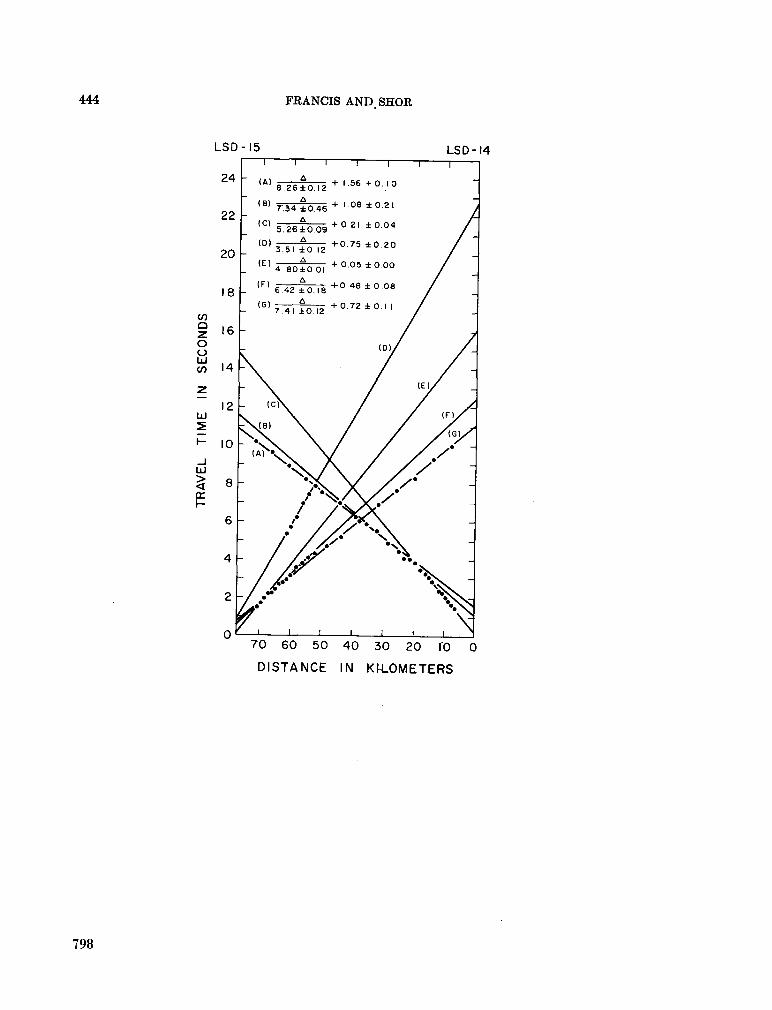
444 FRANCIS AND.SHOR
LSD-15
24
LSD-14
22
20
18
(ft
O o Lü
en 14
(A)
(B)
8.26±0.I2
i 1 r —
+ I .56 +0 .10
T
7-34 ±0.46 + ' 0 8 * 0 . 2 1
(O *-
(D)
(E)
(F)
(G)
5.26±0.09 A
3.51 ±0 12 A
4 80±0.0I A
6.42 ±0.18 A
7.4 I ±0 12
+ 0.21 ±0.04
+ 0.75 ±0 .20
+ 0.05 ±0.00
+ 0.48 ± 0.08
+ 0.72 ±0.11
<D)>
(E)y
70 60 50 40 30 20 10 0
DISTANCE IN KH_0METERS
798
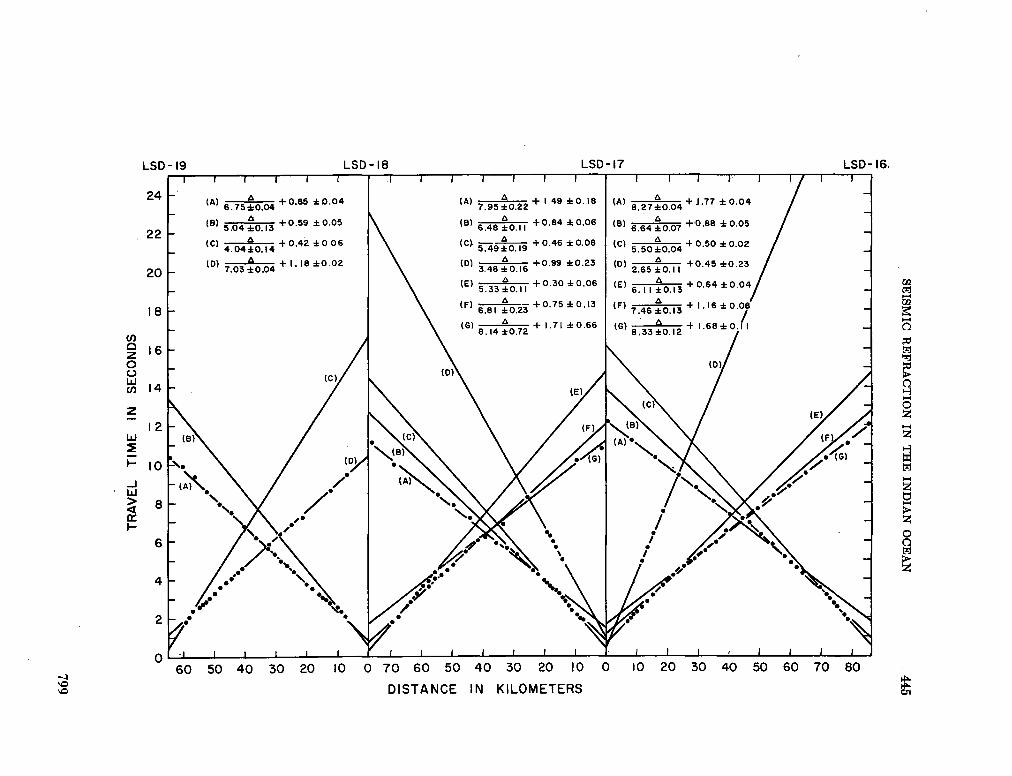
SEISM
IC R
EFR
AC
TIO
N IN
TH
E IN
DIA
N O
CEA
N
445
(0
-as _J -17 LSD -18
Q
00
_l
92 i
1 1
r
1
1 1
1
1
1
1
*" in
CM
IO
*
5^
^—
O
o
O
CM
O
p
^
—w
1. O
O
O
O
d
(
+¡ -H
-H
+; -H
- 3
O
^V
. H
+; i>.
oo
O
m
^"
to
co
r-- to
in
ï
»
-
—
-î d
d
o
d
-
(0
—
+ +
+
+
+
+
+
•4 * o d
•H <1
1
-C
M
CO*
<
0
00
tí
— c
_
d c
-H
H
0>
M
<* a
-
- c
+
H
— <
—
CM
C
M
d •H
<
m
en
N
^ < a
- X
«
1
+ 0.85 ±0
< S d •H
3
u>
< '
1
1
r-o d -H
<]
10
id
» o d •H
<
o m
in
_ d •H
«
m
<o CM
D
L>
O
L
0.08 0.23
4 -H
-H
H
0.46 0.99
h +
+
H
-d
-« «
00
* 10
2 d -H <J
o>
«-in
CO
d +: «
"CO
«•
IO
**. *~
*. a
u
o
L
î U
>
CM
5
O
O
+ 0.42 ±0 + 1.18 ±0
IO
d
-H
4
q
m
d -H
«
O
*
q d +; IO
o i*-*
i "
S
1 1
1
IO
d
-H
<
z U>
Ü
L
) )' C
H
H
5
IÍ 1
l>
5
C
>• H
z d
-H
«
IO
ro
in
J
L
|
IO
d +
; <i
(0
f-'
CM
d -H
IO
IO
00
L
O
10
> d
1
-H
î
—
) —
- +
IO
C
M
d
-H
<
co
<0
CM
d -H
* co
_ L
«>
1 1
l\
^^
•^
^
o ^
S^Q
o
1 1
1 IV
Jv 1
1
1
1
1
X ¿x>
5
X X
»
X
\-X
\«
X
x N^^V»
S
/XL
/ //^
-^ /
/•
^^
S/s
y
^>
/i/ s
/^»
C
A/
/
/'A
X^ N
. ^
x\
>. ^
x\x^^
^^^ S
/+}
//s
S /
m ' -»
//
/
^ Ü • X
\
X
\
s
s
/ /
i x
i
\ A
i i
i
1 1
Y V
¿\
\\
X:» ^
^ •* «
^-
.^ y
.,••'•
//
\f*%
/ • \
> xs
. •
2\ X
. \
1 1
1 y/\
/'
-—
\V
\ • ^w ^O^U
_
^•
^/V
i
<<F-£
' /
. —
—
>-• \y
/ , r
s&
'# • • x
• -
, ,
,^
o
ta
o
-|o o (M
O
IO
O O
m
o (0
o
CVJ tM
CM
O
CM
00
tO
<t
SQ
N003S
co o
co
co
NI
3W
I1
-|3A
Vai
CM
799
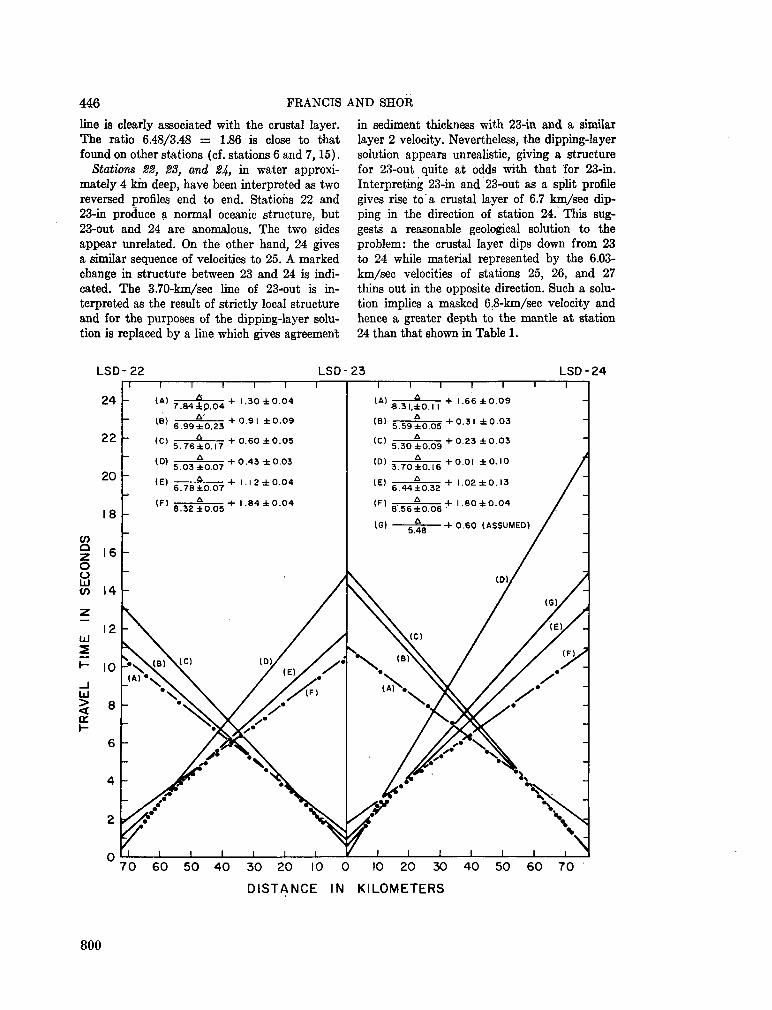
446 FRANCIS AND SHOR
line is clearly associated with the crustal layer. T h e ratio 6.48/3.48 = 1.86 is close to that found on other stations (cf. stations 6 and 7 ,15) .
Stations 22, 23, and 24, in water approximately 4 kin deep, have been interpreted as two reversed profiles end to end. Stations 22 and 23-in produce a normal oceanic structure, but 23-out and 24 are anomalous. The two sides appear unrelated. O n the other hand, 24 gives a similar sequence of velocities to 25. A marked change in structure between 23 and 24 is indicated. The 3.70-km/sec line of 23-out is interpreted as the result of strictly local structure and for the purposes of the dipping-layer solution is replaced by a line which gives agreement
in sediment thickness with 23-in and a similar layer 2 velocity. Nevertheless, the dipping-layer solution appears unrealistic, giving a structure for 23-out quite at odds with that for 23-in. Interpreting 23-in and 23-out as a split profile gives rise to a crustal layer of 6.7 km/sec dipping in the direction of station 24. This suggests a reasonable geological solution to the problem: the crustal layer dips down from 23 to 24 while material represented by the 6.03-km/sec velocities of stations 25, 26, and 27 thins out in the opposite direction. Such a solution implies a masked 6.8-km/sec velocity and hence a greater depth to the mantle at station 24 than that shown in Table 1.
70 60 50 40 30 20 10 0 10 20 30 40 50 60 70
DISTANCE IN KILOMETERS
800
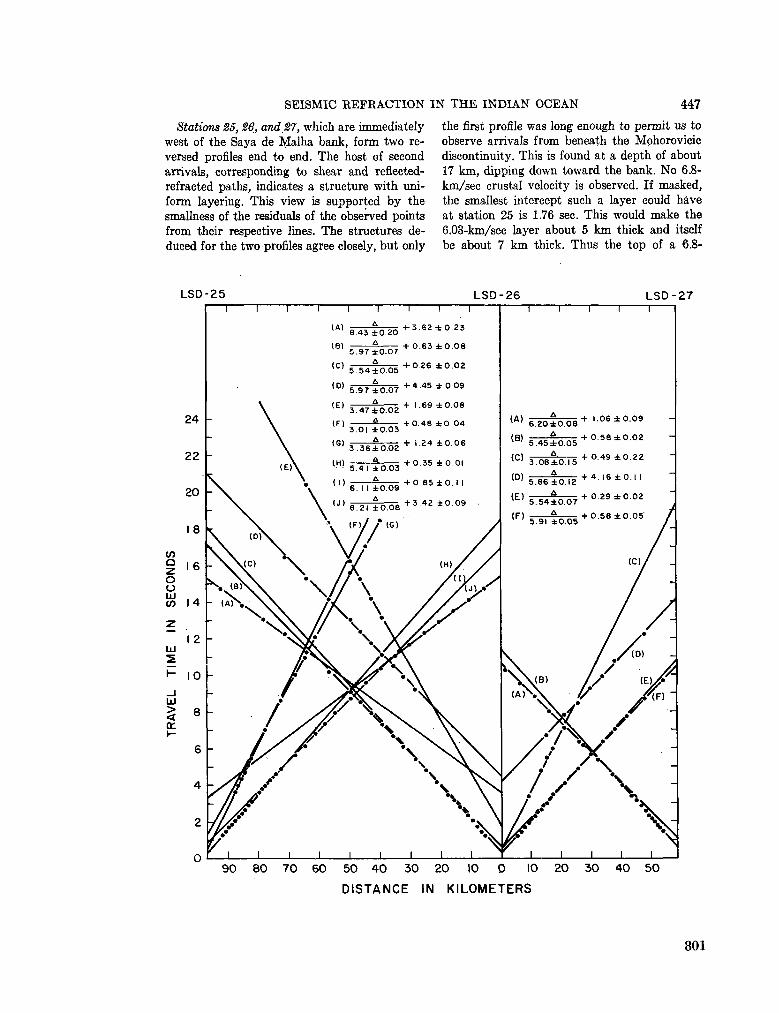
SEISMIC REFRACTION IN THE INDIAN OCEAN 447
Stations 25,26, and,27, which are immediately-west of the Saya de Malha bank, form two reversed profiles end to end. The host of second arrivals, corresponding to shear and reflected-refracted paths, indicates a structure with uniform layering. This view is supported by the smallness of the residuals of the observed points from their respective lines. The structures deduced for the two profiles agree closely, but only
the first profile was long enough to permit us to observe arrivals from beneath the Mphorovicic discontinuity. This is found at a depth of about 17 k m , dipping down toward the bank. N o 6.8-km/sec crustal velocity is observed. If masked, the smallest intercept such a layer could have at station 25 is 1.76 sec. This would make the 6.03-km/sec layer about 5 k m thick and itself be about 7 k m thick. Thus the top of a 6.8-
LSD-25 LSD-26 LSD-27
(A)
i 1 1 1 r
6.43 ±0.20 + 3 6 2 * 0 2 3
(B) 5 . 9 7 Í 0 . 0 7 + 0 6 3 * 0 0 8
1 C 1 5.54±0.05 + 0 2 6 * 0 0 2
(0> 5.97 ±0.07 + 4 4 5 ± 0 0 9
+ 1.69 ±0.08
6.20±0.08
5.45*0.05
+ l.06±0.09
+ 0.58 ±0.02
+ 0.49 ±0.22
+ 4. 16 ±0.1 I
90 80 70 60 50 40 30 20 10 0 10 20 30 40
DISTANCE IN KILOMETERS
801

448 FRANCIS A N D SHOR
km/sec layer, if present, can be no shallower
than 12 k m below sea level and the depth to the
mantle no more than 19 k m .
The 3.01- and 3.36-km/see velocities observed
at station 25 are interpreted as the shear waves
associated with the 5.41- and 6.11-km/sec ve
locities, respectively. The ratios are 5.41/3.01 =
1.80 and 6.11/3.36 = 1.82 (cf. stations 6 and 7,
15). Similarly the 3.47- and 3.08-km/sec veloci
ties of station 26 are from shear waves corre
sponding to the 5.97- and 5.54-km/sec compres-
sional velocities, respectively. The ratios are
5.97/3.47 = 1.72 and 5.54/3.08 = 1,80. Whereas
the P arrivals of station 25 considered alone
indicate 0.3 k m of sediment overlying 2.8 k m
of 5.41-km/sec material, the S arrivals show
0.6 k m of sediment over 2.4 k m of 3.01-km/sec
material.
Reflected-refracted arrivals observed on both
sides of station 26 suffered reflection at the sea
floor in addition to refraction along the 6.03-
km/sec layer. The apparent velocities agree
closely with those of the simply refracted ar
rivals.
Variable-angle reflection shots at station 25
produced strong sub-bottom returns which
clearly originated from the same horizon as the
5.48-km/sec refracted arrivals. These gave a
sediment velocity of 1.70 km/sec, which is con
siderably less than the 2.15 km/sec which has
been assumed throughout this paper. However,
since sub-bottom reflections are seldom dis
tinguishable from single shots (and when they
are, the reflecting horizon is frequently not the
base of the sediment), the assumed velocity has
been used throughout. The difference this makes
to sediment thickness is small: for station 25,
1.70 km/sec gives 0.31 k m of sediment; 2.15
km/sec gives 0.41 k m .
Acknowledgments. W e thank Captain Marvin Hopkins and the crew of the R . V . Horizon and Captain Alan Phinney and the crew of the R . V . Argo for their assistance in gathering the data. Alan Jones was responsible for the instrumentation. Dwight Pollard was in charge of seismic operations on Horizon. George Hohnhaus handled explosives. Professor Russell Raitt gave advice on methods of analysis. Gloria Slack and Shirley Fisher assisted in data reduction. David Crouch drew the illustrations. Professor H . W . Menard and Dr. R . L . Fisher critically reviewed the manuscript and made helpful suggestions. To all these people we express our thanks.
This work was supported by the National Sci
ence Foundation under grant 22255 and by the Office of Naval Research under contract Nonr 2216(05) as part of the International Indian Ocean Expedition.
REFERENCES
Admiralty Marine Science Publication 4> Bathymétrie, magnetic and gravity investigations, H . M . S . O W E N , 1961-1962, London, 1963.
Baker, B . A., and J. A . Miller, Geology and geo-chronology of the Seychelles Islands, Nature, 199, 346-348, 1963.
Balakrishna, S., Velocities of compressional waves in some Indian rocks, Trans. Am. Geophys. Union, 39, 711-712,1958.
Bathymétrie Chart of the Indian Ocean, scale 1:15,000,000, published by the Main Administration of Geodesy and Cartography of the Governmental Geological Committee of the U.S.S.R., Moscow, 1963.
Chayes, F., A pétrographie distinction between Cenozoic volcanics in and around the open oceans, J. Geophys. Res., 69, 1573-1588, 1964.
Davies, D . , and T . J. G . Francis, The crustal structure of the Seychelles bank, Deep-Sea Res., 11, 921-927, 1964.
D u Toit, A . L., Our Wandering Continents, Oliver and Boyd, Edinburgh, 1937.
Ewing, J. I., Elementary theory of seismic refraction and reflection measurements, The Sea, vol. 3, pp. 3-19, Interscience Publishers, New York, 1963.
Ewing, J. I., The mantle rocks, The Sea, vol. 3, pp. 103-107, Interscience Publishers, N e w York, 1963.
Ewing, J. I., and M . Ewing, Seismic refraction measurements in the Atlantic Ocean basins, in the Mediterranean Sea, on the mid-Atlantic ridge, and in the Norwegian Sea, Bull. Geol. Soc. Am., 70, 291-319,1959.
Francis, T . J. G . , D . Davies, and M . N . Hill, Crustal structure between Kenya and the Seychelles, Phil. Trans. Roy. Soc. London, in press, 1965.
Gaskell, T . F., M . N . Hill, and J. C . Swallow, Seismic measurements made by H . M . S . C H A L L E N G E R in the Atlantic, Pacific and Indian Oceans, and in the Mediterranean Sea, 1950-1953, Phil. Trans. Roy. Soc. London, A, 251, 23-83, 1958.
Glennie, E . A. , Report on the value of gravity in the Maldive and Laccadive Islands, John Murray Expedition, 1933-34, Sci. Repts. (Brit. Museum Nat. Hist.), J(4), 95-107, 1936.
Heezen, B . C , and M . Ewing, The midroeeanic ridge, The Sea, vol. 3, pp. 388-408, Interscience Publishers, New York, 1963.
Heezen, B . C. , and M . Tharp, Physiographic Diagram of the Indian Ocean, Geological Society of America, New York, 1965.
Krishnan, M . S., Geology of India and Burma, chapter 15, 4th éd., Higginbothams, Madras, 1960.
802
SEISMIC INFRACTION IN T H E INDIAN O C E A N 449 Le Pichón, X . , R . E . Houtz, C . L . Drakr, and J. E .
Nafe, Crustal structure of the mid-ocean ridges, 1, Seismic refraction measurements, J. Geophys. Res., 70, 319-339, 1965.
Menard, H . W . , Marine Geology oj the Pacific, McGraw-Hill Book Company, New York, 1964.
Neprochnov, Lvu P., Sedimentary thickness in the Arabian Sea basin, Dokl. Akad. Nauk SSR, 139, 177-179, 1961. (Translated by L . Hutchison, edited by R . L . Fisher, Scripps Institution, 1962.)
Pepper, J. F., and G . M . Everhart, The Indian Ocean—The geology of its bordering lands and the configuration of its floor, Miscellaneous Geologic Investigations M a p 1-380, U . S. Geological Survey, Washington, D . C , 1963.
Raitt, R . W . , Geophysical measurements, Océanographie Instrumentation, Rancho Sante Fe Conference, June 21-23, 1952, Nat. Acad. Sci.— Natl. Res. Council Publ. 309, p. 389, 1956.
Raitt, R . W . , Seismic refraction studies of Eniwe-tok atoll, U. S. Geol. Surv. Profess. Paper 260-S, 1957.
Raitt, R . W . , The crustal rocks, The Sea, vol. 3, pp. 85-102, Interscience Publishers, New York, 1963.
Raitt, R . W . , and G . G . Shot-, Jr., Pacific oceanic crust, Preprints oj Abstracts of Papers, p. 49,
First International Océanographie Congress, New York, August 31-September 12, 1959.
Shor, G . G . , Jr., Refraction and reflection techniques and procedure, The Sea, vol. 3, pp. 20-38, Interscience Publishers, New York, 1963.
Shor, G . G . , Jr., and D . D . Pollard, Seismic investigations oí Seychelles and Saya de Malha banks, northwest Indian Ocean, Science, l/t2, 48-49,1963.
Shor, G . G . , Jr., and D . D . Pollard, Mohole site selection studies north of Maui, J. Geophys. Res., 69, 1627-1637,1964.
Steinhart, J. S., and R . P. Meyer, Explosion studies of continental structure, Carnegie Inst. Wash. Publ. 622, 1961.
Wadia, D . N . , Geology oj India, chapter 16, 3rd éd., Macmillan and Company, London, 1953.
Washington, H . W . , Deccan traps and other plateau basalts, Bull. Geol. Soc. Am., 33, 765-804, 1922.
Wilson, J. T. , A resume of the geology of islands in the main ocean basins, vol. 1, Atlantic and Indian Oceans, Sci. Kept. /,, Institute of Earth Sciences, University of Toronto, 1963.
Wiseman, J. D . H . , and R . B . S. Sevvell, The floor of the Arabian Sea, Geol. Mag., 74, 219, 1937.
(Manuscript received August 28, 1965; revised October 25, 1965.)
803
Reprinted from Science, vol. 150. no. 3.696. 1965, p. 605-610.
Copyright 1967 by the American Association for the Advancement of Science.
Igneous Rocks of the Indian Celeste G . Engel
Robert L . Fisher
A . E . J. Engel
The complex ridgelike features and extensive intervening basins of the Indian Ocean were first clearly indicated by surveys of the D a n a and John Murray expeditions, and by the gravity-measuring traverses of Vening Meinesz (I). Recent océanographie investigations undertaken by the International Indian Ocean Expedition, 1960-1965, have further clarified several major geological features, especially its fascinating patterns of both elongated and bifurcated faulted ridges, the large "plateaus" and irregular deeps, and the texture of the deep-sea floor (2). Figure 1 is a simplified m a p of the Indian Ocean showing one version of the gross patterns of the ridge complex shallower than 4000 m . and the locations of islands and dredge samples discussed in this report.
Ocean Floor
Early petrologic studies in the Indian Ocean were confined to the volcanic islands which lie along and flank the Indian Ocean ridges (3). These islands include Mauritius, Rodriguez, Réunion, N e w Amsterdam. St. Paul, Croze», and the Kerguelen Archipelago (Fig. f). Each consists of one or m o r e variously coalescing, 'sometimes fragmented, volcanic cones. Continuing studies, ranging over m o r e than a century, have shown that the d o m i nant volcanic rocks capping these islands and the higher submarine volcanoes are alkali basalts, which are c o m m o n l y accompanied by subordinate, derivative m e m b e r s of the alkali series, especially andesine- and oligo-clase-andesites. trachytes, and m o r e rarely phonolites and rhyolites (4). Olivine-rich (picritic) basalts are
found on some of the islands; tholeiitic basalts with low concentrations of potassium, high concentrations of calciu m and silica, and high ratios of calcium to magnesium are extruded, notably on Mauritius and Réunion islands (5). Small inclusions of m a g n e sium-rich peridot ite and pyroxene a m -phibolite occur in the alkali basalts and in associated beds of ash, but these inclusions represent less than 0.1 percent of the exposed rock. T h e alkali-rich basalts comprise over 9 0 percent of the igneous rocks of most islands.
These relative abundances of rock types from the exposed parts of the volcanic cones along the Indian Ocean ridge systems are similar to those from volcanic islands of the Atlantic and Pacific oceans, where alkali basalts and subordinate m e m b e r s of the alkali series also predominate. In the Atlantic and Pacific, olivine-rich basalts are c o m m o n but volumetrically subordinate. Tholeiitic basalts occur only rarely, except in the several major oceanic rift-island systems such as H a waii and Iceland, where they are abundant (6).
T h e alkali basalts which are typical and predominant constituents of the higher oceanic volcanoes are characterized, a m o n g the basalts, by relatively high concentrations of K , N a , Ti, and P and a high ratio of F e s + to Fe'-' + . They also contain distinctly higher concentrations of B a , La , N b , P b , R b , T h . U , and Zr, and higher ratios of K to R b , Sr87 to Sr8", and Pb 2 "" to Pb-" 4 than are found in picritic and tholeiitic basalts of the oceans. Detailed discussions of the chemical characteristics of oceanic basalts, including abundances of minor and trace elements and of the isotopes of strontium and lead, are being published separately (7).
T h e dominance of alkali-rich basalts on readily accessible oceanic islands caused early penologists to suggest that these rocks were characteristic of the entire oceanic crust (8). It was in the light of this petrologic concept that W i s e m a n (9) examined and first described dredge hauls from the m o r e deeply submerged parts of the ridge complex in the northwestern Indian Ocean. T h e location of Wiseman's samples is shown in Fig. 1 (positior JM). W i s e m a n recognized that the ridge rocks were not typical alkali basalts like those found on the islands of the Indian Ocean. H e noted that the dredged basalts were relatively uni-
Abstract. Four dredge hauls from near the crest and from the eastern flank of the seismlcally active Mid-Indian Ocean Ridge at 23" to 24"S, at depths of 3700 to 4300 meters, produced only low-potassium tholeiitic basalt similar in chemical and minéralogie composition to basalts characteristic of ridges and rises in the A tlantic and Pacific oceans. A fifth haut, from a depth of 4000 meters on the lower flank of a seamount on the ocean side of the Indonesian Trench, recovered tholeiitic basalt with higher concentrations of K and Tl and slightly lower amounts of Si and Ca than the typical oceanic tholellte of the ridge. The last sample is vesicular, suggesting depression of the area since the basalt was emplaced. Many of the rocks dredged are variously decomposed and hydrated, but there is no evidence of important chemical modification toward conversion of the lava flows to spilite during extrusion or solidification.
Collected reprints of the International Indian Ocean Expedition, vol. IV, contribution no. 249 805
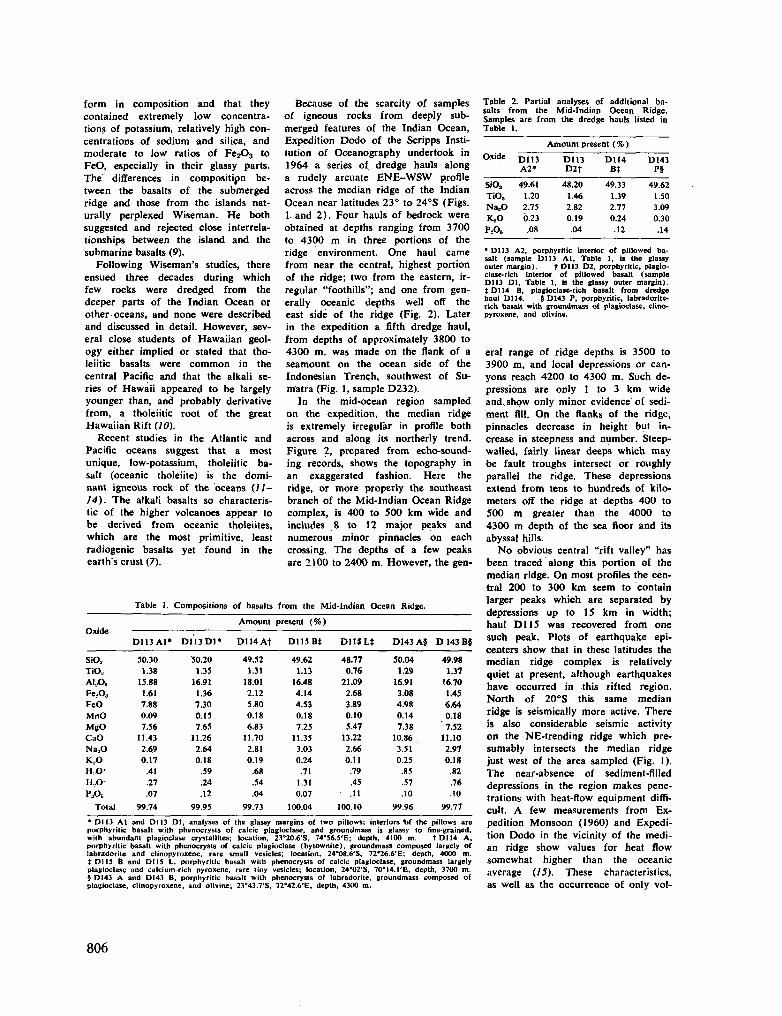
form in composition and that they contained extremely low concentrations of potassium, relatively high concentrations of sodium and silica, and moderate to low ratios of F e 2 0 3 to F e O , especially in their glassy parts. The differences in composition between the basalts of the submerged ridge and those from the islands naturally perplexed W i s e m a n . H e both suggested and rejected close interrelationships between the island and the submarine basalts (9).
Following Wiseman's studies, there ensued three decades during which few rocks were dredged from the deeper parts of the Indian Ocean or other oceans, and none were described and discussed in detail. However, several close students of Hawaiian geology either implied or stated that tho-leiitic basalts were c o m m o n in the central Pacific and that the alkali series of Hawaii appeared to be largely younger than, and probably derivative from, a tholeiitic root of the great Hawaiian Rift (10).
Recent studies in the Atlantic and Pacific oceans suggest that a most unique, low-potassium, tholeiitic basalt (oceanic tholeiite) is the dominant igneous rock of the oceans (11-14). The alkali basalts so characteristic of the higher volcanoes appear to be derived from oceanic tholeiites, which are the most primitive, least radiogenic basalts yet found in the earth's crust (7).
Because of the scarcity of samples of igneous rocks from deeply submerged features of the Indian Ocean, Expedition D o d o of the Scripps Institution of Oceanography undertook in 1964 a series of dredge hauls along a rudely arcuate E N E - W S W profile across the median ridge of the Indian Ocean near latitudes 23° to 24°S (Figs. 1. and 2 ) . Four hauls of bedrock were obtained at depths ranging from 3700 to 4300 m in three portions of the ridge environment. O n e haul came from near the central, highest portion of the ridge; two from the eastern, irregular "foothills"; and one from generally oceanic depths well off the east side of the ridge (Fig. 2). Later in the expedition a fifth dredge haul, from depths of approximately 3800 to 4300 m , was m a d e on the flank of a seamount on the ocean side of the Indonesian Trench, southwest of Sumatra (Fig. 1, sample D 2 3 2 ) .
In the mid-ocean region sampled on the expedition, the median ridge is extremely irregular in profile both across and along its northerly trend. Figure 2, prepared from echo-sounding records, shows the topography in an exaggerated fashion. Here the ridge, or more properly the southeast branch of the Mid-Indian Ocean Ridge complex, is 400 to 500 k m wide and includes 8 to 12 major peaks and numerous minor pinnacles on each crossing. The depths of a few peaks are 2100 to 2400 m . However, the gen-
Table 2. Partial analyses of additional basalts from the Mid-Indian Ocean Ridge. Samples are from the dredge hauls listed in Table 1.
Amount present (%) Oxide
SiOa
TiOa
N a , 0
K 2 0 P„O5
D113 A2»
49.61
1.20
2.75
0.23
.08
D113
D2t
48.20
1.46
2.82
0.19
.04
D114
Bt
49.33
1.39
2.77
0.24
.12
D143
P§
49.62
1.50
3.09
0.30
.14
* D113 A 2 , porphyritic interior of pillowed basalt (sample D113 A l , Table 1, is the glassy outer margin). fD113 D 2 , porphyritic, plagio-dase-rich interior of pillowed basalt (sample D113 D l , Table 1, is the glassy outer margin). Î Dl 14 B , plagioclase-rich basalt from dredge haul D114. § D143 P, porphyritic, labradorite-rich basalt with groundmass of plagioclase, clino-pyroxene, and olivine.
eral range of ridge depths is 3500 to 3900 m , and local depressions or canyons reach 4200 to 4300 m . Such depressions are only 1 to 3 k m wide and.show only minor evidence of sediment fill. O n the flanks of the ridge, pinnacles decrease in height but increase in steepness and number. Steep-walled, fairly linear deeps which m a y be fault troughs intersect or roughly parallel the ridge. These depressions extend from tens to hundreds of kilometers off the ridge at depths 400 to 500 m greater than the 4000 to 4300 m depth of the sea floor and its abyssal hills.
N o obvious central "rift valley" has been traced along this portion of the median ridge. O n most profiles the central 200 to 300 k m seem to contain larger peaks which are separated by depressions up to 15 k m in width; haul D 1 1 5 was recovered from one such peak. Plots of earthquake epicenters show that in these latitudes the median ridge complex is relatively quiet at present, although earthquakes have occurred in this rifted region. North of 20°S this same median ridge is seismically more active. There is also considerable seismic activity on the NE-trending ridge which presumably intersects the median ridge just west of the area sampled (Fig. 1). The near-absence of sediment-filled depressions in the region makes penetrations with heat-flow equipment difficult. A few measurements from Expedition Monsoon (1960) and Expedition D o d o in the vicinity of the median ridge show values for heat flow somewhat higher than the oceanic average (15). These characteristics, as well as the occurrence of only vol-
Table 1. Compositions of basalts from the Mid-Indian Ocean Ridge.
Amount present (%) Oxide ;
SiOa
TiO,
Al,Oa
Fea03
FeO M n O M g O CaO N a . O
K O H O * H . O -
P:A Total
D 1 1 3 A 1 *
50.30
1.38
15.88
1.61
7.88
0.09
7.56
11.43
2.69
0.17
.41
.27
.07 99.74
D 1 1 3 D 1 *
'50.20
1.35
16.91
1.36
7.30
0.15
7.65
11.26
2.64
0.18
.59
.24
.12
99.95
D114At
49.52
1.31
18.01
2.12
5.80
0.18
6.83
11.70
2.81
0.19
.68
.54
.04
99.73
D 1 I 5 B Í
49.62
1.13
16.48
4.14
4.53
0.18
7.25
11.35
3.03
0.24
.71 1.31
0.07
100.04
D115LÍ
48.77
0.76
21.09
2.68
3.89
0.10
5.47
13.22
2.66
0.11
.79
.45
.11 100.10
D143 A§
50.04
1.29
16.91
3.08
4.98
0.14
7.38
10.86
3.51
0.25
.85
.57
.10
99.96
D1431
49.98
1.37
16.70
1.45
6.64
0.18
7.52
11.10
2.97
0.18
.82
.76
.10 99.77
* Dl 13 Al and DII3 Dl , analyses of the glassy margins of two pillows; interiors "of the pillows are porphyritic basalt with phenocrysts of calcic plagioclase, and groundmass is glassy to fine-grained, with abundant plagioclase crystallites; location, 23°20.6'S, 74°56.5'E; depth, 4100 m . tD114 A , porphyritic basalt with phenocrysts of calcic plagioclase (bytownite), groundmass composed largely of labr«rdorite and clinopyroxene, rare small vesicles; location, 24°08.6'S, 72°26.6'E; depth, 4000 m . î D113 B and Dl IS L , porphyritic basalt with phenocrysts of calcic ptagioclase, groundmass largely plagioclase and calcium-rich pyroxene, rare tiny vesicles; location, 24°02'S, 70°l4.1'E, depth, 3700 m . § D143 A and DI43 B . porphyritic basalt with phenocrysts of labradorite, groundmass composed of plagioclase, clinopyroxene, and olivine; 23C43.7'S, 72°42.6'E, depth, 4300 m .
806
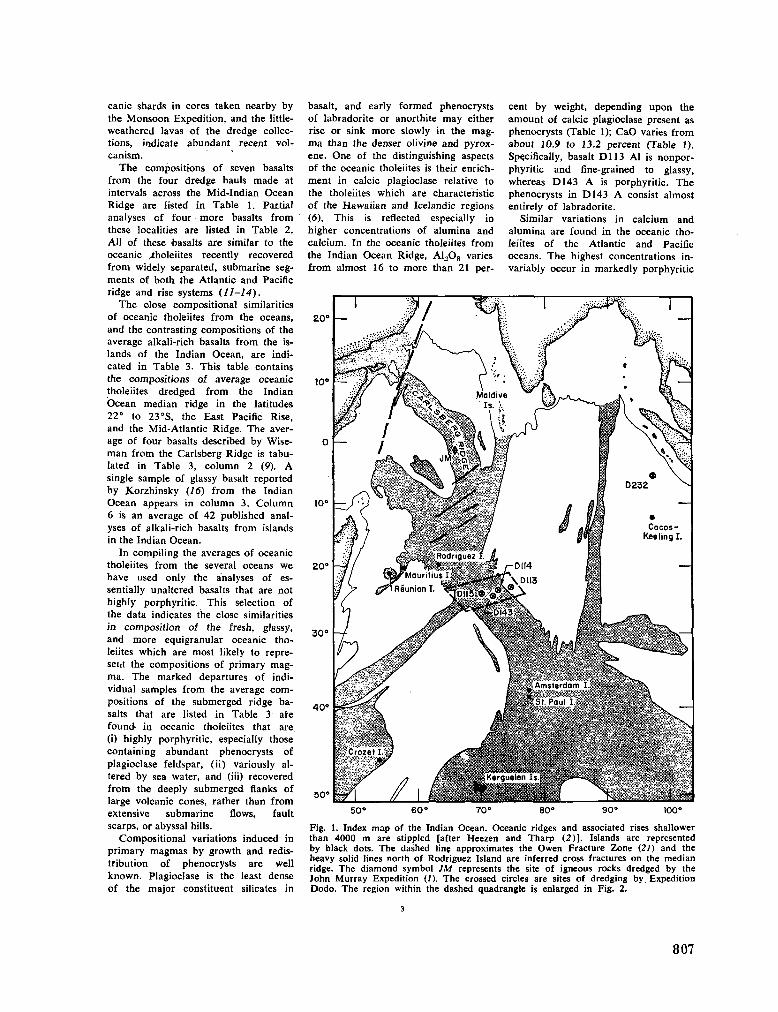
canic shards in cores taken nearby by the M o n s o o n Expedition, and the little-weathered lavas of the dredge collections, indicate abundant recent vol-canism.
T h e compositions of seven basalts from the four dredge hauls m a d e at intervals across the Mid-Indian Ocean Ridge are listed in Table 1. Partial analyses of four more basalts from these localities are listed in Table 2. All of these basalts are similar to the oceanic ytholeiites recently recovered from widely separated, submarine segments pf both the Atlantic and Pacific ridge and rise systems (11-14).
T h e close compositional similarities of oceanic tholeiites from the oceans, and the contrasting compositions of the average alkali-rich basalts from the islands of the Indian Ocean, are indicated in Table 3. This table contains the compositions of average oceanic tholeiites dredged from the Indian Ocean median ridge in the latitudes 22° to 23°S, the East Pacific Rise, and the Mid-Atlantic Ridge. T h e average of four basalts described by Wisem a n from the Carlsberg Ridge is tabulated in Table 3, column 2 (9). A single sample of glassy basalt reported by Xorzhinsky (16) from the Indian Ocean appears in column 3. C o l u m n 6 is an average of 42 published analyses of alkali-rich basalts from islands in the Indian Ocean.
In compiling the averages of oceanic tholeiites from the several oceans w e have used only the analyses of essentially unaltered basalts that are not highly porphyritic. This selection of the data indicates the close similarities in composition of the fresh, glassy, and more equigranular oceanic tholeiites which are most likely to represent the compositions of primary m a g m a . T h e marked departures of individual samples from the average c o m positions of the submerged ridge basalts that are listed in Table 3 afe found- in oceanic tholeiites that are (i) highly porphyritic, especially those containing abundant phenocrysts of plagioclase feldspar, (ii) variously altered by sea water, and (iii) recovered from the deeply submerged flanks of large volcanic cones, rather than from extensive submarine flows, fault scarps, or abyssal hills.
Compositional variations induced in primary m a g m a s by growth and redistribution of phenocrysts are well k n o w n . Plagioclase is the least dense of the major constituent silicates in
basalt, and early formed phenocrysts of labradorite or anorthite m a y either rise or sink more slowly in the m a g m a than the denser olivine and pyroxene. O n e of the distinguishing aspects of the oceanic tholeiites is their enrichment in calcic plagioclase relative to the tholeiites which are characteristic of the Hawaiian and Icelandic regions (6). This is reflected especially in higher concentrations of alumina and calcium. In the oceanic tholeiites from the Indian Ocean Ridge, A 1 2 0 3 varies from almost 16 to more than 21 per
cent by weight, depending upon the amount of calcic plagioclase present as phenocrysts (Table 1); C a O varies from about 10.9 to 13.2 percent (Table 1). Specifically, basalt D 1 1 3 Al is nonpor-phyritic and fine-grained to glassy, whereas D 1 4 3 A is porphyritic. T h e phenocrysts in D 1 4 3 A consist almost entirely of labradorite.
Similar variations in calcium and alumina are found in the oceanic tholeiites of the Atlantic and Pacific oceans. T h e highest concentrations invariably occur in markedly porphyritic
50° 60° 70° 80° 90° 100°
Fig. 1. Index m a p of the Indian Ocean. Oceanic ridges and associated rises shallower than 4000 m are stippled [after Heezen and Tharp (2)]. Islands are represented by black dots. The dashed line approximates the O w e n Fracture Zone (21) and the heavy solid lines north of Rodriguez Island are inferred cross fractures on the median ridge. The diamond symbol JM represents the site of igneous rocks dredged by the John Murray Expedition (/). The crossed circles are sites of dredging by. Expedition Dodo. The region within the dashed quadrangle is enlarged in Fig. 2.
807
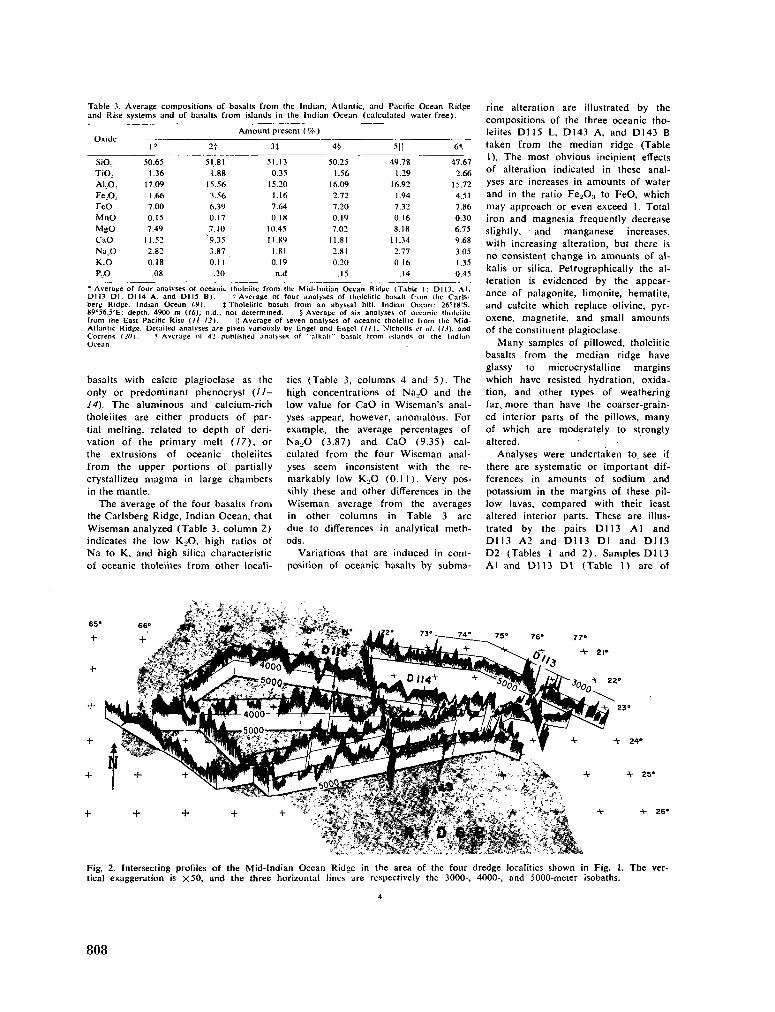
Table 3. Average compositions of basalts from the Indian, Atlantic, and Pacific Ocean Ridge and Rise systems and of basalts from islands in the Indian Ocean (calculated water-free).
Oxide
SiO.
T i O .
ALO ;
FeL.0;
FeO M n O MsO CaO Nil,O
K O p,o
l"
50.65
1.36 17.09
1.66 7.00
0.15
7.49
11.52
2.82
0.18
.08
2-;-
51.81
1.88 15.56
3.56 6.39
0.17
.7.10
9.35
3.87 0.1 1
.20
A m o u n t present ( % )
3t
51.13
0.35
15.20
1.16 7.64
0.18
10.45
11.89
1.81
0.19
n.d
4S
50.25
1.56
16.09
2.72
7.20 0.19
7.02
11.81
2.81
0.20
.15
511 49.78
1.29
16.92
1.94
7.32
0.16
8.18 11.34
2.77
0.16 .14
6<
47.67
2.66
15.72
4.51 7.86
0.30
6.75
9.68
3.05
1.35
0.45
* Average of four analvses of oceanic tholeiite from the Mid-Indian Ocean Ridge (Table I: Dl 13. A I . DI 13 D I . DI 14 A . and DI 15 B ) . t Average of four analyses of tholciitic basalt from the Carls-berg Ridge. Indian Ocean (-9). J Tholciitic basalt from an abyssal hill. Indian Ocean: 26°!8'S. H9°56.5'E: depth. 4900 m (16); n.d-, not determined. § Average of six analyses of oceanic iholeiitc from the East Pacific Rise (JI-12). || Average of seven analyses of oceanic tholeiite from the Mid-Atlantic Ridge. Detailed analyses are given variously by Engel and Engcl (11), Nicholls el til. (IJ), and Correns (20). • Average ol 42 published analyses of "alkali" basalt from islands of the Indian Ocean
basalts with calcic plagioclase as the only or predominant phenocryst (II— 14). The aluminous and calcium-rich tholeiites are either products of partial melting, related to depth of derivation of the primary melt (17), or the extrusions of oceanic tholeiites from the upper portions of partially crystallized m a g m a in large chambers in the mantle.
The average of the four basalts from the Carlsberg Ridge, Indian Ocean, that Wiseman analyzed (Table 3. column 2) indicates the low K . . O , high ratios of N a to K . and high silica characteristic of oceanic tholeiites from other locali
ties (Table 3, columns 4 and 5 ) . The high concentrations of Na^.O and the low value for C a O in Wiseman's analyses appear, however, anomalous. For example, the average percentages of N a . O (3.87) and C a O (9.35) calculated from the four Wiseman analyses seem inconsistent with the remarkably low K o O (0.1 I). Very possibly these and other differences in the Wiseman average from the averages in other columns in Table 3 are due to differences in analytical methods.
Variations that are induced in c o m position of oceanic basalts by subma
rine alteration are illustrated by the compositions of the three oceanic tholeiites D 1 1 5 L , D 1 4 3 A , and D 1 4 3 B taken from the median ridge (Table 1). T h e most obvious incipient effects of alteration indicated in these analyses are increases in amounts of water and in the ratio F e 2 O s to F e O , which m a y approach or even exceed 1. Total iron and magnesia frequently decrease slightly, and manganese increases, with increasing alteration, but there is no consistent change in amounts of alkalis or silica. Petrographically the alteration is evidenced by the appearance of palagonite, limonite, hematite, and calcite which replace olivine, pyroxene, magnetite, and small amounts of the constituent plagioclase.
M a n y samples of pillowed, tholeiitic basalts from the median ridge have glassy to microcrystalline margins which have resisted hydration, oxidation, and other types of weathering far, more than have the coarser-grained interior parts of the pillows, m a n y of which are moderately to strongly altered.
Analyses were undertaken to see if there are systematic or important differences in amounts of sodium and potassium in the margins of these pillow lavas, compared with their least altered interior parts. These are illustrated by the pairs D 1 1 3 A l and D 1 1 3 A 2 and D 1 1 3 D l and D l 13 D 2 (Tables I and 2 ) . Samples D 1 I 3 A I and D 1 1 3 D l (Table I) are of
+ 24»
•V 25°
Fig. 2. Intersecting profiles of the Mid-Indian Ocean Ridge in the area of the four dredge localities shown in Fig. 1. The vertical exaggeration is x50 , and the three horizontal lines are respectively the 3000-, 4000-, and 5000-meter isobaths.
808
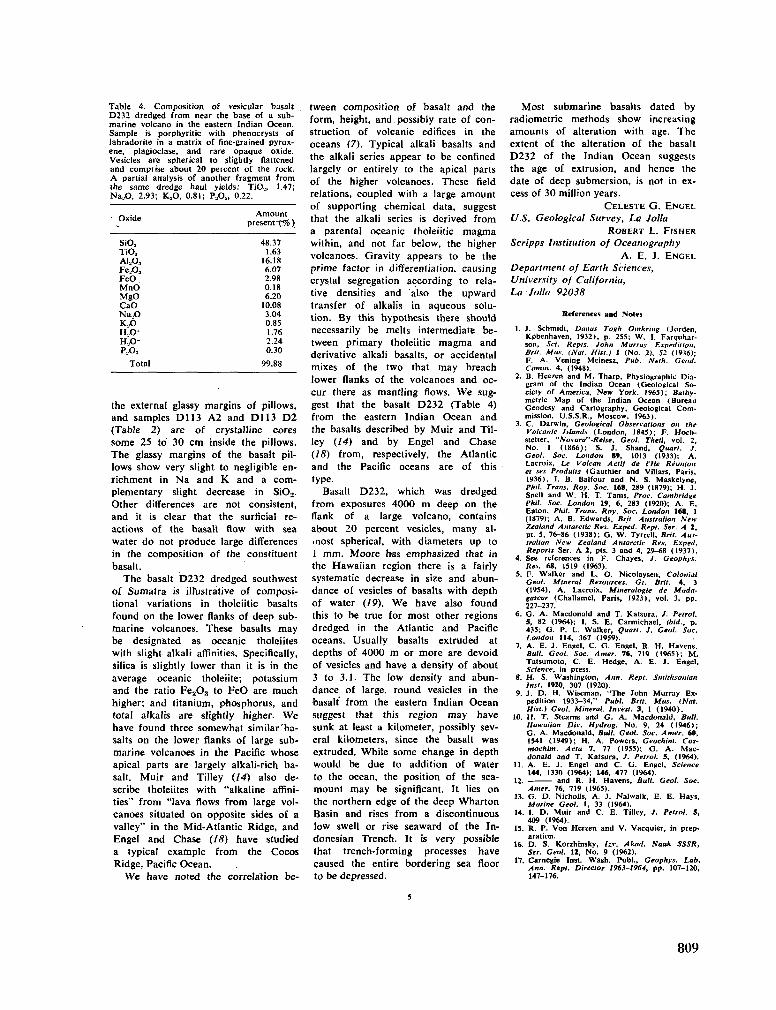
Table 4. Composición of vesicular basait D232 dredged from near the base of a submarine volcano in the eastern Indian Ocean. Sample is porphyritic with phenocrysts of labradorite in a matrix of fine-grained pyroxene, plagioclase, and rare opaque oxide. Vesicles are spherical to slightly flattened and comprise about 20 percent of the rock. A partial analysis of another fragment from the same dredge haul yields: TiO.., 1.47; NagO, 2.93; K . .O , 0.81; P s03 , 0.22.
Oxide
SiO„ TiO.. A L Ó , Fe.03
FeO M n O M g O CaO N a . O K Ó H O * H O P A
Total
Amount present^% )
48.37 1.63
16.18 6.07 2.98 0.18 6.20
10.08 3.04 0.85 1.76 2.24 0.30
99.88
the external glassy margins of pillows, and samples D 1 1 3 A 2 and D 1 1 3 D 2 (Table 2) are of crystalline cores some 25 to 30 c m inside the pillows. T h e glassy margins of the basalt pillows show very slight to negligible enrichment in N a and K . and a c o m plementary slight decrease in SiOo. Other differences are not consistent, and it is clear that the surficial reactions of the basalt flow with sea water do not produce large differences in the composition of the constituent basalt.
T h e basalt D 2 3 2 dredged southwest of Sumatra is illustrative of compositional variations in tholeiitic basalts found on the lower flanks of deep submarine volcanoes. These basalts m a y be designated as oceanic tholeiites with slight alkali affinities. Specifically, silica is slightly lower than it is in the average oceanic tholeiite; potassium and the ratio Fe^O;, to F e O are m u c h higher; and titanium, phosphorus, and total alkalis are slightly higher. W e have found three somewhat similar'ba-salts on the lower flanks of large submarine volcanoes in the Pacific whose apical parts are largely alkali-rich basalt. Muir and Tilley (14) also describe tholeiites with "alkaline affinities" from "lava flows from large volcanoes situated on opposite sides of a valley" in the Mid-Atlantic Ridge, and Engel and Chase (18) have studied a typical example from the Cocos Ridge, Pacific Ocean.
W e have noted the correlation be
tween composition of basalt and the form, height, and.possibly rate of construction of volcanic edifices in the oceans (7). Typical alkali basalts and the alkali series appear to be confined largely or entirely to the apical parts of the higher volcanoes. These field relations, coupled with a large amount of supporting chemical data, suggest that the alkali series is derived from a parental oceanic tholeiitic m a g m a within, and not far below, the higher volcanoes. Gravity appears to be the prime factor in differentiation, causing crystal segregation according to relative densities and also the upward transfer of alkalis in aqueous solution. B y this hypothesis there should necessarily be melts intermediate between primary tholeiitic m a g m a and derivative alkali basalts, or accidental mixes of the two that m a y breach lower flanks of the volcanoes and occur there as mantling flows. W e suggest that the basalt D 2 3 2 (Table 4) from the eastern Indian Ocean and the basalts described by Muir and Til-ley (14) and by Engel and Chase (18) from, respectively, the Atlantic and the Pacific oceans are of this type.
Basalt D 2 3 2 , which was dredged from exposures 4000 m deep on the flank of a large volcano, contains about 20 percent vesicles, m a n y almost spherical, with diameters up to 1 m m . M o o r e has emphasized that in the Hawaiian region there is a fairly systematic decrease in size and abundance of vesicles of basalts with depth of water (19). W e have also found this to be true for most other regions dredged in the Atlantic and Pacific oceans. Usually basalts extruded at depths of 4000 m or m o r e are devoid of vesicles and have a density of about 3 to 3.1. The low density and abundance of large, round vesicles in the basalt from the eastern Indian Ocean suggest that this region m a y have sunk at least a kilometer, possibly several kilometers, since the basalt was extruded. While some change in depth would be due to addition of water to the ocean, the position of the sea-mount m a y be significant. It lies on the northern edge of the deep Wharton Basin and rises from a discontinuous low swell or rise seaward of the Indonesian Trench. It is very possible that trench-forming processes have caused the entire bordering sea floor to be depressed.
Most submarine basalts dated by radiometric methods show increasing amounts of alteration with age. T h e extent of the alteration of the basalt D 2 3 2 of the Indian Ocean suggests the age of extrusion, and hence the date of deep submersion, is not in excess of 30 million years.
CELESTE G . E N G E L
U.S. Geological Survey, La Jolla
R O B E R T L. FISHER
Scripps Institution of Oceanography
A. E. J. E N G E L
Department of Earth Sciences, University of California, La Jolla 92038
References and Notes
1. J. Schmidt, Danas Tofth Oinkring Uorden, K0benhaven. 1932), p. 255; W . I. Farquhar-son, Sci. Repls. John Murray Expédition, Brit. Mus. (Nat. Hist.) t (No. 2), 52 (19.16); F. A . Vening Meinesz. Pub. Neth. Ceod. Comm. 4, (1948).
2. B. Heezen and M . Tharp, Physiographic Diagram of the Indian Ocean (Geological Society of America, New York, i 965); Bathymétrie Map of the Indian Ocean (Bureau Geodesy and Cartography. Geological Commission, U.S.S.R., Moscow, 1963).
3. C. Darwin, Geological Observations on the Volcanic Islands (London, 1845); F. Hoch-stetter, "No\ara"-Relse, Ceol. Theil, vol. 2, No. 1 (1866); S. J. Shand, Quart. J. Ceol. Soc. London 89, 1013 (1933); A . Lacroix, Le Volcan Actif de l'Ile Réunion et ses Produits (Gauthier and Villars, Paris, 1936). I. B. Balfour and N . S. Maskelyne, Phil. Trans. Roy. Soc. 168, 289 (1879); H . J. Snell and W . H . T. Tams, Proc. Cambridge Phil. Soc. London 19, 6, 283 (1920); A . E. Eaton, Phil. Trans. Roy. Soc. London 168, 1 (1879); A , B. Edwards, Brit. Australian New Zealand Antarctic Res. Exped. Rept. Ser. A I, pt. 5, 76-86 (1938); G . W . Tyrrell, Brit. Australian New Zealand Antarctic Res. Exped. Reports Ser. A 2, pts. 3 and 4, 29-68 (1937).
4. See references in F. Chayes, J. Ceophys. Res. 68, 1519 (1963).
5. F. Walker and L. O . Nicolaysen, Colonial Ceol. Mineral Resources, Gt. Brit. 4, 3 (1954); A . Lacroix, Minéralogie de Madagascar (Challante!, Paris, 1923), vol. 3, pp. 227-237.
6. G . A . Macdonald and T. Katsura, / . Petrol. 5, 82 (1964); 1. S. E. Carmichael, ibid., p. 435; G . P. L. Walker, Quart. J. Ceol. Soc. London 114, 367 (1959).
7. A . E. J. Engel, C . G . Engel, R. H . Havens. Bull. Geol. Soc. Amer. 76, 719 (1965); M . Tatsumoto, C . E. Hedge, A . E. J. Engel, Science, in press.
8. H . S. Washington, Ann. Rept. Smithsonian Inst. 1920, 307 (1920).
9. J. D . H . Wiseman, "The John Murray Expedition 1933-34," Publ.. Brit. Mus. (Nat. Hist.) Geol. Mineral. Invest. 3, 1 (1940).
10. H . T. Stearns and G . A . Macdonald, Bull. Hawaiian Div. Hydrog. No. 9, 24 (1946); G . A . Macdonald, Bull. Geol. Soc. Amer. 60, 1541 (1949); H . A . Powers, Ceochim. Cos-mochim. Acta 7, 77 (1955); G . A . Macdonald and T. Katsura, J. Petrol. 5, (1964).
11. A . E. J. Engel and C . G . Engel, Science 144, 1330 (1964); 146, 477 (1964).
12. and R. H . Havens, Bull. Ceol. Soc. Amer. 76, 719 (1965).
13. G . D . Nicholls, A . J. Nalwalk, E . E. Hays, Marine Ceol. I, 33 (1964).
14. 1. D . Muir and C . E. Tilley, / . Petrol. 5, 409 (1964).
15. R. P. Von Herzen and V . Vacquier, in preparation.
16. D . S. Korzhinsky, Izv. Akad. Nauk SSSR, Ser. Ceol. 12, No. 9 (1962).
17. Carnegie Inst. Wash. Publ., Geophys. Lab. Ann. Rept. Director 1963-1964, pp. 107-120, 147-176.
809
18. C . G . Engel and T . E . Chase, U.S. Geol. Survey Profess. Paper 525-C, C161 (1965).
19. J. G . Moore, Amer. J. Sci. 263, 40 (1965). 20. C . W . Correns, Chem. Erde 3. 80 (1930). 21. D . H . Matthews, Nature 198, 950 (1963). 22. Laboratory work on this project was sup
ported by the N S F (Gp-2364), the U . S . Geological Survey, and the University of California. Shipboard work was supported by the N S F (G-22255) and by contracts with the Office of Naval Research. William Riedel and Victor Vacquier provided the rock samples; Bonnie Swope and David Crouch prepared the illustrations. Contribution from the Scripps Institution of Oceanography, University of California, San Diego.
20 August 1965
810
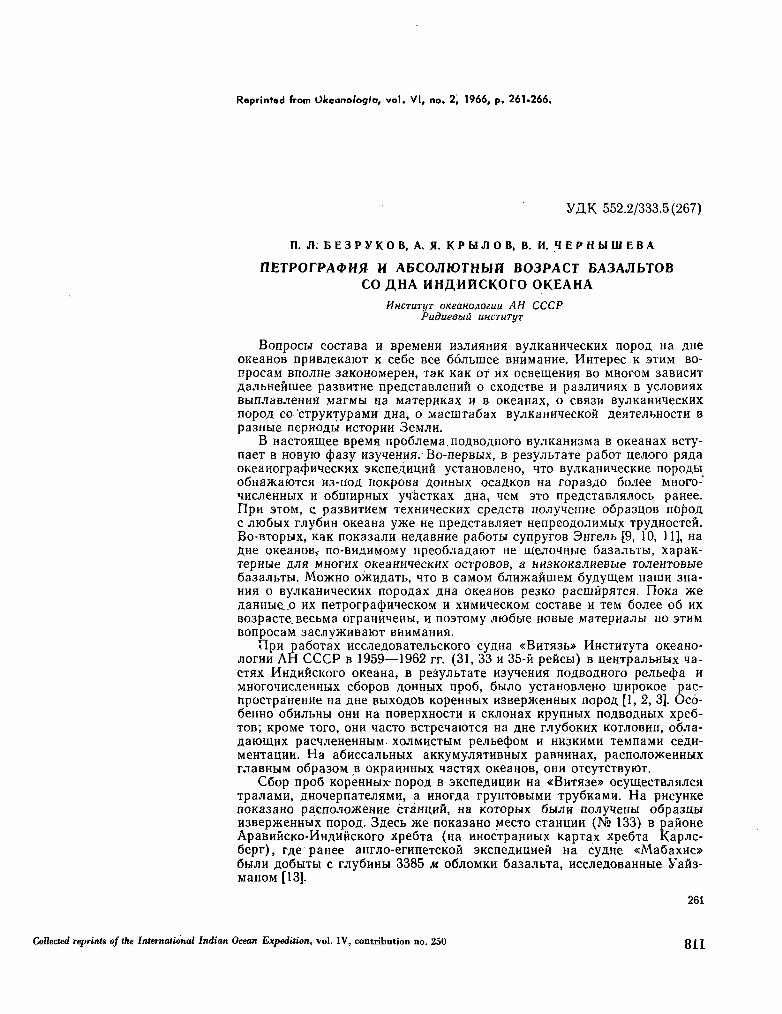
Reprinted from Okeanologia, vol. VI, no. 2, 1966, p. 261-266.
VHK 552.2/333.5(267)
n. Jl; B E 3 P y K O B, A. fl. K P MJI O B, B. H. 1 E P H bl III E B A
nETPOrPA4>Hfl H ABCOJIÍOTHblH B03PACT BA3AJIbTOB CO A H A H H A H H C K O r o OKEAHA
HHCTUTIJT oKeanoAoauu AH CCCP Padueebiû. UHCTUTI/T
Bonpocbi cocTaBa H BpeMeHH H 3 J I H H H H H ByjiKaHHHecKHX nopoA Ha AHe OKeaHOB npHBJieKaioT K ce6e Bee Óójibiiiee BHHMaHHe. Hirrepec K S T H M B O -npOCaM BIKWIHe 3aKOHOMepeH, TaK KaK UT HX OCBemeHHH BO MHOrOM 3aBHCHT
AajibHeñiiiee pa3BHTHe npeflCTaBJieHHH o cxoACTBe H pa3JiHMHHx B ycnoBHHX BbinjiaB^eHHH M a r M H Ha MaTepHKax H B oKeaHax, o C B H 3 H ByjiKaHHHecKHX nopoA co cTpyKTypaMH AHa , o MaciiiTaôax ByjiKaHH^ecKOH fleaTeJibHocTH B pa3Hbie nepHO^bi H C T O P H H 3 e M ; m .
B HacTOHm.ee BpeMH npoôJieManoABOAHoro ByjiKaHH3Ma B oneaHax Bery-naeT B HOByro (pa3y H3yieHHH. Bo-nepBbix, B pe3yjibTaTe pa6oT ueJioro pHAa OKeaHorpa4>HHecKHX SKcneAHUHH ycTaHOBJieHO, H T O ByjiKaHHHecKHe nopoAH oÓHawaiOTCH H3-noA noKpoBa A O H H H X ocaAKOB Ha ropa3AO 6ojiee MHoro-HHCJieHHbix H oôiiiHpHbix ynàcTKax Ana, neivi S T O npeACTaBJiHJiocb paHee. ripH 3 T O M , c. pa3BHTHeM TexHHiecKHx cpeACTB nojiyneHHe o6pa3UOB nopoA c jiK»6bix rjiyÔHH oneaHa y>Ke He npeACTaBJiaeT HenpeoAOJiHMbix TpyAHOcreft. Bo-BTopbix, KaK noKa3ajiH HeflaBHHe paôoTM cynpyroB SHreJib [9, 10, 11], Ha AHe OKeaHOB,- no-BHAHMoiwy npeo6jiaAaiOT He wejioHHbie 6a3ajibTbi, xapaK-TepHbie RJin MHOrHX OKeaHHHCCKHX OCTpOBOB, a HH3K0KaJIHeBbie TO^eHTOBbie
6a3aJibTH. M O J K H O oacHAaTb, H T O B caMOM ÔJiHJKaniueM ô y A y m e M HaïUH 3Ha-H H H o ByjiKaHHHecKHX nopoAax Arta OKeaHOB pe3KO paciuôpHTCH. IloKa xe A3HHbie__o Hx neTporpatpH^ecKOM H xHMHnecKOM cocTaBe H T C M 6ojiee 06 H X B03pacTe. BecbMa orpaHHneHbi, H noaTOiviy juoobie HOBbie MaTepna^bi no S T H M BonpocaM 3acjiy»HBaK)T B H H M a H H H .
tlpH paôoTax HCCJieAOBaTeAbCKoro cyAHa «BHTH3b» HHCTHtyTa oKeaHO-jiorHH A H C C C P B 1959—1962 rr. (31, 33 H 35-ñ peñcbi) B ueHTpajibHbix na-C T H X HHÂHKCKoro OKeaHa, B peâyjibTaTe H3yHeHHH noABOAHoro pejibecpa H MHûroMHCJieHHbix côopoB AOHHbix npo6, 6bijio ycTaHOBJieHo uinpoKoe pac-npocTpaHeHne Ha AHe B H X O A O B KopeHHbix H3BepjKeHHbix nopoA [1, 2 , 3]. Ocó -6eHHo o Ó H ^ b H H OHH Ha nOBepxHOCTH H CKJiOHax KpynHbix noABOAHbix xpeô-T O B ; KpoMe Toro, O H H Macro BcrpenaiOTCH Ha AHe rviyooKHx K O T J I O B H H , objia-AaroiUHX pacHJieHeHHbiM. X O J I M H C T H M pejibetpOM H H H 3 K H M H TeMnaMH ceAH-MCHTaiiHH. H a aÔHcca^bHbix aKKyMyjiHTHBHbix paBHHHax, pacno.no>KeHHbix r.iaBHMM 06pa30M B OKpaHHHblX HaCTHX OKeaHOB, OHH OTCyTCTByKJT.
C6op npo6 KopeHHbix- nopoA B 3KcneAHUHH Ha «BHTH3e» ocymecTBjiHJicH TpajiaMH, AHOiepnaTejiHMH, a HHorAa rpyHTOBMMH TpyÔKaMH. H a pHcyHKe noKa3aHO pacnojioweHHe CTaHUHH, Ha KOTopwx 6 H J I H no^yneHbi o6pa3U,H H3Bep>KeHHbix nopoA. 3Aecb » e noKa3aHO MecTO craHUHH (N° 133) B paftoHe ApaBHHCKO-HHAHHCKOro xpeÓTa (Ha HHOCTpaHHbix KapTax xpeÓTa KapJic-6epr), rAe paHee aHnno-enineTCKOH SKcneAHUHeft Ha cyAHe «MaôaxHc» 6buiH AoôbiTM c rjiyÓHHbi 3385 M O Ó J I O M K H 6a3a^bTa, HCCAeAOBaHHbie yañ3-M a H O M [13].
261
Collected reprints of the International Indian Ocean Expedition, vol. IV, contribution no. 250 811
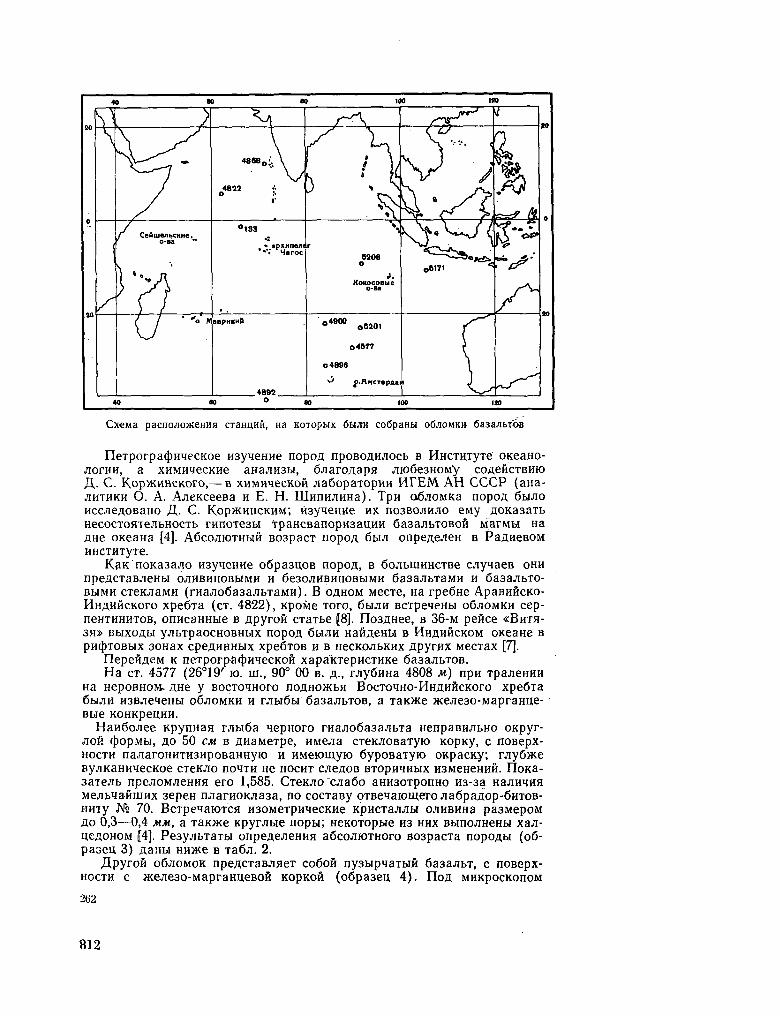
Cxeiwa pacncuiojKeHHH CTaHunñ, na KOTOpux 6£um coCpaHH OÔJIOMKH 6a3ajibTÔB
neTporpa(J)HMecKoe H3yqeHHe nopoA npoBOAHJiocb B HHCTmyTé OKeaHO-/iorHH, a XHMHiecKHe aHajiH3bi, ÓJiaroAapH juo6e3HOMy COACHCTBHIO JX- C . Kop>KHHCKoro,— B xHMHiecKOH jiaôopaTopHH H T E M A H C C C P (aHa-JIHTHKH O . A . AjieKceeBa H E . H . LUnnHJinHa). TpH ofijioMKa nopoA 6HJIO HccaeaoBano JX- C . K O P > K H H C K H M ; Hsy^eHHe H X no3BOJiH.no eMy AOKa3aTb HeCOCTOflTe-lbHOCTb THnOTe3bI T p a H C B a n O p H 3 a U . H H 6 a 3 a ^ b T O B O H M a r M b I H a
AHe OKeaHa [4]. A O C O J H O T H M H B03pacT nopOA 6HJI onpeaeJieH B PaAHeBOM HHCTHTyTC
KaK noKa3ajio H3yqeHMe o6pa3UOB nopoA, B CojibiiiHHCTBe cjiy aeB O H H npeflCTaBJieHbl O.JIHBHHOBbIMH H 6e30JIHBHH0BbIMH 6a3aJIbTaMH H 6a3a.7IbTO-
BbiMH cTeKjraMH (rHajio6a3ajibTaMH). B O A H O M MecTe, Ha rpeÔHe ApaBHÔcKO-HHAHÍícKoro xpeèîa (CT. 4822), KpoÑe Toro, 6buin BCTpeqeHM O 6 ^ O M K H cep-neHTHHHTOB, onHcaHHbie B Apyroñ crraTbe [8]. rio3AHee, B 3 6 - M pence « B H T H -3H» BbixoAbí y^bTpaocHOBHbix nopoA 6biJiH HaHAeHfci B H H A H H C K O M oKeaHe B pHcpTOBbix 30Hax cpeAHHHbix xpeóTOB H B HecKo^bKHx ApyrHX MecTax [7].
riepeñAeM K neTporpatpHHecKoñ xapalcrepHCTHKe 6a3ajibTOB. H a CT. 4577 (26°19' m. ni., 90° 00 B . A . , rjiyÔHHa 4808 M) npn TpajieHHH
Ha HepoBHOM. AHe y Boc/roiHoro noAHOJKbn B O C T O H H O - H H A H H C K O I - O xpeÔTa 6bijiH HSB^e^eHbi OÓJIOMKH H rjibióbi 6a3ajibTOB, a TaKJKe we^ie30-MapraHue-Bbie KOHKpeUHH.
HaHôoJiee KpynHan rJibióa nepHoro rHajjo6a3aJibTa HenpaBH^bHo OKpyr-Jioü cpopMbí, Ao 50 CM B AHaMeTpe, HMejia ereKJiOBaTyio Kopny, c noBepx-HocTH naJiaroHHTH3HpoBaHHyio H HMeiomyio ôypoBaTyio oKpacKy; rjiyôme By/iKaHHHecKoe cTeKJio no^TH He H O C H T oneAOB B T O P H I H W X H3MeHeHHH. IloKa-3aTeJib npe^oMJieHHH ero 1,585. Gremio "CJIa6o aHH30TponHo H3-3a HajiHiHH MejibiafiiUHx 3epeH njiarHOKJia3a, no cocTaBy OTBeHaromeroJiaopaAop-OHTOB-HHTy N° 70. BcTpeiaioTCH H30MeTpHiecKHe KpHCTajiAM OAHBHHa pa3MepoM Ao 0,3—0,4 MM, a TaK>Ke Kpyrjibie nopu; HeKOTopwe H3 H H X BbincriHeHbi xaA-ueAOHOM [4], Pe3yAbTaTbi onpeAe-neHHH aôoyiiOTHoro B03pacTa nopoAH (06-paseu 3) AaHbi HHWe B Ta6ji. 2.
JlpyroH oóJioMOK npeACTaBJiaeT coóofl ny3bipqaTbiH 6a3ajibT, c noBepx-H O C T H c xejie3"o-MapraHueBOH KopKoft (o6pa3eu 4). FIOA MHKpocKonoM
262
812
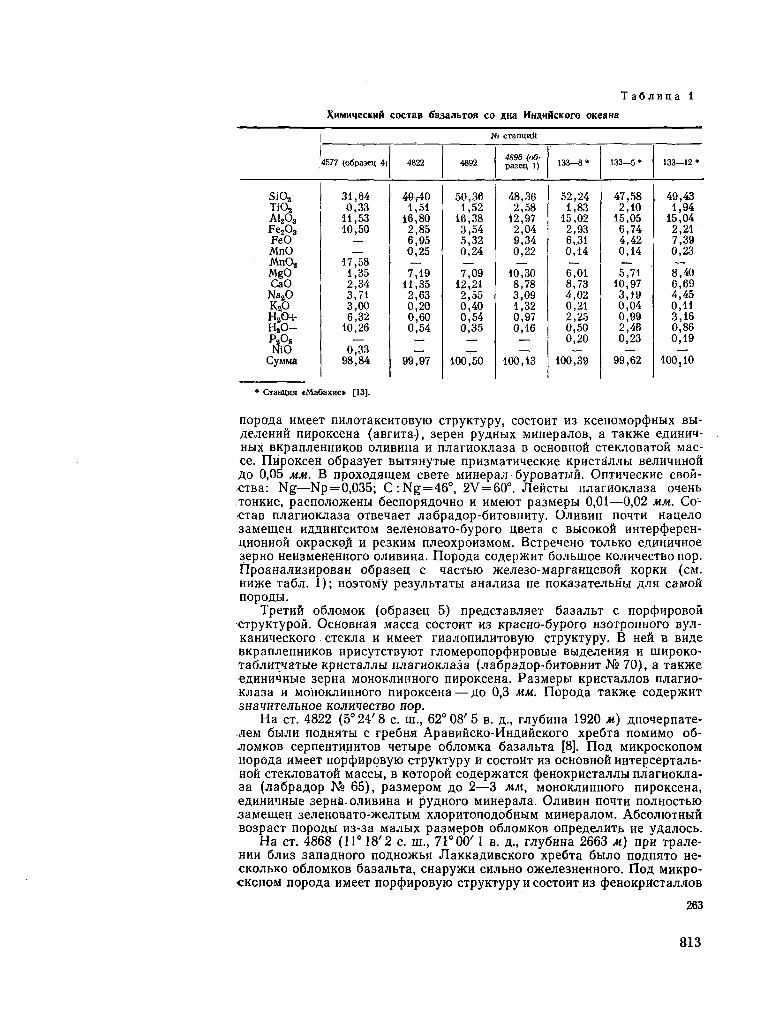
TaôJiHua 1
XHMHiecKtiñ cocTaB SaaaJibTOB co una W H A H M C K O T O oneaHa
JM° cTam;nâ
Si02
Ti02
A1203 F^Oa FeO MnO M n 0 2
MgO CaO
Na20 K a O H 2 0 + H 2 0 -P 2 0 5
NiO CyMMa
4577 (oSpaaei; 4j
31,64 0,33
11,53 10,50
_ —
17,58 1,35 2,34 3,71 3,00 6,32
10,26 —
0,33 98,84
4822
49,40 1,51
16,80 2,85 6,95 0,25 — 7,19
11,35 2,63 0,20 0,60 0,54
— —
99,97
4892
50,36 1,52
16,38 3,54 5,32 0,24 — 7,09
12,21 2,55 0,40 0,54 0,35
— —
100,50
4896 (06-paaeu, 1)
48,36 2,58
12,97 2,04 9,34 0,22 —
10,30 8,78 3,09 1,32 0,97 0,16
— —
100,13
133—8 *
52,24 1,83
15,02 2,93 6,31 0,14 — 6,01 8,73 4,02 0,21 2,25 0,50 0,20
— 100,39
133—5 *
47,58 2,10
15,05 6,74 4,42 0,14 — 5,71
10,97 3,19 0,04 0,99 2,46 0,23
— 99,62
133—12 *
49,43 1,94
15,04 2,21 7,39 0,23 — 8,40 6,69 4,45 0,11 3,16 0,86 0,19
— 100,10
* CraHUHH «Ma6axHC» [13].
nopoAa HMeeT nnjiOTaKCHTOByio erpyKTypy, C O C T O H T H3 KceHOMopcpHwx B H -AejieHHÔ nHpoKcfiHa (aBrHTa), 3epeH pyAHbix MHHepa/ioB, a TaioKe epjHim-Hbix BKpanjieHHHKOB cuiHBHHa H njiarHOKJia3a B O C H O B H O H CTeKJioBaTOH Mac-ce. FlHpoKceH o6pa3yeT BHTHHyTbie npH3MaTHiecKHe KpHCTáJiJibi BejimmHoft Ao 0,05 MM. B npoxoAHiueM CBeTe MHHepaji 6ypoBaTbiñ. OnranecKHe C B O H -CTBa: N g — N p = 0 , 0 3 5 ; C : N g = 4 6 ° , 2V=60° . JleñcTbi njiarHOKJia3a oieHb TOHKHe, pacnojiojKeHbi ôecnopnAorao H HMeiOT pa3Mepbi 0,01—0,02 MM. C O -•craB njiarHOKJia3a OTBe^aeT JiaôpaAop-ÔHTOBHHTy. O J I H B H H IIOHTH Haue.no 3aMemeH HAAHHrcHTOM 3eJieHOBaTO-6yporo UBeTa c B M C O K O H HHTepcpepeH-UHOHHOH OKpaCKQ# H pe3KHM njieOXpOH3MOM. BcTpe^eHO TOJIbKO eAHHHÍHOe
3epHO HeH3MeHeHHoro ojiHBHHa. riopofla coAep>KHT óojibiuoe KojiH^ecTBo nop. llpoaHajiH3HpoBaH o6pa3eu c qacTbro >Kejie30-MapraHueBOH K O P K H ( C M . HHjKe Ta6ji. 1 ) ; nosTOMy pesyjibTara aHa^H3a He noKasaTe/ibribi RJIH. caiwon nopoABi.
TpeTHH oÔJiOMOK (o6pa3eu 5) npeACTaBJineT 6a3ajibT c nopcpHpoBoii CTpyKTypoH. OcffOBHaH Macea C O C T O H T H3 KpacHO-6yporo H30TponHoro Byji-KaHH^ecKoro. cTeKJia H HMeeT rnajionHJiHTOByio çTpyKTypy. B Heft B B H A C BKpanjieHHHKOB npneyTCTByroT rjiOMeponop(pHpoBbie BbiAeJieHHH H uinpoKO-TaÓAHTMaTbie KpHCTajijibi onarHOKJiaáa (jiaópaAop-ÓHTOBHHT N° 70), a TaKJKe «AHHHÚHbie 3epHa MOHOKjiHHHoro nHpoKceHa. Pa3MepH KpHCTajijioB njiarHO-Kjia3a H MOHOKjiHHHoro nnpoKceHa — A O 0,3 MM. FIopoAa TaKwe coAepscHT sHaiHTejibHoe KOJiH^ecTBo nop.
H a C T . 4822 (5° 24'8 c. m . , 62° 08' 5 B . A . , rJiyÔHHa 1920 M) AHonepnaTe-JieM 6biJiH noAHHTH c rpeóHH ApaBHHCKo-HHAHñcKoro xpeÔTa noMHMo 06-JIOMKOB CepneHTHHHTOB MeTbipe O Ó A O M K a 6a3ajIbTa [8]. FIOA MHKpOCKOnOM
nopoAa HMeeT nopcpHpoByio ÇTpyKTypy H C O C T O H T H3 O C H O B H O H HHTepcepTaJib-Hoñ cTeKAOBaToñ Maccbi, B KOTopoñ coAep^aTCH (peHOKpHCTajiJibi njiarHOKJia-3a (jiaôpaAop N° 65), pa3MepoM A O 2—3 MM, M O H O K J I H H H O T O nnpoKceHa, «AHHHMHbie 3epHâ-OJlHBHHa H pyAHOrO MHHepaJia. OjIHBHH nOHTH nOAHOCTbK) 3 a M e m e H 3eJieHOBaTO-}Ke.nTbIM XJIOpHTOnOAOÔHblM MHHepaJIOM. A6COJIK>THbIH B03pacT nopoAH H3-3a Majibix pa3MepoB oójioMKOB onpeAejiHTb He yAajiocb.
H a C T . 4868 (11° 18'2 c. in., 71°00' 1 B . A . , rjiyÔHHa 2663 M) npn Tpajie-H H H 6 A H 3 3anaAHoro noAHOjKbH JlaKKaAHBCKoro xpeÔTa 6MJIO noAHHTO He-cKOJibKo oÔJioMKOB 6a3ajibTa, cHapyxH cHJibHO oweJie3HeHHoro. IIOA MHKpo-cKcnoM nopoAa HMeeT noptpHpoByio ÇTpyKTypy H C O C T O H T H3 (peHOKpHcTajiJiOB
263
813
iuiarH0KJia3a, MOHOKJIKHHOI-O nnpoKceHa (aBrHTa) H pyAHoro MHHepajia, norpyjKeHHHx B HHTepcepTajibHyio ocHOBHyio Maccy. HaôjiiOAaiOTCH C A H H H H -Hbie 3epHa ojiHBHHa. rijiarHOKJia3 B O BKpanjieHHHKax npe.ncTaB.neH iimpoKo-TaójiHTiaTHMH KpHCTajiJiaMH pa3MepoM 1,5—2 MM. CocTaB nJiarHOKJia3a OTBeiaeT JiaópaAop-OHTOBHHTy «Nb 70. KpncTajiJiw aBrHTa HivteioT pa3MepMAO 1 MM. MnHepaji B npoxoAHmeM CBeTe 6ypoBaTbiñ. 3epHa ojiHBHHa B npoxoAH-m e M CBeTe — óecuBeTHbie, HMeKvr pa3Mepu A O 1,5 MM. MecTaMH OJIHBHH 3aniemeH xjiopHTonoAOÔHMM MHHepajioM.
JXpyme OÔJIOMKH C T O H xe CTaHUHH npeACTaBJieHH ny3HpiaTbiM rnaJio-6a3ajibTOM c noptpnpoEOH CTpyKTypoñ. OcHOBHaa Macea no crpyioype nepe-XOAHaH MeJKfly KpHCTaJIAHTOBOH H THajIOnHJIHTOBOH — B ByjIKaHHqeCKOM Te.MHO-6ypoM cTeKJie paccenHbi BecnopHAoiHO opneHTHpoBaHHbie Mejib^añuiHe KpucTajiJibi. Bo BKpanjieHHHKax — jieflcTbi ocHOBHoro njiarHOKjia3a H , pexe, MOHOKJIHHHOFO nHpOKCeHa. Flopbl COCTaBJIHIOT OKOJIO 30% B nOJie UIJIH(pa.
H a CT . 4892 (36°02'0 10. III., 71° 17'0 B . A-, rjiyÓHHa 4740 M) AHOiepna-TeJib npHHec cxojiMHCT.oro AHa KOTJIOBHHM Kpo3e BajiyH oJiHBHHOBoro 6a3aAb-Ta, pa3MepoM 2 5 X 2 1 X 1 8 CM. C noBepxHocTH nopoAa nqKpuTa KopoiKoft OKHCJIOB Fe H M n MomHocTbio 1—2 CM. CTpyKTypa nopoAu nopcpHpoBaa, OcHOBHaa Macea HMeeT HHTepcepTaAbHyio CTpyKTypy H C O C T O H T H3 npo3paq-Horo KopHMHeBaTO-»ejiToro ByjiKaHHHecKoro CTeKjia c noKa3aTejieM npejioM-JieHHH 1,585. Bo BKpanjieHHHKax — JieflcTbi njiarH0KAa3a ( Ô H T O B H H T N o 80— 84%) AJIHHOH A O 2—10 MM H o^eHb Mejmne âepHa M O H O K J I H H H O F O nnpoKceHa c noKa3aTeJieM npejioMJieHHH N g = 1,714 H N p = 1,698; 2V = + 55°5. B He-óojibiuoM KojiHMecTBe npHcyTCTByioT 6oJiee KpynHbie 3epHa ojiHBHHa c. 2V = =90°. B OTAenbHbix 3epHax yAajiocb 3aMépnTb ero noKa3aTejiH npeJiOMJie-
H H H : N g = 1,706, N p = 1,677. O J I H B H H HacTHHHo 3âMemeH3ejieHOBaTo->KeJiTbiM xjiopHTonoAOÔHHM MHHepaJiOM. BcTpe^aiOTCH H30MeTpH«iecKHe 3epna pyjx-Hbix MHHepajioB c pa3MepaMH 0,1—0,2 MM.
H a CT. 4896 (29° 56' 8 K). HI., 83° 00' 6 B . A . , rjiyÓHHa 3805 M) AHOMepna-TeJieM 6bIAH nOAHHTbl C XOJIMHCTOrO AHa UeHTpaJIbHOH KOTJIOBHHM ÔJIH3 3a-naAHoro noAHOJKbH B O C T O I H O - H H A H M C K O I " O xpeÓTa yrjioBaTbie OÔJIOMKH CHJib-HO ny3bipiaToro rHajio6a3aJibTa, norpyxeHHbie B nojiyjKHAKHH HJI (no-BH-AHMOMy, peayAbTaT noABOAHoro onoji3HH na cKJioHe). Pa3Mepbi O Ô A O M K O B AOCTHraioT 10 CM. FIOA MHKpocKonoM ocHOBHan Macea npeACTaBjieHa 6ypwM H3ÓTponHbiM ByjiKaHHiecKHM cTeKJiOM, B KOTopoM coAep>KaTCH jieftcTW njia-rHOKjia3a AJIHHOH Ao 0,5 MM, cooTBeTCTByiomero JiaôpaAOp-ÔHTOBHHTy. OJIHB H H npHcyTCTByeT B BHAe BKpanjieHHHKOB c pa3MepaMH A O 0,5 MM H BHAejie-H H H c pacnJibiBwaTbiMH owepTaHHHMH. BcTpewaiOTCH ynacTKH ABynpejioMjiHio-mero JKejiTOBaTo-KopniHeBoro BemecTBa, no onTHsecKHM KOHeraHTaM 6JIH3-Koro K nnpOKceHy. Pa3MepH nopOA AOCTHraioT 0,5—3 MM.
riopOAH C APyrHX CTaHUHH OnHCbHJaiOTCH KpaTKO, TaK KaK H3yHeHbI TOJIb-K O neTporpa<pHHecKH.
H a CT. 4900 (21°28'2 IO. m . , 83°11'5 B . A . , rJiyÔHHa 4486 M) npHMOTOM-Haa rpyHTOBan TpyÔKa npHHecjia OÓJIOMKH O A H B H H O B O F O 6a3ajibTa, cxoAHorO' co BCTpeyeHHHM Ha C T . 4892. ripo6a 6ujia B3HTa co CKJiOHa xojiMa Ha AHe UeHTpajlbHOH KOTJIOBHHbl.
H a CT . 5171 (10° 54'2 ro. ni., 105° 22' B . A-, iviyÓHHa 4694 M) npHMOTOM-' HOÍi TpyÔKOH ÔbIJia B3HTa KOJIOHKa (pOpaMHHH(pepOBbIX HJIOB, AJIHHOH OKOJIO 3 M. floiTH Ha BceM npoTHWeHHH K O A O H K H B 3THX HJiax coAepjKaTCH yrjio-BaTue OÔJIOMKH BbiBeTpejioro ny3bipqaToro 6a3aAbTa, pa3MepoM A O 4 CM. MeCTO B3HTHH KOJIOHKH HaXOAHTCH ÓAH3 nOAHOJKbH nOABOAHOH TOpbl, 3TO no3BOJiHeT npeAnoAaraTb, M T O OÔJIOMKH 6a3ajibTa nonaAH B ocaAKH B pe-3yAbTate onoji3HH. HaHÔojiee CBeJKHH OÔJIOMOK 6HJI npocMOTpeH noA MHKpo-CKonoM. riopoAa HMeeT nopipHpueyio CTpyKTypy. Bo BKpanjieHHHKax npeoô-AaAaiOT KpHCTajiJiH njiarHOKJia3a (jia6paAop-6HTOBHHT JY» 70) BejiHiHHoft ao 1,5 MM; KpoMe Toro, npHcyTCTByioT 3epHa M O H O K A K H H O T O nnpoKceHa H pyA-Hbix MHHepajioB. OcHOBHasi Macea nopoAW — rnajionHjiHTOBaH. HaôAioAaeTca ôoAbiuoe KOJiHiecTBO nop pa3MepoM O T 0,01 A O 1 MM.
264
814
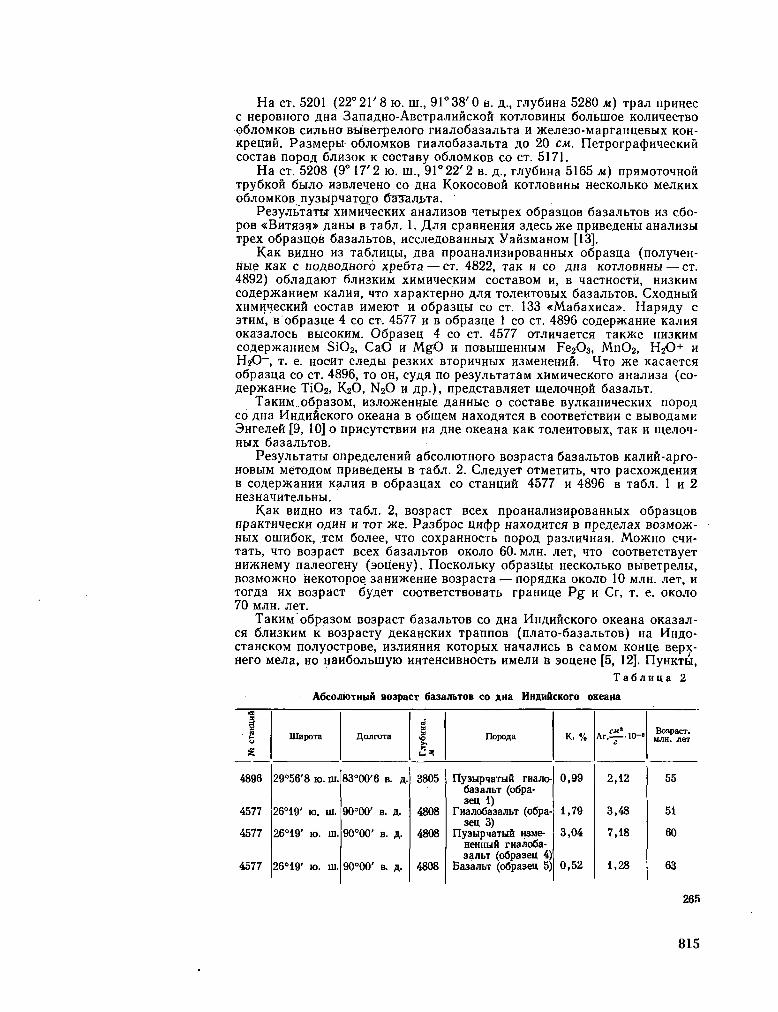
H a CT. 5201 (22° 21'8 to. m . , 91°38'0 B. A . , rjiyÔHHa 5280 M) rpaji npHHec c HepOBHoro AHa 3anaAHO-ABCTpaAHftcKoñ K O T A O B H H M ôojibuioe K O A H I C C T B O OÔJIOMKOB cHJibHO BbiBeTpejioro rHajio6a3ajibTa H >Kejie30-MapraHn.eBbix K O H -KpemiH. Pa3Mepw- OÔJIOMKOB rHaJio6a3aJibTa A O 20 CM. FleTporpacpHMecKHH cocraB nopOA 6JIH3OK K cocTaBy OÔJIOMKOB C O CT. 5171.
H a CT. 5208 (9o 17'2 IO. ni., 91° 22'2 B . A . , rjiyÓHHa 5165 M) npHMOTOMHoñ T p y Ô K O H 6bUIO HSBJieMeHO CO A H a K O K O C O B O H KOTJIOBHHbl H e C K O A b K O M e A K H X
OÔJIOMKOB ny3bipHaToro 6a3~aA.bTa. Pe3yAbTaTBT XHMHHecKHX aHaAH30B leTbipex o6pa3UOB 6a3ajibTOB H3 c6o-
poB « B H T H 3 H » AaHH B Taôji. 1. Rjín cpaBHeHHH 3AecbJKe npHBeAeHH aHaAH3H Tpex o6pa3noB 6a3aAbTOB, HCCJieAOBaHHbix yañ3MaHOM [13].
KaK B.HAHO H3 TaÔAHUbi, ABa npoaHaAH3HpoBaHHbix o6pa3na (nojiyieH-líbie KaK c noABOAHoró xpeÓTa — CT. 4822, TaK H C O AHa K O T A O B H H M — CT. 4892) OÔAaAaiOT 6 J I H 3 K H M XHMHqeCKHM COCTaBOM H, B laCTHOCTH, HH3KHM C0Aep»aHHeM KaAHH, M T O xapaKTepHO nnn T O A C H T O B H X 6a3ajibT0B. C X O A H M H xiiMHHecKHñ cocTaB HMeiOT H o6pa3UH co CT. 133 «MaóaxHca». HapHAy c 3THM, B o6pa3ne 4 co CT. 4577 H B o6pa3iie 1 co CT. 4896 coAepjKaHne KajiHH OKasaAocb B M C O K H M . 06pa3en 4 co CT. 4577 oTJiHiaeTCH TaKMce H H 3 K H M coAepJKamieM Si02, C a O H M g O H noBbiuieHHbiM Fe203, M n 0 2 , H 2 0 + H H 2 0 _ , T . e. H O C H T cjieAH pe3KHx BTopH^Hux H3MeHeHHH. H T O >Ke KacaeTCH o6pa3ua có CT. 4896, T O O H , cyAH no pe3yAbTaTaM xHMHiecKoro aHajiH3a (co-AepKaHHe TÍO2, K2O, N 2 0 H A p ) , npeACraBJineT meAO^Hoñ 6a3ajibT.
TaKHM..o6pa30M, H3AOJKeHHbie AaHHbie o cocTaBe ByAKaHHnecKHX nopOA co AHa HHAHHCKoro oKeaHa B oômeM HaxoAHTca B cooTBercTBHH c BHBOAaMK 3Hrejieft [9, 10] o npncyTCTBHH Ha AHe OKeaHa KaK mneHTOBbix, TaK H meAOH-HblX 6a3aAbTOB.
Pe3yjibTaTbi onpeAeAeHHfl aôcoAioTHoro B03pacTa 6a3aAbT0B KaAnñ-apro-H O B H M MeTOAOM npHBCAeHbl B TaÔA. 2. CAeAyeT OTMeTHTb, 1TO paCXOJKAeHHH
B coAep>KaHHH KaAHH B o6pa3nax co cTaHUHH 4577 H 4896 B raÓn. 1 H 2 He3HaHHTeJIbHbI.
KaK B H A H O H3 TaÓA. 2, B03pacT Bcex npoaHaAH3HpoBaHHbix o6pa3upB npaKTniecKH O A H H H T O T ate. Pa36poc uwpp HaxoAHTCfl B npeA&nax BO3MOJK-Hbix OUIH6OK, TeM 6oAee, ITO coxpaHHOCTb nopOA pa3JiHMHan. M O J K H O C H H -TaTb, H T O B 0 3 p a C T BCeX 6a3aJIbTOB O K O A O 6 0 . M A H . JieT, H T O COOTBeTCTByeT HH^iHeMy naAeoreHy (aoneHy). IlocKOJibKy o6pa3nbi HecKOAbKo BHBeTpeAbí, B03M05KH0 heKOTopoe 3aHH>KeHHe B03pacTa — nopnAKa O K O A D 10 M A H . Jier, H TorAa H X B03pacT óyAer cooTBeTCTBOBaTb rpaHHne Pg H Cr, T . e. O K O A O 70 MAH. ACT.
TaKHM o6pa30M B03pacT 6a3aAbTOB co AHa HHAHHCKoro OKeaHa OKa3aA-CH 6 A H 3 K H M K B03pacTy AeKaHCKHx TpannoB (nAaTO-6a3ajibTOB) Ha H H A O -CTaHCKOM noAyocTpoBe, H 3 A H H H H H KOTopbix HanaAHCb B caMOM KOHue Bepx-Hero MeAa, H O HanooAbuiyio HHTeHCHBHoCTb H M C A H B aoueHe [5, 12]. FlyHKTbi,
T a6 JIHII a 2
ACcoJiiOTHbiH B03pacT 6a3aJibTOB co AHa HHAHHCKoro OKeaHa «5
1
4896
4577
4577
4577
IÜHpoTa
29°56'8 K>. IB.
26c19' K3. m .
26°19' io. m .
26°19' io. iu.
AojiroTa
83°00'6 B. R.
90°00' B. A.
90°00' B . A.
90°00' B. A.
S S o
3805
4808
4808
4808
riopofla
üysbipqaTbiH raa^o-Gasa^bT (o6pa-3eu 1)
rHajio6a3ajibT (o6pa-aeu 3)
üyabipqaTbiH H3Me-HeHHbiH rHaJio6a-sajibT (o6pa3eu 4)
5a3a^bT (ofipaaeu 5)
K, %
0,99
1,79
3,04
0,52
A r , — . 1 0 - »
2,12
3,48
7,18
1,28
BoapacT. MJ1H. JICT
55
51
60
63
265
815
B KOTopbix 6HJI onpe.ne.neH aócoJiioTHbiñ B03pacT 6a3ajibTOB Ha nue OKeaHa, HaxoflHTCH Ha 3HaHHTejibHOM paccTOHHHH ,n,pyr OT flpyra H Ha eme ôojibiueM y^ajieHHH O T HHAoeraHa. 3 T O roBopHT o T O M , M T O HH>KHeTpeTHHHaH ByjiKaHH-necKan AeHTejibHocTb npoHBH^acb B ôacceUHe H H A H H C K O F O OKeaHa Ha orpoM-H O H njiomaflH. JXnn no,a.TBep>KAeHHH SToro BbiBoaa HeoôxoflHMbi flajibHeñuiHe Hcc^eflOBaHHH aôcoJiiOTHoro B03pacTa H3BepJKeHHbix nopofl co aHa OKeaHa.
HajiHHHe Ha AHe HHflH&CKoro OKeaHa HH>KHeTpeTHHHbix 6a3ájibTOB He HCKJironaeT B O 3 M O > K H O C T H pacnpocTpaHeHHH 3Aecb KaK 6o.nee M O J I O A H X , Tan « 6ojiee apeBHHX ByjiKaHnqecKHx nopo,n. H a BepoHTHoe npoHBJieHHe B H H -AHÍÍCKOM OKeaHe HeTBepTHHHOH nOflBCWHOH ByjIKaHHHeCKOH AeHTejIbHOCTH B
JiHTepaType HiueiOTCH yKa3aHHH [6].
JIHTEPATyPA
1. B e 3 p y K o B IL JI. 1961. Hcc/iejiOBaHHH HHAHflcKoro OKeaHa B 33 pence s/c «BnTH3b». OKeaHOJiorHH, 1, Bbin. 4.
2. B e a p y K O B n . JI. 1962. O HepaBHOMepHocra pacnpeaejieHHsi rviyôoKOBOflHbix OKeaHH-wecKMx ocaAKOB. OKeaMojiorHH, II, Bbin. 1.
3. B e 3 p y K O B n . Jl. 1963. MccjreaoBaHHa H H A H H C K O T O OKeaHa B 35 pence s/c «BHTsrab». OKeaHOJiorHH, III, Bbin. 3.
4. K o p * H H C K H H fl. C . 1962. npo6jieMa onmimoB H r»noTe3a rpaHCBanopMaiiHH B cBeTe HOBbix OKeaHOJiormecKHx H ByjiKaHOJiorHiecKHx flaHHbix. H3B. A H G C C P , cep. reoji., N° 9.
5. K p H m H a H M . C . 1954. Teo/iorHa H H A H M H BmpMbi. H 3 A - B O HHoerp. JIHT., M . 6. JI H c H u H H A . II., >K H B a r o A . B . 1968. Pejn>e<p RHU H oca^KH IOJKHOH qacTH H H A H H -
CKoro OKeaHa. H3B. A H C C C P , cep. reorp., N° 3. 7. y j B H i i e B T. B . , 4 e p H bi m e B a B . H . 1965. 06pa3U.bi nopoa MaHTHH H3 puepTOBoft
30HH HH^HH-CKoro OKeaHa. HOKJI. A H CCCPi.165, 5. 8. M e p H H iu e B a B . H . , Beapy icoBl I . Jl. 1966. CepneHTHHHTbi c rpeôHa ApaBHftCKO-
HHjiHHCKoro noflBOflHoro xpeÓTa. ZIOKJI. A H C C C P , 166, JV° 4. 9. E n g e 1 A . E . J., E n g e 1 C . G . 1863. Basalts dredgad from the Northeastern Pacific
ocean. Science, 140, N o 3573. 10. Eii gel A . E . J., E n gel C . G . , 1964. Composition of basalts from the Mid-Atlantic
Ridge. Science, 14, No 3624. 11. E n gel A . E . J., E n gel C . G . and H a v e n s R. G . 1965. Chemical characteristic
of oceanic basalts and the upper mantle. Bull. Geol. Soc. Amer., 76, N o 7. 12. P r a k a s h U . 1960. A survey of the Deccan intertrappean flora of India. J. Paleon-
tol., 34, N o 5. 13. W i s e m a n J. D . H . 1937. Basalts from the Carlsberg ridge, Indian ocean. British
museum. The J. Murray expedition 1933—1934. Scient. Rep., 3, N o I
HocTynHJia B pe.naKii.Hio 12.1.1966
P. L. BEZRUKOV, A. Ya. KRYLOV, V. I. CHERNYSHEVA
P E T R O G R A P H Y A N D T H E A S B O L U T E A G E O F T H E INDIAN O C E A N F L O O R BASALTS
S u m m a r y
Volcanic rock from the Indian Ocean bottom was sampled during the R/V «Vityaz» 1959—62 cruise operations. The pétrographie study of the samples has shown that in most cases the rocks are represented by olivine and nonolivine basalts and basalt glass (hyalobasalts). The chemical analysis has indicated that part of the samples belongs to low kalium tholeitic while another part to alkaline basalts. The K-argon method has been used to determine the absolute age of four rock samples from two stations in the southern part of the ocean. Their age has appeared to be about 60 million years corresponding to Lower Paleogene (Eocene).
816
Reprinted from Okeano/og/a, vol. VI, no. 2, 1966, p. 267-275.
yRK 551.352
3. H. r O P B Y H O B A
PACÍTPEAEJIEHtoE rJIHHHCTWX MHHEPAJIOB B OCAAKAX HHAHHCKOrO OKEAHA
MucTUTyr OKeanoAoauu AH CCCP
JXo noc/ieAHero BpeMeHH rjiHHHCTbie MHHepajibi B ocaAKax H H A H H C K O F O OKeaHa 6HJIH o^eHb Majio H3yHeHH. B JiHTepaType M O N C H O H a n ™ TOAbKO HeKO-Topbie CBeAeHHH o KaiecTBeHHOM H X côcïaBe.
KbHDHeH [14] HccjieAOBa^ peHTreHOBcKHM M C T O A O M ocaAKH Mopeñ Majiañ-CKoro apxnne,nara H npHJieraromen MacTH HHAHñcKoro OKeaHa,. cobpaHHbie B SKcneflHUHH Ha «CHciuiHyce», H HaïueJi B O Bcex o6pa3uax MycKOBHT (Be-P05ITHO, HJIJIHT), KaOJIHHHT H MOHTMOpHJIJIOHHT.
TopoyHOBoii [5] H3yMaJica cocTaB IVIHHHCTHX MHHepa^OB B 30 npoôax ocaflKOB, coôpaHHbix B peñcax « 0 6 H » no pa3pe3y, nepeceK'aio'meMy H H A H H -C K H H oKean OT AHTapKTHAH jo BeHrajibCKoro 3ajiHBa. CocTaB rjiHHHCTbix MHHepaJioB MeHHeTca B HanpaBJieHHH c lora Ha ceBep: B npHaHTapKTHqe-CKoñ oóJiacTH npeoóJiaaaiOT rHApocniOAbi, ceBepHee B03paeraeT coAepHíaHne KaOJIHHHTa.
3JI BSKHJI H PiíJieñ (11], H3yiHB 12 o6pa3uoB, cae/iajiH B H B O A o Ka^ecr-eeHHOM cxoACTBe cocTaBa rjiHHHCTbix MHHepajioB B ATjiaHTHHecKOM, T H X O M H H H A H K C K O M oKeaHax.
BHCKaft [7] HSy^HJI KOJlHMeCTBeHHblH H KaHeCTBeHHblH COCTaB rJlHHHCTHX
MHHepajioB B 50 npoóax ocaAKOB, B 3 H T H X no MepnAHOHajibHOivty pa3pe3y B 3anaAHoft iiacTH H H A H H C K O F O OKeaHa.
MaTepnajiOM AJIH Hc'cjieAOBaHna rjiHHHCTbix MHHepajioB B noBepxHOCTHow CJioe ocaAKOB nocjiyjKHAH npoôa, coôpaHHbie coTpyAHHKaiviH OTAejia MopcKoñ reojiornn HHCTHryTa OKeaHOJiorHH A H C C C P B O speMH 31, 33 H 35-ro peñ-C O B cyAHa «BHTH3b» [1—3]. Bcero 6HJIO nsy^eHo 70 npo6, npeHMymecTBeHHO H3 CeBepHOH H BOCTOIHOH MaCTeft OKeaHa (CM. pHC. 3 ) .
OcHOBHblMH MCTOAaMH H3yjeHHH HIHHHCTblX MHHepaJlOB 6bIJlH peHTTeHO-
rpaCpHieCKHH H AH(ppaKTOMeTpHqeCKHH. G b e M K a 06pa3U0B npOH3BOAHJiaCb
Ha OTeMecTBeHHbix annapaTax yPC-55a c >KeJie3HbiM aHOAOM H AHCppaKTO-MeTpe yPC-50 H M c MeAHHM aHOAOM.
ÓTAe^bHbie oópa3Ubi nepeA cieMKoñ Ha AHippaKTOiueTpe 6biJiu o6pa6o-TaHH no MeTOAy M n p a H ,H>KeKC0Ha [15] una yAajieHHH rHApaTOB OKHCJIOB >Kejie3a H ajiiOMHHHH, a TaioKe aMop(J)Horo KpeMHe3eMa. 3 T O HOSBOJIHAO no-^yHHTb Ha peHTreHorpaMMax H AH(ppaKTorpaMMax leTKHe pecp-JieKCbi.
B H3yneHHbix ocaAKax 6MJIH HaHAeHH MHHepajibi M O H T M O P H J U I O H H T O B O S , HJIJIHTOBOH, KaojiHHHTOBoft, xJiopHTOBOH H naJibiropcKHTOBOH rpynn.
OnpeAeJieHHe MHHepajioB M O H T M O P H J I J I O H H T O B O H rpynnw npoH3BOAHJiocb no pecpJieKcy 17 A nocjie HacbimeHHH o6pa3ù.a iyiHuepHHOM.
Hawôojiee npocTHM HBJiHeTCH onpeAejieHHe MHHepajioB HJIJIHTOBOH (I-HA-pocjirOAHCToft) rpyniibi, HJIJIHT xapaKTepH3yeTCH cepneft 6a3a.JibHbix O T -paJKeHHft: 10 A (001), 5,0 A (002), 3,3 A (003) H T . A . , KOTopbie He H3MeHH-JOTCfl npH HacwmeHHH o6pa3ua rjiHHepHHOM H npn HarpeBaHHH A O 400— 550°.
267
Collected reprints of the International Indian Ocean Expedition, vol. IV, contribution no. 251 817
BojibuiHe TpyAHOCTH B03HHKaK)T npH onpeAeiieHHH MHHepajioB xjiopHTO-B O H H KaojiHHHTOBoñ rpynn. XjiopHTbi xapaKTepH3yK>TCH cepneft 6a3ajibHbix oTpaJKeHHft: 14 A (001), 7 A (002), 4,7 A (003), 3,5 A (004), npHHeM orpa-«eHHH 14 A H 4,7 A >Kejie3HCTbix XJIOPHTOB oneHb cjiaôw, a oipa>KeHHH 7 A H 3,5 A COBnaflaiOT C KaOAHHHTOBblMH.
BHCKañ [7] npczyiaraeT oTJinnaTb S T H MHHepajibi no npncyTCTBHio ABOÍI-ubix oipaxeHHH 7,08 A/7,16 A (xjiopHT, KaoAHHHT) H 3,54 A/3,58 A (xjiopHT, Kao^HHHT). K coHiajieHHK), S T H ABOHHbie oTpajKeHHH B 6ojibiiiHHCTBe cjiynaeB njioxo pa3JiHHaioTCH, noaTOMy npnxoAHTCH nojib30BaTbca peKOMeHAauHHMH BpoyHa [9]. fljia BbiHBJieHHH xjiopHTa nepeA peHTreHOCbeMKoñ o6pa3ii,bi HarpeBajiHCb A O 550 H 400°, TaK KaK y_CTOHHHBOCTb XJIOPHTOB K TepMHHecKoft oôpaôoTKe HeoAHHaKOBa. tlpu T Ü K H X oôpaôoTKax noHBJiHJica neTKHñ pecp-jieKc xjiopHTa 14 A , a petpjieKc 7 A O Ó W H H O Hcne3aeT HJIH ocjiaoeBaer. Kpoiwe Toro, o6pa3Ubi o6pa6aTHBajiHCb 1 0 % - H O H COJIHHOÍÍ KHCJIOTOH, nocjie nero oTpaxeuHe xjiopHTa 7 A cHJibHO ocjiaôeBaAO, a KaoAHHHTa coxpaHHJiocb. X O T H 3Ta MeTOAHKa He coBepiueHHa, Tan KaK CBoflcTBa xjiopHTOB (TepMHHe-CKan ycTOHMHBOCTb H pacTBopeHHe B KHCJiOTe) CHAbHO BapbHpyiOT, H O Apyrofl noKa He cymecTByeT.
B HaCTOflmeft paÓOTe HHTeHCHBHOCTb 6a3aJIbHbIX OTpa>KeHHH rJIHHHCTblX MHHepaJIOB HJIH nJIOmaAH AHCppaKUHOHHblX 9(p(peKTOB npeACTaBJieHbl B BHAe BecoBbix npoueHTOB, KaK 3TO cAeAaHO y BncKan [7]. CneAyeT noA'iepKHyTb, H T O TOHHOCTb 3Toro MeTOAa He BeJiHKa H B AHTepaType HMeiOTCH H Apyrne peKOMeHAaitHH [24].
HeoSxoAUMO TaK>Ke VHHTbmaTb, H T O no peHTreHorpaMMaM M O J K H O onpe-Ae;iHTb TOJibKO HHTeHCHBHOCTb petpJieKCOB, a He n/iomaAH. 3 T O cymecTBeHHO CKa3biBaeTCfl npn onpeAejieHHH coAepjKaHHH MOHTMopHJiJioHHTa. ripn cpaB-HeHHH C AH(ppaKTOMeTpHHeCKHMH flaHHHMH COAepXaHHe MOHTMOpHAJIOHHTa
ciiHJKaeTCH npHMepHO B 1,5 pa3a. CpaBHeHHe HanjHx AaHHbix H MaTepnajioB BncKaa [7] no pañoHy M a A a -
racKapa, n0Ka3a.no, H T O AaHHbie BecoBoro coAepjKaHHH MOHTMopHAJioHHTa, npHBOAHMbie BHCKaeM, CHJIbHO 3aBbIUieHbI. FIo-BHAHMOMy, 3T0CBH3aH0 C Teirf, H T O njiomaAb atpcpeKTa 17 A TpyAHO H3MepHTb T O H H O H3-3a njioxoñ 3anH-C H B oóJiacTH Majibix yrjioB.
YHHTbiBaH HeAOCTaTKH npHHHToro MeTOAa onpeACiieHHH BecoBoro coAep-M O H H H MHHepajioB, cjieAyeT paccMaTpHBaTb HaniH AaHHbie Kak nojiyKOJiH-HeCTBeHHbie.
B BOAOc6opHOM ôacceftHe HHAHñcKoro OKeaHa BbiAeJiaeTCH Hecm/ibKo KAHMaTHHecKHx noHcoB, KaKAbift H3 KOTOpbix xapaKTepH3yeTca onpeAe-JieilHblMH THnaMH nOHB H npeOÔJiaAaiOmHMH B HHX IVIHHHCTblMH M H H e -paji&MH.
B cpeAHeñ nacra AtppnKaHCKoro nooepeacbH no 3anaAHOMy H BOCTOHHOMy no6epe»bHM HHAOCTaHa, B Bapivie, Ha MajiaKKeKOM n-Be, B ioro-BOCTOHHoft A3HH, Ha o-Bax MajiañcKoro apxnnejiara H B ceBepHoñ nacTH ABCTpajiHH pa3BHTbi pa3JiHHHbie noHBbi ryMHAHoro TpbnHnecKoro H cyÔTponHHecKoro noHca. K ceBepy H K rory O T S T O H 3 0 H M Ha A<ppHKaHCKOM MaTepnKe, B ceBep-HOH HaCTH _ H H A H H , Ha 3HaHHTeJlbHOH nJIOmaAH ABCTpaAHH nOHBbl B^aJKHOrO
noHca nocTeneHHO C M E H H I O T C H noHBaMH nojiynycTHHb H nycTHHb. j^aHHbie o cocTaBe niHHHCTbix MHHepajioB B noHBax Ma^añcKoro apxnne-
Aara, MaAaracKapa H 3anaAHoro noôepeJKbH H H A H H npnBOAHTCH B M O H O -rpacpHH M o p a H BapeHa [20]. H a ocHOBaHHH H3yneHHH ôojibinoro (paKTHHe-CKoro MaTepnajia 3 T H aBTopbi npHUiJiH K 3aKAK)HeHHio, H T O cocT.aB r^HHHCTbix MHHepajioB B npeAejiax ryMHAHoro TponHnecKoro noHca onpeAeJineTca B O C H O B H O M ycJioBHHMH ApeHaKa. H a O A H H X H Tex JKe By^KaHHHecKHx ropax O H H HaxoAH^H pa3Hbie MHHepajibi. B BepxHeñ nacTH rop, r\Ae BbiMHBaHHe 6bIJ10 HaHÓOAbUIHM, 06pa3yK)TCH KaOJIHHHTbl, THÓCHTbl, THApOOKHCJIbl »eJie3a, B HHJKHeÜ HaCTH — MOHTMOpHJlAOHHTH. H a CyMaTpe nOHBbl HaCTOJIbKO CHJIbHO npOMHBaiOTCH, HTO KpHCTaJIJIHHeCKHe rJIHHHCTbie MHHepajIbl 3AeCb He 06-
pa3yiOTCH Boo6me.
268
818
flOBOJIbHO nOflpOÔHO HSy^eHbl rJIHHHCTbie MHHepaJIbl B nOMBaX IOJKHOH AfppHKH [16—18]. 3jiecb Ó H J I H BbiAeJieHbi TpH ocHOBHbie rpynnbi noiB: noHBbi nycTHHHbix H noJiynycTbiHHbix pañoHOB, jiaTepHTOBbie H CBH3aHHbie c H H M H noMBH, cyÔTponimecKHe ^epHwe H cBH3aHHbie c H H M H noHBbi. Ka>KAaH H3 3THX rpynn xapaKTepH3yeTCH onpeaejieHHbiM KoMnjieKCOM T J I K H H C T H X MHHe-paJiOB. B nepBbix npeoó^ia^aeT HJIJIHT, HHorAa c HeoojibiiioA npHMeckio M O H T -MOpHJlJIOHHTa HJIH CMeiliaHHOCJIOHCTOrO HJIJIHT-MOHTMOpHJIJIOHHTa. B JiaTe-pHTax npn co^eTaHKH oojibiuoro KOJiHiecTBa ocaAKOB H xopomero apeHa>Ka naKanjiHBaiOTCH KOJIJIOHAH, cocTOHiuHe H3 KaoJiHHHTa, rnôôcHTa H O K H C -JIOB >KeJie3a. B ycjioBHHx njioxoro ApeHa>Ka B Mecrax pacnpocTpaHeHHH HHTpasoHajibHbix MepHbix noiB (TpeTbH rpynna) npeoóJiaAaiOT M O H T M O -pHJIJJOHHTH.
H a 3HaHHTejibHoñ TeppHTOpHH ueHTpajibHoii H K)3KHOH H H A H H pacnpo-cTpaHeHM ABe pa3HOBHAHOCTH noiB (^epHbie H KpacHbie), KOTopwe xapaKTe-. pH3yiOTCH onpeAéJieHHbiM cocraBOM rjiHHHCTbix MHHepajiOB. B T O H K O H (ppaK-U H H HepHbix noHB npeoôJiaflaiOT MHHepajibi M O H T M O P H J I J I O H H T O B O H rpynnu, a B KpaeHbix — Kao^HHHTOBOñ [21—23]. H3yneHH TaK^e HeKOTppbie non-BH B 3anaflHoft BeHrajiHH H B ôacceÔHe p. TaHr, KOTopue coAepwaT M O H T -MOpHJIJIOHHT, HJIJIHT, KaOJIHHHT B pa3HbIX KOJIHHeCTBeHHMX COOTHOHieHH-
H X [10, 6]. KpynHefimHe peKH H H A H H — TaHr H BpaManyTpa HecyT B cocTaBe B3Be-
CH HJIJIHT, XJIOpHT, HeÔOJIbUIOe KOJIHHeCTBO MOHTMOpHJIJIOHHTa H KaOJIHHHTa. PeKH ToflaBapn H BncaKanaTHaM TaioKe B H H O C H T B O C H O B H O M HJIJIHT H He-MHoro KaoJiHHHTa [22].
B noHBax ceBepo-3anaflHbix pañoHOB H H A H H (I7eHflHca6) npeoôJiaAaioT HJIJIHTM H xjiopHTbi ,[12, 13, 15]. B 3T0M xe pañoHe HañfleHbi ApeBHHe OTJIO-X e H H H MOHTMOpHJIJIOHHTOB [8].
B ceBepHoñ iacTH AcppHKH, Ha ApaBHñcKOM n-Be H B 3ana/iHOH ABCTpa-JIHH rjiHHHCTbie MHHepajibi B noiBax Majio H3yqeHbi. B S T H X pañoHax npeoô-jiaAaiOT noiBbi nycTHHHbie H nojiynycTHHHbie, BbmeTpHBaHHe K O T O P H X unex ipe3BbmaHH0 MeAJieHHO. Ü3 r^HHHCTbix MHHepajiOB B TaKHx no^Bax npeo6-JiajiaiOT OÓbPIHO rHflpOCJIHDflbl.
MaKCHMajibHoe KOJiHHecTBO T J I K H H C T H X MHHepajiOB B H H O C H T C H , oneBHAHo, KpynHeñniHMH penaMH H H A H H — H H A O M H TaHroM, KOTopue B CBoeM Bepx-H6M TeieHHH B OCHOBHOM ApeHTHpyiOT nOMBbl, COAepHOIUHe HJIJIHT H XJIOpHT.
B ceBepHoñ HacTH AtppnKH, c ApaBHHCKoro n-Ba H 3ana^Horo noóepeJKbH ABCTpajiHH TOffKOflHcnepcHbin MaTepnaji nocTynaeT B OKeaH rjiaB«HM o6pa-30M B pe3yjibTaTe BeTpoBoñ AeHyAaunn.
TponHMecKHe ryMiiflHbie pañoHbi AtppHKH, H H A H H , O - B O B MajiañcKoro apxHnejiara H cesepHon Macra ABCTpajiHH ApeHHpyioTCH Gojiee M R J I K H M H peKaMH. 3fleCb KÓpbl BbIBeTpHBaHHH COAep>KaT KaOJIHHHT H MOHTMOpHJIJIO-HHTbl. B CeBepHOH ABCTpajiHH rJIHHHCTbie MHHepajIbl npeACTaBJieHbl B OCHOBH O M nJIOXO OKpHCTaJIJIH30BaHHbIMH KaOJIHHHTaMH [25].
06paTHMCH K SKCnepHMeHTajIbHblM flaHHblM O COCTaBe H KOJIHqeCTBeHHOM
canepJkaHHH T J I K H H C T H X MHHepajioB B noBepxHocTHOM cjioe ocaAKOB H H A H H -CKoro OKeaHa.
H J I J I H T H uiHpoKo pacnpocTpaHeHbi B npeaejiax H3yneHHoro pañoHa (pue. 1). MaKCHMajibHoe H X coAep>KaHHe HaôJiioAaeTCH B oca^Kax ApaBHñ-CKOrO M O p H . ZI,H(ppaKTOMeTpHMeCKHe 3Cp(J)eKTbI 3THX MHHepaJIOB Wpe3BbmaHH0 neiKo BbipaweHbi (pHC. 2, C T . 4808). Jinn H H X xapaKTepHo TaKJKe oieHb BwcoKoe coAep^aHHe K 2 Ó (Áo 5—6%), KOTopoe He oTMenajiocb HHrAe B T H X O M OKeaHe [4]. Heoojibiuon MaKCHMyM BMAejineTCH Tanate y ceBepHoñ noJiOBHHbi C y M a T p w . BbicoKoe coAep>KaHHe HJIJIHTOB (AO 40—60%) coxpa-HHeTC3 B ocaAKax npHMepHO A O 3 0 H H K)»Horo naccaTHoro TeneHHH, a K lory nocTeneHHo yMeHbiuaeTcn. riojioca MHHHMajibHoro coAepjKaHHH HJIJIHTOB A O X O A H T A O 30° K). iu., a wxHee KOJiH^ecTBO HJIJIHTOB CHOBa B03pacTaeT. yBejiHHeHHe coAepjKaHHH 9THX MHHepajioB OTMe^eHo TaK>Ke y ceBepo-3anaA-Horo no6epe»bH ABCTpajiHH.
269
819
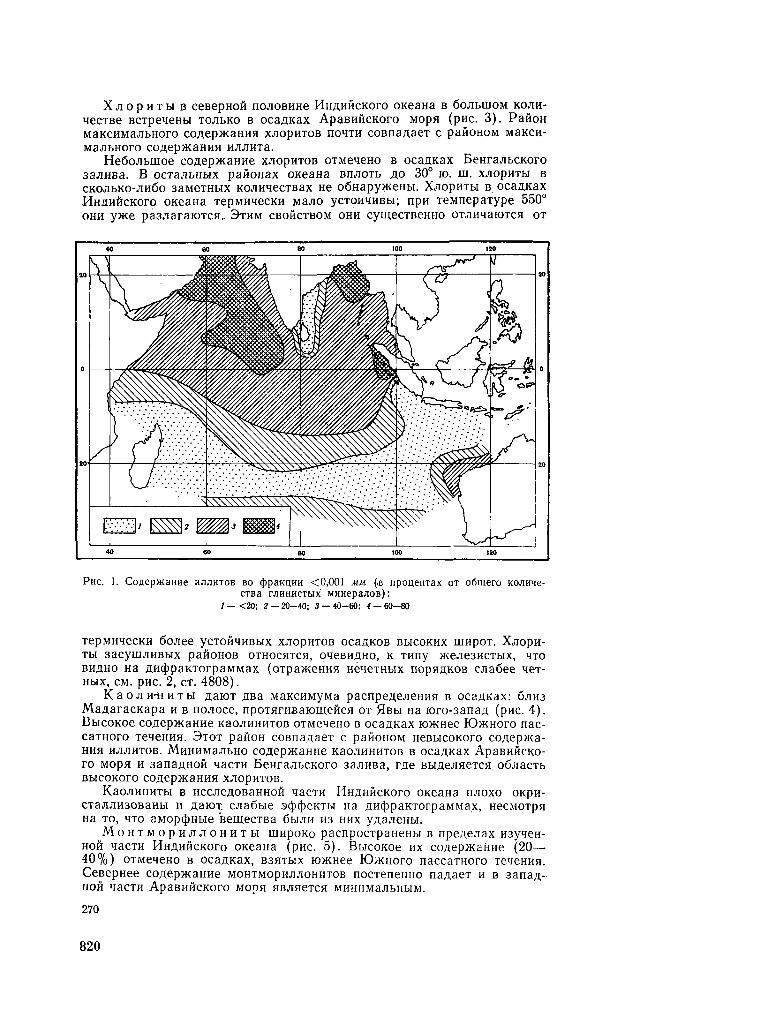
X j I O p H T b l B C e B e p H O H nOJIOBHHe H H A H H C K O r O O K e a H a B ÓOJIblUOM KOJIH-
wecTBe BCTpeneHbi TOJibKo B oca/j,Kax ApaBHHCKoro MopH (pnc. 3). PañoH MaKCHMajibHoro coAepjKaHHH xjiopHTOB noiTH coBnaaaeT c pañoHOM MaKCH-MaJIbHOrO COAepJKaHHH HJIJIHTa.
HeóoJibiuoe coaepscaHHe XJIOPHTOB OTMe^eno B ocaflKax BeHrajibCKoro 3a^HBa. B ocTajibHbix pañoHax OKeaHa BnjiOTb £0 30° 10. m . xjiopHTH B CKOJibKO-JiHÔo 3aMeTHbix KOJiHHecTBax He oÓHapy^íeHbi. XjiopHTbi B ocaflKax M H A H H C K O T O OKeaHa TepMHqecKH Majio ycTOHqHBbi; npn TeMnepaType 550a
O H H yace pa3JiaraK)TCH„ 3 T H M C B O H C T B O M O H H . cymecTBeHHO OTJinnaioTCH O T
P H C . 1. CoaepKaHHe HJIJIHTOB B O (j)paKU!HH <0,O01 MM (,B npoueHTax O T oñmero Konme-CTBa IVIHHHCTMX MHHepaJIOB):
/ — <20; 2 — 20-40; 3 — 40-60; 4 — 60-80
T e p M H H e C K H ÔCUiee y C T O H H H B H X XJIOpHTOB O C a ^ K O B BblCOKHX UIHpOT. XjIopH-Tbl 3aCyiHJIHBbIX paftOHOB O T H O C H T C H , O^eBHflHO, K T H n y JKeJie3HCTbIX, M T O BHflHo Ha AHíjjpaKTorpaMMax (oTpa>KeHHíi HeneTHbix nopaflKOB cjiaôee MeT-HblX, CM. pHC. 2, CT. 4808).
KaojiH-üHTbi AaKiT asa MaKCHMyMa pacnpe,nejieHHH B ocazucax: 6JTH3 MaflaracKapa H B nojioce, npoTHrHBaromencH O T 5ÏBH Ha K)ro-3anaA (pnc. 4) . BbicoKoe coflepjKaHHe KaojiHHHTOB OTMe^eno B ocaflKax K»KHee KtaHoro nac-caTHoro TeneHHH. 3 T O T pañoH coBna^aeT c pafioHOM HeBbicoKoro coAep>Ka-H H H HJIJIHTOB. M H H H M a J I b H O COflepJKaHHe KaOJIHHHTOB B OCaflKaX A p a B H H C K O -
ro MopH H 3anaAHoñ qacTH BeHrajibCKoro 3a;iHBa, i\a.e BbiflejineTCH oôjiacTb BblCOKOrO COflepjKaHHH XJIOpHTOB.
KaoJiHHHTH B HccjieflOBaHHoñ qacTH H H A H H C K O T O OKeaHa njioxo OKpn-CTajiJiH30BaHbi H Aaiox cjiaôbie 3cp(|)eKTbi Ha /iH(ppaKTorpaMMa,x, HecMOTpa Ha T O , qTo aMOpcpHbie BemecTBa OHJIH H3 H H X yAajieHH.
M o H T M o p H J i J i o H H T b i uiHpoKo pacnpocTpaneHbi B npeflejiax H3yqeH-H O H MacTH HHAHHCKoro OKeaHa (pnc. 5). BbicoKoe H X co,nep>KaHHe (20— 40%) OTMeHeHo B ocaflKax, B 3 H T H X io>KHee K)>KHoro naccaTnoro Te^eHHH. CeBepHee coAep>KaHHe M O H T M O P H J I J I O H H T O B nocTenenno najiaeT H B 3ana^,-HOÎÏ H a C T H A p a B H H C K O r O M O O H HBJIHeTCfl M H H H M a j I b H H M .
270
820
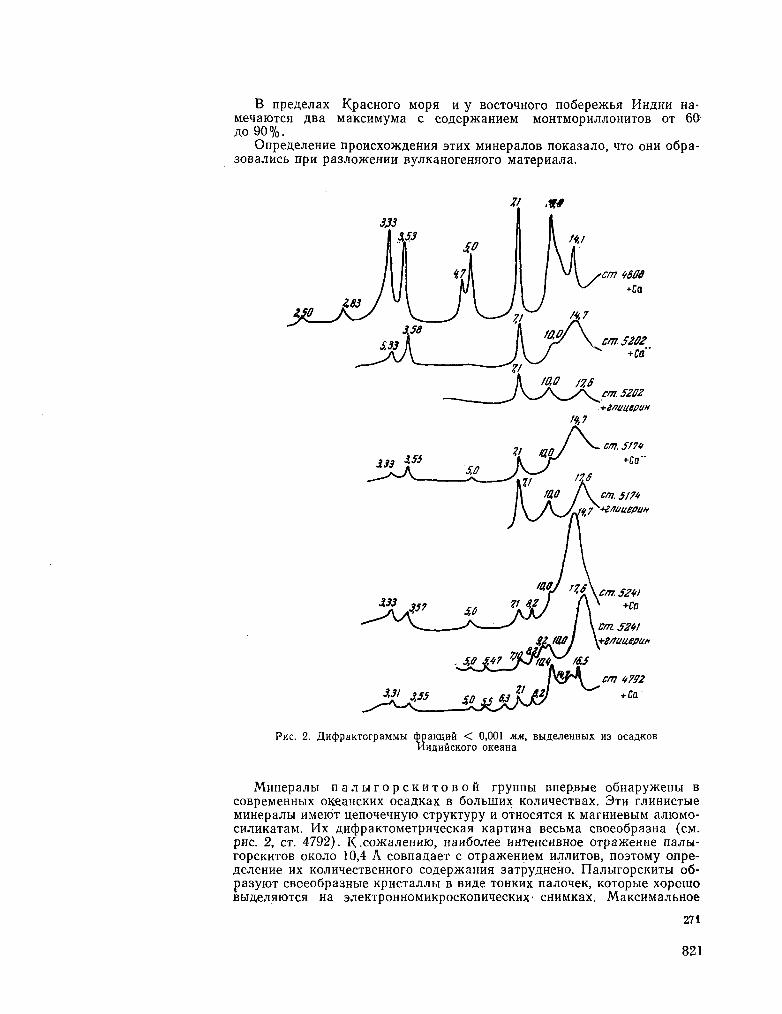
B npeAejiax KpacHoro Mopa H y BocTomioro no6epe>Kb$i H H A H H Ha-Me aiOTCH ,n.Ba MaKCHMyMa c coflepwaHHeM MOHTMOPHJUIOHHTOB OT 60 A O 9 0 % .
OnpeaejieHHe npoHcxoJKfleHHH S T H X MHHepajioB noKa3ajio, I T O O H H o6pa-30BajiHCb npH pa3Jio3KeHHH ByjiKaHoreHHoro MaTepnajia.
>?/ . * #
cm. 52W
cm. 52W
cm 4732
+ Ca
P H C . 2. JUeJjpaKTorpaMMbi (ppaKUHÎf < 0,001 MM, BbiflejieHHbix H3 ocaflKOB HHflHHCKoro oKeaHa
Mimepajibi n a j i b i r o p c K H T O B O H rpynnw Bnep.Bbie oÔHapyweHbi B coBpeMeHHbix oKeaHCKHX ocaflKax B ôoJibuiHx KOJiH^ecTBax. 3 T H rjinHHcrae MHHepajibi HMeioT uenoieiHyio CTpyKTypy H O T H O C H T C H K MarHHeBbiM ajnoMO-CH^HKaTaM. H x AHCppaKTOMeTpHMecKaH KapTHHa BecbMa CBoeo6pa3Ha ( C M . pHc. 2, CT. 4792). K .coJKajieHHio, Hanóojiee HHTencHBHoe OTpaxeHne najibi-ropcKHTOB oKOJio 10,4 Â coBnaAaeT c OTpaJKeHHeM HJIJIHTOB, noaTOMy onpe-flcneHHe H X KOJiHHecTBeHHoro coaep^aHHH 3aTpyAHeHO. FlajibiropcKHTbi 06-pa3yioT CBoeo6pa3Hbie KpncTajuibi B BH^e T O H K H X na^ioneK, KOTopbie xopciuo BblAejIHIOTCH Ha SJieKTpOHHOMHKpOCKOnH^eCKHX CHHMKaX. MaKCHMajIbHOe
27 i
821
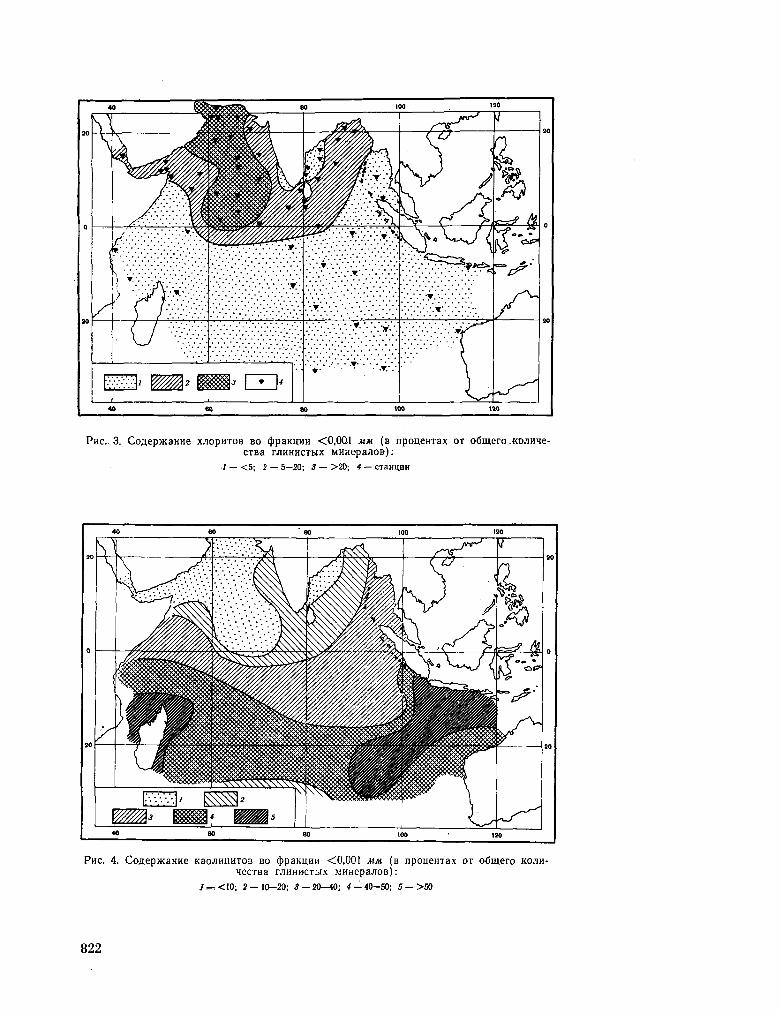
mm> B * M * c Pue. 3. CoflepKaHHe X;IOPHTOB BO (ppaxuuH <0,OQ1 MM (B npouemax OT ofimero.KOJiHHe-
CTBa IVIHHHCThlX MHHepajIOB):
•/ — <5; 2 — 5—20; 3 — >20; 4 — CTannHH
P H C . 4. CoflepjKaHHe KaoJiHHHTOB BO (ppaKuan <0,001 MM (B npouemax OT camero KOJIH-
«eCTBa MHHH'CTHX MHHepajIOB):
J~.<10; 2—10-20; 3 — 20—40; 4 — 40—50; 5 — >50
822
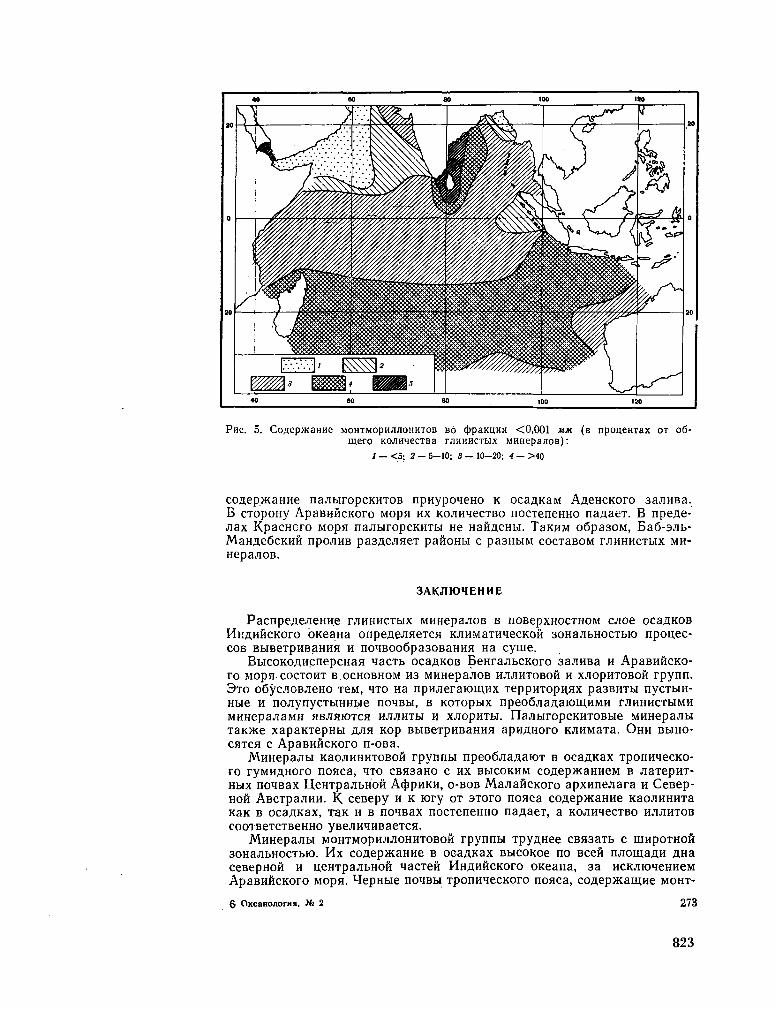
PHC. 5. CoAep>KaHHe MOHTMOPHJUIOHHTOB BÓ (ppaKUHH <0,001 MM (B npouemax OT 06 mero KOJimecTBa rjiHHHCTbix MHHepajroB):
/ — <5; 2 — 5-10; 3 — 10—20; 4 — >40
coaepjKaHHe najibiropcKHTOB npnypoqeHO K oca^KaM A^eHCKoro 3ajTHBa. B cTopoHy ApaBHHCKoro Mopn H X KOJÍHHecTBo nocTeneHHO naflaeT. B npeae-Jiax KpacHcro Mops najiuropcKHTbi He HañfleHbi. TaKHM o6pa30M, Ea6-3Jib-MaHaeócKHH npojiHB pa3AejiaeT pafloHH c pa3HbiM cocTaBOM TJIHHHCTHX M H -HepajioB.
3AKJ1H3HEHHE
PacnpeaejieHHe rjiHHHCTbix unnepanoB B noBepxHOCTHOM cjioe ocaanoB HviflHHCKoro OKeaHa onpeAejineTcn KJiHMaTHiecKoñ 30HajibHOCTbio npou.ec-C O B BbiBeTpHBaHHH H noMBOo6pa30BaHHH Ha cyme.
BbicoKOAHcnepcHan MacTb ocaflKOB BeHrajibCKoro 3a^HBa H ApaBHHCKo-ro M O p H COCTOHT B OCHOBHOM H3 MHHepaJIOB HJIJIHTOBOH H XJIOpHTOBOH rpynn. 3 T O oôycjioBJieHo TeM, M T O Ha npHjieraroiUHX TeppHTopHHX pa3BHTM nycTHH-Hbie H nojiynycTHHHbie noMBH, B K O T O P W X npeo6jiaAaiom.HMH T J I K H H C T H M H MHHepajiaMH HBJIHMTCH HJIJIHTH H xjiopHTbi. riajibiropcKHTOBbie MHHepajibi TaK»e xapaKTepHbi AJIH nop BbiBeTpHBaHHH apHAHoro KJiHMaTa. O H H B H H O -C H T C H c ApaBHHCKoro n-OBa.
MHHepajibi KaojiHHHTOBoñ rpynnw npeoÔJiaAaiOT B ocaAKax TponH^ecKO-ro ryMHAHoro nonca, H T O CBH3aH0 c H X B H C O K H M coAepmaHHeM B jiaTepHT-Hbix noHBax UeHTpa^bHOH AtppHKH, O - B O B MajiañcKoro apxnnejiara H CeBep-Hoñ ABCTpajiHH. K ceBepy H K rory O T 3Toro noHca coAepjKaHHe KaojiHHHTa Kax B ocaAKax, T E K H B noiBax nocTeneHHO naaaeT, a KOAH^ecTBo HJIAHTOB COOTBeTCTBeHHO yBeAHHHBaeTCH.
MHHepajibi MOHTMopHJiJioHHTOBoñ rpynnbi TpyAHee cBH3aTb c umpoTHofi 30HajibHOCTbK). H x coAepraaHHe B ocaAKax BbicoKoe no Been njiomaAH AHa ceBepHoñ H ueHTpa^bHoñ lacren H H A H H C K O F O OKeaHa, 3a HCKJuo^eHHeM ApaBHHCKoro Mopn. HepHbie no^Bbi TponH^ecKoro nonca, coAepjKauine M O H T -
6 OKeanojiorHH, Ns 2 273
823
MopmiJiOHHTbi B KaiecTBe npeoOAaAaroiHHx rjiHHHCTbix MHHepajioB, MoryT 6biTb H C T O H H H K O M Hx nocTynjieHHH B OKeaH.
B O 3 M O J K H O , «ITO qacTb MOHTMopHJiJioHHTa o6pa3yeTCH Ha AHe OKeaHa H3 ByjiKaHoreHHoro MaTepHaAa. 3 T O T MaTepHaji umpoKo pacnpocipaHeH B ocaAKax BeHrajibCKoro 3aAHBa, 6 A H 3 O - B O B MajiaftcKoro apxunejiara H M a -flaracKapa. KaK HanôoJiee BbicoKOAHcnepcHwe MHHepajibi, M O H T M O P H A A O H H -Tbi MoryT nepeHOCHTbCH Ha orpoMHbie paccTOHHHH.
J I H T E P A T y P A
1. B e 3 p y K O B n . JI. 1961. HccjieAOBaHHfl HHAHflCKoro oxeaHa B 3 3 - M pence s/c « B H -TH3b». OKeaHOJIOrH», 1,- BbHT. 4 .
2. B e 3 p y K O B n . JI. 1961. HccjieflOBaHHe A O H H M X ocasaKOB ceBepHoñ M a c ™ HHAHiicKoro OKeaHa. M I T . OKeaHOJionmecKHe Hcc/ie,aoBaHHH. C 6 . eraTeft, N» 9.
3. B e a p y K O B n . JI. 1963. Hecjie/ioBarfHH HHAHfrcxoro OKeaHa B 3 5 - M pence s/c «Bu-TH3b». OKeaHOJiorita, III, BHTI . 3.
4. T o p O y H O B a 3 . H . 1963. rjiHHHCTwe MHHepaJiH B ocaAKax THXoro OKeana. JIHTOJIO-T H H H noJie3HHe HCKonaeMbie, JV» 1.
5. T o p f i y H O B a 3 . H . 1960. BbicoKOflHonepcHbie MHHepa^M B ocaaxax HHauñcKoro OKeawa. /IOKJI. A H C C C P , 134, N° 4.
6. A d h i k a r i M . 1957. Physico-chemical properties of some west Bengal clays. Indian Soc. of Soil Sci., 5, N o 4.
7. B i s c a y e P . E . 1964. Mineralogy and sedimentation of the deep-sea sediment fine fraction in the Atlantic ocean and adjacent seas and oceans. Geochemistry technical report, 8.
8. B o s e A . K . , S e n g u p t a P . 1954. X-ray and differential thermal studies of some Indian montmorillonites. Nature, 174, N o 4418.
9. B r o w n G . and oth. 1961. The X-ray identification and crystal strectures of clay minerals. London.
10. C h a t t e r j e e B . 1955. Properties of some soils of west Bengal clay mineralogy in relation to chemical, electrochemical and physical properties. Proceedings of the symposium on recent trends in soil research, part 2, Alleahabad.
11. El. W a kee l S. K - , R i l e y J. P . 1961. Chemical and mineralogical studies of deep-sea sediments. Geochim. et cosmochim. acta, 25, N o 2.
12. K a n w a r I. S. 1959. T w o dominant clay minerals in Penjab Soils. Indian Soc. of Soil Sci., 7, N o 4.
13. K a n w a r I. S . 1961. Clay minerals in saline alkali soils of the Punjab. Indian Soc. of Soil Sci., 9, N o 1.
14. K u e n e n P . H . 1942. The «Snellius> expedition in the eastern part of the Netherland east Indies, 5, pt. 3, section 1, Leiden.
15. M e h r a O . P . J a c k s o n M . L. 1960. Iron oxide removal from soils and clays system buffered with sodium bicarbonate by dithionite-citrate. Clays and clay m i nerals, 5.
16. M e r w e C . R . van d e r . H e y s t e k H . 1052. Clay minerals of south African soil groups: I. Latérites and related soils. Soil Sci., 74, N o 5.
17. M e r w e C . R . van der, H e y s t e k H . 1955. Clay minerals of south African soil groups: IV. Subtropical black clays and related soils. Soil Sci., 79, N o 2.
18. M e r w e C . R . van der H e y s t e k H . 1955. Clay minerals of South African soil groups: III Soils of the desert and adjoning semiarid region. Soil Sci., 80, N 6.
19. M i t r a R . P . 1954. S o m e resent developments in the field of fundamental clay research. Indian Soc. of Soil Sci., 7, N 4.
20. M o h r E . C . L , B a r e n F . A . V . 1954. Tropical soils. Intersciens pub. 21. N a g e 1 s c h m i d t O . , D e s a 1 A . D . , M u i r A . 1940. The minerals in clay fractions
of a black cotton soil and a red earth from Hyderabad, Deccan state, India. Agricultural Sci., 30, part 4.
22. R a o M . S. 1963. Clay mineral composition of shelf sediments of the east coast India. Indian Acad. Sci. Proc, Sec. A , 58.
23. R a y c h a u d h u r i S. P . , S u l a i m a n M . , B h u i y a n A . B . 1943. Physico-chemical and mineralogical studies of black and red soil profiles near Coimbater. Ind. J. Agricultural Sci., XIII, part III.
24. S c h u l t z L . G . 1960. Quantitative evaluation of the kaolinite and ilute in under-clays. Clays and clay minerals, 5.
25: S i m o n e t t D . S., B a u l e k e M . P . , 1963.. Mineralogy of soils on basalt in North; Queensland. Soil Sci Soc. America Proc, 27, N 2.
IIocTynHJia B pe.naKU.Hio 3.VI.1965
274
824
Z. N. GORBUNOVA
D I S T R I B U T I O N O F C L A Y M I N E R A L S IN T H E S E D I M E N T S O F T H E I N D I A N O C E A N
S u m m a r y
Clay minerals were identified in 70 samples of recent marine sediments from the Indian Ocean north of the latitude 30° S, X-ray diffraction, D T A , electron microscopy, chemical and semi-quantitáTíve analyses having been applied. Illites, chlorites, kaolinites, montmorillonites and palygorskits were shown to be dominant. For the former four minerals the m a p of their distribution in sediments is presented.
Çlay minerals are formed in the crusts of weathering and soils, then carried away by streams and deposited in the ocean. High concentrations of illites and chlorites in sediments of the Arabian Sea can be explained by the fact that they are swept away from desert and semi-desert lands. Kaolinites are carried away from red soils and latosols and deposited in marine sediments of the tropic humid zone. S o m e peculiarities in the distribution of montmorillonites can be explained by their formation in the oceans and soils due to the decomposition of volcanic ash.
6*
825
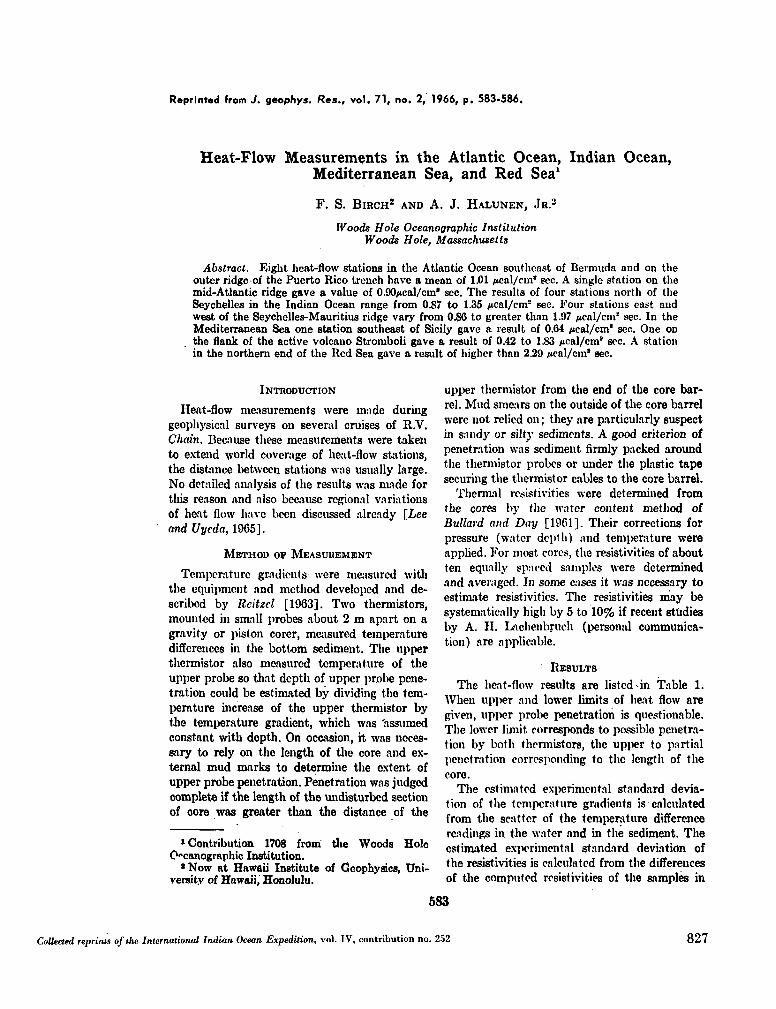
Reprinted (rom J. géophys. Res., vol. 71, no. 1, 1966, p. 583-586.
Heat-Flow Measurements in the Atlantic Ocean, Indian Ocean, Mediterranean Sea, and Red Sea1
F. S. BIRCH 2 A N D A. J. H A L U N E N , JR.3
Woods Hole Océanographie Institution Woods Hole, Massachusetts
Abstract. Eight heat-flow stations in the Atlantic Ocean southeast of Bermuda and on the outer ridge of the Puerto Rico trench have a mean of 1.01 /tcal/cm" sec. A single station on the mid-Atlantic ridge gave a value of 0.90/tcal/cm* sec. The results of four stations north of the Seychelles in the Indian Ocean range from 0.87 to 1.35 /tcal/cnv sec. Four stations east and west of the Seychelles-Mauritius ridge vary from 0.86 to greater than 1.97 /tcal/cm2 sec In the Mediterranean Sea one station southeast of Sicily gave a result of 0.64 ¿tcal/cm' sec. One on the flank of the active volcano Stromboli gave a result of 0.42 to 1.83 /tcal/cm* sec. A station in the northern end of the Red Sea gave a result of higher than 2.29 Mcal/cm* sec.
I N T R O D U C T I O N
Heat-flow measurements were made during geophysical surveys on several cruises of R . V . Chain. Because these measurements were taken to extend world coverage of heat-flow stations, the distance between stations was usually large. N o detailed analysis of the results was m a d e for this reason and also because regional variations of heat flow have been discussed already [Lee and Uycda, 1965].
M E T H O D O P M E A S U R E M E N T
Temperature gradients were measured with the equipment and method developed and described by Rcitzcl [1963]. T w o thermistors, mounted in small probes about 2 m apart on a gravity or piston corer, measured temperature differences in the bottom sediment. The upper thermistor also measured temperature of the upper probe so that depth of upper probe penetration could be estimated by dividing the temperature increase of the upper thermistor by the temperature gradient, which was 'assumed constant with depth. O n occasion, it was necessary to rely on the length of the core and external m u d marks to determine the extent of upper probe penetration. Penetration was judged complete if the length of the undisturbed section of core was greater than the distance of the
1 Contribution 1708 from the Woods Hole Océanographie Institution.
a N o w at Hawaii Institute of Geophysics, University of Hawaii, Honolulu.
upper thermistor from the end of the core barrel. M u d smears on the outside of the core barrel were not relied on ; they are particularly suspect in sandy or silt}- sediments. A good criterion of penetration was sediment firmly packed around the thermistor probes or under the plastic tape securing the thermistor cables to the core barrel.
Thermal resistivities were determined from the cores by the water content method of Bullard and Day [1961]. Their corrections for pressure (water depth) and temperature were applied. For most cores, the resistivities of about ten equally spaced samples were determined and averaged. In some cases it was necessary to estimate resistivities. The resistivities m a y be systematically high by 5 to 10% if recent studies by A . H . Lachenbruch (personal communication) are applicable.
R E S U L T S
The heat-flow results are listed-in Table 1. W h e n upper and lower limits of heat flow are given, upper probe penetration is questionable. The lower limit corresponds to possible penetration by both thermistors, the upper to partial penetration corresponding to the length of the core.
The estimated experimental standard deviation of the temperature gradients is calculated from the scatter of the temperature difference readings in the water and in the sediment. T h e estimated experimental standard deviation of the resistivities is calculated from the differences of the computed resistivities of the samples in
583
Collected reprints of the International Indian Ocean Expedition, vol. IV, contribution no. 252 827
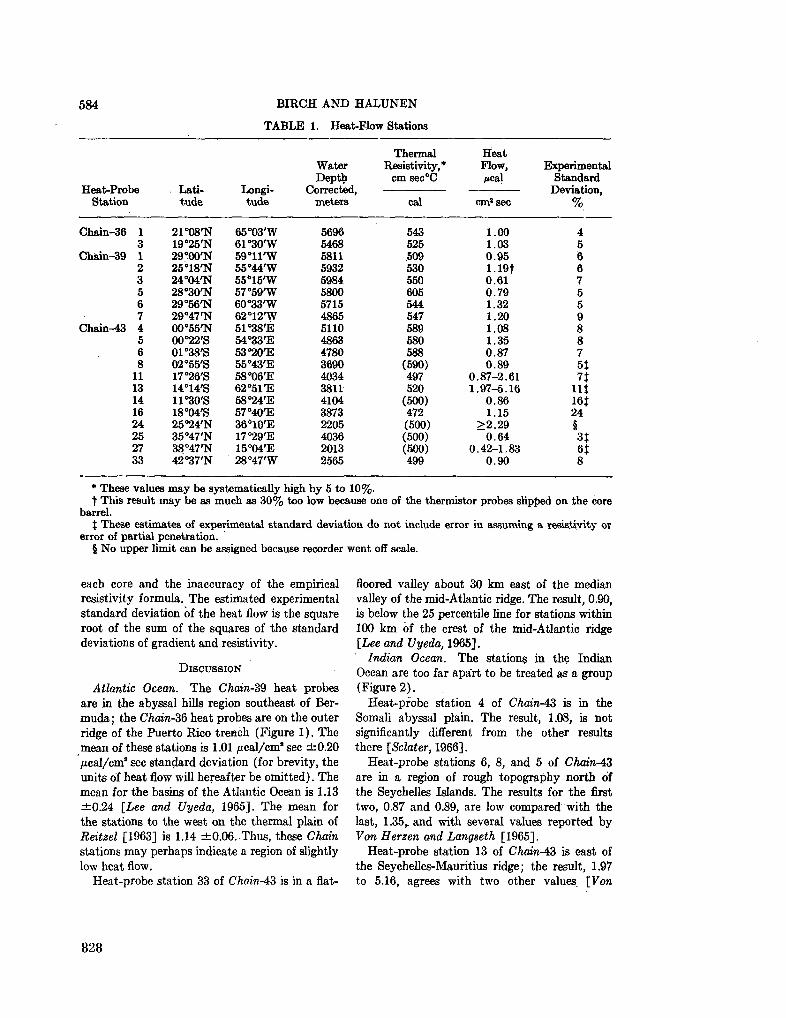
584 BIRCH A N D H A L U N E N
TABLE 1. Heat-Flow Stations
TToaf P r A ^ o ncalr iiu
Station
Chain-36
Chain-39
Chain-43
1 3 1 2 3 5 6 7 4 5 6 8
11 13 14 16 24 25 27 33
Latitude
2 1 W N 19°25'N 29°00'N 25°18'N 24°04'N 28°30'N 29°56'N 29°47'N 00°55'N 00°22'S 01°38'S 02°55'S 17°26'S 14°14'S 11°30'S 18°04'S 25°24'N 35°47'N 38°47'N 42°37'N
Longitude
65°03'W 61°30'W 59'WW 55°44'W 55 6 15'W 57°59'W 60°33'W 62°12'W 51°38'É 54°33'E 53°20'E 55-43'E 58°06'E 62°51'E 58°24'E 57°40'E 36¿10'E 17°29'E 15°04'E 28°47'W
Water Depth
Corrected, meters
5696 5468 5811 5932 5984 5800 5715 4865 5110 4863 4780 3690 4034 3811 4104 3873 2205 4036 2013 2565
Thermal Resistivity,*
c m sec°C
cal
543 525 509 530 550 605 544 547 589 580 588
(590) 497 520
(500) 472 (500) (500) (500) 499
Heat Flow, /ical
c m ' sec
1.00 1.03 0.95 1.19t 0.61 0.79 1.32 1.20 1.08 1.35 0.87 0.89
0.87-2.61 1.97-5.16
0.86 1.15
>2 .29 0.64
0.42-1.83 0.90
Experimental Standard
Deviation,
4 5 6 6 7 5 5 9 8 8 7 fit 71
Ht 16Î 24 § 3Î 6Í 8
* These values m a y be systematically high by 5 to 10%. t This result m a y be as much as 30% too low because one of the thermistor probes slipped on the core
barrel. J These estimates of experimental standard deviation do not include error in assuming a resistivity or
error of partial penetration. § N o upper limit can be assigned because recorder went off scale.
each core and the inaccuracy of the empirical resistivity formula. The estimated experimental standard deviation of the heat flow is the square root of the sum of the squares of the standard deviations of gradient and resistivity.
DISCUSSION
Atlantic Ocean. The Chain-39 heat probes are in the abyssal hills region southeast of Berm u d a ; the Chain-36 heat probes are on the outer ridge of the Puerto Rico trench (Figure 1). The mean of these stations is 1.01 /tcal/cm2 sec ± 0 . 2 0 /¿cal/cm3 sec standard deviation (for brevity, the units of heat flow will hereafter be omitted). The mean for the basins of the Atlantic Ocean is 1.13 ± 0 . 2 4 [Lee and Uyeda, 1965]. The mean for the stations to the west on the thermal plain of Reitzel [1963] is 1.14 ±0 .06 . Thus, these Chain stations m a y perhaps indicate a region of slightly low heat flow.
Heat-probe station 33 of Chain-43 is in a flat-
floored valley about 30 k m east of the median valley of the mid-Atlantic ridge. The result, 0.90, is below the 25 percentile line for stations within 100 k m of the crest of the mid-Atlantic ridge [Lee and Uyeda, 1965].
Indian Ocean. The stations in the Indian Ocean are too far apart to be treated as a group (Figure 2 ) .
Heat-probe station 4 of Chain-43 is in the Somali abyssal plain. The result, 1.08, is not significantly different from the other results there [Sclater, 1966].
Heat-probe stations 6, 8, and 5 of Chain-43 are in a region of rough topography north of the Seychelles Islands. The results for the first two, 0.87 and 0.89, are low compared with the last, 1.35,. and with several values reported by Von Herzen and Langseth [1965].
Heat-probe station 13 of Chain-43 is east of the Seychelles-Mauritius ridge; the result, 1.97 to 5.16, agrees with two other values. [Von
828
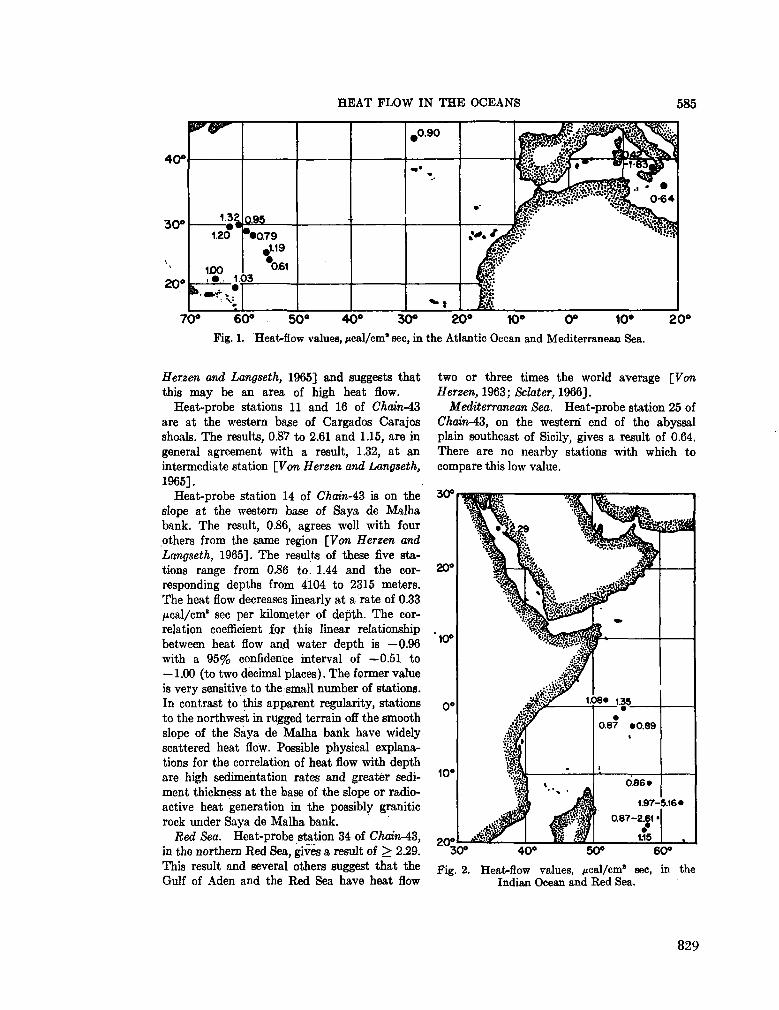
HEAT FLOW IN THE OCEANS 585
70° 60° 50° 40° 30° 20° 10° 0° 10° 20°
Fig. 1. Heat-flow values, /teal/cm' sec, in the Atlantic Ocean and Mediterranean Sea.
Herzen and Langseth, 1965] and suggests that this m a y be an area of high heat flow.
Heat-probe stations 11 and 16 of Chain-43 are at the western base of Cargados Carajos shoals. The results, 0.87 to 2.61 and 1.15, are in general agreement with a result, 1.32, at an intermediate station [Von Herzen and Langseth, 1965].
Heat-probe station 14 of ChainAZ is on the slope at the western base of Saya de Malha bank. T h e result, 0.86, agrees well with four others from the same region [Von Herzen and Langseth, 1965]. T h e results of these five stations range from 0.86 to. 1.44 and the corresponding depths from 4104 to 2315 meters. The heat flow decreases linearly at a rate of 0.33 /teal/cm2 sec per kilometer of depth. T h e correlation coefficient for this linear relationship between heat flow and water depth is —0.96 with a 95% confidence interval of —0.51 to —1.00 (to two decimal places). T h e former value is very sensitive to the small number of stations. In contrast to this apparent regularity, stations to the northwest in rugged terrain off the smooth slope of the Saya de Malha bank have widely scattered heat flow. Possible physical explanations for the correlation of heat flow with depth are high sedimentation rates and greater sediment thickness at the base of the slope or radioactive heat generation in the possibly granitic rock under Saya de Malha bank.
Red Sea. Heat-probe station 34 of ChainAZ, in the northern Red Sea, gives a result of > 2.29. This result and several others suggest that the Gulf of Aden and the Red Sea have heat flow
two or three times the world average [Von Herzen, 1963; Sclater, 1966].
Mediterranean Sea. Heat-probe station 25 of ChainAZ, on the western" end of the abyssal plain southeast of Sicily, gives a result of 0.64. There are no nearby stations with which to compare this low value.
30°
20°
10°
10«
20'
N
J
337™
k
W W
.'.•«"Sr
w
Mm
•4P
38» 1.35 •
• 0.87 «0.69
«
0.86»
1.97-
0.87-2.61 •
1.15
M0i
5 . 1 6 *
30° 40° 50° 60" Fig. 2. Heat-flow values, /¿cal/cm2 sec, in the
Indian Ocean and Red Sea.
829
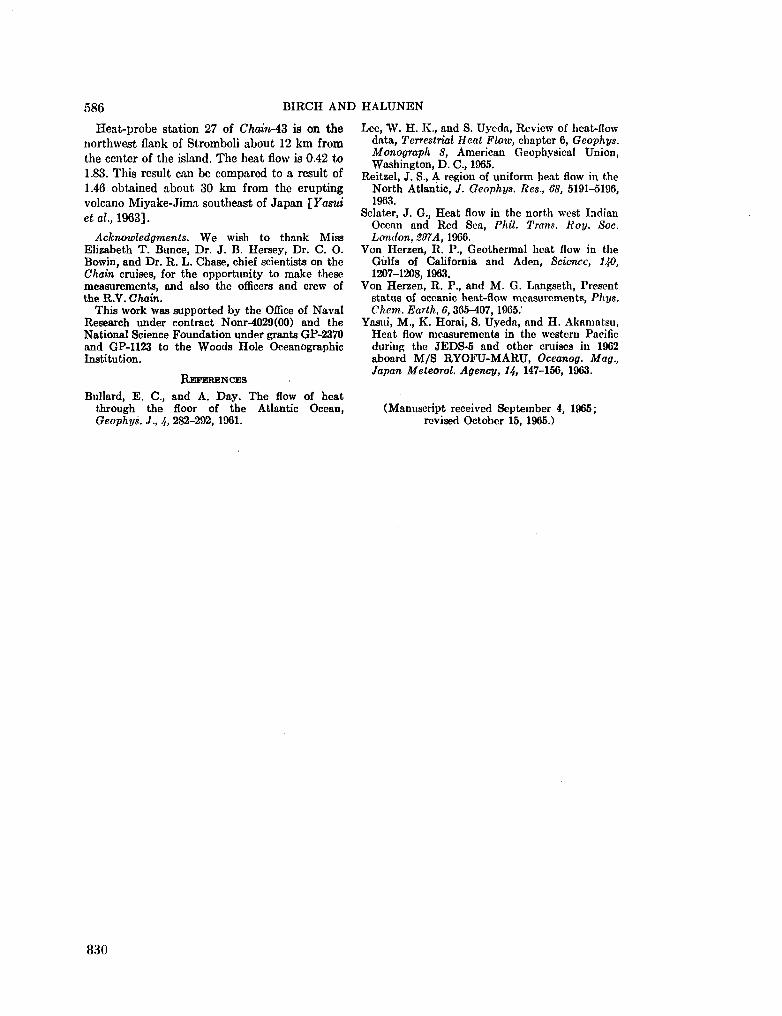
586 BIRCH AND HALUNEN
Heat-probe station 27 of Choin-43 is on the
northwest flank of Stromboli about 12 k m from
the center of the island. The heat flow is 0.42 to
1.83. This result can be compared to a result of
1.46 obtained about 30 k m from the erupting
volcano Miyake-Jima southeast of Japan [Yasui
etal, 1963].
Acknowledgments. W e wish to thank Miss Elizabeth T . Bunce, Dr. J. B . Hersey, Dr. C . O . Bowin, and Dr. R . L . Chase, chief scientists on the Chain cruises, for the opportunity to make these measurements, and also the officers and crew of the R . V . Chain.
This work was supported by the Office of Naval Research under contract Nonr-4029(00) and the National Science Foundation under grants GP-2370 and GP-1123 to the Woods Hole Océanographie Institution.
R E F E R E N C E S
Bullard, E . C , and A . Day. The flow of heat through the floor of the Atlantic Ocean, Geophys. J., /„ 282-292, 1961.
Lee, W . H . K . , and S. Uycda, Review of heat-flow data, Terrestrial Heat Floio, chapter 6, Geophys. Monograph 8, American Geophysical Union, Washington, D . C , 1965.
Reitzel, J. S., A region of uniform heat flow in the North Atlantic, J. Geophys. Res., 68, 5191-5196, 1963.
Sclater, J. G . , Heat flow in the north west Indian Ocean and Red Sea, Phil. Trans. Roy. Soc. London, S97A, 1966.
Von Herzen, R . P., Geothermal heat flow in the Gulfs of California and Aden, Science, 140, 1207-1208, 1963.
Von Herzen, R . P., and M . G . Langseth, Present status of oceanic heat-flow measurements, Phys. Che.m. Earth, 6, 365-407, 1965.
Yasui, M . , K . Horai, S. Uyeda, and H . Akamatsu, Heat flow measurements in the western Pacific during the JEDS-5 and other cruises in 1962 aboard M / S R Y O F U - M A R U , Oceanog. Mag., Japan Meteorol. Agency, 14, 147-156, 1963.
(Manuscript received September 4, 1965; revised October 15, 1965.)
830
Reprinted from J. geophys. Res., vol. 71, no. 10, 1966, p. 2625-2630.
Magnetic Lineation between Carlsberg Ridge and Seychelles Bank, Indian Ocean1
CABL 0. BOWIN
Department of Geophysics, Woods Hole Océanographie Institution Woods Hole, Massachusetts
PETER R. VOGT
Geophysical and Polar Research Center, Department of Geology University of Wisconsin, Madison
The azimuths of isoanomaly lines of strong magnetic anomalies of total intensity, discovered during a cruise of H . M . S . Owen in 1962 in the eastern Somali basin, Indian Ocean, were investigated on a cruise of R . V . Chain in 1964. Forty-eight azimuths were determined, having an average bearing of 295°. Compilation of this result with magnetic information from studies from H . M J S . Owen and R.RJ3. Discovery indicate that a magnetic lineation (305° to 295°) occurs over a broad region (at least 600,000 k m 2 ) of the western Indian Ocean. This lineation m a y become an important key in determining the structure and geologic history of the western Indian Ocean.
I N T R O D U C T I O N
Magnetic anomalies with amplitudes of se\-eral hundred g a m m a s were first observed over the eastern Somali abyssal basin between the Carlsberg ridge and Seychelles bank by scientists on H . M . S . Owen [Hydrographer, 1963; Loncarevic, 1964]. The R . V . Chain of the W o o d s Hole Océanographie Institution also visited this region in M a y 1964 while participating in the Indian Ocean Expedition. At this time the local azimuths of the isoanomaly lines forming these strong anomalies were determined.
M E T H O D
The method used to determine the local azimuth of isoanomaly lines follows that described by Raff [1962]. The sensing head of a Varian nuclear precession magnetometer was towed 150 m astern of the ship, and the total intensity F of the earth's magnetic field was recorded on a graphic strip chart recorder (Varian model G 1 4 ) . The procedure was to allow the magnetic observer to call a 90° course change whenever it appeared that the steepest
1 Contribution 1728 of the W o o d s Hole Océanographie Institution.
slope on the flank of a pronounced anomaly had been reached, that is, a place showing nearly linear change of F with displacement along the ship's track. The new course was held for several miles, long enough to determine the gradient in this direction, whereupon the original heading was resumed and often held for 15 to 30 k m . A second pair of right-angle turns was effected over the opposite slope of the anomaly in such a manner as to return the vessel to its original base track.
A N A L Y S I S O F D A T A
The data were analyzed directly on the analog chart, each course change yielding a • local azimuth for the isoanomaly lines. In Figure 1, Si and & represent reciprocals of directional gradients, in arbitrary units. The azimuth of the isoanomaly lines (yi to ys) equals a + tan"1 & / & , where a is the acute angle between the initial course and the meridian. A large turning radius is thus no problem. S, and «Ss were determined from the chart, in convenient units, and a regional slope correction was applied to each, using the polynomial fitted field represented in Figure 6 of Hydro-grapher [1963]. The regional pattern of total intensity in the locality of the measurements shows a general rise toward the east, but the
2625
Collected reprints of the International Indian Ocean Expedition, vol. IV, contribution no. 253 831
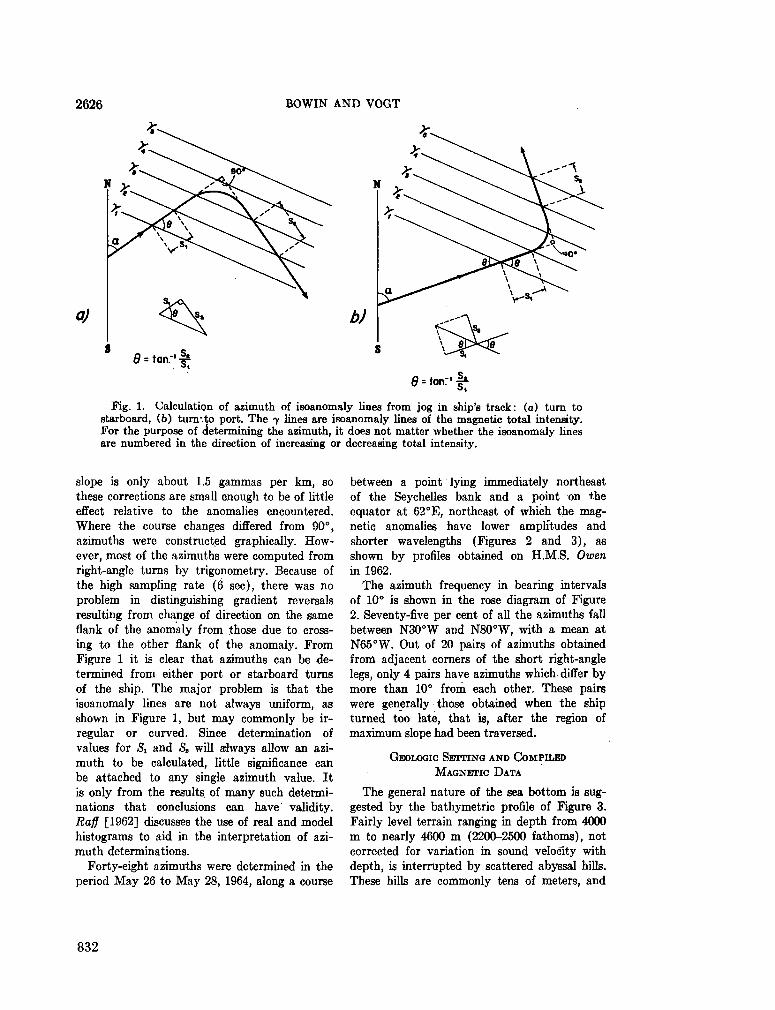
2626 BOWIN AND VOGT
a)
9 = tan:' |^
6 = tan:11»
Fig. 1. Calculation of azimuth of isoanomaly lines from jog in ship's track: (a) turn to starboard, (6) turn-.to port. The y linea are isoanomaly lines of the magnetic total intensity. .For the purpose of determining the azimuth, it does not matter whether the isoanomaly lines are numbered in the direction of increasing or decreasing total intensity.
slope is only about 1.5 gammas per k m , so these corrections are small enough to be of little effect relative to the anomalies encountered. Where the course changes differed from 90°, azimuths were constructed graphically. H o w ever, most of the azimuths were computed from right-angle turns by trigonometry. Because of the high sampling rate (6 sec), there was no problem in distinguishing gradient reversals resulting from change of direction on the same flank of the anomaly from those due to crossing to the other flank of the anomaly. From Figure 1 it is clear that azimuths can be determined from either port or starboard turns of the ship. The major problem is that the isoanomaly lines are not always uniform, as shown in Figure 1, but m a y commonly be irregular or curved. Since determination of values for and S¡, will aiways allow an azimuth to be calculated, little significance can be attached to any single azimuth value. It is only from the results of many such determinations that conclusions can have validity. Raff [1962] discusses the use of real and model histograms to aid in the interpretation of azimuth determinations.
Forty-eight azimuths were determined in the period M a y 26 to M a y 28, 1964, along a course
between a point lying immediately northeast of the Seychelles bank and a point on the equator at 62 °E, northeast of which the magnetic anomalies have lower amplitudes and shorter wavelengths (Figures 2 and 3), as shown by profiles obtained on H . M . S . Owen in 1962.
The azimuth frequency in bearing intervals of 10° is shown in the rose diagram of Figure 2. Seventy-five per cent of all the azimuths fall between N 3 0 ° W and N 8 0 ° W , with a mean at N 6 5 ° W . Out of 20 pairs of azimuths obtained from adjacent corners of the short right-angle legs, only 4 pairs have azimuths which differ by more than 10° from each other. These pairs were generally those obtained when the ship turned too late, that is, after the region of m a x i m u m slope had been traversed.
G E O L O G I C S E T T I N G A N D C O M P I L E D
M A G N E T I C D A T A
The general nature of the sea bottom is suggested by the bathymétrie profile of Figure 3. Fairly level terrain ranging in depth from 4000 m to nearly 4600 m (2200-2500 fathoms), not corrected for variation in sound velocity with depth, is interrupted by scattered abyssal hills. These hills are commonly tens of meters, and
832
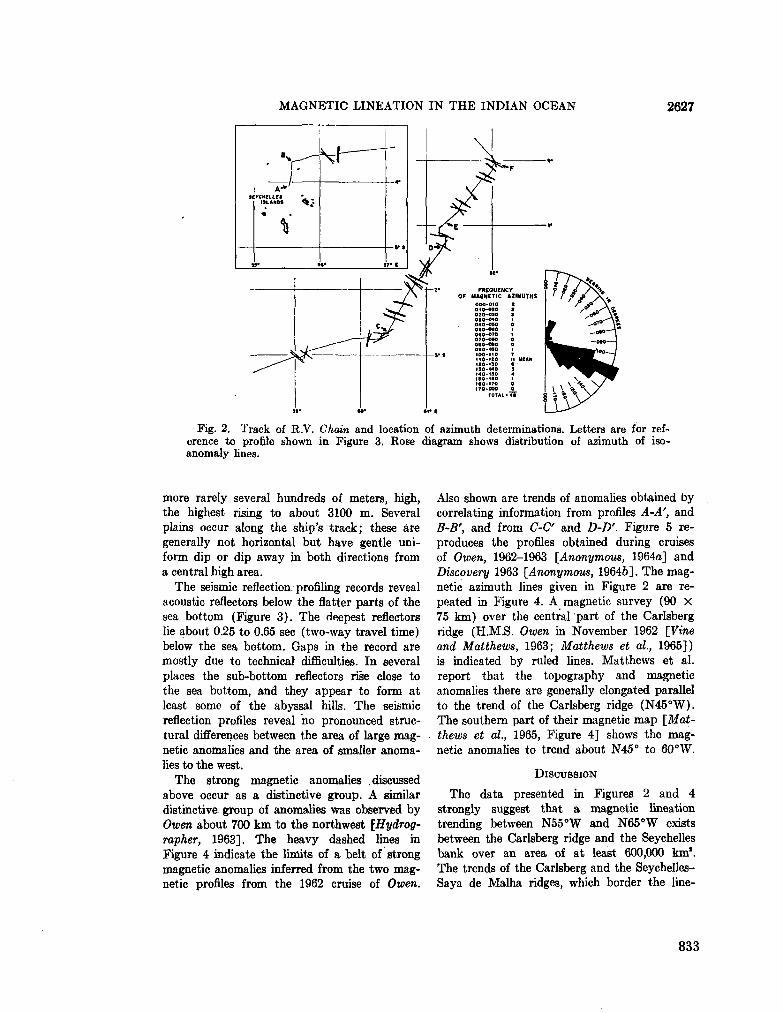
MAGNETIC LINEATION IN THE INDIAN OCEAN 2627
FREQUENCY OF MAGNETIC
0OO-010 Ot0-020 0 2 0 - 0 » 030-040 040-090 090-0*0 0*0-070 0 7 0 - O W 0*0-0*0 0*0-«00 100-110 110-120 120-130 130-140
190-1*0 1*0-170 170-000
TOTAL
AZIMUTHS 2 3 3
0
1 0 O 1 7 11 VEAN
• ' 9 4
0 0
• 4 *
Fig. 2. Track of R . V . Chain and location of azimuth determinations. Letters are for reference to profile shown in Figure 3. Rose diagram shows distribution of azimuth of iso-anomaly lines.
more rarely several hundreds of meters, high, the highest rising to about 3100 m . Several plains occur along the ship's track; these are generally not horizontal but have gentle uniform dip or dip away in both directions from a central high area.
The seismic reflection, profiling records reveal acoustic reflectors below the flatter parts of the sea bottom (Figure 3). The deepest reflectors lie about 0.25 to 0.65 sec (two-way travel time) below the sea bottom. Gaps in the record are mostly due to technical difficulties. In several places the sub-bottom reflectors rise close to the sea bottom, and they appear to form at least some of the abyssal hills. The seismic reflection profiles reveal no pronounced structural differences between the area of large m a g netic anomalies and the area of smaller anomalies to the west.
The strong magnetic anomalies discussed above occur as a distinctive group. A similar distinctive group of anomalies was observed by Owen about 700 k m to the northwest \Hydrog-rapher, 1963]. The heavy dashed lines in Figure 4 indicate the limits of a belt of strong magnetic anomalies inferred from the two m a g netic profiles from the 1962 cruise of Owen.
Also shown are trends of anomalies obtained by correlating information from profiles A-A', and B-B', and from C-C and D - D ' . Figure 5 reproduces the profiles obtained during cruises of Owen, 1962-1963 [Anonymous, 1964a] and Discovery 1963 [Anonymous, 19646]. The m a g netic azimuth lines given in Figure 2 are repeated in Figure 4. A magnetic survey (90 X 75 k m ) over the central part of the Carlsberg ridge ( H . M . S . Owen in November 1962 [Vine and Matthews, 1963; Matthews et al., 1965]) is indicated by ruled unes. Matthews et al. report that the topography and magnetic anomalies there are generally elongated parallel to the trend of the Carlsberg ridge ( N 4 5 ° W ) . The southern part of their magnetic m a p [Matthews et al., 1965, Figure 4] shows the m a g netic anomalies to trend about N45° to 6 0 ° W .
D I S C U S S I O N
The data presented in Figures 2 and 4 strongly suggest that a magnetic lineation trending between N 5 5 ° W and N 6 5 ° W exists between the Carlsberg ridge and the Seychelles bank over an area of at least 600,000 k m 1 . The trends of the Carlsberg and the Seychelles-Saya de Malha ridges, which border the line-
833
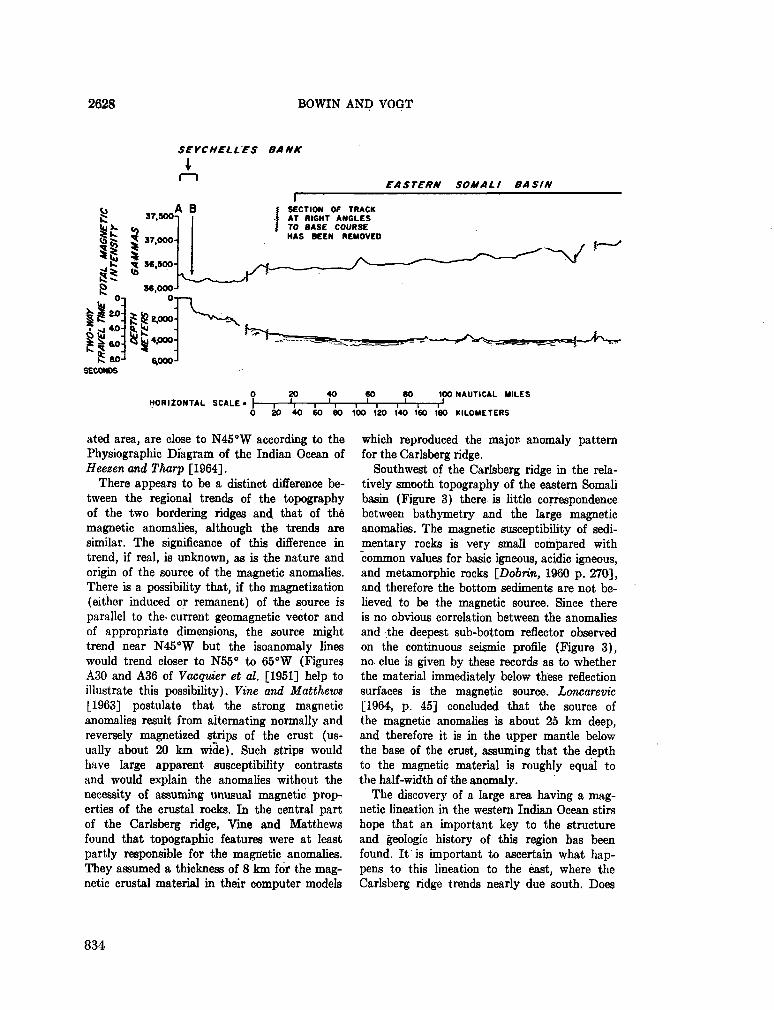
2628 BOWIN AND VOGT
SEYCHELLES BANK
A 37,S00n
37.000-
36.500-
20 T o 4J0
S ao-SECONOS
36,000 0
i&zpoo
<Sg4p00
6,000
EASTERN SOMALI BASIN
SECTION OF TRACK AT RIGHT ANGLES TO BASE COURSE HAS BEEN REMOVED
-v
HORIZONTAL SCALE' | - —I 20
40 -Li
so 80 100 NAUTICAL MILES
T—^n n—i r 40 60 80 100 120 140 160 160 KILOMETERS
ated area, are close to N 4 5 ° W according to the Physiographic Diagram of the Indian Ocean of Heezen and Thorp [1964].
There appears to be a distinct difference between the regional trends of the topography of the two bordering ridges and that of thé magnetic anomalies, although the trends are similar. T h e significance of this difference in trend, if real, is unknown, as is the nature and origin of the source of the magnetic anomalies. There is a possibility that, if the magnetization (either induced or remanent) of the source is parallel to the- current geomagnetic vector and of appropriate dimensions, the source might trend near N 4 5 ° W but the isoanomaly lines would trend closer to N 5 5 " to 6 5 ° W (Figures A 3 0 and A 3 6 of Vacqvier et al. [1951] help to illustrate this possibility). Vine and Matthews [1963] postulate that the strong magnetic anomalies result from alternating normally and reversely magnetized strips of the crust (usually about 20 k m wide). Such strips would have large apparent susceptibility contrasts and would explain the anomalies without the necessity of assuming unusual magnetic properties of the crustal rocks. In the central part of the Carlsberg ridge, Vine and Matthews found that topographic features were at least partly responsible for the magnetic anomalies. They assumed a thickness of 8 k m for the m a g netic crustal material in their computer models
which reproduced the major anomaly pattern for the Carlsberg ridge.
Southwest of the Carlsberg ridge in the relatively smooth topography of the eastern Somali basin (Figure 3) there is little correspondence between bathymetry and the large magnetic anomalies. The magnetic susceptibility of sedimentary rocks is very small compared with c o m m o n values for basic igneous, acidic igneous, and metamorphic rocks [Dobrin, 1960 p. 270], and therefore the bottom sediments are not believed to be the magnetic source. Since there is no obvious correlation between the anomalies and the deepest sub-bottom reflector observed on the continuous seismic profile (Figure 3) , no clue is given by these records as to whether the material immediately below these reflection surfaces is the magnetic source. Loncarevic [1964, p. 45] concluded that the source of the magnetic anomalies is about 25 k m deep, and therefore it is in the upper mantle below the base of the crust, assuming that the depth to the magnetic material is roughly equal to the half-width of the anomaly.
The discovery of a large area having a m a g netic lineation in the western Indian Ocean stirs hope that an important key to the structure and geologic history of this region has been found. It is important to ascertain what happens to this lineation to the east, where the Carlsberg ridge trends nearly due south. Does
834
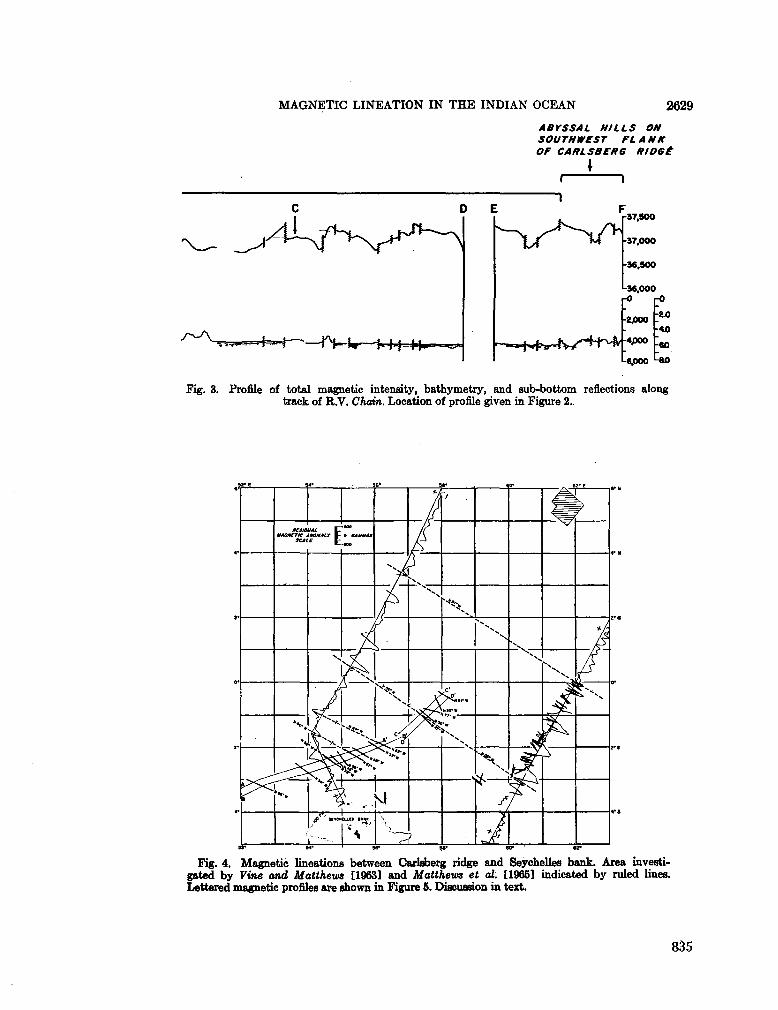
MAGNETIC LINEATION IN THE INDIAN OCEAN 2629
/^A_
ABYSSAL HILLS ON SOUTHWEST FL A NIC OF CARLSBERG RIDGÊ
T
1
^ c ^ - V H 1-37,900
-37.000
36.500
•-36.000
2.0
40
60
80
Fig. 3. Profile of total magnetic intensity, bathymetry, and sub-bottom reflections along track oí R . V . Chain. Location of profile given in Figure 2..
Fig. 4 . Magnetic lineations between Carlsberg ridge and Seychelles bank. Area investigated by Vine and Matthews [19631 and Matthews et al. [1965] indicated by ruled lines. Lettered magnetic profiles are shown in Figure 5. Discussion in text.
835
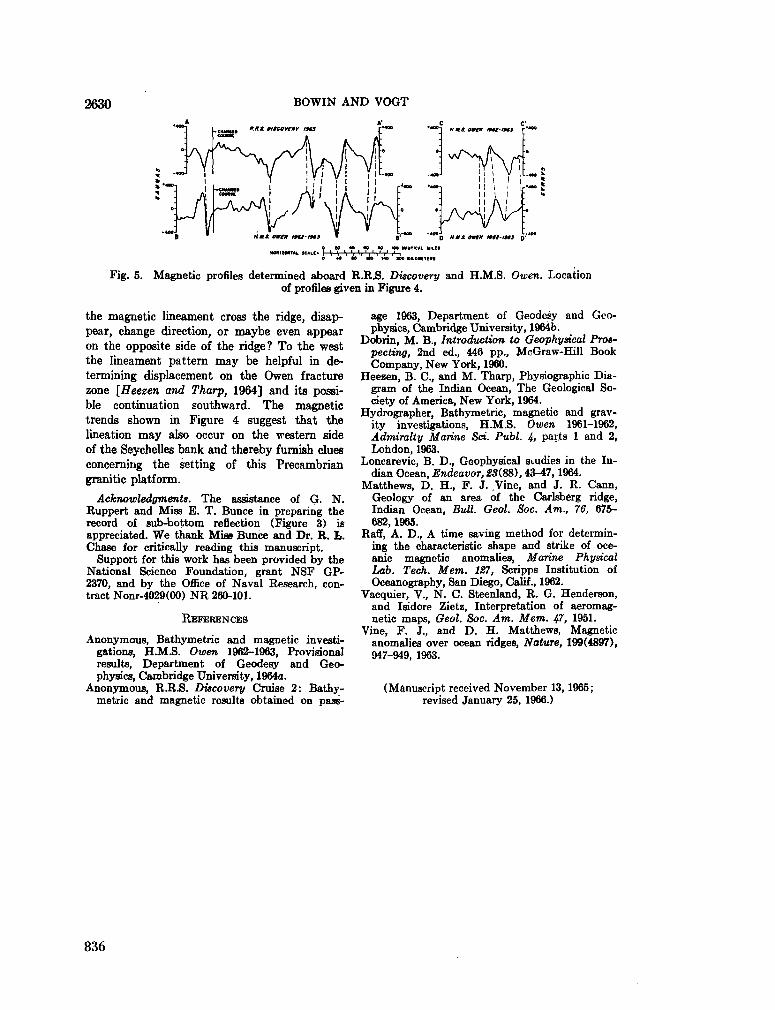
2630 BOWIN AND VOGT
+«o •«*•-
l ami owl*
I* J 1
1
1 1
A /v^
mtt-ttft
' \ / '
1 Í ! i i i
' t B' ~"o * * * owtn n*l-i**3 o'~~
M We tuuTical HiLCt . . . i 1 i1 i1 i
•O M Itt I N K I L O K T M
Fig. 5. Magnetic profiles determined aboard R . R . S . Discovery and H . M . S . Owen. Location of profiles given in Figure 4.
the magnetic lineament cross the ridge, disappear, change direction, or maybe even appear on the opposite side of the ridge? T o the west the lineament pattern m a y be helpful in determining displacement on the O w e n fracture zone [Heezen and Tharp, 1964] and its possible continuation southward. The magnetic trends shown in Figure 4 suggest that the lineation m a y also occur on the western side of the Seychelles bank and thereby furnish clues concerning the setting of this Precambrian granitic platform.
Acknowledgments. The assistance of G . N . Ruppert and Miss E . T . Bunce in preparing the record of sub-bottom reflection (Figure 3) is appreciated. W e thank Miss Bunce and Dr. R . L . Chase for critically reading this manuscript.
Support for this work has been provided by the National Science Foundation, grant N S F G P -2370, and by the Office of Naval Research, contract Nonr-4029(00) N R 260-101.
R E F E R E N C E S
Anonymous, Bathymétrie and magnetic investigations, H . M . S . Owen 1962-1963, Provisional results, Department of Geodesy and Geophysics, Cambridge University, 1964a.
Anonymous, R . R . S . Discovery Cruise 2: Bathymétrie and magnetic results obtained on pass
age 1963, Department of Geodesy and Geophysics, Cambridge University, 1964b.
Dobrin, M . B . , Introduction to Geophysical Prospecting, 2nd éd., 446 pp., McGraw-Hill Book Company, N e w York, 1960.
Heezen, B . C , and M . Tharp, Physiographic Diagram of the Indian Ocean, The Geological Society of America, N e w York, 1964.
Hydrographer, Bathymétrie, magnetic and gravity investigations, H . M . S . Owen 1961-1962, Admiralty Marine Set. Publ. 4, parts 1 and 2, London, 1963.
Loncarevic, B . D . , Geophysical studies in the Indian Ocean, Endeavor, 28(88), 43-47,1964.
Matthews, D . H . , F . J. .Vine, and J. R . Cann, Geology of an area of the Carlsberg ridge, Indian Ocean, Bull. Geol. Soc. A m . , 76, 675-682,1965.
Raff, A . D . , A time saving method for determining the characteristic shape and strike of oceanic magnetic anomalies, Marine Physical Lab. Tech. M e m . 187, Scripps Institution of Oceanography, San Diego, Calif., 1962.
Vacquier, V . , N . C . Steenland, R . G . Henderson, and Isidore Zietz, Interpretation of aeromag-netic maps, Geol. Soc. A m . M e m . 47, 1951.
Vine, F. J., and D . H . Matthews, Magnetic anomalies over ocean ridges, Nature, 199(4897), 947-949, 1963.
(Manuscript received November 13, 1965; revised January 25, 1966.)
836
Reprinted from ErdSI und Kohie-Erdgos-Perrochem/e, 18 Jahrgang, Nr. 12, 1965, S. 945-950.
Über rezente Sedimentation im Indischen Ozean, ihre Bedeutung fur die Entetehung kohlenwasserstoffhaltiger Sedimente
Erster Uberblick*) (Vorausbericht aus den ,,Meteor"-Forschungsberichten, Expedition 1964/1966 in den Indischen Ozean)
Von Wolfgang Schott und Ulrich von StackeCberg**)
Vorgetragen von W. Schott auf der 17. Jahrestagung der Deutschen Geseüschaft für Mineralolwusenschaft und Kohlechemie in Hannover, am 7. Oktoter 1965
Z u s a m m e n f a s s u n g : Der Stand der Kenntnis über Auitreten von Kohlenwasserstoffen in rezenten Sedimenten wird in einem Uberblick beschrieben. Es zeigt sich, dad die Kohlenwassersto&e in rezenten Sedimenten und im Erdól fossiler Sedimente in ihrer Zusammensetzung voneinander abweichen.
Ziel der meeresgeologischen Arbeiten wahrend der Expedition des deutschen ForschungsscEiSes „Meteor" in den Indischen Ozean (1964/1965) war es, u. a. die Bedingungen der Ablagerung, Er-haltung und Umwandlung der organischen Substanz im marinen Sediment zu untersuchen. Als erster vorlâufiger Uberblick werden 2 Karten über die Sedimentverteilung auf dem Meeresboden vor der ostafrikanischen und der indisch-pakistanischen Kiiste vor-gelegt und diskutiert. Beide Gebiete weisen eine àhnliche Sedimentverteilung mit einer deutUchen Abhangigkeit der Fazies von der Meerestieie auf. Von besonderem Interesse ist ein biogener Kalksand, der den grôBten Teil des Schelfes beider Bereiche be-deckt. Es handelt sich hierbei wohl z. T . u m pleistozâne A b -lagerungen.
Recent sedimentation in the Indian O c e a n , its significance for the origin of hydrocarbonaceous sediments: The state'of knowledge on the occurence of hydrocarbons in recent sediments is described briefly. It is shown that the composition of the hydrocarbons in recent sediments and in the petroleum of fossil sediments differ from each other.
The object of the marine geological work during the expedition of the German research ship „Meteor"-in the Indian Ocean in 1964/66 was, amongst other things, to investigate the conditions of deposition, preservation, and transformation of the organic matter in the marine sediment. As a first preliminary summary, two maps showing the distribution of sedimente of the sea floor off the East African and Indian-Pakistan coast are displayed and dicussed. Both areas show a similar distribution of sediments with a clear dependence of the faciès on the water depth. A biogenic calcareous sand which covers the main part of the shelf of both areas is of special interest. Part of this sand is supposed to be a pleistocene deposit.
Einleitung
ErdôUagerstâtten sind vorwiegend in marinen, brackischen und limnischen fossilen Sedimenten vorhanden. Dabei rinden sich die meisten V o r k o m m e n in marinen Ablagerungen. V o n der organischen Súbstanz dieser fossilen Sedimente wird im allgemeinen das Erdôl abgeleitet. Erdôlâhnliche Kohlen-wasserstoffgemische sind nâmlich, wenn auch in geringen difl'usen Spuren, in Sedimentgesteinen ais Mikrónaphtha weit verbreitet1'2-3).
Diese Erkenntnisse haben in den letzten Jahren zu einer intensiven Untersuchnng des organischen Inhaltes rezenter Sedimente geführt. M a n hofft, auf diese Weise weitere Anhalts-punkte über die Bildung von Ol und Gas und über ihre A n -
*) Eine kiirzere Fassung dieser. Ausarbeitung ist in englischer Sprache unter dem Titel,,Recent sedimentation in the Indian Ocean, its significance for the origin of hydrocarbonaceous sediments (First review)" auf dem Third Symposium on the Development of Petroleum Resources of Asia and the Far East, November 1965, in Tokio (Japan) vorgelegt worden und wird spâter von den Vereinten Nationen in den Proceedings dieses Symposiums veroffentlicht werden.
**)Anschrift: Professor Dr. W . Schott, Dr. U . von Stackelberg, Bundesanstalt fur Bodenforschung, Hannover-Buchholz, Alfred - Bentz - Haus.
' ) K. Krewi-Graf, Diagnostik der Herkunft des Erdôls. Erdôl u. Kohle 12, 706/12, 806/16 [1969].
>) , Mikrónaphtha und Entetehung des Erdôls. Mitt. geol. Ges. Wien, Bd . 63, S. 133/76. Wien 1960.
*) N. B. Wassojewitsch, Problème der Erdôlgenese. Z . angew. Géologie 4, 512/16 [1968].
reicherung zu Lagerstatten in der Lithosphàre wâhrend der geologischen Vergangenheit erhalten zu kônnen.
Smith4*) hat flùssige Paraffine, Naphthene und verschiedene aromatische Kohlenwasserstoffe in rezenten marinen, brackischen und limnischen Sedimenten nachgewiesen. Das Material, das Smith untersuchte, stammte vorwiegend aus d e m Golf von Mexico,*len Lagunen und Küstengebieten von Texas und Louisiana, d e m Mississippi- und Orinoco-Delta sowie von d e m californischen Schelf westlich von Los Angeles. Die Z u sammensetzung dieser Kohlenwasserstoffansammlungen in rezenten Sedimenten stimmt nicht mit der des Erdôls Qberein. So konnte Hunt*) in rezenten Ablagerungen keine Ca- bis C8-Kohlenwasserstoffe feststellen, wàhrend sie in fossilen Sedimenten vorhanden sind (l.c.,S. 406). Nach Stevens, Bray u . Evans7) enthalten ferner die Kohlenwasserstoffe rezenter Ablagerungen eine relativ einfache Mischung aromatischer Komponenten im Vergleich zu der komplizierten Z u s a m m e n setzung im Erdôl.
Nach Hedberg9) kônnen daher wegen dieser Unterschiede die flüssigen Kohlenwasserstoffe heutiger Sedimente noch nicht zur Grappe der Erdôle gerechnet werden (1. c , S . 1762). Weitere Veranderangen und Umwandlungen der organischen Substanz und der beobachteten Kohlenwasserstoffe rezenter Ablagerungen werden im Laufe der Zeit erfolgt sein müssen, bis daraus Erdôl entstanden ist, so wie es in fossilen Gesteinen vorkommt.
Viele zusàtzliche Arbeiten werden somit noch erf orderlich sein, u m ein lückenloses Bild der Entwicklungsreihe von den Orga-nismen im Wasserraum über die organische Substanz in rezenten Sedimenten bis z u m Erdôl zu erhalten. Die Unter-suchungen heutiger Ablagerungen, die im B a h m e n der intensiven ozeanOgraphischen Tâtigkeit in alien Meeren wáhrend der letzten Jahre verstârkt eingesetzt haben, werden dabei zweifellos wertvolle Anhaltspunkte über Herkunft und A n -Bammlung von Erdôl in fossilen Ablagerungen erbringen kônnen. So düriten sich fur das groBe erdôlreiche Tertiarbecken von Los Angeles wichtige Erkenntnisse aus der eingehenden Bearbeitung des angrenzenden californischen Schelfes durch Emery') ergeben haben, der hier ein Gebiet heutiger Erdol-bildung sieht. Infrarotspektren der Paraffin-/Naphthen- und der aromatischen Fraktion aus den rezenten Sedimenten des dortigen Schelfgebietes sind namlich den entsprechenden Spektren eines phozânen Erdôls aus d e m Los Angeles-Becken sehr àhnlich.
*) P. V. Smith, Preliminary note on origin of. petroleum. Bull. Amer. Assoc. Petroleum Geologists 36, 411/13 [1952].
•) , Studies on origin of petroleum: Occurences of hydrocarbons in recent sediments. Bull.'Amer. Assoc. Petroleum Geologists 88, 377/404 [1964].
*) J. M . Hunt, Geochemical data on organic matter in sediments. Wiss. Tagung für Erdolbergbau. Vortrâge der III. Internatio-nalen Wissenschaitlichen Konferenz für Geochemie, Mikro-biologie und Erdolchemie, Bd . I, Geochemie und Mikrobio-logie, S. 394/412. Budapest 1963.
' ) V. P. Stevens, E. E, Bray u. E. D . Evans, Hydrocarbons in sediments of Gulf of Mexico. Bull. Amer . Assoc. Petroleum Geologists 40, 975/83 [1956].
") H. D . Bedberg, Geologic aspects of origin of petroleum. Bull» Amer . Assoc. Petroleum Geologists 48, 1757/1803 [1964].
•) K. O. Emery, The Sea off Southern California. A modern habitat of petroleum. 366 Seiten. N e w York-London 1960.
945
Collected reprints of the International Indian Ocean Expedition, vol. IV , contribution no . 254 837
Sedimentation im Indisehen Ozean
Die letzte, neu bearbeitete Übersichtskarte über die Sediment-verteilung im gesamten Indisehen Ozean ist vor 30 Jahren verôffentlicht worden^ 1 1 ) . Hierbei wurden vor allem Vet-breitung, Ausbildung und Entstehung der Tiefsee-Sedimente besprochen, die den grôBten Teil des Meeresbodens im Indisehen Ozean bedecken12). '
Der Indische Ozean, der ein Siebentel der Erdoberflache ein-nimmt, ist von alien Weltmeeren bisher a m wenigsten er-forscht. Deshalb wird z. Z . eine intensive ozeanographische und damit auch meeresgeologische Bearbeitung- dieses Ozeans im R a h m e n der Internationalen Indischen-Ozean-Expedition, die von September 1959 bis Ende 1965 dauert, durchgeführt. 40 Forschungsschiffe mit Wissenschaftlern aus mehr als 20 Lindera sind an dieser Zusammenarbeit beteiligt. Die Bundesrepublik Deutschland hat für diesen Zweck v o m 29. Oktober 1964 bis 18. Mai 1965 das neue deutsche For-schungsschiff „Meteor" in den Indisehen Ozean entsandt13). Hauptzweck der Reise war neben Arbeiten im Roten Meer, im Golf von Aden und im Persischen Golf eine intensive Unter-suchung der Meeresregionen vor der ostafrikanischen Kiiste zwischen K a p Guardafui und M o m b a s a sowie vor der indisch-pakistanischen Kiiste zwischen Cochin und Karachi. Auf 13 Profilen, die von der Kiiste bis in die Tiefsee. des Somali-Beckens bzw. des Arabisehen Beckens hinabreichten, wurden Sedimentproben v o m Meeresboden entnommen. I m AnschluB an die Fahrten der „Meteor" im ArabiBchen Meer erfolgte im • R a h m e n einer deutsch-pakistanischen Zusammenarbeit noch eine spezielle Bearbeitung der Sedimente im Bereich der Indus-Mündung. Für die Untersuchung stehen Sedimentproben von 150 Stationen aus dem Arabisehen Meer zur Verfiigung; sie wurden mit dem Kolbenlot, Schwerelot, van Veen-Greifer, Kastengreifer oder mit dem Kuttertrawl ge-wonnen.
Ziel der meeresgeologischen Arbeiten im Arabisehen Meer ist es, einen Uberblick über den Fazieswechsel der Sedimente von der Küste bis in die Tiefsee zu erhalten und die dort herrschen-den Sedimentationsbedingungen zu erfassen. Femer sollen die diagenetischen Veranderungen der organischen und anorga-nischen Komponenten der Ablagerungen in den bis zu 5 m langen Sedimentkernen untersucht werden. AuBerdem soil versucht werden zu klaren, w o vor allem die feinste Triibe des Induswassers auf d e m Meeresboden des Arabisehen Beckens sedimentiert wird.
Diese Ziele konnen erst nach einer detaillierten Untersuchung des gewonnenen Sedimentmaterials erreicht werden. Gegen-wàrtig kann nur eine erste allgemeine Übersicht über die Sedimentverteilung auf dem heutigen Meeresboden beider Küstenregionen gegeben werden.
Sed imente vor der ostafrikanischen K ü s t e In den Ablagerungen vor der ostafrikanischen Küste lassen sich 5 Faziesbereiche unterscheiden, die sich etwa parallel
'») W. Schott, Die Bodenbedeckung des Indisehen und Stillen Ozeans. In: G. Schott, Géographie des Indisehen und Stillen Ozeans, S. 109/22. Hamburg 1935.
") , Deep-sea sediments of the Indian Ocean. In: Recent Marine Sediments, a Symposium, edited by P. D . Trash, S. 396/408. Published by Amer. Assoc. Petroleum Geologists, Tulsa 1939 ; reprinted bv Soc. econ. Paleontologists Mineralogists, spec. Publ. Nr. 4, 'Tulsa 1965.
w ) , Rezente Tiefseesedimente in ihrer Abhangigkeit vom Ozeanwasser. Festschrift zum 60. Geburtstag von Hans Stille, S. 428/37. Stuttgart 1936.
'*) 0. Dietrich, Die Internationale Indische Ozean-Expedition. — Die Krde 96, Nr. 1, 6/20 [1965]. — Die .Organisation und Durchführung dieses deutschen Bei-tragés zu der Internationalen Indischen-Ozean-Expedition lag in den Hànden der Deutschen Forschungsgemeinschaft.
94g EKDOL U N D KOHLBE
zur Küste anordnen. V o n der Tiefsee in Richtung zur Küste sind folgende Sedimente beobachtet worden (s. Abb. 1):
Tiefseeton
In grôBeren Tiefen des Somalibeckens ist ein rotbrauner Ton mit wechselndem Gehalt an pelagischen Foraminiferen vor-handen. Er wurde in Tiefen zwischen 4130 und 5050 m gefunden.
Globiger inenschlamm
AnschlieBend an den Tiefseeton ist in Tiefen zwischen 1670 und 4610 m bis an den FuB des Kontinentalabhanges Globigerinenschlamm beobachtet worden.
Foraminiferensand
Ostlich von M o m b a s a und Obbia sowie südlich der Insel Sokotra treten a m Kontinentalabhang zwischen 700 und 1710 m olivgraue Foraminiferensande auf. Pelagische Foraminiferen der Familie Globigerinidae herrschen darin vor.
Olivgrauer Schlick
Der obère Teil des Kontinentalabhanges wird zwischen 540 und 980 m vorwiegend von olivgrauem Schlick mit unter-schiedlichem Gehalt an pelagischen Foraminiferen einge-n o m m e n ; stellenweise geht der Schlick seitlich aus dem Foraminiferensand hervor.
Biogener K a l k s a n d
Riffschutt bildet den wesentlichen Anteil eines hellbraunen bis dlivbraunen Kalksandes, der vorwiegend den schmalen Schelf vor der ostafrikanischen Küste zu bedecken scheint, aber auch a m Kontinentalabhang in 650 m Tiefe gefunden wurde. Die flachste Station, die Kalksand lieferte, lag bei 30 m Wassertiefe. In einigen Proben ist ein Teil der Kalk-partikeln leicht abgerollt und von einer Glasur überzogen. Quarz, Glimmer und Glaukonit treten oft in wechselnder Menge auf. Mit d e m Kuttertrawl wurden an einigen Stellen im Bereich der biogenen Kalksandfazies grofie veriestigte Riff-kalkbrocken gewonnen.
Sed imente vor der indisch-pakistanischen K ü s t e 7 Faziesbereiche, deren Grenzen — wie in der ostafrikanischen Region — mehr oder weniger der Küste parallel verlaufen, sind in den Sedimenten von der Tiefsee in Richtung zur Küste festgestellt worden (s. Abb. 2):
Globiger inenschlamm
Gelblichbrauner Globigerinenschlamm bedeckt in einem Tiefenbereich von 1730 bis 3670 m den küstenfernen Meeresboden.
Grauer Schlick
Der untere Teil des Kontinentalabhanges zwischen 1920 und 2980 m wird von einem grauen Schlick eingenommen, der zu den hemipelagischen Sedimenten gehôrt und im Vergleich zum Globigerinenschlamm mengenmàBig weniger pelagische Foraminiferen enthalt. Auf der Hohe von B o m b a y , w o der Kontinentalabhang verhàltnismàBig steil ist, konnte dieser graue Schlick nicht nachgewiesen werden. Hier scheint Globigerinenschlamm direkt an die nachste Fazieszoue zu grenzen.
Olivgrauer Schlick
Den oberen Teil des Kontinentalabhanges bedeckt ein olivgrauer Schlick, in dem, ahnlich wie beim grauen Schlick, nur relativ wenige pelagische Foraminiferen vorhanden sind. Er fand sich in Tiefen zwischen 220 und 2070 m .
Foraminiferensand
Westlich von Cochin tritt a m Schelfrand in 210 m Tiefe ein von dunkelolivbraunem Schlick durchsetzter Foraminiferen-
IDGA3 • PETROCHEMIE 18. JAHRG. / D E Z . 1965 / N R. 12
838
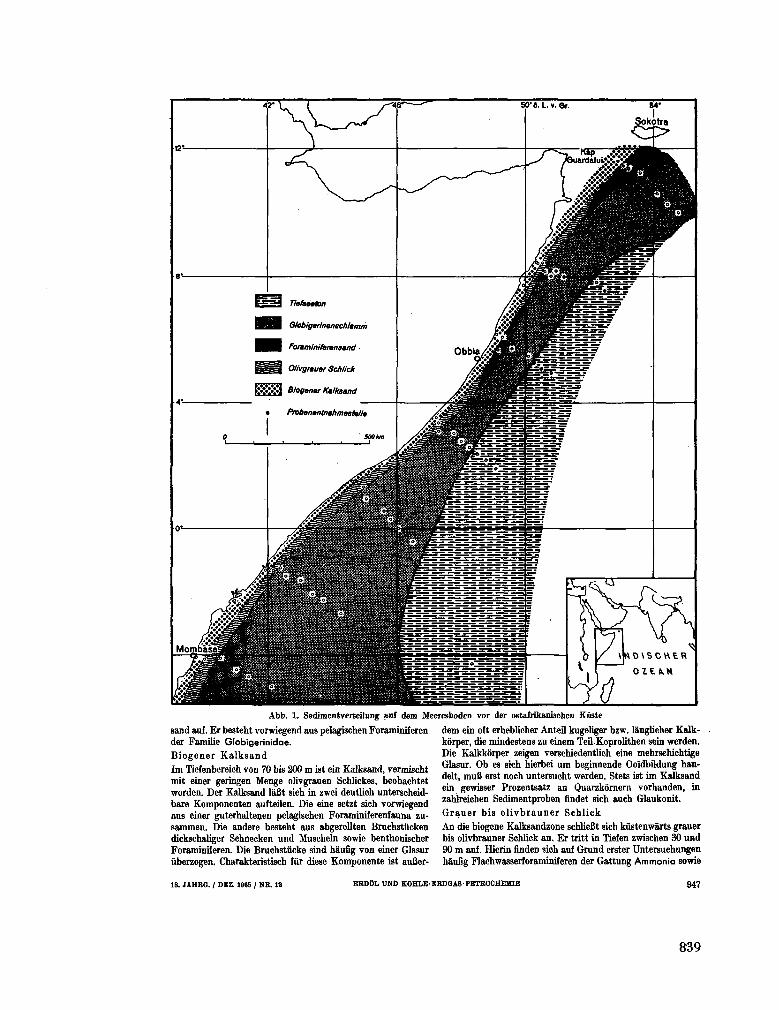
Abb. 1. Sedimentverteilung auf dem Meeresboden vor der ostafrikanischen Küste
sand auf. Er besteht vorwiegend aus pelagischen Foraminiferen der Familie Globigerinidae. Biogener K a l k s a n d I m Tiefenbereich von 70 bis 200 m ist ein Kalksand, vermischt mit einer geringen Menge olivgrauen Schlickes, beobachtet worden. Der Kalksand lafit sich in zwei deutlich unterscheid-bare Komponenten aufteilen. Die eine setzt sich vorwiegend aus einer guterhaltenen pelagischen Forarainiferenfauna zu-s a m m e n . Die andere besteht aus abgerollten Bruchstiicken dickschaliger Schnecken und Muscheln sowie benthonischer Foraminiferen. Die Bruchstücke sind h&ufig von einer Glasur iiberzogen. Charakteristisch für diese Komponente ist auCer-
dem ein oft erheblicher Anteil kugeliger bzw. langlicher Kalk-korper, die mindestens zu einem Teil-Koprolithen sein werden. Die Kalkkbrper zeigen verschiedentlich eine mehrschichtige Glasur. O b es sich hierbei urn beginnende Ooldbildung han-delt, m u B erst noch untersucht werden. Stets ist im Kalksand ein gewisser Prozentsatz an Quarzkornern vorhanden, in zahlreichen Sedimentproben findet sich auch Glaukonit. G r a u e r bis olivbrauner Schlick A n die biogene Kalksandzone schlieBt sich küstenwárts grauer bis olivbrauner Schlick an. Er tritt in Tiefen zwischen 30 und 90 m auf. Hierin flnden sich auf Grand erster Untersuchungen hâufig Flachwasserforaminiferen der Gattung A m m o n i a sowie
IS. JAHRG. / DEZ. 1865 / N B . 12 E R D O L U N D K O H L E E R D G A S P E T R O C H E M I E 947
839
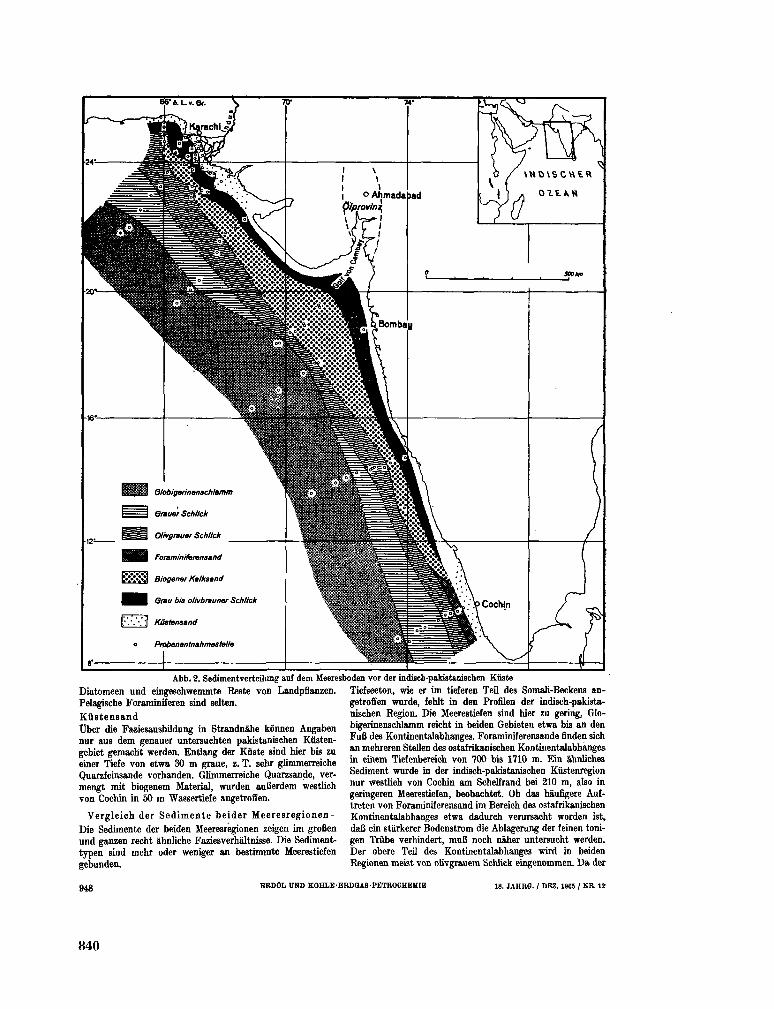
Abb, 2. Sedimentverteilimg auf dem Meeresboden vor der indisch-pakistanischen KQste
Diatomeen und eingeschwemmte Reste von Landpflanzen. Pelagische Foraminiferen sind selten. K ü s t e n s a n d
Über die Faziesausbildung in Strandnàhe kdnnen Angaben nur aus d e m genauer untersuchten pakistanischen Kiisten-gebiet gemacht werden. Entlang der Küste sind hier bis zu einer Tiefe von etwa 30 m graue, z. T . sehr glimmerreiche Quarzfeinsande vorhanden. Gliramerreiclie Quarzsande, ver-mengt mit biogenem Material, wurden auBerdem westlich von Cochin in 50 m Wassertiefe angetroffen.
Vergleich der Sed imente beider Meeresregionen -Die Sedimente der beiden Meeresregionen zeigen im groBen und ganzen recht àhnliche Faziesverhaltnisse. Die Sediment-typen sind mehr oder weniger an bestimnrte Meerestiefen gebunden.
Tiefseeton, wie er im tieferen Tei] des Somali-Beckens angetroffen wurde, fehlt in den Profilen der indisch-pakistanischen Region. Die Meerestiefen sind hier zu gering, GIo-bigerinenschlamm reicht in beiden Gebieten etwa bis an den F u B des Kontinentalabhanges. Foraminif erensande finden sich an mehreren Stellen des ostafrikanischen Kontinentalabhanges in eiñem Tiefenbereich von 700 bis 1710 m . Ein ahnliches Sediment wurde in der indisch-pakistanischen Kiistenregion nur westlich von Cochin a m Schelfrand bei 210 m , also in geringeren Meerestiefen, beobachtet. O b das hâufîgere Auf-treten von Foraminiferensand im Bereich des ostafrikanischen Kontinentalabhanges etwa dadurch verursacht worden ist, daB ein starkerer Bodenstrom die Ablagerung der feinen toni-gen Triibe verhindert, m u B noch naher untersucht werden. Der obère Teil des Kontinentalabhanges wird in beiden Regionen meist von olivgrauem Schlick eingenommen. D a der
E S D O L U N D K O H L E - E R D G A S - P E T R O C H E M I E 18. JAHBG. / DB3. 1965 / N E . 12
840
ostafrikanische Kontinentalabhang i. allg. steiler ist ais der indisch-pakistanische, ist der olivgraue Schlick. vor Ostafrika Dur auí einen sebr schmaleii Streifen beschrankt, wahrend er vor Indien und Pakistan einen wesentlich breiteren R a u m einninunt.
GroBe Unterschiede in ihrer Zusammensetzung und Ver-breitung zeigen die biogenen Kalksande beider Regionen. Auf der ostafrikanischen Seite. zieht sich ein schmaler Streifen dieses biogenen Sandes, der überwiegend aus Riffschutt be-steht, entlahg der Küste, der an einigen Stellen Riffe vor-gelagert sind. Diese Kalksandzone scbeint bis dicht unter die Küste zu reichen. Dire Breite ist gering, da bereits wenige Seemeilen ôstlich der Küste der Meeresboden zur Tiefsee abfâllt. Auf der indisch-pakistaTiischen Seite ist der Schelf dagegen wesentlich breiter; der biogene Kalksand ninunt deshalb bei Meerestiefen ron 70 bis 200 m eine groBere Flàche ein. Das-starke Auftreten von abgerollten Bruchstücken biogenen Materials, von Koprolithen sowie fraglichen Ooiden ist für ihn charakteristisch. In Richtung zur Küste geht der biogene Kalksand in einen Flachwasserschlick über. Âqui-valente dieses Schlickes konnten auf d e m ostafrikanischen Schelf nicht gefunden werden.
Die biogenen Kalksande werf en hinsichtlieh ihres Alters und ihrer Entstehung eine Reihe interessanter Fragen auf, die jedoch vorerst often bleiben müssen, da die Untersuchung des Probenmaterials erst im Anfang stelit. Die im Kalksand ge-fundenen abgerollten Bruchstücke biogenen Materials auf d e m indisch-pakistanischen Schelf und die groBen verfestigten Riff-kalkbrocken vor der ostafrikanischen Küste sind hôchst-wahrscheinlich nicht rezent, sondern haben pleistozanes Alter.
Sviba Rao**) erwShnt von der indischen Schelfregion des Golfes von Bengalen „calcareous oolitic sands", die den biogenen Kalksanden, besonders der indisch-pakistanischen Region, in Zusammensetzung und geographischer Position stark ahneln. Er nimrat an, daB es sich hierbei u m strandnahe pleistoziine Sedimente handelt, die durch die Meeresspiegel-hebung nach der Eiszeit versenkt wurden. Das Fehlen einer Bedeckung mit rezenteñ Sedimenten erklart er durch kiisten-parallele Meeresstromungen.
Stetson16) hat schon 1938 das Auftreten von grôberem Material in küstenferneren Sedimenten a m Schelfrand vor der Ostküste der Yereinigten Staaten in derselben Weise wie Subba Rao gedeutet.
Nach der ersten Durchsicht der Sedimentproben liegen somit auf d e m ostafrikanischen und indisch-pakistanischen Schelf ahnliche Verhaltniase vor wie im Golf von Bengalen ror der Ostküste Indiens bzw. in den siidlichen Teilen des nord-amerikanischen átlantischen Schelfes.
SchluBbemerkungen
Vor allem Beobachtungen in rezenten Flachwassergebieten kônnen Beitrâge zur Lôsung mancher erdôlgeologischer Problème in fossilen Sedimenten liefern. Die Yerteilung des organischen Materials im Wasser und im Sediment spielt dabei eine besonders wichtige Rolle.
Phytoplankton, vorwiegend Diatomeen, sind die Haupt-produzenten der organischen Materie im Oberflachenwasser der heutigen Ozeane. In verschiedenen Meeresrâumen, u. a.
u ) M . Subba Rao, Some aspects of Continental Shelf sediments off the East coast of India. Marine Geology 1, Nr. 1, 59/67 [1964].
") H. G. Stetson, The sediments of the Continental Shelf off the Eastern coast of the United States. Papers in Physical Oceanography and Meteorology, published by Massachusetts Institute of Technology and Woods Hole Océanographie Institution, Vol. V , N r . 4 , S. 1/48. Cambridge und Woods Hole 1938.
18. J A H B G . / DBZ. 1966 / N R , 12 E R D Ü L U N D K O H L B - :
in der indisch-pakistanischen Küstenregion des Arabischen Meeres, beobachtet m a n eine starke Yerbreitung des pflanz-lichen Planktons1*). Dabei zeigen Gebiete mit aufquellendem kaltem Tief enwasser eine besonders intensive Entwicklung des Phythoplanktons, da das aufquellende Wasser viele Nahr-stoffe, wie Phosphate, Nitrate und Silicate, enthâlt.
Das organische Material, das nach d e m Absterben der Orga-nismen auf den Meeresboden absinkt, kann dort nur bei einer gleichzeitigen verhàltnismàBig schnellen Sedimentation von anorganischem Material bzw. bei Anwesenheit von 0 2 - a r m e m oder -freiem Bodenwasser erhalten bleiben. Solche Yerhaltnisse kônnen an tieferen Teilen des Kontinentalabhanges und in Spezialrinnen und -senken innerhalb des Schelfes auftreten*).
Für die Frage einer etwaigen Bildnng von Kohlenwasserstoffen aus d e m organischen Material ist daher die Bearbeitung der Sedimente a m Kontinentalabhang und auf d e m Schelf vor allem wichtig. Günstig liegen in dieser Beziehung die Yerhaltnisse auf der indisch-pakistanischen Seite, da hier der Schelf verhaltnismâBig breit ist (stellenweise über 300 k m ) und der Indus erhebliche Sedimentmassen ins Meer verfrachtet. West-lich von B o m b a y wurden a m Kontinentalabhang bei Tiefen von 480 und 895' m in einem granen Schlick Gase von un-angenehmem fauligem Gernch beobachtet. Diese Gasbildung ist wahrscheinlich auf die Zersetzung von organischem Material zurückzuführen. O b unter den Zersetzungsprodukten auch gasfórmige Kohlenwasserstoffe sind, wie sie z. B . Weber n. Turketjtaúb17) in rezenten Lagunen-Sedimenten des Asow-schen Meeres sowie in Ablagerungen des Schwarzen und Kaspischen Meeres gefunden haben, m u B noch untersucht werdçn.
Die Sedimente im Gebiet nordwestlich von B o m b a y unter d e m 20. Grad nordlicher Breite sind von besonderem Intéresse, wenn m a n in die jüngere geologische Yergangenheit des Indischen Ozeans zurückgeht. Nach den groBen basaltischen Ergüssen des Dekhantrapps (Kreide—Palàozan) ist wahrend des Eozans das Meer aus diesem R a u m im Zuge der groBen Transgressionen gegen das indische Gondwanaland über den heutigen Golf von C a m b a y nach Norden bis weit über die Stadt A h m a d a b a d vorgestoBen. Dieser Transgression des tertiâren Indischen Ozeans ist die Entstehung der dortigen Erdolprovinz zu verdanken (Abb. 2). Mehr als 2000 m tertiâre
• Sedimente marinen und brackischen bis lagunâren Ursprungs bzw. von DeltaschUttungen sind in dieser Erdolprovinz ab-gelagert worden18-1"'20). Der F u n d von Asphalt in Hohlràumen des Dekhanbasaltes bei B o m b a y zeigt, daB Erdôlbildung in der Küstenregion des tertiâren Indischen Ozeans a m Rande des Indischen Kontinents nicht nur auf diese Erdolprovinz von C a m b a y beschrânkt war2 1) . I m Offshoregebiet des Golfes von C a m b a y werden daher seit 1963 von der Oil and Natural
>") K. O. Emery, Océanographie factors in accumulation of petroleum. Proc. 6tb Wld. Petroleum Congr., Sect. I, S. 483/91 (Fig. 2). Hamburg 1964.
") W. W. Weber u. N. M . Turkeljtaub, Die Bildung gasfôrmiger Kohlenwasserstofie in rezenten marinen Sedimenten. W o p r . Sediment 1960, 9/16 (russ.).
") L. P. Mathur u. O. Kohli, Exploration and development for oil in India. Proc. 6th wld. Petroleum Congr., Sect. I, S. 633/68. Hamburg 1964.
") M . C. Poidar, Geology and oil possibilities of the Tertiary rocks of Western India. Proc. 2nd Symposium on the Development of Petroleum Resources of Asia and the Far East, Mineral Resources Development Series, Nr. 18, Vol. I, S. 226/30. N e w York 1963.
") J. F. Pepper, Prospective contributions of the International Indian Ocean Expedition to Indian Ocean continental shelf geology. Ibid., S. 260/55.
" ) C. S. Fox, The occurrence of bitumen in B o m b a y Island. Records of the Geological Survey of India, Vol. 64, S. 117/28. Calcutta 1923.
R D Q A S P E T K O C H E M I E 94g
841
Gas Commission geophysikalische Untersuchungen durch-geführt. Die Sedimentverteilung vor dei pakistanischen Küste im Gebiet dés Indns-Delt&s haher kennenzulernen, ist glerehfalls für die Erklàrung mancher Sedimentationsverhâltnisse in fossüen erdolführenden Ablagerungen wichtig. Werden doch z. B . die olführenden Schichten des Miozân-Pliozàn der Halb-insel Apscheron im Kaspischen Meer ais Deltabildungen der jungtertiaren Flüsse K u r a und Wolga angesehen2').
Dieser kurze erste Überblick über die heutige Sedimentation in der ostafrikanischen und indisch-pakistanischen Meeres-
*•) B . O. Kugler, A visit to Russian oil districts. J. Inst. Petroleum 25, 68/88 [1939].
region des Indischen Ozeans hat somit bereits einige Anhalts-punkte über die Entstehung kohlenwasserstoffhaltiger fossiler Sedimente erbracht. Die detaülierte Ausarbeitung wird sicber-lich wéitere Hihweise liefern.
Die systematische Sammlung des Sedimentmaterials vor der ostafrikanischen Küste wurde durch die Herrén Dr. H. E. Reineek und Dr. W. F. Guimann von der Forschungsanstalt fur Meeres-geoiogie und Meeresbiologie ,,Senckenberg", Wilhelmshaven, und durch den zuerst genannten Verf. dieses Bericbtes vorgenommen, vor der indisch-pakistanischen Küste und im Gebiet des Indus-Deltas von den beiden Verfassern. Im MUndungsgebiet des Indus war auBerdem der Geologe Herr R . Islam von der Geological Survey of Pakistan daran beteiligt. Die deutsch-pakistanische Gemeinschaftsarbeit vor der Indus-Mttndung wurde von der Deutschen Forschungsgemeinschaft unterstiitzt.
842
Reprinted from Erdôl und Kofife-Erdgas-Pefrochem/e, 19 Jahngang, Nr. 4 , 1966, S. 237-243.
Seismische Untersuchungen im nordüchen Teil des Arabischen Meeres (Golf yon O m a n ) Van Herwald Bungensloek, Hans Closs und Karl Him*)
Vorgetragen von H. Closs auf der 17. Jahrestagung der Deutsche» GesellscJiaft für MineraWlwissenschaft und Kohlechemie in Hannover, am 8. Oktooer 1965
Zusammenfassung: Mit der im Jahie 1964 eriolgten Indienst-atellung des neuen Forschungsschiffes „Meteor" wurde es der Bundesrepublik Deutschland ermôglicht, die seit langem geplante Beteiligung an einer intemationalen Gemeinschaftsarbeit zui Untersuchung des Indischen Ozeans (International Indian Ocean Expedition) zu verwirklichen. Im Rahmen des deutschen Beitrags wurden u. a. seismische Untersuchungen im zentralen Téil des Golfes von O m a n ausgeftthrt, iiber die berichtet wird. Registriert wurde auf ,,Meteor" und mittels eines Hubschraubers, der zur Expeditionsausrustung gehôrte. Die Schiesarbeiten wurden von einem Beiboot der „Meteor" ausgeftthrt. £s ergaben sich unter rd. 3000 m Wasserbedeckung erne Sedimentschicht von mehr als 4000 m Màchtigkeit und Geschwindigkeiten von wenigerals 2000 m / s bis zu mehr als 4000 m / s .
Seismic tests in the northern part of the Arabian Gulf : After taking over, in 1964, the new research ship „Meteor", the Federal Republic could realise the long standing plan to participate in the international investigation program for the Indian Ocean (International Indian Ocean Expedition). The German contribution consisted, amongst other matters, in seismic tests in the central part of the Gulf of O m a n . Seismic data were recorded aboard the „Meteor" and by a helicopter which was a part of the expedition's equipment; The shooting was carried out from a tender belonging to the,,Meteor". Layers of sediments with a thickness of more than 4000 m and wave travelling speeds of less than 2000 m/seç up to more than 4000 m/sec were found in a water depth of abt. 3000 m .
1. Einleitung Mit der Indienststellung des neuen Forschungsschiffes „Meteor" im Jahre 1964 wurde nunmehr auch eine deutsche Beteiligung an d e m Programm der Intemationalen Indischen-Ozean-Expedition moglich. Diese Beteiligung an dem Forschungs-unternehmen wurde durch Bereitstellung von Mitteln der Bundesregierung und der Deutschen Forschungsgemeinsdiaft fiaanziert.
Marine Seismik ist innerhalb des vielseitigen Forschungs-programms der „Meteor" auf einigen Frofîlen im Golf von Cambay , im Golf von Kutch und im nôrdlichen Teil des Arabischen Meeres durchgeführt worden. Soweit Untersuchungen in der Tiefsee durchgefiihrt worden sind, handelt es sich u m die ersten deutschen Arbeiten'dieser Art. Über die For-schungen im Golf von O m a n soil bier berichtet werden**).
2 . L a g e des Untersuchungsgebietes Der Golf von O m a n (Abb. 1) ist der nordwestliche Teil des Arabischen Meeres, an den sich nach N W der Persische Golf anschlieBt. Der Golf von O m a n stellt eine etwa dreieckfórmige abyssische Ebene mit maximalen Wassertiefen iiber 3000 m dar. I m S E wird der Golf von O m a n durch den Murray-Ridge, einen etwa N E — S W verlaufenden untermeerischen Riicken, der an einigen Stellen von iiber 3000 m Tiefe bis zu 500 m unter N N aufsteigt, von dem ttbrigen Arabischen Meer ab-getrennt.
3. Zur MeBmethodik Die Profile waxen als refraktionsseismische Messungen angelegt. Die Entf ernungsbestimmung wurde nach MSglichkeit mit d e m an Bord der „Meteor" installierten Wind -Wetter- Radar vor-genommen. Für die seismischen Arbeiten im Arabischen Meer war das Forschungsschiff u. a. mit einem Eubschrauber aus-gerflstet. Es seien nachfolgend die verschiedenen Einsatz-
*) Anschriften: Dipl.-Geophys. H . Bungenstock, Nieders&chsi-sches Landesamt fur Bodenforschung, 3 Hannover-Buchholz, Alfred-Bentz-Haus. — Ltd. Direktor und Professer Dr. H . Closs, Bundesanstalt fur Bodenforschung, 3 Hannover-Buchholz, Alfred-Bentz-Haus. — Dr. K . Hinz, Bundesanstalt fur Bodenforschung, 3 Hannover-Buchholz, Alfred-Bentz-Haus.
**)Vorausbericht aus den „Meteor-Forschungsberichten" der E x pedition 1964/66 in den Indischen Ozean.
móglichkeiten eines Hubschraubers, der seismische Registrie-rungen im Schwebeflug vornimmt, aufgefiihrt (Abb. 2, 3). V o n Erdólgesellschaften sind für die iibliche marine Reflexions-seismik vor allem groBe Hubschrauber schon mehrfach ein-gesetzt worden. Bei der zuriickliegenden Meteorreise sind nicht aile hier be-schriebenen Môghchkeiten angewandt worden, aber die bei den Einsatzen gesammelten Erf ahrungen werden hier mit benutzt. Bei der Arbeitsweise a liegt der Schuflpunkt fest. Der H u b schrauber fliegt auf d e m Profil z u m Begistrieren von einem Beobachtungspunkt z u m anderen, wobei Abstande von etwa 1000 m eingehalten werden. Nachteile diesèr Arbeitsweise hegen darin, dafi ein gróBeres Schiff schon bei geringen W i n d -stârken vertriftet. D a der Abstand Schiff—Sprengladung bei groBeren Ladungen mehrere 100 m betragen m u B , sind zeit-raubende Schiffsmanóver notwendig. W e n n das Schiefiboot ankern kann und starke Strômung herrscht, die das Auslegen der Ladung erieichtert, hat dieses Verfahren Vorziige, also z. B . bei seismischen Aufnahmen von Schelfgebieten mit star-ken Gezeitenstromen. Zur Aufnahme eines vollstandig hin- und riickgeschossenen Profils m u B das Schiff einmal seine Position andern, was bei einer Marschgeschwindigkeit von 10 Knoten etwa 2,5 Stunden in Anspruch nimmt. Die unter a) gezeichnete Aufnahme ist weniger vollstandig, doch ist die bearbeitete Lange des Profils etwas grôBer. Diese Art der Aufnahme von Bichtung und Gégenrichtung ist in tektonisch ruhigen G e -bieten zu verantworten.
Das AusschieBen des Profils mit Hin- und Bückschüssen in Abstânden von 1 k m würde 23 Eiñsatzstunden erfordern, vorausgesetzt, daB sich der Hubschrauber 2 Stunden ohne Unterbrechung in der Luft imiten kann und seine Geschwin-digkeit bei 100 k m / h liegt. Dazu k o m m e n noch 2,5 Stunden für den Positionswechsel, der mit der Aufnahme eines Echolot-profils verbunden werden m u B . D a nur bei Tag geschossen werden kann, benôtigt also ein so ausgeschossenes Profil zwei volle Arbeitstage. Die Arbeitsweise b ist i. allg. vorteilhafter, vor allem auf d e m offenen Ozean. Durch Setzen einer Markierung, z. B . A b -werfen von FarbstofJ, wird eine Beobachtungsstelle für den Hubschrauber markiert. Das Schiff bewegt sich — wobei sich eine Fahrtgeschwindigkeit von 4 kn bei 1000 m SchuBpunkt-abstand bewahrt hat—in Profilrichtung auf den Hubschrauber zu, der immer an derselben Stelle registriert. Entweder wird das Profil wie unter b gezeichnet ausgeschossen, oder das SchieBboot hat das gleiche Profilstück zweimal zu durch-fabren, wahrend der Hubschrauber zunachst an einem und dann am'anderen Profilende registriert. Vorteile dieses Ver-fahrens sind, dafi eine auf der Meeresoberflâche markierte Stellé unter WindeinfluB nur wenig vertriftet, die Peilung z u m Hubschrauber gleich bleibt, wahrend der Arbeitsf ahrt das Bodenprofil ausgelotet wird und die Beobachtungs- bzw. SchuB-intervalle gut eingehalten werden kónnen. Die Sprengladungen lassen sich leicht ausbringen. Die Einsatzzeit fur das voll-stândige Hin- und BückschuBprofil betragt insgesamt etwa 18 Stunden. D a auch eine spezielle Fahrt für die Echolotung entf âllt, kónnen etwa 7 Arbeitsstunden éingesp'art werden, und das seismische Gesamtergebnis ist meist besser. Zwar ist die Arbeitszeit -r- wie m a n sieht — kürzer geworden, doch erfor-dert das Profil immer noch zwei Arbeitstage. Bei der Arbeitsweise c beobachtet der Hubschrauber jeweüs abwechselnd an zwei Punkten, die 5 oder 6 k m Abstand in der Profiilinie haben, wahrend sich das SchieBboot von einem
237
Collected reprints of the International Indian Ocean Expedition, vol. IV , contribution no . 255 843
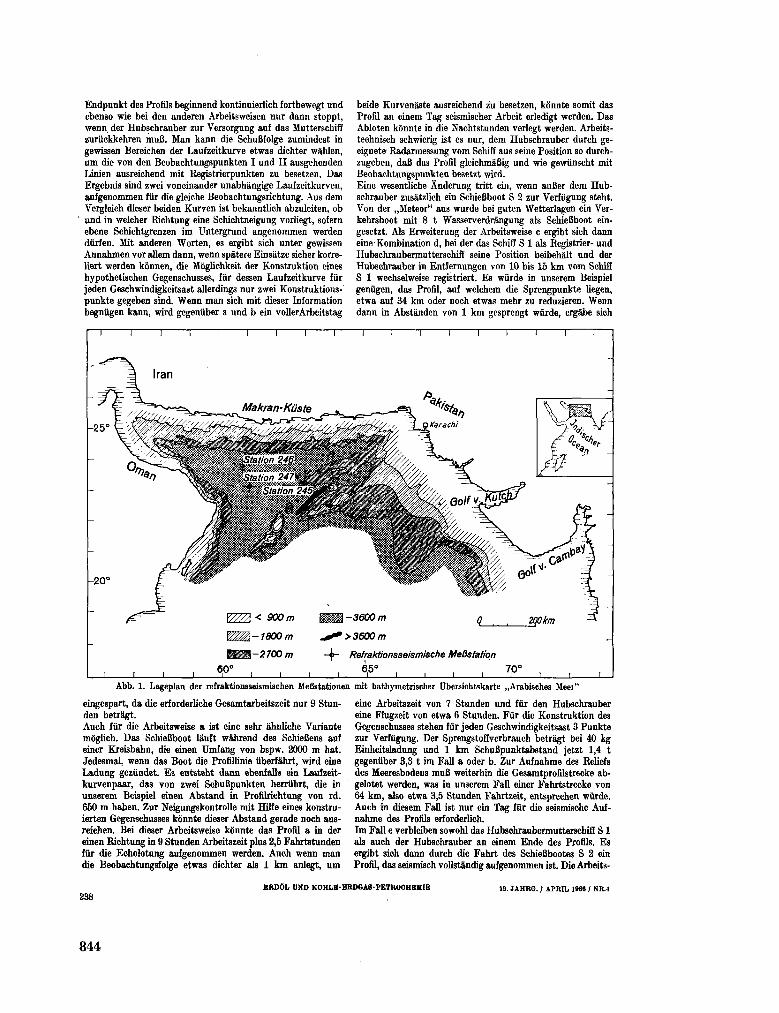
Endpunkt des Profils beginnend kontinuierlich fortbewegt und ebenso wie bei den anderen Arbeitsweisen nur dann stoppt, wenn der Hubschrauber zur Versorgung auf das Mutterschiff zurückkehren m u B . M a n kann die SchuBfolge zumindest in gewissen Bereichen der Laufzeitkurve etwas dichter wahlen, u m die von den Beobachtungspunkten I und II ausgehenden Linien ausreichend mit Kegistrierpunkten zu besetzen. Das Ergebnis sind zwei voneinander unabhângige Laufzeitkurven, aufgenommen fur die gleiche Beobachtungsrichtung. Aus d e m Vergleich dieser beiden Kurven ist bekanntlich abzuleiten, ob und in welcher Richtung eine Schichtneigung vorliegt, sofern ebene Schichtgrenzen im Untergrund angenommen werden dürfen. Mit anderen Worten, es ergibt sich unter gewissen A n n a h m e n vor allem dann, wenn spàtere Einsàtze sicher korre-liert werden kônnen, die Môglichkeit der Konstruktion eines hypothetischen Gegenschusses, fur dessen Laufzeitkurve fur jeden Geschwindigkeitsast allerdings nur zwei Konstruktions-' punkte gegeben sind. W e n n m a n sich mit dieser Information begniigen kann, wird gegeniiber a und b ein vollerArbeitstag
beide Kurvenaste ausreichend zu besetzen, kônnte somit das Profil an einem Tag seismischer Arbeit erledigt werden. Das Abloten kônnte in die Nachtstunden verlegt werden. Arbeits-technisch schwierig ist es nur, d e m Hubschrauber durch ge-eignete Radarmessung v o m Schiff aus seine Position so durch-zugeben, daB das Profil gleichmâBig und wie gewiinscht mit Beobachtungspunkten besetzt wird. Eine wesentliche Ânderung tritt ein, wenn auBer d e m H u b schrauber zusàtzlich ein SchieBboot S 2 zur Verfiigung steht. V o n der „Meteor" aus wurde bei guten Wetterlagen ein Ver-kehrsboot mit 8 t Wasserverdrângung als SchieBboot ein-gesetzt. Als Erweiterung der Arbeitsweise c ergibt sich dann eine-Kombination d, bei der das Schiff S 1 als Registrier- und Hubschraubermutterschiff seine Position beibehalt und der Hubschrauber in Entfernungen von 10 bis 15 k m v o m Schiff S 1 wechselweise registriert. Es wiirde in unserem Beispiel genügen, das Profil, auf welchem die Sprengpunkte liegen, etwa auf 34 k m oder noch etwas mehr zu reduzieren. W e n n dann in Abstànden von 1 k m gesprengt würde, ergabe sich
T "T T T
Iran
Makran-Küste
Karachi
G*1 m 6°"
jgoïm
60°
2700 m - 4 - Refraktionsseismische MeBstation 1 i
6£° 7,0°
Abb. 1. Lageplan der refraktionsseismischen MeBstationen mit bathymetrischer Obersichtskarte ,,Arabisches Meei"
eingespart, da die erforderliche Gesamtarbeitszeit nur 9 Stun-den betragt. Auch fur die Arbeitsweise a ist eine sehr àhnliche Variante môglich. Das SchieBboot làuft wâhrend des SchieBens auf einer Kreisbahn, die einen Umfang von bspw. 2000 m hat. JedesmaL wenn das Boot die Profillinie überfahrt, wird eine Ladung gezündet. Es entsteht dann ebenfalls ein Laulzeit-kurvenpaar, das von zwei SchuBpunkten herriihrt, die in unserem Beispiel einen Abstand in Profilrichtung von rd. 650 m haben. Zur Neigungskontrolle mit Hilfe eines konstru-ierten Gegenschusses kônnte dieser Abstand gerade noch aus-reichen. Bei dieser Arbeitsweise kônnte das Profil a in der einen Richtung in 9 Stunden Arbeitszeit plus 2,5 Fahrtstunden fur die Echolotung aufgenommen werden. A u c h wenn m a n die BeobachtungsfoJge etwas dichter als 1 k m anlegt, u m
eine Arbeitszeit von 7 Stunden und für den Hubschrauber eine Flugzeit von etwa 6 Stunden. Fur die Konstruktion des Gegenschusses stehen für jeden Geschwindigkeitsast 3 Punkte zur Verfiigung. Der Sprengstoffverbrauch betragt bei 40 kg Einheitsladung und 1 k m SchuBpunktabstand jetzt 1,4 t gegeniiber 3,3 t im Fall a oder b. Zur Aufnahme des Reliefs des Meeresbodens m u B weiterhin die Gesamtprofilstrecke ab-gelotet werden, was in unserem Fall einer Fahrtstrecke von 64 k m , also etwa 3,5 Stunden Fahrtzeit, entsprechen würde. Auch in diesem Fall ist nur ein Tag für die seismische Aufn a h m e des Profils erforderlich. I m Fall e verbleiben sowohl das Hubschraubermutterschiff S 1 als auch der Hubschrauber an einem Ende des Profils. Es ergibt sich dann durch die Fahrt des SchieBbootes S 2 ein Profil, das seismisch vollstândig aufgenommen ist. Die Arbeits-
ERDOL UND KOHLE-BRDGASPETBOCHE1IIE
238 19. JAHRG. / APRIL 1966 / NR.4
844
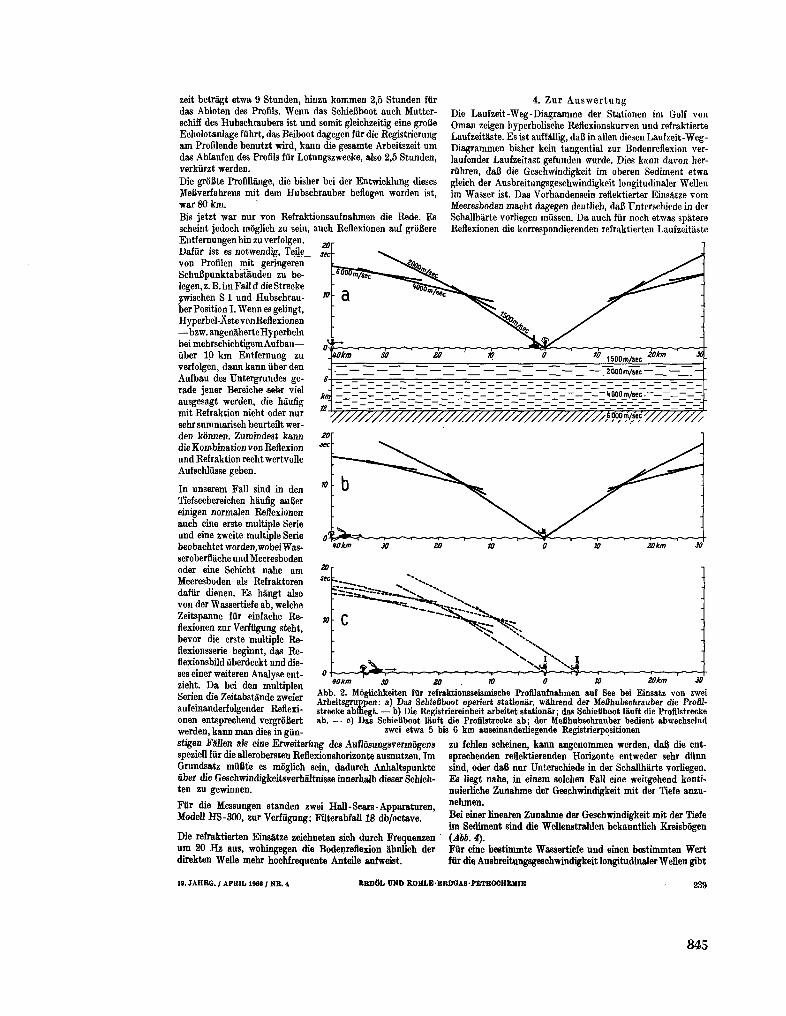
zeit betràgt etwa 9 Stunden, hinzu k o m m e n 2,5 Stunden fur das Abloten des Profils. W e n n das SchieBboot auch Mutter-schiff des Hubschraubers ist und somit gleichzeitig eine grofie Echolotanlage führt, das Beiboot dagegen für die Registrierung a m Profilende benutzt wird, kann die gesamte Arbeitszeit u m das Ablaufen des Profils für Lotungszwecke, also 2,5 Stunden, verkürzt werden.
Die groBte Profillànge, die bisher bei der Entwicklung dieses MeBverfahrens mit dem Hubschrauber beflogen worden ist, war 80 k m .
Bis jetzt war nur von Refraktionsaufnahmen die Rede. Es scheint jedoch móglich zu sein, auch Reflexionen auf groBere Entf ernungen hin zu veriolgen. Dafür ist es notwendig, Teüe_ von Profilen mit geringeren SchuBpunktabstànden zu be-legen,z.B.imFalld dieStrecke ^wischen S 1 und Hubschrauber Position I. W e n n es gelingt, Hyperbel-Àste vonReflexionen — b z w . angenaherte H y perbeln bei mehrschichtigemAufbau— über 10 k m Entfernung zu veri olgen, dann kann über den Aufbau des Untergrundes ge-rade jener Bereiche sehr viel ausgesagt werden, die hàufig mit Refraktion nicht oder nur sehr summarisch beurteilt werden kônnen. Zumindest kann die Kombination von Reflexion und Refraktion recht wertvoile Aufschliisse geben.
In unserem Fall sind in den Tiefseebereichen hàufig auBer einigen normalen Reflexionen auch eine erste multiple Serie und eine zweite multiple Serie beobachtet worden,wobei W a s -seroberfláche und Meeresboden oder eine Schicht nahe a m Meeresboden als Refraktoren dafür dienen. Es hàngt also von der Wassertiefe ab, welche Zeitspanne für eúifache R e flexionen zur Verfügung steht, bevor die erste multiple R e -flexionsserie beginnt, das R e -flexionsbüd überdeckt und dieses einer weiteren Analyse ent-zieht. D a bei den multiplen Serien die Zeitabstànde zweier aufeinanderfolgender Reflexionen entsprechend vergrôBert werden, kann m a n dies in gün-
4. Z u r A u s w e r t u n g Die Laufzeit-Weg-Diagramme der Stationen im Golf von O m a n zeigen hyperbolische Réflexionskurven und refraktierte Laufzeitàste. Es ist auffállig, daB in alien diesen Laufzeit-Weg -Diagrammen bisher kein tangential zur Bodenreflexion ver-laufender Laufzeitast gefunden wurde. Dies kann davon her-riihren, daB die Geschwindigkeit im oberen Sediment etwa gleich der Ausbreitungsgeschwindigkeit longitudinaler Wellen im Wasser ist. Das Vorhandensein reflektierter Einsàtze v o m Meeresboden macht dagegen deutlich, daB Unterschiede in der Schallhàrte vorliegen müssen. D a auch für noch etwas spatere Reflexionen die korrespondierenden refraktierten Laufzeitàste
V///////////////////////////////////////AWIHV//////A
ZOkm
Abb. 2. Moglichkeiten für refraktionsseismische Profilaufnahmen auf See bei Einsatz von zwei Arbeitsgruppen: a) Das SchieBboot operiert stationâr, wâhrend der MeBhubschrauber die Profil-strecke abfliegt. — b) Die Registriereinheit arbeitet stationàr; das SchieBboot lâuft die Profilstrecke ab. — c) Das SchieBboot lâuft die Profilstrecke ab; der MeBhubschrauber bedient abwechselnd
zwei etwa 5 bis 6 k m auseinanderliegende Registrierpositionen
stigen Fallen als eine Erweiteriing des Auflôsungsvennôgens spezieD für die allerobersten Reflexionshorizonte ausnutzen. I m Grundsatz müBte es móglich sein, dadurch Anhaltspunkte über die Geschwindigkeitsverhàltnisse innerhalb dieser Schich-ten zu gewinnen.
Fur die Messungen standen zwei Hall-Sears-Apparaturen, Modell H S - 3 0 0 , zur Verfügung; Filterabfall 18 db/octave.
Die refraktierten Einsàtze zeichneten sich durch Frequenzen u m 20 H z aus, wohingegen die Bodenreflexion àhnlich der direkten Welle rnehr hochfrequente Anteile aufweist.
zu fehlen scheinen, kann angenommen werden, daB die ent-sprechenden reflektierenden Horizonte entweder sehr dünn sind, oder daB nur Unterschiede in der Schallhàrte vorliegen. Es liegt nahe, in einem solchen Fall eine weitgehend konti-nuierliche Z u n a h m e der Geschwindigkeit mit der Tiefe anzu-nehmen.
Bei einer linearen Z u n a h m e der Geschwindigkeit mit der Tiefe im Sediment sind die Wellenstrahlen bekanntlich Kreisbôgen (Abb. 4). Für eine bestimmte Wassertiefe und einen bestimmten Wert für die. Ausbreitungsgeschwindigkeit longitudinaler Wellen gibt
19. JAHRG. / APRIL 1968 / N R . 4 ERDOL UND KOHLEERDGAS-PETBOCHPJHE 239
845
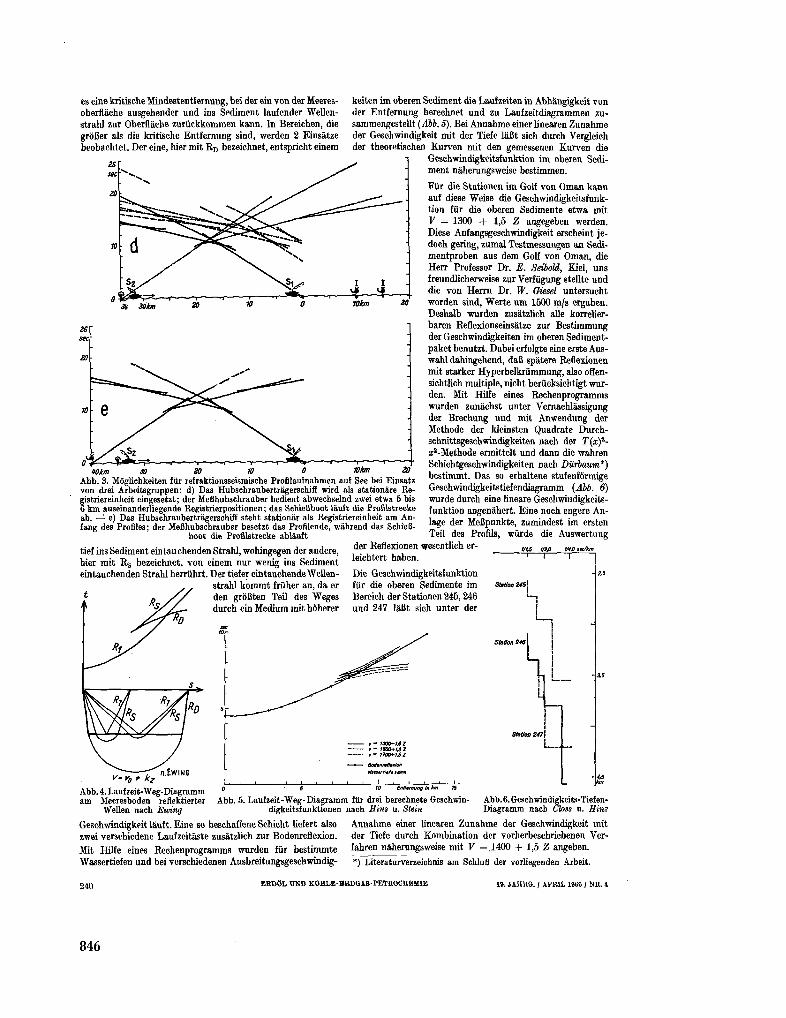
es eine kritische Mindestentfernung, bei der ein von der Meeres-oberflàche ausgehender und ins Sediment laufender Wellen-strahl zur Oberflache zuriickkommen kann. In Bereichen, die groBer als die kritische Entfemung sind, werden 2 Einsàtze beobachtet. Der eine, hier mit R D bezeichnet, entspricht einem
Mon X 10 10 O Wkm 20 A b b . 3. Móglichkeiten für refraktionsseismische Profilauínahmen auí See bei Einsatz von drei Arbeitsgruppen: d) Das Hubschraubertragerschiff wird als stationàre Re-gistriereinheit eingesetzt; der Meûhubschrauber bedient abwechselnd zwei etwa 6 bis 6 k m auseinanderliegende Registrierpositionen; das Schieflboot lâuft die Profilstrecke ab. — e) Das Hubschraubertràgerschiff steht stationer als Registriereinheit a m A n -fang des Profiles; der MeBhubschrauber besetzt das Profilende, wàhrend das SchieB-
boot die Profilstrecke ablàuft
keiten im oberen Sediment die Laufzeiten in Abhàngigkeit von der Entfemung berechnet und zu Laufzeitdiagrammen zu-sammengestellt (Abb. 5). Bei A n n a h m e einer linearen Z u n a h m e der Geschwindigkeit mit der Tiefe làBt sich durch Vergleich der théoretischen Kurven mit den gemessenen Kurven die
Geschwindigkeitsfunktion im oberen Sediment nàherungsweise bcstimmen.
Fur die Stationen im Golf von O m a n kann auf diese Weise die Geschwindigkeitsfunktion fur die oberen Sedimente etwa mit V = 1300 + 1,5 Z angegeben werden. Diese Anfangsgeschwindigkeit erscheint je-doch gering, zumal Testmessungen an Sedi-mentproben aus dem Golf von O m a n , die Herr Professor Dr . E. Seibold, Kiel, uns freundlicherweise zur Veriiigung stellte und die von Herrn Dr . W. diesel untersucht worden sind, Werte u m 1500 m / s ergaben. Deshalb wurden znsâtzlich aile korrelier-baren Reflexionseinsâtze zur Bestimmung der Geschwindigkeiten im oberen Sediment-paket benutzt. Dabei erfolgte eine erste Aus-wahl dahingehend, daB spàtere Reflexionen mit starker Hyperbelkrümmung, also offen-sichtlich multiple, nicht beriicksichtigt wurden. Mit Hilfe eines Rechenprogramms wurden zunàchst unter Vernachlàssigung der Brechung und mit Anwendung der Méthode der kleinsten Quadrate Durch-schnittsgeschwindigkeiten nach der T(xy-xl- Méthode ermittelt und dann die wahren Schichtgeschwindigkeiten nach Diirbaum*) bestimmt. Das so erhaltene stufenfôrmige Geschwindigkeitstiefendiagramm (Abb. 6) wurde durch eine lineare Geschwindigkeitsfunktion angenàhert. Eine noch engere A n -lage der MeBpunkte, zumindest im ersten Teil des Profils, wurde die Auswertung
tief ins Sediment eintauchenden Strahl, wohingegen der andere, hier mit R s bezeichnet, von einem nur wenig ins Sediment eintauchenden Strahl herrührt. Der tiefer eintauchendeWellen-
strahl k o m m t friiher an, da er í - / / den grôBten Teil des Weges
durch ein Medium mit hôherer
der Reflexionen wesentlich er-leichtert haben.
Die Geschwindigkeitsfunktion für die oberen Sedimente im Bereich der Stationen 245, 246 und 247 làBt sich unter der
vu w w •*fo"
Stmtlon 14S] I
\
^ - Í300+UZ v - ISOO+Í.S 2 „ _ t7CO+t,SZ
Abb. 4. Laufzeit- Weg-Diagramm Abb. 6. Geschwindigkeits-Tief en-Diagramm nach Closs a. Him
a m Meeresboden reflektierter Abb. 5. Laufzeit-Weg-Diagramm für drei berechnete Geschwin-Wellen nach Emng digkeitsfunktionen nach Him u. Stein
Geschwindigkeit lâuft. Eine so beschaffene Schicht liefert also A n n a h m e einer linearen Z u n a h m e der Geschwindigkeit mit zwei verschiedene Laufzeitaste zusâtzlich zur Bodenreflexion. der Tiefe durch Kombination der vorherbeschriebenen Ver-Mit Hilfe eines Rechenprogramms wurden für bestimmte fahren nàherungsweise mit V = 1400 + 1,5 Z angeben. Wassertiefen und bei verschiedenen Ausbreitungsgeschwindig- *) Literaturverzeichnis a m SchluB der vorliegenden Arbeit.
240 E R D 0 L U N D KOHLE-EIÎDGAS-PETROCHEMIE 19. JAHRG. / APRIL 1966 / N R . 4
846
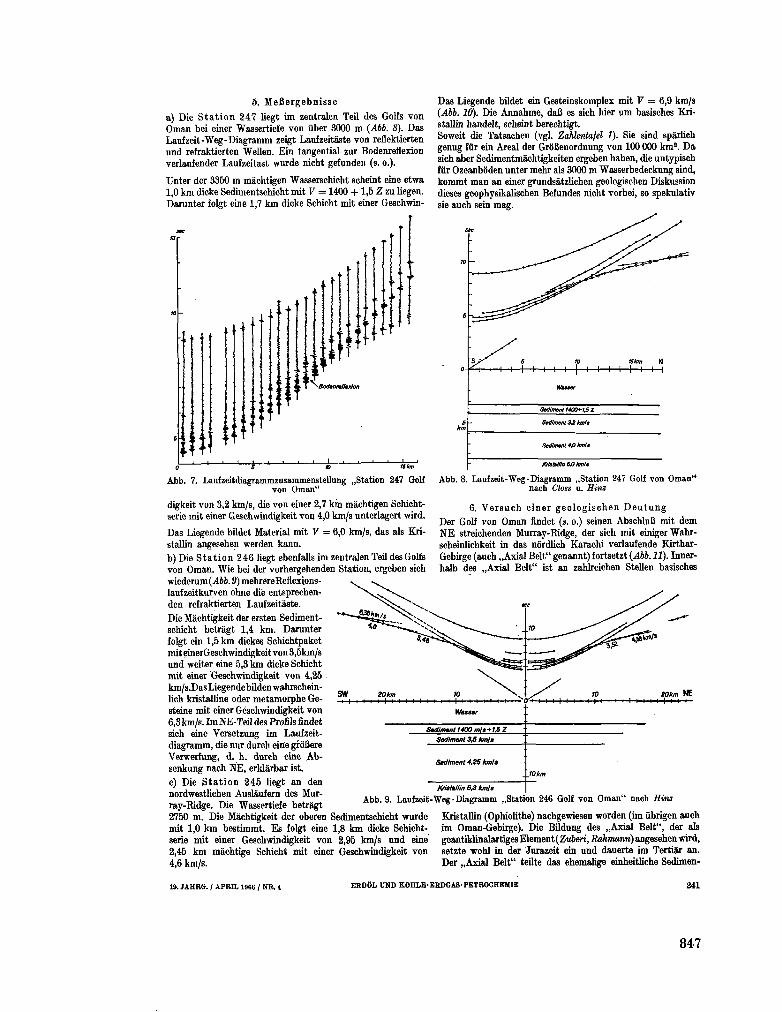
5. MeBergebnisse
a) Die Station 247 liegt im zentralen Teil des Golfs von O m a n bei einer Wassertiefe von über 3000 m (Abb. 8). Das Laufzeit-Weg-Diagramm zeigt Laufzeitaste von reflektierten und refraktierten Wellen. Ein tangential zur Bodenreflexion verlaufender Laufzeitast wurde nicht gefunden (s. o.).
Unter der 3350 m màchtigen Wasserschicht scheint eine etwa 1,0 k m dicke Sedimentschicht mit V = 1400 + 1 , 5 Z zu liegen. Darunter folgt eine 1,7 k m dicke Schicht mit einer Geschwin-
Das Liegende bildet ein Gesteinskomplex mit V — 6,9 k m / s (Abb. 10). Die A n n a h m e , daB es sich hier u m basisches Kri-stallin handelt, scheint berechtigt. Soweit die Tatsachen (vgl. Zahlentafel 1). Sie sind spârlich genug fiir ein Areal der GroBenordnung von 100 000 k m 2 . D a sich aber Sedimentmàchtigkeiten ergeben haben, die untypisch fiir Ozeanbóden unter mehr als 3000 m Wasserbedeckung sind, k o m m t m a n an einer grundsàtzlichen geologischen Diskussion dieses geophysikalischen Befundes nicht vorbei, so spekulativ sie auch sein m a g .
HI:" !i|"
it:.« <<r
a,.
\ Bodenrmf/»x/on
I I I I I I I I I | I I I I I I I I
S9d/jmntt400+I¿z
Sediment 3,2 hnls
Sedlmtnt 4fi kml»
A b b . 7. Laufzeitdiagrammzusammenstellung ,,Station 247 Golf von O m a n "
digkeit von 3,2 k m / s , die von einer 2,7 k m màchtigen Schicht-serie mit einer Geschwindigkeit von 4,0 k m / s unterlagert wird.
D a s Liegende bildet Material mit V = 6,0 k m / s , das als Kri-stallin angesehen werden kann.
b) Die Station 2 4 6 liegt ebenfalls im zentralen Teil des Golfs von O m a n . W i e bei der vorhergehenden Station, ergeben sich wiederum (Abb. 9) mehrereBeflexions-laufzeitkuryen ohne die entsprechen-den refraktierten Laufzeitaste. Die Mâchtigkeit der ersten Sedimentschicht betragt 1,4 k m . Darunter folgt ein 1,5 k m dickes Schichtpaket mit einerGeschwindigkeit von 3 ,5km/s u n d weiter eine 5,3 k m dicke Schicht mit einer Geschwindigkeit von 4,25 km/s.DasLiegendebildenwahrschein-lich kristalline oder metamorphe G é steme mit einer Geschwindigkeit von 6,3 k m / s . I m NE-Teil des Profils findet sich eine Versetzung im Laufzeit-diagramm, die nur durch eine grofiere Verwerfung, d. h . durch eine A b -senkung nach N E , erklârbar ist.
c) Die Station 2 4 5 liegt an den nordwestlichen Auslàufern des M u r ray-Ridge. Die Wassertiefe betràgt 2750 m . Die Mâchtigkeit der oberen Sedimentschicht wurde mit 1,0 k m bestimmt. E s folgt eine 1,8 k m dicke Schicht-serie mit einer Geschwindigkeit von 2,95 k m / s und eine 2,45 k m máchtige Schicht mit einer Geschwindigkeit von 4,6 k m / s .
Kriabllm&Okmla
A b b . 8. Laufzeit-Weg-Diagramm ..Station 247 Golf von O m a n " nach Closs u. Him
6. Versuch einer geologischen D e u t u n g Der Golf von O m a n findet (s. o.) seinen AbschluB mit d e m N E streichenden Murray-Ridge, der sich mit einiger W a h r -scheinlichkeit in das nôrdlich Karachi verlaufende Kirthar-Gebirge (auch „Axial Belt" genannt) fortsetzt (Abb. 11). Inner-halb des „Axial Belt" ist an zahlreichen Stellen basisches
Wâsser
Sediment 1400 ml a+16 Z
Sediment 3,5 km/s
Sediment 4,25 kmfa
Kristtllin £ 3 km¡ a
JOkm
A b b . 9. Laufzeit-Weg-Diagramm ..Station 246 Golf von O m a n " nach Kim
Kristallin (Ophiolithe) nachgewiesen worden (im iibrigen auch im Oman-Gebirge). Die Bildung des „AxiaI Belt", der als geantiklinalartigesElement(ZMten, iSaftman») angesehen wird, setzte wohl in der Jurazeit ein und dauerte im Tertiar an. Der „Axial Belt" teilte das ehemalige einheitliche Sedimen-
1». JAHRG. / APRIL 1966 / N R . 4 E R D O L U N D K O H L E - E R D G A S - P E T R O C H E M I E 241
847
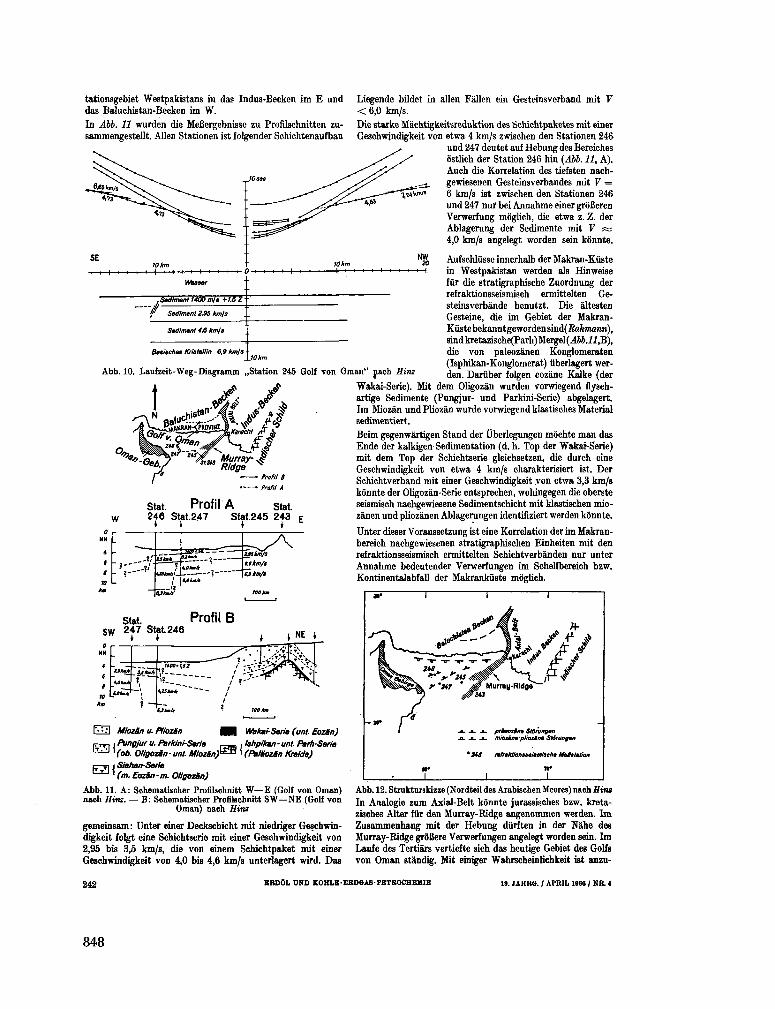
tationsgebiet Westpakistans in das Indus-Becken im E und das Baluchistan-Becken im W .
In Abb. 11 wurden die MeBergebnisse zu Profilsehnitten zu-sammengestellt. AHen Stationen ist folgender Schichtenaufbau
Wsaeer
, Raiment 1400 mis +15 Z
f Sediment 2,95 km/s
Sédiment 4,6 km/a
Besisches Kriatallin 6,9 km/s 10km
Abb. 10. Laufzeit-Weg-Diagramm ,,Station 246 Golf
• • Profil t
• • Profil A
stat. Profil A W 246 Stat.247
Stat. Stat.245 2 4 3 E
-,::-J '¿¿¡né f
_.¿ ejtmfi'
%3tm*
4.0Mmá
B,0kmtt
_ï
( m
Stat. S w 2 4 7 Stat 246
Profil B
Liegende büdet in alien Fallen ein Gesteinsverband mit V < 6,0 k m / s .
Die starke Machtigkeitsreduktion dea Schichtpaketes mit einer Geschwjndigkeit von etwa 4 k m / s zwischen den Stationen 246
und 247 deutet auf Hebung des Bereiches ôstlich der Station 246 hin (Abb. 11, A ) . Âuch die Konelation des tiefsten nach-gewieseren Gesteinsverbandes mit V = 6 k m / s ist zwischen den Stationen 246 und 247 nui bei A n n a h m e einer grôBeren Verwerfung môglich, die etwa z. Z . der Ablagerung der Sedimente mit V s= 4,0 k m / s angelegt worden sein kônnte.
Anfschliisse innerhalb der Makran-Kuste in Westpakistan werden als Hinweise fur die stratigraphische Zuordnung der refraktionsseismisch ermittelten G e -steinsverbànde benutzt. Die âltesten Gesteine, die im Gebiet der Makran-Kuste bekannt geworden sind( Rahrmnri), sindkretazische(Parh)Mergel(.áiM2,B), die von paleozànen Konglomeraten (Isphikan-Konglomerat) überlagert wer-
von O m a n " nach Hinz d e n Dajübe,. Ioigen eoz¡íne Kalke (der
Wakai-Serie). Mit dem Oligozàn wurden vorwiegend flysch-artige Sedimente (Pungjur- und Parkini-Serie) abgelagert. Im Miozàn und Pliozàn wurde vorwiegend klastisches Material sedimentiert.
Beim gegenwàrtigen Stand der Überlegungen môchte m a n das Ende der kalkigen Sedimentation (d. h. Top der Wakai-Serie) mit dem Top der Schichtserie gleichsetzen, die durch eine Geschwindigkeit von etwa 4 k m / s charakterisiert ist. Der Schichtverband mit einer Geschwindigkeit von etwa 3,3 k m / g kônnte der Oligozân-Serie entsprechen, wohingegen die oberste seismisch nachgewiesene Sedimentschicht mit klastischen mio-zânen und pliozànen Ablagerungen identifiziert werden kônnte.
Unter dieser Voraussetzung ist eine Korrelation der im Makran-bereich nachgewiesenen stratigraphischen Einheiten mit den refraktionsseismisch ermittelten Schichtverbànden nur unter A n n a h m e bedeutender Verwerfungen im Schelfbereich bzw. Kontinentalabfall der Makrankflste môglich.
*JOImJi
, L HOO*l,SZ WP%H:
nu
ES
Miozàn u. Pliozën H
Pungjur u. Parklni-Serie . _ _ (ob. Oligozàn-uni Mioziny^ '
Siahan-Serie (m. Eozén-m. Oligozàn)
Wakai-Serie (uni. Eozàn)
Ishpikan-unt. Parh-Serie
(Palàozàn Kreide)
^ .&. .k prtaozine Stôru/igen .a. JL. JL. miozëne-pliozane Stôrungen
* 24f refraktionaaalamtache Attestation
_L j_
Abb. 11. A : Schematischer Profilschnitt W — E (Golf von O m a n ) nach Him. — B : Schematischer Profilschnitt S W — N E (Golf von
O m a n ) nach Sina
gemeinsam : Unter einer Deckschicht mit niedriger Geschwindigkeit folgt eine Schichtserie mit einer Geschwindigkeit von 2,95 bis 3,5 k m / s , die von einem Schichtpaket mit einer Geschwindigkeit von 4,0 bis 4,6 k m / s unterlagert wird. Das
Abb. 12. Strukturskizze (Nordteil des Arabischen Meeres) nach Him In Analogie zum Axial-Belt kônnte jurassisches bzw. kreta-zisches Alter für den Murray-Ridge angenommen werden. I m Zusammenhang mit der Hebung diirften in der Nàhe des Murray-Ridge grôBere Verwerfungen angelegt worden sein. I m Laufe des Tertiârs vertiefte sich das heutige Gebiet des Golfs von O m a n stàndig. Mit einiger Wahrscheinlichkeit ist anzu-
242 ERDOL DND KOHLEERDGABPETROCHEMIE 19. JAHBG. / APRIL 1988 / N R . <
848
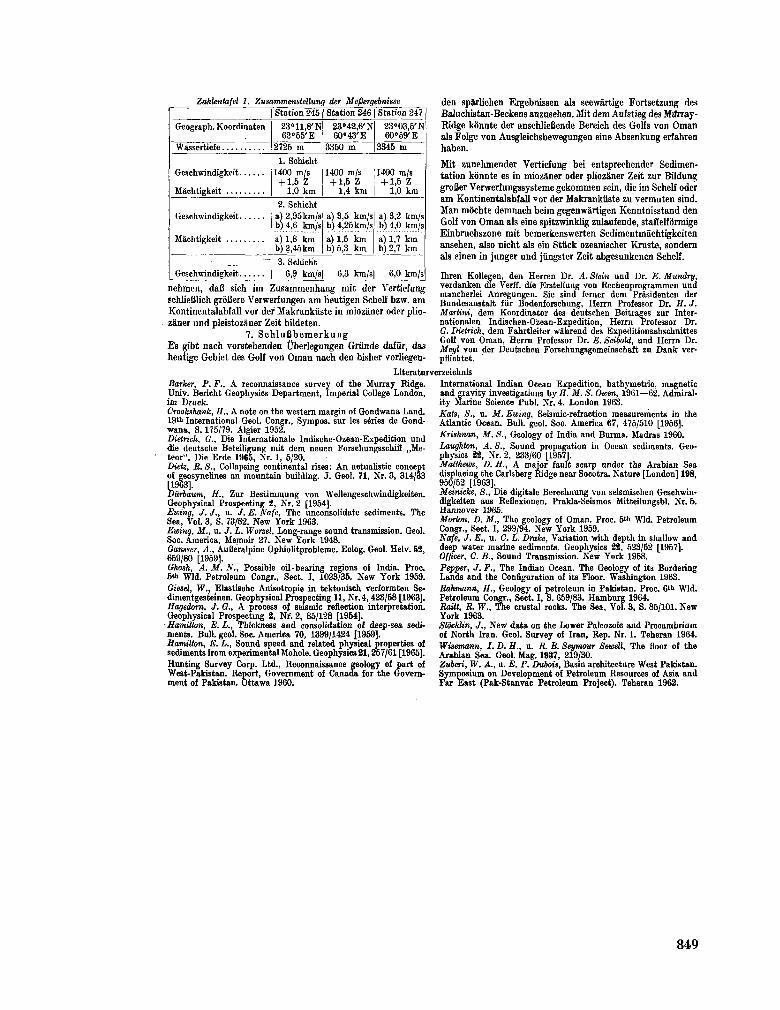
Zàhîentafeî 1. Zusammensiellung der Meflergebnisse
Geograph. Koordinaten
Wassertieie
Geschwindigkeit
Mâchtigkeit
Station 245 23«11,8'N 62°55'E
2725 m
Station 246
23°42,6'N 60°43'E
3360 m
1. Schicht 1400 m / s [1400 m / s
+ 1,6 Z +1,5 Z 1,0 km | 1,4 km
2. Schicht a) 2,95km/s b)4,6 k m / s a) 1,8 km b) 2,46km
a) 3,5 k m / s b) 4,25 km/s a) 1,5 k m b)5,3 k m
Station 247
23° 03,6' N 60»69'E
3346 m
1400 m / s + 1,5 Z
1,0 km
a) 3,2 k m / s b) 4,0 k m / s a) 1,7 km b) 2,7 k m
~ 3. Schiclit Geschwindigkeit | 6,9 k m / s | 6,3 k m / s | 6,0 k m / s
n e h m e n , daB sich im Z u s a m m e n h a n g mit der Verticfung SchlieBlich groBere Verwerfungen a m heutigen Schelf b z w . a m Kontinentalabfall vor der Makrankiiste in miozâner oder plio-zàner und pleistozàner Zeit bildeten.
7. S c h l u B b e m e r k u n g Es gibt nach vorstehenden Überiegungen Griinde dafür, das heutige Gebiet des Golf von O m a n nach den bisher vorliegen-
den spàrlichen Ergebnissen als seewàrtige Fortsetzung des Baluchistan-Beekens anzuselien. Mit d e m Aufstieg des MJrray-Ridge kônnte der anschlieBende Bereich des Golfs von O m a n als Folge von Ausgleichsbewegungen eine Absenkung erfahren haben.
Mit zunehmender Vertiefung bei entsprechender Sedimentation konnte es in miozâner oder pliozàner Zeit zur Bildung groBer Verwerfungssysteme gekommen sein, die im Schelf oder a m Kontinentalabfall vor der Makranküste zu vermuten sind. M a n móchte demnach beim gegenwartigen Kenntnisstand den Golf von O m a n als eine spitzwinklig zulaufende, staffelfôrmige Einbruchszone mit bemerkenswerten Sedimentmàchtigkeiten ansehen, also nicht als ein Stuck ozeanischer Kruste, sondera als einen in junger und jiingster Zeit abgesunkenen Schelf.
Ihren Kollegen, den Herrén Dr. A. Stein und Dr. E. Mundry, verdanken die Verff. die Eistellung von Rechenprogrammen und mancherlei Anregungen. Sie sind ferner dem Prasidenten der Bundesanstalt fur Bodenforschung, Herrn Professor Dr. H. J. Martini, dem ¡Coordinator des deutschen Beitrages zur Inter-nationalen Indischen-Ozean-Expedition, Herrn Professor Dr. G. Dietrich, dem Fahrtleiter wàhrend des Expeditionsabschnittes Golf von O m a n , H e r m Professor Dr. E. Seibold, und Herrn Dr. Meyl von der Deutschen Forschungsgemeinschaft zu Dank ver-pflichtet.
Literaturverzeichnis Barker, P . F., A reconnaissance survey of the Murray Ridge. Univ. Bericht Geophysics Department, Imperial College London, im Druck. Crookshank, H., A note on the western margin of Gondwana Land. 19 t h International Geol. Congr., Sympos. sur les séries de Gondwana, S. 175/79. Algier 1952. Dietrich, G., Die Internationale Indische-Ozean-Expedition und die deutsche Beteiligung mit d e m neuen Forschungsschiff , . M e teor". Die Erde I960, Nr . 1, 5/20. Diets, B.S., Collapsing continental rises: A n actualistic concept of geosynclines an mountain building. J. Geol. 71, Nr . 3, 314/33 [1963]. Dürbaum, H., Zur Bestimmung von Wellengeschwindigkeiten. Geophysical Prospecting 2, Nr . 2 [1954]. Ewing, J. J., u. J. E . Nafe, The unconsolidate sediments. The Sea, Vol. 3, S. 73/82. N e w York 1963. Ewing, M., u . J. L . Worsel, Long-range sound transmission. Geol. Soc. America, Memoir 27. N e w York 1948. Gamser, A . , AufSeralpine Ophiolitprobleme. Eclog. Geol. Helv. 52, 669/80 [1959]. Ghosh, A . M. N . , Possible oil-bearing regions of India. Proc. 5»h W J d . Petroleum Congr., Sect. I, 1023/36. N e w York 1959. Giesel, W., Elastische Anisotropic in tektonisch verformten Se-dimentgesteinen. Geophysical Prospecting 11, Nr.4,423/58 [1963]. Hagedorn, J. G., A process of seismic reflection interpretation. Geophysical Prospecting 2, Nr . 2, 85/128 [1964]. Hamilton, E . L . , Thickness and consolidation of deep-sea sediments. Bull. geol. Soc. America 70, 1399/1424 [1959]. Hamilton, E . L . , Sound speed and related physical properties of sediments from experimental Mohole. Geophysics 21,267/61 [1966]. Hunting Survey Corp. Ltd., Réconnaissance geology of part of West-Pakistan. Report, Government of Canada for the Government of Pakistan. Ottawa 1960.
International Indian Ocean Expedition, bathymétrie, magnetic and gravity investigations by H. M. S. Owen, 1961—62. Admiral-ity Marine Science Publ. Nr . 4 . London 1963. Kats, S., u. M. Emng, Seismic-refraction measurements in the Atlantic Ocean. Bull. geol. Soc. America 67, 475/610 [1956]. Krishnan, M . S., Geology of India and Burma . Madras 1960. Laughton, A . S., Sound propagation in Ocean sediments. Geophysics 22, Nr . 2, 233/60 [1957]. Matlheitis, D . Ü . , A major fault scarp under the Arabian Sea displacing the Carlsberg Ridge near Socotra. Nature [London] 198, 950/52 [1963]. Meinicke, S., Die digitale Berechnung von seismischen Geschwin-digkeiten aus Reflexionen. Prakla-Seismos Mitteilungsbl. Nr . 6. Hannover 1966. Morton, D . M., The geology of O m a n . Proc. 6"" Wld . Petroleum Congr., Sect. I, 299/94. N e w York 1959. Nafe, J. E . , u. C . L . Drake, Variation with depth in shallow and deep water marine sediments. Geophysics 22, 523/52 [1957]. Officer, C. B . , Sound Transmission. N e w York 1968. Pepper, J. F., The Indian Ocean. The Geology of its Bordering Lands and the Configuration of its Floor. Washington 1963. Rahmann, H., Geology of petroleum in Pakistan. Proc. 6"> W l d . Petroleum Congr., Sect. I, S. 659/83. Hamburg 1964. Baiit, B . W., The crustal rocks. The Sea, Vol. 3, S. 85/101. N e w York 1963. Stocklin, J., N e w data on the Lower Paleozoic and Precambrium of North Iran. Geol. Survey of Iran, Rep . Nr . 1. Teheran 1964. Wisemann, I. D . H . , u . R . B . Seymour Sewell, The floor of the Arabian Sea. Geol. M a g . 1937, 219/30. Zuoeri, W. A . , u . E . P . Dubois, Basin architecture West Pakistan. Symposium on Development of Petroleum Resources of Asia and Far East (Pak-Stanvac Petroleum Project). Teheran 1962.
849
Part V Papers presented by title or an abstract only
851
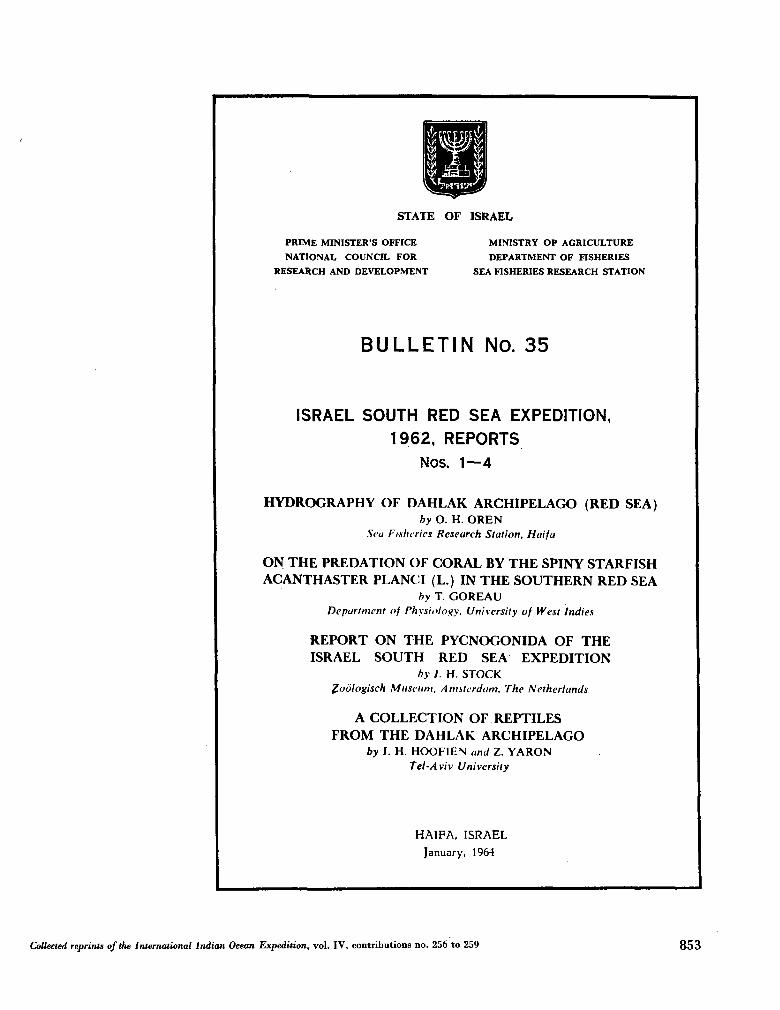
STATE O F ISRAEL
PRIME MINISTER'S OFFICE MINISTRY OP AGRICULTURE NATIONAL COUNCIL FOR DEPARTMENT OF FISHERIES
RESEARCH AND DEVELOPMENT SEA FISHERIES RESEARCH STATION
BULLETIN NO. 35
ISRAEL SOUTH RED SEA EXPEDITION, 1962, REPORTS
Nos. 1—4
HYDROGRAPHY OF DAHLAK ARCHIPELAGO (RED SEA) by O. H . O R E N
Sea Fisheries Research Station, Haifa
ON THE PREDATION OF CORAL BY THE SPINY STARFISH AC ANTH ASTER PL ANC I (L.) IN THE SOUTHERN RED SEA
by T. G O R E A U Department of Physiology, University of West Indies
REPORT ON THE PYCNOGONIDA OF THE ISRAEL SOUTH RED SEA EXPEDITION
by J. H . S T O C K Zoôlogisch Museum, Amsterdam, The Netherlands
A COLLECTION OF REPTILES FROM THE DAHLAK ARCHIPELAGO
by J. H . HOOF1EN and Z. Y A R O N Tel-Aviv University
HAIFA, ISRAEL
January, 1964
Collected reprints of the International Indian Ocean Expedition, vol. IV, contributions no. 256 to 259 853
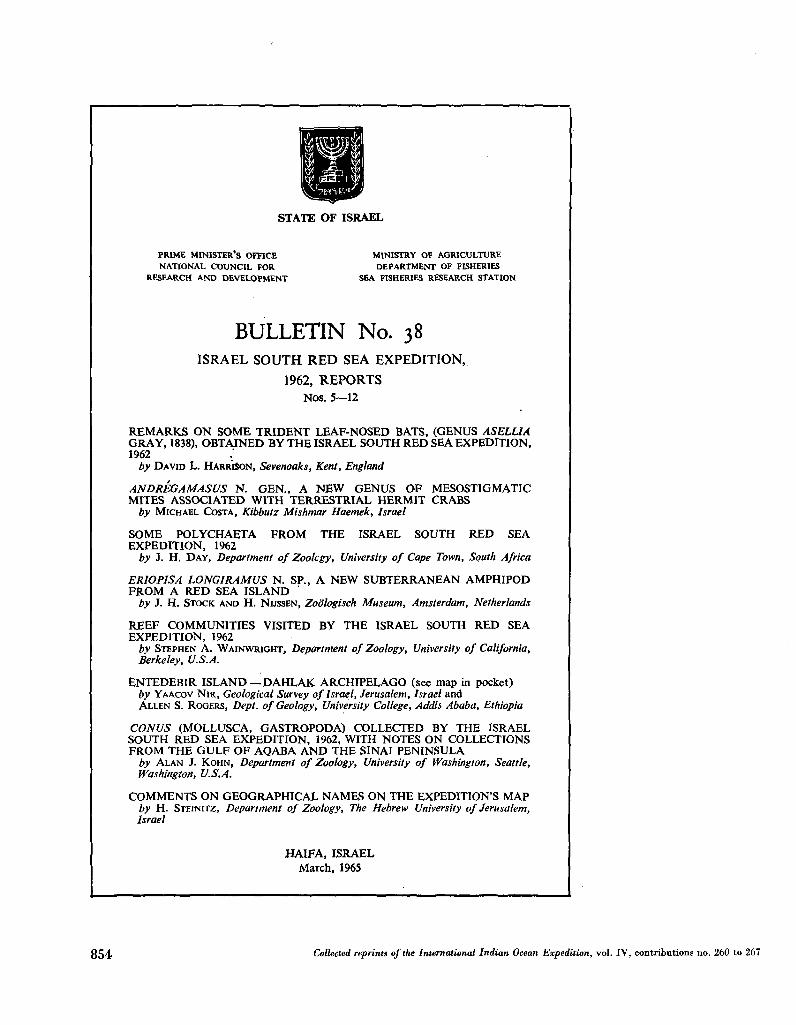
STATE OF ISRAEL
PRIME MINISTER'S OFFICE MINISTRY OF AGRICULTURE NATIONAL COUNCIL FOR DEPARTMENT OF FISHERIES
RESEARCH AND DEVELOPMENT SEA FISHERIES RESEARCH STATION
BULLETIN No. 38 ISRAEL SOUTH RED SEA EXPEDITION,
1962, REPORTS Nos. 5—12
R E M A R K S O N S O M E TRIDENT LEAF-NOSED BATS, (GENUS ASELLIA G R A Y , 1838), OBTAINED BY THE ISRAEL SOUTH RED SEA EXPEDITION, 1962
by D A V I D L. H A R R I S O N , Sevenoaks, Kent, England
ANDRÉGAMASUS N. GEN. , A N E W GENUS OF MESOSTIGMAT1C MITES ASSOCIATED WITH TERRESTRIAL HERMIT CRABS
by M I C H A E L C O S T A , Kibbutz Mishmar Haemek, Israel
SOME POLYCHAETA F R O M THE ISRAEL SOUTH R E D SEA EXPEDITION, 1962
by J. H . D A Y , Department of Zoology, University of Cape Town, South Africa
ERIOPISA LONGIRAMUS N. SP., A N E W SUBTERRANEAN AMPHIPOD F R O M A R E D SEA ISLAND
by J. H . S T O C K A N D H . NIJSSEN, Zoologisch Museum, Amsterdam, Netherlands
REEF COMMUNITIES VISITED BY THE ISRAEL SOUTH RED SEA EXPEDITION, 1962
by STEPHEN A . W A I N W R I G H T , Department of Zoology, University of California,
Berkeley, U.S.A.
ENTEDEBIR ISLAND — D A H L A K A R C H I P E L A G O (see map in pocket) by Y A A C O V N I R , Geological Survey of Israel, Jerusalem, Israel and A L L E N S. R O G E R S , Dept. of Geology, University College, Addis Ababa, Ethiopia
CONUS (MOLLUSCA, GASTROPODA) COLLECTED BY THE ISRAEL SOUTH RED SEA EXPEDITION, 1962, WITH NOTES O N COLLECTIONS F R O M THE GULF OF AQABA A N D THE SINAI PENINSULA
by A L A N J. K O H N , Department of Zoology, University of Washington, Seattle, Washington, U.S.A.
C O M M E N T S O N GEOGRAPHICAL NAMES O N THE EXPEDITION'S M A P by H . STEINITZ, Department of Zoology, The Hebrew University of Jerusalem, Israel
HAIFA, ISRAEL Match, 1965
Collected reprints of the International Indian Ocean Expedition, vol. IV, contributions no. 260 to 267
STATE OF ISRAEL
PRIME MINISTER'S OFFICE MINISTRY OF AGRICULTURE NATIONAL COUNCIL FOR DEPARTMENT OF FISHERIES
RESEARCH A N D DEVELOPMENT SEA FISHERIES RESEARCH STATION
BULLETIN No. 40 ISRAEL SOUTH RED SEA EXPEDITION,
1962, REPORTS Nos. 13—17
SPONGIAIRES RECOLTES PAR L'EXPEDITION ISRAELIENNE PANS LE SUD DE LA MER ROUGE EN 1962
by C L A U D E L E V I , Laboratoire de Biologie générale, Faculté des Sciences de Strasbourg
REPORT ON THE OCTOCORALLIA (STOLONIFERA AND ALCYONACEA) OF THE ISRAEL SOUTH RED SEA EXPEDITION 1962, WITH NOTES ON OTHËR COLLECTIONS FROM THE RED SEA
by J. V E R S E V E L D T , Zwolle, The Netherlands
THREE N E W SPECIES OF ANTHESSIUS (COPEPODA, CYCLOPOIDA, MYICOLIDAE) ASSOCIATED WITH TRWACNA FROM THE RED SEA AND MADAGASCAR
by A R T H U R G . H U M E S , Department of Biology, Boston University, Boston, Mass., U.S.A., and J A N H . S T O C K , Zoologisch Museum, University of Amsterdam, Amsterdam, The Netherlands
CYPRAEIDAE by F . A . S C H I L D E R , Zoological Institute, University of~ Halle, ' German Democratic Republic
ECHIURA AND SIPUNCULA FROM THE ISRAEL SOUTH RED SEA EXPEDITION
by A . C . S T E P H E N , The Royal Scottish Museum, Edinburgh, Scotland
HAIFA, ISRAEL NOVEMBER, 1965
Collected reprints of the International Indian Ocean Expedition, vol. IV, contributions no.,268 to 272 855
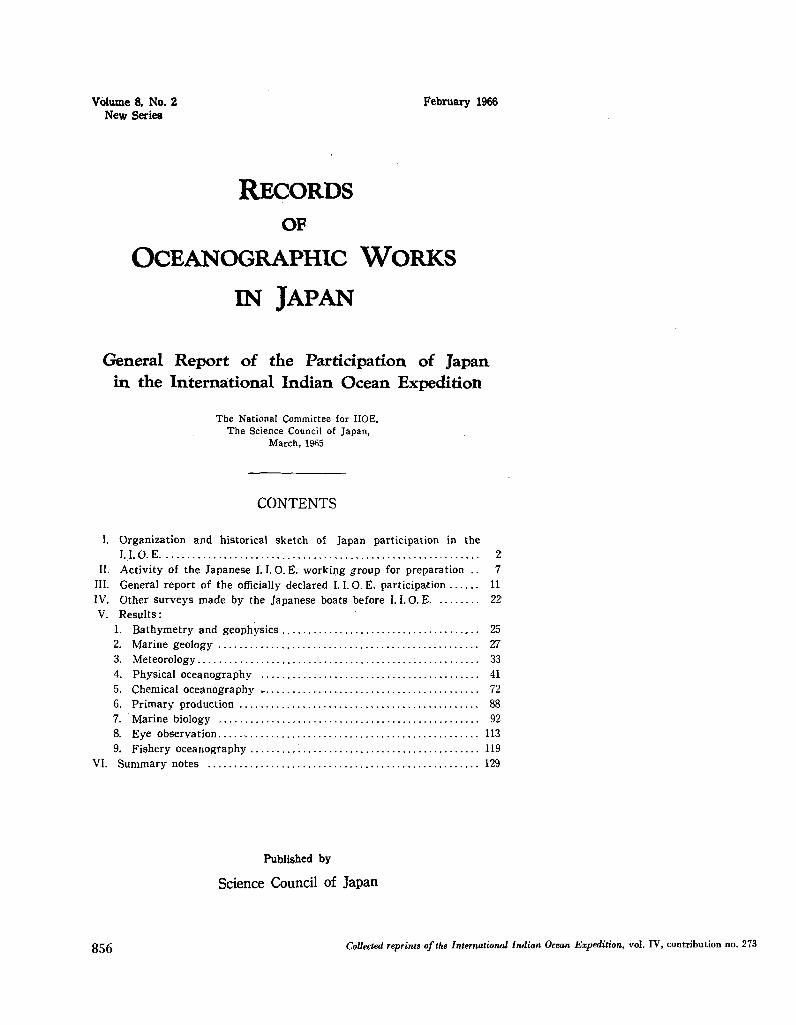
Volume 8, No . 2 N e w Series
February 1966
RECORDS OF
OCEANOGRAPHIC WORKS
IN JAPAN
General Report of the Participation of Japan in the International Indian Ocean Expedition
The National Committee for IIOE, The Science Council of Japan,
March, 1965
CONTENTS
I. Organization a n d historical sketch of Japan participation in the 1.1. 0. E 2
II. Activity of the Japanese 1.1. 0 . E . w o r k i n g .group for preparation .. 7 III. General report of the officially declared 1 . 1 . 0 . E . participation 11 IV. Other surveys made by the Japanese boats before 1.1.0. E 22 V . Results :
1. Bathymetry and geophysics 25 2. Marine geology 27 3. Meteorology 33 4. Physical oceanography 41 5. Chemical oceanography r 72 6. Primary production 88 7. Marine biology 92 8. E y e observation 113 9. Fishery oceanography 119
VI. Summary notes 129
Published b y
Science Council of Japan
856 Collected reprints of the International Indian Ocean Expedition, vol. IV, contribution no. 273
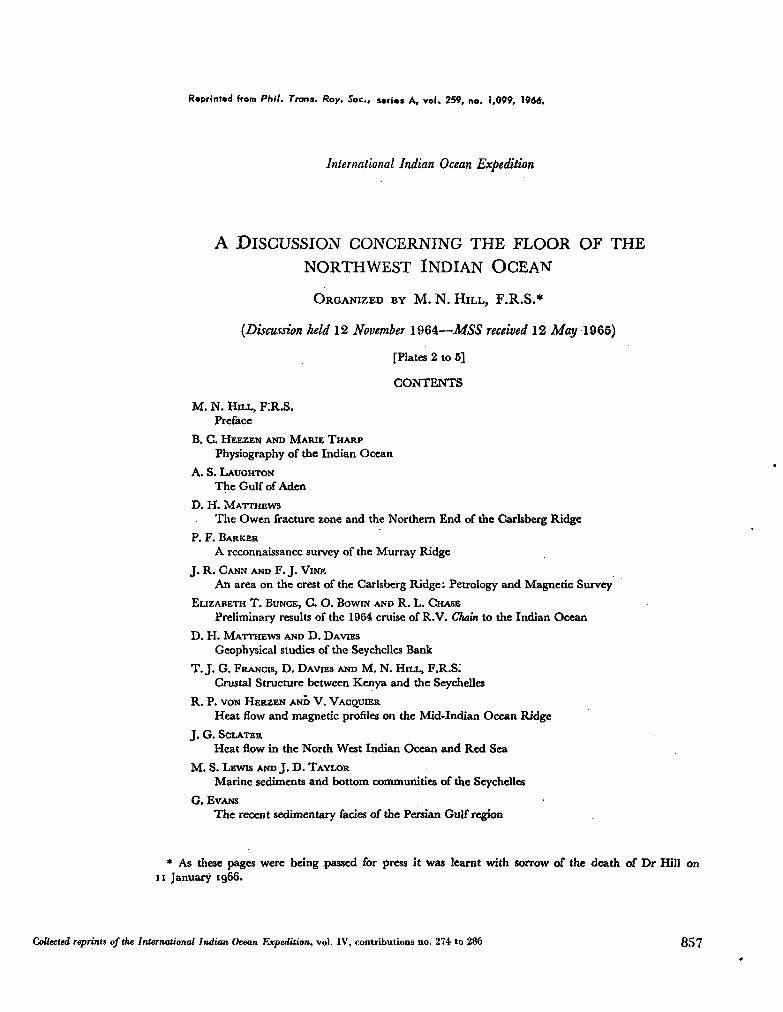
Reprinted from Phil. Trans. Roy. Joe. series A , vol. 259, no. 1,099, 1966.
International Indian Ocean Expedition
A DISCUSSION CONCERNING THE FLOOR OF THE N O R T H W E S T INDIAN O C E A N
ORGANIZED BY M . N . HILL, F.R.S.*
(Discussion held 12 November 1 9 6 4 — M S S received 12 May 1965)
[Plates 2 to 5]
CONTENTS
M . N . HILL, F;R.S. Preface
B. C. H E E Z E N A N D M A R I E T H A R P
Physiography of the Indian Ocean
A . S . L A U O H T O N The Gulf of Aden
D. H . MATTHEWS
The O w e n fracture zone and the Northern End of the Carlsberg Ridge
P. F. B A R K E R
A reconnaissance survey of the Murray Ridge
J. R . C A N N A N D F. J. V I N E A n area on the crest of the Carlsberg Ridge: Petrology and Magnetic Survey
ELIZABETH T. BUNCE, C. O . B O W I N A N D R. L. CHASE
Preliminary results of the 1964 cruise of R . V . Chain to the Indian Ocean
D. H . MATTHEWS AND D . DAVIES
Geophysical studies of the Seychelles Bank
T . J . G . FRANCIS, D . D A V I E S A N D M . N . H I L L , F.R.S."
Crustal Structure between Kenya and the Seychelles
R. P. VON H E R Z E N A N D V . VACQUIER
Heat flow and magnetic profiles on the Mid-Indian Ocean Ridge
J. G. SCLATER
Heat flow in the North West Indian Ocean and Red Sea
M . S. LEWIS AND J. D . T A Y L O R
Marine sediments and bottom communities of the Seychelles
G. EVANS
T h e recent sedimentary faciès of the Persian Gulf region
* As these pages were being .passed for press it was learnt with sorrow of the death of D r Hill on ii January 1966.
Collected reprints of the International Indian Ocean Expedition, vol. IV, contributions no. 274 to 286 857
A DISCUSSION CONCERNING THE FLOOR OF THE NORTHWEST INDIAN OCEAN
Organized for the Royal Society
by
M . N . HILL, F.R.S.
PREFACE
Some years ago at the first and preliminary meeting of the Scientific Committee on
Oceanic Research (S.C.O.R.) of the International Council of Scientific Unions (I.C.S.U.),
one of the prime tasks was to seek some major international sea-going undertaking which
the Committee could initiate and subsequently sponsor. This undertaking would have to
interest many nations and embrace many oceanographical disciplines.
The meeting took place at the Woods Hole Océanographie Institution and it was there
fore appropriate (although not improbable!) that Dr C . H . O ' D . Iselin should be first
to suggest that an international research programme in the Indian Ocean fulfilled both
these objects. H e emphasized that many nations bordered it and that there were interests
in this comparatively unknown ocean for any scientist concerned with meteorology,
biology (above or below sea level), the physics and chemistry of the ocean waters, or the
Earth beneath the sea. H e also made clear that the monsoons made the Indian Ocean
unique as regards oceanic and atmospheric circulation.
The meeting, after lengthy discussion, endorsed Dr Iselin's proposal and the end results
of the tremendous international effort which thereby was created are now coming in.
Some of these results were delivered at a Discussion Meeting held in the rooms of the
Royal Society on 12 November 1964.
The papers given at this meeting, and which are published below were restricted to
geological and geophysical aspects of the northwest Indian Ocean (except for the first
paper concerning the physiography of the whole of the Indian Ocean). This collection of
papers represents, by no means, the last word on these aspects of this area. Indeed there
is much more work to be published on experimental work already completed, and for
many of us the work already accomplished has produced many new problems which
require further experimental work in the area.
The contributors to this Discussion Meeting were from the U . S . A . and the U . K . ;
regrettably, there were none from the U . S . S . R . The results published by the U . S . S . R .
National Academy of Sciences have, however, been extensively used.
Research of the kind discussed below can be divided into various diffuse and interlinked
categories; one is concerned with new concepts and with undiscovered features of the
floor of the Ocean and what lies below, the second is less spectacular in that it confirms
858 Collected reprints of the International Indian Ocean Expedition, vol. IV, contribution no. 274
predictions based on work elsewhere and the third is of an essential but routine nature
without which the other investigations would be valueless and which provides the basic
information for work already completed but not included here, or for work to be under
taken in the future.
T h e main topics described here are:
(i) the description of the physiography of the Indian Ocean, based largely on bathy
metry;
(ii) the geological history and present structural and geophysical features of the Gulf
of A d e n , which, with the R e d Sea, seems to be an area of high stresses and movement in
the mantle and crust of the Earth;
(iii) the major fracture crossing the northern end of the Carlsberg Ridge represented
by the O w e n Fracture Zone and the Murray Ridge, and the consequent displacement of
the axis of the Ridge;
(iv) the mineralogy and petrology of rocks collected from a small but well surveyed and
fractured area of the Carlsberg Ridge lying some hundreds of miles to the southeast of
the O w e n Fracture Zone;
(v) the sediments of-the Seychelles Bank and a description of the late Glacial and post-
Glacial platforms on which they are distributed;
(vi) the age, the deep structure and the origin of the Seychelles Bank;
(vii) the preliminary results concerning the structural changes which exist along the
length of the Seychelles to Mauritius Ridge ;
(viii) the deep structure, obtained by seismic refraction shooting methods, of the section
between the Seychelles and the K e n y a coast, and its relation to the structures found at
each end, and to the structure of the deep ocean between the Seychelles and the Carlsberg
Ridge.
(ix) the relation between the gravity and magnetic field anomalies and the m a n y
structural features of the northwest Indian Ocean;
(x) the heat flow results in the R e d Sea, the Gulf of A d e n and over the Carlsberg
Ridge and its flanks ;
(xi) the recent sediments in the Persian Gulf which represents an exceptional and
almost totally enclosed shallow sea.
W e are indebted to the Royal Society for the opportunity of holding this Discussion
Meeting and I should like to express m y gratitude for the cooperation and hard work
from the participants,,,from.the m e n and organizations ashore and at sea, which resulted
in the Meeting being a success. M . N . HILL
The Report of this Discussion which has been published in Philosophical Transactions of the Royal Society, Series A , Volume 259, is available for general sale as a separate paper and can be obtained either through any bookseller or direct from the Royal Society at £3. 6s. (U.S. $9.90) as part number 1099.
859
PHYSIOGRAPHY OF THE INDIAN OCEAN
By B. G. HEEZEN AND MARIE THARP
Department of Geology and Lamont Geological Observatory, Columbia University, New York, N.Y.
As a result of the International Indian Ocean Expedition, the bottom of the Indian Ocean is n o w one of the best known areas of the ocean floor.
T h e Mid-Indian Ocean Ridge, a rugged mountain range, lies in the centre of the Indian Ocean. North-northeast trending fractures offset the axis of the ridge. In the Arabian Sea these fractures are right lateral; in the southwest Indian Ocean they are left lateral. Displacements range from a few miles* to over 200 miles.
T h e northeast Arabian Sea and the Bay of Bengal are occupied by huge abyssal cones built by sediments discharged from the Indo-Gangetic plain. Extensive abyssal plains lie seaward of the abyssal cones.
In low latitudes smooth topography is characteristic of the continental rise, the abyssal cones, and the oceanic rises. However, near the polar front smooth 'swale' topography laps over the normally rugged Mid-Oceanic Ridge. This 'swale' smoothing appears the result of the higher organic productivity of the Antarctic seas.
Microcontinents, mostly linear meridional ridges, are unique features of the Indian Ocean. These massive but smooth-surfaced blocks contrast markedly with the broad rugged Mid-Oceanic Ridge.
T H E GULF OF A D E N
B Y A. S. LAUGHTON
The National Institute of Oceanography, Wormley, Godalming, Surrey
T h e details of topography outlined in a new contour chart of the sea floor are related to the geophysical studies m a d e in the Gulf of Aden during the last decade. These studies include magnetic and gravity field, seismic refraction, heat flow and earthquake epicentre measurements. T h e Gulf is interpreted as a tensional feature involving the separation of the continental blocks of Arabia and Africa and the formation of new oceanic crust in between. T h e central rough zone is compared with mid-ocean ridges. T h e matching of pre-Miocene continental geology on either side is discussed in the light of this theory.
860 Collected reprints of the International Indian Ocean Expedition, vol. IV, contributions no. 275 and 276
T H E O W E N FRACTURE ZONE AND THE NORTHERN END
OF THE CARLSBERG RIDGE
By D. H. MATTHEWS
Department of Geodesy and Geophysics, University of Cambridge
Examination of the shape of the earthquake epicentre belt near Socotra led to the suggestion that a major fracture displaces the axis of the mid-ocean ridge in that area (Matthews 1963). Subsequent surveys have confirmed the existence of a fracture zone which extends 1500 miles from the coast near Karachi souihwcstwards to the middle of the Somali Basin. Linear ridges and troughs in the zone arc associated with negative gravity anomalies but not with magnetic anomalies. Where 1 he fracture zone crosses the line of the Carlsberg Ridge a sinuous trough is developed: south of this feature a characteristic pattern of magnetic anomalies is associated with the volcanic structures of the mid-ocean ridge, north of it a line of large non-magnetic seamounts has been found. It is concluded that the structure underlying the O w e n fracture zone is a system of parallel transcurrent faults affecting the ocean floor only, at which the axis of the mid-ocean ridge suffers a net right lateral displacement of 170 mi .
A RECONNAISSANCE SURVEY OF THE M U R R A Y RlDGE
BY P. F. BARKER
Department of Geophysics, University of Birmingham
Bathymétrie and magnetic measurements at a 10-mile line spacing across the mouth of the Gulf of O m a n have m a d e a substantial contribution to knowledge of the area. A northeast-southwest alinement of bathymétrie features, the presence of m a n y fault scarps and the occurrence of elongated weakly magnetized seamounts similar to others farther south suggest that the Murray Ridge is continuous with the O w e n fracture zone and support the idea that both are loci of strike-slip movement.
Collected reprints of the International Indian Ocean Expedition, vol. IV, contributions no. 277 and 278 861
A N AREA ON THE CREST OF THE CARLSBERG RIDGE:
PETROLOGY AND MAGNETIC SURVEY
By J. R. CANN
Department of Mineralogy and Petrology, University of Cambridge
AND F. J. VINE*
Department of Geodesy and Geophysics, University of Cambridge
Rocks collected in the vicinity of a transcurrent fault cutting the crest of the Ridge have been alTected by brecciation and, in some cases, mctamorphism and hydrothermal action. These processes have led to the formation of spilites from crystalline basalts, and ultramafic rocks from basalt glasses. Further hydrothcrmal action has taken the form of replacement of some ultramafic rocks by quartz, ending in a nearly pure quartzite. T h e mineralogy is characteristic of greenschist faciès meta-morphism.
Fresh basalts were collected from a nearby hill, which seems to be a recent volcano post-dating the faulting and metamorphism.
T h e magnetic survey reveals a marked parallelism between the anomalies and the trend of the ridge, regardless of bathymetry. Computations confirm that uniform magnetization of the material represented by the bathymetry can in no w a y simulate the observed anomalies. Application of a vector fitting technique suggests that the remanent magnetization of this material is often reversed and from this a very crude and simple model is developed to account for the observed anomalies. T h e model is consistent with an ocean floor spreading hypothesis and periodic reversals in the earth's magnetic field. If substantiated it would have important implications in deducing the history of the ocean basins. Above all it provid.es a plausible explanation to account for the magnetic gradients and amplitudes observed over ridges without implying improbable magnetic contrasts, structures, or changes in petrology.
PRELIMINARY RESULTS OF THE 1964 CRUISE OF R.V. CHAIN
T O THE INDIAN O C E A N *
BY ELIZABETH T. BUNCE, C. O . BOWIN AND R. L. CHASE
Woods Hole Océanographie Institution, Woods Hole, Massachusetts
Geophysical investigations of the northern Somali Basin and the Seychelles-Mauritius Ridge conducted aboard R . V . Chain of the W o o d s Hole Océanographie Institution are described and some results presented. Gravitational and total magnetic fields and bathymetry were measured continuously, and continuous seismic reflexion profiles were recorded over a major portion of the track. Cores, dredge samples, heat flow measurements, and underwater photographs were also obtained.
It is considered that the northern portion of the Somali Basin is a deep sedimentary basin partially enclosed to the east by a submarine ridge from which alkaline gabbro has been dredged and to the south by partially buried abyssal hills.
O n the evidence from seven crossings of the Seychelles-Mauritius Ridge, it is proposed that the Ridge comprises two sections. T h e northern section, composed of nearly horizontally stratified rocks, extends from near the northern part of Saya de Malha Bank to the Seychelles Platform. T h e southern section is a linear, probably volcanic ridge that extends from north of Mauritius through Saya de Malha Bank, and m a y continue as a subsurface feature to the northeast. T h e two sections abut near Saya de Malha Bank, forming a continuous topographic feature.
862 Collected reprints of the International Indian Ocean Expedition, vol. IV , contributions no. 279 and 280
GEOPHYSICAL STUDIES OF THE SEYCHELLES BANK
BY D. H . MATTHEWS AND D. DAVIES
Department of Geodesy and Geophysics, University of Cambridge
Geological studies of the islands on the Seychelles Bank, and the results of seismic refraction experiments m a d e on the bank, are reviewed. They show that the crust is of continental type under the centre of the bank. Gravity measurements confirm that the thick crust extends to the northern edge of the bank and show that the Mohorovicié discontinuity slopes upward at an angle of about 19° under the peripheral cliff. Large narrow magnetic anomalies occurring in •the central area of the bank are ascribed to minor intrusions of dolerite found in the Precambrian granites, and it is suggested that the edge of this area m a y mark the limit of the granite mass. Magnetic anomaly profiles of the Mascarene Ridge are similar to those over the Seychelles Bank and could result from a similar structure.
CRUSTAL STRUCTURE B E T W E E N K E N Y A A N D T H E SEYCHELLES
B Y T. J. G. FRANCIS, D . DAVIES AND M . N . HILL, F.R.S.
Department of Geodesy and Geophysics, University of Cambridge
A series of seismic refraction profiles has been shot between Kenya and the Seychelles Bank and in the neighbourhood of the Bank itself. Thick sediments have been observed for 300 to 400 k m from the African coast. Near Kenya, great thicknesses of material of about 4-8 k m / s velocity match closely the 9 to 10 k m of Karroo beds expected on the coast at L a m u . T h e Mohorovicié discontinuity has been traced from 100 k m off the African coast to the Seychelles Bank. West of the Bank the mantle is unusually shallow, rising to only 8-5 k m below the surface, and the 6-8 k m / s crustal layer unusually thin or absent. T h e absence of a gravity anomaly associated with this very shallow mantle raises a problem which has yet to be resolved.
Collected reprints of the International Indian Ocean Expedition, vol. IV , contributions no. 281 and 282 863
H E A T FLOW AND MAGNETIC PROFILES O N THE MID-INDIAN OCEAN RIDGE*
B Y R. P. VON HERZENÎ AND V. VAGQUIER
Marine Physical Laboratory of the Scripps Institution of Oceanography, University of California, San Diego
Sixty heat flow values were measured along nine profiles across the Mid-Indian Ocean Ridge. The results were roughly of the same character as the ones previously reported for die South Adantic Ridge. The correlation of high heat flow widi the centre of die ridge was less pronounced. T h e scatter of'heat flow values when plotted as a function of distance from die ridge was even greater. The average of all values is 1*35 /teal c m - 2 s-1, indicating diat over die surveyed area die heat flow is normal. The cause for die low values on the flanks of die ridge remains unknown. A right lateral displacement of about 200 k m across the V e m a Trench was measured from die offset of die magnetic anomaly on die ridge crest.
H E A T F L O W IN THE NORTHWEST INDIAN OCEAN AND R E D SEA
BY J. G. SCLATER.
Department of Geodesy and Geophysics, University of Cambridge
Twenty-four measurements of the heat Jîow through the ocean floor were m a d e in the Indian Ocean and three in the Red Sea. A critical analysis of the effects of fluctuations of bottom-water temperature on the geothermal gradient in the R e d Sea shows that these fluctuations do not invalidate the measurements of heat flow. The m e a n value for the Gulf of Aden (this includes five previous measurements) is 3-89 + 0-49 /¿cal c m - 2 s-1. This high value, combined with the shape of a profile across the Gulf, suggests a region of unusually high temperature at a depth of less than 10 k m below the bottom. T h e seventeen heat flow measurements m a d e by R . R . S . Discovery and R . V . Vema between the African coast and the Seychelles show little variation about a m e a n value of 1-17 /¿cal c m - 2 s_I. T h e comparison of these observations and die deep structure, as determined by a series of seismic lines, shows a constant heat flow across die continental margin.
T h e author is indebted to M r R . Belderson of die National Institute of Oceanography for a brief description of the cores taken on the cruise.
864 Collected reprints of the International Indian Ocean Expedition, vol. IV, contributions no. 283 and 284
MARINE SEDIMENTS AND BOTTOM COMMUNITIES OF THE SEYCHELLES
BY M . S. LEWIS AND J. D. TAYLOR
Department of Geology, University of London, King's College
T h e shoal water region of the Seychelles Bank, covering about 31000 k m 2 , is floored by relatively thin detrital carbonate sediments. Around the granitic and coral islands at least four submarine platforms can be recognized and are tentatively related to Late-glacial and Postglacial sea levels. A shallow discontinuous rim is developed around the margin of the Bank.
T h e sediments and bottom communities of the open Bank and of the reef flats are described in terms of nine principal environments. Sedimentary facies are distinguished by the proportions of different organic constituents, by variations, in grain size and by presence or absence of quartz. Syngenetic pyrite and collophane occur locally as minor constituents. A w a y from the reef flats the Bank supports a fairly uniform bottom community, the main elements being mollusca and foraminifera.
T h e reefs m a y be considered as large intertidal pools with m a n y microenvironments and with a complex zonation of communities showing rapid lateral changes in composition. There is a close relation between the sedimentary facies of the reefs and the distribution of the bottom communities.
T H E RECENT SEDIMENTARY FACIES OF THE PERSIAN GULF REGION
B Y G. EVANS
Imperial College, London
T h e Persian Gulf, which is a shallow marginal sea oí the Indian Ocean, is an excellent model for the study of some ancient troughs.
It is bordered on the west by the Arabian Precambrian shield and on die east by the Persian Tertiary fold mountains.
Persia is an area of extensive continental deposition. It is bordered by a narrow submarine shelf. T h e deeper trough of the Persian Gulf lying along the Persian Coast seaward of the shelf is floored by jnarly sediments. East of this, the Arabian shelf is covered with skeletal calcarenites and calcilutites. T o the northwest is the Mesopotamian alluvial plain and deltaic lobe.
Arabia is bordered on the Persian Gulf littoral by a coastal complex of carbonate environments. Barrier islands, tidal deltas (the site of oolitic calcarenite formation) and reefs protect lagoons where calcilutites, pelletal-calcarenites and calcilutites and skeletal calcarenites and calcilutites are forming. There are Mangrove swamps , extensive algal flats and broad intertidal flats bordering the lagoons and landward sides of the islands. A wide coastal plain, the sabkha, borders the mainland. Here evaporation and reactions between the saline waters percolating from the lagoons, and calcium carbonate deposited during a seaward regression, leads to the production of evaporitic minerals including anhydrite, celestite, dolomite, gypsum and halite. Inland, wide dune sand areas pass into the outwash plains skirting the mountain rim of Arabia.
Collected reprints of the International Indian Ocean Expedition, vol. IV, contributions no. 285 and 286 865
Reprinted front Exeerpta Medica International Congress Series No. 91
containing abstracts of papers read at the
SECOND INTERNATIONAL CONFERENCE O N PROTOZOOLOGY London, August 1965
255. Infraciliary morphology of a little-known echinophilous hymenostome ciliate from the Indo-West Pacific
B E R G E R , J., Department of Zoology, University of Toronto, Toronto 5, Canada
Silver-impregnated specimens of the echinophilous inquilinic ciliate, Cryptochilidium polynucleatum Nie, 1934, were obtained during surveys of Indo-West Pacific sea urchins. They do not exhibit a cryptochilid infraciliary morphology.
Superficially, C. polynucleatum displays the laterally-compressed appearance of its presumed congeners. However, its buccal and somatic infraciliature differ significantly from true cryptochi lids. The infraciliature of the 14 sigmoid kineties of the concave right surface is dimorphic. The two kiñeties adjacent to the naked oral region consist entirely of contiguous kinetosomes. T h e posterior 10% of the next 5-6 kineties is of a similar granular density. These dense areas presumably act as a thigmotactic field. The remainder of the dextral kineties are provided with % as many kinetosomes. All dextral kineties extend for ca. % the somatic length leaving an agranular posterior zone continuous with the oral region. T h e convex left surface has 10-12 straight kineties of a non-thigmotacttc kinetosomal density. All somatic cilia are of equal length except the caudal tuft which arises from 3-4 polar-basal granules.
T|ie infraciliary buccal apparatus consists of .two subequatorial parallel rows of 1-3 kinetosomes' width. They extend for ca. % the somatic length along the right margin of the naked inter-kinetal ventral area. The left* membranellar base is longer and less curved than its dextral counterpart. Both end at the cytostome. They resemble pseudo-cohnilembid oral membranes and the composite A Z M of hemispeirid thigmotrichs. A s no somatogenic individuals were observed among the 3 0 0 + specimens examined, speculation concerning the phylogenetic implications of these organelles is premature.
the cytoproct is immediately caudad of the cytostome. A single contractile vacuole pore -lies behind the thigmotactic dextral kineties.
Elevation of C. polynucleatum to a distinct generic status within the H Y M E N O -S T O M A T 1 D A seems justified as does the placing of Cryptochilidium oiakii Yagiu, 193S, into junior synonomy with it.
866 Collected reprints of the International Indian Ocean Expedition, vol. IV, contribution no. 287
Reprinted from Excerpta Medica International Congress Series No. 91
containing abstracts of papers read at the
SECOND INTERNATIONAL CONFERENCE ON PROTOZOOLOGY London, August 1965
272. A preliminary report on the Tintinnida of the Indian Ocean from the collections of Cruise 2 of the "Anton Bruun", June to August, 1963
M c D O W E L L , S., Dept. of Biology, Montclair State College, Upper Montclair, N. J., U.S.A.
Samples were taken from over 40 stations in a north-south transect from Bombay due south on the 70° parallel to south latitude 38° and due north on the 80° parallel to Ceylon and Bombay. Collections were made by surface tows, 200 meter to surface tows, and volume samples from several depths concentrated by millipore filters. The last method revealed few forms except minute ones that tend to escape from the usual nets.
The overall species complex resembled that of the eastern tropical Pacific Ocean. C o m m o n oceanic forms proved to be such genera as Codonella, Cyttarocylis, Rhabdo-nella, Rhabdonellopsis, Parundella, Xystonella, Xystonellopsis, Proplectella, Undella, Amplectella, Dictyocysta, Amphorella, Eutintinnus and Salpingella. The paper will be illustrated by photographs using conventional light as well as phase contrast and polarization optics were made of living specimens and loricas alone.
A more complete account will appear later including collections from other cruises. (Supported by the N S F as a part of the U . S . Program in Biology, International Indian Ocean Expedition.)
Collected reprints of the International Indian Ocean Expedition, vol. IV, contribution no. 288 867


