Embed Size (px)
Citation preview
INTERDEPENDENCIES BETWEEN TURNING POINTS IN LIFE AND LONG-TERM MOBILITY DECISIONS Sigrun BEIGE (corresponding author) Institute of Transport Research German Aerospace Center, Berlin, Germany Phone: 0049-30-67055-346 Fax: 0049-30-67055-283 E-mail: [email protected] Kay W. AXHAUSEN Institute for Transport Planning and Systems Swiss Federal Institute of Technology, Zurich, Switzerland Phone: 0041-44-633-3943 Fax: 0041-44-633-1057 E-mail: [email protected]
Number of words: 5588 words Number of tables 2 tables Number of figures: 2 figures Total: 6588 words

Sigrun BEIGE and Kay W. AXHAUSEN 1
ABSTRACT 1 2 Turning points in life include important personal and familial events as well as changes in the 3 places of residence, education and employment. The latter usually involve alterations in the 4 spatial distribution of activities and, hence, in the activity space, thereby also influencing the 5 daily travel behavior. In this context, the ownership of mobility tools, such as cars and 6 different public transport season tickets, also plays an important role, since people commit 7 themselves to particular travel behaviors as they trade large one-time costs for a low marginal 8 cost at the time of usage. At the same time, decisions concerning mobility tool ownership 9 have lasting effects, as have the decisions concerning location choices. A longitudinal 10 perspective on the dynamics of these long-term mobility decisions is available from people’s 11 life courses, which link different dimensions of life together. 12
In order to study these dynamics and the influence of turning points in life, a longi-13 tudinal survey covering the 20 year period from 1985 to 2004 was carried out at the 14 beginning of 2005 in a stratified sample of municipalities in the Zurich region, Switzerland. 15 The paper describes the data collection and then presents results which show that there exist 16 strong interdependencies between the various turning points and long-term mobility decisions 17 during the life course, as events occur to a great extent simultaneously. Persons tend to aim 18 for compensation between the different dimensions of life. 19 20 INTRODUCTION 21 22 Daily travel behavior is strongly influenced by the location of the places of residence, 23 education and employment. After changes in these spatial structures, e.g., due to moves or 24 changes in occupation, people inevitably show a travel behavior that is different from the 25 travel behavior before these relocations occurred, as usually changes in the spatial distri-26 bution of activities and, hence, in the activity space are implied, influencing trip distances, 27 routing, timing and frequency (1; 2; 3; 4). At the same time, the availability as well as the 28 quality and quantity of the available transport systems change. In turn, the decisions about the 29 ownership and usage of the various mobility tools are influenced, as they provide access to 30 the different transport systems and determine the marginal costs of usage. In this context, the 31 question arises, to what extent the availability of mobility tools already affects the residential 32 and occupational decisions of people, particularly with regard to so-called self-selection 33 processes (5; 6). 34
These long-term mobility decisions form turning points in life. Further important 35 turning points include personal and familial events, such as changes in education and 36 employment as well as family formation (partnership, marriage), expansion (birth of 37 children), contraction (maturation of children) and dissolution (break-up, divorce, death of a 38 partner or spouse). These events have lasting effects, since corresponding changes involve 39 substantial amounts of resources (costs, time, etc.). Therefore, it is necessary to analyze their 40 dynamics over longer periods of time. A longitudinal perspective on the relationships 41 between spatial mobility and mobility tool ownership is available from people’s life courses, 42 which link different dimensions of life together. Besides personal and familial history, 43 locations of residence, education and employment as well as the ownership of various 44 mobility tools can be taken into account. These life course dimensions are usually not in-45 dependent from one another. Events in one area are frequently connected to changes in other 46 areas. Decisions are rarely made in isolation and choice behavior is often context dependent 47

Sigrun BEIGE and Kay W. AXHAUSEN 2
(7). At the same time, this longitudinal approach provides the possibility to observe develop-48 ments over time, as behavior is influenced by time, and to identify state dependencies (7; 8; 49 9; 10; 11). The life course perspective enables the integration of the temporal dimension and 50 dynamics into the analyses of long-term mobility in a comprehensive way (12). 51
Analyzing people’s life courses can contribute to the understanding of their reactions 52 to changes occurring in their personal and familial life, within their household as well as in 53 the spatial structures (13). For instance, one can analyze how a move affects mobility tool 54 ownership and, therefore, travel behavior, since mobility tool ownership can be used as a 55 proxy for the actual travel behavior (6; 13). Through the ownership of mobility tools people 56 commit themselves to particular travel behaviors as they trade large one-time costs for a low 57 marginal cost at the time of usage. 58
Turning points during the life course play a central role, when formulating transport 59 policies, which are designed to influence people’s behavior, as they reconsider and reflect 60 their decisions and choices only in the cases where the situation is very different from the 61 usual context (10; 14; 15). Thereby, questions regarding how, when and why such changes 62 might happen are of large interest for policy makers and planners. From the incorporation of 63 temporal effects, besides spatial effects, into the analyses of long-term mobility, a better 64 assessment of the impact of policies and other interventions on travel behavior is expected 65 (16). 66 67 LIFE COURSE 68 69 The life course itself can be regarded as a contextual system (17). A person’s past affects his 70 or her present, and his or her present affects his or her future (18). Individuals seek coherence 71 and continuity. So, an individual’s life course and the successive events that constitute it are 72 not random, but patterned. 73
The structure of the life course is described with trajectories and transitions (12). As 74 intermediary concept, the life course is seen as a sequence of events (12; 19). In this context, 75 it is worthwhile to understand an event as well as the history leading up to its occurrence, 76 since past behavior is strongly correlated to present behavior (20). A further advantage 77 regarding the investigation and improved understanding and modeling of the dynamic aspects 78 is the provision of more accurate and coherent forecasts of the future (10). 79
These dynamic effects can not be captured with cross-sectional data (21). The 80 analyses of turning points in life and long-term mobility decisions require corresponding 81 longitudinal data that describes people’s life courses. Solely this kind of data enables the 82 investigation of continuity and change over time (18). 83 84 DATA 85 86 Essentially, there are two ways of collecting such longitudinal data. The most obvious and 87 well-recognized method is to conduct a panel survey, in which the same sample of persons is 88 asked about their respective current situation at several points in time to build up a series of 89 observations. Data collected this way is very reliable, since events are observed, as they 90 happen and, hence, inaccuracies due to memory loss are reduced (10; 22; 23). However, 91 panel surveys are difficult and expensive to carry out as well as rather effort and time 92 consuming, due to the long durations required for data collection (24). Normally, it takes 93 several years before it is possible to analyze long-term effects (10). The second method 94

Sigrun BEIGE and Kay W. AXHAUSEN 3
approximating a panel survey is to use a retrospective approach that relies on individual’s 95 recall capacity and, hence, is subject to the limitations of the human memory. With increasing 96 amounts of time elapsed since an event, the amount of information retained decreases in a 97 logarithmic relationship (9; 25). People tend to remember major events, such as residential 98 moves or personal and familial events, so-called turning points in life, better. Therefore, those 99 can be used as support for the memory by further linking different dimensions of life together 100 and in doing so placing single events into a larger context (25). Experiences from Holling-101 worth and Miller showed that a retrospective survey proved to be a favorable alternative to a 102 panel survey (9). At the same time, retrospective data is easier, cheaper and faster to obtain 103 than panel data (26). Retrospective surveys allow for observing longer time spans than 104 usually are feasible with panel surveys, whereas panel data is able to cover a broader range 105 and more detailed information. 106
In order to collect longitudinal data concerning turning points and long-term mobility 107 decisions during the life course, a retrospective survey covering the 20 year period from 1985 108 to 2004 was carried out at the beginning of the year 2005 in a stratified sample of muni-109 cipalities in the Zurich region, Switzerland, taking different spatial and transport related 110 municipality types into account (27). 111
The survey was conducted using a written self-completion questionnaire which was 112 sent out by mail. One reason for choosing this procedure was due to the relative complexity 113 of the survey. In this way, respondents had more time, quiet and privacy when answering the 114 questionnaire, remembering and recollecting their past, possibly looking up documents, if 115 necessary. In addition, it is less demanding to obtain a larger sample, as expenses and costs 116 tend to be in general lower in comparison to face-to-face and telephone interviews (22). 117 However, it is not possible to offer immediate assistance to the respondents, in the case that 118 problems with understanding and filling in the questionnaire occur. 119
The questionnaire consisted of two parts, a household form and a person form. The 120 household form asked for the current address, a short description of all persons living in the 121 household and the household income. In the person form, socio-demographic and socio-122 economic characteristics of the respondents were collected. The essential part of this form 123 was a multidimensional life course calendar, providing a visual reconstruction of the past. So 124 a plain and compressed picture of the respondents’ own life comprising several dimensions is 125 developed which is also interesting and motivating for them to recover. Linking the various 126 aspects together supports their recollection, as associations are formed (25; 28). At the same 127 time, the graphic representation of the life course increases the quality and accuracy of the 128 data, since inconsistencies in the timing of events between different dimensions become 129 easier to detect. Furthermore, the life course calendar permits a comfortable handling of the 130 complexity of the information and a rather straightforward recording of relatively detailed 131 sequences of events in comparison to the conventional question-response format. Besides, it 132 is a very flexible survey instrument (29). 133 134

Sigrun BEIGE and Kay W. AXHAUSEN 4
FIGURE 1 Example of the multidimensional life course calendar
135
The calendar itself is a matrix with a horizontal time axis for the observed time period 136 from 1985 to 2004 with semi-annual precision. The six-month-intervals are chosen, because 137 this time unit is small enough to ascertain the sequence and relation of events (28). But at the 138

Sigrun BEIGE and Kay W. AXHAUSEN 5
same time, it is necessary to consider the amount of detail as well as accuracy and time 139 distinctiveness with which respondents are able to remember. Bird, Born and Erzberger made 140 the experience that specifications on a semi-annual basis are feasible without larger diffi-141 culties (29). Along the other axis of the calendar, the different items of the retrospective 142 survey are arranged vertically. For the 20 year period, information about turning points, such 143 as important events of the personal and familial history, the household size as well as data on 144 moves and corresponding places of residence was collected. Furthermore, the respondents 145 were asked to indicate their changing ownership of cars and different public transport season 146 tickets, such as national and regional tickets as well as half-fare discount tickets. Data on the 147 places of education and employment, on the main mode of transport for the commuting trip 148 as well as on the personal income was collected for the period from 1985 to 2004. FIGURE 1 149 illustrates an example of the multidimensional life course calendar, showing a person which 150 left the parents’ house in the year 1986, then lived two years alone and then moved together 151 with a partner in a new accommodation. In 1989 the couple married and subsequently had 152 two children. Accordingly, the stated household size changes. There is also a connection to 153 the ownership of the different mobility tools visible. 154
Verhoeven found that people have substantial difficulties to remember and recall 155 aspects of their daily travel behavior, such as mode choice, timing etc., in retrospect (30). 156 These short-term mobility decisions tend to vary more frequently, and are therefore rather 157 hard to collect over longer periods of time. Asking instead for the ‘usual’ travel behavior 158 proved problematic, lowering the quality of the data noticeably, particularly with respect to 159 elements with relatively high levels of short-term intra-personal variability (31). 160
The questionnaire was sent out by mail to 3600 households. Each household received, 161 besides one household form, two person forms that were to be filled in by persons aged 18 162 years and older. The response rate amounted to only 23.1%, which is primarily due to the 163 relative length and complexity of the questionnaire (32). Overall, 780 household forms and 164 1166 person forms are available for further statistical analyses. 165 166 RESULTS 167 168 Over time, the occurrence of important personal and familial events, such as the move out of 169 the parents’ house, the birth of persons in the household, partnerships and marriages as well 170 as break-ups and divorces, is fairly constant, with shares ranging between 0% and 2%. In 171 contrast, alterations in residence, education and employment occur noticeably more 172 frequently, e.g., with about 15% of all the persons moving within each year. Concerning the 173 changes in mobility tool ownership, only about 3% of the respondents vary their mobility tool 174 ownership each year. In about one third of all cases, respondents acquire a car, whereas only 175 10% are related to the abandonment of a car. To a lesser extent and in a more balanced way, 176 this also applies to the various public transport season tickets, pointing to a slightly weaker 177 commitment to public transport. 178
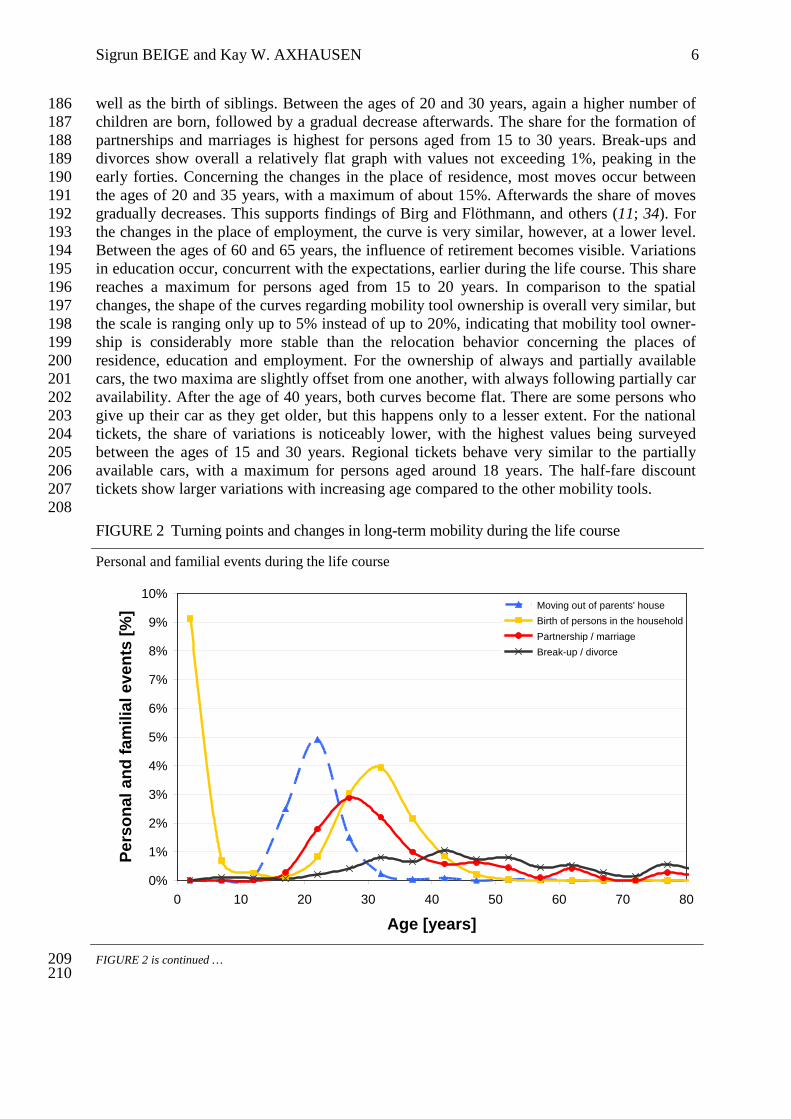
FIGURE 2 shows the occurrence of important turning points during the life course, 179 based on five year intervals. These turning points include personal and familial events, 180 changes in the places of residence, education and employment as well as changes in car 181 availability and public transport season ticket ownership. Most personal and familial events 182 occur rather early in life, consistent with the literature (11; 33; 34). The move out of the 183 parents’ house primarily takes place at the age between 15 and 20 years. The birth of persons 184 in the household shows a maximum at the beginning, covering the respondents’ own birth as 185
Sigrun BEIGE and Kay W. AXHAUSEN 6
well as the birth of siblings. Between the ages of 20 and 30 years, again a higher number of 186 children are born, followed by a gradual decrease afterwards. The share for the formation of 187 partnerships and marriages is highest for persons aged from 15 to 30 years. Break-ups and 188 divorces show overall a relatively flat graph with values not exceeding 1%, peaking in the 189 early forties. Concerning the changes in the place of residence, most moves occur between 190 the ages of 20 and 35 years, with a maximum of about 15%. Afterwards the share of moves 191 gradually decreases. This supports findings of Birg and Flöthmann, and others (11; 34). For 192 the changes in the place of employment, the curve is very similar, however, at a lower level. 193 Between the ages of 60 and 65 years, the influence of retirement becomes visible. Variations 194 in education occur, concurrent with the expectations, earlier during the life course. This share 195 reaches a maximum for persons aged from 15 to 20 years. In comparison to the spatial 196 changes, the shape of the curves regarding mobility tool ownership is overall very similar, but 197 the scale is ranging only up to 5% instead of up to 20%, indicating that mobility tool owner-198 ship is considerably more stable than the relocation behavior concerning the places of 199 residence, education and employment. For the ownership of always and partially available 200 cars, the two maxima are slightly offset from one another, with always following partially car 201 availability. After the age of 40 years, both curves become flat. There are some persons who 202 give up their car as they get older, but this happens only to a lesser extent. For the national 203 tickets, the share of variations is noticeably lower, with the highest values being surveyed 204 between the ages of 15 and 30 years. Regional tickets behave very similar to the partially 205 available cars, with a maximum for persons aged around 18 years. The half-fare discount 206 tickets show larger variations with increasing age compared to the other mobility tools. 207 208 FIGURE 2 Turning points and changes in long-term mobility during the life course
Personal and familial events during the life course
0%
1%
2%
3%
4%
5%
6%
7%
8%
9%
10%
0 10 20 30 40 50 60 70 80
Age [years]
Pers
onal
and
fam
ilial
eve
nts
[%] Moving out of parents' house
Birth of persons in the household Partnership / marriage Break-up / divorce
FIGURE 2 is continued … 209
210

Sigrun BEIGE and Kay W. AXHAUSEN 7
FIGURE 2 continued … 211
Changes in residence, education and employment during the life course
0%
2%
4%
6%
8%
10%
12%
14%
16%
18%
20%
0 10 20 30 40 50 60 70 80
Age [years]
Shar
e of
cha
nges
[%]
Change in place of residence
Change in place of education
Change in place of employment
Changes in car availability and public transport season ticket ownership during the life course
0.0%
0.5%
1.0%
1.5%
2.0%
2.5%
3.0%
3.5%
4.0%
4.5%
5.0%
0 10 20 30 40 50 60 70 80
Age [years]
Shar
e of
cha
nges
[%]
Change in car availability: Always Change in car availability: Partially Change in national ticket ownership Change in regional ticket ownership Change in half-fare discount ticket ownership
212 Analyzing the occurrence and non-occurrence of changes within the same year, 213
significant connections between the different types are observed. The strongest links are 214

Sigrun BEIGE and Kay W. AXHAUSEN 8
detected for always and partially available cars as well as among the various public transport 215 season tickets. The changes in residence, education and employment are also considerably 216 related to one another, confirming findings of Rouwendal and van der Vlist, as well as of 217 others (35). 218
In the following, binomial logit models are presented for the occurrence or non-219 occurrence of changes in residence, education and employment as well as of changes in the 220 ownership of the different mobility tools between the years 1985 and 2004. For this time 221 period, observations on a semi-annual basis are included in the data set. Unfortunately, it is 222 not possible to take the direction of the changes into account, i.e., starting or ending 223 education and employment, since the proportion of changes in the data set is not sufficient to 224 be further distinguished. For the explanatory variables used in the models, the difference 225 between after and before each point in time is calculated on a semi-annual basis. TABLE 1 226 and TABLE 2 show the results of the various estimated binomial logit models. As measure 227 for the goodness of fit, the adjusted ρ2 is given. It is calculated as follows 228
)0((max)12
LKL −
−=ρ , 229
where L(0) and L(max) represent the initial and the final log-likelihoods, respectively, and K 230 denotes the number of estimated parameters (36). In all models, the adjusted ρ2 is relatively 231 high. 232
In the context of the model estimation, it is necessary to take into account that each 233 respondent appears several times as observation and, therefore, to control for unobserved 234 characteristics of the individuals. Thus, an error term is added, which allows individuals who 235 are homogeneous in their observed characteristics to be heterogeneous in their response 236 probabilities (37). Within the model specification, a random parameter is introduced, which is 237 normally distributed across the entire sample, but invariant for each individual. For this 238 parameter, the standard deviation is estimated, while the mean value is set to zero (36). In the 239 models, the estimated standard deviations of the individual-specific error term, which takes 240 the panel effect into account, show relatively low values, indicating a slight heterogeneity in 241 the sample. The sign of the random parameter is not relevant. 242
Concerning the changes in residence, the probability increases with increasing age 243 until reaching a maximum for persons aged between 25 and 30 years, and afterwards the 244 propensity to move declines. This also applies to the alterations in employment. Changes in 245 education are less likely to happen the older the respondents are. Overall, men show a more 246 stable behavior regarding the spatial changes than women. The occurrence of all changes is 247 accompanied by a rising income. Persons moving out of their parents’ house tend to vary the 248 places of education and employment more frequently at the same time. The birth of a person 249 in the household leads to a higher propensity to move as well as to alter employment, 250 confirming results by Aufhauser (33). An increase in the household size influences moving in 251 a negative way, whereas an increase in the accommodation size is related to more changes 252 occurring. For respondents moving abroad, the probability of alterations taking place is 253 reduced, contrary to the expectations. This is related to the specification of the corresponding 254 influencing variable, which further distinguishes the direction of the moves. In this context, 255 the share of persons moving to Switzerland is more than twice as high as the share of persons 256 moving from Switzerland, due to the fact that the retrospective survey was carried out in 257 Switzerland, thereby overemphasizing the negative section of the variable. The index of 258 purchasing power in the residential region measures the changes in consumer prices in a 259
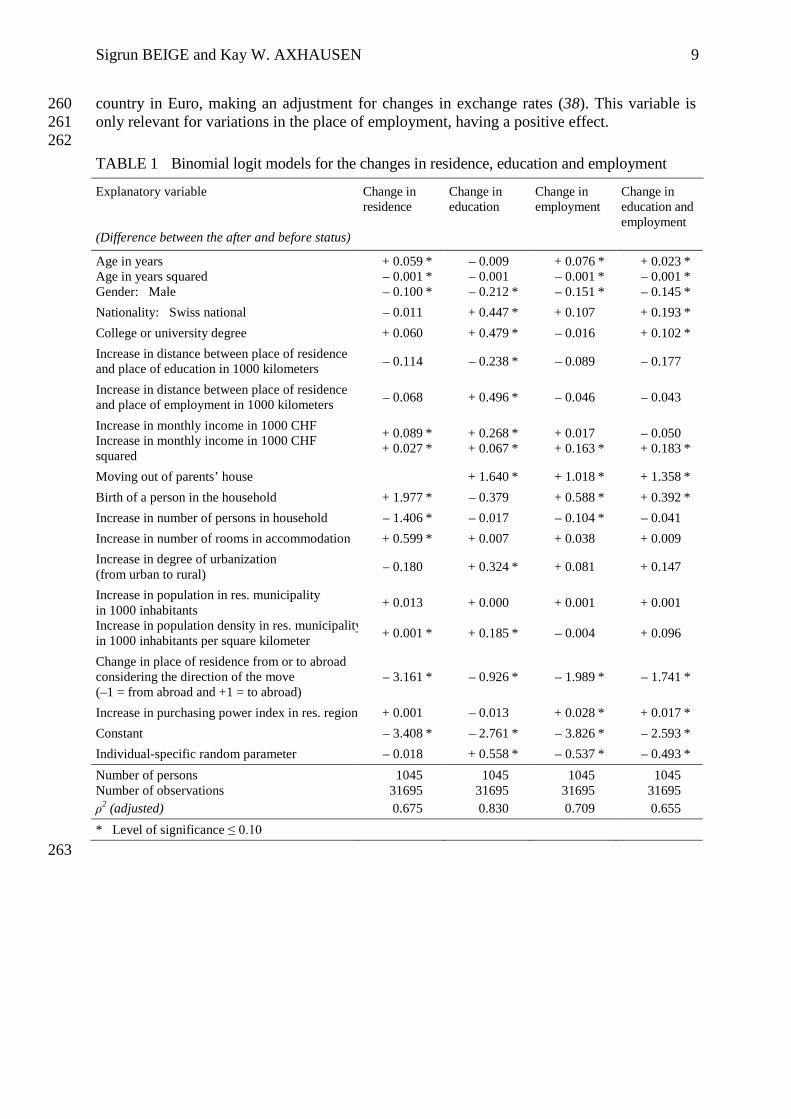
Sigrun BEIGE and Kay W. AXHAUSEN 9
country in Euro, making an adjustment for changes in exchange rates (38). This variable is 260 only relevant for variations in the place of employment, having a positive effect. 261 262 TABLE 1 Binomial logit models for the changes in residence, education and employment
Explanatory variable (Difference between the after and before status)
Change in residence
Change in education
Change in employment
Change in education and employment
Age in years Age in years squared Gender: Male
+ 0.059 * – 0.001 * – 0.100 *
– 0.009 – 0.001 – 0.212 *
+ 0.076 * – 0.001 * – 0.151 *
+ 0.023 * – 0.001 * – 0.145 *
Nationality: Swiss national – 0.011 + 0.447 * + 0.107 + 0.193 * College or university degree + 0.060 + 0.479 * – 0.016 + 0.102 * Increase in distance between place of residence and place of education in 1000 kilometers – 0.114 – 0.238 * – 0.089 – 0.177
Increase in distance between place of residence and place of employment in 1000 kilometers – 0.068 + 0.496 * – 0.046 – 0.043
Increase in monthly income in 1000 CHF Increase in monthly income in 1000 CHF squared
+ 0.089 * + 0.027 *
+ 0.268 * + 0.067 *
+ 0.017 + 0.163 *
– 0.050 + 0.183 *
Moving out of parents’ house + 1.640 * + 1.018 * + 1.358 * Birth of a person in the household + 1.977 * – 0.379 + 0.588 * + 0.392 * Increase in number of persons in household – 1.406 * – 0.017 – 0.104 * – 0.041 Increase in number of rooms in accommodation + 0.599 * + 0.007 + 0.038 + 0.009 Increase in degree of urbanization (from urban to rural) – 0.180 + 0.324 * + 0.081 + 0.147
Increase in population in res. municipality in 1000 inhabitants Increase in population density in res. municipality in 1000 inhabitants per square kilometer
+ 0.013
+ 0.001 *
+ 0.000
+ 0.185 *
+ 0.001
– 0.004
+ 0.001
+ 0.096
Change in place of residence from or to abroad considering the direction of the move (–1 = from abroad and +1 = to abroad)
– 3.161 * – 0.926 * – 1.989 * – 1.741 *
Increase in purchasing power index in res. region + 0.001 – 0.013 + 0.028 * + 0.017 * Constant – 3.408 * – 2.761 * – 3.826 * – 2.593 * Individual-specific random parameter – 0.018 + 0.558 * – 0.537 * – 0.493 * Number of persons Number of observations ρ2 (adjusted)
1045 31695 0.675
1045 31695 0.830
1045 31695 0.709
1045 31695 0.655
* Level of significance ≤ 0.10 263

Sigrun BEIGE and Kay W. AXHAUSEN 10
TABLE 2 Binomial logit models for the changes in car availability and public transport season ticket ownership
Explanatory variable (Difference between the after and before status)
Change in car availability: Always
Change in car availability: Partially
Change in national ticket ownership
Change in regional ticket ownership
Change in half-fare discount ticket ownership
Age in years Age in years squared Gender: Male
+ 0.064 * – 0.002 * – 0.187 *
+ 0.084 * – 0.002 * – 0.327 *
– 0.019 – 0.000 – 0.313 *
+ 0.021 – 0.001 * – 0.364 *
– 0.008 – 0.000 – 0.277 *
Nationality: Swiss national + 0.030 + 0.289 * + 0.731 * + 0.149 + 0.358 * College or university degree – 0.019 + 0.315 * + 1.076 * + 0.004 + 0.457 * Increase in distance between place of residence and place of education in 1000 kilometers – 0.413 * – 0.155 – 0.068 + 0.105 + 0.031
Increase in distance between place of residence and place of employment in 1000 kilometers + 0.051 * + 0.066 * + 0.087 + 0.277 * + 0.080
Increase in monthly income in 1000 CHF Increase in monthly income in 1000 CHF squared
+ 0.257 * + 0.008
+ 0.335 * – 0.004
+ 0.041 + 0.034 *
+ 0.118 * + 0.028 *
+ 0.089 * + 0.034 *
Moving out of parents’ house + 1.597 * + 1.815 * + 1.293 * + 1.392 * + 0.947 * Birth of a person in the household + 0.816 * + 0.759 * – 0.641 + 0.398 + 0.445 Increase in number of persons in household – 0.242 * – 0.141 * – 0.075 – 0.045 – 0.169 * Increase in number of rooms in accommodation + 0.061 + 0.048 + 0.089 + 0.120 * – 0.002 Increase in degree of urbanization (from urban to rural) – 0.203 – 0.325 + 0.293 – 0.245 + 0.171
Increase in population in res. municipality in 1000 inhabitants Increase in population density in res. municipality in 1000 inhabitants per square kilometer
+ 0.001
– 0.025
+ 0.000
– 0.051
– 0.000
+ 0.166
+ 0.001
– 0.079
+ 0.001 *
+ 0.002
Change in place of residence from or to abroad considering the direction of the move (–1 = from abroad and +1 = to abroad)
– 1.132 * – 1.753 * – 0.929 – 0.397 – 2.658 *
Increase in purchasing power index in res. region + 0.014 + 0.023 + 0.006 + 0.046 * + 0.053 * Constant – 4.645 * – 4.817 * – 5.681 * – 3.827 * – 4.175 * Individual-specific random parameter + 0.188 – 0.422 * – 1.032 * – 0.528 * – 0.202 Number of persons Number of observations ρ2 (adjusted)
1045 31695 0.903
1045 31695 0.898
1045 31695 0.928
1045 31695 0.883
1045 31695 0.861
* Level of significance ≤ 0.10 264
Concerning the changes in mobility tool ownership, age as well as gender of the 265 respondents has overall a negative influence on variations in car availability and public 266 transport season ticket ownership. Swiss nationals tend to alter their ownership of mobility 267 tools more frequently than foreign nationals. This also applies to persons holding a college or 268 university degree, except for always available cars. An increase in the distance between the 269 place of residence and the place of education decreases the probability of changes in car 270 availability happening, whereas a place of employment which is further away is accompanied 271

Sigrun BEIGE and Kay W. AXHAUSEN 11
by more alterations. The monthly income has again a positive effect. The move out of the 272 parents’ house results in the occurrence of more changes in the ownership of mobility tools. 273 When a person is born in the household, changes in car availability become more likely, 274 while, at the same time, a growth in household size reduces the respective probability. A 275 move from or to another country leads, contrary to the expectations, to less alterations taking 276 place. An increasing index of purchasing power in the residential region has a positive effect, 277 especially for the variations occurring in public transport season ticket ownership. 278
Overall, turning points in life as well as long-term mobility decisions are considerably 279 connected to one another, this means that changes in the different dimensions of life tend to 280 occur simultaneously. Around 50% of all spatial changes are related to a change in residence, 281 education and employment within the first year. After that, the shares of the longer delays 282 observed strongly decrease. Concerning the delays until the next variation in mobility tool 283 ownership following a move and a change in occupation, the connection is to some extent 284 weaker. Respondents with always available cars show the most stable behavior. In this group 285 changes after a change in residence, education or employment occur for only about 20% of 286 the persons within the first year, whereas this share amounts to about 30% to 35% for persons 287 with partially available cars. For the national and regional tickets, approximately one third of 288 all the delays are shorter than one year. The changes in half-fare discount ticket ownership 289 show trends comparable to the always available cars. And again, the shares of the longer 290 durations until the next change in mobility tool ownership decrease strongly after the first 291 year. An analogue picture arises for the distribution of these durations after variations in car 292 availability and public transport season ticket ownership. In this context, changes among the 293 different mobility tools are very strongly connected to one another. 294
Duration models, which are estimated for the delays occurring subsequent to a move 295 or a change in education or employment until the next changes in the ownership of mobility 296 tools, indicate that with increasing age the so-called hazard or probability of transition 297 decreases, especially after reaching the age of 30 years. Men are in general at a lower risk 298 than women. Already having a car at disposal at the point of time, when a change in 299 residence, education or employment occurs, decreases the probability of changes in car 300 availability of the equal level, whereas an always available car increases the hazard for 301 partially available cars, and vice versa. This means that cars are acquired rather than 302 abandoned, confirming findings of Dargay, providing a further indication of the stability of 303 car availability (21). Among the various public transport season tickets, this relationship 304 between the ownership of the same and another type exists as well. A simultaneous change of 305 the place of residence and the places of education or employment leads to a shorter duration 306 until the next alteration in mobility tool ownership, indicating a stronger effect of such a 307 change (39). 308 309 CONCLUSIONS 310 311 In summary, one can say that there exist strong interdependencies between the various 312 turning points and long-term mobility decisions during the life course. Persons tend to aim 313 for compensation between the different dimensions of life. Changes concerning locations, 314 i.e., the places of residence, education and employment, take place significantly more 315 frequently than changes concerning the ownership of the various mobility tools. At the same 316 time, however, events occur to a great extent simultaneously. As spatial changes take place, 317

Sigrun BEIGE and Kay W. AXHAUSEN 12
the actual travel behavior, using mobility tool ownership as a proxy for this behavior, seems 318 to be reconsidered and altered. 319
Most personal and familial events occur rather early in life. This also applies to the 320 decisions concerning the long-term mobility. In general, persons between the ages of 15 and 321 35 years are most mobile, i.e., moving and changing occupation as well as varying the 322 ownership of mobility tools most frequently. Afterwards they become relatively established. 323 Furthermore, male respondents show a more stable behavior than female respondents. 324 Women seem to be more flexible, for instance, making considerable adjustments following 325 the birth of children. Once children are born and live in a household, they have a stabilizing 326 influence on the long-term mobility of this household. 327
Regarding the design of policy and planning instruments, which seek to change travel 328 behavior, this means that these instruments should aim at the younger generations, as their 329 travel habits and routines are not fully established yet, confirming findings by Prillwitz and 330 Lanzendorf, and, therefore, easier to influence (40). 331
Additional opportunities to significantly affect travel behavior are provided by the 332 turning points in life, such as important personal and familial events as well as changes in 333 residence, education and employment, as habits and routines are broken or at least weakened, 334 and individuals reconsider their behavior and consciously reflect their decisions. There exist 335 only short periods of time during an individual’s life course in which he or she looks into 336 travel choices (14). The analyses of the life courses show that these events play an important 337 role with respect to the ownership of the various mobility tools. In this context, residential 338 relocations as well as changes in occupation seem to be the most important ones. Therefore, 339 these spatial alterations provide interesting starting points for policies and other interventions 340 aiming at travel behavior change, due to accessibility and transport systems changes (41). 341 Corresponding instruments could include the provision of information about alternative ways 342 to travel from or to a new place of residence or occupation, the implementation of more 343 successful mobility management and public transport marketing strategies, especially 344 targeting younger people, new residents or people entering education or employment, as well 345 as the supply of temporary free or discounted public transport tickets, free bicycles, etc. 346 347 REFERENCES 348 349 1 Chapin, F. S., Jr. (1965) Urban Land Use Planning, University of Illinois, Urbana. 350 2 Chapin, F. S., Jr. (1974) Human Activity Patterns in the City, John Wiley & Sons, 351
New York. 352 3 Hägerstrand, T. (1970) What about people in regional science?, Papers in Regional 353
Science, 24 (1) 7-24. 354 4 Scheiner, J. (2006) Housing mobility and travel behaviour: A process-oriented 355
approach to spatial mobility: Evidence from a new research field in Germany, Journal 356 of Transport Geography, 14 (4) 287-298. 357
5 Cao, X., P. L. Mokhtarian and S. L. Handy (2006) Examining the impacts of 358 residential self-selection on travel behavior: Methodologies and empirical findings, 359 Research Report, UCD-ITS-RR-06-18, Institute of Transportation Studies, 360 University of California, Davis. 361
6 Prillwitz, J., S. Harms and M. Lanzendorf (2006) Impact of life course events on car 362 ownership, Transportation Research Record, 1985, 71-77. 363

Sigrun BEIGE and Kay W. AXHAUSEN 13
7 Verhoeven, M., T. Arentze, H. Timmermans and P. van der Waerden (2005) 364 Modeling the impact of key events on long-term transport mode choice decisions: 365 Decision network approach using event history data, Transportation Research 366 Record, 1926, 106-114. 367
8 Hensher, D. A. (1998) The timing of change for automobile transactions: Competing 368 risk multispell specification, in J. de Dios Ortúzar, D. A. Hensher and S. Jara-Diaz 369 (eds.) Travel behavior research: Updating the state of play, 487-506, Elsevier, 370 Oxford. 371
9 Hollingworth, B. J. and E. J. Miller (1996) Retrospective interviewing and its appli-372 cation in study of residential mobility, Transportation Research Record, 1551, 74-81. 373
10 Lanzendorf, M. (2003) Mobility biographies: A new perspective for understanding 374 travel behavior, paper presented at the 10th International Conference on Travel 375 Behavior Research, Lucerne, August 2003. 376
11 Wagner, M. (1990) Wanderungen im Lebensverlauf, in K. U. Mayer (ed.) Lebens-377 verläufe und sozialer Wandel, Kölner Zeitschrift für Soziologie und Sozial-378 psychologie, Sonderheft 31, 212-238. 379
12 Elder, G. H., Jr. (2000) The life course, in E. F. Borgatta (ed.) Encyclopedia of 380 Sociology, 1614-1622, Macmillan Reference, New York. 381
13 Simma, A. and K. W. Axhausen (2003) Commitments and modal usage: Analysis of 382 German and Dutch panels, Transportation Research Record, 1854, 22-31. 383
14 Gorr, H. (1997) Die Logik der individuellen Verkehrsmittelwahl: Theorie und Realität 384 des Entscheidungsverhaltens im Personenverkehr, Focus Verlag, Giessen. 385
15 Jones, P. M., M. C. Dix, M. I. Clarke and I. G. Heggie (1983) Understanding Travel 386 Behaviour, Gower Publishing, Aldershot. 387
16 Lanzendorf, M. (2006) Key events and their effect on mobility biographies: The case 388 of child birth, paper presented at the 11th International Conference on Travel 389 Behaviour Research, Kyoto, August 2006. 390
17 Mayer, K. U. (1990) Lebensverläufe und sozialer Wandel: Anmerkungen zu einem 391 Forschungsprogramm, in K. U. Mayer (ed.) Lebensverläufe und sozialer Wandel, 392 Kölner Zeitschrift für Soziologie und Sozialpsychologie, Sonderheft 31, 7-21. 393
18 Ryder, N. B. (1965) The cohort as a concept in the study of social change, American 394 Sociological Review, 30 (6) 843-861. 395
19 Sackmann, R. and M. Wingens (2001) Theoretische Konzepte des Lebenslaufs: 396 Übergang, Sequenz und Verlauf, in R. Sackmann and M. Wingens (eds.) Strukturen 397 des Lebenslaufs: Übergang, Sequenz, Verlauf, Statuspassagen und Lebenslauf, 1, 17-398 48, Juventa Verlag, Weinheim. 399
20 Box-Steffensmeier, J. M. and B. S. Jones (2004) Event history modeling: A guide for 400 social scientists, Cambridge University Press, Cambridge. 401
21 Dargay, J. M. (2001) The effect of income on car ownership: Evidence of asymmetry, 402 Transportation Research Part A, 35 (9) 807-821. 403
22 Diekmann, A. (1995) Empirische Sozialforschung: Grundlagen, Methoden, An-404 wendungen, Rowohlt Taschenbuch Verlag, Reinbek bei Hamburg. 405
23 Zumkeller, D., J.-L. Madre, B. Chlond and J. Armoogum (2006) Panel surveys, in P. 406 Stopher and C. Stecher (eds.) Travel Survey Methods: Quality and Future Directions, 407 363-398, Elsevier, Oxford. 408
24 Scott, J. and D. Alwin (1998) Retrospective versus prospective measurement of life 409 histories in longitudinal research, in J. Z. Giele and G. H. Elder, Jr. (eds.) Methods of 410

Sigrun BEIGE and Kay W. AXHAUSEN 14
Life Course Research: Qualitative and Quantitative Approaches, 98-127, Sage 411 Publications, Thousand Oaks. 412
25 Brückner, E. (1990) Die retrospektive Erhebung von Lebensverläufen, in K. U. Mayer 413 (ed.) Lebensverläufe und sozialer Wandel, Kölner Zeitschrift für Soziologie und 414 Sozialpsychologie, Sonderheft 31, 374-403. 415
26 Gärling, T. and K. W. Axhausen (2003) Introduction: Habitual travel choice. 416 Transportation, 30 (1) 1-11. 417
27 Beige, S. and K. W. Axhausen (2005) Feldbericht der Befragung zur langfristigen 418 räumlichen Mobilität, Arbeitsberichte Verkehrs- und Raumplanung, 315, Institut für 419 Verkehrsplanung und Transportsysteme, ETH Zürich, Zürich. 420
28 Freedman, D., A. Thornton, D. Camburn, D. Alwin and L. Young-DeMarco (1988) 421 The life history calendar: A technique for collecting retrospective data, Sociological 422 Methodology, 18, 37-68. 423
29 Bird, K., C. Born and C. Erzberger (2000) Ein Bild des eigenen Lebens zeichnen: 424 Zum Einsatz eines Kalenders als Visualisierungsinstrument zur Erfassung individu-425 eller Lebensverläufe, Sfb-Arbeitspapier, 59, Universität Bremen, Bremen. 426
30 Verhoeven, M. (2010) Modelling life trajectories and transport mode choice using 427 Bayesian Belief Networks, dissertation at the Technische Universiteit Eindhoven, 428 Faculteit Bouwkunde, Urban Planning Group, Eindhoven. 429
31 Behrens, R. and R. Del Mistro (2008) Analysing changing personal travel behaviour 430 over time: Methodological lessons from the application of retrospective surveys in 431 Cape Town, paper presented at the 8th International Conference on Survey Methods 432 in Transport: Harmonisation and Data Quality, Annecy, May 2008. 433
32 Axhausen, K. W. (2007) Predicting response rate: A natural experiment, Arbeits-434 berichte Verkehrs- und Raumplanung, 434, Institut für Verkehrsplanung und 435 Transportsysteme, ETH Zürich, Zürich. 436
33 Aufhauser, E. (1995) Wohnchancen – Wohnrisiken: Räumliche Mobilität und 437 wohnungsbezogene Lebensführung in Wien im gesellschaftlichen Wandel, Ab-438 handlungen zur Geographie und Regionalforschung, 4, Institut für Geographie der 439 Universität Wien, Wien. 440
34 Birg, H. and E. J. Flöthmann (1992) Biographische Determinanten der räumlichen 441 Mobilität, in Akademie für Raumforschung und Landesplanung (ed.) Regionale und 442 biographische Mobilität im Lebensverlauf, Forschungs- und Sitzungsberichte, 189, 443 27-52, Akademie für Raumforschung und Landesplanung, Hannover. 444
35 Rouwendal, J. and A. van der Vlist (2005) A dynamic model of commutes, 445 Environment and Planning A, 37 (12) 2209-2232. 446
36 Bierlaire, M. (2005) An introduction to BIOGEME (Version 1.4), Institute of Urban 447 and Regional Planning and Design, EPFL, Lausanne. 448
37 Hsiao, C. (2003) Analysis of Panel Data, Cambridge University Press, Cambridge. 449 38 Olsson, C. (2005) The index of purchasing power of the Euro, Statistics in focus: 450
Economy and Finance, 23, 1-8. 451 39 Beige, S. (2008) Long-term and mid-term mobility decisions during the life course: 452
Findings from a retrospective survey, Südwestdeutscher Verlag für Hochschul-453 schriften, Saarbrücken. 454
40 Prillwitz, J. and M. Lanzendorf (2006) The importance of life course events for daily 455 travel behaviour: A panel analysis, paper presented at the 11th International 456 Conference on Travel Behaviour Research, Kyoto, August 2006. 457

Sigrun BEIGE and Kay W. AXHAUSEN 15
41 Bamberg, S. (2006) Is a residential relocation a good opportunity to change people’s 458 travel behavior? Results from a theory-driven intervention study, Environment and 459 Behavior, 38 (6) 820-840. 460
461


